consulting project for an insurance company with the topic ...
Upload
khangminh22Category
view
5download
0
65yearsof excellence
annual report2013


Page 4 Page 6
Page 12 Page 20
Page 10
introduction chairman’s review
financial highlights governance
report
the governance structure
internal audit
risk management report
board of directors
financial statements
corporate
company profile
senior management
corporate social
sustainability
responsibility
report
read more stories
Page 24 Page 42
Page 50 Page 55
Page 72Page 60 Page 66
65thanniversary
Page 98

youarehere
introduction
company profile 10
corporate governance report 20
risk management report 60
sustainability report 72
financial statements 98
4
introductiondear shareholder,The Board of Directors is pleased to present the Annual Report of The Mauritius Union Assurance Cy. Ltd for the year ended 31 December 2013.This Annual Report was approved by the Board of Directors on 28 March 2014.

Youarehere
OveRview
On the international scene, the global economy maintained its slow growth which translated itself into modest enhancements in economic activity but gradual improvements in premium rates in large key markets. However, the low-interest environment continued to challenge the profitability of insurance companies. Nonetheless, on a more positive note, low catastrophe losses and reserve releases have helped underwriting results. In Mauritius, the economy grew by 3.2% in 2013, a commendable performance, although it was still below its true potential and less than the 3.4% registered in 2012. The growth of the finance and insurance sector decelerated slightly from 5.7% to 5.4%. For the insurance sector, the main occurrence was the flash flood of 30th March 2013 which resulted in estimated losses of Rs500m for the industry. Despite these losses, the market remained soft amidst strong price competition among insurers.
Results
The gross earned premiums for the Group increased by 7% to Rs2.3bn and the profit before tax increased by 11% to Rs301m. Overall profit after tax rose by 12% to Rs260m.Concerning the short-term business, gross earned premiums rose by 8% to reach Rs1, 610m and net claims incurred increased by 14% to Rs719m mainly on the back of the effect of flash flood. Investment income fell from Rs74m to Rs63m as funds were invested in lower yield US dollar deposits to finance the acquisition in sub-Saharan Africa. Profit before tax fell by 25% to Rs203m. Taxation charge increased from Rs36m to Rs42m. Overall profit after tax decreased from Rs236m to Rs162m.
Regarding long-term business, gross premiums increased by 6% to Rs675m. Our initiatives to control costs started to bear fruits with operating expenses falling by 15% to Rs111m. The strong performance of the equity markets helped to turn around the fair value deficit in 2012 into a surplus of Rs458m for the year.
DiviDeND
The Board has again declared a total dividend of Rs100.2m, equivalent to a dividend of Rs5.00 per share. It took into account both the prescribed minimum regulatory capital requirements and the expected capital commitments for a number of strategic initiatives.
65th
anniversary2013 was marked by the celebration of the 65th anniversary of Mauritius Union. It gave us the opportunity to trace the company’s roots back to its creation in 1948 and recall its continued progress in line with the socioeconomic development of our country. We also availed ourselves of the occasion to meet all our stakeholders to reassure them of our ongoing support and commitment for our mutual benefit.
sustaiNaBility RepORtiNg
The group has embarked on a new initiative in respect of sustainable development. It carried out an audit of its practices in terms of sustainable development and identified the issues that must be addressed to promote best practices. A summarized version of the report is presented on page 72.
pROspects
Initial estimates for 2014 show that global growth should maintain its recovery at 3.7%, led primarily by a recovery in developed economies. The local economy is also set to grow by 3.7%. However, the growth of the finance and investment sector should ease from 5.4% to 5.2% in 2014. At the level of the group, we are taking all the steps to modernize our IT architecture to enhance our operational efficiency. In this respect, we plan to complete our new Health Insurance application and a common accounting platform during the course of 2014. Our cross-border acquisition in sub-Saharan Africa will provide us with a strong growth foundation to deal with future challenges whilst allowing us to capitalize on the opportunities that go hand in hand with these challenges.
cONclusiON
In closing, I would like to thank all the staff of the Mauritius Union Group for their continued dedication and contribution during the year. My sincere thanks go to all my colleagues on the Board of Directors for their support throughout 2013.I also have to pay tribute to all our intermediaries- brokers, accredited agents and salespersons that have provided the link between our group and our customers.
Domique GALEAcHaiRMaN
6
chairman’s review
DEAR SHAREHOLDER,On behalf of the Board, I am pleased to submit to you the annual report of the Mauritius Union Group for the year ended 31 December 2013.
introduction
company profile 10
corporate governance report 20
risk management report 60
sustainability report 72
financial statements 98
chairman’s review
retrospect of 65 years & milestones

Youarehere
tHe fOuNDeR, MR. NOël cOigNetMr. Noël Coignet was a humanist and a businessman who cared for everyone. His main motivation was to provide insurance cover for everyone. He wanted all ethnic groups to be involved and the first board of administration was as colorful as the nation. He was also a man of action. He was not afraid to go out and explain how contracting insurance could help face difficult situations. His creativity went beyond mere business matters and he proved it by creating the advertising line: “Maximum security for minimum bonus” along with an affordable policy of only Rs2.00 per month.
a MauRitiaN cOMpaNy
At the end of World War II, Mauritius was the scene of great changes. The population was growing; major road works were being undertaken while schools and hospitals were being built. Mauritians were enjoying a better quality of life and greater longevity with fewer health issues. Therefore, Mauritius Union offered access to affordable financial protection to Mauritian citizens earning a humble income. It was the democratization of insurance, and the objective behind it was to help Mauritians secure their future. It was also the time when the company diversified its products so as to address the changing situation. New policies covering thefts and accidents were made available.
values aND visiON
Through all the years, the mission of the Mauritius Union has been to look after people, both its staff and clients. Today this mission statement is still the bedrock of all our actions. The spirit that motivated the founder continues to inspire the company which thrives by innovating and modernizing its products and image.
tHe celeBRatiON
The Mauritius Union Group invited the Honorable Xavier Luc Duval, Vice Prime Minister and Minister of Finance and Economic Development, Me Marc Hein President of the Financial Service Commission and Mrs. Clairette Ah Hen, Chief Executive Officer of the Financial Service Commission, to join the group for a celebration under the theme retro-chic. Several activities were organised in Port Louis to commemorate the great work that has been accomplished over all these years, with special attention given to employees who have been serving the company for more than 30 years. This highlights the loyalty and devotion that characterize the Mauritius Union Group.
8
RETROSPECT OF
65 years & milestonesin 1948 when Mr. Noël coignet founded an insurance company, his humble mission was to protect his relatives and friends from risks and create a business for Mauritians by Mauritians, an audacious project, led by a visionary man. it has grown to become one of the top insurance companies 65 years later. this is an opportunity to highlight the achievement of all those who have contributed to the growth of Mauritius union.
introduction
company profile 10
corporate governance report 20
risk management report 60
sustainability report 72
financial statements 98
chairman’s review
retrospect of 65 years & milestones

youarehere
companyprofile
10
introduction 4
company profile
corporate governance report 20
risk management report 60
sustainability report 72
financial statements 98

Youarehere
YOUAREHERE
4
introduction 1
financial highlights
corporateinformation 7
board of directors 11
director’s profile 12
senior managementteam 20
chairman’s review 26
chief executiveofficer’s report 29
corporategovernance report 33
risk managementreport 50
secretary 57
auditor’s report 61
financial statements 74
GROUP RESULTS (Rs’M)
2013
2,27
0
1,90
7
301
2009 2010 2011 20121,
055
917
324
2,04
0
1,72
9
302
2,12
9
1,79
6
272
1,81
3
1,48
7
390
2009GPE
NEP
PBT
1,055
917
324
1,813
1,487
390
2,040
1,729
302
2,129
1,796
272
2,270
1,907
301
2010 2011 2012 2013
FINANCIAL POSITION (Rs’M)
2009SF
TA
1,230
5,214
1,101
7,948
1,368
8,122
1,448
8,641
1,722
9,702
2010 2011 2012 2013
2013
1,72
2
9,70
2
2009 2010 2011 2012
1,23
0
5,21
4
1,36
8
8,12
2
1,44
8
8,64
1
1,10
1
7,94
8
Gross Premium EarnedNet Earned PremiumProfit Before Tax
Shareholders FundsTotal Assets
Net Assets Per Share
GROUP NET ASSETS PER SHARE GROUP NET ASSETS PER SHARE (Rs)
200961.39 54.94 68.24 72.26 85.95
2010 2011 2012 2013NAPS
90.0080.0070.0060.0050.0040.0030.00
2009 2010 2011 2012 2013
61.3
9
54.9
4 68.2
4
72.2
6 85.9
5
2009 2010 2011 2012 2013
NET GENERAL INSURANCE PREMIUM (Rs’M)
2009NIP 643 805 1,244 1,250 1,282
2010 2011 2012 2013
Net Insurance Premium
1,28
2
643
1,24
4
1,25
0
805
2009 2010 2011 2012 2013
NET LIFE INSURANCE PREMIUM (Rs’M)
2009NIP 317 470 572 580 652
2010 2011 2012 2013
Net Insurance Premium
652
317
572 58
0
470
LIFE ASSURANCE FUND
2009 2010 2011 2012 2013
2,97
1
4,85
6
4,89
1
5,11
2 5,84
2
6,000
5,000
4,000
3,000
2,000
Life Assurance Fund
LIFE ASSURANCE FUND (Rs’M)
20092,971 4,856 4,891 5,112 5,842
2010 2011 2012 2013LAF
12
financial highlights
introduction 4
company profile
corporate governance report 20
risk management report 60
sustainability report 72
financial statements 98
financial highlights
group structure & core businesses
corporate information
management review by chief executive officer

Youarehere
RegisteReD Office4, Leoville L’Homme StreetPort LouisRepublic of MauritiusTelephone: +230 207 5500Fax: +230 212 2962Email: [email protected]: www.mauritiusuniongroup.com
auDitORsernst & young
actuaRiesDeloitte Actuarial & Insurance Solutions, South Africa
MaiN BaNkeRsABC Banking Corporation LtdAfrasia Bank LimitedBank One LimitedBanque des Mascareignes LteeBarclays Bank PlcHong Kong & Shanghai Banking Corporation LimitedInvestec Bank (Mauritius) LtdMauritius Commercial Bank LtdSBI (Mauritius) LtdStandard Bank (Mauritius) LimitedState Bank of Mauritius Ltd
secRetaRyECS Secretaries Ltd
sHaRe RegistRyAbax Corporate Administrators
group structure & core businesses
corporateinformation
14
la pRuDeNce(MauRicieNNe)
assuRaNcesltee
assOciateDBROkeRs ltD
feBeRassOciates
ltD
NatiONalMutual
fuND ltD
MauRitius uNiONassuRaNce cy. ltD
Short-term Insurance (health included)
Long-term Insurance
Collective Investment Schemes Manager
Investment Dealer
Pension Scheme Administrator, Investment Advisor (Unrestricted),
Actuarial Services
100%
100% 98.57%
80%
introduction 4
company profile
corporate governance report 20
risk management report 60
sustainability report 72
financial statements 98
financial highlights
group structure & core businesses
corporate information
management review by chief executive officer

Youarehere
management reviewand performance
MANAGEMENTreviewBy tHe cHief executive OfficeR
We are pleased to present to you a review of the performance of the Group and the Company for the year ended 31 December 2013. Despite the fact that the insurance market registered claims to the tune of Rs500m following the flash flood in March 2013, premium rates have remained under pressure as market conditions stayed soft.
gROup’s peRfORMaNce
Rs M 2013 2012
Gross Earned Premium 2,270 2,129
Net Claims and Benefits -1,893 -1,222
Operations and Administrative Expenses -637 -658
Profit from Operations 316 288
Profit before Tax 301 271
Income tax expense -40 -38
Profit after tax 260 233
The gross earned premiums for the Group increased by 7% to Rs2.3bn and the profit before tax increased by 11% to Rs301m. Overall profit after tax rose by 12% to Rs260m.
geNeRal iNsuRaNce Review
Rs M 2013 2012
Gross Earned Premium 1,609 1,493
Net Claims and Benefits -719 -631
Operations and Administrative Expenses -487 -478
Profit from Operations 219 288
Profit before Tax 203 271
Income tax expense -41 -35
Profit after Tax 162 236
The year 2013 has been mainly marked by the flash flood that occurred on 30th March 2013. This has had a significant impact on the profitability of the overall general insurance portfolio. The company recorded a total of 235 claims amounting to Rs114M; the main classes of business affected were the Motor, Fire & Allied Perils and Engineering during this unfortunate event. In addition, the company registered several fire claims which adversely impacted the Fire & Allied line of business.The general insurance market has experienced severe downward pressure on premium rates, mainly explained by a soft reinsurance market and increased competition. Despite this situation, the Gross Earned Premium increased by 8% to reach Rs1.6bn. We have enhanced our underwriting approach through strict control on rates and pricing, while detailed analysis of all commercial risks, at their renewal, have been instigated for a better underwriting appreciation and decision. Such corrective actions are expected to help reap benefits in 2014 and onwards. All classes of business contributed positively to the overall underwriting results in 2013 and we have been able to maintain operating and administrative expenses within an increase of 5%.The motor business remains one of the main classes of the general insurance portfolio in terms of turnover and profitability. This line of business experienced a decrease of 2.5% in premium contribution in 2013, mainly explained by the downward pressure on premium rates. We have maintained strict selection of risks and control, which have resulted in an increase in underwriting profit, despite the above-mentioned fall in gross premium. During the year, we have also reviewed our internal processes of underwriting and claims to streamline the current operations while maintaining strict control on underwriting, pricing and claims handling. We are confident that such a review is expected to reap further benefits and to add positively to overall premium contribution and profitability in 2014.The health portfolio is another major class of business within the general insurance portfolio. This line of business has contributed significantly to the overall general insurance results, with an increase of 18% and 5% in gross premium and underwriting results respectively. We have maintained a strict underwriting discipline in risk selection and pricing, while exerting rigorous claims handling control through better screening. Such actions have impacted positively both on premium contribution and
16
introduction 4
company profile
corporate governance report 20
risk management report 60
sustainability report 72
financial statements 98
financial highlights
group structure & core businesses
corporate information
management review by chief executive officer

Youarehere
IT systems, a new enterprise-class data centre is being built to provide an optimal operating environment to our IT equipment.Following the successful launch of online e-commerce portals in 2013, the group will further enhance such services so as to improve operational efficiency and customer service.
HuMaN ResOuRces
In line with the group’s philosophy of promoting employee happiness, well-being and career development, we implemented several initiatives to sustain the development, motivation and retention of our human assets whilst embedding a performance result-oriented culture. In this respect the performance appraisal system has been enhanced for a better alignment of the objectives of the group with those of the employees. During the year the group has continued to invest in staff learning, education and training. In 2013, we enhanced the capabilities of our management, especially in terms of technical skills.
pROspects
The local market continues to be impacted by pressure on rates. Competition amongst local insurance companies is not showing sign of abating and premium rates on certain lines of business are well below technical rates. On the reinsurance side, the market is likely to remain soft as capacity remains plentiful.We are confident that our expansion strategy in sub-Saharan Africa will provide a strong foundation to sustain growth over the long term.
gROup suBsiDiaRiesfeBeR assOciates
Feber Associates, founded in 1985, is a pioneer in all corporate pension needs (administration, actuarial and investments). The company showed a good resilience during the past year and posted an increase in its turnover to reach Rs22.3m and a marked increase of 38% on its profitability before tax. These good results were driven by new businesses, reinforcement of the Group Actuarial department and continuous efficiency improvement in the pension administration process. On the back of the strength of the Group, the development of its pension activities and its foreign partnerships, Feber Associates has significantly increased its number of institutional clients.We are confident that the new legislative environment, the broad array of pension capabilities, and the constant commitment to client service will maintain Feber in its leadership position in the pension industry.
NatiONal Mutual fuND
The National Mutual Fund (NMF), founded in 1990, is a pioneer in mutual funds investment and the first Mauritian player to engage in unit trust activities. It is currently licensed as a CIS manager. During the year 2013, NMF has significantly worked on its image in order to position itself as the ideal savings vehicle for Mauritians. Our campaign on social media platforms and through TV adverts has significantly helped us to modernize and increase the dynamic image and visibility of the NMF. It posted a profit before tax of Rs1.7m and a turnover of Rs9m. NMF is the Fund Manager of two exclusive and well-performing funds, the NMF General Fund and the NMF Property Trust. Both funds have achieved commendable performance during the year and paid dividends in excess of banks’ savings rate. The NMF General Fund size as at 31 December 2013 was MUR 594m whereas the NMF Property Trust stood at Rs126m. The key objective of the company is to maintain an efficient and a competitive risk / return approach for both funds.
assOciateD BROkeRs
The company was incorporated in 1989 to undertake stock broking activities on the newly created Port Louis Stock Exchange. Associated Brokers Ltd (ABL) was one of the pioneers of the equity market development in Mauritius. It has since been involved in many assignments as Financial Advisor and Sponsoring Stockbroker in Public Offerings, Rights Issues and Private Placements of Shares of various Companies. ABL employs well-qualified staff members who are conversant with all issues concerning the floatation of various types of capital market instruments and has a well-balanced client base. Today the company stands with substantial assets in the form of an office building from which it operates, an appreciable equities’ portfolio and cash at bank and has been showing steady profits year after year.
cONclusiON
On behalf of the Board, I would like to thank all members of the staff of the Group for their contribution during the past year. I also put on record the trust placed by all our customers.
Lakshmana (Kris) LUTCHMENARRAIDOOcHief executive OfficeR
profitability. The challenge is to maintain the claims cost and administrative expenses at reasonable levels while enhancing customer service. In the light of these objectives, the company has invested heavily in a modern information system that will enhance the efficiency of the operation on this line of business.We have further improved our performance on the Financial & Special Risks businesses with an increase of 36% and 14% in premium and underwriting results respectively. We continued to strengthen our partnership with our reinsurers, international brokers and other intermediaries. This has reinforced our position on the market.On the investment front, the company invested in short-term USD deposits-funds earmarked to finance the overseas acquisition and this resulted in lower interest income.Overall, the profit from operations was impacted negatively by 23% to reach Rs219m. This is mainly explained by the flash flood episode and the lower investment income. Profit before tax reached 203M, while the profit after tax amounted to Rs161M.
life iNsuRaNce Review
Rs’000 2013 2012
gwP 675,647 635,391
Net claims 444,481 370,618
Net underwriting results 196,851 206,212
Management expenses 99,099 116,077
Investment income 288,146 332,467
Expense ratio (%) 14.7% 18.3%
Life fund 5,842 5,112
Shareholder fund 295.8 195.6
We were expecting a challenging year in 2013 due to the far-reaching negative impact of the world economic situation.On the sales side, with the drop in the purchasing power of Mauritians, we knew that special efforts would have to be deployed in order to achieve our targets. The actions started with a complete review of our product offerings and were followed by the launch of our revised set of pure risk products early in the year. A planned incentive program was also put in place
to boost our sales force for better performance with a view to capturing a higher portion of the pure risk life assurance market. To further increase our market share for this line of business, more emphasis was laid on developing new distribution channels. We exceeded our new business target by 20% and our gross written premium reached Rs676m for the year- an increase of 6% over 2012.At the other end, the harmonization of unit linked funds, which were designed earlier, were systematically followed and resulted in a new fund structure with clear investment strategies. The combined portfolio return for the year was at 14.2% due to a good recovery of the local equity market over the year. The life fund reached Rs5.9bn by year end.Management expenses were kept under constant review during the year. This resulted in a significant improvement in expense ratio. This was combined with a review of the department’s structure and processes. Thus we improved our operational efficiency and service level. On the regulatory side, we saw a series of draft rules being issued for consultation before implementation. Some rules of the Private Pension Scheme Act were enforced and some were modified, engendering a major change in the structure which is currently being implemented.
seycHelles
Our branch in Seychelles is picking up momentum slowly. We continued to build our HR capacity and recruited a Seychellois to oversee our operations. We further increased our visibility through a number of marketing and communications campaigns carried out during the year.
iNfORMatiON systeMs
With regard to Information Systems, as part of its IT strategy, the group has embarked on a major systems implementation project which consists of replacing its core business applications with a view to improving operational efficiency, customer service and business agility. The implementation, initiated in the second quarter of 2013, is being undertaken in a phased manner starting with Lending, Health Insurance and a common accounting platform. The Lending system went live in December 2013 and the other two will be operational by the third quarter of 2014.On the infrastructure side, given the criticality of our
introduction 4
company profile
corporate governance report 20
risk management report 60
sustainability report 72
financial statements 98
financial highlights
group structure & core businesses
corporate information
management review by chief executive officer
18

youarehere
corporategovernancereport
introduction 4
company profile 10
corporate governance report
risk management report 60
sustainability report 72
financial statements 98
20

Youarehere
22
The Board of directors of The Mauritius Union Assurance Cy. Ltd (the Board) endorses the Code of Corporate Governance for Mauritius issued by the National Committee on Corporate Governance.The Board advocates the conduct of business practices that display characteristics of good corporate governance, namely discipline, transparency, independence, accountability, fairness and social responsibility. The directors further confirm that the Company has striven to comply, in all material respects, with the principles of the Code and has provided the necessary explanations where appropriate.
introduction
introduction 4
company profile 10
corporate governance report
risk management report 60
sustainability report 72
financial statements 98
introduction
board of directors
committees of the board
director’s attendance at board meetings and committees of the board

Youarehere
organised on various topics related to Board matters and Corporate Governance issues.The Board has agreed to a formal evaluation of its own performance and that of its directors. This task has been entrusted to an independent consultant. The objective of the exercise is to assess the performance of the Board as a whole, its individual members including the chairman, and to identify areas requiring improvement. As recommended by the Code of Corporate Governance, all directors will stand for re-election at the annual meeting of shareholders. The Chairperson assumes his role for a pre-agreed period and is elected on an annual basis by the Board of Directors.
The Company has a unitary Board consisting of eleven directors, six of whom are independent non-executives, four non-executives and one executive, namely the Chief Executive Officer.This composition aims at achieving a balanced Board which has the appropriate skills, experience, knowledge and independence required for it to assume fully its responsibilities while discharging its duties effectively. The strong executive management presence, as recommended by the Code, is ensured by the Chief Executive Officer who is an appointed member of the Board, the CEO Designate, the Chief Finance Officer and the Head of Group Strategy & Financial Services who, although not appointed members of the Board, attend all meetings and contribute actively to its deliberations. The appointment of a second executive director would be looked into this coming year. The Board is ultimately responsible for the corporate policy and strategy of the Company and its subsidiaries and is governed by a Board Charter and Code of Good Conduct which were reviewed and adopted on 11 November 2010.The Board holds a minimum of six scheduled meetings every year during which it validates and monitors strategies, policies and business plans as well as considers all statutory matters, including the approval of unaudited quarterly results for publication, audited financial statements, the declaration of dividends, the review of the company’s performance through budgets and forecasts and the Chief Executive Officer’s report. In addition, the Board meets between scheduled meetings to address any matter that may require its attention.The Board met eight times during the year under review.There is a clear separation between the role of the Chairperson and that of the Chief Executive Officer. The Chairperson leads the Board, ensuring that all directors participate fully and constructively in the functioning of the Company and in the decision-making process. He acts as the main informal link between the Board and management
and, particularly, between the Board and the Chief Executive Officer. He ensures, with the Company Secretary’s participation, unhindered access to information by all Board and committee members so that they may contribute in a meaningful way to board meetings and to other discussions and are able to take informed decisions. The Chief Executive Officer’s responsibilities encompass the development and recommendation of a long-term company vision and strategy that will generate satisfactory levels of shareholder value as well as positive and reciprocal relations with relevant stakeholders. He prepares the annual business plans and budgets to be presented to the Board, strives to achieve the company’s financial and operating goals and objectives, and ensures that day-to-day business is professionally and appropriately monitored and managed. The Chief Executive Officer is responsible for the implementation of strategies and policies approved by the Board.The independent non-executive directors bring to the Board a wide range of experience and skills. They are clear of any conflicting business interest or other relationships which could materially affect their ability to exercise independent judgement.Directors newly appointed to the Board go through an induction whereby they receive a pack of materials containing basic information on the Company such as contained in its constitution and its code of good conduct and are made aware of the restrictions in respect of dealings in shares and the disclosure obligations in case of conflicts of interest. Upon appointment, directors’ interests, if any, are recorded in a Directors’ Interest Register which is kept under the control of the Company Secretary and updated as and when required. Meetings are organised with senior staff in order to familiarise the new director with the Company’s operations, products and business environment. Being committed to professional development, the Board encourages its members to participate in appropriate forums in order to update and improve their skills and knowledge. During the year under review, all board members attended conferences
board of directors
introduction 4
company profile 10
corporate governance report
risk management report 60
sustainability report 72
financial statements 98
introduction
board of directors
committees of the board
director’s attendance at board meetings and committees of the board
24

Youarehere
mr lakshmana (kris) lutchmenarraidoo executive Director – appointed in 2011
Mr Lakshmana (Kris) Lutchmenarraidoo, born in 1951, worked for the State Bank of Mauritius from 1973 to 1986 and holds a Banking Diploma from Finafrica Institute.He held the following Senior Management positions:• Assistant General Manager of the State Bank
of Mauritius from 1982 to 1986. • General Manager of Mauritius Leasing
Company Ltd from 1987 to 1997, and Managing Director from 1997 to 2002.
• President of the Financial Services arm of the British American Group from 1999 to 2002.
• Executive Chairman of Mauritius Post Ltd from 2002 to 2003.
• Chief Executive Officer of the Mauritius Post and Cooperative Bank Ltd from May 2003 to September 2005,
• General Manager of Mauritours Ltd from December 2005 to August 2007.
• General Manager of La Prudence (Mauricienne) Assurances Ltee from September 2007 to December 2010.
• Chief Executive Officer of The Mauritius Union Assurance Cy. Ltd as from 1 January 2011.
Mr Lutchmenarraidoo is also the Chairman Fondation Mauritius Union Ltd, and a Director of La Prudence (Mauricienne) Assurances Ltee, of National Mutual Fund Ltd, of Associated Brokers Ltd and of Feber Associates Ltd.
mr vincent ah chuenDirector - appointed in 1992
Mr Vincent Ah Chuen, born in 1944, is the Managing Director of ABC Group of Companies. He was appointed to the Board of The Mauritius Union Assurance Cy. Ltd in 1992 and is a member of its Corporate Governance, Nomination and Remuneration Committee. He is the Chairman of Associated Brokers Ltd and a Director of La Prudence (Mauricienne) Assurances Ltee. Mr Ah Chuen is also a Director of Les Moulins de La Concorde Ltee, of POLICY Ltd, of ABC Motors Co. Ltd, of New Goodwill Investment Ltd and Council Member of Sir J. Moilin Ah-Chuen Foundation.
mr dominique galeaDirector – appointed in 2010
Mr Dominique Galea, born in 1952, holds a “Hautes Etudes Commerciales” (HEC) degree. He started his career in the textile industry in the early 1980s by setting up an agency business, Kasa Textile & Co Ltd. He has since diversified his activities by acquiring a majority interest in Ducray Lenoir Ltd in 1988, and in Rey & Lenferna Ltd in 1998. The latter subsequently took over Forges Tardieu Ltd in early 2005. He was appointed to the Board of The Mauritius Union Assurance Cy. Ltd in June 2010 and was elected Chairman. Mr Galea is a member of its Corporate Governance, Nomination and Remuneration Committee. He is also the chairman of La Prudence (Mauricienne) Assurances Ltee, of United Docks Ltd, of Rey & Lenferna Ltd and of Forges Tardieu Ltd, and a director of Associated Brokers Ltd and Ascencia Ltd.
directors’ profile
introduction 4
company profile 10
corporate governance report
risk management report 60
sustainability report 72
financial statements 98
introduction
board of directors
committees of the board
director’s attendance at board meetings and committees of the board
26

Youarehere
mr bertrand de chazalDirector – appointed in 2012
Mr Bertrand de Chazal is a fellow member of the Institute of Chartered Accountants of England and Wales. He served as a senior financial analyst with the World Bank from 1986 to 2003 and was a senior manager with Touche Ross in France and West Africa. Mr de Chazal has a wide experience as director of listed companies and has been actively involved as Chairman of several audit committees.Mr de Chazal was appointed to the Board of Mauritius Union Assurance Cy Ltd in June 2012 and is the chairman of the Audit and Risk committee. Mr de Chazal is also the Chairman of the MCB Equity Fund and a director of MCB Capital Markets Ltd. He also sits on the boards and chairs the audit committees of Promotion and Development Ltd and Caudan Development Ltd.
mrs melanie faugier Director – appointed in 2010
Mrs Melanie Faugier, born in 1980, is the Managing Director of Cottons Trading Ltd and Senior Homes Ltd. From June 2004 to July 2007 she was the Trading Manager of Thon des Mascareignes (which belongs to the IBL Group). She also worked for Schlumberger Oilfield Services in Equatorial Guinea and for Association Solidari’terre in Madagascar. Mrs Faugier was appointed to the Board of The Mauritius Union Assurance Cy. Ltd in July 2010 and is a member of the Audit & Risk Committee. She is also the chairperson of the National Mutual Fund Ltd and of Feber Associates Ltd. Mrs Faugier holds a DEUG in economics from University of Paris I – Pantheon Sorbonne and an Msc in Management from EM Lyon School of Management.Alternate director: Mr Olivier Maurel
mr bruno de froberville Director – appointed in 2010
Mr Bruno de Froberville, born in 1962, is currently the General Manager and owner of Square Lines Ltd, a property development company. He has extensive knowledge of the building sector. From 2005 to 2008 he worked with La Prudence (Mauricienne) Assurances Ltee for property development. He was the general manager and owner of B.E.A.M. Ltd (a residential and industrial buildings company) between July 1994 and December 2004, and the manager of Building Art Ltd from July 1988 to June 1994. He was also the marketing manager of Loom Art Ltd, a manufacturer of hand-made carpets. He was appointed to the Board of The Mauritius Union Assurance Cy. Ltd in August 2010.Mr de Froberville holds an MBA from the University of Birmingham, a Bachelor in Science and a Major in Marketing from Louisiana State University.
mrs priscilla balgobin-bhoyrulDirector - appointed in 2008
Mrs Priscilla Balgobin-Bhoyrul, born in 1975, holds a LLB (Hons) degree from the London School of Economics and Political Science. She was called to the Bar of England and Wales in 1998 and to the Mauritian Bar in 1999. She is a member of the Middle Temple and is currently practising as a barrister-at-law. Her main areas of practice are international, commercial, civil and industrial law. She was appointed to the Board of The Mauritius Union Assurance Cy. Ltd in August 2008. She is also a Director of the Mauritius Commercial Bank Ltd.
mr alfred bouckaertDirector – Appointed by the Board of Directors in December 2013 up to the forthcoming annual meeting of the shareholders of the Company where he will stand for election.
Mr. Bouckaert born in 1946 holds a bachelor degree from the University of Louvain, Belgium.He started his career at Arthur Andersen and joined the Chase Manhattan Bank in 1972 where he held various positions as manager commercial banking Belgium, General Manager Chase Denmark, and General Manager Chase Belgium. In 1989 the Chase Manhattan sold most of its European operation to Credit Lyonnais where Mr. Bouckaert became CEO Belgium. He became in 1993 General Manager of the international operations of Credit Lyonnais and was in charge of the divestiture of 21 banks of the group. Subsequently he joined AXA in 1999 where he was appointed General Manager of their Belgian acquisition “Royale Belge” (largest p/c cy in Belgium) later rebranded Axa Belgium. In 2004 his responsibilities were extended to the northern region of AXA which comprises Belgium, Germany, Switzerland (with the acquisition of Winterthur), the central European countries, Ukraine and Russia. Mr Bouckaert became a member of the directoire of AXA in 2006. He retired from Axa in 2010 and was later asked by the Belgian government to preside over the Belgian arm of Dexia which had collapsed in 2011. He left that responsibility in 2013 and now holds positions in several boards of non-quoted and quoted companies.
introduction 4
company profile 10
corporate governance report
risk management report 60
sustainability report 72
financial statements 98
introduction
board of directors
committees of the board
director’s attendance at board meetings and committees of the board
29

Youarehere
mr arjoon suddhooDirector – appointed in 2010
Mr. Arjoon Suddhoo, born in 1958, holds a BSc (1st Class Hons) in aeronautical engineering and a PhD in computational mathematics from the University of Manchester and an MBA (Distinction) from the University of Liverpool. He is a Fellow of the Mauritius Academy of Science and Technology, a Fellow of the Mauritius Institute of Directors, Fellow of the Royal Aeronautical Society and President of the Aeronautical Society of Mauritius. Mr Suddhoo started his career in 1986 as a research scientist at Rolls Royce Aerospace Ltd, UK which he left in 1993 as the research and development manager. He is currently the Executive Director of the Mauritius Research Council, a post he occupies since 1999. He also holds directorships in various other private and governmental organizations and was the Chairman of Air Mauritius Ltd from 2001 to 2005. In 2006, Mr Suddhoo was appointed visiting Professor at Queen’s University in Northern Ireland. He was appointed to the Board of The Mauritius Union Assurance Cy. Ltd in August 2010 and is a member of its Corporate Governance, Nomination & Remuneration Committee.
mr lawrence poisson Director – appointed in 2010
Mr Lawrence Poisson, born in 1952, holds a Diploma in Agriculture and Sugar Technology and a Diplôme superieur en administration des enterprises. He is a Fellow of the Institute of Chartered Secretaries and Administrators. He currently works for Illovo Group Holdings Ltd. He was appointed to the Board of The Mauritius Union Assurance Cy. Ltd in July 2010, and to that of La Prudence (Mauricienne) Assurances Ltee in September 2010. Mr Poisson is the Chairman of the Corporate Governance, Nomination & Remuneration Committee of The Mauritius Union Assurance Cy. Ltd. He is also a director of Associated Brokers Ltd and of Fondation Mauritius Union Ltd.
mr gerard de rauvilleDirector - appointed in 2011
Mr Gerard de Rauville, born in 1941, practised as a chartered accountant before becoming involved in the business world. He retired from the board of Zurich SA after serving on the board for 29 years. He was board member of a number of companies listed on the Johannesburg Stock Exchange and holds numerous appointments on boards of trustees and of unlisted companies. He is involved in the property sector and the listed property stocks on the Johannesburg Stock Exchange.Mr de Rauville was appointed to the Board of The Mauritius Union Assurance Cy. Ltd in June 2011 and is a member of its Audit & Risk Committee and the chairman of its Investment Committee.
introduction 4
company profile 10
corporate governance report
risk management report 60
sustainability report 72
financial statements 98
introduction
board of directors
committees of the board
director’s attendance at board meetings and committees of the board
31

Youarehere
DiRectORs’ iNteRests iN sHaRes Of tHe cOMpaNy
The direct and indirect interests of the directors in the ordinary shares of the Company as at 31 December 2013, together with the category they fall in, are set out in the table below:
Directors category Number of shares
Direct indirect
Mr Vincent Ah-Chuen Non-executive 158,387 157,703
Mrs Priscilla Balgobin-Bhoyrul Independent Non-Executive 500 -
Mr Alfred Bouckaert Independent Non-Executive - -
Mr Bertrand de Chazal Independent Non-Executive 500 -
Mrs Melanie Faugier Non-Executive 500 1,087,830
Mr Bruno de Froberville Non-executive 500 358,859
Mr Dominique Galea Non-Executive 17,200 2,064,950
Mr Lakshmana (Kris) Lutchmenarraidoo Executive 7,500 -
Mr Lawrence Poisson Independent Non-Executive 178,905 -
Mr Gerard de Rauville Independent Non-Executive 11,000 -
Mr Arjoon Suddhoo Independent Non-Executive 500 -
RelateD paRty tRaNsactiONs aND cONflict Of iNteRests
The Board of Directors has adopted a Code of Conduct providing amongst others clear guidance on disclosures of interests that may arise.For related party transactions, please refer to Note 36 of the Financial Statements.
DiRectORs’ DealiNg iN sHaRes
The directors of the Company follow the principles of the Model Code for Securities Transactions as detailed in Appendix 6 of the Listing Rules in all their dealings.During the year under review, Mr. Lawrence Poisson disposed of 2,000 shares of the Company.
executive DiRectOR’s seRvice cONtRact
The Chief Executive Officer, Mr Lakshmana (Kris) Lutchmenarraidoo has a two-year fixed term contract ending on 31 December 2014.
cONtRacts Of sigNificaNce
There was no contract of significance subsisting during the year to which the Company, or one of its subsidiaries, was a party and in which a director was materially interested, either directly or indirectly.
cHaNges iN DiRectORsHip
Upon recommendation of the Corporate Governance Committee and approval of the Financial Services Commission, the Board of Directors has appointed Mr Alfred Bouckaert as independent non-executive director of the Company on 23 December 2013 up to the forthcoming annual meeting of the shareholders where his appointment would be put to the approval of the shareholders. Mr Bouckaert’s profile is found on page 28 of this report.
DiRectORsHips iN OtHeR listeD cOMpaNies aND suBsiDiaRies Of listeD cOMpaNies
The directorships held by the Board Members of The Mauritius Union Assurance Cy. Ltd in other listed companies are shown in the table below:
Director listed companies and/or subsidiaries of listed companies
Mr. Vincent Ah Chuen POLICY Ltd, Les Moulins de La Concorde Ltee, ABC Motors Co Ltd, ABC Banking Corporation Ltd
Mrs. Priscilla Balgobin-Bhoyrul The Mauritius Commercial Bank Ltd
Mr. Bertrand de Chazal Promotion and Development Ltd, Caudan Development Ltd, MCB Capital Markets Ltd, MCB Equity Fund
Mr. Bruno de Froberville Mauritius Freeport Development Co Ltd
Mr. Dominique Galea Ascensia Ltd, United Docks Ltd, Forges Tardieu Ltd
Mr. Gerard de Rauville Zurich Insurance Company South Africa Limited
Mr Alfred Bouckaert Leasinvest and CFE
Mrs. Melanie Faugier, Messrs. Lakshmana (Kris) Lutchmenarraidoo, Lawrence Poisson and Arjoon Suddhoo do not serve as directors in other listed companies or subsidiaries of other listed companies.
introduction 4
company profile 10
corporate governance report
risk management report 60
sustainability report 72
financial statements 98
introduction
board of directors
committees of the board
director’s attendance at board meetings and committees of the board
33

Youarehere
committeesof the board
directors and senior management and advises on the composition of the Board in general and the balance between executive and non-executive directors appointed to the Board.
b) The committee makes recommendations regarding the company’s general policy pertaining to executive, non-executive, independent non-executive fees and senior management remuneration. Succession planning is included in the terms of reference of this committee.
The Committee met four times in 2013. Its members as at 31 December 2013 were:
- Mr Lawrence Poisson (Chairperson)- Mr Vincent Ah Chuen- Mr Dominique Galea- Mr Lakshmana (Kris) Lutchmenarraidoo- Mr Arjoon Suddhoo
Mrs Marie-Anne Adam of ECS Secretaries Ltd acts as Secretary.
iNvestMeNt cOMMittee
The objectives of the Investment Committee are to:- Devise the Group investment strategy- Define the investment philosophy and
specific investment objectives of the Group consistent with this strategy
- Define responsibilities with regard to the management of the Group investment portfolio
- Determine appropriate levels of investment
risk which the Group is prepared to accept with the broader guidelines set by the Mauritius Union Group Risk Policy and the Board
- Determine capital allocation criteria- Determine appropriate benchmarks for the
measurement of performance
While the Board is ultimately responsible for ensuring that the appropriate structure and process are in place to effectively manage capital and treasury risk, the Investment Committee decides on the appropriate asset allocation, on portfolio construction and asset manager selection (where applicable) in order to achieve the goals set out in the investment strategy.The Investment Committee, in consultation with the investment advisors, is responsible for the regular review of the overall investment strategy and the submission of appropriate recommendations to the Board for consideration.The Committee met three times in 2013 and its members as at 31 December 2013 were:
- Mr Gerard de Rauville (Chair)- Mr Bruno de Froberville- Mr Dominique Galea- Mr Lakshmana (Kris) Lutchmenarraidoo- Mr Laval Foo-Kune- Mr Marc Hardy (Independent Consultant)
Mrs Marie-Anne Adam of ECS Secretaries Ltd acts as Secretary.
Three committees of the Board have been constituted, namely an Audit & Risk Committee, an Investment Committee and a Corporate Governance, Nomination & Remuneration Committee.These committees were set up in order to assist the directors in the discharge of their duties through a comprehensive evaluation of specific issues. They may seek information from any employee of the Company in order to correctly perform their duties.The Committees may, at the Company’s expense, request such independent external professional advice that they consider necessary to perform their duties.
auDit & Risk cOMMittee
Members of the Audit & Risk Committee as at 31 December 2013 were:- Mr Bertrand de Chazal (Chairperson)- Mrs Priscilla Balgobin-Bhoyrul- Mrs Melanie Faugier- Mr Bruno de Froberville - Mr Gerard de Rauville
Mrs Marie-Anne Adam of ECS Secretaries Ltd acts as Secretary.
The Board has established formal terms of reference for the Audit & Risk Committee. The Committee confirms that it has discharged its responsibilities for the year in compliance with these terms of reference. The Committee met four times during the year under review.
The Audit & Risk Committee focuses on:- the functioning of the internal control system and
internal audit- the risk areas of the company’s operations to
be covered within the remit of the internal and external audits, with the exclusion of legal risks
- the reliability and accuracy of financial information provided to management and other users of financial statements
- the company’s compliance with regulatory requirements with regard to both financial and non-financial matters
- the scope and results of the external audit, its cost-effectiveness, independence and objectivity
- the nature and extent of non-audit services provided by external auditors
External and Internal Auditors attend meetings when required.
cORpORate gOveRNaNce, NOMiNatiON & ReMuNeRatiON cOMMittee
The Corporate Governance, Nomination & Remuneration Committee is appointed by the Board and consists of a Chairman who is an independent non-executive director and four members.
a) It is responsible for implementing the Code of Corporate Governance for Mauritius (the Code) throughout the Company and for ensuring that the reporting requirements on corporate governance are made in accordance with the principles enunciated in the Code. It makes recommendations to the Board on the appointment of new executives, non-executive
introduction 4
company profile 10
corporate governance report
risk management report 60
sustainability report 72
financial statements 98
board of directors
committees of the board
director’s attendance at board meetings and committees of the board
directors’ remuneration whilst in office
35

Youarehere
directors’ attendance at board meetings
mrvincentah chuen
mrlakshmana (kris) lutchmenarraidoo
mrspriscilla balgobin-bhoyrul
mrdominique galea
mrlawrence poisson
mrarjoon suddhoo
Mr Gerard de Rauville was granted leave from the Board during year 2013 for personal reasons.
BOARDMEETINGS
8 out of 8CORPORATEGOVERNANCECOMMITTEE
4 out of 4
BOARDMEETINGS
8 out of 8AUDIT & RISKCOMMITTEE
4 out of 4INVESTMENTCOMMITTEE
1 out of 2
BOARDMEETINGS
6 out of 8AUDIT & RISKCOMMITTEE
4 out of 4
BOARDMEETINGS
8 out of 8CORPORATEGOVERNANCECOMMITTEE
4 out of 4INVESTMENTCOMMITTEE
3 out of 3
BOARDMEETINGS
8 out of 8AUDIT & RISKCOMMITTEE
4 out of 4
BOARDMEETINGS
6 out of 8CORPORATEGOVERNANCECOMMITTEE
3 out of 4INVESTMENTCOMMITTEE
3 out of 3
BOARDMEETINGS
7 out of 8AUDIT & RISKCOMMITTEE
1 out of 2
BOARDMEETINGS
7 out of 8CORPORATEGOVERNANCECOMMITTEE
4 out of 4
BOARDMEETINGS
7 out of 8CORPORATEGOVERNANCECOMMITTEE
3 out of 4
mrbertrandde chazal
mrsmelanie faugier
mrbruno de froberville
introduction 4
company profile 10
corporate governance report
risk management report 60
sustainability report 72
financial statements 98
board of directors
committees of the board
director’s attendance at board meetings and committees of the board
directors’ remuneration whilst in office
37

Youarehere
whilst in officedirectors’ remuneration
total rs 13,705,000
total rs 10,598,000 total rs 927,000
DiRectORs’ ReMuNeRatiON pHilOsOpHy The remuneration of Directors and Senior Executives of the Company is subject to an annual review, according to the criteria
contained in the terms of reference of the Remuneration Committee.
The remuneration philosophy is based on transparency and merit while performance-based reward is at the heart of organisational culture.
Remuneration of Directors has not been disclosed on an individual basis as the Board considers this as sensitive information.
ReMuNeRatiON fROM suBsiDiaRies
Additionally, directors of subsidiaries, who did not sit on the Mauritius Union Assurance Cy. Ltd board during the year, received the following remuneration and benefits:
ReMuNeRatiON fROM tHe cOMpaNy
2013 20132012 2012
rs
4,0
42,0
00
rs 6,556,000 rs
316
,000
rs 563,000
rs
3,9
36
,000
rs 9,769,000
rs
341
,000
rs 586,000
executive Directors non-executive Directors
total rs 879,000
introduction 4
company profile 10
corporate governance report
risk management report 60
sustainability report 72
financial statements 98
director’s attendance at board meetings and committees of the board
directors’ remuneration whilst in office
company secretary
39

Youarehere
The Company Secretary plays a key role in the application of corporate governance in the Company. He ensures that the Company complies with its constitution and all relevant statutory and regulatory requirements, codes of conduct and rules established by the Board. He provides guidance to the Board as a whole and to directors individually as to how their responsibilities should be discharged in the best interests of the Company. He advises the board on matters of ethics and good governance and is the focal point of contact within the Company for shareholders.
company secretary
introduction 4
company profile 10
corporate governance report
risk management report 60
sustainability report 72
financial statements 98
directors’ remuneration whilst in office
company secretary
senior management
shareholding
41

Youarehere
bertrand casteres,Msc.ceO Designate
Mr Casteres, born in 1978, holds a Master’s degree in applied mathematics, actuarial science and finance and he is currently completing an Executive MBA at HEC Paris business school. Mr Casteres has worked for major insurance companies in Europe. Before joining the Mauritius Union Group in January 2012 as Head of Internal Audit, Mr Casteres worked in the internal audit department of Aviva Europe as audit senior manager in the financial management and actuarial audit department, conducting internal audit reviews in actuarial processes across Aviva’s European subsidiaries. He was also involved in the implementation of Solvency II EU Directive within the Aviva Group.He was appointed as CEO Designate effective 1 January 2013.
senior management
delphine ahnee,llB (HONs)Head of claims
Mrs Ahnee, born in 1972, holds an LLB (Hons) degree from the University of Mauritius and was Major de Promotion for her master’s thesis on The Conflict of Laws in Private International Law. She worked at the Chambers of Me Edwin Venchard, QC and contributed to the updating of the Statutory Laws of Mauritius and of the Mauritius Reports. She has successfully completed the Quality Management System Auditor/ Lead Auditor course.Mrs Ahnee joined La Prudence (Mauricienne) Assurances Ltee in 2000 as Claims Manager of the General Business.She is a director of Fondation Mauritius Union Ltd. She holds the position of Head of Group Risk, Legal and Compliance since January 2014.
sin cham (laval) foo-kune, Bacc (wits), ca (sa)Group Chief Finance Officer
Mr Foo-Kune, born in 1967, is a Chartered Accountant having graduated with a Bachelor of Commerce and a Bachelor of Accountancy from the University of the Witwatersrand, South Africa. He worked for Levenstein & Partners, a medium-size auditing firm in South Africa, from 1992 to 1995. He left the firm to work for Symo Corporation Ltd, a manufacturing group of companies in Johannesburg, as accountant from 1995 to 1996. In 1996, he joined IBM South Africa as senior financial analyst and was responsible for the financial operations of several business units within the company. He left IBM in 1998 to join La Prudence (Mauricienne) Assurances Ltee as Financial Manager. In 2010, when The Mauritius Union Assurance Cy. Ltd merged with La Prudence (Mauricienne) Assurances Ltee, he was appointed Senior Manager in charge of the Finance and Accounting department of the Group.
naresh gokulsing, fcca, MBa, Ba accOuNtiNg & fiNaNceHead of group strategy & financial services
Mr Gokulsing, born in 1970, holds a BA in accounting and finance from the University of Leeds and an MBA from Warwick Business School. He is also a Fellow Member of the Association of Chartered Certified Accountants (FCCA). He started his career in the audit and advisory services division of PwC in 1993. In 1997, he joined Cim Stockbrokers as Head of Research and was General Manager from 2000 to 2002.Mr Gokulsing moved within the Cim group as Head of Finance of Cim Insurance from 2002 to 2007 and as Chief Operations Officer and executive director of Cim Insurance and Cim Life from 2009 to 2011. He also spent one year as Managing Director of Cim Property Fund Management in 2008 to launch Ascencia Ltd. He joined Mauritius Union in 2012.Mr Gokulsing served as Director of the Stock Exchange of Mauritius Ltd from 2000 to 2002. He is currently a director of the National Mutual Fund Ltd.
the executive committee of the Mauritius Union Group has been constituted to manage business issues, opportunities and threats that have cross-divisional implications or are considered as material and/or sensitive for the Mauritius Union Group. The Committee is the executive decision-making body of the Mauritius Union Group and it acts as the primary forum through which decisions of a transverse nature are taken. To effectively address matters of relevance to its duties and responsibilities, the Committee has set up appropriate management sub-committees which provide comprehensive evaluation on key issues for members of the Executive Committee to reach informed decisions.
The Executive Committee of the Mauritius Union Group, which is chaired by the CEO, consists of the following senior management team members:
introduction 4
company profile 10
corporate governance report
risk management report 60
sustainability report 72
financial statements 98
directors’ remuneration whilst in office
company secretary
senior management
shareholding
43

Youarehere
vanisha pursun,Ba (HONs) MatHeMatics, fiaHead of group actuarial services
Ms Pursun, born in 1975, holds an Honours degree in Mathematics from the University of Delhi and is a Fellow of the Institute and Faculty of Actuaries.She started working in IT consulting with De Chazal Du Mee & Co Ltd. She subsequently embarked on a career in Pensions and Employee Benefits actuarial consulting in 1999 with Bacon Woodrow and Legris Ltd (now Aon Hewitt) and qualified as an Actuary in 2008. She left Aon in 2008 to join Novilis Pensions Ltd, then administrators of the Sugar Industry Pension Fund (SIPF), as Consulting Actuary. She joined the Mauritius Union Group in 2011 as a Consulting Actuary with Feber Associates Ltd and took on the responsibility of the Group Actuarial department as from July 2012. Since January 2013, she has also been managing the operations of La Prudence Life Insurance.
iswurduth (rishi)sewnundun,B. eNg., MBaHead of information systems & logistics
Mr Sewnundun, born in 1974, graduated in computer science and engineering at the University of Mauritius. He also holds an MBA in marketing from the same university. He joined J. Kalachand & Co. Ltd in 1998 where he worked as systems manager and later as sales manager. He was recruited in May 2005 as Head of Information Systems and appointed senior manager in January 2008.
kenny wong kee you,Bsc (HONs), gstat, aNZiif (assOc) cipHead of Reinsurance, financial & special Risks
Mr. Wong, born in 1982, graduated with First Class Honours from the London School of Economics and Political Science. His fields of study included Risk Theory, Actuarial Mathematics, Applied Statistics and Structured Finance. He is a Fellow and Graduate Statistician of the Royal Statistical Society of London, and a Certified Insurance Professional and Associate of the Australian and New Zealand Institute of Insurance and Finance. He joined The Mauritius Union Assurance Cy. Ltd in January 2009 as Reinsurance Manager and was appointed Senior Manager – Technical Reinsurance in July 2012. Prior to joining Mauritius Union, Mr Wong held various positions in reinsurance broking, investment banking, and marketing both in Mauritius and London.
clarel marie,MBa, aciigeneral Manager, la prudence life insurance
Mr Marie, born in 1960, holds an MBA and is an Associate of the Chartered Insurance Institute, London. He worked for the Anglo-Mauritius Assurance Society Ltd from 1979 to 1993 where he acquired broad experience in the long-term insurance business both in the individual life and the pension business. He joined Albatross Insurance in 1993 to develop the long-term individual assurance products and was appointed technical manager for Life and Pension in 2001. He joined La Prudence (Mauricienne) Assurances Ltee in August 2006 as technical manager of the Life and Pension department and is currently in charge of the operations side of La Prudence Life Insurance. Mr. Marie is also a director of Fondation Mauritius Union Ltd.
ashraf musbally,Bsc. (HONs), MBa & Dic, fciiHead of general insurance
Mr Musbally, born in 1969, graduated in 1993 from City University, London, with a BSc. (Hons) in insurance and investment. He also holds an MBA from Imperial College, London, and is a Fellow of the Chartered Insurance Institute, London. He worked for some time as a management consultant at Kemp Chatteris Deloitte & Touche. He joined La Prudence (Mauricienne) Assurances Ltee in 1997 to manage and develop its health insurance department, a post he held until 2004 when he was appointed Chief Operations Officer – General Insurance. In 2010, he took charge of the health, travel & product development department. In January 2012 his duties were extended to include the management of the underwriting department of the motor and non-motor businesses.
introduction 4
company profile 10
corporate governance report
risk management report 60
sustainability report 72
financial statements 98
directors’ remuneration whilst in office
company secretary
senior management
shareholding
45

Youarehere
As at 31 December 2013, the following shareholders owned more than 5% of the issued share capital:• Ducray-Lenoir Investments Ltd – 11.57%• Devlin Investments Ltd – 7.5%• Societe Robert de Froberville – 7.16%• Mr Pierre-Emile Joseph Latour-Adrien – 6.16%
DistRiButiON Of sHaReHOlDiNg at 31 DeceMBeR 2013
cOMMON DiRectORs at 31 DeceMBeR 2013
legal eNtity
DiRectOR Mau
ritiu
s u
nion
a
ssur
ance
cy.
ltd
la p
rude
nce
(Mau
ricie
nne)
a
ssur
ance
s lt
ee
ass
ocia
ted
Brok
ers
ltd
febe
r ass
ocia
tes
ltd
Nat
iona
l Mut
ual
fund
ltd
fond
atio
n M
aurit
ius
uni
on l
td
cie
du D
ecad
el l
tee
Risk
adv
isor
y se
rvic
es l
td
prud
ence
pro
pert
ies
ltd
prud
ence
Rea
lty l
td
Mr Vincent Ah Chuen • • •
Mrs Priscilla Balgobin-Bhoyrul •
Mr Manickchand Beejan • • • • • • •
Mr Alfred Bouckaert •
Mr Bertrand de Chazal • •
Mrs Melanie Faugier • • •
Mr Bruno de Froberville •
Mr Dominique Galea • • •
Mr Lakshmana (Kris) Lutchmenarraidoo • • • • • • • • • •
Mr Lawrence Poisson • • • •
Mr Gerard de Rauville •
Mr Axel Roussety •
Mr Arjoon Suddhoo •
shareholding
6.16%
10.76%
42.25%
13.74%
8.51%
18.58%
NO. Of sHaRes
NO. Of sHaReHOlDeRs
NO. Of sHaRes OwNeD
1 – 5,000 1,163 1,234,409
5,001 – 50,000 238 3,722,809
500,001 – 20,040,000 6 8,467,921
50,001 – 100,000 30 2,156,438
100,001 – 250,000 19 2,752,738
250,001 – 500,000 5 1,705,685
tOtal 1,461 20,040,000
% Of tOtal issueD sHaRes
100.00%
introduction 4
company profile 10
corporate governance report
risk management report 60
sustainability report 72
financial statements 98
company secretary
senior management
shareholding
share price information
47

Youarehere
cONstitutiON
The Constitution of the Company is in conformity with the Companies Act 2001 and the Listing Rules of the Stock Exchange of Mauritius. There are no restrictions on the transfer of fully paid-up shares.In accordance with the Constitution of the Company, no shareholder can hold more than 5% of the issued share capital of the Company, without the prior authorisation of the Board of Directors.
sHaReHOlDeRs’ agReeMeNt
The Company is not aware of any shareholders’ agreement.
MaNageMeNt agReeMeNt
The Group has not entered into any management agreement with third parties.
DiviDeND pOlicy
The payment of dividends is subject to the profitability of the Company, to its cash flow and to its capital expenditure requirements.
* Values are at end of month
sHaRe OptiON
The Company has no share option plan.
sHaRe pRice iNfORMatiON The chart below shows the evolution of the The Mauritius Union Assurance Cy. Ltd share price as compared to the Mauritius Stock Exchange Index (Semdex) during the year under review.
110
130
Dec-12 Apr-13Feb-13 Jun-13 Oct-13Jan-13 May-13Mar-13 Jul-13 Nov-13Aug-13 Dec-13Sep-13
100
120
90
80
MauRitius uNiON sHaRe pRice veRsus seMDex (rebased)*
Mauritius Union rebased
seMDeX rebased
49
introduction 4
company profile 10
corporate governance report
risk management report 60
sustainability report 72
financial statements 98
senior management
shareholding
share price information
internal audit
49

Youarehere
RepORtiNg liNes
The internal audit derives its authority from the Board through the Audit & Risk Committee. Internal auditors have a direct reporting line to the Audit & Risk Committee and maintain an open and constructive communication with the management. They also have direct access to the Chairperson of the Board. This structure allows the Internal Auditors to remain independent.
cOveRage
The Internal Audit plan, which is approved by the Audit & Risk Committee, is based on the principles of risk management designed to ensure that their scope of work is congruent with the degree of risk attributable to the area being audited.
RestRictiONs
The Internal Auditors have unrestricted access to the Company’s records, to management and employees.
The function of the internal audit is to provide assurance to the Board regarding the implementation, operation and effectiveness of internal control and risk management. Internal auditors are independent appraisers of existing controls. For this reason, the department recommends, but does not design or implement, controls. It should be noted that part of its responsibility, namely regulatory compliance and effectiveness of operations, has been delegated to the Risk & Compliance department while the Internal Audit department focuses on financial reporting, efficiency of operations and auditing of risk & compliance activities. An overview of the company’s internal control system is illustrated hereunder:
Our in-house internal audit team carries out the internal audit. The scope of their work encompasses:- Identification of risk areas and the evaluation of the
level of risk for each risk area
- Review of internal control processes and recommendations thereon to the Audit & Risk Committee and to the Management
- Monitoring of the implementation of the recommendations and reporting on these to the audit committee
The team carried out ten internal audit reviews during 2013.
internal audit
Standard:ifRs / ias
Standard:law
Standard:Operations & procedures Manual
introduction 4
company profile 10
corporate governance report
risk management report 60
sustainability report 72
financial statements 98
shareholding
share price information
internal audit
donations
51
Youarehere
tHe gROup tHe cOMpaNy
2013 2012 2013 2012
Rs’000 Rs’000 Rs’000 Rs’000
auDit fees paiD tO:
ernst & young 2,278 2,256 1,447 1,289
fees paiD fOR OtHeR seRvices pROviDeD By
ernst & young 398 780 206 341
Details:
- Tax computation fees 187 330 85 126
- Review of the annual statutory return to the FSC 211 248 121 115
- Advisory services - 202 - 100
DONatiONs
charitable Donations 2013
Charitable donations made by the Company during the year amounted to Rs 831,095 as compared to Rs 2,485,438 in 2012. These donations were channelled through the Fondation Mauritius Union Limited which handles the Group’s CSR activities.This year’s actions were centred on education and poverty alleviation, health and wellness, training and empowerment as well as the protection of the environment.
political Donations
In line with the Company’s policy, no political donations were made during the year under review.
Risk MaNageMeNt
Risk management is discussed in the Risk Management Report on page 60.
auditors’remuneration
donations + risk management
introduction 4
company profile 10
corporate governance report
risk management report 60
sustainability report 72
financial statements 98
internal audit
donations
risk management
auditors’ remuneration
53

Youarehere
eNviRONMeNt, HealtH & safety
Environmental implications are considered before operational and strategic decisions are taken, even if these may entail additional costs for the Company.A Health and Safety procedure has been formulated and posted on Mauritius Union Group’s intranet system. It explains and demonstrates the Company’s attitude with regard to health and safety as well as the steps, arrangements and systems the Company has put in place to ensure compliance with health and safety legislation. As required by the health and safety legislation, a corporate Safety, Health and Welfare Committee has been constituted. It meets once every two months and one of its main objectives is to create a greater awareness among the staff of the need for a safe and healthy work environment.The security and comfort of employees posted in branches is also taken into account. There are regular visits to branches. Risk assessment and ergonomics reports are generated to ensure that the working environment remains safe and wholesome.Employees also follow regular training on the handling of fire extinguishers, on evacuation simulation exercises and first-aid care.Activities such as a blood donation and workshops on the introduction of Driving License Counterpart were organized for the benefit of both the Blood Bank and our staff, respectively.
cORpORate sOcial RespONsiBility
CSR activities were carried out and aligned with the Company’s corporate mission statement and values.Initiatives in that context were once again geared towards poverty alleviation and the fight against exclusion in specific parts of the island. We also extended our support to needy constituents living in Rodrigues through Caritas Rodrigues.
CSR activities for the year 2013 included the following:- Education and poverty alleviation - Health & Wellness - Trining and Empowerment/Development - Catastrophe Intervention- Employee Involvement
Actions by the Fondation Mauritius Union Limited in 2013 were based on an open-source approach by conducting a three-phase process: hear, create and deliver. We shall raise awareness of every employee with regard to CSR and continually work to positively impact the daily life of less privileged people of our community through small actions that make a great difference.
sustaiNaBility RepORtiNg
The Company recognises that it operates within a broader social and economic community. Consequently, when it takes decisions and carries out its activities, it is committed to considering not only economic viability but also environmental consequences and social implications. The Company recognises its key role regarding job and wealth creation in the Mauritian society. Reporting sustainability is generally recognised as a way for a company to strike the right balance between economic, environmental and social integration, often through commitment and activities that extend beyond mere compliance with legislation. A detailed Sustainability Report is presented on page 72.In this respect, the Fondation Mauritius Union Limited was incorporated on 14th October 2010. It received official Corporate Social Responsibility (CSR) Accreditation from the National Empowerment Foundation in December 2010. Using the Fondation as a special purpose vehicle, we are now able to execute our CSR projects in a more efficient and structured manner, thereby contributing to the betterment of the community.
etHics
The Company has adopted a Code of Ethics which goes beyond minimum legal requirements and outlines core principles that should guide business conduct. It is based on our corporate values which are essential for us to maintain the trust and reliability that have been earned over the years. The Code of Ethics establishes standards for behaviour and provides guidance as to ethical dilemmas or conflicts of interest faced at work.All employees have taken cognizance of the Code and have pledged to abide by its contents.A transparent recruitment procedure based on merit is adopted by the Company.
environment, health & safety + csr
sustainability reporting + ethics
introduction 4
company profile 10
corporate governance report
risk management report 60
sustainability report 72
financial statements 98
sustainability reporting
ethics
environment, health
corporate social
55

Youarehere
timetable of important upcoming events
sepaug Dec JaNJul NOvJuN Oct feB
20 JuNe 2014 Payment of Interim Dividends
15 august 2014 Publication of unaudited accounts for quarter ended 30 June 2014
15 NOveMBeR 2014 Publication of unaudited accounts for quarter ended 30 September 2014
27 JuNe 2014 Annual Meeting of Shareholders
14 NOveMBeR 2014 Declaration of Final Dividends
19 DeceMBeR 2014 Payment of Final Dividends
introduction 4
company profile 10
corporate governance report
risk management report 60
sustainability report 72
financial statements 98
environment, health & safety
corporate social responsibility
timetable of important upcoming events
directors’ statement of responsibilities
57

Youarehere
directors’ statementof responsibilities
Approved by the Board of Directors on 28 March 2014 and signed on its behalf by:
Dominique GALEAcHaiRMaN
Lakshmana (Kris) LUTCHMENARRAIDOOcHief executive OfficeR
ECS Secretaries LtdcOMpaNy secRetaRy
stateMeNt Of cOMpliaNce(SECTION 75(3) OF THE FINANCIAL REPORTING ACT)
Name of public interest entity: The Mauritius Union Assurance Cy LtdReporting period: Year ended 31 December 2013
We, the Directors of The Mauritius Union Assurance Cy Ltd, confirm that, to the best of our knowledge, the Company has endeavoured to comply with the obligations and requirements under the Code of Corporate Governance in all material aspects, except for Sections 2.2.3 and 2.8.2 of the Code for which the necessary explanations have been provided in the Corporate Governance Report.
Dominique GALEAcHaiRMaN
Lakshmana (Kris) LUTCHMENARRAIDOOcHief executive OfficeR
28 March 2014
fiNaNcial stateMeNts
The Directors of the Mauritius Union Assurance Cy. Ltd are required by the Companies Act 2001 to prepare, for every financial year, financial statements which present a true and fair view of the financial position of the Company and the Group at the end of the financial year as well as the results of their operations for the year then ended. They are responsible for the adequacy and accuracy of these financial statements and for the objectivity of any other information presented therein.
The Directors confirm that in preparing these financial statements they have:i) Selected suitable accounting policies that are
compliant with International Financial Reporting Standards and applied them consistently
ii) Made judgments and estimates that are reasonable and prudent
iii) Prepared the financial statements on a going-concern basis
iv) Kept proper accounting records which disclose with reasonable accuracy at any time the financial position of the Company
v) Taken appropriate measures to safeguard the assets of the Company through the application of appropriate internal control, risk management systems and procedures
vi) Taken reasonable steps for the prevention and detection of fraud and other irregularities.
iNteRNal cONtROl
The Directors are responsible for the Company’s systems of internal control. The systems have been designed to provide the Directors with reasonable assurance that assets are safeguarded, that transactions are authorised and properly recorded and that material errors and irregularities are either prevented or detected within a reasonable time. An internal audit and a risk and compliance function have been established to assist management in the effective discharge of its responsibilities. Internal audit review business controls on an ongoing basis are carried out independently of management. Reports are presented directly to the Audit and Risk Committee.
Risk MaNageMeNt
Through the Audit & Risk Committee, Directors are made aware of the risk areas that affect the Company and ensure that Management has taken appropriate measures to mitigate these risks.The Board ensures that the principles of good governance are also applied in the Company’s subsidiaries.
introduction 4
company profile 10
corporate governance report
risk management report 60
sustainability report 72
financial statements 98
environment, health & safety
corporate social responsibility
timetable of important upcoming events
directors’ statement of responsibilities
59

youarehere
risk management report
introduction 4
company profile 10
corporate governance report 20
risk management report
sustainability report 72
financial statements 98
61

Youarehere
systeMs aND tOOlsCommunication, Education, Training and Guidance
tHe Risk MaNageMeNt fRaMewORk
The Group Audit and Risk Methodology is fully risk-based and aligned on COSO (Committee of Sponsoring Organisations of the Treadway Commission) Enterprise Risk Management (ERM) Framework. The COSO ERM Framework is the broadly accepted standard against which organisations can benchmark their internal control activities.
Mauritius Union Group’s risk management framework forms an integral part of the management and Board processes as well as the decision-making framework across the Group. The key elements of the risk management framework are illustrated and described below.
risk management philosophy
We are fully committed to embedding risk management in what we do and it is the source of value creation as well as an essential form of control. It is an integral part of maintaining financial stability for our customers, shareholders and other stakeholders.
Our sustainability and financial strength are buttressed by an effective risk management process which helps us identify major risks to which we may be exposed, while instituting appropriate controls and taking mitigating actions for the benefit of our customers and shareholders. The Mauritius Union Group’s risk strategy is to invest its available capital to optimize the balance between return and risk whilst maintaining an appropriate level of economic (i.e. risk-based) capital and regulatory capital in accordance with its risk appetite. Consequently, its risk management objectives are based on the following:Open risk culture: Promote a strong risk management culture driven by a robust risk governance structure and clear risk appetites.Ensure that sufficient capital surpluses are available to meet the expectations of customers, shareholders and regulators, and to meet our liabilities even if a number of extreme risks were to materialise.clear accountability: Our operations are based on the principle of delegated and clearly defined authority. Individuals are accountable for the risks they take on, and their incentives are aligned with the Group’s overall business objectives.
and objectives
iNsigHt(Management information)
OveRsigHt(Governance)
Risk Profiles & Quantification Analysis
pReseNtpolicies
Predictor EventsfutuRe committees
Incidents & Loss EventsleaRN fROM
pastRoles &
Delegated authorities
introduction 4
company profile 10
corporate governance report 20
risk management report
sustainability report 72
financial statements 98
risk management philosophy and objectives
the governance structure
the risk environment
63

Youarehere
Risk MaNageMeNt RespONsiBilities
The Mauritius Union Group has adopted the ‘three-lines-of-defence’ model where ownership for risk is taken at all levels in the Group.The Three Lines of Defence model is widely adopted by financial services companies globally. It clearly sets out the risk management responsibilities across the business and is consistent with the current regulatory climate encompassing corporate governance, systems and controls.
Risk pOlicies aND pROceDuRes
To inculcate a consistent and rigorous approach to risk management across all the businesses in which we operate, we observe a set of formal risk policies. These delineate risk management and control requirements for the Group’s operations. As our business responds to changing market conditions and customer needs, we regularly monitor the appropriateness of our risk policies to ensure that they remain up-to-date.Businesses regularly identify and review risk exposures. Where risks are outside of tolerance, action plans are required. Similarly, controls are regularly reviewed for effectiveness and corrective actions implemented where necessary. This helps to provide assurance to the various risk oversight committees that there are appropriate controls in place for all our core business activities, and that the processes for managing risk are understood and followed consistently across our businesses.
Risk appetiteThe risk appetite is the level of risk the Group acknowledges and is able to accept in the pursuit of its strategic objectives.The following statements, which are reviewed and approved by the Board, demonstrate a key focus on balance sheet strength and protection of the franchise value.The strategic and operational planning process supports the group in optimally exploiting its opportunities. This involves the consideration of the portfolio of opportunities identified by businesses, leading to decisions by the Board in relation to the opportunities the group wishes to pursue.Capital is allocated to businesses to support delivery of these plans. The group’s required returns will be reflected in the targets set for businesses, including targets for return on capital employed, growth in business and profitability and dividend payment expectations.The group’s business plan, capital allocation and business targets are therefore a key component of the group’s risk appetite. Risk appetite will accordingly continually evolve and be reviewed annually.
Risk MaNageMeNt
The Group’s approach to risk management ensures that significant existing or emerging risks are efficiently identified, measured, managed, monitored and reported on a perpetual basis. Risks are measured by considering the significance of the risk to the business and its stakeholders (both internal and external) in the context of our strategy, objectives and risk appetite. Monitoring ensures that risk management approaches are effective, and also seeks to identify risk-taking opportunities to improve the risk-adjusted performance of the Group.We incorporate risk considerations and capital needs into day-to-day management and decision-making processes. We actively manage our risk profile through a wide range of techniques, including product design, pricing, underwriting, asset allocation, investment management, reinsurance, acquisitions and disposals.The development and evaluation of our business plans and our various capital and risk management actions are supported by the implementation of risk policies. This has been a key area of improvement throughout 2013.
auDit aND Risk cOMMittee
Regu
latOR
seNiOR MaNageMeNt
exteRN
al a
uD
itOR
BusiNess OpeRatiONs
1st liNe Of DefeNceAccountable for the management of all risks relevant to the business while embedding a risk culture.
Risk aND cONtROl fuNctiONs
2ND liNe Of DefeNceAccountable for quantitative and qualitative oversight and challenge of the identification, measurement, management, monitoring and reporting of key risks and for developing in the risk management framework.
iNteRNal auDit
3RD liNe Of DefeNceAccountable for providing reliable independent assurance to the Audit and Risk Committees, Board members and Executive Management of Mauritius Union on the adequacy and effectiveness of the risk management and control frameworks operated by the 1st and 2nd line of defence which includes governance.
1st line of defence 2nd line of defence3rd line
of defence
introduction 4
company profile 10
corporate governance report 20
risk management report
sustainability report 72
financial statements 98
risk management philosophy and objectives
the governance structure
the risk environment
65

Youarehere
On the general insurance side, Mauritius Union’s business was impacted by the flash flood and it registered gross claims to the tune of Rs114m but the incidence on the company was significantly mitigated by the reinsurance treaties in place. In 2013, the market environment continued to be affected by pressure on premium rates across all lines of business with some players quoting rates below technical pricing. On the life insurance side, the reduction in long-term yields continued to exert pressure on actuarial valuation but the good investment performance of the portfolio boosted solvency levels.
tHe Risk pROfile
The main types of risk to which the Group is exposed are:- Strategy and Planning- Customers, Products and Markets- Operations & Resource Management- Financial Process- Financial- InsuranceClose risk monitoring allows us to detect potential deviations from our risk tolerance at an early stage both at the Group level and the operating entity level.
stRategy & plaNNiNg Risk
Strategy and Planning risk is the risk of an unexpected negative change in the company value, arising from the adverse effect of
management decisions regarding business strategies and their implementation. This risk reflects the compatibility between strategic goals, the business strategies and the resources deployed to achieve those goals. Strategic risk also includes the lack of management’s ability to effectively analyze and react to external factors (e.g. market conditions) which could affect the future direction of the relevant operating entity or the Group as a whole.The strategic planning process hinges on the development of a three-year strategic plan which is reviewed annually during the budgetary exercise to ensure that strategic initiatives are on track and/or have to be amended in light of changes, both within the group and in the external environment.All strategic projects are regrouped within a project register to facilitate implementation and progress monitoring.
custOMeRs, pRODucts & MaRkets Risks
During insurance operations, there may be a risk related to customer management, brand management, products and distribution management which can cause significant damage to the group’s reputation, profitability, future business and market share.
a) customer RiskCustomers are the key component of any business and customer risks are very likely to arise upon failure to communicate effectively
with existing and new customers in the process of providing them with the necessary information or during the delivery of the service. Such failure may result in customer complaints, litigated claims, cancelled policies and increased claim frequency or severity. The group has in place a customer care department to professionally and promptly handle customer complaints.
b) Brand & Marketing communication RiskThese risks arise due to the inability to devise and implement integrated corporate marketing program with a view to developing and promoting the reputation of the organization through its brand portfolio. This may result in the inability to sustain competitive advantage in chosen markets. The marketing department uses a whole array of tools in its promotional mix as part of its corporate advertising strategy. The group also makes use of surveys to assess the impact of its marketing campaign.
c) Distribution Management RiskThese risks occur when the group’s distribution strategy fails to support effective, diversified distribution channels in line with its business objectives. The business development committee reviews the distribution channel strategy whilst monitoring potential inherent risks.
The Board has the overall responsibility to ensure that risks are effectively identified, measured, monitored and managed with respect to the corporate governance structure adopted by Mauritius Union. The Board discharges its duty through policies and frameworks as well as committees as illustrated in the chart hereunder.
•Set strategic objectives•Monitor performance•Set risk apetite•Set and uphold values•Set risk policies
•Set business standards•Monitor performance•Oversee risk and capital
management•Provide challenge•Recommend risk
management activity
group
board
the governance structure the risk environment
introduction 4
company profile 10
corporate governance report 20
risk management report
sustainability report 72
financial statements 98
risk management philosophy and objectives
the governance structure
the risk environment
BOaRD OfDiRectORs
cORpORate gOveRNaNce, NOMiNatiON & ReMuNeRatiON
cOMMittee
auDit & Risk cOMMittee
iNvestMeNt cOMMittee
cHief executive
OfficeR
executive cOMMitteeMaNageMeNt cOMMittees
67

Youarehere
fiNaNcial Risks
cReDit Risk
a) Reinsurance credit RiskReinsurance Credit Risk is defined as the reluctance or inability on the part of reinsurers to honour financial obligations towards the Company.A dedicated unit selects the Company’s reinsurance partners and only reinsurers with strong credit profiles are considered. We may also require evidence of parental guarantee, details of retrocession arrangements, or other financial measures to further mitigate our exposure to reinsurance Credit Risk.The unit monitors and manages the concentration of risk to each reinsurer as well as their credit rating and solvency movements, with the objective of diversifying our reinsurance placements such that the financial impact of default by any one reinsurer is limited.As of 31 December 2013, the reinsurance of the Company was distributed among 34 different reinsurers (for the purpose of classification, Lloyd’s Syndicates are considered as 1 reinsurer).The unit also performs back-to-back verifications for facultative placements in order to ensure that there are no discrepancies between the insurance and reinsurance contracts.
b) investment credit RiskThe group invests in debt instruments and there are risks that the issuer of debt securities defaults on capital or interest payments. The bulk of the group’s investment portfolio is in local government bonds. Investment in foreign debt securities should carry at least a BBB rating.
c) loans credit RiskBoth Mauritius Union General Insurance and La Prudence Life Insurance grant loans in their normal course of business. Loan credit risk is the risk that a borrower defaults on capital or interest payments. This risk is mitigated through holding appropriate security against all loans granted, which are closely monitored, by the credit committee chaired by the Chief Executive Officer. The legal department monitors payment procedures and debt recovery through appropriate legal action, if necessary.
d) Debtors credit RiskThis risk is attributable to the inability of customers to pay amounts in full when insurance premiums are due. The group has in place a policy for granting credit and maintains records of the payment history for contract holders with whom it conducts regular business. The credit terms are based on the client payment history. The exposure to individual counterparties is also managed by other mechanisms, such as the right of offset where counterparties are both debtors and creditors of the Group. A deposit premium payable in advance is also requested upfront to minimise the risk of default. The receivables are closely monitored, reminders are sent to policy holders when their accounts are overdue and the policies are cancelled if payments are not received following the reminders.
fOReigN excHaNge RiskThe group holds a number of deposits, equity investments, property investments and bank balances denominated in foreign currencies and is primarily exposed to fluctuations of the United States dollar, the Euro and the British Pound. Exposure to foreign currency is not hedged but closely monitored by management.The bulk of the insurance contracts written by the group is in rupees. The reinsurance treaties have also been established in the local currency. There is only one treaty which is denominated in USD.
capital MaNageMeNt
The company is required to maintain a minimum capital requirement ratio of 150% at all times (with a minimum of Rs25m) as required by the Insurance Act 2005. The amount of capital required takes into account investment concentration limits, policy liabilities risks, catastrophe risks and reinsurance cession risks. The company’s capital requirement ratio has been maintained well above the minimum statutory limit of 150%.On the long-term side, the minimum capital requirement is determined by the external actuary after taking into account stress test requirements. In order to demonstrate
solvency, La Prudence Life Insurance must have assets in excess of liabilities to cover the minimum capital requirement by at least a multiple of one. La Prudence Life Insurance has also satisfied the minimum capital requirements under the Insurance Act 2005.
liquiDity Risk
Prudent liquidity risk management implies maintaining sufficient cash and marketable securities to meet short-term debts. Liquidity risk is considered to be very low and the investment portfolio is managed under the guidance of the external actuary.The external actuary has confirmed that there are appropriate assets in place to match the liabilities in nature and term.
iNteRest Rate Risk
Interest rate risk refers to the risk that the value of future cash flows from financial instrument backing the liabilities would be insufficient to fund guaranteed benefits payable, especially under long-term Life Assurance contracts. This risk is mitigated through a well-diversified portfolio of fixed income securities and equity investments.Under general insurance contracts, liabilities are not directly sensitive to the level of market interest rates as they are contractually non-interest bearing. In case of bodily injury claims which are settled over long periods, these long-tail liabilities are hedged by the equity portion of the investment portfolio of the general business.
MaRket Risk
Market risk is the risk that the value of financial instruments will fluctuate as a result of changes in market prices, whether these changes are caused by factors specific to the individual security or its issuer or factors affecting all securities traded in the market.The Investment Committee ensures that investments are sufficiently diversified in order to match assets and liabilities and liquidity requirements.
OpeRatiONs aND ResOuRce MaNageMeNt Risks
Operational risks are risks of loss and/or opportunity gain foregone resulting from inadequate or untried internal processes, human error and systems’ malfunction or from external events. One or more of the following may cause such losses:
a) Human Resources RiskSuch risk stems from the fact that staff members entrusted with the management and control of various stages of the business process chain lack the requisite knowledge, skills and experience needed to ensure that critical business objectives are achieved and that significant business risks are reduced to an acceptable level. An internal training program has been initiated to minimize such risk while external training is also provided with the same objective in mind.
b) compliance RiskCompliance risk, also referred to as non-conformance risk, results in lower quality, higher costs, loss of revenue and undue delays. Non-conformance also gives rise to product/service failure risk because if not detected and corrected before a product or service is delivered to the customer, a product or performance failure could result. The legal and compliance department monitors such matters.
c) Business interruption RiskThe Company’s capability to operate normally is highly dependent on the availability of information technology, of skilled labour and other resources. If people with the requisite experience and skills or other key resources were unavailable or if critical systems happened to break down, the Company would experience difficulty in transacting business. A business continuity plan has been devised. It is based on the duplication of our records and information systems on back-up servers at a remote location. Insurance transactions are updated daily to these servers, through the Mauritius Telecom frame relay network. Full and uninterrupted customer service can be delivered from the remote location.
d) Health and safety RiskWorker health and safety risks are significant if unchecked because they can expose the Company to substantial liability in respect of workers’ compensation. Non-compliance with Health and Safety legislation may result in heavy fines. The
Health and Safety Committee ensures that these risks are minimised through control, follow-up and communication procedures. The Human Resources Department ensures compliance with labour laws.
e) information technology RiskThis refers to the risk that hardware and software do not operate as intended and that the integrity and reliability of data and information are compromised. This would impact the smooth running of day-to-day business. Hence the IT department has put in place a risk management policy along with relevant controls to ensure that potential risks are monitored and any impact mitigated.
fiNaNcial pROcess RisksFinancial process risks refer to the failure to maintain sufficient reserves to cover liabilities, to take tax opportunities and to keep proper accounting records while preparing financial statements.
a) financial Reporting RiskIt is the failure to generate trusted data from efficient processes and systems that meet governance and shareholder expectations resulting in the risk of misstatement (i.e. true and fair view) of internal or external financial information. The finance department has implemented a financial reporting risk management policy with adequate controls to manage these risks.
b) Reserve RiskWe estimate and hold reserves for claims that have not yet been settled. If reserves were not sufficient, due to unforeseen factors, to cover forthcoming settlement of claims in abeyance, we would experience losses.Claims handling is closely monitored so as to ensure that the loss reported is covered and properly assessed. Where legally justified, the Company may sue third parties for payment of some or all liabilities (subrogation). The Company ensures that claims provisions are determined using the best information available about claims settlement patterns, forecast inflation and settlement of claims. Estimation techniques also involve obtaining corroborative evidence from as wide a range of sources as possible and combining these to form the best overall estimates.
introduction 4
company profile 10
corporate governance report 20
risk management report
sustainability report 72
financial statements 98
risk management philosophy and objectives
the governance structure
the risk environment
69

Youarehere
introduction 4
company profile 10
corporate governance report 20
risk management report
sustainability report 72
financial statements 98
risk management philosophy and objectives
the governance structure
the risk environment
iNsuRaNce Risks
The main activity of the group is the acceptance of risk under an insurance contract where in return for a consideration (the premium), a policyholder is compensated for pecuniary loss suffered as a result of a specified uncertain future event, or of a certain future event where the timing of the occurrence is uncertain.
a) underwriting RiskUnderwriting risk is defined as the risk of insured losses in our general insurance business being higher than our expectations. This may arise from the type of products, the inaccurate pricing of risks when underwritten or when assumptions made in product design differ from the actual experience. To mitigate such risks, underwriting guidelines are reviewed regularly. Also, the Group makes use of appropriate pricing tools and methodologies under the supervision of the Underwriting Unit.
b) claims RiskClaims risk arises due to failure to deliver acceptable claims service to customers while claim costs may exceed assumed pricing calculations.
ROle Of uNDeRwRitiNg ReiNsuRaNce claiMs cOMMittee
The role of the Underwriting, Reinsurance Claims Committee (URCC) is to oversee the development of, and compliance to, underwriting and reinsurance guidelines and to monitor procedures relating to exceptions thereto. The URCC also has the responsibility for formulating the Company’s underwriting and reinsurance strategies in line with Board’s vision. The URCC reports to the executive committee.The main responsibilities and duties of the URCC are:- To receive and approve reports regarding
operational activities of the Underwriting and Reinsurance departments so as to ensure that set strategies are respected;
- To establish, review and maintain underwriting criteria, limits, guidelines, policies and processes;
- To review reports with respect to compliance of the underwriting guidelines and policies, and to make recommendations to the Executive Committee for approval relating to cases where risks deviate from set criteria;
- To review and make recommendations on entry into new lines of insurance and reinsurance businesses;
- To review existing lines of insurance and reinsurance business and to make recommendations on continued writing or withdrawal of such businesses;
- To perform such other responsibilities regarding the company’s underwriting, reinsurance and claims activities or other matters as the Executive Committee may assign to the URCC from time to time.
7171

sustainability report
youarehere
introduction 4
company profile 10
corporate governance report 20
risk management report 60
sustainability report
financial statements 98
73

Youarehere
iNteRview Of MR laksHMaNa (kRis) lutcHMeNaRRaiDOO, cHief executive OfficeR
interview:
mr lakshmana (kris) lutchmenarraidoo
This year you wanted to publish a non-financial group report: what are the reasons for it?
The merger of the Mauritius Union with La Prudence was an important moment for us and, together with the Board of Directors, we decided to rebuild our vision and mission. This is actually an on-going exercise, but we already know that one of the pillars of our strategy will be linked to sustainable development. Until now, this dimension was primarily handled through the CSR activities and our foundation. But in future, we target to integrate it within a more comprehensive approach.In a timely manner, this coincides with the company’s 65 year anniversary. At this occasion, we wanted to place special emphasis on the fact that we are a responsible insurer. This very strong conviction is at the origin of the Mauritius Union. This is what we want to reinstate in this day and age, so as to meet the challenges of our time head on. Naturally, we are also aware that, together with our teams, we will all have to be more sensitive to sustainable development issues.
what are the ambitions of the Mauritius union for the coming years, and how do they fit in with the demands of sustainable development?
Our ambition as an insurance company is to be a benchmark in accountability and responsibility. Once again, this goal is aligned with our customers’ expectations. They have greater expectations today about quality of service and have a clear idea of the responsibilities involved. Sustainable development will have to be fully integrated within this responsible practice of our business.However, our activity has a direct link to natural disasters. Even in a scenario where major risks may be decreasing in number, we can see clearly that they are increasing in intensity. Numerous studies show that many natural disasters are caused by changes in climate. Therefore, we should support sensitization to actions against what causes global warming. Ideally, we should offer products that encourage virtuous behaviour.In terms of asset management, we are considering offering the possibility to invest in socially responsible funds to our clients. But, today, the main limitation in Mauritius is the size of the stock market, which does not yet provide this type of fund.
The floods in 2013 were an important event. How did you respond to it and what role are the insurance companies expected to play in Mauritius in the prevention of risks related to natural disasters?
The events of 2013 were a shock for all Mauritians and brought new awareness. When we talk about natural disasters in Mauritius, we tend to think in terms of cyclonic winds but we rarely picture water damage. A cement house can be wind-proof, but that does not mean it is protected against flooding.Following the floods and tragic car pileups, an important debate took place to try and determine what a comprehensive cover encompasses in regard to cars. Some victims complained about not being covered by their insurance, as they thought the damage that occurred then should have been provided for by any comprehensive cover. But, unfortunately, in Mauritius, compulsory insurance products are not standardized. Depending on the insurance company where the client has purchased their premium, the comprehensive cover may or may not include the risk of flood. Mauritius Union is among the insurers which include the risk of flood as part of the comprehensive cover. We understand how this absence of regulation gives rise to opportunity to propose cheap insurance products on the market, but it also confuses clients. In the end, is it really in the clients’ best interest? The question is one worth asking.
at this stage, where do you set the bar in the field of sustainable insurance for the Mauritius union? what commitments are you willing to make to ensure implementation?
From the beginning of 2014, we are setting up a Department of Risk and Method whose mission includes driving the sustainable development strategy. The head of this department will answer to the CEO. This department will also oversee everything related to customer care. The insurer is an important actor in society and we believe that attention to the customer is in itself a sustainable development challenge. That is why we strive to ensure maximum transparency in the management of customer complaints.
in light of its mission, what current issues would you prioritize for the Mauritius union?
Insurance practice is a social activity in itself. From the onset, the core mission is to pool the risks borne by a community of persons to support the needs of one of them whenever a problem occurs. On our part, we consider that our main concern today is our customers and their expectations. I really mean that, because as an insurer, this is precisely where our major responsibility and duty lie. In other words, the insurance business is about selling the promise to customers that we will be able to respond to any contingency. But making promises is something that anyone, any competitor can do. Now, the real question is whether one is able (or not) to fulfill that promise. That is the moment where we make the difference: at the fulfillment of the promise.Fundamentally, our mission is pure risk management. To that aim, we can encourage our customers to reduce the risks they take, this in turn allowing them to pay lower insurance premiums. But our most important focus is internal: we have established an extensive system of risk management so as to meet our commitments at any time, which consists in us being constantly solvent to pay claims.
introduction 4
company profile 10
corporate governance report 20
risk management report 60
sustainability report
financial statements 98
interview: Mr lakshmana (kris) lutchmenarraidoo
building sustainability in relation to our mission and strategies
responsible products and services
75

Youarehere
building sustainability
OuR MilestONes iN sustaiNaBle iNsuRaNce pRactices
in relation to our mission and strategies
introduction 4
company profile 10
corporate governance report 20
risk management report 60
sustainability report
financial statements 98
interview: Mr Lakshmana (Kris) Lutchmenarraidoo
building sustainability in relation to our mission and strategies
responsible products and services
1940
2005 20102007 20122006 201120092008 2013
1950 1960 1970 1980 1990 2000
1948Foundation of the first 100% Mauritian insurance company, with a number of shareholders gathered around the same objective: to make of Mauritius Union an insurer in touch with local realities.
2005Allocation of a budget dedicated to Social Responsibility, the Mauritius Union mainly supporting the education of children and women in distress
2010Merger between Mauritius Union Insurance and La Prudence. Together they become the Mauritius Union GroupCreation of the Fondation Mauritius Union Limited
1971Launch of the pioneering comprehensive home insurance in Mauritius
1992Opening, in Flacq, of the first of 11 regional branches
2012First sensitization campaign on life insurance, accompanied by a wide distribution of plants
1949Launch of the first life insurance accessible to all with a minimum subscription of Rs 2 per month
2006For the first time “sustainability” is addressed in the annual report as a sub-chapter based on three main topics: “Ethics”; “Environment, Health and Safety”; and “Social Responsibility”
1973Founding member of the Insurers’ Association to promote best practices in insurance business in Mauritius
1993Opening of shareholding with the entry of the Mauritius Union Assurance on the stock market
2013First blood donation campaign in support to hospitalsLaunch of our internal code of ethics
2011Opening of the Seychelles branch, the first overseas branchSignatory of the customer charter launched by the Insurers’ Association
77

Youarehere
OuR pRiORities iN sustaiNaBle stRategies
We consulted with our external stakeholders about their main expectations towards of the Mauritius Union for a responsible practice of the insurance business. This allowed us to identify the major sustainability issues linked with our activities. These issues were then evaluated by our management team and prioritized for action in accordance with our business strategy. As a result of this assessment process, the issues were categorized as ranging from “critical” for immediate focus, to “secondary” for our business activity, the latter thus requiring “further consideration”. That is not to say, however, that those secondary issues will be excluded from our present action plan. The existence of a Board Charter already promotes the code of good governance among the Directors and ensures its implementation. We took a similar approach with our employees in 2013, with the implementation of a new code of ethics. This document aims at promoting our values and ethical behavior. It encourages us to set the mark for our business practices higher than the minimum legal requirements. This document is meant to be signed by all our employees.
RespONsiBleBusiNess pRatices
eNviRONMeNtal MaNageMeNt
cORpORate citiZeNsHip
•Comply with our financial commitments
•Clarity and transparency on products
•Customer care
•Product accessibility / flexibility
•Ecological products and incentives
•Responsible HR Practices
•Clear strategic objectives
•Ethical governance and transparency
•Staff involvement in Sustainable development
•Environmental footprint of our internal activities
• Involvement to promote reduction of systemic risks
•Sustainable investments
•Dedicated management to sustainable development
• Involvement to promote good practices in health system
introduction 4
company profile 10
corporate governance report 20
risk management report 60
sustainability report
financial statements 98
interview: Mr Lakshmana (Kris) Lutchmenarraidoo
building sustainability in relation to our mission and strategies
responsible products and services
Two years ago, the UNEP-FI (United Nation Environment Program – Finance Initiative) launched the Principles for Sustainable Insurance (PSI). This initiative aims at considering insurers as a lever of change to promote good practices, for a livelier planet, one less subject to the systemic risks caused by human activities.Some of the major expectations from the UNEP-FI towards Mauritius Union as an African Insurance Company are:
- To take into consideration the risks’ increase in our area due to climate change
- To also take into account the major epidemiologic risks- To stay vigilant about insurance accessibility for the underprivileged- To commit ourselves through the various means of impact we may
have as an economic actor and local investorThese considerations are filled in into our management agenda and our sustainability report is already largely inspired from the PSI.The Mauritius Union is now engaged in the formal process of continuous improvement for a sustainable insurance. Step by step, we will keep focusing on best practices in that field. We invite our stakeholders to remain in a constructive dialogue with us, to help us in this continuous improvement process.http://www.unepfi.org/psi/
pro-psior not?
fOR
fuRt
HeR
cON
siD
eRat
iON
siM
pORt
aN
tiM
pORt
aN
ttO
Be
cON
siD
eReD
cRit
ica
l
79

Youarehere
sustaiNaBle DevelOpMeNt gOveRNaNce stRuctuRe
At the Mauritius Union Group, we follow the 3 lines of defence of the governance model strictly. This implies a set of controls at each level:
The three lines of Defence model is widely adopted by financial services campanies. It clearly sets out the risk management responsibilities across the business and is consistent with the current regulatory climate around corporate governance, systems and controls.
Few insurers have their own risk management department, as we do, and one of our distinctive strengths is that we have our own internal audit department which was established in April 2011.
tHiRD liNe Of DefeNce
secOND liNe Of DefeNce
fiRst liNe Of DefeNce
introduction 4
company profile 10
corporate governance report 20
risk management report 60
sustainability report
financial statements 98
interview: Mr Lakshmana (Kris) Lutchmenarraidoo
building sustainability in relation to our mission and strategies
responsible products and services
Business areas - such as Finance, Customer Experience, BC/IT, Distribution & Marketing own their business risk. They have primary responsibility for identifying, reporting, monitoring and managing their risks.
Includes teams like Compliance Risk Management and Legal. They provide risk frameworks and guidance within which the business must operate. They also challenge the business on how risks and controls are being managed.
Group audit provide independent assurance over the first and second lines of defence.
81

Youarehere
responsible products and services
OuR actiONs fOR custOMeR cOMplaiNts MaNageMeNt
The Financial Services Commission (FSC) has edited guidelines relating to complaints handling by insurance companies. Each company should have its own complaints handling policy to ensure effective action. This policy should be displayed on the premises or communicated clearly to customers. These guidelines also stipulate the necessity of hiring a Complaints Coordinator in order to handle complaints as per the internal policy, but also within the procedure defined by the FSC.(http://www.mauritiusunion.com/en/support_customer.aspx)
Every 6 months, in accordance with the regulations of the Financial Service Commission, the Mauritius Union complies with its obligation to send a report to its Board of Directors stating:
The amount of complaints received by the company
The amount of complaints that were justified
The amount of complaints that were not justified
Ideally, the Mauritius Union is favourable to the principle that the FSC should publish the statistics about complaints received and processed by each insurance company in Mauritius. This would clearly improve the insurance practice to the benefit of the customer.
custOMeR caRe
Our commitment to customer satisfactionEach year, we make sure to analyze the Customer Satisfaction Index through a survey conceptualized by an independent institution. In 2013, we carried out two such surveys. The most important findings contained in these surveys relate to the areas in which our customers wish to see improvement. Our customers are satisfied with our range of products and the contract handling process in our branches. However, they expect better and faster service from our claims settlement system, telephone service and accounting desk.
- Our own customer charter with a new set of objectives derived from our customers’ expectations and a focus on our employees’ commitment to adhere to this Charter
- Better accessibility of services via our website, both for claim follow-ups and insurance products
- Endeavours to keep a continuous dialogue with our clients; they are our main asset for improvement
Our commitments for 2014
1. The client asks for service at Mauritius Union
In case of dissatisfaction, the client can address his complaint to the Complaints Officer
Case not settled
2. The company has 3 working days to acknowledge receipt and 30 days to give a complete explanation
3. The client sends his complaint to the Financial Service Commission for arbitration and settlement
✔casesettleD
introduction 4
company profile 10
corporate governance report 20
risk management report 60
sustainability report
financial statements 98
Mr Lakshmana (Kris) Lutchmenarraidoo
building sustainability in relation to our mission and strategies
responsible products and services
our internal activities
✔
✔
✔
83

Youarehere
geNeRal iNsuRaNce
focus: 30.03.2013 Black saturdayOn 30th March 2013, heavy rains caused
severe flooding in the Port Louis region. In addition to the lives
forever shattered by these tragic events, significant damages occurred, particularly in homes and businesses. The highway was submerged; many
vehicles were trapped or carried downstream. It is in
tragic circumstances such as those that our profession takes on its
full significance. That same day, Mauritius Union acted in a most responsible way by establishing a crisis management cell.● The national incidence, excluding
infrastructure, was estimated to represent losses between Rs500 and Rs600 million
● Mauritius Union has disbursed more than Rs114 million
MOtOR iNsuRaNce
In 10 years, the number of vehicles in Mauritius has increased by 60%. With an average of 1 vehicle for less than 3 Mauritians, this trend confirms our dependence on individual means of transport and the
resultant ecological impacts (road development,
parking spaces and gas importation).
at Mauritius union, the 4 main sustainability issues regarding motor insurance are:- To have clear and transparent insurance
products, easy for our clients to understand - To provide affordable products, since
motor insurance is compulsory in Mauritius and car owners are increasing in number
- To provide strong support and a fast assistance to our clients
- To promote virtuous behavior so as to improve road safety
clear and affordable productsIn the field of motor insurance, it is possible to cover a wide range of risks and services. Though this evolution was intended to better serve the customers, it can sometimes result in confusion for them. At Mauritius Union, we are trying to simultaneously resolve three key issues:- the ability to offer affordable insurance
products, - the ability to provide extensive insurance
covers, - and all of this in a format that is easy for
the client to understand.
For these reasons, we decided to propose the best standard covers as basic offers. All the other types of extra services can be purchased as optional cover. Those add-ons are very specific, allowing the client to customize their car insurance according to their respective needs. As an example, they can decide whether they want to be covered, or not, for any of the following:- loss of car keys (including lock replacement)- personal belongings- damages caused by rodents- misfuelling
assistance and service to our clientsFor our clients who opt for a comprehensive cover, we have set up a 24/7 hotline, including technical assistance. They can dial 211 3030 in case of emergency.An accident is an event that affects our customers’ lives. In recent years, we have improved our processes to give feedback to our clients and ensure claim handling within the same day.
introduction 4
company profile 10
corporate governance report 20
risk management report 60
sustainability report
financial statements 98
Mr Lakshmana (Kris) Lutchmenarraidoo
building sustainability in relation to our mission and strategies
responsible products and services
our internal activities
evolution of the complaints ratio on motor insurance (major portfolio at the Mauritius union)
evolution of the complaints ratio on health insurance
- 5 working days: we aim to answer customer complaints within 5 working days rather than the 30 days requested by the regulation.
- 0 complaints sent to the fsc: we expect our services to provide the required level of attention to reassure the client as to our integrity and transparency in the handling of their case.
- We intend to maintain our policy of continuous training so our employees may have an extensive and thorough knowledge of our products and services. We believe this is key in avoiding misunderstandings between Mauritius Union and our customers.
- To ensure that customer satisfaction is our main focus, we have decided at Mauritius Union to hire not only a Complaints Officer, but to create a Customer Care Department.
- The complete complaint procedure is displayed in all our branches and on our web site. The customer care department can also be contacted directly by mail, through the web site.
Our commitments for 2014
what we do
2011
2012
2.2%
0.04%
2013
2013
1.3%
0.04%
30/03/2013
keeping connected to our philosophyFollowing the flooding and financial losses suffered by many individuals, including the less fortunate, Mauritius Union issued a new home insurance policy specially designed for the lower income group.Going forward, the company will lay emphasis on educating on the importance of being properly insured.
- The very same day we proved ourselves to be extremely proactive and established a crisis management cell at Mauritius Union, composed of thirty employees who worked tirelessly to meet the victims’ expectations.
- For motor insurance, we provided an important number of replacement vehicles so our policyholders could resume the normal course of their lives as soon as possible.
- Thanks to this mobilisation we contacted, visited, helped out and provided replacement vehicles to more than 100 flash flood victims within 48 hours. 75% of the repairs were approved within week and Total Losses settled in 15 working days to the exception of few complex cases. This proved false the infamous sally that insurers are more keen to collect premiums than to settle claims.
what we did
Our commitments for the future
276,371 veHiclesiN 2003
443,495 veHiclesiN 2013
443,000 veHicles iNsuReD iN MauRitius
MauRitius uNiON Has a
28% MaRket sHaRe Of tHe MOtOR BusiNess
2012
1.7%
85

Youarehere
Now for 2014, we are targeting to improve our lead time from the evaluation of repairs and the surveyor’s report to the approval of repairs. We target to reduce the approval process by at least 2 more days.
Road safety: a matter of self-responsibility and defensive driving after all!The increase in the number of road accidents is not correlated with the increase in the number of vehicles on our roads. Thus, road insecurity is not a fatality linked with traffic intensity. It is a multi-factorial issue that at once involves individual good driving practices and, of course, the quality of the infrastructures. Regarding the latter, we obviously can see efforts in the quality of roads, speed cameras or legislation that should definitely help improve road safety.
HealtH iNsuRaNce
So far, we have identified four major sustainability issues in the field of Health insurance:- To provide the required assistance to the
client accordingly, along with therapy - To provide affordable, inclusive and
equitable health insurance covers - To contribute, at our level, to the
emergence of a transparent health management system in the country
- To promote healthy behaviour to reduce risks
life iNsuRaNce
The purpose of life insurance is to ensure the client’s peace of mind from a two-fold perspective: in prevention of a foreseen situation or in case of unexpected death or incapacity. Accordingly, the client allocates a regular amount of money to cover the risks about which he/she is most concerned.Hence, the major responsibilities for our company are: - To guarantee the financial protection of
the client • By payment in case of death or disability • By setting up a sustainable capital to be
used when needed (over a defined or undefined period)
- To invest our client’s savings in a responsible manner
- To select strong and safe reinsurers - To ensure a reciprocal transparency
with each client while simultaneously guaranteeing the confidentiality of personal information
A handy guide is given to each of our clients to help them in case of accident.
We intend to support a preventive campaign directed towards our youths on responsible driving and the dangers they face if they “drink and drive”.
Other than the car’s value, the other elements impacting the insurance premium are the risk factors, and the most important ones are: - A loss ratio exceeding 75%- Drivers with less than 3 years
of experience- Whether one drives a sport
vehicle- The age of the driver (those
under 21 years)
what we do
Our commitmentsfor 2014
who is a risky driver?
20%
2004 20082006 20102005 20092007 2011 2012 2013
10%
0
-10%
Claims rate of increase
tRaffic iNteNsity v/s claiMs iNcRease at MauRitius uNiON
introduction 4
company profile 10
corporate governance report 20
risk management report 60
sustainability report
financial statements 98
Mr Lakshmana (Kris) Lutchmenarraidoo
building sustainability in relation to our mission and strategies
responsible products and services
our internal activities
This last couple of years, Mauritius Union has organized an event to raise awareness among Mauritians and prevent health risks. In 2013, we organised a blood donation campaign during the month of September at Le Caudan, Port Louis and helped by collecting 100 pints of blood.
Blood donation
we pROviDe MeDical iNsuRaNce tO
375 clieNtsOveR
70 years of age
vehicles rate of increase
87

Youarehere
secuRiNg tHe fiNaNcial stReNgtH Of OuR cOMMitMeNts
The solvency and the financial strength of our Life Insurance Funds are regularly evaluated by an actuary. This information is integrated in the actuarial report that is sent every year to the Financial Services Commission.
cOMMitteD tO OuR clieNts
Some of our life insurance products may require that our customers go for a medical check-up. This information is required to evaluate the risk attached to the life of the insured. Our clients can rest assured that all their personal information related to life insurance is kept in a restricted area, with limited access. Mauritius Union duly complies with the obligation to submit any communication about its Life Insurance products to the Financial Services Commission for approval first, before disclosing it to clients. These obligations for communication are stated in the Insurance Act 2005. As per this same legislation, we are required to communicate regularly with our clients about their premiums and savings. Furthermore, we have brought innovation to our products, so as to propose a wider range of benefits and funds to our clients.
pReseNtatiON Of life iNsuRaNce aND its MaJOR sustaiNaBility issues
OuR Best pRactices We select our reinsurers among the best operating in this part of the world. We require them to be high up on the list of either AM Best or Standard & Poor’s. Once our choice made, we rarely put the treaty out for tender except in special circumstances, in order to get better terms. The long term nature of our business allows us to nurture a bond of trust and stability with them.
selection process of our reinsurers
introduction 4
company profile 10
corporate governance report 20
risk management report 60
sustainability report
financial statements 98
Mr Lakshmana (Kris) Lutchmenarraidoo
building sustainability in relation to our mission and strategies
responsible products and services
our internal activities
ContriBUtor Co
ntriBUtor
others
BeNeficiaRies
ReiNsuRaNce
clieNts
MauRitius uNiON iNvestMeNt DepaRtMeNt
DEFINED OR UNDEFINEDPERIOD OF TIME
puRe Risk iNvestMeNt plaNs
Protection plans (life or incapacity)
LESS MOREFLEXIBLE FLEXIBLE
retirement studies savings
iNvestMeNtssocial and green
insurance premiums
clients’savings insurance cover
or invested capital in case of contributor’s death
otherslocalforeign
investment returns
• tRaNspaReNcy• etHics aND
iNtegRity iN cOMMuNicatiON
• selectiON pROcess Of Re-iNsuReRs
• eNsuRe effective payMeNt iN accORDaNce witH cOMMitMeNts
• ecOlOgical aND sOcial fOOtpRiNt Of iNvesteD pORtfOliO
• gOOD gOveRNaNce pRactices
rs 6 billion iNvesteD iN MauRitius
rs 675 millionlife iNsuRaNce pReMiuM ReceiveD iN 2013. tHis aMOuNt iNcluDes BOtH Risk cOveRage pReMiuMs aND lONg teRM
iNvestMeNts13.9% RetuRN as Of 31/12/2013 ON OuR cOMBiNeD pORtfOliO
89

Youarehere
iMpact ON tHe eNviRONMeNt
carbon footprintImpact and risks concerning climate change are sensitive issues of which we should all be aware. This applies to us particularly as an insurance company which may have to face increasing claims pertaining to damages due to natural disasters. With this in mind, we decided to start monitoring our impact on the environment, starting with CO2 emissions. The subsequent evaluation allowed us to note
that there had been an increase in electricity consumption
throughout our 14 agencies in Mauritius, leading to more CO2 emissions. This awareness was the first step which will result in further actions, both to decrease our energy consumption and
to start offsetting our CO2 emissions.
our internal activities
paper consumptionOne of the other major impacts that our activity may have on the environment is through paper consumption. This item has been rather stable over the last three years and 2013 ended with a total use of 3 566 665 sheets of paper. This equals to an average of 8,100 sheets of paper per employee (16 reams). This signifies approximately 20 tons of paper were used in 2013. It is generally accepted that at least twice this weight in dried wood is required to produce that amount of paper.
printed sheets of paper
good practiceNew efforts were taken to reduce these consumables. The company decided to centralize the printers within its various departments, thus reducing waste. Our endeavors to provide on-line insurance
services are also part of our efforts to reduce the use of paper.
Other consumables and purchasesThe insurance business does not involve major purchasing issues except for paper and IT
equipment. To date, there is no internal policy focusing on responsible products or charter for responsible
practices in purchasing. The regular internal procedure still
applies.
1 ton of recycled paper requires 6 times less water for its production and 4 times less energy than regular paper. Also taking into consideration that recycled paper does not require wood for its production, Mauritius Union will evaluate to what extent we could use recycled paper in the future.
Our commitmentfor 2014
3,750,000
3,450,000
3,667,831 3,566,665
3,356,885
3,600,000
3,300,000
3,150,0002011 2012 2013
In 2013, our end of year gifts consisted almost exclusively of eco-labelled products amounting to Rs 1.2 million. No alcohol was included on the gift list.
eco-labelled corporate gifts:
introduction 4
company profile 10
corporate governance report 20
risk management report 60
sustainability report
financial statements 98
Mr Lakshmana (Kris) Lutchmenarraidoo
building sustainability in relation to our mission and strategies
responsible products and services
our internal activities
cO2 eMissiONsiN 2013
1,535 tons
eNeRgy 1174
tons
tRaNspORt
340 tons
cO2
eMissiONs
- A first step was taken in 2013 to change all our halogen lamps to led lights.
- Every day, 5 company buses convey 130 employees to our offices in Port Louis. This policy helps us both provide our employees with a comfortable means of transportation to get to work and to optimise gas consumption per employee.
The company takes note of these issues and will attend to them in the near future so as to take appropriate action to mitigate these impacts.
Our actions
Our commitments for 2014
3 567 000pRiNteD sHeets iN 2013, aN aveRage Of 8,100 pages peR eMplOyee. 22 pages peR Day peR eMplOyee. tHe aveRage iN euROpe is 28 pages peR Day (ipsOs 2011 fOR lexMaRk).
OuR wisH is tO Be a papeR-less cOMpaNy. tHis is ONe Of OuR MaJOR 2014-2015 pROJects. ON a sHORt teRM Basis we wisH tO at least OffeR tHe cHOice tO custOMeRs BetweeN Digital aND papeR fORMat By applyiNg tHe electRONic tRaNsactiONs act aND eNsuRiNg a HigHly secuReD it eNviRONMeNt. we Have alReaDy aMeNDeD OuR payMeNt MetHOD By eNcOuRagiNg OuR staff aND custOMeRs tO Opt fOR BaNk tRaNsfeRs iNsteaD Of cHeques ReceiveD tHROugH pOstal Mail. iN a NeaR futuRe we taRget 90% OuR settleMeNts tO Be papeR-less.
lakshmana (kris) lutchmenarraidoo ceO
Power consumption (in kWh / employee)
Gas and Gas-oil consumption(in L)
2,407
2,549
317N/A
2012
2013
20132012
90

Youarehere
cOMMuNity iNvOlveMeNt
The Fondation Mauritius Union Limited (FMU) stays within the philosophy of the Mauritius Union, and focuses on Caring and Protecting.
Almost from its inception, Mauritius Union developed a culture of engagement in Mauritian society. It dedicated a part of its profits to that effect, several years prior to the introduction of the CSR law which requires companies to donate 2% of their annual profit. The enforcement of CSR was thus an opportunity to set up a governance structure to manage the fund designated for social projects.
governanceThe FMU is a non-profit company with a board, whose chairman is the CEO of the company. The foundation is managed by a coordinator who works part time. Each board member is responsible for a subcommittee and invites the staff to participate in the initiatives of this committee; it is a way to involve staff in CSR projects.
wasteThe business of insurance is not an important waste producer. The two main types of waste we may generate are electronic waste and paper/cardboard. At this stage most of what is printed is archived and our obsolete equipment is handed over to organizations for second-hand utilisation. For any other waste, at this time, there is still no sorting or recycling policy at the Mauritius Union. Waste reductionA first step was taken this year towards waste reduction by acting on the use of cups at coffee machines. Two decisions were implemented: the first action was to provide each employee with a ceramic mug so as to avoid the use of disposable cups. The second action was to replace all the plastic cups with recycled cardboard cups. These cups should now be used only for extra practice, for example when receiving a visitor. A new system has also been set up for the recycling of ink cartridges: our supplier is responsible for managing the refill and reuse process.
introduction 4
company profile 10
corporate governance report 20
risk management report 60
sustainability report
financial statements 98
Mr Lakshmana (Kris) Lutchmenarraidoo
building sustainability in relation to our mission and strategies
responsible products and services
our internal activities
We will assess the existing possibilities for the recycling of at least part of our waste. A procedure will also be defined to ensure the best practices as to management of electronic waste.
Our commitmentsfor 2014
BOaRDMeMBeR
BOaRDMeMBeR
BOaRDMeMBeR
BOaRDMeMBeR
Sustainable Development Committee
Children, Elderly & Family Welfare
Committee
Health, Sports and National Catastrophic Intervention
Poverty Alleviation,
Empowerment & Social Housing
Capacity Building and
Education Committee
csR cOORDiNatOR
BOaRDMeMBeR
cHaiRMaN(CEO OF
MAURITIUS UNION)
92

Youarehere
examples of major projects supported by our committees:
eNviRONMeNt, cONseRvatiON aND NatiONal DisasteRsThe Fondation participated in the national movement of solidarity following the floods of 2013, with financial contribution and donation of beds and mattresses.
eDucatiON, welfaRe aND DevelOpMeNt Of vulNeRaBle cHilDReNcaritas food project (Rodrigues)Since 2009, we finance the daily lunch of 50 vulnerable children attending Ronald Gandy RCA School. This project aims both at supporting the children’s growth and reducing absenteeism.
ReMeDial cOuRses fOR cHilDReNWe subsidized the wages for 3 teachers to run remedial classes and helped in the running of the centre Sa Nou Vize − Residence Bethleem − Rose-Belle.
pROtectiON, HealtH aND sOcial iNtegRatiON Of vulNeRaBle gROupsArtificial limbsWe contributed to the Global Rainbow Foundation to provide artificial limbs for amputees.addictionsWe helped in paying the wages of a specialized therapeutic educator at Etoile d’Esperance, for the rehabilitation of women suffering from alcohol addiction.
aDvOcacy, awaReNess aND pReveNtive caMpaigNsawareness on communicable diseaseWe supported a preventive campaign on communicable disease, aimed mainly at sex workers and the general public around the island to increase awareness of modes of transmission of diseases and their treatment and to promote safe practices to avoid being infected. The campaign was implemented by the NGO Chrysalide.
All CSR projects of the Mauritius Union Group are approved by the board:
Our initiatives
applicatiONIf request is within guidelines and budget
Analyse request and organise site visit by the CSR CoordinatorPrepare project summary and make recommendations to CSR Committee
appROvalIf approved by committee
Ratify by FMU ChairmanSend Acceptance LetterSign MOU (both parties)
payMeNt & MONitORiNg
Organise payment with finance departmentMonitor the outcome of the project through site visit, receive regular reportPrepare completion report
5% Environment, conservation and national disasters
39% Education, welfare and development of vulnerable children
24% Protection, health and social integration of vulnerable groups
23% Poverty alleviation, community development and capacity building
9% Advocacy, awareness and preventive campaigns
introduction 4
company profile 10
corporate governance report 20
risk management report 60
sustainability report
financial statements 98
Mr Lakshmana (Kris) Lutchmenarraidoo
building sustainability in relation to our mission and strategies
responsible products and services
our internal activities
CSR Contributions 2013:
- Our current organization with thematic committees allows us to stay focused on our projects. In the future; we may also integrate a better holistic and systemic approach on social and environmental issues. Hence, this year, we will define a more precise strategic roadmap for the FMU, to bring better quality support to the community.
- The next step would be to allow a better involvement of Mauritius Union employees. They should be allowed to volunteer in civic activities. The company considers this an excellent way to raise awareness on social issues and it can only be positive to improve our empathy for others and our customers.
stronger commitments
A step ahead of the law:We decided not to restrict ourselves to the new method of calculating (2% of CSR), which leads to the allocation of a sum only at the end of each year. Instead, we opted to allocate an annual budget to CSR independently of the mandatory 2% of profits.
good practice
94

Youarehere
eMplOyee satisfactiONOur efforts to keep and attract talents include an annual employee satisfaction survey. These indicators constitute a piece of good news about the great work done together only 3 years after the successful merger between Mauritius Union and La Prudence. There is still room for the improvement regarding our work culture and team spirit, with targets including a clearer leadership and better communication. We shall keep promoting employee happiness in the workplace.
key iNDicatORs
sOcial 2012 2013 2012 - 2013 change
Total headcount 435 448 +3.0%
Gender balance: proportion of women Total 60% 58% -2pts
Executives 40% 41% +1pt
Employee turnover 12.6% 10.1% -2.5pts
Employee satisfaction Average (all indicators) 58.5% 60.3% +1.8pts
Sense of belonging 78% 78% -
Proportion of variable pay 11% 23% +12pts
Average number of training hours per employee 12.6 15.5 +2.9
eNviRONMeNtal 2012 2013 2012 - 2013 change
Power consumption (kWh / employee) 2,407 2,549 +142
CO2 emissions (T.CO2 eq. / employee) - 3.43 -
Paper consumption (kg / employee) 43.2 44.6 +1.4
We have set up an Employee Welfare Team, constituted by staff representatives, with its own chairman and secretary. We consult with the EWT to improve our employees’ satisfaction and happiness at work.
Our good practice for employee welfare
78%Of OuR eMplOyees Have a pOsitive seNse Of BelONgiNg tO tHe MauRitius uNiON gROup
72%Of OuR eMplOyees aRe satisfieD witH tHe wORk cONDitiONs
HuMaN ResOuRcesMauritius Union employs about 440 persons, and our success relies mostly
on their enthusiasm and dedication. With 65 years
of existence, Mauritius Union allies experience to the dynamism of a young workforce. 16% of our employees have been loyal to the company
for over 10 years and are invited to pass the Mauritius Union attitude
down to new generations.
tRaiNiNgAn extensive range of training programs is provided to our employees, whether to develop human or professional skills, technical or managerial practices.
HealtH at wORkThe objectives are to create a quality environment at work that prevents any health risk while promoting well-being. The company relies on the intervention
of our Health and Safety Officer who intervenes within our premises as per the
Operational Safety and Health Act 2005. This can lead us to audit the air quality in our offices every two years or, occasionally, to organize medical prevention campaigns. The last one was an eye check-up for our employees in 2012.
introduction 4
company profile 10
corporate governance report 20
risk management report 60
sustainability report
financial statements 98
Mr Lakshmana (Kris) Lutchmenarraidoo
building sustainability in relation to our mission and strategies
responsible products and services
our internal activities
448eMplOyees
35.1tHe age aveRage at tHe MauRitius uNiON gROup
40%Of wOMeN iN tHe MaNageRial staff
Average numberof training hours
per employee
2012
12.6 hours
2013
15.5 hours
96

financialstatements
youarehere
introduction 4
company profile 10
corporate governance report 20
risk management report 60
sustainability report 72
financial statements
98

Youarehere
youarehere
statutory disclosures
The Directors have pleasure in submitting the Annual Report of The Mauritius Union Assurance Company Limited together with the audited financial statements for the year ended December 31, 2013.
pRiNcipal activitiesThe principal activity of the Company during the year comprised the transacting of all classes of insurance business. The Company also granted secured loans and invested in shares. There has been no change in the nature of its business.
DiRectORs’ seRvice cONtRactsNone of the directors proposed for re-election at the forthcoming annual meeting have unexpired service contracts.
DiRectORsRemuneration and benefits received, or due and receivable from the Company and its subsidiaires were as follows :
Directors of the Mauritius union assurance company limited
FROM THE COMPANY FROM SUBSIDIARIES
2013 2012 2013 2012
Rs’000 Rs’000 Rs’000 Rs’000
executive Directors
Full-time 6,556 9,769 - -
Non-executive Directors 4,042 3,936 - -
10,598 13,705 - -
cONtRacts Of sigNificaNceThere was no contract of significance subsisting during the year to which the company, or one of its subsidiary was a party to or in which a director was materially interested, either directly or indirectly.
DONatiONscharitable donationsCharitable donations made by the Company during the year amounted to Rs 831,095 as compared to Rs 2,485,438 in 2012. These donations were channelled through the Fondation Mauritius Union Ltd which handles the Group’s CSR activities
political DonationsIn line with Group’s policy, no political donations were made during the year under review.
auDitORs’ feesThe fees paid to the auditors, for audit and other services were:
tHe gROup tHe cOMpaNy
2013 2012 2013 2012
Rs’000 Rs’000 Rs’000 Rs’000
Audit fees paid to: Ernst & Young 2,278 2,256 1,447 1,289
Fees paid for other services provided by: Ernst & Young 398 780 206 341
Approved by the Board of Directors on 28 March 2014 and signed on its behalf by:
Dominique GALEAcHaiRMaN
Lakshmana (Kris) LUTCHMENARRAIDOOcHief executive OfficeR
ECS Secretaries LtdcOMpaNy secRetaRy
7.1 statutory disclosures for the year ended december 31, 2013 7.1 statutory disclosures for the year ended december 31, 20137. fiNaNcial stateMeNts fOR tHe yeaR eNDeD DeceMBeR 31, 2013 7. fiNaNcial stateMeNts fOR tHe yeaR eNDeD DeceMBeR 31, 2013
introduction 4
company profile 10
corporate governance report 20
risk management report 60
sustainability report 72
financial statements
statutory disclosures
secretary’s certificate
independent auditors’ report
statement of financial position
statement of comprehensive income
100

Youarehere
youarehere
secretary’s certificate
We certify, to the best of our knowledge and belief, that the Company has filed with the Registrar of Companies all such returns as are required of the Company under the Companies Act 2001.
ECS Secretaries LtdcOMpaNy secRetaRy
28 March 2014
7.2 secretary’s certificate for the year ended december 31, 2013
7. fiNaNcial stateMeNts fOR tHe yeaR eNDeD DeceMBeR 31, 2013
introduction 4
company profile 10
corporate governance report 20
risk management report 60
sustainability report 72
financial statements
statutory disclosures
secretary’s certificate
independent auditors’ report
statement of financial position
statement of comprehensive income
102

Youarehere
RepORt ON tHe fiNaNcial stateMeNtsWe have audited the consolidated financial statements of The Mauritius Union Assurance Company Limited (the ‘’Company’’) and its subsidiaries (together referred to as the “Group”) on pages 106 to 203 which comprise the statements of financial position as at December 31, 2013 and the statements of comprehensive income, statements of changes in equity and statements of cash flows for the year then ended and a summary of significant accounting policies and other explanatory notes.
Directors’ Responsibility for the financial statementsThe directors are responsible for the preparation and fair presentation of these financial statements in accordance with International Financial Reporting Standards and in compliance with the requirements of the Companies Act 2001, and for such internal control as the directors determine is necessary to enable the preparation of financial statements that are free from material misstatement, whether due to fraud or error.
auditors’ ResponsibilityOur responsibility is to express an opinion on these financial statements based on our audit. We conducted our audit in accordance with International Standards on Auditing. Those Standards require that we comply with ethical requirements and plan and perform the audit to obtain reasonable assurance whether the financial statements are free from material misstatement.
An audit involves performing procedures to obtain audit evidence about the amounts and disclosures in the financial statements. The procedures selected depend on the auditors’ judgement, including the assessment of the risks of material misstatement of the financial statements, whether due to fraud or error. In making those risk assessments, the auditors consider internal control relevant to the Company’s preparation and fair presentation of the financial statements in order to design audit procedures that are appropriate in the circumstances, but not for the purpose of expressing an opinion on the effectiveness of the Company’s internal control. An audit also includes evaluating the appropriateness of accounting policies used and the reasonableness of accounting estimates made by the directors, as well as evaluating the overall presentation of the financial statements.We believe that the audit evidence we have obtained is sufficient and appropriate to provide a basis for our audit opinion.
OpinionIn our opinion, the financial statements on pages 106 to 203 give a true and fair view of the financial position of the Group and of the Company as at December 31, 2013 and of its financial performance and its cash flows for the year then ended in accordance with International Financial Reporting Standards and comply with the Companies Act 2001.
Other matterThis report, including the opinion, has been prepared for and only for the Company’s members, as a body, in accordance with Section 205 of the Companies Act 2001 and for no other purpose. We do not, in giving this opinion, accept or assume responsibility for any other purpose or to any other person to whom this report is shown or into whose hands it may come save where expressly agreed by our prior consent in writing.
RepORt ON OtHeR legal aND RegulatORy RequiReMeNts
companies act 2001We have no relationship with or interests in the Company or any of its subsidiaries, other than in our capacity as auditors, tax advisors, and dealings in the ordinary course of business. We have obtained all the information and explanations we have required. In our opinion, proper accounting records have been kept by the Company as far as it appears from our examination of those records.
financial Reporting act 2004The directors are responsible for preparing the corporate governance report. Our responsibility is to report on the extent of compliance with the Code of Corporate Governance (the “Code”) as disclosed in the annual report and on whether the disclosure is consistent with the requirements of the Code.In our opinion, the disclosure in the corporate governance report is consistent with the requirements of the Code.
insurance act 2005The financial statements have been prepared in the manner and meet the requirements specified by the Financial Services Commission (FSC).
ernst & youngeBèNe, MauRitius
Patrick NG TSEUNG, A.C.AliceNseD By fRc
28 March 2014
7.3 independent auditors’ report to the members of the mauritius union assurance company ltd7. fiNaNcial stateMeNts fOR tHe yeaR eNDeD DeceMBeR 31, 2013 7. fiNaNcial stateMeNts fOR tHe yeaR eNDeD DeceMBeR 31, 2013
7.3 independent auditors’ report to the members of the mauritius union assurance company ltdyouarehere
introduction 4
company profile 10
corporate governance report 20
risk management report 60
sustainability report 72
financial statements
statutory disclosures
secretary’s certificate
independent auditors’ report
statement of financial position
statement of comprehensive income
independent auditors’ report
104
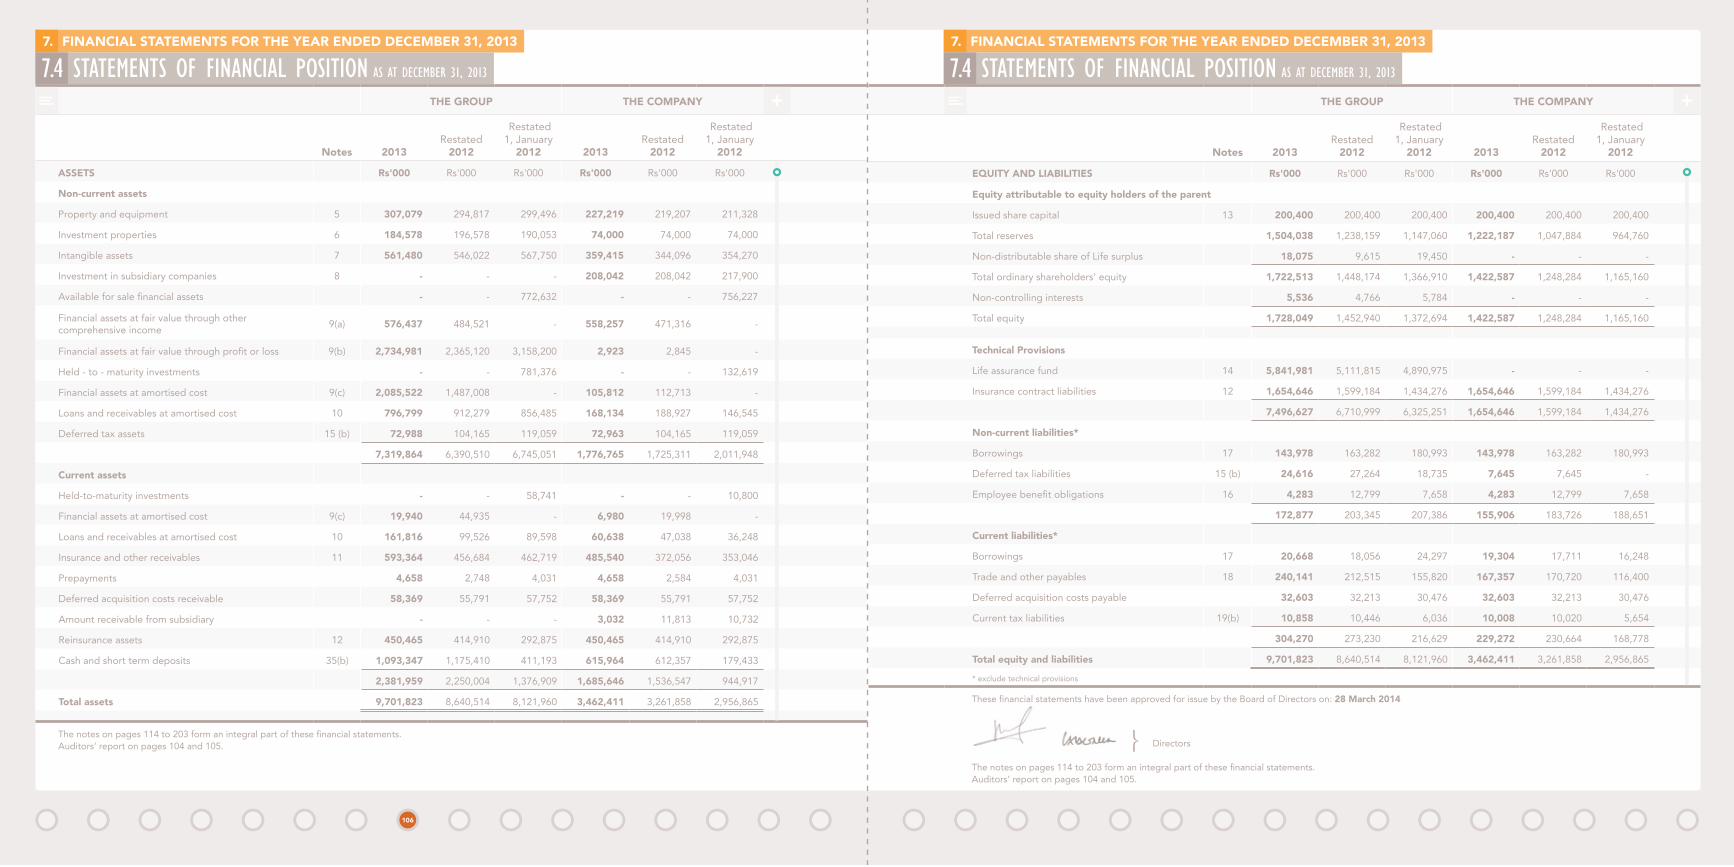
tHe gROup tHe cOMpaNy
Notes 2013Restated
2012
Restated 1, January
2012 2013Restated
2012
Restated 1, January
2012
equity aND liaBilities Rs'000 rs'000 rs'000 Rs'000 rs'000 rs'000
equity attributable to equity holders of the parent
Issued share capital 13 200,400 200,400 200,400 200,400 200,400 200,400
Total reserves 1,504,038 1,238,159 1,147,060 1,222,187 1,047,884 964,760
Non-distributable share of Life surplus 18,075 9,615 19,450 - - -
Total ordinary shareholders' equity 1,722,513 1,448,174 1,366,910 1,422,587 1,248,284 1,165,160
Non-controlling interests 5,536 4,766 5,784 - - -
Total equity 1,728,049 1,452,940 1,372,694 1,422,587 1,248,284 1,165,160
technical provisions
Life assurance fund 14 5,841,981 5,111,815 4,890,975 - - -
Insurance contract liabilities 12 1,654,646 1,599,184 1,434,276 1,654,646 1,599,184 1,434,276
7,496,627 6,710,999 6,325,251 1,654,646 1,599,184 1,434,276
Non-current liabilities*
Borrowings 17 143,978 163,282 180,993 143,978 163,282 180,993
Deferred tax liabilities 15 (b) 24,616 27,264 18,735 7,645 7,645 -
Employee benefit obligations 16 4,283 12,799 7,658 4,283 12,799 7,658
172,877 203,345 207,386 155,906 183,726 188,651
current liabilities*
Borrowings 17 20,668 18,056 24,297 19,304 17,711 16,248
Trade and other payables 18 240,141 212,515 155,820 167,357 170,720 116,400
Deferred acquisition costs payable 32,603 32,213 30,476 32,603 32,213 30,476
Current tax liabilities 19(b) 10,858 10,446 6,036 10,008 10,020 5,654
304,270 273,230 216,629 229,272 230,664 168,778
total equity and liabilities 9,701,823 8,640,514 8,121,960 3,462,411 3,261,858 2,956,865
* exclude technical provisions
These financial statements have been approved for issue by the Board of Directors on: 28 March 2014
⎬ Directors
The notes on pages 114 to 203 form an integral part of these financial statements.Auditors’ report on pages 104 and 105.
tHe gROup tHe cOMpaNy
Notes 2013Restated
2012
Restated 1, January
2012 2013Restated
2012
Restated 1, January
2012
assets Rs'000 rs'000 rs'000 Rs'000 rs'000 rs'000
Non-current assets
Property and equipment 5 307,079 294,817 299,496 227,219 219,207 211,328
Investment properties 6 184,578 196,578 190,053 74,000 74,000 74,000
Intangible assets 7 561,480 546,022 567,750 359,415 344,096 354,270
Investment in subsidiary companies 8 - - - 208,042 208,042 217,900
Available for sale financial assets - - 772,632 - - 756,227
Financial assets at fair value through other comprehensive income 9(a) 576,437 484,521 - 558,257 471,316 -
Financial assets at fair value through profit or loss 9(b) 2,734,981 2,365,120 3,158,200 2,923 2,845 -
Held - to - maturity investments - - 781,376 - - 132,619
Financial assets at amortised cost 9(c) 2,085,522 1,487,008 - 105,812 112,713 -
Loans and receivables at amortised cost 10 796,799 912,279 856,485 168,134 188,927 146,545
Deferred tax assets 15 (b) 72,988 104,165 119,059 72,963 104,165 119,059
7,319,864 6,390,510 6,745,051 1,776,765 1,725,311 2,011,948
current assets
Held-to-maturity investments - - 58,741 - - 10,800
Financial assets at amortised cost 9(c) 19,940 44,935 - 6,980 19,998 -
Loans and receivables at amortised cost 10 161,816 99,526 89,598 60,638 47,038 36,248
Insurance and other receivables 11 593,364 456,684 462,719 485,540 372,056 353,046
Prepayments 4,658 2,748 4,031 4,658 2,584 4,031
Deferred acquisition costs receivable 58,369 55,791 57,752 58,369 55,791 57,752
Amount receivable from subsidiary - - - 3,032 11,813 10,732
Reinsurance assets 12 450,465 414,910 292,875 450,465 414,910 292,875
Cash and short term deposits 35(b) 1,093,347 1,175,410 411,193 615,964 612,357 179,433
2,381,959 2,250,004 1,376,909 1,685,646 1,536,547 944,917
total assets 9,701,823 8,640,514 8,121,960 3,462,411 3,261,858 2,956,865
The notes on pages 114 to 203 form an integral part of these financial statements.Auditors’ report on pages 104 and 105.
7. fiNaNcial stateMeNts fOR tHe yeaR eNDeD DeceMBeR 31, 2013
7.4 statements of financial position as at december 31, 2013
7. fiNaNcial stateMeNts fOR tHe yeaR eNDeD DeceMBeR 31, 2013
7.4 statements of financial position as at december 31, 2013
106

tHe gROup tHe cOMpaNy
Notes 2013 2012 2013 2012
Rs'000 rs'000 Rs'000 rs'000
Profit for the year 260,120 233,183 161,985 235,727
Other comprehensive income:
Items that will not be reclassified to profit or loss in subsequent periods:
Increase/(decrease) arising on revaluation of financial assets at fair value through other comprehensive income 9(a) 116,054 (48,596) 113,110 (47,421)
Re-measurement of defined benefit obligations 16 (436) (1,042) (436) (1,042)
Other comprehensive income for the year - net of tax 115,618 (49,638) 112,674 (48,463)
Total comprehensive income for the year 375,738 183,545 274,659 187,264
attributable to :
Equity holders of the parent 374,695 183,828 274,659 187,264
Non-controlling interests 1,043 (283) - -
375,738 183,545 274,659 187,264
The notes on pages 114 to 203 form an integral part of these financial statements.Auditors’ report on pages 104 and 105.
tHe gROup tHe cOMpaNy
Notes 2013 2012 2013 2012
Rs'000 rs'000 Rs'000 rs'000
cONtiNuiNg OpeRatiONs:
Gross premiums earned 20 2,270,132 2,129,259 1,609,060 1,493,868
Premiums ceded to reinsurers 20 (363,169) (333,545) (339,266) (279,481)
Net earned premiums 20 1,906,963 1,795,714 1,269,794 1,214,387
Fees and commission income 104,098 99,581 90,019 81,905
Investment income 21 343,566 393,971 62,911 73,688
Realised gains 22 726 9,650 545 14,971
Unrealised gains/(losses) 23 455,827 (184,770) 78 (433)
Other operating income 24 37,348 56,000 2,331 13,154
total revenue 2,848,528 2,170,146 1,425,678 1,397,672
Gross claims paid 12 (1,323,270) (1,042,021) (877,334) (659,299)
Claims ceded to reinsurers 12 166,994 47,680 165,540 35,577
Gross change in contract liabilities 12 (764,270) (339,628) (34,104) (118,788)
Change in contract liabilities ceded to reinsurers 12 26,561 111,201 26,561 111,201
Net claims and benefits (1,893,985) (1,222,768) (719,337) (631,309)
Commission and brokerage fees paid (159,046) (170,718) (134,202) (148,537)
Other operating and administrative expenses 25 (478,904) (487,951) (353,009) (329,465)
Total claims, benefits and other expenses (2,531,935) (1,881,437) (1,206,548) (1,109,311)
Profit from operations 316,593 288,709 219,130 288,361
Finance costs 26 (15,478) (16,994) (15,360) (16,873)
Profit before tax 301,115 271,715 203,770 271,488
Income tax expense 19 (40,995) (38,532) (41,785) (35,761)
Profit for the year 260,120 233,183 161,985 235,727
attRiButaBle tO :
Equity holders of the parent 259,490 233,209
Non-controlling interests 630 (26)
260,120 233,183
Basic and diluted earnings per share (Rs/cs) 34 12.95 11.64
The notes on pages 114 to 203 form an integral part of these financial statements.Auditors’ report on pages 104 and 105.
7. fiNaNcial stateMeNts fOR tHe yeaR eNDeD DeceMBeR 31, 2013
7.5 statements of comprehensive income for year ended december 31, 2013
7. fiNaNcial stateMeNts fOR tHe yeaR eNDeD DeceMBeR 31, 2013
7.5 statements of comprehensive income for year ended december 31, 2013
108

attRiButaBle tO OwNeRs Of tHe paReNt
tHe gROup Not
es
share capital
Revaluation reserves
fair value reserve
on available-for-sale financial assets
investment revaluation
reserveRetained earnings
total reserves
Non distributable share of life
surplus
Non-controlling interests total
Rs'000 Rs'000 Rs'000 Rs'000 Rs'000 Rs'000 Rs’000 Rs'000 Rs'000
Balance at January 1, 2013 200,400 1,142 - (84,209) 1,321,226 1,238,159 9,615 4,766 1,452,940
Transfer of gains on disposal of financial assets at fair value through other comprehensive income
- - - 10,418 (10,418) - - - -
Release arising on disposal of financial assets at fair value through other comprehensive income
- - - (156) - (156) - - (156)
Profit for the year - - - - 259,490 259,490 630 260,120
Other comprehensive income
- - - 115,641 (436) 115,205 413 115,618
Total comprehensive income
- - - 115,641 259,054 374,695 - 1,043 375,738
Transfer of distributable share of Life Surplus
32 - - - - (8,460) (8,460) 8,460 - -
Dividends 29 - - - - (100,200) (100,200) (273) (100,473)
Balance at December 31, 2013
200,400 1,142 - 41,694 1,461,202 1,504,038 18,075 5,536 1,728,049
The notes on pages 114 to 203 form an integral part of these financial statements.Auditors’ report on pages 104 and 105.
attRiButaBle tO OwNeRs Of tHe paReNt
tHe gROup Not
esshare capital
Revaluation reserves
fair value reserve
on available-for-sale financial assets
investment revaluation
reserveRetained earnings
total reserves
Non distributable
share of life surplus
Non-controlling interests total
Rs'000 Rs'000 Rs'000 Rs'000 Rs'000 Rs'000 Rs'000 Rs'000 Rs'000
Balance at January 1, 2012 (as previously stated)
200,400 1,142 (47,359) - 1,193,929 1,147,712 19,450 5,784 1,373,346
Effect of adopting ias 19 - - - - (652) (652) - - (652)
Balance at January 1, 2012 (restated) 200,400 1,142 (47,359) - 1,193,277 1,147,060 19,450 5,784 1,372,694
Effect of change in accounting policy for classification and measurement of financial assets
- - 47,359 (14,899) (32,460) - - - -
Transfer of gains on disposal of financial assets at fair value through other comprehensive income
- - - (18,615) 18,607 (8) - 8 -
Release arising on disposal of financial assets at fair value through other comprehensive income
- - - (2,366) - (2,366) - - (2,366)
Profit for the year - - - - 233,209 233,209 - (26) 233,183
Other comprehensive income - - - (48,339) (1,042) (49,381) - (257) (49,638)
Total comprehensive income - - - (48,339) 232,167 183,828 - (283) 183,545
Movement in reserves - - - 10 - 10 - 3 13
Share buy back - - - - - - - (143) (143)
Transfer of distributable share of Life Surplus 32 - - - - 9,835 9,835 (9,835) - -
Dividends 29 - - - - (100,200) (100,200) - (603) (100,803)
Balance at December 31, 2012 200,400 1,142 - (84,209) 1,321,226 1,238,159 9,615 4,766 1,452,940
7. fiNaNcial stateMeNts fOR tHe yeaR eNDeD DeceMBeR 31, 2013
7.6 statements of changes in equity for year ended december 31, 2013
7. fiNaNcial stateMeNts fOR tHe yeaR eNDeD DeceMBeR 31, 2013
7.6 statements of changes in equity for year ended december 31, 2013 (continued)
110

tHe cOMpaNy Not
es issued share capital
Revaluation reserves
fair value reserve on available-for-sale financial assets
investment revaluation
reserveRetained earnings
total reserves
Non distributable share of life
surplus total
Rs’000 Rs’000 Rs’000 Rs’000 Rs’000 Rs’000 Rs’000 Rs’000
Balance at January 1, 2012 200,400 2,460 (20,403) - 983,355 965,412 - 1,165,812
Effect of adopting IAS 19 - - - - (652) (652) - (652)
Balance at January 1, 2012 (restated) 200,400 2,460 (20,403) - 982,703 964,760 - 1,165,160
Effect of change in accounting policy for classification and measurement of financial assets
- - 20,403 12,057 (32,460) - - -
Transfer of gains on disposal of financial assets at fair value through other comprehensive income
- - - (18,079) 18,079 - - -
Release arising on disposal of financial assets at fair value through other comprehensive income
- - - (3,940) - (3,940) - (3,940)
Profit for the year - - - - 235,727 235,727 - 235,727
Other comprehensive income - - - (47,421) (1,042) (48,463) - (48,463)
Total comprehensive income - - - (47,421) 234,685 187,264 - 187,264
Dividends 29 - - (100,200) (100,200) - (100,200)
Balance at December 31, 2012 200,400 2,460 - (57,383) 1,102,807 1,047,884 - 1,248,284
Balance at January 1, 2013 200,400 2,460 - (57,383) 1,102,807 1,047,884 - 1,248,284
Transfer of loss on disposal of financial assets at fair value through other comprehensive income
- - - 10,418 (10,418) - - -
Release arising on disposal of financial assets at fair value through other comprehensive income
- - - (156) (156) - (156)
Profit for the year - - - 161,985 161,985 - 161,985
Other comprehensive income - - - 113,110 (436) 112,674 - 112,674
Total comprehensive income - - - 113,110 161,549 274,659 - 274,659
Dividends 29 - - (100,200) (100,200) - (100,200)
Balance at December 31, 2013 200,400 2,460 - 65,989 1,153,738 1,222,187 - 1,422,587
The notes on pages 114 to 203 form an integral part of these financial statements.Auditors’ report on pages 104 and 105.
7. fiNaNcial stateMeNts fOR tHe yeaR eNDeD DeceMBeR 31, 2013
7.6 statements of changes in equity for year ended december 31, 2013 (continued)
tHe gROup tHe cOMpaNy
Notes 2013 2012 2013 2012
Rs'000 rs'000 Rs'000 rs'000
Operating activities
Net cash generated from operations 35(a) 228,447 476,967 104,167 319,356
Dividend received 78,363 168,921 15,876 28,685
Interest received 238,788 211,720 39,588 52,760
Interest paid (15,478) (18,319) (15,360) (17,752)
Income tax paid (11,434) (10,202) (10,020) (8,805)
Net cash generated from operating activities 518,686 829,087 134,251 374,244
iNvestiNg activities
Proceeds on disposal of property and equipment 4,019 3,454 3,382 3,429
Proceeds on disposal/maturity of financial assets 316,857 1,171,709 60,847 280,897
Proceeds on shares redemption 8 (a) - - - 9,858
Purchase of property and equipment 5 (33,959) (32,466) (33,012) (30,905)
Purchase of intangible assets 7 (44,115) (8,240) (33,756) (7,497)
Purchase of financial assets 9 (776,877) (1,017,172) (14,623) (34,925)
Loans recovered 224,558 216,919 82,750 65,398
Loans granted (169,844) (284,410) (73,781) (120,370)
Amount granted to subsidiary - - - (1,081)
Loan paid (17,711) (16,248) (17,711) (16,248)
Net cash (used in)/generated from investing activities (497,072) 33,546 (25,904) 148,556
fiNaNciNg activities
Dividends - Owners of the Parent 29 (100,200) (100,200) (100,200) (100,200)
- Non-controlling interest (273) (603) - -
Redemption of shares - (143) - -
Cash used in financing activities (100,473) (100,946) (100,200) (100,200)
Net (decrease)/increase in cash and cash equivalents (78,859) 761,687 8,147 422,600
MOveMeNt iN casH aND casH equivaleNts
At January 1, 1,175,065 403,144 612,357 179,433
Net (decrease)/increase in cash and cash equivalents (78,859) 761,687 8,147 422,600
Exchange (losses)/ gains on cash and cash equivalents (4,223) 10,234 (4,540) 10,324
at December 31, 35(b) 1,091,983 1,175,065 615,964 612,357
The notes on pages 114 to 203 form an integral part of these financial statements.Auditors’ report on pages 104 and 105.
7. fiNaNcial stateMeNts fOR tHe yeaR eNDeD DeceMBeR 31, 2013
7.7 statement of cash flows for year ended december 31, 2013
112
Youarehere
1. cORpORate iNfORMatiON aND activities
The Mauritius Union Assurance Company Limited is a limited liability company incorporated and domiciled in Mauritius. These financial statements will be submitted for adoption at the forthcoming Annual Meeting of the Company. The address of the registered office is 4 Leoville l’Homme Street, Port Louis. Following changes in the insurance legislation, whereby an insurance company cannot undertake both life (long term and non life business (short term), as from January 1, 2011, the company’s principal activity was to transact only in short term insurance business. The life business of the Company was transferred to La Prudence Mauricienne Limitee, (LPM ) one of the company’s subsidiary companies.
2. suMMaRy Of sigNificaNt accOuNtiNg pOlicies
2.1 Basis of preparation
The consolidated financial statements provide comparative information in respect of the previous period. In addition, the Group presents an additional statement of financial position at the beginning of the earliest period presented when there is retrospective application of an accounting policy, a retrospective restatement, or a reclassification of items in the financial statements. An additional statement of financial position as at January 1, 2012 is presented in these consolidated financial statements due to retrospective application of certain accounting policies, refer to Note 2.2.The consolidated financial statements have been prepared under the historical cost basis except for the revaluation of land and buildings, financial assets at fair value through other comprehensive income, financial assets at fair value through profit or loss and investment properties which are stated at their fair value.The consolidated financial statements are presented in rupees (Rs) rounded to the nearest thousand (Rs’000), unless otherwise indicated.
statement of complianceThe consolidated financial statements have been prepared in accordance with International Financial Reporting Standards (“IFRS”) and comply with the Companies Act 2001.
The principal accounting policies applied in the preparation of these consolidated financial statements are set out below.
Basis of consolidationThe consolidated financial statements comprise the financial statements of the Group and its subsidiaries as at 31 December 2013. Control is achieved when the Group is exposed, or has rights, to variable returns from its involvement with the investee and has the ability to affect those returns through its power over the investee. Specifically, the Group controls an investee if and only if the Group has:•• Power over the investee (i.e. existing rights
that give it the current ability to direct the relevant activities of the investee)•• Exposure, or rights, to variable returns from its
involvement with the investee, and•• The ability to use its power over the investee
to affect its returnsWhen the Group has less than a majority of the voting or similar rights of an investee, the Group considers all relevant facts and circumstances in assessing whether it has power over an investee, including:•• The contractual arrangement with the other
vote holders of the investee•• Rights arising from other contractual
arrangements•• The Groups voting rights and potential
voting rightsThe Group re-assesses whether or not it controls an investee if facts and circumstances indicate that there are changes to one or more of the three elements of control. Consolidation of a subsidiary begins when the Group obtains control over the subsidiary and ceases when the Group loses control of the subsidiary. Assets, liabilities, income and expenses of a subsidiary acquired or disposed of during the year are included in the statement of comprehensive income from the date the Group gains control until the date the Group ceases to control the subsidiary.Profit or loss and each component of other comprehensive income (OCI) are attributed to the equity holders of the parent of the Group and to the non-controlling interests, even if this results in the non-controlling interests having a deficit balance. When necessary, adjustments
are made to the financial statements of subsidiaries to bring their accounting policies into line with the Group’s accounting policies. All intra-group assets and liabilities, equity, income, expenses and cash flows relating to transactions between members of the Group are eliminated in full on consolidation.A change in the ownership interest of a subsidiary, without a loss of control, is accounted for as an equity transaction. If the Group loses control over a subsidiary, it:•• Derecognises the assets (including
goodwill) and liabilities of the subsidiary•• Derecognises the carrying amount of
any non-controlling interests•• Derecognises the cumulative
translation differences recorded in equity•• Recognises the fair value of the
consideration received•• Recognises the fair value of any
investment retained•• Recognises any surplus or deficit in
profit or loss•• Reclassifies the parent’s share of
components previously recognised in OCI to profit or loss or retained earnings, as appropriate, as would be required if the Group had directly disposed of the related assets or liabilities
2.2 changes in accounting policy and disclosures
New and amended standards and interpretationsThe accounting policies adopted are consistent with those of the previous financial year, except for the following new and amended IFRS which are relevant and have been adopted in the year commencing January 1, 2013:
ias 1 presentation of items of Other comprehensive income - amendments to ias 1The amendments to IAS 1 change the grouping of items presented in Other Comprehensive Income (OCI). Items that could be reclassified (or ‘recycled’) to profit or loss at a future point in time (for example, actuarial gains and losses on defined benefit plans and revaluation of land and buildings) would be presented separately from items that will never be reclassified (for example, net gain on hedge of net investment, exchange differences on translation of foreign operations, net movement on cash flow hedges and net loss or gain on available-for-sale financial assets. The amendment becomes effective for annual periods beginning on or after July 1, 2012, and has therefore been applied. The Group has assessed those items presented in other comprehensive Income (OCI) which will and those which will not be recycled to profit or loss.
IAS 1 Clarification of the requirement for comparative information (amendment)These amendments clarify the difference between voluntary additional comparative information and the minimum required comparative information. An entity must include comparative information in the related notes to the financial statements when it voluntarily provides comparative information beyond the minimum required comparative period. The amendments clarify that the opening statement of financial position (as at January 1, 2012 in the case of the Group and the Company), presented as a result of retrospective restatement or reclassification of items in financial statements does not have to be accompanied by comparative information in the related notes. As a result, the Group has not included comparative information in respect of the opening statement of financial position as at January1, 2012. The amendments affect presentation only and have no impact
on the Group’s financial position or performance.
IAS 19 Employee Benefits (Revised)The Group applied IAS 19 (Revised 2011) retrospectively in the current period in accordance with the transitional provisions set out in the revised standard. The opening statement of financial position of the earliest comparative period presented (January 1, 2012) and the comparative figures have been accordingly restated.IAS 19 (Revised 2011) changes, amongst other things, the accounting for defined benefit plans. Some of the key changes that impacted the Group include the following:All past service costs are recognised at the earlier of when the amendment/curtailment occurs or when the related restructuring or termination costs are recognised. As a result, unvested past service costs can no longer be deferred and recognised over the future vesting period. Previously, the Group had a balance of unrecognized service cost Rs 652,000 as at January 1, 2012. Upon transition to IAS 19 (Revised 2011), this balance was charged to equity (retained earnings) as at January 1, 2012 The interest cost and expected return on plan assets used in the previous version of IAS 19 are replaced with a net-interest amount under IAS 19 (Revised 2011), which is calculated by applying the discount rate to the net defined benefit liability or asset at the start of each annual reporting period. IAS 19 (Revised 2011) also requires more extensive disclosures. These have been provided in Note 16.
IAS 19 (Revised 2011) has been applied retrospectively, with following permitted exceptions:The carrying amounts of other assets have not been adjusted for changes in employee benefit costs that were included before January 1, 2012.
7.8 notes to the financial statements for year ended december 31, 2013 7.8 notes to the financial statements for year ended december 31, 20137. fiNaNcial stateMeNts fOR tHe yeaR eNDeD DeceMBeR 31, 2013 7. fiNaNcial stateMeNts fOR tHe yeaR eNDeD DeceMBeR 31, 2013
114
introduction 4
company profile 10
corporate governance report 20
risk management report 60
sustainability report 72
financial statements
statement of comprehensive income
statement of changes in equity
statement of cash flows
notes to the financial statements

Youarehere
2. suMMaRy Of sigNificaNt accOuNtiNg pOlicies (continued)
2.2 changes in accounting policy and disclosures (continued)
IAS 19 Employee Benefits (Revised) (continued)
Sensitivity disclosures for the defined benefit obligation for comparative period (year ended December, 31 2012) have not been provided
Impact on profit or loss and OCI (increase / (decrease) in profit /OCI):
ias 28 investments in associates and Joint ventures (as revised in 2011)As a consequence of the new IFRS 11 Joint Arrangements, and IFRS 12 Disclosure of Interests in Other Entities, IAS 28 Investments in Associates, has been renamed IAS 28 Investments in Associates and Joint Ventures, and describes the application of the equity method to investments in joint ventures in addition to associates. This standard has not impacted on the Group’s financial position as the Group does not have any investment in Associates and Joint ventures.
ifRs 7 Disclosures - Offsetting financial assets and financial liabilities - amendments to ifRs 7These amendments require an entity to disclose information about rights to set-off and related arrangements (e.g., collateral agreements). The disclosures would provide users with information that is useful in evaluating the effect of netting arrangements on an entity’s financial position. The new disclosures are required for all recognised financial instruments that are set off in accordance with IAS 32 Financial Instruments: Presentation. The disclosures also apply to recognised financial instruments that are subject to an enforceable master netting arrangement or similar agreement, irrespective of whether they are set off in accordance with IAS 32. These amendments did not impact the Group’s financial position or performance.
ifRs 10 consolidated financial statements, ias 27 separate financial statementsIFRS 10 replaces the portion of IAS 27 Consolidated and Separate Financial Statements
that addresses the accounting for consolidated financial statements. It also addresses the issues raised in SIC-12 Consolidation - Special Purpose Entities.IFRS 10 establishes a single control model that applies to all entities including special purpose entities. The changes introduced by IFRS 10 requires management to exercise significant judgement to determine which entities are controlled and therefore are required to be consolidated by a parent, compared with the requirements that were in IAS 27. Based on the analyses performed, IFRS 10 did not result in any change in the consolidation status of its subsidiaries.
ias 27: separate financial statements (as revised in 2011)As a consequence of the new IFRS 10 and IFRS 12, what remains of IAS 27 is limited to accounting for subsidiaries, jointly controlled entities, and associates in separate financial statements. The adoption of this standard did not have any impact on the financial performance, financial position or disclosures in the separate financial statements of the Company.
ifRs 11 Joint arrangementsIFRS 11 replaces IAS 31 interests in Joint Ventures and SIC 13 Jointly controlled Entities Non monetary Contributions by Ventures. IFRS 11 removes the option to account for jointly controlled entities (JCEs) using proportionate consolidation. Instead, JCEs that meet the definition of a joint venture must be accounted for using the equity method. IFRS 11 did not have any impact on Group’s financial position, as the Group is not party to any Joint Arrangements.
ifRs 12 Disclosure of interests in Other entitiesIFRS 12 sets out the requirements for disclosures relating to an entity’s interests in subsidiaries, joint arrangements, associates and structured entities. The requirements in IFRS 12 are more comprehensive than the previously existing disclosure requirements for subsidiaries. For example, where a subsidiary is controlled with less than a majority of voting rights. While the Group has a subsidiary with material non-controlling interests, it has no unconsolidated structured entities. IFRS 12 disclosures are provided in Note 8.
ifRs 13 fair value MeasurementIFRS 13 establishes a single source of guidance under IFRS for all fair value measurements. IFRS 13 does not change when an entity is required to use fair value, but rather provides guidance on how to measure fair value under IFRS. IFRS 13 defines fair value as an exit price. As a result of the guidance in IFRS 13, the Group re-assessed its policies for measuring fair values, in particular, its valuation inputs such as non-performance risk for fair value measurement of liabilities. IFRS 13 also requires additional disclosures.Application of IFRS 13 has not materially impacted the fair value measurements of the Group. Additional disclosures where required, are provided in the individual notes relating to the assets and liabilities whose fair values were determined. Fair value hierarchy is provided in Note 30.
2.3 standards issued but not yet effective
Standards issued but not yet effective up to the date of issuance of the Group’s financial statements are listed below. The Group intends to adopt applicable standards when they become effective except for IFRS 9 which have been early adopted in 2012.The following standards, amendments to existing standards and interpretations were in issue but not yet effective. They are mandatory for accounting periods beginning on the specified dates, but the Group has not early adopted them:
New or revised standards and interpretations: effective for accounting period beginning on or after
- IFRS 9 Financial Instruments – Financial Instruments (Hedge Accounting) Not yet confirmed- IAS 32 Financial Instruments: Presentation – Offsetting Financial Assets and Financial Liabilities January 1, 2014- Investment Entities (Amendments to IFRS 10, IFRS 12 and IAS 27) January 1, 2014- Recoverable Amount Disclosures for Non-Financial Assets (Amendments to IAS 36) – effective 1 January 2014 January 1, 2014- Novation of Derivatives and Continuation of Hedge Accounting (Amendments to IAS 39) January 1, 2014- Defined Benefit Plans: Employee Contributions (Amendments to IAS 19) July 1, 2014- Annual Improvements 2010-2012 Cycle July 1, 2014- Annual Improvements 2011-2013 Cycle July 1, 2014- IFRIC 21 Levies January 1, 2014- IFRS 14 Regulatory Deferral Accounts January 1, 2016
ifRs 9 financial instruments – Hedge accounting IFRS 9 introduces new requirements for hedge accounting which addresses the following::•• Introduces a new chapter to IFRS 9 on hedge accounting, putting in place a new hedge accounting model that is designed to be more closely
aligned with how entities undertake risk management activities when hedging financial and non-financial risk exposures•• Permits an entity to apply only the requirements introduced in IFRS 9 (2010) for the presentation of gains and losses on financial liabilities
designated as at fair value through profit or loss without applying the other requirements of IFRS 9, meaning the portion of the change in fair value related to changes in the entity’s own credit risk can be presented in other comprehensive income rather than within profit or loss•• Removes the mandatory effective date of IFRS 9 (2013), IFRS 9 (2010) and IFRS 9 (2009), leaving the effective date open pending the finalisation
of the impairment and classification and measurement requirements. Notwithstanding the removal of an effective date, each standard remains available for application.
7.8 notes to the financial statements for year ended december 31, 2013 7.8 notes to the financial statements for year ended december 31, 20137. fiNaNcial stateMeNts fOR tHe yeaR eNDeD DeceMBeR 31, 2013 7. fiNaNcial stateMeNts fOR tHe yeaR eNDeD DeceMBeR 31, 2013
116
introduction 4
company profile 10
corporate governance report 20
risk management report 60
sustainability report 72
financial statements
statement of comprehensive income
statement of changes in equity
statement of cash flows
notes to the financial statements

Youarehere
2. suMMaRy Of sigNificaNt accOuNtiNg pOlicies (continued)
2.3 standards issued but not yet effective (continued)
ias 32 financial instruments: presentation – Offsetting financial assets and financial liabilities – effective January 1, 2014This amendment to IAS 32 Financial Instruments: Presentation was made to clarify certain aspects because of diversity in application of the requirements on offsetting thereby focusing on four main areas:•• the meaning of ‘currently has a legally
enforceable right of set-off’•• the application of simultaneous realisation and
settlement•• the offsetting of collateral amounts•• the unit of account for applying the offsetting
requirements. Defined Benefit Plans: Employee Contributions
investment entities (amendments to ifRs 10, ifRs 12 and ias 27) – effective January 1, 2014These amendments to IFRS 10 Consolidated Financial Statements, IFRS 12 Disclosure of Interests in Other Entities and IAS 27 Separate Financial Statements were made to:•• provide ‘investment entities’ (as defined) an
exemption from the consolidation of particular subsidiaries and instead require that an investment entity measure the investment in each eligible subsidiary at fair value through profit or loss in accordance with IFRS 9 Financial Instruments or IAS 39 Financial Instruments: Recognition and Measurement•• require additional disclosure about why
the entity is considered an investment entity, details of the entity’s unconsolidated subsidiaries, and the nature of relationship and certain transactions between the investment entity and its subsidiaries•• require an investment entity to account for its
investment in a relevant subsidiary in the same way in its consolidated and separate financial statements (or to only provide separate financial statements if all subsidiaries are unconsolidated).
Recoverable amount Disclosures for Non-financial assets (amendments to ias 36) – effective January 1, 2014IAS 36 Impairment of Assets was amended to reduce the circumstances in which the recoverable amount of assets or cash-generating units is required to be disclosed, clarify the disclosures required, and to introduce an explicit requirement to disclose the discount rate used in determining impairment (or reversals) where recoverable amount (based on fair value less costs of disposal) is determined using a present value technique.
Novation of Derivatives and continuation of Hedge accounting (amendments to ias 39) – effective January 1, 2014The amendments to IAS 39 Financial Instruments: Recognition and Measurement were made to clarify that there is no need to discontinue hedge accounting if a hedging derivative is novated, provided certain criteria are met.A novation indicates an event where the original parties to a derivative agree that one or more clearing counterparties replace their original counterparty to become the new counterparty to each of the parties. In order to apply the amendments and continue hedge accounting, novation to a central counterparty (CCP) must happen as a consequence of laws or regulations or the introduction of laws or regulations.
Defined Benefit Plans: Employee Contributions (amendments to ias 19) - effective July 1, 2014This amendment to IAS 19 Employee Benefits clarifies the requirements that relate to how contributions from employees or third parties that are linked to service should be attributed to periods of service. In addition, it permits a practical expedient if the amount of the contributions is independent of the number of years of service, in that contributions, can, but are not required, to be recognised as a reduction in the service cost in the period in which the related service is rendered.
annual improvements 2010-2012 cycle - effective July 1, 2014The annual improvements 2010-2012 Cycle make amendments to the following standards:
•• ifRs 2 - Amends the definitions of ‘vesting condition’ and ‘market condition’ and adds definitions for ‘performance condition’ and ‘service condition’;•• ifRs 3 - Require contingent
consideration that is classified as an asset or a liability to be measured at fair value at each reporting date;•• ifRs 8 - Requires disclosure of the
judgements made by management in applying the aggregation criteria to operating segments, clarify reconciliations of segment assets only required if segment assets are reported regularly;•• ifRs 13 - Clarify that issuing IFRS 13
and amending IFRS 9 and IAS 39 did not remove the ability to measure certain short-term receivables and payables on an undiscounted basis (amends basis for conclusions only);•• ias 16 and ias 38 - Clarify that the
gross amount of property, plant and equipment is adjusted in a manner consistent with a revaluation of the carrying amount; and •• ias 24 - Clarify how payments to
entities providing management services are to be disclosed.
annual improvements 2011-2013 cycle
- effective July 1, 2014The annual improvements 2011-2013 Cycle make amendments to the following standards:•• ifRs 1 - Clarify which versions of
IFRSs can be used on initial adoption (amends basis for conclusions only);•• ifRs 3 - Clarify that IFRS 3 excludes
from its scope the accounting for the formation of a joint arrangement in the financial statements of the joint arrangement itself;•• ifRs 13 - Clarify the scope of the
portfolio exception in paragraph 52; and •• ias 40 - Clarifying the interrelationship
of IFRS 3 and IAS 40 when classifying property as investment property or owner-occupied property.
ifRic 21 levies - effective January 1, 2014Provides guidance on when to recognise a liability for a levy imposed by a government, both for levies that are accounted for in accordance with IAS 37 Provisions, Contingent Liabilities and Contingent Assets and those where the timing and amount of the levy is certain.The Interpretation identifies the obligating event for the recognition of a liability as the activity that triggers the payment of the levy in accordance with the relevant legislation. It provides the following guidance on recognition of a liability to pay levies:•• The liability is recognised progressively
if the obligating event occurs over a period of time; and •• If an obligation is triggered on
reaching a minimum threshold, the liability is recognised when that minimum threshold is reached.
ifRs 14 Regulatory Deferral accounts - effective January 1, 2016The Interpretation was issued to provide first-time adopters of IFRS with relief from derecognizing rate-regulated assets and liabilities until a comprehensive project on accounting for such assets and liabilities as completed by the IASB. This interim standard is intended to encourage rate-regulated entities to adopt IFRS while bridging the gap with entities that already apply IFRS, but do not recognize regulatory deferral accounts. The standard will have no impact on the financial position or performance of the Company.
2.4 Significant accounting policies
(a) Business combinations and goodwill
Basis of consolidation prior to January 1, 2010Business combinations are accounted for using the acquisition method. The cost of an acquisition is measured as the aggregate of the consideration
transferred, measured at acquisition date fair value and the amount of any non-controlling interest in the acquiree. For each business combination, the acquirer measures the noncontrolling interest in the acquiree either at fair value or at the proportionate share of the acquiree’s identifiable net assets. Acquisition costs incurred are expensed and included in administrative expenses.When the Group acquires a business, it assesses the financial assets and liabilities assumed for appropriate classification and designation in accordance with the contractual terms, economic circumstances and pertinent conditions as at the acquisition date. This includes the separation of embedded derivatives in host contracts by the acquiree.If the business combination is achieved in stages, the acquisition date fair value of the acquirer’s previously held equity interest in the acquiree is remeasured to fair value at the acquisition date through profit or loss.Any contingent consideration to be transferred by the acquirer will be recognised at fair value at the acquisition date. Subsequent changes to the fair value of the contingent consideration which is deemed to be an asset or liability, will be recognised in accordance with IAS 39 either in profit or loss or as a change to other comprehensive income. If the contingent consideration is classified as equity, it should not be remeasured until it is finally settled within equity.Goodwill is initially measured at cost being the excess of the aggregate of the consideration transferred and the amount recognised for non-controlling interest over the net identifiable assets acquired and liabilities assumed. If this consideration is lower than the fair value of the net assets of the subsidiary acquired, the difference is recognised in profit or loss.
7.8 notes to the financial statements for year ended december 31, 2013 7.8 notes to the financial statements for year ended december 31, 20137. fiNaNcial stateMeNts fOR tHe yeaR eNDeD DeceMBeR 31, 2013 7. fiNaNcial stateMeNts fOR tHe yeaR eNDeD DeceMBeR 31, 2013
118
introduction 4
company profile 10
corporate governance report 20
risk management report 60
sustainability report 72
financial statements
statement of comprehensive income
statement of changes in equity
statement of cash flows
notes to the financial statements

Youarehere
2. suMMaRy Of sigNificaNt accOuNtiNg pOlicies (continued)
2.4 Significant accounting policies (continued)
(a) Business combinations and goodwill (continued)
Basis of consolidation prior to January 1, 2010 (continued)After initial recognition, goodwill is measured at cost less any accumulated impairment losses. For the purpose of impairment testing, goodwill acquired in a business combination is, from the acquisition date, allocated to each of the Group’s cash-generating units that are expected to benefit from the combination, irrespective of whether other assets or liabilities of the acquiree are assigned to those units.Where goodwill forms part of a cash-generating unit and part of the operation within that unit is disposed of, the goodwill associated with the operation disposed of is included in the carrying amount of the operation when determining the gain or loss on disposal of the operation. Goodwill disposed of in this circumstance is measured based on the relative values of the operation disposed of and the portion of the cash-generating unit retained.In comparison to the above-mentioned requirements, the following differences applied:Business combinations were accounted for using the purchase method. Transaction costs directly attributable to the acquisition formed part of the acquisition costs. The non-controlling interest (formerly known as minority interest) was measured at the proportionate share of the acquiree’s identifiable net assets.Business combinations achieved in stages were accounted for as separate steps. Any additional acquired share of interest did not affect previously recognised goodwill.Contingent consideration was recognised if, and only if, the Group had a present obligation, the economic outflow was more likely than not and a reliable estimate was determinable. Subsequent adjustments to the contingent consideration were recognised as part of goodwill.
(b) foreign currency translation
Items included in the financial statements of each of the Group’s entities are measured using Mauritian rupees, the currency of the primary economic environment in which the entities operate (“functional currency”). The consolidated financial statements are presented in Mauritian rupees.
transactions and balancesForeign currency transactions are translated into the functional currency using the exchange rates prevailing on the dates of the transactions. Foreign exchange gains and losses resulting from the settlement of such transactions and from the translation at year-end exchange rates of monetary assets and liabilities denominated in foreign currencies are recognised in profit or loss.Non-monetary items that are measured at historical cost in a foreign currency are translated using the exchange rate at the date of the transaction. Non-monetary items that are measured at fair value in a foreign currency are translated using the exchange rates at the date the fair value was determined.
(c) insurance contracts
(i) Classification of insurance contracts
The Group issues contracts which transfer insurance risk. Insurance contracts are those contracts which transfer significant insurance risk at the inception of the contract. Such contracts remain insurance contracts until all rights and obligations are extinguished or expired. Investment contracts are those contracts that transfer financial risk with no significant insurance risk.Some insurance contracts contain a Discretionary Participation Feature (DPF). These types of insurance contracts entitle the contract holder, in supplement of a guaranteed amount, to a contractual right to receive additional profits or bonuses. The magnitude of the profits or bonuses as well as the timing of the payments is however at the discretion of the Group. The Group has an obligation to eventually pay to contract holders 93.5% (2012: 93.5%) of the DPF eligible surplus (i.e all interest and realised gains and losses arising from the assets backing these contracts). The remaining 6.5% (2012: 6.5%) accrues to the shareholders. Any portion of the DPF eligible surplus accruing to contract holders that is not declared as a profit or bonus is retained as a liability in the Life Assurance Fund, until declared and credited to contract holders in future periods. The portion of the DPF eligible surplus accruing to shareholders is transferred annually to a Non Distributable reserve under shareholder’s equity. All DPF liabilities including unallocated surpluses, both guaranteed and discretionary, at the end of the reporting period are held within insurance contract liabilities, as appropriate.100% of all profits arising out of the non-profit annuity and unit-linked books of business is now
allocated to shareholders.Insurance contracts issued by the Group are classified within the following main categories:
short-term insurance contractsShort-term insurance contracts are mainly in respect of motor business but the Group also sells fire and allied perils, health, marine, engineering and other miscellaneous insurance contracts. These contracts protect the Group’s customers from damage suffered to property or goods, value of property and equipment lost, losses and expenses incurred, sickness and loss of earnings resulting from the occurrence of the insured events.
long-term insurance contracts with fixed and guaranteed termsThese contracts insure events associated with human life, i.e. death, disability or survival over a long term. A liability for contractual benefits that are expected to be incurred in future is recorded once the first premium under such a contract has been recognised. The liability is based on best estimates assumptions regarding future mortality, persistency, maintenance expenses and investment income that are determined at each valuation date based on an analysis of recent experience modified by expectation of future trends. The best estimate assumptions are adjusted to include a margin for prudence.
long-term insurance contracts without fixed terms and with DPFThese types of insurance contracts contain a DPF which entitles the contract holder, in supplement to a guaranteed amount, to a contractual right to receive additional profits or bonuses. The magnitude of the profits or bonuses as well as the timing of the payments are however
at the discretion of the Group. The Group has an obligation to eventually pay to contract holders 93.5% (2012: 93.5%) of the DPF eligible surplus (i.e. all interest and realised gains and losses arising from the assets backing these contracts). The remaining 6.5% (2012: 6.5%) accrues to the shareholders. Any portion of the DPF eligible surplus accruing to contract holders that is not declared as a profit or bonus is retained as a liability in the Life Assurance Fund, until declared and credited to contract holders in future periods. The portion of the DPF eligible surplus accruing to shareholders is transferred annually to a Non Distributable reserve under shareholders’ equity.
unit linked contractsThese are insurance contracts which include an embedded derivative linking payments on the contracts to units of an internal investment fund set up by the Group with the consideration received from contract holders. This embedded derivative meets the definition of an insurance contract and has therefore not been accounted for separately from the host insurance contract. The liability of such contracts is adjusted for all changes in the fair value of underlying assets.
(ii) Reinsurance contracts
Contracts entered into by the Group with reinsurers under which the Group is compensated for losses on one or more contracts issued by the Group are classified as reinsurance contracts held. Insurance contracts entered into by the Group under which the contract holder is another insurer (inwards reinsurance) are included with insurance contracts.Reinsurance contracts used by the Group are proportional and non-proportional treaties and facultative arrangements.
7.8 notes to the financial statements for year ended december 31, 2013 7.8 notes to the financial statements for year ended december 31, 20137. fiNaNcial stateMeNts fOR tHe yeaR eNDeD DeceMBeR 31, 2013 7. fiNaNcial stateMeNts fOR tHe yeaR eNDeD DeceMBeR 31, 2013
120
introduction 4
company profile 10
corporate governance report 20
risk management report 60
sustainability report 72
financial statements
statement of comprehensive income
statement of changes in equity
statement of cash flows
notes to the financial statements

Youarehere
2. suMMaRy Of sigNificaNt accOuNtiNg pOlicies (continued)
2.4 Significant accounting policies (continued)
(c) insurance contracts (continued)
(ii) Reinsurance contracts (continued)
Proportional reinsurance can be either ‘quota share’ where the proportion of each risk reinsured is stated or “surplus” which is a more flexible form of reinsurance and where the Group can fix its retention limit. Non-proportional reinsurance is mainly ‘excess-of-loss’ type of reinsurance where, in consideration for a premium, the reinsurer agrees to pay all claims in excess of a specified amount, i.e. the retention, and up to a maximum amount. Facultative insurance contracts generally relate to specific insured risks which are underwritten separately. Under treaty arrangements, risks underwritten by the Group falling under the terms and limits of the treaties are reinsured automatically. Reinsurance assets or liabilities are derecognised when the contractual rights are extinguished or expire or when the contract is transferred to another party.
(iii) Receivables and payables related to insurance contracts
Receivables and payables are recognised when due. These include amounts due to and from agents, brokers and insurance contract holders.
(iv) impairment of reinsurance assets
Reinsurance assets are reviewed for impairment at each reporting date or more frequently when an indication of impairment arises during the reporting year. If a reinsurance asset is impaired, the Group reduces the carrying amount accordingly and recognises that impairment in profit or loss. A reinsurance asset is impaired if there is objective evidence, as a result of an event that occurred after initial recognition of that asset, that the Group may not recover all amounts due under the terms of the contract and that the event has a measurable impact on the amounts that the Group will receive from the reinsurer.
(v) claims expenses and outstanding claims provisions
Outstanding claims provisions are based on the ultimate costs of all claims incurred but not settled at the end of financial reporting period, whether reported or incurred but not reported (IBNR). Notified claims are only recognised when the Company considers that it has a contractual liability to settle the claims. IBNR has been provided for on an actuarial method which consists in the projection of incurred but not reported claims based on the claims reporting delay pattern for the Company over the last ten years. Claims expenses are charged to profit or loss as incurred based on the estimated liability for compensation owed to contract holders or third parties. There are often delays between the occurrence of the insured event and the time it is actually reported to the Company, particularly in respect of liability business, the ultimate cost of which cannot be known with certainty at the end of the financial reporting period. Following the identification and notification of the insured loss, there may still be uncertainty as to the magnitude and timing of the settlement of the claim. Outstanding claims provisions are not discounted and exclude any allowances for expected future recoveries. Recoveries represent claims recoverable from third party insurers. Recoveries are accounted for as and when received. However, non-insurance assets that have been acquired by exercising rights to sell, salvage or subrogate under the terms of the insurance contracts are included when providing for outstanding claims.
(vi) incurred but not reported claims (iBNR)
IBNR calculation is calculated on an actuarial method which consists in the projection of incurred but not reported claims based on the claims reporting delay pattern for the Company over the last ten years.
(vii) salvage and subrogation reimbursements
Estimates of salvage recoveries are included as an allowance in the measurement of the insurance liabilities for claims, and salvage
property is recognised in other assets when the liability is settled. The allowance is the amount that can reasonably be recovered from the disposal of the property.
(viii) Deferred acquisition costs
The liability for commissions payable is recognised at the inception date of the insurance contract/endorsement.Commissions payable and reinsurance commissions receivable relating to unexpired premiums are recognised and released to profit or loss as and when the premiums are earned.
(ix) provision for unearned premiums
The provision for unearned premiums represents the portion of premiums written on short-term insurance contracts relating to periods of insurance risks subsequent to the reporting date. It is calculated on the inception basis (daily method). The movement on the provision is taken to profit or loss in order for revenue to be recognised over the period of the risk. The provision is derecognised when the contract expires, is discharged or cancelled.
(x) liability adequacy test
short-term insuranceAt end of financial reporting period, a liability adequacy test is performed to ensure the adequacy of the contract liabilities. In performing the test, current best estimates of future contractual cash flows (including claims handling and administration expenses) and expected investment returns on assets backing such liabilities are used. Assets relate mainly to investment that is held by LPM, the subsidiary dealing in Life insurance. Any deficiency is immediately charged to profit or loss and a provision is established for losses arising from the liability
adequacy test (the unexpired risk provision).
long-term insuranceThe Group’s Independent Actuaries review the adequacy of insurance liabilities for long term contracts on an annual basis and ensure that provisions made by the Group are adequate.
(d) financial instruments
financial assetsAs from January 1, 2012, the Group classifies its financial assets in the following measurement categories: those measured at fair value and those measured at amortised cost. This classification depends on whether the financial asset is a debt or equity investment.
Debt investments(i) financial assets at
amortised cost
A debt investment is classified as ‘amortised cost’ only if both of the following criteria are met: the objective of the group’s business model is to hold the asset to collect the contractual cash flows; and the contractual terms give rise on specified dates to cash flows that are solely payments of principal and interest on the principal outstanding.
(ii) financial assets at fair value
If either of the two criteria above is not met, the debt instrument is classified as ‘fair value through profit or loss’.The Group has not designated any debt investment as measured at fair value through profit or loss to eliminate or significantly reduce an accounting mismatch.
equity investmentsRegular purchases and sales of financial assets are recognised on the trade-date, the date on which the Group commits to purchase or sell the asset. Financial assets are derecognised when the rights to receive cash flows from the investments have expired or have been transferred and the Group has transferred substantially all risks and rewards of ownership.At initial recognition, the Group measures a financial asset at its fair value plus, in the case of a financial asset not at fair value through profit or loss, transaction costs that are directly attributable to the acquisition of the financial asset. Transaction costs of financial assets carried at fair value though profit or loss is expensed in profit or loss.All equity investments are measured at fair value. Equity investments that are held for trading are measured at fair value through profit or loss. For all other equity investments, the Group can make an irrevocable election at initial recognition to recognise changes in fair value through other comprehensive income rather than profit or loss.A gain or loss on a debt investment that is subsequently measured at fair value is recognised in profit or loss and presented as part of ‘other (losses)/gains - net’ in the period in which they arise.A gain or loss on a debt investment that is subsequently measured at amortised cost is recognised in profit or loss when the financial asset is derecognised or impaired and through the amortisation process using the effective interest rate method.
7.8 notes to the financial statements for year ended december 31, 2013 7.8 notes to the financial statements for year ended december 31, 20137. fiNaNcial stateMeNts fOR tHe yeaR eNDeD DeceMBeR 31, 2013 7. fiNaNcial stateMeNts fOR tHe yeaR eNDeD DeceMBeR 31, 2013
122
introduction 4
company profile 10
corporate governance report 20
risk management report 60
sustainability report 72
financial statements
statement of comprehensive income
statement of changes in equity
statement of cash flows
notes to the financial statements

Youarehere
2. suMMaRy Of sigNificaNt accOuNtiNg pOlicies (continued)
2.4 Significant accounting policies (continued)
(d) financial instruments (continued)
(ii) financial assets at fair value (continued)
equity investments (continued)The Group subsequently measures all equity investments at fair value. Where the Group’s management has elected to present unrealised and realised fair value gains and losses on equity investments in other comprehensive income, there is no subsequent recycling of fair value gains and losses to profit or loss. Dividends from such investments continue to be recognised in profit or loss as long as they represent a return on investment.The Group is required to reclassify all affected debt investments when and only when its business model for managing those assets changes.
(e) Impairment of financial assets
financial assets carried at amortised cost If there is objective evidence that an impairment loss on assets carried at amortised cost has been incurred, the amount of the impairment loss is measured as the difference between the asset’s carrying amount and the present value of estimated future cash flows (excluding future expected credit losses that have not been incurred) discounted at the financial asset’s original effective interest rate. The carrying amount of the asset is reduced and the loss is recorded in profit or loss.The Group first assesses whether objective evidence of impairment exists individually for financial assets that are individually significant, and individually or collectively for financial assets that are not individually significant. If it is determined that no objective evidence of impairment exists for an individually assessed financial asset, whether significant or not, the asset is included in a group of financial assets with similar credit risk characteristics and that group of financial assets is collectively assessed for impairment. Assets that are
individually assessed for impairment and for which an impairment loss is or continues to be recognised are not included in a collective assessment of impairment. The impairment assessment is performed at each reporting date.If, in a subsequent period, the amount of the impairment loss decreases and the decrease can be related objectively to an event occurring after the impairment was recognised, the previously recognised impairment loss is reversed. Any subsequent reversal of an impairment loss is recognised in profit or loss, to the extent that the carrying value of the asset does not exceed its amortised cost at the reversal date.
loan receivablesEvidence of impairment may include indications that the debtor is experiencing significant financial difficulty, default or delinquency in interest or principal payments, the probability that it will enter bankruptcy or other financial reorganisation and where observable data indicate that there is a measurable decrease in the estimated future cash flows, such as changes in arrears or economic conditions that correlate with defaults.
(f) financial liabilities
initial recognition and measurementFinancial liabilities are classified as financial liabilities at fair value through profit or loss or loans and borrowings as appropriate. The Group determines the classification of its financial liabilities at initial recognition.All financial liabilities are recognised initially at fair value plus, in case of borrowings, directly attributable transaction costs.The Group’s financial liabilities include trade and other payables, bank overdrafts and loans and borrowings.
subsequent measurementLOANS AND BORROWINGSAfter initial recognition, interest bearing loans and borrowings are subsequently measured at amortised cost using the EIR method. Gains and losses are recognised in
profit or loss when the liabilities are derecognised as well as through the EIR amortisation process. Amortised cost is calculated by taking into account any discount or premium on acquisition and fees or costs that are an integral part of the EIR. The EIR amortisation is included as finance costs in profit or loss.
(g) Derecognition of financial instruments
financial assetsA financial asset (or, where applicable a part of a financial asset or part of a group of similar financial assets) is derecognised when:•• the rights to receive cash flows
from the asset have expired;•• the Group has transferred its
rights to receive cash flows from an asset or has entered into a pass-through arrangement, and has neither transferred nor retained substantially all the risks and rewards of the asset nor transferred control of the asset, the asset is recognised to the extent of the Group’s continuing involvement in the asset. Continuing involvement that takes the form of a guarantee over the transferred asset is measured at the lower of the original carrying amount of the asset and the maximum amount of consideration that the Group could be required to repay.
financial liabilitiesA financial liability is derecognised when the obligation under the liability is discharged, cancelled or expires. Where an existing financial liability is replaced by another from the same lender on substantially different terms, or the terms of an existing liability are substantially modified, such an exchange or modification is treated as a derecognition of the original liability
and the recognition of a new liability, and the difference in the respective carrying amounts is recognised in profit or loss.
(h) Offsetting of financial instruments
Financial assets and liabilities are offset and the net amount is reported in the consolidated statement of financial position if, and only if, there is a currently enforceable legal right to offset the recognised amounts and there is an intention to settle on a net basis, or to realise the assets and settle the liabilities simultaneously. Income and expenses will not be offset in the profit or loss unless required or permitted by any accounting standard or interpretation, as specifically disclosed in the accounting policies of the Group.
(i) investment in subsidiary companies
Subsidiaries are all entities (including structured entities) over which the Group has control. The Group controls an entity when the Group is exposed to, or has rights to, variable returns from its involvement with the entity and has the ability to affect those returns through its power over the entity. Subsidiaries are fully consolidated from the date on which control is transferred to the Group. They are deconsolidated from the date that control ceases.
Separate financial statementsInvestments in subsidiaries in the separate financial statements of the Company are carried at cost, net of any impairment. Where the carrying amount of an investment is greater than its estimated recoverable amount, it is written down immediately to its recoverable amount and the difference is recognised in profit or loss. Upon
disposal of the investment, the difference between the net disposal proceeds and the carrying amount is recognised in profit or loss.
(j) equity instruments
An equity instrument is any contract that evidences a residual interest in the assets of an entity after deducting all of its liabilities. Equity instruments issued by the Company are recognised at the proceeds received, net of direct issue costs.
(k) equity movements
Dividends on ordinary shares are recognised as a liability and deducted from equity when they are approved by the Group’s shareholders. Interim dividends are deducted from equity when they are paid.Dividends for the year that are approved after the reporting date are dealt with as a non-adjusting event after the reporting date.
(l) property and equipment
Property and equipment is initially stated at cost, net of accumulated depreciation and accumulated impairment losses, if any. Cost excludes the cost of day to day servicing. Replacement or major inspection cost are capitalised when incurred and if probable that future economic benefits associated with the item will flow to the entity and the cost of the item can be measured reliably.Land and buildings are subsequently shown at market value, based on valuations by external independent valuers, less subsequent depreciation for property. The valuation is performed every three years. All other property and equipment is stated at historical cost less accumulated depreciation and accumulated impairment.
7.8 notes to the financial statements for year ended december 31, 2013 7.8 notes to the financial statements for year ended december 31, 20137. fiNaNcial stateMeNts fOR tHe yeaR eNDeD DeceMBeR 31, 2013 7. fiNaNcial stateMeNts fOR tHe yeaR eNDeD DeceMBeR 31, 2013
124
introduction 4
company profile 10
corporate governance report 20
risk management report 60
sustainability report 72
financial statements
statement of comprehensive income
statement of changes in equity
statement of cash flows
notes to the financial statements

Youarehere
2. suMMaRy Of sigNificaNt accOuNtiNg pOlicies (continued)
2.4 Significant accounting policies (continued)
(l) property and equipment (continued)
Any accumulated depreciation at the date of revaluation is eliminated against the gross carrying amount of the asset and the net amount is restated to the revalued amount of the asset. Revaluations are done with sufficient regularity to ensure that the carrying amount does not differ materially from that would be determined using fair value at the end of the reporting date. Any accumulated depreciation at the date of the revaluation is eliminated against the gross carrying amount of the asset, and the net amount is restated by the revalued amount of the asset. Any revaluation surplus is recognised in other comprehensive income and accumulated in the asset revaluation reserve in equity, except to the extent that it reverses a revaluation decrease of the same asset previously recognised in profit or loss, in which case the increase is recognised in profit or loss. A revaluation deficit is recognised in profit or loss, except to the extent that it offsets an existing surplus on the same asset recognised in the asset revaluation reserve. Increases and decreases in the carrying amounts arising on revaluation of land and buildings belonging to the life business are credited/debited to the Life Assurance Fund.Depreciation is calculated on the straight line method to write off the cost of each asset, or the revalued amount, to its residual values over its estimated useful life as follows: Rate per annumBuildings 1% - 2%Office equipment, fixtures and fittings 10 - 33.33%Motor vehicles 20%
The assets’ residual values and useful lives are reviewed and adjusted prospectively if appropriate, at each financial reporting period end. The residual value of all property and equipment is nil.Where the carrying amount of an asset is greater than its estimated recoverable
amount, it is written down immediately to its recoverable amount.Gains and losses on disposal of property and equipment are determined by reference to their carrying amounts and are taken into account in determining operating profit and the surplus of the Life Assurance Fund. On disposal of revalued assets, any amounts in revaluation reserve relating to those assets are transferred to retained earnings.
(m) investment properties
Properties held to earn rentals or capital appreciation or both and not occupied by the Group is classified as investment properties. Investment properties are measured initially at cost, including transaction costs. The carrying amount includes the cost of replacing part of an existing investment properties at the time that cost is incurred if the recognition criteria are met; and excludes the costs of day to day servicing of an investment property. Subsequent to initial recognition, investment properties are stated at fair value, which reflects market conditions at the reporting date. Gains or losses arising from changes in the fair values of investment properties are included in the profit or loss and the Life Assurance Fund in the period in which they arise. Fair values are determined based on the evaluation performed by an accredited external, independent valuer.Investment properties are derecognised when either they have been disposed of or when the investment properties are permanently withdrawn from use and no future economic benefit is expected from its disposal. Any gains or losses on the retirement or disposal of an investment property are recognised in profit or loss in the year of retirement or disposal.Transfers made to or from investment properties are only made when there is a change in use evidenced by the end of owner-occupation, commencement of an operating lease to another party or completion of construction or development. For a transfer from investment property to owner occupied property, the deemed cost for subsequent accounting is the fair value at the date of change in use. If owner occupied property becomes an investment property,
the Group accounts for such property in accordance with the policy stated under plant and equipment up to the date of the change in use.When the Group completes the construction or development of a self constructed investment property, any difference between the fair value of the property at that date and its previous carrying amount is recognised in profit or loss.
(n) goodwill
Goodwill acquired in a business combination is initially measured at cost being the excess of the cost of the business combination over the Group’s interest in the net fair value of the identifiable assets, liabilities and contingent liabilities. Following initial recognition, goodwill is measured at cost less any accumulated impairment losses. Goodwill is reviewed for impairment, annually or more frequently if events or changes in circumstances indicate that the carrying value may be impaired.For the purpose of impairment testing, goodwill acquired in a business combination is, from the acquisition date, allocated to each of the Group’s cash-generating units, or groups of cash-generating units, that are expected to benefit from the synergies of the combination, irrespective of whether other assets or liabilities of the Group are assigned to those units or groups of units. Each unit or group of units to which the goodwill is so allocated:•• represents the lowest level
within the Group at which the goodwill is monitored for internal management purposes; and•• is not larger than a segment based
on either the Group’s primary or the Group’s secondary reporting format determined in accordance with IFRS 8 Segment Reporting.
(o) intangible assets
Intangible assets with finite lives are amortised over the useful economic life and assessed for impairment whenever there is an indication that the intangible asset may be impaired. The amortisation period and the amortisation method for an intangible asset with a finite useful life are reviewed at least at the end of each reporting period. Changes in the expected useful life or the expected pattern of consumption of future economic benefits embodied in the asset are considered to modify the amortisation period or method, as appropriate, and are treated as changes in accounting estimates. The amortisation expense on intangible assets with finite lives is recognised in profit or loss in the expense category that is consistent with the function of the intangible assets.Gains or losses arising from derecognition of an intangible asset are measured as the difference between the net disposal proceeds and the carrying amount of the asset and are recognised in profit or loss when the asset is derecognised.
acquisition of client portfolioThe cost of acquisition of a client portfolio is capitalised and amortised using the straight-line method over five to twenty five years.
computer softwareComputer software is initially recorded at cost and amortised using the straight-line method over the estimated useful life of 5 years.
(p) Impairment of non-financial assets
The Group assesses at each reporting date whether there is an indication that an asset may be impaired. If any such indication exists, or when annual impairment testing for an asset is required, the Group estimates the asset’s recoverable amount. An asset’s recoverable amount is the higher of an asset’s or cash-generating unit’s fair value less costs to sell and its value in use. The recoverable amount is determined for an individual asset, unless the asset does not generate cash inflows that are largely independent of those from other assets or groups of assets. In assessing value in use, the estimated future cash flows are discounted to their present value using a pre-tax discount rate that reflects current market assessments of the time value of money and the risks specific to the asset. In determining fair value less costs to sell, recent market transactions are taken into account, if available.
(q) cash and cash equivalents
Cash and short-term deposits in the statement of financial position comprise cash at banks and on hand and short-term deposits with a maturity of three months or less. Cash and cash equivalents is measured at amortised cost.For the purpose of the consolidated statement of cash flows, cash and cash equivalents consist of cash and short-term deposits as defined above, net of outstanding bank overdrafts.
7.8 notes to the financial statements for year ended december 31, 2013 7.8 notes to the financial statements for year ended december 31, 20137. fiNaNcial stateMeNts fOR tHe yeaR eNDeD DeceMBeR 31, 2013 7. fiNaNcial stateMeNts fOR tHe yeaR eNDeD DeceMBeR 31, 2013
126
introduction 4
company profile 10
corporate governance report 20
risk management report 60
sustainability report 72
financial statements
statement of comprehensive income
statement of changes in equity
statement of cash flows
notes to the financial statements

Youarehere
2. suMMaRy Of sigNificaNt accOuNtiNg pOlicies (continued)
2.4 Significant accounting policies (continued)
(r) provisions (continued)
Provisions are recognised when the Group has a present obligation (legal or constructive) as a result of a past event, and it is probable that an outflow of resources embodying economic benefits will be required to settle the obligation and a reliable estimate can be made of the amount of the obligation. Where the Group expects some or all of a provision to be reimbursed, the reimbursement is recognised as a separate asset but only when the reimbursement is virtually certain. The expense relating to any provision is presented in profit or loss net of any reimbursement. If the effect of the time value of money is material, provisions are discounted using a current pre-tax rate that reflects, where appropriate, the risks specific to the liability. Where discounting is used, the increase in the provision due to the passage of time is recognised as a borrowing cost.
(s) segment reporting
Segments are reported in a manner consistent with the internal reporting provided to management.
(t) taxes
current income taxCurrent income tax assets and liabilities for the current and prior periods are measured at the amount expected to be recovered from or paid to the taxation authorities. The tax rates and tax laws used to compute the amount are those that are enacted or substantively enacted by the reporting date, in the countries where the Group operates and generates taxable income. The income tax is recognised as a charge in profit or loss.
Deferred income taxDeferred income tax is provided using the liability method on temporary differences at the reporting date between the tax bases of assets and liabilities and their carrying
amounts for financial reporting purposes.Deferred tax liabilities are recognised for all taxable temporary differences, except:•• where the deferred tax liability arises from
the initial recognition of goodwill or of an asset or liability in a transaction that is not a business combination and, at the time of the transaction, affects neither the accounting profit nor taxable profit or loss; and•• in respect of taxable temporary differences
associated with investments in subsidiaries, associates and interests in joint ventures, where the timing of the reversal of the temporary differences can be controlled and it is probable that the temporary differences will not reverse in the foreseeable future.
Deferred income tax assets are recognised for all deductible temporary differences, carry-forward of unused tax credits and unused tax losses, to the extent that it is probable that taxable profit will be available against which the deductible temporary differences, and the carry-forward of unused tax credits and unused tax losses can be utilised except:•• where the deferred income tax asset
relating to the deductible temporary difference arises from the initial recognition of an asset or liability in a transaction that is not a business combination and, at the time of the transaction, affects neither the accounting profit nor taxable profit or loss; and•• In respect of deductible temporary
differences associated with investments in subsidiaries, associates and interests in joint ventures, deferred income tax assets are recognised only to the extent that it is probable that the temporary differences will reverse in the foreseeable future and taxable profit will be available against which the temporary differences can be utilised.
The carrying amount of deferred income tax assets is reviewed at each reporting date and reduced to the extent that it is no longer probable that sufficient taxable profit will be available to allow all or part of the deferred
income tax asset to be utilised. Unrecognised deferred income tax assets are reassessed at each reporting date and are recognised to the extent that it has become probable that future taxable profit will allow the deferred tax asset to be recovered.Deferred tax assets and liabilities are measured at the tax rates that are expected to apply to the year when the asset is realised or the liability is settled, based on tax rates (and tax laws) that have been enacted or substantively enacted at the reporting date.Deferred tax relating to items recognised outside profit or loss is recognised outside profit or loss. Deferred tax items are recognised in correlation to the underlying transaction either in other comprehensive income or directly in equity.Deferred income tax assets and deferred income tax liabilities are offset, if a legally enforceable right exists to set off current income tax assets against current income tax liabilities and the deferred income taxes relate to the same taxable entity and the same taxation authority.Deferred income tax assets and deferred income tax liabilities are offset only where both criteria below are met:(i) has a legally enforceable right to
set off the recognised amounts; and
(ii) intends either to settle on a net basis, or to realise the asset and settle the liability simultaneously.
The Group and the Company have disclosed deferred income tax assets and deferred income tax liabilities separately as it does not meet the above criteria.corporate social ResponsibilityIn line with the definition within the Income Tax Act 1995, Corporate
Social Responsibility (CSR) is regarded as a tax and is therefore subsumed with the income tax shown within the Statement of Comprehensive Income and the income tax liability on the Statement of Financial Position.The CSR charge for the current period is measured at the amount expected to be paid to the Mauritian tax authorities. The CSR rate and laws used to compute the amount are those charged or substantively enacted by the reporting date.
alternative Minimum tax (aMt)Alternative Minimum Tax (AMT) is provided for where the Company has a tax liability of less than 7.5% of its book profit and pays a dividend. AMT is calculated as the lower of 10% of the dividend declared and 7.5% of book profit.
(u) Revenue recognition
(i) premiums earned
Premiums on short-term insurance contracts represent gross premiums net of premiums ceded to reinsurers and are recognised as revenue (net earned premiums) on an inception basis (daily method).Premiums on long-term insurance contracts are recognised in the Life Assurance Fund when receivable, i.e. when payments are due.
(ii) consideration for annuities
Consideration for annuities is recognised in the Life Assurance Fund when receivable.
(iii) Other revenues
Other revenues are recognised on the following bases:•• Fees and commission income
- on the accrual basis in accordance with the substance of the relevant agreements.•• Interest income - it is
recognised using the effective interest method as it accrues.•• Dividend income - when the
shareholder’s right to receive payment is established.
(v) shareholders’ share of the surplus generated by the life Business
The Group recognises the shareholders’ share of the DPF eligible surplus on an annual basis and transfers this amount from/to the Life Assurance Fund to/from the shareholders’ share of Life surplus in equity. The non-distributable share of the surplus is transferred annually from retained earnings to a non-distributable reserve in the equity. Whenever bonuses are paid/credited to policyholders, an amount representing 7% (2012: 7%) of these bonuses is transferred from the non-distributable reserve to retained earnings in the Statement of Changes in Equity.
(w) life assurance fund
The increase in the Life Assurance Fund represents the increase in the value of policy liabilities. The adequacy of the liabilities is determined annually by actuarial valuation. At the end of every year, a valuation of the assets and liabilities, and therefore of the DPF eligible surplus, is performed. In the light of this valuation a final bonus is set for policyholders. The cost of this bonus is met in full at the end of every year. The amount of the DPF eligible surplus distributable to shareholders is limited to 7% (2012: 7%) of the cost to the final bonuses allocated to policyholders.
7.8 notes to the financial statements for year ended december 31, 2013 7.8 notes to the financial statements for year ended december 31, 20137. fiNaNcial stateMeNts fOR tHe yeaR eNDeD DeceMBeR 31, 2013 7. fiNaNcial stateMeNts fOR tHe yeaR eNDeD DeceMBeR 31, 2013
128
introduction 4
company profile 10
corporate governance report 20
risk management report 60
sustainability report 72
financial statements
statement of comprehensive income
statement of changes in equity
statement of cash flows
notes to the financial statements

Youarehere
2. suMMaRy Of sigNificaNt accOuNtiNg pOlicies (continued)
2.4 Significant accounting policies (continued)
(w) life assurance fund (continued)
The shareholders’ share of the DPF eligible surplus is recognised annually and transferred from the Life Assurance Fund to the Non-distributable share of Life surplus in equity when there is a surplus or from Non-distributable Share of Life Assurance Fund when there is a deficit. The non-distributable share of the surplus is transferred annually from the retained earnings to a non-distributable reserve in the Statement of Changes in Equity. Whenever bonuses are paid/credited to policyholders, an amount representing 7% (2012: 7%) of these bonuses is transferred from the non-distributable surplus to retained earnings in the Statement of Changes in Equity.
(x) Retirement benefit obligations
(i) Defined Contribution Pension Scheme
Retirement benefits to employees of the Group are provided by a Defined Contribution Pension Scheme, the Mauritius Union Group Pension Scheme, which is funded by contributions from the Group and the employees. Payments made by the Group are charged to profit or loss /Life Assurance Fund in the year in which they are payable.
(ii) Defined Benefit Pension Scheme
Members of the Defined Contribution Scheme, who were previously members of the MUA Staff Pension Scheme, a Defined Benefit Scheme, are entitled to a No Worse Off Guarantee (“NWOG”) based on the benefits of the Defined Benefit Pension Scheme.In the current year, the Group has applied IAS 19 Employee Benefits (as revised in 2011) and the related consequential amendments for the first time.IAS 19 (as revised in 2011) changes the accounting for defined benefit plans and termination benefits. The most significant
change relates to the accounting for changes in defined benefit obligations and plan assets. The amendments require the recognition of changes in defined benefit obligations and in the fair value of plan assets when they occur, and hence eliminate the ‘corridor approach’ permitted under the previous version of IAS 19 and accelerate the recognition of past service costs. All actuarial gains and losses are recognised immediately through other comprehensive income in order for the net pension asset or liability recognised in the consolidated statement of financial position to reflect the full value of the plan deficit or surplus. Furthermore, the interest cost and expected return on plan assets used in the previous version of IAS 19 are replaced with a ‘net interest’ amount under IAS 19 (as revised in 2011), which is calculated by applying the discount rate to the net defined benefit liability or asset. These changes have had an impact on the amounts recognised in profit or loss and other comprehensive income in prior years.Specific transitional provisions are applicable to first-time application of IAS 19 (as revised in 2011). The Group has applied the relevant transitional provisions and restated the comparative amounts on a retrospective basis
(y) lease
The determination of whether an arrangement is a lease, or contains a lease, is based on the substance of the arrangement at the inception date and requires an assessment of whether the fulfillment of the arrangement is dependent on the use of a specific asset or assets and the arrangement conveys a right to use the asset, even if that right is not explicitly specified in an arrangement.Finance leases that transfer to the Group substantially all of the risks and benefits incidental to ownership of the leased item, are capitalised at the commencement of the lease at the fair value of the leased property or, if lower, at the present value of the minimum lease payments. Lease payments are apportioned between finance charges
and reduction of the lease liability so as to achieve a constant rate of interest on the remaining balance of the liability. Finance charges are recognised in finance cost in profit or loss.Leased assets are depreciated over the useful life of the asset. However, if there is no reasonable certainty that the Company will obtain ownership by the end of the lease term, the asset is depreciated over the shorter of the estimated useful life of the asset and the lease term.Operating lease payments are recognised as an operating expense in profit or loss on a straight-line basis over the lease term.
group as a lessor Leases in which the Group does not transfer substantially all the risks and benefits of ownership of an asset are classified as operating leases. Initial direct costs incurred in negotiating an operating lease are added to the carrying amount of the leased asset and recognised over the lease term on the same basis as rental income.
(z) fair value measurement
The Group measures financial instruments, such as, financial assets at fair value through profit or loss , financial assets at fair value through comprehensive income , and non-financial assets such as investment properties, at fair value at each reporting date. Also, fair values of financial instruments measured at amortised cost are disclosed in Note 30.Fair value is the price that would be received to sell an asset or paid to transfer a liability in an orderly transaction between market participants at the measurement date. The fair value measurement is based on the presumption that the transaction to sell the asset or transfer the liability takes
place either:•• In the principal market for the
asset or liability, or•• In the absence of a principal
market, in the most advantageous market for the asset or liability
The principal or the most advantageous market must be accessible to by the Group.The fair value of an asset or a liability is measured using the assumptions that market participants would usewhen pricing the asset or liability, assuming that market participants act in their economic best interest.A fair value measurement of a non-financial asset takes into account a market participant’s ability to generate economic benefits by using the asset in its highest and best use or by selling it to another market participant that would use the asset in its highest and best use.The Group uses valuation techniques that are appropriate in the circumstances and for which sufficient data are available to measure fair value, maximising the use of relevant observable inputs and minimising the use of unobservable inputs.All assets and liabilities for which fair value is measured or disclosed in the financial statements are categorised within the fair value hierarchy, described as follows, based on the lowest level input that is significant to the fair value measurement as a whole:•• Level 1 - Quoted (unadjusted)
market prices in active markets for identical assets or liabilities•• Level 2 - Valuation techniques
for which the lowest level input that is significant to the fair value measurement is directly or indirectly observable•• Level 3 - Valuation techniques
for which the lowest level input that is significant to the fair value measurement is unobservable
The level in the fair value hierarchy within which the fair value measurement is categorised in its entirety is determined on the basis of the lowest level input that is significant to the fair value measurement in its entirety. For this purpose, the significance of an input is assessed against the fair value measurement in its entirety. If a fair value measurement uses observable inputs that require significant adjustment based on unobservable inputs, that measurement is a level 3 measurement. Assessing the significance of a particular input to the fair value measurement in its entirety requires judgement, considering factors specific to the asset or liability.The determination of what constitutes ‘observable’ requires significant judgement by the Group. Management considers observable data to be that market data that is readily available, regularly distributed or updated, reliable and verifiable, not proprietary, and provided by independent sources that are actively involved in the relevant market.For assets and liabilities that are recognised in the financial statements on a recurring basis, the Group determines whether transfers have occurred between Levels in the hierarchy by re-assessing categorisation (based on the lowest level input that is significant to the fair value measurement as a whole) at the end of each reporting period.The Group’s valuation committee determines the policies and procedures for both recurring fair value measurement, such as financial assets at fair value through profit or loss and Financial Assets at Fair value through other comprehensive income.External valuers are involved for valuation of significant assets, such as investment properties.
7.8 notes to the financial statements for year ended december 31, 2013 7.8 notes to the financial statements for year ended december 31, 20137. fiNaNcial stateMeNts fOR tHe yeaR eNDeD DeceMBeR 31, 2013 7. fiNaNcial stateMeNts fOR tHe yeaR eNDeD DeceMBeR 31, 2013
130
introduction 4
company profile 10
corporate governance report 20
risk management report 60
sustainability report 72
financial statements
statement of comprehensive income
statement of changes in equity
statement of cash flows
notes to the financial statements
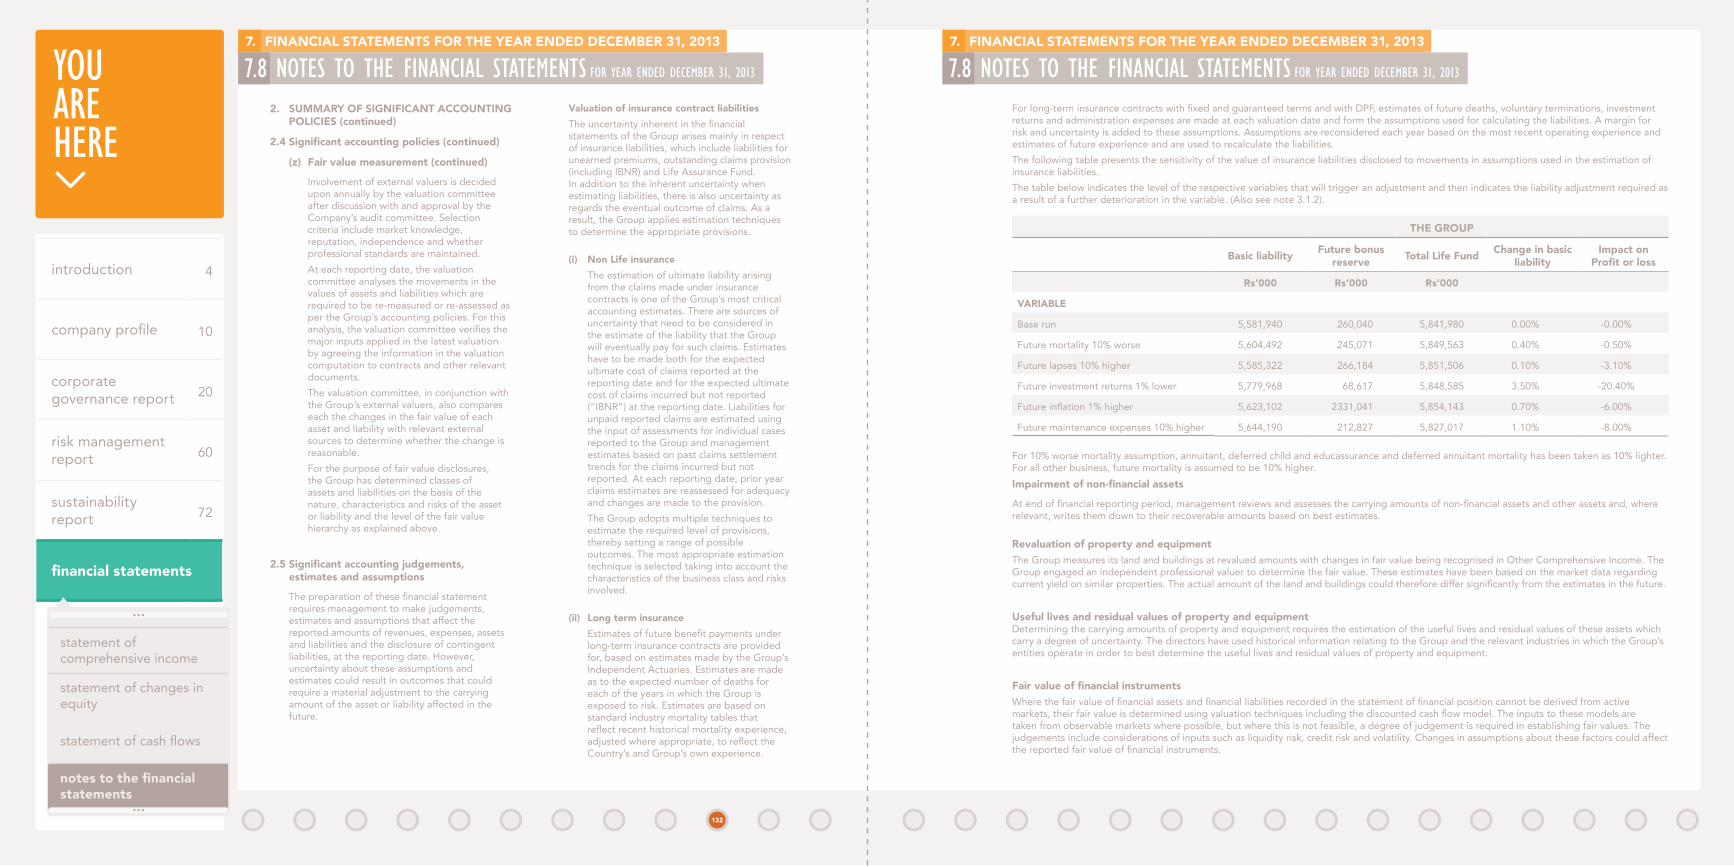
Youarehere
2. suMMaRy Of sigNificaNt accOuNtiNg pOlicies (continued)
2.4 Significant accounting policies (continued)
(z) fair value measurement (continued)
Involvement of external valuers is decided upon annually by the valuation committee after discussion with and approval by the Company’s audit committee. Selection criteria include market knowledge, reputation, independence and whether professional standards are maintained. At each reporting date, the valuation committee analyses the movements in the values of assets and liabilities which are required to be re-measured or re-assessed as per the Group’s accounting policies. For this analysis, the valuation committee verifies the major inputs applied in the latest valuation by agreeing the information in the valuation computation to contracts and other relevant documents.The valuation committee, in conjunction with the Group’s external valuers, also compares each the changes in the fair value of each asset and liability with relevant external sources to determine whether the change is reasonable.For the purpose of fair value disclosures, the Group has determined classes of assets and liabilities on the basis of the nature, characteristics and risks of the asset or liability and the level of the fair value hierarchy as explained above.
2.5 Significant accounting judgements, estimates and assumptions
The preparation of these financial statement requires management to make judgements, estimates and assumptions that affect the reported amounts of revenues, expenses, assets and liabilities and the disclosure of contingent liabilities, at the reporting date. However, uncertainty about these assumptions and estimates could result in outcomes that could require a material adjustment to the carrying amount of the asset or liability affected in the future.
valuation of insurance contract liabilitiesThe uncertainty inherent in the financial statements of the Group arises mainly in respect of insurance liabilities, which include liabilities for unearned premiums, outstanding claims provision (including IBNR) and Life Assurance Fund. In addition to the inherent uncertainty when estimating liabilities, there is also uncertainty as regards the eventual outcome of claims. As a result, the Group applies estimation techniques to determine the appropriate provisions.
(i) Non life insuranceThe estimation of ultimate liability arising from the claims made under insurance contracts is one of the Group’s most critical accounting estimates. There are sources of uncertainty that need to be considered in the estimate of the liability that the Group will eventually pay for such claims. Estimates have to be made both for the expected ultimate cost of claims reported at the reporting date and for the expected ultimate cost of claims incurred but not reported (“IBNR”) at the reporting date. Liabilities for unpaid reported claims are estimated using the input of assessments for individual cases reported to the Group and management estimates based on past claims settlement trends for the claims incurred but not reported. At each reporting date, prior year claims estimates are reassessed for adequacy and changes are made to the provision.The Group adopts multiple techniques to estimate the required level of provisions, thereby setting a range of possible outcomes. The most appropriate estimation technique is selected taking into account the characteristics of the business class and risks involved.
(ii) long term insuranceEstimates of future benefit payments under long-term insurance contracts are provided for, based on estimates made by the Group’s Independent Actuaries. Estimates are made as to the expected number of deaths for each of the years in which the Group is exposed to risk. Estimates are based on standard industry mortality tables that reflect recent historical mortality experience, adjusted where appropriate, to reflect the Country’s and Group’s own experience.
For long-term insurance contracts with fixed and guaranteed terms and with DPF, estimates of future deaths, voluntary terminations, investment returns and administration expenses are made at each valuation date and form the assumptions used for calculating the liabilities. A margin for risk and uncertainty is added to these assumptions. Assumptions are reconsidered each year based on the most recent operating experience and estimates of future experience and are used to recalculate the liabilities.The following table presents the sensitivity of the value of insurance liabilities disclosed to movements in assumptions used in the estimation of insurance liabilities.The table below indicates the level of the respective variables that will trigger an adjustment and then indicates the liability adjustment required as a result of a further deterioration in the variable. (Also see note 3.1.2).
tHe gROup
Basic liability future bonus reserve total life fund change in basic
liabilityimpact on
Profit or loss
Rs’000 Rs’000 Rs’000
vaRiaBle
Base run 5,581,940 260,040 5,841,980 0.00% -0.00%
Future mortality 10% worse 5,604,492 245,071 5,849,563 0.40% -0.50%
Future lapses 10% higher 5,585,322 266,184 5,851,506 0.10% -3.10%
Future investment returns 1% lower 5,779,968 68,617 5,848,585 3.50% -20.40%
Future inflation 1% higher 5,623,102 2331,041 5,854,143 0.70% -6.00%
Future maintenance expenses 10% higher 5,644,190 212,827 5,827,017 1.10% -8.00%
For 10% worse mortality assumption, annuitant, deferred child and educassurance and deferred annuitant mortality has been taken as 10% lighter. For all other business, future mortality is assumed to be 10% higher.Impairment of non-financial assets
At end of financial reporting period, management reviews and assesses the carrying amounts of non-financial assets and other assets and, where relevant, writes them down to their recoverable amounts based on best estimates.
Revaluation of property and equipmentThe Group measures its land and buildings at revalued amounts with changes in fair value being recognised in Other Comprehensive Income. The Group engaged an independent professional valuer to determine the fair value. These estimates have been based on the market data regarding current yield on similar properties. The actual amount of the land and buildings could therefore differ significantly from the estimates in the future.
useful lives and residual values of property and equipmentDetermining the carrying amounts of property and equipment requires the estimation of the useful lives and residual values of these assets which carry a degree of uncertainty. The directors have used historical information relating to the Group and the relevant industries in which the Group’s entities operate in order to best determine the useful lives and residual values of property and equipment.
Fair value of financial instrumentsWhere the fair value of financial assets and financial liabilities recorded in the statement of financial position cannot be derived from active markets, their fair value is determined using valuation techniques including the discounted cash flow model. The inputs to these models are taken from observable markets where possible, but where this is not feasible, a degree of judgement is required in establishing fair values. The judgements include considerations of inputs such as liquidity risk, credit risk and volatility. Changes in assumptions about these factors could affect the reported fair value of financial instruments.
7.8 notes to the financial statements for year ended december 31, 2013 7.8 notes to the financial statements for year ended december 31, 20137. fiNaNcial stateMeNts fOR tHe yeaR eNDeD DeceMBeR 31, 2013 7. fiNaNcial stateMeNts fOR tHe yeaR eNDeD DeceMBeR 31, 2013
132
introduction 4
company profile 10
corporate governance report 20
risk management report 60
sustainability report 72
financial statements
statement of comprehensive income
statement of changes in equity
statement of cash flows
notes to the financial statements

Youarehere
2. suMMaRy Of sigNificaNt accOuNtiNg pOlicies (continued)
2.5 Significant accounting judgements, estimates and assumptions (continued)
(iii) long term insurance
Recoverable amount on insurance and other receivables
In preparing those consolidated financial statements, the directors have made estimates of the recoverable amounts of insurance and other receivables and impaired those receivables where the carrying amounts exceeded recoverable amounts. The estimation of recoverable amounts involve an assessment of the financial condition of the debtors concerned and estimate of the timing and the extent of cash flows likely to be received by the Group.
limitation of sensitivity analysis
Sensitivity analysis in respect of market risk demonstrates the effect of a change in a key assumption while other assumptions remain unchanged. In reality, there is a correlation between the assumptions and other factors. It should also be noted that these sensitivities are non-linear and larger or smaller impacts should not be interpolated or extrapolated from these results.Sensitivity analysis does not take into consideration that the Group’s assets and liabilities are managed. Other limitations include the use of hypothetical market movements to demonstrate potential risk that only represent the Group’s view of possible near-term market changes that cannot be predicted with any certainty.
estimated impairment of goodwill
Determining whether goodwill is impaired requires an estimation of the value in use of the cash generating units to which goodwill has been allocated. The value in use calculation requires MUA to estimate the future cash flows expected to arise from the cash generating units and a suitable discount rate in order to calculate present value The Group test goodwill annually for impairment, or more frequently if there are indicators that goodwill might be impaired.
The recoverable amount of a CGU is determined based on the value in use calculations. These calculations use cash flow projections based on financial budgets approved by management. Cash flows are extrapolated using the estimated growth rates. Management does not expect that the growth rate to exceed the long term average growth rate in which the CGU operates. Management believe that any reasonably possible change in key assumptions on which recoverable amount is based would not cause the aggregate carrying amount to exceed the aggregate recoverable amount of the cash generating unit. Management have reviewed the carrying amount of the goodwill at the end of the reporting period and is in the opinion, they have not been impaired.
Classification and recognition of financial assets
Management has evaluated that all its equity securities except for the corporate bonds are held for strategic reason rather than for trading purposes. Consequently these do not qualify as financial assets at fair value through profit or loss. The impact of such a decision is that changes in fair value is recognised in other comprehensive income rather through profit or loss. Similarly the concept of impairment will no longer apply to these investments. This decision is irrevocable.On the other hand, the corporate bonds (i.e. debt securities) were not considered to meet the criteria to be classified at amortised cost in accordance with IFRS 9, because the objective of the Group’s business model is not to hold these debt securities in order to collect their contractual cash flows but rather to sell the instrument prior to its contractual maturity to realise their fair value changes. They were therefore reclassified from available for sale to financial assets at fair value through profit or loss upon adoption of IFRS 9.
Recognition of deferred tax assets
Deferred tax assets are recognised for all unused tax losses to the extent that is probable that taxable profit will be available against which losses can be utilised. Significant management judgement is required to determine the
amount of deferred tax assets that can be recognised, based upon the likely timing and level of future taxable profits together with future tax planning strategies.
3. MaNageMeNt Of iNsuRaNce aND fiNaNcial Risks
3.1 insurance risks
Insurance risk is transferred when the Group agrees to compensate a policyholder if a specified uncertain future event (other than a change in a financial variable) adversely affects the policyholder. By the very nature of an insurance contract, this risk is random and therefore unpredictable.The main risk that the Group faces under its insurance contracts is that actual claims and benefit payments exceed the carrying amount of the insurance liabilities. This may occur if the frequency or severity of claims and benefits are greater than estimated. Experience shows that the larger the portfolio of similar insurance contracts, the smaller the relative variability about the expected outcome. In addition, a more diversified portfolio is less likely to be affected across the board by a change in any subset of the portfolio. The Group has developed its insurance underwriting strategy so as to diversify the type of insurance risks accepted and within each of these categories to achieve a sufficiently large population of risks to reduce the variability of the expected outcome. Factors that aggravate insurance risk include lack of risk diversification in terms of type and amount of risk, accumulation of risk and type of industry covered.
3.1.1 insurance liabilities
(a) short-term insuranceThe frequency and severity of claims can be affected by several factors. The most significant claims result from accident, liability claims awarded by the Court, fire and allied perils and their consequences. Inflation is also a significant factor due to the long period typically required to settle some claims.
The Group’s underwriting strategy attempts to ensure that the underwritten risks are well diversified in type, amount of risk and industry. The Group has underwriting limits by type of risks and by industry. Performance of individual insurance policies are reviewed by management and the Group reserves the right not to renew individual policies. It can impose deductibles and has the right to reject the payment of a fraudulent claim. Where relevant, the Group may sue third parties for payment of some or all liabilities (subrogation). Claims development and provisioning levels are closely monitored. The reinsurance arrangements of the Group include proportional, excess-of-loss and catastrophe coverage and as such, the maximum loss that the Group may suffer in any one year is pre-determined.
(b) long-term insuranceFor long-term insurance contracts, where the insured event is death, the most significant factors that could impact on insurance claims are diseases like heart problems, diabetes, high blood pressure or changes in lifestyle, such as eating habits, smoking and lack of exercise, resulting in higher and earlier claims being submitted to the Group. For contracts where survival is the insured risk, the most significant factor is continued improvement in medical science and social conditions that would increase longevity. The liabilities in terms of insurance contracts are based on recommendations of the Group’s Independent Actuaries.
7.8 notes to the financial statements for year ended december 31, 2013 7.8 notes to the financial statements for year ended december 31, 20137. fiNaNcial stateMeNts fOR tHe yeaR eNDeD DeceMBeR 31, 2013 7. fiNaNcial stateMeNts fOR tHe yeaR eNDeD DeceMBeR 31, 2013
134
introduction 4
company profile 10
corporate governance report 20
risk management report 60
sustainability report 72
financial statements
statement of comprehensive income
statement of changes in equity
statement of cash flows
notes to the financial statements

7.8 notes to the financial statements for year ended december 31, 20133. MaNageMeNt Of iNsuRaNce aND fiNaNcial Risks (continued)
3.1 insurance risks (continued)
3.1.2 concentration of insurance risk (continued)
(b) long-term insurance
The table below presents the concentration of insured benefits across bands of insured benefits per individual life assured.
tHe gROupTotal benefits insured
tHe cOMpaNyTotal benefits insured
Benefits assured per life assured at the end of 2013 Before reinsurance after reinsurance Before reinsurance after reinsurance
Rs’000 Rs’000 % Rs’000 % Rs’000 % Rs’000 %
0 - 50 134,921 1 153,704 2 - - - -
50 - 100 456,891 3 517,061 7 - - - -
100 - 150 771,489 5 877,256 12 - - - -
150 - 200 825,363 5 2,905,446 38 - - - -
200 - 250 863,720 5 421,386 5 - - - -
250 - 300 876,611 6 440,406 6 - - - -
More than 300 11,889,829 75 2,290,150 30 - - - -
total 15,818,824 100 7,605,409 100 - - - -
tHe gROupTotal benefits insured
tHe cOMpaNyTotal benefits insured
Benefits assured per life assured at the end of 2012 Before reinsurance after reinsurance Before reinsurance after reinsurance
Rs’000 Rs’000 % Rs’000 % Rs’000 % Rs’000 %
0 - 50 186,516 1 203,376 3 - - - -
50 - 100 398,205 3 453,936 6 - - - -
100 - 150 732,989 6 819,106 11 - - - -
150 - 200 816,378 7 2,523,696 34 - - - -
200 - 250 760,635 6 360,691 5 - - - -
250 - 300 776,279 6 397,469 5 - - - -
More than 300 8,856,874 71 2,772,960 36 - - - -
total 12,527,876 100 7,531,234 100 - - - -
3. MaNageMeNt Of iNsuRaNce aND fiNaNcial Risks (continued)
3.1 insurance risks (continued)
3.1.2 concentration of insurance risk
(a) short-term insurance
The following table discloses the concentration of outstanding claims by class of business, gross and net of reinsurance.
tHe gROup aND tHe cOMpaNy OutstaNDiNg claiMs2013
class of business No. of claims gross liabilities Reinsurance of liabilities Net
Rs’000 Rs’000 Rs’000
Motor 12,153 437,423 (23,601) 413,822
Fire 231 103,574 (106,033) (2,459)
Personal Accident 192 27,753 (25,320) 2,433
transport 123 16,828 (3,805) 13,023
Miscellaneous 1,717 264,911 (159,637) 105,274
IBNR - 69,870 (3,974) 65,896
total 14,416 920,359 (322,370) 597,989
OutstaNDiNg claiMs2012
class of business No. of claims gross liabilities Reinsurance of liabilities Net
Rs’000 Rs’000 Rs’000
Motor 12,461 425,963 (15,698) 410,265
Fire 147 123,580 (108,792) 14,788
Personal Accident 146 29,395 (25,694) 3,701
transport 105 19,451 (7,001) 12,450
Miscellaneous 1,248 233,210 (136,716) 96,494
IBNR - 54,656 (1,908) 52,748
total 14,107 886,255 (295,809) 590,446
7. fiNaNcial stateMeNts fOR tHe yeaR eNDeD DeceMBeR 31, 20137. fiNaNcial stateMeNts fOR tHe yeaR eNDeD DeceMBeR 31, 2013
7.8 notes to the financial statements for year ended december 31, 2013
136

7.8 notes to the financial statements for year ended december 31, 20133. MaNageMeNt Of iNsuRaNce aND fiNaNcial Risks (continued)
3.1 insurance risks (continued)
3.1.3 sources of uncertainty (continued)
(b) long-term insurance (continued)
The Group has a predetermined retention limit on any single life insured and the Group reinsures the excess of the insured benefit above the retention limit.
tHe gROup aND tHe cOMpaNy
2013 change in asssumptions
impact on gross liabilities
impact on net liabilities
impact on profit before tax impact on equity
Rs’000 Rs’000 Rs’000 Rs’000
average claim cost 10% 85,049 53,209 (31,840) (27,064)
tHe gROup aND tHe cOMpaNy
2012 change in asssumptions
impact on gross liabilities
impact on net liabilities
impact on profit before tax impact on equity
Rs’000 Rs’000 Rs’000 Rs’000
average claim cost 10% 83,160 53,770 (29,390) (24,982)
3.1.4 claims development tables
The development of insurance liabilities provides a measure of the Group’s ability to estimate the ultimate value of claims. The table below illustrates how the estimates of total claims outstanding from its general business ( short term insurance) for each year have changed at successive year ends and reconciles the cumulative claims to the amount appearing in the statement of financial position.
tHe gROup aND tHe cOMpaNy
Net estimate of ultimate claim costsunderwriting year
2009 2010 2011 2012 2013
Rs’000 Rs’000 Rs’000 Rs’000 Rs’000
At end of claim year 62,110 275,855 123,260 100,563 92,040
One year later 58,550 89,143 101,542 102,880 -
Two years later 70,414 65,480 67,784 - -
Three years later 63,196 52,493 - - -
Four years later 51,483 - - - -
3. MaNageMeNt Of iNsuRaNce aND fiNaNcial Risks (continued)
3.1 insurance risks (continued)
3.1.2 concentration of insurance risk (continued)
(a) long-term insurance (continued)
The following table for annuity insurance contracts illustrates the concentration of risk in bands that group these contracts in relation to the amount payable per annum as if the annuities were in payment at the year end. The Company does not hold any reinsurance contracts against the liabilities carried for these contracts.
tHe gROup tHe cOMpaNy
annuities payable per annum per life insured at end of 2013
total annuities payable per annum
2013 2012 2013 2012
Rs’000 Rs’000 % Rs’000 % Rs’000 % Rs’000 %
0 - 10 1,506 3 1,211 4 - - - -
10 - 20 2,719 6 2,338 7 - - - -
20 - 50 7,656 18 6,089 18 - - - -
50 - 100 8,741 20 6,767 20 - - - -
100 - 150 6,209 14 4,437 13 - - - -
More than 150 16,923 39 12,833 38 - - - -
total 43,754 100 33,675 100 - - - -
3.1.3 sources of uncertainty
(a) short-term insurance
Claims on short-term insurance contracts are payable on a claims occurrence basis for motor and liability business and on a claims made basis for non-motor. Under the claims occurrence basis, the Group is liable for all insured events that occurred during the term of the contract, even if the loss is discovered after the end of the contract. As a result, liability claims may be settled over a long period of time and a larger element of the claims provision relates to incurred but not reported claims (IBNR). For the claims made basis, the Group is liable only if the claims are reported within the specific underwriting year, based on the terms of the contract.
The estimated costs of claims include direct expenses to be incurred in settling claims, net of subrogation and salvage recoveries. The Group ensures that claims provisions are determined using the best information available of claims settlement patterns, forecast inflation and settlement of claims. Estimation techniques also involve obtaining corroborative evidence from as wide a range of sources as possible and combining these to form the best overall estimates. However, given the uncertainty in claims provisions, it is very probable that estimated costs and subsequent settlement amounts would differ.
(b) long-term insurance
The Group manages long-term insurance risks through its underwriting strategy and reinsurance arrangements. Management ensures that risks underwritten are well diversified in terms of type of risk and the level of insured benefits. Medical selection is included in the Group’s underwriting procedures, with premiums varied to reflect the health condition and family medical history of the applicant. Insurance risk may also be affected by the contract holder’s behaviour who may decide to amend terms or terminate the contract or exercise a guaranteed annuity option.
7. fiNaNcial stateMeNts fOR tHe yeaR eNDeD DeceMBeR 31, 20137. fiNaNcial stateMeNts fOR tHe yeaR eNDeD DeceMBeR 31, 2013
7.8 notes to the financial statements for year ended december 31, 2013
139

7.8 notes to the financial statements for year ended december 31, 20133. MaNageMeNt Of iNsuRaNce aND fiNaNcial Risks (continued)
3.2 financial risks
The Group is exposed to financial risks through its financial assets, financial liabilities, insurance and reinsurance assets and liabilities. In particular, the key financial risk is that proceeds from financial assets are not sufficient to fund the obligations arising from insurance contracts.
Risk management is carried out by the investment department under policies approved by the investment committee. The investment department identifies and evaluates financial risks in close co-operation with the Group’s operating units. The committee provides written principles for overall risk management, as well as written policies covering specific areas, such as foreign exchange risks, interest rate risks and investment of excess liquidity.
The main risks to which the Group is exposed include:
• Market risk (which includes foreign exchange risk, interest rate risk and equity price risk);• Credit risk;• Liquidity risk;• Capital management; and• Fair value estimation.
3.2.1 Market risk
Market risk is the risk of adverse financial impact due to changes in fair value of future cash flows of financial instruments from fluctuations in foreign currency exchange rates, interest rates and equity prices.
(i) foreign exchange risk
Currency risks that the fair value of future cashflows will fluctuate because of changes in foreign exchange rates.
Exposure to foreign currency is not hedged but closely monitored by management. The Group policy is to invest in foreign exchange where appreciation is expected.
tHe gROup - 2013
Concentration of financial assets and liabilities usD euR gBp sgD auD ZaR scR MuR tOtal
assets Rs’000 Rs’000 Rs’000 Rs’000 Rs’000 Rs’000 Rs’000 Rs’000 Rs’000
Financial assets at fair value through other comprehensive income 9,574 16,279 - - - - - 550,584 576,437
Financial assets at fair value through profit or loss 73,352 - 26,330 2,968 1,773 - - 2,630,558 2,734,981
Financial assets at amotised cost - - - - - - - 2,105,462 2,105,462
Loans and receivables at amortised cost - - - - - - - 958,615 958,615
Insurance and other receivables - - - - - - - 593,365 593,365
Reinsurance assets - - - - - - - 450,465 450,465
Cash and short term deposits 458,615 3,586 8,140 - 5 3,254 10,580 609,167 1,093,347
541,541 19,865 34,470 2,968 1,778 3,254 10,580 7,898,216 8,512,672
3. MaNageMeNt Of iNsuRaNce aND fiNaNcial Risks (continued)
3.1 insurance risks (continued)
3.1.4 claims development tables (continued)
(a) long-term insurance
fiNaNcial liaBilities
long term insurance contracts 2013 2012
Rs’000 Rs’000
No stated Maturity 2,074,232 1,750,311
0 - 1 yr 161,072 143,911
1 - 2 yrs 163,235 137,956
2 - 3 yrs 171,088 146,754
> 3 yrs 3,272,353 2,932,883
5,841,980 5,111,815
The development of insurance liabilities provides a measure of the Group’s ability to estimate the ultimate value of claims. The table below illustrates how the estimates of total claims outstanding for each year from its general business (short term insurance) have changed at successive year ends and reconciles the cumulative claims to the amount appearing in the statement of financial position.
tHe gROup aND tHe cOMpaNy
2009 2010 2011 2012 2013 tOtal
Rs'000 Rs'000 Rs'000 Rs’000 Rs'000 Rs’000
Current estimates of cumulative claims 706,582 541,633 670,986 807,019 367,016 3,093,236
Cumulative payments 655,099 489,140 603,202 704,139 274,976 2,726,556
Liability 51,483 52,493 67,784 102,880 92,040 366,680
Liability in respect of prior years 165,413
Incurred but not reported (IBNR) 65,896
total liability (net) 597,989
Note: For reasons of practicability and due to lack of adequate information, net estimate of ultimate claim costs has been disclosed for Company only and claims development tables disclose net claims only.
7. fiNaNcial stateMeNts fOR tHe yeaR eNDeD DeceMBeR 31, 20137. fiNaNcial stateMeNts fOR tHe yeaR eNDeD DeceMBeR 31, 2013
7.8 notes to the financial statements for year ended december 31, 2013
141

3. MaNageMeNt Of iNsuRaNce aND fiNaNcial Risks (continued)
3.2 financial risks (continued)
3.2.1 Market risk (continued)
(i) foreign exchange risk (continued)
tHe cOMpaNy - 2013
Concentration of financial assets and liabilities usD euR gBp sgD auD ZaR scR MuR tOtal
assets Rs’000 Rs’000 Rs’000 Rs’000 Rs’000 Rs’000 Rs’000 Rs’000 Rs’000
Financial assets at fair value through other comprehensive income 9,574 16,279 - - - - - 532,404 558,257
Financial assets at fair value through profit or loss - - - - - - - 2,923 2,923
Financial assets at amortised cost - - - - - - - 112,792 112,792
Loans and receivables at amortised cost - - - - - - - 228,772 228,772
Insurance and other receivables - - - - - - - 485,540 485,540
Reinsurance assets - - - - - - - 450,465 450,465
Amount receivable from subsidiary - - - - - - - 3,032 3,032
Cash and short term deposits 445,814 1,863 2 - 5 4 10,580 157,696 615,964
455,388 18,142 2 - 5 4 10,580 1,973,624 2,457,745
liaBilities
Borrowings - - - - - - - 163,282 163,282
Trade and other payables - - - - - - - 126,385 126,385
- - - - - - - 289,667 289,667
7.8 notes to the financial statements for year ended december 31, 20133. MaNageMeNt Of iNsuRaNce aND fiNaNcial Risks (continued)
3.2 financial risks (continued)
3.2.1 Market risk (continued)
(i) foreign exchange risk (continued)
tHe gROup - 2013
Concentration of financial assets and liabilities (continued) usD euR gBp sgD auD ZaR scR MuR tOtal
liaBilities Rs’000 Rs’000 Rs’000 Rs’000 Rs’000 Rs’000 Rs’000 Rs’000 Rs’000
Borrowings - - - - - - - 164,646 164,646
Trade and other payables 99 - - - - 17,074 - 181,996 199,169
99 - - - - 17,074 - 346,642 363,815
tHe gROup - 2012
usD euR gBp sgD auD ZaR scR MuR tOtal
assets Rs’000 Rs’000 Rs’000 Rs’000 Rs’000 Rs’000 Rs’000 Rs’000 Rs’000
Financial assets at fair value through other comprehensive income 11,654 13,910 7,912 - 4,721 - - 446,324 484,521
Financial assets at fair value through profit or loss 46,934 - 26,858 8,607 4,329 - - 2,278,392 2,365,120
Financial assets at amotised cost - - - - - - - 1,531,944 1,531,944
Loans and receivables at amortised cost - - - - - - - 1,011,433 1,011,433
Insurance and other receivables - - - - - - - 456,684 456,684
Reinsurance assets - - - - - - - 414,910 414,910
Cash and short term deposits 541,834 1,290 1,648 - 73 256 4,200 626,109 1,175,410
600,422 15,200 36,418 8,607 9,123 256 4,200 6,765,796 7,440,022
liaBilities
Borrowings - - - - - - - 181,338 181,338
Trade and other payables 200 - - - - 6,946 - 168,060 175,206
200 - - - - 6,946 - 349,398 356,544
7. fiNaNcial stateMeNts fOR tHe yeaR eNDeD DeceMBeR 31, 20137. fiNaNcial stateMeNts fOR tHe yeaR eNDeD DeceMBeR 31, 2013
7.8 notes to the financial statements for year ended december 31, 2013
143

7.8 notes to the financial statements for year ended december 31, 20133. MaNageMeNt Of iNsuRaNce aND fiNaNcial Risks (continued)
3.2 financial risks (continued)
3.2.1 Market risk (continued)
(i) foreign exchange risk (continued)
tHe gROup
December 31,2013 December 31,2012
changes in variables Impact on profit before tax
impact on equity
Impact on profit before tax
impact on equity
Rs'000 Rs'000 Rs'000 Rs'000
usD +2.5% 13,297 239 14,719 291
euR +2.5% 90 407 32 348
gBp +2.5% 862 - 713 198
sgD +2.5% 74 - 215 -
auD +2.5% 44 - 110 118
ZaR +2.5% (346) - (167) -
scR +2.5% 265 - 105 -
usD -2.5% (13,297) (239) (14,719) (291)
euR -2.5% (90) (407) (32) (348)
gBp -2.5% (862) - (713) (198)
sgD -2.5% (74) - (215) -
auD -2.5% (44) - (110) (118)
ZaR -2.5% 346 - 167 -
scR -2.5% (265) - (105) -
3. MaNageMeNt Of iNsuRaNce aND fiNaNcial Risks (continued)
3.2 financial risks (continued)
3.2.1 Market risk (continued)
(i) foreign exchange risk (continued)
tHe cOMpaNy - 2012
usD euR gBp sgD auD ZaR scR MuR tOtal
assets Rs’000 Rs’000 Rs’000 Rs’000 Rs’000 Rs’000 Rs’000 Rs’000 Rs’000
Financial assets at fair value through other comprehensive income 11,654 13,910 7,912 - 4,721 - - 433,119 471,316
Financial assets at fair value through profit or loss - - - - - - - 2,845 2,845
Financial assets at amortised cost - - - - - - - 132,711 132,711
Loans and receivables at amortised cost - - - - - - - 235,965 235,965
Insurance and other receivables - - - - - - - 372,056 372,056
Reinsurance assets - - - - - - - 414,910 414,910
Amount receivable from subsidiary - - - - - - - 11,813 11,813
Cash and short term deposits 512,165 1,064 1,384 - 73 167 4,200 93,304 612,357
523,819 14,974 9,296 - 4,794 167 4,200 1,696,723 2,253,973
liaBilities
Borrowings - - - - - - - 180,993 180,993
Trade and other payables - - - - - - - 133,411 133,411
- - - - - - - 314,404 314,404
The Group has no significant concentration of currency risk.
The analysis that follows is performed for reasonably possible movements in key vairables with all other variables held constant, showing the impact on profit before tax and equity due to changes in the fair value of currency sensitive monetary assets and liabilities including contract claim liabilities. The correlation of variables will have a signifcant effect in determining the ultimate impact on the market risk, but to demonstrate the impact due to changes in variables,variables had to be changed on an individual basis.
7. fiNaNcial stateMeNts fOR tHe yeaR eNDeD DeceMBeR 31, 20137. fiNaNcial stateMeNts fOR tHe yeaR eNDeD DeceMBeR 31, 2013
7.8 notes to the financial statements for year ended december 31, 2013
145

7.8 notes to the financial statements for year ended december 31, 20133. MaNageMeNt Of iNsuRaNce aND fiNaNcial Risks (continued)
3.2 financial risks (continued)
3.2.1 Market risk (continued)
(ii) interest rate risk (continued)
The analysis that follows is performed for reasonably possible movements in key variables with all other variables held constant, showing the impact on profit before tax and equity.
tHe gROup
December 31,2013 December 31,2012
changes in variables Impact on profit before tax
impact on equity
Impact on profit before tax
impact on equity
Rs'000 Rs'000 Rs'000 Rs'000
+ 250 basis points 42,548 - 39,733 -
- 250 basis points (42,548) - (39,733) -
tHe cOMpaNy
December 31,2013 December 31,2012
changes in variables Impact on profit before tax
impact on equity
Impact on profit before tax
impact on equity
Rs'000 Rs'000 Rs'000 Rs'000
+ 250 basis points 12,487 - (2,180) -
- 250 basis points (12,487) - 2,180 -
(iii) equity price risk
Equity price risk is the risk that the value of the financial instruments will fluctuate as a result of changes in market prices whether these changes are caused by factors specific to the individual security or its issuer or factors affecting all securities traded in the market.
3. MaNageMeNt Of iNsuRaNce aND fiNaNcial Risks (continued)
3.2 financial risks (continued)
3.2.1 Market risk (continued)
(i) foreign exchange risk (continued)
tHe cOMpaNy
December 31, 2013 December 31, 2012
changes in variables Impact on profit before tax
impact on equity
Impact on profit before tax
impact on equity
Rs'000 Rs'000 Rs'000 Rs'000
usD +2.5% 11,145 239 12,804 291
euR +2.5% 47 407 27 348
gBp +2.5% - - 35 198
sgD +2.5% - - - -
auD +2.5% - - 2 118
ZaR +2.5% - - 4 -
scR +2.5% 265 - 105 -
usD -2.5% (11,145) (239) (12,804) (291)
euR -2.5% (47) (407) (27) (348)
gBp -2.5% - - (35) (198)
sgD -2.5% - - - -
auD -2.5% - - (2) (118)
ZaR -2.5% - - (4) -
scR -2.5% (265) - (105) -
The method used for deriving sensitivity information and significant variables did not change from the previous method.
(ii) interest rate risk
Interest rate risk refers to the risk that the value or future cashflows from financial instrument backing the liabilities because of changes in market interest rates would be insufficient to fund guaranteed benefits payable especially under long-term Life Assurance contracts. Under short- term insurance contracts, liabilities are not directly sensitive to the level of market interest rates, as they are contractually non-interest bearing; except in case of bodily injury claims which are settled over long periods. Fluctuations in interest rates however impact on returns on financial instruments. This is closely monitored by Management through a well diversified portfolio of fixed income securities and equity investments.
7. fiNaNcial stateMeNts fOR tHe yeaR eNDeD DeceMBeR 31, 20137. fiNaNcial stateMeNts fOR tHe yeaR eNDeD DeceMBeR 31, 2013
7.8 notes to the financial statements for year ended december 31, 2013
147

7.8 notes to the financial statements for year ended december 31, 20133. MaNageMeNt Of iNsuRaNce aND fiNaNcial Risks (continued)
3.2 financial risks (continued)
3.2.2 credit risk (continued)
tHe gROup tHe cOMpaNy
fiNaNcial iNstRuMeNts 2013 2012 2013 2012
Rs’000 Rs’000 Rs’000 Rs’000
Financial assets at fair value through other comprehensive income 576,437 484,521 558,257 471,316
Financial assets at fair value through profit or loss 2,734,981 2,365,120 2,923 2,845
Financial assets at amortised cost 2,105,462 1,531,943 112,792 132,711
Loans and receivables at amortised cost 958,615 1,011,805 228,772 235,965
Insurance and other receivable 593,364 456,684 485,540 372,056
Amount receivable from subsidiary - - 3,032 11,813
Reinsurance assets 450,465 414,910 450,465 414,910
Bank balances and cash 1,093,347 1,175,410 615,964 612,357
8,512,671 7,440,393 2,457,745 2,253,973
3.2.3 liquidity risk
Prudent liquidity risk management implies maintaining sufficient cash and marketable securities. Liquidity risk is considered to be low since the Group maintains an adequate level of cash resources or assets that are readily available on demand.
The table below summarises the maturity profile of the Group’s and the Company’s financial liabilities at December 31, 2013 based on contractual undiscounted payments.
tHe gROup
2013 On demand less than 3 months 3 to 12 months 1 to 5 years above 5 years total
Rs'000 Rs'000 Rs'000 Rs'000 Rs’000 Rs’000
Interest bearing loans and borrowings 1,363 - 25,000 150,000 - 176,363
Trade and other payables 156,808 - 42,361 - - 199,169
158,171 - 67,361 150,000 - 375,532
3. MaNageMeNt Of iNsuRaNce aND fiNaNcial Risks (continued)
3.2 financial risks (continued)
3.2.1 Market risk (continued)
(iii) equity price risk (continued)
The analysis below is performed for reasonably possible movements in key variables with all other variables held constant, showing the impact on profit before tax and equity.
tHe gROup
December 31,2013 December 31,2012
changes in variables Impact on profit before tax
impact on equity
Impact on profit before tax
impact on equity
Rs'000 Rs'000 Rs'000 Rs'000
+2.5% 68,375 14,411 59,128 12,113
-2.5% (68,375) (14,411) (59,128) (12,113)
tHe cOMpaNy
December 31,2013 December 31,2012
changes in variables Impact on profit before tax
impact on equity
Impact on profit before tax
impact on equity
Rs'000 Rs'000 Rs'000 Rs'000
+2.5% 73 13,956 71 11,783
-2.5% (73) (13,956) (71) (11,783)
3.2.2 credit risk
Credit risks is a risk that a counterparty will be unable to pay an amount in full when due. The Group’s credit risk is primarily attributable to its reinsurance assets, loans, insurance and other receivables. The amounts presented in the statement of financial position are net of allowances for doubtful receivables, estimated by management based on prior experience and the current economic environment. The Credit Control department assesses the creditworthiness of brokers, agents and of contractholders based on details of recent payment history, past experience and by taking into account their financial position. The Group is exposed to the possibility of default by its reinsurers for their share of insurance liabilities and refunds in respect of claims already paid. Management monitors the financial strength of its reinsurers and the Group has policies in place to ensure that risks are ceded to top-rated and credit-worthy reinsurers only. The creditworthiness of reinsurers is considered on an annual basis by reviewing their financial strength prior to finalisation of any contract. The table shows the maximum exposure to credit risk for the components of the financial position.
7. fiNaNcial stateMeNts fOR tHe yeaR eNDeD DeceMBeR 31, 20137. fiNaNcial stateMeNts fOR tHe yeaR eNDeD DeceMBeR 31, 2013
7.8 notes to the financial statements for year ended december 31, 2013
149

7.8 notes to the financial statements for year ended december 31, 20133. MaNageMeNt Of iNsuRaNce aND fiNaNcial Risks (continued)
3.2 financial risks (continued)
3.2.4 fair values
The Group’s financial assets and liabilities include financial assets at fair value through other comprehensive income, financial assets at fair value through profit or loss, financial assets at amotised cost, loan and receivables at amortised cost, insurance and other receivables, amount receivable from subsidiary, cash and cash equivalents, other financial assets, trade and other payables, and borrowings. Except where otherwise stated, the carrying amounts of these financial assets and liabilities approximate their fair values.
3.2.5 capital management
The Group’s objectives when managing capital are:
• to comply with the minimum capital requirements of the Insurance Act 2005 and the Insurance Rules and Regulations 2007.• to safeguard the Group’s ability to continue as a going concern so that it can continue to provide returns for shareholders and benefits for its
policyholders.• to provide an adequate return to shareholders by pricing insurance contracts in line with the level of risk and therefore solvency.
The Group met the Minimum Capital Requirement at December 31, 2013 for both life and general businesses.
Capital available has been computed from the shareholders fund less any unadmitted asset.
The operations of the Group is also subject to regulatory requirements within the Mauritian jurisdictions where it operates. Such regulations not only prescribe approval and monitoring of activities, but also impose certain restrictive provisions (eg: capital adequacy) to minimise the risk of default and insolvency on the part of MUA to meet unforseen liabiities. In reporting financial strength, capital and solvency is measured using the rules prescibed by the Insurance Act. Per the Insurance Rules 2007, a general insurer shall have at all times a capital requirement ratio of 150% and a solvency margin of at least 100% of the minimum requirements. The Group and regulated entities within it have met all these requirements.
3. MaNageMeNt Of iNsuRaNce aND fiNaNcial Risks (continued)
3.2 financial risks (continued)
3.2.3 liquidity risk (continued)
tHe gROup
2012 On demand less than 3 months 3 to 12 months 1 to 5 years above 5 years total
Rs'000 Rs'000 Rs'000 Rs'000 Rs’000 Rs’000
Interest bearing loans and borrowings 345 - 25,000 185,417 - 210,762
Trade and other payables 142,587 395 32,224 - - 175,206
142,932 395 57,224 185,417 - 385,968
tHe cOMpaNy
2013 On demand less than 3 months 3 to 12 months 1 to 5 years above 5 years total
Rs'000 Rs'000 Rs'000 Rs'000
Interest bearing loans and borrowings - - 25,000 150,000 - 175,000
Trade and other payables 126,385 - - - - 126,385
126,385 - 25,000 150,000 - 301,385
tHe cOMpaNy
2012 On demand less than 3 months 3 to 12 months 1 to 5 years above 5 years total
Rs'000 Rs'000 Rs'000 Rs'000 Rs’000 Rs’000
Interest bearing loans and borrowings - - 25,000 185,417 - 210,417
Trade and other payables 133,411 - - - - 133,411
133,411 - 25,000 185,417 - 343,828
7. fiNaNcial stateMeNts fOR tHe yeaR eNDeD DeceMBeR 31, 20137. fiNaNcial stateMeNts fOR tHe yeaR eNDeD DeceMBeR 31, 2013
7.8 notes to the financial statements for year ended december 31, 2013
151

7.8 notes to the financial statements for year ended december 31, 20137. fiNaNcial stateMeNts fOR tHe yeaR eNDeD DeceMBeR 31, 2013
5. pROpeRty aND equipMeNt
(a) the group
laND aND BuilDiNgs
2013 freehold land Buildings on freehold land
Office equipment, fixtures & fittings Motor vehicles total
cOst OR valuatiON Rs’000 Rs’000 Rs’000 Rs’000 Rs’000
At January 1, 2013 40,000 176,048 224,756 52,268 493,072
Additions - - 29,988 3,971 33,959
Transfer from investment property - 12,000 - - 12,000
Disposals - - (4,966) (10,507) (15,473)
at December 31, 2013 40,000 188,048 249,778 45,732 523,558
DepReciatiON
At January 1, 2013 - 3,481 169,824 24,950 198,255
Charge for the year - 3,662 16,949 9,057 29,668
Disposals - - (4,808) (6,636) (11,444)
at December 31, 2013 - 7,143 181,965 27,371 216,479
caRRyiNg aMOuNt
at December 31, 2013 40,000 180,905 67,813 18,361 307,079
4. Risk MaNageMeNt fRaMewORk
4.1 governance framework
The primary objective of the Company’s risk and financial management framework is to protect the Company’s shareholders from events that hinder the sustainable achievement of financial performance objectives, including failing to exploit opportunities. Key management recognised the critical importance of having efficient and effective risk management systems in place.
The board of directors approves the Company risk management policies and meets regularly to approve any commercial, regulatory and organisational requirements of such policies. These policies define the Company’s identification of risk and its interpretation, limit structure to ensure the appropriate quality and diversification of assets align underwriting and reinsurance strategy to the corporate goals, and specify reporting requirements.
4.2 Regulatory framework
Regulators are primarily interested in protecting the rights of policyholders and monitor them closely to ensure that the Company is satisfactorily managing affairs for their benefit. At the same time, regulators are also interested in ensuring that the Company maintains an appropriate solvency position to meet unforseen liabilities arising from economic shocks or natural disasters.
The operations of the Company are subject to regulatory requirements within the jurisdictions in which it operates. Such regulations not only prescribe approval and monitoring of activites, but also impose certain restrictive provisions (e.g., capital adequacy) to minimise the risk of default and insolvency on the part of insurance companies to meet unforseen liabilities as these arise.
7. fiNaNcial stateMeNts fOR tHe yeaR eNDeD DeceMBeR 31, 2013
7.8 notes to the financial statements for year ended december 31, 2013
153

7.8 notes to the financial statements for year ended december 31, 20137. fiNaNcial stateMeNts fOR tHe yeaR eNDeD DeceMBeR 31, 2013
5. pROpeRty aND equipMeNt (continued)
(b) the company
laND aND BuilDiNgs
2013 freehold land Buildings on freehold land
Office equipment, fixtures & fittings Motor vehicles total
cOst OR valuatiON Rs’000 Rs’000 Rs’000 Rs’000 Rs’000
At January 1, 2013 40,000 123,369 98,183 45,054 306,606
Additions - - 29,041 3,971 33,012
Disposals - - (2,921) (9,121) (12,042)
At December 31, 2013 40,000 123,369 124,303 39,904 327,576
DepReciatiON
at January 1, 2013 - 2,467 62,728 22,204 87,399
Charge for the year - 2,467 11,637 7,832 21,936
Disposals - - (2,782) (6,196) (8,978)
At December 31, 2013 - 4,934 71,583 23,840 100,357
caRRyiNg aMOuNt
at December 31, 2013 40,000 118,435 52,720 16,064 227,219
5. pROpeRty aND equipMeNt (continued)
(a) the group (continued)
laND aND BuilDiNgs
2012 freehold land Buildings on freehold land
Office equipment, fixtures & fittings Motor vehicles total
cOst OR valuatiON Rs’000 Rs’000 Rs’000 Rs’000 Rs’000
At January 1, 2012 40,000 181,143 196,244 53,230 470,617
Additions - - 28,749 3,717 32,466
Transfer to investment property - (5,095) - - (5,095)
Disposals - - (237) (4,679) (4,916)
At December 31, 2012 40,000 176,048 224,756 52,268 493,072
DepReciatiON
At January 1, 2012 - - 153,680 17,441 171,121
Charge for the year - 3,481 16,241 9,245 28,967
Disposals - - (97) (1,736) (1,833)
at December 31, 2012 - 3,481 169,824 24,950 198,255
caRRyiNg aMOuNt
at December 31, 2012 40,000 172,567 54,932 27,318 294,817
7. fiNaNcial stateMeNts fOR tHe yeaR eNDeD DeceMBeR 31, 2013
7.8 notes to the financial statements for year ended december 31, 2013
155

7.8 notes to the financial statements for year ended december 31, 20137. fiNaNcial stateMeNts fOR tHe yeaR eNDeD DeceMBeR 31, 2013
6. iNvestMeNt pROpeRties - at faiR value
tHe gROup tHe cOMpaNy
2013 2012 2013 2012
Rs’000 Rs’000 Rs’000 Rs’000
At January 1, 196,578 190,053 74,000 74,000
Transfer to property and equipment (12,000) - - -
Transfer from property and equipment - 5,095 - -
Increase in fair value - 1,430 - -
at December 31, 184,578 196,578 74,000 74,000
The Group’s investment properties were last revalued on December 31, 2011 by an external professional valuer, Messrs JPW International . The directors performed an internal valuation of its investment properties and believe that there has been no significant change in the fair value of the investment property pertaining to the parent company since last independent valuation. The next independent valuation of the investment properties is planned in year 2014. The rental income arising during the year amounted to Rs 741,000 (2012 – Rs 945,000), (Company Rs 220,000 : 2012 Rs nil ) , which is included in investment income. Direct operating expense arising in respect of this property during the year amounted to Rs 58,305 (2012 - Rs 99,425).
There is no restriction on reliability of investment property or the remittance of income and proceeds of disposal. The Group has no contractual obligation to purchase, construct or develop investment property or for repairs, maintenance or enhancement.
5. pROpeRty aND equipMeNt (continued)
(b) the company (continued)
laND aND BuilDiNgs
2012 freehold land Buildings on freehold land
Office equipment, fixtures & fittings Motor vehicles total
cOst OR valuatiON Rs’000 Rs’000 Rs’000 Rs’000 Rs’000
At January 1, 2012 40,000 123,369 69,886 47,336 280,591
Additions - - 28,514 2,391 30,905
Disposals - - (217) (4,673) (4,890)
at December 31, 2012 40,000 123,369 98,183 45,054 306,606
DepReciatiON
At January 1, 2012 - - 53,213 16,050 69,263
Charge for the year - 2,467 9,591 7,904 19,962
Disposals - - (76) (1,750) (1,826)
at December 31, 2012 - 2,467 62,728 22,204 87,399
caRRyiNg aMOuNt
at December 31, 2012 40,000 120,902 35,455 22,850 219,207
(c) The land and building, which is presently occupied by the Group, was last revalued at December 31, 2011 by independent valuers on an open market basis, by reference to market evidence of transaction prices for similar properties.
(d) If land and buildings had been stated on a historical cost basis, the amounts would be as follows:
tHe gROup tHe cOMpaNy
2013 2012 2013 2012
Rs'000 Rs'000 Rs'000 Rs'000
Cost 195,153 195,153 163,369 163,369
Accumulated depreciation (9,423) (6,442) (7,394) (4,927)
Net book values 185,730 188,711 155,975 158,442
7. fiNaNcial stateMeNts fOR tHe yeaR eNDeD DeceMBeR 31, 2013
7.8 notes to the financial statements for year ended december 31, 2013
157

7.8 notes to the financial statements for year ended december 31, 20137. fiNaNcial stateMeNts fOR tHe yeaR eNDeD DeceMBeR 31, 2013
7. iNtaNgiBle assets (continued)
tHe cOMpaNy
2013 goodwill client portfolio computer software work in progress total
cOst Rs’000 Rs’000 Rs’000 Rs’000 Rs’000
At January 1, 2013 133,188 245,478 62,248 - 440,914
Additions - - 6,276 27,480 33,756
at December 31, 2013 133,188 245,478 68,524 27,480 474,670
aMORtisatiON
At January 1, 2013 - 51,911 44,907 - 96,818
Charge for the year - 12,510 5,927 - 18,437
at December 31, 2013 - 64,421 50,834 - 115,255
caRRyiNg aMOuNt
at December 31, 2013 133,188 181,057 17,690 27,480 359,415
tHe cOMpaNy
2012 goodwill client portfolio computer software total
cOst Rs’000 Rs’000 Rs’000 Rs’000
At January 1, 2012 133,188 245,478 54,751 433,417
Additions - - 7,497 7,497
at December 31, 2012 133,188 245,478 62,248 440,914
aMORtisatiON
At January 1, 2012 - 39,401 39,746 79,147
Charge for the year - 12,510 5,161 17,671
at December 31, 2012 - 51,911 44,907 96,818
caRRyiNg aMOuNt
at December 31, 2012 133,188 193,567 17,341 344,096
Capital work in progress represents the implementation of a new software.
7. iNtaNgiBle assets
tHe gROup
2013 goodwill client portfolio computer software work in progress total
cOst Rs’000 Rs’000 Rs’000 Rs’000 Rs’000
At January 1, 2013 206,165 376,978 117,854 - 700,997
Additions - - 16,635 27,480 44,115
at December 31, 2013 206,165 376,978 134,489 27,480 745,112
aMORtisatiON
At January 1, 2013 - 66,376 88,599 - 154,975
Charge for the year - 17,770 10,887 - 28,657
at December 31, 2013 - 84,146 99,486 - 183,632
caRRyiNg aMOuNt
at December 31, 2013 206,165 292,832 35,003 27,480 561,480
tHe gROup
2012 goodwill client portfolio computer software work in progress total
cOst Rs’000 Rs’000 Rs’000 Rs’000 Rs’000
At January 1, 2012 206,165 376,978 109,614 - 692,757
Additions - - 8,240 - 8,240
at December 31, 2012 206,165 376,978 117,854 - 700,997
aMORtisatiON
At January 1, 2012 - 48,606 76,401 - 125,007
Charge for the year - 17,770 12,198 - 29,968
at December 31, 2012 - 66,376 88,599 - 154,975
caRRyiNg aMOuNt
at December 31, 2012 206,165 310,602 29,255 - 546,022
7. fiNaNcial stateMeNts fOR tHe yeaR eNDeD DeceMBeR 31, 2013
7.8 notes to the financial statements for year ended december 31, 2013
159

7.8 notes to the financial statements for year ended december 31, 20137. fiNaNcial stateMeNts fOR tHe yeaR eNDeD DeceMBeR 31, 2013
8. iNvestMeNt iN suBsiDiaRy cOMpaNies (continued)
(b) Summarised financial information on subsidiary with material non-controlling interests:
Proportion of equity interest held by non-controlling interests:
NaMe cOuNtRy Of iNcORpORatiON aND OpeRatiON 2013 2012
Associated Brokers Ltd Mauritius 20% 20%
2013 2012
Rs’000 Rs’000
Accumulated balances of material non-controlling interest: 5,411 4,643
Profit/(Loss) allocated to material non-controlling interest: 611 (31)
Dividends paid to non-controlling interests 258 603
The summarised financial information of the subsidiary is provided below. This information is based on amounts before inter-company eliminations.
Summarised statement of profit or loss: 2013 2012
Rs’000 Rs’000
Revenue 7,147 7,688
Profit before tax 1,420 1,872
Income tax expenses (179) (212)
Profit after tax 1,241 1,660
Other comprehensive income 2,059 (1,286)
total comprehensive income 3,300 374
8. iNvestMeNt iN suBsiDiaRy cOMpaNies
(a) unquoted
tHe gROup
2013 2012
Rs'000 Rs'000
At January 1, 208,042 217,900
Redemption of shares (note(i)) - (9,858)
at December 31, 208,042 208,042
(i) Redemption during the previous year represented sale of 987,720 shares in The National Mutual Fund Ltd under buy back scheme for a sale consideration of Rs 9,857,142 which is equivalent to the cost.
(b) The financial statements of the following subsidiary companies, incorporated in Mauritius, have been included in the consolidated financial statements. The subsidiaries have the same reporting date as the holding company and operate on the local market.
MaiN activities NOMiNal value Of iNvestMeNt
class Of
sHaRes HelD
% Of OwNeRsHip
iNteRest aND vOtiNg pOweR HelD
% Of OwNeRsHip iNteRest aND
vOtiNg pOweR HelD By Nci
2013 2012 2013 2012 2013 2012
DiRect sHaReHOlDiNg Rs’000 Rs’000
La Prudence (Mauricienne) Assurances Limitee Life Insurance 167,327 167,327 Ordinary 100% 100% - -
The National Mutual Fund Ltd Fund management 28,561 28,561 Ordinary 98.6% 98.6% 1.40% 1.40%
Associated Brokers Ltd Stock broker 10,979 10,979 Ordinary 80% 80% 20% 20%
Compagnie du Decadel Limitee Property holding 675 675 Ordinary 100% 100% - -
Feber Associates Limited Manager and consultants of pension fund 500 500 Ordinary 100% 100% - -
iNDiRect sHaReHOlDiNg - -
Risk Advisory Services Limited Property holding 75 75 Ordinary 100% 100% - -
7. fiNaNcial stateMeNts fOR tHe yeaR eNDeD DeceMBeR 31, 2013
7.8 notes to the financial statements for year ended december 31, 2013
161

7.8 notes to the financial statements for year ended december 31, 20137. fiNaNcial stateMeNts fOR tHe yeaR eNDeD DeceMBeR 31, 2013
9. fiNaNcial assets
(a) financial assets at fair value through other comprehensive income
tHe gROup tHe cOMpaNy
Rs’000 Rs’000
Balance transferred from AFS * 648,104 631,699
Additions 36,974 34,925
Disposals (151,961) (147,887)
Decrease in fair value (48,596) (47,421)
at December 31, 2012 484,521 471,316
tHe gROup tHe cOMpaNy
analysed as follows: Rs’000 Rs’000
Quoted securities 407,204 394,599
Unquoted securities 18,800 18,788
Open Ended Mutual Funds 58,517 57,929
Total financial assets at fair value through other comprehensive income 484,521 471,316
tHe gROup tHe cOMpaNy
Rs’000 Rs’000
at January 1, 2013 484,521 471,316
Additions 16,655 14,623
Disposals (40,793) (40,792)
Incresase in fair value 116,054 113,110
at December 31, 2013 576,437 558,257
8. iNvestMeNt iN suBsiDiaRy cOMpaNies (continued)
(b) Summarised financial information on subsidiary with material non-controlling interests (continued):
Summarised statement of financial position as at December 31: 2013 2012
cuRRReNt: Rs’000 Rs’000
Assets 8,443 11,379
Liabilities (5,270) (8,499)
Total current net assets 3,173 2,880
NON-cuRRReNt:
Assets 23,945 22,231
Liabilities (51) (74)
Total non current net assets 23,894 22,157
Net assets 27,067 25,037
Summarised cash flows information for year ended December 31: 2013 2012
Rs’000 Rs’000
Operating (2,218) 15,204
Investing 509 557
Financing (1,293) (3,017)
Net (decrease)/ increase in cash and cash equivalents (3,002) 12,744
7. fiNaNcial stateMeNts fOR tHe yeaR eNDeD DeceMBeR 31, 2013
7.8 notes to the financial statements for year ended december 31, 2013
163

7.8 notes to the financial statements for year ended december 31, 20137. fiNaNcial stateMeNts fOR tHe yeaR eNDeD DeceMBeR 31, 2013
9. fiNaNcial assets (continued)
(a) financial assets at fair value through other comprehensive income (continued)
(iii) Reconciliation - (the company)
Measurement categoryias 39
carrying amount December 31, 2011
ReclassificationsifRs 9
carrying amount January 1 , 2012
Retained earnings effect on
January 1, 2012
Rs’000 Rs’000 Rs’000 Rs’000
Available-for-sale financial assets 756,227 - 756,227
Available-for-sale financial assets (IAS 39) to financial assets at fair value through profit or loss (IFRS 9) - corporate bonds
- (124,528) (124,528) -
Total change to financial assets fair value through other comprehensive income 756,227 (124,528) 631,699 -
Reconciliation - (the group)
The Group disposed of investments with a cost of Rs 51m (2012: Rs 121m) from investments in equity instruments measured at fair value through other comprehensive income. The investments were sold to maintain the Group’s desired balance of investments between different industries. The fair value of these investments at the date of derecognition was Rs 41m (2012: Rs 142m). The cumulative gain on disposal was Rs 10.4 m (2012: Rs 18.6m). As these investments were disposed after the date of application of IFRS 9 the gain on disposal was not transferred to profit or loss but reclassified from the investment revaluation reserve to retained earnings within equity.
9. fiNaNcial assets (continued)
(a) financial assets at fair value through other comprehensive income (continued)
tHe gROup tHe cOMpaNy
analysed as follows: Rs’000 Rs’000
Quoted securities 495,872 478,381
Unquoted securities 26,658 25,969
Open Ended Mutual Funds 53,907 53,907
Total financial assets at fair value through other comprehensive income 576,437 558,257
(i) (*) The opening balance of the comparative period for financial assets at fair value through other comprehensive income does not include equity instruments that were previously classified as available-for-sale under IAS 39. These equity instruments have been captured in the balance transferred from AFS line. Furthermore, the balance transferred from AFS line excludes the corporate bonds instruments that have been reclassified from AFS to financial assets at fair value through profit or loss upon early adoption of IFRS 9.
Upon first application of IFRS 9 the Group has designated the above equity investments at fair value through other comprehensive income because they are held for long-term investment rather than for trading. Accordingly, the whole portfolio is classified as non-current.
(ii) Reconciliation - (the group)
Measurement categoryias 39
carrying amount December 31, 2011
ReclassificationsifRs 9
carrying amount January 1 , 2012
Retained earnings effect on
January 1, 2012
Rs’000 Rs’000 Rs’000 Rs’000
Available-for-sale financial assets 772,632 - 772,632 -
Available-for-sale financial assets (IAS 39) to financial assets at fair value through profit or loss (IFRS 9) - corporate bonds
- (124,528) (124,528) -
Total change to financial assets at fair value through other comprehensive income 772,632 (124,528) 648,104 -
7. fiNaNcial stateMeNts fOR tHe yeaR eNDeD DeceMBeR 31, 2013
7.8 notes to the financial statements for year ended december 31, 2013
165
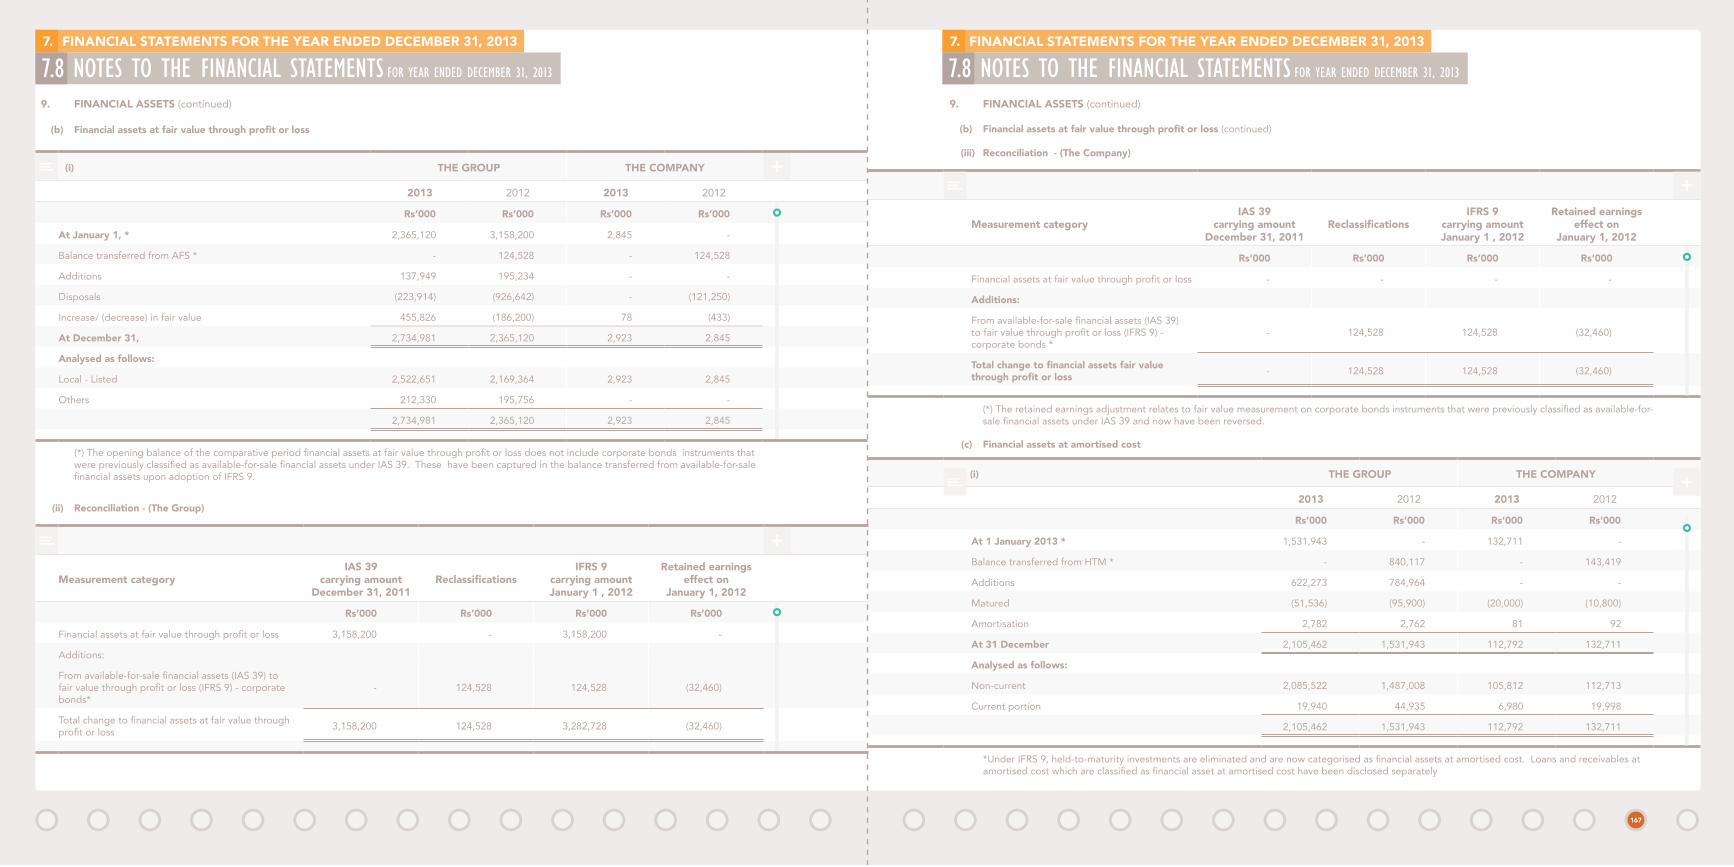
7.8 notes to the financial statements for year ended december 31, 20137. fiNaNcial stateMeNts fOR tHe yeaR eNDeD DeceMBeR 31, 2013
9. fiNaNcial assets (continued)
(b) Financial assets at fair value through profit or loss (continued)
(iii) Reconciliation - (the company)
Measurement categoryias 39
carrying amount December 31, 2011
ReclassificationsifRs 9
carrying amount January 1 , 2012
Retained earnings effect on
January 1, 2012
Rs’000 Rs’000 Rs’000 Rs’000
Financial assets at fair value through profit or loss - - - -
additions:
From available-for-sale financial assets (IAS 39) to fair value through profit or loss (IFRS 9) - corporate bonds *
- 124,528 124,528 (32,460)
Total change to financial assets fair value through profit or loss - 124,528 124,528 (32,460)
(*) The retained earnings adjustment relates to fair value measurement on corporate bonds instruments that were previously classified as available-for-sale financial assets under IAS 39 and now have been reversed.
(c) financial assets at amortised cost
(i) tHe gROup tHe cOMpaNy
2013 2012 2013 2012
Rs’000 Rs’000 Rs’000 Rs’000
at 1 January 2013 * 1,531,943 - 132,711 -
Balance transferred from HTM * - 840,117 - 143,419
Additions 622,273 784,964 - -
Matured (51,536) (95,900) (20,000) (10,800)
amortisation 2,782 2,762 81 92
at 31 December 2,105,462 1,531,943 112,792 132,711
analysed as follows:
Non-current 2,085,522 1,487,008 105,812 112,713
Current portion 19,940 44,935 6,980 19,998
2,105,462 1,531,943 112,792 132,711
*Under IFRS 9, held-to-maturity investments are eliminated and are now categorised as financial assets at amortised cost. Loans and receivables at amortised cost which are classified as financial asset at amortised cost have been disclosed separately
9. fiNaNcial assets (continued)
(b) Financial assets at fair value through profit or loss
(i) tHe gROup tHe cOMpaNy
2013 2012 2013 2012
Rs’000 Rs’000 Rs’000 Rs’000
at January 1, * 2,365,120 3,158,200 2,845 -
Balance transferred from AFS * - 124,528 - 124,528
Additions 137,949 195,234 - -
Disposals (223,914) (926,642) - (121,250)
Increase/ (decrease) in fair value 455,826 (186,200) 78 (433)
at December 31, 2,734,981 2,365,120 2,923 2,845
analysed as follows:
Local - Listed 2,522,651 2,169,364 2,923 2,845
Others 212,330 195,756 - -
2,734,981 2,365,120 2,923 2,845
(*) The opening balance of the comparative period financial assets at fair value through profit or loss does not include corporate bonds instruments that were previously classified as available-for-sale financial assets under IAS 39. These have been captured in the balance transferred from available-for-sale financial assets upon adoption of IFRS 9.
(ii) Reconciliation - (the group)
Measurement categoryias 39
carrying amount December 31, 2011
ReclassificationsifRs 9
carrying amount January 1 , 2012
Retained earnings effect on
January 1, 2012
Rs’000 Rs’000 Rs’000 Rs’000
Financial assets at fair value through profit or loss 3,158,200 - 3,158,200 -
Additions:
From available-for-sale financial assets (IAS 39) to fair value through profit or loss (IFRS 9) - corporate bonds*
- 124,528 124,528 (32,460)
Total change to financial assets at fair value through profit or loss 3,158,200 124,528 3,282,728 (32,460)
7. fiNaNcial stateMeNts fOR tHe yeaR eNDeD DeceMBeR 31, 2013
7.8 notes to the financial statements for year ended december 31, 2013
167
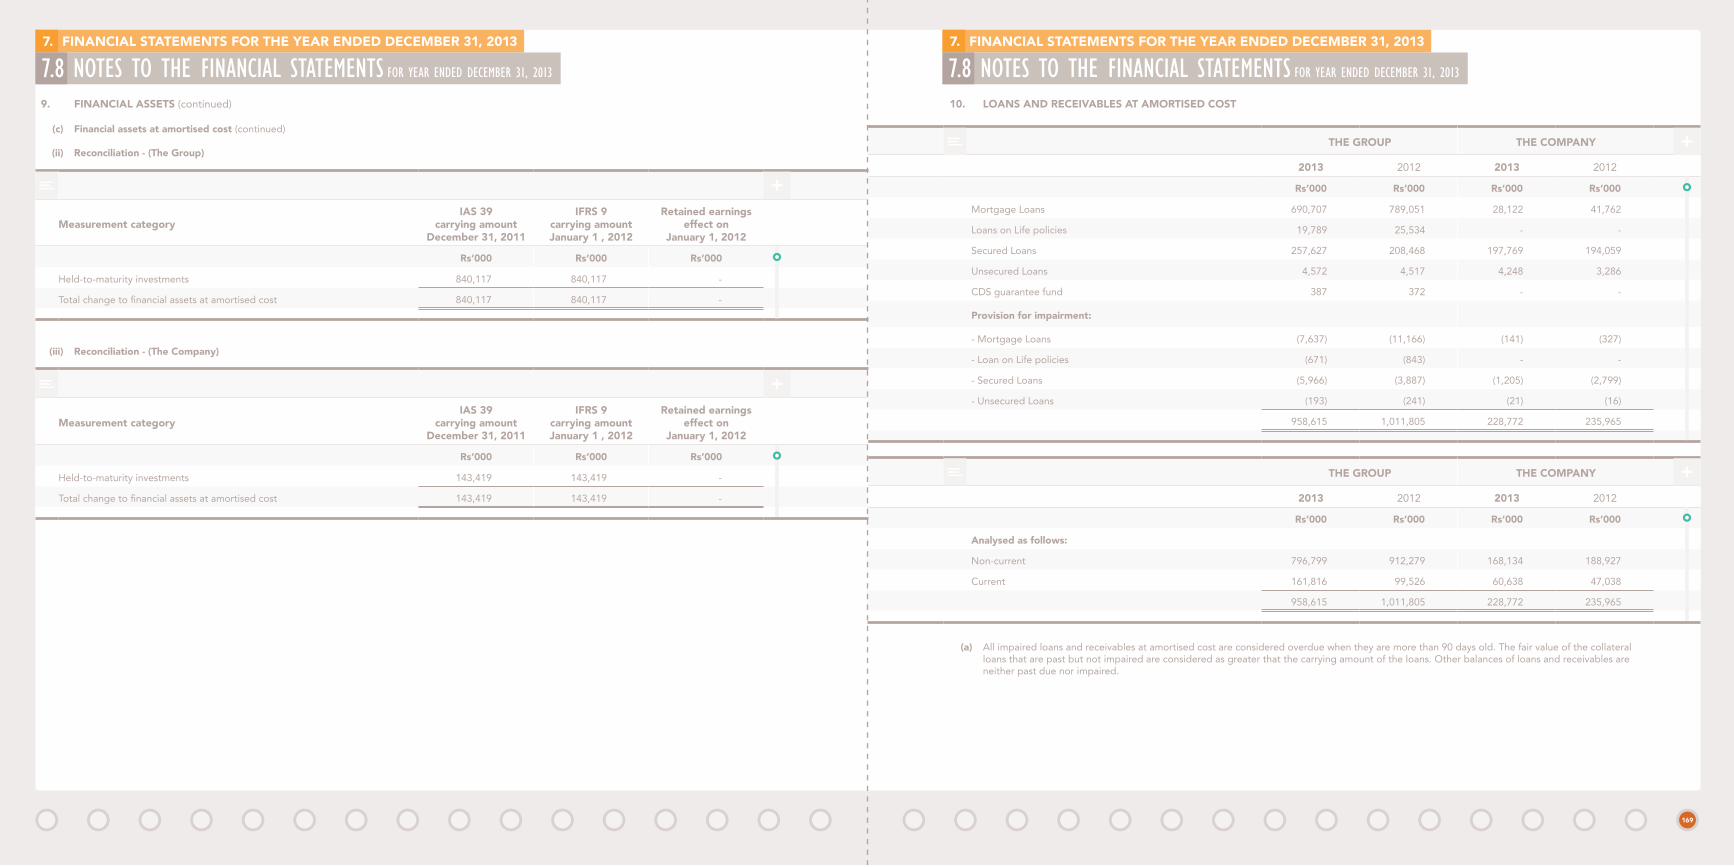
7.8 notes to the financial statements for year ended december 31, 20137. fiNaNcial stateMeNts fOR tHe yeaR eNDeD DeceMBeR 31, 2013
10. lOaNs aND ReceivaBles at aMORtiseD cOst
tHe gROup tHe cOMpaNy
2013 2012 2013 2012
Rs’000 Rs’000 Rs’000 Rs’000
Mortgage Loans 690,707 789,051 28,122 41,762
Loans on Life policies 19,789 25,534 - -
Secured Loans 257,627 208,468 197,769 194,059
Unsecured Loans 4,572 4,517 4,248 3,286
CDS guarantee fund 387 372 - -
provision for impairment:
- Mortgage Loans (7,637) (11,166) (141) (327)
- Loan on Life policies (671) (843) - -
- Secured Loans (5,966) (3,887) (1,205) (2,799)
- Unsecured Loans (193) (241) (21) (16)
958,615 1,011,805 228,772 235,965
tHe gROup tHe cOMpaNy
2013 2012 2013 2012
Rs’000 Rs’000 Rs’000 Rs’000
analysed as follows:
Non-current 796,799 912,279 168,134 188,927
Current 161,816 99,526 60,638 47,038
958,615 1,011,805 228,772 235,965
(a) All impaired loans and receivables at amortised cost are considered overdue when they are more than 90 days old. The fair value of the collateral loans that are past but not impaired are considered as greater that the carrying amount of the loans. Other balances of loans and receivables are neither past due nor impaired.
9. fiNaNcial assets (continued)
(c) financial assets at amortised cost (continued)
(ii) Reconciliation - (the group)
Measurement categoryias 39
carrying amount December 31, 2011
ifRs 9 carrying amount January 1 , 2012
Retained earnings effect on
January 1, 2012
Rs’000 Rs’000 Rs’000
Held-to-maturity investments 840,117 840,117 -
Total change to financial assets at amortised cost 840,117 840,117 -
(iii) Reconciliation - (the company)
Measurement categoryias 39
carrying amount December 31, 2011
ifRs 9 carrying amount January 1 , 2012
Retained earnings effect on
January 1, 2012
Rs’000 Rs’000 Rs’000
Held-to-maturity investments 143,419 143,419 -
Total change to financial assets at amortised cost 143,419 143,419 -
7. fiNaNcial stateMeNts fOR tHe yeaR eNDeD DeceMBeR 31, 2013
7.8 notes to the financial statements for year ended december 31, 2013
169

7.8 notes to the financial statements for year ended december 31, 20137. fiNaNcial stateMeNts fOR tHe yeaR eNDeD DeceMBeR 31, 2013
11. iNsuRaNce aND OtHeR ReceivaBles
tHe gROup tHe cOMpaNy
2013 2012 2013 2012
Rs’000 Rs’000 Rs’000 Rs’000
Premium debtors and agents' balances 390,961 356,234 381,118 353,878
Provision for credit impairment (14,415) (16,258) (14,415) (16,258)
376,546 339,976 366,703 337,620
Amount due by reinsurers 26,996 10,120 26,996 10,120
Deposit (*) 67,629 - 67,629 -
Other receivables 122,193 106,588 24,212 24,316
593,364 456,684 485,540 372,056
* The deposit represents a down payment made to a third party in view of the acquisition of an overseas insurance company.
(a) Premium debtors and agents’ balances that are less than three months past due are not considered impaired. As at December 31, 2013, the Group had Rs 110.4m, and the Company had Rs 110.4m (2012: The Group Rs 88.2m, the Company Rs 88.2m) that were more than 3 months past due but not impaired. The ageing analysis of these premium debtors is as follows:
tHe gROup tHe cOMpaNy
2013 2012 2013 2012
Rs’000 Rs’000 Rs’000 Rs’000
Up to 3 months 266,120 251,763 256,277 249,407
3 to 6 months 78,874 62,775 78,874 62,775
6 to 12 months 31,552 25,438 31,552 25,438
376,546 339,976 366,703 337,620
10. lOaNs aND ReceivaBles at aMORtiseD cOst (continued)
(a) (continued)
The ageing analysis of loan and receivables is as follows:
2013 2012
tHe gROupNeither past due
nor impaired
past due but not impaired total
Neither past due
nor impaired
Past due but not impaired Total
Rs'000 Rs'000 Rs'000 Rs'000 Rs’000 Rs’000
Loans and advances to customers 777,874 180,741 958,615 780,759 231,046 1,011,805
2013 2012
tHe cOMpaNyNeither past due
nor impaired
past due but not impaired total
Neither past due
nor impaired
Past due but not impaired Total
Rs'000 Rs'000 Rs'000 Rs'000 Rs’000 Rs’000
Loans and advances to customers 226,592 2,180 228,772 234,810 1,155 235,965
(b) Movement in provision for impairment of loans
tHe gROup tHe cOMpaNy
2013 2012 2013 2012
Rs’000 Rs’000 Rs’000 Rs’000
at January 1, (16,137) (14,481) (3,142) (1,343)
Recoveries 3,478 281 1,895 281
Charge for the year (1,808) (2,878) (120) (2,080)
Write off during the year - 941 - -
Increase/ (decrease) in fair value 455,826 (186,200) 78 (433)
at December 31, (14,467) (16,137) (1,367) (3,142)
(c) There is no concentration of risk with respect to loans and receivables at amortised cost since balances are widely spread.
(d) Loans and receivables at amortised cost are secured by life insurance policies and fixed charges.
(e) All loans and receivables at amortised cost are denominated in Mauritian rupees.
(f) The carrying amounts of loans and receivables approximate their fair values. The fair value of the collateral of loans that are past due but not impaired are considered as greater than the carrying value of the loans.
7. fiNaNcial stateMeNts fOR tHe yeaR eNDeD DeceMBeR 31, 2013
7.8 notes to the financial statements for year ended december 31, 2013
171
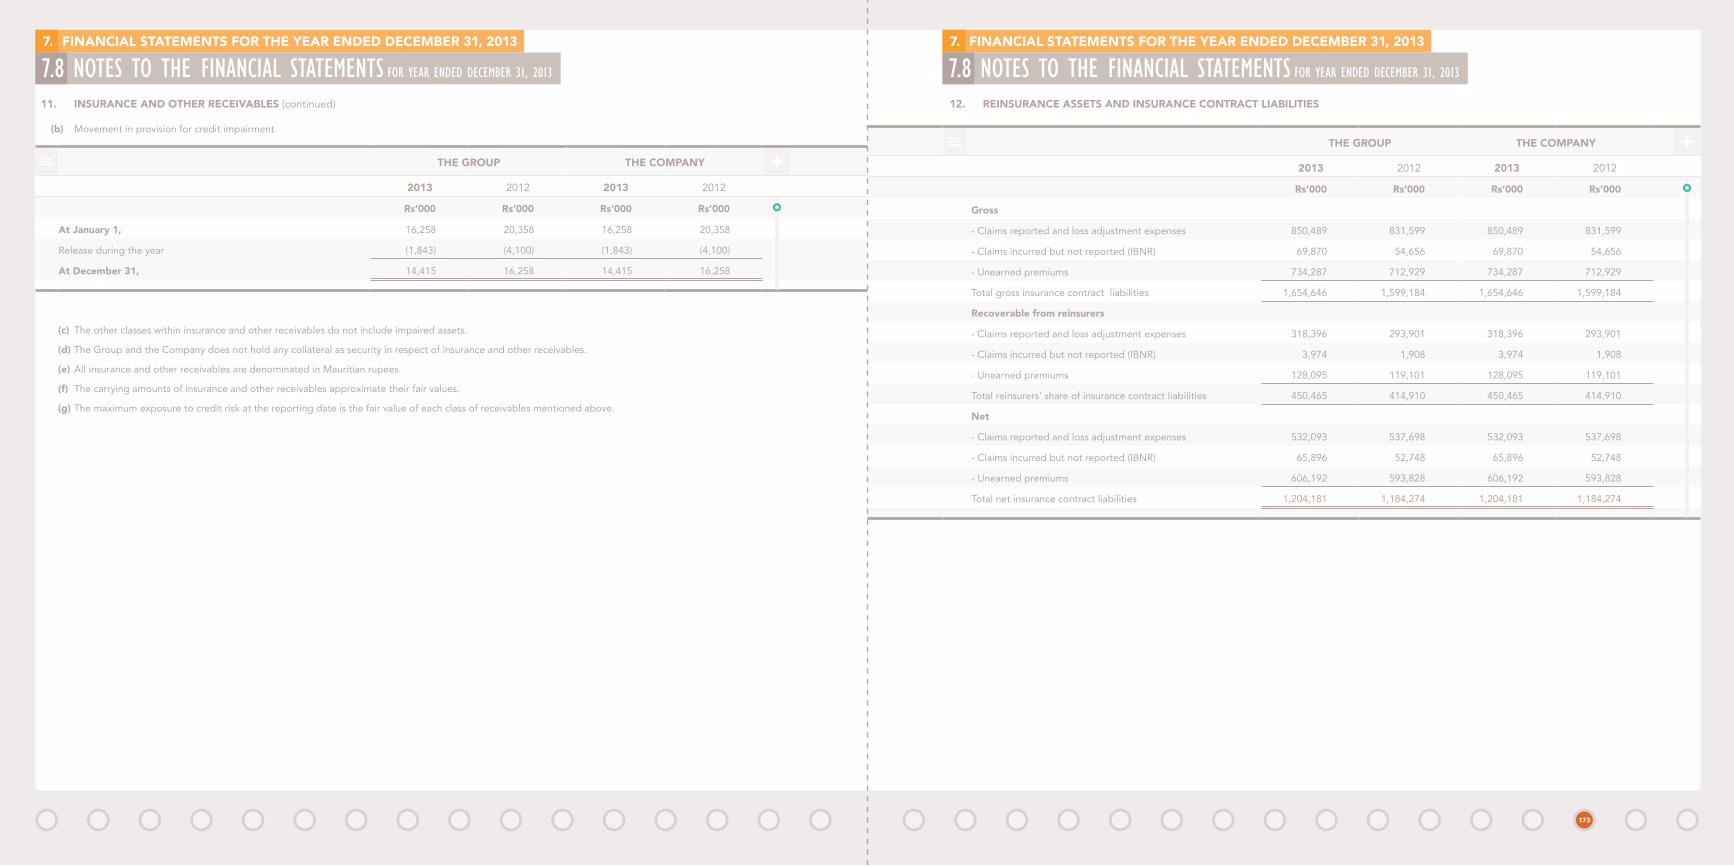
7.8 notes to the financial statements for year ended december 31, 20137. fiNaNcial stateMeNts fOR tHe yeaR eNDeD DeceMBeR 31, 2013
12. ReiNsuRaNce assets aND iNsuRaNce cONtRact liaBilities
tHe gROup tHe cOMpaNy
2013 2012 2013 2012
Rs’000 Rs’000 Rs’000 Rs’000
gross
- Claims reported and loss adjustment expenses 850,489 831,599 850,489 831,599
- Claims incurred but not reported (IBNR) 69,870 54,656 69,870 54,656
- Unearned premiums 734,287 712,929 734,287 712,929
Total gross insurance contract liabilities 1,654,646 1,599,184 1,654,646 1,599,184
Recoverable from reinsurers
- Claims reported and loss adjustment expenses 318,396 293,901 318,396 293,901
- Claims incurred but not reported (IBNR) 3,974 1,908 3,974 1,908
- Unearned premiums 128,095 119,101 128,095 119,101
Total reinsurers' share of insurance contract liabilities 450,465 414,910 450,465 414,910
Net
- Claims reported and loss adjustment expenses 532,093 537,698 532,093 537,698
- Claims incurred but not reported (IBNR) 65,896 52,748 65,896 52,748
- Unearned premiums 606,192 593,828 606,192 593,828
Total net insurance contract liabilities 1,204,181 1,184,274 1,204,181 1,184,274
11. iNsuRaNce aND OtHeR ReceivaBles (continued)
(b) Movement in provision for credit impairment
tHe gROup tHe cOMpaNy
2013 2012 2013 2012
Rs’000 Rs’000 Rs’000 Rs’000
at January 1, 16,258 20,358 16,258 20,358
Release during the year (1,843) (4,100) (1,843) (4,100)
at December 31, 14,415 16,258 14,415 16,258
(c) The other classes within insurance and other receivables do not include impaired assets.
(d) The Group and the Company does not hold any collateral as security in respect of insurance and other receivables.
(e) All insurance and other receivables are denominated in Mauritian rupees.
(f) The carrying amounts of insurance and other receivables approximate their fair values.
(g) The maximum exposure to credit risk at the reporting date is the fair value of each class of receivables mentioned above.
7. fiNaNcial stateMeNts fOR tHe yeaR eNDeD DeceMBeR 31, 2013
7.8 notes to the financial statements for year ended december 31, 2013
173

7.8 notes to the financial statements for year ended december 31, 20137. fiNaNcial stateMeNts fOR tHe yeaR eNDeD DeceMBeR 31, 2013
12. ReiNsuRaNce assets aND iNsuRaNce cONtRact liaBilities (continued)
the company
(i) claims
2013 2012
gross Reinsurance Net gross Reinsurance Net
Rs’000 Rs’000 Rs’000 Rs’000 Rs’000 Rs’000
At January 1, 886,255 (295,809) 590,446 767,468 (184,608) 582,860
Claims incurred during the year 911,438 (192,101) 719,337 778,086 (146,778) 631,308
Cash paid for claims settled during the year (877,334) 165,540 (711,794) (659,299) 35,577 (623,722)
at December 31, 920,359 (322,370) 597,989 886,255 (295,809) 590,446
Recognised notified claims 850,489 (318,396) 532,093 831,599 (293,901) 537,698
Incurred but not reported 69,870 (3,974) 65,896 54,656 (1,908) 52,748
920,359 (322,370) 597,989 886,255 (295,809) 590,446
Movement during the year 34,104 (26,561) 7,543 118,788 (111,201) 7,587
(ii) provision for unearned premiums
2013 2012
gross Reinsurance Net gross Reinsurance Net
Rs’000 Rs’000 Rs’000 Rs’000 Rs’000 Rs’000
At January 1, 712,929 (119,101) 593,828 666,808 (108,267) 558,541
Premium written during the year 1,630,418 (348,260) 1,282,158 1,539,989 (290,315) 1,249,674
Premium earned during the year (1,609,060) 339,266 (1,269,794) (1,493,868) 279,481 (1,214,387)
at December 31, 734,287 (128,095) 606,192 712,929 (119,101) 593,828
12. ReiNsuRaNce assets aND iNsuRaNce cONtRact liaBilities (continued)
the group
(i) claims
2013 2012
gross Reinsurance Net gross Reinsurance Net
Rs’000 Rs’000 Rs’000 Rs’000 Rs’000 Rs’000
At January 1, 886,255 (295,809) 590,446 767,468 (184,608) 582,860
Claims incurred during the year 911,438 (192,101) 719,337 778,086 (146,778) 631,308
Cash paid for claims settled during the year (877,334) 165,540 (711,794) (659,299) 35,577 (623,722)
at December 31, 920,359 (322,370) 597,989 886,255 (295,809) 590,446
Recognised notified claims 850,489 (318,396) 532,093 831,599 (293,901) 537,698
Incurred but not reported (IBNR) 69,870 (3,974) 65,896 54,656 (1,908) 52,748
920,359 (322,370) 597,989 886,255 (295,809) 590,446
Movement in outstanding claims 34,104 (26,561) 7,543 118,788 (111,201) 7,587
Increase in value of Life policy liabilities 730,166 - 730,166 220,840 - 220,840
Movement during the year 764,270 (26,561) 737,709 339,628 (111,201) 228,427
Total claims and benefits paid
Claims-Non Life 877,334 (165,540) 711,794 659,299 (35,577) 623,722
Claims and benefits-Life 445,936 (1,454) 444,482 382,722 (12,103) 370,619
1,323,270 (166,994) 1,156,276 1,042,021 (47,680) 994,341
(ii) provision for unearned premiums
2013 2012
gross Reinsurance Net gross Reinsurance Net
Rs’000 Rs’000 Rs’000 Rs’000 Rs’000 Rs’000
At January 1, 712,929 (119,101) 593,828 666,808 (108,267) 558,541
Premium written during the year 1,630,418 (348,260) 1,282,158 1,539,989 (290,315) 1,249,674
Premium earned during the year (1,609,060) 339,266 1,269,794) (1,493,868) 279,481 (1,214,387)
at December 31, 734,287 (128,095) 606,192 712,929 (119,101) 593,828
7. fiNaNcial stateMeNts fOR tHe yeaR eNDeD DeceMBeR 31, 2013
7.8 notes to the financial statements for year ended december 31, 2013
175

7.8 notes to the financial statements for year ended december 31, 20137. fiNaNcial stateMeNts fOR tHe yeaR eNDeD DeceMBeR 31, 2013
15. DefeRReD tax (continued)
(b) The following amounts are shown in the statement of financial position:
tHe gROup tHe cOMpaNy
2013 2012 2013 2012
Rs’000 Rs’000 Rs’000 Rs’000
Deferred tax liabilities (24,616) (27,264) (7,645) (7,645)
Deferred tax assets 72,988 104,165 72,963 104,165
48,372 76,901 65,318 96,520
Deferred tax assets and liabilities are attributable to the following:
tHe gROup tHe cOMpaNy
DefeRReD tax liaBilities 2013 2012 2013 2012
Rs’000 Rs’000 Rs’000 Rs’000
Deferred tax on client portfolio (16,766) (17,555) - -
Deferred tax CSR (145) - - -
Provision for legal costs (7,645) (7,645) (7,645) (7,645)
Difference between capital allowances and depreciation (60) (2,064) - -
(24,616) (27,264) (7,645) (7,645)
tHe gROup tHe cOMpaNy
DefeRReD tax assets 2013 2012 2013 2012
Rs’000 Rs’000 Rs’000 Rs’000
Difference between capital allowances and depreciation 31,456 24,912 31,431 24,912
Provision for bad debts 205 647 205 647
Provision for impairment of receivables 2,172 2,961 2,172 2,961
Retirement benefit obligations 643 1,666 643 1,666
Tax losses carried forward 38,512 73,979 38,512 73,979
72,988 104,165 72,963 104,165
Deferred tax assets are recognised only to the extent that realisation of the related tax benefit is probable. The Group has tax losses of Rs. 666m (2012: Rs.492m) to carry forward against future taxable income.
13. sHaRe capital
autHORiseD issueD aND fully paiD
tHe gROup aND tHe cOMpaNy 2013 & 2012 2013 2012
Rs’000 Rs’000 Rs’000
Ordinary shares of Rs.10 each 500,000 200,400 200,400
Number of ordinary shares ('000) 50,000 20,040 20,040
14. life assuRaNce fuND
tHe gROup tHe cOMpaNy
tHe gROup aND tHe cOMpaNy 2013 2012 2013 2012
Rs’000 Rs’000 Rs’000 Rs’000
At January 1, 5,111,815 4,890,975 - -
Transfer of surplus from the Life Business revenue account 730,166 220,840 - -
at December 31, 5,841,981 5,111,815 - -
15. DefeRReD tax
Deferred income tax is calculated on all temporary differences under the liability method at 15%.
(a) The movement on the deferred tax account is as follows:
tHe gROup tHe cOMpaNy
2013 2012 2013 2012
Rs’000 Rs’000 Rs’000 Rs’000
At January 1, 76,901 100,324 96,520 119,059
Under/(over)provision of deferred tax 1,461 - (394) -
Deferred tax charge for the year (note 19) (29,990) (23,423) (30,808) (22,539)
at December 31, 48,372 76,901 65,318 96,520
Deferred income tax assets and liabilities are offset when the deferred income taxes relate to the same fiscal authority.
7. fiNaNcial stateMeNts fOR tHe yeaR eNDeD DeceMBeR 31, 2013
7.8 notes to the financial statements for year ended december 31, 2013
177
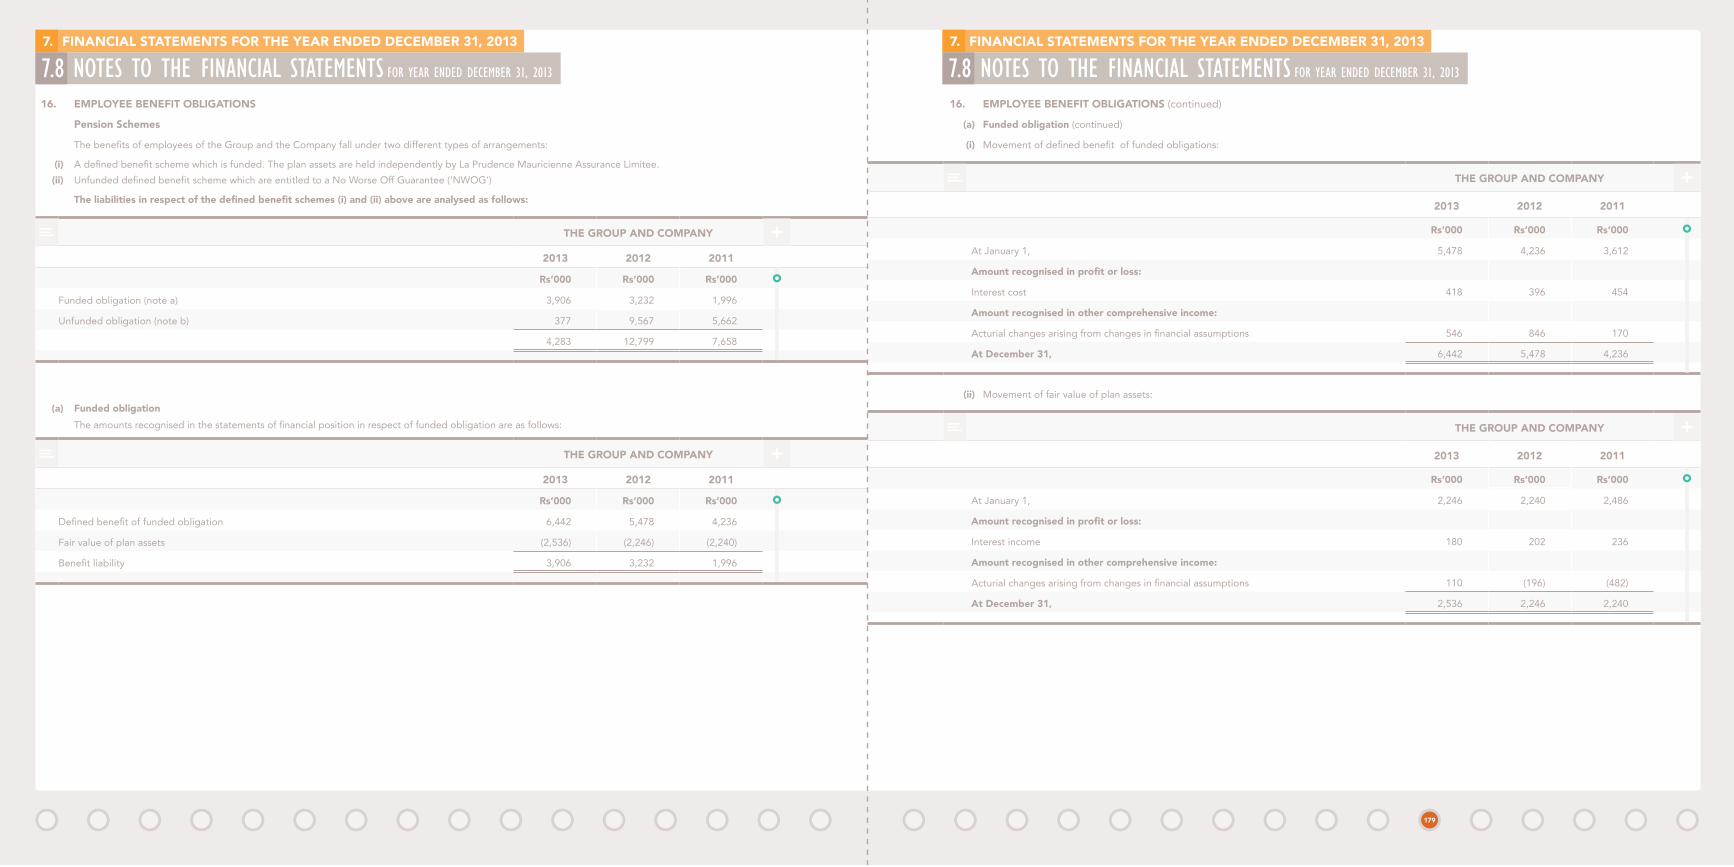
7.8 notes to the financial statements for year ended december 31, 20137. fiNaNcial stateMeNts fOR tHe yeaR eNDeD DeceMBeR 31, 2013
16. eMplOyee BeNefit OBligatiONs (continued)
(a) funded obligation (continued)
(i) Movement of defined benefit of funded obligations:
tHe gROup aND cOMpaNy
2013 2012 2011
Rs’000 Rs’000 Rs’000
At January 1, 5,478 4,236 3,612
Amount recognised in profit or loss:
Interest cost 418 396 454
amount recognised in other comprehensive income:
Acturial changes arising from changes in financial assumptions 546 846 170
at December 31, 6,442 5,478 4,236
(ii) Movement of fair value of plan assets:
tHe gROup aND cOMpaNy
2013 2012 2011
Rs’000 Rs’000 Rs’000
At January 1, 2,246 2,240 2,486
Amount recognised in profit or loss:
Interest income 180 202 236
amount recognised in other comprehensive income:
Acturial changes arising from changes in financial assumptions 110 (196) (482)
at December 31, 2,536 2,246 2,240
16. eMplOyee BeNefit OBligatiONs
pension schemes
The benefits of employees of the Group and the Company fall under two different types of arrangements:
(i) A defined benefit scheme which is funded. The plan assets are held independently by La Prudence Mauricienne Assurance Limitee. (ii) Unfunded defined benefit scheme which are entitled to a No Worse Off Guarantee (‘NWOG’)
The liabilities in respect of the defined benefit schemes (i) and (ii) above are analysed as follows:
tHe gROup aND cOMpaNy
2013 2012 2011
Rs’000 Rs’000 Rs’000
Funded obligation (note a) 3,906 3,232 1,996
Unfunded obligation (note b) 377 9,567 5,662
4,283 12,799 7,658
(a) funded obligation The amounts recognised in the statements of financial position in respect of funded obligation are as follows:
tHe gROup aND cOMpaNy
2013 2012 2011
Rs’000 Rs’000 Rs’000
Defined benefit of funded obligation 6,442 5,478 4,236
Fair value of plan assets (2,536) (2,246) (2,240)
Benefit liability 3,906 3,232 1,996
7. fiNaNcial stateMeNts fOR tHe yeaR eNDeD DeceMBeR 31, 2013
7.8 notes to the financial statements for year ended december 31, 2013
179

7.8 notes to the financial statements for year ended december 31, 20137. fiNaNcial stateMeNts fOR tHe yeaR eNDeD DeceMBeR 31, 2013
16. eMplOyee BeNefit OBligatiONs (continued)
(a) funded obligation (continued)
The principal acturial assumptions used for accounting purposes were:
tHe gROup aND cOMpaNy
2013 2012 2011
% % %
Discount rate 7.5 8 9
Expected rate of return on plan assets 7.5 8 9
Future salary increases 0.0 0 0
Future pension increases 3.0 3 3
Deferred pension increases 0.0 0 0
Acturial table for employee mortality: PMA 92-PFA
A quantitative sensitivity analysis for signifcant assumption as at 31 Decemebr 2013 is shown as follows below:
assuMptiONs DiscOuNt Rate expecteD Rate Of RetuRN ON plaN assets
futuRe peNsiON cOst iNcRease
1% 1% 1% 1% 1% 1%
seNsitivty level increase decrease increase decrease increase decrease
Rs’000 Rs’000 Rs’000 Rs’000 Rs’000 Rs’000
Impact on defined benefit obligation 1,263 (997) Nil 728 (625)
assuMptiONs life expectaNcy Of Male peNsiONeRs
life expectaNcy Of feMale peNsiONeRs
seNsitivty level increase decrease increase decrease
1 year 1 year 1 year 1 year
65 (66) 85 (87)
The sensitivity analsysis above have been determined based on a method that extrapolates the impact on defined benefit obligation as a result of reasonable changes in key assumptions occuring at the end of the reporting period.
No contributions are expected to be paid to the defined benefit plan obligation in future years.
The average duration of the defined benefit plan obligation at the end of the reporting period is 15 years (2012: 16 yrs).
16. eMplOyee BeNefit OBligatiONs (continued)
(a) funded obligation (continued)
Amounts for the current and previous four periods are as follows:
tHe gROup aND cOMpaNy
2013 2012 2011 2010
Rs’000 Rs’000 Rs’000 Rs’000
Present value of defined benefit obligations (6,442) (5,478) (4,236) (3,612)
Plan assets 2,536 2,246 2,240 2,486
Deficit (3,906) (3,232) (1,996) (1,126)
experience adjustments on:
Plan liabilities (defined benefit obligations) - - 18 301
Plan assets 110 (196) (482) 22
The main categories of plan assets are as follows:
tHe gROup aND cOMpaNy
2013 2012 2011
% % %
Local equities 54% 56% 56%
Local -Debt Maturity >=12 months 34% 26% 26%
Local-Cash and Debt Maturity 7% 8% 8%
Overseas equities 5% 5% 5%
Overseas-Debt Maturity >=12 months 0% 3% 3%
Overseas- Cash and Debt Maturity 0% 2% 2%
100% 100% 100%
7. fiNaNcial stateMeNts fOR tHe yeaR eNDeD DeceMBeR 31, 2013
7.8 notes to the financial statements for year ended december 31, 2013
181

7.8 notes to the financial statements for year ended december 31, 20137. fiNaNcial stateMeNts fOR tHe yeaR eNDeD DeceMBeR 31, 2013
16. eMplOyee BeNefit OBligatiONs (continued)
(b) unfunded obligation (continued)
The principal actuarial assumptions used for accounting purposes were:
tHe gROup tHe cOMpaNy
2013 2012 2013 2012
% % % %
Discount rate 7.3 8.0 7.3 8.0
Future salary increase 6.3 7.0 6.3 7.0
Future pension increase 0.0 0.0 0.0 0.0
Expected return on plan assets N/A N/A N/A N/A
The Group does not expect any contribution in 2014 as the person who was under this scheme has already retired.The expected return on plan assets was determined by considering the expected returns available on the assets underlying the current investment policy. Expected yields on fixed interest investments are based on gross redemption yields as at reporting date.Expected returns on equity reflect the long-term real rates of return experienced in the respective markets.The overall expected rate of return is a weighted average of the expected returns of the various categories of plan assets held. Management assessment of the expected returns is based on historical returns trends and analysts predictions of the market for the asset in the next twelve months.No sensivity analysis for the unfunded obligation has been made as the balance is insignificant.
17. BORROwiNgs
tHe gROup tHe cOMpaNy
2013 2012 2013 2012
Rs’000 Rs’000 Rs’000 Rs’000
Preference share capital (i) 100,000 100,000 100,000 100,000
Other borrowings (ii) 63,282 80,993 63,282 80,993
Bank overdraft (iii) 1,364 345 - -
164,646 181,338 163,282 180,993
analysed as follows:
Non-current 143,978 163,282 143,978 163,282
Current 20,668 18,056 19,304 17,711
164,646 181,338 163,282 180,993
16. eMplOyee BeNefit OBligatiONs (continued)
(a) funded obligation (continued)
The overall expected rate of return is a weighted average of the expected returns of the various categories of plan assets held. Management assessment of the expected returns is based on historical returns trends and analysts predictions of the market for the asset in the next twelve months.
The Group does not expect any contribution in 2014.
(b) unfunded obligation
The amounts recognised in the statements of financial position in respect of unfunded obligation are as follows:
tHe gROup aND tHe cOMpaNy
2013 2012 2011
Rs’000 Rs’000 Rs’000
Present value of unfunded obligation 377 9,567 5,662
(i) Movement in the liability recognised in the statements of financial position:
tHe gROup aND tHe cOMpaNy
2013 2012 2011
Rs’000 Rs’000 Rs’000
At January 1, 9,567 5,662 683
Amount recognised in profit or loss: 5 785 343
Interest cost 5 785 343
amount recognised in other comprehensive income: 20 3,120 4,636
Actuarial losses 20 3,120 4,636
Benefit paid (9,215) - -
at December 31, 377 9,567 5,662
(ii) Amounts for the current and previous four periods are as follows:
tHe gROup aND tHe cOMpaNy
2013 2012 2011 2010 2009
Rs’000 Rs’000 Rs’000 Rs’000 Rs’000
Present value of defined benefit obligation 377 9,567 5,662 683 399
Deficit 377 9,567 5,662 683 399
7. fiNaNcial stateMeNts fOR tHe yeaR eNDeD DeceMBeR 31, 2013
7.8 notes to the financial statements for year ended december 31, 2013
183

7.8 notes to the financial statements for year ended december 31, 20137. fiNaNcial stateMeNts fOR tHe yeaR eNDeD DeceMBeR 31, 2013
19. cuRReNt tax liaBilities (continued)
(b) In the Statement of financial position
tHe gROup tHe cOMpaNy
2013 2012 2013 2012
Rs’000 Rs’000 Rs’000 Rs’000
At January 1, 10,446 6,036 10,020 5,654
Payment (11,435) (10,182) (10,020) (8,805)
Tax withheld (619) - (12) -
Under provision of income tax 779 347 - 347
Income tax expenses 1,591 888 - -
CSR tax 76 3,337 - 2,804
Alternative Minimum Tax 10,020 10,020 10,020 10,020
at December 31, 10,858 10,446 10,008 10,020
(c) The tax on the profit before tax differs from the theoretical amount that would arise using the basic tax rate as follows:
tHe gROup tHe cOMpaNy
2013 2012 2013 2012
Rs’000 Rs’000 Rs’000 Rs’000
Profit before taxation 301,115 271,715 203,770 271,488
Tax thereon (15%) 45,167 40,757 30,566 40,723
tax effect of:
Income not subject to tax (54,153) (101,076) - (10,062)
Expenses not deductible for tax purposes 3,485 68,832 3,721 4,004
Income exempt for tax (2,032) - (3,085) -
Deferred tax assets not recognised 39,114 26,699 -
Under/(over) provision of income tax 779 (12,162) - (13,853)
(Over)/ under provision of deferred tax (1,461) 398 563 398
Unutilised tax losses lapsed - 1,727 - 1,727
CSR contribution 76 3,337 2,804
Alternative Minimum Tax 10,020 10,020 10,020 10,020
40,995 38,532 41,785 35,761
17. BORROwiNgs (continued)
The Mauritius Commercial Bank has discharged of its claims amounting to Rs250m against the Company in exchange of Rs100m redeemable preference share of Rs1,000 each and Rs150m interest free loan.
(i) A preferential cummulative dividend of 3% per annum, calculated on the issue price, is payable to the preference shareholder. These preference shares are redeemable on May 30, 2016 but the Company has the option to defer the redemption of these shares until 2021. A preferential cummulative dividend of 5% will then be payable as from the initial redemption date.
(ii) The Rs150m shall be paid in 6 equal yearly instalment of Rs25m each starting on May 31, 2011 through May 31, 2016.
(iii) The bank overdraft is secured by floating charges on the assets of one of its subsidiary company.
18. tRaDe aND OtHeR payaBles
tHe gROup tHe cOMpaNy
2013 2012 2013 2012
Rs’000 Rs’000 Rs’000 Rs’000
Loans repaid in advance 1,265 1,265 1,265 1,265
Premiums prepaid 40,972 37,309 40,972 37,309
Amounts due to reinsurers 52,669 50,388 37,303 45,593
Other payables and accruals 145,235 123,553 87,817 86,553
240,141 212,515 167,357 170,720
The carrying amounts of trade and other payables approximate their fair value.
19. cuRReNt tax liaBilities
(a) in the statements of comprehensive income
tHe gROup tHe cOMpaNy
2013 2012 2013 2012
Rs’000 Rs’000 Rs’000 Rs’000
Income tax provision for the year at 15% 1,591 1,354 - -
Alternative Minimum Tax 10,020 10,020 10,020 10,020
CSR tax 76 3,337 - 2,804
Under provision of income tax 779 398 563 398
(Over)/ under provision of deferred tax (1,461) - 394 -
Deferred tax charge (Note 15) 29,990 23,423 30,808 22,539
Tax charge for the year 40,995 38,532 41,785 35,761
7. fiNaNcial stateMeNts fOR tHe yeaR eNDeD DeceMBeR 31, 2013
7.8 notes to the financial statements for year ended december 31, 2013
185

7.8 notes to the financial statements for year ended december 31, 20137. fiNaNcial stateMeNts fOR tHe yeaR eNDeD DeceMBeR 31, 2013
22. RealiseD gaiNs
tHe gROup tHe cOMpaNy
2013 2012 2013 2012
Rs’000 Rs’000 Rs’000 Rs’000
property and equipment
Realised /(loss) gain (10) 426 320 426
Financial assets
Realised gains 736 9,224 225 14,545
investment property - -
726 9,650 545 14,971
23. uNRealiseD gaiN / (lOsses)
tHe gROup tHe cOMpaNy
2013 2012 2013 2012
Rs’000 Rs’000 Rs’000 Rs’000
Fair value gains on investment properties - 1,430 - -
Fair value on fair value through profit or loss financial instruments 455,827 (186,200) 78 (433)
455,827 (184,770) 78 (433)
24. OtHeR OpeRatiNg iNcOMe
tHe gROup tHe cOMpaNy
2013 2012 2013 2012
Rs’000 Rs’000 Rs’000 Rs’000
Brokerage fees 6,232 5,960 - -
Administration fees 18,734 16,508 - -
Management fees 8,238 7,913 - -
Exchange gains - 10,234 - 10,234
Other income 4,144 15,385 2,331 2,920
37,348 56,000 2,331 13,154
20. Net eaRNeD pReMiuMs
(a) gross premium earned is as follows:
tHe gROup tHe cOMpaNy
2013 2012 2013 2012
Rs’000 Rs’000 Rs’000 Rs’000
Non Life insurance 1,630,418 1,539,989 1,630,418 1,539,989
Life insurance 661,072 635,391 - -
Change in unearned premiums provision (21,358) (46,121) (21,358) (46,121)
2,270,132 2,129,259 1,609,060 1,493,868
(b) premium ceded to reinsurers is as follows:
tHe gROup tHe cOMpaNy
2013 2012 2013 2012
Rs’000 Rs’000 Rs’000 Rs’000
Non Life insurance (348,260) (290,315) (348,260) (290,315)
Life insurance (23,903) (54,064) - -
Change in unearned premiums provision 8,994 10,834 8,994 10,834
(363,169) (333,545) (339,266) (279,481)
Net earned premiums 1,906,963 1,795,714 1,269,794 1,214,387
21. iNvestMeNt iNcOMe
tHe gROup tHe cOMpaNy
2013 2012 2013 2012
Rs’000 Rs’000 Rs’000 Rs’000
Rental income from investment property 741 945 220 -
Dividend income 85,467 165,024 20,566 24,788
Interest on loans and financial assets 223,305 200,430 30,339 38,635
Interest on bank accounts 34,053 27,572 11,786 10,265
343,566 393,971 62,911 73,688
7. fiNaNcial stateMeNts fOR tHe yeaR eNDeD DeceMBeR 31, 2013
7.8 notes to the financial statements for year ended december 31, 2013
187

7.8 notes to the financial statements for year ended december 31, 20137. fiNaNcial stateMeNts fOR tHe yeaR eNDeD DeceMBeR 31, 2013
27. pROfit BefORe tax
tHe gROup tHe cOMpaNy
2013 2012 2013 2012
Rs’000 Rs’000 Rs’000 Rs’000
The profit before tax has been arrived at
after crediting:
Investment income
- dividend income 85,467 165,024 20,566 24,788
- interest on financial assets 257,358 228,002 42,125 48,900
Profit on disposal on financial assets (note 22) 736 9,224 225 14,545
(Loss)/gain on sale of property and equipment (10) 426 320 426
and charging:
Auditors' fees 2,278 2,392 1,447 1,093
Employee benefit expenses (note 28) 263,991 235,781 185,828 165,837
Depreciation on property and equipment (note 5) 29,668 28,967 21,936 19,962
Amortisation of intangible assets (note 7) 28,657 29,968 18,437 17,671
28. eMplOyee BeNefit expeNses
tHe gROup tHe cOMpaNy
2013 2012 2013 2012
Rs’000 Rs’000 Rs’000 Rs’000
Wages and salaries 214,997 211,522 156,751 139,099
Social Security costs 7,858 7,517 6,022 5,376
- Defined contributions 14,205 10,318 9,895 9,305
- Defined benefits 263 979 263 979
Other benefits 26,668 5,445 12,897 11,078
Total 263,991 235,781 185,828 165,837
25. OtHeR OpeRatiNg aND aDMiNstRative expeNses
NOtes tHe gROup tHe cOMpaNy
2013 2012 2013 2012
Rs’000 Rs’000 Rs’000 Rs’000
Exchange loss 4,223 - 4,540 -
Management expenses 416,356 429,016 308,096 291,832
Depreciation 5 29,668 28,967 21,936 19,962
amortisation 7 28,657 29,968 18,437 17,671
478,904 487,951 353,009 329,465
26. fiNaNce cOsts
tHe gROup tHe cOMpaNy
2013 2012 2013 2012
Rs’000 Rs’000 Rs’000 Rs’000
Interest expense:
- Notional interest on interest free loan 6,360 7,873 6,360 7,873
- Dividend on redeemable preference shares 9,000 9,000 9,000 9,000
- Interest on bank overdraft 118 121 - -
15,478 16,994 15,360 16,873
7. fiNaNcial stateMeNts fOR tHe yeaR eNDeD DeceMBeR 31, 2013
7.8 notes to the financial statements for year ended december 31, 2013
189

7.8 notes to the financial statements for year ended december 31, 20137. fiNaNcial stateMeNts fOR tHe yeaR eNDeD DeceMBeR 31, 2013
30. faiR value MeasuReMeNts (continued)
tHe gROup (continued) faiR value as at
assets /liaBilites31
December 2013
31 December
2012
fair value Hierarchy
valuation technique(s) and key input(s)
Significant unobservable
input(s)
Relationship of unobservable
inputs to fair value
financial assets at fair value through other comprehensive income:
Rs’000 Rs’000
quoted securities:
Banks and Insurance 239,630 194,539 Level 1 Quoted Market Value N/A N/A
Commerce 7,710 10,472 Level 1 Quoted Market Value N/A N/A
Industry 9,388 9,541 Level 1 Quoted Market Value N/A N/A
Investments 40,837 36,323 Level 1 Quoted Market Value N/A N/A
Leisure and Hotels 115,116 87,087 Level 1 Quoted Market Value N/A N/A
sugar 53,549 45,937 Level 1 Quoted Market Value N/A N/A
Others 29,642 23,305 Level 1 Quoted Market Value N/A N/A
unquoted securities:
Property Development - 1,778 Level 3 Dividend yield Dividend ratio **
Foreign Equities 25,272 16,313 Level 3 Dividend yield Dividend ratio **
Commerce 72 72 Level 3 Dividend yield Dividend ratio **
Others 1,314 637 Level 3 Dividend yield Dividend ratio **
Open ended Mutual funds:
Local 53,907 36,545 Level 2 nav N/A N/A
Foreign - 21,972 Level 2 nav N/A N/A
financial assets at fair value
quoted securities:
Banks and Insurance 1,185,531 890,657 Level 1 Quoted Market Value N/A N/A
Commerce 179,927 187,601 Level 1 Quoted Market Value N/A N/A
Industry 126,118 134,555 Level 1 Quoted Market Value N/A N/A
Investments 746,756 697,666 Level 1 Quoted Market Value N/A N/A
Leisure and Hotels 251,687 214,835 Level 1 Quoted Market Value N/A N/A
sugar 32,632 44,050 Level 1 Quoted Market Value N/A N/A
Others 212,330 195,756 Level 1 Quoted Market Value N/A N/A
** A 5% change in dividend ratio will have an impact of Rs 1.3m (2012: Rs 1M) on equity for financial assets at fair value through other comprehensive income.
29. DiviDeNDs paiD
tHe gROup aND tHe cOMpaNy
2013 2012
paid Rs’000 Rs’000
Interim ordinary dividend of 15% (2012 -15%) 30,060 30,060
Final ordinary dividend 35 % (2012 - 35%) 70,140 70,140
100,200 100,200
30. faiR value MeasuReMeNts
This note provides information and how the Group and Company determines fair value of various assets and liabilities.
(a) Fair Value of the Group and Company assets and liabilites that are measued at fair value on a recurring basis:
Some of the Group and Company’s assets and liabilites are measured at fair value at the end of each reporting period. The following table gives the information about how the fair value of these assets and liabilites are determined (in particular the valuation technique(s)and the inputs used).
tHe gROup faiR value as at
assets /liaBilites 31 December 2013
31 December 2012
fair value Hierarchy
valuation technique(s) and key input(s)
Significant unobservable
input(s)
Relationship of unobservable inputs
to fair value
investment properties Rs’000 Rs’000
Land 70,000 70,000 Level 2 Sales comparison approach N/A N/A
Building 114,578 114,578 Level 2 Sales comparison approach N/A N/A
7. fiNaNcial stateMeNts fOR tHe yeaR eNDeD DeceMBeR 31, 2013
7.8 notes to the financial statements for year ended december 31, 2013
191

7.8 notes to the financial statements for year ended december 31, 20137. fiNaNcial stateMeNts fOR tHe yeaR eNDeD DeceMBeR 31, 2013
30. faiR value MeasuReMeNts (continued)
(b) Fair Value of the Group and Company’s assets and liabilites that are not measued at fair value on a recurring basis (but fair value are required).
Except as detailed in the following table, the directors consider that the carrying amounts of financial assets and financial liabilities recognised approiximates their fair values.
2013 2012
tHe gROup aND tHe cOMpaNy carrying amount fair value carrying amount fair value
financial liabilities: Rs’000 Rs’000 Rs’000 Rs’000
Borrowings 63,282 68,000 80,993 98,000
faiR value HieRaRcHy as at 31 DeceMBeR 2013
level 1 level 2 level 3 total
financial liabilities: Rs’000 Rs’000 Rs’000 Rs’000
Borrowings - 68,000 - 68,000
faiR value HieRaRcHy as at 31 DeceMBeR 2012
level 1 level 2 level 3 total
financial liabilities: Rs’000 Rs’000 Rs’000 Rs’000
Borrowings - 98,000 - 98,000
Valuation technique used is the present value of future cash flows.
30. faiR value MeasuReMeNts (continued)
tHe cOMpaNy faiR value as at
assets /liaBilites 31 December 2013
31 December 2012
fair value Hierarchy
valuation technique(s) and key input(s)
Significant unobservable
input(s)
Relationship of unobservable inputs
to fair value
investment properties Rs’000 Rs’000
Land 70,000 70,000 Level 2 Sales comparison approach N/A N/A
Building 4,000 4,000
financial assets at fair value through other comprehensive income:
quoted securities:
Banks and Insurance 224,714 182,399 Level 1 Quoted Market Value N/A N/A
Commerce 7,710 10,472 Level 1 Quoted Market Value N/A N/A
Industry 9,388 9,541 Level 1 Quoted Market Value N/A N/A
Investments 40,838 36,323 Level 1 Quoted Market Value N/A N/A
Leisure and Hotels 115,116 87,087 Level 1 Quoted Market Value N/A N/A
sugar 53,063 45,483 Level 1 Quoted Market Value N/A N/A
Others 27,552 23,294 Level 1 Quoted Market Value N/A N/A
unquoted securities:
Property Development - 1,778 Level 3 Dividend yield Dividend ratio **
Foreign Equities 25,272 16,313 Level 3 Dividend yield Dividend ratio **
Commerce 72 72 Level 3 Dividend yield Dividend ratio **
Others 625 625 Level 3 Dividend yield Dividend ratio **
Open ended Mutual funds:
Local 53,907 36,545 Level 2 nav N/A N/A
Foreign - 21,384 Level 2 nav N/A N/A
financial assets at fair value through profit or loss:
Local Corporate debt 2,923 2,845 Level 1 Quoted Market Value na na
** A 5% change in dividend ratio will have an impact of Rs 1.3m (2012: Rs 0.9M) on equity for financial assets at fair value through other comprehensive income.
7. fiNaNcial stateMeNts fOR tHe yeaR eNDeD DeceMBeR 31, 2013
7.8 notes to the financial statements for year ended december 31, 2013
193

7.8 notes to the financial statements for year ended december 31, 20137. fiNaNcial stateMeNts fOR tHe yeaR eNDeD DeceMBeR 31, 2013
31. segMeNt iNfORMatiON
Management has determined the operating segments based on the reports reviewed by the chief operating decision maker that are used to make strategic decisions.
The Group’s reportable segments under IFRS8 are based on insurance classes.
(i) Casualty - includes motor, liability, cash in transit, personal accident and health.
(ii) Property - includes fire and allied perils, engineering, marine, and all risks
(iii) Life - includes both life and pensions Revenue in the above segments is derived primarily from insurance premiums, investment income and realised gain on financial assets.
(iv) Other - consists of stock-broking. Revenue in this segment is derived primarily from brokerage commissions, investment income and realised gains on financial assets. The Company customer portfolio base is widely spread and no customer accounts for more than 10% of the total revenue.
tHe gROup
2013 casualty property total general * life Other consolidated
adjustments total
income Rs’000 Rs’000 Rs’000 Rs’000 Rs’000 Rs’000 Rs’000
Net earned premium 1,162,418 107,376 1,269,794 651,745 - (14,576) 1,906,963
Fee and commission income 44,391 45,628 90,019 14,431 - (352) 104,098
Brokerage fees - - - - 6,232 - 6,232
Investment and other income 50,152 11,095 61,247 288,367 32,728 (11,157) 371,185
Fair value gains 64 15 79 455,748 - - 455,827
Segment income 1,257,025 164,114 1,421,139 1,410,291 38,960 (26,085) 2,844,305
30. faiR value MeasuReMeNts (continued)
(c) Reconciliation of Level 3 fair value measurements.
The following table shows a reconciliation of the opening balance and closing recorded amount of Level 3 financial assets which are recorded at fair value:
2013tHe gROup
2012tHe gROup
financial assets at fair value
through profit or loss
financial assets at fair value
through other comprehensive
income
total
financial assets at fair value
through profit or loss
financial assets at fair value
through other comprehensive
income
total
Rs’000 Rs’000 Rs’000 Rs’000 Rs’000 Rs’000
At January 1, 195,756 18,800 214,556 453,593 - 453,593
Balance transferred from AFS - - - - 16,112 16,112
Total gains/(loss) in profit or loss* 10,066 - 10,066 33,618 - 33,618
Total gains/(loss) in other comprehensive income - 10,648 10,648 - 908 908
Purchases 56,076 - 56,076 12,683 1,780 14,463
Disposals (49,568) (2,790) (52,358) (304,138) - (304,138)
At 31 December 212,330 26,658 238,988 195,756 18,800 214,556
2013tHe cOMpaNy
2012tHe cOMpaNy
financial assets at fair value through other
comprehensive incometotal
financial assets at fair value through other
comprehensive incometotal
Rs’000 Rs’000 Rs’000 Rs’000
At January 1, 18,788 18,788 - -
Balance transferred from AFS - - 16,102 16,102
Total gains/(loss) in other comprehensive income 9,971 9,971 908 908
Purchases - - 1,778 1,778
Disposals (2,790) (2,790) - -
At 31 December 25,969 25,969 18,788 18,788
7. fiNaNcial stateMeNts fOR tHe yeaR eNDeD DeceMBeR 31, 2013
7.8 notes to the financial statements for year ended december 31, 2013
195

7.8 notes to the financial statements for year ended december 31, 20137. fiNaNcial stateMeNts fOR tHe yeaR eNDeD DeceMBeR 31, 2013
31. segMeNt iNfORMatiON (continued)
tHe gROup (continued)
2012 (continued) casualty property total general * life Other consolidated
adjustments total
expenses Rs’000 Rs’000 Rs’000 Rs’000 Rs’000 Rs’000 Rs’000
Gross claims and benefits 600,450 58,849 659,299 382,722 - - 1,042,021
Claims recovered from Reinsurers (11,688) (23,889) (35,577) (12,103) - - (47,680)
Movement in outstanding claims 4,580 3,007 7,587 220,840 - - 228,427
Commission and brokerage fee paid 114,257 34,280 148,537 22,181 - - 170,718
Management expenses 240,530 51,302 291,832 116,077 22,215 (1,108) 429,016
Finance costs 13,903 2,970 16,873 - 121 - 16,994
Depreciation 16,450 3,512 19,962 7,978 1,027 - 28,967
amortisation 14,561 3,110 17,671 6,749 288 5,260 29,968
Fair value gains and losses 357 76 433 185,767 - (1,430) 184,770
993,400 133,217 1,126,617 930,211 23,651 2,722 2,083,201
Segment profit before tax 226,559 44,928 271,487 1,260 12,142 (13,174) 271,715
Profit before taxation 271,715
Taxation (38,532)
Profit for the year 233,183
* it represents that of the Company only.
31. segMeNt iNfORMatiON (continued)
tHe gROup (continued)
2013 (continued) casualty property total general * life Other consolidated
adjustments total
expenses Rs’000 Rs’000 Rs’000 Rs’000 Rs’000 Rs’000 Rs’000
Gross claims and benefits 677,363 199,971 877,334 445,936 - - 1,323,270
Claims recovered from Reinsurers (33,064) (132,476) (165,540) (1,454) - - (166,994)
Movement in outstanding claims 21,859 (14,316) 7,543 730,166 - - 737,709
Commission and brokerage fees paid 101,805 32,398 134,203 24,843 - - 159,046
Management expenses 252,847 55,249 308,096 99,099 27,016 (17,855) 416,356
Finance costs 12,577 2,783 15,360 - 118 - 15,478
Depreciation 17,962 3,974 21,936 6,562 1,170 - 29,668
amortisation 15,097 3,340 18,437 4,878 82 5,260 28,657
1,066,446 150,923 1,217,369 1,310,030 28,386 (12,595) 2,543,190
Segment profit before tax 190,579 13,191 203,770 100,261 10,574 (13,490) 301,115
Profit before taxation 301,115
Taxation (40,995)
Profit for the year 260,120
* it represents that of the Company only.
tHe gROup
2012 casualty property total general * life Other consolidated
adjustments total
income Rs’000 Rs’000 Rs’000 Rs’000 Rs’000 Rs’000 Rs’000
Net earned premium 1,097,657 116,730 1,214,387 581,327 - - 1,795,714
Fee and commission income 38,409 43,496 81,905 17,676 - - 99,581
Brokerage fees - - - - 5,960 - 5,960
Investment and other income 83,893 17,919 101,812 332,468 29,833 (10,452) 453,661
Segment income 1,219,959 178,145 1,398,104 931,471 35,793 (10,452) 2,354,916
7. fiNaNcial stateMeNts fOR tHe yeaR eNDeD DeceMBeR 31, 2013
7.8 notes to the financial statements for year ended december 31, 2013
197

7.8 notes to the financial statements for year ended december 31, 20137. fiNaNcial stateMeNts fOR tHe yeaR eNDeD DeceMBeR 31, 2013
31. segMeNt iNfORMatiON (continued)
tHe gROup (continued)
2012 (continued) casualty property total general * life Other consolidated
adjustments total
capital expenditure Rs’000 Rs’000 Rs’000 Rs’000 Rs’000 Rs’000 Rs’000
Property, plant and equipment 25,466 5,439 30,905 1,533 28 - 32,466
Intangible assets 6,177 1,320 7,497 743 - - 8,240
Depreciation 16,450 3,512 19,962 7,978 1,027 - 28,967
amortisation 14,561 3,110 17,671 6,749 288 5,260 29,968
* it represents that of the Company only.
32. sHaReHOlDeRs sHaRe Of life suRplus
In accordance with the accounting policy in Note 2, the independent actuaries have assessed the amount of the Discretionary Participating Feature (DPF) eligible surplus to be transferred to/(from) the Life Assurance Fund (from)/to Profit or Loss at Rs.8.4m (2012 - Rs.9.8m). Assets and liabilities of the Company’s subsidiary and owed by the shareholders and policyholders. Surplus for the year attributable to the policyholders are then transferred to the Life Assurance Fund.
33. OutstaNDiNg fiNaNcial cOMMitMeNts
tHe gROup tHe cOMpaNy
2013 2012 2013 2012
Rs’000 Rs’000 Rs’000 Rs’000
Loans approved by the Board of Directors but not yet disbursed 35,725 72,055 1,840 1,649
34. OutstaNDiNg fiNaNcial cOMMitMeNts
tHe gROup
2013 2012
earnings per share is based on the following: Rs’000 Rs’000
Profit attributable to equity holders of the parent 259,490 233,209
Number of ordinary shares in issue and ranking for dividends 20,040,000 20,040,000
Earnings per share 12.95 11.64
31. segMeNt iNfORMatiON (continued)
tHe gROup
2013 casualty property total general * life Other consolidated
adjustments total
Rs’000 Rs’000 Rs’000 Rs’000 Rs’000 Rs’000 Rs’000
Segment assets 2,835,211 627,200 3,462,411 6,206,494 62,037 (29,119) 9,701,823
Segment liabilities 315,405 69,773 385,178 68,685 12,835 10,449 477,147
technical liabilities
- Unearned premium reserve 734,287
- Life assurance fund 5,841,981
- Outstanding claims 920,359
Total equity 1,728,049
capital expenditure
Property, plant and equipment 27,032 5,980 33,012 881 66 - 33,959
Intangible assets 27,642 6,114 33,756 10,359 - - 44,115
Depreciation 17,962 3,974 21,936 6,562 1,170 - 29,668
amortisation 15,097 3,340 18,437 4,878 82 5,260 28,657
* it represents that of the Company only.
tHe gROup
2012 casualty property total general * life Other consolidated
adjustments total
Rs’000 Rs’000 Rs’000 Rs’000 Rs’000 Rs’000 Rs’000
Segment assets 2,687,756 574,102 3,261,858 5,351,414 60,107 (32,865) 8,640,514
Segment liabilities 341,455 72,935 414,390 44,033 17,394 758 476,575
technical liabilities
- Unearned premium reserve 712,929
- Life assurance fund 5,111,815
- Outstanding claims 886,255
Total equity 1,452,940
7. fiNaNcial stateMeNts fOR tHe yeaR eNDeD DeceMBeR 31, 2013
7.8 notes to the financial statements for year ended december 31, 2013
199

7.8 notes to the financial statements for year ended december 31, 20137. fiNaNcial stateMeNts fOR tHe yeaR eNDeD DeceMBeR 31, 2013
35. NOtes tO casH flOw stateMeNts (continued)
(b) cash and short tem deposits
For the purpose of the statement of cash flows, cash and cash equivalents comprise the following at December,31:
tHe gROup tHe cOMpaNy
2013 2012 2013 2012
Rs’000 Rs’000 Rs’000 Rs’000
Cash at banks and on hand 677,172 674,030 615,964 612,357
Short-term deposits 416,175 501,380 - -
1,093,347 1,175,410 615,964 612,357
Less: Bank overdraft (note 17) (1,364) (345) - -
1,091,983 1,175,065 615,964 612,357
Cash at bank earns interest at fixed rates based on a daily basis deposit rates. Short-term deposits are made for varying periods of between one day and the three months, depending on the immediate cash requirements of the Group and earn interest at the respective short-term deposits rates
36. RelateD paRty tRaNsactiONs
tHe gROup tHe cOMpaNy
Relationship 2013 2012 2013 2012
Rs’000 Rs’000 Rs’000 Rs’000
loans granted to
Directors and key management personnel 7,275 7,246 3,640 501
amount owed by
Directors and key management personnel 80,087 85,305 3,654 946
Receivables from:
NMF Property Trust Sister company 138 75 -
NMF General Fund Sister company 825 709 -
La Prudence Mauricienne Assurance Ltee Subsidiary - - 3,032 11,813
Decadel Ltee Subsidiary - - 4,227 4,566
Feber Associates Ltd Subsidiary - - 173 420
35. NOtes tO casH flOw stateMeNts
(a) cash generated from operations
NOtes tHe gROup tHe cOMpaNy
2013 2012 2013 2012
cash generated from operations Rs’000 Rs’000 Rs’000 Rs’000
Profit before taxation 301,115 271,715 203,770 271,488
(Increase)/decrease in fair value of investment 23 (455,827) 186,200 (78) 433
Increase in fair value of investment properties 6 - (1,430) - -
Exchange losses/(gains) on cash and cash equivalents 24/25 4,223 (10,234) 4,540 (10,324)
Provision for retirement benefit obligations 263 4,100 263 4,099
(Reversal)/ provision for credit impairment 10/11 (3,513) (2,445) (3,618) (2,301)
Dividend income 21 (85,467) (165,024) (20,566) (24,788)
Interest income 21 (257,358) (228,002) (42,125) (48,900)
Interest payable 26 15,478 16,994 15,360 16,873
Depreciation 5 29,668 28,967 21,936 19,962
amortisation 7 28,657 29,968 18,437 17,671
Loss/(profit) on sale of property and equipment 22 10 (426) (320) (426)
Profit on disposal of financial assets 22 (736) (9,224) (225) (14,545)
(423,487) 121,159 197,374 229,242
Change in unearned premium 12,364 35,287 12,363 35,287
Change in insurance and other receivables (116,940) 35,910 (100,924) (7,937)
Change in outstanding claims 737,709 228,427 7,542 7,586
Change in trade and other payables 28,016 56,184 (2,973) 55,178
Change in employee benefit obligations (9,215) - (9,215) -
Net cash generated from operations (refer to page 113) 228,447 476,967 104,167 319,356
7. fiNaNcial stateMeNts fOR tHe yeaR eNDeD DeceMBeR 31, 2013
7.8 notes to the financial statements for year ended december 31, 2013
200

7.8 notes to the financial statements for year ended december 31, 20137. fiNaNcial stateMeNts fOR tHe yeaR eNDeD DeceMBeR 31, 2013
38. eveNts afteR tHe RepORtiNg Date
On the 3rd October 2013, the Company entered into a Sales and Purchase Agreement (SPA) with third party vendors pursuant to which MUA proposes to acquire all of the issued shares of Phoenix Transafrica Holdings Limited (PTHL), a company incorporated in the Republic of Kenya whose subsidiaries are duly licenced to carry out general insurance in their respective jurisdiction. The purchase price will be adjusted in accordance with the terms of the SPA to obtain the final price for the transactions.
Up to March 2014, not all conditions precedent to the deal have been satisfied.
36. RelateD paRty tRaNsactiONs (continued)
tHe gROup tHe cOMpaNy
Relationship 2013 2012 2013 2012
Rs’000 Rs’000 Rs’000 Rs’000
payables to:
La Prudence Mauricienne Assurance Ltee Subsidiary - - - -
Other related parties - - - -
purchase of goods and services from
Subsidiary company 378 742 14,854 231
Other related parties -Accredited agents 21,904 22,410 21,904 22,410
sale of services to
Directors and key management personnel 295,560 20,181 294,183 15,585
income receivable from:
Subsidiary companies - - 7,020 6,414
Remuneration of key management personnel
Salaries and short-term employee benefits 36,289 58,164 25,088 35,116
Post-employments benefits 3,918 4,356 2,560 2,490
Key management personnel consist of Chief Executive Offficers, Senior managers and Deputy senior managers.
teRMs aND cONDitiONs Of tRaNsactiONs witH RelateD paRties
The sales to and purchases from related parties are made at normal market prices. Outstanding balances at the year end are unsecured, interest free except for loan granted to directors and settlements occurs in cash. There have been no guarantees provided or received for any related party receivables and payables. At each financial year, an assessment of provision for impairment is undertaken through examining the financial position of the related party and the market in which the related party operates.
37. capital cOMMitMeNts
tHe gROup tHe cOMpaNy
OpeRatiNg lease 2013 2012 2013 2012
Rs’000 Rs’000 Rs’000 Rs’000
The future minimum lease payments under non cancellable operating leases are as follows: -
Not later than one year - 2,658 - -
7. fiNaNcial stateMeNts fOR tHe yeaR eNDeD DeceMBeR 31, 2013
7.8 notes to the financial statements for year ended december 31, 2013
202

concept and design by
Notice is hereby given that the Annual Meeting of Shareholders of The Mauritius Union Assurance Cy. Ltd will be held at the Registered Office of the Company, 4 Léoville L’Homme Street, Port-Louis, Mauritius, on Friday 27 June 2014 at 10.00 hours to transact the following business:
ageNDa
1. To consider the Annual Report for the year ended 31 December 2013
2. To receive the Auditors’ report
3. To consider and adopt the Annual Financial Statements for the year ended 31 December 2013.
4. To re-appoint under separate resolution the following persons as director of the Company:a. Vincent AH CHUENb. Melanie FAUGIERc. Bruno de FROBERVILLEd. Dominique GALEAe. Lakshmana (Kris) LUTCHMENARRAIDOOf. Arjoon SUDDHOO
5. In accordance with Section 138(6) of the Companies Act 2001 to re-appoint under separate resolution the following persons as director of the Company:a. Bertrand de CHAZALb. Gerard de RAUVILLE
6. To appoint under separate resolution the following persons as director of the Company:a. Alfred BOUCKAERT as Independent Non-Executive Directorb. Angelo LETIMIER as Independent Non-Executive Directorc. Bertrand CASTERES as Executive Director
7. To take note of the automatic reappointment of Messrs. Ernst & Young as auditors of the Company in compliance with Section 40(3) of the Insurance Act 2005 and to authorise the Board of Directors to fix their remuneration for the year ending 31 December 2014.
NOtes
(a) A member of the Company, entitled to attend and vote at this Meeting, may appoint a proxy (whether a shareholder or not) to attend and vote on his behalf, or may cast his vote by post. If no specific direction as to voting is given, the proxy will exercise his/her discretion as to how he/she votes.
(b) Any power of attorney appointing a proxy shall be deposited with the share registry, Abax Corporate Administrators Ltd, 6th floor, Tower A, 1 Cybercity, Ebène, Mauritius at latest on Thursday 26 June 2014 at 10.00 hours and in default, the instrument of proxy shall not be treated as valid.
(c) The notice for casting a postal vote must be made in writing on the attached form and sent to the attention of Mrs. Nisha Proag-Dookun, the person authorized by the board of directors of the Company to receive and count the postal votes at the Annual Meeting. The document should reach the share registry, Abax Corporate Administrators Ltd, 6th floor, Tower A, 1 Cybercity, Ebène, Mauritius at latest on Wednesday 25 June 2014 at 10.00 hours, and in default, the notice of postal vote shall not be treated as valid.
(d) For the purpose of this Meeting, the Directors have resolved, in compliance with section 120 of the Companies Act 2001, that the shareholders who are entitled to receive notice and attend the Meeting, shall be those shareholders whose names are registered in the share register of the Company as at 5 June 2014.
(e) The profiles of the Directors are set out on pages 26 to 31 of the Annual Report.
(f) The profile of Mr Angelo Letimier is as follows: Mr J. Angelo Letimier born in 1948 is an experienced banking executive with international experience. He has enjoyed a stimulating career with
MCB Ltd in two-times slots: 1966-1992 and the 2005 till today. He was responsible of establishing the first Credit Card Program of Mauritius in 1988 and opening the Representative office of the bank in Paris in 1990. In 1992 he joined MasterCard International Inc as Senior Vice President and General Manager Middle East & Africa Region based in Paris for 8 years.
He has been a director of Investec Bank (Mauritius) Ltd-2000-2004; Bramer Investment Management Co Ltd – 2000-2001; AXA Assistance Ocean Indien –2005-2010; Director of Happy World Ltd-2004 to date.
In 2008, he created as a subsidiary of the MCB Group ICPS Ltd (International Card Processing Services Ltd) a company involved in all aspects of Card Processing for banks and financial institutions. He is the Managing Director of ICPS.
By order of the Board ecs secRetaRies ltDper Marie-anne adam, acisCompany Secretary
9 May 2014
notice of meeting to shareholders

I/We
of
being a member of The Mauritius Union Assurance Cy. Ltd, hereby appoint
of or failing him,
of as my/our proxy to vote for me/us and on my/our behalf at the Annual Meeting of Shareholders of the Company to be held on Friday 27 June 2014 at 10.00 hours at the Registered Office of the Company, 4 Léoville L’Homme Street, Port-Louis, and at any adjournment thereof. The proxy will vote on the under-mentioned resolutions, as indicated:
castiNg pOstal vOtes (see note c in side column)
I/We
of
being a member of The Mauritius Union Assurance Cy. Ltd, desire my/our vote/s to be cast as indicated on the under-mentioned resolutions at the Annual Meeting of Shareholders of the Company to be held on Friday 27 June 2014 and at any adjournment thereof:
as ORDiNaRy ResOlutiONs fOR agaiNst aBstaiN
3. To consider and adopt the Annual Financial Statements for the year ended 31 December 2013.
4. To re-appoint under separate resolution the following persons as director of the Company:
a. Vincent AH CHUEN
b. Melanie FAUGIER
c. Bruno de FROBERVILLE
d. Dominique GALEA
e. Lakshmana (Kris) LUTCHMENARRAIDOO
f. Arjoon SUDDHOO
5. In accordance with Section 138(6) of the Companies Act 2001 to re-appoint under separate resolution the following persons as director of the Company:
a. Bertrand DE CHAZAL
b. Gerard de RAUVILLE
6. To appoint under separate resolution the following persons as director of the Company:
a. Alfred BOUCKAERT as Independent Non-Executive Director
b. Angelo LETIMIER as Independent Non-Executive Director
c. Bertrand CASTERES as Executive Director
7. To take note of the automatic reappointment of Messrs. Ernst & Young as auditors of the Company in compliance with Section 40(3) of the Insurance Act 2005 and to authorise the Board of Directors to fix their remuneration for the year ending 31 December 2014.
sigNatuRe Date
proxy / casting postal vote formappointment of proxy
NOtes
(a) A member of the Company, entitled to attend and vote at this meeting, may appoint a proxy (whether a shareholder or not) to attend and vote on his behalf, or may cast his vote by post. If no specific direction as to voting is given, the proxy will exercise his/her discretion as to how he/she votes.
(b) Any power of attorney appointing a proxy shall be deposited with the share registry, Abax Corporate Administrators Ltd, 6th floor, Tower A, 1 Cybercity, Ebène, Mauritius at latest on Thursday 26 June 2014 at 10.00 hours and in default, the instru¬ment of proxy shall not be treated as valid.
(c) The notice for casting a postal vote must be made in writing on the attached form and sent to the attention of Mrs. Nisha Proag-Dookun, the person authorized by the board of directors of the Company to receive and count the postal votes at the Annual Meeting. The document should reach the share registry, Abax Corporate Administrators Ltd, 6th floor, Tower A, 1 Cybercity, Ebène, Mauritius at latest on Wednesday 25 June 2014 at 10.00 hours, and in default, the notice of postal vote shall not be treated as valid.
(d) For the purpose of this Meeting, the Directors have resolved, in compliance with section 120 of the Companies Act 2001, that the shareholders who are entitled to receive notice and vote at the Meeting, shall be those shareholders whose names are registered in the share register of the Company as at 5 June 2014.

4 leoville l’homme streetport louis, mauritius
tel 230 207 5500fax 230 212 2962
www.mauritiusuniongroup.com BRN c07000714
Copyright © 2022 FDOKUMEN