High Dietary Lipid Level Is Associated with Persistent Hyperglycaemia and Downregulation of Muscle...
11
High Dietary Lipid Level Is Associated with Persistent Hyperglycaemia and Downregulation of Muscle Akt- mTOR Pathway in Senegalese Sole (Solea senegalensis) Pedro Borges 1,2 , Luı´sa M. P. Valente 1 , Vincent Ve ´ ron 2 , Karine Dias 2 , Ste ´ phane Panserat 2 , Franc ¸oise Me ´ dale 2 * 1 CIMAR/CIIMAR, Centro Interdisciplinar de Investigac ¸a ˜o Marinha e Ambiental and ICBAS, Instituto de Cie ˆncias Biome ´dicas de Abel Salazar, Universidade do Porto, Porto, Portugal, 2 INRA-UR 1067 Nutrition Me ´tabolisme Aquaculture, Po ˆ le Hydrobiologie, Saint Pe ´ e-sur-Nivelle, France Abstract High levels of dietary lipids are incorporated in feeds for most teleost fish to promote growth and reduce nitrogen waste. However, in Senegalese sole (Solea senegalensis) previous studies revealed that increasing the level of dietary lipids above 8% negatively affect growth and nutrient utilization regardless of dietary protein content. It has been shown that glucose regulation and metabolism can be impaired by high dietary fat intake in mammals, but information in teleost fish is scarce. The aim of this study was to assess the possible effect of dietary lipids on glucose metabolism in Senegalese sole with special emphasis on the regulation of proteins involved in the muscle insulin-signalling pathway. Senegalese sole juveniles (29 g) were fed two isonitrogenous diets (53% dry matter) for 88 days. These two diets were one with a high lipid level (,17%, HL) and a moderate starch content (,14%, LC), and the other being devoid of fish oil (4% lipid, LL) and with high starch content (,23%, HC). Surprisingly, feeding Senegalese sole the HL/LC diet resulted in prolonged hyperglycaemia, while fish fed on LL/HC diet restored basal glycaemia 2 h after feeding. The hyperglycaemic phenotype was associated with greater glucose-6-phosphatase activity (a key enzyme of hepatic glucose production) and lower citrate synthase activity in the liver, with significantly higher liver glycogen content. Sole fed on HL/LC diet also had significantly lower hexokinase activity in muscle, although hexokinase activity was low with both dietary treatments. The HL/LC diet was associated with significant reductions in muscle AKT, p70 ribosomal S6-K1 Kinase (S6K-1) and ribosomal protein S6 (S6) 2 h after feeding, suggesting down regulation of the AKT-mTOR nutrient signalling pathway in these fish. The results of this study show for the first time that high level of dietary lipids strongly affects glucose metabolism in Senegalese sole. Citation: Borges P, Valente LMP, Ve ´ron V, Dias K, Panserat S, et al. (2014) High Dietary Lipid Level Is Associated with Persistent Hyperglycaemia and Downregulation of Muscle Akt-mTOR Pathway in Senegalese Sole (Solea senegalensis). PLoS ONE 9(7): e102196. doi:10.1371/journal.pone.0102196 Editor: Ayyalasomayajula Vajreswari, National Institute of Nutrition, India Received December 17, 2013; Accepted June 16, 2014; Published July 18, 2014 Copyright: ß 2014 Borges et al. This is an open-access article distributed under the terms of the Creative Commons Attribution License, which permits unrestricted use, distribution, and reproduction in any medium, provided the original author and source are credited. Funding: The present study was supported by Fundac ¸a ˜o para a Cie ˆncia e Tecnologia of Portugal (PhD grant SFRH/BD/47780/2008). The funders had no role in study design, data collection and analysis, decision to publish, or preparation of the manuscript. Competing Interests: The authors have declared that no competing interests exist. * Email: [email protected] Introduction The main functions of dietary lipids are energy provision and storage in body compartments as energy reserves [1]. High levels of dietary lipids are incorporated in feeds for most teleost fish to promote growth and reduce nitrogen waste [2]. However, the Senegalese sole is a lean fish with atypical lipid metabolism, due to the limited capacity to utilize or store dietary lipids (less than 7% wet weight basis). Previous studies revealed that increasing the level of dietary lipids above 8% negatively affect growth performance and nutrient utilization, resulting in decreased protein accretion and slower growth rate [3]. It was initially hypothesized that the results obtained might be linked to the high dietary protein level incorporated into the diets (56% of dry matter - DM). However, further research demonstrated that even below the dietary protein requirement, increasing dietary lipid levels did not promote better protein retention or growth performance [4], despite the fact that Senegalese sole can digest and absorb dietary lipids efficiently [5]. Surprisingly, the diets with low fat content, but rich in dietary starch enhanced PFK-1 activity in the muscle [4], suggesting the potential use of carbohydrates as a non-protein energy source in this species. There has been considerable debate over the years about the limited ability of carnivorous teleost fish to utilize dietary carbohydrates efficiently, and impaired control of plasma glucose levels, leading to glucose intolerance in such species [6]. Despite having all the metabolic pathway to utilize dietary carbohydrates [7], carnivorous fish in general cannot tolerate more than 20% of dietary carbohydrates without adverse effects on growth perfor- mance and feed utilization [8,9]. However, carbohydrates can be used as a valuable source of energy to some extent. No effects on growth performance were reported in Solea senegalensis fed 11% or 19% dietary carbohydrates, regardless of the nature of carbohydrates (raw or extruded starch) or dietary lipid level (11 and 21%) [10]. It was recently suggested [11] that protein content could be reduced from 55% to 45% by increasing dietary starch from 8.6% to 19.6%, indicating efficient use of carbohydrates as a non-protein energy source in this species. However, the mecha- nisms remain to be explained that allow Solea senegalensis, a lean fish with low capacity to utilize or store dietary lipids, to achieve PLOS ONE | www.plosone.org 1 July 2014 | Volume 9 | Issue 7 | e102196
-
Upload
independent -
Category
Documents
-
view
1 -
download
0
Transcript of High Dietary Lipid Level Is Associated with Persistent Hyperglycaemia and Downregulation of Muscle...

High Dietary Lipid Level Is Associated with PersistentHyperglycaemia and Downregulation of Muscle Akt-mTOR Pathway in Senegalese Sole (Solea senegalensis)Pedro Borges1,2, Luısa M. P. Valente1, Vincent Veron2, Karine Dias2, Stephane Panserat2,
Francoise Medale2*
1 CIMAR/CIIMAR, Centro Interdisciplinar de Investigacao Marinha e Ambiental and ICBAS, Instituto de Ciencias Biomedicas de Abel Salazar, Universidade do Porto, Porto,
Portugal, 2 INRA-UR 1067 Nutrition Metabolisme Aquaculture, Pole Hydrobiologie, Saint Pee-sur-Nivelle, France
Abstract
High levels of dietary lipids are incorporated in feeds for most teleost fish to promote growth and reduce nitrogen waste.However, in Senegalese sole (Solea senegalensis) previous studies revealed that increasing the level of dietary lipids above8% negatively affect growth and nutrient utilization regardless of dietary protein content. It has been shown that glucoseregulation and metabolism can be impaired by high dietary fat intake in mammals, but information in teleost fish is scarce.The aim of this study was to assess the possible effect of dietary lipids on glucose metabolism in Senegalese sole withspecial emphasis on the regulation of proteins involved in the muscle insulin-signalling pathway. Senegalese sole juveniles(29 g) were fed two isonitrogenous diets (53% dry matter) for 88 days. These two diets were one with a high lipid level(,17%, HL) and a moderate starch content (,14%, LC), and the other being devoid of fish oil (4% lipid, LL) and with highstarch content (,23%, HC). Surprisingly, feeding Senegalese sole the HL/LC diet resulted in prolonged hyperglycaemia,while fish fed on LL/HC diet restored basal glycaemia 2 h after feeding. The hyperglycaemic phenotype was associated withgreater glucose-6-phosphatase activity (a key enzyme of hepatic glucose production) and lower citrate synthase activity inthe liver, with significantly higher liver glycogen content. Sole fed on HL/LC diet also had significantly lower hexokinaseactivity in muscle, although hexokinase activity was low with both dietary treatments. The HL/LC diet was associated withsignificant reductions in muscle AKT, p70 ribosomal S6-K1 Kinase (S6K-1) and ribosomal protein S6 (S6) 2 h after feeding,suggesting down regulation of the AKT-mTOR nutrient signalling pathway in these fish. The results of this study show forthe first time that high level of dietary lipids strongly affects glucose metabolism in Senegalese sole.
Citation: Borges P, Valente LMP, Veron V, Dias K, Panserat S, et al. (2014) High Dietary Lipid Level Is Associated with Persistent Hyperglycaemia andDownregulation of Muscle Akt-mTOR Pathway in Senegalese Sole (Solea senegalensis). PLoS ONE 9(7): e102196. doi:10.1371/journal.pone.0102196
Editor: Ayyalasomayajula Vajreswari, National Institute of Nutrition, India
Received December 17, 2013; Accepted June 16, 2014; Published July 18, 2014
Copyright: � 2014 Borges et al. This is an open-access article distributed under the terms of the Creative Commons Attribution License, which permitsunrestricted use, distribution, and reproduction in any medium, provided the original author and source are credited.
Funding: The present study was supported by Fundacao para a Ciencia e Tecnologia of Portugal (PhD grant SFRH/BD/47780/2008). The funders had no role instudy design, data collection and analysis, decision to publish, or preparation of the manuscript.
Competing Interests: The authors have declared that no competing interests exist.
* Email: [email protected]
Introduction
The main functions of dietary lipids are energy provision and
storage in body compartments as energy reserves [1]. High levels
of dietary lipids are incorporated in feeds for most teleost fish to
promote growth and reduce nitrogen waste [2]. However, the
Senegalese sole is a lean fish with atypical lipid metabolism, due to
the limited capacity to utilize or store dietary lipids (less than 7%
wet weight basis). Previous studies revealed that increasing the
level of dietary lipids above 8% negatively affect growth
performance and nutrient utilization, resulting in decreased
protein accretion and slower growth rate [3]. It was initially
hypothesized that the results obtained might be linked to the high
dietary protein level incorporated into the diets (56% of dry matter
- DM). However, further research demonstrated that even below
the dietary protein requirement, increasing dietary lipid levels did
not promote better protein retention or growth performance [4],
despite the fact that Senegalese sole can digest and absorb dietary
lipids efficiently [5]. Surprisingly, the diets with low fat content,
but rich in dietary starch enhanced PFK-1 activity in the muscle
[4], suggesting the potential use of carbohydrates as a non-protein
energy source in this species.
There has been considerable debate over the years about the
limited ability of carnivorous teleost fish to utilize dietary
carbohydrates efficiently, and impaired control of plasma glucose
levels, leading to glucose intolerance in such species [6]. Despite
having all the metabolic pathway to utilize dietary carbohydrates
[7], carnivorous fish in general cannot tolerate more than 20% of
dietary carbohydrates without adverse effects on growth perfor-
mance and feed utilization [8,9]. However, carbohydrates can be
used as a valuable source of energy to some extent. No effects on
growth performance were reported in Solea senegalensis fed 11%
or 19% dietary carbohydrates, regardless of the nature of
carbohydrates (raw or extruded starch) or dietary lipid level (11
and 21%) [10]. It was recently suggested [11] that protein content
could be reduced from 55% to 45% by increasing dietary starch
from 8.6% to 19.6%, indicating efficient use of carbohydrates as a
non-protein energy source in this species. However, the mecha-
nisms remain to be explained that allow Solea senegalensis, a lean
fish with low capacity to utilize or store dietary lipids, to achieve
PLOS ONE | www.plosone.org 1 July 2014 | Volume 9 | Issue 7 | e102196

better growth performance when fed diets with low fat (4% DM)
and energy content compared to fish fed diet with high lipid
content (12–20% DM) [3,4]. We therefore, hypothesized that the
observed growth impairment when sole were fed diets with high
lipid content might be linked to the lean nature of this species, and
might result from a metabolic disorder promoted by interaction
between lipids and carbohydrates, as reported in higher
vertebrates [12,13]. Most studies in fish species such as trouthave
been focused on the relationship between dietary carbohydrates
and proteins in the development of impaired glucose regulation
[14,15]. However, the effects of dietary lipid levels on this
phenomenon have not been investigated in detail and no results
are available regarding lean fish.
Panserat et al. [16] reported ten years ago that high lipid diets
induced glucose-6-phosphatase expression, contributing to hyper-
glycaemia. Figueiredo et al. [17] recently reported that diets with
high lipid/high carbohydrate content resulted in prolonged
hyperglycaemia and exogenous insulin resistance in rainbow
trout, similar to that observed in pre-diabetic mammalian subjects.
These authors also observed a significant reduction of insulin
receptor substrate 1 (IRS1) protein content in muscle of trout fed
on the high lipid- diet. IRS proteins are considered to be key
components in the insulin-signalling cascade [18]. Once activated
by insulin binding, insulin receptor (IR), a tyrosine kinase
membrane receptor, phosphorylate IRS, which in turn initiates
numerous downstream cellular responses through several mole-
cules. One such key molecule in the signalling cascade is
phosphatidylinositol 3-kinase (PI3K) that subsequently phosphor-
ylates a number of downstream proteins including AKT, also
known as protein kinase B [19]. The cascade IRS-PI3K-AKT can
phosphorylate mTOR which activates downstream proteins like
ribosomal S6 kinase protein (S6K1) and finally, leads to the
regulation of genes involved in intermediary metabolism, protein
accretion and cell growth, among other functions [20,21,22]. The
AKT-mTOR pathway can be activated by either amino-acids or
insulin in rainbow trout as in mammals and is sensitive to the
dietary protein to carbohydrate ratio. As such, it is considered as a
major nutrient signalling pathway in fish [20,23,24]. However, it
has never been investigated in Senegalese sole. Although the
precise involvement of insulin-signalling defects in the develop-
ment of insulin resistance remains unclear even in mammals, a
reduction of the IRS1 protein content in insulin-sensitive tissues,
like skeletal muscle, has been proposed as one of the mechanisms
inducing insulin resistance in mammals [23] and, more recently, in
trout [24].
Although there is no single metabolic aberration that precedes
hyperglycaemia, the current epidemics of diabetes and obesity are
seemingly related [25] and several studies have been carried out
establishing that high fat intake as one of the causes of the
development of this condition in mammals [26–31]. It was initially
hypothesized that hyperglycaemia resulting from high carbohy-
drate intake by carnivorous fish was due to insufficient insulin
secretion [32]. However, it was later observed that plasma insulin
levels were equal to or higher than mammals [33]. The other
possible causes suggested have been the reduced number of muscle
insulin receptors [34] and the low affinity of glucose to its
transporters [35], as well as a lack of capacity to downregulate liver
gluconeogenic pathways [16], which constitutes one step to
achieving normal glucose homeostasis [36,37].
The purpose of this study was to analyse the consequences of
two isoproteic diets with different lipid/carbohydrate ratios on
plasma metabolites and glucose metabolism of the Sole. Juveniles
of Senegalese sole were fed one of two isonitrogenous diets: the
HL/LC diet had a high lipid level and moderate carbohydrate
content (,17% lipids and ,14% starch DM basis) while the LL/
HC diet had no addition of fish oil however contained high level of
dietary carbohydrates (,4% lipids and ,23% starch DM basis).
At the end of the trial, plasma glucose, triglyceride and lactate
levels were analyzed at different time intervals. Glycogen content
and key glycolytic enzyme activity were measured in the liver and
muscle. Muscle proteins involved in the AKT-mTOR pathway
(the major nutrient signalling pathway) like insulin receptor (IR),
AKT, S6K-1 and S6 were also assayed to assess the impact of
dietary lipid to carbohydrate ratios.
Materials and Methods
Ethics StatementExperiments were conducted by trained scientists (following
FELASA category C recommendations) and carried out in
accordance with the clear boundaries of EU legal frameworks,
specifically those related to the protection of animals used for
scientific purposes (i.e. Directive 2010/63/EU) and under the
Portuguese legislation regarding the protection of animals used for
scientific purposes (Law Nu 113/2013). The study was performed
at the experimental facilities of CIIMAR, Porto, Portugal, certified
for animal experiments by Direccao Geral de Alimentacao e
Veterinaria, which is the competent authority. All procedures used
in this study were approved by the ethics committee of CIIMAR.
The experimental diets met nutritional requirements of flatfish
according to NRC (2011) and fish were sedated with an
anaesthetic before handling.
Experimental dietsTwo experimental diets were formulated to contain 54%
protein (DM basis) and two different levels of lipids (4 and 17%
DM) and starch (14 and 23% DM) (Table 1). Increased lipid level
was achieved by adding fish oil and lowering the amount of wheat
meal, so that the diet with 17% lipids had lower starch content
(14% DM) than the diet with 4% lipids (23% DM). Ingredients
and chemical composition are presented in Table 1. All
ingredients were finely ground, mixed and dry-pelleted (2.0 mm
diameter) without steaming, using a laboratory pelleting machine
(C-300 model; California Pellet Mill, San Francisco, CA, USA).
Experimental conditionsSenegalese sole (Solea senegalensis) juveniles were obtained
from a commercial fish farm (Coelho & Castro, Portugal). After
arrival at the experimental unit, fish were acclimatized to the new
facilities for two weeks. Homogeneous groups of 20 fish (average
initial body weight 2961.7 g; initial density 3.4 kg/m2) were
distributed into six 45 L white fibreglass tanks (50 cm635 cm) and
each diet was tested in triplicate, with 60 individuals in each
dietary treatment. To ensure homogeneity of the groups, fish were
selected according to their weight. Tanks were randomly assigned
to each treatment. Each tank was supplied with filtered, heated
(2061uC) salt water (30%), at a flow rate of 1.5 L min21. Water
parameters (temperature, dissolved O2, salinity, pH and nitroge-
nous compounds) were monitored during the entire trial and
maintained at levels within limits recommended for marine
species. Fish were exposed to an artificial photoperiod of 12 h
light. At the beginning and end of the experiment, individual
weights and lengths of fish were recorded. Fish were fed ad libitumsix to eight meals a day (24 h) by automatic feeders over a period
of 88 days. All tanks were monitored daily and feed distribution
adjusted based on feed losses in each tank [3].
Ten fish from the initial stock and three fish per tank, at the end
of the trial were sampled and stored at 220u for subsequent whole
Dietary Lipid and Glucose Metabolism in Sole
PLOS ONE | www.plosone.org 2 July 2014 | Volume 9 | Issue 7 | e102196
body analysis. Three days before sampling, feed distribution was
reduced to two meals a day to satiation (8 a.m. and 20 p.m.) to
ensure that all fish would have eaten on the sampling day and that
plasma glucose levels could be assessed up to 16 hours after
feeding, without being affected by the previous meal. The last meal
before sampling was delivered in the morning (8 a.m.). Three fish
per tank were then sampled at different time intervals after the
meal (0.5, 1, 2, 5, 9, 12 and 16 h after feeding). All fish were
randomly selected for subsequent analysis. Fish were anaesthetized
with MS-222 (200 mg/L) to achieve stage II of anaesthesia and
only sampled when they did not respond to stimulus (,3 min to be
completely anesthetized). Blood samples were taken from the
caudal vein, using syringes (1 ml) containing 20 mL EDTA 2%
and plasma was obtained after centrifugation (50006g for 5 min at
4uC) and stored at 280uC pending analysis of glucose, lactate and
triglyceride levels. After blood collection, fish were sacrificed by
decapitation and intestinal contents were examined to check
whether they had eaten. Whole livers and samples from the
anterior part of the white muscle were collected five hours after
feeding to determine glycogen content. For enzymatic assays, liver
and muscle were collected 16 h after feeding to assess the possible
effect of the dietary treatments. For Western Blot analysis, muscle
was collected both at 2 h, to assess AKT-mTOR signal
transduction, when it peaks (short term regulation) [24], and also
16 h after feeding, when enzyme activities were also measured. All
samples were frozen in liquid nitrogen immediately after dissection
and kept at 280uC.
Analytical methodsWhole fish from each tank were ground and pooled, and
moisture content was measured (105uC for 24 h). Fish were
subsequently freeze-dried, before further analysis. Feed and whole
body samples were analyzed for dry matter (105uC for 24 h), ash
by combustion in a muffle furnace (Nabertherm L9/11/B170;
Bremen, Germany; 550uC for 6 h), crude protein by automatic
flash combustion (Leco FP-528, Leco, St. Joseph, USA; N66.25),
lipid content by petroleum ether extraction, using a Soxtherm
Multistat/SX PC (Gerhardt, Konigswinter, Germany; 150uC)
(feed and whole body samples only), and gross energy in an
adiabatic bomb calorimeter (Werke C2000; IKA, Staufen,
Germany).
Liver and muscle glycogen levels were determined following the
method of Keppler et al. [38]. Hexokinase (HK; EC 2.7.1.1) and
glucokinase (GK; EC 2.7.1.2) activities were determined as
previously described [16] and PFK-1 (EC 2.7.1.11) activity was
assayed as described in Borges et al. [4]. To assess citrate synthase
and glucose-6-phophatase activities, tissues were homogenized by
ultrasonic disruption in 9 vol of ice-cold buffer containing
50 mmol/L Tris (pH 7.6), 5 mmol/l EDTA, 2 mmol/L 1,4-
dithiothreitol, and a protease inhibitor cocktail (Sigma, St. Louis,
MO; P-2714). The homogenate was centrifuged, and the
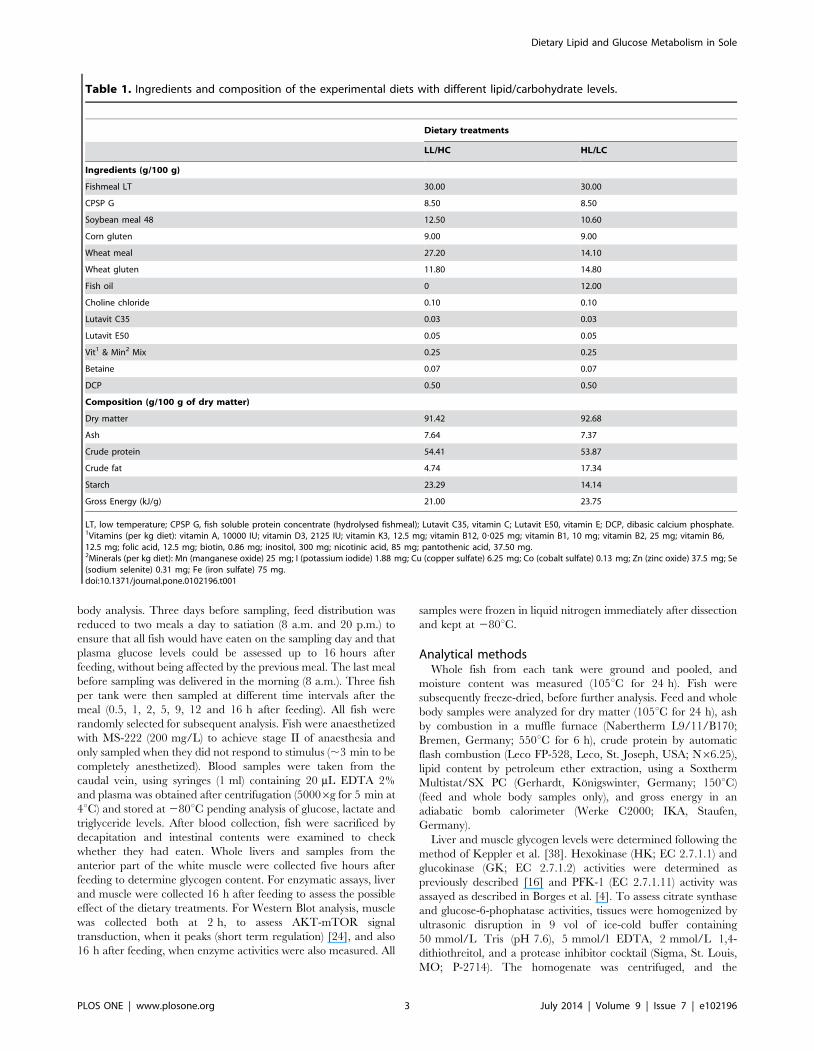
Table 1. Ingredients and composition of the experimental diets with different lipid/carbohydrate levels.
Dietary treatments
LL/HC HL/LC
Ingredients (g/100 g)
Fishmeal LT 30.00 30.00
CPSP G 8.50 8.50
Soybean meal 48 12.50 10.60
Corn gluten 9.00 9.00
Wheat meal 27.20 14.10
Wheat gluten 11.80 14.80
Fish oil 0 12.00
Choline chloride 0.10 0.10
Lutavit C35 0.03 0.03
Lutavit E50 0.05 0.05
Vit1 & Min2 Mix 0.25 0.25
Betaine 0.07 0.07
DCP 0.50 0.50
Composition (g/100 g of dry matter)
Dry matter 91.42 92.68
Ash 7.64 7.37
Crude protein 54.41 53.87
Crude fat 4.74 17.34
Starch 23.29 14.14
Gross Energy (kJ/g) 21.00 23.75
LT, low temperature; CPSP G, fish soluble protein concentrate (hydrolysed fishmeal); Lutavit C35, vitamin C; Lutavit E50, vitamin E; DCP, dibasic calcium phosphate.1Vitamins (per kg diet): vitamin A, 10000 IU; vitamin D3, 2125 IU; vitamin K3, 12.5 mg; vitamin B12, 0?025 mg; vitamin B1, 10 mg; vitamin B2, 25 mg; vitamin B6,12.5 mg; folic acid, 12.5 mg; biotin, 0.86 mg; inositol, 300 mg; nicotinic acid, 85 mg; pantothenic acid, 37.50 mg.2Minerals (per kg diet): Mn (manganese oxide) 25 mg; I (potassium iodide) 1.88 mg; Cu (copper sulfate) 6.25 mg; Co (cobalt sulfate) 0.13 mg; Zn (zinc oxide) 37.5 mg; Se(sodium selenite) 0.31 mg; Fe (iron sulfate) 75 mg.doi:10.1371/journal.pone.0102196.t001
Dietary Lipid and Glucose Metabolism in Sole
PLOS ONE | www.plosone.org 3 July 2014 | Volume 9 | Issue 7 | e102196

supernatant was used immediately for enzyme assays. Citrate
synthase (CS; EC 4.1.3.7) was measured according to Singer et al.
[39] by following the reduction of DTNB at 412 nm. G6Pase was
measured according to Alegre et al. [40], monitoring the increase
in absorbance (NADH production), using glucose dehydrogenase
(Sigma) in excess, as the coupling enzyme. One unit of enzyme
activity was defined as the amount of enzyme that catalyzed the
hydrolysis of 1 mmol of substrate per minute under the specified
conditions. Enzyme activity was expressed per mg of soluble
protein. Protein concentration was measured according to
Bradford’s method [41], using a protein assay kit (Bio Rad,
Munchen, Germany) with bovine serum albumin as standard.
For Western blotting, individual muscle samples (300 mg) were
homogenized on ice with an Ultraturrax homogenizer in 9 vol of
buffer containing 150 mmol/L NaCl, 10 mmol/L Tris, 1 mmol/
L EGTA, 1 mmol/L EDTA (pH 7.4), 100 mmol/L sodium
fluoride, 4 mmol/L sodium pyrophosphate, 2 mmol/L sodium
orthovanadate, 1% Triton X-100, 0.5% NP-40-IGEPAL and a
protease inhibitor cocktail (Roche, Basel, Switzerland). Homoge-
nates were centrifuged for 15 min at 12,000g and the resulting
supernatant were stored at 280uC. Protein concentrations were
determined, using the Bio-Rad protein assay kit (BIO-RAD,
Hercules, CA, USA). Protein lysates (40 mg of protein) were
subjected to SDS–PAGE and Western blotting using anti-IR, anti-
phospho-AKT, anti-phospho-S6K1 and anti-phospho-S6. After
washing, membranes were incubated with an IRDye infrared
secondary antibody (Li-COR Inc. Biotechnology, Lincoln, NE,
USA). Bands were visualized by Infrared Fluorescence, using the
Odyssey Imaging System (Li-COR Inc. Biotechnology, Lincoln,
NE, USA) and quantified by Odyssey infrared imaging system
software (Application Software, version 1.2). Gels were then
stripped and total protein forms and B tubulin were quantified to
normalize protein expression.
Statistical analysisStatistical analyses followed the methods outlined by Zar [42].
All data were tested for homogeneity of variances by Leven’s tests,
and then submitted to one-way ANOVA at each sampling point or
to two-way ANOVA with time and diet as independent variables.
When diet x time interactions were significant (P#0?05),
individual means were compared using Tukey’s test. For growth
performance data (Table 2) the experimental unit was the tank,
after pooling 3 fish (3/20), and for the remaining analysis, the
experimental unit was individual fish. All data were analysed using
IBM SPSS statistics version 19 (IBM Corp., New York, USA).
Differences were considered significant when P,0.05.
Results
Data on weight gain, feed efficiency, nutrient intake and gain
and whole body composition of Senegalese sole fed the two diets
for 88 days are presented in Table 2. Weight gain and daily
growth index were similar with both dietary treatments, although
sole fed on LL/HC diet reached a slightly higher final weight than
those fed on HL/LC diet. Protein and energy intake were similar
between treatments however lipid and starch intake were
significantly different due to difference in feed formulae (p,
0.05). As expected, fish fed on HL/LC diet had a higher lipid
intake than those fed on LL/HC diet (1.78 vs 0.48), whereas the
opposite was recorded for starch intake (HL/LC = 1.45 and LL/
HC = 2.38). Protein gain was significantly higher in fish fed the
LL/HC diet and no significant differences were recorded for lipid
gain, although the value was slightly higher in fish fed the HL/LC
diet. In accordance with protein and lipid gain, whole body
protein was higher with the LL/HC diet compared to the HL/LC
diet and the inverse was recorded for whole body lipid gain.
Two-way ANOVA was conducted to examine the effects of
dietary treatment and postprandial time on plasma triglyceride
(Fig. 1A), glucose (Fig. 1B) and lactate (Fig. 1C) concentrations. In
general, there was a significant interaction between the effects of
dietary treatment and postprandial time for all three parameters
analysed. Plasma triglyceride levels were higher in the HL/LC
than in LL/HC treatment, although diet-induced differences were
only significant at 5 and 16 h after the meal. Glucose plasma levels
peaked between 1 and 2 hours after feeding. The HL/LC diet
resulted in persistent elevated plasma glucose levels from 1 h until
5 h after feeding, while glucose levels decreased one hour after
reaching the peak in fish fed the LL/HC diet, despite larger
carbohydrate intake. Despite the interaction observed, plasma
lactate levels did not present any differences between treatments
due to wide individual variations.
Liver glycogen content (Fig. 2A) was significantly higher in fish
fed on HL/LC diet, while glycogen levels in the muscle (Fig. 2B)
were not affected by dietary treatments. GK and HK activity in
the liver (Table 3) were comparable, irrespective of dietary
treatment. On the other hand, G6Pase activity was significantly
higher in fish fed the HL/LC diet compared to those fed the LL/
HC diet, whereas CS was down-regulated. Muscle-HK activity
was significantly higher in fish fed on LL/HC diet compared to
those fed on HL/LC diet. Muscle PFK and CS activities were
comparable between treatments.
No significant differences were found with regards to muscle IR
content (Fig. 3A), irrespective of dietary treatment or sampling
time. There was a significant interaction between the effects of
dietary treatment and postprandial time on muscle AKT. AKT
phosphorylation status (Fig. 3B) was increased approximately 2-3
fold, 2 h after feeding on LL/HC diet, although no differences
were noted in the total AKT content. Sixteen hours after feeding,
AKT phosphorylation status on LL/HC diet decreased to values
close to those with the HL/LC diet. For both S6K1 (Fig. 3C) and
S6 (Fig. 3D), there was a significant interaction between the effects
of dietary treatment and postprandial time. The results clearly
demonstrated that this pathway was more active 2 h after feeding
than sixteen hours after feeding, and phosphorylation status of
these proteins clearly increased 2 h after feeding the LL/HC diet.
Discussion
The decrease in dietary lipid to carbohydrate ratio (LL/HC
diet) promoted higher protein gain and a slight increase in growth,
when compared to the high fat to low carbohydrate ratio (HL/LC
diet). From our first report [3] until now, several studies have
reported lower or similar growth performance in Senegalese solejuveniles fed on high lipid diets, compared to low lipid diets, with
no advantage to growth performance following the inclusion of fat
as a non-protein energy source [4,10,43,44]. By contrast, in other
carnivorous species, high fat diets have been reported to promote
better growth [45–48], although mostly due to increased fat
deposition. In the sole, the HL/LC diet also increased whole body
fat content, however decreased whole body protein and protein
gain, as in previous studies, where similar lipid levels were tested
[3,4,43]. Plasma triglyceride levels reflected the difference in lipid
content of both diets. Five hours after the meal, the HL/LC diet
resulted in higher plasma triglyceride level than the LL/HC diet,
which seems to be the peak of lipid absorption in this species [5].
Compared to lipids, the use of carbohydrates, as energy source in
teleost fish is limited [8,49,50]. It was recently reported that
dietary protein could be reduced from 55% to 45%, through an
Dietary Lipid and Glucose Metabolism in Sole
PLOS ONE | www.plosone.org 4 July 2014 | Volume 9 | Issue 7 | e102196

Ta
ble
2.
Effe
cts
of
LL/H
Co
rH
L/LC
die
to
nSe
ne
gal
ese
sole
gro
wth
,in
take
and
nu
trie
nt
gai
nan
dw
ho
leb
od
yco
mp
osi
tio
n.
Die
tary
tre
atm
en
ts
LL
/HC
HL
/LC
Gro
wth
Init
ial
bo
dy
we
igh
t(g
)2
9.2
16
0.7
42
9.0
46
0.8
3
We
igh
tG
ain
(g)
29
.76
61
.63
26
.40
62
.10
Dai
lyG
row
thIn
de
x(D
GI)
0.9
26
0.0
50
.84
60
.06
Fee
de
ffic
ien
cy(F
E)0
.75
60
.06
0.6
96
0.0
5
Inta
ke
(go
rk
j/A
BW
Kg
/da
y)
Pro
tein
5.5
66
0.4
05
.54
60
.45
Lip
ids
0.4
86
0.0
3b
1.7
86
0.1
4a
Star
ch2
.38
60
.17
a1
.45
60
.12
b
Ene
rgy
(kj)
21
4.6
36
15
.34
24
0.0
66
19
.85
Ga
in(g
/Kg
/da
y)
Pro
tein
1.6
76
0.0
4a
1.0
96
0.0
8b
Lip
ids
0.3
26
0.1
40
.50
60
.10
Wh
ole
bo
dy
com
po
siti
on
(%W
W)
Pro
tein
19
.22
60
.27
a1
8.1
66
0.3
5b
Lip
ids
4.8
06
1.0
2b
7.1
86
0.8
8a
Re
sult
sar
ee
xpre
sse
das
me
ans
6SD
(n=
3).
Dat
aw
ere
sub
mit
ted
toa
on
ew
ayA
NO
VA
.a-
bM
ean
valu
es
wit
hin
aro
ww
ith
dif
fere
nt
sup
ers
crip
tle
tte
rsw
ere
sig
nif
ican
tly
dif
fere
nt
(P0
?05
).D
GI,
dai
lyg
row
thin
de
x;FE
,fe
ed
eff
icie
ncy
;A
BW
,av
era
ge
bo
dy
we
igh
t.D
GI=
10
06((
fin
alb
od
yw
eig
ht)
1/3
-(i
nit
ial
bo
dy
we
igh
t)1
/3)/
day
s.FE
=w
eig
ht
gai
n/d
ryfe
ed
inta
ke.N
utr
ien
tin
take
=n
utr
ien
tin
take
/ave
rag
eb
od
yw
eig
ht
((in
itia
lb
od
yw
eig
ht+
fin
alb
od
yw
eig
ht)
/2)/
day
s.W
W=
we
tw
eig
ht
do
i:10
.13
71
/jo
urn
al.p
on
e.0
10
21
96
.t0
02
Dietary Lipid and Glucose Metabolism in Sole
PLOS ONE | www.plosone.org 5 July 2014 | Volume 9 | Issue 7 | e102196

increase in starch level in diets with high lipid levels (16%),
suggesting good use of carbohydrates in this species [11]. In the
present study, the LL/HC diet led to better overall growth
performance. Despite having a starch level slightly higher than
recommended for carnivorous species (less than 20%), fish fed this
diet re-established plasma glucose levels two hours after feeding.
On the other hand, the HL/LC diet resulted in typical
hyperglycaemic phenotype of fish fed on carbohydrates, despite
supplying lower amount of starch than the LL/HC diet.
Increasing lipid content to promote a protein sparing effect, has
become a common practice in fish nutrition. Although there are a
few studies linking dietary fat intake to carbohydrate metabolism
in fish species, some authors have reported that diets with high
lipid content can also induce hyperglycaemia [17,51–53].
The observed development of hyperglycaemic phenotype in fish
fed on HL/LC diet could be due to dietary lipid content, as these
fish regulated plasma glucose homeostasis less efficiently than fish
fed the LL/HC diet (higher starch and lower lipid intakes). These
results are in general accordance with the observations in higher
mammals, where higher dietary fat intake and higher plasma
triglyceride levels result in impaired glucose tolerance [27,54,55].
In addition to the higher plasma glucose levels, HL/LC diet
affected liver glycogen content. Glycogen content in mammalian
liver can vary as much as two-fold during the day, increasing from
breakfast (the lowest point) until 4–5 hours after dinner [56]. In
the present study, at 5 hours after the meal, the HL/LC diet
resulted in increased liver glycogen content associated with
hyperglycaemia, as also previously reported in rainbow trout
[16,17] and sea bream [57]. The pathways involved in this
phenomenon do not seem to be regulated in the same way as in
higher vertebrates, since in the latter hyperglycaemia is accom-
panied by lower glycogen levels [58].
Regulation of gluconeogenesis (endogenous glucose production)
and glycolysis is coordinated, so that when one of the pathways is
active the other is relatively inactive. The liver participates in
blood glucose homeostasis by regulating glucose storage and
utilization (energy production) and gluconeogenesis according to
metabolic state. When glucose is taken up, it is phosphorylated and
enters either the glycolysis or glycogen synthesis pathway. In
Senegalese sole, liver glucokinase activity, the first step of glycolysis,
was similar with both treatments, whereas G6Pase (last step of
glucose production) was up-regulated in fish fed HL/LC diet,
contributing possibly to the hyperglycaemia. Gluconeogenesis in
Senegalese sole fed on high protein/low starch diet was higher
compared to a low protein/high starch diet and this was attributed
to increased protein supply throught diet [11]. However, in the
latter study, diets were isolipidic. In studies on rainbow trout
wherein a possible interaction between dietary lipids and glucose
utilization was evaluated, high lipid-diets did not cause such a
response with regard to G6Pase [16,17]. In contrast to the results
obtained in the present study, protein intake was significantly
greater with low fat diets, probably inducing G6Pase up-regulation
[15].
Moreover, the activity of mitochondrial citrate synthase was
lower in the HL/LC group than in the LL/HC group, suggesting
that oxidative phosphorylation in the liver was less active in fish
fed on HL/LC diet. It was observed that liver citrate synthase and
oxygen consumption were comparable in obese and lean zucker
rats [59]. However, recent findings have shown that impaired
oxidative phosphorylation mechanisms in muscle mitochondria
might be responsible for insulin resistance and resultant hypergly-
caemia [60–62].
In brown trout (Salmo truta), white muscle is the main tissue
responsible for glucose disposal after carbohydrate intake,
although only 50% of glucose is taken up 10 h after feeding
[63]. In contrast, mammals take only two hours after feeding to
uptake 85% of the glucose absorbed [64]. Nonetheless, it was
observed in brown trout that most of the glucose taken up was
Figure 1. Postprandial plasma triglycerides (A), glucose (B) andlactate (C) of fish fed LL/HC or HL/LC diet (n = 9). Data weresubmitted to a two way ANOVA.doi:10.1371/journal.pone.0102196.g001
Dietary Lipid and Glucose Metabolism in Sole
PLOS ONE | www.plosone.org 6 July 2014 | Volume 9 | Issue 7 | e102196

Figure 2. Liver (A) and muscle (B) glycogen of fish fed LL/HC or HL/LC diet (n = 9). Data were submitted to a one way ANOVA.doi:10.1371/journal.pone.0102196.g002
Dietary Lipid and Glucose Metabolism in Sole
PLOS ONE | www.plosone.org 7 July 2014 | Volume 9 | Issue 7 | e102196

phosphorylated despite low hexokinase activity. In the present
study, hexokinase was up-regulated in sole fed on LL/HC diet, but
no significant diet-induced effects were found for PFK-1 or citrate
synthase. Borges et al. [4] reported that PFK-1 activity, one of the
early rate-limiting steps of glycolysis [65,66], was up-regulated in
fish fed diets with low fat level in combination with low protein
and high starch content. The disparity in the results can be
attributed to the differences in the starch contents (lower in the
present study) and sampling time (6 h vs 16 h in the present study),
resulting in almost 50% reduction in the activity of this enzyme
(,1000 vs ,550 mU/mg protein). In contrast to liver, muscle
citrate synthase activity was not affected by the dietary treatments.
As stated earlier, several studies have reported mitochondrial
oxidative dysfunction in subjects with impaired glucose tolerance
and insulin resistance, although down-regulation of citrate
synthase activity was only detected in in vitro myocyte culture
[61].
Despite the lack of significant difference in muscle glycogen
content, the HL/LC diet reduced the levels of phosphorylated
AKT, S6K1 and S6. It is well known that AKT, S6K1 and S6 can
be activated by amino acids [21,24,67]. However, in the present
study protein intake was similar with both diets, suggesting that
amino acids are not responsible for the depression of the insulin
signalling pathway recorded in the fish fed the HL/LC diet. The
insulin receptor (IR) level was similar with both diets, but the diet-
induced changes in downstream events two hours after feeding
suggested a different level of interaction between IR and its ligand
(insulin or insulin growth factor 1). There are several similarities in
insulin receptors of fish and mammals [34], and similar responses
are triggered upon ligand-receptor interaction [68–71]. The
receptor-ligand interaction is the beginning of a network of
possible responses that depend on the crosstalk between pathways.
According to Taniguchi et al. [72], AKT is involved at a critical
stage in the insulin signalling pathway. After upstream activation
(insulin receptor (IR)/insulin receptor substrate), AKT phosphor-
ylation can initiate the signalling of the family of proteins involved
in cytoskeletal re-organization that is required for the translocation
of glucose transporter GLUT4, promoting greater glucose uptake.
Although not conclusive, the impaired glycaemic regulation
observed in HL/LC group may be due to defective signalling of
skeletal muscle insulin, explaining to some extent the observed
lower protein gain in fish fed HL/LC diet.
On the contrary, the higher level of AKT phosphorylation
observed with LL/HC diet compared to HL/LC diet led to
downstream activation of S6K1 and S6, the major indicators of
the mTOR (nutrient) signalling cascade, which is involved in
growth and nutrient sensing. In Senegalese sole, apart from IGF
findings [73], there are no studies relating insulin and carbohy-
drate utilization. Although it has not been possible to accurately
quantify circulating insulin levels in the sole, we found that the
muscle levels of phosphorylated AKT, S6K1 and S6 were
increased in the group fed on high carbohydrates diet. Given
the observation that plasma glucose levels were normalized to the
basal level along with greater protein gain it appears that
Senegalese sole seemed to cope well with a diet with high starch
level and low lipid level.
Previous studies in Senegalese sole have demonstrated growth
impairment and lower protein accretion in fish fed on high fat
diets. Our study sheds some light on this subject, by demonstrating
a lipid/carbohydrate interaction in the glucose regulatory
pathway. In conclusion, HL/LC diet affected glucose metabolism
leading to prolonged hyperglycaemia, probably by increasing
endogenous glucose production. Data obtained from muscle
support the theory of a possible insulin resistance state as levels
Ta
ble
3.
Act
ivit
ies
(mU
/mg
of
pro
tein
)o
fliv
er
He
xoki
nas
e(H
K),
Glu
coki
nas
e(G
K),
Glu
cose
-6-p
ho
sph
atas
e(G
6P
ase
)an
dC
itra
tesy
nth
ase
(CS)
and
mu
scle
HK
,ph
osp
ho
fru
cto
kin
ase
-1
(PFK
-1)
and
CS
16
haf
ter
fee
din
gLL
/HC
or
HL/
LCd
iet.
LL
/HC
HL
/LC
Liv
er
HK
1.2
60
.89
2.5
66
1.9
2
GK
6.9
86
4.6
11
0.4
16
2.9
9
G6
Pa
se3
9.7
96
7.6
6b
50
.17
63
.94
a
CS
26
.77
61
5.5
6b
13
.99
65
.07
a
Mu
scle
HK
1.9
86
0.7
a1
.46
0.3
6b
PF
K-1
53
9.9
56
37
8.0
66
87
61
91
CS
17
.78
36
4.7
24
51
5.9
96
4.3
8
Re
sult
sar
ee
xpre
sse
das
me
ans
6SD
(n=
9).
Dat
aw
ere
sub
mit
ted
toa
on
ew
ayA
NO
VA
.a-b
Me
anva
lue
sw
ith
ina
row
wit
hd
iffe
ren
tsu
pe
rscr
ipt
lett
ers
we
resi
gn
ific
antl
yd
iffe
ren
t(P
,0?0
5).
do
i:10
.13
71
/jo
urn
al.p
on
e.0
10
21
96
.t0
03
Dietary Lipid and Glucose Metabolism in Sole
PLOS ONE | www.plosone.org 8 July 2014 | Volume 9 | Issue 7 | e102196

of several major proteins involved in the insulin and nutrient
signalling pathway were reduced in fish fed on high fat diet.
Results suggested that starch may be a valuable source of energy in
Senegalese sole diets.
Author Contributions
Conceived and designed the experiments: PB FM SP LMPV. Performed
the experiments: PB VV KD. Analyzed the data: PB. Contributed
reagents/materials/analysis tools: KD VV. Wrote the paper: PB FM SP
LMPV.
References
1. Tocher DR (2003) Metabolism and functions of lipids and fatty acids in teleost
fish. Rev Fish Sci 11: 107–184.
2. Cho CY, Hynes JD, Wood KR, Yoshida HK (1994) Development of high-
nutrient-dense, low-pollution diets and prediction of aquaculture wastes using
biological approaches. Aquaculture 124: 293–305.
3. Borges P, Oliveira B, Casal S, Dias J, Conceicao L, et al. (2009) Dietary lipid
level affects growth performance and nutrient utilisation of Senegalese sole (Soleasenegalensis) juveniles. Br J Nutr 102: 1007–1014.
4. Borges P, Medale F, Dias J, Valente LMP (2013) Protein utilisation and
intermediary metabolism of Senegalese sole (Solea senegalensis) as a function of
protein:lipid ratio. Br J Nutr 109: 1373–1381.
5. Borges P, Medale F, Veron V, Pires MdA, Dias J, et al. (2013) Lipid digestion,
absorption and uptake in Solea senegalensis. Comp Biochem Physiol Part A Mol
Integr Physiol 166: 26–35.
6. Moon TW (2001) Glucose intolerance in teleost fish: fact or fiction? Comp
Biochem Physiol B Biochem Mol Biol 129: 243–249.
7. Enes P, Panserat S, Kaushik S, Oliva-Teles A (2009) Nutritional regulation of
hepatic glucose metabolism in fish. Fish Physiol Biochem 35: 519–539.
Figure 3. Insulin receptor (IR-A) levels and Akt (B), S6K1 (C) and S6 (D) phosphorylation status in muscle of Senegalese sole fed LL/HC or HL/LC diet (n = 6). Results are expressed as the ratio between total protein and reference protein (b-tubulin) for IR and ratio betweenphosphorylated form and total form for the remaining proteins. Representative blots are shown. Data were submitted to a two way ANOVA. Gelswere loaded with 40 mg total protein per lane.doi:10.1371/journal.pone.0102196.g003
Dietary Lipid and Glucose Metabolism in Sole
PLOS ONE | www.plosone.org 9 July 2014 | Volume 9 | Issue 7 | e102196

8. Stone DAJ (2003) Dietary carbohydrate utilization by fish. Rev Fish Sci 11: 337–369.
9. Hemre GI, Sandnes K, Lie O, Torrissen O, Waagbo R (1995) Carbohydratenutrition in Atlantic salmon, Salmo salar L.: Growth and feed utilization. Aquac
Res 26: 149–154.
10. Dias J, Rueda-Jasso R, Panserat S, da Conceicao LEC, Gomes EF, et al. (2004)
Effect of dietary carbohydrate-to-lipid ratios on growth, lipid deposition and
metabolic hepatic enzymes in juvenile Senegalese sole (Solea senegalensis,Kaup). Aquac Res 35: 1122–1130.
11. Guerreiro I, Peres H, Castro C, Perez-Jimenez A, Castro-Cunha M, et al. (2012)Water temperature does not affect protein sparing by dietary carbohydrate in
Senegalese sole (Solea senegalensis) juveniles. Aquac Res 45: 289–298.
12. Randle PJ (1998) Regulatory interactions between lipids and carbohydrates: the
glucose fatty acid cycle after 35 years. Diabetes Metab Rev 14: 263–283.
13. Hue L, Taegtmeyer H (2009) The Randle cycle revisited: a new head for an old
hat. Am J Physiol Endocrinol Metab 297: E578–E591.
14. Kirchner S, Kaushik S, Panserat S (2003) Low protein intake is associated with
reduced hepatic gluconeogenic enzyme expression in rainbow trout (Oncorhyn-chus mykiss). J Nutr 133: 2561–2564.
15. Kirchner S, Seixas P, Kaushik S, Panserat S (2005) Effects of low protein intakeon extra-hepatic gluconeogenic enzyme expression and peripheral glucose
phosphorylation in rainbow trout (Oncorhynchus mykiss). Comp Biochem
Physiol B Biochem Mol Biol 140: 333–340.
16. Panserat S, Perrin A, Kaushik S (2002) High Dietary Lipids Induce Liver
Glucose-6-Phosphatase Expression in Rainbow Trout (Oncorhynchus mykiss).J Nutr 132: 137–141.
17. Figueiredo-Silva AC, Panserat S, Kaushik S, Geurden I, Polakof S (2012) Highlevels of dietary fat impair glucose homeostasis in rainbow trout. J Exp Biol 215:
169–178.
18. White MF (1997) The insulin signalling system and the IRS proteins.
Diabetologia 40: S2–S17
19. Hay N, Sonenberg N (2004) Upstream and downstream of mTOR. Genes Dev
18: 1926.
20. Cheng Z, Tseng Y, White MF (2010) Insulin signaling meets mitochondria in
metabolism. Trends Endocrinol Metab 21: 589–598.
21. Holz MK, Blenis J (2005) Identification of S6 kinase 1 as a novel mammalian
target of rapamycin (mTOR)-phosphorylating kinase. J Biol Chem 280: 26089.
22. Skiba-Cassy S, Lansard M, Panserat S, Medale F (2009) Rainbow troutgenetically selected for greater muscle fat content display increased activation of
liver TOR signaling and lipogenic gene expression. Am. J. Physiol. Regul.Integr. Comp. Physiol. 297, R1421–R1429.
23. Zhande R, Mitchell JJ, Wu J, Sun XJ (2002). Molecular mechanism of insulin-induced degradation of insulin receptor substrate 1. Mol Cell Biol 22: 1016–
1026
24. Seiliez I, Gabillard J-C, Skiba-Cassy S, Garcia-Serrana D, Gutierrez J, et al.
(2008) An in vivo and in vitro assessment of TOR signaling cascade in rainbow
trout (Oncorhynchus mykiss). Am J Physiol Regul Integr Comp Physiol 295:R329–R335.
25. Mokdad AH, Ford ES, Bowman BA, Dietz WH, Vinicor F, et al. (2003)Prevalence of obesity, diabetes, and obesity-related health risk factors, 2001.
JAMA 289: 76–79.
26. Um SH, D’Alessio D, Thomas G (2006) Nutrient overload, insulin resistance,
and ribosomal protein S6 kinase 1, S6K1. Cell Metab 3: 393–402.
27. Bergman RN, Ader M (2000) Free Fatty Acids and Pathogenesis of Type 2
Diabetes Mellitus. Trends Endocrinol Metab 11: 351–356.
28. Ding S, Chi MM, Scull BP, Rigby R, Schwerbrock NMJ, et al. (2010) High-Fat
Diet: Bacteria Interactions Promote Intestinal Inflammation Which Precedesand Correlates with Obesity and Insulin Resistance in Mouse. PLoS One 5:
e12191.
29. Wang Y, Miura Y, Kaneko T, Li J, Qin L-Q, et al. (2002) Glucose intolerance
induced by a high-fat/low-carbohydrate diet in rats. Endocrine 17: 185–191.
30. Wang Y, Wang P-Y, Qin L-Q, Davaasambuu G, Kaneko T, et al. (2003) Thedevelopment of diabetes mellitus in wistar rats kept on a high-fat/low-
carbohydrate diet for long periods. Endocrine 22: 85–92.
31. Hildreth KL, Van Pelt RE, Schwartz RS (2012) Obesity, Insulin resistance and
Alzheimer/’s Disease. Obesity 20: 1549–1557.
32. Palmer TN, Ryman BE (1972) Studies on oral glucose intolerance in fish. J Fish
Biol 4: 311–319.
33. Mommsen TP, Plisetskaya EM (1991) Insulin in Fishes and Agnathans: History,
Structure, and Metabolic Regulation. Rev Aquat Sci 4: 225–259.
34. Planas JV, Mendez E, Banos N, Capilla E, Castillo J, et al. (2000) Fish Insulin,
IGF-I and IGF-II Receptors: A Phylogenetic Approach. Amer Zool 40: 223–233.
35. Dıaz M, Capilla E, Planas JV (2007) Physiological regulation of glucosetransporter (GLUT4) protein content in brown trout (Salmo trutta) skeletal
muscle. J Exp Biol 210: 2346–2351.
36. Barzilai N, Rossetti L (1993) Role of glucokinase and glucose-6-phosphatase inthe acute and chronic regulation of hepatic glucose fluxes by insulin. J Biol
Chem 268: 25019–25025.
37. Nordlie RC, Foster JD, Lange AJ (1999) Regulation of glucose production by the
liver. Annu Rev Nutr 19: 379–406.
38. Keppler D, Decker K, Bergmeyer HU (1974) Glycogen determination with
amyloglucosidase. Methods of Enzymatic Analysis (H-U Bergemeyer). NewYork: Academic Press. pp. 1127–1131.
39. Singer TD, Mahadevappa VG, Ballantyne JS (1990) Aspects of the Energy
Metabolism of Lake Sturgeon, Acipenser fulvescens, with Special Emphasis on
Lipid and Ketone Body Metabolism. Can J Fish Aquat Sci 47: 873–881.
40. Alegre M, Ciudad CJ, Fillat C, Guinovart JJ (1988) Determination of glucose-6-
phosphatase activity using the glucose dehydrogenase-coupled reaction. Anal
Biochem 173: 185–189.
41. Bradford MM (1976) A rapid and sensitive method for the quantitation of
microgram quantities of protein utilizing the principle of protein dye binding.
Anal Biochem 72: 248–254.
42. Zar JH (1999) Biostatistical Analysis. London: Prentice Hall. 663 p.
43. Guerreiro I, Peres H, Castro-Cunha M, Oliva-Teles A (2012) Effect of
temperature and dietary protein/lipid ratio on growth performance and nutrient
utilization of juvenile Senegalese sole (Solea senegalensis). Aquac Nutr 18: 98–
106.
44. Valente LMP, Linares F, Villanueva JLR, Silva JMG, Espe M, et al. (2011)
Dietary protein source or energy levels have no major impact on growth
performance, nutrient utilisation or flesh fatty acids composition of market-sized
Senegalese sole. Aquaculture 318: 128–137.
45. Dias J, Alvarez MJ, Diez A, Arzel J, Corraze G, et al. (1998) Regulation of
hepatic lipogenesis by dietary protein/energy in juvenile European seabass
(Dicentrarchus labrax). Aquaculture 161: 169–186.
46. Lee DJ, Putnam GB (1973) The response of rainbow trout to varying protein/
energy ratios in a test diet. J Nutr 103: 916–922.
47. Vergara JM, Robaina L, Izquierdo M, De La Higuera M (1996) Protein Sparing
Effect of Lipids in Diets for Fingerlings of Gilthead Sea Bream. Fisheries Sci 62:
624–628.
48. Hillestad M, Johnsen F (1994) High-energy/low-protein diets for Atlantic
salmon: effects on growth, nutrient retention and slaughter quality. Aquaculture
124: 109.
49. Wilson RP (1994) Utilization of dietary carbohydrate by fish. Aquaculture 124:
67–80.
50. Enes P, Panserat S, Kaushik S, Oliva-Teles A (2011) Dietary Carbohydrate
Utilization by European Sea Bass (Dicentrarchus labrax L.) and Gilthead Sea
Bream (Sparus aurata L.) juveniles. Rev Fish Sci 19: 201–215.
51. Hemre G-I, Sandnes K (1999) Effect of dietary lipid level on muscle composition
in Atlantic salmon Salmo salar. Aquac Nutr 5: 9–16.
52. Hutchins CG, Rawles SD, Gatlin DM (1998) Effects of dietary carbohydrate
kind and level on growth, body composition and glycemic response of juvenile
sunshine bass (Morone chrysops [female symbol]6M. saxatilis [male symbol]).
Aquaculture 161: 187–199.
53. Cheng A-C, Chen C-Y, Liou C-H, Chang C-F (2006) Effects of Dietary Protein
and Lipids on Blood Parameters and Superoxide Anion Production in the
Grouper, Epinephelus coioides (Serranidae: Epinephelinae). Zool Stud 45: 492–
502.
54. Massillon D, Barzilai N, Hawkins M, Prus-Wertheimer D, Rossetti L (1997)
Induction of Hepatic Glucose-6-Phosphatase Gene Expression by Lipid
Infusion. Diabetes 46: 153–157.
55. Winzell MS, Ahren B (2004) The High-Fat Diet–Fed Mouse: A Model for
Studying Mechanisms and Treatment of Impaired Glucose Tolerance and Type
2 Diabetes. Diabetes 53: S215–S219.
56. Wise S, Nielsen M, Rizza R (1997) Effects of Hepatic Glycogen Content on
Hepatic Insulin Action in Humans: Alteration in the Relative Contributions of
Glycogenolysis and Gluconeogenesis to Endogenous Glucose Production. J Clin
Endocrinol Metab 82: 1828–1833.
57. Meton I, Mediavilla D, Caseras A, Canto E, Fernandez F, et al. (1999) Effect of
diet composition and ration size on key enzyme activities of glycolysis-
gluconeogenesis, the pentose phosphate pathway and amino acid metabolism
in liver of gilthead sea bream (Sparus aurata). Br J Nutr 82: 223–232.
58. Kusunoki M, Tsutsumi K, Hara T, Ogawa H, Nakamura T, et al. (2002)
Correlation between lipid and glycogen contents in liver and insulin resistance in
high-fat[ndash ]fed rats treated with the lipoprotein lipase activator NO-1886.
Metabolism 51: 792–795.
59. Flamment M, Arvier M, Gallois Y, Simard G, Malthiery Y, et al. (2008) Fatty
liver and insulin resistance in obese Zucker rats: No role for mitochondrial
dysfunction. Biochimie 90: 1407–1413.
60. Bruce CR, Anderson MJ, Carey AL, Newman DG, Bonen A, et al. (2003)
Muscle Oxidative Capacity Is a Better Predictor of Insulin Sensitivity than Lipid
Status. J Clin Endocrinol Metab 88: 5444–5451.
61. Ørtenblad N, Mogensen M, Petersen I, Højlund K, Levin K, et al. (2005)
Reduced insulin-mediated citrate synthase activity in cultured skeletal muscle
cells from patients with type 2 diabetes: Evidence for an intrinsic oxidative
enzyme defect. BBA- Mol Basis Dis 1741: 206–214.
62. Mogensen M, Sahlin K, Fernstrom M, Glintborg D, Vind BF, et al. (2007)
Mitochondrial Respiration Is Decreased in Skeletal Muscle of Patients With
Type 2 Diabetes. Diabetes 56: 1592–1599.
63. Blasco J, Fernandez-Borras J, Marimon I, Requena A (1996) Plasma glucose
kinetics and tissue uptake in brown trout in vivo: effect of an intravascular
glucose load. J Comp Physiol B 165: 534–541.
64. DeFronzo RA, Jacot E, Jequier E, Maeder E, Wahren J, et al. (1981) The effect
of insulin on the disposal of intravenous glucose. Results from indirect
calorimetry and hepatic and femoral venous catheterization. Diabetes 30:
1000–1007.
Dietary Lipid and Glucose Metabolism in Sole
PLOS ONE | www.plosone.org 10 July 2014 | Volume 9 | Issue 7 | e102196

65. Su JY, Storey KB (1995) Fish muscle phosphofructokinase: Influences of protein
concentration on enzyme kinetic behaviour. Int J Biochem Cell Biol 27: 1277–
1283.
66. Mediavilla D, Meton I, Baanante IV (2007) Purification and kinetic properties of
6-phosphofructo-1-kinase from gilthead sea bream muscle. BBA -Gen Subjects
1770: 706–715.
67. Hinault C, Mothe-Satney I, Gautier N, Lawrence JC, van Obberghen E (2004)
Amino acids and leucine allow insulin activation of the PKB/mTOR pathway in
normal adipocytes treated with wortmannin and in adipocytes from db/db mice.
FASEB J 18: 1894.
68. Polakof S, Skiba-Cassy S, Choubert G, Panserat S (2010) Insulin-induced
hypoglycaemia is co-ordinately regulated by liver and muscle during acute and
chronic insulin stimulation in rainbow trout (Oncorhynchus mykiss). J Exp Biol
213: 1443–1452.
69. Polakof S, Mommsen TP, Soengas JL (2011) Glucosensing and glucose
homeostasis: From fish to mammals. Comp Biochem Physiol B Biochem MolBiol 160: 123–149.
70. Seiliez I, Panserat S, Skiba-Cassy S, Polakof S (2011) Effect of acute and chronic
insulin administrations on major factors involved in the control of muscle proteinturnover in rainbow trout (Oncorhynchus mykiss). Gen Comp Endocrinol 172:
363–370.71. Caruso MA, Sheridan MA (2011) New insights into the signaling system and
function of insulin in fish. Gen Comp Endocrinol 173: 227–247.
72. Taniguchi CM, Emanuelli B, Kahn CR (2006) Critical nodes in signallingpathways: insights into insulin action. Nat Rev Mol Cell Biol 7: 85–96.
73. Funes V, Asensio E, Ponce M, Infante C, Canavate JP, et al. (2006) Insulin-likegrowth factors I and II in the sole Solea senegalensis: cDNA cloning and
quantitation of gene expression in tissues and during larval development. GenComp Endocrinol 149: 166–172.
Dietary Lipid and Glucose Metabolism in Sole
PLOS ONE | www.plosone.org 11 July 2014 | Volume 9 | Issue 7 | e102196