The allometry of chronic myeloid leukemia
17
1 The allometry of chronic myeloid leukemia Jorge M. Pacheco 1 , Arne Traulsen 2 , David Dingli 3 , 1 ATP-Group, CFTC & Departamento de Física da Faculdade de Ciências, P-1649-003 Lisboa Codex, Portugal 2 Max Planck Institute for Evolutionary Biology, 24306 Plön, Germany 3 Division of Hematology, College of Medicine, Mayo Clinic, Rochester, MN 55905, USA ABSTRACT Chronic myeloid leukemia (CML) is an acquired neoplastic hematopoietic stem cell (HSC) disorder characterized by the expression of the bcr-abl oncoprotein. This gene product is necessary and sufficient to explain the chronic phase of CML. The only known cause of CML is radiation exposure leading to a mutation of at least one HSC, although the vast majority of patients with CML do not have a history of radiation exposure. Nonetheless, in humans, significant radiation exposure (after exposure to atomic bomb fallout), leads to disease diagnosis in 3 to 5 years. In murine models, disease dynamics are much faster and CML is fatal over the span of a few months. Our objective is to develop a model that accounts for CML across all mammals. In the following, we combine a model of CML dynamics in humans with allometric scaling of hematopoiesis across mammals to illustrate the natural history of chronic phase CML in various mammals. We show how a single cell can lead to a fatal illness in mice and humans but a higher burden of CML stem cells is necessary to induce disease in larger mammals such as elephants. The different dynamics of the disease is rationalized in terms of mammalian mass. Our work illustrates the relevance of animal models to understand human disease and highlights the importance of considering the re-scaling of the dynamics that accrues to the same biological process when planning experiments involving different species.
-
Upload
independent -
Category
Documents
-
view
2 -
download
0
Transcript of The allometry of chronic myeloid leukemia
1
The allometry of chronic myeloid leukemia
Jorge M. Pacheco1, Arne Traulsen
2, David Dingli
3,
1 ATP-Group, CFTC & Departamento de Física da Faculdade de Ciências, P-1649-003
Lisboa Codex, Portugal
2 Max Planck Institute for Evolutionary Biology, 24306 Plön, Germany
3 Division of Hematology, College of Medicine, Mayo Clinic, Rochester, MN 55905, USA
ABSTRACT
Chronic myeloid leukemia (CML) is an acquired neoplastic hematopoietic stem cell
(HSC) disorder characterized by the expression of the bcr-abl oncoprotein. This gene
product is necessary and sufficient to explain the chronic phase of CML. The only known
cause of CML is radiation exposure leading to a mutation of at least one HSC, although
the vast majority of patients with CML do not have a history of radiation exposure.
Nonetheless, in humans, significant radiation exposure (after exposure to atomic bomb
fallout), leads to disease diagnosis in 3 to 5 years. In murine models, disease dynamics
are much faster and CML is fatal over the span of a few months. Our objective is to
develop a model that accounts for CML across all mammals. In the following, we
combine a model of CML dynamics in humans with allometric scaling of hematopoiesis
across mammals to illustrate the natural history of chronic phase CML in various
mammals. We show how a single cell can lead to a fatal illness in mice and humans but a
higher burden of CML stem cells is necessary to induce disease in larger mammals such
as elephants. The different dynamics of the disease is rationalized in terms of mammalian
mass. Our work illustrates the relevance of animal models to understand human disease
and highlights the importance of considering the re-scaling of the dynamics that accrues
to the same biological process when planning experiments involving different species.

2
1. INTRODUCTION
Chronic myeloid leukemia (CML) is a myeloproliferative disorder (Fialkow et al.,
1977; Goldman, 2004) that originates in a hematopoietic stem cell (HSC). The disease is
characterized by the Philadelphia chromosome [t(9;22)(q34;q11)] (Rowley, 1973), a
translocation that brings the C-ABL proto-oncogene, normally present on chromosome 9,
near the major breakpoint cluster region (BCR) on chromosome 22. The BCR-ABL fusion
gene that results, leads to the aberrant expression of the ABL kinase (Groffen et al., 1984)
and transformation of a HSC to a leukemic stem cell (LSC). Animal models suggest that
aberrant expression of BCR-ABL in HSC may be enough to explain the chronic phase of
the disease (Daley et al., 1990; Zhao et al., 2001). Proof that CML arises within a HSC is
provided by the observation that BCR-ABL is found in both myeloid and lymphoid cells,
including a small fraction of T and NK cells (Martin et al., 1980). CML is not unique to
humans, and has been described in several other species including dogs, cats and rodents
(Frith et al., 1993; Leifer et al., 1983; Pollet et al., 1978; Thomsen et al., 1991) although
the exact incidence of this disease in non-human species is not known. In this work, we
investigate the chronic phase of CML across terrestrial mammals.
In previous papers, we have developed a model for the architecture of
hematopoiesis in humans (Dingli et al., 2007b), employed allometric principles to relate
blood formation in humans to other mammals ( Dingli and Pacheco, 2006, Dingli et al.,
2008c) and analyzed the dynamics of CML in humans based on this architecture (Dingli
et al., 2008b). This allowed us to determine the number of active HSC as well as the
number of cells on each level of differentiation as a function of mammalian mass. Here,
we combine our previous work on the dynamics of CML in humans with allometric
ideas, assuming a common architecture of hematopoiesis in mammals that relates HSC to
circulating blood cells. For the first time, this enables us to make hypotheses on the
incidence and dynamics of CML in non-human mammals, which are of great interest to
infer details of the disease from animal studies.
The number of HSC that contribute to hematopoiesis increases with mammalian
size, scaling with the mass of adult mammals as 4/3~ MN SC (Dingli and Pacheco, 2006).
In a healthy adult human (M ~70 kg), approximately 400 HSC, each replicating on
average once per year (Buescher et al., 1985; Dingli and Pacheco, 2006) are responsible

3
for the daily marrow output of ~ 11105.3 × cells. This process is disturbed in CML leading
to an increased marrow output with ¥1012
cells/day (Holyoake et al., 2002). In CML, the
HSC pool is not expanded (Jamieson et al., 2004; Udomsakdi et al., 1992) and BCR-ABL
expression does not give a fitness advantage to the LSC compared to HSC (Huntly et al.,
2004). Thus, after the appearance of the first LSC, the expansion into a clone can only
occur via neutral drift (Figure 1). Hence, clonal expansion of LSC is intrinsically less
likely and will take longer with increasing mammalian mass, despite the fact that the
expected life-span also increases with mass (Lopes et al., 2007). In contrast, BCR-ABL
expression in progenitor cells gives them a fitness advantage due to a higher probability
of self-renewal (Gordon et al., 1998; Marley and Gordon, 2005) that enables them to
expand, leading to myeloproliferation and increased bone marrow cellular output (Figure
1). As current evidence suggests, CML is mostly driven by progenitor cell expansion
(Gordon et al., 1998; Marley and Gordon, 2005), despite originating in the HSC pool.
Hematopoiesis can be metaphorically represented by a hierarchical multi-
compartmental model connecting HSC to circulating blood cells. Each compartment
represents a different stage of differentiation of blood cells, as illustrated in Figure 1. At
the root of hematopoiesis lie the HSC. Under normal conditions, hematopoiesis
corresponds to a state of dynamic equilibrium in which cells “move” from one
compartment to the next as they become increasingly differentiated (Dingli et al., 2007b).
In this work, we show how allometric scaling principles provide a rationale for the
scattered information that is known to date on CML in mammals, leading to a unified
view of CML dynamics across all mammals.
2. MATHEMATICAL MODEL
Here, we first recapitulate our previous work on mathematical modeling of hematopoiesis
and CML. Combining this model with allometric principles, we make quantitative
predictions on the disease in other mammals in Section 3.
2.1. Allometric characterization of mammalian species
In biology, many observables related to the circulatory system (generally denoted
by Y ) scale with the mass M of the organism as aMYY 0= . In many instances, the
4
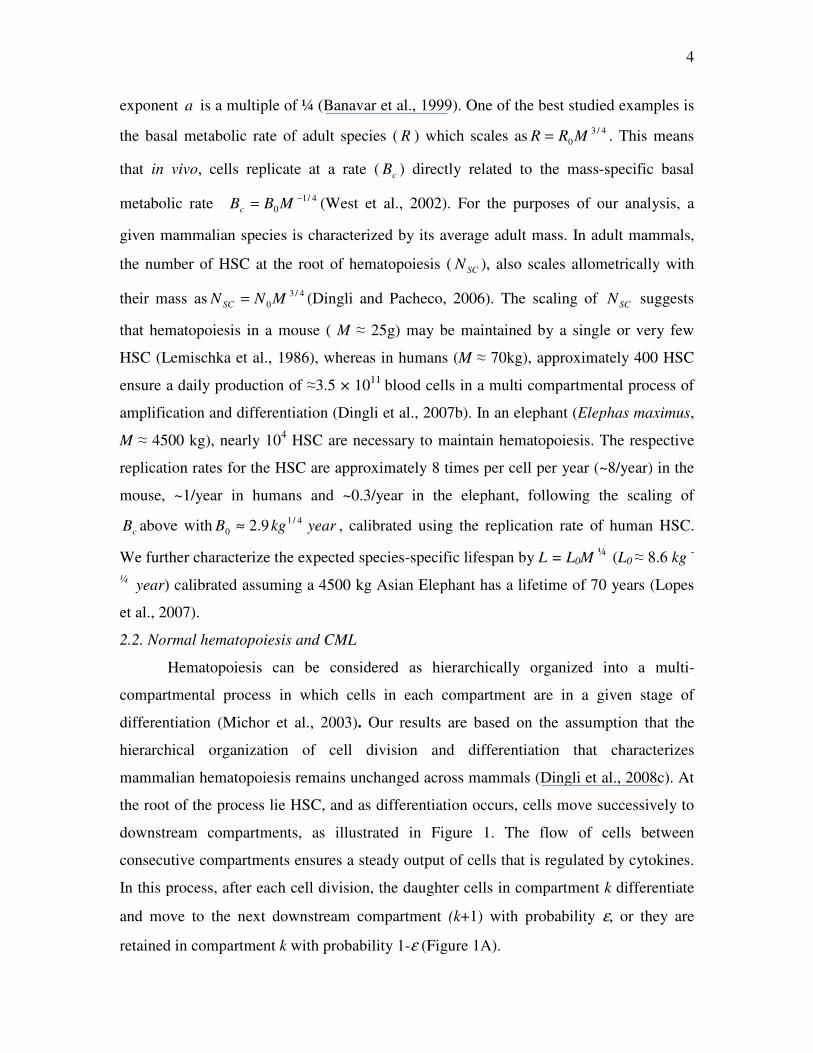
exponent a is a multiple of ¼ (Banavar et al., 1999). One of the best studied examples is
the basal metabolic rate of adult species ( R ) which scales as 4/3
0 MRR = . This means
that in vivo, cells replicate at a rate ( cB ) directly related to the mass-specific basal
metabolic rate 4/1
0
−= MBBc (West et al., 2002). For the purposes of our analysis, a
given mammalian species is characterized by its average adult mass. In adult mammals,
the number of HSC at the root of hematopoiesis ( SCN ), also scales allometrically with
their mass as 4/3
0 MNN SC = (Dingli and Pacheco, 2006). The scaling of SCN suggests
that hematopoiesis in a mouse ( M ≈ 25g) may be maintained by a single or very few
HSC (Lemischka et al., 1986), whereas in humans (M ≈ 70kg), approximately 400 HSC
ensure a daily production of ≈3.5 × 10¹¹
blood cells in a multi compartmental process of
amplification and differentiation (Dingli et al., 2007b). In an elephant (Elephas maximus,
M ≈ 4500 kg), nearly 104 HSC are necessary to maintain hematopoiesis. The respective
replication rates for the HSC are approximately 8 times per cell per year (~8/year) in the
mouse, ~1/year in humans and ~0.3/year in the elephant, following the scaling of
cB above with yearkgB4/1
0 9.2≈ , calibrated using the replication rate of human HSC.
We further characterize the expected species-specific lifespan by L = L0M ¼
(L0 ≈ 8.6 kg -
¼ year) calibrated assuming a 4500 kg Asian Elephant has a lifetime of 70 years (Lopes
et al., 2007).
2.2. Normal hematopoiesis and CML
Hematopoiesis can be considered as hierarchically organized into a multi-
compartmental process in which cells in each compartment are in a given stage of
differentiation (Michor et al., 2003). Our results are based on the assumption that the
hierarchical organization of cell division and differentiation that characterizes
mammalian hematopoiesis remains unchanged across mammals (Dingli et al., 2008c). At
the root of the process lie HSC, and as differentiation occurs, cells move successively to
downstream compartments, as illustrated in Figure 1. The flow of cells between
consecutive compartments ensures a steady output of cells that is regulated by cytokines.
In this process, after each cell division, the daughter cells in compartment k differentiate
and move to the next downstream compartment (k+1) with probability ε, or they are
retained in compartment k with probability 1-ε (Figure 1A).

5
Thus, the number of cells in compartment k can be approximated as
ddt
Nk = −(2ε −1) ⋅ rk ⋅ Nk + 2ε ⋅ rk−1 ⋅ Nk−1. (1)
Under stationary conditions, we recover normal hematopoiesis (Dingli et al., 2007b). In
this case, we have,ε ≡ ε0 = 0.85 , implying that cells have a limited ability for self-renewal
(1-ε =
0.15) and are more likely to differentiate and move to a downstream compartment
(Dingli et al., 2007b). The rate of replication of cells, as well as the average number of
cells in each stage of differentiation, increase exponentially across the 32=K
compartments that link HSC to the circulating blood cells (Dingli et al., 2007b), as
illustrated in Figure 1B.
Cell dynamics within the HSC pool can be described by a neutral Moran process
(Figure 1C). At each time step, a cell is randomly chosen for reproduction and this is
followed by the random selection of a cell for export (that is, the cell moves into the next
downstream compartment) so that the size of the HSC pool remains constant. In the case
of CML, the appearance of a LSC does not alter the stochastic dynamics, since BCR-ABL
does not give the LSC a fitness advantage (Huntly et al., 2004) and the LSC clone can
only expand by neutral drift (in the absence of new mutations).
The appearance of the first LSC within the HSC pool disturbs normal
hematopoiesis. The progeny of the mutant cell that move to the next downstream
compartment have a higher self-renewal capability ( 0εε <CML ), estimated at
72.0~CMLε (Dingli et al., 2008b). This gives the mutant cells an effective fitness
advantage (Dingli et al., 2007a). As a result, in humans, the progeny of one LSC lead to
myeloproliferation and marrow output > 1012
cells/day with a time lag of up to ~ 5 years.
This time decreases as the number of LSC driving the disease is increased.
We can model disease dynamics by approximating the differentiation process in each
compartment k by a differential equation for the number of CML cells Nk ,
ddt
Nk = −(2εCML
−1) ⋅ rkNk
CML+ 2ε
CML⋅ rk−1Nk−1
CML (2)
Due to 0εε <CML , CML cells have a reproductive advantage compared to normal cells in
each compartment. Ultimately, this leads to a higher bone marrow output. We solve Eqs.
1 and 2 numerically with a constant number of HSC, N0
CML= const., to compute the time

6
until the normal bone marrow output increases 4-fold, which is the condition for
diagnosis of the disease in humans (Holyoake et al., 2002).
We apply this model of CML dynamics to different mammals by scaling the
process across species, given the mass scaling of the active stem cell pool, the overall rate
of cell replication and the species expected lifespan. We follow the dynamics for the
respective mammal. Diagnosis required a sustained increase in bone marrow output of ~
4 times normal as in the human condition (Holyoake et al., 2002).
3. RESULTS
3.1. The number of LSC driving the disease
We have previously determined that between 1 and 8 LSC are enough to explain
disease dynamics in chronic phase CML in humans(Dingli et al., 2008b). Since one LSC
is enough to lead to diagnosis in humans, for smaller mammals, one LSC will always be
sufficient to induce disease (Daley et al., 1990; Minami et al., 2008) given their smaller
number of HSC contributing to hematopoiesis. However, for larger mammals, the
situation can reverse. For example, an elephant with a mass of ~ 4500kg has ~9100 HSC
contributing to blood formation. Each of these cells replicates, on average, once every 3
years (Dingli and Pacheco, 2006). The large number of active HSC in the elephant confer
it a significant risk of acquiring a mutant cell carrying the BCR-ABL oncoprotein (Dingli
et al., 2008a). However, once this single mutation arises, the probability that it develops
into a sizeable clone is small since it can only expand by neutral drift in a large pool of
HSC (Dingli et al., 2008a). Moreover, the impact of such a cell on hematopoietic output
will be small compared to smaller animals (our results show that marrow output
essentially doubles, in contrast to humans with CML where it can increase by a factor of
4 or to mice, where it can increase at least 10-fold), given the relative contribution of a
single LSC and its progeny to the overall marrow production. Consequently, and unlike
humans, an elephant will thus reap the benefit of a larger HSC population that protects it
from neutral clonal evolution (Lopes et al., 2007): Assuming CML in elephants to be
biologically similar to that in humans, our results indicate that at least 3 LSC must be
present in the elephant for the disease to be diagnosed within its lifetime (see Figure 2A).
3.2. Transit times

7
We define the cell transit time as the time between the occurrence of the first
mutation in a HSC and the appearance of progeny in the circulation. This time will be
different across mammals, although it also generally scales allometrically, i.e. as M−1/ 4 .
The minimum transit time is easily estimated assuming that cells always move into the
downstream compartment upon replication. This leads to the sum of the average lifetime
of each cell type in the corresponding compartment, that is,
(with time in years, mass in kilograms and 27.1=η across mammals). At the other
extreme, given the fact that CML progenitors usually divide more often than normal
progenitors in each compartment (Brummendorf et al., 2000; Dingli et al., 2008b), we
can estimate an upper bound simply by scaling minT with the factor )2( CMLε− ; this
ignores that cell number increases in each compartment contributing to an overall faster
transit time. Nonetheless, this upper bound also leads to an allometric scaling relation for
the transit time
4/132
1
max 70.112
MB
Tk
k
c
CML≈
−= ∑
= η
ε.
Naturally the transit time will be shortest for the mouse (~6 months), while for humans it
will take approximately 3.8 years, being longest for the elephant where it will take on
average ~11 years. It is noteworthy, however, that this transit time is usually shorter than
the time necessary for diagnosis after the appearance of the first LSC since, depending on
the mammal, the clone may have to expand and its progeny reach a critical threshold for
the diagnosis to be established.
3.3. CML is CML in all mammals
It is estimated that the time from the appearance of the first LSC in humans to the
diagnosis of CML is 3 – 5 years (Ichimaru, 1981). In a mouse, one LSC is enough to lead
to a rapidly fatal illness since the pool of stem cells contributing to blood formation is so
small (Daley et al., 1990; Lemischka et al., 1986). Using the scalings defined in the
methods for the cell replication rates, and assuming that the biology of CML remains
Tmin =1
Bc
1
ηk
k=1
32
∑ ≈1.28 M1/ 4

8
unchanged across mammals, we estimate that starting with 1 LSC the average time for
diagnosis of CML is ~4 months for a mouse. Similarly, in a human being, a few LSC (1 –
8) are enough to drive CML with the typical time scales observed (Dingli et al., 2008b)
(Figure 2B). However, in an elephant a single LSC will not be able to contribute
sufficiently to induce disease and only if the number of LSC increases to >3 will CML be
diagnosed. Although the expansion to 3 cells (which will occur only with probability
1/3), will on average only take ≈3 years in the elephant, the probability of diagnosis is
small during the lifetime of the animal, because even 3 cells will require ~30 years to
lead to disease (Figure 2A). Again, neutral evolution among stem cells will protect the
elephant from such a process since it is very difficult for the LSC clone to expand in the
stem cell compartment in the absence of a fitness advantage. Since the probability that a
single mutant LSC undergoes extinction is given by1− NSC
−1 , spontaneous elimination of
the clone is much more likely in elephants than in humans or mice.
A mutant cell is only relevant as long as it leads to disease and, in this respect,
mutations in HSC can be highly problematic, given the potential impact of those
mutations across the hematopoietic tree. Interestingly, the transit time starting with 1
LSC, when expressed in terms of the expected lifespan of the mammal, remains invariant
across mammals, implying that BCR-ABL has the same biological effect across species,
thus providing an allometric rationale for the use of laboratory animals to study human
disease.
4. DISCUSSION
BCR-ABL expression is both necessary and sufficient to explain the chronic phase
of CML (Daley et al., 1990; Zhao et al., 2001). The only established cause of CML is
radiation exposure (Ichimaru et al., 1991; Ichimaru, 1981) that could lead to the
chromosomal translocation necessary [t(9;22)(q34;q11)] to start the disease. However,
most patients with CML do not have significant radiation exposure suggesting that in the
majority of patients, the translocation occurs due to a replication error. The mutation rate
is very similar across mammals and so it seems reasonable to assume that CML can also
occur spontaneously in other species. Indeed, the disease has been described in cats, dogs
and rodents (Frith et al., 1993; Leifer et al., 1983; Pollet et al., 1978; Thomsen et al.,
1991). In this work, we assumed that the genomic location of BCR and ABL is such that

9
they allow recombination for the fusion BCR-ABL product to be generated. We
acknowledge that in some specific species this may not be possible, although this should
not invalidate the overall scenario studied here.
The injection of syngeneic hematopoietic stem cells transduced with a retroviral
vector coding for BCR-ABL leads to a myeloproliferative disorder that resembles CML in
irradiated mice. Southern blot analysis proved that the disease was clonal and arising
from one single HSC. The interval between injection of the cells and ‘diagnosis’ of a
CML-like disorder, was of the order of 8 weeks (Daley et al., 1990; Minami et al., 2008).
This is half what our model predicts. The reason for this discrepancy is that mice injected
with the transduced cells are not in a steady state − instead they are recovering from the
conditioning insult and the marrow is reconstituting (Marciniak-Czochra et al., 2008). It
is natural then to expect that the disease will exhibit faster dynamics than our model
predicts under steady state conditions. Indeed, CML cells are sensitive to growth factors
and cytokines such as IL-3 and G-CSF (Marley et al., 2003) that are expected to be
elevated after stem cell transplantation.
Our model predicts that one LSC is enough to induce a disorder like CML in the
mouse and this is supported by experimental evidence (Daley et al., 1990; Minami et al.,
2008). Perhaps the readers will wonder how a single LSC can lead to CML in humans
that are so much larger than mice. However, we wish to point out that 1 LSC is the
minimum; in serious cases of human CML the number of LSC grows, on average, by 1
per year. Hence, one expects that many diagnosed patients will have more than one LSC.
More importantly, the characteristic time scales of disease evolution are different ─ in
humans it takes ~5 years for a single LSC to give rise to disease manifestations. In the
case of an elephant, a single LSC will not be able to lead to disease and we estimate that
at least 3 LSC are necessary. This, in turn, constitutes a major advantage for this large
mammal, since LSC can only expand by neutral drift and, in an active HSC pool of
~10,000 cells, this is extremely difficult. Moreover, 3 cells will lead to a significant
marrow output only after 30 years which is half of the elephant’s expected lifespan.
Therefore, the largest mammals would be expected to be ‘protected’ from CML (Lopes et
al., 2007), given that LSC expansion proceeds via neutral drift: In the context of neutral
evolution, larger is better for hematopoiesis.

10
The mathematical analysis presented provides additional credence to the use of
animal models to understand human disease. Murine models are convenient since the
disease dynamics are significantly faster and results that could be potentially life-saving
can be obtained rapidly. However, the difference in dynamics is not only an experimental
convenience – it must be taken into consideration when planning the experiments and
capturing data. Otherwise, important events can be missed if mice are treated as little
humans (Pacheco et al., 2008). The interval between observations must be adjusted
appropriately and here the insights obtained from allometry become essential. The rate of
bone marrow output in mice is quite different from that of humans and it is this overall
difference in rates that dictates the way dynamics unfold for the same disease. In other
words, the same molecular defect will unfold in a different time frame depending on the
host animal.
A major question that remains to be answered is why CML is more common in
humans compared to other species. The underlying reason could be the fact that humans
live far longer (≈75 years) than the allometric estimate for their lifespan (≈25 years).
Hence, our HSC cumulatively divide three times more than predicted by allometry
(Dingli et al., 2008c) and thus the risk of acquiring the BCR-ABL mutation leading to
disease increases threefold. Moreover, the longer lifespan of humans allows the disease to
progress and be diagnosed more often than in other mammals. Our extended longevity is
a result of our ability to alter the environment through agriculture and, indirectly, the
development of language that led to cultural evolution and the rapid dissemination of
knowledge. This knowledge has enabled Homo sapiens to fight infections, reduce
accidental deaths and curb perinatal mortality, the major causes of ‘premature’ death in
the not too distant past. Unfortunately, the resulting increase in expected lifespan comes
with the price of a higher cumulative risk of cancer, now the second most common cause
of death in many countries. Therefore it makes intuitive sense that CML affects humans
in the fifth or sixth decade of life, when the allometric estimate of human lifespan is
exceeded (Jaffe et al., 2001).
In summary, we provide a unifying view of the chronic phase of CML across
mammals. Under normal conditions, the disease starts from a single LSC that expresses
BCR-ABL. The oncoprotein does not give an advantage to the LSC but to the progenitor

11
pool that expands and takes over hematopoiesis. A disease like CML is rare in small
mammals since their active HSC pool is small (Lemischka et al., 1986). However, the
Philadelphia chromosome in the murine HSC leads to a fatal illness over the period of a
few weeks. In humans, 1 LSC can lead to CML although the dynamics are slow and it
will require ~5 years for diagnosis. The largest mammals such as elephants are protected
from CML since the LSC has to expand to lead to disease, a long journey given the
animal’s expected lifespan. Indeed, such expansion is most unlikely given that it occurs
by neutral drift in such a ‘large’ pool of cells.
ACKNOWLEDGEMENTS
This work is supported in part by FCT Portugal (JMP), the Emmy-Noether Program of
the German Research Foundation (AT) and Mayo Foundation (DD).
12
REFERENCES
Banavar, J.R., Maritan, A., and Rinaldo, A., 1999. Size and form in efficient
transportation networks. Nature 399, 130-2.
Brummendorf, T.H., Holyoake, T.L., Rufer, N., Barnett, M.J., Schulzer, M., Eaves, C.J.,
Eaves, A.C., and Lansdorp, P.M., 2000. Prognostic implications of differences in
telomere length between normal and malignant cells from patients with chronic myeloid
leukemia measured by flow cytometry. Blood 95, 1883-90.
Buescher, E.S., Alling, D.W., and Gallin, J.I., 1985. Use of an X-linked human neutrophil
marker to estimate timing of lyonization and size of the dividing stem cell pool. J Clin
Invest 76, 1581-4.
Daley, G.Q., Van Etten, R.A., and Baltimore, D., 1990. Induction of chronic
myelogenous leukemia in mice by the P210bcr/abl gene of the Philadelphia chromosome.
Science 247, 824-30.
Dingli, D., and Pacheco, J.M., 2006. Allometric scaling of the active hematopoietic stem
cell pool across mammals. PLoS ONE 1, e2.
Dingli, D., Traulsen, A., and Michor, F., 2007a. (A)Symmetric stem cell replication and
cancer. PLoS Comput Biol 3, e53.
Dingli, D., Traulsen, A., and Pacheco, J.M., 2007b. Compartmental architecture and
dynamics of hematopoiesis. PLoS ONE 2, e345.
Dingli, D., Pacheco, J.M., and Traulsen, A., 2008a. Multiple mutant clones in blood
rarely coexist. Phys Rev E Stat Nonlin Soft Matter Phys 77, 021915.
Dingli, D., Traulsen, A., and Pacheco, J.M., 2008b. Chronic myeloid leukemia: origin,
development, response to therapy, and relapse. Clinical Leukemia 2, 133-9.
Dingli, D., Traulsen, A., and Pacheco, J.M., 2008c. Dynamics of haemopoiesis across
mammals. Proc Biol Sci 275, 2389-92.
Fialkow, P.J., Jacobson, R.J., and Papayannopoulou, T., 1977. Chronic myelocytic
leukemia: clonal origin in a stem cell common to the granulocyte, erythrocyte, platelet
and monocyte/macrophage. Am J Med 63, 125-30.
Frith, C.H., Ward, J.M., and Chandra, M., 1993. The morphology,
immunohistochemistry, and incidence of hematopoietic neoplasms in mice and rats.
Toxicol Pathol 21, 206-18.

13
Goldman, J.M., 2004. Chronic myeloid leukemia-still a few questions. Exp Hematol 32,
2-10.
Gordon, M.Y., Marley, S.B., Lewis, J.L., Davidson, R.J., Nguyen, D.X., Grand, F.H.,
Amos, T.A., and Goldman, J.M., 1998. Treatment with interferon-alpha preferentially
reduces the capacity for amplification of granulocyte-macrophage progenitors (CFU-GM)
from patients with chronic myeloid leukemia but spares normal CFU-GM. J Clin Invest
102, 710-5.
Groffen, J., Stephenson, J.R., Heisterkamp, N., de Klein, A., Bartram, C.R., and
Grosveld, G., 1984. Philadelphia chromosomal breakpoints are clustered within a limited
region, bcr, on chromosome 22. Cell 36, 93-9.
Holyoake, T.L., Jiang, X., Drummond, M.W., Eaves, A.C., and Eaves, C.J., 2002.
Elucidating critical mechanisms of deregulated stem cell turnover in the chronic phase of
chronic myeloid leukemia. Leukemia 16, 549-58.
Huntly, B.J., Shigematsu, H., Deguchi, K., Lee, B.H., Mizuno, S., Duclos, N., Rowan, R.,
Amaral, S., Curley, D., Williams, I.R., Akashi, K., and Gilliland, D.G., 2004. MOZ-TIF2,
but not BCR-ABL, confers properties of leukemic stem cells to committed murine
hematopoietic progenitors. Cancer Cell 6, 587-96.
Ichimaru, M., Tomonaga, M., Amenomori, T., and Matsuo, T., 1991. Atomic bomb and
leukemia. J Radiat Res (Tokyo) 32 Suppl 2, 14-9.
Ichimaru, M., Ishimaru, T., Mikami, M., Yamada, Y., Ohkita, T., 1981. Incidence of
leukemia in a fixed cohort of atomic bomb survivors and controls, Hiroshima and
Nagasaki October 1950-December 1978: Technical Report RERF TR 13-81. Radiation
Effects Research Foundation, Hiroshima (1981).
Jaffe, E.S., Harris, N.L., Stein, H., and Vardiman, J.W., 2001. Pathology and genetics of
tumours of haematopoietic and lymphoid tissues. IARC Press, Lyon.
Jamieson, C.H., Ailles, L.E., Dylla, S.J., Muijtjens, M., Jones, C., Zehnder, J.L., Gotlib,
J., Li, K., Manz, M.G., Keating, A., Sawyers, C.L., and Weissman, I.L., 2004.
Granulocyte-macrophage progenitors as candidate leukemic stem cells in blast-crisis
CML. N Engl J Med 351, 657-67.
Leifer, C.E., Matus, R.E., Patnaik, A.K., and MacEwen, E.G., 1983. Chronic
myelogenous leukemia in the dog. J Am Vet Med Assoc 183, 686-9.

14
Lemischka, I.R., Raulet, D.H., and Mulligan, R.C., 1986. Developmental potential and
dynamic behavior of hematopoietic stem cells. Cell 45, 917-27.
Lopes, J.V., Pacheco, J.M., and Dingli, D., 2007. Acquired hematopoietic stem-cell
disorders and mammalian size. Blood 110, 4120-2.
Marciniak-Czochra, A., Stiehl, T., Ho, A.D., Jager, W., and Wagner, W., 2008. Modeling
of Asymmetric Cell Division in Hematopoietic Stem Cells - Regulation of Self-Renewal
is Essential for Efficient Repopulation. Stem Cells Dev.
Marley, S.B., and Gordon, M.Y., 2005. Chronic myeloid leukaemia: stem cell derived but
progenitor cell driven. Clin Sci (Lond) 109, 13-25.
Marley, S.B., Lewis, J.L., and Gordon, M.Y., 2003. Progenitor cells divide symmetrically
to generate new colony-forming cells and clonal heterogeneity. Br J Haematol 121, 643-
8.
Martin, P.J., Najfeld, V., Hansen, J.A., Penfold, G.K., Jacobson, R.J., and Fialkow, P.J.,
1980. Involvement of the B-lymphoid system in chronic myelogenous leukaemia. Nature
287, 49-50.
Michor, F., Nowak, M.A., Frank, S.A., and Iwasa, Y., 2003. Stochastic elimination of
cancer cells. Proc Biol Sci 270, 2017-24.
Minami, Y., Stuart, S.A., Ikawa, T., Jiang, Y., Banno, A., Hunton, I.C., Young, D.J.,
Naoe, T., Murre, C., Jamieson, C.H., and Wang, J.Y., 2008. BCR-ABL-transformed
GMP as myeloid leukemic stem cells. Proc Natl Acad Sci U S A 105, 17967-72.
Pacheco, J.M., Traulsen, A., Antal, T., and Dingli, D., 2008. Cyclic neutropenia in
mammals. American Journal of Hematology 83, 920-1.
Pollet, L., Van Hove, W., and Mattheeuws, D., 1978. Blastic crisis in chronic
myelogenous leukaemia in a dog. J Small Anim Pract 19, 469-75.
Rowley, J.D., 1973. Letter: A new consistent chromosomal abnormality in chronic
myelogenous leukaemia identified by quinacrine fluorescence and Giemsa staining.
Nature 243, 290-3.
Thomsen, M.K., Jensen, A.L., Skak-Nielsen, T., and Kristensen, F., 1991. Enhanced
granulocyte function in a case of chronic granulocytic leukemia in a dog. Vet Immunol
Immunopathol 28, 143-56.
Udomsakdi, C., Eaves, C.J., Swolin, B., Reid, D.S., Barnett, M.J., and Eaves, A.C., 1992.

15
Rapid decline of chronic myeloid leukemic cells in long-term culture due to a defect at
the leukemic stem cell level. Proc Natl Acad Sci U S A 89, 6192-6.
West, G.B., Woodruff, W.H., and Brown, J.H., 2002. Allometric scaling of metabolic
rate from molecules and mitochondria to cells and mammals. Proc Natl Acad Sci U S A
99 Suppl 1, 2473-8.
Zhao, R.C., Jiang, Y., and Verfaillie, C.M., 2001. A model of human p210(bcr/ABL)-
mediated chronic myelogenous leukemia by transduction of primary normal human
CD34(+) cells with a BCR/ABL-containing retroviral vector. Blood 97, 2406-12.

16
Figure 1. The dynamics of hematopoiesis. A. With the exception of HSC (see C), when a cell
divides, the two daughter cells either differentiate with probability ε or self-renew with
probability 1-ε. B. Differentiated cells move to the next downstream compartment. A total of 32
compartments mediate HSC and circulating blood cells. Under normal hematopoiesis, a steady
flow of cells takes place “from left to right” across all compartments. C. HSC occupy the earliest
and smallest compartment. Their population is constant and at any one time, a cell is chosen for
reproduction (double arrow) and another cell is chosen for export, thereby taking the path of
differentiation by becoming a progenitor cell. In CML, the LSC have no fitness advantage and
they are selected for reproduction or export with the same probability as normal HSC.

17
Figure 2. CML diagnosis across mammals. A. We show the time required to diagnose CML
assuming the disease is driven by a constant number of LSC. We employ the model developed in
(Dingli et al., 2008b) scaling the cell replication rates and compartment sizes allometrically, as
defined in the methods. We plot data for various mammals studied recently in the medical
literature in connection with hematopoiesis. B. Given the allometric scaling of expected lifespan
defined in the methods, we use the model developed in (Dingli et al., 2008b) (rescaled for each
value of the adult mass) to calculate the time for diagnosis as a function of mass assuming CML
is driven by 1 (circles) or 2 (squares) LSC at all times. The crossing of the data with the curve for
the lifespan defines the theoretical limit of mammalian size for which diagnosis of CML can be
reached within the animal lifespan. The inset is the same plot on a linear scale to emphasize the
larger mammals while the main plot encompasses the whole spectrum of mammals from the
smallest shrew to the elephant.