Expression profile and specific network features of the apoptotic machinery explain relapse of acute...
13
RESEARCH ARTICLE Open Access Expression profile and specific network features of the apoptotic machinery explain relapse of acute myeloid leukemia after chemotherapy Marco Ragusa 1 , Giuseppe Avola 2 , Rosario Angelica 1 , Davide Barbagallo 1 , Maria Rosa Guglielmino 1 , Laura R Duro 1 , Alessandra Majorana 1 , Luisa Statello 1 , Loredana Salito 1 , Carla Consoli 2 , Maria Grazia Camuglia 2 , Cinzia Di Pietro 1 , Giuseppe Milone 2 , Michele Purrello 1* Abstract Background: According to the different sensitivity of their bone marrow CD34+ cells to in vitro treatment with Etoposide or Mafosfamide, Acute Myeloid Leukaemia (AML) patients in apparent complete remission (CR) after chemotherapy induction may be classified into three groups: (i) normally responsive; (ii) chemoresistant; (iii) highly chemosensitive. This inversely correlates with in vivo CD34+ mobilization and, interestingly, also with the prognosis of the disease: patients showing a good mobilizing activity are resistant to chemotherapy and subject to significantly higher rates of Minimal Residual Disease (MRD) and relapse than the others. Based on its known role in patients’ response to chemotherapy, we hypothesized an involvement of the Apoptotic Machinery (AM) in these phenotypic features. Methods: To investigate the molecular bases of the differential chemosensitivity of bone marrow hematopoietic stem cells (HSC) in CR AML patients, and the relationship between chemosensitivity, mobilizing activity and relapse rates, we analyzed their AM expression profile by performing Real Time RT-PCR of 84 AM genes in CD34+ pools from the two extreme classes of patients (i.e., chemoresistant and highly chemosensitive), and compared them with normal controls. Results: The AM expression profiles of patients highlighted features that could satisfactorily explain their in vitro chemoresponsive phenotype: specifically, in chemoresistant patients we detected up regulation of antiapoptotic BIRC genes and down regulation of proapoptotic APAF1, FAS, FASL, TNFRSF25. Interestingly, our analysis of the AM network showed that the dysregulated genes in these patients are characterized by high network centrality (i.e., high values of betweenness, closeness, radiality, stress) and high involvement in drug response. Conclusions: AM genes represent critical nodes for the proper execution of cell death following pharmacological induction in patients. We propose that their dysregulation (either due to inborn or de novo genomic mutations selected by treatment) could cause a relapse in apparent CR AML patients. Based on this, AM profiling before chemotherapy and transplantation could identify patients with a predisposing genotype to MRD and relapse: accordingly, they should undergo a different, specifically tailored, therapeutic regimen and should be carefully checked during the post-treatment period. * Correspondence: [email protected] 1 Dipartimento di Scienze BioMediche, Unità di BioMedicina Molecolare Genomica e dei Sistemi Complessi, Genetica, Biologia Computazionale G Sichel, Via Santa Sofia 87, 95123 Catania, Italy, EU Ragusa et al. BMC Cancer 2010, 10:377 http://www.biomedcentral.com/1471-2407/10/377 © 2010 Ragusa et al; licensee BioMed Central Ltd. This is an Open Access article distributed under the terms of the Creative Commons Attribution License (http://creativecommons.org/licenses/by/2.0), which permits unrestricted use, distribution, and reproduction in any medium, provided the original work is properly cited.
-
Upload
independent -
Category
Documents
-
view
2 -
download
0
Transcript of Expression profile and specific network features of the apoptotic machinery explain relapse of acute...

RESEARCH ARTICLE Open Access
Expression profile and specific network featuresof the apoptotic machinery explain relapse ofacute myeloid leukemia after chemotherapyMarco Ragusa1, Giuseppe Avola2, Rosario Angelica1, Davide Barbagallo1, Maria Rosa Guglielmino1, Laura R Duro1,Alessandra Majorana1, Luisa Statello1, Loredana Salito1, Carla Consoli2, Maria Grazia Camuglia2, Cinzia Di Pietro1,Giuseppe Milone2, Michele Purrello1*
Abstract
Background: According to the different sensitivity of their bone marrow CD34+ cells to in vitro treatment withEtoposide or Mafosfamide, Acute Myeloid Leukaemia (AML) patients in apparent complete remission (CR) afterchemotherapy induction may be classified into three groups: (i) normally responsive; (ii) chemoresistant; (iii) highlychemosensitive. This inversely correlates with in vivo CD34+ mobilization and, interestingly, also with the prognosisof the disease: patients showing a good mobilizing activity are resistant to chemotherapy and subject tosignificantly higher rates of Minimal Residual Disease (MRD) and relapse than the others. Based on its known rolein patients’ response to chemotherapy, we hypothesized an involvement of the Apoptotic Machinery (AM) in thesephenotypic features.
Methods: To investigate the molecular bases of the differential chemosensitivity of bone marrow hematopoieticstem cells (HSC) in CR AML patients, and the relationship between chemosensitivity, mobilizing activity and relapserates, we analyzed their AM expression profile by performing Real Time RT-PCR of 84 AM genes in CD34+ poolsfrom the two extreme classes of patients (i.e., chemoresistant and highly chemosensitive), and compared themwith normal controls.
Results: The AM expression profiles of patients highlighted features that could satisfactorily explain their in vitrochemoresponsive phenotype: specifically, in chemoresistant patients we detected up regulation of antiapoptoticBIRC genes and down regulation of proapoptotic APAF1, FAS, FASL, TNFRSF25. Interestingly, our analysis of the AMnetwork showed that the dysregulated genes in these patients are characterized by high network centrality (i.e.,high values of betweenness, closeness, radiality, stress) and high involvement in drug response.
Conclusions: AM genes represent critical nodes for the proper execution of cell death following pharmacologicalinduction in patients. We propose that their dysregulation (either due to inborn or de novo genomic mutationsselected by treatment) could cause a relapse in apparent CR AML patients. Based on this, AM profiling beforechemotherapy and transplantation could identify patients with a predisposing genotype to MRD and relapse:accordingly, they should undergo a different, specifically tailored, therapeutic regimen and should be carefullychecked during the post-treatment period.
* Correspondence: [email protected] di Scienze BioMediche, Unità di BioMedicina MolecolareGenomica e dei Sistemi Complessi, Genetica, Biologia Computazionale GSichel, Via Santa Sofia 87, 95123 Catania, Italy, EU
Ragusa et al. BMC Cancer 2010, 10:377http://www.biomedcentral.com/1471-2407/10/377
© 2010 Ragusa et al; licensee BioMed Central Ltd. This is an Open Access article distributed under the terms of the Creative CommonsAttribution License (http://creativecommons.org/licenses/by/2.0), which permits unrestricted use, distribution, and reproduction inany medium, provided the original work is properly cited.
BackgroundAML is heterogeneous both at the cytogenetic and themolecular level [1,2]. Many of these alterations haveprognostic impact on the clinical outcome, especially onresistance to chemotherapy and relapse rates [1,2]. Aswith other tumours, one of the main obstacles to suc-cessful chemotherapy is drug resistance [3,4]. Nearly80% of AML patients apparently achieve CR followingchemotherapy induction, however a high proportion ofthem relapses and eventually dies of the disease [5,6].To explain MRD or relapses in these patients after che-motherapy, it has been suggested that the bone marrowmicroenvironment may protect cancer hematopoieticcells, allowing them to resist treatment and survive [7].This form of resistance (called de novo drug resistance)could be in part attributable to the interaction of theVery Late Antigen (VLA)-4 of leukemic cells with fibro-nectin within bone marrow stroma [8]. VLA-4 andother adhesion molecules are involved in homing andmobilization of hematopoietic stem cells (HSC) [9].Treatment strategies, based on blocking adhesion mole-cules or other proteins involved in homing, might mini-mize MRD [10]. It has been demonstrated that patientsthat are good mobilizers are significantly more likely tobe responsive to chemotherapy than poor mobilizers[10]. However, unlike other leukemic patients, goodmobilizers CR AML patients are subject to significantlyhigher rates of relapse than patients with lower mobili-zation capacity; they also have a higher rate of MRD atremission [11-13]. A high ability to mobilize CD34+cells in peripheral blood (PB) was proved to be an unfa-vourable prognostic factor, independent of others suchas class of cytogenetic risk or FAB morphotype [11-13].It has been hypothesized that intrinsic or acquired che-moresistance of leukemic bone marrow precursors maybe a possible explanation for the association betweenhigh mobilization of CD34+ cells and MRD. Further-more, it has been demonstrated that non-leukemic HSCfrom AML patients show differential chemosensitivity:this allowed the identification of three categories ofpatients, characterized by: (i) normal chemosensitivity,(ii) chemoresistance, (iii) increased chemosensitivity,respectively (Milone et al: Chemo-sensitivity of cloni-genic marrow precursors in AML patients in completeremission: association with CD34+ mobilization andwith disease-free survival, submitted). A statistically sig-nificant correlation between in vitro chemosensitivity ofCFU-GM to Etoposide and Mafosfamide, CD34+ cellsmobilization and survival was detected: patients withhigh mobilization capacity showed chemoresistance oftheir BFU-E and CFU-GM and lower survival rates thanpatients with normal or low mobilization activity. Dysre-gulation of the Apoptotic Machinery (AM) plays a
primary role in the response to antineoplastic therapy[14,15]. In a previous work by some of us, it wasdemonstrated that the highly interconnected nodes ofthe AM network (hubs) typically represent the geneswith the highest number of genome, transcriptome andproteome alterations in several cancer models [16].Moreover, we found that most of AM proteins targetedby drugs were characterized by high connectivity; in par-ticular, there was a highly significant associationbetween the betweenness of these proteins and theirbeing targets of drugs [16]. Based on these findings andon our data on AM involvement in anticancer treatment(i.e., Fenretinide in neuroblastoma and Imatinib inCML) [16], we explored the hypothesis that specific AMexpression profiles in CR AML patients may determinethe differential chemosensitivity, shown in vitro by theirbone marrow HSC. The results allow us to propose thatthere is a relationship between the AM network specificstructure and its proneness to dysregulation.
MethodsThe transcriptome of 84 human genes, assigned to theApoptotic Machinery [17], was analyzed in bone marrowCD34+ cells from a cohort of AML patients in apparentCR and from normal controls: in all of them, BFU-E,CFU-E, CFU-GM hematopoietic clonogenic precursorswere checked for in vitro chemoresistance. Chemosensi-tivity tests on freshly collected cells and molecular ana-lysis after cell cryopreservation were performed on thesame bone marrow samples. AML patients were selectedfrom a cohort of 37 patients studied prospectively, inwhich the HSC in vitro chemosensitivity was deter-mined. Based on their in vitro drug sensitivity in com-parison to normal controls, patients were divided intothree groups: (i) normally chemoresponsive, (ii) che-moresistant, (iii) highly chemosensitive. Three patientsfrom the second group and three from the last one wereselected for further detailed molecular analysis.
Clinical Features of AML PatientsPatients’ clinical characteristics are reported in Addi-tional File 1. At the time of the study, all patients werein first apparent CR after a cycle of chemotherapyinduction and consolidation. Remission was determinedby cytogenetic analysis, cytofluorometry, immunopheno-typing. The study was approved by the InstitutionalEthics Committee and all patients and control donorsgave their informed consent for participation in thisresearch.
CD34+ Cells Mobilization in PB of AML PatientsAll patients were treated using a similar chemothera-peutic regimen: one or two induction cycles with
Ragusa et al. BMC Cancer 2010, 10:377http://www.biomedcentral.com/1471-2407/10/377
Page 2 of 13

antracycline, cytarabine (ARA-C) and etoposide, fol-lowed by a consolidation cycle with ARA-C and Mitox-antrone in CR patients. A group of normal bonemarrow donors (n = 15) was also studied as control.CD34+ mobilization was performed in all CR AMLpatients after the induction phase. CR was confirmed atthat time by immunophenotyping and by cytogeneticassessment in patients showing cytogenetic abnormal-ities at diagnosis. CD34+ mobilization was carried outduring the recovery phase after the first consolidationcycle: G-CSF was administered at the dose of 10 mcg/kg/day sc, starting 10 days after the end of the consoli-dation cycle and until the end of the aphaeretic harvest.During mobilization, PB CD34+ cells were daily assessedfrom the day in which the WBC count in the PB was >1 × 10⁹/L; the peak value of the CD34+ cells was usedas end point for evaluating the mobilizing ability.
Selection of CD34+ CellsMononuclear cells from bone marrow were purified ona Ficoll gradient at the time of in vitro chemosensitivityassays, frozen in FBS with 10% DMSO, and stored inliquid nitrogen. After thawing and washing with IMDM(containing 2% FBS) to remove DMSO, cells were incu-bated with DNAse to degrade free DNA in solution thatwould compromise separation efficiency. Separation ofCD34+ cells was performed using the CD34 MicroBeadKit (Miltenyi Biotec Macs mini). A final cell purityhigher than 80% was achieved.
In Vitro ChemoSensitivity Assay Of HematopoieticPrecursorsBone marrow aspiration in AML patients was carriedout between the fourth and sixth week after the end ofCD34+ cells mobilization, during disease evaluation.Bone marrow from normal donors was collectedthrough the harvest procedure for allogeneic transplan-tation. Mononuclear cells were collected from bonemarrow samples by Ficoll density gradient separationand divided into six aliquots of 10 million cells inTC199. After a short incubation at 37°C, cell aliquotswere treated with increasing concentrations of Etoposide(40 and 60 mcg/ml) or Mafosfamide (50, 75, 100, 150mcg/ml), whereas one aliquot was left untreated as con-trol. Cells were incubated at 37°C for 30’, washed incold TC199 (4°C), resuspended in IMDM with 2% FBS,seeded (2 × 10⁴/ml) in methylcellulose medium supple-mented with erythropoietin (HSC-CFU lite withEPO MEDIA MACS Miltenyi Biotec), and incubated ina 37°C, 5% CO2, humidified incubator. After 14 d, thecolonies (BFU-E, CFU-E, CFU-GM) were analyzed byinverted light microscopy. Drug sensitivity was mea-sured by comparing the number of hematopoietic colo-nies in samples treated with drugs to untreated controls.
Real Time PCRDue to the very low amount of cells at the end of thepurification procedure, we had to pool CD34+ cellsfrom three patients with an identical chemophenotypeto perform our analysis. Total RNA was extracted byusing FastPure™ RNA Kit (Takara), according to theManufacturer instructions. 1 μg of total RNA wasreverse-transcribed using the High Capacity RNA-to-cDNA Kit (Applied Biosystems). 10 ng of cDNA wereadded to each well of a 96 well PCR array for quanti-tative PCR (The Human Apoptosis RT2 Profiler™ PCRArray, SuperArray Bioscience Corporation, MD,USA). The array consisted of 96 primers for 84 pro-tein-encoding AM genes, plus five control genes(ACTB, B2 M, GAPDH, HPRT1, RPL13A), togetherwith PCR and sample quality controls. PCR cycleswere performed according to the manufacturerinstructions. All experiments were performed induplicate. Quantitative real time PCR was performedon a Mx3005P™ QPCR system (Stratagene, La Jolla,CA, USA). The threshold cycle (Ct), defined as thecycle number at which the amount of amplified targetreaches a fixed threshold, was obtained for each genein each sample. The Ct for each gene in each samplewas normalized to the Ct of control genes, providedin the array, and with respect to each other (normalvs resistant; normal vs sensitive; resistant vs sensi-tive), according to the 2-ΔΔCT method [17]. We alsoreported our data and the corresponding fold changesapplying the following procedure (see Results): if the2-ΔΔCT (RQ) was ≥1, we used the same RQ number(the fold change is positive = up regulation); on theother hand, if RQ was < 1, we calculated -1/RQ. Inthis last case, the fold change was negative (down reg-ulation). Analysis and visualization of data wasobtained by using the MultiExperiment Viewer 4.4[18]. To identify differentially expressed genes for thethree different comparison reported above, we applieda t-test between subjects (ΔCt) by using the followingparameters: assumption of equal variance; Alpha(overall threshold p-value) = 0.05; the p-value wasbased on t-distribution; the significance was deter-mined by the Adjusted Bonferroni Correction. Wereported as up- or down regulated genes having anexpression fold change at least ≥ 2 and ≤ -2, respec-tively. Data were partitioned through HierarchicalClustering, by using the Euclidean distance metric,and the Average Linkage Clustering as linkagemethod.
Network AnalysisThe global AM network was generated by retrieving,through cytoscape plug-in APID2NET [19,20], all theavailable experimental interactions among all the 84 AM
Ragusa et al. BMC Cancer 2010, 10:377http://www.biomedcentral.com/1471-2407/10/377
Page 3 of 13

genes analyzed through the Human Apoptosis RT2 Pro-filer™ PCR Array. To create the three specific AM net-works, based on three different patient class expressionprofiles, we applied on APID2NET-interaction maps thethree different expression datasets from the chemore-sponse classes, using both colour and size gradients ofnodes to indicate expression fold changes. Analysis ofnetwork centrality was performed by using the plug-inNetwork Analyzer, which allows to retrieve all the cen-trality parameters of a node from an established network[21]. The degree of a node inside any biological networkmirrors the general topological features of the network,not the real functional importance of the specific node.For this reason, we focused our analysis also on othercentrality metrics (i.e., betweenness, closeness, radiality,stress): in biological terms, these may be interpreted asthe probability of a protein to be functionally relevantfor other proteins and its functional ability to connectdifferent cell nodes. Mathematical details of these cen-trality metrics are reported by Brandes and Erlebach[22]. Data on functional interactions between genes anddrugs were extracted from the Comparative Toxicoge-nomics Database (CTD), a manually curated repositoryof specific chemical-gene and chemical-protein interac-tions in vertebrates and invertebrates from published lit-erature [23]. We inferred the possible correlationbetween dysregulation of AM genes and their networkcentrality (NC) or overall drug response (ODR, esti-mated through the number of literature citations fordrugs) by comparing the different NC and ODR in thetwo different gene expression classes (differentiallyexpressed genes and unchanged genes) by the WilcoxonRank Sum test (p-value< 0.05).
ResultsIn Vitro ChemoSensitivity Of Hematopoietic PrecursorsIn normal subjects, after incubation with maphospha-mide at 50 mcg/mL, the mean percentage of normalizedresidual growth of CFU-GM was 45% (range 24% to57%). In AML patients, the sensitivity of CFU-GM washighly heterogeneous: by using the values found in nor-mal controls as cut-off points, three groups of patientscould be identified. A first group was made of 13/37(35%) AML patients, with a sensitivity in the range ofnormal controls and a mean residual CFU-GM of 33.8%(normally chemoresponsive patients). In 6/37 patients(16%), CFU-GM showed increased resistance with aresidual CFU-GM above the upper limit of the normalrange and a mean of 73.8% (chemoresistant patients).The third group comprised 18/37 (48%) AML patientswith an increased sensitivity to maphosphamide, a resi-dual growth of CFU-GM below the lower limit of thenormal range and a mean of 6.2% (highly chemosensi-tive patients).
AM Expression Profile in CD34+ Cells from CR AMLPatientsQuantitative PCR array technology was exploited toexamine the transcript levels of 84 AM genes in CD34+pools from CR AML patients, exhibiting a chemoresis-tant or a chemosensitive phenotype after in vitro treat-ment, and control donors. Transcript quantification bythe 2-ΔΔCT method showed that 23 AM genes from theBcl2, Birc, Bnip, caspases, death receptors, death ligandsgene families had a nearly similar expression profile inboth classes (Tables 1 and 2; Figure 1). On the otherhand, 42 AM genes had a different expression profile inpatients from either the chemoresistant or the chemo-sensitive class with respect to controls (Table 1; Figure1). With the exception of BCL10, BCLAF1, DFFA, thatwere up regulated, all of these AM genes were downexpressed with respect to controls (Table 1; Figure 1).Up regulation of proapoptotic genes BCL10, BCLAF1,DFFA and down regulation of antiapoptotic BAG3,BIRC4, BIRC8, BNIP1, BNIP2, CARD6, CD70, CFLAR,NOL3 in CD34+ bone marrow cells, from both che-moresistant and chemosensitive CR patients, stronglysuggest that their AM molecular profile is prone to acti-vation (Tables 1 and 2; Figure 1). We also found thatproapoptotic DAPK1, TNFRSF11B, TNFSF8, TP73genes were down regulated in CD34+ cells from ourcohort of CR AML patients (Tables 1 and 2; Figure 1),as already reported for other leukaemia patients afterchemotherapy [24-26]; we also observed a down regula-tion of antiapoptotic BAG3, CD70, NOL3 (Tables 1 and2; Figure 1), that had been previously reported inpatients with primary B chronic lymphocytic leukaemiaafter chemotherapy [27-29]. The comparison of the AMexpression profile between resistant and sensitive sam-ples also demonstrated the up regulation of BIRC2 andBIRC3 (two members of the antiapoptotic BIRC family)and down regulation of APAF1, BCL2A1, BCL2L1,CD40LG, CIDEB, FAS, FASL, TNFRSF25, TNFSF10 inthe former class (Tables 1 and 3; Figure 1). This expres-sion profile would appropriately explain the in vitroacquired chemoresistant phenotype of CD34+ cells fromhigh mobilizers: in fact, up regulation of BIRC genes wasalready reported to be related to drug resistance in leu-kemias and other cancers, as well as the down regula-tion of proapoptotic APAF1, FAS, FASL, TNFRSF25[30-34]. Contrary to data previously reported on in vivoresistant AML cells, we detected a down regulation ofantiapoptotic BCL2A1 and BCL2L1, respectively, inin vitro chemoresistant CD34+ cells from our cohort ofCR patients (Tables 1 and 3; Figure 1).
Specific Features of the AM Network in AML PatientsThe analysis of network centrality showed that AMgenes differentially expressed in in vitro resistant CD34+
Ragusa et al. BMC Cancer 2010, 10:377http://www.biomedcentral.com/1471-2407/10/377
Page 4 of 13

Table 1 Expression fold changes of 84 AM genes in CD34+ cells from CR AML patients
Genes chemoresistantvs
control
chemosensitive vscontrol
chemoresistantvs
chemosensitive
Genes chemoresistantvs
control
chemosensitivevs
control
chemoresistantvs
chemosensitive
ABL1 1.05 (0.85) -1.04 (1) -1.11 (1) CASP7 -2.08 (0.14) -2 (0.03) -1.26 (0.17)
AKT1 -1.55 (0.15) -1.05 (0.87) -1.79 (0.18) CASP8 -15.74 (0.006) -19.29 (0.04) 1.01 (1)
APAF1 1.35 (0.29) 2.66 (0.08) -2.38 (0.007) CASP9 -1.95 (0.20) -1.46 (0.08) -1.61 (0.09)
BAD 1.35 (0.26) 1.47 (0.20) -1.32 (0.46) CD27 -1.49 (0.24) -2.33 (0.11) 1.29 (0.99)
BAG1 1.75 (0.34) 1.55 (0.47) -1.07 (1) CD40 -3.11 (0.02) -4.89 (0.01) 1.3 (0.50)
BAG3 -41.26 (0.0004) -76.11 (0.00009) 1.53 (1) CD40LG -16.3 (0.01) -2.57 (0.04) -7.67 (0.02)
BAG4 -2.34 (0.09) -2.99 (0.08) 1.06 (1) CD70 -10.31 (0.002) -17.03 (0.01) 1.37 (0.62)
BAK1 -1.11 (1) -1.26 (0.47) -1.06 (1) CFLAR -51.86 (0.002) -22.01 (0.003) -2.85 (0.03)
BAX 1.43 (0.80) 1.31 (0.73) -1.11 (1) CIDEA -15.74 (0.008) -19.29 (0.009) 1.01 (1)
BCL10 3.09 (0.007) 3.01 (0.007) 1.01 (1) CIDEB 1.26 (0.37) 2.55 (0.03) -2.45 (0.001)
BCL2 2.15 (0.12) 1.9 (0.23) -1.35 (0.30) CRADD -1.24 (0.18) -1.77 (0.07) 1.18 (0.52)
BCL2A1 -5.19 (0.01) -2.81 (0.02) -2.23 (0.004) DAPK1 -15.74 (0.0006) -19.29 (0.0002) 1.01 (1)
BCL2L1 -3.5 (0.007) 1.06 (0.44) -4.47 (0.005) DFFA 3.11 (0.00008) 3.01 (0.00009) 1.01 (1)
BCL2L10 -15.74 (0.01) -19.29 (0.02) 1.01 (1) FADD -5.02 (0.004) -6.41 (0.004) 1.06 (1)
BCL2L11 1.36 (0.25) 1.38 (0.26) -1.22 (0.72) FAS -7.19 (0.01) -3.53 (0.04) -2.46 (0.003)
BCL2L2 -1.25 (0.24) -1.04(1) -1.44 (0.21) FASLG -22.58 (0.005) -4.32 (0.02) -6.32 (0.01)
BCLAF1 3.12 (0.003) 3.04(0.002) 1.01 (1) GADD45A -2.09 (0.16) -2.69 (0.22) 1.06 (1)
BFAR 3.01 (0.0006) 1.84(0.03) 1.01 (1) HRK -3.75 (0.01) -6.11 (0.01) 1.35 (0.30)
BID -1.03 (0.93) 1.16 (0.43) -1.44 (0.21) IGF1R -2.29 (0.08) -3.16 (0.07) 1.14 (1)
BIK 1.1 (1) 1.47 (0.34) -1.61 (0.38) LTA -7.34 (0.05) -4.72 (0.01) -1.88 (0.12)
BIRC2 3.77 (0.006) -7.26 (0.004) 22.63 (0.001) LTBR -1.38 (0.25) -1.13 (0.47) -1.47 (0.27)
BIRC3 -3.02 (0.001) -10.13 (0.004) 2.77 (0.001) MCL1 1.51 (0.33) 1.34 (0.46) -1.07 (0.51)
BIRC4 -11.77 (0.0007) -15.14 (0.0007) 1.06 (1) NAIP 1.96 (0.13) 1.39 (0.34) 1.16 (1)
BIRC6 -1.08 (0.85) 1.04 (0.73) -1.37 (0.18) NOD1 -1.31 (0.36) -1.09 (0.94) -1.44 (0.75)
BIRC8 -17.71 (0.0005) -21.71 (0.0002) 1.01 (1) NOL3 -15.74 (0.001) -10.34 (0.0003) -1.84 (0.21)
BNIP1 -9.17 (0.0008) -10.41 (0.001) -1.06 (1) PYCARD 1.12 (0.48) 1.79 (0.07) -1.93 (0.05)
BNIP2 -8.15 (0.005) -7.52 (0.007) -1.31 (0.24) RIPK2 -1.11 (0.21) -1.69 (0.48) 1.26 (0.08)
BNIP3 -8.38 (0.02) -9.71 (0.03) -1.04 (1) TNF 2.08 (0.18) 2.3 (0.31) -1.34 (0.29)
BNIP3L -3.75 (0.02) -4.41 (0.01) -1.03 (1) TNFRSF10A -6.13 (0.013) -4.03 (0.01) -1.84 (0.13)
BRAF -1.09 (0.83) -1.27 (0.15) -1.04 (1) TNFRSF10B -5.72 (0.016) -4.92 (0.02) -1.4 (0.43)
CARD6 -15.74 (0.001) -19.29 (0.0008) 1.01 (1) TNFRSF11B -15.74 (0.007) -19.29 (0.007) 1.01 (1)
CARD8 -4.55 (0.01) -3.76 (0.01) -1.46 (0.19) TNFRSF1A 2.42 (0.13) 1.65 (0.11) 1.21 (0.76)
CASP1 -1.35 (0.45) 1.06 (0.48) -1.74 (0.01) TNFRSF21 1.1 (0.29) -1.48 (0.83) 1.35 (0.12)
CASP10 -5.12 (0.01) -6.5 (0.012) 1.05 (1) TNFRSF25 1.07 (1) 3.61 (0.03) -4.06 (0.03)
CASP14 -25.4 (0.03) -58.89 (0.0004) 1.92 (0.02) TNFRSF9 -15.74 (0.03) -18.38 (0.01) -1.04 (1)
CASP2 1.05 (1) 1.1 (1) -1.27 (1) TNFSF10 -1.25 (0.12) 1.45 (0.08) -2.2 (0.01)
CASP3 1.07 (1) -1.13 (0.68) -1.01 (1) TNFSF8 -9.04 (0.007) -10.7 (0.008) -1.02 (1)
CASP4 -1.47 (0.08) -1.57 (0.09) -1.13 (0.72) TP53 1.27 (0.20) 1.2 (0.23) -1.14 (0.70)
CASP5 -12.27 (0.002) -11.71 (0.002) -1.27 (0.16) TP53BP2 -15.74 (0.02) -19.29 (0.003) 1.01 (1)
CASP6 1.2 (0.34) 1.2 (0.43) -1.21 (0.99) TP73 -53.32 (0.006) -48.5 (0.006) -1.33 (0.70)
Fold changes of 84 AM gene expression, according to the alternative version of 2-ΔΔCT method, for three different comparisons between phenotypic classes:chemoresistant vs control; chemosensitive vs control; chemoresistant vs chemosensitive. When the RQ is ≥1, we reported the same RQ number (positive foldchange); when RQ is < 1, we reported -1/RQ: (negative fold change). We considered as up regulated or down regulated those genes with fold change ≥2 and ≤
-2, respectively. Genes with a fold change between 2 and -2 are considered as unchanged. Adjusted Bonferroni p-value is reported between brackets.
Ragusa et al. BMC Cancer 2010, 10:377http://www.biomedcentral.com/1471-2407/10/377
Page 5 of 13
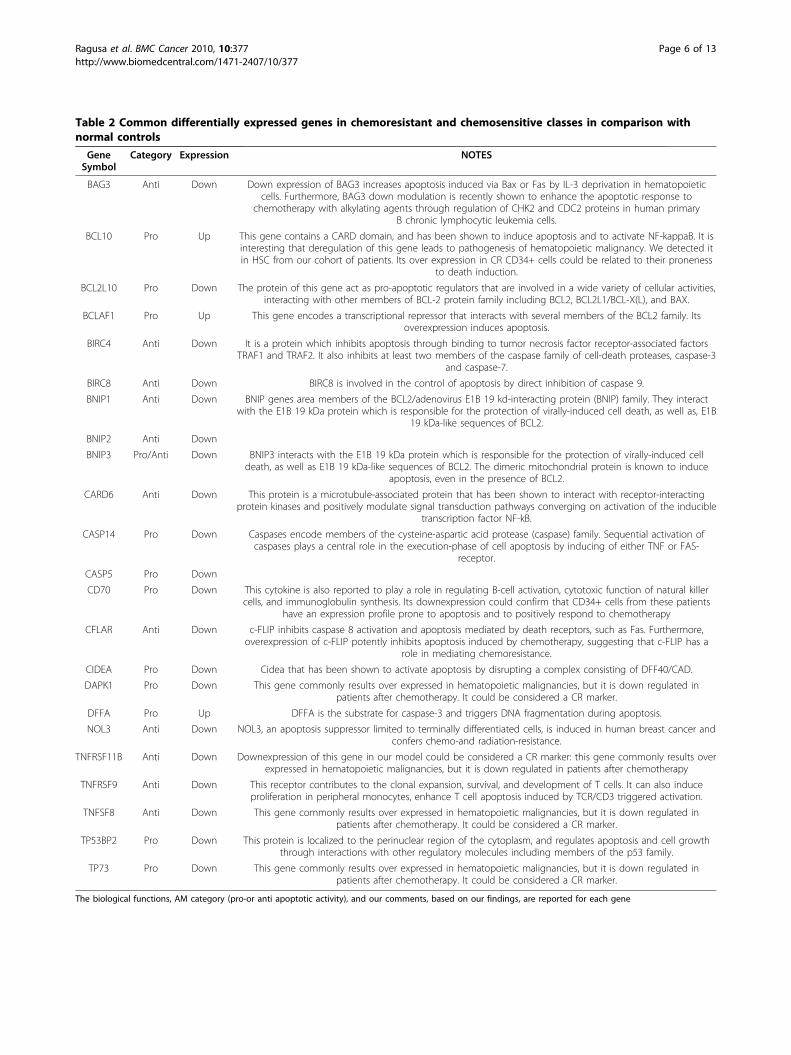
Table 2 Common differentially expressed genes in chemoresistant and chemosensitive classes in comparison withnormal controls
GeneSymbol
Category Expression NOTES
BAG3 Anti Down Down expression of BAG3 increases apoptosis induced via Bax or Fas by IL-3 deprivation in hematopoieticcells. Furthermore, BAG3 down modulation is recently shown to enhance the apoptotic response to
chemotherapy with alkylating agents through regulation of CHK2 and CDC2 proteins in human primaryB chronic lymphocytic leukemia cells.
BCL10 Pro Up This gene contains a CARD domain, and has been shown to induce apoptosis and to activate NF-kappaB. It isinteresting that deregulation of this gene leads to pathogenesis of hematopoietic malignancy. We detected itin HSC from our cohort of patients. Its over expression in CR CD34+ cells could be related to their proneness
to death induction.
BCL2L10 Pro Down The protein of this gene act as pro-apoptotic regulators that are involved in a wide variety of cellular activities,interacting with other members of BCL-2 protein family including BCL2, BCL2L1/BCL-X(L), and BAX.
BCLAF1 Pro Up This gene encodes a transcriptional repressor that interacts with several members of the BCL2 family. Itsoverexpression induces apoptosis.
BIRC4 Anti Down It is a protein which inhibits apoptosis through binding to tumor necrosis factor receptor-associated factorsTRAF1 and TRAF2. It also inhibits at least two members of the caspase family of cell-death proteases, caspase-3
and caspase-7.
BIRC8 Anti Down BIRC8 is involved in the control of apoptosis by direct inhibition of caspase 9.
BNIP1 Anti Down BNIP genes area members of the BCL2/adenovirus E1B 19 kd-interacting protein (BNIP) family. They interactwith the E1B 19 kDa protein which is responsible for the protection of virally-induced cell death, as well as, E1B
19 kDa-like sequences of BCL2.
BNIP2 Anti Down
BNIP3 Pro/Anti Down BNIP3 interacts with the E1B 19 kDa protein which is responsible for the protection of virally-induced celldeath, as well as E1B 19 kDa-like sequences of BCL2. The dimeric mitochondrial protein is known to induce
apoptosis, even in the presence of BCL2.
CARD6 Anti Down This protein is a microtubule-associated protein that has been shown to interact with receptor-interactingprotein kinases and positively modulate signal transduction pathways converging on activation of the inducible
transcription factor NF-kB.
CASP14 Pro Down Caspases encode members of the cysteine-aspartic acid protease (caspase) family. Sequential activation ofcaspases plays a central role in the execution-phase of cell apoptosis by inducing of either TNF or FAS-
receptor.
CASP5 Pro Down
CD70 Pro Down This cytokine is also reported to play a role in regulating B-cell activation, cytotoxic function of natural killercells, and immunoglobulin synthesis. Its downexpression could confirm that CD34+ cells from these patients
have an expression profile prone to apoptosis and to positively respond to chemotherapy
CFLAR Anti Down c-FLIP inhibits caspase 8 activation and apoptosis mediated by death receptors, such as Fas. Furthermore,overexpression of c-FLIP potently inhibits apoptosis induced by chemotherapy, suggesting that c-FLIP has a
role in mediating chemoresistance.
CIDEA Pro Down Cidea that has been shown to activate apoptosis by disrupting a complex consisting of DFF40/CAD.
DAPK1 Pro Down This gene commonly results over expressed in hematopoietic malignancies, but it is down regulated inpatients after chemotherapy. It could be considered a CR marker.
DFFA Pro Up DFFA is the substrate for caspase-3 and triggers DNA fragmentation during apoptosis.
NOL3 Anti Down NOL3, an apoptosis suppressor limited to terminally differentiated cells, is induced in human breast cancer andconfers chemo-and radiation-resistance.
TNFRSF11B Anti Down Downexpression of this gene in our model could be considered a CR marker: this gene commonly results overexpressed in hematopoietic malignancies, but it is down regulated in patients after chemotherapy
TNFRSF9 Anti Down This receptor contributes to the clonal expansion, survival, and development of T cells. It can also induceproliferation in peripheral monocytes, enhance T cell apoptosis induced by TCR/CD3 triggered activation.
TNFSF8 Anti Down This gene commonly results over expressed in hematopoietic malignancies, but it is down regulated inpatients after chemotherapy. It could be considered a CR marker.
TP53BP2 Pro Down This protein is localized to the perinuclear region of the cytoplasm, and regulates apoptosis and cell growththrough interactions with other regulatory molecules including members of the p53 family.
TP73 Pro Down This gene commonly results over expressed in hematopoietic malignancies, but it is down regulated inpatients after chemotherapy. It could be considered a CR marker.
The biological functions, AM category (pro-or anti apoptotic activity), and our comments, based on our findings, are reported for each gene
Ragusa et al. BMC Cancer 2010, 10:377http://www.biomedcentral.com/1471-2407/10/377
Page 6 of 13

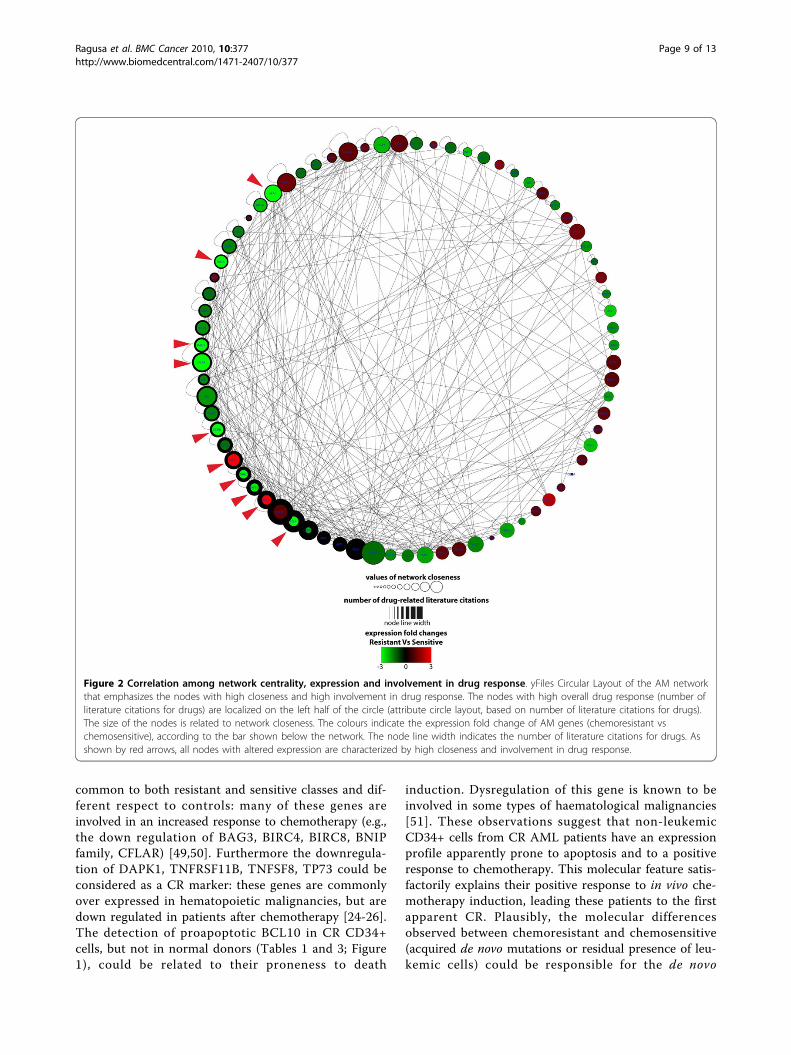
cells were positively associated to higher network central-ity respect to unchanged genes (Wilcoxon Rank Sumtest): betweenness (p-value = 0.043), closeness (p-value =0.019), radiality (p-value = 0.019), stress (p-value = 0.041)(Figure 2). Moreover, these genes were more tightly asso-ciated to drug response than unchanged genes (p-value =0.003) (Figure 2). These network centrality parametersare biologically more important than the simple networkdegree of a node, because they demonstrate the ability ofa protein to functionally connect to and be relevant forseveral others within a complex signalling network [35].By comparing chemoresistant and chemosensitive classes,we found that dysregulated genes are frequently criticalnodes of the AM network and drug-related genes. More-over, by integrating the expression values of the threeprofiles into the network structure, we found that theexpression modification of some nodes could lead toimportant alterations of the network topology (Figure 3).When compared to those from normal donors, the net-works of resistant and sensitive classes appeared quitesimilar; on the contrary, the direct comparison betweenresistant and sensitive classes identified differences thatcould unbalance the functional equilibrium of the AMnetwork (e.g., the down regulation of many proapoptoticgenes) (Table 3, Figure 3). These altered network struc-tures could explain the different AM behaviour as well asthe different in vitro drug sensitivity and the clinicalphenotype of patients (i.e., MRD and relapse).
DiscussionDrug resistance is a major cause of failure in cancertreatment [7,36]. Chemotherapy exerts on tumour cellsa strong selective pressure: accordingly, their survivalrelies on a dynamic mutation process, possibly leadingto an ever fitting chemoresistance phenotype [37]. Thebone marrow microenvironment is a secluded andpotentially safe body niche, in which cancer cells can beprotected against chemotoxic agents. Mobilization fromthis compartment is a complex process, that requiresthe orchestrated participation of several molecules aschemokines, adhesion molecules, and their downstreamtargets [10,38]. The molecular events that regulateHSCs’ engraftment and mobilization are still incomple-tely defined. The precise mechanism of mobilization bythe Colony Stimulating Factors (CSF), the factor mostcommonly used to mobilize hematopoietic cells frombone marrow to PB, remains unsatisfactorily character-ized [39,40]. CSF binding to its receptor leads to theactivation of several downstream signalling cascadesaffecting cell survival, proliferation, differentiation,migration [41]; moreover, it is well known that CSF sup-presses apoptosis in both normal HSCs and cancer cells[42]. In our experiments, we observed that CR patientswith high CD34+ mobilization activity showed in vitro
Figure 1 Expression matrix of AM genes in CD34+ cells fromCR AML patients. Up regulated genes are in red, down regulatedgenes in green, according to the bar shown below the matrix. Eachrow represents the colour coded expression of a specific gene; thecolumns represent the colour coded AM profiles, obtained foreach type of comparison between classes: A = chemosensitivepatients vs controls; B = chemoresistant patients vs controls;C = chemoresistant vs chemosensitive patients. Hierarchicalclustering of expression values is based on euclidean distancesand average linkage.
Ragusa et al. BMC Cancer 2010, 10:377http://www.biomedcentral.com/1471-2407/10/377
Page 7 of 13
chemoresistance of their BFU-E and CFU-GM. This wascoupled to a poorer prognosis, due to an increasedrelapse rate respect to normally or highly chemosensi-tive patients. Intriguingly, chemoresistant patientsshowed an AM expression profile that strongly sug-gested the involvement of the AM network in theirin vitro drug resistance. Thus, a relationship betweenmobilization from bone marrow, apoptosis inductionand chemoresistance seems to exist in these patients.The chemoresistant class is characterized by up regula-tion of Birc genes (BIRC2 and BIRC3), that inhibit theaction of caspases, and down expression of proapoptoticgenes as APAF1 (an apoptosome component), FAS,FASL, TNFRSF25, TNFSF10. This molecular phenotypecould lead to a failure in activating apoptosis inresponse to chemotherapy [30-34]. It is well known thatGM-CSF inhibits Fas-induced apoptosis and stimulatesexpression of BIRC family members [43,44]. This pro-tective effect of CSF can also explain the lower completeremission rates after chemotherapy in AML patients,whose cells have a higher responsiveness to hematopoie-tic viability factors in vitro [45]. Our data demonstrate adown regulation of proapoptotic genes CD40LG,CIDEB, TNFSF10 in chemoresistant AML patients, pre-viously not reported in association with drug resistance.Furthermore, differently from previous reports thatin vivo resistant AML cells express high levels ofBCL2A1 and BCL2L1 [30,34], we found that both genesare down regulated in chemoresistant AML patients in
comparison to those from the chemosensitive class. Wesuggest that this discrepancy is due to the specific fea-tures of the different cell types analyzed: we analyzed invitro selected chemoresistant, possibly non-leukemicCD34+ cells from CR AML patients, whereas Eiseleet al. and Valdez et al. studied myeloid blasts from AMLpatients [46] or mononuclear cells from AML patients[31], respectively. Why are some CR AML patients goodresponders to CSF and others are not? The continuedpressure of chemotherapy may induce or select genomicmutations, able to alter the cytokine cross-talking net-work between cell migration and apoptosis: this wouldresult in an acquired drug resistance phenotype [8]. Wemay otherwise assume that within the HSC populationof some CR patients, few leukemic cells survive che-motherapy and persist under the CR threshold to beeventually selected by the mobilizing treatment [47,48].The presence of a substantial number of MRD cellscould influence the microenvironment and enhancetheir protective effect from chemotherapy damage. Thiswould explain not only the high relapse rate, but alsothe high mobilization activity through a reduced myelo-toxicity induced by chemotherapy. Based on our results,we suggest that the presence of MRD can lead to amodulation of BM microenvironment that could causedysregulation of some components of the AM networkin HSC. Interestingly, by comparing both the resistantand the sensitive class with control samples, we noticedthat 23 AM genes showed an expression profile
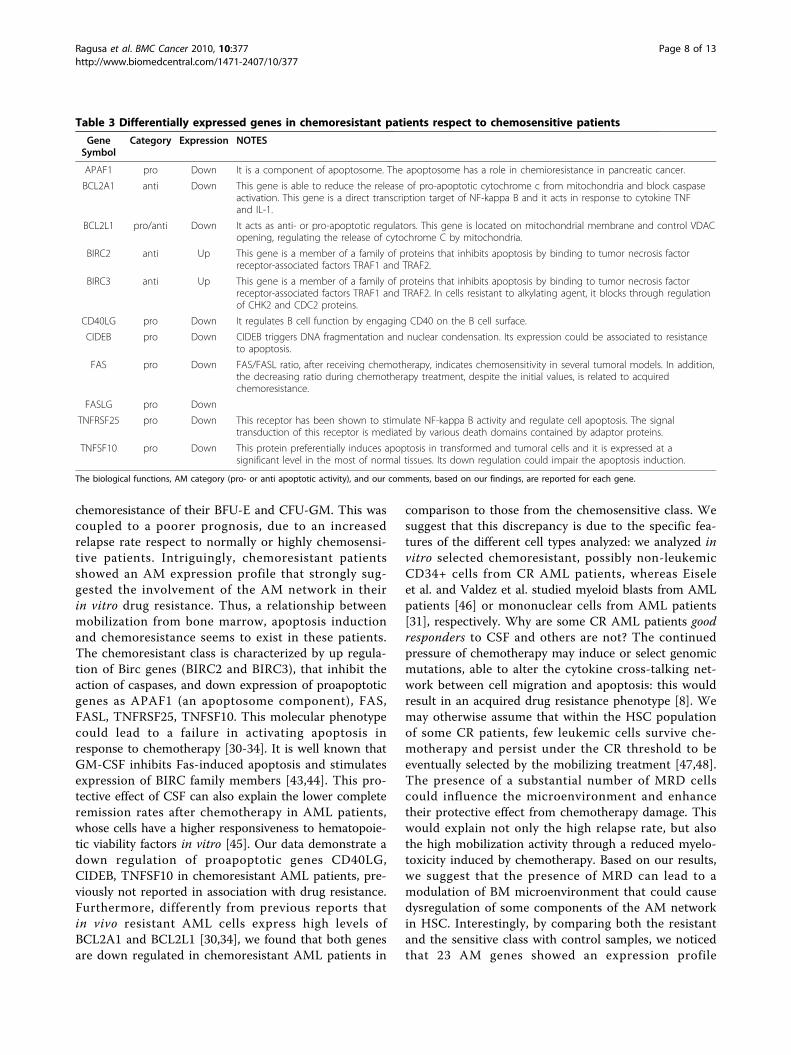
Table 3 Differentially expressed genes in chemoresistant patients respect to chemosensitive patients
GeneSymbol
Category Expression NOTES
APAF1 pro Down It is a component of apoptosome. The apoptosome has a role in chemioresistance in pancreatic cancer.
BCL2A1 anti Down This gene is able to reduce the release of pro-apoptotic cytochrome c from mitochondria and block caspaseactivation. This gene is a direct transcription target of NF-kappa B and it acts in response to cytokine TNFand IL-1.
BCL2L1 pro/anti Down It acts as anti- or pro-apoptotic regulators. This gene is located on mitochondrial membrane and control VDACopening, regulating the release of cytochrome C by mitochondria.
BIRC2 anti Up This gene is a member of a family of proteins that inhibits apoptosis by binding to tumor necrosis factorreceptor-associated factors TRAF1 and TRAF2.
BIRC3 anti Up This gene is a member of a family of proteins that inhibits apoptosis by binding to tumor necrosis factorreceptor-associated factors TRAF1 and TRAF2. In cells resistant to alkylating agent, it blocks through regulationof CHK2 and CDC2 proteins.
CD40LG pro Down It regulates B cell function by engaging CD40 on the B cell surface.
CIDEB pro Down CIDEB triggers DNA fragmentation and nuclear condensation. Its expression could be associated to resistanceto apoptosis.
FAS pro Down FAS/FASL ratio, after receiving chemotherapy, indicates chemosensitivity in several tumoral models. In addition,the decreasing ratio during chemotherapy treatment, despite the initial values, is related to acquiredchemoresistance.
FASLG pro Down
TNFRSF25 pro Down This receptor has been shown to stimulate NF-kappa B activity and regulate cell apoptosis. The signaltransduction of this receptor is mediated by various death domains contained by adaptor proteins.
TNFSF10 pro Down This protein preferentially induces apoptosis in transformed and tumoral cells and it is expressed at asignificant level in the most of normal tissues. Its down regulation could impair the apoptosis induction.
The biological functions, AM category (pro- or anti apoptotic activity), and our comments, based on our findings, are reported for each gene.
Ragusa et al. BMC Cancer 2010, 10:377http://www.biomedcentral.com/1471-2407/10/377
Page 8 of 13
common to both resistant and sensitive classes and dif-ferent respect to controls: many of these genes areinvolved in an increased response to chemotherapy (e.g.,the down regulation of BAG3, BIRC4, BIRC8, BNIPfamily, CFLAR) [49,50]. Furthermore the downregula-tion of DAPK1, TNFRSF11B, TNFSF8, TP73 could beconsidered as a CR marker: these genes are commonlyover expressed in hematopoietic malignancies, but aredown regulated in patients after chemotherapy [24-26].The detection of proapoptotic BCL10 in CR CD34+cells, but not in normal donors (Tables 1 and 3; Figure1), could be related to their proneness to death
induction. Dysregulation of this gene is known to beinvolved in some types of haematological malignancies[51]. These observations suggest that non-leukemicCD34+ cells from CR AML patients have an expressionprofile apparently prone to apoptosis and to a positiveresponse to chemotherapy. This molecular feature satis-factorily explains their positive response to in vivo che-motherapy induction, leading these patients to the firstapparent CR. Plausibly, the molecular differencesobserved between chemoresistant and chemosensitive(acquired de novo mutations or residual presence of leu-kemic cells) could be responsible for the de novo
Figure 2 Correlation among network centrality, expression and involvement in drug response. yFiles Circular Layout of the AM networkthat emphasizes the nodes with high closeness and high involvement in drug response. The nodes with high overall drug response (number ofliterature citations for drugs) are localized on the left half of the circle (attribute circle layout, based on number of literature citations for drugs).The size of the nodes is related to network closeness. The colours indicate the expression fold change of AM genes (chemoresistant vschemosensitive), according to the bar shown below the network. The node line width indicates the number of literature citations for drugs. Asshown by red arrows, all nodes with altered expression are characterized by high closeness and involvement in drug response.
Ragusa et al. BMC Cancer 2010, 10:377http://www.biomedcentral.com/1471-2407/10/377
Page 9 of 13

acquired resistant phenotype, and accordingly for therelapse. Unsurprisingly, these differentially expressedgenes are characterized by high centrality within theAM network. Furthermore, many published data linkthese genes to drug response, suggesting that they per-form a critical role within AM signalling activated bypharmacological treatments. Taken together these datastrongly suggest that the topology of AM network isstrictly related to its proper biological functioning. Mal-functioning of these central nodes affects the stability ofthe network and profoundly modify the physiological
cell behaviour. In agreement with other published data,our results suggest that tumour-related defects in AMhubs are preferentially selected [16,52]. The functionalimpairment of a few nodes, which control directly orindirectly the activities of many others in the context ofthe co-occurrence of multiple genetic defects, couldrepresent a selective advantage during neoplastic trans-formation and in response to pharmacological treat-ment. The differential expression of topologicallyimportant AM nodes in CR AML patients could ser-iously impair the physiological equilibrium of AM.
Figure 3 Different AM network structure based on three different expression profiles. AM network structure alterations in threedifferent comparisons among chemoresponse classes. A = chemoresistant patients vs controls; B = chemosensitive patients vs controls;C = chemoresistant vs chemosensitive patients. The fold changes are shown by gradients of node colours and sizes, according to the bar shownbelow the networks. The use of different sizes to show the expression values underlines as different expression profiles could notably alter thestructure of a biological network: down regulated nodes have smaller sizes and, accordingly, minor molecular and functional effects on thenetwork; on the other hand, up regulated nodes have larger sizes and a higher potential influence on network functions.
Ragusa et al. BMC Cancer 2010, 10:377http://www.biomedcentral.com/1471-2407/10/377
Page 10 of 13

CD34+ cells from both classes of CR AML patientsshowed AM network features that make these cellsprone to apoptosis: accordingly, it is not surprising thatthese patients were in apparent CR after the first cycleof chemotherapy induction and consolidation (Figure 3).On the other hand, the AM network of the resistantclass showed some critical features respect to that of thesensitive class: by impairing proapoptotic componentsand activating prosurvival nodes, these differences couldreduce the ability of these cells to appropriately respondto death stimuli (Figure 3). Some of these AM genes areknown to be dysregulated in leukaemia: up regulation ofBIRC3 and down regulation of APAF1, CIDEB, FAS,TNFRSF25, TNFSF10 were previously identified by ourgroup as specific alterations of AM genes in leukemiccells [16].
ConclusionsThe ability of some cancer cell types to elude pharma-cological apoptosis induction is apparently based onmolecular mechanisms, similar to those involved inescaping physiological cell death. In this scenario, someAM genes represent critical nodes for the properresponse to chemotherapy. Their dysregulation in HSCsfrom CR AML patients could be related to their highmobilizing ability, in vitro chemoresistance and highrelapse rates. This molecular phenotype could resultfrom de novo mutations, selected by the treatment, orbe due to residual leukemic cells, positively selected bythe cytokines used for mobilization. The AM expressionprofile of CD34+ cells seems to discriminate CR AMLpatients from normal controls, as well as in vitro che-moresistant CR AML patients from those who are sen-sitive. These differences affect some critical nodes of theAM network and could represent one of the causes ofthe differential in vitro resistance of these cells. Accord-ingly, AM profiling before chemotherapy and transplan-tation could allow the identification of patients with agenotype highly predisposing to relapse, in order totreat them by different, specifically designed, therapies.Specifically, low expression levels of APAF1, CD40LG,CIDEB, FAS, FASL, TNFRSF25, TNFSF10 and up regu-lation of BIRC2 and BIRC3 could pinpoint patients whoare prone to relapse. Otherwise, the characterization ofthe genotype of the cells from PB could demonstratethe characteristic molecular signature of leukemic cellsand accordingly guide the design of the therapeuticstrategy.
Additional material
Additional file 1: Clinical characteristics of the patients.
AbbreviationsAM: Apoptotic Machinery; AML: Acute Myeloid Leukaemia; BFU-E: BurstForming Units Erythroid; BM: Bone Marrow; CFU-E: Colony-Forming-UnitsErythroid; CFU-GM: Colony Forming Unit Granulocyte-Macrophage; CR:Complete Remission; CSF: Colony-Stimulating Factor; G-CSF: GranulocyteColony-Stimulating Factor; GM-CSF: Granulocyte-Macrophage Colony-Stimulating Factor; HSC: Hematopoietic Stem Cells; MRD: Minimal ResidualDisease; PB: Peripheral Blood; VLA: Very Late Antigen.
AcknowledgementsThis project was financed with funds from Ministero dell’Università e dellaRicerca Scientifica e Tecnologica to MP (in particular, FIRB 2007: DallaProteomica alla Biologia Cellulare; FAR 2007: Generation of a technologicalplatform to study the effects of antineoplastic drugs and to investigate theirpotential efficacy as neuroprotective agents; PRA 2007: Caratterizzazionedelle Omiche del Macchinario Apoptotico e dell’Apparato di Trascrizione:ruolo biologico dei microRNA e loro coinvolgimento in Patologia). We thankProf S Stefani and her Collaborators (Dipartimento di ScienzeMicrobiologiche, Università degli Studi di Catania) for allowing the use oftheir Real Time Instrument for some of our experiments. Finally, weacknowledge the technical collaboration of Mrs M Cocimano, Mr L Messina,Mr F Mondio, Mr A Vasta.
Author details1Dipartimento di Scienze BioMediche, Unità di BioMedicina MolecolareGenomica e dei Sistemi Complessi, Genetica, Biologia Computazionale GSichel, Via Santa Sofia 87, 95123 Catania, Italy, EU. 2Dipartimento di ScienzeBioMediche, Sezione di Ematologia, 95125 Catania, Italy, EU.
Authors’ contributionsMP conceived and coordinated the project with the critical collaboration ofMR and GM. MP, MR, GM, CDP designed experiments, the other Researchersperformed them. All Authors contributed to the critical revision of the data.MP and MR wrote the paper, that was revised and approved by all Authors(MR, GA, RA, DB, MRG, LRD, AM, LS, LS, CC, MGC, CDP, GM, MP).
Competing interestsThe authors declare that they have no competing interests.
Received: 12 March 2010 Accepted: 19 July 2010Published: 19 July 2010
References1. Mrózek K, Bloomfield CD: Chromosome aberrations, gene mutations and
expression changes, and prognosis in adult acute myeloid leukemia.Hematology Am Soc Hematol Educ Program 2006, 169-77.
2. Mrózek K: Cytogenetic, molecular genetic, and clinical characteristics ofacute myeloid leukemia with a complex karyotype. Semin Oncol 2008,35(4):365-77.
3. Chauncey TR: Drug resistance mechanisms in acute leukemia. Curr OpinOncol 2001, 13(1):21-6.
4. Marie JP: Drug resistance in hematologic malignancies. Curr Opin Oncol2001, 13(6):463-9.
5. Estey E, Döhner H: Acute myeloid leukaemia. Lancet 2006, 368(9550):1894-907.
6. Jabbour EJ, Estey E, Kantarjian HM: Adult acute myeloid leukemia. MayoClin Proc 2006, 81(2):247-60.
7. Meads MB, Hazlehurst LA, Dalton WS: The bone marrowmicroenvironment as a tumor sanctuary and contributor to drugresistance. Clin Cancer Res 2008, 14(9):2519-26.
8. Li ZW, Dalton WS: Tumor microenvironment and drug resistance inhematologic malignancies. Blood Rev 2006, 20(6):333-42.
9. Papayannopoulou T, Scadden DT: Stem-cell ecology and stem cells inmotion. Blood 2008, 111(8):3923-30.
10. Gazitt Y: Homing and mobilization of hematopoietic stem cells andhematopoietic cancer cells are mirror image processes, utilizing similarsignaling pathways and occurring concurrently: circulating cancer cellsconstitute an ideal target for concurrent treatment with chemotherapyand antilineage-specific antibodies. Leukemia 2004, 18(1):1-10.
Ragusa et al. BMC Cancer 2010, 10:377http://www.biomedcentral.com/1471-2407/10/377
Page 11 of 13

11. Keating S, Suciu S, de Witte T, Zittoun R, Mandelli F, Belhabri A, Amadori S,Fibbe W, Gallo E, Fillet G, Varet B, Meloni G, Hagemeijer A, Fazi P, Solbu G,Willemze R, EORTC Leukemia Group, GIMEMA Leukemia Group: The stemcell mobilizing capacity of patients with acute myeloid leukemia incomplete remission correlates with relapse risk: results of the EORTC-GIMEMA AML-10 trial. Leukemia 2003, 17:60-67.
12. Feller N, Schuurhuis GJ, van der Pol MA, Westra G, Weijers GW, van Stijn A,Huijgens PC, Ossenkoppele GJ: High percentage of CD34-positive cells inautologous AML peripheral blood stem cell products reflects inadequatein vivo purging and low chemotherapeutic toxicity in a subgroup ofpatients with poor clinical outcome. Leukemia 2003, 17:68-75.
13. Grimwade D, Walker H, Oliver F, Wheatley K, Harrison C, Harrison G, Rees J,Hann I, Stevens R, Burnett A, Goldstone A: The Importance of DiagnosticCytogenetics on Outcome in AML: Analysis of 1,612 Patients EnteredInto the MRC AML 10 Trial. Blood 1998, 92:2322-2333.
14. Rodriguez-Nieto S, Zhivotovsky B: Role of Alterations in the ApoptoticMachinery in Sensitivity of Cancer Cells to Treatment. CurrentPharmaceutical Design 2006, 12:4411-4425.
15. Mellor HR, Callaghan R: Resistance to Chemotherapy in Cancer: AComplex and Integrated Cellular Response. Pharmacology 2008,81:275-300.
16. Di Pietro C, Ragusa M, Barbagallo D, Duro LR, Guglielmino MR, Majorana A,Angelica R, Scalia M, Statello L, Salito L, Tomasello L, Pernagallo S, Valenti S,D’Agostino V, Triberio P, Tandurella I, Palumbo GA, La Cava P, Cafiso V,Bertuccio T, Santagati M, Li Destri G, Lanzafame S, Di Raimondo F, Stefani S,Mishra B, Purrello M: The apoptotic machinery as a biological complexsystem: analysis of its omics and evolution, identification of candidategenes for fourteen major types of cancer, and experimental validationin CML and neuroblastoma. BMC Med Genomics 2009, 2(1):20.
17. Livak KJ, Schmittgen TD: Analysis of relative gene expression data usingreal-time quantitative PCR and the 2(-Delta Delta C(T)) Method. Methods2001, 25(4):402-8.
18. Saeed AI, Sharov V, White J, Li J, Liang W, Bhagabati N, Braisted J, Klapa M,Currier T, Thiagarajan M, Sturn A, Snuffin M, Rezantsev A, Popov D,Ryltsov A, Kostukovich E, Borisovsky I, Liu Z, Vinsavich A, Trush V,Quackenbush J: TM4: a free, open-source system for microarray datamanagement and analysis. Biotechniques 2003, 34(2):374-8.
19. Shannon P, Markiel A, Ozier O, Baliga NS, Wang JT, Ramage D, Amin N,Schwikowski B, Ideker T: Cytoscape: a software environment forintegrated models of biomolecular interaction networks. Genome Res2003, 13:2498-2504.
20. Hernandez-Toro J, Prieto C, De las Rivas J: APID2NET: unified interactomegraphic analyzer. Bioinformatics 2007, 23(18):2495-7.
21. Assenov Y, Ramírez F, Schelhorn SE, Lengauer T, Albrecht M: Computingtopological parameters of biological networks. Bioinformatics 2008,24(2):282-284.
22. Brandes U, Erlebach T: Network Analysis Berlin: Springer Verlag 2005.23. Mattingly CJ, Rosenstein MC, Davis AP, Colby GT, Forrest JN, Boyer JL: The
Comparative Toxicogenomics Database: a cross-species resource forbuilding chemical-gene interaction networks. Toxicol Sci 2006,92(2):587-95.
24. Nagy B, Lundán T, Larramendy ML, Aalto Y, Zhu Y, Niini T, Edgren H,Ferrer A, Vilpo J, Elonen E, Vettenranta K, Franssila K, Knuutila S: Abnormalexpression of apoptosis-related genes in haematological malignancies:overexpression of MYC is poor prognostic sign in mantle celllymphoma. Br J Haematol 2003, 120(3):434-41.
25. Gattei V, Degan M, Gloghini A, De Iuliis A, Improta S, Rossi FM, Aldinucci D,Perin V, Serraino D, Babare R, Zagonel V, Gruss HJ, Carbone A, Pinto A:CD30 ligand is frequently expressed in human hematopoieticmalignancies of myeloid and lymphoid origin. Blood 1997, 89(6):2048-59.
26. Lucena-Araujo AR, Panepucci RA, dos Santos GA, Jácomo RH, Santana-Lemos BA, Lima AS, Garcia AB, Araújo AG, Falcão RP, Rego EM: Theexpression of DeltaNTP73, TATP73 and TP53 genes in acute myeloidleukaemia is associated with recurrent cytogenetic abnormalities and invitro susceptibility to cytarabine cytotoxicity. Br J Haematol 2008,142(1):74-8.
27. Bonelli P, Petrella A, Rosati A, Romano MF, Lerose R, Pagliuca MG, Amelio T,Festa M, Martire G, Venuta S, Turco MC, Leone A: BAG3 protein regulatesstress-induced apoptosis in normal and neoplastic leukocytes. Leukemia2004, 18(2):358-60.
28. Mercier I, Vuolo M, Madan R, Xue X, Levalley AJ, Ashton AW, Jasmin JF,Czaja MT, Lin EY, Armstrong RC, Pollard JW, Kitsis RN: ARC, an apoptosissuppressor limited to terminally differentiated cells, is induced in humanbreast cancer and confers chemo- and radiation-resistance. Cell DeathDiffer 2005, 12(6):682-6.
29. Cho D, Kim YI, Kang JS, Hahm E, Yang Y, Kim D, Kim S, Kim YS, Hur D,Park H, Hwang YI, Kim TS, Lee WJ: Resistance to cytotoxic chemotherapyis induced by NK cells in non-Hodgkin’s Lymphoma Cells. J Clin Immunol2004, 24(5):553-60.
30. Vaziri SA, Grabowski DR, Tabata M, Holmes KA, Sterk J, Takigawa N,Bukowski RM, Ganapathi MK, Ganapathi R: c-IAP1 is overexpressed in HL-60 cells selected for doxorubicin resistance: effects on etoposide-induced apoptosis. Anticancer Res 2003, 23(5A):3657-61.
31. Valdez BC, Murray D, Ramdas L, de Lima M, Jones R, Kornblau S,Betancourt D, Li Y, Champlin RE, Andersson BS: Altered gene expression inbusulfan-resistant human myeloid leukemia. Leuk Res 2008, 32(11):1684-97.
32. Corvaro M, Fuoco C, Wagner M, Cecconi F: Analysis of apoptosomedysregulation in pancreatic cancer and of its role in chemoresistance.Cancer Biol Ther 2007, 6(2):209-17.
33. Longley DB, Wilson TR, McEwan M, Allen WL, McDermott U, Galligan L,Johnston PG: c-FLIP inhibits chemotherapy-induced colorectal cancer celldeath. Oncogene 2006, 25(6):838-48.
34. Nadal C, Maurel J, Gallego R, Castells A, Longarón R, Marmol M, Sanz S,Molina R, Martin-Richard M, Gascón P: FAS/FAS ligand ratio: a marker ofoxaliplatin-based intrinsic and acquired resistance in advancedcolorectal cancer. Clin Cancer Res 2005, 11(13):4770-4.
35. Joy MP, Brock A, Ingber DE, Huang S: High-betweenness proteins in theyeast protein interaction network. J Biomed Biotechnol 2005,2005(2):96-103.
36. Luqmani YA: Mechanisms of drug resistance in cancer chemotherapy.Med Princ Pract 2005, 14(Suppl 1):35-48.
37. Meads MB, Gatenby RA, Dalton WS: Environment-mediated drugresistance: a major contributor to minimal residual disease. Nat RevCancer 2009, , 9: 665-74.
38. Kopp HG, Avecilla ST, Hooper AT, Rafii S: The bone marrow vascular niche:home of HSC differentiation and mobilization. Physiology 2005, 20:349-56.
39. Bociek RG, Armitage JO: Hematopoietic growth factors. CA Cancer J Clin1996, 46(3):165-84.
40. Lotem J, Sachs L: Cytokine control of developmental programs in normalhematopoiesis and leukemia. Oncogene 2002, 21(21):3284-94.
41. Liongue C, Wright C, Russell AP, Ward AC: Granulocyte colony-stimulatingfactor receptor: stimulating granulopoiesis and much more. Int J BiochemCell Biol 2009, 41(12):2372-5.
42. Derouet M, Thomas L, Cross A, Moots RJ, Edwards SW: Granulocytemacrophage colony-stimulating factor signaling and proteasomeinhibition delay neutrophil apoptosis by increasing the stability of Mcl-1.J Biol Chem 2004, 279(26):26915-21.
43. Kotone-Miyahara Y, Yamashita K, Lee KK, Yonehara S, Uchiyama T, Sasada M,Takahashi A: Short-term delay of Fas-stimulated apoptosis by GM-CSF asa result of temporary suppression of FADD recruitment in neutrophils:evidence implicating phosphatidylinositol 3-kinase and MEK1-ERK1/2pathways downstream of classical protein kinase C. J Leukoc Biol 2004,76(5):1047-56.
44. Gu L, Chiang KY, Zhu N, Findley HW, Zhou M: Contribution of STAT3 tothe activation of survivin by GM-CSF in CD34+ cell lines. Exp Hematol2007, 35(6):957-66.
45. Sachs L, Lotem J: Control of Programmed Cell Death in Normal andLeukemic Cells: New Implications for Therapy. Blood 1993, , 82: 15-21.
46. Eisele L, Klein-Hitpass L, Chatzimanolis N, Opalka B, Boes T, Seeber S,Moritz T, Flasshove M: Differential expression of drug-resistance-relatedgenes between sensitive and resistant blasts in acute myeloid leukemia.Acta Haematol 2007, 117(1):8-15.
47. Murayama T, Imoto S, Natazuka T, Chihara K, Matsui T: Proliferativereaction of myelogenous leukemia cells with cytokines G-CSF, GM-CSF,M-CSF, SCF and TPO. Leuk Res 1998, 22(6):557-60.
48. Inukai T, Sugita K, Iijima K, Goi K, Tezuka T, Kojika S, Kagami K, Mori T,Kinoshita A, Suzuki T, O-Koyama T, Nakazawa S: Leukemic cells with 11q23translocations express granulocyte colony-stimulating factor (G-CSF)receptor and their proliferation is stimulated with G-CSF. Leukemia 1998,12(3):382-9.
Ragusa et al. BMC Cancer 2010, 10:377http://www.biomedcentral.com/1471-2407/10/377
Page 12 of 13

49. Seal S, Hockenbery DM, Spaulding EY, Kiem HP, Abbassi N, Deeg HJ:Differential responses of FLIPLong and FLIPShort-overexpressing humanmyeloid leukemia cells to TNF-alpha and TRAIL-initiated apoptoticsignals. Exp Hematol 2008, 36(12):1660-72.
50. Zang F, Sun B, Zhao X, Niu R, Zhang S, Yu M, Wei X, Zhang L: Critical rolefor c-FLIP(L) on Fas resistance in colon carcinoma cell line HT-29. Cell BiolInt 2008, 32(3):329-36.
51. Grimwade D, Du MQ, Langabeer S, Rogers J, Solomon E: Screening formutations of Bcl10 in leukaemia. Br J Haematol 2000, 109(3):611-5.
52. Cui Q, Ma Y, Jaramillo M, Bari H, Awan A, Yang S, Zhang S, Liu L, Lu M,O’Connor-McCourt M, Purisima EO, Wang E: A map of human cancersignaling. Mol Syst Biol 2007, 3:152.
Pre-publication historyThe pre-publication history for this paper can be accessed here:http://www.biomedcentral.com/1471-2407/10/377/prepub
doi:10.1186/1471-2407-10-377Cite this article as: Ragusa et al.: Expression profile and specific networkfeatures of the apoptotic machinery explain relapse of acute myeloidleukemia after chemotherapy. BMC Cancer 2010 10:377.
Submit your next manuscript to BioMed Centraland take full advantage of:
• Convenient online submission
• Thorough peer review
• No space constraints or color figure charges
• Immediate publication on acceptance
• Inclusion in PubMed, CAS, Scopus and Google Scholar
• Research which is freely available for redistribution
Submit your manuscript at www.biomedcentral.com/submit
Ragusa et al. BMC Cancer 2010, 10:377http://www.biomedcentral.com/1471-2407/10/377
Page 13 of 13