Genome-wide epigenetic analysis delineates a biologically distinct immature acute leukemia with...
11
doi:10.1182/blood-2008-08-172387 Prepublished online January 23, 2009; 2009 113: 2795-2804 J. M. Valk, Ari Melnick and Ruud Delwel Peter Erpelinck-Verschueren, Anton W. Langerak, Bob Löwenberg, Melissa Fazzari, John M. Greally, Maria E. Figueroa, Bas J. Wouters, Lucy Skrabanek, Jacob Glass, Yushan Li, Claudia A. J. immature acute leukemia with myeloid/T-lymphoid features Genome-wide epigenetic analysis delineates a biologically distinct http://bloodjournal.hematologylibrary.org/content/113/12/2795.full.html Updated information and services can be found at: (956 articles) Myeloid Neoplasia (1412 articles) Lymphoid Neoplasia (1730 articles) Free Research Articles Articles on similar topics can be found in the following Blood collections http://bloodjournal.hematologylibrary.org/site/misc/rights.xhtml#repub_requests Information about reproducing this article in parts or in its entirety may be found online at: http://bloodjournal.hematologylibrary.org/site/misc/rights.xhtml#reprints Information about ordering reprints may be found online at: http://bloodjournal.hematologylibrary.org/site/subscriptions/index.xhtml Information about subscriptions and ASH membership may be found online at: Copyright 2011 by The American Society of Hematology; all rights reserved. Washington DC 20036. by the American Society of Hematology, 2021 L St, NW, Suite 900, Blood (print ISSN 0006-4971, online ISSN 1528-0020), is published weekly For personal use only. by guest on June 3, 2013. bloodjournal.hematologylibrary.org From
Transcript of Genome-wide epigenetic analysis delineates a biologically distinct immature acute leukemia with...

doi:10.1182/blood-2008-08-172387Prepublished online January 23, 2009;2009 113: 2795-2804
J. M. Valk, Ari Melnick and Ruud Delwel
PeterErpelinck-Verschueren, Anton W. Langerak, Bob Löwenberg, Melissa Fazzari, John M. Greally, Maria E. Figueroa, Bas J. Wouters, Lucy Skrabanek, Jacob Glass, Yushan Li, Claudia A. J. immature acute leukemia with myeloid/T-lymphoid featuresGenome-wide epigenetic analysis delineates a biologically distinct
http://bloodjournal.hematologylibrary.org/content/113/12/2795.full.htmlUpdated information and services can be found at:
(956 articles)Myeloid Neoplasia � (1412 articles)Lymphoid Neoplasia �
(1730 articles)Free Research Articles �Articles on similar topics can be found in the following Blood collections
http://bloodjournal.hematologylibrary.org/site/misc/rights.xhtml#repub_requestsInformation about reproducing this article in parts or in its entirety may be found online at:
http://bloodjournal.hematologylibrary.org/site/misc/rights.xhtml#reprintsInformation about ordering reprints may be found online at:
http://bloodjournal.hematologylibrary.org/site/subscriptions/index.xhtmlInformation about subscriptions and ASH membership may be found online at:
Copyright 2011 by The American Society of Hematology; all rights reserved.Washington DC 20036.by the American Society of Hematology, 2021 L St, NW, Suite 900, Blood (print ISSN 0006-4971, online ISSN 1528-0020), is published weekly
For personal use only. by guest on June 3, 2013. bloodjournal.hematologylibrary.orgFrom

MYELOID NEOPLASIA
Genome-wide epigenetic analysis delineates a biologically distinct immatureacute leukemia with myeloid/T-lymphoid features*Maria E. Figueroa,1 *Bas J. Wouters,2 Lucy Skrabanek,3 Jacob Glass,4 Yushan Li,1 Claudia A. J. Erpelinck-Verschueren,2
Anton W. Langerak,5 Bob Lowenberg,2 Melissa Fazzari,6 John M. Greally,4,7 Peter J. M. Valk,2 Ari Melnick,1 and Ruud Delwel2
1Department of Medicine (Hematology Oncology Division), Weill Cornell Medical College, New York, NY; 2Department of Hematology, Erasmus UniversityMedical Center, Rotterdam, The Netherlands; 3Department of Physiology and Biophysics and HRH Prince Alwaleed Bin Talal Bin Abdulaziz Alsaud Institute forComputational Biomedicine, Weill Cornell Medical College, New York, NY; 4Department of Molecular Genetics, Albert Einstein College of Medicine, New York,NY; 5Department of Immunology, Erasmus University Medical Center, Rotterdam, The Netherlands; and Departments of 6Epidemiology and Population Healthand 7Medicine, Albert Einstein College of Medicine, New York, NY
Acute myeloid leukemia is a heteroge-neous disease from the molecular andbiologic standpoints, and even patientswith a specific gene expression profilemay present clinical and molecular heter-ogeneity. We studied the epigenetic pro-files of a cohort of patients who shared acommon gene expression profile but dif-fered in that only half of them harboredmutations of the CEBPA locus, whereasthe rest presented with silencing of this
gene and coexpression of certain T-cellmarkers. DNA methylation studies re-vealed that these 2 groups of patientscould be readily segregated in an unsu-pervised fashion based on their DNAmethylation profiles alone. Furthermore,CEBPA silencing was associated with thepresence of an aberrant DNA hypermeth-ylation signature, which was not presentin the CEBPA mutant group. This aber-rant hypermethylation occurred more fre-
quently at sites within CpG islands.CEBPA-silenced leukemias also displayedmarked hypermethylation compared withnormal CD34� hematopoietic cells,whereas CEBPA mutant cases showedonly mild changes in DNA methylationcompared with these normal progenitors.Biologically, CEBPA-silenced leukemiaspresented with a decreased response tomyeloid growth factors in vitro. (Blood.2009;113:2795-2804)
Introduction
Aberrant transcriptional programming is a hallmark of leukemogen-esis.1 Although it is well accepted that transcription factors play acrucial role in directing lineage decisions during normal hematopoi-esis, it is becoming increasingly clear that epigenetic modificationsalso have a profound influence on regulation of gene transcription.2
It is probable that these levels of regulation are not mutuallyexclusive; for instance, it has been shown that certain lineage-specific transcription factors such as PU.1 can guide the locationsin the genome that become methylated.3 Still, it remains largelyunknown how DNA methylation patterns are determined.
The basic leucine zipper transcription factor CCAAT/enhancerbinding protein-� (C/EBP�) is a key regulator of hematopoieticstem cell homeostasis and normal myeloid development, anddisruption of its normal function has been implicated in myeloidmalignancies.4,5 The CEBPA gene is reported to be mutated in 5%to 15% of all cases of acute myeloid leukemia (AML).6-9 Further-more, it can also be aberrantly repressed by oncogenes, such asAML1-ETO,10 or modified at the posttranslational level throughthe actions of FLT3 and Ras.11,12 Methylation of the CEBPApromoter has also been reported in AML as well as in othermalignancies.13-16
In a genome-wide gene expression profiling study of 285 casesof de novo AML, it was found that AMLs with mutations in CEBPA(CEBPAmut) featured gene expression signatures that clearly dis-criminated them from other AML subgroups.17 However, a smallsubset of leukemias without CEBPA gene aberrations was found to
express a similar gene expression signature. It was found that afrequent characteristic in this subset of leukemias was CpGhypermethylation of the CEBPA proximal promoter, which wasassociated with silencing of CEBPA expression (CEBPAsil). Subse-quent analyses revealed an immature mixed myeloid/T-lymphoidimmunophenotype and frequent NOTCH1 mutations as additionalcharacteristics of these leukemias.16
Although these studies suggested a role for epigenetic silencingof CEBPA in the leukemic phenotype, they also raised severalquestions: (1) Is silencing of CEBPA through hypermethylation anisolated event or rather one aspect of broader epigenetic modifica-tions? (2) Are particular biologic pathways specifically involved inthe disease phenotype? (3) Are these leukemias more similar toT-cell acute lymphoblastic leukemia (T-ALL) than AML? Toaddress these questions and further investigate the role of DNAmethylation in this subgroup of leukemias, we analyzed DNAmethylation on a genome-wide scale in CEBPAmut and CEBPAsil
patients and also in T-ALL. We found that CEBPA methylation wasassociated with aberrant hypermethylation of many genes com-pared with CEBPAmut AMLs or to normal CD34� hematopoieticprogenitor cells. These hypermethylated genes included manyfactors involved in transcriptional regulation and mesenchymal celldifferentiation and harbored several common genomic features.The epigenetic signature of this form of leukemia was distinct fromT-ALL. Taken together, these data suggest the existence of asubtype of immature myeloid/T-lymphoid leukemia in which
Submitted July 31, 2008; accepted January 8, 2009. Prepublished online as BloodFirst Edition paper, January 23, 2009; DOI 10.1182/blood-2008-08-172387.
*M.E.F. and B.J.W. contributed equally to this study.
The online version of this article contains a data supplement.
The publication costs of this article were defrayed in part by page chargepayment. Therefore, and solely to indicate this fact, this article is herebymarked ‘‘advertisement’’ in accordance with 18 USC section 1734.
© 2009 by The American Society of Hematology
2795BLOOD, 19 MARCH 2009 � VOLUME 113, NUMBER 12
For personal use only. by guest on June 3, 2013. bloodjournal.hematologylibrary.orgFrom
aberrant epigenetic programming results in a disease that isrefractory to normal environmental signals and antileukemiatherapy.
Methods
Patient samples
Twenty-five acute leukemia cases were studied. They included 14 of15 leukemias from the original gene expression cluster 4 described by Valket al,17 and represented 8 cases with CEBPA mutations and 6 cases withsilenced CEBPA characteristics. Two additional cases of CEBPA-silencedleukemias, which had been identified in a second AML cohort anddescribed in our previous work,16 were also studied. Nine adult T-ALLswere selected, representing various stages of maturation. Characteristics ofthese T-ALL cases are given in Table S1 (available on the Blood website;see the Supplemental Materials link at the top of the online article). NormalCD34� progenitor cells were purified from bone marrow specimens from8 healthy donors: 4 acquired from the Translational Trials Development andSupport Laboratory, Cincinnati Children’s Hospital (Cincinnati, OH) and4 purchased from Allcells (Emeryville, CA). This research was approved bythe institutional review boards at Albert Einstein College of Medicine, WeillCornell Medical College, and Erasmus University, and donor informedconsent was obtained in accordance with the Declaration of Helsinki.
DNA methylation analysis by HELP
High-molecular-weight DNA was isolated from white cell fractions using astandard high salt procedure, and the HELP (HpaII tiny fragment enrich-ment by ligation-mediated PCR) assay was carried out as previouslydescribed.18,19 All samples for microarray hybridization were processed atthe Roche-NimbleGen Service Laboratory. Samples were labeled usingCy-labeled random primers (9 mers) and then hybridized onto a humanHG17 custom-designed oligonucleotide array (50-mers) covering25 626 HpaII-amplifiable fragments located at gene promoters and im-printed regions. HpaII-amplifiable fragments are defined as genomicsequences contained between 2 flanking HpaII sites found within 200 to2000 bp from each other. Each HpaII-amplifiable fragment on the array isrepresented by 15 individual probes distributed randomly across themicroarray slide. Scanning was performed using a GenePix 4000B scanner(Molecular Devices, Sunnyvale, CA) as previously described.20 Qualitycontrol and data analysis of HELP microarrays were performed as describedby Thompson et al.21 DNA methylation was measured as the log(HpaII/MspI) ratio, where HpaII reflects the hypomethylated fraction of thegenome and MspI represents the whole genome reference. All microarraydata have been submitted to the Gene Expression Omnibus (GEO)repository (accession number GSE14417).22
Gene expression microarrays
Detailed protocols are provided in Document S1.
Microarray data analysis
Unsupervised clustering of HELP and gene expression data by principalcomponent analysis were performed using the statistical software R version2.6.2 and the BioConductor package MADE4.23 Supervised analysis wascarried out using a moderated t test with a significance level of P less than.001 (all P values were still significant at P � .05 after correcting formultiple testing using the Benjamini-Hochberg approach) and fold changemore than 2 for gene expression. In the case of the methylation data, anabsolute difference in methylation more than 2 between the means of the2 populations was required to increase the likelihood of detection ofbiologically significant changes in methylation levels.
Quantitative DNA methylation analysis by MassARRAYEpiTyping
This analysis is described in Document S1.
CEBPA status classifier
The DNA methylation status for each HpaII-amplifiable fragment wascategorized as follows: fragments having log 2 (HpaII/MspI) less than 0were considered methylated, and those with log 2 ratios greater than 0 wereconsidered hypomethylated. AML samples were categorized according totheir CEBPA locus mutation status, and a Fisher exact test was performed ateach locus to rank its predictive ability. Cutoffs for perfect, intermediate,and poor classifiers were set at P values of 1.55e�4 (which corresponds toFisher exact P value based on perfect classification for this sample size), .2,and more than .2, respectively. The use of .20 as the threshold was setarbitrarily but represents an acceptable P value range for intermediateclassification ability given the sample size.
Sequence analysis
Sequence retrieval, repeat element analysis, and motif analysis are de-scribed in Document S1.
In vitro cultures and thymidine incorporation assay
These are described in Document S1.
Results
CEBPA silencing is associated with an aberrant DNAmethylation signature
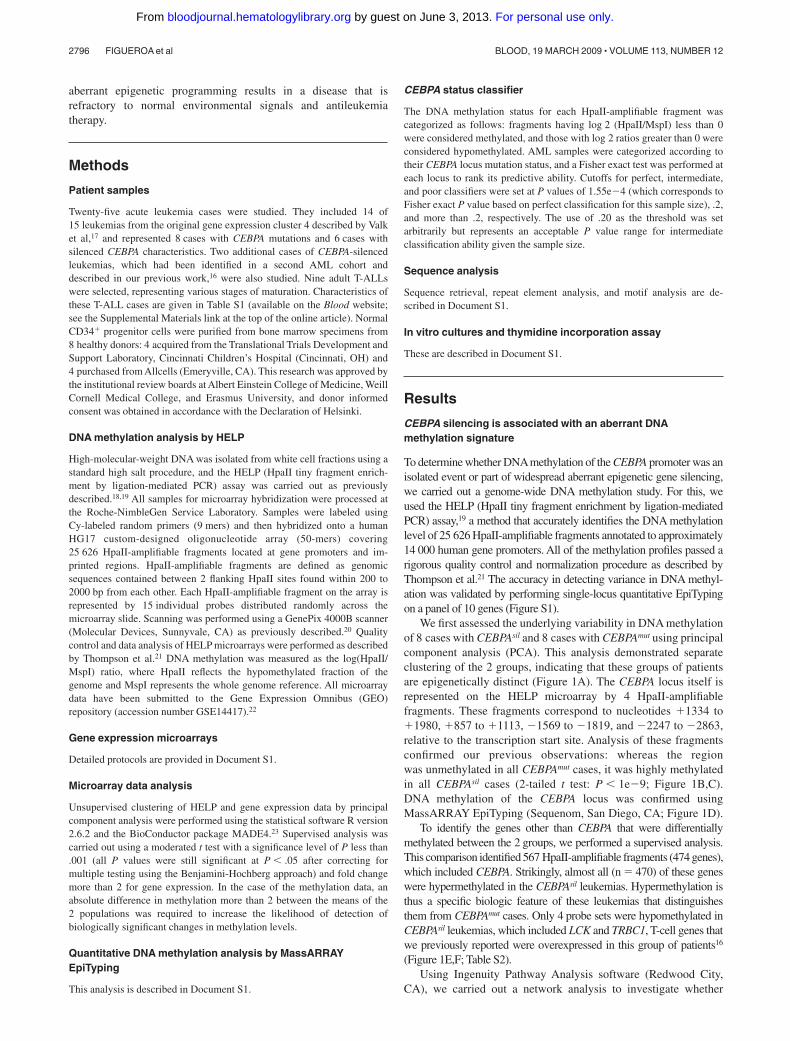
To determine whether DNAmethylation of the CEBPA promoter was anisolated event or part of widespread aberrant epigenetic gene silencing,we carried out a genome-wide DNA methylation study. For this, weused the HELP (HpaII tiny fragment enrichment by ligation-mediatedPCR) assay,19 a method that accurately identifies the DNA methylationlevel of 25 626 HpaII-amplifiable fragments annotated to approximately14 000 human gene promoters. All of the methylation profiles passed arigorous quality control and normalization procedure as described byThompson et al.21 The accuracy in detecting variance in DNA methyl-ation was validated by performing single-locus quantitative EpiTypingon a panel of 10 genes (Figure S1).
We first assessed the underlying variability in DNA methylationof 8 cases with CEBPAsil and 8 cases with CEBPAmut using principalcomponent analysis (PCA). This analysis demonstrated separateclustering of the 2 groups, indicating that these groups of patientsare epigenetically distinct (Figure 1A). The CEBPA locus itself isrepresented on the HELP microarray by 4 HpaII-amplifiablefragments. These fragments correspond to nucleotides �1334 to�1980, �857 to �1113, �1569 to �1819, and �2247 to �2863,relative to the transcription start site. Analysis of these fragmentsconfirmed our previous observations: whereas the regionwas unmethylated in all CEBPAmut cases, it was highly methylatedin all CEBPAsil cases (2-tailed t test: P � 1e�9; Figure 1B,C).DNA methylation of the CEBPA locus was confirmed usingMassARRAY EpiTyping (Sequenom, San Diego, CA; Figure 1D).
To identify the genes other than CEBPA that were differentiallymethylated between the 2 groups, we performed a supervised analysis.This comparison identified 567 HpaII-amplifiable fragments (474 genes),which included CEBPA. Strikingly, almost all (n � 470) of these geneswere hypermethylated in the CEBPAsil leukemias. Hypermethylation isthus a specific biologic feature of these leukemias that distinguishesthem from CEBPAmut cases. Only 4 probe sets were hypomethylated inCEBPAsil leukemias, which included LCK and TRBC1, T-cell genes thatwe previously reported were overexpressed in this group of patients16
(Figure 1E,F; Table S2).Using Ingenuity Pathway Analysis software (Redwood City,
CA), we carried out a network analysis to investigate whether
2796 FIGUEROA et al BLOOD, 19 MARCH 2009 � VOLUME 113, NUMBER 12
For personal use only. by guest on June 3, 2013. bloodjournal.hematologylibrary.orgFrom

genes in this differentially methylated signature interrelated witheach other. Interestingly, the 2 top-scoring networks were centeredaround CEBPA and NF�B and could almost exclusively begenerated using genes that were differentially methylated (32 of 35and 24 of 35 genes in the networks, respectively). The fact that themajority of genes in the network were affected by aberrantmethylation is highly suggestive of the biologic importance of thisobservation. An additional network involved several bone morpho-genetic protein (BMP) factors (in which 25 of 34 genes wereinvolved), suggesting potential involvement of transforming growthfactor-� signaling in these tumors as well. The genes involved inthe 3 top-scoring networks are listed in Table 1 and Figure S2.Among the most represented gene ontology terms within thehypermethylated signature were regulation of transcription andmesenchymal cell development (Table 2). Despite the associationof some CEBPAsil cases with Notch1 activating mutations, we didnot find a significant overlap between this hypermethylated genesignature and the Notch1 signature reported by Palomero et al.24
CEBPAsil and CEBPAmut leukemia cells are epigeneticallydistinct from normal bone marrow CD34� cells
Does hypermethylation in CEBPAsil leukemic blasts representaberrant epigenetic programming compared with normal CD34�
cells? In a supervised comparison of CEBPAsil leukemia cells withCD34� healthy donor bone marrow fractions (n � 8), a largenumber of differentially methylated loci (1035 HpaII-amplifiablefragments, 876 unique genes) was found. Similarly as in theprevious analyses, most of the genes (841 of 876) were hypermethy-lated in the CEBPAsil leukemia subgroup (Figure 2A,B). Moreover,281 of these 876 genes appeared to be hypermethylated bothcompared with normal CD34� cells and to CEBPAmut leukemias,indicating that aberrant hypermethylation of these genes occurredexclusively in CEBPAsil cases. These included, among others, thetumor suppressors CDKN2B and IRF8, the cell cycle regulatorMyoD1, and the WNT signaling antagonist SFRP1. Loss of allthese genes has been previously implicated in tumorigenesis.25-29
Furthermore, hypermethylation of the promoter regions of CDKN2B,MyoD1, and SFRP1 has been described in association with severalforms of leukemia.30-35 A complete list of the genes exclusivelymethylated in the CEBPAsil subgroup versus normal CD34� cells isprovided in Table S3. Both of the proximal HpaII-amplifiablefragments for the CEBPA locus reached statistical significance andshowed hypermethylation in the CEBPAsil group versus the normalCD34� cells, with an absolute methylation change slightly belowour set threshold of 2 (change, �1.63 and 1.99; Figure S3). Only45 of the 1035 HpaII-amplifiable fragments were hypomethylated
Figure 1. A unique methylation profile distinguishes CEBPAsil from CEBPAmut AML. (A) Principal component analysis of DNA methylation data using the HELP assay on8 CEBPAsil and 8 CEBPAmut AML cases revealed that the cases were readily segregated into 2 clusters, which matched exactly with CEBPA status. (B) Heatmap representationof the 4 probe sets annotated to the CEBPA locus on the HELP microarray; cases are clustered according to their methylation status. CEBPAsil cases cluster together (leftnode), and all show higher levels of methylation for at least 3 of the 4 probe sets. (C) Representation of the positioning of the 4 probe sets relative to the genomic localization ofthe CEBPA locus and its CpG island on chromosome 19. HELP methylation values for each leukemia case are represented in one row; the y-axis represents centered log2(HpaII/MspI) ratios. Positive values correspond to hypomethylated fragments, whereas a negative deflection reflects a methylated fragment. The first 8 rows correspond to theCEBPAsil cases (in red), and the remaining rows to the CEBPAmut cases (in blue). (D) Heatmap representing the DNA methylation status at 5 different regions of the CEBPAlocus. Percentage cytosine methylation was determined at these regions for all cases using MassARRAY EpiTyper. (E) Two-dimensional hierarchical clustering of genesdifferentially methylated between the 2 leukemia subgroups, illustrated by a heatmap. Supervised analysis identified 567 HpaII-amplifiable fragments (P � .001 and absolutedifference in methylation � 2). Cases are represented in the columns; probe sets are represented in the rows. CEBPAsil cases are clustered in the left node and display highmethylation levels for 563 HpaII-amplifiable fragments. (Right) Heatmap representation of the 4 probe sets that displayed the opposite behavior, ie, relative hypomethylation inCEBPAsil leukemia. (F) A plot of methylation difference between CEBPAsil and CEBPAmut cases (x-axis) versus statistical significance (y-axis) shows the marked asymmetry ofthe 2 branches, illustrating the overall tendency to higher methylation levels in the CEBPAsil cases. Red points represent probe sets that reached both criteria for differentialmethylation on our analysis (P � .001 and absolute methylation difference � 2).
EPIGENETIC BASIS OF LINEAGE INFIDELITY AML 2797BLOOD, 19 MARCH 2009 � VOLUME 113, NUMBER 12
For personal use only. by guest on June 3, 2013. bloodjournal.hematologylibrary.orgFrom
in the CEBPAsil cases and hypermethylated in normal CD34� cells.These loci included the T-cell genes CD3D and TRBC1.
In the CEBPAmut group, abnormal methylation was less abundant,with only 322 HpaII-amplifiable fragments (286 unique genes) detectedas differentially methylated with respect to normal CD34� cells.Moreover, the difference in DNA methylation was distributed evenly,where approximately half of these probe sets were hypermethylated andthe other half hypomethylated (Figure 2C,D). This finding indicates thatthe markedly increased prevalence of abnormal promoter hypermethyl-ation is highly specific to CEBPAsil cases among the CEBPA geneexpression signature AML patients.
When we compared both subgroups of leukemias with normalCD34� cells, 100 unique genes were found to be aberrantlymethylated in the leukemia samples. These included CDKN2A,CCR7, MT2A, and NOS3 and were all linked together in acancer/cell signaling network through Ingenuity Pathway Analysis(Table S4). This finding suggests that aberrant hypermethylation ofthese genes is a common event in both these leukemogenicprocesses and therefore deserves further study.
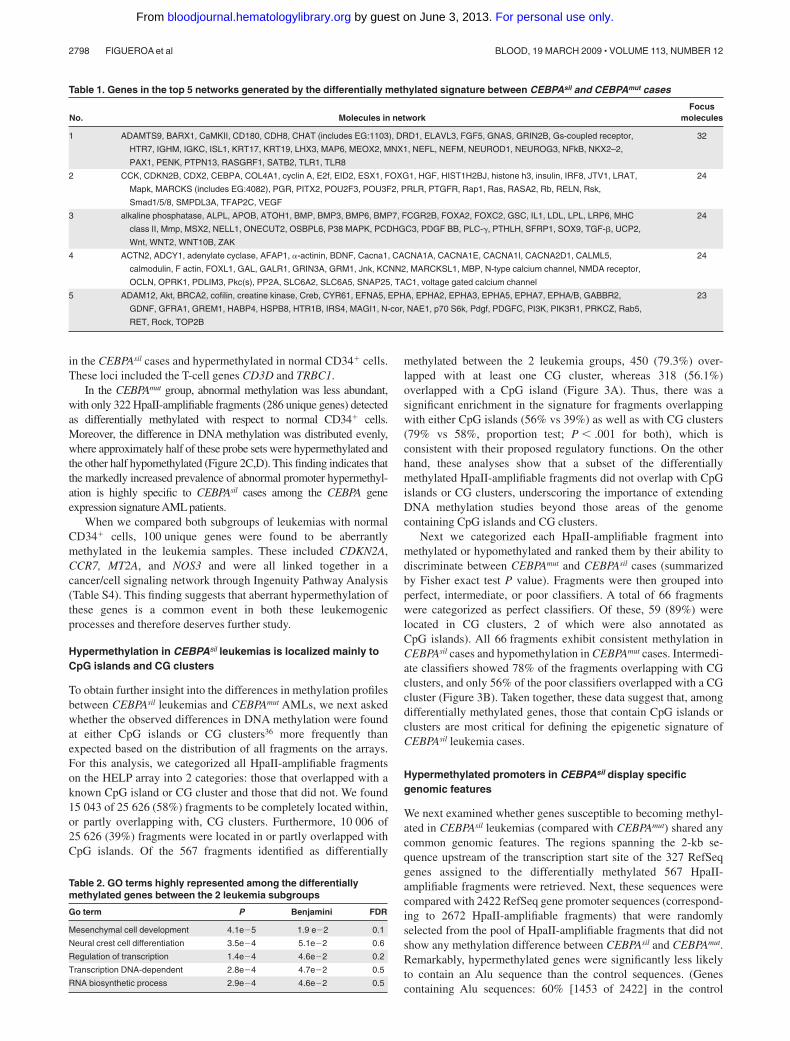
Hypermethylation in CEBPAsil leukemias is localized mainly toCpG islands and CG clusters
To obtain further insight into the differences in methylation profilesbetween CEBPAsil leukemias and CEBPAmut AMLs, we next askedwhether the observed differences in DNA methylation were foundat either CpG islands or CG clusters36 more frequently thanexpected based on the distribution of all fragments on the arrays.For this analysis, we categorized all HpaII-amplifiable fragmentson the HELP array into 2 categories: those that overlapped with aknown CpG island or CG cluster and those that did not. We found15 043 of 25 626 (58%) fragments to be completely located within,or partly overlapping with, CG clusters. Furthermore, 10 006 of25 626 (39%) fragments were located in or partly overlapped withCpG islands. Of the 567 fragments identified as differentially
methylated between the 2 leukemia groups, 450 (79.3%) over-lapped with at least one CG cluster, whereas 318 (56.1%)overlapped with a CpG island (Figure 3A). Thus, there was asignificant enrichment in the signature for fragments overlappingwith either CpG islands (56% vs 39%) as well as with CG clusters(79% vs 58%, proportion test; P � .001 for both), which isconsistent with their proposed regulatory functions. On the otherhand, these analyses show that a subset of the differentiallymethylated HpaII-amplifiable fragments did not overlap with CpGislands or CG clusters, underscoring the importance of extendingDNA methylation studies beyond those areas of the genomecontaining CpG islands and CG clusters.
Next we categorized each HpaII-amplifiable fragment intomethylated or hypomethylated and ranked them by their ability todiscriminate between CEBPAmut and CEBPAsil cases (summarizedby Fisher exact test P value). Fragments were then grouped intoperfect, intermediate, or poor classifiers. A total of 66 fragmentswere categorized as perfect classifiers. Of these, 59 (89%) werelocated in CG clusters, 2 of which were also annotated asCpG islands). All 66 fragments exhibit consistent methylation inCEBPAsil cases and hypomethylation in CEBPAmut cases. Intermedi-ate classifiers showed 78% of the fragments overlapping with CGclusters, and only 56% of the poor classifiers overlapped with a CGcluster (Figure 3B). Taken together, these data suggest that, amongdifferentially methylated genes, those that contain CpG islands orclusters are most critical for defining the epigenetic signature ofCEBPAsil leukemia cases.
Hypermethylated promoters in CEBPAsil display specificgenomic features
We next examined whether genes susceptible to becoming methyl-ated in CEBPAsil leukemias (compared with CEBPAmut) shared anycommon genomic features. The regions spanning the 2-kb se-quence upstream of the transcription start site of the 327 RefSeqgenes assigned to the differentially methylated 567 HpaII-amplifiable fragments were retrieved. Next, these sequences werecompared with 2422 RefSeq gene promoter sequences (correspond-ing to 2672 HpaII-amplifiable fragments) that were randomlyselected from the pool of HpaII-amplifiable fragments that did notshow any methylation difference between CEBPAsil and CEBPAmut.Remarkably, hypermethylated genes were significantly less likelyto contain an Alu sequence than the control sequences. (Genescontaining Alu sequences: 60% [1453 of 2422] in the control
Table 1. Genes in the top 5 networks generated by the differentially methylated signature between CEBPAsil and CEBPAmut cases
No. Molecules in networkFocus
molecules
1 ADAMTS9, BARX1, CaMKII, CD180, CDH8, CHAT (includes EG:1103), DRD1, ELAVL3, FGF5, GNAS, GRIN2B, Gs-coupled receptor,
HTR7, IGHM, IGKC, ISL1, KRT17, KRT19, LHX3, MAP6, MEOX2, MNX1, NEFL, NEFM, NEUROD1, NEUROG3, NFkB, NKX2–2,
PAX1, PENK, PTPN13, RASGRF1, SATB2, TLR1, TLR8
32
2 CCK, CDKN2B, CDX2, CEBPA, COL4A1, cyclin A, E2f, EID2, ESX1, FOXG1, HGF, HIST1H2BJ, histone h3, insulin, IRF8, JTV1, LRAT,
Mapk, MARCKS (includes EG:4082), PGR, PITX2, POU2F3, POU3F2, PRLR, PTGFR, Rap1, Ras, RASA2, Rb, RELN, Rsk,
Smad1/5/8, SMPDL3A, TFAP2C, VEGF
24
3 alkaline phosphatase, ALPL, APOB, ATOH1, BMP, BMP3, BMP6, BMP7, FCGR2B, FOXA2, FOXC2, GSC, IL1, LDL, LPL, LRP6, MHC
class II, Mmp, MSX2, NELL1, ONECUT2, OSBPL6, P38 MAPK, PCDHGC3, PDGF BB, PLC-�, PTHLH, SFRP1, SOX9, TGF-�, UCP2,
Wnt, WNT2, WNT10B, ZAK
24
4 ACTN2, ADCY1, adenylate cyclase, AFAP1, �-actinin, BDNF, Cacna1, CACNA1A, CACNA1E, CACNA1I, CACNA2D1, CALML5,
calmodulin, F actin, FOXL1, GAL, GALR1, GRIN3A, GRM1, Jnk, KCNN2, MARCKSL1, MBP, N-type calcium channel, NMDA receptor,
OCLN, OPRK1, PDLIM3, Pkc(s), PP2A, SLC6A2, SLC6A5, SNAP25, TAC1, voltage gated calcium channel
24
5 ADAM12, Akt, BRCA2, cofilin, creatine kinase, Creb, CYR61, EFNA5, EPHA, EPHA2, EPHA3, EPHA5, EPHA7, EPHA/B, GABBR2,
GDNF, GFRA1, GREM1, HABP4, HSPB8, HTR1B, IRS4, MAGI1, N-cor, NAE1, p70 S6k, Pdgf, PDGFC, PI3K, PIK3R1, PRKCZ, Rab5,
RET, Rock, TOP2B
23
Table 2. GO terms highly represented among the differentiallymethylated genes between the 2 leukemia subgroups
Go term P Benjamini FDR
Mesenchymal cell development 4.1e�5 1.9 e�2 0.1
Neural crest cell differentiation 3.5e�4 5.1e�2 0.6
Regulation of transcription 1.4e�4 4.6e�2 0.2
Transcription DNA-dependent 2.8e�4 4.7e�2 0.5
RNA biosynthetic process 2.9e�4 4.6e�2 0.5
2798 FIGUEROA et al BLOOD, 19 MARCH 2009 � VOLUME 113, NUMBER 12
For personal use only. by guest on June 3, 2013. bloodjournal.hematologylibrary.orgFrom
sequences vs 26% [85 of 327] in the differentially methylatedsequences; Fisher exact test, P � 2.2e�16; Table 3.) This was theonly repeat element that showed a statistically significant distribu-tion difference between the CEBPAsil signature and the randomlyselected control group. All other repeat sequences (eg, SINE/MIRs,LINEs, or MERs) were present in approximately equal proportions.We also looked at the promoter regions from 780 RefSeq genesannotated to the 1035 HpaII-amplifiable fragments differentiallymethylated between CEBPAsil leukemias versus normal CD34�
bone marrow cells. We compared these with 3086 randomlyselected RefSeq promoters (corresponding to 4470 control HpaII-amplifiable fragments). Once again, we found that differentiallymethylated sequences were less likely to contain Alu elements(60% in control sequences [1865 of 3086] vs 35% in thedifferentially methylated sequences [277 of 780]; Fisher exact test,P � 2.2e�16).
To determine whether a specific DNA sequence was associatedwith the differentially methylated genes, we used the FindingInformative Regulatory Elements (FIRE) algorithm37 to look at aregion containing 2 kb of sequence upstream of the reportedtranscription start site. This analysis identified a nondegenerate5-CGCGCTC-3 motif, which was significantly enriched in thedifferentially methylated sequences compared with the controlsequences. The nondegenerate motif could be detected in 45% of
the differentially methylated sequences (147 of 327), whereas itwas found in less than 24% of the control sequences (574 of 2422;Fisher exact test, P � 3.3e�13). An independent FIRE analysiswas carried out to study the promoter sequences of the RefSeqgenes annotated to the probe sets in the CEBPAsil versus normalCD34� cell signature. Although this analysis discovered the samenondegenerate motif as before, it was slightly less successful atdiscriminating between the 2 groups (present in 32% of thedifferentially methylated sequences [251 of 780] vs 20% of thecontrol sequences [628 of 3086]; Fisher exact test, P � 8.7e�12).Although this motif does not correspond to a known transcriptionfactor binding site, FIRE annotated sequences containing this motifas being associated with the Gene Ontology term GO:0043565,involved in sequence-specific DNA binding (P � 1e�7). Theenrichment of this element within the hypermethylated signature issuggestive of the existence of a putative DNA binding protein thatmight participate in establishing this epigenetic signature.
Methylated genes in CEBPAsil leukemias tend to be expressedat low levels
To determine the correlation of DNA methylation with geneexpression, we examined genome-wide mRNA transcript abun-dance of the same CEBPAsil and CEBPAmut cases using Affymetrix
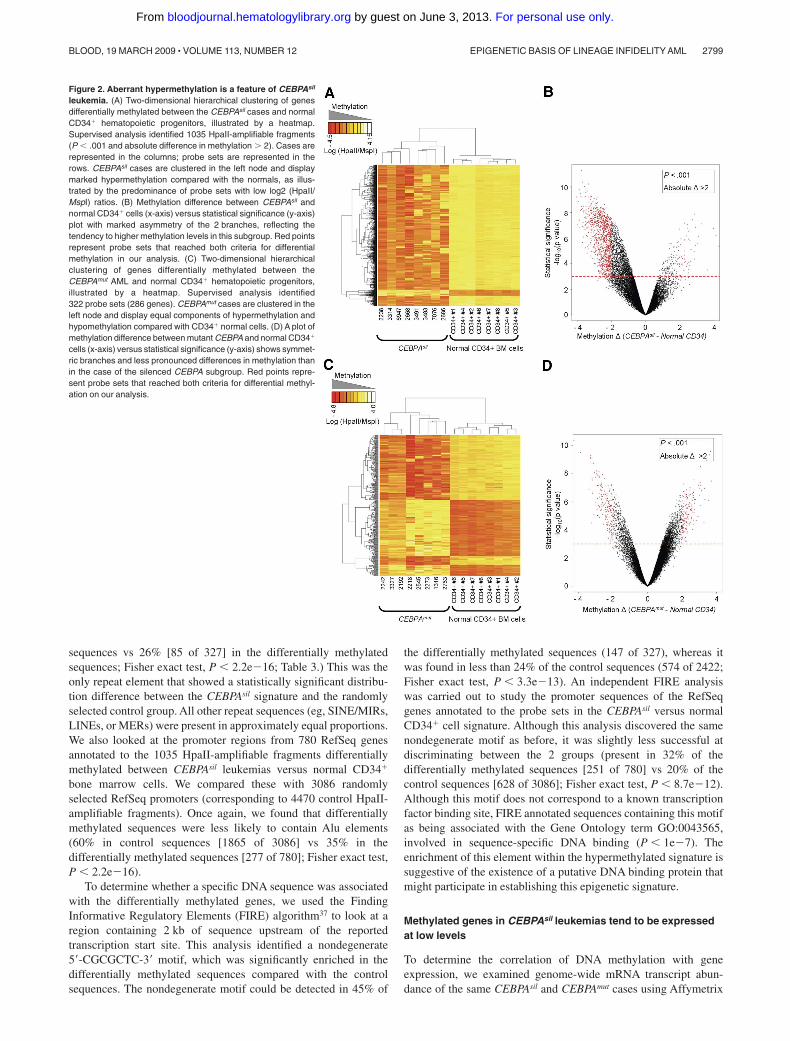
Figure 2. Aberrant hypermethylation is a feature of CEBPAsil
leukemia. (A) Two-dimensional hierarchical clustering of genesdifferentially methylated between the CEBPAsil cases and normalCD34� hematopoietic progenitors, illustrated by a heatmap.Supervised analysis identified 1035 HpaII-amplifiable fragments(P � .001 and absolute difference in methylation � 2). Cases arerepresented in the columns; probe sets are represented in therows. CEBPAsil cases are clustered in the left node and displaymarked hypermethylation compared with the normals, as illus-trated by the predominance of probe sets with low log2 (HpaII/MspI) ratios. (B) Methylation difference between CEBPAsil andnormal CD34� cells (x-axis) versus statistical significance (y-axis)plot with marked asymmetry of the 2 branches, reflecting thetendency to higher methylation levels in this subgroup. Red pointsrepresent probe sets that reached both criteria for differentialmethylation in our analysis. (C) Two-dimensional hierarchicalclustering of genes differentially methylated between theCEBPAmut AML and normal CD34� hematopoietic progenitors,illustrated by a heatmap. Supervised analysis identified322 probe sets (286 genes). CEBPAmut cases are clustered in theleft node and display equal components of hypermethylation andhypomethylation compared with CD34� normal cells. (D) A plot ofmethylation difference between mutant CEBPA and normal CD34�
cells (x-axis) versus statistical significance (y-axis) shows symmet-ric branches and less pronounced differences in methylation thanin the case of the silenced CEBPA subgroup. Red points repre-sent probe sets that reached both criteria for differential methyl-ation on our analysis.
EPIGENETIC BASIS OF LINEAGE INFIDELITY AML 2799BLOOD, 19 MARCH 2009 � VOLUME 113, NUMBER 12
For personal use only. by guest on June 3, 2013. bloodjournal.hematologylibrary.orgFrom

HGU133 Plus 2.0 microarrays (Santa Clara, CA). An unsupervisedanalysis using PCA indicated that, in contrast to DNA methylationprofiles, expression data did not result in segregation along themajor axes (Figure S4). Nevertheless, a supervised analysisidentified 587 probe sets, corresponding to 415 unique genes, asdifferentially expressed between the 2 groups of leukemias, whichis in line with our previous findings16 (Figure 4A). Overlapbetween the differentially methylated and differentially expressedgenes was only minimal (12 unique genes, including CEBPA itself).This is consistent with our previous report showing that geneexpression and methylation profiling tend to capture biologicvariance in different sets of genes.18 Interestingly, signal intensities
of 62.5% of the genes detected as differentially hypermethylatedwere measured at low abundance (intensity � log2[100]) in boththe CEBPAsil and the CEBPAmut groups. This may imply that thesegenes are epigenetically silenced by DNA methylation in one groupand repressed through a different mechanism in the other. Alongthese lines, expression levels for most of these genes were detectedat similarly low levels in an independent cohort of 400 AML casesof other subtypes (data not shown). Methylation and gene expres-sion were validated by MassARRAY on 15 genes for 3 CEBPAsil
and 4 CEBPAmut randomly selected cases and by quantitativereverse-transcribed polymerase chain reaction on 10 of these geneson 2 to 4 randomly selected cases from each group (Figure S5).
We next examined whether differential methylation in the genescontained within the CEBPAsil versus CEBPAmut subtypes was morecorrelated to expression levels than methylation occurring inrandomly selected subsets of genes. For this we determined thecorrelation between transcript abundance and DNA methylationstatus for the 474 genes differentially methylated between the2 leukemia subgroups and compared it with that of genes annotatedto 600 randomly selected probe sets from the HELP microarray.This comparison was repeated for 5 different randomly selectedgroups of control probe sets. In every instance, the differentiallymethylated genes showed a slightly stronger correlation with geneexpression levels (corresponding to a negative biologic correlationbetween DNA methylation and gene expression) than the randomlyselected genes (Figure 4B).
CEBPAsil leukemias are epigenetically distinct from T-ALL
We hypothesized that CEBPAsil leukemias, although expressingcertain T-cell genes, are biologically and epigenetically not onlydifferent from other AMLs, but also from T-ALL. To test thishypothesis, we generated HELP profiles from a selection of9 T-ALL cases from various maturation stages and compared thosewith the methylation data of the CEBPAsil leukemias. Unsupervisedanalysis of HELP using PCA resulted in separate clustering of theCEBPAsil leukemias and the T-ALL cases (Figure 5A). A supervisedanalysis identified 164 genes (199 HpaII-amplifiable fragments)differentially methylated between the CEBPAsil leukemias andT-ALLs (Figure 5B; Table S5). Specific analysis of the CEBPAlocus HpaII-amplifiable fragments indicated a mixed pattern in theT-ALL samples. Whereas the majority of cases (n � 6) showedhypermethylation of the CEBPA proximal promoter, the remaining3 did not (Figure S6). A similar separation of CEBPAsil leukemiasand T-ALL samples was observed based on gene expression data(Figure 5C), indeed suggesting that CEBPAsil leukemias arebiologically and epigenetically distinct from T-ALL.
CEBPAsil leukemia cells are resistant to myeloid growth factors
To study whether silencing by methylation of the myeloid specifictranscription factor CEBPA corresponded with altered biologicresponse to natural growth stimuli, we compared growth factorstimulated 3H-TdR incorporation data obtained from pretreatmentCEBPAsil and CEBPAmut AML samples. Remarkably, CEBPAsil
leukemia cells showed little or no response to the myeloid growthstimuli interleukin-3 (IL-3), granulocyte-macrophage colony-stimulating factor (GM-CSF), or granulocyte colony-stimulatingfactor (G-CSF), whereas CEBPAmut samples were particularlysensitive to IL-3, but in certain cases also to GM-CSF (Figure 6;Table S6). Whereas 2 of the CEBPAmut cases (3327 and 2192)showed comparable results to the CEBPAsil cases, this did notappear to be explained by their methylation profiles, and we think
Figure 3. Aberrant hypermethylation colocalizes to CpG islands and CGclusters. (A) The genomic position of every HpaII-amplifiable fragment on the HELParray was compared with the location of known CpG islands and CG clusters, and thefragments on the array were divided into 2 categories: those overlapping with eitherone of these genomic elements and those not overlapping. To determine whether thedifferentially methylated genes between CEBPAsil and CEBPAmut leukemias wereenriched for either one of these types of elements, a proportions test was used tocompare the relative proportion of the 2 types of HpaII fragments in the signature(overlapping vs not overlapping) to the relative proportion on the array. Stacking barsare used to illustrate the finding of a significant enrichment for HpaII-amplifiablefragments overlapping with CpG islands (right) and CG clusters (left) in thehypermethylated signature of CEBPAsil leukemia, as it compares with the genomiclocalization of all HpaII-amplifiable fragments on the HELP array. (B) Each HpaII-amplifiable fragment represented on the HELP array was also categorized accordingto its ability to discriminate between CEBPAsil and CEBPAmut leukemias as perfect,intermediate, or poor classifiers, and the proportional amount of fragments overlap-ping with CG clusters was calculated for each group of classifiers. Better classifierswere more frequently associated with CG clusters.
Table 3. Alu elements are depleted from RefSeq promoters thatbecome hypermethylated in CEBPAsil leukemia
Silenced RefSeq(n � 327)
Random RefSeqcontrols (n � 2422)
P(Fisher exact test)
Alu 85 (26%) 1453 (60%) � 2.2e�16
No Alu 242 (74%) 969 (40%)
2800 FIGUEROA et al BLOOD, 19 MARCH 2009 � VOLUME 113, NUMBER 12
For personal use only. by guest on June 3, 2013. bloodjournal.hematologylibrary.orgFrom

that it is a reflection of the biologic heterogeneity of the group. Incontrast, both CEBPAsil and CEBPAmut patient cells showed weakbut significant response to factors that stimulate primitive cells, inparticular thrombopoietin or stem cell factor (Table S6). These dataare in agreement with previous data showing loss of the granulo-cyte macrophage progenitors fraction and enrichment of hematopoi-etic stem cell population in marrow of conditional Cebpa knockoutanimals.38 Interestingly, we did not observe promoter hypermethyl-ation of the genes encoding the receptors for IL-3, GM-CSF, orG-CSF, suggesting other mechanisms of altered growth factorresponse. Several of the growth factor receptors appeared to beexpressed as determined by gene expression profiling analysis,
although we observed significantly lower expression of CSF2RB,the gene encoding the common beta chain of the receptors ofIL-3 and GM-CSF (P � .02, Wilcoxon rank-sum test) inCEBPAsil patients compared with CEBPAmut AML samples.Together, these data suggest that CEBPAsil cases reflect a moreprimitive hematopoietic cell that does not enter cell cycle inresponse to myeloid growth factors, an event that could beassociated with chemoresistance. In agreement, although thenumbers of patients were too small to rule out the influence ofcovariables, the CEBPAsil patient outcomes (5-year overall survival25%) were considerably worse than that of the CEBPAmut cases (5-yearoverall survival 88%; log-rank test P � .003).
Figure 4. DNA methylation and gene expression capture complementary information. (A) Two-dimensional hierarchical clustering of genes differentially expressedbetween the 2 leukemia subgroups, illustrated by a heatmap. Supervised analysis identified 587 probe sets (415 genes) at a P � .001 and fold change more than 2. Cases arerepresented in the columns; probe sets are represented in the rows. CEBPAsil cases are clustered in the right node, and CEBPAmut cases are clustered in the left node.(B) Density (y-axis) plot for the gene-by-gene correlations (x-axis) between gene expression log intensity and log(HpaII/MspI) values. A positive correlation between these2 measures translates into a negative biologic correlation, that is, hypermethylation in combination with lower expression levels, or hypomethylation in combination with higherexpression levels. In black, density plot for the correlation between expression and methylation for a set of 600 randomly selected probe sets. In red, density plot for thecorrelation between expression and methylation measured by the 567 probe sets in the genes differentially methylated between the 2 subgroups. The shifting of the density plotto the right reflects a tendency to a stronger correlation of DNA methylation with gene expression levels in this subset of genes. The figure is representative of 5 analyses, eachtime using a different set of 600 randomly selected HpaII-amplifiable fragments for the calculation of correlations.
Figure 5. CEBPAsil leukemias differ genetically and epigenetically from T-ALL. (A) Principal component analysis of DNA methylation data comparing 8 immature acutemyeloid/T lymphoid CEBPAsil cases with a selection of 9 T-ALL cases representing a spectrum of maturation stages, showing separate clustering of the 2 groups of leukemias.(B) Two-dimensional hierarchical clustering of genes differentially methylated between the CEBPAsil leukemias and the T-ALL cases, illustrated by a heatmap. Cases arerepresented in the columns; probe sets are represented in the rows. Supervised analysis identified 213 differentially methylated probe sets (199 genes). CEBPAsil cases areclustered in the left node and display a predominance of hypomethylated probe sets. (C) Principal component analysis of gene expression data for the same cases alsodemonstrates separate clustering of the 2 groups of leukemias, indicating that these 2 groups display distinct expression profiles.
EPIGENETIC BASIS OF LINEAGE INFIDELITY AML 2801BLOOD, 19 MARCH 2009 � VOLUME 113, NUMBER 12
For personal use only. by guest on June 3, 2013. bloodjournal.hematologylibrary.orgFrom

Discussion
The subtype of immature myeloid/T-lymphoid leukemia reportedin this study was first captured as belonging to a larger group ofpatients all sharing a specific gene expression signature (originallydesignated as cluster 4).17 A subset of these patients was subse-quently observed to harbor hypermethylation and silencing of theCEBPA gene along with expression of T-cell genes.16 In the currentstudy, we applied integrated epigenetic profiling to explore ingreater depth the nature of this disease, and demonstrate that this isindeed a biologic entity that is distinct from both AML and T-ALLand has unique epigenetic, transcriptional, and biologic features.
Given the similarity in gene expression profiles of CEBPAsil andCEBPAmut AML found initially, we were primarily interested indetermining whether DNA methylation profiles might more readilydiscriminate these 2 groups. Along these lines, we have previouslyshown that integrating information obtained from DNA methyl-ation profiling and gene expression profiling in human leukemiaspecimens could yield more in-depth insight into biologic differ-ences between patients.18 We find that PCA, an unbiased method todiscriminate biologic differences, showed a marked separationbetween epigenetic profiles of patients with mutant or silencedCEBPA. This indicates that these are 2 biologically distinct entities,which is further supported by the differences in growth factorresponses between the 2 leukemia subtypes. In contrast, geneexpression was not as obviously distinct, demonstrating for the firsttime in a practical manner that these 2 methods of interpretingtranscriptional programming are complementary and when com-bined can most robustly identify new disease subtypes.
One remarkable finding in the CEBPAsil cases was that theirunique DNA methylation signature consisted almost entirelyof hypermethylation of hundreds of loci compared with theirCEBPAmut counterparts. By chance, one would expect a more orless balanced distribution between hypermethylation and hypo-methylation, as observed in the comparison between CEBPAmut
cases and normal CD34� cells. The greater tendency towardhypermethylation of these leukemias with silenced CEBPA wasfurther confirmed by the comparison of the CEBPAsil subgroup withnormal CD34� hematopoietic cells. Together, this suggests epige-netic deregulation to play a more critical role in leukemogenesis ofthose cases than of CEBPAmut cases. Such a hypothesis is supportedby our observation of involvement of a majority of the members ofgene regulatory networks centered around the CEBPA, NF�B, and
BMP pathways, all implicated in the normal homeostasis ofhematopoietic stem cells and the myeloid lineage.
When DNA methylation profiles and gene expression profileswere queried by supervised analysis, 474 and 415 genes wereidentified as significantly differentially methylated or differentiallyexpressed, respectively. Yet there was only minimal overlapbetween these 2 gene lists. This is consistent with our previousobservation that gene expression and DNA methylation arraystudies capture different sets of genes and thus are complementaryto each other when collecting information on biologic variance.18
The fact that expression of more than 60% of the genes in thehypermethylated signature was not detected in both groups partlyexplains this finding because differences in low abundance tran-scripts may be hard to detect by expression arrays. Despite all thesetechnical limitations, we still observed a greater tendency to overallinverse correlation between gene expression and DNA methylationstatus among those genes whose methylation status varied betweenthe 2 groups. This result suggests that the biologic impact ofepigenetic modifications may vary between gene subsets. Althoughthis has been shown for specific histone modifications, such as theassociation between HOX cluster genes and methylation of lysine27 on histone 3,39,40 a similar situation has not been previouslyshown for cytosine methylation beyond that of its distributionrelative to CpG islands.
Although the existence of a hypermethylated phenotype inCEBPAsil immature acute myeloid/T-lymphoid leukemia could berelated to a relatively more immature cell type involved in theleukemic transformation, an alternative explanation could lie inleukemia-specific mechanisms. The latter either could involve aglobal up-regulation of DNA methylation machinery, leading tomore or less uncontrolled hypermethylation of multiple loci, or,alternatively, could be a specific effect of targeted methylation ofselected genes. We took several approaches to investigate thevarious possibilities. Comparative analyses between the 2 leuke-mia subgroups and immature CD34� control samples from healthyindividuals indicated indeed a greater state of hypermethylation inthe CEBPAsil leukemia blasts than in normal CD34� cells. This issuggestive for the idea that hypermethylation is not primarily aread-out for cellular maturation status. In contrast, CEBPAmut
AMLs had markedly fewer hypermethylated genes compared withCD34�, indicating that an increase in DNA methylation is not ageneral feature of all AMLs. Interestingly, mRNA expression levelsof the de novo DNA methyltransferase DNMT3B were significantlyincreased in CEBPAsil versus CEBPAmut leukemias but showed
Figure 6. CEBPAsil leukemia cells are resistant tomyeloid growth. Tritiated thymidine incorporation experi-ment of 3 CEBPAsil and 7 CEBPAmut leukemia samples.Response of leukemia cells to IL-3, GM-CSF, and G-CSFis shown relative to irradiated nonstimulated cells (ie,stimulation index), based on the mean of 3 measure-ments.
2802 FIGUEROA et al BLOOD, 19 MARCH 2009 � VOLUME 113, NUMBER 12
For personal use only. by guest on June 3, 2013. bloodjournal.hematologylibrary.orgFrom
similarly high levels in normal CD34� cells (data not shown).Thus, although expression of methylating enzymes may be high inhealthy immature cells as well, this does not necessarily lead to asimilar hypermethylated signature as found in the leukemic sub-group. There were no differences in expression of other DNAmethyltransferases (data not shown).
Specific targeting of methylation to certain genes by complexesinvolving DNA methyltransferases and transcription factors has beenshown previously.41 Inversely, it could be hypothesized that loss ofprotective mechanisms, such as DNA-binding proteins and nucleosomepositioning, could render certain promoters susceptible to the targetingby the DNA methylation machinery.42 A common characteristic of theleukemia subgroup studied here was silencing of the transcription factorC/EBP�. Using algorithms for motif analysis comparing significantlyhypermethylated genes with control genes, we were unable to detect asignificant enrichment for C/EBP binding sites among these genes,arguing against a direct role for the absence of C/EBP�. These analysesdid, however, yield 2 potentially relevant findings. First, we identifiedenrichment of a novel sequence motif. This sequence could possiblyplay a role in either directing the binding certain protein complexes toDNA or in helping determine nucleosome positioning. Second, asignificant depletion of Alu repeats was detected in the promoters ofdifferentially methylated RefSeq genes. Although the causes behindsuch a finding can only be speculated on, similar observation have beenmade in the past, suggesting that this is probably not a random finding.43
CEBPAsil leukemias were previously found to have a mixedmyeloid/T-lymphoid phenotype. We were therefore interested todetermine how their DNA methylation profiles related to thosefrom T-ALL samples. Comparisons of the DNA methylation andexpression profiles of a representative collection of 9 T-ALL cases,ranging from very immature to mature, to those of the CEBPAsil
leukemias revealed significant differences between the 2 types ofleukemias. This is consistent with the idea that CEBPAsil leukemiasrepresent an entity not entirely myeloid but also not entirelyT-lymphoid and may represent a very immature myeloid/T-lymphoid subtype that is in current clinical practice sometimesdiagnosed as AML and sometimes as T-ALL.
The discovery of a hypermethylation profile in a specificleukemia subgroup is particularly interesting in light of the recentdevelopments of demethylating drugs. Notably, the CEBPAsil
leukemia subgroup showed a markedly worse treatment responsethan CEBPAmut AML.16 Interestingly, this is in contrast with theprevious report by Hackanson et al, who found that methylation ofCEBPA was associated with favorable prognostic groups in AML.13
However, the cases reported by that group all displayed methyl-ation restricted to an upstream region of the CEBPA locus, whereasthe methylation in our samples was more extensive, covering bothproximal and distal regions. Although the numbers are small andmultivariable analysis with additional covariates such as cytoge-netic and molecular subgroups is warranted, these results identifyCEBPAsil leukemia cases as attractive candidates for investigative
treatment with such demethylating agents. It is interesting tospeculate that restoring the normal programming of CEBPA, NF�B,and BMP pathways could facilitate targeting of these tumors witheither standard antileukemia regimens or with specific targetedtherapy agents.
Taken together, we show that integrated epigenetic and geneexpression analyses of leukemia can distinguish and illustratephenotypes with biologic and potential clinical significance. Analy-sis of the genes involved in aberrant epigenetic programmingallows for generation of hypotheses toward dissecting previouslyunrecognized mechanisms of leukemogenesis. A broader applica-tion of integrated gene expression and epigenetic profiling to acuteleukemia might allow many other such entities to be resolved.
Acknowledgments
The authors thank the colleagues of the bone marrow transplanta-tion group and the molecular diagnostics laboratory of the Depart-ment of Hematology at Erasmus University Medical Center forstorage of samples, molecular analysis, and in vitro culture ofleukemia cells; Arjan van de Berg and Kirsten van Lom formorphologic and cytochemical analysis; Tom Cupedo for hisassistance with flow cytometry; and Timurs Maculins for muta-tional analysis of NOTCH1 in T-ALL samples.
This work was supported by the National Institutes of Health(NIH; CA118316; R.D.), the Dutch Cancer Society KoninginWilhelmina Fonds (EMCR 2006-3522; R.D., P.J.M.V., and B.L.),and ErasmusMC (MRace; R.D.). M.E.F. is supported by anAmerican Society of Hematology Fellow Scholar Award. A.M. issupported by the National Cancer Institute (R01 CA104348), theChemotherapy Foundation, the Sam Waxman Cancer ResearchFoundation, and the G&P Foundation and is a Leukemia &Lymphoma Society Scholar. J.M.G. is supported by NIH (R01HD044078). J.G. is supported by NIH (MSTP training grantGM007288).
Authorship
Contribution: M.E.F., B.J.W., J.M.G., A.M., and R.D. conceivedand designed the research; M.E.F., B.J.W., Y.L., and C.A.J.E.-V.performed the research; M.E.F., B.J.W., L.S., J.G., M.F., A.M., andR.D. analyzed the data; A.W.L., B.L., P.J.M.V., and R.D. contrib-uted research material; B.L., J.M.G., and P.J.M.V. contributed todata interpretation; M.F. and J.M.G. contributed analytical tools;and M.E.F., B.J.W., L.S., J.G., A.M., and R.D. wrote the manuscript.
Conflict-of-interest disclosure: The authors declare no compet-ing financial interests.
Correspondence: Ari Melnick, Weill Cornell Medical College,525 E 68th St, WMC box 113 (C-620), New York, NY 10021;e-mail: [email protected].
References
1. Rosenbauer F, Tenen DG. Transcription factors inmyeloid development: balancing differentiationwith transformation. Nat Rev Immunol. 2007;7:105-117.
2. Rice KL, Hormaeche I, Licht JD. Epigenetic regu-lation of normal and malignant hematopoiesis.Oncogene. 2007;26:6697-6714.
3. Suzuki M, Yamada T, Kihara-Negishi F, et al. Site-specific DNA methylation by a complex of PU.1and Dnmt3a/b. Oncogene. 2006;25:2477-2488.
4. Nerlov C. C/EBPalpha mutations in acute myeloidleukaemias. Nat Rev Cancer. 2004;4:394-400.
5. Pabst T, Mueller BU. Transcriptional dysregula-tion during myeloid transformation in AML. Onco-gene. 2007;26:6829-6837.
6. Pabst T, Mueller BU, Zhang P, et al. Dominant-nega-tive mutations of CEBPA, encoding CCAAT/en-hancer binding protein-alpha (C/EBPalpha), in acutemyeloid leukemia. Nat Genet. 2001;27:263-270.
7. Frohling S, Schlenk RF, Stolze I, et al. CEBPA
mutations in younger adults with acute myeloidleukemia and normal cytogenetics: prognosticrelevance and analysis of cooperating mutations.J Clin Oncol. 2004;22:624-633.
8. Preudhomme C, Sagot C, Boissel N, et al. Favor-able prognostic significance of CEBPA mutationsin patients with de novo acute myeloid leukemia:a study from the Acute Leukemia French Associa-tion (ALFA). Blood. 2002;100:2717-2723.
9. Barjesteh van Waalwijk van Doorn-Khosrovani S,
EPIGENETIC BASIS OF LINEAGE INFIDELITY AML 2803BLOOD, 19 MARCH 2009 � VOLUME 113, NUMBER 12
For personal use only. by guest on June 3, 2013. bloodjournal.hematologylibrary.orgFrom

Erpelinck C, Meijer J, et al. Biallelic mutations inthe CEBPA gene and low CEBPA expression lev-els as prognostic markers in intermediate-riskAML. Hematol J. 2003;4:31-40.
10. Pabst TMB, Harakawa N, Schoch C, et al. AML1-ETO downregulates the granulocytic differentia-tion factor C/EBPalpha in t(8;21) myeloid leuke-mia. Nat Med. 2001;7:444-451.
11. Radomska HSBD, Zheng R, Zhang P, et al. Blockof C/EBP alpha function by phosphorylation inacute myeloid leukemia with FLT3 activating mu-tations. J Exp Med. 2006;203:371-381.
12. Behre GSS, Liu H, Bortolin LT, et al. Ras signal-ing enhances the activity of C/EBP alpha to in-duce granulocytic differentiation by phosphoryla-tion of serine 248. J Biol Chem. 2002;277:26293-26299.
13. Hackanson B, Bennett KL, Brena RM, et al. Epi-genetic modification of CCAAT/enhancer bindingprotein alpha expression in acute myeloid leuke-mia. Cancer Res. 2008;68:3142-3151.
14. Tada Y, Brena RM, Hackanson B, et al. Epige-netic modulation of tumor suppressor CCAAT/enhancer binding protein alpha activity in lungcancer. J Natl Cancer Inst. 2006;98:396-406.
15. Bennett KL, Hackanson B, Smith LT, et al. Tumorsuppressor activity of CCAAT/enhancer bindingprotein alpha is epigenetically down-regulated inhead and neck squamous cell carcinoma. CancerRes. 2007;67:4657-4664.
16. Wouters BJ, Jorda MA, Keeshan K, et al. Distinctgene expression profiles of acute myeloid/T-lym-phoid leukemia with silenced CEBPA and muta-tions in NOTCH1. Blood. 2007;110:3706-3714.
17. Valk PJ, Verhaak RG, Beijen MA, et al. Prognosti-cally useful gene-expression profiles in acute my-eloid leukemia. N Engl J Med. 2004;350:1617-1628.
18. Figueroa ME, Reimers M, Thompson RF, et al. Anintegrative genomic and epigenomic approach forthe study of transcriptional regulation. PLoSONE. 2008;3:e1882.
19. Khulan B, Thompson R, Ye K, et al. Comparativeisoschizomer profiling of cytosine methylation:the HELP assay. Genome Res. 2006;16:1046-1055.
20. Selzer RR, Richmond TA, Pofahl NJ, et al. Analy-sis of chromosome breakpoints in neuroblastomaat sub-kilobase resolution using fine-tiling oligo-nucleotide array CGH. Genes ChromosomesCancer. 2005;44:305-319.
21. Thompson RFRM, Khulan B, Gissot M, et al. Ananalytical pipeline for genomic representationsused for cytosine methylation studies. Bioinfor-matics. 2008;24:1161-1167.
22. Edgar R, Domrachev M, Lash AE. Gene Expres-sion Omnibus: NCBI gene expression and hybrid-ization array data repository. Nucl Acid Res.2002;30:207-210.
23. Culhane AC, Thioulouse J, Perriere G, HigginsDG. MADE4: an R package for multivariate anal-ysis of gene expression data. Bioinformatics.2005;21:2789-2790.
24. Palomero T, Lim WK, Odom DT, et al. NOTCH1directly regulates c-MYC and activates a feed-forward-loop transcriptional network promotingleukemic cell growth. Proc Natl Acad Sci U S A.2006;103:18261-18266.
25. Stock W, Tsai T, Golden C, et al. Cell cycle regu-latory gene abnormalities are important determi-nants of leukemogenesis and disease biology inadult acute lymphoblastic leukemia. Blood. 2000;95:2364-2371.
26. Konieczna I, Horvath E, Wang H, et al. Constitu-tive activation of SHP2 in mice cooperates withICSBP deficiency to accelerate progression toacute myeloid leukemia. J Clin Invest. 2008;118:853-867.
27. Turcotte K, Gauthier S, Tuite A, Mullick A, Malo D,Gros P. A mutation in the Icsbp1 gene causessusceptibility to infection and a chronic myeloidleukemia-like syndrome in BXH-2 mice. J ExpMed. 2005;201:881-890.
28. Dahl E, Wiesmann F, Woenckhaus M, et al. Fre-quent loss of SFRP1 expression in multiple hu-man solid tumours: association with aberrant pro-moter methylation in renal cell carcinoma.Oncogene. 2007;26:5680-5691.
29. Huang J, Zhang YL, Teng XM, et al. Down-regula-tion of SFRP1 as a putative tumor suppressorgene can contribute to human hepatocellular car-cinoma. BMC Cancer. 2007;7:126.
30. Toyota M, Kopecky KJ, Toyota MO, Jair KW,Willman CL, Issa JP. Methylation profiling in acutemyeloid leukemia. Blood. 2001;97:2823-2829.
31. Cameron EE, Baylin SB, Herman JG.p15(INK4B) CpG island methylation in primaryacute leukemia is heterogeneous and suggestsdensity as a critical factor for transcriptional si-lencing. Blood. 1999;94:2445-2451.
32. Shimamoto T, Ohyashiki JH, Ohyashiki K. Methyl-
ation of p15(INK4b) and E-cadherin genes is in-dependently correlated with poor prognosis inacute myeloid leukemia. Leuk Res. 2005;29:653-659.
33. Tessema M, Langer F, Dingemann J, Ganser A,Kreipe H, Lehmann U. Aberrant methylation andimpaired expression of the p15(INK4b) cell cycleregulatory gene in chronic myelomonocytic leuke-mia (CMML). Leukemia. 2003;17:910-918.
34. Liu TH, Raval A, Chen SS, Matkovic JJ, Byrd JC,Plass C. CpG island methylation and expressionof the secreted frizzled-related protein gene fam-ily in chronic lymphocytic leukemia. Cancer Res.2006;66:653-658.
35. Roman-Gomez J, Cordeu L, Agirre X, et al. Epi-genetic regulation of Wnt-signaling pathway inacute lymphoblastic leukemia. Blood. 2007;109:3462-3469.
36. Glass J, Thompson R, Khulan B, et al. CGdinucleotide clustering is a species-specific prop-erty of the genome. Nucleic Acids Res. 2007;35:6798-6807.
37. Elemento O, Slonim N, Tavazoie S. A universalframework for regulatory element discoveryacross all genomes and data types. Mol Cell.2007;28:337-350.
38. Zhang P, Iwasaki-Arai J, Iwasaki H, et al. En-hancement of hematopoietic stem cell repopulat-ing capacity and self-renewal in the absence ofthe transcription factor C/EBP alpha. Immunity.2004;21:853-863.
39. Cao R, Wang L, Wang H, et al. Role of histone H3lysine 27 methylation in Polycomb-group silenc-ing. Science. 2002;298:1039-1043.
40. Agger K, Cloos PA, Christensen J, et al. UTX andJMJD3 are histone H3K27 demethylases in-volved in HOX gene regulation and development.Nature. 2007;449:731-734.
41. Di Croce L, Raker VA, Corsaro M, et al. Methyl-transferase recruitment and DNA hypermethyl-ation of target promoters by an oncogenic tran-scription factor. Science. 2002;295:1079-1082.
42. Hinshelwood RA, Huschtscha LI, Melki J,Stirzaker C, Reddel RR, Clark SJ. The relation-ship between nucleosome positioning and aber-rant p16-INK4A DNA methylation: proceedings ofthe AACR special conference in Cancer Re-search. Cancer Epigenetics. 2008:PR9.
43. Feltus FA, Lee EK, Costello JF, Plass C, VertinoPM. DNA motifs associated with aberrant CpGisland methylation. Genomics. 2006;87:572-579.
2804 FIGUEROA et al BLOOD, 19 MARCH 2009 � VOLUME 113, NUMBER 12
For personal use only. by guest on June 3, 2013. bloodjournal.hematologylibrary.orgFrom