Tryptophan transport in human fibroblast cells-a functional characterization
Upload
khangminh22Category
view
5download
0
Fibroblast Regional Identity in the Murine
Lymphoid System
by
Sarah Jayne Flavell
A thesis submitted to the School of Immunity and Infection
of the University of Birmingham
for the degree of
DOCTOR OF PHILOSOPHY
Department of Rheumatology
School of Immunity and Infection
College of Medical and Dental Sciences
University of Birmingham
B15 2TT
September 2009

University of Birmingham Research Archive
e-theses repository This unpublished thesis/dissertation is copyright of the author and/or third parties. The intellectual property rights of the author or third parties in respect of this work are as defined by The Copyright Designs and Patents Act 1988 or as modified by any successor legislation. Any use made of information contained in this thesis/dissertation must be in accordance with that legislation and must be properly acknowledged. Further distribution or reproduction in any format is prohibited without the permission of the copyright holder.

i
ABSTRACT
Fibroblasts are the most abundant cell type of the stroma, producing extracellular matrix
components which provide mechanical strength to tissues. Recent work has shown that
fibroblasts are not simply passive structural cells but active participants in the immune response.
Work on human fibroblasts has demonstrated distinct gene expression profiles dependent on
their tissue of origin, indicating that fibroblasts impart topographical memory and positional
identity to tissues.
In this study fibroblast heterogeneity within the murine lymphoid system was investigated by
analysing gene and protein expression. Their functional ability to form lymphoid like structures
was also assessed. Fibroblasts were isolated from a range of lymphoid and peripheral sites. Our
findings show that fibroblasts grown from different sites show heterogeneous gene and protein
expression and are also functionally different in their response to lymphotoxin α treatment in
vitro and in their capacity to recruit host leucocytes in vivo. A novel in vivo functional assay has
been developed using a collagen sponge as a three-dimensional structure in the kidney capsule
transfer model, to assess the ability of fibroblasts to form and maintain lymphoid structures.
We conclude that murine fibroblasts isolated from lymphoid tissues, display site specific
features. They are phenotypically distinct with site specific gene and protein expression profiles.
These differences are reflected in functionally unique interactions with leucocytes and their cell
products. This suggests that murine lymphoid fibroblasts have positional memory and help
impart anatomical identity. An important implication of these findings is the effect this diversity
may have in conveying site specificity to immune responses. Our work supports the hypothesis
that fibroblasts help define a stromal postcode that directs leucocyte behaviour within lymphoid
tissues.

ii
Dedicated to Mum and Dad
iii
ACKNOWLEDGEMENTS
Firstly, I would like to thank my supervisor, Professor Chris Buckley for his guidance and
encouragement throughout my PhD. His enthusiasm for science is infectious and I have never
failed to leave a meeting feeling positive.
Huge thanks to „The Buckettes‟ (Dr Sian Lax, Dr Ewan Ross, Dr TieZheng Hou, Dr Debbie
Hardie, Dr Amy Wilson, Ruth Coughlan and Fern Barrington). I hope you will always wear
your T-Shirts with pride! I have loved being a member of „Team Mouse‟ and I will miss
working with you all immensely. Dr Sian Lax „my first port of call‟ has answered numerous
ridiculous questions over the years and painstakingly read my thesis. Fern Barrington
(Barry/Fren/The Glue) without whom I‟d be lost in a world of cell culture. Not only has she
been a tremendous help in the lab but she has become one of my very best friends and is now
part of „Team Bridesmaid‟.
I would like to thank Dr Dagmar Scheel-Toellner and Dr Kai Toellner with whom I first
worked with on my arrival at Birmingham. They taught me essential lab skills that I have
used throughout my PhD. Thanks also to Steve Kissane and Celia Menckeberg for their
advice and assistance with microarray studies and Sonia Parnell for providing me with
primers for my end point PCRs. The anatomy group within the IBR have been a great help in
setting up the kidney capsule experiments and sourcing embryonic tissues, especially Dr
Stephanie Glanville who gave us an intensive two week course in surgery and Dr Andrea
White for her technical assistance. In addition, I would like to acknowledge the Medical
Research Council for funding my PhD.
Also, thanks must go to many people on the 3rd
floor that have helped out generally in the lab
and made it such great place to work. Dr Graham Wallace, for proof reading my thesis, which
was no small task! Katherine Howlett, my wife, my gym buddy, provider of the Take That
chart and member of „Team Bridesmaid‟. Thankyou for my many birthday cakes,
engagement desk decorations and even the occasional cuddle! Dr Peter Hampson, I forgive
you for being a Man U supporter as we have had much sporting banter. Take care of little
Pete and thanks for proof reading the odd chapter. Hema Chahal, without whom I would be at
least two stone heavier! There is never a good enough excuse to miss one of your classes,
least of all leaving the department. Alastair Denniston for our mutual sharing of stationary
and race to the finish. Leigh Church who I have driven crazy for wedding advice but whose
sayings I wrote this thesis by „why say it in four words when you can say it in one‟. Lorraine
Yeo for her excellent muffins, I leave you the best desk in the office! Marianne Fairclough
for our American road trip which was full of surprises! I look forward to meeting „Peanut‟.
Special thanks to my family for their constant love and support in everything I do. My Mum
and Dad, who think nothing of visiting from „up North‟ for just an evening, not least for their
financial support throughout my University career, but for the knowledge that whatever
happened they‟d be there. My little bro, Tom, whose courage and sense of humour over the
last couple of years has been inspiring and I am such a proud big sis.
Last but not least I would like to thank my fiancé Steve for his support, friendship and ability
to make me smile. I look forward to being Drs Essex!
iv
ABBREVIATIONS
Ab Antibody
Ag Antigen
APC Antigen Presenting Cell
BAFF B Cell Activating Factor
BLyS B Lymphocyte Stimulator
BSA Bovine Serum Albumin
Caspase Cysteinyl Aspartic Acid Protease
CAF Carcinoma-Associated Fibroblast
CD Cluster of Differentiation
cDNA Complementary Deoxyribonucleic Acid
CM Conditioned Media
DABCO 1,4-diazobicyclo(2,2,2) octane
DAVID Database for Annotation, Visualisation and Integrated Discovery
dH2O Distilled Water
DNase Deoxyribonuclease
DC Dendritic Cell
E Embryonic Day
ECM Extracellular Matrix
EDTA Ethylene-Diamine-Tetra-Acetic Acid
EMT Epithelial-Mesenchymal Transition
E-selectin Endothelial Selectin
FACS Fluorescent Activated Cell Sorter
FCS Foetal Calf Serum
FDC Follicular Dendritic Cell
FDR False Discovery Rate
FITC Fluorescein-Isothiocyanate
FRC Fibroblastic Reticular Cell
FS Forward Scatter
GFP Green Fluorescent Protein
HEV High Endothelial Venule
HLA Human Leukocyte Antigen
HOX Homeobox
ICAM-1 Intercellular Adhesion Molecule-1
IFN Interferon
Ig Immunoglobulin
IL Interleukin
KO Knockout
LCMV Lymphocytic Choriomeningitis Virus
LDA Low Density Array
LPS Lipopolysaccharide
LT Lymphotoxin
LTi Lymphoid Tissue Inducer
LTo Lymphoid Tissue Organiser
M Molar
mAb Monoclonal Antibody
MadCAM Mucosal Addressin Cell Adhesion Molecule
mM Millimolar
v
NALT Nasal-Associated Lymphoid Tissue
MMP Matrix Metalloproteinase
MOMA-1 Marginal Zone of Monoclonal Antibody-1
mRNA Messenger Ribonucleic Acid
MSC Mesenchymal Stem Cell
MHC Major Histocompatibility Complex
PALS Periarteriolar Lymphoid Sheath
PAMPs Pathogen-Associated Molecular Patterns
PBS Phosphate Buffered Saline
PCA Principle Component Analysis
PCR Polymerase Chain Reaction
PE Phycoerythrin
PDGF Platelet Derived Growth Factor
PNAd Peripheral Lymph Node Addressin
PRRs Pattern-Recognition Receptors RA Rheumatoid Arthritis
RT-PCR Real Time Polymerase Chain Reaction
SAM Significance Analysis of Microarrays
α-SMA α-Smooth Muscle Actin
SMP Splanchnic Mesodermal Plate
SOP Standard Operating Procedure
SS Side Scatter
TBS Tris Buffered Saline
TCR T-cell receptor
TH cells Helper T cells
TLR Toll-Like Receptor
TMEV The Institute of Genomic Research Multi-Experiment Viewer
TNF Tumour Necrosis Factor
TRANCE Tumour Necrosis Factor-Related Activation-Induced Cytokine
VEGF Vascular Endothelial Growth Factor
VCAM-1 Vascular Cell Adhesion Molecule-1
VLA-4 Very Late Antigen-4
vi
CONTENTS
Page No.
Abstract i
Dedication ii
Acknowledgements iii
Abbreviations iv
Contents vi
List of figures ix
List of tables xi
Chapter 1: Introduction 1-46
1.1 The Immune System 2
1.1.1 Innate Immunity 3
1.1.2 Adaptive Immunity 6
1.1.2.1 Lymphocytes 6
1.1.2.2 Lymphocyte homing and trafficking 8
1.2 The Lymphoid System 10
1.2.1 Lymph node development 11
1.2.1.1 Lymphotoxin signalling 13
1.2.1.2 TNF signalling 14
1.2.1.3 Lymphoid tissue organiser cells 16
1.2.1.4 Lymph node developmental progression 17
1.2.1.5 Adult LTi 18
1.2.2 Lymph node structure 19
1.2.2.1 Lymph node T zone stroma 21
1.2.2.1.1 Glycoprotein 38 (Podoplanin) 22
1.2.2.2 Lymph node B zone stroma 23
1.2.2.3 The conduit system 23
1.2.3 Splenic development 24
1.2.4 Splenic structure 25
1.2.4.1 Red pulp 26
1.2.4.2 White pulp 27
1.3 Inflammation 29
1.3.1 Acute Inflammation 29
1.3.2 Chronic Inflammation 30
1.3.2.1 Lymphoid neogenesis in inflammation 32
1.4 The Fibroblast 33
1.4.1 Fibroblast origin 34
1.4.2 Identifying fibroblasts 35
1.4.2.1 CD248 37
1.4.3 Fibroblast heterogeneity 38
1.4.4 The function of fibroblasts 41
1.4.4.1 The role of fibroblasts in rheumatoid arthritis 42
1.4.4.2 The role of fibroblasts in cancer 43
1.4.4.3 Fibroblasts and their relationship to MSC 44
1.5 Hypothesis 45
1.6 Aims of thesis 46
vii
Chapter 2: Materials and Methods 47-69 2.1 Media, solutions and other reagents 48
2.1.1 Complete fibroblast medium 48
2.1.2 Washing medium 48
2.1.3 Phosphate buffered saline (PBS) 48
2.1.4 Tissue digestion buffer 48
2.1.5 Red blood cell lysis buffer 48
2.1.6 10x Annexin V staining buffer 48
2.1.7 Freezing medium 48
2.1.8 TBE buffer 48
2.1.9 1% Agarose gel 49
2.1.10 Hoechst nuclear counterstain 49
2.1.11 1, 4-diazabicyclo[2.2.2]octane (DABCO) 49
2.2 Antibodies 49
2.2.1 Isotype controls 49
2.2.2 Anti-mouse primary antibodies 50
2.2.3 Secondary antibodies 51
2.3 Mice 52
2.4 Cell culture 52
2.4.1 Non-enzymatic digestion 52
2.4.2 Enzymatic digestion 53
2.4.3 Passaging 53
2.4.4 Freezing of cell cultures for long term storage 53
2.4.5 Cell recovery from long term storage 54
2.4.6 Cell Imaging 54
2.4.7 Cell Sorting 54
2.5 RNA extraction 55
2.5.1 cDNA preparation 56
2.5.2 Polymerase chain reaction (PCR) 56
2.6 Real time PCR (Q-PCR) 58
2.7 Microarrays 59
2.7.1 cDNA amplification 59
2.7.2 CyDye labelling of cDNA 60
2.7.3 Array hybridisation and analysis 61
2.8 Indirect-immunofluorescent staining 62
2.9 Flow cytometry 63
2.10 Lymphotoxin α treatment 64
2.11 Cellular co-culture 65
2.12 Reaggregates 65
2.12.1 Grafting under the kidney capsule 66
2.13 Statistical analysis 69
Chapter 3: Characterisation of Fibroblasts from Lymphoid and Peripheral
Sites in the Adult Mouse 70-114
3.1 Introduction 71
3.2 Results 72
3.2.1 Fibroblast characterisation 72
3.2.1.1 Fibroblast morphology 72
3.2.1.2 Fibroblast gene expression 74
3.2.1.3 Fibroblast protein expression 78
viii
3.2.2 Homogeneous stromal cell cultures 80
3.2.2.1 Sorting stromal cell cultures 80
3.2.2.2 Flow cytometry analysis of sorted stromal cell
cultures 82
3.2.2.3 Immunofluorescent analysis of sorted stromal
cell cultures 85
3.2.2.4 Whole genome array analysis of sorted stromal
cells 90
3.2.2.5 End point PCR 99
3.2.2.6 Site Specific TaqMan LDA 102
3.3 Discussion 105
Chapter 4: In vitro Function of Fibroblast Populations from Different
Sites 115-133
4.1 Introduction 116
4.2 Results 117
4.2.1 LTα treatment of stromal cells 117
4.2.1.1 Gene profile of LTα treated stromal cells 124
4.2.2 Leucocyte survival in co-culture with stromal cells 126
4.3 Discussion 129
Chapter 5: In vivo Function of Fibroblast Populations from Different
Sites 134-163
5.1 Introduction 135
5.2 Results 136
5.2.1 Pilot kidney capsule model studies using stromal cell 136
reaggregates
5.2.2 Development of the kidney capsule transfer model 148
5.2.3 Kidney capsule transfer using gelatin sponge supported
stromal cells 155
5.3 Discussion 161
Chapter 6: General Discussion 164-171
6.1 Fibroblast reticular cell phenotype 166
6.2 Fibroblast heterogeneity exists between murine lymphoid organs 167
6.3 Future work leading from this study 169
Chapter 7: Reference List 172-191
Chapter 8: Appendix 192-194
ix
LIST OF FIGURES
Chapter One: Introduction
Figure 1.1 Cell lineage in the immune system 3
Figure 1.2 Transendothelial migration 9
Figure 1.3 The human lymphoid system 11
Figure 1.4 Requirements for the generation of functional lymphoid tissue
inducers and organisers 13
Figure 1.5 Differentiation of stromal organiser cells 17
Figure 1.6 Lymph node structure 21
Figure 1.7 Structure of the spleen 26
Figure 1.8 Dynamic balance of cell accumulation 31
Figure 1.9 Secondary and tertiary lymphoid tissues 33
Figure 1.10 A migrating fibroblast 34
Figure 1.11 The cellular variation arising from EMT 35
Figure 1.12 Principle component analysis of peripheral and lymphoid
fibroblasts 39
Figure 1.13 Human fibroblasts gene expression patterns 41
Chapter Two: Materials and Methods
Figure 2.1 Kidney capsule transfer 68
Chapter Three: Characterisation of Adult Mouse Fibroblasts from
Lymphoid and Peripheral Sites
Figure 3.1 Stromal cell culture heterogeneity 73
Figure 3.2 Splenic stromal cell culture heterogeneity 73
Figure 3.3 Differential gene expression between lymphoid organs
and lymph nodes 76
Figure 3.4 Cell surface protein expression of cultured stromal cells
from different lymphoid organs 79
Figure 3.5 Stromal cell sorting based on CD45 expression 81
Figure 3.6 Cell surface protein expression of cultured CD45 negative
stromal cells from lymphoid and peripheral organs 84
Figure 3.7 Immunofluorescence staining of CD45 negative sorted stromal
cells 87
Figure 3.8 Immunofluorescence staining of CD45 negative sorted
lymph node stromal cells 88
Figure 3.9 Immunofluorescence staining of CD45 negative sorted peripheral
stromal cells 89
Figure 3.10 Whole mouse genome array analysis of CD45 negative sorted
stromal cell gene expression 92
Figure 3.11 DAVID pathway analysis of 2935 genes differentially expressed
between peripheral and lymphoid stromal cells 93
Figure 3.12 PCA of the in vitro cultured cells, immortalised cell lines and
ex vivo sorted cells 96
Figure 3.13 Whole mouse genome array analysis of in vitro cultured
CD45 negative lymph node stromal cell cultures and
immortalised lymph node stromal cell lines 97
x
Figure 3.14 DAVID pathway analysis of 261 genes differentially
expressed between in vitro cultured and immortalised
lymph node stromal cells 98
Figure 3.15 End point PCR results of selected genes from CD45
negative sorted stromal cells 101
Figure 3.16 Gene expression of CD45 negative stromal cells on site
specific LDA 104
Chapter Four: In vitro Function of Fibroblast Populations from Different Sites
Figure 4.1 LTα increases VCAM-1 and ICAM-1 expression in splenic
stromal cells 119
Figure 4.2 Effect of LTα expression on VCAM-1 and ICAM-1
expression on stromal cells 122
Figure 4.3 Effect of LTα treatment on VCAM-1 and ICAM-1
expression on splenic stromal cell cultures throughout
development 123
Figure 4.4 Differential gene expression between LTα treated and untreated
stromal cells 125
Figure 4.5 Percentage B cell survival in co-culture with stromal cells 127
Figure 4.6 Percentage T cell survival in co-culture with stromal cells 128
Chapter Five: In vivo Function of Fibroblast Populations from Different Sites
Figure 5.1 Grafting of whole lymphoid organs under the kidney capsule 137
Figure 5.2 Stromal cell reaggregate formation 138
Figure 5.3 Grafting of CD45 negative stromal cell reaggregates under the
kidney capsule 142
Figure 5.4 Content and structure of a grafted liver stromal cell reaggregate 143
Figure 5.5 Content and structure of a grafted cervical stromal cell reaggregate 145
Figure 5.6 End point PCR from recovered kidney capsule grafts 147
Figure 5.7 Structure and viability of stromal cell reaggregates 149
Figure 5.8 Lymphotoxin α treated splenic stromal cell reaggregates 152
Figure 5.9 Seven day grafted, LTα treated splenic stromal cell reaggregate 153
Figure 5.10 Seven day grafted, splenic stromal cells suspended in a
gelatine sponge 157
Figure 5.11 Fourteen day grafted, splenic stromal cells suspended in a
gelatine sponge 159
xi
LIST OF TABLES
Chapter One: Introduction
Table 1.1 Fibroblast indicators 36
Chapter Two: Methods and Materials
Table 2.1 Isotype control antibodies 49
Table 2.2 Primary antibodies 50
Table 2.3 Secondary antibodies 51
Table 2.4 Primer sequences and conditions 57
Chapter Three: Characterisation of Fibroblasts from Lymphoid and Peripheral Sites in
the adult mouse
Table 3.1 Fibroblast LDA differentially expressed genes 77

Chapter One Introduction 1
Chapter One
Introduction
Chapter One Introduction 2
CHAPTER ONE
Introduction
1.1 The Immune System
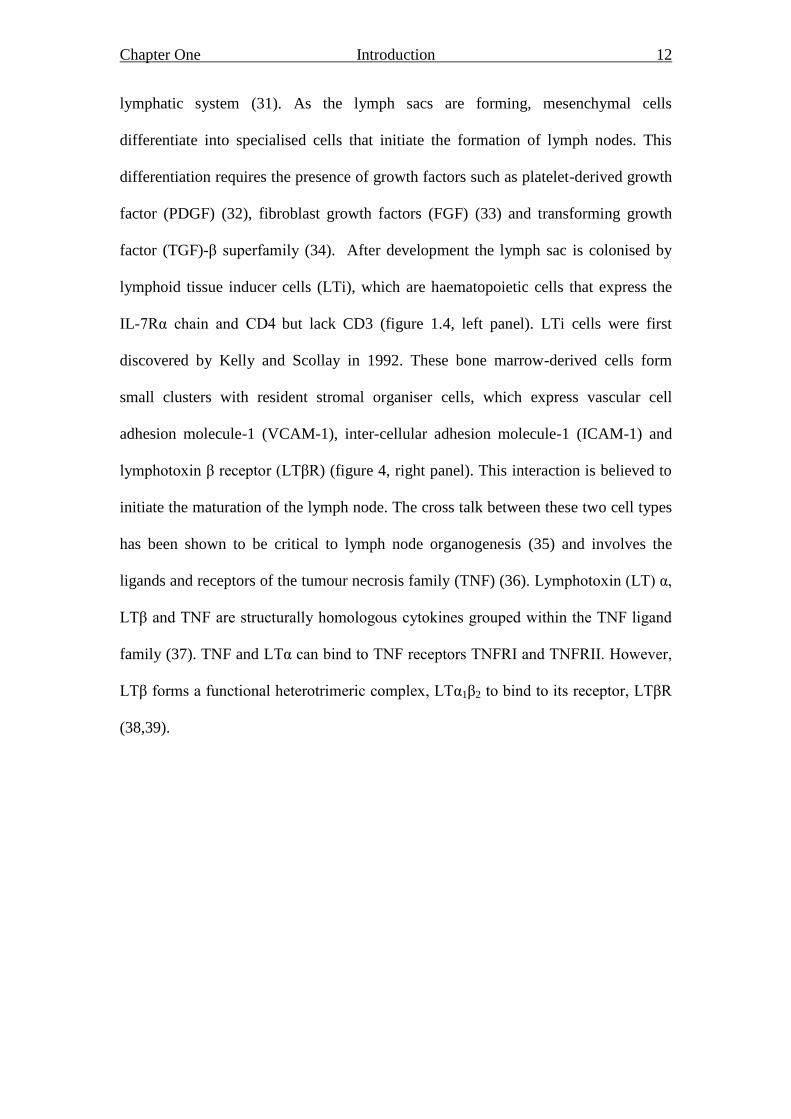
Pathogens are encountered routinely, but only rarely cause disease. Pathogens first
face anatomic barriers such as skin and mucous membranes and physiologic barriers
such as temperature, the low pH of the stomach and lysozyme in tears. Should a
pathogen get past these barriers the human immune system has various methods of
recognising and responding to invasion by non-self (1).
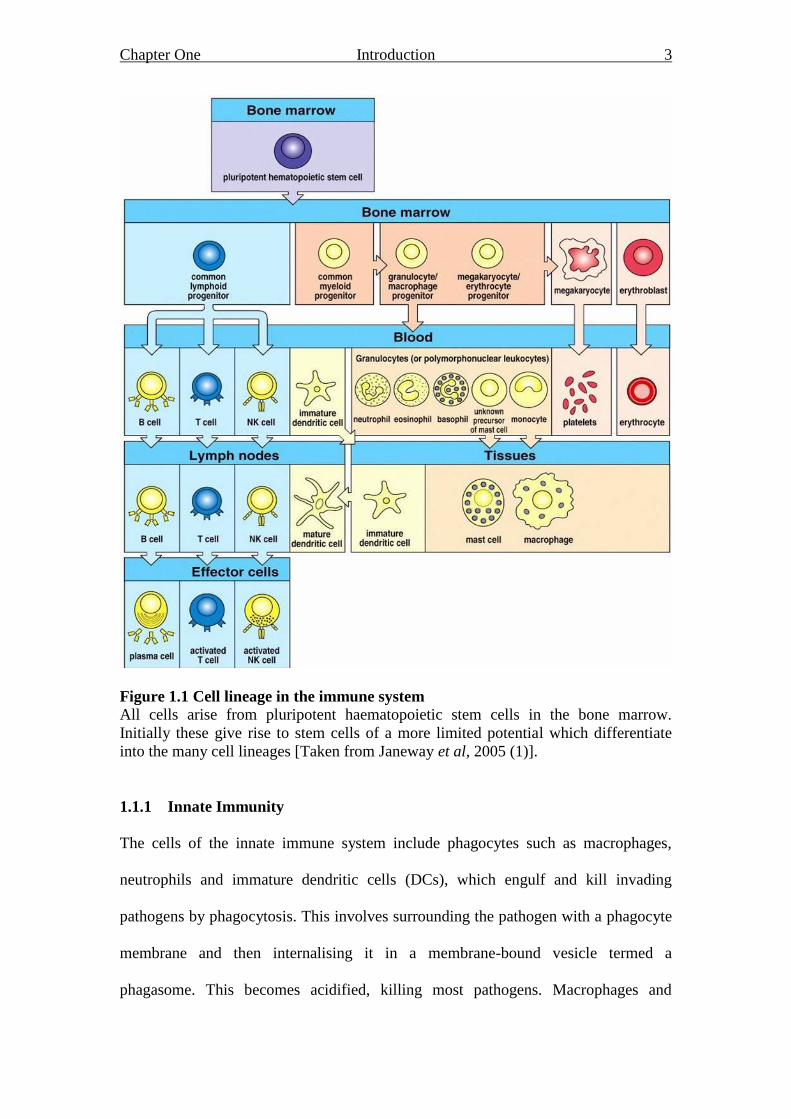
The immune system comprises many cell types which differentiate from a pluripotent
haematopoietic stem cell (figure 1.1). These cells mediate an immune response which
consists of two branches; the innate and adaptive systems. Innate immunity is driven
by an antigen-non-specific mechanism which a host uses immediately or within
several hours after exposure to an antigen. This is the initial response by the host to
eradicate microbes and prevent infection. However, although it can distinguish self
from non-self, it offers no memory or lasting protective immunity. Adaptive
immunity is driven by an antigen-specific mechanism that takes several days to
become protective. It is designed to react with and remove a specific antigen and
continues to develop throughout life, providing memory against re-infection (2).
Chapter One Introduction 3
Figure 1.1 Cell lineage in the immune system All cells arise from pluripotent haematopoietic stem cells in the bone marrow.
Initially these give rise to stem cells of a more limited potential which differentiate
into the many cell lineages [Taken from Janeway et al, 2005 (1)].
1.1.1 Innate Immunity
The cells of the innate immune system include phagocytes such as macrophages,
neutrophils and immature dendritic cells (DCs), which engulf and kill invading
pathogens by phagocytosis. This involves surrounding the pathogen with a phagocyte
membrane and then internalising it in a membrane-bound vesicle termed a
phagasome. This becomes acidified, killing most pathogens. Macrophages and
Chapter One Introduction 4
neutrophils also contain lysosomes which are membrane bound granules containing
enzymes, proteins and peptides. The phagosome fuses with one or more lysosomes to
form a phagolysosome, in which the lysosomal contents are released to destroy the
pathogen (3). Neutrophils are short lived cells and die after completing phagocytosis,
they are the most abundant leucocyte population, representing about 60% of all
circulating leucocytes (4). In comparison macrophage cells are long lived and after
phagocytosis continue to produce new lysosomes (3). Immature DCs, phagocytose
pathogens and present their degraded proteins using major histocompatablity complex
(MHC) proteins whilst simultaneously upregulating co-receptors for T cell activation
such as CD80 and CD86 and also CCR7 which encourages the DC to travel to the
spleen or a lymph node. Here they function as an antigen presenting cell (APC) and
can induce an adaptive immune response. The DCs enter the lymph nodes as mature
non-phagocytic cells which can activate antigen-specific thymus derived (T) cells (5).
In addition, granulocytes such as mast cells, eosinophils and basophils release
cytokines that cause dilation of blood vessels and increased vascular permeability.
These cells are thought to be involved in allergic responses and defence against
parasites (3).
As well as the cellular component of the innate immune system which acts mainly in
the tissues, the complement system is an enzyme system activated in the blood. There
are three pathways leading to complement activation: the classical pathway, the
mannose binding (MB) lectin pathway and the alternative pathway (6). The classical
pathway is activated by IgG or IgM antibody molecules produced by bone marrow
derived (B) cells and is part of the adaptive immune response (7). The MB lectin
pathway is activated by mannose and fructose residues on bacterial cell walls, and the
alternative pathway by spontaneous hydrolysis of C3 from plasma to the surface of a
Chapter One Introduction 5
pathogen, both of which are innate mechanisms (8). The pathways all lead to the
activation of C3, which is the central component of the cascade. The larger fragment
of C3, C3b, binds to the surface of the pathogen present and activates the complement
cascade which ultimately results in the formation of membrane attack complexes.
These insert into the pathogen cell membrane, form a transmembrane pore and cause
lysis of the bacterium (1).
A third system utilised by the innate immune system is recognition of common
pathogen associated components, named pathogen-associated molecular patterns
(PAMPs). These are usually components of a pathogen that they cannot survive
without or cannot easily mutate without affecting their capacity to cause infection (9).
The innate immune system relies on a set of germline encoded receptors called
pattern-recognition receptors (PRRs) to recognise these PAMPs. Examples of these
PRRs include Toll-like receptors (TLRs) of which over ten have been identified in
humans that recognise different PAMPs. Examples of PAMPs include
lipopolysaccharide (LPS) and peptidoglycan recognised by TLR4 and 2 respectively
(10). The role of the TLRs is then to activate phagocytes and DCs to respond to the
pathogens by secreting chemokines and cytokines, and to induce DC maturation (11).
The key to the innate response is its rapid onset with the peak response being just a
few hours after infection. Without this, many infections would prove lethal while
waiting for the body to mount an adaptive response. The innate response subsides
either as an infection is resolved or as the adaptive response comes into play (12).
Chapter One Introduction 6
1.1.2 Adaptive Immunity
Many pathogens can evade the initial non-specific response, this is when the adaptive
arm of the immune response comes into play. This is a specific response to a pathogen
and occurs over a period of several days from when a pathogen is first encountered.
The adaptive immune response requires T and B lymphocytes that recognise specific
antigens presented on the surface of APCs. Both T and B lymphocytes originate in the
bone marrow, but only the B lymphocytes mature there. T lymphocytes migrate to the
thymus and it is here they undergo maturation and selection. Once maturation is
completed both cell types enter the bloodstream, from which they traffick to lymph
and peripheral lymphoid organs continuously. It is in the peripheral lymphoid organs
where antigen and lymphocytes will eventually meet, triggering the adaptive immune
response (1).
1.1.2.1 Lymphocytes
Lymphocytes account for 20-40% of all white cells in the circulating blood. Early in
lymphocyte development their receptor genes undergo rearrangement so that each
receptor is structurally diverse. There are approximately 1011
different lymphocytes in
the human body, each with the ability to bind different antigen (1,2).
B cells produce antibodies which interact with pathogens and their toxic products in
the extracellular spaces of the body. The immunoglobulin receptors of the B cell
recognise antigen in its unprocessed state, the antigen-recognition molecules produced
are made both as membrane bound receptors and as secreted antibodies. The majority
of B cell responses, though, depend on the interaction with specialised T cells, in
lymphoid tissues, for the generation of efficient high affinity antibody responses (6).
Chapter One Introduction 7
In contrast, T cells are specialised for cell-cell interaction. Antigen presented to T
cells must be displayed bound to MHC proteins on the surface of the body‟s own
cells. There are two main types of T cells, helper T cells which express CD4 and
cytotoxic T cells which express CD8. CD4+ T cells generally interact with peptide
antigens bound to MHC class II proteins (13). These peptides are generated from
exogenous antigens taken up by APCs, which process the antigen intracellularly and
present the resulting peptides on MHC class II proteins in combination with co-
stimulatory molecules such as CD80 and CD86 to CD4+ T cells. APCs include DCs
and macrophages, however only DCs are thought to be able to activate or “prime”
naïve, not previously activated T cells (14). CD4 expressing T cells are split into two
further subsets; Th1 cells which are important in intracellular bacterial infections and
Th2 cells which are involved in stimulating B cells, mast cells and eosinophils and are
important in parasite infections (15). More recently a new population of CD4+ T cells
has become apparent; these are CD4+CD25
+ and have been named regulatory T cells
(Tregs). The Tregs make up approximately 5-10% of the lymphocyte population and
they can inhibit activation of effector T cells by secreting inhibitory cytokines, such as
IL-10, which prevents IL-2 production (16). The peptides activating the Treg receptor
tend to be self peptides and so it is thought they have a role in the prevention of
autoimmune responses (17). Cytotoxic CD8+ T cells recognise their antigen in
conjunction with MHC class I proteins (18). MHC class I is expressed by most
nucleated cells. MHC class I proteins generally present peptides derived from proteins
produced within the presenting cell. CD8+ effector T cell antigens recognise cells
infected with virus or other intracellular pathogens and kill directly by inducing
apoptosis of the infected cell. Some CD8+ T cells require CD4
+ T cell help to become
activated, it is thought that the presence of the CD4+ T cell compensates for the
Chapter One Introduction 8
inadequate co-stimulation of the naïve CD8+ T cell. The CD4
+ T cell induces the APC
to increase co-stimulatory activity and thus activates the CD8+
T cell (19).
All T cell subsets develop in the thymus, however, only 3% become mature naïve T
cells (20). These naïve T cells constantly recirculate between secondary lymphoid
organs, blood and lymphatic systems. Once primed following interaction with an
antigen experienced DC, the activated T cells down-regulate L-selectin and increase
very late antigen-4 (VLA-4) expression on their cell surface. This change in
phenotype results in the loss of lymph node homing, so that they are more likely to
enter inflamed or infection sites in response to signals from innate cells such as
macrophages (21). Importantly, for the adaptive response, while the vast majority of T
cells die by apoptosis as the response resolves, a small subset remain after resolution
of an infection. These memory T cells can rapidly mobilise and proliferate should the
same antigen be re-encountered. Compared to naïve T cells, memory T cells can be
activated by macrophages and generate a faster and more effective response at lower
doses of antigen (22).
1.1.2.2 Lymphocyte homing and trafficking
Lymphocytes continuously re-circulate through the blood, lymphatic system and non-
lymphoid tissue to ensure continuous surveillance for foreign antigen. It takes
approximately 24 hours for a T cell to complete one round of migration through all
the body‟s lymph nodes (23). Their homing and extravasation across endothelium is
an important process as it is in the peripheral lymphoid organs where antigen and
lymphocytes will eventually meet, triggering the adaptive immune response. The site
where a lymphocyte extravasates is determined by the active cell surface receptor on
Chapter One Introduction 9
the lymphocyte interacting with its corresponding ligand on the endothelial cell. Many
endothelial adhesion molecules are upregulated under inflammatory conditions.
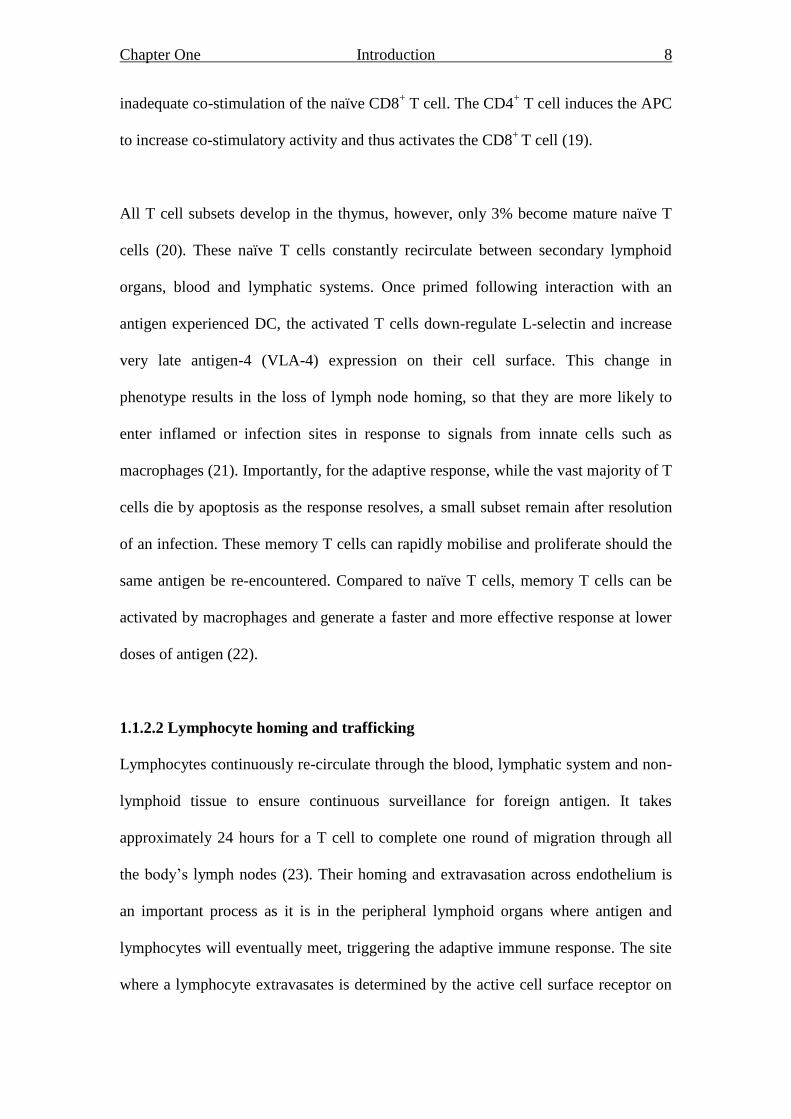
Transendothelial migration takes place in four stages: lymphocyte rolling, activation
of integrins, tight adhesion and diapedesis (figure 1.2).
Figure 1.2 Transendothelial migration
Neutrophil recruitment, lymphocyte recirculation and monocyte trafficking all require
adhesion and transmigration through blood-vessel walls. The traditional three steps of
rolling, activation and firm adhesion, have recently been augmented and refined. Slow
rolling, adhesion strengthening, intraluminal crawling and paracellular and
transcellular migration are now recognized as separate, additional steps. [Taken from
Ley et al, 2007 (24)].
Lymphocyte rolling is a reversible attachment of the cell to the endothelium; this
slows down the cell in the bloodstream so that it may detect signals from the
endothelium. L-selectin is expressed by most lymphocytes, this binds to receptors
such as glycosylation-dependent cell adhesion molecule-1 (GlyCAM-1), CD34 and
mucosal addressin cell adhesion molecule (MAdCAM) on the endothelium in the
rolling process (25). Next the lymphocyte is activated by chemokines produced by the
endothelial cells, this leads to increased integrin expression on the lymphocyte and the
cells arrest. Tight adhesion of the lymphocyte to the endothelial cell is then induced
Chapter One Introduction 10
by members of the immunoglobulin superfamily present on the endothelial cell
surface binding to these integrins (26). The lymphocyte then induces the opening of
the junction between two endothelial cells by disrupting cell-cell interactions. This
step is believed to involve an immunoglobulin type molecule called
platelet/endothelial cell adhesion molecule one (PECAM-1) or CD31; enabling the
lymphocyte to „crawl‟ along the cell to the basement membrane (24). Finally the
lymphocyte secretes enzymes to breakdown the basement membrane and enter the
subendothelial tissue (24-26).
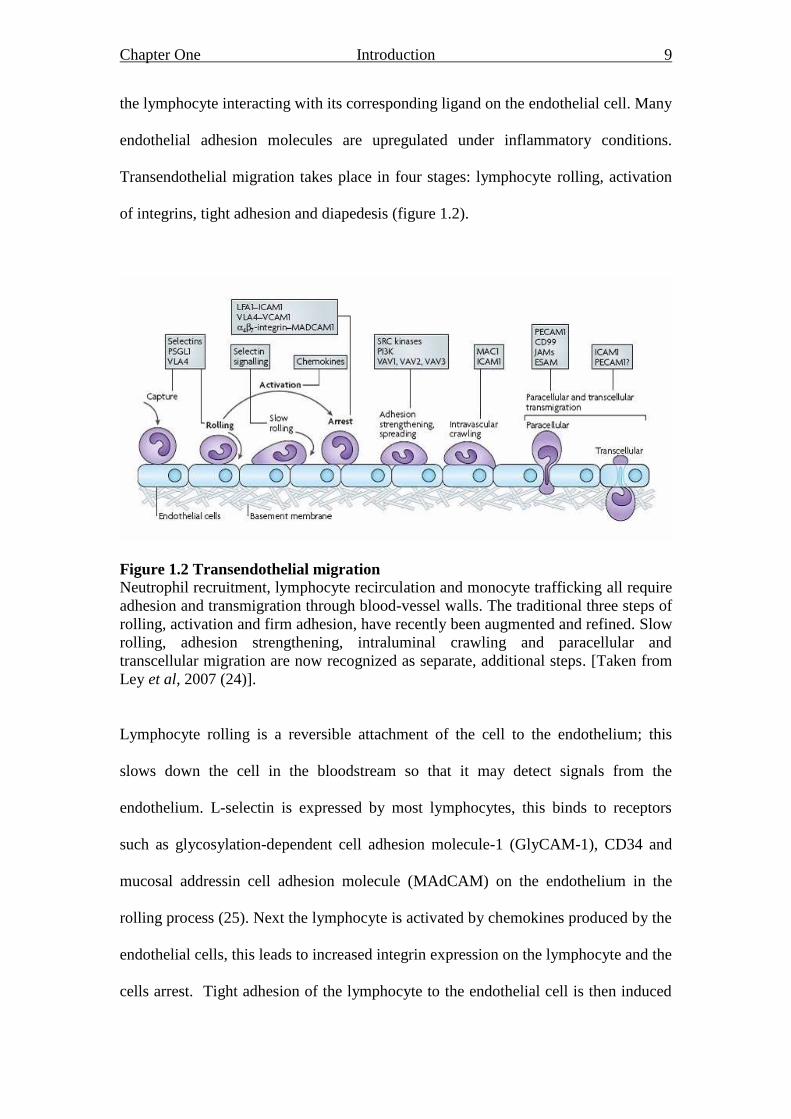
1.2 The Lymphoid System
The specialised structure in the human body for the distribution of immune cells is the
lymphoid system. The lymphoid system consists of primary lymphoid organs,
secondary lymphoid organs, and lymphatic vessels (figure 1.3). Primary lymphoid
organs such as the bone marrow and the thymus are where the B and T cells
respectively mature (1). After maturation, both B cells and T cells circulate through
and accumulate in secondary lymphoid organs. Secondary lymphoid organs consist of
the highly organised lymph nodes and spleen as well as the less organised appendix,
Peyer‟s patches and tonsils. Secondary lymphoid organs are the predominant site of
lymphoid sensitisation to novel antigens (27). The lymphatic vasculature forms a
secondary circulatory system which connects the blood and lymphoid organs (28).
Blood plasma constantly leaks out of the capillaries to deliver oxygen and nutrients to
the tissues. Whilst most of the fluid re-enters capillaries and is returned to the
bloodstream, some enters the lymph vessels. This lymph fluid flows through regional
lymph nodes and eventually enters the circulatory system at the heart to maintain the
fluid volume of the circulation (1,27).
Chapter One Introduction 11
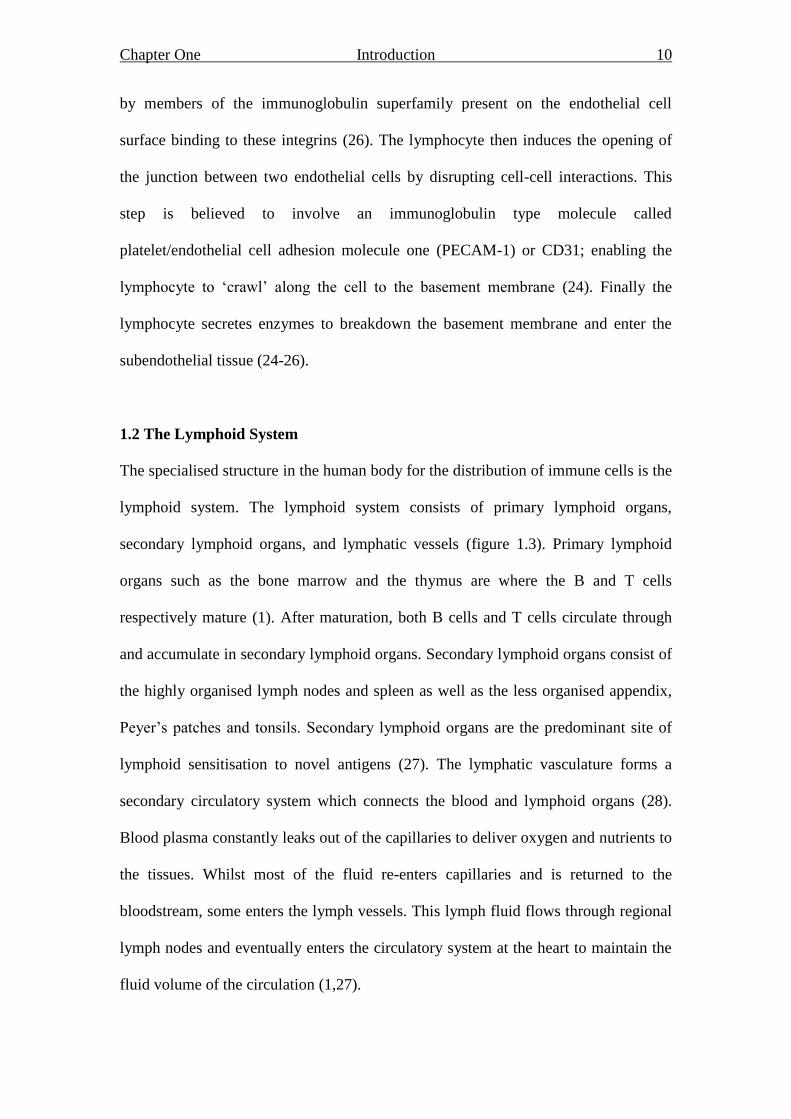
Figure 1.3 The human lymphoid system
Lymphocytes arise from stem cells in the bone marrow and differentiate in the
primary lymphoid organs (yellow). They then migrate to secondary lymphoid organs
(blue) and recirculate between these and the blood until they encounter their specific
antigen. [Taken from Janeway et al, 2005 (1)].
1.2.1 Lymph node development
Development of secondary lymphoid tissue has primarily been investigated in the
murine system. Lymph node development begins during embryogenesis and is
thought to continue several weeks after birth (29). The precise signals that induce
lymph node development has yet to be established, however Sabin hypothesised in
1902 that lymphatic vessels arise by sprouting from venous endothelial cells after an
appropriate signal (30). More recent work in mice has shown the earliest lymph sacs
to develop at embryonic day (E) 10.5 and that the homeobox gene Prox1 is essential
for the normal development of the lymphatic system. In Prox1 null mice initial
budding from the veins occurred but could not be maintained causing arrest of the
lymphatic development. However, the loss of Prox1 did not affect vascular
development suggesting it is specifically required for the development of the
Chapter One Introduction 12
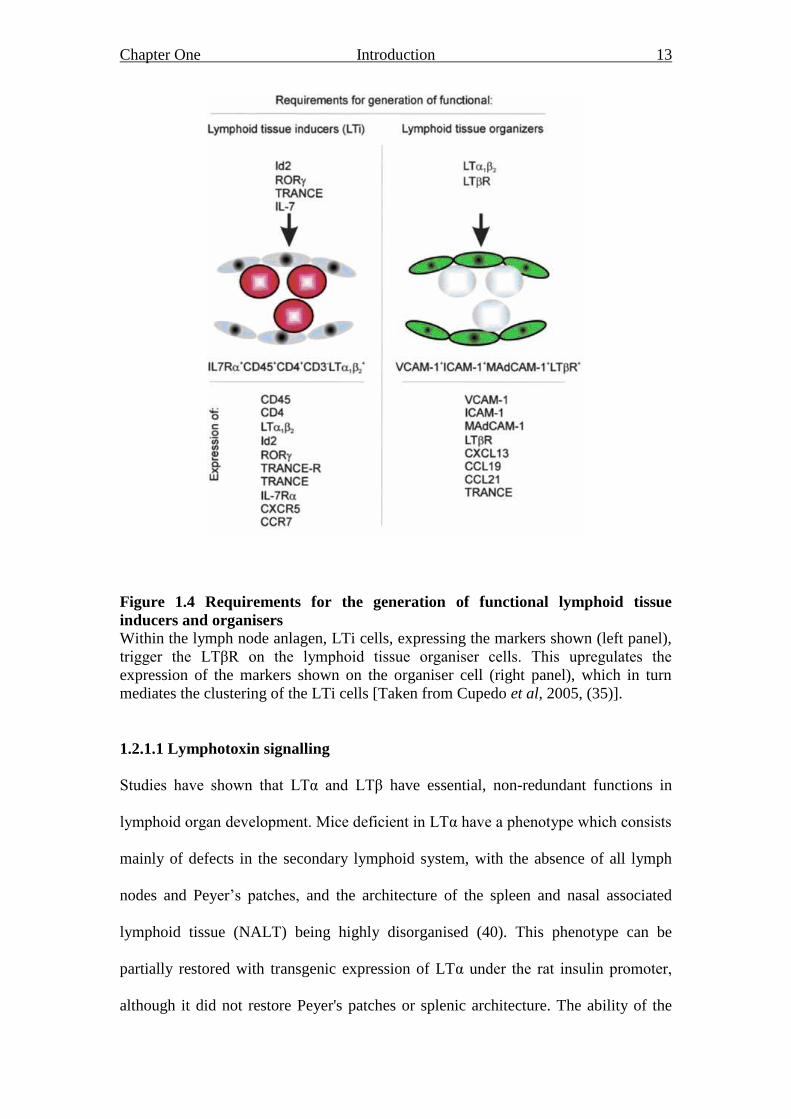
lymphatic system (31). As the lymph sacs are forming, mesenchymal cells
differentiate into specialised cells that initiate the formation of lymph nodes. This
differentiation requires the presence of growth factors such as platelet-derived growth
factor (PDGF) (32), fibroblast growth factors (FGF) (33) and transforming growth
factor (TGF)-β superfamily (34). After development the lymph sac is colonised by
lymphoid tissue inducer cells (LTi), which are haematopoietic cells that express the
IL-7Rα chain and CD4 but lack CD3 (figure 1.4, left panel). LTi cells were first
discovered by Kelly and Scollay in 1992. These bone marrow-derived cells form
small clusters with resident stromal organiser cells, which express vascular cell
adhesion molecule-1 (VCAM-1), inter-cellular adhesion molecule-1 (ICAM-1) and
lymphotoxin β receptor (LTβR) (figure 4, right panel). This interaction is believed to
initiate the maturation of the lymph node. The cross talk between these two cell types
has been shown to be critical to lymph node organogenesis (35) and involves the
ligands and receptors of the tumour necrosis family (TNF) (36). Lymphotoxin (LT) α,
LTβ and TNF are structurally homologous cytokines grouped within the TNF ligand
family (37). TNF and LTα can bind to TNF receptors TNFRI and TNFRII. However,
LTβ forms a functional heterotrimeric complex, LTα1β2 to bind to its receptor, LTβR
(38,39).
Chapter One Introduction 13
Figure 1.4 Requirements for the generation of functional lymphoid tissue
inducers and organisers
Within the lymph node anlagen, LTi cells, expressing the markers shown (left panel),
trigger the LTβR on the lymphoid tissue organiser cells. This upregulates the
expression of the markers shown on the organiser cell (right panel), which in turn
mediates the clustering of the LTi cells [Taken from Cupedo et al, 2005, (35)].
1.2.1.1 Lymphotoxin signalling
Studies have shown that LTα and LTβ have essential, non-redundant functions in
lymphoid organ development. Mice deficient in LTα have a phenotype which consists
mainly of defects in the secondary lymphoid system, with the absence of all lymph
nodes and Peyer‟s patches, and the architecture of the spleen and nasal associated
lymphoid tissue (NALT) being highly disorganised (40). This phenotype can be
partially restored with transgenic expression of LTα under the rat insulin promoter,
although it did not restore Peyer's patches or splenic architecture. The ability of the
Chapter One Introduction 14
spleen to form germinal centres and follicular dendritic cell (FDC) networks was
however restored (41). LTβ knockout (KO) mice lack all peripheral lymph nodes and
Peyer‟s patches but retain mucosal, cervical and sacral lymph nodes. The defects seen
in the spleen and NALTs are decreased compared with the LTα KO mice (36,42-44).
It has been reasoned that mesenteric and cervical lymph node formation in the LTβ
KO mice, when other lymph nodes do not form, is due to the differential expression
of LTβR by the corresponding stromal cells. Signalling through this receptor initiates
a cascade of events during lymph node formation which may not be present in other
lymph nodes (45) (section 1.2.1.3). LTβR KO mice lack all lymph nodes, Peyer‟s
patches and colon-associated lymphoid tissue. The architecture of the spleen,
germinal centre formation, FDC networks and immunoglobulin responses are also
impaired. Interestingly the LTβR KO mice exhibit distinct defects not seen in the LTα
or LTβ KOs, which suggests that the LTβR also integrates signals from other TNF
family members (46). Taken together, these data using KO mice demonstrate the
crucial and non-redundant functions of LTα and LTβ in lymphoid organ development.
1.2.1.2 TNF signalling
TNF binds to TNFRI and TNFRII. TNFRI is expressed in most tissues and can be
activated by membrane bound and soluble trimeric forms of TNF, whereas TNFRII is
found mainly in cells involved in the immune system and responds to membrane
bound TNF. Upon TNFR ligation the adaptor protein TRADD binds to the death
domain upon the receptor and acts as a platform for further protein binding. Three
signalling cascades are then initiated, activation of NF-kB and MAP kinase pathways
and also the induction of cell death pathways. These pathways have conflicting effects
with the activation of NF-kB considered anti-apoptotic and the activation of MAP
Chapter One Introduction 15
kinase and cell death pathways pro-apoptotic. This diverse signalling provides a
mechanism by which varied responses can occur under different conditions (37).
Tumour necrosis factor-related activation-induced cytokine (TRANCE), a TNF
family member, is found on LTi cells and stromal cells within developing lymph
nodes, and acts locally by attracting or differentiating LTi. Signalling via the
TRANCE-R or the IL-7R initiates surface LT expression (47) and defects in these
pathways affect the development of lymph nodes, with mice deficient for each
receptor having unique phenotypes (48). Mice deficient in IL-7R signalling lack all
Peyer‟s patches and only develop mesenteric and brachial lymph nodes (49). Whereas
in mice lacking TRANCE-R, Peyer‟s patches are present with most lymph nodes
missing (47). Interestingly TRANCE-R KO newborn mice still have LTi cells at sites
where the mesenteric lymph nodes should have developed, but their numbers are
severely reduced. This leads to a failure of most lymph nodes to develop, which
suggests that there is a minimum number of LTi‟s required to initiate lymph node
formation (47). The notion that there is a threshold number of LTi‟s is supported by,
White et al, 2007, where a critical number of both LTi and stromal organiser cells was
needed for normal inguinal lymph node development. Upon grafting E17 inguinal
lymph nodes under the kidney capsule of adult mice, organisation of host T and B
cells was observed, however inguinal lymph nodes grafted at E15 had no such
organisation. This was thought to be due to the low numbers of LTi and mature
stromal organiser cells at E15, as when a purified IL-7 cultured LTi population was
added to a to the E15 inguinal lymph node cell suspension, lymphoid tissue formed
upon kidney capsule grafting (50).
Chapter One Introduction 16
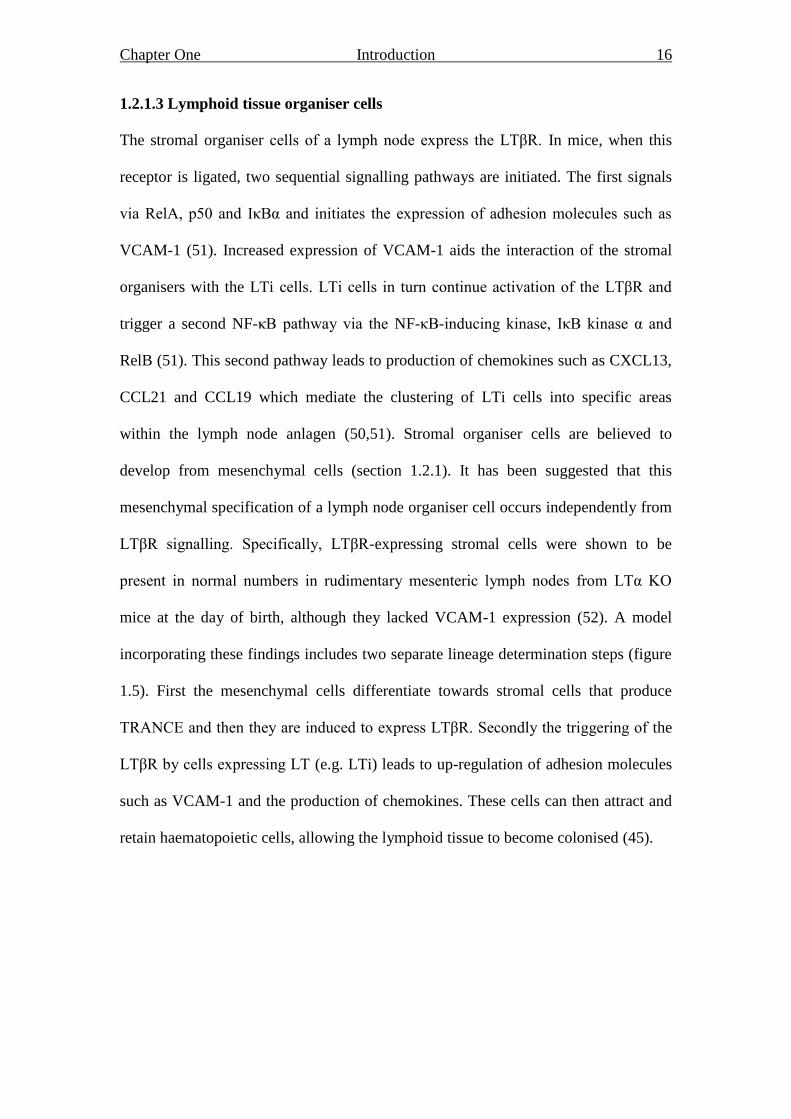
1.2.1.3 Lymphoid tissue organiser cells
The stromal organiser cells of a lymph node express the LTβR. In mice, when this
receptor is ligated, two sequential signalling pathways are initiated. The first signals
via RelA, p50 and IκBα and initiates the expression of adhesion molecules such as
VCAM-1 (51). Increased expression of VCAM-1 aids the interaction of the stromal
organisers with the LTi cells. LTi cells in turn continue activation of the LTβR and
trigger a second NF-κB pathway via the NF-κB-inducing kinase, IκB kinase α and
RelB (51). This second pathway leads to production of chemokines such as CXCL13,
CCL21 and CCL19 which mediate the clustering of LTi cells into specific areas
within the lymph node anlagen (50,51). Stromal organiser cells are believed to
develop from mesenchymal cells (section 1.2.1). It has been suggested that this
mesenchymal specification of a lymph node organiser cell occurs independently from
LTβR signalling. Specifically, LTβR-expressing stromal cells were shown to be
present in normal numbers in rudimentary mesenteric lymph nodes from LTα KO
mice at the day of birth, although they lacked VCAM-1 expression (52). A model
incorporating these findings includes two separate lineage determination steps (figure
1.5). First the mesenchymal cells differentiate towards stromal cells that produce
TRANCE and then they are induced to express LTβR. Secondly the triggering of the
LTβR by cells expressing LT (e.g. LTi) leads to up-regulation of adhesion molecules
such as VCAM-1 and the production of chemokines. These cells can then attract and
retain haematopoietic cells, allowing the lymphoid tissue to become colonised (45).
Chapter One Introduction 17
Figure 1.5 Differentiation of stromal organiser cells
A model for the differentiation of the lymph node stromal organiser cell. An
intermediate precursor arises from a mesenchymal stem cell which then differentiates
into a lymph node organiser cell by the ligation of the LTβR. [Taken from Cupedo et
al, 2005 (35)].
1.2.1.4 Lymph node developmental progression
Lymph nodes have been demonstrated to develop in a certain order based on in vivo
blocking experiments with LTαR-Fc. They begin at E10.5 with the mesenteric lymph
nodes, next are the cervical at E11.5 and then the brachial and axillary after E12.5.
The inguinal and Peyer‟s patches development begins at E16 but the Peyer‟s patches
continue development until after birth. Finally after birth, the NALT develops
(36,42,53). Each lymph node has their own set of developmental cues and signalling,
as when different elements are blocked in the signalling pathway varying lymph
nodes are affected. One explanation for the differences seen is a variation in the
stromal cell compartment of each lymph node. It has been shown that, at least in the
mesenteric and peripheral lymph nodes two populations of stromal cells exist; ICAM-
1, VCAM-1 and MadCAM high expressing cells (IVMhigh
) and those expressing the
same adhesion molecules at an intermediate level (IVMint
) (45). The intermediate
expressing cells were the larger population and these represented the previously
described organiser cells. Both of these populations express LTβR, with the IVMint
Chapter One Introduction 18
population expressing a higher number of LTβRs. They also produced mRNA for
homeostatic chemokines CXCL13, CCL19 and CCL21, with the IVMint
population
expressing lower amounts. The expression profile of these populations identifies these
cells as lymphoid tissue organisers. When comparing mesenteric lymph nodes to
peripheral lymph nodes it was found that the IVMint
population was approximately 10
fold reduced in the peripheral lymph nodes while the IVMhigh
was only slightly
reduced. This finding may explain why these lymph nodes have different signalling
requirements during embryonic development (45).
1.2.1.5 Adult LTi
It is clear that LTi – stromal cell crosstalk is required in the developing lymph node,
however, whether this continues in adult secondary lymphoid organs is a key
question. Cells equivalent to LTi have been found in adult mice, a key difference in
the adult LTi is their expression of OX40 and CD30 (54). These adult LTi have been
described as having a role in the generation of memory T cells (55) as well as having
a role in the maintenance in secondary lymphoid tissue structure (56). Recent work
has shown that LTi – stromal cell interactions persist in the adult and provide a
significant mechanism for restoring secondary lymphoid organ integrity after
infection (57). In a mouse model using infection with lymphocytic choriomeningitis
virus (LCMV), the T zone stroma is destroyed, rendering the host particularly
vulnerable to secondary infection. A study using this model demonstrated T zone
stroma restoration through the proliferation of resident LTi cells and their interaction
with lymphoid stromal cells. In addition, accumulation of LTi cells was seen in the
spleen and lymph nodes coinciding with the peak of immunopathological damage.
This accumulation was also shown to be as a result of LTi proliferation during the
Chapter One Introduction 19
infection. When LTi cells were removed from this system however, the restoration of
normal splenic architecture post infection was delayed. This delay was also seen when
LTβR signalling was blocked, suggesting that following infection, LTi – stromal cell
cross talk is reactivated similar to that observed during embryonic development. Of
importance, however, this study also showed that under normal conditions LTi cells
were not required to maintain secondary lymphoid structure. Therefore it is possible
that LTi cells present in the adult tissue are required only when considerable damage
is sustained within the secondary lymphoid organs (57). More recently, in adult mice
and humans, a population of IL-22 producing mucosal cells in mucosa-associated
lymphoid tissues (MALT) have been described that share features of both LTi and
NK cells, termed NK22 cells (58). In contrast to LTi cells, they express NKp46, a
natural cytotoxicity receptor (59), but compared to NK cells express little or no
classical NK markers such as NK1.1 and perforin (60). It has been suggested that LTi
cells and NK cells come from a common precursor, with factors such as IL-15 and IL-
7 influencing the differentiation into NK or LTi cells and signals from the commensal
microflora subsequently inducing the differentiation of NK22 cells from LTi cells
(61). These cells are thought to be involved in immunity and homeostasis in mucosal
tissues.
1.2.2 Lymph node structure
Two important vascular systems are found in the lymph node; lymphatic vessels and
high endothelial venules (HEVs) (62,63). Immediately after birth, all HEVs express
MAdCAM-1, the ligand for the integrin α4β7. This is rapidly replaced by peripheral
lymph node addressin (PNAd) in mouse peripheral lymph nodes, functioning as the
main L-selectin ligand that contributes to the mature peripheral lymph node HEV
Chapter One Introduction 20
phenotype. Conversely, in mucosal lymph nodes HEVs maintain their expression of
MAdCAM-1 in addition to PNAd (64).
The mature lymph node can be separated into three distinct regions: cortex,
paracortex and medulla (figure 1.6). The cortex contains lymphoid nodules called
primary follicles; these are composed of B cells and follicular dendritic cells (FDCs).
It is here that the B cells undergo proliferation after antigen stimulation, forming
secondary follicles termed germinal centres (65). Inside the cortex is the paracortex
which is composed of T cells and DCs. The medulla consists of strings of
macrophages and antibody secreting plasma cells known as the medullary cords.
Lymphocytes enter the lymph node by extravasation across the HEV. Soluble antigen
and DCs enter by afferent lymphatic vessels at multiple sites on the outer capsule
(62,66).
There are many types of stromal cell within the lymph node. Fibroblastic reticular
cells (FRCs) in the T zone (67) and FDCs (68) and marginal reticular cells (MRCs)
(69) in B cell zones. Also present in the CD45 negative cells of the lymph node are
blood endothelial cells which express CD31 but not gp38 and lymphatic endothelial
cells which express both gp38 and CD31 (67).
Chapter One Introduction 21
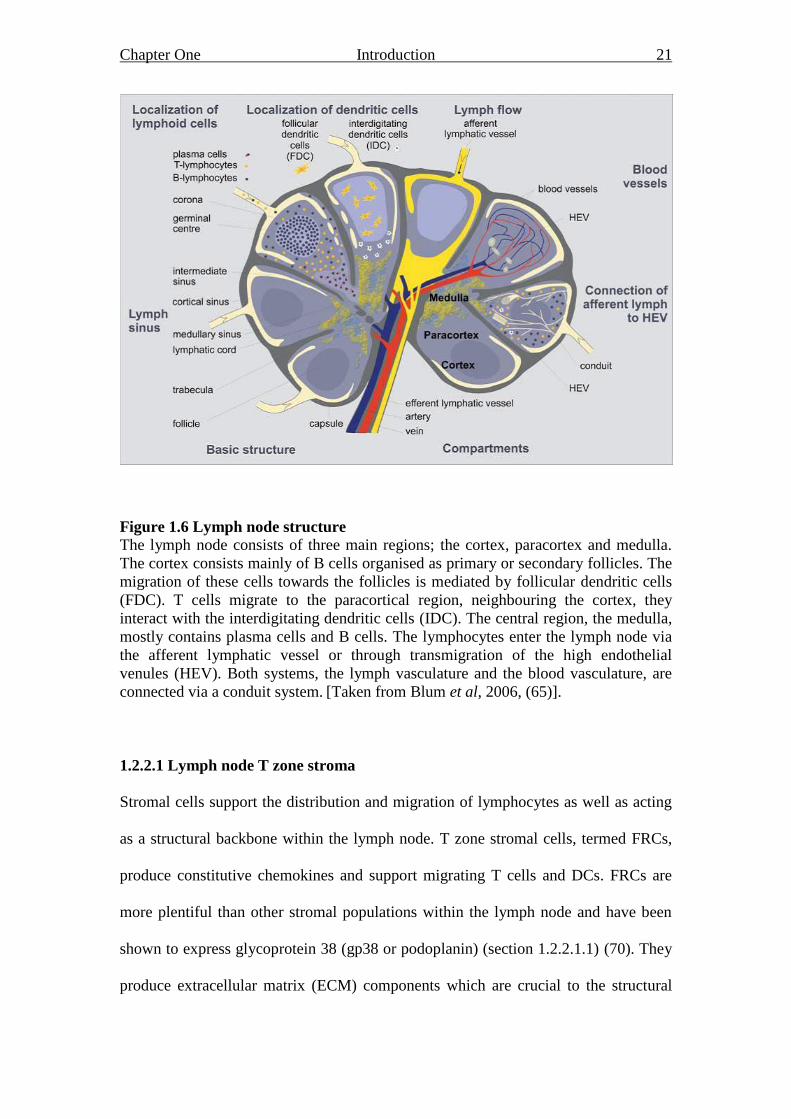
Figure 1.6 Lymph node structure
The lymph node consists of three main regions; the cortex, paracortex and medulla.
The cortex consists mainly of B cells organised as primary or secondary follicles. The
migration of these cells towards the follicles is mediated by follicular dendritic cells
(FDC). T cells migrate to the paracortical region, neighbouring the cortex, they
interact with the interdigitating dendritic cells (IDC). The central region, the medulla,
mostly contains plasma cells and B cells. The lymphocytes enter the lymph node via
the afferent lymphatic vessel or through transmigration of the high endothelial
venules (HEV). Both systems, the lymph vasculature and the blood vasculature, are
connected via a conduit system. [Taken from Blum et al, 2006, (65)].
1.2.2.1 Lymph node T zone stroma
Stromal cells support the distribution and migration of lymphocytes as well as acting
as a structural backbone within the lymph node. T zone stromal cells, termed FRCs,
produce constitutive chemokines and support migrating T cells and DCs. FRCs are
more plentiful than other stromal populations within the lymph node and have been
shown to express glycoprotein 38 (gp38 or podoplanin) (section 1.2.2.1.1) (70). They
produce extracellular matrix (ECM) components which are crucial to the structural
Chapter One Introduction 22
stability of the lymph nodes and express CCL21 and CCL19 which attract the CCR7
expressing T cells and DCs to the T zone. They also enhance the survival of T cells by
producing IL-7 (71).
1.2.2.1.1 Glycoprotein 38 (Podoplanin)
A novel glycoprotein, gp38, was characterised by Farr et al, 1992, (72) and was later
named podoplanin due to its low level expression in kidney podocytes (73). gp38 is a
mucin type transmembrane protein of 43kDa first found to be expressed by stromal
cells of peripheral lymphoid tissue, in particular the FRCs of the T cell dependant area
(72). In addition, gp38 is also expressed in other cells including lymphatic endothelial
cells (74) and thymic epithelial cells (75). The gp38 KO mouse model shows
increased embryonic and foetal death; in homozygote embryos, 40% die between
stages E10-E16 and in the neonatal homozygotes, 50% die within the first weeks of
life. This is in contrast to the heterozygous mice, which have been shown to reach
sexual maturity. The causes of embryonic death have been linked to heart defects
whereas the cause of neonatal death is still unknown (72,76). In other studies LTα1β2,
produced by B cells, was shown to be required for gp38 expression. B cell deficient
spleens had a three to five fold reduction in the area stained by CD3 and the T zone
stroma marker gp38 (77). This indicates a role for B cells in the development of T
zones in the spleen. In addition, impaired B and T cell segregation within the white
pulp of the spleen correlates with a lack of gp38 expression on the T zone stroma,
suggesting a role for gp38 in the separation of lymphocytes (78). Taken together,
these findings suggest that gp38 is important in lymphatic patterning during
development (74).
Chapter One Introduction 23
1.2.2.2 Lymph node B zone stroma
The B zone consists of stromal cells and B cells, the main stromal cell being the FDC.
FDCs produce CXCL13 which attract and retain CXCR5 expressing B cells to the B
zone (68). The fibroblastic morphology of FDCs and their expression of vimentin and
desmin suggests a mesenchymal origin (79). FDC development at sites of chronic
inflammation indicates their differentiation from local mesenchymal cells (80). The
ligands and receptors necessary for B cell growth and survival have been identified as
TNF family members (81). B lymphocyte stimulator (BLyS), also known B cell
activating factor (BAFF) or TNF13B, is produced by FDCs and plays a role in B cell
survival and activation (82).
More recently, a stromal cell population, termed MRCs was found in the outer
follicular region immediately underneath the subcapsular sinus of lymph nodes in
adult mice (69). These cells expressed VCAM-1, ICAM-1, MadCAM-1, CXCL13,
TRANCE, BP-3 and gp38 and have been described as specialised reticular fibroblasts.
These cells are thought to be the adult equivalent of embryonic LTo cells with a role
in organising the structure of adult secondary lymphoid organs (69).
1.2.2.3 The conduit system
During infection lymph-borne antigens are first found in the subcapsular sinus of the
lymph node. From here they are transported either directly into the medullary sinuses
or into a reticular conduit system (figure 1.6). The conduit system has been described
as the infrastructure of the lymph node, transporting fluid and low molecular weight
molecules (<70kDa) (83). It is a network of collagen fibres ensheathed by FRCs,
which extends from the subcapsular sinus to the deeper cortex and medullary regions,
Chapter One Introduction 24
suspending blood vessels and sinuses (84). The FRCs produce collagen and basement
membrane components that form a highly organised core around which the FRCs are
wrapped, they are also connected along the longitudinal axis by junctional complexes.
In places where the basement membrane is not covered by FRCs, DCs are positioned,
which enables them to gain access to antigens that have entered the conduit (85). This
structure means lymphocytes are not in contact with the basement membrane, only the
FRC membrane, hence the FRCs have an important role in the guidance of
lymphocytes. More recent work has shown that the conduit network does not act as a
barrier to lymphocyte migration but rather as an active support and provider of
guidance cues underlying T and B cell movement within the T zone of lymph nodes
(86). The conduit system is involved in the movement of antigen before it is sampled
by APCs, such as DCs, and therefore has a functional role in antigen presentation
(87). Small molecules such as chemokines can also be moved through the conduit
system, with peripherally produced chemokines able to drain into the conduit system.
These can then be presented on the luminal side of HEVs which will ultimately affect
leucocyte entry (88). The spleen also contains a conduit system, which is similar to
that of the lymph node, with the only major difference being that it is not connected to
the lymphatic system but to the blood (84). Further work within the spleen has shown
that movement within the conduit system is not just dependent on size but also on the
molecule‟s 3-D configuration or electrostatic charge (83).
1.2.3 Splenic development
Relative to the lymph node, splenic development has been poorly characterised with
fewer studies completed. There remains a large gap in the literature to be filled. The
spleen is normally situated on the left side of the abdominal cavity, closely associated
Chapter One Introduction 25
with the pancreas and located on the left lateral side of the stomach. During
development the leftward expansion of the mesenchyme provides the tissue in which
the spleen forms, with the initiation of splenogenesis and leftward pancreatic growth
closely linked (89). Splenic development in mice begins at E9.5 with the formation of
the splanchnic mesodermal plate (SMP). The SMP, which is derived from mesoderm,
is an anlage or organising centre for the formation of the spleen. In conditions where
the SMP is defective the spleen does not form, for example mice carrying the
dominant hemimelia mutation or a deficiency in bagpipe homeobox homologue 1
(89,90). The first cells to colonise the spleen are the progenitors of the erythroid and
myeloid lineages. Later, at E13.5, LTi cells are present in the spleen. These are known
to provide the inductive signal for the formation of lymph nodes and may therefore
have a role in white pulp formation. Finally at E14.5 the first haematopoietic cells
reside in the spleen (91).
1.2.4 Splenic structure
The spleen is the largest single secondary lymphoid organ in mammals. It has a role in
both innate and adaptive immunity and also in the removal of senescent red blood
cells. The two roles are compartmentalised in two distinct components, the red pulp
and the white pulp. The afferent splenic artery branches into central arterioles which
are sheathed by white pulp areas. The arterioles end in cords in the red pulp where the
blood runs into the venous sinuses and collects in the efferent splenic vein. A capsule
surrounds the spleen and contains the connective tissue trabeculae in which the larger
arteries and veins run (figure 1.7a) (92).
Chapter One Introduction 26
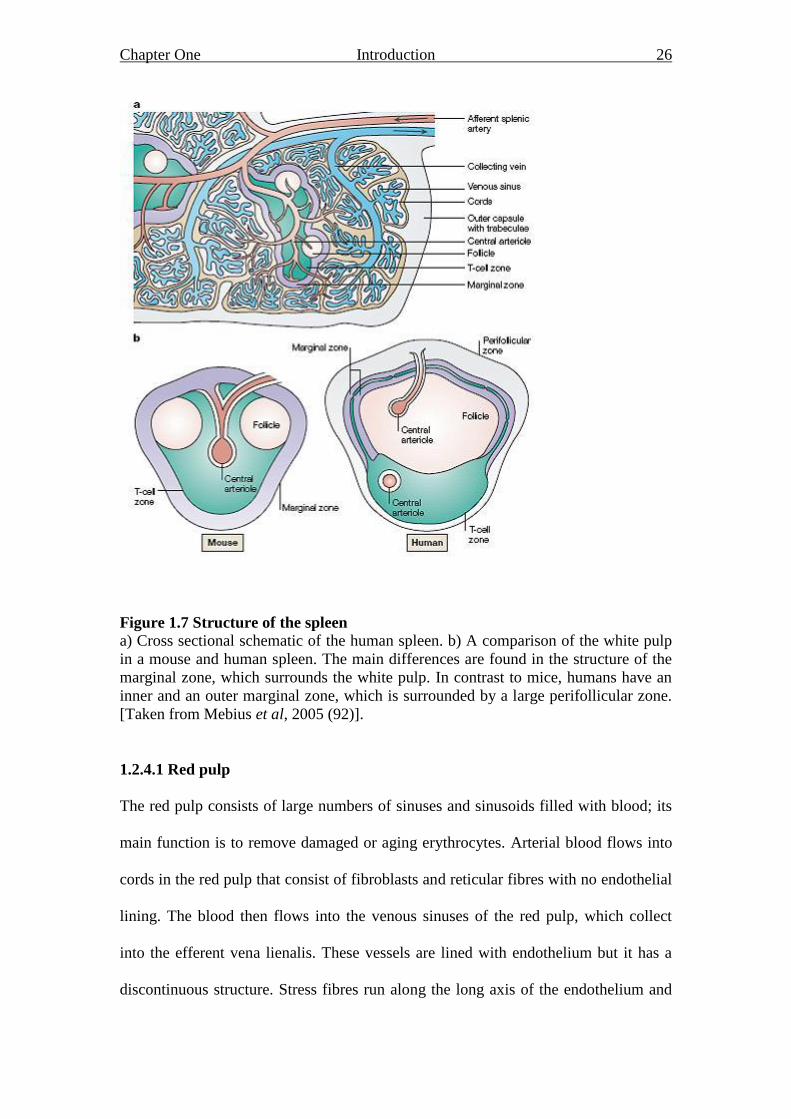
Figure 1.7 Structure of the spleen
a) Cross sectional schematic of the human spleen. b) A comparison of the white pulp
in a mouse and human spleen. The main differences are found in the structure of the
marginal zone, which surrounds the white pulp. In contrast to mice, humans have an
inner and an outer marginal zone, which is surrounded by a large perifollicular zone.
[Taken from Mebius et al, 2005 (92)].
1.2.4.1 Red pulp
The red pulp consists of large numbers of sinuses and sinusoids filled with blood; its
main function is to remove damaged or aging erythrocytes. Arterial blood flows into
cords in the red pulp that consist of fibroblasts and reticular fibres with no endothelial
lining. The blood then flows into the venous sinuses of the red pulp, which collect
into the efferent vena lienalis. These vessels are lined with endothelium but it has a
discontinuous structure. Stress fibres run along the long axis of the endothelium and
Chapter One Introduction 27
are most prominent during contraction. This structure forces the blood from the cords
into the sinuses through slits formed by the stress fibres. As erythrocytes age, their
membranes become rigid, causing slower migration through these stress fibres,
thereby enabling phagocytosis by local macrophage (92). In both humans and mice
adult erythropoiesis occurs in the bone marrow. However, it is important to note that
stress erythropoiesis occurs in the murine splenic red pulp during embryonic
development and acute anaemia (93). Splenic erythropoiesis is not a feature of human
haematopoiesis, extramedullary erythropoiesis is only seen in certain pathological
conditions such as primary myelofibrosis (94).
1.2.4.2 White pulp
The white pulp consists of aggregates of lymphoid tissue and is responsible for the
immunological function of the spleen. It is present in the form of a periarteriolar
lymphoid sheath (PALS), containing B cell follicles and a T cell zone. At the edge of
the T zone is a region known as the marginal zone where larger lymphocytes and
antigen presenting DCs are located (figure 1.7b) (92). The white pulp closely
resembles the structure of the lymph node, one major difference being that lymph
nodes collect antigen from the periphery via afferent lymphatics, whereas the spleen
receives antigen directly from the blood (62,95). The splenic organisation is
maintained by specific chemokines that attract the T and B cells to their respective
zones. Like in the lymph node, CXCL13 here produced by CD35+FDCs and their
adjacent stromal cells, induce B cells to migrate to the B cell zones via interaction
with CXCR5 (96). Signalling through CXCR5 on the B cell induces expression of
LTα1β1. This then induces differentiation of neighbouring FDCs and their expression
of CXCL13 creating a positive feedback loop (97). The B cells expression of LTα1β1
Chapter One Introduction 28
also induces CCL21 expression by stromal cells which is vital in the recruitment and
retention of T cells in the T cell zones. Along with CCL21, CCL19 is also involved in
attracting T cells and DCs to the T zones via interaction with CCR7 (98).
LTα has also been found to have a role upstream of these chemokines. LTα deficient
mice do not have the normal segregation of B and T cell zones and the average size of
the white pulp is decreased. The formation of FDC clusters and germinal centres
within the white pulp of the spleen does not occur within these mice, which also lack
lymph nodes and Peyer‟s patches. In addition LTα KO mice do not have the marginal
zone of monoclonal antibody (MOMA-1) staining, which highlights metallophilic
macrophages. This is in contrast to the TNFR-1 deficient mice, suggesting that LTα
can regulate certain aspects of the splenic white pulp through other receptors (99).
Interestingly, when BM transplantation was utilised, the LTα deficient mouse
demonstrated that although LTα is vital for the initial segregation of B and T zones, it
is not crucial for maintaining the structure (100,101). This was in contrast to the
generation and continuance of FDC clusters within the spleen, which was shown to be
LTα dependent (102).
In the spleen both innate and adaptive immune responses can occur, the white pulp is
involved in adaptive immunity whereas the marginal zone is involved in both innate
and adaptive immunity (92). An important property of the spleen is that most of the
blood flow passes through the marginal zone and then along the white pulp, making
the spleen a very efficient monitor of the blood. A critical role of the spleen is
protection against blood-borne pathogens, splenectomy due to infection, inflammation
or trauma, leads to a lifelong requirement for antibiotics (103).
Chapter One Introduction 29
1.3 Inflammation
Inflammation is a basic mechanism of our immune system. It is an attempt by the
body to restore and maintain homeostasis after injury and is an integral part of body
defences. Most defence elements are transported in the blood and inflammation is the
means by which these elements leave the blood and enter the tissue around the injured
or infected site. Inflammation plays three important roles in combating an infection, it
delivers additional effector molecules, provides a physical barrier to prevent
spreading and promotes the repair of injured tissue (6). The signs of inflammation
were first described by Celsus over 2000 years ago as calor, dolor, rubor and tumor
(2). Acute inflammation is essentially beneficial; however, excess or prolonged
inflammation can cause harm. Chronic inflammation is an inflammatory response
characterised by the infiltration of mononuclear cells, tissue destruction, angiogenesis
and fibrosis. Persistent inflammatory diseases lead to the development of long-lasting
or frequently recurring inflammation, for example rheumatoid arthritis (RA) (section
1.4.4.1), lupus, and inflammatory bowel disease (2).
1.3.1 Acute Inflammation
An acute inflammatory response is a normal process in response to injury or infection.
It is characterised by local dilation of blood vessels and increased vessel permeability
to improve blood flow to the area. Acute inflammation is primarily mediated by
neutrophils, which are the first leucocytes to enter the injured site (2).
Normally after a pathogen has been eliminated the immune response ceases and so the
inflammation subsides and is cleared. Clearance of the acute inflammatory response
involves apoptosis of the vast majority of the infiltrating leucocytes with subsequent
Chapter One Introduction 30
phagocytosis and tissue structure and function returning to normal (2,104). Acute
inflammation is also under strict endogenous control involving anti-inflammatory
mediators which reverse vascular changes and inhibit leucocyte migration and
activation. Examples of anti-inflammatory mediators include cytokines IL-1, IL-4, IL-
10 and TGF-β (6). In addition, there are also pro-resolution agonists that do not just
inhibit the inflammatory cascade, as anti-inflammatory mediators do, but actively
dismantle it. Pro-resolution agonists include lipoxins, resolvins and protectins (105).
Lipoxins have been described as early braking signals for inflammation, increasing
apoptotic neutrophil phagocytosis, decreasing adhesion molecule activation and
decreasing migration of neutrophils and eosinophils (106,107). Cyclopentenone
prostoglandins have also been shown to play a role in the resolution of inflammation
through repression of pro-inflammatory macrophage function (108).
1.3.2 Chronic Inflammation
Prolonged inflammation ceases to be beneficial and can contribute to the pathogenesis
of many diseases. Chronic inflammation is primarily mediated by monocytes and
long-lived macrophages. Later stages involve the persistent accumulation of
lymphocytes suggesting a distorted balance between mechanisms that increase cell
number, recruitment, retention and proliferation and those that decrease cell number,
emigration and death (figure 1.8) (10). For example, clearance of the inflammatory
infiltrate by apoptosis can be inhibited by anti-apoptotic factors present in the local
microenvironment, such as joints of patients with RA. Interaction with synovial
fibroblasts upregulated Bcl-xL but not Bcl-2 and thereby prevented T cell apoptosis
(109). Type 1 interferons, which are produced by synovial fibroblasts and
macrophages in RA, have also been demonstrated as a survival factor for T cells.
Chapter One Introduction 31
Thereby increasing the number of T cells in the joint (110). As well as increased
survival, inappropriate retention of T cells has also been observed. Upregulation of
CXCR4 on T cells and it‟s ligand CXCL12 on stromal cells within the RA joint
caused the T cells to be retained within the chronic inflammatory site rather than
emigrating (111). Lymphocyte egress requires sphingosine 1-phosphate receptor-1
(S1P1) (112), IFNα and β have been found to inhibit lymphocytes responsiveness to
sphingosine 1-phosphate by inducing cell surface activation marker CD69. S1P1
forms a complex with CD69, promoting downmodulation and inhibiting lymphocyte
egress (112).
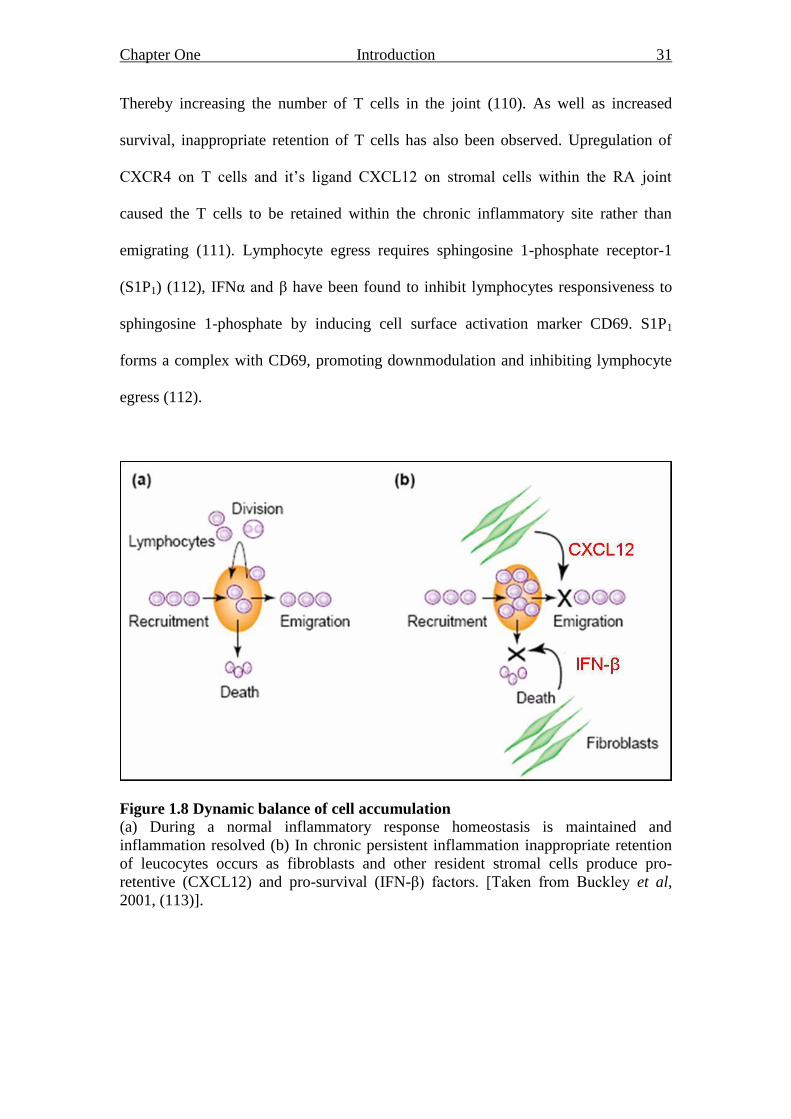
Figure 1.8 Dynamic balance of cell accumulation
(a) During a normal inflammatory response homeostasis is maintained and
inflammation resolved (b) In chronic persistent inflammation inappropriate retention
of leucocytes occurs as fibroblasts and other resident stromal cells produce pro-
retentive (CXCL12) and pro-survival (IFN-β) factors. [Taken from Buckley et al,
2001, (113)].
Chapter One Introduction 32
1.3.2.1 Lymphoid neogenesis in inflammation
During chronic inflammation a specialised type of lymphogenesis can occur, which
results in tertiary lymphoid neogenesis. Kratz et al (1996), demonstrated a unified
model for lymphoid organ structure development during chronic inflammation based
on LTα expression (104). Tertiary lymphoid organs arise under environmental
influences and are the ectopic accumulations of lymphoid cells. It is important to note
that these structures have many similarities to secondary lymphoid organs especially
lymph nodes (figure 1.9). They arise randomly in adult peripheral tissue often in non-
lymphoid locations and have been found in immune diseases (114), microbial
infection (115) and chronic allograft rejection (116). In addition, transgenic mouse
models of chronic inflammation that over express inflammatory cytokines, for
example TNF and LTα have been shown to develop these structures (117). In diseases
such as RA, where chronic inflammation occurs, cytokine and chemokine expression
is constitutive. It is under these conditions that tertiary lymphoid organs are found in
the joints of a RA patients but why they form and the molecular basis for their
persistence is unknown (35,118). Stromal cells, in particular fibroblasts, contribute to
the microenvironment in chronic inflammation, by providing pro-survival and
retention signals via production of factors such as TGF-β and CXCL12. As such they
have been implicated in the formation of tertiary lymphoid tissues (110,111).
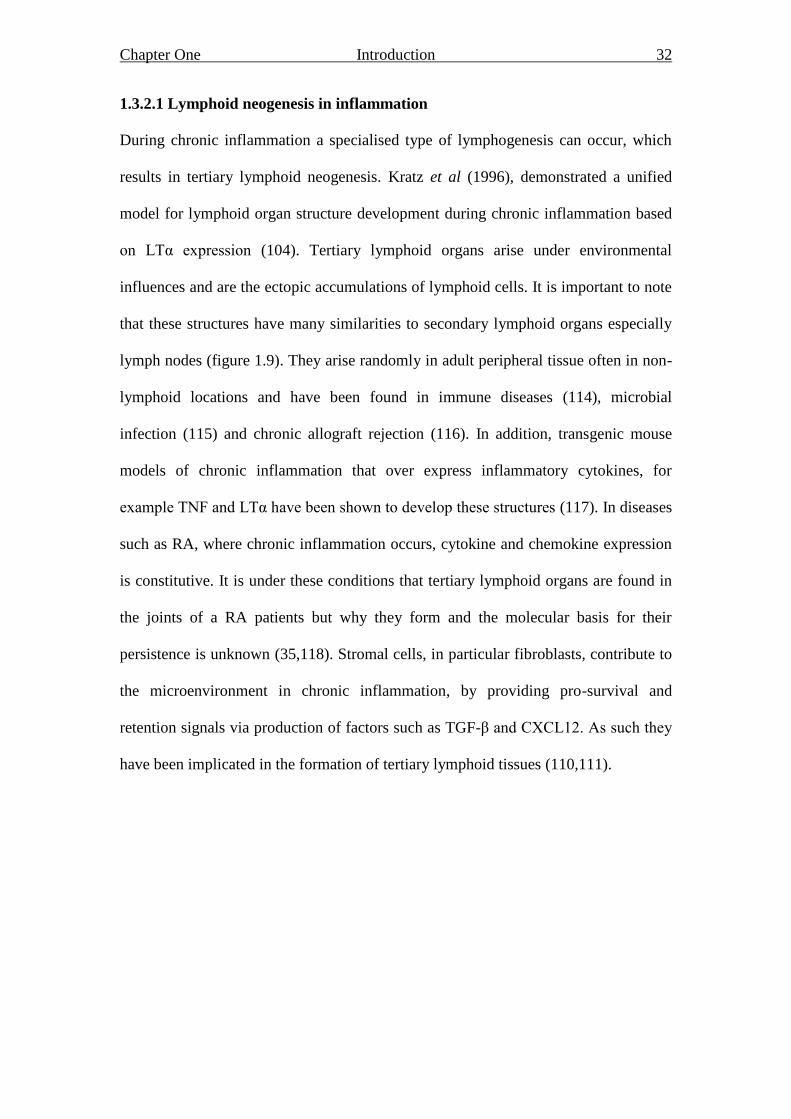
Chapter One Introduction 33
Figure 1.9 Secondary and tertiary lymphoid tissues
(a) Secondary lymphoid tissues; hematoxylin and eosin stain of normal spleen, lymph
node and tonsil architecture (b) Tertiary lymphoid tissues; hematoxylin and eosin
stain of inflamed synovium in Rheumatoid arthritis, salivary gland in Sjogrens
syndrome and thyroid gland in Hashimoto‟s thyroditis. [Pictures courtesy of Dr
Debbie Hardie and Dr Karim Raza, Division of Immunity and Infection, University of
Birmingham].
1.4 The Fibroblast
Stroma is an important structural component of vertebrate animals. It consists of
ECM, mesenchymal cells and a scaffold consisting of blood and lymphatic vessels,
nerves and inflammatory cells (119). The most abundant cell type of tissue stroma is
the fibroblast (120) (figure 1.10). Fibroblasts are traditionally identified by their
spindle shaped morphology and their ability to adhere to plastic in vitro (121).
Fibroblasts are ubiquitous cells that provide mechanical strength to tissues by
producing ECM components which form a supporting framework. These components
include type I, III and V collagen and fibronectin (122). They also produce factors
that are involved in the formation of basement membranes such as type IV collagen
and laminin (123). Fibroblasts have a role in ECM homeostasis as they not only
Chapter One Introduction 34
produce the ECM components but also the proteases that degrade it and regulate its
turnover, such as metalloproteinases (MMPs) (124).
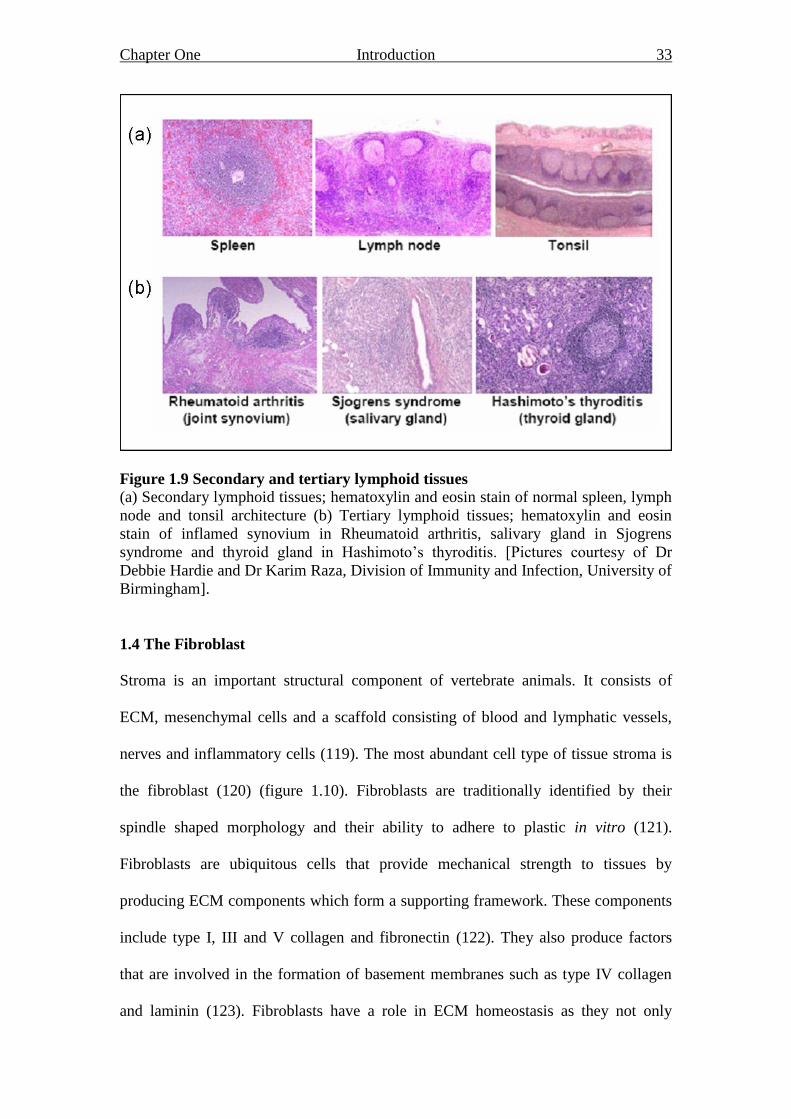
Figure 1.10 A migrating fibroblast
Red = β-actin mRNA, Green = β-actin protein and Blue = nuclear staining. [Taken
from Dahm et al, 2005, (125)].
1.4.1 Fibroblast origin
Fibroblasts are believed to arise from three distinct cellular origins: primary
mesenchyme, local epithelial-mesenchymal transition (EMT) or bone marrow derived
precursors.
It is widely accepted that the majority of fibroblasts originate from primary
mesenchymal cells and that upon the appropriate stimulation these fibroblasts can
proliferate to generate new fibroblasts (126). Local EMT is a central mechanism for
diversifying cells in the formation of complex tissues (figure 1.11) (127). Fibroblasts
can be derived by this process in adult tissue following epithelial stress such as
inflammation or tissue injury. Essentially EMT disaggregates epithelial cells and
reshapes epithelia for movement. The epithelium loses polarity, adherens junctions,
tight junctions, desmosomes and cytokeratin intermediate filaments. They also
rearrange their F-actin stress fibres producing filopodia and lamellopodia (127). A
combination of cytokines associated with digestion of the basement membrane is
believed to instigate EMT, as well as MMPs (128) and TGF-β (129). However, the
Chapter One Introduction 35
order of importance of the cytokines involved during inflammation is still unclear as
many are present in significant amounts at the site. EMT also contributes to the
growing premise that fibroblasts are not a homogeneous population and are a much
more active and heterogeneous cell population than first appreciated (130-132).
Generation of fibroblasts has also been reported from precursor cells called fibrocytes.
These cells represent ~0.05% of circulating blood cells that are believed to arise from
CD14+ peripheral blood monocytes (133). They express both haematopoietic and
stromal cell markers and are thought to differentiate into fibroblasts at inflammatory
or wound sites (134,135). All three of these processes appear to contribute to the
pathological accumulation of fibroblasts (126,127,136,137).
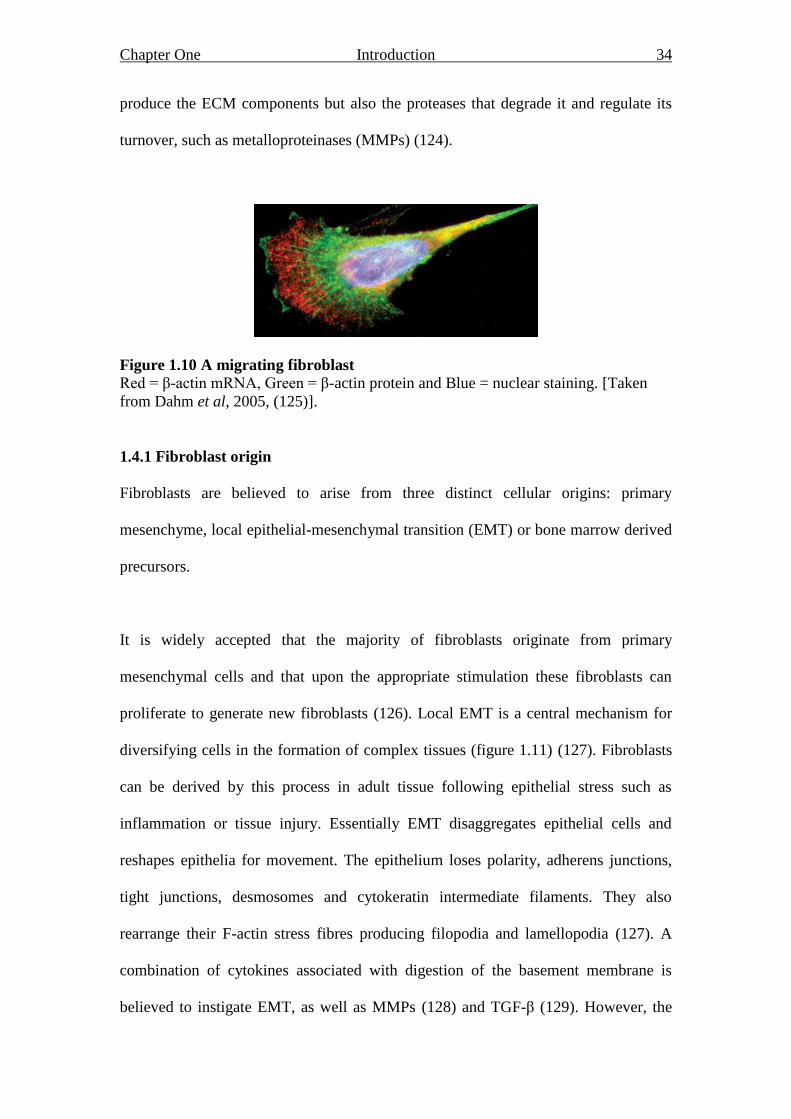
Figure 1.11 The cellular variation arising from EMT
Epithelia undergo EMT to form the cells of connective tissue, including astrocytes,
adipocytes chondrocytes, osteoblasts, muscle cells, and fibroblasts. These processes
are regulated by morphogenic cues and a variety of transcription factors. [Adapted
from Kalluri et al, 2003, (138)]
1.4.2 Identifying fibroblasts
Research into fibroblasts has lagged behind that of other cell types, partly due to their
phenotypic and functional heterogeneity but also their plasticity in differentiation
capacity (section 1.4.3). Moreover, a lack of selective markers for isolating and
Chapter One Introduction 36
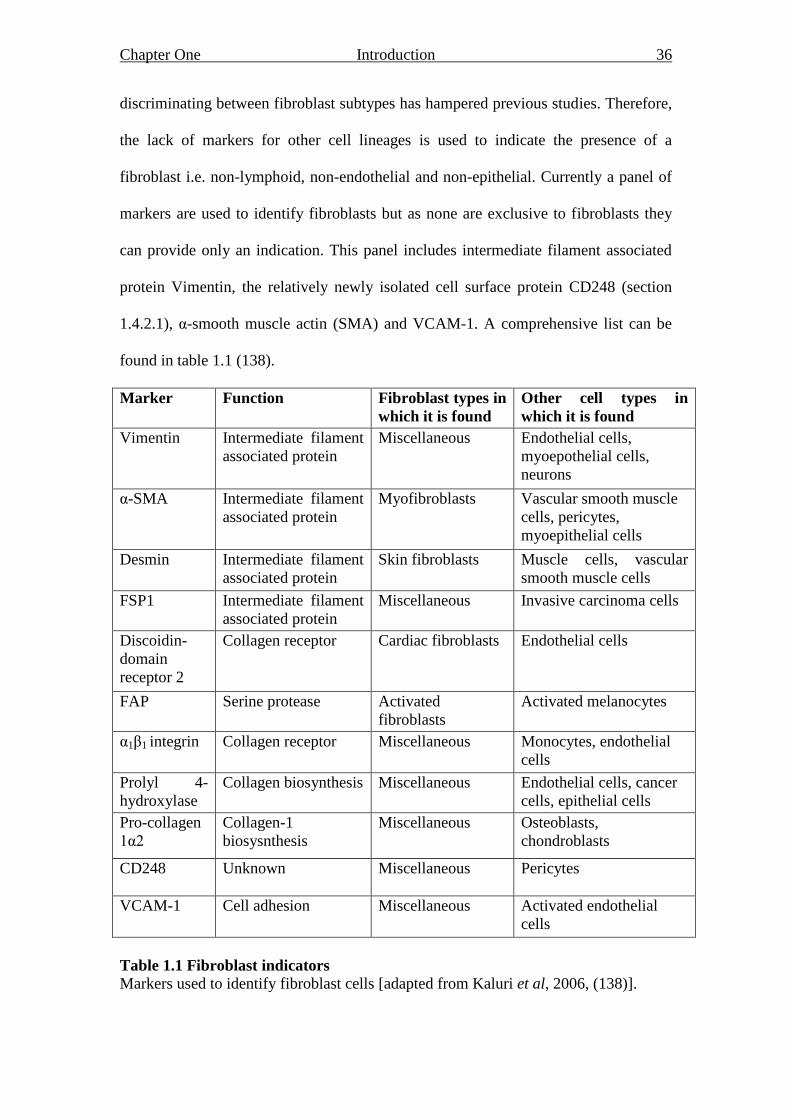
discriminating between fibroblast subtypes has hampered previous studies. Therefore,
the lack of markers for other cell lineages is used to indicate the presence of a
fibroblast i.e. non-lymphoid, non-endothelial and non-epithelial. Currently a panel of
markers are used to identify fibroblasts but as none are exclusive to fibroblasts they
can provide only an indication. This panel includes intermediate filament associated
protein Vimentin, the relatively newly isolated cell surface protein CD248 (section
1.4.2.1), α-smooth muscle actin (SMA) and VCAM-1. A comprehensive list can be
found in table 1.1 (138).
Marker Function Fibroblast types in
which it is found
Other cell types in
which it is found
Vimentin Intermediate filament
associated protein
Miscellaneous Endothelial cells,
myoepothelial cells,
neurons
α-SMA Intermediate filament
associated protein
Myofibroblasts Vascular smooth muscle
cells, pericytes,
myoepithelial cells
Desmin Intermediate filament
associated protein
Skin fibroblasts Muscle cells, vascular
smooth muscle cells
FSP1 Intermediate filament
associated protein
Miscellaneous Invasive carcinoma cells
Discoidin-
domain
receptor 2
Collagen receptor Cardiac fibroblasts Endothelial cells
FAP Serine protease Activated
fibroblasts
Activated melanocytes
α1β1 integrin Collagen receptor Miscellaneous Monocytes, endothelial
cells
Prolyl 4-
hydroxylase
Collagen biosynthesis Miscellaneous Endothelial cells, cancer
cells, epithelial cells
Pro-collagen
1α2
Collagen-1
biosysnthesis
Miscellaneous Osteoblasts,
chondroblasts
CD248
Unknown Miscellaneous Pericytes
VCAM-1 Cell adhesion Miscellaneous Activated endothelial
cells
Table 1.1 Fibroblast indicators
Markers used to identify fibroblast cells [adapted from Kaluri et al, 2006, (138)].
Chapter One Introduction 37
1.4.2.1 CD248
CD248, also known as endosialin or tumour endothelial marker-1 (TEM-1) has been
described as a marker of interstitial fibroblasts in human (139) and mouse (140)
tissues. It was identified after screening for monoclonal antibodies (mAbs) that
recognise proteins with a fibroblast-restricted distribution. CD248 is found in its
immature form within the Golgi network, it is then modified by approximately 95kDa
of highly sialylated O-linked oligosaccharides to form the 175kDa mature protein
(139). In addition, CD248 is expressed on a subset of pericytes, a relatively
undifferentiated cell associated with the walls of small blood vessels (141).
Expression of CD248 on pericytes as well as interstitial fibroblasts, suggests that they
may have been recruited from a stromal fibroblast population or that they are
undergoing fibroblast differentiation (139).
CD248 is part of a family of molecules implicated in tissue remodelling and repair,
including CD93 and CD141 (142,143). It has been demonstrated to be involved in
development, showing high expression in the embryo which decreases postnatally
(140,144). Although this pattern of expression has been observed in many tissues,
variations in expression were noted between different lymphoid tissues, suggesting
site specific expression (140,145). Interestingly, a role for CD248 in remodelling has
been suggested. When challenging a mouse with Salmonella infection, induced
splenomegaly occurs, which is associated with complete remodelling of the splenic
architecture. Upon remodelling of the spleen CD248 expression is significantly
increased which then decreases upon resolution of the infection (140). These findings
suggest that populations of CD248 expressing fibroblasts are involved in embryonic
development and the remodelling of tissues in the adult. Loss of CD248 expression
Chapter One Introduction 38
due to siRNA-mediated silencing showed a decrease in fibroblast proliferation and
migration (146). Studies in the CD248 KO mouse confirmed these effects on
migration and proliferation as tumour growth, invasiveness and metastasis was
reduced in abdominal sites (147). However normal tumour growth was seen in
tumours implanted in subcutaneous sites, again indicating site specific expression. In
addition, CD248 expression has been observed on mesenchymal stromal cells (MSCs)
(section 1.4.4.3) and it has been postulated that CD248 can be used as a marker for
MSCs (146,148).
1.4.3 Fibroblast heterogeneity
The difficulty of finding specific fibroblast markers is further complicated as
fibroblasts isolated from different anatomical sites exhibit different functional
properties, such as altered migratory capacity, ECM production, degradation and
contractility (149). Previous work in our group, identified two groups of human
fibroblasts based on their gene and protein expression. These were termed typical
(peripheral) and atypical (lymphoid) fibroblasts (figure 1.12) (150). It was shown that
upon stimulation with inflammatory mediators such as TNFα, IL-4 and IFNγ the gene
expression of the typical fibroblast could be modified such that they adopt features of
atypical fibroblasts. This finding strongly suggests that inflammation can, at least
transiently, alter fibroblast gene expression profiles (150).
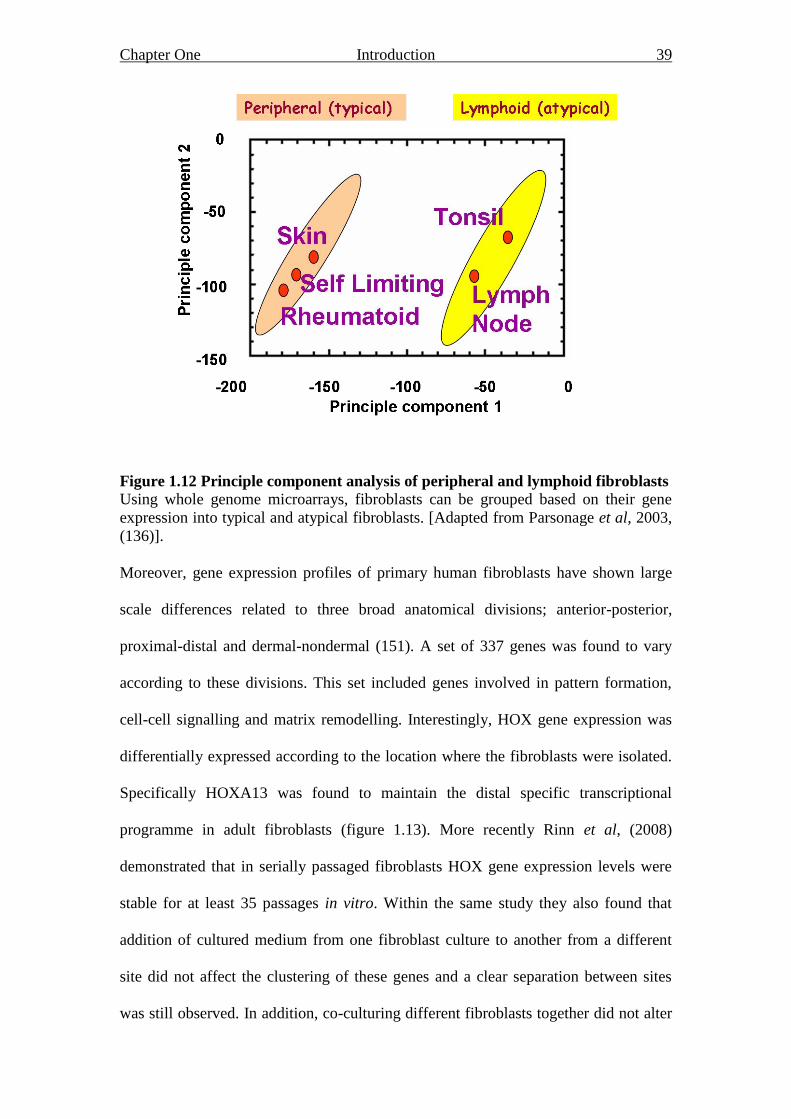
Chapter One Introduction 39
Figure 1.12 Principle component analysis of peripheral and lymphoid fibroblasts
Using whole genome microarrays, fibroblasts can be grouped based on their gene
expression into typical and atypical fibroblasts. [Adapted from Parsonage et al, 2003,
(136)].
Moreover, gene expression profiles of primary human fibroblasts have shown large
scale differences related to three broad anatomical divisions; anterior-posterior,
proximal-distal and dermal-nondermal (151). A set of 337 genes was found to vary
according to these divisions. This set included genes involved in pattern formation,
cell-cell signalling and matrix remodelling. Interestingly, HOX gene expression was
differentially expressed according to the location where the fibroblasts were isolated.
Specifically HOXA13 was found to maintain the distal specific transcriptional
programme in adult fibroblasts (figure 1.13). More recently Rinn et al, (2008)
demonstrated that in serially passaged fibroblasts HOX gene expression levels were
stable for at least 35 passages in vitro. Within the same study they also found that
addition of cultured medium from one fibroblast culture to another from a different
site did not affect the clustering of these genes and a clear separation between sites
was still observed. In addition, co-culturing different fibroblasts together did not alter
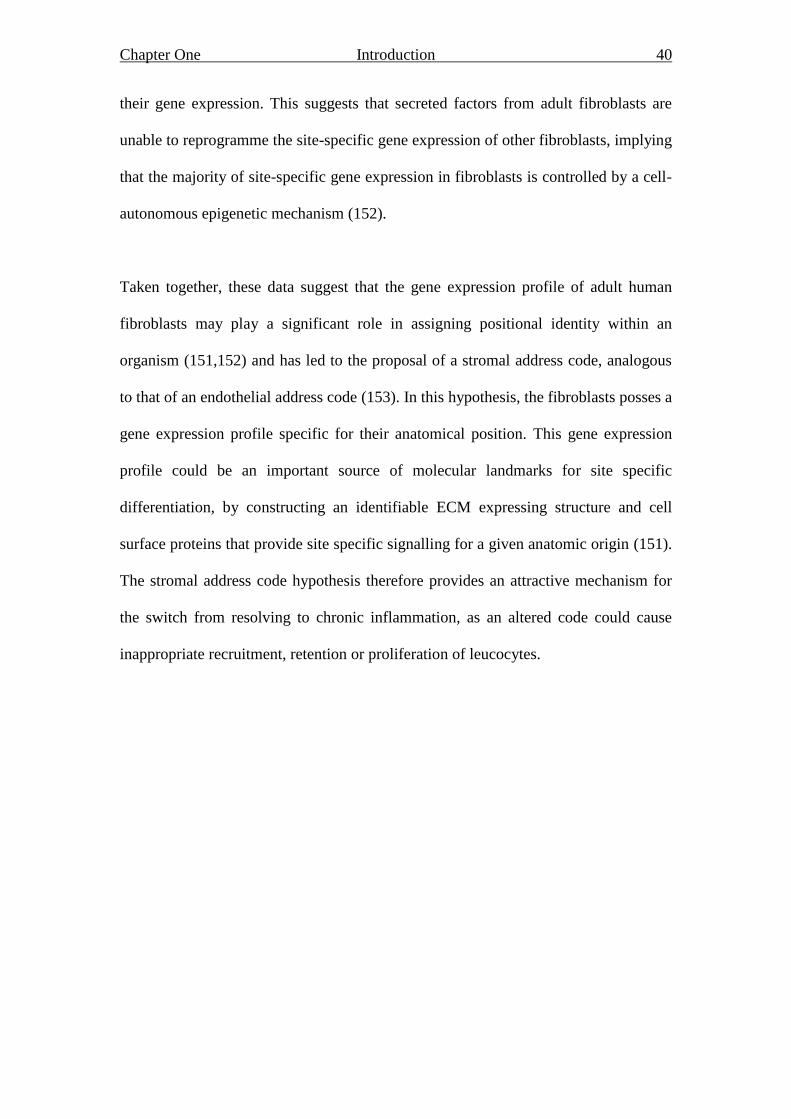
Chapter One Introduction 40
their gene expression. This suggests that secreted factors from adult fibroblasts are
unable to reprogramme the site-specific gene expression of other fibroblasts, implying
that the majority of site-specific gene expression in fibroblasts is controlled by a cell-
autonomous epigenetic mechanism (152).
Taken together, these data suggest that the gene expression profile of adult human
fibroblasts may play a significant role in assigning positional identity within an
organism (151,152) and has led to the proposal of a stromal address code, analogous
to that of an endothelial address code (153). In this hypothesis, the fibroblasts posses a
gene expression profile specific for their anatomical position. This gene expression
profile could be an important source of molecular landmarks for site specific
differentiation, by constructing an identifiable ECM expressing structure and cell
surface proteins that provide site specific signalling for a given anatomic origin (151).
The stromal address code hypothesis therefore provides an attractive mechanism for
the switch from resolving to chronic inflammation, as an altered code could cause
inappropriate recruitment, retention or proliferation of leucocytes.
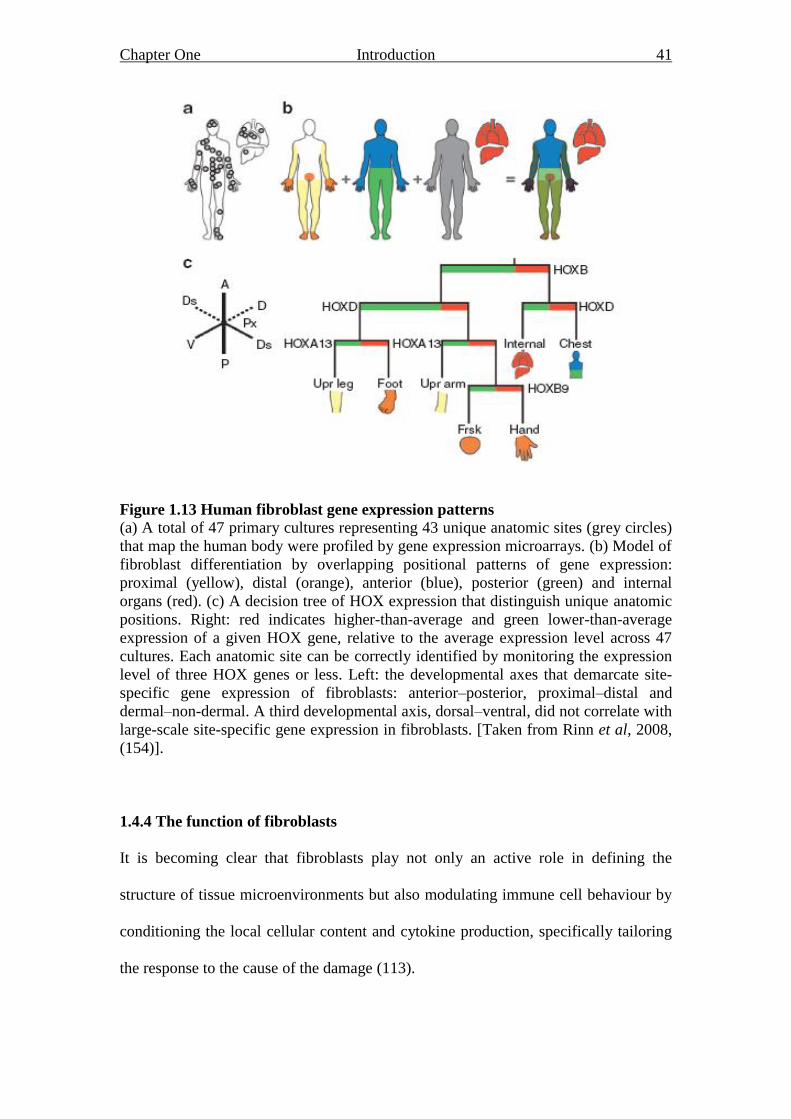
Chapter One Introduction 41
Figure 1.13 Human fibroblast gene expression patterns
(a) A total of 47 primary cultures representing 43 unique anatomic sites (grey circles)
that map the human body were profiled by gene expression microarrays. (b) Model of
fibroblast differentiation by overlapping positional patterns of gene expression:
proximal (yellow), distal (orange), anterior (blue), posterior (green) and internal
organs (red). (c) A decision tree of HOX expression that distinguish unique anatomic
positions. Right: red indicates higher-than-average and green lower-than-average
expression of a given HOX gene, relative to the average expression level across 47
cultures. Each anatomic site can be correctly identified by monitoring the expression
level of three HOX genes or less. Left: the developmental axes that demarcate site-
specific gene expression of fibroblasts: anterior–posterior, proximal–distal and
dermal–non-dermal. A third developmental axis, dorsal–ventral, did not correlate with
large-scale site-specific gene expression in fibroblasts. [Taken from Rinn et al, 2008,
(154)].
1.4.4 The function of fibroblasts
It is becoming clear that fibroblasts play not only an active role in defining the
structure of tissue microenvironments but also modulating immune cell behaviour by
conditioning the local cellular content and cytokine production, specifically tailoring
the response to the cause of the damage (113).
Chapter One Introduction 42
Fibroblast activation leads to the production of appropriate cytokines, chemokines and
prostanoids such as PGE2 (138). Fibroblasts can also regulate the behaviour of
haematopoietic cells present in damaged tissue, CD40-CD40 ligand interaction lead to
activation of the NF-κB family of receptors, causing fibroblasts to synthesise high
levels of IL-6, IL-8, cyclooxygenase-2 and the polysaccharide hyaluronan (155). This
mechanism is analagous to the cross talk that occurs between lymphocytes and APCs,
suggesting a role for fibroblast and leucocyte crosstalk during an immune response.
Therefore as fibroblasts are relatively long lived it is important that their activation is
tightly regulated (156-158). Fibroblasts have been shown to contribute to the
pathology of many diseases, either directly for example by overproduction of matrix
components during fibrosis and/or indirectly by influencing the behaviour of
neighbouring cell types (159-161).
1.4.4.1 The role of fibroblasts in rheumatoid arthritis
Rheumatoid arthritis is the most common chronic inflammatory disease affecting
approximately 1% of the population worldwide (162). The main feature of RA is
persistent joint inflammation. The disease is characterised by inflammation and
hyperplasia of the synovial membranes of diarthrodial joints in a symmetrical fashion
(163). This causes pain and joint failure and can eventually lead to disfiguration and
disability (164,165). Over 20 years ago fibroblasts isolated from diseased tissues were
shown to be phenotypically different from those taken from normal tissue.
Fassbender, (1983) described subpopulations of fibroblasts within the synovial
membrane which showed morphological and biological differences (166). In RA,
specifically, fibroblasts are thought to play a key role in the pathogenesis of the
disease, as synovial fibroblasts are not only different between healthy and RA patients
Chapter One Introduction 43
but also between the layers of the rheumatoid synovium (155). Fibroblasts from the
lining layer have features of cell activation and are believed to result in aggressive,
invasive behaviour. This has been demonstrated in vivo using co-implantation of
fibroblasts and cartilage under the kidney capsule. Fibroblasts from RA synovium
invade cartilage when implanted together whereas fibroblasts from osteoarthritis or
healthy patients do not (167). In addition, these fibroblasts also appear to differ
morphologically, with a more rounded shape, a larger pale nucleus and prominent
nucleoli. Differences in shape were further reported in RA patients, where a
reorganisation of the actin cytoskeleton and disregulation of ECM adhesion was
observed (155). As well as the phenotypic changes, synovial fibroblasts from RA
patients have also been shown functionally to affect the accumulation and survival of
lymphocytes in the joint by increasing survival and recruitment of T cells (109). The
properties of these fibroblasts suggest a transformed cell phenotype and lead to the
hypothesis that the rheumatoid synovium is a locally invasive tumour (168,169).
1.4.4.2 The role of fibroblasts in cancer
The microenvironment surrounding malignant cells is named the tumour stroma, this
consists of non-malignant cells, ECM and growth factors embedded in the ECM
(170). Fibroblasts are a component of the tumour stroma and have also been shown to
have a role in cancer at all stages including progression (171), growth (172) and
metastasis (173). Specifically, at the site of a tumour the surrounding fibroblasts
remain continuously activated and have a modified phenotype. It is believed that they
may facilitate angiogenesis and cancer progression, such fibroblasts have been named
cancer-associated fibroblasts (CAFs) (138). In breast carcinomas, approximately 80%
of stromal fibroblasts are thought to have this activated phenotype, expressing α-SMA
Chapter One Introduction 44
and have been termed myofibroblasts. Myofibroblasts and CAFs produce increased
amounts of MMPs, affecting ECM turnover and altering the ECM composition (174).
A source of CAFs may be EMT (section 1.4.1) from cancer cells and also normal
epithelial cells, this process has been recognised as an important factor in cancer
progression and may also modulate the progression by providing fibroblasts-like cells
with an altered genome (175). The stromal elements of a tumour have, in recent
studies, shown significant prognostic value. The stromal gene signature found could
be used alone or in combination with existing techniques to improve molecular
classification and outcome prediction, such as patients who would respond better to
aggressive treatment (176).
1.4.4.3 Fibroblasts and their relationship to MSC
Mesenchymal stem cells (MSCs) are typically found in the bone marrow but can also
be expanded from a wide variety of adult and fetal tissues (177,178). MSCs are
multipotent stem cells that can differentiate into a variety of cell types including
osteoblasts, chondrocytes and adipocytes (179). In recent literature, it is important to
note that the terms mesenchymal stem cell and mesenchymal stromal cell have been
used interchangeably. Whether they describe an identical cell type remains
controversial. Of relevance to this thesis, it has been found that MSCs can suppress
virtually all immune cell responses. For example they can suppress T cell
proliferation, induce T cell anergy and apoptosis and modulate cytokine production
through the production of soluble factors (180). A role for IFN-γ in the
immunosuppression mediated by stromal cells has been suggested. IFN-γ induces
indoleamine 2,3-dioxygenase (IDO) which accelerates tryptophan degradation,
thereby suppressing T cells (181). However, to distinguish fibroblasts from MSCs is
Chapter One Introduction 45
difficult as cell surface antigens used to define MSCs are also expressed on fibroblasts
(182). Fibroblasts have also been found to have the potential to differentiate into other
cell types such as adipocytes, osteocytes and chondrocytes and effect proliferation and
survival of lymphocytes (120). Despite this it may be that all stromal or fibroblast-like
cells have immunosuppressive potential. A study by Jones et al (2007) supports this
theory as they conclude that immunosuppressive effect is a fundamental characteristic
of all stroma (183).
MSCs have been described as a heterogeneous population and it is quite plausible that
fibroblasts such as those described previously by our group and Rinn et al, 2008 may
be termed mesenchymal stromal cells (183).
1.5 Hypothesis
Previous work by our group has proposed that in addition to the well described
endothelial area code fibroblasts help define a stromal postcode that regulates
leucocyte survival, retention, proliferation and differentiation within tissues (136).
Inappropriate expression of all or parts of the code may be involved in the switch
from resolving to persistent inflammation.
The hypothesis is that fibroblasts derived from different murine lymphoid sites have
site specific gene and protein expression and that this results in functional differences
during interactions with other cell types and products.
Chapter One Introduction 46
1.6 Aims of thesis
The main aims of this thesis were to:
a) identify whether mouse fibroblasts from lymphoid and peripheral organs
have site specific gene expression as reported in the human studies (151)
and if so what genes are site defining.
b) determine whether LTα stimulation affects this pattern of gene
expression, for example inducing a more lymphoid like profile in
peripheral fibroblasts.
c) consider the functional relevance of these differing fibroblast gene
expression profiles in the mouse by using in vivo models of organ grafting
under the kidney capsule and assessing leucocyte accumulation in
differing fibroblast microenvironments.

Chapter Two Materials and Methods 47
Chapter Two
Materials and Methods
Chapter Two Materials and Methods 48
CHAPTER TWO
Materials and Methods
2.1 Media, solutions and other reagents
All reagents were purchased from Sigma Aldrich (Poole, UK) unless otherwise stated.
2.1.1 Complete fibroblast medium Dulbecco‟s Modified Eagles Medium
10% Fetal Calf Serum
2mM glutamine
100U/ml penicillin
100g/ml streptomycin
2.1.2 Washing medium RPMI 1640
10% Fetal Calf Serum
2.1.3 Phosphate buffered saline (PBS) Dissolve 1 tablet in 100ml distilled water
-autoclave at 115°C for 10 minutes.
2.1.4 Tissue digestion buffer RPMI 1640
10% Fetal Calf Serum
1mg/ml Collagenase/Dispase (Roche
Diagnostics, Germany)
20µg/ml DNase
2.1.5 Red blood cell lysis buffer (pH 7.2) 1 litre dH20
8.29g NH4Cl (0.17M)
1g KHCO3 (1µM)
37.2mg EDTA (1mM)
2.1.6 10x Annexin V staining buffer 100ml dH20
0.1M HEPES
1.4M NaCl
25mM CaCl2
2.1.7 Freezing medium Fetal Calf Serum
10% Dimethyl sulfoxide
2.1.8 TBE buffer 89nM Tris HCL
89nM Boric Acid
3mM EDTA
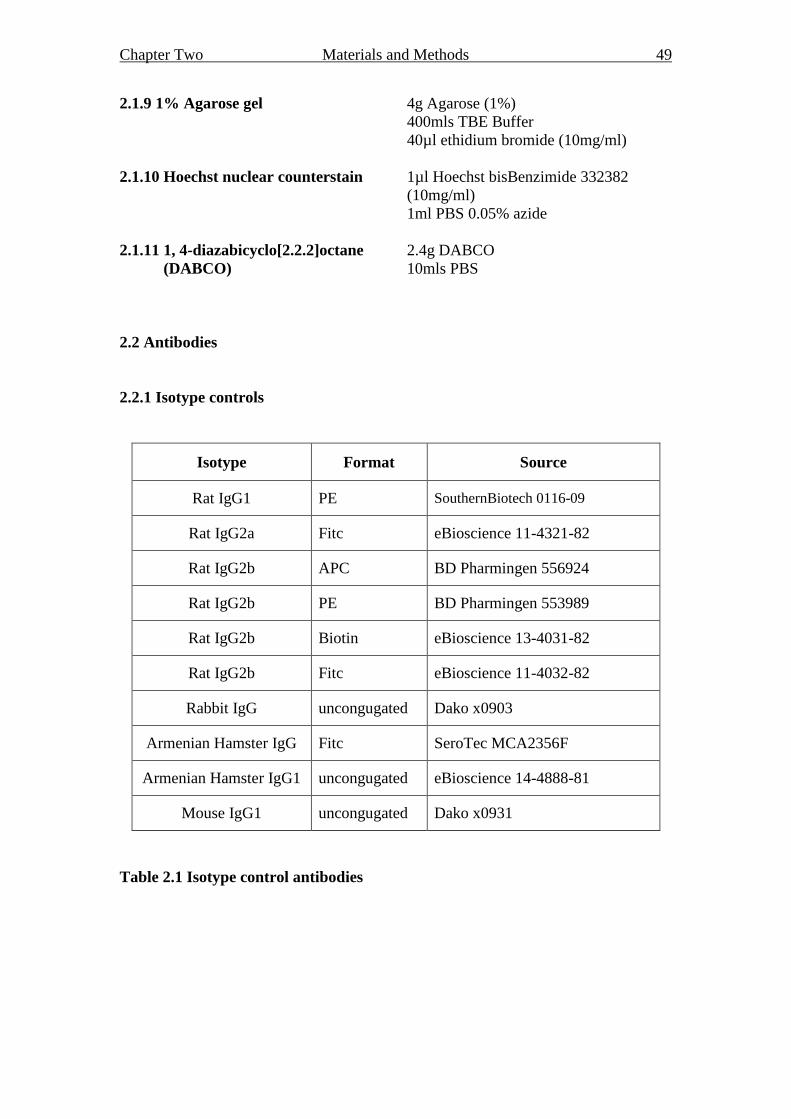
Chapter Two Materials and Methods 49
2.1.9 1% Agarose gel 4g Agarose (1%)
400mls TBE Buffer
40µl ethidium bromide (10mg/ml)
2.1.10 Hoechst nuclear counterstain 1µl Hoechst bisBenzimide 332382
(10mg/ml)
1ml PBS 0.05% azide
2.1.11 1, 4-diazabicyclo[2.2.2]octane 2.4g DABCO
(DABCO) 10mls PBS
2.2 Antibodies
2.2.1 Isotype controls
Isotype Format Source
Rat IgG1 PE SouthernBiotech 0116-09
Rat IgG2a Fitc eBioscience 11-4321-82
Rat IgG2b APC BD Pharmingen 556924
Rat IgG2b PE BD Pharmingen 553989
Rat IgG2b Biotin eBioscience 13-4031-82
Rat IgG2b Fitc eBioscience 11-4032-82
Rabbit IgG uncongugated Dako x0903
Armenian Hamster IgG Fitc SeroTec MCA2356F
Armenian Hamster IgG1 uncongugated eBioscience 14-4888-81
Mouse IgG1 uncongugated Dako x0931
Table 2.1 Isotype control antibodies
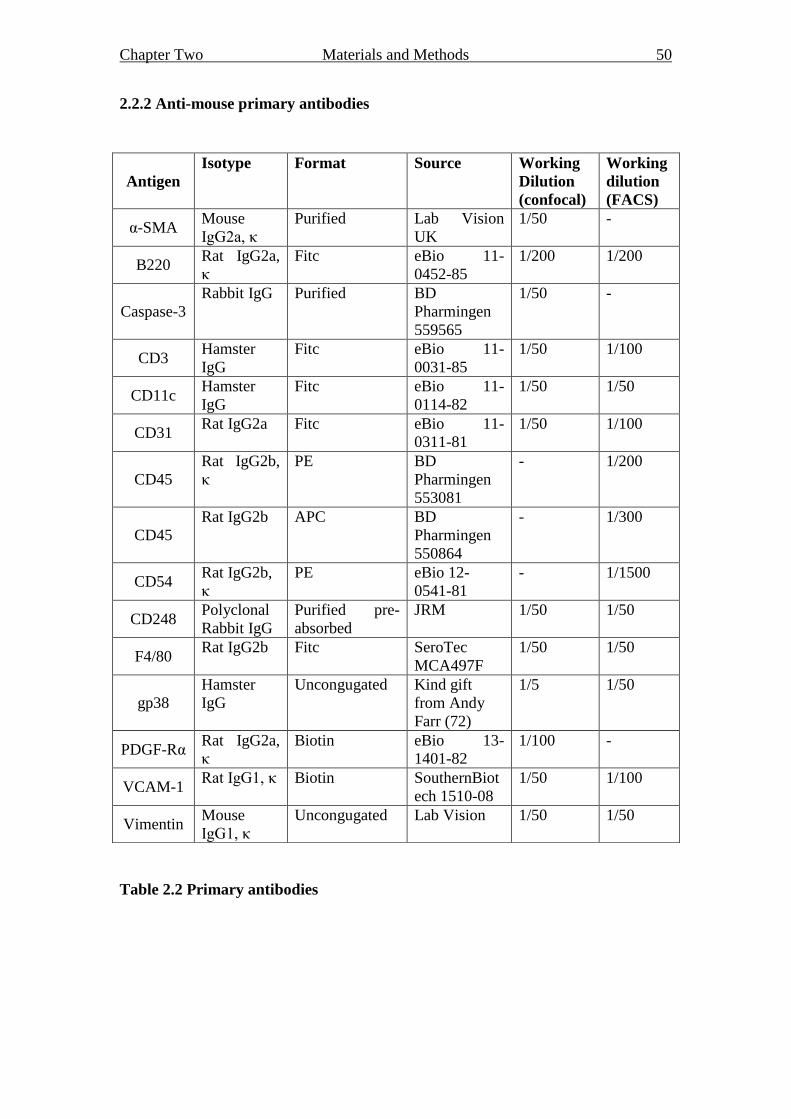
Chapter Two Materials and Methods 50
2.2.2 Anti-mouse primary antibodies
Table 2.2 Primary antibodies
Antigen
Isotype Format Source Working
Dilution
(confocal)
Working
dilution
(FACS)
α-SMA Mouse
IgG2a, κ
Purified Lab Vision
UK
1/50 -
B220 Rat IgG2a,
κ
Fitc eBio 11-
0452-85
1/200 1/200
Caspase-3
Rabbit IgG Purified BD
Pharmingen
559565
1/50 -
CD3 Hamster
IgG
Fitc eBio 11-
0031-85
1/50 1/100
CD11c Hamster
IgG
Fitc eBio 11-
0114-82
1/50 1/50
CD31 Rat IgG2a Fitc eBio 11-
0311-81
1/50 1/100
CD45
Rat IgG2b,
κ
PE BD
Pharmingen
553081
- 1/200
CD45
Rat IgG2b APC BD
Pharmingen
550864
- 1/300
CD54 Rat IgG2b,
κ
PE eBio 12-
0541-81
- 1/1500
CD248 Polyclonal
Rabbit IgG
Purified pre-
absorbed
JRM 1/50 1/50
F4/80 Rat IgG2b Fitc SeroTec
MCA497F
1/50 1/50
gp38
Hamster
IgG
Uncongugated Kind gift
from Andy
Farr (72)
1/5 1/50
PDGF-Rα Rat IgG2a,
κ
Biotin eBio 13-
1401-82
1/100 -
VCAM-1 Rat IgG1, κ Biotin SouthernBiot
ech 1510-08
1/50 1/100
Vimentin Mouse
IgG1, κ
Uncongugated Lab Vision 1/50 1/50
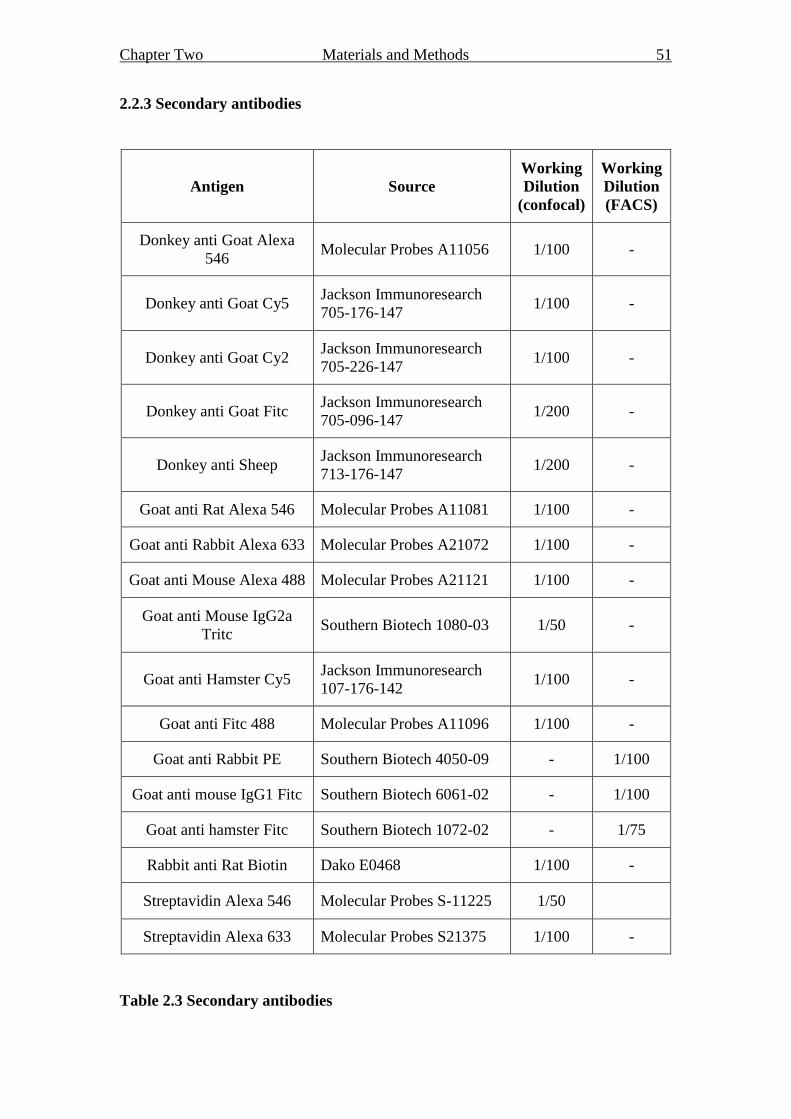
Chapter Two Materials and Methods 51
2.2.3 Secondary antibodies
Antigen Source
Working
Dilution
(confocal)
Working
Dilution
(FACS)
Donkey anti Goat Alexa
546 Molecular Probes A11056 1/100 -
Donkey anti Goat Cy5 Jackson Immunoresearch
705-176-147 1/100 -
Donkey anti Goat Cy2 Jackson Immunoresearch
705-226-147 1/100 -
Donkey anti Goat Fitc Jackson Immunoresearch
705-096-147 1/200 -
Donkey anti Sheep Jackson Immunoresearch
713-176-147 1/200 -
Goat anti Rat Alexa 546 Molecular Probes A11081 1/100 -
Goat anti Rabbit Alexa 633 Molecular Probes A21072 1/100 -
Goat anti Mouse Alexa 488 Molecular Probes A21121 1/100 -
Goat anti Mouse IgG2a
Tritc Southern Biotech 1080-03 1/50 -
Goat anti Hamster Cy5 Jackson Immunoresearch
107-176-142 1/100 -
Goat anti Fitc 488 Molecular Probes A11096 1/100 -
Goat anti Rabbit PE Southern Biotech 4050-09 - 1/100
Goat anti mouse IgG1 Fitc Southern Biotech 6061-02 - 1/100
Goat anti hamster Fitc Southern Biotech 1072-02 - 1/75
Rabbit anti Rat Biotin Dako E0468 1/100 -
Streptavidin Alexa 546 Molecular Probes S-11225 1/50
Streptavidin Alexa 633 Molecular Probes S21375 1/100 -
Table 2.3 Secondary antibodies
Chapter Two Materials and Methods 52
2.3 Mice
All experiments were performed in accordance with UK laws and with the approval of
the University of Birmingham ethics committee. All mice were bred and maintained
in the Biomedical Services Unit (BMSU) at the University of Birmingham.
2.4 Cell culture
Required tissues were isolated from mice by dissection under sterile conditions;
routinely spleen, liver, thymus, skin, lung and inguinal, axillary and cervical lymph
nodes were taken. The tissues were stored in 2mls of RPMI/10%FCS on ice. These
were then either non-enzymatically (section 2.4.1.) or enzymatically (section 2.4.2)
digested for culture. All cells were cultured in complete fibroblast medium (section
2.1.1) and maintained at 37°C, 5% CO2, with media changed every 3-4 days.
2.4.1 Non-enzymatic digestion
Tissues were mashed directly on a sterile 50µm-nylon filter gauze in a Petri dish with
approximately 200μl of complete fibroblast medium (section 2.1.1) using a 5ml
syringe plunger. The gauze was then washed with a further 2ml complete fibroblast
medium and the cell suspension transferred to a 6 or 24 well plate; 6 well plates were
routinely used with 24 well plates used for those organs where a small cell suspension
was obtained e.g. lymph nodes. Complete fibroblast medium was then added to the
well to a total volume of 4mls per well in a 6 well plate and 2mls per well in a 24 well
plate. Cell cultures were washed in PBS (section 2.1.3) after 7 days to remove cell
debris and all non-adherent cells.
Chapter Two Materials and Methods 53
2.4.2 Enzymatic digestion
Bone marrow flushes were collected, centrifuged at 300g for 5 minutes at 4°C and
resuspended in 2mls tissue digestion buffer (TDB) (section 2.1.4). All solid organs
were cut into small pieces and incubated at 37°C in 2ml TDB for a maximum of 40
minutes, resuspending the cells every 5 minutes by pipetting. The quality of the cell
suspension was checked every 10 minutes microscopically. Once a single cell
suspension was obtained 1ml of washing medium (section 2.1.2) was added and the
cells centrifuged at 300g for 4 minutes at 4°C. Cells were resuspended in 1ml
complete fibroblast medium (section 2.1.1) and transferred into 6 or 24 well plates as
in section 2.4.1. Cell cultures were washed in PBS (section 2.1.3) after 7 days to
remove cell debris and all non-adherent cells.
2.4.3 Passaging
Once 90-100% confluence was reached cultures were washed with PBS and passaged
using a 2X trypsin-ethylene-diamine-tetra-acetic acid (EDTA) solution (Sigma). Once
cells had detached, as assessed microscopically, fresh complete fibroblast medium
(section 2.1.1) was added to neutralise the trypsin and the resulting cell suspension
centrifuged at 300g for 4 minutes at 4C. The cells were then either resuspended in
33% conditioned fibroblast medium diluted with fresh complete fibroblast medium
for continued culture or in 1 ml of culture medium ready for long term storage
(section 2.4.4).
2.4.4 Freezing of cell cultures for long term storage
Cells resuspended in 1ml of culture medium as described in section 2.4.3 were
counted using trypan blue (Sigma) and then centrifuged at 300g for 4 minutes at 4C.
Chapter Two Materials and Methods 54
Cells were resuspended in freezing medium (section 2.1.7) and stored at -80°C for 24
hours after which they were then transferred to liquid N2 for long term storage. The
number of cells frozen was then used to compare with the number of live cells
obtained post-recovery from storage as described in section 2.4.5.
2.4.5 Cell recovery from long term storage
Cells were defrosted at 37C, reconstituted in 12ml of complete fibroblast medium
(section 2.1.1) and centrifuged at 300g for 4 minutes at 4C. The cell pellet was then
resuspended in 1ml complete fibroblast medium and the number of live cells were
counted using trypan blue. The number of live cells being brought up per vial was
recorded for comparison with number frozen down. The cells were then maintained at
37C in a 5% CO2 atmosphere.
2.4.6 Cell imaging
During their time in culture, cells were imaged in 6 well plates at x10 magnification
using the Axiover 200 microscope (Zeiss, Germany). Images were processed using
capture (AIC) software (Digital Pixel, UK).
2.4.7 Cell sorting
Cells were sorted into two populations based on their CD45 expression using the
MoFlow Cell Sorter (Coulter). Briefly, cells were lifted from the plate using a non-
enzymatic cell dissociation buffer (Gibco). The cells were centrifuged at 300g at 4°C
for 8 minutes and resuspended in tissue digestion buffer (section 2.1.4) for 10 minutes
at 37°C to negate cell clumping. The cells were washed, pelleted as above, re-
suspended in 500µl RPMI 10% FCS containing anti-mouse CD16/32 (1:50) to block
Chapter Two Materials and Methods 55
Fc receptors on the cells and incubated on ice for 20 minutes. The cells were then
centrifuged at 300g for 8 minutes at 4°C and resuspended with 220µl of RPMI
10%FCS. Two 10µl aliquots of cells were then added to 190µl of RPMI 10%FCS for
the unstained and irrelevant controls, with the remaining to be stained with the
antibody of interest. Antibodies (section 2.2.1 and 2.2.2) were added to the respective
tubes and incubated on ice for 30 minutes after which, the cells were washed with
RPMI 10% FCS and pelleted before being filtered through a 50µM filter to remove
any clumped cells or debris. The cells were then sorted based on their CD45
expression using the MoFlow Cell Sorter (Coulter). Sorted cells were resuspended in
complete fibroblast medium (section 2.1.1) and transferred into 6 or 24 well plates for
culture.
2.5 RNA extraction
Using the RNeasy mini kit (QIAgen, 74965) RNA extraction was performed as per
the manufactures instructions. Briefly, pelleted, trypsinised cells (section 2.4.3) were
lysed by 600µl of a highly denaturing guanidine-thiocynate-containing buffer,
containing 1% β-mercaptoethanol, which immediately inactivates RNases to ensure
purification of intact RNA. The lysate was then homogenised using a QIAshredder
spin column (QIAgen, 79654). Genomic DNA was removed from each sample using
the RNase-free DNase kit (QIAgen, 79254) according to the manufactures
instructions. Purified total RNA was eluted with 30µl of RNase-free water, the
concentration determined using a spectrophotometer (BioPhotometer, Eppendorf) and
stored at -80°C.
Chapter Two Materials and Methods 56
2.5.1 cDNA preparation
Complementary DNA (cDNA) was synthesised using the smart PCR cDNA synthesis
kit (BD Biosciences, K1052-1) as per the manufacturer‟s instructions. Briefly, 5µg of
total RNA was incubated with 3µg of oligo-dN6 to prime for cDNA synthesis for 10
minutes at 70C, after which the reaction was stopped by placing it on ice. Reverse
transcription (RT) was performed for 1 hr at 41°C with the enzyme deactivated by
incubating the mixture at 90°C for 10 minutes; using the following master mix;
1.25l H2O
6l 5X first strand buffer
3l 0.1M DTT
1.5l dNTP (10mM)
0.75l RNAse Inhibitor (RNAguard, Pharmacia, ~40 U/l)
1.5l M-MLV (Gibco) (1 l/g RNA, stock 200 U/l)
The cDNA was stored at 4C for up to a week and -20C for longer periods.
2.5.2 Polymerase chain reaction (PCR)
Using cDNA as the template (section 2.5.1), PCR was performed using ReddyMix
manufactured by ABIgene (AB-0575-LDb), along with primers for the gene of
interest. Reactions were carried out using a PCR Sprint Thermal Cycler (Hybaid
systems, Waltham, MA). The general programme used was: 92°C for 2 minutes, 30
cycles of 92°C for 15s, 65°C for 30s and 70°C for 45s. Then finally 72°C for 5
minutes. Cycle number and the annealing temperature were dependent on the primers
being used (table 2.4). The PCR products obtained were then analysed by running on
a 1% (w/v) agarose gel containing EtBr (section 2.1.9) in a TBE running buffer
(section 2.1.8). One microgram of one hundred base pair molecular weight markers
were also run on each gel (Roche Diagnostics, Germany). The DNA bands were
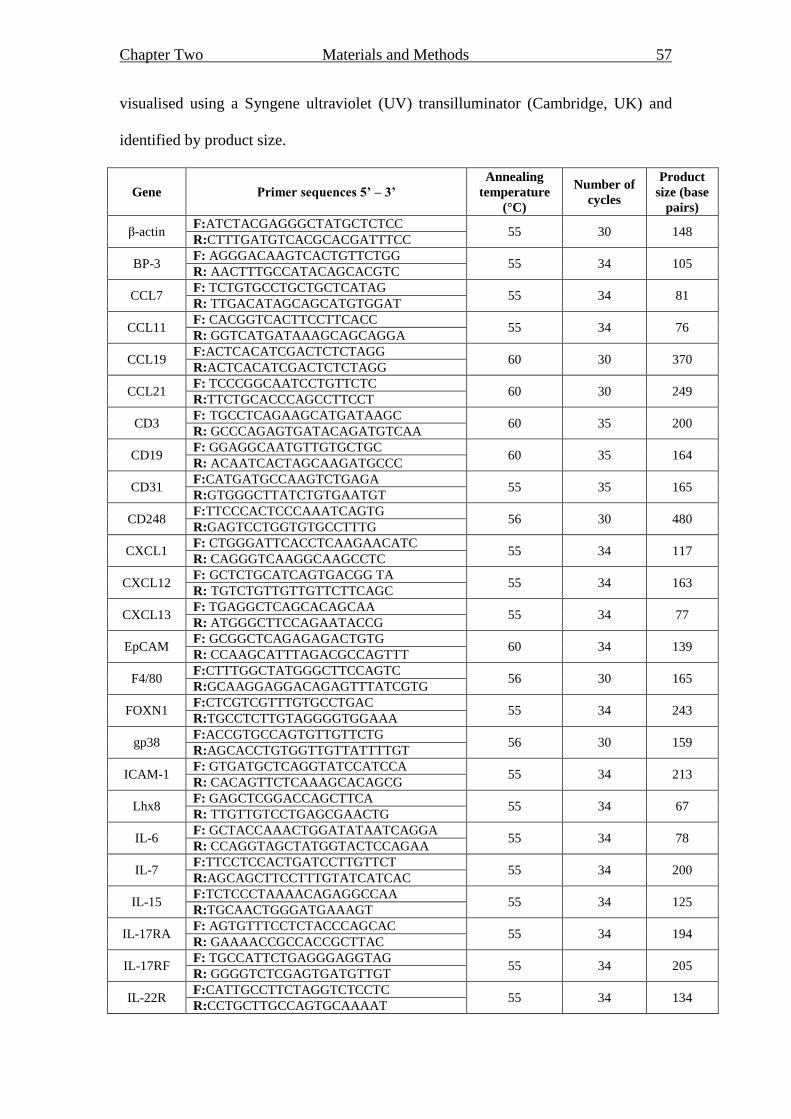
Chapter Two Materials and Methods 57
visualised using a Syngene ultraviolet (UV) transilluminator (Cambridge, UK) and
identified by product size.
Gene Primer sequences 5’ – 3’
Annealing
temperature
(°C)
Number of
cycles
Product
size (base
pairs)
β-actin F:ATCTACGAGGGCTATGCTCTCC
55 30 148 R:CTTTGATGTCACGCACGATTTCC
BP-3 F: AGGGACAAGTCACTGTTCTGG
55 34 105 R: AACTTTGCCATACAGCACGTC
CCL7 F: TCTGTGCCTGCTGCTCATAG
55 34 81 R: TTGACATAGCAGCATGTGGAT
CCL11 F: CACGGTCACTTCCTTCACC
55 34 76 R: GGTCATGATAAAGCAGCAGGA
CCL19 F:ACTCACATCGACTCTCTAGG
60 30 370 R:ACTCACATCGACTCTCTAGG
CCL21 F: TCCCGGCAATCCTGTTCTC
60 30 249 R:TTCTGCACCCAGCCTTCCT
CD3 F: TGCCTCAGAAGCATGATAAGC
60 35 200 R: GCCCAGAGTGATACAGATGTCAA
CD19 F: GGAGGCAATGTTGTGCTGC
60 35 164 R: ACAATCACTAGCAAGATGCCC
CD31 F:CATGATGCCAAGTCTGAGA
55 35 165 R:GTGGGCTTATCTGTGAATGT
CD248 F:TTCCCACTCCCAAATCAGTG
56 30 480 R:GAGTCCTGGTGTGCCTTTG
CXCL1 F: CTGGGATTCACCTCAAGAACATC
55 34 117 R: CAGGGTCAAGGCAAGCCTC
CXCL12 F: GCTCTGCATCAGTGACGG TA
55 34 163 R: TGTCTGTTGTTGTTCTTCAGC
CXCL13 F: TGAGGCTCAGCACAGCAA
55 34 77 R: ATGGGCTTCCAGAATACCG
EpCAM F: GCGGCTCAGAGAGACTGTG
60 34 139 R: CCAAGCATTTAGACGCCAGTTT
F4/80 F:CTTTGGCTATGGGCTTCCAGTC
56 30 165 R:GCAAGGAGGACAGAGTTTATCGTG
FOXN1 F:CTCGTCGTTTGTGCCTGAC
55 34 243 R:TGCCTCTTGTAGGGGTGGAAA
gp38 F:ACCGTGCCAGTGTTGTTCTG
56 30 159 R:AGCACCTGTGGTTGTTATTTTGT
ICAM-1 F: GTGATGCTCAGGTATCCATCCA
55 34 213 R: CACAGTTCTCAAAGCACAGCG
Lhx8 F: GAGCTCGGACCAGCTTCA
55 34 67 R: TTGTTGTCCTGAGCGAACTG
IL-6 F: GCTACCAAACTGGATATAATCAGGA
55 34 78 R: CCAGGTAGCTATGGTACTCCAGAA
IL-7 F:TTCCTCCACTGATCCTTGTTCT
55 34 200 R:AGCAGCTTCCTTTGTATCATCAC
IL-15 F:TCTCCCTAAAACAGAGGCCAA
55 34 125 R:TGCAACTGGGATGAAAGT
IL-17RA F: AGTGTTTCCTCTACCCAGCAC
55 34 194 R: GAAAACCGCCACCGCTTAC
IL-17RF F: TGCCATTCTGAGGGAGGTAG
55 34 205 R: GGGGTCTCGAGTGATGTTGT
IL-22R F:CATTGCCTTCTAGGTCTCCTC
55 34 134 R:CCTGCTTGCCAGTGCAAAAT
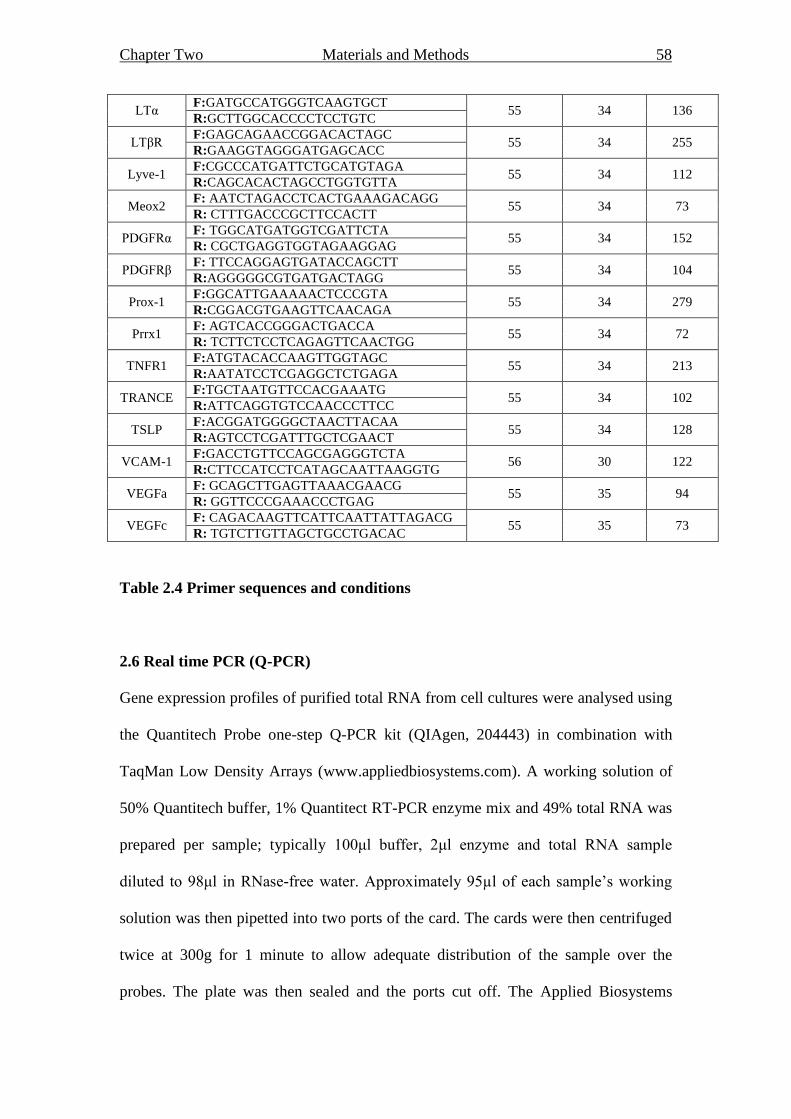
Chapter Two Materials and Methods 58
LTα F:GATGCCATGGGTCAAGTGCT
55 34 136 R:GCTTGGCACCCCTCCTGTC
LTβR F:GAGCAGAACCGGACACTAGC
55 34 255 R:GAAGGTAGGGATGAGCACC
Lyve-1 F:CGCCCATGATTCTGCATGTAGA
55 34 112 R:CAGCACACTAGCCTGGTGTTA
Meox2 F: AATCTAGACCTCACTGAAAGACAGG
55 34 73 R: CTTTGACCCGCTTCCACTT
PDGFRα F: TGGCATGATGGTCGATTCTA
55 34 152 R: CGCTGAGGTGGTAGAAGGAG
PDGFRβ F: TTCCAGGAGTGATACCAGCTT
55 34 104 R:AGGGGGCGTGATGACTAGG
Prox-1 F:GGCATTGAAAAACTCCCGTA
55 34 279 R:CGGACGTGAAGTTCAACAGA
Prrx1 F: AGTCACCGGGACTGACCA
55 34 72 R: TCTTCTCCTCAGAGTTCAACTGG
TNFR1 F:ATGTACACCAAGTTGGTAGC
55 34 213 R:AATATCCTCGAGGCTCTGAGA
TRANCE F:TGCTAATGTTCCACGAAATG
55 34 102 R:ATTCAGGTGTCCAACCCTTCC
TSLP F:ACGGATGGGGCTAACTTACAA
55 34 128 R:AGTCCTCGATTTGCTCGAACT
VCAM-1 F:GACCTGTTCCAGCGAGGGTCTA
56 30 122 R:CTTCCATCCTCATAGCAATTAAGGTG
VEGFa F: GCAGCTTGAGTTAAACGAACG
55 35 94 R: GGTTCCCGAAACCCTGAG
VEGFc F: CAGACAAGTTCATTCAATTATTAGACG
55 35 73 R: TGTCTTGTTAGCTGCCTGACAC
Table 2.4 Primer sequences and conditions
2.6 Real time PCR (Q-PCR)
Gene expression profiles of purified total RNA from cell cultures were analysed using
the Quantitech Probe one-step Q-PCR kit (QIAgen, 204443) in combination with
TaqMan Low Density Arrays (www.appliedbiosystems.com). A working solution of
50% Quantitech buffer, 1% Quantitect RT-PCR enzyme mix and 49% total RNA was
prepared per sample; typically 100μl buffer, 2μl enzyme and total RNA sample
diluted to 98μl in RNase-free water. Approximately 95µl of each sample‟s working
solution was then pipetted into two ports of the card. The cards were then centrifuged
twice at 300g for 1 minute to allow adequate distribution of the sample over the
probes. The plate was then sealed and the ports cut off. The Applied Biosystems
Chapter Two Materials and Methods 59
7900HT Fast Real-Time PCR System was used to perform the real time-PCR with the
following cycle conditions: 50°C for 30 minutes, 94.5°C for 15 minutes and the 40
cycles of 96°C for 30 seconds and 59.7°C for 1 minute.
Data was analysed using SDS 2.2 (Applied Biosystems). Relative quantification of
signal per cell was achieved by setting thresholds within the logarithmic phase of the
PCR for the control gene and the target gene. The cycle number (Ct) at which the
threshold was reached was then determined. The Ct for the target gene was subtracted
from the Ct for the control gene and the relative quantity was calculated as 2-∆CT
. RT-
PCRs using identical primers and probes run in separate plates were analysed together
with the same threshold and baseline settings so that they could be compared.
2.7 Microarrays
Whole mouse genome arrays of 37,632 genes (AROS version 4.0, Operon, USA)
were printed by Liverpool Microarray Facility (Liverpool University, England).
2.7.1 cDNA amplification
For use with microarrays first strand cDNA was synthesised and amplified from
approximately 0.05-1ug of total RNA. The protocol supplied for the SMART cDNA
synthesis kit (BD biosciences, K1052-1) was utilised with the following adaptations:
3‟SMART CDS Primer II A (sequence 5‟-
AAGCAGTGGTATCAACGCAGAGTACT(30)N-1N-3‟ (Invitrogen); SMART II A
oligonucleotide (sequence 5‟-AAGCAGTGGTATCAACGCAGAGTACGCGGG-3‟,
(Invitrogen); 5‟ PCR primer II A (sequence 5‟-
AAGCAGTGGTATCAACGCAGAGT-3‟ (Invitrogen); superscript II reverse
Chapter Two Materials and Methods 60
transcriptase (Invitrogen) and its accompanying 1st strand buffer used in place of
Powerscript reverse transcriptase.
After amplification the cDNA was purified using NucleoSpin Extract II (Macherey
Nagel, 740609.250) following the kit instructions, with cDNA eluted in 50µl H2O.
The eluted cDNA was then quantified by measuring absorbance at 260nm with a
spectrophotometer (BioPhotometer, Eppendorf) and purity assessed visually by β-
actin PCR on an electrophoresis gel. All cDNA was stored at -20°C.
2.7.2 CyDye labelling of cDNA
Cy3-dCTP and Cy5-dCTP labelling was performed using 10µl of sample cDNA. To
do this 20µl of random primer mix (Bioprime Labelling Kit, Invitrogen, 18094-011)
and 13µl deionised H2O was added. The mix was heated to 94°C for 5 minutes and
then cooled on ice for the addition of other reagents.
The following was then added: 1.2µl 10mM dATP; 1.2µl dTTP; 1.2µl dGTP; 0.72µl
dCTP (100mM dNTP Set PCR Grade, Invitrogen 10297-018); 0.68µl H2O; 1µl of
either Cy3 dCTP (sample) (Amersham Biosciences, PA53021) or Cy5 dCTP
(reference) (Amersham Biosciences, PA55021); 1µl 40U/µl Klenow enzyme
(Bioprime Labelling Kit, Invitrogen, 18094-011). The reaction was then incubated at
37°C for 8 hours.
The labelled cDNA was purified by means of NucleoSpin Extract II (Macherey
Nagel, 740609.250) as per the instructions eluting in 70µl H2O. The quantity of
labelled cDNA was then assessed using a spectrophotometer by calculating
Chapter Two Materials and Methods 61
absorbance at 550nm (Cy3-dCTP) or 650nm (Cy5-dCTP). The yield in pmol was
calculated by the following:
For Cy3 = Abs550 x 50µl/0.15
For Cy5 = Abs 650 x 50µl/0.25
The labelled cDNA was then stored in the dark at 4°C before hybridisation.
2.7.3 Array hybridisation and analysis
GAPS II coated slide arrays (Corning, 40006) were pre-hybridised as per the
instructions using formamide (Sigma, F-9037) with the pre-hybridisation solution for
2 hours at 42°C. The pre-hybridised slide was dipped in H2O, and spun to dry. It was
then placed into a corning hybridisation chamber (Corning, 2551) and the preparation
instructions for the chamber followed.
Labelled cDNA (100pmols) from test and reference samples was taken, mixed and
concentrated using Microcon YM-30 concentration columns, as per the instructions,
(Millipore, 42410) eluting in a final volume of 30µl H2O. 50µl of cDNA mix
containing 5µg PolyA DNA and 8µg Cot1 DNA as nucleic acid-blockers and
formamide was added to the 30µl labelled probe and the mix denatured at 95°C for 5
minutes. The probe mix was then applied to the surface of the slide and a Lifter Slip
(VWR International, 7370042) applied. The hybridisation chamber was then closed,
wrapped in a damp paper towel and foil and hybridised at 42°C for 16-20 hours. After
hybridisation the slides were immersed in 2x saline-sodium citrate (SSC) buffer +
0.1% SDS at 42°C to remove the coverslip. The slide was then subsequently washed
for 5 minutes at 42°C in 2 x SSC + 0.1% SDS, followed by 5 minutes room
Chapter Two Materials and Methods 62
temperature in 0.2 x SSC and four 5 minutes room temperature washes in 0.05 x SSC.
Finally, slides were dipped into H2O and centrifuged at 500g for 15 minutes at room
temperature to dry.
The arrays were then scanned using Scan Array GX Plus (Perkin Elmer) and software
Scan Array Express (Perkin Elmer) and aligned manually. MultiExperiment Viewer
version 4.0 (TM4 Software Suite) was used to analyse the data obtained. Hierarchical
clustering was performed to group samples together based on the similarity of their
gene expression profiles. Significance analysis of microarrays (SAM) was used to
find the genes significantly different between the samples. This is based largely upon
the student T-test with the addition of a false discovery rate (FDR). The relative
difference (d(i)) was compared to the distribution of d(i) following random
permutation of the sample categories. For each d(i), a certain proportion of all genes
in the permutation set (control set) will be found to be 'significant' by chance and this
parameter was then used to calculate a FDR. The FDR was set to 10% when SAM
analysis was completed.
2.8 Indirect-immunofluorescent staining
Cells to be used for immunofluorescence analysis were grown in 8-well chamber
slides (BD Biosciences, 354108). Once confluent, the media and chambers were
removed, slides washed in PBS for 5 minutes at room temperature and left to air dry
for 1 hour. The cells were fixed in 100% acetone at 4°C for 20 minutes, allowed to
dry at room temperature for 10 minutes and stored at -80°C for future use.
When staining, the slide was removed from the freezer and defrosted at room
temperature. Each cell area was drawn round with a hydrophobic pen to prevent
Chapter Two Materials and Methods 63
leakage and placed in PBS for 10 minutes to re-hydrate the cells. Cells were blocked
with 10% goat serum diluted in PBS/2%BSA for 10 minutes at room temperature to
prevent non-specific binding. Cells were then incubated with primary or irrelevant
control antibodies in PBS/2%BSA (sections 2.2.1 and 2.2.2, respectively).
Subsequently, the slides were washed in PBS for 10 minutes and cells incubated with
secondary antibody in PBS/2%BSA (section 2.2.3). All incubations were at room
temperature, for 1 hour in a humidity chamber, with fluorophores protected from
light. Finally, the slides were washed in PBS for 10 minutes and incubated with the
nuclear counterstain Hoechst (section 2.1.10) for 2 minutes to visualise cell nuclei.
The sections were then mounted with glycerol containing anti-fade reagent, DABCO
(section 2.1.11), a coverslip was added and slides stored at -20°C. Cell staining was
visualised using a LSM510 confocal microscope (Zeiss, Germany) at x10 or x40
magnification. Images were captured and processed using Zeiss LSM image software
(Zeiss, Germany).
2.9 Flow cytometry
All flow cytometry on stromal cells was performed using an EPICS XL Flow
Cytometer (Beckman Coulter). The Dako Cyan-ADP high performance flow
cytometer (Colorado, US) was used with all other cells.
The analysis of specific surface molecules from freshly isolated cells was achieved
using standard flow cytometry techniques. Briefly, cells were resuspended at
1x10⁶/ml in PBS/2%BSA. Approximately 1x10
5 cells were transferred into a fetal calf
serum (FCS) coated well of a 96 well round-bottomed plate to reduce adherence of
the cells to the plate. These were washed, pelleted by centrifuging at 300g for 4
Chapter Two Materials and Methods 64
minutes, and then re-suspended in PBS/2%BSA containing anti-mouse CD16/32
(1:20) to block Fc receptors on the cells. The plate was then incubated on ice for 20
minutes after which cells were pelleted and resupended in primary antibody (section
2.2.2) and incubated on ice for a further 20 minutes. The cells were then washed twice
with 150µl PBS/2%BSA and resuspended in secondary antibody (section 2.2.3) or
PBS 2%BSA (depending on whether immunofluorescence was direct or indirect) and
incubated on ice for 20 minutes. Finally the cells were washed as above and
transferred to FCS-coated FACS tubes in a total volume of 400µl. For each antibody
irrelevant controls (section 2.2.1) were also performed using the same working
concentration. The cells were then run through the EPICS XL Flow Cytometer
(Beckman Coulter) or the Dako Cyan-ADP high performance flow cytometer
(Colorado, USA). Flow cytometry data was analysed using WinMDI software
(version 2.8, Scripps Research Institute, La Jolla, CA) or Summit software (version
4.3, Dako, Colorado, USA).
2.10 Lymphotoxin α treatment
CD45 negative stromal cells were seeded at 5x10⁴ in a 24-well plate in 500µl of
complete fibroblast medium (section 2.1.1). After 24 hours the medium was replaced
with 500µl of fresh complete fibroblast medium containing 1µg/ml lymphotoxin (LT)
α. Control wells with no LTα were also carried out. After 24 hours the stromal cells
were washed in PBS and removed from the plate by incubating with 1ml cell
dissociation buffer (Gibco) for 20 minutes at 37°C, 5%CO2. The cells were then
stained for VCAM-1 and ICAM-1 expression using flow cytometry (section 2.9).
Chapter Two Materials and Methods 65
2.11 Cellular co-culture
CD45 negative stromal cells were seeded at 3x10⁵ in a 6-well plate in 3mls of
complete fibroblast medium (section 2.1.1). After 24 hours 1.5mls of conditioned
medium from the cultures was added to a fresh well and a further 1.5mls of fresh
complete fibroblast medium was added to every well. 3mls fresh complete fibroblast
medium was also used as a control. A spleen, taken from a C57BL6 mouse was
mashed through a 0.22µm filter, the cells washed and resuspended in red blood cell
lysis buffer (section 2.1.6) for 10 minutes on ice. The lymphocytes were then counted
and resuspended in complete fibroblast medium. 1x10⁶ lymphocytes isolated from the
spleen were added to each well. The plate was then incubated at 37°C, 5% CO2. After
4 days the wells were washed vigorously and the splenocytes stained for flow
cytometry (section 2.9). The percentage of viable cells was also determined by flow
cytometry with Annexin V. Post antibody incubations, cells were washed in cold
PBS, followed by a single wash in Annexin V staining buffer (section 2.1.6). The
cells were then pelleted as above, resuspended in 100µl of the staining buffer,
containing Annexin V Fitc antibody (5:200) and incubated on ice for 20 minutes. The
cells were then analysed by flow cytometry (section 2.9).
2.12 Reaggregates
Reaggregates were formed using 1x10⁵
cells/200µl complete fibroblast media (section
2.1.1) in a well of a V-well plate (Sterilin, UK). The plate was then centrifuged at
900g for 5 minutes at room temperature and again at 225g for 5 minutes at room
temperature, to ensure complete formation of the pellet. The plate was then placed at
37°C/5%CO2 for 24 hours prior to use. For the LTα treated reaggregates, 1µg/ml LTα
was added to the media in the V-well plate during the formation of the reaggregate.
Chapter Two Materials and Methods 66
When using the collagen sponge for structural support, 1x10⁵ cells in 50µl of
complete fibroblast media were added to the sponge (2-3mm3) (Pfizer, UK) and
incubated at 37°C/5%CO2 for 2 hours prior to use.
2.12.1 Grafting under the kidney capsule
Cell reaggregates (section 2.12) were grafted under the kidney capsule of a 6-8 week
old C57BL6 mouse (figure 2.1). Mice were anaesthetised using 4% Isofluorane (May
and Baker, Dagenham, UK) carried in oxygen. Pre-operative Buprenorphine
(Temgesic, AnimalCare, York, UK) was administered sub-cutaneously using a
syringe fitted with a 25 Gauge needle at a dose of 2mg/kg. The fur was removed from
the left lumbar region using clippers and area cleaned with 70% ethanol (figure 2.1A).
A small cut was made in the left lower lumbar region approx 0.5-1cm in length
depending on the size of the mouse, using surgical blunt ended scissors (F.S.T) (figure
2.1B). Scissors were used to make space between the skin and peritoneum before
making a similar size cut in the peritoneum. Blunt forceps were used to locate the
kidney, which was then eased out of the body cavity using the fat attached to the
lower end, the kidney was kept moist using gauze soaked in PBS (figure 2.1C). Sharp
forceps were used to pierce a small hole in the capsule of the kidney, and open up a
small space beneath the capsule. The reaggregate was then placed under the capsule
with up to three reaggragates placed under each kidney capsule. The edges of the skin
and peritoneum were lifted from beneath the kidney to allow it to slip back into the
abdominal cavity. The peritoneum was closed with at least two stitches using size 5,
round-bodied, vicryl sutures (Johnson and Johnson Intl). The skin was cleaned using a
cotton bud dipped in PBS and the wound closed with a clip (VetTech Solutions, UK)

Chapter Two Materials and Methods 67
(figure 2.1D). The grafts were removed and analysed by immunofluorescence (section
2.8) after 1-4 weeks.
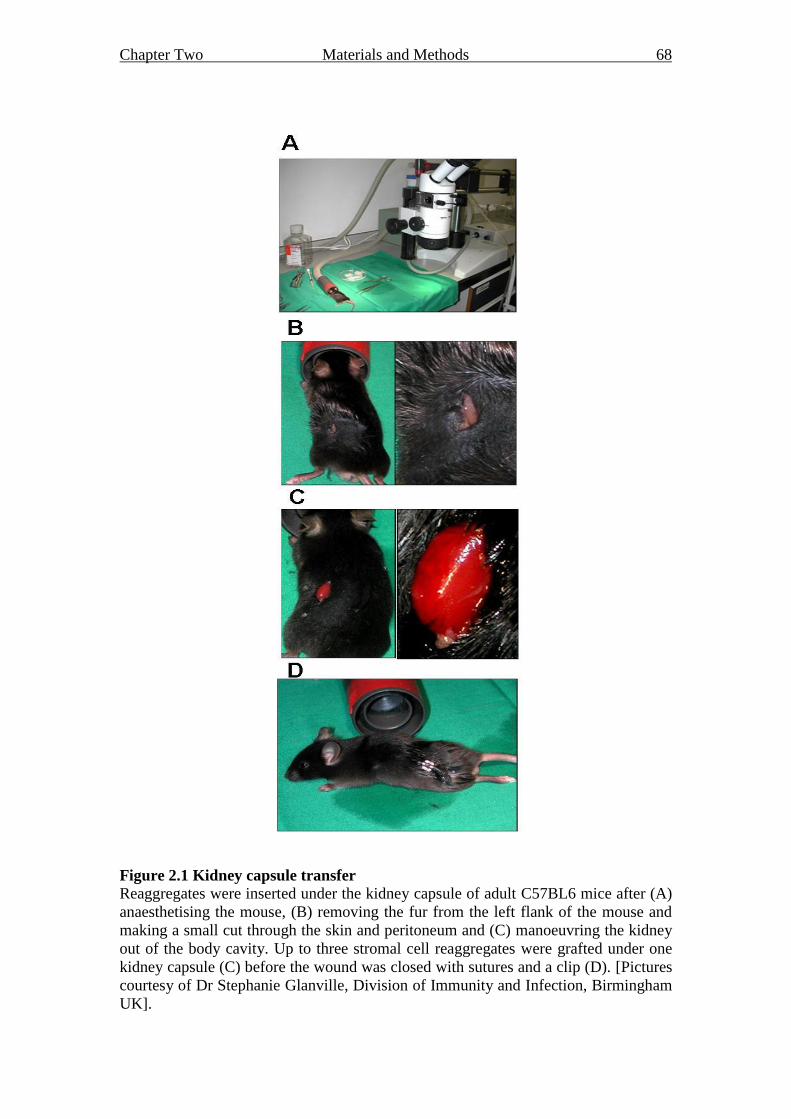
Chapter Two Materials and Methods 68
Figure 2.1 Kidney capsule transfer
Reaggregates were inserted under the kidney capsule of adult C57BL6 mice after (A)
anaesthetising the mouse, (B) removing the fur from the left flank of the mouse and
making a small cut through the skin and peritoneum and (C) manoeuvring the kidney
out of the body cavity. Up to three stromal cell reaggregates were grafted under one
kidney capsule (C) before the wound was closed with sutures and a clip (D). [Pictures
courtesy of Dr Stephanie Glanville, Division of Immunity and Infection, Birmingham
UK].

Chapter Two Materials and Methods 69
2.13 Statistical analysis
Statistical analysis of flow cytometry data was carried out using GraphPad Prism
computer software (GraphPad Software, Inc., San Diego, CA) and performing a
paired T-test.
Chapter Three Results 70
Chapter Three
Characterisation of Fibroblasts from
Lymphoid and Peripheral Sites in
the Adult Mouse
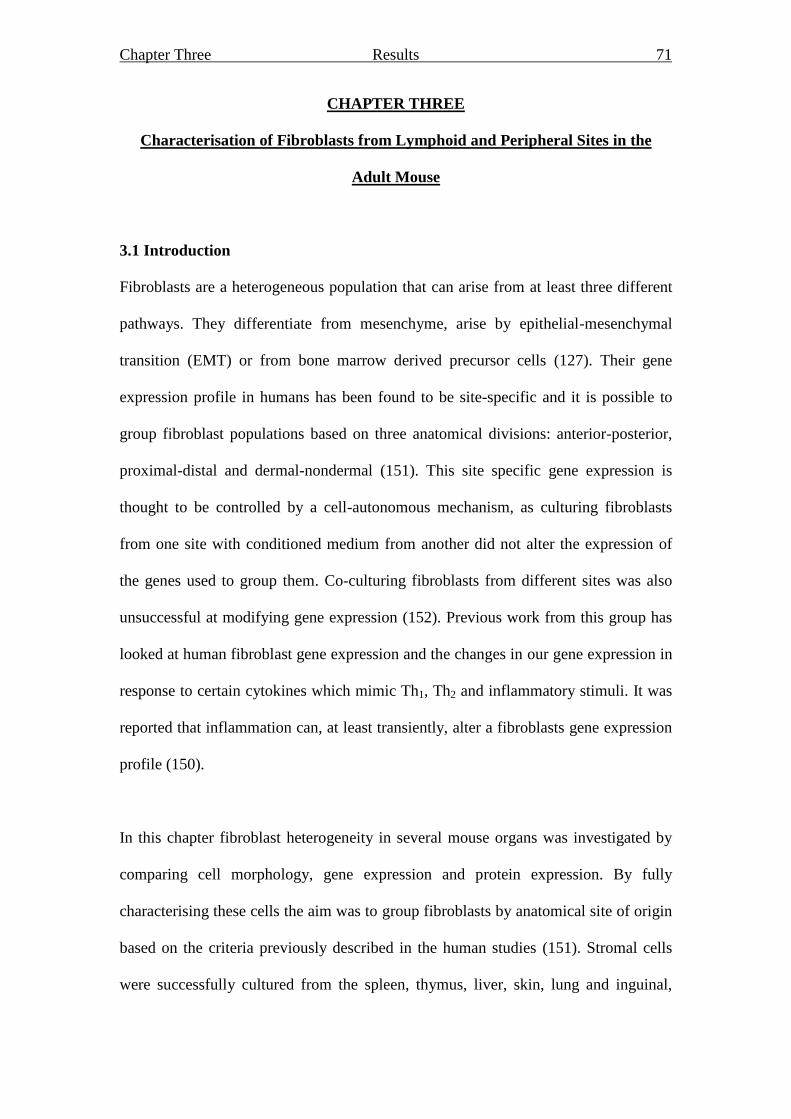
Chapter Three Results 71
CHAPTER THREE
Characterisation of Fibroblasts from Lymphoid and Peripheral Sites in the
Adult Mouse
3.1 Introduction
Fibroblasts are a heterogeneous population that can arise from at least three different
pathways. They differentiate from mesenchyme, arise by epithelial-mesenchymal
transition (EMT) or from bone marrow derived precursor cells (127). Their gene
expression profile in humans has been found to be site-specific and it is possible to
group fibroblast populations based on three anatomical divisions: anterior-posterior,
proximal-distal and dermal-nondermal (151). This site specific gene expression is
thought to be controlled by a cell-autonomous mechanism, as culturing fibroblasts
from one site with conditioned medium from another did not alter the expression of
the genes used to group them. Co-culturing fibroblasts from different sites was also
unsuccessful at modifying gene expression (152). Previous work from this group has
looked at human fibroblast gene expression and the changes in our gene expression in
response to certain cytokines which mimic Th1, Th2 and inflammatory stimuli. It was
reported that inflammation can, at least transiently, alter a fibroblasts gene expression
profile (150).
In this chapter fibroblast heterogeneity in several mouse organs was investigated by
comparing cell morphology, gene expression and protein expression. By fully
characterising these cells the aim was to group fibroblasts by anatomical site of origin
based on the criteria previously described in the human studies (151). Stromal cells
were successfully cultured from the spleen, thymus, liver, skin, lung and inguinal,
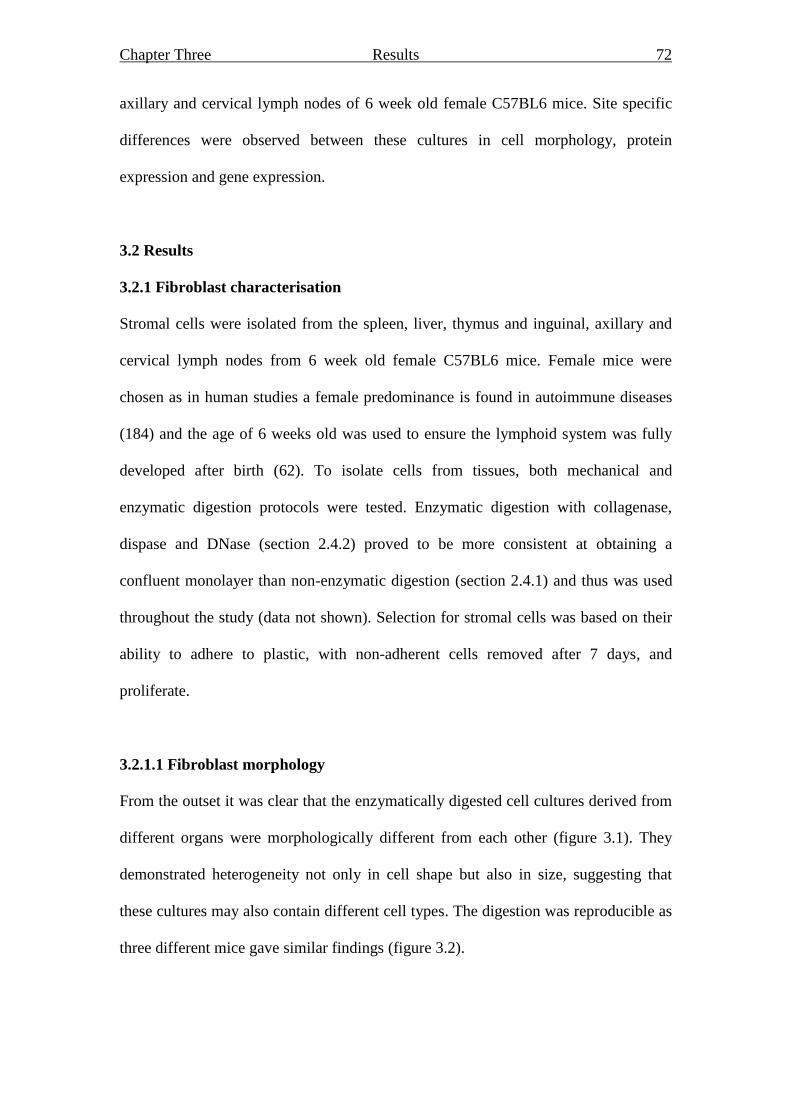
Chapter Three Results 72
axillary and cervical lymph nodes of 6 week old female C57BL6 mice. Site specific
differences were observed between these cultures in cell morphology, protein
expression and gene expression.
3.2 Results
3.2.1 Fibroblast characterisation
Stromal cells were isolated from the spleen, liver, thymus and inguinal, axillary and
cervical lymph nodes from 6 week old female C57BL6 mice. Female mice were
chosen as in human studies a female predominance is found in autoimmune diseases
(184) and the age of 6 weeks old was used to ensure the lymphoid system was fully
developed after birth (62). To isolate cells from tissues, both mechanical and
enzymatic digestion protocols were tested. Enzymatic digestion with collagenase,
dispase and DNase (section 2.4.2) proved to be more consistent at obtaining a
confluent monolayer than non-enzymatic digestion (section 2.4.1) and thus was used
throughout the study (data not shown). Selection for stromal cells was based on their
ability to adhere to plastic, with non-adherent cells removed after 7 days, and
proliferate.
3.2.1.1 Fibroblast morphology
From the outset it was clear that the enzymatically digested cell cultures derived from
different organs were morphologically different from each other (figure 3.1). They
demonstrated heterogeneity not only in cell shape but also in size, suggesting that
these cultures may also contain different cell types. The digestion was reproducible as
three different mice gave similar findings (figure 3.2).
Chapter Three Results 73
Figure 3.1 Stromal cell culture heterogeneity
Images from cell cultures derived from different organs at passage two after six weeks
in culture, (a) spleen (b) thymus (c) liver (d) inguinal lymph node (e) axillary lymph
node (f) cervical lymph node. Heterogeneity seen is representative of 3 independent
cultures for each organ. Images taken at x10 magnification.
Figure 3.2 Splenic stromal cell culture heterogeneity Images from splenic stromal cells at passage two after six weeks in culture.
Demonstrating the heterogeneity observed within three separate cultures (a-c). Images
taken at x10.
Chapter Three Results 74
3.2.1.2 Fibroblast gene expression
The TaqMan low density array (LDA) is a customisable 384-well micro fluidic card,
designed for use with the Applied Biosystems 7900HT Fast Real-Time PCR System,
to perform hundreds of real-time PCR reactions simultaneously (section 2.6). To
determine the gene expression profiles of the cultured cells described in section
3.2.1.1 a Fibroblast LDA was used containing a variety of genes. This included
stromal cell associated genes, for example VCAM-1, vimentin and collagen type 1
and 3 isoforms, TNF family genes which are important in stromal cell interactions
with many cell types, genes expressed by other cell lineages for elimination purposes
and housekeeping genes such as β-actin as controls (appendix 8.1).
To analyse gene expression data from each of the cell cultures, RNA was extracted at
passage four to six and approximately 1µg was hybridised to the Fibroblast LDA.
Following real-time PCR all data was normalised to the expression of β-actin
(appendix 8.2). Significance analysis of microarrays (SAM) analysis (section 2.7) was
used to determine the gene expression that differed significantly between the cultures
(figure 3.3a). There were 28 differentially expressed genes (table 3.1), these included
TNF family members, interleukins and cytokine receptors. Genes indicative of the
presence of other cell types such as CD86 expressed on antigen presenting cells (185)
and CD80 expressed on activated B cells and monocytes (186) were observed in
lymphoid organ cultures. CD117 which is expressed on haematopoietic stem cells
(187) and PECAM-1 (CD31) which is expressed on endothelial cells, monocytes and
lymphocytes (188,189) were seen within lymph node cultures. Using principle
component analysis (PCA) the samples could cluster based on the expression of these
28 genes (figure 3.3b). The principle component analysis clearly demonstrates that the

Chapter Three Results 75
liver, spleen and thymus stromal cell cultures cluster together whereas the lymph node
stromal cell cultures form a more tightly clustered separate group. This suggests that it
is possible to differentiate between stromal cells from the lymph node compared to the
liver, spleen and thymus based on their gene expression.
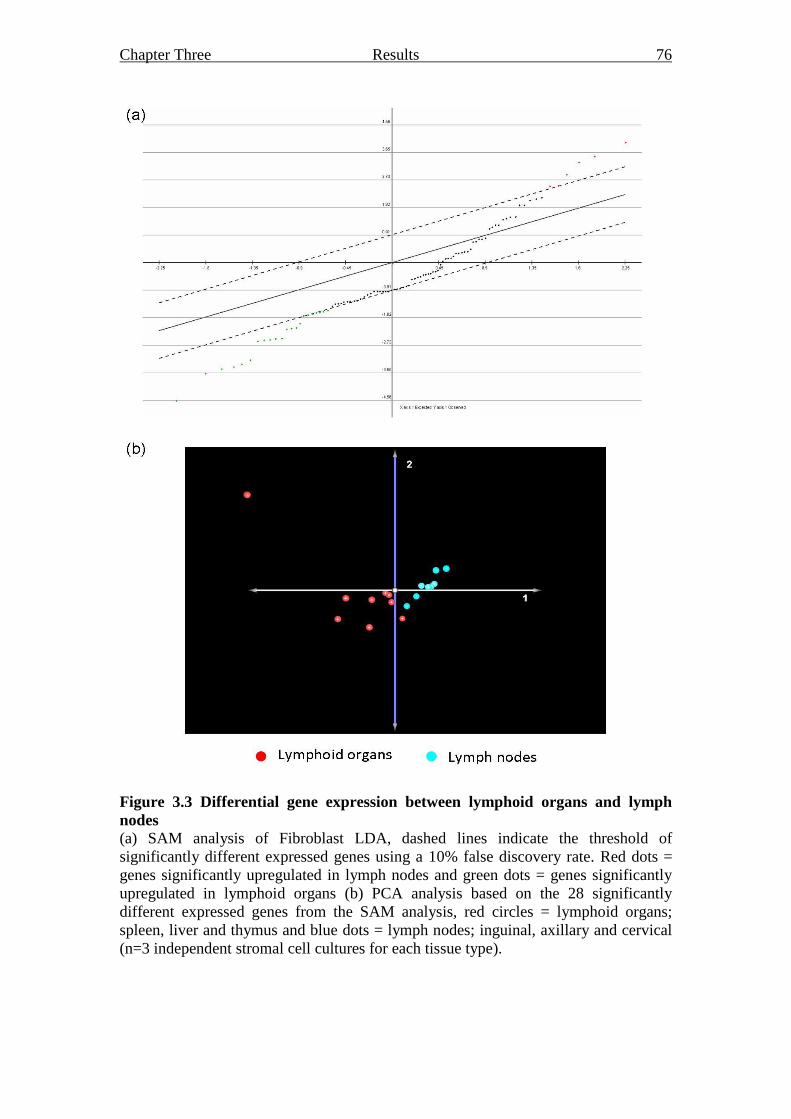
Chapter Three Results 76
Figure 3.3 Differential gene expression between lymphoid organs and lymph
nodes
(a) SAM analysis of Fibroblast LDA, dashed lines indicate the threshold of
significantly different expressed genes using a 10% false discovery rate. Red dots =
genes significantly upregulated in lymph nodes and green dots = genes significantly
upregulated in lymphoid organs (b) PCA analysis based on the 28 significantly
different expressed genes from the SAM analysis, red circles = lymphoid organs;
spleen, liver and thymus and blue dots = lymph nodes; inguinal, axillary and cervical
(n=3 independent stromal cell cultures for each tissue type).
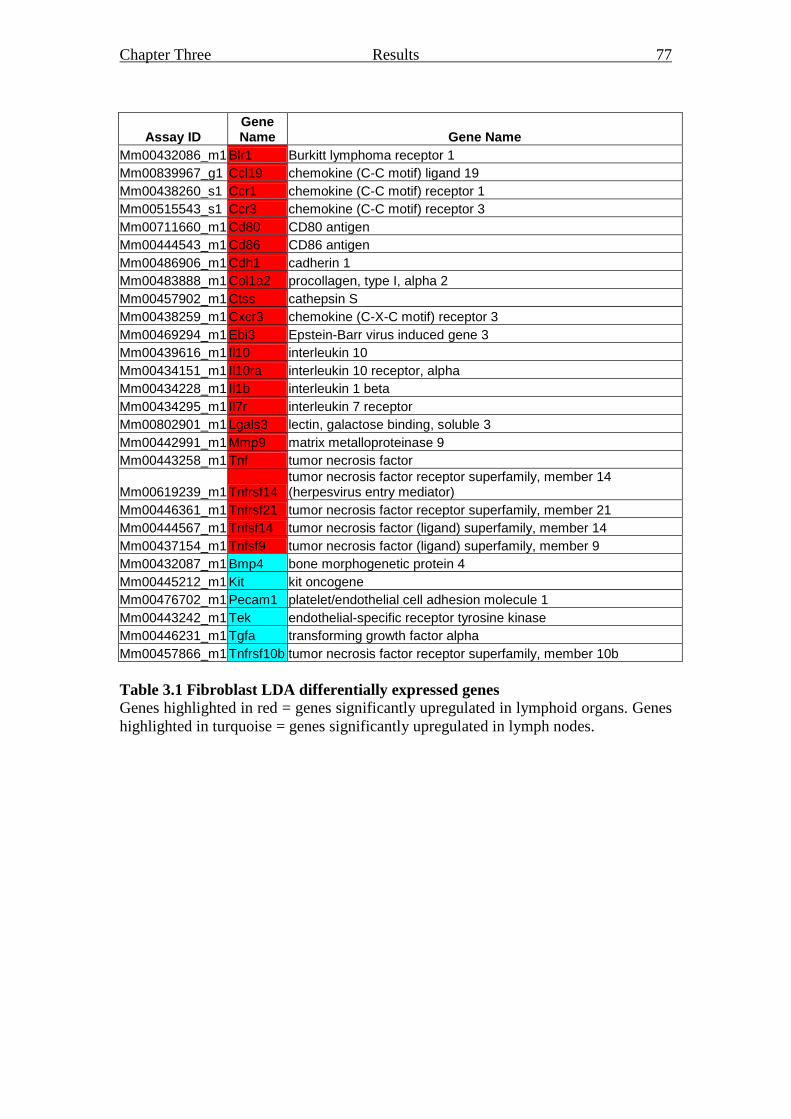
Chapter Three Results 77
Assay ID Gene Name Gene Name
Mm00432086_m1 Blr1 Burkitt lymphoma receptor 1
Mm00839967_g1 Ccl19 chemokine (C-C motif) ligand 19
Mm00438260_s1 Ccr1 chemokine (C-C motif) receptor 1
Mm00515543_s1 Ccr3 chemokine (C-C motif) receptor 3
Mm00711660_m1 Cd80 CD80 antigen
Mm00444543_m1 Cd86 CD86 antigen
Mm00486906_m1 Cdh1 cadherin 1
Mm00483888_m1 Col1a2 procollagen, type I, alpha 2
Mm00457902_m1 Ctss cathepsin S
Mm00438259_m1 Cxcr3 chemokine (C-X-C motif) receptor 3
Mm00469294_m1 Ebi3 Epstein-Barr virus induced gene 3
Mm00439616_m1 Il10 interleukin 10
Mm00434151_m1 Il10ra interleukin 10 receptor, alpha
Mm00434228_m1 Il1b interleukin 1 beta
Mm00434295_m1 Il7r interleukin 7 receptor
Mm00802901_m1 Lgals3 lectin, galactose binding, soluble 3
Mm00442991_m1 Mmp9 matrix metalloproteinase 9
Mm00443258_m1 Tnf tumor necrosis factor
Mm00619239_m1 Tnfrsf14 tumor necrosis factor receptor superfamily, member 14 (herpesvirus entry mediator)
Mm00446361_m1 Tnfrsf21 tumor necrosis factor receptor superfamily, member 21
Mm00444567_m1 Tnfsf14 tumor necrosis factor (ligand) superfamily, member 14
Mm00437154_m1 Tnfsf9 tumor necrosis factor (ligand) superfamily, member 9
Mm00432087_m1 Bmp4 bone morphogenetic protein 4
Mm00445212_m1 Kit kit oncogene
Mm00476702_m1 Pecam1 platelet/endothelial cell adhesion molecule 1
Mm00443242_m1 Tek endothelial-specific receptor tyrosine kinase
Mm00446231_m1 Tgfa transforming growth factor alpha
Mm00457866_m1 Tnfrsf10b tumor necrosis factor receptor superfamily, member 10b
Table 3.1 Fibroblast LDA differentially expressed genes
Genes highlighted in red = genes significantly upregulated in lymphoid organs. Genes
highlighted in turquoise = genes significantly upregulated in lymph nodes.
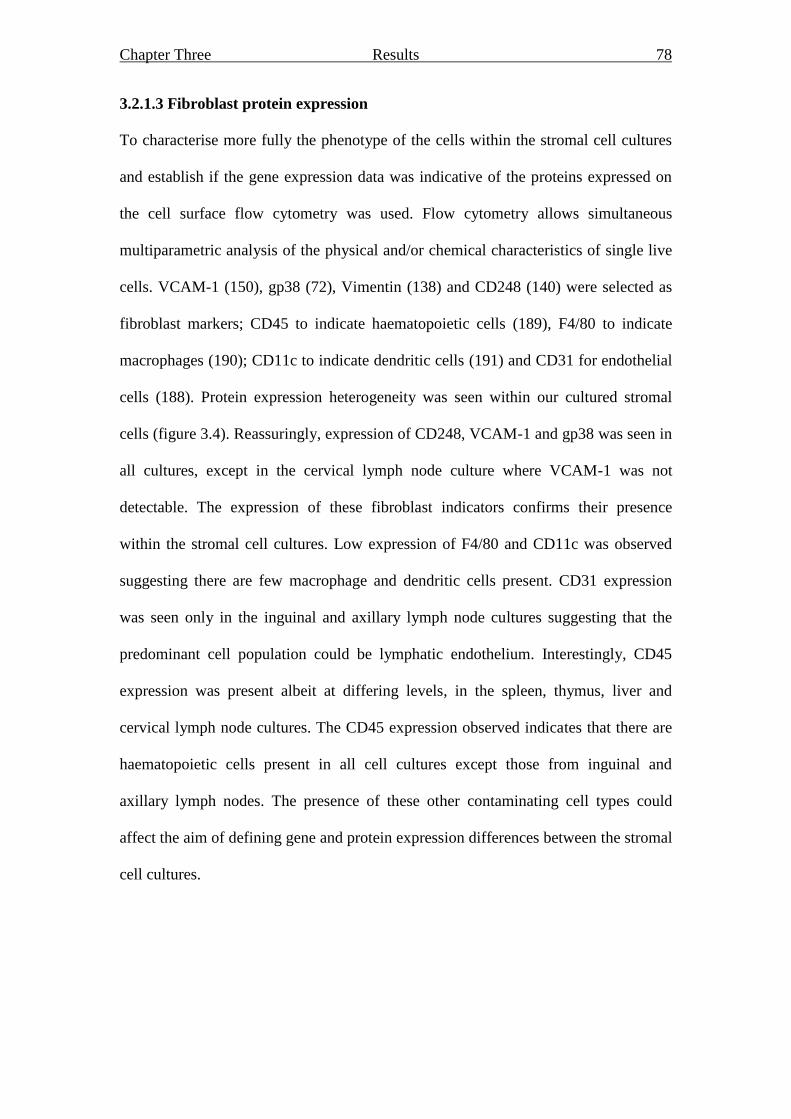
Chapter Three Results 78
3.2.1.3 Fibroblast protein expression
To characterise more fully the phenotype of the cells within the stromal cell cultures
and establish if the gene expression data was indicative of the proteins expressed on
the cell surface flow cytometry was used. Flow cytometry allows simultaneous
multiparametric analysis of the physical and/or chemical characteristics of single live
cells. VCAM-1 (150), gp38 (72), Vimentin (138) and CD248 (140) were selected as
fibroblast markers; CD45 to indicate haematopoietic cells (189), F4/80 to indicate
macrophages (190); CD11c to indicate dendritic cells (191) and CD31 for endothelial
cells (188). Protein expression heterogeneity was seen within our cultured stromal
cells (figure 3.4). Reassuringly, expression of CD248, VCAM-1 and gp38 was seen in
all cultures, except in the cervical lymph node culture where VCAM-1 was not
detectable. The expression of these fibroblast indicators confirms their presence
within the stromal cell cultures. Low expression of F4/80 and CD11c was observed
suggesting there are few macrophage and dendritic cells present. CD31 expression
was seen only in the inguinal and axillary lymph node cultures suggesting that the
predominant cell population could be lymphatic endothelium. Interestingly, CD45
expression was present albeit at differing levels, in the spleen, thymus, liver and
cervical lymph node cultures. The CD45 expression observed indicates that there are
haematopoietic cells present in all cell cultures except those from inguinal and
axillary lymph nodes. The presence of these other contaminating cell types could
affect the aim of defining gene and protein expression differences between the stromal
cell cultures.
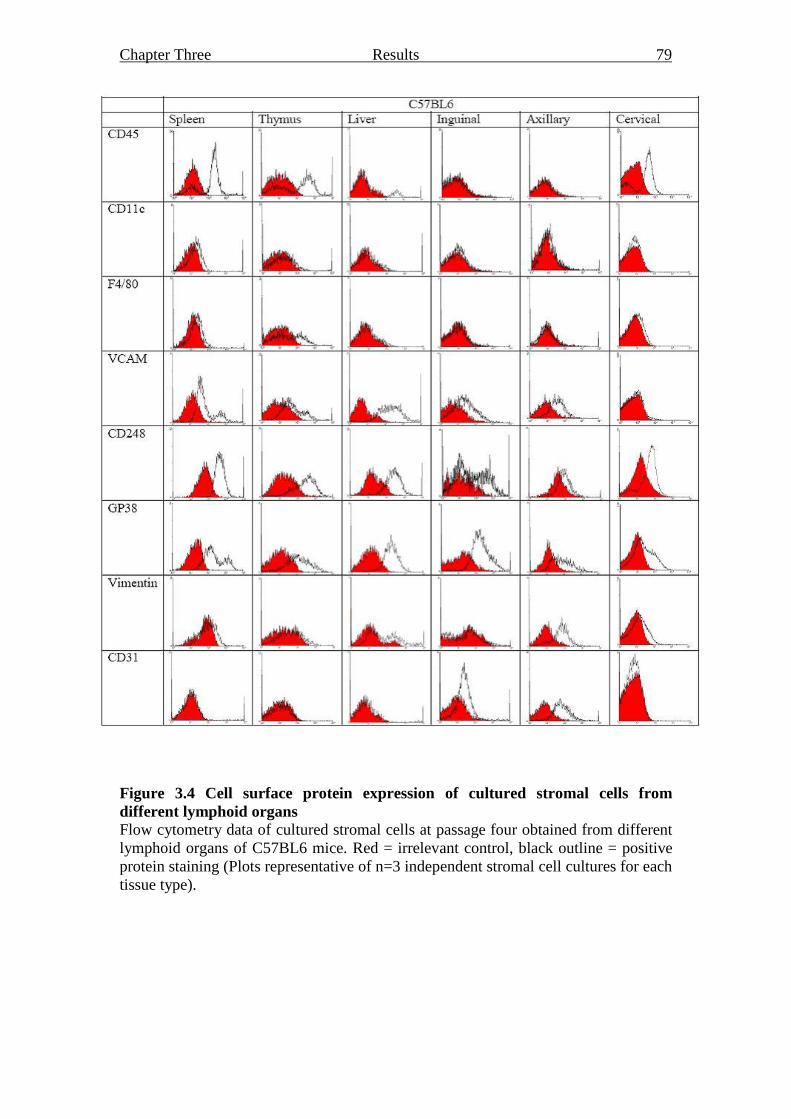
Chapter Three Results 79
Figure 3.4 Cell surface protein expression of cultured stromal cells from
different lymphoid organs
Flow cytometry data of cultured stromal cells at passage four obtained from different
lymphoid organs of C57BL6 mice. Red = irrelevant control, black outline = positive
protein staining (Plots representative of n=3 independent stromal cell cultures for each
tissue type).
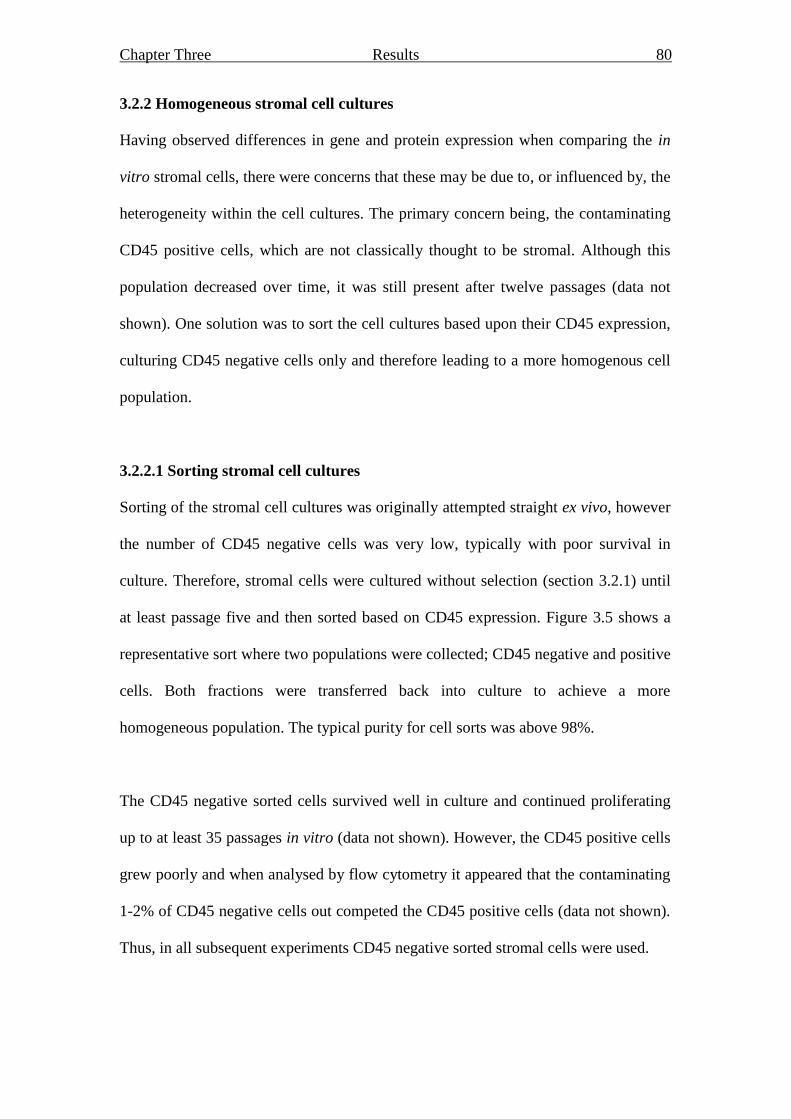
Chapter Three Results 80
3.2.2 Homogeneous stromal cell cultures
Having observed differences in gene and protein expression when comparing the in
vitro stromal cells, there were concerns that these may be due to, or influenced by, the
heterogeneity within the cell cultures. The primary concern being, the contaminating
CD45 positive cells, which are not classically thought to be stromal. Although this
population decreased over time, it was still present after twelve passages (data not
shown). One solution was to sort the cell cultures based upon their CD45 expression,
culturing CD45 negative cells only and therefore leading to a more homogenous cell
population.
3.2.2.1 Sorting stromal cell cultures
Sorting of the stromal cell cultures was originally attempted straight ex vivo, however
the number of CD45 negative cells was very low, typically with poor survival in
culture. Therefore, stromal cells were cultured without selection (section 3.2.1) until
at least passage five and then sorted based on CD45 expression. Figure 3.5 shows a
representative sort where two populations were collected; CD45 negative and positive
cells. Both fractions were transferred back into culture to achieve a more
homogeneous population. The typical purity for cell sorts was above 98%.
The CD45 negative sorted cells survived well in culture and continued proliferating
up to at least 35 passages in vitro (data not shown). However, the CD45 positive cells
grew poorly and when analysed by flow cytometry it appeared that the contaminating
1-2% of CD45 negative cells out competed the CD45 positive cells (data not shown).
Thus, in all subsequent experiments CD45 negative sorted stromal cells were used.
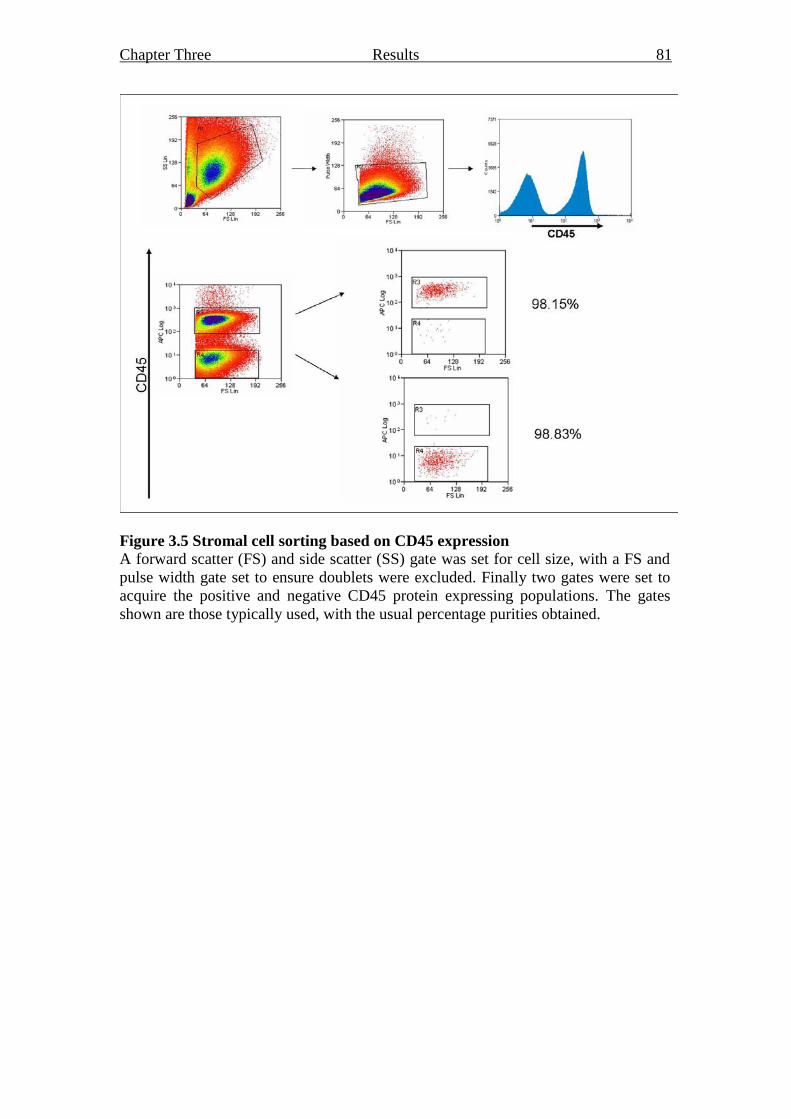
Chapter Three Results 81
Figure 3.5 Stromal cell sorting based on CD45 expression A forward scatter (FS) and side scatter (SS) gate was set for cell size, with a FS and
pulse width gate set to ensure doublets were excluded. Finally two gates were set to
acquire the positive and negative CD45 protein expressing populations. The gates
shown are those typically used, with the usual percentage purities obtained.

Chapter Three Results 82
3.2.2.2 Flow cytometry analysis of sorted stromal cell cultures
To determine the homogeneity of the sorted CD45 negative populations, the panel of
surface protein markers used on the unsorted cell cultures (figure 3.4) was repeated on
the cultures at passage 4/5 post sorting (figure 3.6).
Importantly, it was observed that the sorted CD45 negative stromal cells maintain
their CD45 negative expression phenotype. In addition, in comparison to the unsorted
cells there was a more homogeneous phenotype across all stromal cell cultures; there
was no F4/80 expression with concomitant high expression of VCAM-1, CD248 and
gp38. Interestingly, the low CD31 expression observed only in the inguinal and
axillary lymph node stromal cell cultures still remained post sorting. This indicates
that these stromal cell cultures have an endothelial-like phenotype. CD11c expression
was not assessed as this expression was very low in the unsorted cultures, however
inter-cellular adhesion molecule 1 (ICAM-1) was added to the panel as current
literature states its importance in stromal cell interactions with other cell types (35).
ICAM-1 is differentially expressed amongst the stromal cell cultures, with spleen,
liver and inguinal lymph node stromal cell cultures contain ICAM-1 positive cells
whereas the thymus, axillary and cervical lymph nodes do not. At this juncture CD45
negative sorted stromal cell cultures from peripheral sites such as lung and skin were
also included. This is a significant comparison to include as previous work in humans
has shown that fibroblasts from peripheral sites can be grouped separately to those
from lymphoid sites using gene expression analysis (150). Whether this is mirrored in
the murine system is an important point to clarify. In addition to the lymphoid organ
stromal cell cultures, the lung and skin stromal cell cultures also maintained their
CD45 negative phenotype. They did not express F4/80 or CD31 and had high

Chapter Three Results 83
expression of VCAM-1, CD248 and gp38. The lung stromal cell cultures expressed
ICAM-1 whereas the skin stromal cells did not.
Chapter Three Results 84
Figure 3.6 Cell surface protein expression of cultured CD45 negative stromal
cells from lymphoid and peripheral organs
Flow cytometry data of cultured CD45 negative sorted stromal cells at passage 4/5
post sort, from lymphoid and peripheral organs of C57BL6 mice. Red = irrelevant
control, black outline = positive protein staining (Plots representative of n=3 stromal
cell cultures for each tissue type).
Chapter Three Results 85
3.2.2.3 Immunofluorescent analysis of sorted stromal cell cultures
As a complimentary method to flow cytometry, immunofluorescence was used to
examine the cell surface proteins present on the cultured stromal cells. As with flow
cytometry, it can determine both the presence and relative quantity of a specific
protein but also has the added benefit of revealing the location of the protein within a
cell population. Protein heterogeneity was observed within cultured CD45 negative
stromal cell populations (figure 3.7 – 3.9). Importantly, no CD45, F4/80 or CD11c
positive staining was observed (data not shown). This suggests that not only do the
sorted stromal cell cultures maintain their CD45 negative phenotype but also that
sorting provides a more homogeneous cell culture with no haematopoietic, dendritic
or macrophage cell contamination, confirming the flow cytometry data. Again
consistent with the flow cytometry data all cultures expressed the stromal markers
gp38 and CD248. Interestingly, both single and double positive populations were
present in all cultures although to differing extents. In contrast however, VCAM-1
expression differed from that observed by flow cytometry, with only very low levels
observed in the liver (figure 3.7c), cervical lymph node (figure 3.8c) and skin (figure
3.9b) stromal cell cultures. Co-expression of gp38 and VCAM-1 was observed in the
spleen (figure 3.7a), thymus (figure 3.7b) and inguinal lymph node (figure 3.8a)
stromal cell cultures with co-expression of CD248, VCAM-1 and gp38 only observed
in spleen (figure 3.7a) and axillary lymph node (figure 3.8b) stromal cell cultures. In
all stromal cell cultures, where seen, CD248, gp38 and VCAM-1 protein expression
was observed uniformly on the cell surface with no nuclear staining apparent. Taken
together these data demonstrate that there are phenotypic differences between stromal
cell cultures from distinct sites. Although more homogeneous, immunofluorescence

Chapter Three Results 86
highlights that the stromal populations present still differ within each culture, even
when looking at only three stromal markers.
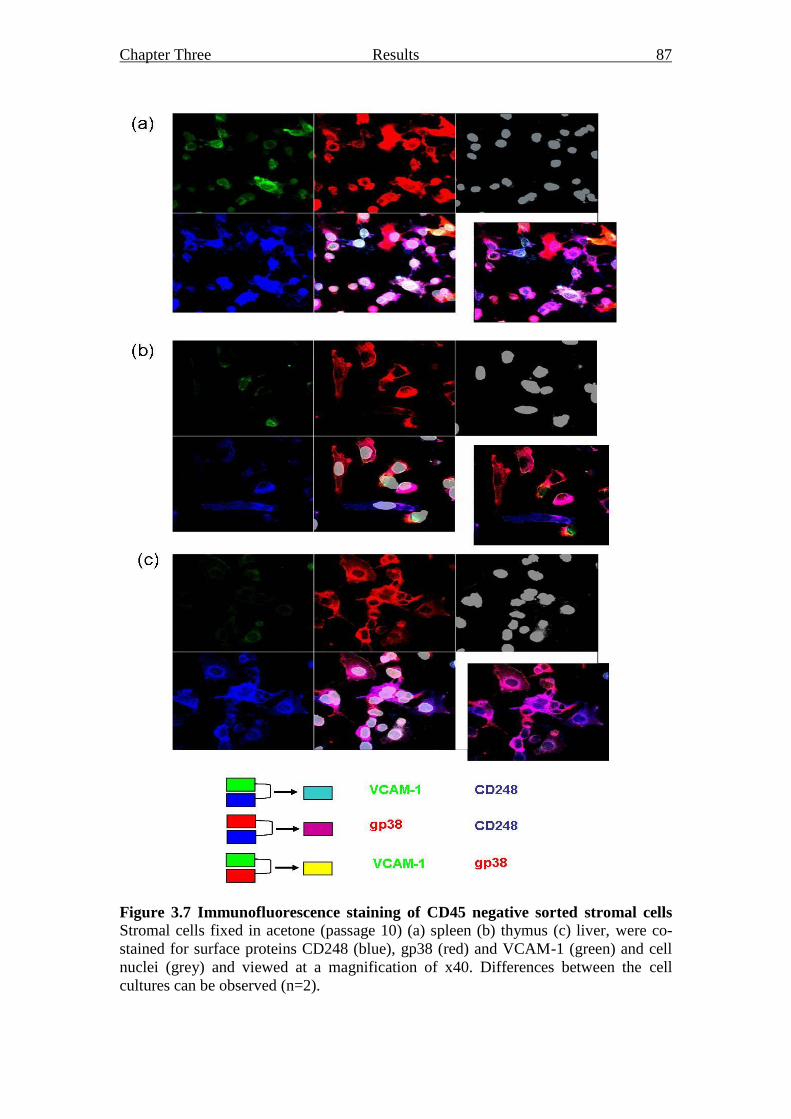
Chapter Three Results 87
Figure 3.7 Immunofluorescence staining of CD45 negative sorted stromal cells Stromal cells fixed in acetone (passage 10) (a) spleen (b) thymus (c) liver, were co-
stained for surface proteins CD248 (blue), gp38 (red) and VCAM-1 (green) and cell
nuclei (grey) and viewed at a magnification of x40. Differences between the cell
cultures can be observed (n=2).
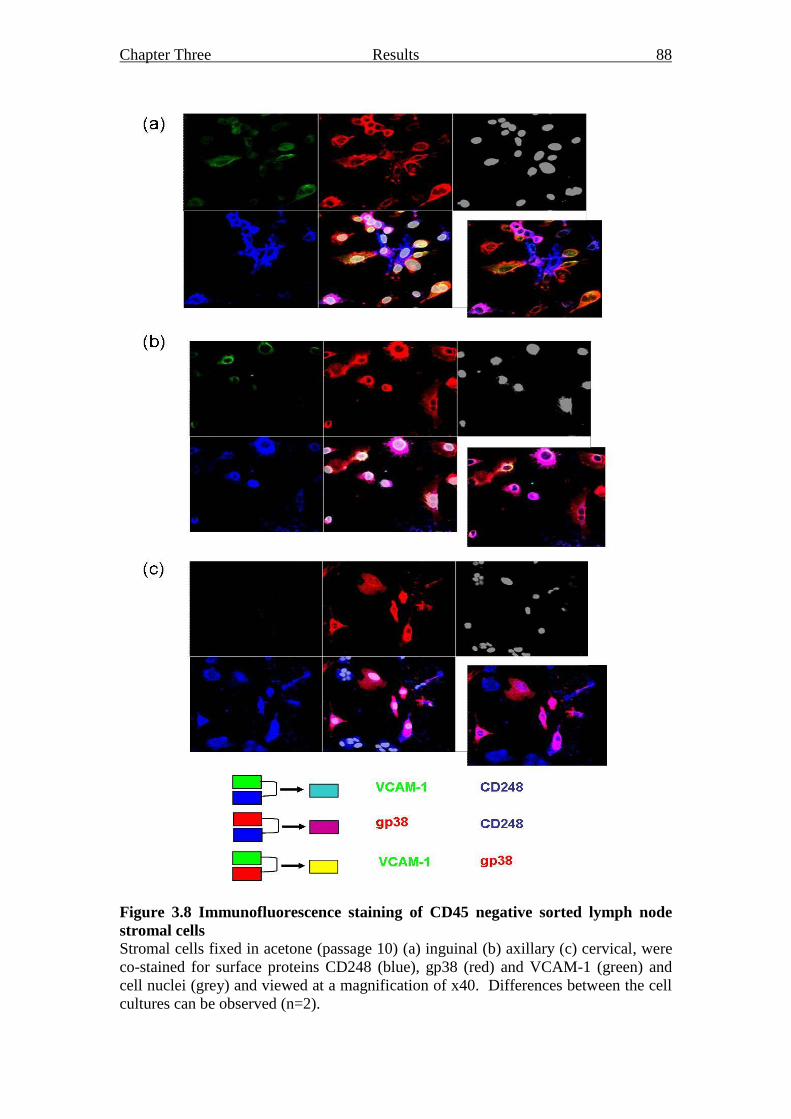
Chapter Three Results 88
Figure 3.8 Immunofluorescence staining of CD45 negative sorted lymph node
stromal cells
Stromal cells fixed in acetone (passage 10) (a) inguinal (b) axillary (c) cervical, were
co-stained for surface proteins CD248 (blue), gp38 (red) and VCAM-1 (green) and
cell nuclei (grey) and viewed at a magnification of x40. Differences between the cell
cultures can be observed (n=2).
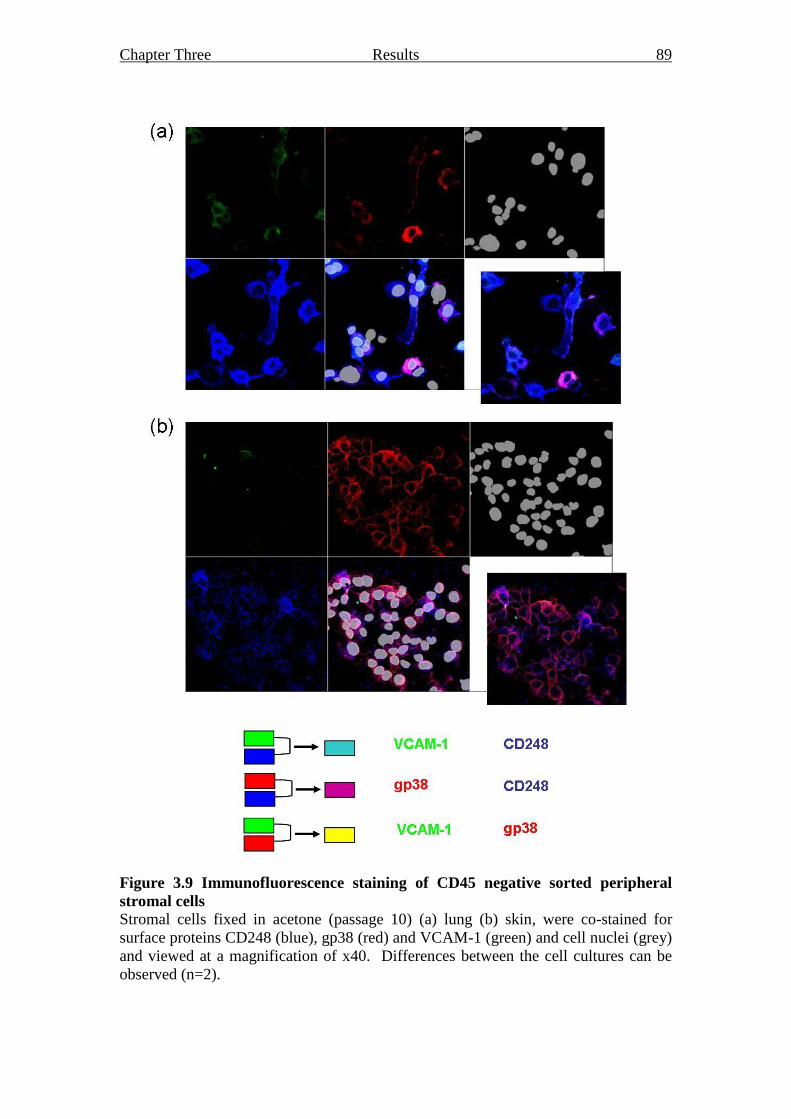
Chapter Three Results 89
Figure 3.9 Immunofluorescence staining of CD45 negative sorted peripheral
stromal cells
Stromal cells fixed in acetone (passage 10) (a) lung (b) skin, were co-stained for
surface proteins CD248 (blue), gp38 (red) and VCAM-1 (green) and cell nuclei (grey)
and viewed at a magnification of x40. Differences between the cell cultures can be
observed (n=2).
Chapter Three Results 90
3.2.2.4 Whole genome array analysis of sorted stromal cells
Having observed heterogeneity between cultures derived from different sites based on
protein expression, the gene expression profiles of each culture were next analysed to
determine whether they could be grouped anatomically analogous to the human
studies (151). RNA was extracted from all stromal cell lines, reverse transcribed and
CyDye labelled with approximately 100pmols of labelled cDNA hybridised onto
whole mouse genome arrays (section 2.7). The arrays contained 37,632 genes and
were used as an unbiased approach to determine if a specific lymphoid organ
fibroblast gene signature could be established (appendix 8.3).
As with the Fibroblast LDAs, SAM analysis was used to determine the gene
expression that differed significantly between the cultures (section 2.7.3). Using a
0.03% false discovery rate (FDR), 2935 genes were found to be significantly different
between peripheral and lymphoid stromal cell cultures (appendix 8.4). Normally the
FDR is set to 10% during SAM analysis, however this gave a gene list that was too
large to further analyse and therefore the FDR was decreased to 0.03%, which gave a
workable number of genes. A hierarchical cluster, produced by the Institute of
Genomic Research multi-experiment viewer (TMEV), of all samples using the 2935
genes, showed peripheral stromal cell cultures, skin and lung, to be more similar to
each other than to the lymphoid organ stromal cell cultures (figure 3.10a). PCA was
used to cluster the samples based on the expression of the 2935 genes (figure 3.10b).
This observation agrees with that found in human studies where whole genome
expression grouped peripheral and lymphoid fibroblasts separately (150). When using
this approach within the lymphoid stromal cell cultures alone, significant site specific
gene expression was unable to group the samples into the lymphoid organ from which
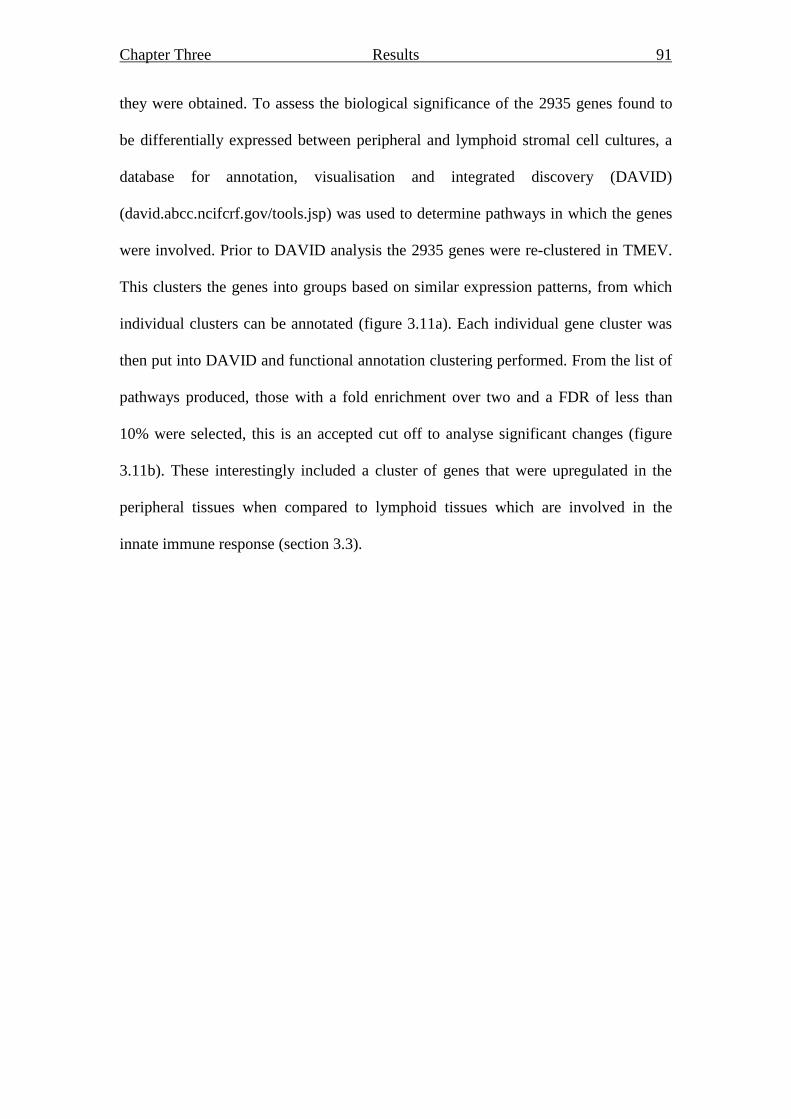
Chapter Three Results 91
they were obtained. To assess the biological significance of the 2935 genes found to
be differentially expressed between peripheral and lymphoid stromal cell cultures, a
database for annotation, visualisation and integrated discovery (DAVID)
(david.abcc.ncifcrf.gov/tools.jsp) was used to determine pathways in which the genes
were involved. Prior to DAVID analysis the 2935 genes were re-clustered in TMEV.
This clusters the genes into groups based on similar expression patterns, from which
individual clusters can be annotated (figure 3.11a). Each individual gene cluster was
then put into DAVID and functional annotation clustering performed. From the list of
pathways produced, those with a fold enrichment over two and a FDR of less than
10% were selected, this is an accepted cut off to analyse significant changes (figure
3.11b). These interestingly included a cluster of genes that were upregulated in the
peripheral tissues when compared to lymphoid tissues which are involved in the
innate immune response (section 3.3).
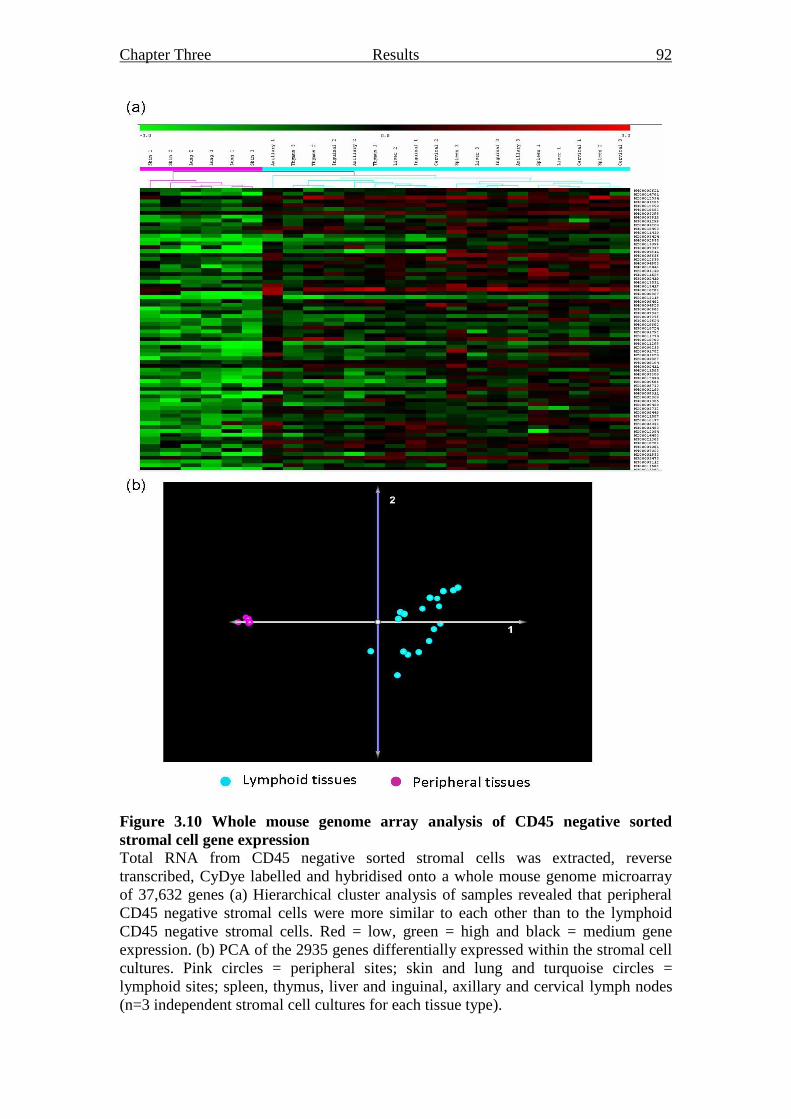
Chapter Three Results 92
Figure 3.10 Whole mouse genome array analysis of CD45 negative sorted
stromal cell gene expression
Total RNA from CD45 negative sorted stromal cells was extracted, reverse
transcribed, CyDye labelled and hybridised onto a whole mouse genome microarray
of 37,632 genes (a) Hierarchical cluster analysis of samples revealed that peripheral
CD45 negative stromal cells were more similar to each other than to the lymphoid
CD45 negative stromal cells. Red = low, green = high and black = medium gene
expression. (b) PCA of the 2935 genes differentially expressed within the stromal cell
cultures. Pink circles = peripheral sites; skin and lung and turquoise circles =
lymphoid sites; spleen, thymus, liver and inguinal, axillary and cervical lymph nodes
(n=3 independent stromal cell cultures for each tissue type).
Chapter Three Results 93
Figure 3.11 DAVID pathway analysis of 2935 genes differentially expressed
between peripheral and lymphoid stromal cells
Significant genes from SAM analysis of whole genome microarrays were (a)
Hierarchically clustered into groups of similar gene expression patterns A-J. Red =
low, green = high and black = medium gene expression. (b) Pathways over two fold
enriched with a FDR <10% are shown.
Chapter Three Results 94
As well as comparing the CD45 negative cultured stromal cells, immortalised spleen,
thymus and mesenteric and peripheral lymph node stromal cell lines derived from
clones and ex vivo splenic stromal cells sorted on gp38 and CD31 expression were
also analysed using the whole mouse genome arrays. These were prepared and used
with the permission of Dr Tobias Vogt and Dr Mirjam Britchgi, University of
Lausanne, Switzerland. The purpose of this comparison was to determine the
differential gene expression between in vivo, in vitro and immortalised cells. PCA of
all 99 samples shows a clear separation of the ex vivo sorted cells from the in vitro
cultured and immortalised cells lines (figure 3.12). Due to the large sample size SAM
analysis could not be performed to determine the gene expression that differed
significantly between all the samples. Therefore, SAM analysis was performed only
on immortalised lymph node cell lines and the in vitro CD45 negative cultured lymph
node cultures. Following analysis, 261 genes were found to be expressed
differentially, with a FDR of 10%, between the five groups (appendix 8.5).
Hierarchical clustering using these genes demonstrates that the immortalised cell lines
group together, as do the in vitro cultured cells (figure 3.13a). PCA of these samples
using the 261 genes shows not only a clear separation of immortalised cells lines and
in vitro cultured cells but also separation within these groups based on the precise
lymph node from which the cells were obtained, although the inguinal and axillary
lymph node stromal cells were less tightly clustered (figure 3.13b). These genes were
then clustered in TMEV and their grouped genes annotated for use in DAVID (figure
3.14a). Pathways with a fold enrichment over two and a FDR of less than 10% were
selected (figure 3.14b). Interestingly, five of the eight pathways that were different
between the immortalised and the CD45 negative cultured lymph node stromal cells

Chapter Three Results 95
were related to apoptosis (section 3.3). These were increased in the CD45 negative
cultured cells compared with the immortalised cells.
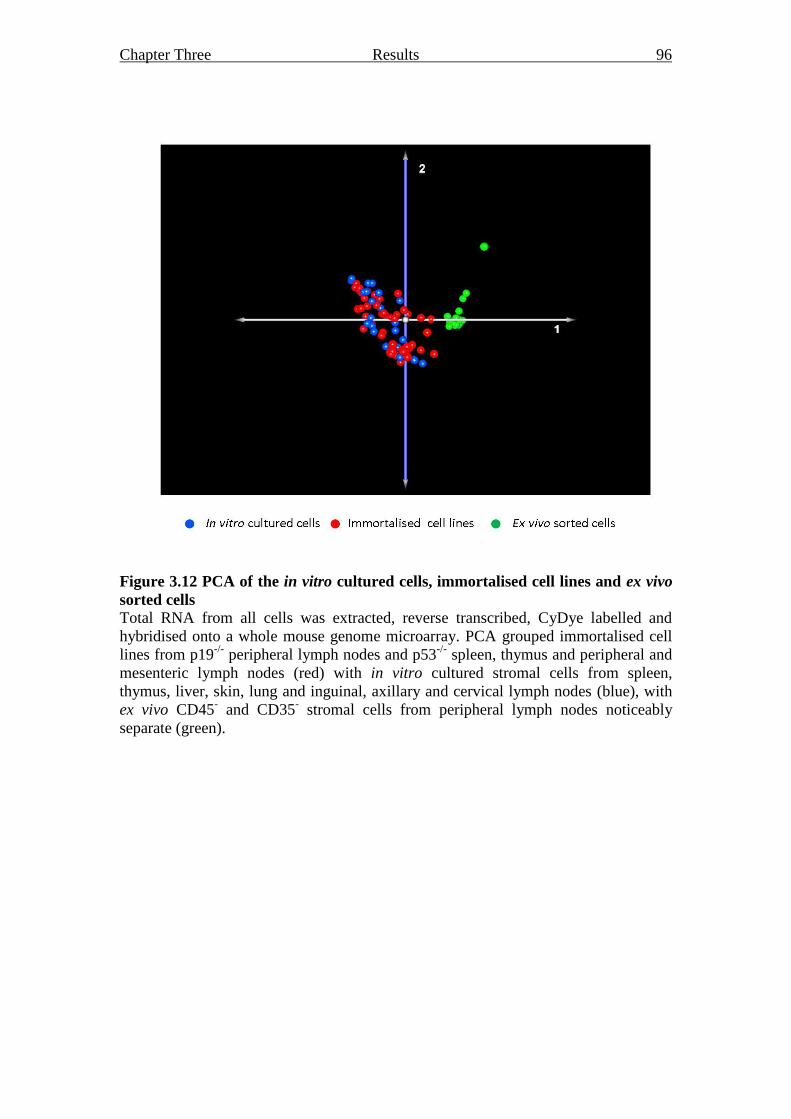
Chapter Three Results 96
Figure 3.12 PCA of the in vitro cultured cells, immortalised cell lines and ex vivo
sorted cells
Total RNA from all cells was extracted, reverse transcribed, CyDye labelled and
hybridised onto a whole mouse genome microarray. PCA grouped immortalised cell
lines from p19-/-
peripheral lymph nodes and p53-/-
spleen, thymus and peripheral and
mesenteric lymph nodes (red) with in vitro cultured stromal cells from spleen,
thymus, liver, skin, lung and inguinal, axillary and cervical lymph nodes (blue), with
ex vivo CD45- and CD35
- stromal cells from peripheral lymph nodes noticeably
separate (green).
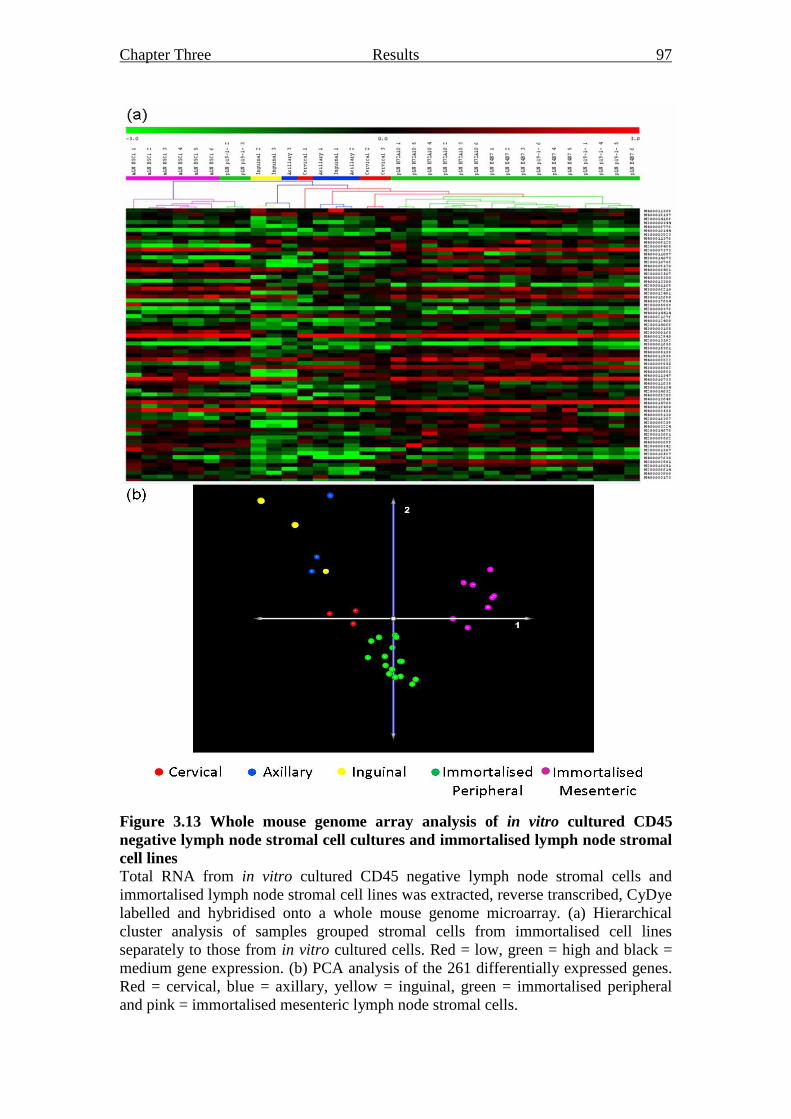
Chapter Three Results 97
Figure 3.13 Whole mouse genome array analysis of in vitro cultured CD45
negative lymph node stromal cell cultures and immortalised lymph node stromal
cell lines
Total RNA from in vitro cultured CD45 negative lymph node stromal cells and
immortalised lymph node stromal cell lines was extracted, reverse transcribed, CyDye
labelled and hybridised onto a whole mouse genome microarray. (a) Hierarchical
cluster analysis of samples grouped stromal cells from immortalised cell lines
separately to those from in vitro cultured cells. Red = low, green = high and black =
medium gene expression. (b) PCA analysis of the 261 differentially expressed genes.
Red = cervical, blue = axillary, yellow = inguinal, green = immortalised peripheral
and pink = immortalised mesenteric lymph node stromal cells.
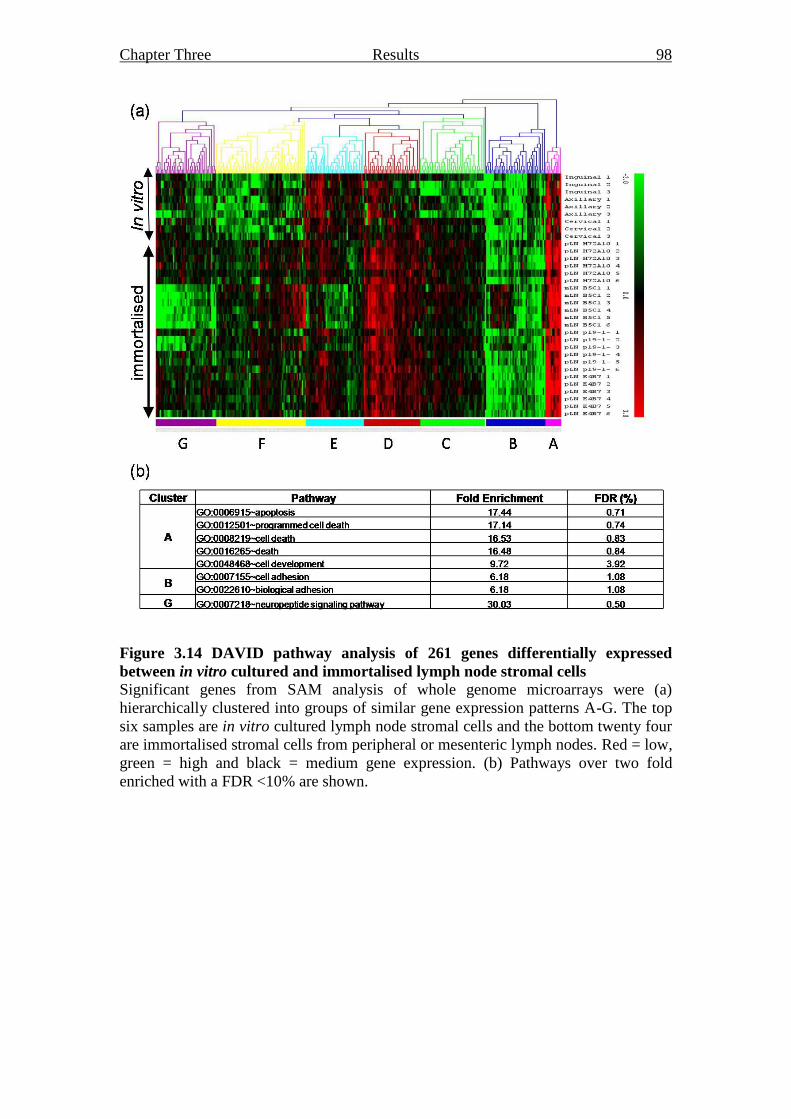
Chapter Three Results 98
Figure 3.14 DAVID pathway analysis of 261 genes differentially expressed
between in vitro cultured and immortalised lymph node stromal cells
Significant genes from SAM analysis of whole genome microarrays were (a)
hierarchically clustered into groups of similar gene expression patterns A-G. The top
six samples are in vitro cultured lymph node stromal cells and the bottom twenty four
are immortalised stromal cells from peripheral or mesenteric lymph nodes. Red = low,
green = high and black = medium gene expression. (b) Pathways over two fold
enriched with a FDR <10% are shown.
Chapter Three Results 99
3.2.2.5 End point PCR
End point PCR was used to validate microarray results by determining the expression
of a number of genes thought to be highly expressed for example CCL7, CCL19.
CCL21, CXCL12, IL-7, LTβR, TNFR1, TRANCE. In addition, to validate the
presence of fibroblasts expression of genes such as CD248, gp38, ICAM-1 and
VCAM-1 were also determined. The end point PCR was analysed by running the
products on a 1% agarose gel with molecular weight markers to determine their size
(section 2.5.2) (figure 3.15). All stromal cell cultures showed expression of CCL7,
CCL19, CCL21, CD248, CXCL1, CXCL12, gp38, ICAM-1, IL-7, IL-17RA, LTβR,
PDGFRα, PDGFRβ, TNFR1, TRANCE, VEGFa, VEGFc and VCAM-1, which is
consistent with the gene expression observed in the whole genome microarrays. Many
of the genes expressed throughout the stromal cell cultures are stromal organiser cell
markers, VCAM-1, ICAM-1, LTβR, TRANCE, CCL19 and CCL21 (35).
Interestingly CXCL13, which is thought to be produced by stromal organiser cells,
was only expressed in stromal cell cultures from the inguinal lymph node, skin and
lung. In addition expression of other stromal markers gp38, CD248, PDGFRα,
PDGFRβ and TNFR1 was consistently seen. However differential gene expression
between the stromal cell cultures was also observed, the lymphatic endothelial
markers CD31 and Lyve-1 were expressed in the cervical and axillary lymph node
and the skin and lung stromal cell cultures but not in the others. EpCAM was not
expressed in any of the cell cultures. The differential expression observed between
stromal cell cultures was not mirrored by the pattern of expression seen using the
microarrays. However, expression of EpCAM was very low in all stromal cell
cultures using microarray analysis. The gene expression observed by end point PCR
of CD248, gp38 and VCAM-1 correlated with protein expression observed by flow

Chapter Three Results 100
cytometry in the stromal cell lines (section 3.2.2.2). However, ICAM-1 gene
expression was seen in all stromal cell cultures by end point PCR whereas ICAM-1
protein expression was only seen in the spleen, liver, inguinal lymph node and lung
stromal cells. This differential expression between transcript and protein may be due
to the lack of translation of that gene in particular cell lines.
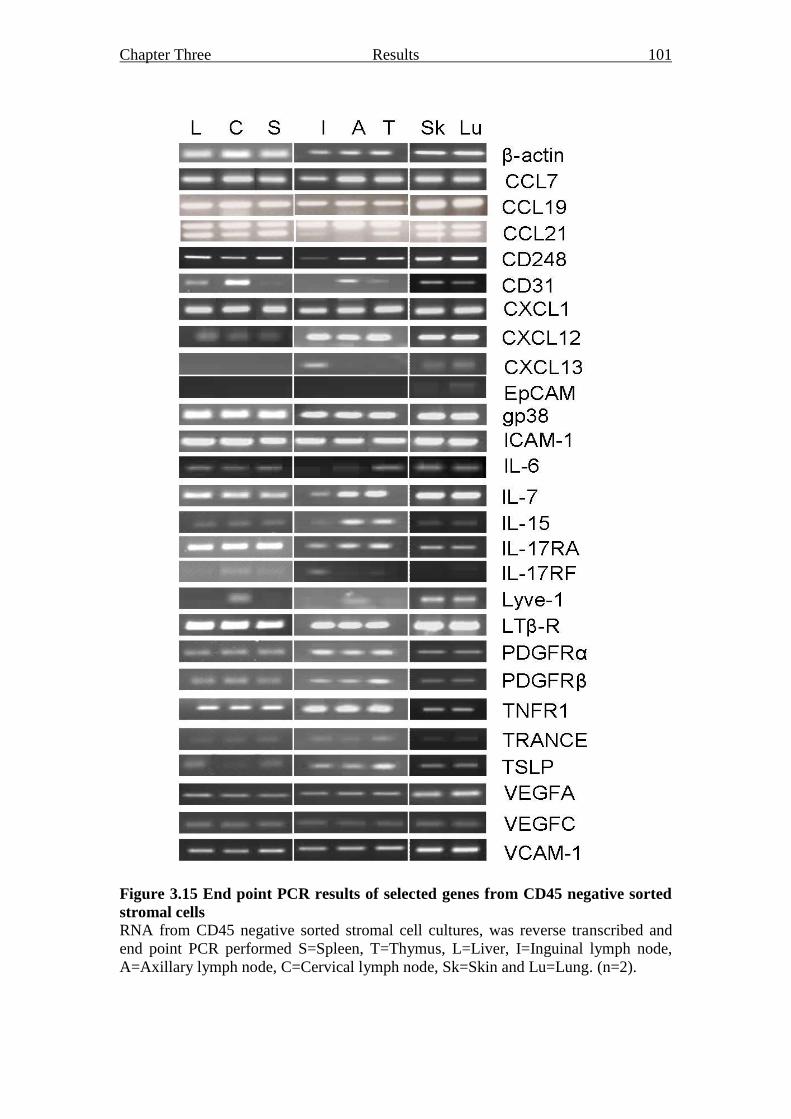
Chapter Three Results 101
Figure 3.15 End point PCR results of selected genes from CD45 negative sorted
stromal cells
RNA from CD45 negative sorted stromal cell cultures, was reverse transcribed and
end point PCR performed S=Spleen, T=Thymus, L=Liver, I=Inguinal lymph node,
A=Axillary lymph node, C=Cervical lymph node, Sk=Skin and Lu=Lung. (n=2).
Chapter Three Results 102
3.2.2.6 Site Specific TaqMan LDA
The whole mouse genome microarrays were used as an unbiased approach to
determine if a specific lymphoid organ fibroblast gene signature could be established.
From these it was possible to separate cultured stromal cells from peripheral and
lymphoid tissues but not those within the lymphoid tissue group. Therefore, a
TaqMan LDA was designed based on the 337 genes found to be human fibroblast site
specific as previously described by Rinn et al, 2006. The site specific LDA contained
47 of the genes found to important in defining human fibroblast site specificity,
covering a broad range of families (appendix 8.6). To analyse gene expression data
from each of the stromal cell cultures, RNA was extracted and approximately 1µg was
hybridised to the LDA. Following real-time PCR all data was normalised to the
expression of housekeeping gene 18S (appendix 8.7). Hox gene expression was
analysed first given their reported importance in the literature (151,152) (figure
3.16a). Similar high gene expression levels were seen of Hoxa5 with very low gene
expression of Hoxa13 across all stromal cell cultures. Hoxb2 expression was
decreased in the skin stromal cell cultures with Hoxa11 noticeably decreased in lung
stromal cells and to a lesser extent in the thymus. Hoxd8 showed the greatest variation
between the stromal cell cultures, very high expression was seen in all lymph node
stromal cell cultures, with a decrease in spleen, thymus and liver and to a greater
extent in the skin and lung stromal cell cultures. From the 47 genes on the low density
array 15 non-Hox genes were observed to have differential expression between the
stromal cell cultures (figure 3.16b). CD31 and Lyve-1 were highly expressed in the
inguinal, axillary and cervical lymph node stromal cell cultures compared to all other
stromal cell cultures, mirroring that seen in the whole mouse genome arrays (section
3.2.2.4). In addition, CD248, Wisp2, Fxf1a, Gulp, Fn, Adam9, Col11a1, Plat and
Chapter Three Results 103
Bmp4 gene expression was lower in the skin and lung stromal cell cultures than the
lymphoid stromal cell cultures. A decrease in expression of Wisp2 was also observed
in the liver stromal cell cultures and a decrease in Plat expression in the splenic
stromal cell cultures. In addition, CXCL1 was increased in the cervical lymph node
stromal cell cultures alone and Grem2 expression was increased in the cervical lymph
node, skin and lung stromal cell cultures. Grem2 is thought to play a role in regulating
organogenesis, body patterning, and tissue differentiation (192). Moreover, this low
density array also demonstrated some differences in gene expression between all the
stromal cell cultures with Cdh1 and Mmp3 having variable expression. Cdh1 is the
gene for the cell adhesion protein epithelial-cadherin (193) and Mmp3 is an enzyme
involved in the breakdown of extracellular matrix (194). The site specific LDA
highlights again the gene expression differences between lymphoid and peripheral
stromal cell cultures. In addition, it reveals genes, Grem2, Cdh1 and Mmp3, that are
differentially expressed between all the stromal cells cultures.
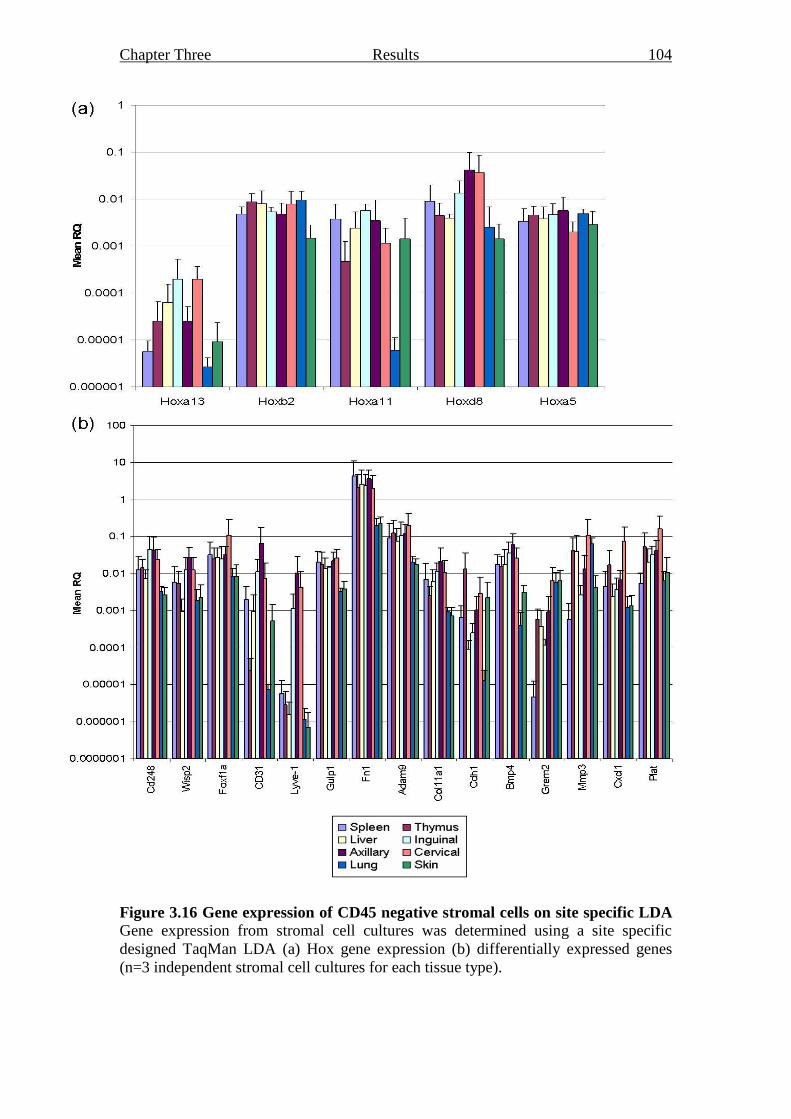
Chapter Three Results 104
Figure 3.16 Gene expression of CD45 negative stromal cells on site specific LDA Gene expression from stromal cell cultures was determined using a site specific
designed TaqMan LDA (a) Hox gene expression (b) differentially expressed genes
(n=3 independent stromal cell cultures for each tissue type).
Chapter Three Results 105
3.3 Discussion
The aim of this chapter was to characterise fibroblasts from different sites within the
mouse; gene and protein expression was assessed to achieve this.
Importantly from this chapter an efficient protocol for the growth of stromal cells
from mouse lymphoid tissues, which can be reliably used for future functional studies,
has been derived. In the literature the most favourable culture conditions for growing
human and mouse fibroblasts are stated as 10% FCS in Dulbecco‟s Modified Eagles
Medium (167,195,196). This method is now part of our standard operating procedure
(SOP) for mouse fibroblast cell culture. For experimental work, fibroblasts have
previously been described to be used at between passage five (151) and passage ten
(119). We found that above passage five was an optimum passage number for use
with the cell sorter and after sorting cells have maintained their phenotype above
passage 35 so far.
Although a specific marker has not yet been found for fibroblasts, there are several
markers that can be used, however none are exclusive (138,197). For these reasons a
panel of fibroblast indicators were used on the stromal cell populations acquired by
enzymatic digestion from the spleen, thymus, liver, skin, lung and inguinal, axillary
and cervical lymph nodes. This included VCAM-1 (150), CD248 (140) and gp38 (72)
along with classic markers of other cell types, including haematopoietic cells (CD45)
(189), macrophages (F4/80) (190), dendritic cells (CD11c) (191) and endothelial cells
(CD31) (188), to exclude non-fibroblast-like cells. Parsonage et al (2003), observed
morphological, mRNA and protein expression differences when growing human
fibroblasts in culture (150). This correlates with the differential gene and protein
Chapter Three Results 106
expression seen in cultured stromal cells (section 3.2); following FACS analysis
CD248, gp38 and VCAM-1 protein expression was observed in all cultures.
Moreover, genes such as vimentin and the pro-collagens were shown to be highly
transcribed in the Fibroblast LDA (figure 3.3). Taken together these data suggest that
fibroblasts are present in the cultures. However, protein expression of markers for
other cell types including haematopoietic cells (CD45), dendritic cells (CD11c),
endothelial cells (CD31) and macrophages (F4/80) was also seen. From the Fibroblast
LDA, it became clear that other cell populations were present in the cell cultures.
SAM analysis gave gene expression that differed significantly between cultures. For
example CD80 and CD86 were increased in spleen, liver and thymus stromal cultures,
suggesting the presence of antigen presenting cells. CD80 is expressed on activated B
cells and monocytes (185). CD86 provides co-stimulatory signals for T cell activation
and survival (186). CD117 (KIT), a molecule expressed on the surface of
haematopoietic stem cells showed high expression on lymph node stromal cell
populations (187). Furthermore high CD31 expression was observed in lymph node
stromal cell populations, which indicates the presence of endothelial cells (188). The
conclusion from the flow cytometry and Fibroblast LDA data was that the in vitro
cultures were heterogeneous and included cell types other than the fibroblast.
To address the concerns about the heterogeneity of the cultures, the stromal cells were
sorted on CD45 expression (section 3.2.2.1), with CD45 negative stromal cells grown
successfully to obtain a more homogenous population. Upon analysis of gene and
protein expression of these CD45 negative sorted cells (section 3.2.2.4 and
3.2.2.2/3.2.2.3 respectively) differences in gene and protein expression between the
cell cultures was still observed, which was not due to contaminating CD45 positive
Chapter Three Results 107
cells. It was at this stage that peripheral sites, lung and skin, were included. It has
been shown previously within humans that fibroblasts can be grouped into peripheral
and lymphoid sites using whole genome microarray analysis (150). This is an
important finding to address within the murine studies and was intended to be used as
a positive control in addition to the groupings within the lymphoid tissues. The
protein expression of the CD45 negative sorted cells (section 3.2.2.2) assessed by
flow cytometry showed a more homogeneous population, with no F4/80 expression
and high levels of VCAM-1, CD248 and gp38 in all stromal cell cultures. High
expression of CD248 and gp38 was also seen by immunofluorescence (section
3.2.2.3), along with an elongated, spindle shaped morphology which is associated
with fibroblasts. The single positive CD248 or gp38 stromal cells observed may due
to their stage in the cell cycle, as by flow cytometry all cells expressed both markers.
Interestingly, VCAM-1 expression was variable when analysed by
immunofluorescence where it was highest in spleen, with lower expression detected in
all but the cervical lymph node stromal cell cultures where none was detected.
However, VCAM-1 gene expression was found to be high in gene arrays and end
point PCR so there may have been technical issues with the immunofluorescent
staining. This could be due to the treatment of the cells prior to staining, cells are
fixed before immunofluorescent staining, which could have affected the VCAM-1
protein expression or available epitope required. Whereas, for flow cytometry, cell
dissociation buffer is used, which may preferentially release VCAM-1 high
populations of stromal cells. Finally, when immunofluorescence was performed triple
staining of CD248/gp38/VCAM-1 was used whereas for flow cytometry single colour
staining was performed for each marker. It is possible that the fluorescence of the
other antibodies affected that of the VCAM-1. Ultimately the sensitivity of the
Chapter Three Results 108
techniques could explain the differences seen, if there is only a small amount of
VCAM-1 present a more sensitive technique would highlight it. The dysregulation
between mRNA and protein expression is often seen and probably due to the high
sensitivity of PCR and post-transcriptional control. In the inguinal and axillary lymph
node stromal cell cultures there was a very low amount of CD31 expression observed
by flow cytometry, indicating these cells may have a more endothelial-like phenotype.
This was confirmed by the whole genome microarrays and the site specific LDA
where expression of CD31 and lymphatic endothelial marker Lyve-1 was observed
(section 3.2.2.4 and 3.2.2.6). One consistent difference between the stromal cell
cultures was protein expression of ICAM-1, expression was seen in spleen, liver, lung
and inguinal lymph node cultures. Studies by Cupedo et al (45) and Okuda et al (198)
have highlighted distinct populations of stromal organiser cells within peripheral and
mesenteric lymph nodes, that have intermediate or high levels of ICAM-1 and
VCAM-1. Whilst both lymph nodes contained the different populations, they were
present in different numbers and ratios. The genes differentially expressed in these
populations included VCAM-1, ICAM-1, CXCL13, CCL21 and CCL19. This may
demonstrate the varied microenvironment present in these lymph nodes and provides
evidence as to why they have diverse developmental requirements (section 1.2.1.4).
The ICAM-1 expression variation seen in the stromal cell cultures may be indicative
of the dominant stromal organiser population present in the spleen, liver, lung and
inguinal lymph node cultures.
Following protein expression analysis, whole genome microarrays were used to
determine if a specific lymphoid organ fibroblast gene signature could be established.
The gene expression observed was able to group the stromal cell cultures into
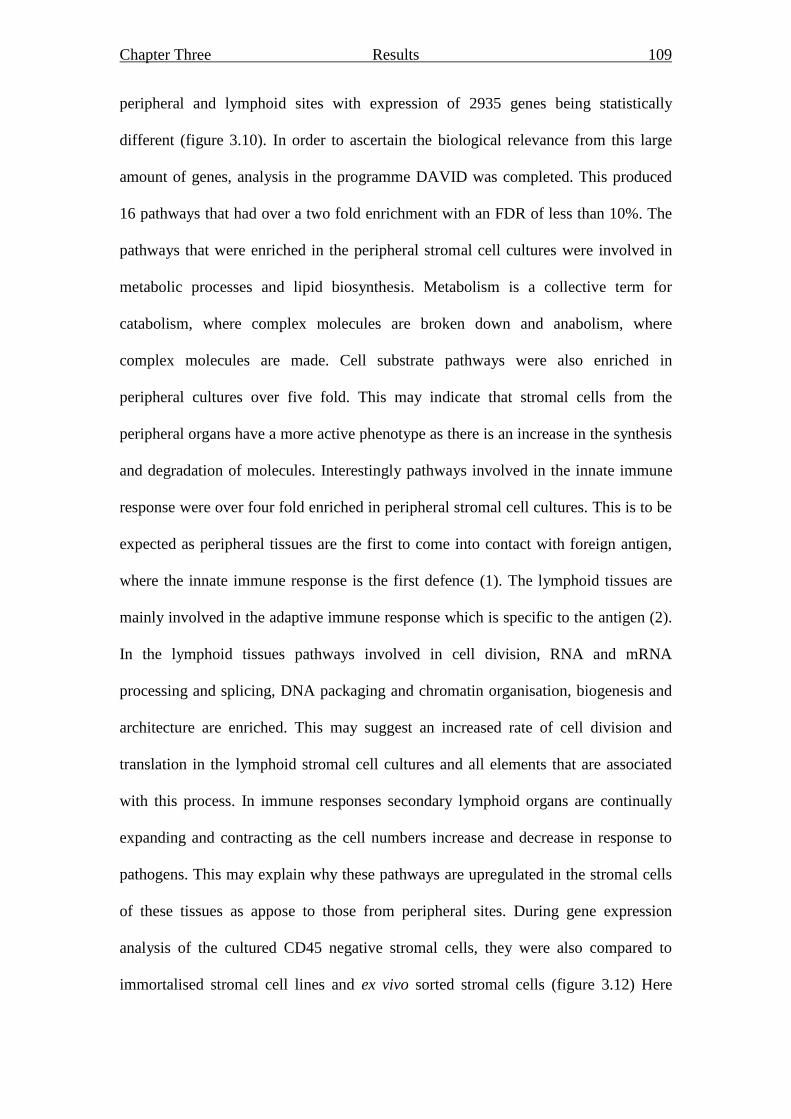
Chapter Three Results 109
peripheral and lymphoid sites with expression of 2935 genes being statistically
different (figure 3.10). In order to ascertain the biological relevance from this large
amount of genes, analysis in the programme DAVID was completed. This produced
16 pathways that had over a two fold enrichment with an FDR of less than 10%. The
pathways that were enriched in the peripheral stromal cell cultures were involved in
metabolic processes and lipid biosynthesis. Metabolism is a collective term for
catabolism, where complex molecules are broken down and anabolism, where
complex molecules are made. Cell substrate pathways were also enriched in
peripheral cultures over five fold. This may indicate that stromal cells from the
peripheral organs have a more active phenotype as there is an increase in the synthesis
and degradation of molecules. Interestingly pathways involved in the innate immune
response were over four fold enriched in peripheral stromal cell cultures. This is to be
expected as peripheral tissues are the first to come into contact with foreign antigen,
where the innate immune response is the first defence (1). The lymphoid tissues are
mainly involved in the adaptive immune response which is specific to the antigen (2).
In the lymphoid tissues pathways involved in cell division, RNA and mRNA
processing and splicing, DNA packaging and chromatin organisation, biogenesis and
architecture are enriched. This may suggest an increased rate of cell division and
translation in the lymphoid stromal cell cultures and all elements that are associated
with this process. In immune responses secondary lymphoid organs are continually
expanding and contracting as the cell numbers increase and decrease in response to
pathogens. This may explain why these pathways are upregulated in the stromal cells
of these tissues as appose to those from peripheral sites. During gene expression
analysis of the cultured CD45 negative stromal cells, they were also compared to
immortalised stromal cell lines and ex vivo sorted stromal cells (figure 3.12) Here
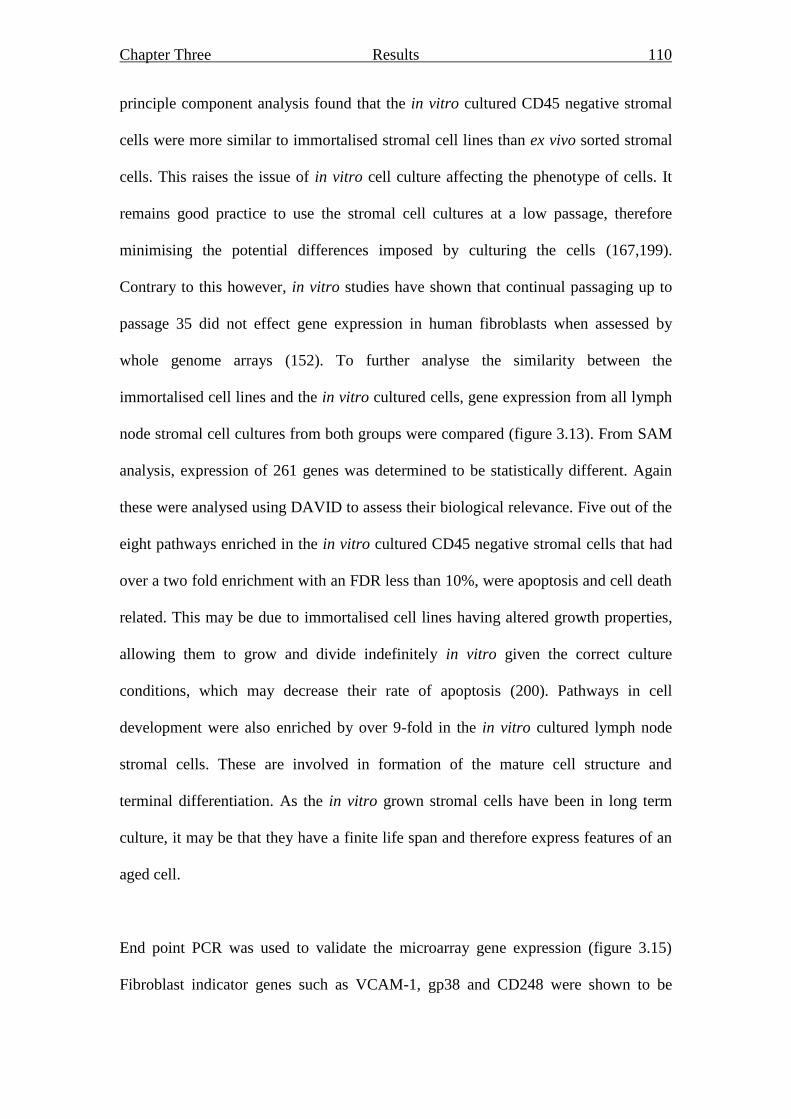
Chapter Three Results 110
principle component analysis found that the in vitro cultured CD45 negative stromal
cells were more similar to immortalised stromal cell lines than ex vivo sorted stromal
cells. This raises the issue of in vitro cell culture affecting the phenotype of cells. It
remains good practice to use the stromal cell cultures at a low passage, therefore
minimising the potential differences imposed by culturing the cells (167,199).
Contrary to this however, in vitro studies have shown that continual passaging up to
passage 35 did not effect gene expression in human fibroblasts when assessed by
whole genome arrays (152). To further analyse the similarity between the
immortalised cell lines and the in vitro cultured cells, gene expression from all lymph
node stromal cell cultures from both groups were compared (figure 3.13). From SAM
analysis, expression of 261 genes was determined to be statistically different. Again
these were analysed using DAVID to assess their biological relevance. Five out of the
eight pathways enriched in the in vitro cultured CD45 negative stromal cells that had
over a two fold enrichment with an FDR less than 10%, were apoptosis and cell death
related. This may be due to immortalised cell lines having altered growth properties,
allowing them to grow and divide indefinitely in vitro given the correct culture
conditions, which may decrease their rate of apoptosis (200). Pathways in cell
development were also enriched by over 9-fold in the in vitro cultured lymph node
stromal cells. These are involved in formation of the mature cell structure and
terminal differentiation. As the in vitro grown stromal cells have been in long term
culture, it may be that they have a finite life span and therefore express features of an
aged cell.
End point PCR was used to validate the microarray gene expression (figure 3.15)
Fibroblast indicator genes such as VCAM-1, gp38 and CD248 were shown to be
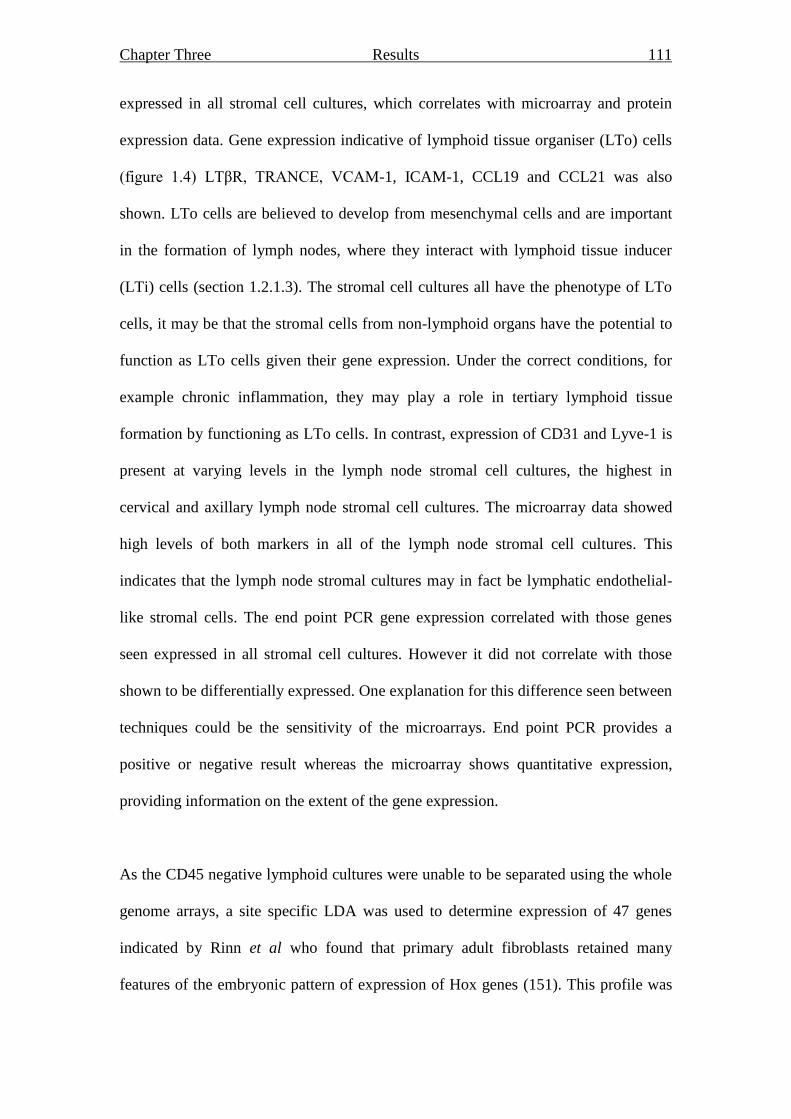
Chapter Three Results 111
expressed in all stromal cell cultures, which correlates with microarray and protein
expression data. Gene expression indicative of lymphoid tissue organiser (LTo) cells
(figure 1.4) LTβR, TRANCE, VCAM-1, ICAM-1, CCL19 and CCL21 was also
shown. LTo cells are believed to develop from mesenchymal cells and are important
in the formation of lymph nodes, where they interact with lymphoid tissue inducer
(LTi) cells (section 1.2.1.3). The stromal cell cultures all have the phenotype of LTo
cells, it may be that the stromal cells from non-lymphoid organs have the potential to
function as LTo cells given their gene expression. Under the correct conditions, for
example chronic inflammation, they may play a role in tertiary lymphoid tissue
formation by functioning as LTo cells. In contrast, expression of CD31 and Lyve-1 is
present at varying levels in the lymph node stromal cell cultures, the highest in
cervical and axillary lymph node stromal cell cultures. The microarray data showed
high levels of both markers in all of the lymph node stromal cell cultures. This
indicates that the lymph node stromal cultures may in fact be lymphatic endothelial-
like stromal cells. The end point PCR gene expression correlated with those genes
seen expressed in all stromal cell cultures. However it did not correlate with those
shown to be differentially expressed. One explanation for this difference seen between
techniques could be the sensitivity of the microarrays. End point PCR provides a
positive or negative result whereas the microarray shows quantitative expression,
providing information on the extent of the gene expression.
As the CD45 negative lymphoid cultures were unable to be separated using the whole
genome arrays, a site specific LDA was used to determine expression of 47 genes
indicated by Rinn et al who found that primary adult fibroblasts retained many
features of the embryonic pattern of expression of Hox genes (151). This profile was
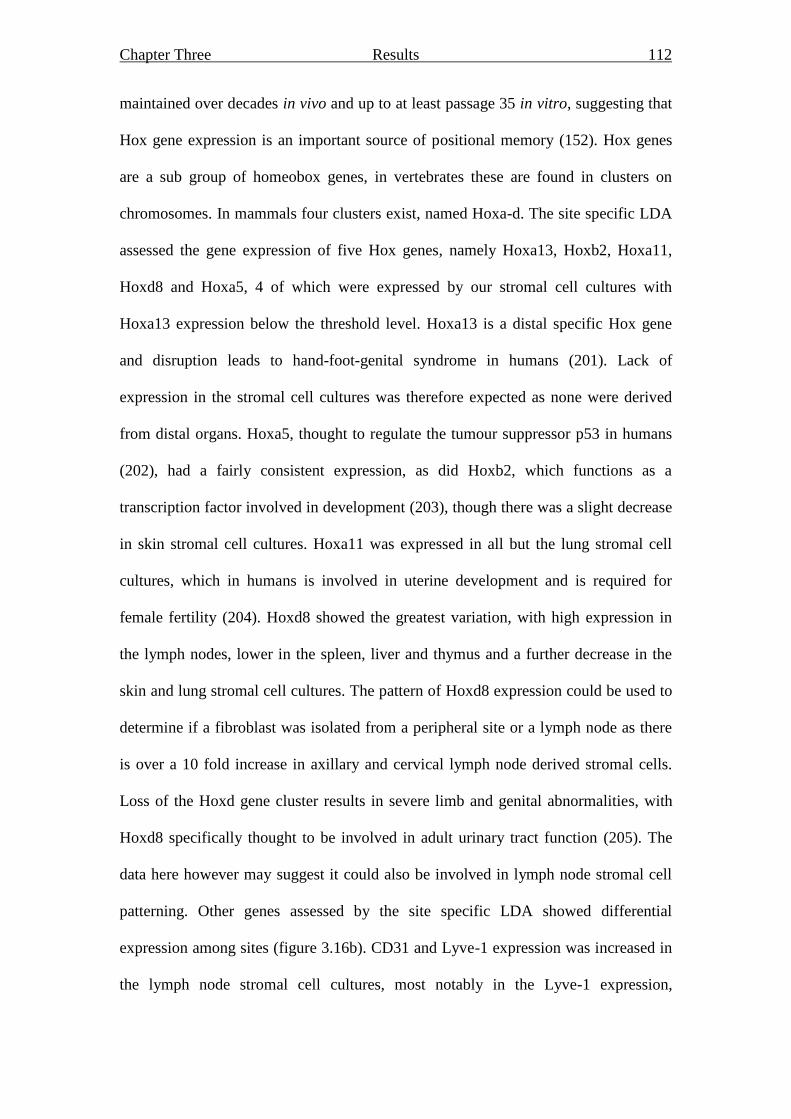
Chapter Three Results 112
maintained over decades in vivo and up to at least passage 35 in vitro, suggesting that
Hox gene expression is an important source of positional memory (152). Hox genes
are a sub group of homeobox genes, in vertebrates these are found in clusters on
chromosomes. In mammals four clusters exist, named Hoxa-d. The site specific LDA
assessed the gene expression of five Hox genes, namely Hoxa13, Hoxb2, Hoxa11,
Hoxd8 and Hoxa5, 4 of which were expressed by our stromal cell cultures with
Hoxa13 expression below the threshold level. Hoxa13 is a distal specific Hox gene
and disruption leads to hand-foot-genital syndrome in humans (201). Lack of
expression in the stromal cell cultures was therefore expected as none were derived
from distal organs. Hoxa5, thought to regulate the tumour suppressor p53 in humans
(202), had a fairly consistent expression, as did Hoxb2, which functions as a
transcription factor involved in development (203), though there was a slight decrease
in skin stromal cell cultures. Hoxa11 was expressed in all but the lung stromal cell
cultures, which in humans is involved in uterine development and is required for
female fertility (204). Hoxd8 showed the greatest variation, with high expression in
the lymph nodes, lower in the spleen, liver and thymus and a further decrease in the
skin and lung stromal cell cultures. The pattern of Hoxd8 expression could be used to
determine if a fibroblast was isolated from a peripheral site or a lymph node as there
is over a 10 fold increase in axillary and cervical lymph node derived stromal cells.
Loss of the Hoxd gene cluster results in severe limb and genital abnormalities, with
Hoxd8 specifically thought to be involved in adult urinary tract function (205). The
data here however may suggest it could also be involved in lymph node stromal cell
patterning. Other genes assessed by the site specific LDA showed differential
expression among sites (figure 3.16b). CD31 and Lyve-1 expression was increased in
the lymph node stromal cell cultures, most notably in the Lyve-1 expression,
Chapter Three Results 113
indicating a lymphatic endothelium genotype as observed with the end point PCR and
microarray data. Interestingly, Grem2 which was not observed in the spleen stromal
cells, expressed at low levels in the inguinal lymph node stromal cells, at intermediate
levels in the thymus, liver and axillary stromal cells and high levels in the cervical
lymph node, lung and skin stromal cells, is thought to play a role in regulating
organogenesis, body patterning and tissue differentiation (206). This may indicate a
novel role in fibroblast regional specificity. Cdh1 and Mmp3 are also differentially
expressed between sites. Cdh1 encodes a cell-cell adhesion protein and has a tumour
suppressor function (207) and Mmp3 is an enzyme involved in the breakdown of
extracellular matrix (194). The differential expression of these genes may represent
the specific needs of the microenvironment of that stromal cell population. CD248,
Wisp2, FoxF1a, Gulp, Adam9, Fn, Colla1, Bmp4 and Plat all had a lower expression
in the peripheral stromal cell cultures compared to lymphoid stromal cell cultures.
Again this could be due to the requirements of a specific microenvironment, with
peripheral fibroblasts having different extracellular matrix components and supports
the differences observed between lymphoid and peripheral stromal cell cultures using
whole genome microarrays.
In conclusion, these data highlight major differences between unsorted lymph node
stromal cell cultures and those from the spleen, thymus and liver. In CD45 negative
sorted cultures a gene signature of lymphoid tissue stromal cells was determined that
was different to that from peripheral tissue stromal cells. However this could not
differentiate between lymphoid tissue stromal cells. Further studies using LDA
showed that Hoxd8, Grem2, Cdh1 and Mmp3 may be used to differentiate between
lymphoid tissue stromal cells, although protein expression has yet to be determined so

Chapter Three Results 114
this data needs further investigation. Finally the gene expression observed indicates
that the stromal cell cultures may have the expression profile of LTo cells. This
finding needs to be further investigated using functional assays.
Chapter Four Results 115
Chapter Four
In vitro Function of Fibroblast
Populations from Different Sites
Chapter Four Results 116
CHAPTER FOUR
In vitro Function of Fibroblast Populations from Different Sites
4.1 Introduction
The cross talk between lymphoid tissue inducer (LTi) cells and lymphoid tissue
organiser (LTo) cells has been shown to be critical to lymph node organogenesis (35)
and involves the ligands and receptors of the tumour necrosis family (TNF) family
(36). Lymphotoxin (LT) α, LTβ and TNF are structurally homologous cytokines
grouped within the TNF ligand family (37). TNF and LTα can bind to TNF receptors
TNFRI and TNFRII. However, LTβ forms a functional heterotrimeric complex,
LTα1β2 to bind to its receptor, lymphotoxin β receptor (LTβR) (38,39). The
importance of this interaction in functional secondary lymphoid organ formation has
been demonstrated by LTα knockout mice. In these mice all lymph nodes and Peyer‟s
patches are absent, with the spleen and nasal-associated lymphoid tissue (NALT)
being highly disorganised (40). LTα has been shown to be a key factor in the
differentiation of stromal cells into stromal organiser cells, recognised by the
upregulated expression of several surface proteins including VCAM-1 and ICAM-1
(35). In this study the gene expression, for example LTβR, TRANCE, VCAM-1,
ICAM-1, CCL19 and CCL21, of all the stromal cell cultures is indicative of LTo
cells. Therefore the stromal cells were treated with LTα to determine if their
functional response was also suggestive of an LTo phenotype.
Another function of the LTo is their interaction with lymphocytes. Previous work has
shown that stromal cells co-cultured with lymphocytes results in an increase in
lymphocyte survival. This is thought to be mediated by survival factors produced
Chapter Four Results 117
from the stromal cells and IL-7 was shown to be at least partly responsible for this
enhanced survival (67). In this study the gene expression of known lymphocyte
survival factors such as IL-6 (208), IL-7 (209,210) and CCL19 (67) were observed in
the stromal cell cultures, therefore the co-culture of lymphocytes with cultured
stromal cells from different mouse organs was assessed to determine if enhanced
survival occurred and if this was affected by the origin of the stromal cell.
In this chapter functional differences were seen between lymphoid and peripheral
stromal cell populations in their response to LTα, and also within the lymphoid tissue
stromal cells in terms of the degree of their response. Increased lymphocyte survival
was observed in co-culture with all stromal cells, however B cells showed only a
minimal enhancement of survival with the effect on T cell survival being much
greater.
4.2 Results
4.2.1 LTα treatment of stromal cells
Having noted that the phenotype of the stromal cell cultures was similar to that
described in the literature as a lymphoid tissue organiser (LTo) cell, the function of
these cells was analysed. As LTα has been shown to be a key factor in the
differentiation of stromal cells into stromal organiser cells and in LTo interaction with
LTi, its effect on the cultured stromal cells was determined. The effect of LTα on
VCAM-1 and ICAM-1 expression in stromal cell cultures was assessed by treating
splenic stromal cell cultures with LTα at a range of concentrations for 24 hours
(figure 4.1a). LTα was shown to increase expression of both VCAM-1 and ICAM-1,
with increasing concentrations of LTα also increasing protein expression. Although

Chapter Four Results 118
2.5µg/ml of LTα increased VCAM-1 expression as compared to 1µg/ml, it did not
warrant using a dose 2.5 times higher. ICAM-1 expression increased up to a LTα
concentration of 1µg/ml but no further increase in expression was seen with 2.5µg/ml.
Therefore, 1µg/ml of LTα was used during a time course to assess dynamics of
VCAM-1 and ICAM-1 expression (figure 4.1b). LTα treatment increased ICAM-1
expression up to 24 hours and then decreased by 72 hours. VCAM-1 expression was
increased up to 12 hours after LTα treatment, where it remains high to 24 hours and
then similar to ICAM-1 decreased by 72 hours. Therefore splenic stromal cells were
treated with 1µg/ml of LTα for 24 hours as determined by the titration and time
course (figure 4.1c). No effect was seen of LTα treatment on isotype control
expression and a clear increase in VCAM-1 and ICAM-1 expression was observed.
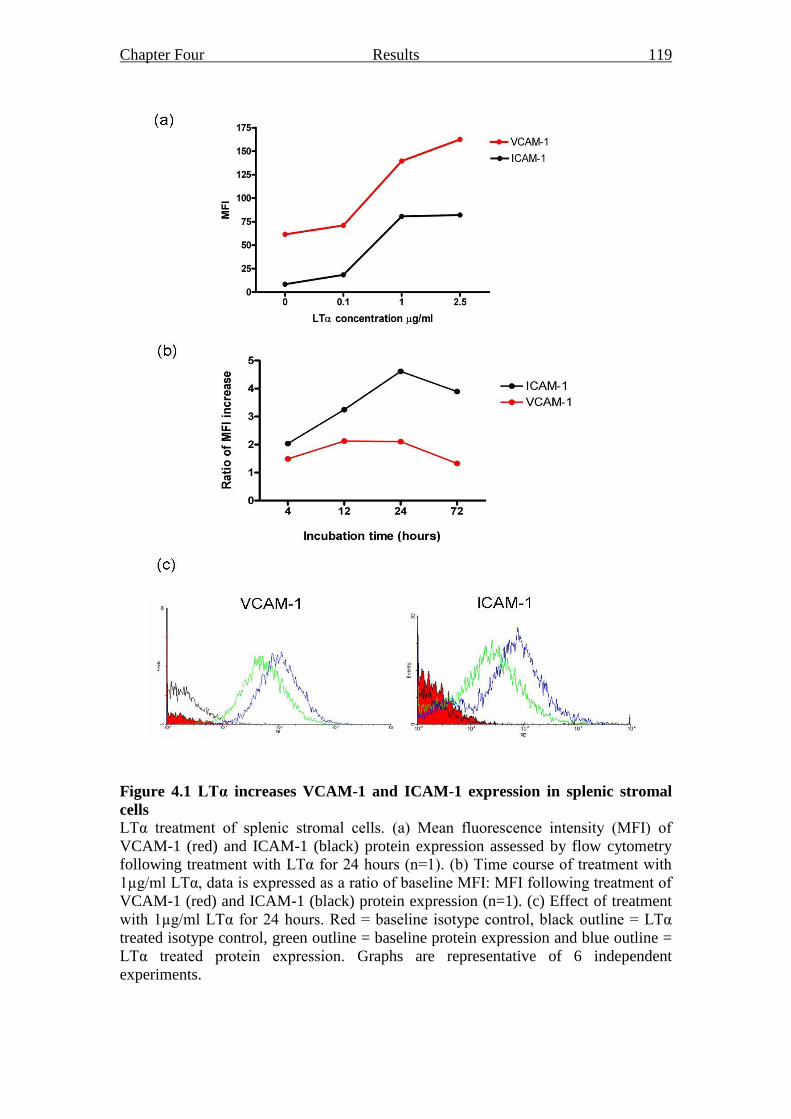
Chapter Four Results 119
Figure 4.1 LTα increases VCAM-1 and ICAM-1 expression in splenic stromal
cells
LTα treatment of splenic stromal cells. (a) Mean fluorescence intensity (MFI) of
VCAM-1 (red) and ICAM-1 (black) protein expression assessed by flow cytometry
following treatment with LTα for 24 hours (n=1). (b) Time course of treatment with
1µg/ml LTα, data is expressed as a ratio of baseline MFI: MFI following treatment of
VCAM-1 (red) and ICAM-1 (black) protein expression (n=1). (c) Effect of treatment
with 1µg/ml LTα for 24 hours. Red = baseline isotype control, black outline = LTα
treated isotype control, green outline = baseline protein expression and blue outline =
LTα treated protein expression. Graphs are representative of 6 independent
experiments.
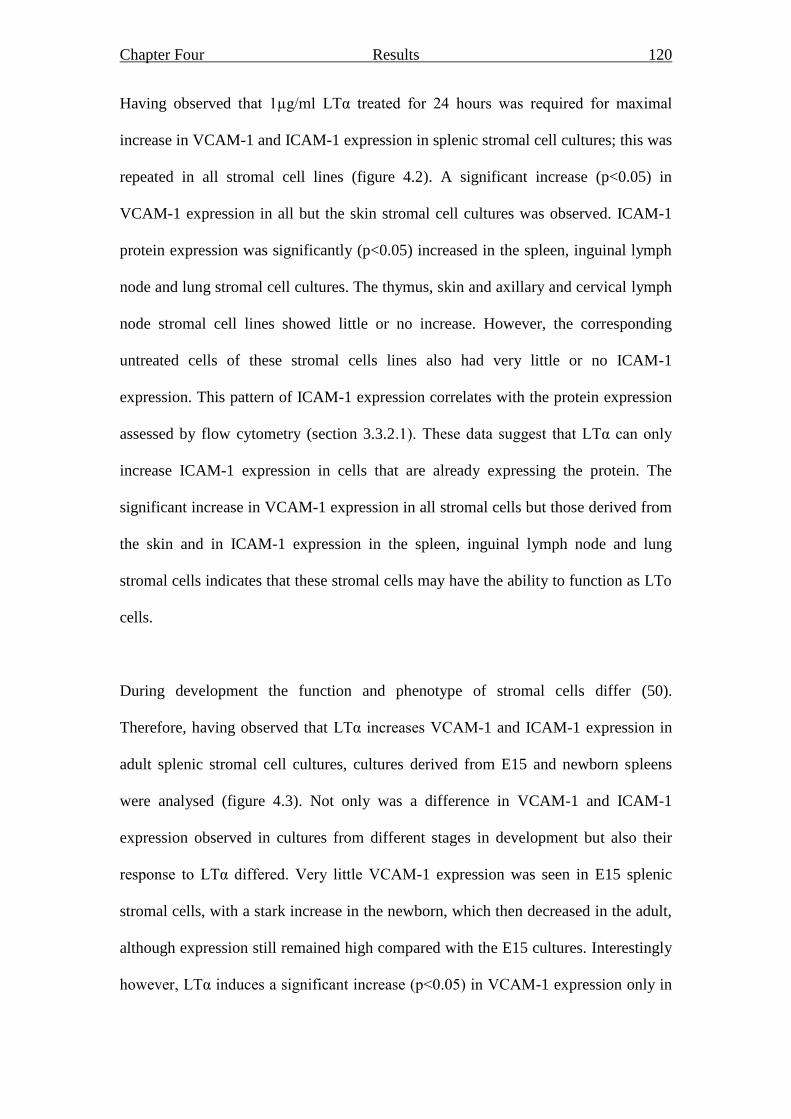
Chapter Four Results 120
Having observed that 1µg/ml LTα treated for 24 hours was required for maximal
increase in VCAM-1 and ICAM-1 expression in splenic stromal cell cultures; this was
repeated in all stromal cell lines (figure 4.2). A significant increase (p<0.05) in
VCAM-1 expression in all but the skin stromal cell cultures was observed. ICAM-1
protein expression was significantly (p<0.05) increased in the spleen, inguinal lymph
node and lung stromal cell cultures. The thymus, skin and axillary and cervical lymph
node stromal cell lines showed little or no increase. However, the corresponding
untreated cells of these stromal cells lines also had very little or no ICAM-1
expression. This pattern of ICAM-1 expression correlates with the protein expression
assessed by flow cytometry (section 3.3.2.1). These data suggest that LTα can only
increase ICAM-1 expression in cells that are already expressing the protein. The
significant increase in VCAM-1 expression in all stromal cells but those derived from
the skin and in ICAM-1 expression in the spleen, inguinal lymph node and lung
stromal cells indicates that these stromal cells may have the ability to function as LTo
cells.
During development the function and phenotype of stromal cells differ (50).
Therefore, having observed that LTα increases VCAM-1 and ICAM-1 expression in
adult splenic stromal cell cultures, cultures derived from E15 and newborn spleens
were analysed (figure 4.3). Not only was a difference in VCAM-1 and ICAM-1
expression observed in cultures from different stages in development but also their
response to LTα differed. Very little VCAM-1 expression was seen in E15 splenic
stromal cells, with a stark increase in the newborn, which then decreased in the adult,
although expression still remained high compared with the E15 cultures. Interestingly
however, LTα induces a significant increase (p<0.05) in VCAM-1 expression only in

Chapter Four Results 121
the adult derived cultures. Expression of VCAM-1 in newborn cultures does generally
increase, however failed to reach significance. ICAM-1 expression followed the same
trend as VCAM-1 in the untreated cells, in that ICAM-1 expression was increased in
newborn cultures with concomitant decrease in adult cultures, however expression in
the adult cultures was lower than in E15. Upon LTα treatment E15, newborn and
adult splenic cultures significantly increased ICAM-1 expression (p<0.05, p<0.001,
p<0.05 respectively).
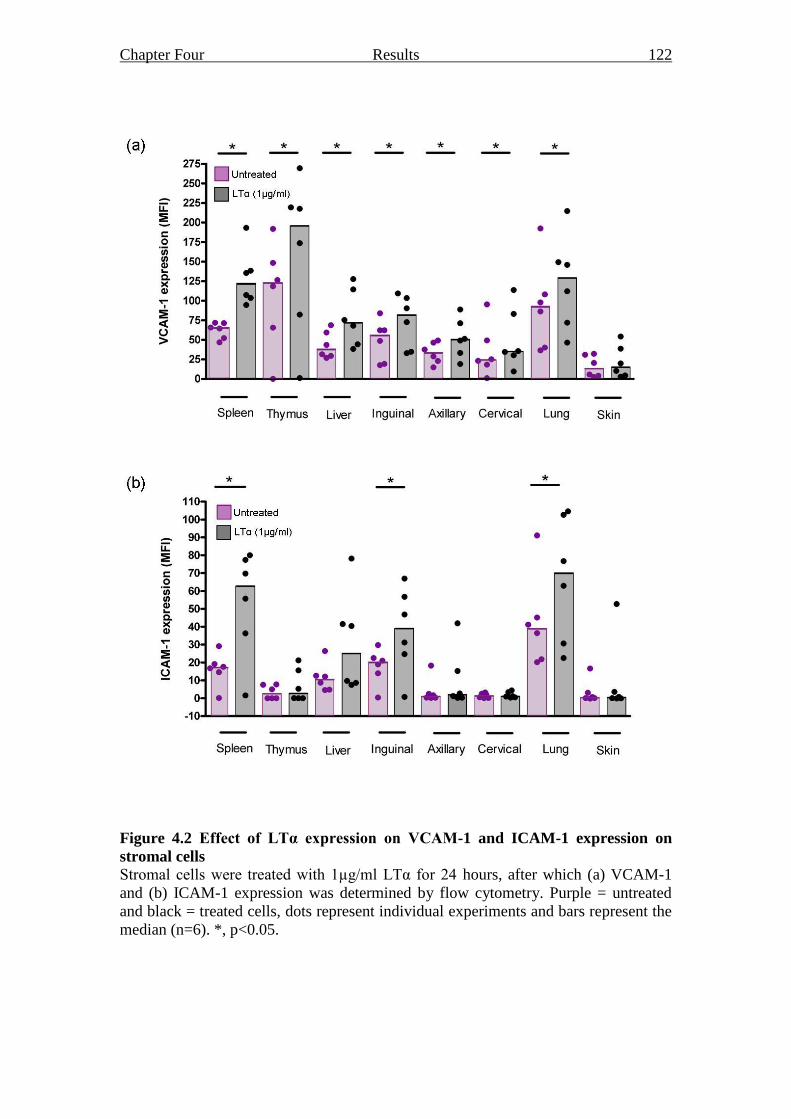
Chapter Four Results 122
Figure 4.2 Effect of LTα expression on VCAM-1 and ICAM-1 expression on
stromal cells
Stromal cells were treated with 1µg/ml LTα for 24 hours, after which (a) VCAM-1
and (b) ICAM-1 expression was determined by flow cytometry. Purple = untreated
and black = treated cells, dots represent individual experiments and bars represent the
median (n=6). *, p<0.05.
Chapter Four Results 123
Figure 4.3 Effect of LTα treatment on VCAM-1 and ICAM-1 expression on
splenic stromal cell cultures throughout development
Splenic stromal cell cultures from E15, newborn and adult mice were treated with
1µg/ml LTα for 24 hours, after which (a) VCAM-1 and (b) ICAM-1 expression was
determined by flow cytometry. Purple = untreated and black = treated cells, dots
represent individual experiments and bars represent the median (n=6). *, p<0.05 **,
p<0.001.
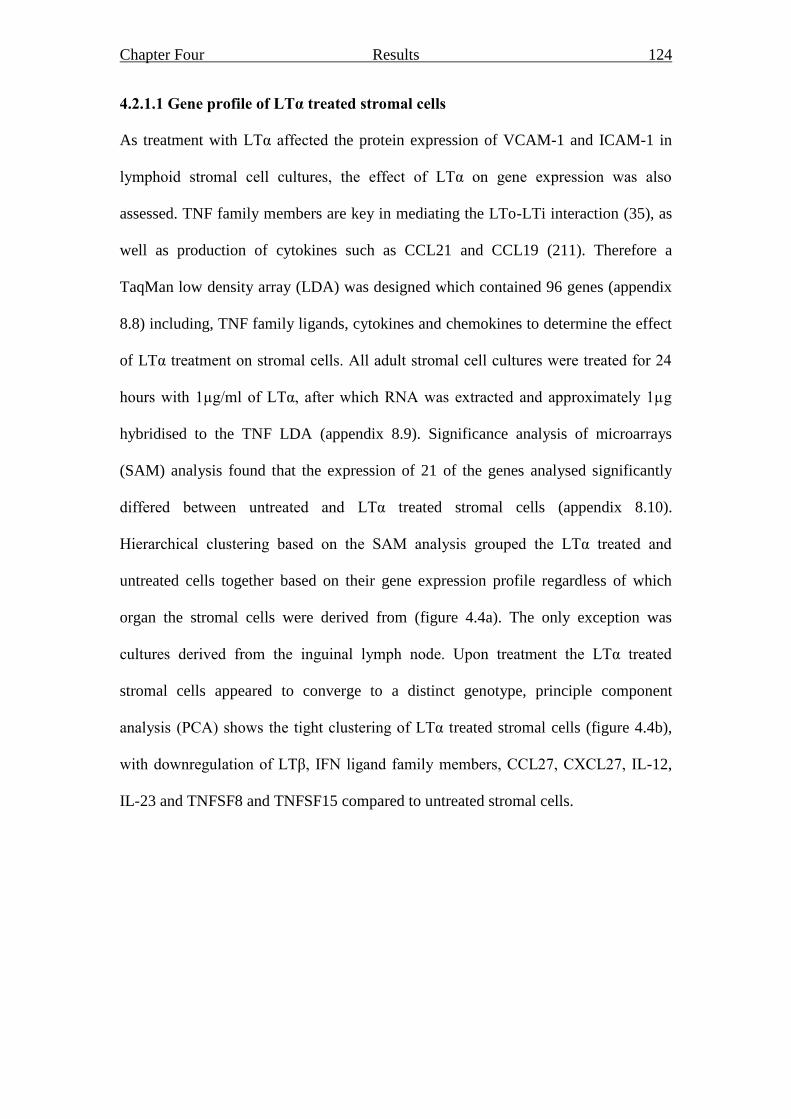
Chapter Four Results 124
4.2.1.1 Gene profile of LTα treated stromal cells
As treatment with LTα affected the protein expression of VCAM-1 and ICAM-1 in
lymphoid stromal cell cultures, the effect of LTα on gene expression was also
assessed. TNF family members are key in mediating the LTo-LTi interaction (35), as
well as production of cytokines such as CCL21 and CCL19 (211). Therefore a
TaqMan low density array (LDA) was designed which contained 96 genes (appendix
8.8) including, TNF family ligands, cytokines and chemokines to determine the effect
of LTα treatment on stromal cells. All adult stromal cell cultures were treated for 24
hours with 1µg/ml of LTα, after which RNA was extracted and approximately 1µg
hybridised to the TNF LDA (appendix 8.9). Significance analysis of microarrays
(SAM) analysis found that the expression of 21 of the genes analysed significantly
differed between untreated and LTα treated stromal cells (appendix 8.10).
Hierarchical clustering based on the SAM analysis grouped the LTα treated and
untreated cells together based on their gene expression profile regardless of which
organ the stromal cells were derived from (figure 4.4a). The only exception was
cultures derived from the inguinal lymph node. Upon treatment the LTα treated
stromal cells appeared to converge to a distinct genotype, principle component
analysis (PCA) shows the tight clustering of LTα treated stromal cells (figure 4.4b),
with downregulation of LTβ, IFN ligand family members, CCL27, CXCL27, IL-12,
IL-23 and TNFSF8 and TNFSF15 compared to untreated stromal cells.
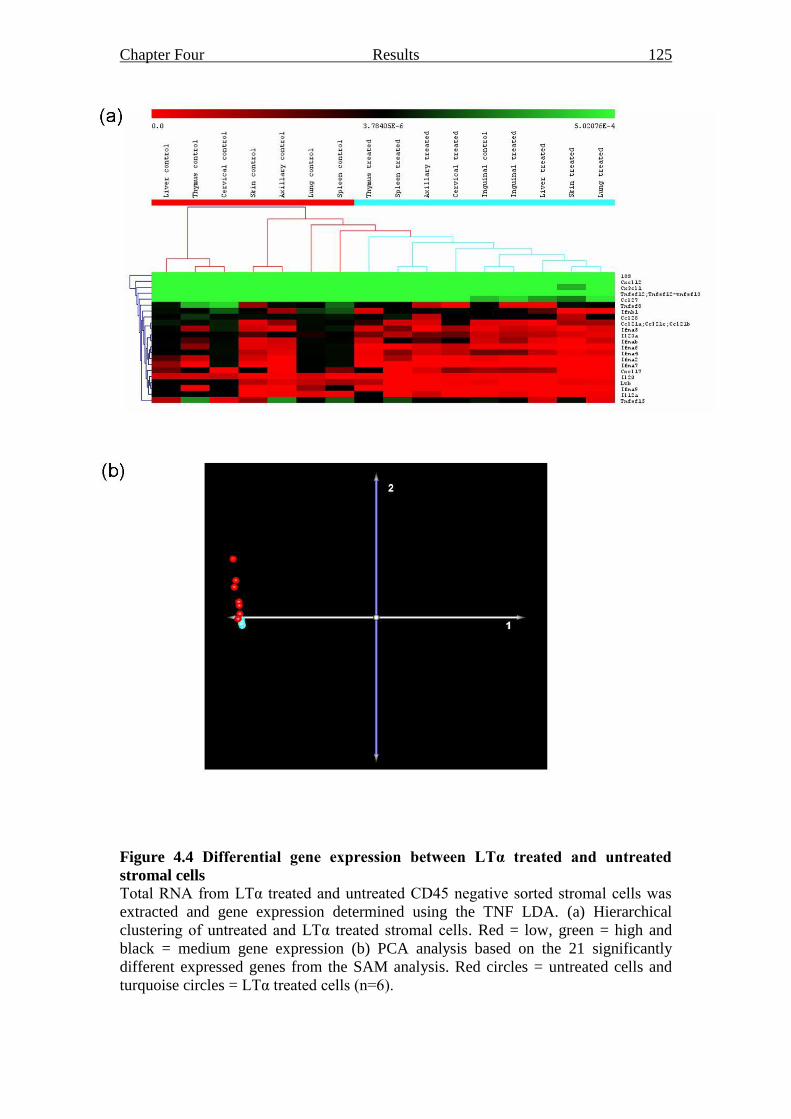
Chapter Four Results 125
Figure 4.4 Differential gene expression between LTα treated and untreated
stromal cells
Total RNA from LTα treated and untreated CD45 negative sorted stromal cells was
extracted and gene expression determined using the TNF LDA. (a) Hierarchical
clustering of untreated and LTα treated stromal cells. Red = low, green = high and
black = medium gene expression (b) PCA analysis based on the 21 significantly
different expressed genes from the SAM analysis. Red circles = untreated cells and
turquoise circles = LTα treated cells (n=6).
Chapter Four Results 126
4.2.2 Leucocyte survival in co-culture with stromal cells
Having established that the stromal cell cultures, as assessed by VCAM-1 and ICAM-
1 expression, responded to LTα in a manner indicative of LTo-like cells and coupled
with the observation that the cultures produced of factors associated with lymphocyte
survival, such as IL-6, IL-7 and CCL19 (section 3.2.2.5), lymphocyte survival was
assessed in a co-culture system. Whole splenocytes were co-cultured with adult
stromal cells derived from lymphoid and peripheral organs, conditioned medium or
fresh medium as a control. After four days incubation, the survival of the B cells
(CD19+) and T cells (CD3
+) was determined by Annexin V using flow cytometry.
Annexin V is a marker of cells in an early stage of apoptosis (212). Gates were used
to eliminate apoptotic cells by including only Annexin V negative cells. A significant
increase in the survival of B cells was observed when cultured with stromal cells from
all organs, rather than conditioned or fresh media (figure 4.5). However, the
percentage survival was low, generally below 10%, with little or no survival seen
when lymphocytes were cultured with conditioned or fresh media. When T cell
survival was assessed a significant increase was observed when cultured with all
stromal cells, compared to conditioned or fresh media (figure 4.6). Interestingly, the
percentage T cell survival was greater than B cell survival with the same stromal
cells. In addition, the conditioned media was more effective at increasing T cell
survival compared to B cells, suggesting that soluble factors present in the
conditioned media may also play a role in T cell survival. The survival experiments
were completed twice with three replicates in each. The two different experiments
demonstrated variation in survival of both B and T cells, although replicates were
tightly clustered.
Chapter Four Results 127
Figure 4.5 Percentage B cell survival in co-culture with stromal cells
One million splenocytes were added to cultured stromal cells (purple bars) or
conditioned medium (turquoise bars) from (a) spleen, (b) thymus, (c) liver, (d)
inguinal lymph node, (e) axillary lymph node, (f) cervical lymph node, (g) lung and
(h) skin, with fresh medium as a control. B cell survival was determined by flow
cytometry using Annexin V staining after four days in culture (n=6). *, p<0.05. **,
p<0.0001.
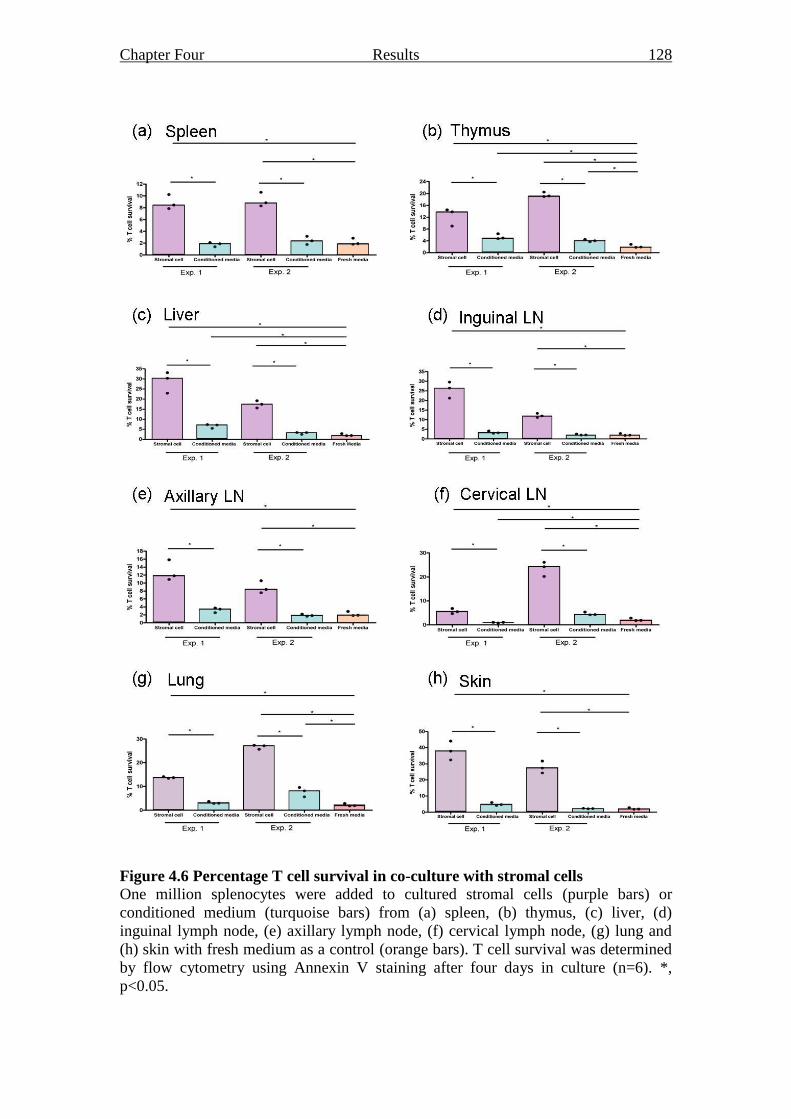
Chapter Four Results 128
Figure 4.6 Percentage T cell survival in co-culture with stromal cells
One million splenocytes were added to cultured stromal cells (purple bars) or
conditioned medium (turquoise bars) from (a) spleen, (b) thymus, (c) liver, (d)
inguinal lymph node, (e) axillary lymph node, (f) cervical lymph node, (g) lung and
(h) skin with fresh medium as a control (orange bars). T cell survival was determined
by flow cytometry using Annexin V staining after four days in culture (n=6). *,
p<0.05.
Chapter Four Results 129
4.3 Discussion
Gene expression profiles of all stromal cell cultures, for example LTβR, TRANCE,
VCAM-1, ICAM-1, CCL19 and CCL21, suggested a LTo cell phenotype (chapter 3).
These cells, in conjunction with LTi cells in vivo form secondary lymphoid tissue
(35). An important interaction between these two cell types is the activation of LTo
by LTα produced by the LTi cell, resulting in an increase in expression of many
proteins including VCAM-1 and ICAM-1 (35). Therefore, the response of the stromal
cell cultures to LTα was assessed by measuring VCAM-1 and ICAM-1 protein cell
surface expression. A significant increase (p<0.05) in VCAM-1 expression was seen
in all stromal cell cultures except those derived from the skin. The lack of response in
the skin stromal cell cultures is not surprising as this is not a secondary lymphoid site
and therefore it is reasonable to assume that it would be less likely to respond to LTα.
Interestingly however, the lung stromal cell cultures show a significant increase even
though it is not a secondary lymphoid site, perhaps indicating its potential for tertiary
lymphoid formation under chronic inflammatory conditions (104). Of note, smaller
increases in protein expression were seen in the three lymph node stromal cell
cultures compared with cell cultures from other lymphoid sites. This may indicate a
different phenotype within these stromal cells, which would correlate with the
differential gene expression seen in chapter 3, where the lymph node stromal cells had
expression of CD31 and Lyve-1, suggesting a lymphatic endothelial-like phenotype. It
is tempting to speculate therefore that the different basal levels of VCAM-1
expression in the stromal cell cultures represents the requirements of the specific
stromal microenvironment at each site. Conversely, ICAM-1 expression did not
follow the same pattern, it was significantly increased (p<0.05) only in the spleen,
inguinal lymph node and lung stromal cell cultures, which correlates with the protein
Chapter Four Results 130
expression data (section 3.2.2.2). When analysing the ICAM-1 expression, stromal
cell cultures that expressed ICAM-1 when resting could respond to LTα and increase
expression. However, in cultures that did not express ICAM-1 in the resting cell, it
was unable to be induced upon treatment with LTα. Previous studies have highlighted
a variation in ICAM-1 expression in stromal cell populations from different lymphoid
tissues, such as Peyer‟s patches and peripheral and mesenteric lymph nodes (45,198).
It is possible that the cultured stromal cells in this study obtained from the different
sites are representative of these different populations indicating ICAM-1 expression
as a protein that can differentiate different stromal populations.
As the LTo-LTi interaction is key in development, E15 and newborn splenic stromal
cell cultures were also treated with LTα. The E15 stromal cell cultures expressed very
low levels of VCAM-1 which was not upregulated upon LTα treatment, however
ICAM-1 expression was observed and this was significantly upregulated after LTα
treatment. Studies by White et al, 2007, found that at E15 the largest stromal cell
population in the inguinal lymph node was ICAM-1 positive VCAM-1 negative (50),
which correlates with the expression found in E15 splenic stromal cultures. In the
same study it was shown that as the lymph node develops the single positive stromal
cells mature into double positive VCAM-1/ICAM-1 expressing stromal cells by
postnatal day 1 (50). Again these findings correlate with this study as in the newborn
splenic stromal cell culture both VCAM-1 and ICAM-1 expression was found. The
adult splenic stromal cell cultures show lower expression of ICAM-1 and VCAM-1
compared with newborn splenic stromal cell cultures. This may be due to the
maturation of the spleen in the adult mouse. However the adult spleen still upregulates
expression of both VCAM-1 and ICAM-1 upon treatment with LTα, demonstrating
Chapter Four Results 131
that the adult stromal cells still have the ability to respond when required. Scandella et
al, 2008 demonstrated a reactivation of the LTo-LTi relationship seen in development
after alterations in the homeostasis of adult secondary lymphoid organs (57). LTi
cells, which are not thought to be needed to maintain non-inflammatory secondary
lymphoid organ homeostasis, were reactivated upon destruction of the T zone stroma
by lymphocytic choriomeningitis virus (LCMV) (57). This study provided evidence
that the LTo-LTi interactions are still important in the adult, long after secondary
lymphoid organ development has been completed. When analysing gene expression
before and after LTα treatment, it was possible to group the adult stromal cell cultures
into control and treated populations. The stromal cells seemed to converge into a
distinct phenotype, with the treated stromal cells having a more similar gene
expression than the untreated group. Significant downregulation of LTβ, IFN ligand
family members, CCL27, CXCL27, IL-12, IL-23 and TNFSF8 and TNFSF15 was
observed following SAM analysis. Most of these genes are involved in the
inflammatory response, either by homing of T cells (CCL27) (213), differentiation of
T cells (IL-12) (214) attracting dendritic cells and monocytes (CXCL17) (215),
regulating lymphocyte survival (TNFSF8) (216) or promoting upregulation of
inflammatory pathways (IL-23) (217). Downregulation of these genes is
counterintuitive seeing as LTα is thought to be pro-inflammatory (218) and play a key
role tertiary lymphoid formation in chronic inflammatory diseases (219). This could
be due to the fact 1µg/ml LTα for 24 hours was not the correct dose or timing to alter
gene expression, or it may be that LTα does not effect gene expression, only protein,
therefore further investigations such as a luminex assay could assess
chemokines/cytokines produced. It could also be due to the requirement for ligation of
Chapter Four Results 132
other receptors on the stromal cell by mechanisms which would occur in vivo such as
cell-cell contact between the LTo cells and the LTi cell.
In addition to how the stromal cell cultures are affected by LTα, their own effect on
lymphocyte survival was investigated. Previous work by Link et al, 2007, has shown
an increase in survival with stromal cells via IL-7 and CCL19 (67), for which the
cultured stromal cells have all been shown to express the genes (section 3.3.3). A
significant increase (p<0.05) in B and T cell survival was observed, with T cell
survival much greater when cultured with all stromal cell cultures. The difference
seen in survival between the two separate experiments could be explained by different
proliferation rates of the stromal cells which, in turn is dependant on where in the cell
cycle they were when seeded. This could be addressed in future experiments by
irradiating the stromal cells before seeding. The percentage B cell survival was
comparable with that seen by Link et al, 2007 (67). However the percentage T cell
survival after 4 days was lower. This highlights that the stromal cell cultures do not
keep T cells alive as well as observed this study. It may be due to how the apoptotic
cells were identified; in this study Annexin V staining was used by flow cytometry
whereas in the study by Link et al, trypan blue dye exclusion was used. Annexin V
staining by flow cytometry is a less subjective method for determining cell death as
the number of apoptotic cells is determined by the flow cytometer using set gates and
a large population of the cells.
Previously, phenotypic differences between peripheral and lymphoid stromal cells
were observed. In addition, within lymphoid stromal cells, the lymph node cultures
showed differences. The aim of this chapter was to see if these phenotypic differences
Chapter Four Results 133
would be mirrored in function. The response to LTα showed a definite difference
between peripheral and lymphoid stromal cell cultures and possibly within lymphoid
stromal cell cultures as the lymph node cultures showed a smaller increase in VCAM-
1 and ICAM-1 protein expression. Interestingly the lung stromal cells may act more
like lymphoid tissue stromal cells when forced. All cultures increased lymphocyte
survival indicating a general function of stroma (180). The phenotype of the stromal
cell cultures found in chapter 3, for example LTβR, TRANCE, VCAM-1, ICAM-1,
CCL19 and CCL21 suggested LTo-like cells. This coupled with the ability to keep T
cells alive more successfully than B cells and gp38 gene and protein expression,
indicates that the stromal cell cultures are comparable to a population termed
fibroblastic reticular cells (FRCs). These are the main stromal cell population from
the T zone of secondary lymphoid organs and have a role in the migration and
survival of T cells within the T zone (67).
Chapter Five Results 134
Chapter Five
In vivo Function of Fibroblast
Populations from Different Sites
Chapter Five Results 135
CHAPTER FIVE
In vivo Function of Fibroblast Populations from Different Sites
5.1 Introduction
Stromal cells support the distribution, migration and survival of lymphocytes as well
as acting as the structural backbone within lymph nodes. T zone stromal cells, termed
fibroblastic reticular cells (FRCs); produce constitutive chemokines and support
migrating T cells and dendritic cells (DCs). FRCs are more plentiful than other
stromal populations within the lymph node and have been shown to express
glycoprotein 38 (gp38 or podoplanin) (section 1.2.2.1.1) (70). They produce extra
cellular matrix (ECM) components, which are crucial to the structural stability of the
lymph nodes, and CCL21 and CCL19 which attract the CCR7 expressing T cells and
DCs to the T zone. In addition, they also enhance the survival of T cells by producing
IL-7 (71). In this study, the gene expression of the stromal cell cultures, for example
gp38, CCL19 and CCL21, and the increase in T cell survival upon co-culture
indicates that the stromal cell cultures are comparable to FRCs (section 1.2.2.1). To
determine if the stromal cell cultures function as FRCs, an in vivo model was used to
assess recruitment and organisation of leucocytes. Previous studies have shown that
grafting embryonic lymph nodes under the kidney capsule of adult mice results in the
formation of lymphoid tissues containing host lymphocytes which organise into B and
T cell areas similar to the adult lymph nodes (50,220). Therefore, in this chapter,
stromal cells alone were applied to this technique with reaggregation, host cell
recruitment and subsequent organisation analysed.
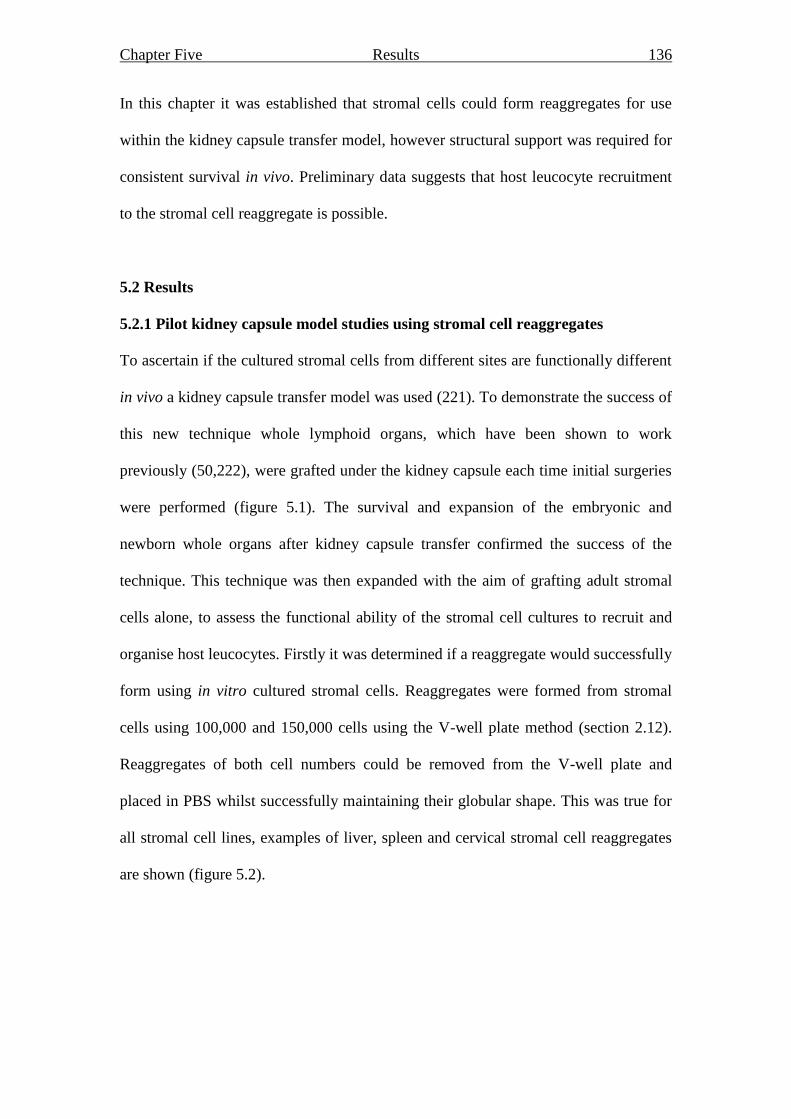
Chapter Five Results 136
In this chapter it was established that stromal cells could form reaggregates for use
within the kidney capsule transfer model, however structural support was required for
consistent survival in vivo. Preliminary data suggests that host leucocyte recruitment
to the stromal cell reaggregate is possible.
5.2 Results
5.2.1 Pilot kidney capsule model studies using stromal cell reaggregates
To ascertain if the cultured stromal cells from different sites are functionally different
in vivo a kidney capsule transfer model was used (221). To demonstrate the success of
this new technique whole lymphoid organs, which have been shown to work
previously (50,222), were grafted under the kidney capsule each time initial surgeries
were performed (figure 5.1). The survival and expansion of the embryonic and
newborn whole organs after kidney capsule transfer confirmed the success of the
technique. This technique was then expanded with the aim of grafting adult stromal
cells alone, to assess the functional ability of the stromal cell cultures to recruit and
organise host leucocytes. Firstly it was determined if a reaggregate would successfully
form using in vitro cultured stromal cells. Reaggregates were formed from stromal
cells using 100,000 and 150,000 cells using the V-well plate method (section 2.12).
Reaggregates of both cell numbers could be removed from the V-well plate and
placed in PBS whilst successfully maintaining their globular shape. This was true for
all stromal cell lines, examples of liver, spleen and cervical stromal cell reaggregates
are shown (figure 5.2).
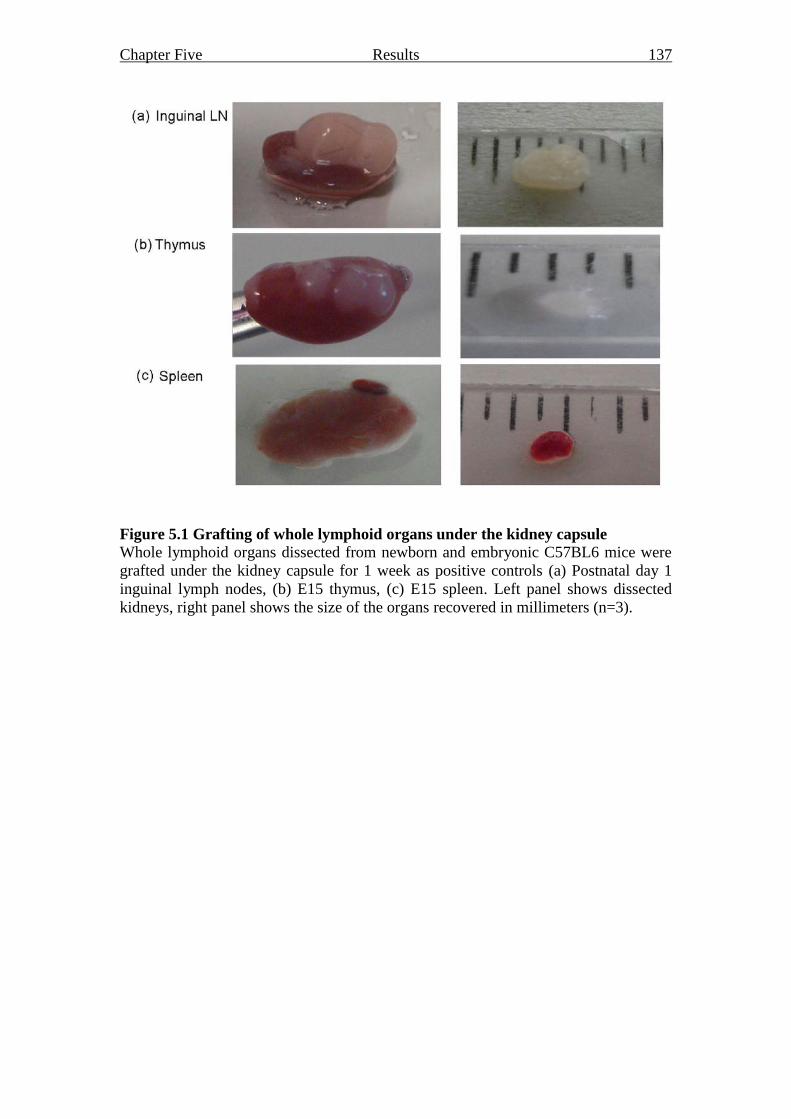
Chapter Five Results 137
Figure 5.1 Grafting of whole lymphoid organs under the kidney capsule
Whole lymphoid organs dissected from newborn and embryonic C57BL6 mice were
grafted under the kidney capsule for 1 week as positive controls (a) Postnatal day 1
inguinal lymph nodes, (b) E15 thymus, (c) E15 spleen. Left panel shows dissected
kidneys, right panel shows the size of the organs recovered in millimeters (n=3).
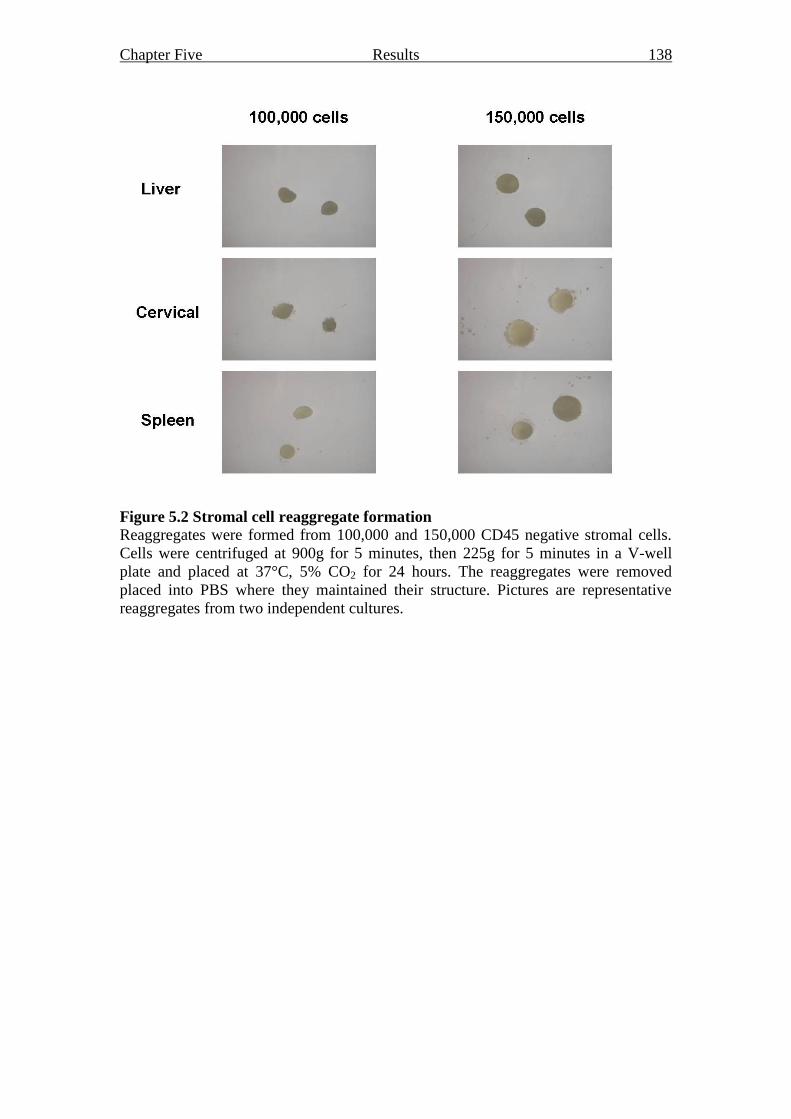
Chapter Five Results 138
Figure 5.2 Stromal cell reaggregate formation Reaggregates were formed from 100,000 and 150,000 CD45 negative stromal cells.
Cells were centrifuged at 900g for 5 minutes, then 225g for 5 minutes in a V-well
plate and placed at 37°C, 5% CO2 for 24 hours. The reaggregates were removed
placed into PBS where they maintained their structure. Pictures are representative
reaggregates from two independent cultures.
Chapter Five Results 139
Having demonstrated that the stromal cells successfully formed reaggregates, cervical
lymph node and liver stromal cell reaggregates, formed from 100,000 cells, were
grafted under the kidney capsule of an adult C57BL6 mouse. Stromal cells derived
from these sites were chosen initially to compare recruitment and organisation of
leucocytes by stromal cells from a lymph node against stromal cells from a non-
lymph node organ. When kidney capsule surgery was performed a postnatal day one
inguinal lymph node or an E15 spleen or thymus was grafted into a separate mouse to
ensure the technique was successful. The reaggregates were incubated for four weeks
following grafting, a length of time used in previous kidney capsule transfer studies
(222). After four weeks, the stromal cell reaggregate grafts had enlarged, as they were
then clearly visible by eye (figure 5.3). The reaggregates were then dissected from the
kidney, snap frozen and cryogenically sectioned. Immunofluorescent staining was
performed using stromal cell markers including CD248, gp38 and VCAM-1 as well as
markers for infiltrating host cells such as macrophage (F4/80), dendritic cells
(CD11c), B cells (B220) and T cells (CD3). The CD45 negative stromal cells derived
from the liver maintained their phenotype from the in vitro culture (section 3.2.2.2);
high CD248, gp38 and VCAM-1 expression was observed in the liver stromal cell
graft (figure 5.4). However, the staining of the stromal cell markers was not
homogeneous and may indicate organisation of these cells within the graft. The
positive collagen type I staining suggests that the stromal cells are functional,
producing ECM components. The punctate PDGFRα staining indicates
vascularisation of the graft (223). The protein expression from the liver CD45
negative stromal cell reaggregate shows a recruitment of F4/80, CD11c, CD3 and
small population of B220 positive cells. This suggests that host macrophages,
dendritic cells, T cells and a small number of host B cells have been recruited into the
Chapter Five Results 140
graft. Interestingly, there may be some structural organisation as there were regions
where CD11c and CD3 positive cells clustered. Specifically, there were areas where
CD248 was not expressed and CD3 and gp38 expression were high (figure 5.4c,d).
This suggests a T zone area may have formed as gp38 has been shown to be expressed
on FRC of the T zone stroma (section 1.2.2.1.1). Of note, there was a population of
cells observed that were CD3 and CD248 positive (figure 5.4d), CD248 expression
has been restricted to stromal cells in the previous studies (224,225), this may be due
to the close proximity of the cell membranes of the T cell and stromal cells. Further
staining and higher magnification images could answer this question. The protein
expression observed from the cervical CD45 negative stromal cell graft showed
expression of stromal markers CD248 and gp38 but this was mostly restricted to a
capsular like structure around the edge of the graft (figure 5.5). Interestingly, VCAM-
1 expression was not seen within the graft, even though the cervical stromal cells in
culture showed high VCAM-1 expression (section 3.2.2.2). Collagen type I
expression again indicated that the stromal cells were functional by producing ECM
components. Punctate PDGFRα was present indicating vascularisation of the graft.
Recruitment of host macrophage, dendritic cells, T cells and B cells was observed but
to a lesser extent than the liver stromal cell graft. F4/80 positive staining was
throughout the graft where as CD11c, CD3 and B220 seemed to be restricted to the
subcapsular area. Again B220 staining was rarely seen which concurs with the low B
cell survival observed during in vitro co-culture with the stromal cells. The outer
capsule which was gp38, CD248 and collagen type I positive may indicate that the
stromal cells were attempting to form a lymph node type structure although there was
no evidence of T and B cell compartmentalisation. Gene expression from sections of
the recovered grafts showed expression of T cell marker CD3 and B cell marker

Chapter Five Results 141
CD19 in both grafts and confirmed the recruitment of T and B cells observed by
immunofluorescent staining (figure 5.6).
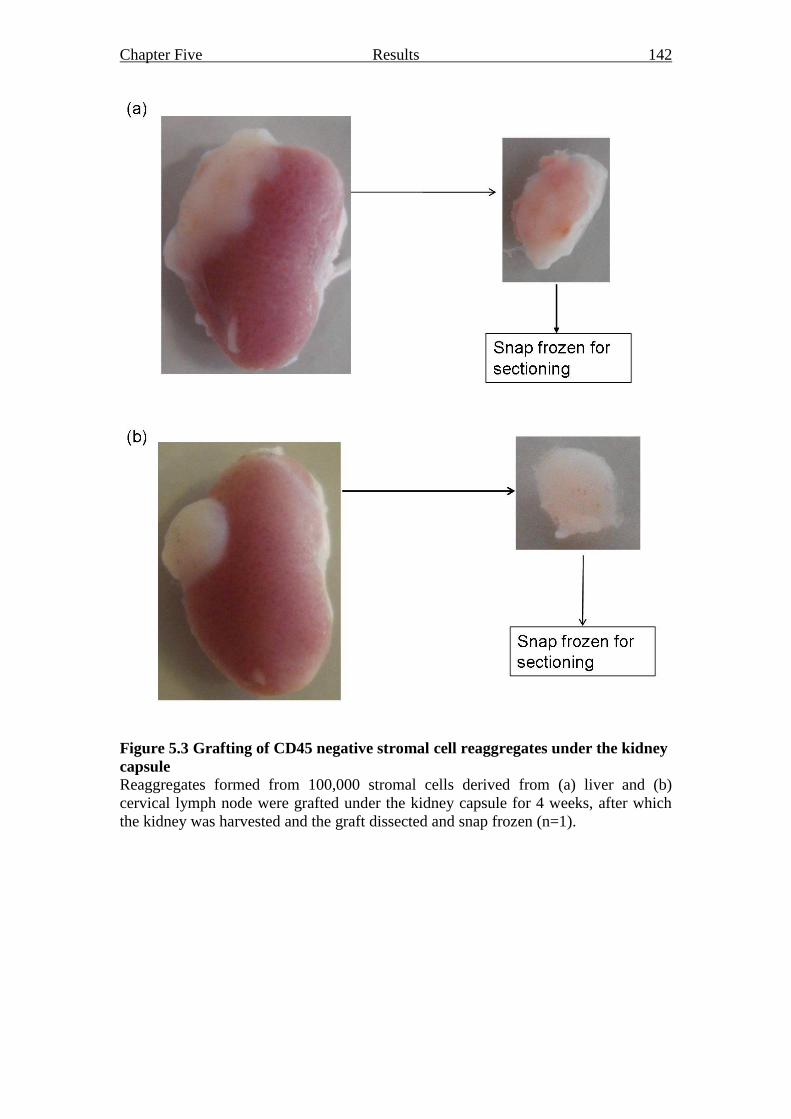
Chapter Five Results 142
Figure 5.3 Grafting of CD45 negative stromal cell reaggregates under the kidney
capsule
Reaggregates formed from 100,000 stromal cells derived from (a) liver and (b)
cervical lymph node were grafted under the kidney capsule for 4 weeks, after which
the kidney was harvested and the graft dissected and snap frozen (n=1).
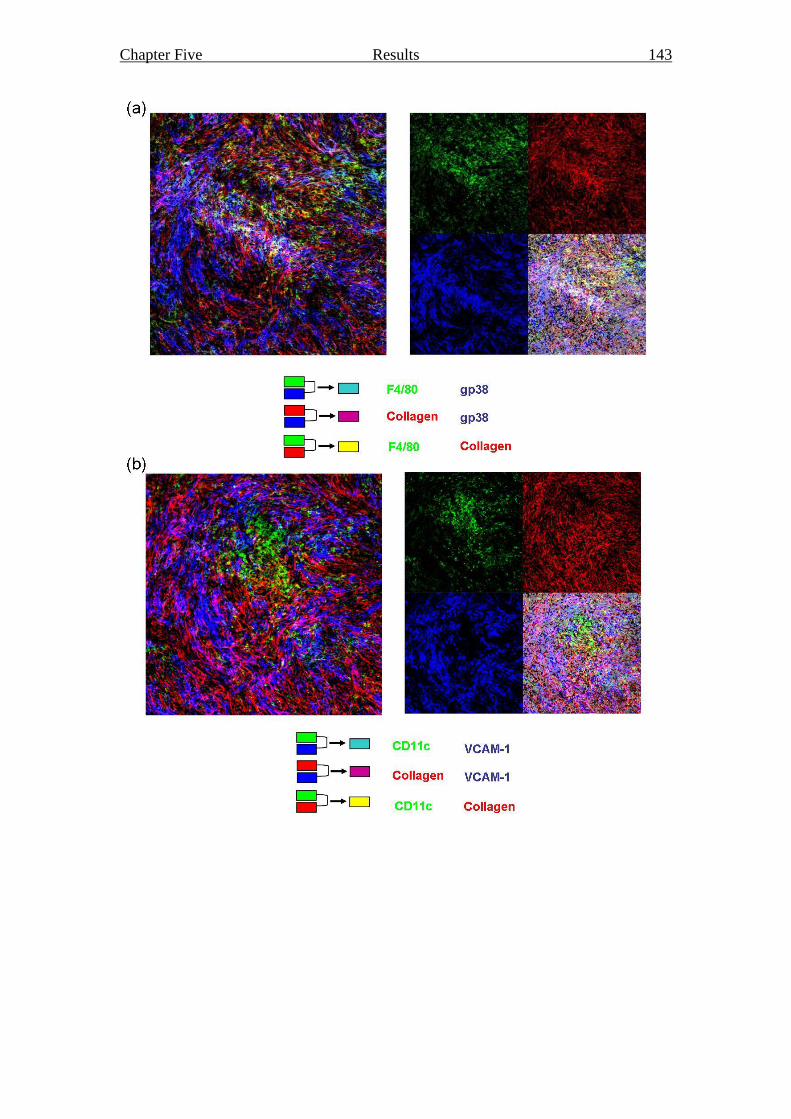
Chapter Five Results 143
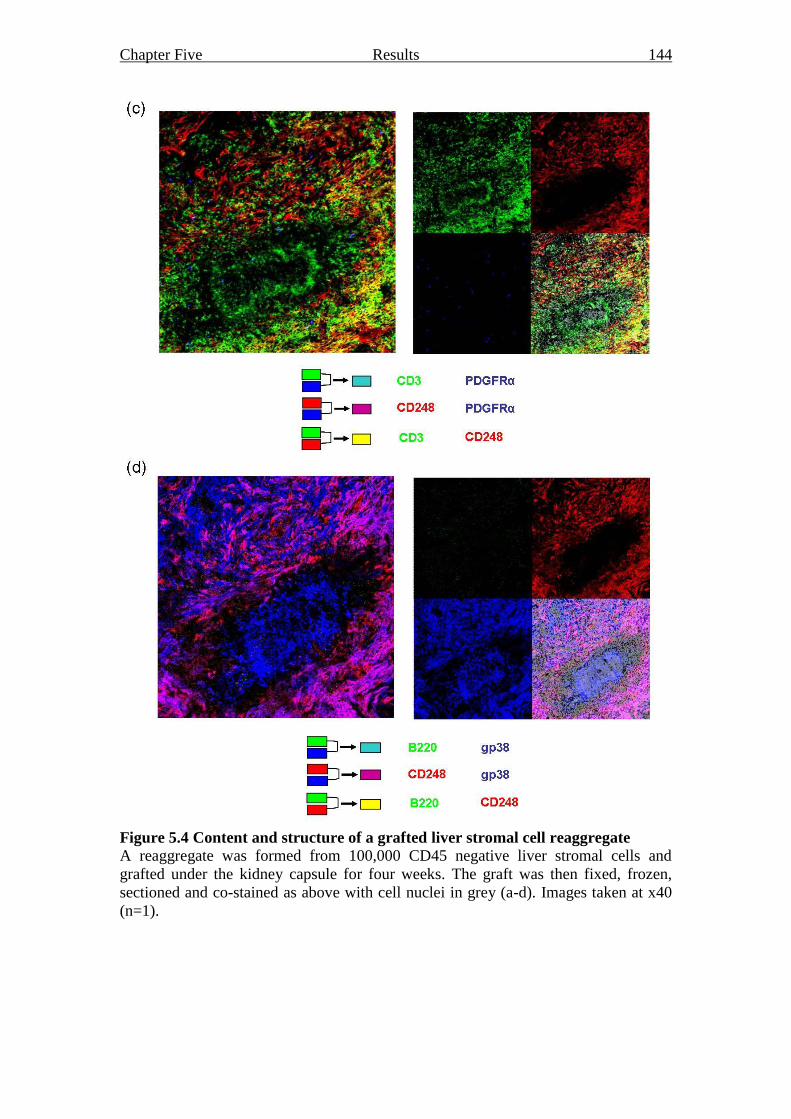
Chapter Five Results 144
Figure 5.4 Content and structure of a grafted liver stromal cell reaggregate A reaggregate was formed from 100,000 CD45 negative liver stromal cells and
grafted under the kidney capsule for four weeks. The graft was then fixed, frozen,
sectioned and co-stained as above with cell nuclei in grey (a-d). Images taken at x40
(n=1).
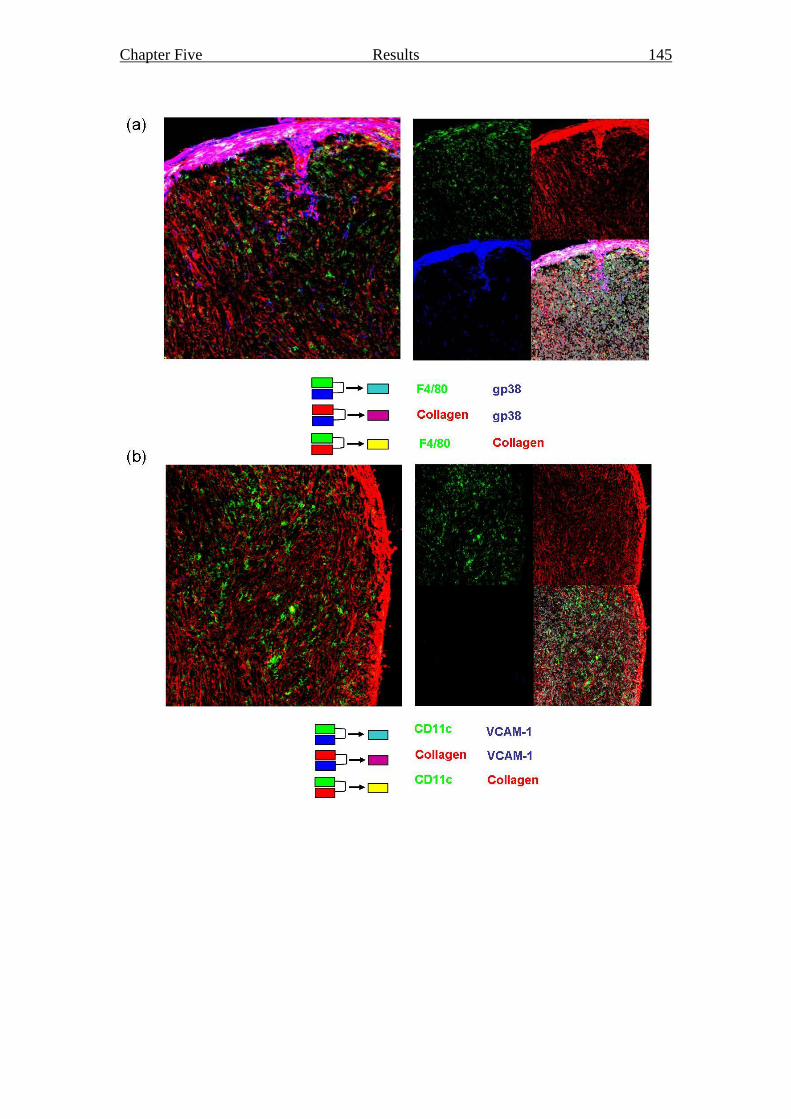
Chapter Five Results 145
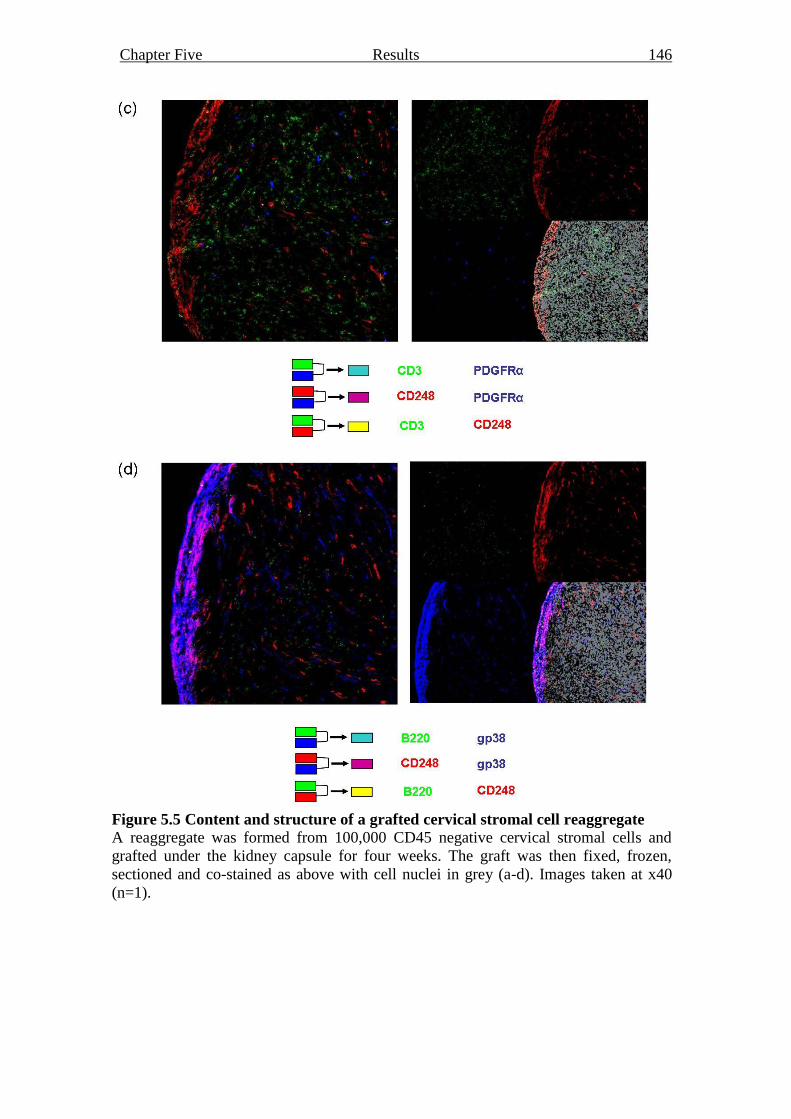
Chapter Five Results 146
Figure 5.5 Content and structure of a grafted cervical stromal cell reaggregate A reaggregate was formed from 100,000 CD45 negative cervical stromal cells and
grafted under the kidney capsule for four weeks. The graft was then fixed, frozen,
sectioned and co-stained as above with cell nuclei in grey (a-d). Images taken at x40
(n=1).
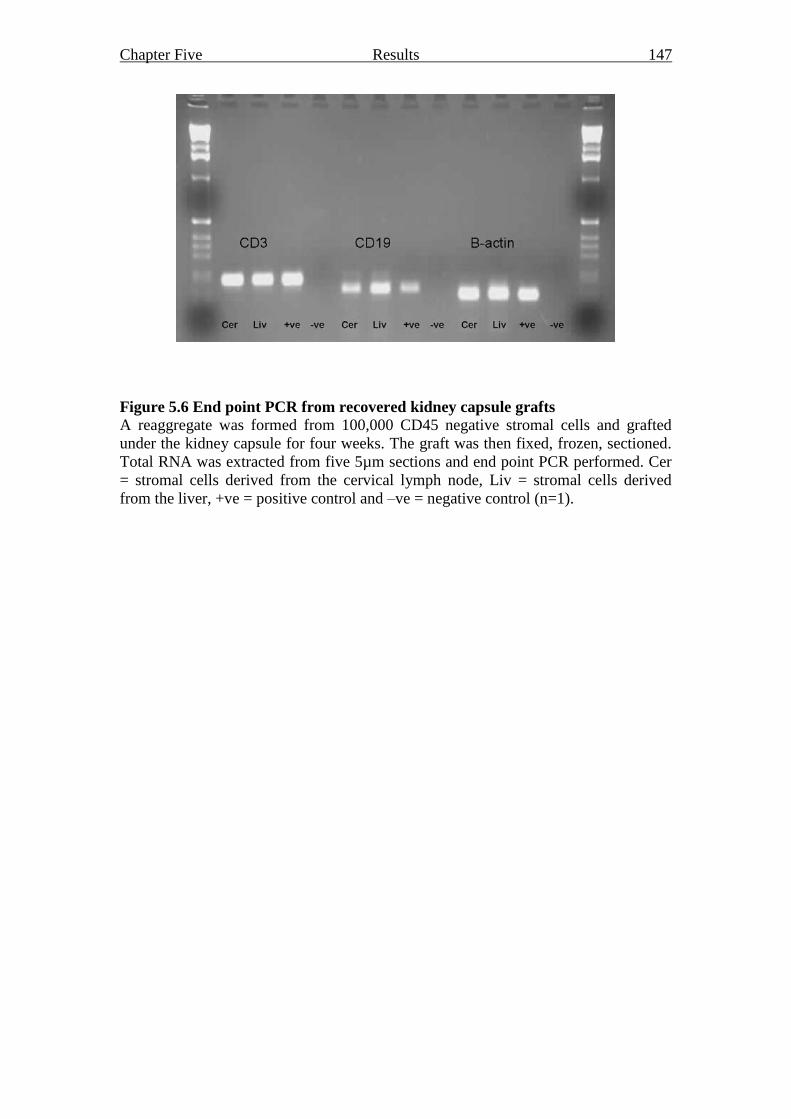
Chapter Five Results 147
Figure 5.6 End point PCR from recovered kidney capsule grafts
A reaggregate was formed from 100,000 CD45 negative stromal cells and grafted
under the kidney capsule for four weeks. The graft was then fixed, frozen, sectioned.
Total RNA was extracted from five 5µm sections and end point PCR performed. Cer
= stromal cells derived from the cervical lymph node, Liv = stromal cells derived
from the liver, +ve = positive control and –ve = negative control (n=1).
Chapter Five Results 148
5.2.2 Development of the kidney capsule transfer model
Having observed the clear survival and expansion of liver and cervical lymph node
stromal cell reaggregates in the pilot study, the technique was then repeated with the
remaining stromal cell cultures. As initial surgeries were completed in male and
female mice successfully, the sex of the host mice was not thought to be an issue and
subsequent surgeries were carried out using mostly male mice due to the ease of
access to the kidney without the presence of ovaries. However, the successful growth
of the other stromal cell culture reaggregates was not observed, nor could the
successful liver and cervical lymph node stromal cell grafts be repeated, with no
reaggregates present four weeks after grafting. To determine why the kidney capsule
of stromal cells alone could not be repeated the quality of the reaggregate was first
assessed. Reaggregates were made from all stromal cell cultures and instead of
grafting under the kidney capsule were sectioned, fixed and immunofluoresently
stained for early apoptosis marker active-caspase 3, to assess cell death within the
reaggregates (figure 5.7). Very little or no active-caspase 3 staining was observed in
reaggregates from all stromal cell lines. The lack of grafting success therefore, does
not seem to be due to the increased cell death in the reaggregate. As well as active-
caspase 3, the reaggregate sections were co-stained with gp38 and VCAM-1. High
gp38 expression was also present in all reaggregates; however VCAM-1 expression
was not consistent. Expression of VCAM-1 was highest in spleen and inguinal lymph
node reaggregates with little or no expression observed in the thymus, liver, skin, lung
and axillary and cervical lymph node stromal reaggregates.
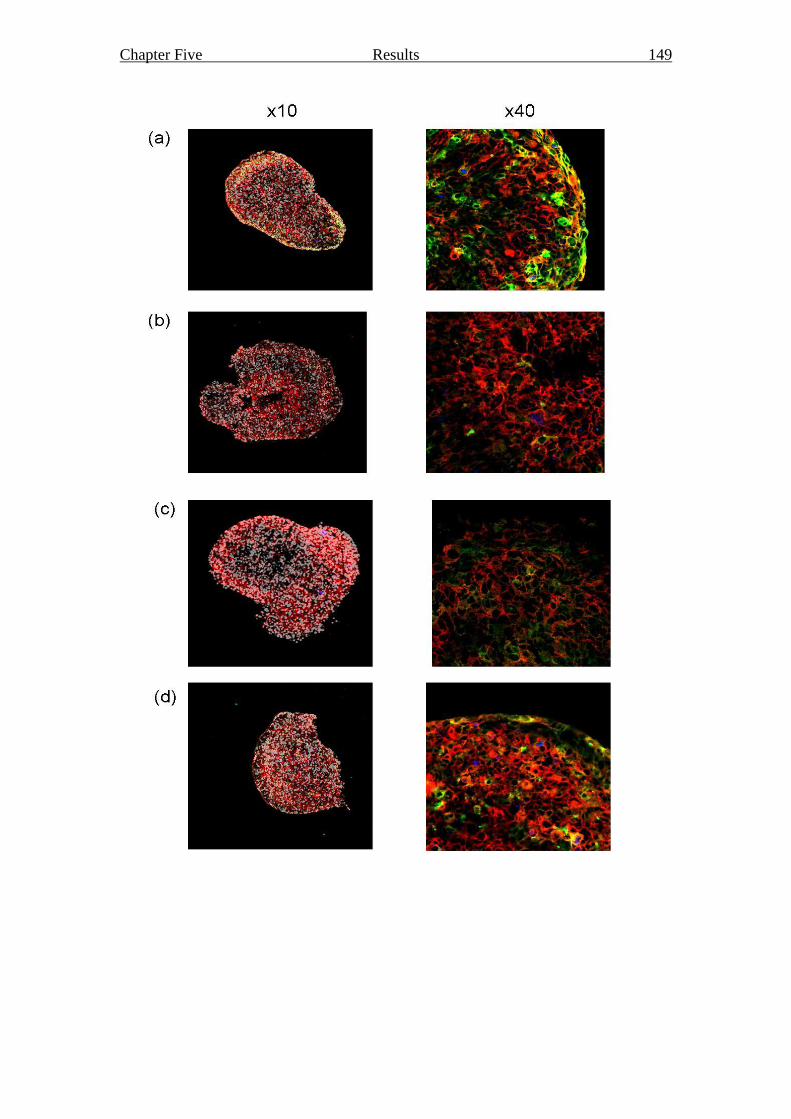
Chapter Five Results 149
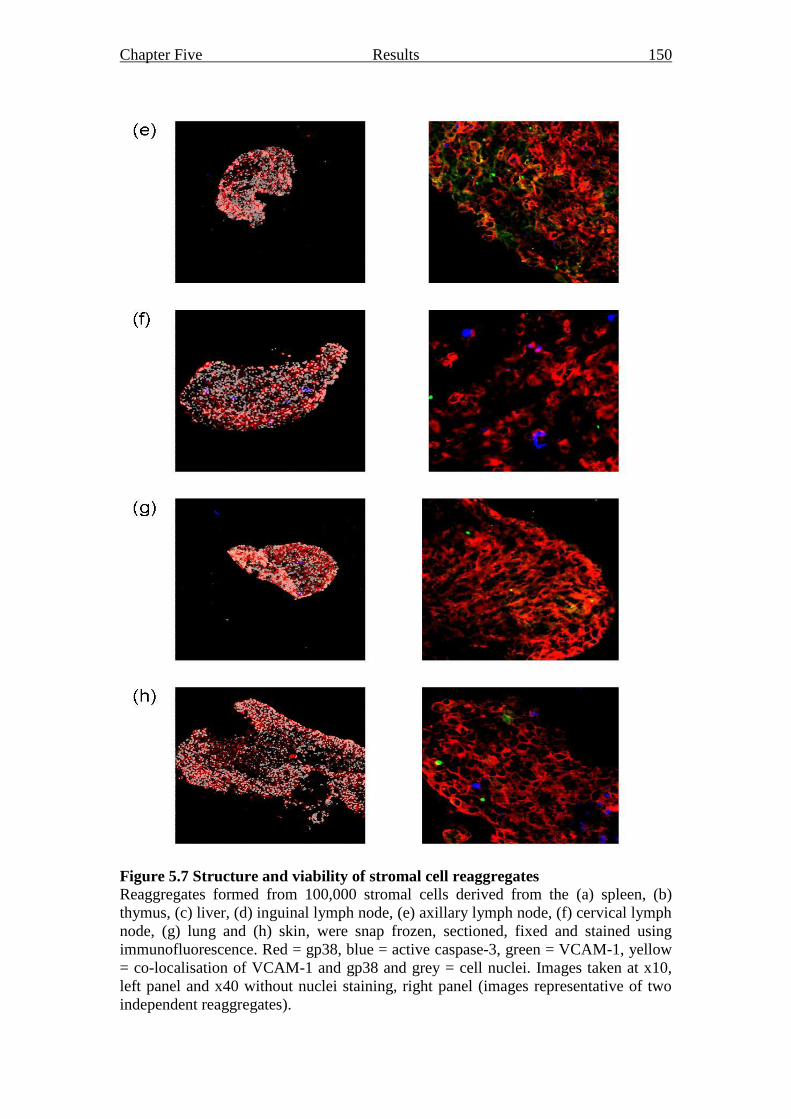
Chapter Five Results 150
Figure 5.7 Structure and viability of stromal cell reaggregates
Reaggregates formed from 100,000 stromal cells derived from the (a) spleen, (b)
thymus, (c) liver, (d) inguinal lymph node, (e) axillary lymph node, (f) cervical lymph
node, (g) lung and (h) skin, were snap frozen, sectioned, fixed and stained using
immunofluorescence. Red = gp38, blue = active caspase-3, green = VCAM-1, yellow
= co-localisation of VCAM-1 and gp38 and grey = cell nuclei. Images taken at x10,
left panel and x40 without nuclei staining, right panel (images representative of two
independent reaggregates).
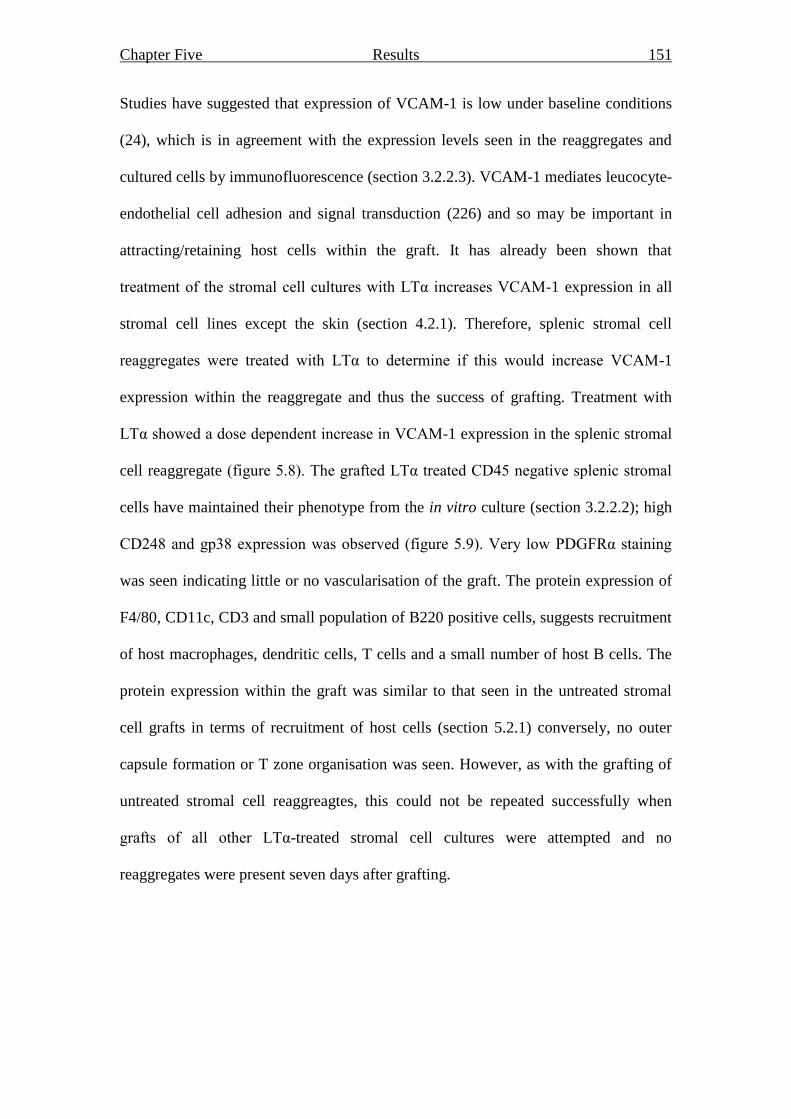
Chapter Five Results 151
Studies have suggested that expression of VCAM-1 is low under baseline conditions
(24), which is in agreement with the expression levels seen in the reaggregates and
cultured cells by immunofluorescence (section 3.2.2.3). VCAM-1 mediates leucocyte-
endothelial cell adhesion and signal transduction (226) and so may be important in
attracting/retaining host cells within the graft. It has already been shown that
treatment of the stromal cell cultures with LTα increases VCAM-1 expression in all
stromal cell lines except the skin (section 4.2.1). Therefore, splenic stromal cell
reaggregates were treated with LTα to determine if this would increase VCAM-1
expression within the reaggregate and thus the success of grafting. Treatment with
LTα showed a dose dependent increase in VCAM-1 expression in the splenic stromal
cell reaggregate (figure 5.8). The grafted LTα treated CD45 negative splenic stromal
cells have maintained their phenotype from the in vitro culture (section 3.2.2.2); high
CD248 and gp38 expression was observed (figure 5.9). Very low PDGFRα staining
was seen indicating little or no vascularisation of the graft. The protein expression of
F4/80, CD11c, CD3 and small population of B220 positive cells, suggests recruitment
of host macrophages, dendritic cells, T cells and a small number of host B cells. The
protein expression within the graft was similar to that seen in the untreated stromal
cell grafts in terms of recruitment of host cells (section 5.2.1) conversely, no outer
capsule formation or T zone organisation was seen. However, as with the grafting of
untreated stromal cell reaggreagtes, this could not be repeated successfully when
grafts of all other LTα-treated stromal cell cultures were attempted and no
reaggregates were present seven days after grafting.
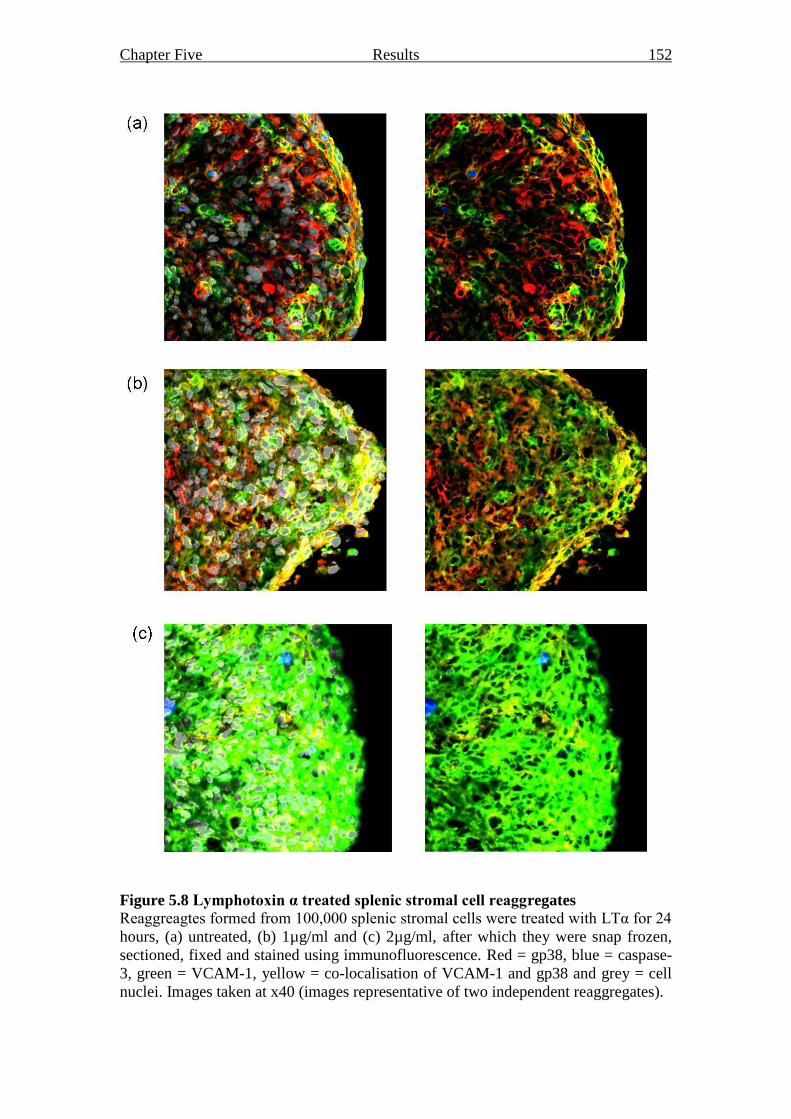
Chapter Five Results 152
Figure 5.8 Lymphotoxin α treated splenic stromal cell reaggregates
Reaggreagtes formed from 100,000 splenic stromal cells were treated with LTα for 24
hours, (a) untreated, (b) 1µg/ml and (c) 2µg/ml, after which they were snap frozen,
sectioned, fixed and stained using immunofluorescence. Red = gp38, blue = caspase-
3, green = VCAM-1, yellow = co-localisation of VCAM-1 and gp38 and grey = cell
nuclei. Images taken at x40 (images representative of two independent reaggregates).
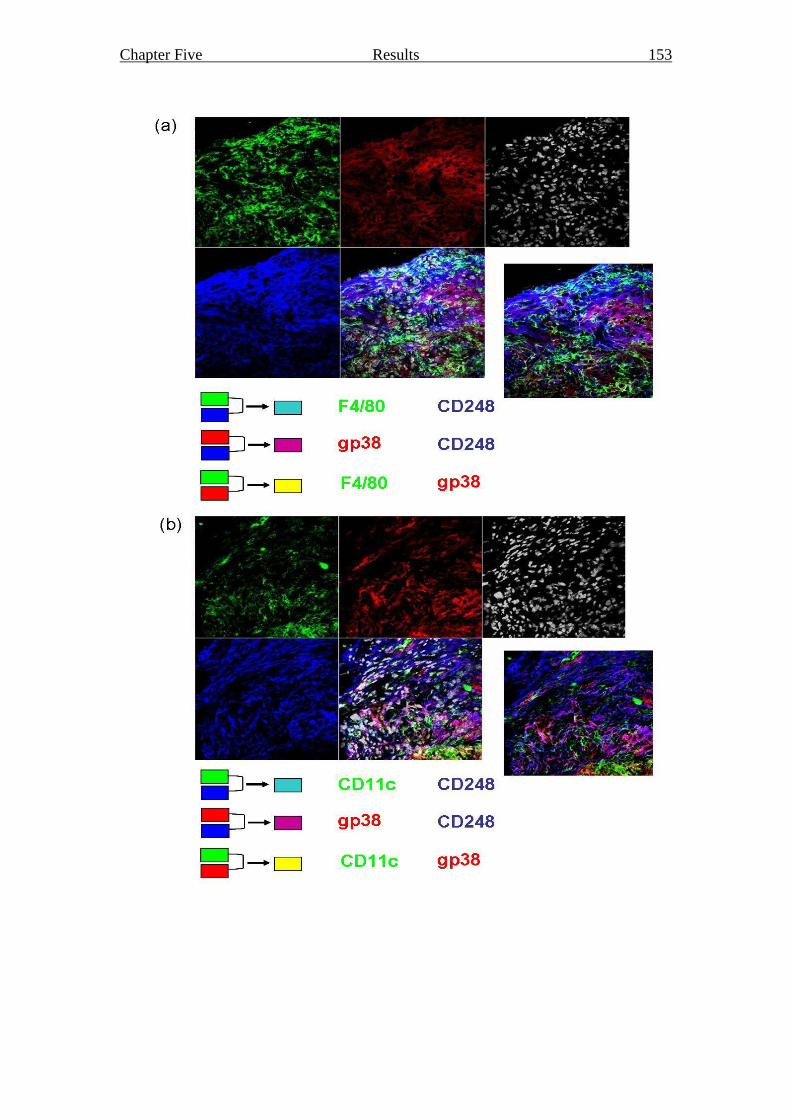
Chapter Five Results 153
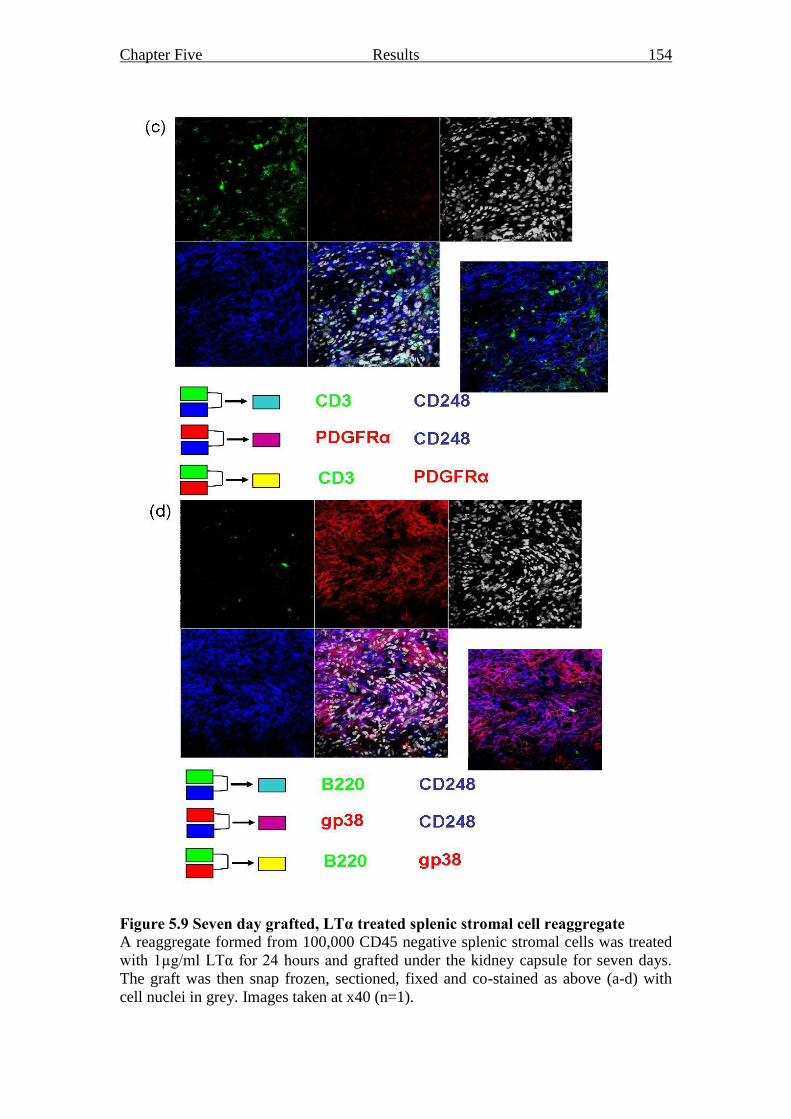
Chapter Five Results 154
Figure 5.9 Seven day grafted, LTα treated splenic stromal cell reaggregate
A reaggregate formed from 100,000 CD45 negative splenic stromal cells was treated
with 1µg/ml LTα for 24 hours and grafted under the kidney capsule for seven days.
The graft was then snap frozen, sectioned, fixed and co-stained as above (a-d) with
cell nuclei in grey. Images taken at x40 (n=1).
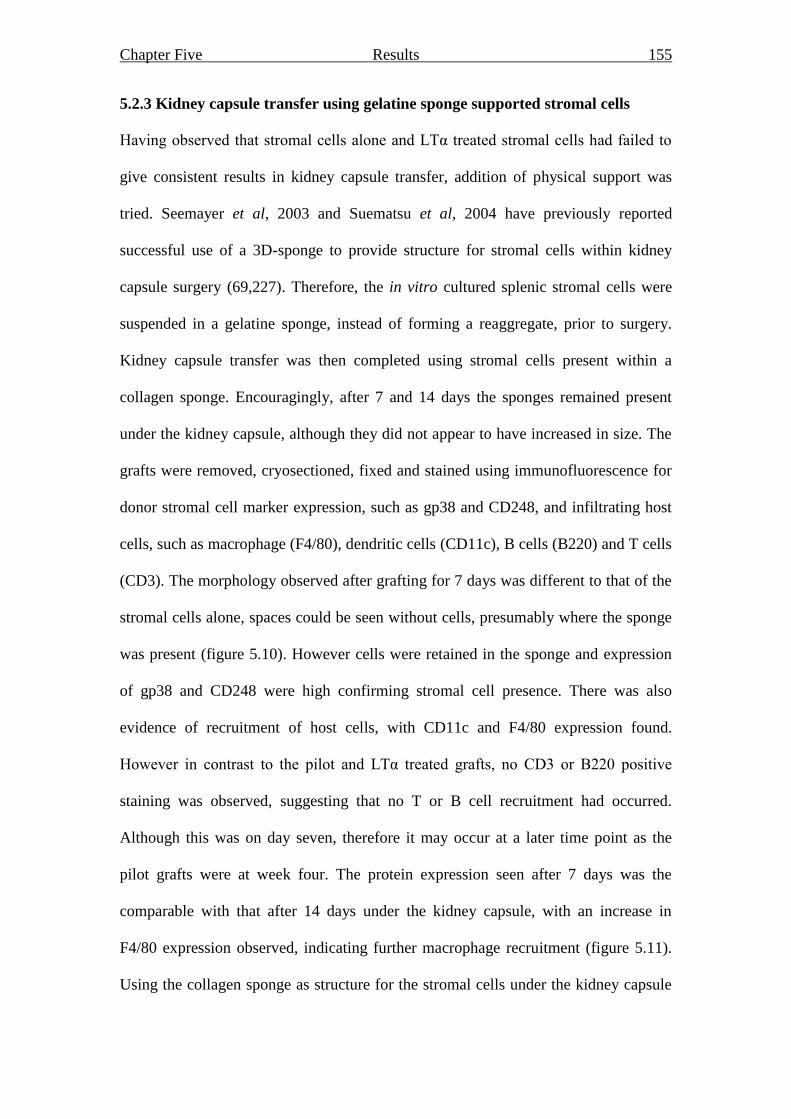
Chapter Five Results 155
5.2.3 Kidney capsule transfer using gelatine sponge supported stromal cells
Having observed that stromal cells alone and LTα treated stromal cells had failed to
give consistent results in kidney capsule transfer, addition of physical support was
tried. Seemayer et al, 2003 and Suematsu et al, 2004 have previously reported
successful use of a 3D-sponge to provide structure for stromal cells within kidney
capsule surgery (69,227). Therefore, the in vitro cultured splenic stromal cells were
suspended in a gelatine sponge, instead of forming a reaggregate, prior to surgery.
Kidney capsule transfer was then completed using stromal cells present within a
collagen sponge. Encouragingly, after 7 and 14 days the sponges remained present
under the kidney capsule, although they did not appear to have increased in size. The
grafts were removed, cryosectioned, fixed and stained using immunofluorescence for
donor stromal cell marker expression, such as gp38 and CD248, and infiltrating host
cells, such as macrophage (F4/80), dendritic cells (CD11c), B cells (B220) and T cells
(CD3). The morphology observed after grafting for 7 days was different to that of the
stromal cells alone, spaces could be seen without cells, presumably where the sponge
was present (figure 5.10). However cells were retained in the sponge and expression
of gp38 and CD248 were high confirming stromal cell presence. There was also
evidence of recruitment of host cells, with CD11c and F4/80 expression found.
However in contrast to the pilot and LTα treated grafts, no CD3 or B220 positive
staining was observed, suggesting that no T or B cell recruitment had occurred.
Although this was on day seven, therefore it may occur at a later time point as the
pilot grafts were at week four. The protein expression seen after 7 days was the
comparable with that after 14 days under the kidney capsule, with an increase in
F4/80 expression observed, indicating further macrophage recruitment (figure 5.11).
Using the collagen sponge as structure for the stromal cells under the kidney capsule

Chapter Five Results 156
provided more consistent results with successful repeats of both seven and fourteen
day grafts.
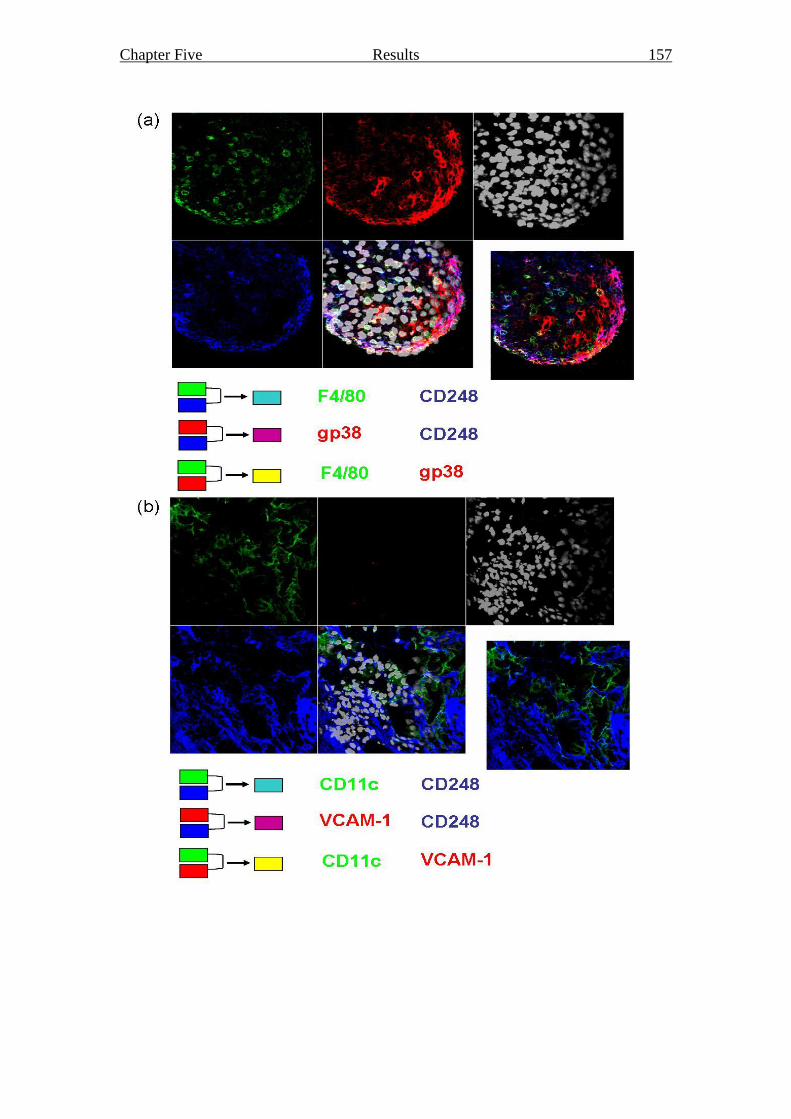
Chapter Five Results 157
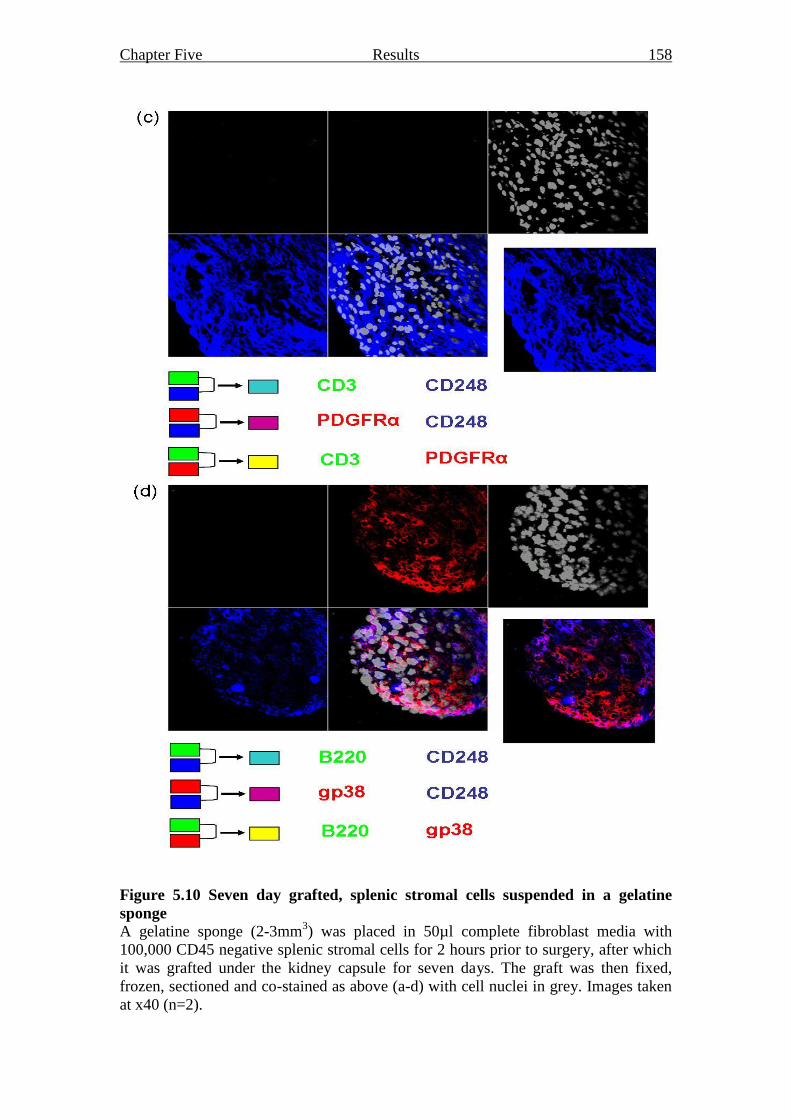
Chapter Five Results 158
Figure 5.10 Seven day grafted, splenic stromal cells suspended in a gelatine
sponge
A gelatine sponge (2-3mm3) was placed in 50µl complete fibroblast media with
100,000 CD45 negative splenic stromal cells for 2 hours prior to surgery, after which
it was grafted under the kidney capsule for seven days. The graft was then fixed,
frozen, sectioned and co-stained as above (a-d) with cell nuclei in grey. Images taken
at x40 (n=2).
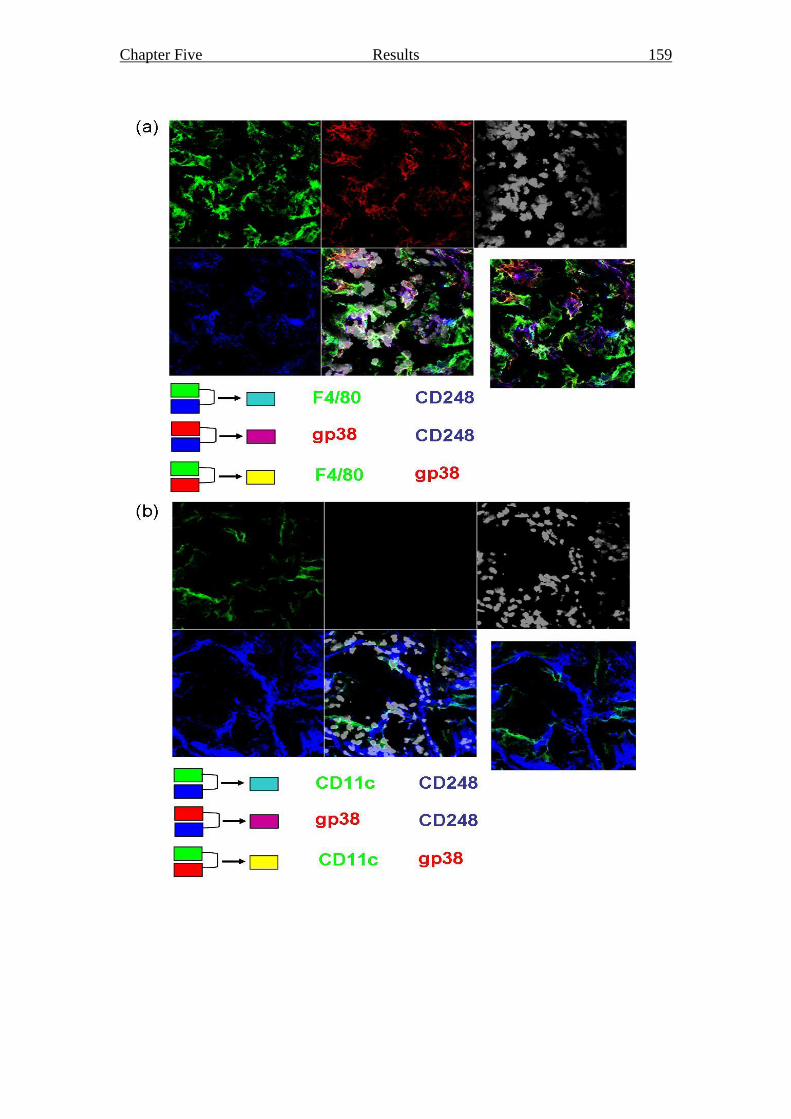
Chapter Five Results 159
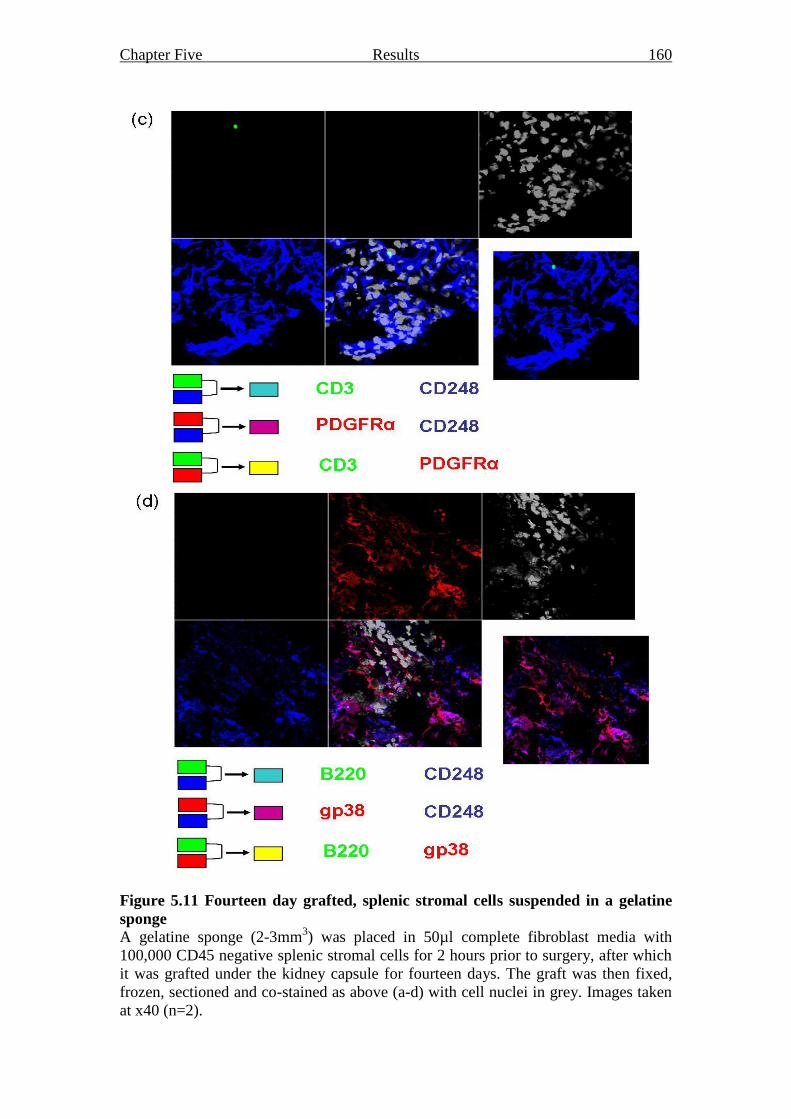
Chapter Five Results 160
Figure 5.11 Fourteen day grafted, splenic stromal cells suspended in a gelatine
sponge
A gelatine sponge (2-3mm3) was placed in 50µl complete fibroblast media with
100,000 CD45 negative splenic stromal cells for 2 hours prior to surgery, after which
it was grafted under the kidney capsule for fourteen days. The graft was then fixed,
frozen, sectioned and co-stained as above (a-d) with cell nuclei in grey. Images taken
at x40 (n=2).
Chapter Five Results 161
5.3 Discussion
Gene and protein data suggested that not only are adult CD45 negative stromal cells
cultured from peripheral and lymphoid organs different but also that lymph node
cultures had different profiles when compared to other lymphoid organs tested
(chapter 3). These differences were also upheld when in vitro functional studies were
performed (chapter 4). Moreover, these data highlighted that the stromal cell cultures
maybe similar to the FRCs due to their ability to differentially keep CD3 positive cells
alive (section 4.2.2). Therefore, the kidney capsule transfer model was utilised to
examine whether these stromal cells, in vivo, were able to survive, organise and
recruit host leucocytes, differentially depending on these differences observed.
An initial pilot study demonstrated that it was possible to form reaggregates from the
CD45 negative stromal cells using the V-well plate method, which grew successfully
when grafted under the kidney capsule. This study suggested that these grafts were
able to recruit host dendritic cells, macrophages, T and B cells into the reaggregate. It
was also indicated that there may be differences between the stromal cells used with
the liver stromal cell reaggregate organising the T cells into areas where there was
low expression of CD248 or collagen type I. Interestingly, these T cell areas had a
high expression of gp38, which is thought to be expressed on T zone stromal cells
(72). In contrast, the cervical stromal cell graft was quite different; there was little
evidence of any host cell organisation but CD248,
gp38 and collagen type I
expressing stromal cells formed a capsule-like structure around the edges of the graft.
Protein expression within the capsule agrees with that seen previously by Lax et al
(2007) where CD248 expression was observed in the lymph node caspsule (140) and
also by Katakai et al (2004) where gp38 expression was seen the lymph node capsule

Chapter Five Results 162
(71). However, the data could not be repeated nor was it successful with the
remaining stromal cell lines. Therefore, the quality of the stromal cell reaggregates
was assessed by active-caspase 3 expression, which confirmed that the reaggregates
did not contain many apoptotic cells. To further ensure the quality of the grafts, the
quantity of necrotic cells could also be assessed using haematoxylin and eosin
staining. VCAM-1 expression in these reaggregates was low and as VCAM-1 is
thought to be important in the interaction between stromal cells and lymphocytes
(226), it was reasoned that increasing VCAM-1 expression could make a more
successful reaggregate. LTα treatment has been shown to increase VCAM-1
expression in cultured stromal cells, therefore the reaggreagates were treated with
LTα (1µg/ml) for 24 hours. The preliminary LTα treated splenic stromal cell
reaggregate was successful and after seven days had recruited host macrophage,
dendritic cells, T and B cells, although less stromal organisation was appreciated
compared to the pilot grafts. However, when repeated again, as with untreated LTα
stromal cells, the grafts were unsuccessful. A technique used by Seemayer et al
(2003) is to use a 3D-sponge as structure for the implanted cells (227). Cells are
trypsinised and added onto the sponge, which is then co-implanted with pieces of
human cartilage under the renal capsule of SCID mice to analyse the invasion of the
cartilage by fibroblasts. Therefore, this technique was adopted for use with the
stromal cells. Importantly, the kidney capsule grafting using the gelatine sponge
structural support were successful with grafts analysed after seven and fourteen days
post implantation. The data from these grafts showed consistent growth and survival,
with expression of stromal cell markers CD248 and gp38 but not VCAM-1. Host
macrophage and dendritic cells but no T or B cells were recruited unlike unsupported
Chapter Five Results 163
grafts. T and B cell entry may occur after fourteen days as the pilot grafts were
incubated for four weeks.
In conclusion, data in this chapter provides a method for analysing the function of
cultured stromal cells in vivo. This involves using a gelatine sponge as structural
support for the implanted stromal cells. Using this technique, adult splenic stromal
cells for the first time have been shown to form a structure which is able to recruit and
support host CD11c and F4/80 positive leucocytes. It will be interesting in the future
to repeat with all cultured stromal cells and look for possible differences between
peripheral and lymphoid sites in the recruitment of leucocytes.

Chapter Six General Discussion 164
Chapter Six
General Discussion
Chapter Six General Discussion 165
CHAPTER SIX
General Discussion
Stroma is an important structural component of vertebrate animals. It consists of
extracellular matrix (ECM), mesenchymal cells and a scaffold consisting of nerves
and blood and lymphatic vessels (119). The most abundant cell type of tissue stroma
is the fibroblast (120). In recent years it has become clear that fibroblasts play not
only an active role in defining the structure of tissue microenvironments but also
modulating immune cell behaviour by conditioning the local cellular content and
cytokine production, specifically tailoring the response to the cause of the damage
(113). Fibroblast gene expression in humans has been studied by many groups
(119,136,150,151,228). It has become apparent that there is considerable positional
memory and topographic differentiation as defined by their gene expression profiles.
Interestingly, a set of 337 human fibroblast genes has been found which varies
according to three anatomical divisions: anterior-posterior, proximal-distal and
dermal-nondermal. These genes were involved in pattern formation, cell-cell
signalling and matrix remodelling (151). It is therefore reasonable to hypothesise that
this may also be the case among mouse fibroblasts, in particular for this study within
the murine lymphoid organs. In addition, given the degree of homology between
many human and murine genes, it could be possible that the site defining genes found
in the human are also important in the mouse.
In this thesis, stromal cells from different lymphoid and peripheral sites were cultured
and characterised in terms of morphology, protein expression and gene expression to
define site specific profiles within the populations. In addition, following phenotypic
Chapter Six General Discussion 166
and genotypic analysis functional differences between the cultured stromal cells were
investigated. These analyses confirmed the diversity of morphology, gene and protein
expression between the cultured stromal cells. Furthermore, preliminary functional
assays also confirm that fibroblasts from different sites differ in their ability to not
only to respond to lymphotoxin α (LTα) in vitro, but also form tissue reaggregates and
recruit host leucocytes in vivo.
6.1 Fibroblast reticular cell phenotype
In this study a method of successfully culturing stromal cells and sorting these into a
homogenous fibroblast population based on CD45 protein expression was developed.
Fibroblast populations were defined by their ability to adhere to plastic, expression
cell surface proteins (CD248, VCAM-1 and gp38) and gene expression (CCL19,
CCL21, CD248, VCAM-1, ICAM-1, gp38, CXCL12 and LTβR) with a lack of
expression of other cell lineage markers. Previous studies have described a stromal
cell type called a fibroblast reticular cell (FRC) from the T zones of lymph nodes.
These cells highly express gp38, PDGFRα, LTβR and VCAM-1 amongst others and
were also found to be a major source of IL-7 (67,71). This phenotype is very similar
to the cultured stromal cells described in chapter three. Importantly a consistent
finding was that the lymph node stromal cells had differential gene expression of
CD31 and Lyve-1 when compared to the stromal cells from other sites, which may
suggest a lymphatic endothelial population from the lymph nodes. In addition to the
FRC cell type, a gp38, CD31, Lyve-1, VCAM-1 and LTβR positive population was
also described (67), termed lymphatic endothelial cells (LECs), which closely
matches that seen in the lymph node stromal cell populations. Therefore, these data
indicate that two different populations are being isolated from the different sites using
Chapter Six General Discussion 167
the same method. More recently, a stromal cell population, termed marginal reticular
cells (MRCs) was found in the outer follicular region immediately underneath the
subcapsular sinus of lymph nodes in adult mice. These cells expressed VCAM-1,
ICAM-1, MadCAM-1, CXCL13, TRANCE, BP-3 and gp38 and have been described
as specialised reticular fibroblasts (69). The stromal cells in this study express little or
no CXCL13 but given the similarity in gene expression to the MRCs, it is possible
that they are present in the stromal cell cultures. In chapter four, in vitro functional
studies showed that all cultured stromal cells increased the survival of T cells more so
than B cells in a co-culture system. Preliminary results from the in vivo kidney
caspsule transfer pilot studies in chapter five also showed a preferential recruitment of
T cells to B cells into the stromal cell grafts. Taken together, these data indicate that
the cultured lymphoid stromal cells in this study are comparable to FRCs. As FRCs
are found in the T zones of secondary lymphoid organs, the FRC-like cells derived
from non-lymphoid sites may have the potential to form tertiary lymphoid structures
should the correct conditions arise, for example chronic inflammation.
6.2 Fibroblast heterogeneity exists between murine lymphoid organs
Primary adult human fibroblasts have been shown to retain many features of the
embryonic pattern of the expression of HOX genes (119,151). It is thought that the
expression of these genes may dictate positional identity. The stability of HOX gene
expression was shown over 35 passages by Rinn et al in 2008. Gene expression
patterns were assessed by culturing fibroblasts from one site in conditioned media
from another and also culturing two sets of fibroblasts from different sites together.
Neither of these altered the gene expression significantly and the fibroblasts were still
able to be clustered site specifically based on their gene expression. However it was
Chapter Six General Discussion 168
reported that gene expression of cultured fibroblasts can be altered by treatment with a
histone deacetylase inhibitor. These results are consistent with earlier findings that
site specific HOX expression is epigenetically maintained by chromatin modifications
in fibroblasts (152,229). Stability was also observed in the cultured murine stromal
cell cultures in this study with regard to their protein and gene expression over many
passages. A gene signature from CD45 negative stromal cells was determined using
whole genome microarrays, which was able to differentiate lymphoid tissue stromal
cells from peripheral tissue stromal cells. However, this could not differentiate
between stromal cells from different lymphoid tissues. Further studies using low
density arrays (LDAs) containing genes found to be important in grouping human
fibroblasts indicated that Hoxd8, Grem2, Cdh1 and Mmp3 may differentiate between
lymphoid tissue derived stromal cells, although protein expression has yet to be
determined and requires further investigation. Functional data from in vitro LTα
treatment in chapter four confirmed a definite difference between peripheral and
lymphoid stromal cell cultures, where LTα was able to induce a significant increase in
VCAM-1 protein expression in all stromal cell cultures but not in those derived from
the skin. Differences were also seen within lymphoid stromal cell cultures as the
lymph node cultures showed lesser response to LTα treatment in comparison to other
sites. Pilot in vivo kidney capsule studies in chapter five demonstrated a difference in
organisation of donor stromal cells and host recruited leucocytes between liver and
cervical lymph node derived stromal cell grafts. These data illustrate that differences
observed in gene and protein expression may also be relevant when considering
function of stromal cells derived from different sites.
Chapter Six General Discussion 169
Previous work by this group has suggested a stromal area postcode regulates
leucocyte survival, retention, proliferation and differentiation within lymphoid tissues.
This thesis supports this hypothesis, with peripheral tissues, lymphoid tissues and
lymph node stromal cells having distinct phenotypes and preliminary functional data
showing differences in their response to LTα and in the recruitment and survival of
leucocytes. Many inflammatory diseases have site specific manifestations, for
example rheumatoid arthritis mainly in the synovium and psoriasis in the skin.
Inappropriate expression of all or parts of the code may therefore play a key role in
the instigation or continuance of disease and make stromal cells a therapeutic target.
Specific medication targeting „activation markers‟ of stromal cells could alter the
phenotype of the cell to a more „resting state‟, thereby modifying the function of the
stromal cells as an anti-inflammatory therapy.
6.3 Future work leading from this study
The investigations within this thesis have examined the hypothesis of a stromal area
postcode within murine lymphoid tissues. The genes found to be differentially
expressed by the TNF LDA between the stromal cell cultures from different sites,
require further investigation, such as completion of protein expression of these genes
to confirm they are differentially expressed. Should these genes be able to
differentiate between stromal cells from different sites it would be interesting to
manipulate the genes involved. For example using a gene knock-in to induce
expression or RNA interference to silence the gene, to analyse whether one particular
stromal cell then becomes more phenotypically like another. To assess functionality,
cultured stromal cells from different sites of eYFP expressing mice could be
adoptively transferred to determine if they traffic back to their organ of origin, this
Chapter Six General Discussion 170
would be a key experiment to answer the question of the stability of regional identity.
Combining these two experiments and altering the gene expression of the stromal
cells before adoptive transfer would show whether it is possible to then change
stromal cell function by modifying its phenotype and analysing the trafficking of that
altered stromal cell.
The in vitro cultured stromal cell genotype was more similar to an immortalised
stromal cell than an ex vivo sorted stromal cell, suggesting that in vitro culture affects
the stromal cell gene expression. Although ex vivo stromal cell numbers are low, it
would be interesting to sort stromal cells from different sites and compare their gene
expression. Resting and inflamed tissue could also be compared to determine if
regional identity is maintained in an inflammatory response.
The kidney capsule transfer model using the structural support of the gelatine sponge
can be used to analyse in vivo recruitment and survival of host leucocytes from
splenic stromal cell cultures. This model can now be used as an in vivo functional
readout for the role of stromal cells and other cell types in the formation of lymphoid-
like structures. Kidney capsule transfers for all stromal cell cultures should be
completed to confirm the technique and look for differences in recruitment and
survival of leucocytes. eYFP mice should next be used to confirm that the stromal
cells found in the recovered grafts are from the donor cell cultures and the leucocytes
found are host derived, as there is the possibility of host stromal cell invasion. This
model could then be expanded, by creating reaggregates for grafting of stromal cells
from different sites with lymphoid tissue inducer (LTi) cells from the same or other

Chapter Six General Discussion 171
sites to see if these can recruit leucocytes and organise them into classical T and B
cell compartments.
Taken together these data emphasise the phenotypic and functional differences of
stromal cells derived from peripheral tissues, lymphoid tissues and lymph nodes and
consolidate stromal cells as more than just a structural component within organs.

Chapter Seven Reference List 172
Chapter Seven
Reference List
Chapter Seven Reference List 173
CHAPTER SEVEN
Reference List
1. Janeway, C. J., P. Travers, M. Walport, and M. J. Sholmchik. 2005.
Immunobiology, 6 ed. Garland Science Publishing, New York.
2. Lawrence, T., D. A. Willoughby, and D. W. Gilroy. 2002. Anti-inflammatory
lipid mediators and insights into the resolution of inflammation. Nat. Rev.
Immunol. 2: 787-795.
3. Medzhitov, R., and C. Janeway, Jr. 2000. Innate immunity. N. Engl. J. Med.
343: 338-344.
4. Borregaard, N., and J. B. Cowland. 1997. Granules of the human neutrophilic
polymorphonuclear leukocyte. Blood 89: 3503-3521.
5. Steinman, R. M. 2006. Linking innate to adaptive immunity through dendritic
cells. Novartis. Found. Symp. 279: 101-109.
6. Alberts, B., A. Johnson, J. Lewis, M. Raff, K. Roberts, and P. Walter. 2002.
Molecular Biology of the cell, 4 ed. Garland Science Publishing, New York.
7. Kemper, C., and J. P. Atkinson. 2007. T-cell regulation: with complements
from innate immunity. Nat. Rev. Immunol. 7: 9-18.
8. Fujita, T. 2002. Evolution of the lectin-complement pathway and its role in
innate immunity. Nat. Rev. Immunol. 2: 346-353.
9. Medzhitov, R. 2001. Toll-like receptors and innate immunity. Nat. Rev.
Immunol. 1: 135-145.
10. Akira, S., K. Takeda, and T. Kaisho. 2001. Toll-like receptors: critical proteins
linking innate and acquired immunity. Nat. Immunol. 2: 675-680.
11. Akira, S., and K. Takeda. 2004. Toll-like receptor signalling. Nat. Rev.
Immunol. 4: 499-511.
12. Kuma, V., A. K. Abbas, and N. Fausto. 2004. Robbins and Cotran's
Pathologic Basis of Disease, 7 ed. Saunders Co Ltd.
13. Geginat, J., F. Sallusto, and A. Lanzavecchia. 2001. Cytokine-driven
proliferation and differentiation of human naive, central memory, and effector
memory CD4(+) T cells. J. Exp. Med. 194: 1711-1719.
14. McBride, J. M., and C. G. Fathman. 2002. A complicated relationship:
fulfilling the interactive needs of the T lymphocyte and the dendritic cell.
Pharmacogenomics. J. 2: 367-376.
15. O'garra, A., and N. Arai. 2000. The molecular basis of T helper 1 and T helper
2 cell differentiation. Trends Cell Biol. 10: 542-550.
Chapter Seven Reference List 174
16. Takahashi, T., Y. Kuniyasu, M. Toda, N. Sakaguchi, M. Itoh, M. Iwata, J.
Shimizu, and S. Sakaguchi. 1998. Immunologic self-tolerance maintained by
CD25+CD4+ naturally anergic and suppressive T cells: induction of
autoimmune disease by breaking their anergic/suppressive state. Int. Immunol.
10: 1969-1980.
17. Read, S., and F. Powrie. 2001. CD4(+) regulatory T cells. Curr. Opin.
Immunol. 13: 644-649.
18. Marrack, P., and J. Kappler. 1987. The T cell receptor. Science 238: 1073-
1079.
19. Barry, M., and R. C. Bleackley. 2002. Cytotoxic T lymphocytes: all roads lead
to death. Nat. Rev. Immunol. 2: 401-409.
20. Surh, C. D., and J. Sprent. 1994. T-cell apoptosis detected in situ during
positive and negative selection in the thymus. Nature 372: 100-103.
21. Mackay, C. R., W. Marston, and L. Dudler. 1992. Altered patterns of T cell
migration through lymph nodes and skin following antigen challenge. Eur. J.
Immunol. 22: 2205-2210.
22. Geginat, J., F. Sallusto, and A. Lanzavecchia. 2001. Cytokine-driven
proliferation and differentiation of human naive, central memory, and effector
memory CD4(+) T cells. J. Exp. Med. 194: 1711-1719.
23. Westermann, J., B. Engelhardt, and J. C. Hoffmann. 2001. Migration of T
cells in vivo: molecular mechanisms and clinical implications. Ann. Intern.
Med. 135: 279-295.
24. Ley, K., C. Laudanna, M. I. Cybulsky, and S. Nourshargh. 2007. Getting to
the site of inflammation: the leukocyte adhesion cascade updated. Nat. Rev.
Immunol. 7: 678-689.
25. Bradley, L. M., and S. R. Watson. 1996. Lymphocyte migration into tissue:
the paradigm derived from CD4 subsets. Curr. Opin. Immunol. 8: 312-320.
26. Johnson-Leger, C., M. Aurrand-Lions, and B. A. Imhof. 2000. The parting of
the endothelium: miracle, or simply a junctional affair? J. Cell Sci. 113 ( Pt 6):
921-933.
27. Gunn, M. D., S. Kyuwa, C. Tam, T. Kakiuchi, A. Matsuzawa, L. T. Williams,
and H. Nakano. 1999. Mice lacking expression of secondary lymphoid organ
chemokine have defects in lymphocyte homing and dendritic cell localization.
J. Exp. Med. 189: 451-460.
28. Jackson, D. G. 2003. The lymphatics revisited: new perspectives from the
hyaluronan receptor LYVE-1. Trends Cardiovasc. Med. 13: 1-7.
29. Mebius, R. E. 2003. Organogenesis of lymphoid tissues. Nat. Rev. Immunol. 3:
292-303.
Chapter Seven Reference List 175
30. Sabin, F. R. 1916. The method of growth of the lymphatic system. Science 44:
145-158.
31. Wigle, J. T., and G. Oliver. 1999. Prox1 function is required for the
development of the murine lymphatic system. Cell 98: 769-778.
32. Hoch, R. V., and P. Soriano. 2003. Roles of PDGF in animal development.
Development 130: 4769-4784.
33. Ornitz, D. M., and N. Itoh. 2001. Fibroblast growth factors. Genome Biol. 2:
REVIEWS3005.
34. Mummery, C. L. 2001. Transforming growth factor beta and mouse
development. Microsc. Res. Tech. 52: 374-386.
35. Cupedo, T., and R. E. Mebius. 2005. Cellular interactions in lymph node
development. J. Immunol. 174: 21-25.
36. Rennert, P. D., D. James, F. Mackay, J. L. Browning, and P. S. Hochman.
1998. Lymph node genesis is induced by signaling through the lymphotoxin
beta receptor. Immunity. 9: 71-79.
37. Smith, C. A., T. Farrah, and R. G. Goodwin. 1994. The TNF receptor
superfamily of cellular and viral proteins: activation, costimulation, and death.
Cell 76: 959-962.
38. Ware, C. F., T. L. VanArsdale, P. D. Crowe, and J. L. Browning. 1995. The
ligands and receptors of the lymphotoxin system. Curr. Top. Microbiol.
Immunol. 198: 175-218.
39. Force, W. R., B. N. Walter, C. Hession, R. Tizard, C. A. Kozak, J. L.
Browning, and C. F. Ware. 1995. Mouse lymphotoxin-beta receptor.
Molecular genetics, ligand binding, and expression. J. Immunol. 155: 5280-
5288.
40. Banks, T. A., B. T. Rouse, M. K. Kerley, P. J. Blair, V. L. Godfrey, N. A.
Kuklin, D. M. Bouley, J. Thomas, S. Kanangat, and M. L. Mucenski. 1995.
Lymphotoxin-alpha-deficient mice. Effects on secondary lymphoid organ
development and humoral immune responsiveness. J. Immunol. 155: 1685-
1693.
41. Sacca, R., S. Turley, L. Soong, I. Mellman, and N. H. Ruddle. 1997.
Transgenic expression of lymphotoxin restores lymph nodes to lymphotoxin-
alpha-deficient mice. J. Immunol. 159: 4252-4260.
42. Rennert, P. D., J. L. Browning, R. Mebius, F. Mackay, and P. S. Hochman.
1996. Surface lymphotoxin alpha/beta complex is required for the
development of peripheral lymphoid organs. J. Exp. Med. 184: 1999-2006.
43. Alimzhanov, M. B., D. V. Kuprash, M. H. Kosco-Vilbois, A. Luz, R. L.
Turetskaya, A. Tarakhovsky, K. Rajewsky, S. A. Nedospasov, and K. Pfeffer.
Chapter Seven Reference List 176
1997. Abnormal development of secondary lymphoid tissues in lymphotoxin
beta-deficient mice. Proc. Natl. Acad. Sci. U. S. A 94: 9302-9307.
44. Koni, P. A., R. Sacca, P. Lawton, J. L. Browning, N. H. Ruddle, and R. A.
Flavell. 1997. Distinct roles in lymphoid organogenesis for lymphotoxins
alpha and beta revealed in lymphotoxin beta-deficient mice. Immunity. 6: 491-
500.
45. Cupedo, T., M. F. Vondenhoff, E. J. Heeregrave, A. E. De Weerd, W. Jansen,
D. G. Jackson, G. Kraal, and R. E. Mebius. 2004. Presumptive lymph node
organizers are differentially represented in developing mesenteric and
peripheral nodes. J. Immunol. 173: 2968-2975.
46. Futterer, A., K. Mink, A. Luz, M. H. Kosco-Vilbois, and K. Pfeffer. 1998. The
lymphotoxin beta receptor controls organogenesis and affinity maturation in
peripheral lymphoid tissues. Immunity. 9: 59-70.
47. Kim, D., R. E. Mebius, J. D. MacMicking, S. Jung, T. Cupedo, Y. Castellanos,
J. Rho, B. R. Wong, R. Josien, N. Kim, P. D. Rennert, and Y. Choi. 2000.
Regulation of peripheral lymph node genesis by the tumor necrosis factor
family member TRANCE. J. Exp. Med. 192: 1467-1478.
48. Yoshida, H., A. Naito, J. Inoue, M. Satoh, S. M. Santee-Cooper, C. F. Ware,
A. Togawa, S. Nishikawa, and S. Nishikawa. 2002. Different cytokines induce
surface lymphotoxin-alphabeta on IL-7 receptor-alpha cells that differentially
engender lymph nodes and Peyer's patches. Immunity. 17: 823-833.
49. Adachi, S., H. Yoshida, K. Honda, K. Maki, K. Saijo, K. Ikuta, T. Saito, and
S. I. Nishikawa. 1998. Essential role of IL-7 receptor alpha in the formation of
Peyer's patch anlage. Int. Immunol. 10: 1-6.
50. White, A., D. Carragher, S. Parnell, A. Msaki, N. Perkins, P. Lane, E.
Jenkinson, G. Anderson, and J. H. Caamano. 2007. Lymphotoxin a-dependent
and -independent signals regulate stromal organizer cell homeostasis during
lymph node organogenesis. Blood 110: 1950-1959.
51. Muller, J. R., and U. Siebenlist. 2003. Lymphotoxin beta receptor induces
sequential activation of distinct NF-kappa B factors via separate signaling
pathways. J. Biol. Chem. 278: 12006-12012.
52. Cupedo, T., W. Jansen, G. Kraal, and R. E. Mebius. 2004. Induction of
secondary and tertiary lymphoid structures in the skin. Immunity. 21: 655-667.
53. Yoshida, H., K. Honda, R. Shinkura, S. Adachi, S. Nishikawa, K. Maki, K.
Ikuta, and S. I. Nishikawa. 1999. IL-7 receptor alpha+ CD3(-) cells in the
embryonic intestine induces the organizing center of Peyer's patches. Int.
Immunol. 11: 643-655.
54. Kim, M. Y., F. M. Gaspal, H. E. Wiggett, F. M. McConnell, A. Gulbranson-
Judge, C. Raykundalia, L. S. Walker, M. D. Goodall, and P. J. Lane. 2003.
CD4(+)CD3(-) accessory cells costimulate primed CD4 T cells through OX40
Chapter Seven Reference List 177
and CD30 at sites where T cells collaborate with B cells. Immunity. 18: 643-
654.
55. Gaspal, F. M., M. Y. Kim, F. M. McConnell, C. Raykundalia, V. Bekiaris, and
P. J. Lane. 2005. Mice deficient in OX40 and CD30 signals lack memory
antibody responses because of deficient CD4 T cell memory. J. Immunol. 174:
3891-3896.
56. Kim, M. Y., F. M. McConnell, F. M. Gaspal, A. White, S. H. Glanville, V.
Bekiaris, L. S. Walker, J. Caamano, E. Jenkinson, G. Anderson, and P. J.
Lane. 2007. Function of CD4+CD3- cells in relation to B- and T-zone stroma
in spleen. Blood 109: 1602-1610.
57. Scandella, E., B. Bolinger, E. Lattmann, S. Miller, S. Favre, D. R. Littman, D.
Finke, S. A. Luther, T. Junt, and B. Ludewig. 2008. Restoration of lymphoid
organ integrity through the interaction of lymphoid tissue-inducer cells with
stroma of the T cell zone. Nat. Immunol. 9: 667-675.
58. Cella, M., A. Fuchs, W. Vermi, F. Facchetti, K. Otero, J. K. Lennerz, J. M.
Doherty, J. C. Mills, and M. Colonna. 2009. A human natural killer cell subset
provides an innate source of IL-22 for mucosal immunity. Nature 457: 722-
725.
59. Moretta, A., R. Biassoni, C. Bottino, M. C. Mingari, and L. Moretta. 2000.
Natural cytotoxicity receptors that trigger human NK-cell-mediated cytolysis.
Immunol. Today 21: 228-234.
60. Takatori, H., Y. Kanno, W. T. Watford, C. M. Tato, G. Weiss, I. I. Ivanov, D.
R. Littman, and J. J. O'Shea. 2009. Lymphoid tissue inducer-like cells are an
innate source of IL-17 and IL-22. J. Exp. Med. 206: 35-41.
61. Vivier, E., H. Spits, and T. Cupedo. 2009. Interleukin-22-producing innate
immune cells: new players in mucosal immunity and tissue repair? Nat. Rev.
Immunol. 9: 229-234.
62. Drayton, D. L., S. Liao, R. H. Mounzer, and N. H. Ruddle. 2006. Lymphoid
organ development: from ontogeny to neogenesis. Nat. Immunol. 7: 344-353.
63. Oliver, G. 2004. Lymphatic vasculature development. Nat. Rev. Immunol. 4:
35-45.
64. Berlin, C., E. L. Berg, M. J. Briskin, D. P. Andrew, P. J. Kilshaw, B.
Holzmann, I. L. Weissman, A. Hamann, and E. C. Butcher. 1993. Alpha 4
beta 7 integrin mediates lymphocyte binding to the mucosal vascular addressin
MAdCAM-1. Cell 74: 185-195.
65. Blum, K. S., and R. Pabst. 2006. Keystones in lymph node development. J.
Anat. 209: 585-595.
66. Cyster, J. G. 2003. Lymphoid organ development and cell migration.
Immunol. Rev. 195: 5-14.
Chapter Seven Reference List 178
67. Link, A., T. K. Vogt, S. Favre, M. R. Britschgi, H. Acha-Orbea, B. Hinz, J. G.
Cyster, and S. A. Luther. 2007. Fibroblastic reticular cells in lymph nodes
regulate the homeostasis of naive T cells. Nat. Immunol. 8: 1255-1265.
68. Allen, C. D., and J. G. Cyster. 2008. Follicular dendritic cell networks of
primary follicles and germinal centers: phenotype and function. Semin.
Immunol. 20: 14-25.
69. Katakai, T., H. Suto, M. Sugai, H. Gonda, A. Togawa, S. Suematsu, Y.
Ebisuno, K. Katagiri, T. Kinashi, and A. Shimizu. 2008. Organizer-like
reticular stromal cell layer common to adult secondary lymphoid organs. J.
Immunol. 181: 6189-6200.
70. Luther, S. A., H. L. Tang, P. L. Hyman, A. G. Farr, and J. G. Cyster. 2000.
Coexpression of the chemokines ELC and SLC by T zone stromal cells and
deletion of the ELC gene in the plt/plt mouse. Proc. Natl. Acad. Sci. U. S. A
97: 12694-12699.
71. Katakai, T., T. Hara, M. Sugai, H. Gonda, and A. Shimizu. 2004. Lymph node
fibroblastic reticular cells construct the stromal reticulum via contact with
lymphocytes. J. Exp. Med. 200: 783-795.
72. Farr, A. G., M. L. Berry, A. Kim, A. J. Nelson, M. P. Welch, and A. Aruffo.
1992. Characterization and cloning of a novel glycoprotein expressed by
stromal cells in T-dependent areas of peripheral lymphoid tissues. J. Exp.
Med. 176: 1477-1482.
73. Breiteneder-Geleff, S., K. Matsui, A. Soleiman, P. Meraner, H. Poczewski, R.
Kalt, G. Schaffner, and D. Kerjaschki. 1997. Podoplanin, novel 43-kd
membrane protein of glomerular epithelial cells, is down-regulated in
puromycin nephrosis. Am. J. Pathol. 151: 1141-1152.
74. Schacht, V., M. I. Ramirez, Y. K. Hong, S. Hirakawa, D. Feng, N. Harvey, M.
Williams, A. M. Dvorak, H. F. Dvorak, G. Oliver, and M. Detmar. 2003.
T1alpha/podoplanin deficiency disrupts normal lymphatic vasculature
formation and causes lymphedema. EMBO J. 22: 3546-3556.
75. Farr, A., A. Nelson, and S. Hosier. 1992. Characterization of an antigenic
determinant preferentially expressed by type I epithelial cells in the murine
thymus. J. Histochem. Cytochem. 40: 651-664.
76. Mahtab, E. A., M. C. Wijffels, N. M. Van Den Akker, N. D. Hahurij, H. Lie-
Venema, L. J. Wisse, M. C. DeRuiter, P. Uhrin, J. Zaujec, B. R. Binder, M. J.
Schalij, R. E. Poelmann, and A. C. Gittenberger-de Groot. 2008. Cardiac
malformations and myocardial abnormalities in podoplanin knockout mouse
embryos: Correlation with abnormal epicardial development. Dev. Dyn. 237:
847-857.
77. Ngo, V. N., R. J. Cornall, and J. G. Cyster. 2001. Splenic T zone development
is B cell dependent. J. Exp. Med. 194: 1649-1660.
Chapter Seven Reference List 179
78. Bekiaris, V., D. Withers, S. H. Glanville, F. M. McConnell, S. M. Parnell, M.
Y. Kim, F. M. Gaspal, E. Jenkinson, C. Sweet, G. Anderson, and P. J. Lane.
2007. Role of CD30 in B/T segregation in the spleen. J. Immunol. 179: 7535-
7543.
79. Rademakers, L. H. 1991. Follicular dendritic cells in germinal centre
development. Res. Immunol. 142: 257-260.
80. Lindhout, E., M. van Eijk, M. van Pel, J. Lindeman, H. J. Dinant, and C. de
Groot. 1999. Fibroblast-like synoviocytes from rheumatoid arthritis patients
have intrinsic properties of follicular dendritic cells. J. Immunol. 162: 5949-
5956.
81. Park, C. S., and Y. S. Choi. 2005. How do follicular dendritic cells interact
intimately with B cells in the germinal centre? Immunology 114: 2-10.
82. Hase, H., Y. Kanno, M. Kojima, K. Hasegawa, D. Sakurai, H. Kojima, N.
Tsuchiya, K. Tokunaga, N. Masawa, M. Azuma, K. Okumura, and T. Kobata.
2004. BAFF/BLyS can potentiate B-cell selection with the B-cell coreceptor
complex. Blood 103: 2257-2265.
83. Nolte, M. A., J. A. Belien, I. Schadee-Eestermans, W. Jansen, W. W. Unger,
N. van Rooijen, G. Kraal, and R. E. Mebius. 2003. A conduit system
distributes chemokines and small blood-borne molecules through the splenic
white pulp. J. Exp. Med. 198: 505-512.
84. Gretz, J. E., A. O. Anderson, and S. Shaw. 1997. Cords, channels, corridors
and conduits: critical architectural elements facilitating cell interactions in the
lymph node cortex. Immunol. Rev. 156: 11-24.
85. Sixt, M., N. Kanazawa, M. Selg, T. Samson, G. Roos, D. P. Reinhardt, R.
Pabst, M. B. Lutz, and L. Sorokin. 2005. The conduit system transports
soluble antigens from the afferent lymph to resident dendritic cells in the T
cell area of the lymph node. Immunity. 22: 19-29.
86. Bajenoff, M., J. G. Egen, L. Y. Koo, J. P. Laugier, F. Brau, N. Glaichenhaus,
and R. N. Germain. 2006. Stromal cell networks regulate lymphocyte entry,
migration, and territoriality in lymph nodes. Immunity. 25: 989-1001.
87. Hayakawa, M., M. Kobayashi, and T. Hoshino. 1988. Direct contact between
reticular fibers and migratory cells in the paracortex of mouse lymph nodes: a
morphological and quantitative study. Arch. Histol. Cytol. 51: 233-240.
88. Gretz, J. E., C. C. Norbury, A. O. Anderson, A. E. Proudfoot, and S. Shaw.
2000. Lymph-borne chemokines and other low molecular weight molecules
reach high endothelial venules via specialized conduits while a functional
barrier limits access to the lymphocyte microenvironments in lymph node
cortex. J. Exp. Med. 192: 1425-1440.
89. Hecksher-Sorensen, J., R. P. Watson, L. A. Lettice, P. Serup, L. Eley, C. De
Angelis, U. Ahlgren, and R. E. Hill. 2004. The splanchnic mesodermal plate
Chapter Seven Reference List 180
directs spleen and pancreatic laterality, and is regulated by Bapx1/Nkx3.2.
Development 131: 4665-4675.
90. Green, M. C. 1967. A defect of the splanchnic mesoderm caused by the
mutant gene dominant hemimelia in the mouse. Dev. Biol. 15: 62-89.
91. Seifert, M. F., and S. C. Marks, Jr. 1985. The regulation of hemopoiesis in the
spleen. Experientia 41: 192-199.
92. Mebius, R. E., and G. Kraal. 2005. Structure and function of the spleen. Nat.
Rev. Immunol. 5: 606-616.
93. Lenox, L. E., L. Shi, S. Hegde, and R. F. Paulson. 2009. Extramedullary
erythropoiesis in the adult liver requires BMP-4/Smad5-dependent signaling.
Exp. Hematol. 37: 549-558.
94. Lopez-Guillermo, A., F. Cervantes, M. Bruguera, A. Pereira, E. Feliu, and C.
Rozman. 1991. Liver dysfunction following splenectomy in idiopathic
myelofibrosis: a study of 10 patients. Acta Haematol. 85: 184-188.
95. Sainte-Marie, G., and F. S. Peng. 1986. Diffusion of a lymph-carried antigen
in the fiber network of the lymph node of the rat. Cell Tissue Res. 245: 481-
486.
96. Ngo, V. N., H. Korner, M. D. Gunn, K. N. Schmidt, D. S. Riminton, M. D.
Cooper, J. L. Browning, J. D. Sedgwick, and J. G. Cyster. 1999. Lymphotoxin
alpha/beta and tumor necrosis factor are required for stromal cell expression of
homing chemokines in B and T cell areas of the spleen. J. Exp. Med. 189: 403-
412.
97. Ansel, K. M., V. N. Ngo, P. L. Hyman, S. A. Luther, R. Forster, J. D.
Sedgwick, J. L. Browning, M. Lipp, and J. G. Cyster. 2000. A chemokine-
driven positive feedback loop organizes lymphoid follicles. Nature 406: 309-
314.
98. Ngo, V. N., H. Korner, M. D. Gunn, K. N. Schmidt, D. S. Riminton, M. D.
Cooper, J. L. Browning, J. D. Sedgwick, and J. G. Cyster. 1999. Lymphotoxin
alpha/beta and tumor necrosis factor are required for stromal cell expression of
homing chemokines in B and T cell areas of the spleen. J. Exp. Med. 189: 403-
412.
99. Ngo, V. N., H. Korner, M. D. Gunn, K. N. Schmidt, D. S. Riminton, M. D.
Cooper, J. L. Browning, J. D. Sedgwick, and J. G. Cyster. 1999. Lymphotoxin
alpha/beta and tumor necrosis factor are required for stromal cell expression of
homing chemokines in B and T cell areas of the spleen. J. Exp. Med. 189: 403-
412.
100. Matsumoto, M., Y. X. Fu, H. Molina, and D. D. Chaplin. 1997. Lymphotoxin-
alpha-deficient and TNF receptor-I-deficient mice define developmental and
functional characteristics of germinal centers. Immunol. Rev. 156: 137-144.
Chapter Seven Reference List 181
101. Ansel, K. M., V. N. Ngo, P. L. Hyman, S. A. Luther, R. Forster, J. D.
Sedgwick, J. L. Browning, M. Lipp, and J. G. Cyster. 2000. A chemokine-
driven positive feedback loop organizes lymphoid follicles. Nature 406: 309-
314.
102. Matsumoto, M., Y. X. Fu, H. Molina, and D. D. Chaplin. 1997. Lymphotoxin-
alpha-deficient and TNF receptor-I-deficient mice define developmental and
functional characteristics of germinal centers. Immunol. Rev. 156: 137-144.
103. Amlot, P. L., and A. E. Hayes. 1985. Impaired human antibody response to the
thymus-independent antigen, DNP-Ficoll, after splenectomy. Implications for
post-splenectomy infections. Lancet 1: 1008-1011.
104. Kratz, A., A. Campos-Neto, M. S. Hanson, and N. H. Ruddle. 1996. Chronic
inflammation caused by lymphotoxin is lymphoid neogenesis. J. Exp. Med.
183: 1461-1472.
105. Haworth, O., and C. D. Buckley. 2007. Resolving the problem of persistence
in the switch from acute to chronic inflammation. Proc. Natl. Acad. Sci. U. S.
A 104: 20647-20648.
106. Maddox, J. F., S. P. Colgan, C. B. Clish, N. A. Petasis, V. V. Fokin, and C. N.
Serhan. 1998. Lipoxin B4 regulates human monocyte/neutrophil adherence
and motility: design of stable lipoxin B4 analogs with increased biologic
activity. FASEB J. 12: 487-494.
107. Soyombo, O., B. W. Spur, and T. H. Lee. 1994. Effects of lipoxin A4 on
chemotaxis and degranulation of human eosinophils stimulated by platelet-
activating factor and N-formyl-L-methionyl-L-leucyl-L-phenylalanine.
Allergy 49: 230-234.
108. Gilroy, D. W., P. R. Colville-Nash, D. Willis, J. Chivers, M. J. Paul-Clark, and
D. A. Willoughby. 1999. Inducible cyclooxygenase may have anti-
inflammatory properties. Nat. Med. 5: 698-701.
109. Salmon, M., D. Scheel-Toellner, A. P. Huissoon, D. Pilling, N. Shamsadeen,
H. Hyde, A. D. D'Angeac, P. A. Bacon, P. Emery, and A. N. Akbar. 1997.
Inhibition of T cell apoptosis in the rheumatoid synovium. J. Clin. Invest 99:
439-446.
110. Pilling, D., A. N. Akbar, J. Girdlestone, C. H. Orteu, N. J. Borthwick, N.
Amft, D. Scheel-Toellner, C. D. Buckley, and M. Salmon. 1999. Interferon-
beta mediates stromal cell rescue of T cells from apoptosis. Eur. J. Immunol.
29: 1041-1050.
111. Buckley, C. D., N. Amft, P. F. Bradfield, D. Pilling, E. Ross, F. Arenzana-
Seisdedos, A. Amara, S. J. Curnow, J. M. Lord, D. Scheel-Toellner, and M.
Salmon. 2000. Persistent induction of the chemokine receptor CXCR4 by
TGF-beta 1 on synovial T cells contributes to their accumulation within the
rheumatoid synovium. J. Immunol. 165: 3423-3429.
Chapter Seven Reference List 182
112. Shiow, L. R., D. B. Rosen, N. Brdickova, Y. Xu, J. An, L. L. Lanier, J. G.
Cyster, and M. Matloubian. 2006. CD69 acts downstream of interferon-
alpha/beta to inhibit S1P1 and lymphocyte egress from lymphoid organs.
Nature 440: 540-544.
113. Buckley, C. D., D. Pilling, J. M. Lord, A. N. Akbar, D. Scheel-Toellner, and
M. Salmon. 2001. Fibroblasts regulate the switch from acute resolving to
chronic persistent inflammation. Trends Immunol. 22: 199-204.
114. Schroder, A. E., A. Greiner, C. Seyfert, and C. Berek. 1996. Differentiation of
B cells in the nonlymphoid tissue of the synovial membrane of patients with
rheumatoid arthritis. Proc. Natl. Acad. Sci. U. S. A 93: 221-225.
115. Ghosh, S., A. C. Steere, B. D. Stollar, and B. T. Huber. 2005. In situ
diversification of the antibody repertoire in chronic Lyme arthritis synovium.
J. Immunol. 174: 2860-2869.
116. Baddoura, F. K., I. W. Nasr, B. Wrobel, Q. Li, N. H. Ruddle, and F. G.
Lakkis. 2005. Lymphoid neogenesis in murine cardiac allografts undergoing
chronic rejection. Am. J. Transplant. 5: 510-516.
117. Hjelmstrom, P. 2001. Lymphoid neogenesis: de novo formation of lymphoid
tissue in chronic inflammation through expression of homing chemokines. J.
Leukoc. Biol. 69: 331-339.
118. Paavonen, K., J. Mandelin, T. Partanen, L. Jussila, T. F. Li, A. Ristimaki, K.
Alitalo, and Y. T. Konttinen. 2002. Vascular endothelial growth factors C and
D and their VEGFR-2 and 3 receptors in blood and lymphatic vessels in
healthy and arthritic synovium. J. Rheumatol. 29: 39-45.
119. Chang, H. Y., J. T. Chi, S. Dudoit, C. Bondre, R. M. van de, D. Botstein, and
P. O. Brown. 2002. Diversity, topographic differentiation, and positional
memory in human fibroblasts. Proc. Natl. Acad. Sci. U. S. A 99: 12877-12882.
120. Filer, A., C. Pitzalis, and C. D. Buckley. 2006. Targeting the stromal
microenvironment in chronic inflammation. Curr. Opin. Pharmacol. 6: 393-
400.
121. Tarin, D., and C. B. Croft. 1969. Ultrastructural features of wound healing in
mouse skin. J. Anat. 105: 189-190.
122. Sabatelli, P., P. Bonaldo, G. Lattanzi, P. Braghetta, N. Bergamin, C. Capanni,
E. Mattioli, M. Columbaro, A. Ognibene, G. Pepe, E. Bertini, L. Merlini, N.
M. Maraldi, and S. Squarzoni. 2001. Collagen VI deficiency affects the
organization of fibronectin in the extracellular matrix of cultured fibroblasts.
Matrix Biol. 20: 475-486.
123. Marinkovich, M. P., D. R. Keene, C. S. Rimberg, and R. E. Burgeson. 1993.
Cellular origin of the dermal-epidermal basement membrane. Dev. Dyn. 197:
255-267.
Chapter Seven Reference List 183
124. Tomita, T., T. Nakase, M. Kaneko, K. Shi, K. Takahi, T. Ochi, and H.
Yoshikawa. 2002. Expression of extracellular matrix metalloproteinase
inducer and enhancement of the production of matrix metalloproteinases in
rheumatoid arthritis. Arthritis Rheum. 46: 373-378.
125. Dahm, R., and M. Kiebler. 2005. Cell biology: silenced RNA on the move.
Nature 438: 432-435.
126. Iwano, M., D. Plieth, T. M. Danoff, C. Xue, H. Okada, and E. G. Neilson.
2002. Evidence that fibroblasts derive from epithelium during tissue fibrosis.
J. Clin. Invest 110: 341-350.
127. Kalluri, R., and E. G. Neilson. 2003. Epithelial-mesenchymal transition and its
implications for fibrosis. J. Clin. Invest 112: 1776-1784.
128. Zeisberg, M., G. Bonner, Y. Maeshima, P. Colorado, G. A. Muller, F. Strutz,
and R. Kalluri. 2001. Renal fibrosis: collagen composition and assembly
regulates epithelial-mesenchymal transdifferentiation. Am. J. Pathol. 159:
1313-1321.
129. Zeisberg, M., J. Hanai, H. Sugimoto, T. Mammoto, D. Charytan, F. Strutz, and
R. Kalluri. 2003. BMP-7 counteracts TGF-beta1-induced epithelial-to-
mesenchymal transition and reverses chronic renal injury. Nat. Med. 9: 964-
968.
130. Garrett, D. M., and G. W. Conrad. 1979. Fibroblast-like cells from embryonic
chick cornea, heart, and skin are antigenically distinct. Dev. Biol. 70: 50-70.
131. Schor, S. L., and A. M. Schor. 1987. Clonal heterogeneity in fibroblast
phenotype: implications for the control of epithelial-mesenchymal
interactions. Bioessays 7: 200-204.
132. Dugina, V., A. Alexandrova, C. Chaponnier, J. Vasiliev, and G. Gabbiani.
1998. Rat fibroblasts cultured from various organs exhibit differences in
alpha-smooth muscle actin expression, cytoskeletal pattern, and adhesive
structure organization. Exp. Cell Res. 238: 481-490.
133. Abe, R., S. C. Donnelly, T. Peng, R. Bucala, and C. N. Metz. 2001. Peripheral
blood fibrocytes: differentiation pathway and migration to wound sites. J.
Immunol. 166: 7556-7562.
134. Bucala, R., L. A. Spiegel, J. Chesney, M. Hogan, and A. Cerami. 1994.
Circulating fibrocytes define a new leukocyte subpopulation that mediates
tissue repair. Mol. Med. 1: 71-81.
135. Pilling, D., C. D. Buckley, M. Salmon, and R. H. Gomer. 2003. Inhibition of
fibrocyte differentiation by serum amyloid P. J. Immunol. 171: 5537-5546.
136. Parsonage, G., A. D. Filer, O. Haworth, G. B. Nash, G. E. Rainger, M.
Salmon, and C. D. Buckley. 2005. A stromal address code defined by
fibroblasts. Trends Immunol. 26: 150-156.
Chapter Seven Reference List 184
137. Postlethwaite, A. E., H. Shigemitsu, and S. Kanangat. 2004. Cellular origins of
fibroblasts: possible implications for organ fibrosis in systemic sclerosis. Curr.
Opin. Rheumatol. 16: 733-738.
138. Kalluri, R., and M. Zeisberg. 2006. Fibroblasts in cancer. Nat. Rev. Cancer 6:
392-401.
139. MacFadyen, J. R., O. Haworth, D. Roberston, D. Hardie, M. T. Webster, H. R.
Morris, M. Panico, M. Sutton-Smith, A. Dell, G. P. van der, D. Wienke, C. D.
Buckley, and C. M. Isacke. 2005. Endosialin (TEM1, CD248) is a marker of
stromal fibroblasts and is not selectively expressed on tumour endothelium.
FEBS Lett. 579: 2569-2575.
140. Lax, S., T. Z. Hou, E. Jenkinson, M. Salmon, J. R. MacFadyen, C. M. Isacke,
G. Anderson, A. F. Cunningham, and C. D. Buckley. 2007. CD248/Endosialin
is dynamically expressed on a subset of stromal cells during lymphoid tissue
development, splenic remodeling and repair. FEBS Lett. 581: 3550-3556.
141. Hirschi, K. K., S. A. Rohovsky, L. H. Beck, S. R. Smith, and P. A. D'Amore.
1999. Endothelial cells modulate the proliferation of mural cell precursors via
platelet-derived growth factor-BB and heterotypic cell contact. Circ. Res. 84:
298-305.
142. Norsworthy, P. J., L. Fossati-Jimack, J. Cortes-Hernandez, P. R. Taylor, A. E.
Bygrave, R. D. Thompson, S. Nourshargh, M. J. Walport, and M. Botto. 2004.
Murine CD93 (C1qRp) contributes to the removal of apoptotic cells in vivo
but is not required for C1q-mediated enhancement of phagocytosis. J.
Immunol. 172: 3406-3414.
143. Conway, E. M., W. M. Van de, S. Pollefeyt, K. Jurk, H. Van Aken, A. De
Vriese, J. I. Weitz, H. Weiler, P. W. Hellings, P. Schaeffer, J. M. Herbert, D.
Collen, and G. Theilmeier. 2002. The lectin-like domain of thrombomodulin
confers protection from neutrophil-mediated tissue damage by suppressing
adhesion molecule expression via nuclear factor kappaB and mitogen-
activated protein kinase pathways. J. Exp. Med. 196: 565-577.
144. Bagley, R. G., N. Honma, W. Weber, P. Boutin, C. Rouleau, S. Shankara, S.
Kataoka, I. Ishida, B. L. Roberts, and B. A. Teicher. 2008. Endosialin/TEM
1/CD248 is a pericyte marker of embryonic and tumor neovascularization.
Microvasc. Res. 76: 180-188.
145. MacFadyen, J., K. Savage, D. Wienke, and C. M. Isacke. 2007. Endosialin is
expressed on stromal fibroblasts and CNS pericytes in mouse embryos and is
downregulated during development. Gene Expr. Patterns. 7: 363-369.
146. Christian, S., R. Winkler, I. Helfrich, A. M. Boos, E. Besemfelder, D.
Schadendorf, and H. G. Augustin. 2008. Endosialin (Tem1) is a marker of
tumor-associated myofibroblasts and tumor vessel-associated mural cells. Am.
J. Pathol. 172: 486-494.
Chapter Seven Reference List 185
147. Nanda, A., B. Karim, Z. Peng, G. Liu, W. Qiu, C. Gan, B. Vogelstein, B. St
Croix, K. W. Kinzler, and D. L. Huso. 2006. Tumor endothelial marker 1
(Tem1) functions in the growth and progression of abdominal tumors. Proc.
Natl. Acad. Sci. U. S. A 103: 3351-3356.
148. Bagley, R. G., W. Weber, C. Rouleau, M. Yao, N. Honma, S. Kataoka, I.
Ishida, B. L. Roberts, and B. A. Teicher. 2009. Human mesenchymal stem
cells from bone marrow express tumor endothelial and stromal markers. Int. J.
Oncol. 34: 619-627.
149. Fries, K. M., T. Blieden, R. J. Looney, G. D. Sempowski, M. R. Silvera, R. A.
Willis, and R. P. Phipps. 1994. Evidence of fibroblast heterogeneity and the
role of fibroblast subpopulations in fibrosis. Clin. Immunol. Immunopathol.
72: 283-292.
150. Parsonage, G., F. Falciani, A. Burman, A. Filer, E. Ross, M. Bofill, S. Martin,
M. Salmon, and C. D. Buckley. 2003. Global gene expression profiles in
fibroblasts from synovial, skin and lymphoid tissue reveals distinct cytokine
and chemokine expression patterns. Thromb. Haemost. 90: 688-697.
151. Rinn, J. L., C. Bondre, H. B. Gladstone, P. O. Brown, and H. Y. Chang. 2006.
Anatomic demarcation by positional variation in fibroblast gene expression
programs. PLoS. Genet. 2: e119.
152. Rinn, J. L., J. K. Wang, N. Allen, S. A. Brugmann, A. J. Mikels, H. Liu, T. W.
Ridky, H. S. Stadler, R. Nusse, J. A. Helms, and H. Y. Chang. 2008. A dermal
HOX transcriptional program regulates site-specific epidermal fate. Genes
Dev. 22: 303-307.
153. Nash, G. B., C. D. Buckley, and R. G. Ed. 2004. The local physicochemical
environment conditions the proinflammatory response of endothelial cells and
thus modulates leukocyte recruitment. FEBS Lett. 569: 13-17.
154. Rinn, J. L., J. K. Wang, H. Liu, K. Montgomery, R. M. van de, and H. Y.
Chang. 2008. A systems biology approach to anatomic diversity of skin. J.
Invest Dermatol. 128: 776-782.
155. Pap, T., U. Muller-Ladner, R. E. Gay, and S. Gay. 2000. Fibroblast biology.
Role of synovial fibroblasts in the pathogenesis of rheumatoid arthritis.
Arthritis Res. 2: 361-367.
156. Smith, R. S., T. J. Smith, T. M. Blieden, and R. P. Phipps. 1997. Fibroblasts as
sentinel cells. Synthesis of chemokines and regulation of inflammation. Am. J.
Pathol. 151: 317-322.
157. Zhang, Y., H. J. Cao, B. Graf, H. Meekins, T. J. Smith, and R. P. Phipps.
1998. CD40 engagement up-regulates cyclooxygenase-2 expression and
prostaglandin E2 production in human lung fibroblasts. J. Immunol. 160:
1053-1057.
158. Mueller, D. L. 2000. T cells: A proliferation of costimulatory molecules. Curr.
Biol. 10: R227-R230.
Chapter Seven Reference List 186
159. Tlsty, T. D. 2001. Stromal cells can contribute oncogenic signals. Semin.
Cancer Biol. 11: 97-104.
160. Postlethwaite, A. E., M. A. Holness, H. Katai, and R. Raghow. 1992. Human
fibroblasts synthesize elevated levels of extracellular matrix proteins in
response to interleukin 4. J. Clin. Invest 90: 1479-1485.
161. Illsley, M. C., J. H. Peacock, R. J. McAnulty, and J. R. Yarnold. 2000.
Increased collagen production in fibroblasts cultured from irradiated skin and
effect of TGF beta(1)- clinical study. Br. J. Cancer 83: 650-654.
162. Khurana, R., and S. M. Berney. 2005. Clinical aspects of rheumatoid arthritis.
Pathophysiology. 12: 153-165.
163. Firestein, G. S. 2003. Evolving concepts of rheumatoid arthritis. Nature 423:
356-361.
164. Khurana, R., and S. M. Berney. 2005. Clinical aspects of rheumatoid arthritis.
Pathophysiology. 12: 153-165.
165. Goronzy, J. J., and C. M. Weyand. 2005. Rheumatoid arthritis. Immunol. Rev.
204: 55-73.
166. Fassbender, H. G. 1983. Histomorphological basis of articular cartilage
destruction in rheumatoid arthritis. Coll. Relat Res. 3: 141-155.
167. Muller-Ladner, U., J. Kriegsmann, B. N. Franklin, S. Matsumoto, T. Geiler, R.
E. Gay, and S. Gay. 1996. Synovial fibroblasts of patients with rheumatoid
arthritis attach to and invade normal human cartilage when engrafted into
SCID mice. Am. J. Pathol. 149: 1607-1615.
168. Aidinis, V., P. Carninci, M. Armaka, W. Witke, V. Harokopos, N. Pavelka, D.
Koczan, C. Argyropoulos, M. M. Thwin, S. Moller, K. Waki, P.
Gopalakrishnakone, P. Ricciardi-Castagnoli, H. J. Thiesen, Y. Hayashizaki,
and G. Kollias. 2005. Cytoskeletal rearrangements in synovial fibroblasts as a
novel pathophysiological determinant of modeled rheumatoid arthritis. PLoS.
Genet. 1: e48.
169. Firestein, G. S. 1996. Invasive fibroblast-like synoviocytes in rheumatoid
arthritis. Passive responders or transformed aggressors? Arthritis Rheum. 39:
1781-1790.
170. Sund, M., and R. Kalluri. 2009. Tumor stroma derived biomarkers in cancer.
Cancer Metastasis Rev. 28: 177-183.
171. Ronnov-Jessen, L., O. W. Petersen, and M. J. Bissell. 1996. Cellular changes
involved in conversion of normal to malignant breast: importance of the
stromal reaction. Physiol Rev. 76: 69-125.
172. Dvorak, H. F. 1986. Tumors: wounds that do not heal. Similarities between
tumor stroma generation and wound healing. N. Engl. J. Med. 315: 1650-1659.
Chapter Seven Reference List 187
173. Schedin, P., and A. Elias. 2004. Multistep tumorigenesis and the
microenvironment. Breast Cancer Res. 6: 93-101.
174. Rodemann, H. P., and G. A. Muller. 1991. Characterization of human renal
fibroblasts in health and disease: II. In vitro growth, differentiation, and
collagen synthesis of fibroblasts from kidneys with interstitial fibrosis. Am. J.
Kidney Dis. 17: 684-686.
175. Thiery, J. P. 2001. [Role of growth factor signaling in epithelial cell plasticity
during development and in carcinogenesis]. Bull. Acad. Natl. Med. 185: 1279-
1292.
176. Finak, G., N. Bertos, F. Pepin, S. Sadekova, M. Souleimanova, H. Zhao, H.
Chen, G. Omeroglu, S. Meterissian, A. Omeroglu, M. Hallett, and M. Park.
2008. Stromal gene expression predicts clinical outcome in breast cancer. Nat.
Med. 14: 518-527.
177. da Silva, M. L., P. C. Chagastelles, and N. B. Nardi. 2006. Mesenchymal stem
cells reside in virtually all post-natal organs and tissues. J. Cell Sci. 119: 2204-
2213.
178. Campagnoli, C., I. A. Roberts, S. Kumar, P. R. Bennett, I. Bellantuono, and N.
M. Fisk. 2001. Identification of mesenchymal stem/progenitor cells in human
first-trimester fetal blood, liver, and bone marrow. Blood 98: 2396-2402.
179. Pittenger, M. F., A. M. Mackay, S. C. Beck, R. K. Jaiswal, R. Douglas, J. D.
Mosca, M. A. Moorman, D. W. Simonetti, S. Craig, and D. R. Marshak. 1999.
Multilineage potential of adult human mesenchymal stem cells. Science 284:
143-147.
180. Jones, S., N. Horwood, A. Cope, and F. Dazzi. 2007. The antiproliferative
effect of mesenchymal stem cells is a fundamental property shared by all
stromal cells. J. Immunol. 179: 2824-2831.
181. Haniffa, M. A., X. N. Wang, U. Holtick, M. Rae, J. D. Isaacs, A. M.
Dickinson, C. M. Hilkens, and M. P. Collin. 2007. Adult human fibroblasts
are potent immunoregulatory cells and functionally equivalent to
mesenchymal stem cells. J. Immunol. 179: 1595-1604.
182. Haniffa, M. A., M. P. Collin, C. D. Buckley, and F. Dazzi. 2009.
Mesenchymal stem cells: the fibroblasts' new clothes? Haematologica 94:
258-263.
183. Jones, E., and D. McGonagle. 2008. Human bone marrow mesenchymal stem
cells in vivo. Rheumatology. (Oxford) 47: 126-131.
184. Criswell, L. A., K. A. Pfeiffer, R. F. Lum, B. Gonzales, J. Novitzke, M. Kern,
K. L. Moser, A. B. Begovich, V. E. Carlton, W. Li, A. T. Lee, W. Ortmann, T.
W. Behrens, and P. K. Gregersen. 2005. Analysis of families in the multiple
autoimmune disease genetics consortium (MADGC) collection: the PTPN22
620W allele associates with multiple autoimmune phenotypes. Am. J. Hum.
Genet. 76: 561-571.
Chapter Seven Reference List 188
185. Freeman, G. J., G. S. Gray, C. D. Gimmi, D. B. Lombard, L. J. Zhou, M.
White, J. D. Fingeroth, J. G. Gribben, and L. M. Nadler. 1991. Structure,
expression, and T cell costimulatory activity of the murine homologue of the
human B lymphocyte activation antigen B7. J. Exp. Med. 174: 625-631.
186. Freeman, G. J., J. G. Gribben, V. A. Boussiotis, J. W. Ng, V. A. Restivo, Jr.,
L. A. Lombard, G. S. Gray, and L. M. Nadler. 1993. Cloning of B7-2: a
CTLA-4 counter-receptor that costimulates human T cell proliferation.
Science 262: 909-911.
187. Vliagoftis, H., A. S. Worobec, and D. D. Metcalfe. 1997. The protooncogene
c-kit and c-kit ligand in human disease. J. Allergy Clin. Immunol. 100: 435-
440.
188. Bogen, S. A., H. S. Baldwin, S. C. Watkins, S. M. Albelda, and A. K. Abbas.
1992. Association of murine CD31 with transmigrating lymphocytes
following antigenic stimulation. Am. J. Pathol. 141: 843-854.
189. Nakano, A., T. Harada, S. Morikawa, and Y. Kato. 1990. Expression of
leukocyte common antigen (CD45) on various human leukemia/lymphoma
cell lines. Acta Pathol. Jpn. 40: 107-115.
190. Lin, H. H., D. E. Faunce, M. Stacey, A. Terajewicz, T. Nakamura, J. Zhang-
Hoover, M. Kerley, M. L. Mucenski, S. Gordon, and J. Stein-Streilein. 2005.
The macrophage F4/80 receptor is required for the induction of antigen-
specific efferent regulatory T cells in peripheral tolerance. J. Exp. Med. 201:
1615-1625.
191. Banchereau, J., and R. M. Steinman. 1998. Dendritic cells and the control of
immunity. Nature 392: 245-252.
192. Im, J., H. Kim, S. Kim, and E. H. Jho. 2007. Wnt/beta-catenin signaling
regulates expression of PRDC, an antagonist of the BMP-4 signaling pathway.
Biochem. Biophys. Res. Commun. 354: 296-301.
193. Bacani, J. T., M. Soares, R. Zwingerman, N. di Nicola, J. Senz, R. Riddell, D.
G. Huntsman, and S. Gallinger. 2006. CDH1/E-cadherin germline mutations
in early-onset gastric cancer. J. Med. Genet. 43: 867-872.
194. Mott, J. D., and Z. Werb. 2004. Regulation of matrix biology by matrix
metalloproteinases. Curr. Opin. Cell Biol. 16: 558-564.
195. Gordon, J. R., and S. J. Galli. 1994. Promotion of mouse fibroblast collagen
gene expression by mast cells stimulated via the Fc epsilon RI. Role for mast
cell-derived transforming growth factor beta and tumor necrosis factor alpha.
J. Exp. Med. 180: 2027-2037.
196. Chiaradonna, F., D. Gaglio, M. Vanoni, and L. Alberghina. 2006. Expression
of transforming K-Ras oncogene affects mitochondrial function and
morphology in mouse fibroblasts. Biochim. Biophys. Acta 1757: 1338-1356.
Chapter Seven Reference List 189
197. Strutz, F., H. Okada, C. W. Lo, T. Danoff, R. L. Carone, J. E. Tomaszewski,
and E. G. Neilson. 1995. Identification and characterization of a fibroblast
marker: FSP1. J. Cell Biol. 130: 393-405.
198. Okuda, M., A. Togawa, H. Wada, and S. Nishikawa. 2007. Distinct activities
of stromal cells involved in the organogenesis of lymph nodes and Peyer's
patches. J. Immunol. 179: 804-811.
199. Filer, A., M. Bik, G. N. Parsonage, J. Fitton, E. Trebilcock, K. Howlett, M.
Cook, K. Raza, D. L. Simmons, A. M. Thomas, M. Salmon, D. Scheel-
Toellner, J. M. Lord, G. A. Rabinovich, and C. D. Buckley. 2009. Galectin 3
induces a distinctive pattern of cytokine and chemokine production in
rheumatoid synovial fibroblasts via selective signaling pathways. Arthritis
Rheum. 60: 1604-1614.
200. Wang, Y., D. D. Belsham, and M. Glogauer. 2009. Rac1 and Rac2 in
Osteoclastogenesis: A Cell Immortalization Model. Calcif. Tissue Int.
201. Mortlock, D. P., and J. W. Innis. 1997. Mutation of HOXA13 in hand-foot-
genital syndrome. Nat. Genet. 15: 179-180.
202. Stasinopoulos, I. A., Y. Mironchik, A. Raman, F. Wildes, P. Winnard, Jr., and
V. Raman. 2005. HOXA5-twist interaction alters p53 homeostasis in breast
cancer cells. J. Biol. Chem. 280: 2294-2299.
203. Prabagaran, E., A. H. Bandivdekar, V. Dighe, and V. P. Raghavan. 2007.
HOXBES2: a novel epididymal HOXB2 homeoprotein and its domain-
specific association with spermatozoa. Biol. Reprod. 76: 314-326.
204. Connell, K. A., M. K. Guess, H. W. Chen, T. Lynch, R. Bercik, and H. S.
Taylor. 2009. HOXA11 promotes fibroblast proliferation and regulates p53 in
uterosacral ligaments. Reprod. Sci. 16: 694-700.
205. Di Poi, N., J. Zakany, and D. Duboule. 2007. Distinct roles and regulations for
HoxD genes in metanephric kidney development. PLoS. Genet. 3: e232.
206. Zuniga, A., O. Michos, F. Spitz, A. P. Haramis, L. Panman, A. Galli, K.
Vintersten, C. Klasen, W. Mansfield, S. Kuc, D. Duboule, R. Dono, and R.
Zeller. 2004. Mouse limb deformity mutations disrupt a global control region
within the large regulatory landscape required for Gremlin expression. Genes
Dev. 18: 1553-1564.
207. Semb, H., and G. Christofori. 1998. The tumor-suppressor function of E-
cadherin. Am. J. Hum. Genet. 63: 1588-1593.
208. Teague, T. K., P. Marrack, J. W. Kappler, and A. T. Vella. 1997. IL-6 rescues
resting mouse T cells from apoptosis. J. Immunol. 158: 5791-5796.
209. Vella, A., T. K. Teague, J. Ihle, J. Kappler, and P. Marrack. 1997. Interleukin
4 (IL-4) or IL-7 prevents the death of resting T cells: stat6 is probably not
required for the effect of IL-4. J. Exp. Med. 186: 325-330.
Chapter Seven Reference List 190
210. Akbar, A. N., N. J. Borthwick, R. G. Wickremasinghe, P. Panayoitidis, D.
Pilling, M. Bofill, S. Krajewski, J. C. Reed, and M. Salmon. 1996. Interleukin-
2 receptor common gamma-chain signaling cytokines regulate activated T cell
apoptosis in response to growth factor withdrawal: selective induction of anti-
apoptotic (bcl-2, bcl-xL) but not pro-apoptotic (bax, bcl-xS) gene expression.
Eur. J. Immunol. 26: 294-299.
211. Luther, S. A., A. Bidgol, D. C. Hargreaves, A. Schmidt, Y. Xu, J. Paniyadi,
M. Matloubian, and J. G. Cyster. 2002. Differing activities of homeostatic
chemokines CCL19, CCL21, and CXCL12 in lymphocyte and dendritic cell
recruitment and lymphoid neogenesis. J. Immunol. 169: 424-433.
212. Bacso, Z., R. B. Everson, and J. F. Eliason. 2000. The DNA of annexin V-
binding apoptotic cells is highly fragmented. Cancer Res. 60: 4623-4628.
213. Homey, B., H. Alenius, A. Muller, H. Soto, E. P. Bowman, W. Yuan, L.
McEvoy, A. I. Lauerma, T. Assmann, E. Bunemann, M. Lehto, H. Wolff, D.
Yen, H. Marxhausen, W. To, J. Sedgwick, T. Ruzicka, P. Lehmann, and A.
Zlotnik. 2002. CCL27-CCR10 interactions regulate T cell-mediated skin
inflammation. Nat. Med. 8: 157-165.
214. Schulz, E. G., L. Mariani, A. Radbruch, and T. Hofer. 2009. Sequential
polarization and imprinting of type 1 T helper lymphocytes by interferon-
gamma and interleukin-12. Immunity. 30: 673-683.
215. Pisabarro, M. T., B. Leung, M. Kwong, R. Corpuz, G. D. Frantz, N. Chiang,
R. Vandlen, L. J. Diehl, N. Skelton, H. S. Kim, D. Eaton, and K. N. Schmidt.
2006. Cutting edge: novel human dendritic cell- and monocyte-attracting
chemokine-like protein identified by fold recognition methods. J. Immunol.
176: 2069-2073.
216. Duckett, C. S., and C. B. Thompson. 1997. CD30-dependent degradation of
TRAF2: implications for negative regulation of TRAF signaling and the
control of cell survival. Genes Dev. 11: 2810-2821.
217. Zelante, T., A. De Luca, P. Bonifazi, C. Montagnoli, S. Bozza, S. Moretti, M.
L. Belladonna, C. Vacca, C. Conte, P. Mosci, F. Bistoni, P. Puccetti, R. A.
Kastelein, M. Kopf, and L. Romani. 2007. IL-23 and the Th17 pathway
promote inflammation and impair antifungal immune resistance. Eur. J.
Immunol. 37: 2695-2706.
218. Ruddle, N. H., and R. Homer. 1988. The role of lymphotoxin in inflammation.
Prog. Allergy 40: 162-182.
219. Ruddle, N. H. 1999. Lymphoid neo-organogenesis: lymphotoxin's role in
inflammation and development. Immunol. Res. 19: 119-125.
220. Rothkotter, H. J., and R. Pabst. 1990. Autotransplantation of lymph node
fragments. Structure and function of regenerated tissue. Scand. J. Plast.
Reconstr. Surg. Hand Surg. 24: 101-105.
Chapter Seven Reference List 191
221. Yamada, K., A. Shimizu, R. Utsugi, F. L. Ierino, P. Gargollo, G. W. Haller, R.
B. Colvin, and D. H. Sachs. 2000. Thymic transplantation in miniature swine.
II. Induction of tolerance by transplantation of composite thymokidneys to
thymectomized recipients. J. Immunol. 164: 3079-3086.
222. Glanville, S. H., V. Bekiaris, E. J. Jenkinson, P. J. Lane, G. Anderson, and D.
R. Withers. 2009. Transplantation of embryonic spleen tissue reveals a role for
adult non-lymphoid cells in initiating lymphoid tissue organization. Eur. J.
Immunol. 39: 280-289.
223. Zhang, J., R. Cao, Y. Zhang, T. Jia, Y. Cao, and E. Wahlberg. 2009.
Differential roles of PDGFR-alpha and PDGFR-beta in angiogenesis and
vessel stability. FASEB J. 23: 153-163.
224. Buckley, C. D., S. Halder, D. Hardie, G. Reynolds, R. Torensma, V. J. De
Villeroche, D. Brouty-Boye, and C. M. Isacke. 2005. Report on antibodies
submitted to the stromal cell section of HLDA8. Cell Immunol. 236: 29-41.
225. Halder, S., D. L. Hardie, D. Scheel-Toellner, M. Salmon, and C. D. Buckley.
2005. Generation and characterization of novel stromal specific antibodies.
Cell Res. 15: 739-744.
226. Chen, C., J. L. Mobley, O. Dwir, F. Shimron, V. Grabovsky, R. R. Lobb, Y.
Shimizu, and R. Alon. 1999. High affinity very late antigen-4 subsets
expressed on T cells are mandatory for spontaneous adhesion strengthening
but not for rolling on VCAM-1 in shear flow. J. Immunol. 162: 1084-1095.
227. Seemayer, C. A., S. Kuchen, M. Neidhart, P. Kuenzler, V. Rihoskova, E.
Neumann, M. Pruschy, W. K. Aicher, U. Muller-Ladner, R. E. Gay, B. A.
Michel, G. S. Firestein, and S. Gay. 2003. p53 in rheumatoid arthritis synovial
fibroblasts at sites of invasion. Ann. Rheum. Dis. 62: 1139-1144.
228. Buckley, C. D., A. Filer, O. Haworth, G. Parsonage, and M. Salmon. 2004.
Defining a role for fibroblasts in the persistence of chronic inflammatory joint
disease. Ann. Rheum. Dis. 63 Suppl 2: ii92-ii95.
229. Bernstein, B. E., M. Kamal, K. Lindblad-Toh, S. Bekiranov, D. K. Bailey, D.
J. Huebert, S. McMahon, E. K. Karlsson, E. J. Kulbokas, III, T. R. Gingeras,
S. L. Schreiber, and E. S. Lander. 2005. Genomic maps and comparative
analysis of histone modifications in human and mouse. Cell 120: 169-181.

Chapter Eight Appendix 192
Chapter Eight
Appendix
Chapter Eight Appendix 193
CHAPTER EIGHT
Appendix
Please see enclosed CD for appendix data.
8.1 Fibroblast low density array genes.
8.2 Fibroblast low density array normalised data.
8.3 Whole genome array genes and normalised results for all samples.
8.4 Gene expression that differed significantly from whole genome
microarrays between peripheral and lymphoid samples.
8.5 Gene expression that differed significantly from whole genome
microarrays between immortialised and in vitro cultured lymph node
samples.
8.6 Site specific low density array genes.
8.7 Site specific low density array normalised data.
8.8 Ligand low density array genes.
8.9 Ligand low density array normalised data.
8.10 Gene expression that differed significantly from the ligand low density
array between LTα treated and untreated stromal cell cultures.
Chapter Eight Appendix 194
Publications arising from this thesis
1. Flavell,S.J., Hou,T.Z., Lax,S., Filer,A.D., Salmon,M., Buckley,C.D.
Fibroblasts as novel therapeutic targets in chronic inflammation. Br J
Pharmacol. 2008; 153: S241-S246.
2. Hou,T.Z., Mustafa,M.Z., Flavell,S.J., Barrington,A.F., Jenkinson,E.J.,
Anderson,G., Lane,P.J., Withers,D.R., Buckley,C.D. Splenic stromal cells
mediate IL-7 independent adult lymphoid tissue inducer cell survival. Eur J
Immunol. 2009; 10.1002/eji.200939776
Copyright © 2022 FDOKUMEN