B-cell CD25 Expression in Murine Primary and Secondary Lymphoid Tissue
11
B-cell CD25 Expression in Murine Primary and Secondary Lymphoid Tissue S. Amu 1 , I. Gjertsson 2 , A. Tarkowski 2 & M. Brisslert 2 Introduction B cells are considered to be part of both innate and adap- tive immune system. In addition to antibody production, these cells display variety of immunoregulatory properties including cytokine production [1, 2] and antigen presen- tation [3]. These features render them not only a signifi- cant role in the defence against pathogens but also in the pathogenesis of certain autoimmune diseases. In mice, there are three major subsets of peripheral mature B cells; B-1 cells that can further be divided into B-1a cells, expressing the surface molecule CD5, and B-1b cells lacking this expression, B-2 cells and marginal zone B cells (MZ B cells) [4, 5]. B-1 cells and MZ B cells are responsible for early, usually low-affinity and fre- quently polyreactive antibody secretion, being T-cell independent [6]. B-1 cells are located in peritoneal and pleural cavities, in blood and in inflamed tissues, whereas MZ B cells are found in the splenic marginal zone. Both populations are important to combat infections and in maintaining homeostasis of the host [6, 7]. MZ B cells are suggested to play an important role in protection against blood-borne encapsulated bacteria [7], whereas B- 2 cells, also known as follicular B cells, participate in the adaptive immune system. IL-2 receptor is expressed by B lymphocytes, CD4 and CD8 lymphocytes and some natural killer (NK) cells. The high-affinity receptor consists of three chains, IL-2Ra (CD25), IL-2Rb (CD122) and IL-2Rc (CD132), all of which interact with the ligand [8]. IL-2Rb and IL-2Rc chains together form an intermediate affinity IL-2 receptor that is capable of signal transduction upon lig- and binding [9]. IL-2Ra chain alone binds IL-2 with low affinity but the interaction does not lead to any detect- able biological activity in the cell. However, IL-2Ra together with IL-2Rb and IL-2Rc forms the high-affinity IL-2 receptor resulting in a strong intracellular signal [8, 10, 11]. Interleukin-2 (IL-2), the ligand for IL-2R, is Department of Rheumatology and Inflammation Research, Sahlgrenska Academy at Go ¨teborg University, Go ¨teborg, Sweden Received 13 February 2006; Accepted in revised form 28 June 2006 Correspondence to: S. Amu, Department of Rheumatology and Inflammation Research, Guldhedsgatan 10A, Sahlgrenska Academy at Go ¨teborg University, 413 46 Go ¨teborg, Sweden. E-mail: [email protected] 1 SA carried out the experimental work and participated in data analysis and manuscript preparation. 2 IG, AT and MB designed the study and participated in data analysis and manuscript preparation. Abstract B cells are in analogy with T cells capable of expressing functional IL-2 recep- tors. IL-2R a-chain (CD25) positive T cells have been studied in detail but not much is known about CD25 positive B cells. The aim of this study was to examine the phenotypic properties of the CD25 expressing B cells collected from different lymphoid organs in mice. Samples were stained for various cell surface markers and analysed using flow cytometry. We found that approxi- mately 49% of B cells in bone marrow, 16% in peritoneal cavity, 2% in spleen and 1% in lymph nodes express CD25. In contrast, CD25 expressing B cells were not found in the blood or in Peyer’s patches. Phenotypic characteri- zation showed that CD25 + B cells in spleen, lymph nodes and peritoneal cav- ity have higher expression of AA4.1, CD5, CD69, CD80, CD86, CD122, CD132, IgA, IgG and IgM on their surface in comparison with CD25 ) B cells. In contrast, expression of IgD and IA-IE was lower on CD25 + B cells in spleen and lymph nodes. In bone marrow, the expression of CD5, CD80, CD86, CD122, CD132, IgA, IgD and IgM was lower, while the expression of AA4.1, IgG and IA-IE was increased on CD25 + B cells compared with CD25 ) B cells. In conclusion, our results indicate that B cells expressing CD25 are phenotypically distinctly different from those that are CD25 negat- ive. Our findings suggest that CD25 + B cells are more prone to efficient anti- gen presentation and display a more mature phenotype. doi: 10.1111/j.1365-3083.2006.01832.x .................................................................................................................................................................. Ó 2006 The Authors 482 Journal compilation Ó 2006 Blackwell Publishing Ltd. Scandinavian Journal of Immunology 64, 482–492
-
Upload
independent -
Category
Documents
-
view
2 -
download
0
Transcript of B-cell CD25 Expression in Murine Primary and Secondary Lymphoid Tissue

B-cell CD25 Expression in Murine Primary andSecondary Lymphoid Tissue
S. Amu1, I. Gjertsson2, A. Tarkowski2 & M. Brisslert2
Introduction
B cells are considered to be part of both innate and adap-tive immune system. In addition to antibody production,these cells display variety of immunoregulatory propertiesincluding cytokine production [1, 2] and antigen presen-tation [3]. These features render them not only a signifi-cant role in the defence against pathogens but also in thepathogenesis of certain autoimmune diseases.
In mice, there are three major subsets of peripheralmature B cells; B-1 cells that can further be divided intoB-1a cells, expressing the surface molecule CD5, andB-1b cells lacking this expression, B-2 cells and marginalzone B cells (MZ B cells) [4, 5]. B-1 cells and MZ Bcells are responsible for early, usually low-affinity and fre-quently polyreactive antibody secretion, being T-cellindependent [6]. B-1 cells are located in peritoneal andpleural cavities, in blood and in inflamed tissues, whereasMZ B cells are found in the splenic marginal zone. Both
populations are important to combat infections and inmaintaining homeostasis of the host [6, 7]. MZ B cellsare suggested to play an important role in protectionagainst blood-borne encapsulated bacteria [7], whereas B-2 cells, also known as follicular B cells, participate in theadaptive immune system.
IL-2 receptor is expressed by B lymphocytes, CD4 andCD8 lymphocytes and some natural killer (NK) cells.The high-affinity receptor consists of three chains,IL-2Ra (CD25), IL-2Rb (CD122) and IL-2Rc (CD132),all of which interact with the ligand [8]. IL-2Rb andIL-2Rc chains together form an intermediate affinity IL-2receptor that is capable of signal transduction upon lig-and binding [9]. IL-2Ra chain alone binds IL-2 with lowaffinity but the interaction does not lead to any detect-able biological activity in the cell. However, IL-2Ratogether with IL-2Rb and IL-2Rc forms the high-affinityIL-2 receptor resulting in a strong intracellular signal[8, 10, 11]. Interleukin-2 (IL-2), the ligand for IL-2R, is
Department of Rheumatology and
Inflammation Research, Sahlgrenska Academy
at Goteborg University, Goteborg, Sweden
Received 13 February 2006; Accepted inrevised form 28 June 2006
Correspondence to: S. Amu, Department of
Rheumatology and Inflammation Research,
Guldhedsgatan 10A, Sahlgrenska Academy at
Goteborg University, 413 46 Goteborg,
Sweden. E-mail: [email protected]
1SA carried out the experimental work and
participated in data analysis and manuscript
preparation.
2IG, AT and MB designed the study and
participated in data analysis and manuscript
preparation.
Abstract
B cells are in analogy with T cells capable of expressing functional IL-2 recep-tors. IL-2R a-chain (CD25) positive T cells have been studied in detail butnot much is known about CD25 positive B cells. The aim of this study was toexamine the phenotypic properties of the CD25 expressing B cells collectedfrom different lymphoid organs in mice. Samples were stained for various cellsurface markers and analysed using flow cytometry. We found that approxi-mately 49% of B cells in bone marrow, 16% in peritoneal cavity, 2% inspleen and 1% in lymph nodes express CD25. In contrast, CD25 expressing Bcells were not found in the blood or in Peyer’s patches. Phenotypic characteri-zation showed that CD25+ B cells in spleen, lymph nodes and peritoneal cav-ity have higher expression of AA4.1, CD5, CD69, CD80, CD86, CD122,CD132, IgA, IgG and IgM on their surface in comparison with CD25) Bcells. In contrast, expression of IgD and IA-IE was lower on CD25+ B cells inspleen and lymph nodes. In bone marrow, the expression of CD5, CD80,CD86, CD122, CD132, IgA, IgD and IgM was lower, while the expression ofAA4.1, IgG and IA-IE was increased on CD25+ B cells compared withCD25) B cells. In conclusion, our results indicate that B cells expressingCD25 are phenotypically distinctly different from those that are CD25 negat-ive. Our findings suggest that CD25+ B cells are more prone to efficient anti-gen presentation and display a more mature phenotype.
doi: 10.1111/j.1365-3083.2006.01832.x..................................................................................................................................................................
� 2006 The Authors
482 Journal compilation � 2006 Blackwell Publishing Ltd. Scandinavian Journal of Immunology 64, 482–492
a cytokine with distinct activities on the immune systemstimulating proliferation of B and T lymphocytes andNK cells [12–14].
During the last decade, it has been possible to recog-nize a subpopulation of suppressive T cells (Treg) expres-sing CD25+ [15]. Approximately 10% of peripheralCD4+ cells and less than 1% of CD8+ cells in healthy,naıve adult mice express the CD25 molecule [16]. Studieson mice lacking IL-2Ra (CD25) show normal phenotypi-cal B and T cell populations in young mice whereas olderanimals exhibit enlarged lymphoid glands due to animbalance between clonal expansion and cell death fol-lowing lymphocyte activation [17].
We have in a recent study showed that human cir-culating B cells expressing CD25 display distinct phen-otypic and functional properties compared with the Bcells lacking CD25 expression. When compared withCD25) counterpart, CD25+ circulating human B cellsexpressed significantly higher levels of surface immuno-globulin but lacked the ability to secrete them. CD25+
B cells also performed significantly better as antigen-presenting cells (APC) in allogeneic mixed lymphocytereaction (MLR) compared with CD25) B cells and theblocking of the CD25 expression led to abrogation ofthe MLR [18]. As knowledge of CD25 expression onmurine B cells is lacking we have examined the phe-notype of CD25+ B cells in primary and secondarylymphoid tissues.
Materials and methods
Mouse strain and specimen collection. Naval MedicalResearch Institute (NMRI) female mice between 8 and16 weeks of age were used. Spleen, lymph nodes andPeyer’s patches were collected and passed through a70 lm nylon mesh (BD Bioscience, Erembodegem,Belgium), into a Petri dish containing 10 ml of phos-phate-buffered saline (PBS). The lymph node and Peyer’spatch suspensions were centrifuged for 5 min at 400 g,
the pelleted cells were washed in PBS and resuspended inFACS-buffer (containing 1% FCS, 0.1% sodium azideand PBS). Spleen suspension was after another centrifuga-tion resuspended in NH4Cl solution (0.83%, pH 7.29)and kept on ice for 7 min to lyse erythrocytes, followedby two washing steps in cold PBS, and finally resuspend-ed in FACS-buffer. For bone marrow lymphocytes,femurs were carefully dissected. One hole was made ateach end of the bone and 2 ml of cold PBS was forcedthrough. Cells were centrifuged and erythrocytes wereremoved as described above. Cells from peritoneal cavitywere collected after an injection of 3 ml of sterile PBSinto the peritoneum followed by a massage of abdomenand collection of the fluid. Cells were washed and storedas described above. Peripheral blood was collected in hep-arin containing tubes by axillary bleeding and erythro-cytes were removed as described above.
Flow cytometry. For flow cytometry analysis, 105–106
cells were placed in 96-well plates and pelleted (3 min,300 g, 4 �C). To avoid unspecific binding via Fc-receptorinteractions, cells were incubated with Fc block (2.4G2,BD Bioscience, Stockholm, Sweden) for 20 min at roomtemperature. Samples labelled with goat anti-mouse IgGand its matched control were incubated with 0.1% goatserum instead of Fc block for 20 min at room temperature.
All antibodies (Ab) were diluted in FACS buffer tooptimal concentrations after titration experiments. Theantibodies used were either directly conjugated withfluorescein isothiocyanate (FITC), r-phycoerythin (PE)or biotin. Antibodies conjugated with biotin were fur-ther exposed to streptavidin conjugated either with PEor allophycocyanin (APC). Ab used included AA4.1,anti-CD3e (145-2C11), anti-CD5 (53-7.3), anti-CD19(1D3), anti-CD21 (7G6), CD23 (B3B4), anti-CD25(3C7 and PC61), anti-CD27 (LG.3A10), anti-CD69(H1.2F3), anti-CD80 (16-10A1), anti-CD86 (GL1),anti-CD122 (TM-ß1), anti-CD132 (TUGm2), anti-mouse I-A/I-E (2G9), GL7, anti-mouse IgA (C10-1),anti-mouse IgD (11-26c.2a) or anti-mouse IgM
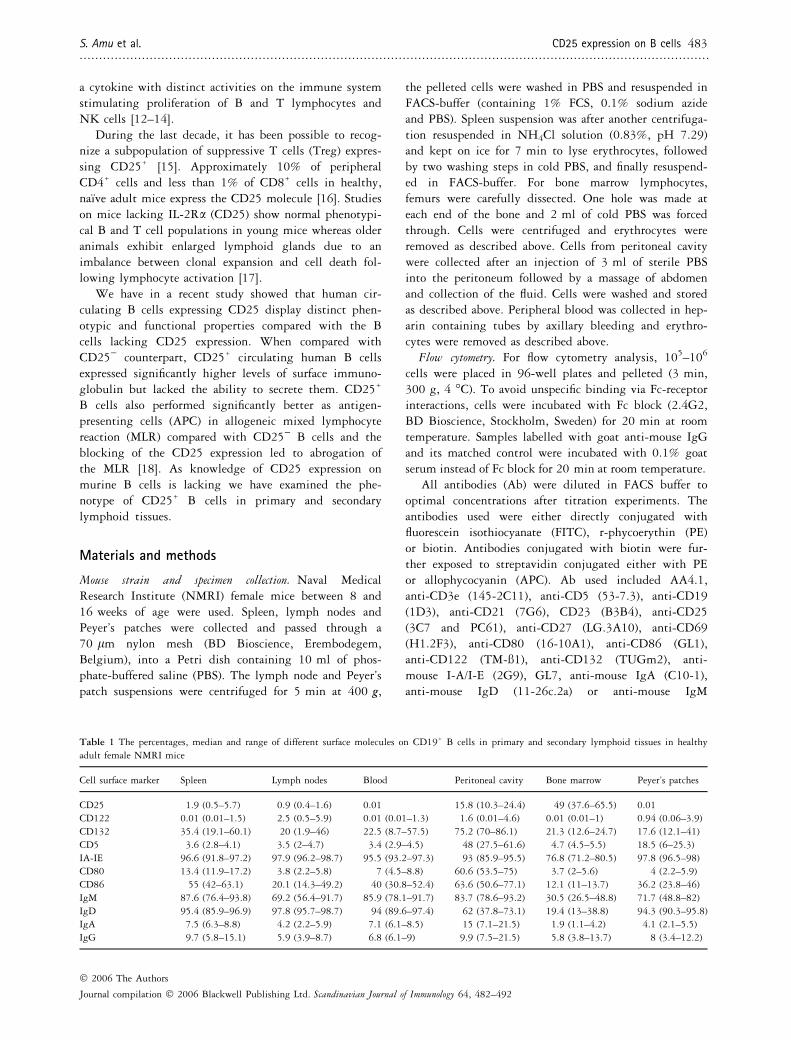
Table 1 The percentages, median and range of different surface molecules on CD19+ B cells in primary and secondary lymphoid tissues in healthy
adult female NMRI mice
Cell surface marker Spleen Lymph nodes Blood Peritoneal cavity Bone marrow Peyer’s patches
CD25 1.9 (0.5–5.7) 0.9 (0.4–1.6) 0.01 15.8 (10.3–24.4) 49 (37.6–65.5) 0.01
CD122 0.01 (0.01–1.5) 2.5 (0.5–5.9) 0.01 (0.01–1.3) 1.6 (0.01–4.6) 0.01 (0.01–1) 0.94 (0.06–3.9)
CD132 35.4 (19.1–60.1) 20 (1.9–46) 22.5 (8.7–57.5) 75.2 (70–86.1) 21.3 (12.6–24.7) 17.6 (12.1–41)
CD5 3.6 (2.8–4.1) 3.5 (2–4.7) 3.4 (2.9–4.5) 48 (27.5–61.6) 4.7 (4.5–5.5) 18.5 (6–25.3)
IA-IE 96.6 (91.8–97.2) 97.9 (96.2–98.7) 95.5 (93.2–97.3) 93 (85.9–95.5) 76.8 (71.2–80.5) 97.8 (96.5–98)
CD80 13.4 (11.9–17.2) 3.8 (2.2–5.8) 7 (4.5–8.8) 60.6 (53.5–75) 3.7 (2–5.6) 4 (2.2–5.9)
CD86 55 (42–63.1) 20.1 (14.3–49.2) 40 (30.8–52.4) 63.6 (50.6–77.1) 12.1 (11–13.7) 36.2 (23.8–46)
IgM 87.6 (76.4–93.8) 69.2 (56.4–91.7) 85.9 (78.1–91.7) 83.7 (78.6–93.2) 30.5 (26.5–48.8) 71.7 (48.8–82)
IgD 95.4 (85.9–96.9) 97.8 (95.7–98.7) 94 (89.6–97.4) 62 (37.8–73.1) 19.4 (13–38.8) 94.3 (90.3–95.8)
IgA 7.5 (6.3–8.8) 4.2 (2.2–5.9) 7.1 (6.1–8.5) 15 (7.1–21.5) 1.9 (1.1–4.2) 4.1 (2.1–5.5)
IgG 9.7 (5.8–15.1) 5.9 (3.9–8.7) 6.8 (6.1–9) 9.9 (7.5–21.5) 5.8 (3.8–13.7) 8 (3.4–12.2)
S. Amu et al. CD25 expression on B cells 483..................................................................................................................................................................
� 2006 The Authors
Journal compilation � 2006 Blackwell Publishing Ltd. Scandinavian Journal of Immunology 64, 482–492

(R6-60.2) all purchased from (BD Bioscience) and anti-mouse IgG from (Jackson ImmunoResearch laborator-ies). The specific isotype controls for all Ab were runat the same time. Isotype controls used were hamsterIgG1j (A19-3), hamster IgG2j (B81-3), rat IgG1k(A110-1), rat IgG1j (R3-34), rat IgG2aj (R35-95),rat IgG2bj (A95-1), rat IgMj (R4-22) from (BDBioscience) and non-immune goat IgG from (RDsystems).
Cells were incubated with respective Ab for a mini-mum of 20 min at 4 �C in dark followed by two wash-ing steps with cold FACS buffer. Biotin-conjugated Ab
was incubated in one additional step with streptavidinfor a minimum of 20 min at 4 �C in dark. After furtherwashing pelleted cells were resuspended in FACS-bufferbefore analyses. 2 · 104–1 · 105 cells were collectedusing a FACSCalibur (BD). Instrument setting was donewith CaliBRITErmTM 3 (BD Biosciences) and data analy-ses were performed using the Flowjo software (Tree StarInc., Ashland, OR, USA). All data in the study is presen-ted as levels above the background.
Statistical evaluation. All statistical analyses have beendone using the Prism software and Wilcoxon matchedpaired test.
Spleen
104
104
103
103
102
102
CD19 CD19 CD25
Lymph node
Bone marrow
Peritoneum
101
101100
100
104100
80
60
40
20
0104
103
103
102
102
101
101100
100 104103102101100
CD25
100
80
60
40
20
0104103102101100
CD
25C
D25
% o
f Max
% o
f Max
104
104
103
103
102
102
CD19 CD19
101
101100
100
104
104
103
103
102
102
101
101100
100
Isot
ype
cont
rol
Isot
ype
cont
rol
CD25
100
80
60
40
20
0104103102101100
CD
25
% o
f Max
104
104
103
103
102
102
CD19 CD19
101
101100
100
104
104
103
103
102
102
101
101100
100
Isot
ype
cont
rol
CD25
100
80
60
40
20
0104103102101100
CD
25
% o
f Max
104
104
103
103
102
102
CD19 CD19
101
101100
100
104
104
103
103
102
102
101
101100
100
Isot
ype
cont
rol
A B C
FED
G H I
LKJ
Figure 1 Expression of CD25 on CD19+ B
cells from spleen, lymph nodes, peritoneal cav-
ity and bone marrow. For each tissue, spleen
(A–C), lymph nodes (D–F), peritoneal cavity
(G–I) and bone marrow (J–L) representative
dot plots are provided showing isotype control
gated on CD19+ B cells (A, D, G and J),
CD25 expression on CD19+ B cells gated
according to the isotype control (B, E, H and
K) and fluorescence intensity histograms
showing isotype control and CD25+ expression
on CD19+ B cells (C, F, I and L). The grey
line on each histogram is isotype control and
the black one shows CD25 intensity on CD19+
B cells. The horizontal lines on the histograms
are gates showing CD25 positive B cells and
are drawn from the isotype control.
484 CD25 expression on B cells S. Amu et al...................................................................................................................................................................
� 2006 The Authors
Journal compilation � 2006 Blackwell Publishing Ltd. Scandinavian Journal of Immunology 64, 482–492

Results
Number of B cells in different lymphoid organs
In Peyer’s patches, 67% of lymphocytes were CD19+ Bcells, 52.5% in bone marrow, 51.6% in spleens, 46.7%in peritoneal cavity, 37.7% in blood and 9.3% in lymphnodes.
The frequency of the different cell surface markers onthese B cells is summarized in Table 1.
CD25 expression on B cells
The frequencies of CD25+ B cells, varied considerablybetween different primary and secondary lymphoidorgans. In bone marrow, 49% of B cells expressed CD25,15.8% in peritoneal cavity, 2% in spleen and 0.9% inlymph nodes. In contrast, CD25+B cells were absent inblood or Peyer’s patches in the majority of the animals(Table 1). Representative examples of CD25 staining onB cells in all the tissues studied are presented in Fig. 1.
Spleen A B C D
E F G H
I J K L
M N O P
Lymph nodes
Bone marrow
Peritoneum
100
80
60
40
20
0
% o
f Max
100
80
60
40
20
0 0 200 400 600
FSC CD80 800 1000
% o
f Max
100
80
60
40
20
0
% o
f Max
100
80
60
40
20
0
% o
f Max
104 103 102 101 100
CD86 104 103 102 101 100
IA-IE
IA-IE
104 103 102 101 100
100
80
60
40
20
0
% o
f Max
100
80
60
40
20
0 0 200 400 600
FSC CD80 800 1000
% o
f Max
100
80
60
40
20
0
% o
f Max
100
80
60
40
20
0
% o
f Max
104 103 102 101 100
CD86 104 103 102 101 100 104 103 102 101 100
IA-IE
100
80
60
40
20
0
% o
f Max
100
80
60
40
20
0 0 200 400 600
FSC CD80 800 1000
% o
f Max
100
80
60
40
20
0
% o
f Max
100
80
60
40
20
0
% o
f Max
104 103 102 101 100
CD86 104 103 102 101 100 104103 102 101 100
IA-IE
100
80
60
40
20
0
% o
f Max
100
80
60
40
20
0 0 200 400 600
FSC CD80 800 1000
% o
f Max
100
80
60
40
20
0
% o
f Max
100
80
60
40
20
0
% o
f Max
104 103 102 101 100
CD86 104 103 102 101 100 104 103 102 101 100
Figure 2 Expression of CD80, CD86 and IA-IE on CD25+ and CD25) B cells in spleen, lymph nodes, peritoneal cavity and in bone marrow. CD25
expression, high (black) and low (grey) in spleen (A), lymph nodes (E), peritoneal cavity (I) and bone marrow (M). Representative histograms of CD80
(B, F, J and N), CD86 (C, G, K and O) and IA-IE (D, H, L and P) expression on CD19+CD25+ and CD19+CD25) subpopulations is shown for each
tissue. The dashed lines in each histogram show isotype control for the marker of interest, grey lines show the expression of the marker of interest on
the CD19+CD25) subpopulation and black lines show the expression of the marker of interest within CD19+CD25+ subpopulation.
S. Amu et al. CD25 expression on B cells 485..................................................................................................................................................................
� 2006 The Authors
Journal compilation � 2006 Blackwell Publishing Ltd. Scandinavian Journal of Immunology 64, 482–492

Representative histograms exemplify CD19+CD25+ andCD19+CD25) populations showing FSC, CD80, CD86and IA-IE as presented in Fig. 2.
Expression of the IL-2R subunits CD122 and CD132 on
CD25+B cells
Subdivision of the entire B-cell population with respectto the CD25 expression showed that the frequency of theCD122 on CD25+ B cells was significantly higher inlymph nodes (P ¼ 0.01), spleen (P ¼ 0.008) and in peri-toneal cavity (P ¼ 0.016) when compared with CD25) Bcells (Fig. 3A). Also CD25+ B cells displayed signifi-cantly higher intensities of CD122 in lymph nodes (P ¼0.01), spleen (P ¼ 0.008) and peritoneal cavity (P ¼0.016) (Fig. 3B). In contrast, bone marrow cells dis-played significantly lower intensities of CD122 onCD25+ B cells (P ¼ 0.016). The frequency of CD132was significantly higher on CD25+ B cells compared with
CD25) B cells in spleen (P ¼ 0.03), lymph nodes (P ¼0.01) and in peritoneal cavity (P ¼ 0.015) (Fig. 3C). Theintensity of CD132 expression was significantly higheron CD25+ B cells in spleen (P ¼ 0.015), lymph nodes(P ¼ 0.04) and peritoneal cavity (P ¼ 0.015) (Fig. 3D).In contrast, in bone marrow cells displayed significantlylower (P ¼ 0.015) frequencies as well as intensities ofthe CD132 on CD25+ B cells compared with CD25) Bcells (Fig. 3D). The quadruple staining for high-affinityIL-2 receptor showed that 1% of CD25+B cells in bonemarrow, 10% in spleen, 8% in lymph nodes and 10% inperitoneal cavity are positive for the entire receptor.
Expression of AA4.1, CD5, CD69, CD80 and CD86 on CD25+
B cells
To investigate the maturity and activation status ofCD25+ B cells in different lymphoid organs, we chose toanalyse AA4.1, CD69, co-stimulatory molecules, CD80
Figure 3 Expression of the IL-2 receptor subsets CD122 and CD132 on CD19+ B cells in primary and secondary lymphoid organs Lymphoid cells
(105–106) from bone marrow, spleen, lymph nodes, and from peritoneal cavity were stained for CD19 and CD25 in combination with CD122 (A and
B) and CD132 (C and D). Collected cells were analysed using flow cytometry. In (A) and (C) each dot represents frequency of expression and in (B)
and (D) the fluorescence intensity (mean fluorescent intensity, MFI) for the CD122 or CD132. Statistical evaluation was performed using Wilcoxon-
matched paired test. The horizontal lines show median values in each group. The horizontal lines with short cross-lines show the significant differ-
ences between the CD25+ and CD25) B cells where present. *P < 0.05; **P < 0.01.
486 CD25 expression on B cells S. Amu et al...................................................................................................................................................................
� 2006 The Authors
Journal compilation � 2006 Blackwell Publishing Ltd. Scandinavian Journal of Immunology 64, 482–492
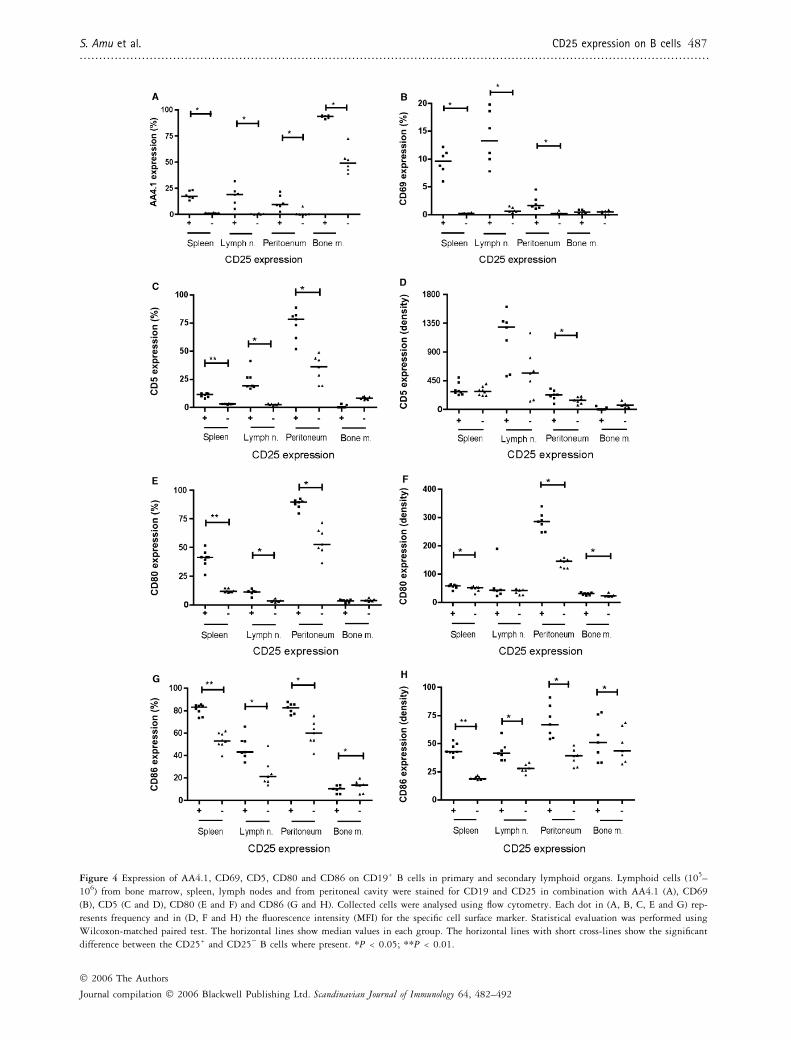
Figure 4 Expression of AA4.1, CD69, CD5, CD80 and CD86 on CD19+ B cells in primary and secondary lymphoid organs. Lymphoid cells (105–
106) from bone marrow, spleen, lymph nodes and from peritoneal cavity were stained for CD19 and CD25 in combination with AA4.1 (A), CD69
(B), CD5 (C and D), CD80 (E and F) and CD86 (G and H). Collected cells were analysed using flow cytometry. Each dot in (A, B, C, E and G) rep-
resents frequency and in (D, F and H) the fluorescence intensity (MFI) for the specific cell surface marker. Statistical evaluation was performed using
Wilcoxon-matched paired test. The horizontal lines show median values in each group. The horizontal lines with short cross-lines show the significant
difference between the CD25+ and CD25) B cells where present. *P < 0.05; **P < 0.01.
S. Amu et al. CD25 expression on B cells 487..................................................................................................................................................................
� 2006 The Authors
Journal compilation � 2006 Blackwell Publishing Ltd. Scandinavian Journal of Immunology 64, 482–492

and CD86, and finally CD5, a marker for B-1 subpopula-tion of B cells being found in peritoneal cavity and sug-gested to participate in the secretion of autoantibodies.
CD25+ B cells displayed significantly more frequent(P ¼ 0.03) expression of AA4.1 in bone marrow, spleen,lymph nodes and peritoneal cavity compared withCD25) B cells (Fig. 4A). In addition, CD25+ B cellsshowed significantly more frequent (P ¼ 0.03) expressionof CD69 in spleen, lymph nodes and peritoneal cavitycompared with CD25) B cells. In bone marrow, theexpression of CD69 was overall very low on B cells irres-pective of main CD25 expression (Fig. 4B).
The frequency of the CD5 was significantly higheron CD25+ compared with CD25) B cells in spleen(P ¼ 0.008), lymph nodes (P ¼ 0.01) and in peritonealcavity (P ¼ 0.015) (Fig. 4C). Also the intensity of theCD5 was significantly higher on CD25+ B cells whencompared with CD25) B cells in peritoneal cavity (P ¼0.015) (Fig. 4D).
In spleen, lymph nodes and peritoneal cavity, the fre-quency of CD80 was significantly higher on CD25+ Bcells (P ¼ 0.008, 0.01 and 0.015 respectively) comparedwith CD25) B cells (Fig. 4E). In addition, we found asignificantly higher intensity of CD80 on CD25+ B cellsin spleen (P ¼ 0.015), bone marrow (P ¼ 0.015) andperitoneal cavity (P ¼ 0.015) (Fig. 4F). The frequency ofthe co-stimulatory molecule CD86 was significantlyhigher on CD25+ B cells in spleen (P ¼ 0.008), lymphnodes (P ¼ 0.01) and in peritoneal cavity (P ¼ 0.015)(Fig. 4G). In contrast, the frequency of the CD86 onCD25+ B bone marrow cells was significantly lower(P ¼ 0.031). Intensity of CD86 was significantly higheron CD25+ B cells in spleen (P ¼ 0.008), lymph nodes(P ¼ 0.01), peritoneal cavity (P ¼ 0.015) and in bonemarrow (P ¼ 0.031) compared with CD25) B cells(Fig. 4H).
Expression of CD21, CD23 and GL7 on CD25+B cells
To analyse the geographical location of CD25+B cells, westained the B cells for CD21 and CD23. A slightly lowerfrequency of CD21 and CD23 was expressed by CD25+
compared with CD25) B cells. GL7 expression was pre-sent on B cells in bone marrow, spleen and lymph nodesand was significantly more frequent (P ¼ 0.03) onCD25+ B cells compared with CD25) B cells (Fig. 5A).Dot plots of quadruple staining with CD23 and GL7 inspleen, lymph nodes and bone marrow is shown inFig. 5B–G.
MHC class II expression on CD25+ B cells
The frequency of the IA–IE was significantly lower onCD25+ B cells in lymph nodes (P ¼ 0.01). In contrast,the IA–IE frequency was significantly higher (P ¼ 0.03)
A
B C
20 * * *
15
10
5
0+ - + - + -
GL
7 ex
pre
ssio
n (
%)
Spleen
SpleenCD25+ B cells
Lymph nodes
CD25+ B cells
Bone marrow
CD25+ B cells CD25- B cells
CD25- B cells
CD25- B cells
Lymph n. Bone m.
CD25 expression
104
104
103
103
102
GL7
102
CD23
101
101100
100
104
104
103
103
102
GL7
102
CD23
101
101100
100
D
F
E
G
104
104
103
103
102
GL7
102
CD23
101
101100
100
104
104
103
103
102
GL7
102
CD23
101
101100
100
104
104
103
103
102
GL7
102
CD23
101
101100
100
104
104
103
103
102
GL7
102
CD23
101
101100
100
Figure 5 Expression of GL7, CD21 and CD23 molecule on CD19+ B
cells in spleen, lymph nodes and bone marrow. (A) Lymphoid cells
(105–106) from bone marrow, spleen and from lymph nodes were
stained for CD19 and CD25 in combination with GL7. Collected cells
were analysed using flow cytometry. Each dot in the figure represents
frequency of GL7. Statistical evaluation was performed using Wilcoxon-
matched paired test. The horizontal lines show median values in each
group. The horizontal lines with short cross-lines show the significant
difference between the CD25+ and CD25) B cells where present.
*P < 0.05. (B–G) Representative dot plots showing staining for GL7
and CD23 on B cells from spleen (B and C), lymph nodes (D and E)
and bone marrow (F and G). The cells were first gated for CD19 and
CD25. The dot plots show expression of GL7 and CD23 on
CD19+CD25+ subpopulations (B, D and F) and on CD19+CD25) in
(C, E and G). The gates are drawn according to the isotype controls.
488 CD25 expression on B cells S. Amu et al...................................................................................................................................................................
� 2006 The Authors
Journal compilation � 2006 Blackwell Publishing Ltd. Scandinavian Journal of Immunology 64, 482–492

on CD25+ B cells in bone marrow (Fig. 6A) comparedwith CD25) B cells. The intensity of the IA–IE was sig-nificantly higher in lymph nodes (P ¼ 0.03) and in peri-toneal cavity (P ¼ 0.015) and significantly lower inspleen and bone marrow (P ¼ 0.03 and 0.015 respect-ively) on CD25+ B cells compared with CD25) B cells(Fig. 6B).
Surface Ig expression on CD25+ B cells
Analysis of surface-bound immunoglobulin expressionrevealed that the frequency of IgM on CD25+ B cells wassignificantly higher in peritoneal cavity (P ¼ 0.015) butlower in bone marrow (P ¼ 0.016) compared withCD25) B cells (Fig. 7A). The intensity of IgM was signi-ficantly higher on CD25+ B cells in spleen (P ¼ 0.008)and peritoneal cavity (P ¼ 0.015) (Fig. 7B). In contrast,the intensity of surface IgM on CD25+ B cells was signi-ficantly lower in bone marrow (P ¼ 0.015). In spleen,peritoneal cavity and bone marrow, we found a signifi-cantly lower frequency (P ¼ 0.04, 0.015 and 0.015respectively) of IgD on CD25+ B cells, whereas thedecrease did not reach statistical significance in lymphnodes (Fig. 7C). The intensity of IgD was significantlyhigher on CD25+ B cells in lymph nodes (P ¼ 0.01) butnot in spleen. In contrast, the IgD intensity was signifi-cantly lower on CD25+ B cells in peritoneal cavity (P ¼0.015) but not in bone marrow compared with CD25) Bcells (Fig. 7D).
The frequency of the IgA expression was significantlyhigher on CD25+ B cells in spleen (P ¼ 0.008), lymphnodes (P ¼ 0.03) and peritoneal cavity (P ¼ 0.015),whereas in bone marrow the frequency of the IgA expres-sion was significantly lower (P ¼ 0.015) on CD25+ Bcells compared with CD25) B cells (Fig. 7E). IgA inten-
sity was significantly higher on CD25+ compared withCD25) B cells in spleen (P ¼ 0.008) and in peritonealcavity (P ¼ 0.015). The intensity of the IgA was signifi-cantly lower (P ¼ 0.015) on CD25+ B cells in bone mar-row (Fig. 7F). The frequency of IgG was significantlyhigher on CD25+ B cells in spleen (P ¼ 0.008), lymphnodes (P ¼ 0.03), peritoneal cavity (P ¼ 0.03) and bonemarrow (P ¼ 0.03) (Fig. 7G), and the intensity of theIgG was also significantly higher on CD25+ B cells inspleen (P ¼ 0.008), lymph nodes (P ¼ 0.03) peritonealcavity (P ¼ 0.03) and in bone marrow (P ¼ 0.03) com-pared with CD25) B cells (Fig. 7H).
Discussion
In this study, we have examined CD25 expressing B cellsin different lymphoid organs in mice. We have found alarge variation of CD25 expression on B cells dependingof their tissue origin.
CD25 (p55) is the a-chain of the IL-2 receptor presenton B and T lymphocytes. Previous studies, mostly doneon T cells, showed that CD25 alone binds IL-2 with lowaffinity and the interaction does not lead to any detect-able biological activity of the cell. However, CD25together with CD122 (IL-2R b-chain) and CD132(IL-2R c-chain) forms the high-affinity receptor resultingin a strong intracellular signalling upon interaction withIL-2 [8, 10, 11]. Higher expression of CD122 andCD132 on CD25+B cells in the secondary lymphoid tis-sues indicates that these cells have fully functional high-affinity IL-2 receptor. Indeed, quadruple staining for thehigh-affinity IL-2 receptor showed that 1% of all CD25+
B cells in bone marrow and around 10% in spleen,lymph nodes and peritoneal cavity express this receptor.As IL-2 is one of the cytokines that contributes to B-cell
Figure 6 Expression of MHC-II molecule on CD19+ B cells in primary and secondary lymphoid organs. Lymphoid cells (105–106) from bone marrow,
spleen, lymph nodes and from peritoneal cavity were stained for CD19 and CD25 in combination with IA–IE (MHC-II). Collected cells were analysed
using flow cytometry. Each dot in (A) represents frequency and in (B) the fluorescence intensity (MFI). Statistical evaluation was performed using
Wilcoxon-matched paired test. The horizontal lines show median values in each group. The horizontal lines with short cross-lines show the significant
difference between the CD25+ and CD25) B cells where present. *P < 0.05.
S. Amu et al. CD25 expression on B cells 489..................................................................................................................................................................
� 2006 The Authors
Journal compilation � 2006 Blackwell Publishing Ltd. Scandinavian Journal of Immunology 64, 482–492
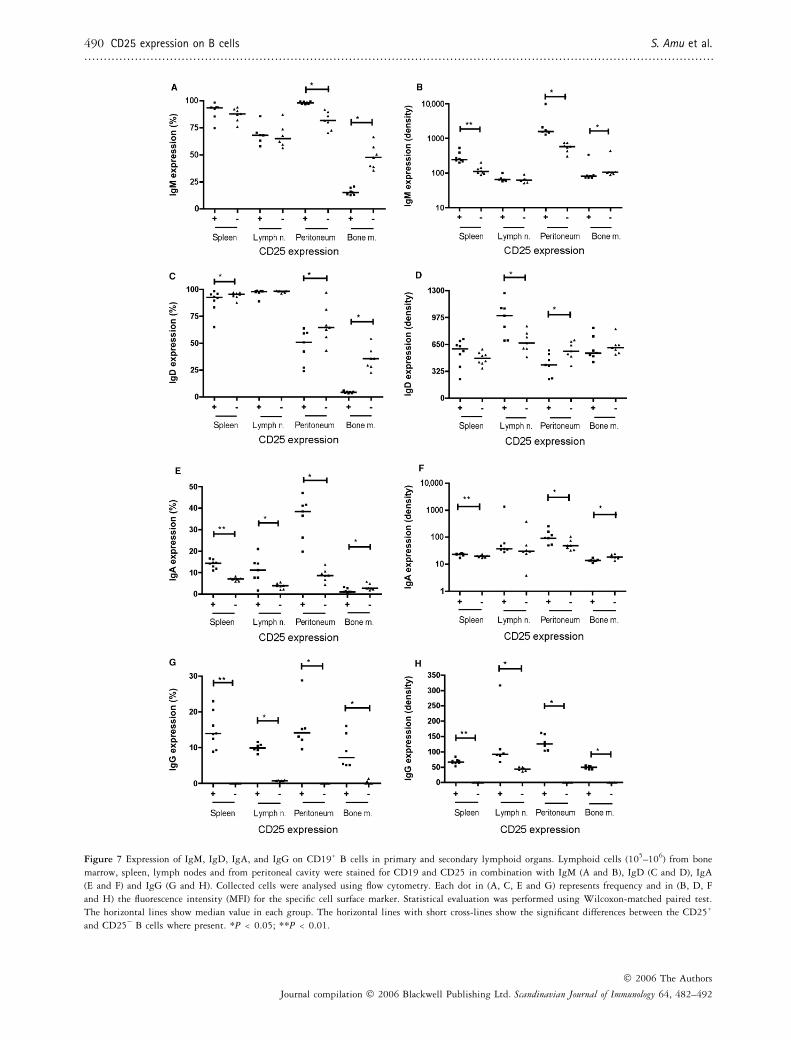
Figure 7 Expression of IgM, IgD, IgA, and IgG on CD19+ B cells in primary and secondary lymphoid organs. Lymphoid cells (105–106) from bone
marrow, spleen, lymph nodes and from peritoneal cavity were stained for CD19 and CD25 in combination with IgM (A and B), IgD (C and D), IgA
(E and F) and IgG (G and H). Collected cells were analysed using flow cytometry. Each dot in (A, C, E and G) represents frequency and in (B, D, F
and H) the fluorescence intensity (MFI) for the specific cell surface marker. Statistical evaluation was performed using Wilcoxon-matched paired test.
The horizontal lines show median value in each group. The horizontal lines with short cross-lines show the significant differences between the CD25+
and CD25) B cells where present. *P < 0.05; **P < 0.01.
490 CD25 expression on B cells S. Amu et al...................................................................................................................................................................
� 2006 The Authors
Journal compilation � 2006 Blackwell Publishing Ltd. Scandinavian Journal of Immunology 64, 482–492

proliferation [12], our findings indicate that B cells willreadily proliferate in the secondary lymphoid tissues.
Higher expression of AA4.1, a marker for immature Bcells on CD25+ B cells, confirms earlier studies showingCD25 expressing B cells in bone marrow as immature[19]. Significantly higher expression of this marker onCD25+ B cells in secondary lymphoid organs indicatesthat these cells kept CD25 expression after leaving bonemarrow and may thus be regarded as recent bone marrowemigrants.
The high expression of CD80 and CD86, co-stimula-tory molecules for T-cell activation, and major histocom-pability complex class II (IA–IE) on CD25+ B cells inthe secondary lymphoid tissues, suggests that CD25+ Bcells are efficient APC. In this context, we have previ-ously demonstrated that human CD25+ B cells are signi-ficantly better APC than CD25) B cells [18].
During the maturation process, B lymphocytes passthrough distinct stages of development characterized bythe expression of distinct immunoglobulin classes. NaıveB cells express mostly IgD and IgM, but during thecourse of maturation and activation the expression of theIgA, IgE and IgG increases. Our results showing higherexpression of the IgA, IgG, IgM expression but lowerexpression of the IgD on CD25+ B cells in the secondarylymphoid organs suggest a more mature phenotype ofthese cells compared with the CD25) B cells population.CD69 is an early lymphoid cell activation marker. Asexpression of this marker was significantly higher onCD25+ B cells in secondary lymphoid organs studied itsuggests that CD25 expressing B cells are in transitionduring an ongoing activation process.
CD25 expression was highest on peritoneal cavity Bcells compared with other sources of B cells studied.The peritoneal cavity is a site of a distinct subpopula-tion of B cells. The majority of these cells expressCD5 and are also known as B-1a B cells. CD5+ Bcells spontaneously secrete IgM antibodies, the so-callednatural antibodies, that often are polyspecific and aresuggested to play a crucial role in the amplification ofearly innate microbial defence [20]. CD5+ B cells arealso found in spleen and in blood but to a very lowextent in lymph nodes [21, 22]. We have found thatCD5+ B cells are also present in the Peyer’s patchesunderlining the importance of the mucosal immunesystem as first line defence against microbial agents(Table 1). The expression of CD5 was high on CD25+
B cells in all the secondary lymphoid organs studiedhere, but highest levels were detected on CD25+ Bcells originating from peritoneal cavity.
To classify peripheral CD25 expression of B cells withrespect to their geographical localization (germinal centreversus marginal zone B cells), we assessed their CD21,CD23 and GL7 expressions. The results indicate thatCD25+ B cells belong to germinal centre B cells as they
express high levels of GL7. Regarding CD21 and CD23staining both CD25+ and CD25) B cells highly expressedthese markers even if the frequency of the markers waslower on CD25+B cells. As both subpopulations expressIgD highly, it is difficult to classify CD25+ versus CD25)
B cells to marginal zone or follicular B cells.Compared with other lymphoid organs studied, bone
marrow CD25+ B cells were most prevalently expressingMHC class II. Bone marrow CD25) B cells had, whencompared with CD25+ B cells, a higher expression ofCD5, CD80, CD86, CD122, CD132, IgA, IgD and IgM.B lymphocytes in the bone marrow are mostly naıvecells. They are released early in their development andtravel by blood to other lymphoid tissues, where theymature becoming immuno-competent [23, 24]. CD25 isexpressed during the early stages of B-cell development[25, 26] but is probably downregulated when the maturenaıve B cells leave bone marrow, to be upregulated againfollowing B-cell activation in the secondary lymphoidorgans. Thus, we believe that the high CD25+ expressionon bone marrow B cells is a sign of immaturity in con-trast to the situation regarding functional B cells.
In conclusion, the expression of CD25 on B cells ori-ginating from primary and secondary lymphoid organsindicates major differences in the maturity and activity ofthese cells as judged by their phenotypical properties.The ongoing in vitro studies will help to understandfunctional properties of these cell populations.
Acknowledgment
This research was supported by the Swedish MedicalSociety, King Gustaf V 80-years Foundation, the Ad-lerbertska Research Foundation, Magnus Bergvalls Foun-dation, Wilhelm and Martina Lundgrens ScienceFoundation, Goteborg Medical Society, the Lars HiertaMemorial Foundation, the Swedish Association againstRheumatism, the Swedish Medical Research Council, theNanna Svartz Foundation, and the Sahlgrenska Academyat Goteborg University.
Conflict of interest
There are no competing interests for the authors of thisstudy.
References
1 O’Garra A, Stapleton G, Dhar V et al. Production of cytokines by
mouse B cells: B lymphomas and normal B cells produce interleu-
kin 10. Int Immunol 1990;2:821–32.
2 Harris DP, Haynes L, Sayles PC et al. Reciprocal regulation of
polarized cytokine production by effector B and T cells. Nat Immu-nol 2000;1:475–82.
3 Pierce SK, Morris JF, Grusby MJ et al. Antigen-presenting function
of B lymphocytes. Immunol Rev 1988;106:149–80.
S. Amu et al. CD25 expression on B cells 491..................................................................................................................................................................
� 2006 The Authors
Journal compilation � 2006 Blackwell Publishing Ltd. Scandinavian Journal of Immunology 64, 482–492

4 Herzenberg LA. B-1 cells: the lineage question revisited. Immunol
Rev 2000;175:9–22.
5 Martin F, Kearney JF. B-cell subsets and the mature preimmune
repertoire. Marginal zone and B1 B cells as part of a ‘natural
immune memory’. Immunol Rev 2000;175:70–9.
6 Martin F, Oliver AM, Kearney JF. Marginal zone and B1 B cells
unite in the early response against T-independent blood-borne par-
ticulate antigens. Immunity 2001;14:617–29.
7 Lopes-Carvalho T, Kearney JF. Development and selection of margi-
nal zone B cells. Immunol Rev 2004;197:192–205.
8 Minami Y, Kono T, Miyazaki T, Taniguchi T. The IL-2 receptor
complex: its structure, function, and target genes. Annu Rev Immunol
1993;11:245–68.
9 Nakamura Y, Russell SM, Mess SA et al. Heterodimerization of the
IL-2 receptor beta- and gamma-chain cytoplasmic domains is
required for signalling. Nature 1994;369:330–3.
10 Teshigawara K, Wang HM, Kato K, Smith KA. Interleukin 2
high-affinity receptor expression requires two distinct binding pro-
teins. J Exp Med 1987;165:223–38.
11 Wang HM, Smith KA. The interleukin 2 receptor. Functional con-
sequences of its bimolecular structure. J Exp Med 1987;166:1055–
69.
12 Tigges MA, Casey LS, Koshland ME. Mechanism of interleukin-2
signaling: mediation of different outcomes by a single receptor and
transduction pathway. Science 1989;243:781–6.
13 Smith KA. Interleukin-2: inception, impact, and implications. Sci-
ence 1988;240:1169–76.
14 Biron CA, Young HA, Kasaian MT. Interleukin 2-induced prolifer-
ation of murine natural killer cells in vivo. J Exp Med1990;171:173–88.
15 Kuniyasu Y, Takahashi T, Itoh M, Shimizu J, Toda G, Sakaguchi
S. Naturally anergic and suppressive CD25(+)CD4(+) T cells as a
functionally and phenotypically distinct immunoregulatory T cell
subpopulation. Int Immunol 2000;12:1145–55.
16 Sakaguchi S, Sakaguchi N, Asano M, Itoh M, Toda M. Immuno-
logic self-tolerance maintained by activated T cells expressing IL-2
receptor alpha-chains (CD25). Breakdown of a single mechanism of
self-tolerance causes various autoimmune diseases. J Immunol 1995;
155:1151–64.
17 Willerford DM, Chen J, Ferry JA, Davidson L, Ma A, Alt FW.
Interleukin-2 receptor alpha chain regulates the size and content of
the peripheral lymphoid compartment. Immunity 1995;3:521–30.
18 Brisslert M, Bokarewa M, Larsson P, Wing K, Collins LV, Tarkow-
ski A. Phenotypic and functional characterization of human CD25+
B cells. Immunology 2006;117:548–57.
19 Chen J, Ma A, Young F, Alt FW. IL-2 receptor alpha chain expres-
sion during early B lymphocyte differentiation. Int Immunol
1994;6:1265–8.
20 Berland R, Wortis HH. Origins and functions of B-1 cells with
notes on the role of CD5. Annu Rev Immunol 2002;20:253–300.
21 Wardemann H, Boehm T, Dear N, Carsetti R. B-1a B cells that
link the innate and adaptive immune responses are lacking in the
absence of the spleen. J Exp Med 2002;195:771–80.
22 Kantor AB, Stall AM, Adams S, Watanabe K, Herzenberg LA. De
novo development and self-replenishment of B cells. Int Immunol1995;7:55–68.
23 Hale PL, Haynes FB. Overview of development and function of
lymphocytes. In: Gallin IJ, Sakaguchi N, eds. Infammation: Basic
Principles and Clinical Correlates, Vol. 3. Philadelphia, PA: Lippin-
cott Williams & Wilkins, 1999:119–35.
24 Lam K-P, Rajewsky K. B-cell development. In: Gallin IJ, Snyder-
man R, eds. Inflammation: Basic Principles and Clinical Correlates, Vol.
3. Philadelphia, PA: Lippincott Williams & Wilkins, 1999:151–65.
25 Kearney JF, Won WJ, Benedict C et al. B cell development in
mice. Int Rev Immunol 1997;15:207–41.
26 Rolink A, Grawunder U, Winkler TH, Karasuyama H, Melchers F.
IL-2 receptor alpha chain (CD25, TAC) expression defines a crucial
stage in pre-B cell development. Int Immunol 1994;6:1257–64.
492 CD25 expression on B cells S. Amu et al...................................................................................................................................................................
� 2006 The Authors
Journal compilation � 2006 Blackwell Publishing Ltd. Scandinavian Journal of Immunology 64, 482–492