Draft Red Herring Prospectus Standard Chartered PLC
804
Draft Red Herring Prospectus Standard Chartered PLC (Incorporated in England and Wales on 18 November 1969 and registered as a public limited company under company number 00966425. The Company changed its name from Standard Chartered Bank Public Limited Company to Standard Chartered PLC on 1 January 1985.) Registered Office: 1 Aldermanbury Square, London EC2V 7SB Principal Place of Business in the UK: 1 Basinghall Avenue, London EC2V 5DD Company Secretary: Annemarie Durbin Compliance Officer: Kanchan Bhave Tel: +44 (0)20 7885 8888; Fax: +44 (0)20 7885 7337; Website: www.standardchartered.com; Email: [email protected] ISSUE OF 220,000,000 INDIAN DEPOSITORY RECEIPTS (‘‘IDRs’’) AT AN OFFERING PRICE OF Rs. [*] PER IDR WITH EVERY [*] IDRS* REPRESENTING ONE SHARE OF STANDARD CHARTERED PLC OF US$0.50 NOMINAL VALUE THE PRICE BAND AND THE MINIMUM BID LOT WILL BE DECIDED BY THE COMPANY IN CONSULTATION WITH THE BOOK RUNNING LEAD MANAGERS AND ADVERTISED AT LEAST ONE BUSINESS DAY PRIOR TO THE BID/ISSUE OPENING DATE In the case of revision in the Price Band, the Bid/Issue Period will be extended by at least three additional Business Days after revision of the Price Band subject to the Bid/Issue Period not exceeding 10 Business Days. Any revision in the Price Band and the Bid/Issue Period, if applicable, will be widely disseminated by notification to the Stock Exchanges, by issuing a press release, and also by indicating the change on the websites of the BRLMs and at the terminals of the Syndicate. All investors other than QIBs may participate in this Issue through an Application Supported by Blocked Amount (‘‘ASBA’’) process providing details of the ASBA Account in which the Bid Amount will be blocked by the Self Certified Syndicate Bank. For details, see the section titled ‘‘Issue Procedure’’ on page 382 of this Draft Red Herring Prospectus. The IDRs have not been and will not be registered under the US Securities Act or any state securities laws in the US and may not be offered or sold within the US (as defined in Regulation S), except pursuant to an exemption from, or in a transaction not subject to, the registration requirements of the US Securities Act and applicable US state securities laws. Accordingly, the IDRs are being offered outside of the US in reliance on Regulation S and the applicable laws of the jurisdiction where those offers and sales occur. The distribution of this Draft Red Herring Prospectus and the offering or sale of the IDRs in certain jurisdictions other than India may be restricted by law. Persons into whose possession this Draft Red Herring Prospectus comes should inform themselves about, and observe, any such restriction. Failure to comply with any such restriction may constitute a violation of the securities laws of such jurisdiction. This Draft Red Herring Prospectus does not constitute an offer or an invitation to purchase or subscribe for any securities or a solicitation of an offer to buy any securities pursuant to this Draft Red Herring Prospectus or otherwise in any jurisdiction in which such offer or solicitation is unlawful. This Draft Red Herring Prospectus has been prepared for the purposes of complying with Indian law and the information disclosed may not be the same as that which would have been disclosed if this Draft Red Herring Prospectus had been prepared in accordance with the laws of jurisdictions outside India. In accordance with Regulation 98 of the SEBI Regulations, the Issue is being made through a 100% Book Building Process where at least 50% of the Issue will be Allotted to QIBs on a proportionate basis. Provided that the Company may allocate up to 30% of the QIB Portion to Anchor Investors on a discretionary basis out of which one-third shall be reserved for domestic Mutual Funds. 5% of the QIB Portion (excluding the Anchor Investor Portion) shall be available for allocation on a proportionate basis to Mutual Funds only, and the remainder of the QIB Portion shall be available for allocation on a proportionate basis to all QIB Bidders, including Mutual Funds, subject to valid Bids being received at or above the Issue Price. Furthermore, not less than 20% of the Issue shall be available for allocation on a proportionate basis to Non-Institutional Bidders and not less than 30% of the Issue shall be available for allocation on a proportionate basis to Retail Individual Bidders. Under-subscription, if any, in any category except the QIB Portion, would be allowed to be met with spill-over from any other category or combination of categories at the discretion of the Company in consultation with the BRLMs and the Designated Stock Exchange. RISK IN RELATION TO THE FIRST ISSUE This being the first public issue of IDRs representing the underlying Shares of the Company, there has been no formal market for the IDRs. No assurance can be given regarding active and/or sustained trading in the IDRs of the Company or regarding the price at which the IDRs will be traded after listing. GENERAL RISKS The IDRs are of a specialist nature and should only be bought and traded by investors who are particularly knowledgeable in investment matters. In making an investment decision, prospective investors must rely on their own examination of the Company and the terms of the Issue, including the risks involved. For a discussion of certain factors that should be considered in connection with an investment in the IDRs, see the section titled ‘‘Risk Factors’’ on page 62 of this Draft Red Herring Prospectus. For information on the material rights, obligations and entitlements applicable to IDR Holders, please refer to the section titled ‘‘Frequently Asked Questions on the IDR Facility’’ and ‘‘Terms and Conditions of the Indian Depository Receipts’’ on pages 42 and 352 respectively of this Draft Red Herring Prospectus and also the other sections. The IDRs offered in the Issue have not been recommended or approved by SEBI, nor does the SEBI guarantee the accuracy or adequacy of this Draft Red Herring Prospectus. Specific attention of the investors is drawn to the section titled ‘‘Risk Factors’’ on page 62 of this Draft Red Herring Prospectus. ISSUER’S ABSOLUTE RESPONSIBILITY The Company, having made all reasonable enquiries, accepts responsibility for and confirms that this Draft Red Herring Prospectus contains all information with regard to the Company and the Issue that is material in the context of the Issue, that the information contained in this Draft Red Herring Prospectus is true, correct and adequate in all material respects and is not misleading in any material respect, that the opinions and intentions expressed herein are honestly held and that there are no other facts, the omission of which makes this Draft Red Herring Prospectus as a whole, or any of such information or the expression of any such opinions or intentions, misleading in any material respect. LISTING ARRANGEMENT The IDRs offered through this Draft Red Herring Prospectus are proposed to be listed on the BSE and the NSE. The Company has applied for an in-principle approval from the BSE and the NSE for the listing of the IDRs pursuant to their letters dated 30 March 2010 and 30 March 2010, respectively. For the purposes of this Issue, the Designated Stock Exchange shall be [*]. Application will be made to the UK Listing Authority for the underlying Shares to be admitted to the Official List, to the London Stock Exchange and for such Shares to be admitted to trading on the London Stock Exchange’s market for listed securities and to the Hong Kong Stock Exchange for the listing of, and permission to deal in, the underlying Shares. Admission will become effective and dealings will commence in the underlying Shares on [*]. GLOBAL COORDINATORS AND BOOK RUNNING LEAD MANAGERS REGISTRAR TO THE ISSUE UBS Securities India Private Limited 2F, 2 North Avenue Maker Maxity Bandra Kurla Complex Bandra (E) Mumbai 400 051 Tel: +91 (0)22 6155 6000 Fax: +91 (0)22 6155 6300 Email: [email protected] Investor Grievance Email: [email protected] Contact Person: Puneet Gandhi Website: www.ubs.com/indian-dr SEBI registration: INM000010809 Goldman Sachs (India) Securities Private Limited Rational House, 951A Appasaheb Marathe Marg Prabhadevi Mumbai 400 025 Tel: +91 (0)22 6616 9000 Fax: +91 (0)22 6616 9090 Email: [email protected] Investor Grievance Email: [email protected] Contact Person: Pranita Gramopadhye Website: www2.goldmansachs.com/ worldwide/india/ SEBI registration: INM000011054 Karvy Computershare Private Limited 17 to 24, Vithalrao Nagar, Madhapur, Hyderabad 500 001, Andhra Pradesh Tel: +91 (0)40 2342 0818 Fax: +91 (0)40 2343 1551 Email: [email protected] Website: www.karvy.com Contact Person: Krishna M Murali SEBI registration: INR000000221 BOOK RUNNING LEAD MANAGERS JM Financial Consultants Private Limited 141, Maker Chambers III Nariman Point Mumbai 400 021 Tel: +91 (0)22 6630 3030 Fax: +91 (0)22 2204 7185 Email: scplc.idr@jmfinancial.in Investor Grievance Email: grievance.ibd@jmfinancial.in Contact Person: Kailash Soni Website: www.jmfinancial.in SEBI registration: INM000010361 DSP Merrill Lynch Limited 10th Floor, Mafatlal Centre Nariman Point Mumbai 400 021 Tel: +91 (0)22 6632 8000 Fax: +91 (0)22 2204 8518 Email: [email protected] Investor Grievance Email: [email protected] Contact Person: N.S. Shekhar Website: www.dspml.com SEBI registration: INM000011625 Kotak Mahindra Capital Company Limited 1st Floor, Bakhtawar 229 Nariman Point Mumbai 400 021 Tel: +91 (0)22 6634 1100 Fax: +91 (0)22 2283 7517 Email: [email protected] Investor Grievance Email: [email protected] Contact Person: Chandrakant Bhole Website: www.kotak.com SEBI registration: INM000008704 SBI Capital Markets Limited Address: 202, Maker Towers ‘E’, Cuffe Parade, Mumbai 400 005 Tel: +91 (0)22 2217 8300 Fax: +91 (0)22 2218 8332 Email: [email protected] Investor Grievance Email: [email protected] Contact Person: Nishit Mathur Website: www.sbicaps.com SEBI registration: INM000003531 BID/ISSUE PROGRAMME BID/ISSUE OPENS ON [*]** BID/ISSUE CLOSES ON [*]** The date of this Draft Red Herring Prospectus is 30 March 2010. *Exchange Ratio will be finalised and disclosed at the stage of filing of the Red Herring Prospectus with the Registrar of Companies, New Delhi. ** The Company may consider participation by Anchor Investors. The Anchor Investor Bid/Issue Period shall be one Business Day prior to the Bid/Issue Opening Date.
-
Upload
independent -
Category
Documents
-
view
0 -
download
0
Transcript of Draft Red Herring Prospectus Standard Chartered PLC

Draft Red Herring Prospectus
Standard Chartered PLC(Incorporated in England and Wales on 18 November 1969 and registered as a public limited company under company number 00966425.The Company changed its name from Standard Chartered Bank Public Limited Company to Standard Chartered PLC on 1 January 1985.)
Registered Office: 1 Aldermanbury Square, London EC2V 7SB
Principal Place of Business in the UK: 1 Basinghall Avenue, London EC2V 5DD
Company Secretary: Annemarie Durbin
Compliance Officer: Kanchan Bhave
Tel: +44 (0)20 7885 8888; Fax: +44 (0)20 7885 7337; Website: www.standardchartered.com;Email: [email protected]
ISSUE OF 220,000,000 INDIAN DEPOSITORY RECEIPTS (‘‘IDRs’’) AT AN OFFERING PRICE OF Rs. [*] PER IDRWITH EVERY [*] IDRS* REPRESENTING ONE SHARE OF STANDARD CHARTERED PLC OF US$0.50 NOMINAL
VALUE
THE PRICE BAND AND THE MINIMUM BID LOT WILL BE DECIDED BY THE COMPANYIN CONSULTATION WITH THE BOOK RUNNING LEAD MANAGERS AND ADVERTISED
AT LEAST ONE BUSINESS DAY PRIOR TO THE BID/ISSUE OPENING DATE
In the case of revision in the Price Band, the Bid/Issue Period will be extended by at least three additional Business Days after revision of the Price Band subject to the Bid/IssuePeriod not exceeding 10 Business Days. Any revision in the Price Band and the Bid/Issue Period, if applicable, will be widely disseminated by notification to the Stock Exchanges, byissuing a press release, and also by indicating the change on the websites of the BRLMs and at the terminals of the Syndicate.
All investors other than QIBs may participate in this Issue through an Application Supported by Blocked Amount (‘‘ASBA’’) process providing details of the ASBA Account inwhich the Bid Amount will be blocked by the Self Certified Syndicate Bank. For details, see the section titled ‘‘Issue Procedure’’ on page 382 of this Draft Red Herring Prospectus.
The IDRs have not been and will not be registered under the US Securities Act or any state securities laws in the US and may not be offered or sold within the US (as defined inRegulation S), except pursuant to an exemption from, or in a transaction not subject to, the registration requirements of the US Securities Act and applicable US state securitieslaws. Accordingly, the IDRs are being offered outside of the US in reliance on Regulation S and the applicable laws of the jurisdiction where those offers and sales occur.
The distribution of this Draft Red Herring Prospectus and the offering or sale of the IDRs in certain jurisdictions other than India may be restricted by law. Persons into whosepossession this Draft Red Herring Prospectus comes should inform themselves about, and observe, any such restriction. Failure to comply with any such restriction may constitute aviolation of the securities laws of such jurisdiction. This Draft Red Herring Prospectus does not constitute an offer or an invitation to purchase or subscribe for any securities or asolicitation of an offer to buy any securities pursuant to this Draft Red Herring Prospectus or otherwise in any jurisdiction in which such offer or solicitation is unlawful. This DraftRed Herring Prospectus has been prepared for the purposes of complying with Indian law and the information disclosed may not be the same as that which would have beendisclosed if this Draft Red Herring Prospectus had been prepared in accordance with the laws of jurisdictions outside India.
In accordance with Regulation 98 of the SEBI Regulations, the Issue is being made through a 100% Book Building Process where at least 50% of the Issue will be Allotted to QIBson a proportionate basis. Provided that the Company may allocate up to 30% of the QIB Portion to Anchor Investors on a discretionary basis out of which one-third shall bereserved for domestic Mutual Funds. 5% of the QIB Portion (excluding the Anchor Investor Portion) shall be available for allocation on a proportionate basis to Mutual Funds only,and the remainder of the QIB Portion shall be available for allocation on a proportionate basis to all QIB Bidders, including Mutual Funds, subject to valid Bids being received ator above the Issue Price. Furthermore, not less than 20% of the Issue shall be available for allocation on a proportionate basis to Non-Institutional Bidders and not less than 30% ofthe Issue shall be available for allocation on a proportionate basis to Retail Individual Bidders.
Under-subscription, if any, in any category except the QIB Portion, would be allowed to be met with spill-over from any other category or combination of categories at the discretionof the Company in consultation with the BRLMs and the Designated Stock Exchange.
RISK IN RELATION TO THE FIRST ISSUE
This being the first public issue of IDRs representing the underlying Shares of the Company, there has been no formal market for the IDRs. No assurance can be given regardingactive and/or sustained trading in the IDRs of the Company or regarding the price at which the IDRs will be traded after listing.
GENERAL RISKS
The IDRs are of a specialist nature and should only be bought and traded by investors who are particularly knowledgeable in investment matters. In making an investment decision,prospective investors must rely on their own examination of the Company and the terms of the Issue, including the risks involved. For a discussion of certain factors that should beconsidered in connection with an investment in the IDRs, see the section titled ‘‘Risk Factors’’ on page 62 of this Draft Red Herring Prospectus. For information on the materialrights, obligations and entitlements applicable to IDR Holders, please refer to the section titled ‘‘Frequently Asked Questions on the IDR Facility’’ and ‘‘Terms and Conditions of theIndian Depository Receipts’’ on pages 42 and 352 respectively of this Draft Red Herring Prospectus and also the other sections. The IDRs offered in the Issue have not beenrecommended or approved by SEBI, nor does the SEBI guarantee the accuracy or adequacy of this Draft Red Herring Prospectus. Specific attention of the investors is drawn to thesection titled ‘‘Risk Factors’’ on page 62 of this Draft Red Herring Prospectus.
ISSUER’S ABSOLUTE RESPONSIBILITY
The Company, having made all reasonable enquiries, accepts responsibility for and confirms that this Draft Red Herring Prospectus contains all information with regard to theCompany and the Issue that is material in the context of the Issue, that the information contained in this Draft Red Herring Prospectus is true, correct and adequate in all materialrespects and is not misleading in any material respect, that the opinions and intentions expressed herein are honestly held and that there are no other facts, the omission of whichmakes this Draft Red Herring Prospectus as a whole, or any of such information or the expression of any such opinions or intentions, misleading in any material respect.
LISTING ARRANGEMENT
The IDRs offered through this Draft Red Herring Prospectus are proposed to be listed on the BSE and the NSE. The Company has applied for an in-principle approval from theBSE and the NSE for the listing of the IDRs pursuant to their letters dated 30 March 2010 and 30 March 2010, respectively. For the purposes of this Issue, the Designated StockExchange shall be [*]. Application will be made to the UK Listing Authority for the underlying Shares to be admitted to the Official List, to the London Stock Exchange and forsuch Shares to be admitted to trading on the London Stock Exchange’s market for listed securities and to the Hong Kong Stock Exchange for the listing of, and permission to dealin, the underlying Shares. Admission will become effective and dealings will commence in the underlying Shares on [*].
GLOBAL COORDINATORS AND BOOK RUNNING LEAD MANAGERS REGISTRAR TO THE ISSUE
UBS Securities India Private Limited
2F, 2 North AvenueMaker Maxity
Bandra Kurla ComplexBandra (E)
Mumbai 400 051Tel: +91 (0)22 6155 6000Fax: +91 (0)22 6155 6300
Email: [email protected] Grievance Email:
[email protected] Person: Puneet Gandhi
Website: www.ubs.com/indian-drSEBI registration: INM000010809
Goldman Sachs (India) Securities
Private LimitedRational House, 951A
Appasaheb Marathe MargPrabhadevi
Mumbai 400 025Tel: +91 (0)22 6616 9000Fax: +91 (0)22 6616 9090
Email: [email protected] Grievance Email:
[email protected] Person: Pranita Gramopadhye
Website: www2.goldmansachs.com/worldwide/india/SEBI registration: INM000011054
Karvy Computershare Private Limited
17 to 24, Vithalrao Nagar, Madhapur,Hyderabad 500 001, Andhra Pradesh
Tel: +91 (0)40 2342 0818Fax: +91 (0)40 2343 1551
Email: [email protected]: www.karvy.comContact Person: Krishna M Murali
SEBI registration: INR000000221
BOOK RUNNING LEAD MANAGERS
JM Financial Consultants Private Limited
141, Maker Chambers III
Nariman Point
Mumbai 400 021
Tel: +91 (0)22 6630 3030
Fax: +91 (0)22 2204 7185
Email: [email protected]
Investor Grievance Email:
Contact Person: Kailash Soni
Website: www.jmfinancial.in
SEBI registration: INM000010361
DSP Merrill Lynch Limited
10th Floor, Mafatlal Centre
Nariman Point
Mumbai 400 021
Tel: +91 (0)22 6632 8000
Fax: +91 (0)22 2204 8518
Email: [email protected]
Investor Grievance Email:
Contact Person: N.S. Shekhar
Website: www.dspml.com
SEBI registration: INM000011625
Kotak Mahindra Capital Company
Limited
1st Floor, Bakhtawar
229 Nariman Point
Mumbai 400 021
Tel: +91 (0)22 6634 1100
Fax: +91 (0)22 2283 7517
Email: [email protected]
Investor Grievance Email: [email protected]
Contact Person: Chandrakant Bhole
Website: www.kotak.com
SEBI registration: INM000008704
SBI Capital Markets Limited
Address: 202, Maker Towers ‘E’,
Cuffe Parade, Mumbai 400 005
Tel: +91 (0)22 2217 8300
Fax: +91 (0)22 2218 8332
Email: [email protected]
Investor Grievance Email:
Contact Person: Nishit Mathur
Website: www.sbicaps.com
SEBI registration: INM000003531
BID/ISSUE PROGRAMME
BID/ISSUE OPENS ON [*]** BID/ISSUE CLOSES ON [*]**
The date of this Draft Red Herring Prospectus is 30 March 2010.
*Exchange Ratio will be finalised and disclosed at the stage of filing of the Red Herring Prospectus with the Registrar of Companies, New Delhi.
** The Company may consider participation by Anchor Investors. The Anchor Investor Bid/Issue Period shall be one Business Day prior to the Bid/Issue Opening Date.

TABLE OF CONTENTS
PAGE
DEFINITIONS AND ABBREVIATIONS 4
FORWARD-LOOKING STATEMENTS 16
INDUSTRY AND MARKET DATA 17
ENFORCEMENT OF LIABILITIES 18
EXCHANGE RATES 19
PRESENTATION OF FINANCIAL INFORMATION 25
GENERAL INFORMATION 26
SUMMARY OF THE ISSUE 40
FREQUENTLY ASKED QUESTIONS ON THE IDR FACILITY 42
SELECTED FINANCIAL INFORMATION 52
RISK FACTORS 62
INDUSTRY 76
BUSINESS 95
MANAGEMENT DISCUSSION AND ANALYSIS OF THE FINANCIALCONDITION AND RESULTS OF OPERATIONS 119
PRINCIPAL SUBSIDIARIES AND ASSOCIATES 251
LIST OF SUBSIDIARIES, ASSOCIATES, JOINT VENTURES AND SPECIALPURPOSE ENTITIES 280
DIRECTORS AND SENIOR MANAGEMENT 285
CAPITALISATION STATEMENT 319
CAPITAL STRUCTURE 322
DIVIDENDS 341
BASIS FOR ISSUE PRICE 344
MARKET PRICE INFORMATION 347
SELECTED STATISTICAL INFORMATION 350
USE OF PROCEEDS 351
TERMS AND CONDITIONS OF THE INDIAN DEPOSITORY RECEIPTS 352
INFORMATION ON THE DEPOSITORY AND CERTAIN IMPORTANT
INFORMATION IN RESPECT OF THE SHARES WHILE IN IDR FORM 375
SUMMARY OF CERTAIN PROVISIONS RELATING TO THE IDRS WHILE IN
DEMATERIALISED FORM 378
TRANSFER OF EQUITY SHARES AND DEPOSITORY RECEIPTS 380
ISSUE PROCEDURE 382
TAXATION FRAMEWORK IN INDIA AND UK 406
LITIGATION 414
REGULATORY ENVIRONMENT 415
FOREIGN INVESTMENT, EXCHANGE CONTROLS AND OTHER INDIAN LAWS 423
GOVERNMENT APPROVALS 425
2
c102100pu010Proof7:28.3.10B/LRevision:0OperatorSadK

PAGE
COMPARISON OF RIGHTS OF SHAREHOLDERS 426
COMPARISON OF CORPORATE GOVERNANCE 435
THE UK SECURITIES MARKET 444
THE HONG KONG SECURITIES MARKET 452
MAIN PROVISIONS OF THE ARTICLES OF ASSOCIATION 457
MATERIAL CONTRACTS AND DOCUMENTS FOR INSPECTION 463
ADDITIONAL INFORMATION 464
SUMMARY DIFFERENCES BETWEEN INDIAN GAAP AND IFRS 465
AUDITOR’S REPORT FOR THE IDR ISSUE AND FINANCIAL INFORMATION 473
SELECTED FINANCIAL INFORMATION 475
AUDITED HISTORICAL FINANCIAL STATEMENTS 486
ELIGIBILITY TABLE 802
DECLARATION 803
3
c102100pu010Proof7:28.3.10B/LRevision:0OperatorSadK

DEFINITIONS AND ABBREVIATIONS
1994 ESOS 1994 Executive Share Option Scheme of the Company
1997/2006 RSS 1997/2006 Restricted Share Scheme of the Company
2000 ESOS 2000 Executive Share Option Scheme of the Company
2001 PSP 2001 Performance Share Plan of the Company
2004 DBP 2004 Deferred Bonus Plan of the Company
2007 SRSS 2007 Supplementary Restricted Share Scheme of the Company
A Brain A Brain Co. Limited
ABS Asset-backed securities
AEB American Express Bank Limited
Africa Includes Botswana, Cameroon, Côte d’Ivoire, Gambia, Ghana,
Kenya, Nigeria, Sierra Leone, South Africa, Tanzania, Uganda,
Zambia and Zimbabwe
AIM Alternative Investment Market
ALCO Asset and Liability Committee
ALM Asset and Liability Management
All Employee Sharesave Schemes 1994 UK Sharesave, 1996 International Sharesave, 2004 UK and
International Sharesave and/or 2008 Irish Shareshave schemes of
the Company, as the case may be
Allotment/Allot/Allotted Unless the context otherwise requires, the allotment of IDRs by the
IDR Depository pursuant to the Issue
Americas, the UK and Europe Includes Argentina, Bahamas, Brazil, Canada, Colombia, the
Falkland Islands, Ireland, Jersey, Mexico, Peru, Switzerland,
Turkey, the UK, the US and Venezuela
Anchor Investor A QIB, applying under the Anchor Investor category, with aminimum Bid of Rs. 100 million
Anchor Investor Bid/Issue Period The day, one Business Day prior to the Bid/Issue Opening Date, on
which Bids by Anchor Investors shall be submitted and allocation
to Anchor Investors shall be completed
Anchor Investor Issue Price The final price at which IDRs will be issued and Allotted to Anchor
Investors in terms of the Red Herring Prospectus and the
Prospectus, which price will be equal to or higher than the Issue
Price but not higher than the Cap Price. The Anchor Investor Issue
Price will be decided by the Company in consultation with theBRLMs
Anchor Investor Margin Amount An amount representing 25% of the Bid Amount payable by the
Anchor Investors at the time of submission of their Bid
Anchor Investor Portion Up to 30% of the QIB Portion which may be allocated by the
Company to Anchor Investors on a discretionary basis. One-third
of the Anchor Investor Portion shall be reserved for domestic
Mutual Funds, subject to valid Bids being received from domestic
Mutual Funds at or above the Anchor Investor Issue Price
Application Supported by BlockedAmount/ASBA
The application (whether physical or electronic) used by all Biddersother than QIBs to make a Bid authorising the SCSB to block the
Bid Amount in their ASBA Account maintained with the SCSB
Arbitration and Conciliation Act The Arbitration and Conciliation Act, 1996 as amended from time
to time
Articles The articles of association of the Company
4
c102100pu010Proof7:28.3.10B/LRevision:0OperatorSadK

ASBA Account An account maintained with the SCSBs and specified in the ASBA
Bid cum Application Form for blocking an amount mentioned in
the ASBA Bid cum Application Form
ASBA Bid cum Application Form/
ASBA Application-cum-Bidding
Form
The form, whether physical or electronic, used by a Bidder (other
than a QIB) to make a Bid through ASBA process, which will be
considered as the application for Allotment for the purposes of the
Red Herring Prospectus and the Prospectus
ASBA Revision Form The form used by the Bidders (other than a QIB) to modify the
quantity of IDRs or the Bid Amount in any of their ASBA Bid cumApplication Forms or any previous ASBA Revision Form(s)
ATM Automated teller machine
Audit and Risk Committee The audit and risk committee of the Board
Auditors The statutory auditors of the Company, KPMG Audit Plc
Banker(s) to the Issue [*]
Banking Ordinance The Hong Kong Banking Ordinance (Chapter 155 of the Laws of
Hong Kong), as amended from time to time
Banking Regulation Act The Banking Regulation Act, 1949, as amended from time to time
Basel II The June 2004 Basel Accord of the Basel Committee on BankingSupervision, as amended from time to time
Basis of Allotment The basis on which IDRs will be allotted to successful Bidders
under the Issue and which is described in the section titled ‘‘Issue
Procedure’’ beginning on page 382 of this Draft Red Herring
Prospectus
Bid An indication to make an offer during the Bid/Issue Period by aBidder pursuant to submission of Bid cum Application Form or
ASBA Bid cum Application Form, as the case may be, or during
the Anchor Investor Bid/Issue Period by the Anchor Investors, to
subscribe to the IDRs representing underlying Shares of the
Company at a price within the Price Band, including all revisions
and modifications thereto
Bid Amount The highest value of the optional Bids indicated in the Bid cumApplication Form
Bid cum Application Form/
Application-cum-Bidding Form
The form used by a Bidder (including the ASBA Bid cum
Application Form, as applicable) to make a Bid and which will
be considered as the application for Allotment for the purposes of
the Red Herring Prospectus and the Prospectus
Bidder Any prospective investor who makes a Bid pursuant to the terms of
the Red Herring Prospectus and the Bid cum Application Form
Bid/Issue Closing Date Except in relation to any Bids received from Anchor Investors, the
date after which the Syndicate and the Designated Branches of
SCSBs will not accept any Bids for the Issue, which shall be notified
in an English national newspaper and a Hindi national newspaper
in India, each with a wide circulation
Bid/Issue Opening Date Except in relation to any Bids received from Anchor Investors, the
date on which the Syndicate and the Designated Branches of SCSBs
will start accepting Bids for the Issue, which shall be the date
notified in an English national newspaper and a Hindi national
newspaper in India, each with a wide circulation
Bid/Issue Period The period between the Bid/Issue Opening Date and the Bid/IssueClosing Date inclusive of both days and during which prospective
Bidders (other than Anchor Investors) can submit their Bids,
including any revisions thereof
BIS Bank for International Settlement
5
c102100pu010Proof7:28.3.10B/LRevision:0OperatorSadK

Board/Board of Directors The board of directors of the Company from time to time,
including a duly constituted committee thereof
Book Building Process The book building process as provided in Schedule XI of the SEBI
Regulations, in terms of which this Issue is being made
BRLMs The book running lead managers, being the Global Coordinators,
JM Financial Consultants Private Limited, DSP Merrill Lynch
Limited, Kotak Mahindra Capital Company Limited and SBICapital Markets Limited
BSE Bombay Stock Exchange Limited
Business Day Any day (other than a Saturday or Sunday) on which theCustodian, or where applicable, settlement system in which
Deposited Shares are held, is open for business in its respective
markets and on which banks are generally open for business in
London and Mumbai
Buy Back and Stabilisation
Regulation
The Buy-back and Stabilisation Regulation 2003 (Commission
Regulation 2273/2003) as amended from time to time
BWP The lawful currency of Botswana
CAN/Confirmation of Allocation
Note
Note or advice or intimation of allocation of IDRs sent to (i) the
Bidders (other than Anchor Investors) who have been allocated
IDRs after discovery of the Issue Price in accordance with the Book
Building Process and (ii) Anchor Investors who have been allocated
IDRs after discovery of the Anchor Investor Price
Cap Price The higher end of the Price Band, above which the Issue Price or
the Anchor Investor Issue Price will not be finalised and above
which no Bids will be accepted
CCASS The Central Clearing and Settlement System established and
operated by HKSCC
CDOs Collateralised debt obligations
CDSL Central Depository Services (India) Limited
City Code The UK City Code on Takeovers and Mergers, as amended from
time to time
Civil Jurisdiction and Judgments
Act
The Civil Jurisdiction and Judgments Act 1982 of the UK, as
amended from time to time
CMBS Commercial mortgage-backed securities
Co-BRLM or SC Caps Standard Chartered - STCI Capital Markets Limited
Combined Code The Combined Code on Corporate Governance of the Financial
Reporting Council 2008 of the UK, as amended from time to time
Companies Ordinance The Companies Ordinance (Chapter 32 of the Laws of Hong
Kong), as such ordinance may be amended, modified or re-enacted
from time to time
Company, The Company or
Standard Chartered
Unless the context otherwise indicates or implies, refers to Standard
Chartered PLC, a public limited company incorporated in Englandand Wales and registered under the UK Companies Act with
registration number 00966425, having its registered office at
1 Aldermanbury Square, London, EC2V 7SB
Compliance Officer Kanchan Bhave
Conditions The terms and conditions of the IDRs as described in the section
titled ‘‘Terms and Conditions of the Indian Depository Receipts’’ on
page 352 of this Draft Red Herring Prospectus
Controlling Branches Such branches of the SCSB which coordinates with the BRLMs,
the Registrar to the Issue and the Stock Exchanges, and a list of
which is available on http://www.sebi.gov.in
6
c102100pu010Proof7:28.3.10B/LRevision:0OperatorSadK

CRA Credit Support Annexes
CREST The system for the paperless settlement of trades in securities andthe holding of uncertificated securities in accordance with the
Uncertificated Securities Regulations operated by Euroclear
CRR Cash reserve ratio
Custodian The Bank of New York Mellon or any other custodian from time to
time appointed under the Custody Agreement
Custody Agreement The agreement between the Depository and the Custodian dated
[*], as amended from time to time
Cut-off Price Issue Price, finalised by the Company in consultation with the
BRLMs. Only Retail Individual Bidders whose Bid Amount can
not exceed Rs. 100,000 are entitled to Bid at the Cut-off Price. QIBs
and Non-Institutional Bidders are not entitled to Bid at the Cut-off
Price.
Deed of Assignment The deeds of assignment executed by the Company in favour of the
Depository, each dated [*], relating to the assignment of the
Company’s rights under the Tripartite Agreements.
Dematerialised IDRs An IDR admitted into the security depository system maintained
by NSDL and CDSL and identified by an ISIN assigned by NSDL
and CDSL pursuant to the Tripartite Agreements defined below
Demographic Details The demographic details of a Bidder including address, bank
account details, MICR code and occupation
Deposit Agreement The deposit agreement between the Company and the Depository
dated [*], as amended from time to time
Deposited Shares Shares which are deposited and held by the Custodian on behalf ofthe Depository pursuant to the terms of the Custody Agreement
and such other shares and securities received by the Custodian on
behalf of the Depository in respect thereof and held pursuant to the
terms of the Custody Agreement
Depository/IDR Depository Standard Chartered Bank, Mumbai or any other Depository which
may from time to time be appointed under the Deposit Agreement
Deposited Property Means and includes the Deposited Shares and all and any rights,
interests and other securities, property and cash for the time being
held by the Depository or the Custodian or their respective agents
and attributable to the Deposited Shares together with any right of
the Depository or the Custodian (or their respective delegates) to
receive Deposited Shares or any such rights, interests and securities,
property and cash
Designated Branches Such branches of the SCSBs that shall collect the ASBA Bid cum
Application Form used by Bidders (other than QIBs) applying
through ASBA process and a list of which is available on http://
www.sebi.gov.in
Designated Date The date on which funds are transferred from the Escrow Account
or the amount blocked by the SCSB is transferred from the ASBAAccount of the Bidder, as the case may be, to the Public Issue
Account or the Refund Account, as the case may be, after the
Prospectus is filed with the RoC, following which the IDRs shall be
Allotted to successful Bidders
Designated Stock Exchange [*]
DIFC Dubai International Finance Centre
Director(s) A director/directors of the Company
Disclosure and Transparency Rules
or DTRs
The disclosure and transparency rules made by the UK Listing
Authority under Part VI of FSMA, as amended
7
c102100pu010Proof7:28.3.10B/LRevision:0OperatorSadK

DP ID A Settlement Depository’s Participant’s identity
Draft Red Herring Prospectus
or DRHP
This draft red herring prospectus issued in accordance with the
IDR Rules, Chapter X and other applicable provisions of the SEBI
Regulations, which does not contain complete particulars on the
price at which the IDRs are offered
DSPML DSP Merrill Lynch Limited
ECS Electronic Clearing Service
EEA European Economic Area as established by the agreement on the
European Economic Area signed at Oporto on 2 May 1992
EIU Economist Intelligence Unit
EPS Earnings per share, i.e. profit after tax for a fiscal year divided by
the weighted average outstanding number of equity shares at the
end of that fiscal year
Escrow Account An account to be opened with the Escrow Collection Bank(s) for
the Issue and in whose favour the Bidder (excluding the Bidders
applying through ASBA process) will issue cheques or drafts in
respect of the Bid Amount when submitting a Bid
Escrow Agreement Agreement to be entered into by the Company, the Registrar to the
Issue, the BRLMs, the Syndicate Members and the EscrowCollection Bank(s) for collection of the Bid Amounts and, where
applicable, refunds of the amounts collected to the Bidders
(excluding the Bidders applying through ASBA process) on the
terms and conditions thereof
Escrow Collection Bank(s) The bank(s) which is/are clearing member(s) and registered with the
SEBI as Banker to the Issue with whom the Escrow Account will be
opened and in this case being [*]
EU The European Union first established by the treaty made at
Maastricht on 7 February 1992
Euro/e The single currency of the member states of the European
Community that adopt or have adopted the euro as their lawful
currency under the legislation of the EU or European Territory
Union
Euroclear Euroclear UK & Ireland Limited
FEMA The Foreign Exchange Management Act, 1999 read with rules and
regulations thereunder, as amended
FII(s) Foreign Institutional Investor(s) as defined under the SEBI
(Foreign Institutional Investor) Regulations, 1995 registered with
the SEBI under applicable laws in India
First Bidder The Bidder whose name appears first in the Bid cum Application
Form or Revision Form or the ASBA Bid cum Application Formor ASBA Revision Form
Floor Price The lower end of the Price Band, at or above which the Issue Priceor the Anchor Investor Issue Price will be finalised and below which
no Bids will be accepted
FRC The Financial Reporting Council of the UK
FSA The Financial Services Authority of the UK
FSMA The Financial Services and Markets Act 2000 of the UK, asamended
GALCO Group Asset and Liability Committee
GBP/£ The lawful currency of the UK
GCC Group Credit Committee
GCRO Group Chief Risk Officer
8
c102100pu010Proof7:28.3.10B/LRevision:0OperatorSadK

GDP Gross Domestic Product
GIR General Index Register
Global Coordinators UBS and Goldman Sachs
Goldman Sachs Goldman Sachs (India) Securities Private Limited
GMC Group Management Committee
GMRC Group Market Risk Committee
GORC Group Operational Risk Committee
GRC Group Risk Committee
the ‘‘Group’’ The Company, together with its subsidiaries and subsidiary
undertakings (as defined by section 1159 and 1162 of the UK
Companies Act)
Group Executive Directors The executive directors of the Company set out in the section titled
‘‘Directors and Senior Management’’ on page 285 of this Draft Red
Herring Prospectus
GRRRC Group Reputational Risk and Responsibility Committee
GSAM Group Special Assets Management
Harrison Lovegrove Harrison Lovegrove & Co. Limited
HDRs Hong Kong Depository receipts
HKD/HK$ The lawful currency of Hong Kong
HKMA The Hong Kong Monetary Authority
HKSCC Hong Kong Securities Clearing Company Limited
Hong Kong Hong Kong Special Administrative Region of the People’s
Republic of China
Hong Kong Listing Rules The Rules governing the listing of securities on the Hong Kong
Stock Exchange, as amended
Hong Kong Stock Exchange The Stock Exchange of Hong Kong Limited
Hsinchu Hsinchu International Bank, Taiwan
HUF Hindu undivided family
IAS International Accounting Standards
IASB The International Accounting Standards Board
IDR Certificate A certificate evidencing the IDRs issued by the Depository in
accordance with the Deposit Agreement
IDR Facility Means the separate account created by the Custodian held on trustfor the Depository in which the Deposited Shares are credited and
the separate accounts of the Custodian in which cash and the
Deposited Property are deposited in the name of the Depository
IDR Holders The person or persons recorded in the Register of IDR Holders as a
holder of an IDR from time to time
IDR Listing Agreements The agreements to be entered into between the Company and each
of the BSE and the NSE on or about [*] in relation to the listing of
the IDRs
IDR Rules The Companies (Issue of Indian Depository Receipts) Rules, 2004,as amended, and notified by the Central Government in relation to
the IDRs
IDRs Indian Depository Receipts issued by the Depository pursuant to
the Deposit Agreement
IFRIC International Financial Reporting Interpretation Committee
IFRS International Financial Reporting Standards and IFRIC
Interpretations, as adopted by the EU
9
c102100pu010Proof7:28.3.10B/LRevision:0OperatorSadK

IFSC Indian Financial System Code
IIP Individual Impairment Provisions
Income Tax Act The Income Tax Act, 1961 as amended from time to time
Indian Companies Act The Companies Act, 1956, as amended from time to time
Indian GAAP Generally accepted accounting principles in India
IPO Initial public offering
IRB Internal Ratings-Based
ISIN International Securities Identification Number
Issue Issue of [*] IDRs, every [*] IDRs representing one Share of the
Company at an Issue Price of Rs. [*] per IDR*
Issue Agreement The agreement entered into on 30 March 2010 between the
Company, the BRLMs and the Co-BRLM, pursuant to which
certain arrangements are agreed to in relation to the Issue
Issue Price The final price at which IDRs will be issued and Allotted in terms
of the Prospectus. The Issue Price will be decided by the Company
in consultation with the BRLMs on the Pricing Date
Issue Proceeds The proceeds of the Issue that are available to the Company
JM Financial JM Financial Consultants Private Limited
JPY The lawful currency of Japan
Korean Bank Act The Korean Bank Act of 1950, as amended from time to time
Korean FSC Korean Financial Services Commission
Korean FSS Korean Financial Supervisory Service
Kotak Kotak Mahindra Capital Company Limited
KRW or Korean Won The lawful currency of South Korea
LMC Liquidity Management Committee
London Stock Exchange or LSE London Stock Exchange plc or its successors
MAC Model Assessment Committee
Margin Amount The amount paid by the Bidder or blocked in the ASBA Account
of, at the time of submission of the Bid, being 10% to 100% of the
Bid Amount, as applicable
MAS Monetary Authority of Singapore
MAS Act Monetary Authority of Singapore Act, Chapter 186 of Singapore,
as amended or modified from time to time
Master Creation Format Means the document to be used by the Depository to notify the
Settlement Depositories of the Issue of IDRs in the form agreedwith the Settlement Depositories
Memorandum The memorandum of association of the Company
Middle East and Other South Asia
or MESA
Includes the UAE, Bahrain, Qatar, Oman, Jordan, Lebanon,
Pakistan, Bangladesh and Sri Lanka
MICR A nine-digit magnetic ink character recognition number/code
MiFID Directive 2004/39/EC of the European Parliament and of the
Council of 21 April 2004 on markets in financial instruments, as
amended from time to time
m/mn Million
Model Code The Model Code on directors’ dealings in securities set out in the
UK Listing Rules
10
c102100pu010Proof7:28.3.10B/LRevision:0OperatorSadK
*Exchange Ratio will be finalised and disclosed at the stage of filing of the Red Herring Prospectus with the Registrar of Companies,New Delhi.

Mutual Fund A mutual fund registered with the SEBI under the SEBI (Mutual
Funds) Regulations, 1996, as amended from time to time
Mutual Funds Portion 5% of the QIB Portion (excluding the Anchor Investor Portion), or
[*] IDRs available for allocation to Mutual Funds only
N/A Not applicable
NEFT National Electronic Fund Transfer
NIM Net Interest Margin
Nomination Committee The nomination committee of the Board
Non-Institutional Bidders All Bidders that are not QIBs or Retail Individual Bidder(s) and
who have Bid for IDRs for an amount of more than Rs. 100,000
Non-Institutional Portion The portion of the Issue being not less than [*] IDRs available for
allocation to Non-Institutional Bidders
NRI Non-resident Indian – a person resident outside India, as defined
under FEMA and the FEMA (Transfer or Issue of Security by a
Person Resident Outside India) Regulations, 2000, as amended
from time to time
NSDL National Securities Depository Limited
NSE The National Stock Exchange of India Limited
OCBs A company, partnership, society or other corporate body owned
directly or indirectly to the extent of at least 60% by NRIs includingoverseas trusts, in which not less than 60% of beneficial interest is
irrevocably held by NRIs directly or indirectly as defined under
Foreign Exchange Management (Transfer or Issue of Security by a
Person Resident Outside India) Regulations, 2000, as amended
from time to time. OCBs are not allowed to invest in this Issue
OECD Organisation for Economic Co-operation and Development
Official List The official list of the UK Listing Authority
Other Asia Pacific Includes Brunei, Cambodia, China, Indonesia, the Philippines,Taiwan, Thailand and Vietnam
p.a. Per annum
PAN Permanent Account Number allotted under the Income Tax Act
Panel The UK Panel on Takeovers and Mergers
PDMR Person discharging managerial responsibilities
P/E ratio Price-earnings ratio
Pay-in Date The last date specified in the CAN sent to the Bidders (if any) for
payment of the balance amount
Pembroke Pembroke Group Limited
Permata Bank PT Bank Permata Tbk, Indonesia
PILON Payment in lieu of notice
PIP Portfolio Impairment Provision
PKR The lawful currency of Pakistan
Price Band A price band of a minimum price (Floor Price) of [*] and the
maximum price (Cap Price) of Rs. [*] and includes revisions
thereof. The Price Band and the minimum Bid lot size for the Issue
will be decided by the Company in consultation with the BRLMsand advertised in an English and a Hindi newspaper of wide
circulation in India at least one Business Day prior to the Bid/Issue
Opening Date
Pricing Date The date on which the Company, in consultation with the BRLMs,
finalises the Issue Price
11
c102100pu010Proof7:28.3.10B/LRevision:0OperatorSadK

Prospectus The prospectus to be filed with the RoC in accordance with section
605 of the Indian Companies Act and rule 5(2)(vi) of the IDR
Rules, containing, inter alia, the Issue Price that is determined at
the end of the Book Building process, the size of the Issue andcertain other information
Public Issue Account The account opened with the Banker(s) to the Issue to receive
monies from the Escrow Account, and from the SCSBs from the
ASBA Accounts of the Bidders applying through ASBA process,on the Designated Date
QIB Portion The portion of the Issue being at least [*] IDRs to be Allotted to
QIBs
QIB Margin Amount An amount representing at least 10% of the Bid Amount, paid by
QIB Bidders (excluding Anchor Investors) at the time of
submission of their Bid
QIBs A Qualified Institutional Buyer means a public financial institution
as defined in section 4A of the Indian Companies Act, a scheduled
commercial bank, a Mutual Fund, an FII and sub-account
registered with SEBI, other than a sub-account which is a foreign
corporate or foreign individual, a multilateral and bilateral
development financial institution, a state industrial development
corporation
RBI Reserve Bank of India
RBI Act The Reserve Bank of India Act, 1934, as amended from time totime
RBI Circular RBI Circular number RBI/2009-10/106 A.P. (DIR Series) Circular
No. 5 dated 22 July 2009
Red Herring Prospectus or RHP The red herring prospectus to be issued in accordance with the
applicable provisions of the Indian Companies Act and the SEBI
Regulations, which will not have complete particulars of the price
at which the IDRs are offered. The Red Herring Prospectus will be
filed with the RoC at least three days before the Bid/Issue Opening
Date and will become a Prospectus upon filing with the RoC after
the Pricing Date
Refund Account The account opened with the Escrow Collection Bank(s), from
which refunds, if any, of the whole or part of the Bid Amount
(excluding to the Bidders applying through ASBA process) shall be
made
Refund Banker [*]
Refunds through electronic transferof funds
Refunds through ECS, Direct Credit, RTGS, NEFT or the ASBAprocess, as applicable
Register The register of IDR Holders of the Company from time to time
maintained by the Depository
Registrar Agreement The agreement between the Registrar to the Issue, the Depository
and the Company dated [*], as amended from time to time
Registrar to the Issue or Registrar Karvy Computershare Private Limited
Regulation S Regulation S under the US Securities Act
Remuneration Committee The remuneration committee of the Board
Retail Individual Bidder(s) Those individual Bidders (including HUFs applying through their
Karta and eligible NRIs) who have not Bid for IDRs for an amount
of more than Rs. 100,000 in any of the bidding options in the Issue
Retail Portion The portion of the Issue being not less than [*] IDRs available for
allocation to Retail Individual Bidder(s)
12
c102100pu010Proof7:28.3.10B/LRevision:0OperatorSadK

Revision Form The form used by the Bidders, excluding Bidders applying through
ASBA process, to modify the quantity of IDRs or the Bid Amount
in any of their Bid cum Application Forms or any previous revision
form(s)
RMBS Residential mortgage-backed securities
RMF Risk management framework
RoC The Registrar of Companies in Delhi
RONW Return on net worth
RM or MYR The lawful currency of Malaysia
Rp. The lawful currency of Indonesia
Rs. or INR The lawful currency of India
RSS Restricted Share Scheme
RTGS Real-time gross settlement
RWA Risk weighted assets
S$/SGD Singapore dollars
SBI Caps SBI Capital Markets Limited
SCB Standard Chartered Bank, UK
SCB Court The Court or Board of Directors of SCB
SCFB Standard Chartered First Bank Korea Limited
SDRT Stamp duty reserve tax
SEBI The Securities and Exchange Board of India constituted under the
SEBI Act
SEBI Act The Securities and Exchange Board of India Act, 1992, as amended
from time to time
SEBI Guidelines The SEBI (Disclosure and Investor Protection) Guidelines, 2000
SEBI Regulations The SEBI (Issue of Capital and Disclosure Requirements)
Regulations, 2009, as amended from time to time
Self Certified Syndicate Bank/
SCSB
The banks which are registered with SEBI under the SEBI (Bankers
to an Issue) Regulations, 1994, as amended from time to time and
offer services of ASBA, and a list of which is available on http://
www.sebi.gov.in
Settlement Depositories NSDL and CDSL
Settlement Depository Participant A Depository participant as defined under the Depositories Act,
1996, as amended from time to time
SFC The Securities and Futures Commission of Hong Kong
SFO The Securities and Futures Ordinance (Chapter 571 of the Laws of
Hong Kong), as amended from time to time
Shares Ordinary Shares of US$0.50 each in the capital of the Company
SIC The IASB’s Standards Interpretations Committee
Singapore Banking Act Banking Act, Chapter 19 of Singapore, as amended or modified
from time to time
SME Small and medium enterprises
South Korea Republic of Korea
SPV or SPE Special purpose vehicle
Standard Chartered Share Schemes All Employee Sharesave Schemes, the 1994 ESOS, the 2000 ESOS,
the 2001 PSP, the 1997/2006 RSS, the 2007 SRSS and the 2004DBP
Stock Exchange(s) BSE and/or NSE, as the case may be
13
c102100pu010Proof7:28.3.10B/LRevision:0OperatorSadK

Sustainability and Responsibility
Committee
The sustainability and responsibility committee of the Board
Syndicate The BRLMs, Co-BRLM and the Syndicate Members
Syndicate Agreement The agreement to be entered into between the Syndicate and the
Company in relation to the collection of Bids in this Issue excluding
Bids from the Bidders applying through ASBA process
Syndicate Members JM Financial Services Private Limited, Kotak Securities Limited
and SBICAP Securities Limited
Takeover Directive The Directive on Takeover Bids (2004/25/EC), as amended from
time to time
THB The lawful currency of Thailand
TMC Tax Management Committee
Transfer Agent Agreement The agreement between the Registrar, the Company and
Depository dated [*], as amended from time to time
Tripartite Agreements The agreements between (i) NSDL, the Company and the
Registrar; and (ii) CDSL, the Company and the Registrar, each
dated [*]
TRS or Transaction Registration
Slip
The slip or document issued by a member of the Syndicate or the
SCSB (only on demand), as the case may be, to the Bidder as proof
of registration of the Bid
TSR Total shareholder return
TWD The lawful currency of Taiwan
TZS The lawful currency of Tanzania
UBS UBS Securities India Private Limited
UAE United Arab Emirates
UK or United Kingdom The United Kingdom of Great Britain and Northern Ireland
UK Companies Act The Companies Act 1985 or, where applicable, the Companies Act
2006, as may be amended, modified or re-enacted from time to time
UK Foreign Judgments Act The Foreign Judgments (Reciprocal Enforcement) Act 1933 of the
UK, as amended from time to time
UK GAAP Generally accepted accounting principles in the UK
UK Listing Authority or UKLA The FSA in its capacity as competent authority under FSMA
UK Listing Rules The listing rules made by the UK Listing Authority under Part VI
of FSMA, as amended from time to time
Uncertificated Securities
Regulations 2001
The Uncertificated Securities Regulations 2001 (SI 2001 No. 3755),
as amended from time to time
Underwriters The BRLMs and the Syndicate Members
Underwriting Agreement The agreement between the Underwriters and the Company to be
entered into on or after the Pricing Date
Union Bank Union Bank Limited, Pakistan
US/USA/United States The United States of America, its territories and possessions, any
state of the United States and the District of Columbia
US$, $ or US Dollar The lawful currency of the United States
US Securities Act The US Securities Act of 1933, as amended from time to time
UTI UTI Securities Limited
VaR Value at risk
VND The lawful currency of Vietnam
14
c102100pu010Proof7:28.3.10B/LRevision:0OperatorSadK

Walker Review A review of corporate governance in UK banks and other financial
industry entities commissioned by Her Majesty’s Treasury and
conducted by Sir David Walker, with final recommendations
published on 26 November 2009
Whistlejacket Whistlejacket Capital Limited
Yeahreum Yeahreum Mutual Savings Bank
15
c102100pu010Proof7:28.3.10B/LRevision:0OperatorSadK

FORWARD-LOOKING STATEMENTS
Certain statements included herein may constitute forward-looking statements that involve a numberof risks and uncertainties. Such forward-looking statements can be identified by the use of forward-looking terminology such as ‘‘believes’’, ‘‘expects’’, ‘‘may’’, ‘‘are expected to’’, ‘‘intends’’, ‘‘will’’, ‘‘willcontinue’’, ‘‘should’’, ‘‘would be’’, ‘‘seeks’’, ‘‘approximately’’ or ‘‘anticipates’’ or similar expressions orthe negative thereof or other variations thereof or comparable terminology. These forward-lookingstatements include all matters that are not historical facts. They appear in a number of placesthroughout this Draft Red Herring Prospectus and include statements regarding the Group’sintentions, beliefs or current expectations concerning, among other things, the Group’s results ofoperations, financial condition, liquidity, prospects, growth, strategies and the industry in which itoperates. By their nature, forward-looking statements involve risks and uncertainties because theyrelate to events and depend on circumstances that may or may not occur in the future.
Prospective investors should be aware that forward-looking statements are not guarantees of futureperformance and that the Group’s actual results of operations, financial condition and liquidity, andthe development of the industry in which it operates, may differ materially from those made in orsuggested by the forward-looking statements contained in this Draft Red Herring Prospectus.Forward-looking statements contained in this Draft Red Herring Prospectus based on past or currenttrends or activities should not be taken as a representation that such trends or activities will continuein the future. In addition, even if the Group’s results of operations, financial condition and liquidityand the development of the industry in which it operates are consistent with the forward-lookingstatements contained in this Draft Red Herring Prospectus, those results or developments may not beindicative of results or developments in subsequent periods. Important factors that could cause thosedifferences include, but are not limited to:
* anticipated growth of the Group’s businesses and anticipated growth of its cross-selling activities
among client segments and products; and
* expectations as to the Group’s expansion.
Factors that could cause actual results to differ materially from the Group’s expectations arecontained in cautionary statements in this Draft Red Herring Prospectus and include, among otherthings, the following:
* overall political, economic and business conditions across the world, including commodity prices;
* the demand for the Group’s services and products;
* competitive factors in the industries in which the Group and its customers compete;
* changes in government and regulatory requirements;
* changes in tax requirements, including tax rate changes, new tax laws and revised tax law
interpretations;
* interest rate fluctuations and other capital market conditions;
* exchange rate fluctuations;
* economic and political conditions in international markets, including governmental changes;
* hostilities and restrictions on the ability to transfer capital across borders; and
* the timing, impact and other uncertainties of future actions.
The sections titled ‘‘Risk Factors’’, ‘‘Management Discussion and Analysis of the Financial Conditionand Results of Operations’’ and ‘‘Audited Historical Financial Statements’’ on pages 62, 119 and 486respectively of this Draft Red Herring Prospectus contain a more extensive discussion of the factorsthat could affect the Group’s future performance and the industry in which it operates. In light ofthese risks, uncertainties and assumptions, the forward-looking events described in this Draft RedHerring Prospectus may not occur.
Readers are cautioned not to place undue reliance on these forward-looking statements, which speakonly as of the date hereof. Except as required by the FSA, the London Stock Exchange, the HongKong Stock Exchange, the SEBI or applicable law, Standard Chartered does not undertake anyobligation to update or revise any forward-looking statement, whether as a result of new information,future events or otherwise. All subsequent written and oral forward-looking statements attributable toStandard Chartered or to persons acting on its behalf are expressly qualified in their entirety by thecautionary statements referred to above and contained elsewhere in this Draft Red HerringProspectus.
16
c102100pu010Proof7:28.3.10B/LRevision:0OperatorSadK

INDUSTRY AND MARKET DATA
Information regarding market position, growth rates and other industry data pertaining to the
Company’s business contained in this Draft Red Herring Prospectus consists of estimates based on
data reports compiled by professional organisations and analysts, on data from other external sources
and on the Company’s knowledge of its markets.
This data is subject to change and cannot be verified with complete certainty due to limits on the
availability and reliability of raw data and other limitations and uncertainties inherent in anystatistical survey. In many cases, there is no readily available external information (whether from
trade associations, government bodies or other organisations) to validate market-related analyses and
estimates, so the Company relies on internally developed estimates. Where the Company has
compiled, extracted and reproduced market or other industry data from external sources, including
third parties or industry or general publications, the Company accepts responsibility for accurately
reproducing such data, but neither the Company nor the BRLMs make any representation regarding
the accuracy of such data. Similarly, while the Company believes its internal estimates to be
reasonable, such estimates have not been verified by any independent sources and neither theCompany nor the BRLMs can assure potential investors as to their accuracy.
Where the Company has compiled, extracted and reproduced data on associate companies, jointventure companies and major shareholders from external sources, the Company accepts responsibility
for accurately reproducing such data, but neither the Company nor the BRLMs make any
representation regarding the accuracy of such data.
17
c102100pu010Proof7:28.3.10B/LRevision:0OperatorSadK

ENFORCEMENT OF LIABILITIES
The Company is incorporated in England and Wales and registered as a public limited company. The
enforcement by investors of civil liabilities outside the UK, including the ability to effect service of
process and to enforce judgments of courts outside the UK may be affected adversely by the fact that
the Company is incorporated in England and Wales and all of its Directors reside outside India. Asubstantial proportion of the Company’s assets are located outside India. As a result, it may be
difficult to effect service of process initiated in India or to enforce judgments obtained in India
against the Company, its executive officers and Directors.
Judgments delivered by a recognised court or tribunal in India which are final and conclusive (or
require an interim payment to be made) and require the payment of a sum of money other than in
respect of a tax, a fine or a penalty are enforceable in the UK by registration under the UK Foreign
Judgments Act. If the UK Foreign Judgments Act applies, the claimant may, within six years of the
judgment, apply for registration of the judgment.
Under the UK Foreign Judgments Act, registration is required to be set aside if:
(a) the judgment was not one to which the UK Foreign Judgments Act applies, or one that was
registered in contravention of the provisions of the UK Foreign Judgments Act;
(b) the foreign court acted without jurisdiction;
(c) the defendant did not receive notice of the original proceedings in sufficient time to enable him
to defend them and did not appear;
(d) the judgment was obtained by fraud;
(e) the enforcement of the judgment would be contrary to public policy in England and Wales;
(f) the rights under the judgment are not vested in the applicant; or
(g) the judgment was obtained in proceedings which were brought in breach of section 32 of the
Civil Jurisdiction and Judgments Act (that is, in breach of a valid arbitration or choice of court
clause).
Under the UK Foreign Judgments Act, registration may be set aside if the registering court is
satisfied that the subject matter of the judgment had already been the subject of a final and
conclusive judgment by a court having jurisdiction. In addition, the registering court has powers toset aside registration on application by the defendant in certain circumstances (for example, if an
appeal is pending).
18
c102100pu010Proof7:28.3.10B/LRevision:0OperatorSadK

EXCHANGE RATES
Convenience translation
In this Draft Red Herring Prospectus, all references to ‘‘Great Britain Pound Sterling’’, ‘‘Sterling’’,
‘‘GBP’’ and ‘‘£’’ are to the legal currency of Great Britain, all references to ‘‘Hong Kong Dollars’’,‘‘HKD’’ and ‘‘HK$’’ are to the legal currency of Hong Kong, all references to ‘‘INR’’, ‘‘Indian
Rupees’’, ‘‘Rupees’’ and ‘‘Rs.’’ are to the legal currency of India and all references to ‘‘USD’’, ‘‘US
Dollars’’ and ‘‘US$’’ are to the legal currency of the United States of America. Solely for the
convenience of the reader and in accordance with the provisions of IDR Rules and SEBI Regulations,
this Draft Red Herring Prospectus contains translations of certain US$, GBP and HKD amounts into
Rs. at specified rates. This should not be construed as a representation that those US$, GBP or
HKD amounts could have been, or could be, converted into Rs., at any particular rate or at all.
Except as otherwise stated in this Draft Red Herring Prospectus, all translations from US$, GBP orHKD to Rs. are based on the exchange rates of Rs. 46.68 per US$1.00 and Rs. 75.0334 per GBP1.00
as published on the RBI website on 31 December 2009 and Rs. 6.029 per HKD1.00 as published by
Bloomberg on 31 December 2009. No representation is made that the US$, GBP or HKD represent
Rs. amounts or have been, could have been or could be converted into Rs. at such rates or any other
rates. Any discrepancies in any table between totals and sums of the amounts listed are due to
rounding.
Historical exchange rates
Exchange Rate Rs./US$
Period End
Buying
Rate Average High Low
2005
First quarter 43.75 43.71 44.02 43.36
Second quarter 43.51 43.60 43.83 43.30Third quarter 43.99 43.69 44.12 43.39
Fourth quarter 45.07 45.41 46.33 44.09
2006First quarter 44.61 44.41 45.05 44.07
Second quarter 46.08 45.51 46.43 44.61
Third quarter 45.96 46.37 46.95 45.86
Fourth quarter 44.23 44.97 45.84 44.23
2007
First quarter 43.59 44.17 44.61 43.14
Second quarter 40.75 41.20 43.15 40.45
Third quarter 39.74 40.53 41.57 39.70
Fourth quarter 39.41 39.47 39.85 39.27
2008
First quarter 39.97 39.78 40.77 39.27
Second quarter 42.95 42.86 44.07 41.89
Third quarter 46.94 43.75 46.94 41.89
Fourth quarter 48.45 48.76 50.52 46.88
2009
First quarter 50.95 49.76 52.06 48.37
Second quarter 47.87 48.67 50.53 46.84
Third quarter 48.04 48.42 49.40 47.54
Fourth quarter 46.68 46.64 47.86 45.91
(source: RBI website)
19
c102100pu010Proof7:28.3.10B/LRevision:0OperatorSadK

Exchange Rate Rs./US$
Period End
Buying
Rate Average High Low
March 2009 50.95 51.23 52.06 50.14
April 2009 50.22 50.06 50.53 49.49
May 2009 47.29 48.53 49.83 47.19
June 2009 47.87 47.77 48.91 46.84
July 2009 48.16 48.48 49.40 47.79
August 2009 48.88 48.34 48.98 47.54
September 2009 48.04 48.44 49.06 47.96October 2009 46.96 46.72 47.86 45.91
November 2009 46.48 46.57 47.13 46.09
December 2009 46.68 46.63 46.85 46.22
January 2010 46.37 45.96 46.65 45.36
February 2010 46.23 46.33 46.81 46.02
(source: RBI website)
20
c102100pu010Proof7:28.3.10B/LRevision:0OperatorSadK

Exchange Rate Rs./£
Period End
Buying
Rate Average High Low
2005
First quarter 82.09 82.66 84.19 80.98
Second quarter 78.75 80.86 83.94 78.75
Third quarter 77.78 78.03 80.75 75.56
Fourth quarter 77.89 79.38 81.67 77.43
2006
First quarter 77.80 77.82 79.01 76.82
Second quarter 84.45 83.36 87.43 77.15
Third quarter 86.09 86.95 88.77 84.71
Fourth quarter 86.91 86.22 88.30 84.46
2007
First quarter 85.53 86.31 87.61 84.71
Second quarter 81.63 81.84 85.36 80.08
Third quarter 80.34 81.91 83.08 79.88Fourth quarter 78.74 80.77 82.66 78.02
2008
First quarter 79.53 78.67 82.25 76.85Second quarter 85.62 82.18 85.62 78.66
Third quarter 85.57 83.00 86.53 78.09
Fourth quarter 70.01 76.59 85.19 70.01
2009First quarter 72.86 71.53 74.60 67.61
Second quarter 80.08 75.76 80.08 72.86
Third quarter 76.43 79.54 81.13 76.43
Fourth quarter 75.03 76.29 77.93 73.64
(source: RBI website)
21
c102100pu010Proof7:28.3.10B/LRevision:0OperatorSadK

Exchange Rate Rs./£
Period End
Buying
Rate Average High Low
March 2009 72.86 72.92 74.60 71.60
April 2009 73.88 73.61 74.61 72.86
May 2009 75.86 74.83 76.26 72.88
June 2009 80.08 78.18 80.08 75.20
July 2009 79.75 79.34 80.02 78.37
August 2009 79.21 79.95 80.91 79.04
September 2009 76.43 79.36 81.13 76.43October 2009 77.66 75.73 77.87 73.64
November 2009 76.91 77.36 77.93 76.73
December 2009 75.03 75.78 77.12 74.28
January 2010 74.78 74.31 75.25 72.94
February 2010 70.66 72.48 73.91 70.66
(source: RBI website)
22
c102100pu010Proof7:28.3.10B/LRevision:0OperatorSadK

Exchange Rate Rs./HK$
Period End
Buying
Rate Average High Low
2005
First quarter 5.61 5.61 5.64 5.57
Second quarter 5.60 5.60 5.62 5.55
Third quarter 5.67 5.62 5.68 5.56
Fourth quarter 5.81 5.85 5.97 5.67
2006
First quarter 5.75 5.72 5.82 5.69
Second quarter 5.93 5.86 5.98 5.75
Third quarter 5.89 5.96 6.04 5.88
Fourth quarter 5.69 5.78 5.90 5.65
2007
First quarter 5.56 5.65 5.72 5.51
Second quarter 5.21 5.28 5.56 5.18
Third quarter 5.12 5.19 5.29 5.10Fourth quarter 5.05 5.08 5.15 5.04
2008
First quarter 5.15 5.11 5.25 5.03Second quarter 5.50 5.34 5.53 5.11
Third quarter 6.05 5.60 6.05 5.38
Fourth quarter 6.28 6.29 6.50 6.00
2009First quarter 6.61 6.42 6.70 6.22
Second quarter 6.21 6.31 6.55 6.06
Third quarter 6.21 6.24 6.33 6.13
Fourth quarter 6.03 6.02 6.21 5.95
(source: Bloomberg)
23
c102100pu010Proof7:28.3.10B/LRevision:0OperatorSadK

Exchange Rate Rs./HK$
Period End
Buying
Rate Average High Low
March 2009 6.61 6.62 6.70 6.50
April 2009 6.46 6.47 6.55 6.41
May 2009 6.14 6.29 6.46 6.08
June 2009 6.21 6.16 6.27 6.06
July 2009 6.24 6.25 6.33 6.18
August 2009 6.28 6.23 6.32 6.13
September 2009 6.21 6.25 6.33 6.19October 2009 6.09 6.04 6.21 5.95
November 2009 6.02 6.01 6.12 5.96
December 2009 6.03 6.01 6.05 5.95
January 2010 5.97 5.92 6.01 5.85
February 2010 5.98 5.97 6.02 5.92
(source: Bloomberg)
24
c102100pu010Proof7:28.3.10B/LRevision:0OperatorSadK

PRESENTATION OF FINANCIAL INFORMATION
The Company prepares its financial statements in accordance with IFRS, which differs in certain
respects from Indian GAAP. For a comparison of accounting principles under IFRS and accounting
principles under Indian GAAP, see the section titled ‘‘Summary Differences between Indian GAAP and
IFRS’’ on page 465 of this Draft Red Herring Prospectus. The Company publishes its consolidatedfinancial statements in US$. The audited consolidated financial statements of the Company as of and
for the years ended 31 December 2009, 2008 and 2007 included in this Draft Red Herring Prospectus
have been prepared in accordance with IFRS and are referred to herein as the ‘‘Financial
Statements’’. References to a particular ‘‘fiscal’’ year are to the Company’s fiscal year ended
31 December of such year.
In order to comply with paragraph 6 of the Schedule to the IDR Rules and clause 14 of Part A of
Schedule XIX of the SEBI Regulations, consolidated income statement, cash flow statements and
balance sheet for the Group for the years ended 31 December, 2009, 2008 and 2007 has been
extracted from the Audited Historical Financial Statements and presented in US$ and INR.
Capitalisation statement for the same period is presented in US$ and INR. The rate used for theconversion of US$ into INR for each of these statements is US$1=INR 45.63. This is the exchange
rate used by the Company for the translation and used by the auditors in reperforming the
translations as set out in the section titled ‘‘Auditor’s Report for the IDR Issue and Financial
Information’’ on page 473 of this Draft Red Herring Prospectus.
25
c102100pu010Proof7:28.3.10B/LRevision:0OperatorSadK

GENERAL INFORMATION
Registered Office of the Company
Standard Chartered PLC
Registered Office: 1 Aldermanbury Square, London EC2V 7SB
Principal place of
business in the UK: 1 Basinghall Avenue, London EC2V 5DD
Tel: +44 (0)20 7885 8888
Fax: +44 (0)20 7885 7337
Email: [email protected]
Website: www.standardchartered.com
Contact Person: Annemarie Durbin, Group Company Secretary
Principal office in India: 90 Mahatma Gandhi Road, Fort, Mumbai 400 001
Tel: +91 (0)22 2267 0162
Fax: +91 (0)22 2284 4801
Email: [email protected]
Website: www.standardchartered.co.in
Contact Person: Kanchan Bhave
IDR Depository for the IDRs
Standard Chartered Bank, Mumbai
Address: 90 Mahatma Gandhi Road, Fort, Mumbai 400 001
Tel: +91 (0)22 2267 0162
Fax: +91 (0)22 2284 4801
Email: [email protected]
Website: www.standardchartered.co.in
Contact Person: Rajesh Sharma
Overseas Custodian Bank
The Bank of New York Mellon
Address: 1 Canada Square, London E14 5AL
Tel: +44 (0)20 7570 1784
Fax: +44 (0)20 7964 6028
Email: [email protected]
Website: www.bnymellon.com
Contact Person: Mark Wilson
Global Coordinators and Book Running Lead Managers
UBS Securities India Private Limited
Address: 2/F, 2 North Avenue, Maker Maxity, Bandra-Kurla Complex, Bandra (E),
Mumbai 400 051
Tel: +91 (0)22 6155 6000
Fax: +91 (0)22 6155 6300
Email: [email protected]
Investor Grievance
Email: [email protected]
Website: www.ubs.com/indian-dr
Contact Person: Puneet Gandhi
SEBI registration: INM000010809
26
c102100pu010Proof7:28.3.10B/LRevision:0OperatorSadK

Goldman Sachs (India) Securities Private Limited
Address: Rational House, 951-A, Appasaheb Marathe Marg, Prabhadevi, Mumbai
400 025
Tel: +91 (0)22 6616 9000
Fax: +91 (0)22 6616 9090
Email: [email protected]
Investor Grievance
Email: [email protected]
Contact Person: Pranita Gramopadhye
Website: www2.goldmansachs.com/worldwide/india/
SEBI registration: INM000011054
Book Running Lead Managers
JM Financial Consultants Private Limited
Address: 141 Maker Chambers III, Nariman Point, Mumbai 400 021
Tel: +91 (0)22 6630 3030
Fax: +91 (0)22 2204 7185
Email: [email protected]
Investor GrievanceEmail: [email protected]
Contact Person: Kailash Soni
Website: www.jmfinancial.in
SEBI registration: INM000010361
DSP Merrill Lynch Limited
Address: 10th Floor, Mafatlal Centre, Nariman Point, Mumbai 400 021
Tel: +91 (0)22 6632 8000
Fax: +91 (0)22 2204 8518
Email: [email protected]
Investor Grievance
Email: [email protected]
Contact Person: N.S. Shekhar
Website: www.dspml.com
SEBI registration: INM000011625
Kotak Mahindra Capital Company Limited
Address: 1st Floor, Bakhtawar, 229 Nariman Point, Mumbai 400 021
Tel: +91 (0)22 6634 1100
Fax: +91 (0)22 2283 7517
Email: [email protected]
Investor Grievance
Email: [email protected]
Contact Person: Chandrakant Bhole
Website: www.kotak.com
SEBI registration: INM000008704
27
c102100pu010Proof7:28.3.10B/LRevision:0OperatorSadK

SBI Capital Markets Limited
Address: 202, Maker Tower ‘E’, Cuffe Parade, Mumbai 400 005, India
Tel: +91 (0)22 2217 8300
Fax: +91 (0)22 2218 8332
Email: [email protected]
Investor Grievance
Email: [email protected]
Contact Person: Nishit Mathur
Website: www.sbicaps.com
SEBI registration: INM000003531
Co-BRLM
Standard Chartered – STCI Capital Markets Limited
Address: 1st Floor, Dheeraj Arma, Anant Kanekar Marg, Bandra (East),
Mumbai 400 051
Tel: +91 (0)22 6751 5999
Fax: +91 (0)22 6751 5820
Email: [email protected]
Investor Grievance
Email: [email protected]
Contact Person: Ramesh Ramanathan
Website: www.standardchartered-wealthmanagers.co.in
SEBI registration: INM000011542
Syndicate Members
JM Financial Services Private Limited
Address: Apeejay House, 3 Dinshaw Waccha Road, Churchgate, Mumbai 400 020
Tel: +91 (0)22 6704 0404
Fax: +91 (0)22 6654 1511/1512
Email: [email protected]
Contact Person: Deepak Vaidya
Website: www.jmfinancial.in
Kotak Securities Limited
Address: 1st Floor, Nirlon House, Dr. Annie Besant Road, Near Old Passport Office,
Worli, Mumbai- 400025
Tel: +91 (0)22 6652 9191
Fax: +91 (0)22 6661 7064
Email: [email protected]
Contact Person: Umesh Gupta
Website: www.kotak.com
SBICAP Securities Limited
Address: 191, Maker Towers ‘F’, Cuffe Parade, Mumbai-400 005
Tel: +91 22 3027 3309
Fax: +91 22 3027 3402
Email: [email protected]
Contact Person: Prasad Chitnis
Website: www.sbicapsec.com
28
c102100pu010Proof7:28.3.10B/LRevision:0OperatorSadK

Legal Advisers
Legal Counsel to the Company
as to Indian Law Legal Counsel to the Company as to UK and Hong Kong Law
Amarchand & Mangaldas & Suresh A.
Shroff & Co.
Peninsula Chambers
Peninsula Corporate Park
Ganpatrao Kadam MargLower Parel
Mumbai 400 013
Tel: +91 (0)22 2496 4455
Fax: +91 (0)22 2496 3666
Slaughter and May
One Bunhill Row
London EC1Y 8YY
Tel: +44 (0)20 7600 1200
Fax: +44 (0)20 7090 5000
Slaughter and May
47th Floor
Jardine House
One Connaught Place
CentralHong Kong
Tel: +852 (0)2521 0551
Fax: +852 (0)2845 2125
Legal Counsel to the Underwriters
as to Indian Law Legal Counsel to the Underwriters as to UK and Hong Kong Law
Talwar Thakore & Associates
3rd Floor
Kalpataru Heritage
127, Mahatma Gandhi RoadMumbai 400 001
Tel: +91 (0)22 6613 6900
Fax: +91 (0)22 6613 6901
Linklaters LLP
a28-00, One MarinaBoulevardSingapore 018989Tel: +65 (0)6890 7300Fax: +65 (0)6890 7308
Linklaters
10th Floor Alexandra House
18 Chater Road
Hong KongTel: +852 (0)2842 4888
Fax: +852 (0)2810 8133
Registrar to the Issue
Karvy Computershare Private Limited
Address: 17 to 24, Vithalrao Nagar, Madhapur, Hyderabad 500 001
Tel: +91 (0)40 2342 0818
Fax: +91 (0)40 2343 1551
Email: [email protected]
Website: www.karvy.com
Contact Person: Krishna M Murali
SEBI registration: INR000000221
Bankers to the Issue and Escrow Collection Banks
[*]
Bankers to the Company
[*]
29
c102100pu010Proof7:28.3.10B/LRevision:0OperatorSadK

Auditors to the Company
KPMG Audit Plc
Address: 8 Salisbury Square, London EC4Y 8BB
Tel: +44 (0)20 7311 1000
Fax: +44 (0)20 7311 3311
Email: [email protected]
Website: www.kpmg.co.uk
Contact Person: M. St. J. Ashley
Tax Adviser
Ernst & Young
Address: Express Towers, 18th Floor, Nariman Point, Mumbai 400 021
Tel: +91 (0)22 66655554/+91 (0)22 66579200
Email: [email protected]: +91 (0)22 22876401
Website: www.ey.com
Contact Person: Sameer Gupta
Compliance Officer
Kanchan Bhave
Address: Standard Chartered Bank, 23-25 Mahatma Gandhi Road,
Fort, Mumbai 400 001
Tel: +91 (0)22 6735 5300
Fax: +91 (0)22 2284 4801Email: [email protected]
Stock Exchanges
Bombay Stock Exchange Limited
Address: Phiroze Jeejeebhoy Towers, Dalal Street, Mumbai 400 001Tel: +91 (0)22 2272 1233/4
Fax: +91 (0)22 2272 1919
Website: bseindia.com
Email: [email protected]
The National Stock Exchange of India Limited
Address: Exchange Plaza, Plot no. C/1, G Block, Bandra-Kurla Complex,
Bandra (E), Mumbai 400 051
Tel: +91 (0)22 2659 8100 – 8114
Fax: +91 (0)22 2659 8120
Website: www.nse.co.in
Email: [email protected]
Self Certified Syndicate Banks
The list of banks that have been notified by SEBI to act as a SCSB for the ASBA process are
provided on www.sebi.gov.in. For details on Designated Branches of SCSB collecting as per Bid cum
Application Form, please refer to the abovementioned link.
30
c102100pu010Proof7:28.3.10B/LRevision:0OperatorSadK

Statement of Inter Se Allocation of Responsibilities amongst the BRLMs and the Co-BRLM
Activity Responsibility Coordinator
1 Capital structuring including the following:* Getting relevant approvals for further issue of capital* Designing the dilution and exchange ratios* Discount in Issue Price to Retail Individual Bidders and
part payment option to Non-Institutional Bidders, if
applicable* Deciding size and designing any Green Shoe Option, if
applicable
UBS, GoldmanSachs, JMFinancial, Kotak,DSPML, SBI Caps
UBS
2 Reviewing and finalising, with the legal counsels, appropriatesubmissions and applications required to be made in India
UBS, GoldmanSachs, JMFinancial, Kotak,DSPML, SBI Caps
JMFinancial
3 Reviewing and finalising, with the legal counsels, appropriatesubmissions and applications required to be made outside India
UBS
4 Due diligence of Company’s operations/management/businessplans/legal etc. Drafting, design and approval/filing ofProspectus and related documents with the legal counsels
UBS, GoldmanSachs, JMFinancial, Kotak,DSPML, SBI Caps
JMFinancial
5 Drafting and approval of all statutory advertisements with thelegal counsels
UBS, GoldmanSachs, JMFinancial, Kotak,DSPML, SBI Caps
JMFinancial
6 Drafting and approval of all publicity material to be released inIndia other than statutory advertisements as mentioned in point5 above or the publicity materials as mentioned in point 7 below,including corporate advertisement, brochure, etc with the legalcounsels, to the extent reviewed and approved by UBS only
UBS
7 Drafting and approval of all publicity material other thanstatutory advertisements as mentioned in point 5 above or thepublicity materials as mentioned in point 6, including corporateadvertisement, brochure, etc with the legal counsels, to the extentreviewed and approved by the BRLMs and Co-BRLM
UBS, GoldmanSachs, JMFinancial, Kotak,DSPML, SC Caps,SBI Caps
Kotak
8 Appointment of other intermediaries, like Registrar, Depository,printers, advertisement agency etc
UBS, GoldmanSachs, JMFinancial, Kotak,DSPML, SC Caps,SBI Caps
Kotak
9 Preparation of the management road show presentations andfrequently asked questions for overall marketing
UBS, GoldmanSachs, JMFinancial, Kotak,DSPML, SC Caps,SBI Caps
UBS
10 Pre-marketing feedback and presentation UBS, GoldmanSachs, JMFinancial, Kotak,DSPML, SC Caps,SBI Caps
UBS
11 Retail marketing strategy* Formulating marketing strategies, preparation of
publicity budget* Finalise media and public relations strategy* Finalising centres for holding conferences for press and
brokers
UBS, GoldmanSachs, JMFinancial, Kotak,DSPML, SC Caps,SBI Caps
Kotak
31
c102100pu010Proof7:28.3.10B/LRevision:0OperatorSadK

Activity Responsibility Coordinator
* Follow-up on distribution of publicity and issuematerial including form, Prospectus and deciding on the
quantum of the Issue material* Finalise collection centres
12 Domestic institutions/banks/Mutual Fund marketing strategy* Finalise the list and division of investors for one to one
meetings, institutional allocation in consultation with the
Company, and* Finalising investor meeting schedules
UBS, GoldmanSachs, JMFinancial, Kotak,DSPML, SC Caps
JMFinancial
13 International institutional marketing strategy* Finalise the list and division of investors for one to one
meetings, in consultation with the Company* Finalising the international road show schedule and
investor meeting schedules
UBS, GoldmanSachs, JMFinancial, Kotak,DSPML
GoldmanSachs
14 Non-institutional marketing strategy* Finalising centres for holding conferences
UBS, GoldmanSachs, JMFinancial, Kotak,DSPML, SC Caps,SBI Caps
DSPML
15 Co-ordination with Stock Exchanges for book building software,bidding terminals and mock trading
UBS, GoldmanSachs, JMFinancial, Kotak,DSPML, SBI Caps
Kotak
16 Post-Issue activitiesFinalisation of trading and dealing of instruments and dispatchof certificates and demat of delivery of shares
UBS, GoldmanSachs, JMFinancial, Kotak,DSPML, SC Caps,SBI Caps
Kotak
Book Building Process
Book Building Process, with reference to the Issue, refers to the process of the collection of Bids on
the basis of the Red Herring Prospectus within the Price Band. The Issue Price is finalised after the
Bid/Issue Closing Date. The principal parties involved in the Book Building Process are:
1. the Company;
2. the BRLMs;
3. Syndicate Members who are intermediaries registered with SEBI or registered as brokers with
BSE/NSE and eligible to act as Underwriters. The Syndicate Members are appointed by the
BRLMs;
4. the SCSBs;
5. the Escrow Collection Bank(s); and
6. the Registrar to the Issue.
In accordance with Regulation 98 of the SEBI Regulations, the Issue is being made through a 100%
Book Building Process where at least 50% of the Issue will be allocated to QIBs on a proportionate
basis. Provided that the Company may allocate up to 30% of the QIB Portion to Anchor Investors
on a discretionary basis out of which one-third shall be reserved for domestic Mutual Funds. 5% of
the QIB Portion (excluding the Anchor Investor Portion) shall be available for allocation on a
proportionate basis to Mutual Funds only, and the remainder of the QIB Portion shall be available
for allocation on a proportionate basis to all QIB Bidders, including Mutual Funds, subject to valid
Bids being received at or above the Issue Price. Further, not less than 20% of the Issue shall beavailable for allocation on a proportionate basis to Non-Institutional Bidders and not less than 30%
of the Issue shall be available for allocation on a proportionate basis to Retail Individual Bidders.
Under-subscription, if any, in any category except the QIB Portion, would be allowed to be met with
spill-over from any other category or combination of categories at the discretion of the Company in
consultation with the BRLMs and the Designated Stock Exchange.
32
c102100pu010Proof7:28.3.10B/LRevision:0OperatorSadK

Pursuant to the SEBI Regulations, a QIB Bidder is not allowed to withdraw its Bid after the Bid/
Issue Closing Date. Please refer to the section titled ‘‘Issue Procedure’’ on page 382 of this Draft Red
Herring Prospectus.
The Company will comply with the SEBI Regulations and any other ancillary directions issued by
SEBI and the RBI for this Issue. In this regard, the Company has appointed the BRLMs to manage
the Issue and procure subscriptions to the Issue.
Investors are advised to make their own judgement about investment through the Book Building Process
prior to making a Bid or application in the Issue.
Illustration of Book Building Process and Price Discovery Process (Investors should note that this example is
solely for illustrative purposes and is not specific to the Issue. It excludes bidding by Anchor Investors or under
the ASBA process)
Bidders can bid at any price within the Price Band. For instance, assume a price band of Rs. 20 to
Rs. 24 per IDR, issue size of 3,000 IDRs and receipt of five bids from bidders, details of which are
shown in the table below. A graphical representation of the consolidated demand and price would be
made available at the bidding centres during the bidding period. The illustrative book as shown below
shows the demand for the IDRs of the issuer company at various prices and is collated from bids
received from various investors.
Bid Quantity
Bid Price
(Rs.)
Cumulative
Quantity Subscription
500 24 500 16.67%
1,000 23 1,500 50.00%
1,500 22 3,000 100.00%
2,000 21 5,000 166.67%
2,500 20 7,500 250.00%
The price discovery is a function of demand at various prices. The highest price at which the issuer is
able to issue the desired number of IDRs is the price at which the book cuts off, i.e. Rs. 22 in the
above example. The Company, in consultation with the BRLMs, will finalise the issue price at or
below such cut-off price, i.e. at or below Rs. 22. All bids at or above this issue price and cut-off bids
are valid bids and are considered for allocation in the respective categories.
Steps to be taken by the Bidders for bidding:
1. Check eligibility for making a Bid (see section titled ‘‘Issue Procedure – Who Can Bid’’ on page
385 of this Draft Red Herring Prospectus).
2. Ensure that you have a demat account and the demat account details are correctly mentioned in
the Bid cum Application Form.
3. Ensure that you have mentioned your PAN (see the section titled ‘‘Issue Procedure – Permanent
Account Number’’ on page 397 of this Draft Red Herring Prospectus).
4. Ensure that the Bid cum Application Form is duly completed as per instructions given in this
Draft Red Herring Prospectus and in the Bid cum Application Form.
Withdrawal of the Issue
The Company, in consultation with the BRLMs, reserves the right not to proceed with the Issue at
any time after the Bid/Issue Opening Date but before Allotment of the IDRs without assigning any
reason thereof.
Letters of Allotment
In accordance with the requirements of the Stock Exchanges and the SEBI Regulations, the Company
further undertakes that Allotment of IDRs will be made only in dematerialised form within 15 daysfrom the Bid/Issue Closing Date.
Refund
Investors can contact the Compliance Officer or the Registrar to the Issue in case of any pre-Issue or
post-Issue related problems, such as non-receipt of letters of Allotment, credit of Allotted IDRs in the
33
c102100pu010Proof7:28.3.10B/LRevision:0OperatorSadK

respective beneficiary account and refund orders. In the event of over-subscription, the excess amount
after adjustment shall be refunded within 15 days from the Bid/Issue Closing Date.
If the permission to deal in and for an official quotation of the IDRs is not granted by any of the
Stock Exchanges, the Company shall forthwith repay, without interest, all monies received from the
applicants in pursuance of the Red Herring Prospectus. If such money is not repaid within 15 days
from the Bid/Issue Closing Date, then the Company along with every Director who is in default shall,
on and from expiry of such 15 days, be liable to repay the money, with interest at the rate of 15%p.a. on application money.
The Company shall pay interest at 15% p.a. for any delay beyond the 15 day period as mentioned
above, if Allotment is not made and refund orders are not dispatched or if, in a case where the
refund or portion thereof is made in electronic manner, the refund instructions have not been givento the clearing system in the disclosed manner and/or demat credits are not made to investors within
the 15 day period stated above.
The Company shall ensure that all steps for the completion of the necessary formalities for listingand commencement of trading at the Stock Exchanges are taken within seven Business Days of
finalisation of the Basis of Allotment for the Issue.
Bid/Issue Programme
Bid/Issue Period
BID/ISSUE OPENS ON [*]BID/ISSUE CLOSES ON [*]
The Company may consider participation by Anchor Investors. The Anchor Investor Bid/Issue Period
shall be the Business Day falling immediately prior to the Bid/Issue Opening Date.
The Issue shall be kept open for at least three Business Days and not more than ten Business Days.
Except in relation to the Bids received from Anchor Investors, bids and any revision in Bids shall be
accepted only between 10.00 a.m. and 3.00 p.m. (Indian Standard Time) during the Bid/Issue Period as
mentioned above at the bidding centres mentioned on the Bid cum Application Form or in the caseof Bids submitted through the ASBA process, at the Designated Branches of the SCSBS and
uploaded until: (i) 5.00 p.m. (Indian Standard Time) in case of Bids by QIB Bidders and Non-
Institutional Bidders where the Bid Amount is in excess of Rs. 100,000; and (ii) such time as
permitted by the NSE and the BSE, in case of Bids by Retail Individual Bidders where the Bid
Amount is less than Rs. 100,000. Due to limitation of time available for uploading the Bids on the
Bid/Issue Closing Date, Bidders are advised to submit their Bids one day prior to the Bid/Issue
Closing Date and, in any case, no later than 3.00 p.m. (Indian Standard Time) on the Bid/Issue
Closing Date. Bidders are cautioned that in the event a large number of Bids are received on the Bid/Issue Closing Date, as is typically experienced in public offerings, some Bids may not be uploaded
due to lack of sufficient time to upload. In such circumstances, Bids which have not been uploaded
will not be considered for allocation under the Issue. Bids will only be accepted on Business Days.
Bids by the Bidders applying through ASBA process shall be uploaded by the SCSBs in the electronicsystem to be provided by the Stock Exchanges.
In case of discrepancy in the data entered in the electronic book vis-à-vis the data contained in the
physical Bid cum Application Form, for a particular Bidder, the details as per the physical Bid cumApplication Form of the Bidder may be taken as the final data for the purpose of Allotment. In case
of discrepancy in the data entered in the electronic book vis-à-vis the data contained in the physical
or electronic ASBA Bid cum Application Form, for a particular Bidder applying through ASBA
process, the Registrar to the Issue shall ask for rectified data from the SCSB.
The Company reserves the right to revise the Price Band during the Bid/Issue Period. Any upward or
downward revision of the Cap Price or the Floor Price shall be in accordance with the SEBI
Regulations provided that the Cap Price is less than or equal to 120% of the Floor Price. The Floor
Price can be revised up or down to a maximum of 20% of the Floor Price.
In the case of revision of the Price Band, the Bid/Issue Period will be extended for at least three
additional Business Days after revision of the Price Band subject to the total Bid/Issue Period not
exceeding ten Business Days. Any revision in the Price Band and the revised Bid/Issue Period, if
applicable, will be widely disseminated by notification to the SCSBs and the Stock Exchanges by
34
c102100pu010Proof7:28.3.10B/LRevision:0OperatorSadK

issuing a press release and also by indicating the changes on the websites of the BRLMs and the
terminals of the Syndicate.
Underwriting Agreement
In the opinion of the Board (based on a declaration/certificate given by the Underwriters), the
resources of the Underwriters are sufficient to enable them to discharge their respective underwritingobligations in full. The Underwriters are registered with the SEBI or have been granted a Certificate
of Registration by the SEBI to act as an underwriter in accordance with the SEBI (Underwriters)
Regulations 1993 or the SEBI (Stock-Brokers and Sub-Brokers) Regulations 1992 or the SEBI
(Merchant Bankers) Regulations 1992 and such certificate is valid and in existence and the
Underwriters are hence entitled to carry on business as underwriters or registered as brokers with the
Stock Exchange(s).
The Underwriters have indicated their intention to underwrite the following number of IDRs:
This portion has been intentionally left blank and will be filled in before filing of the Prospectus with the
RoC.
Name and Address of the Underwriters
IndicatedNumber ofIDRs to be
Underwritten
AmountUnderwritten
(Rs. inmillion)
UBS Securities India Private Limited2/F, 2 North AvenueMaker MaxityBandra Kurla ComplexBandra (E)Mumbai 400 051 [*] [*]
Goldman Sachs (India) Securities Private LimitedRational House, 951-AAppasaheb Marathe MargPrabhadeviMumbai 400 025 [*] [*]
JM Financial Consultants Private Limited141, Maker Chambers IIINariman PointMumbai 400 021 [*] [*]
DSP Merrill Lynch Limited10th Floor, Mafatlal CentreNariman PointMumbai 400 021 [*] [*]
Kotak Mahindra Capital Company Limited1st Floor, Bakhtawar229 Nariman PointMumbai 400 021 [*] [*]
SBI Capital Markets Limited202, Maker Tower ‘E’Cuffe ParadeMumbai 400 005
JM Financial Services Private LimitedApeejay House3 Dinshaw Vaccha RoadChurchgateMumbai 400 021 [*] [*]
Kotak Securities Limited1st Floor, Nirlon HouseDr. Annie Besant RoadNear Old Passport OfficeWorli, Mumbai- 400025 [*] [*]
35
c102100pu010Proof7:28.3.10B/LRevision:0OperatorSadK

Name and Address of the Underwriters
IndicatedNumber ofIDRs to be
Underwritten
AmountUnderwritten
(Rs. inmillion)
SBICAP Securities Limited191, Maker Tower ‘F’Cuffe ParadeMumbai 400 005
The above-mentioned is indicative underwriting and this will be finalized after the pricing and actual
allocation.
Maintenance of Issue Proceeds
The Board certifies that all monies received from the Issue shall be credited/transferred to the Public
Issue Account. The funds will be maintained in this account and the Company shall have no recourseto such funds until the approval for trading of the IDRs from all the Stock Exchanges where listing
is sought has been received.
Mechanism for Redress of Investor Grievances Concerning the Issue Process
The Registrar Agreement provides for retention of records by the Registrar to the Issue for a period
of three years from the last date of dispatch of the letters of Allotment, demat credit and refundorders to enable the investors to approach the Registrar to the Issue for redressal of their grievances.
All grievances relating to the Issue process may be addressed to the Registrar to the Issue, giving full
details such as name and address of the applicant, number of IDRs applied for, amount paid on
application and the bank branch or collection centre where the application was submitted.
If the Registrar to the Issue is unable to resolve the grievance within one month of receipt, it shall be
passed to the Depository for redress. In the event that the Depository is also unable to resolve the
grievance within ten Business Days, it shall be passed to the Company for redress.
Mechanism for Redress of Routine Investor Grievances
The Company is not, under UK law or regulation, required to have a formal shareholder/investor
grievance committee as typically set up by Indian companies. Instead, shareholders of the Company
may discuss any issues or concerns with the Senior Independent Director where they have been
unable to resolve them through existing channels for investor communications.
However, in relation to IDRs, the Registar shall endeavour to redress routine investor grievances
within ten Business Days from the date of receipt of the complaint. In the case of complaints which
the Registrar to the Issue is unable to resolve within that time, the Depository or the Company will
seek to redress these complaints as expeditiously as possible.
Grievance register
The Registrar shall maintain a register of all received grievances from IDR Holders (whether
concerning the process for the Issue and the listing of the IDRs, or of a routine nature) and shall
send a regular grievance report to the Company, expected to be on a fortnightly basis. The
Depository shall maintain, on behalf of the Company, a register of any such grievances which are
escalated to it.
All grievances relating to the ASBA process may be addressed to the SCSB, giving full details such as
name, address of the applicant, application number, number of IDRs applied for, amount paid on
application and the Designated Branch or the collection centre of the SCSB where the ASBA Bidcum Application Form was submitted by such Bidders.
If the SCSB is unable to resolve the grievance within one month of receipt, it shall be passed to the
Depository for redress. In the event that the Depository is also unable to resolve the grievance within
ten Business Days, it shall be passed to the Company for resolution.
36
c102100pu010Proof7:28.3.10B/LRevision:0OperatorSadK

Compliance Officer and Jurisdiction
The Company has also appointed Kanchan Bhave as the Compliance Officer for this Issue and she
may be contacted, in case of any pre-Issue or post-Issue-related problems, at the address providedabove.
The Company undertakes to subject itself to the jurisdiction of courts in India having jurisdiction
over the Stock Exchanges regarding grievances of IDR Holders.
Impersonation
Any person who makes, in a fictitious name, an application to the Company to subscribe for the
IDRs or to otherwise induce the Company to allot IDRs to him or her or any other person in afictitious name shall be subject to criminal action.
Details of availability of the Red Herring Prospectus and Bid cum Application forms
[*]
Amount and mode of payment seeking issue of IDRs
See the section titled ‘‘Payment Instructions’’ on page 395 of this Draft Red Herring Prospectus.
Disclaimer
The Company, its Directors, the BRLMs and the Co-BRLM accept no responsibility for statements
made otherwise than in this Draft Red Herring Prospectus or in the advertisements or any other
material issued at their instance and anyone placing reliance on any other source of information,including the Company’s website www.standardchartered.com, shall be doing so at his or her own
risk.
All information shall be made available by the Company and the BRLMs to the public and investorsat large and no selective or additional information will be available for a section of the investors in
any manner whatsoever including at road show presentations, in research or sales reports, at bidding
centres or elsewhere.
Neither the Company nor the Syndicate is liable for any failure in downloading the Bids due to faults
in any software/hardware system or otherwise.
Investors that bid in the Issue will be required to confirm and will be deemed to have represented tothe Company, the Underwriters and their respective directors, officers, agents, affiliates and
representatives that they are eligible under all applicable laws, rules, regulations, guidelines and
approvals to acquire the IDRs and will not issue, sell, pledge or transfer the IDRs to any person who
is not eligible under any applicable laws, rules, regulations, guidelines and approvals to acquire IDRs.
The Company, the Underwriters and their respective directors, officers, agents, affiliates and
representatives accept no responsibility or liability for advising any investor on whether such investor
is eligible to acquire IDRs.
The BRLMs and their respective associates and affiliates may engage in transactions with, and
perform services for, the Company and their respective group companies, affiliates or associates in the
ordinary course of business and have engaged, or may in future engage, in commercial banking and
investment banking transactions with the Company, for which they have received, and may in futurereceive, compensation. The BRLMs have furnished to SEBI a due diligence certificate dated 30 March
2010 which reads as follows:
WE, THE UNDERNOTED, HAVE BEEN APPOINTED AS MERCHANT BANKERS(HEREINAFTER COLLECTIVELY REFERRED TO AS THE ‘‘BOOK RUNNING LEAD
MANAGERS’’) TO THE PROPOSED ISSUE OF IDRS BY THE COMPANY AND WE STATE
AS FOLLOWS:
1. THE DRAFT RED HERRING PROSPECTUS (HEREINAFTER REFERRED TO AS THE
‘‘DRHP’’) IS BEING FILED WITH SEBI IN COMPLIANCE WITH THE SEBI
REGULATIONS OR ANY STATUTORY MODIFICATION OR RE-ENACTMENT
THEREOF READ WITH THE IDR RULES, ON A PUBLIC BASIS, FOR APPROVAL.
2. WE HAVE EXAMINED THE DISCLOSURES MADE BY THE COMPANY IN
JURISDICTIONS WHERE ITS UNDERLYING SHARES ARE LISTED SO AS TO
ENSURE UNIFORMITY AND PARITY OF INFORMATION SHARED WITH INVESTORS
ACROSS DIFFERENT REGULATORY JURISDICTIONS (HEREINAFTER REFERRED TO
37
c102100pu010Proof7:28.3.10B/LRevision:0OperatorSadK

AS ‘‘PUBLICLY AVAILABLE INFORMATION’’) AND PARTICIPATED IN DISCUSSIONS
WITH THE SENIOR MANAGEMENT OF THE COMPANY FOR THE PURPOSE OF
PREPARING DISCLOSURES ON THE COMPANY IN THE DRHP.
3. WE HAVE EXAMINED VARIOUS DOCUMENTS, MORE PARTICULARLY REFERRED
TO IN THE ANNEXURE HERETO, IN CONNECTION WITH THE FINALISATION OF
THE DRHP PERTAINING TO THE SAID ISSUE.
4. ON THE BASIS OF SUCH EXAMINATION AND THE DISCUSSIONS WITH THE
COMPANY, ITS DIRECTORS AND OTHER OFFICERS AND OTHER INDEPENDENT
AGENCIES/EXPERTS/REPORTS, WE CONFIRM THAT:
(A) THE DRHP FORWARDED TO THE SEBI IS IN CONFORMITY WITH THE
PUBLICLY AVAILABLE INFORMATION AND INFORMATION BASED ON
REPRESENTATIONS MADE BY THE SENIOR MANAGEMENT OF THECOMPANY;
(B) THE REQUIREMENTS UNDER THE IDR RULES AND THE SEBI REGULATIONS
AND OTHER RELEVANT LAWS FRAMED BY THE SEBI, THE GOVERNMENTAND ANY OTHER COMPETENT AUTHORITY IN THIS BEHALF HAVE BEEN
DULY COMPLIED WITH; AND
(C) BASED ON THE PUBLICLY AVAILABLE INFORMATION ANDREPRESENTATIONS MADE BY THE SENIOR MANAGEMENT OF THE
COMPANY, THE DISCLOSURES MADE IN THE DRHP ARE CERTIFIED TO BE
TRUE AND ARE ADEQUATE TO ENABLE THE INVESTORS TO MAKE A WELL
INFORMED DECISION AS TO THE INVESTMENT IN THE PROPOSED ISSUE.
5. WE CONFIRM THAT BESIDES OURSELVES, ALL THE OTHER INTERMEDIARIES
NAMED IN THE DRHP, ARE REGISTERED WITH THE SEBI AND THAT TILL DATE
SUCH REGISTRATION IS VALID.
6. WE HAVE SATISFIED OURSELVES ABOUT THE WORTH OF THE UNDERWRITERS
TO FULFIL THEIR UNDERWRITING COMMITMENTS.
7. WE CERTIFY THAT THE PROPOSED ACTIVITIES OF THE COMPANY FOR WHICH
THE FUNDS ARE BEING RAISED IN THE PRESENT ISSUE FALL WITHIN THE ‘MAIN
OBJECTS’ LISTED IN THE OBJECT CLAUSE OF THE MEMORANDUM OF
ASSOCIATION OF THE COMPANY AND THAT THE ACTIVITIES WHICH HAVE BEEN
CARRIED OUT UNTIL NOW ARE VALID IN TERMS OF THE OBJECT CLAUSE OF
ITS MEMORANDUM OF ASSOCIATION.
8. WE CONFIRM THAT NECESSARY ARRANGEMENTS HAVE BEEN MADE TO ENSURE
THAT THE MONEYS RECEIVED PURSUANT TO THE ISSUE ARE KEPT IN A
SEPARATE BANK ACCOUNT AND THAT SUCH MONEYS SHALL BE RELEASED BY
THE SAID BANK ONLY AFTER PERMISSION FOR LISTING OF THE IDRS, ISOBTAINED FROM ALL THE STOCK EXCHANGES MENTIONED IN THE DRHP. WE
FURTHER CONFIRM THAT THE AGREEMENT ENTERED INTO BETWEEN THE
BANKERS TO THE ISSUE AND THE COMPANY SPECIFICALLY CONTAINS THIS
CONDITION – TO BE COMPLIED WITH.
9. WE CERTIFY THAT NO PAYMENT IN THE NATURE OF DISCOUNT, COMMISSION,
ALLOWANCE OR OTHERWISE SHALL BE MADE BY THE COMPANY OR THE
PROMOTERS, DIRECTLY OR INDIRECTLY, TO ANY PERSON WHO RECEIVES IDRS
BY WAY OF FIRM ALLOTMENT IN THE ISSUE – NOT APPLICABLE.
10. WE CERTIFY THAT DISCLOSURE HAS BEEN MADE IN THE DRHP THAT THE
INVESTORS SHALL BE GIVEN AN OPTION TO GET THE IDRS IN DEMAT OR
PHYSICAL MODE.
11. WE CERTIFY THAT THE FOLLOWING DISCLOSURES HAVE BEEN MADE IN THE
DRHP:
(A) AN UNDERTAKING FROM THE COMPANY THAT AT ANY GIVEN TIME THERE
SHALL BE ONLY ONE DENOMINATION FOR THE IDRS OF THE COMPANY;
AND
38
c102100pu010Proof7:28.3.10B/LRevision:0OperatorSadK

(B) AN UNDERTAKING FROM THE COMPANY THAT IT SHALL COMPLY WITH
SUCH DISCLOSURE AND ACCOUNTING NORMS SPECIFIED BY SEBI FROM
TIME TO TIME.
12. WE CONFIRM THAT NONE OF THE INTERMEDIARIES NAMED IN THE DRHP HAVE
BEEN DEBARRED FROM FUNCTIONING BY ANY REGULATORY AUTHORITY.
13. WE CONFIRM THAT ALL THE MATERIAL DISCLOSURES IN RESPECT OF THE
COMPANY HAVE BEEN MADE IN THE DRHP AND CERTIFY THAT ANY MATERIAL
DEVELOPMENT IN THE COMPANY OR RELATING TO THE ISSUE, UP TO THECOMMENCEMENT OF LISTING AND TRADING OF THE IDRS OFFERED THROUGH
THIS ISSUE, SHALL BE INFORMED THROUGH PUBLIC NOTICES/ADVERTISEMENTS
IN ALL THOSE NEWSPAPERS IN WHICH PRE-ISSUE ADVERTISEMENT AND
ADVERTISEMENT FOR OPENING OR CLOSURE OF THE ISSUE HAVE BEEN GIVEN –
TO BE COMPLIED WITH.
14. WE CONFIRM THAT THE ABRIDGED PROSPECTUS CONTAINS ALL THE
DISCLOSURES AS SPECIFIED IN THE REGULATIONS – TO BE COMPLIED WITH.
15. WE CONFIRM THAT AGREEMENTS HAVE BEEN ENTERED INTO WITH BOTH THE
DEPOSITORIES FOR DEMATERIALISATION OF THE IDRS OF THE COMPANY – TO
BE COMPLIED WITH.
39
c102100pu010Proof7:28.3.10B/LRevision:0OperatorSadK

SUMMARY OF THE ISSUE
The following is a general summary of the Issue of IDRs. For detailed information on the material
rights, obligations and entitlements applicable to IDR Holders, please refer to the section titled
‘‘Frequently Asked Questions on the IDR Facility’’ on pages 42 to 51 of this Draft Red Herring
Prospectus and also the other sections referred to therein.
Issuer Standard Chartered PLC, a public company incorporated in
England and Wales with limited liability.
IDRs being offered and to be
outstanding immediately after thisIssue
220,000,000 IDRs are being offered in India and certain other
jurisdictions (excluding the United States). The offering or sale ofIDRs in certain jurisdictions other than India may be restricted by
law.
Number of IDRs per Share [*] IDRs represent one Share.
Shares outstanding As of 26 March 2010 there were 2,028,192,590 Shares outstanding.
Shares outstanding immediately
after this Issue
Immediately after this Issue there will be [*] Shares outstanding,
including [*] Shares represented by the IDRs offered and sold in
this Issue.
Issue Price Rs. [*] per IDR.
Use of Proceeds The net Issue Proceeds, after deduction of management fees,
underwriting fees, selling commissions and all other expenses
associated with this Issue including listing fees of approximately
Rs. [*], are expected to be approximately Rs. [*], million whichwill be used to support growth across the Company’s business. In
accordance with the decision of the Board, Standard Chartered’s
management will have flexibility in deploying the net Issue
Proceeds. For further details, see section titled ‘‘Use of Proceeds’’
on page 351 of this Draft Red Herring Prospectus.
Restriction on disposition of
securities
The IDRs and the Shares to be represented by such IDRs, have not
been, and will not be, registered under the US Securities Act. Offers
and sales of the IDRs and the Shares will be subject to certain
restrictions described in the section titled ‘‘Transfer of Equity
Shares and Depository Receipts’’ on page 380 of this Draft RedHerring Prospectus.
Risk Factors For a discussion of risk factors, see the section titled ‘‘Risk Factors’’
on page 62 of this Draft Red Herring Prospectus.
Listing and trading markets for the
IDRs
Application will be made to admit the IDRs to trading on the BSE
and the NSE.
Listing and trading markets for the
Shares
The Shares are listed on the Official List and traded on the London
Stock Exchange. The Shares are also listed and traded on the HongKong Stock Exchange.
Depository for the IDRs Standard Chartered Bank, Mumbai.
Taxation For a discussion of certain tax considerations relevant to an
investment in the IDRs, see the section titled ‘‘Taxation Framework
in India and UK’’ on page 406 of this Draft Red Herring Prospectus.
Governing law The Deposit Agreement will be governed by English law.
ISIN [*]
40
c102100pu010Proof7:28.3.10B/LRevision:0OperatorSadK

Plan of Distribution (Ref: Clause 2(b) of Part A of Schedule XIX of SEBI Regulations)
In accordance with Regulation 98 of SEBI Regulations, the Issue is being made through a 100%
Book Building Process where at least 50% of the Issue will be Allotted to QIBs on a proportionatebasis. Provided that the Company may allocate up to 30% of the QIB Portion to Anchor Investors
on a discretionary basis out of which one-third shall be reserved for domestic Mutual Funds. 5% of
the QIB Portion (excluding the Anchor Investor Portion) shall be available for allocation on a
proportionate basis to Mutual Funds only, and the remainder of the QIB Portion shall be available
for allocation on a proportionate basis to all QIB Bidders, including Mutual Funds, subject to valid
Bids being received at or above the Issue Price. Furthermore not less than 20% of the Issue should be
available for allocation on a proportionate basis to Non-Institutional Bidders and not less than 30%
of the Issue shall be available for allocation on a proportionate basis to Retail Individual Bidders.Under-subscription, if any, in any category except the QIB Portion, would be allowed to be met with
spill-over from any other category or combination of categories at the discretion of the Company in
consultation with the BRLMs and the Designated Stock Exchange.
Markets (Ref: Clause 2(c) of Part A of Schedule XIX of SEBI Regulations)
[*]
Dilution (Ref: Clause 2(e) of Part A of Schedule XIX of SEBI Regulations)
[*]
Expenses of the Issue (Ref: Clause 2(f) of Part A of Schedule XIX of SEBI Regulations)
See ‘‘Issue Expenses’’ in the section titled ‘‘Use of Proceeds’’ on page 351 of this Draft Red Herring
Prospectus.
41
c102100pu010Proof7:28.3.10B/LRevision:0OperatorSadK

FREQUENTLY ASKED QUESTIONS ON THE IDR FACILITY
The following provides a summary of only the material rights, obligations and entitlements of the IDR
Holders in respect of the IDRs. This summary is derived from and should be read in conjunction with,
the sections of this Draft Red Herring Prospectus listed below, the terms of which shall prevail to the
extent of any inconsistency with the terms set out in this section:
* ‘‘Terms and Conditions of the Indian Depository Receipts’’ on page 352 of this Draft Red Herring
Prospectus;
* ‘‘Risks relating to the Investment in IDRs’’ in the section titled ‘‘Risk Factors’’ on page 62 of this
Draft Red Herring Prospectus;
* ‘‘Information on the Depository and Certain Important Information in respect of the Shares while
in IDR form’’ on page 375 of this Draft Red Herring Prospectus;
* ‘‘Summary of Certain Provisions relating to the IDRs while in Dematerialised Form’’ on page 378
of this Draft Red Herring Prospectus;
* ‘‘Transfer of Equity Shares and Depository Receipts’’ on page 380 of this Draft Red Herring
Prospectus;
* ‘‘Foreign Investment, Exchange Controls and other Indian laws’’ on page 423 of this Draft Red
Herring Prospectus; and
* ‘‘Taxation Framework in India and UK’’ on page 406 of this Draft Red Herring Prospectus.
Capitalised terms used herein and not otherwise defined have the respective meanings given to such terms
in the section titled ‘‘Terms and Conditions of the Indian Depository Receipts’’ on page 352 of this
Draft Red Herring Prospectus.
In addition, information contained in any of the websites listed herein does not form part of this Draft
Red Herring Prospectus.
THE IDR FACILITY, PRINCIPAL PARTICIPANTS AND KEY DOCUMENTATION
What are IDRs?
IDRs are depository receipts denominated in Indian Rupees issued by the Depository. Every [*]
IDRs will represent an ownership interest in one Share.* Shares underlying the IDRs will be
deposited with the Custodian who will hold the Shares on behalf of the Depository in accordancewith the terms of the Custody Agreement (for the purposes of this section, referred to as the
‘‘Deposited Shares’’). Each IDR will also represent any securities, cash or other property attributable
to the Deposited Shares that has been deposited with the Custodian or the Depository but has not
been directly distributed to the IDR Holders (for the purposes of this section, together with the
Deposited Shares, referred to as the ‘‘Deposited Property’’).
Pursuant to the Issue, [*] IDRs representing [*] Deposited Shares will initially be issued by the
Depository. Every [*] IDRs represent one Share.*
Who are the principal participants in the IDR Facility and what are their roles?
The principal participants in the IDR Facility are the Company, the Custodian, the Depository and
the Registrar.
Under the IDR Facility, the Company deposits the Deposited Shares with the Custodian who holdsthe Deposited Shares on behalf of the Depository. The Company owes certain obligations to the
Depository (and, under a Deed Poll executed by the Company to the IDR Holders) in respect of the
Deposited Property under the Deposit Agreement. These obligations are described further throughout
this summary.
The Depository is appointed by the Company pursuant to the Deposit Agreement. The Depositorywill issue the IDRs representing the Deposited Shares to IDR Holders and will hold the Deposited
Property (and all rights, benefits and obligations attaching thereto) as bare trustee under English law
for the IDR Holders. The Depository owes certain obligations to IDR Holders in respect of the
Deposited Property under the terms and conditions of the IDRs. These obligations are described
further throughout this summary.
42
c102100pu010Proof7:28.3.10B/LRevision:0OperatorSadK
*Exchange Ratio will be finalised and disclosed at the stage of filing of the Red Herring Prospectus with the Registrar of Companies,New Delhi.
The Custodian is appointed by the Depository pursuant to the Custody Agreement. The Custodian
will hold the Deposited Property on behalf of the Depository and will, upon receipt of instructions
from the Depository, take certain actions with respect to the Deposited Property to enable IDR
Holders to obtain the benefit of such Deposited Property.
The Registrar is appointed by the Company and the Depository under the Registrar Agreement and
the Transfer Agent Agreement to provide certain services to the Depository in relation to the IDR
Facility.
In the event that the appointment of any of the Depository, the Custodian or the Registrar is
terminated or any of those entities resigns from office, no such resignation or termination of
appointment will be effective until a successor entity has been appointed to act in the relevantcapacity. IDR Holders will be notified of any such changes.
Where are the rights and obligations of IDR Holders under the terms of the IDRs set out?
The rights and obligations of IDR Holders in respect of the IDRs are set out in the terms andconditions of the IDRs which are set out in full in the section titled ‘‘Terms and Conditions of the
Indian Depository Receipts’’ on page 352 of this Draft Red Herring Prospectus. IDR Holders can also
view a copy of the Conditions after the filing of the Red Herring Prospectus on the websites of each
of the Company, the Depository and the Registrar which are www.standardchartered.com,
www.standardchartered.co.in and www.karvy.com.
The Conditions include summaries of, and are subject to, the detailed provisions of the Deposit
Agreement. IDR Holders can view a copy of the Deposit Agreement at the registered office of the
Depository at 90 Mahatma Gandhi Road, Fort Mumbai from 10.00 a.m. to 4.00 p.m. on anyBusiness Day.
Can IDR Holders deposit further Shares in the IDR Facility?
IDR Holders cannot deposit further Shares in the IDR Facility. The Company may deposit furtherShares in the IDR Facility in limited circumstances. For example, additional Shares may be deposited
in the IDR Facility in the event that (i) such Shares are issued as a dividend or free distribution on
Deposited Shares; (ii) such Shares are acquired by IDR Holders from the Company during a rights
issue; or (iii) such Shares are issued by the Company to the IDR Holders in respect of the Deposited
Shares as a result of any change in the par value, sub-division, consolidation or other reclassification
of Deposited Shares or upon any reorganisation, merger or consolidation of the Company. However,
such deposits of further shares would be subject to certain limitations as further described herein.
Other shareholders of the Company cannot deposit shares in the IDR Facility.
Can IDR Holders withdraw the Deposited Shares represented by the IDRs from the IDR Facility?
IDR Holders may only withdraw the Deposited Shares with the prior approval of the RBI. In
addition, under Indian law, there is an absolute prohibition on the withdrawal of Deposited Shares
for a period of one year following the date of the issue of the IDRs. Each IDR Holder will have toindividually approach the RBI for such approval at their own expense. At present, there is no
specified format for making such an application. An IDR Holder will have to make a general
application pursuant to the provisions of FEMA. There can be no assurance that such approval will
be granted by the RBI in a timely manner or at all. Moreover, IDR Holders will not be able to
withdraw fractions of Shares.
In addition, IDR Holders who are able to cancel their IDRs and become shareholders of the
Company may still be subject to certain limitations not applicable to other shareholders. See the riskfactor titled ‘‘IDR Holders that are able to cancel their IDRs and become shareholders of the Company
may still be subject to certain limitations not applicable to other shareholders’’ in the section titled
‘‘Risk Factors’’ on page 74 of this Draft Red Herring Prospectus for further information.
If an IDR Holder withdraws Deposited Shares having obtained the required approvals, the IDR
Holder will be required to provide a Withdrawal Order in the form annexed to the Deposit
Agreement (a copy of which can be obtained from the Registrar) to the Depository, pay a fee of
US$0.05 or less (exchanged into INR at prevailing exchange rates) per Deposited Share evidenced bythose IDRs to the Depository and have such Shares registered in the IDR Holder’s name or that of a
designated nominee. A Withdrawal Order cannot be given in respect of a fraction of a Deposited
Share. Deposited Shares, once withdrawn, may be traded on the London Stock Exchange (or, upon
completion of certain procedures by an IDR Holder, on the Hong Kong Stock Exchange). Following
withdrawal of the Deposited Shares, IDR Holders would also have to pay certain customary fees and
43
c102100pu010Proof7:28.3.10B/LRevision:0OperatorSadK

charges in connection with the trading of such withdrawn Shares on these stock exchanges, which
would include brokerage commissions and applicable stamp duties. Other persons resident in India
including resident individuals are allowed to hold the Deposited Shares only for the purpose of sale
within a period of 30 days from the date of conversion of IDRs.
OWNERSHIP AND TRANSFER OF IDRS
Who can hold IDRs?
Pursuant to the current SEBI Regulations and the RBI Circular, IDRs may be held, purchased or
transferred by Retail Individual Bidders, non-institutional bidders and qualified institutional bidders
including persons resident in India, NRIs and FIIs, including SEBI approved sub-accounts of FIIsregistered with SEBI, or to, or for the account or benefit of, such persons, in each case subject to
applicable laws. Insurance companies are not permitted to invest in or hold IDRs. Commercial banks
may invest or hold IDRs subject to compliance with applicable prudential limits specified by the RBI
from time to time.
How will IDR Holders acquire and hold the IDRs?
The IDRs will initially be represented by Dematerialised IDRs evidenced by the Register maintained
or procured to be maintained by the Depository showing the latest available registered holding
position received from NSDL and CDSL. NSDL and CDSL will credit the dematerialised account of
an IDR Holder with the relevant number of IDRs held by that IDR Holder.
Can IDR Holders ever hold IDRs in physical form?
IDR Holders may, at their option, elect to hold the IDRs in physical form represented by an IDR
Certificate, rather than in electronic form represented by Dematerialised IDRs. IDR Holders will be
required to pay a sum per IDR Certificate which is determined by the Depository to be a reasonable
charge to reflect the work, costs and expenses involved, if such an election is made. In addition, IDR
Holders will be entitled to receive IDR Certificates at the expense of the Company upon the
occurrence of certain events relating to NSDL and CDSL ceasing to operate or in the event that the
Depository determines that by holding IDR Certificates certain deductions or withholdings frompayments to IDR Holders would be avoided.
Can IDRs be transferred?
IDRs will be listed on the Stock Exchanges and may be bought and sold through the facilities of the
Stock Exchanges in accordance with the procedures, rules and regulations and other applicable lawsrelating to the transfer of listed securities in India.
FEES AND OTHER PAYMENTS BY IDR HOLDERS
Are there any fees and charges payable by IDR Holders to the Depository with respect to the IDRs?
IDR Holders are required to pay a fixed fee of US$0.05 or less (exchanged into INR at prevailing
exchange rates) per Share evidenced by [*] IDRs upon a withdrawal of the Shares from the IDR
Facility and on the issue of any future IDRs (other than the Issue).
For services performed by the Depository, any of the Depository’s agents, including the Custodian, orthe agents of the Depository’s agents in connection with the IDRs, in relation to the servicing of
Deposited Shares or other Deposited Property, IDR Holders will be charged a fee of US$0.016 or
less per Share evidenced by [*] IDRs (and a proportionate amount where an IDR Holder holds less
than [*] IDRs representing less than a Share), and that amount will be deducted by the Depository
from each cash dividend or other cash distribution received by the Depository on or in respect of the
underlying Shares or other Deposited Property.
The service fee per Share evidenced by the IDRs will be calculated on a sliding scale depending on
the amount of the dividend per Share as illustrated by the following table:
Dividend (US$) Service fee (US$)
From To
0 0.0049 –
0.0049 0.009 0.0010
0.009 0.014 0.0020
0.014 0.019 0.0030
0.019 0.024 0.0040
44
c102100pu010Proof7:28.3.10B/LRevision:0OperatorSadK

Dividend (US$) Service fee (US$)
From To
0.024 0.049 0.00500.049 0.099 0.0100
0.099 0.149 0.0120
0.149 0.199 0.0130
0.199 0.249 0.0150
0.249 100 0.0160
In respect of any issue of rights or distribution of Shares (whether or not evidenced by IDRs) or
other securities or other property (other than cash) upon exercise of any rights, any free distribution,
stock dividend or other distribution, IDR Holders will be required to pay a sum per IDR which is
determined by the Depository to be a reasonable charge to reflect the costs and expenses incurred by
or on behalf of the Company or the Depository or any of the Depository’s agents, including the
Custodian, or the agents of the Depository’s agents, in connection with such issue of rights or
distribution of Shares or other securities or other property.
Are there any other fees and charges that are likely to be payable by IDR Holders?
Certain additional fees may become payable if particular services are requested by IDR Holders. For
example, if an IDR Holder requests the issue of an IDR Certificate in definitive registered form
(including in replacement for a mutilated, defaced, lost, stolen or destroyed IDR Certificate), subject
to indemnification where appropriate, there would be a charge per IDR Certificate that is determined
by the Depository to be a reasonable charge to reflect the work, costs (including printing costs) and
expenses involved. In addition, there would be an administrative charge for the provision of copies of
certain documents, such as the Deposit Agreement, upon request by an IDR Holder. The Depository
is also entitled to charge IDR Holders for all expenses (including currency conversion expenses),transfer and registration fees, taxes, duties and charges payable by the Depository, the Registrar or
the Custodian, or any of their agents, in connection with its services.
IDR Holders will also have to pay the Depository certain fees together with any costs, charges, taxesand expenses incurred by the Depository if and when it assists IDR Holders in participating in a
tender offer, open market buy-back or takeover offer in respect of the Shares including in a tender of
Shares to the Company following a de-listing of the Shares from the London Stock Exchange.
Who pays taxes arising in relation to the IDRs?
The Company will pay all taxes and stamp duties in the United Kingdom and India associated with
the initial issuance of the Deposited Shares to the Custodian in accordance with the terms of the
IDR Facility. IDR Holders will be responsible for all other taxes or other governmental charges
payable on the IDRs or on the Deposited Shares.
The Depository is not liable for any taxes, duties in the United Kingdom and India, charges, costs or
expenses which may become payable in respect of the Deposited Shares or other Deposited Property
or the IDRs. Such part thereof as is proportionate or referable to an IDR shall be payable by the
IDR Holder to the Depository at any time on request or may be deducted from any amount due orbecoming due on such IDR in respect of any dividend or other distribution. A failure to comply with
such request may result in the sale of the Deposited Shares represented by the IDRs of the defaulting
IDR Holder.
Payments to IDR Holders of dividends or other distributions in respect of the Deposited Shares shallbe subject to deduction of applicable withholding taxes. For further details on tax aspects, IDR
Holders should refer to the section titled ‘‘Taxation Framework in India and UK’’ on pages 406 to 413
of this Draft Red Herring Prospectus.
RIGHTS AND ENTITLEMENTS OF IDR HOLDERS
Are IDR Holders entitled to the same rights and entitlements as holders of Shares?
The Company has agreed that for all corporate actions (including voting, rights issues, the paymentof dividends and other distributions), it will treat IDR Holders on an equitable basis vis-à-vis other
holders of Shares in the home country of the Company. Additionally, where the Shares are also listed
on other exchanges in addition to its home country, the Company will ensure that IDR Holders are
also treated on an equitable basis vis-à-vis the holders of such Shares in other jurisdictions where the
Shares are listed. In circumstances where certain corporate actions, which are available to the holders
45
c102100pu010Proof7:28.3.10B/LRevision:0OperatorSadK

of Shares in the home country of the Company and other jurisdictions where the Shares are listed,
are not permitted by Indian laws to be offered to IDR Holders, the Company has agreed to provide
equitable treatment to the IDR Holders for such corporate actions as allowed by applicable law and
to the extent possible. The practical effect of the Company’s obligation in this regard is that, subjectto certain exceptions, whenever the Company and/or the Depository is unable to make distributions
available to the IDR Holders, the Depository will try and sell the Deposited Property that is the
subject of the distribution on behalf of the IDR Holders and distribute the net proceeds thereof as a
cash distribution to the IDR Holders. However, there is no assurance as to the value, if any, that the
Depository would receive upon the sale of such Deposited Property.
Subject to this general principle, the rights of IDR Holders will be affected by certain operational
practices of and the requirement to pay certain fees to the Depository, as a result of participating in
the IDR Facility, which would not be applicable to other holders of Shares.
The principal practical limitation is the additional procedural step involved in communicating with
IDR Holders which can limit the ability of IDR Holders to exercise their rights and receive their
entitlements in respect of various corporate actions relating to the Company under the Conditions.
Holders of the Shares of the Company will receive notice directly from the Company and will be able
to submit their instructions in respect of any corporate action directly to the Company or, if
applicable, a third party. IDR Holders, in contrast, will receive the notice in accordance with theDeposit Agreement. Pursuant to the Deposit Agreement the Company will provide the notice to the
Depository. The Depository shall as soon as reasonably practicable forward to the IDR Holders
notice of such event and, in any event, no later than ten days before the date of the relevant meeting
and/or the date of acceptance of instructions in relation to the relevant corporate action. In order to
exercise their right to participate in a corporate action relating to the Company, IDR Holders must
provide their instruction in respect of the corporate event to the Depository. Because of this
additional procedural step, the process for the submission of instructions may take longer for IDR
Holders than for holders of the Shares. Further, IDR Holders may not be able to receive thedocumentation relating to the corporate event in time to enable them to return their instructions to
the Depository in a timely manner. IDRs for which the Depository does not receive timely
instructions will not be eligible to participate in the corporate event.
Where can I find information on the rights and entitlements of holders of Shares?
For information on certain of the rights and entitlements of holders of Shares, IDR Holders should
refer to the sections titled ‘‘Main Provisions of the Articles of Association’’ and ‘‘Dividends’’ on pages
457 to 462 and 341 to 343 respectively of this Draft Red Herring Prospectus.
The Company is incorporated under the laws of England and Wales and is also subject to certainobligations as a consequence of its shares being listed on the London Stock Exchange and the Hong
Kong Stock Exchange. For these and other reasons, the rights of a shareholder of the Company
differ in certain respects from holders of equity shares in a company that is incorporated in India.
For a summary of certain of these differences, please refer to the sections titled ‘‘Comparison of
Rights of Shareholders’’ and ‘‘Comparison of Corporate Governance’’ on pages 426 to 434 and 435 to
443 respectively of this Draft Red Herring Prospectus.
What will be the record date for the purposes of determining an IDR Holder’s entitlement to distributions?
An IDR Holder will only be entitled to receive distributions if it is an IDR Holder on the record
date established by the Depository. This record date shall be the same date as the corresponding
record date set by the Company in respect of the Shares or, if different from the record date set by
the Company, shall be set after consultation with the Company and shall be as near as practicable to
any record date set by the Company. Notice of such record date shall be given promptly by theDepository to IDR Holders.
Will IDR Holders receive cash dividends and other cash distributions on the Deposited Shares represented bythe IDRs?
An IDR Holder will be entitled to dividends and other cash distributions in respect of the Deposited
Shares represented by their IDRs if the Company declares such a cash dividend or cash distribution
to be payable to holders of Shares (and the Depository receives from the Company such cash
dividend or other cash distribution) and the IDR Holder is registered as an IDR Holder on the
relevant record date set by the Depository.
46
c102100pu010Proof7:28.3.10B/LRevision:0OperatorSadK

Payments of cash dividends and other cash amounts in respect of IDRs represented by Dematerialised
IDRs will be made by the Depository through the Registrar.
Any dividend or other sum payable in cash in respect of the IDRs to IDR Holders, will be paid bycheque, demand draft or pay order sent by post to the IDR Holder at his registered address recorded
in the Register maintained by the Registrar.
Prior to distribution, the Depository will make reasonable efforts to convert the amount received into
Indian Rupees. If it is impractical to effect such conversion, the Depository may distribute the
dividend in the relevant foreign currency to the extent permitted under applicable law or hold such
other currency for the benefit of IDR Holders entitled thereto. The Depository is under no obligation
to invest any currency that it cannot convert and it will not be liable for any interest. If exchange
rates fluctuate during a time when the Depository cannot convert such cash distribution, IDRHolders may lose some or all of the value of the distributions.
Will IDR Holders receive any dividends or other distributions on the Deposited Shares represented by theIDRs that are not in the form of cash?
IDR Holders should be aware that there are certain limitations on the ability of the Company to
make available to IDR Holders through the Depository any dividends or other distributions on the
Deposited Shares that are not in the form of cash. This is because of provisions of English law and
the potential application of certain provisions of Indian law. See the risk factor titled ‘‘Certain
corporate actions of the Company may entitle existing shareholders of the Company to receive further
Shares from the Company. However, the ability of IDR Holders to receive such further shares from the
Company (either in the form of Shares or IDRs representing the Shares) may be restricted’’ in the
section titled ‘‘Risk Factors’’ on page 69 of this Draft Red Herring Prospectus for furtherinformation.
This would be particularly applicable if the Company were to undertake a rights issue or a bonus
issue of shares or offer holders of Shares the right to receive Shares instead of all or part of a cash
dividend (a scrip dividend alternative) and the IDR Holder were to accept this option. In relation to
a scrip dividend alternative, the Company would normally send a circular to holders of Shares giving
details of the terms of the relevant election and how an election can be made, together with a form
of election stating the number of new Shares that a holder is entitled to receive instead of the cash
dividend. If the Company determines that it is permissible and practical for IDR Holders toparticipate in any scrip dividend alternative, IDR Holders would receive the relevant notice of
election and be entitled to submit their election through the Depository.
Other distributions
If the Depository receives any distribution in securities (other than Shares) or in other property (other
than cash), the Depository will distribute such securities or other property to the IDR Holders
entitled thereto in a manner deemed equitable and practicable by the Depository subject to applicable
laws (which may involve the sale of such securities or other property and the distribution of the sale
proceeds as a cash distribution to the IDR Holders entitled thereto).
What happens in the event that the Company undertakes a rights issue?
IDR Holders should be aware that there are certain limitations on the ability of the Company to
make a rights issue available to IDR Holders through the Depository because of provisions of
English law and the potential application of certain provisions of Indian law. See ‘‘Risks relating to
the Investment in IDRs’’ in the section titled ‘‘Risk Factors’’ on page 69 of this Draft Red HerringProspectus for further information.
In addition, making a rights issue available to IDR Holders could have timetable implications that
cannot be satisfactorily resolved and which may make it difficult for the Company to undertake a
rights issue simultaneously in the UK and in India. Whilst the time period between the date of
announcement and the date of allotment is 10 Business Days in a rights issue in the UK, the existing
guidelines on rights issues in India require that the rights issue be kept open for a substantially longer
period. In light of the existing differences in the timeline followed for a rights issue in the UK and inIndia, it would be difficult for the Company to undertake the rights issue simultaneously in the UK
and in India. A rights issue to the same class of shareholder may not be able to operate on two
different time lines as this would give rise to trading and fungibility issues as well as questions in the
home market on equality of treatment of shareholders, where shareholders in certain jurisdictions are
given a longer time frame within which to accept.
47
c102100pu010Proof7:28.3.10B/LRevision:0OperatorSadK

Given the limitations above, it is likely that, subject to certain conditions, the Depository will exercise
the option available under the Conditions to either sell such rights and distribute the net proceeds of
the IDR Holders entitled thereto or, in the event that is not lawful or practicable, for the Depository
to take such action, to permit the rights to lapse and notify the IDR Holders of such decision.
However, the Depository may, in substitution of this option, if it is lawful or practicable to do so,
either: (i) take such steps as are necessary to enable IDR Holders to subscribe for the Shares
represented by such rights, and issue additional IDRs to the IDR Holders who subscribe for such
Shares; (ii) distribute the rights themselves to the IDR Holders; or (iii) arrange for IDR Holders to
subscribe for any additional rights which are available due to lack of take-up by other holders of
Shares. In the event that it is not lawful or practicable for the Depository to take any of these
specified actions or if there are rights to which the IDR Holders are not entitled because of fractional
entitlements to shares, the Depository shall permit the rights or, as applicable, the relevant rights tolapse and will notify the IDR Holders of such decision.
If the Depository determines to take such steps as are necessary to implement the option set out in
(i) above, IDR Holders who elect to take up such rights will be obliged to pay an amount to the
Depository representing (in Indian Rupees) an amount equal to the subscription price for such rights
plus any additional amount in respect of such subscription price to ensure that the Depository (acting
in good faith) will, after conversion of such Indian Rupees into the currency by which subscriptions
may be made, have sufficient funds to satisfy the subscription price taking account of any possible
fluctuations in rates of foreign currency. Following conversion of this amount by the Depository to
the relevant foreign currency and payment of the subscription price in the relevant foreign currency,the Depository will return any surplus subscription amounts (after converting such amounts into
Indian Rupees) to IDR Holders at the time of issue of the additional IDRs representing the new
Deposited Shares or as a cash distribution.
Will IDR Holders be entitled to vote the Deposited Shares represented by the IDRs?
IDR Holders have voting rights with respect to the Deposited Shares and will generally be entitled to
vote on resolutions of the Company. The Articles of the Company provide that a shareholder is
required to hold four Shares in order to register one vote on a poll. Accordingly the IDR Holders
are required to hold IDRs representing at least four Shares so as to register one vote on a poll. For
further information on the voting rights attached to the Shares please see the section titled ‘‘Main
Provisions of the Articles of Association’’ on page 457 of this Draft Red Herring Prospectus. If IDR
Holders wish to attend shareholder meetings they will be able to instruct the Depository to appoint
them as proxy in respect of the Shares underlying the IDRs. IDR Holders are entitled to instruct theDepository to exercise voting rights in respect of the Shares represented by their IDRs subject to the
right of the Depository to request certain legal opinions from the Company’s legal counsel in advance
of any such exercise in certain limited circumstances.
The Company will provide notice of any meetings where votes will be cast to the Depository. Upon
receiving such notice, the Depository will send to IDR Holders a notice (with a requirement under
the Deposit Agreement to provide such notice no less than 10 days before the date of the relevant
meeting) stating: (i) such information as is contained in the notice provided by the Company to the
Depository; (ii) the date by which voting instructions must be received from IDR Holders; (iii) the
manner in which such instructions may be given to the Depository; and (iv) how the IDR Holdersmay instruct the Depository in respect of the Shares represented by that IDR Holders’ IDRs.
Following receipt of such instructions from IDR Holders, the Depository will procure that the
Custodian shall appoint the relevant persons as proxies in respect of the Deposited Shares as specified
in the instruction provided by IDR Holders to the Depository.
The Depository will not vote or cause to be voted any Deposited Shares unless specifically instructed
by an IDR Holder. If an IDR Holder does not so instruct the Depository, the votes attaching to the
Deposited Shares will be counted as an abstention.
There are practical limitations upon the IDR Holders’ ability to exercise their voting rights due to the
additional procedural steps involved in communicating with IDR Holders. Holders of the Shares will
receive notice directly from the Company and will be able to exercise their voting rights by eitherattending the meeting in person or voting by power of attorney. IDR Holders, in contrast, will not
receive notice directly from the Company. Rather, in accordance with the Deposit Agreement, the
Company will provide the notice to the Depository. The Depository has undertaken, in turn, as soon
as practicable thereafter, to forward to the IDR Holders such notices, the voting instructions, if and
as received by the Depository from the Company, and a statement as to the manner in which
48
c102100pu010Proof7:28.3.10B/LRevision:0OperatorSadK

instructions may be given by IDR Holders. To exercise their voting rights, IDR Holders must then
instruct the Depository how to vote the Shares evidenced by the IDRs they hold or instruct the
Depository to appoint a proxy. Because of this additional procedural step involving the Depository,
the process for the exercise of voting rights may take longer for IDR Holders than for holders of theShares. IDR Holders may not be able to receive voting materials in time to enable them to return
voting instructions to the Depository in a timely manner, and IDRs for which the Depository does
not receive timely voting instructions will not be voted.
What happens in the event of a capital reorganisation?
In the event of any change in the par value, sub-division, consolidation or other reclassification of
Deposited Shares or any other part of the Deposited Property or upon any reduction of capital or
reorganisation, merger or consolidation of the Company, the Depository will give notice of such event
to IDR Holders and, in its discretion, may distribute any Shares, cash or other property received
from the Company pursuant to such event to the IDR Holders as it would distribute any regulardistribution under the Conditions subject, in each case, to the limitations in respect of certain
distributions that are not in the form of cash described elsewhere in this section.
Will IDR Holders be able to participate in tender offers, open-market buy-backs or takeover offers relating tothe Shares?
In the event that an open-market buy-back, tender offer or takeover offer is made with respect to the
Shares, the Depository and the Company will be obliged to take certain reasonable steps to enable
IDR Holders to participate in such events in the same manner and to the same extent as holders of
the Shares. Such steps will include the submission, at the election of the IDR Holder, of the
Deposited Shares represented by the IDRs for purchase to the Company or (in the case of a takeover
offer) to the third party acquirer, and the distribution of the proceeds of such sale by the Depositoryto the IDR Holder in the event that the Deposited Shares are acquired pursuant to the open-market
buy-back, tender offer or takeover offer.
Can the Deposited Shares represented by the IDRs be compulsorily acquired?
In the event that, pursuant to a takeover offer or otherwise, any person acquires 90% or more of the
Shares, that person is entitled under the UK Companies Act to compulsorily acquire any Shares held
by any person, including Deposited Shares represented by IDRs.
What happens if an IDR holding does not represent a whole number of Shares?
The rights of an IDR Holder will in general not be affected. So, for example, IDR Holders will have
a proportionate entitlement to cash dividends, IDR Holders will receive all company communications
which are sent to its Shareholders and the IDR Holders will be entitled to vote at a general meeting
on a show of hands in respect of IDRs representing one Share and on a poll in respect of IDRsrepresenting four Shares. Where IDRs represent less than a whole number of Shares, entitlements to
participate in corporate actions, such as rights issues and share distributions will be affected. In these
circumstances, the IDR Holders will receive their proportionate entitlement to any cash amount which
may be received by the Depository in respect of the relevant corporate action.
INFORMATION TO BE PROVIDED TO IDR HOLDERS BY THE DEPOSITORY
What notices relating to the IDRs will be provided to IDR Holders and how?
IDR Holders will, in general, receive through the Depository, a copy of all notices given by the
Company to its shareholders.
All notices will be mailed to IDR Holders at their respective addresses recorded in the Register
maintained by the Registrar and, so long as the IDRs are listed on the BSE and/or the NSE and the
rules of such exchanges so require, such notices will also be published in one leading Hindi and one
leading English national newspaper in India.
What other information will IDR Holders be sent?
IDR Holders will be sent annual reports, prepared in accordance with the requirements of the IDRListing Agreement and applicable laws.
In certain circumstances, if permitted by applicable law, IDR Holders may only receive suchinformation in electronic format, including by way of reference to a website where such informationwill be made available.
49
c102100pu010Proof7:28.3.10B/LRevision:0OperatorSadK

OBLIGATIONS OF IDR HOLDERS
Are IDR Holders required to disclose their ownership of the IDRs?
In certain circumstances, following receipt of a request from the Company or the Depository, IDRHolders may be required to provide information as to the capacity in which they hold or held IDRsand regarding the identity of any other persons then or previously interested in such IDRs and thenature of such interest and various other matters.
In addition, IDR Holders are also required to notify the Company in the event that they hold(whether through the IDR Facility or otherwise) 3% or more of the voting rights attached to theShares of the Company and also at certain other specified thresholds. For a more detailed descriptionof the nature of the legal obligations of IDR Holders in this regard and the consequences of non-compliance, see the section titled ‘‘Information on the Depository and certain important information inrespect of the Shares while in IDR form – Important legal information – Disclosure of shareholdingsunder the Disclosure and Transparency Rules’’ on pages 375 to 377 of this Draft Red HerringProspectus. For information on how IDR Holders can make such notifications, see the section titled‘‘Information on the Depository and certain important information in respect of the Shares while in IDRform – Important procedure-related Information – Making notifications in respect of the underlyingShares’’ on page 377 of this Draft Red Herring Prospectus.
An IDR Holder should be aware that non-compliance with such notification obligations could lead toit being subject to certain sanctions. Accordingly, each IDR Holder is advised to actively monitor allcommunications received by it at the mailing address recorded in the Register maintained by theRegistrar for: (i) any information requests received from the Company or the Depository pursuant toCondition 20.2 and Condition 20.3; and (ii) independently, its obligation to comply with theDisclosure and Transparency Rules as set out in Condition 20.5.
AMENDMENT OF THE TERMS AND CONDITIONS
Can the terms and conditions of the IDRs be altered?
All and any of the terms and conditions of the Deposit Agreement may, at any time, and from timeto time, be amended by written agreement between the Company and the Depository, provided thatany approval of such regulatory authority as may be required in India, the United Kingdom or HongKong which is deemed necessary or desirable is first obtained.
Notice of any such amendment will be given to IDR Holders. Any amendment which increases orimposes fees or charges payable by IDR Holders or which is otherwise materially prejudicial to IDRHolders (as a class) will not become effective until three months after such notice is given to IDRHolders. During this three month period, IDR Holders may withdraw the Deposited Sharesrepresented by their IDRs free of charge but otherwise in accordance with the Conditions. However,please refer above for certain restrictions that apply to the withdrawal of Shares by IDR Holders.Any IDR Holder who does not withdraw the Deposited Shares during this three month period willbe deemed to have approved the relevant amendment and will be bound by such amendment.
DISPUTES IN RELATION TO THE IDRs
How can IDR Holders enforce the obligations of the Depository and the Company?
The Company has executed a Deed Poll which entitles an IDR Holder to enforce any provision(s) ofthe Deposit Agreement with which the Company fails to comply as if the IDR Holder were a partyto the Deposit Agreement and was the Depository. The Deed Poll and the Deposit Agreement aregoverned by English law. IDR Holders may refer such dispute to arbitration in India in accordancewith the Arbitration and Conciliation Act.
Under the terms of issue of the IDRs, the Company, the Depository and IDR Holders from time totime agree that any dispute, controversy, cause of action or proceeding brought by any of them(including, for the avoidance of doubt, any former IDR Holders) arising out of or relating to theDeposited Shares or other Deposited Property, the IDRs or the Deposit Agreement, or any breachthereof, including any question regarding existence, validity, termination, and any counterclaims thatmay be related thereto, must be referred to, and finally resolved by, binding arbitration in accordancewith the Arbitration and Conciliation Act. Notices in this regard can be sent to the ComplianceOfficer appointed by the Company.
50
c102100pu010Proof7:28.3.10B/LRevision:0OperatorSadK

LIMITATIONS ON THE OBLIGATIONS OF THE COMPANY AND THE DEPOSITORY
Are there any limitations on the obligations and liability of the Company and the Depository?
The Conditions and the Deposit Agreement expressly limit the obligations and liability of theCompany and the Depository.
Neither the Company nor the Depository shall incur any liability to an IDR Holder if either of themshall be prevented, delayed or forbidden from doing or performing any act which they are required toperform by reason of (i) any provision of any present laws (save for Indian and English law) or anyfuture applicable law or regulation of any country or of any relevant governmental authority orinterpretation thereof; (ii) any future provision of the constitutive documents of the Company; or (iii)any other circumstances beyond their control.
Further, save in cases of wilful default, negligence or bad faith and, in certain cases, breach ofcontract, the Depository shall not be liable for (i) exercising or any failure to exercise discretionunder the Deposit Agreement; (ii) having accepted as valid or not having rejected any certificate forShares or any IDR Certificate purporting to be such and subsequently found to be forged or notauthentic; (iii) any terms of sale or conversion of any Deposited Property, if required, or if such saleor conversion shall not be possible for any reason; or (iv) any failure to determine that it may belawful or practicable to make rights available to IDR Holders in general or to any IDR Holder inparticular in connection with a rights issue of the Company.
TERMINATION OF THE IDR FACILITY
Under what circumstances may the IDR Facility be terminated (by means of a termination of the DepositAgreement) and what happens in these circumstances?
There are three circumstances in which the IDR Facility (by means of a termination of the DepositAgreement) may be terminated and the IDRs consequently delisted: (i) at the option of the Company;(ii) by the Stock Exchanges by reason of a breach by the Company of applicable rules andregulations; or (iii) if the Shares are delisted resulting in such Shares not being listed on any securitiesexchange in any jurisdiction.
Under the Deposit Agreement, the Depository is required to give notice of termination of the IDRFacility (by means of termination of the Deposit Agreement) to IDR Holders and the consequentdelisting of the IDRs under each of the circumstances described above.
In the case of a termination of the Deposit Agreement and consequent de-listing of the IDRs for thereasons described under (i) and (ii) above, there are two alternative ways in which value may bereturned to IDR Holders: either (1) each IDR Holder may elect to receive the relevant DepositedProperty on payment of any sums payable by the Depository to the Custodian and/or any otherexpenses incurred by the Depository in connection with such withdrawal (the right to withdraw beingsubject to certain limitations as described elsewhere in this section); or (2) the Depository will sell theShares attributable to the relevant IDRs and will deliver the net proceeds of any such sale, togetherwith any other Deposited Property then held by it under the Deposit Agreement, pro rata to therelevant IDR Holders.
In the case of a sale of Shares under (2) above, the Shares will be sold at the prevailing market rateon the London Stock Exchange and the cash distributed to that IDR Holder within 15 Business Daysof the completion of the sale of all of the relevant Deposited Property. Neither the Depository, theCompany nor any of their respective agents will be responsible or liable for any loss or damage(whether actual or alleged) arising from the terms of or timing of any sale.
In the case of a termination of the Deposit Agreement and consequent de-listing of the IDRs for thereasons described under (iii) above, the IDR Holders will receive the Shares and other DepositedProperty relating to their IDRs on payment by the IDR Holders of any sums payable by theDepository to the Custodian and/or any other expenses incurred by the Depository in connectionwith such delivery. The mechanism for selling the Shares described above will not be available if theShares are delisted. In addition, it will not be possible to deliver fractions of a Share; fractions willtherefore be disregarded.
In all the above circumstances, the IDRs will be cancelled after Deposited Property has beentransferred to IDR Holders or, as applicable, sold as described above.
51
c102100pu010Proof7:28.3.10B/LRevision:0OperatorSadK

SELECTED FINANCIAL INFORMATION
The selected historical financial information in relation to the Company in this section has been
extracted without material adjustment except as noted in the foot notes below from the Consolidated
Financial Statements in the Annual Reports and Accounts 2007, 2008 and 2009 in respect of the
years ended 31 December 2007, 2008 and 2009 respectively.
The consolidated income statement, consolidated statement of comprehensive income, consolidated
balance sheet, consolidated statement of changes in equity and cash flow statement for the Group for
the years ended 31 December, 2009, 2008 and 2007 has been extracted from the Audited Historical
Financial Statements and presented in US$ and INR. A capitalisation statement for the year ended31 December 2009, 31 December 2008 and 31 December 2007 is presented in US$ and INR on pages
319 to 321. The rate used for the conversion of US$ into INR for these statements is US$1=INR
46.68.
The consolidated annual financial statements have been audited by KPMG Audit Plc, independentauditors.
Consolidated Income Statement
FY2009 FY20081 FY2007US$million US$million US$million
Interest income 12,926 16,378 16,176Interest expense (5,303) (8,991) (9,911)
Net interest income 7,623 7,387 6,265
Fees and commission income 3,824 3,420 3,189Fees and commission expense (454) (479) (528)Net trading income 2,890 2,405 1,261Other operating income 1301 1,235 880
Non-interest income 7,561 6,581 4,802
Operating income 15,184 13,968 11,067
Staff costs (4,912) (4,737) (3,949)Premises costs (698) (738) (592)General administrative expenses (1,822) (1,711) (1,329)Depreciation and amortisation (520) (425) (345)
Operating expenses (7,952) (7,611) (6,215)
Operating profit before impairment losses and taxation 7,232 6,357 4,852Impairment losses on loans and advances and (2,000) (1,321) (761)other credit risk provisionsOther impairment (102) (469) (57)Profit from associates 21 1 1
Profit before taxation 5,151 4,568 4,035Taxation (1,674) (1,224) (1,046)
Profit for the year 3,477 3,344 2,989
Profit attributable to:Minority interests 97 103 148Parent company shareholders 3,380 3,241 2,841
Profit for the year 3,477 3,344 2,989
Earnings per share:Basic earnings per ordinary share (cents) 167.9 192.1 176.0
Diluted earnings per ordinary share (cents) 165.3 191.1 174.2
1 Amounts have been restated following the early adoption of an amendment to IAS 32 Financial Instruments: Presentation, whichhas reclassified the $233 million gain and associated tax of $66 million in respect of the rights issue option into equity.
52
c102100pu010Proof7:28.3.10B/LRevision:0OperatorSadK

Consolidated Income Statement
FY2009 FY20081 FY2007
Rs million Rs million Rs million
Interest income 603,386 764,525 755,096Interest expense (247,544) (419,700) (462,645)
Net interest income 355,842 344,825 292,450
Fees and commission income 178,504 159,646 148,863
Fees and commission expense (21,193) (22,360) (24,647)
Net trading income 134,905 112,265 58,863
Other operating income 60,731 57,650 41,078
Non-interest income 352,947 307,201 224,157
Operating income 708,789 652,026 516,608
Staff costs (229,292) (221,123) (184,339)
Premises costs (32,583) (34,450) (27,635)General administrative expenses (85,051) (79,869) (62,038)
Depreciation and amortisation (24,274) (19,839) (16,105)
Operating expenses (371,199) (355,281) (290,116)
Operating profit before impairment losses and taxation 337,590 296,745 226,491
Impairment losses on loans and advances and (93,360) (61,664) (35,523)
other credit risk provisions
Other impairment (4,761) (21,893) (2,661)
Profit from associates 980 47 47
Profit before taxation 240,449 213,234 188,354Taxation (78,142) (57,136) (48,827)
Profit for the year 162,306 156,098 139,527
Profit attributable to:Minority interests 4,528 4,808 6,909
Parent company shareholders 157,778 151,290 132,618
Profit for the year 162,306 156,098 139,527
Earnings per share:
Basic earnings per ordinary share (Rupees) 78.38 89.67 82.16
Diluted earnings per ordinary share (Rupees) 77.16 89.21 81.32
1 Amounts have been restated following the early adoption of an amendment to IAS 32 Financial Instruments: Presentation, whichhas reclassified the Rs.10,876 million gain and associated tax of Rs.3,081 million in respect of the rights issue option into equity.
53
c102100pu010Proof7:28.3.10B/LRevision:0OperatorSadK

Consolidated statement of comprehensive income
FY 2009 FY 20081 FY 2007
US$million US$million US$million
Profit for the year 3,477 3,344 2,989Other comprehensive income:
Exchange differences on translation of foreign operations
Net gains/(losses) taken to equity 600 (2,794) 415
Income on repatriation of branch capital — — (109)
Actuarial losses on retirement benefits (150) (229) 237
Share of other comprehensive income of associates 19 — —
Available-for-sale investments:
Net valuation gains/(losses) taken to equity 455 (738) 675Reclassified to income (580) (198) (252)
Cash flow hedges:
Net gains/(losses) taken to equity 14 (176) 57
Reclassified to income 106 (18) (58)
Taxation relating to components of other comprehensive income 62 218 (99)
Other comprehensive income for the year, net of taxation 526 (3,935) 866
Total comprehensive income for the year 4,003 (591) 3,855
Attributable to:
Minority interests 111 (3) 196Parent company shareholders 3,892 (588) 3,659
4,003 (591) 3,855
1 Amounts have been restated following the early adoption of an amendment to IAS 32 Financial Instruments: Presentation, whichhas reclassified the $233 million gain and associated tax of $66 million in respect of the rights issue option into equity.
54
c102100pu010Proof7:28.3.10B/LRevision:0OperatorSadK

Consolidated statement of comprehensive income
FY 2009 FY 20081 FY 2007
Rs million Rs million Rs million
Profit for the year 162,306 156,098 139,527Other comprehensive income:
Exchange differences on translation of foreign operations
Net gains/(losses) taken to equity 28,008 (130,424) 19,372
Income on repatriation of branch capital — — (5,088)
Actuarial losses on retirement benefits (7,002) (10,690) 11,063
Share of other comprehensive income of associates 887 — —
Available-for-sale investments:
Net valuation gains/(losses) taken to equity 21,239 (34,450) 31,509Reclassified to income (27,074) (9,243) (11,763)
Cash flow hedges: — — —
Net gains/(losses) taken to equity 654 (8,216) 2,661
Reclassified to income 4,948 (840) (2,707)
Taxation relating to components of other comprehensive income 2,894 10,176 (4,621)
Other comprehensive income for the year, net of taxation 24,554 (183,686) 40,425
Total comprehensive income for the year 186,860 (27,588) 179,951
Attributable to:
Minority interests 5,181 (140) 9,149Parent company shareholders 181,679 (27,448) 170,802
186,860 (27,588) 179,951
1 Amounts have been restated following the early adoption of an amendment to IAS 32 Financial Instruments: Presentation, whichhas reclassified the Rs.10,876 million gain and associated tax of Rs.3,081 million in respect of the rights issue option into equity.
55
c102100pu010Proof7:28.3.10B/LRevision:0OperatorSadK

Consolidated Balance Sheet
FY2009 FY2008 FY20071
US$million US$million US$million
AssetsCash and balances at central banks 18,131 24,161 10,175
Financial assets held at fair value through profit or loss 22,446 15,425 22,958
Derivative financial instruments 38,193 69,657 26,204
Loans and advances to banks 50,885 46,583 35,365
Loans and advances to customers 198,292 174,178 154,266
Investment securities 75,728 69,342 55,274
Other assets 17,201 20,374 11,011
Current tax assets 203 764 633Prepayments and accrued income 3,241 3,466 3,857
Interests in associates 514 511 269
Goodwill and intangible assets 6,620 6,361 6,374
Property, plant and equipment 4,103 3,586 2,892
Deferred tax assets 1,096 660 593
Total assets 436,653 435,068 329,871
Liabilities
Deposits by banks 38,461 31,909 25,880
Customer accounts 251,244 234,008 179,760
Financial liabilities held at fair value through profit or loss 14,505 15,478 14,250
Derivative financial instruments 36,584 67,775 26,270Debt securities in issue 29,272 23,447 27,137
Other liabilities 16,139 17,363 14,742
Current tax liabilities 802 512 818
Accruals and deferred income 4,113 4,132 3,429
Subordinated liabilities and other borrowed funds 16,730 16,986 15,740
Deferred tax liabilities 193 176 33
Provisions for liabilities and charges 184 140 38
Retirement benefit obligations 506 447 322
Total liabilities 408,733 412,373 308,419
Equity
Share capital 1,013 948 705Reserves 26,327 21,192 20,146
Total parent company shareholders’ equity 27,340 22,140 20,851
Minority interests 580 555 601
Total equity 27,920 22,695 21,452
Total equity and liabilities 436,653 435,068 329,871
1 Amounts have been restated as explained in Note 53 of the Annual Report of financial year 2008.
56
c102100pu010Proof7:28.3.10B/LRevision:0OperatorSadK

Consolidated Balance Sheet
FY2009 FY2008 FY20071
Rs million Rs million Rs million
AssetsCash and balances at central banks 846,355 1,127,835 474,969
Financial assets held at fair value through profit or loss 1,047,779 720,039 1,071,679
Derivative financial instruments 1,782,849 3,251,589 1,223,203
Loans and advances to banks 2,375,312 2,174,494 1,650,838
Loans and advances to customers 9,256,271 8,130,629 7,201,137
Investment securities 3,534,983 3,236,885 2,580,190
Other assets 802,943 951,058 513,993
Current tax assets 9,476 35,664 29,548Prepayments and accrued income 151,290 161,793 180,045
Interests in associates 23,994 23,853 12,557
Goodwill and intangible assets 309,022 296,931 297,538
Property, plant and equipment 191,528 167,394 134,999
Deferred tax assets 51,161 30,809 27,681
Total assets 20,382,962 20,308,974 15,398,378
Liabilities
Deposits by banks 1,795,359 1,489,512 1,208,078
Customer accounts 11,728,070 10,923,493 8,391,197
Financial liabilities held at fair value through profit or loss 677,093 722,513 665,190
Derivative financial instruments 1,707,741 3,163,737 1,226,284Debt securities in issue 1,366,417 1,094,506 1,266,755
Other liabilities 753,369 810,505 688,157
Current tax liabilities 37,437 23,900 38,184
Accruals and deferred income 191,995 192,882 160,066
Subordinated liabilities and other borrowed funds 780,956 792,906 734,743
Deferred tax liabilities 9,009 8,216 1,540
Provisions for liabilities and charges 8,589 6,535 1,774
Retirement benefit obligations 23,620 20,866 15,031
Total liabilities 19,079,656 19,249,572 14,396,999
Equity
Share capital 47,287 44,253 32,909Reserves 1,228,944 989,243 940,415
Total parent company shareholders’ equity 1,276,231 1,033,495 973,325
Minority interests 27,074 25,907 28,055
Total equity 1,303,306 1,059,403 1,001,379
Total equity and liabilities 20,382,962 20,308,974 15,398,378
1 Amounts have been restated as explained in Note 53 of the Annual Report of financial year 2008.
57
c102100pu010Proof7:28.3.10B/LRevision:0OperatorSadK

Consolidated statement of changes in equity
Share
capital
Share
premium
account
Capital
reserve and
Capital
redemption
reserve1
Merger
reserve
Available-
for-sale
reserve
Cash flow
hedge
reserve
Translation
reserve
Retained
earnings
Parent
Company
Share
holders’
Equity
Minority
interests Total
US$million US$million US$million US$million US$million US$million US$million US$million US$million US$million US$million
At 1 January 2007 692 3,865 18 3,149 410 51 678 7,990 16,853 542 17,395Profit for the Year — — — — — — — 2,841 2,841 148 2,989Other comprehensive income — — — — 340 6 303 169 818 48 866Distributions — — — — — — — — — (120) (120)Shares issued, net of expenses 5 856 — — — — — — 861 — 861Net own shares adjustment — — — — — — — 24 24 — 24Share option expense and related
taxation — — — — — — — 55 55 — 55Capitalised on scrip dividend 8 (8) — — — — — — — — —Dividends, net of scrip — — — — — — — (601) (601) — (601)Arising on Acquisitions — 3 3Other increases/(Reductions) — — — — — — — — — (20) (20)
At 31 December 2007 705 4,713 18 3,149 750 57 981 10,478 20,851 601 21,452
Profit for the Year — — — — — — — 3,408 3,408 103 3,511Other comprehensive income — — — — (755) (140) (2,765) (169)3 (3,829) (106) (3,935)Distributions — — — — — — — — — (147) (147)Shares issued, net of expenses 237 36 — 2,468 — — — — 2,741 — 2,741Rights issue option, net of tax — — — (167) — — — — (167) — (167)Net own shares adjustment — — — — — — — (67) (67) — (67)Share option expense and related
taxation — — — — — — — 128 128 — 128Capitalised on scrip dividend 6 (6) — — — — — — — — —Dividends, net of scrip — — — — — — — (925) (925) — (925)Other increases/(Reductions) — — — — — — — — — 104 104
At 31 December 2008 948 4,743 18 5,450 (5) (83) (1,784) 12,853 22,140 555 22,695
Restatement2 — — — 167 — — — (167) — — —At 31 December 2008 as restated 948 4,743 18 5,617 (5) (83) (1,784) 12,686 22,140 555 22,695
Profit for the Year 3,380 3,380 97 3,477Other comprehensive income — — — — (88) 98 599 (97)4 512 14 526Distributions — — — — — — — — — (87) (87)Shares issued, net of expenses 44 106 — 1,667 — — — — 1,817 — 1,817Net own shares adjustment — — — — — — — (81) (81) — (81)Share option expense and related
taxation — — — — — — — 311 311 — 311Capitalised on scrip dividend 21 (21) — — — — — — — — —Dividends, net of scrip — — — — — — — (739) (739) — (739)Other increases/(Reductions) — — — — — — — — — 1 1
At 31 December 2009 1,013 4,828 18 7,284 (93) 15 (1,185) 15,460 27,340 580 27,920
1 Includes capital reserve of $5 million and capital redemption reserve of $13 million at 1 January 2008, 31 December 2008 and 2009.
2 Amounts have been restated following the early adoption of an amendment to IAS 32 Financial Instruments: Presentation, whichhas reclassified the $233 million gain and associated tax of $66 million in respect of the rights issue option into equity.
3 Comprises actuarial losses, net of taxation.
4 Comprises actuarial losses, net of taxation and minority interests of $116 million, share of Comprehensive Income from associatesof $19 million.
58
c102100pu010Proof7:28.3.10B/LRevision:0OperatorSadK

Consolidated statement of changes in equity
Share
capital
Share
premium
account
Capital
reserve and
Capital
redemption
reserve1
Merger
reserve
Available-
for-sale
reserve
Cash flow
hedge
reserve
Translation
reserve
Retained
earnings
Parent
Company
Share
holders’
Equity
Minority
interests Total
Rs million Rs million Rs million Rs million Rs million Rs million Rs million Rs million Rs million Rs million Rs million
At 1 January 2007 32,303 180,418 840 146,995 19,139 2,381 31,649 372,973 786,698 25,301 811,999Profit for the Year — — — — — — — 132,618 132,618 6,909 139,527Other comprehensive income — — — — 15,871 280 14,144 7,889 38,184 2,241 40,425Distributions — — — — — — — — — (5,602) (5,602)Shares issued, net of expenses 233 39,958 — — — — — — 40,191 — 40,191Net own shares adjustment — — — — — — — 1,120 1,120 — 1,120Share option expense and related
taxation — — — — — — — 2,567 2,567 — 2,567Capitalised on scrip dividend 373 (373) — — — — — — — — —Dividends, net of scrip — — — — — — — (28,055) (28,055) — (28,055)Arising on Acquisitions — — — — — — — — — 140 140Other increases/(Reductions) — — — — — — — — — (934) (934)
At 31 December 2007 32,909 220,003 840 146,995 35,010 2,661 45,793 489,113 973,325 28,055 1,001,379
Profit for the Year — — — — — — — 159,085 159,085 4,808 163,893Other comprehensive income — — — — (35,243) (6,535) (129,070) (7,889)3(178,738) (4,948) (183,686)Distributions — — — — — — — — — (6,862) (6,862)Shares issued, net of expenses 11,063 1,680 — 115,206 — — — — 127,950 — 127,950Rights issue option, net of tax — — — (7,796) — — — — (7,796) — (7,796)Net own shares adjustment — — — — — — — (3,128) (3,128) — (3,128)Share option expense and related
taxation — — — — — — — 5,975 5,975 — 5,975Capitalised on scrip dividend 280 (280) — — — — — — — — —Dividends, net of scrip — — — — — — — (43,179) (43,179) — (43,179)Other increases/(Reductions) — — — — — — — — — 4,855 4,855
At 31 December 2008 44,253 221,403 840 254,406 (233) (3,874) (83,277) 599,978 1,033,495 25,907 1,059,403
Restatement2 — — — 7,796 — — — (7,796) — — —At 31 December 2008 as restated 44,253 221,403 840 262,202 (233) (3,874) (83,277) 592,182 1,033,495 25,907 1,059,403
Profit for the Year — — — — — — — 157,778 157,778 4,528 162,306Other comprehensive income — — — — (4,108) 4,575 27,961 (4,528)4 23,900 654 24,554Distributions — — — — — — — — — (4,061) (4,061)Shares issued, net of expenses 2,054 4,948 — 77,816 — — — — 84,818 — 84,818Net own shares adjustment — — — — — — — (3,781) (3,781) — (3,781)Share option expense and related
taxation — — — — — — — 14,517 14,517 — 14,517Capitalised on scrip dividend 980 (980) — — — — — — — — —Dividends, net of scrip — — — — — — — (34,497) (34,497) — (34,497)Other increases/(Reductions) — — — — — — — — — 47 47
At 31 December 2009 47,287 225,371 840 340,017 (4,341) 700 (55,316) 721,673 1,276,231 27,074 1,303,306
1 Includes capital reserve of Rs. 233 million and capital redemption reserve of Rs. 607 million at 1 January 2008, 31 December 2008and 2009.
2 Amounts have been restated following the early adoption of an amendment to IAS 32 Financial Instruments: Presentation, whichhas reclassified the Rs. 10,876 million gain and associated tax of Rs. 3,081 million in respect of the rights issue option into equity.
3 Comprises actuarial losses, net of taxation.
4 Comprises actuarial losses, net of taxation and minority interests of Rs. 5,415 million, share of Comprehensive Income fromassociates of Rs. 887 million.
59
c102100pu010Proof7:28.3.10B/LRevision:0OperatorSadK

Cash Flow Statement
FY 2009 FY 20081 FY 20072
US$million US$million US$million
Cash flows from operating activitiesProfit before taxation 5,151 4,568 4,035
Adjustments for:
Non-cash items included within income statement 1,385 1,995 1,259
Change in operating assets 2,962 (88,103) (38,199)
Change in operating liabilities (11,219) 105,913 53,102
Contributions to defined benefit schemes (124) (95) 16
UK and overseas taxes paid, net of refunds (1,210) (1,400) (1,097)
Net cash (used in)/from operating activities (3,055) 22,878 19,116
Net cash flows from investing activities
Purchase of property, plant and equipment (261) (579) (471)
Disposal of property, plant and equipment 218 73 22
Acquisition of investment in subsidiaries, net of cash acquired (68) 6,209 (85)
Disposal of investment in subsidiaries — 159 —
Purchase of investment securities (129,739) (109,938) (78,292)
Disposal and maturity of investment securities 126,678 97,756 74,457Dividends received from investment in associates 11 — —
Net cash used in investing activities (3,161) (6,320) (4,369)
Net cash flows from financing activities
Issue of ordinary and preference share capital, net of expenses 1,817 2,753 861
Purchase of own shares (103) (76) (15)
Exercise of share options through ESOP 22 9 39
Interest paid on subordinated liabilities (361) (718) (737)Gross proceeds from issue of subordinated liabilities 2,063 3,667 3,051
Repayment of subordinated liabilities (2,440) (1,436) (505)
Dividends paid to minority interests and preference
shareholders net of scrip (188) (257) (148)
Dividends paid to ordinary shareholders net of scrip (638) (815) (573)
Net cash from financing activities 172 3,127 1,973
Net (decrease)/increase in cash and cash equivalents (6,044) 19,685 16,720Cash and cash equivalents at beginning of the year 73,699 55,338 38,161
Effect of exchange rate movements on cash and cash
equivalents 418 (1,324) 457
Cash and cash equivalents at end of the year 68,073 73,699 55,338
1 Amounts have been restated as explained in Note 50 of the Annual Report of financial year 2009.
2 Amounts have been restated as explained in Note 53 of the Annual Report of financial year 2008.
60
c102100pu010Proof7:28.3.10B/LRevision:0OperatorSadK

Cash Flow Statement
FY 2009 FY 20081 FY 20072
Rs million Rs million Rs million
Cash flows from operating activitiesProfit before taxation 240,449 213,234 188,354
Adjustments for:
Non-cash items included within income statement 64,652 93,127 58,770
Change in operating assets 138,266 (4,112,648) (1,783,129)
Change in operating liabilities (523,703) 4,944,019 2,478,801
Contributions to defined benefit schemes (5,788) (4,435) 747
UK and overseas taxes paid, net of refunds (56,483) (65,352) (51,208)
Net cash (used in)/from operating activities (142,607) 1,067,945 892,335
Net cash flows from investing activities
Purchase of property, plant and equipment (12,183) (27,028) (21,986)
Disposal of property, plant and equipment 10,176 3,408 1,027
Acquisition of investment in subsidiaries, net of cash acquired (3,174) 289,836 (3,968)
Disposal of investment in subsidiaries — 7,422 —
Purchase of investment securities (6,056,217) (5,131,906) (3,654,671)
Disposal and maturity of investment securities 5,913,329 4,563,250 3,475,653Dividends received from investment in associates 513 — —
Net cash used in investing activities (147,555) (295,018) (203,945)
Net cash flows from financing activities
Issue of ordinary and preference share capital, net of expenses 84,818 128,510 40,191
Purchase of own shares (4,808) (3,548) (700)
Exercise of share options through ESOP 1,027 420 1,821
Interest paid on subordinated liabilities (16,851) (33,516) (34,403)Gross proceeds from issue of subordinated liabilities 96,301 171,176 142,421
Repayment of subordinated liabilities (113,899) (67,032) (23,573)
Dividends paid to minority interests and preference
shareholders net of scrip (8,776) (11,997) (6,909)
Dividends paid to ordinary shareholders net of scrip (29,782) (38,044) (26,748)
Net cash from financing activities 8,029 145,968 92,100
Net (decrease)/increase in cash and cash equivalents (282,134) 918,896 780,490Cash and cash equivalents at beginning of the year 3,440,269 2,583,178 1,781,355
Effect of exchange rate movements on cash and cash
equivalents 19,512 (61,804) 21,333
Cash and cash equivalents at end of the year 3,177,648 3,440,269 2,583,178
1 Amounts have been restated as explained in Note 50 of the Annual Report of financial year 2009.
2 Amounts have been restated as explained in Note 53 of the Annual Report of financial year 2008.
61
c102100pu010Proof7:28.3.10B/LRevision:0OperatorSadK

RISK FACTORS
Prospective investors should carefully consider the risks set forth below and the other information
contained in this Draft Red Herring Prospectus prior to making any investment decision with respect
to the IDRs and the Shares. Each of the risks highlighted below could have a material adverse effect
on the business, operations, financial condition or prospects of the Company and the Group, which,in turn, could have a material adverse effect on the amount of any distribution which investors will
receive in respect of the IDRs and the Shares. In addition, each of the risks highlighted below could
adversely affect the trading price of the IDRs and the Shares or the rights of investors under the
IDRs and the Shares and, as a result, investors could lose some or all of their investment.
Prospective investors should note that the risks described below are not the only risks the Company
and the Group face. The Company has described only those risks relating to its operations that it
considers to be material. There may be additional risks that it currently considers not to be material
or of which it is not currently aware, and any of these risks could have the effects set forth above.
Internal Risks and Risks relating to the Group’s Business Operations
1. Changes in the credit quality and the recoverability of loans and amounts due from counterpartiesmay have an adverse effect on the Group’s financial condition and results of operations
Risks arising from changes in credit quality and the recoverability of loans and amounts due
from counterparties are inherent in a wide range of the Group’s businesses. Adverse changes in
the credit quality of the Group’s borrowers and counterparties, or adverse changes arising from
a general deterioration in global economic conditions or systemic risks in the financial systems,could reduce the recoverability and value of the Group’s assets and require an increase in the
Group’s level of provision for bad and doubtful debts. An adverse change in economic
conditions could also adversely affect the level of banking activity and the Group’s interests and
other income. Although the Group devotes considerable resources to managing the above risks,
failure to manage these risks can impact the Group adversely.
Information on non-performing assets in 2009 is given in the section titled ‘‘Management
Discussion and Analysis of the Financial Condition and Results of Operations’’ on page 119 of this
Draft Red Herring Prospectus.
2. The Group’s business could be affected if its capital is not managed effectively
Effective management of the Group’s capital position is important to its ability to operate its
business, to continue to grow organically and to pursue its strategy. Any future change that
limits the Group’s ability to manage its balance sheet and capital resources effectively or to
access funding on commercially acceptable terms, could have a material adverse effect on the
Group’s financial condition and regulatory capital position.
3. Lack of liquidity is a risk to the Group’s business
Liquidity risk is the risk that the Group either does not have sufficient financial resources
available to meet all its obligations and commitments as they fall due, or can access them only
at excessive cost. This risk is inherent in banking operations and can be heightened by a number
of factors, including changes in credit ratings or market-wide phenomena such as financial
market instability and natural disasters. Credit markets worldwide have experienced andcontinue to experience a reduction in liquidity and term-funding in the aftermath of events in
the US sub-prime residential mortgage market and the current severe financial market
conditions. It is the policy of the Group to manage its liquidity prudently in all geographic
locations and for all currencies. Exceptional market events of the type described above can
impact the Group adversely.
4. Failure to manage legal and regulatory risk properly can impact the Group adversely
The Group is subject to a wide variety of banking, insurance and financial services laws and
regulations and is supervised by a large number of regulatory and enforcement authorities in
each of, or which govern its business and activities in and in relation to, the jurisdictions in
which it operates. As a result, the Group is exposed to many forms of legal and regulatory risk,
which may arise in a number of ways, primarily:
* loss may be caused by changes in applicable laws;
62
c102100pu020Proof7:28.3.10B/LRevision:0OperatorSadK

* the Group is subject to a variety of complex legal and regulatory regimes in many of the
countries where it operates, in respect of which requirements, standards or sanctions may
differ significantly from country to country;
* the Group is subject to extensive laws and regulations which are designed to combat
money laundering and terrorist financing and to enforce compliance with sanctions against
designated countries and persons, including countries in which, and persons with which,
the Group may conduct and may have conducted business from time to time;
* risk from defective transactions or contracts, either where contractual obligations are not
enforceable or do not allocate rights and obligations as intended, or where contractual
obligations are enforceable against the Group in an adverse way or by defective security
arrangements;
* the title to and ability to control the assets of the Group (including the intellectual
property of the Group, such as its trade names) may not be adequately protected; and
* the Group may be liable for damages to third parties where legal proceedings are brought
against it. Regardless of whether such claims have merit, the outcome of legal proceedings
is inherently uncertain and could result in financial loss.
Although the Group has processes and controls to manage legal and regulatory risks, failure to
manage such risks properly can impact the Group adversely or result in administrative actions,
penalties or other proceedings involving the Group which may have a material adverse effect on
the Group’s business and reputation and ultimately the value of the IDRs and the Shares. In
addition, a failure to comply with the applicable laws or regulations in various jurisdictions by
the Group’s employees, representatives, agents and third party service providers, or those of itssubsidiaries either in or outside the course of their services, or suspected or perceived failures by
them, may result in enquiries or investigations by regulatory and enforcement authorities, or in
regulatory or enforcement action against the Group, its subsidiaries or such employees,
representatives, agents and third party service providers. Such actions may adversely impact the
reputation of the Company or the Group, result in adverse media reports, lead to increased or
enhanced regulatory or supervisory concerns, additional costs, penalties, claims and expenses
being incurred by the Group or impact adversely the Group’s ability to conduct business.
The Company cannot predict the timing or form of any current or future regulatory or law
enforcement initiatives which the Company notes are increasingly common for international
banks and financial institutions. The Company would expect to cooperate with any relevant
authorities in connection with any such regulatory investigation or proceeding.
5. Operational risks are inherent in the Group’s business
Operational risk is the risk of direct or indirect loss due to an event or action resulting from the
failure of internal processes, people and systems, or from external events. Any of these risks
could result in an adverse impact on the Group’s financial condition and results of operations.
The Group seeks to ensure that key operational risks are managed in a timely and effective
manner through a framework of policies, procedures and tools to identify, assess, monitor,
control and report such risks. The Group Operational Risk Committee (‘‘GORC’’) supervisesand directs the management of operational risks across the Group. GORC is also responsible
for ensuring adequate and appropriate policies and procedures are in place for the identification,
assessment, monitoring, control and reporting of operational risks.
The Group’s operational risk team is responsible for setting the operational risk policy, definingstandards for measurement and for operational risk capital calculation. An operational risk
assurance function, independent from the Group’s operating businesses, is responsible for
deploying and assuring the operational risk management framework, and for monitoring the
Group’s key operational risk exposures. This unit is supported by units within the Wholesale
Banking and Consumer Banking businesses who have responsibility for ensuring compliance
with policies and procedures in the business, monitoring key operational risk exposures and the
provision of guidance to the respective business areas on operational risk.
6. The Company operates primarily through its subsidiaries and there are risks related to thisstructure
As a holding company, the Company’s business is operated through its subsidiaries. As a result,
the Company’s right to participate in any distribution of the assets of a subsidiary, upon its
dissolution, winding-up, liquidation or reorganisation or otherwise, and the ability of investors
63
c102100pu020Proof7:28.3.10B/LRevision:0OperatorSadK

to benefit indirectly from that distribution, is subject to the prior claims of creditors of that
subsidiary, except to the extent that the Company may be a creditor of that subsidiary and its
claims are recognised. There are legal limitations on the extent to which some of the Company’s
subsidiaries may extend credit, pay dividends or otherwise supply funds to, or engage intransactions with, the Company or some of its other subsidiaries. Accordingly, the Shares will
be effectively subordinated to all existing and future liabilities of the Company’s subsidiaries (as
well as of the Company) and holders of the Shares should look only to the Company’s assets
for payment.
7. The business of the Group may be affected if it is unable to recruit, retain and develop appropriatesenior management and skilled personnel
The Group’s continued success depends in part on the continued service of key members of its
management team. The ability to continue to attract, train, motivate and retain highly qualified
professionals is a key element of the Group’s strategy. The successful implementation of the
Group’s growth strategy depends on the availability of skilled management at its head office and
at each of its business units and international locations. If the Group or one of its business
units or other functions fails to staff their operations appropriately, or loses one or more of itskey senior executives and fails to replace them in a satisfactory and timely manner, its business,
financial condition and results of operations, including control and operational risks, may be
adversely affected. Likewise, if the Group fails to attract and appropriately train, motivate and
retain qualified professionals, its business may also be affected.
8. The Group is expanding its operations and this growth may represent a risk if not managedeffectively
The Group is experiencing significant growth as it expands geographically and in the scope of
products and services it offers, including through acquisitions. The Group’s business strategy is
based on organic growth but includes selective plans to continue to acquire assets or businesses
that it believes are logical extensions of its existing businesses to increase cash flow and
earnings. The Group continues to look at potential acquisitions in a number of markets. The
Group may experience some, or all, of the difficulties described below. The failure effectively tomanage its expansion, whether organic or inorganic, could have a material adverse effect on the
Group’s financial condition and results of operations.
The success of the Group’s acquisitions will depend, in part, on the ability of its management to
integrate the operations of newly-acquired businesses with its existing operations and to integrate
various departments, systems and procedures.
The Group’s ability to implement its business strategy may be constrained and the timing of
such implementation may be impacted due to demands placed on existing resources by that
process. There can be no assurance that:
* the Group will be successful in acquiring all the entities it seeks to acquire;
* the acquired entities will achieve the level of performance that the Group anticipates or
that the carrying value of goodwill on acquisition will be fully supported by the cash flows
of the cash generating unit to which it has been allocated for the purposes of impairment
testing;
* the projected demand and prices of the Group’s products and services will be realised;
* the acquired entities will not cause a disruption to the Group’s ongoing businesses, distract
management attention and other resources or make it difficult to maintain the Group’s
standards, internal controls and procedures;
* the Group will not be required to incur debt or issue equity securities to pay for
acquisitions, for which financing may not be available or may not be available on
acceptable terms;
* the Group’s current ratings will not be affected by such acquired entities;
* the Group will be able to successfully integrate the services, products and personnel of an
acquired entity into its operations, especially if the Group acquires large businesses; or
* the Group will not assume unforeseen liabilities and exposures as a result of the
acquisitions.
64
c102100pu020Proof7:28.3.10B/LRevision:0OperatorSadK

9. There can be no assurances that the Company will pay dividends on the Shares underlying theIDRs
The payment of dividends by the Company is an entirely discretionary matter. In addition,
under UK company law, there are restrictions on a company’s ability to pay dividends. See the
section titled ‘‘Dividends’’ on page 341 of this Draft Red Herring Prospectus.
In addition, as a holding company, the Company’s ability to pay dividends in the future is
affected by a number of factors, principally its ability to receive sufficient dividends from its
subsidiaries. The payment of dividends to the Company by its subsidiaries is, in turn, subject to
restrictions, including certain regulatory requirements and the existence of sufficient distributablereserves and cash in the Company’s subsidiaries. The ability of these subsidiaries to pay
dividends and the Company’s ability to receive distributions from its investments in other
entities is subject to applicable local laws and regulatory requirements and other restrictions,
including, but not limited to, applicable tax laws and covenants in some of the Company’s debt
facilities. These laws and restrictions could limit the payment of dividends and distributions to
the Company by its subsidiaries, which could in future restrict the Company’s ability to fund
other operations or to pay a dividend to holders of the Shares.
External Risk Factors
1. Macroeconomic risks could result in an adverse impact on the Group’s financial condition andresults of operations
The Group operates in over 70 countries and territories and is affected by the prevailing
economic conditions in each market. Macroeconomic factors that have an impact on personalexpenditure and consumption, demand for business products and services, the debt service
burden of consumers or businesses, and the general availability of credit, will influence the
Group’s customers and, by extension, the Group’s financial condition and results of operations.
One of the principal uncertainties is the extent to which the economic slowdown currently being
experienced in certain western markets may feed through to the Group’s major markets, and the
timing of that impact. The linkages between economic activities in different markets are complex
and depend not only on direct drivers such as the balance of trade and investment between
countries, but also on domestic monetary, fiscal and other policy responses to address
macroeconomic conditions.
Consequently, one uncertainty for the corporate sectors in Wholesale Banking and the SME
segment in Consumer Banking will be the extent to which exports are impacted by a slowdown
in other economies, particularly in the US and Europe. Similarly, there will be uncertainty about
domestic demand in SCB’s markets, which is a function of a number of factors includingconsumer and business confidence.
Another principal uncertainty for the Group relates to the management of inflationary pressures,
to the extent to which they arise. These inflationary pressures may be exacerbated in somecountries by the reduction or removal of fuel price subsidies and the impact of significant rises
in the price of certain foodstuffs. An increase in inflation can have a number of adverse impacts
on the Group’s business, including, but not limited to, increasing its operating expenses, which
would reduce profits attributable to Group IDR Holders. High inflation can also have an
adverse effect on the credit quality of the Group’s individual and corporate borrowers, as well
as its counterparties, which could lead to an increase in delinquencies and defaults across a
range of sectors, which could also impact profitability and otherwise have a negative effect on
the Group’s financial condition and results of operations.
The Group’s geographic and business diversification will help to mitigate any impact on
revenues, or of increased loan impairment, that may stem from a slowdown in any one market.No single country accounts for more than 20% of total loans and advances to customers. There
are also no unduly significant concentrations across industries among the corporate customer
base. However, diversification of the Group may not be effective to safeguard the Group from
the effect of certain macroeconomic factors which may impact the overall economy in a single
country or globally.
65
c102100pu020Proof7:28.3.10B/LRevision:0OperatorSadK

2. The Group operates primarily in Asia, Africa and the Middle East, and these operations expose itto risks arising from the political and economic environment of markets in these areas that couldadversely affect its financial condition and results of operations
The primary markets in which the Group operates are Asia, Africa and the Middle East. Some
of these markets are typically more volatile and less developed economically and politically than
markets in Western Europe and North America. The Group faces significant economic andpolitical risks, including economic volatility, recession, inflationary pressure, exchange rate
fluctuation risk and interruption of business, as well as civil unrest, imposition of exchange
controls, sanctions relating to specific countries, expropriation, nationalisation, renegotiation or
nullification of existing contracts and changes in law or tax policy. These risks could result in an
adverse impact on the Group’s financial condition and results of operations.
3. The Group operates in competitive markets, which may have an adverse effect on its financialcondition and results of operations
The Group is subject to significant competition from local banks and many other international
banks operating in the emerging markets described above, including competitors that may have
greater financial and other resources. Local regulations in a number of jurisdictions that favour
local banks by restricting the ability of international banks operating in the relevant country to
enter the market and/or expand their existing operations could adversely affect the Group’sability to compete in these markets. Many of the international and local banks operating in the
Group’s markets compete for substantially the same customers as the Group. Competition may
increase in some or all of the Group’s principal markets and may have an adverse effect on its
financial condition and results of operations.
4. The Group operates in a highly regulated industry and changes to bank regulations and laws andregulations could have an impact on its operations or impair its financial condition
The Group is subject to financial services laws, regulations, administrative actions and policies in
each location in which it operates. During the recent market turmoil, there has been an
unprecedented level of government and regulatory intervention and scrutiny, and changes to the
regulations applying to financial institutions. Regulatory and governmental authorities are likely
to continue to adopt new, or enhance the existing, legal and regulatory requirements intended to
prevent future crises or otherwise ensure the stability of institutions under their supervision. Forinstance, the UK Government published a White Paper in July 2009 which contained a number
of proposals for reforming the UK financial system, including more stringent capital and
liquidity requirements for systemically significant firms, requirements for banks to develop
detailed plans for winding down their businesses and enhanced regulatory powers for the FSA.
A number of the proposals set out in the White Paper now form part of the Financial Services
Bill that was published on 19 November 2009 and which is currently going through the UK
Parliamentary approval process. The Financial Services Bill will, among other things, place a
duty on the FSA to make rules requiring financial institutions to create and maintain recoveryand resolution plans in preparation for potential adverse scenarios that could compromise their
business models (living wills). Under a recovery plan a bank is required to consider in advance
what it would do if it were to fall under extreme stress. Under a resolution plan, a bank is
required to plan how it would provide the authorities in a timely manner with information the
authorities would require in order to make a choice among the resolution methods available to
resolve the bank, should this be required.
The Basel Committee on Banking Supervision published new requirements in July 2009 that will
increase (in some cases significantly) the amount of capital that banks are required to hold in
respect of their trading activities which will be implemented into EU legislation through CRD
III. Further proposals followed in December 2009. The FSA also published proposedenhancements to its capital standards in December 2009.
In addition, the rules on consumer protection in a number of the Company’s markets areattracting increased regulatory attention. Recent proposals and measures taken by governmental,
tax and regulatory authorities and future changes in supervision and regulation, in particular in
the United Kingdom, are beyond the Group’s control and could materially affect the Group’s
business, the products and services offered or the value of assets and significantly increase
operational costs.
66
c102100pu020Proof7:28.3.10B/LRevision:0OperatorSadK

Whilst there is growing international regulatory cooperation on such initiatives, the Group is,
and will continue to be, subject to the increased complexity of complying with different
requirements in multiple jurisdictions. Changes in UK legislation and regulation to address the
stability of the financial sector may also affect the competitive position of UK banks, includingStandard Chartered, particularly if such changes are implemented before international consensus
is reached on key issues affecting the industry.
Although the Group works closely with its regulators and continually monitors the situation,future changes in regulation, fiscal or other policies can be difficult to predict and are beyond
the control of the Group. No assurance can be given generally that laws or regulations will be
adopted, enforced or interpreted in a manner that will not have an adverse effect on the
Group’s business.
5. The business and operations of the Company may be affected by the provisions of the Banking Act2009 which gives the UK Treasury, the FSA and the Bank of England wide-ranging powers tomake certain orders in respect of deposit-taking institutions
The Banking Act 2009 came into force on 21 February 2009 and applies to deposit-takinginstitutions that are incorporated in or formed under the law of any part of the UK (such as
SCB). It provides the Treasury, the Bank of England and the FSA with powers to deal with
banks which are failing or likely to fail to satisfy the threshold conditions within the meaning of
section 41(1) and Schedule 6 of the FSMA where it is not reasonably likely that action will be
taken by or in respect of the bank to satisfy those threshold conditions. The Banking Act 2009
creates a special resolution regime which comprises three stabilisation options and two new
insolvency procedures. The stabilisation options involve (i) the transfer of a bank, or bank
holding company, into temporary public ownership; (ii) the transfer of all or part of a bank toa private sector purchaser and (iii) the transfer of all or part of a bank to a bridge bank wholly
owned by the Bank of England. The new insolvency procedures are (i) bank insolvency,
designed to secure that eligible depositors’ accounts are transferred to another bank, or that
eligible depositors are compensated under the Financial Services Compensation Scheme, followed
by winding up the affairs of the bank so as to achieve the best result for the bank’s creditors
and (ii) a bank administration procedure designed to ensure that where the transfer of part of a
bank to a private sector purchaser or bridge bank is effected in accordance with the special
resolution regime, the non-sold or non-transferred bank continues to provide services andfacilities to the business which has been transferred to enable the commercial purchaser or
transferee to operate effectively.
Whilst the Treasury, the Bank of England and the FSA must have regard to specified objectives
when exercising the special resolution regime powers (the protection and enhancement of thestability of the UK financial system, protecting and enhancing public confidence in the stability
of the UK banking system, protecting depositors, protecting public funds and avoiding
interference with property rights in contravention of the European Convention on Human
Rights), the effect of the Banking Act 2009 (if any) on the IDR Holders cannot be ascertained
in advance.
6. Downgrades to the Group’s credit ratings or outlook could impair the Group’s access to fundingand the Group’s competitive position
The Group’s ability to access the capital and, to a lesser extent, the wholesale markets, and thecost of borrowing in these markets is influenced by the Group’s credit ratings. There can be no
guarantee that the Group will not be subject to downgrades to its credit ratings. Any changes in
the credit ratings of the Group could impact the volume and pricing of its funding, and this
could impact profit.
7. Changes in interest rates, foreign exchange rates, equity prices and other market risks couldadversely affect the groups financial condition and results of operations
Market risk is the exposure created by potential changes in market prices and rates. The Groupis exposed to market risk arising principally from customer-driven transactions. Some of the
significant market risks the Group faces are interest rate, foreign exchange and bond price risks.
Changes in interest levels, yield curves and spreads may affect, among other things, interest rate
margins and trading profits. Changes in currency rates may affect, among other things, the value
of assets and liabilities denominated in foreign currencies and also the earnings reported by the
67
c102100pu020Proof7:28.3.10B/LRevision:0OperatorSadK

Company’s non-US$ denominated branches and subsidiaries. Although the Group devotes
considerable resources to managing the above risks, failure to manage these risks effectively
could impact the Group adversely.
8. Financial markets volatility globally and in the markets in which the Group operates could result inan adverse impact on the Group’s assets, financial condition and results of operations
Additional volatility and further dislocation affecting certain financial markets and asset classes,
are factors that may also impact the Group’s financial condition and results of operations.
These factors may have an impact on the mark-to-market valuations of assets in the Group’savailable-for-sale and trading portfolios. In addition, any further deterioration in the
performance of the assets underlying the ABS portfolio could lead to additional impairment.
The ABS portfolio accounts for less than 0.7% of Group assets (as at 31 December 2009).
9. Systemic risk resulting from failures in the banking industry could adversely affect the Group
Within the banking industry the default of any institution could lead to defaults by otherinstitutions. Concerns about, or a default by, one institution could lead to significant liquidity
problems, losses or defaults by other institutions because the commercial soundness of many
financial institutions may be closely related as a result of their credit, trading, clearing or other
relationships. This risk is sometimes referred to as ‘‘systemic risk’’ and may adversely affect
financial intermediaries, such as clearing agencies, clearing houses, banks, securities firms and
exchanges with whom the Group interacts on a daily basis, which could have an adverse effect
on the Group’s ability to raise new funding and on the Group’s business, financial condition
and results of operations.
10. Country risk could result in an adverse impact on the Group’s financial condition and results ofoperations
Country risk is the risk that a counterparty is unable to meet its contractual obligations as a
result of adverse economic conditions or actions taken by the government of the relevantcountry. This includes the risk that:
* a sovereign borrower may be unable or unwilling to fulfil its foreign currency or cross-
border contractual obligations; and/or
* a non-sovereign counterparty may be unable to fulfil its contractual obligations as a result
of currency shortage due to adverse economic conditions or actions taken by thegovernment of the relevant country.
These risks could have an adverse impact on the Group’s financial condition and results ofoperations.
11. The Group operates in some markets that have relatively less developed judicial and disputeresolution systems, which could have an adverse effect on the Group’s operations
In the less developed markets in which the Group operates, judicial and dispute resolution
systems may be less developed. In case of a breach of contract, there may be difficulties inmaking and enforcing claims against contractual counterparties. On the other hand, if claims are
made against the Group, there may be difficulties in defending such allegations. If the Group
becomes party to legal proceedings in a market with an insufficiently developed judicial system,
it could have an adverse effect on the Group’s financial condition and results of operations.
12. Regional hostilities, terrorist attacks or social unrest as well as natural calamities in the markets inwhich the Group operates could adversely affect the Group’s business and results of operations
Some of the countries in which the Group operates have, from time to time, experienced social
and civil unrest, hostilities both internally and with neighbouring countries and terrorist attacks.
Some of those countries have also experienced natural calamities like earthquakes, floods and
drought in the past few years. These and similar hostilities, tensions and natural disasters could
lead to political or economic instability in the markets in which the Group operates and
adversely affect its business and results of operations.
68
c102100pu020Proof7:28.3.10B/LRevision:0OperatorSadK
Risks relating to the Investment in IDRs
Risks relating to the IDR regime and an investment in the IDRs
1. The legal regime in respect of the issuance of IDRs has only been recently introduced and itsefficacy and efficiency is yet to be established
The SEBI regime for the issuance of IDRs was introduced in 2006. Chapter VIA of the SEBI
Guidelines and the IDR Rules were amended subsequently. The SEBI Guidelines have now been
substituted by the SEBI Regulations, and Chapter X read with Schedule XIX of the SEBI
Regulations sets out the disclosure requirements for the Issue. As of the date of this Draft Red
Herring Prospectus, the Issue is expected to be the first in India under the IDR regime. There
are uncertainties as to:
* how Indian regulators will interpret and apply the legal regime to both the Company and
the IDRs;
* how well internal procedures and systems of various intermediaries such as, the
Depository, the Custodian, the Registrar to the Issue and the Stock Exchanges, will be
able to meet requirements of the legal regime in respect of IDRs for the first time and on
an ongoing basis;
* the effectiveness of the legal regime in respect of IDRs with respect to issuance, trading,
exchange and cancellation of the instrument and ongoing rights and obligations underlying
the instrument.
Furthermore, the efficacy and efficiency of IDRs as an instrument is as yet untested. Prospective
investors are therefore advised to make their own judgement about an investment in the IDRs.
Risks relating to the exercise of rights and receipt of entitlements under the Conditions by IDR Holders
2. Certain corporate actions of the Company may entitle existing Shareholders of the Company toreceive further Shares from the Company. However, the ability of IDR Holders to receive suchfurther Shares from the Company (either in the form of Shares or IDRs representing the Shares)may be restricted
IDR Holders are subject to certain risks that may not be applicable to shareholders of the
Company if there is a distribution of Shares by the Company or certain other corporate actions
following certain corporate events. In particular, IDR Holders are unlikely to be able to receive
additional Shares from the Company in a rights offering or a bonus issue of Shares or following
an election made, at their option, to receive scrip dividend from the Company (if offered by the
Company). This is due to factors related to the application of provisions of English law and thepotential application of certain provisions of Indian law.
Pursuant to the UK Companies Act, the Company must offer holders of equity shares pre-
emptive rights to subscribe and pay for a proportionate number of shares to maintain theirexisting ownership percentages prior to the issuance of new equity shares, unless the pre-emptive
rights have been waived by adopting a special resolution passed by 75% of the shareholders
present and voting at a general meeting. The shareholders of the Company generally pass such a
resolution at each annual general meeting in relation to a maximum of 5% of the ordinary share
capital in any one year. IDR Holders may therefore be unable to exercise pre-emptive rights in
respect of Shares underlying their IDRs to the extent that any such offer of Shares falls within
the waiver given by the shareholders of the Company.
Under the Indian Companies Act, a company incorporated outside India cannot issue, circulate
or distribute any offer of securities to more than 49 persons (other than professional investors)
resident in India without registering a prospectus with the RoC. Such a prospectus is required
to contain the information specified in the Indian Companies Act and the SEBI Regulations.See the section titled ‘‘Foreign Investment, Exchange Controls and other Indian Laws – Ability to
withdraw Shares from the IDR Facility and to deposit further shares into the IDR Facility’’ on
page 423 of this Draft Red Herring Prospectus.
The exact law applicable to and the process to be followed for the registration is not clear at
present. However, it is anticipated that the process of registration would be burdensome. If the
Company decides not to obtain such registration, IDR Holders may be either prevented or
restricted in participating in a rights issue or other securities offerings of the Company.
69
c102100pu020Proof7:28.3.10B/LRevision:0OperatorSadK

Similarly, if the Company offers scrip dividends or a bonus issue of Shares to IDR Holders, the
same could be considered as a further issue of IDRs by the Company. Such further issue of
IDRs would require permission from the Stock Exchanges and may require registration of a
new prospectus in India.
If a Depository is unable to distribute Shares under the relevant provisions of the Conditions,
subject to the other provision of the Conditions, the Depository may sell the rights or the
Shares in question and distribute the proceeds to IDR Holders as a cash distribution. However,
IDR Holders who are unable to receive further Shares in the form of IDRs face several risks.
Firstly, there is no assurance as to the value, if any, that the Depository would receive upon the
sale of such securities or the rights in respect of such securities. Secondly, to the extent that
IDR Holders are unable to exercise pre-emptive rights or other rights to acquire Shares, their
proportionate interests in the Company will be diluted. Thirdly, these restrictions in respect ofdistribution could affect the liquidity and value of an IDR Holder’s investment.
3. If an IDR Holder holds IDRs that together represent less than four Shares, that IDR Holder willnot have a vote where voting is by way of poll
Subject to any special terms as to voting on which any shares may have been issued, every
holder of Shares who is present in person or by duly appointed proxy shall, on a show of
hands, have one vote and, on a poll, have one vote for every US$2 nominal value of share
capital of which he is the holder. Given that the nominal value of each Share is US$0.50, on a
vote taken on a poll, a person needs to hold four Shares in order to register one vote.
Therefore, if an IDR Holder holds IDRs representing less than four Shares, that IDR Holderwill not be able to register the vote where voting is by way of a poll. At the Company’s annual
general meeting the votes are taken by a poll.
4. As [*] IDRs represent one Share, certain entitlements will be affected unless [*] IDRs (orintegral multiples thereof) are held by the IDR Holder
In addition to the voting restriction described above, certain rights will be affected if an IDR
Holder does not hold [*] IDRs or an integral multiple thereof. In particular:
* withdrawals are not permitted of fractions of a Share;
* entitlements to participate in corporate actions, such as rights issues and share distributions
are determined by holdings of whole numbers of Shares (although IDR Holders will
receive their proportionate entitlement to any cash amount which may be received by the
Depository); and
* if the IDR Facility is terminated by reason of the Shares not being listed on any securitiesexchange in any jurisdiction, rights in respect of fractions of a Share will be disregarded.
Risks relating to enforcement actions by an IDR Holder
5. The ability of IDR Holders to obtain the Deposited Shares may be impaired in an insolvency ofthe Depository
Upon an insolvency of the Depository, IDR Holders may have to file a claim in the winding-upproceedings of the Depository in India and request the English liquidator to recognise such
proceedings in the winding-up proceedings in England. The insolvency procedures applied by an
English court in respect of any pre-existing/parallel liquidation proceedings before Indian courts
will be dealt with by ordinary principles of private international law. In general, English courts
may recognise principles of comity, and will generally assist an overseas office holder if this does
not conflict with the rights of English creditors. However recognition of the effects of an Indian
judicial procedure by English courts is discretionary, subject to the provisions of the UK
Foreign Judgments Act.
6. It may be difficult for IDR Holders to enforce any judgment or arbitral award obtained in Indiaagainst the Company in the UK
Under the Deed Poll, IDR Holders have the right to submit any disputes to arbitration in India
in accordance with the Arbitration and Conciliation Act.
However, as the Company is incorporated in England and Wales and all of its Directors reside
outside India, it likely that IDR Holders pursuing the enforcement of an arbitral award would
have to file for enforcement of the arbitral award in England. An IDR Holder would therefore
70
c102100pu020Proof7:28.3.10B/LRevision:0OperatorSadK

have to undertake the additional step and suffer the additional costs of making an application
to an English court for such enforcement (provided it satisfied certain conditions under the UK
Foreign Judgements Act).
7. The Deposit Agreement and the Deed Poll are governed by English law and, in case of a dispute,an IDR Holder may be required to obtain and present expert evidence on English law to an Indiancourt as arbitration panel
Both the Deposit Agreement (which sets out the terms and conditions relating to the IDRs),
and the Deed Poll (pursuant to which IDR Holders have direct enforcement rights against the
Company) are governed by English law. To the extent IDR Holders are enforcing their rights
under either of these documents before an arbitration panel or court, because English law is the
governing law, the arbitration panel or court may require expert evidence on English law
matters to be presented to it prior to making any decision. It may therefore be necessary to
obtain and pay for expert evidence on English law if IDR Holders wish to enforce their rights
under either of these documents and this could represent additional cost for the IDR Holder.
Other risks relating to an investment in the IDRs
8. IDR Holders will bear the risk of factors affecting the price of the Shares
Risks relating to the stock exchange where the Shares are listed
The market price of the IDRs is expected to be affected by factors underlying the market price
of the Shares. The price of the Shares may experience significant fluctuation on the London
Stock Exchange and/or the Hong Kong Stock Exchange. Any fluctuations that occur on theLondon Stock Exchange and/or the Hong Kong Stock Exchange which affect the price of the
Shares may, in turn, affect the price and trading of the IDRs listed on the Stock Exchanges. It
is not possible to predict whether the price of the Shares, and consequently of the IDRs, will
rise or fall. Sale of a substantial number of Shares in the open market could adversely affect the
prevailing market price of the Shares. Any decline in the price of the Shares may have an
adverse effect on the market price of the IDRs.
Risks relating to the Company
The trading price of the Shares and the IDRs could also be subject to significant volatility in
response to the following factors, among others:
* performance of the Company’s competitors, the Indian financial markets, the Indian
financial services industry and perception in the market about investment in these sectors;
* changes in government policies including jurisdictions in which the Company operates;
* announcements by the Company or its competitors of significant contracts, acquisitions,
joint ventures or capital commitments;
* announcements by the Company or its competitors of new product offerings, technological
innovations or changes in pricing policies;
* changes in public expectations regarding the Company’s operational results, financial
condition or future financial performance;
* announcement of actual variations in the Company’s operating or financial results;
* announcement by third parties of significant claims or proceedings against the Company;
or
* general political, economic, financial and other factors.
9. Sales, or the real or perceived possibility of sales, of a significant number of the IDRs or theShares in the public market could adversely affect prevailing market prices for the IDRs or theShares
The Company cannot predict the effect, if any, that market sales of IDRs or Shares, or the
availability of IDRs or Shares for future sale, will have on the market price of the IDRs or
Shares, but the availability of Shares that are eligible for public sale could adversely affect theprice of the IDRs or Shares. Subsequent equity offerings may dilute the percentage holding of
an IDR Holder. In addition, the Company currently has shares in issue that have rights,
preferences or privileges senior to those of the Shares and may also issue such Shares in the
future. The availability of such shares could also adversely affect the price of the IDRs or the
Shares.
71
c102100pu020Proof7:28.3.10B/LRevision:0OperatorSadK

10. IDR Holders may be subject to risks relating to fluctuations in foreign exchange
The price of the IDRs will be quoted in Rs. on the Stock Exchanges. The Deposited Shares are
quoted in GBP on the London Stock Exchange. Fluctuations in the exchange rate between the
Rs. and the GBP will affect the Rs. equivalent of the GBP price of the Shares on the London
Stock Exchange and, as a result, are likely to affect the price of the IDRs. Such fluctuations will
also affect the Rs. value of the proceeds an IDR Holder would receive upon the sale in the UK
of any Deposited Shares withdrawn from the IDR Facility pursuant to permission granted by
the RBI. There can be no assurance of the rate at which IDR Holders will be able to convertGBP proceeds into Rs. or any other currency. Furthermore, because the nominal value of the
Shares is represented in US$ and all payments in respect of those securities are to be made in
US$, an investment in the Shares and consequently in the IDRs entails risks for a purchaser
resident other than in the US or a purchaser that conducts its business or activities in a
currency other than US$. Under the Conditions, any cash dividend or other cash distribution
on, or in respect of, the Deposited Shares (including any amounts received in the liquidation of
the Company) received by the Depository from the Company will (to the extent reasonably
practicable for the Depository and subject to applicable law and regulation) be converted intoRs. before distribution to the IDR Holders. Depreciation of the US$ against the Rs. will result
in a decrease in value, expressed in Rs., of such distributions in the hands of the IDR Holders.
The Group has no control over a number of factors affecting these types of risks, including
economic, financial and political events that are important in determining the existence,magnitude and longevity of these risks and their results. In recent years, rates of exchange for
certain currencies, including the US$, GBP and HKD, have been volatile, and this volatility
may be expected to continue in the future. Fluctuations in any particular exchange rate that
have occurred in the past are not necessarily indicative of fluctuations in the rates that may
occur in the future.
This description of foreign currency risks does not describe all the risks of an investment in
securities denominated in a currency other than the home currency.
11. Any adverse change of law may affect the trading price of the IDRs
The terms of, and rights attaching to, the IDRs and the Shares are subject to various provisions
of both Indian law and English law. No assurance can be given as to the impact on the trading
price of the IDRs of any possible judicial decision or change to Indian law or administrative
practice or any possible judicial decision or change to English law or administrative practice
after the date of issue of the IDRs.
12. There is no prior market for the IDRs and no assurance can be given that one will develop toprovide liquidity for the IDRs
The IDRs do not have any trading market. The Company will apply to list the IDRs on the
Stock Exchanges. There is no assurance of such permission for listing being obtained. No
assurance can be given that an active trading market for the IDRs will develop, or as to the
liquidity or sustainability of any such market, the ability of IDR Holders to sell their IDRs or
the price at which IDR Holders will be able to sell their IDRs. If an active market for the
IDRs fails to develop or is not sustained, the trading price of the IDRs could fall. If an active
trading market were to develop, the IDRs could trade at prices that may be either higher or
lower than the initial offering price of the IDRs. There will be no market-makers for the IDRs.
13. If an IDR Holder wishes for any reason to withdraw Shares from the IDR facility, it may belimited in its ability to do so because of certain provisions of Indian law
The IDRs are not fungible with Shares and there are restrictions on the withdrawal of Shares
from the IDR facility, including an absolute prohibition on the withdrawal of Shares for a
period of one year following the date of the issue of the IDRs. In addition, each IDR Holder
will have to individually seek the approval of the RBI for any withdrawals following the end of
this one-year period and the process for seeking such approval remains unclear at present.
Further, residents in India are only permitted to hold the Shares for the purpose of sale and arerequired to sell the same within 30 days following withdrawal. This will adversely affect the
liquidity of the IDRs. There are a number of reasons why an IDR Holder may wish to
withdraw from its investment in the IDRs. If it wishes to do so, it has the option to sell those
IDRs. However, if that IDR Holder wishes to withdraw Shares from the IDR facility, it may be
restricted from doing so.
72
c102100pu020Proof7:28.3.10B/LRevision:0OperatorSadK

14. The IDRs may not be a suitable investment for all investors
Each potential investor must determine the suitability of any investment in the IDRs in light of
his/her/its own circumstances. In particular, each potential investor should:
* have sufficient knowledge and experience to make a meaningful evaluation of the IDRs,
the merits and risks of investing in the IDRs and the information contained in this Draft
Red Herring Prospectus;
* consult their legal advisers to determine whether and to what extent: (i) the IDRs are legal
investments for them; (ii) the IDRs can be used as collateral for various types ofborrowing; and (iii) other restrictions that apply to their purchase or pledge of the IDRs;
* have access to, and knowledge of, appropriate analytical tools to evaluate, in the context
of their particular financial situation, an investment in the IDRs and the impact such
investment will have on their overall investment portfolio;
* have sufficient financial resources and liquidity to bear all of the potential risks of an
investment in the IDRs;
* understand thoroughly the terms of the IDRs and the Shares and be familiar with the
behaviour of any relevant indices and financial markets; and
* be able to evaluate (either alone or with the help of a financial adviser) possible scenarios
for economic, interest rate and other factors that may affect their investment and their
ability to bear the applicable risks.
15. Economic developments and volatility in securities markets in other countries may cause the priceof the IDRs to decline
The securities markets are influenced by economic developments and volatility in securities
markets in other countries and, in particular, in other emerging markets. Investor reaction to
developments in one country may have an adverse effect on the market price of securities ofcompanies located in other countries. For instance, the economic downturn in the US and
several European countries from 2001 to 2003 adversely affected market prices in the world’s
securities markets. Financial markets in the United States, Europe and Asia, including India,
have been experiencing extreme disruption in the past two years, including, among other things,
volatility in security prices, severely diminished liquidity and credit availability, rating
downgrades of certain investments and declining valuations of others. These and other related
events, such as the collapse of a number of financial institutions, have had and continue to have
a significant adverse impact on the securities markets. Negative economic developments, such asrising fiscal or trade deficits, or a default on sovereign debt, in other emerging market countries
may affect investor confidence and cause increased volatility in securities.
16. IDR issue may raise concerns relating to tax treatment
The Income Tax Act and other regulations do not specifically refer to the taxation of IDRs.
IDRs may therefore be taxed differently from ordinarily listed shares issued by other companies
in India. In particular, income by way of capital gains may be subject to a higher rate of tax.
The tax treatment in future may also vary depending on the provisions of the proposed Direct
Taxes Code which is currently due to take effect from 1 April 2011 and which is only in draft
form at this time.
Investors are advised to consult their own tax advisers and to consider carefully the potential
tax consequences of an investment in IDRs. For further details please refer to ‘‘Indian Taxation’’
under section titled ‘‘Taxation Framework in India and UK’’ on page 407 of this Draft Red
Herring Prospectus.
17. Various factors may impact the continued listing of the IDRs
The IDR issuance and listing is made under the existing IDR regulatory environment and
market conditions in India. Material changes to such environment and conditions may cause the
Company to reassess the general viability of maintaining the listing of the IDRs in India. Thefactors for such consideration may include, among others, incremental costs relating to
regulatory compliance and program maintenance, the pricing and trading volume for the IDRs
and the local market perception towards the Company. The implementation of a decision to
discontinue the listing of the IDRs (and potentially to terminate the IDR Facility) would be
subject to then applicable laws and discussions with Indian regulators and the Stock Exchanges.
73
c102100pu020Proof7:28.3.10B/LRevision:0OperatorSadK

In addition, the Stock Exchanges may delist the IDRs for breach by the Company of applicable
rules and regulations. Pursuant to the Conditions, if the IDRs were to be delisted for any of
these reasons, an IDR Holder would be entitled to withdraw the Shares underlying that IDR
Holder’s IDRs, (the right to withdraw being subject to certain limitations described elsewhere inthis Draft Red Herring Prospectus). If any IDR Holder that withdraws the Shares underlying
the relevant IDRs wishes to hold such Shares in dematerialised form, it would need to make
appropriate arrangements to hold such Shares through CREST or CCASS, which may involve
appointing a third party custodian or other nominee. If the IDR Holder is unable to hold
Shares directly, and the IDR Facility is discontinued, those Shares will be sold at the prevailing
market rate and the cash distributed to that IDR Holder. The price received by IDR Holders
for those Shares following such sale may be higher or lower than the price paid for the IDRs
under the Issue and the average market price at which the IDRs are traded on the StockExchanges.
The IDRs will be delisted if the Shares are delisted. Pursuant to the Conditions, if this were tohappen, an IDR Holder would receive the Shares underlying that IDR Holder’s IDRs. The
mechanism for selling the Shares described above will not be available if the Shares are delisted.
The Company will not follow the reverse book building process (followed for delisting of equity
shares by Indian companies in India) in the event of delisting of the IDRs.
18. Potential abolition of the 1.5% SDRT charge on entry into a depository receipt system
Investors should be aware that on 1 October 2009 the European Court of Justice (‘‘ECJ’’) ruled,
in C-569/07 HSBC Holdings Plc, Vidacos Nominees Limited v The Commissioners of Her
Majesty’s Revenue & Customs, that the 1.5% SDRT charge on the issue of shares into a
clearance service is contrary to EU law. Although the decision of the ECJ deals with the issue
of chargeable securities into a clearance system, HM Revenue and Customs have implied that
they accept that the same reasoning applies to an issue of chargeable securities into a depository
receipt arrangement, but dispute that this extends to issuers of depository receipts which are
resident outside the EU. As such, there remain uncertainties as to territorial scope and as to
how the decision may impact depository receipts. If the decision is held to apply to the issue of
securities into non-EU depository receipt schemes, the 1.5% SDRT charge may be unlawful. It isat this stage unclear whether legislative change will be introduced to charge transfers of
depository receipts where either no entry charge has been paid or the entry charge has been
reclaimed.
Risks to IDR Holders who cancel their IDRs and become shareholders
19. IDR Holders that are able to cancel their IDRs and become shareholders of the Company may stillbe subject to certain limitations not applicable to other shareholders
Under Indian law, IDR Holders that are resident in India are only permitted to hold the Sharesunderlying their IDRs for the purpose of sale and are required to sell the shares within a period
of 30 days following the withdrawal.
In addition, IDR Holders may also be subject to certain risks that are not applicable to other
shareholders of the Company if there is a distribution by the Company in the form of an issue
of additional Shares to existing shareholders. In particular, IDR Holders are unlikely to be able
to receive additional Shares from the Company in a rights offering or a bonus issue of shares or
following an election made, at their option, to receive scrip dividend from the Company (if
offered by the Company). This is because of the continuing application of certain provisions of
Indian law to distributions made by the Company in India. See the risk factor titled ‘‘Certain
corporate actions of the Company may entitle existing shareholders of the Company to receive
further Shares from the Company. However, the ability of IDR Holders to receive such further
Shares from the Company (either in the form of Shares or IDRs representing the Shares) may be
restricted’’ above.
74
c102100pu020Proof7:28.3.10B/LRevision:0OperatorSadK

THE CONSIDERATIONS SET OUT ABOVE ARE NOT INTENDED TO BE A
COMPREHENSIVE LIST OF ALL CONSIDERATIONS RELEVANT TO A DECISION TO
PURCHASE OR HOLD ANY OF THE IDRs.
Notes to risk factors:
Issue of 220,000,000 IDRs at an offering price of Rs. [*] per IDR with every [*]* IDRs
representing one Share.
The Issue is being made through a 100% Book Building Process where at least 50% of the Issue shall
be Allotted to QIBs on a proportionate basis. Provided that the Company may allocate up to 30% of
the QIB Portion to Anchor Investors on a discretionary basis out of which one-third shall be reserved
for domestic Mutual Funds. 5% of the QIB Portion (excluding the Anchor Investor Portion) shall beavailable for allocation on a proportionate basis to Mutual Funds only, and the remainder of the
QIB Portion shall be available for allocation on a proportionate basis to all QIB Bidders, including
Mutual Funds, subject to valid Bids being received at or above the Issue Price. Furthermore, not less
than 20% of the Issue will be available for allocation on a proportionate basis to Non-Institutional
Bidders and not less than 30% of the Issue will be available for allocation on a proportionate basis
to Retail Individual Bidders. Under-subscription, if any, in any category except the QIB Portion,
would be allowed to be met with spill-over from any other category or combination of categories at
the discretion of the Company in consultation with the BRLMs and the Designated Stock Exchange.
The net worth of the Group was US$27,340 million as of 31 December 2009 as per the Group’s
financial statements included in this Draft Red Herring Prospectus.
For any clarification or information relating to the Issue, investors may contact the BRLMs or the
Company, who will be obliged to provide such clarification or information to the investors at large.
No selective or additional information would be available for a section of investors in any mannerwhatsoever.
Investors may contact the Compliance Officer or the Registrar to the Issue for any complaintspertaining to the Issue.
Allotment and trading in IDRs for all investors shall be in dematerialised form only.
Investors are advised to refer to the section titled ‘‘Basis for Issue Price’’ on page 344 of this Draft
Red Herring Prospectus.
75
c102100pu020Proof7:28.3.10B/LRevision:0OperatorSadK
*Exchange Ratio will be finalised and disclosed at the stage of filing of the Red Herring Prospectus with the Registrar of Companies, NewDelhi.

INDUSTRY
INDUSTRY OVERVIEW
GLOBAL ECONOMIC OVERVIEW
The global economy is starting to recover after the events of the past two years ended the strongest
period of global growth and profitability in recent history. However, the global recovery is occuring
at different rates in different regions. Economic growth has solidified and broadened to advanced
economies in the second half of 2009 (source: IMF, World Economic Outlook, January 2010). The
International Monetary Fund (the ‘‘IMF’’) World Economic Outlook revised its outlook for World
GDP growth in January 2010 from its earlier report published in October 2009. The IMF now
predicts a 4% increase in world output in 2010 which represents an upward revision of 75 basispoints from the October 2009 estimate. In most advanced economies, recovery is expected to remain
sluggish by past standards, whereas in many emerging and developing economies, activity is expected
to be relatively vigorous, largely driven by buoyant internal demand. Policies need to foster a
rebalancing of global demand, remaining supportive where recoveries are not yet well sustained.
This recovery of the global economy has been led by stimuli provided by governments around the
world. Monetary policy has been highly expansionary, with interest rates at record lows in most
advanced and in many emerging economies, while central bank balance sheets expanded to
unprecedented levels in key advanced economies. Fiscal policy has also provided major stimulus in
response to the downturn.
These measures have helped the economic recovery with major equity indices such as the Dow Jones
Industrial Average, the S&P 500, the NASDAQ composite, the FTSE, the Dow Jones Euro Stoxx 50,the Nikkei and the Hang Seng having risen by up to 52% between January 2009 and December 2009
(source: Bloomberg) indicating that markets are starting to see some signs of stability. The Chicago
Board Options Exchange SPX Volatility Index (a measure of volatility) which reached a peak of
80.86 in November 2008 in the wake of the collapse of Lehman Brothers averaged only 31.49 from
January 2009 to December 2009 (source: Bloomberg).
Output in the advanced economies is now expected to expand by 2.1% in 2010, following a sharp
decline in output in 2009. However, recovery in advanced economies is still expected to be weak by
historical standards, with real output remaining below its pre-crisis level until late 2011. On the other
hand, growth in emerging and developing economies is expected to rise to about 6% in 2010,
following a modest 2% growth in 2009. Stronger economic frameworks and swift policy responseshave helped many emerging economies to cushion the impact of the unprecedented external shock
and quickly re-attract capital flows.
Exchange rates and inflation
The value of the US Dollar relative to a broad group of currencies rose during 2008 and the first
part of 2009 as the United States currency strengthened against those of its trading partners. Astrengthened US Dollar in large measure was the result of a flight to cash in exchange for a perceived
‘‘safe haven’’ currency. In the first half of 2008 the Euro rose 7% against the US Dollar and then fell
14% from July to December. The Euro had previously gained 30% against the US Dollar between
January 2006 and its peak in July 2008. The British Pound, the Canadian US Dollar and the Korean
won all displayed similar trends, falling sharply against the dollar in the second half of 2008, after a
long period of appreciation (source: WTO, World Trade Report 2009).
However, 2009 has seen the global currencies recover against the US Dollar after witnessing this
period of volatility as exchange flows are directed towards emerging and other economies with higher
return oportunities. By the end of 2009 major currencies like the Euro, British Pound and Japanese
Yen have recovered between 2.7-12.9% from the lows of November 2008. (source: Bloomberg).
Capacity utilization levels remain low and well-anchored inflation expectations are expected to containinflationary pressures. In advanced economies, headline inflation is expected to pick up from zero in
2009 to 1.25% in 2010, as rebounding energy prices more than offset slowing labour costs. In
emerging and developing economies, inflation is expected to rise to 6.25% in 2010, as some of these
economies may face growing upward pressures due to more limited economic slack and increased
capital flows (source: IMF, World Economic Outlook, January 2010).
76
c102100pu020Proof7:28.3.10B/LRevision:0OperatorSadK

World Trade
World trade flows sagged and production slumped, first in developed economies and then in
developing countries due to signs of sharp deterioration in the global economy in the second half of2008 and the first few months of 2009. (source: WTO, World Trade Report 2009). However, global
trade bounced back in the second half of 2009. Confidence rebounded strongly on both the financial
and real fronts, as extraordinary policy support forestalled another Great Depression. In advanced
economies, the beginning of a turn in the inventory cycle and the unexpected strength in US
consumption contributed to positive developments. Final domestic demand was very strong in key
emerging and developing economies. Despite recovery in the second half of 2009, world trade volume
is expected to have contracted by 12.3% in 2009 (source: IMF, World Economic Outlook, January
2010).
However, world trade is expected to rebound in 2010 and 2011 in line with global economic recovery.
World trade volume is expected to grow by 5.8% and 6.3% in 2010 and 2011 respectively. Both
emerging and advanced economies are expected to show positive growth in trade with imports inemerging economies rising by 6.5% and in advanced economies by 5.5% in 2010. In 2010, exports for
emerging economies and advanced economies are expected to rise by 5.4% and 5.9% respectively
(source: IMF, World Economic Outlook, January 2010).
Asia
Asia is estimated to have grown by 2.8% in 2009 on the back of strong growth by emerging Asian
economies. Industrial economies are estimated to have contracted by 4.4% overall with Japan
contracting by 5.4% in 2009. Asia is rebounding fast from the depths of the global crisis as the world
pulls out of recession. As international trade and finance normalizes, it is expected to generate an
outsized Asian upturn. Asia’s recovery has been aided by a thawing of international capital markets,which has restored firms’ access to critical long-term equity and debt financing. Additionally, Asia’s
relatively strong initial conditions have given it the space to cut interest rates sharply and adopt large
fiscal stimulus packages. As a result, overall domestic demand has held up remarkably well. In line
with global recovery, Asia is expected to grow by 5.8% in 2010 led by China and India and with all
major Asian economies showing positive GDP growth. (source: IMF, Regional Economic Outlook
(Asia), October 2009).
China
China’s economy boomed in recent years, growing by more than 11% in 2006 and 2007 (source: IMFWorld Economic Outlook Database, April 2008). However, the growth slowed, with the economy
growing 9.6% and 8.7% in 2008 and 2009 respectively (source: IMF, World Economic Outlook,
January 2010). Public spending accelerated in 2009 as fiscal stimulus was used to support the
economy, notably through a range of infrastructure projects, such as railways, airports, environmental
infrastructure and low-cost housing. Fiscal inflows picked up sharply in the second half of 2009,
offsetting a very weak first half. The People’s Bank of China (China’s central bank) has begun to
tighten monetary and credit policy though it still remains very loose. Total lending growth is likely to
fall from the elevated levels of 2009, but is still expected to be buoyant in 2010 (source: EIU). Chinais expected to grow at 10.0% in 2010 and 9.7% in 2011 (source: IMF, World Economic Outlook,
January 2010) and is expected to continue to be a major engine of global growth (source: National
Bureau of Statistics, China).
India
The Indian economy has enjoyed a strong annual growth rate of above 9% in the period from 2005
to 2007, in comparison to the previous trend of around 6% during 1995-2004 (source: IMF, World
Economic Outlook, April 2009). India is in a relatively comfortable position compared with other
Asian economies due to its relatively closed economy. Thus, the immediate result of lower export-demand was not felt in India in the same way as in some of the more export-driven South East
Asian economies. India’s GDP grew by 7.3% and 5.6% in 2008 and 2009 respectively (source: IMF,
World Economic Outlook, January 2010). Growth in industrial production, investment and exports
has rebounded on the back of government stimulus measures, pent-up domestic demand and low
interest rates (source: EIU). India is expected to grow at 7.7% and 7.8% in 2010 and 2011
respectively (source: IMF, World Economic Outlook, January 2010).
The relatively limited impact of the global financial crisis on the Indian economy coupled with the
fact that many domestic macroeconomic indicators are looking healthier and the recent surge in
77
c102100pu020Proof7:28.3.10B/LRevision:0OperatorSadK

inflation suggest that interest rates could move upward. In October 2009 the Reserve Bank of India
(RBI, the central bank of India) had to raise its inflation target for March 2010 to 6.5%, from the
5% target set previously. The current rate of inflation for primary articles stands at 14.2% for the
week ended 3 March 2010 (source: RBI). Amid this surge in inflation, the RBI has been underpressure to tighten monetary policy. The RBI announced a hike in the cash reserve ratio (‘‘CRR’’) by
75 basis points in two stages to take it to 5.75%. The repurchase (repo) rate is forecast to be raised
to 6% by the end of 2010 and to 6.75% by the end of 2011, but the increasing upside inflationary
risks means that there is a possibility of greater or faster monetary tightening (source: EIU). On 19
March 2010, the RBI raised the repo rate and reverse repo rate by 25 basis points each to 5.0% and
3.5% respectively.
Hong Kong
Hong Kong has experienced strong and broad-based economic growth in recent years. Real GDP has
grown year-on-year at a rate of 7.0% and 6.4% in 2006 and 2007 respectively (source: Hong Kong
Trade Development Council – Economic and Trade Information on Hong Kong, 30 December 2008).
In 2008, Hong Kong’s real GDP growth came down to 2.5% impacted by the global economic crisis
(source: IMF, World Economic Outlook, April 2009). Hong Kong’s economy grew on a quarter-on-quarter basis in both the second and third quarters of 2009. Despite this, GDP is still estimated to
have contracted by 3.5% in 2009 as a whole, owing to a slump in exports (source: EIU).
Hong Kong is expected to grow by 4.6% and 3.7% in 2010 and 2011 respectively. Consumer
confidence is likely to be boosted by an improvement in the job market, increase in nominal wages
and rising visitor arrival numbers as world tourism and business travel pick up. Trade flows will also
improve considerably relative to their 2009 levels. The rise in trade is expected to impart momentum
to job creation and as businesses become confident to take advantage of loose credit conditions,
investment is expected to rise. Inflationary pressures are not expected to be a major concern in HongKong in 2010 and 2011. Consumer price inflation is forecast to average only 2.2% in the period,
following average inflation of just 0.5% in 2009.
Singapore
Singapore is a strong, free-market economy. It has very low levels of corruption and among the
highest per capita income in the world. The economy is heavily dependent on exports, particularlyconsumer electronics, information technology products, and increasingly bio-technology and
pharmaceuticals. The rate of growth of Singapore’s economy decreased in the period from 2001 to
2003 due to the global recession, the slowdown in the growth of the technology sector and an
outbreak of Severe Acute Respiratory Syndrome in 2003, which adversely impacted tourism and
consumer spending. The government implemented various fiscal and monetary policies in the period
from 2004 to 2007 in order to facilitate the recovery of Singapore’s economy. Due to these policies
Singapore witnessed a real GDP growth averaging 7% annually (source: Central Intelligence Agency
(the ‘‘CIA’’) The World Factbook Singapore 2 October 2008).
The economy grew by 1.1% in 2008 and is estimated to have contracted by 2.1% in 2009. However,
in line with an improvement in the global economy, and owing to the fiscal and monetary measures
adopted by the government, Singapore’s economy is forecast to grow by 4.9% and 4.8% in 2010 and
2011 respectively. The main drivers of growth are expected to be private consumption and gross fixed
investment, with the increase in the latter being spurred by government investment. Net exports of
goods and services will be supported by stronger global economic growth. Following an eight-month
spell of deflation from April 2009, consumer prices are expected to return to an upward trend in
2010, with annual inflation set to average 2.3% in 2010 (source: EIU).
Malaysia
The Malaysian economy was growing at a healthy pace at the start of 2008 despite the global
slowdown. The GDP growth rate was over 4.6% in 2008 (source: IMF, World Economic Outlook,
April 2009). This followed GDP growth of 6.3% in 2007, driven by high commodity prices, consumer
spending and steady investment, and was supported by the Malaysian government’s fiscal spending.While manufacturing exports underperformed in 2008, this was offset by high commodity prices, with
the rural economy benefiting from high palm oil prices. Malaysia is Asia’s largest producer of
commodities and the region’s only net exporter of oil.
However, the Malaysian economy is estimated to have contracted by 2.4% in 2009, its largest
contraction since the 1997-1998 Asian financial crisis. In line with global recovery, Malaysia is
78
c102100pu020Proof7:28.3.10B/LRevision:0OperatorSadK

expected to post a GDP growth of 3.7% and 4.0% in 2010 and 2011 respectively. A pick-up in
economic activity in Singapore, the US, Japan and the Euro area this year will help to stimulate
Malaysia’s external economy, as these four centres combined account for approximately 53% of
Malaysian exports. Price pressures are likely to remain subdued in 2010, when consumer priceinflation is expected to average 1.5%. Reductions in the fuel subsidy will generate upward price
pressure, but other factors are likely to have a dampening effect on prices (source: EIU).
South Korea
The South Korean economy is primarily driven by exports and thus has suffered significantly from
the contraction in demand from the developed economies. A shortage of US Dollar liquidity has also
been a problem, though the provision of a US Dollar swap line with the US should alleviate the
problem. Therefore, having suffered particularly acutely at the start of the financial crisis, prospects
for South Korea are now stabilising. The country saw GDP growth of 2.2% in 2008 and 0.5% in
2009. The economy is expected to recover, over time, taking into account the weaker Korean Won, a
fiscal stimulus and significant rate cuts. South Korea’s GDP is projected to grow by 4.9% and 4.0%in 2010 and 2011 respectively (source: EIU).
Europe
Europe has been severely tested in the recent economic downturn, with both emerging Europe andWestern Europe suffering. Many countries have experienced negative growth, most notably Germany
and the UK.
After gathering pace through early 2009, the contraction appears to have ended in mid-2009, helped
by rebounding confidence and a tentative recovery of global trade. Headline inflation remains low,
reflecting developments in commodity prices and weak demand, especially investment. Interest rate
cuts, unconventional monetary measures, and rapidly accumulating fiscal deficits helped put a floorunder falling economic activity and an array of financial sector interventions succeeded in dissipating
systemic hazards and lifting risk appetite and asset prices. (source: IMF, Regional Economic Outlook
(Europe), October 2009).
The recovery is expected to be slow with rising unemployment and scarcity of credit as banks
continue to deleverage their balance sheets, weighing on economic activity. Strong policy action across
many advanced and emerging economies has helped stabilize demand. Equity values are well off theirlows and there are signs that declines in housing prices are abating, but with credit declining and
unemployment looking set to rise, upward momentum is likely to remain weak for some time (source:
IMF, Regional Economic Outlook (Europe), October 2009).
As a result the outlook for 2010 is moderately positive with Europe expected to grow by 0.8%
overall, with advanced European economies and emerging European economies expected to grow by
0.5% and 1.7% respectively (source: IMF, Regional Economic Outlook (Europe), October 2009.
Middle East and North Africa (‘‘MENA’’)
With the high oil prices and strong interest of the global investors in the region, the Middle East and
North Africa (MENA) region grew by 5.1% on average during 2000-2008. However, the sharpdecrease in oil prices in the second half of 2008, the food crisis and the global financial crisis have
created some concerns for the countries of the region. GDP growth is expected to be as low as 2.2%
in 2009. The region’s growth advances have had some spillovers for job creation, but unemployment
remains the greatest development challenges facing the region. Much of the economic landscape of
the MENA region has changed positively but with the persistence of the financial crisis and the
uncertain global economic environment, MENA faces prospects of a high impact of the global crisis
on its real economy due to adverse developments or uncertainty in international trade, oil prices,
tourism, remittances, and international financing conditions (source: World Bank Brief: Middle Eastand North Africa Region, October 2009).
Sub-Saharan Africa
After nearly a decade of strong economic performance, the growth in Africa’s sub-Saharan economyreduced to 1.6% in 2009 from 5.6% in 2008 (source: IMF, World Economic Outlook, January 2010).
The downturn has slashed the exports of many sub-Saharan countries and disrupted capital flows. Oil
exporters and middle income countries have been particularly hard hit, with low-income countries to
a relatively lower extent. Relatively prudent policies during the upswing have provided space for
domestic economies to absorb some of the shocks, supported by specific countercyclical measures.
79
c102100pu020Proof7:28.3.10B/LRevision:0OperatorSadK

Financial sectors in a number of sub-Saharan countries have come under strain. However, they have
largely escaped the huge contractions and losses witnessed in many other countries.
Looking ahead, the budding recovery in the global economy is expected to sustain a revival in
Africa’s sub-Saharan economic growth to 4.3% in 2010 and 5.5% in 2011 (source: IMF, Regional
Economic Outlook (Sub-Saharan Africa), October 2009 & IMF, World Economic Outlook, January
2010).
United States
The US is the largest and most technologically advanced economy in the world, with an estimated
per capita GDP of US$46,900 (source: CIA, The World Factbook). The rise in US GDP in the
period from 2004 to 2007 was driven by substantial gains in productivity. However, a rising budget
deficit, entitlement liabilities in respect of the significant numbers of people who are retiring and
entering the social security system, a low savings rate and a large current account deficit are among
the concerns facing the US economy. The merchandise trade deficit reached a record US$840 billion
in 2008 before shrinking to US$450 billion in 2009. The global economic downturn, the sub-prime
mortgage crisis, investment bank failures, falling home prices, and a tightening of credit pushed theUnited States into a recession by mid-2008. GDP contracted till the third quarter of 2009, making
this the deepest and longest downturn since the Great Depression. To help stabilize financial markets,
the US Congress established a US$700 billion Troubled Asset Relief Program (TARP) in October
2008. The government used some of these funds to purchase equity in US banks and other industrial
corporations. In January 2009 the US Congress passed, and President Barack Obama signed, a bill
providing an additional US$787 billion fiscal stimulus to be used over 10 years - two-thirds on
additional spending and one-third on tax cuts - to create jobs and to help the economy recover.
Approximately two-thirds of these funds will have been injected into the economy by the end of 2010(source: CIA, The World Factbook).
US GDP contracted by 2.5% in 2009 but is expected to bounce back to 2.5% growth in 2010. The
strength of growth in 2010 largely reflects massive stimulus and partial reversal of sharp cuts in
inventories. The US economy is expected to grow by 1.4% in 2011 as policy support is withdrawn at
a slightly slower pace than previously expected (source: EIU).
The Federal Reserve (the Fed, the central bank of the US) remains focused on finding the right
balance between providing sufficient support for the recovery and the risk of excessive inflation.
Inflation has picked up in recent months. The large demand shortage caused by the downturn will
exert strong downward pressures on prices in 2010 and in 2011. Core inflation (excluding energy and
food) is expected to remain positive, but there is a risk of a sustained decline in prices, as the
depressed state of household finances undermines business pricing power and the weak labour marketreduces workers’ bargaining potential in wage negotiations (source: EIU).
The Federal Reserve Board on 10 February 2009 announced that it is prepared to undertake a
substantial expansion of the Term Asset-Backed Securities Loan Facility (‘‘TALF’’). The expansion
could increase the size of the TALF to as much as US$1 trillion and could broaden the eligible
collateral to encompass other types of newly issued AAA-rated ABS, such as CMBS, private-label
RMBS, and other ABS. An expansion of the TALF would be supported by the provision by the USTreasury of additional funds from the TARP. The Federal Reserve Board’s objective in expanding
the TALF would be to provide additional assistance to financial markets and institutions in meeting
the credit needs of households and businesses and thus to support overall economic growth in the
current period of severe financial strains (source: Federal Reserve website).
On 14 January 2010, the US President announced his intention to propose a Financial CrisisResponsibility Fee that would require the largest and most highly levered Wall Street firms to pay
back taxpayers for the assistance provided so that the TARP program does not add to the deficit.
The proposed fee would be levied on the debt of financial firms with more than US$50 billion in
consolidated assets. Both domestic firms and US subsidiaries of foreign firms would be subject to the
fee. The proposed fee would be assessed at approximately 15 basis points of Covered Liabilities(where Covered Liabilities = Assets – Tier 1 capital – FDIC-assessed deposits (and/or insurance policy
reserves, as appropriate)). The fee, which could come into effect on 30 June 2010, would last at least
10 years. If the costs have not been recouped after 10 years, the fee would remain in place until they
are paid back in full. Complete details of the proposed Financial Crisis Responsibility Fee will be
released in conjunction with the President’s budget. The proposal is subject to approval by Congress.
80
c102100pu020Proof7:28.3.10B/LRevision:0OperatorSadK

On 21 January 2010, the US president announced a proposal to restrict the size and scope of banks
and other financial institutions to rein in excessive risk taking and to protect taxpayers. The proposal
is subject to approval by Congress.
On 18 February 2010 the Federal Reserve made modifications to the terms of its discount window
lending programs in light of an apparent improvement in financial market conditions. The Federal
Reserve increased the primary credit rate from 0.5% to 0.75%, which became effective on 19 February2010 (source: Federal Reserve).
United Kingdom
The UK’s growth remained in the 2% to 3% range from 2004 to 2008, outpacing most of Europe
(source: CIA, The World Factbook United Kingdom, 15 July 2008). Services, particularly banking,
insurance and business services, account for by far the largest proportion of GDP while industry
continues to decline in importance. London’s prominence in these areas has been a significant sourceof growth in recent years, but now as unemployment and uncertainty in these areas rise with the
financial crisis, the results are being felt throughout the economy. The UK’s GDP growth slowed
down to 0.7% in 2008 and is estimated to have contracted by 4.8% in 2009 (source: IMF, World
Economic Outlook, January 2010). Economic policy remains focused on containing the fallout from
the financial and economic crisis. Government measures to support the financial sector via an array
of state-funded loans, guarantees and capital injections total around £1trn (US$1.7trn; 75% of GDP),
with taxpayers holding major stakes in two large UK banks – the Royal Bank of Scotland and
Lloyds Banking Group.
The UK has started to show signs of recovery with the economy officially crawling out of recession
in the final three months of 2009 with quarterly growth of 0.3%. Current trends continue to point to
a stabilisation in macroeconomic conditions and headline GDP is likely to receive a temporary boostfrom inventory rebuilding. Private-sector balance sheets have improved slightly and private
consumption is expected to see a modest rise in 2011. GDP is expected to grow by 0.7% and 0.9%
in 2010 and 2011 respectively (source: EIU).
81
c102100pu020Proof7:28.3.10B/LRevision:0OperatorSadK

BANKING SECTOR OVERVIEW
Trends
Recent developments
The financial system has been significantly stabilised over the past six months, underpinned by the
authorities’ sustained support for the banking system and monetary policy measures. Low risk-free
interest rates and reduced uncertainty among investors have led to a rebound in a range of asset
prices. Activity in many capital markets has resumed, reducing financing risks for some borrowers.
The market rally has boosted bank profits and lowered concerns about potential future losses, and
banks have raised further external capital. As solvency concerns have eased, banks have been able to
issue unguaranteed term debt, helping them to reduce their reliance on short-term funding (source:
Bank of England, Financial Stability Report, December 2009).
Market liquidity
The recent disruption of the credit markets has resulted in assets being moved back onto the balance
sheets of banks. This has reduced banks’ ability to lend. The disruption has created an imbalance
between the supply and demand for many classes of financial assets and has led to debt traders
adopting a very cautious approach to the purchase of any securities which are neither fully
transparent in risk profile nor of assured liquidity. Although this liquidity strain began in the asset-
backed securities markets, it has since spread to more traditional investment classes. Banks are now
limited to their available capital and funding resources for the sourcing of assets. This environment isless disruptive to banks that fund their lending through deposits than those that historically relied on
the securitisation markets for funding.
Progressive alignment of the capital adequacy framework towards economic capital
As banks have implemented the Basel II requirements in respect of capital adequacy, their capital
requirements have been more closely aligned with their risk profiles. Future increases in capital
requirements and changes in capital regulations are expected as a result of measures taken to address
the causes of the recent financial crisis. In an environment of economic uncertainty many banks mayneed to reduce lending due to forecasted increases in capital requirements arising from their exposure
to credit risk together with anticipated future higher capital requirements. Banks’ reduction in risk
appetite may, potentially, accelerate the deterioration in credit quality as credit availability is
restricted during a downturn in the economic cycle. When coupled with a lack of market liquidity
this may lead to polarisation within the banking system. Banks with greater capital and liquidity
resources will be better placed to meet the ongoing banking requirements of their customers than
other banks which are more constrained in this regard.
Increasing product competition
As markets develop, banks are exposed to an increasingly competitive environment, resulting in
falling margins. In particular, the increased level of foreign ownership in a number of markets has
resulted in intense competition as foreign financial institutions continue to transfer know-how and
capital to these markets. As the global economy continues to become more integrated, market
convergence accelerates. Less developed markets become more stable in terms of economic
development, funding costs for banks decrease, and the level of customer and product sophistication
increases. With increasing GDP per capita, the need for more sophisticated banking products is rising
quickly in various markets, generating significant cross-selling opportunities for a number of value-added products such as asset management products, insurance and credit cards. Many banks have
taken initiatives to realise the potential of selling these products to generate higher income. The level
of competition regarding these product areas therefore continues to increase.
Consolidation
The banking industry is consolidating, both regionally and within individual countries. Continued
local consolidation will most likely be induced by existing economies of scale, in particular in retail
banking, as well as by the competitive advantage that foreign-owned banks enjoy due to premium
consumer perception and better access to funding, in addition to frequently having a moresophisticated product offering. The trend towards consolidation in the global financial services
industry is stimulating the emergence of competitors in the market offering broad ranges of products
and services, broad access to capital, and greater operating efficiency and pricing power. This is
coupled with a shift from mere price competition to competition based on other factors such as
innovation, customer service and the range of products and services offered.
82
c102100pu020Proof7:28.3.10B/LRevision:0OperatorSadK

Advances in technology
The number of customer transactions continues to grow at a considerably higher rate than the growth
of the underlying balances or accounts. Many banks are therefore seeking to reduce the cost ofservicing individual transactions to maintain their profit margins. Installing automated, secure
transaction channels requires significant investment and therefore gives larger-scale banks a
competitive advantage. Despite widespread adoption by both banks and customers of these new
transaction methods, the reduction in the use of traditional transaction methods has been slower than
expected with many banking customers preferring to use the old methods. However, there is a trend
among the younger portfolio of customers of increased use in system-aided self-service methods,
particularly for savings accounts, credit cards and simple investments.
It is likely that the use of 24-hour self-service channels, such as ATMs, internet, mobile phone and
voice response units and the sophistication of products sold via such channels will increase, as such
services become increasingly commonplace. The growing importance of these channels may reduce the
importance of extensive branch networks and result in increased competition from other financial
institutions. It may also lower barriers to entry into the market for new competitors such as providersof direct or electronic banking services.
Changes in regulation
Initiatives such as Basel II and the EU Directive 2009/111/EC, together with the increasingly
international scope of financial services, have raised the level of cooperation between regulatory
authorities in different countries. Enhanced understanding of how risks are originated and dispersed
in modern financial markets has reinforced the need to address how best to regulate the increasingly
integrated and international nature of banking and financial services; this has been evidenced
throughout the financial crisis in coordinated discussions between countries and international
institutions. In addition, the enlargement of the EU, the introduction of MiFID and the continued
effort to endorse consistent standards and enforcement have encouraged regulatory bodies to worktogether more closely. Interaction and cooperation have led to competitive and regulatory issues
emerging in one country rapidly being taken up in other jurisdictions or on a supra-national basis.
Uniform standards, however, continue to be complicated by differing local interpretations or
additional local laws and regulation.
REGIONAL OVERVIEW
India
(source: All the data in this section has been sourced from materials prepared by the government of
India and the RBI).
Reserve Bank of India
The RBI is the central bank of India. It is the central regulatory and supervisory authority for banksoperating in India. The RBI is responsible for:
* managing money supply and foreign exchange including through the establishment of monetary
policies;
* serving as the central bank for the government of India; and
* issuing guidelines on exposure limits, asset classification, investment valuation and capital
adequacy for commercial banks, long-term lending institutions, non-banking finance companiesand other specialised and government-owned financial institutions. The RBI requires these
institutions to report to it on a regular basis.
The Indian financial sector was subject to stringent regulations until the early 1990s. During this
period, interest rates were administered and asset allocation was governed through various formal andinformal mechanisms and strict controls limited the entry into, and the expansion of, the financial
sector. In 1991, the government of India initiated a reform programme for India, which encompassed
the financial sector.
Commercial banks: Commercial banks in India focus on the short-term financial needs of entitiesundertaking industrial, trade or agricultural activities. As of 31 March 2009, there were 171
‘‘scheduled commercial banks’’ in the country, with a network of 79,056 branches holding
approximately Rs. 39.37 trillion in deposits and Rs. 28.58 trillion in loans. Scheduled commercial
banks are banks that are listed in the schedule to the RBI Act as public sector banks, private sector
banks or foreign banks.
83
c102100pu020Proof7:28.3.10B/LRevision:0OperatorSadK

Public sector banks: Public sector banks form the largest of the three categories of scheduled
commercial banks in India. These banks include the State Bank of India and its seven associate
banks, 20 nationalised banks and 86 regional rural banks. In aggregate, these banks had 70,019
branches, and accounted for 77% of the outstanding gross bank credit and 76% of the aggregatedeposits of the scheduled commercial banks as at 31 March 2009. The public sector banks’ large
network of branches enables them to fund themselves from deposits at low cost.
Private sector banks: In July 1993, as part of the banking reform process and as a measure to induce
competition in the banking sector, the RBI permitted entry of the private sector into the banking
system. As at 31 March 2009, there were 23 private sector banks with a network of 8,761 branches
accounting for 11% of the total branch network of scheduled commercial banks in the country. As at
31 March 2009, private sector banks accounted for approximately 18% of aggregate deposits and 18%
of outstanding gross bank credit of the scheduled commercial banks.
Foreign banks: As of 31 March 2009, foreign banks had 276 branches operating in India, accounting
for 6% of the aggregate deposits and 5% of the outstanding gross bank credit of scheduled
commercial banks. As part of the liberalisation process, the RBI has permitted foreign banks to
operate more freely, subject to requirements largely similar to those imposed on domestic banks.While the primary activity of most foreign banks in India has traditionally been in the corporate
sector, some of the larger foreign banks have increasingly made consumer financing a larger part of
their portfolios, offering an array of products such as automobile finance, home loans, credit cards
and household consumer finance.
The RBI issued a notification, entitled ‘‘Roadmap for presence of foreign banks in India’’, on 28
February 2005, announcing the following measures with respect to the presence of foreign banks:
* during the first phase (up to March 2009), foreign banks will be allowed to establish a presence
by setting up wholly-owned subsidiaries or by converting existing branches into wholly-owned
subsidiaries;
* in addition, during the first phase, foreign banks will be allowed to acquire a controlling stake
in a phased manner only in private sector banks that are identified by the RBI for restructuring;
* for new and existing foreign banks, it has been proposed to go beyond the existing World Trade
Organization commitment of allowing increases of 12 branches per year. A more liberal policy
will be adopted in areas with a lower presence of bank branches; and
* during the second phase (from April 2009 onwards), after a review of the first phase, foreign
banks will be allowed to acquire up to 74% of private sector banks in India.
However, in view of the current global financial market turmoil, there are uncertainties surrounding
the financial strength of banks around the world. Further, the regulatory and supervisory policies at
national and international levels are under review. In view of this, it has been decided, for the time
being, to continue with the current policy and procedures governing the presence of foreign banks in
India. The proposed review will be taken up after due consultation with the stakeholders once there
is greater clarity regarding stability, recovery of the global financial system, and a sharedunderstanding on the regulatory and supervisory architecture around the world.
In its January 2010 review of monetary policy, the RBI highlighted its concern on managing recoveryand inflation. It announced an increase in cash reserve ratio from 5.0% to 5.75% in two stages; the
first stage of increase of 50 basis points was effective from 13 February 2010, followed by the next
stage of 25 basis points effective 27 February 2010. As a result of the increase in the CRR, about Rs.
36,000 crore of excess liquidity was absorbed from the system. On 19 March 2010, the RBI raised the
repo rate and reverse repo rate by 25 basis points each to 5.0% and 3.5% respectively.
84
c102100pu020Proof7:28.3.10B/LRevision:0OperatorSadK

Market Share of Major Commercial Banks as at 31 March 2009
Deposits Loans
Public Sector Banks % %
State Bank of India 18.3 18.1
Canara Bank 4.6 4.6
Punjab National Bank 5.2 5.2
Private Sector Banks
ICICI Bank 5.4 7,3
HDFC Bank 3.5 3.3
AXIS Bank 2.9 2.7
Foreign Banks
Citibank 1.3 1.3Hong Kong & Shanghai Banking Corporation 1.2 0.9
Standard Chartered Bank 1.0 1.3
Cooperative Banks
Cooperative banks cater to the financing needs of persons conducting agriculture and small-scale
industry and self-employed businessmen in urban and semi-urban areas of India. The state-owned
land development banks and the primary land development banks provide long-term credit foragriculture. At present, the RBI is responsible for the supervision and regulation of urban cooperative
banks, and the National Bank for Agriculture and Rural Development is responsible for the
supervision of state and district cooperative banks. The RBI has been granted the authority to
regulate all cooperative banks in India by the provisions of the Banking Regulation (Amendment)
and Miscellaneous Provisions Act, 2004.
Long-Term Lending Institutions
Long-term lending institutions such as IDFC Limited, IFCI Limited, ICICI Limited (prior toamalgamation) and the Industrial Investment Bank of India were established to provide medium-term
and long-term financial assistance to various industries for the establishment of new projects and for
the expansion and modernisation of existing facilities. These institutions provide fund-based and non-
fund-based assistance to industry in the form of loans, underwriting and direct subscription to shares,
debentures and guarantees. Although the initial role of these institutions was largely limited to
providing a channel for government funding to industry, the reform process required them to expand
the scope of their business activities. Their new activities include:
* fee-based activities such as investment banking and advisory services; and
* short-term lending activities, including corporate finance and issuing working capital loans.
Non-Bank Finance Companies
As at 31 March 2009, there were over 12,739 non-bank finance companies in India, mostly in the
private sector. All non-bank finance companies are required to register with the RBI. The non-bank
finance companies may be categorised into entities which take public deposits and those which do
not. The companies which accept public deposits are subject to strict supervision by the RBI and are
required to maintain the capital adequacy requirements of the RBI. The primary activities of the non-
bank finance companies include the provision of consumer credit, including automobile finance, homefinance and consumer durable products finance, as well as wholesale finance products such as bill
discounting for SMEs, and fee-based services such as investment banking and underwriting. In 2003,
Kotak Mahindra Finance Limited, a large non-bank finance company, was granted a banking licence
by the RBI and converted itself into Kotak Mahindra Bank Ltd. Over the past few years, certain
non-bank finance companies in India have been involved in actions including bankruptcy proceedings
initiated by investors and depositors alleging defaults by these companies, many of which are
currently pending.
Impact of liberalisation on the Indian financial sector
As discussed above, until 1991, the financial sector in India was stringently regulated and commercial
banks and long-term lending institutions had mutually exclusive roles and objectives and operated in
an environment with little or no competition. Long-term lending institutions were focused on
85
c102100pu020Proof7:28.3.10B/LRevision:0OperatorSadK

achieving the government of India’s various socio-economic objectives, including balanced industrial
growth and creating employment, especially in the under-developed regions of India. These
institutions had access to long-term funds at subsidised rates from the government. The focus of the
commercial banks was primarily on mobilising household savings through demand and time depositsand to use these deposits to meet the short-term financial needs of borrowers in industry, trade and
agriculture. In addition, the commercial banks provided a range of banking services to individuals
and business entities.
However, since 1991, there have been comprehensive changes in the Indian financial system. Various
financial sector reforms have transformed the operating environment of the banks and long-term
lending institutions. In particular, the deregulation of interest rates; the emergence of a liberalised
domestic capital market; the entry of new private sector banks; and the broadening of long-term
lending institutions’ product portfolios have progressively intensified competition between banks and
long-term lending institutions. The RBI has permitted long-term lending institutions to carry out
banking activities, subject to compliance with the prudential norms applicable to banks.
Recent trends and performance
The banking sector in India has become increasingly more competitive in recent years. Public sector
banks have lost their market share to the more dynamic private sector banks and, to a lesser extent,
to foreign banks.
The scheduled commercial banks in India, unlike their global counterparts, showed considerable
resilience against the backdrop of global financial crisis and its effects on India’s economy. While the
balance sheet of public sector banks maintained their growth momentum, the private sector banks
and foreign banks registered a deceleration in growth rate.
The profitability ratios of Indian commercial banks are relatively moderate but their core recurring
income and profits are on a rising trend. Public sector banks appear marginally less profitable than
their private sector counterparts, and foreign banks in India appear to be more profitable. Going
forward, the increasing disintermediation and competition for good quality credit could exert somepressure on revenue streams and margins.
The robust deposit franchises of the larger Indian banks and, in particular, the public sector banks,helps to ensure such banks sources of relatively cheap and stable funding and provides them with a
comfortable liquidity profile. This will play an important role in the growth of these banks. In terms
of efficiency, RBI data as at 31 March 2009 shows that Indian commercial banks have a cost-to-
income ratio of approximately 48%. This compares favourably with the ratios of international banks.
Asia Pacific
Hong Kong
Hong Kong classifies deposit-taking institutions into three tiers:
Licensed banks: These are commonly known as commercial banks. Only licensed banks may operate
current and savings accounts. They accept deposits of any size and maturity, grant loans andadvances, discount trade bills and bankers’ acceptances, deal in gold, foreign exchange and securities
and provide business consultative services and private banking. Licensed banks are required to have a
paid-up share capital of at least HK$300m and total assets of at least HK$4 billion.
Restricted-licence banks (‘‘RLBs’’): These are commonly known as investment or merchant banks.
They principally engage in merchant banking and capital market activities. RLBs are only allowed to
accept deposits of HK$500,000 and above. RLBs are required to have a paid-up share capital of at
least HK$100m.
Deposit-taking companies (‘‘DTCs’’): These are finance companies that engage in a range of specialised
activities, including consumer finance, trade finance, leasing, factoring and securities business. DTCs
are only permitted to accept deposits of a minimum of HK$100,000, with an original maturity of not
less than three months. DTCs are required to have a paid-up share capital of at least HK$25m.
86
c102100pu020Proof7:28.3.10B/LRevision:0OperatorSadK
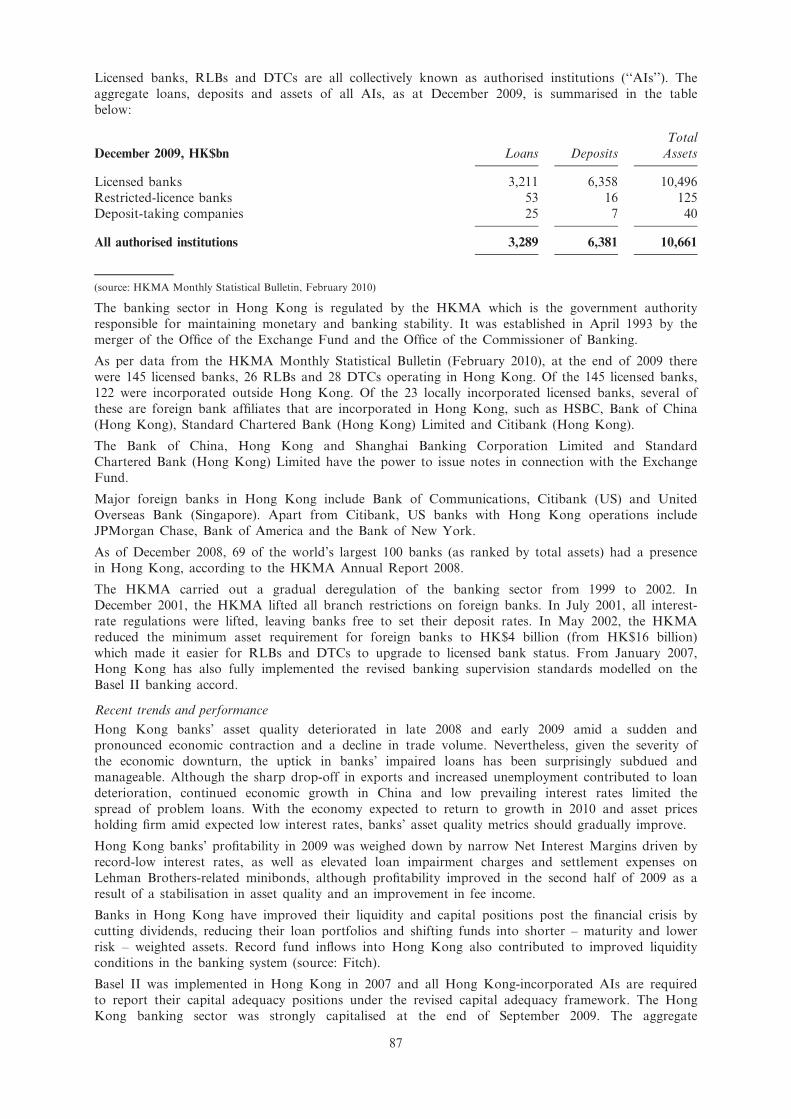
Licensed banks, RLBs and DTCs are all collectively known as authorised institutions (‘‘AIs’’). The
aggregate loans, deposits and assets of all AIs, as at December 2009, is summarised in the table
below:
December 2009, HK$bn Loans Deposits
Total
Assets
Licensed banks 3,211 6,358 10,496
Restricted-licence banks 53 16 125
Deposit-taking companies 25 7 40
All authorised institutions 3,289 6,381 10,661
(source: HKMA Monthly Statistical Bulletin, February 2010)
The banking sector in Hong Kong is regulated by the HKMA which is the government authority
responsible for maintaining monetary and banking stability. It was established in April 1993 by the
merger of the Office of the Exchange Fund and the Office of the Commissioner of Banking.
As per data from the HKMA Monthly Statistical Bulletin (February 2010), at the end of 2009 there
were 145 licensed banks, 26 RLBs and 28 DTCs operating in Hong Kong. Of the 145 licensed banks,
122 were incorporated outside Hong Kong. Of the 23 locally incorporated licensed banks, several of
these are foreign bank affiliates that are incorporated in Hong Kong, such as HSBC, Bank of China
(Hong Kong), Standard Chartered Bank (Hong Kong) Limited and Citibank (Hong Kong).
The Bank of China, Hong Kong and Shanghai Banking Corporation Limited and Standard
Chartered Bank (Hong Kong) Limited have the power to issue notes in connection with the Exchange
Fund.
Major foreign banks in Hong Kong include Bank of Communications, Citibank (US) and United
Overseas Bank (Singapore). Apart from Citibank, US banks with Hong Kong operations include
JPMorgan Chase, Bank of America and the Bank of New York.
As of December 2008, 69 of the world’s largest 100 banks (as ranked by total assets) had a presence
in Hong Kong, according to the HKMA Annual Report 2008.
The HKMA carried out a gradual deregulation of the banking sector from 1999 to 2002. In
December 2001, the HKMA lifted all branch restrictions on foreign banks. In July 2001, all interest-
rate regulations were lifted, leaving banks free to set their deposit rates. In May 2002, the HKMA
reduced the minimum asset requirement for foreign banks to HK$4 billion (from HK$16 billion)
which made it easier for RLBs and DTCs to upgrade to licensed bank status. From January 2007,Hong Kong has also fully implemented the revised banking supervision standards modelled on the
Basel II banking accord.
Recent trends and performance
Hong Kong banks’ asset quality deteriorated in late 2008 and early 2009 amid a sudden and
pronounced economic contraction and a decline in trade volume. Nevertheless, given the severity of
the economic downturn, the uptick in banks’ impaired loans has been surprisingly subdued and
manageable. Although the sharp drop-off in exports and increased unemployment contributed to loan
deterioration, continued economic growth in China and low prevailing interest rates limited the
spread of problem loans. With the economy expected to return to growth in 2010 and asset pricesholding firm amid expected low interest rates, banks’ asset quality metrics should gradually improve.
Hong Kong banks’ profitability in 2009 was weighed down by narrow Net Interest Margins driven by
record-low interest rates, as well as elevated loan impairment charges and settlement expenses on
Lehman Brothers-related minibonds, although profitability improved in the second half of 2009 as a
result of a stabilisation in asset quality and an improvement in fee income.
Banks in Hong Kong have improved their liquidity and capital positions post the financial crisis by
cutting dividends, reducing their loan portfolios and shifting funds into shorter – maturity and lower
risk – weighted assets. Record fund inflows into Hong Kong also contributed to improved liquidity
conditions in the banking system (source: Fitch).
Basel II was implemented in Hong Kong in 2007 and all Hong Kong-incorporated AIs are required
to report their capital adequacy positions under the revised capital adequacy framework. The Hong
Kong banking sector was strongly capitalised at the end of September 2009. The aggregate
87
c102100pu020Proof7:28.3.10B/LRevision:0OperatorSadK

consolidated capital adequacy ratio of locally incorporated AIs was 16.6% at the end of September
2009. This increased by 2.8% as compared to 13.8% at the end of September 2008. However, this
level remained well above the minimum international standard of 8% (source: HKMA Quarterly
Bulletin, December 2009).
Singapore
The government of Singapore began liberalising the banking sector in 1999 in order to strengthen
domestic banks and to give foreign banks increased access to the local market. At present there are
six domestic banks in Singapore. The largest of these is the Development Bank of Singapore Group.
This is a government-controlled bank and was formed in 1998 from the merger of the Development
Bank of Singapore and the Post Office Savings Bank. The United Overseas Bank group resulted fromthe merger of UOB and Overseas Union Bank in August 2001. The Overseas Chinese Banking
Corporation group was created from the merger of OCBC with Keppel TatLee Bank in August 2001.
The other three local banks in Singapore are Bank of Singapore, Far Eastern Bank (a subsidiary of
United Overseas Bank) and Islamic Bank of Asia (majority owned by the Development Bank of
Singapore group).
Domestic banks are allowed to offer a wide range of services in both traditional and investment
banking. The MAS has announced that it would like local banks to maintain a market share of atleast 50% in the banking sector in Singapore. Consequently, it is pushing local banks to increase their
competitiveness through such steps as restructuring and improving the quality of senior management.
According to the MAS, Singapore has 119 commercial banks; seven of these are domestic banks and
112 are foreign banks. In addition, Singapore has 46 merchant banks; these banks focus primarily on
investment banking activities. Nearly all of the merchant banks operating in Singapore are foreign
banks.
The aggregate loans, deposits and assets of all the domestic banking units in Singapore, as at
November 2009, are summarised in the table below:
Loans Deposits
Total
Assets
November 2009, S$bn 278 384 708
(source: MAS Monthly Statistical Bulletin, December 2009)
The MAS serves as the central bank of Singapore. Following its merger with the Board of
Commissioners of Currency on 1 October 2002, the MAS has also taken responsibility for issuing
currency. The MAS supervises and regulates commercial banks, merchant banks, insurance companies
and other financial institutions (such as non-banking finance companies), and is responsible for the
control and supervision of the securities industry.
Singapore’s foreign banks are categorised as full banks, wholesale banks or offshore banks. Full
banks are allowed to offer the complete range of banking services. Wholesale banks and offshorebanks are restricted in their activities in Singapore. According to the MAS, as at 8 February 2010, of
the 112 foreign banks operating in Singapore, 25 are full banks, 45 are wholesale banks and 42 are
offshore banks.
Most full banks in Singapore operate Asian currency units (‘‘ACUs’’). An ACU is a separate
accounting unit used by banks for foreign currency denominated transactions. An ACU is eligible for
numerous tax incentives. Banks running ACUs are authorised to accept deposits and extend loans in
foreign currencies. Many full banks also act as dealers in the primary and secondary markets forSingapore government securities.
Wholesale banks in Singapore cannot operate S$ savings accounts for, or accept S$ fixed deposits of
less than S$250,000 from, non-bank customers. They also cannot operate interest-bearing S$ current
accounts for Singapore resident individuals.
Offshore banks cannot operate S$ savings accounts for, or accept S$ fixed deposits from, residentnon-bank customers and can only provide them with credit facilities of up to S$500m.
The issuance of six full bank licences to foreign banks was the most significant promoter of
competition at the retail level of the banking sector in Singapore. The six banks: ABN Amro
(Netherlands), BNP Paribas (France), Citibank (US), HSBC (UK), Malayan Banking (Malaysia) and
88
c102100pu020Proof7:28.3.10B/LRevision:0OperatorSadK

Standard Chartered (UK) were granted qualifying full bank status between late 1999 and December
2001. This status allows them to operate in up to 25 locations, which can be either branches or off-
site ATM locations. The banks are also allowed to create a shared ATM network and provide debit
cards through an electronic funds-transfer point of sale network. The banks are able to providecentral provident fund investment scheme and supplementary retirement scheme accounts and accept
central provident fund-fixed deposits.
Recent trends and performance
The global economic downturn led to a slowdown in trading and business activity in Singapore over
the second half of 2008 and early 2009, reducing the demand for bank loans. Banks in Singapore
have also been more cautious due to counterparty credit risk concerns and expectations of weakened
corporate performance given the economic uncertainty. However, non-bank lending has recovered tothe October 2008 peak after bottoming out in April 2009. The weakness in business lending was
attributable to both tightened credit conditions as well as lower credit demand from corporates most
affected by the economic slowdown. Government measures, notably the risk-sharing schemes
introduced in early 2009 to facilitate lending to SMEs, have helped alleviate funding strains on
creditworthy firms. Consumer loan growth since the first quarter of 2009 has been underpinned by a
surge in housing loans given the heightened activity in the domestic private property market recently.
Nonetheless, Singapore banks’ exposure to the property sector remains within regulatory limits and
their loan exposures overall continue to be well-diversified.
The profitability of the banking sector improved in the second half of 2009 with year-on-year
earnings turning positive in the third quarter of 2009. This resilience in earnings was due to a stablesource of net interest income and robust trading and fee income alongside more recent improvements
in market sentiment.
The gross loan-to-deposit ratio of the banking system remains healthy at 86% (as of September 2009)even as loan books have expanded. Given the banking system’s stable and relatively cheap deposit
funding base, net interest margins have stayed above 2% throughout the economic downturn (source:
MAS Financial Stability Review, November 2009).
Basel II took effect in Singapore on 1 January 2008, marking a milestone in MAS’ efforts to
implement a more risk-sensitive capital framework for banks incorporated in Singapore. The local
banks in Singapore have a strong capital basis, with the Tier 1 capital ratio averaging 13.5% at the
end of September 2009. This is well above the MAS’ minimum requirement of 6%. At the end of
September 2009, the aggregate regulatory capital to risk-weighted assets ratio for the local banks in
Singapore stood at 16.5% (as compared to 14.3% at the end of September 2008) and the
shareholders’ funds to total assets ratio stood at 10.5% (as compared to 8.5% at the end ofSeptember 2008) (source: MAS Financial Stability Review, November 2009).
Malaysia
Since the regional crisis in the period 1997 and 1998, the Malaysian banking sector has undergone
significant consolidation. By January 2003, the central bank, Bank Negara Malaysia, had
concentrated Malaysia’s 58 domestic banking institutions into ten ‘‘anchor banks’’, or consolidated
groups of domestically owned banks. Anchor banks were required to have minimum shareholders’
funds of RM2 billion and assets of at least RM25 billion; foreign-owned banking institutions were
also required to increase capital funds to RM300m. The number of ‘‘anchor banks’’ reduced to ninein 2006 when Southern Bank, Malaysia’s second smallest bank at the time, agreed to a takeover offer
from Bumiputra-Commerce Holdings.
According to Bank Negara Malaysia, in Malaysia there are 22 commercial banks (nine with local
ownership, 13 with foreign ownership) and 17 Islamic banks (11 with local ownership, six with
foreign ownership).
89
c102100pu020Proof7:28.3.10B/LRevision:0OperatorSadK

The aggregate loans, deposits and assets of all the domestic banking units in Malaysia, as at
December 2009, is summarised in the table below:
December 2009, RMbn Loans Deposits
Total
Assets
Domestic banks 639 829 1,088
Foreign banks 139 199 274
Total 778 1,028 1,362
(Source: Bank Negara Malaysia, Monthly Statistical Bulletin, December 2009)
Domestic commercial banks: The leading local banking groups in Malaysia are Malayan Banking
(Maybank), Bumiputra-Commerce Holdings (CIMB Bank), Public Banking Group, RHB Capital
Group and Ambank Group.
Foreign banks: Foreign banks in Malaysia are authorised to engage in a full range of commercial
banking activities, including retail deposit-taking. Despite restrictions and increased competition from
domestic banks, foreign banks maintain a significant presence in the commercial banking sector. The
total value of the assets of all foreign banks in Malaysia stood at RM274 billion as at December
2009, representing 20% of the total assets of all banking institutions in Malaysia. The 13 foreign-controlled banks are locally incorporated because, under the Banking and Financial Institutions Act
1989, they had to place their operations under a Malaysian corporation with a local board of
directors answerable to Bank Negara Malaysia. Under the legislation, the foreign parent was
permitted to maintain 100% equity ownership but, in order to secure domestic status and be allowed
to open further branches, at least 51% of its equity needed to be divested to local partners. In
addition, there are 24 foreign banks maintaining representative offices in Malaysia that are prohibited
from conducting normal banking business but are permitted to engage in liaison services (source: EIU
Country finance report, Malaysia, December 2009).
Islamic banking: The total value of the assets of Islamic banks in Malaysia stood at RM234 billion as
at December 2009, representing 17% of total assets of all banking institutions in Malaysia (source:
Monthly Statistical Bulletin, December 2009). All local banks, the five largest foreign banks and most
investment banks offer Islamic banking services.
Bank Negara Malaysia oversees and sets guidelines for banks, insurance companies and other
financial institutions; monitors liquidity; issues government securities; formulates exchange-control
guidelines; manages foreign reserves; and controls statutory reserve requirements and payment
systems.
Recent trends and performance
As of November 2009 Malaysia’s financial institutions had weathered the volatility in the globalfinancial markets. They had negligible exposure to both sub-prime related securities and to the
affected financial institutions of other countries. More than 90% of total assets of banks and
insurance companies are in local denominated assets. The strong capital positions of banks, coupled
with ample liquidity in the financial system, provided a buffer against the global downturn. The levels
of non-performing loans held by commercial banks actually declined in the first three quarters of
2009 (souce: EIU, Country finance report, Malaysia, December 2009).
The well-contained consumer loan quality is underpinned by an improved labour market, with the
unemployment rate easing to 3.6% in the second quarter of 2009, partly driven by the fiscal response,
which created additional jobs in the public sector. Also, low interest rates helped alleviate consumers’
debt servicing burden. With these mitigating factors likely to continue into 2010, and amid a tentative
economic recovery, consumer-related delinquencies are likely to remain manageable (source: Fitch).
The average return on assets of the Malaysian banks was around 0.9% in 2009, down from 1.11% in
2008. However, excluding one-off write downs, the estimated return on assets for 2009 is 1.06% which
would be comparable with the 2008 results. This was despite the moderate rise in credit costs, which
was offset by higher treasury income amid low interest rates in Malaysia (source: Fitch).
In Malaysia, the standardised approach under the revised capital framework for conventional banks
(Basel II) and the Capital Adequacy Framework for Islamic banks, came into effect on 1 January
90
c102100pu020Proof7:28.3.10B/LRevision:0OperatorSadK

2008. The Malaysian banking system’s capitalisation remains strong and at the end of December
2009, the risk-weighted capital ratio and the core capital ratio for the banking system (including
Islamic banks) stood at 14.7% and 13.1% respectively. (source: Bank Negara Malaysia, Monetary and
Financial Developments December 2009).
South Korea
In the early 1990s the financial sector in South Korea underwent a degree of liberalisation. However,
following a number of large corporate insolvencies in 1997 and the consequent rapid build-up of
financial institutions’ bad loans, significant measures were implemented to address the situation. In
1998 five banks whose capital adequacy ratios were below the 8% BIS guideline were forced to exit
the market. Nine banks merged to form four banks in 1999, and two merged to form one bank in2000. Eight banks were also nationalised through a recapitalisation by the government.
In South Korea commercial banks have adopted a branch banking system with a nationwide, or
province-wide, network. As per the Bank of Korea (the ‘‘BOK’’), the total number of domestic
branches of commercial banks, as at June 2008, was about 4,900. As of the end of December 2008,commercial banks consisted of:
Nationwide commercial banks: Seven nationwide commercial banks, operating a branch banking
system throughout the country and handling long-term financing in addition to short-term financing.
The nationwide commercial banks operating in South Korea are: Woori Bank, SCFB (formerly Korea
First Bank), Hana Bank, Korea Exchange Bank, Shinhan Bank, Citi Bank Korea and KookminBank. Nationwide commercial banks held assets amounting to a total of approximately 983.0 trillion
Won as of the end of June 2008, representing a 90.7% share in the total assets of commercial banks.
As per the Financial Supervisory Service (‘‘FSS’’), the number of domestic branches of nationwide
commercial banks totalled 4,302 as of December 2008.
Local/Regional banks: Six local banks operate branch banking systems within their province. Their
business is oriented to regional SMEs. The local banks operating in South Korea are: Daegu Bank,
Pusan Bank, Kwangju Bank, Jeju Bank, Jeonbuk Bank and Kyongnam Bank. The financial structure
of local banks is largely similar to that of the nationwide commercial banks, but their reliance on
domestic currency deposits and securities investment is higher. As per the FSS, the number of
domestic branches of regional banks totalled 745 as of December 2008.
Foreign bank branches: 38 foreign bank branches with wholesale banking and recently strengthened
retail banking activities. Foreign bank branches now carry on their business under almost identical
conditions to South Korean banks as preferential treatment and discriminatory business regulations
have been reduced. Other foreign banks with a presence in South Korea include HSBC (UK),
JPMorgan Chase (US) and UBS (Switzerland). Since 1998, established foreign banks have been able
to set up subsidiaries in the country under the Korean Bank Act.
Specialised banks
At the end of December 2008, there were five specialised banks. The specialised banks which were
established to provide funds to particular sectors experienced insufficient funding from commercial
banks due to limited availability or low profitability. With subsequent changes in the financial
environment, however, the specialised banks have expanded their business into commercial banking
areas, although their share of funds allocated to their relevant sectors is still relatively high. At
present most specialised banks have, by and large, the same pattern of business as commercial banks;they rely heavily on deposits from the public for their sources of funds in addition to the issue of
debentures and borrowing from the government. Therefore, specialised banks compete with
commercial banks in acquiring deposits.
The Financial Supervisory Commission (the ‘‘FSC’’) is the body in charge of making policy decisions
for the financial services industry. The FSC authorises the establishment and closure of financialinstitutions and defines its role as a controller rather than a supervisor. The central bank, the BOK,
continues to act as the bank for commercial banks and the government, but its banking supervisory
functions were handed over to the FSC in 1998. The BOK is now only responsible for controlling
inflation and executing monetary and credit policy.
The operating environment for South Korean banks has been improving rapidly as it has recovered
from the global financial crisis. Domestic commercial banks’ loan-to-deposit ratio (including certificate
of deposits (CDs)) has been improving since July 2008. Bank deposits have been on a steady rise,
while banks are relying less on CDs and bonds for funding (source: Korea Financial Supervisory
Service 2009).
91
c102100pu020Proof7:28.3.10B/LRevision:0OperatorSadK
The return on assets for the South Korean banking system was estimated at 0.4% in 2009, however,
this is expected to improve due to a substantial improvement in NIM (2.16% in 2009) and stabilising
credit costs (source: Fitch).
The pressure from the regulators to bring down the high loan/deposit ratio to below 100% should benegative for NIM but may be offset by higher credit spreads as competition for loans will be
dampened, as well as the effect of rate increases. The recent financial crisis have led banks to charge
borrowers wider spreads, particularly household customers, due to the strong pressure from the
authorities to support small and medium-sized enterprises (SMEs) by extending credits (source: Fitch).
As per the Bank of Korea, at the end of June 2009, the BIS capital adequacy ratio of Korean
commercial banks stood at 14.25% (Basel II basis), up 1.53 percentage points from 12.72% at the end
of 2008. The aggregate Tier 1 capital ratio of the Korean commercial banks stood at 10.50% at the
end of June 2009, as compared to 9.01% at the end of December 2008. At the end of June 2009,Korean commercial banks’ share in total capital, although at approximately the same level as the
corresponding figure among the world’s top 30 banks, remained low compared to those of US
commercial banks, whose capital increases have been driven mainly by preferred share issuance using
public funds (source: The Bank of Korea Financial Stability Report, November 2009).
Other Asia Pacific
In the Other Asia Pacific region, Standard Chartered has offices in Australia, Brunei, Cambodia,
China, Indonesia, Japan, Laos, Mauritius, the Philippines, Taiwan, Thailand and Vietnam.
In these markets, the external environment for the banking sector was challenging in 2008 due to
weak domestic demand, falling exports and subdued equity markets (source: the Company’s Annual
Report 2008, page 18). However, since the start of 2009, the recovery for Asian economies and banks
has been rapid, resulting in much better than expected results for 2009 and for most of the region’s
banks, generally positive trends going into 2010. The expected sharp deterioration in bank assetquality arising from the global recession did not materialise as the rebound in Asian economies
limited the deterioration in asset quality to moderate and manageable levels. As a result, Asian banks
remained generally resilient in 2009. Government guarantees for banks have helped helped maintain
depositor confidence and bank fund-raising efforts (source: Fitch).
Middle East and Other South Asia
In the Middle East region Standard Chartered has offices in Bahrain, Egypt, Jordan, Lebanon,
Oman, Qatar and the UAE. In the Other South Asia region, Standard Chartered has offices in
Afghanistan, Bangladesh, Kazakhstan, Nepal, Pakistan and Sri Lanka.
In 2009, the operating environment for banks deteriorated due to lower business volumes, tighter
liquidity, and the regional stock market slump since the end of third-quarter 2008. The sectors that
have been most impacted, real estate and construction, were among the main contributors of recentgrowth at local banks. As a result, asset quality is on a downward trend and some banks have
decided to take substantial general loan loss provisions in anticipation of rising amounts of NPLs.
However, local banks have entered this tougher environment from a position of relative strength and
have benefited from supportive measures from local governments (source: Standard & Poor’s).
Africa
In the Africa region Standard Chartered has offices in Botswana, Cameroon, Côte d’Ivoire, Ghana,
Kenya, Nigeria, Sierra Leone, South Africa, Tanzania, The Gambia, Uganda, Zambia and Zimbabwe.
The business environment in these regions has been impacted by the effects of the global credit crisis
and reduced capital inflows into these regions. This has slowed down the growth of the local banking
sector, although its levels of market penetration are expected to continue to catch up with the levels
of more advanced economies.
Americas, UK and Europe
In Europe Standard Chartered has offices in Austria, France, Germany, Guernsey, Ireland, Italy,Jersey, Luxembourg, Monaco, Poland, Romania, Russia, Spain, Sweden, Switzerland, Turkey, the UK
and the Ukraine.
In the Americas region Standard Chartered has offices in Argentina, Bahamas, Brazil, Canada,
Cayman Islands, Chile, Colombia, Falkland Islands, Mexico, Peru, United States, Uruguay and
Venezuela.
92
c102100pu020Proof7:28.3.10B/LRevision:0OperatorSadK

Across the Americas, the UK and Europe, Standard Chartered competes with a large range of
institutions. These markets are highly competitive and characterised by rapid innovation. Regulators
monitor the financial services sector closely and conduct reviews into the long-term prospects of the
banking sector. Legislators continue to introduce legislation with the aim of improving competitionand protecting consumers and promoting financial stability. Further changes and a strengthening of
the regulatory environment are expected following the on-going financial market turmoil and
economic crisis. In particular, the banking sectors of Europe and the United States have been most
impacted by the financial crisis whereas the banking sector of Latin American countries has shown
more resilience.
Legislators and regulators have taken several steps to alleviate the banking crisis that has hurt the
financial performance of local banks.
On 8 October 2008, the UK Government, the Bank of England and the FSA (the ‘‘Tripartite
Authorities’’) announced that they would implement a comprehensive £500 billion plan to support the
UK banking system. The plan addressed both the issues of capital and liquidity together. Additionalmeasures were introduced by the UK in 2009 including an extended drawdown window for new debt
under the credit guarantee scheme, a new guarantee facility for ABS, a Bank of England facility for
purchasing high quality assets, capital protection through an asset protection scheme covering future
credit losses on certain assets for banks, and an extended maturity date for the Bank of England’s
discount window facility.
Both the Basel Committee on Banking Supervision and the European Commission have proposed
improvements to the regulatory regime as a result of the financial crisis. The first set of amendments
to the EU Capital Requirements Directive (the ‘‘CRD’’) was adopted in September 2009 and is
required to be implemented in Member States by 31 December 2010. The amendments will:
* Tighten the limits on large exposures, in particular through placing limits on inter-bank loans.
* Adopt harmonised rules on the eligibility of Tier 1 hybrids as regulatory capital.
* Improve the supervision of cross-border groups through the reinforcement of colleges of
regulators for banking groups operating in more than one Member State. Bank liquidity will be
considered and co-ordinated through such colleges.
* Improve the framework for securitisation. Banks and investment firms regulated in the EEA will
only be able to invest in securitisation positions if the originator, sponsor or original lender(which may or may not be regulated) has retained a 5% economic exposure (‘‘skin in the
game’’).
On 13 July 2009 the Commission proposed further changes in respect of trading book capital,
re-securitisations and the supervisory review of remuneration policies (CRD III). These proposals were
foreshadowed in a June 2009 Commission communication and are intended to be consistent with
proposals made by the Basel Committee in 2009 to improve Basel II. The following changes will be
made to the capital requirements for banks’ trading book:
* An additional capital buffer will be introduced based on stressed VaR to the ordinary VaR
figure for banks using their own internal models to determine capital charges for market risks.
* Extending the existing charge for default risk in the trading book to capture losses short of
issuer default, e.g. rating downgrades.
* Basing the charge for securitisation positions in the trading book on the existing risk weights for
the banking book.
* These changes are expected to roughly double the capital requirements for banks’ trading books.
In line with proposals made by the Basel Committee, resecuritisation positions will be assigned a
higher capital requirement than other securitisation positions to reflect the higher risk of unexpectedimpairment losses.
The FSA published proposals in CP 09/29 Strengthening Capital Standards 3 to implement thesechanges together with those required by EU Directive 2009/111/EC by 31st December 2010.
Authorised firms will be required to have remuneration policies that are aligned with effective risk
management. The relevant principles will be set out in further revisions to the CRD, but will be
closely aligned with those set out in a Commission recommendation on remuneration policies.
Remuneration will also be brought within the scope of supervisory review, and supervisors will be
able to require a firm to take measures to rectify any problems that they identify. The Walker Review
93
c102100pu020Proof7:28.3.10B/LRevision:0OperatorSadK

contained proposals in this respect, further details of which are given on page 435 of this Draft Red
Herring Prospectus.
On 26 February 2010 the Commission published a working document on further changes to the CRD
(CRD IV). This document proposes to implement proposals published for consultation by the Basel
Committee in December 2009. CRD IV aims to:
* Improve the quality and quantity of capital through new harmonised requirements for core Tier
1 capital, non-core Tier 1 capital and Tier 2 capital.
* Abolish innovative Tier 1 capital and Tier 3 capital. Tier 2 capital will be simplified based on
the requirements for lower Tier 2 capital (but without allowing any incentive to redeem).
* Establish a harmonised treatment for deductions from capital (regulatory adjustments) with most
deductions being made from common equity.
* Introduce new requirements to address counterparty credit risk on derivatives, repos and
securities financing transactions.
* Introduce a leverage ratio for banks as a backstop to the Basel II risk-based framework.
* Promote the building up of capital buffers in good times that can be drawn down in periods of
stress.
* Address the risks posed by financial institutions that are systemically important.
The Basel Committee on Banking Supervision is currently consulting on key design features of some
of these reforms which will reflect the findings of the Quantitative Impact Study (QIS) being
conducted by Basel Committee in the first half of 2010.
The Commission is also proposing the elimination of many national discretions under the CRD.
Neither CRD IV, nor the Basel proposals on which they are based, include a calibration. It is
accordingly not possible to assess the impact on the Group of an implementation of these proposals.
In January 2009 the FSA published a statement on regulatory capital announcing as a supervisory
framework that banks (including Standard Chartered Bank) will be expected to hold post-stress Tier 1
capital of 6-7% while meeting a minimum core Tier 1 ratio of 4%.
In December 2009, the Basel Committee on Banking Supervision approved for consultation a package
of proposals to strengthen global liquidity regulations with the goal of promoting a more resilient
banking sector.
94
c102100pu020Proof7:28.3.10B/LRevision:0OperatorSadK

BUSINESS
INTRODUCTION
The Company operates through a number of subsidiaries including SCB, one of the leading
international banking and financial services company. SCB particularly focuses on the markets of
Asia, Africa and the Middle East. The Company has no significant operations or assets other than its
100% interest in SCB. As at 31 December 2009, the Group operates in approximately 1,700 branchesand outlets in more than 70 countries. As at 31 December 2009, the Group employed over 75,000
employees worldwide. The Group has significant operations in the Asia region, which accounted for
over 75% of its US$5,151 million total profit before taxation for the year ended 31 December 2009.
At 31 December 2009, the Company had total consolidated assets of US$437 billion, total
consolidated customer loans and advances of US$198,292 million, total consolidated customer
deposits of US$251,244 million and total parent company shareholders’ equity (excluding minority
interests) of US$27,340 million. Standard Chartered’s total capital ratio as at 31 December 2009 was
16.5% and its Tier 1 capital ratio was 11.5%.
The Company is headquartered in the UK where it is regulated by the FSA. The Group’s head office
provides guidance on governance and regulatory standards across the Group’s network. Standard
Chartered operates two business divisions, Consumer Banking and Wholesale Banking, which are
described below. For the year ended 31 December 2009, Consumer Banking and Wholesale Banking
contributed 17% and 79% respectively, of Standard Chartered’s operating profit before taxation andimpairment.
The Company was incorporated in 1969 pursuant to a merger of The Chartered Bank and The
Standard Bank Limited. Both banks were established in the mid-nineteenth century and their origins
lie in financing trade in the emerging markets of Asia and Africa. The Chartered Bank opened itsfirst branches in Mumbai, Kolkata and Shanghai in 1858, followed by Hong Kong in 1859 and was
given a licence to issue Hong Kong bank notes in 1862. The Company’s Shares and preference shares
are listed on the Official List and traded on the London Stock Exchange. The Company’s Shares are
also listed and traded on the Hong Kong Stock Exchange.
STRENGTHS AND STRATEGY
Strengths
Longstanding presence in growth markets
The Group has had a presence in many of its key geographies for a significant amount of time,
stretching back to the first branches being opened in India and China in 1858. As a result, the Group
has built deep and longstanding relationships with its customer base and has an extensive distribution
network.
Wide ranging products and services
Given its global capabilities and local knowledge, the Group develops products and services whichmeet the diverse and ever-changing needs of individual, corporate and institutional customers in some
of the world’s most exciting and dynamic markets within Asia, Africa and the Middle East. During
2008/2009, the Group:
* commenced execution of its new Consumer Banking strategy which includes accelerating theshift to a customer centric business; introducing a new participation model by market and
standardising processes;
* strengthened Private Banking with the integration of AEB;
* completed the acquisition of Asia Trust in Taiwan, thereby adding seven branch licences in
Taiwan;
* expanded its Financial Markets and Corporate Finance businesses;
* completed the acquisition of Cazenove Asia in Hong Kong (subsequently renamed Standard
Chartered Securities (Hong Kong) Limited;
* expanded Saadiq Berhad in Malaysia to introduce a full range of Islamic services;
* became the first bank to open onshore trade settlement accounts for offshore companies under
the RMB cross border trade settlement pilot scheme; and
* strengthened its presence in the Middle East region by opening the Middle East’s largest trading
floor in the DIFC.
95
c102100pu020Proof7:28.3.10B/LRevision:0OperatorSadK

Retaining and developing talent
The Group has been successful in supporting its growth due to its ability to attract, engage and
develop international talent across its markets. The Group had over 75,000 employees as at31 December 2009, and it continues to step up recruitment to support its business growth. The
Group believes that its ‘‘strengths-based’’ philosophy is one of the cornerstones of its approach to
talent management. By identifying and leveraging an employee’s talents into strengths, and then
creating the environment in which these strengths can flourish, the Group enables its employees to do
what they do best, every day. The Group’s approach towards rewarding employees is closely aligned
to performance.
The Group’s size and reach facilitate exposure to international banking standards and work
experience by providing employees with opportunities to travel, interact and learn from other cultures.
Nearly half of the employees are women, and almost 70 nationalities are represented among the
senior management, reflecting the Group’s policy of providing equal opportunity for all employees.The current turmoil in the global financial markets has provided Standard Chartered with good
opportunities to hire talented people.
Strong track record of strategic acquisitions
The Group has a track record of strategic acquisitions to create shareholder value with the followingobjectives:
* to overcome obstacles to organic growth: for example, in 2005, the Group acquired Korea FirstBank to grow in the South Korean market. Similarly, Hsinchu International Bank and Permata
Bank were acquired to strengthen its position in Taiwan and Indonesia, respectively;
* to build local scale: in 2006 the Group acquired Union Bank of Pakistan and became the sixth
largest bank in Pakistan in terms of profits. It has also acquired Nakornthon Bank (Thailand),
Asia Trust and Investment Corp (Taiwan), ANZ Grindlays Bank (Middle East and South Asian
businesses) and Yeahreum Mutual Savings Bank (Korea) to enhance scale;
* to acquire capabilities: the Group acquired Pembroke (an aircraft leasing, financing and
management company) and Harrison Lovegrove (an oil and gas advisory company) which will
add specialist capabilities. Also, it acquired AEB to expand the Private Banking network and
Transaction Banking capabilities. Cazenove Asia Limited, a leading Asian equity capital
markets, corporate finance and institutional brokerage was acquired to help bolster offerings inequity capital markets. Other acquisitions included Asia Trust and Investment Corporation in
Taiwan, and A Brain (Korean fund administration company); and
* to create options for future growth: in 2005 the Group invested in Travelex to support organic
growth of its franchise in SME and retail foreign exchange products in Asia, and on SME
business and trade products in the Middle East. The investments in Fleming Family and
Partners and China Bohai Bank Co. Ltd have helped the Group to position itself
advantageously in the fast-growing Wealth Management market for ultra-high net worth
individuals and the Chinese market, respectively.
The Group has a track record of acquisition integration to render successful effective inorganic
growth.
Risk Management
Standard Chartered has a defined risk appetite which is approved by the Board. This plays a central
role in the development of the Company’s strategic plans and policy. The Group’s proactive approach
to risk management, and steps taken early on in the current economic crisis to reshape the
Company’s portfolios and tighten underwriting standards helped to mitigate the impact of market
turbulence on the Company’s performance. Throughout 2009, the Company’s balance sheet andliquidity position remained strong, and the Company is well positioned to address further challenges
and potential economic weakness in 2010. For a further discussion of its risk management practice,
please refer to ‘‘Risk Management’’ later in this section on page 106 of this Draft Red Herring
Prospectus.
Identifying organic growth opportunities
The Group has been able to identify growth opportunities and has committed resources to capitalise
on those opportunities. The strategic aim for Consumer Banking is to become the world’s best
international consumer bank in each of the Group’s chosen markets and customer segments across
Asia, Africa and the Middle East. Some of the priorities are set out below:
96
c102100pu020Proof7:28.3.10B/LRevision:0OperatorSadK

* consistently deliver superior service by providing financial solutions which meet our customers’
evolving needs, empowering and engaging the Company’s employees and making a difference in
the Company’s communities;
* differentiate with standardised systems and processes and through targeted marketing and
stronger analytical capabilities; and
* continue to enhance transaction convenience by providing outstanding internet and mobile
capability, relationship rewards and integrated card offerings supported by convenient branch
and ATM access.
Wholesale Banking has invested in people and products and has broadened its geographic and
product coverage. Some key initiatives in the Wholesale Banking segment were:
* the focus of investments on the Group’s major engines of growth such as Hong Kong, India
and Singapore;
* the significant strengthening of the Group’s presence in the UAE to further support growing
client demand in the region;
* the investment in building the Group’s Equity Derivatives, Commodity Derivatives, Convertibles
and Principal Finance businesses; and
* the establishment of the Wholesale Banking Sustainable Business Council to commercialise
environmental opportunities.
Strategy
Standard Chartered’s strategic intent is to be one of the world’s best international banks, leading the
way in Asia, Africa and the Middle East.
Sustaining organic momentum as a priority, with growth supplemented through selective acquisitions
The core of the Group’s strategy is to grow organically, supplemented by selective acquisitions and
alliances.
Continuously improving the way the Group works
The Group strives to become operationally excellent by embedding a culture of continuous
improvement. By doing this, it aims to provide its customers with quality service, make life easier for
its staff and customers and create capacity to enable the Group to grow on a sustained basis.
The Group also focuses on other important aspects of improving the way it works, such as itsculture, its values and the way people interact with each other and with the Group’s customers. Its
culture and values allow the Group to collaborate across borders and across businesses, attract new
personnel, keep personnel in the Group and attract clients.
Building the Group’s leadership
Attracting and retaining the best talent, driving performance and engagement and building leadership
capability are critical priorities for the Group. Standard Chartered’s brand promise, ‘Leading by
Example to be The Right Partner’, means living the Group’s core values. Its five values – Creative,
Responsive, International, Courageous and Trustworthy – form the basis of how it keeps its
employees engaged with its strategic business objectives.
Reinforcing the brand
The Group recognises that how it continues to build its brand will have an impact on shareholder
value. The Group wants to build its brand at the pace it is growing the business. A big part of brand
building is the Group’s commitment to live the brand and its culture and values in everything it does.
The Group continues to embed its brand promise, ‘Leading by Example to be The Right Partner’ inits markets, and into its business agenda.
Consumer Banking
Consumer Banking went through a year of significant change and transformation in 2008. Despite achallenging economic environment the business continued to invest in Consumer Banking to grow the
franchise. Certain key priorities for the Consumer Banking segment are set out below:
* continue to implement the Company’s new customer-focused transformation designed to drive
sustainable competitive advantage;
* continue implementation of country models;
97
c102100pu020Proof7:28.3.10B/LRevision:0OperatorSadK

* deepen customer relationships by delivering on the Company’s Customer Charter;
* roll out new customer value propositions for all segments;
* deliver strong asset and deposit growth;
* further enhance efficiencies and productivity through re-engineering projects; and
* maintain disciplined risk, cost and performance management.
Wholesale Banking
Wholesale Banking’s strategic aim is to be the core bank to each of its clients. The focus of the
business is on building a client-driven franchise, being the leading international banks of choice in
Asia, Africa and the Middle East, and leveraging its in-depth local knowledge and extensive cross-
border network, providing clients with a broader range of solutions and services, servicing local and
and financial institutions doing business for and in Asia, Africa, and the Middle East. Certain key
priorities for Wholesale Banking are set out below:
* grow product capabilities in the Company’s core businesses and scale in key local markets;
* strengthen and deepen relationships to become a core bank to key clients;
* increase cross-border opportunities across our international network;
* expand its product sophistication and provide increasingly strategic and value-added capabilities
to clients;
* invest to increase industry coverage and grow the Company’s solution delivery capabilities;
* maintain disciplined management of costs, capital, liquidity and risk; and
* continue to remain true to the Company’s values and culture.
BUSINESS DIVISIONS
Consumer Banking
Consumer Banking products and services include banking services, deposit-taking services, credit
cards, personal loans, mortgages, auto finance and Wealth Management services. Major markets
include Hong Kong, Singapore, Malaysia, Indonesia, Korea, Pakistan, India, Taiwan and the UAE.
Principal customers of the Consumer Banking business are individuals in Asia, Africa and the Middle
East. In addition to serving individuals, Consumer Banking also offers a range of deposit-taking,
trade, lending and other banking services to SMEs in its key Asian markets. The Group provides
products and services to its Consumer Banking customers through its branches, direct sales force and
via online banking.
The Group had approximately 1,700 branches and outlets located in over 70 countries as at
31 December 2009. These are a key part of the distribution network for its Consumer Bankingbusiness.
Consumer Banking provides products and services to over 14 million customers, including individualsand SMEs in Asia, Africa and the Middle East. In 2007, Consumer Banking launched Standard
Chartered Private Bank to serve the growing demand for more specialised products and services
tailored for high net worth individuals in the Group’s markets. Standard Chartered Private Bank has
a broad geographic footprint with offices spreading across 29 locations.
Products and services offered by Standard Chartered Private Bank include:
* cash and cash alternatives, i.e. balance sheet deposits in several currencies, fiduciary deposits,
liquidity funds, capital guaranteed products and FDIC-insured certificates of deposit;
* structured products giving exposure to currency, interest rate, bond, commodity, fund and equity
markets which increase yields or protect against market volatility;
* client-directed mutual fund portfolios which allow clients to construct their own portfolio of
mutual funds from a hand-picked group of some of the most well-known mutual fund providers
in the world;
* discretionary portfolios where professional managers handle the asset allocation and investment
selection;
* signature portfolios which offer a choice of geographic focus and fixed income, equity or
balanced orientation and are managed by investment managers chosen from the best in the
business;
98
c102100pu020Proof7:28.3.10B/LRevision:0OperatorSadK

* insurance including life insurance, insurance owned by fiduciary structure and insurance
premium financing;
* credit facilities; and
* collateralised trading programmes.
Product Mix
Cards and Personal Loans
The Group charges fees for the use of its cards and earns interest on outstanding balances from its
card customers and commissions from merchants for transactions processed. It has focused ongrowing both card volumes and balances. The Group had approximately 6.3 million cards in issue at
31 December 2009, compared with approximately 6.6 million cards in issue at the end of 2008.
Standard Chartered is a member of the VISA International and MasterCard International
organisations. Standard Chartered operates as a card issuer in India, with approximately 1.1 million
cards in issue in India as of 31 December 2009.
Personal loans include loans to individuals for purposes such as education and purchasing of
consumer goods. It has launched a range of innovative loan products. Personal loans are typically
unsecured, granted at floating rate and either repayable by instalments or on a revolving basis.
Wealth Management and Deposits
Wealth Management offers an integrated approach for customers to protect, manage and grow theirwealth. It offers a wide range of products including structured products, deposits, investments, mutual
funds, treasury products and bancassurance to all customer segments including private banking.
The Group is an independent distributor of third-party mutual funds in Asia. Leveraging off itsglobal model, the Group seeks to obtain a wide range of best-of-breed products for its customers at
competitive rates.
The Group also offers priority banking services especially tailored to meet the Wealth Management
needs of more affluent customers. Priority banking customers have access to the Group’s servicesthrough over 235 priority banking centres in 21 countries.
SCB has recently shown a strong growth track record in consumer deposits which grew by 12% for
the period 30 June 2008 until 31 December 2009. The bank has also focused on driving newtransactional propositions to capture a greater share of customer deposits. As at 31 December 2009,
the bank had over 14 million customers and about 4 million registered internet users. Online banking
is available in 29 markets and mobile banking in 30 countries.
Mortgages and Auto Finance
At 31 December 2009, residential mortgages represented 29% of Standard Chartered’s total loans and
advances to customers or 61% of Standard Chartered’s retail loans and advances to customers. As at31 December 2009 India contributed 3% of the mortgage business.
Standard Chartered also provides auto financing in a number of locations across its footprint.
Wholesale Banking
With business operations located in Singapore and a delivery footprint that spans its network,
Standard Chartered’s Wholesale Banking business provides corporate and institutional clients with
trade finance, cash management, securities services, foreign exchange and risk management, capital
raising, corporate and principal finance solutions. Building on a history of over 150 years in some of
the world’s most dynamic markets, Wholesale Banking is a client-centred business that bases its
strategy on client need and deepening relationships with clients. Wholesale Banking is growing at astrong rate and is focusing on being the core bank to its clients (within the top three providers). The
business is adding to its product suite and strategic capabilities and has made a series of recent
strategic niche acquisitions to support these aims. The Group has strong cross-border capabilities and
is well positioned to capitalise on international trade flows as a result of its broad geographical
footprint. The Group works with local and global corporates looking to expand across its footprint,
and corporates and financial institutions eager to further penetrate its markets from OECD countries.
Wholesale Banking customers include multinational and large local corporations, banks, other
financial institutions and medium-sized local companies.
99

Product Mix
Transaction Banking
The Group is a global leader in the provision of transaction banking services. It provides basic
lending services, as well as a full suite of trade finance, securities services and cash management
products and services. The Group believes that it has market-leading positions in cash management,
sub-custody and dollar clearing. Transaction banking accounts for a significant portion of Wholesale
Banking’s overall client revenue and is a fundamental service for many corporate and financial
institution clients. Straight2Bank, a premier online trading platform for FX, trade, cash and securities
services was launched in 2007.
Trade-related services offered by the Group include letters of credit, short-term trade loans, factoring
and invoice discounting, insurance and document preparation services. Standard Chartered provides a
range of lending facilities for both trade-related and non-trade-related activities.
In cash management, the Group offers domestic cash management products that assist companies
with their payments and receivables processing and liquidity management.
Custody services include securities settlement, safekeeping of securities, monitoring and action of
corporate events, proxy voting, fund valuation and administration services, and provision of market
information. This provides clients with customised solutions using a uniform processing system across
Standard Chartered’s Asian network.
Financial Markets
Financial Markets at Standard Chartered is a globally integrated business spanning Asia, Africa, theMiddle East, the UK and US. Financial Markets includes trading functions such as equities,
commodities, fixed income trading (rate, foreign exchange and credit), the Group’s capital markets
business and structured products. Standard Chartered acts both as arranger and participant in
syndicated loans and in the fixed income market. The Group’s capital markets business, comprising
Fixed Income, Asset Securitisation and Loan Syndications, consistently dominates league tables and
rankings in markets core to the Group’s footprint. In Asia, the Group was rated top bookrunner of
all Asian currency bonds excluding Japan, Australia and China (source: Thomson Reuters 2008) and
top Asian mandated arranger for all international currency syndicated and club loans excludingAustralia and Japan (source: Basis Point 2008). The Group has a strong offering in Islamic financing
and cross-border issuance capabilities. The Group was ranked number one in Currency Derivatives
(source: AsiaRisk Corporate End-user Survey 2008-2009) and ranked number one in Interest Rate
Derivatives in Asia (source: AsiaRisk Corporate End-user Survey 2009). The Group is a major
participant in the global rates and FX markets, actively trading in over 100 onshore and offshore
currencies. The Group is a market leader in the provision of emerging markets liquidity and has
pioneered the development of new FX Options markets and products. The Group was also rated first
for Overall FX Services for corporates in India (source: AsiaMoney Polls 2008).
Consistent with its strategic focus, Standard Chartered does not undertake major proprietary
derivative trading activities. The Group focuses its activities on facilitating and supporting customer
transactions. The VaR figures resulting from such activities form part of the total VaR figures shown
in the Group’s financial statements. The total average daily VaR for the Group for the half year
ended 31 December 2009 was US$38.9 million. A description of the VaR methodology and the
quantification of risk is set out in the paragraph headed ‘‘Value at Risk’’ in the section headed ‘‘Risk
Management’’ on page 112 of this Draft Red Herring Prospectus.
Corporate Finance
The Corporate Finance business at the Group has shown growth in recent years. It is one of the key
focal points for the Wholesale Banking strategy of adding sophisticated product and service capability
and as such, accounts for an increasing proportion of the Company’s overall business. Corporate
Finance offers corporate advisory services focusing on mergers and acquisitions advisory services and
leveraged finance. The Group has a corporate advisory team with a pool of professionals across itsnetwork. Corporate Finance also offers structured finance, project and export finance and structured
trade finance services to a broad range of clients. The Group has a dedicated renewable energy
capability. The Group has won widespread industry recognition for innovative deal-making across its
footprint. The Group continues to add niche capability, through a series of targeted acquisitions in
strategic sectors, as well as by building organically.
100
c102100pu020Proof7:28.3.10B/LRevision:0OperatorSadK

Principal Finance
Standard Chartered’s Principal Finance business focuses on corporate private equity, infrastructure
and real estate (through a dedicated fund in each area) and alternative investments. The focus inprivate equity is on investing in mid-to-late stage companies and management buy-outs and focuses
on companies across the Standard Chartered footprint.
The Alternative Investment Group focuses on delivery of solutions for distressed and high yield assets
and companies, and invests in senior debt, mezzanine and equity instruments.
GEOGRAPHIC MARKETS
Hong Kong
Standard Chartered Bank (Hong Kong) Limited is one of the country’s leading financial institutions
providing Consumer Banking and Wholesale Banking services with over 77 branch outlets, 223 ATMs
and as at 31 December 2009 employed over 5,000 employees.
In Hong Kong, Consumer Banking provides credit cards, personal loans, mortgages, deposit-taking
and Wealth Management services to individuals and SMEs. Wholesale Banking provides corporate
and institutional clients with services in trade finance, commodity trade finance, cash management,lending, custody, foreign exchange, debt capital markets and corporate finance.
The Group has been issuing bank notes in Hong Kong since 1862. The Group’s Hong Kong businesswas locally incorporated on 1 July 2004 to take advantage of the Closer Economic Partnership
Agreement opportunities as Hong Kong plays an increasing role as a platform for growth in greater
China.
The Hong Kong market reinforced its position in 2007 as Standard Chartered’s biggest market by
becoming the first market in the Group to report profit before tax of more than US$1 billion.
Consumer Banking in Hong Kong in 2007, the Group’s biggest single source of income, achieved
double-digit income growth (of 28%) for the first time in seven years on rising revenues from Wealth
Management and SMEs. Wholesale Banking saw broad-based contributions from across client groups
and products.
For the year ended 31 December 2008, Hong Kong-based activities contributed US$2,255 million
operating income and US$989 million profit before tax to the Group. For the year ended31 December 2009, Hong Kong activities contributed US$2,370 million operating income and
US$1,062 million profit before tax to the Group.
The Group is one of the largest credit card issuers in Hong Kong, with more than 10% of the
market share based on the number of cards issued and more than 11% of the card-related
outstanding balances as at 31 December 2009.
Residential mortgages are an important part of Standard Chartered’s business in Hong Kong.
Standard Chartered is a leader in new home mortgage lending. Standard Chartered has a material
share in the new mortgage loan market and its mortgage portfolio in Hong Kong grew 14% since
31 December 2008 to US$14.8 billion as at 31 December 2009.
Standard Chartered Bank (Hong Kong) Limited acquired 100% of the share capital of Cazenove Asia
Limited on 30 January 2009.
India
Standard Chartered Bank, Mumbai, which operates as a branch of the subsidiary of the Company is
one of the country’s largest foreign banks, in terms of branch network, with over 90 branches in 37
cities. As at 31 December 2009 Standard Chartered India had approximately 17,500 employees
accounting for over 20% of the Group’s headcount. The Company has had a presence in India since
1858.
In India, Consumer Banking offers a wide range of personal banking products and services including
credit cards, mortgages, personal loans, Wealth Management products and business finance solutionsfor SMEs. Wholesale Banking provides a wide range of traditional as well as structured banking
products to corporate and institutional clients with services in comprehensive trade finance, supply
and dealer chain financing, cash management services, securities services, debt capital markets,
corporate finance and foreign exchange. Standard Chartered India also has a primary dealership,
which deals exclusively in government securities.
101
c102100pu020Proof7:28.3.10B/LRevision:0OperatorSadK

Standard Chartered has a substantial network of branches in India, including the Group’s global
shared service centre in Chennai, which provides operational and technology support to the Group’s
businesses across the world. For the year ended 31 December 2008, India contributed operating
income of US$1,694 million and profit before tax of US$891 million to the Group. For the yearended 31 December 2009, India contributed operating income of US$1,813 million and profit before
tax of US$1,060 million to the Group, making it the Group’s second largest contributor of profits
after Hong Kong.
India has shown growth over the last five years, as the operating income and profits before tax of the
Indian business has grown at a compound annual growth rate of 32% and 40%, respectively.
Standard Chartered completed the disposal of its Indian asset management business which includedStandard Chartered Trustee Company Private Limited and Standard Chartered Asset Management
Company Private Limited in 2008.
Standard Chartered participated in several high-profile, cross-border acquisitions, advising andfunding both Indian and foreign multinationals. On 11 January 2008, the Group completed the
acquisition of a 49% joint venture interest in UTI, an equity brokerage firm, subsequently renamed
Standard Chartered – STCI Capital Markets Limited. The Group acquired an additional 25.9% stake
on 12 December 2008 which increased the Group’s investment stake to 74.9%. In 2008 Standard
Chartered India celebrated 150 years in business.
South Korea
Standard Chartered has had a presence in Korea since 1929. The Group acquired Korea First Bank,
a major banking group in South Korea in April 2005 and completed the rebranding as Standard
Chartered First Bank in September 2005. In November 2005, the Group’s branch business in Korea
was integrated with Standard Chartered First Bank (‘‘SCFB’’). In Korea, the bank had 379 branches
with 1,675 ATMs with over 6,800 employees as at 31 December 2009. In Korea, Consumer Banking
provides credit cards, personal loans, mortgages, deposit-taking and wealth management. Wholesale
Banking provides corporate and institutional clients with services in trade finance, cash management,
lending, custody, foreign exchange, debt capital markets and corporate finance. For the year ended 31December 2008, Korea contributed operating income of US$1,546 million and profit before tax of
US$329 million to the Group. For the year ended 31 December 2009, Korea contributed operating
income of US$1,554 million and profit before tax of US$322 million. The Group has invested in
measures to boost productivity and efficiency, refurbished and relocated branches and broadened the
Wholesale Banking product suite. SCFB established Standard Chartered Securities Korea Ltd.
(‘‘SCSK’’), a wholly-owned subsidiary, to perform its securities business. SCSK obtained a licence for
its securities business from the Financial Supervisory Commission on 25 July 2008. In June 2009,
Standard Chartered First Bank became the first foreign institution to gain approval to form afinancial holding company.
Singapore
Singapore is one of the largest markets for the Group in terms of profits and remains a key
geography with both Consumer Banking and Wholesale Banking headquartered out of Singapore.
The Standard Chartered Private Bank is also headquartered in Singapore. Established in Singapore in
1859, Standard Chartered Singapore had over 5,500 employees as at 31 December 2009. StandardChartered has broadly based its businesses in Singapore as a result of long-established franchises.
Standard Chartered was among the first foreign banks in Singapore to be awarded a qualifying full
bank license in October 1999 and is currently one of only six foreign banks to hold that status in
Singapore (source: The Association of Banks in Singapore).
For the year ended 31 December 2008, Singapore contributed US$1,317 million operating income and
US$608 million profit before tax to the Group. For the year ended 31 December 2009, Singapore
contributed US$1,592 million operating income and US$714 million profit before tax to the Group.
Standard Chartered is a major player in the Consumer Banking market in Singapore. Standard
Chartered also offers a range of Wholesale Banking services to its customer base in Singapore, with
an emphasis on developing total solutions for its customers.
In Singapore, Consumer Banking provides credit cards, personal loans, mortgages, deposit-taking,
wealth management and private banking services to individuals and SMEs. It has 18 branches,
28 ATMs and six priority banking centres. Standard Chartered is the only international bank to offer
Network for Electronic Transfers service, giving its customers access to Electronic Fund Transfers at
102
c102100pu020Proof7:28.3.10B/LRevision:0OperatorSadK

Point of Sale at over 17,000 outlets islandwide. Wholesale Banking has a strong track record of
client-focused, award-winning solutions. It provides corporate and institutional clients with capital
raising, corporate finance, currency and risk management solutions as well as cash management,
securities services and trade finance solutions.
Other Asia Pacific Regions (‘‘APR’’)
The Company’s presence in this region spans 14 markets and includes Australia, Brunei, China,
Permata, Indonesia, Japan, Mauritius, Malaysia (which has been grouped in this geographic segmentsince 2009), Philippines, Taiwan, Thailand and Vietnam.
For the year ended 31 December 2008, Other APR business including Malaysia contributed US$2,960
million operating income and US$705 million profit before tax to the Group.
For the year ended 31 December 2009, Other APR business including Malaysia contributed US$2,888million operating income and US$770 million profit before tax to the Group.
Malaysia
Malaysia is another of Standard Chartered’s important markets, with a broadly-based business as a
result of long-established franchises. Standard Chartered was the first bank to be established in
Malaysia in 1875 with a history of over 130 years. It has a network of 41 offices spread acrossMalaysia and a contact centre at Tamen Tan Dr Ismail. The Group employed approximately 5,000
people as at 31 December 2009 within banking operations which includes the Global Shared Services
Centre in Kuala Lumpur.
The Group’s Malaysian business offers a range of products from Consumer Banking, Wholesale
Banking to Islamic Banking. Standard Chartered Saadiq, the Group’s Islamic brand, was launched in
Malaysia in 2007 and expanded to a full range of Islamic banking services in 2008.
Standard Chartered is a strong provider of mortgages. Its Mortgage One product, which it has
successfully launched in Malaysia, was subsequently offered in Hong Kong, Singapore and India.
Standard Chartered also provides a range of Wholesale Banking services in Malaysia to its customer
base, with an emphasis on financial institutions and multinational and large local corporations.
China
Standard Chartered is the oldest foreign bank in China, with its first branch in Shanghai set up in
1858. The Group was one of the first foreign banks to locally incorporate in China in April 2007 and
now offers financial products and services in renminbi to local residents and through a network of 54
outlets, (including 15 branches, 37 sub-branches, one representative office and one village bank and
114 ATMs. Income increased 17% to US$738 million in 2009 with over three-quarters beinggenerated by the Wholesale Banking business. China is increasingly becoming a major driver of
income for the Group. As at 31 December 2009 Standard Chartered China employed over 4,200 staff
and offers Consumer Banking and Wholesale Banking products and services.
In China, Wholesale Banking provides seamless cross-border solutions and products for customers,
including cash management services, trade and supply chain financing solutions, funding solutions,
securities services, risk management, debt capital markets and corporate finance. In 2009, StandardChartered was the first bank to open onshore trade settlement accounts for offshore companies under
the RMB cross border trade settlement pilot scheme, SMEs, financing and credit card and personal
loans.
Since April 2007, Standard Chartered has been investing to capture the opportunities afforded by the
market reforms, such as providing renminbi consumer banking services and positioning its franchise
as a business of scale and breadth.
For the year ended 31 December 2008, China contributed income of US$631 million and profit
before tax of US$69 million. Operating income in China increased 17% to US$738 million against the
year ended 31 December 2008.
Taiwan
The Group has had a presence in Taiwan since 1985. In October 2006, Standard Chartered Taiwan
completed the successful tender offer for Hsinchu, a leading domestic bank. At the time the
transaction represented the biggest international investment in Taiwan’s banking sector and the largest
ever public tender offer in Taiwan as well as the first time a Taiwanese bank completely joined a
foreign bank. Standard Chartered Taiwan completed its amalgamation with Hsinchu in July 2007. As
103
c102100pu020Proof7:28.3.10B/LRevision:0OperatorSadK

at 31 December 2009, Standard Chartered Taiwan had 86 branches, 359 ATMs and over 3,850
employees.
Standard Chartered, in October 2008, agreed to purchase Asia Trust and Investment Corporation
from the Taiwanese Government’s Central Deposit Insurance Corporation. Under the terms of the
transaction, Standard Chartered Bank (Taiwan) Limited will be able to relocate up to seven
additional branches into Taipei, giving the Group the opportunity to expand its scale and reach in
the Greater Taipei region.
By leveraging the international network and crossborder product capability, the Group seeks to
capture a greater share of Taiwan’s rapidly growing trade and investment flows. Standard Chartered
Taiwan provides both Consumer Banking and Wholesale Banking products to its customer base. It is
particularly targeting wealth management and also banking services to SMEs. For the full year ended
31 December 2009, Taiwan contributed operating income of US$533 million.
Thailand
The Group has had a presence in Thailand since 1894, when the first branch was opened in Bangkok,
and offers both Consumer Banking and Wholesale Banking products and services. As at 31 December
2009 Standard Chartered Thailand employed approximately 2,000 staff and had 39 branches
throughout Thailand.
In September 1999, Standard Chartered Thailand acquired a majority stake in Nakornthon Bank
which was renamed Standard Chartered Nakornthon Bank. On 1 October 2005, the two banking
businesses (SCB, Bangkok Branch and Standard Chartered Nakornthon Bank) were integrated into
Standard Chartered Bank (Thai) Public Company Limited.
In Thailand, Consumer Banking provides credit cards, personal loans, mortgages and wealth
management services to individuals and SMEs. Consumer Banking has launched innovative products
and services, including power saver plus, which provides higher interest rates on fixed deposits with
the flexibility of a savings account. Wholesale Banking provides corporate and institutional clients
with services in trade finance, cash management, lending, securities services, foreign exchange, debt
capital markets and corporate finance.
Indonesia
The Group has a history of over 145 years in Indonesia. With 13 branch offices in six major cities
and a network of over 12,000 shared ATMs, Standard Chartered is an international bank with a widegeographical footprint across Indonesia. Permata Bank, in which SCB has a 44.51% interest, aspires
to be the outstanding financial services provider in Indonesia, focusing on the Consumer and
Commercial segments. Permata Bank serves approximately 1.9 million customers in 55 cities in
Indonesia. As at 25 February 2010, Permata Bank has approximately 5,000 employees, 269
conventional branches, 10 Sharia branches and 569 proprietary ATMs with additional access to more
than 20,000 ATMs (source: Permata press release dated 12 August 2009).
Middle East and Other South Asia
The Group operates in 11 markets in the Middle East and Other South Asia region (‘‘MESA’’).Whilst the UAE remains the largest of the Company’s MESA markets, others such as Bahrain and
Qatar have also demonstrated tremendous potential. For the year ended 31 December 2008, the
Middle East and Other South Asia region contributed operating income of US$1,658 million and
profit before tax of US$652 million to the Group. For the year ended 31 December 2009, the Middle
East and Other South Asia contributed operating income of US$2,078 million and profit before tax
of US$366 million to the Group.
The Group opened its first branch in the UAE in 1958 and was the first bank to receive a
commercial banking licence in DIFC. Standard Chartered provides Consumer Banking, Wholesale
Banking, Islamic Banking and Private Banking services. Standard Chartered has the largest network
among international banks with 11 branches and over 130 ATMs in the UAE. As at 31 December
2009 employees in the UAE exceeded 2,000.
Consumer Banking provides credit cards, personal loans, mortgages, deposit-taking and wealth
management services to individuals and SMEs. Wholesale Banking provides corporate and
institutional clients with services in trade finance, cash management, lending, security services, foreign
exchange, debt capital markets and corporate finance.
104
c102100pu020Proof7:28.3.10B/LRevision:0OperatorSadK

Standard Chartered is the sole mandated clearing bank and also one of the settlement banks for the
NASDAQ Dubai which aims to become the leading stock exchange located between Western Europe
and East Asia.
The Group is the only financial institution to have a branch in Dragonmart, the largest Chinese
trading platform outside mainland China. Dragonmart is a purpose-built, joint-venture complexbetween the governments of Dubai and China to facilitate trade flows.
In Pakistan, Standard Chartered opened its first branch in Karachi in 1863. Standard Chartered Bank
(Pakistan) Limited is the largest international bank in Pakistan with 174 branches spread over 41 cities
and a workforce of over 3,000 people as at 31 December 2009.
The Consumer Banking business provides its customers with a variety of products from SME
banking, secured loans (mortgage loans), unsecured loans (credit cards, personal loans), wealth
management, consumer transaction banking and bancassurance. The Consumer Banking business was
awarded the Best Retail Bank in Pakistan for the year 2008 by the Asian Banker publication.
SCB is the first international bank to get an Islamic Banking licence and to open the first Islamic
Banking branch in Pakistan.
The end of 2006 marked the beginning of a major transformation for Standard Chartered’s
operations in Pakistan when it announced the acquisition of a controlling stake in Union Bank. The
acquisition, the largest ever transaction in Pakistan’s banking history, spearheaded the establishmentof Standard Chartered Bank (Pakistan) Limited, the first international bank in Pakistan to be locally
incorporated. Standard Chartered has made rapid progress with the integration of Union Bank.
However, the political environment has had a negative impact, particularly on loan impairments and
Standard Chartered entered 2008 with a somewhat cautious stance.
Africa
As at 31 December 2009, the Group has a presence in 13 countries in Africa, of which Nigeria and
Kenya contributed approximately 32% of total Africa income in 2009. The Group’s core African
markets are Botswana, Ghana, Kenya, Nigeria, Zambia, Tanzania and Uganda. For the year ended
31 December 2008, Africa contributed operating income of US$910 million and profit before tax of
US$313 million to the Group. For the year ended 31 December 2009, Africa contributed operating
income of US$1,089 million and profit before tax of US$482 million.
As at 31 December 2009, Nigeria continued to be the Group’s biggest market in the Africa region,
where the Group has had a presence since 1999. Standard Chartered Bank Nigeria Limited offers
both Consumer Banking and Wholesale Banking and operated through a network of 18 branchesemploying approximately 480 people.
In Kenya, Standard Chartered opened its first branches in Mombasa and Nairobi in January 1911.The Group operates through a network of 34 branches and employs over 1,500 staff. Standard
Chartered Kenya provides both Consumer and Wholesale Banking products.
In these geographic markets, Consumer Banking provides debit cards, unsecured personal loans,
overdrafts, secured products such as auto loans and mortgages, business financial services and wealth
management services, which include current accounts, savings, fixed deposit and foreign currency
accounts. Wholesale Banking offers lending, trade and cash management in commercial banking. It
also offers FX sales and trading, derivatives, options, structured trade finance, assets and liabilities
management, syndication and fixed income in global markets.
The Americas, the UK and Europe
In the Americas, the UK and Europe, the Group is focused on serving clients with needs in Asia,
Africa and the Middle East, offering specialised products to multinational organisations. For the year
ended 31 December 2008, the Group’s operations in the Americas, the UK and Europe contributed
operating income of US$1,627 million and a profit before tax of US$81 million to the Group. For
the year ended 31 December 2009, operating income was US$1,800 million and operating profitbefore tax was US$375 million.
The Group’s head office is based in London, along with the majority of Group functions. London is
home to the Group’s lead regulator, the FSA and four out of five of the Group Executive Directors
operate out of London Head Office. Standard Chartered’s Wholesale Banking team in London plays
a key role in serving corporate and financial institutional clients conducting business in its markets.
The acquisitions of Pembroke, Harrison Lovegrove and AEB have added specialist capabilities to the
105
c102100pu020Proof7:28.3.10B/LRevision:0OperatorSadK

Group and helped expand its Private Banking network and Transaction Banking capabilities. For
details see page 120.
The Group has had a presence in New York since 1902. The US Dollar clearing business is based in
New York and as at July 2009 it was rated seventh largest globally as derived from the rankings of
the Clearing House Interbank Payments System (‘‘CHIPS’’). The CHIPS still ranks Standard
Chartered and AEB separately and AEB is ranked thirteenth largest globally.
Standard Chartered’s Latin American operations provide cash management, lending and trade finance
services to a range of multinational corporations, banks, other financial institutions and domestic
corporations. Standard Chartered has several offices in Latin America including in Argentina, Brazil,
Peru and Venezuela.
RISK MANAGEMENT
Risk management framework
Effective risk management is fundamental to being able to generate profits consistently andsustainably and is thus a central part of the financial and operational management of the Group.
Through the Company’s risk management framework the Company manages enterprise-wide risks,
with the objective of maximising risk adjusted returns while remaining within the Company’s risk
appetite. As part of this framework, the Company uses a set of principles that describes the risk
management culture the Company wishes to sustain:
* Balancing risk and reward: risk is taken in support of the requirements of the Company’s
stakeholders, in line with the Company’s strategy and within the Company’s risk appetite.
* Responsibility: it is the responsibility of all employees to ensure that risk-taking is disciplined
and focused. The Company takes account of the Company’s social, environmental and ethical
responsibilities in taking risk to produce a return.
* Accountability: risk is taken only within agreed authorities and where there is appropriate
infrastructure and resource. All risk-taking must be transparent, controlled and reported.
* Anticipation: The Company seeks to anticipate future risks and maximise awareness of all risks.
* Competitive advantage: The Company seeks competitive advantage through efficient and
effective risk management and control.
Risk governance
Ultimate responsibility for setting the Company’s risk appetite and for the effective management of
risk rests with the Board. Executive responsibility for risk management is held by the SCB Court
which comprises the Group executive directors and other directors of Standard Chartered Bank. The
Court delegates authority for the management of risk to several committees.
The GRC is responsible for the management of all risks other than those delegated by the Court to
the GALCO and the Group Pensions Executive Committee. The GRC is responsible for the
establishment of, and compliance with, policies relating to credit risk, country cross-border risk,
market risk, operational risk, regulatory risk and reputational risk. The GRC also defines the
Company’s overall risk management framework.
The GALCO is responsible for the management of capital ratios and the establishment of, and
compliance with, policies relating to balance sheet management, including management of the
Company’s liquidity, capital adequacy and structural foreign exchange rate risk.
The Group Pensions Executive Committee is responsible for the management of pension risk.
Members of the Court are also members of both the GRC and GALCO. The GRC is chaired by the
Group Chief Risk Officer (GCRO). The GALCO is chaired by the Group Finance Director.
Risk limits and risk exposure approval authority frameworks are set by the GRC in respect of credit
risk, country crossborder risk and market risk. The GALCO sets the approval authority framework
in respect of liquidity risk. Risk approval authorities may be exercised by risk committees or
authorised individuals.
Acting within an authority delegated by the Board, the Audit and Risk Committee (ARC), whose
members are all non-executive directors of the Group, reviews specific risk areas and monitors the
activities of the GRC and GALCO. The ARC receives regular reports on risk management, including
the Company’s portfolio trends, policies and standards, adherence with internal controls, regulatory
compliance, liquidity and capital adequacy, and is authorised to investigate or seek any information
106
c102100pu020Proof7:28.3.10B/LRevision:0OperatorSadK
relating to an activity within its terms of reference. As of 4 March 2010, the ARC was divided into a
Board Risk Committee and a Board Audit Committee.
The committee governance structure ensures that risk-taking authority and risk management policies
are cascaded down from the Board through to the appropriate functional, divisional and country-level
committees. Information regarding material risk issues and compliance with policies and standards is
communicated to the country, business, functional committees and Group-level committees.
Business, governance and functional heads are accountable for risk management in their businesses
and functions, and for countries where they have governance responsibilities.
This includes:
* implementing across all business activities the policies and standards as agreed by the Group-
level risk committees;
* managing risk in line with appetite levels agreed by the Group-level risk committees; and
* developing and maintaining appropriate risk management infrastructure and systems to facilitate
compliance with risk policies.
The GCRO directly manages a risk function which is separate from the origination, trading and salesfunctions of the businesses. The GCRO also chairs the GRC and is a member of the Group
Management Committee. Chief risk officers for both Wholesale and Consumer Banking have their
primary reporting lines into the GCRO. Country chief risk officers take overall responsibility for risk
within the Company’s principal countries.
The Risk function is responsible for upholding the integrity of the Company’s risk/return decisions,and in particular for ensuring that risks are properly assessed, that risk/return decisions are made
transparently on the basis of this proper assessment, and are controlled in accordance with the
Company’s standards.
The Risk function is independent of the origination and sales functions to ensure that the necessary
balance in risk/return decisions is not compromised by short-term pressures to generate revenues.
The Risk function is also responsible for maintaining the RMF, ensuring it remains appropriate to
the Group’s activities, and is effectively communicated and implemented across the Group. The Risk
function also administers the Company’s Risk-related governance and reporting processes. The
Company’s RMF identifies the risk types to which the Company are exposed, each of which is
controlled by a designated risk type owner. The major risk types are described individually in thefollowing sections. The RTOs have responsibility for establishing minimum standards and for
implementing governance and assurance processes. The RTOs report up through specialist risk
committees to the GRC or GALCO.
Group Internal Audit is a separate Group function that reports to the Chairman of the ARC and to
the Group Chief Executive. It provides independent confirmation of compliance with Group andbusiness standards, policies and procedures. Where necessary, it will recommend corrective action to
restore or maintain such standards.
Risk appetite
Standard Chartered manages the Company’s risks to build a sustainable franchise in the interests of
all the Company’s stakeholders. Risk appetite is an expression of the amount of risk the Company is
willing to take in pursuit of the Company’s strategic objectives, reflecting the Company’s capacity to
sustain losses and to continue to meet the Company’s obligations arising from a range of different
stress trading conditions.
The Company defines the Company’s risk appetite in terms of both volatility of earnings and the
maintenance of minimum regulatory capital requirements under stress scenarios. The Company also
defines a risk appetite with respect to liquidity risks and reputational risk. The Company’s
quantitative risk profile is assessed through a ‘bottom up’ analytical approach covering all of the
Company’s major businesses, countries and products. The risk appetite is approved by the Board and
forms the basis for establishing the risk parameters within which the businesses must operate,
including policies, concentration limits and business mix.
The GRC is responsible for ensuring that the Company’s risk profile is managed in compliance with
the risk appetite set by the Board.
107
c102100pu020Proof7:28.3.10B/LRevision:0OperatorSadK

Stress testing
Stress testing and scenario analysis are used to assess the financial and management capability of
Standard Chartered to continue operating effectively under extreme but plausible trading conditions.Such conditions may arise from economic, legal, political, environmental and social factors.
The Company’s stress testing framework is designed to:
* contribute to the setting and monitoring of risk appetite;
* identify key risks to the Company’s strategy, financial position, and reputation;
* examine the nature and dynamics of the risk profile and assess the impact of stresses on the
Company’s profitability and business plans;
* ensure effective governance, processes and systems are in place to co-ordinate and integrate
stress testing;
* inform senior management; and
* ensure adherence to regulatory requirements.
A stress testing forum, led by the Risk function with participation from the businesses, Group
Finance, Global Research and Group Treasury, aims to ensure that the earnings and capital
implications of specific stress scenarios are fully understood. The stress testing forum generates and
considers pertinent and plausible scenarios that have the potential to adversely affect the Company’s
business.
In 2009, stress testing activity was intensified at country, business and Group levels, with specific
focus on certain asset classes, customer segments and the potential impact of macro economic factors.Stress tests have taken into consideration possible future scenarios that could arise as a result of the
development of prevailing market conditions.
Stress testing themes such as inflation, US dollar depreciation, declines in asset values, swine flu, or
potential border conflicts are co-ordinated by the stress testing forum to ensure consistency of impacts
on different risk types or countries. Stress tests for country or risk type are also performed. Examples
of risk type stress testing are covered in the section ‘‘Market risk’’ on page 112 of this DRHP.
Credit risk
Credit risk is the risk that a counterparty to a financial transaction will fail to discharge an
obligation, resulting in financial loss to Standard Chartered. Credit exposures may arise from both thebanking and trading books. Credit risk is managed through a framework that sets out policies and
procedures covering the measurement and management of credit risk. There is a clear segregation of
duties between transaction originators in the businesses and approvers in the Risk function. All credit
exposure limits are approved within a defined credit approval authority framework.
Credit policies
Group-wide credit policies and standards are considered and approved by the Group Risk
Committee, which also oversees the delegation of credit approval and loan impairment provisioningauthorities.
Policies and procedures specific to each business are established by authorised risk committees withinWholesale and Consumer Banking. These are consistent with the Company’s Group-wide credit
policies, but are more detailed and adapted to reflect the different risk environments and portfolio
characteristics.
Credit rating and measurement
Risk measurement plays a central role, along with judgement and experience, in informing risk-taking
and portfolio management decisions. It is a primary area for sustained investment and senior
management attention.
For IRB portfolios, a standard alphanumeric credit risk grade (CG) system is used in both Wholesale
and Consumer Banking. The grading is based on the Company’s internal estimate of probability ofdefault over a one-year horizon, with customers or portfolios assessed against a range of quantitative
and qualitative factors. The numeric grades run from 1 to 14 and some of the grades are further sub-
classified A, B or C. Lower credit grades are indicative of a lower likelihood of default. Credit grades
1A to 12C are assigned to performing customers or accounts, while credit grades 13 and 14 are
assigned to non-performing or defaulted customers. The Company’s credit grades in Wholesale
108
c102100pu020Proof7:28.3.10B/LRevision:0OperatorSadK

Banking are not intended to replicate external credit grades, and ratings assigned by external ratings
agencies are not used in determining the Company’s internal credit grades. Nonetheless, as the factors
used to grade a borrower may be similar, a borrower rated poorly by an external rating agency is
typically assigned a worse internal credit grade. Advanced IRB models cover a substantial majority ofthe Company’s exposures and are used extensively in assessing risks at customer and portfolio level,
setting strategy and optimizing the Company’s risk-return decisions.
For IRB portfolios, risk measurement models are approved by the responsible risk committee, on the
recommendation of the MAC. The MAC supports risk committees in ensuring risk identification and
measurement capabilities are objective and consistent, so that risk control and risk origination
decisions are properly informed. Prior to review by the MAC, all IRB models are validated in detail
by a model validation team, which is separate from the teams which develop and maintain themodels. Models undergo a detailed annual review. Such reviews are also triggered if the performance
of a model deteriorates materially against predetermined thresholds during the ongoing model
performance monitoring process.
Credit approval
Major credit exposures to individual counterparties, groups of connected counterparties and portfolios
of retail exposures are reviewed and approved by the GCC. The GCC derives its authority from the
GRC. All other credit approval authorities are delegated by the GRC to individuals based both on
their judgement and experience and a risk-adjusted scale which takes account of the estimated
maximum potential loss from a given customer or portfolio. Credit origination and approval roles are
segregated in all but a very few authorised cases. In those very few exceptions where they are not,
originators can only approve limited exposures within defined risk parameters.
Concentration risk
Credit concentration risk is managed within concentration caps set for a counterparty or groups ofconnected counterparties, by industry sector and country in Wholesale Banking; and by product and
country in Consumer Banking. Additional targets are set and monitored for concentrations by credit
rating. Credit concentrations are monitored by the responsible risk committees in each of the
businesses and concentration limits that are material to the Group are reviewed and approved at least
annually by the Group Credit Committee.
Credit monitoring
The Company regularly monitors credit exposures, portfolio performance, and external trends which
may impact risk management outcomes. Internal risk management reports are presented to risk
committees, containing information on key environmental, political and economic trends across major
portfolios and countries; portfolio delinquency and loan impairment performance; as well as IRBportfolio metrics including credit grade migration.
The Wholesale Banking Credit Issues Forum, which is a sub-committee of the Wholesale Banking
Risk Committee, meets regularly to assess the impact of external events and trends on the Wholesale
Banking credit risk portfolio and to define and implement the Company’s response in terms of
appropriate changes to portfolio shape, underwriting standards, risk policy and procedures.
Corporate accounts or portfolios are placed on Early Alert when they display signs of weakness or
financial deterioration, for example, where there is a decline in the customer’s position within the
industry, a breach of covenants, non-performance of an obligation, or there are issues relating toownership or management. Such accounts and portfolios are subjected to a dedicated process
overseen by GSAM, the Company’s specialist recovery unit. Account plans are re-evaluated and
remedial actions are agreed and monitored. Remedial actions include, but are not limited to, exposure
reduction, security enhancement, exiting the account or immediate movement of the account into the
control of GSAM.
In Consumer Banking, portfolio delinquency trends are monitored continuously at a detailed level.
Individual customer behaviour is also tracked and informs lending decisions. Accounts which are pastdue are subject to a collections process, managed independently by the Risk function. Charged-off
accounts are managed by specialist recovery teams. In some countries, aspects of collections and
recovery functions are outsourced. The SME business is managed within Consumer Banking in two
distinct segments: small businesses and medium enterprises, differentiated by the annual turnover of
the counterparty. Medium enterprise accounts are monitored in line with Wholesale Banking
109
c102100pu020Proof7:28.3.10B/LRevision:0OperatorSadK

procedures, while small business accounts are monitored in line with other Consumer Banking
accounts. Medium enterprise and private banking past due accounts are managed by GSAM.
Credit mitigation
Potential credit losses from any given account, customer or portfolio are mitigated using a range of
tools such as collateral, netting agreements, credit insurance, credit derivatives and other guarantees.
The reliance that can be placed on these mitigants is carefully assessed in light of issues such as legal
certainty and enforceability, market valuation correlation and counterparty risk of the guarantor. Risk
mitigation policies determine the eligibility of collateral types. Collateral types which are eligible for
risk mitigation include: cash; residential, commercial and industrial property; fixed assets such as
motor vehicles, aircraft, plant and machinery; marketable securities; commodities; bank guarantees;and letters of credit. Standard Chartered also enters into collateralised reverse repurchase agreements.
Collateral is valued in accordance with the Company’s risk mitigation policy, which prescribes the
frequency of valuation for different collateral types, based on the level of price volatility of each type
of collateral and the nature of the underlying product or risk exposure. Collateral held against
impaired loans is maintained at fair value. Where appropriate, credit derivatives are used to reduce
credit risks in the portfolio. Due to their potential impact on income volatility, such derivatives are
used in a controlled manner with reference to their expected volatility.
Traded products
Credit risk from traded products is managed within the overall credit risk appetite for corporate and
financial institutions. The credit risk exposure from traded products is derived from the positive
mark-to-market value of the underlying instruments, and an additional component to cater for
potential market movements. For derivative contracts, the Company limits the Company’s exposure
to credit losses in the event of default by entering into master netting agreements with certain
counterparties. As required by IAS 32, exposures are not presented net in the financial statements. Inaddition, the Company enters into CSA with counterparties where collateral is deemed a necessary or
desirable mitigant to the exposure. Under a variation margin process, additional collateral is called
from the counterparty if total uncollateralised mark-to-market exposure exceeds the threshold and
minimum transfer amount specified in the CSA. With certain counterparties, the CSA is bilateral and
requires us to post collateral if the overall mark-to-market value of positions is in the counterparty’s
favour and exceeds an agreed threshold.
Securities
Within Wholesale Banking, the Underwriting Committee approves the portfolio limits and parameters
by business unit for the underwriting and purchase of all pre-defined securities assets to be held for
sale. The Underwriting Committee is established under the authority of the GRC. Wholesale Banking
operates within set limits, which include country, single issuer, holding period and credit grade limits.
Day-to-day credit risk management activities for traded securities are carried out by Traded Credit
Risk Management whose activities include oversight and approval of temporary excesses within the
levels delegated by the Underwriting Committee. Issuer credit risk, including settlement and pre-settlement risk, is controlled by Wholesale Banking Credit Risk, while price risk is controlled by
Group Market Risk. The Underwriting Committee approves individual proposals to underwrite new
corporate security issues. Where an underwritten security is held for a period longer than the target
sell-down period, the final decision on whether to sell the position rests with the Risk Function.
Problem credit management and provisioning
Consumer Banking
In Consumer Banking, where there are large numbers of small value loans, a primary indicator of
potential impairment is delinquency. However, not all delinquent loans (particularly those in the early
stage of delinquency) will be impaired. Within Consumer Banking an account is considered to be
delinquent when payment is not received on the due date. For delinquency reporting purposes the
Company follows industry standards, measuring delinquency as of 1, 30, 60, 90, 120 and 150 days
past due. Accounts that are overdue by more than 30 days are more closely monitored and subject to
specific collections processes.
Provisioning within Consumer Banking reflects the fact that the product portfolios (excluding medium
enterprises among SME customers and Private Banking customers) consist of a large number of
comparatively small exposures. As a result, much of the provisioning is initially done at an account
110
c102100pu020Proof7:28.3.10B/LRevision:0OperatorSadK

level for each product and a PIP is raised on a portfolio basis. PIP is set using expected loss rates,
based on past experience supplemented by an assessment of specific factors affecting the relevant
portfolio. These include an assessment of the impact of economic conditions, regulatory changes and
portfolio characteristics such as delinquency trends and early alert trends. The PIP methodologyprovides for accounts for which an individual impairment provision has not been raised.
For the main unsecured products and loans secured by automobiles, the entire outstanding amount is
generally written off at 150 days past due. Unsecured consumer finance loans are similarly written offat 90 days past due. For secured loans (other than those secured by automobiles) IIP are generally
raised at either 150 days (mortgages) or 90 days (other) past due.
The provisions are based on the estimated present values of future cashflows, in particular thoseresulting from the realisation of security. Following such realisation any remaining loan will be
written off. The days past due used to trigger write offs and IIP are broadly driven by past
experience, which shows that once an account reaches the relevant number of days past due, the
probability of recovery (other than by realising security where appropriate) is low. For all products
there are certain situations where the individual impairment provisioning or write off process is
accelerated, such as in cases involving bankruptcy, fraud and death. Write off and IIP is accelerated
for all restructured accounts to 90 days past due (unsecured and automobile finance) and 120 days
past due (secured) respectively.
The procedures for managing problem credits for Private Banking and the medium enterprises in the
SME segment of Consumer Banking are similar to those adopted in Wholesale Banking. Non-
performing loans are defined as loans past due by more than 90 days or that are otherwiseindividually impaired.
The cover ratio is a common metric used in considering trends in provisioning and non-performing
loans. It should be noted, however, that, as explained above, a significant proportion of the PIP isintended to reflect losses inherent in the loan portfolio that is less than 90 days delinquent and hence
recorded as performing.
Wholesale Banking
Loans are classified as impaired and considered non-performing where analysis and review indicates
that full payment of either interest or principal is questionable, or as soon as payment of interest or
principal is 90 days overdue. Impaired accounts are managed by the Company’s specialist recovery
unit, GSAM, which is separate from the Company’s main businesses. Where any amount is
considered irrecoverable, an individual impairment provision is raised. This provision is the difference
between the loan carrying amount and the present value of estimated future cash flows.
The individual circumstances of each customer are taken into account when GSAM estimates future
cash flow. All available sources, such as cash flow arising from operations, selling assets or
subsidiaries, realising collateral or payments under guarantees, are considered. In any decision relating
to the raising of provisions, the Company attempts to balance economic conditions, local knowledgeand experience, and the results of independent asset reviews. Where it is considered that there is no
realistic prospect of recovering a portion of an exposure against which an impairment provision has
been raised, that amount will be written off.
As with Consumer Banking, there is a PIP to cover the inherent risk of losses which although not
identified, are known to be present in any portfolio. In Wholesale Banking, this is set with reference
to historic loss rates and subjective factors such as the economic environment and the trends in key
portfolio indicators. The PIP methodology provides for accounts for which an individual impairment
provision has not been raised.
Gross non-performing loans in Wholesale Banking increased by US$1.1 billion from 2008 to 2009,
and this is driven by a small number of individually significant accounts, the largest of which are two
closely linked customers in Saudi Arabia, included within the MESA region. The cover ratio reflects
the extent to which gross nonperforming loans are covered by individual and portfolio impairment
provisions. The balance uncovered by individual impairment provisions represents the value of
collateral held and/or the Company’s estimate of the net outcome of any workout strategy.
Country cross border risk
Country cross border risk is the risk that the Company will be unable to obtain payment from the
Company’s customers or third parties on their contractual obligations as a result of certain actions
taken by foreign governments, chiefly relating to convertibility and transferability of foreign currency.
111
c102100pu020Proof7:28.3.10B/LRevision:0OperatorSadK

The GRC is responsible for the Company’s country cross border risk limits and delegates the setting
and management of country limits to the Group Country Risk function. The business and country
chief executive officers manage exposures within these limits and policies. Countries designated as
higher risk are subject to increased central monitoring.
Cross border assets comprise loans and advances, interest-bearing deposits with other banks, trade
and other bills, acceptances, amounts receivable under finance leases, derivatives, certificates of deposit
and other negotiable paper investment securities, and formal commitments where the counterparty is
resident in a country other than that where the assets are recorded. Cross border assets also include
exposures to local residents denominated in currencies other than the local currency.
Market risk
The Company recognises market risk as the risk of loss resulting from changes in market prices andrates. The Company’s exposure to market risk arises principally from customer-driven transactions.
The objective of the Company’s market risk policies and processes is to obtain the best balance of
risk and return whilst meeting customers’ requirements. The primary categories of market risk for
Standard Chartered are:
* Interest rate risk: arising from changes in yield curves, credit spreads and implied volatilities on
interest rate options.
* Currency exchange rate risk: arising from changes in exchange rates and implied volatilities on
foreign exchange options.
* Commodity price risk: arising from changes in commodity prices and commodity option implied
volatilities; covering energy, precious metals, base metals and agriculture.
* Equity price risk: arising from changes in the prices of equities, equity indices, equity baskets
and implied volatilities on related options.
Market risk governance
The GRC approves the Company’s market risk appetite taking account of market volatility, the range
of traded products and asset classes, business volumes and transaction sizes. Market risk appetite has
remained broadly stable in 2009.
The GMRC, under authority delegated by the GRC, is responsible for setting VaR and stress loss
limits for market risk within the Company’s risk appetite. The GMRC is also responsible for policies
and other standards for the control of market risk and overseeing their effective implementation.
These policies cover both trading and non-trading books of the Group. The trading book is defined
as per the FSA Handbook’s Prudential Sourcebook for Banks, Building Societies and Investment
Firms. This is more restrictive than the broader definition within IAS 39 ‘Financial Instruments:
Recognition and Measurement’, as the FSA only permits certain types of financial instruments or
arrangements to be included within the trading book. Limits by location and portfolio are proposedby the businesses within the terms of agreed policy.
Group Market Risk approves the limits within delegated authorities and monitors exposures against
these limits. Additional limits are placed on specific instruments and position concentrations where
appropriate. Sensitivity measures are used in addition to VaR as risk management tools. For example,
interest rate sensitivity is measured in terms of exposure to a one basis point increase in yields,
whereas foreign exchange, commodity and equity sensitivities are measured in terms of the underlyingvalues or amounts involved. Option risks are controlled through revaluation limits on underlying
price and volatility shifts, limits on volatility risk and other variables that determine the options’
value.
Value at Risk (‘VaR’)
The Company measures the risk of losses arising from future potential adverse movements in market
rates, prices and volatilities using a VaR methodology. VaR, in general, is a quantitative measure of
market risk that applies recent historic market conditions to estimate the potential future loss in
market value that will not be exceeded in a set time period at a set statistical confidence level. VaR
provides a consistent measure that can be applied across trading businesses and products over timeand can be set against actual daily trading profit and loss outcome.
VaR is calculated for expected movements over a minimum of one business day and to a confidence
level of 97.5%. This confidence level suggests that potential daily losses, in excess of the VaR
112
c102100pu020Proof7:28.3.10B/LRevision:0OperatorSadK

measure, are likely to be experienced six times per year. The Company apply two VaR
methodologies:
* Historic simulation: involves the revaluation of all un-matured contracts to reflect the effect of
historically observed changes in market risk factors on the valuation of the current portfolio.
This approach is applied for general market risk factors.
* Monte Carlo simulation: this methodology is similar to historic simulation but with considerably
more input risk factor observations. These are generated by random sampling techniques, butthe results retain the essential variability and correlations of historically observed risk factor
changes. This approach is applied for credit spread VaR.
In both methods a historical observation period of one year is chosen and applied. VaR is calculated
as the Company’s exposure as at the close of business, generally London time. Intra-day risk levels
may vary from those reported at the end of the day.
Back testing
To assess their predictive power, VaR models are back tested against actual results. In 2009 there was
only one exception in the regulatory back testing, compared with three in 2008. This is well within
the ‘‘green zone’’ applied internationally to internal models by bank supervisors, and implies that
model reliability is statistically greater than 95%.
Stress testing
Losses beyond the confidence interval are not captured by a VaR calculation, which therefore gives
no indication of the size of unexpected losses in these situations. Group Market Risk complements
the VaR measurement by weekly stress testing of market risk exposures to highlight the potential risk
that may arise from extreme market events that are rare but plausible. Stress testing is an integral
part of the market risk management framework and considers both historical market events and
forward-looking scenarios. A consistent stress testing methodology is applied to trading and non-
trading books. The stress testing methodology assumes that scope for management action would belimited during a stress event, reflecting the decrease in market liquidity that often occurs.
Stress scenarios are regularly updated to reflect changes in risk profile and economic events. The
Group Market Risk Committee has responsibility for reviewing stress exposures and, where necessary,
enforcing reductions in overall market risk exposure. The GRC considers the results of stress tests as
part of its supervision of risk appetite.
Regular stress test scenarios are applied to interest rates, credit spreads, exchange rates, commodity
prices and equity prices. This covers all asset classes in the Financial Markets banking and trading
books. Ad hoc scenarios are also prepared reflecting specific market conditions and for particular
concentrations of risk that arise within the businesses.
Market risk VaR coverage
Interest rate risk from across the non-trading book portfolios is transferred to Financial Markets
where it is managed by local ALM desks under the supervision of local ALCO. The ALM desks deal
in the market in approved financial instruments in order to manage the net interest rate risk, subject
to approved VaR and risk limits. The interest rate risk on securities issued by Group Treasury is
hedged to floating rate and is not included within Group VaR.
VaR and stress tests are therefore applied to non-trading book exposures in the same way as for the
trading book, including listed available for sale securities. Securities classed as ‘loans and receivables’or ‘held to maturity’ are not reflected in VaR or stress tests since they are accounted on an amortised
cost basis, so market price movements have no effect on either profit and loss or reserves. Foreign
exchange risk on the non-trading book portfolios is minimised by match funding assets and liabilities
in the same currency. Structural foreign exchange currency risks are not included within Group VaR.
Equity risk relating to non-listed private equity and strategic investments is not included within the
VaR. It is separately managed through delegated limits for both investment and divestment, and is
also subject to regular review by an investment committee.
Market risk regulatory capital
At the Group level, the FSA specifies minimum capital requirements against market risk. The FSA
has granted the Group Capital Adequacy Directive 2 internal model approval covering the majority
113
c102100pu020Proof7:28.3.10B/LRevision:0OperatorSadK

of interest rate and foreign exchange risk in the trading book. In 2008 the scope was extended to
include precious and base metals market risk. Positions outside the Capital Adequacy Directive 2
scope are assessed according to standard FSA rules.
Derivatives
Derivatives are contracts with characteristics and value derived from underlying financial instruments,
interest and exchange rates or indices. They include futures, forwards, swaps and options transactions.Derivatives are an important risk management tool for banks and their customers because they can
be used to manage market price risk. The market risk of derivatives is managed in essentially the
same way as other traded products. The Company’s derivative transactions are principally in
instruments where the mark-to-market values are readily determinable by reference to independent
prices and valuation quotes.
The Company enters into derivative contracts in the normal course of business to meet customer
requirements and to manage the Company’s exposure to fluctuations in market price movements.
Derivatives are carried at fair value and shown in the balance sheet as separate totals of assets and
liabilities. Recognition of fair value gains and losses depends on whether the derivatives are classified
as trading or held for hedging purposes.
The credit risk arising from all financial derivatives is managed as part of the overall lending limits to
financial institutions and corporate customers.
Hedging
Countries within the Group use futures, forwards, swaps and options transactions primarily to
mitigate interest and foreign exchange risk arising from their own country exposures. The Companyalso uses futures, forwards and options to hedge foreign exchange and interest rate risk. In
accounting terms under IAS 39, hedges are classified into three types: fair value hedges,
predominantly where fixed rates of interest or foreign exchange are exchanged for floating rates; cash
flow hedges, predominantly where variable rates of interest or foreign exchange are exchanged for
fixed rates; and hedges of net investments in overseas operations translated to the parent company’s
functional currency, US dollars.
The Company may also, under certain individually approved circumstances, enter into ‘economic
hedges’ which do not qualify for IAS 39 hedge accounting treatment, and which are accordingly
marked to market through the profit and loss account, thereby creating an accounting asymmetry.
These are entered into primarily to ensure that residual interest rate and foreign exchange risks arebeing effectively managed.
Structural currency exposure management
The Company has investments in foreign operations (subsidiaries and branches) in currencies other
than the Company’s functional currency, US dollars. Foreign exchange movements on those net
investments in foreign currencies are taken to the Company’s reserves; these reserves form part of the
capital base. The effect of exchange rate movements on the capital ratio is partially mitigated by the
fact that both the value of these investments and the risk weighted assets in those currencies follow
broadly the same exchange rate movements.
The Company hedges the net investments in limited circumstances if it is anticipated that the capital
ratio will be materially affected by exchange rate movements.
Liquidity risk
Liquidity risk is the risk that the Company either does not have sufficient financial resources available
to meet all the Company’s obligations and commitments as they fall due, or can only access these
financial resources at excessive cost. It is the Company’s policy to maintain adequate liquidity at all
times, in all geographic locations and for all currencies, and hence to be in a position to meet allobligations as they fall due. The Company manages liquidity risk both on a short-term and medium-
term basis. In the short-term, the Company’s focus is on ensuring that the cash flow demands can be
met through asset maturities, customer deposits and wholesale funding where required. In the
medium-term, the focus is on ensuring the balance sheet remains structurally sound.
The GALCO is the responsible governing body that approves the Company’s liquidity management
policies. The LMC receives authority from the GALCO and is responsible for setting liquidity limits
and proposing liquidity risk policies and practices. Liquidity in each country is managed by the
114
c102100pu020Proof7:28.3.10B/LRevision:0OperatorSadK

Country ALCO within the pre-defined liquidity limits set by the LMC and in compliance with Group
liquidity policies and local regulatory requirements. The Group Treasury and Group Market Risk
functions propose and oversee the implementation of policies and other controls relating to the above
risks.
The Company seeks to manage the Company’s liquidity prudently in all geographical locations and
for all currencies. Exceptional market events can impact us adversely, thereby affecting the
Company’s ability to fulfil the Company’s obligations as they fall due. The principal uncertainties forliquidity risk are that customer depositors withdraw their funds at a substantially faster rate than
expected, or that repayment for asset maturities is not received on the intended day. To mitigate
these uncertainties, the Company’s customer deposit base is diversified by type and maturity. In
addition the Company has a portfolio of liquid assets that can be realised if a liquidity stress occurs,
as well as ready access to wholesale funds under normal market conditions.
Policies and procedures
Due to the diversified nature of the Company’s business, the Company’s policy is that liquidity is
more effectively managed locally, in-country. Each ALCO is responsible for ensuring that the country
is self-sufficient, able to meet all its obligations to make payments as they fall due, and operates
within the local regulations and liquidity limits set for the country. The Company’s liquidity risk
management framework requires limits to be set for prudent liquidity management. There are limits
on:
* the mismatch in local and foreign currency behavioural cash flows;
* the level of wholesale borrowing to ensure that the size of this funding is proportionate to the
local market and the Company’s local operations;
* commitments, both on and off balance sheet, to ensure there are sufficient funds available in the
event of drawdown on these commitments;
* the advances to deposits ratio to ensure that commercial advances are funded by stable sources
and that customer lending is funded by customer deposits;
* the amount of medium-term funding to support the asset portfolio; and
* the amount of local currency funding sourced from foreign currency sources.
In addition, the Company prescribes a liquidity stress scenario that assumes accelerated withdrawal of
deposits over a period of time. Each country has to ensure that cash inflows exceed outflows under
such a scenario.
All limits are reviewed at least annually, and more frequently if required, to ensure that they remain
relevant given market conditions and business strategy. Compliance with limits is monitored
independently on a regular basis by Group Market Risk. Limit excesses are escalated and approved
under a delegated authority structure and reviewed by ALCO. Excesses are also reported monthly to
the LMC and GALCO which provide further oversight.
In addition, regular reports to the ALCO include the following:
* information on the concentration and profile of debt maturities; and
* depositor concentration report to monitor reliance on large individual depositors.
The Company has significant levels of marketable securities, principally government securities and
bank paper, which can be realised, repo’d or used as collateral in the event that there is a need for
liquidity in a crisis. In addition, liquidity crisis management plans are maintained by the Group andwithin each country, and are reviewed and approved annually. The liquidity crisis management plan
lays out trigger points and actions in the event of a liquidity crisis to ensure that there is an effective
response by senior management.
Primary sources of funding
A substantial portion of the Company’s assets is funded by customer deposits made up of currentand savings accounts and other deposits. These customer deposits, which are widely diversified by
type and maturity, represent a stable source of funds. The Asset and Liability Committee in each
country monitors trends in the balance sheet and ensures that any concerns that might impact the
stability of these deposits are addressed effectively. ALCO also reviews balance sheet plans to ensure
that projected asset growth is matched by growth in the stable funding base.
115
c102100pu020Proof7:28.3.10B/LRevision:0OperatorSadK

The Company maintains access to the interbank wholesale funding markets in all major financial
centres and countries in which the Company operates. This seeks to ensure that the Company has
flexibility around maturity transformation, has market intelligence, maintains stable funding lines and
can obtain optimal pricing when the Company performs the Company’s interest rate risk managementactivities.
Operational risk
Operational risk is the risk of direct or indirect loss due to an event or action resulting from thefailure of internal processes, people and systems, or from external events. The Company seeks to
minimise exposure to operational risk, subject to cost trade-offs. Operational risk exposures are
managed through a consistent set of management processes that drive risk identification, assessment,
control and monitoring.
The GORC oversees the management of operational risks across the Group, supported by business,
functional, and country-level committees. This formal structure of governance provides the Group
Risk Committee with confidence that operational risks are being proactively identified and effectively
managed. Group Operational Risk is responsible for setting and maintaining standards for
operational risk management and measurement. An independent assurance function, separate from the
business and functions, is responsible for assuring adherence to the Company’s operational riskcontrols.
Regulatory risk
Regulatory risk includes the risk of loss arising from a failure to comply with the laws, regulations or
codes applicable to the financial services industry. The Regulatory Risk function within the GroupCompliance and Assurance is responsible for developing and maintaining an appropriate framework
of regulatory compliance policies and procedures. Compliance with such policies and procedures is the
responsibility of all employees and is monitored by the Compliance and Assurance function.
The Group Compliance and Regulatory Risk Committee reviews and approves the Company’s
Regulatory Compliance standards and monitors key regulatory risks across the Group.
Reputational risk
Reputational risk is that the Company fails to meet the standards of performance or behaviour
mandated by the Company’s Board and expected by the Company’s stakeholders in the way in which
business is conducted. It is the Company’s policy that protecting the Company’s reputation should at
all times take priority over all other activities, including revenue generation. Reputational risk will
arise from the failure to effectively mitigate one or more of country, credit, liquidity, market,
regulatory, operational, environmental or social risk. All employees are responsible for day-to-day
identification and management of reputational risk.
The Wholesale Banking Responsibility and Reputational Risk Committee and the Consumer Banking
Responsibility and Reputational Risk Committee have responsibility for managing reputational risk intheir respective businesses, while the Group Risk Committee provides oversight, sets Group-wide
policy and monitors any material risk issues. At the country level, it is the responsibility of the
country Chief Executive Officer to protect the Company’s reputation in that market. To achieve this,
the country Chief Executive Officer and country management committee must actively:
* promote awareness and application of the Company’s policy and procedures regarding
reputational risk;
* encourage business and functions to take account of the Company’s reputation in all decision-
making, including dealings with customers and suppliers;
* implement effective in-country reporting systems to ensure they are aware of all potential issues;
and
* promote effective, proactive stakeholder management.
Pension risk
Pension risk is the risk caused by the Company’s obligations to provide pension benefits to the
Company’s employees. Pension risk exposure is not concerned with the financial performance of the
Company’s pension schemes but is focused upon the risk to the Company’s financial position arising
from the Company’s need to meet the Company’s pension scheme funding obligations. The risk
116
c102100pu020Proof7:28.3.10B/LRevision:0OperatorSadK

assessment is focused on the Company’s obligations towards the Company’s major pension schemes,
ensuring that the Company’s funding obligation to these schemes is comfortably within the
Company’s financial capacity. Pension risk is monitored on a quarterly basis, taking account of the
actual variations in asset values and updated expectations regarding the progression of the pensionfund assets and liabilities.
The Pensions Executive Committee is the body responsible for governance of pension risk and it
receives its authority directly from the Court.
Tax risk
Tax risk is any uncertainty of outcome regarding the Company’s tax position. The Company manages
tax risk through the TMC, which receives its authority from the GALCO. Tax risks are identified at
both a country and the Group level; significant tax risks identified in this way, and mitigating action
both planned and taken, are reported to the TMC and GALCO on a quarterly basis.
Monitoring
Group Internal Audit is a separate Group function that reports to the chairman, Group Chief
Executive and the ARC. Group Internal Audit provides independent confirmation that Group and
business standards, policies and procedures are being complied with. Where necessary, corrective
action is recommended.
COMPETITION
In almost all activities in which Standard Chartered is engaged and in all geographic areas in which it
operates, Standard Chartered experiences competition from major financial institutions (including
commercial banks, consumer finance companies and investment banks), as well as local banks and
niche players. Such a competitive landscape is fast changing, which in turn provides significant
opportunities and challenges for Standard Chartered. Competitors vary by geography with only ahandful of names competing in multiple geographies. Typically, local banks are the principal
competitors for both the Consumer Banking and Wholesale Banking businesses given their extensive
distribution networks and large market shares.
Technological innovations, including new and expanding information and communicationtechnologies, increase the channels via which financial institutions can sell their products and services
to their customers.
Partnerships or alliances between financial institutions and technology and telecommunications
providers are also seen as competitors, although they tend to be more restricted to a specific area orproduct attribute.
Standard Chartered believes that it is in a strong competitive position in the markets in which it
operates. Standard Chartered believes that in many of these markets regulatory or other barriers to
entry are still high. Standard Chartered’s network is one which has been built over an extended
period of time and which it believes is not easily replicated.
At the same time, Standard Chartered believes that its wide product offering and large scale of
operations in many of the emerging markets in which it operates can offer a competitive advantage.
In addition, unlike in many of the developed countries, the demand for banking services is expanding
in the emerging markets. Thus, Standard Chartered’s strategy is based on opportunities for growth
arising from both increasing market size and its ability to increase market share.
PROPERTIES
The net book value of all of the Group’s properties as at 31 December 2009 was US$2,224 million.
INTELLECTUAL PROPERTY
As at 31 January 2010, the Company had 448 trade mark registrations for, and approximately 156
applications for registration relating to, the Standard Chartered name and/or Standard Chartered logo(or variations thereof) in all countries where the Group has significant operations. In addition, in
specific countries, the Company has 713 trade mark registrations for, and 139 applications for
registration relating to, other trade marks relevant to its products and/or business. Other than in
respect of the Standard Chartered name and/or Standard Chartered logo, the Group is not materially
dependent on any intellectual property right.
117
c102100pu020Proof7:28.3.10B/LRevision:0OperatorSadK

EMPLOYEES
As at 31 December 2009, the Group employed over 77,300 employees worldwide as compared with
approximately 80,600 and 77,200 as at 31 December 2008 and 2007, respectively. As at 31 December2009, the Group had 47,522 employees in Consumer Banking, 17,379 employees in Wholesale
Banking and 12,425 employees in Support Services.
RECENT DEVELOPMENTS
No circumstance has arisen since the date of the last financial statements as disclosed in this Draft
Red Herring Prospectus which materially and adversely affects or is likely to affect the trading or
profitability of the Company or the value of its assets, or its ability to pay its liabilities within thenext 12 months.
118
c102100pu020Proof7:28.3.10B/LRevision:0OperatorSadK

MANAGEMENT DISCUSSION AND ANALYSIS OF THE FINANCIALCONDITION AND RESULTS OF OPERATIONS
The following discussion is based upon, and should be read together with, the audited consolidated
financial statements of the Company for the years ended 31 December 2009, 2008 and 2007.
The audited consolidated financial statements have been prepared in accordance with IFRS, which differ
in certain respects from Indian GAAP. For a narrative summary of the significant differences between
IFRS and Indian GAAP see the section titled ‘‘Summary Differences between Indian GAAP and IFRS’’
on page 465 of this Draft Red Herring Prospectus.
The Company’s functional and presentation currency is the US dollar (US$) and the Group’s
presentation currency is US$. Some financial information has been translated from US$ into Rs. for
reference only on the basis and at the rates set out in the section titled ‘‘Exchange rates’’ on page 19 of
this Draft Red Herring Prospectus.
Prospective investors’ attention is drawn to the section titled ‘‘Forward-Looking Statements’’ on page 16
of this Draft Red Herring Prospectus regarding forward-looking statements in this part of this Draft
Red Herring Prospectus.
The following discussion is subject to the risk factors described in the section titled ‘‘Risk Factors’’ on
page 62 of this Draft Red Herring Prospectus.
Under English law, the Company is not obliged to prepare quarterly financial statements. However, the
Company is required to issue an interim management statement during each six-month period of its
financial year which must contain an explanation of material events and transactions and their impact on
the financial position of the Company, together with a general description of the financial position and
performance of the Company, for the period to which the statement relates. The Company is required to
release such an interim management statement by no later than 19 May 2010 in respect of the period
from 1 January 2010 to the date of publication of that statement. The Company currently intends to
release such a statement in the first week of May 2010.
The following is extracted without material adjustment from the Annual Report 2009 and 2008 and the
statements are made as at the date of the Annual Report 2009 and 2008, as applicable, rather than the
date of this Draft Red Herring Prospectus.
Overview of the Group
Standard Chartered operates two business divisions which are also the two main business segments:
Wholesale Banking and Consumer Banking. A brief description of the main business segments isprovided below and a more detailed description of these businesses is provided in the section titled
‘‘Business’’ on page 95 of this Draft Red Herring Prospectus.
Consumer Banking products and services include banking services, deposit-taking services, credit
cards, personal loans, mortgages, auto finance and wealth management services. Major markets
include Hong Kong, Singapore, Malaysia, Indonesia, South Korea, Pakistan, India, Taiwan and the
UAE. Principal customers of the Consumer Banking business are individuals in Asia, Africa and the
Middle East. In addition to serving individuals, Consumer Banking also offers a range of deposit-
taking, trade, lending and other banking services to SMEs. As at 31 December 2009, the Group has
approximately 1,700 branches, 5679 ATMs and operating in more than 71 markets. These are a keypart of the distribution network for its Consumer Banking business.
Wholesale Banking provides a wide range of solutions to help corporate and institutional clients
facilitate trade and finance across some of the important growing markets and trade corridors in
today’s global economy. The Wholesale Banking structure, bringing Corporate and Institutional
Banking and Global Markets under one management team, provides customers with an efficient level
of service and promotes the cross-selling of products and services to customers through the Group’s
emerging market network in Asia, Africa and the Middle East. This is complemented by a sales
origination platform in India, the UK, the US, Australia and Japan. Wholesale Banking customersinclude multinational and large local corporations, banks, other financial institutions and, particularly
in Hong Kong, India, the UAE, Singapore and Malaysia, medium-sized local companies.
The Group’s secondary reporting format comprises geographic segments, classified by location of the
customer. The eight main geographic markets are as follows: India, Hong Kong, Singapore, South
Korea, Other Asia Pacific including Malaysia, MESA, Africa and the Americas, the UK and Europe.
119
c102100pu025Proof7:28.3.10B/LRevision:0OperatorSadK

Business Review
Financial performance
The Group continues to build on its record of consistent performance. 2009 is the seventh successive
year of record income and profits and fourth year of generating over $1 billion of incremental
organic income. Over the last seven years, the Company achieved a compounded annual growth rate
(CAGR) of 19% and 22% for income and profits, respectively.
Further analysis on the financial performance of the Group is discussed in subsequent pages of this
section.
Consumer Banking
Consumer Banking’s operating income increased/(decreased) year-on-year by 24%, 3% and (5)% and
operating profit increased/(decreased) year-on-year by 27%, (33%) and (22)% for the years ended31 December 2007, 2008 and 2009, respectively. With the Group firmly focused on balance sheet
strength, Consumer Banking has continued its drive to gather deposits. Further details of the financial
results and analysis of Consumer Banking for the relevant periods are provided on pages 132 and 193
of this Draft Red Herring Prospectus.
Wholesale Banking
Wholesale Banking’s operating income increased year-on-year by 34%, 43% and 24% and operating
profit increased year-on-year by 27%, 28% and 36% for the years ended 31 December 2007, 2008 and2009, respectively. Further details of the financial results and analysis of Wholesale Banking for the
relevant periods are provided on pages 137 and 197 of this Draft Red Herring Prospectus.
Acquisitions
While organic growth continues to drive performance, the Group also conducted acquisitions to
achieve scale and create future growth. The principal acquisitions completed by the Group from
1 January 2006 to 31 Dececmber 2009 are as follows:
* on 5 September 2006, the Group acquired a further 12.96% in Permata Bank, a provider of
wholesale and retail banking products in Indonesia. The Group owned 44.51% of Permata Bank
at 31 December 2007;
* on 5 September 2006, the Group acquired 95.4% of Union Bank, a provider of wholesale and
retail banking products in Pakistan. On 30 December 2006 the assets and business of Union andthe SCB branch in Pakistan were amalgamated into Standard Chartered Bank (Pakistan)
Limited. The Group owned 99.0% of the combined entity at 31 December 2006;
* on 19 October 2006 the Group acquired a controlling interest in Hsinchu, a provider ofwholesale and retail banking products in Taiwan. The Group owned 96.2% of Hsinchu at
31 December 2006. During 2007 the Group acquired the remaining minority shareholding
interest of Hsinchu;
* the Group completed the acquisition of: 100% of Pembroke, an aircraft leasing, financing and
management company based in Ireland, on 5 October 2007; 100% of Harrison Lovegrove, an oil
and gas advisory company based in London, UK, on 3 December 2007; and 80% of A Brain, a
South Korean fund administration company, on 5 December 2007. The Group acquired the
remaining 20% of A Brain in January 2008;
* on 11 January 2008, the Group completed the acquisition of a 49% joint venture interest in
UTI, an equity brokerage firm in India subsequently renamed as Standard Chartered – STCI
Capital Markets Limited (SC Caps);
* on 25 February 2008, the Group completed the acquisition of the South Korean mutual savings
bank, Yeahreum;
* on 29 February 2008, the Group acquired 100% of AEB, a leading financial services company
present in 47 countries;
* on 24 July 2008, Standard Chartered Bank (Hong Kong) Limited acquired a further 6.16% of
the shares in Asia Commercial Bank, Vietnam (‘‘ACB’’) and a further 7.10% in the convertible
bonds of ACB. The transaction increased the investment of the Group in ACB from 8.84% of
ACB’s shares to 15.00% and from 8.76% of ACB’s convertible bonds to 15.86%;
120
c102100pu025Proof7:29.3.10B/LRevision:0OperatorBeeR

* on 7 October 2008, it was announced that Standard Chartered Bank (Taiwan) Limited had been
named as the preferred Bidder in a government auction to acquire the ‘‘good bank’’ portion of
Asia Trust and Investment Corporation in Taiwan and these assets were amalgamated into the
Group as of 30 June 2009;
* on 13 November 2008, it was announced that Standard Chartered Bank (Hong Kong) Limited
had entered into an agreement to acquire 100% of the share capital of Cazenove Asia Limited.
The acquisition was completed on 30 January 2009;
* on 12 December 2008, the Group acquired an additional stake of 25.9% in SC Caps;
* on 30 June 2009, the Group acquired the remaining 75% interest in First Africa; and
* During 2009 the Group acquired a further 2% interest in its subsidiary in Ghana for an
additional $8 million generating goodwill of $6 million.
As described previously, the Group’s businesses fall into two main segments: Consumer Banking and
Wholesale Banking.
Summary of financials for the years ended 31 December 2009 and 31 December 2008
Group operating income and profit2009 2008 2009 vs 2008
$million $million %
Net interest income 7,623 7,387 3
Fees and commissions income, net 3,370 2,941 15
Net trading income 2,890 2,405 20
Other operating income 1,301 1,235 57,561 6,581 15
Operating income 15,184 13,968 9
Operating expenses (7,952) (7,611) 4
Operating profit before impairment losses and taxation 7,232 6,357 14
Impairment losses on loans and advances and other credit risk
provisions (2,000) (1,321) 51
Other impairment (102) (469) (78)Profit from associates 21 1 nm1
Profit before taxation 5,151 4,568 13
2009 2008 2009 vs 2008
Rs.million Rs.million %
Net interest income 355,842 344,825 3
Fees and commissions income, net 157,312 137,286 15
Net trading income 134,905 112,265 20
Other operating income 60,731 57,650 5
352,947 307,201 15
Operating income 708,789 652,026 9Operating expenses (371,199) (355,281) 4
Operating profit before impairment losses and taxation 337,590 296,745 14
Impairment losses on loans and advances and other credit risk
provisions (93,360) (61,664) 51
Other impairment (4,761) (21,893) (78)
Profit from associates 980 47 nm1
Profit before taxation 240,449 213,234 13
1 Not Material
121
c102100pu025Proof7:28.3.10B/LRevision:0OperatorSadK

Acquisitions in 2009
On 30 January 2009, the Company completed the acquisition of Cazenove Asia Limited (subsequently
renamed Standard Chartered Securities (Hong Kong) Limited) in Hong Kong.
On 30 June 2009, the Company completed the acquisition of the remaining 75% equity shareholding
in First Africa, in South Africa.
The effects of the above acquisitions were not material to the Company’s 2009 performance.
On 30 June 2009, the assets of the ‘good bank’ business of Asia Trust and Investment Corporation
(ATIC) in Taiwan were amalgamated into Standard Chartered Bank (Taiwan) Limited. Theintegration of the business is largely complete.
Group summary – financial years ended 31 December 2009 and 31 December 2008
The Group has delivered a record performance for the year ended 31 December 2009. Profit before
taxation rose 13% to $5,151 million and operating income increased by 9% to $15,184 million. On a
constant currency basis, profit before taxation was up 18% and operating income up 14%.
This is the seventh consecutive year in which the Company has demonstrated a sustained and
consistent track record of delivering record operating income and record profits. Over this period, the
Company achieved a compounded annual growth rate (CAGR) of 19% and 22% for income and
profits, respectively.
The normalised cost to income ratio improved from 56.1% in 2008 to 51.3%. Normalised earnings per
share increased by 2.8% to 179.8 cents. Further details of basic and diluted earnings per share areprovided in note 13 on page 136 of the 2009 Annual Report.
After the exceptional events in the latter part of 2008, this year continued to be a challenging anduncertain period for the banking industry. The Company navigated the year by retaining a keen focus
on the fundamentals of sound banking practice: capital and liquidity management, proactive risk
management and discipline on expenses.
The Company’s capital position is strong. The Core Tier 1 ratio at 31 December 2009 was 8.9%,
compared to 7.5% at the end of 2008. It was strengthened by organic equity generation of over $3
billion and a share issue in August 2009 of $1.7 billion. Balance sheet and risk weighted asset (RWA)
growth was appropriately paced.
The Company remains highly liquid. The advances to deposit ratio at 31 December 2009 was 78.6%,
compared to 74.8% at the end of 2008 and the Company remain’s a net lender into the interbank
market. Whilst the Company benefitted from being a ‘‘flight to quality’’ institution for deposits, the
Company also further improved its liability mix. For example, low cost current and saving accountbalances now comprise 53% of its total deposit base, up from 43% at the end of 2008. Current and
saving account balances grew strongly by over $40 billion to $157 billion, up 34%.
The balance sheet is conservatively positioned with minimal exposure to problem asset classes.
Although the Company benefitted in the second half of 2009 from a moderating risk environment,
the Company also took steps to de-risk the portfolio and loan Impairment fell in both businesses in
the second half. In Consumer Banking, over 75% of the portfolios are now secured.
Expense management in 2009 was very good with overall cost growth of 4%, well below 9% income
growth so resulting in operating ‘jaws’ of 5%. During the early part of the year, when the economic
outlook was uncertain, discretionary spending was reined in. As the year progressed and trading
conditions became more settled, we accelerated the Company’s investment to support trading
momentum into 2010.
The Company’s capital, liquidity and risk foundations are excellent and the Company enter 2010 with
good momentum, well placed to meet the opportunities and challenges that the Company will face.
Group performance
Operating income grew by $1,216 million, or 9%, to $15,184 million. This was despite the income
drag that came from margin compression on liabilities and the adverse impact of foreign exchange
(FX) movements, primarily in India, Korea and certain countries in Africa. On a constant currency
basis, the Company’s income was up 14%.
Income growth was driven by Wholesale Banking, broadly spread across geographies and well
diversified over multiple product lines. Five individual markets now deliver over $1 billion of income.
122
c102100pu025Proof7:28.3.10B/LRevision:0OperatorSadK

Net interest income
Net interest income grew $236 million or 3%. In Consumer Banking net interest income fell $331
million or 8% as net margins on deposits remained some 60 basis points lower than in 2008 reflectingthe low interest rate environment. Wholesale Banking net interest income rose $567 million or 17%.
The Cash Management and Custody businesses were also impacted by low margins and income here
fell 24% despite a 24% growth in balances. However the Trade and Lending businesses more than
compensated for this reduction growing income 26% and 54% respectively with re-pricing actions
serving to increase asset margins. The Group’s net interest margin fell from 2.5% in 2008 to 2.3%,
with higher asset margins more than offset by compressed liability margins.
Interest income for the financial year ended 31 December 2009 decreased US$3.5 billion, or 21%,
when compared with the equivalent period in 2008. The decrease in interest income was largely due
to sales falling offset by an increase in volume. Interest expense for the financial year ended
31 December 2009 decreased by US$3.7 billion, or 41% when compared with 2008. The decrease islargely due to lower interest rates and reduced volume.
The following table shows, for the periods indicated, the principal components of interest income and
expenses:
Interest Income
2009
US$m
2008
US$m
2009
Rs.m
2008
Rs.m
Balances at central banks 6 32 280 1,494
Treasury bills 656 835 30,622 38,978
Loans and advances to banks 755 1,382 35,243 64,512
Loans and advances to customers 9,370 11,397 437,392 532,012
Listed debt securities 885 1,147 41,312 53,542
Unlisted debt securities 1,196 1,545 55,829 72,121Accrued on impaired assets (discount unwind) 58 40 2,707 1,867
12,926 16,378 603,386 764,525
Interest ExpenseDeposits by banks 854 1,268 39,865 59,190
Customer accounts:
Interest-bearing current accounts and savings
deposits 785 1,009 36,644 47,100
Time deposits 2,394 4,328 111,752 202,031
Debt securities in issue 769 1,338 35,897 62,458
Subordinated liabilities and other borrowed funds:
Wholly repayable within five years 37 389 1,727 18,159Other 464 659 21,660 30,762
5,303 8,991 247,544 419,700
Net Interest Income 7,623 7,387 355,842 344,825
123
c102100pu025Proof7:28.3.10B/LRevision:0OperatorSadK

The following table analyses the estimated change in the Group’s net interest income attributable to
changes in the average volume of interest-earning assets and interest-bearing liabilities, and changes in
their respective interest rates for the periods presented. Volume and rate variances have been
determined based on movements in average balances and average exchange rates over the period andchanges in interest rates on average interest-earning assets and average interest-bearing liabilities.
Variances caused by changes in both volume and rate have been allocated to changes in volume.
2009 versus 2008
Increase/(decrease)
in interest due to:
Net
increase/
(decrease)
in interest
Volume Rate
$million $million $million
Interest earning assetsCash and unrestricted balances at central banks 2 (28) (26)
Loans and advances to banks 101 (728) (627)
Loans and advances to customers 481 (2,489) (2,008)
Investment securities 347 (1,137) (790)
Total interest earning assets 931 (4,382) (3,451)
Interest bearing liabilities
Subordinated liabilities and other borrowed funds (678) 130 (548)
Interest bearing current accounts and savings deposits 143 (516) (373)
Time and other deposits 157 (2,354) (2,197)
Debt securities in issue (97) (472) (569)
Total interest bearing liabilities (475) (3,212) (3,687)
2009 versus 2008
Increase/(decrease) in
interest due to:
Net
increase/
(decrease)
in interest
Volume Rate
Rs.million Rs.million Rs.million
Interest earning assets
Cash and unrestricted balances at central banks 93 (1,307) (1,214)Loans and advances to banks 4,715 (33,983) (29,268)
Loans and advances to customers 22,453 (116,187) (93,733)
Investment securities 16,198 (53,075) (36,877)
Total interest earning assets 43,459 (204,552) (161,093)
Interest bearing liabilities
Subordinated liabilities and other borrowed funds (31,649) 6,068 (25,581)
Interest bearing current accounts and savings deposits 6,675 (24,087) (17,412)
Time and other deposits 7,329 (109,885) (102,556)
Debt securities in issue (4,528) (22,033) (26,561)
Total interest bearing liabilities (22,173) (149,936) (172,109)
124
c102100pu025Proof7:28.3.10B/LRevision:0OperatorSadK

Non-interest income
2009
US$m
2008
US$m
2009
Rs.m
2008
Rs.m
Increase
%
Fees and commissions income, net 3,370 2,941 157,312 137,286 15
Net trading income 2,890 2,405 134,905 112,265 20
Other operating income 1,301 1,235 60,731 57,650 5Non-interest income 7,561 6,581 352,947 307,201 15
Non-interest income grew $980 million or 15%, to $7,561 million.
Net fees and commission income
Net fees and commissions income grew $429 million, or 15%, to $3,370 million. In Consumer
Banking, whilst demand for Wealth Management products improved steadily through the year, fee
income levels were still below those of 2008. Wholesale Banking fee income was higher as a result ofstrong corporate advisory income and capital market fees, which more than offset reduced custody
income.
Net trading income
Net trading income increased $485 million, or 20%, to $2,890 million. Asset and Liability
Management (ALM) income was up 6% through realisations from positions taken at the end of 2008
capturing both high interest rates and wide credit spreads. Trading income also grew through
increased client demand with gains in securities, interest rate and credit and other derivatives.
The following table sets forth, for the periods indicated, the principal components of net trading
income:
2009 2008
$million $million
Gains less losses on instruments held for trading: 2,770 2,402
Gains less losses from fair value hedging: (8) 6
Gains less losses on instruments designated at fair value: 128 (3)
2,890 2,405
2009 2008
Rs.million Rs.million
Gains less losses on instruments held for trading: 129,304 112,125
Gains less losses from fair value hedging: (373) 280
Gains less losses on instruments designated at fair value: 5,975 (140)
134,905 112,265
Other operating income
Other operating income was up $66 million, or 5%, to $1,301 million. Other operating income
includes $592 million of net profits on available for sale (AFS) assets including disposals from private
equity and strategic portfolios, $264 million of gains arising from the buy back of subordinated debt,
and $156 million related to lease income.
Operating expenses
Operating expenses increased $341 million or 4% to $7,952 million. On a constant currency basis
expenses were up 10%. Expenses include $170 million for the buy back of structured notes from the
PEM Group in Taiwan and a $58 million charge in respect of the UK bank payroll tax. Both these
items have been normalised for the purposes of EPS and cost income ratio. The Company has again
125
c102100pu025Proof7:28.3.10B/LRevision:0OperatorSadK

maintained a tight rein on expenses this year. Group headcount reduced by over 3,000 both through
natural attrition and selective restructuring initiatives. Consumer Banking expenses were $3,709
million, down 3% on 2008. Consumer Banking continued a number of restructuring initiatives.
Expenses increased towards the end of 2009 as the business increased investment in the light ofimproving income and impairment levels. Wholesale Banking expenses were $4,185million, up 11%.
This increase was driven by the flow through effect of investments in skills and infrastructure in
previous years together with increased variable compensation driven by a strong income performance.
The following table sets forth, for the periods indicated, the principal components of operating
expenses:
2009
US$m
2008
US$m
2009
Rs.m
2008
Rs.m
Staff costs:Wages and salaries 3,634 3,793 169,635 177,057
Social security costs 98 93 4,575 4,341
Other pension costs 138 172 6,442 8,029
Share based payments 375 121 17,505 5,648
Other staff costs 667 558 31,136 26,047
4,912 4,737 229,292 221,123
Premises and equipment expenses:Rental of premises 338 337 15,778 15,731
Other premises and equipment costs 341 376 15,918 17,552
Rental of computers and equipment 19 25 887 1,167
698 738 32,583 34,450
General administrative expenses 1,822 1,711 85,051 79,869
Depreciation and amortisation expenses:
Premises 119 98 5,555 4,575Equipment 193 152 9,009 7,095
Intangibles:
Software 139 94 6,489 4,388
Acquired on business combinations 69 81 3,221 3,781
520 425 24,274 19,839
Total Operating Expenses 7,952 7,611 371,199 355,281
The Group’s normalised cost to income ratio improved to 51.3%, down from 56.1% in 2008.
Operating profit before impairment losses and taxation (also referred to as ‘working profit’) increased
by $875 million, or 14%, to $7,232 million. On a constant currency basis, the increase in working
profit was 19%.
Impairment provisions
Loan impairment was up $679 million or 51% to $2,000 million. The challenging credit environment
seen in the latter half of 2008 continued into the early part of the year. In the second half bothbusinesses have generally seen an improving credit environment. Loan impairment was down on the
first half in Consumer Banking and in Wholesale Banking by 13% and 19%, respectively, the latter
despite the portfolio provision taken in respect of exposures in the Middle East.
Other impairment charges were $102 million, down 78% from $469 million in 2008. In 2009 the other
impairment charge relates mainly to asset backed securities whereas in 2008 the charge also comprised
write downs in the valuation of the private equity and strategic investment portfolios.
Profit before taxation was up $583 million, or 13%, to $5,151 million. India joined Hong Kong as the
second geography to deliver operating profits in excess of $1 billion.
126
c102100pu025Proof7:28.3.10B/LRevision:0OperatorSadK

The Group’s effective tax rate (ETR) was 32.5%, compared to 26.8% in 2008. The 2009 ETR was
higher than the Company’s normal underlying tax rate due to the effects of a collaborative exercise
with Her Majesty’s Revenue and Customs (HMRC) which finalised prior year UK tax computations
from 1990 to 2006 resulting in a one-off net charge of $190 million in the current year.
Normalised return on ordinary shareholders’ equity was 14.3% in 2009, compared to 15.2% in 2008
reflecting the further strengthening of the Company’s capital positioning.
Profit and Loss, by class of business and geographic markets, for the financial years ended 31 December 2009
and 31 December 2008
The Group is organised on a worldwide basis for management and reporting purposes into two main
business segments: Consumer Banking and Wholesale Banking. The businesses’ focus is on
broadening and deepening the relationship with customers, rather than maximising a particular
product line. Hence the Group evaluates segmental performance based on overall profit or loss before
taxation (excluding corporate items not allocated) and not individual product profitability. Product
revenue information is used as a way of assessing customer needs and trends in the market place. The
strategies adopted by Consumer Banking and Wholesale Banking need to be adapted to local market
and regulatory requirements, which is the responsibility of country management teams. While not theprimary driver of the business, country performance is an important part of the Group’s matrix
structure and is also used to evaluate performance and reward staff. Corporate items not allocated
are not aggregated into the businesses because of the one-off nature of these items.
The Group’s entity-wide disclosure comprises geographic areas, classified by the location of the
customer.
Transactions between the business segments and geographic areas are carried out on an arms length
basis. Apart from the entities that have been acquired in the last two years, Group central expenses
have been distributed between the business segments and geographic areas in proportion to their
direct costs, and the benefit of the Group’s capital has been distributed between segments in
proportion to their average risk weighted assets. In the year in which an acquisition is made, the
Group does not charge or allocate the benefit of the Group’s capital. The distribution of central
expenses is phased in over two years, based on the estimate of central management costs associated
with the acquisition.
By class of business
2009 2008
Consumer
Banking
Wholesale
Banking
Total
reportable
segments
Corporate
items not
allocated3 Total
Consumer
Banking
Wholesale
Banking
Total
reportable
segments
Corporate
items not
allocated4 Total
$million $million $million $million $million $million $million $million $million $million
Internal income (55) 55 — — — (78) 78 — — —
Net interest income 3,876 3,747 7,623 — 7,623 4,224 3,163 7,387 — 7,387
Other income 1,808 5,489 7,297 264 7,561 1,806 4,248 6,054 527 6,581
Operating income 5,629 9,291 14,920 264 15,184 5,952 7,489 13,441 527 13,968
Operating expenses (3,709) (4,185) (7,894) (58) (7,952) (3,843) (3,768) (7,611) — (7,611)
Operating profit before impairment
losses and taxation 1,920 5,106 7,026 206 7,232 2,109 3,721 5,830 527 6,357
Impairment losses on loans and
advances and other credit risk
provisions (1,052) (948) (2,000) — (2,000) (937) (384) (1,321) — (1,321)
Other impairment (1) (82) (83) (19) (102) (56) (336) (392) (77) (469)
Profit from associates — — — 21 21 — — — 1 1
Profit before taxation 867 4,076 4,943 208 5,151 1,116 3,001 4,117 451 4,568
Total assets employed1 103,534 331,306 434,840 1,813 436,653 86,402 346,731 433,133 1,935 435,068
Total liabilities employed 144,167 263,571 407,738 995 408,733 129,029 282,656 411,685 688 412,373
Other segment items:
Capital expenditure2 160 901 1,061 — 1,061 375 1,207 1,582 — 1,582
Depreciation 161 151 312 — 312 157 93 250 — 250
Interests in associates1 — — — 514 514 — — — 511 511
Amortisation of intangible assets 71 137 208 — 208 93 82 175 — 175
1 Interests in associates at 31 December 2008 included $511 million previously allocated by business that has now been included in‘Corporate items not allocated.’
127
c102100pu025Proof7:28.3.10B/LRevision:0OperatorSadK

2 Includes capital expenditure in Wholesale Banking of $631 million in respect of operating lease assets (31 December 2008: $852million).
3 Relates to gain on buy-back of subordinated debt, UK payroll tax, impairment of associates and the Group’s share of profit fromassociates.
4 Relates to gain on buy-back of subordinated debt, disposal of business, impairment of associates and other strategic investmentsand the Group’s share of profit from associates.
By class of business
2009 2008
Consumer
Banking
Wholesale
Banking
Total
reportable
segments
Corporate
items not
allocated3 Total
Consumer
Banking
Wholesale
Banking
Total
reportable
segments
Corporate
items not
allocated4 Total
Rs.million Rs.million Rs.million Rs.million Rs.million Rs.million Rs.million Rs.million Rs.million Rs.million
Internal income (2,567) 2,567 — — — (3,641) 3,641 — — —
Net interest income 180,932 174,910 355,842 — 355,842 197,176 147,649 344,825 — 344,825
Other income 84,397 256,227 340,624 12,324 352,947 84,304 198,297 282,601 24,600 307,201
Operating income 262,762 433,704 696,466 12,324 708,789 277,839 349,587 627,426 24,600 652,026
Operating expenses (173,136) (195,356) (368,492) (2,707) (371,199) (179,391) (175,890) (355,281) — (355,281)
Operating profit before impairment
losses and taxation 89,626 238,348 327,974 9,616 337,590 98,448 173,696 272,144 24,600 296,745
Impairment losses on loans and
advances and other credit risk
provisions (49,107) (44,253) (93,360) — (93,360) (43,739) (17,925) (61,664) — (61,664)
Other impairment (47) (3,828) (3,874) (887) (4,761) (2,614) (15,684) (18,299) (3,594) (21,893)
Profit from associates — — — 980 980 — — — 47 47
Profit before taxation 40,472 190,268 230,739 9,709 240,449 52,095 140,087 192,182 21,053 213,234
Total assets employed1 4,832,967 15,465,364 20,298,331 84,631 20,382,962 4,033,245 16,185,403 20,218,648 90,326 20,308,974
Total liabilities employed 6,729,716 12,303,494 19,033,210 46,447 19,079,656 6,023,074 13,194,382 19,217,456 32,116 19,249,572
Other segment items:
Capital expenditure2 7,469 42,059 49,527 — 49,527 17,505 56,343 73,848 — 73,848
Depreciation 7,515 7,049 14,564 — 14,564 7,329 4,341 11,670 — 11,670
Interests in associates1 — — — 23,994 23,994 — — — 23,853 23,853
Amortisation of intangible assets 3,314 6,395 9,709 — 9,709 4,341 3,828 8,169 — 8,169
1 Interests in associates at 31 December 2008 included $511 million previously allocated by business that has now been included in‘Corporate items not allocated.’
2 Includes capital expenditure in Wholesale Banking of $631 million in respect of operating lease assets (31 December 2008: $852million).
3 Relates to gain on buy-back of subordinated debt, UK payroll tax, impairment of associates and the Group’s share of profit fromassociates.
4 Relates to gain on buy-back of subordinated debt, disposal of business, impairment of associates and other strategic investmentsand the Group’s share of profit from associates.
128
c102100pu025Proof7:28.3.10B/LRevision:0OperatorSadK

Entity-wide information
By geography
The Group manages its reportable business segments on a global basis. The operations are based in eight
main geographic areas. The UK is the home country of the Company.
2009
Asia Pacific
Hong
Kong Singapore Korea
Other
Asia
Pacific1 India
Middle
East &
Other
S Asia Africa
Americas
UK &
Europe2 Total
$million $million $million $million $million $million $million $million $million
Internal income 14 (18) (62) 43 195 (42) 39 (169) —
Net interest income 1,308 782 908 1,505 724 1,134 491 771 7,623
Fees and commissions income, net 542 291 187 502 546 494 320 488 3,370
Net trading income 456 357 322 502 259 356 221 417 2,890
Other operating income 50 180 199 336 89 136 18 293 1,301
Operating income 2,370 1,592 1,554 2,888 1,813 2,078 1,089 1,800 15,184
Operating expenses (1,168) (801) (953) (1,778) (571) (891) (553) (1,237) (7,952)
Operating profit before impairment losses and
taxation 1,202 791 601 1,110 1,242 1,187 536 563 7,232
Impairment losses on loans and advances and
other credit risk provisions (145) (37) (278) (395) (201) (811) (54) (79) (2,000)
Other impairment 10 (40) (1) 26 19 (10) — (106) (102)
(Loss)/profit from associates (5) — — 29 — — — (3) 21
Profits before taxation 1,062 714 322 770 1,060 366 482 375 5,151
Loans and advances to customers – average 29,194 25,938 32,372 38,972 8,351 18,972 3,316 31,336 188,451
Net interest margins (%) 1.8 1.7 1.8 2.3 3.8 3.7 4.8 1.0 2.3
Loans and advances to customers – period end 29,973 31,399 36,804 41,992 8,866 18,484 4,029 30,256 201,803
Loans and advances to banks – period end 19,453 5,085 2,780 7,232 511 1,864 300 15,708 52,933
Total assets employed3 91,739 62,137 63,222 83,191 31,719 44,275 13,633 91,149 481,065
Capital expenditure4 24 164 63 32 49 19 37 673 1,061
1 Other Asia Pacific region (Other APR) includes Malaysia: operating income of $488 million; operating expenses of $(207) million,impairment losses on loans and advances and other credit risk provisions of $(61) million and profit before taxation of$220 million. Total assets employed of $13,881 million.
2 Americas UK & Europe includes operating income of $967 million and total assets employed of $76,541 million in respect of theUK, the Company’s country of domicile.
3 Total assets employed includes intra-group items of $45,711 million and excludes tax assets of $1,299 million. Assets held at thecentre have been distributed between geographic areas in proportion to their total assets employed.
4 Includes capital expenditure in Americas, UK and Europe of $631 million in respect of operating lease assets. Other capitalexpenditure comprises additions to property and equipment and software related intangibles including any post-acquisitionadditions made by the acquired entities.
129
c102100pu025Proof7:28.3.10B/LRevision:0OperatorSadK
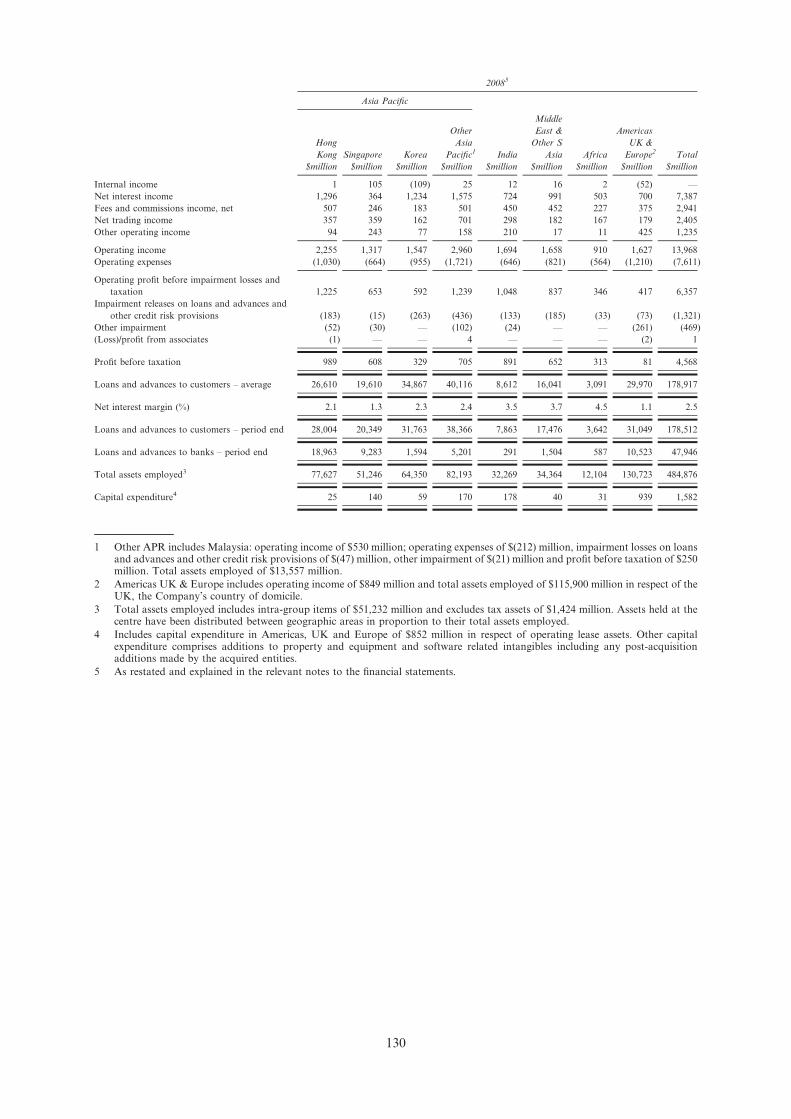
20085
Asia Pacific
Hong
Kong Singapore Korea
Other
Asia
Pacific1 India
Middle
East &
Other S
Asia Africa
Americas
UK &
Europe2 Total
$million $million $million $million $million $million $million $million $million
Internal income 1 105 (109) 25 12 16 2 (52) —
Net interest income 1,296 364 1,234 1,575 724 991 503 700 7,387
Fees and commissions income, net 507 246 183 501 450 452 227 375 2,941
Net trading income 357 359 162 701 298 182 167 179 2,405
Other operating income 94 243 77 158 210 17 11 425 1,235
Operating income 2,255 1,317 1,547 2,960 1,694 1,658 910 1,627 13,968
Operating expenses (1,030) (664) (955) (1,721) (646) (821) (564) (1,210) (7,611)
Operating profit before impairment losses and
taxation 1,225 653 592 1,239 1,048 837 346 417 6,357
Impairment releases on loans and advances and
other credit risk provisions (183) (15) (263) (436) (133) (185) (33) (73) (1,321)
Other impairment (52) (30) — (102) (24) — — (261) (469)
(Loss)/profit from associates (1) — — 4 — — — (2) 1
Profit before taxation 989 608 329 705 891 652 313 81 4,568
Loans and advances to customers – average 26,610 19,610 34,867 40,116 8,612 16,041 3,091 29,970 178,917
Net interest margin (%) 2.1 1.3 2.3 2.4 3.5 3.7 4.5 1.1 2.5
Loans and advances to customers – period end 28,004 20,349 31,763 38,366 7,863 17,476 3,642 31,049 178,512
Loans and advances to banks – period end 18,963 9,283 1,594 5,201 291 1,504 587 10,523 47,946
Total assets employed3 77,627 51,246 64,350 82,193 32,269 34,364 12,104 130,723 484,876
Capital expenditure4 25 140 59 170 178 40 31 939 1,582
1 Other APR includes Malaysia: operating income of $530 million; operating expenses of $(212) million, impairment losses on loansand advances and other credit risk provisions of $(47) million, other impairment of $(21) million and profit before taxation of $250million. Total assets employed of $13,557 million.
2 Americas UK & Europe includes operating income of $849 million and total assets employed of $115,900 million in respect of theUK, the Company’s country of domicile.
3 Total assets employed includes intra-group items of $51,232 million and excludes tax assets of $1,424 million. Assets held at thecentre have been distributed between geographic areas in proportion to their total assets employed.
4 Includes capital expenditure in Americas, UK and Europe of $852 million in respect of operating lease assets. Other capitalexpenditure comprises additions to property and equipment and software related intangibles including any post-acquisitionadditions made by the acquired entities.
5 As restated and explained in the relevant notes to the financial statements.
130
c102100pu025Proof7:28.3.10B/LRevision:0OperatorSadK

Entity-wide information
By geography
The Group manages its reportable business segments on a global basis. The operations are based in eight
main geographic areas. The UK is the home country of the Company.
2009
Asia Pacific
Hong
Kong Singapore Korea
Other
Asia
Pacific1 India
Middle
East &
Other S
Asia Africa
Americas
UK &
Europe2 Total
Rs.million Rs.million Rs.million Rs.million Rs.million Rs.million Rs.million Rs.million Rs.million
Internal income 654 (840) (2,894) 2,007 9,103 (1,961) 1,821 (7,889) —
Net interest income 61,057 36,504 42,385 70,253 33,796 52,935 22,920 35,990 355,842
Fees and commissions income, net 25,301 13,584 8,729 23,433 25,487 23,060 14,938 22,780 157,312
Net trading income 21,286 16,665 15,031 23,433 12,090 16,618 10,316 19,466 134,905
Other operating income 2,334 8,402 9,289 15,684 4,155 6,348 840 13,677 60,731
Operating income 110,632 74,315 72,541 134,812 84,631 97,001 50,835 84,024 708,789
Operating expenses (54,522) (37,391) (44,486) (82,997) (26,654) (41,592) (25,814) (57,743) (371,199)
Operating profit before impairment losses and
taxation 56,109 36,924 28,055 51,815 57,977 55,409 25,020 26,281 337,590
Impairment losses on loans and advances and
other credit risk provisions (6,769) (1,727) (12,977) (18,439) (9,383) (37,857) (2,521) (3,688) (93,360)
Other impairment 467 (1,867) (47) 1,214 887 (467) — (4,948) (4,761)
(Loss)/profit from associates (233) — — 1,354 — — — (140) 980
Profits before taxation 49,574 33,330 15,031 35,944 49,481 17,085 22,500 17,505 240,449
Loans and advances to customers – average 1,362,776 1,210,786 1,511,125 1,819,213 389,825 885,613 154,791 1,462,764 8,796,893
Net interest margins (%) 1.8 1.7 1.8 2.3 3.8 3.7 4.8 1.0 2.3
Loans and advances to customers – period end 1,399,140 1,465,705 1,718,011 1,960,187 413,865 862,833 188,074 1,412,350 9,420,164
Loans and advances to banks – period end 908,066 237,368 129,770 337,590 23,853 87,012 14,004 733,249 2,470,912
Total assets employed3 4,282,377 2,900,555 2,951,203 3,883,356 1,480,643 2,066,757 636,388 4,254,835 22,456,114
Capital expenditure4 1,120 7,656 2,941 1,494 2,287 887 1,727 31,416 49,527
1 Other Asia Pacific region (Other APR) includes Malaysia: operating income of $488 million; operating expenses of $(207) million,impairment losses on loans and advances and other credit risk provisions of $(61) million and profit before taxation of$220 million. Total assets employed of $13,881 million.
2 Americas UK & Europe includes operating income of $967 million and total assets employed of $76,541 million in respect of theUK, the Company’s country of domicile.
3 Total assets employed includes intra-group items of $45,711 million and excludes tax assets of $1,299 million. Assets held at thecentre have been distributed between geographic areas in proportion to their total assets employed.
4 Includes capital expenditure in Americas, UK and Europe of $631 million in respect of operating lease assets. Other capitalexpenditure comprises additions to property and equipment and software related intangibles including any post-acquisitionadditions made by the acquired entities.
131
c102100pu025Proof7:28.3.10B/LRevision:0OperatorSadK

20085
Asia Pacific
Hong
Kong Singapore Korea
Other
Asia
Pacific1 India
Middle
East &
Other S
Asia Africa
Americas
UK &
Europe2 Total
Rs.million Rs.million Rs.million Rs.million Rs.million Rs.million Rs.million Rs.million Rs.million
Internal income 47 4,901 (5,088) 1,167 560 747 93 (2,427) —
Net interest income 60,497 16,992 57,603 73,521 33,796 46,260 23,480 32,676 344,825
Fees and commissions income, net 23,667 11,483 8,542 23,387 21,006 21,099 10,596 17,505 137,286
Net trading income 16,665 16,758 7,562 32,723 13,911 8,496 7,796 8,356 112,265
Other operating income 4,388 11,343 3,594 7,375 9,803 794 513 19,839 57,650
Operating income 105,263 61,478 72,214 138,173 79,076 77,395 42,479 75,948 652,026
Operating expenses (48,080) (30,996) (44,579) (80,336) (30,155) (38,324) (26,328) (56,483) (355,281)
Operating profit before impairment losses and
taxation 57,183 30,482 27,635 57,837 48,921 39,071 16,151 19,466 296,745
Impairment releases on loans and advances and
other credit risk provisions (8,542) (700) (12,277) (20,352) (6,208) (8,636) (1,540) (3,408) (61,664)
Other impairment (2,427) (1,400) — (4,761) (1,120) — — (12,183) (21,893)
(Loss)/profit from associates (47) — — 187 — — — (93) 47
Profit before taxation 46,167 28,381 15,358 32,909 41,592 30,435 14,611 3,781 213,234
Loans and advances to customers – average 1,242,155 915,395 1,627,592 1,872,615 402,008 748,794 144,288 1,399,000 8,351,846
Net interest margin (%) 2.1 1.3 2.3 2.4 3.5 3.7 4.5 1.1 2.5
Loans and advances to customers – period end 1,307,227 949,891 1,482,697 1,790,925 367,045 815,780 170,009 1,449,367 8,332,940
Loans and advances to banks – period end 885,193 433,330 74,408 242,783 13,584 70,207 27,401 491,214 2,238,119
Total assets employed3 3,623,628 2,392,163 3,003,858 3,836,769 1,506,317 1,604,112 565,015 6,102,150 22,634,012
Capital expenditure4 1,167 6,535 2,754 7,936 8,309 1,867 1,447 43,833 73,848
1 Other APR includes Malaysia: operating income of $530 million; operating expenses of $(212) million, impairment losses on loansand advances and other credit risk provisions of $(47) million, other impairment of $(21) million and profit before taxation of $250million. Total assets employed of $13,557 million.
2 Americas UK & Europe includes operating income of $849 million and total assets employed of $115,900 million in respect of theUK, the Company’s country of domicile.
3 Total assets employed includes intra-group items of $51,232 million and excludes tax assets of $1,424 million. Assets held at thecentre have been distributed between geographic areas in proportion to their total assets employed.
4 Includes capital expenditure in Americas, UK and Europe of $852 million in respect of operating lease assets. Other capitalexpenditure comprises additions to property and equipment and software related intangibles including any post-acquisitionadditions made by the acquired entities.
5 As restated and explained in the relevant notes to the financial statements.
Consumer Banking
The following tables provide an analysis of operating profit by geography for Consumer Banking:
2009
Asia Pacific
Hong
Kong Singapore Korea
Other
Asia
Pacific1 India
Middle
East &
Other
S Asia Africa
Americas
UK &
Europe
Consumer
Banking
Total
$million $million $million $million $million $million $million $million $million
Operating income 1,082 635 995 1,283 444 678 351 161 5,629
Operating expenses (604) (297) (701) (1,046) (248) (395) (229) (189) (3,709)
Loan impairment (104) (34) (185) (240) (147) (285) (28) (29) (1,052)
Other impairment 5 — (1) (2) 5 — — (8) (1)
Operating profit/(loss) 379 304 108 (5) 54 (2) 94 (65) 867
1 Other Asia Pacific (Other APR) includes Malaysia : operating income $246 million, operating expenses $(122) million, loanimpairment $(53) million, operating profit $71 million.
132
c102100pu025Proof7:28.3.10B/LRevision:0OperatorSadK

2008
Asia Pacific
Hong
Kong Singapore Korea
Other
Asia
Pacific1 India
Middle
East
& Other S
Asia Africa
Americas
UK &
Europe
Consumer
Banking
Total
$million $million $million $million $million $million $million $million $million
Operating income 1,163 618 1,017 1,393 484 700 344 233 5,952
Operating expenses (587) (289) (726) (1,007) (317) (410) (250) (257) (3,843)
Loan impairment (106) (20) (161) (311) (89) (178) (19) (53) (937)
Other impairment (25) — — (2) (7) — — (22) (56)
Operating profit/(loss) 445 309 130 73 71 112 75 (99) 1,116
1 Other APR includes Malaysia : operating income $265 million, operating expenses $(128) million, loan impairment $(48) million,operating profit $89 million.
An analysis of Consumer Banking income by product is set out below:
2009 2008 2009 vs
Operating income by product US$million US$million 2008%
Cards, Personal Loans and Unsecured Lending 1,992 2,106 (5)
Wealth Management and Deposits 2,232 2,789 (20)
Mortgages and Auto Finance 1,244 928 34Other 161 129 25
Total operating income 5,629 5,952 (5)
Consumer Banking
The following tables provide an analysis of operating profit by geography for Consumer Banking:
2009
Asia Pacific
Hong
Kong Singapore Korea
Other
Asia
Pacific1 India
Middle
East &
Other S
Asia Africa
Americas
UK &
Europe
Consumer
Banking
Total
Rs.million Rs.million Rs.million Rs.million Rs.million Rs.million Rs.million Rs.million Rs.million
Operating income 50,508 29,642 46,447 59,890 20,726 31,649 16,385 7,515 262,762
Operating expenses (28,195) (13,864) (32,723) (48,827) (11,577) (18,439) (10,690) (8,823) (173,136)
Loan impairment (4,855) (1,587) (8,636) (11,203) (6,862) (13,304) (1,307) (1,354) (49,107)
Other impairment 233 — (47) (93) 233 — — (373) (47)
Operating profit/(loss) 17,692 14,191 5,041 (233) 2,521 (93) 4,388 (3,034) 40,472
1 Other Asia Pacific (Other APR) includes Malaysia : operating income $246 million, operating expenses $(122) million, loanimpairment $(53) million, operating profit $71 million.
2008
Asia Pacific
Hong
Kong Singapore Korea
Other
Asia
Pacific1 India
Middle
East
& Other S
Asia Africa
Americas
UK &
Europe
Consumer
Banking
Total
Rs.million Rs.million Rs.million Rs.million Rs.million Rs.million Rs.million Rs.million Rs.million
Operating income 54,289 28,848 47,474 65,025 22,593 32,676 16,058 10,876 277,839
Operating expenses (27,401) (13,491) (33,890) (47,007) (14,798) (19,139) (11,670) (11,997) (179,391)
Loan impairment (4,948) (934) (7,515) (14,517) (4,155) (8,309) (887) (2,474) (43,739)
Other impairment (1,167) — — (93) (327) — — (1,027) (2,614)
Operating profit/(loss) 20,773 14,424 6,068 3,408 3,314 5,228 3,501 (4,621) 52,095
1 Other APR includes Malaysia : operating income $265 million, operating expenses $(128) million, loan impairment $(48) million,operating profit $89 million.
133
c102100pu025Proof7:28.3.10B/LRevision:0OperatorSadK

An analysis of Consumer Banking income by product is set out below:
2009 2008 2009 vs
Operating income by product Rs.million Rs.million 2008%
Cards, Personal Loans and Unsecured Lending 92,987 98,308 (5)
Wealth Management and Deposits 104,190 130,191 (20)
Mortgages and Auto Finance 58,070 43,319 34
Other 7,515 6,022 25
Total operating income 262,762 277,839 (5)
Consumer Banking continued the execution of its transformation initiative, delivering early results,
despite an economic and business environment that remained challenging.
The early part of 2009 saw a continuation of the difficult trading conditions of 2008 with low interest
rates, compressed liability margins, subdued demand for Wealth Management products and
challenging credit conditions. The second half of 2009 was more encouraging for the Consumer
Banking business. Demand for Wealth Management products continued to recover, secured lendingvolumes were up and margins improved. As the credit environment improved, loan impairment fell.
As profitability improved, the Company accelerated investment.
These factors affected all the Company’s Consumer Banking markets, whose results were furtheraffected by adverse currency translation impacts.
Full year operating income fell US$323 million or 5% to US$5,629 million. On a constant currency
basis, income was flat to 2008. Second half income was up 10% on first half and 6% on a constantcurrency basis.
Net interest income dropped US$331 million, or 8%, to US$3,815 million. There was good growth in
Mortgage lending with balances up 21% over the year and improved margins on 2008. However, eventhough liability balances were up 12% on 2008, liability margins remained 60 basis points lower
pushing down net interest income.
Non interest income at US$1,814 million was flat to that of the previous year. Sales of WealthManagement products comprise the majority of non interest income and demand for these products
reduced sharply in late 2008. Since that time there has been consistent steady growth in Wealth
Management income on a quarter by quarter basis.
Expenses were down US$134 million, or 3%, to US$3,709 million. On a constant currency basis, they
were up 2%. Expenses included a $170 million charge in the first half for the buy back of structured
notes issued by the PEM Group in Taiwan. This was offset by some reduction in the workforce as
well as other efficiency measures, which in the latter part of the year created room for investment in
relationship managers, infrastructure and products.
Loan impairment increased by US$115 million, or 12%, to US$1,052 million. In the first half of 2009,
difficult credit conditions continued driving up impairment across all markets, mainly in the unsecured
and SME portfolios. The portfolios have been actively de-risked and with an improving economic
environment delinquency rates also improved in the second half of the year. Loan impairment was
13% down on the first half.
Operating profit fell US$249 million, or 22%, to US$867 million, but second half operating profit was
49% up on the first half.
Consumer Banking continued to be an important source of liquidity for the Group. Liabilities grew
by 12% driven by Priority customers and a 21% increase in SME balances. The mix of deposits was
also improved by reducing time and other deposits and increasing the relatively less expensive and
more stable current and savings accounts (CASA). CASA is now 60% of the deposit base, up from
44% in the previous year.
Product performance
Income from Cards, Personal Loans and Unsecured Lending fell $114 million, or 5%, to $1,992
million. This fall was driven by the Company’s Consumer Banking strategy to de-emphasise
unsecured lending in the light of stressed credit conditions in markets such as India, Taiwan and
Pakistan. The decline in income was partially offset by volume gains in Korea, Hong Kong and
China.
134
c102100pu025Proof7:28.3.10B/LRevision:0OperatorSadK

Income from Wealth Management and Deposits fell $557 million, or 20%, to $2,232 million. Income
has been driven down by two significant factors. Firstly customer demand for Wealth Management
products is still well below the levels seen in early 2008, although it has been steadily increasing and
income has grown quarter on quarter throughout 2009. Secondly, deposit balances grew by $13billion helped by enhancement of online banking capabilities and increasing co-operation with
Wholesale Banking to source payroll accounts; this volume growth has, however, been insufficient to
offset the margin compression of 60 basis points.
Income from Mortgages and Auto Finance (Mortgages) grew by $316 million, or 34%, to $1,244
million. This strong growth was driven by the Company’s focus on lower risk secured lending
products. Net interest margins improved year on year due to lower funding expenses and mortgage
re-pricing. The improving property market, especially in countries such as Singapore and Hong Konghas supported new Mortgage business in the latter part of the year.
Geographic performance
Hong Kong
Income was down $81 million, or 7%, to $1,082 million. To compensate for a subdued Wealth
Management contribution the business focused on growing secured lending. Mortgage balances,
including in the SME book, grew $2 billion, or 16%, driven by successful HIBOR-linked mortgage
campaigns. Income from these mortgages was also supported by a widening of the Prime-HIBOR
spread. The Group captured approximately 17% of all new Mortgage business booked in Hong
Kong, up from 15.5% in 2008. SME lending increased by 28%. Fee income from unit trust sales
started to pick up again in the latter part of the year amongst signs of an increase in demand forstructured products. Operating expenses were marginally higher at $604 million. Discretionary spend
was carefully managed and headcount fell primarily through natural attrition. Working profit was
down $98 million, or 17%, to $478 million. Loan impairment remained flat at $104 million. In the
latter part of 2008 loan impairment from the SME segment had increased. The upward trend was
stopped by the Hong Kong Government’s SME loan guarantee scheme which now covers all the
Company’s new SME exposures in Hong Kong. Personal bankruptcies peaked in April 2009 but have
since reduced. Operating profit fell $66 million, or 15%, to $379 million.
Singapore
Income was up $17 million, or 3%, to $635 million. Wealth Management revenue remained under
pressure though campaigns like E$aver top-up deposit helped to grow liabilities by 15%. Income from
Mortgages grew by 28%. Whilst mortgage margins remained flat, there was good volume growthdriven by customer focussed product innovations such as ‘MortgageOne SIBOR’. There was also
double digit income growth in unsecured lending as the business grew market share. SME income
increased as volumes grew supported by the Singapore Government guarantee scheme. The Company
was the leading bank disbursing these government guaranteed loans in 2009. Operating expenses
increased $8 million, or 3%, to $297 million, with investment in frontline marketing and infrastructure
being largely funded by operational savings. Working profit was up $9 million, or 3%, at $338
million. Loan impairment was up $14 million, or 70%, to $34 million driven primarily by SME
related impairments in the first half of the year. The introduction of guarantees improved the profileof the Company’s SME book and impairment was substantially reduced in the second half. Operating
profit was slightly lower by $5 million or 2% at $304 million.
Korea
Income was down $22 million, or 2%, to $995 million. On a constant currency, basis income was up
13% year on year. Wealth Management and Deposit income fell 25%. SME income was also down by
over 30% as the business reduced unsecured lending products such as Business Instalment Loans.
These were offset by double digit income growth in Mortgages driven by strong sales volumes and
increasing margins. Income also benefitted in the second half by $68 million profit from the sale of
the Company’s investment in BC Cards. Operating expenses were down $25 million, or 3%, to $701
million. On a constant currency basis, they were 13% higher, largely driven by investment ininfrastructure such as refurbishing and renovation work undertaken on the Company’s property
portfolio and the opening of 47 new branches The increase is distorted by a previous year curtailment
release from the retirement plan. Working profit was flat at $294 million. Loan impairment was up
$24 million, or 15%, to $185 million driven by unsecured lending as bankruptcies and industry debt
restructuring increased. Loan impairment in the second half of 2009 fell 41% on the first half as the
135
c102100pu025Proof7:28.3.10B/LRevision:0OperatorSadK

SME portfolio continued to be de-risked and the environment improved. Operating profit was down
$22 million, or 17%, to $108 million, equating to a 10% fall on a constant currency basis.
Other Asia Pacific
Income was down $110 million, or 8%, to $1,283 million. All countries in Other Asia Pacific (Other
APR) were adversely impacted by the slow down in Wealth Management. Income in China was up
20% to $172 million driven by strong volume growth in personal loans and mortgages and improvedasset margins. Income in Taiwan was severely affected by margin compression. However, there was
strong double digit growth in Mortgage income as balances grew 10% year on year. Income in
Malaysia was down 7% to $246 million adversely impacted by the low interest rates. Operating
expenses in Other APR were up $39 million, or 4%, to $1,046 million. Expenses across the region
were generally flat or down, with Taiwan driving the increase. This was due to the $170 million
charge for the buy back of structured notes issued by the PEM Group, partly offset by a reduction
in retirement obligations of $52 million. Efficiency gains in China enabled expenses to be held 4%
lower at $228 million whilst investing in four new outlets. Other APR working profit was down $149million, or 39%, to $237 million. Loan impairment was down $71 million, or 23%, to $240 million.
Taiwan delivered a $57 million reduction and Thailand a $22 million reduction in impairment as
enhanced collection efforts took effect and delinquency rates improved. Loan impairment in China
also reduced by $11 million to $3 million as portfolios improved resulting in a reduction in the
operating loss in Consumer Banking China to $60 million. Other APR delivered an operating loss of
$5 million against a profit of $73 million in 2008.
India
Income was down $40 million, or 8%, to $444 million. On a constant currency basis, income was up
by 1%. As in other geographies Wealth Management was under pressure and income was down on
2008. The Mortgages business, whilst growing from a small base, delivered a 75% increase in incomeas volumes grew and margins doubled. SME income was driven by the growth in both secured
lending and deposit volumes. Operating expenses were $69 million, or 22%, lower at $248 million. On
a constant currency basis, expenses were lower by 14%. Expenses benefitted from a service tax rebate,
but also from tight cost control coupled with restructuring initiatives such as consolidation of contact
centres. Investment in the franchise continued with four new branch openings and continued
refurbishment of the existing branch network. Working profit was up $29 million, or 17%, to $196
million. On a constant currency basis, the growth in working profit was 28%. Loan impairment was
up $58 million, or 65%, to $147 million driven by increased delinquencies on unsecured SME andpersonal lending products. Operating profit was lower by $17 million, or 24%, at $54 million. On a
constant currency basis, operating profit was lower by 18%.
MESA
Income was down $22 million, or 3%, to $678 million. The reduction in total MESA income was
largely driven by Pakistan where customer lending was significantly reduced and margin compression
offset strong deposit growth. In UAE, income was flat year on year and was impacted by a reduction
of the high-yield personal loan portfolio in light of economic stress and tighter underwriting criteria.
Wealth Management had a difficult first half, but recovered in the latter part of the year. Operating
expenses in MESA were lower by $15 million, or 4%, at $395 million. Pakistan expenses fell by $21
million or 16% mainly due to exchange rate movements and efficiency initiatives. UAE expenses wereup by $14 million or 9% with investment in Private Banking and branch refurbishment. Working
profit for MESA was down $7 million, or 2%, to $283 million. Loan impairment was higher at $285
million, 60% up on 2008. This was predominantly in UAE where loan impairment more than doubled
as unemployment increased. This resulted in higher delinquency on unsecured lending and some stress
in the mortgage book. MESA delivered an operating loss of $2 million, compared to an operating
profit of $112 million in 2008.
Africa
Income was up $7 million, or 2%, at $351 million. On a constant currency basis, income growth was
20%. Wealth Management and Deposits fared relatively well compared to the other Consumer
Banking markets with income growing 6%. Nigeria, Ghana and Kenya all drove income growth withthe liability businesses. In addition, a new strategic partnership for distribution of Bancassurance
products increased fee income. There was strong momentum in SME. Operating expenses were $21
million, or 8%, lower at $229 million. On a constant currency basis, expenses were higher by 7% and
were driven by investments to strengthen the distribution network as well as the introduction of new
136
c102100pu025Proof7:28.3.10B/LRevision:0OperatorSadK
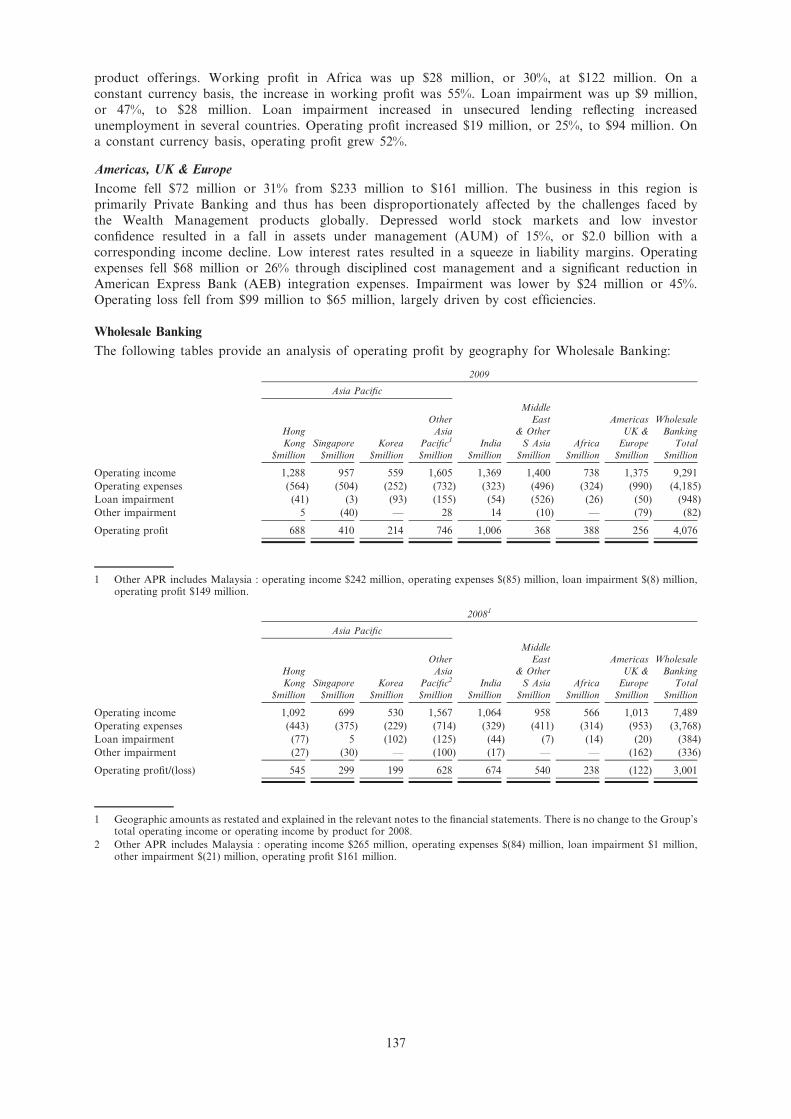
product offerings. Working profit in Africa was up $28 million, or 30%, at $122 million. On a
constant currency basis, the increase in working profit was 55%. Loan impairment was up $9 million,
or 47%, to $28 million. Loan impairment increased in unsecured lending reflecting increased
unemployment in several countries. Operating profit increased $19 million, or 25%, to $94 million. Ona constant currency basis, operating profit grew 52%.
Americas, UK & Europe
Income fell $72 million or 31% from $233 million to $161 million. The business in this region is
primarily Private Banking and thus has been disproportionately affected by the challenges faced by
the Wealth Management products globally. Depressed world stock markets and low investor
confidence resulted in a fall in assets under management (AUM) of 15%, or $2.0 billion with a
corresponding income decline. Low interest rates resulted in a squeeze in liability margins. Operating
expenses fell $68 million or 26% through disciplined cost management and a significant reduction inAmerican Express Bank (AEB) integration expenses. Impairment was lower by $24 million or 45%.
Operating loss fell from $99 million to $65 million, largely driven by cost efficiencies.
Wholesale Banking
The following tables provide an analysis of operating profit by geography for Wholesale Banking:
2009
Asia Pacific
Hong
Kong Singapore Korea
Other
Asia
Pacific1 India
Middle
East
& Other
S Asia Africa
Americas
UK &
Europe
Wholesale
Banking
Total
$million $million $million $million $million $million $million $million $million
Operating income 1,288 957 559 1,605 1,369 1,400 738 1,375 9,291
Operating expenses (564) (504) (252) (732) (323) (496) (324) (990) (4,185)
Loan impairment (41) (3) (93) (155) (54) (526) (26) (50) (948)
Other impairment 5 (40) — 28 14 (10) — (79) (82)
Operating profit 688 410 214 746 1,006 368 388 256 4,076
1 Other APR includes Malaysia : operating income $242 million, operating expenses $(85) million, loan impairment $(8) million,operating profit $149 million.
20081
Asia Pacific
Hong
Kong Singapore Korea
Other
Asia
Pacific2 India
Middle
East
& Other
S Asia Africa
Americas
UK &
Europe
Wholesale
Banking
Total
$million $million $million $million $million $million $million $million $million
Operating income 1,092 699 530 1,567 1,064 958 566 1,013 7,489
Operating expenses (443) (375) (229) (714) (329) (411) (314) (953) (3,768)
Loan impairment (77) 5 (102) (125) (44) (7) (14) (20) (384)
Other impairment (27) (30) — (100) (17) — — (162) (336)
Operating profit/(loss) 545 299 199 628 674 540 238 (122) 3,001
1 Geographic amounts as restated and explained in the relevant notes to the financial statements. There is no change to the Group’stotal operating income or operating income by product for 2008.
2 Other APR includes Malaysia : operating income $265 million, operating expenses $(84) million, loan impairment $1 million,other impairment $(21) million, operating profit $161 million.
137
c102100pu025Proof7:28.3.10B/LRevision:0OperatorSadK

Wholesale Banking
The following tables provide an analysis of operating profit by geography for Wholesale Banking:
2009
Asia Pacific
Hong
Kong Singapore Korea
Other
Asia
Pacific1 India
Middle
East
& Other
S Asia Africa
Americas
UK &
Europe
Wholesale
Banking
Total
Rs.million Rs.million Rs.million Rs.million Rs.million Rs.million Rs.million Rs.million Rs.million
Operating income 60,124 44,673 26,094 74,921 63,905 65,352 34,450 64,185 433,704
Operating expenses 26,328 23,527 11,763 34,170 15,078 23,153 15,124 46,213 195,356
Loan impairment 1,914 140 4,341 7,235 2,521 24,554 1,214 2,334 44,253
Other impairment 233 1,867 — 1,307 654 467 — 3,688 3,828
Operating profit 32,116 19,139 9,990 34,823 46,960 17,178 18,112 11,950 190,268
1 Other APR includes Malaysia : operating income $242 million, operating expenses $(85) million, loan impairment $(8) million,operating profit $149 million.
20081
Asia Pacific
Hong
Kong Singapore Korea
Other
Asia
Pacific2 India
Middle
East
& Other
S Asia Africa
Americas
UK &
Europe
Wholesale
Banking
Total
Rs.million Rs.million Rs.million Rs.million Rs.million Rs.million Rs.million Rs.million Rs.million
Operating income 50,975 32,629 24,740 73,148 49,668 44,719 26,421 47,287 349,587
Operating expenses 20,679 17,505 10,690 33,330 15,358 19,185 14,658 44,486 175,890
Loan impairment 3,594 233 4,761 5,835 2,054 327 654 934 17,925
Other impairment 1,260 1,400 — 4,668 794 — — 7,562 15,684
Operating profit/(loss) 25,441 13,957 9,289 29,315 31,462 25,207 11,110 5,695 140,087
1 Geographic amounts as restated and explained in the relevant notes to the financial statements. There is no change to the Group’stotal operating income or operating income by product for 2008.
2 Other APR includes Malaysia : operating income $265 million, operating expenses $(84) million, loan impairment $1 million,other impairment $(21) million, operating profit $161 million.
Income by product is set out below:
Operating income by product 2009 2008
2009 vs
2008
$million $million %
Lending and Portfolio Management 849 551 54
Transaction Banking 2,537 2,663 (5)
Global Markets1
Financial Markets 3,311 2,365 40
Asset and Liability Management (ALM) 963 912 6
Corporate Finance 1,294 745 74
Principal Finance 337 253 33
Total Global Markets 5,905 4,275 38
Total operating income 9,291 7,489 24
1 Global Markets comprises the following businesses: Financial Markets (foreign exchange, interest rate and other derivatives,commodities and equities, debt capital markets, syndications); ALM; Corporate Finance (corporate advisory, structured tradefinance, structured finance and project and export finance); and Principal Finance (corporate private equity, real estateinfrastructure and alternative investments).
138
c102100pu025Proof7:28.3.10B/LRevision:0OperatorSadK

Financial Markets operating income by desk 2009 2008
2009 vs
2008
$million $million %
Foreign Exchange 1,349 1,194 13
Rates 879 748 18
Commodities and Equities 389 141 176
Capital Markets 409 234 75Credit and Other 285 48 494
Total Financial Markets operating income 3,311 2,365 40
Operating income by product 2009 2008
2009 vs
2008
Rs.million Rs.million %
Lending and Portfolio Management 39,631 25,721 54
Transaction Banking 118,427 124,309 (5)
Global Markets1
Financial Markets 154,557 110,398 40Asset and Liability Management (ALM) 44,953 42,572 6
Corporate Finance 60,404 34,777 74
Principal Finance 15,731 11,810 33
Total Global Markets 275,645 199,557 38
Total operating income 433,704 349,587 24
1 Global Markets comprises the following businesses: Financial Markets (foreign exchange, interest rate and other derivatives,commodities and equities, debt capital markets, syndications); ALM; Corporate Finance (corporate advisory, structured tradefinance, structured finance and project and export finance); and Principal Finance (corporate private equity, real estateinfrastructure and alternative investments).
Financial Markets operating income by desk 2009 2008
2009 vs
2008
Rs.million Rs.million %
Foreign Exchange 62,971 55,736 13
Rates 41,032 34,917 18
Commodities and Equities 18,159 6,582 176
Capital Markets 19,092 10,923 75
Credit and Other 13,304 2,241 494
Total Financial Markets operating income 154,557 110,398 40
Wholesale Banking has had another excellent year, with broad based income growth driven bycontinued client income momentum, which remains the cornerstone of a consistent and well executed
strategy.
The market dislocation and volatility in the early part of 2009 enabled Wholesale Banking to drive
exceptionally strong income growth. The business made gains in market share and benefitted fromincreased asset margins. Competitors remained distracted and ALM benefitted from strong accrual
income as a result of strategic positioning in late 2008. However low interest rates drove Cash and
Custody income down and stressed economic conditions fuelled loan impairment. As economic
conditions moderated in the second half so did income growth. Client income remained robust and
there was good underlying volume growth in the lending and flow businesses. Loan impairment
moderated as the economic conditions improved.
Operating income grew $1,802 million, or 24%, to $9,291 million. On a constant currency basis,
operating income increased 30%.
139
c102100pu025Proof7:28.3.10B/LRevision:0OperatorSadK

Net interest income was up $567 million, or 17%, to $3,808 million. Non-interest income was up
$1,235 million, or 29%, to $5,483 million. Client income represented 74% of total income and was up
22% on the previous year.
Operating expenses grew $417 million, or 11%, to $4,185 million. On a constant currency basis, the
increase in expenses was 15%. This increase, which was well below income growth, was driven by
staff costs. The business continued to invest in specialist skills and expertise, building in areas such as
sales, trading and financial institutions teams.
Working profit increased $1,385 million, or 37%, to $5,106 million. On a constant currency basis, the
increase in working profit was 45%.
Loan impairment increased by $564 million to $948 million reflecting the challenging economic
environment. A significant portion of the impairment arose in MESA while other markets such as
Korea, India and Other APR were also impacted but to a lesser extent. The portfolio remains well
diversified and is increasingly well collateralised.
Other impairment was lower by $254 million, or 76%, at $82 million. The 2008 charge reflected a fall
in equity and other markets and a drop in value on the ABS, private equity and strategic investment
portfolios. In 2009, as economic conditions moderated, impairment reduced. The business alsobenefitted from recoveries on disposal of private equity and strategic investments.
Operating profit increased $1,075 million, or 36%, to $4,076 million and constitutes nearly 80% of the
Group profits. On a constant currency basis, the increase was 44%. Second half operating profit was
down 19% on first half as spreads narrowed and volatility reduced.
Product performance
Lending and Portfolio Management income increased by $298 million, or 54%, to $849 million. This
was primarily driven by improved margins through re-pricing and an increase in fee income from new
deals.
Transaction banking income fell by $126 million, or 5%, to $2,537 million. Despite a 10% fall in
volumes, Trade income grew by 26% as margins increased. Cash income fell by 23% due to margin
compression in a low interest rate environment. However, the business continues to gain significantcash management mandates and volumes increased by some 21%.
Global Markets income increased by $1,630 million, or 38%, to $5,905 million.
Within Global Markets, the Financial Markets (FM) business was the largest contributor. Income
was up $946 million, or 40%, to $3,311 million. The FM business primarily comprises sales and the
trading of exchange and interest rate products. In 2009, there has been diversification of income
streams with increased contributions from commodity, equity and credit derivatives. Nearly 70% ofFM income was client driven. This included the sale of products to meet client’s hedging
requirements, supported through upgraded risk management capabilities. The Company was
favourably positioned to meet client demand for risk management solutions in a volatile and
uncertain market, benefitting from wider bid-offer spreads and the rates business had a record year.
This FM flow trading arose by virtue of being a market maker and was a key driver for the increase
in own account income, which for the Group, also comprises ALM and Principal Finance.
The commodities and equities business delivered impressive growth of 176% driven by opportunities
arising in the energy and metals business, most notably in Africa. In the equities business, there wassignificant growth with strong primary deal flows.
ALM income was up $51 million, or 6%, at $963 million. Positions put on at the end of 2008
captured both high fixed interest rates and wide credit spreads benefitting from lower funding rates.
In addition to sales from the AFS portfolio, re-investment throughout 2009 in relatively steep curves
generated income on accruals.
Corporate Finance income was up $549 million, or 74%, to $1,294 million with strong income growthacross all products. Much of this growth was driven by Corporate Advisory, where income more than
doubled, driven by a number of landmark deals in India and Africa.
Principal Finance income was up $84 million, or 33% higher, at $337 million and realisations
benefitted as Asian market prices rose.
140
c102100pu025Proof7:28.3.10B/LRevision:0OperatorSadK

Geographic performance
The Group maintains a Global Booking Unit (GBU) in the UK in which are recorded the income
and expenses related to the private equity portfolio, portfolio management and some FM products. In2008 income and expenses related to the private equity portfolio were apportioned and reported
across a number of geographies and the remainder of the GBU was reported in Americas, UK &
Europe. In 2009, FM income and expenses have also apportioned over other geographies to better
align financial reporting with underlying organisational changes. In order to facilitate a more
meaningful comparison, the 2008 Wholesale Banking geography split has been restated. The
geographic performance commentary is based on the restated 2008 numbers. The restatement does not
affect the Group’s total operating income.
Hong Kong
Income was up $196 million or 18%, to $1,288 million. Both Fixed Income and ALM increased
income capturing opportunities arising from volatile interest rates and FX markets. Lending and
Trade income both grew as re-pricing actions widened margins; the former also benefitted from
increased volumes. However these advances were offset by shrinking margins in Cash and Custody
and lower AUM. Operating expenses grew $121 million, or 27%, to $564 million driven by higher
staff costs and increased investment in infrastructure including a new dealing room. Working profit
was up $75 million, or 12%, to $724 million. Loan impairment was lower by $36 million, down
almost a half, compared to 2008. Proactive engagement in debt relief plans helped mitigateimpairment. Other impairment reflects some recovery on realisation of previously impaired
investments. Operating profit was up $143 million or 26%, at $688 million.
Singapore
Income grew $258 million, or 37%, to $957 million. Client income benefitted from increased Trade
Finance, a number of Corporate Finance deals and increased volumes through the offshore banking
unit. Trading income was driven higher by fixed income being well positioned to take advantage of
volatile market conditions. Operating expenses grew $129 million, or 34%, to $504 million. Staff
related costs constituted a major part of the increase. The full year impact of prior year hiringtogether with an increase in front line, client facing staff, drove up staff expenses. This hiring activity
represents investment in specialist teams in areas such as commodities, options and interest rate
derivatives and has helped drive income growth as evident from the positive jaws. Working profit was
up 40% at $453 million. Other impairment of $40 million represents provisions made against private
equity investments. Operating profit was up $111 million, or 37%, at $410 million.
Korea
Income at $559 million was up $29 million or 5%. On a constant currency basis, income was 22%
higher. Client income grew substantially, driven by strong business momentum across all product linesincluding Transaction Banking, Lending and FM sales. Own account income was down as ALM
accruals were adversely impacted by re-pricing. Operating expenses were higher by $23 million, or
10%, at $252 million. On a constant currency basis, expenses rose 27%. The increase is distorted by a
prior year curtailment release from the retirement plan. Underlying expense growth was driven by the
flow through of previous year investments in infrastructure expansion. Working profit was slightly up
by $6 million, or 2%, at $307 million. On a constant currency basis, working profit rose 18%. Loan
impairment was down 9% at $93 million, primarily comprising provisions raised in respect of
exposures on certain foreign exchange transactions. Operating profit was up by $15 million, or 8%, at$214 million. On a constant currency basis, operating profit rose 25%.
Other Asia Pacific
Income was up $38 million, or 2%, at $1,605 million. Across Other APR, lending income increased
through higher margins. However this was offset by lower income from Transaction Banking which
was impacted by lower margins in a low interest rate environment and intense competition. In China,
a major component of Other APR, income grew by 16% to $566 million with further benefit from the
Private Equity portfolio. In Taiwan, income was down 19% due to margin compression in both cashand custody despite record liability levels. Other APR operating expenses were up $18 million, or 3%,
to $732 million. Expenses increased as a result of staff and premises costs and flow through from
prior year investments. China operating expenses were up 10% to $252 million. In Taiwan, operating
expenses were down 9% reflecting a reduction in retirement obligations. Working profit in Other APR
was higher by 2% at $873 million. Loan impairment was up $30 million from $125 million in 2008.
141
c102100pu025Proof7:28.3.10B/LRevision:0OperatorSadK

The increase was driven by Thailand and Japan. In China, loan impairment reduced by $4 million to
$9 million. In Taiwan, the results of recovery actions offset new loan impairment charges. Other
impairment benefitted from the reversal of prior year provisions on sale of private equity investments.
Operating profit was $118 million, or 19%, higher at $746 million. China operating profit was $333million.
India
Income grew $305 million or 29%, to $1,369 million. On a constant currency basis income growth
was 43%. Income growth was broad based across all products. Trade and lending income was upthrough re-pricing and higher margins. Corporate Advisory income grew on the back of cross border
financing and leveraging deal structuring capabilities. This helped offset reduced cash and custody
income which was impacted by margin compression and sluggish equity markets. Operating expenses
of $323 million were flat to 2008. On a constant currency basis, expenses were higher by 8%, driven
by staff and premises related costs, partially offset by a service tax rebate. Working profit was up
$311 million, or 42%, at $1,046 million. On a constant currency basis, working profit grew 59%. Loan
impairment was up $10 million, or 23%, at $54 million driven by middle market clients. Other
impairment release of $14 million reflects a recovery on Private Equity disposals compared to a $17million charge in 2008. Operating profit was up $332 million, or 49%, to $1,006 million. On a
constant currency basis operating profit grew 67%. This constitutes 20% of the Group’s operating
profit and makes India the first geography within the Wholesale Banking business to generate profits
in excess of one billion dollars.
MESA
Income was up $442 million, or 46%, to $1,400 million driven by increases in both client and own
account income. Capital Markets grew income benefitting from bond mandates including a number of
Sukuks. Islamic banking income doubled to $120 million. UAE led income growth with an overall
increase of 74%. Qatar income doubled driven by client revenue, principally FX sales and commodity
derivatives. Bahrain income grew 28% driven by lending volumes and re-pricing, large Corporate
Advisory deals and a strong Islamic banking performance. Pakistan was affected by political and
economic uncertainty which impacted business sentiment. MESA operating expenses were up $85million, or 21%, to $496 million driven by staff and investment expenditure. MESA working profit
was up $357 million, or 65%, to $904 million. Loan impairment was up by $519 million over 2008. A
substantial portion of this increase relates to individual impairment charges on corporate exposure in
the Gulf and an increased portfolio impairment provision for the region generally. The total loan
portfolio is $14 billion of which $10 billion is in the UAE. Certain high profile entities within this
portfolio have experienced stress. The Company’s exposure to these entities is around $500 million.
The resolution process is ongoing, but in the event losses arise, the Company does not expect they
would be material. Operating profit was $172 million, or 32%, lower than the previous year.
Africa
Income was up $172 million or 30%, to $738 million. On a constant currency basis, income grew 54%
driven by excellent corporate finance and capital markets performances. Trade and Lending income
increased on higher volumes benefitting from Asia trade flows coupled with aggressive re-pricing. Thisincrease in income helped offset a fall in cash income where higher volumes could only partially make
up for margin compression. Corporate Finance benefitted from several landmark deals. Whilst South
Africa and Ghana registered particularly strong income growth, other major markets such as Nigeria,
Kenya, Zambia and Uganda have all delivered broad based income growth. Operating expenses were
up $10 million, or 3%, to $324 million. On a constant currency basis expenses were 18% higher
reflecting investments in people and infrastructure. Working profit was up $162 million or 64%, to
$414 million. The loan impairment charge remained low at $26 million. Operating profit was up $150
million, or 63%, to $388 million. On a constant currency basis operating profit doubled.
Americas, UK & Europe
Income was higher by $362 million, or 36%, to $1,375 million. In 2009, there was broad based
income growth in Commercial Banking and Trading income. Lending and Trade saw volume
increases and re-pricing actions, which helped offset the drop in Cash income.
The fixed income business was primarily driven by the growth in rates and commodities and equity
derivative business. Trading income benefitted from favourable ALM accruals in a low interest rate
environment and from sales from the AFS portfolio.
142
c102100pu025Proof7:28.3.10B/LRevision:0OperatorSadK

Operating expenses were higher by $37 million at $990 million. Staff expense increases were partially
offset through a reduction in premises and other costs as synergies from the successful integration of
AEB. Working profit grew $325 million. Impairment was higher by $30 million or 150%. Other
impairment was $79 million down by $83 million from 2008 which reflected write down of strategicinvestments. Operating profit was $256 million compared to an operating loss of $122 million in the
previous year. The fixed income business was primarily driven by the growth in rates and
commodities and equity derivative business. Trading income benefitted from favourable ALM accruals
in a low interest rate environment and from sales from the AFS portfolio.
Risk management review for the financial year ended 31 December 2009
In the first quarter of 2009, economic conditions in much of the Company’s footprint continued to
worsen, but by the second half of the year credit conditions had generally begun to improve as the
worst of the global financial crisis passed.
In Consumer Banking there was a moderate increase in loan impairment in the first half of the year,
as trends that became evident during the fourth quarter of 2008 continued into 2009. This was
primarily driven by unsecured portfolios impacted by rising unemployment and bankruptcy rates. Theunsecured portfolios most affected were in Hong Kong and Korea where bankruptcy and debt
restructuring programme filings increased markedly, in India where consumer leverage was particularly
high, and in UAE where there was a rise in unemployment rates and a significant fall in property
values.
In the second half of the year, as credit conditions improved, delinquency and impairment rates
across most of the Company’s principal markets and product portfolios improved, and came back
down below levels experienced at the end of 2008.
In Wholesale Banking loan impairment rose in the first half of 2009 relative to the second half of
2008. The increase occurred primarily in the Local Corporates portfolio, where the effects of the
deteriorating economic environment were most acutely felt. However, in the context of gradually
improving credit conditions, Wholesale Banking impairment in the second half of 2009 was lower
than in the first half of 2009. A large portion of Wholesale Banking impairment for 2009 was
concentrated on a very small number of accounts.
Elsewhere, the portfolio remained resilient. There were non-material levels of impairment on the ABS
portfolio in 2009. The carrying value of the ABS portfolio reduced, primarily as a result of
redemptions and some sales. The overall quality of the ABS book remains good with no direct US
sub-prime, and minimal Alt-A, exposures. The Company’s net exposure to ABS represents less than
one per cent of total Group assets and has had limited impact on the Company’s performance.
Sharp increases in the volatility of credit spreads following the collapse of Lehman Brothers inSeptember 2008 drove an increase in non-trading book VaR through most of 2009, which in turn was
a key factor in an increase in total average VaR in 2009 compared to 2008.
Principal uncertainties
The Company is in the business of taking selected risks to generate shareholder value, and the
Company seeks to contain and mitigate these risks to ensure they remain within its risk appetite andare adequately compensated. However, risks are by their nature uncertain and the management of
risk relies on judgments and predictions about the future.
The key uncertainties the Company faces in the coming year are set out below. This should not be
regarded as a complete and comprehensive statement of all potential risks and uncertainties that the
Company may experience.
Changing macroeconomic conditions in footprint countries
Macroeconomic conditions have an impact on personal expenditure and consumption, demand for
business products and services, the debt service burden of consumers and businesses, the general
availability of credit for retail and corporate borrowers and the availability of capital and liquidity
funding for the Company’s business. All these factors may impact the Company’s performance.
The world economy now appears to be emerging from the worst downturn since the 1930s. An even
more serious recession would have occurred had governments globally not embarked upon a
synchronised and extensive programme of monetary and fiscal easing, which has been a key driver of
the current gradual return to growth in the Company’s markets and globally. There is a risk that as
this stimulus is withdrawn economic conditions will deteriorate again, which could impact the
143
c102100pu025Proof7:28.3.10B/LRevision:0OperatorSadK

Company’s performance as described above. The Company operates primarily in markets that appear
well positioned to avoid another major downturn.
The Company balances risk and return taking account of changing conditions through the economic
cycle, and monitors economic trends in its markets very closely. The Company also continuously
reviews the suitability of the Company’s risk policies and controls. The Company’s risk management
processes are pro-active and dynamic, allowing us to respond quickly to changes in economicconditions or outlook.
Regulatory changes and compliance
The Company’s business as an international bank is subject to a complex regulatory framework
comprising legislation, regulation and codes of practice, in each of the countries in which the
Company operates.
A key uncertainty relates to the way in which governments and regulators adjust laws and regulations
and economic policies in response to macroeconomic and other systemic conditions. The financial
crisis has spurred unprecedented levels of proposals to change the regulations governing financial
institutions and further changes to regulations remain under consideration in many jurisdictions.
The nature and impact of future changes in laws, regulations and economic policies are not
predictable and could run counter to the Company’s strategic interests. The Company supports
changes to laws, regulations or codes of practice that will improve the overall stability of the financial
system. However, the Company also has concerns that certain proposals may not achieve this desired
objective and may have unintended consequences, either individually or in terms of aggregate impact.Proposed changes could affect the volatility and liquidity of the financial markets and, consequently,
the way the Company conducts business and manages capital and liquidity. These effects may directly
or indirectly impact the Company’s financial performance.
Both unilaterally and through the Company’s participation in industry forums, the Company
endeavours to influence the development of relevant laws and regulatory policies in the Company’s
key markets. The Company also keeps close watch on key regulatory developments in order to
anticipate changes and their potential impact.
The Company has a commitment to maintaining strong relationships with governments and regulators
in the countries in which it operates. At any time the Group may be in discussion with a range of
authorities and regulatory bodies in different countries on matters that relate to its past or current
business activities.
HM Treasury regulations require compliance with sanctions adopted by the UK government.
Similarly, US laws and regulations require compliance with US economic sanctions against designated
foreign countries, nationals and others. The Group has a US Dollar payments and clearing business
and has policies, procedures and controls designed to ensure compliance with relevant laws and
regulations. Several US agencies have investigated how a number of other financial institutions haveprocessed US Dollar payments potentially involving sanctioned parties. In the light of that activity
relating to other institutions, the Group has initiated discussions with US authorities to discuss its
past business.
On 29 February 2008, the Group completed the acquisition of American Express Bank. Prior to the
acquisition, subsidiaries of the American Express Bank group located in New York and Miami had
entered separately into a Written Agreement with the New York State Banking Department and a
Cease and Desist Order with the Federal Reserve Bank of Atlanta to address deficiencies relating to
compliance with applicable federal and state laws and regulations governing anti-money laundering.
On 15 January 2010, the New York State Banking Department notified the Group that Standard
Chartered International (USA) Ltd. (formally American Express Bank Ltd) had satisfied the terms of
the written agreement and that the agreement was therefore terminated. The Cease and Desist Order
remains in place. However, the Board believes that during the year the Group achieved substantial
compliance with the terms of this document and the status of this matter continues to be monitoredclosely by the Board.
Financial markets dislocation
Financial market volatility subsided in the second half of 2009. However there remains a risk that
renewed volatility or a sudden financial market dislocation could affect the Company’s performance
over the coming year. These factors may have an impact on the mark-to-market valuations of assets
144
c102100pu025Proof7:28.3.10B/LRevision:0OperatorSadK

in the Company’s available-for-sale and trading portfolios. The potential losses incurred by certain
customers holding derivative contracts during periods of financial market volatility could also lead to
an increase in customer disputes and corporate defaults.
At the same time, financial market instability could cause some financial institution counterparties to
experience tighter liquidity conditions or even fail. Government action has reduced the systemic risk,
but the impact on the financial services industry of ongoing uncertainty in the broader economicenvironment means that the risk nonetheless remains.
The Company has low exposure to risky asset classes and segments. The Company also maintainsrobust appropriateness and suitability processes to mitigate the risk of customer disputes. The
Company closely monitors the performance of its financial institution counterparties and adjusts its
exposure to these counterparties as necessary
Geopolitical events
The Company operates in a large number of markets around the world, and the Company’s
performance is in part reliant on the openness of cross-border trade and capital flows. The Company
faces a risk that geopolitical tensions or conflict in its footprint could impact trade flows, itscustomers’ ability to pay, and its ability to manage capital or operations across borders.
The Company actively monitors the political situation in all of its principal markets, and conductsstress tests of the impact of extreme but plausible geopolitical events on its performance and the
potential for such events to jeopardise its ability to operate within its stated risk appetite.
Reduced access to funding
Liquidity risk is the risk that the Company either does not have sufficient financial resources available
to meet all its obligations and commitments as they fall due, or can access funding only at excessive
cost. Exceptional market events can impact us adversely, thereby affecting the Company’s ability tofulfil the Company’s obligations as they fall due. The principal uncertainties for liquidity risk are that
customers withdraw their deposits at a substantially faster rate than expected, or that asset
repayments are not received on the intended maturity date.
The company seeks to manage its liquidity prudently in all geographical locations and for all
currencies. The Company’s customer deposit base is diversified both by type and maturity, and the
company has a low dependence on wholesale funding. The Company also holds a portfolio of liquid
assets that can be realised if a liquidity stress event occurs.
145
c102100pu025Proof7:28.3.10B/LRevision:0OperatorSadK

Exchange rate movements
Changes in exchange rates affect, among other things, the value of the Company’s assets and
liabilities denominated in foreign currencies, as well as the earnings reported by the Company’s non-US dollar denominated branches and subsidiaries. A sharp fall in the value of the US dollar could
also impact trade flows and the wealth of clients holding US dollar-denominated assets, both of
which could have an impact on the Company’s performance.
The Company monitors exchange rate movements closely and adjusts its exposures accordingly.
Under certain circumstances, the Company may take the decision to hedge the Company’s foreign
exchange exposures in order to protect the Company’s capital ratios from the effects of changes in
exchange rates. The effect of exchange rate movements on the capital adequacy ratio is mitigated by
corresponding movements in risk weighted assets. The table below sets out the period end and
average currency exchange rates per US dollar for India, Korea and Singapore for 31 December 2009
and 31 December 2008.
Exchange rates
Year
ended
31.12.09
Year
ended
31.12.08
Indian rupee
Average 48.35 43.50
Period end 46.54 48.65
Korean won
Average 1,276.62 1,101.82
Period end 1,164.47 1,259.91
Singapore dollar
Average 1.45 1.42Period end 1.40 1.44
As a result of the Company’s normal business operations, Standard Chartered is exposed to a
broader range of risks than those principal risks mentioned previously, and the Company’s approach
to managing risk is detailed on the following pages.
Risk Management Framework
For a description of the Company’s Risk Management Framework see the section titled ‘‘Business’’
on page 95 of this Draft Red Herring Prospectus.
Loan portfolio
Loans and advances to customers have grown by $23.3 billion to $201.8 billion.
Compared to 2008, the Consumer Banking portfolio in 2009 has grown by $13.9 billion, or 17%,
mainly due to increased mortgage lending.
The growth in the mortgage portfolio is in line with Consumer Banking’s strategy of de-risking the
overall portfolio by increasing the proportion of secured advances and taking advantage of thestrengthening property markets. Growth was mostly in Korea, Singapore and Hong Kong which
increased by $3.3 billion, $2.1 billion and $1.8 billion respectively.
Growth in the Wholesale Banking customer portfolio was $9.6 billion, or 10%. Growth was spread
across several regions, with Singapore particularly strong at $6.9 billion, or 72% of that growth.
The growth in Singapore is primarily in trade loans, due to business growth and the acquisition ofnew clients, receivables financing and other corporate loans.
Exposures to banks grew by 10 per cent. The Company continues to be highly liquid, with much ofthat liquidity placed with high quality bank counterparties, and remains a net provider of liquidity to
the inter bank money markets.
The Wholesale Banking portfolio remains diversified across both geography and industry, with no
significant concentration within the industry classifications of Manufacturing; Financing, insurance
and business services; Commerce; or Transport, storage and communication.
146
c102100pu025Proof7:28.3.10B/LRevision:0OperatorSadK

Single borrower concentration risk has been mitigated by active distribution of assets to banks and
institutional investors, some of which is achieved through credit-default swaps and synthetic risk
transfer structures.2009
Asia Pacific
HongKong Singapore Korea
OtherAsia
Pacific1 India
MiddleEast &
OtherS Asia Africa
AmericasUK &
Europe Total$million $million $million $million $million $million $million $million $million
Loans to individuals
Mortgages 14,816 8,149 20,460 11,016 1,685 1,128 212 171 57,637
Other 2,971 4,957 4,951 5,012 772 2,396 678 1,909 23,646
Small and medium enterprises 1,641 2,370 4,024 3,258 1,255 636 113 3 13,300
Consumer Banking 19,428 15,476 29,435 19,286 3,712 4,160 1,003 2,083 94,583
Agriculture, forestry and fishing 16 81 25 351 75 150 613 630 1,941
Construction 274 49 370 350 342 788 116 234 2,523
Commerce 2,508 4,819 939 3,612 861 4,959 765 4,576 23,039
Electricity, gas and water 538 53 188 523 31 371 239 1,395 3,338
Financing, insurance and business
services 2,319 4,150 668 4,515 543 4,036 174 5,406 21,811
Governments — 966 344 3,256 1 250 34 366 5,217
Mining and quarrying 120 569 3 280 139 185 172 4,941 6,409
Manufacturing 2,586 1,061 3,369 7,794 2,485 1,857 685 5,735 25,572
Commercial real estate 1,274 2,275 997 908 360 672 4 518 7,008
Transport, storage and
communication 579 1,438 310 1,024 399 1,115 258 4,323 9,446
Other 397 507 268 296 6 234 21 61 1,790
Wholesale Banking 10,611 15,968 7,481 22,909 5,242 14,617 3,081 28,185 108,094
Portfolio impairment provision (66) (45) (112) (203) (88) (293) (55) (12) (874)
Total loans and advances to
customers 29,973 31,399 36,804 41,992 8,866 18,484 4,029 30,256 201,803
Total loans and advances to banks 19,453 5,085 2,780 7,232 511 1,864 300 15,708 52,933
1 Other Asia Pacific region (Other APR) includes Malaysia: Total loans and advances to customers $9,022 million; Total loans andadvances to banks $390 million.
Total loans and advances to customers include $3,511 million held at fair value through profit or
loss. Total loans and advances to banks include $2,048 million held at fair value through profit or
loss.
147
c102100pu025Proof7:28.3.10B/LRevision:0OperatorSadK

2008
Asia Pacific
Hong
Kong Singapore Korea
Other
Asia
Pacific1 India
Middle
East &
Other
S Asia Africa
Americas
UK &
Europe Total
$million $million $million $million $million $million $million $million $million
Loans to individuals
Mortgages 12,977 6,044 17,120 8,786 1,447 891 171 131 47,567
Other 2,826 3,529 4,383 5,389 910 2,742 564 1,106 21,449
Small and medium enterprises 1,288 1,754 3,603 2,660 1,093 710 170 370 11,648
Consumer Banking 17,091 11,327 25,106 16,835 3,450 4,343 905 1,607 80,664
Agriculture, forestry and fishing 27 65 34 193 34 106 383 562 1,404
Construction 142 81 367 424 305 823 40 143 2,325
Commerce 2,150 2,685 964 3,533 749 4,150 725 2,395 17,351
Electricity, gas and water 453 15 93 532 34 242 71 1,246 2,686
Financing, insurance and business
services 3,455 2,303 427 2,988 533 3,329 453 12,075 25,563
Governments — 366 — 3,480 — 383 26 427 4,682
Mining and quarrying — 355 26 174 104 257 194 4,710 5,820
Manufacturing 2,756 1,153 3,475 7,866 2,255 1,864 598 4,892 24,859
Commercial real estate 1,353 1,265 787 1,245 332 526 10 839 6,357
Transport, storage and
communication 470 366 356 921 121 1,218 220 2,113 5,785
Other 168 415 217 403 12 319 48 85 1,667
Wholesale Banking 10,974 9,069 6,746 21,759 4,479 13,217 2,768 29,487 98,499
Portfolio impairment provision (61) (47) (89) (228) (66) (84) (31) (45) (651)
Total loans and advances to
customers 28,004 20,349 31,763 38,366 7,863 17,476 3,642 31,049 178,512
Total loans and advances to banks 18,963 9,283 1,594 5,201 291 1,504 587 10,523 47,946
1 Other APR includes Malaysia: Total loans and advances to customers $7,955 million; Total loans and advances to banks $411million.
Total loans and advances to customers include $4,334 million held at fair value through profit or
loss. Total loans and advances to banks include $1,363 million held at fair value through profit or
loss.
148
c102100pu025Proof7:28.3.10B/LRevision:0OperatorSadK

2009
Asia Pacific
HongKong Singapore Korea
OtherAsia
Pacific1 India
MiddleEast &
OtherS Asia Africa
AmericasUK &
Europe TotalRs.million Rs.million Rs.million Rs.million Rs.million Rs.million Rs.million Rs.million Rs.million
Loans to individuals
Mortgages 691,611 380,395 955,073 514,227 78,656 52,655 9,896 7,982 2,690,495
Other 138,686 231,393 231,113 233,960 36,037 111,845 31,649 89,112 1,103,795
Small and medium enterprises 76,602 110,632 187,840 152,083 58,583 29,688 5,275 140 620,844
Consumer Banking 906,899 722,420 1,374,026 900,270 173,276 194,189 46,820 97,234 4,415,134
Agriculture, forestry and fishing 747 3,781 1,167 16,385 3,501 7,002 28,615 29,408 90,606
Construction 12,790 2,287 17,272 16,338 15,965 36,784 5,415 10,923 117,774
Commerce 117,073 224,951 43,833 168,608 40,191 231,486 35,710 213,608 1,075,461
Electricity, gas and water 25,114 2,474 8,776 24,414 1,447 17,318 11,157 65,119 155,818
Financing, insurance and business
services 108,251 193,722 31,182 210,760 25,347 188,400 8,122 252,352 1,018,137
Governments — 45,093 16,058 151,990 47 11,670 1,587 17,085 243,530
Mining and quarrying 5,602 26,561 140 13,070 6,489 8,636 8,029 230,646 299,172
Manufacturing 120,714 49,527 157,265 363,824 116,000 86,685 31,976 267,710 1,193,701
Commercial real estate 59,470 106,197 46,540 42,385 16,805 31,369 187 24,180 327,133
Transport, storage and
communication 27,028 67,126 14,471 47,800 18,625 52,048 12,043 201,798 440,939
Other 18,532 23,667 12,510 13,817 280 10,923 980 2,847 83,557
Wholesale Banking 495,321 745,386 349,213 1,069,392 244,697 682,322 143,821 1,315,676 5,045,828
Portfolio impairment provision (3,081) (2,101) (5,228) (9,476) (4,108) (13,677) (2,567) (560) (40,798)
Total loans and advances to
customers 1,399,140 1,465,705 1,718,011 1,960,187 413,865 862,833 188,074 1,412,350 9,420,164
Total loans and advances to banks 908,066 237,368 129,770 337,590 23,853 87,012 14,004 733,249 2,470,912
1 Other Asia Pacific region (Other APR) includes Malaysia: Total loans and advances to customers $9,022 million; Total loans andadvances to banks $390 million.
Total loans and advances to customers include $3,511 million held at fair value through profit or
loss. Total loans and advances to banks include $2,048 million held at fair value through profit or
loss.
149
c102100pu025Proof7:28.3.10B/LRevision:0OperatorSadK

2008
Asia Pacific
Hong
Kong Singapore Korea
Other Asia
Pacific1 India
Middle
East &
Other
S Asia Africa
Americas
UK &
Europe Total
Rs.million Rs.million Rs.million Rs.million Rs.million Rs.million Rs.million Rs.million Rs.million
Loans to individuals
Mortgages 605,766 282,134 799,162 410,130 67,546 41,592 7,982 6,115 2,220,428
Other 131,918 164,734 204,598 251,559 42,479 127,997 26,328 51,628 1,001,239
Small and medium enterprises 60,124 81,877 168,188 124,169 51,021 33,143 7,936 17,272 543,729
Consumer Banking 797,808 528,744 1,171,948 785,858 161,046 202,731 42,245 75,015 3,765,396
Agriculture, forestry and fishing 1,260 3,034 1,587 9,009 1,587 4,948 17,878 26,234 65,539
Construction 6,629 3,781 17,132 19,792 14,237 38,418 1,867 6,675 108,531
Commerce 100,362 125,336 45,000 164,920 34,963 193,722 33,843 111,799 809,945
Electricity, gas and water 21,146 700 4,341 24,834 1,587 11,297 3,314 58,163 125,382
Financing, insurance and business
services 161,279 107,504 19,932 139,480 24,880 155,398 21,146 563,661 1,193,281
Governments — 17,085 — 162,446 — 17,878 1,214 19,932 218,556
Mining and quarrying — 16,571 1,214 8,122 4,855 11,997 9,056 219,863 271,678
Manufacturing 128,650 53,822 162,213 367,185 105,263 87,012 27,915 228,359 1,160,418
Commercial real estate 63,158 59,050 36,737 58,117 15,498 24,554 467 39,165 296,745
Transport, storage and
communication 21,940 17,085 16,618 42,992 5,648 56,856 10,270 98,635 270,044
Other 7,842 19,372 10,130 18,812 560 14,891 2,241 3,968 77,816
Wholesale Banking 512,266 423,341 314,903 1,015,710 209,080 616,970 129,210 1,376,453 4,597,933
Portfolio impairment provision (2,847) (2,194) (4,155) (10,643) (3,081) (3,921) (1,447) (2,101) (30,389)
Total loans and advances to
customers 1,307,227 949,891 1,482,697 1,790,925 367,045 815,780 170,009 1,449,367 8,332,940
Total loans and advances to banks 885,193 433,330 74,408 242,783 13,584 70,207 27,401 491,214 2,238,119
1 Other APR includes Malaysia: Total loans and advances to customers $7,955 million; Total loans and advances to banks $411million.
Total loans and advances to customers include $4,334 million held at fair value through profit or
loss. Total loans and advances to banks include $1,363 million held at fair value through profit orloss.
Maturity analysis
Approximately half of the Company’s loans and advances to customers are short-term having a
contractual maturity of one year or less. The Wholesale Banking portfolio is predominantly short-
term, with 70% of loans and advances having a contractual maturity of one year or less. In
Consumer Banking, 61% of the portfolio is in the mortgage book, traditionally longer term in natureand well secured. Whilst the Other and SME loans in Consumer Banking have short contractual
maturities, typically they may be renewed and repaid over longer terms in the normal course of
business.
150
c102100pu025Proof7:28.3.10B/LRevision:0OperatorSadK

The following tables show the contractual maturity of loans and advances to customers by each
principal category of borrowers business or industry.
2009
One year
or less
One to five
years
Over five
years Total
$million $million $million $million
Loans to individuals
Mortgages 2,455 7,818 47,364 57,637
Other 14,266 7,158 2,222 23,646
Small and medium enterprises 7,110 3,054 3,136 13,300
Consumer Banking 23,831 18,030 52,722 94,583
Agriculture, forestry and fishing 1,515 348 78 1,941Construction 1,921 482 120 2,523
Commerce 19,981 2,919 139 23,039
Electricity, gas and water 1,056 825 1,457 3,338
Financing, insurance and business services 15,282 6,484 45 21,811
Governments 4,754 398 65 5,217
Mining and quarrying 3,296 1,531 1,582 6,409
Manufacturing 18,979 5,286 1,307 25,572
Commercial real estate 3,325 3,523 160 7,008Transport, storage and communication 3,665 4,312 1,469 9,446
Other 1,369 268 153 1,790
Wholesale Banking 75,143 26,376 6,575 108,094
Portfolio impairment provision (874)
201,803
2008
One year
or less
One to five
years
Over five
years Total
$million $million $million $million
Loans to individuals
Mortgages 2,357 6,883 38,327 47,567
Other 11,575 7,118 2,756 21,449
Small and medium enterprises 6,780 2,653 2,215 11,648
Consumer Banking 20,712 16,654 43,298 80,664
Agriculture, forestry and fishing 1,008 259 137 1,404
Construction 1,943 356 26 2,325Commerce 15,732 1,477 142 17,351
Electricity, gas and water 1,108 345 1,233 2,686
Financing, insurance and business services 19,057 6,026 480 25,563
Governments 4,476 43 163 4,682
Mining and quarrying 3,238 1,449 1,133 5,820
Manufacturing 18,300 5,293 1,266 24,859
Commercial real estate 2,186 4,064 107 6,357
Transport, storage and communication 2,988 1,743 1,054 5,785Other 1,271 337 59 1,667
Wholesale Banking 71,307 21,392 5,800 98,499
Portfolio impairment provision (651)
178,512
151
c102100pu025Proof7:28.3.10B/LRevision:0OperatorSadK

2009
One year
or less
One to five
years
Over five
years Total
Rs.million Rs.million Rs.million Rs.million
Loans to individuals
Mortgages 114,599 364,944 2,210,952 2,690,495
Other 665,937 334,135 103,723 1,103,795
Small and medium enterprises 331,895 142,561 146,388 620,844
Consumer Banking 1,112,431 841,640 2,461,063 4,415,134
Agriculture, forestry and fishing 70,720 16,245 3,641 90,606
Construction 89,672 22,500 5,602 117,774
Commerce 932,713 136,259 6,489 1,075,461Electricity, gas and water 49,294 38,511 68,013 155,818
Financing, insurance and business services 713,364 302,673 2,101 1,018,137
Governments 221,917 18,579 3,034 243,530
Mining and quarrying 153,857 71,467 73,848 299,172
Manufacturing 885,940 246,750 61,011 1,193,701
Commercial real estate 155,211 164,454 7,469 327,133
Transport, storage and communication 171,082 201,284 68,573 440,939
Other 63,905 12,510 7,142 83,557
Wholesale Banking 3,507,675 1,231,232 306,921 5,045,828
Portfolio impairment provision (40,798)
9,420,164
2008
One year
or less
One to five
years
Over five
years Total
Rs.million Rs.million Rs.million Rs.million
Loans to individuals
Mortgages 110,025 321,298 1,789,104 2,220,428
Other 540,321 332,268 128,650 1,001,239
Small and medium enterprises 316,490 123,842 103,396 543,729
Consumer Banking 966,836 777,409 2,021,151 3,765,396
Agriculture, forestry and fishing 47,053 12,090 6,395 65,539
Construction 90,699 16,618 1,214 108,531
Commerce 734,370 68,946 6,629 809,945
Electricity, gas and water 51,721 16,105 57,556 125,382Financing, insurance and business services 889,581 281,294 22,406 1,193,281
Governments 208,940 2,007 7,609 218,556
Mining and quarrying 151,150 67,639 52,888 271,678
Manufacturing 854,244 247,077 59,097 1,160,418
Commercial real estate 102,042 189,708 4,995 296,745
Transport, storage and communication 139,480 81,363 49,201 270,044
Other 59,330 15,731 2,754 77,816
Wholesale Banking 3,328,611 998,579 270,744 4,597,933
Portfolio impairment provision (30,389)
8,332,940
Problem credit management and provisioning
Consumer Banking
In Consumer Banking, where there are large numbers of small value loans, a primary indicator ofpotential impairment is delinquency. However, not all delinquent loans (particularly those in the early
stage of delinquency) will be impaired. Within Consumer Banking an account is considered to be
delinquent when payment is not received on the due date. For delinquency reporting purposes the
Company follows industry standards, measuring delinquency as of 1, 30, 60, 90, 120 and 150 days
152
c102100pu025Proof7:28.3.10B/LRevision:0OperatorSadK

past due. Accounts that are overdue by more than 30 days are more closely monitored and subject to
specific collections processes.
Provisioning within Consumer Banking reflects the fact that the product portfolios (excluding medium
enterprises among SME customers and Private Banking customers) consist of a large number of
comparatively small exposures. As a result, much of the provisioning is initially done at an account
level for each product and a portfolio impairment provision (PIP) is raised on a portfolio basis. PIPis set using expected loss rates, based on past experience supplemented by an assessment of specific
factors affecting the relevant portfolio. These include an assessment of the impact of economic
conditions, regulatory changes and portfolio characteristics such as delinquency trends and early alert
trends. The PIP methodology provides for accounts for which an individual impairment provision has
not been raised.
For the main unsecured products and loans secured by automobiles, the entire outstanding amount is
generally written off at 150 days past due. Unsecured consumer finance loans are similarly written off
at 90 days past due. For secured loans (other than those secured by automobiles) individual
impairment provisions (IIP) are generally raised at either 150 days (mortgages) or 90 days (other) past
due.
The provisions are based on the estimated present values of future cashflows, in particular those
resulting from the realisation of security. Following such realisation any remaining loan will bewritten off. The days past due used to trigger write offs and IIP are broadly driven by past
experience, which shows that once an account reaches the relevant number of days past due, the
probability or recovery (other than by realising security where appropriate) is low. For all products
there are certain situations where the individual impairment provisioning or write off process is
accelerated, such as in cases involving bankruptcy, fraud and death. Write off and IIP is accelerated
for all restructured accounts to 90 days past due (unsecured and automobile finance) and 120 days
past due (secured) respectively.
The procedures for managing problem credits for Private Banking and the medium enterprises in the
SME segment of Consumer Banking are similar to those adopted in Wholesale Banking (described on
page 52 of the 2009 Annual Report).
Non-performing loans are defined as loans past due by more than 90 days or that are otherwise
individually impaired. Consumer Banking has seen significant improvements in the level of non
performing loans in Taiwan and Korea due to de-risking actions taken and improvements incollections processes. These have been offset to some extent by increases in India and UAE.
The cover ratio is a common metric used in considering trends in provisioning and non-performingloans. It should be noted, however, that, as explained above, a significant proportion of the PIP is
intended to reflect losses inherent in the loan portfolio that is less than 90 days delinquent and hence
recorded as performing.
The following tables set out the total non-performing loans for Consumer Banking:
2009
Asia Pacific
Hong
Kong
$million
Singapore
$million
Korea
$million
Other
Asia
Pacific1
$million
India
$million
Middle
East &
Other
S Asia
$million
Africa
$million
Americas,
UK &
Europe
$million
Total
$million
Loans and advances
Gross non-performing 80 47 190 482 65 263 28 97 1,252
Individual impairment provision (64) (20) (63) (212) (17) (91) (10) (61) (538)
Non-performing loans net of individual
impairment provision 16 27 127 270 48 172 18 36 714
Portfolio impairment provision (519)
Net non-performing loans and advances 195
Cover ratio 84%
1 Other APR includes Malaysia: Gross non-performing $166 million; Individual impairment provision $(47) million; Non-performing loans net of individual impairment provision $119 million.
153
c102100pu025Proof7:28.3.10B/LRevision:0OperatorSadK

2008
Asia Pacific
Hong
Kong
$million
Singapore
$million
Korea
$million
Other
Asia
Pacific1
$million
India
$million
Middle
East &
Other
S Asia
$million
Africa
$million
Americas,
UK &
Europe
$million
Total
$million
Loans and advances
Gross non-performing 85 65 287 601 49 170 35 95 1,387
Individual impairment provision (39) (18) (76) (291) (10) (71) (12) (26) (543)
Non-performing loans net of individual
impairment provision 46 47 211 310 39 99 23 69 844
Portfolio impairment provision (449)
Net non-performing loans and advances 395
Cover ratio 72%
1 Other APR includes Malaysia: Gross non-performing $164 million; Individual impairment provision $(41) million; Non-performing loans net of individual impairment provision $123 million.
The following tables set out the total non-performing loans for Consumer Banking:
2009
Asia Pacific
Hong
Kong
Rs.million
Singapore
Rs.million
Korea
Rs.million
Other
Asia
Pacific1
Rs.million
India
Rs.million
Middle
East &
Other
S Asia
Rs.million
Africa
Rs.million
Americas,
UK &
Europe
Rs.million
Total
Rs.million
Loans and advances
Gross non-performing 3,734 2,194 8,869 22,500 3,034 12,277 1,307 4,528 58,443
Individual impairment
provision (2,988) (934) (2,941) (9,896) (794) (4,248) (467) (2,847) (25,114)
Non-performing loans net of
individual impairment
provision 747 1,260 5,928 12,604 2,241 8,029 840 1,680 33,330
Portfolio impairment
provision (24,227)
Net non-performing loans
and advances 9,103
Cover ratio 84%
1 Other APR includes Malaysia: Gross non-performing $166 million; Individual impairment provision $(47) million; Non-performing loans net of individual impairment provision $119 million.
154
c102100pu025Proof7:28.3.10B/LRevision:0OperatorSadK

2008
Asia Pacific
Hong
Kong
Rs.million
Singapore
Rs.million
Korea
Rs.million
Other
Asia
Pacific1
Rs.million
India
Rs.million
Middle
East &
Other
S Asia
Rs.million
Africa
Rs.million
Americas,
UK &
Europe
Rs.million
Total
Rs.million
Loans and advances
Gross non-performing 3,968 3,034 13,397 28,055 2,287 7,936 1,634 4,435 64,745
Individual impairment
provision (1,821) (840) (3,548) (13,584) (467) (3,314) (560) (1,214) (25,347)
Non-performing loans net of
individual impairment
provision 2,147 2,194 9,849 14,471 1,821 4,621 1,074 3,221 39,398
Portfolio impairment
provision (20,959)
Net non-performing loans
and advances 18,439
Cover ratio 72%
1 Other APR includes Malaysia: Gross non-performing $164 million; Individual impairment provision $(41) million; Non-performing loans net of individual impairment provision $123 million.
The Consumer Banking total net impairment charge has increased by $115 million, or 12%.
Mortgages dominate the Consumer Banking portfolio, making up 61% of loans and advances to
customers. The mortgage portfolio has an average loan to value ratio of 48%, loss rates are low and
have improved through the second half of the year. The exception to this is in UAE, where the
significant fall in Dubai property prices has impacted the mortgage portfolio.
The increases in impairment have arisen primarily in the unsecured portfolios in MESA, India,
Singapore and Korea. In UAE the impairment charge has been impacted by rising unemployment,with the bulk of the charge taken in the unsecured credit card and personal loan portfolios. The high
level of expatriate customers in this market has made collections a particular challenge. In India the
impairment charge is driven by the unsecured credit card and instalment loan portfolios which have
suffered with the high levels of customer debt leverage seen in this market. Rising unemployment and
falling export orders have led to increased impairment in the unsecured and SME portfolios in
Singapore. The unsecured portfolios in Korea have also been impacted by increases in personal
bankruptcy and debt restructuring programme filings.
The tables below set out the net impairment charge by geographic area:
2009
Asia Pacific
Hong
Kong
$million
Singapore
$million
Korea
$million
Other
Asia
Pacific1
$million
India
$million
Middle
East &
Other
S Asia
$million
Africa
$million
Americas,
UK &
Europe
$million
Total
$million
Gross impairment charge 139 64 200 424 163 256 31 33 1,310
Recoveries/provisions no longer required (38) (20) (21) (150) (26) (39) (11) (7) (312)
Net individual impairment charge 101 44 179 274 137 217 20 26 998
Portfolio impairment provision charge 54
Net impairment charge 1,052
1 Other APR includes Malaysia: Gross impairment charge $90 million; Recoveries/provisions no longer required $(41) million; Netindividual impairment charge $49 million.
155
c102100pu025Proof7:28.3.10B/LRevision:0OperatorSadK

2008
Asia Pacific
Hong
Kong
$million
Singapore
$million
Korea
$million
Other
Asia
Pacific1
$million
India
$million
Middle
East &
Other
S Asia
$million
Africa
$million
Americas,
UK &
Europe
$million
Total
$million
Gross impairment charge 135 39 165 442 110 197 27 64 1,179
Recoveries/provisions no longer required (37) (26) (16) (130) (28) (25) (11) (8) (281)
Net individual impairment charge 98 13 149 312 82 172 16 56 898
Portfolio impairment provision charge 39
Net impairment charge 937
1 Other APR includes Malaysia: Gross impairment charge $85 million; Recoveries/provisions no longer required $(43) million; Netindividual impairment charge $42 million.
The tables below set out the net impairment charge by geographic area:
2009
Asia Pacific
Hong
Kong
Rs.million
Singapore
Rs.million
Korea
Rs.million
Other
Asia
Pacific1
Rs.million
India
Rs.million
Middle
East &
Other
S Asia
Rs.million
Africa
Rs.million
Americas,
UK &
Europe
Rs.million
Total
Rs.million
Gross impairment charge 6,489 2,988 9,336 19,792 7,609 11,950 1,447 1,540 61,151
Recoveries/provisions no
longer required (1,774) (934) (980) (7,002) (1,214) (1,821) (513) (327) (14,564)
Net individual impairment
charge 4,715 2,054 8,356 12,790 6,395 10,130 934 1,214 46,587
Portfolio impairment
provision charge 2,521
Net impairment charge 49,107
1 Other APR includes Malaysia: Gross impairment charge $90 million; Recoveries/provisions no longer required $(41) million; Netindividual impairment charge $49 million.
2008
Asia Pacific
Hong
Kong
Rs.million
Singapore
Rs.million
Korea
Rs.million
Other
Asia
Pacific1
Rs.million
India
Rs.million
Middle
East &
Other
S Asia
Rs.million
Africa
Rs.million
Americas,
UK &
Europe
Rs.million
Total
Rs.million
Gross impairment charge 6,302 1,821 7,702 20,633 5,135 9,196 1,260 2,988 55,036
Recoveries/provisions no
longer required (1,727) (1,214) (747) (6,068) (1,307) (1,167) (513) (373) (13,117)
Net individual impairment
charge 4,575 607 6,955 14,564 3,828 8,029 747 2,614 41,919
Portfolio impairment
provision charge 1,821
Net impairment charge 43,739
1 Other APR includes Malaysia: Gross impairment charge $85 million; Recoveries/provisions no longer required $(43) million; Netindividual impairment charge $42 million.
156
c102100pu025Proof7:28.3.10B/LRevision:0OperatorSadK

Wholesale Banking
Loans are classified as impaired and considered non-performing where analysis and review indicates
that full payment of either interest or principal is questionable, or as soon as payment of interest orprincipal is 90 days overdue. Impaired accounts are managed by the Company’s specialist recovery
unit, Group Special Assets Management (GSAM), which is separate from the Company’s main
businesses. Where any amount is considered irrecoverable, an individual impairment provision is
raised. This provision is the difference between the loan carrying amount and the present value of
estimated future cash flows.
The individual circumstances of each customer are taken into account when GSAM estimates future
cash flow. All available sources, such as cash flow arising from operations, selling assets or
subsidiaries, realising collateral or payments under guarantees, are considered. In any decision relating
to the raising of provisions, the Company attempts to balance economic conditions, local knowledge
and experience, and the results of independent asset reviews.
Where it is considered that there is no realistic prospect of recovering a portion of an exposure
against which an impairment provision has been raised, that amount will be written off.
As with Consumer Banking, a portfolio impairment provision (PIP) to cover the inherent risk of
losses which although not identified, are known to be present in any portfolio. In Wholesale Banking,
this is set with reference to historic loss rates and subjective factors such as the economicenvironment and the trends in key portfolio indicators. The PIP methodology provides for accounts
for which an individual impairment provision has not been raised.
Gross non performing loans in Wholesale Banking have increased by $1.1 billion since 2008, and this
is driven by a small number of individually significant accounts, the largest of which are two closely
linked customers in Saudi Arabia, included within the MESA region.
The cover ratio reflects the extent to which gross non-performing loans are covered by individual and
portfolio impairment provisions. The cover ratio has increased from 61% as at 31 December 2008 to
65% as at 31 December 2009. It continues to be impacted by downgrades of accounts in which
recovery of principal is expected and so a low level of provision has been raised, in accordance with
IAS 39. The balance uncovered by individual impairment provisions represents the value of collateral
held and/or the Company’s estimate of the net outcome of any workout strategy.
The total net impairment charge in Wholesale Banking has increased by $564 million, largely driven
by the increase in the MESA region. A significant individual impairment charge has been taken
against two closely linked customers in Saudi Arabia. To address the exceptional amount of economic
stress still being experienced in the region, and the unusual level of uncertainty, the Group hassignificantly increased the portfolio impairment provision in 2009.
The following tables set out the total non-performing loans for Wholesale Banking:
2009
Asia Pacific
Hong
Kong
$million
Singapore
$million
Korea
$million
Other
Asia
Pacific1
$million
India
$million
Middle
East &
Other
S Asia
$million
Africa
$million
Americas,
UK &
Europe
$million
Total
$million
Loans and advances
Gross non-performing 207 10 352 780 207 855 160 189 2,760
Individual impairment provision (117) (7) (204) (408) (74) (469) (53) (115) (1,447)
Non-performing loans net of individual
impairment provision 90 3 148 372 133 386 107 74 1,313
Portfolio impairment provision (357)
Net non-performing loans and advances 956
Cover ratio 65%
1 Other APR includes Malaysia: Gross non-performing $37 million; Individual impairment provision $(18) million; Non-performing loans and advances, net of individual impairment provision $19 million.
157
c102100pu025Proof7:28.3.10B/LRevision:0OperatorSadK

2008
Asia Pacific
Hong
Kong
$million
Singapore
$million
Korea
$million
Other
Asia
Pacific1
$million
India
$million
Middle
East &
Other
S Asia
$million
Africa
$million
Americas,
UK &
Europe
$million
Total
$million
Loans and advances
Gross non-performing 201 3 193 533 61 241 80 308 1,620
Individual impairment provision (125) (2) (78) (314) (34) (99) (42) (87) (781)
Non-performing loans net of individual
impairment provision 76 1 115 219 27 142 38 221 839
Portfolio impairment provision (208)
Net non-performing loans and advances 631
Cover ratio 61%
1 Other APR includes Malaysia: Gross non-performing $16 million; Individual impairment provision $(16) million; Non-performing loans and advances, net of individual impairment provision $nil million.
The following tables set out the total non-performing loans for Wholesale Banking:
2009
Asia Pacific
Hong
Kong
Rs.million
Singapore
Rs.million
Korea
Rs.million
Other
Asia
Pacific1
Rs.million
India
Rs.million
Middle
East &
Other
S Asia
Rs.million
Africa
Rs.million
Americas,
UK &
Europe
Rs.million
Total
Rs.million
Loans and advances
Gross non-performing 9,663 467 16,431 36,410 9,663 39,911 7,469 8,823 128,837
Individual impairment
provision (5,462) (327) (9,523) (19,045) (3,454) (21,893) (2,474) (5,368) (67,546)
Non-performing loans net of
individual impairment
provision 4,201 140 6,909 17,365 6,208 18,018 4,995 3,454 61,291
Portfolio impairment
provision (16,665)
Net non-performing loans
and advances 44,626
Cover ratio 65%
1 Other APR includes Malaysia: Gross non-performing $37 million; Individual impairment provision $(18) million; Non-performing loans and advances, net of individual impairment provision $19 million.
158
c102100pu025Proof7:28.3.10B/LRevision:0OperatorSadK

2008
Asia Pacific
Hong
Kong
Rs.million
Singapore
Rs.million
Korea
Rs.million
Other
Asia
Pacific1
Rs.million
India
Rs.million
Middle
East &
Other
S Asia
Rs.million
Africa
Rs.million
Americas,
UK &
Europe
Rs.million
Total
Rs.million
Loans and advances
Gross non-performing 9,383 140 9,009 24,880 2,847 11,250 3,734 14,377 75,622
Individual impairment
provision (5,835) (93) (3,641) (14,658) (1,587) (4,621) (1,961) (4,061) (36,457)
Non-performing loans net of
individual impairment
provision 3,548 47 5,368 10,223 1,260 6,629 1,774 10,316 39,165
Portfolio impairment
provision (9,709)
Net non-performing loans
and advances 29,455
Cover ratio 61%
1 Other APR includes Malaysia: Gross non-performing $16 million; Individual impairment provision $(16) million; Non-performing loans and advances, net of individual impairment provision $nil million.
The tables below set out the net impairment charge by geographic area:
2009
Asia Pacific
Hong
Kong
$million
Singapore
$million
Korea
$million
Other
Asia
Pacific1
$million
India
$million
Middle
East &
Other
S Asia
$million
Africa
$million
Americas,
UK &
Europe
$million
Total
$million
Gross impairment charge 52 3 111 194 55 394 15 58 882
Recoveries/provisions no longer required (8) (5) (18) (23) (6) (6) (3) (7) (76)
Net individual impairment charge 44 (2) 93 171 49 388 12 51 806
Portfolio impairment provision charge 142
Net impairment charge 948
1 Other APR includes Malaysia: Gross impairment charge $11 million; Recoveries/provisions no longer required $(5) million; Netindividual impairment charge $6 million.
159
c102100pu025Proof7:28.3.10B/LRevision:0OperatorSadK
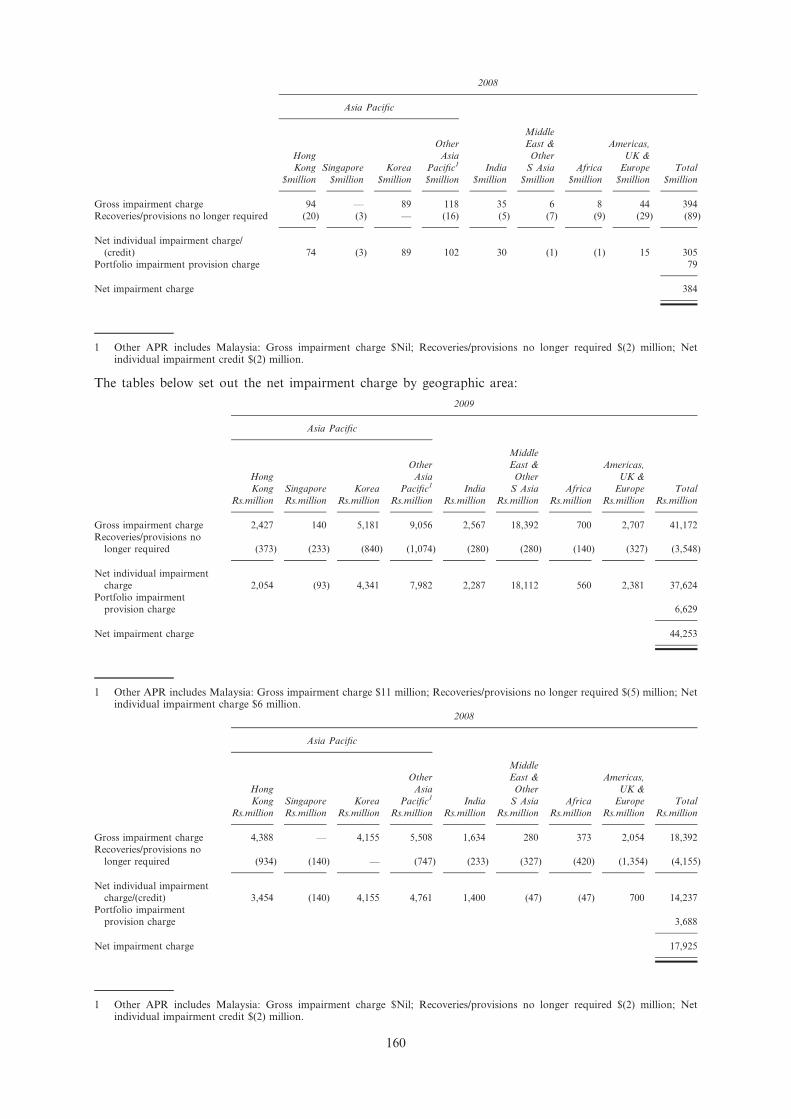
2008
Asia Pacific
Hong
Kong
$million
Singapore
$million
Korea
$million
Other
Asia
Pacific1
$million
India
$million
Middle
East &
Other
S Asia
$million
Africa
$million
Americas,
UK &
Europe
$million
Total
$million
Gross impairment charge 94 — 89 118 35 6 8 44 394
Recoveries/provisions no longer required (20) (3) — (16) (5) (7) (9) (29) (89)
Net individual impairment charge/
(credit) 74 (3) 89 102 30 (1) (1) 15 305
Portfolio impairment provision charge 79
Net impairment charge 384
1 Other APR includes Malaysia: Gross impairment charge $Nil; Recoveries/provisions no longer required $(2) million; Netindividual impairment credit $(2) million.
The tables below set out the net impairment charge by geographic area:
2009
Asia Pacific
Hong
Kong
Rs.million
Singapore
Rs.million
Korea
Rs.million
Other
Asia
Pacific1
Rs.million
India
Rs.million
Middle
East &
Other
S Asia
Rs.million
Africa
Rs.million
Americas,
UK &
Europe
Rs.million
Total
Rs.million
Gross impairment charge 2,427 140 5,181 9,056 2,567 18,392 700 2,707 41,172
Recoveries/provisions no
longer required (373) (233) (840) (1,074) (280) (280) (140) (327) (3,548)
Net individual impairment
charge 2,054 (93) 4,341 7,982 2,287 18,112 560 2,381 37,624
Portfolio impairment
provision charge 6,629
Net impairment charge 44,253
1 Other APR includes Malaysia: Gross impairment charge $11 million; Recoveries/provisions no longer required $(5) million; Netindividual impairment charge $6 million.
2008
Asia Pacific
Hong
Kong
Rs.million
Singapore
Rs.million
Korea
Rs.million
Other
Asia
Pacific1
Rs.million
India
Rs.million
Middle
East &
Other
S Asia
Rs.million
Africa
Rs.million
Americas,
UK &
Europe
Rs.million
Total
Rs.million
Gross impairment charge 4,388 — 4,155 5,508 1,634 280 373 2,054 18,392
Recoveries/provisions no
longer required (934) (140) — (747) (233) (327) (420) (1,354) (4,155)
Net individual impairment
charge/(credit) 3,454 (140) 4,155 4,761 1,400 (47) (47) 700 14,237
Portfolio impairment
provision charge 3,688
Net impairment charge 17,925
1 Other APR includes Malaysia: Gross impairment charge $Nil; Recoveries/provisions no longer required $(2) million; Netindividual impairment credit $(2) million.
160
c102100pu025Proof7:28.3.10B/LRevision:0OperatorSadK

Movement in Group Individual impairment provision
The following tables set out the movements in the Company’s total individual impairment provision
against loans and advances:
2009
Asia Pacific
Hong
Kong
$million
Singapore
$million
Korea
$million
Other
Asia
Pacific1
$million
India
$million
Middle
East &
Other
S Asia
$million
Africa
$million
Americas,
UK &
Europe
$million
Total
$million
Provisions held at 1 January 2009 164 20 154 605 44 170 54 113 1,324
Exchange translation differences — — 21 26 4 (6) 3 1 49
Amounts written off (154) (50) (215) (501) (162) (218) (24) (5) (1,329)
Recoveries of acquisition fair values — — (7) (29) — (4) — — (40)
Recoveries of amounts previously
written off 32 14 6 100 19 19 — 3 193
Discount unwind (6) (1) (13) (27) (2) (6) (2) (2) (59)
Other — — 49 1 2 (1) — (3) 48
New provisions 191 69 311 618 218 651 46 83 2,187
Recoveries/provisions no longer required (46) (25) (39) (173) (32) (45) (14) (14) (388)
Net charge against profit 145 44 272 445 186 606 32 69 1,799
Provisions held at 31 December 2009 181 27 267 620 91 560 63 176 1,985
1 Other APR includes Malaysia: Provisions held at 31 December 2009 $64 million.
2008
Asia Pacific
Hong
Kong
$million
Singapore
$million
Korea
$million
Other
Asia
Pacific1
$million
India
$million
Middle
East &
Other
S Asia
$million
Africa
$million
Americas,
UK &
Europe
$million
Total
$million
Provisions held at 1 January 2008 74 44 137 623 44 197 66 88 1,273
Exchange translation differences 1 — (43) (24) (10) (28) (9) (3) (116)
Amounts written off (94) (48) (156) (450) (114) (178) (17) (62) (1,119)
Recoveries of acquisition fair values — — (19) (55) — (4) — — (78)
Recoveries of amounts previously
written off 31 15 2 88 23 12 — 9 180
Acquisitions — — 3 28 — — — 15 46
Discount unwind (3) (1) (9) (24) (1) (1) (1) — (40)
Other — — 10 5 (1) 1 — (5) 10
New provisions 213 39 245 560 136 203 33 109 1,538
Recoveries/provisions no longer required (58) (29) (16) (146) (33) (32) (18) (38) (370)
Net charge against profit 155 10 229 414 103 171 15 71 1,168
Provisions held at 31 December 2008 164 20 154 605 44 170 54 113 1,324
1 Other APR includes Malaysia: Provisions held at 31 December 2008 $57 million.
161
c102100pu025Proof7:28.3.10B/LRevision:0OperatorSadK

Movement in Group Individual impairment provision
The following tables set out the movements in the Company’s total individual impairment provision
against loans and advances:
2009
Asia Pacific
Hong
Kong
Rs.million
Singapore
Rs.million
Korea
Rs.million
Other
Asia
Pacific1
Rs.million
India
Rs.million
Middle
East &
Other
S Asia
Rs.million
Africa
Rs.million
Americas,
UK &
Europe
Rs.million
Total
Rs.million
Provisions held at 1 January
2009 7,656 934 7,189 28,241 2,054 7,936 2,521 5,275 61,804
Exchange translation
differences — — 980 1,214 187 (280) 140 47 2,287
Amounts written off (7,189) (2,334) (10,036) (23,387) (7,562) (10,176) (1,120) (233) (62,038)
Recoveries of acquisition fair
values — — (327) (1,354) — (187) — — (1,867)
Recoveries of amounts
previously written off 1,494 654 280 4,668 887 887 — 140 9,009
Discount unwind (280) (47) (607) (1,260) (93) (280) (93) (93) (2,754)
Other — — 2,287 47 93 (47) — (140) 2,241
New provisions 8,916 3,221 14,517 28,848 10,176 30,389 2,147 3,874 102,089
Recoveries/provisions no
longer required (2,147) (1,167) (1,821) (8,076) (1,494) (2,101) (654) (654) (18,112)
Net charge against profit 6,769 2,054 12,697 20,773 8,682 28,288 1,494 3,221 83,977
Provisions held at
31 December 2009 8,449 1,260 12,464 28,942 4,248 26,141 2,941 8,216 92,660
1 Other APR includes Malaysia: Provisions held at 31 December 2009 $64 million.
2008
Asia Pacific
Hong
Kong
Rs.million
Singapore
Rs.million
Korea
Rs.million
Other
Asia
Pacific1
Rs.million
India
Rs.million
Middle
East &
Other
S Asia
Rs.million
Africa
Rs.million
Americas,
UK &
Europe
Rs.million
Total
Rs.million
Provisions held at 1 January
2008 3,454 2,054 6,395 29,082 2,054 9,196 3,081 4,108 59,424
Exchange translation
differences 47 — (2,007) (1,120) (467) (1,307) (420) (140) (5,415)
Amounts written off (4,388) (2,241) (7,282) (21,006) (5,322) (8,309) (794) (2,894) (52,235)
Recoveries of acquisition fair
values — — (887) (2,567) — (187) — — (3,641)
Recoveries of amounts
previously written off 1,447 700 93 4,108 1,074 560 — 420 8,402
Acquisitions — — 140 1,307 — — — 700 2,147
Discount unwind (140) (47) (420) (1,120) (47) (47) (47) — (1,867)
Other — — 467 233 (47) 47 — (233) 467
New provisions 9,943 1,821 11,437 26,141 6,348 9,476 1,540 5,088 71,794
Recoveries/provisions no
longer required (2,707) (1,354) (747) (6,815) (1,540) (1,494) (840) (1,774) (17,272)
Net charge against profit 7,235 467 10,690 19,326 4,808 7,982 700 3,314 54,522
Provisions held at
31 December 2008 7,656 934 7,189 28,241 2,054 7,936 2,521 5,275 61,804
1 Other APR includes Malaysia: Provisions held at 31 December 2008 $57 million.
162
c102100pu025Proof7:28.3.10B/LRevision:0OperatorSadK

Asset backed securities
Total exposures to asset backed securities
31 December 2009 31 December 2008
Percentage
of notional
value of
portfolio
Notional
$million
Carrying
value
$million
Fair
value1
$million
Percentage
of notional
value of
portfolio
Notional
$million
Carrying
value
$million
Fair
value1
$million
Residential Mortgage Backed
Securities (‘RMBS’)
– US Alt-A 2% 74 42 31 2% 84 57 35
– US Prime — 1 — — — 2 1 —
– Other 24% 819 767 708 23% 1,024 969 858
Collateralised Debt Obligations
(‘CDOs’)
– Asset Backed Securities 2% 77 13 10 5% 208 32 30
– Other CDOs 10% 353 285 273 9% 379 306 225
Commercial Mortgage Backed
Securities (‘CMBS’)
– US CMBS 4% 139 122 108 3% 147 129 92
– Other 19% 664 480 373 15% 671 525 466
Other Asset Backed Securities
(‘Other ABS’) 39% 1,315 1,227 1,204 43% 1,935 1,740 1,551
100% 3,442 2,936 2,707 100% 4,450 3,759 3,257
Of which included within:
– Financial assets held at fair
value through profit or loss 3% 103 97 97 — — — —
– Investment securities –
available-for-sale 26% 903 608 608 26% 1,145 725 725
– Investment securities – Loans
and receivables 71% 2,436 2,231 2,002 74% 3,305 3,034 2,532
100% 3,442 2,936 2,707 100% 4,450 3,759 3,257
1 Fair value reflects the value of the entire portfolio, including assets redesignated to loans and receivables.
163
c102100pu025Proof7:28.3.10B/LRevision:0OperatorSadK

Asset backed securities
Total exposures to asset backed securities
31 December 2009 31 December 2008
Percentage
of notional
value of
portfolio
Notional
Rs.million
Carrying
value
Rs.million
Fair
value1
Rs.million
Percentage
of notional
value of
portfolio
Notional
Rs.million
Carrying
value
Rs.million
Fair
value1
Rs.million
Residential Mortgage Backed
Securities (‘RMBS’)
– US Alt-A 2% 3,454 1,961 1,447 2% 3,921 2,661 1,634
– US Prime — 47 — — — 93 47 —
– Other 24% 38,231 35,804 33,049 23% 47,800 45,233 40,051
Collateralised Debt Obligations
(‘CDOs’)
– Asset Backed Securities 2% 3,594 607 467 5% 9,709 1,494 1,400
– Other CDOs 10% 16,478 13,304 12,744 9% 17,692 14,284 10,503
Commercial Mortgage Backed
Securities (‘CMBS’)
– US CMBS 4% 6,489 5,695 5,041 3% 6,862 6,022 4,295
– Other 19% 30,996 22,406 17,412 15% 31,322 24,507 21,753
Other Asset Backed Securities
(‘Other ABS’) 39% 61,384 57,276 56,203 43% 90,326 81,223 72,401
100% 160,673 137,052 126,363 100% 207,726 175,470 152,037
Of which included within:
– Financial assets held at fair
value through
profit or loss 3% 4,808 4,528 4,528 — — — —
– Investment securities –
available-for-sale 26% 42,152 28,381 28,381 26% 53,449 33,843 33,843
– Investment securities – Loans
and receivables 71% 113,712 104,143 93,453 74% 154,277 141,627 118,194
100% 160,673 137,052 126,363 100% 207,726 175,470 152,037
1 Fair value reflects the value of the entire portfolio, including assets redesignated to loans and receivables.
The carrying value of asset backed securities represents 0.7% (31 December 2008: 0.9%) of the
Company’s total assets.
The notional value of the ABS portfolio fell by approximately $1 billion during 2009 due to natural
redemptions in the portfolio. The difference between carrying value and fair value of the remaining
portfolio narrowed to $229 million at 31 December 2009, benefitting from both the redemptions and
a recovery in market prices in certain asset classes
The credit quality of the asset backed securities portfolio remains strong. With the exception of those
securities subject to an impairment charge, 80% of the overall portfolio is rated A or better, and 39%
of the overall portfolio is rated as AAA. The portfolio is broadly diversified across asset classes and
geographies, and there is no direct exposure to the US sub-prime market. The portfolio has an
average credit grade of AA-, unchanged from year-end 2008.
26% of the overall portfolio is invested in RMBS, with a weighted average credit rating of AA (AA+
in 2008). 45% of the residential mortgage exposures were originated in 2005 or earlier.
12% of the overall portfolio is in CDOs. This includes $77 million of exposures to Mezzanine and
High Grade CDOs of ABS, of which $56 million have been impaired. The remainder of the CDOs
have a weighted average credit rating of BBB (AA+ in 2008).
23% of the overall portfolio is in CMBS, of which $139 million is in respect of US CMBS with a
weighted average credit grade of AAA (AAA in 2008). The weighted average credit rating of the
Other CMBS is A- (AA in 2008).
39% of the overall portfolio is in Other ABS, which includes securities backed by credit card
receivables, bank collateralised loan obligations, future flows and student loans, with a weighted creditrating of AA.
The Group reclassified some asset backed securities from trading and available-for-sale to loans and
receivables with effect from 1 July 2008. The securities were reclassified at their fair value on the date
164
c102100pu025Proof7:28.3.10B/LRevision:0OperatorSadK

of reclassification. Note 14 on page 143 of the Annual Report 2009 provides details of the remaining
balance of those assets reclassified in 2008. No assets were reclassified in the twelve months to
31 December 2009.
Writedowns of asset backed securities
Trading
Available
-for-sale
Loans and
receivables Total
$million $million $million $million
31 December 2009
Credit to available-for-sale reserves — 26 — 26
Charge to the profit and loss account — (70) (7) (77)
31 December 2008
Charge to available-for-sale reserves — (309) — (309)
Charge to the profit and loss account (74) (90) — (164)
Writedowns of asset backed securities
Trading
Available
-for-sale
Loans and
receivables Total
Rs.million Rs.million Rs.million Rs.million
31 December 2009
Credit to available-for-sale reserves — 1,214 — 1,214
Charge to the profit and loss account — (3,268) (327) (3,594)
31 December 2008
Charge to available-for-sale reserves — (14,424) — (14,424)
Charge to the profit and loss account (3,454) (4,201) — (7,656)
Country cross-border risk
Country cross border risk is the risk that the Company will be unable to obtain payment from the
Company’s customers or third parties on their contractual obligations as a result of certain actionstaken by foreign governments, chiefly relating to convertibility and transferability of foreign currency.
The GRC is responsible for the Company’s country cross border risk limits and delegates the setting
and management of country limits to the Group Country Risk function.
The business and country chief executive officers manage exposures within these limits and policies.
Countries designated as higher risk are subject to increased central monitoring.
Cross border assets comprise loans and advances, interest-bearing deposits with other banks, trade
and other bills, acceptances, amounts receivable under finance leases, derivatives, certificates of deposit
and other negotiable paper investment securities, and formal commitments where the counterparty is
resident in a country other than that where the assets are recorded. Cross border assets also include
exposures to local residents denominated in currencies other than the local currency.
Cross border exposure to China, India, Hong Kong, Singapore and UAE has risen significantly
reflecting the Company’s focus and continued expansion in the Company’s core countries and theexecution of underlying business strategies in these key markets.
Cross border exposure to UAE has increased as the Company grew its Abu Dhabi portfolio. In
South Korea growth in the Wholesale Banking business was offset by a significant reduction in the
marked to market positions on the Company’s derivative exposure and short-term exposure to the
USA has continued to expand primarily in support of the Company’s substantial clearing capabilities.
Cross border exposure to countries in which the Company does not have a significant presence
predominantly relates to short-dated money market and some global corporate activity. This business
is originated in the Company’s key markets, but is conducted with counterparties domiciled in the
country against which the exposure is reported, as indicated by the increased positions on France,
Australia, the Netherlands and Switzerland.
165
c102100pu025Proof7:28.3.10B/LRevision:0OperatorSadK

The following table, based on the Company’s internal country cross border risk reporting
requirements, shows cross border outstandings where they exceed one per cent of total assets.
2009 2008
One year
or less
Over
one year Total
One year
or less
Over
one year Total
$million $million $million $million $million $million
US 14,484 5,604 20,088 12,839 5,449 18,288
India 8,370 10,470 18,840 8,806 6,862 15,668
Hong Kong 12,410 4,856 17,266 9,481 4,136 13,617
Singapore 13,135 3,411 16,546 9,715 3,003 12,718
South Korea 8,555 6,500 15,055 8,803 7,040 15,843
United Arab Emirates 5,807 9,071 14,878 5,989 4,546 10,535
China 5,979 4,007 9,986 4,480 3,292 7,772
France 5,680 2,328 8,008 3,071 1,835 4,906Australia 2,466 2,566 5,032 2,000 1,552 3,552
Netherlands 2,350 2,461 4,811 2,445 1,648 4,093
Switzerland 2,844 1,638 4,482 3,147 623 3,770
2009 2008
One year
or less
Over
one year Total
One year
or less
Over
one year Total
Rs.million Rs.million Rs.million Rs.million Rs.million Rs.million
US 676,113 261,595 937,708 599,325 254,359 853,684
India 390,712 488,740 879,451 411,064 320,318 731,382
Hong Kong 579,299 226,678 805,977 442,573 193,068 635,642
Singapore 613,142 159,225 772,367 453,496 140,180 593,676
South Korea 399,347 303,420 702,767 410,924 328,627 739,551United Arab Emirates 271,071 423,434 694,505 279,567 212,207 491,774
China 279,100 187,047 466,146 209,126 153,671 362,797
France 265,142 108,671 373,813 143,354 85,658 229,012
Australia 115,113 119,781 234,894 93,360 72,447 165,807
Netherlands 109,698 114,879 224,577 114,133 76,929 191,061
Switzerland 132,758 76,462 209,220 146,902 29,082 175,984
Market risk
The Company recognises market risk as the risk of loss resulting from changes in market prices and
rates. The Company’s exposure to market risk arises principally from customer-driven transactions.The objective of the Company’s market risk policies and processes is to obtain the best balance of
risk and return whilst meeting customers’ requirements.
The primary categories of market risk for Standard Chartered are:
* interest rate risk: arising from changes in yield curves, credit spreads and implied volatilities on
interest rate options.
* currency exchange rate risk: arising from changes in exchange rates and implied volatilities onforeign exchange options.
* commodity price risk: arising from changes in commodity prices and commodity option implied
volatilities; covering energy, precious metals, base metals and agriculture.
* equity price risk: arising from changes in the prices of equities, equity indices, equity baskets
and implied volatilities on related options.
Market risk governance
The Group Risk Committee (GRC) approves the Company’s market risk appetite taking account of
market volatility, the range of traded products and asset classes, business volumes and transaction
sizes. Market risk appetite has remained broadly stable in 2009.
166
c102100pu025Proof7:28.3.10B/LRevision:0OperatorSadK

The Group Market Risk Committee (GMRC), under authority delegated by the GRC, is responsible
for setting Value at Risk (VaR) and stress loss limits for market risk within the Company’s risk
appetite. The GMRC is also responsible for policies and other standards for the control of market
risk and overseeing their effective implementation. These policies cover both trading and non-tradingbooks of the Group. The trading book is defined as per the FSA Handbook’s Prudential Sourcebook
for Banks, Building Societies and Investment Firms (BIPRU). This is more restrictive than the
broader definition within IAS 39 ‘Financial Instruments: Recognition and Measurement’, as the FSA
only permits certain types of financial instruments or arrangements to be included within the trading
book. Limits by location and portfolio are proposed by the businesses within the terms of agreed
policy.
Group Market Risk (GMR) approves the limits within delegated authorities and monitors exposures
against these limits. Additional limits are placed on specific instruments and position concentrations
where appropriate. Sensitivity measures are used in addition to VaR as risk management tools. For
example, interest rate sensitivity is measured in terms of exposure to a one basis point increase in
yields, whereas foreign exchange, commodity and equity sensitivities are measured in terms of the
underlying values or amounts involved. Option risks are controlled through revaluation limits on
underlying price and volatility shifts, limits on volatility risk and other variables that determine the
options’ value.
Value at Risk (‘VaR’)
The Company measures the risk of losses arising from future potential adverse movements in market
rates, prices and volatilities using a VaR methodology. VaR, in general, is a quantitative measure of
market risk that applies recent historic market conditions to estimate the potential future loss in
market value that will not be exceeded in a set time period at a set statistical confidence level. VaR
provides a consistent measure that can be applied across trading businesses and products over timeand can be set against actual daily trading profit and loss outcome.
VaR is calculated for expected movements over a minimum of one business day and to a confidence
level of 97.5%. This confidence level suggests that potential daily losses, in excess of the VaR
measure, are likely to be experienced six times per year.
The Company applies two VaR methodologies:
* historic simulation: involves the revaluation of all unmatured contracts to reflect the effect of
historically observed changes in market risk factors on the valuation of the current portfolio.
This approach is applied for general market risk factors.
* Monte Carlo simulation: this methodology is similar to historic simulation but with considerably
more input risk factor observations. These are generated by random sampling techniques, but
the results retain the essential variability and correlations of historically observed risk factorchanges. This approach is applied for credit spread VaR.
In both methods an historical observation period of one year is chosen and applied.
VaR is calculated as the Company’s exposure as at the close of business, generally London time.
Intra-day risk levels may vary from those reported at the end of the day.
Back testing
To assess their predictive power, VaR models are back tested against actual results. In 2009 there was
only one exception in the regulatory back testing, compared with three in 2008. This is well within
the ‘green zone’ applied internationally to internal models by bank supervisors, and implies that
model reliability is statistically greater than 95%.
Stress testing
Losses beyond the confidence interval are not captured by a VaR calculation, which therefore gives
no indication of the size of unexpected losses in these situations.
Group Market Risk complements the VaR measurement by weekly stress testing of market risk
exposures to highlight the potential risk that may arise from extreme market events that are rare but
plausible.
Stress testing is an integral part of the market risk management framework and considers both
historical market events and forward-looking scenarios. A consistent stress testing methodology is
applied to trading and non-trading books. The stress testing methodology assumes that scope for
167
c102100pu025Proof7:28.3.10B/LRevision:0OperatorSadK

management action would be limited during a stress event, reflecting the decrease in market liquidity
that often occurs.
Stress scenarios are regularly updated to reflect changes in risk profile and economic events. The
Group Market Risk Committee has responsibility for reviewing stress exposures and, where necessary,
enforcing reductions in overall market risk exposure. The GRC considers the results of stress tests aspart of its supervision of risk appetite.
Regular stress test scenarios are applied to interest rates, credit spreads, exchange rates, commodityprices and equity prices. This covers all asset classes in the Financial Markets banking and trading
books.
Ad hoc scenarios are also prepared reflecting specific market conditions and for particular
concentrations of risk that arise within the businesses.
Market risk changes
Total average VaR rose in 2009 against 2008. This stemmed mainly from the non-trading book VaR,
and reflected sharp increases in the volatility of credit spreads that followed the collapse of Lehman
Brothers in September 2008. The one year historic data window applied as an input to the VaR
model continued to reflect this period of particularly high credit spread volatility throughout most of2009. Average trading book VaR rose slightly in 2009, with Commodities and Equities VaR
increasing as these businesses continue to expand their activities.
Securities classed as loans and receivables or held to maturity were removed from VaR in June 2009.
These non-traded securities are accounted for on an amortised cost basis, so market price movements
have no effect on either profit and loss or reserves. This alignment of VaR with accounting treatment
resulted in an $8.6 million reduction in total VaR at the time of implementation. The inclusion of the
listed part of the Company’s Private Equity portfolio in non-trading VaR from October 2009 resulted
in a $3 million increase in total VaR.
Daily value at risk (VaR at 97.5%, 1 day)
2009 2008
Trading and Non-trading Average High3 Low3 Actual4 Average High3 Low3 Actual4
$million $million $million $million $million $million $million $million
Interest rate risk1 37.3 46.7 24.7 25.5 25.1 37.6 14.2 36.7Foreign exchange risk 7.8 16.1 3.5 5.0 6.0 8.7 3.3 4.8Commodity risk 3.0 5.5 1.3 3.7 1.3 2.4 0.6 2.1Equity risk 4.3 11.1 1.1 10.8 1.4 2.4 0.5 0.8
Total2 38.9 47.9 27.6 31.8 31.5 42.5 17.8 41.7
TradingInterest rate risk1 11.7 17.8 8.7 10.5 12.0 16.0 8.5 9.3Foreign exchange risk 7.8 16.1 3.5 5.0 6.0 8.7 3.3 4.8Commodity risk 3.0 5.5 1.3 3.7 1.3 2.4 0.6 2.1Equity risk 2.7 3.6 1.0 2.5 1.4 2.4 0.5 0.8
Total2 14.5 19.3 9.9 13.2 14.2 20.6 9.2 9.8
Non-tradingInterest rate risk1 32.4 41.0 20.8 22.2 19.8 39.6 10.6 38.8Equity risk5 1.8 9.9 — 9.1 — — — —
Total2 32.7 41.0 22.6 23.5 19.8 39.6 10.6 38.8
1 Interest rate risk VaR includes credit spread risk arising from securities held for trading or available-for-sale.
2 The total VaR shown in the tables above is not a sum of the component risks due to offsets between them.
3 Highest and lowest VaR for each risk factor are independent and usually occur on different days.
4 Actual one day VaR as at period end date.
5 Non-trading equity risk VaR was included only from October 2009. For the period October to December 2009, non-trading equityrisk VaR average was $9.1 million, with a low of $8.7 million.
168
c102100pu025Proof7:28.3.10B/LRevision:0OperatorSadK

Daily value at risk (VaR at 97.5%, 1 day)
2009 2008
Trading and Non-trading Average High3 Low3 Actual4 Average High3 Low3 Actual4
Rs.million Rs.million Rs.million Rs.million Rs.million Rs.million Rs.million Rs.million
Interest rate risk1 1,741 2,180 1,153 1,190 1,172 1,755 663 1,713Foreign exchange risk 364 752 163 233 280 406 154 224Commodity risk 140 257 61 173 61 112 28 98Equity risk 201 518 51 504 65 112 23 37
Total2 1,816 2,236 1,288 1,484 1,470 1,984 831 1,947
TradingInterest rate risk1 546 831 406 490 560 747 397 434Foreign exchange risk 364 752 163 233 280 406 154 224Commodity risk 140 257 61 173 61 112 28 98Equity risk 126 168 47 117 65 112 23 37
Total2 677 901 462 616 663 962 429 457
Non-tradingInterest rate risk1 1,512 1,914 971 1,036 924 1,849 495 1,811Equity risk5 84 462 — 425 — — — —
Total2 1,526 1,914 1,055 1,097 924 1,849 495 1,811
1 Interest rate risk VaR includes credit spread risk arising from securities held for trading or available-for-sale.
2 The total VaR shown in the tables above is not a sum of the component risks due to offsets between them.
3 Highest and lowest VaR for each risk factor are independent and usually occur on different days.
4 Actual one day VaR as at period end date.
Average daily income earned from market risk related activities
Trading
2009 2008
$million $million
Interest rate risk 5.0 3.4
Foreign exchange risk 5.3 5.1Commodity risk 1.0 0.6
Equity risk 0.4 —
Total 11.7 9.1
Non-Trading
Interest rate risk 4.5 3.2
Total 4.5 3.2
169
c102100pu025Proof7:28.3.10B/LRevision:0OperatorSadK

Trading
2009 2008
Rs.million Rs.million
Interest rate risk 233 159
Foreign exchange risk 247 238
Commodity risk 47 28Equity risk 19 —
Total 546 425
Non-Trading
Interest rate risk 210 149
Total 210 149
Market risk VaR coverage
Interest rate risk from across the non-trading book portfolios is transferred to Financial Markets
where it is managed by local Asset and Liability Management (ALM) desks under the supervision oflocal Asset and Liability Committees (ALCO). The ALM desks deal in the market in approved
financial instruments in order to manage the net interest rate risk, subject to approved VaR and risk
limits. The interest rate risk on securities issued by Group Treasury is hedged to floating rate and is
not included within Group VaR.
VaR and stress tests are therefore applied to non-trading book exposures in the same way as for the
trading book, including listed available for sale securities. Securities classed as ‘loans and receivables’
or ‘held to maturity’ are not reflected in VaR or stress tests since they are accounted on an amortised
cost basis, so market price movements have no effect on either profit and loss or reserves.
Foreign exchange risk on the non-trading book portfolios is minimised by match funding assets and
liabilities in the same currency. Structural foreign exchange currency risks are not included within
Group VaR.
Equity risk relating to non-listed Private Equity and strategic investments is not included within the
VaR. It is separately managed through delegated limits for both investment and divestment, and is
also subject to regular review by an investment committee. Equity shareholdings are detailed in
note 22 on page 151 of the 2009 Annual Report.
Market risk regulatory capital
At Group level, the FSA specifies minimum capital requirements against market risk. The FSA has
granted the Group CAD2 internal model approval covering the majority of interest rate and foreign
exchange risk in the trading book. In 2008 the scope was extended to include precious and base
metals market risk. Positions outside the CAD2 scope are assessed according to standard FSA rules.
At 31 December 2009, the Company’s market risk regulatory capital requirement was $1.6 billion
(31 December 2008: $0.7 billion). The increase occurred despite a reduction in trading book market
risk as reflected above in internal VaR. It arises primarily due to energy derivative positions that are
subject to FSA standard rules and for which application has been made to the FSA for CAD2
approval.
Derivatives
Derivatives are contracts with characteristics and value derived from underlying financial instruments,
interest and exchange rates or indices. They include futures, forwards, swaps and options transactions.
Derivatives are an important risk management tool for banks and their customers because they can
be used to manage market price risk. The market risk of derivatives is managed in essentially the
same way as other traded products.
The Company’s derivative transactions are principally in instruments where the mark-to-market values
are readily determinable by reference to independent prices and valuation quotes.
170
c102100pu025Proof7:28.3.10B/LRevision:0OperatorSadK

The Company enters into derivative contracts in the normal course of business to meet customer
requirements and to manage its exposure to fluctuations in market price movements.
Derivatives are carried at fair value and shown in the balance sheet as separate totals of assets and
liabilities. Recognition of fair value gains and losses depends on whether the derivatives are classified
as trading or held for hedging purposes.
The credit risk arising from all financial derivatives is managed as part of the overall lending limits to
financial institutions and corporate customers. This is covered in more detail in the Credit risk section
on page 51 of the 2009 Annual Report.
Hedging
Countries within the Group use futures, forwards, swaps and options transactions primarily to
mitigate interest and foreign exchange risk arising from their own country exposures. The Company
also uses futures, forwards and options to hedge foreign exchange and interest rate risk.
In accounting terms under IAS 39, hedges are classified into three types: fair value hedges,
predominantly where fixed rates of interest or foreign exchange are exchanged for floating rates; cash
flow hedges, predominantly where variable rates of interest or foreign exchange are exchanged for
fixed rates; and hedges of net investments in overseas operations translated to the parent company’s
functional currency, US dollars.
The use of interest rate swaps for the purposes of hedging significantly increased in 2009 compared to
2008. A large part of the increase arose in cash flow hedges from hedging of the returns on mortgagebacked securities obtained in 2009 following the government sponsored mortgage acquisition
programme in Korea. The use of fair value hedging was also expanded as part of the Company’s
focus on liquidity management. Foreign exchange options were also taken out during the year to
provide more flexibility in managing the foreign exchange risks in elements of the Company’s non-US
dollar cost base.
The Company may also, under certain individually approved circumstances, enter into ‘economic
hedges’ which do not qualify for IAS 39 hedge accounting treatment, and which are accordinglymarked to market through the profit and loss account, thereby creating an accounting asymmetry.
These are entered into primarily to ensure that residual interest rate and foreign exchange risks are
being effectively managed.
Structural currency exposure management
The Company has investments in foreign operations (subsidiaries and branches) in currencies otherthan its functional currency, US dollars. Foreign exchange movements on those net investments in
foreign currencies are taken to the Company’s reserves; these reserves form part of the capital base.
The effect of exchange rate movements on the capital ratio is partially mitigated by the fact that both
the value of these investments and the risk weighted assets in those currencies follow broadly the
same exchange rate movements. The Company hedges the net investments in limited circumstances if
it is anticipated that the capital ratio will be materially affected by exchange rate movements.
Liquidity risk
Liquidity risk is the risk that the Company either does not have sufficient financial resources available
to meet all its obligations and commitments as they fall due, or can only access these financial
resources at excessive cost.
It is the Company’s policy to maintain adequate liquidity at all times, in all geographic locations and
for all currencies, and hence to be in a position to meet all obligations as they fall due. TheCompany manages liquidity risk both on a short-term and medium-term basis. In the short-term, the
Company’s focus is on ensuring that the cash flow demands can be met through asset maturities,
customer deposits and wholesale funding where required. In the medium-term, the focus is on
ensuring the balance sheet remains structurally sound.
The GALCO is the responsible governing body that approves the Company’s liquidity management
policies. The Liquidity Management Committee (LMC) receives authority from the GALCO and isresponsible for setting liquidity limits and proposing liquidity risk policies and practices. Liquidity in
each country is managed by the Country ALCO within the pre-defined liquidity limits set by the
LMC and in compliance with Group liquidity policies and local regulatory requirements. The Group
Treasury and Group Market Risk functions propose and oversee the implementation of policies and
other controls relating to the above risks.
171
c102100pu025Proof7:28.3.10B/LRevision:0OperatorSadK

The Company seeks to manage the Company’s liquidity prudently in all geographical locations and
for all currencies. Exceptional market events can impact us adversely, thereby affecting the
Company’s ability to fulfill the Company’s obligations as they fall due. The principal uncertainties for
liquidity risk are that customer depositors withdraw their funds at a substantially faster rate thanexpected, or that repayment for asset maturities is not received on the intended day. To mitigate
these uncertainties, the Company’s customer deposit base is diversified by type and maturity. In
addition the Company has a portfolio of liquid assets that can be realised if a liquidity stress occurs,
as well as ready access to wholesale funds under normal market conditions.
Policies and procedures
Due to the diversified nature of the Company’s business, the Company’s policy is that liquidity is
more effectively managed locally, in-country. Each ALCO is responsible for ensuring that the country
is self-sufficient, able to meet all its obligations to make payments as they fall due, and operates
within the local regulations and liquidity limits set for the country.
The Company’s liquidity risk management framework requires limits to be set for prudent liquidity
management. There are limits on:
* the mismatch in local and foreign currency behavioural cash flows.
* the level of wholesale borrowing to ensure that the size of this funding is proportionate to thelocal market and the Company’s local operations.
* commitments, both on and off balance sheet, to ensure there are sufficient funds available in the
event of drawdown on these commitments.
* the advances to deposits ratio to ensure that commercial advances are funded by stable sources
and that customer lending is funded by customer deposits.
* the amount of medium-term funding to support the asset portfolio.
* the amount of local currency funding sourced from foreign currency sources.
In addition, the Company prescribes a liquidity stress scenario that assumes accelerated withdrawal of
deposits over a period of time. Each country has to ensure that cash inflows exceed outflows under
such a scenario.
All limits are reviewed at least annually, and more frequently if required, to ensure that they remain
relevant given market conditions and business strategy. Compliance with limits is monitored
independently on a regular basis by Group Market Risk. Limit excesses are escalated and approved
under a delegated authority structure and reviewed by ALCO. Excesses are also reported monthly to
the LMC and GALCO which provide further oversight.
In addition, regular reports to the ALCO include the following:
* information on the concentration and profile of debt maturities.
* depositor concentration report to monitor reliance on large individual depositors.
The Company has significant levels of marketable securities, principally government securities and
bank paper, which can be realised, repo’d or used as collateral in the event that there is a need for
liquidity in a crisis. In addition, liquidity crisis management plans are maintained by Group and
within each country, and are reviewed and approved annually. The liquidity crisis management planlays out trigger points and actions in the event of a liquidity crisis to ensure that there is an effective
response by senior management.
Primary sources of funding
A substantial portion of the Company’s assets is funded by customer deposits made up of current
and savings accounts and other deposits. These customer deposits, which are widely diversified bytype and maturity, represent a stable source of funds. The Asset and Liability Committee in each
country monitors trends in the balance sheet and ensures that any concerns that might impact the
stability of these deposits are addressed effectively. ALCO also reviews balance sheet plans to ensure
that projected asset growth is matched by growth in the stable funding base.
The Company maintains access to the interbank wholesale funding markets in all major financial
centres and countries in which it operates. This seeks to ensure that the Company has flexibility
around maturity transformation, has market intelligence, maintains stable funding lines and can
obtain optimal pricing when the Company performs its interest rate risk management activities.
172
c102100pu025Proof7:28.3.10B/LRevision:0OperatorSadK

Liquidity metrics
The Company monitors key liquidity metrics on a regular basis. Liquidity is managed on a country
basis and in aggregate across the Group. The key metrics are:
Advances to deposit ratio
This is defined as the ratio of total loans and advances to customers relative to total customer
deposits. A low advances to deposits ratio demonstrates that customer deposits exceed customer loans
resulting from emphasis placed on generating a high level of stable funding from customers.
31 December
2009
$million
2008
$million
Loans and advances to customers1 201,803 178,512
Customer accounts2 256,746 238,591
% %
Advances to deposits ratio 78.6 74.8
1 see note 18 on page 148 of the 2009 Annual Report.
2 see note 30 on page 161 of the 2009 Annual Report.
31 December
2009
Rs.million
2008
Rs.million
Loans and advances to customers1 9,420,164 8,332,940
Customer accounts2 11,984,903 11,137,428
% %
Advances to deposits ratio 78.6 74.8
1 see note 18 on page 148 of the 2009 Annual Report.
2 see note 30 on page 161 of the 2009 Annual Report.
Liquid asset ratio
This is the ratio of liquid assets to total assets. The significant level of holdings of liquid assets in the
balance sheet reflects the application of the Company’s liquidity policies and practices. The following
table shows the ratio of liquid assets to total assets:
31 December
2009
%
2008
%
Liquid assets1 to total assets ratio 26.2 23.1
1 Liquid assets are the total of Cash (less restricted balances), net interbank, treasury bills and debt securities less illiquid securities.
Capital management 2009
The Company’s approach to capital management is driven by the Company’s desire to maintain a
strong capital base to support the development of the Company’s business, to meet regulatory capital
requirements at all times and to maintain good credit ratings.
Strategic, business and capital plans are drawn up annually covering a three year horizon and are
approved by the Board. The capital plan ensures that adequate levels of capital and an optimum mix
of the different components of capital are maintained to support the Company’s strategy.
The capital plan takes the following into account:
* regulatory capital requirements.
* forecast demand for capital to support the credit ratings.
* increases in demand for capital due to business growth, market shocks or stresses.
173
c102100pu025Proof7:28.3.10B/LRevision:0OperatorSadK

* available supply of capital and capital raising options.
* internal controls and governance for managing the Group’s risk, performance and capital.
The Company uses a capital model to assess the capital demand for material risks, and support the
Company’s internal capital adequacy assessment. Each material risk is assessed, relevant mitigants
considered, and appropriate levels of capital determined. The capital modelling process is a key part
of the Company’s management disciplines.
A strong governance and process framework is embedded in the Company’s capital planning and
assessment methodology. Overall responsibility for the effective management of risk rests with the
Board. The Audit and Risk Committee reviews specific risk areas and the issues discussed at the key
capital management committees. The Group Asset and Liability Committee (GALCO) sets internal
triggers and target ranges for capital management and oversees adherence with these.
Current compliance with Capital Adequacy Regulations
The Company’s lead supervisor is the FSA. The capital that the Company is required to hold by the
FSA is determined by the Company’s balance sheet, off-balance sheet, counterparty and other risk
exposures.
Capital in branches and subsidiaries is maintained on the basis of host regulators’ regulatory
requirements. Suitable processes and controls are in place to monitor and manage capital adequacy
and ensure compliance with local regulatory ratios in all the Company’s legal entities. These processes
are designed to ensure that we have sufficient capital available to meet local regulatory capital
requirements at all times.
The table on page 70 of the Company’s 2009 Annual Report summarises the consolidated capital
position of the Group. The principal forms of capital are included in the following items on the
consolidated balance sheet: share capital and reserves (called-up ordinary share capital and preference
shares, and eligible reserves), subordinated liabilities (innovative Tier 1 securities and qualifying
subordinated liabilities), and loans to banks and customers (portfolio impairment provision).
Movement in capital
On a Basel II basis, total capital increased by $5,823 million during the year. The issue of shares in
August 2009 increased ordinary share capital by $65 million and the $5,073 million increase in eligible
reserves is primarily on account of retained profits less dividends paid. We issued $1,500 million of
Innovative Tier 1 securities in the period and gave notice of redemption of EUR500 million of
Preferred Securities in full. Qualifying subordinated liabilities, net of associated amortisations,
decreased on account of the redemption of a variety of Upper and Lower Tier 2 securities amountingto approximately $1,000 million, the impact of which was partially offset by the issuance of TWD10
billion and KRW300 billion Lower Tier 2 subordinated debt.
Basel II
The Basel Committee on Banking Supervision published a framework for the InternationalConvergence of Capital Measurement and Capital Standards (commonly referred to as ‘Basel II’),
which replaced the original 1988 Basel I Accord. Basel II is structured around three ‘pillars’ which
are outlined below:
* Pillar 1 sets out minimum regulatory capital requirements - the minimum amount of regulatory
capital banks must hold against the risks they assume
* Pillar 2 sets out the key principles for the supervisory review of a bank’s risk management
framework and its capital adequacy. It sets out specific oversight responsibilities for the Board
and senior management, reinforcing principles of internal control and other corporate
governance practices
* Pillar 3 aims to bolster market discipline through enhanced disclosure by banks
Basel II provides three approaches of increasing sophistication for the calculation of credit risk
capital; the Standardised Approach, the Foundation Internal Ratings Based Approach and the
Advanced Internal Ratings Based Approach. Basel II also introduces capital requirements for
operational risk for the first time.
The EU Capital Requirements Directive (CRD) is the means by which Basel II has been implemented
in the EU. In the case of the provisions relating to the advanced approaches for credit risk and
operational risk, implementation commenced from 1 January 2008. In the UK the CRD is
174
c102100pu025Proof7:28.3.10B/LRevision:0OperatorSadK

implemented by the FSA through its General Prudential Sourcebook and its Prudential Sourcebook
for Banks, Building Societies and Investment Firms.
From 1 January 2008, the Company has been using the Advanced Internal Ratings Based approach
for the measurement of credit risk capital. This approach builds on the Company’s risk management
practices and is the result of a significant investment in data warehousing and risk models.
The Company uses Value at Risk (VaR) models for the measurement of market risk capital for part
of its trading book exposures where permission to use such models has been granted by the FSA.
Where its market risk exposures are not approved for inclusion in VaR models, the capitalrequirements are determined using standard rules provided by the regulator which are less risk
sensitive.
The Company applies the Standardised Approach for determining the capital requirements for
operational risk.
During the initial years of Basel II implementation, the minimum capital requirements were restrictedby reference to the Basel I framework, so they could not fall below 80% of the Basel I capital
requirements in 2009. This restriction was due to expire at the end of 2009, but the FSA has decided
to retain this capital floor indefinitely.
175
c102100pu025Proof7:28.3.10B/LRevision:0OperatorSadK

The GALCO targets Tier 1 and total capital ratios within a range of 7 to 9% and 12 to 14%
respectively. In light of the uncertain economic environment and evolving regulatory debate on banks’
capital structures, the Company believes it is appropriate to remain strongly capitalised above its
target ranges.
2009 20081
$million $million
Tier 1 capital:Called-up ordinary share capital 1,013 948
Eligible reserves2 25,001 19,928
Minority interests 256 228
Less: excess expected losses3 (502) (483)
Less: securitisation (97) (85)
Goodwill and other intangible assets (6,620) (6,361)
Other regulatory adjustments 51 5
Core Tier 1 capital 19,102 14,180
Innovative Tier 1 securities 2,860 1,974
Preference shares 2,694 2,664
Tax on excess expected losses2 163 130
Less: material holdings (237) (216)
Total Tier 1 capital 24,582 18,732
Tier 2 capital:Eligible revaluation reserves 253 107
Portfolio impairment provision 242 251
Less: excess expected losses3 (502) (483)
Qualifying subordinated liabilities:
Perpetual subordinated debt 1,535 1,823
Other eligible subordinated debt 9,547 10,520
Less: amortisation of qualifying subordinated liabilities — (1,126)
Less: material holdings and securitisations (335) (301)
Total Tier 2 capital 10,740 10,791
Deductions from Tier 1 and Tier 2 capital (57) (81)
Total capital base 35,265 29,442
Risk weighted assets
Credit risk 173,315 161,276
Operational risk 20,696 18,340
Market risk 19,912 9,205
Total risk weighted assets 213,923 188,821
Capital ratios
Core Tier 1 capital 8.9% 7.5%
Tier 1 capital 11.5% 9.9%
Total capital ratio 16.5% 15.6%
1 The capital for December 2008 has been restated in accordance with the definitions of Core Tier 1 capital as advised by the FSAon 1 May 2009.
2 The tax benefit on excess expected losses is included 50% in eligible reserves and 50% in tax on excess expected losses.
3 Excess expected losses are shown gross.
176
c102100pu025Proof7:28.3.10B/LRevision:0OperatorSadK

Risk weighted assets
2009 2008
$million $million
Consumer Banking 53,215 52,124
Wholesale Banking 160,708 136,697
Total risk weighted assets 213,923 188,821
Hong Kong 24,706 21,072
Singapore 21,531 15,064
Korea 26,093 27,020
Other Asia Pacific1 41,276 37,053
India 17,381 15,578
Middle East & Other S Asia 28,727 22,070
Africa 10,228 7,247Americas, UK & Europe 52,921 51,744
222,863 196,848
Less : Intra-group balances2 (8,940) (8,027)
Total risk weighted assets 213,923 188,821
1 Other APR includes Malaysia risk weighted assets of $7,041 million (2008: $6,314 million).
2 Intra-group balances are netted in calculating capital ratios.
177
c102100pu025Proof7:28.3.10B/LRevision:0OperatorSadK

The GALCO targets Tier 1 and total capital ratios within a range of 7 to 9% and 12 to 14%
respectively. In light of the uncertain economic environment and evolving regulatory debate on banks’
capital structures, the Company believes it is appropriate to remain strongly capitalised above its
target ranges.
2009 20081
Rs. million Rs. million
Tier 1 capital:Called-up ordinary share capital 47,287 44,253
Eligible reserves2 1,167,047 930,239
Minority interests 11,950 10,643
Less: excess expected losses3 (23,433) (22,546)
Less: securitisation (4,528) (3,968)
Goodwill and other intangible assets (309,022) (296,931)
Other regulatory adjustments 2,381 233
Core Tier 1 capital 891,681 661,922
Innovative Tier 1 securities 133,505 92,146
Preference shares 125,756 124,356
Tax on excess expected losses2 7,609 6,068
Less: material holdings (11,063) (10,083)
Total Tier 1 capital 1,147,488 874,410
Tier 2 capital:Eligible revaluation reserves 11,810 4,995
Portfolio impairment provision 11,297 11,717
Less: excess expected losses3 (23,433) (22,546)
Qualifying subordinated liabilities:
Perpetual subordinated debt 71,654 85,098
Other eligible subordinated debt 445,654 491,074
Less: amortisation of qualifying subordinated liabilities — (52,562)
Less: material holdings and securitisations (15,638) (14,051)
Total Tier 2 capital 501,343 503,724
Deductions from Tier 1 and Tier 2 capital (2,661) (3,781)
Total capital base 1,646,170 1,374,353
Risk weighted assets
Credit risk 8,090,344 7,528,364
Operational risk 966,089 856,111
Market risk 929,492 429,689
Total risk weighted assets 9,985,926 8,814,164
Capital ratios
Core Tier 1 capital 8.9% 7.5%
Tier 1 capital 11.5% 9.9%
Total capital ratio 16.5% 15.6%
1 The capital for December 2008 has been restated in accordance with the definitions of Core Tier 1 capital as advised by the FSAon 1 May 2009.
2 The tax benefit on excess expected losses is included 50% in eligible reserves and 50% in tax on excess expected losses.
3 Excess expected losses are shown gross.
178
c102100pu025Proof7:28.3.10B/LRevision:0OperatorSadK

Risk weighted assets
2009 2008
Rs. million Rs. million
Consumer Banking 2,484,076 2,433,148
Wholesale Banking 7,501,849 6,381,016
Total risk weighted assets 9,985,926 8,814,164
Hong Kong 1,153,276 983,641
Singapore 1,005,067 703,188
Korea 1,218,021 1,261,294
Other Asia Pacific1 1,926,764 1,729,634
India 811,345 727,181
Middle East & Other S Asia 1,340,976 1,030,228
Africa 477,443 338,290Americas, UK & Europe 2,470,352 2,415,410
10,403,245 9,188,865
Less : Intra-group balances2 (417,319) (374,700)
Total risk weighted assets 9,985,926 8,814,164
1 Other APR includes Malaysia risk weighted assets of Rs.328,674 million (2008: Rs.294,738 million).
2 Intra-group balances are netted in calculating capital ratios.
Risk weighted assets (RWA) increased by $25 billion or 13% compared to 2008, largely driven
through Wholesale Banking, whose RWA increased by $24 billion, or 18%. RWA growth was
concentrated in Singapore, Hong Kong and MESA.
Credit risk RWA increased by $12 billion, or 7%, largely driven by downgrades in Wholesale Banking
resulting in an increase of $13 billion as a result of credit migration. The rate of credit migration
eased in the second half of the year, accounting for $2 billion of the $13 billion during the year.
Asset growth was muted resulting in an RWA increase of $1.6 billion whereas savings through RWA
efficiencies ($5.2 billion) were higher through collaterals, better data capture and lower risk weighting
of the product mix. Against this, savings through the use of CDOs decreased by $1.6 billion due to
challenging market conditions. In Consumer Banking the RWA growth was more muted and mainlydriven by increases in Other APR, secured on real estate property and SME portfolios, and
Singapore, due to the increase in cards, mortgages, SME and Private Banking, partly offset by a
decline in Retail and Personal Loans.
Market risk RWA increased by $11 billion, or 116%, in line with increased trading in energy-related
products and as a result of changes in methodology as advised by the FSA in respect of credit
default swaps.
Operational risk RWA increased by $2 billion, or 13%, and given that it is primarily determined by
the change in income drivers over a rolling three year time horizon, the growth reflects the strong
performance of the Wholesale Banking businesses over that period.
179
c102100pu025Proof7:28.3.10B/LRevision:0OperatorSadK

Summary of financials for the years ended 31 December 2008 and 31 December 2007
The following is extracted without material adjustment from the Annual Report 2008 and the statements
are made as at the date of the Annual Report 2008 rather than the date of this Draft Red Herring
Prospectus.
Group operating income and profit
2008 2007
AEB
US$million
*Underlying
US$million
As reported
US$million
As reported
US$million
Net interest income 240 7,147 7,387 6,265Fees and commissions income, net 252 2,689 2,941 2,661
Net trading income 62 2,343 2,405 1,261
Other operating income (2) 1,237 1,235 880
312 6,269 6,581 4,802
Operating income 552 13,416 13,968 11,067
Operating expenses (603) (7,008) (7,611) (6,215)
Operating profit before impairment losses andtaxation** (51) 6,408 6,357 4,852
Impairment losses on loans and advances and
other credit risk provisions (74) (1,247) (1,321) (761)
Other impairment — (469) (469) (57)
Profit from associates 1 — 1 1
Operating (loss)/profit (124) 4,692 4,568 4,035
* Underlying performance of the Group excludes the post-acquisition results of AEB only.
** ‘Operating profit before impairment losses and taxation’ is also referred to as ‘working profit’.
2008 2007
AEB
Rs.million
*Underlying
Rs.million
As reported
Rs.million
As reported
Rs.million
Net interest income 11,203 333,622 344,825 292,450
Fees and commissions income, net 11,763 125,523 137,286 124,215
Net trading income 2,894 109,371 112,265 58,863
Other operating income (93) 57,743 57,650 41,078
14,564 292,637 307,201 224,157
Operating income 25,767 626,259 652,026 516,608Operating expenses (28,148) (327,133) (355,281) (290,116)
Operating profit before impairment losses and
taxation** (2,381) 299,125 296,745 226,491
Impairment losses on loans and advances and
other credit risk provisions (3,454) (58,210) (61,664) (35,523)
Other impairment — (21,893) (21,893) (2,661)
Profit from associates 47 — 47 47
Operating (loss)/profit (5,788) 219,023 213,234 188,354
* Underlying performance of the Group excludes the post-acquisition results of AEB only.
** ‘Operating profit before impairment losses and taxation’ is also referred to as ‘working profit’.
Note: The acquisitions of Pembroke and Harrison Lovegrove are included within the ‘Americas, the UK and Europe’ segment. Theacquisition of A Brain is included within the ‘South Korea’ segment. Additional disclosures of the effect of these acquisitions for thesesegments have not been made as the impact is not significant.
180
c102100pu025Proof7:28.3.10B/LRevision:0OperatorSadK

Acquisitions
The Group made a number of acquisitions in 2007 and 2008.
On 30 June 2007, the assets and business of the SCB branch in Taiwan were amalgamated intoHsinchu, and the combined entity was renamed Standard Chartered Bank (Taiwan) Limited.
On 29 February 2008, the Group completed the purchase of AEB from American Express Company.
The acquisitions of Pembroke Group Limited (‘‘Pembroke’’), Harrison Lovegrove & Co. Limited
(‘‘Harrison Lovegrove’’) and A Brain Co. Limited (‘‘A Brain’’) were completed on 5 October 2007, 3
December 2007 and 5 December 2007 respectively. The Group acquired the remaining share of A
Brain on 21 January 2008.
On 11 January 2008, the Group completed the acquisition of a 49% joint venture interest in UTI an
equity brokerage firm in India. On 12 December 2008, the Group exercised its option to acquire a
further 25.9%, which increased the Group’s investment to 74.9%. This is currently accounted as ajoint venture and the Group has the option to obtain full control by acquiring the balance of 25.1%
in 2010.
On 25 February 2008, the Group completed the acquisition of a mutual savings bank, Yeahreum
Mutual Savings Bank (‘‘Yeahreum’’), in Korea.
On 27 December 2008, the Group completed the acquisition of the ‘good bank’ portion of Asia Trust
International Corporation (‘‘ATIC’’) in Taiwan.
In September 2008, the Group received regulatory approval to exercise its nil cost option to convert
the US$4 million of convertible preference shares it holds into equity of First Africa, which, when
exercised, would give the Group an equity shareholding of 65%. Following such conversion, theGroup exercised its call option over the remaining 35% of the company. Both transactions completed
in the first half of 2009. As the conversion options were exercisable since September 2008, the Group
has consolidated First Africa from this date in line with the requirements of IAS 27.
The only significant acquisition was that of AEB. Its only material impact on performance was in the
Americas, UK & Europe geographic segments. A description of the overall performance of AEB is
included on page 180 of this Draft Red Herring Prospectus. References to ‘underlying’ exclude the
post acquisition results of AEB.
Group summary – financial years ended 31 December 2008 and 31 December 2007
The Group has delivered another strong performance for the year ended 31 December 2008.Operating profit rose 13% to US$4,568 million, with operating income increasing 26% to US$13,968
million.
The normalised cost to income ratio was 56%, flat to 2007. Normalised earnings per share increased
by 1% to 174.9 US$ cents. Further details of basic and diluted earnings per share are provided in
note 14 of 2008 Annual report.
In what has been a difficult year for the financial sector, the Group has focused on balance sheet
management as a key priority. There has been a focus on maintaining a liquid balance sheet and the
efforts of both Wholesale Banking and Consumer Banking to raise deposits have driven animprovement in the asset to deposit ratio of the Group to 75% at the end of 2008, from 86% at the
end of 2007. The Group remains a net lender into the interbank market.
The capital position of the Group was further strengthened by a rights issue in December 2008 and
the Core Tier 1 ratio of 7.6% is up from 6.6% at the end of 2007.
The quality of the asset portfolios positions the Group well for 2009. The Group has tightened
underwriting criteria, invested in collections capacity and tightened control processes. Whilst some
deterioration in asset quality was seen in the latter months of the year, the quality of the customer
assets is good.
Expenses remain under control. In the face of difficult trading conditions, Consumer Banking hasbeen restructuring, reducing headcount while investing in distribution and product capabilities.
Wholesale Banking, even though it has had a very strong year, has also shown a disciplined approach
to expenses, reducing its costs in the second half of the year.
The Group’s balance sheet, capital resources and expense base have been positioned to face what is a
challenging outlook.
181
c102100pu025Proof7:28.3.10B/LRevision:0OperatorSadK

The early part of 2008 was characterised by strong economic growth across the Group’s key markets,
driven by strong regional trade flows, with the Middle East benefiting from high oil prices. In the
middle of the year, increasing fuel and food prices heightened concerns over rising inflation, with a
number of countries taking pre-emptive action to raise interest rates and moderate inflationarypressures. The last few months of 2008 witnessed severe disruption in financial markets, including a
significant deterioration in international trade flows and a fall in confidence across much of the world.
This has already prompted significant policy stimulus measures in a number of countries.
The Group maintained a liquid and well capitalised balance sheet throughout 2008, which was further
bolstered by a rights issue launched in November 2008. As at 31 December 2008, the Group was a
net lender into the interbank markets and had strong capital ratios. The failure of some financial
institutions and stock market falls have, however, significantly reduced the appetite of retail and
corporate customers for structured equity, commodity and exchange rate linked products, and this has
affected performance, particularly in the fourth quarter. The Group saw an increase in loan
impairment in the latter months of 2008, and this has contributed to a slowing performance in thesecond half of 2008.
Net interest income
Net interest income grew US$1,122 million or 18%. Interest rates across most markets have been on
a downwards trend. Against a deteriorating credit environment, Consumer Banking has moved its
focus to secured products, de-emphasising relatively higher-yielding unsecured loans. Underwriting
standards have also been tightened and additional resources have been allocated to recoverymanagement. Interest expense reduced as interest paid on customer current accounts and time
deposits reduced even though customer deposits grew 31%. Net interest margin was 2.5%, in line with
2008.
Interest income for the financial year ended 31 December 2008 increased US$202 million, or 1.2%,
when compared with the equivalent period in 2007. The increase in interest income is due to the
increase in volumes of US$2.6 billion largely offset by falling rates. The average balance of interest-
bearing loans and advances to customers, banks and investment securities for the financial year ended
31 December 2008 grew 20%, 30% and 10%, respectively, when compared with the equivalent period
in 2007.
Interest expense for the financial year ended 31 December 2008 decreased by US$920 million, or 9%
when compared with the equivalent period in 2007. The decrease is due to lower rates on deposits by
US$2.5bn offset by increase in volume by US$1.6bn. The average interest-bearing balances of current,
savings and time deposit accounts for the financial year ended 31 December 2008 growing 30% whencompared with the equivalent period in 2007, and an increase in issued debt securities and
subordinated liabilities for the financial year ended 31 December 2008 of 6% and 17%, respectively,
when compared with the equivalent period in 2007.
182
c102100pu025Proof7:28.3.10B/LRevision:0OperatorSadK

The following table shows, for the periods indicated, the principal components of interest income and
expenses:
Interest Income
2008
US$m
2007
US$m
2008
Rs.m
2007
Rs.m
Balances at central banks 32 39 1,494 1,821
Treasury bills 835 884 38,978 41,265Loans and advances to banks 1,382 1,975 64,512 92,193
Loans and advances to customers 11,397 10,746 532,012 501,623
Listed debt securities 1,147 1,081 53,542 50,461
Unlisted debt securities 1,545 1,385 72,121 64,652
Accrued on impaired assets (discount unwind) 40 66 1,867 3,081
16,378 16,176 764,525 755,096
Interest Expense
Deposits by banks 1,268 1,497 59,190 69,880
Customer accounts:
Interest-bearing current accounts and savings
deposits 1,009 1,508 47,100 70,393Time deposits 4,328 4,552 202,031 212,487
Debt securities in issue 1,338 1,543 62,458 72,027
Subordinated liabilities and other borrowed funds:
Wholly repayable within five years 389 245 18,159 11,437
Other 659 566 30,762 26,421
8,991 9,911 419,700 462,645
Net Interest Income 7,387 6,265 344,825 292,450
183
c102100pu025Proof7:28.3.10B/LRevision:0OperatorSadK
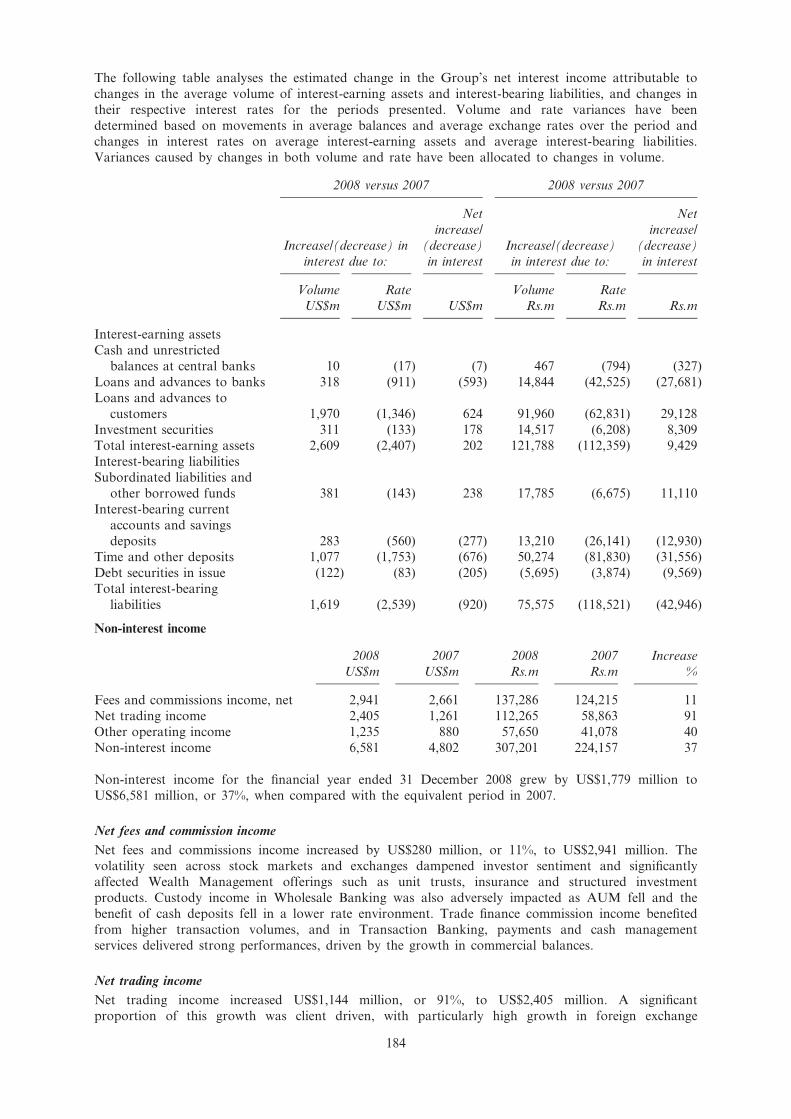
The following table analyses the estimated change in the Group’s net interest income attributable to
changes in the average volume of interest-earning assets and interest-bearing liabilities, and changes in
their respective interest rates for the periods presented. Volume and rate variances have been
determined based on movements in average balances and average exchange rates over the period andchanges in interest rates on average interest-earning assets and average interest-bearing liabilities.
Variances caused by changes in both volume and rate have been allocated to changes in volume.
2008 versus 2007 2008 versus 2007
Increase/(decrease) in
interest due to:
Net
increase/
(decrease)
in interest
Increase/(decrease)
in interest due to:
Net
increase/
(decrease)
in interest
Volume
US$m
Rate
US$m US$m
Volume
Rs.m
Rate
Rs.m Rs.m
Interest-earning assets
Cash and unrestricted
balances at central banks 10 (17) (7) 467 (794) (327)
Loans and advances to banks 318 (911) (593) 14,844 (42,525) (27,681)
Loans and advances to
customers 1,970 (1,346) 624 91,960 (62,831) 29,128Investment securities 311 (133) 178 14,517 (6,208) 8,309
Total interest-earning assets 2,609 (2,407) 202 121,788 (112,359) 9,429
Interest-bearing liabilities
Subordinated liabilities and
other borrowed funds 381 (143) 238 17,785 (6,675) 11,110
Interest-bearing current
accounts and savings
deposits 283 (560) (277) 13,210 (26,141) (12,930)Time and other deposits 1,077 (1,753) (676) 50,274 (81,830) (31,556)
Debt securities in issue (122) (83) (205) (5,695) (3,874) (9,569)
Total interest-bearing
liabilities 1,619 (2,539) (920) 75,575 (118,521) (42,946)
Non-interest income
2008
US$m
2007
US$m
2008
Rs.m
2007
Rs.m
Increase
%
Fees and commissions income, net 2,941 2,661 137,286 124,215 11
Net trading income 2,405 1,261 112,265 58,863 91
Other operating income 1,235 880 57,650 41,078 40
Non-interest income 6,581 4,802 307,201 224,157 37
Non-interest income for the financial year ended 31 December 2008 grew by US$1,779 million to
US$6,581 million, or 37%, when compared with the equivalent period in 2007.
Net fees and commission income
Net fees and commissions income increased by US$280 million, or 11%, to US$2,941 million. The
volatility seen across stock markets and exchanges dampened investor sentiment and significantly
affected Wealth Management offerings such as unit trusts, insurance and structured investment
products. Custody income in Wholesale Banking was also adversely impacted as AUM fell and the
benefit of cash deposits fell in a lower rate environment. Trade finance commission income benefited
from higher transaction volumes, and in Transaction Banking, payments and cash managementservices delivered strong performances, driven by the growth in commercial balances.
Net trading income
Net trading income increased US$1,144 million, or 91%, to US$2,405 million. A significant
proportion of this growth was client driven, with particularly high growth in foreign exchange
184
c102100pu025Proof7:28.3.10B/LRevision:0OperatorSadK

income. The high volatility seen in key markets such as Korea and India drove increased client
demand and the Group was well positioned in terms of product capabilities to meet customer needs.
Own account trading performance was strong with significant gains in foreign exchange, debt
securities trading and ALM.
The following table sets forth, for the periods indicated, the principal components of net trading
income:
2008
US$m
2007
US$m
2008
Rs.m
2007
Rs.m
Gains less losses on foreign currency 2,596 862 121,181 40,238Gains less losses on trading securities 238 102 11,110 4,761
Other trading profits (429) 297 (20,026) 13,864
2,405 1,261 112,265 58,863
Other operating income
Other operating income increased US$355 million, or 40%, to US$1,235 million. Other operating
income benefited from a US$146 million gain on the disposal of the asset management business inIndia, and US$384 million of gains on the buy back of Upper Tier 2 floating rate notes. These gains
were offset, in part, by lower dividend income. Other operating income also benefited from US$80
million of recoveries in respect of assets that had been fair valued at acquisition in Taiwan, Korea
and Pakistan, down US$18 million, or 18%, from 2007.
Operating expenses
Operating expenses increased US$1,396 million, or 22%, to US$7,611 million. Almost 60% of thisincrease was driven by staff costs which increased 20%, or US$788 million, to US$4,737 million.
Consumer Banking made organisational changes to improve efficiency and to generate headroom for
investment. Wholesale Banking took advantage of the market dislocation to recruit staff with
specialist market and product knowledge to augment its existing technical skill base. Variable
compensation also increased in line with the strong business performance. Other investments were
directed at enhancing the product suite and extending and upgrading branch networks in China,
Hong Kong, Pakistan, Taiwan and Korea. Expenditure was also incurred to upgrade and expand
office premises and to strengthen regulatory compliance and control systems.
185
c102100pu025Proof7:28.3.10B/LRevision:0OperatorSadK

The following table sets forth, for the periods indicated, the principal components of operating
expenses:
2008
US$m
2007
US$m
2008
Rs.m
2007
Rs.m
Staff costs:
Wages and salaries 3,793 2,970 177,057 138,640
Social security costs 93 67 4,341 3,128Other pension costs 172 213 8,029 9,943
Other staff costs 679 699 31,696 32,629
4,737 3,949 221,123 184,339
Premises and equipment expenses:
Rental of premises 337 259 15,731 12,090
Other premises and equipment costs 376 307 17,552 14,331
Rental of computers and equipment 25 26 1,167 1,214
738 592 34,450 27,635
General administrative expenses 1,711 1,329 79,869 62,038
Depreciation and amortisation expenses:
Premises 98 78 4,575 3,641
Equipment 152 104 7,095 4,855
Intangibles:
Software 94 86 4,388 4,014Acquired on business combinations 81 77 3,781 3,594
425 345 19,839 16,105
Total Operating Expenses 7,611 6,215 355,281 290,116
Impairment provisions
The charge for loan impairment increased by US$560 million, or 74%, to US$1,321 million. In the
second half of the year, the credit environment became increasingly challenging for corporate andretail customers alike, with an increase in delinquencies. There was higher specific provisioning and
also an increase in the PIP as flow rates deteriorated.
Other impairment charges increased significantly to US$469 million, from US$57 million in 2007,
driven primarily by write downs in ABS of US$41 million, impairment of private equity investments
of US$171 million and impairment of the strategic investment portfolio of US$186 million.
Profit and Loss, by class of business and geographic markets, for the financial years ended 31 December 2008
and 31 December 2007
The Group is organised on a worldwide basis into two main business segments: Wholesale Bankingand Consumer Banking.
186
c102100pu025Proof7:28.3.10B/LRevision:0OperatorSadK

By Class of Business
2008 2007
Consumer
Banking
US$m
Wholesale
Banking
US$m
Corporate
items not
allocated
US$m
Total
US$m
Consumer
Banking
US$m
Wholesale
Banking
US$m
Corporate
items not
allocated
US$m
Total
US$m
Internal income (78) 78 — — (77) 77 — —
Net interest income 4,224 3,163 — 7,387 4,194 2,071 — 6,265
Other income 1,806 4,248 527 6,581 1,689 3,095 18 4,802
Operating income 5,952 7,489 527 13,968 5,806 5,243 18 11,067
Operating expenses (3,843) (3,768) — (7,611) (3,393) (2,814) (8) (6,215)
Operating profit before
impairment losses and
taxation 2,109 3,721 527 6,357 2,413 2,429 10 4,852
Impairment (losses)/releases on
loans and advances and
other credit risk provisions (937) (384) — (1,321) (736) (25) — (761)
Other impairment (56) (336) (77) (469) — (57) — (57)
Profit/(loss) from associates — — 1 1 — — 1 1
Operating profit 1,116 3,001 451 4,568 1,677 2,347 11 4,035
Rights issue option — — 233 233
Profit before taxation 1,116 3,001 684 4,801 1,677 2,347 11 4,035
Total assets employed 86,504 347,140 1,424* 435,068 90,237 238,408 1,226* 329,871
Total liabilities employed 129,029 282,656 688* 412,373 110,904 196,664 851* 308,419
Other segment items:
Capital expenditure 375 1,207 — 1,582 418 208 — 626
Depreciation 157 93 — 250 136 46 — 182
Amortisation of intangible
assets 93 82 — 175 68 95 — 163
* As required by IAS 14, tax balances are not allocated.
187
c102100pu025Proof7:28.3.10B/LRevision:0OperatorSadK

2008 2007
Consumer
Banking
Rs.million
Wholesale
Banking
Rs.million
Corporate
items not
allocated
Rs.million
Total
Rs.million
Consumer
Banking
Rs.million
Wholesale
Banking
Rs.million
Corporate
items not
allocated
Rs.million
Total
Rs.million
Internal income (3,641) 3,641 — — (3,594) 3,594 — —
Net interest income 197,176 147,649 — 344,825 195,776 96,674 — 292,450
Other income 84,304 198,297 24,600 307,201 78,843 144,475 840 224,157
Operating income 277,839 349,587 24,600 652,026 271,024 244,743 840 516,608
Operating expenses (179,391) (175,890) — (355,281) (158,385) (131,358) (373) (290,116)
Operating profit before impairment
losses and taxation 98,448 173,696 24,600 296,745 112,639 113,386 467 226,491
Impairment (losses)/releases on
loans and advances and other
credit risk provisions (43,739) (17,925) — (61,664) (34,356) (1,167) — (35,523)
Other impairment (2,614) (15,684) (3,594) (21,893) — (2,661) — (2,661)
Profit/(loss) from associates — — 47 47 — — 47 47
Operating profit 52,095 140,087 21,053 213,234 78,282 109,558 513 188,354
Rights issue option — — 10,876 10,876 — — — —
Profit before taxation 52,095 140,087 31,929 224,111 78,282 109,558 513 188,354
Total assets employed 4,038,007 16,204,495 66,472* 20,308,974 4,212,263 11,128,885 57,230* 15,398,378
Total liabilities employed 6,023,074 13,194,382 32,116* 19,249,572 5,176,999 9,180,276 39,725* 14,396,999
Other segment items:
Capital expenditure 17,505 56,343 — 73,848 19,512 9,709 — 29,222
Depreciation 7,329 4,341 — 11,670 6,348 2,147 — 8,496
Amortisation of intangible assets 4,341 3,828 — 8,169 3,174 4,435 — 7,609
* As required by IAS 14, tax balances are not allocated.
188
c102100pu025Proof7:28.3.10B/LRevision:0OperatorSadK

By geographic segment
The Group manages its business segments on a global basis. The operations are based in nine main
geographic areas*. The UK is the home country of the parent.
2008
Asia Pacific
HongKong
US$millionSingapore
US$millionMalaysia
US$millionKorea
US$million
Other AsiaPacific
US$millionIndia
US$million
Middle East& Other
S AsiaUS$million
AfricaUS$million
AmericasUK &
EuropeUS$million
TotalUS$million
Internal income 1 105 (10) (109) 35 12 16 2 (52) —
Net interest income 1,296 364 274 1,234 1,301 724 991 503 700 7,387
Fees and commissions
income, net 507 246 60 183 441 450 452 227 375 2,941
Net trading income 369 468 152 191 542 350 258 166 (91) 2,405
Other operating income 94 243 39 77 119 210 17 11 425 1,235
Operating income 2,267 1,426 515 1,576 2,438 1,746 1,734 909 1,357 13,968
Operating expenses (1,017) (637) (212) (955) (1,509) (646) (813) (564) (1,258) (7,611)
Operating profit before
impairment losses and
taxation 1,250 789 303 621 929 1,100 921 345 99 6,357
Impairment losses on loans
and advances and other
credit risk provisions (183) (15) (47) (263) (389) (133) (185) (33) (73) (1,321)
Other impairment (52) (30) (21) — (81) (24) — — (261) (469)
Profit/(loss) from associates (1) — — — 4 — — — (2) 1
Operating profit/(loss) 1,014 744 235 358 463 943 736 312 (237) 4,568
Rights issue option — — — — — — — — 233 233
Profit/(loss) before taxation 1,014 744 235 358 463 943 736 312 (4) 4,801
Loans and advances to
customers – average 26,610 19,610 10,275 34,867 29,841 8,612 16,041 3,091 29,970 178,917
Net interest margins (%) 2.1 0.8 1.9 2.5 2.4 3.4 3.0 4.4 0.4 2.5
Loans and advances to
customers – period end 28,004 20,349 7,955 31,763 30,411 7,863 17,476 3,642 31,049 178,512
Loans and advances to
banks – period end 18,963 9,283 411 1,594 4,790 291 1,504 587 10,523 47,946
Total assets employed** 76,162 57,422 13,935 70,438 68,732 31,362 38,194 12,154 147,934 516,333
Total risk weighted assets
(Basel II){ 21,072 15,064 6,314 27,020 30,739 15,578 22,070 7,247 51,744 196,848
Capital expenditure{{ 25 140 13 59 157 178 40 31 939 1,582
* Other Asia Pacific does not include Malaysia in the financials pre-dating 1 January 2009 and is counted as a separate geographicalarea.
** Total assets employed includes intra-group items of US$82,689 million and excludes tax balances of US$1,424 million.{ Total risk weighted assets include US$8,027 million of intra-group balances which are netted in calculating capital ratios.{{ Includes capital expenditure in Americas, UK and Europe of US$852 million (2007: US$nil million) in respect of operating lease
assets.
189
c102100pu025Proof7:28.3.10B/LRevision:0OperatorSadK
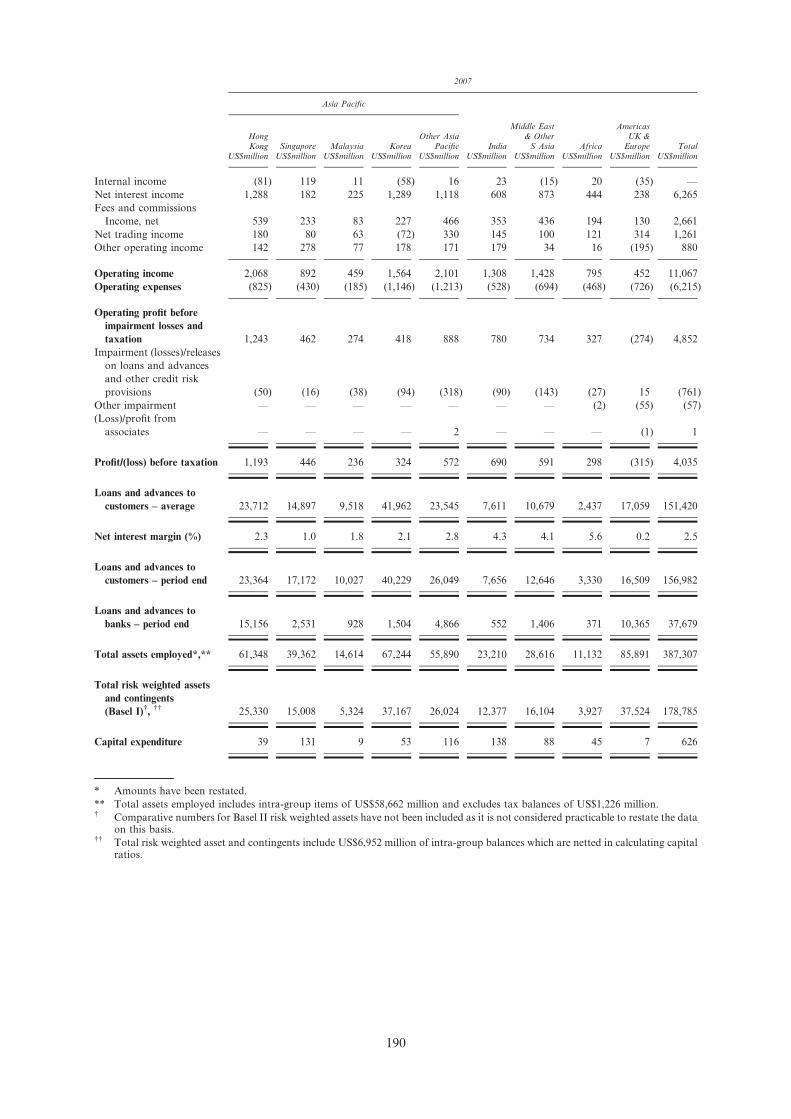
2007
Asia Pacific
HongKong
US$millionSingapore
US$millionMalaysia
US$millionKorea
US$million
Other AsiaPacific
US$millionIndia
US$million
Middle East& Other
S AsiaUS$million
AfricaUS$million
AmericasUK &
EuropeUS$million
TotalUS$million
Internal income (81) 119 11 (58) 16 23 (15) 20 (35) —
Net interest income 1,288 182 225 1,289 1,118 608 873 444 238 6,265
Fees and commissions
Income, net 539 233 83 227 466 353 436 194 130 2,661
Net trading income 180 80 63 (72) 330 145 100 121 314 1,261
Other operating income 142 278 77 178 171 179 34 16 (195) 880
Operating income 2,068 892 459 1,564 2,101 1,308 1,428 795 452 11,067
Operating expenses (825) (430) (185) (1,146) (1,213) (528) (694) (468) (726) (6,215)
Operating profit before
impairment losses and
taxation 1,243 462 274 418 888 780 734 327 (274) 4,852
Impairment (losses)/releases
on loans and advances
and other credit risk
provisions (50) (16) (38) (94) (318) (90) (143) (27) 15 (761)
Other impairment — — — — — — — (2) (55) (57)
(Loss)/profit from
associates — — — — 2 — — — (1) 1
Profit/(loss) before taxation 1,193 446 236 324 572 690 591 298 (315) 4,035
Loans and advances to
customers – average 23,712 14,897 9,518 41,962 23,545 7,611 10,679 2,437 17,059 151,420
Net interest margin (%) 2.3 1.0 1.8 2.1 2.8 4.3 4.1 5.6 0.2 2.5
Loans and advances to
customers – period end 23,364 17,172 10,027 40,229 26,049 7,656 12,646 3,330 16,509 156,982
Loans and advances to
banks – period end 15,156 2,531 928 1,504 4,866 552 1,406 371 10,365 37,679
Total assets employed*,** 61,348 39,362 14,614 67,244 55,890 23,210 28,616 11,132 85,891 387,307
Total risk weighted assets
and contingents
(Basel I){, {{ 25,330 15,008 5,324 37,167 26,024 12,377 16,104 3,927 37,524 178,785
Capital expenditure 39 131 9 53 116 138 88 45 7 626
* Amounts have been restated.
** Total assets employed includes intra-group items of US$58,662 million and excludes tax balances of US$1,226 million.{ Comparative numbers for Basel II risk weighted assets have not been included as it is not considered practicable to restate the data
on this basis.{{ Total risk weighted asset and contingents include US$6,952 million of intra-group balances which are netted in calculating capital
ratios.
190
c102100pu025Proof7:28.3.10B/LRevision:0OperatorSadK

2008
Asia Pacific
Hong
Kong
Rs.million
Singapore
Rs.million
Malaysia
Rs.million
Korea
Rs.million
Other
Asia
Pacific
Rs.million
India
Rs.million
Middle
East &
Other
S Asia
Rs.million
Africa
Rs.million
Americas
UK &
Europe
Rs.million
Total
Rs.million
Internal income 47 4,901 (467) (5,088) 1,634 560 747 93 (2,427) —
Net interest income 60,497 16,992 12,790 57,603 60,731 33,796 46,260 23,480 32,676 344,825
Fees and commissions
income, net 23,667 11,483 2,801 8,542 20,586 21,006 21,099 10,596 17,505 137,286
Net trading income 17,225 21,846 7,095 8,916 25,301 16,338 12,043 7,749 (4,248) 112,265
Other operating income 4,388 11,343 1,821 3,594 5,555 9,803 794 513 19,839 57,650
Operating income 105,824 66,566 24,040 73,568 113,806 81,503 80,943 42,432 63,345 652,026
Operating expenses (47,474) (29,735) (9,896) (44,579) (70,440) (30,155) (37,951) (26,328) (58,723) (355,281)
Operating profit before
impairment losses and
taxation 58,350 36,831 14,144 28,988 43,366 51,348 42,992 16,105 4,621 296,745
Impairment losses on loans
and advances and other
credit risk provisions (8,542) (700) (2,194) (12,277) (18,159) (6,208) (8,636) (1,540) (3,408) (61,664)
Other impairment (2,427) (1,400) (980) — (3,781) (1,120) — — (12,183) (21,893)
Profit/(loss) from associates (47) — — — 187 — — — (93) 47
Operating profit/(loss) 47,334 34,730 10,970 16,711 21,613 44,019 34,356 14,564 (11,063) 213,234
Rights issue option — — — — — — — — 10,876 10,876
Profit/(loss) before taxation 47,334 34,730 10,970 16,711 21,613 44,019 34,356 14,564 (187) 224,111
Loans and advances to
customers – average 1,242,155 915,395 479,637 1,627,592 1,392,978 402,008 748,794 144,288 1,399,000 8,351,846
Net interest margins (%) 2.1 0.8 1.9 2.5 2.4 3.4 3 4.4 0.4 2.5
Loans and advances to
customers – period end 1,307,227 949,891 371,339 1,482,697 1,419,585 367,045 815,780 170,009 1,449,367 8,332,940
Loans and advances to banks –
period end 885,193 433,330 19,185 74,408 223,597 13,584 70,207 27,401 491,214 2,238,119
Total assets employed* 3,555,242 2,680,459 650,486 3,288,046 3,208,410 1,463,978 1,782,896 567,349 6,905,559 24,102,424
Total risk weighted assets
(Basel II)** 983,641 703,188 294,738 1,261,294 1,434,897 727,181 1,030,228 338,290 2,415,410 9,188,865
Capital expenditure{ 1,167 6,535 607 2,754 7,329 8,309 1,867 1,447 43,833 73,848
* Total assets employed includes intra-group items of US$82,689 million and excludes tax balances of US$1,424 million.
** Total risk weighted assets include US$8,027 million of intra-group balances which are netted in calculating capital ratios.{ Includes capital expenditure in Americas, UK and Europe of US$852 million (2007: US$nil million) in respect of operating lease
assets.
191
c102100pu025Proof7:28.3.10B/LRevision:0OperatorSadK

2007
Asia Pacific
Hong
Kong
Rs.million
Singapore
Rs.million
Malaysia
Rs.million
Korea
Rs.million
Other
Asia
Pacific
Rs.million
India
Rs.million
Middle
East &
Other
S Asia
Rs.million
Africa
Rs.million
Americas
UK &
Europe
Rs.million
Total
Rs.million
Internal income (3,781) 5,555 513 (2,707) 747 1,074 (700) 934 (1,634) —
Net interest income 60,124 8,496 10,503 60,171 52,188 28,381 40,752 20,726 11,110 292,450
Fees and commissions
income net 25,161 10,876 3,874 10,596 21,753 16,478 20,352 9,056 6,068 124,215
Net trading income 8,402 3,734 2,941 (3,361) 15,404 6,769 4,668 5,648 14,658 58,863
Other operating income 6,629 12,977 3,594 8,309 7,982 8,356 1,587 747 (9,103) 41,078
Operating income 96,534 41,639 21,426 73,008 98,075 61,057 66,659 37,111 21,099 516,608
Operating expenses (38,511) (20,072) (8,636) (53,495) (56,623) (24,647) (32,396) (21,846) (33,890) (290,116)
Operating profit before 58,023 21,566 12,790 19,512 41,452 36,410 34,263 15,264 (12,790) 226,491
Impairment (losses)/
releases on loans and
advances and other
credit risk provisions (2,334) (747) (1,774) (4,388) (14,844) (4,201) (6,675) (1,260) 700 (35,523)
Other impairment — — — — — — — (93) (2,567) (2,661)
(Loss)/profit from
associates — — — — 93 — — — (47) 47
Profit/(loss) before
taxation 55,689 20,819 11,016 15,124 26,701 32,209 27,588 13,911 (14,704) 188,354
Loans and advances to
customers – average 1,106,876 695,392 444,300 1,958,786 1,099,081 355,281 498,496 113,759 796,314 7,068,286
Net interest margin (%) 2.3 1 1.8 2.1 2.8 4.3 4.1 5.6 0.2 2.5
Loans and advances to
customers – period end 1,090,632 801,589 468,060 1,877,890 1,215,967 357,382 590,315 155,444 770,640 7,327,920
Loans and advances to
banks 707,482 118,147 43,319 70,207 227,145 25,767 65,632 17,318 483,838 1,758,856
Total assets employed*,** 2,863,725 1,837,418 682,182 3,138,950 2,608,945 1,083,443 1,335,795 519,642 4,009,392 18,079,491
Total risk weighted assets 1,182,404 700,573 248,524 1,734,956 1,214,800 577,758 751,735 183,312 1,751,620 8,345,684
Capital expenditure 1,821 6,115 420 2,474 5,415 6,442 4,108 2,101 327 29,222
* Amounts have been restated.
** Total assets employed includes intra-group items of US$58,662 million and excludes tax balances of US$1,226 million.{ Comparative numbers for Basel II risk weighted assets have not been included as it is not considered practicable to restate the data
on this basis.{{ Total risk weighted asset and contingents include US$6,952 million of intra-group balances which are netted in calculating capital
ratios.
192
c102100pu025Proof7:28.3.10B/LRevision:0OperatorSadK

Consumer Banking
The following tables provide an analysis of operating profit by geographic segment for Consumer
Banking:2008
Asia Pacific
Hong
Kong
US$million
Singapore
US$million
Malaysia
US$million
Korea
US$million
Other
Asia
Pacific
US$million
India
US$million
Middle
East
& Other
S Asia
US$million
Africa
US$million
Americas
UK &
Europe
US$million
Consumer
Banking
Total
US$million
Underlying
US$million
Operating income 1,163 618 265 1,017 1,128 484 700 344 233 5,952 5,682
Operating expenses (587) (289) (128) (726) (879) (317) (410) (250) (257) (3,843) (3,492)
Loan impairment (106) (20) (48) (161) (263) (89) (178) (19) (53) (937) (869)
Other impairment (25) — — — (2) (7) — — (22) (56) (56)
Operating profit/
(loss) 445 309 89 130 (16) 71 112 75 (99) 1,116 1,265
2007
Asia Pacific
HongKong
US$millionSingapore
US$millionMalaysia
US$millionKorea
US$million
OtherAsia
PacificUS$million
IndiaUS$million
MiddleEast
& OtherS Asia
US$millionAfrica
US$million
AmericasUK &
EuropeUS$million
ConsumerBanking
TotalUS$million
Operating income 1,188 471 274 1,142 1,167 408 751 310 95 5,806
Operating expenses (478) (191) (116) (907) (760) (268) (395) (224) (54) (3,393)
Loan impairment (53) (15) (41) (96) (308) (77) (129) (17) — (736)
Operating profit 657 265 117 139 99 63 227 69 41 1,677
2008
Asia Pacific
Hong Kong
Rs.million
Singapore
Rs.million
Malaysia
Rs.million
Korea
Rs.million
Other
Asia
Pacific
Rs.million
India
Rs.million
Middle
East &
Other
S Asia
Rs.million
Africa
Rs.million
Americas
UK &
Europe
Rs.million
Consumer
Banking
Total
Rs.million
Underlying
Rs.million
Operating income 54,289 28,848 12,370 47,474 52,655 22,593 32,676 16,058 10,876 277,839 265,236
Operating expenses (27,401) (13,491) (5,975) (33,890) (41,032) (14,798) (19,139) (11,670) (11,997) (179,391) (163,007)
Loan impairment (4,948) (934) (2,241) (7,515) (12,277) (4,155) (8,309) (887) (2,474) (43,739) (40,565)
Other impairment (1,167) — — — (93) (327) — — (1,027) (2,614) (2,614)
Operating profit/
(loss) 20,773 14,424 4,155 6,068 (747) 3,314 5,228 3,501 (4,621) 52,095 59,050
2007
Asia Pacific
Hong KongRs.million
SingaporeRs.million
MalaysiaRs.million
KoreaRs.million
OtherAsia
PacificRs.million
IndiaRs.million
MiddleEast &
OtherS Asia
Rs.millionAfrica
Rs.million
AmericasUK &
EuropeRs.million
ConsumerBanking
TotalRs.million
Operating income 55,456 21,986 12,790 53,309 54,476 19,045 35,057 14,471 4,435 271,024
Operating expenses (22,313) (8,916) (5,415) (42,339) (35,477) (12,510) (18,439) (10,456) (2,521) (158,385)
Loan impairment (2,474) (700) (1,914) (4,481) (14,377) (3,594) (6,022) (794) — (34,356)
Operating profit 30,669 12,370 5,462 6,489 4,621 2,941 10,596 3,221 1,914 78,282
193
c102100pu025Proof7:28.3.10B/LRevision:0OperatorSadK

For 2008, Consumer Banking’s operating income increased by US$146 million, or 3%, to US$5,952
million. Net interest income grew US$30 million, or 1%, to US$4,224 million, with an increase in
asset and liabilities volumes offsetting lower margins. Other income grew US$117 million, or 7%, to
US$1,806 million.
Across the geographic segments, Singapore, India, Africa and the Americas, UK and Europe all
delivered strong double digit income growth. Hong Kong, Malaysia, Korea, MESA and Other Asia
Pacific delivered reduced income year on year reflecting the difficult trading conditions, and to someextent adverse exchange translation effects.
Operating expenses increased by US$450 million, or 13%, to US$3,843 million. Against a backdrop of
slowing revenue growth the Group has been rigorous in reducing the cost base. Headcount has beenreduced which has created capacity in the expense base for investment in infrastructure such as
branch renovations in Korea, China and Taiwan, a continuation of the Private Banking roll out in
China, Hong Kong and Singapore and product rollouts across the franchise.
Loan impairment increased by US$201 million, or 27%, to US$937 million. Worsening creditconditions have driven up impairment charges across the franchise in the latter part of 2008, most
notably in the unsecured and SME portfolios in Hong Kong, Korea, the UAE and India. Individual
impairment provision accounts for US$121 million of the increase and US$80 million from PIP. AEB
accounts for US$68 million of the total increase in loan impairment. The impact of the deteriorating
markets on the Consumer Banking portfolio has been mitigated with over three quarters of the asset
portfolio secured, and the average loan to value in the mortgage books being under 52%. The Group
has also taken early action to tighten lending criteria, adjust pricing to reflect the higher risk
environment and to increase collections resources.
Operating profit fell US$561 million, or 33%, to US$1,116 million.
Product Performance
An analysis of Consumer Banking income by product is set out below:
Operating income by product
2008
US$m
2007
US$m
2008
Rs.m
2007
Rs.m
Cards, Personal Loans and Unsecured Lending 2,106 2,089 98,308 97,515
Wealth Management and Deposits 2,789 2,621 130,191 122,348
Mortgages and Auto Finance 928 906 43,319 42,292
Other 129 190 6,022 8,869
Total operating income 5,952 5,806 277,839 271,024
Cards, Personal Loans and Unsecured Lending grew operating income by US$17 million, or 1%, toUS$2,106 million. Excluding the revenue from the partial sale of Visa shares of US$17 million,
US$107 million in 2007, income growth was 5%. Income was reduced by actions taken to move into
lower risk and more secured portfolios, notably in Korea, Thailand, India and Pakistan. This fall was
partially mitigated by strong volume growth in Personal Loans driven by Hong Kong, Taiwan,
Singapore, China and Malaysia. Actions were taken early in the year to reduce the risk of the SME
portfolio and this has had some initial adverse impact on income.
Wealth Management grew operating income by US$168 million, or 6%, to US$2,789 million. Falling
equity markets and retail customer risk aversion following the collapse of Lehman Brothers adversely
affected fee income, primarily in funds and structured notes sales, where income in the second half of
the year was down over 50% and 67% respectively, with Hong Kong and Taiwan being particularly
affected. This reduction in fee income was partly offset by customers switching into ‘all weather’
products such as treasury, capital protected and deposit products. Wealth Management liabilities grewby 19% driven by deposit product innovation such as Marathon Savings in Hong Kong, E$aver Kids
in Singapore, Do-Dream accounts in Korea and E$aver in Malaysia. Although the average liability
margin was constant throughout the year, there were significant underlying fluctuations with margins
reducing in the last quarter of 2008.
Mortgages and Auto Finance income grew by US$22 million, or 2%, to US$928 million. Net interest
margins were under pressure in the latter half of the year particularly in Hong Kong, due to
narrowing of the Prime-HIBOR spread, in Korea due to increased funding costs and in Taiwan due
to intense competition. This has been compensated to some extent by an increase in volumes in Hong
194
c102100pu025Proof7:28.3.10B/LRevision:0OperatorSadK

Kong, Singapore and Taiwan driven by new products such as tracker rate mortgages in Singapore
and Hong Kong.
Geographic Performance
Hong Kong
Income was down US$25 million, or 2%, to US$1,163 million. The second half of 2008 was
particularly challenging. Falling equity markets and the failure of Lehman Brothers in mid-September
led to widespread public concern over wealth management products in general. Sales of unit trusts,
structured notes and other investment products slowed sharply in the second half of the year with a
fall in fee income. Mortgage volumes grew US$1.1 billion, but spread compression reduced interestincome, although this was offset to some extent by increased fees on home insurance products,
amongst others. Income from deposits increased, supported by new products and savings rate offer
campaigns driving up liabilities by 23%, which more than compensated for reduced margins.
Operating expenses grew US$109 million, or 23%, to US$587 million. Expenses increased, largely due
to incremental staff and premises costs as a result of the expansion in the branch network.
Incremental expenses relating to the impact of financial dislocation were incurred in the Wealth
Management business. Working profit was down US$134 million, or 19%, to US$576 million. Loan
impairment grew US$53 million, or 100%, to US$106 million. The rise in loan impairment was drivenprimarily by the SME segment which deteriorated in the latter part of the year as economic
conditions worsened. Other impairment of US$25 million reflects impairment on strategic investments.
Operating profit was down US$212 million, or 32%, to US$445 million.
Singapore
Income grew US$147 million, or 31%, to US$618 million. Income from mortgages rose, supported by
lower customer attrition, and stronger sales which resulted in a doubling of share of new market sales
to 20%. Margins improved in the early part of the year, then compressed as a result of increased
funding costs and intense competition. Wealth Management income grew 52%, mainly from the
acquisition of AEB.
Income was driven up by customer deposits which grew by 60% as deposit gathering campaigns were
launched, coupled with Wealth Management customers retaining funds largely in deposits.
Excluding AEB, Wealth Management was adversely impacted by the global downturn, as customers
switched away from unit trusts into lower fee earning treasury and deposit products. Operating
expenses grew US$98 million, or 51%, to US$289 million. Flow through costs from 2007 investments
in Private Banking and other products contributed US$31 million of this increase. Working profit
grew US$49 million, or 18%, to US$329 million. Loan impairment was up US$5 million, or 33%, toUS$20 million. An increase in the unsecured loan impairment as a result of the deteriorating
economic conditions was offset by a lower charge in mortgages and SME, which benefited from
proactive risk management. Operating profit was up US$44 million, or 17%, to US$309 million.
Malaysia
Income was down US$9 million, or 3%, to US$265 million. Mortgage income was lower as margins
fell in the face of competition. A decrease in Wealth Management income reflected a lack of
consumer confidence in the equities markets. There was, however, an improvement in unsecured
lending income, which benefited from the implementation of a revised sales and incentives scheme.
Operating expenses grew US$12 million, or 10%, to US$128 million. Expenses were driven higher byprojects, reorganisation expenses and also costs related to product development. Working profit was
down US$21 million, or 13%, to US$137 million. Loan impairment was up US$7 million, or 17%, to
US$48 million. The second half of the year saw an increase in delinquencies across unsecured
products driving up the impairment charge. Reduced income, increased costs and loan impairment
drove operating profit down US$28 million, or 24%, to US$89 million.
Korea
Income was down US$125 million, or 11%, to US$1,017 million. On a constant currency basis
income rose 4%. Income was adversely affected by the sharp downturn in the investment servicesmarket, where in the second half of 2008 income fell 52% from the first half, and by a decision to
reduce new sales in SME unsecured lending; a product set with higher margins but also higher risk.
Margins on mortgages also reduced in the latter part of the year. Income benefited from recoveries of
US$14 million on assets that had been fair valued at acquisition, although this was down US$53
million from 2007. Income also included a credit of US$24 million from the economic hedges of the
195
c102100pu025Proof7:28.3.10B/LRevision:0OperatorSadK

mortgage portfolio, which had an adverse impact on income of US$102 million in 2007. Operating
expenses were down US$181 million, or 20%, to US$726 million. On a constant currency basis
expenses fell 5%. Expenses were tightly controlled with the extension of an early retirement program
helping reduce headcount and salary costs. Approximately 200 staff were redeployed to sales areas,with a similar number taking early retirement. Expenses also benefited from the release of certain
provisions related to staff costs.
This was offset by costs relating to repositioning and upgrading the branch footprint as part of the
strategic reorganisation of the business, with 109 branches upgraded during the year. Marketing and
brand expenditure also drove expenses higher. Working profit was up US$56 million, or 24%, toUS$291 million. On a constant currency basis working profit was up 39%. Loan impairment was up
US$65 million, or 68%, to US$161 million. Impairment was driven higher by a number of factors.
Increased debt restructuring applications increased impairment on unsecured lending products as the
number of applicants increased through 2008. There was also deterioration in the SME sector, and in
particular, the performance of the Business Installment Loan portfolio in the second half of the year.
Operating profit was down US$9 million, or 6%, to US$130 million, though on a constant currency
basis operating profit increased 2%.
Other Asia Pacific
Income was down US$39 million, or 3%, to US$1,128 million. In China income was up 20% to
US$143 million driven by deposit growth of 53% and strong volume growth in personal loans,
mortgages and Business Installment Loans, although Wealth Management sales fell in the second halfof the year. In Thailand income reduced as secured lending volumes fell and margins compressed.
Taiwan saw a sharp decrease in Wealth Management income as consumer confidence fell sharply in
the light of volatile equity markets. Income in Taiwan benefited from recoveries of US$37 million on
assets that had been fair valued at acquisition, up US$36 million from 2007. Operating expenses in
Other Asia Pacific were up US$119 million, or 16%, to US$879 million. Expenses were up US$103
million in China to US$238 million, driven higher by the rapid expansion of the workforce as the
number of outlets grew to 54 from 38 at the end of the previous year. China and Taiwan also both
saw expenses increase from flow through depreciation from branch premises investment in previousyears. Working profit in Other Asia Pacific was down US$158 million, or 39%, to US$249 million,
with loan impairment down US$45 million, or 15%, to US$263 million. Thailand saw a reduction in
impairment as actions taken to de-risk the portfolios took effect. In Taiwan, impairment was down as
collections efforts were enhanced in the face of a weakening credit environment and the introduction
of new bankruptcy laws. In China loan impairment was up US$5 million to US$14 million and other
impairment was US$2 million. Overall, the operating loss of US$16 million in Other Asia Pacific was
down US$115 million on 2007. Losses in China increased from US$25 million to US$111 million.
India
Income was up US$76 million, or 19%, to US$484 million. Income was driven up by increased
product volumes in SME and mortgages, with strong momentum in the second half. This strong
volume growth more than offset a reduction in margins due to an increased cost of funding. Wealth
Management was impacted by the global downturn with unit trust sales down sharply in the lastquarter. Cards income fell as margins were squeezed and volumes were also reduced to de-risk the
portfolio. Operating expenses were up US$49 million, or 18%, to US$317 million. Expenses were
driven higher by flow through investment costs from 2007 and incremental premises and technology
costs. Working profit was up US$27 million, or 19%, to US$167 million. Loan impairment was up
US$12 million, or 16%, to US$89 million. Impairment was driven higher by increased delinquencies
on personal lending products. There has however been no equivalent deterioration on cards or
mortgages products. Other impairment was US$7 million, reflecting impairment on strategic
investments. Operating profit was up US$8 million, or 13%, to US$71 million.
MESA
Income was down US$51 million, or 7%, to US$700 million. In the UAE income fell 3%, as deposit
spreads fell in a low interest rate environment, and a weaker performance in the Wealth Managementbusiness was only partially compensated for by liability growth of 11%. The mortgage portfolio grew
throughout the year, although this growth stalled in the last quarter of the year as levels of activity
in the market fell. In Wealth Management, whilst customer AUM remained flat over the whole year,
the second half of the year saw a steady decline in bancassurance product sales in the light of global
equity market falls. In Pakistan economic factors contributed to a difficult trading environment with
196
c102100pu025Proof7:28.3.10B/LRevision:0OperatorSadK

income down 25% year on year. Operating expenses in MESA were up US$15 million, or 4%, to
US$410 million. In the UAE management has taken strong action on expenses and the cost run rate
reduced in the second half of the year. In Pakistan expenses were down as the workforce reduced by
9%, partly offset by expenditure on the branch network. Working profit in MESA was down US$66million, or 19%, to US$290 million, and loan impairment was up US$49 million, or 38%, to US$178
million. The principal increase was in the UAE where loan impairment was up over 90% driven by
unsecured lending and in the SME sector, with some early signs of stress in the mortgage book as
property prices fall and loan to value amounts increase. As a result of falling income, increased
expenses and loan impairment, operating profit for the MESA region fell US$115 million, or 51%, to
US$112 million.
Africa
Income was up US$34 million, or 11%, to US$344 million. In Nigeria, recent investments in brancheshelped drive performance with income up US$15 million, or 58%, with liability growth of 41%. In
Uganda and Zambia, income growth was strong, increasing by 36% and 33% respectively,
compensating for the flat growth in Kenya where momentum slipped after the elections. New product
launches and targeted deposit campaigns served to drive a double digit percentage increase in liability
balances in all markets though this growth was offset by currency translation effects. Operating
expenses in Africa increased US$26 million, or 12%, to US$250 million. Staff costs were driven higher
across the region primarily due to wage inflation. Zambia and Ghana both incurred redundancy costs
as the organisations were restructured. Working profit in Africa was up US$8 million, or 9%, toUS$94 million. Loan impairment was up US$2 million, or 12%, to US$19 million. Operating profit in
Africa was up US$6 million, or 9%, to US$75 million.
Americas, UK and Europe
The impact of the AEB acquisition was material. Underlying income increased US$13 million, or 14%
to US$108 million. Income growth was achieved despite falling interest rates and market volatility by
realigning the relationship management sales teams, and by driving higher fee income, primarily from
foreign exchange products and premium currency investments. Underlying operating expenses were up
US$1 million, or 2%, to US$55 million. Underlying working profit was up US$12 million, or 29%, to
US$53 million. Underlying other impairment was up US$22 million representing provisions onstrategic investments, which eliminated the improvements made at the working profit level. Underlying
operating profit was down US$10 million, or 24%, to US$31 million.
Wholesale Banking
The following tables provide an analysis of operating profit by geographic segment for Wholesale
Banking:
2008
Asia Pacific
Hong
Kong
US$million
Singapore
US$million
Malaysia
US$million
Korea
US$million
Other
Asia
Pacific
US$million
India
US$million
Middle
East
& Other
S Asia
US$million
Africa
US$million
Americas
UK &
Europe
US$million
Wholesale
Banking
Total
US$million
Underlying
US$million
Operating income 1,104 808 250 559 1,310 1,116 1,034 565 743 7,489 7,207
Operating expenses (430) (348) (84) (229) (630) (329) (403) (314) (1,001) (3,768) (3,516)
Loan impairment (77) 5 1 (102) (126) (44) (7) (14) (20) (384) (378)
Other impairment (27) (30) (21) — (79) (17) — — (162) (336) (336)
Operating profit/(loss) 570 435 146 228 475 726 624 237 (440) 3,001 2,977
197
c102100pu025Proof7:28.3.10B/LRevision:0OperatorSadK

2007
Asia Pacific
Hong
Kong
US$million
Singapore
US$million
Malaysia
US$million
Korea
US$million
Other
Asia
Pacific
US$million
India
US$million
Middle
East
& Other
S Asia
US$million
Africa
US$million
Americas
UK &
Europe
US$million
Wholesale
Banking
Total
US$million
Operating income 870 421 184 418 933 899 676 485 357 5,243
Operating expenses (347) (239) (69) (239) (445) (260) (299) (244) (672) (2,814)
Loan impairment 3 (1) 3 2 (10) (13) (14) (10) 15 (25)
Other impairment — — — — — — — (2) (55) (57)
Operating profit/(loss) 526 181 118 181 478 626 363 229 (355) 2,347
2008
Asia Pacific
Hong
Kong
Rs.million
Singapore
Rs.million
Malaysia
Rs.million
Korea
Rs.million
Other
Asia
Pacific
Rs.million
India
Rs.million
Middle
East &
Other
S Asia
Rs.million
Africa
Rs.million
Americas
UK &
Europe
Rs.million
Wholesale
Banking
Total
Rs.million
Underlying
Rs.million
Operating income 51,535 37,717 11,670 26,094 61,151 52,095 48,267 26,374 34,683 349,587 336,423
Operating expenses (20,072) (16,245) (3,921) (10,690) (29,408) (15,358) (18,812) (14,658) (46,727) (175,890) (164,127)
Loan impairment (3,594) 233 47 (4,761) (5,882) (2,054) (327) (654) (934) (17,925) (17,645)
Other impairment (1,260) (1,400) (980) — (3,688) (794) — — (7,562) (15,684) (15,684)
Operating profit/(loss) 26,608 20,306 6,815 10,643 22,173 33,890 29,128 11,063 (20,539) 140,087 138,966
2007
Asia Pacific
Hong
Kong
Rs.million
Singapore
Rs.million
Malaysia
Rs.million
Korea
Rs.million
Other
Asia
Pacific
Rs.million
India
Rs.million
Middle
East &
Other
S Asia
Rs.million
Africa
Rs.million
Americas
UK &
Europe
Rs.million
Wholesale
Banking
Total
Rs.million
Operating income 40,612 19,652 8,589 19,512 43,552 41,965 31,556 22,640 16,665 244,743
Operating expenses (16,198) (11,157) (3,221) (11,157) (20,773) (12,137) (13,957) (11,390) (31,369) (131,358)
Loan impairment 140 (47) 140 93 (467) (607) (654) (467) 700 (1,167)
Other impairment — — — — — — — (93) (2,567) (2,661)
Operating profit/(loss) 24,554 8,449 5,508 8,449 22,313 29,222 16,945 10,690 (16,571) 109,558
Wholesale Banking had another strong year, with broad based income growth driven by continued
client revenue momentum, which remains the cornerstone of a consistent and well executed strategy.
Own account income also reported a significant increase reflecting strong ALM income growth, and
the benefits from the recent investment in the capabilities of the Financial Markets teams who were
well positioned to take advantage of the opportunities provided by market volatility. Targeted
investments in core strategic markets and products strengthened and broadened capabilities into the
large geographies. This, together with the further acquisition of talent, has provided product depthand breadth to better meet customer needs.
Operating income grew US$2,246 million, or 43%, to US$7,489 million. Net interest income was up
US$1,092 million, or 53%, to US$3,163 million while non-interest income was up US$1,153 million,
or 37%, to US$4,248 million. Client revenues represented 75% of total income and were up 31% on
the previous year.
Operating expenses grew US$954 million, or 34%, to US$3,768 million. Approximately a third of this
increase was driven by staff expenses. The business continued to invest in skills and expertise,
building in areas such as sales, trading and financial institutions teams. Flow through expenses from
projects and new investments also drove up expenses together with increased property costs. In thelight of market uncertainty, Wholesale Banking reduced its expense run rate in the latter part of the
year and second half expenses were 6% lower than the first half.
Working profit increased US$1,292 million, or 53%, to US$3,721 million.
Loan impairment increased US$359 million to US$384 million reflecting the deteriorating economic
environment. Most of the increased impairment came in the last quarter of the year notably in
198
c102100pu025Proof7:28.3.10B/LRevision:0OperatorSadK

Korea, Hong Kong and Other Asia Pacific. The portfolio remains well diversified and is increasingly
well collateralised.
Other impairment increased reflecting impairment on private equity investments of US$171 million,
and on ABS of US$41 million, and impairment provisions being taken against bonds of US$60
million and other strategic investments of US$55 million.
Operating profit increased US$654 million, or 28%, to US$3,001 million.
Product Performance
During the year Wholesale Banking has realigned its financial disclosures to provide greater
transparency. As a result the Trade and Lending businesses have been split; the ‘Trade’ business, with
income of US$1,023 million in 2008 and US$699 million in 2007, is now reported together with ‘Cash
Management and Custody’ which are part of ‘Transaction Banking’. The ‘Lending’ business, with
income of US$551 million in 2008 and US$537 million in 2007, has been separated into ‘Lending and
Portfolio Management’. ‘Global Markets’ remains unchanged. An analysis of Wholesale Banking
income by product is set out below:
Operating income by product
2008
US$
million
2007
US$
million
Lending and Portfolio Management 551 537
Transaction Banking 2,663 2,033
Global Markets*
Financial Markets 2,365 1,323
ALM 912 496
Corporate Finance 745 454Principal Finance 253 400
Total Global Markets 4,275 2,673
Total operating income 7,489 5,243
* Global Markets comprises the following businesses: Financial Markets (foreign exchange, interest rate and other derivatives,commodities and equities, debt capital markets, syndications); ALM; Corporate Finance (corporate advisory, structured tradefinance, structured finance and project and export finance); and Principal Finance (corporate private equity, real estateinfrastructure and alternative investments).
Financial Markets income by desk2008
US$million
2007
US$million
Foreign Exchange 1,194 1,017
Rates 748 158
Commodities and Equities 141 49Capital Markets 234 259
Credit and Other 48 (160)
Total Financial Markets operating income 2,365 1,323
199
c102100pu025Proof7:28.3.10B/LRevision:0OperatorSadK

Operating income by product2008
Rs. million
2007
Rs. million
Lending and Portfolio Management 25,721 25,067Transaction Banking 124,309 94,900
Global Markets*
Financial Markets 110,398 61,758
ALM 42,572 23,153
Corporate Finance 34,777 21,193
Principal Finance 11,810 18,672
Total Global Markets 199,557 124,776
Total operating income 349,587 244,743
* Global Markets comprises the following businesses: Financial Markets (foreign exchange, interest rate and other derivatives,commodities and equities, debt capital markets, syndications); ALM; Corporate Finance (corporate advisory, structured tradefinance, structured finance and project and export finance); and Principal Finance (corporate private equity, real estateinfrastructure and alternative investments).
Financial Markets income by desk2008
Rs. million
2007
Rs. million
Foreign Exchange 55,736 47,474
Rates 34,917 7,375
Commodities and Equities 6,582 2,287
Capital Markets 10,923 12,090
Credit and Other 2,241 (7,469)
Total Financial Markets operating income 110,398 61,758
Lending and Portfolio Management income increased by US$14 million, or 3%, to US$551 million.
Gross lending was up 47% year on year but was impacted by higher portfolio management costs in
line with higher distribution activity.
Transaction Banking income increased by US$630 million, or 31%, to US$2,663 million. The increase
in income was driven by Trade, where income increased by 46%, with strong growth in trade
origination and improved margins as the business repriced to reflect the higher risk environment and
tighter market liquidity. Cash management and custody income was up 23% year on year, driven by
a 24% increase in volumes, more than offsetting the effects of reduced margins.
Global Markets’ income increased by US$1,602 million, or 60%, to US$4,275 million.
The Financial Markets business is primarily driven by client income. Financial Markets grew income
US$1,042 million, or 79%, to US$2,365 million with strong growth across most products. Foreign
exchange income increased 17% with growth being adversely impacted by provisions raised in relation
to model and counterparty risk. Rates had an exceptional year in both sales and trading. Sales were
driven higher by an increasing number of large transactions with corporates, notably in India, Korea
and the UAE. Enhanced risk management practices, correct positioning on rate reductions, and gains
from government bonds all helped drive income higher.
ALM income grew 84% from US$496 million to US$912 million benefitting from strategic positioning
in late 2007 coupled with timely re-investment in 2008 to maximise accruals from steepening yield
curves.
Corporate Finance income was up 64% with strong revenue growth across all products. Much of the
growth was fuelled by Corporate Advisory with income more than doubling, driven by a number of
landmark deals in South Asia.
Principal Finance income was down 37% year on year due to adverse mark to market valuations as a
result of distressed global equity markets.
200
c102100pu025Proof7:28.3.10B/LRevision:0OperatorSadK

Geographical performance
Hong Kong
Income was up US$234 million, or 27%, to US$1,104 million. Client revenue was up 23% andcomprised over 85% of total income. Transaction Banking grew US$45 million, or 11%, as strong
volume growth more than offset the impact of reduced margins in a lower rate environment.
Operating expenses grew US$83 million, or 24%, to US$430 million. Expenses were driven higher by
increased variable compensation for Global Markets staff and also by an increase in headcount.
Investment expenditure also increased along with premises and infrastructure expenses. Working profit
was up US$151 million, or 29%, to US$674 million. Loan impairment grew US$80 million, from a
net recovery of US$3 million in 2007. This was primarily due to deterioration in the local corporate
and middle market segments. Other impairment of US$27 million reflects provisions for strategicinvestments. Operating profit was up US$44 million, or 8%, to US$570 million.
Singapore
Income grew US$387 million, or 92%, to US$808 million. Own account had a very strong year
delivering strong income growth as ALM and fixed income trading were able to take advantage of
volatile market conditions. Client income increased 50% with interest rate derivative sales, foreign
exchange and debt capital markets all performing well. Operating expenses grew US$109 million, or
46%, to US$348 million. The main driver of the increase was staff expenses and investment in
specialist teams in areas such as commodities, options and interest rate derivatives, as well as variable
compensation and investment expenses. Working profit grew US$278 million, or 153%, to US$460
million. Loan impairment was down US$6 million, to a net recovery of US$5 million and wasreflective of strong risk management processes. Other impairment of US$30 million represents
provisions made against private equity investments. Operating profit was up US$254 million, or 140%,
to US$435 million.
Malaysia
Income was up US$66 million, or 36%, to US$250 million. Income growth was driven by structured
finance, foreign exchange and derivative sales. Interest rate derivatives also performed strongly
particularly in the first half of the year, bolstered by good volumes. Own account was also higher
with ALM and foreign currency trading making strong contributions. Operating expenses grew US$15
million, or 22%, to US$84 million. Expenses were driven higher by higher staff costs from variable
compensation and from investment costs. Working profit was up US$51 million, or 44%, to US$166million. The continued net recovery position reflects strong risk management and collections efforts.
Other impairment was up US$21 million as provisions were made against private equity investments.
Operating profit was up US$28 million, or 24%, to US$146 million.
Korea
The business had a good year. Income was up US$141 million, or 34%, to US$559 million. On a
constant currency basis income rose 55%. The weakening of the won provided opportunities to drive
significant income gains on foreign exchange and derivatives sales. In the latter half of the year
interest rate derivative sales also made strong advances as prevailing interest rates moved favourably.
Income benefited from recoveries of US$4 million on assets that had been fair valued at acquisition,
though this was down US$28 million from 2007. Income also benefited from a US$32 million creditto income from the economic hedges of the mortgage portfolio, as compared to an adverse charge in
2007 of US$53 million. Income was also adversely impacted by a US$118 million reversal of income
relating to foreign exchange option contracts. Operating expenses were down US$10 million, or 4%,
to US$229 million. On a constant currency basis, expenses rose 13%. Expenses were driven higher by
staff and premises costs though these were significantly offset by a retirement plan release arising
from a curtailment. Working profit was up US$151 million, or 84%, to US$330 million. On a
constant currency basis, working profit rose 109%. Loan impairment was up US$104 million, from a
net recovery of US$2 million in 2007. This was driven up US$79 million by provisions raised inrespect of corporate customers who are disputing the terms of certain foreign exchange related
transactions. Operating profit was up US$47 million, or 26%, to US$228 million. On a constant
currency basis, operating profit rose 43%.
Other Asia Pacific
Income was up US$377 million, or 40%, to US$1,310 million. Strong Transaction Banking income
growth was driven off deposit growth, improved margins and fee income. In Thailand the loosening
201
c102100pu025Proof7:28.3.10B/LRevision:0OperatorSadK

of capital control measures allowed increases in currency and interest rate product sales to increase
income. Income in Taiwan benefited from recoveries of US$21 million on assets that had been fair
valued at acquisition, up US$18 million from 2007. China, Indonesia and Vietnam all saw an increase
in foreign exchange and derivative sales. In China income was up 29% to US$489 million. Operatingexpenses in Other Asia Pacific were up US$185 million, or 42%, to US$630 million. Expenses across
all countries were driven higher by staff and premises costs and investments. In China operating
expenses were up 40% to US$229 million. Working profit across the region was up US$192 million,
or 39%, to US$680 million. Loan impairment was up US$116 million from US$10 million in 2007.
Loan impairment increased in Indonesia from exposure to the steel sector and in Taiwan against
electronic and computer manufacturers. Loan impairment in China was up US$12 million to US$13
million. Other impairment in Other Asia Pacific was up US$79 million as provisions were made
against private equity investments; US$70 million of this increase relates to China. Operating profitwas down US$3 million, or 1%, to US$475 million, of which US$177 million came from China.
India
Income was up US$217 million, or 24%, to US$1,116 million. Client revenues drove income growth.
Corporate Finance and advisory transactions performed very strongly and higher foreign exchange
and derivatives sales also contributed. Cash management benefited from higher balances. There was
strong growth in all customer segments led by local corporates where income grew 91%. Own account
performed well driven by Trading and ALM offset by lower Principal Finance. Operating expenseswere up US$69 million, or 27%, to US$329 million. Staff and premises related costs contributed to
an increase in expenses. Working profit was up US$148 million, or 23%, to US$787 million. Loan
impairment was up US$31 million, or 238%, to US$44 million. This increase in impairment reflects a
general worsening in economic conditions, with the greatest impact in the middle market customer
segment. Other impairment was up US$17 million as provisions were made against private equity and
strategic investments. Operating profit was up US$100 million, or 16%, to US$726 million.
MESA
Income was up US$358 million, or 53%, to US$1,034 million. Client revenues increased by 33% andown account revenues also grew strongly. Islamic banking income grew by over 60%. The UAE led
income growth in MESA with an overall increase of 84%, driven by lending, corporate finance and
trade. Pakistan delivered income growth of 8%. This was driven by good growth in both the
customer and own account areas. Operating expenses in MESA were up US$104 million, or 35%, to
US$403 million driven by staff and investment expenditure. Working profit was up US$254 million,
or 67%, to US$631 million. Loan impairment was down US$7 million, or 50%, to US$7 million.
Operating profit in MESA was up US$261 million, or 72%, to US$624 million.
Africa
Income was up US$80 million, or 16%, to US$565 million. Operating income growth was client led,
up 29%, and now forms 78% of total income. This growth was driven by treasury products and in
particular Financial Market sales and Corporate Finance, where combined revenue grew US$71
million, or 40%, to US$250 million. Nigeria saw good income growth of 23%, driven by Financial
Market sales and Corporate Finance. In Ghana, Botswana, Uganda and Zambia, the combined
income grew 19%. Transaction Banking revenue across the region grew by 17% with trade finance up
over 40%. Operating expenses in Africa were up US$70 million, or 29%, to US$314 million. Working
profit was up US$10 million, or 4%, to US$251 million. Loan impairment was up US$4 million, or40%, to US$14 million. Operating profit was up US$8 million, or 3%, to US$237 million.
Americas, UK and Europe
The impact of the AEB acquisition was material. Income on an underlying basis increased by US$116
million, or 32%, to US$473 million. Growth in client revenues in fixed income sales was strong, up
23%, and Corporate Advisory and Structured Finance up 75%. ALM also performed well taking
advantage of declining interest rates. The income growth was, however, offset by higher credit loss
provisions. Underlying expenses grew US$123 million, or 18%, to US$795 million, reflecting continuedinvestment in the region, amortisation of intangibles relating to the acquisitions of Harrison
Lovegrove and Pembroke, and increased depreciation on aircraft leases in respect of the Pembroke
business. Loan impairment charges increased US$28 million from a net recovery position of
US$15 million in 2007. Other impairment charges increased by US$107 million to US$162 million.
This was due to provisions taken for impairment on debt securities, private equity and strategic
202
c102100pu025Proof7:28.3.10B/LRevision:0OperatorSadK

investments. Impairment on ABS was up US$6 million to US$41 million. The underlying operating
loss increased from US$355 million to US$497 million.
Risk management review for the financial year ended 31 December 2008
2008 was a turbulent year in global financial markets. Despite this volatility, the Group’s balance
sheet and liquidity position remained strong and Standard Chartered is prepared to deal with the
challenges arising from global recessionary conditions. The Group has taken pre-emptive action to
reshape the portfolio, tighten underwriting standards and increase the frequency of risk monitoring
and stress testing. These actions will not immunise the Group from the effects of a cyclical downturnin its core markets, but should mitigate their impact.
The Group’s position at the end of 2008 is marked by several key factors. The Group has lowexposure to higher-risk asset classes, and has maintained vigilance and discipline in responding to the
challenging environment. It also has a diversified portfolio across countries, products and customer
segments; disciplined liquidity management; a well-established risk governance structure; and an
experienced senior team.
As a result of its focused strategy, Standard Chartered has low exposure to asset classes and segments
outside of its core markets and target customer base. The Group has no mass market business in the
US, UK and Europe. Exposure to securitised assets, leveraged loans, commercial real estate and
hedge funds is low.
Standard Chartered has been disciplined in its management of risk. The Group has increased its focus
on the inter-relationships between risk types and, where deemed appropriate, underwriting standardshave been tightened. It has also conducted periodic reviews of risk exposure limits and risk control
disciplines in anticipation of a global economic downturn. In the face of financial market turbulence,
exposures to financial institutions have been subject to close and continuous review. To ensure the
Group is prepared for a higher level of market volatility and economic uncertainty the Group
regularly subjects its exposures to a range of stress tests across a wide range of products and
customer segments at country, business and Group level.
The stress testing exercises address different types of risk and cover the impact of specific shocks as
well as a downturn in macroeconomic factors.
The Group’s lending portfolio is diversified across a wide range of products, industries and customer
segments, which serves to mitigate risk. The Group operates in over 70 countries and there is no
single country which accounts for more than 20% of loans and advances to customers, or operatingincome.
The Group’s liquidity has been further strengthened by good inflows of customer deposits, resulting
in a strong advances-to-deposit ratio. Liquidity will continue to be deployed to support growth
opportunities in Standard Chartered’s chosen markets. The Group manages its liquidity prudently in
all geographical locations and for all currencies, and continues to be a net provider of liquidity to the
interbank money markets.
The Group benefits from a well-established risk governance structure and an experienced senior team.
Senior level membership of risk committees ensures that risk oversight is a critical focus for all of the
Group’s directors, while substantial common membership between risk committees helps the Group to
address the inter-relationships between risk types.
The Group invested considerable effort preparing for the introduction of the Basel II capital
adequacy framework by refining analytical tools, ensuring data quality, improving data infrastructureand strengthening processes. These enhanced capabilities and the resultant management information
are being leveraged to inform further the Group’s business, risk and capital management decisions.
Risk performance review
For much of 2008, the credit environment remained broadly stable in most of the Group’s core
markets. However, towards the end of the year there were signs of strain appearing in some of thosemarkets as the global financial crisis began to adversely affect economic activity.
In Consumer Banking, portfolio delinquencies and loan impairment charges remained consistent with
normal performance given the Group’s product mix and the maturity profile of the portfolios.
However, in the fourth quarter there was an increase in delinquency rates in certain portfolios. In
countries such as India, Malaysia and the UAE, which have seen rapid growth in consumer debt over
the last few years, impairment rates in unsecured products such as Cards and Personal Loans began
203
c102100pu025Proof7:28.3.10B/LRevision:0OperatorSadK

to increase. There was an increase in impairment rates of unsecured portfolios in Hong Kong and
Korea, driven by a rise in personal bankruptcy petitions. The performance of SME portfolios in
Hong Kong, Korea, Taiwan and China has deteriorated as economic activity has slowed. The
performance of Residential Mortgages remained stable.
The Wholesale Banking portfolio remained sound. Problem credits and consequent impairment
charges increased in the fourth quarter from historical lows but still remain below cyclical averages.
Recoveries and releases continued to be achieved albeit at lower levels than in 2007 due to a lower
stock of problem accounts. The increase in impairment charges can be partly attributed to the cyclical
slowdown being experienced in some countries, particularly in the manufacturing sector. In addition,the unusual levels of volatility in financial markets have resulted in a limited number of customer
defaults and disputes related to derivative contracts. The impact of financial institution failures to
date has been limited.
Severe dislocation of the ABS market continued to affect the Group’s ABS portfolio. A framework is
in place to identify and proactively manage ABS assets that show signs of stress. The overall quality
of the ABS book remains good with no direct US sub-prime, and minimal Alt-A, exposures. The netexposure to ABS represents less than one 1% of total Group assets and had limited impact on the
Group’s performance.
Market risk is tightly monitored using VaR methodologies complemented by sensitivity measures,
gross nominal limits and management action triggers at a detailed portfolio level. This is
supplemented with extensive stress testing which takes account of more extreme price movements.
VaR rose in 2008 primarily as a consequence of increased market volatility across global markets.
The integration of AEB into the Group’s risk control frameworks and processes is now well under
way and is progressing to plan.
Since 1 January 2008, for the purposes of reporting to the FSA, the Group has been using the
advanced IRB approach under the Basel II regulatory framework to calculate credit risk capital forthe vast majority of its assets globally. Although the FSA’s approval covers the Group’s global
operations, in several jurisdictions the Group is required to apply separately to adopt advanced IRB
approaches for local reporting. Wherever the Group has chosen to do this to date the application has
been successful.
Principal risks and uncertainties
Standard Chartered is in the business of taking risk and the Group seeks to contain and mitigate
those risks to ensure they remain within the Group’s risk appetite and are adequately compensated.However, risks are by their nature uncertain and the management of risk relies on judgements and
predictions about the future.
The key risks and uncertainties faced by the Group in the coming year are set out below. This should
not be regarded as a complete and comprehensive statement of all potential risks and uncertainties
that the Group may experience.
Macroeconomic conditions in footprint countries
The Group’s principal risks and uncertainties arise from slowing economic growth in the major
countries in its footprint and the various uncertainties surrounding global financial markets in 2009.
The Group operates in many countries and is affected by the prevailing economic conditions in each.
Macroeconomic conditions have an impact on personal expenditure and consumption; demand for
business products and services; the debt service burden of consumers and businesses; the generalavailability of credit for retail and corporate borrowers; and the availability of capital and liquidity
funding for the Group. All these factors may impact the performance of the Group.
One of the principal uncertainties is the extent to which the economic downturn currently being
experienced in Western markets will feed through to the Group’s major Asian and Middle-Eastern
markets. The linkages between economic activity in different markets are complex and depend not
only on factors such as the balance of trade and investment between countries, but also on domesticmonetary, fiscal and other policy responses to address macroeconomic conditions.
The Group monitors economic trends in its markets very closely and continuously reviews the
suitability of its risk policies and controls.
204
c102100pu025Proof7:28.3.10B/LRevision:0OperatorSadK

Changes in government and regulatory policy
A key uncertainty for the Group relates to the way in which governments and regulators will adjust
their economic policies, laws and regulations in response to macroeconomic and other systemicconditions. Such changes may be wide-ranging and influence the volatility and liquidity of financial
markets, as well as the ability and willingness of customers to repay their loans. These effects may
directly or indirectly impact the Group’s financial performance. For example, history has shown that
changes in bankruptcy laws may affect customers’ willingness to repay. Standard Chartered plays an
active role, through its participation in industry forums, in the development of relevant laws and
regulatory policies in its key markets.
Financial markets dislocation
Continued volatility and dislocation affecting financial markets and asset classes may also affect the
Group’s performance over the coming year. These factors may have an impact on the mark-to-market
valuations of assets in the Group’s available-for-sale and trading portfolios; while any further
deterioration in the performance of the assets underlying the Group’s ABS portfolio could lead to
additional impairment. The continued market volatility may also negatively impact certain customers
exposed to derivative contracts. While the Group has a robust customer suitability and
appropriateness process in place, the potential losses incurred by certain customers as a result ofderivative contracts could lead to an increase in customer disputes and corporate defaults.
Instability in the financial services industry
The availability of liquidity and capital to financial institutions represents a material counterparty
risk. Availability depends on the underlying strength and performance of each institution and, just as
importantly, on the market perception of that institution at any given point in time. It remains
possible that some institutions will experience tighter liquidity conditions. Government action has
reduced the systemic risk, but the impact on the financial services industry of ongoing uncertainty inthe broader economic environment means that the risk nevertheless remains. The Group continues to
monitor closely the performance of its financial institutions customers and counterparties, taking
action to mitigate risks as appropriate.
Reduced access to funding
Liquidity risk is the risk that the Group either does not have sufficient financial resources available to
meet all its obligations and commitments as they fall due, or can access funding only at excessivecost. Exceptional market events can impact the Group adversely, thereby affecting the Group’s ability
to fulfil its obligations as they fall due. The principal uncertainties for liquidity risk are that
customers withdraw their deposits at a substantially faster rate than expected, or that asset
repayments are not received on the intended maturity date. The Group manages its liquidity
prudently in all geographical locations and for all currencies. Standard Chartered has a customer
deposit base diversified both by type and maturity, and a low dependence on wholesale funding. It
also holds a portfolio of liquid assets which can be realised if a liquidity stress event occurs.
Exchange rates
Changes in exchange rates affect, among other things, the value of the Group’s assets and liabilities
denominated in foreign currencies, as well as the earnings reported by the Group’s non-US Dollar
denominated branches and subsidiaries. The effect of exchange rate movements on the capital
adequacy ratio is mitigated by corresponding movements in risk weighted assets. Under certain
circumstances, the Group may take the decision to hedge its foreign exchange exposures in order to
protect the Group’s capital ratios from the effects of changes in exchange rates.
There have been significant movements in currency exchange rates in some of the Group’s key
markets over the past year and Standard Chartered expects to continue to be exposed to such
fluctuations in the coming year. The table below sets out the period end and average currencyexchange rates per US Dollar for India, Korea and Singapore for 31 December 2007 and
31 December 2008.
205
c102100pu025Proof7:28.3.10B/LRevision:0OperatorSadK

Year ended Year ended
Exchange rates 31.12.08 31.12.07
Indian Rupee
Average 43.50 41.08
Period end 48.45 39.39
Korean Won
Average 1,101.82 928.24
Period end 1,259.91 936.31
Singapore Dollar
Average 1.42 1.51
Period end 1.44 1.44
Risk management 2008
The management of risk lies at the heart of Standard Chartered’s business. One of the main risks the
Group incurs arises from extending credit to customers through its trading and lending operations.
Beyond credit risk, it is also exposed to a range of other risk types such as country, market, liquidity,
operational, regulatory, pension and reputational risks which are inherent to Standard Chartered’s
strategy, product range and geographical coverage.
Risk management framework
Effective risk management is fundamental to being able to generate profits consistently and
sustainably – and is thus a central part of the financial and operational management of the Group.
Through its risk management framework the Group manages enterprise-wide risks, with the objective
of maximising risk-adjusted returns while remaining within its risk appetite.
As part of this framework, the Group uses a set of principles that describe the risk management
culture the Group wishes to sustain:
* Balancing risk and reward: risk is taken in support of the requirements of the Group’s
stakeholders, in line with the Group’s strategy and within its risk appetite;
* Responsibility: it is the responsibility of all employees to ensure that risk-taking is disciplined
and focused. The Group takes account of its social, environmental and ethical responsibilities in
taking risk to produce a return;
* Accountability: risk is taken only within agreed authorities and where there is appropriate
infrastructure and resource. All risk-taking must be transparent, controlled and reported;
* Anticipation: the Group looks to anticipate future risks and maximise awareness of all risks;
and
* Competitive advantage: the Group seeks competitive advantage through efficient and effective
risk management and control.
Risk governance
Ultimate responsibility for setting the Group’s risk appetite and for the effective management of risk
rests with the board of Standard Chartered PLC (the board). Executive responsibility for risk
management is delegated to the Standard Chartered Bank court (the court) which comprises the
Group executive directors and other directors of Standard Chartered Bank.
The Group Asset and Liability Committee (GALCO), through its authority delegated by the court, is
responsible for the management of capital ratios and the establishment of, and compliance with,policies relating to balance sheet management, including management of the Group’s liquidity, capital
adequacy and structural foreign exchange rate risk. The Group Pensions Executive Committee,
through its authority delegated by the court, is responsible for the management of pension risk.
The Group Risk Committee (GRC), through its authority delegated by the court, is responsible for
the management of all other risks, including the establishment of, and compliance with, policies
relating to credit risk, country risk, market risk, operational risk, regulatory risk and reputationalrisk. The GRC is also responsible for defining the Group’s overall risk management framework.
Members of the court are also members of both the GRC and GALCO. The GRC is chaired by the
Group chief risk officer (GCRO). The GALCO is chaired by the Group finance director.
206
c102100pu025Proof7:28.3.10B/LRevision:0OperatorSadK

Acting within an authority delegated by the board, the Audit and Risk Committee (ARC), whose
members are all non-executive directors of the Company, reviews specific risk areas and monitors the
activities of the GRC and GALCO. The ARC receives regular reports on risk management, including
the Group’s portfolio trends, policies and standards, adherence with internal controls, regulatorycompliance, liquidity and capital adequacy, and is authorised to investigate or seek any information
relating to an activity within its terms of reference.
The committee governance structure ensures that risk-taking authority and risk management policies
are cascaded down through the organisation from the board through to the appropriate functional,
divisional and country-level committees. Information regarding material risk issues and compliance
with policies and standards is communicated through the country, business and functional committees
up to the Group-level committees.
Risk limits and risk exposure approval authority frameworks are set by the GRC in respect of credit
risk, country risk and market risk. The GALCO sets the approval authority framework in respect of
liquidity risk. Risk approval authorities may be exercised by risk committees or authorised
individuals.
Business governance and functional heads are accountable for risk management in their businesses
and functions, and for countries where they have governance responsibilities. This includes:
* implementing across all business activities the policies and standards as agreed by the Group-
level risk committees;
* managing risk in line with appetite levels agreed by the Group-level risk committees; and
* developing and maintaining appropriate risk management infrastructure and systems to facilitate
compliance with risk policies.
The GCRO chairs the GRC and is a member of the Group Management Committee. The GCRO
directly manages a risk function which is separate from the origination, trading and sales functions of
the businesses. Chief risk officers for both the Wholesale and Consumer Banking businesses have their
primary reporting lines into the GCRO. Country chief risk officers take overall responsibility for risk
within the Group’s principal countries.
The Risk function performs the following core activities:
* informs and challenges business strategy in order to encourage rigour, quality, optimisation and
transparency in relation to the deployment of risk capital;
* controls risk management processes separately from the businesses and seeks to ensure discipline
and consistency with risk standards, policy and appetite;
* advises on risk management frameworks, the structuring of products and transactions and on
the assessment and measurement of risk;
* facilitates and manages risk processes and seeks to ensure operational efficiency, effectiveness
and best practice; and
* communicates with stakeholders to demonstrate compliance with requirements in relation to risk
management.
The Group’s Risk Management Framework (RMF) identifies the risk types to which the Group is
exposed, each of which is controlled by a designated risk type owner (RTO). The major risk types aredescribed individually in the sections below. The RTOs, who are all approved persons under the FSA
regulatory framework, have responsibility for establishing minimum standards and for implementing
governance and assurance processes. The RTOs report up through specialist risk committees to the
GRC or GALCO.
Group Internal Audit is a separate Group function that reports to the chairman of the ARC and to
the Group chief executive officer. It provides independent confirmation of compliance with Group
and business standards, policies and procedures. Where necessary, it will recommend corrective action
to restore or maintain such standards.
Risk appetite
Risk appetite is an expression of the amount of risk the Group is willing to take in pursuit of its
strategic objectives. Risk appetite reflects the Group’s capacity to sustain potential losses arising from
a range of potential outcomes under different stress scenarios.
207
c102100pu025Proof7:28.3.10B/LRevision:0OperatorSadK

The Group defines its risk appetite in terms of both volatility of earnings and the maintenance of
minimum regulatory capital requirements under stress scenarios.
The Group’s risk profile is assessed through a ‘bottom-up’ analytical approach covering all of the
Group’s major businesses, countries and products. The risk appetite is approved by the board and
forms the basis for establishing the risk parameters within which the businesses must operate,
including policies, concentration limits and business mix.
The GRC is responsible for ensuring that the Group’s risk profile is managed in compliance with the
risk appetite set by the board.
Stress testing
Stress testing and scenario analysis are used to assess the financial and management capability of the
Group to continue operating effectively under extreme but plausible trading conditions. Such
conditions may arise from economic, legal, political, environmental and social factors.
The Group has a stress testing framework designed to:
* contribute to the setting and monitoring of risk appetite;
* identify key risks to the Group’s strategy, financial position, and reputation;
* examine the nature and dynamics of the risk profile and assess the impact of stresses on the
Group’s profitability and business plans;
* ensure effective governance, processes and systems are in place to co-ordinate and integrate
stress testing;
* inform senior management; and
* ensure adherence to regulatory requirements.
A stress testing forum is led by the Risk function with participation from the businesses, Group
Finance and Group Treasury. Its primary objective is to ensure that the Group understands the
earnings and capital implications of specific stress scenarios. The stress testing forum generates and
considers pertinent and plausible scenarios that have the potential to affect the Group adversely.
In view of recent market turbulence, stress testing activity has been intensified at country, business
and Group levels, with specific focus on certain asset classes, customer segments and the potential
impact of macroeconomic factors. Stress tests have taken into consideration possible future scenarios
that could arise as a result of the development of prevailing market conditions.
Business stress testing themes such as high inflation, low inflation or declines in asset values are co-
ordinated by the stress testing forum to ensure consistency of impacts on different risk types or
countries. Specific stress tests for country or risk type are also performed. Examples of risk type
stress testing are covered in the section on Market risk.
Credit risk
Credit risk is the risk that the counterparty to a financial transaction will fail to discharge an
obligation, resulting in financial loss to the Group. Credit exposures may arise from both the banking
book and the trading book.
Credit risk is managed through a framework which sets out policies and procedures covering the
measurement and management of credit risk. There is a clear segregation of duties between
transaction originators in the businesses and approvers in the Risk function. All credit exposure limits
are approved within a defined credit approval authority framework.
Credit policies
Group-wide credit policies and standards are considered and approved by the GRC, which also
oversees the delegation of credit approval and loan impairment provisioning authorities.
Policies and procedures that are specific to each business are established by authorised risk
committees within Wholesale and Consumer Banking. These are consistent with the Group-wide credit
policies, but are more detailed and adapted to reflect the different risk environments and portfolio
characteristics.
208
c102100pu025Proof7:28.3.10B/LRevision:0OperatorSadK

Credit rating and measurement
Risk measurement plays a central role, along with judgement and experience, in informing risk-taking
and portfolio management decisions. It is a primary target for sustained investment and seniormanagement attention.
A standard alphanumeric credit risk-grading system is used in both Wholesale and Consumer
Banking. The grading is based on the Group’s internal estimate of probability of default, with
customers or portfolios assessed against a range of quantitative and qualitative factors. The numeric
grades run from one to 14 and the grades are sub-classified A, B or C. Lower credit grades are
indicative of a lower likelihood of default. Credit grades 1A to 12C are assigned to performingcustomers or accounts, while credit grades 13 and 14 are assigned to non-performing or defaulted
customers.
There is no direct relationship between the Group’s internal credit grades and those used by external
rating agencies. The Group’s credit grades are not intended to replicate external credit grades
although, as the factors used to grade a borrower may be similar, a borrower rated poorly by an
external rating agency is typically rated in the lower rank of the Group’s internal credit grades.
Credit grades for the majority of consumer accounts are based on a probability of default calculated
using advanced IRB models. These models are based on application and behavioural scorecards which
make use of credit bureau information as well as the Group’s own data. For Consumer Banking
portfolios where IRB models have not yet been developed, the probability of default is calculated by
the Risk function using historical portfolio delinquency flow rates and judgement, where applicable.
Advanced IRB models cover a substantial majority of the Group’s loans and are used extensively inassessing risks at customer and portfolio level, setting strategy and optimising the Group’s risk-return
decisions.
Risk measurement models are approved by the responsible risk committee, on the recommendation of
the Group Model Assessment Committee (MAC). The MAC supports risk committees in ensuring
risk identification and measurement capabilities are objective and consistent, so that risk control and
risk origination decisions are properly informed. Prior to review by the MAC, all IRB models arevalidated in detail by a model validation team, which is separate from the teams which develop and
maintain the models. Models undergo a detailed review at least annually. Such reviews are also
triggered if the performance of a model deteriorates materially.
Credit approval
Major credit exposures to individual counterparties, groups of connected counterparties and portfolios
of retail exposures are reviewed and approved by the Group Credit Committee (GCC). The GCC
derives its authority from the GRC.
All other credit approval authorities are delegated by the GRC to individuals based on their
judgement and experience, and based on a risk-adjusted scale which takes account of the estimated
maximum potential loss from a given customer or portfolio. Credit origination and approval roles are
segregated in all but a very few authorised cases. In those very few exceptions where they are not,
originators can only approve limited exposures within defined risk parameters.
Concentration risk
Credit concentration risk is managed within concentration caps set by counterparty or groups of
connected counterparties, by industry sector and country in Wholesale Banking; and by product andcountry in Consumer Banking. Additional targets are set and monitored for concentrations by credit
rating.
Credit concentrations are monitored by the responsible risk committees in each of the businesses and
concentration limits that are material to the Group are reviewed and approved at least annually by
the GCC.
Credit monitoring
The Group regularly monitors credit exposures and external trends which may impact riskmanagement outcomes.
Internal risk management reports are presented to risk committees, containing information on key
environmental, political and economic trends across major portfolios and countries; portfolio
209
c102100pu025Proof7:28.3.10B/LRevision:0OperatorSadK

delinquency and loan impairment performance; as well as IRB portfolio metrics including migration
across credit grades.
In Wholesale Banking, accounts or portfolios are placed on Early Alert when they display signs of
weakness or financial deterioration, for example, where there is a decline in the customer’s position
within the industry, a breach of covenants, non-performance of an obligation, or there are issues
relating to ownership or management.
Such accounts and portfolios are subjected to a dedicated process overseen by Group Special Assets
Management (GSAM), the specialist recovery unit. Account plans are re-evaluated and remedial
actions are agreed and monitored. Remedial actions include, but are not limited to, exposure
reduction, security enhancement, exit of the account or immediate movement of the account into the
control of GSAM.
In Consumer Banking, portfolio delinquency trends are monitored continuously at a detailed level.
Individual customer behaviour is also tracked and informs lending decisions. Accounts which are past
due are subject to a collections process, managed independently by the Risk function. Charged-off
accounts are managed by a specialist recovery team. In some countries, aspects of collections and
recovery functions are outsourced. Medium enterprise and private banking past due accounts are
managed by GSAM.
The SME business is managed within Consumer Banking in two distinct segments: small businesses,
and medium enterprises, differentiated by the annual turnover of the counterparty. Medium enterprise
accounts are monitored in line with Wholesale Banking procedures, while small business accounts are
monitored in line with other Consumer Banking accounts.
Credit mitigation
Potential credit losses from any given account, customer or portfolio are mitigated using a range of
tools such as collateral, credit insurance, credit derivatives and other guarantees. The reliance that can
be placed on these mitigants is carefully assessed in light of issues such as legal enforceability, market
value and counterparty risk of the guarantor.
Collateral types which are eligible for risk mitigation include: cash; residential, commercial andindustrial property; fixed assets such as motor vehicles, aircraft, plant and machinery; marketable
securities; commodities; bank guarantees; and letters of credit. The Group also enters into
collateralised reverse repurchase agreements. Risk mitigation policies control the approval of collateral
types.
Collateral is valued in accordance with the Group’s risk mitigation policy, which prescribes thefrequency of valuation for different collateral types. The valuation frequency is driven by the level of
price volatility of each type of collateral and the nature of the underlying product or risk exposure.
Collateral held against impaired loans is maintained at fair value.
Certain credit exposures are mitigated using credit default insurance.
Where appropriate, credit derivatives are used to reduce credit risks in the portfolio. Due to their
potential impact on income volatility, such derivatives are used in a controlled manner with reference
to their expected volatility.
Traded products
Credit risk from traded products is managed within the overall credit risk appetite for corporates andfinancial institutions.
The credit risk exposure from traded products is derived from the positive mark-to-market value of
the underlying instruments, and an additional component to cater for potential market movements.
For derivative contracts, the Group limits its exposure to credit losses in the event of default by
entering into master netting agreements with certain counterparties. As required by IAS 32, exposures
are not presented net in the financial statements, as in the ordinary course of business they are not
intended to be settled net.
In addition, the Group enters into Credit Support Annexes (CSA) with counterparties where collateral
is deemed a necessary or desirable mitigant to the exposure. Under a variation margin process,
additional collateral is called from the counterparty if total uncollateralised mark-to-market exposure
exceeds the threshold and minimum transfer amount specified in the CSA. With certain
210
c102100pu025Proof7:28.3.10B/LRevision:0OperatorSadK

counterparties, the CSA is bilateral and requires the Group to post collateral if the overall mark-to-
market value of positions is in the counterparty’s favour and exceeds an agreed threshold.
Securities
Within Wholesale Banking, the Underwriting Committee approves the portfolio limits and parameters
by business unit for the underwriting and purchase of all pre-defined securities assets to be held for
sale. The Underwriting Committee is established under the authority of the GRC. The business
operates within set limits, which include country, single issuer, holding period and credit grade limits.
Day-to-day credit risk management activities for traded securities are carried out by Traded Credit
Risk Management whose activities include oversight and approval of temporary excesses within the
levels delegated by the Underwriting Committee. Issuer credit risk, including settlement and pre-
settlement risk, is controlled by Wholesale Banking Credit Risk, while price risk is controlled by
Group Market Risk.
The Underwriting Committee approves individual proposals for the underwriting of new corporate
security issues. Where an underwritten security is held for a period longer than the target sell-down
period, decision-making authority on the sale price moves to the Risk function.
Loan Portfolio
Loans and advances to customers have grown by US$21.5 billion to US$178.5 billion.
Compared to 2007, the Consumer Banking portfolio in 2008 has declined by US$1.6 billion mainly
due to currency depreciation in Korea, Malaysia, India and Pakistan.
The mortgage portfolios in Singapore and Hong Kong have grown by US$1.4 billion and
US$1.1 billion respectively, driven by customer refinancing due to competitive pricing and focused
sales targeting at wealth management customers. In Korea, the mortgage portfolio grew by two 2% in
local currency terms, although the significant depreciation of the Korean Won during 2008 led to an
overall reduction in the value of the portfolio of US$5.5 billion, or 24%.
Growth in the Wholesale Banking customer portfolio was US$23.2 billion, or 31%. Over 18% of that
growth was in Other Asia Pacific, widely spread across a number of countries. The growth in the
Americas, UK and Europe was driven by an increase in credit facilities extended to customers to
support the business they do elsewhere in the Group’s network.
Exposures to banks grew by 27%. This reflects the Group’s strong liquidity position, with much of
that liquidity placed with high quality bank counterparties. The growth was primarily in Asia Pacific.
Single borrower concentration risk has been mitigated by active distribution of assets to banks and
institutional investors, some of which is achieved through credit-default swaps and synthetic risk
transfer structures.
The Wholesale Banking portfolio remains well diversified across both geography and industry, with
no significant concentration within the industry classifications of Manufacturing; Financing, insuranceand business services; Commerce; or Transport, storage and communication.
211
c102100pu025Proof7:28.3.10B/LRevision:0OperatorSadK

2008
Asia Pacific
Hong Kong
US$ million
Singapore
US$ million
Malaysia
US$ million
Korea
US$ million
Other Asia
Pacific
US$ million
India
US$ million
Middle East
& Other
S Asia
US$ million
Africa
US$ million
Americas
UK &
Europe
US$ million
Total
US$ million
Loans to individuals
Mortgages 12,977 6,044 2,114 17,120 6,672 1,447 891 171 131 47,567
Other 2,826 3,529 1,077 4,383 4,312 910 2,742 564 1,106 21,449
Small and medium enterprises 1,288 1,754 842 3,603 1,818 1,093 710 170 370 11,648
Consumer Banking 17,091 11,327 4,033 25,106 12,802 3,450 4,343 905 1,607 80,664
Agriculture, forestry and fishing 27 65 41 34 152 34 106 383 562 1,404
Construction 142 81 41 367 383 305 823 40 143 2,325
Commerce 2,150 2,685 397 964 3,136 749 4,150 725 2,395 17,351
Electricity, gas and water 453 15 79 93 453 34 242 71 1,246 2,686
Financing, insurance and
business services 3,455 2,303 418 427 2,570 533 3,329 453 12,075 25,563
Governments — 366 2,240 — 1,240 — 383 26 427 4,682
Mining and quarrying — 355 1 26 173 104 257 194 4,710 5,820
Manufacturing 2,756 1,153 534 3,475 7,332 2,255 1,864 598 4,892 24,859
Commercial real estate 1,353 1,265 3 787 1,242 332 526 10 839 6,357
Transport, storage and
communication 470 366 190 356 731 121 1,218 220 2,113 5,785
Other 168 415 8 217 395 12 319 48 85 1,667
Wholesale Banking 10,974 9,069 3,952 6,746 17,807 4,479 13,217 2,768 29,487 98,499
Portfolio impairment provision (61) (47) (30) (89) (198) (66) (84) (31) (45) (651)
Total loans and advances
to customers 28,004 20,349 7,955 31,763 30,411 7,863 17,476 3,642 31,049 178,512
Total loans and advances
to banks 18,963 9,283 411 1,594 4,790 291 1,504 587 10,523 47,946
Total loans and advances to customers include US$4,334 million held at fair value through profit or
loss. Total loans and advances to banks include US$1,363 million held at fair value through profit or
loss.
2007
Asia Pacific
Hong Kong
US$ million
Singapore
US$ million
Malaysia
US$ million
Korea
US$ million
Other
Asia Pacific
US$ million
India
US$ million
Middle East
& Other
S Asia
US$ million
Africa
US$ million
Americas
UK &
Europe
US$ million
Total
US$ million
Loans to individualsMortgages 11,845 4,615 2,441 22,634 6,333 1,638 493 254 120 50,373Other 2,288 1,396 1,002 4,712 3,929 1,208 2,829 615 170 18,149
Small and medium enterprises 1,188 1,687 828 5,937 2,375 920 660 143 2 13,740
Consumer Banking 15,321 7,698 4,271 33,283 12,637 3,766 3,982 1,012 292 82,262
Agriculture, forestry and fishing 16 163 102 26 186 51 193 335 529 1,601Construction 111 35 38 204 246 225 487 48 27 1,421Commerce 1,865 2,094 369 434 2,510 722 2,430 703 1,758 12,885Electricity, gas and water 550 76 45 176 352 9 411 277 883 2,779Financing, insurance and
business services 2,129 1,858 606 910 2,276 566 1,517 227 4,540 14,629Governments — 3,220 3,941 8 26 — 341 8 265 7,809Mining and quarrying — 31 8 93 159 65 238 138 2,722 3,454Manufacturing 1,908 701 453 3,533 5,896 1,789 1,524 374 3,727 19,905Commercial real estate 1,050 675 3 1,094 995 364 99 8 10 4,298Transport, storage and
communication 313 323 209 124 680 137 709 196 1,660 4,351Other 148 338 7 424 268 18 796 22 102 2,123
Wholesale Banking 8,090 9,514 5,781 7,026 13,594 3,946 8,745 2,336 16,223 75,255
Portfolio impairment provision (47) (40) (25) (80) (182) (56) (81) (18) (6) (535)
Total loans and advancesto customers 23,364 17,172 10,027 40,229 26,049 7,656 12,646 3,330 16,509 156,982
Total loans and advancesto banks 15,156 2,531 928 1,504 4,866 552 1,406 371 10,365 37,679
Total loans and advances to customers include US$2,716 million held at fair value through profit or
loss. Total loans and advances to banks include US$2,314 million held at fair value through profit or
loss.
212
c102100pu025Proof7:28.3.10B/LRevision:0OperatorSadK

2008
Asia Pacific
Hong
Kong
Rs.million
Singapore
Rs.million
Malaysia
Rs.million
Korea
Rs.million
Other
Asia
Pacific
Rs.million
India
Rs.million
Middle
East
& Other
S Asia
Rs.million
Africa
Rs.million
Americas
UK &
Europe
Rs.million
Total
Rs.million
Loans to individuals
Mortgages 605,766 282,134 98,682 799,162 311,449 67,546 41,592 7,982 6,115 2,220,428
Other 131,918 164,734 50,274 204,598 201,284 42,479 127,997 26,328 51,628 1,001,239
Small and medium enterprises 60,124 81,877 39,305 168,188 84,864 51,021 33,143 7,936 17,272 543,729
Consumer Banking 797,808 528,744 188,260 1,171,948 597,597 161,046 202,731 42,245 75,015 3,765,396
Agriculture, forestry and
fishing 1,260 3,034 1,914 1,587 7,095 1,587 4,948 17,878 26,234 65,539
Construction 6,629 3,781 1,914 17,132 17,878 14,237 38,418 1,867 6,675 108,531
Commerce 100,362 125,336 18,532 45,000 146,388 34,963 193,722 33,843 111,799 809,945
Electricity, gas and water 21,146 700 3,688 4,341 21,146 1,587 11,297 3,314 58,163 125,382
Financing, insurance and 161,279 107,504 19,512 19,932 119,968 24,880 155,398 21,146 563,661 1,193,281
Governments — 17,085 104,563 — 57,883 — 17,878 1,214 19,932 218,556
Mining and quarrying — 16,571 47 1,214 8,076 4,855 11,997 9,056 219,863 271,678
Manufacturing 128,650 53,822 24,927 162,213 342,258 105,263 87,012 27,915 228,359 1,160,418
Commercial real estate 63,158 59,050 140 36,737 57,977 15,498 24,554 467 39,165 296,745
Transport, storage and
communication 21,940 17,085 8,869 16,618 34,123 5,648 56,856 10,270 98,635 270,044
Other 7,842 19,372 373 10,130 18,439 560 14,891 2,241 3,968 77,816
Wholesale Banking 512,266 423,341 184,479 314,903 831,231 209,080 616,970 129,210 1,376,453 4,597,933
Portfolio impairment provision (2,847) (2,194) (1,400) (4,155) (9,243) (3,081) (3,921) (1,447) (2,101) (30,389)
Total loans and advances to
customers 1,307,227 949,891 371,339 1,482,697 1,419,585 367,045 815,780 170,009 1,449,367 8,332,940
Total loans and advances to
banks 885,193 433,330 19,185 74,408 223,597 13,584 70,207 27,401 491,214 2,238,119
Total loans and advances to customers include US$4,334 million held at fair value through profit or
loss. Total loans and advances to banks include US$1,363 million held at fair value through profit or
loss.
213
c102100pu025Proof7:29.3.10B/LRevision:0OperatorBeeR

2007
Asia Pacific
Hong
Kong
Rs.million
Singapore
Rs.million
Malaysia
Rs.million
Korea
Rs.million
Other
Asia
Pacific
Rs.million
India
Rs.million
Middle
East
& Other
S Asia
Rs.million
Africa
Rs.million
Americas
UK &
Europe
Rs.million
Total
Rs.million
Loans to individuals
Mortgages 552,925 215,428 113,946 1,056,555 295,624 76,462 23,013 11,857 5,602 2,351,412
Other 106,804 65,165 46,773 219,956 183,406 56,389 132,058 28,708 7,936 847,195
Small and medium enterprises 55,456 78,749 38,651 277,139 110,865 42,946 30,809 6,675 93 641,383
Consumer Banking 715,184 359,343 199,370 1,553,650 589,895 175,797 185,880 47,240 13,631 3,839,990
Agriculture, forestry and
fishing 747 7,609 4,761 1,214 8,682 2,381 9,009 15,638 24,694 74,735
Construction 5,181 1,634 1,774 9,523 11,483 10,503 22,733 2,241 1,260 66,332
Commerce 87,058 97,748 17,225 20,259 117,167 33,703 113,432 32,816 82,063 601,472
Electricity, gas and water 25,674 3,548 2,101 8,216 16,431 420 19,185 12,930 41,218 129,724
Financing, insurance and 99,382 86,731 28,288 42,479 106,244 26,421 70,814 10,596 211,927 682,882
Governments — 150,310 183,966 373 1,214 — 15,918 373 12,370 364,524
Mining and quarrying — 1,447 373 4,341 7,422 3,034 11,110 6,442 127,063 161,233
Manufacturing 89,065 32,723 21,146 164,920 275,225 83,511 71,140 17,458 173,976 929,165
Commercial real estate 49,014 31,509 140 51,068 46,447 16,992 4,621 373 467 200,631
Transport, storage and
communication 14,611 15,078 9,756 5,788 31,742 6,395 33,096 9,149 77,489 203,105
Other 6,909 15,778 327 19,792 12,510 840 37,157 1,027 4,761 99,102
Wholesale Banking 377,641 444,114 269,857 327,974 634,568 184,199 408,217 109,044 757,290 3,512,903
Portfolio impairment provision (2,194) (1,867) (1,167) (3,734) (8,496) (2,614) (3,781) (840) (280) (24,974)
Total loans and advances to
customers 1,090,632 801,589 468,060 1,877,890 1,215,967 357,382 590,315 155,444 770,640 7,327,920
Total loans and advances to
banks 707,482 118,147 43,319 70,207 227,145 25,767 65,632 17,318 483,838 1,758,856
Total loans and advances to customers include US$2,716 million held at fair value through profit orloss. Total loans and advances to banks include US$2,314 million held at fair value through profit or
loss.
Maturity Analysis
Approximately 52% of the Group’s loans and advances to customers are short-term, having a
contractual maturity of one year or less. The Wholesale Banking portfolio is predominantly short-
term, with 72% of loans and advances having a contractual maturity of one year or less. InConsumer Banking, 59% of the portfolio is in the mortgage book, traditionally longer-term in nature
and well secured. Whilst the Other and SME loans in Consumer Banking have short contractual
maturities, typically they may be renewed and repaid over longer terms in the normal course of
business.
214
c102100pu025Proof7:29.3.10B/LRevision:0OperatorBeeR

The following tables show the maturity of loans and advances to customers by each principal
category of borrower’s business or industry:
2008
One year
or less
US$million
One to five
years
US$million
Over
five years
US$million
Total
US$million
Loans to individuals
Mortgages 2,357 6,883 38,327 47,567
Other 11,575 7,118 2,756 21,449
Small and medium enterprises 6,780 2,653 2,215 11,648
Consumer Banking 20,712 16,654 43,298 80,664
Agriculture, forestry and fishing 1,008 259 137 1,404
Construction 1,943 356 26 2,325Commerce 15,732 1,477 142 17,351
Electricity, gas and water 1,108 345 1,233 2,686
Financing, insurance and business services 19,057 6,026 480 25,563
Governments 4,476 43 163 4,682
Mining and quarrying 3,238 1,449 1,133 5,820
Manufacturing 18,300 5,293 1,266 24,859
Commercial real estate 2,186 4,064 107 6,357
Transport, storage and communication 2,988 1,743 1,054 5,785Other 1,271 337 59 1,667
Wholesale Banking 71,307 21,392 5,800 98,499
Portfolio impairment provision (651)
178,512
215
c102100pu025Proof7:28.3.10B/LRevision:0OperatorSadK

2007
One year
or less
US$million
One to five
years
US$million
Over
five years
US$million
Total
US$million
Loans to individuals
Mortgages 3,490 8,027 38,856 50,373
Other 8,941 7,325 1,883 18,149
Small and medium enterprises 8,028 3,494 2,218 13,740
Consumer Banking 20,459 18,846 42,957 82,262
Agriculture, forestry and fishing 1,332 227 42 1,601Construction 1,128 249 44 1,421
Commerce 11,585 1,066 234 12,885
Electricity, gas and water 1,727 398 654 2,779
Financing, insurance and business services 12,073 2,054 502 14,629
Governments 7,618 86 105 7,809
Mining and quarrying 1,515 1,029 910 3,454
Manufacturing 15,603 3,128 1,174 19,905
Commercial real estate 2,761 1,510 27 4,298Transport, storage and communication 2,373 980 998 4,351
Other 1,704 348 71 2,123
Wholesale Banking 59,419 11,075 4,761 75,255
Portfolio impairment provision (535)
156,982
216
c102100pu025Proof7:28.3.10B/LRevision:0OperatorSadK

2008
One year
or less
Rs.million
One to five
years
Rs.million
Over five
years
Rs.million
Total
Rs.million
Loans to individuals
Mortgages 110,025 321,298 1,789,104 2,220,428
Other 540,321 332,268 128,650 1,001,239
Small and medium enterprises 316,490 123,842 103,396 543,729
Consumer Banking 966,836 777,409 2,021,151 3,765,396
Agriculture, forestry and fishing 47,053 12,090 6,395 65,539Construction 90,699 16,618 1,214 108,531
Commerce 734,370 68,946 6,629 809,945
Electricity, gas and water 51,721 16,105 57,556 125,382
Financing, insurance and business services 889,581 281,294 22,406 1,193,281
Governments 208,940 2,007 7,609 218,556
Mining and quarrying 151,150 67,639 52,888 271,678
Manufacturing 854,244 247,077 59,097 1,160,418
Commercial real estate 102,042 189,708 4,995 296,745Transport, storage and communication 139,480 81,363 49,201 270,044
Other 59,330 15,731 2,754 77,816
Wholesale Banking 3,328,611 998,579 270,744 4,597,933
Portfolio impairment provision (30,389)
8,332,940
217
c102100pu025Proof7:28.3.10B/LRevision:0OperatorSadK

2007
One year
or less
Rs.million
One to five
years
Rs.million
Over five
years
Rs.million
Total
Rs.million
Loans to individuals
Mortgages 162,913 374,700 1,813,798 2,351,412
Other 417,366 341,931 87,898 847,195
Small and medium enterprises 374,747 163,100 103,536 641,383
Consumer Banking 955,026 879,731 2,005,233 3,839,990
Agriculture, forestry and fishing 62,178 10,596 1,961 74,735Construction 52,655 11,623 2,054 66,332
Commerce 540,788 49,761 10,923 601,472
Electricity, gas and water 80,616 18,579 30,529 129,724
Financing, insurance and business services 563,568 95,881 23,433 682,882
Governments 355,608 4,014 4,901 364,524
Mining and quarrying 70,720 48,034 42,479 161,233
Manufacturing 728,348 146,015 54,802 929,165
Commercial real estate 128,883 70,487 1,260 200,631Transport, storage and communication 110,772 45,746 46,587 203,105
Other 79,543 16,245 3,314 99,102
Wholesale Banking 2,773,679 516,981 222,243 3,512,903
Portfolio impairment provision (24,974)
7,327,920
Problem Credit Management and Provisioning
For an explanation of credit management and provisioning for Consumer Banking, Wholesale
Banking and country risk, market risk, derivatives, hedging, liquidity risk, operational risk, regulatory
risk, legal risk, reputational risk and monitoring, please refer to ‘‘Problem Credit Management and
Provisioning’’ in the section titled ‘‘Business’’ on page 110 of this Draft Red Herring Prospectus.
Consumer Banking
The table below sets out the total non-performing loans in Consumer Banking, which includes
US$543 million (2007: US$655 million) of individual impairment provisions. The increase in the non-
performing loans reflects the deterioration in delinquency rates in certain portfolios in the fourthquarter of 2008.
218
c102100pu025Proof7:28.3.10B/LRevision:0OperatorSadK

The following table sets out the total non-performing portfolio in Consumer Banking:
2008
Asia Pacific
Hong KongUS$ million
SingaporeUS$ million
MalaysiaUS$ million
KoreaUS$ million
Other AsiaPacific
US$ millionIndia
US$ million
Middle East& Other
S AsiaUS$ million
AfricaUS$ million
AmericasUK &
EuropeUS$ million
TotalUS$ million
Loans and advances
Gross non-performing 85 65 164 287 437 49 170 35 95 1,387
Individual impairment
provision (39) (18) (41) (76) (250) (10) (71) (12) (26) (543)
Non-performing loans
net of individual
impairment provision 46 47 123 211 187 39 99 23 69 844
Portfolio impairment
provision (449)
Net non-performing
loans and advances 395
Cover ratio 72%
2007
Asia Pacific
Hong KongUS$ million
SingaporeUS$ million
MalaysiaUS$ million
KoreaUS$ million
Other AsiaPacific
US$ millionIndia
US$ million
Middle East& Other
S AsiaUS$ million
AfricaUS$ million
AmericasUK &
EuropeUS$ million
TotalUS$ million
Loans and advances
Gross non-performing 65 61 166 336 475 56 126 38 1 1,324
Individual impairment
provision (24) (26) (38) (125) (329) (19) (75) (18) (1) (655)
Non-performing loans
net of individual
impairment provision 41 35 128 211 146 37 51 20 — 669
Portfolio impairment
provision (412)
Net non-performing
loans and advances 257
Cover ratio 81%
219
c102100pu025Proof7:28.3.10B/LRevision:0OperatorSadK

2008
Asia Pacific
Hong KongRs.million
SingaporeRs.million
MalaysiaRs.million
KoreaRs.million
Other AsiaPacific
Rs.millionIndia
Rs.million
Middle East& Other
S AsiaRs.million
AfricaRs.million
AmericasUK &
EuropeRs.million
TotalRs.million
Loans and advances
Gross non-performing 3,968 3,034 7,656 13,397 20,399 2,287 7,936 1,634 4,435 64,745
Individual impairment
provision (1,821) (840) (1,914) (3,548) (11,670) (467) (3,314) (560) (1,214) (25,347)
Non-performing loans
net of individual
impairment provision 2,147 2,194 5,742 9,849 8,729 1,821 4,621 1,074 3,221 39,398
Portfolio impairment
provision (20,959)
Net non-performing
loans 18,439
Cover ratio 72%
2007
Asia Pacific
Hong KongRs.million
SingaporeRs.million
MalaysiaRs.million
KoreaRs.million
Other AsiaPacific
Rs.millionIndia
Rs.million
Middle East& Other
S AsiaRs.million
AfricaRs.million
AmericasUK &
EuropeRs.million
TotalRs.million
Loans and advances
Gross non-performing 3,034 2,847 7,749 15,684 22,173 2,614 5,882 1,774 47 61,804
Individual impairment
provision (1,120) (1,214) (1,774) (5,835) (15,358) (887) (3,501) (840) (47) (30,575)
Non-performing loans
net of individual
impairment provision 1,914 1,634 5,975 9,849 6,815 1,727 2,381 934 — 31,229
Portfolio impairment
provision (19,232)
Net non-performing
loans 11,997
Cover ratio 81%
2008
Asia Pacific
Hong KongUS$ million
SingaporeUS$ million
MalaysiaUS$ million
KoreaUS$ million
Other AsiaPacific
US$ millionIndia
US$ million
Middle East& Other
S AsiaUS$ million
AfricaUS$ million
AmericasUK &
EuropeUS$ million
TotalUS$ million
Gross impairment charge 135 39 85 165 357 110 197 27 64 1,179
Recoveries/provisions no
longer required (37) (26) (43) (16) (87) (28) (25) (11) (8) (281)
Net individual
impairment (credit)/
charge 98 13 42 149 270 82 172 16 56 898
Portfolio impairment
provision 39
Net impairment charge 937
220
c102100pu025Proof7:28.3.10B/LRevision:0OperatorSadK

2007
Asia Pacific
Hong KongUS$ million
SingaporeUS$ million
MalaysiaUS$ million
KoreaUS$ million
Other AsiaPacific
US$ millionIndia
US$ million
Middle East& Other
S AsiaUS$ million
AfricaUS$ million
AmericasUK &
EuropeUS$ million
TotalUS$ million
Gross impairment charge 98 45 108 114 468 91 153 23 — 1,100
Recoveries/provisions no
longer required (42) (31) (63) (18) (95) (26) (39) (9) — (323)
Net individual
impairment (credit)/
charge 56 14 45 96 373 65 114 14 — 777
Portfolio impairment
provision (41)
Net impairment charge 736
2008
Asia Pacific
HongKong
Rs.millionSingaporeRs.million
MalaysiaRs.million
KoreaRs.million
Other AsiaPacific
Rs.millionIndia
Rs.million
Middle East& Other
S AsiaRs.million
AfricaRs.million
AmericasUK &
EuropeRs.million
TotalRs.million
Gross impairment charge 6,302 1,821 3,968 7,702 16,665 5,135 9,196 1,260 2,988 55,036
Recoveries/provisions no
longer required (1,727) (1,214) (2,007) (747) (4,061) (1,307) (1,167) (513) (373) (13,117)
Net individual
impairment (credit)/
charge 4,575 607 1,961 6,955 12,604 3,828 8,029 747 2,614 41,919
Portfolio impairment
provision 1,821
Net impairment charge 43,739
2007
Asia Pacific
Hong KongRs.million
SingaporeRs.million
MalaysiaRs.million
KoreaRs.million
Other AsiaPacific
Rs.millionIndia
Rs.million
Middle East& Other
S AsiaRs.million
AfricaRs.million
AmericasUK &
EuropeRs.million
TotalRs.million
Gross impairment charge 4,575 2,101 5,041 5,322 21,846 4,248 7,142 1,074 — 51,348
Recoveries/provisions no
longer required (1,961) (1,447) (2,941) (840) (4,435) (1,214) (1,821) (420) — (15,078)
Net individual
impairment (credit)/
charge 2,614 654 2,101 4,481 17,412 3,034 5,322 654 — 36,270
Portfolio impairment
provision (1,914)
Net impairment charge 34,356
221
c102100pu025Proof7:28.3.10B/LRevision:0OperatorSadK

Wholesale Banking
The cover ratio reflects the extent to which gross non-performing loans are covered by individual and
portfolio impairment provisions. The cover ratio is impacted by a number of large downgrades whererecovery of principal is expected and so a low level of provision has been raised, in accordance with
IAS 39. The balance uncovered by individual impairment provision represents the value of collateral
held and/or the Group’s estimate of the net value of any work-out strategy.
The following table sets out the total non-performing portfolio in Wholesale Banking:
2008
Asia Pacific
Hong KongUS$ million
SingaporeUS$ million
MalaysiaUS$ million
KoreaUS$ million
Other AsiaPacific
US$ millionIndia
US$ million
Middle East& Other
S Asia US$million
AfricaUS$ million
AmericasUK &
EuropeUS$ million
TotalUS$ million
Loans and advances
Gross non-performing 201 3 16 193 517 61 241 80 308 1,620
Individual impairment
provision (125) (2) (16) (78) (298) (34) (99) (42) (87) (781)
Non-performing loans
and advances net of
individual impairment
provision 76 1 — 115 219 27 142 38 221 839
Portfolio impairment
provision (208)
Net non-performing
loans and advances 631
Cover ratio 61%
2007
Asia Pacific
Hong KongUS$ million
SingaporeUS$ million
MalaysiaUS$ million
KoreaUS$ million
Other AsiaPacific US$
millionIndia
US$ million
Middle East& Other
S AsiaUS$ million
AfricaUS$ million
AmericasUK &
EuropeUS$ million
TotalUS$ million
Loans and advances
Gross non-performing 92 26 23 47 358 27 147 79 193 992
Individual impairment
provision (50) (18) (21) (12) (235) (25) (122) (48) (87) (618)
Non-performing loans
and advances net of
individual impairment
provision 42 8 2 35 123 2 25 31 106 374
Portfolio impairment
provision (124)
Net non-performing
loans and advances 250
Cover ratio 75%
222
c102100pu025Proof7:28.3.10B/LRevision:0OperatorSadK

2008
Asia Pacific
Hong KongRs.million
SingaporeRs.million
MalaysiaRs.million
KoreaRs.million
Other AsiaPacific
Rs.millionIndia
Rs.million
Middle East& Other
S AsiaRs.million
AfricaRs.million
AmericasUK &
EuropeRs.million
TotalRs.million
Loans and advances
Gross non-performing 9,383 140 747 9,009 24,134 2,847 11,250 3,734 14,377 75,622
Individual impairment
provision (5,835) (93) (747) (3,641) (13,911) (1,587) (4,621) (1,961) (4,061) (36,457)
Non-performing loans
and advances net of
individual impairment
provision 3,548 47 — 5,368 10,223 1,260 6,629 1,774 10,316 39,165
Portfolio impairment
provision (9,709)
Net non-performing
loans and advances 29,455
Cover ratio 61%
2007
Asia Pacific
Hong KongRs.million
SingaporeRs.million
MalaysiaRs.million
KoreaRs.million
OtherAsia
PacificRs.million
IndiaRs.million
Middle East& Other
S AsiaRs.million
AfricaRs.million
AmericasUK &
EuropeRs.million
TotalRs.million
Loans and advances
Gross non-performing 4,295 1,214 1,074 2,194 16,711 1,260 6,862 3,688 9,009 46,307
Individual impairment
provision (2,334) (840) (980) (560) (10,970) (1,167) (5,695) (2,241) (4,061) (28,848)
Non-performing loans
and advances net of
individual impairment
provision 1,961 373 93 1,634 5,742 93 1,167 1,447 4,948 17,458
Portfolio impairment
provision (5,788)
Net non-performing
loans and advances 11,670
Cover ratio 75%
2008
Asia Pacific
Hong KongUS$ million
SingaporeUS$ million
MalaysiaUS$ million
KoreaUS$ million
Other AsiaPacific
US$ millionIndia
US$ million
Middle East& Other
S AsiaUS$ million
AfricaUS$ million
AmericasUK &
EuropeUS$ million
TotalUS$ million
Gross impairment charge 94 — — 89 118 35 6 8 44 394
Recoveries/provisions no
longer required (20) (3) (2) — (14) (5) (7) (9) (29) (89)
Net individual
impairment (credit)/
charge 74 (3) (2) 89 104 30 (1) (1) 15 305
Portfolio impairment
provision 79
Net impairment charge 384
223
c102100pu025Proof7:28.3.10B/LRevision:0OperatorSadK

2007
Asia Pacific
Hong KongUS$ million
SingaporeUS$ million
MalaysiaUS$ million
KoreaUS$ million
Other AsiaPacific
US$ millionIndia
US$ million
Middle East& Other
S AsiaUS$ million
AfricaUS$ million
AmericasUK &
EuropeUS$ million
TotalUS$ million
Gross impairment charge 22 7 1 5 11 13 18 15 2 94
Recoveries/provisions no
longer required (25) (9) (4) (3) (5) (7) (11) (14) (17) (95)
Net individual
impairment (credit)/
charge (3) (2) (3) 2 6 6 7 1 (15) (1)
Portfolio impairment
provision 26
Net impairment charge 25
2008
Asia Pacific
Hong KongRs.million
SingaporeRs.million
MalaysiaRs.million
KoreaRs.million
Other AsiaPacific
Rs.millionIndia
Rs.million
Middle East& Other
S AsiaRs.million
AfricaRs.million
AmericasUK &
EuropeRs.million
TotalRs.million
Gross impairment charge 4,388 — — 4,155 5,508 1,634 280 373 2,054 18,392
Recoveries/provisions no
longer required (934) (140) (93) — (654) (233) (327) (420) (1,354) (4,155)
Net individual
impairment (credit)/
charge 3,454 (140) (93) 4,155 4,855 1,400 (47) (47) 700 14,237
Portfolio impairment
provision 3,688
Net impairment charge 17,925
2007
Asia Pacific
Hong KongRs.million
SingaporeRs.million
MalaysiaRs.million
KoreaRs.million
Other AsiaPacific
Rs.millionIndia
Rs.million
Middle East&
OtherS Asia
Rs.millionAfrica
Rs.million
AmericasUK &
EuropeRs.million
TotalRs.million
Gross impairment charge 1,027 327 47 233 513 607 840 700 93 4,388
Recoveries/provisions no
longer required (1,167) (420) (187) (140) (233) (327) (513) (654) (794) (4,435)
Net individual
impairment (credit)/
charge (140) (93) (140) 93 280 280 327 47 (700) (47)
Portfolio impairment
provision 1,214
Net impairment charge 1,167
224
c102100pu025Proof7:28.3.10B/LRevision:0OperatorSadK

Movement in Group Individual Impairment Provision
The following tables set out the movements in the Group’s total individual impairment provision
against loans and advances:
2008
Asia Pacific
Hong KongUS$ million
SingaporeUS$ million
MalaysiaUS$ million
KoreaUS$ million
Other AsiaPacific
US$ millionIndia
US$ million
Middle East& Other
S AsiaUS$ million
AfricaUS$ million
AmericasUK &
EuropeUS$ million
TotalUS$ million
Provisions held at
1 January 2008 74 44 59 137 564 44 197 66 88 1,273
Exchange translation
differences 1 — (3) (43) (21) (10) (28) (9) (3) (116)
Amounts written off (94) (48) (53) (156) (397) (114) (178) (17) (62) (1,119)
Recoveries of acquisition
fair values — — — (19) (55) — (4) — — (78)
Recoveries of amounts
previously written off 31 15 16 2 72 23 12 — 9 180
Acquisitions — — — 3 28 — — — 15 46
Discount unwind (3) (1) (2) (9) (22) (1) (1) (1) — (40)
Other — — — 10 5 (1) 1 — (5) 10
New provisions 213 39 85 245 475 136 203 33 109 1,538
Recoveries/provisions no
longer required (58) (29) (45) (16) (101) (33) (32) (18) (38) (370)
Net charge against profit 155 10 40 229 374 103 171 15 71 1,168
Provisions held at
31 December 2008 164 20 57 154 548 44 170 54 113 1,324
2007
Asia Pacific
Hong KongUS$ million
SingaporeUS$ million
MalaysiaUS$ million
KoreaUS$ million
Other AsiaPacific US$
millionIndia
US$ million
Middle East& Other
S Asia US$million
AfricaUS$ million
AmericasUK &
EuropeUS$ million
TotalUS$ million
Provisions held at
1 January 2007 159 84 92 285 625 39 176 68 154 1,682
Exchange translation
differences — 2 5 (1) 6 5 (3) 5 1 20
Amounts written off (161) (62) (92) (128) (468) (84) (115) (19) (54) (1,183)
Recoveries of acquisition
fair values — — — (98) — — — — — (98)
Recoveries of amounts
previously
written off 34 12 16 — 42 19 12 1 3 139
Discount unwind (4) (4) (4) (21) (28) (1) (1) (2) (1) (66)
Other — — — — 2 1 7 — — 10
New provisions 113 52 109 119 484 98 170 35 2 1,182
Recoveries/provisions no
longer required (67) (40) (67) (19) (99) (33) (49) (22) (17) (413)
Net charge against/(credit
to) profit 46 12 42 100 385 65 121 13 (15) 769
Provisions held at
31 December 2007 74 44 59 137 564 44 197 66 88 1,273
225
c102100pu025Proof7:28.3.10B/LRevision:0OperatorSadK

2008
Asia Pacific
Hong KongRs.million
SingaporeRs.million
MalaysiaRs.million
KoreaRs.million
Other AsiaPacific
Rs.millionIndia
Rs.million
Middle East& Other
S AsiaRs.million
AfricaRs.million
AmericasUK &
EuropeRs.million
TotalRs.million
Provisions held at
1 January 2008 3,454 2,054 2,754 6,395 26,328 2,054 9,196 3,081 4,108 59,424
Exchange translation
differences 47 — (140) (2,007) (980) (467) (1,307) (420) (140) (5,415)
Amounts written off (4,388) (2,241) (2,474) (7,282) (18,532) (5,322) (8,309) (794) (2,894) (52,235)
Recoveries of acquisition
fair values — — — (887) (2,567) — (187) — — (3,641)
Recoveries of amounts
previously written off 1,447 700 747 93 3,361 1,074 560 — 420 8,402
Acquisitions — — — 140 1,307 — — — 700 2,147
Discount unwind (140) (47) (93) (420) (1,027) (47) (47) (47) — (1,867)
Other — — — 467 233 (47) 47 — (233) 467
New provisions 9,943 1,821 3,968 11,437 22,173 6,348 9,476 1,540 5,088 71,794
Recoveries/provisions no
longer required (2,707) (1,354) (2,101) (747) (4,715) (1,540) (1,494) (840) (1,774) (17,272)
Net charge against profit 7,235 467 1,867 10,690 17,458 4,808 7,982 700 3,314 54,522
Provisions held at
31 December 2008 7,656 934 2,661 7,189 25,581 2,054 7,936 2,521 5,275 61,804
2007
Asia Pacific
Hong KongRs.million
SingaporeRs.million
MalaysiaRs.million
KoreaRs.million
Other AsiaPacific
Rs.millionIndia
Rs.million
Middle East& Other
S AsiaRs.million
AfricaRs.million
AmericasUK &
EuropeRs.million
TotalRs.million
Provisions held at
1 January 2007 7,422 3,921 4,295 13,304 29,175 1,821 8,216 3,174 7,189 78,516
Exchange translation
differences — 93 233 (47) 280 233 (140) 233 47 934
Amounts written off (7,515) (2,894) (4,295) (5,975) (21,846) (3,921) (5,368) (887) (2,521) (55,222)
Recoveries of acquisition
fair values — — — (4,575) — — — — — (4,575)
Recoveries of amounts
previously written off 1,587 560 747 — 1,961 887 560 47 140 6,489
Discount unwind (187) (187) (187) (980) (1,307) (47) (47) (93) (47) (3,081)
Other — — — — 93 47 327 — — 467
New provisions 5,275 2,427 5,088 5,555 22,593 4,575 7,936 1,634 93 55,176
Recoveries/provisions no
longer required (3,128) (1,867) (3,128) (887) (4,621) (1,540) (2,287) (1,027) (794) (19,279)
Net charge against/(credit
to) profit 2,147 560 1,961 4,668 17,972 3,034 5,648 607 (700) 35,897
Provisions held at
31 December 2007 3,454 2,054 2,754 6,395 26,328 2,054 9,196 3,081 4,108 59,424
226
c102100pu025Proof7:28.3.10B/LRevision:0OperatorSadK
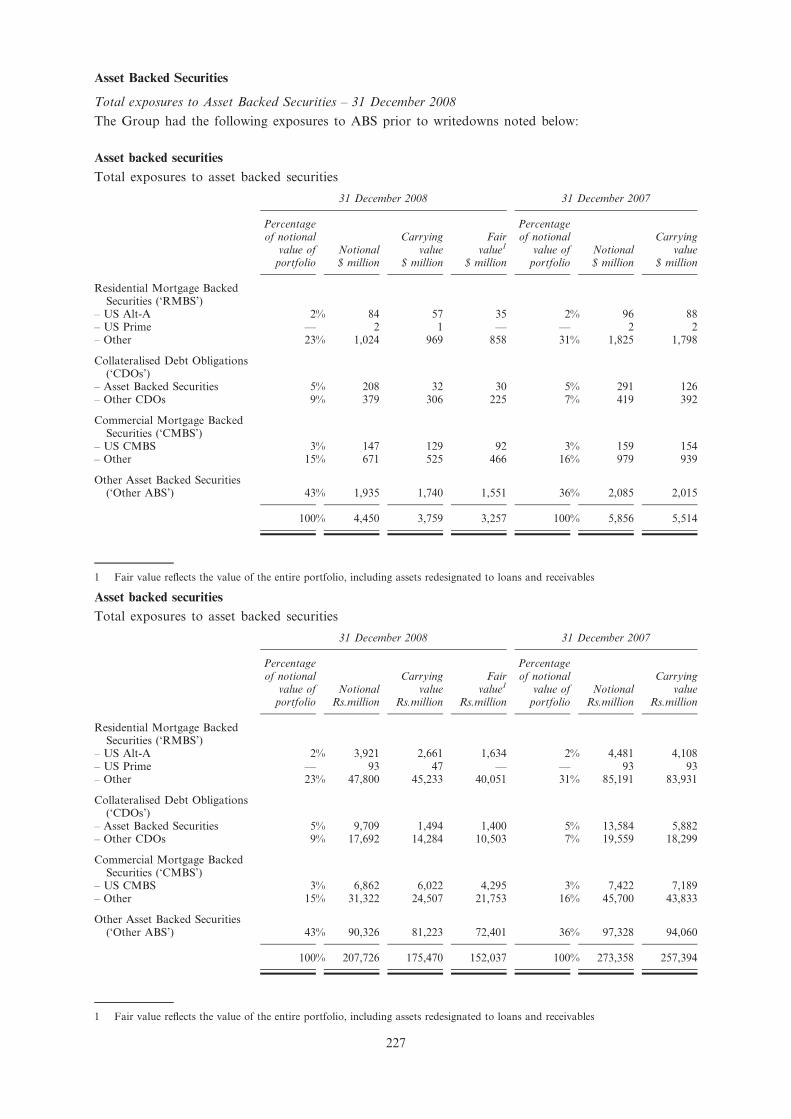
Asset Backed Securities
Total exposures to Asset Backed Securities – 31 December 2008
The Group had the following exposures to ABS prior to writedowns noted below:
Asset backed securities
Total exposures to asset backed securities
31 December 2008 31 December 2007
Percentageof notional
value ofportfolio
Notional$ million
Carryingvalue
$ million
Fairvalue1
$ million
Percentageof notional
value ofportfolio
Notional$ million
Carryingvalue
$ million
Residential Mortgage BackedSecurities (‘RMBS’)
– US Alt-A 2% 84 57 35 2% 96 88– US Prime — 2 1 — — 2 2– Other 23% 1,024 969 858 31% 1,825 1,798
Collateralised Debt Obligations(‘CDOs’)
– Asset Backed Securities 5% 208 32 30 5% 291 126– Other CDOs 9% 379 306 225 7% 419 392
Commercial Mortgage BackedSecurities (‘CMBS’)
– US CMBS 3% 147 129 92 3% 159 154– Other 15% 671 525 466 16% 979 939
Other Asset Backed Securities(‘Other ABS’) 43% 1,935 1,740 1,551 36% 2,085 2,015
100% 4,450 3,759 3,257 100% 5,856 5,514
1 Fair value reflects the value of the entire portfolio, including assets redesignated to loans and receivables
Asset backed securities
Total exposures to asset backed securities
31 December 2008 31 December 2007
Percentageof notional
value ofportfolio
NotionalRs.million
Carryingvalue
Rs.million
Fairvalue1
Rs.million
Percentageof notional
value ofportfolio
NotionalRs.million
Carryingvalue
Rs.million
Residential Mortgage BackedSecurities (‘RMBS’)
– US Alt-A 2% 3,921 2,661 1,634 2% 4,481 4,108– US Prime — 93 47 — — 93 93– Other 23% 47,800 45,233 40,051 31% 85,191 83,931
Collateralised Debt Obligations(‘CDOs’)
– Asset Backed Securities 5% 9,709 1,494 1,400 5% 13,584 5,882– Other CDOs 9% 17,692 14,284 10,503 7% 19,559 18,299
Commercial Mortgage BackedSecurities (‘CMBS’)
– US CMBS 3% 6,862 6,022 4,295 3% 7,422 7,189– Other 15% 31,322 24,507 21,753 16% 45,700 43,833
Other Asset Backed Securities(‘Other ABS’) 43% 90,326 81,223 72,401 36% 97,328 94,060
100% 207,726 175,470 152,037 100% 273,358 257,394
1 Fair value reflects the value of the entire portfolio, including assets redesignated to loans and receivables
227
c102100pu025Proof7:28.3.10B/LRevision:0OperatorSadK

The carrying value of asset backed securities represents 0.9% (31 December 2007: 1.7%) of the
Group’s total assets. The credit quality of the asset backed securities portfolio remains strong. With
the exception of those securities which have been subject to an impairment charge, 81% of the overall
portfolio is rated A, or better, and 67% of the overall portfolio is rated as AAA. The portfolio isbroadly diversified across asset classes and geographies, and there is no direct exposure to the US
sub-prime market. 25% of the overall portfolio is invested in RMBS, with a weighted average credit
rating of AA+. 58% of the residential mortgage exposures were originated in 2005 or earlier. 14% of
the overall portfolio is in CDOs. This includes $208 million of exposures to Mezzanine and High
Grade CDOs of ABS, of which $173 million have been impaired. The remainder of the CDOs have a
weighted average credit rating of AA+.
18% of the overall portfolio is in CMBS, of which $147 million is in respect of US CMBS with a
weighted average credit grade of AAA. The weighted average credit rating of the Other CMBS isAA. 43% of the overall portfolio is in Other ABS, which includes securities backed by credit card
receivables, bank collateralized loan obligations, future flows and student loans, with a weighted
credit rating of AA. Following an amendment to IAS 39 in 2008, the Group reclassified some of its
asset backed securities from trading and available-for-sale to loans and receivables. The securities
were reclassified at their fair value on the date of reclassification.
Writedowns of Asset Backed Securities
Trading
US$million
Available-
for-sale
US$million
Total
US$million
31 December 2008:
Charge to available-for-sale reserves — (309) (309)
Charge to the income statement (74) (90) (164)
31 December 2007:
Charge to available-for-sale reserves — (83) (83)
Charge to the income statement (44) (122) (166)
Trading
Rs.million
Available-
for-sale
Rs.million
Total
Rs.million
31 December 2008:
Charge to available-for-sale reserves — (14,424) (14,424)
Charge to the income statement (3,454) (4,201) (7,656)
31 December 2007:
Charge to available-for-sale reserves — (3,874) (3,874)
Charge to the income statement (2,054) (5,695) (7,749)
Country Risk
Cross border exposure to several of the Group’s key markets has risen significantly year on year. This
reflects the Group’s focus and continued expansion in its core countries and the execution of
underlying business strategies in these key markets. This is demonstrated by the overall exposure
increases across various businesses in China, India, Hong Kong, Singapore and the UAE.
Cross border exposure to the USA has increased as overnight positions have grown in support of the
Group’s enhanced clearing capabilities following the acquisition and integration of AEB. In Korea, a
significant portion of the overall exposure increase is due to mark-to-market increases on existingderivative positions, driven by volatility in currency exchange rates and interest rates.
Cross border exposure to countries in which the Group does not have a significant presence
predominantly relates to short dated money market and some global corporate activity. This business
is originated in the Group’s key markets, but is conducted with counterparties domiciled in the
country against which the exposure is reported, as indicated by the increased position on France.
228
c102100pu025Proof7:28.3.10B/LRevision:0OperatorSadK

The following table, based on the Group’s internal country risk reporting requirements, shows cross
border outstandings where they exceed 1% of the Group’s total assets.
2008 2007
One year
or less
US$million
Over
one year
US$million
Total
US$million
One year
or less
US$million
Over
one year
US$million
Total
US$million
USA 12,839 5,449 18,288 8,622 5,835 14,457
Korea 8,803 7,040 15,843 6,617 4,299 10,916
India 8,806 6,862 15,668 6,228 3,667 9,895
Hong Kong 9,481 4,136 13,617 7,681 3,043 10,724
Singapore 9,715 3,003 12,718 5,490 1,700 7,190
UAE 5,989 4,546 10,535 4,600 3,004 7,604
China 4,480 3,292 7,772 3,634 2,041 5,675
France 3,071 1,835 4,906 2,142 1,001 3,143
2008 2007
One year
or less
Rs.million
Over
one year
Rs.million
Total
Rs.million
One year
Rs.million
Over
one year
Rs.million
Total
Rs.million
USA 599,325 254,359 853,684 402,475 272,378 674,853
Korea 410,924 328,627 739,551 308,882 200,677 509,559India 411,064 320,318 731,382 290,723 171,176 461,899
Hong Kong 442,573 193,068 635,642 358,549 142,047 500,596
Singapore 453,496 140,180 593,676 256,273 79,356 335,629
UAE 279,567 212,207 491,774 214,728 140,227 354,955
China 209,126 153,671 362,797 169,635 95,274 264,909
France 143,354 85,658 229,012 99,989 46,727 146,715
Value at Risk
Trading, non-trading and total VaR continued to rise in 2008 as a consequence of rising market
volatility across the wider global markets. The one year observation period applied for VaR
increasingly reflected the increased volatility.
The acquisition of AEB in 2008 increased Group VaR by US$1.1 million.
From 2008, reported Group VaR reflects adjustments made for the inclusion of credit spread VaR
arising from non-trading book activity, and the exclusion of structural Group Treasury debt capital
issuance positions.
Trading and Non-trading (VaR at 97.5%, 1 day)
2008 2007
Daily value at riskAverage
US$millionHigh
US$millionLow
US$millionActual^^
US$millionAverage
US$millionHigh
US$millionLow
US$millionActual^^
US$million
Interest rate risk* 25.1 37.6 14.2 36.7 12.2 19.6 7.0 17.1Foreign exchange
risk 6.0 8.7 3.3 4.8 3.2 7.2 1.7 4.4Commodity risk 1.3 2.4 0.6 2.1 0.6 3.5 0.2 0.6Equity risk 1.4 2.4 0.5 0.8 0.6 1.9 — 1.4
Total** 31.5 ^ 42.5 ^ 17.8 41.7 12.9 20.0 7.5 18.6
229
c102100pu025Proof7:28.3.10B/LRevision:0OperatorSadK
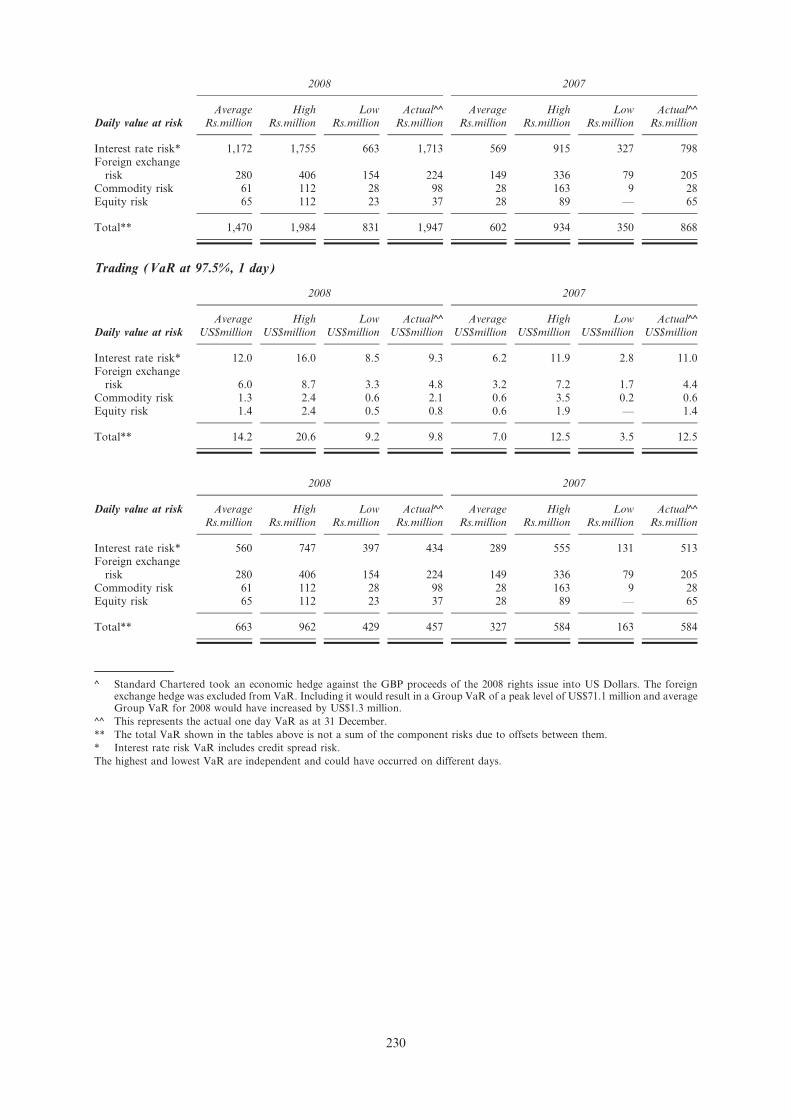
2008 2007
Daily value at riskAverage
Rs.millionHigh
Rs.millionLow
Rs.millionActual^^
Rs.millionAverage
Rs.millionHigh
Rs.millionLow
Rs.millionActual^^
Rs.million
Interest rate risk* 1,172 1,755 663 1,713 569 915 327 798Foreign exchange
risk 280 406 154 224 149 336 79 205Commodity risk 61 112 28 98 28 163 9 28Equity risk 65 112 23 37 28 89 — 65
Total** 1,470 1,984 831 1,947 602 934 350 868
Trading (VaR at 97.5%, 1 day)
2008 2007
Daily value at riskAverage
US$millionHigh
US$millionLow
US$millionActual^^
US$millionAverage
US$millionHigh
US$millionLow
US$millionActual^^
US$million
Interest rate risk* 12.0 16.0 8.5 9.3 6.2 11.9 2.8 11.0Foreign exchange
risk 6.0 8.7 3.3 4.8 3.2 7.2 1.7 4.4Commodity risk 1.3 2.4 0.6 2.1 0.6 3.5 0.2 0.6Equity risk 1.4 2.4 0.5 0.8 0.6 1.9 — 1.4
Total** 14.2 20.6 9.2 9.8 7.0 12.5 3.5 12.5
2008 2007
Daily value at risk Average High Low Actual^^ Average High Low Actual^^Rs.million Rs.million Rs.million Rs.million Rs.million Rs.million Rs.million Rs.million
Interest rate risk* 560 747 397 434 289 555 131 513Foreign exchange
risk 280 406 154 224 149 336 79 205Commodity risk 61 112 28 98 28 163 9 28Equity risk 65 112 23 37 28 89 — 65
Total** 663 962 429 457 327 584 163 584
^ Standard Chartered took an economic hedge against the GBP proceeds of the 2008 rights issue into US Dollars. The foreignexchange hedge was excluded from VaR. Including it would result in a Group VaR of a peak level of US$71.1 million and averageGroup VaR for 2008 would have increased by US$1.3 million.
^^ This represents the actual one day VaR as at 31 December.
** The total VaR shown in the tables above is not a sum of the component risks due to offsets between them.
* Interest rate risk VaR includes credit spread risk.
The highest and lowest VaR are independent and could have occurred on different days.
230
c102100pu025Proof7:28.3.10B/LRevision:0OperatorSadK

The average daily income earned from market risk related activities is as follows:
2008
US$million
2007
US$million
Interest rate risk 3.4 2.3
Foreign exchange risk 5.1 3.0
Commodity risk 0.6 0.1
Equity risk 0.0 —
Total 9.1 5.4
2008
Rs.million
2007
Rs.million
Interest rate risk 159 107
Foreign exchange risk 238 140
Commodity risk 28 5
Equity risk — —
Total 425 252
Non-trading (VaR at 97.5%, 1 day)
2008 2007
Daily value at riskAverage
US$millionHigh
US$millionLow
US$millionActual*
US$millionAverage
US$millionHigh
US$millionLow
US$millionActual*
US$million
Interest rate risk 19.8 39.6 10.6 38.8 9.5 16.8 6.5 14.7
2008 2007
Daily value at riskAverage
Rs.millionHigh
Rs.millionLow
Rs.millionActual*
Rs.millionAverage
Rs.millionHigh
Rs.millionLow
Rs.millionActual*
Rs.million
Interest rate risk 924 1,849 495 1,811 443 784 303 686
* This represents the actual one day VaR as at 31 December.
The highest and lowest VaR are independent and could have occurred on different days.
The average daily income earned from non-trading market risk related activities is as follows:
2008
US$million
2007
US$million
Interest rate risk 3.2 1.7
2008
Rs.million
2007
Rs.million
Interest rate risk 149 79
231
c102100pu025Proof7:28.3.10B/LRevision:0OperatorSadK

Liquidity Risk
Liquid assets to total assets ratio
This is the ratio of liquid assets to total assets. The level of holdings of liquid assets in the balance
sheet reflects the prudent approach of the Group’s liquidity policies and practices.
2008
%
2007
%
Liquid assets* to total assets ratio 23.1 23.9
* Liquid assets is the total of Cash (less restricted balances), net interbank, Treasury bills and Debt securities less illiquid securities.
Advances to deposit ratio
This is defined as the ratio of loans and advances to customers relative to customer deposits. A lowadvances to deposits ratio demonstrates that customer deposits exceed customer loans resulting from
emphasis placed on generating a high level of stable funding from customers.
2008
US$million
2007
US$million
Loans and advances to customer 178,512 156,982
Customer accounts 238,591 182,596
% %
Advances to deposits ratio 74.8 86.0
2008 2007
Rs.million Rs.million
Loans and advances to customer 8,332,940 7,327,920
Customer accounts 11,137,428 8,523,581
% %
Advances to deposits ratio 74.8 86.0
Capital management
The Group’s capital management approach is driven by its desire to maintain a strong capital base to
support the development of its business, to meet regulatory capital requirements at all times and to
maintain good credit ratings.
Strategic business and capital plans are drawn up annually covering a three year horizon and
approved by the board. The plan ensures that adequate levels of capital and an optimum mix of thedifferent components of capital are maintained by the Group to support the strategy. This is
integrated with the Group’s annual planning process that takes into consideration business growth
assumptions across products and geographies and the related impact on capital resources.
The capital plan takes the following into account:
* regulatory capital requirements;
* forecast demand for capital to maintain the credit ratings;
* increases in demand for capital due to business growth, market shocks or stresses;
* available supply of capital and capital raising options; and
* internal controls and governance for managing the Group’s risk, performance and capital.
The Group uses a capital model to assess the capital demand for material risks, and to support its
internal capital adequacy assessment. Each material risk is assessed, relevant mitigants considered, and
appropriate levels of capital determined. The capital model is a key part of the Group’s management
disciplines.
232
c102100pu025Proof7:28.3.10B/LRevision:0OperatorSadK

A strong governance and process framework is embedded in the capital planning and assessment
methodology. Overall responsibility for the effective management of risk rests with the Group’s
board. The ARC reviews specific risk areas and reviews the issues discussed at the key capital
management committees. The GALCO has set internal triggers and target ranges for capitalmanagement, and oversees adherence with these.
Compliance with Capital Adequacy Regulations
The Group’s lead supervisor is the FSA. The capital that the Group is required to hold by the FSA
is determined by its balance sheet, off-balance sheet and market risk positions weighted according to
the type of counterparty instrument and collateral held. Further detail on counterparty and market
risk positions is included in the Risk management section on pages 59 to 61 of 2008 Annual Report.
Capital in branches and subsidiaries is maintained on the basis of host regulator’s requirements.
Processes are in place to ensure compliance with local regulatory ratios in all entities. The Group has
put in place processes and controls to monitor and manage capital adequacy, and no breaches were
reported during the year.
The table on page 65 of the Annual Report 2008 summarises the capital position of the Group. Theprincipal forms of capital are included in the following balances on the consolidated balance sheet:
share capital and reserves (called-up ordinary share capital and preference shares, and eligible
reserves), subordinated liabilities (innovative Tier 1 securities and qualifying subordinated liabilities),
and loans to banks and customers (portfolio impairment provision).
Movement in capital
On a Basel II basis, total capital increased by $1,328 million during the year. The rights issue
completed in December 2008 increased ordinary share capital by $2,680 million. The issuance of
preference shares in May and September 2008 increased capital by $925 million. Qualifying
subordinated liabilities increased following the issue of £700 million, c400 million, KRW350 billion,SGD450m million and JPY10 billion of Lower Tier 2 subordinated debt. The increase attributable to
qualifying securities is offset by the repurchase of $1,025 million Upper Tier 2 capital which took
place in December 2008.
Basel II
The Basel Committee on Banking Supervision published a framework for International Convergence
of Capital Measurement and Capital Standards (commonly referred to as ‘Basel II’), which replaced
the original 1988 Basel I Accord. Basel II is structured around three ‘pillars’:
* Pillar 1 sets out minimum regulatory capital requirements - the minimum amount of regulatory
capital banks must hold against the risks they assume;
* Pillar 2 sets out the key principles for supervisory review of a bank’s risk management
framework and its capital adequacy. It sets out specific oversight responsibilities for the boardand senior management, thus reinforcing principles of internal control and other corporate
governance practices; and
* Pillar 3 aims to bolster market discipline through enhanced disclosure by banks.
Basel II provides three approaches of increasing sophistication to the calculation of credit risk capital;
the Standardised Approach, the Foundation Internal Ratings Based Approach and the Advanced
Internal Ratings Based Approach. Basel II also introduces capital requirements for operational risk
for the first time.
The EU Capital Requirements Directive (CRD) is the means by which Basel II has been implemented
in the EU. EU Member States were required to bring implementing provisions into force by 1 January
2007. In the case of the provisions relating to advanced approaches for credit risk and operationalrisk, implementation commenced from 1 January 2008. In the UK the CRD is implemented by the
FSA through its General Prudential Sourcebook (GENPRU) and BIPRU.
From 1 January 2008 the Group has been using the Advanced Internal Ratings Based Approach for
the measurement of credit risk capital. This approach builds on the Group’s risk management
practices and is the result of a significant investment in data warehouse and risk models.
The Group applies a VaR model for the measurement of market risk capital in accordance with the
scope of the permission to use such a model granted by the FSA. Where the Group’s market risk
233
c102100pu025Proof7:28.3.10B/LRevision:0OperatorSadK

exposures are not approved for inclusion in its VaR model, capital requirements are based on
standard rules provided by the regulator which are less risk sensitive.
The Group applied the Standardised Approach for determining the capital requirements for
operational risk.
During the initial years of Basel II implementation, the minimum capital requirements must not be
less than 90% of Basel I capital requirements in 2008 reducing to 80% in 2009.
The GALCO targets Tier 1 and total capital ratios within a range of seven to nine per cent and 12
to 14% respectively.
234
c102100pu025Proof7:28.3.10B/LRevision:0OperatorSadK

Basel II Basel I
2008
$million
2007*
$million
2007*
$million
Tier 1 capital:
Called-up ordinary share capital and preference shares 12,478 8,915 8,915
Eligible reserves** 11,191 11,502 11,382Minority interests 228 271 271
Innovative Tier 1 securities 1,974 2,338 2,338
Less: restriction on Innovative Tier 1 securities — — —
Less: excess expected losses** (483) (221) —
Goodwill and other intangible assets (6,361) (6,374) (6,374)
Unconsolidated associated companies — — 283
Other regulatory adjustments 5 (17) (19)
Total Tier 1 capital 19,032 16,414 16,796
Tier 2 capital:
Eligible revaluation reserves 107 927 927
Portfolio impairment provision 251 153 536Less: excess expected losses** (483) (221) —
Qualifying subordinated liabilities:
Perpetual subordinated debt 1,823 3,394 3,394
Other eligible subordinated debt 10,520 8,764 8,764
Less: amortisation of qualifying subordinated liabilities (1,126) (1,037) (1,037)
Total Tier 2 capital 11,092 11,980 12,584
Investments in other banks (431) (136) (136)
Other deductions (251) (144) (511)
Total deductions from Tier 1 and Tier 2 capital (682) (280) (647)
Total capital base 29,442 28,114 28,733
Risk weighted assets#
Credit risk 161,276 162,995 163,437
Operational risk 18,340 13,963 —
Market risk 9,205 8,396 8,396
Total risk weighted assets# 188,821 185,354 171,833
Capital ratios
Core Tier 1 capital# 7.6% 6.6% 7.2%
Tier 1 capital# 10.1% 8.8% 9.8%
Total capital ratio# 15.6% 15.2% 16.7%
Core Tier 1 capital#
Total Tier 1 capital 19,032 16,414 16,796
Less:
Innovative Tier 1 securities (1,974) (2,338) (2,338)
Preference shares (2,664) (1,847) (1,847)
Other deductions — — (282)
Total core Tier 1# 14,394 12,229 12,329
* Amounts have been restated as explained in note 53 on page 163 of Annual Report 2008.
** Excess expected losses are shown gross. The tax benefit on excess expected losses is included in eligible reserves.
235
c102100pu025Proof7:28.3.10B/LRevision:0OperatorSadK

Basel II Basel I
2008
Rs million
2007*
Rs million
2007*
Rs million
Tier 1 capital:
Called-up ordinary share capital and preference shares 582,473 416,152 416,152
Eligible reserves** 522,396 536,913 531,312Minority interests 10,643 12,650 12,650
Innovative Tier 1 securities 92,146 109,138 109,138
Less: restriction on Innovative Tier 1 securities — — —
Less: excess expected losses** (22,546) (10,316) —
Goodwill and other intangible assets (296,931) (297,538) (297,538)
Unconsolidated associated companies — — 13,210
Other regulatory adjustments 233 (794) (887)
Total Tier 1 capital 888,414 766,206 784,037
Tier 2 capital:
Eligible revaluation reserves 4,995 43,272 43,272
Portfolio impairment provision 11,717 7,142 25,020
Less: excess expected losses** (22,546) (10,316) —
Qualifying subordinated liabilities:
Perpetual subordinated debt 85,098 158,432 158,432
Other eligible subordinated debt 491,074 409,104 409,104Less: amortisation of qualifying subordinated liabilities (52,562) (48,407) (48,407)
Total Tier 2 capital 517,775 559,226 587,421
Investments in other banks (20,119) (6,348) (6,348)
Other deductions (11,717) (6,722) (23,853)
Total deductions from Tier 1 and Tier 2 capital (31,836) (13,070) (30,202)
Total capital base 1,374,353 1,312,362 1,341,256
Risk weighted assets#
Credit risk 7,528,364 7,608,607 7,629,239
Operational risk 856,111 651,793 —
Market risk 429,689 391,925 391,925
Total risk weighted assets# 8,814,164 8,652,325 8,021,164
Capital ratios
Core Tier 1 capital# 7.6% 6.6% 7.2%
Tier 1 capital# 10.1% 8.8% 9.8%
Total capital ratio# 15.6% 15.2% 16.7%
Core Tier 1 capital#
Total Tier 1 capital 888,414 766,206 784,037
Less:
Innovative Tier 1 securities (92,146) (109,138) (109,138)
Preference shares (124,356) (86,218) (86,218)
Other deductions — — (13,164)
Total core Tier 1# 671,912 570,850 575,518
* Amounts have been restated as explained in note 53 on page 163 of Annual Report 2008.
** Excess expected losses are shown gross. The tax benefit on excess expected losses is included in eligible reserves.
236
c102100pu025Proof7:28.3.10B/LRevision:0OperatorSadK

Contingent liabilities and commitments
The table below shows the contract or underlying principal amounts, credit equivalent amounts and
risk weighted amounts of unmatured off-balance sheet transactions at the balance sheet date. Thecontract or underlying principal amounts indicate the volume of business outstanding and do not
represent amounts at risk.
31.12.09
US$million
31.12.08
US$million
31.12.07
US$million
Contingent liabilities1:
Guarantees and irrevocable letters of credit 28,731 28,051 25,681
Other contingent liabilities 9,927 11,494 8,038
38,658 39,545 33,719
Commitments1:
Documentary credits and short term trade-related transactions 6,695 5,270 6,504Forward asset purchases and forward deposits placed 874 40 64
Undrawn formal standby facilities, credit lines and other
commitments to lend:
One year and over 20,616 14,450 13,888
Less than one year 20,729 14,903 18,260
Unconditionally cancellable 45,344 42,388 45,279
94,258 77,051 83,995
Risk weighted amount:
Contingent liabilities 13,422 12,8272 16,3853
Commitments 8,856 6,9672 7,1943
1 Includes amounts relating to the Group’s share of its joint ventures.
2 Amounts have been adjusted to present consistently with 2009 as a result of continuing refinement in Basel II. This has not had animpact on the Group’s total risk weighted assets.
3 On a Basel I basis.
237
c102100pu025Proof7:28.3.10B/LRevision:0OperatorSadK

31.12.09
Rs.million
31.12.08
Rs.million
31.12.07
Rs.million
Contingent liabilities1:
Guarantees and irrevocable letters of credit 1,341,163 1,309,421 1,198,789
Other contingent liabilities 463,392 536,540 375,214
1,804,555 1,845,961 1,574,003
Commitments1:Documentary credits and short term trade-related transactions 312,523 246,004 303,607
Forward asset purchases and forward deposits placed 40,798 1,867 2,988
Undrawn formal standby facilities, credit lines and other
commitments to lend:
One year and over 962,355 674,526 648,292
Less than one year 967,630 695,672 852,377
Unconditionally cancellable 2,116,658 1,978,672 2,113,624
4,399,963 3,596,741 3,920,887
Risk weighted amount:
Contingent liabilities 626,539 5,987,737 764,852
Commitments 413,398 3,252,289 335,816
1 Includes amounts relating to the Group’s share of its joint ventures.
2 Amounts have been adjusted to present consistently with 2009 as a result of continuing refinement in Basel II. This has not had animpact on the Group’s total risk weighted assets.
3 On a Basel I basis.
Derivative financial instruments
Derivatives are financial instruments that derive their value in response to changes in interest rates,
financial instrument prices, commodity prices, foreign exchange rates, credit risk and indices. The
types of derivatives used by the Group are set out below.
All derivatives are classified as trading and recognised and subsequently measured at fair value, with
all revaluation gains recognised in profit and loss (except where cash flow or net investment hedging
has been achieved, in which case the effective portion of changes in fair value is recognised within
reserves).
These tables analyse the notional principal amounts and the positive and negative fair values of the
Group’s derivative financial instruments. Notional principal amounts are the amount of principal
underlying the contract at the reporting date.
238
c102100pu025Proof7:28.3.10B/LRevision:0OperatorSadK
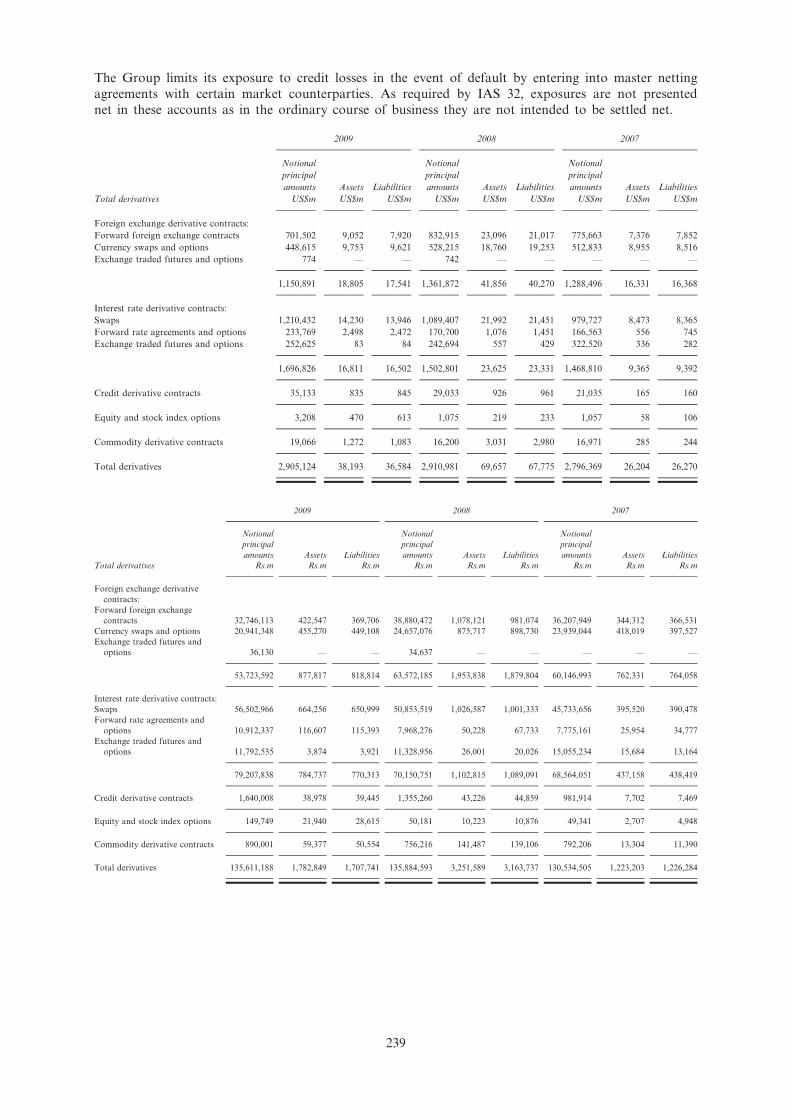
The Group limits its exposure to credit losses in the event of default by entering into master netting
agreements with certain market counterparties. As required by IAS 32, exposures are not presented
net in these accounts as in the ordinary course of business they are not intended to be settled net.
2009 2008 2007
Total derivatives
Notional
principal
amounts
US$m
Assets
US$m
Liabilities
US$m
Notional
principal
amounts
US$m
Assets
US$m
Liabilities
US$m
Notional
principal
amounts
US$m
Assets
US$m
Liabilities
US$m
Foreign exchange derivative contracts:
Forward foreign exchange contracts 701,502 9,052 7,920 832,915 23,096 21,017 775,663 7,376 7,852
Currency swaps and options 448,615 9,753 9,621 528,215 18,760 19,253 512,833 8,955 8,516
Exchange traded futures and options 774 — — 742 — — — — —
1,150,891 18,805 17,541 1,361,872 41,856 40,270 1,288,496 16,331 16,368
Interest rate derivative contracts:
Swaps 1,210,432 14,230 13,946 1,089,407 21,992 21,451 979,727 8,473 8,365
Forward rate agreements and options 233,769 2,498 2,472 170,700 1,076 1,451 166,563 556 745
Exchange traded futures and options 252,625 83 84 242,694 557 429 322,520 336 282
1,696,826 16,811 16,502 1,502,801 23,625 23,331 1,468,810 9,365 9,392
Credit derivative contracts 35,133 835 845 29,033 926 961 21,035 165 160
Equity and stock index options 3,208 470 613 1,075 219 233 1,057 58 106
Commodity derivative contracts 19,066 1,272 1,083 16,200 3,031 2,980 16,971 285 244
Total derivatives 2,905,124 38,193 36,584 2,910,981 69,657 67,775 2,796,369 26,204 26,270
2009 2008 2007
Total derivatives
Notional
principal
amounts
Rs.m
Assets
Rs.m
Liabilities
Rs.m
Notional
principal
amounts
Rs.m
Assets
Rs.m
Liabilities
Rs.m
Notional
principal
amounts
Rs.m
Assets
Rs.m
Liabilities
Rs.m
Foreign exchange derivative
contracts:
Forward foreign exchange
contracts 32,746,113 422,547 369,706 38,880,472 1,078,121 981,074 36,207,949 344,312 366,531
Currency swaps and options 20,941,348 455,270 449,108 24,657,076 875,717 898,730 23,939,044 418,019 397,527
Exchange traded futures and
options 36,130 — — 34,637 — — — — —
53,723,592 877,817 818,814 63,572,185 1,953,838 1,879,804 60,146,993 762,331 764,058
Interest rate derivative contracts:
Swaps 56,502,966 664,256 650,999 50,853,519 1,026,587 1,001,333 45,733,656 395,520 390,478
Forward rate agreements and
options 10,912,337 116,607 115,393 7,968,276 50,228 67,733 7,775,161 25,954 34,777
Exchange traded futures and
options 11,792,535 3,874 3,921 11,328,956 26,001 20,026 15,055,234 15,684 13,164
79,207,838 784,737 770,313 70,150,751 1,102,815 1,089,091 68,564,051 437,158 438,419
Credit derivative contracts 1,640,008 38,978 39,445 1,355,260 43,226 44,859 981,914 7,702 7,469
Equity and stock index options 149,749 21,940 28,615 50,181 10,223 10,876 49,341 2,707 4,948
Commodity derivative contracts 890,001 59,377 50,554 756,216 141,487 139,106 792,206 13,304 11,390
Total derivatives 135,611,188 1,782,849 1,707,741 135,884,593 3,251,589 3,163,737 130,534,505 1,223,203 1,226,284
239
c102100pu025Proof7:28.3.10B/LRevision:0OperatorSadK
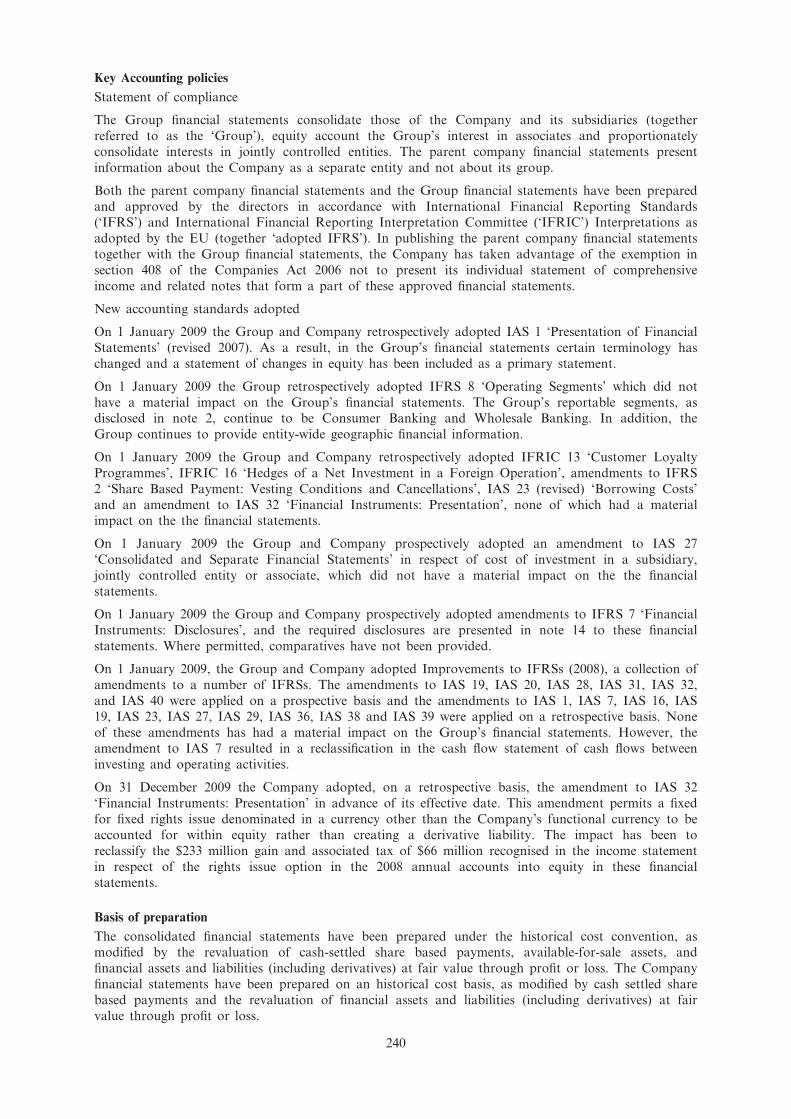
Key Accounting policies
Statement of compliance
The Group financial statements consolidate those of the Company and its subsidiaries (together
referred to as the ‘Group’), equity account the Group’s interest in associates and proportionately
consolidate interests in jointly controlled entities. The parent company financial statements present
information about the Company as a separate entity and not about its group.
Both the parent company financial statements and the Group financial statements have been prepared
and approved by the directors in accordance with International Financial Reporting Standards(‘IFRS’) and International Financial Reporting Interpretation Committee (‘IFRIC’) Interpretations as
adopted by the EU (together ‘adopted IFRS’). In publishing the parent company financial statements
together with the Group financial statements, the Company has taken advantage of the exemption in
section 408 of the Companies Act 2006 not to present its individual statement of comprehensive
income and related notes that form a part of these approved financial statements.
New accounting standards adopted
On 1 January 2009 the Group and Company retrospectively adopted IAS 1 ‘Presentation of Financial
Statements’ (revised 2007). As a result, in the Group’s financial statements certain terminology has
changed and a statement of changes in equity has been included as a primary statement.
On 1 January 2009 the Group retrospectively adopted IFRS 8 ‘Operating Segments’ which did not
have a material impact on the Group’s financial statements. The Group’s reportable segments, asdisclosed in note 2, continue to be Consumer Banking and Wholesale Banking. In addition, the
Group continues to provide entity-wide geographic financial information.
On 1 January 2009 the Group and Company retrospectively adopted IFRIC 13 ‘Customer Loyalty
Programmes’, IFRIC 16 ‘Hedges of a Net Investment in a Foreign Operation’, amendments to IFRS
2 ‘Share Based Payment: Vesting Conditions and Cancellations’, IAS 23 (revised) ‘Borrowing Costs’
and an amendment to IAS 32 ‘Financial Instruments: Presentation’, none of which had a materialimpact on the the financial statements.
On 1 January 2009 the Group and Company prospectively adopted an amendment to IAS 27
‘Consolidated and Separate Financial Statements’ in respect of cost of investment in a subsidiary,
jointly controlled entity or associate, which did not have a material impact on the the financial
statements.
On 1 January 2009 the Group and Company prospectively adopted amendments to IFRS 7 ‘Financial
Instruments: Disclosures’, and the required disclosures are presented in note 14 to these financial
statements. Where permitted, comparatives have not been provided.
On 1 January 2009, the Group and Company adopted Improvements to IFRSs (2008), a collection of
amendments to a number of IFRSs. The amendments to IAS 19, IAS 20, IAS 28, IAS 31, IAS 32,
and IAS 40 were applied on a prospective basis and the amendments to IAS 1, IAS 7, IAS 16, IAS19, IAS 23, IAS 27, IAS 29, IAS 36, IAS 38 and IAS 39 were applied on a retrospective basis. None
of these amendments has had a material impact on the Group’s financial statements. However, the
amendment to IAS 7 resulted in a reclassification in the cash flow statement of cash flows between
investing and operating activities.
On 31 December 2009 the Company adopted, on a retrospective basis, the amendment to IAS 32
‘Financial Instruments: Presentation’ in advance of its effective date. This amendment permits a fixed
for fixed rights issue denominated in a currency other than the Company’s functional currency to beaccounted for within equity rather than creating a derivative liability. The impact has been to
reclassify the $233 million gain and associated tax of $66 million recognised in the income statement
in respect of the rights issue option in the 2008 annual accounts into equity in these financial
statements.
Basis of preparation
The consolidated financial statements have been prepared under the historical cost convention, asmodified by the revaluation of cash-settled share based payments, available-for-sale assets, and
financial assets and liabilities (including derivatives) at fair value through profit or loss. The Company
financial statements have been prepared on an historical cost basis, as modified by cash settled share
based payments and the revaluation of financial assets and liabilities (including derivatives) at fair
value through profit or loss.
240
c102100pu025Proof7:28.3.10B/LRevision:0OperatorSadK

The preparation of financial statements in conformity with adopted IFRS requires the use of certain
critical accounting estimates. It also requires management to exercise its judgement in the process of
applying the Group’s accounting policies.
The accounting policies set out below have been applied consistently across the Group and to all
periods presented in these financial statements.
Consolidation
Subsidiaries
Subsidiaries are all entities, including special purpose entities (‘SPEs’), over which the Group has thepower to directly or indirectly govern the financial and operating policies, generally accompanying a
shareholding of more than one half of the voting rights. Subsidiaries are fully consolidated from the
date on which the Group effectively obtains control. They are de-consolidated from the date that
control ceases.
SPEs are consolidated when the substance of the relationship between the Group and its entity
indicates the control by the Group. Potential indicators of control include amongst others, an
assessment of risks and benefits in respect of the SPE’s activities.
The purchase method of accounting is used to account for the acquisition of subsidiaries by the
Group. The cost of an acquisition is measured as the fair value of the assets given, equity instruments
issued and liabilities incurred or assumed at the date of exchange, together with costs directly
attributable to the acquisition. Identifiable net assets and contingent liabilities acquired are fair valued
at the acquisition date.The excess of the cost of acquisition over the fair value of the Group’s share
of the identifiable net assets and contingent liabilities acquired is recorded as goodwill. If the cost of
acquisition is less than the fair value of the net assets and contingent liabilities of the subsidiary
acquired, the difference is recognised directly in the income statement. Where the fair values of theidentifiable net assets and contingent liabilities acquired have been determined provisionally, or where
contingent or deferred consideration is payable, any adjustments arising from their subsequent
finalisation are made as of the date of acquisition and amounts restated as appropriate.
Inter-company transactions, balances and unrealised gains and losses on transactions between Group
companies are eliminated in the Group accounts.
Associates
Associates are all entities over which the Group has the ability to significantly influence, but not
control, the financial and operating policies and procedures generally accompanying a shareholding of
between 20% and 50% of the voting rights.
Investments in associates are accounted for by the equity method of accounting and are initially
recognised at cost.
The Group’s investment in associates includes goodwill identified on acquisition (net of any
accumulated impairment loss).
The Group’s share of its associates’ post-acquisition profits or losses is recognised in the income
statement, and its share of post-acquisition movements in other comprehensive income is recognised
in reserves. The cumulative post-acquisition movements are adjusted against the carrying amount of
the investment. When the Group’s share of losses in an associate equals or exceeds its interest in the
associate, including any other unsecured receivables, the Group does not recognise further losses,
unless it has incurred obligations or made payments on behalf of the associate.
Unrealised gains and losses on transactions between the Group and its associates are eliminated to
the extent of the Group’s interest in the associates.
Joint ventures
Interests in jointly controlled entities are recognised using proportionate consolidation whereby the
Group’s share of the joint venture’s assets, liabilities, income and expenses are combined line by line
with similar items in the Group’s financial statements.
Investment in subsidiaries, associates and joint ventures
In the Company’s financial statements, investment in subsidiaries, associates and joint ventures are
held at cost less impairment and dividends from pre-acquisition profits received prior to 1 January
2009, if any.
241
c102100pu025Proof7:28.3.10B/LRevision:0OperatorSadK

Foreign currency translation
Both the parent company financial statements and the Group financial statements are presented in US
dollars, which is the presentation currency of the Group and the functional and presentation currencyof the Company.
Transactions and balances
Foreign currency transactions are translated into the functional currency using the exchange rates
prevailing at the dates of the transactions. Foreign exchange gains and losses resulting from the
settlement of such transactions, and from the translation at year-end exchange rates of monetaryassets and liabilities denominated in foreign currencies, are recognised in the income statement. Non-
monetary assets and liabilities are translated at historical exchange rates if held at historical cost, or
year-end exchange rates if held at fair value, and the resulting foreign exchange gains and losses are
recognised in either the income statement or shareholders’ equity depending on the treatment of the
gain or loss on the asset or liability.
Group companies
The results and financial position of all the entities included in the Group financial statements that
have a functional currency different from the Group’s presentation currency are accounted for as
follows:
* assets and liabilities for each balance sheet presented are translated at the closing rate at thebalance sheet date;
* income and expenses for each income statement are translated at average exchange rates or at
rates on the date of the transaction where exchange rates fluctuate significantly; and
* all resulting exchange differences arising since 1 January 2004 are recognised as a separate
component of equity.
On consolidation, exchange differences arising from the translation of the net investment in foreign
entities, and of borrowings and other currency instruments designated as hedges of such investments,
are taken to other comprehensive income. When a foreign operation is sold or capital repatriated theyare recognised in the income statement as part of the gain or loss on disposal.
Goodwill and fair value adjustments arising on the acquisition of a foreign entity are treated as assets
and liabilities of the foreign entity and translated at the closing rate.
Intangible assets
Goodwill
Goodwill represents the excess of the cost of an acquisition over the fair value of the Group’s share
of the identifiable net assets and contingent liabilities of the acquired subsidiary, associate or joint
venture at the date of acquisition. Goodwill on acquisitions of subsidiaries and joint ventures isincluded in ‘Intangible assets’. Goodwill on acquisitions of associates is included in ‘Investments in
associates’. Goodwill included in intangible assets is assessed at each balance sheet date for
impairment and carried at cost less any accumulated impairment losses. Gains and losses on the
disposal of an entity include the carrying amount of goodwill relating to the entity sold. Goodwill is
allocated to cash-generating units for the purpose of impairment testing. Cash generating units
represent the lowest level within the Group at which the goodwill is monitored for internal
management purposes. These are smaller than the Group’s reportable segments (as set out in note 2)
as the Group views its reportable segments on a global basis. Note 26 sets out the major cash-generating units to which goodwill has been allocated.
Acquired intangibles
At the date of acquisition of a subsidiary or associate, intangible assets which are deemed separable
and that arise from contractual or other legal rights are capitalised and included within the net
identifiable assets acquired. These intangible assets are initially measured at fair value, which reflectsmarket expectations of the probability that the future economic benefits embodied in the asset will
flow to the entity, and are amortised on the basis of their expected useful lives (four to 16 years). At
each balance sheet date, these assets are assessed for indicators of impairment. In the event that an
asset’s carrying amount is determined to be greater than its recoverable amount, the asset is written
down immediately.
242
c102100pu025Proof7:28.3.10B/LRevision:0OperatorSadK

Computer software
Acquired computer software licences are capitalised on the basis of the costs incurred to acquire and
bring to use the specific software. Costs associated with the development of software are capitalisedwhere it is probable that it will generate future economic benefits in excess of its cost. Computer
software costs are amortised on the basis of expected useful life (three to five years). Costs associated
with maintaining software are recognised as an expense as incurred. At each balance sheet date, these
assets are assessed for indicators of impairment. In the event that an asset’s carrying amount is
determined to be greater than its recoverable amount, the asset is written down immediately.
Property, plant and equipment
Land and buildings comprise mainly branches and offices. All property, plant and equipment is stated
at cost less accumulated depreciation and impairment losses. Cost includes expenditure that is directly
attributable to the acquisition of the assets.
Subsequent costs are included in the asset’s carrying amount or are recognised as a separate asset, as
appropriate, only when it is probable that future economic benefits associated with the item will flow
to the Group and the cost of the item can be measured reliably. All other repairs and maintenanceare charged to the income statement during the financial period in which they are incurred.
Freehold land is not depreciated although it is subject to impairment testing. Depreciation on other
assets is calculated using the straight-line method to allocate their cost to their residual values over
their estimated useful lives, as follows:
Buildings up to 50 years
Leasehold improvements life of lease, up to 50 years
Equipment and motor vehicles three to 15 years
The assets’ residual values and useful lives are reviewed, and adjusted if appropriate, at each balance
sheet date. At each balance sheet date, assets are also assessed for indicators of impairment. In the
event that an asset’s carrying amount is determined to be greater than its recoverable amount, the
asset is written down immediately to the recoverable amount.
Gains and losses on disposals are included in the income statement.
Leases
Where a Group company is the lessee
The leases entered into by the Group are primarily operating leases. The total payments made under
operating leases are charged to the income statement on a straight-line basis over the period of thelease.
When an operating lease is terminated before the lease period has expired, any payment required to
be made to the lessor by way of penalty is recognised as an expense in the period in which
termination takes place.
Where the Group is a lessee under finance leases, the leased assets are capitalised and included in
‘Property, plant and equipment’ with a corresponding liability to the lessor recognised in ‘Otherliabilities’. Finance charges payable are recognised over the period of the lease based on the interest
rate implicit in the lease to give a constant periodic rate of return.
Where a Group company is the lessor
When assets are leased to customers under finance leases, the present value of the lease payments is
recognised as a receivable. The difference between the gross receivable and the present value of thereceivable is recognised as unearned finance income. Lease income is recognised over the term of the
lease using the net investment method (before tax), which reflects a constant periodic rate of return
ignoring tax cash flows.
Assets leased to customers under operating leases are included within ‘Property, plant and equipment’
and depreciated over their useful lives. Rental income on these leased assets is recognised in the
income statement on a straight-line basis unless another systematic basis is more representative.
Cash and cash equivalents
For the purposes of the cash flow statement, cash and cash equivalents comprise cash, on demand
and overnight balances with central banks (unless restricted) and balances with less than three months
243
c102100pu025Proof7:28.3.10B/LRevision:0OperatorSadK

maturity from the date of acquisition, including: treasury bills and other eligible bills, loans and
advances to banks, and short-term government securities.
Provisions
Provisions for restructuring costs and legal claims are recognised when the Group has a present legal
or constructive obligation as a result of past events; it is more likely than not that an outflow of
resources will be required to settle the obligation and the amount can be reliably estimated.
Employee benefits
Pension obligations
The Group operates a number of pension and other post-retirement benefit plans around the world,including defined contribution plans and defined benefit plans.
For defined contribution plans, the Group pays contributions to publicly or privately administered
pension plans on a mandatory, contractual or voluntary basis, and such amounts are charged to
operating expenses. The Group has no further payment obligations once the contributions have been
paid.
For funded defined benefit plans, the liability recognised in the balance sheet is the present value of
the defined benefit obligation at the balance sheet date less the fair value of plan assets. Forunfunded defined benefit plans the liability recognised at the balance sheet date is the present value of
the defined benefit obligation. The defined benefit obligation is calculated annually by independent
actuaries using the projected unit method. The present value of the defined benefit obligation is
determined by discounting the estimated future cash outflows using an interest rate equal to the yield
on high-quality corporate bonds that are denominated in the currency in which the benefits will be
paid, and that have a term to maturity approximating to the term of the related pension liability.
Actuarial gains and losses that arise are recognised in shareholders’ equity and presented in the
statement of other comprehensive income in the period they arise. Past service costs are recognisedimmediately to the extent that benefits are vested and are otherwise recognised over the average
period until benefits are vested on a straight-line basis. Current service costs and any past service
costs, together with the unwinding of the discount on plan liabilities, offset by the expected return on
plan assets where applicable, are charged to operating expenses.
Share-based compensation
The Group operates equity-settled and cash-settled share-based compensation plans. The fair value of
the employee services received in exchange for the grant of the options is recognised as an expense.
For equity-settled awards, the total amount to be expensed over the vesting period is determined by
reference to the fair value of the options granted, which excludes the impact of any non-market
vesting conditions (for example, profitability and growth targets). The fair value of equity instruments
granted is based on market prices, if available, at the date of grant. In the absence of market prices,
the fair value of the instruments is estimated using an appropriate valuation technique, such as a
binomial option pricing model. Non-market vesting conditions are included in assumptions about the
number of options that are expected to vest. At each balance sheet date, the Group revises itsestimates of the number of options that are expected to vest. It recognises the impact of the revision
of original estimates, if any, in the income statement, and a corresponding adjustment to equity over
the remaining vesting period. Forfeitures prior to vesting attributable to factors other than the failure
to satisfy a non-market vesting condition are treated as a cancellation and the remaining unamortised
charge is debited to the income statement at the time of cancellation.
The proceeds received net of any directly attributable transaction costs are credited to share capital
(nominal value) and share premium when the options are exercised.
Cash-settled awards are revalued at each balance sheet date and a liability recognised on the balance
sheet for all unpaid amounts, with any changes in fair value charged or credited to staff costs in the
income statement. Where forfeitures occur prior to vesting that are attributable to factors other than
a failure to satisfy market-based performance conditions, the cumulative charge incurred up to the
date of forfeiture is credited to the income statement.
244
c102100pu025Proof7:28.3.10B/LRevision:0OperatorSadK

Taxation
Deferred tax is provided in full, using the liability method, on temporary differences arising between
the tax bases of assets and liabilities and their carrying amounts in the consolidated financialstatements. Deferred income tax is determined using tax rates (and laws) that have been enacted or
substantially enacted as at the balance sheet date, and that are expected to apply when the related
deferred income tax asset is realised or the deferred income tax liability is settled.
Deferred tax assets are recognised where it is probable that future taxable profit will be available
against which the temporary differences can be utilised.
Income tax payable on profits is based on the applicable tax law in each jurisdiction and is
recognised as an expense in the period in which profits arise. The tax effects of income tax losses
available for carry forward are recognised as an asset when it is probable that future taxable profits
will be available against which these losses can be utilised.
Current and deferred tax relating to items which are charged or credited directly to equity, is credited
or charged directly to equity and is subsequently recognised in the income statement together with the
current or deferred gain or loss.
Borrowings held at amortised cost
Borrowings are recognised initially at fair value, being their issue proceeds (fair value of consideration
received) net of directly attributable transaction costs incurred. Borrowings are subsequently stated at
amortised cost, with any difference between proceeds net of directly attributable transaction costs and
the redemption value recognised in the income statement over the period of the borrowings using the
effective interest method.
Preference shares which carry a mandatory coupon that represents a market rate of interest at theissue date, or which are redeemable on a specific date or at the option of the shareholder are
classified as financial liabilities and are presented in other borrowed funds. The dividends on these
preference shares are recognised in the income statement as interest expense on an amortised cost
basis using the effective interest method.
If the Group purchases its own debt, it is removed from the balance sheet, and the difference
between the carrying amount of the liability and the consideration paid is included in other income.
Share capital
Incremental costs directly attributable to the issue of new shares or options are shown in equity as a
deduction, net of tax, from the proceeds.
Dividends on ordinary shares and preference shares classified as equity are recognised in equity in the
period in which they are declared.
Where the Company or other members of the consolidated Group purchases the Company’s equity
share capital, the consideration paid is deducted from the total shareholders’ equity of the Group
and/or of the Company as treasury shares until they are cancelled. Where such shares are
subsequently sold or reissued, any consideration received is included in shareholders’ equity of the
Group and/or the Company.
Fiduciary activities
The Group commonly acts as trustee and in other fiduciary capacities that result in the holding or
placing of assets on behalf of individuals, trusts, retirement benefit plans and other institutions. The
assets and income arising thereon are excluded from these financial statements, as they are not assets
of the Group.
Financial assets and liabilities (excluding derivatives)
The Group classifies its financial assets into the following measurement categories: financial assets
held at fair value through to profit or loss; loans and receivables; held-to-maturity investments and
available-for-sale financial assets. Financial liabilities are classified as either held at fair value through
profit or loss, or at amortised cost. Management determines the classification of its financial assets
and liabilities at initial recognition or, where appropriate, at the time of reclassification.
245
c102100pu025Proof7:28.3.10B/LRevision:0OperatorSadK

(a) Financial assets and liabilities held at fair value through profit or loss
This category has two sub-categories: financial assets and liabilities held for trading, and those
designated at fair value through profit or loss at inception. A financial asset or liability is classified astrading if acquired principally for the purpose of selling in the short term.
Financial assets and liabilities may be designated at fair value through profit or loss when:
* the designation eliminates or significantly reduces a measurement or recognition inconsistency
that would otherwise arise from measuring assets or liabilities on a different basis; or
* a group of financial assets and/or liabilities is managed and its performance evaluated on a fair
value basis; or
* the assets or liabilities include embedded derivatives and such derivatives are required to be
recognised separately.
(b) Loans and receivables
Loans and receivables are non-derivative financial assets with fixed or determinable payments that are
not quoted in an active market and it is expected that substantially all of the initial investment will
be recovered, other than because of credit deterioration.
(c) Held-to-maturity
Held-to-maturity assets are non-derivative financial assets with fixed or determinable payments and
fixed maturities that the Group’s management has the positive intention and ability to hold to
maturity.
(d) Available-for-sale
Available-for-sale assets are those non-derivative financial assets intended to be held for an indefinite
period of time, which may be sold in response to liquidity requirements or changes in interest rates,
exchange rates, commodity prices or equity prices.
Initial recognition
Purchases and sales of financial assets and liabilities held at fair value through profit or loss, financialassets held-to-maturity and available-for-sale are initially recognised on trade-date (the date on which
the Group commits to purchase or sell the asset). Loans are recognised when cash is advanced to the
borrowers. Financial assets and financial liabilities are initially recognised at fair value plus, for those
financial assets and liabilities not carried at fair value through profit and loss, directly attributable
transaction costs. In those cases where the initially recognised fair value is based on a valuation
model that uses inputs which are not observable in the market, the difference between the transaction
price and the valuation model is not recognised immediately in the income statement. The difference
is amortised to the income statement until the inputs become observable, or the transaction maturesor is terminated.
Subsequent measurement
Financial assets and liabilities held at fair value through profit or loss are subsequently carried at fair
value, with gains and losses arising from changes in fair value taken directly to the income statement.
Available-for-sale financial assets are subsequently carried at fair value, with gains and losses arising
from changes in fair value taken to a separate component of equity until the asset is sold, or is
impaired, when the cumulative gain or loss is transferred to the income statement.
Loans and receivables and held-to-maturity financial assets are subsequently carried at amortised cost
using the effective interest method.
The fair values of quoted financial assets or financial liabilities in active markets are based on current
prices. If the market for a financial asset or financial liability is not active, and for unlisted securities,
the Group establishes fair value by using valuation techniques. These include the use of recent arm’s
length transactions, discounted cash flow analysis, option pricing models and other valuation
techniques commonly used by market participants.
Reclassifications
Reclassifications of financial assets, other than as set out below, or of financial liabilities between
categories are not permitted following their initial recognition.
246
c102100pu025Proof7:28.3.10B/LRevision:0OperatorSadK

Held for trading non-derivative financial assets can only be transferred out of the held at fair value
through profit or loss category in the following circumstances: (i) to the available-for-sale category,
where, in rare circumstances, they are no longer held for the purpose of selling or repurchasing in the
near term; or (ii) to the loan and receivables category, where they are no longer held for the purposeof selling or repurchasing in the near term and they would have met the definition of a loan and
receivable at the date of reclassification and the Group has the intent and ability to hold the assets
for the foreseeable future or until maturity.
Financial assets can only be transferred out of the available-for-sale category to the loan and
receivables category, where they would have met the definition of a loan and receivable at the date of
reclassification and the Group has the intent and ability to hold the assets for the foreseeable future
or until maturity.
Held-to-maturity assets must be reclassified to the available-for-sale category if the portfolio becomestainted following the sale of other than an insignificant amount of held-to-maturity assets prior to
their maturity.
Financial assets are reclassified at their fair value on the date of reclassification. For financial assets
reclassified out of the available-for-sale category into loans and receivables, any gain or loss on those
assets recognised in shareholders’ equity prior to the date of reclassification is amortised to the
income statement over the remaining life of the financial asset, using the effective interest method.
Renegotiated loans
Loans whose original terms have been modified are considered renegotiated loans. If the
renegotiations are on terms that are not consistent with those readily available on the market, this
provides objective evidence of impairment and the loan is assessed accordingly.
Derecognition
Financial assets are derecognised when the rights to receive cash flows from the financial assets haveexpired or where the Group has transferred substantially all risks and rewards of ownership. If
substantially all the risks and rewards have been neither retained nor transferred and the Group has
retained control, the assets continue to be recognised to the extent of the Group’s continuing
involvement. Financial liabilities are derecognised when they are extinguished.
Income recognition
For available-for-sale assets and financial assets and liabilities held at amortised cost, interest income
and interest expense is recognised in the income statement using the effective interest method.
Gains and losses arising from changes in the fair value of financial instruments at fair value through
profit or loss are included in the income statement in the period in which they arise. Contractual
interest income and expense on financial instruments held at fair value through profit or loss is
recognised within net interest income.
Gains and losses arising from changes in the fair value of available-for-sale financial assets, other
than foreign exchange gains and losses from monetary items, are recognised directly in equity, until
the financial asset is derecognised or impaired at which time the cumulative gain or loss previously
recognised in equity is recognised in profit or loss.
Dividends on equity instruments are recognised in the income statement within ‘Other income’ when
the Group’s right to receive payment is established.
Impairment of financial assets
The Group assesses at each balance sheet date whether there is objective evidence that a financial
asset or group of financial assets is impaired. A financial asset or a group of financial assets is
impaired and impairment losses are incurred if, and only if, there is objective evidence of impairmentas a result of one or more events that occurred after the initial recognition of the asset (a ‘loss
event’), and that loss event (or events) has an impact on the estimated future cash flows of the
financial asset or group of financial assets that can be reliably estimated.
The following factors are considered in assessing objective evidence of impairment:
* whether the counterparty is in default of principal or interest payments;
* a counterparty files for bankruptcy protection (or the local equivalent) where this would avoid
or delay repayment of its obligation;
247
c102100pu025Proof7:28.3.10B/LRevision:0OperatorSadK

* the Group files to have the counterparty declared bankrupt or files a similar order in respect of
a credit obligation;
* the Group consents to a restructuring of the obligation, resulting in a diminished financial
obligation, demonstrated by a material forgiveness of debt or postponement of scheduled
payments;
* the Group sells a credit obligation at a material credit-related economic loss; or
* there is observable data indicating that there is a measurable decrease in the estimated future
cash flows of a group of financial assets, although the decrease cannot yet be identified with
specific individual financial assets.
Assets carried at amortised cost
The Group first assesses whether objective evidence of impairment exists individually for financial
assets that are individually significant, and individually or collectively for financial assets that are notindividually significant.
If the Group determines that no objective evidence of impairment exists for an individually assessedfinancial asset, whether significant or not, it includes the asset in a group of financial assets with
similar credit risk characteristics and collectively assesses them for impairment. Assets that are
individually assessed for impairment and for which an impairment loss is or continues to be
recognised, are not included in a collective assessment of impairment.
If there is objective evidence that an impairment loss on a loan and receivable or a held-to-maturity
asset has been incurred, the amount of the loss is measured as the difference between the asset’s
carrying amount and the present value of estimated future cash flows (excluding future credit losses
that have not been incurred), discounted at the asset’s original effective interest rate. The carrying
amount of the asset is reduced through the use of an allowance account and the amount of the loss
is recognised in the income statement. If a loan and receivable or held-to-maturity asset has a
variable interest rate, the discount rate for measuring any impairment loss is the current effectiveinterest rate determined under the contract. As a practical expedient, the Group may measure
impairment on the basis of an instrument’s fair value using an observable market price.
The calculation of the present value of the estimated future cash flows of a collateralised financialasset reflects the cash flows that may result from foreclosure, less costs for obtaining and selling the
collateral, whether or not foreclosure is probable. For the purposes of a collective evaluation of
impairment, financial assets are grouped on the basis of similar credit risk characteristics (i.e. on the
basis of the Group’s grading process which considers asset type, industry, geographic location,
collateral type, past-due status and other relevant factors). These characteristics are relevant to the
estimation of future cash flows for groups of such assets being indicative of the debtors’ ability to
pay all amounts due according to the contractual terms of the assets being evaluated.
Future cash flows in a group of financial assets that are collectively evaluated for impairment are
estimated on the basis of the historical loss experience for assets with credit risk characteristics similar
to those in the group. Historical loss experience is adjusted on the basis of current observable data toreflect the effects of current conditions that did not affect the period on which the historical loss
experience is based, and to remove the effects of conditions in the historical period that do not exist
currently.
To the extent a loan is irrecoverable, it is written off against the related provision for loan
impairment. Such loans are written off after all the necessary procedures have been completed, it is
decided that there is no realistic probability of recovery and the amount of the loss has been
determined. Subsequent recoveries of amounts previously written off decrease the amount of the
provision for loan impairment in the income statement. If, in a subsequent period, the amount of the
impairment loss decreases and the decrease can be related objectively to an event occurring after the
impairment was recognised (such as an improvement in the debtor’s credit rating), the previously
recognised impairment loss is reversed by adjusting the allowance account. The amount of thereversal is recognised in the income statement.
Available-for-sale assets
A significant or prolonged decline in the fair value of an equity security below its cost is considered
amongst other factors in assessing objective evidence of impairment for equity securities. Where
objective evidence of impairment exists for available-for-sale financial assets, the cumulative loss
248
c102100pu025Proof7:28.3.10B/LRevision:0OperatorSadK

(measured as the difference between the amortised cost and the current fair value, less any
impairment loss on that financial asset previously recognised in the income statement) is removed
from equity and recognised in the income statement. If, in a subsequent period, the fair value of a
debt instrument classified as available-for-sale increases and the increase can be objectively related toan event occurring after the impairment loss was recognised, the impairment loss is reversed through
the income statement. Impairment losses recognised in the income statement on equity instruments are
not reversed through the income statement.
Derivative financial instruments and hedge accounting
Derivatives are categorised as trading unless they are designated as hedging instruments.
Derivative contracts are initially recognised at fair value on the date on which a derivative contract is
entered into and are subsequently remeasured at their fair value. Fair values may be obtained from
quoted market prices in active markets, recent market transactions, and valuation techniques,
including discounted cash flow models and option pricing models, as appropriate. Where the initially
recognised fair value of a derivative contract is based on a valuation model that uses inputs whichare not observable in the market, it follows the same initial recognition accounting policy as for other
financial assets and liabilities. All derivatives are carried as assets when fair value is positive and as
liabilities when fair value is negative.
Certain derivatives embedded in other financial instruments, such as the conversion option in a
convertible bond held, are treated as separate derivatives when their economic characteristics and
risks are not closely related to those of the host contract and the host contract is not carried at fairvalue through profit or loss. These embedded derivatives are measured at fair value with changes in
fair value recognised in the income statement.
The method of recognising the resulting fair value gain or loss depends on whether the derivative is
designated as a hedging instrument, and if so, the nature of the item being hedged. The Group
designates certain derivatives as either: (1) hedges of the fair value of recognised assets or liabilities or
firm commitments (fair value hedge); (2) hedges of highly probable future cash flows attributable to arecognised asset or liability, or a forecasted transaction (cash flow hedge); or (3) hedges of the net
investment of a foreign operation (‘net investment hedges’). Hedge accounting is used for derivatives
designated in this way provided certain criteria are met.
The Group documents, at the inception of the transaction, the relationship between hedging
instruments and hedged items, as well as its risk management objective and strategy for undertakingvarious hedge transactions. The Group also documents its assessment, both at hedge inception and on
an ongoing basis, of whether the derivatives that are used in hedging transactions are highly effective
in offsetting changes in fair values or cash flows of hedged items.
(a) Fair value hedge
Changes in the fair value of derivatives that are designated and qualify as fair value hedging
instruments are recorded in the income statement, together with any changes in the fair value of the
hedged asset or liability that are attributable to the hedged risk. If the hedge no longer meets thecriteria for hedge accounting, the adjustment to the carrying amount of a hedged item for which the
effective interest method is used is amortised to the income statement over the period to maturity or
derecognition.
(b) Cash flow hedge
The effective portion of changes in the fair value of derivatives that are designated and qualify as
cash flow hedging instruments is recognised in equity. The gain or loss relating to the ineffectiveportion is recognised immediately in the income statement.
Amounts accumulated in equity are recycled to the income statement in the periods in which the
hedged item affects profit or loss.
When a hedging instrument expires or is sold, or when a hedge no longer meets the criteria for hedge
accounting, any cumulative gain or loss existing in equity at that time remains in equity and is
recognised when the forecast transaction is ultimately recognised in the income statement. When a
forecast transaction is no longer expected to occur, the cumulative gain or loss that was reported in
equity is immediately transferred to the income statement.
249
c102100pu025Proof7:28.3.10B/LRevision:0OperatorSadK

(c) Net investment hedge
Hedges of net investments in foreign operations are accounted for similarly to cash flow hedges. Any
gain or loss on the hedging instrument relating to the effective portion of the hedge is recognised inthe translation reserve; the gain or loss relating to the ineffective portion is recognised immediately in
the income statement. Gains and losses accumulated in equity are included in the income statement
when the foreign operation is disposed of.
Derivatives that do not qualify for hedge accounting
Changes in the fair value of any derivative instrument that does not qualify for hedge accounting are
recognised immediately in the income statement.
Offsetting financial instruments
Financial assets and liabilities are offset and the net amount reported in the balance sheet when there
is a legally enforceable right to offset the recognised amounts and there is an intention to settle on a
net basis, or to realise the asset and settle the liability simultaneously.
Sale and repurchase agreements
Securities sold subject to repurchase agreements (repos) remain on the balance sheet; the counterparty
liability is included in deposits by banks, or customer accounts, as appropriate. Securities purchased
under agreements to resell (reverse repos) are recorded as loans and advances to other banks or
customers, as appropriate. The difference between sale and repurchase price is treated as interest and
accrued over the life of the agreements using the effective interest method.
Securities lent to counterparties are also retained in the financial statements. Securities borrowed are
not recognised in the financial statements, unless these are sold to third parties, in which case the
purchase and sale are recorded with the gain or loss included in trading income.
Interest income and expense
Interest income and expense is recognised in the income statement using the effective interest method.
The effective interest method is a method of calculating the amortised cost of a financial asset or afinancial liability and of allocating the interest income or interest expense over the relevant period.
The effective interest rate is the rate that discounts estimated future cash payments or receipts
through the expected life of the financial instrument or, when appropriate, a shorter period, to the
net carrying amount of the financial asset or financial liability. When calculating the effective interest
rate, the Group estimates cash flows considering all contractual terms of the financial instrument (for
example, prepayment options) but does not consider future credit losses. The calculation includes all
fees paid or received between parties to the contract that are an integral part of the effective interest
rate, transaction costs and all other premiums or discounts.
Where the estimates of cash flows have been revised, the carrying amount of the financial asset or
liability is adjusted to reflect the actual and revised cash flows, discounted at the instruments original
effective interest rate. The adjustment is recognised as interest income or expense in the period inwhich the revision is made.
If the financial asset has been reclassified, subsequent increases in the estimates of future cash receiptsas a result of increased recoverability are recognised as an adjustment to the effective interest rate
from the date of the change in estimate.
Once a financial asset or a group of similar financial assets has been written down as a result of an
impairment loss, interest income is recognised using the rate of interest used to discount the future
cash flows for the purpose of measuring the impairment loss.
Fees and commissions
Fees and commissions are generally recognised on an accrual basis when the service has been
provided or significant act performed. Loan syndication fees are recognised as revenue when the
syndication has been completed and the Group retained no part of the loan package for itself, orretained a part at the same effective interest rate as for the other participants. Portfolio and other
management advisory and service fees are recognised based on the applicable service contracts,
usually on a time-apportionate basis.
250
c102100pu025Proof7:28.3.10B/LRevision:0OperatorSadK

PRINCIPAL SUBSIDIARIES AND ASSOCIATES
The Company has over 300 direct and indirect subsidiaries, joint ventures and associates. The
information in this section relates to the 11 principal subsidiaries of the Company as well as its
principal associates and joint ventures. They contribute approximately 90% of the Group’s business in
terms of total operating income as at 31 December 2009.
251
c102100pu070Proof7:28.3.10B/LRevision:0OperatorSadK

Structure chart of principal subsidiaries
* H
oldi
ng c
ompa
ny o
f prin
cipa
l sub
sidi
ary
rath
er th
an p
rinci
pal s
ubsi
diar
y. T
heir
stan
d al
one
finan
cial
s ar
e no
t mat
eria
l to
the
Gro
up s
o ha
ve n
ot b
een
disc
lose
d in
this
Dra
ft R
ed H
errin
g P
rosp
ectu
s.
252
c102100pu070Proof7:28.3.10B/LRevision:0OperatorSadK

Principal Subsidiaries
At 31 December 2009, the principal subsidiary undertakings, all indirectly held and principally
engaged in the business of banking and provision of other financial services, were as follows:
Name and place of incorporation or registration Main areas of operation
Group’s interest in
ordinary share capital
Standard Chartered Bank, England and Wales UK, Middle East, South Asia, Asia Pacific,
Americas and, through Group companies,
Africa
100%
Standard Chartered First Bank Korea
Limited, Korea
Korea 100%
Standard Chartered Bank Malaysia Berhad,
Malaysia
Malaysia 100%
Standard Chartered Bank (Pakistan) Limited,
Pakistan
Pakistan 98.99%
Standard Chartered Bank (Taiwan) Limited,
Taiwan
Taiwan 100%
Standard Chartered Bank (Hong Kong)
Limited, Hong Kong
Hong Kong 100%
Standard Chartered Bank (China) Limited,
China
China 100%
Standard Chartered Bank (Thai) Public
Company Limited, Thailand
Thailand 99.99%
Standard Chartered Bank Nigeria Limited,
Nigeria
Nigeria 100%
Standard Chartered Bank Kenya Limited,
Kenya
Kenya 74.3%
Standard Chartered Private Equity Limited,
Hong Kong
Hong Kong 100%
Joint Ventures
The Group has a 44.51% interest through a joint venture company which holds a majority investment
in PT Bank Permata Tbk (Permata Bank), in Indonesia.
Information on Permata Bank is given on page 270 on this Draft Red Herring Prospectus.
The Group has a 74.9% interest in SC Caps. SC Caps is an equity brokerage and its main operations
are in India. Although the Group’s investment in SC Caps is greater than 50% of the share capital,
the Group contractually shares control of the strategic financial and operating policies of SC Caps
and accordingly it is accounted for as joint venture.
253
c102100pu070Proof7:28.3.10B/LRevision:0OperatorSadK

Principal Associates
As at 31 December 2009, the Group’s principal associates are:
Associate Main areas of operation
Group interest in
ordinary share
capital
China Bohai Bank Co. Ltd. China 19.9%
Fleming Family & Partners Limited Asia 20.0%
MCashback Limited UK 30.0%
Merchant Solutions Pte Limited Hong Kong 44.0%Asia Commercial Bank Vietnam 15.0%
The financial information for principal subsidiaries, joint ventures and principal associates set out
below cannot necessarily be reconciled with the consolidated financial information of the Company
given that the consolidated financial information has been prepared in accordance with IFRS and the
financial information for principal subsidiaries, joint ventures and principal associates except StandardChartered Bank set out below has been prepared in accordance with local GAAP.
Principal Subsidiaries
Certain of the following joint principal subsidiaries do not report their financial results in US Dollars.
In these instances, the translation to US Dollars uses the following exchange rates depending on theyear in which the financial results fall. The translation from US Dollars to Indian Rupees uses the
convenience exchange rate set out in the section titled ‘‘Exchange Rates’’ on page 19 of this Draft
Red Herring Prospectus.
The period end rate (the ‘‘PE Rate’’) is used for balance sheet conversions and the Average Rate is
used for profit and loss conversions.
Year
2009 2008 2007 2006
Principal Subsidiary
Reporting
Currency PE Rate Avg Rate PE Rate Avg Rate PE Rate Avg Rate PE Rate Avg Rate
SCFB, Korea KRW 1164.4714 1276.6163 1259.9072 1101.8152 936.3060 928.2449 929.8786 955.4360
Standard Chartered Bank
Malaysia Berhad, Malaysia MYR 3.4267 3.5225 3.4662 3.3321 3.3068 3.4321 3.5271 3.6705
Standard Chartered Bank
(Pakistan) Limited, Pakistan PKR 84.1059 81.6887 79.0556 70.6171 62.0000 60.7002 60.8855 60.2085
Standard Chartered Bank
(Taiwan) Limited, Taiwan TWD 32.1114 33.0437 32.8309 31.5300 32.4463 32.8634 32.6226 32.5271
Standard Chartered Bank (Hong
Kong) Limited, Hong Kong HKD 7.7545 7.7518 7.7504 7.7873 7.8004 7.8021 7.7790 7.7683
Standard Chartered Bank (Thai)
Public Company Limited,
Thailand THB 33.385 34.3265 35.0400 33.3539 33.7000 34.5514 36.1800 37.9205
Standard Chartered Private Equity
Ltd, Hong Kong HKD 7.7545 7.7518 7.7504 7.7873 7.8004 7.8021 7.7790 7.7683
Standard Chartered Bank Nigeria
Limited, Nigeria NGN 149.55 149.7904 139.49 118.5628 117.994 125.481 128.653 128.515
Standard Chartered Bank Kenya
Limited, Kenya KES 75.9 77.3137 78.2 69.6123 63.800 67.143 69.583 72.074
Process of conversion
1. The numbers provided by the principal subsidiaries were converted to US$ at the respective currency exchange rates given above.
2. The converted US$ numbers were then converted to INR (Indian Rupees) using 46.68 as the standard conversion rate.
Where the earnings per share was not published in the annual reports of respective companies, the
same has been calculated by dividing profit after tax by number of shares outstanding at the end of
the reporting period.
254
c102100pu070Proof7:28.3.10B/LRevision:0OperatorSadK

STANDARD CHARTERED BANK
Corporate Information
SCB, an indirect subsidiary of the Company, was incorporated in England and Wales with limited
liability on 29 December 1853. Presently, its principal office is located at 1 Aldermanbury Square,
London EC2V 7SB. It is engaged in the business of banking and financial services.
Shareholding Pattern (as of 26 March 2010)
S. No. Name of shareholder
No. of equity shares/
preference shares
Percentage
of voting
1.
Standard Chartered
Holdings Limited 11,245,529,642 Ordinary Shares of US$1.00 100
2.
Standard Chartered
Capital Investments LLC
2,400,000 non-cumulative irredeemable preference
shares of US$0.01 0
3. Standard Chartered PLC
7,500 6.409% non-cumulative redeemable preference
shares of US$5.00 0
4. Standard Chartered PLC
7,500 7.014% non-cumulative redeemable preference
shares of US$5.00 0
5. Standard Chartered PLC
462,500 8.125% non-cumulative redeemable preference
shares of US$5.00 0
Court of Directors (as of 26 March 2010)
The Court of directors of SCB consists of:
Name Position
Bertamini, Stefano Paolo DirectorBindra, Jaspal Singh Director
Bullock, Gareth Richard Director
Meddings, Richard Henry Director
Miller, Timothy John Director
Rees, Alun Michael Guest Director
Sands, Peter Alexander Director, Chairman
255
c102100pu070Proof7:28.3.10B/LRevision:0OperatorSadK

Financial Performance
The following consoldiated financial information is extracted from the audited financial statements of
SCB Group, based on results reported under IFRS, for the financial years ended 31 December 2009,2008 and 2007 are as follows. This does not constitute SCB Group’s statutory accounts under the
Companies Act 2006.
Year ended Year ended Year ended31 December
200931 December
200831 December
2007
(In US$m except share data)
Net Interest Income 7,671 7,465 6,295
Total Operating Income
(including Net interest income) 15,214 13,670 11,174
Profit after tax 3,526 3,126 3,025
Equity Share Capital 11,246 8,746 8,746
Reserve and Surplus 13,659 10,291 13,186Earning per share (of US$1 each) 0.28 0.33 0.33
Net Asset Value per share (of US$1 each) 2.21 2.18 2.51
Year ended Year ended Year ended31 December
200931 December
200831 December
2007
(In Rs.m except share data)
Net Interest Income 358,082 348,466 293,851
Total Operating Income(including Net interest income) 710,190 638,116 521,602
Profit after tax 164,594 145,922 141,207
Equity Share Capital 524,963 408,263 408,263
Reserve and Surplus 637,602 480,384 615,522
Earning per share (of US$1 each) 13.27 15.40 15.36
Net Asset Value per share (of US$1 each) 103.00 102.00 117.00
256
c102100pu070Proof7:28.3.10B/LRevision:0OperatorSadK

STANDARD CHARTERED FIRST BANK KOREA LIMITED
Corporate Information
SCFB, an indirect subsidiary of the Company, was incorporated on 1 July 1929. Presently, its
registered office is located at 100 Gongpyung-dong, Jongno-gu, Seoul, 110-702, Republic of Korea. It
is engaged in the business of banking and the provision of other financial services. For more details
see the section titled ‘‘Business’’ on page 95 of this Draft Red Herring Prospectus.
Shareholding Pattern (as of 26 March 2010)
S. No. Name of the shareholder No. of equity shares
Percentage
of voting
1. Standard Chartered Korea Limited
262,608,618 Ordinary
shares of KRW
5,000.00 100
Board of Directors (as of 26 March 2010)
The board of directors of SCFB consists of:
Name Position
Bok, Kim Gyu Director
Edwards, David Director
Harris, Thomas Director
Hill, Richard Charles Representative Director
Ko, Young Joon Director
Lee, Seung Han Director
Miller, Timothy John Director, ChairmanOh, Kap Soo Director
Williams, Edward Martin Director
Financial Performance
The audited financial results for SCFB, based on results reported under local GAAP, for the financial
years ended 31 December 2008, 2007 and 2006 are as follows:
Year ended Year ended Year ended
31 December
2008
31 December
2007
31 December
2006
(In US$m except share data)
Net Interest Income 1,291 1,305 1,173
Total Operating Income
(including Net interest income) 1,652 1,419 1,236Profit after tax 280 302 162
Equity Share Capital 1,042 1,321 1,330
Reserve and Surplus 1,803 1,781 1,514
Earning per share (of KRW5,000 each) 1.08 1.22 0.69
Net Asset Value per share (of KRW5,000 each) 10.99 12.54 12.11
Year ended Year ended Year ended
31 December
2008
31 December
2007
31 December
2006
(In Rs.m except share data)
Net Interest Income 60,264 60,917 54,756
Total Operating Income
(including Net interest income) 77,115 66,239 57,696
Profit after tax 13,070 14,097 7,562Equity Share Capital 48,641 61,664 62,084
Reserve and Surplus 84,164 83,137 70,674
Earning per share (of KRW5,000 each) 50.42 56.93 32.15
Net Asset Value per share (of KRW5,000 each) 512.96 585.43 565.12
257
c102100pu070Proof7:28.3.10B/LRevision:0OperatorSadK

STANDARD CHARTERED BANK MALAYSIA BERHAD
Corporate Information
Standard Chartered Bank Malaysia Berhad, an indirect subsidiary of the Company, was incorporated
on 29 February 1984. Presently, its registered office is located at Level 16, Menara Standard
Chartered, 30, Jalan Sultan Ismail, 50250 Kuala Lumpur, Malaysia. It is engaged in the business of
banking and the provision of other financial services. For more details see the section titled‘‘Business’’ on page 95 of this Draft Red Herring Prospectus.
Shareholding Pattern (as of 26 March 2010)
S. No. Name of the shareholder No. of equity shares
Percentage
of voting
1. Standard Chartered Holdings (Asia Pacific) B.V.
125,000,000 Ordinary
shares of RM1.00 100
Board of Directors (as of 26 March 2010)
The board of directors of Standard Chartered Bank Malaysia Berhad consists of:
Name Position
Abas, Datuk Ishak bin Imam Director
Choy, Dato’ Yam Kong Director
Fawcett, Karen DirectorFerguson, Raymond John Director, Deputy Chairman
Foo, Mee Har Director
Kassim, Tan Sri Dato’ Mohd. Sheriff Bin Mohd Chairman
Kendut, Datuk Abu Hassan Director
Morad, Osman Tarique Managing Director and Chief Executive Officer
Williams, Edward Martin Director
Financial Performance
The audited financial results for Standard Chartered Bank Malaysia Berhad and its subsidiaries,
based on results reported under local GAAP, for the financial years ended 31 December 2008, 2007
and 2006 are as follows:
Year ended Year ended Year ended
31 December
2008
31 December
2007
31 December
2006
(In US$m except share data)
Net Interest Income 250 271 235
Total Operating Income
(including Net interest income) 544 438 351
Profit after tax 216 155 122Equity Share Capital 36 38 35
Reserve and Surplus 567 492 524
Earning per share (of RM 1 each) 1.72 1.24 0.98
Net Asset Value per share (of RM 1 each) 4.82 4.24 4.48
Year ended Year ended Year ended
31 December
2008
31 December
2007
31 December
2006
(In Rs.m except share data)
Net Interest Income 11,670 12,650 10,970
Total Operating Income
(including Net interest income) 25,394 20,446 16,385Profit after tax 10,083 7,235 5,695
Equity Share Capital 1,680 1,774 1,634
Reserve and Surplus 26,468 22,967 24,460
Earning per share (of RM 1 each) 80.51 58.01 45.63
Net Asset Value per share (of RM 1 each) 225.20 197.89 209.01
258
c102100pu070Proof7:28.3.10B/LRevision:0OperatorSadK

STANDARD CHARTERED BANK (PAKISTAN) LIMITED
Corporate Information
Standard Chartered Bank (Pakistan) Limited, an indirect subsidiary of the Company, was
incorporated on 19 July 2006. Presently, its registered office is located at P.O. Box No. 5556, I.I.
Chundrigar Road, Karachi, 74000, Pakistan. It is engaged in the business of banking and the
provision of other financial services. For more details see the section titled ‘‘Business’’ on page 95 of
this Draft Red Herring Prospectus.
Shareholding Pattern (as of 26 March 2010)
S. No. Name of the shareholder
No. of equity shares
(all Ordinary shares
of PKR10.00)
Percentage of
voting
1 Ghias, Sultan Mohammad Parvez 1 0
2 Hardacre, Andrew 1 0
3 Kazmi, Badar 1 0
4 Nelson, Shayne Keith 1 05 Chaudhri, Najmul Islam 1 0
6 Small, John Brian 1 0
7 Standard Chartered Bank 3,832,339,162 98.986
8 Zaki, Shahid 1 0
9 Third Party/ies 39,245,852 1.014
Board of Directors (as of 26 March 2010)
The board of directors of Standard Chartered Bank (Pakistan) Limited consists of:
Name Position
Chaudhri, Najmul Islam Non Executive Director
Ghias, Sultan Mohammad Parvez Director
Gursahani, Mahendra Director
Hardacre, Andrew DirectorKazmi, Badar Director
Nelson, Shayne Keith Director/Chairman
Zaki, Shahid Non Executive Director
259
c102100pu070Proof7:28.3.10B/LRevision:0OperatorSadK

Financial Performance
The audited financial results for Standard Chartered Bank (Pakistan) Limited, based on results
reported under local GAAP, for the financial years ended 31 December 2009, 2008 and 2007 are asfollows:
Year ended Year ended Year ended
31 December
2009
31 December
2008
31 December
2007
(In US$m except share data)
Net Interest Income 199 233 267
Total Operating Income
(including Net interest income) 168 194 268
Profit after tax 8 9 46Equity Share Capital 460 490 624
Reserve and Surplus 107 51 70
Earning per share (of PKR10 each) 0.002 0.002 0.012
Net Asset Value per share (of PKR10 each) 0.15 0.14 0.18
Year ended Year ended Year ended
31 December
2009
31 December
2008
31 December
2007
(In Rs.m except share data)
Net Interest Income 9,289 10,876 12,464
Total Operating Income
(including Net interest income) 7,842 9,056 12,510Profit after tax 373 420 2,147
Equity Share Capital 21,473 22,873 29,128
Reserve and Surplus 4,995 2,381 3,268
Earning per share (of PKR10 each) 0.10 0.11 0.55
Net Asset Value per share (of PKR10 each) 6.84 6.52 8.38
STANDARD CHARTERED BANK (TAIWAN) LIMITED
Corporate Information
Standard Chartered Bank (Taiwan) Limited, an indirect subsidiary of the Company, was incorporated
on 15 September 1948. Presently, its registered office is located at No. 106 Chungyang Road,
Hsinchu, Taiwan, Province of China. It is engaged in the business of banking and the provision ofother financial services. For more details see the section titled ‘‘Business’’ on page 95 of this Draft
Red Herring Prospectus.
Shareholding Pattern (as of 26 March 2010)
S. No. Name of the shareholder No. of equity sharesPercentage
of voting
1. SCB
2,910,571,976Ordinary shares of
TWD10.00 100
260
c102100pu070Proof7:28.3.10B/LRevision:0OperatorSadK

Board of Directors (as of 26 March 2010)
The board of directors of Standard Chartered Bank (Taiwan) Limited consists of:
Name Position
Bindra, Jaspal Singh Director
Fou-Tsong, Ling Director
Hu, Kuei-Ling Director
Kaushal, Sunil Director
Pratt, Michael Director
Tsang, Katherine King Suen Chairman
Wang, Titan Director
Yin, Norman DirectorZoutendijk, Olga Louise Director
Financial Performance
The audited financial results for Standard Chartered Bank (Taiwan) Limited and its subsidiaries,
based on results reported under local GAAP, and the years ended 31 December 2008, 2007 and 2006
are as follows:
Year ended Year ended Year ended
31 December
2008
31 December
2007
31 December
2006
(In US$m except share data)
Net Interest Income 327 276 234
Total Operating Income
(including Net interest income) 586 522 388
Profit after tax 1 (15) (158)
Equity Share Capital 757 665 507Reserve and Surplus 205 70 (49)
Earning per share (of TWD 10 each) 0.00 (0.01) (0.10)
Net Asset Value per share (of TWD 10 each) 0.54 0.38 0.28
Year ended
31 December
2008
Year ended
31 December
2007
Year ended
31 December
2006
(In Rs.m except share data)
Net Interest Income 15,264 12,884 10,923
Total Operating Income
(including Net interest income) 27,354 24,367 18,112
Profit after tax 47 (700) (7,375)Equity Share Capital 35,337 31,042 23,667
Reserve and Surplus 9,569 3,268 (2,287)
Earning per share (of TWD 10 each) 0.01 (0.37) (4.53)
Net Asset Value per share (of TWD 10 each) 25.08 17.89 13.14
261
c102100pu070Proof7:28.3.10B/LRevision:0OperatorSadK

STANDARD CHARTERED BANK (HONG KONG) LIMITED
Corporate Information
Standard Chartered Bank (Hong Kong) Limited, an indirect subsidiary of the Company, was
incorporated on 12 December 2003. Presently, its registered office is located at 32nd Floor, 4-4A Des
Voeux Road, Central, Hong Kong. It is engaged in the business of banking and the provision of
other financial services.
Shareholding Pattern (as of 26 March 2010)
S. No. Name of the shareholder No. of equity shares
Percentage
of voting
1. SCB
705,823,543 Ordinary A of
HKD0.05 38.780
2. Standard Chartered Sherwood (HK) Limited
1,231,315,097 Ordinary B of
HKD0.05 61.220
Board of Directors (as of 26 March 2010)
The board of directors of Standard Chartered Bank (Hong Kong) Limited consists of:
Name Position
Bindra, Jaspal Singh Director
Chan, Wing Kin Director
Chow, Chung Kong Director, Chairman
Fong, Julian Loong Choon Director
Hung, Pi Cheng Benjamin Director
Kwok, Raymond Ping Luen DirectorLyle, Norman Director
Ma, Xuezheng Director
Pratt, Michael Director
Tan, Siew Boi Director
Tsang, Katherine King Suen Non Executive Director
Zoutendijk, Olga Louise Director
Financial Performance
The audited financial results for Standard Chartered Bank (Hong Kong) Limited and its subsidiaries,
based on results reported under local GAAP, for the financial years ended 31 December 2009, 2008
and 2007 are as follows:
Year ended Year ended Year ended
31 December
2009
31 December
2008
31 December
2007
(In US$m except share data)
Net Interest Income 1,252 1,288 1,295
Total Operating Income
(including Net interest income) 2,108 2,031 2,070
Profit after tax 631 737 944
Paid in Capital 13 13 12Reserve and Surplus 4,981 4,320 3,837
Earning per share (of HKD0.05 each) 0.326 0.381 0.488
Net Asset Value per share (of HKD0.05 each) 2.58 2.24 1.99
262
c102100pu070Proof7:28.3.10B/LRevision:0OperatorSadK

Year ended Year ended Year ended
31 December
2009
31 December
2008
31 December
2007
(In Rs.m except share data)
Net Interest Income 58,443 60,124 60,451
Total Operating Income
(including Net interest income) 98,401 94,807 96,628
Profit after tax 29,455 34,403 44,066
Paid in Capital 607 607 560
Reserve and Surplus 232,513 201,658 179,111
Earning per share (of HKD0.05 each) 15.20 17.77 22.76
Net Asset Value per share (of HKD0.05 each) 120.34 104.41 92.76
STANDARD CHARTERED BANK (CHINA) LIMITED
Corporate Information
Standard Chartered Bank (China) Limited, an indirect subsidiary of the Company, was incorporated
on 29 March 2007. Presently, its registered office is located at Standard Chartered Tower, 201 Centry
Avenue, Pudong, Shanghai, 200120, China. It is engaged in the business of banking and the provision
of other financial services. For more details see the section titled ‘‘Business’’ on page 95 of this Draft
Red Herring Prospectus.
Shareholding Pattern (as of 26 March 2010)
S. No. Name of the shareholder
Registered Capital
(RMB)*
Percentage
of voting
1. SCB 8,727,000,000 RMB 100
* The registered capital of Standard Chartered Bank (China) Limited is RMB 8,727,000,000 or equivalent in freely convertiblecurrencies.
Board of Directors (as of 26 March 2010)
The board of directors of Standard Chartered Bank (China) Limited consists of:Name Position
Bester, Andrew John Milton DirectorBindra, Jaspal Singh Non Executive DirectorBrowne, Lance Vice ChairmanFong, Julian Loong Choon DirectorLim, Cheng Teck Vice ChairmanMa, Zhong Zhi Non Executive DirectorNiu, Jack DirectorTsang, Katherine King Suen Non Executive ChairmanVerplancke, Jan Paul DirectorWilliams, Edward Martin DirectorXie, Qi Hua DirectorZoutendijk, Olga Louise Non Executive Director
263
c102100pu070Proof7:28.3.10B/LRevision:0OperatorSadK

Financial Performance
The audited financial results for Standard Chartered Bank (China) Limited, based on results reported
under local GAAP, for the years ended 31 December 2008 and the nine month period ended31 December 2007 are as follows:
Year ended
Nine
month
period
ended
31 December
2008
31 December
2007
(In US$m except
share data)
Net Interest Income 383 209
Total Operating Income (including Net interest income) 607 344
Profit after tax 92 94
Paid in Capital 772 772
Reserve and Surplus 444 315
Earning per share N/A* N/A*
Net Asset Value per share N/A* N/A*
Year ended
31 December
2008
Nine
month
period
ended
31 December
2007
(In Rs.m except
share data)
Net Interest Income 17,878 9,756
Total Operating Income (including Net interest income) 28,335 16,058
Profit after tax 4,295 4,388Paid in Capital 36,037 36,037
Reserve and Surplus 20,726 14,704
Earning per share N/A* N/A*
Net Asset Value per share N/A* N/A*
*EPS and NAV is not available as there are no equity shares issued.
STANDARD CHARTERED BANK (THAI) PUBLIC COMPANY LIMITED
Corporate Information
Standard Chartered Bank (Thai) Public Company Limited, a subsidiary of the Company, was
incorporated on 15 June 1993. At present, its registered office is located at 90 North Sathorn Road,
Silom, Bangrak, Bangkok, Thailand 10500. It is engaged in the business of banking and the provisionof other financial services. For more details see the section titled ‘‘Business’’ on page 95 of this Draft
Red Herring Prospectus.
264
c102100pu070Proof7:28.3.10B/LRevision:0OperatorSadK

Shareholding Pattern (as of 26 March 2010)
S. No. Name of the shareholder
No. of equity shares
(all Ordinary shares of
THB10.00)
Percentage
of voting
1. SCB 1,481,795,116 99.871
2. Registered Provident Fund of Standard Chartered Bank’s
Employees 1,750,753 0.118
3. Third Party/ies 158,679 0.011
Board of Directors (as of 26 March 2010)
The board of directors of Standard Chartered Bank (Thai) Public Company Limited consists of:
Name Position
Ayudhya, Pakorn Malakul Na Deputy Chairman
Devadason, Mark Phillip Director
Ferguson, Raymond John Chairman
Fuangaromya, Chalaw Director
Gertphol, Thippaporn Director
Knott, Peter Richard Andrew Director
Papadopoulos, Christos Andreou Director
Richupan, Somchai Director
Svasti-Xuto, Pratamaporn Director
Financial Performance
The audited financial results for Standard Chartered Bank (Thai) Public Company Limited and its
subsidiary, based on results reported under local GAAP, for the financial years ended 31 December
2009, 2008 and 2007 are as follows:
Year ended Year ended Year ended
31 December
2009
31 December
2008
31 December
2007
(In US$m except share data)
Net Interest Income 204 215 263
Total Operating Income
(including Net interest income) 339 384 388
Profit after tax 51 61 51
Equity Share Capital 444 325 338
Reserve and Surplus 521 344 286
Earning per share (of 10 THB each) 0.038 0.054 0.044
Net Asset Value per share (of 10 THB each) 650.94 587.51 547.73
Year ended Year ended Year ended
31 December
2009
31 December
2008
31 December
2007
(In Rs.m except share data)
Net Interest Income 9,523 10,036 12,277
Total Operating Income
(including Net interest income) 15,825 17,925 18,112
Profit after tax 2,381 2,847 2,381
Equity Share Capital 20,726 15,171 15,778
Reserve and Surplus 24,320 16,058 13,350
Earning per share (of 10 THB each) 1.75 2.52 2.07
Net Asset Value per share (of 10 THB each) 30,386 27,425 25,568
265
c102100pu070Proof7:28.3.10B/LRevision:0OperatorSadK

STANDARD CHARTERED BANK NIGERIA LIMITED
Corporate Information
Standard Chartered Bank Nigeria Limited, an indirect subsidiary of the Company, was incorporated
on 6 May 1999. At present, its registered office is located at 142, Ahmadu Bello Way, Victoria
Island, Lagos, Nigeria. It is engaged in the business of banking and the provision of other financial
services. For more details see the section titled ‘‘Business’’ on page 95 of this Draft Red Herring
Prospectus.
Shareholding Pattern (as of 26 March 2010)
S. No. Name of the shareholder No. of equity sharesPercentage
of voting
1. Standard Chartered Holdings (Africa) B.V.
2,500,000,000Ordinary shares of
NGN1.00 100
2. Standard Chartered Holdings (Africa) B.V.
510,000,000Irredeemable Non
CumulativePreference shares of
NGN1.00 0
Board of Directors (as of 26 March 2010)
The board of directors of Standard Chartered Bank Nigeria Limited consists of:
Name Position
Ajayi, Olusegun Bamidele DirectorDua, Anil Non Executive DirectorHart, Michael Charles DirectorKnight, Christopher Managing DirectorMalami, Alhaji Shehu DirectorOmotoso, Oluremi Festus DirectorOwolabi, Yemi DirectorSanusi, Joseph Oladele ChairmanSriram, Padmanabhan Non Executive Director
Financial Performance
The audited financial results for Standard Chartered Bank Nigeria Limited, based on results reported
under local GAAP, for the financial years ended 31 December 2008, 2007 and 2006 are as follows:
Year ended Year ended Year ended31 December
200831 December
200731 December
2006
(In US$m except share data)Net Interest Income 104 75 60Total Operating Income
(including Net interest income) 165 118 93Profit after tax 68 55 45Equity Share Capital 18 21 19Reserve and Surplus 232 256 228Earning per share (of NGN1 each) 0.027 0.022 0.018Net Asset Value per share (of NGN1 each) 0.10 0.11 0.10
266
c102100pu070Proof7:28.3.10B/LRevision:0OperatorSadK

Year ended Year ended Year ended31 December
200831 December
200731 December
2006
(In Rs.m except share data)Net Interest Income 4,855 3,501 2,801Total Operating Income
(including Net interest income) 7,702 5,508 4,341Profit after tax 3,174 2,567 2,101Equity Share Capital 840 980 887Reserve and Surplus 10,830 11,950 10,643Earning per share (of NGN1 each) 1.26 1.02 0.83Net Asset Value per share (of NGN1 each) 4.66 5.18 4.62
STANDARD CHARTERED BANK KENYA LIMITED
Corporate Information
Standard Chartered Bank Kenya Limited, an indirect subsidiary of the Company, was incorporated
on 2 September 1963. Presently, its registered office is located at Stanbank House, Moi Avenue,
PO Box 30003, Nairobi, Kenya. It is engaged in the business of banking and the provision of other
financial services. For more details see the section titled ‘‘Business’’ on page 95 of this Draft Red
Herring Prospectus.
Shareholding Pattern (as of 26 March 2010)
S. No. Name of the shareholder No. of equity shares/
preference shares
Percentage
of voting
1. Standard Chartered Africa Holdings Limited –
Dissolved 20/3/2001
1,306,800 Ordinary shares
of KES 5.00
0.480
2. Standard Chartered Holdings (Africa) B.V. 200,751,336 Ordinary
shares of KES 5.00
73.814
3. Standard Chartered Nominees Limited 13,200 Ordinary shares of
KES 5.00
0.005
4. Third Party/ies 69,896,474 Ordinary shares
of KES 5.00
25.700
5. Standard Chartered Holdings (Africa) B.V. 56,000,000 Preference
shares of KES 5.00
0
Board of Directors (as of 26 March 2010)
The board of directors of Standard Chartered Bank Kenya Limited consists of:
Name Position
Etemesi, Richard Managing DirectorHart, Michael Charles Director
Kiboro, Wilfred Director
Mule, Harris Director
Murgor, Chemutai Director
Mutahi, Anne Director
Ngari, Kariuki Director
Odusanya, Segun Director
Shah, Kaushik Director
267
c102100pu070Proof7:28.3.10B/LRevision:0OperatorSadK
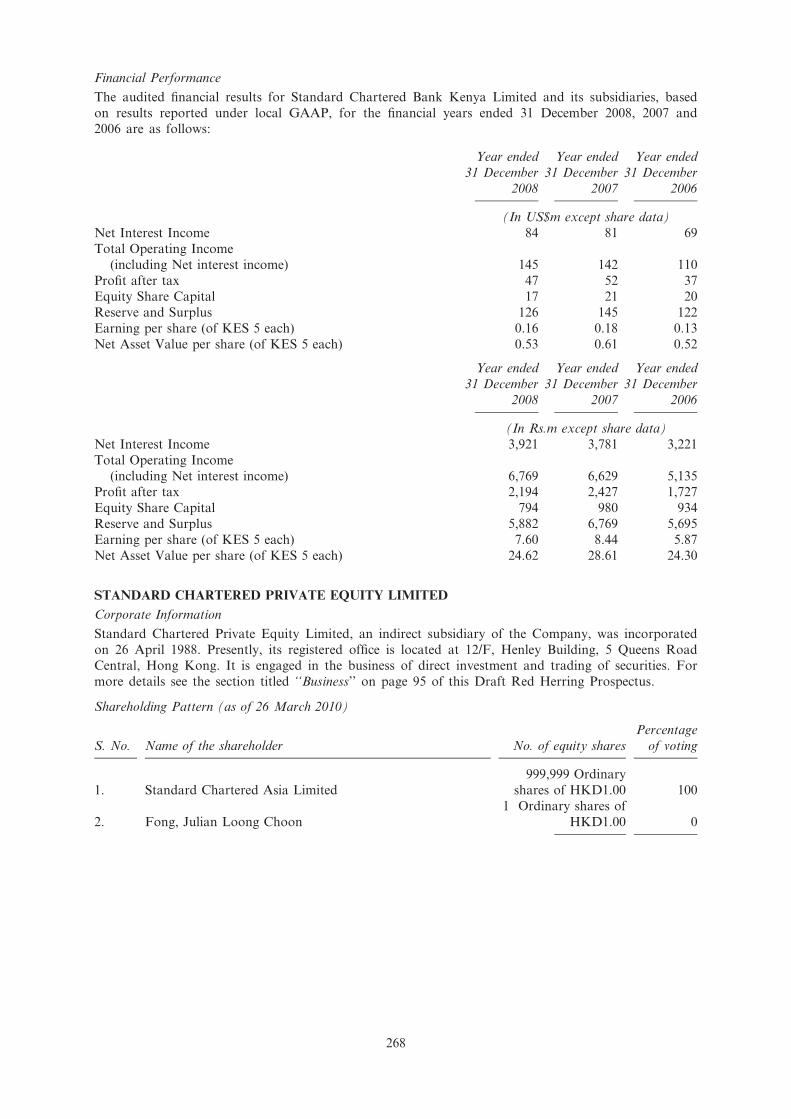
Financial Performance
The audited financial results for Standard Chartered Bank Kenya Limited and its subsidiaries, based
on results reported under local GAAP, for the financial years ended 31 December 2008, 2007 and2006 are as follows:
Year ended Year ended Year ended
31 December
2008
31 December
2007
31 December
2006
(In US$m except share data)
Net Interest Income 84 81 69
Total Operating Income
(including Net interest income) 145 142 110
Profit after tax 47 52 37Equity Share Capital 17 21 20
Reserve and Surplus 126 145 122
Earning per share (of KES 5 each) 0.16 0.18 0.13
Net Asset Value per share (of KES 5 each) 0.53 0.61 0.52
Year ended Year ended Year ended
31 December
2008
31 December
2007
31 December
2006
(In Rs.m except share data)
Net Interest Income 3,921 3,781 3,221
Total Operating Income
(including Net interest income) 6,769 6,629 5,135Profit after tax 2,194 2,427 1,727
Equity Share Capital 794 980 934
Reserve and Surplus 5,882 6,769 5,695
Earning per share (of KES 5 each) 7.60 8.44 5.87
Net Asset Value per share (of KES 5 each) 24.62 28.61 24.30
STANDARD CHARTERED PRIVATE EQUITY LIMITED
Corporate Information
Standard Chartered Private Equity Limited, an indirect subsidiary of the Company, was incorporated
on 26 April 1988. Presently, its registered office is located at 12/F, Henley Building, 5 Queens RoadCentral, Hong Kong. It is engaged in the business of direct investment and trading of securities. For
more details see the section titled ‘‘Business’’ on page 95 of this Draft Red Herring Prospectus.
Shareholding Pattern (as of 26 March 2010)
S. No. Name of the shareholder No. of equity shares
Percentage
of voting
1. Standard Chartered Asia Limited
999,999 Ordinary
shares of HKD1.00 100
2. Fong, Julian Loong Choon
1 Ordinary shares of
HKD1.00 0
268
c102100pu070Proof7:28.3.10B/LRevision:0OperatorSadK

Board of Directors (as of 26 March 2010)
The board of directors of Standard Chartered Private Equity Limited consists of:
Name Position
Dawson, Andrew William DirectorFong, Julian Loong Choon Director
Kwan, Yik Fong Director
Financial Performance
The audited financial results for Standard Chartered Private Equity Limited, based on results reported
under local GAAP, for the financial years ended 31 December 2008, 2007 and 2006 are as follows:
Year ended Year ended Year ended
31 December
2008
31 December
2007
31 December
2006
(In US$m except share data)
Turnover 11 5 6
Profit from operations 175 260 84
Profit after tax 152 210 69Equity Share Capital N/A N/A N/A
Reserve and Surplus 457 561 307
Earning per share (of HKD1 each) 152.44 210.42 69.39
Net Asset Value per share (of HKD1 each) 457.35 561.32 307.25
Year ended Year ended Year ended
31 December
2008
31 December
2007
31 December
2006
(In Rs.m except share data)
Turnover 513 233 280
Profit from operations 8,169 12,137 3,921
Profit after tax 7,095 9,803 3,221
Equity Share Capital N/A N/A N/AReserve and Surplus 21,333 26,187 14,331
Earning per share (of HKD1 each) 7,116 9,823 3,239
Net Asset Value per share (of HKD1 each) 21,349 26,202 14,342
269
c102100pu070Proof7:28.3.10B/LRevision:0OperatorSadK

JOINT VENTURES AND ASSOCIATES
Certain of the following joint ventures and associates do not report their financial results in US
Dollars. In these instances, the translation to US Dollars uses the following exchange rates dependingon the year in which the financial results fall. The translation from US Dollars to Indian Rupees uses
the convenience exchange rate set out in the section titled ‘‘Exchange Rates’’ on page 19 of this Draft
Red Herring Prospectus.
The PE Rate is used for balance sheet conversions and the Average Rate is used for profit and loss
conversions.
Year
2009 2008 2007 2006
S Joint Venture/ Reporting
No. Associate Name Currency PE Rate Avg Rate PE Rate Avg Rate PE Rate Avg Rate PE Rate Avg Rate
1 Permata Bank IDR 9,433.5484 10,393.8081 11,170.9677 9,683.6196 9,410.0000 9,144.1086 9,014.0323 9,167.8544
2 Fleming Family &
Partners Limited GBP 0.6195 0.6405 0.6900 0.5442 0.5031 0.4987 0.5107 0.5426
3 Asia Commercial
Bank VND 18,474.0000 17,812.3601 17,483.0000 16,424.6097 16,010.0000 16,074.8732 16,052.2067 15,990.5077
4 MCashBack
Limited GBP 0.6195 0.6405 0.6900 0.5442 0.5031 0.4987 0.5107 0.5426
5 Merchant Pte
Solutions Ltd USD 1.0000 1.0000 1.0000 1.0000 1.0000 1.0000 1.0000 1.0000
6 China Bohai
Bank Co., Ltd RMB 6.8257 6.831 6.8091 6.9487 7.3074 7.5958 7.8120 7.9756
Process of conversion
1. The numbers provided by the associates/joint venture was converted to US$ at the respective currency exchange rates given above.
2. The converted US$ numbers were then converted to INR (Indian Rupees) using INRex as the standard conversion rate.
PT BANK PERMATA TBK
The information relating to Permata Bank has been extracted, as far as available and unless otherwise
specified, from an international report dated 9 March 2010 containing information from localcorporate registries and other publicly available information filed by that company in accordance with
Indonesian law. The Company’s share of Permata Bank is included in the consolidated financial
accounts of the Company.
Corporate Information
Permata Bank, a joint venture of the Company, was incorporated on 17 December 1954. Presently,
its registered office is located at Tower 1, Jalan Jend. Sudirman Kav. 27, Jakarta 12920, Indonesia. It
is engaged in the business of banking and the provision of other financial services. For more detailssee the section titled ‘‘Business’’ on page 95 of this Draft Red Herring Prospectus.
Authorised share capital – Rp.2,600,000,000,000
Issued share capital – Rp.1,300,534,000,000
Shareholding Pattern (as of 9 March 2010)
S. No. Name of the shareholder Percentage
1. PT Astra International Tbk 44.505
2. SCB 44.505
3. Public 10.990
Total 100.00
270
c102100pu070Proof7:28.3.10B/LRevision:0OperatorSadK

Board of Directors
The board of directors of Permata Bank consists of:
Name Position
Mr David Martin Fletcher President Director
Mr Herwidayatmo Vice President Director
Mr Sunil Mehta Director
Mr Giridhar S. Varadachari Director
Mr Guy Roland Isherwood Director
Mr Honggo Widjojo Kangmasto Director
Mrs Lauren Sulistiawati Director
Mrs Indri Koesindrijastueti H DirectorMr Timothty Utama Director
Ms Chisca Mirawati Compliance Director
(Source: PT Bank Permata TBK’s website as at 26 March 2010)
Financial Performance
The audited financial results for Permata Bank, based on results reported under local GAAP, for the
financial years ended 31 December 2008, 2007 and 2006 are as follows:
Year ended Year ended Year ended
31 December
2008
31 December
2007
31 December
2006
(In US$m except share data)
Net Interest Income 259 251 217
Total Operating Income (including Net interest income) 320 364 277
Profit after tax 48 55 34
Equity Share Capital 638 757 791Revenue and Surplus (254) (343) (373)
Year ended Year ended Year ended
31 December
2008
31 December
2007
31 December
2006
(In Rs.m except share data)
Net Interest Income 12,090 11,717 10,130
Total Operating Income (including Net interest income) 14,938 16,992 12,930
Profit after tax 2,241 2,567 1,587
Equity Share Capital 29,782 35,337 36,924
Revenue and Surplus (11,857) (16,011) (17,412)
STANDARD CHARTERED – STCI CAPITAL MARKETS LIMITED
The information relating to SC Caps has been extracted, as far as available and unless otherwise
specified from an international report dated 9 March 2010 containing information from localcorporate registries and other publicly available information filed by that company in accordance with
Indian law (and certain other publicly available information). The Company’s share of SC Caps is
included in the consolidated financial accounts of the Company.
Corporate Information
SC Caps, a joint venture of the Company, was incorporated on 28 June 1994. Presently its registered
office is located at 1st Flr Dheeraj Arma Station Road, Anant Kanekar Marg Bandra (E), Mumbai –
400 051, Maharashtra, India. It is engaged in the business of stock broking, investment banking and
distribution of financial products. It is also registered as a depositary participant with CDSL andNSDL. The Group acquired a 49% stake in UTI Securities Limited in India and subsequently
renamed as Standard Chartered – STCI Capital Markets Limited. The Group acquired an additional
25.9% stake in December 2008. Following the acquisition of the further stake by the Group, SC Caps
remains a joint venture company on the basis of the control exercisable over it by the joint venture
parties.
271
c102100pu070Proof7:28.3.10B/LRevision:0OperatorSadK

Shareholding Pattern (as at 9 March 2010)
S. No. Name of the shareholder No. of equity shares
Percentage
of holding
1 Standard Chartered Bank (Mauritius) Limited and its
nominees 24,048,254 74.9
2 Securities Trading Corporation of India Limited 8,060,312 25.1
Total 32,108,566 100.00
S. No. Name of the shareholder
No. of Preference
shares
Percentage
of holding
Standard Chartered Investment & Loans (India) Limited 2,500,000 100.0
Total 2,500,000 100.0
(Source: SC Caps)
Board of Directors (as at 9 March 2010)
Name Position
Somasundaram Palamadairamaswamy Managing Director
Neeraj Swaroop Chairman & Director
Adil Kaikhusru Kotwal Independent Director
Pradeep Madhav Addititional Director
Pundarik Sanyal Director
Sushen Chander Jhingan Director
Shyam Tirunelvelu Srinivasan Director
Peter Warbanoff Director
(Source: SC Caps website)
Financial Performance
The audited financial results for SC Caps, based on results reported under local GAAP, for the
financial years ended 31 March 2009, 2008 and 2007 are as follows:
Year ended Year ended Year ended
31 March
2009
31 March
2008
31 March
2007
(In US$m except share data)
Total Operating Income (including Net interest income) 5 11 13
Profit after tax (4) (1) 2
Equity Share Capital 7 6 7
Reserve and Surplus 4 4 6
Year ended Year ended Year ended
31 March
2009
31 March
2008
31 March
2007
(In Rs.m except share data)
Total Operating Income (including Net interest income) 233 513 609
Profit after tax (187) (47) 93
Equity Share Capital 327 280 327
Reserve and Surplus 187 187 280
Note: The Rs. numbers for UTI are extracted from local audited statements and not translated at convenience rates.
272
c102100pu070Proof7:28.3.10B/LRevision:0OperatorSadK

PRINCIPAL ASSOCIATES
CHINA BOHAI BANK CO., LTD
The information relating to China Bohai Bank Co., Ltd has been extracted, as far as available, from
annual report for the year 2008 filed by that company in accordance with Chinese law. The
Company’s share of China Bohai Bank Co., Ltd is included in the consolidated financial accounts of
the Company.
Corporate Information
China Bohai Bank Co., Ltd, an associate of the Company, was incorporated on 30 December 2005.
Presently, its registered office is located at No. 201-205 Machang Road, Hexi District, Tianjin,People’s Republic of China. It is engaged in the business of banking and the provision of other
financial services. For more details see the section titled ‘‘Business’’ on page 95 of this Draft Red
Herring Prospectus.
Shareholding Pattern (as of 31 December 2008)
S. No. Name of the shareholder No. of equity shares Percentage
1. TEDA Investment Holding Co., Ltd 1,250,000,000 25.00
2. Standard Chartered Bank (Hong Kong) Limited 999,500,000 19.99
3. China Ocean Shipping (Group) Company 683,500,000 13.674. State Development and Investment Corporation 583,500,000 11.67
5. Baosteel Group Corporation 583,500,000 11.67
6. Tianjin Trust and Investment Co., Ltd. 500,000,000 10.00
7. Tianjin Shanghui Investment (Holding) Co. Ltd 400,000,000 8.00
Total 5,000,000,000 100.00
Board of Directors (as of 31 December 2008)
The board of directors of China Bohai Bank Co., Ltd consists of:
Name Position
Mr Yang Zilin Chairman of the Board of Directors
Ms Elizabeth Leung Ching Ching Vice Chairman of the Board of Directors
Mr Liu Huiwen Director
Ms Zhang Yulan Director
Mr Zhang Fusheng Director
Mr Lv Yimin Director
Mr Yu Yeming DirectorMr Yan Xijun Director
Mr Ma Teng Director and Chief Executive Officer
Mr Lian Voon Fui Director and Deputy Chief Executive Officer
Mr Phang Yew Kiat Director and Deputy Chief Executive Officer
Ms Guo Rongli Director and Chief Financial Officer
Mr Liu Zhaofu Independent Director
Mr Ong Ka Thai Independent Director
Mr Tian Ruizhang Independent DirectorMr Cao Yuan Zheng Independent Director
Mr Sun Liguo Secretary of the Board of Directors
273
c102100pu070Proof7:28.3.10B/LRevision:0OperatorSadK

Financial Performance
The audited financial results for China Bohai Bank Co., Ltd, based on results as reported under local
GAAP, for the financial years ended 31 December 2008, 2007 and 2006 are as follows:
Year ended Year ended Year ended
31 December
2008
31 December
2007
31 December
2006
(In US$m)
Net Interest Income 143 68 28
Total Operating Income (including Net interest income) 185 80 28
Profit after tax 18 6 (27)
Equity Share Capital 734 684 640
Reserve and Surplus 4 3 (25)
Year ended Year ended Year ended
31 December
2008
31 December
2007
31 December
2006
(In Rs.m)
Net Interest Income 6,675 3,174 1,307
Total Operating Income (including Net interest income) 8,636 3,734 1,307
Profit after tax 840 280 (1,260)
Equity Share Capital 34,263 31,929 29,875
Reserve and Surplus 187 140 (1,167)
FLEMING FAMILY & PARTNERS LIMITED
The information relating to Fleming Family & Partners Limited has been extracted, as far as
available, from the annual return made up to 2 June 2009 (with the list of shareholders given as at 2June 2009) and the annual accounts for the years ended 31 March 2009, 2008 and 2007 filed by that
company in accordance with UK law. The Company’s share of Fleming Family & Partners Limited is
included in the consolidated financial accounts of the Company.
Corporate Information
Fleming Family & Partners Limited, an associate of the Company, was incorporated on 2 June 2000.
Presently, its registered office is located at 15 Suffolk Street, London SW1Y 4HG. It is engaged inthe business of banking and the provision of other financial services.
Shareholding Pattern (as of 2 June 2009)
S. No. Name of the shareholder No. of equity shares Percentage
1. Badgery United SA 6,875,454 1.53
2. BBHISL Nominees Limited A/C 126472 164,530,340 36.67
3. Brendale Investment Holdings Limited 21,124,254 4.71
4. Davies, Mark 3,239,314 0.72
5. Dawnay, Edward 3,124,098 0.70
6. Fitzalan Howard, Richard 1,613,636 0.36
7. Fleming, Philip 14,894,658 3.32
8. Fleming Family & Partners (Liechtenstein) AG
(as Trustee Rawlinson Family Trust) 4,696,239 1.05
9. Garber, Mark 23,345,455 5.20
10. Gibbs, Sir Roger 10,000,000 2.23
11. Gibbs, Sir Roger Geoffrey; Godwin-Austen, Jonathan Reade;
Richards, Geoffrey 4,400,000 0.98
12. HSBC Global Custody Nominees UK Limited 1,200,000 0.27
13. Oxigan Investment Corp 3,442,424 0.77
14. Renwick, Lord Robin 11,562,084 2.58
15. Roy Nominees Limited A/C 205000 6,807,098 1.52
16. Said Holdings Limited 25,704,703 5.73
17. Savernake Holdings (D) Limited 1,171,537 0.26
18. SCB 89,727,767 20.00
274
c102100pu070Proof7:28.3.10B/LRevision:0OperatorSadK

S. No. Name of the shareholder No. of equity shares Percentage
19. Sukhanov, Denis 3,153,885 0.70
20. Regent Trust Co Limited 15,869,350 3.54
21. Von Moos, Patrick 1,115,909 0.25
22. Collspring Securities Limited 7,295,454 1.63
23. Jane Fletcher 5,674,242 1.26
24. Frank Nominees Ltd 3,000,000 0.67
25. Other third parties 15,064,810 3.36
Total 448,632,711 100
* Holdings of less than 1,000,000 shares have been aggregated into the category ‘‘Other third parties’’.
Board of Directors (as of 2 June 2009)
The board of directors of Fleming Family & Partners Limited consists of:
Name Position
Beringer, Guy Director
Bullock, Gareth Richard Director
Davies, Mark Edward Trehearne Director
Durbin, Annemarie Verna Florence Director
Fleming, Philip Director
Fleming, Valentine Patrick DirectorGarber, Mark Rafailovich Director
Lord William Waldegrave of North Hill Director
Lord Robin Renwick of Clifton Director
Flemming, Adam Richard Director
Schuster, Richard Douglas Director
Financial Performance
The consolidated audited financial results for Fleming Family & Partners Limited, based on results
reported under local GAAP, for the financial years ended 31 March 2009, 2008 and 2007 are as
follows:
Year ended Year ended Year ended
31 March
2009
31 March
2008
31 March
2007
(In US$m)
Turnover (including share of turnover of joint venture) 83 122 120
Profit after tax (2) 16 14
Equity Share Capital 23 26 26
Reserve and Surplus 23 40 29
Year ended Year ended Year ended
31 March
2009
31 March
2008
31 March
2007
(In Rs.m)
Turnover (including share of turnover of joint venture) 3,874 5,695 5,602
Profit after tax (93) 747 654Equity Share Capital 1,074 1,214 1,214
Reserve and Surplus 1,074 1,867 1,354
275
c102100pu070Proof7:28.3.10B/LRevision:0OperatorSadK

MCASHBACK LIMITED1
The information relating to MCashback Limited has been extracted, as far as available, from the
annual return for the year ended 30 July 2009 filed by that company in accordance with UK law.The Company’s share of MCashback Limited is included in the consolidated financial accounts of the
Company.
Corporate Information
MCashback Limited, an associate of the Company, was incorporated on 30 July 2002. Presently, its
registered office is located at 130 Shaftesbury Avenue, London W1D 5EU. It is engaged in the
business of banking and the provision of other financial services.
Shareholding Pattern (as of 30 July 2009)
S. No. Name of the shareholder No. of equity shares Percentage
1. Cooper, David 137,338 4.474
2. Cooper, Robert 776,054 25.279
3. Doyle, Charlotte Mary 273,708 8.916
4. The Gildersleeve Settlement 225,000 7.329
5. MEG LLP — —
6. Morris, David 10,083 0.328
7. Morris, Pam 10,083 0.328
8. Pearce, Anthony 92,000 39. Reed, Christopher 40,000 1.303
10. Roe, Adrian 59,168 1.927
11. Strong, Stephen 22,166 0.722
12. Vadeboncoeur, Thomas Wayne 90,000 2.932
13. Zghari, Ahmed 240,400 7.831
14. SCB 973,951 31.725
15. Alliance Trust Pensions Ltd 10,000 0.326
16. Cornell, Timothy 90,000 2.93217. Morton, David 20,000 0.651
Total 3,069,951 100
Board of Directors (as of 30 July 2009)
The board of directors of MCashback Limited consists of:
Name Position
Bradford, Paul Martin DirectorCooper, Robert Director
Kennedy, Paul Director
Laws, Gavin Crawford Director
Roe, Adrian Director
Morton, David Alan Director
Hadley, David Michael Director
1 Administrator appointed on 29 January 2010.
276
c102100pu070Proof7:28.3.10B/LRevision:0OperatorSadK

Financial Performance
The audited financial results for MCashback Limited, based on results reported under local GAAP,
for the financial years ended 31 December 2008 and 2007 are as follows:
Year ended Year ended
31 December
2008
31 December
2007
(In US$m)
Operating Income — —
Profit after tax (16) (12)
Equity Share Capital 0 0
Reserve and Surplus 2 20
Year ended Year ended
31 December
2008
31 December
2007
(In Rs.m)
Operating Income — —
Profit after tax 747 (560)
Equity Share Capital 0 0
Reserve and Surplus 93 933
MERCHANT SOLUTIONS PTE LIMITED
The information relating to Merchant Solutions Pte Limited has been extracted, as far as available,
from an international report supplied by the Accounting and Corporate Regulatory Authority on
9 March 2010. The information was filed by that company in accordance with Singaporean law. The
Company’s share of Merchant Solutions Pte Ltd is included in the consolidated financial accounts of
the Company.
Corporate Information
Merchant Solutions Pte Limited, an associate of the Company, was incorporated on 10 November
2006. Presently, its registered office is located at Millenia Tower, 1 Temasek Ave #27-01, 039192
Singapore. It is engaged in the business of banking and the provision of other financial services.
Shareholding Pattern (as of 9 March 2010)
S. No. Name of the shareholder No. of equity shares Percentage
1. Standard Chartered Bank (Hong Kong) Limited 440,000 44.002. First Data Orca JV Holdco Pte Limited 560,000 56.00
Total 1,000,000 100
Board of Directors (as of 9 March 2010)
The board of directors of Merchant Solutions Pte Limited consists of:
Name Position
Mathenz, Marc Kay Chief Executive Officer
Hesh, Sean S. Managing DirectorHeimrich, Golfgang Helmut Director
Janardhan, Cadambi Parthasarathi Director
Fawcett, Karen Director
Lee, Nigel Laurie Director
Bell, Robyn Patricia Director
Teo, Patricia Sales Manager
Chen, Matthew Sales Manager
277
c102100pu070Proof7:28.3.10B/LRevision:0OperatorSadK

Financial Performance
The financial results for Merchant Solutions Pte Limited are not publicly available; this information
does not form part of the international report supplied by the Accounting and Corporate RegulatoryAuthority.
ASIA COMMERCIAL BANK, VIETNAM
The information relating to Asia Commercial Bank, Vietnam has been extracted, as far as available,
from an international report dated 9 March 2010 containing information from local corporate
registries and other publicly available information filed by that company in accordance with
Vietnamese law (including the Annual Report 2008). The Company’s share of Asia Commercial Bank,Vietnam is included in the consolidated financial accounts of the Company.
Corporate Information
Asia Commercial Bank, Vietnam was incorporated in 13 May 1993. Presently, its registered office is
located at 442 Nguyen Thi Minh Khai Street, District 3, Ho Chi Min City, Vietnam. It is a Vietnam-
based financial institution. The company provides consumer and corporate banking services, including
taking deposits in VND, gold and foreign currencies, lending, equity investment in VND, gold and
foreign currencies, payment services, treasury services, remittances, bancassurance, foreign exchange
trading and gold trading, credit card and debit card issuance.
Shareholding Pattern (as of 9 March 2010)
S. No. Name of major shareholders No. of equity shares
1. Connaught Investors Ltd. (Jardine Matheson Group) 46,123,341
2. Standard Chartered APR Ltd. 55,667,575
3. Dragon Financial Holdings Limited 43,269,112
4. Standard Chartered Bank (Hong Kong) Ltd. 39,803,244
Paid up Capital VND 6,355,813,000,000
Board of Directors
The senior company personnel of Asia Commercial Bank, Vietnam (as per the 2010 international
report) consists of:
Name Position
Mr. Tran Xuan Gia ChairmanMr. Pham Trung Cang Vice-Chairman
Mr. Trinh Kim Quang Vice-Chairman
Mr. Le Vu Ky Vice-Chairman
Mr. Tran Hung Huy Member
Mr. Ly Xuan Hai Member
Mr. Huynh Quang Tuan Member
Mr. Alain Cany Member
Mr. Dominic Scriven MemberMr. Julian Fong Loong Choon Member
Mr. Luong Van Tu Member
278
c102100pu070Proof7:28.3.10B/LRevision:0OperatorSadK

Financial Performance
The audited financial results for Asia Commercial Bank, Vietnam, based on results reported under
local GAAP, for the three months ended 31 March 2009 and the financial years ended 31 December2008 and 2007 are as follows:
Three months
ended Year ended Year ended
31 March
2009
31 December
2008
31 December
2007
(In US$m except share data)
Total income 140 821 398
Profit after tax 20 135 109
Equity Share Capital 344 364 164Reserve and Surplus 64 81 227
Three
months
ended Year ended
31 March
2009
31 December
2008
31 December
2007
(In Rs.m except share data)
Total income 6,535 38,324 18,579
Profit after tax 934 6,302 5,088
Equity Share Capital 16,058 16,992 7,656
Reserve and Surplus 2,988 3,781 10,596
Listed subsidiaries of the Company
Name of the subsidiary Primary Stock Exchange of listing Country
Year of
Listing
Standard Chartered Bank Ghana
Limited Ghana Stock Exchange Ghana 1991
Standard Chartered Bank Kenya
Limited Nairobi Stock Exchange, Kenya Kenya 1986
Standard Chartered Bank
(Pakistan) Limited The Karachi Stock Exchange Pakistan 2007Standard Chartered Bank
Modaraba (Pakistan) The Karachi Stock Exchange Pakistan 1987
Standard Chartered Leasing
Limited (Pakistan) The Karachi Stock Exchange Pakistan 1994
Standard Chartered Bank
Zambia Plc The Lusaka Stock Exchange Ltd Zambia 1998
Standard Chartered Bank
Botswana Limited Botswana Stock Exchange Botswana 1984Standard Chartered Bank Nepal
Limited Nepal Stock Exchange Limited Nepal 1988
Listed associates of the Company
Name of Associate Primary Stock Exchange of listing Country
Year of
Listing
PT Bank Permata Tbk Indonesia Stock Exchange Indonesia 1990Asia Commercial Bank Vietnam Stock Exchange Vietnam 2006
For a complete list of Standard Chartered’s subsidiaries, please see the section titled ‘‘List of
Subsidiaries, Associates, Joint Ventures and Special Purpose Entities’’ on page 280 of this Draft Red
Herring Prospectus.
279
c102100pu070Proof7:28.3.10B/LRevision:0OperatorSadK
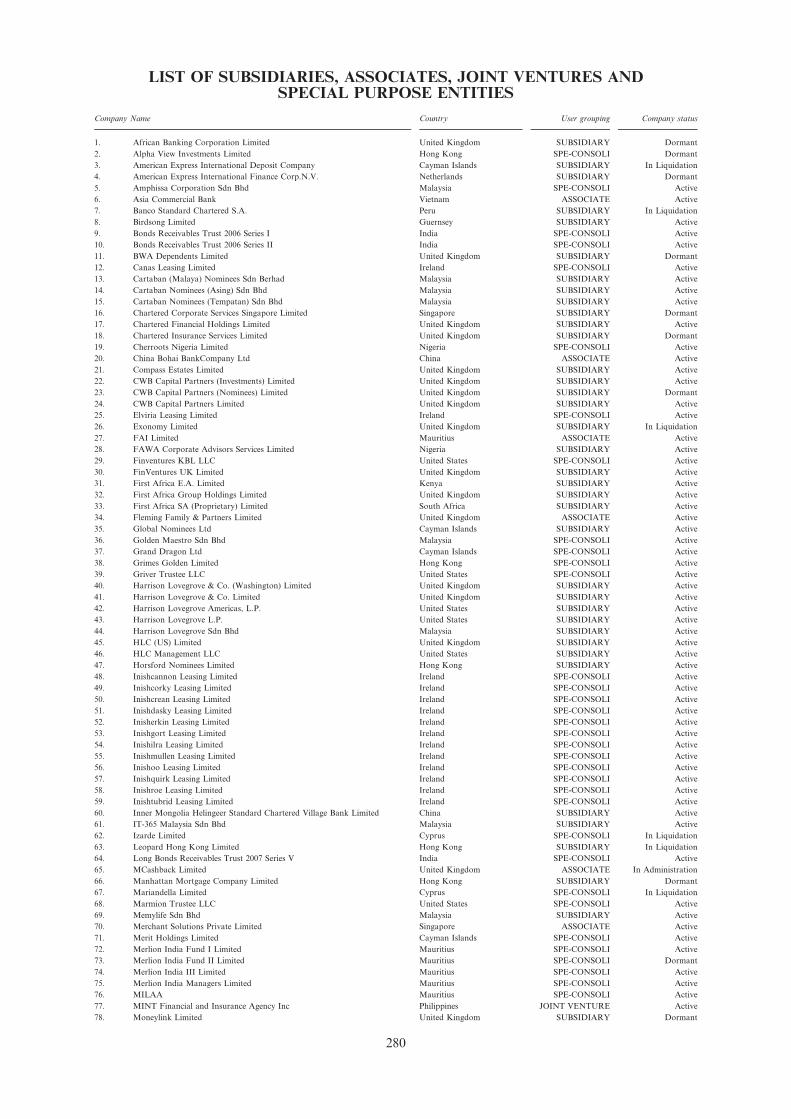
LIST OF SUBSIDIARIES, ASSOCIATES, JOINT VENTURES ANDSPECIAL PURPOSE ENTITIES
Company Name Country User grouping Company status
1. African Banking Corporation Limited United Kingdom SUBSIDIARY Dormant
2. Alpha View Investments Limited Hong Kong SPE-CONSOLI Dormant
3. American Express International Deposit Company Cayman Islands SUBSIDIARY In Liquidation
4. American Express International Finance Corp.N.V. Netherlands SUBSIDIARY Dormant
5. Amphissa Corporation Sdn Bhd Malaysia SPE-CONSOLI Active
6. Asia Commercial Bank Vietnam ASSOCIATE Active
7. Banco Standard Chartered S.A. Peru SUBSIDIARY In Liquidation
8. Birdsong Limited Guernsey SUBSIDIARY Active
9. Bonds Receivables Trust 2006 Series I India SPE-CONSOLI Active
10. Bonds Receivables Trust 2006 Series II India SPE-CONSOLI Active
11. BWA Dependents Limited United Kingdom SUBSIDIARY Dormant
12. Canas Leasing Limited Ireland SPE-CONSOLI Active
13. Cartaban (Malaya) Nominees Sdn Berhad Malaysia SUBSIDIARY Active
14. Cartaban Nominees (Asing) Sdn Bhd Malaysia SUBSIDIARY Active
15. Cartaban Nominees (Tempatan) Sdn Bhd Malaysia SUBSIDIARY Active
16. Chartered Corporate Services Singapore Limited Singapore SUBSIDIARY Dormant
17. Chartered Financial Holdings Limited United Kingdom SUBSIDIARY Active
18. Chartered Insurance Services Limited United Kingdom SUBSIDIARY Dormant
19. Cherroots Nigeria Limited Nigeria SPE-CONSOLI Active
20. China Bohai BankCompany Ltd China ASSOCIATE Active
21. Compass Estates Limited United Kingdom SUBSIDIARY Active
22. CWB Capital Partners (Investments) Limited United Kingdom SUBSIDIARY Active
23. CWB Capital Partners (Nominees) Limited United Kingdom SUBSIDIARY Dormant
24. CWB Capital Partners Limited United Kingdom SUBSIDIARY Active
25. Elviria Leasing Limited Ireland SPE-CONSOLI Active
26. Exonomy Limited United Kingdom SUBSIDIARY In Liquidation
27. FAI Limited Mauritius ASSOCIATE Active
28. FAWA Corporate Advisors Services Limited Nigeria SUBSIDIARY Active
29. Finventures KBL LLC United States SPE-CONSOLI Active
30. FinVentures UK Limited United Kingdom SUBSIDIARY Active
31. First Africa E.A. Limited Kenya SUBSIDIARY Active
32. First Africa Group Holdings Limited United Kingdom SUBSIDIARY Active
33. First Africa SA (Proprietary) Limited South Africa SUBSIDIARY Active
34. Fleming Family & Partners Limited United Kingdom ASSOCIATE Active
35. Global Nominees Ltd Cayman Islands SUBSIDIARY Active
36. Golden Maestro Sdn Bhd Malaysia SPE-CONSOLI Active
37. Grand Dragon Ltd Cayman Islands SPE-CONSOLI Active
38. Grimes Golden Limited Hong Kong SPE-CONSOLI Active
39. Griver Trustee LLC United States SPE-CONSOLI Active
40. Harrison Lovegrove & Co. (Washington) Limited United Kingdom SUBSIDIARY Active
41. Harrison Lovegrove & Co. Limited United Kingdom SUBSIDIARY Active
42. Harrison Lovegrove Americas, L.P. United States SUBSIDIARY Active
43. Harrison Lovegrove L.P. United States SUBSIDIARY Active
44. Harrison Lovegrove Sdn Bhd Malaysia SUBSIDIARY Active
45. HLC (US) Limited United Kingdom SUBSIDIARY Active
46. HLC Management LLC United States SUBSIDIARY Active
47. Horsford Nominees Limited Hong Kong SUBSIDIARY Active
48. Inishcannon Leasing Limited Ireland SPE-CONSOLI Active
49. Inishcorky Leasing Limited Ireland SPE-CONSOLI Active
50. Inishcrean Leasing Limited Ireland SPE-CONSOLI Active
51. Inishdasky Leasing Limited Ireland SPE-CONSOLI Active
52. Inisherkin Leasing Limited Ireland SPE-CONSOLI Active
53. Inishgort Leasing Limited Ireland SPE-CONSOLI Active
54. Inishilra Leasing Limited Ireland SPE-CONSOLI Active
55. Inishmullen Leasing Limited Ireland SPE-CONSOLI Active
56. Inishoo Leasing Limited Ireland SPE-CONSOLI Active
57. Inishquirk Leasing Limited Ireland SPE-CONSOLI Active
58. Inishroe Leasing Limited Ireland SPE-CONSOLI Active
59. Inishtubrid Leasing Limited Ireland SPE-CONSOLI Active
60. Inner Mongolia Helingeer Standard Chartered Village Bank Limited China SUBSIDIARY Active
61. IT-365 Malaysia Sdn Bhd Malaysia SUBSIDIARY Active
62. Izarde Limited Cyprus SPE-CONSOLI In Liquidation
63. Leopard Hong Kong Limited Hong Kong SUBSIDIARY In Liquidation
64. Long Bonds Receivables Trust 2007 Series V India SPE-CONSOLI Active
65. MCashback Limited United Kingdom ASSOCIATE In Administration
66. Manhattan Mortgage Company Limited Hong Kong SUBSIDIARY Dormant
67. Mariandella Limited Cyprus SPE-CONSOLI In Liquidation
68. Marmion Trustee LLC United States SPE-CONSOLI Active
69. Memylife Sdn Bhd Malaysia SUBSIDIARY Active
70. Merchant Solutions Private Limited Singapore ASSOCIATE Active
71. Merit Holdings Limited Cayman Islands SPE-CONSOLI Active
72. Merlion India Fund I Limited Mauritius SPE-CONSOLI Active
73. Merlion India Fund II Limited Mauritius SPE-CONSOLI Dormant
74. Merlion India III Limited Mauritius SPE-CONSOLI Active
75. Merlion India Managers Limited Mauritius SPE-CONSOLI Active
76. MILAA Mauritius SPE-CONSOLI Active
77. MINT Financial and Insurance Agency Inc Philippines JOINT VENTURE Active
78. Moneylink Limited United Kingdom SUBSIDIARY Dormant
280
c102100pu070Proof7:28.3.10B/LRevision:0OperatorSadK

Company Name Country User grouping Company status
79. Mortgage Asset Receivables Securitisation (1) Limited Bermuda SUBSIDIARY Active
80. New Group Investments Limited Virgin Islands, British SUBSIDIARY Active
81. Newton Bond Investments Limited Hong Kong SPE-CONSOLI Dormant
82. Nightjar Limited Ireland SPE-CONSOLI Active
83. Nominees One Limited Guernsey SUBSIDIARY Active
84. Nominees Two Limited Guernsey SUBSIDIARY Active
85. Pembroke 23822 Limited Ireland SPE-CONSOLI Active
86. Pembroke 55067 Limited Ireland SPE-CONSOLI Active
87. Pembroke 7006 Leasing Limited Ireland SPE-CONSOLI Active
88. Pembroke 717 Leasing Limited Ireland SPE-CONSOLI Active
89. Pembroke Alpha Limited Ireland SPE-CONSOLI Active
90. Pembroke B717 Holdings B.V. Netherlands SPE-CONSOLI Active
91. Pembroke Capital Limited Ireland SPE-CONSOLI Active
92. Pembroke Capital Shannon Limited Ireland SPE-CONSOLI Active
93. Pembroke Funding BV Netherlands SPE-CONSOLI Active
94. Pembroke Group Limited Isle of Man SPE-CONSOLI Active
95. Pembroke Holland B.V. Netherlands SPE-CONSOLI Active
96. Pembroke Nominees Limited Ireland SPE-CONSOLI Active
97. Pembroke Orlando Limited Ireland SPE-CONSOLI Active
98. Pembroke Thai Aircraft ll B.V. Netherlands SPE-CONSOLI Active
99. Pembroke Toto Limited Ireland SPE-CONSOLI Active
100. Pembroke Wizard Limited Ireland SPE-CONSOLI Active
101. PF Financial Money-Leading Korea Limited Korea, Republic of SUBSIDIARY Active
102. Popular Ambience Sdn Bhd Malaysia SPE-CONSOLI Active
103. Price Solutions Philippines Inc Philippines SUBSIDIARY Active
104. Price Solutions Sdn Bhd Malaysia SUBSIDIARY Active
105. Price Solutions Singapore Pte Ltd Singapore SUBSIDIARY Active
106. PrimeCredit Limited Hong Kong SUBSIDIARY Active
107. Prime Financial Holdings Limited Singapore SUBSIDIARY Active
108. Prime Financial Limited Hong Kong SUBSIDIARY Active
109. PT Bank Permata Tbk Indonesia JOINT VENTURE Active
110. PT Standard Chartered Securities Indonesia Indonesia SUBSIDIARY Active
111. PT. Price Solutions Indonesia Indonesia SUBSIDIARY Active
112. Raffles Nominees (Pte) Limited Singapore SUBSIDIARY Active
113. Resolution Alliance Sdn Bhd Malaysia SPE-CONSOLI Active
114. Ricanex Participations N.V. Netherlands SUBSIDIARY Active
115. Saluscap B.V. Netherlands SPE-CONSOLI Active
116. S C Learning Limited Hong Kong SUBSIDIARY Active
117. SC (Secretaries) Limited United Kingdom SUBSIDIARY Dormant
118. SC Transport Leasing 1 Limited United Kingdom SPE-CONSOLI Active
119. SC Transport Leasing 2 Limited United Kingdom SPE-CONSOLI Active
120. SC Transport Leasing Partnership 1 United Kingdom SPE-CONSOLI Active
121. SC Transport Leasing Partnership 2 United Kingdom SPE-CONSOLI Active
122. SC Transport Leasing Partnership 3 United Kingdom SPE-CONSOLI Active
123. SC Transport Leasing Partnership 4 United Kingdom SPE-CONSOLI Active
124. SC2 Investments (Singapore) Private Limited Singapore SPE-CONSOLI Active
125. SCB Nominees (CI) Limited Jersey SUBSIDIARY Active
126. SCB Securities Limited United Kingdom SUBSIDIARY In Liquidation
127. SCL Consulting (Shanghai) Co. Ltd China SUBSIDIARY Active
128. SCMB Overseas Limited United Kingdom SUBSIDIARY Active
129. Scope International (China) Co. Limited China SUBSIDIARY Active
130. Scope International (M) Sdn Bhd Malaysia SUBSIDIARY Active
131. Scope International Private Limited India SUBSIDIARY Active
132. Seychelles International Mercantile Banking Corporation Limited. Seychelles Active
133. Shananda Limited Ireland SPE-CONSOLI In Liquidation
134. Shenzhen PrimeCredit Gerent Guarantee Company Limited China SUBSIDIARY Active
135. Shenzhen PrimeCredit Limited China SUBSIDIARY Active
136. Skua Limited Ireland SPE-CONSOLI Active
137. Smart Application Investment B.V. Netherlands SUBSIDIARY Active
138. Sociedad Fiduciaria Extebandes S.A. Colombia SPE-CONSOLI In Liquidation
139. Songbird Limited Guernsey SUBSIDIARY Active
140. St Helen’s Nominees India Private Limited India SUBSIDIARY Active
141. St. Helens Nominees Limited United Kingdom SUBSIDIARY Dormant
142. Stanchart Forex Bureau Limited Tanzania, United Republic of SUBSIDIARY Dormant
143. Stanchart Leasing Limited United Kingdom SUBSIDIARY Dormant
144. Stanchart Nominees Limited United Kingdom SUBSIDIARY Dormant
145. StanChart Securities International, Inc. United States SUBSIDIARY Active
146. Standard Chartered – Istithmar Real Estate Advisory Services (India) Pvt. Ltd India SPE-CONSOLI Strike Off Requested
147. Standard Chartered – STCI Capital Markets Limited India JOINT VENTURE Active
148. Standard Chartered (1996) Limited Singapore SPE-CONSOLI Active
149. Standard Chartered (2000) Limited Singapore SPE-CONSOLI Active
150. Standard Chartered (CT) PLC United Kingdom SUBSIDIARY Active
151. Standard Chartered (GCT) Limited United Kingdom SUBSIDIARY Active
152. Standard Chartered (India) Wealth Advisory Services Private Limited India SUBSIDIARY Dormant
153. Standard Chartered (Jersey) Holdings Limited Jersey SUBSIDIARY Active
154. Standard Chartered (Jersey) Limited Jersey SUBSIDIARY Active
155. Standard Chartered (SFD No.1) Limited United Kingdom SUBSIDIARY Active
156. Standard Chartered (SFD No.2) Limited United Kingdom SUBSIDIARY Active
157. Standard Chartered (Thai) Asset Management Co., Ltd. Thailand SPE-CONSOLI Active
158. Standard Chartered (Thailand) Company Limited Thailand SUBSIDIARY Active
159. Standard Chartered Africa PLC United Kingdom SUBSIDIARY Active
160. Standard Chartered APR Limited United Kingdom SUBSIDIARY Active
281
c102100pu070Proof7:28.3.10B/LRevision:0OperatorSadK

Company Name Country User grouping Company status
161. Standard Chartered Asia 2 (Hong Kong) Limited Hong Kong SUBSIDIARY Dormant
162. Standard Chartered Asia Limited Hong Kong SUBSIDIARY Active
163. Standard Chartered Asia Real Estate Fund Company Limited Cayman Islands SPE-CONSOLI Active
164. Standard Chartered Bank United Kingdom SUBSIDIARY Active
165. Standard Chartered Bank (Bahamas) Limited Bahamas SUBSIDIARY In Liquidation
166. Standard Chartered Bank (China) Limited China SUBSIDIARY Active
167. Standard Chartered Bank (Hong Kong) Limited Hong Kong SUBSIDIARY Active
168. Standard Chartered Bank (Mauritius) Limited Mauritius SUBSIDIARY Active
169. Standard Chartered Bank (Pakistan) Limited Pakistan SUBSIDIARY Active
170. Standard Chartered Bank (Switzerland) S.A. Switzerland SUBSIDIARY Active
171. Standard Chartered Bank (Taiwan) Limited Taiwan, Province of China SUBSIDIARY Active
172. Standard Chartered Bank (Thai) Public Company Limited Thailand SUBSIDIARY Active
173. Standard Chartered Bank (Vietnam) Limited Vietnam SUBSIDIARY Active
174. Standard Chartered Bank Botswana Insurance Agency (Pty) Limited Botswana SUBSIDIARY Active
175. Standard Chartered Bank Botswana Investment Services (Pty) Limited Botswana SUBSIDIARY Active
176. Standard Chartered Bank Botswana Limited Botswana SUBSIDIARY Active
177. Standard Chartered Bank Cameroon SA Cameroon SUBSIDIARY Active
178. Standard Chartered Bank Cote d’ Ivoire SA Cote D’Ivoire SUBSIDIARY Active
179. Standard Chartered Bank Gambia Limited Gambia SUBSIDIARY Active
180. Standard Chartered Bank Ghana Limited Ghana SUBSIDIARY Active
181. Standard Chartered Bank International (Americas) Limited United States SUBSIDIARY Active
182. Standard Chartered Bank Kenya Limited Kenya SUBSIDIARY Active
183. Standard Chartered Bank Latin America B.V. Netherlands SPE-CONSOLI Active
184. Standard Chartered Bank Malaysia Berhad Malaysia SUBSIDIARY Active
185. Standard Chartered Bank Nepal Limited Nepal SUBSIDIARY Active
186. Standard Chartered Bank Nigeria Limited Nigeria SUBSIDIARY Active
187. Standard Chartered Bank Nominees (Jersey) Limited Jersey SUBSIDIARY Active
188. Standard Chartered Bank Representacao Limitada Brazil SPE-CONSOLI Active
189. Standard Chartered Bank SAL Lebanon SUBSIDIARY Active
190. Standard Chartered Bank Sierra Leone Limited Sierra Leone SUBSIDIARY Active
191. Standard Chartered Bank Tanzania Limited Tanzania, United Republic of SUBSIDIARY Active
192. Standard Chartered Bank Uganda Limited Uganda SUBSIDIARY Active
193. Standard Chartered Bank Zambia Plc Zambia SUBSIDIARY Active
194. Standard Chartered Bank Zimbabwe Limited Zimbabwe SUBSIDIARY Active
195. Standard Chartered Basinghall Nominees Limited United Kingdom SUBSIDIARY Dormant
196. Standard Chartered Capital (Jersey) Limited Jersey SUBSIDIARY Active
197. Standard Chartered Capital (Korea) Company Limited Korea, Republic of SUBSIDIARY Active
198. Standard Chartered Capital I L.P. United States SPE-CONSOLI Active
199. Standard Chartered Capital Investments, LLC United States SPE-CONSOLI Active
200. Standard Chartered Capital Management (Jersey), LLC United States SPE-CONSOLI Active
201. Standard Chartered Capital Markets Limited United Kingdom SUBSIDIARY Active
202. Standard Chartered Capital Trust I United States SPE-CONSOLI Active
203. Standard Chartered Corporate Advisory Co. Ltd China SUBSIDIARY Active
204. Standard Chartered Corporate Finance (Canada) Limited United Kingdom SUBSIDIARY Active
205. Standard Chartered Corporate Finance (Eurasia) Limited United Kingdom SUBSIDIARY Active
206. Standard Chartered Custody (Hong Kong) Limited Hong Kong SUBSIDIARY Dormant
207. Standard Chartered Cyber International Limited (In Members’ Voluntary
Liquidation)
Virgin Islands, British SUBSIDIARY In Liquidation
208. Standard Chartered Debt Trading Limited United Kingdom SPE-CONSOLI Active
209. Standard Chartered Equitor Global Asset Management Limited United Kingdom SUBSIDIARY Dormant
210. Standard Chartered Equitor Group Limited Cook Islands SUBSIDIARY Dormant
211. Standard Chartered Equitor Limited United Kingdom SUBSIDIARY Active
212. Standard Chartered Export Finance Limited United Kingdom SUBSIDIARY Dormant
213. Standard Chartered Finance (Brunei) Bhd Brunei Darussalam SUBSIDIARY Active
214. Standard Chartered Finance (Jersey) Limited Jersey SUBSIDIARY Active
215. Standard Chartered Finance B.V. Netherlands SUBSIDIARY Dormant
216. Standard Chartered Finance Limited India SUBSIDIARY Active
217. Standard Chartered Financial Investments Limited United Kingdom SPE-CONSOLI Active
218. Standard Chartered Financial Services (Luxembourg) S.A. Luxembourg SUBSIDIARY In Liquidation
219. Standard Chartered Financial Services Limited Kenya SUBSIDIARY Dormant
220. Standard Chartered Financing No.1 (UK) Limited United Kindom SUBSIDIARY Active
221. Standard Chartered Financing No.2 (UK) Limited United Kingdom SUBSIDIARY Active
222. Standard Chartered First Bank Korea Limited Korea, Republic of SUBSIDIARY Active
223. Standard Chartered Fund Service Korea Limited Korea, Republic of SUBSIDIARY Active
224. Standard Chartered Forex Corporation Philippines SUBSIDIARY Dormant
225. Standard Chartered Funding (Jersey) Limited Jersey SUBSIDIARY Active
226. Standard Chartered FURBS Trustee Limited United Kingdom SUBSIDIARY Dormant
227. Standard Chartered Global Trading Investments Limited Hong Kong SUBSIDIARY Active Non-Trading
228. Standard Chartered Grindlays Pty Limited Australia SUBSIDIARY Dormant
229. Standard Chartered Holdings (Africa) B.V. Netherlands SUBSIDIARY Active
230. Standard Chartered Holdings (Asia Pacific) B.V. Netherlands SUBSIDIARY Active
231. Standard Chartered Holdings (Germany) GmbH Germany SUBSIDIARY Dormant
232. Standard Chartered Holdings (International) B.V. Netherlands SUBSIDIARY Active
233. Standard Chartered Holdings Inc. United States SUBSIDIARY Active
234. Standard Chartered Holdings Limited United Kingdom SUBSIDIARY Active
235. Standard Chartered IL&FS Management (Singapore) Pte. Limited Singapore SPE-CONSOLI Active
236. Standard Chartered Insurance Limited Isle of Man SUBSIDIARY Active
237. Standard Chartered International (USA) Ltd. United States SUBSIDIARY Active
238. Standard Chartered Investment Services Limited Ghana SPE-CONSOLI Dormant
239. Standard Chartered Investment Services Limited Hong Kong SUBSIDIARY Active
240. Standard Chartered Investment Services Limited Kenya SUBSIDIARY Active
241. Standard Chartered Investments (Cayman) Limited Cayman Islands SUBSIDIARY Active
282
c102100pu070Proof7:28.3.10B/LRevision:0OperatorSadK

Company Name Country User grouping Company status
242. Standard Chartered Investments (Singapore) Private Limited Singapore SPE-CONSOLI Active
243. Standard Chartered Investments and Loans (India) Limited India SUBSIDIARY Active
244. Standard Chartered Investments Limited United Kingdom SUBSIDIARY Dormant
245. Standard Chartered Kenya Nominees Limited Kenya SUBSIDIARY Dormant
246. Standard Chartered Korea Limited Korea, Republic of SUBSIDIARY Active
247. Standard Chartered Lease Trustee Limited United Kingdom SUBSIDIARY Dormant
248. Standard Chartered Leasing (UK) 2 Limited United Kingdom SPE-CONSOLI Active
249. Standard Chartered Leasing (UK) 3 Limited United Kingdom SPE-CONSOLI Active
250. Standard Chartered Leasing (UK) Limited United Kingdom SPE-CONSOLI Active
251. Standard Chartered Leasing Limited Pakistan SUBSIDIARY Active
252. Standard Chartered Life Insurance Agency Company Taiwan, Province of China SUBSIDIARY Active
253. Standard Chartered Management Services Limited Kenya SUBSIDIARY Dormant
254. Standard Chartered MB Holdings B.V. Netherlands SUBSIDIARY Active
255. Standard Chartered Metropolitan Holdings SAL Lebanon SUBSIDIARY Active
256. Standard Chartered Modaraba Pakistan SUBSIDIARY Active
257. Standard Chartered Mortgage Finance Limited United Kingdom SUBSIDIARY Dormant
258. Standard Chartered Mutual Savings Bank Korea Co. Ltd Korea, Republic of SUBSIDIARY Active
259. Standard Chartered NEA Limited United Kingdom SUBSIDIARY Active
260. Standard Chartered Nominees (Singapore) Pte Ltd Singapore SUBSIDIARY Active
261. Standard Chartered Nominees (Western Samoa) Limited Samoa SUBSIDIARY Active
262. Standard Chartered Nominees Limited United Kingdom SUBSIDIARY Dormant
263. Standard Chartered Offshore Limited Jersey SUBSIDIARY Active
264. Standard Chartered Overseas Holdings Limited United Kingdom SUBSIDIARY Active
265. Standard Chartered Overseas Investment, Inc. United States SUBSIDIARY Active
266. Standard Chartered Portfolio Trading (UK) Limited United Kingdom SPE-CONSOLI Active
267. Standard Chartered Principal Finance (Cayman) Limited Cayman Islands SPE-CONSOLI Dormant
268. Standard Chartered Private Equity (Mauritius) II Limited Mauritius SPE-CONSOLI Active
269. Standard Chartered Private Equity (Mauritius) Limited Mauritius SPE-CONSOLI Active
270. Standard Chartered Private Equity (Mauritius) III Limited Mauritius SPE-CONSOLI Active
271. Standard Chartered Private Equity (Singapore) Pte. Ltd Singapore SPE-CONSOLI Active
272. Standard Chartered Private Equity Advisory (India) Private Limited India SPE-CONSOLI Active
273. Standard Chartered Private Equity Limited Hong Kong SUBSIDIARY Active
274. Standard Chartered Private Equity Managers (Hong Kong) Limited Hong Kong SUBSIDIARY Active
275. Standard Chartered Private Equity Managers (Singapore) Pte. Ltd Singapore SPE-CONSOLI Active
276. Standard Chartered Private Equity Managers Korea Limited Korea, Republic of SPE-CONSOLI Dormant
277. Standard Chartered Real Estate Advisory Services (UK) Limited Beijing
Representative
China SPE-CONSOLI Active
278. Standard Chartered Real Estate Advisory Services (Hong Kong) Limited Hong Kong SPE-CONSOLI Active
279. Standard Chartered Real Estate Fund Management (Singapore) Pte. Limited Singapore SPE-CONSOLI Active
280. Standard Chartered Receivables (UK) Limited United Kingdom SPE-CONSOLI Active
281. Standard Chartered Saadiq Berhad Malaysia SUBSIDIARY Active
282. Standard Chartered Secretaries (Guernsey) Limited Guernsey SUBSIDIARY Active
283. Standard Chartered Securities (Hong Kong) Limited Hong Kong SUBSIDIARY Active
284. Standard Chartered Securities (North America) Inc. United States SPE-CONSOLI Active
285. Standard Chartered Securities (Singapore) Pte. Limited Singapore SUBSIDIARY Active
286. Standard Chartered Securities Korea Limited Korea, Republic of SUBSIDIARY Active
287. Standard Chartered Share Trustees Limited United Kingdom SUBSIDIARY Dormant
288. Standard Chartered Sherwood (HK) Limited Hong Kong SUBSIDIARY Active
289. Standard Chartered Sierra Leone Dependents Limited Sierra Leone SUBSIDIARY Active
290. Standard Chartered Strategic Brand Management Limited United Kingdom SUBSIDIARY Active
291. Standard Chartered Trade Services Corporation United States SPE-CONSOLI Active
292. Standard Chartered Trade Support (HK) Limited Hong Kong SPE-CONSOLI Active
293. Standard Chartered Trust (Cayman) Limited Cayman Islands SUBSIDIARY Active
294. Standard Chartered Trust (Guernsey) Limited Guernsey SUBSIDIARY Active
295. Standard Chartered Trustees (UK) Limited United Kingdom SUBSIDIARY Dormant
296. Standard Chartered UK Holdings Limited United Kingdom SUBSIDIARY Active
297. Standard Chartered Uruguay Representacion S.A. Uruguay SUBSIDIARY Active
298. Standard Chartered Zambia Nominees Limited Zambia SUBSIDIARY Active
299. Taiwan Standard Chartered Insurance Agency Company Taiwan, Province of China SUBSIDIARY Active
300. Thai Exclusive Leasing Company Limited Thailand SUBSIDIARY Active
301. The C.B.I. Development Corporation Limited United Kingdom SUBSIDIARY Dormant
302. Treasureland Worldwide Limited Virgin Islands, British SPE-CONSOLI Dormant
303. Vesey Limited Cayman Islands SUBSIDIARY Active
304. Westwood Limited Samoa SUBSIDIARY Active
305. Ying Ji Li Asset Management Company Limited Taiwan, Province of China SUBSIDIARY Active
283
c102100pu070Proof7:28.3.10B/LRevision:0OperatorSadK

Glossary of ‘‘user groupings’’
Associate An entity over which the Group has the ability to significantly
influence, but not control, the financial and operating policies andprocedures generally accompanying a shareholding of between 20%
and 50% of the voting rights.
Joint venture An entity over which the Group has joint control.
SPE-Consoli An SPE is an entity that is consolidated when the substance of the
relationship between the Group and the entity indicates control bythe Group. Potential indicators of control include amongst others,
an assessment of risks and benefits in respect of the SPE’s activities.
Subsidiary An entity, including a special purpose entity, over which the Group
has the power to directly or indirectly govern the financial and
operating policies, generally accompanying a shareholding of more
than one half of the voting rights.
284
c102100pu070Proof7:28.3.10B/LRevision:0OperatorSadK

DIRECTORS AND SENIOR MANAGEMENT
Promoters
The Company has no promoters and is professionally managed by the Board.
Directors
The following table sets forth details regarding the Board as of the date of filing this Draft Red
Herring Prospectus with SEBI:
Name and Position in the Company Age Other Directorships Position
J W Peace
Chairman
61 Burberry Group plc
Experian plc (Jersey)
Experian Holdings Limited
Experian North America, Inc
Musto Topco Limited
The First American Corporation
Director
Director
Director
Director
Director
Director
P A Sands
Group Chief Executive
48 The Hong Kong Association
The Roundhouse Trust
Institute of International Finance
Director
Director
Director
S P Bertamini
Group Executive Director
45 — —
J S Bindra
Group Executive Director
49 Vital Voices Global Partnership Director
G R Bullock
Group Executive Director(stepping down 30 April 2010)
56 Fleming Family & Partners Limited
Spirax-Sarco Engineering plc
Director
Director
R H Meddings
Group Finance Director
52 3i Group plc Director
A M G ReesGroup Executive Director
54 — —
R Delbridge
Non-executive Director
67 Tate & Lyle PLC Director
J F T Dundas
Non-executive Director
59 Drax Group PLC1
Jupiter Investment Management Holdings
Limited
Jupiter Asset Management Group Limited
Jupiter Fund Management Group Limited
Macmillan Cancer Support
The Property Investment Market
Operations Limited (entered into members’voluntary liquidation)
Xchangeco Limited (entered into members’
voluntary liquidation)
Director
Director
Director
Director
Director
Director
Director
Director
V F Gooding CBE
Non-executive Director
59 J Sainsbury plc
British Broadcasting Corporation
Director
Director
Lawn Tennis AssociationKingston Theatre Trust
DirectorDirector
Dr Han Seung-soo KBE
Non-executive Director
73 — —
S J Lowth
Non-executive Director (from
1 May 2010)
48 AstraZeneca PLC
AstraZeneca UK Limited
AstraZeneca Intermediale Holdings
Limited
Director
Director
Director
285
c102100pu070Proof7:28.3.10B/LRevision:0OperatorSadK
1 J F T Dundas is stepping down from the Drax Group PLC board of directors on 21 April 2010

Name and Position in the Company Age Other Directorships Position
R H P Markham
Non-executive Director and Senior
Independent Director
64 AstraZeneca PLC
Legal & General Group PLC
The Financial Reporting Council Limited
UCL Partners Limited
United Parcel Service, Inc.
Moorfields Eye Hospital
Director
Director
Director
Director
Director
Director
R Markland
Non-executive Director
57 The Sage Group PLC
WRVSWRVS Enterprises Limited
WRVS Food Services Limited
WRVS Office Premises Limited
Director
DirectorDirector
Director
Director
WRVS Services Welfare Limited
Arcadis NV
Director
Director
J G H PaynterNon-executive Director
55 Jardine Lloyd Thompson Group plc110 Drayton Gardens Management
Company Limited
Director
Director
P D Skinner
Non-executive Director
65 Air Liquide S.A.
INSEAD
Tetra Laval International SA
Director
Director
Director
O H J Stocken
Non-executive Director
68 Chichester Festival Theatre Limited
Felsted School Trustee Limited
Home Retail Group plc
Hoyle Barn Limited
Oval Limited
Stanhope Group Holdings LimitedThe Natural History Museum Trading
Company Limited
The Cricket Foundation
Director
Director
Director
Director
Director
Director
Director
Director
Marylebone Cricket Club (MCC) Director
All of the above non-executive Directors are independent.
The address of each of the Directors is the Company’s principal place of business in the UK at
1 Basinghall Avenue, London EC2V 5DD.
Brief Profile of the Directors
John Wilfred Peace, 61
John Peace joined the Board as Deputy Chairman in August 2007. He was appointed ActingChairman on 14 January 2009, and Chairman on 2 July 2009. John is chairman of Experian plc and
Burberry Group plc. He is also a member of the board of governors of Nottingham Trent University,
deputy lieutenant for the County of Nottinghamshire, a fellow of the Royal Society of Arts and
Chairman of The Work Foundation. Between 2000 and 2006, he was chief executive of GUS plc,
having joined the board in 1997.
Peter Alexander Sands, 48
Peter was appointed Group Chief Executive on 20 November 2006. Peter joined the Board on 14 May
2002 as Finance Director, with responsibility for finance, risk, strategy and technology and
operations. He joined Standard Chartered from consultancy McKinsey & Co, where he was a directorworking in the banking and technology sectors in a wide range of international markets.
Stefano Paolo Bertamini, 45
Steve was appointed Chief Executive, Consumer Banking on 1 June 2008. Steve previously spent 22
years with GE, most recently as Chairman and chief executive of GE North East Asia. He was
appointed president of GE Capital Asia in January 2001, and assumed responsibility for the
conglomerate’s merger and acquisition business in the Asia-Pacific region from 2004.
286
c102100pu070Proof7:28.3.10B/LRevision:0OperatorSadK

Jaspal Singh Bindra, 49
Jaspal was appointed as Group Executive Director from 1 January 2010, keeping his responsibilities
for growth and governance in Asia. Jaspal joined the Bank in 1998 and is a director of StandardChartered Bank. He has a wide range of international experience including Global Head of Client
Relationships where he played a key role in the introduction of the client focused strategy that has
served Wholesale Banking so well. As Chief Executive Officer in India, he oversaw the successful
acquisition and integration of Grindlays Bank and set India on its path to become the second largest
market in the Company today.
Gareth Richard Bullock, 56
Gareth joined the Bank in 1996 to head Corporate Banking and governance in the United Kingdom
before moving to run what is now Wholesale Banking in Hong Kong, China and North East Asia.
During this time, the Bank enjoyed unprecedented growth in this franchise and laid the foundations
for the China business. Subsequently, he held a number of senior positions including CEO, Africa,
where he modernised the Company’s African business and opened the Company’s successful Nigerian
business. As Group Head, Technology and Operations, he led the development of the Company’sGlobal Shared Service Centres in Chennai and Kuala Lumpur and during his tenure as Head, Group
Strategy, the Bank made significant strides in implementing its current strategy, including key
acquisitions.
After a long and distinguished career with Standard Chartered, Gareth will be stepping down from
the Board with effect from 30 April 2010. His responsibilities for the Risk function transitioned, from
4 March 2010, to Richard Meddings, Group Finance Director.
Richard Henry Meddings, 52
Richard was appointed Finance Director on 20 November 2006, and is responsible for finance,
corporate treasury, group strategy, corporate development and risk. Prior to this Richard joined the
Board on 16 November 2002 as Group Executive Director with responsibility for risk and special
assets management. In February 2004 he assumed responsibility for legal and compliance, and from
March 2005 responsibility for growth and governance across Africa, the Middle East, Pakistan, the
United Kingdom, Europe and the Americas. He joined Standard Chartered from Barclays PLC,where he served as Chief Operating Officer for private clients and prior to that as Group Financial
Controller. He was Group Finance Director of Woolwich plc. He is a non-executive director of 3i
Group plc and is a member of both the Governing Council of the International Chamber of
Commerce UK.
Alun Michael Guest Rees, 54
Mike was appointed to the Board on 4 August 2009. He joined in 1990 as chief financial officer for
treasury, and was appointed regional treasurer in Singapore, responsible for the Company’s South
East Asia treasury businesses, in October 1994. He was appointed Head of Global Markets in late
2000, and two years later was appointed Chief Executive Wholesale Banking, with responsibility for
all wholesale banking products in addition to his responsibilities for global markets products.
Richard Delbridge, 67
Richard joined the Board on 1 January 2010. Richard has been Senior Independent Director of
Tate & Lyle PLC since December 2003. In 1976, he joined JP Morgan and was Group Comptroller
and later Managing Director of the London offices. In 1989, he was appointed Director, Group
Finance, at Midland Bank plc, later becoming Group Finance Director, HSBC Holdings plc. In 1996,
Richard was appointed Director and Group Chief Financial Officer of National Westminster BankPlc, a position he held until April 2000. Richard’s previous non executive director positions include
JP Morgan Cazenove, Fortis N.V., Fortis SA/NV, Balfour Beatty plc, Gallaher Group Plc, Innogy
plc and Egg plc. He was a council member and treasurer of the Open University for eight years until
2009.
James Frederick Trevor Dundas, 59
Jamie was appointed to the Board on 15 March 2004. He is chairman of Jupiter Investment
Management Holdings Limited and will be stepping down as non-executive director of Drax Group
plc on 21 April 2010. He is also chairman of Macmillan Cancer Support. Over his career, Jamie has
287
c102100pu070Proof7:28.3.10B/LRevision:0OperatorSadK

been chief executive of UK-based property company MEPC, finance director of the Airport Authority
Hong Kong and a director of Morgan Grenfell & Co Limited.
Val Frances Gooding CBE, 59
Val was appointed to the Board on 1 January 2005. Val is a non-executive director of J Sainsbury
plc, the Lawn Tennis Association and the BBC and a trustee of the British Museum. Between 1998
and 2008, Val was chief executive officer of healthcare organisation BUPA, which she joined fromBritish Airways where she held several executive positions.
Dr Han Seung-soo KBE, 73
Dr Han is a former Prime Minister of the Republic of Korea joined the Board on 1 January 2010.
He has a distinguished political, diplomatic and administrative career serving as Deputy Prime
Minister and Minister of Finance, Foreign Affairs, and Industry and Trade before serving as Prime
Minister in 2008 and 2009. He also served as Korean Ambassador to the United States, Chief of
Staff to the President, President of the 56th Session of the United Nations General Assembly, Special
Envoy of the UN Secretary-General on Climate Change and Chairman of the 2009 OECD Ministerial
Council Meeting in Paris. He is currently on the UN Secretary-General’s Advisory Board on Water
and Sanitation as well as Founding Chair of the High-Level Expert Panel on Water and Disaster/UNSGAB.
Simon Jonathan Lowth, 48
Simon will be appointed to the Board on 1 May 2010. He is an executive director and chief financial
officer of AstraZeneca PLC. Previously, he was financial director of Scottish Power plc and has 15
years’ experience at McKinsey & Company, latterly as a senior director.
Rudolph Harold Peter Markham, 64
Rudy was appointed to the Board on 19 February 2001. He is a non-executive director of Legal &
General Group Plc, AstraZeneca PLC and United Parcel Service, Inc. and a member of the board of
the Financial Reporting Council. He is also a non-executive chairman of Moorfields Eye Hospital and
a member of the Operational Board of the Foreign and Commonwealth Office. He served as chief
financial officer at Unilever from 2000 to 2007, having joined the board in 1998 as strategy and
technology director.
Ruth Markland, 57
Ruth was appointed to the Board on 3 November 2003. Ruth is chairman of the board of trustees of
charity WRVS and a non-executive director of The Sage Group plc and a member of the supervisoryboard of Arcadis NV. She was a partner at international law firm Freshfields Bruckhaus Deringer,
managing their Asian offices.
John Gregor Hugh Paynter, 55
John was appointed to the Board on 1 October 2008. He is a non-executive director of Jardine Lloyd
Thompson Group plc and was previously Vice Chairman of JPMorgan Cazenove. He joined
Cazenove in 1979, where he worked for 29 years. He was appointed partner in 1986 and later headed
corporate finance, its largest business.
Paul David Skinner, 65
Paul was appointed to the Board on 3 November 2003. Paul is chair of the advisory board of
Infrastructure UK, a division of HM Treasury, mandated to bring a strategic focus to infrastructure
development as a driver of economic growth in the UK. He is also a non-executive director of L’Air
Liquide SA and the Tetra Laval Group. He was formerly group managing director of Royal DutchShell and CEO of its global oil products business. Following his retirement from Shell in 2003 he was
chairman of Rio Tinto from 2003 to 2009. He has also recently served as chair of the
Commonwealth Business Council, as a member of the Defence Board of the Ministry Of Defence and
as a board member of the INSEAD business school.
Oliver Henry James Stocken, 68
Oliver was appointed to the Board on 1 June 2004. Oliver is chairman of Home Retail Group plc,
Oval Limited and Stanhope Group Holdings Limited. He is also Chairman of the MCC, trustee
288
c102100pu070Proof7:28.3.10B/LRevision:0OperatorSadK

director of the Cricket Foundation and Chairman of the trustees of the Natural History Museum.
Previously he was deputy chairman of 3i Group plc and finance director of Barclays PLC.
Borrowing Powers of the Board
Subject to the Company’s Memorandum and Articles, the UK Companies Act and any directions
given by the Company by special resolution, the business of the Company is managed by the Board
who may exercise all the powers of the Company. In particular, the Board may exercise all the
powers of the Company to borrow money and to mortgage or charge any of its undertaking,
property, assets (present and future) and uncalled capital and to issue debentures and other securities
and to give security for any debt, liability or obligation of the Company or of any third party.
Details of Appointment of the Directors
Name
Contract/Appointment
Letter/Resolution Term
J W Peace Contract of Employment,
2 July 2009
12 months’ rolling notice
Initial three-year term
P A Sands Contract of Employment,
31 December 2003
12 months’ rolling notice
J S Bindra Contract of Employment,
1 January 2010
12 months’ rolling notice
S P Bertamini Contract of Employment,
22 April 2008
12 months’ rolling notice
G R Bullock Contract of Employment,
19 October 2004
12 months’ rolling notice
R H Meddings Contract of Employment,
12 December 2003
12 months’ rolling notice
A M G Rees Contract of Employment,
4 August 2009
12 months’ rolling notice
The non-executive Directors of the Company are appointed for an initial three-year term.
Corporate Governance
The provisions of the IDR Listing Agreements with respect to corporate governance and the SEBI
Regulations in respect of corporate governance will be applicable to the Company immediately upon
the listing of the IDRs on the Stock Exchanges and the Company shall comply with the same. The
Company undertakes to adopt the corporate governance code as per Clause 27 of the IDR Listing
Agreement. Pursuant to Clause 27 of the IDR Listing Agreement, the Company shall comply withthe corporate governance norms applicable in its home country and other jurisdictions in which its
equity shares are listed.
In relation to the Shares, the Company has established a process for handling issues and queries
raised by investors through its registrars, to whom many issues and queries tend to be addressed. The
process includes a requirement for correspondence from investors to be dealt with within a five day
period and for a monthly management report to be sent to the Company summarising how, and the
time frame within which, such correspondence has been dealt with. Any correspondence from
investors received by the Company is also handled within a five day period. There is no requirementunder applicable law or regulations for the Company to make public investor grievances or to include
information about such grievances in any document. As at 26 March 2010 the Company had no
outstanding complaints from shareholders.
The Company is not, under UK law or regulation, required to have a formal Shareholder/Investor
Grievance Committee as typically set up by Indian companies. Instead, shareholders of the Company
may discuss any issues or concerns with the Senior Independent Director where they have been
unable to resolve them through existing channels for investor communications.
In relation to the IDRs, in the IDR Listing Agreement, the Company has agreed that the competent
courts, tribunals and regulatory authorities in India shall have jurisdiction in the event of any dispute,
either with the stock exchange or any investor, concerning the IDRs offered and subscribed or
bought in India. Further, in the IDR Listing Agreement, the Company has agreed that it shall ensure
the protection of the interests of IDR Holders particularly with respect to all corporate benefits
289
c102100pu070Proof7:28.3.10B/LRevision:0OperatorSadK

permissible under Indian laws and the laws of its home country and disclosures made by it in this
Draft Red Herring Prospectus and it has agreed to address all investor grievances adequately. Further
details of the mechanisms established by the Company for this purpose are set out on page 36
(‘‘Mechanism for Redress of Investor Grievances’’ and the ‘‘Grievance Register’’).
The Board consists of a total of 16 Directors and the Company has the following corporate
governance related committees:
Board Committees
In 2009, the Board had four existing Board Committees: the Audit and Risk Committee; the
Nomination Committee; the Remuneration Committee and the Sustainability and Responsibility
Committee. Each Board Committee was responsible for the review and oversight of the activities
within its defined terms of reference. Although the Company believes that its Board is highly
effective, as a result of its internal governance review the Company re-configured its Board
Committees with effect from 4 March 2010. The Company believes that this change will further
enhance the Board’s performance and allow more time to be spent on strategic issues. This alsodemonstrates the Company’s proactive approach to corporate governance with:
* the separation of the Audit and Risk Committee into two committees, one covering financial,
internal controls and compliance (the Audit Committee) and the other covering risk issues (the
Risk Committee);
* an enhanced remit and new name for the Sustainability and Responsibility Committee (to be
called Brand and Values Committee); and
* the formation of a Governance Committee.
Summaries of each Board Committee’s terms of reference are outlined below.
Audit Committee
Members:
* R H P Markham (Chairman)
* R Delbridge
* J F T Dundas
* R Markland
* J G H Paynter
Terms of reference/scope of the Audit Committee:
All the members of the Audit Committee are independent non-executive Directors. The Board
considers that each member brings a broad experience and knowledge of financial reporting to the
Audit Committee’s deliberations. The Board is satisfied that the Audit Committee’s chairman has
recent and relevant financial experience.
The Audit Committee reviews, on behalf of the Board, the company’s internal financial controls to
identify, assess, manage and monitor financial risks.
At least once a year, the Audit Committee meets separately with each of the external auditor and
Group Head of Internal Audit without management being present to discuss matters relating to theauditor’s remit and any issues arising from the audit.
The Audit Committee’s responsibilities include:
* to review and monitor the integrity of statutory accounts, published financial statements and
circulars to shareholders of the Group and any formal announcements relating to the Group’s
financial performance, including significant financial reporting judgements contained in them;
and
* to keep under review the appropriateness of the accounting policies of the Group and to
consider changes to these; and
* to review the Group’s internal financial controls and to review the Group’s internal control
systems and report to the Board.
In relation to the Group’s internal audit function, the Audit Committee’s responsibilities include:
290
c102100pu070Proof7:28.3.10B/LRevision:0OperatorSadK
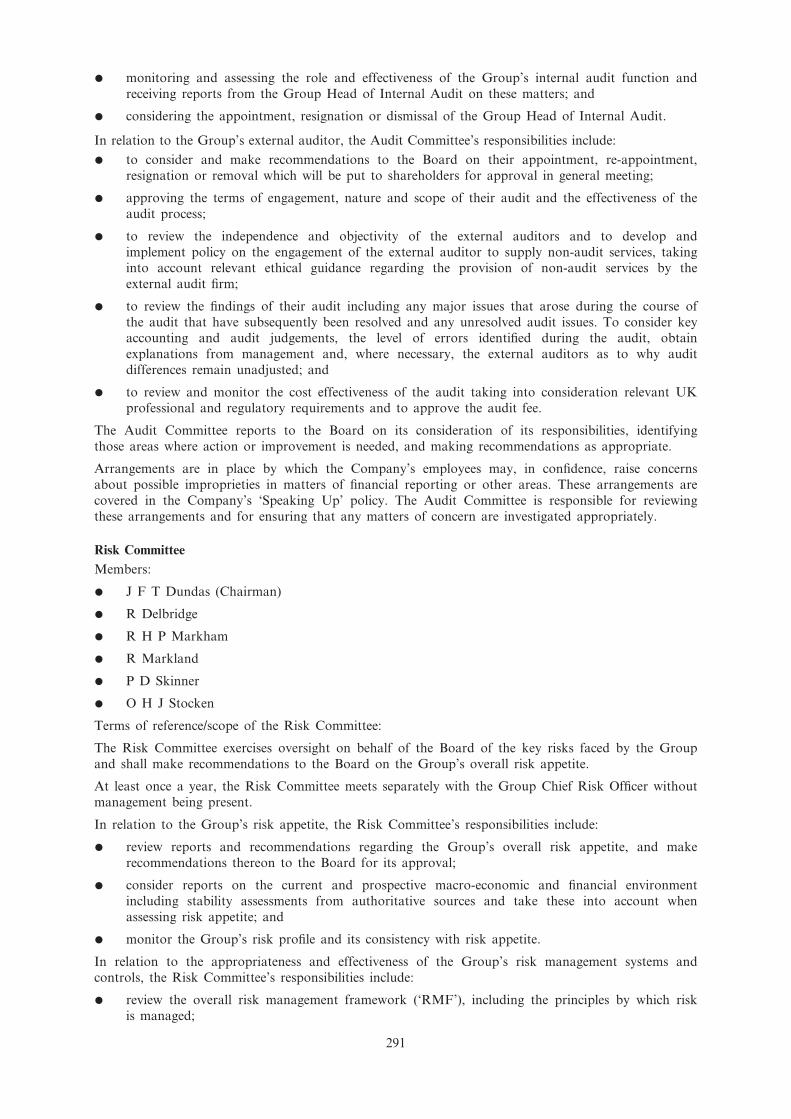
* monitoring and assessing the role and effectiveness of the Group’s internal audit function and
receiving reports from the Group Head of Internal Audit on these matters; and
* considering the appointment, resignation or dismissal of the Group Head of Internal Audit.
In relation to the Group’s external auditor, the Audit Committee’s responsibilities include:
* to consider and make recommendations to the Board on their appointment, re-appointment,
resignation or removal which will be put to shareholders for approval in general meeting;
* approving the terms of engagement, nature and scope of their audit and the effectiveness of the
audit process;
* to review the independence and objectivity of the external auditors and to develop and
implement policy on the engagement of the external auditor to supply non-audit services, takinginto account relevant ethical guidance regarding the provision of non-audit services by the
external audit firm;
* to review the findings of their audit including any major issues that arose during the course of
the audit that have subsequently been resolved and any unresolved audit issues. To consider keyaccounting and audit judgements, the level of errors identified during the audit, obtain
explanations from management and, where necessary, the external auditors as to why audit
differences remain unadjusted; and
* to review and monitor the cost effectiveness of the audit taking into consideration relevant UKprofessional and regulatory requirements and to approve the audit fee.
The Audit Committee reports to the Board on its consideration of its responsibilities, identifying
those areas where action or improvement is needed, and making recommendations as appropriate.
Arrangements are in place by which the Company’s employees may, in confidence, raise concerns
about possible improprieties in matters of financial reporting or other areas. These arrangements are
covered in the Company’s ‘Speaking Up’ policy. The Audit Committee is responsible for reviewing
these arrangements and for ensuring that any matters of concern are investigated appropriately.
Risk Committee
Members:
* J F T Dundas (Chairman)
* R Delbridge
* R H P Markham
* R Markland
* P D Skinner
* O H J Stocken
Terms of reference/scope of the Risk Committee:
The Risk Committee exercises oversight on behalf of the Board of the key risks faced by the Group
and shall make recommendations to the Board on the Group’s overall risk appetite.
At least once a year, the Risk Committee meets separately with the Group Chief Risk Officer without
management being present.
In relation to the Group’s risk appetite, the Risk Committee’s responsibilities include:
* review reports and recommendations regarding the Group’s overall risk appetite, and make
recommendations thereon to the Board for its approval;
* consider reports on the current and prospective macro-economic and financial environment
including stability assessments from authoritative sources and take these into account when
assessing risk appetite; and
* monitor the Group’s risk profile and its consistency with risk appetite.
In relation to the appropriateness and effectiveness of the Group’s risk management systems and
controls, the Risk Committee’s responsibilities include:
* review the overall risk management framework (‘RMF’), including the principles by which risk
is managed;
291
c102100pu070Proof7:28.3.10B/LRevision:0OperatorSadK

* consider and keep under review the Group’s capability for identifying and managing new risk
types or risk correlations which may not be covered by existing RMF arrangements at any given
time;
* review reports on the Group’s management of risk, including on adherence to Group policies
and standards and the maintenance of a supportive culture; and
* review issues arising from Internal Audit that in the view of the Group Head of Internal Audit
are to material to the Committee’s deliberations.
The Risk Committee will consider the implications of changes proposed to regulations and legislationthat are material to the Group’s risk appetite, risk exposure and management of risk
The Risk Committee reports to the Board on its consideration of its responsibilities, identifying those
areas where action or improvement is needed, and making recommendations as appropriate.
Nomination Committee
Members:
* J W Peace (Chairman)
* J F T Dundas
* R H P Markham
* R Markland
* P D Skinner
The Nomination Committee’s responsibilities include:
* regularly review the structure, size and composition (including the skills, knowledge, experience
and compliance with corporate governance best practice) of the Board and makerecommendations with regard to any adjustments that are deemed necessary;
* evaluate the balance of skills, knowledge and experience on the Board and, in the light of this
evaluation, prepare a description of the role and capabilities required for a particular
appointment; and
* keep under review the leadership needs of and succession planning for the Group in relation to
both Directors and other senior executives with a view to ensure the continued ability tocompete effectively in the marketplace and make consequential recommendations to the Board.
The Nomination Committee is also responsible for making recommendations to the Board for the
appointment of the Group Chairman, Group Chief Executive or any other Director. The Group
Chairman will not chair any meeting at which the Nomination Committee is considering the
appointment of a successor to the Group Chairman.
Remuneration Committee
Members:
* R Markland (Chairman)
* J W Peace
* V F Gooding CBE
* J G H Paynter
* P D Skinner
The Remuneration Committee determines the pay and benefits of the Group Chairman, the GroupChief Executive and all other executive Directors. It also reviews and approves the remuneration of
certain other highly paid senior management. The remuneration of all Directors and senior
management is subject to regular monitoring to ensure that levels of remuneration and compensation
are appropriate.
The Remuneration Committee’s responsibilities include:
* to determine and agree with the Board the framework and broad policy for the remuneration ofthe Group’s Chairman, Group Chief Executive, the executive Directors and such other senior
executives as it is designated to consider;
* to approve any proposal to award a remuneration package to any new recruit to the Group’s
staff in excess of an amount to be specified by the Remuneration Committee from time to time;
292
c102100pu070Proof7:28.3.10B/LRevision:0OperatorSadK

* to approve any proposal for individual bonus awards to a member of the Group’s staff in
excess of an amount to be specified by the Remuneration Committee from time to time;
* to review the design of all share incentive plans for approval by the Board and shareholders.
For any such plans, determine each year whether awards will be made, and if so, the overallamount of such awards, the individual awards to executive Directors and other senior
executives, the performance targets to be used and whether any awards formally vest. In
addition, ensure that all share plans operate within the relevant dilution limits stated in any plan
rules;
* to determine the policy for, and scope of, pension arrangements for each executive director and
other designated senior executives.
Brand and Values Committee
Members:
* P D Skinner (Chairman)
* J F T Dundas
* V F Gooding CBE
* Dr Han Seung-soo KBE
* J W Peace
* P A Sands
The Brand and Values Committee oversees the brand, values and good reputation of the Group,
ensuring that reputational risk is consistent with the risk appetite approved by the Board and the
creation of long term shareholder value. In particular, the Brand and Values Committee’s role covers:
brand positioning, culture and values, reputational risk management and all aspects falling within the
Group’s sustainability agenda. This includes the Group’s social, economic and environmental
contribution. The Brand and Values Committee also ensures the Group appropriately manages its
delivery of the Company’s brand and values’ commitments, including the Company’s client/customerfocus, to employees, external stakeholders and society at large.
The Brand and Values Committee’s responsibilities include:
* to oversee and review the positioning of the Group’s brand ensuring that there is a clear
strategy being delivered which increases the value of the brand and the Group’s standing,
reputation and legitimacy in the eyes of all stakeholders;
* to review the processes by which the Group identifies and manages reputational risk in an
effective and transparent manner, consistent with the Board approved Group Risk Appetite
Statement;
* to oversee the implementation of Standard Chartered Bank’s client/customer focus, including theFSA’s ‘‘Treating Customers Fairly’’ requirements; and
* to review the Group’s sustainable business priorities assuring the Group has policies in place to
respond to the issues arising from external trends in (i) environment and climate change; (ii)
social contribution; and (iii) governance..
The Brand and Values Committee is responsible for ensuring an effective mechanism to update the
Board on key issues discussed after each Committee meeting and provide assurance that the key areas
of responsibility within the Brand and Values Committee’s purpose are being managed appropriately
by the Group.
Governance Committee
Members:
* J W Peace (Chairman)
* R H P Markham
* P A Sands
The Governance Committee is responsible for maintaining oversight of existing and emerging
corporate governance principles, practices and processes with a view to maintaining a culture within
the Company and its subsidiaries whereby high standards of corporate governance are embraced
holistically.
293
c102100pu070Proof7:28.3.10B/LRevision:0OperatorSadK

The Governance Committee’s responsibilities include:
* to oversee all material corporate governance issues affecting the Group and make
recommendations to the Board;
* to monitor developments and emerging best practices in corporate governance making
recommendations to the Board as appropriate;
* to oversee the process for ensuring that Directors have individualised induction programmes and
ongoing development programmes designed to maximise their effectiveness;
* to oversee the process by which the Board, each Committee and individual Directors assess their
effectiveness (including the use of an external facilitator periodically) and report to the Board on
the findings and recommendations; and
* to have oversight of the Group’s approach to governance of its subsidiaries.
Directors’ interests in ordinary shares 2009
The following table shows the interests of the Directors in the Shares as at 31 December 2009:
At 1 January 2009 Personal Family At 31 Dec 2009
Director Total interests* interests interests Total interests**
J W Peace 6,648 6,648 — 6,648
P A Sands 108,237 321,532 — 321,532
S P Bertamini 40,659 41,133 — 41,133
G R Bullock 180,471 120,000 — 120,000
J F T Dundas 2,792 2,792 — 2,792
V F Gooding 2,753 2,804 — 2,804
R H P Markham 3,312 3,462 — 3,462R Markland 2,997 3,135 — 3,135
R H Meddings 208,030 183,611 — 183,611
J G H Paynter 2,659 5,000 — 5,000
A M G Rees(a) 286,781 160,297 — 160,297
P D Skinner 5,328 8,565 — 8,565
O H J Stocken 14,221 15,820 — 15,820
S B Mittal(b) 2,000 2,000 — 2,000
Lord Davies(c) 33,184 2,659 30,525 33,184
* Or at date of appointment to the Board, if later.
** Or date of resignation from the Board, if earlier.
Notes* The beneficial interests of directors and their families in the ordinary shares of the Company are set out above. The directors do not
have any non-beneficial interests in the Company’s shares.* No director had an interest in the Company’s preference shares or loan stock, nor the shares or loan stocks of any subsidiary or
associated undertaking of the Group.* No director had any corporate interests in the Company’s ordinary shares.* In accordance with the UK regulatory requirements the Company is obliged to announce any changes in relation to directors
shareholdings. Since 31 December 2009 it has been announced that Peter Sands’ shareholding is 241,532 Shares, Gareth Bullock’sshareholding is 80,000 Shares, Richard Meddings’ shareholding is 120,000 Shares, Mike Rees’ shareholding is 120,297 Shares, andPaul Skinner’s shareholding is 8,951 Shares.
* Since 31 December 2009 it has been announced that Jaspal Bindra’s shareholding is 130,279 Shares, Dr Han Seung-soo’sshareholding is 2,000 Shares, and Richard Delbridge’s shareholding is 2,000 Shares.
(a) Mike Rees was appointed to the Board on 4 August 2009.
(b) Sunil Mittal stepped down from the Board on 31 July 2009.
(c) Lord Davies resigned from the Board with effect from 14 January 2009.
294
c102100pu070Proof7:28.3.10B/LRevision:0OperatorSadK
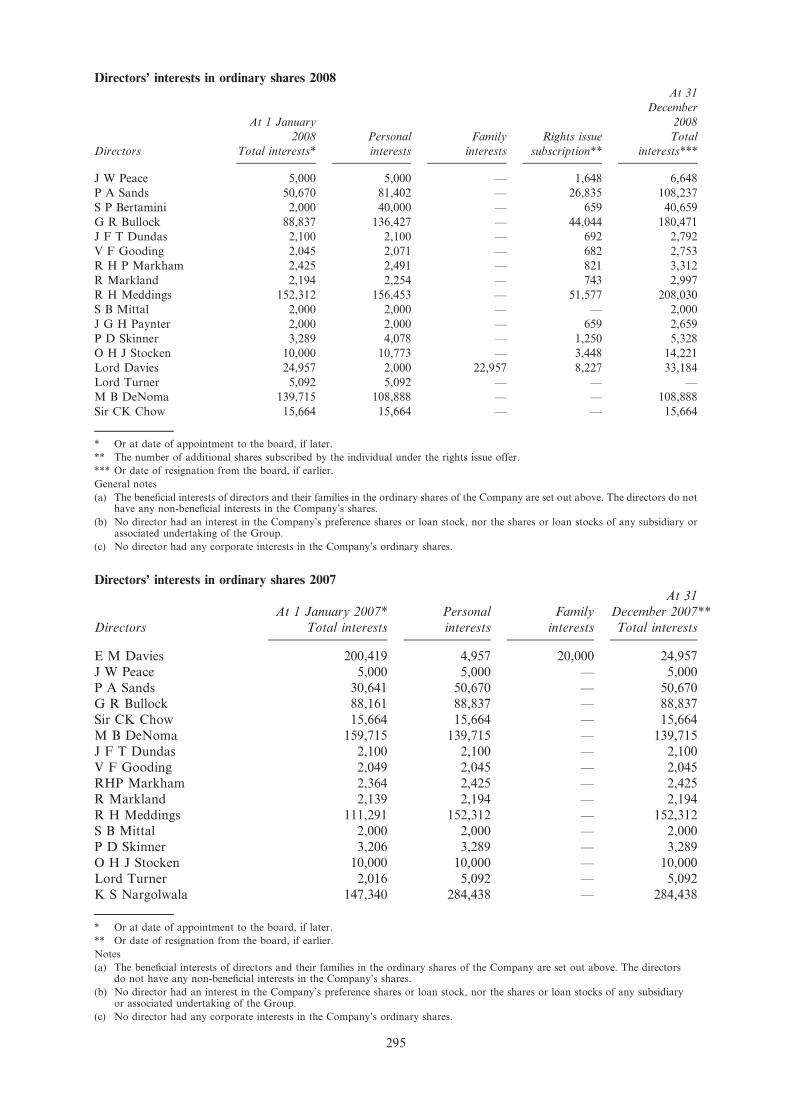
Directors’ interests in ordinary shares 2008
Directors
At 1 January
2008
Total interests*
Personal
interests
Family
interests
Rights issue
subscription**
At 31
December
2008
Total
interests***
J W Peace 5,000 5,000 — 1,648 6,648
P A Sands 50,670 81,402 — 26,835 108,237
S P Bertamini 2,000 40,000 — 659 40,659
G R Bullock 88,837 136,427 — 44,044 180,471
J F T Dundas 2,100 2,100 — 692 2,792
V F Gooding 2,045 2,071 — 682 2,753
R H P Markham 2,425 2,491 — 821 3,312
R Markland 2,194 2,254 — 743 2,997
R H Meddings 152,312 156,453 — 51,577 208,030
S B Mittal 2,000 2,000 — — 2,000
J G H Paynter 2,000 2,000 — 659 2,659
P D Skinner 3,289 4,078 — 1,250 5,328
O H J Stocken 10,000 10,773 — 3,448 14,221
Lord Davies 24,957 2,000 22,957 8,227 33,184
Lord Turner 5,092 5,092 — — —
M B DeNoma 139,715 108,888 — — 108,888
Sir CK Chow 15,664 15,664 — — 15,664
* Or at date of appointment to the board, if later.
** The number of additional shares subscribed by the individual under the rights issue offer.
*** Or date of resignation from the board, if earlier.
General notes
(a) The beneficial interests of directors and their families in the ordinary shares of the Company are set out above. The directors do nothave any non-beneficial interests in the Company’s shares.
(b) No director had an interest in the Company’s preference shares or loan stock, nor the shares or loan stocks of any subsidiary orassociated undertaking of the Group.
(c) No director had any corporate interests in the Company’s ordinary shares.
Directors’ interests in ordinary shares 2007
Directors
At 1 January 2007*
Total interests
Personal
interests
Family
interests
At 31
December 2007**
Total interests
E M Davies 200,419 4,957 20,000 24,957
J W Peace 5,000 5,000 — 5,000
P A Sands 30,641 50,670 — 50,670G R Bullock 88,161 88,837 — 88,837
Sir CK Chow 15,664 15,664 — 15,664
M B DeNoma 159,715 139,715 — 139,715
J F T Dundas 2,100 2,100 — 2,100
V F Gooding 2,049 2,045 — 2,045
RHP Markham 2,364 2,425 — 2,425
R Markland 2,139 2,194 — 2,194
R H Meddings 111,291 152,312 — 152,312S B Mittal 2,000 2,000 — 2,000
P D Skinner 3,206 3,289 — 3,289
O H J Stocken 10,000 10,000 — 10,000
Lord Turner 2,016 5,092 — 5,092
K S Nargolwala 147,340 284,438 — 284,438
* Or at date of appointment to the board, if later.
** Or date of resignation from the board, if earlier.
Notes
(a) The beneficial interests of directors and their families in the ordinary shares of the Company are set out above. The directorsdo not have any non-beneficial interests in the Company’s shares.
(b) No director had an interest in the Company’s preference shares or loan stock, nor the shares or loan stocks of any subsidiaryor associated undertaking of the Group.
(c) No director had any corporate interests in the Company’s ordinary shares.
295
c102100pu070Proof7:28.3.10B/LRevision:0OperatorSadK

Interests of Directors
Except as stated in ‘‘Related Party Transactions’’ on page 594 of the section titled ‘‘Audited Historical
Financial Statements’’ and to the extent of their shareholding in the Company, the Directors and KeyManagerial Personnel do not have any other interest in the Company’s business other than to the
extent of the remuneration or benefits to which they are entitled as per their terms of appointment
and reimbursement of expenses incurred by them during the ordinary course of business and to the
extent of the Shares held by them in the Company, if any, and options granted to them under the
1994 and/or 2000 ESOS.
Changes in the Board of Directors in the last three years
The following changes have occurred in the Board of Directors of the Company in the last three
years:
Name of Director
Date of Appointment
/Re-appointment Date of cessation Reason
S J Lowth 1 May 2010 — Appointed
Dr Han Seung-soo KBE 1 January 2010 — Appointed
R Delbridge 1 January 2010 — Appointed
J S Bindra 1 January 2010 — Appointed
A M G Rees 4 August 2009 — Appointed
S B Mittal 1 August 2007 31 July 2009 Ceased
Lord Davies 16 December 1997 14 January 2009 Ceased
J G H Paynter 1 October 2008 — Appointed
S P Bertamini 1 June 2008 — Appointed
M B DeNoma 12 May 2000 1 June 2008 Ceased
Sir C K Chow 24 February 1997 7 May 2008 Retired
K S Nargolwala 7 May 1999 6 September 2007 Retired
G R Bullock 6 August 2007Stepping down on
31 March 2010 Appointed
J W Peace 1 August 2007 — Appointed
Lord Turner 1 August 2006 19 September 2008 Ceased
Key Managerial Personnel
All the key managerial personnel mentioned below are permanent employees of the Company. Theaddress of each of the key managerial personnel mentioned below is the Company’s principal place of
business in the UK at 1 Basinghall Avenue, London EC2V 5DD.
Standard Chartered Bank
The Directors of SCB comprise the Group Executive Directors of Standard Chartered and thefollowing senior executive:
Tim Miller, 52
Tim joined Standard Chartered in 2000. He is Director, Property, Research and Assurance and has
responsibility for corporate real estate, compliance and regulatory risk, legal, global research. He alsohas functional responsibility for internal audit and the corporate secretariat. He was previously Group
Head of Human Resources. He is Chairman of Standard Chartered First Bank Korea Limited and
Standard Chartered Korea Limited. He is also a non-executive director of Michael Page International
plc, Vice President, Organisation and Resourcing at the Chartered Institute of Personnel and
Development and Chairman of the Governing Board of the School of Oriental and African Studies.
Group Management Committee
The GMC as at 31 December 2009 comprises the directors of SCB and the following senior
executives:
296
c102100pu070Proof7:28.3.10B/LRevision:0OperatorSadK
Tracy Clarke, 43
Tracy joined Standard Chartered in 1985. She is Group Head of Human Resources and
Communications. She has previously held the positions of Group Head Corporate Affairs, Head ofthe Group Chief Executive’s Office and other banking roles in the UK and Hong Kong. She is a
non-executive director of eaga plc.
Richard Goulding, 50
Richard joined Standard Chartered in 2002. Richard is Group Chief Risk Officer. He was previously
the Chief Operating Officer of Wholesale Banking. Prior to joining the Group he was Chief Operating
Officer of the Old Mutual Group Financial Services and before that was a member of the globalexecutive board of UBS investment banking division.
V Shankar, 52
Shankar joined Standard Chartered in 2001. Shankar is Group Head of Origination and Client
Coverage and is Executive Chairman of Principal Finance and Chairman of The Standard Chartered
Private Bank. He has previously held the position of Group Head, Corporate Finance. He is a
member of the board of the Inland Revenue Authority of Singapore and a member of the Economic
Strategies Committee, National Integration Council and on the board of trustees of Sinda, Singapore.As of 1 May 2010 Shankar will be appointed CEO, the Middle East, Africa, the Americas and
Europe, and will become a Director of Standard Chartered Bank.
Jan Verplancke, 46
Jan joined Standard Chartered in 2004. He is Chief Information Officer and Group Head of
Technology and Operations and is responsible for all systems development, technology support and
banking operations. He is non-executive director of Scope International Private Limited and StandardChartered Bank (China) Limited and is a non-executive director of Monitise Plc. Prior to joining the
Group he was Chief Information Officer – EMEA at Dell.
Payment or Benefit to officers of the Company
The following description of the Directors’ remuneration is derived from the Director’s Remuneration
Report in the 2009 Annual Accounts.
Reward Policy
Standard Chartered’s success depends upon the performance and commitment of talented employees.
The Company’s reward programmes support and drive the Company’s business strategy and reinforce
the Company’s values in the context of a clearly articulated risk appetite and effective risk
management. The reward policy is designed to:
* support a strong performance-oriented culture ensuring that individual rewards and incentives
relate directly to the performance of the individual, the operations and functions in which they
work or for which they are responsible, Standard Chartered as a whole and shareholders’
interests; and
* maintain competitive reward that reflects the international nature and enables the Company to
attract and retain talented executives. Many of our employees bring international experience and
expertise, and the Company recruits from a global marketplace.
The Remuneration Committee reviews the reward policy on a regular basis against significant
regulatory developments, market practice and shareholder expectations.
Target remuneration levels for the Group Executive Directors are set with reference to the market,
individual experience levels and internal affordability. The annual performance award targets are now
set as defined dollar amounts. This breaks the link to salary and provides the Committee withincreased flexibility to deliver an appropriate balance between fixed and variable compensation. The
Committee aims to ensure that the balance of target remuneration places greatest weighting on
performance-related elements. The market information draws on the Company’s international banking
peers and the FTSE 30. These two groupings have business characteristics, such as international scope
of operations, complexity and size, which are similar to the Company’s, and represents organisations
that it competes alongside for talent.
297
c102100pu070Proof7:28.3.10B/LRevision:0OperatorSadK

Management Structure
Jam
ie
Du
nd
as
Val
G
oo
din
gC
BE
Ric
har
d
Del
bri
dg
e
Inde
pend
ent
Non
-E
xecu
tive
Dire
ctor
Pet
er
San
ds
Oli
ver
Sto
cken
P
aul
Ski
nn
er
Dr
Han
Seu
ng
-so
oK
BE
Sta
nd
ard
Ch
arte
red
PL
C
Jasp
al
Sin
gh
B
ind
ra
Sim
on
Lo
wth
BO
AR
D
Ric
har
d
Go
uld
ing
GM
C
Gro
up
Chi
ef R
isk
Offi
cer
Tra
cy
Cla
rke
GM
C
Gro
up
Hea
d of
H
uman
R
esou
rces
an
d C
omm
uni-
catio
ns
V
Sh
anka
r
GM
C
Gro
up
Hea
d C
lient
R
elat
ion
ship
s
GM
C
Joh
nP
eace
Cha
irman
Ste
veB
erta
min
i G
aret
hB
ull
ock
M
ike
Ree
sJa
spal
S
ing
h
Bin
dra
Gro
up
Exe
cutiv
e D
irect
or
Gro
up C
hief
E
xecu
tive
and
Cha
irman
of
GM
C
Inde
pend
ent
Non
-E
xecu
tive
Dire
ctor
Inde
pend
ent
Non
-E
xecu
tive
Dire
ctor
Inde
pend
ent
Non
-E
xecu
tive
Dire
ctor
Inde
pend
ent
Non
-E
xecu
tive
Dire
ctor
Inde
pend
ent
Non
-E
xecu
tive
Dire
ctor
Inde
pend
ent
Non
-E
xecu
tive
Dire
ctor
(fro
m 1
May
20
10)
GM
C
Gro
up
Exe
cutiv
e D
irect
or
GM
C
Gro
up
Exe
cutiv
e D
irect
or
GM
C
Gro
up
Exe
cutiv
e D
irect
or
GM
C
Gro
up
Exe
cutiv
e D
irect
or
Ste
veB
erta
min
i
Gro
up
Exe
cutiv
e D
irect
or
Gar
eth
Bu
llo
ck
Exe
cutiv
e D
irect
or (
step
ping
do
wn
on 3
0 A
pril
2010
)
Ric
har
dM
edd
ing
s
Gro
up
Fin
ance
D
irect
or
Mik
eR
ees
Gro
up
Exe
cutiv
e D
irect
or
Ru
dy
Mar
kham
Inde
pend
ent
Non
-E
xecu
tive
Dire
ctor
and
Sen
ior
Inde
pend
ent
Dire
ctor
Ru
thM
arkl
and
Inde
pend
ent
Non
-E
xecu
tive
Dire
ctor
Joh
nP
ayn
ter
Inde
pend
ent
Non
-E
xecu
tive
Dire
ctor
GM
C
Gro
up
Fin
ance
D
irect
or
Ric
har
dM
edd
ing
s T
im
Mil
ler
GM
C
Dire
ctor
, P
rope
rty,
R
esea
rch
and
Ass
uran
ce
Jan
V
erp
lan
cke
GM
C
Chi
ef
Info
rmat
ion
Offi
cer
and
Gro
up H
ead
of G
roup
T
echn
olog
y an
d O
pera
tion
s
298
c102100pu070Proof7:28.3.10B/LRevision:0OperatorSadK

The Board is ultimately accountable for ensuring that, as a collective body, it has the appropriate
skills, knowledge and experience to perform its role effectively. It provides leadership through
oversight, review and providing guidance whilst setting the strategic direction. It is also the primary
decision-making body for all matters considered as material to Standard Chartered.
The Board aim for the highest standards of corporate governance, and in pursuit of this objective,
follow an approach that complies with all of the provisions of the UK Financial Reporting Council’s
Combined Code on Corporate Governance (the Code) and with Appendix 14 of the Hong KongListing Rules, save one exception: under the Code, all non-executive directors are formally required to
meet major shareholders as part of their induction programmes. However, Rudy Markham, the
Company’s Senior Independent Director, met with a number of institutional investors and John
Peace, the Company’s Chairman, had regular meetings with institutional shareholders. The Company’s
Board received regular updates on the views of the Company’s institutional shareholders and
stakeholders including a presentation from one institutional shareholder on its view of the company
as an investment. The Company’s Board openly seek the views of the Company’s shareholders and
during 2009, the Chairman, Group Chief Executive and Group Finance Director met 23 out of theCompany’s top 25 investors. As part of the Company’s regulatory obligations, it has in place a code
of conduct related to securities transactions by directors the terms of which are no less exacting than
required by Appendix 10 of the Hong Kong Listing Rules; the Company can confirm that the
directors were in compliance.
The Board meets regularly and has a formal schedule of matters specifically reserved for its decision.
These matters include determining and reviewing the strategy of the Company and the Group,
overseeing the Group’s compliance with statutory and regulatory obligations and issues relating to the
Company’s and the Group’s capital.
It is also responsible for the Group’s structure and areas of operation, financial reporting, ensuring
there is a sound system of internal control and risk management, and appointments to the Board.
The Group has a policy on delegated authority which sets out how executive authority is delegated
from the Board to the CEO and on to the executive Directors and other senior management. In
addition, specific responsibilities have been delegated to Board Committees which have adopted terms
of reference that govern their authority which can be found on the Company’s website atwww.standardchartered.com.
Remuneration Structure
Base Salaries and Benefits
Salary levels for executive Directors are reviewed annually by the Remuneration Committee, takingaccount of the latest available market data.
Annual Performance Award
Objective
* To focus participants on the achievement of annual objectives, which align the short-term
performance of the Group with the sustainable creation of shareholder value;
* To provide a portion of total reward which is performance related; and
* To ensure that the proportion of variable compensation (which might be delivered through a
cash award and deferred shares) increases with seniority.
Delivery and Details
* Awards are in two components: cash and deferred shares. Awards in excess of $50,000 have a
proportion deferred into shares;
* The greater the amount of the annual performance award, the greater the level of deferral;
* Deferred shares vest in equal tranches after one, two and three years;
* Deferral levels are reviewed annually taking account of the latest regulatory and market
practice. In 2009 The Group strengthened the deferral framework with new higher percentages
of deferral to a maximum marginal rate of 65%; and
* The unvested deferred element is normally forfeited in the event of a voluntary resignation or
termination for cause. Deferred awards are subject to clawback in exceptional circumstances,
such as a material re-statement of Group financials or where, as a result of an appropriate
299
c102100pu070Proof7:28.3.10B/LRevision:0OperatorSadK

accountability review, an individual has been deemed to have caused in full or in part a material
loss for the Group, as a result of i. reckless, negligent or wilful actions or ii. inappropriate
values or behaviour.
Long-Term Incentives
Standard Chartered operates a share incentive programme designed to provide competitive long-term
incentives. Details of the employee share schemes (including the executive schemes) are contained on
pages 327 to 339 of this Draft Red Herring Prospectus.
Retirement Benefits
Retirement benefits are provided through a combination of approved and/or unapproved defined
benefit and cash structures depending upon when an executive director joined Standard Chartered and
his geographical location. Executive directors are given the opportunity to waive a proportion of the
cash element of any potential annual performance award to enhance their unfunded unapproved
retirement benefits. Base salary is the only element of remuneration which is pensionable.
Service Agreements
All executive Directors have contracts subject to 12 months’ rolling notice. The contracts containpayment in lieu of notice (PILON) provisions which can be exercised at the Group’s discretion. The
PILON comprises an amount equal to 12 months’ base salary, pension contributions/entitlement and
certain benefits and allowances (such as life assurance and car allowance). Annual performance
awards payable as part of a PILON are determined by the Remuneration Committee, after taking
into consideration the performance of both the individual and Standard Chartered. Payments under
PILON are made in quarterly instalments and are subject to mitigation.
Special provisions apply in the event where the Company terminates the executive director’s contract
in the 12 months following a change of control without giving notice. Unless the executive director
has been summarily dismissed or is serving out their notice an amount equal to 12 months’ base
salary, annual performance award, pension contributions/entitlement and certain benefits andallowances will be paid in four equal instalments. The annual performance award payable in respect
of the 12 months following the date of termination is equivalent to the executive director’s target
performance award. The annual performance award payable in respect of the performance period
prior to termination is decided by the Committee, taking into account both the performance of the
individual and Standard Chartered. A pro rata target performance award is payable if this period is
less than six months.
Audited information
Remuneration of Group Chairman 2009
2009(4) 2008
Cash fee
Shares
based fee Benefits Total Fees Benefits Total
Chairman US$’000 US$’000 US$’000 US$’000 US$’000 US$’000 US$’000
J W Peace(1), (2), (3) 988 781 2 1,771 276 – 276
Notes
(1) The above cash fee includes pro rating of the annual fee of US$1,014,839 which was payable to John when he was Acting Chairmanbetween 15 January 2009 and 30 June 2009.
(2) Following his appointment as Chairman, John now receives part of his annual fee in restricted shares. Accordingly he was grantedan initial award over 41,528 shares in the Company on 28 September 2009.
(3) John was a member of the Audit and Risk Committee until 2 July 2009, and remains a member of the Nomination Committee andRemuneration Committee.
(4) Payment to a former director – Lord Davies resigned as an employee and stepped down from the Board, Nomination Committeeand Sustainability and Responsibility Committee on 14 January 2009. He received emoluments in 2009 of US$38,000 (2008:US$1,195,000) in respect of this base fee and US$7,000 (2008: US$41,000) in respect of core benefits.
300
c102100pu070Proof7:28.3.10B/LRevision:0OperatorSadK

Remuneration of non-executive directors 2009
2009 2008
Fees Benefits Total Fees Benefits Total
Non-Executive Directors US$’000 US$’000 US$’000 US$’000 US$’000 US$’000
J F T Dundas(1), (2), (4) 204 – 204 214 – 214
V F Gooding(3), (4) 173 – 173 180 – 180
R H P Markham(1), (2), (5) 292 – 292 263 – 263
R Markland(1), (2), (3) 255 – 255 270 – 270
J G H Paynter(1) 177 – 177 44 – 44
P D Skinner(3) 161 – 161 168 – 168
O H J Stocken(3), (4) 173 – 173 180 – 180S B Mittal(6) 68 – 68 133 – 133
Total 1,503 – 1,503 1,452 – 1,452
Notes
(1) Member of the Audit and Risk Committee.
(2) Member of the Nomination Committee.
(3) Member of the Remuneration Committee.
(4) Member of the Sustainability and Responsibility Committee.
(5) Senior Independent Director.
(6) Sunil Mittal stepped down from the Board on 31 July 2009.
General notes
(a) Any base salary/fee or benefit item in the table above has been converted using the average foreign exchange rates throughout therelevant financial year. The rates are £1: US$1.5613 (2009) and £1: US$1.8377 (2008).
Remuneration of executive directors 2009
2009
Fixed (US$’000) Total Variable Compensation (US$’000)
Annual Performance Award
Directors
Salary/
fees Benefits(1)Cash
bonus(2)Deferred
Shares(3)
Voluntary
Deferred
Shares Sub Total PSP(4) Total
P A Sands 1,444 97 – 2,240 960 3,200 2,179 6,920
S P Bertamini(6) 1,113 772 – 980 420 1,400 1,173 4,458
G R Bullock 781 65 420 980 – 1,400 – 2,246R H Meddings 1,054 69 – 1,540 660 2,200 1,341 4,664
A M G Rees(7) 625 37 – 7,700 3,300 11,000 1,609 13,271
Total 5,017 1,040 420 13,440 5,340 19,200 6,302 31,559
301
c102100pu070Proof7:28.3.10B/LRevision:0OperatorSadK

2008
Fixed (US$’000) Total Variable Compensation (US$’000)
Annual Performance Award
Directors
Salary/
fees Benefits
Cash
bonus
Deferred
Shares
Voluntary
Deferred
Shares Sub Total PSP Total
P A Sands 1,516 97 1,051 878 697 2,626 1,799 6,038
S P Bertamini(5), (6) 701 467 563 1,746 266 2,575 1,270 5,013
G R Bullock 907 76 189 327 279 795 740 2,518
R H Meddings 1,096 68 913 558 355 1,826 1,112 4,102
A M G Rees(7) 643 38 4,383 3,911 472 8,766 623 10,070
Total 4,863 746 7,099 7,420 2,069 16,588 5,544 27,741
Notes
(1) The benefits column includes amounts relating to car allowances and medical and life assurance benefits. Steve Bertamini carries outhis duties overseas and his remuneration was adjusted to take local living costs into account. This adjustment was to put Steve in aposition, after taxation differentials, where he would be no worse off as a result of carrying out his duties overseas. The benefitscolumn for Steve also includes additional benefits, such as allowances for working overseas, the provision of accommodation oreducation of children. The 2008 benefits column has been restated to include life assurance benefit as follows: Peter SandsUS$32,057 (2009: US$30,692), Steve Bertamini US$5,252 (2009: US$3,737), Gareth Bullock US$22,716 (2009: US$18,453), RichardMeddings US$24,912 (2009: US$25,624), and Mike Rees US$3,717 (2009: US$5,416).
(2) The cash element of the annual performance award is shown net of any amounts waived to provide additional pension benefits.Gareth Bullock waived US$415,000 of his 2008 performance award into his pension arrangement. This was disclosed in the 2008annual report and accounts.
(3) The amounts shown in the deferred shares column include the proportion of the annual performance award deferred into restrictedshares and/or the deferred bonus plan for each executive director. In 2009, the Committee determined that a portion of eachexecutive director s performance awards, above and beyond any deferral threshold specified under the Financial Services Authoritycode on remuneration should be deferred into restricted shares vesting over a three year period. This resulted in a minimum of 70%of any performance award being delivered in restricted shares. In addition, certain executive directors elected to voluntarily waiveadditional amounts into the deferred bonus plan in both 2008 and 2009, as shown in the voluntary deferred shares columns.
(4) The expected value of any performance share awards granted in March 2010 in respect of the 2009 financial year. The values arebased on an initial value adjusted for factors such as performance conditions, forfeiture risk and lack of dividends.
(5) Steve Bertamini received a total 2008 discretionary annual performance award of US$1,125,000 of which US$296,250 andUS$266,000 is deferred into restricted shares under the 2006 RSS and the DBP respectively. In addition, in recognition of thesubstantial elements of deferred compensation and share awards which he forfeited on leaving his previous employer, he was alsoawarded, as part of his joining arrangements, a one-off award of deferred shares of US$1,449,300 (£1,000,000) granted in March2009. This will vest in March 2010. No guarantee was made to Steve in the respect of the 2009 performance and financial year.
(6) Steve Bertamini received cash allowances of US$315,000 (2008: US$140,905) in lieu of his participation in any pension plan and thisis reflected in the table above, as part of salary/fees.
(7) Mike Rees was appointed to the Board on 4 August 2009. His 2008 compensation has been provided for comparison purposes.
General notes
(a) Any base salary/fee or benefit item in the table above has been converted using the average foreign exchanges rates throughout therelevant financial year. The rates are £1: US$1.5613 (2009) and £1: US$1.8377 (2008).
(b) Any performance award (both cash and deferred elements) are determined in US dollars and shown as such in the table. Theproposed PSP awards in respect of the 2009 performance year are determined in pounds sterling, but for the purposes of the tableconverted into US dollars using the exchange rate at the time of award £1:US$1.5593 (2009: £1:US$1.4493).
302
c102100pu070Proof7:28.3.10B/LRevision:0OperatorSadK

Remuneration of directors 2008/2007
2008 2007
Fixed Variable
Directors
Salary/
fees Benefits(a)Cash
bonus(b)Deferred
shares(c) PSP(d) Total
Salary/
fees Benefits(a)Cash
bonus(b)Deferred
bonus(c) Total PSP(d)
Total
including
PSP
US$000 US$000 US$000 US$000 US$000 US$000 US$000 US$000 US$000 US$000 US$000 US$000 US$000
Lord Davies(e) 1,195 41 — — — 1,236 1,304 21 — — 1,325 — 1,325
Sub total 1,195 41 — — — 1,236 1,304 21 — — 1,325 — 1,325
P A Sands(f) 1,516 65 1,051 1,575 1,799 6,006 1,504 63 2,005 1,003 4,575 2,422 6,997S P Bertamini(g)(h) 701 462 563 2,012 1,270 5,008 — — — — — — —G R Bullock 907 53 189 606 740 2,495 900 50 543 521 2,014 1,424 3,438R H Meddings 1,096 43 913 913 1,112 4,077 1,023 46 1,036 682 2,787 1,647 4,434M B DeNoma(h)(j) 1,274 2,884 — — — 4,158 1,218 1,233 1,103 551 4,105 1,243 5,348
Sub total 5,494 3,507 2,716 5,106 4,921 21,744 4,645 1,392 4,687 2,757 13,481 6,736 20,217
J W Peace(p) 276 — — — — 276 125 — — — 125 — 125J F T Dundas(f)(i)(k) 214 — — — — 214 180 — — — 180 — 180V F Gooding(f)(l) 180 — — — — 180 159 — — — 159 — 159R H P Markham(i)(k)(q) 263 — — — — 263 250 — — — 250 — 250R Markland(i)(k)(l) 270 — — — — 270 224 — — — 224 — 224
S B Mittal 133 — — — — 133 54 — — — 54 — 54J G H Paynter(k)(m) 44 — — — — 44 — — — — — — —P D Skinner(l) 168 — — — — 168 153 — — — 153 — 153O H J Stocken(f)(l) 180 — — — — 180 156 — — — 156 — 156Sir CK Chow(n) 44 — — — — 44 282 — — — 282 — 282Lord Turner(o) 154 — — — — 154 188 — — — 188 — 188
Sub total 1,926 — — — — 1,926 1,771 — — — 1,771 — 1,771
Total 8,615 3,548 2,716 5,106 4,921 24,906 7,720 1,413 4,687 2,757 16,577 6,736 23,313
Notes
(a) The benefits column includes amounts relating to car allowances and medical and life insurance benefits. Mr Bertamini and MrDeNoma carried out their duties overseas and had their remuneration adjusted to take local living costs into account. Thisadjustment was to put them in a position, after taxation differentials, where they would be no worse off as a result of carrying outtheir duties overseas. The benefits column for these directors also includes additional benefits, such as allowances for workingoverseas, the provision of accommodation or education of children. For Mr Bertamini and Mr DeNoma, these allowances andbenefits amounted to US$461,878 (2007: n/a) and US$2,883,919 (2007: US$1,233,100) respectively. In line with the Group’sinternational mobility policy Mr DeNoma was tax equalised for those cash benefits which have been paid through payroll and foremployee share scheme exercises made in 2008, which amounted to a total of US$381,481.
(b) The cash bonus amounts shown are net of any amounts waived to provide additional pension benefits.
(c) The amounts shown in the 2008 deferred shares column includes, firstly, the standard proportion of the annual performance awarddeferred into restricted shares, under the 2006 Restricted Share Scheme and, secondly, an additional portion that the directorsindicated to the committee they wished to defer voluntarily into the Deferred Bonus Plan. The amounts of the additional deferralinto the Deferred Bonus Plan for each director are as follows: Mr Sands US$697,000, Mr Bertamini US$266,000, Mr BullockUS$279,500 and Mr Meddings US$355,000.
(d) The expected value of any performance share awards granted or to be granted (i.e. March 2009) in respect of the 2007 and 2008financial years. The values are based on an initial value adjusted for factors such as performance conditions, forfeiture risk and lackof dividends. For Mr Bertamini an initial joining grant made in September 2008 of US$1,086,975 (£750,000) is also included.
(e) Lord Davies resigned as an employee and stepped down from the board, board nomination committee and sustainability andresponsibility committee on 14 January 2009.
(f) Member of the sustainability and responsibility committee.
(g) Mr Bertamini received a total 2008 discretionary annual performance award of US$1,125,000 of which US$296,250 and US$266,000is deferred into restricted shares under the 2006 Restricted Share Scheme and the Deferred Bonus Plan respectively. In addition, inrecognition of the substantial elements of deferred compensation and share awards which Mr Bertamini forfeited when he left hisprevious employer, he was also awarded, as part of his joining arrangements, a one-off award of deferred shares to be granted inMarch 2009 of US$1,449,300 (£1,000,000). This will vest in February 2010.
(h) Mr Bertamini and Mr DeNoma received cash allowances of US$140,905 (2007: n/a) and US$273,053 (2007: US$258,648)respectively in lieu of their participation in any pension plan and this is reflected in the table above, as part of salary/fees.
(i) Member of the board nomination committee.
(j) Mr DeNoma resigned from the board on 1 June 2008. However, he will continue to be an employee of the Group until 30 June 2009.His base salary and other contractual benefits will continue to be paid until 30 June 2009 in line with his contract of employment.
(k) Member of the audit and risk committee.
(l) Member of the board remuneration committee.
(m) Mr Paynter was appointed as an independent non-executive director with effect from 1 October 2008 and as a member of the auditand risk committee from 1 November 2008.
(n) Sir CK Chow retired from the board on 7 May 2008, but remains chairman of Standard Chartered Bank (Hong Kong) Limited forwhich he receives a fee of HK$1.75 million per annum. In 2007 he received an all-inclusive fee for his Hong Kong and StandardChartered PLC Board duties of HK$2,100,000.
(o) Lord Turner stepped down from the board on 19 September 2008.
(p) Mr Peace received an all-inclusive fee of US$275,655 (£150,000) as deputy chairman. In 2007 he received an all-inclusive fee ofUS$300,810 for his membership of the Audit and Risk Committee and to the Board as Deputy Chairman and Senior IndependentDirector.
303
c102100pu070Proof7:28.3.10B/LRevision:0OperatorSadK

(q) Mr Markham was appointed Senior Independent Director on 1 January 2007 and stepped down from this role on 1 August 2007,following the appointment of Mr Peace. An additional fee of US$23,396 (based on an annualised equivalent fee of £20,000) waspayable to Mr Markham during this period to reflect the further workload that was associated specifically with this role. This figureis reflected in the table above.
General notes
Any base salary/fee or benefit item in the table above has been converted using the average rates throughout the relevant financial year of£1:US$1.8377 (2008) and £1:US$2.0054 (2007). Any performance award (comprising cash bonus and deferred shares) for 2008 isdetermined in US dollars and shown as such in the table. The proposed PSP awards in respect of the 2008 performance year aredetermined in sterling but for the purposes of the table converted into US dollars using the exchange rate at the end of the year(£1:US$1.4993). All emoluments in 2007 have, where necessary, been converted using the average exchange rate for 2007, consistent withthe basis shown in last year’s report and accounts.
Mr Nargolwala resigned from the Board on 6 September 2007. However, he continued to be an employee of the Group until 31December 2007. His base salary and other contractual benefits continued to be paid until 31 December 2007 in line with his contract ofemployment. Mr Nargolwala remuneration for 2007 was US$1,160,000 (US$496,000 in salary and US$664,000 in benefits). MrNargolwala carried out his duties overseas and had his remuneration adjusted to take local living costs into account. This adjustmentwas to put him in a position, after taxation differentials, where he was no worse off as a result of carrying out his duties overseas. Theadditional benefits, included such as allowances for working overseas, the provision of accommodation or education of children. For MrNargolwala, these allowances and benefits amounted to US$664,336 (2007).
Compensation to past director: As reported in the 2006 report and accounts, Mr B K Sanderson
stepped down from the Board on 19 November 2006. However, he continued to be an employee ofthe Group until 31 March 2007. His base salary and other contractual benefits continued to be paid
until 31 March 2007 in line with his contract of employment and totalled US$227,657 (£113,522). His
contract of employment was subject to 12 months’ rolling notice and contained PILON provisions. In
accordance with the terms of his contract, Mr Sanderson received a PILON comprising an amount
equal to 12 months’ base fee and certain benefits and allowances. The PILON was paid in four
quarterly instalments of £203,750 starting on 25 April 2007. Following an announcement to the
London Stock Exchange on 19 October 2007, stating that Mr Sanderson had been appointed as
Chairman of Northern Rock PLC, the fourth and final PILON instalment was reduced to reflect hisduty to mitigate.
Remuneration of Group Chairman 2009
2009(4) 2008
Cash fee
Shares
based fee Benefits Total Fees Benefits Total
Chairman Rs’000 Rs.’000 Rs.’000 Rs.’000 Rs.’000 Rs.’000 Rs.’000
J W Peace(1), (2), (3) 46,120 36,457 93 82,670 12,884 — 12,884
Notes
(1) The above cash fee includes pro rating of the annual fee of Rs.47,372,685 which was payable to John when he was Acting Chairmanbetween 15 January 2009 and 30 June 2009.
(2) Following his appointment as Chairman, John now receives part of his annual fee in restricted shares. Accordingly he was grantedan initial award over 41,528 shares in the Company on 28 September 2009.
(3) John was a member of the Audit and Risk Committee until 2 July 2009, and remains a member of the Nomination Committee andRemuneration Committee.
(4) Payment to a former director – Lord Davies resigned as an employee and stepped down from the Board, Nomination Committeeand Sustainability and Responsibility Committee on 14 January 2009. He received emoluments in 2009 of Rs.1,773,840 (2008:Rs.55,782,600) in respect of this base fee and Rs.326,760 (2008: Rs.1,913,880) in respect of core benefits.
304
c102100pu070Proof7:28.3.10B/LRevision:0OperatorSadK

Remuneration of non-executive directors 2009
2009 2008
Fees Benefits Total Fees Benefits Total
Non-Executive Directors Rs.’000 Rs.’000 Rs.’000 Rs.’000 Rs.’000 Rs.’000
J F T Dundas(1), (2), (4) 9,523 — 9,523 9,990 — 9,990
V F Gooding(3), (4) 8,076 — 8,076 8,402 — 8,402
R H P Markham(1), (2), (5) 13,631 — 13,631 12,277 — 12,277
R Markland(1), (2), (3) 11,903 — 11,903 12,604 — 12,604
J G H Paynter(1) 8,262 — 8,262 2,054 — 2,054
P D Skinner(3) 7,516 — 7,516 7,842 — 7,842
O H J Stocken(3), (4) 8,076 — 8,076 8,402 — 8,402S B Mittal(6) 3,174 — 3,174 6,208 — 6,208
Total 70,160 — 70,160 67,779 — 67,779
Notes
(1) Member of the Audit and Risk Committee.
(2) Member of the Nomination Committee.
(3) Member of the Remuneration Committee.
(4) Member of the Sustainability and Responsibility Committee.
(5) Senior Independent Director.
(6) Sunil Mittal stepped down from the Board on 31 July 2009.
General notes
(a) Any base salary/fee or benefit item in the table above has been converted using the average foreign exchange rates throughout therelevant financial year. The rates are £1: US$1.5613 (2009) and £1: US$1.8377 (2008).
Remuneration of executive directors 2009
2009
Fixed (Rs.’000) Total Variable Compensation (Rs.’000)
Annual Performance Award
DirectorsSalary/
fees Benefits(1)Cash
bonus(2)Deferred
Shares(3)
VoluntaryDeferred
Shares Sub Total PSP(4) Total
P A Sands 67,406 4,528 — 104,563 44,813 149,376 101,716 323,026
S P Bertamini(6) 51,955 36,037 — 45,746 19,606 65,352 54,756 208,099
G R Bullock 36,457 3,034 19,606 45,746 — 65,352 — 104,843
R H Meddings 49,201 3,221 — 71,887 30,809 102,696 62,598 217,716A M G Rees(7) 29,175 1,727 — 359,436 154,044 513,480 75,108 619,490
Total 234,194 48,547 19,606 627,379 249,271 896,256 294,177 1,473,174
305
c102100pu070Proof7:28.3.10B/LRevision:0OperatorSadK

2008
Fixed (Rs.’000) Total Variable Compensation (Rs.’000)
Annual Performance Award
DirectorsSalary/
fees BenefitsCash
bonusDeferred
Shares
VoluntaryDeferred
Shares Sub Total PSP Total
P A Sands 70,767 4,528 49,061 40,985 32,536 122,582 83,977 281,854
S P Bertamini(5), (6) 32,723 21,800 26,281 81,503 12,417 120,201 59,284 234,007
G R Bullock 42,339 3,548 8,823 15,264 13,024 37,111 34,543 117,540
R H Meddings 51,161 3,174 42,619 26,047 16,571 85,238 51,908 191,481
A M G Rees(7) 30,015 1,774 204,598 182,565 22,033 409,197 29,082 470,068
Total 227,005 34,823 331,381 346,366 96,581 774,328 258,794 1,294,950
(1) The benefits column includes amounts relating to car allowances and medical and life assurance benefits. Steve Bertamini carries outhis duties overseas and his remuneration was adjusted to take local living costs into account. This adjustment was to put Steve in aposition, after taxation differentials, where he would be no worse off as a result of carrying out his duties overseas. The benefitscolumn for Steve also includes additional benefits, such as allowances for working overseas, the provision of accommodation oreducation of children. The 2008 benefits column has been restated to include life assurance benefit as follows: Peter SandsRs.1,496,421 (2009: Rs.1,432,703), Steve Bertamini Rs.245,163 (2009: Rs.174,443), Gareth Bullock Rs.1,060,383 (2009: Rs.861,386),Richard Meddings Rs.1,162,892 (2009: Rs.1,196,128), and Mike Rees Rs.173,510 (2009: Rs.252,819).
(2) The cash element of the annual performance award is shown net of any amounts waived to provide additional pension benefits.Gareth Bullock waived Rs.19,372,200 of his 2008 performance award into his pension arrangement. This was disclosed in the 2008annual report and accounts.
(3) The amounts shown in the deferred shares column include the proportion of the annual performance award deferred into restrictedshares and/or the deferred bonus plan for each executive director. In 2009, the Committee determined that a portion of eachexecutive director s performance awards, above and beyond any deferral threshold specified under the Financial Services Authoritycode on remuneration should be deferred into restricted shares vesting over a three year period. This resulted in a minimum of 70%of any performance award being delivered in restricted shares. In addition, certain executive directors elected to voluntarily waiveadditional amounts into the deferred bonus plan in both 2008 and 2009, as shown in the voluntary deferred shares columns.
(4) The expected value of any performance share awards granted in March 2010 in respect of the 2009 financial year. The values arebased on an initial value adjusted for factors such as performance conditions, forfeiture risk and lack of dividends.
(5) Steve Bertamini received a total 2008 discretionary annual performance award of Rs.52,515,000 of which Rs.13,828,950 andRs.12,416,880 is deferred into restricted shares under the 2006 RSS and the DBP respectively. In addition, in recognition of thesubstantial elements of deferred compensation and share awards which he forfeited on leaving his previous employer, he was alsoawarded, as part of his joining arrangements, a one-off award of deferred shares of Rs.67,653,324 (£1,000,000) granted in March2009. This will vest in March 2010. No guarantee was made to Steve in the respect of the 2009 performance and financial year.
(6) Steve Bertamini received cash allowances of Rs.14,704,200 (2008: Rs.6,577,445) in lieu of his participation in any pension plan andthis is reflected in the table above, as part of salary/fees.
(7) Mike Rees was appointed to the Board on 4 August 2009. His 2008 compensation has been provided for comparison purposes.
General notes
(a) Any base salary/fee or benefit item in the table above has been converted using the average foreign exchanges rates throughout therelevant financial year. The rates are £1: US$1.5613 (2009) and £1: US$1.8377( 2008).
(b) Any performance award (both cash and deferred elements) are determined in US dollars and shown as such in the table. Theproposed PSP awards in respect of the 2009 performance year are determined in pounds sterling, but for the purposes of the tableconverted into US dollars using the exchange rate at the time of award £1:US$1.5593 (2009 £1:US$1.4493).
306
c102100pu070Proof7:28.3.10B/LRevision:0OperatorSadK

Remuneration of directors 2008/2007
2008 2007
Fixed Variable
Salary/
fees Benefits(a)Cash
bonus(b)Deferred
shares(c) PSP(d) Total
Salary/
fees Benefits(a)Cash
bonus(b)Deferred
bonus(c) Total PSP(d)
Total
including
PSP
Directors Rs. 000 Rs. 000 Rs. 000 Rs. 000 Rs. 000 Rs. 000 Rs. 000 Rs. 000 Rs. 000 Rs. 000 Rs. 000 Rs. 000 Rs. 000
Lord Davies(e) 55,783 1,914 — — — 57,697 60,871 980 — — 61,851 — 61,851
Sub total 55,783 1,914 — — — 57,697 60,871 980 — — 61,851 — 61,851
P A Sands(f) 70,767 3,034 49,061 73,521 83,977 280,360 70,207 2,941 93,593 46,820 213,561 113,059 326,620S P Bertamini(g)(h) 32,723 21,566 26,281 93,920 59,284 233,774 — — — — — — —G R Bullock 42,339 2,474 8,823 28,288 34,543 116,467 42,012 2,334 25,347 24,320 94,013 66,472 160,485R H Meddings 51,161 2,007 42,619 42,619 51,908 190,314 47,754 2,147 48,360 31,836 130,097 76,882 206,979M B DeNoma(h)(j) 59,470 134,625 — — — 194,095 56,856 57,556 51,488 25,721 191,621 58,023 249,644
Sub total 256,460 163,706 126,784 238,348 229,712 1,015,010 216,829 64,978 218,788 128,697 629,292 314,436 943,728
J W Peace(p) 12,884 — — — — 12,884 5,835 — — — 5,835 — 5,835J F T Dundas(f)(i)(k) 9,990 — — — — 9,990 8,402 — — — 8,402 — 8,402V F Gooding(f)(l) 8,402 — — — — 8,402 7,422 — — — 7,422 — 7,422R H P Markham(i)(k)(q) 12,277 — — — — 12,277 11,670 — — — 11,670 — 11,670R Markland(i)(k)(l) 12,604 — — — — 12,604 10,456 — — — 10,456 — 10,456
S B Mittal 6,208 — — — — 6,208 2,521 — — — 2,521 — 2,521J G H Paynter(k)(m) 2,054 — — — — 2,054 — — — — — — —P D Skinner(l) 7,842 — — — — 7,842 7,142 — — — 7,142 — 7,142O H J Stocken(f)(l) 8,402 — — — — 8,402 7,282 — — — 7,282 — 7,282Sir CK Chow(n) 2,054 — — — — 2,054 13,164 — — — 13,164 — 13,164Lord Turner(o) 7,189 — — — — 7,189 8,776 — — — 8,776 — 8,776
Sub total 89,906 — — — — 89,906 82,670 — — — 82,670 — 82,670
Total 402,149 165,620 126,784 238,348 229,712 1,162,613 360,370 65,958 218,788 128,697 773,813 314,436 1,088,249
Notes
(a) The benefits column includes amounts relating to car allowances and medical and life insurance benefits. Mr Bertamini and MrDeNoma carried out their duties overseas and had their remuneration adjusted to take local living costs into account. Thisadjustment was to put them in a position, after taxation differentials, where they would be no worse off as a result of carrying outtheir duties overseas. The benefits column for these directors also includes additional benefits, such as allowances for workingoverseas, the provision of accommodation or education of children. For Mr Bertamini and Mr DeNoma, these allowances andbenefits amounted to Rs.21,560,465 (2007: n/a) and Rs.134,621,339 (2007: Rs.57,561,108) respectively. In line with the Group’sinternational mobility policy Mr DeNoma was tax equalised for those cash benefits which have been paid through payroll and foremployee share scheme exercises made in 2008, which amounted to a total of Rs.17,807,533.
(b) The cash bonus amounts shown are net of any amounts waived to provide additional pension benefits.
(c) The amounts shown in the 2008 deferred shares column includes, firstly, the standard proportion of the annual performance awarddeferred into restricted shares, under the 2006 Restricted Share Scheme and, secondly, an additional portion that the directorsindicated to the committee they wished to defer voluntarily into the Deferred Bonus Plan. The amounts of the additional deferralinto the Deferred Bonus Plan for each director are as follows: Mr Sands Rs.32,535,960, Mr Bertamini Rs.12,416,880, Mr BullockRs.13,047,060 and Mr Meddings Rs.16,571,400.
(d) The expected value of any performance share awards granted or to be granted (i.e. March 2009) in respect of the 2007 and 2008financial years. The values are based on an initial value adjusted for factors such as performance conditions, forfeiture risk and lackof dividends. For Mr Bertamini an initial joining grant made in September 2008 of Rs.50,739,993 (£750,000) is also included.
(e) Lord Davies resigned as an employee and stepped down from the board, board nomination committee and sustainability andresponsibility committee on 14 January 2009.
(f) Member of the sustainability and responsibility committee.
(g) Mr Bertamini received a total 2008 discretionary annual performance award of Rs.52,515,000 of which Rs.13,828,950 andRs.12,416,880 is deferred into restricted shares under the 2006 Restricted Share Scheme and the Deferred Bonus Plan respectively.In addition, in recognition of the substantial elements of deferred compensation and share awards which Mr Bertamini forfeitedwhen he left his previous employer, he was also awarded, as part of his joining arrangements, a one-off award of deferred shares tobe granted in March 2009 of Rs.67,653,324 (£1,000,000). This will vest in February 2010.
(h) Mr Bertamini and Mr DeNoma received cash allowances of Rs.6,577,445 (2007: n/a) and Rs.12,746,114 (2007: Rs.12,073,689)respectively in lieu of their participation in any pension plan and this is reflected in the table above, as part of salary/fees.
(i) Member of the board nomination committee.
(j) Mr DeNoma resigned from the board on 1 June 2008. However, he will continue to be an employee of the Group until 30 June 2009.His base salary and other contractual benefits will continue to be paid until 30 June 2009 in line with his contract of employment.
(k) Member of the audit and risk committee.
(l) Member of the board remuneration committee.
(m) Mr Paynter was appointed as an independent non-executive director with effect from 1 October 2008 and as a member of the auditand risk committee from 1 November 2008.
(n) Sir CK Chow retired from the board on 7 May 2008, but remains chairman of Standard Chartered Bank (Hong Kong) Limited forwhich he receives a fee of R.s.10,550,750 per annum. In 2007 he received an all-inclusive fee for his Hong Kong and StandardChartered PLC Board duties of R.s.98,028,000.
(o) Lord Turner stepped down from the board on 19 September 2008.
(p) Mr Peace received an all-inclusive fee of R.s.12,867,575 (£150,000) as deputy chairman. In 2007 he received an all-inclusive fee ofR.s.14,041,811 for his membership of the Audit and Risk Committee and to the Board as Deputy Chairman and Senior IndependentDirector.
307
c102100pu070Proof7:28.3.10B/LRevision:0OperatorSadK

(q) Mr Markham was appointed Senior Independent Director on 1 January 2007 and stepped down from this role on 1 August 2007,following the appointment of Mr Peace. An additional fee of R.s.1,092,125 (based on an annualised equivalent fee of £20,000) waspayable to Mr Markham during this period to reflect the further workload that was associated specifically with this role. This figureis reflected in the table above.
General notes
Any base salary/fee or benefit item in the table above has been converted using the average rates throughout the relevant financial year of£1:US$1.8377 (2008) and £1:US$2.0054 (2007). Any performance award (comprising cash bonus and deferred shares) for 2008 isdetermined in US dollars and shown as such in the table. The proposed PSP awards in respect of the 2008 performance year aredetermined in sterling but for the purposes of the table converted into US dollars using the exchange rate at the end of the year(£1:US$1.4493). All emoluments in 2007 have, where necessary, been converted using the average exchange rate for 2007, consistent withthe basis shown in last year’s report and accounts.
Mr Nargolwala resigned from the Board on 6 September 2007. However, he continued to be an employee of the Group until 31December 2007. His base salary and other contractual benefits continued to be paid until 31 December 2007 in line with his contract ofemployment. Mr Nargolwala remuneration for 2007 was R.s.54,148,800 (R.s.23,153,280 in salary and R.s.30,995,520 in benefits). MrNargolwala carried out his duties overseas and had his remuneration adjusted to take local living costs into account. This adjustmentwas to put him in a position, after taxation differentials, where he was no worse off as a result of carrying out his duties overseas. Theadditional benefits, included such as allowances for working overseas, the provision of accommodation or education of children. For MrNargolwala, these allowances and benefits amounted to R.s.31,011,204 (2007).
Retirement benefits of executive directors 2009
Accrued pension US$’000
Transfer value of
accrued pension
US$’000(1), (2)
Increase in accrued pension
(net of inflation and waiver)
during 2009 US$’000(4)
Director
At
1 January
2009
Increase
during the
year
At 31
December
2009
At
1 January
2009
Increase
during the
year net
of waiver
At 31
December
2009
2009
waiver
US$’000(3)
Annual
pension
Transfer
value
P A Sands 241 79 350 3,635 1,703 5,809 — 79 1,331
G R Bullock 270 31 332 4,575 1,309 6,698 — 30 608
R H Meddings 249 68 347 3,911 1,713 6,127 — 67 1,209
A M G Rees 170 40 230 2,687 973 3,999 — 39 738
Notes
(1) The accrued pension amounts include benefits arising from transfer payments received in respect of service with previous employers.
(2) The transfer values in respect of benefits under the unapproved unfunded retirement benefits scheme have been calculated using ourpension accounting methodology and assumptions.
(3) Executive directors are given the opportunity to waive a proportion of any potential annual performance award payable in cash and/or salary to enhance their unfunded unapproved retirement benefits. The amounts waived in respect of 2009 are shown in the table.
(4) The increase in the accrued pension (net of inflation and performance award waiver) during the year is the difference between theaccrued pension at the end of 2008 increased by an allowance for inflation of 0.3% (2008: 3.0%) and the accrued pension at the endof 2009 excluding any performance award waiver.
General notes
(a) The ages of the executive directors are shown on pages 286 to 287.
(b) In addition to the amounts identified in the table above Standard Chartered paid US$449,612 (2008: US$605,996) in retirementbenefits to former directors and their dependants.
(c) The amounts included in the table above as at 1 January and 31 December 2009 are calculated using the exchange rates at the end of2008 (£1:US$1.4493) and 2009 (£1:US$1.6142) respectively. The other entries are calculated using the exchange rates £1: US$1.5613(2009) and £1: US$1.8377 (2008).
(d) Steve Bertamini received cash supplements and does not participate, like the other executive directors, in the defined benefit plans setout above. The cash supplement amounts are shown in the executive directors’ remuneration table on page 303.
Retirement benefits of executive directors and the former Group chairman 2008
Accrued pension US$000*
Transfer value of accrued
pension US$000** ***
Increase in accrued pension
(net of inflation and waiver)
during 2008 US$000{{
Directors
At 1
January
2008
Increase
during the
year
At 31
December
2008
At 1
January
2008
Increase
during the
year net
of waiver
At 31
December
2008
2008
waiver
US$000{Annual
pension
Transfer
value
P A Sands 251 74 241 4,558 395 3,635 — 67 1,029
G R Bullock 278 85 270 5,284 389 4,575 415 47 793
R H Meddings 264 72 249 4,658 653 3,911 — 65 1,039
Notes
* Mr Bertamini and Mr DeNoma received cash supplements and do not participate, like the other executive directors, in the definedbenefit plans set out above.
308
c102100pu070Proof7:28.3.10B/LRevision:0OperatorSadK

** The accrued pension amounts include benefits arising from transfer payments received in respect of service with previous employers.
*** The transfer values in respect of benefits under the unapproved unfunded retirement benefits scheme have been calculated using theGroup’s pension accounting methodology and assumptions.
{ Executive directors are given the opportunity to waive a proportion of any potential bonus and/or salary to enhance their unfundedunapproved retirement benefits. The amounts waived in respect of 2008 are shown in the table.
{{ The increase in the accrued pension (net of inflation and bonus waiver) during the year is the difference between the accrued pensionat the end of 2007 increased by an allowance for inflation of 3.0% (2007: 4.3%) and the accrued pension at the end of 2008 excludingany bonus waiver in 2008.
General notes
(a) Lord Davies ceased to accrue additional pension benefits on 1 January 2007. His pension payments commenced in November 2007.As at 31 December 2008 he was in receipt of a pension from the Group of US$171,602 per annum.
(b) In addition to the amounts identified in the table above the Group paid US$605,996 (2007: US$367,688) in retirement benefits toformer directors and their dependents.
(c) The amounts included in the table above as at 1 January and 31 December 2008 are calculated using the exchange rates at the end of2007 (£1:US$1.9877) and 2008 (£1:US$1.4493) respectively. The other entries are calculated using the average rates throughout therelevant financial year of £1:US$1.8377 (2008) and £1:US$2.0054 (2007).
Retirement benefits of executive directors 2007
Accrued pension US$000(d)
Transfer value of accrued pension
US$000(f)(g)
Increase in accrued pension (net of
inflation and waiver) during 2007
US$000(i)
Directors
At
1 January
2007
Increase/
(decrease)
during the
year
At 31
December
2007
At
1 January
2007
Increase
during the
year net
of waiver
At 31
December
2007
2007
waiver
US$000(h)
Annual
pension
Transfer
value
E M Davies(c) 363 (76) 293 6,732 96 6,930 — —
P A Sands 144 105 251 2,814 1,717 4,558 — 99 1,930
G R Bullock(e) 181 96 278 3,517 1,147 5,284 496 58 1,153
R H Meddings 189 73 264 3,437 815 4,658 324 45 869
K S Nargolwala 227 96 326 4,829 1,023 6,539 614 54 1,093
Notes
(a) With effect from 1 January 2007, Mr Davies ceased to accrue additional pension benefits. His pension payments commenced inNovember 2007.
(b) Mr DeNoma only receives a cash supplement and does not participate, like the other executive directors, in the defined benefit plansset out above.
(c) Mr Bullock’s retirement provision remained unchanged on his appointment to the Board.
(d) The accrued pension amounts include benefits arising from transfer payments received in respect of service with previous employers.
(e) The transfer values in respect of benefits under the unapproved unfunded retirement benefits scheme have been calculated using theGroup’s pension accounting methodology and assumptions.
(f) Executive directors are given the opportunity to waive a proportion of any potential bonus and/or salary to enhance their unfundedunapproved retirement benefits. The amounts waived in respect of 2007 are shown in the table above.
(g) The increase in the accrued pension (net of inflation and bonus waiver) during the year is the difference between the accrued pensionat the end of 2006 increased by an allowance for inflation of 4.3% (2006: 3.9%) and the accrued pension at the end of 2007 excludingany bonus waiver in 2007.
(h) In addition to the amounts identified in the table above the Group paid US$367,688 (2006: US$308,662) in retirement benefits toformer directors and their dependants.
(i) The amounts included in the table above as at 1 January and 31 December 2007 are calculated using the exchange rates at the end of2006 (£1 :US$1.9579) and 2007 (£1:US$1.9877) respectively. The other entries are calculated using the average rates throughout therelevant financial year of £1:US$2.0054 (2007) and £1:US$1.8431 (2006).
309
c102100pu070Proof7:28.3.10B/LRevision:0OperatorSadK
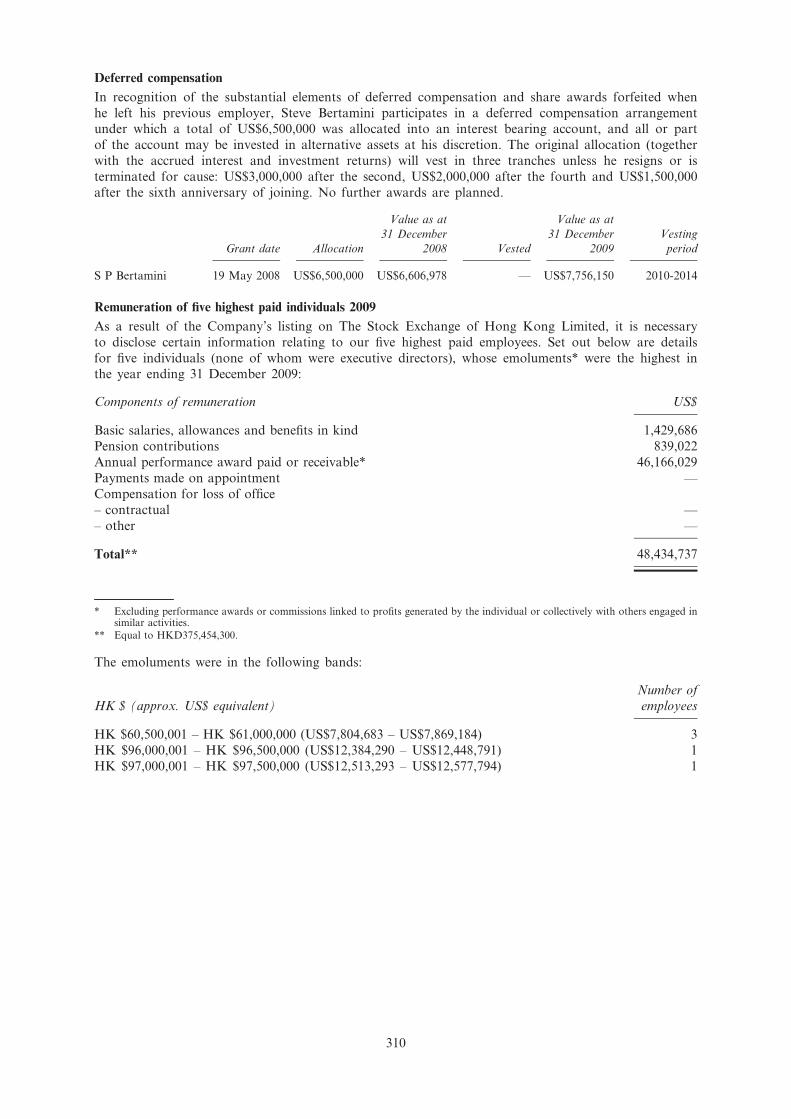
Deferred compensation
In recognition of the substantial elements of deferred compensation and share awards forfeited when
he left his previous employer, Steve Bertamini participates in a deferred compensation arrangementunder which a total of US$6,500,000 was allocated into an interest bearing account, and all or part
of the account may be invested in alternative assets at his discretion. The original allocation (together
with the accrued interest and investment returns) will vest in three tranches unless he resigns or is
terminated for cause: US$3,000,000 after the second, US$2,000,000 after the fourth and US$1,500,000
after the sixth anniversary of joining. No further awards are planned.
Grant date Allocation
Value as at
31 December
2008 Vested
Value as at
31 December
2009
Vesting
period
S P Bertamini 19 May 2008 US$6,500,000 US$6,606,978 — US$7,756,150 2010-2014
Remuneration of five highest paid individuals 2009
As a result of the Company’s listing on The Stock Exchange of Hong Kong Limited, it is necessary
to disclose certain information relating to our five highest paid employees. Set out below are details
for five individuals (none of whom were executive directors), whose emoluments* were the highest inthe year ending 31 December 2009:
Components of remuneration US$
Basic salaries, allowances and benefits in kind 1,429,686
Pension contributions 839,022
Annual performance award paid or receivable* 46,166,029
Payments made on appointment —
Compensation for loss of office
– contractual —
– other —
Total** 48,434,737
* Excluding performance awards or commissions linked to profits generated by the individual or collectively with others engaged insimilar activities.
** Equal to HKD375,454,300.
The emoluments were in the following bands:
HK $ (approx. US$ equivalent)
Number of
employees
HK $60,500,001 – HK $61,000,000 (US$7,804,683 – US$7,869,184) 3
HK $96,000,001 – HK $96,500,000 (US$12,384,290 – US$12,448,791) 1
HK $97,000,001 – HK $97,500,000 (US$12,513,293 – US$12,577,794) 1
310
c102100pu070Proof7:28.3.10B/LRevision:0OperatorSadK

Remuneration of five highest paid individuals 2008
As a result of the Company’s listing on The Stock Exchange of Hong Kong Limited, it is necessary
to disclose certain information relating to the five highest paid employees in the Group. Set out beloware details for five individuals, (none of whom were executive directors) whose emoluments* were the
highest in the year ending 31 December 2008:
Components of remuneration US$
Basic salaries, allowances and benefits in kind 2,659,535
Pension contributions 521,949
Bonuses paid or receivable* 43,040,294
Payments made on appointment —
Compensation for loss of office
– contractual —– other —
Total** 46,221,778
* Excluding bonuses or commissions linked to profits generated by the individual or collectively with others engaged in similaractivities.
** Equal to HK$359,942,851.
The emoluments were in the following bands:
HK (approx. US$ equivalent)
Number of
employees
HK $41,500,001 – HK $42,000,000 (US$5,329,190 – US$5,393,397) 1
HK $42,000,001 – HK $42,500,000 (US$5,393,397 – US$5,457,604) 1
HK $45,500,001 – HK $46,000,000 (US$5,842,847 – US$5,907,054) 1
HK $47,000,001 – HK $47,500,000 (US$6,035,468 – US$6,099,675) 1
HK $182,000,001 – HK $182,500,000 (US$23,371,387 – US$23,435,594) 1
Remuneration of five highest paid individuals 2007
In addition to its responsibilities for the remuneration of executive directors, the Committee ensures
that the remuneration policy of the Group is consistently applied for other senior executives.
Specifically, the Committee approves any significant remuneration packages for newly appointed
senior executives.
As a result of the Company’s listing on The Stock Exchange of Hong Kong Limited, it is necessary
to disclose certain information relating to the five highest paid employees in the Group. Set out below
are details for five individuals (four of whom are not executive directors) whose emoluments* were
the highest in the year ending 31 December 2007:
Components of remuneration US$000
Basic salaries, allowances and benefits in kind 4,046Pension contributions 1,620
Bonuses paid or receivable* 27,712
Payments made on appointment —
Compensation for loss of office
– contractual —
– other —
Total** 33,378
* Excluding bonuses or commissions linked to profits generated by the individual or collectively with others engaged in similaractivities.
** Equal to HK$260,420,689.
311
c102100pu070Proof7:28.3.10B/LRevision:0OperatorSadK

The emoluments were in the following bands:
HK$ (approx. US$ equivalent)
Number of
employees
HK$45,500,001 – HK$46,000,000 (US$5,831,763-US$5,895,849) 1HK$48,000,001 – HK$48,500,000 (US$6,152,190-US$6,216,275) 1
HK$54,000,001 – HK$54,500,000 (US$6,921,214-US$6,985,299) 2
HK$57,000,001 – HK$58,000,000 (US$7,305,725-US$7,433,896) 1
2004 Deferred Bonus Plan 2009
Directors
Shares held in
trust at
1 January
2009*
Shares
awarded
during the
period(1)
Shares
awarded in
respect of
notional
dividend(2)
Shares vested
during the
period(1)
Shares held in
trust at
31 December
2009
P A Sands 34,270 70,532 338 34,608 70,532
S P Bertamini — 170,081 — — 170,081
G R Bullock 17,820 28,283 175 17,995 28,283
R H Meddings 23,303 35,923 229 23,532 35,923
A M G Rees 47,814 — — — 47,814
* Or at date of appointment to the Board, if later.
Notes
(1) Market value on date of awards/vesting (9 March 2009) was 698.50 pence.
(2) Under the 2004 DBP, shares were conditionally awarded as part of the executive director’s deferred element of their annualperformance award. The shares are held in an employee benefit trust and automatically vest one year after the date of acquisition.No exercise is necessary. A notional scrip dividend accrues on the shares held in the trust.The dividend is normally delivered in theform of shares and is released on vesting.
(3) In accordance with UK regulatory requirements the Company is obliged to announce any changes in relation to the award orexercise of Shares under the Deferred Bonus Plan by the directors. The Company made two announcements on the 9 March 2010regarding awards and releases under the Deferred Bonus Plan, which has resulted in the Directors total Shares held in trust to be asfollows: Peter Sands 63,675, Richard Meddings 43,777, Steve Bertamini 27,858, Jaspal Bindra 12,187, Gareth Bullock 12,187 andMike Rees 218,885.
2004 Deferred Bonus Plan 2008
Directors
Shares held
in trust
at 1 January
2008*
Shares awarded
during the
period(a)
Shares awarded
in respect of
notional
dividend(b)
Shares vested
during the
period(a)
Rights issue
adjustment**
Shares held
in trust at
31 December
2008***
P A Sands 24,845 29,998 190 25,035 4,272 34,270
S P Bertamini — — — — — —
G R Bullock 14,789 15,599 113 14,902 2,221 17,820
R H Meddings 18,693 20,398 143 18,836 2,905 23,303
Lord Davies 37,859 — 290 38,149 — —
M B DeNoma 17,746 16,499 135 17,881 — 16,449
* Or at date of appointment to the board, if later.
** Adjustments made to all unexercised share awards granted under the Group’s employee share scheme as part of the rights issue.
*** Or date of resignation from the board, if earlier.
Notes
(a) Market value on date of awards/vesting (6 March 2008) was 1643 pence.
(b) Under the 2004 Deferred Bonus Plan, shares were conditionally awarded as part of the director’s deferred element of their annualperformance award. The shares are held in an employee benefit trust and automatically vest one year after the date of acquisition.No exercise is necessary. A notional scrip dividend accrues on the shares held in the trust. The dividend is delivered in the form ofshares and is released on vesting.
312
c102100pu070Proof7:28.3.10B/LRevision:0OperatorSadK

2004 Deferred Bonus Plan 2007
Directors
Shares held
in trust at
1 January
2007*
Shares
awarded
during the
period(a)
Shares
awarded in
respect of
notional
dividend(b)
Shares
vested
during the
period(a)
Shares held
in trust at
31
December
2007**
E M Davies 34,884 37,859 305 35,189 37,859
P A Sands 22,893 24,845 200 23,093 24,845
G R Bullock 14,789 — — — 14,789
M B DeNoma 17,442 17,746 152 17,594 17,746
R H Meddings 16,897 18,693 148 17,045 18,693
K S Nargolwala 17,442 19,360 152 17,594 19,360(c)
* Or at date of appointment to the Board, if later.
** Or date of resignation from the Board, if earlier.
Notes
(a) Market value on date of awards/vesting (6 March 2007) was 1404 pence.
(b) Under the 2004 Deferred Bonus Plan, shares are conditionally awarded instead of part of the director’s annual cash bonus.The shares are held in an employee benefit trust and automatically vest one year after the date of acquisition. No exercise isnecessary. A notional dividend accrues on the shares held in the trust. The dividend is delivered in the form of shares and isreleased on vesting.
(c) This award subsequently lapsed when Mr Nargolwala ceased to be employed by the Group on 31 December 2007.
Long term incentives 2009
Share options
Director Scheme Grant date
As at
1 January
2009*
Exercise
price
(pence) Exercised Lapsed
As at
31December
2009**
Period of
exercise
P A Sands ESOS 20 May 2002 234,638 754.35 234,6381(1) — — —
ESOS 5 March 2003 223,357 604.41 223,3571(1) — — —
ESOS 4 March 2004 109,908 818.86 109,9081(1) — — —
ESOS 9 March 2005 111,772 849.94 111,7721(1) — — —
Sharesave 26 September 2007 1,543 1,088.03 — — 1,543 2012-2013
S Bertamini Sharesave 9 October 2009 1,356 1,146 — — 1,356 2014-2015
G R Bullock Sharesave 29 September 2008 943 1,017.12 — — 943 2011-2012
R H Meddings ESOS 4 March 2004 74,798 818.86 74,7981 — — —
Sharesave 8 September 2006 1,003 931.34 1,003(2) — — —
A M G Rees ESOS 9 March 2005 61,768 818.86 — — 61,768 2009-2015
Lord Davies ESOS 9 March 2005 3,662 818.86 — — 3,662 2009-2010(3)
* Or at date of appointment to the Board or date of grant if later.
** Or date of resignation from the Board, if earlier.
Notes
(1) Market value on date of exercise (3 November 2009) was 1467.30 pence.
(2) Market value on date of exercise (1 December 2009) was 1523.00 pence.
(3) Lord Davies has entered into a personal arrangement with an independent trustee under which he has agreed that such awardscannot be exercised without the written authority of such trustee for the duration of any appointment that he might have in the UKgovernment. This award was exercisable at the time Lord Davies stepped down from the Board. It will remain exercisable until 15February 2010 at which point any unexercised award will lapse.
(4) In accordance with UK regulatory requirements the Company is obliged to announce any changes in relation to the award orexercise of share options by the directors. The Company made an announcement on the 9 March 2010 regarding the exercise ofMike Rees award under the ESOS of 61,768 Shares.
313
c102100pu070Proof7:28.3.10B/LRevision:0OperatorSadK

Share awards
Director Scheme Grant Date
As at
1 January
2009** Exercised Lapsed
As at
31December
2009***
Period of
exercise
J W Peace RSS 28 September 20091 41,528 — — 41,528 2011-2018
P A Sands PSP 09 June 2004 41,863 41,8633 — — —
PSP 09 March 2005 111,772 111,7724 — — —
PSP 14 March 2006 83,592 71,0525 12,5407 — —
PSP 11 May 2006 41,079 32,4525 8,6277 — —
PSP 12 March 2007 162,389 — — 162,389 2010-20178
PSP 11 March 2008 184,774 — — 184,774 2011-2018
PSP 11 March 20092 356,481 — — 356,481 2012-2019
Deferred RSS 11 March 20092 84,231 — — 84,231 2011-2016
S P Bertamini PSP 16 September 2008 59,337 — — 59,337 2011-2018
PSP 11 March 20092 159,033 — — 159,033 2012-2019
Deferred RSS 11 March 20092 28,437 — — 28,437 2011-2016
G R Bullock PSP 14 March 2006 55,728 47,3683 8,3607 — —
PSP 11 May 2006 20,539 16,2265 4,3137 — —
PSP 12 March 2007 93,102 — — 93,102 2010-20178
PSP 11 March 2008 108,665 — — 108,665 2011-2018
PSP 11 March 20092 146,604 — — 146,604 2012-2019
Deferred RSS 11 March 20092 31,292 — — 31,292 2011-2016
R H Meddings PSP 14 March 2006 68,466 58,1963 10,2707 — —
PSP 11 May 2006 25,235 19,9355 5,3007 — —
PSP 12 March 2007 100,385 — — 100,385 2010-20178
PSP 11 March 2008 125,646 — — 125,646 2011-2018
PSP 11 March 20092 220,370 — — 220,370 2012-2019
Deferred RSS 11 March 20092 53,514 — — 53,514 2011-2016
A M G Rees RSS 9 March 2005 29,414 29,4146 — — —
RSS 14 March 2006 55,728 55,7286 — — —
RSS 12 March 2007 55,113 27,5566 — 27,557 2010-2017
RSS 11 March 2008 126,701 — — 126,701 2010-2015
Deferred RSS 11 March 20092 86,419 — — 86,419 2011-2016
Deferred SRSS 11 March 20092 288,939 — — 288,939 2011-2016
PSP 9 March 2005 51,473 51,4736 — — —
PSP 14 March 2006 55,728 47,3686 8,3607 — —
PSP 12 March 2007 55,113 — — 55,113 2010-20178
PSP 11 March 2008 55,432 — — 55,432 2011-2018
PSP 11 March 20092 123,456 — — 123,456 2012-2019
Lord Davies PSP 14 March 2006 127,379 108,272 19,107 — 9, 10
PSP 11 May 2006 93,898 74,178 19,720 — 9, 10
PSP 12 March 2007 204,708 — — 204,708 201010, 11
* Details of performance conditions for PSP awards are described on page 328.
** Or at a date of appointment to the Board or date of grant if later.
*** Or date of resignation from the Board, if earlier.
Notes
(1) Market value on date of award (28 September 2009) was 1509.00 pence.
(2) Market value on date of award (11 March 2009) was 798.50 pence.
(3) Market value on date of exercise (16 March 2009) was 859.94 pence.
(4) Market value on date of exercise (30 June 2009) was 1152.9 pence.
(5) Market value on date of exercise (11 May 2009) was 1223.95 pence.
(6) Market value on date of exercise (6 August 2009) was 1374.84 pence.
(7) The performance conditions were partially met for those PSP awards granted in March and May 2006. Therefore the number ofshares lapsed indicates the portion of the award which did not satisfy the performance conditions.
(8) The performance conditions attached to these awards have been partially met (77.48%).
(9) Lord Davies entered into a personal arrangement with an independent trustee under which he has agreed that such awards cannotbe exercised without the written authority of such trustee for the duration of any appointment that he might have in the UKgovernment.
(10) The performance conditions attached to these awards have been partially met (85% for March awards and 79% for May andSeptember awards) and the awards can now be exercised. Market value on the dates of exercise (6 April 2009) was 1014.00 penceand (14 May 2009) 1187.00 pence.
(11) The 2010 performance conditions attached to these awards have been partially met (77.48%). The award will be exercisable from 12March 2010 and will remain exercisable until 31 December 2010 at which point any unexercised award will lapse.
(12) In accordance with UK regulatory requirements the Company is obliged to announce any changes in relation to the award orexercise of share options by the directors. The Company made three announcements on the 12 March 2010 and one announcementon 15 March 2010 regarding awards and releases under the RSS, SRSS and PSP, which has resulted in the Directors total Sharesheld under option to be as follows: Peter Sands 873,253, Richard Meddings 555,339, Steve Bertamini 374,743, Jaspal Bindra344,092, Gareth Bullock 313,510 and Mike Rees 824,493. This includes shares held under the ESOS, Sharesave, PSP, RSS, andSRSS.
314
c102100pu070Proof7:28.3.10B/LRevision:0OperatorSadK

Long-term incentives 2008
Share options
Directors Scheme Grant date
As at1 January
2008*
Adjustedexercise
price(pence)** Exercised Lapsed
Rights issuesubscription***
At31 December
2008****Period of
exercise
P A Sands 754.35ESOS 20 May 2002 205,384 (861.80) — — 29,254 234,638 2009-2012
604.41ESOS 5 March 2003 195,510 (690.50) — — 27,847 223,357 2009-2013
818.86ESOS 4 March 2004 96,205 (935.50) — — 13,703 109,908 2009-2014
849.94ESOS 9 March 2005 97,837 (971.00) — — 13,935 111,772 2009-2015
1,088.03Sharesave 26 September 2007 1,351 (1,243.00) — — 192 1,543 2010-2011
G R Bullock 818.86ESOS 4 March 2004 64,136 (935.50) 64,136(b) — — — —
849.94ESOS 9 March 2005 50,205 (971.00) 50,205(b) — — — —
561.08Sharesave 8 September 2003 2,472 (641.00) 2,824(c) — 352 — —
1,017.12Sharesave 29 September 2008 826 (1,162.00) — — 117 943 2011-2012
R H Meddings 818.86ESOS 4 March 2004 65,473 (935.50) — — 9,325 74,798 2009-2014
849.94ESOS 9 March 2005 74,794 (971.00) 74,794(b) — — — —
931.34Sharesave 8 September 2006 878 (1,064.00) — — 125 1,003 2009-2010
818.86Lord Davies ESOS 4 March 2004 3,206 (935.50) — — 456 3,662 2009-2010(e)(f)
849.94ESOS 9 March 2005 154,479 (971.00) 154,479(b) — — — —
849.94M B DeNoma ESOS 9 March 2005 64,109 (971.00) 64,109(d) — — — —
* Or at date of appointment to the board or date of grant if later.
** The original exercise price in pence prior to the rights issue is shown in brackets.
*** Adjustments made to all unexercised share options/share awards granted under the Group’s employee share schemes as part of the rights issue.
**** Or date of resignation from the board, if earlier.
For notes see table below.
315
c102100pu070Proof7:28.3.10B/LRevision:0OperatorSadK

Share awards
Directors Scheme Grant date
As at1 January
2008* Exercised LapsedRights issue
subscription**
As at31 December
2008***Period of
exercise
P A Sands RSS 20 May 2002 52,216 52,216(b) — — — —
PSP 4 March 2004 48,102 48,102(b) — — — —
PSP 9 June 2004 36,644 — — 5,219 41,863 2009-2014(i)
PSP 9 March 2005 97,837 — — 13,935 111,772 2009-2015(i)
PSP 14 March 2006 73,170 — — 10,422 83,592 2009-2016(j)
PSP 11 May 2006 35,958 — — 5,121 41,079 2009-2016(j)
PSP 12 March 2007 142,143 — — 20,246 162,389 2010-2017
PSP 11 March 2008(g) 161,737 — — 23,037 184,774 2011-2018
S P Bertamini PSP 16 September 2008(h) 51,939 — — 7,398 59,337 2011-2018
G R Bullock PSP 9 March 2005 58,573 58,573(d) — — — —
PSP 14 March 2006 48,780 — — 6,948 55,728 2009-2016(j)
PSP 11 May 2006 17,979 — — 2,560 20,539 2009-2016(j)
PSP 12 March 2007 81,495 — — 11,607 93,102 2010-2017
PSP 11 March 2008(g) 95,117 — — 13,548 108,665 2011-2018
R H Meddings PSP 9 March 2005 74,794 74,794(b) — — — —
PSP 14 March 2006 59,930 — — 8,536 68,466 2009-2016(j)
PSP 11 May 2006 22,089 — — 3,146 25,235 2009-2016(j)
PSP 12 March 2007 87,870 — — 12,515 100,385 2010-2017
PSP 11 March 2008(g) 109,981 — — 15,665 125,646 2011-2018
Lord Davies PSP 9 March 2005 154,479 154,479(d) — — — —
PSP 14 March 2006 111,498 — — 15,881 127,379 2009-2010(e)(k)
PSP 11 May 2006 82,191 — — 11,707 93,898 2009-2010(e)(k)
PSP 12 March 2007 179,186 — — 25,522 204,708 2010(e)(l)
M B DeNoma PSP 9 March 2005 74,794 74,794(d) — — — —
PSP 14 March 2006 59,930 — — — 59,930 2009-2016(j)
PSP 11 May 2006 22,089 — — — 22,089 2009-2016(j)
PSP 12 March 2007 84,424 — — — 84,424 2010-2017
PSP 11 March 2008(g) 83,025 — — — 83,025 2011-2018
* Or at date of appointment to the board or date of grant if later.
** Adjustments made to all unexercised share options/share awards granted under the Group’s employee share schemes as part of therights issue.
*** Or date of resignation from the board, if earlier.
Notes
(a) Details of performance conditions are described on pages 84 and 85 of the Annual Report 2008.
(b) Market value on date of exercise (8 May 2008) was 1839 pence.
(c) Market value on date of exercise (19 December 2008) was 740 pence.
(d) Market value on date of exercise (10 March 2008) was 1578 pence.
(e) Lord Davies has entered into a personal arrangement with an independent trustee under which he has agreed that such awards cannot be exercised without the written authority of such trustee for the duration of any appointment that he might have in the UKGovernment.
(f) This award was exercisable at the time Lord Davies stepped down from the board of directors. It will remain exercisable until 14January 2010 at which point any unexercised award will lapse.
(g) Market value on date of award (11 March 2008) was 1626 pence.
(h) Market value on date of award (16 September 2008) was 1386 pence.
(i) These awards are exercisable as any associated performance and service conditions have already been met.
(j) The performance conditions attached to these awards have been partially met (85% for March awards and 79% for May andSeptember awards) and the awards will be exercisable after meeting the service conditions on 14 March and 11 May 2009respectively.
(k) The performance conditions attached to these awards have been partially met (85% for March awards and 79% for May andSeptember awards) and the awards will be exercisable from 14 March and 11 May 2009 respectively. The March 2006 and May2006 awards will remain exercisable until 14 January 2010 at which point any unexercised awards will lapse.
(l) The number of shares under award will be reduced to reflect the period of employment as a proportion of the performance periodand will be subject to the performance conditions being satisfied, from March 2010 until December 2010, at which point anyunexercised award will lapse.
(m) Market value of awards in previous years: 20 May 2002 – 861.8 pence; 5 March 2003 – 690.5 pence; 13 May 2003 – 742.5 pence; 4March 2004 – 935.5 pence; 9 June 2004 – 921 pence; 9 March 2005 – 971 pence; 14 March 2006 – 1450 pence; 11 May 2006 – 1460pence; 12 March 2007 – 1430 pence.
(n) Market value at year end was 875 pence and the highest and lowest values during the year were 664 pence and 1903 pencerespectively.
316
c102100pu070Proof7:28.3.10B/LRevision:0OperatorSadK

Long Term Incentives 2007
Share options
Director Scheme Grant Date
As At
1 January
2007*
Exercise
Price
(pence) Exercised Lapsed
At 31
December
2007**
Period of
exercise
E M Davies 1994 ESOS(a) 5 September 1997 20,000 808.5 20,000(b) — — —
1994 ESOS(a) 5 August 1999 52,365 888 52,365(b) — — —
2000 ESOS 12 June 2000 117,104 871.02 117,104(b) — — —
2000 ESOS 2 April 2001 119,733 902 119,733(b) — — —
2000 ESOS 5 March 2003 347,574 690.5 347,574(b) — — —
2000 ESOS 4 March 2004 138,963 935.5 135,757(b) — 3,206 2008-2014
2000 ESOS 9 March 2005 154,479 971 — — 154,479 2008-2015
Sharesave 6 September 2002 2,957 559.5 2,957(c) — — 2008-2008
P A Sands 2000 ESOS 20 May 2002 208,865 861.8 3,481(d) — 205,384 2008-2012
2000 ESOS 5 March 2003 195,510 690.5 — — 195,510 2008-2013
2000 ESOS 4 March 2004 96,205 935.5 — — 96,205 2008-2014
2000 ESOS 9 March 2005 97,837 971 — — 97,837 2008-2015
Sharesave 6 September 2002 2,957 559.5 2,957(c) — — —
Sharesave 26 September 2007(f) 1,351 1243 — — 1,351 2010-2011
G R Bullock 2000 ESOS 4 March 2004 64,136 935.5 — — 64,136 2008-2014
2000 ESOS 9 March 2005 50,205 971 — — 50,205 2008-2015
Sharesave 8 September 2003 2,472 641 — — 2,472 2008-2009
M B DeNoma 2000 ESOS 4 March 2004 85,515 935.5 85,515(d) — — —
2000 ESOS 9 March 2005 64,109 971 — — 64,109 2008-2015
R H Meddings 2000 ESOS 4 March 2004 65,473 935.5 — — 65,473 2008-2014
2000 ESOS 9 March 2005 74,794 971 — — 74,794 2008-2015
Sharesave 8 September 2006 878 1064 — — 878 2009-2010
K S Nargolwala 2000 ESOS 4 March 2004 85,515 935.5 85,515(e) — — —
2000 ESOS 9 March 2005 64,109 971 — — 64,109 2008-2015(g)
* Or at date of appointment to the Board or date of grant, if later.
** Or date of resignation from Board if earlier.
Notes
(a) This scheme is now closed. No awards have been made under this scheme since August 1999.
(b) Market value on date of exercise (4 May 2007) was 1556 pence.
(c) Market value on date of exercise (7 December 2007) was 1945 pence.
(d) Market value on date of exercise (6 March 2007) was 1404 pence.
(e) Market value on date of exercise (20 June 2007) was 1658 pence.
(f) Market value on date of grant (26 September 2007) was 1618 pence.
(g) These awards subsequently lapsed when Mr Nargolwala ceased to be employed by the Group on 31 December 2007.
(h) Market value at year end was 1844 pence and the highest and lowest values during the year were 1366 pence and 1960 pencerespectively,
317
c102100pu070Proof7:28.3.10B/LRevision:0OperatorSadK

Share awards
Director Scheme Grant date
As at
1 January
2007* Exercised Lapsed
As at
31 December
2007**
Period of
exercise
E M Davies PSP 4 March 2004 69,481 69,481(b) — — —
PSP 9 June 2004 70,575 70,575(c) — — —
PSP 9 March 2005 154,479 — — 154,479 2008-2015(i)
PSP 14 March 2006 111,498 — — 111,498 2009-2016
PSP 11 May 2006 82,191 — — 82,191 2009-2016
PSP 12 March 2007(f) 179,186 — — 179,186 2010-2017
P A Sands RSS 20 May 2002 52,216 — — 52,216 2008-2009(h)
PSP 4 March 2004 48,102 — — 48,102 2008-2014(h)
PSP 9 June 2004 36,644 — — 36,644 2008-2014(h)
PSP 9 March 2005 97,837 — — 97,837 2008-2015(i)
PSP 14 March 2006 73,170 — — 73,170 2009-2016
PSP 11 May 2006 35,958 — — 35,958 2009-2016
PSP 12 March 2007(f) 142,143 — — 142,143 2010-2017
G R Bullock PSP 9 March 2005 58,573 — — 58,573 2008-2015(i)
PSP 14 March 2006 48,780 — — 48,780 2009-2016
PSP 11 May 2006 17,979 — — 17,979 2009-2016
PSP 12 March 2007(f) 81,495 — — 81,495 2010-2017
M B DeNoma PSP 4 March 2004 42,757 42,757(d) — — —
PSP 9 June 2004 21,715 21,715(e) — — —
PSP 9 March 2005 74,794 — — 74,794 2008-2015(i)
PSP 14 March 2006 59,930 — — 59,930 2009-2016
PSP 11 May 2006 22,089 — — 22,089 2009-2016
PSP 12 March 2007(f) 84,424 — — 84,424 2010-2017
R H Meddings PSP 4 March 2004 37,413 37,413(e) — — —
PSP 9 June 2004 9,500 9,500(e) — — —
PSP 9 March 2005 74,794 — — 74,794 2008-2015(i)
PSP 14 March 2006 59,930 — — 59,930 2009-2016
PSP 11 May 2006 22,089 — — 22,089 2009-2016
PSP 12 March 2007(f) 87,870 — — 87,870 2010-2017
K S Nargolwala PSP 5 March 2003 55,032 55,032(d) — — —
PSP 4 March 2004 42,757 42,757(d) — — —
PSP 9 June 2004 21,715 21,715(e) — — —
PSP 9 March 2005 74,794 — — 74,794 2008-2015(j)
PSP 14 March 2006 59,930 — — 59,930 2009-2016(j)
PSP 11 May 2006 29,452 — — 29,452 2009-2016(j)
PSP 12 March 2007(f) 97,605 — — 97,605 2010-2017(j)
* Or at date of appointment to the Board or date of grant if later.
** Or date of resignation from the Board, if earlier.
Notes
(a) Details of performance conditions are described on pages 75 and 76 of the Annual Report 2007.
(b) Market value on date of exercise (4 May 2007) was 1556 pence.
(c) Market value on date of exercise (16 October 2007) was 1658 pence.
(d) Market value on date of exercise (6 March 2007) was 1404 pence.
(e) Market value on date of exercise (20 June 2007) was 1658 pence.
(f) Market value on date of award (12 March 2007) was 1430 pence.
(g) Market value of awards in previous years: 20 May 2002 - 861.8 pence; 5 March 2003 - 690.5 pence; 13 May 2003 - 742.5 pence;4 March 2004 - 935.5 pence; 9 June 2004 - 921 pence; 9 March 2005 - 971 pence; 14 March 2006 - 1450 pence; 11 May 2006-1460 pence.
(h) These awards are exercisable as any associated performance and service conditions have already been met.
(i) The performance conditions attached to these awards have been met and the awards will be exercisable after meeting the serviceconditions on 9 March 2008.
(j) These awards subsequently lapsed when Mr Nargolwala ceased to be employed by the Group on 31 December 2007.
Interests of key managerial personnel in long-term incentive plans
The key managerial personnel also participate in the long-term incentive plans and in aggregate hold
interests over 1,614,041 Shares as at 26 March 2010. Together they hold less than 1% of the current
issued share capital of the Company.
318
c102100pu070Proof7:28.3.10B/LRevision:0OperatorSadK

CAPITALISATION STATEMENT
Capitalisation and indebtedness
The following table sets out the consolidated capitalisation of the Group as at 31 December 2009 and
31 December 2008.
31 December 2009 31 December 2008
US$m Rs.m US$m Rs.mBorrowings
Short term (with less than or up to one year residual maturity)
Debt securities in issue 20,524 958,060 18,369 857,465
Sub debt and other borrowings 723 33,750 2,149 100,315
Total short term borrowings 21,247 991,810 20,518 957,780
Long term (with more than one year residual maturity)
Debt securities in issue 12,735 594,470 8,700 406,116
Sub debt and other borrowings 16,007 747,207 14,837 692,591
Total long term borrowings 28,742 1,341,677 23,537 1,098,707
Total borrowings 49,989 2,333,487 44,055 2,056,487
Equity
Share Capital 1,013 47,287 948 44,253
Reserves 26,327 1,228,944 21,192 989,243
Total equity 27,340 1,276,231 22,140 1,033,495
Debt/Equity 1.8 1.8 2.0 2.0
Long term debt/ Equity 1.1 1.1 1.1 1.1
Notes
The residual maturity details are extracted from Note 46 of Annual report 2009.
31 December2009
31 December2009
31 December2008
31 December2008
Capitalisation (US$m) (Rs.m) (US$m) (Rs.m)
Authorised share capital3,632 mn Shares of US$0.50 each 1,816 84,771 1,316 61,431500 mn Non-cumulative irredeemable
preference shares of £1.00 each 807 37,671 725 33,843300 mn Non-cumulative redeemable
preference shares of US$5.00 each 1,500 70,020 1,500 70,0201 mn Non-cumulative redeemable preference
shares of Euro 1,000 each 1,433 66,892 1,392 64,979100 mn Non-Cumulative Preference Shares
of AED 1.00 each 27 1,260 — —100 mn Non-Cumulative Preference Shares
of HKD 1.00 each 13 607 — —100 mn Non-Cumulative Preference Shares
of INR 10.00 each 21 1,027 — —100 mn Non-Cumulative Preference Shares
of KRW 5000.00 each 429 20,026 — —100 mn Non-Cumulative Preference Shares
of SGD 1.00 each 71 3,314 — —
Total authorised share capital 6,118 285,558 4,933 230,272
Shareholders’ equityAllotted, called-up and fully paid share capitalOrdinary shares 1,013 47,287 948 44,253Share premium 4,828 225,371 4,743 221,403Merger reserve 7,284 340,017 5,617 262,202Reserves and retained earnings 14,215 663,556 10,832 505,638
Total shareholders’ equity 27,340 1,276,231 22,140 1,033,495
319
c102100pu080Proof7:28.3.10B/LRevision:0OperatorSadK

31 December
2009
31 December
2009
31 December
2008
31 December
2008
Subordinated Liabilities and Other Borrowed
Funds: (US$m) (Rs.m) (US$m) (Rs.m)
Subordinated loan capital – issued by subsidiaryundertakings
£675 million 5.375% undated step upSubordinated Notes (callable and floating ratefrom 2020) 658 30,715 1,064 49,668
£600 million 8.103% Step-Up Callable PerpetualTrust Preferred Securities (callable 2016) 1,164 54,336 1,085 50,648
£700 million 7.75% Subordinated debt 2018 1,201 56,063 1,090 50,881
£300 million 6.0% Subordinated debt 2018 530 24,740 486 22,686
£300 million 6.75% Notes 2009 — — 390 18,205
£200 million 7.75% Notes (callable 2022) 390 18,205 360 16,805
£30 million Floating Rate Notes 2009 — — 44 2,054
c1,100 million 5.875% Subordinated debt 2017 1,701 79,403 1,609 75,108
c750 million 3.625% Subordinated Notes 2017(Floating rate from 2012) 1,113 51,955 1,066 49,761
c675 million Floating Rate Notes 2018 972 45,373 951 44,393
c600 million 5.375% Notes 2009 — — 755 35,243
c500 million 8.16% non-cumulative TrustPreferred Securities (callable 2010) 723 33,750 711 33,189
$1 billion 6.4% Subordinated debt 2017 1,101 51,395 1,203 56,156
$700 million 8.0% Subordinated Notes 2031 574 26,794 1,022 47,707
$500 million Floating Rate Notes 2015 499 23,293 499 23,293
$500 million Floating Rate Notes 2016 499 23,293 499 23,293
$350 million 4.375% Notes 2014 (Floating ratefrom 2009) — — 358 16,711
$300 million Floating Rate Notes 2017 298 13,911 297 13,864
$100 million Floating Rate Notes 2018 100 4,668 100 4,668
$22 million 9.75% fixed to floating rate note 2021(Callable 2016) 22 1,027 — —
BWP 75 million Subordinated debt 2017 11 513 10 467
BWP 50 million Fixed and Floating RateSubordinated Notes 2015 8 373 7 327
HKD 670 million Floating Rate Notes 2014 — — 77 3,594
HKD 500 million 3.5% Notes 2014 (Floating ratefrom 2009) — — 66 3,081
IDR 500 billion Floating Rate Notes 2016 22 1,027 20 934
KRW 205 billion Subordinated debt 2009 — — 158 7,375
KRW 30 billion Subordinated debt 2011 26 1,214 24 1,120
KRW 3 billion Subordinated debt 2011 2 93 2 93
KRW 90 billion Subordinated debt 2018 78 3,641 81 3,781
KRW 260 billion Subordinated debt 2018 227 10,596 219 10,223
MYR 500 million 4.28% Subordinated Bonds2017 149 6,955 150 7,002
PKR 1 billion Floating Rate Notes 2013 12 560 13 607
PKR 750 million Floating Rate Notes 2011 6 280 9 420
TWD 10 billion undated Floating Rate Notes 312 14,564 305 14,237
TWD 10 billion 2.9% Subordinated debt 2019(Callable 2014) 310 14,471 — —
KRW 300 billion Subordinated debt 2019 259 12,090 — —
JPY 10bn 3.35% Sub Debt Maturing April 2023 116 5,415 116 5,415
SGD 450m Sub Debt Maturing 10 April 2023 325 15,171 334 15,591
TZS 8 billion Subordinated Notes 2015 6 280 6 280
$1.5 billion 9.5% Perpetual Preferred Securities 2049 1,509 70,440 — —
14,923 696,606 15,186 708,882
320
c102100pu080Proof7:28.3.10B/LRevision:0OperatorSadK

31 December
2009
31 December
2009
31 December
2008
31 December
2008
Subordinated loan capital – issued by Company (US$m) (Rs.m) (US$m) (Rs.m)
Primary Capital Floating Rate Notes:US$400 mn 58 2,707 58 2,707
US$300 mn (Series 2) 82 3,828 82 3,828
US$400 mn (Series 3) 84 3,921 84 3,921
US$200 mn (Series 4) 52 2,427 52 2,427
£150 mn 242 11,297 217 10,130
518 24,180 493 23,013
Other borrowings – issued by Company 1,289 60,171 1,307 61,011US$925 mn 8.125% redeemable preference shares 964 32,909 727 33,936
£96 mn 7.375% irredeemable preference shares 160 7,469 154 7,189
£99 mn 8.25% irredeemable preference shares 165 7,702 159 7,422
1,807 84,351 1,800 84,024
Total for Group 16,730 780,956 16,986 792,906
Total for Company 1,751 81,737 1,736 81,036
Total Capitalisation and Indebtedness 44,070 2,057,188 39,126 1,826,402
Notes
(1) All subordinated liabilities described above are unsecured, unguaranteed and subordinated to the claims of other creditorsincluding without limitation, customer deposits and deposits by banks. The Group has the right to settle these debt instruments incertain circumstances as set out in the contractual agreements.
(2) Liabilities denominated in foreign currencies are translated into US Dollars at market exchange rates prevailing at 31 December2009.
The exchange rates used were £1.00 = US$ 1.61420; US$1.00 = HK$ 7.7545; US$1.00 = BWP 6.6622; US$1.00 = KRW 1164.4714;
US$1.00 = TZS 1337.9286; US$1.00 = Euro 0.6979; US$1.00 = IDR 9433.5484; US$1.00 = PKR 84.1059.
(3) Contingent liabilities amounted to US$39 billion as at 31 December 2009, of which US$29 billion related to guarantees andirrevocable letters of credit.
(4) The total amount of all other borrowings and indebtedness as at 31 December 2009 was US$329 billion, comprising deposits bybanks US$39 billion, customer accounts US$257 billion and other debt securities in issue such as certificates of deposits wasUS$33 billion. These obligations are unsecured and are not guaranteed. However, US$1.6 billion of the deposits by banks andUS$0.4 billion of the customer accounts include liabilities under repurchase agreements, which are collateralised with treasurybills/bonds.
(5) Of the total subordinated liabilities and other borrowings, $11,564 million is at fixed interest rates (2008: $11,865 million).
(6) Details of debt issued/ matured/ bought back since 1st January 2009.
a) On 21 April 2009, Standard Chartered First Bank Korea Limited (SCFB) issued KRW300 billion Lower Tier 2 Notes with acoupon of 7.05% maturing due 2019, callable 2014.
b) During 2009, Standard Chartered Bank (SCB) repurchased a total of $193 million of its 8% subordinated notes due May2031.
c) On 27 April 2009, £281 million fixed to floating step up subordinated notes callable 14 July 2020 issued by SCB wereexchanged for £198 million senior notes due 2014 issued by Standard Chartered PLC.
d) On 15 June 2009, SCB issued $1.5 billion 9.5% Step up Perpetual Preferred Securities, callable 2014.
e) On 17 June 2009, PT Bank Permata Tbk issued $100 million subordinated notes with a coupon of 9.75% maturing June 2021,callable June 2016. The Group subscribed for $50 million of these notes. As PT Bank Permata TBk is a joint venture of theGroup, on a proportionately consolidated basis, $22 million is treated as a liability for the Group.
f) On 28 October 2009, Standard Chartered Bank (Taiwan) Limited issued TWD10 billion subordinated notes with a fixedcoupon rate of 2.9% for the first five years, 3.4% for the remaining 5 years, maturing 2019, callable 2014.
g) On 4 December 2009, Standard Chartered Bank (Hong Kong) Limited exercised the call option on its $350 million 4.375%subordinated notes due December 2014; HKD 500 million 3.5% subordinated notes due December 2014 and HKD 670million floating rate notes due December 2014.
h) During 2009, £30 million floating rate notes, c600 million 5.375% notes, £300 million 6.75% notes and KRW205 billionsubordinated debt matured.
i) On 30 December 2009, SCB announced the intention to redeem in full the c500 million 8.16% non-cumulative trust preferredsecurities on the first call date of 23 March 2010.
j) On 4 February 2010, SCB exercised its right to redeem its $500 million subordinated floating rate note in full on the firstoptional call date.
321
c102100pu080Proof7:28.3.10B/LRevision:0OperatorSadK

CAPITAL STRUCTURE
The share capital of the Company as at 26 March 2010, being the latest practicable date prior to the
publication of this Draft Red Herring Prospectus, is set forth below:
Aggregate Value at Face Value Aggregate Value at Issue Price
In US$* In Rs. In US$* In Rs.
A. AUTHORISED CAPITAL
Shares of US$0.50 each 1,816,000,000 84,770,880,000 [*] [*]
Non-cumulative preference shares of
£1.00 each 807,102,502 37,675,544,794 [*] [*]
Non-cumulative preference shares of
US$5.00 each 1,500,000,000 70,020,000,000 [*] [*]
Non-cumulative preference shares of
c1,000 each 1,432,870,039 66,886,373,406 [*] [*]
Non-cumulative preference shares of
AED 1.00 each 27,225,701 1,270,895,726 [*] [*]
Non-cumulative preference shares of
HK$1.00 each 12,895,738 601,973,048 [*] [*]
Non-cumulative preference shares of
Rs10.00 each 21,422,451 1,000,000,000 [*] [*]
Non-cumulative preference shares of
KRW5,000 each 429,379,373 20,043,429,147 [*] [*]
Non-cumulative preference shares of
S$1.00 each 71,209,855 3,324,076,052 [*] [*]
Total Authorised Share Capital 6,118,105,659 285,593,172,173 [*] [*]
A. ISSUED AND FULLY PAID
CAPITAL BEFORE THE ISSUE
Shares of US$0.50 each 1,014,096,295 47,338,015,051 [*] [*]
Non-cumulative preference shares of
£1.00 each 315,230,024 14,714,937,530 [*] [*]
Non-cumulative preference shares of
US$5.00 each 2,387,500 111,448,500 [*] [*]
Total shareholders’ equity 1,331,713,819 62,164,401,081 [*] [*]
C. PRESENT ISSUE IN TERMS OF
THIS DRAFT RED HERRING
PROSPECTUS
[*] Shares which are represented by
[*] IDRs of Rs. [*] each fully paid
up [*] [*] [*] [*]
D. SHARE PREMIUM ACCOUNT
Before the Issue [*] [*] [*] [*]
After the Issue [*] [*] [*] [*]
Paid up [*] [*] [*] [*]
E. EQUITY CAPITAL AFTER THE
ISSUE
[*] Shares each fully paid up [*] [*] [*] [*]
* Note: The exchange rates used for US$ conversion were USD1.00 = £0.6195, USD1.00 = EUR0.6979; US$1.00 = HK$ 7.7545;US$1.00 = KRW 1164.4714; US$1.00=SGD1.4043; US$1.00=AED3.6730
All Shares are identical to and rank pari passu with all other Shares in all respects.
The non-cumulative irredeemable preference shares of £1.00 each in issue consist of 81/4 % non-
cumulative preference shares of £1 each and 73/8% non-cumulative irredeemable preference shares of
£1 each.
322
c102100pu080Proof7:28.3.10B/LRevision:0OperatorSadK

As at 26 March 2010 (being the latest practicable date prior to the date of this Draft Red Herring
Prospectus), the issued share capital of the Company consisted of:
* 99,250,000 81/4% non-cumulative preference shares of £1 each with no equity voting rights;
* 96,035,000 73/8% non-cumulative irredeemable preference shares of £1 each with no equity voting
rights;
* 462,500 8.125% non-cumulative redeemable preference shares of US$5 each with no equity
voting rights;
* 15,000 American Depository Shares representing 15,000 non-cumulative redeemable preference
shares of US$5 each with no equity voting rights;
* 2,028,192,590 Shares; and
* the Shares of US$0.50 each with voting rights of one vote for every US$2 nominal value.
The Company holds no shares in treasury. All of the Shares listed above have been issued fully paid.
The authorised share capital of the Company is US$6,118 million made up of 3,632,000,000 Shares of
US$0.50 each, 500 million non-cumulative irredeemable preference shares of £1 each, 300 million non-
cumulative redeemable preference shares of US$5 each, 1 million non-cumulative redeemablepreference shares of c1,000 each, 100 million non-cumulative irredeemable preference shares of AED
1 each, 100 million non-cumulative irredeemable preference shares of HKD 1 each, 100 million non-
cumulative irredeemable preference shares of INR 10 each, 100 million non-cumulative irredeemable
preference shares of KRW 5,000 each, and 100 million non-cumulative irredeemable preference shares
of SGD 1 each.
The Company raised £1,779 million (net of expenses) by way of a rights issue of 470,014,830 new
Shares at 390 pence per Share on the basis of 30 new Shares for every 91 existing Shares announcedon 24 November 2008.
The Company raised £1,020 million gross by way of a placing of 75 million new shares at £13.60 per
Placing Share, announced on 4 August 2009.
For a description of the rights of shareholders see the section titled ‘‘Comparison of Rights of
Shareholders’’ on page 426 of this Draft Red Herring Prospectus.
The Shares and the Company’s 81/4% non-cumulative irredeemable preference shares of £1 each, 73/8%
non-cumulative irredeemable preference shares of £1, American Depository Shares representing 15,000non-cumulative redeemable preference shares of US$5 each, and 8.125% non-cumulative redeemable
preference shares of US$5 each, as well as the Company’s sterling undated primary capital floating
rate notes, US$ undated primary capital floating rate notes (Series 2), US$ undated primary capital
floating rate notes (Series 3), US$ undated primary capital floating rate notes (Series 4), 5.50% US$
notes due 18/11/2014, 4.875% Euro notes due 11/03/2011, US$ floating rate notes due 18/04/2011,
2.48% SGD notes due 07/04/2010, 6.5% sterling notes due 28/04/2014, 5.75% Euro notes due 30/04/
2014, and 5.50% US$ notes due 18/11/2014 are admitted to the Official List and trading on the
London Stock Exchange. The Shares are also admitted to listing on the Hong Kong Stock Exchange.
There shall be only one denomination of the IDRs, unless otherwise permitted by law. The Company
shall comply with such disclosure and accounting practices as may be specified by the SEBI from
time to time.
Major Shareholders
As at 26 March 2010 (being the latest practicable date prior to the publication of this Draft Red
Herring Prospectus), the Company has received notification that the following shareholders currentlyhold 3% or more of the Shares of the Company:
Shareholder
Percentage
of Shares
held
Temasek Holdings (Private) Limited* 18.38%
Blackrock, Inc 6.23%
Legal & General Group Plc 3.98%
* Temasek Holdings (Private) Limited’s interest is held indirectly through Fullerton Management Pte Ltd and its subsidiaries andDover Investments Pte Ltd.
323
c102100pu080Proof7:28.3.10B/LRevision:0OperatorSadK

Incorporated in 1974, Temasek Holdings (Private) Limited is an Asia investment company
headquartered in Singapore. As at 31 July 2009, Temasek has reported that it owns a diversified
S$172 billion (US$119 billion) portfolio, concentrated principally in Singapore, Asia and the emerging
economies. Temasek’s headquarters in Singapore is at 60B Orchard Road, 06-18 Tower 2, TheAtrium, Orchard, Singapore 238891.
Established in 1836, Legal & General Group Plc is a UK based financial services company withoperations in the USA, France, the Netherlands, Germany and the UK. Legal & General has
reported that it is responsible for investing £280 billion worldwide, as at 31 December 2008, on behalf
of investors, policy holders and institutions. Legal & General’s registered office is at One Coleman
Street, London, EC2R 5AA, UK.
Established in 1988, BlackRock, Inc is an asset management firm and provider of global investment
management, risk management and advisory services to institutional, intermediary and individual
investors around the world. Blackrock has reported that as of 31 December 2009, it’s assets under
management totalled US$3.35 trillion across equity, fixed income, cash management, alternative
investment, real estate and advisory strategies. Blackrock’s registered office is at BlackRock, Inc., 40
East 52nd Street, New York, NY 10022.
324
c102100pu080Proof7:28.3.10B/LRevision:0OperatorSadK

Capital Issuances
The following tables show the movements in called-up share capital over the last five years.
In US$:
Number
of
Shares
Ordinary
share
capital
Preference
share capital
Share
premium
account Total
Notes (m) US$m US$m US$m US$m
At 1 January 2003 1,170 585 351 2,764 3,700
Issued instead of dividends 1 3 2 — 46 48
Issued under employee share schemes 2 2 1 — 3 4
At 31 December 2003 1,175 588 351 2,813 3,752
Exchange translation 3 — — 26 — 26
Issued instead of dividends 4 3 1 — 15 16
Issued under employee share schemes 5 1 1 — 7 8
At 31 December 2004 1,179 590 377 2,835 3,802
Adoption of IAS 32 and 39 6 — — (375) — (375)
At 1 January 2005 1,179 590 2 2,835 3,427
Issued instead of dividends 9 4 2 — (2) —
Shares issued, net of expenses —
i) New issue 7 118 59 — — 59
ii) Issued under employee share
schemes 8, 9 15 7 — 201 208
At 31 December 2005 1,316 658 2 3,034 3,694
Shares repurchased 12 — — (2) — (2)
Preference shares 10 — — — 750 750
Issued instead of dividends 11 15 7 — (7) —
i) New issue 12 52 27 — 88 115
ii) Issued under employee share
schemes 11 1 — — — —
At 31 December 2006 1,384 692 — 3,865 4,557
Preference shares 15 — — — 750 750
Issued instead of dividends 13 16 8 — (8) —
Issued under employee share schemes 14 10 5 — 106 111
At 31 December 2007 1,410 705 — 4,713 5,418
Issued instead of dividends 16 11 6 — (6) —
Issued under employee share schemes 17 5 2 — 36 38
Issued under the rights issue 18 470 235 — — 235
At 31 December 2008 1,896 948 — 4,743 5,691
Issued instead of dividends 19 41 21 — (21) —
Issued under employee share schemes 20 13 7 — 106 113
Issued under the placing 21 75 37 — — 37
At 31 December 2009 2,025 1,013 — 4,828 5,841
Issued under employee share schemes 22 3 1 — (1) —
At 26 March 2010 2,028 1,014 — 4,828 5,841
325
c102100pu080Proof7:28.3.10B/LRevision:0OperatorSadK
1 Source: www.temasekholdings.com.sg
2 Source: www.legalandgeneralgroup.com
3 Source: http://www2.blackrock.com

In Rs.:
Number
of
Shares
Ordinary
share
capital
Preference
share capital
Share
premium
account Total
Notes (m) Rs.m Rs.m Rs.m Rs.m
At 1 January 2003 1,170 27,308 16,385 129,024 172,716
Issued instead of dividends 1 3 93 — 2,147 2,241
Issued under employee share schemes 2 2 47 — 140 187
At 31 December 2003 1,175 27,448 16,385 131,311 175,143
Exchange translation 3 — — 1,214 — 1,214
Issued instead of dividends 4 3 47 — 700 747
Issued under employee share schemes 5 1 47 — 327 373
At 31 December 2004 1,179 27,541 17,598 132,338 177,477
Adoption of IAS 32 and 39 6 — — (17,505) — (17,505)
At 1 January 2005 1,179 27,541 93 132,338 159,972
Issued instead of dividends 9 4 93 — (93) —
Shares issued, net of expenses
i) New issue 7 118 2,754 — — 2,754
ii) Issued under employee share
schemes 8, 9 15 327 — 9,383 9,709
At 31 December 2005 1,316 30,715 93 141,627 172,436
Shares repurchased 12 — — (93) — (93)
Preference shares 10 — — — 35,010 35,010
Issued instead of dividends 11 15 327 — (327) —
i) New issue 12 52 1,260 — 4,108 5,368
ii) Issued under employee share
schemes 11 1 — — — —
At 31 December 2006 1,384 32,303 — 180,418 212,721
Preference shares 15 — — — 35,010 35,010
Issued instead of dividends 13 16 373 — (373) —
Issued under employee share schemes 14 10 233 — 4,948 5,181
At 31 December 2007 1,410 32,909 — 220,003 252,912
Issued instead of dividends 16 11 280 — (280) —
Issued under employee share schemes 17 5 93 — 1,680 1,774
Issued under the rights issue 18 470 10,970 — — 10,970
At 31 December 2008 1,896 44,253 — 221,403 265,656
Issued instead of dividends 19 41 980 — (980) —
Issued under employee share plans 20 13 327 — 4,948 5,275
Issued under the placing 21 75 1,727 — — 1,727
At 31 December 2009 2,025 47,287 — 225,371 272,658
Issued under employee share schemes 22 3 47 — (47) —
At 26 March 2010 2,028 47,333 — 225,371 272,658
Notes to the table:
(1) On 13 May 2003, 1,897,212 Shares were issued instead of the 2002 final dividend. On 10 October 2003, 858,819 Shares were issuedinstead of the 2003 interim dividend.
(2) 2,010,942 Shares were issued under the Standard Chartered Share Schemes during 2003.
(3) The exchange translation relates to revaluation of GBP denominated preference shares.
(4) On 14 May 2004, 2,066,122 Shares were issued instead of the 2003 final dividend. On 8 October 2004, 912,977 Shares were issuedinstead of the 2004 interim dividend.
(5) 1,272,055 Shares were issued under the Standard Chartered Share Schemes during 2004.
326
c102100pu080Proof7:28.3.10B/LRevision:0OperatorSadK

(6) On adoption of IAS 32 and 39, £195 million non-cumulative irredeemable preference shares have been reclassified from equity toliabilities.
(7) On 10 January 2005, the Company placed 117,902,943 Shares of US$0.50 each at a price of 920 pence per Share representingapproximately 9.99% of the Company’s existing issued ordinary share capital. The placees (comprising more than six in number)were professional and institutional investors, independent and not connected with the Company and its subsidiaries and theirrespective associates. The Shares were issued on 14 January 2005 raising net proceeds of approximately £1,071 million (US$2.0billion), a net price per Share of 908.5 pence. The market price of the Shares at close of business in London on 10 January 2005was 928.5 pence. The Shares that were issued had an aggregate nominal amount of US$58,981,471.50.
The purpose of the share issue was to aid the funding of the purchase of the entire share capital of Korea First Bank forapproximately KRW3.4 trillion (US$3.3 billion) in cash.
On 16 February 2005, the Company repurchased 3,000 8.9% non-cumulative preference shares. The preference shares wererepurchased at a premium of US$3 million and were cancelled.
(8) On 23 May 2005, the Company issued 11,700,000 Shares at a price of 985.6 pence per Share (£115 million, US$211 million) to theEmployee Benefit Trust towards satisfaction of the vested shares under the Company’s discretionary share schemes.
(9) On 13 May 2005, 2,522,654 Shares were issued instead of the 2004 final cash dividend. On 14 October 2005, 1,735,708 Shares wereissued instead of the 2005 interim cash dividend. A further 3,525,788 Shares were issued under the Standard Chartered ShareSchemes during 2005.
(10) On 8 December 2006, the Company issued 7,500 non-cumulative redeemable preference shares of US$5 each at a placing price ofUS$100,000 each. The shares are redeemable at the option of the Company and have discretionary coupon payments and areaccordingly classified as equity as required by IAS 32. The shares were issued to fund the continuing business of the Group.
(11) On 12 May 2006, the Company issued 9,960,348 Shares instead of the 2005 final dividend. On 11 October 2006, the Companyissued 4,912,941 Shares instead of the 2006 interim dividend. A further 1,496,807 Shares were issued under the Standard CharteredShare Schemes during 2006.
(12) On 12 January 2006, the Company issued 3,401,290 Shares at an average price of 1,301 pence per Share representingapproximately 0.3% of the Company’s existing issued ordinary share capital. The middle market price on 12 January 2006 was1,323 pence. The issue of Shares was used to acquire 20% of Fleming Family & Partners Limited. On 4 October 2006, theCompany issued 48,500,000 Shares each at a placing price of 1,375 pence per Share representing approximately 3.7% of theCompany’s existing issued share capital. The middle market price on 4 October 2006 was 1,363 pence. This issue of Shares wasused to acquire Hsinchu. On 2 October 2006, the Company repurchased the remaining 328,388 8.9% non-cumulative preferenceshares. The preference shares were repurchased at a premium of US$326 million and were cancelled. The premium paid on the8.9% non-cumulative preference shares redeemed in 2006 has been reclassified as a deduction from retained earnings rather than adeduction from the share premium account.
(13) On 10 May 2007, the Company issued 12,765,274 Shares instead of the 2006 final dividend. On 10 October 2007, the Companyissued 3,163,466 Shares instead of the 2007 interim dividend.
(14) 9,012,891 Shares were issued under the Standard Chartered Share Schemes during 2007.
(15) On 25 May 2007, the Company issued 7,500 non-cumulative redeemable preference shares of US$5 each at a placing price ofUS$100,000 each. The shares are redeemable at the option of the Company in accordance with the terms of the shares at the paid-up amount (which includes premium) and have discretionary dividend payments and are accordingly classified as equity asrequired by IAS 32. The shares were issued to fund the continuing business of the Group.
(16) On 16 May 2008, the Company issued 8,142,490 Shares instead of the 2007 final dividend. On 9 October 2008, the Companyissued 2,940,049 Shares instead of the 2008 interim dividend.
(17) 5,410,537 Shares were issued under the Standard Chartered Share Schemes during 2008.
(18) On 18 December 2008, the Company issued 470,014,830 Shares under the Standard Chartered rights issue announced on 24November 2008.
(19) On 15 May 2009, the Company issued 32,270,731 Shares instead of the 2008 final dividend. On 8 October 2009, the Companyissued 9,157,053 Shares instead of the 2009 interim dividend.
(20) 12,594,749 Shares were issued under the Standard Chartered Share Schemes during 2009.
(21) On 7 August 2009, the Company issued 75,000,000 Shares under the Standard Chartered placing announced on 4 August 2009.
(22) 2,992,819 Shares were issued under the Standard Chartered Share Schemes between 1 January 2010 and 26 March 2010.
Share Schemes
Options
1994 Executive Share Option Scheme (closed)
No awards have been made under this scheme since August 1999 as the scheme was replaced by the
2000 Executive Share Option Scheme. Awards made under this scheme are not subject to the
valuation criteria of IFRS 2, as all awards were granted prior to 7 November 2002, and were allvested as at that date. Executive share options to purchase ordinary shares in the Company are
exercisable after the third, but before the tenth anniversary of the date of grant. The exercise price is
the share price at the date of grant and options can only be exercised if EPS increases by at least
15% over three consecutive years. There are no outstanding options in this scheme.
2000 Executive Share Option Scheme
The 2000 scheme is designed to be internationally competitive and focus executive directors and their
senior management teams on delivering long-term performance. An EPS performance criterion mustbe met before options can be exercised. Executive share options to purchase ordinary shares in the
Company are exercisable after the third, but before the tenth, anniversary of the date of grant. The
exercise price per share is the share price at the date of grant and options can only be exercised if a
performance condition is satisfied. The remaining life of the scheme is one year after which options
will not be granted under this scheme.
327
c102100pu080Proof7:28.3.10B/LRevision:0OperatorSadK

2001 Performance Share Plan (PSP)
Outline of the 2001 Performance Share Plan
The PSP is an intrinsic element of total remuneration for the Company’s executive directors and
executive population. Its significance as a percentage of these individuals’ total potential remuneration
is one of the strongest indicators of the Company’s commitment to paying for sustainableperformance. A performance test is applied both at the time of award and upon vesting.
Given that the PSP is currently under review, awards to the majority of senior executives for 2009
will be made by way of the RSS at the equivalent expected value.
Performance conditions
Half the award is dependent upon the Company’s total shareholder return (TSR) performance
compared to that of a group of peers at the end of a three year period. The other half is subject to a
target for earnings per share (EPS) growth applied over the same three year period.
The Company reviewed the performance conditions in 2009 and concluded that, in aggregate, thecombination of these measures and targets was appropriate and provided a balance between driving
stretching performance and having an effective retention and motivation tool. The rationale for the
selection of TSR and EPS performance conditions is set out below:
TSR Relative total shareholder return, which measures the growth in share price plus dividends
paid to shareholders, is recognised as one of the best indicators as to whether they have
achieved a good return investing in a specific company relative to a basket of similar
companies or a single index
EPS Earnings per share provide an appropriate measure of a company’s underlying financialperformance
A review of the Company’s performance conditions is currently being undertaken and the Company
is considering proposing to the shareholders that a measure relating to economic profit is included inthe design of the Company’s PSP.
TSR element
The constituents of the Company’s comparison peer group for awards made in 2009 are set out
below:
For awards made in 2009
Banco Santander JP Morgan Chase
Bank of America Kookmin
Bank of China Lloyds Banking Group
Bank of East Asia Overseas Chinese Banking Corporation
Barclays Royal Bank of Scotland
Citigroup Standard BankDBS Group State Bank of India
Deutsche Bank Unicredito
HSBC United Overseas Bank
ICBC Standard Chartered
ICICI
A comprehensive review of the comparison group was made in June 2008 by the Company, which
decided to increase the number of constituents from 15 to 21 for awards to be made in 2009 and
beyond. The enlarged group better reflects the increased size and scope of the Company’s current
business. The Committee used a combination of measures, including size, business scope and
geographic spread, to identify the most appropriate companies before agreeing the constituents.
Following the increase in the number of constituents, the vesting schedule has been recalibrated to
ensure the vesting level at median and upper quintile remains broadly unchanged. The percentage of
awards exercisable at the end of the relevant three year performance period is calculated on a
straightline basis. Minimum vesting occurs if we achieve median ranking, with full vesting achieved if
we are ranked in the upper quintile or above position in the Company’s comparison group.
328
c102100pu080Proof7:28.3.10B/LRevision:0OperatorSadK

Comparison group for awards in 2010 onwards
In December 2009, the Company reviewed the continued appropriateness of the Company’s
comparison peer group and decided to make a minor refinement to the constituents, which resulted inthe replacement of Lloyds Banking Group by Credit Suisse. This will affect awards made in 2010 and
onwards.
The Company believes that it is preferable to measure total shareholder return performance using a
local currency approach. This reflects the international composition of the comparison group, but also
takes into account that a significant proportion of each company’s profits is generated in the same
currency as its primary listing. This approach measures the real impact for a shareholder by focusing
on relative stock movement rather than taking into account exchange rate fluctuations.
EPS element
The percentage of award which is normally exercisable at the end of the relevant three yearperformance period is as follows:
Increase in EPS
Percentage of award
exercisable
Less than 15% Nil
15% 15
15 to 30% More than 15 but less than 50*
More than 30% 50
* Calculated on a straightline basis.
Vesting of 2007 awards
The Committee recently reviewed whether the performance conditions for awards granted in 2007
were satisfied at the end of December 2009. The table below sets out earnings per share and total
shareholder return performance over the three-year period and the percentage of the 2007 awards that
has now vested.
Element Performance 2007 Awards
EPS growth 20.35% 27.48%
TSR ranking 1 out of 15 50%
Total 77.48%
For awards granted in 2009, normalised EPS of 179.8 cents has been used as a base figure.
1997/2006 Restricted Share Scheme (RSS)
The RSS is used as a vehicle for deferring part of annual performance awards to employees and as
an incentive plan to motivate and retain high performing staff. Except where used for deferral
purposes, executive directors are not generally eligible to participate in the RSS. However, awardsmay be made on an exceptional basis at the time of their appointment. For example, RSS may be
used to compensate a newly appointed executive director for share awards forfeited when they left
their previous employer. No such awards have been made since 2003.
Under the RSS, the value of shares awarded in any year to any individual may not exceed two times
their base salary. Half of the award vests two years after the date of grant and the balance after
three years.
2007 Supplementary Restricted Share Scheme (SRSS)
We also operate a SRSS, which is similar to the RSS. This scheme is principally used for Global
Markets employees but is also used to defer one third of an employee’s deferred annual performance
award which vests after one year. Executive directors are specifically prohibited from this scheme.New shares cannot be issued to satisfy awards. There is no individual annual limit.
Both the restricted share and supplementary restricted share schemes, in line with similar schemes
operated by the Company’s competitors, do not have performance conditions.
329
c102100pu080Proof7:28.3.10B/LRevision:0OperatorSadK

2004 Deferred Bonus Plan (DBP)
Under the DBP, shares are conditionally awarded in order to defer one third of a director’s deferred
annual performance award which vests after one year. The DBP is used for directors only instead ofthe SRSS as under the scheme rules directors are unable to participate in the SRSS.
All Employee Sharesave Schemes
No awards have been made under the 1994 UK Sharesave and 1996 International Sharesave Schemes
since 2003, as these were replaced by the 2004 UK and International Sharesave Schemes.
We strongly believe in encouraging employee share ownership at all levels in the organisation. We
seek to engage employees in the Company’s performance to align their interests more closely with
those of the Company’s shareholders and offer them an opportunity for long-term savings and a
share in the financial success that they help to create.
It is not possible to offer Sharesave schemes in some countries in which we operate because of local
securities laws or regulatory issues. We offer an equivalent cash-based scheme to these employees as
an alternative.
As at 31 December 2009, 37% of employees globally participated in the Company’s all employee
Sharesave schemes (2008: 37%). There are no performance conditions attached to options grantedunder these schemes.
Further details on the long-term incentives operated by Standard Chartered are set out in note 39 to
the financial statements.
Financial Details of Employer Share Schemes
1994 Executive Share Option Scheme
Awards made under the 1994 ESOS are not subject to the valuation criteria of IFRS 2, as all awards
are granted prior to 7 November 2002 and are all vested as at that date.
A reconciliation of option movements over the years to 31 December 2009 and 2008 is shown below:
2009 2008
No. of
shares
Weighted
average
exercise
price (£)
No. of
shares
Weighted
average
exercise
price (£)
Outstanding at 1 January — — 10,806 6.20
Lapsed — — — —
Exercised — — (10,806) 6.20
Outstanding at 31 December — — — —
Exercisable at 31 December — — — —
2009 2008
Range of exercise price for options outstanding
Weighted
average
exercise
price (£)
Weighted
average
remaining
contractual
life
Weighted
average
exercise
price (£)
Weighted
average
remaining
contractual
life
n/a — — — —
330
c102100pu080Proof7:28.3.10B/LRevision:0OperatorSadK

2009 2008
No. of
shares
Weighted
average
exercise
price (Rs.)
No. of
shares
Weighted
average
exercise
price (Rs.)
Outstanding at 1 January — — 10,806 465.21
Lapsed — — — —
Exercised — — (10,806) 465.21
Outstanding at 31 December — — — —
Exercisable at 31 December — — — —
2009 2008
Range of exercise price for options outstanding
Weighted
average
exercise
price (Rs.)
Weighted
average
remaining
contractual
life
Weighted
average
exercise
price (Rs.)
Weighted
average
remaining
contractual
life
n/a — — — —
The weighted average share price at the time the options were exercised during 2008 was £17.23.
2000 Executive Share Option Scheme
No share awards were granted under the 2000 ESOS during 2009 or 2008.
A reconciliation of option movements over the period to 31 December 2009 and 31 December 2008 is
shown below:
2009 2008
No. of
shares
Weighted
average
exercise
price (£)
No. of
shares
Weighted
average
exercise
price (£)
Outstanding at 1 January 7,485,925 7.18 8,575,209 8.28
Additional Shares for rights issue — — 937,283 —
Lapsed (5,253) 8.19 (3,348) 6.05
Exercised (4,076,707) 7.08 (2,023,219) 7.47
Outstanding at 31 December 3,403,965 7.29 7,485,925 7.18
Exercisable at 31 December 3,403,965 7.29 7,485,925 7.18
2009 2008
Range of exercise price for options outstanding
Weighted
average
exercise
price (£)
Weighted
average
remaining
contractual
life
Weighted
average
exercise
price (£)
Weighted
average
remaining
contractual
life
£6.05/£9.10 7.29 3.2 years 7.18 4.0 years
331
c102100pu080Proof7:28.3.10B/LRevision:0OperatorSadK

2009 2008
No. of
shares
Weighted
average
exercise
price (Rs.)
No. of
shares
Weighted
average
exercise
price (Rs.)
Outstanding at 1 January 7,485,925 538.74 8,575,209 621.28
Additional Shares for rights issue — — 937,283 —
Lapsed (5,253) 614.52 (3,348) 453.95
Exercised (4,076,707) 531.24 (2,023,219) 560.50
Outstanding at 31 December 3,403,965 546.99 7,485,925 538.74
Exercisable at 31 December 3,403,965 546.99 7,485,925 538.74
2009 2008
Range of exercise price for options outstanding
Weighted
average
exercise
price (Rs.)
Weighted
average
remaining
contractual
life
Weighted
average
exercise
price (Rs.)
Weighted
average
remaining
contractual
life
Rs. 453.95/Rs. 682.8 546.99 3.2 years 538.74 4.0 years
The intrinsic value of vested 2000 ESOS cash-settled awards as at 31 December 2009 was US$3
million (2008: US$0.8 million).
The weighted average share price at the time the options were exercised during 2009 was £14.28
(2008: £17.23).
2001 Performance Share Plan (PSP)
The fair value of awards is based on the market value less an adjustment to take into account the
expected dividends over the vesting period. The same fair value is applied for awards made to both
the directors and employees of the Group. As set out in the Directors’ remuneration report, half the
award is dependent on a TSR performance condition and half dependent on an EPS performancecondition. The fair value of the TSR component is derived by discounting 50% of the award that is
subject to the TSR condition by the loss of expected dividends over the performance period, together
with the probability of meeting the TSR condition, which is calculated by the area under the TSR
vesting schedule curve. The EPS fair value is derived by discounting 50% of the award by the loss of
expected dividends over the performance period. In respect of the EPS component only, the number
of shares expected to vest is adjusted for actual performance when calculating the charge for the year.
2009 2008
Grant date 3 December 15 September 23 June 11 March 16 September 24 April 11 March
Share price at grant date (£) 15.51 14.41 11.75 8.10 13.86 17.82 16.26Share price at grant date(Rs.) 1,163.77 1,081.23 881.64 607.77 1,039.96 1,337.10 1,220.04Vesting period (years) 3 3 3 3 3 3 3Expected dividends (yield)(%) 3.43 3.43 3.41 3.41 2.6 2.6 2.6Fair value (EPS) (£) 7.13 6.63 5.40 3.73 12.83 16.5 15.06Fair value (EPS) (Rs.) 534.99 497.47 405.18 279.87 962.68 1,238.05 1,130.00Fair value (TSR) (£) 2.81 2.61 2.13 1.46 5.04 6.49 5.89Fair value (TSR) (Rs.) 210.84 195.84 159.82 109.55 378.17 486.97 441.95
The expected dividend yield is based on the historical dividend yield over the three years prior to
grant.
332
c102100pu080Proof7:28.3.10B/LRevision:0OperatorSadK
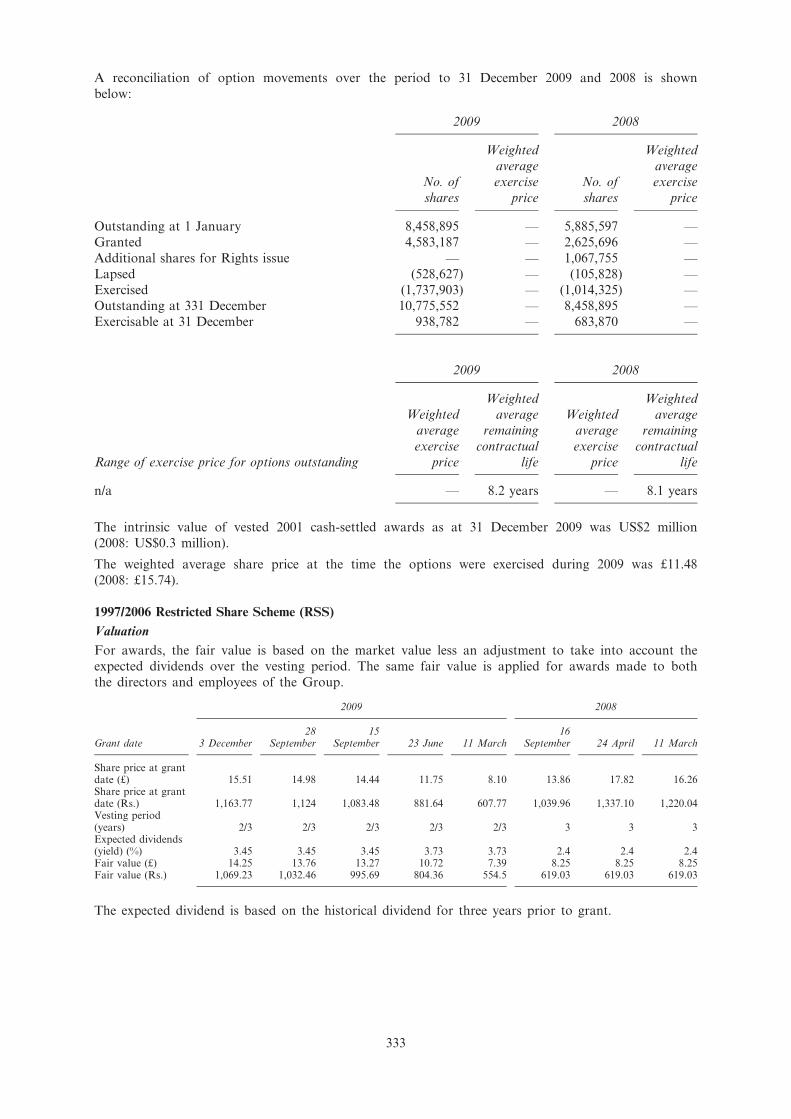
A reconciliation of option movements over the period to 31 December 2009 and 2008 is shown
below:
2009 2008
No. of
shares
Weighted
average
exercise
price
No. of
shares
Weighted
average
exercise
price
Outstanding at 1 January 8,458,895 — 5,885,597 —
Granted 4,583,187 — 2,625,696 —
Additional shares for Rights issue — — 1,067,755 —
Lapsed (528,627) — (105,828) —
Exercised (1,737,903) — (1,014,325) —Outstanding at 331 December 10,775,552 — 8,458,895 —
Exercisable at 31 December 938,782 — 683,870 —
2009 2008
Range of exercise price for options outstanding
Weighted
average
exercise
price
Weighted
average
remaining
contractual
life
Weighted
average
exercise
price
Weighted
average
remaining
contractual
life
n/a — 8.2 years — 8.1 years
The intrinsic value of vested 2001 cash-settled awards as at 31 December 2009 was US$2 million
(2008: US$0.3 million).
The weighted average share price at the time the options were exercised during 2009 was £11.48
(2008: £15.74).
1997/2006 Restricted Share Scheme (RSS)
Valuation
For awards, the fair value is based on the market value less an adjustment to take into account the
expected dividends over the vesting period. The same fair value is applied for awards made to both
the directors and employees of the Group.
2009 2008
Grant date 3 December28
September15
September 23 June 11 March16
September 24 April 11 March
Share price at grantdate (£) 15.51 14.98 14.44 11.75 8.10 13.86 17.82 16.26Share price at grantdate (Rs.) 1,163.77 1,124 1,083.48 881.64 607.77 1,039.96 1,337.10 1,220.04Vesting period(years) 2/3 2/3 2/3 2/3 2/3 3 3 3Expected dividends(yield) (%) 3.45 3.45 3.45 3.73 3.73 2.4 2.4 2.4Fair value (£) 14.25 13.76 13.27 10.72 7.39 8.25 8.25 8.25Fair value (Rs.) 1,069.23 1,032.46 995.69 804.36 554.5 619.03 619.03 619.03
The expected dividend is based on the historical dividend for three years prior to grant.
333
c102100pu080Proof7:28.3.10B/LRevision:0OperatorSadK

A reconciliation of option movements over the period to 31 December 2009 and 2008 is shown
below:
2009 2008
No. of
shares
Weighted
average
exercise
price
No. of
shares
Weighted
average
exercise
price
Outstanding at 1 January 7,285,927 — 6,275,898 —
Granted 12,675,994 — 2,137,992 —
Additional Shares for rights issue — — 925,127 —
Lapsed (528,860) — (294,595) —
Exercised (2,155,899) — (1,758,495) —Outstanding at 31 December 17,277,162 — 7,285,927 —
Exercisable at 31 December 1,986,203 — 1,900,102 —
The weighted average share price at the time the options were exercised during 2009 was £11.98(2008: £15.69).
2009 2008
Range of exercise price for options outstanding
Weighted
average
exercise
price
Weighted
average
remaining
contractual
life
Weighted
average
exercise
price
Weighted
average
remaining
contractual
life
n/a — 5.6 years — 5.0 years
The intrinsic value of vested 1997/2006 RSS cash-settled awards as at 31 December 2009 was US$12
million (2008: US$3 million).
2007 Supplementary Restricted Share Scheme (SRSS)
Valuation
The first awards under this scheme were made on 12 March 2007. For awards, the fair value is based
on the market value less an adjustment to take into account the expected dividends over the vesting
period. The same fair value is applied for awards made to both the directors and employees of the
Group.
2009 2008
Grant date 3 December 15 September 23 June 11 March 16 September 11 March
Share price at grant date (£) 15.51 14.44 11.75 8.10 13.86 16.26
Share price at grant date (Rs.) 1,163.77 1,083.48 881.64 607.77 1,039.96 1,220.04
Vesting period (years) 2/3 2/3 2/3 2/3 2/3 2/3
Expected dividends (yield) (%) 3.45 3.45 3.73 3.73 2.4 2.4Fair value (£) 14.25 13.27 10.72 7.39 13.06 12.41
Fair value (Rs.) 1,069.23 995.69 804.36 554.50 979.94 931.16
The expected dividend is based on the historical dividend for three years prior to grant.
334
c102100pu080Proof7:28.3.10B/LRevision:0OperatorSadK
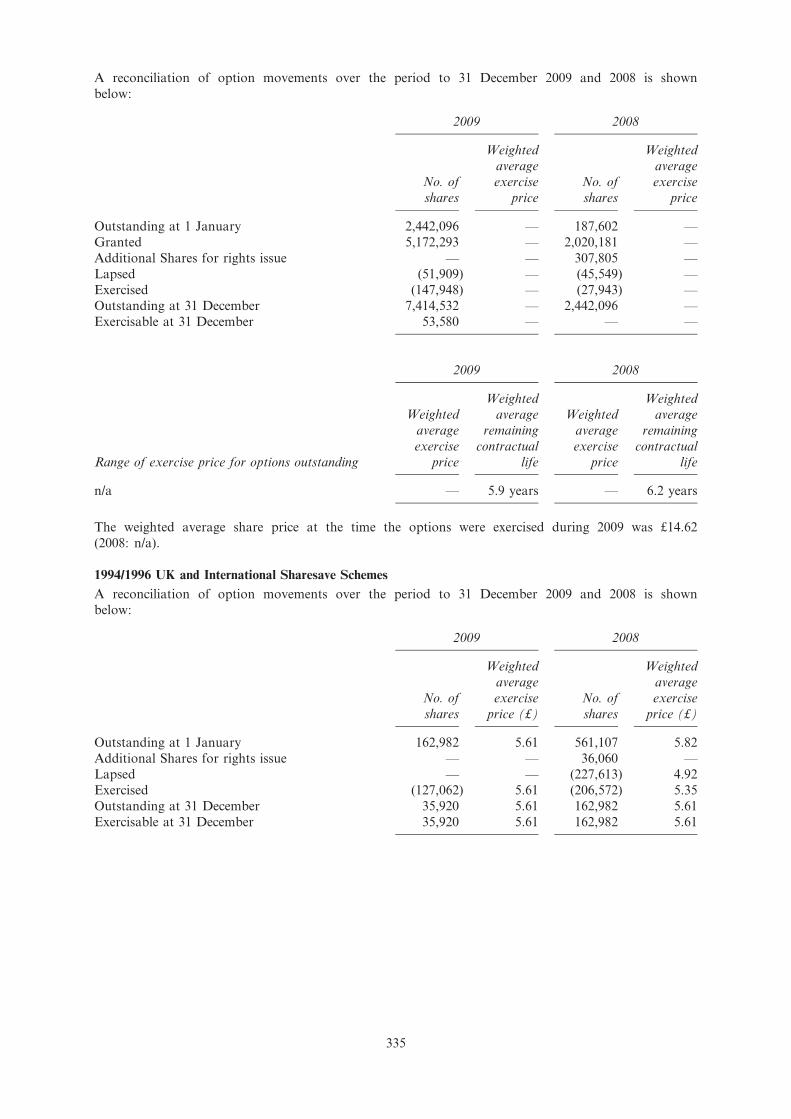
A reconciliation of option movements over the period to 31 December 2009 and 2008 is shown
below:
2009 2008
No. of
shares
Weighted
average
exercise
price
No. of
shares
Weighted
average
exercise
price
Outstanding at 1 January 2,442,096 — 187,602 —
Granted 5,172,293 — 2,020,181 —
Additional Shares for rights issue — — 307,805 —
Lapsed (51,909) — (45,549) —
Exercised (147,948) — (27,943) —Outstanding at 31 December 7,414,532 — 2,442,096 —
Exercisable at 31 December 53,580 — — —
2009 2008
Range of exercise price for options outstanding
Weighted
average
exercise
price
Weighted
average
remaining
contractual
life
Weighted
average
exercise
price
Weighted
average
remaining
contractual
life
n/a — 5.9 years — 6.2 years
The weighted average share price at the time the options were exercised during 2009 was £14.62
(2008: n/a).
1994/1996 UK and International Sharesave Schemes
A reconciliation of option movements over the period to 31 December 2009 and 2008 is shownbelow:
2009 2008
No. of
shares
Weighted
average
exercise
price (£)
No. of
shares
Weighted
average
exercise
price (£)
Outstanding at 1 January 162,982 5.61 561,107 5.82
Additional Shares for rights issue — — 36,060 —Lapsed — — (227,613) 4.92
Exercised (127,062) 5.61 (206,572) 5.35
Outstanding at 31 December 35,920 5.61 162,982 5.61
Exercisable at 31 December 35,920 5.61 162,982 5.61
335
c102100pu080Proof7:28.3.10B/LRevision:0OperatorSadK

2009 2008
Range of exercise price for options outstanding
Weighted
average
exercise
price (£)
Weighted
average
remaining
contractual
life
Weighted
average
exercise
price (£)
Weighted
average
remaining
contractual
life
£5.61 5.61 — 5.61 0.3 years
2009 2008
No. of
shares
Weighted
average
exercise
price (Rs.)
No. of
shares
Weighted
average
exercise
price (Rs.)
Outstanding at 1 January 162,982 420.94 561,107 436.69
Additional Shares for rights issue — — 36,060 —
Lapsed — — (227,613) 369.16
Exercised (127,062) 420.94 (206,572) 401.43
Outstanding at 31 December 35,920 420.94 162,982 420.94
Exercisable at 31 December 35,920 420.94 162,982 420.94
2009 2008
Range of exercise price for options outstanding
Weighted
average
exercise
price (Rs.)
Weighted
average
remaining
contractual
life
Weighted
average
exercise
price (Rs.)
Weighted
average
remaining
contractual
life
Rs. 420.94 420.94 — 420.94 0.3 years
The weighted average share price at the time the options were exercised during 2009 was £10.86
(2008: £13.89) for 1994 UK Sharesave Scheme and £10.28 (2008: £13.89) for 1996 International
Sharesave Scheme.
The intrinsic value of vested 1994/1996 UK and International Sharesave cash-settled awards as at
31 December 2009 was US$nil million (2008: US$0.1 million).
2008 Irish Sharesave Scheme
The first awards under this scheme were made on 29 September 2008.
336
c102100pu080Proof7:28.3.10B/LRevision:0OperatorSadK
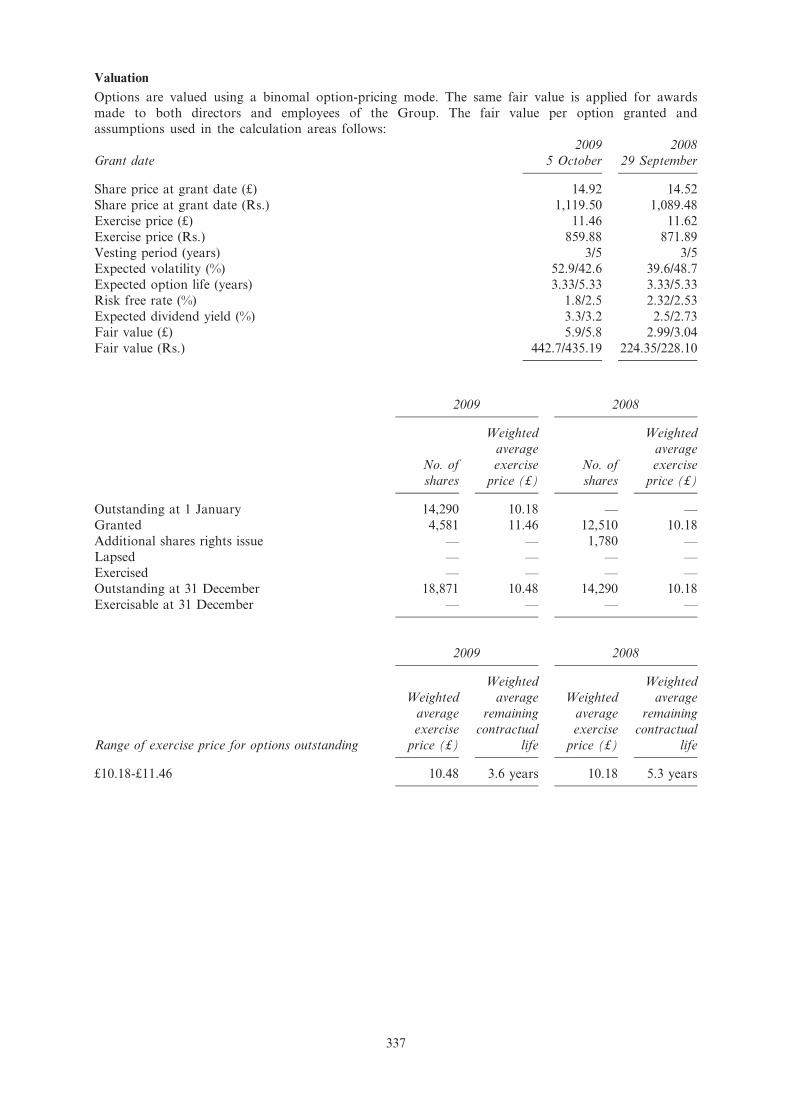
Valuation
Options are valued using a binomal option-pricing mode. The same fair value is applied for awards
made to both directors and employees of the Group. The fair value per option granted andassumptions used in the calculation areas follows:
2009 2008
Grant date 5 October 29 September
Share price at grant date (£) 14.92 14.52
Share price at grant date (Rs.) 1,119.50 1,089.48
Exercise price (£) 11.46 11.62
Exercise price (Rs.) 859.88 871.89
Vesting period (years) 3/5 3/5Expected volatility (%) 52.9/42.6 39.6/48.7
Expected option life (years) 3.33/5.33 3.33/5.33
Risk free rate (%) 1.8/2.5 2.32/2.53
Expected dividend yield (%) 3.3/3.2 2.5/2.73
Fair value (£) 5.9/5.8 2.99/3.04
Fair value (Rs.) 442.7/435.19 224.35/228.10
2009 2008
No. of
shares
Weighted
average
exercise
price (£)
No. of
shares
Weighted
average
exercise
price (£)
Outstanding at 1 January 14,290 10.18 — —
Granted 4,581 11.46 12,510 10.18
Additional shares rights issue — — 1,780 —Lapsed — — — —
Exercised — — — —
Outstanding at 31 December 18,871 10.48 14,290 10.18
Exercisable at 31 December — — — —
2009 2008
Range of exercise price for options outstanding
Weighted
average
exercise
price (£)
Weighted
average
remaining
contractual
life
Weighted
average
exercise
price (£)
Weighted
average
remaining
contractual
life
£10.18-£11.46 10.48 3.6 years 10.18 5.3 years
337
c102100pu080Proof7:28.3.10B/LRevision:0OperatorSadK

2009 2008
No. of
shares
Weighted
average
exercise
price (Rs.)
No. of
shares
Weighted
average
exercise
price (Rs.)
Outstanding at 1 January 14,290 763.84 — —
Granted 4,581 859.88 12,510 763.84
Additional shares rights issue — — 1,780 —
Lapsed — — — —
Exercised — — — —
Outstanding at 31 December 18,871 786.35 14,290 —
Exercisable at 31 December — — — 763.84
2009 2008
Range of exercise price for options outstanding
Weighted
average
exercise
price (Rs.)
Weighted
average
remaining
contractual
life
Weighted
average
exercise
price (Rs.)
Weighted
average
remaining
contractual
life
Rs. 763.84-Rs. 859.88 786.35 3.6 years 763.84 5.3 years
2004 UK and International Sharesave Schemes
Valuation
Options are valued using a binomial option-pricing model. The same fair value is applied for awards
made to both the directors and employees of the Group. The fair value per option granted and the
assumptions used in the calculation are as follows:
2009 2008
Grant date 9 October 5 October 3 October 16 September
Share price at grant date (£) 15.57 14.92 14.52 14.52
Share price at grant date (Rs.) 1,168.27 1,119.50 1,089.48 1,089.48
Exercise price (£) 11.46 11.46 11.62 11.62Exercise price (Rs.) 859.88 859.88 871.89 871.89
Vesting period (years) 3/5 3/5 3/5 3/5
Expected volatility (%) 52.9/43.7 52.9/42.6 39.6/48.7 39.6/48.7
Expected option life (years) 3.33/5.33 3.33/5.33 3.33/5.33 3.33/5.33
Risk free rate (%) 1.8/2.5 1.8/2.5 2.32/2.53 2.32/2.53
Expected dividend yield (%) 3.3/3.2 3.3/3.2 2.5/2.73 2.5/2.73
Fair value (£) 6.4/6.2 5.9/5.8 2.99/3.04 2.99/3.04
Fair value (Rs.) 480.21/465.21 442.7/435.19 224.35/228.10 224.35/228.10
The expected volatility is based on historical volatility over the last three to five years, or three to five
years prior to grant. The expected life is the average expected period to exercise. The risk-free rate of
return is the yield on zero-coupon UK government bonds of a term consistent with the assumedoption life. The expected dividend yield is based on historical dividend yield over the last three years
or three years prior to grant. Where two amounts are shown for volatility, risk-free rates, expected
dividend yield and fair values, the first relates to a three-year vesting period and the second to a five-
year vesting period.
338
c102100pu080Proof7:28.3.10B/LRevision:0OperatorSadK

A reconciliation of option movements over the period to 31 December 2009 and 2008 is shown
below:
2009 2008
No. of
shares
Weighted
average
exercise
price (£)
No. of
shares
Weighted
average
exercise
price (£)
Outstanding at 1 January 20,229,858 9.69 14,266,731 10.91
Granted 3,881,940 11.46 6,241,929 10.18
Additional shares rights issue — — 2,579,391 —
Lapsed (2,160,450) 10.26 (2,574,039) 10.14
Exercised (4,484,911) 8.81 (284,154) 7.04
Outstanding at 31 December 17,466,437 10.28 20,229,858 9.69
Exercisable at 31 December 2,018,787 9.17 3,588,924 9.69
2009 2008
Range of exercise price for options outstanding
Weighted
average
exercise
price (£)
Weighted
average
remaining
contractual
life
Weighted
average
exercise
price (£)
Weighted
average
remaining
contractual
life
£6.51/£11.46 10.28 2.2 years 9.69 1.9 years
2009 2008
No. of
shares
Weighted
average
exercise
price (Rs.)
No. of
shares
Weighted
average
exercise
price (Rs.)
Outstanding at 1 January 20,229,858 727.07 14,266,731 818.61
Granted 3,881,940 859.88 6,241,929 763.84
Additional shares rights issue — — 2,579,391 —
Lapsed (2,160,450) 769.84 (2,574,039) 760.84
Exercised (4,484,911) 661.04 (284,154) 528.24
Outstanding at 31 December 17,466,437 771.34 20,229,858 727.07
Exercisable at 31 December 2,018,787 688.06 3,588,924 727.07
2009 2008
Range of exercise price for options outstanding
Weighted
average
exercise
price (Rs.)
Weighted
average
remaining
contractual
life
Weighted
average
exercise
price (Rs.)
Weighted
average
remaining
contractual
life
Rs. 488.47-Rs. 859.88 771.34 2.2 years 727.07 1.9 years
The weighted average share price at the time the options were exercised during 2009 was £14.16
(2008: £13.92) for the UK Sharesave scheme and £12.73 (2008: £13.92) for the International Sharesave
scheme.
339
c102100pu080Proof7:28.3.10B/LRevision:0OperatorSadK

The intrinsic value of vested 2004 UK and International Sharesave cash-settled awards as at 31
December 2009 was US$7 million (2008: US$0.4 million).
2004 Deferred Bonus Plan (DBP)
Under this plan shares are issued directly to participants upon vesting.
A reconciliation of share movements over the years to 31 December 2009 and 2008 is shown below:
2009 2008
No. of
shares
No. of
shares
Outstanding at 1 January 352,857 351,340
Shares vested (347,836) (324,002)
Shares awarded 352,633 307,760
Additional shares rights issue — 43,756
Shares lapsed (7,073) (25,997)Outstanding at 31 December 350,581 352,857
Market value of shares on date of 2009 awards (6 March 2009) was £6.98 (2008: £16.43). The shares
vest one year after the date of award. A notional scrip dividend accrues on the shares held in theTrust. The dividend is normally delivered in the form of shares and is released on vesting.
For details of interests in shares held by directors and key managerial personnel please see the sectiontitled ‘‘Directors and Senior Management’’ on page 285 of this Draft Red Herring Prospectus.
340
c102100pu080Proof7:28.3.10B/LRevision:0OperatorSadK

DIVIDENDS
Standard Chartered does not have a dividend policy. There is no guarantee that any future dividends
will be declared or paid. The declaration and payment of dividends will depend upon, among other
things, expected future earnings, capital requirements of the Group and the general financial and
business conditions of the Company at the time. Under the UK Companies Act, dividends may bepaid out of the profits of a company in the year in which the dividend is declared or out of the
undistributed profits or reserves of previous financial years.
Subject to the provisions of the UK Companies Act and the Articles, the Company may pay
dividends upon a recommendation by the Board and approval by a majority of the shareholders, who
have the right to decrease but not to increase the amount of the dividend recommended by theBoard. Such dividends are known as final dividends and become a debt payable to shareholders when
they are approved by the shareholders. Subject to the provisions of the UK Companies Act and the
Articles, the Board may declare and pay dividends without shareholder approval at an annual general
meeting. Such dividends are known as interim dividends and, unlike final dividends, become a debt
payable to the shareholders only upon actual payment. The Board may also pay any dividend
payable at a fixed rate at intervals settled by the Board in accordance with the terms of issue of the
shares to which such dividend attaches.
The Board normally declares an interim dividend on Shares in respect of the first half of a financial
year representing a proportion of the total anticipated dividend distribution for the full financial year.
If an interim dividend is declared it is usually paid in October with any final dividend being paid
during May.
Dividends are declared in US$ but are paid in GBP, US$ or HKD. Cash dividends are paid to UK
Shareholders in GBP unless the shareholder has elected to receive payment in either US$ or HKD,
and to Hong Kong Shareholders in HKD unless Shareholder has elected to receive payment in either
US$ or GBP.
The Shares represented by the IDRs will rank pari passu with other Shares in respect of dividendsand so will be entitled to a payment in respect of any dividend declared on the Shares in respect of
the financial period in which the IDRs are issued and allotted. IDR Holders will be entitled to
receive dividends paid on Shares represented by such IDRs in accordance with the terms of the
Deposit Agreement. Cash dividends on Shares represented by the IDRs will be paid to the
Depository in US$ and, except as otherwise described in the section titled ‘‘Terms and Conditions of
the Indian Depository Receipts’’ on page 352 of this Draft Red Herring Prospectus, will be converted
by the Depository into Rs. and distributed, net of any fees, taxes, duties, charges, costs and expenses,
to the IDR Holders.
In addition, the Company may offer holders of Shares the right to elect to receive Shares instead of
all or part of a cash dividend (scrip dividend alternative). In such circumstances, the Company will
send a circular to holders of Shares giving details of the terms of the election and how an election
can be made, together with a form of election stating the number of new Shares such holder is
entitled to receive instead of the cash dividend.
The Articles give the Board the power to set a record date for any dividend such that all
shareholders who appear on the register of members of the Company as on the ‘‘record date’’ are
entitled to the dividend declared by the Company. Any shareholder who ceases to be a shareholder
prior to the record date or becomes a shareholder after the record date will not be entitled to the
dividend declared by the Company. The Company is only obliged to pay dividends to those
shareholders who are on the register of members of the Company on the record date.
The London Stock Exchange sets, on an annual basis, a timetable to assist company secretaries,
registrars and advisers in determining the cash dividend dates for the relevant year. This dividend
procedure timetable sets out a series of ex-dividend dates, corresponding record dates and latest
announcement dates. Ex-dividend dates normally fall on the Wednesday of each week, with the
associated record date falling two Business Days later (not including the ex-dividend date). Therefore,each ex-dividend date has a set record date and vice versa. Companies which follow this dividend
procedure timetable are not required to notify the London Stock Exchange in advance, provided an
announcement is made. The announcement must include the dividend amount (net or gross), record
date, pay date and the availability of any scrip dividend, dividend reinvestment plan or currency
elections.
341
c102100pu085Proof7:28.3.10B/LRevision:0OperatorSadK

If the ex-dividend date or record date is the key date driving the issuer’s dividend timetable, the
issuer must declare the dividend on or before the announcement date on the same line in the dividend
procedure timetable as the relevant ex-dividend date or record date. If the announcement date is the
key date driving the issuer’s dividend timetable, the issuer may choose the ex-dividend date or recorddate on the same line in the dividend procedure timetable as the announcement date or on any
subsequent line.
The Hong Kong Stock Exchange does not provide a timetable. However, listed companies in Hong
Kong are required to inform the Hong Kong Stock Exchange and publish an announcement at least
seven clear Business Days in advance of the date fixed for any board meeting at which the
declaration, recommendation or payment of a dividend is expected to be decided. Once such decision
is made, a listed company is obliged to inform the Hong Kong Stock Exchange and publish an
announcement disclosing details of the dividend, including the rate and amount.
See the section titled ‘‘Taxation Framework in India and UK’’ on page 406 of this Draft Red Herring
Prospectus for details of the impact of tax on IDR Holders.
The pre-rights dividends (in US$ cents) paid on each Share in respect of the last five years are as
follows:
Period
Date of
recommendation/
declaration Date payable
Dividend
per Share
(US$ cents)
Dividend
per Share
(Rs.)
Dividend
yield (p.a.)*
2009 Final 3 March 2010 13 May 2010 44.80 20.91 3.5%
2009 Interim 4 August 2009 8 October 2009 21.23 9.91
2008 Final 3 March 2009 15 May 2009 42.32 19.75 2.6%
2008 Interim 5 August 2008 9 October 2008 25.67 11.98
2007 Final 26 February 2008 16 May 2008 56.23 26.26 2.5%
2007 Interim 7 August 2007 10 October 2007 23.12 10.79
2006 Final 27 February 2007 11 May 2007 50.21 23.44 2.8%
2006 Interim 8 August 2006 11 October 2006 20.83 9.722005 Final 2 March 2006 12 May 2006 45.06 21.03 3.2%
2005 Interim 8 August 2005 14 October 2005 18.94 8.84
2004 Final 16 February 2005 13 May 2005 40.44 18.88 3.4%
2004 Interim 4 August 2004 8 October 2004 17.06 7.96
2003 Final 18 February 2004 14 May 2004 36.49 17.03 4.0%
2003 Interim 6 August 2003 10 October 2003 15.51 7.24
* Dividend yield indicates the pay-outs in dividends each year relative to the market share price. Dividend yield is calculated bydividing the dividend per share with the market price per share. Average market price for the period up to 30 June, 31 July to 31December has been used for this calculation.
There have been no changes between the amount of the proposed dividend for the Shares for theperiods set out in the table above and the amount of the dividend actually paid.
342
c102100pu085Proof7:28.3.10B/LRevision:0OperatorSadK
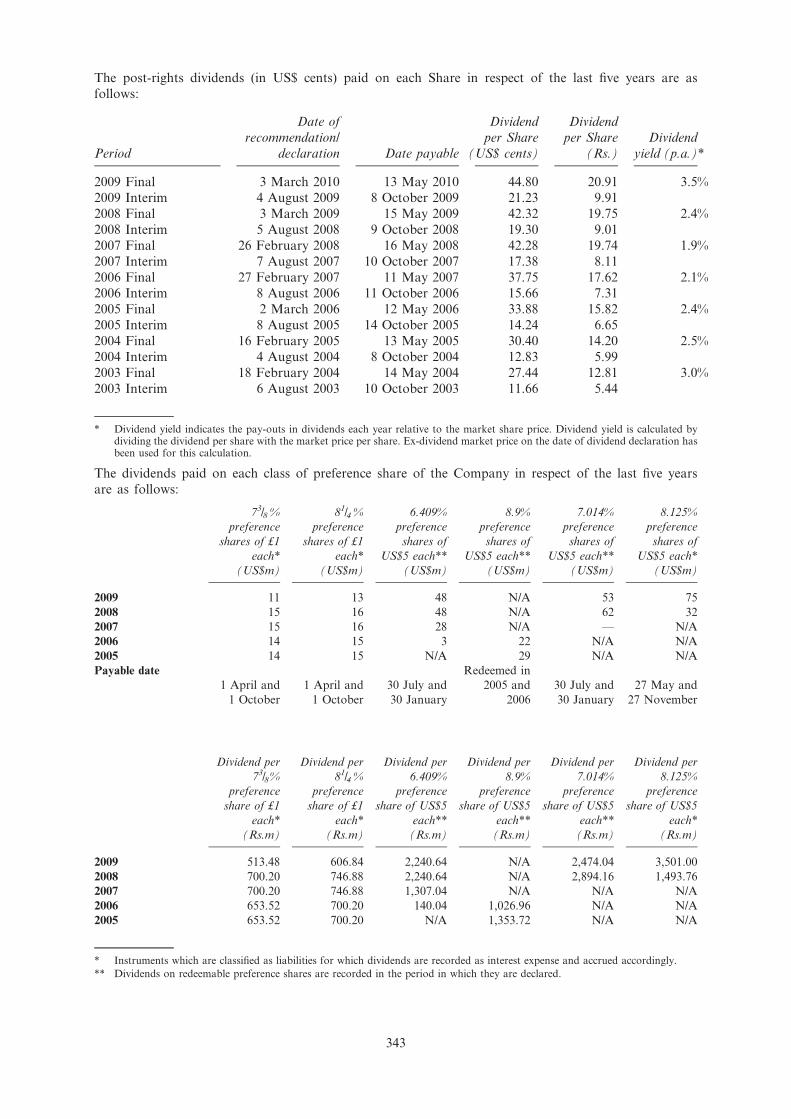
The post-rights dividends (in US$ cents) paid on each Share in respect of the last five years are as
follows:
Period
Date of
recommendation/
declaration Date payable
Dividend
per Share
(US$ cents)
Dividend
per Share
(Rs.)
Dividend
yield (p.a.)*
2009 Final 3 March 2010 13 May 2010 44.80 20.91 3.5%
2009 Interim 4 August 2009 8 October 2009 21.23 9.91
2008 Final 3 March 2009 15 May 2009 42.32 19.75 2.4%
2008 Interim 5 August 2008 9 October 2008 19.30 9.01
2007 Final 26 February 2008 16 May 2008 42.28 19.74 1.9%
2007 Interim 7 August 2007 10 October 2007 17.38 8.11
2006 Final 27 February 2007 11 May 2007 37.75 17.62 2.1%2006 Interim 8 August 2006 11 October 2006 15.66 7.31
2005 Final 2 March 2006 12 May 2006 33.88 15.82 2.4%
2005 Interim 8 August 2005 14 October 2005 14.24 6.65
2004 Final 16 February 2005 13 May 2005 30.40 14.20 2.5%
2004 Interim 4 August 2004 8 October 2004 12.83 5.99
2003 Final 18 February 2004 14 May 2004 27.44 12.81 3.0%
2003 Interim 6 August 2003 10 October 2003 11.66 5.44
* Dividend yield indicates the pay-outs in dividends each year relative to the market share price. Dividend yield is calculated bydividing the dividend per share with the market price per share. Ex-dividend market price on the date of dividend declaration hasbeen used for this calculation.
The dividends paid on each class of preference share of the Company in respect of the last five years
are as follows:
73/8 %
preference
shares of £1
each*
(US$m)
81/4 %
preference
shares of £1
each*
(US$m)
6.409%
preference
shares of
US$5 each**
(US$m)
8.9%
preference
shares of
US$5 each**
(US$m)
7.014%
preference
shares of
US$5 each**
(US$m)
8.125%
preference
shares of
US$5 each*
(US$m)
2009 11 13 48 N/A 53 75
2008 15 16 48 N/A 62 32
2007 15 16 28 N/A — N/A
2006 14 15 3 22 N/A N/A
2005 14 15 N/A 29 N/A N/A
Payable date
1 April and
1 October
1 April and
1 October
30 July and
30 January
Redeemed in
2005 and
2006
30 July and
30 January
27 May and
27 November
Dividend per
73/8 %
preference
share of £1
each*
(Rs.m)
Dividend per
81/4 %
preference
share of £1
each*
(Rs.m)
Dividend per
6.409%
preference
share of US$5
each**
(Rs.m)
Dividend per
8.9%
preference
share of US$5
each**
(Rs.m)
Dividend per
7.014%
preference
share of US$5
each**
(Rs.m)
Dividend per
8.125%
preference
share of US$5
each*
(Rs.m)
2009 513.48 606.84 2,240.64 N/A 2,474.04 3,501.00
2008 700.20 746.88 2,240.64 N/A 2,894.16 1,493.76
2007 700.20 746.88 1,307.04 N/A N/A N/A
2006 653.52 700.20 140.04 1,026.96 N/A N/A
2005 653.52 700.20 N/A 1,353.72 N/A N/A
* Instruments which are classified as liabilities for which dividends are recorded as interest expense and accrued accordingly.
** Dividends on redeemable preference shares are recorded in the period in which they are declared.
343
c102100pu085Proof7:28.3.10B/LRevision:0OperatorSadK

BASIS FOR ISSUE PRICE
The Price Band and the minimum Bid lot will be decided by the Company in consultation with the
book running lead managers and advertised at least one Business Day prior to the Bid Issue Opening
Date. Projected earnings shall not be used as a justification of the Issue Price. The face value of the
IDRs is Rs. [*] each and the Floor Price is [*] times the face value and the Cap Price is [*] timesthe face value.
Qualitative Factors
For some of the qualitative factors which form the basis for computing the price, please see the
sections titled ‘‘Business’’ on page 95 of this Draft Red Herring Prospectus and ‘‘Risk Factors’’ on
page 62 of this Draft Red Herring Prospectus.
Quantitative Factors
The Company understands that the quantitative factors are listed below:
* Basic and Diluted Earnings Per Share
Basic EPS of face value of £[*] on a consolidated basis:
Basic EPS
Basic EPS
($ cents)
Basic EPS
(Rs.) Weight
Fiscal 2007 176.0 82.16 1
Fiscal 2008 192.1 89.67 2
Fiscal 2009 167.9 78.38 3WEIGHTED AVERAGE 177.3 82.77
Diluted EPS
Diluted
EPS
($ cents)
Diluted
EPS (Rs.) Weight
Fiscal 2007 174.2 81.32 1
Fiscal 2008 191.1 89.21 2
Fiscal 2009 165.3 77.16 3
WEIGHTED AVERAGE 175.4 81.87
The basic EPS has been computed by dividing net profit attributable to equity shareholders by
the weighted average number of equity shares outstanding during the year, in accordance with
IAS 33.
The diluted EPS has been computed by dividing net profit attributable to equity shareholders, as
restated, by the sum of the weighted average number of equity shares outstanding during the
year considered for deriving basic EPS and the weighted average number of equity shares which
could have been issued on the conversion of dilutive potential equity shares such as dilutiveoptions and dilutive convertible preference shares, in accordance with IAS 33.
* (a) Price/Earnings ratio in relation to Price Band
(i) On a standalone basis:
Particulars
P/E at the lower end of
Price Band (no. of times)
P/E at the higher end of
Price Band (no. of times)
[*] [*] [*]
[*] [*] [*]
[*] [*] [*]
344
c102100pu085Proof7:28.3.10B/LRevision:0OperatorSadK

(ii) On a consolidated basis:
Particulars
P/E at the lower end of
Price Band (no. of times)
P/E at the higher end of
Price Band (no. of times)
[*] [*] [*]
[*] [*] [*]
[*] [*] [*]
(b) P/E ratio for the industry is as follows:
Industry P/E
Highest [*]
Lowest [*]
Industry Composite [*]
(source: [*])
* Normalized Return on Shareholder’s Equity
Year/Period
RONW
(%) Weight
Fiscal 2007 15.6% 1
Fiscal 2008 15.2% 2
Fiscal 2009 14.3% 3
WEIGHTED AVERAGE 14.8%
Normalised return on shareholders’ equity is calculated as the normalised profit attributable to
ordinary shareholders as a percentage of average shareholders’ equity.
* Minimum Return on post-Issue Return on Shareholder’s Equity Required to Maintain Pre-Issue EPS:
Minimum Return on post-Issue Return on Shareholder’s Equity required to maintain pre-Issue
EPS is [*]%.
The projected earnings shall not be used as a justification for the Issue Price in this Draft Red
Herring Prospectus.
* Net Asset Value per Equity Share
Particulars
Amount
(US$)
Amount
(Rs.)
Net Asset Value per Equity Share (standalone) as of 31 December 2009 7.3 340.80
Net Asset Value per Equity Share (consolidated) as of 31 December 2009 13.5 630.24
The net asset value per equity share has been computed by dividing net worth excluding share
application money and preference share capital at the end of the period by the number of equity
shares outstanding at the end of the period.
345
c102100pu085Proof7:28.3.10B/LRevision:0OperatorSadK
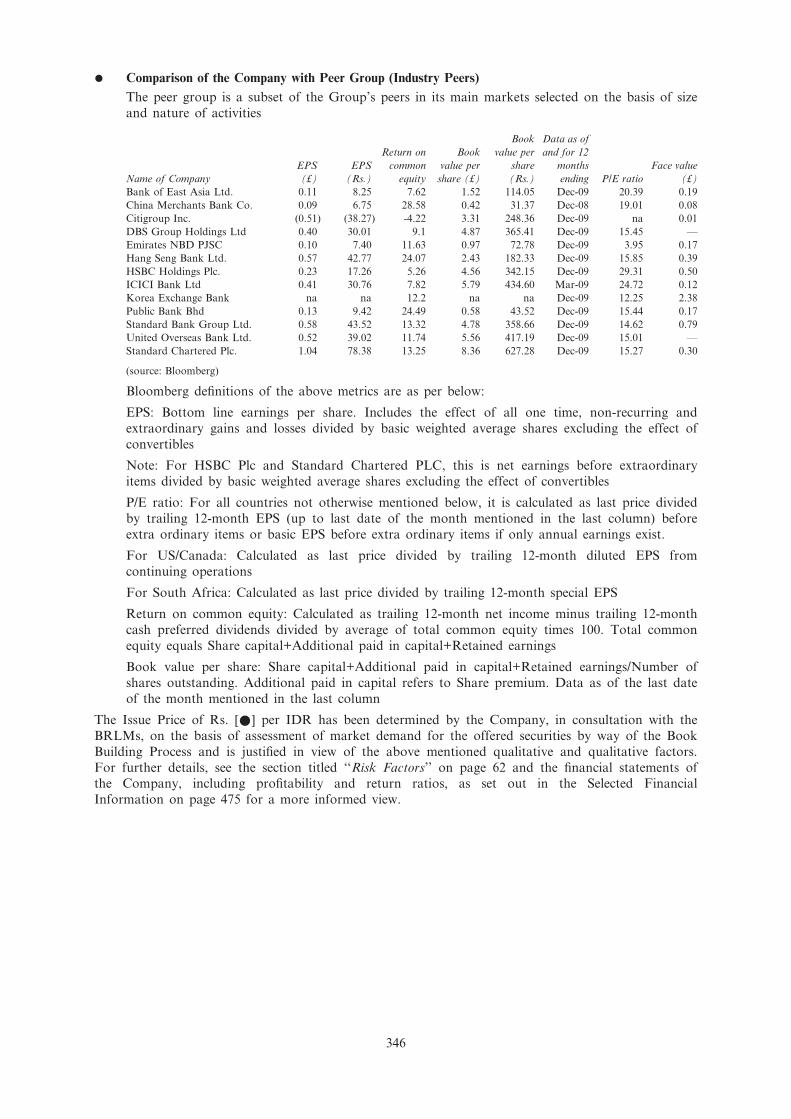
* Comparison of the Company with Peer Group (Industry Peers)
The peer group is a subset of the Group’s peers in its main markets selected on the basis of size
and nature of activities
Name of Company
EPS
(£)
EPS
(Rs.)
Return on
common
equity
Book
value per
share (£)
Book
value per
share
(Rs.)
Data as of
and for 12
months
ending P/E ratio
Face value
(£)
Bank of East Asia Ltd. 0.11 8.25 7.62 1.52 114.05 Dec-09 20.39 0.19
China Merchants Bank Co. 0.09 6.75 28.58 0.42 31.37 Dec-08 19.01 0.08
Citigroup Inc. (0.51) (38.27) -4.22 3.31 248.36 Dec-09 na 0.01
DBS Group Holdings Ltd 0.40 30.01 9.1 4.87 365.41 Dec-09 15.45 —
Emirates NBD PJSC 0.10 7.40 11.63 0.97 72.78 Dec-09 3.95 0.17
Hang Seng Bank Ltd. 0.57 42.77 24.07 2.43 182.33 Dec-09 15.85 0.39
HSBC Holdings Plc. 0.23 17.26 5.26 4.56 342.15 Dec-09 29.31 0.50
ICICI Bank Ltd 0.41 30.76 7.82 5.79 434.60 Mar-09 24.72 0.12
Korea Exchange Bank na na 12.2 na na Dec-09 12.25 2.38
Public Bank Bhd 0.13 9.42 24.49 0.58 43.52 Dec-09 15.44 0.17
Standard Bank Group Ltd. 0.58 43.52 13.32 4.78 358.66 Dec-09 14.62 0.79
United Overseas Bank Ltd. 0.52 39.02 11.74 5.56 417.19 Dec-09 15.01 —
Standard Chartered Plc. 1.04 78.38 13.25 8.36 627.28 Dec-09 15.27 0.30
(source: Bloomberg)
Bloomberg definitions of the above metrics are as per below:
EPS: Bottom line earnings per share. Includes the effect of all one time, non-recurring and
extraordinary gains and losses divided by basic weighted average shares excluding the effect of
convertibles
Note: For HSBC Plc and Standard Chartered PLC, this is net earnings before extraordinary
items divided by basic weighted average shares excluding the effect of convertibles
P/E ratio: For all countries not otherwise mentioned below, it is calculated as last price divided
by trailing 12-month EPS (up to last date of the month mentioned in the last column) before
extra ordinary items or basic EPS before extra ordinary items if only annual earnings exist.
For US/Canada: Calculated as last price divided by trailing 12-month diluted EPS from
continuing operations
For South Africa: Calculated as last price divided by trailing 12-month special EPS
Return on common equity: Calculated as trailing 12-month net income minus trailing 12-month
cash preferred dividends divided by average of total common equity times 100. Total common
equity equals Share capital+Additional paid in capital+Retained earnings
Book value per share: Share capital+Additional paid in capital+Retained earnings/Number of
shares outstanding. Additional paid in capital refers to Share premium. Data as of the last date
of the month mentioned in the last column
The Issue Price of Rs. [*] per IDR has been determined by the Company, in consultation with the
BRLMs, on the basis of assessment of market demand for the offered securities by way of the Book
Building Process and is justified in view of the above mentioned qualitative and qualitative factors.
For further details, see the section titled ‘‘Risk Factors’’ on page 62 and the financial statements ofthe Company, including profitability and return ratios, as set out in the Selected Financial
Information on page 475 for a more informed view.
346
c102100pu085Proof7:28.3.10B/LRevision:0OperatorSadK

MARKET PRICE INFORMATION
The Company’s outstanding equity shares are currently listed and traded on the London Stock
Exchange and Hong Kong Stock Exchange. For information regarding conditions in the UK and
Hong Kong securities markets, see the sections titled ‘‘The UK Securities Market’’ on page 444 of this
Draft Red Herring Prospectus and ‘‘The Hong Kong Securities Market’’ on page 452 of this DraftRed Herring Prospectus.
As of 26 March 2010, 2,028,192,590 Shares were outstanding. The prices for the equity shares asquoted in the Official List of the London Stock Exchange and the Hong Kong Stock Exchange are in
GBP and HKD, respectively. The following table shows:
* the reported high and low trading prices quoted in GBP and HKD for the Shares on the
London Stock Exchange and the Hong Kong Stock Exchange;
* the imputed high and low trading prices for the Shares, translated into Rs., for GBP based onthe noon buying rate of the RBI, for HKD based data published by Bloomberg, in each case
on the last Business Day of each period presented; and
* the average of the aggregate trading volume of the Shares on the London Stock Exchange and
the Hong Kong Stock Exchange.
London Stock Exchange
Fiscal Year High (£) Low (£) High (Rs.) Low (Rs.)
Average Daily
Trading
Volume
2006
First quarter 15.40 12.96 1,245.71 1,048.33 8,209,368
Second quarter 15.24 12.15 1,232.76 982.81 8,536,908
Third quarter 13.97 12.28 1,130.03 993.33 7,221,099
Fourth quarter 15.25 13.58 1,233.57 1,098.49 6,998,366
2007First quarter 15.52 13.66 1,255.41 1,104.96 9,417,760
Second quarter 17.27 14.50 1,396.97 1,172.91 9,398,625
Third quarter 17.08 14.44 1,381.60 1,168.05 13,614,604
Fourth quarter 19.60 15.88 1,585.44 1,284.53 8,748,208
2008
First quarter 15.05 12.04 1,205.23 963.92 9,271,197
Second quarter 15.57 11.82 1,247.25 946.69 7,969,771
Third quarter 13.45 10.39 1,077.11 831.76 10,082,667Fourth quarter 11.66 5.67 933.97 454.29 7,392,685
2009
First quarter 9.52 5.59 714.39 419.77 10,755,952
Second quarter 12.76 8.74 957.37 655.60 8,495,215
Third quarter 15.44 11.20 1,158.52 840.67 5,649,733
Fourth quarter 16.90 14.37 1,267.69 1,078.23 5,224,115
347
c102100pu085Proof7:28.3.10B/LRevision:0OperatorSadK

Month High (£) Low (£) High (Rs.) Low (Rs.)
Average Daily
Trading
Volume
March 2009 9.18 5.59 689.04 419.77 15,598,263
April 2009 10.48 8.74 786.42 655.60 12,032,336
May 2009 12.76 10.50 957.37 787.90 7,518,427
June 2009 12.56 11.24 942.51 843.65 6,123,240
July 2009 14.08 11.20 1,056.24 840.67 5,366,491
August 2009 14.30 13.16 1,072.98 987.11 6,895,987September 2009 15.44 13.58 1,158.52 1,018.95 4,812,890
October 2009 16.05 14.78 1,204.29 1,108.99 4,863,710
November 2009 16.90 14.84 1,267.69 1,113.50 5,762,782
December 2009 15.90 14.37 1,193.03 1,078.23 5,063,014
January 2010 16.37 14.28 1,228.30 1,071.48 5,770,741
February 2010 15.62 14.03 1,172.02 1,052.72 4,983,117
Hong Kong Stock Exchange
Fiscal Year High (HK$) Low (HK$) High (Rs.) Low (Rs.)
Average Daily
Trading
Volume
2006
First quarter 209.20 177.10 1,165.87 986.98 77,120
Second quarter 214.60 178.60 1,195.97 995.34 67,021
Third quarter 207.20 177.90 1,154.73 991.44 72,910
Fourth quarter 233.40 200.00 1,300.74 1,114.60 83,1842007
First quarter 239.00 208.00 1,331.95 1,159.18 120,474
Second quarter 269.60 224.40 1,502.48 1,250.58 141,533
Third quarter 273.00 227.20 1,521.43 1,266.19 310,882
Fourth quarter 314.20 253.60 1,751.04 1,413.31 210,857
2008
First quarter 231.93 176.75 1,433.58 1,092.49 191,649
Second quarter 233.91 185.24 1,445.79 1,144.96 168,954Third quarter 204.45 150.34 1,263.67 929.22 354,681
Fourth quarter 159.12 72.25 983.52 446.60 518,957
2009
First quarter 109.27 64.37 655.60 386.24 1,322,248
Second quarter 160.51 94.28 963.06 565.65 1,127,804
Third quarter 192.40 141.09 1,154.40 846.54 854,900
Fourth quarter 217.80 182.20 1,306.80 1,093.20 814,810
348
c102100pu085Proof7:28.3.10B/LRevision:0OperatorSadK

Month High (HK$) Low (HK$) High (Rs.) Low (Rs.)
Average Daily
Trading
Volume
March 2009 106.02 64.37 636.10 386.24 1,667,700
April 2009 117.01 94.28 702.08 565.65 1,483,255
May 2009 155.16 125.83 930.96 754.99 1,295,722
June 2009 160.51 143.47 963.06 860.81 659,646
July 2009 181.81 141.09 1,090.87 846.54 649,336
August 2009 184.79 173.20 1,108.71 1,039.20 1,289,105September 2009 192.40 170.60 1,154.40 1,023.60 645,995
October 2009 208.60 183.50 1,251.60 1,101.00 615,879
November 2009 217.80 185.50 1,306.80 1,113.00 793,880
December 2009 199.70 182.20 1,198.20 1,093.20 1,015,635
January 2010 203.40 179.20 1,220.40 1,075.20 626,464
February 2010 187.10 169.90 1,122.60 1,019.40 582,102
London Stock Exchange
Month
Opening
Price
(£)
Closing
Price
(£)
Opening
Price
(Rs.)
Closing
Price
(Rs.)
Exchange
rate
Trading
Volume
26 February 2010 15.46 15.62 1,092.02 1103.68 70.66 6,542,858
Hong Kong Stock Exchange
Month
Opening
Price
(HK$)
Closing
Price
(HK$)
Opening
Price
(Rs.)
Closing
Price
(Rs.)
Exchange
rate
Trading
Volume
26 February 2010 183.4 184.4 1,096.37 1102.34 5.98 306,571
(source: Bloomberg)
349
c102100pu085Proof7:28.3.10B/LRevision:0OperatorSadK

SELECTED STATISTICAL INFORMATION
Analysis of Changes in Interest
Income and Interest Volume and
Rate Analysis
See the section titled ‘‘Management Discussion and Analysis of the
Financial Condition and Results of Operations’’ at pages 124 and 184
Total Deposits including
geographic distribution
See Notes 34 and 33 under the section titled ‘‘Audited Historical
Financial Statements’’ on pages 656 and 760 of this Draft Red
Herring Prospectus
Total Borrowings See the section titled ‘‘Capitalisation Statement’’ on page 319 of this
Draft Red Herring Prospectus
Asset-Liability Gap See Notes 46, 49 and 47 under the section titled ‘‘Audited Historical
Financial Statements’’ on pages 582, 683 and 786 of this Draft Red
Herring Prospectus
Loan Portfolio See Notes 48, 51 and 49 under the section titled ‘‘Audited Historical
Financial Statements’’ on pages 586, 687 and 789 of this Draft RedHerring Prospectus
Industry-Wise Exposure See sections titled ‘‘Loan Portfolio’’ on pages 146 to 150 and 211 to214 of this Draft Red Herring Prospectus
Non-performing Assets See ‘‘Problem Credit Management and Provisioning’’ in the section
titled ‘‘Management Discussion and Analysis of the Financial
Condition and Results of Operations’’ at pages 152 and 218 of this
Draft Red Herring Prospectus
Provisioning and Write-offs See Notes 20, 21 and 20 under the section titled ‘‘Audited Historical
Financial Statements’’ on pages 536, 638 and 743 of this Draft Red
Herring Prospectus
Capital Adequacy Ratios See the section titled ‘‘Management Discussion and Analysis of the
Financial Condition and Results of Operations’’ on pages 173 to 179
and 232 to 236 of this Draft Red Herring Prospectus
Fixed Rate and Floating Rate
Liabilities
See Notes 34, 38 and 37 under the section titled ‘‘Audited Historical
Financial Statements’’ on pages 556, 665 and 769 of this Draft Red
Herring Prospectus
2007 2008 2009
Interest income 16,176 16,378 12,926
Average interest-earning assets 251,747 299,239 328,688
Interest expense 9,911 8,991 5,303Average interest-bearing liabilities 219,191 275,996 298,365
Net interest income 6,265 7,387 7,623
Yield(1) 6.4% 5.5% 3.9%
Cost of funds(2) 4.5% 3.3% 1.8%
Spread(3) 1.9% 2.2% 2.2%
Net interest margin(4) 2.5% 2.5% 2.3%
Notes
* In US$ million.
(1) Yield of interest-earning assets.
(2) Cost of interest-bearing liabilities.
(3) Spread is the difference between yield on average interest-earning assets and cost of funds.
(4) Net interest margin is the ratio of net interest income to average interest-earning assets. The difference in net interest margin andspread arises due to the difference in the amount of average interest-earning assets and average interest-bearing liabilities. Ifaverage interest-bearing assets exceed average interest-bearing liabilities, net interest margin is greater than the spread. If averageinterest-bearing assets is less than average interest-bearing liabilities, net interest margin is less than the spread.
350
c102100pu085Proof7:28.3.10B/LRevision:0OperatorSadK

USE OF PROCEEDS
It is expected that the total Issue Proceeds will be Rs. [*] million. After deducting underwriting and
management fees, selling commissions and all other Issue-related expenses including listing fees of
approximately Rs. [*] million, the net Issue Proceeds will be approximately Rs. [*] million.
Objects of the Issue
The objects of the Issue are:
* to provide Indian investors with an opportunity to invest in the Company and participate in its
growth. The Company has been established in India for many years, is committed to India’s
future and believes that India will remain a growing and key market – the Issue demonstrates
that commitment;
* to increase the market visibility and brand perception of the Company in India;
* to support growth across the Company’s businesses globally. The current economic
circumstances and related market dislocation have presented unique opportunities to deploy
capital into selected areas where the competitive environment, pricing levels and returns are
particularly attractive; and
* to widen the Company’s investor base and to provide a new source of capital.
The net proceeds of the Issue shall be used entirely to meet the objects of the Issue.
Requirement and Sources of Funds
Requirement of Funds (Rs.m)
To meet the objects of the Issue as mentioned above [*] to [*]Estimated Issue expenses [*]
Total [*] to [*]
Sources of Funds (Rs.m)
Proceeds of the Issue [*] to [*]
Total [*] to [*]
The main objects clause and objects incidental or ancillary to the main objects clause of theCompany’s Memorandum enable the Company to undertake the existing activities and the activities
for which funds are being raised by it through this Issue. In accordance with the decision of the
Board, Standard Chartered’s management will have flexibility in deploying the net Issue Proceeds.
Issue Expenses
The expenses of this Issue include, among others, underwriting and management fees, printing and
distribution expenses, legal fees, statutory advertisement expenses and listing fees. The estimated Issue
expenses are as follows:
Activity
Expense
(Rs.m)
Lead management, underwriting commission* [*]
Advertising and Marketing expenses [*]
Printing and stationery [*]
Others (Registrar’s fee, legal fees etc.) [*]
Total estimated Issue expenses [*]
* will be incorporated after finalisation of Issue Price
351
c102100pu085Proof7:28.3.10B/LRevision:0OperatorSadK

TERMS AND CONDITIONS OF THE INDIAN DEPOSITORY RECEIPTS
The following terms and conditions (subject to amendment) will apply to Dematerialised IDRs and
certificated IDRs and, in the case of certificated IDRs, will be endorsed on each IDR Certificate. By
applying for, acquiring or holding an IDR, an IDR Holder will be treated as having agreed to hold the
IDR subject to these terms and conditions, as amended from time to time as provided herein and subject
to the terms of the Deposit Agreement (as defined below).
[*] IDRs representing one ordinary share of par value USD 0.50 (the ‘‘Shares’’) in Standard
Chartered PLC (the ‘‘Company’’) pursuant to and subject to an agreement dated [*] 2010, and made
between the Company and Standard Chartered Bank, Mumbai in its capacity as depository (the
‘‘Domestic Depository’’ which expression shall include any successor to Standard Chartered Bank,
Mumbai in its capacity as such) in relation to the issue of the IDRs (such agreement, as amended
from time to time, being hereinafter referred to as the ‘‘Deposit Agreement’’).
Pursuant to the provisions of the Deposit Agreement, the Domestic Depository has appointed The
Bank of New York Mellon as Overseas Custodian (the ‘‘Overseas Custodian’’ which expression shallinclude any successor to the Bank of New York Mellon in its capacity as such) to receive and hold
on its behalf the Shares and such other Shares received by the Overseas Custodian in respect thereof
and held pursuant to the terms of the Deposit Agreement (the ‘‘Deposited Shares’’) and all rights,
interests and other securities, property and cash deposited with the Overseas Custodian which are
attributable to the Deposited Shares (together with the Deposited Shares, the ‘‘Deposited Property’’).
References in these terms and conditions (the ‘‘Conditions’’) to the ‘‘IDR Holder’’ of any IDR shall
mean the person or persons registered on the register of IDR Holders maintained or caused to be
maintained by the Domestic Depository (the ‘‘Register’’) under the Deposit Agreement.
References to the ‘‘Domestic Depository Office’’ mean the office of the Domestic Depository at 90Mahatma Gandhi Road, Fort, Mumbai, 400001. References to the ‘‘Registrar Office’’ mean the office
of the Registrar at 17-24, Vithalrao Nagar, Madhapur, Hyderabad, 500 081.
The Domestic Depository shall hold the Deposited Property for the benefit of the IDR Holders as a
bare trustee under English law in proportion to their holdings of IDRs.
These Conditions include summaries of, and are subject to, the detailed provisions of the Deposit
Agreement, which include the form of the IDR Certificate. Copies of the Deposit Agreement are
available for inspection at the Domestic Depository Office and the Deposit Agreement which includes
a copy of these Conditions and the Deed Poll is also available on the website of the Company and
the Domestic Depository. The Conditions are also available on the website of the Registrar. Termsused in these Conditions and not defined herein but which are defined in the Deposit Agreement have
the meanings ascribed to them in the Deposit Agreement.
The Deed Poll executed by the Company in favour of the IDR Holders provides that, if the
Company fails to perform the obligations imposed on it by certain specified provisions of the Deposit
Agreement, any IDR Holder may enforce the relevant provisions of the Deposit Agreement as if it
were a party to the Deposit Agreement and was the ‘‘Domestic Depository’’ in respect of that
number of Deposited Shares or part thereof to which the IDRs of which he is the IDR Holder relate.
The Domestic Depository has only those duties, obligations and responsibilities that are expressly
specified in the Deposit Agreement and the Conditions and, other than holding the DepositedProperty as a bare trustee under English law, does not assume any relationship of trust for or with
the IDR Holders or any other person.
All and any of the provisions of the Deed Poll may at any time and from time to time be amended
by the Company and, if required, with the approval of such regulatory authority as deemed necessary
or desirable by the Company. Notice of any amendment of the Deed Poll shall be duly given to the
IDR Holders by the Company and any amendment shall not become effective until the expiry of
three (3) months after such notice shall have been given. During such period of three (3) months,
each IDR Holder shall be entitled to obtain delivery of the Deposited Property related to each IDRheld by it upon surrender thereof, free of charge, but otherwise in accordance with the provisions
relating to withdrawal in the Deposit Agreement. Each IDR Holder at the time when any such
amendment so becomes effective shall be deemed, by continuing to hold an IDR, to approve such
amendment and to be bound by the terms thereof in so far as it affects the rights of the IDR
Holders.
352
c102100pu090Proof7:28.3.10B/LRevision:0OperatorSadK
The Deposit Agreement has been drafted, as far as has been possible, taking into account the
expectations of the Indian market, the IDR Rules, the SEBI Regulations, the IDR Listing Agreement
and the practice followed in international capital markets in relation to depository receipts program
governed by English law. English law has been adopted as the governing law because the principlesthat would normally underlie an international depository receipt programme are not well-established
under Indian law.
1. DEPOSIT OF SHARES
1.1 Domestic Depository holds Shares for the benefit of IDR Holders
The Domestic Depository holds all Deposited Property for the benefit of the IDR Holders as a bare
trustee under English law in proportion to the number of Shares or part thereof in respect of which
the IDRs held by them are issued.
1.2 Further deposits of Shares
After the initial deposit of Shares by the Company in connection with the issue of the IDRs, unless
otherwise agreed by the Domestic Depository and the Company and permitted by applicable law,
neither the Company nor any IDR Holder may deposit any Shares with the Domestic Depository
except for:
(A) Shares issued as a dividend or free distribution on Deposited Shares pursuant to Condition 5;
(B) Shares subscribed to or acquired by IDR Holders from the Company through the exercise of
rights distributed by the Company to such persons in respect of Deposited Shares pursuant toCondition 6; and
(C) any other securities issued by the Company to the IDR Holders in respect of Deposited Shares
as a result of any change in the par value, sub-division, consolidation or other reclassification of
Deposited Shares or otherwise pursuant to Condition 10.
Any such deposit permitted by Conditions 1.2(A), (B) or (C) will be subject to receipt by the
Domestic Depository of:
(i) (at the cost of the Company) any written opinion reasonably required by the DomesticDepository in relation to such deposit from legal counsel in any applicable jurisdiction; and
(ii) a Company Certificate in respect of such further Shares.
Following any such deposit permitted by Conditions 1.2(A), (B) or (C), the Domestic Depository
must issue IDRs or, as applicable, credit relevant accounts with Dematerialised IDRs in respect of
Shares accepted for deposit under this Condition to the relevant IDR Holders as soon as possible
and make the necessary adjustment to the records in accordance with Condition 1.3.
1.3 Adjustment to records
Subject to these Conditions and applicable law, upon deposit with the Overseas Custodian of the
Shares, delivery by the Company to the Domestic Depository of a Company Certificate and payment
of necessary taxes, governmental charges (including transfer taxes) and other charges by the relevant
IDR Holder, the Domestic Depository will cause the Register to be updated for the number of IDRs
issued in respect of the Shares so deposited and will either:
(A) credit or arrange the crediting of relevant accounts with additional Dematerialised IDRs or issue
or arrange the issue of IDR Certificates in respect of the additional IDRs; and
(B) notify SEBI and the Indian Stock Exchanges of any such increase, if applicable.
1.4 Refusal of deposit
Notwithstanding anything contained in Condition 1.2:
(A) the Domestic Depository may refuse to accept Shares for deposit with the Overseas Custodian
whenever it is notified in writing that the Company has restricted the transfer of such Shares to
comply with ownership restrictions under any applicable law or that such deposit would result
in any violation of any applicable law or any applicable governmental or stock exchange
regulations; and
353
c102100pu090Proof7:28.3.10B/LRevision:0OperatorSadK

(B) the Domestic Depository may refuse to accept Shares and/or other securities for deposit with
the Overseas Custodian if such refusal is deemed necessary or desirable or advisable by the
Domestic Depository, in good faith, at any time or from time to time because of any
requirement of law or of any government or governmental authority, body or commission, orstock exchange or under any provision of the Deposit Agreement.
2 WITHDRAWAL OF DEPOSITED PROPERTY
2.1 Limitation on withdrawal of Deposited Property
Deposited Property may only be withdrawn subject to applicable law and to the provisions of this
Condition 2.
2.2 Request for withdrawal
Subject to this Condition and Condition 2.1, any IDR Holder may request withdrawal of, and the
Domestic Depository must upon request relinquish, the Deposited Property attributable to any IDR,
upon production by the IDR Holder at the Registrar Office of:
(A) such evidence that such person is the holder of, and entitled to, the relevant IDR as theDomestic Depository may reasonably require, including the IDR Certificate (if any);
(B) a duly executed Withdrawal Order or, if permitted, an electronic certification in lieu of such
Withdrawal Order, requesting the withdrawal of the Deposited Property and requesting the
Domestic Depository to arrange the delivery of such Deposited Property either to a nominated
securities account maintained by the IDR Holder’s agent or (if such method of delivery is
reasonably practicable) to:
(i) the Registrar Office; or
(ii) the office of any other person or persons designated in such Withdrawal Order (at the
request, risk and expense of the IDR Holder); and
(C) such fees, duties, charges and expenses as may be required under these Conditions or any
applicable law
provided that where an IDR represents a fraction of a Share, a request for withdrawal of Deposited
Property may only be made in respect of such number of IDRs as would together represent a wholenumber of Shares.
2.3 Restrictions
Certificates (if issued) for withdrawn Deposited Shares will contain such legends (including, if
applicable, the legend required in respect of the US Securities Act of 1933, as amended (the‘‘Securities Act’’)), and withdrawals of Deposited Shares may be subject to such further transfer
restrictions or certifications as the Company or the Domestic Depository may from time to time
determine to be necessary for compliance with applicable laws.
2.4 Refusal to register withdrawal
The board of directors of the Company may in certain circumstances refuse to register the transfer of
Deposited Shares from the name of the Overseas Custodian or its nominee where such transfer is in
violation of any applicable law.
2.5 Procedure for withdrawal
Upon production of such documentation and the making of such payment as aforesaid in accordance
with Condition 2.2, the Domestic Depository must direct the Overseas Custodian, by tested telex,
facsimile or SWIFT message, within a reasonable time after receiving such direction from an IDR
Holder, to deliver as instructed in the Withdrawal Order:
(A) the Deposited Shares, either by:
(i) for Deposited Shares that are held in dematerialised form: transferring such Deposited
Shares in accordance with the rules and procedures of the relevant Settlement System to,
or to the order in writing of, the person or persons specified in the Withdrawal Order; or
354
c102100pu090Proof7:28.3.10B/LRevision:0OperatorSadK

(ii) for Deposited Shares that are held in certificated form: delivery of a certificate for, or
other appropriate instrument of title to, the relevant Deposited Shares, registered in the
name of the Overseas Custodian or its nominee and accompanied by such instruments of
transfer in blank or to the person or persons specified in the Withdrawal Order and suchother documents, if any, as are required by law for the transfer of the Deposited Shares;
and
(B) all other property forming part of the Deposited Property attributable to such IDR,
accompanied, if required by law, by one or more duly executed endorsements or instruments of
transfer in respect thereof as aforesaid.
2.6 Cancellation of IDRs
Prior to completion of the withdrawal of any Deposited Shares and Deposited Property in accordance
with Condition 2.5, the Domestic Depository must cancel the IDRs representing such Deposited
Shares and Deposited Property by:
(A) arranging for the Register to be amended to record the cancellation of such IDRs and, if the
relevant IDRs are represented by an IDR Certificate, destroying the relevant IDR Certificate;and
(B) taking any other action necessary to effect the cancellation of the IDRs, including notifying the
Security Depositories if applicable.
IDR Holders whose IDRs are cancelled in accordance with this Condition 2.6 will no longer be
entitled to any benefits under these Conditions or the Deed Poll and will have no valid or enforceable
rights against the Domestic Depository or the Company for any purpose.
2.7 Delivery subject to applicable laws
Delivery by the Domestic Depository and the Overseas Custodian of all certificates, instruments,
dividends or other property forming part of the Deposited Property as specified in this Condition will
be made subject to any applicable laws or regulations.
2.8 Suspension of withdrawal
(A) The Domestic Depository may suspend or restrict the withdrawal of all or any category ofDeposited Property during any period when the register of shareholders or other relevant
holders of other securities of the Company is closed, generally or in one or more localities, or in
order to comply with the Deposit Agreement or with any applicable law or governmental or
stock exchange regulations on which the IDRs or the Shares are listed.
(B) The Domestic Depository shall restrict the withdrawal of Deposited Shares whenever it is
notified in writing that such withdrawal would result in a breach of ownership restrictions under
applicable law.
3 OWNERSHIP AND TRANSFER
3.1 Ownership and transfer
(A) The IDRs are in registered form, each corresponding to [*] of a Share.
(B) Title to IDRs represented by IDR Certificates passes by registration in the Register.
(C) Title to Dematerialised IDRs is evidenced by the Register and title to such IDRs passes in
accordance with the procedures of the relevant Security Depositories.
(D) The Domestic Depository will refuse to accept for transfer any IDRs if such transfer would
result in a violation of applicable laws.
(E) Except as required by law, no person shall be recognised as holding any IDR upon any trust
and neither the Domestic Depository nor the Company shall be bound by or compelled in anyway to recognise (even when having notice thereof) any equitable, contingent, future or partial
interest in any IDR, or any interest in any fractional part of an IDR or any other right in
respect of any IDR except an absolute right to the whole of the IDR in the registered holder
(as shown on the Register).
(F) The Register is conclusive as regards the information set out therein and shall be used for all
purposes, including determining ownership and/or entitlements in respect of IDRs.
355
c102100pu090Proof7:28.3.10B/LRevision:0OperatorSadK
(G) The Domestic Depository and the Company shall be entitled to rely on the latest available
registered holding position in respect of the Dematerialised IDRs received from the Security
Depositories from time to time as being an accurate record of holdings from time to time of
Dematerialised IDRs. Neither the Company nor the Domestic Depository shall be liable for anyfailure by any Security Depository to transmit information as regards Dematerialised IDRs
correctly or at all.
3.2 Restriction on transfers
Other than in accordance with applicable laws, IDRs may not be offered, sold, pledged or otherwise
transferred to any person located in any jurisdiction outside of India or resident in any jurisdiction
outside of India, or to, or for the account or benefit of, such person.
3.4 Circumstances where IDR Certificates will be issued
(A) IDR Holders shall submit requests in writing to the Security Depositories for exchange of their
Dematerialised IDRs for IDR Certificates. On receipt of notification from a Security Depository
that an IDR Holder has made a request, the Domestic Depository will exchange, or will arrange
the exchange of, any Dematerialised IDRs for an IDR Certificate representing such IDRs
registered in the name of the relevant IDR Holder in exchange for that IDR Holder’s interest in
such Dematerialised IDRs, subject to payment by the IDR Holder of any relevant fees, taxes,duties, charges, costs and expenses to the Domestic Depository.
(B) If at any time when Deposited Shares are represented by Dematerialised IDRs, (i) any Security
Depository advises the Domestic Depository in writing at any time that it is unwilling or unableto continue as a security depository and a successor security depository is not appointed within
90 calendar days of such notice; or (ii) any Security Depository is closed for business for a
continuous period of 14 days (other than by reason of holiday, statutory or otherwise) or
announces an intention permanently to cease business or does in fact do so, and no alternative
clearing system satisfactory to the Domestic Depository is available within 45 days of such
announcement; or (iii) the Domestic Depository has determined that, on the occasion of the
next payment in respect of the IDRs, the Domestic Depository or its agent would be required
to make any deduction or withholding from any payment in respect of the IDRs which wouldnot be required were the IDRs represented by IDR Certificates (provided that the Domestic
Depository shall have no obligation to so determine or to attempt to so determine), the
Domestic Depository will, within 60 days, make, or arrange to make, IDR Certificates available
subject to and in accordance with the provisions of the Deposit Agreement. Any such exchange
shall be at the expense (including printing costs) of the Company.
4 CASH DISTRIBUTIONS
4.1 Conversion of cash distributions
If the Domestic Depository receives any cash dividend or other cash distribution on or in respect of
the Deposited Shares (including any amounts received in the liquidation of the Company) or
otherwise in connection with the Deposited Property, the Domestic Depository shall as soon as
practicable convert the same into Indian Rupees in accordance with Condition 8.
4.2 Entitlement, notification and payment
The Domestic Depository shall, in accordance with the requirements of the IDR Listing Agreements,distribute any amounts referred to in Condition 4.1 to the IDR Holders in proportion to the number
of Deposited Shares (or part thereof) represented by the IDRs so held by them respectively, subject
to and in accordance with the provisions of Conditions 9 and 11:
(A) in the event that any Deposited Shares shall not be entitled, by reason of the date of issue ortransfer or otherwise, to such a distribution, the amount so distributed to the relative IDR
Holders shall be adjusted accordingly; and
(B) the Domestic Depository will distribute only such amounts of cash dividends and otherdistributions as may be distributed without attributing to any IDR a fraction of the lowest
integral unit of currency in which the distribution is made by the Domestic Depository and any
balance remaining shall be held by the Domestic Depository (without liability for interest on
such amount) and added to and become part of the next sum received by the Domestic
Depository for distribution to IDR Holders outstanding at the time of the next distribution.
356
c102100pu090Proof7:28.3.10B/LRevision:0OperatorSadK

5 DISTRIBUTIONS OF SHARES AND OTHER PROPERTY
5.1 Distributions of Shares
Subject to the limitation set out in Condition 5.3, if the Domestic Depository receives any
distribution in respect of Deposited Shares which consists of a dividend in, or free distribution orbonus issue of, Shares, the Domestic Depository shall cause to be distributed to the IDR Holders
entitled thereto, in proportion to the number of Deposited Shares (or part thereof) represented by the
IDRs held by them respectively, additional IDRs representing an aggregate number of Shares received
pursuant to such dividend or distribution. Such additional IDRs shall be distributed by an increase in
the number of IDRs in the records of the Security Depositories or an issue of IDR Certificates in
respect of the additional IDRs, according to the manner in which the IDR Holders hold their IDRs.
5.2 Distributions of other property
Subject to the limitation set out in Condition 5.3, if the Domestic Depository receives any dividend
or distribution in securities (other than Shares) or in other property (other than cash) on or in respectof the Deposited Property, the Domestic Depository shall cause to be distributed such securities or
other property to the IDR Holders entitled thereto, in proportion to the number of Deposited Shares
(or part thereof) represented by the IDRs held by them respectively, in any manner that the Domestic
Depository may deem equitable and practicable for effecting such distribution, subject to applicable
laws.
5.3 Limitation on distributions of Shares and other property
If and in so far as the Domestic Depository deems any such distribution to all or any IDR Holders
not to be reasonably practicable (including, without limitation, owing to the fractions which wouldotherwise result or to any requirement that the Company, the Overseas Custodian or the Domestic
Depository withhold an amount on account of taxes or other governmental charges) or to be
unlawful, the Domestic Depository shall sell such Shares, securities or other property so received
(either by public or private sale and otherwise at its discretion, subject to prior consultation with the
Company and applicable laws and regulations) and distribute the net proceeds of such sale as a cash
distribution to the IDR Holders entitled thereto in accordance with Condition 29.11.
6 RIGHTS ISSUES
6.1 Notice of rights issues
If the Company announces its intention to make any offer or invitation to the Company’s
shareholders to subscribe for or to acquire Shares, securities or other assets by way of rights, theDomestic Depository shall as soon as practicable and, in any event, no less than 10 days before the
date set by the Company for final acceptance, give notice to the IDR Holders of such offer or
invitation specifying, if applicable, the earliest date established for acceptance thereof, the last date
established for acceptance thereof (being a date at least 3 Business Days prior to the date set by the
Company for final acceptance thereof), and the manner by which and time during which IDR
Holders may request the Domestic Depository to exercise such rights as provided below or, if such be
the case, give details of how the Domestic Depository proposes to distribute the rights or the
proceeds of sale.
6.2 Dealing with rights issues
The Domestic Depository will deal with such rights in accordance with the following paragraphs:
(A) the Domestic Depository may make arrangements, in compliance with applicable law, whereby
the IDR Holders may, upon payment of the subscription price in Indian Rupees (including,
subject to applicable law, any additional amount in respect of such subscription price to ensure
that the Domestic Depository will, after conversion of such Indian Rupees into the currency by
which subscriptions may be made, have sufficient funds to satisfy (in its opinion acting in good
faith) the subscription price taking account of any possible fluctuations in rates of foreign
currency exchange), or other currency (where appropriate) together with such fees, taxes, duties,
charges, costs and expenses as may be required under applicable law and completion of suchundertakings, declarations, certifications and other documents as the Domestic Depository may
reasonably require, request the Domestic Depository to exercise such rights on their behalf with
respect to the Deposited Shares and in the case of Shares so subscribed or acquired to distribute
them (together with any excess amounts paid to the Domestic Depository to cover possible
fluctuations in rates of foreign currency exchange) to the IDR Holders entitled thereto by an
357
c102100pu090Proof7:28.3.10B/LRevision:0OperatorSadK

increase in the number of IDRs in the records of the Security Depositories or an issue of IDR
Certificates in respect of the additional IDRs, according to the manner in which the IDR
Holders hold their IDRs;
(B) the Domestic Depository may, in compliance with applicable law, distribute or arrange the
distribution of such securities or other assets by way of rights or the rights themselves to the
IDR Holders entitled thereto in proportion to the number of Deposited Shares (or, where
possible, part thereof) represented by the IDRs held by them respectively in such manner as theDomestic Depository may determine;
(C) the Domestic Depository may, if permitted by the terms of the rights issue and applicable law,
make arrangements for IDR Holders to subscribe for any additional rights which are availabledue to lack of take-up by other holders of Shares; or
(D) if the Domestic Depository is not satisfied that the arrangements described in paragraphs (A),
(B) and/or (C) above are lawful or practicable (for reasons outside its control), or if there are
rights to which IDR Holders are not entitled because of fractional entitlements to Shares, theDomestic Depository may notify the IDR Holders of such conclusion and sell such rights (either
by public or private sale and otherwise at its discretion, subject to prior consultation with the
Company and all applicable laws and regulations) and distribute the net proceeds of such sale
as a cash distribution to the IDR Holders entitled thereto in accordance with Condition 29.11
except to the extent prohibited by applicable law.
6.3 Circumstances when rights may lapse
If at the time of the offering of any rights, at its discretion, subject to prior consultation with theCompany, the Domestic Depository shall be satisfied that it is not lawful or practicable (for reasons
outside its control) to deal with the rights in any manner provided in Condition 6.2(A), (B) or (C)
above, and the actions described under Condition 6.2(D) above are prohibited by applicable law, the
Domestic Depository shall permit the rights (or, as applicable, the relevant rights) to lapse and shall
notify the IDR Holders of such decision.
6.4 Legal opinions
The Domestic Depository may reasonably request, in circumstances where the Domestic Depository is
of the reasonable opinion that there is a genuine need for such legal opinion, at the Company’s
expense, an opinion from any counsel of any relevant jurisdiction reasonably satisfactory to the
Domestic Depository to determine whether any action contemplated by the Domestic Depository
under this Condition 6 would be lawful under the applicable laws of such relevant jurisdiction.
7 REGISTRATION OF RIGHTS
If the Company notifies the Domestic Depository that registration is required in any jurisdictionunder any applicable law of the rights, securities or other property to be distributed under these
Conditions or the securities to which such rights relate, in order for the Domestic Depository to offer
such rights or distribute such securities or other property to the IDR Holders and to sell the
securities represented by such rights, the Domestic Depository will not offer such rights or distribute
such securities or other property to IDR Holders or sell such securities unless and until the Company
procures, at the Company’s expense, the receipt by the Domestic Depository of an opinion from
counsel reasonably satisfactory to the Domestic Depository that the necessary registration has been
effected or that the offer and sale of such rights, securities or property to IDR Holders are exemptfrom registration. Neither the Company nor the Domestic Depository shall be liable to register such
rights, securities or other property or the securities to which such rights relate and they shall not be
liable for any losses, damages or expenses resulting from any failure to do so.
8 CONVERSION OF FOREIGN CURRENCY
8.1 Conversion
If the Domestic Depository receives any currency other than Indian Rupees, by way of dividend orother distribution or as the net proceeds from the sale of securities or other property rights, the
Domestic Depository may, if reasonably practicable, and subject to applicable law and regulation,
convert or cause to be converted, by sale or in any other manner that it may reasonably determine,
the currency so received into Indian Rupees and shall promptly distribute such Indian Rupees in
accordance with these Conditions. The Domestic Depository undertakes that, in the event that a
358
c102100pu090Proof7:28.3.10B/LRevision:0OperatorSadK

conversion or distribution can only be effected with the approval or licence of any government or
agency thereof, the Domestic Depository will take reasonable efforts to apply or procure that an
application is made for such approval or license.
8.2 Distribution of foreign currency
If the Domestic Depository determines that conversion in accordance with Condition 8.1 is
impractical, the Domestic Depository may distribute any foreign currency received by it (or an
appropriate document evidencing the right to receive such other currency) to the IDR Holders
entitled thereto to the extent permitted under applicable law, or the Domestic Depository may in its
discretion hold such other currency for the benefit of the IDR Holders entitled thereto.
8.3 Part conversion
If conversion of any such currency can be effected in whole or in part for distribution to some (but
not all) IDR Holders entitled thereto, the Domestic Depository may at its discretion make such
conversion and distribution in Indian Rupees to the extent possible to the IDR Holders entitled
thereto and may distribute the balance of such other currency received by the Domestic Depository
to, or hold such balance on non-interest bearing accounts for the account of, the IDR Holders
entitled thereto and notify the IDR Holders accordingly.
9 DISTRIBUTION OF ANY PAYMENTS
9.1 Record date
Any distribution will be made or be arranged to be made by the Domestic Depository to those IDR
Holders who are IDR Holders of record on the record date established by the Domestic Depository
(which shall be the same date as the corresponding record date set by the Company in respect of the
Shares or, if different from the record date set by the Company, shall be set after consultation with
the Company and shall be as near as practicable to any record date set by the Company) for that
purpose and, if practicable in the opinion of the Domestic Depository, notice shall be given promptly
to IDR Holders, in each case subject to any laws or regulations applicable thereto, and, save to theextent provided in Condition 8.2, distributions will be made in Indian Rupees by cheques, pay orders
or demand drafts and payable at par at the place where the IDR Holders reside as per the last
available address with the Registrar or in such other manner as permitted by applicable laws.
9.2 Deductions
The Domestic Depository may deduct and retain from all monies due in respect of such IDR in
accordance with these Conditions all fees, taxes, duties, charges, costs and expenses which may
become or have become payable by the relevant IDR Holder under these Conditions or underapplicable law or regulation in respect of such IDR or the relative Deposited Property.
9.3 Delivery subject to applicable laws
Delivery of any securities, certificates, instruments, dividends or other property or rights forming part
of the Deposited Property shall be made as soon as practicable to the entitled IDR Holder, subject to
any laws or regulations applicable thereto.
Any securities, certificates, instruments, dividends or other property or rights forming part of the
Deposited Property sent in accordance with these Conditions (other than to the Registrar Office in
accordance with Condition 2.2(B)) will be sent at the risk of the IDR Holder. Neither the Company
nor the Domestic Depository will be responsible for any IDR Certificate lost or delayed in the course
of delivery.
Any dividend or other sum payable in cash in respect of the Deposited Shares represented by an IDR
Holder’s IDRs may be paid by cheque, pay orders or demand drafts sent by post addressed to the
IDR Holder at his registered address and payable at par at that location. Every cheque, pay orders
or demand drafts shall, unless the IDR Holder otherwise directs, be made payable to the IDR
Holder, and shall be sent at that IDR Holder’s risk, and payment of the cheque, pay orders or
demand drafts by the financial institution on which it is drawn shall constitute a good discharge tothe Domestic Depository. In addition, any such dividend or other sum may be paid by any bank or
other funds transfer system or such other means including, in respect of Dematerialised IDRs, by
means of the facilities and requirements of the system(s) of the Security Depositories and to or
through such person as the IDR Holder may in writing direct and the Domestic Depository may
agree, and the making of such payment shall be a good discharge to the Domestic Depository and
359
c102100pu090Proof7:28.3.10B/LRevision:0OperatorSadK

the Domestic Depository shall have no responsibility for any sums lost or delayed in the course of
payment by any such system or other means or where it has acted on any such directions and
accordingly, payment by any such system or other means shall constitute a good discharge to the
Domestic Depository. Where a person is entitled by transmission to an IDR, any dividend or othersum payable by the Domestic Depository in respect of the Deposited Shares underlying the IDR may
be paid as if he were a holder of the IDR and his address noted in the Register were his registered
address.
9.4 Unclaimed distributions
If any distribution made by the Company with respect to the Deposited Property and received by the
Domestic Depository shall remain unclaimed at the end of 12 years from the first date upon which
such distribution is made available to IDR Holders in accordance with these Conditions, all rights of
the IDR Holders to such distribution or the proceeds of the sale thereof shall be extinguished and the
Domestic Depository shall (except for any distribution upon the liquidation of the Company, which
remains unclaimed for such period as aforesaid, when the Domestic Depository shall retain the same)transfer an amount equal to that unclaimed distribution to the ‘‘Investor Protection and Education
Fund’’ established pursuant to the Securities and Exchange Board of India (Investor Protection and
Education Fund) Regulations, 2009.
10 CAPITAL REORGANISATIONS
Upon any change in the par value, sub-division, consolidation or other reclassification of Deposited
Shares or any other part of the Deposited Property or upon any reduction of capital or upon any
reorganisation, merger or consolidation of the Company or to which it is a party (except where the
Company is the continuing corporation), the Domestic Depository shall as soon as practicable give
notice of such event to the IDR Holders and may (and shall, if the Company shall so request in
writing) adopt either one or more of the following options: (i) treat such event as a distribution andcomply with the relevant provisions of these Conditions with respect to such distribution; or (ii)
execute and deliver additional IDRs in respect of Shares; or (iii) require the exchange of existing
IDRs for new IDRs which reflect the effect of such change.
11 TAXATION AND AUTHORISATIONS
11.1 Withholding taxes
Payments to IDR Holders of dividends or other distributions made to IDR Holders on or in respect
of the Deposited Shares will be subject to deduction of applicable withholding taxes, if any, at the
applicable rates.
11.2 Authorisations etc
(A) If any governmental or administrative authorisation, consent, registration or permit or any
report to any governmental or administrative authority is required under any applicable law by
the Domestic Depository in order for the Domestic Depository to receive from the Company
Shares or other securities to be deposited under the Conditions, or in order for Shares, other
securities or other property to be distributed or to be subscribed, or to offer any rights or sell
any securities represented by such rights relevant to any Deposited Shares, the Company willapply for such authorisation, consent, registration or permit or file such report on behalf of the
Domestic Depository within the time required under such law. The Domestic Depository shall
not be obliged to distribute IDRs representing such Shares, other securities or other property to
be deposited under the Conditions or make any offer of any such rights or sell any securities
corresponding to any such rights with respect to which (as notified to the Domestic Depository
by the Company) such authorisation, consent, registration or permit or such report has not been
obtained or filed, as the case may be, and shall have no duties to obtain any such authorisation,
consent, registration or permit, or to file any such report except in circumstances where thesame may only be obtained or filed by the Domestic Depository. This clause does not require
the Company to seek any authorisation, consent, registration, permit or report for any
individual IDR Holder and is restricted to seeking such authorisation, consent, registration,
permit or report as aforesaid for the Domestic Depository.
360
c102100pu090Proof7:28.3.10B/LRevision:0OperatorSadK

(B) The Company has undertaken in the Deposit Agreement, to take such action as may be
reasonably required in obtaining or filing the same.
11.3 No obligation on Domestic Depository
The Domestic Depository is not obliged to distribute IDRs, Shares, other securities or other propertyto be deposited under the Conditions or make any offer of any such rights or sell any securities
corresponding to any such rights with respect to which any required authorisation, consent,
registration or permit or such report has not been obtained or filed, as the case may be, and shall
have no duties to obtain any such authorisation, consent, registration, or permit or to file any such
report except in circumstances where the same may only be obtained or filed by the Domestic
Depository and can be carried out without unreasonable burden or expense.
12 CERTAIN CORPORATE ACTION EVENTS
12.1 No limitation on rights of withdrawal
For the avoidance of doubt, the rights conferred on IDR Holders by this Condition 12 are in
addition to, and in no way limit, hinder or abrogate, the rights contained in Condition 2.
12.2 Corporate Action Events
Subject to applicable law at the time of such occurrence, the Company and the Domestic
Depository shall use their reasonable endeavours to enable the IDR Holders to have the option
of conversion of IDRs into Shares by way of withdrawal of the Deposited Property in the
circumstances set out in, and in accordance with the terms of, this Condition 12.2 (each such
circumstance being a ‘‘Corporate Action Event’’). In each case, the Domestic Depository shall
give notice to the IDR Holders of the relevant Corporate Action Event as soon as reasonably
practicable and, in any event, no later than 10 days before the date of any relevant meeting or,
if there is no meeting, before the final date for acceptance of instructions in relation to therelevant Corporate Action Event.
(A) Company tender offer
(i) In the event of a buy-back of Shares by way of a tender offer made by the Company to
all ordinary shareholders (a ‘‘Tender Offer’’), each IDR Holder may, on any day from and
including the first day on which IDR Holders are given notice of the Tender Offer
pursuant to Condition 17, to and including such date as may be set by the Domestic
Depository in its discretion as the final date for acceptance of instructions from IDR
Holders in respect of such Tender Offer, irrevocably instruct the Domestic Depository totender to the Company a number of Deposited Shares attributable to such IDR Holder’s
IDRs (such instructions to be supported by such documentation as the Domestic
Depository may in its discretion require) provided that no such instruction may be given in
respect of a fraction of a Deposited Share.
(ii) The Domestic Depository shall, subject to applicable law and regulation, instruct the
Overseas Custodian to transfer the requisite number of Deposited Shares to the escrow
account under the Tender Offer (or to such other account as may be relevant for the
purposes of the Tender Offer).
(iii) If all the Deposited Shares transferred by the Overseas Custodian into the escrow account
are purchased by the Company pursuant to the Tender Offer, the Domestic Depository
will distribute the aggregate Tender Offer price received in respect of such Deposited
Shares (together with all other Deposited Property attributable to the IDRs representing
such tendered Deposited Shares) less any fees, costs, charges, taxes and expenses of
whatever nature incurred by or on behalf of, or due to, the Domestic Depository to the
relevant instructing IDR Holders and will cancel the IDRs representing such tendered
Deposited Shares.
(iv) The Company undertakes that the instructing IDR Holders shall receive the same price per
Deposited Share so tendered as part of the Tender Offer as the price per Share received by
other shareholders of the Company, less a pro rata share of any fees, costs, charges, taxes
or expenses incurred by or on behalf of, or due to, the Domestic Depository.
361
c102100pu090Proof7:28.3.10B/LRevision:0OperatorSadK

(v) If only part of the Deposited Shares transferred by the Overseas Custodian into the escrow
account (or such other account) are purchased by the Company pursuant to the Tender
Offer, the Domestic Depository will distribute the aggregate of the Tender Offer price
received in respect of such Deposited Shares (together with all other Deposited Propertyattributable to the IDRs representing Deposited Shares accepted under the Tender Offer)
less any fees, costs, charges, taxes and expenses incurred by or on behalf of, or due to, the
Domestic Depository pro rata amongst the relevant instructing IDR Holders and will
cancel the IDRs representing such Deposited Shares accepted under the Tender Offer.
(vi) The Domestic Depository will direct the Overseas Custodian to continue to hold any
unaccepted Deposited Shares transferred back to the Overseas Custodian from the escrow
account on behalf of the Domestic Depository and the IDRs representing such unaccepted
Deposited Shares shall continue to exist and shall represent such unaccepted DepositedShares on a pro rata basis.
(vii) The Domestic Depository shall make such adjustments in respect of the IDRs that
represent unaccepted Deposited Shares, and/or such unaccepted Deposited Shares and the
related Deposited Property, as it deems appropriate for the purpose of avoiding any
resulting fractional IDRs.
(B) Open market buy-back
(i) In the event of a buy-back of Shares initiated by the Company through open market
purchases (a ‘‘Buy-back OMP Offer’’’), the Company undertakes to accept at an officedesignated by the Company and purchase on a pro rata basis the Deposited Shares
tendered by the Domestic Depository (or the Overseas Custodian at the instruction of the
Domestic Depository) at the instruction of the IDR Holders at such office, except those
Deposited Shares which have been tendered after the buy-back quantity has been
exhausted.
(ii) Each IDR Holder may, on any day from and including the first day on which IDR
Holders are given notice of the Buy-back OMP Offer pursuant to Condition 17, to and
including such date as may be set by the Domestic Depository in its discretion as the finaldate for acceptance of instructions from IDR Holders in respect of such Buy-back OMP
Offer, irrevocably instruct the Domestic Depository to tender to the Company a number of
Deposited Shares attributable to such IDR Holder’s holding (such instructions to be
supported by such documentation as the Domestic Depository may in its discretion
require) provided that no such instruction may be given in respect of a fraction of a
Deposited Share.
(iii) The Domestic Depository shall, subject to applicable law and regulation, instruct the
Overseas Custodian to rematerialize the relevant number of Deposited Shares and totender the physical Shares together with duly executed transfer forms to the office
designated by the Company.
(iv) If all the Deposited Shares tendered by the Overseas Custodian in connection with such
Buy-back OMP Offer are purchased by the Company pursuant to the Buy-back OMP
Offer, the Domestic Depository will distribute the aggregate price received in respect of
such Deposited Shares (together with all other Deposited Property attributable to the IDRs
representing such tendered Deposited Shares) less any fees, costs, charges, taxes and
expenses of whatever nature incurred by or on behalf of, or due to, the DomesticDepository to the relevant instructing IDR Holders and will cancel the IDRs representing
such tendered Deposited Shares.
(v) The Company undertakes that the instructing IDR Holders shall receive the same price per
Deposited Share so tendered as part of the Buy-back OMP Offer as the price per Share
received by other shareholders of the Company, less a pro rata share of any fees, costs,
charges, taxes or expenses incurred by or on behalf of, or due to, the Domestic
Depository.
(vi) If only part of the Deposited Shares tendered by the Overseas Custodian in connectionwith the Buy-back OMP Offer are purchased by the Company pursuant to the Buy-back
OMP Offer (by reason of the buy-back quantity being exhausted or otherwise), the
Domestic Depository will distribute the aggregate price received in respect of such
Deposited Shares (together with all other Deposited Property attributable to the IDRs
representing the Deposited Shares accepted under the Buy-back OMP Offer) less any fees,
362
c102100pu090Proof7:28.3.10B/LRevision:0OperatorSadK

costs, charges, taxes and expenses incurred by or on behalf of, or due to, the Domestic
Depository pro rata amongst the relevant instructing IDR Holders and will cancel the
IDRs representing the Deposited Shares accepted under the Buy-back OMP Offer.
(vii) The Domestic Depository will direct the Overseas Custodian to continue to hold the
unaccepted Deposited Shares on behalf of the Domestic Depository and the IDRs
representing such unaccepted Deposited Shares shall continue to exist and shall representsuch unaccepted Deposited Shares on a pro rata basis.
(viii) The Domestic Depository shall make such adjustments in respect of the IDRs thatrepresent unaccepted Deposited Shares, and/or such unaccepted Deposited Shares and the
related Deposited Property, as it deems appropriate for purposes of avoiding any resulting
fractional IDRs.
(C) Takeover Offer
(i) In the event that an offer is made by any person either:
(a) by way of scheme of arrangement under the UK Companies Acts; or
(b) by way of an offer regulated by the UK City Code on Takeovers and Mergers,
for the acquisition of all of the Shares (subject to any terms and conditions as may be
applicable) (a ‘‘Takeover Offer’’), each IDR Holder may, on any day from and including
the first day on which IDR Holders are given notice of the Takeover Offer pursuant to
Condition 17, to and including such date as may be set by the Domestic Depository in its
discretion as the final date for acceptance of instructions from IDR Holders in respect of
such Takeover Offer, irrevocably instruct the Domestic Depository to accept the TakeoverOffer (subject to such offer becoming unconditional) in respect of any number of
Deposited Shares attributable to such IDR Holder’s IDRs (such instructions to be
supported by such documentation as the Domestic Depository may in its discretion
require) provided that no such instruction may be given in respect of a fraction of a
Deposited Share.
(ii) The Domestic Depository shall, subject to applicable law and regulation and subject to
such offer becoming unconditional, instruct the Overseas Custodian to transfer the requisite
number of Deposited Shares to the person making the Takeover Offer in accordance with
the terms of such Takeover Offer.
(iii) If the Takeover Offer becomes unconditional and the Deposited Shares are transferred by
the Overseas Custodian, the Domestic Depository will distribute the proceeds of such sale
(together with all other Deposited Property attributable to the IDRs representing such
tendered Deposited Shares) less any fees, costs, charges, taxes and expenses of whatevernature incurred by or on behalf of, or due (under Condition 21) to, the Domestic
Depository to the relevant instructing IDR Holders and will cancel the IDRs representing
such tendered Deposited Shares.
(D) Compulsory acquisition
In the event that, pursuant to a Takeover Offer or otherwise, any person acquires an interest in
90% or more of the Shares, that person is entitled (and each IDR Holder acknowledges suchentitlement) under the Companies Acts to compulsorily acquire any Shares held by any person,
and, if that person elects to so acquire such Shares, the Domestic Depository must take all
actions necessary to transfer the Shares represented by the IDRs to that person (without
requiring the consent of the relevant IDR Holder) and to distribute the proceeds of such
transfer (together with any other Deposited Property attributable to the IDRs representing such
Deposited Shares) less any fees, costs, charges, taxes and expenses of whatever nature incurred
by or on behalf of, or due (under Condition 21) to, the Domestic Depository pro rata to the
relevant IDR Holders and will cancel the IDRs representing such transferred Deposited Shares.
12.3 Withdrawal subject to the Deposit Agreement
Any withdrawal of Deposited Property following a Corporate Action Event is subject to all other
requirements and conditions relating to withdrawal set out in the Deposit Agreement.
363
c102100pu090Proof7:28.3.10B/LRevision:0OperatorSadK

13 VOTING RIGHTS
13.1 IDR Holders to have voting rights
IDR Holders have voting rights with respect to the Deposited Shares in accordance with thisCondition 13 and clause 9 of the Deposit Agreement but only in respect of such IDRs as together
represent at least one Share (and thereafter multiples thereof) as regards voting on a show of hands
and at least four Shares (and thereafter multiples thereof) as regards voting on a poll.
13.2 Dissemination of voting information
As soon as practicable after receipt from the Overseas Custodian of notice of any meeting or
solicitation of consents or proxies of holders of Shares, the Domestic Depository shall fix a record
date in accordance with Condition 9.1 and, unless otherwise requested in writing by the Company to
comply with applicable law, send to IDR Holders a notice (such notice to be given no less than 10days before the date of the relevant meeting):
(A) accompanied by a copy of the notice and any solicitation materials;
(B) stating that each IDR Holder on the record date set by the Domestic Depository will be entitled
to instruct the Domestic Depository as to the exercise of voting rights, if any, pertaining to the
Deposited Shares represented by the relevant IDRs, up until the date specified by the Domestic
Depository to the IDR Holders for receipt of such instructions (being a date at least 3 Business
Days prior to the date set by the Company for final receipt of the relevant voting instructions);and
(C) stating the manner in which such instructions may be given, including setting out information as
to how IDR Holders may, in their absolute discretion, give instructions to the Domestic
Depository to grant a proxy in accordance with Condition 13.3 below subject to any applicable
laws and the memorandum and articles of association of the Company.
13.3 Domestic Depository to procure the appointment of proxies in accordance with instructions
Upon receipt of instructions from an IDR Holder in the manner and on or before the dateestablished by the Domestic Depository for such purpose, the Domestic Depository shall procure that
the Overseas Custodian or its nominee shall appoint proxies in respect of any Deposited Shares in
accordance with such instructions, subject to any applicable laws and the memorandum and articles
of association of the Company.
The following three options are available to IDR Holders with respect to voting instructions:
(A) if the IDR Holder so wishes – the appointment of the person designated by the Company
(which could include, for the avoidance of doubt, a nominee of the Domestic Depository) as a
proxy in respect of the relevant number of Deposited Shares;
(B) if the IDR Holder wishes to nominate a third party to attend the relevant meeting in person –
the appointment of that third party as a proxy in respect of the relevant number of Deposited
Shares;
(C) if the IDR Holder wishes to attend the relevant meeting in person – the appointment of the
IDR Holder as a proxy in respect of the relevant number of Deposited Shares.
13.4 Action if voting instructions not received
The Domestic Depository will not itself exercise any voting discretion in respect of any DepositedShares and will not grant or instruct the Overseas Custodian to grant any proxy over the voting
discretion in respect of any Deposited Shares unless specifically instructed by an IDR Holder in
accordance with Condition 13.3. If no voting instructions are received by the Domestic Depository
(either because no voting instructions are returned to the Domestic Depository or because the voting
instructions are incomplete, illegible or unclear or are received after the date specified) from an IDR
Holder with respect to any or all of the Deposited Shares represented by the relevant IDRs on or
before the record date specified by the Domestic Depository, the Domestic Depository will not vote
or cause to be voted such Shares.
13.5 No voting by Overseas Custodian other than in accordance with instructions
The Domestic Depository shall use all reasonable endeavours to procure that the Overseas Custodian
and its nominee do not vote or attempt to exercise the right to vote that attaches to the Deposited
Shares other than in accordance with instructions received from the Domestic Depository.
364
c102100pu090Proof7:28.3.10B/LRevision:0OperatorSadK

13.6 Legal opinion
(A) If the Domestic Depository reasonably requests, in circumstances where the Domestic
Depository is of the reasonable opinion that there is a genuine need for such legal opinion, theCompany has undertaken to procure (at the expense of the Company) a legal opinion from the
Company’s legal counsel (such counsel being reasonably acceptable to the Domestic Depository)
to the effect that:
(i) the arrangements contemplated by this Condition 13 are valid and binding on IDR
Holders under applicable laws and the statutes of the Company; and
(ii) the Domestic Depository is permitted to exercise votes in accordance with the provisions of
this Condition 13, but that in doing so the Domestic Depository will not be deemed to be
exercising voting discretion.
(B) If the Company is unable to procure the legal opinion specified in Condition 13.6(A), the
Domestic Depository shall not be required to take any action required by this Condition 13.
14 DOCUMENTS, TAXES, DUTIES AND CHARGES
14.1 No liability
The Domestic Depository shall not be liable for any taxes, duties, charges, costs or expenses which
may become payable in respect of the Deposited Shares or other Deposited Property or the IDRs,
whether under any present or future fiscal or other laws or regulations, and such part thereof as is
proportionate or referable to an IDR shall be payable by the IDR Holder thereof to the DomesticDepository at any time on request or may be deducted from any amount due or becoming due on
such IDR in respect of any dividend or other distribution.
14.2 Default
Subject to applicable law and, where possible, giving reasonable notice to such an IDR Holder, in the
event of any default by an IDR Holder of the obligations set out in Condition 14.1, the Domestic
Depository may, for the account of the IDR Holder, discharge the same out of the proceeds of sale
of an appropriate number of Deposited Shares (being an integral multiple of the number of Shares in
respect of which a single IDR is issued) or other Deposited Property and subsequently pay any
surplus to the IDR Holder.
14.3 Disclaimer
No liability under the United States Securities Act 1933, as amended, is intended by any provision ofthe Deposit Agreement or these Conditions.
15 REPLACEMENT IDRS
In the event that the IDRs are represented by IDR Certificates, subject to the payment of the
relevant fees, taxes, duties, charges, costs and expenses and such terms as to evidence and indemnity
as the Domestic Depository may require, replacement IDR Certificates will be issued by the Domestic
Depository and will be delivered in exchange for or in replacement of outstanding lost, stolen,
mutilated, defaced or destroyed IDR Certificates upon surrender thereof (except in the case of
destruction, loss or theft) at the Domestic Depository Office.
16 AMENDMENT OF CONDITIONS
16.1 Amendments
Subject to clause 17.2 of the Deposit Agreement, all and any of the provisions of the Deposit
Agreement and these Conditions (other than this Condition 16 and clause 17 of the Deposit
Agreement) may at any time and from time to time be amended by written agreement between the
Company and the Domestic Depository and, if required, with the prior written approval of suchregulatory authority as may be required in India, the United Kingdom or Hong Kong or any other
jurisdiction, in any respect which they may deem necessary or desirable.
16.2 Notice to IDR Holders
Notice of any amendment of these Conditions (except to correct a manifest error) shall be duly given
to the IDR Holders by the Domestic Depository and any amendment (except as aforesaid) which
shall increase or impose fees or charges payable by IDR Holders or which shall otherwise be
materially prejudicial to the interests of the IDR Holders (as a class) shall not become effective so as
365
c102100pu090Proof7:28.3.10B/LRevision:0OperatorSadK

to impose any obligation on the IDR Holders of the outstanding IDRs until the expiry of three
months after such notice shall have been given. During such period of three months, each IDR
Holder shall be entitled to obtain delivery of the Deposited Property relative to each IDR held by it
upon surrender thereof, free of charge but otherwise in accordance with these Conditions, including,in particular, Condition 2.
16.3 Deemed approval
Each IDR Holder at the time when any such amendment so becomes effective shall be deemed, by
continuing to hold an IDR, to approve such amendment and to be bound by the terms thereof in so
far as it affects the rights of the IDR Holders.
16.4 No impairment
In no event shall any amendment impair the right of any IDR Holder to receive the Deposited
Property attributable to the relevant IDR.
17 NOTICES TO IDR HOLDERS
17.1 Valid notice
All notices to IDR Holders shall be validly given if mailed to them at their respective addresses in
the Register and so long as the IDRs are listed on the BSE and/or NSE and the rules of the BSE
and/or NSE or the IDR Listing Agreements so require, published in one leading Hindi and oneleading English national daily newspaper in India.
17.2 Time of service
Any such notice shall be deemed to have been given on the later of such publication and the third
day after being so mailed.
17.3 Company to provide notices to Domestic Depository
All notices required to be given by the Company to the IDR Holders pursuant to any applicablelaws, regulations or other agreements shall be given by the Company to the Domestic Depository and
upon receipt of any such notices, the Domestic Depository shall forward such notices to the IDR
Holders. The Domestic Depository shall not be liable for any notices required to be given by the
Company which the Domestic Depository has not received from the Company, nor shall the
Domestic Depository be liable to monitor the obligations of the Company to provide such notices to
the IDR Holders.
17.4 Electronic notices
Notwithstanding anything in this Condition 17, if the IDR Listing Agreements and applicable law
permit the Company to provide notices to IDR Holders through electronic means, the Domestic
Depository and the Company may satisfy their obligations under this Condition 17 by providing
notices to IDR Holders in electronic format in accordance with the relevant provisions of the IDR
Listing Agreements.
18 ANNUAL REPORTS
(A) The Company has undertaken in the Deposit Agreement (so long as any IDR is outstanding) tomake available to the Domestic Depository sufficient copies of the annual report, prepared in
accordance with the requirements of the IDR Listing Agreements and applicable laws, to enable
the Domestic Depository to provide such annual report to each IDR Holder.
(B) Notwithstanding Condition 18(A), if the IDR Listing Agreements and applicable law permit the
Company to provide annual reports to IDR Holders through electronic means (including by
display on a website), the company and the Domestic Depository may satisfy their obligations
under Condition 18(A) by providing annual reports to IDR Holders in electronic format in
accordance with the relevant provisions of the IDR Listing Agreements.
19 COPIES OF OTHER COMPANY NOTICES
(A) The Company has undertaken in the Deposit Agreement that on the day when the Company
gives notice, by mail, publication or otherwise, to holders of any Shares or other Deposited
Property, whether in relation to the taking of any action in respect thereof or in respect of any
366
c102100pu090Proof7:28.3.10B/LRevision:0OperatorSadK

dividend or other distribution thereon or of any meeting or adjourned meeting of such holders
or otherwise, it will transmit to the Domestic Depository such number of copies of such notice
and any other material furnished to such holders by the Company in connection therewith as
the Domestic Depository may reasonably request.
(B) The Domestic Depository shall, as soon as practicable after receiving notice of such transmission
or (where appropriate) upon completion of translation thereof, and in any event not less than
10 days before the date of the relevant meeting or the last date for taking the relevant action,
give due notice to the IDR Holders, and shall make the same available to IDR Holders in such
manner as it may determine.
(C) Notwithstanding anything else in this Condition 19, if the IDR Listing Agreements and
applicable law permit the Company to provide other notices to IDR Holders through electronic
means, the Company and the Domestic Depository may satisfy their obligations under this
Condition 19 by providing such notices to IDR Holders in electronic format in accordance withthe relevant provisions of the IDR Listing Agreements.
20 DISCLOSURE OF BENEFICIAL OWNERSHIP
20.1 Requests from the Domestic Depository
The Domestic Depository may from time to time request IDR Holders or former IDR Holders or
any clearing system in which the IDRs are from time to time cleared to provide information as to the
capacity in which they hold or held IDRs and regarding the identity of any other persons then or
previously interested in such IDRs and the nature of such interest and various other matters.
20.2 IDR Holders to respond
Each IDR Holder agrees to provide any such information reasonably requested by the Domestic
Depository pursuant to this Condition 20.2 whether or not still an IDR Holder at the time of such
request.
20.3 Agreement with the Company
Notwithstanding any provision of these Conditions, by being an IDR Holder, each IDR Holder
agrees to provide such information as the Company may request in a disclosure notice given pursuant
to the Companies Acts, or the memorandum and articles of association of the Company.
20.4 Sanctions
By holding any IDR, each IDR Holder acknowledges that it understands that failure to comply with
a disclosure notice described in Condition 20.3 may result in the imposition of sanctions, following
reasonable notice being given to such IDR Holder of the intention to impose such sanctions, againstthe holder of the Shares in respect of which the non-complying person is or was, or appears to be or
has been, interested as provided in the Companies Acts, and the memorandum and articles of
association of the Company, which currently include the withdrawal of the voting rights of such
Shares and the imposition of restrictions on the rights to receive dividends on and to transfer such
Shares.
20.5 Disclosure and Transparency Rules
In addition, by holding any IDR each IDR Holder agrees to comply with the provisions of theDisclosure and Transparency Rules with regard to the notification to the Company of interests in
Shares, which currently provide, inter alia, that any person who holds 3% or more of the voting
rights attached to the Shares must within two London business days after becoming so interested or
so aware (and thereafter in certain circumstances upon any change to the particulars previously
notified) notify the Company as required by the Disclosure and Transparency Rules. After the
relevant threshold is exceeded, similar notifications must be made in respect of whole percentage
figure increases or decreases, rounded down to the nearest whole number.
20.6 List of IDR Holders
The Company has the right to inspect transfer records of the Domestic Depository and any records
maintained by the Registrar at the direction of the Domestic Depository, take copies of such records
and require the Domestic Depository to supply copies of such portions of such records as the
Company may request. The Domestic Depository must, and must instruct the Registrar to, furnish to
367
c102100pu090Proof7:28.3.10B/LRevision:0OperatorSadK

the Company promptly upon the written request of the Company a list of the names, addresses and
holdings of IDR Holders as of a date within seven days of the Domestic Depository’s receipt of such
request.
21 DOMESTIC DEPOSITORY’S FEES, COSTS, EXPENSES AND INDEMNITIES
21.1 Fees and charges from IDR Holders
The Domestic Depository shall be entitled to charge the IDR Holders the following remuneration and
to receive the following remuneration and reimbursement (such remuneration and reimbursement
being payable on demand and, where applicable, being converted into Indian Rupees at prevailing
exchange rates) in respect of its services under the Deposit Agreement:
(A) for the issue of IDRs (other than upon the initial issue of IDRs pursuant to clause 2.3 of the
Deposit Agreement) or the cancellation of IDRs upon the withdrawal of Deposited Property:
US$0.05 or less per Deposited Share evidenced by those IDRs (and a proportionate amount
where an IDR Holder holds IDRs representing less than a Share) issued or cancelled;
(B) for issuing IDR Certificates in definitive registered form in replacement for mutilated, defaced,
lost, stolen or destroyed IDR Certificates (and subject to indemnification where appropriate): a
sum per IDR Certificate which is determined by the Domestic Depository to be a reasonablecharge to reflect the work, costs and expenses involved;
(C) for services performed by the Domestic Depository, any of the Domestic Depository’s agents,including the Overseas Custodian, or the agents of the Domestic Depository’s agents, in
connection with the IDRs, the Deposited Shares or other Deposited Property: US$0.016 or less
per Deposited Share evidenced by IDRs (and a proportionate amount where an IDR Holder
holds IDRs representing less than a Share), such amount to be deducted by the Depository
from each cash dividend or other cash distribution received by the Depository on or in respect
of the Deposited Shares or other Deposited Property; and
(D) in respect of any issue of rights or distribution of Shares (whether or not evidenced by IDRs) or
other securities or other property (other than cash) upon exercise of any rights, any free
distribution, stock dividend or other distribution: a sum per IDR which is determined by theDomestic Depository to be a reasonable charge to reflect the costs and expenses incurred by or
on behalf of the Company or the Domestic Depository or any of the Domestic Depository’s
agents, including the Overseas Custodian, or the agents of the Domestic Depository’s agents in
connection with such issue of rights or distribution of Shares or other securities or other
property,
together with all expenses (including currency conversion expenses), transfer and registration fees,
taxes, duties and charges payable by the Domestic Depository, the Registrar or the Overseas
Custodian, or any of their agents, in connection with any of the above.
21.2 Fees payable by the Company
(A) The Domestic Depository shall be entitled to charge the Company such sums and amounts as
may be specified in a letter between the Company and the Domestic Depository of even date
herewith in respect of its services under the Deposit Agreement.
(B) All fees, taxes, duties, charges, costs and expenses which are payable by the Company shall be
paid by the Company to the Domestic Depository upon demand therefor subject to all
necessary exchange controls and other consents and approvals having been obtained (which the
Company undertakes to use its best endeavours to obtain).
22 LIABILITY
(A) In acting under the Deposit Agreement the Domestic Depository shall have only those duties,
obligations and responsibilities as specified in the Deposit Agreement and these Conditions
including, but not limited to, holding the Deposited Property for the benefit of IDR Holders asa bare trustee under English law.
(B) Neither the Domestic Depository nor the Company, nor any of their agents, officers, directors
or employees shall incur any liability to any other of them or to any IDR Holder if, by reason
of any provision of any present laws (save for Indian and English law) or future applicable law
or regulation of any country or of any relevant governmental authority or by reason of the
interpretation or application of any such present or future law or regulation or any change
368
c102100pu090Proof7:28.3.10B/LRevision:0OperatorSadK

therein or by reason of any other circumstances beyond their control or, in the case of the
Domestic Depository or any of its agents, officers, directors or employees, by reason of any
future provision of the constitutive documents of the Company, any of them shall be prevented,
delayed or forbidden from doing or performing any act or thing which the terms of the DepositAgreement or these Conditions provide shall or may be done or performed; nor (save in the
case of wilful default, negligence or bad faith) shall any of them incur any liability to any IDR
Holder, or person with an interest in any IDR by reason of any non-performance or delay,
caused as aforesaid, in performance of any act or thing which the terms of the Deposit
Agreement or these Conditions provide shall or may be done or performed, or by reason of any
exercise of, or failure to exercise, caused as aforesaid, any voting rights attached to the
Deposited Shares or any of them or any other discretion or power provided for in the Deposit
Agreement or these Conditions. Any such party may rely on, and shall be protected in actingupon, any written notice, request, direction or other document believed by it to be genuine and
to have been duly signed or presented (including a translation which is made by a translator
believed by it to be competent or which appears to be authentic).
(C) The Domestic Depository shall not be liable (except by reason of its own breach of contract,
wilful default, negligence or bad faith or that of its agent, officers, directors or employees) to
the Company or any IDR Holder, by reason of having accepted as valid or not having rejected
any certificate for Shares or IDR Certificate purporting to be such and subsequently found to be
forged or not authentic.
(D) The Domestic Depository shall endeavour to effect any sale of any Deposited Property
contemplated by the Conditions or any such conversion as is referred to in Condition 8 in
accordance with usual practices and procedures, but neither it nor its agents shall have any
liability (save in the case of wilful default, negligence or bad faith) if such sale or conversion
shall not be possible. In addition, none of the Domestic Depository, the Company or any of
their respective agents shall have any liability or responsibility for any loss or damage (whetheractual or alleged) arising from the terms of or timing of any sale or conversion of Deposited
Property.
(E) In the absence of its own breach of contract, wilful default, negligence or bad faith the
Domestic Depository will not be responsible for any failure to determine that it may be lawfulor practicable to make rights available to IDR Holders in general or to any IDR Holder in
particular, but without limitation, pursuant to Condition 6.
23 LISTING OF IDRs
(A) The Company has undertaken in the Deposit Agreement to, subject to the Company’s ability to
elect at any time to delist the IDRs in accordance with applicable legislation and/or guidelines,
use its reasonable endeavours to maintain the admission to trading of the IDRs on the BSE and
the NSE.
24 SEVERABILITY
If any one or more of the provisions contained in the Deposit Agreement or in these Conditions shall
be or become invalid, illegal or unenforceable in any respect, the validity, legality and enforceability
of the remaining provisions contained therein or herein shall in no way be affected, prejudiced or
otherwise disturbed thereby.
25 GOVERNING LAW AND ARBITRATION
25.1 Choice of governing law
The Deposit Agreement, the Conditions and the IDRs (including any non-contractual obligations
relating thereto) are governed by and shall be construed in accordance with English law. The rights
and obligations relating to the Deposited Shares shall be governed by English law.
25.2 Arbitration
(A) The Domestic Depository agrees and the IDR Holders from time to time shall be deemed to
agree by virtue of their holding of IDRs that any dispute, difference, controversy, cause of
action or claim brought by any of them (including, for the avoidance of doubt, any former IDR
Holders) arising out of or relating to the Deposited Shares or other Deposited Property, the
IDRs, the Deposit Agreement or these Conditions, or any breach thereof, including any
369
c102100pu090Proof7:28.3.10B/LRevision:0OperatorSadK

question regarding existence, validity, termination, or enforceability of the Deposit Agreement or
these Conditions and any claims and/or counterclaims that may be related thereto, shall be
referred to, and finally resolved by, binding arbitration in accordance with the Arbitration Act.
(B) The Domestic Depository and the IDR Holders shall co-operate in good faith to expedite, tothe maximum extent practicable, the conduct of any such arbitral proceedings.
25.3 Jurisdiction
Subject to Condition 25.2 and the Arbitration Act, the courts in Mumbai, India will exercise exclusive
jurisdiction in respect of disputes mentioned in this Condition 25.
25.4 Waiver
The Domestic Depository agrees and IDR Holders from time to time shall be deemed to agree by
virture of their holding of IDRs not to challenge the terms, validity and/or enforceability of this
Condition 25 including, but not limited to, any challenge based on lack of mutuality, and the
Domestic Depository and the IDR Holders from time to time hereby irrevocably waive any right to
make such challenge.
25.5 Place and language of arbitration
The place of arbitration shall be Mumbai, India and the language of arbitration shall be English.
25.6 Appointment of arbitrators
In the event of dispute between the Domestic Depository and the IDR Holder(s), there shall be one
arbitrator who shall be appointed in accordance with the provisions of the Arbitration Act.
25.7 No effect on obligations
Any reference of any dispute, controversy, cause of action or proceeding to arbitration under this
Condition 25 shall not affect the performance by the Company or the Domestic Depository or the
IDR Holders, as the case may be, of their obligations under the Deposit Agreement, other than the
obligation relating to the dispute, controversy, cause of action or proceeding referred to arbitration.
Subject to Condition 25.2, the competent courts in Mumbai, India shall have jurisdiction in all
matters arising out of these Conditions.
25.8 Deed Poll
The Company has executed the Deed Poll to allow IDR Holders to obtain the benefit of this
Condition 25 as against the Company.
26 REGISTRAR
(A) The Domestic Depository and the Company have agreed to appoint the Registrar pursuant to
the Registrar Agreements.
(B) The Company and the Domestic Depository may terminate the appointment of the Registrar inaccordance with the terms of the Registrar Agreements and only with unanimous consent of the
Company and the Domestic Depository. The Registrar may terminate the Registrar Agreements
in accordance with their terms. Upon termination of the appointment of the Registrar, the
Domestic Depository and the Company may, with unanimous consent, appoint another entity to
act as the registrar with respect to the IDRs.
(C) Notice of appointment or removal of the Registrar or of any change in the Registrar Office
must be duly given by the Domestic Depository to the IDR Holders as soon as practicable.
27 OVERSEAS CUSTODIAN
(A) The Domestic Depository and the Company have agreed to appoint the Overseas Custodian
pursuant to the Custody Agreement.
(B) The Domestic Depository has agreed with the Overseas Custodian that all the Deposited
Property will be held by the Overseas Custodian in the IDR Facility and will be identified as
being held for the account of the Domestic Depository and is segregated in the books of the
Overseas Custodian from all other property, particularly property of the same type and class,
held by the Overseas Custodian.
370
c102100pu090Proof7:28.3.10B/LRevision:0OperatorSadK

(C) The Overseas Custodian has agreed, subject to the terms of the Custody Agreement, to be
subject at all times and in all respects to the direction of the Domestic Depository and has
agreed to be responsible solely to it pursuant to the Custody Agreement.
(D) The Overseas Custodian may resign (‘‘Notice of Resignation’’) or be removed by the Domestic
Depository from its duties by giving 90 days’ prior written notice. The termination of the
appointment or resignation of the Overseas Custodian shall take effect on the date specified insuch notice, provided that no such termination of appointment or resignation shall take effect
until the appointment by the Domestic Depository (following authorisation by the Company) of
a successor overseas custodian under the Custody Agreement and the acceptance of such
appointment to act by the successor overseas custodian, substantially in accordance with the
terms of the Custody Agreement.
(E) The Domestic Depository has undertaken to use its best endeavours to procure the appointment
of a successor overseas custodian with effect from the date of termination specified in such
notice as soon as reasonably possible following such Notice of Resignation.
(F) If the Domestic Depository fails to appoint a successor overseas custodian within 60 days of the
Notice of Resignation being given by the Overseas Custodian, the Overseas Custodian will have
the right to terminate the Custody Agreement on a further 90 days’ prior written notice, unless
the Domestic Depository appoints a successor overseas custodian within 60 days of such notice
in which case the Custody Agreement will not terminate.
(G) Notwithstanding the foregoing, the Domestic Depository may temporarily deposit the Deposited
Property in a manner or a place other than as therein specified if considered necessary by the
Domestic Depository. In case of transportation of the Deposited Property under this Condition,the Domestic Depository shall obtain appropriate insurance at the expense of the Company if
and to the extent that the obtaining of such insurance is reasonably practicable and the
premiums payable are, in the opinion of the Domestic Depository, a reasonable amount.
(H) Notice of any change of Overseas Custodian shall be given to IDR Holders by the Domestic
Depository as soon as practicable after such change taking effect.
28 RESIGNATION AND TERMINATION OF APPOINTMENT OF THE DOMESTIC
DEPOSITORY
28.1 Termination by notice
The Company may terminate the appointment of the Domestic Depository under the Deposit
Agreement by giving at least 90 days’ prior notice in writing to the Domestic Depository and the
Overseas Custodian, and the Domestic Depository may resign as Domestic Depository by giving atleast 90 days’ prior notice in writing to the Company and the Overseas Custodian.
28.2 Notification
Within 30 days after the giving of either such notice, notice thereof shall be duly given by theDomestic Depository to the IDR Holders and to the Indian Stock Exchanges and SEBI.
28.3 Effect of termination
The termination of the appointment or resignation of the Domestic Depository shall take effect on
the date specified in such notice, provided that no such termination of appointment or resignationshall take effect until the appointment by the Company of a successor depository under the Deposit
Agreement and the acceptance of such appointment to act substantially in accordance with the terms
thereof and of these Conditions, by the successor depository.
28.4 Successor depository
The Company has undertaken in the Deposit Agreement to use its reasonable endeavours to procure
the appointment of a successor depository with effect from the date of termination specified in such
notice as soon as reasonably possible following notice of such termination or resignation. Upon any
such appointment and acceptance, notice thereof shall be duly given by the Domestic Depository to
the IDR Holders and to the Indian Stock Exchanges and SEBI.
28.5 Obligations of the Domestic Depository to successor depository
Upon the termination of the appointment or resignation of the Domestic Depository and against
payment of all fees and expenses due to the Domestic Depository from the Company under the
371
c102100pu090Proof7:28.3.10B/LRevision:0OperatorSadK

Deposit Agreement, the Domestic Depository shall deliver to its successor as depository sufficient
information and records to enable such successor efficiently to perform its obligations under the
Deposit Agreement and shall deliver and pay to such successor depository any Deposited Property
and cash held by it under the Deposit Agreement.
28.6 Effect on the Overseas Custodian
The Deposit Agreement provides that, upon the date when such termination of appointment or
resignation takes effect the Overseas Custodian shall be deemed to be the Overseas Custodian
thereunder for such successor depository and shall hold the Deposited Property for such successor
depository, and the Domestic Depository shall thereafter have no obligation under the Deposit
Agreement or these Conditions (other than liabilities accrued prior to the date of termination of
appointment or resignation or any liabilities stipulated in relevant laws or regulations).
28.7 Survival of certain provisions
Any payment obligations of the IDR Holders, any obligations of the Company herein to make
payments to the Domestic Depository and indemnify it, and any obligation of the Domestic
Depository to indemnify the Company shall, in respect of any event occurring before termination of
the appointment of, or resignation by, the Domestic Depository, survive any such termination or
resignation. Termination of the appointment of, or resignation by, the Domestic Depository will not
affect accrued rights or existing commitments under this Agreement.
29 TERMINATION OF DEPOSIT AGREEMENT
29.1 Termination by notice
The Company may terminate the Deposit Agreement by giving not less than 90 days’ notice to the
Domestic Depository and to the Overseas Custodian. Such notice shall specify the date of termination
of the Deposit Agreement.
29.2 Termination on delisting of the IDRs by the Indian Stock Exchanges
The Deposit Agreement will terminate upon the delisting of the IDRs by the Indian Stock Exchanges.
29.3 Termination on delisting of the Shares
The Deposit Agreement will terminate on the delisting of the Shares resulting in such Shares not
being listed on any securities exchange in any jurisdiction.
29.4 Delisting on termination
Following an event giving rise to a termination of the Deposit Agreement as provided underConditions 29.1 or 29.3 above, the Company will apply to the Indian Stock Exchanges for the
delisting for the IDRs such that the IDRs will cease to be listed upon termination of the Deposit
Agreement.
29.5 Notice of termination
The Company will give notice to the Domestic Depository, the Overseas Custodian and the Indian
Stock Exchanges of a termination of the Deposit Agreement as provided under Conditions 29.2 or
29.3 above as soon as reasonably practicable after becoming aware of the event giving rise to suchtermination.
29.6 Notification to IDR Holders
As soon as reasonably practicable following the receipt of such notice under Conditions 29.1 or 29.5
above, notice of such termination shall be duly given by the Domestic Depository to IDR Holders.
29.7 Entitlement to obtain delivery of Deposited Property
In the event of a termination of this Agreement as provided under Conditions 29.1 or 29.2 above,during the period beginning on the date of the giving of such notice by the Domestic Depository to
the IDR Holders and ending, in the case of Condition 29.1 above, on the date on which such
termination takes effect, and, in the case of Condition 29.2 above, ending 15 Business Days after
notice being given of such event under Condition 29.6 above, each IDR Holder shall be entitled to
receive delivery of the Deposited Property relative to each IDR held by it, by submitting a
372
c102100pu090Proof7:28.3.10B/LRevision:0OperatorSadK

Withdrawal Order or, if permitted, an electronic certification in lieu of such Withdrawal Order, in
accordance with the provisions of Condition 2, and on payment by the IDR Holder of any sums
payable by the Domestic Depository to the Overseas Custodian and/or any other expenses incurred
by the Domestic Depository in connection with such delivery and withdrawal, and otherwise inaccordance with the Deposit Agreement provided that a request for withdrawal of Deposited Property
may only be made in respect of such number of IDRs as would together represent a whole number
of Shares. Fractions will be dealt with as provided in Condition 29.12 below.
29.8 Outstanding IDRs in the event of a termination by notice or termination following delisting of the IDRs
by the Indian Stock Exchanges
If after termination of the Deposit Agreement pursuant to Conditions 29.1 or 29.2 above and expiry
of any period during which a Withdrawal Order may be given, any IDRs remain outstanding after
the date of termination of the Deposit Agreement, the Domestic Depository shall as soon as
reasonably practicable sell the Deposited Property then held by it under the Deposit Agreement in
accordance with Condition 29.11 and shall not register transfers, shall not pass on dividends or
distributions or take any other action. After making such sale, the Domestic Depository shall bedischarged from all obligations under the Deposit Agreement and these Conditions.
29.9 Delivery of Deposited Property upon delisting of the Shares
If the Deposit Agreement is terminated under Condition 29.3 above, the Domestic Depository shall assoon as reasonably practicable following the giving of notice by the Domestic Depository to the IDR
Holders of such termination as specified under Condition 29.6 above, deliver the Deposited Property
relative to each IDR held by it in accordance with the provisions of Condition 2 and on payment by
the IDR Holder of any sums payable by the Domestic Depository to the Overseas Custodian and/or
any other expenses incurred by the Domestic Depository in connection with such delivery and
otherwise in accordance with the Deposit Agreement, provided that the Domestic Depository will
only be obliged to deliver whole numbers of Shares under this Condition 29.9. Fractions of Shares
will be aggregated and the resultant Shares will be surrendered by the Custodian on behalf of IDRHolders to the Company for no consideration.
29.10 Survival of certain provisions
Any payment obligations of the IDR Holders, obligations of the Company herein to make payments
to the Domestic Depository and indemnify it and any obligation of the Domestic Depository toindemnify the Company shall in respect of any event occurring before termination survive any such
termination. Termination of the Deposit Agreement will not affect accrued rights or existing
commitments under the Deposit Agreement.
29.11 Sale of Deposited Property
Where the Domestic Depository is obligated to sell any Deposited Property held by it or any
entitlements arising from the Deposited Property held by it pursuant to the terms of the Deposit
Agreement, the Domestic Depository shall sell such Deposited Property or entitlements at the
prevailing market price and shall procure that the net proceeds from any such sale shall be deposited
in a trustee account maintained by the Overseas Custodian. The Domestic Depository shall procure
the distribution of such proceeds, together with any interest which has accrued on the same, and
subject to the deduction of any tax payable on the interest attributable to the relevant IDR Holder,pro rata to each relevant IDR Holder by reference to that proportion of the Deposited Property
which is represented by the IDRs of which that person is the IDR Holder within 15 Business Days of
the completion of the sale of all of the relevant Deposited Property.
29.12 Fractional entitlements
Where an IDR represents a fraction of a Share and IDR Holders have fractional entitlements to
Shares after giving effect to withdrawals under Condition 29.7 above, the Domestic Depository is
entitled to aggregate such fractions and to sell the relevant Shares under and in accordance with
Condition 29.11 above.
373
c102100pu090Proof7:28.3.10B/LRevision:0OperatorSadK

30 CONTRACTS (RIGHTS OF THIRD PARTIES) ACT 1999
No person shall have any right to enforce these terms and conditions under the Contracts (Rights of
Third Parties) Act 1999 except and to the extent (if any) that these terms and conditions expresslyprovide for such Act to apply.
374
c102100pu090Proof7:28.3.10B/LRevision:0OperatorSadK

INFORMATION ON THE DEPOSITORY AND CERTAIN IMPORTANTINFORMATION IN RESPECT OF THE SHARES WHILE IN IDR FORM
Information relating to the Depository
The Depository is Standard Chartered Bank, Mumbai. Standard Chartered Bank, Mumbai is a
banking subsidiary of the Company. The Depository is a branch office registered in Mumbai on
10 May 1952. The registered office of Standard Chartered Bank is located at 1 Aldermanbury Square,
London EC2V 7SB, UK. The registered office of the Depository in India is located at 90 MahatmaGandhi Road, Fort, Mumbai 400 001, India.
Certain important information in respect of the Shares while in IDR form
Important legal information
Disclosure of shareholdings under the Disclosure and Transparency Rules
There is a legal obligation under DTR 5 to notify an issuer of shares of certain voting rights onreaching or exceeding certain thresholds. These obligations relate to shares of UK and non-UK
issuers which are admitted to trading on a regulated market in the UK. At the end of each calendar
month, an issuer must (assuming an increase or decrease has occurred) announce the total number of
voting rights and capital in respect of each class of share which it issues, and the total number of
voting rights attaching to shares held in treasury. It is the responsibility of each shareholder to
monitor company announcements: the number of issued shares as announced by the company is
taken as the denominator for determining whether disclosure thresholds have been reached by a
shareholder (even where it has not engaged in any dealings).
Pursuant to DTR 5.1.2R, a person (which includes a natural person, a legal person or an
unincorporated body such as a partnership) must notify an issuer of the percentage of its voting
rights that he holds as a shareholder or is deemed to hold through his direct or indirect holding of
financial instruments which fall within DTR 5.3.1R. DTR 5.3.1R provides that a person must make a
notification in respect of two types of financial instruments. Firstly it applies to instruments which are
qualifying financial instruments these are transferable securities, options, futures, swaps, forward rateagreements, and any other derivative contracts which result in a formal agreement for the holder to
unilaterally acquire shares of the issuer (either through an unconditional right to acquire the shares or
through a discretion to). Secondly a person must make a notification in respect of financial
instruments which are referenced to the shares of the issuer and have similar economic effects to (but
which are not) qualifying financial instruments.
The disclosure obligation does not apply to financial instruments held by a client-serving intermediaryacting in a client-serving capacity which satisfies the following conditions: it is appropriately
authorised by the relevant regulator, it has appropriate systems and controls in place in order to
distinguish between its client-serving and proprietary dealings, it does not intervene in or attempt to
exert influence on the management of the issuer when acting in a client-serving capacity and it has
certified in writing to the FSA that it satisfies these conditions. The client-serving intermediary must
notify the FSA if it no longer satisfies any of these conditions and must provide the FSA with
information relevant to its status as a client-serving intermediary. Acting in a client-serving capacity is
defined as fulfilling client orders on a non-proprietary basis, responding to clients’ requests on a non-proprietary basis and hedging any resultant positions.
Notifications must be made when the percentage of voting rights held (even if the exercise of such
rights is suspended) reaches, exceeds or falls below 3%, 4%, 5%, 6%, 7%, 8%, 9%, 10% and each 1%
threshold thereafter up to 100% (for a UK issuer, for a non-UK issuer these thresholds are 5%, 10%,
15%, 20%, 25%, 30%, 50% and 75% in most circumstances) as a result of an acquisition or disposal
of shares or financial instruments falling within DTR 5.3.1R. The notification requirements also applywhere a holding changes as a result of changes to the share capital of an issuer, and where the issuer
has announced information in respect of the total number of voting rights and capital which would
cause the shareholding to be re-calculated. Direct and indirect holdings of shares and relevant
financial instruments must be aggregated.
Notifications must be made as soon as possible and in any case not later than two trading days (forUK issuers) after the date on which the notifying person learns, or having regard to the
circumstances, should have learnt, of the event that has given rise to the requirement to make the
disclosure. In general, a person will be deemed to have knowledge of the event no later than two
trading days after the event has taken place. The notification obligation is an individual obligation on
each direct shareholder or indirect shareholder.
375
c102100pu090Proof7:28.3.10B/LRevision:0OperatorSadK

IDR Holders that have to make such notifications should refer to ‘‘Important procedure-related
information – Making notifications in respect of the underlying Shares’’ below.
DTR 5.1.3 provides that a notification need never be made in respect of:
* shares acquired for clearing and settlement purposes within a four-day settlement cycle;
* shares held by a custodian or nominee (in its capacity as such), provided that the custodian or
nominee receives its instructions in written or electronic form;
* shares held by a market maker in its capacity as such, up to a 10% holding and subject to
certain conditions;
* shares held or shares underlying financial instruments (as set out in DTR 5.3.1R) to the extent
that such financial instruments are held by a credit institution or investment firm, provided theyare held on the trading book, they do not exceed a 5% holding, and the voting rights are not
used ‘‘to intervene in the management of the issuer’’;
* shares held by a collateral taker under a collateral transaction, provided the collateral taker does
not declare any intention of exercising (and does not exercise) the voting rights attached to such
shares; and
* shares acquired under a stock loan, provided the borrower on-loans the shares or equivalent
stock by the end of the next trading day, and the borrower does not declare any intention of
exercising (and does not exercise) the voting rights attached to such shares.
Certain voting rights only have to be disclosed at 5% and 10% under DTR 5.1.5R as follows:
* an FSA-authorised manager’s interest in voting rights attaching to shares managed for the
shareholder under a written agreement;
* voting rights exercisable by the operator of an authorised unit trust scheme, a recognised
scheme, or a UCITS (Undertakings for Collective Investment in Transferable Securities) scheme;
* voting rights exercisable by an ICVC (Investment Company with Variable Capital); or
* voting rights exercisable by certain prescribed categories of investment entity (this includes USinvestment advisors, who are treated in the same way as EEA investment managers for the
purposes of DTR 5).
Under DTR 5.2.1(e) and 5.2.2G(1), a parent company must generally aggregate its holdings with
those of its ‘‘controlled undertakings’’. In certain circumstances, holdings of an asset manager and its
parent may be required to be aggregated (see DTR 5.4). To avoid the requirement for such
aggregation, a parent undertaking must ensure that it does not, and must be able to demonstrate to
the FSA that it does not, interfere with the exercise of voting rights by the asset manager.
There are no criminal sanctions for non-compliance with shareholders, but section 91(1B) FSMA
allows the FSA to impose a penalty on a person (of such amount as it considers appropriate) for
breaching a provision of the DTRs. There may also be consequences for the issuer.
CREST
Euroclear is the central securities depository for the UK, Ireland, the Isle of Man, Jersey and
Guernsey. Euroclear owns and operates CREST. The Uncertificated Securities Regulations 2001 allow
shares to be held in demateralised (uncertificated) form. CREST is a computerised system which
allows shares to be held, and trades to be settled, electronically. The UK Listing Rules requirecompanies considering listing their shares to ensure that their shares are eligible for electronic
settlement. Euroclear are required to maintain and update a register of members holding
uncertificated shares in each listed company (the ‘‘Operator Register’’). Each listed company has a
Company Registrar who keeps a register of members who hold their shares in certificated form (the
‘‘Issuer Register’’) and a copy of the Operator Register, which is frequently updated. As share
transfers are settled through CREST, CREST updates the company’s Operator Register by issuing a
‘‘record update request’’ or ‘‘RUR’’. Only ‘‘users’’ can input instructions into CREST directly. A
‘‘user’’ may be a member. Members communicate directly or through gateway operators called‘‘users’’. CREST members appoint a settlement bank which agrees to satisfy its payment obligations.
CREST maintains a securities account (detailing shareholdings) and a cash memorandum account
(detailing the member’s credit limit set by the settlement bank) for each member. The terms of the
trade are confirmed and the obligations of the buyer and seller determined (cleared) before the trade
is settled. A transfer of shares is effected when CREST receives an electronic instruction from both
376
c102100pu090Proof7:28.3.10B/LRevision:0OperatorSadK

the seller and the purchaser which match, provided there are sufficient securities and credit to
complete the transaction.
A shareholder can hold shares in CREST one of four ways:
* as a direct user (a form of member): direct users have direct connections to CREST and are
usually banks or stockbrokers;
* as a sponsored member: a sponsored member appoints a direct user to act on its behalf, but the
sponsored member holds the stock in his own name, which appears on the company register of
members;
* by holding shares through a nominee (a direct user): the nominee holds shares on behalf of the
shareholder in an account with shares held on behalf of other clients. The nominee is a direct
user and its name will appear on the company register of members; or
* by holding shares as a personal member (individual): a personal member is an individual who
needs a sponsor but who has a securities account.
IDR Holders wishing to open a CREST account as a personal member should refer to ‘‘Important
procedure-related information – Opening of a CREST account’’ below.
Important procedure-related Information
Making notifications in respect of the underlying Shares
Notifications must be made as soon as possible and in any case not later than two trading days (forUK issuers) after the date on which the notifying person learns, or having regard to the
circumstances, should have learnt, of the event that has given rise to the requirement to make the
disclosure. In general, a person will be deemed to have knowledge of the event no later than two
trading days after the event has taken place. Notification must be made by the standard form
available on the FSA website. The notification obligation is an individual obligation on each direct
shareholder or indirect shareholder. When disclosure is made to an issuer whose shares are traded on
a regulated market, a copy of the notification must also be filed electronically with the FSA. The
issuer must as soon as possible make the disclosure public.
Opening of a CREST account
Investors who wish to become a sponsored member of CREST (a ‘‘Personal Member’’) should obtain
a copy of the CREST Admission Agreement from their sponsor and complete and sign this and send
it to their sponsor. The sponsor will usually be the applicant’s bank or stockbroker, who is a direct
user of CREST. The sponsor will record the application and carry out a preliminary check before
forwarding the application to CREST who will scrutinise the application and, if satisfied, will enable
the membership account.
Listing of the underlying Shares
Shareholders who are registered on the UK share register can move their shareholding onto the Hong
Kong branch share register (and vice versa) by completing a transmission document (available from
the UK and Hong Kong share registrars) and sending it together with their documents of entitlement
to the UK or Hong Kong share registrars (Computershare Investor Services PLC and Computershare
Hong Kong Investor Services Limited, respectively). Once processed their shareholding will move onto
the other share register and the relevant share registrar will send the shareholder their new documents
of entitlement.
377
c102100pu090Proof7:28.3.10B/LRevision:0OperatorSadK

SUMMARY OF CERTAIN PROVISIONS RELATING TO THE IDRS WHILE INDEMATERIALISED FORM
The IDRs will initially be evidenced by Dematerialised IDRs. The Deposit Agreement contains provisions
which apply to the IDRs while they are in dematerialised form. The following is a summary of certain of
those provisions that are specifically applicable to Dematerialised IDRs only and includes, in particular,
detailed information in relation to the exchange of Dematerialised IDRs for IDR Certificates. For
detailed information on other material rights, obligations and entitlements applicable to IDR Holders
holding Dematerialised IDRs, please refer to the section titled ‘‘Frequently Asked Questions on the IDR
Facility’’ on pages 42 to 51 of this Draft Red Herring Prospectus and also the other sections referred to
therein. Unless otherwise defined herein, the terms defined in the Conditions shall have the same meaning
herein and the numbering of the Conditions shall refer to the numbering as set out in the Deposit
Agreement.
Individual IDR Certificates
The Depository will exchange IDRs represented by Dematerialised IDRs for IDR Certificates on
request by an IDR Holder, but subject to payment of a sum per IDR Certificate which is determinedby the Depository to be a reasonable charge to reflect the work, costs and expense involved, by such
IDR Holder.
The Depository has also undertaken, subject to and in accordance with the Deposit Agreement, to
deliver IDR Certificates in exchange for the Dematerialised IDRs to IDR Holders in the event that:
(i) either NSDL or CDSL or any successor advises the Depository in writing at any time that it is
unwilling or unable to continue as a security depository and a successor security depository is
not appointed within 90 days of such notice;
(ii) either NSDL or CDSL is closed for business for a continuous period of 14 days (other than by
reason of holiday, statutory or otherwise) or announces an intention permanently to cease
business or does in fact do so, and no alternative clearing system satisfactory to the Depositoryis available within 45 days of such announcement; or
(iii) the Depository has determined that, on the occasion of the next payment in respect of the
IDRs, the Depository or its agent would be required to make any deduction or withholding
from any payment in respect of the IDRs which would not be required were the IDRs
represented by IDR Certificates (provided that the Depository shall have no obligation to so
determine or to attempt to so determine).
Any such exchange shall be at the expense (including printing costs) of the Company.
An IDR evidenced by an IDR Certificate will not be eligible for clearing and settlement through
NSDL or CDSL.
Upon any exchange for IDR Certificates, or any distribution of IDRs pursuant to the Conditions or
any reduction in the number of IDRs represented by Dematerialised IDRs following any withdrawalof Deposited Property pursuant to Condition 2, the relevant details shall be entered by the
Depository in the Register maintained by the Depository (which shall be maintained at all times in
India), whereupon the number of Deposited Shares represented by Dematerialised IDRs will be
reduced or increased (as the case may be) accordingly.
No temporary documents of title have been or will be issued.
Payments, distributions and voting rights
Payments of cash dividends and other amounts (including cash distributions) in respect of the IDRs
represented by Dematerialised IDRs will be made by the Depository through the Registrar on behalf
of persons entitled thereto upon receipt of funds thereof from the Company. Any free distribution or
rights issue of Shares to the Depository on behalf of the IDR Holders will result in the records of
the Depository being adjusted to reflect the enlarged number of IDRs represented by DematerialisedIDRs.
Payments of dividends and other cash distributions payable in respect of the IDRs represented by
Dematerialised IDRs will be made by the Depository in Rs.
IDR Holders will have voting rights in respect of the underlying Shares as set out in Condition 13
and Clause 9 of the Deposit Agreement. Voting rights will be exercised by the Depository only upon
receipt of written instructions in accordance with the Conditions and the Deposit Agreement.
378
c102100pu090Proof7:28.3.10B/LRevision:0OperatorSadK
Under Condition 13, the Depository is entitled to receive a legal opinion with respect to Condition 13
in certain circumstances. If the Company is unable to procure the legal opinion specified in Condition
13.6(A), the Depository shall not be required to take any action pursuant to Condition 13.
Surrender of IDRs
Any requirement in the Conditions relating to the surrender of an IDR to the Depository shall be
satisfied by the production by NSDL or CDSL, on behalf of a person entitled to an interest therein,
of such evidence of entitlement of such person as the Depository may reasonably require, which is
expected to be a certificate or other documents issued by NSDL or CDSL. The delivery or
production of any such evidence shall be sufficient evidence, in favour of the Depository, the
Registrar and the Custodian of the title of such person to receive (or to issue instructions for thereceipt of) all monies or other property payable or distributable and to issue voting instructions in
respect of the Deposited Property represented by such IDR.
Notices
Notices to IDR Holders may be given by the Depository by delivery of the relevant notice to the
Registrar, for communication to IDR Holders. The Depository will, through the Registrar, provide
notices to IDR Holders and so long as the IDRs are listed on the BSE and/or NSE and the rules ofthe BSE and/or NSE or the IDR Listing Agreements so require, published in a national newspaper in
India.
379
c102100pu090Proof7:28.3.10B/LRevision:0OperatorSadK

TRANSFER OF EQUITY SHARES AND DEPOSITORY RECEIPTS
Transfer of Shares
Under the UK Listing Rules, the shares of a UK listed company must be freely transferable.
Transfer of IDRs
The IDRs are in registered form, [*] IDRs representing one Share*. Title to IDRs represented by
IDR Certificates passes by registration in the Register maintained, or procured to be maintained, by
the Depository.
Title to IDRs represented by Dematerialised IDRs is evidenced by the Register and title to such
IDRs passes in accordance with the procedures of NSDL and CDSL.
The Depository may refuse to accept a transfer of any IDRs in certain circumstances.
The IDR Holder will (except as otherwise required by law) be treated by the Depository and the
Company as the beneficial owner of the relevant IDRs for all purposes (whether or not any payment
or other distribution in respect of such IDR is overdue and regardless of any notice of ownership,trust or any interest in it or any writing on, or the theft or loss of, any certificate issued in respect of
it) and no person will be liable for so treating the IDR Holder.
Transfer restrictions in respect of IDRs
This offering is being made in reliance on Regulation S. The IDRs have not been, and will not be,
registered under the Securities Act or with any securities regulatory authority of any state of the
United States or any other jurisdiction, and may only be offered, sold or delivered outside the United
States in offshore transactions in reliance on Regulation S, and in accordance with any other
applicable law.
Each IDR Holder will be deemed to have represented and agreed and acknowledged as follows (terms
used herein are defined in Regulation S):
(i) The IDRs and the underlying Shares have not been, and will not be, registered under the
Securities Act or with any securities regulatory authority of any state of the United States orany other jurisdiction of the United States and are subject to restrictions on transfer.
(ii) It understands that all IDRs, unless otherwise agreed between the Company and the Depository,
are subject to the restriction set out in the following legend (which legends for ‘‘IDR’’ Holders
holding IDR Certificates, will also be endorsed on the IDR Cerfiticate):
‘‘THIS REGULATION S INDIAN DEPOSITORY RECEIPT AND THE EQUITY SHARES OF
STANDARD CHARTERED PLC REPRESENTED HEREBY (THE SHARES) HAVE NOT BEEN
AND WILL NOT BE REGISTERED UNDER THE UNITED STATES SECURITIES ACT OF
1933, AS AMENDED (THE SECURITIES ACT), OR WITH ANY SECURITIES REGULATORY
AUTHORITY OF ANY STATE OR OTHER JURISDICTION OF THE UNITED STATES AND
MAY NOT BE OFFERED, SOLD, PLEDGED OR OTHERWISE TRANSFERRED EXCEPT INAN OFFSHORE TRANSACTION IN ACCORDANCE WITH RULE 903 OR RULE 904 OF
REGULATION S UNDER THE SECURITIES ACT AND IN ACCORDANCE WITH ANY
OTHER APPLICABLE SECURITIES LAWS OF THE UNITED STATES OR ANY STATE OR
OTHER JURISDICTION OF THE UNITED STATES.
THE HOLDER HEREOF, BY PURCHASING THE IDRS REPRESENTED BY THIS
CERTIFICATE, AGREES FOR THE BENEFIT OF STANDARD CHARTERED PLC AND THE
DEPOSITORY NAMED BELOW THAT OTHER THAN IN ACCORDANCE WITH
APPLICABLE LAWS, IDRS MAY NOT BE OFFERED, SOLD, PLEDGED OR OTHERWISETRANSFERRED TO ANY PERSON LOCATED IN ANY JURISDICTION OUTSIDE OF INDIA
OR RESIDENT IN ANY JURISDICTION OUTSIDE OF INDIA, OR TO, OR FOR THE
ACCOUNT OR BENEFIT OF, SUCH PERSON.
AN IDR HOLDER WILL BE ENTITLED TO WITHDRAW THE DEPOSITED PROPERTY
REPRESENTED BY THE IDRS SUBJECT TO COMPLIANCE WITH APPLICABLE LAW.
NO PERSON SHALL BE PERMITTED TO MAKE ANY FURTHER DEPOSIT OF SHARES
INTO THE IDR FACILITY.’’
380
c102100pu090Proof7:28.3.10B/LRevision:0OperatorSadK
* Exchange Ratio will be finalised and disclosed at the stage of filing of the Red Herring Prospectus with the Registrar ofCompanies, New Delhi.

(iii) The Company, the Depository, the purchasers and their respective affiliates and others, will rely
upon the truth and accuracy of the foregoing acknowledgements, representations and
agreements.
(iv) It understands that the IDRs offered in reliance on Regulation S will be evidenced by the
Dematerialised IDRs at the time of the Issue.
Any resale or other transfer, or attempted resale or other transfer, made other than in compliance
with the above stated restriction shall not be recognised by the Company or the Depository in respect
of the IDRs or the Shares represented by the IDRs.
381
c102100pu090Proof7:28.3.10B/LRevision:0OperatorSadK

ISSUE PROCEDURE
This section applies to all Bidders. Please note that all Bidders other than QIBs can participate in the
Issue through the ASBA process. Bidders should note that the ASBA process involves different
application procedures. Bidders applying through the ASBA process should carefully read the
provisions applicable to such applications before making their application through the ASBA process.
Authority for the Issue
The Company has general authority to allot Shares pursuant to the Issue. Resolutions will beproposed at the Company’s Annual General Meeting on 7 May 2010 seeking specific authority for
the Board to allot shares pursuant to the Issue.
This Issue has been authorised in principle by resolutions of the Board dated 28 October 2008 and
15 September 2009. The Draft Red Herring Prospectus was confidentially filed with SEBI with theapproval of a committee of the Board pursuant to a resolution dated 26 February 2009. This public
filing of the Draft Red Herring Prospectus has been authorised by a resolution of the Board dated
15 September 2009 and a resolution of a committee of the Board dated 22 March 2010. The number
of IDRs to be issued has been approved by a resolution of a committee of the Board dated 25
March 2010. The filing of the Red Herring Prospectus with the RoC has been approved by a
resolution of the Board dated [*]. The filing of the Prospectus has been approved by a resolution of
the Board dated [*].
Terms of the IDRs
Please see the section titled ‘‘Terms and Conditions of the Indian Depository Receipts’’ on page 352 of
this Draft Red Herring Prospectus.
Minimum Subscription
If a minimum subscription of 90% of the Issue is not received, including devolvement of Underwritersor if the subscription level falls below 90% after the Bid/Issue Closing Date on account of cheques
having being returned unpaid or withdrawal of applications within 60 days from the Bid/Issue Closing
Date, the Company shall forthwith refund the entire subscription amount received with interest to the
subscribers at the rate of 15% p.a. for the period of the delay beyond 60 days.
If at least 50% of the Issue cannot be Allotted to QIBs, then the entire application money will be
refunded forthwith.
The IDRs have not been and will not be registered, listed or otherwise qualified in any other jurisdiction
outside India and may not be offered or sold, and Bids may not be made by persons in any suchjurisdiction, except in compliance with the applicable laws of such jurisdiction.
Disclaimer Clause of the BSE
A copy of this Draft Red Herring Prospectus will be submitted to the BSE. The disclaimer clause as
intimated by the BSE to the Company, after scrutiny of this Draft Red Herring Prospectus, shall be
included in the Red Herring Prospectus prior to the RoC filing.
Disclaimer Clause of the NSE
A copy of this Draft Red Herring Prospectus will be submitted to the NSE. The disclaimer clause as
intimated by the NSE to the Company, after scrutiny of this Draft Red Herring Prospectus, shall be
included in the Red Herring Prospectus prior to the RoC filing.
Filing
A copy of this Draft Red Herring Prospectus, has been filed with the SEBI at Corporation Finance
Department, Plot No. C4-A, ‘G’ Block, Bandra Kurla Complex, Bandra (East), Mumbai 400 051.
A copy of the Red Herring Prospectus, along with the documents required to be filed, will be
delivered for registration to the RoC and a copy of the Prospectus will be delivered for registration
with the RoC at its office.
382
c102100pu090Proof7:28.3.10B/LRevision:0OperatorSadK

Listing
Applications have been made to the Stock Exchanges for permission to deal in and for an official
quotation of the IDRs. [*] will be the Designated Stock Exchange with which the Basis of Allotmentwill be finalised.
If the permissions to deal in and for an official quotation of the IDRs are not granted by any of the
Stock Exchanges, the Company will forthwith repay, without interest, all monies received from the
applicants in pursuance of the Red Herring Prospectus. If such money is not repaid when the
Company becomes liable to repay it, i.e. 15 days from the Bid/Issue Closing Date, then the
Company, and every Director of the Company who is in default, shall, be liable to repay the money,
with interest, at the rate of 15% p.a. on application money.
The Company shall ensure that all steps for the completion of the necessary formalities for listing
and commencement of trading at all the Stock Exchanges mentioned above are taken within sevenBusiness Days of finalisation of the Basis of Allotment for the Issue.
Issue Structure
The Issue is being made through the 100% Book Building Process.
QIBs(1) Non-Institutional Bidders Retail Individual Bidders
Number of IDRs(2) [*] IDRs. [*] IDRs available for
allocation or issue less
allocation to QIB
Bidders and RetailIndividual Bidders.
[*] IDRs available for
allocation or issue less
allocation to QIB
Bidders and Non-Institutional Bidders.
Percentage of Issuesize available for
Allotment
At least 50% of Issuebeing Allotted.
Not less than 20% ofIssue available for
allocation or issue less
allocation to QIB
Bidders and Retail
Individual Bidders.
Not less than 30% ofIssue available for
allocation or issue less
allocation to QIB
Bidders and Non-
Institutional Bidders.
Basis of allocation if
respective category is
oversubscribed
Proportionate. Proportionate. Proportionate.
Minimum Bid Such number of IDRs
that the Bid Amount
exceeds Rs. 100,000 and
in multiples of [*] IDRs
thereafter.
Such number of IDRs
that the Bid Amount
exceeds Rs. 100,000 and
in multiples of [*] IDRs
thereafter.
Such number of IDRs
that the Bid Amount
exceeds Rs. 20,000 and in
multiples of [*] IDRs
thereafter.
Maximum Bid Such number of IDRs
not exceeding the Issue,subject to applicable
limits.
Such number of IDRs
not exceeding the Issue,subject to applicable
limits.
Such number of IDRs
whereby the Bid Amountdoes not exceed Rs.
100,000.
Mode of Allotment Compulsorily in
dematerialised form.
Compulsorily in
dematerialised form.
Compulsorily in
dematerialised form.
Bid Lot [*] IDRs and inmultiples of [*] IDRs
thereafter.
[*] IDRs and inmultiples of [*] IDRs
thereafter.
[*] IDRs and inmultiples of [*] IDRs
thereafter.
Allotment Lot [*] IDRs and in
multiples of one IDR
thereafter.
[*] IDRs and in
multiples of one IDR
thereafter.
[*] IDRs and in
multiples of one IDR
thereafter.
Trading Lot One IDR. One IDR. One IDR.
Who can apply(3) A public financial
institution as defined in
section 4A of the Indian
Companies Act a
scheduled commerical
Resident Indian
individuals, eligible
NRIs, HUF (in the name
of the Karta), domestic
companies, corporate
Resident Indian
individuals, eligible
NRIs and HUF (in the
name of the Karta).
383
c102100pu090Proof7:28.3.10B/LRevision:0OperatorSadK

QIBs(1) Non-Institutional Bidders Retail Individual Bidders
bank, a Mutual Fund, a
FII and sub-account
registered with SEBI,
other than a sub-account
which is a foreign
corporate or foreign
individual, a multilateral
and bilateraldevelopment financial
institution, a state
industrial development
corporation.
bodies, scientific
institutions, societies and
trusts, a sub-account
registered with SEBI
which is a foreign
corporate or foreign
individual.
Terms of Payment Margin Amount shall be
payable at the time of
submission of Bid cum
Application Form to the
Syndicate (except for
Anchor Investors).
Amount shall be payable
at the time of submission
of Bid cum Application
Form to the Syndicate(5).
Amount shall be payable
at the time of submission
of Bid cum Application
Form to the Syndicate.(4)
Margin Amount 10%(5) 100% 100%
(1) The Company may allocate up to 30% of the QIB Portion to Anchor Investors on a discretionary basis. One-third of the AnchorInvestor Portion shall be reserved for domestic Mutual Funds, subject to valid Bids being received from domestic Mutual Funds ator above the price at which allocation is being done to other Anchor Investors. For further details, please see the section titled‘‘Issue Procedure’’ on page 382 of this Draft Red Herring Prospectus.
(2) The Issue is being made through the 100% Book Building Process wherein at least 50% of the Issue will be Allotted on aproportionate basis to QIBs. If at least 50% of the Issue cannot be Allotted to QIBs, then the entire application money will berefunded forthwith. Provided that out of the QIB Portion (excluding the Anchor Investor Portion), 5% shall be available forallocation on a proportionate basis to Mutual Funds only. The remainder shall be available for allocation on a proportionatebasis to QIBs and Mutual Funds, subject to valid Bids being received from them at or above the Issue Price. Further, not less than20% of the Issue will be available for allocation on a proportionate basis to Non-Institutional Bidders and not less than 30% of theIssue will be available for allocation on a proportionate basis to Retail Individual Bidders, subject to valid Bids being received ator above the Issue Price.
Under-subscription, if any, in any category except the QIB Category, would be allowed to be met with spill-over from any othercategory or combination of categories at the discretion of the Company in consultation with the BRLMs and the DesignatedStock Exchange.
(3) In the case that the Bid cum Application Form is submitted in joint names, the investors should ensure that the demat account isalso held in the same joint names and that they are in the same sequence in which they appear in the Bid cum Application Form.
(4) In the case of Bidders submitting ASBA Bid cum Application Form, the SCSB shall be authorised to block an amount equal to theBid Amount in the ASBA Account as specified in the ASBA Bid cum Application Form.
(5) Anchor Investors are required to bring a Margin Amount of at least 25% on application with the balance to be paid within twodays of the Bid/Issue Closing Date.
Withdrawal of the Issue
The Company, in consultation with the BRLMs, reserves the right not to proceed with the Issue at
any time after the Bid/Issue Opening Date but before the Allotment of IDRs without assigning any
reason. In the event of withdrawal of this issue, a public notice shall be published in an Englishnational newspaper and a Hindi national newspaper, each with a wide circulation and the Stock
Exchanges shall be informed promptly.
Bid cum Application Form
Bidders are required to submit their Bids through the Syndicate. The Co-BRLM or its affiliate
syndicate members can only process Bids from domestic institutional investors and retail investors.Further, QIB Bids can be procured and submitted only through the BRLMs or their affiliate
syndicate members. In the case of QIB Bidders, the Company, in consultation with the BRLMs, may
reject Bids at the time of acceptance of the Bid cum Application Form. In the case of Non-
Institutional Bidders and Retail Individual Bidders, the Company would have a right to reject the
Bids only on technical grounds.
384
c102100pu090Proof7:28.3.10B/LRevision:0OperatorSadK

Investors should note that the IDRs will be Allotted to all successful Bidders only in dematerialised
form. Bidders will not have the option of being Allotted IDRs in physical form. The IDRs on
Allotment shall be traded only in the dematerialised segment of the Stock Exchanges.
Bidders shall only use the specified Bid cum Application Form bearing the stamp of the Syndicate for
the purpose of making a Bid in terms of the Red Herring Prospectus. The Bidder shall have the
option to make a maximum of three Bids in the Bid cum Application Form and such options shall
not be considered as multiple Bids. Upon the allocation of IDRs, dispatch of the CAN, and filing ofthe Prospectus with the RoC, the Bid cum Application Form shall be considered as the Application
Form.
ASBA Bid cum Application Form
In case of application in physical mode, the Bidder shall submit the ASBA Bid cum Application
Form at the relevant Designated Branch. In case of application in electronic form, the Bidder shall
submit the ASBA Bid cum Application Form either through the internet banking facility available
with the SCSB, or such other electronically enabled mechanism for bidding and blocking funds in the
ASBA Account held with SCSB, and accordingly registering such Bids. ASBA Bid cum Application
Forms should bear the stamp of the Syndicate Member and/or Designated Branch of the concernedSCSB. ASBA Bid cum Application Forms which do not bear the stamp will be rejected.
The prescribed colour of the Bid cum Application Form for various categories is as follows:
Category
Colour of
Bid cum
Application
Form
Resident Indians and eligible NRIs applying on a non-repatriation basis White
Eligible NRIs, FIIs, registered Multilateral and Bilateral Development Financial
Institutions applying on a repatriation basis Blue
Bidders applying through ASBA process [*]
Anchor Investors* [*]
* Bid cum Application forms for Anchor Investors have been made available at the office of the BRLMs.
Upon completing and submitting the Bid cum Application Form to the Syndicate or SCSBs, as the
case may be, the Bidder is deemed to have authorised the Company to make the necessary changes in
the Red Herring Prospectus as would be required for filing with the RoC and as would be required
by the RoC after such filing, without prior or subsequent notice of such changes to the Bidder.
Who can Bid?
* Persons resident in India who are not minors in single or joint names (not more than three);
* HUFs, in the individual name of the Karta. The Bidder should specify that the Bid is being
made in the name of the HUF in the Bid cum Application Form as follows: ‘‘Name of Sole orFirst bidder: XYZ Hindu Undivided Family applying through XYZ, where XYZ is the name of
the Karta’’. Bids by HUFs would be considered at par with those from individuals;
* Companies, corporate bodies and societies registered under the applicable laws in India and
authorised to invest in securities;
* Mutual Funds;
* Eligible NRIs on a repatriation basis or a non-repatriation basis, subject to applicable laws;
* Indian financial institutions, commercial banks (excluding foreign banks), regional rural banks,cooperative banks (subject to RBI regulations and the SEBI Regulations and regulations, as
applicable);
* FIIs and sub-accounts registered with SEBI, subject applicable laws;
* State Industrial Development Corporations;
385
c102100pu090Proof7:28.3.10B/LRevision:0OperatorSadK

* Trusts/societies registered under the Societies Registration Act, 1860, as amended, or under any
other law relating to trusts/societies and who are authorised under their constitution to hold and
invest in securities; and
* Scientific and/or industrial research organisations authorised to invest in securities.
Participation by associates of BRLMs and Syndicate Members
The BRLMs and Syndicate Members shall not be allowed to subscribe to this Issue in any manner
except towards fulfilling their underwriting obligations. However, associates and affiliates of the
BRLMs and Syndicate Members may subscribe to or purchase IDRs, either in the QIB Portion
(excluding Anchor Investors Portion) or in Non-Institutional Portion as may be applicable to such
investors, where the allocation is on a proportionate basis.
The BRLMs and any persons related to the BRLMs cannot apply in the Issue under the AnchorInvestor Portion.
Bids by Mutual Funds
An eligible Bid by a Mutual Fund shall first be considered for allocation proportionately in the
Mutual Fund Portion. In the event that the demand is greater than [*] IDRs, allocation shall be
made to Mutual Funds proportionately, to the extent of the Mutual Fund Portion. The remaining
demand by the Mutual Funds shall, as part of the aggregate demand by QIBs, be available for
allocation proportionately out of the remainder of the QIB Portion, after excluding the allocation in
the Mutual Fund Portion.
One-third of the Anchor Investor Portion shall be reserved for domestic Mutual Funds, subject to
valid Bids being received from domestic Mutual Funds at or above the Anchor Investor Issue Price.
In the case of a Mutual Fund, a separate Bid can be made in respect of each scheme of the Mutual
Fund registered with SEBI and such Bids in respect of more than one scheme of the Mutual Fund
will not be treated as multiple Bids provided that the Bids clearly indicate the scheme concerned for
which the Bid has been made.
No mutual fund scheme shall invest more than 10% of its net asset value in the equity shares or equityrelated instruments of any single company provided that the limit of 10% shall not be applicable for
investments in index funds or sector or industry-specific funds. No Mutual Fund under all its schemes
should own more than 10% of any company’s paid-up share capital carrying voting rights.
Bids by eligible NRIs
1. Bid cum Application Forms will be made available for eligible NRIs at the principal office and
with the Syndicate.
2. Eligible NRI applicants may please note that only such applications as are accompanied by
payment in free foreign exchange shall be considered for Allotment. The eligible NRIs who
intend to make payment through Non-Resident Ordinary (‘‘NRO’’) accounts shall use the form
meant for Resident Indians.
Bids by FIIs
Subject to compliance with all applicable Indian laws, rules, regulations guidelines and approvals in
terms of regulation 15A(1) of the Securities Exchange Board of India (Foreign Institutional Investors)
Regulations 1995, as amended, an FII may invest inter alia in IDRs.
Further RBI has clarified that FII’s are permitted to invest in IDRs in accordance with the terms of
the RBI Circular.
No single individual or single entity or group of entities in India, other than QIBs, shall hold, directly or
indirectly, IDRs exceeding 5% of the Issue. No single QIB or a group of QIBs shall hold IDRs
exceeding 15% of the Issue.
In accordance with the regulations of the RBI, no bank in India shall: (i) grant a loan to any investor
for the purpose of subscribing for any IDRs; or (ii) grant a loan to any person which is secured againstany IDRs.
The above information is given for the benefit of the Bidders. The Company and the BRLMs and Co-
BRLM are not liable for any amendments or modification or changes in applicable laws or regulations
which may occur after the date of this Draft Red Herring Prospectus. Bidders are advised to make their
386
c102100pu090Proof7:28.3.10B/LRevision:0OperatorSadK

own independent investigations and ensure that the number of IDRs bid for do not exceed the applicable
limits under laws or regulations.
Maximum and Minimum Bid Size
(a) For Retail Individual Bidders: The Bid must be for a minimum of [*] IDRs and in multiples of
[*] IDRs thereafter, so as to ensure that the Bid Price payable by the Bidder does not exceed
Rs. 100,000. In the case of revision of Bids, the Retail Individual Bidders must ensure that the
Bid Price does not exceed Rs. 100,000. In the case that the Bid Price is over Rs. 100,000 due to
revision of the Bid or revision of the Price Band or on exercise of the Cut-off option, the Bidwould be considered for allocation under the Non-Institutional Bidders Portion. The Cut-off
option is an option given only to the Retail Individual Bidders indicating their agreement to bid
and purchase at the final Issue Price as determined at the end of the Book Building Process.
(b) For Other Bidders (Non-Institutional Bidders and QIBs): The Bid must be for a minimum
number of IDRs such that the Bid Amount exceeds Rs. 100,000 and in multiples of [*] IDRs
thereafter. A Bid cannot be submitted for more than the Issue size. However, the maximum Bid
by a QIB investor should not exceed the investment limits prescribed for them by applicable
laws. A QIB Bidder cannot withdraw its Bid after the Bid/Issue Closing Date and is required topay the Margin Amount upon submission of the Bid.
In case of revision of Bids, the Non-Institutional Bidders, who are individuals, have to ensure
that the Bid Amount is greater than Rs. 100,000 to be considered for allocation in the Non-
Institutional Portion. In the case that the Bid Amount reduces to Rs. 100,000 or less due to a
revision of Bids or revision of the Price Band, Bids by Non-Institutional Bidders who are
eligible for allocation in the Retail Portion would be considered for allocation under the Retail
Portion. Non-Institutional Bidders and QIBs are not allowed to Bid at ‘Cut-off’.
(c) For Bidders in the Anchor Investor Portion: The Bid must be for a minimum of such number of
IDRs such that the Bid Amount exceeds Rs. 100 million and in multiples of [*] IDRs
thereafter. Bids by Anchor Investors under the Anchor Investor Portion and the QIB Portion
shall not be considered as multiple Bids. Bids cannot be submitted for more than 30% of the
QIB Portion under the Anchor Investor Portion. Anchor Investors cannot withdraw their Bids
after the Anchor Investor Bid/ Issue Period.
Bidders are advised to ensure that any single Bid from them does not exceed the investment limitsor maximum number of IDRs that can be held by them under applicable law or regulation or as
specified in this Draft Red Herring Prospectus.
Information for the Bidders:
(a) The Bid/Issue Opening Date and Bid/Issue Closing Date shall be declared in the Red HerringProspectus to be registered with the RoC and also publish the same in an English national
newspaper and a Hindi national newspaper, each with wide circulation.
(b) The Company will file the Red Herring Prospectus with the RoC at least three Business Days
before the Bid/ Issue Opening Date.
(c) The Syndicate will circulate copies of the Red Herring Prospectus along with the Bid cum
Application Form to potential investors and the copies of the Red Herring Prospectus will also
be available with the SCSBs.
(d) Any investor (who is eligible to invest in the IDRs) who would like to obtain the Red Herring
Prospectus and/or the Bid cum Application Form can obtain the same from the Company’s
principal office or from any of the Syndicate.
(e) Eligible investors who are interested in subscribing for the IDRs should approach any of the
BRLMs and Co-BRLM or Syndicate Members or their authorised agent(s) or SCSBs to register
their Bids. The Co-BRLM or its affiliate syndicate members can only process the Bids from
domestic institutional investors and retail investors.
(f) The Bids should be submitted on the prescribed Bid cum Application Form only. Bid cum
Application Forms (other than the ASBA Bid cum Application Forms) should bear the stamp
of the Syndicate. Bid cum Application Forms which do not bear the stamp of the Syndicate will
be rejected. Physical ASBA Bid cum Application Forms shall be accepted by the Designated
387
c102100pu090Proof7:28.3.10B/LRevision:0OperatorSadK
Branches in accordance with the SEBI Regulations and any circulars issued by SEBI in this
regard. Bidders applying through the ASBA process also have an option to submit the ASBA
Bid cum Application Form in electronic form.
Method and Process of Bidding
(a) The Company and the BRLMs shall declare the Bid/Issue Opening Date and the Bid/Issue
Closing Date in the Red Herring Prospectus with the RoC and also publish the same in two
national newspapers (an English newspaper and a Hindi newspaper, each with a wide
circulation). This information shall also be published on the following website: [*]. This
advertisement shall be in the format prescribed in schedule XX-A to the SEBI Regulations. The
Price Band and the minimum bid lot will be decided by the Company in consultation with theBRLMs and advertised at least one Business Day prior to the Bid/Issue Opening Date. The
Syndicate and the SCSBs shall accept Bids from the Bidders (excluding Anchor Investors)
during the Bid/Issue Period in accordance with the terms of the Syndicate Agreement.
(b) The Bid/Issue Period shall be for a minimum of three Business Days and shall not exceed
10 Business Days. The Bid/Issue Period may be extended, if required, by three additional
Business Days, subject to the total Bid/Issue Period not exceeding 10 Business Days. Any
revision in the Price Band and the revised Bid/Issue Period, if applicable, will be published in
two national newspapers (one each in English and Hindi) and also by indicating the change on
the websites of the BRLMs and Co-BRLM and at the terminals of the Syndicate.
(c) Each Bid cum Application Form will give the Bidder the choice to Bid for up to three optional
prices (for details refer to the paragraph titled ‘‘Bids at Different Price Levels and Revision of
Bids’’ on page 389 of this Draft Red Herring Prospectus) within the Price Band and specify thedemand (i.e. the number of IDRs bid for) in each option. The price and demand options
submitted by the Bidder in the Bid cum Application Form will be treated as optional demands
from the Bidder and will not be cumulated. After determination of the Issue Price, the
maximum number of IDRs Bid for by a Bidder at or above the Issue Price will be considered
for allocation/Allotment and the rest of the Bid(s), irrespective of the Bid Price, will become
automatically invalid.
(d) The Bidder cannot Bid on another Bid cum Application Form after Bids on one Bid cum
Application Form have been submitted to the Syndicate or SCSB. Submission of a second Bid
cum Application Form to either the same or to another Syndicate or SCSB will be treated as
multiple Bids and is liable to be rejected either before entering the Bid into the electronic
bidding system, or at any point in time prior to the allocation or Allotment of IDRs in thisIssue. However, the Bidder can revise the Bid through the Revision Form or ASBA Revision
Form, as the case may be, the procedure for which is detailed under the paragraph titled ‘‘Bids
at Different Price Levels and Revision of Bids’’ on page 389 of this Draft Red Herring
Prospectus.
(e) Except in relation to Bids received from the Anchor Investors, the Syndicate or the SCSB, as
the case may be, will enter each Bid option into the electronic bidding system as a separate Bid
and generate a Transaction Registration Slip (‘‘TRS’’) for each price and demand option and
give the same to the Bidder. Therefore, a Bidder can receive up to three TRSs for each Bid cum
Application Form.
(f) The Syndicate shall accept Bids from all clients/investors who place orders through them and
shall have the right to vet the Bids, subject to the terms of the Syndicate Agreement and the
Red Herring Prospectus, provided that the Co-BRLM and its affiliate Syndicate members canonly process Bids from domestic institutional investors and retail investors.
(g) The BRLMs shall accept Bids from the Anchor Investors during the Anchor Investor Bid/ IssuePeriod i.e. one Business Day prior to the Bid/ Issue Opening Date. Bids by Anchor Investors
under the Anchor Investor Portion and the QIB Portion shall not be considered as multiple
Bids.
(h) Along with the Bid cum Application Form, all Bidders (other than those applying through
ASBA process) will make payment in the Escrow Account(s) in the manner described under the
paragraph titled ‘‘Escrow Mechanism for Bidders other than those applying through ASBA
process’’ on page 395 of this Draft Red Herring Prospectus.
388
c102100pu090Proof7:28.3.10B/LRevision:0OperatorSadK

(i) Upon receipt of the ASBA Bid cum Application Form, submitted whether in physical or
electronic mode, the Designated Branch of the SCSB shall verify if sufficient funds equal to the
Bid Amount are available in the ASBA Account, as mentioned in the ASBA Bid cum
Application Form, prior to uploading such Bids with the Stock Exchanges.
(j) If sufficient funds are not available in the ASBA Account, the Designated Branch of the SCSB
shall reject such Bids and shall not upload such Bids with the Stock Exchanges.
(k) If sufficient funds are available in the ASBA Account, the SCSB shall block an amount
equivalent to the Bid Amount mentioned in the ASBA Bid cum Application Form and willenter each Bid option into the electronic bidding system as a separate Bid and generate a TRS
for each price and demand option. The TRS shall be furnished to such Bidder on request.
(l) The Bid Amount shall remain blocked in the aforesaid ASBA Account until finalisation of the
Basis of Allocation and consequent transfer of the Bid Amount against the allocated IDRs to
the Public Issue Account, or until withdrawal/failure of the Issue or until withdrawal/rejection of
the ASBA Bid cum Application Form, as the case may be. Once the Basis of Allocation is
finalized, the Registrar to the Issue shall send an appropriate request to the Controlling Branchof the SCSB for unblocking the relevant ASBA Accounts and for transferring the amount
allocable to the successful Bidders to the Public Issue Account. In case of withdrawal/failure of
the Issue, the blocked amount shall be unblocked on receipt of such information from the
Registrar to the Issue.
Bids at Different Price Levels and Revision of Bids
(a) The Bidders can Bid at any price within the Price Band, in multiples of Rs. 1 (One). The Price
Band and the minimum bid lot will be decided by the Company in consultation with the
BRLMs and advertised at least one Business Day prior to the Bid/Issue Opening Date.
(b) The Company, in consultation with the BRLMs, reserves the right to revise the Price Band
during the Bid/Issue Period. The cap on the Price Band should not be more than 20% of the
Floor Price of the Price Band. Subject to compliance with the immediately preceding sentence,the floor of the Price Band can move up or down to the extent of 20% of the floor of the Price
Band. In case of revision of the Price Band, the Bid/Issue Period will be extended subject to the
total Bid/Issue Period not exceeding 10 Business Days. Any revision in the Price Band and the
revised Bid/Issue Period, if applicable, will be widely disseminated by notification to the Stock
Exchanges by issuing a press release and also by indicating the changes on the websites of the
BRLMs and Co-BRLM.
(c) The Company, in consultation with the BRLMs, will finalise the Issue Price within the PriceBand in accordance with this clause, without the prior approval of, or intimation to, the
Bidders.
(d) The Company, in consultation with the BRLMs, will finalise the Anchor Investor Issue Price
within the Price Band in accordance with this clause, without the prior approval of, or
intimation, to the Anchor Investors.
(e) The Bidder can Bid at any price within the Price Band. The Bidder has to Bid for the desired
number of IDRs at a specific price. Retail Individual Bidders may bid at the Cut-off Price.
However, bidding at the Cut-off Price is prohibited for QIBs and Non-Institutional Bidders and
such Bids from QIBs and Non-Institutional Bidders shall be rejected.
(f) Retail Individual Bidders, who Bid at the Cut-off Price, agree that they shall purchase the IDRs
at any price within the Price Band. Retail Individual Bidders other than those applying throughASBA process shall submit the Bid cum Application Form along with a cheque/demand draft
for the Bid Amount based on the cap of the Price Band with the Syndicate. In the event the
Bid Amount is higher than the subscription amount payable by the Retail Individual Bidders,
who had Bid at the Cut-off Price, they shall receive the refund of the excess amounts from the
respective Refund Account. In case of Retail Individual Bidders submitting ASBA Bid cum
Application Form bidding at Cut-off Price, such Bidders shall instruct the SCSBs to block an
amount based on the cap of the Price Band.
(g) In the case of an upward revision in the Price Band announced as above, Retail Individual
Bidders who had Bid at Cut-off Price could either (i) revise their Bid, or (ii) make additional
payment based on the cap of the revised Price Band (such that the total amount, i.e. original
Bid Amount plus additional payment, does not exceed Rs. 100,000 if the Bidder wants to
389
c102100pu090Proof7:28.3.10B/LRevision:0OperatorSadK

continue to Bid at Cut-off Price), with the Syndicate or the SCSBs to whom the original Bid
was submitted. In the case of the total amount (i.e. original Bid Amount plus additional
payment) exceeding Rs. 100,000, the Bid will be considered for allocation under the Non-
Institutional Portion in terms of the Red Herring Prospectus. If, however, the Bidder does noteither revise the Bid or make additional payment and the Issue Price is higher than the cap of
the Price Band prior to the revision, the number of IDRs Bid for shall be adjusted downwards
for the purpose of allocation, such that no additional payment would be required from the
Bidder and the Bidder is deemed to have approved such revised Bid at Cut-off Price.
(h) In the case of a downward revision in the Price Band, announced as above, Retail Individual
Bidders who have Bid at the Cut-off Price could revise their Bid, or the excess amount paid at
the time of bidding would be refunded from the Refund Account (or in the case of ASBA Bids,
the SCSB shall unblock the additional amount).
(i) In the event of any revision in the Price Band, whether upwards or downwards, the minimum
application size shall remain [*] IDRs.
(j) Revisions can be made in both the desired number of IDRs and the Bid price by using the
Revision Form or the ASBA Revision Form, as the case may be. Apart from mentioning the
revised options in the Revision Form or the ASBA Revision Form, as the case may be, the
Bidder must also enter the details of all the options in his or her Bid cum Application Form or
earlier Revision Form or the ASBA Revision Form, as the case may be. For example, if a
Bidder has Bid for three options in the Bid cum Application Form and such Bidder is changing
only one of the options in the Revision Form or the ASBA Revision Form, as the case may be,
such Bidder must still fill the details of the other two options that are not being revised in theRevision Form or the ASBA Revision Form, as the case may be. The Syndicate or the SCSBs
will not accept incomplete or inaccurate Revision Forms or ASBA Revision Forms, as the case
may be.
(k) The Bidder can make this revision any number of times during the Bid/Issue Period. However,for any revision(s) in the Bid, the Bidders will have to use the services of the same Syndicate or
the SCSB through whom such Bidder had placed the original Bid.
(l) Bidders are advised to retain copies of the blank Revision Form or the ASBA Revision Form,as the case may be and the revised Bid must be made only in such Revision Form or the ASBA
Revision Form, as the case may be or copies thereof.
(m) Any revision of the Bid (other than ASBA Bids) shall be accompanied by payment in the form
of a cheque or demand draft for the incremental amount, if any, to be paid on account of theupward revision of the Bid. With respect to the ASBA Bids, if revision of the Bids results in an
incremental amount, the SCSB shall block the additional Bid Amount. The excess amount, if
any, resulting from downward revision of the Bid would be returned to the Bidder (or, in the
case of ASBA Bids, the SCSB shall unblock the additional amount) at the time of refund in
accordance with the terms of the Red Herring Prospectus. In the case of QIB Bidders, the
Syndicate shall collect the payment in the form of a cheque or demand draft for the incremental
amount in the QIB Margin Amount, if any, to be paid on account of the upward revision of
the Bid at the time of one or more revisions by the QIB Bidders.
(n) When a Bidder revises his or her Bid, he or she shall surrender the earlier TRS and get a
revised TRS from the Syndicate or the SCSB, as applicable. It is the responsibility of the Bidder
to request and obtain the revised TRS, which will act as proof of his or her having revised theprevious Bid.
(o) Only Bids that are uploaded on the online IPO system of the Stock Exchanges shall be
considered for allocation/ Allotment. In case of discrepancy of data between the online IPO
system and the physical Bid cum Application Form, the decision of the Company inconsultation with the BRLMS based on the physical records of Bid Application Forms shall be
final and binding on all concerned.
(p) In case of ASBA Bids, SCSBs shall provide aggregate information about the numbers of ASBABid cum Application Forms uploaded, total number of IDRs and total amount blocked against
the uploaded ASBA Bid cum Application Forms and other information pertaining to the
Bidders to the Registrar to the Issue. The Registrar to the Issue shall reconcile the electronic
data received from the Stock Exchanges and the information received from the SCSBs. In the
event of any error or discrepancy, the Registrar to the Issue shall inform the concerned SCSB of
390
c102100pu090Proof7:28.3.10B/LRevision:0OperatorSadK

the same. The concerned SCSB shall be responsible to provide the rectified data within the time
stipulated by the Registrar to the Issue. Further, the decision of the Company in consultation
with the BRLMs and the Registrar to the Issue and the Company, in the regard shall be final
and binding.
Electronic Registration of Bids
(a) The Syndicate and the SCSBS will register the Bids using the online facilities of the Stock
Exchanges. There will be at least one online connectivity in each city, where a stock exchange islocated in India and where Bids are being accepted.
(b) The Stock Exchanges will offer an electronic facility for registering Bids for the Issue. This
facility will be available on the terminals of the Syndicate and their authorised agents during the
Bid/Issue Period. Syndicate Members and the Designated Branches can also set up facilities for
off-line electronic registration of Bids subject to the condition that they will subsequently upload
the off-line data file into the online facilities for Book Building on a regular basis. On the Bid/
Issue Closing Date, the Syndicate shall upload the Bids until such time as may be permitted by
the Stock Exchanges. Bidders are cautioned that a high inflow of Bids typically experienced on
the last day of bidding may lead to some Bids received on the last day not being uploaded dueto lack of sufficient uploading time, and such Bids that could not be uploaded may not be
considered for allocation.
(c) The aggregate demand and price for Bids registered on the electronic facilities of the Stock
Exchanges will be uploaded and displayed online at all bidding centres and on the websites of
the Stock Exchanges. A graphical representation of consolidated demand and price will be made
available at the bidding centres during the Bid/Issue Period.
(d) At the time of registering each Bid, the Syndicate shall enter the following details of the investor
in the online system:
(i) name of the Bidder;
(ii) investor category – Individual, Corporate, NRI, FII or Mutual Fund etc.;
(iii) numbers of IDRs Bid for;
(iv) Bid Amount;
(v) Bid cum Application Form number;
(vi) whether the Margin Amount, as applicable, has been paid upon submission of Bid cumApplication Form; and
(vii) DP ID number and Client Identification Number of the beneficiary account of the Bidder.
With respect to ASBA Bids, at the time of registering each Bid, the Designated Branches of the
SCSBs shall enter the following information pertaining to the Bidder into the electronic bidding
system:
* Name of the Bidder(s);
* Application Number;
* PAN;
* Number of IDRs Bid for; and
* DP ID number and Client Identification Number of the beneficiary account of the Bidder.
(e) A system generated TRS will be given to the Bidder as proof of the registration of each of the
bidding options. It is the Bidder’s responsibility to obtain the TRS from the Syndicate or the
Designated Branches. The registration of the Bid by the Syndicate or the Designated Branches
does not guarantee that the IDRs shall be allocated either by the Syndicate or the DesignatedBranches or the Company.
(f) Such TRS will be non-negotiable and by itself will not create any obligation of any kind.
(g) In the case of QIB Bidders, the Syndicate other than the Co-BRLM also have the right to
accept the Bid or reject it. However, such rejection should be made at the time of receiving the
Bid and only after assigning a reason for such rejection in writing. In the case of Non-
Institutional Bidders and Retail Individual Bidders who Bid, Bids will not be rejected except for
grounds listed on page 397 of this Draft Red Herring Prospectus.
391
c102100pu090Proof7:28.3.10B/LRevision:0OperatorSadK

(h) The permission given by the Stock Exchanges to use their network and the software of the
online system should not in any way be deemed or construed to mean that the compliance with
various statutory and other requirements by the Company and/or the BRLMs and Co-BRLM is
cleared or approved by the Stock Exchanges; nor does it in any manner warrant, certify orendorse the correctness or completeness of any of the compliance with the statutory and other
requirements; nor does it take any responsibility for the financial or other soundness of the
Company, its management or any scheme or project of the Company.
(i) It is also to be distinctly understood that the approval given by the Stock Exchanges should not
in any way be deemed or construed as if this Draft Red Herring Prospectus has been cleared or
approved by the Stock Exchanges; nor does it in any manner warrant, certify or endorse the
correctness or completeness of any of the contents of this Draft Red Herring Prospectus; nor
does it warrant that the IDRs will be listed or will continue to be listed on the Stock
Exchanges.
(j) Details of Bids in the Anchor Investor Portion will not be registered on the electronic facilities
of the Stock Exchanges.
Build-up of the Book
(a) Bids registered by various Bidders through the Syndicate and the SCSBs shall be electronically
transmitted to the Stock Exchanges mainframe on a regular basis.
(b) The book gets built up at various price levels. This information will be available with the
BRLMs and Co-BRLM on a regular basis.
(c) During the Bid/Issue Period, any Bidder who has registered his or her interest in the IDRs at a
particular price level is free to revise his or her Bid within the Price Band using the printed
Revision Form or the ASBA Revision Form, as the case may be, which is a part of the Bid
cum Application Form or the ASBA Bid cum Application Form.
GENERAL INSTRUCTIONS
Dos:
* Check if you are eligible to apply.
* Ensure that you have Bid within the Price Band;
* Read all the instructions carefully and complete the Bid cum Application Form.
* Ensure that the details about the Settlement Depository Participant and the beneficiary account
number are correct as Allotment of IDRs will be in dematerialised form only.
* Ensure that the Bids are submitted at the bidding centres only on forms bearing the stamp of
the Syndicate or with respect to ASBA Bids, ensure that your Bid is submitted at a Designated
Branch of the SCSB where such Bidder or the person whose bank account will be utilised by
the Bidder for bidding has a bank account.
* Details of Bids in the Anchor Investor Portion will not be registered on the online facilities of
electronic facilities of the Stock Exchanges.
* Ensure that you have been given a TRS for all your Bid options.
* Ensure that you have funds equal to the Bid Amount in your bank account maintained with the
SCSB before submitting the ASBA Bid cum Application Form to the respective Designated
Branch of the SCSB;
* Instruct your respective banks to not release the funds blocked in the bank account under theASBA process;
* Submit revised Bids to the same Syndicate or the SCSBs, as the case may be through whom the
original Bid was placed and obtain a revised TRS.
* Except for Bids submitted on behalf of the Central Government or the State Government and
officials appointed by a court, all Bidders should mention their PAN allotted under the Income
Tax Act.
* Ensure that the Demographic Details (as defined hereinbelow) are updated, true and correct in
all respects.
392
c102100pu090Proof7:28.3.10B/LRevision:0OperatorSadK

* Ensure that the name(s) given in the Bid cum Application Form is exactly the same as the
name(s) in which the beneficiary account is held with the Settlement Depository Participant. In
case the Bid cum Application Form is submitted in joint names, ensure that the beneficiary
account is also held in the same joint names and such names are in the same sequence as theyappear in the Bid cum Application Form.
Don’ts:
* Do not Bid for lower than the minimum Bid size.
* Do not submit a Bid through ASBA process if you are a QIB.
* Do not Bid/revise Bid price to less than the Floor Price or higher than the Cap Price.
* Do not Bid on another Bid cum Application Form after you have submitted a Bid to
the Syndicate or the SCSBs.
* Do not pay the Bid Amount in cash, by money order, by postal order or by stockinvest.
* Do not send Bid cum Application Forms by post; instead submit the same to the Syndicate or
the SCSBs only.
* Do not submit the GIR number instead of the PAN.
* Do not Bid at Cut-off Price (for QIB Bidders and Non-Institutional Bidders where Bid Amount
exceeds Rs. 100,000).
* Do not fill in the Bid cum Application Form such that the number of IDRs bid for exceeds theIssue size and/or investment limit or maximum number of IDRs that can be held under the
applicable laws or regulations or maximum amount permissible under the applicable regulations.
* Do not Bid for a Bid Amount exceeding Rs. 100,000 (for Bids by Retail Individual Bidders).
* Do not submit the Bid without the QIB Margin Amount in case of Bids by a QIB.
INSTRUCTIONS FOR COMPLETING THE BID CUM APPLICATION FORM
Bids and revisions of Bids must be:
(a) Made only in the prescribed Bid cum Application Form or Revision Form or the ASBA
Revision Form, as applicable.
(b) Completed in full, in capital letters in English and in accordance with the instructions contained
herein, in the Bid cum Application Form or the Revision Form or ASBA Revision Form.
Incomplete Bid cum Application Forms or Revision Forms or ASBA Revision Forms are liable
to be rejected.
(c) For Retail Individual Bidders, the Bid must be for a minimum of [*] IDRs and in multiples of[*] IDRs thereafter subject to a maximum Bid Amount of Rs. 100,000.
(d) For Non-Institutional Bidders and QIB Bidders, Bids must be for a minimum of such number
of IDRs that the Bid Amount exceeds or is equal to Rs. 100,000 and in multiples of [*] IDRs
thereafter. Bids cannot be made for more than the Issue size. Bidders are advised to ensure that
a single Bid from them should not exceed the investment limits or maximum number of shares
that can be held by them under the applicable laws or regulations.
(e) For Ancher Investors, Bids must be for a minimum of such member of IDRs that the Bid
Amount exceeds as is equal to Rs. 100 million and in multiples of [*] IDRs thereafter.
(f) In a single name or in joint names (not more than three, and in the same order as theirSettlement Depository Participant details).
(g) Thumb impressions and signatures other than in the languages specified in the Eighth Schedule
to the Constitution of India must be attested by a Magistrate or a Notary Public or a Special
Executive Magistrate under official seal.
Bidder’s Settlement Depository Participant Account and Bank Account Details
Bidders should note that on the basis of name of the Bidders, Settlement Depository Participant’s
name, DP ID and beneficiary account number provided by them in the Bid cum Application Form,
the Registrar to the Issue will obtain from the Settlement Depository the demographic details
including address, Bidders bank account details, MICR Code and occupation (hereinafter referred to
as the (‘‘Demographic Details’’). These bank account details would be used for giving refunds
393
c102100pu090Proof7:28.3.10B/LRevision:0OperatorSadK

including through physical refund warrants, direct credit, ECS, NEFT and RTGS) or unblocking of
ASBA Account. Hence, Bidders are advised to immediately update their bank account details as
appearing on the records of the Settlement Depository Participant. Please note that failure to do so
could result in delays in dispatch/credit of refunds to Bidders or unblocking of ASBA Account at theBidders’ sole risk and neither the BRLMs and Co-BRLM, the Registrar to the Issue, or the Escrow
Collection Banks or the SCSBs nor the Company shall have any responsibility and undertake any
liability for the same. Hence, Bidders should carefully fill in their Settlement Depository Account
details in the Bid cum Application Form.
IT IS MANDATORY FOR ALL THE BIDDERS TO GET THEIR IDRs IN DEMATERIALISEDFORM. ALL BIDDERS SHOULD MENTION THEIR SETTLEMENT DEPOSITORY
PARTICIPANT’S NAME, SETTLEMENT DEPOSITORY PARTICIPANT IDENTIFICATION
NUMBER AND BENEFICIARY ACCOUNT NUMBER IN THE BID CUM APPLICATION
FORM. INVESTORS MUST ENSURE THAT THE NAME GIVEN IN THE BID CUM
APPLICATION FORM IS EXACTLY THE SAME AS THE NAME IN WHICH THE
SETTLEMENT DEPOSITORY ACCOUNT IS HELD. IN CASE THE BID CUM APPLICATION
FORM IS SUBMITTED IN JOINT NAMES, IT SHOULD BE ENSURED THAT THE
SETTLEMENT DEPOSITORY ACCOUNT IS ALSO HELD IN THE SAME JOINT NAMESAND ARE IN THE SAME SEQUENCE IN WHICH THEY APPEAR IN THE BID CUM
APPLICATION FORM.
These Demographic Details will be used for all correspondence with the Bidders including mailing of
the CANs/allocation advice and printing of bank particulars on the refund orders or for refunds
through electronic transfer of funds, as applicable. The Demographic Details given by Bidders in the
Bid cum Application Form would not be used for any other purpose by the Registrar to the Issue.
By signing the Bid cum Application Form, the Bidder will be deemed to have authorised the
Depositories to provide, upon request, to the Registrar to the Issue, the required Demographic
Details as available in its records.
Refund orders allocation advise/CAN would be mailed at the address of the Bidder as per theDemographic Details received from the Depositories. Bidders may note that delivery of refund orders/
allocation advice/CANs may get delayed if the same, once sent to the address obtained from the
Settlement Depositories, are returned undelivered. In such an event, the address and other details
given by the Bidder (other than those applying through ASBA process) in the Bid cum Application
Form would be used only to ensure dispatch of refund orders. Please note that any such delay shall
be at such Bidders’ sole risk and neither the Company, the Registrar to the Issue, Escrow Collection
Bank(s) nor the BRLMS and Co-BRLM shall be liable to compensate such Bidder for any losses
caused to such Bidder due to any such delay or liable to pay any interest for such delay.
In the case no corresponding record is available with the Settlement Depositories which matches three
parameters, namely names of the Bidders (including the order of names of joint holders), the DP ID
and the beneficiary’s identity, then such Bids are liable to be rejected.
The Company, in its absolute discretion, reserves the right to permit the holder of the power ofattorney to request the Registrar to the Issue that for the purpose of printing particulars on the
refund order and mailing of the refund order/CANs/allocation advice/refunds through electronic
transfer of funds, the Demographic Details given on the Bid cum Application Form should be used
(and not those obtained from the Settlement Depository of the Bidder). In such cases, the Registrar
to the Issue shall use the Demographic Details as given in the Bid cum Application Form instead of
those obtained from the Settlement Depositories.
Refunds, dividends and other distributions, if any, will be payable in INR. only and net of Depository
charges and/or commission.
As per the RBI regulations, OCBs are not permitted to participate in the Issue.
Bids under Power of Attorney
In the case of Bids made pursuant to a power of attorney or by limited companies, corporate bodiesor registered societies, a certified copy of the power of attorney or the relevant resolution or
authority, as the case may be, along with a certified copy of the Memorandum and Articles and/or
by-laws, must be lodged along with the Bid cum Application Form. Failing this, the Company
reserves the right to accept or reject any Bid in whole or in part, in either case without assigning any
reason therefor.
394
c102100pu090Proof7:28.3.10B/LRevision:0OperatorSadK

In the case of Bids made pursuant to a power of attorney by FIIs, a certified copy of the power of
attorney or the relevant resolution or authority, as the case may be, along with a certified copy of
their SEBI registration certificate must be lodged along with the Bid cum Application Form. Failing
this, the Company reserves the right to accept or reject any Bid in whole or in part, in either casewithout assigning any reason therefor.
In the case of Bids made by provident funds with minimum corpus of Rs. 250 million (subject to
applicable law) and pension funds with minimum corpus of Rs. 250 million, a certified copy of a
certificate from a chartered accountant certifying the corpus of the provident fund/pension fund must
be lodged along with the Bid cum Application Form. Failing this, the Company reserves the right to
accept or reject any Bid in whole or in part, in either case without assigning any reason therefor.
The Company, in its absolute discretion, reserves the right to relax the above condition of
simultaneous lodging of the power of attorney along with the Bid cum Application Form, subject to
such terms and conditions that the Company and the BRLMs may deem fit.
PAYMENT INSTRUCTIONS
Escrow Mechanism for Bidders other than those applying through ASBA process
(a) The Company and the Syndicate shall open Escrow Accounts with one or more Escrow
Collection Bank(s) in whose favour the Bidders shall make the cheque or demand draft inrespect of his/her Bid or revision of Bid, Cheques or demand drafts received for full Bid
Amount from Bidders in a certain category would be deposited in the Escrow Account.
(b) The Escrow Collection Bank(s) will act in terms of the Red Herring Prospectus and the Escrow
Agreement. The Escrow Collection Bank(s) for and on behalf of the Bidders shall maintain the
monies in the Escrow Account. The Escrow Collection Bank(s) shall not exercise any lien
whatsoever over the monies deposited therein and shall hold the monies therein in trust for the
Bidders. On the Designated Date, the Escrow Collection Bank(s) shall transfer funds from the
Escrow Account, as applicable, into the Public Issue Account with the Banker(s) to the Issue.
The balance amount in the Escrow Account after transfer to the Public Issue Account shall betransferred to the Refund Account. Payments of refund to the Bidders shall also be made from
the Refund Account are per the terms of the Escrow Agreement and this Draft Red Herring
Prospectus.
(c) The Bidders should note that the escrow mechanism is not prescribed by the SEBI and has been
established as an arrangement between the Company, the Syndicate, the Escrow Collection
Bank(s) and the Registrar to the Issue to facilitate collections from the Bidders.
(d) Each Bidder shall draw a cheque or demand draft for the amount payable on the Bid and/or on
allocation/Allotment as per the following terms:
(i) QIB Bidders shall provide the applicable Margin Amount, with the submission of the Bid
cum Application Form. The Margin Amount payable by each category of Bidders ismentioned under the section titled ‘‘Issue Structure’’ on pages 383 and 384 of this Draft
Red Herring Prospectus.
(ii) The Bidders for whom the applicable Margin Account is equal to 100%, shall, with the
submission of the Bid cum Application Form draw a payment instrument for the Bid
Amount in favour of the Escrow Account and submit the same to the Syndicate.
(iii) Where the Margin Amount paid by the QIB Bidder is less than the Issue Price multiplied
by the IDRs Allotted to such QIB Bidders, the balance amount shall be payable by such
QIB Bidder within the period specified in the CAN which shall be subject to a minimum
period of two Business Days from the date of communication of the allocation list to theSyndicate by the BRLMs. If the payment is not made favouring the Escrow Account
within the time stipulated above, the Bid of the QIB Bidder is liable to be cancelled.
(iv) The payment instruments for payment into the Escrow Account should be drawn in favour
of:
(a) In case of resident QIB Bidders: ‘‘[*]’’
(b) In case of non-resident QIB Bidders: ‘‘[*]’’
(c) In case of resident Retail and Non-Institutional Bidders: ‘‘[*]’’
(d) In case of non-resident Retail and Non-Institutional Bidders: ‘‘[*]’’
395
c102100pu090Proof7:28.3.10B/LRevision:0OperatorSadK

(v) Anchor Investors would be required to pay the Anchor Investor Margin Amount at the
time of submission of the Bid cum Application Form and the balance (calculated by
reference to the Issue Price multiplied by the IDRs Allotted to such Anchor Investors)
shall be payable within two days of the Bid/ Issue Closing Date. In the event of IssuePrice being higher than the price at which allocation is made to Anchor Investors, the
Anchor Investors shall be required to pay such additional amount to the extent of shortfall
between the price at which allocation is made to them and the Issue Price. If the Issue
Price is lower than the price at which allocation is made to Anchor Investors, the amount
in excess of the Issue Price paid by Anchor Investors shall not be refunded to them.
(vi) For Anchor Investors, the payment instruments for payment into the Escrow Account
should be drawn in favour of:
(a) In case of resident Anchor Investors: ‘‘[*]’’
(b) In case of non-resident Anchor Investors: ‘‘[*]’’
(vii) In case of Bids by NRIs applying on repatriation basis, the payments must be madethrough Indian Rupee drafts purchased abroad or cheques or bank drafts, for the amount
payable on application remitted through normal banking channels or out of funds held in
Non-Resident External (‘‘NRE’’) Accounts or Foreign Currency Non-Resident (‘‘FCNR’’)
Accounts, maintained with banks authorised to deal in foreign exchange in India, along
with documentary evidence in support of the remittance. Payment will not be accepted out
of Non-Resident Ordinary (NRO) Account of Non-Resident Bidder bidding on a
repatriation basis. Payment by drafts should be accompanied by bank certificate confirming
that the draft has been issued by debiting to NRE Account or FCNR Account.
(viii) In case of Bids by FIIs, the payment should be made out of funds held in [*] along withdocumentary evidence in support of the remittance. Payment by drafts should be
accompanied by a bank certificate confirming that the draft has been issued by debiting to
[*].
(ix) On the Designated Date and no later than 15 days from the Bid/Issue Closing Date, the
Escrow Collection Bank(s) shall also refund all amounts payable to unsuccessful Bidders
(other than those applying through ASBA process) and also the excess amount paid on the
Bid, if any, after adjusting for allocation/Allotment to such Bidders.
(x) Payments should be made by cheque or demand draft drawn on any bank (including a
Co-operative bank), which is situated at, and is a member of or sub-member of, thebankers’ clearing house located at the centre where the Bid cum Application Form is
submitted. Outstation cheques/bank drafts drawn on banks not a member or sub member
of the banker’s clearing house will not be accepted and applications accompanied by such
cheques or bank drafts are liable to be rejected. Cash/stockinvest/money orders/postal
orders will not be accepted.
Payment by stockinvest cash/money order
Payment through stockinvest cash/money order will not be accepted in this Issue.
OTHER INSTRUCTIONS
Joint Bids in the case of Individuals
Bids may be made in single or joint names (not more than three). In the case of joint Bids, all
payments will be made out in favour of the Bidder whose name appears first in the Bid cum
Application Form or Revision Form. All communications will be addressed to the First Bidder and
will be dispatched to his or her address as per the Demographic Details received from the Settlement
Depository.
Multiple Bids
A Bidder should submit only one Bid (and not more than one) for the total number of IDRs
required. Two or more Bids will be deemed to be multiple Bids if the sole or First Bidder is one and
the same.
In this regard, the procedures which would be followed by the Registrar to the Issue to detect
multiple applications are given below:
396
c102100pu090Proof7:28.3.10B/LRevision:0OperatorSadK

* All applications are electronically strung on first name, address (first line) and applicant’s status.
Further, these applications are electronically matched for common first name and address and, if
matched, these are checked manually for age, signature and father/husband’s name to determine
if they are multiple applications.
* Applications which do not qualify as multiple applications as per the above procedure are
further checked for common DP ID/beneficiary ID. In the case of applications with common
DP ID/beneficiary ID, they are manually checked to eliminate the possibility of data entry error
to determine if they are multiple applications.
* Applications which do not qualify as multiple applications as per the above procedure are
further checked for common PAN. All such matched applications with common PAN are
manually checked to eliminate possibility of data capture error to determine if they are multiple
applications.
* In the case of a Mutual Fund, a separate Bid can be made in respect of each scheme of the
Mutual Fund registered with the SEBI and such Bids in respect of more than one scheme of the
Mutual Fund will not be treated as multiple Bids provided that the Bids clearly indicate the
scheme concerned for which the Bid has been made.
* In cases where there are more than 20 valid applications having a common address, such IDRs
will be kept in abeyance, post-Allotment and released on confirmation of ‘‘know your client’’
norms by the depositories.
The Company reserves the right to reject, in its absolute discretion, all or any multiple Bids in any or
all categories.
Permanent Account Number
The Bidder or, in the case of a Bid in joint names, each of the Bidders, should mention his/her PAN
allotted under the Income Tax Act. In accordance with the SEBI Regulations, the PAN would be the
sole identification number for participants transacting in the securities market, irrespective of theamount of transaction. Any Bid cum Application Form without the PAN is liable to be rejected. It is
to be specifically noted that Bidders should not submit the GIR number instead of the PAN as the Bid is
liable to be rejected on this ground.
RIGHT TO REJECT BIDS
In the case of QIB Bidders, the Company in consultation with the BRLMs may reject Bids providedthat the reasons for rejecting the same shall be provided to such Bidders in writing. In the case of
Non-Institutional Bidders and Retail Individual Bidders who Bid, the Company has a right to reject
Bids based on technical grounds.
GROUNDS FOR TECHNICAL REJECTION
Bidders are advised to note that Bids are liable to be rejected, inter alia, on the following technicalgrounds:
* the amount paid does not tally with the amount payable for the highest value of IDRs Bid for;
* age of first Bidder not given;
* in the case of partnership firms, IDRs may be registered in the names of the individual partners
and no firm as such shall be entitled to apply;
* Bids by persons not competent to contract under the Indian Contract Act, 1872 including
minors and insane persons;
* PAN not mentioned in the Bid cum Application Form;
* GIR number furnished instead of PAN;
* Bids for lower number of IDRs than specified for that category of investors;
* Bids at a price less than the Floor Price;
* Bids at a price more than the Cap Price;
* submission of more than five ASBA Bid cum Application Forms per bank account;
* Bids at the Cut-off Price by Non-Institutional and QIB Bidders;
* Bids for number of IDRs which are not in multiples of [*];
397
c102100pu090Proof7:28.3.10B/LRevision:0OperatorSadK

* category not ticked;
* multiple Bids as defined in this Draft Red Herring Prospectus;
* in the case of Bids under power of attorney or by limited companies, corporate, trust etc.,
relevant documents are not submitted;
* Bids accompanied by stockinvest/money order/postal order/cash;
* signature of sole and/or joint Bidders missing;
* Bid cum Application Forms do not have the stamp of the BRLMs and Co-BRLM or SyndicateMembers or the SCSB;
* Bid cum Application Forms do not have Bidder’s Settlement Depository account details;
* Bid cum Application Forms are not delivered by the Bidders within the time prescribed as per
the Bid cum Application Forms, Bid/Issue Opening Date advertisement and the Red HerringProspectus and as per the instructions in the Red Herring Prospectus and the Bid cum
Application Forms;
* with respect to ASBA Bids, inadequate funds in the ASBA Account to block the Bid Amount
specified in the ASBA Bid cum Application Form;
* in the case that no corresponding record is available with the depositories that matches threeparameters, namely, the names of the Bidders (including the order of names of joint holders),
the DP ID and the beneficiary’s account number;
* Bids for amounts greater than the maximum permissible amounts prescribed by the regulations;
* Bids where clear funds are not available in the Escrow Account as per the final certificate fromthe Escrow Collection Bank(s);
* Bids in respect whereof the Bid cum Application Form do not reach the Registrar to the Issueprior to the finalisation of the Basis of Allotment;
* Bids by QIBs not submitted through the Syndicate;
* Bids by OCBs;
* Bids not duly signed by the sole/joint Bidders;
* Bids by persons prohibited from buying, selling or dealing in the Shares directly or indirectly by
the SEBI or any other regulatory authority; and
* Bids by persons who are not eligible to acquire IDRs of the Company in terms of all applicable
laws, rules, regulations, guidelines and approvals.
* in case of ASBA Bids, if Bids have been made by QIBs.
Price Discovery and allocation
1. After the Bid/Issue Closing Date, the BRLMs will analyse the demand generated at various
price levels.
2. The Company in consultation with the BRLMs shall finalise the Issue Price.
3. The allotment to QIBs will be at least 50% of the Issue on a proportionate basis. The Company
may allocate up to 30% of the QIB Portion to Anchor Investors at the Anchor Investor Price
on a discretionary basis, out of which at least one-third will be available for allocation to
domestic Mutual Funds only. 5% of the QIB Portion (excluding the Anchor Investor Portion)
shall be available for allocation on a proportionate basis to Mutual Funds only. The remainder
of the QIB Portion shall be available for allocation on a proportionate basis to QIBs, subject to
valid Bids being received from them at or above the Issue Price.
Not less than 20% of the Issue shall be available for allocation on a proportionate basis to
Non-Institutional Bidders and not less than 30% of the Issue shall be available for allocation ona proportionate basis to Retail Individual Bidders, in a manner specified in the SEBI
Regulations and the Red Herring Prospectus, in consultation with the Designated Stock
Exchange and subject to valid Bids being received at or above the Issue Price.
4. Under-subscription, if any, in any category, except the QIB Portion, would be allowed to be
met with spill-over from any other category or combination of categories at the discretion of the
Company in consultation with the BRLMs and the Designated Stock Exchange. If at least 50%
of the Issue is not Alloted to the QIBs, the entire subscription monies shall be refunded.
398
c102100pu090Proof7:28.3.10B/LRevision:0OperatorSadK

5. The BRLMs, in consultation with the Company, shall notify the Syndicate of the Issue Price
and allocations to their respective Bidders, where the full Bid Amount has not been collected
from the Bidders.
6. The Company reserves the right to cancel the Issue at any time after the Bid/Issue Opening
Date without assigning any reasons whatsoever. Under the terms of the SEBI Regulations, QIB
Bidders shall not be allowed to withdraw their Bid after the Bid/Issue Closing Date. Further
Anchor Investors shall not be allowed to withdraw their Bids after the Anchor Investor Bid/
Issue Period.
7. The Allotment details shall be put on the website of the Registrar to the Issue.
Signing of the Underwriting Agreement and the RoC Filing
1. The Company, the BRLMs and the Syndicate Members shall enter into an Underwriting
Agreement on finalisation of the Issue Price.
2. After signing the Underwriting Agreement, the Company will update and file the updated Red
Herring Prospectus with RoC, which then would be termed the ‘Prospectus’. The Prospectus will
have details of the Issue Price, Issue size and underwriting arrangements and will be complete in
all material respects.
Announcement of Pre-Issue Advertisement
The Company shall, upon registering the Red Herring Prospectus with the RoC, publish an
advertisement, in the form prescribed under the SEBI Regulations, in two national newspapers (one
each in English and Hindi), each with wide circulation in India.
Advertisement regarding Issue Price and Prospectus
A statutory advertisement will be issued by the Company after the filing of the Prospectus with the
RoC in an English national newspaper, a Hindi national newspaper, each with wide circulation. This
advertisement, in addition to the information that has to be set out in the statutory advertisement,
shall indicate the Issue Price along with a table showing the number of IDRs and the amountpayable by an investor. Any material updates between the date of the Red Herring Prospectus and
the Prospectus shall be included in such statutory advertisement.
Issuance of CAN
1. The BRLMs or the Registrar to the Issue shall send to the Syndicate a list of the Bidders who
have been allocated IDRs in the Issue. The approval of the Basis of Allotment by the
Designated Stock Exchange for QIB Bidders may be made simultaneously with or prior to the
approval of the basis of allocation for the Retail Individual Bidders and Non-Institutional
Bidders. However, investors should note that the Company will ensure that the date of
Allotment of the IDRs to all investors in this Issue shall be on the same date.
2. The Syndicate will dispatch a CAN to their Bidders who have been allocated IDRs in the Issue.
The dispatch of a CAN shall be deemed a valid, binding and irrevocable contract for the Bidder
to pay the entire Issue Price as may be called by the Company for all the IDRs allocated to
such Bidder. Those Bidders who have not paid the entire Bid Amount payable on application at
the time of bidding shall pay in full the amount payable into the Escrow Account by the Pay-in
Date specified in the CAN.
3. Bidders who have been allocated IDRs and who have already paid the Bid Amount payable on
application at the time of bidding will directly receive the CAN from the Registrar to the Issue
subject, however, to realisation of his or her cheque or demand draft. The dispatch of a CAN
shall be deemed a valid, binding and irrevocable contract for the Bidder to pay the entire Issue
Price as may be called by the Company for Allotment to such Bidder.
Notice to Anchor Investors: Allotment Reconciliation and Revised CANs
A physical book will be prepared by the Registrar to the Issue on the basis of the Bid cumApplication Forms received from Anchor Investors. Based on the physical book and at the discretion
of the Company and the BRLMs and Co-BRLMs, selected Anchor Investors may be sent a CAN,
within two working days of the Anchor Investor Bid/ Issue Period, indicating the number of IDRs
that may be allocated to them. The provisional CAN shall constitute the valid, binding and
irrevocable contract (subject only to the issue of a revised CAN) for the Anchor Investors to pay the
399
c102100pu090Proof7:28.3.10B/LRevision:0OperatorSadK

entire Anchor Investor Issue Price for all the IDRs allocated to such Anchor Investor. This
provisional CAN and the final allocation is subject to the physical application being valid in all
respect along with receipt of stipulated documents, the Issue Price being finalised at a price not higher
than the Anchor Investor Issue Price and allotment by the Board of Directors. In the event that theIssue Price is higher than the Anchor Investor Issue Price, a revised CAN will be sent to Anchor
Investors. The price of the IDRs in such revised CAN may be different from that specified in the
earlier CAN. Anchor Investors should note that they may be required to pay additional amounts, if
any, by the Pay-in Date specified in the revised CAN, for any increased allocation of IDRs or
increased price of IDRs. The Pay-in Date in the revised CAN shall not be later than two working
days after the Bid/ Issue Closing Date. Any revised CAN, if issued, will supersede in entirety the
earlier CAN.
Notice to QIBs: Allotment Reconciliation and Revised CANs
After the Bid/Issue Closing Date, an electronic book will be prepared by the Registrar to the Issue onthe basis of Bid cum Application Forms received. Based on the electronic book, QIB Bidders will be
sent a CAN on or prior to [*], indicating the number of IDRs that may be allocated to them. This
CAN is subject to the final Basis of Allotment, which will be approved by the Designated Stock
Exchange and reflected in the reconciled book prepared by the Registrar to the Issue. Subject to the
SEBI Regulations, certain Bids may be rejected due to technical reasons, non-receipt of funds,
cancellation of cheques, cheque bouncing, incorrect details, etc., and these rejected applications will be
reflected in the reconciliation and Basis of Allotment as approved by the Designated Stock Exchange
and specified in the reconciled book. As a result, a revised CAN may be sent to QIB Bidders, andthe allocation of IDRs in such revised CAN may be different from that specified in the earlier CAN.
QIBs should note that they may be required to pay additional amounts, if any, by the Pay-in Date
specified in the revised CAN, for any increased Allotment of IDRs. The CAN will constitute the
valid, binding and irrevocable contract (subject only to the issue of a revised CAN) for the QIB
Bidder to pay the entire Issue Price for all the IDRs allocated to such QIB Bidder. The revised CAN,
if issued, will supersede in entirety the earlier CAN.
Designated Date and Allotment of IDRs
The Allotment of IDRs to the Bidders shall be carried out by the following steps:
* the Shares of the Company underlying the IDRs will be issued in the form of book entries or in
electronic form to the Custodian;
* the Custodian bank sends electronic confirmation of deposit of the underlying Shares to the
IDR Depository;
* the Depository will issue a master creation format with the names of the successful Bidders.
This document will be stamped and delivered to the Settlement Depositories, for
dematerialisation and conversion to electronic form; and
* each IDR Holder will be notified of its holding and assigned a deposit account number as an
electronic record in respect of the IDRs it holds.
Further:
1. The Company will ensure that the Allotment of IDRs is made within 15 days of the Bid/Issue
Closing Date. After the funds are transferred from the Escrow Account to the Public Issue
Account on the Designated Date, the Company will ensure the credit to the successful Bidders’
depository account. Allotment of the IDRs to the Allottees shall be within two Business Daysof the date of Allotment.
2. IDRs will be issued and Allotment shall be made only in dematerialised form to the Allottees.Allottees will have the option to re-materialise the IDRs, if they so desire.
3. Investors are advised to instruct their Settlement Depository Participant to accept the IDRs that
may be Allotted to them pursuant to this Issue.
BASIS OF ALLOTMENT
A. For Retail Individual Bidders
* Bids received from the Retail Individual Bidders at or above the Issue Price shall begrouped together to determine the total demand under this category. The Allotment to allthe successful Retail Individual Bidders will be made at the Issue Price.
400
c102100pu090Proof7:28.3.10B/LRevision:0OperatorSadK

* The number of IDRs available under the Retail Portion shall be available for Allotment toRetail Individual Bidders who have Bid in the Issue at a price that is equal to or greaterthan the Issue Price.
* If the aggregate demand in this category is less than or equal to [*] IDRs at or above theIssue Price, full Allotment shall be made to the Retail Individual Bidders to the extent oftheir valid Bids.
* If the aggregate demand in this category is greater than [*] IDRs at or above the IssuePrice, the Allotment shall be made on a proportionate basis up to a minimum of [*]. Forthe method of proportionate basis of Allotment, refer below.
B. For Non-Institutional Bidders
* Bids received from Non-Institutional Bidders at or above the Issue Price shall be groupedtogether to determine the total demand under this category. The Allotment to all successfulNon-Institutional Bidders will be made at the Issue Price.
* The number of IDRs available under the Non-Institutional Portion shall be available forAllotment to Non-Institutional Bidders who have Bid in the Issue at a price that is equalto or greater than the Issue Price.
* If the aggregate demand in this category is less than or equal to [*] IDRs at or above theIssue Price, full Allotment shall be made to Non-Institutional Bidders to the extent of theirdemand.
* In the case that the aggregate demand in this category is greater than [*] IDRs at orabove the Issue Price, Allotment shall be made on a proportionate basis up to a minimumof [*] IDRs. For the method of proportionate Basis of Allotment refer below.
C. For QIB Bidders
* Bids received from the QIB Bidders at or above the Issue Price shall be grouped togetherto determine the total demand under this category. The allotment to all the QIB Bidderswill be made at the Issue Price.
* The QIB Portion shall be available for allocation to QIB Bidders on a proportionate basiswho have bid in the Issue at a price that is equal to or greater than the Issue Price.
* The allocation would be decided by the Company in consultation with the BRLMs andwould be at the sole discretion of the Company, based on various factors, such as natureof the Bidder, size, price and date of the Bid.
* The aggregate allocation to QIBs shall be at least 10,000,000 IDRs.
* Allotment shall be undertaken in the following manner:
(a) In the first instance allocation to Mutual Funds for up to 5% of the QIB Portion(excluding Anchor Investor Portion) shall be determined as follows:
(i) In the event that Bids by Mutual Fund exceed 5% of the QIB Portion(excluding Anchor Investor Portion), allocation to Mutual Funds shall be doneon a proportionate basis for up to 5% of the QIB Portion (excluding AnchorInvestor Portion).
(ii) In the event that the aggregate demand from Mutual Funds is less than 5% ofthe QIB Portion (excluding Anchor Investor Portion) then all Mutual Fundsshall get full Allotment to the extent of valid Bids received above the IssuePrice.
(iii) IDRs remaining unsubscribed, if any, not allocated to Mutual Funds shall beavailable for Allotment to all QIB Bidders as set out in (b) below;
(b) In the second instance Allotment to all QIBs shall be determined as follows:
(i) In the event of oversubscription in the QIB Portion (excluding the AnchorInvestor Portion), all QIB Bidders who have submitted Bids above the IssuePrice shall be Allotted IDRs on a proportionate basis for up to 95% of the QIBPortion (excluding the Anchor Investor Portion).
(ii) Mutual Funds, who have received allocation as per (a) above, for less than thenumber of IDRs Bid for by them, are eligible to receive IDRs on aproportionate basis along with other QIB Bidders.
401
c102100pu090Proof7:28.3.10B/LRevision:0OperatorSadK

(iii) Under-subscription below 5% of the QIB Portion (excluding Anchor InvestorPortion), if any, from Mutual Funds, would be included for allocation to theremaining QIB Bidders on a proportionate basis.
D. For Anchor Investor Portion
* Allocation of IDRs to Anchor Investors at the Anchor Investor Issue Price will be at thediscretion of the Company, in consultation with the BRLMs, subject to compliance withthe following requirements:
(a) not more than 30% of the QIB Portion will be allocated to Anchor Investors;
(b) one-third of the Anchor Investor Portion shall be reserved for domestic MutualFunds, subject to valid Bids being received from domestic Mutual Funds at or abovethe price at which allocation is being done to other Anchor Investors;
(c). allocation to Anchor Investors shall be on a discretionary basis and subject to aminimum number of two Anchor Investors for allocation upto Rs. 2,500 million andminimum number of five Anchor Investors for allocation more than Rs. 2,500million.
* The number of IDRs Allotted to Anchor Investors and the Anchor Investor Issue Price,shall be made available in the public domain by the BRLMs before the Bid/ Issue OpeningDate by intimating the same to the Stock Exchanges.
* IDRs Allotted to Anchor Investors shall be subject to a lock-in for a period of 30 daysfrom the date of Allotment of IDRs.
Method of Proportionate Basis of Allotment for Retail Individual Bidders and Non-Institutional Bidders
In the event of the Issue being over-subscribed, the Company shall finalise the Basis of Allotment inconsultation with the Designated Stock Exchange. The Executive Director (or any other senior officialnominated by them) of the Designated Stock Exchange along with the BRLMs and the Registrar tothe Issue shall be responsible for ensuring that the Basis of Allotment is finalised in a fair and propermanner.
The Allotment shall be made in marketable lots, on a proportionate basis as explained below:
(a) Bidders will be categorised according to the number of IDRs applied for.
(b) The total number of IDRs to be Allotted in the category of Retail Individual Bidders and Non-Institutional Bidders shall be arrived at on a proportionate basis, which is the total number ofIDRs applied for by such category (number of Bidders in the category multiplied by the numberof IDRs applied for) multiplied by the inverse of the over-subscription ratio.
(c) The number of IDRs to be Allotted to the successful Bidders in the category of RetailIndividual Bidders and Non-Institutional Bidders will be arrived at on a proportionate basis,which is the total number of IDRs applied for by each Bidder in such category multiplied bythe inverse of the over-subscription ratio.
(d) In all Bids where the proportionate Allotment is less than [*] IDRs per Bidder, the Allotmentshall be made as follows:
* the successful Bidders out of the total Bidders for a category shall be determined bydrawing of lots in a manner such that the total number of IDRs Allotted in that categoryis equal to the number of IDRs calculated in accordance with (b) above; and
* each successful Bidder shall be Allotted a minimum of [*] IDRs.
(e) If the proportionate Allotment to a Bidder is a number that is more than [*] but is not amultiple of one (which is the market lot), the decimal would be rounded up to the higher wholenumber if that decimal is 0.5 or higher. If that number is lower than 0.5, it would be roundeddown to the lower whole number. Allotment to all Bidders in such categories would be arrivedat after such rounding off.
PAYMENT OF REFUND
Bidders other than those applying through ASBA process must note that on the basis of the name ofthe Bidders, the name of the Settlement Depository Participant, DP ID and beneficiary accountnumber provided by them in the Bid cum Application Form, the Registrar to the Issue will obtain,from the Settlement Depository, the Bidders’ bank account details, including the MICR code asappearing on a cheque leaf. Hence, Bidders are advised to immediately update their bank accountdetails as appearing on the records of the Settlement Depository Participant. Please note that failure
402
c102100pu090Proof7:28.3.10B/LRevision:0OperatorSadK

to do so could result in delays in dispatch of refund orders or refunds through electronic transfer offunds, as applicable, and any such delay shall be at the Bidders’ sole risk and neither the Company,the Registrar to the Issue, the Escrow Collection Bank(s), the Bankers to the Issue nor the BRLMsand Co-BRLM shall be liable to compensate the Bidders for any losses caused to the Bidders due toany such delay or be liable to pay any interest for such delay.
Mode of making refunds
The payment of refunds, if any, for Bidders other than those applying through ASBA process wouldbe made through various modes as given hereunder:
* ECS – Payment of refunds would be made through ECS for applicants having an account atany of the centres where such facility has been made available. This mode of payment ofrefunds would be subject to availability of complete bank account details including the MICRcode as appearing on a cheque leaf from the Settlement Depository. The payment of refunds ismandatory for applicants having a bank account at any of such centres, except where theapplicant, being eligible, opts to receive a refund through NEFT, direct credit or RTGS.
* Direct Credit – Applicants having bank accounts with the Refund Banker(s), as mentioned inthe Bid cum Application Form, shall be eligible to receive refunds through direct credit.Charges, if any, levied by the Refund Bank(s) for the same would be borne by the Company.
* RTGS – Applicants having a bank account at any of the centres where such facility has beenmade available and whose refund amount exceeds Rs. five million, have the option to receive arefund through RTGS. Such eligible applicants who indicate their preference to receive refundsthrough RTGS are required to provide the IFSC code in the Bid cum Application Form. In theevent the same is not provided, refund shall be made through ECS. Charges, if any, levied bythe Refund Bank(s) for the same would be borne by the Company. Charges, if any, levied bythe applicant’s bank receiving the credit would be borne by the applicant.
* NEFT – Payment of refund shall be undertaken through NEFT wherever the applicant’s bankhas been assigned the IFSC, which can be linked to a MICR, if any, available to that particularbank branch. The IFSC will be obtained from the website of the RBI as on a date immediatelyprior to the date of payment of refund, duly mapped with MICR numbers. Wherever theapplicants have registered their MICR number and their bank account number while openingand operating the demat account, the same will be duly mapped with the IFSC of thatparticular bank branch and the payment of refunds will be made to the applicants through thismethod. The process flow in respect of refunds by way of NEFT is at an evolving stage andhence use of NEFT is subject to operational feasibility, cost and process efficiency.
* For all other applicants, including those who have not updated their bank particulars with theMICR code, the refund orders will be dispatched under certificate of posting for value up to Rs.1,500 and through Speed Post/Registered Post for refund orders of Rs. 1,500 and above. Suchrefunds will be made by cheque, pay orders or demand drafts drawn on the Escrow CollectionBanks and payable at par at places where Bids are received. Bank charges, if any, for cashingsuch cheques, pay orders or demand drafts at other centres will be payable by the Bidders.
Letters of Allotment or Refund Orders
The Company shall give credit to the beneficiary account with Settlement Depository Participantswithin two Business Days from the date of Allotment. Applicants (other than those applying throughthe ASBA process) residing at centres where clearing houses are managed by the RBI and otherbanks, will get refunds through ECS only except where the applicant is otherwise disclosed as eligibleto get refunds through direct credit or RTGS. The Company shall ensure dispatch of refund orders,if any, of value up to Rs. 1,500 by ‘‘Under Certificate of Posting’’, and shall dispatch refund ordersabove Rs. 1,500, if any, by Registered Post or Speed Post at the sole or First Bidder’s sole riskwithin 15 days of the Bid/Issue Closing Date. Applicants to whom refunds are made throughelectronic transfer of funds will be sent a letter through ordinary post informing them about themode of credit of refund within 15 days of closure of the Bid/Issue.
The Company will provide adequate funds required for dispatch of refund orders or Allotment adviceto the Registrar to the Issue.
Refunds will be made by cheque, pay orders or demand drafts drawn on a bank appointed by us, asRefund Bank, and payable at par at places where Bids are received. Bank charges, if any, for cashingsuch cheques, pay orders or demand drafts at other centres will be payable by the Bidders.
403
c102100pu090Proof7:28.3.10B/LRevision:0OperatorSadK

DISPOSAL OF APPLICATIONS AND APPLICATION MONIES AND INTEREST IN CASE OF
DELAY
The Company shall ensure the dispatch of Allotment advice and refund orders (except for Bidderswho receive refunds through electronic transfer of funds), give benefit to the beneficiary account withSettlement Depository Participants and submit the documents pertaining to the Allotment to theStock Exchanges within two Business Days of the date of Allotment of IDRs.
In the case of applicants who receive refunds through ECS, direct credit or RTGS, the refundinstructions will be given to the clearing system within 15 days from the Bid/Issue Closing Date. Asuitable communication shall be sent to the Bidders receiving refunds through this mode within 15days of the Bid/Issue Closing Date, giving details of the bank where refunds shall be credited alongwith the amount and expected date of electronic credit of refund.
The Company shall use best efforts to ensure that all steps for completion of the necessary formalitiesfor listing and commencement of trading at all the Stock Exchanges where the IDRs are proposed tobe listed are taken within seven Business Days of Allotment.
In accordance with the requirements of the Stock Exchanges and the SEBI Regulations, the Companyfurther undertakes that:
* Allotment of IDRs shall be made only in dematerialised form within 15 days of the Bid/IssueClosing Date;
* refund orders will be dispatched or, in a case where the refund or portion thereof is made inelectronic manner, the refund instructions will be given to the clearing system within 15 days ofthe Bid/Issue Closing Date; and
* the Company shall pay interest at 15% p.a. for any delay beyond that 15-day period ifAllotment is not made and refund orders are not dispatched or if, in a case where the refund orportion thereof is made in electronic manner, the refund instructions have not been given to theclearing system in the disclosed manner and/or demat credits are not made to investors withinthe 15-day period stated above.
UNDERTAKINGS BY THE COMPANY
The Company undertakes the following:
i. that the complaints received in respect of the Issue shall be attended to by the Companyexpeditiously and satisfactorily;
ii. that all steps for completion of the necessary formalities for listing and commencement oftrading at all Stock Exchanges where the securities are to be listed are taken within sevenBusiness Days of finalization of Basis of Allotment;
iii. that it shall apply in advance for the listing of IDRs and the underlying shares;
iv. that funds required for making refunds to unsuccessful applicants as per the mode(s) disclosedshall be made available to the Registrar to the Issue by the Company;
v. that where refunds are made through electronic transfer of funds, a suitable communicationshall be sent to the applicant within 15 days of Bid/Issue Closing Date giving details of thebank where refunds shall be credited along with amount and expected date of electronic creditof refund;
vi. that the certificates of the securities or refund orders to the NRI shall be dispatched withinspecified time;
vii. that no further issue of securities shall be made until the securities offered through the RedHerring Prospectus are listed or till the application moneys are refunded on account of non-listing, under subscription, etc.; and
viii. that adequate arrangements shall be made to collect all ASBA Bid cum Application Form andto consider them similar to non-ASBA applications while finalizing the Basis of Allotment.
IDRs IN DEMATERIALISED FORM WITH NSDL AND CDSL
* The Allotment of IDRs in this Issue shall be only in a dematerialised form (i.e. not in the formof physical certificates) but be fungible and be represented by the statement issued through theelectronic mode.
* In this context, the Company has executed the following agreements:
* agreement dated [*] between NSDL, the Company and the Registrar to the Issue; and
404
c102100pu090Proof7:28.3.10B/LRevision:0OperatorSadK

* agreement dated [*] between CDSL, the Company and the Registrar to the Issue.
Additionally the Company has also executed deeds of assignment to assign the rights andobligations under the Tripartite Agreements to the Depository.
* All Bidders can seek Allotment only in dematerialised mode. Bids from any Bidder withoutrelevant details of his or her Settlement Depository account are liable to be rejected.
* A Bidder applying for IDRs must have at least one beneficiary account with either of theSettlement Depository Participants of either NSDL or CDSL prior to making the Bid.
* The Bidder must fill in the details (including the Beneficiary Account Number and DP IDnumber) appearing in the Bid cum Application Form or Revision Form or ASBA RevisionForm.
* Allotment to a successful Bidder will be credited in electronic form directly to the beneficiaryaccount (with the Settlement Depository Participant) of the Bidder.
* Names in the Bid cum Application Form or Revision Form or ASBA Revision Form should beidentical to those appearing in the account details in the Settlement Depository. In the case ofjoint holders, the names must be in the same sequence as they appear in the account details inthe Settlement Depository.
* If incomplete or incorrect details are given under the heading ‘Bidders Settlement DepositoryAccount Details’ in the Bid cum Application Form or Revision Form or ASBA Revision Form,it is liable to be rejected.
* The Bidder is responsible for the correctness of his or her Demographic Details given in the Bidcum Application Form vis-à-vis those with his or her Settlement Depository Participant.
* IDRs in electronic form can be traded only on the Stock Exchanges having electronicconnectivity with Settlement Depositories. All the Stock Exchanges where IDRs are proposed tobe listed have electronic connectivity with Settlement Depositories.
Communications
All future communications in connection with Bids made in this Issue should be addressed to theRegistrar to the Issue quoting the full name of the sole or first bidder, Bid cum Application Formnumber, Bidders’ Settlement Depository account details, number of IDRs applied for, date of the Bidcum Application Form, name and address of the Syndicate where the Bid was submitted and chequeor draft number and issuing bank thereof.
Investors can contact the Compliance Officer or the Registrar to the Issue in case of any pre-Issue orpost-Issue related problems such as non-receipt of letters of Allotment, credit of Allotted IDRs in therespective beneficiary accounts, refund orders etc.
405
c102100pu090Proof7:28.3.10B/LRevision:0OperatorSadK

TAXATION FRAMEWORK IN INDIA AND UK
United Kingdom Taxation
General
The following statements are only a guide to the general position and are based on current UKtaxation legislation and published practice of HM Revenue and Customs in the UK at the date of
this Draft Red Herring Prospectus, both of which are subject to change, possibly with retrospective
effect. These statements relate solely to persons who are neither resident nor (if an individual)
ordinarily resident in the UK, who are absolute beneficial owners of IDRs (and not trustees), who
hold their IDRs as an investment and not as trading stock and who have not (and are not deemed to
have) acquired their IDRs by reason of an office or employment.
The comments below are not exhaustive and may not apply to certain classes of IDR Holders such
as (but not limited to) dealers in securities, insurance companies and collective investment schemes.
They also assume that an IDR Holder is beneficially entitled to the Shares and to the dividends on
those Shares.
If investors are in any doubt as to their tax position, or if investors are subject to tax in a jurisdiction
other than the UK, investors should consult their own professional advisers. Investors who are considering
converting their IDRs into Shares should consult their own professional advisers.
Withholding tax
The Company will not be required to make a withholding or deduction for or on account of UK tax
when paying a dividend on the Shares.
Dividends
An IDR Holder who is not resident for tax purposes in the UK should not, in general, be subject to
UK income tax or corporation tax on dividends paid on the Shares unless the IDR Holder’s IDRs
are attributable to a trade, profession or vocation carried on by the IDR Holder in the UK througha branch or agency or, in the case of a corporate IDR Holder, through a permanent establishment.
Chargeable Gains
An IDR Holder who is neither resident nor (if an individual) ordinarily resident in the UK will notnormally be liable to UK tax on any capital gains realised on the disposal of IDRs, unless the IDRs
are used, held or acquired for the purposes of a trade, profession or vocation carried out in the UK
through a branch or agency or, in the case of a corporate IDR Holder, through a permanent
establishment. Such an IDR Holder may be subject to foreign taxation on any gain under local law.
An IDR Holder who is an individual and who has ceased to be resident or ordinarily resident in the
UK for UK tax purposes for a period of less than five years of assessment and who disposes of all
or part of their IDRs during that period of non-residence may be liable on their return to the UK to
taxation on chargeable gains arising during the period of absence, subject to any available exemption
or relief. This paragraph only applies to IDRs that were owned at the time the IDR Holder ceased to
be resident or ordinarily resident in the UK.
In the event that an IDR Holder is permitted to exercise the right to convert their IDRs into Shares,
the IDR Holder, as beneficial owner of the Shares, should not be liable to UK tax on receipt of
those Shares or on the direct transfer of those Shares to the nominated CREST account of the IDR
Holder.
Stamp Duty and Stamp Duty Reserve Tax
The Finance Act 1986 provides that where shares are issued to, or to a nominee or agent for, aperson whose business is or includes issuing depository receipts, SDRT is payable at the rate of 1.5%
of the issue price of the shares. This liability for SDRT will strictly speaking fall on the Depository
but the Company has agreed to pay all applicable stamp duties and other similar duties or taxes
payable in the United Kingdom on or in connection with the issue of the IDRs.
The lawfulness of this 1.5% SDRT charge is in considerable doubt following the European Court of
Justice (‘‘ECJ’’) ruling, in C-569/07 HSBC Holdings Plc, Vidacos Nominees Limited v The
Commissioners of Her Majesty’s Revenue & Customs, that the 1.5% SDRT charge on the issue of
shares into a clearance service is contrary to EU law.
406
c102100pu100Proof7:28.3.10B/LRevision:0OperatorSadK

Although the decision of the ECJ deals with the issue of chargeable securities into a clearance system,
HM Revenue and Customs have implied that they accept that the same reasoning applies to an issue
of chargeable securities into a depository receipt arrangement, but dispute that this extends to issuers
of depository receipts which are resident outside the EU. As such, there remain uncertainties as toterritorial scope and as to how the decision may impact depository receipts. If the decision is held to
apply to the issue of securities into non-EU depository receipt schemes, the 1.5% SDRT charge may
be unlawful. It is at this stage unclear whether legislative change will be introduced to charge
transfers of depository receipts where either no entry charge has been paid or the entry charge has
been reclaimed.
No liability for stamp duty should arise on a transfer of IDRs, provided that any document effecting
such transfer is not executed in the UK and remains at all times outside the UK. Any agreement to
transfer IDRs should not give rise to a liability for SDRT.
In the event that an IDR Holder is permitted to exercise the right to convert their IDRs into Shares,
no stamp duty or SDRT should be payable on the resulting acquisition of Shares by the IDR
Holder. This should also be the case if the Shares are transferred directly from the Custodian to the
nominated CREST account of the IDR Holder. However, any subsequent transfer of the Shares
would be subject to stamp duty or SDRT, normally at 0.5% of the amount or value of theconsideration.
Inheritance tax
The following is only a general guide as to how the IDRs may be treated for the purposes of UK
inheritance tax and IDR Holders should consult their own professional advisers.
The IDRs may constitute assets situated in the UK for the purposes of UK inheritance tax. In
particular, the death of an IDR Holder who is an individual, or the death of an individual who has
within a certain time period prior to death made a gift of IDRs, may result in a liability to UK
inheritance tax even if such individual was neither domiciled in the UK nor treated as being
domiciled there under rules relating to long residence or previous domicile.
Indian Taxation
Under Income-tax Act, 1961
The following is a summary of the principal Indian tax consequences for investors investing in the
IDRs. The summary is based on the taxation law and practice in force in India at the time of this
Draft Red Herring Prospectus and is subject to change. Further, it only addresses the tax
consequences for persons who acquire IDRs and who hold such IDRs as capital assets. It does not
address the tax consequences which may be relevant to other classes of investors, including dealers. It
does not address the tax consequences arising post conversion of IDRs into Shares. This summary isnot intended to constitute a legal opinion or to be a complete analysis under Indian law of the tax
consequences of the ownership, transfer of the IDRs or conversion of IDRs into Shares.
Each prospective investor is advised to consult its tax advisers about the particular tax consequences toit on account of an investment in the IDRs including, specifically, tax consequences under Indian Income-
tax Act, 1961 (‘Income-tax Act’) and the applicable double tax avoidance treaty (‘DTAA’) entered into
by the Government of India.
Investors should note that the draft Direct Taxes Code Bill, 2009 (DTC) has recently been issued by the
Indian Government for public comments; the DTC seeks to replace the existing Income-tax Act. Once
the Bill is passed, it could have an impact on the tax implications for IDR holders under the current
Income tax Act discussed below (please refer to paragraph titled ‘‘Direct Taxes Code Bill, 2009’’ for
brief discussion).
Income-tax on IDR Holders
The Income-tax Act is the law relating to taxes on income in India. The Income-tax Act provides for
the taxation of persons resident in India on global income and persons not resident in India on
income received, accruing or arising in India or deemed to have been received, accrued or arising inIndia. Sections 4, 5 and 9 of the Income-tax Act set forth the circumstances under which residents
and non-residents in India are subject to income tax in India. Under these provisions of the Income-
tax Act, capital gains on transfer of IDRs listed on the Indian Stock Exchanges shall be considered
as accruing or arising in India and shall be taxable in India. Further, under these provisions of the
Income-tax Act, dividends paid to resident IDR Holders shall be taxable in India. Dividends paid to
407
c102100pu100Proof7:28.3.10B/LRevision:0OperatorSadK

non-resident IDR Holders shall be taxable in India, if it is received in India or deemed to be received
by IDR Holders in India.
Presently, there are no specific tax provisions under the Income-tax Act with respect to taxation of
IDRs. The following summary applicable to income earned by the IDR Holders pursuant to the
ownership and transfer of IDRs, is therefore based on the general provisions under the Income-tax
Act. All rates specified in this section are based on the Finance (No. 2) Act, 2009 and are subject to
revision and change every financial year.
IDR Holders should note that various tax treatments, tax benefits and concessions which are
available to investors holding equity shares of an Indian-listed company may not be available tothem.
The discussion below on the tax rates covers only certain specific categories of IDR Holders viz
resident individuals and corporates, corporate FIIs, foreign companies and non-resident Indians. It
does not cover other categories of taxpayers such as resident firms, HUFs, etc, as well as non-resident
non-corporate entities.
Taxation of dividends
Under the Income-tax Act, dividends declared by an Indian company (or any other company whichhas made the prescribed arrangement for the declaration and payment of dividends in India), shall be
subject to a dividend distribution tax payable by the company. Such dividends shall then be exempt
from tax in the hands of the shareholder under section 10(34) of the Income-tax Act. This exemption
from dividend income under section 10(34) is not applicable to dividends paid to IDR Holders and
accordingly, the dividends received by the IDR Holders in India shall be taxable in the hands of the
IDR Holders. Please refer to the table below for a summary of the tax rates applicable on dividend
income earned by various categories of IDR Holders.
Dividends received by resident IDR Holders shall not be subject to deduction of tax at source.
However, dividends received by non-resident IDR Holders may be subject to deduction of tax at the
applicable rates, where the dividend is chargeable to tax in India.
Tax rate on dividends
Resident assesses:
Resident individual assesses will be taxable on dividends at the rates applicable to the relevant income
slabs, with the maximum rate of 30%, plus education cess at the rate of 3% of the tax.
Resident corporates will be taxable on dividends at the rate of 30%, plus surcharge at the rate of10%1 and education cess at the rate of 3% of the tax and surcharge.
Non-resident assesses:
FIIs and other foreign companies will be taxable on the dividend income at the tax rate of 20%, plus
surcharge at the rate of 2.5% and education cess at the rate of 3% of the tax and surcharge, under
the provisions of section 115AD and section 115A of the Income-tax Act, respectively.
Non-resident Indians will be taxable on dividends at the rates applicable to the relevant income slabs,with the maximum rate of 30%, plus education cess at the rate of 3% of the tax.
Taxation of capital gains
Presently, there are no specific provisions in the Income-tax Act with respect to taxation of capital
gains on sale of IDRs. Further, IDR Holders should note that the tax exemptions and concessions
which are currently available to investors holding equity shares of an Indian-listed company may not
be available to IDR Holders. Accordingly, IDR Holders will be liable to capital gains tax on transfer
of IDRs.
Under the Income-tax Act, there are two types of capital gains: ‘long-term capital gains’ and ‘short-
term capital gains’. A gain arising on the sale of shares in a company, listed securities or units will be
considered as long-term capital gains if they are held for a period exceeding 12 months and a gain
arising on the sale of these assets held for 12 months or less will be considered as a short-term
408
c102100pu100Proof7:28.3.10B/LRevision:0OperatorSadK
1 Surcharge will be applicable only where the total income exceeds Rs. 10 million. The rate of surcharge is proposed to be reducedto 7.5% vide the Finance Bill, 2010 (Bill) introduced in the Indian Parliament on February 26, 2010. The Bill will be discussed inthe Parliament before it is enacted and is therefore subject to any amendments that may be made pursuant to these discussions.

capital gain. Since IDR will be a listed security, the capital gains on sale thereof will be considered
long-term if the IDR is held for more than 12 months from the date of purchase.
Section 48 of the Income-tax Act prescribes the mode of computation of capital gains. It provides for
the deduction of (i) the cost of acquisition/improvement and (ii) expenses incurred (in connection with
the transfer of a capital asset), from the sale consideration to arrive at a capital gains figure. In
respect of long-term capital gains, it offers a benefit by permitting substitution of the cost of
acquisition/improvement with the indexed cost of acquisition/improvement by a cost inflation index as
prescribed from time to time by the Central Government.
Rates of tax on capital gains
Section 10(38) of the Income-tax Act exempts income arising from transfer of long-term capital asset
being equity share or a unit of an equity-oriented fund on which securities transaction tax (‘STT’) has
been paid. Further, under section 111A of the Income-tax Act, short-term capital gains arising on
transfer of equity shares in a company or a unit of an equity-oriented fund are taxed at the
concessional rate of 15%, plus applicable surcharge and education cess.
Based on the current provisions of Chapter VII of the Finance (No.2) Act, 2004, pertaining to STT,
IDRs should not be subject to STT. Accordingly, the corresponding exemption from long-term capital
gains tax under section 10(38) of the Income-tax Act and the concessional tax rate for short-term
capital gains under section 111A of the Income-tax Act will not be available to IDR Holders on
transfer of IDRs.
Long-term capital gains on sale of IDRs
Resident assesses:
For resident assesses, under section 112 of the Income-tax Act, long-term capital gains on sale of
IDRs will be subject to tax at the rate of 20%, plus surcharge at the rate of 10%1 (only for
corporates) and education cess at the rate of 3% of the tax and surcharge. The computation of
capital gains will be subject to cost indexation benefits. However, as per the proviso to section 112(1)
of the Income-tax Act, if the tax on long-term capital gains resulting on transfer of listed securities
(which should include IDRs), calculated at the rate of 20% with indexation benefits exceeds the tax
on long-term capital gains computed at the rate of 10% without indexation benefit, then such gains
without indexation benefit are chargeable to tax at a concessional rate of 10%, plus applicablesurcharge and education cess.
Non-resident assesses:
Under section 115AD of the Income-tax Act, FIIs will be taxable at the concessional tax rate of 10%
plus surcharge at the rate of 2.5% and education cess at the rate of 3% of the tax and surcharge, onlong-term capital gains on sale of IDRs.
For foreign companies (other than FIIs), as well as non-resident Indians, under section 112 of the
Income-tax Act, long-term capital gains on sale of IDRs will be subject to tax at the rate of 20%,
plus surcharge at the rate of 2.5% (only for foreign companies) and education cess at the rate of 3%
of the tax and surcharge. The aforesaid tax rate is subject to indexation benefits. However, as per the
proviso to section 112(1) of the Income-tax Act, if the tax on long-term capital gains resulting ontransfer of listed securities (which should include IDRs), calculated at the rate of 20% with indexation
benefits exceeds the tax on long-term capital gains computed at the rate of 10% without indexation
benefit, then such gains without indexation benefit are chargeable to tax at a concessional rate of 10%
plus applicable surcharge and education cess.
Short-term capital gains on sale of IDRs
Resident assesses:
Resident individual assesses will be taxable on short-term capital gains on sale of IDRs at the rates
applicable to the relevant income slabs, with the maximum rate of 30%, plus education cess at the
rate of 3% of the tax.
Resident corporates will be taxable on short-term capital gains on sale of IDRs at the rate of 30%,
plus surcharge at the rate of 10%1 and education cess at the rate of 3% of the tax and surcharge.
Non-resident assesses:
Under section 115AD of the Income-tax Act, FIIs will be taxable at the tax rate of 30% plus
surcharge at the rate of 2.5% and education cess at the rate of 3% of the tax and surcharge, on
short-term capital gains on sale of IDRs. Further, foreign companies (other than FIIs) will be taxable
409
c102100pu100Proof7:28.3.10B/LRevision:0OperatorSadK
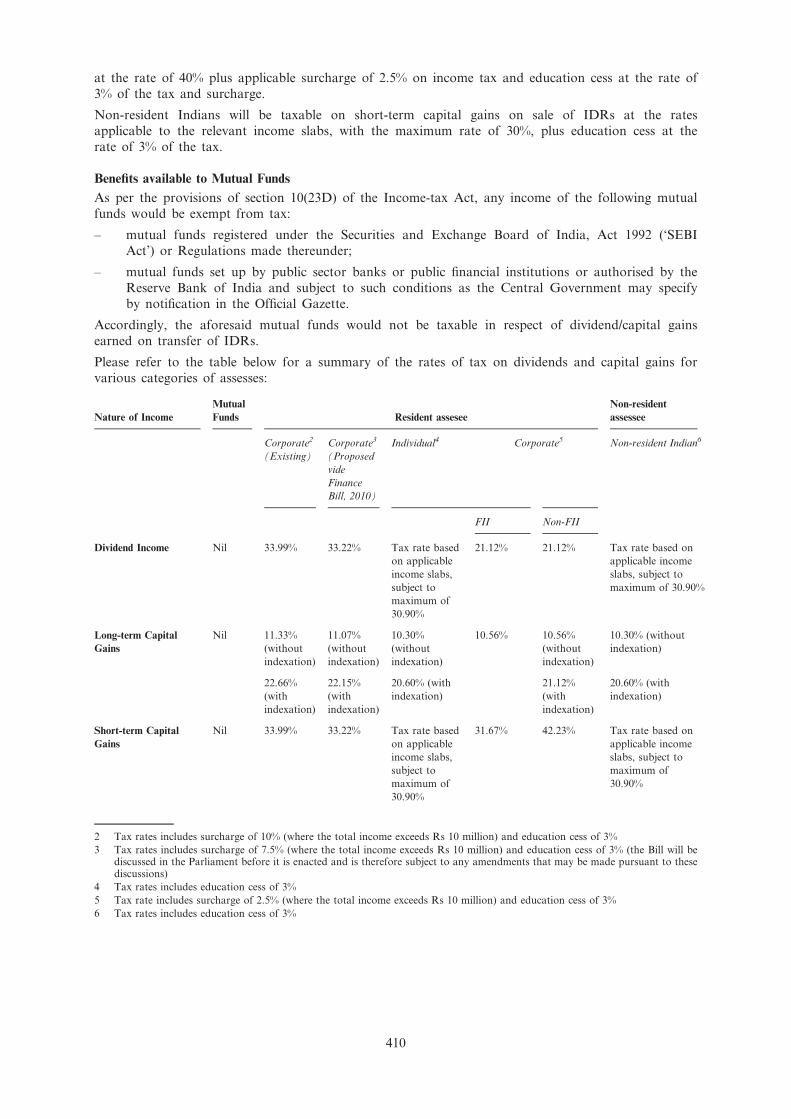
at the rate of 40% plus applicable surcharge of 2.5% on income tax and education cess at the rate of
3% of the tax and surcharge.
Non-resident Indians will be taxable on short-term capital gains on sale of IDRs at the rates
applicable to the relevant income slabs, with the maximum rate of 30%, plus education cess at the
rate of 3% of the tax.
Benefits available to Mutual Funds
As per the provisions of section 10(23D) of the Income-tax Act, any income of the following mutual
funds would be exempt from tax:
– mutual funds registered under the Securities and Exchange Board of India, Act 1992 (‘SEBI
Act’) or Regulations made thereunder;
– mutual funds set up by public sector banks or public financial institutions or authorised by the
Reserve Bank of India and subject to such conditions as the Central Government may specify
by notification in the Official Gazette.
Accordingly, the aforesaid mutual funds would not be taxable in respect of dividend/capital gains
earned on transfer of IDRs.
Please refer to the table below for a summary of the rates of tax on dividends and capital gains for
various categories of assesses:
Nature of Income
Mutual
Funds Resident assesee
Non-resident
assessee
Corporate2
(Existing)
Corporate3
(Proposed
vide
Finance
Bill, 2010)
Individual4 Corporate5 Non-resident Indian6
FII Non-FII
Dividend Income Nil 33.99% 33.22% Tax rate based
on applicable
income slabs,
subject to
maximum of
30.90%
21.12% 21.12% Tax rate based on
applicable income
slabs, subject to
maximum of 30.90%
Long-term Capital
Gains
Nil 11.33%
(without
indexation)
11.07%
(without
indexation)
10.30%
(without
indexation)
10.56% 10.56%
(without
indexation)
10.30% (without
indexation)
22.66%
(with
indexation)
22.15%
(with
indexation)
20.60% (with
indexation)
21.12%
(with
indexation)
20.60% (with
indexation)
Short-term Capital
Gains
Nil 33.99% 33.22% Tax rate based
on applicable
income slabs,
subject to
maximum of
30.90%
31.67% 42.23% Tax rate based on
applicable income
slabs, subject to
maximum of
30.90%
2 Tax rates includes surcharge of 10% (where the total income exceeds Rs 10 million) and education cess of 3%
3 Tax rates includes surcharge of 7.5% (where the total income exceeds Rs 10 million) and education cess of 3% (the Bill will bediscussed in the Parliament before it is enacted and is therefore subject to any amendments that may be made pursuant to thesediscussions)
4 Tax rates includes education cess of 3%
5 Tax rate includes surcharge of 2.5% (where the total income exceeds Rs 10 million) and education cess of 3%
6 Tax rates includes education cess of 3%
410
c102100pu100Proof7:28.3.10B/LRevision:0OperatorSadK

Applicable slab rates for individuals are as under:
Total income Rates of income-tax (Existing)
Rates of income-tax
(Proposed vide Finance Bill, 20107)
(1) where the total income doesnot exceed Rs 160,000* Nil Nil
(2) where the total income
exceeds Rs 160,000* but
does not exceed Rs 300,000
10% of the amount by which the
total income exceeds Rs 160,000*10% of the amount by which the
total income exceeds Rs 160,000*(3) where the total income
exceeds Rs 300,000 but does
not exceed Rs 500,000
Rs 14,000 plus 20% of the amount
by which the total income exceeds
Rs 300,000
(4) where the total income
exceeds Rs 500,000 but doesnot exceed Rs 800,000
Rs 54,000 plus 30% of the amount
by which the total income exceedsRs 500,000
Rs 34,000 plus 20% of the amount
by which the total income exceedsRs 500,000
(5) where the total income
exceeds Rs 800,000
Rs 144,000 plus 30% of the
amount by which the total
income exceeds Rs 800,000
Rs 94,000 plus 30% of the amount
by which the total income exceeds
Rs 800,000
7 The Bill will be discussed in the Parliament before it is enacted and is therefore subject to any amendments that may be madepursuant to these discussions.
* Rs 190,000 in the case of resident women below 65 years of age and Rs 240,000 in the case of every individual who is 65 years ormore of age.
Tax exemption on investment of long-term capital gains on transfer of IDRs
As per the provisions of section 54EC of the Income-tax Act and subject to the conditions and to the
extent specified therein, long-term capital gains arising on transfer of IDRs will not be chargeable to
tax if the capital gains are invested (upto a maximum of Rs 5 million) in a ‘‘long-term specified
asset’’, within a period of six months from the date of transfer. If only part of capital gains is so
invested, exemption shall be proportionately reduced. However, if the said ‘‘long-term specified asset’’
is transferred or converted into money within a period of three years from the date of its acquisition,the amount of capital gains exempted earlier would become chargeable to tax in such year. The
‘‘long-term specified asset’’ specified for this section is a bond redeemable after three years issued by
the National Highway Authority of India or by the Rural Electrification Corporation.
Further, as per the provisions of section 54F of the Income-tax Act and subject to the conditions and
to the extent specified therein, long-term capital gains arising to an individual or Hindu Undivided
Family (HUF), on transfer of IDRs will not be chargeable to tax if the net consideration from such
IDRs is used for purchase of residential house property within a period of one year before or two
years after the date of which the transfer took place or for construction of residential house propertywithin a period of three years after the date of transfer. However, this is subject to the condition that
the individual or HUF should not own more than one residential house, other than the new asset, on
the date of the transfer of original asset. If the cost of residential house property is less than net
consideration then exemption shall be proportionately reduced. If the residential house in which the
investment has been made is transferred within a period of three years from the date of its purchase
or construction, the amount of capital gains tax exempted earlier would become chargeable to tax as
long-term capital gains in the year in which such residential house is transferred. Similarly, if the
shareholder purchases within a period of two years or constructs within a period of three years afterthe date of transfer of capital asset, another residential house, the original exemption will be taxed as
capital gains in the year in which the additional residential house is acquired.
Conversion of IDRs into Shares
Conversion of IDRs into Shares may be considered as a taxable transfer, in the absence of specific
exemption in the Income-tax Act in this regard and may therefore be taxable.
Tax Treaties
Section 90(2) of the Income-tax Act provides that where the Government of India has entered into an
agreement with the Government of any other country for granting relief of tax, then in relation to an
411
c102100pu100Proof7:28.3.10B/LRevision:0OperatorSadK

assessee to whom such agreement applies, the provisions of the Income-tax Act shall apply to the
extent they are more beneficial to that assessee. Based on the same, in the case of non-resident IDR
Holders, the provisions of the DTAA between India and the country of residence of such IDR
Holder, to the extent they are more beneficial than the provisions of the Income-tax Act, will applyin determining such IDR Holder’s Indian tax liability.
Direct Taxes Code Bill, 2009
The Finance Minister released the Direct Taxes Code Bill, 2009 (DTC) for public comments along
with a discussion paper on 12 August 2009. The DTC seeks to replace the existing Income-tax Act.The Government’s intention is to make the DTC effective from 1 April 2011. The DTC may undergo
changes upon receipt of comments/representations from various stakeholders, pursuant to which a bill
for introduction of a new DTC is likely to be presented before the Indian Parliament. It is possible
that the current provisions of the DTC may undergo amendments based on the outcome of the
public comments. Accordingly, it is currently unclear what effect the DTC would have on investors in
IDRs. The following is a brief summary of the provisions of the DTC, as they stand currently,
relating to taxation of dividends and capital gains on sale of IDRs.
Classification:
The DTC does not contain specific provisions dealing with the taxation of IDRs. Under the DTC, all
assets are classified into business assets and investment assets.
This summary only discusses the proposed tax consequences for persons who acquire IDRs and who
hold such IDRs as investment assets. It does not discuss the tax consequences which may be relevant
to persons who acquire IDRs as business assets.
Taxation of Dividend
Dividend received by IDR Holder will not be subject to dividend distribution tax and consequently,
the same will be taxable in hands of IDR Holder. In the case of resident assessee, the dividend will
be taxable under head income from residuary source at the applicable tax rates based on the income
slabs mentioned above. In the case of non-resident assessee, where such dividend is received in India,
it will be taxed at the rate of 20%.
Taxation of capital gains
Unlike in the case of the current provisions of the Income-tax Act, the DTC does not provide any
beneficial/concessional regime for capital gains tax on listed equity shares vis-à-vis IDRs. The DTC
does not provide for levy of securities transaction tax. Under the DTC, capital gains arising on sale
of IDRs are proposed to be treated on par with capital gains on sale of equity shares. Under the
DTC, there is also no distinction between short-term capital asset and long-term capital asset.
However, for investment assets transferred after one year from the end of the financial year ofacquisition of the asset, the benefit of indexation is proposed to be made available.
Section 47 of the DTC prescribes the mode of computation of capital gains. It provides for the
deduction of (i) (indexed) cost of acquisition/ improvement and (ii) expenditure incurred (in
connection with the transfer of a investment asset) from the full value of consideration. Theapplicable tax rates for capital gains on sale of IDRs under the DTC may be summarised as under:
Assessee Tax rate8
Non-resident assesses 30%*
Resident assesses:
– Individual / co-operative society Applicable slab rates
(Refer table below)
– Non-profit organisation 15%
– Every unincorporated body (firm, association of person, body of individuals) 30%
– Local authority 30%– Company 25%
8 Surcharge and Cess chargeable as specified under the relevant Finance Act
* Every foreign company may be liable to branch profits tax at the rate of 15% on its branch profits (total income less income-taxthereon).
412
c102100pu100Proof7:28.3.10B/LRevision:0OperatorSadK

Applicable slab rates for individuals:
Total income Rates of income-tax
(1) where the total income does not exceed Rs 160,000* Nil
(2) where the total income exceeds Rs 160,000* but does notexceed Rs 1,000,000
10% of the amount by which the totalincome exceeds Rs 160,000*
(3) where the total income exceeds Rs 1,000,000 but does not
exceed Rs 2,500,000
Rs 84,000 plus 20% of the amount by
which the total income exceeds Rs
1,000,000
(4) where the total income exceeds Rs 2,500,000
Rs 384,000 plus 30% of the amount by
which the total income exceeds Rs
2,500,000
* Rs 190,000 in the case of resident women below 65 years of age and Rs 240,000 in the case of every individual who is 65 years ormore of age.
413
c102100pu100Proof7:28.3.10B/LRevision:0OperatorSadK

LITIGATION
As of the date of this Draft Red Herring Prospectus, neither the Company, any member of the
Group, any Director or any material associate of the Company are involved in any material
governmental, legal or arbitration proceedings or litigation and the Company is not aware of any
pending or threatened material governmental, legal or arbitration proceedings or litigation relating tothe Company, any member of the Group, any Director or any material associate which, in either
case, may have a significant effect on the performance of the Group, and there are no liabilities or
defaults (including arrears and potential liabilities) in relation to such material proceedings or
litigation which would be required to be disclosed under the SEBI Regulations.
414
c102100pu100Proof7:28.3.10B/LRevision:0OperatorSadK

REGULATORY ENVIRONMENT
Standard Chartered’s operations throughout the world are regulated and supervised by the relevant
central banks and regulatory authorities in each of the jurisdictions in which Standard Chartered has
offices, branches and subsidiaries. These authorities impose certain reserve and reporting requirements
and controls (e.g. capital adequacy, liquidity, depositor protection and prudential supervision) onbanks. In addition, a number of countries in which Standard Chartered operates impose additional
limitations on (or that affect) foreign or foreign-owned or controlled banks and financial institutions,
including:
* restrictions on the opening of local offices, branches or subsidiaries and the types of activities
that may be conducted by those local offices, branches or subsidiaries;
* restrictions on the acquisition of local banks or requiring a specified percentage of localownership; and
* restrictions on investment and other financial flows entering or leaving the country.
The FSA is the principal supervisor for Standard Chartered on a consolidated basis. The FSA has
been responsible for authorising and supervising UK banks since 1 June 1998, when the Bank of
England Act 1998 transferred responsibility for banking supervision from the Bank of England to theFSA. Standard Chartered is not regulated or supervised by the RBI. The RBI regulates the branch
operations of Standard Chartered Bank in India, which form part of the global operations of the
Group.
Changes in the supervisory and regulatory regimes of the countries where Standard Chartered
operates, particularly in Asia, the Middle East and Africa, will determine to some degree the services
and products that Standard Chartered will be able to offer in those markets and how Standard
Chartered structures specific operations there.
Indian Regulation and Supervision
The RBI is the primary regulatory authority responsible for overseeing the operations of banks in
India. The Ministry of Finance of the government of India, in consultation with the RBI, governs the
foreign investment aspects of the Indian banking sector. The Banking Regulation Act is the umbrella
legislation in the Indian banking sector. It governs the establishment of banks, their operation andmanagement. The RBI Act, on the other hand, is the statute which established the RBI, and
primarily governs its operation, including empowering it to supervise other banks in India. The
banking sector in India is a highly regulated sector. However, the laws applicable thereto are not
consolidated. The Banking Regulation Act is supplemented by secondary legislation such as circulars
and notifications. In addition to RBI, SCB and other group entities in India are regulated by
regulators like the Securities Exchange Board of India, National Securities Depository Limited,
Central Depository Services (India) Limited and the Telecom Regulatory Authority of India due to
other businesses conducted in India.
Banking laws in India are enforced primarily by licensing, reporting, supervision and penalisation.
Commercial banks in India are required under the Banking Regulation Act to obtain a licence from
the RBI to carry on banking business in India. Before granting the licence, the RBI must be satisfiedthat certain conditions are complied with, including: (i) that the bank has the ability to pay its
present and future depositors in full as their claims accrue; (ii) that the affairs of the bank will not be
or are not likely to be conducted in a manner detrimental to the interests of present or future
depositors; (iii) that the bank has adequate capital and earnings prospects; and (iv) that the public
interest will be served if such licence is granted to the bank. Foreign banks seeking a banking licence
in India may be subject to additional scrutiny before such licence is granted. The RBI may cancel
any licence for violations of the conditions under which it was granted or if the bank ceases to carry
on banking operations in India.
The RBI has also stipulated guidelines for consolidated accounting and consolidated supervision for
banks. Under these guidelines, as a supervisory tool, banks are required to prepare consolidated
financial statements intended for public disclosure. Banks are also required to submit to the RBIconsolidated prudential returns reporting their compliance with various prudential norms on a
consolidated basis. Further, the Banking Regulation Act specifically requires banks to maintain books
and records in a particular manner and file the same with the RBI on a periodic basis. The Know
Your Customer Guidelines framed by the RBI also provide for certain records to be maintained for a
minimum period of ten years.
415
c102100pu100Proof7:28.3.10B/LRevision:0OperatorSadK

Banks in India are subject to the capital adequacy requirements of the RBI, which are based on the
guidelines of the Basel Committee on Banking Supervision. Banks are required to submit quarterly
reports in relation to the evaluation of compliance with the capital adequacy framework to the RBI.
The RBI conducts regular inspections of banking companies under the provisions of the Banking
Regulation Act. The RBI monitors prudential parameters at quarterly intervals. To this end, and to
enable off-site monitoring and surveillance by the RBI, banks are required to report to the RBI onaspects such as:
* assets, liabilities and off-balance sheet exposures;
* the risk weighting of these exposures, the capital base and the capital ratio;
* the unaudited operating results for each quarter;
* asset quality;
* concentration of exposures;
* connected and related lending and the profile of ownership, control and management; and
* other prudential parameters.
The RBI also conducts periodical on-site inspections on matters relating to the bank’s portfolio, risk
management systems, internal controls, credit allocation and regulatory compliance, at intervals
ranging from one to three years. On-site supervision of selected branches of banks with respect to
their general operations and foreign exchange related transactions is also conducted by the RBI as
and when it deems fit.
The RBI may impose penalties on banks and their employees in the case of infringement of
regulations under the Banking Regulation Act. The penalty may be a fixed amount or may be related
to the amount involved in any contravention of the regulations. RBI can also file complaints tocompetent courts for any alleged breach of the Banking Regulation Act and the penalty may also
include imprisonment. Banks are required to disclose the penalty in their annual reports.
The RBI has also stipulated ownership and governance norms for banks which require ultimateownership and control of a private sector bank to be well diversified. Under the Banking Regulation
Act, no single entity or group of related entities are permitted to exercise voting rights over more
than 10% of the paid-up equity capital of a private sector bank. Any higher level of acquisition
requires prior approval of the RBI. The RBI also has significant powers as regards the management
of a bank. No appointment or reappointment or termination of appointment of a chairman,
managing or whole time director, manager or CEO, by whatever name called, can have effect unless
such appointment, reappointment or termination of appointment is made with the prior approval of
the RBI.
The government of India also regulates foreign ownership of Indian banks. The total foreign
ownership in a private sector bank cannot exceed 74% of the paid-up capital, and shares held by FIIs
within this limit of 74% cannot exceed 49% of the paid-up capital.
United Kingdom Regulation and Supervision
The primary statute governing the regulation of UK banks is FSMA. The provisions of European
Community directives provide a framework for regulation of banks throughout the EU and the wider
EEA. These directives are implemented through legislation and national implementing rules.
Regulatory capital requirements are based on the EU Capital Requirements Directive (CRD), which
applies to all UK authorised banks from 1 January 2008. The FSA requires banks to hold capital on
authorisation (‘initial capital’) and also capital against risks. The former represents a minimum
although for most banks the capital they are required to hold against risks will be significantly in
excess of the authorisation minimum.
Pursuant to its rule-making powers under FSMA, the FSA has issued rules and guidance, including
prudential requirements for the authorisation of banks, which are contained in the FSA Handbook.
The FSA monitors authorised institutions through interviews and the review of periodically requiredreports relating to financial and prudential matters. The FSA may obtain independent reports, usually
from the auditors of an authorised institution, as to the adequacy of systems governing internal
controls as well as systems governing records and accounts. The FSA may also object, on prudential
grounds, to persons who hold, or intend to hold, 10% or more of the shares or voting power in a
financial institution. The criteria for approval of shareholder controllers have been harmonised across
416
c102100pu100Proof7:28.3.10B/LRevision:0OperatorSadK

the EU by the Acquisitions Directive which was implemented in the UK on 21 March 2009 by the
Financial Services and Markets Act 2000 (Controllers) Regulations 2009.
Under FSMA, the FSA is also responsible for the regulation of entities conducting investment
business in the UK. Thus, it is responsible for regulating Standard Chartered’s activities in the UK in
securities and contractually-based investments, and its investment management business. The FSA hasalso implemented restrictions (derived from EU directives) on a bank’s ‘‘large exposures’’. A large
exposure is an exposure of 10% or more of a bank’s Tier 1 plus Tier 2 capital: (i) to an individual
counterparty; (ii) to connected counterparties; and (iii) to a group of connected clients. Generally, a
large exposure may not exceed 25% of the bank’s Tier 1 plus Tier 2 capital (less deductions) and the
total of all large exposures cannot exceed 800% of the bank’s Tier 1 and Tier 2 capital (less
deductions). These limits may be exceeded in respect of exposures arising out of short-term trading
activities (although the FSA is consulting on removing this treatment in CP 09/29). The limits are
also modified when applied on a consolidated basis.
As the supervisor of Standard Chartered on a consolidated basis, the FSA receives information on
the capital adequacy of, and sets requirements for, the Group as a whole. The FSA meets regularlywith Standard Chartered’s senior executives to confirm that Standard Chartered adheres to the FSA’s
prudential requirements. The FSA and senior executives regularly discuss fundamental matters relating
to Standard Chartered’s business, such as strategic and operating plans, risk control, loan portfolio
composition and organisational changes.
The Financial Services Compensation Scheme (‘‘FSCS’’) is an independent body set up under FSMA
to insure deposits and investments with authorised institutions in the UK up to a maximum of
£50,000 and applies, basically, to retail customers. Corporate deposits are not insured other than
certain small business deposits. The FSA is responsible for determining the rules within which the
scheme operates, including persons’ eligibility to make a claim, and the level of compensation that is
payable. Under amendments made to the EU Deposit Protection Directive a harmonised limit ofc100,000 per authorised entity will be introduced with effect from 31 December 2010 unless an
impact assessment by the European Commission, due by 31 December 2009, concludes that this is not
necessary. This impact assessment has not yet been published and the increased limit is still under
discussion. No changes to the UK compensation limit are anticipated in advance of this.
However, other changes have been introduced including speeding up the payment of compensation,
ensuring the FSCS has early access to information, simplifying the eligibility criteria and allowing
payments to be made on a gross basis. Most of these changes will come into effect on 31 December
2010, although the changes to eligibility were introduced on 1 August 2009.
The FSA has powers to intervene in the affairs of an authorised institution in the event that it ceases
to comply with applicable prudential requirements. The FSA may, in appropriate cases, take
disciplinary action against individuals and banks that fail to comply with applicable regulatory
requirements. These can include banning individuals, the imposition of fines and the withdrawal ofauthorisation in a serious case.
The Banking Act 2009 introduced three pre-insolvency stabilisation options as well as two new
insolvency procedures for banks in financial difficulties. The intention is to provide the Treasury, the
FSA and the Bank of England (the ‘‘Authorities’’) with a range of tools to deal with failing banks.
The Act replaced the temporary powers set out in the Banking (Special Provisions) Act 2008 which
lapsed on 21 February 2009.
The stabilisation options comprise:
* The sale of all or part of a bank to a private sector purchaser (‘‘PSP’’).
* The transfer of all or part of a bank to a ‘‘bridge bank’’ wholly-owned by the Bank of England
(‘‘Bridge Bank’’).
* The transfer of a bank or a bank holding company into temporary public ownership (‘‘TPO’’).
These powers apply only to a UK bank or bank holding company. They do not apply to overseas
banks with a branch in the UK.
A stabilisation power may only be exercised if the FSA is satisfied that: (1) the bank is failing, or is
likely to fail, to satisfy the threshold conditions for authorisation within the meaning of section 41(1)
of FSMA; and (2) having regard to timing and other relevant circumstances it is not reasonably likely
that action will be taken by or in respect of the bank to satisfy those conditions.
417
c102100pu100Proof7:28.3.10B/LRevision:0OperatorSadK

In exercising any of the stabilisation powers, or the new insolvency procedures, the Authorities must
have regard to specified objectives. These are the protection and enhancement of the stability of the
UK financial systems, the stability of the UK banking systems, protecting depositors, protecting
public funds and avoiding unjustified interference with property rights. These objectives are to bebalanced as appropriate in each case. The Treasury is required to publish a code of practice about
the use of the new powers, although this code is not legally binding. The code was published in
February 2009.
The Bank of England can exercise the PSP or Bridge Bank powers if it is satisfied (after consultation
with the Treasury and the FSA) that it is necessary having regard to the public interest in the
stability of the UK financial systems, the maintenance of public confidence in the stability of the UKbanking systems or the protection of depositors.
The Treasury may exercise the TPO power if it is satisfied (after consultation with the Bank of
England and the FSA) that either the exercise of the power is necessary to resolve or reduce a serious
threat to the stability of the UK financial systems or that it is necessary to protect the public interest
where the Treasury has provided financial assistance to the bank.
The stabilisation powers are supplemented by a broad range of powers to transfer shares or property
(including foreign property) as well as overriding contractual rights that could interfere with the
transfer.
In addition, the Banking Act creates two new insolvency procedures for failing banks: the bank
insolvency procedure provided for by the Bank Insolvency (England and Wales) Rules, 2009, and the
bank administration procedure, provided for by the Bank Administration (England and Wales) Rules2009.
The Bank of England, the FSA or the Secretary of State may apply to the court to make a bank
insolvency order. An order may be made if (i) the bank is unable, or is likely to become unable, to
pay its debts, (ii) winding up would be in the public interest or (iii) winding up the bank would be
fair. The bank must have depositors eligible to be compensated under the FSCS (banks that do not
have such depositors may still be subject to the stabilisation powers referred to above, or to
administration or winding up under the Insolvency Act 1986.)
Once a bank insolvency order is made the liquidator has two objectives. The first is to work with the
FSCS to ensure, as soon as is reasonably practicable, that accounts are transferred to another bank,
or eligible depositors receive compensation under the FSCS. Once this objective has been
accomplished, the task of the liquidator is to wind up the affairs of the bank so as to achieve the
best results for the bank’s creditors as a whole. The general law of insolvency applies with some
modifications to a bank insolvency and the liquidator has similar powers to get in the bank’s assetsand, once the eligible deposits have been transferred, or compensation paid, creditors will receive a
distribution in accordance with their rights.
Other insolvency proceedings remain possible (e.g. administration or liquidation), although no
application can be determined until the FSA has decided not to apply for a bank insolvency order.
The Banking Act 2009 also introduces a new bank administration regime. This may be used wherepart of the business of a UK bank is sold to a commercial purchaser, or is transferred to a Bridge
Bank, under the stabilisation powers. The purpose of bank administration is principally to ensure that
the non-sold or non-transferred part of the bank continues to provide services to enable the purchaser
or Bridge Bank to operate effectively. Once the Bank of England notifies the bank administrator that
the residual bank is no longer required by the commercial purchaser or Bridge Bank, the bank will
proceed to a normal administration where the objective is either to rescue the residual bank as a
going concern or, if this is not possible, to achieve a better result for the bank’s creditors as a whole
than in a winding up.
In addition, the Financial Services Bill currently before the UK Parliament will require the FSA to
make rules requiring financial institutions to create and maintain recovery and resolution plans
(commonly referred to as ‘‘living wills’’) in preparation for potential adverse scenarios that could
compromise their business model.
Hong Kong Regulation and Supervision
Banking in Hong Kong is primarily subject to the provisions of the Banking Ordinance, and to the
powers, functions and duties given by the Banking Ordinance to the HKMA. The principal function
of the HKMA is to promote the general stability and effective working of the banking system in
418
c102100pu100Proof7:28.3.10B/LRevision:0OperatorSadK

Hong Kong. The HKMA is responsible for supervising compliance with the provisions of the
Banking Ordinance and also supervises compliance with the HKMA’s guidelines, and legislation
promulgated by the SFC. The Chief Executive of Hong Kong has the power to give directions to the
HKMA and the Financial Secretary of Hong Kong, which the Banking Ordinance requires them tofollow. The Banking Advisory Committee, whose members are appointed by the Financial Secretary
under the delegated authority conferred by the Chief Executive and which is chaired by the Financial
Secretary, advises the Chief Executive on matters connected with the Banking Ordinance. In
particular it advises in relation to banks and the carrying on of banking business in Hong Kong.
The HKMA has responsibility for authorising banks and has discretion to attach conditions to its
authorisation. The HKMA expects every authorised institution to have in place a comprehensive risk
management system to identify, measure, monitor and control the various types of risk within its
activities and, where appropriate, to hold capital against those risks.
The HKMA adopts a risk-based supervisory approach which seeks to determine whether authorised
institutions have appropriate systems of risk management and internal control. This approach involvesthe preparation of an institutional overview (based primarily on internal and public sources of data,
as well as information gathered from periodic on-site visits) and a risk assessment narrative designed
to identify the type, level and direction of risks of an authorised institution. The HKMA will prepare
a planning and scope memorandum for the purpose of planning the supervisory work and defining
the examination activities. A risk-focused on-site examination is performed to evaluate the
effectiveness of the risk management system of the authorised institution for each type of inherent
risk. The results of this exercise are factored into the CAMEL rating (CAMEL is an internationally
recognised framework for assessing capital adequacy, asset quality, management, earnings andliquidity. The overall rating is expressed through the use of a numerical scale of 1 to 5 in ascending
order of supervisory concern). The process is complemented by on-site visits, prudential interviews
with the senior managers and overseas head offices and annual tripartite meetings with the institution
and its external auditors.
If the power of the HKMA to propose revocation of authorisation of an authorised institution
becomes exercisable, and the HKMA:
(i) considers that it is necessary in the interests of depositors or potential depositors of the
institution; or
(ii) is advised by the Financial Secretary that he considers that it is in the public interest,
that urgent action be taken, the HKMA may, after consultation with the Financial Secretary suspend
its authorisation for no more than 14 days, or for up to six months, which may be renewed for an
additional six months.
The HKMA may also revoke authorisation in the event of an institution’s non-compliance with
certain provisions of the Banking Ordinance or on any other ground specified in the Banking
Ordinance.
The Banking Ordinance and related subsidiary legislation requires that banks submit to the HKMA
certain returns and other information and establishes certain minimum standards and ratios, forexample relating to capital adequacy, liquidity, capitalisation, limitations on shareholdings, exposure
to any one customer, unsecured advances to persons affiliated with the bank and holdings of interests
in land, with which banks must comply.
To facilitate more effective cooperation with other financial supervisory authorities, the Banking
Ordinance enables the HKMA to cooperate and assist with other recognised financial supervisory
authorities in Hong Kong and abroad. The Banking Ordinance’s secrecy provisions permit the
HKMA to, subject to certain conditions, exchange information with such other authorities in a place
outside Hong Kong, and also permit the HKMA to disclose information to the Chief Executive, the
Financial Secretary and other financial officials, where the HKMA thinks such disclosure is desirable
or expedient that information should be so disclosed in the interests of depositors, potentialdepositors or the public or where the disclosure would aid the recipients in the exercise of their
functions and is not contrary to the interests of the depositors, potential depositors or the public.
The HKMA has entered into a Memorandum of Understanding with the SFC pursuant to which the
HKMA shall be responsible for the day-to-day supervision of the regulated activities carried out by
authorised institutions. The SFC is an independent non-governmental statutory body outside the civil
service, responsible for regulating the securities and futures markets in Hong Kong. It regulates all
419
c102100pu100Proof7:28.3.10B/LRevision:0OperatorSadK

corporations and individuals licensed to carry out regulated activities. It also has power to investigate
and take action against market misconduct, and other breaches of the SFO and related legislation.
There are other regulatory and enforcement bodies in Hong Kong whose supervisory and investigative
functions are relevant and applicable to businesses generally undertaken by banks, namely: the
Mandatory Provident Fund Authority, which regulates and monitors the operation of the Mandatory
Provident Fund System and compliance with the Mandatory Provident Fund Schemes Ordinance
(Cap. 485 of the Laws of Hong Kong); the Privacy Commissioner’s Office for Personal Data, which
oversees the enforcement of the Personal Data (Privacy) Ordinance (Cap. 486 of the Laws of Hong
Kong); the Insurance Authority (Office of the Commissioner of Insurance), which administers the
Insurance Companies Ordinance (Cap. 41 of the Laws of Hong Kong) and regulates insurers andinsurance intermediaries and the Hong Kong Federation of Insurers, a self-regulatory body of
insurers which promulgates codes of practice applicable to insurers and insurance agents; and the
Joint Financial Intelligence Unit, which receives suspicious money laundering transactions reports and
passes them to the appropriate law enforcement authorities for investigation.
Singapore Regulation and Supervision
Banking in Singapore is regulated by and subject to the provisions of the Singapore Banking Act and
the subsidiary legislation issued thereunder, which are administered by the MAS. Under the
provisions of the Singapore Banking Act and the MAS Act, the MAS is empowered to issue notices,
directives, circulars, guidelines and recommendations from time to time to banks in Singapore.
The MAS is a statutory body set up under the MAS Act and is accountable to the Parliament ofSingapore through the Minister of Finance. The objectives of the MAS include the promotion of
price stability conducive to the sustainable growth of the Singapore economy as well as fostering a
sound and progressive financial services sector.
The MAS may (under conditions of secrecy) inspect the books (which include any records or
accounts) of any bank in Singapore. It may (again under conditions of secrecy) investigate the books
of any bank in Singapore suspected of carrying on business in a manner likely to be detrimental tothe interests of depositors and other creditors or having insufficient assets to meet its liabilities to the
public or contravening the provisions of the Singapore Banking Act. Its supervision of banks and
other financial institutions in Singapore is carried out through a system of on-site inspections, review
of data and other information provided to the MAS and analytical reviews of statistical and other
information submitted by these institutions. The MAS may appoint an independent auditor to
exercise its power of inspection and investigation. The key areas of the MAS’s concern are the quality
of management, earnings and assets and adequacy of capital and liquidity, operational and
technology risk, market risk, legal and reputational risk and market conduct.
The MAS also relies on internal auditors and approved external auditors to identify weaknesses and
areas of non-compliance. Banks are required to submit a copy of their external auditor’s reports to
the MAS together with the annual accounts. An external auditor is required under the Singapore
Banking Act to immediately report to the MAS if he comes across any serious violations of the
Singapore Banking Act, criminal offences involving fraud or dishonesty, losses that reduce the capital
funds of the bank by 50% or more, serious irregularities and inadequacy of assets to cover the claimsof creditors.
The Singapore Banking Act requires banks to submit to the MAS returns and other information and
establishes certain minimum standards relating to capital adequacy, liquidity, capitalisation,
shareholdings, exposure to any single counterparty or counterparty group, unsecured exposures to any
director group and holdings of interests in immovable property, with which banks must comply.
Furthermore, the head offices of foreign banks who have banking operations in Singapore are usually
required by the MAS, as a condition of their licence to conduct banking business in Singapore to
give an undertaking to provide financial support to their banking operations in Singapore in times of
need.
The MAS also has powers to institute actions, for instance, where a bank is suspected of carrying onbusiness in a manner likely to be detrimental to the interests of depositors or other creditors or where
the MAS deems necessary in the interests of the public. It may appoint a person to advise a bank on
the proper management of its business or assume control of and manage the business of the bank.
The Singapore Banking Act also contains conditions and procedures for the MAS to revoke a bank’s
licence.
420
c102100pu100Proof7:28.3.10B/LRevision:0OperatorSadK

Korean Regulation and Supervision
The banking system in Korea is governed by the Korean Bank Act. Korean banks are subject to the
regulations and supervision of the Ministry of Strategy and Finance, the Korean FSC, the KoreanFSS (the executive body of the Korean FSC), and the Bank of Korea. The Ministry of Strategy and
Finance focuses on economic, tax and foreign currency policies. The Bank of Korea manages
monetary policies focusing on price stabilisation. The Korean FSC concentrates on financial policies,
the approval process for establishing financial institutions and imposing sanctions on banks violating
the Korean Bank Act and other laws and regulations. The Korean FSS is subject to the instructions
and directives of the Korean FSC and carries out the supervision and examination of commercial
banks. In particular, the Korean FSS sets requirements both for prudent control of liquidity and for
capital adequacy and establishes reporting requirements within the authority delegated to it under theKorean FSC regulations, pursuant to which banks are required to submit annual reports on financial
performance and shareholdings, regular reports on management strategy and non-performing loans,
including write-offs, and management of problem companies and plans for the settlement of bad
loans.
Under the Korean Bank Act, all banks must meet minimum ratios of Tier 1 and Tier 2 capital (less
any capital deductions, and hereinafter the same shall apply) to risk-weighted assets, determined inaccordance with Korean FSC requirements that have been formulated based on Bank of International
Settlements, or BIS, standards. Specifically all domestic banks and foreign bank branches must meet a
minimum ratio of Tier 1 and Tier 2 capital to risk-weighted assets of 8%. In January 2008, Basel II,
a new capital standard framework which provides a range of options for determining the capital
requirements for credit risk and operating risk, was implemented for domestic banks. Under Basel II,
the capital requirements for credit risk can be calculated by the IRB approach or the standardised
approach. All banks are required to ensure adequate liquidity by matching the maturities of their
assets and liabilities in accordance with the Korean Bank Act. Banks may not invest an amountexceeding 60% of their Tier 1 and Tier 2 capital in stocks and other securities with a maturity of
more than three years.
Under the Korean Bank Act, the sum of large exposures by a bank generally must not exceed five
times the sum of Tier 1 and Tier 2 capital. In addition, banks generally may not extend credit in
excess of 20% of the sum of Tier 1 and Tier 2 capital to a single individual or juridical person, orgrant credit in excess of 25% of the sum of Tier 1 and Tier 2 capital to a single group of companies,
as defined in the Monopoly Regulations and Fair Trade Act. The Korean Bank Act also provides for
certain restrictions on extending credits to a major stockholder. Under these restrictions, a bank may
not extend credits to its major stockholder (together with persons who have a special relationship
with that stockholder) in an amount greater than the lesser of: (i) 25% of the sum of the bank’s Tier
1 and Tier 2 capital; and (ii) the relevant major stockholder’s shareholding ratio multiplied by the
sum of the bank’s Tier 1 and Tier 2 capital. In addition, the total sum of credits granted to all major
stockholders must not exceed 25% of the bank’s Tier 1 and Tier 2 capital.
A bank may possess real estate property to conduct its business only, and even in such a case, the
aggregate value of the real estate property cannot exceed 60% of Tier 1 and Tier 2 capital. Under the
Korean Bank Act, a bank may not own more than 15% of shares outstanding with voting rights of
another company, with some exceptions.
Under the Korean Bank Act, a single stockholder and persons who have a special relationship with
that stockholder generally may acquire no more than 10% of a nationwide bank’s total issued and
outstanding shares with voting rights. Acquiring voting shares of such bank in excess of 4% up to
10% requires the filing of a report with the Korean FSC.
If they are non-financial business operators, however, they must obtain the prior approval of theKorean FSC in the following situations: (a) acquiring shares of a nationwide bank in excess of 9% of
that bank’s outstanding voting shares; or (b) (i) acquiring such voting shares in excess of 4% and (ii)
serving as the largest shareholder of the bank or participating in the management of the bank. Even
with such prior approval of the Korean FSC, non-financial business operators cannot acquire more
than 10% of a nationwide bank’s outstanding voting shares.
Any person (whether a Korean national or a foreign investor), with the exception of non-financial
business operators described above, may acquire more than 10% of a nationwide bank’s total voting
shares issued and outstanding by obtaining an approval from the Korean FSC. The shareholding
thresholds triggering the Korean FSC approval requirement are 10%, 25% or 33% of the bank’s total
voting shares issued and outstanding, provided that in addition to the foregoing threshold
421
c102100pu100Proof7:28.3.10B/LRevision:0OperatorSadK

shareholding ratios, the Korean FSC may, at its discretion, designate a separate and additional
threshold shareholding ratio requiring its approval.
There is a proposed amendment to the Korean Bank Act with respect to, among others: (i)
expanding the scope of businesses that can be conducted by a bank; and (ii) refining qualification
requirements applicable to outside directors of a bank.
A bank must register with the Ministry of Strategy and Finance to conduct foreign exchange
business, which is governed by the Foreign Exchange Transaction Law. A bank must obtain the
permission of the Korean FSC to enter certain areas of securities business, which is governed by theFinancial Services and Capital Market Act. Under these laws, a bank may engage in foreign exchange
business, securities repurchase business, government/public bond underwriting business and
government bond dealing business. In addition, a bank must obtain an approval from the Korean
FSC in order for it to engage in credit card business. The credit card business is governed by the
Credit Specialised Financial Business Act. A bank must obtain approval from the Korean FSC to
engage in trust business. The Trust Act and the Financial Services and Capital Market Act govern
trust activities of banks, and they are subject to various legal and accounting procedures and
requirements.
422
c102100pu100Proof7:28.3.10B/LRevision:0OperatorSadK

FOREIGN INVESTMENT, EXCHANGE CONTROLS AND OTHERINDIAN LAWS
UK Exchange Control Regulations
There are currently no UK laws which affect the import or export of capital, or the remittance ofdividends, interest or other payments. There are no restrictions on the transfer of UK securities.
Hong Kong Foreign Investment and Exchange Control
There are currently no Hong Kong laws which restrict foreign investment (other than in relation toinvestments in certain telecommunications and broadcasting service providers) or impose foreignexchange control in Hong Kong. It is specified in the Basic Law of Hong Kong that no foreignexchange control policies shall be adopted.
Indian Exchange Control Regulations
Pursuant to the terms of the RBI Circular, prior approval of the sectoral regulator(s) is required forraising funds through issuance of IDRs by financial/banking companies having a presence in India,either through a branch or subsidiary. The RBI approved the Issue on 7 October 2009.
Pursuant to a letter dated 14 January 2010, terms of the approval letter dated 7 October 2009 werepartially modified and clarified by the RBI. Further, the RBI on 22 March 2010 permitted the issueof IDRs not exceeding 5% of the total Shares of the Company. This approval is valid for a period ofthree months.
Remittance of proceeds from the Issue
Pursuant to the terms of the RBI Circular issued under FEMA, the proceeds of the issue of IDRsare required to be repatriated outside India.
Investment in IDRs
Pursuant to the terms of the RBI Circular, FIIs including SEBI approved sub-accounts of the FIIs,registered with SEBI and NRIs may invest, purchase, hold and transfer IDRs, subject to the ForeignExchange Management (Transfer or Issue of Security by a Person Resident Outside India)Regulations, 2000. Further, NRIs are allowed to invest in the IDRs out of funds held in their NRE/FCNR(B) account, maintained with an authorised dealer/authorised bank.
No single individual or single entity or group of entities in India, other than QIBs, shall hold, directlyor indirectly, IDRs exceeding 5% of the Issue. No single QIB or a group of QIBs shall hold IDRsexceeding 15% of the Issue.
In accordance with the regulations of the RBI, no bank in India shall: (i) grant a loan to anyinvestor for the purpose of subscribing for any IDRs; or (ii) grant a loan to any person which issecured against any IDRs.
Ability to withdraw Shares from the IDR Facility and to deposit further shares into the IDR Facility
Pursuant to the terms of the RBI Circular, IDRs are not redeemable into underlying equity sharesbefore the expiry of a one-year period from the date of issue of the IDRs. The SEBI Regulationsstate that automatic fungibility of IDRs is not permitted. Therefore, fungibility of IDRs into theunderlying Shares would be permitted only after the expiry of the one year period from the date ofissue of the IDRs and subsequent to obtaining RBI approval on a case-by-case basis. Further, two-way fungibility (the ability to purchase existing Shares on the London Stock Exchange and/or theHong Kong Stock Exchange and deposit them into the IDR programme) is not currently permitted.Additionally, in terms of the RBI Circular, at the time of redemption/conversion of IDRs intounderlying shares, the Indian holders (persons resident in India) of IDRs are required to comply withthe provisions of the Foreign Exchange Management (Transfer or Issue of Any Foreign Security)Regulations, 2004.
The ability of Indian residents to hold underlying Shares is limited. Pursuant to the terms of the RBICircular, resident individuals are allowed to hold the underlying Shares only for the purpose of sale.The IDR Holders are required to sell the underlying Shares within a period of 30 days from the dateof conversion of the IDRs into underlying Shares.
The FEMA provisions are not applicable to the holding of the underlying Shares, on redemption ofIDRs by the FIIs including SEBI approved sub-accounts of the FIIs and NRIs.
Under the existing guidelines, an individual resident in India is permitted to remit only up toUS$200,000 per financial year to undertake any capital account/current account transactions including
423
c102100pu100Proof7:28.3.10B/LRevision:0OperatorSadK

investment in foreign securities. Furthermore, a company incorporated in India can invest only up to50% of its net worth by way of overseas portfolio investments per financial year.
Possible restrictions on the ability of the Company to distribute further shares in India
Under the Indian Companies Act, a company incorporated outside India cannot issue, circulate ordistribute any offer of securities to more than 50 persons (other than professional investors) residentin India without registering a prospectus with the RoC. Such a prospectus is required to contain theinformation specified in the Indian Companies Act and the SEBI Regulations. The exact lawapplicable to and the process to be followed for the registration of such a prospectus is not clear atpresent.
Certain restrictions on the ability of the Company to undertake a rights offering simultaneously in the UK and
in India
There are significant differences in the timeline for rights issues in India and the UK. Whilst the timeperiod between the date of announcement and the date of allotment is 10 Business Days in a rightsissue in UK, the existing guidelines on rights issues in India require that the rights issue should bekept open for subscription between 15-30 days. After the closing of the subscription, the company isrequired to allot the shares to investors within a period of 15 days.
424
c102100pu100Proof7:28.3.10B/LRevision:0OperatorSadK

GOVERNMENT APPROVALS
Legal Regime
The issue of IDRs by a company incorporated outside India is primarily regulated by the IDR Rules,
IDR Listing Agreement, Chapter X and other applicable provisions of the SEBI Regulations andsuch other rules and regulations which permit companies incorporated outside India to issue IDRs in
accordance with the procedure laid down thereunder without obtaining any regulatory approvals.
Approvals for the Issue
Except for approval from SEBI for the Issue, RBI approval to undertake the Issue, listing and
trading approvals from the Stock Exchanges and approvals required under the current exchange
control regulations, there are no other Indian regulatory approvals required in relation to the Issue.
For more details, see the sections titled ‘‘Issue Procedure – Filing’’ on page 382 of this Draft RedHerring Prospectus, ‘‘Issue Procedure – Listing’’ on page 383 of this Draft Red Herring Prospectus
and ‘‘Foreign Investment, Exchange Controls and other Indian Laws – Indian Exchange Control
Regulations’’ on page 423 of this Draft Red Herring Prospectus.
Regulatory filings
See the section ‘‘Issue Procedure – Filing’’ on page 382 of this Draft Red Herring Prospectus.
Approvals from UK authorities
Application will be made to the FSA, as the UK Listing Authority, for the Shares to be admitted to
the Official List and to the London Stock Exchange for such Shares to be admitted to trading on the
main market of the London Stock Exchange, a regulated market for the purposes of MiFID.
Approvals from Hong Kong authorities
Application will be made to the Hong Kong Stock Exchange for the listing of, and permission todeal in, the Shares on the Hong Kong Stock Exchange.
425
c102100pu100Proof7:28.3.10B/LRevision:0OperatorSadK

COMPARISON OF RIGHTS OF SHAREHOLDERS
The Company is incorporated under the laws of England and Wales. The following section
summarises certain material differences between the rights of holders of the Shares and rights of
holders of equity shares of a typical company incorporated under Indian law which result from
differences in governing documents, the laws of England and Wales and of India and the applicablesecurities laws and regulations. As a holder of IDRs, your rights differ in certain respects from those
of holders of equity shares in India.
This summary does not purport to be a complete statement of the rights of the Company’s
shareholders under applicable law in the UK and the Memorandum of Association of the Company
and Articles or the rights of holders of equity shares of a typical company incorporated under Indian
law.
Indian Law English Law
Annual and General Meetings of Shareholders
While the shareholders of a company do not
have any right to call for an annual general
meeting, shareholders holding one-tenth of the
voting share capital of the company have a right
to request an extraordinary general meeting.
However, in the event the company fails to holdan annual general meeting within 15 months
from the date of its last annual general meeting,
the government of India may order a meeting to
be held upon the application of any shareholder.
The provisions of the UK Companies Act require
annual general meetings to be held within six
months of the end of each financial year.
Under the UK Companies Act, general meetings
may be convened at any time by the Directors attheir discretion or by the Directors at the request
of the Company’s shareholders holding in
aggregate not less than 5% of the Company’s
paid-up capital. A request by shareholders to
convene a general meeting must state the general
nature of the business to be dealt with at the
meeting and may include the text of a resolution
that may properly be moved and is intended tobe moved at the meeting.
Shareholders holding in the aggregate not less
than 5% also have the right to require the
Company to include matters other than
resolutions to be passed in the business of the
annual general meeting.
Notice of an annual general meeting must be
provided to shareholders at least 21 days prior to
the date of the proposed meeting. Notice of a
general meeting must be provided to shareholders
at least 21 days prior to the date of the proposed
meeting unless two conditions are met. The first
is that a special resolution is passed at the
immediately preceding annual general meeting, orat another general meeting held since the annual
general meeting. The second is that the Company
makes provision for all shareholders, who have
the right to vote, to vote via electronic means. If
both these conditions are satisfied notice may be
provided 14 days prior to the date of the
proposed meeting. Any notice shall be exclusive
of the day on which it is served, or deemed to beserved, and the day on which the meeting is held.
Certain information must also be displayed on
the Company’s website before and after the
meeting.
426
c102100pu100Proof7:28.3.10B/LRevision:0OperatorSadK

Quorum Requirements for Meetings of Shareholders
Indian law allows the articles of association of a
company to specify the number of members whoshall constitute a quorum; however in no event
shall such number be less than five members
present in person for a meeting for a public
company.
The Articles specify that five members present in
person or by proxy and entitled to voteconstitute the quorum required to conduct
business at a general meeting. At any adjourned
meeting one member present in person or by
proxy and entitled to vote (whatever the number
of shares held by him) will constitute a quorum.
Board of Directors
Under Indian law, every public company isrequired to have a minimum of three directors.
The number of directors may be increased or
reduced by ordinary resolution within the limits
as fixed by its articles of association.
The Articles provide that unless otherwisedetermined by ordinary resolution of the
Company, the number of Directors (disregarding
alternate directors) shall be neither less than five
nor more than 30.
The appointment and removal of directors
requires approval of shareholders. However, with
respect to additional directors, a company’sarticles of association can empower the board of
directors to appoint the additional directors.
Under English law, a director has a fiduciary
duty to act in a company’s best interests. The
UK Companies Act provides that directors owethe following duties:
* to act and exercise his or her powers in
accordance with the company’s constitution
and for proper purposes;
* to promote the success of the company;
* to exercise independent judgement;
* to use reasonable care, skill and diligence;
* to avoid conflicts of interest;
* not to accept benefits from third parties;
and
* to declare interests in proposed transactions
and arrangements.
The UK Companies Act contains certain
restrictions on a company’s power to make loans
and confer other benefits to directors and persons
connected with them.
Removal of Directors
Under Indian law, a director of a company,
other than a director appointed by the
government of India, may be removed by
ordinary resolution, provided that special notice
of the resolution is sent in accordance with the
provisions of the Indian Companies Act.
Under the UK Companies Act, shareholders may
remove a director without cause by ordinary
resolution, irrespective of any provision of the
company’s articles of association or service
contract the director has with the company,
provided, however, that at least 28 days’ notice is
given to the company.
Additionally, the Articles allow shareholders to
remove any Director before the expiry of his
term of office by special resolution.
Filling Vacancies on the Board of Directors
A vacancy created by the removal of a director
may be filled by appointing another director
provided that special notice given for removal of
the director also provides for appointment ofanother director. However, if special notice is not
given for such appointment, the board of
directors has the power to fill a vacancy on the
Shareholders may by ordinary resolution appoint
a person who is willing to act to be a director to
fill a vacancy or to become an additional
director, subject to the maximum number ofdirectors provided in the company’s articles of
association.
427
c102100pu100Proof7:28.3.10B/LRevision:0OperatorSadK

board. Any director so appointed shall hold
office only so long as the vacating director would
have held such office if no vacancy had occurred.
Subject to the maximum of 30 Directors
contained in the Articles, the Board may also
appoint any person who is willing to act to be a
Director either to fill a vacancy or as an additionto the existing Board. Any Director appointed by
the Board must retire at the next annual general
meeting of the Company and will be eligible for
re-appointment by the Company.
Under the Articles, at the meeting at which a
Director retires the Company can pass an
ordinary resolution to re-appoint the Director orto appoint some other eligible person in his
place.
The Articles provide that at every annual general
meeting a minimum of one-third of the Directors
must retire. These retiring Directors may be re-
appointed by the meeting.
Interested Directors’ Transactions
Under Indian law, a director who is interested in
contracts or arrangements is required to obtain
the consent of the board of directors to enter
into such contracts or arrangements. However, in
the case of a company having a paid-up share
capital of not less than Rs. 10 million, prior
approval of the government of India will berequired. Furthermore, the interested director is
required to disclose the nature of interest or
concern at a meeting of the board of directors.
Such interested director is not allowed to
participate in the discussion of, or vote on, such
contracts or arrangements and if he does vote,
such vote shall be void. The presence of such
interested director is not counted for thepurposes of the quorum. Further contravention
of the relevant provisions is punishable with a
fine.
The Articles allow a Director to be a party to, or
otherwise interested in, a contract with the
Company provided he has declared the nature
and extent of that interest to the Directors in
accordance with the UK Companies Act. Subject
to limited exceptions, the interested Director
must not vote or be counted in the quorum inrelation to any resolution of the Board in respect
of any contract in which he or his associates has
an interest which is to his knowledge a material
interest. If an interested Director does vote, his
vote will not be counted.
Under the Articles, the Board may authorise any
matter which would otherwise involve a Directorbreaching his duty under the UK Companies Act
to avoid conflicts of interest. The relevant
Director and any other Director with a similar
interest shall not count towards the quorum nor
vote on any resolution giving such authority and
may, if the other members of the Board so
decide, be excluded from any Board meeting
while the conflict is under consideration.
Voting
At any general meeting, voting is by a show of
hands unless a poll is demanded by a shareholder
or shareholders present in person or by proxy
holding at least 10% of the total shares entitled
to vote on the resolution or on which an
aggregate sum of not less than Rs. 50,000 is paid
up. Upon a show of hands, each shareholder
entitled to vote and present in person has onevote and, on a poll, every shareholder entitled to
vote and present in person or by proxy has
voting rights in proportion to the paid-up capital
held by such shareholder. Ordinary resolutions
are adopted at general meetings of shareholders
by a simple majority of the shareholders having
Under English law, unless the articles of
association provide otherwise, a shareholder
entitled to vote at a shareholders’ meeting is
entitled to one vote on a show of hands
regardless of the number of shares he or she
holds. Voting occurs by a show of hands unless
a poll is demanded by: (1) the chairman of the
meeting; (2) any group of five ordinaryshareholders or their proxies (three in the
Company’s case); (3) any shareholder or his or
her proxy representing at least 10% of the total
voting rights; or (4) a shareholder or
shareholders present in person or by proxy
holding shares conferring a right to vote at the
428
c102100pu100Proof7:28.3.10B/LRevision:0OperatorSadK

voting rights present in person or by proxy.
However, certain resolutions, such as
commencement of a new line of business,
amendment of its memorandum and articles ofassociation, waiver of pre-emptive rights, issue of
further shares to persons other than existing
shareholders and reduction of share capital,
require that votes cast in favour of the
resolution, whether by a show of hands or poll,
are not less than three times the number of
votes, if any, cast against the resolution by
members so entitled and voting. Under theprovisions of section 42 of the Indian Companies
Act, subsidiaries are not permitted to be
members of the holding company. Even if any
subsidiary holds shares in its holding company
prior to its becoming a subsidiary, the shares
held by the subsidiary will not have any voting
rights. Any shareholder may appoint a proxy.
The instrument appointing a proxy must bedelivered to the Company at its registered office
at least 48 hours prior to the meeting. A proxy
may not vote except on a poll. A corporate
shareholder is also entitled to appoint an
authorised representative to attend and vote
(both upon a show of hands and upon a poll) on
its behalf at general meetings.
meeting (being shares on which an aggregate sum
has been paid up equal to not less than 10% of
the total sum paid up on all shares conferring
that right). On a poll, a shareholder of theCompany has one vote for every US$2 nominal
value of share capital which he holds. On a poll,
a member entitled to more than one vote need
not, if he votes, use all his votes or cast all the
votes he uses in the same way.
Under English law, ordinary resolutions may be
decided on a show of hands and must beapproved by at least a majority of the
shareholders present in person or by proxy. If a
poll is demanded, the resolution conducted on a
poll must be approved by holders of at least a
majority of the votes cast at the meeting whether
in person or by proxy. Special resolutions require
the affirmative vote of at least 75% of the votes
cast at the meeting whether in person or byproxy.
Under the Uncertificated Securities Regulations
2001 the record date for a shareholders’ meeting
may not be more than 48 hours prior to the time
fixed for such a meeting excluding non-working
days.
The Indian Companies Act permits a company to
issue shares with differential rights as to
dividend, voting or otherwise subject to certain
conditions. For a company to issue shares with
differential voting rights it should have
distributable profits (as specified under the Indian
Companies Act) for a period of three financial
years, it should not have defaulted in filingannual accounts and annual returns for the
immediately preceding three years, and the
articles of association of the company should
permit the issuance of such shares with
differential voting rights.
Shareholder Action without a Meeting
There is no concept of a written resolution under
Indian law.
Under English law, a public company cannot
pass a written shareholder resolution.
Business Combinations
Under Indian law, a compromise or arrangement
between a company, its creditors or any class of
them or between a company, its members or any
class of them is required to be sanctioned by a
tribunal and approved by a majority in number
representing three-quarters in value of the
creditors or class of creditors or members, or
class of members, as the case may be.
Under English law, a compromise or
arrangement between a company, its creditors or
any class of them or between the company, its
members or any class of them is required to be
sanctioned by the courts and approved by a
majority in number representing three-quarters in
value of the creditors or class of creditors, or
members or class of members, as the case maybe.
429
c102100pu100Proof7:28.3.10B/LRevision:0OperatorSadK

Limitations on Personal Liability of Directors
Generally, Indian law provides that directors are
not personally liable in respect of contracts ofthe company. However, where a director acts
without the approval or ratification of the
company, such director may be personally liable.
Directors are also personally liable for breach of
trust or misfeasance, both civilly and, in some
cases, criminally. The Indian Companies Act
contains certain provisions making directors
personally liable to discharge certain monetaryobligations in their capacity as directors, such as
the non-refund of share application monies or
excess application monies within the time limit
stipulated by the Indian Companies Act.
Similarly, the Indian Companies Act provides for
civil liability of directors for misstatements in a
prospectus issued by the company that has been
signed by the directors, including the obligationto pay compensation to any persons subscribing
to the shares of the company on the faith of the
statements made in the prospectus.
Under the UK Companies Act, the Company
may ratify, by ordinary resolution, a Director’sconduct amounting to negligence, default, breach
of duty or breach of trust in relation to the
Company. However, the votes of the Director
concerned or any connected person will not be
counted. A fellow Director could be a connected
person for these purposes. See also the paragraph
headed ‘‘Indemnification of Directors and Officers’’
below.
Indemnification of Directors and Officers
Under Indian law, any provision under the
articles of association of a company or in an
agreement with a company or in any other
instrument, exempting any officer of the company
or any person employed by the company asauditor from, or indemnifying him against, any
liability which, by virtue of any rule of law,
would otherwise attach to him in respect of any
negligence, default, misfeasance, breach of duty
or breach of trust of which he may be guilty in
relation to the company, shall be void. However,
a company may indemnify any such officer or
auditor against any liability incurred by him indefending any proceedings, whether civil or
criminal, in which judgment is given in his
favour or in which he is acquitted or discharged
or in which relief is granted to him by the
courts.
Under the UK Companies Act, any provision
that purports to exempt a Director of the
Company from any liability that would otherwise
attach to him in connection with any negligence,
default, breach of duty or breach of trust inrelation to the Company is void.
However, the general prohibition is subject to a
relaxation which allows the Company to provide
a qualifying third party indemnity provision, that
is, the Company is permitted to:
* indemnify its Directors and a director of an
associated company in respect of
proceedings brought by third parties
(covering both legal costs and the financial
costs of any adverse judgment, except for
the legal costs of unsuccessful defence of
criminal proceedings, fines imposed incriminal proceedings, penalties imposed by
regulatory bodies and unsuccessful
application for relief from liability under
the provisions for relief in the UK
Companies Act); and
* pay Directors’ defence costs as they areincurred, even if the action is brought by
the Company itself. The Director would still
be liable to pay any damages awarded to
the Company and to repay his defence costs
to the Company if his defence were
unsuccessful (other than where the
Company chooses to indemnify him in
respect of legal costs incurred in civil thirdparty proceedings).
430
c102100pu100Proof7:28.3.10B/LRevision:0OperatorSadK

The UK Companies Act also allows the
Company to purchase and maintain for a
Director of the Company, or a director of an
associated company, insurance against anyliability that would otherwise attach to the
Director in connection with any negligence,
default, breach of duty or breach of trust in
relation to the Company. The Company should
maintain an insurance policy if it is to comply
with the UK corporate governance guidance (or
explain the reason for non-compliance in its
annual report).
The Company’s Articles provide that, to the
extent permitted by the UK Companies Act, the
Company may indemnify any Director of the
Company or any director of any associated
company against any liability and may purchase
and maintain for any Director of the Company,
or any director of any associated company,insurance against any liability.
Shareholders’ Suits
Under the Indian Companies Act, shareholders
holding not less than one-tenth of the issued
share capital of the company or not less than
100 members of the company or not less than
one-tenth of the total number of its members,
whichever is less, provided that the applicant orapplicants have paid all calls and other sums due
on their shares, may apply to the National
Company Law Tribunal for relief in cases of
oppression and mismanagement, particularly if;
(a) the company’s affairs are being conducted in
a manner prejudicial to public interest or in a
manner oppressive to any member or members;
(b) a material change has taken place in themanagement or control of the company; and (c)
the winding-up of the company would unfairly
prejudice such member or members, but that
otherwise a winding-up order would be made on
the ground that it was just and equitable that the
company should be wound up.
Under English law, a member may bring a
derivative claim on behalf of the Company in
respect of a cause of action arising from an
actual or proposed act or omission involving
negligence, default, breach of duty or breach of
trust by a Director. There is no requirement forthe Director to have benefited personally from
the breach in order for a derivative action to be
brought. A derivative claim may be brought
against the Directors of the Company and/or, in
limited circumstances, third parties. It is
immaterial whether the cause of action arose
before or after the person seeking to bring or
continue the derivative claim became a memberof the Company.
The member must establish a prima facie case for
permission of the court to continue a derivative
claim. The court must take into account various
statutory requirements in determining whether a
prima facie case has been established. If the court
is satisfied as to either of the following then itmust refuse permission to continue the derivative
claim:
* that a person acting in accordance with the
general duty to promote the success of the
Company would not seek to continue the
claim; or
* the act or omission giving rise to the cause
of action has been authorised or ratified by
the Company.
Inspection of Books and Records
Under Indian law, it is required that the minutes
of the proceedings of any general meeting shallbe kept open during business hours for
Except when closed under the provisions of the
UK Companies Act, the register and index ofnames of shareholders of an English company
431
c102100pu100Proof7:28.3.10B/LRevision:0OperatorSadK

inspection by any member without charge. In the
event of refusal, the company, and every officer
of the company who is in default, shall be
ordered to pay a fine. Further, the company isobliged to keep the books of account and other
books and papers open for inspection during
business hours.
A copy of every balance sheet (including the
profit and loss account, the auditor’s report and
every other document required by law to be
annexed or attached, as the case may be, to thebalance sheet) which is to be laid before a
company in a general meeting should be
provided to each member of the company not
less than 21 days before the date of the meeting.
The auditor’s report shall be read before the
company in a general meeting and shall be open
for inspection by any member of the company.
All contracts entered into by a company for theappointment of a manager, managing director,
managing agent or secretaries and treasurers,
shall be open for inspection by any member of
the company at such office. The register of
directors shall be open for inspection by any
member of the company without charge and to
any other person on payment of one Rs. for
each document inspected during business hourssubject to such reasonable restrictions as the
company may by its articles of association or in
general meeting impose, so long as not less than
two hours in each day are allowed for inspection.
In the event of refusal, the company, and every
officer of the company who is in default, shall be
ordered to pay a fine. The register of directors’
shareholdings will be open for inspection duringbusiness hours during the period beginning 14
days before the date of the company’s annual
general meeting and ending three days after the
date of its conclusion, and it shall be open for
inspection by any member. In the event of
default, the company and every officer will be
ordered to pay a fine.
The copies of instruments creating charges kept
in pursuance of section 136 of the Indian
Companies Act, and the register of charges kept
in pursuance of section 143 of the Indian
Companies Act, shall be open during business
hours (but subject to such reasonable restrictions
as the company in general meeting may impose,
so long as not less than two hours in each dayare allowed for inspection) for inspection of any
creditor or member of the company without fee,
at the registered office of the company. If
inspection of the said copies or register is
refused, the company, and every officer of the
company who is in default, shall be ordered to
pay a fine. The register of members commencing
may be inspected:
* without payment by its shareholders; or
* for a fee by any other person.
In both cases, the documents may be copied for
a fee.
The shareholders of an English public company
may also inspect, without charge:
* minutes of meetings of the shareholders
(and obtain copies of the minutes for a fee);
and
* service contracts of the company’s directors,
if the contracts have more than 12 months
to run or require more than 12 months’
notice to terminate.
In addition, public companies are required to
provide copies of their annual accounts to
shareholders and make available such accounts to
shareholders at a general meeting.
The Companies (Company Records) Regulations
2008, which came into effect on 1 October 2009,
provide that a public company shall make itscompany records available for inspection by a
person for at least two hours between 9.00 a.m.
and 5.00 p.m. on each working day.
432
c102100pu100Proof7:28.3.10B/LRevision:0OperatorSadK

from the date of registration of the company, the
index of members, the register and index of
debenture holders, and copies of all annual
returns under the Indian Companies Act must beopen during business hours for the inspection of
any member. If inspection of the said copies or
register is refused, the company, and every officer
of the company who is in default, shall be
ordered to pay a fine.
Amendment of Governing Documents
Under Indian law, the provisions of the
governing documents, i.e. provisions of thememorandum of association and articles of
association, of a company may be altered, subject
to additional approval from the government of
India, in certain circumstances, by a special
resolution.
Under the UK Companies Act, shareholders have
the power to amend any provisions of thecompany’s articles of association, by special
resolution.
Under English law, the board of directors is not
authorised to change the articles of association.
From 1 October 2009, a company’s
memorandum of association ceased to be part ofits constitution and merely contains limited
information regarding the founders of the
company. The objects clause contained in the
memorandum of association automatically
became part of the articles of association and
may be deleted or amended by special resolution.
Distributions and Dividends; Repurchases and Redemptions
Under Indian law, a dividend can be declared by
a company for any financial year out of the
profits of the company for that year arrived at
after providing for depreciation, or out of the
profits of the company for any previous financial
year or years arrived at after providing for
depreciation and remaining undistributed, or out
of both. There are certain other requirements tobe met to determine distributable profits. A
company may only pay a dividend in an amount
in excess of 10% of its paid-up capital out of
profits of that year after it has transferred to the
reserves of the company a percentage of its
profits for that year ranging between 2.5% to
10% depending on the rate of dividend proposed
to be declared in that year. If the profits for thatyear are insufficient, the dividend for that year
may be declared out of the accumulated profits
earned in previous years and transferred to
reserves, subject to the following conditions: (i)
the rate of dividend to be declared may not
exceed the lesser of the average of the rates at
which dividends were declared in the five years
immediately preceding the year, or 10% of paid-up capital; (ii) the total amount to be drawn
from the accumulated profits from previous years
and transferred to reserves may not exceed an
amount equivalent to one-tenth of the paid-up
capital and free reserves and the amount so
drawn is first to be used to set off the losses
Subject to the prior rights of holders of preferred
shares, an English company may pay dividends
on its shares only out of its distributable profits,
defined as accumulated realised profits less
accumulated realised losses, and not out of share
capital. Share capital includes the share premium
account, which is an amount equal to the excess
of the aggregate consideration received by acompany for the issue of its shares over the
aggregate nominal amount of such shares.
Amounts credited to the share premium account,
however, may be used to pay up unissued shares
which may then be distributed to shareholders in
proportion to their holdings.
In addition, under English law, a company is notpermitted to make a distribution if, at the time,
the amount of its net assets is less than the
aggregate of its issued and paid-up share capital
and undistributable reserves.
Under English law, a public company may issue
redeemable shares if authorised by its articles of
association, which the Company is, subject toany conditions stated therein. The terms of the
redemption must either be set out in the articles
of association or, if authorised by the articles of
association or an ordinary resolution, the
directors can determine such terms.
433
c102100pu100Proof7:28.3.10B/LRevision:0OperatorSadK

incurred in the financial year before any
dividends in respect of preference or equity
shares are paid; and (iii) the balance of reserves
after withdrawals must not be below 15% ofpaid-up capital. Shareholders have a right to
claim a dividend, after such dividend has been
declared by the company at a general meeting.
Shareholders also have a right to claim the
interim dividends, which may be declared
pursuant to a resolution of the company’s board
of directors. Dividends may be paid in cash only.
Where a dividend has been declared by acompany but has not been paid within 30 days
from the date of declaration to any shareholder
entitled to the payment of such dividend, a
penalty can be imposed on a director who is
knowingly a party to such default.
Under Indian law, no company can buy back its
shares unless the buy-back is approved by specialresolution of the shareholders in general meeting
and is authorised by the articles of association of
the company. However, in the event that the
buy-back is for less than 10% of the total paid-
up share capital of the company, a resolution of
the board of directors of the company shall
suffice. Further, a company is required to fulfil
the following requirements:
* the buy-back should be out of the free
reserves or securities premium account of
the company or out of the proceeds of any
issue of securities (other than equity shares)
of the company;
* the buy-back should be no greater than
25% of the total paid-up share capital of
the company in that financial year;
* the ratio of the debt owed by the company
should not be more than twice the capitaland its free reserves after the buy-back;
* all the shares of the company being bought
back are fully paid up;
* the buy-back has to be completed within 12months from the date of passing of the
special resolution or the resolution of the
board; and
* no buy-back can be made within a period
of 365 days from a previous buy-back.
A company may purchase its own shares, if the
purchase is not restricted by its articles of
association, which in the Company’s case it is
not, and:
* in the case of a market purchase, authority
to make the market purchase has been
given by any ordinary resolution of its
shareholders (although normal practice is to
seek approval by way of special resolution);or
* in the case of an off-market purchase, has
been approved by a special resolution.
Companies can enter into an off-market
purchase contract before obtaining a special
resolution provided that no shares may bepurchased until a special resolution
authorising the contract has been passed.
A company may redeem or repurchase shares
only if the shares are fully paid up and, in the
case of public companies, only out of:
* distributable profits; or
* the proceeds of a new issue of shares, made
for the purpose of the repurchase or
redemption of these shares for cancellation.
The UK Listing Rules require that where acompany has issued shares which are listed on
the Official List and are convertible into a class
of shares to be repurchased, the holders of the
convertible shares must first pass a special
resolution approving any repurchase at a separate
class meeting.
The UK Listing Rules also require thatpurchases within a 12-month period of 15% or
more of a company’s share capital must be made
through either a tender or partial offer to all
shareholders, at a stated maximum or fixed price.
Purchases within a 12-month period below the
15% threshold may be made through:
* the market, provided that the price is not
more than the higher of (i) 5% above the
average of the market values of those
shares for the five Business Days before the
purchase is made, and (ii) the price
stipulated by Article 5(1) of the Buy Back
and Stabilisation Regulation; or
* an off-market transaction negotiated with
one or more shareholders subject to prior
approval of the transaction by special
resolution.
434
c102100pu100Proof7:28.3.10B/LRevision:0OperatorSadK

COMPARISON OF CORPORATE GOVERNANCE
As a company incorporated in England and Wales with ordinary shares listed on the London Stock
Exchange and Hong Kong Stock Exchange, the Company is required to comply with the UK and
Hong Kong corporate governance regimes or, in the case of non-compliance, explain the reasons
therefor.
The Indian corporate governance practices set out in the table below are typically imposed on Indian-
listed entities under an equity listing agreement between the listed entity and the Indian Stock
Exchanges. However, under the IDR Listing Agreement, the Company is required only to complywith the applicable UK and Hong Kong practices.
As required by the IDR Listing Agreement, the following table summarises certain material
differences in the corporate governance requirements usually applicable to an Indian-listed entityunder its equity listing agreement with the Indian Stock Exchanges and the corporate governance
requirements which the Company will comply with as a UK and Hong Kong listed company.
Indian Practice UK and HK Practice
Corporate Governance Code
Mandatory corporate governance requirementsand certain non-mandatory requirements are
usually set out in a listing agreement between the
listed entity and the Indian Stock Exchanges.
The Combined Code complements andsupplements the UK Listing Rules by providing
‘‘best practice’’ guidelines. Although compliance
with the Combined Code is not strictly
mandatory, the Company is required to include
in its annual report and accounts a statement as
to whether or not it has complied with the
provisions of the Combined Code and, if it has
not complied, state the provisions it has notcomplied with, the period of non-compliance in
the case of provisions of a continuing nature and
the reasons for non-compliance.
Following the Walker Review, which published
its final recommendations for corporate
governance practices in certain banks and
financial institutions on 26 November 2009, theFRC launched a consultation on proposed
changes to the Combined Code. The FRC
consultation proposes that the amended
Combined Code, to be re-named ‘‘The UK
Corporate Governance Code’’, will adopt certain
of the Walker Review recommendations to the
extent that they are appropriate for all listed
companies and will apply in respect of financialyears beginning on or after 29 June 2010. The
FSA has also launched a consultation to review
its governance regime for regulated firms in light
of the Walker Review recommendations.
The regime in Hong Kong is similar to the UK.
The HK Code on Corporate Governance
Practices provides ‘‘best practice’’ guidelines but
is not mandatory. However, any deviation from
the code provisions is required to be stated in the
interim and the annual report of the Company.
Board Composition
The board of directors of a company shall have
an optimum combination of executive and non-
The board of directors should include a balance
of executive and non-executive directors (and in
435
c102100pu100Proof7:28.3.10B/LRevision:0OperatorSadK

executive directors with not less than 50% of the
board of directors comprising non-executive
directors.
particular independent non-executive directors)
such that no individual or small group of
individuals can dominate the board’s decision
taking. In the UK, at least half the board,excluding the chairman, should comprise non-
executive directors determined by the board to be
independent.
In Hong Kong, it is required that the board of
directors must include at least three independent
non-executive directors and it is recommended
that independent non-executive directors shouldrepresent at least one-third of the board.
There should be a clear division of
responsibilities between the management of the
board and day to day management of the
company’s business. No one individual should
have unfettered powers of decision. In Hong
Kong, such division of responsibilities should beclearly set out in writing.
Under the Combined Code, the chief executive
should not go on to be chairman of the same
company. If, exceptionally, the board of directors
decides that a chief executive should become
chairman, the board should consult major
shareholders in advance and should set out itsreasons to shareholders at the time of the
appointment and in the next annual report.
Board Meetings
The board is required to meet at least four times
a year, with a maximum time gap of four
months between any two meetings. The board
must be provided with various information
including, if material, non-compliance with anyregulatory, statutory or listing requirements and
Shareholders services such as non-payment of
dividend, delay in share transfer etc.
Under UK practice, the board should meet
sufficiently often to discharge its duties
effectively. In Hong Kong, the board should
meet at least four times a year at approximately
quarterly intervals.
In the UK, the chairman should hold meetings
with the non-executive directors without the
executives present. Led by the senior independent
director, the non-executive directors should meet
without the chairman present at least once a year
to appraise the chairman’s performance.
Similarly, under the HK Code of CorporateGovernance Practices the chairman should at
least annually hold meetings with the non-
executive directors without the executive directors
present, although there is not the concept of a
‘‘senior independent director’’.
In the UK, directors should record any
unresolved concerns about the running of thecompany or a proposed action in the board
minutes and on resignation a non-executive
director should provide a written statement of
any such concerns they have to be circulated to
the board. There is no such requirement or
recommendation in Hong Kong.
436
c102100pu100Proof7:28.3.10B/LRevision:0OperatorSadK

Director Independence
Where the chairman of the board is a non-
executive director, at least one-third of the boardshould comprise of independent directors and if
he is an executive director, at least half of the
board should comprise of independent directors.
Provided that where the non-executive Chairman
is a promoter of the company or is related to
any promoter or person occupying management
positions at Board level or at one level below theBoard, at least one-half of the Board of the
company shall consist of independent directors.
‘‘Independent director’’, as defined under the
equity listing agreement, means a non-executive
director of the company who; (a) apart from
receiving director’s remuneration, does not have
any material pecuniary relationships ortransactions with the company, its promoters, its
directors, its senior management or its holding
company, its subsidiaries and associates which
may affect the independence of the director; (b)
is not related to the promoters or persons
occupying management positions at the board
level or at one level below the board; (c) has not
been an executive of the company in theimmediately preceding three financial years; (d) is
not a partner or an executive or was not a
partner or an executive during the preceding
three years of any statutory audit firm or the
internal audit firm that is associated with the
company or legal firm(s) and consulting firm(s)
that have a material association with the
company; (e) is not a material supplier, serviceprovider or customer or a lessor or lessee of the
company, which may affect the independence of
the director; (f) is not a substantial shareholder
of the company, i.e. owning 2% or more of the
block of voting shares; and (g) is not less than
21 years of age.
Independent directors may have a tenure on theboard of directors of the company not exceeding,
in aggregate, a period of nine years.
In the UK, the board should identify in the
annual report each non-executive director itconsiders to be independent. The board should
determine whether the director is independent in
character and judgement and whether there are
relationships or circumstances which are likely to
affect, or could appear to affect, the director’s
judgement. Serving more than nine years and his
holding of share options could be relevant to the
determination of a non-executive director’sindependence. There are similar rules in
Hong Kong, although holding of share options is
not expressly stated to be a relevant factor.
In the UK, the chairman should on appointment
meet the independence criteria, but thereafter the
test of independence is not appropriate in
relation to the chairman. In addition, the boardshould appoint one of the independent non-
executive directors to be the senior independent
director. Such person should be available to
shareholders if they have concerns which contact
through the normal channels of chairman, chief
executive or finance director has failed to resolve
or for which such contact is inappropriate. There
are no such requirements or recommendations inHong Kong.
The Walker Review recommends that the time
commitment of non-executive directors of certain
banks and other financial institutions should be
greater than has been normal in the past with a
minimum expected time commitment of 30-36
days per annum to be clearly indicated in lettersof appointment for a major bank board with
several non-executive directors. Dedicated support
should be provided to non-executive directors
where required. The FSA is proposing to clarify
its guidance on approved persons to emphasise
the ability of the person to meet the time
commitment specified by the firm in its
contractual terms of appointment for the role.
The Walker Review further recommends that the
chairman of certain banks and other financial
institutions should be proposed for election on
an annual basis with the board keeping under
review the possibility of moving to annual
elections of all board members. The FRC is
proposing that the Combined Code is amendedsuch that either the chairman or the entire board
must put themselves up for re-election on an
annual basis.
Audit Committee
The audit committee shall have a minimum of
three directors as members. Two-thirds of the
members of the audit committee shall be
In the UK, the board should establish an audit
committee of at least three members who should
all be independent non-executive directors. The
437
c102100pu100Proof7:28.3.10B/LRevision:0OperatorSadK

independent directors. All members of the audit
committee shall be financially literate and at least
one member shall have accounting or related
financial management expertise. The chairman ofthe audit committee shall be an independent
director and is required to be present at the
annual general meeting to answer shareholder
queries. The company secretary shall act as the
secretary to the committee.
The audit committee should meet at least four
times a year and not more than four monthsshall elapse between two meetings. The quorum
shall be either two members or one-third of the
members of the audit committee, whichever is
greater, but there should be a minimum of two
independent members present.
The audit committee has powers to investigate
any activity within its terms of reference, seekinformation from any employee, obtain outside
legal or other professional advice, and secure
attendance of outsiders with relevant expertise, if
it considers this necessary.
The CEO, i.e. the managing director or manager,
and the CFO, i.e. the whole-time finance director
or any other person heading the finance function,are required to review the financial statements
and the cash flow statement for the year and
certify to the board that, to the best of their
knowledge and belief, these statements do not
contain any materially untrue statement or omit
any material fact or contain statements that
might be misleading, and present a true and fair
view of the company’s affairs and are incompliance with existing accounting standards,
applicable laws and regulations. They are also
required to certify that, to the best of their
knowledge and belief, the company has not
entered into transactions which are fraudulent,
illegal or in violation of the company’s code of
conduct.
They hold the responsibility for establishing and
maintaining internal controls for financial
reporting and evaluating the effectiveness of
internal control systems of the company
pertaining to financial reporting. They are also
responsible for disclosing deficiencies in the
design or operation of such internal controls, if
any, of which they are aware and the steps theyhave taken or propose to take to rectify these
deficiencies to the auditors and the audit
committee. They have to certify that they have
indicated to the auditors and the audit
committee:
* significant changes in internal controls over
board should satisfy itself that at least one
member of the audit committee has recent and
relevant financial experience.
The HK Listing Rules require that an audit
committee must comprise non-executive directors
only, with a minimum of three members. At least
one of the members must be an independent
non-executive director with appropriate
professional qualifications or accounting or
related financial management expertise.
In Hong Kong, the majority of the audit
committee members must be independent non-
executive directors, one of whom must chair the
audit committee.
In the UK the main role and responsibilities of
the audit committee should be set out in written
terms of reference and should include:
* to monitor the integrity of the financial
statements of the company, and any formal
announcements relating to the company’s
financial performance, reviewing significant
financial reporting judgements contained inthem;
* to review the company’s internal financial
controls and, unless expressly addressed by
a separate board risk committee composed
of independent directors, or by the board
itself, to review the company’s internal
control and risk management systems;
* to monitor and review the effectiveness of
the company’s internal audit function;
* to make recommendations to the board, for
it to put to the shareholders for their
approval in general meeting, in relation to
the appointment, re-appointment and
removal of the external auditor and toapprove the remuneration and terms of
engagement of the external auditor;
* to review and monitor the external auditor’s
independence and objectivity and the
effectiveness of the audit process, taking
into consideration relevant UK professional
and regulatory requirements;
* to develop and implement policy on the
engagement of the external auditor to
supply non-audit services, taking into
account relevant ethical guidance regarding
the provision of non-audit services by the
external audit firm; and
* to report to the board, identifying any
matters in respect of which it considers that
438
c102100pu100Proof7:28.3.10B/LRevision:0OperatorSadK
financial reporting during the year;
* significant changes in accounting policies
during the year and that the same havebeen disclosed in the notes to the financial
statements; and
* instances of significant fraud of which they
have become aware and the involvement
therein, if any, of the management or an
employee having a significant role in the
company’s internal control system overfinancial reporting.
action or improvement is needed and
making recommendations as to the steps to
be taken.
There are similar provisions in Hong Kong.
In the UK, the audit committee should review
arrangements by which staff of the company
may, in confidence, raise concerns about possible
improprieties in matters of financial reporting or
other matters. There are no equivalent rules or
recommendations in Hong Kong.
In both the UK and Hong Kong, the auditcommittee should monitor and review the
effectiveness of the internal audit activities.
Certain requirements contained in the Disclosure
and Transparency Rules overlap with the above
requirements. These apply to accounting periods
commencing on or after 29 June 2008 and
require the company to have a body responsiblefor carrying out audit functions, and for the
company to issue a statement identifying the
body which carries out the audit functions and
describes how that body is composed. There are
no equivalent rules in Hong Kong.
The Walker Review recommends that certain
banks and other financial insitutions shouldestablish a board risk committee separately from
the audit committee with responsibility for
oversight and advice to the board on the current
risk exposures of the firm and future risk
strategy, including strategy for capital and
liquidity management. The board should also be
served by a chief risk officer reporting to the
board risk committee. The FSA is proposing toamend its high levels systems and controls
guidance in order to implement these
recommendations for regulated firms.
Remuneration Committee
The board may set up a remuneration/
compensation committee to determine the
company’s policy on specific remuneration
packages for executive directors including pensionrights and any compensation payment on their
behalf and on behalf of the shareholders. This
committee should comprise of at least three
directors, all of whom should be non-executive
directors and the chairman of the committee
should be an independent director.
In the UK, the board should establish a
remuneration committee of at least three
independent non-executive directors. The
chairman of the company may be a member of,but not chair, the committee if he was considered
independent on appointment as chairman.
The HK Code of Corporate Governance
Practices recommends that a majority of the
members of the committee should be independent
non-executive directors.
In the UK and Hong Kong, the remuneration
committee should have delegated responsibility
for setting remuneration for all executive
directors and the senior management, including
pension rights and any compensation payments.
439
c102100pu100Proof7:28.3.10B/LRevision:0OperatorSadK

The HK Code of Corporate Governance
Practices recommends that where the board
resolves to approve any remuneration or
compensation arrangements which theremuneration committee has previously resolved
not to approve, the board must disclose the
reasons for its resolution in its next annual
report.
The board itself or, where required by the
articles of association, the shareholders should
determine the remuneration of the non-executivedirectors within the limits set in the articles of
association. The articles provide that the directors
shall be paid a fee at such rate as may from time
to time be determined by the board provided
that the aggregate of all fees so paid to directors
(excluding amounts payable under any other
provision of the articles) does not exceed
£750,000 p.a. or such higher amount as mayfrom time to time be decided by ordinary
resolution of the company.
The Walker Review recommended extending the
oversight of the remuneration committee for
certain banks and other financial institutions to
all ‘‘high end’’ employees. The FSA is proposing
to review its Remuneration Code in order toimplement this recommendation.
Shareholders/Investors Grievance Committee
A board committee under the chairmanship of a
non-executive director shall be formed to
specifically look into the redressal of shareholder
and investor complaints such as the transfer of
shares, non-receipt of balance sheet and non-
receipt of declared dividends. This committeeshall be designated as the ‘‘Shareholders/Investors
Grievance Committee’’.
The Combined Code recommends that the board
appoints one of the independent non-executive
directors to be the senior independent director
and that such person should be available to
shareholders if they have concerns which contact
through the normal channels of chairman, chiefexecutive or finance director has failed to resolve
or for which such contact is inappropriate.
The HK Code of Corporate Governance
Practices recommends that the chairman should
ensure that appropriate steps are taken to
provide effective communication with
shareholders and that the views of shareholdersare communicated to the board as a whole.
Compensation Plans
All fees/compensation paid to non-executive
directors, including independent directors, shall
be fixed by the board of directors with the prior
approval of the shareholders in general meeting.
The shareholders’ resolution shall specify the
limits for the maximum number of stock options
that can be granted to non-executive directors,including independent directors, in any financial
year and in aggregate.
Notwithstanding the foregoing, the requirement
of obtaining prior approval of shareholders in
Levels of remuneration should be sufficient to
attract, retain and motivate directors of the
quality required to run the company successfully,
but a company should avoid paying more than is
necessary for this purpose. A significant
proportion of executive directors’ remuneration
should be structured so as to link rewards tocorporate and individual performance.
Shareholders should be invited specifically to
approve all new long-term incentive schemes and
significant changes to existing schemes, save in
440
c102100pu100Proof7:28.3.10B/LRevision:0OperatorSadK

general meeting shall not apply to payment of
sitting fees to non-executive directors, if made
within the limits prescribed under the Indian
Companies Act for payment of sitting feeswithout approval of the Central Government.
The company is required to disclose all pecuniary
relationships or transactions of the non-executive
directors vis-à-vis the company in the annual
report. Further, the section on corporate
governance in the annual report should
specifically mention all elements of theremuneration package of individual directors
summarised under major groups, such as salaries,
benefits, bonuses, stock options, pensions etc.,
details of fixed component and performance-
linked incentives, along with the performance
criteria, service contracts, notice period, severance
fees and stock option details, if any, whether
issued at a discount, as well as the period overwhich accrued and over which exercisable. The
company is also required to publish its criteria of
making payments to non-executive directors in its
annual report. Alternatively, the same may be
put up on the company’s website and reference
thereto may be drawn in the annual report. The
annual report should also disclose the number of
shares and convertible instruments held by non-executive directors.
Additionally, non-executive directors are required
to disclose in the notice to the general meeting
called for appointment of such director their
shareholding (both owned or held by/for other
persons on a beneficial basis) in the listed
company in which they are proposed to beappointed as director, prior to their appointment.
the circumstances permitted by the UK Listing
Rules. The HK Listing Rules provide that
shareholders’ approval at a general meeting is
required before an issuer or its subsidiaries canapprove a service contract of a director or a
proposed director which: (a) is for a duration
that may exceed three years; or (b) has a notice
period of more than one year or requires
compensation or other payments equivalent to
more than one year’s emoluments.
Levels of remuneration for non-executivedirectors should reflect the time commitment and
responsibilities of the role. In the UK,
remuneration for non-executive directors should
not include share options. There is no such
restriction in Hong Kong. In the UK, if,
exceptionally, options are granted, shareholder
approval should be sought in advance and any
shares acquired by exercise of the options shouldbe held until at least one year after the non-
executive director leaves the board. There is no
such requirement or recommendation in Hong
Kong, although the grant, acquisition, transfer or
exercise of an option involving an issuer and its
directors will be treated as a connected
transaction, which may be subject to
shareholders’ approval depending on the size ofthe transaction.
The remuneration committee should consider
what compensation commitments (including
pension contributions and all other elements)
their directors’ terms of appointment would entailin the event of early termination. The aim should
be to avoid rewarding poor performance. In the
UK, the remuneration committee should take a
robust line on reducing compensation to reflect
departing directors’ obligations to mitigate loss.
There is no such requirement or recommendation
in Hong Kong.
The Walker Review recommends that for certain
banks and other financial institutions the deferral
of incentive payments should provide the primary
risk adjustment mechanism to align rewards with
sustainable performance for executive board
members and ‘‘high end’’ employees included
within the scope of the FSA Remuneration Code.Incentives should be balanced so that at least
one-half of variable remuneration offered in
respect of a financial year is in the form of a
long-term incentive scheme. Short term bonus
awards should be paid over a three-year period
with provision for claw-back in the event of
misstatement and misconduct.
Executive board members and ‘‘high-end’’
employees will be expected to maintain a
shareholding or retain a portion of vested awards
441
c102100pu100Proof7:28.3.10B/LRevision:0OperatorSadK

in an amount in line with their total
compensation. The Walker Review also
recommends disclosure of the number of ‘‘high-
end’’ employees, including executive boardmembers, whose total expected remuneration falls
within specified bands.
The FSA is proposing to review its
Remuneration Code in order to implement these
recommendations.
Restrictions on Membership of Committees
A listing agreement entered into by an Indian-listed entity usually restricts a director from being
a member of more than ten committees or acting
as chairman of more than five committees across
all of the companies of which he is a director.
Furthermore, it is also a mandatory annual
requirement for every director to inform the
company about the committee positions he
occupies in other companies and to notifychanges as and when they take place.
The Combined Code was revised at the end ofJune 2008 to remove the restriction on an
individual chairing more than one FTSE 100
company. This applies to accounting periods
beginning on or after 29 June 2008.
There is no such restriction or recommendation
in Hong Kong. However, it is recommended that
each director should disclose to the issuer at thetime of his appointment, and on a periodic basis,
among other things, the number and nature of
offices held in public companies or organisations
and other significant commitments, with the
identity of the public companies or organisations
and an indication of the time involved.
Code of Business Conduct and Ethics
A listing agreement entered into by an Indian-
listed entity usually requires the board to laydown a code of conduct for all board members
and senior management of the company. The
code of conduct shall be posted on the website of
the company. Further, all board members and
senior management personnel shall affirm
compliance with the code on an annual basis.
The annual report of the company shall contain
a declaration to this effect signed by the CEO.
While there is no requirement in the UK
corporate governance regime to adhere to a codeof business conduct and ethics, Standard
Chartered has adopted a Group Code of
Conduct relating to the lawful and ethical
conduct of business and this is supported by the
Group’s core values. The Group Code of
Conduct has been communicated to all
employees. All employees are expected to observe
high standards of integrity and fair dealing inrelation to customers, staff and regulators in the
communities in which the Group operates.
There is no such requirement or recommendation
in Hong Kong.
Annual Report
In terms of the equity listing agreement, a
company is required, in its annual report, to
provide a brief statement on the company’sphilosophy on code of governance. Further, a
brief description of the audit committee,
remuneration committee and shareholders’
committee is required to be provided. The annual
report should also contain disclosures in relation
to materially significant related party transactions
that may have potential conflict with the interests
of the company at large and details of non-compliance by the company and penalties, if any,
imposed on the company during the last three
years.
In the UK, the list of suggested items to be
included in the annual report of companies
includes, among other things: (a) a statement ofhow the board operates, including a high-level
statement of which types of decisions are to be
taken by the board and which are to be
delegated to management; (b) the number of
meetings of the board and those committees and
individual attendance by directors; (c) the other
significant commitments of the chairman and any
changes to them during the year; (d) howperformance evaluation of the board, its
committees and its directors has been conducted;
(e) the names of the non-executive directors
442
c102100pu100Proof7:28.3.10B/LRevision:0OperatorSadK
whom the board determines to be independent,
with reasons where necessary; and (f) the
remuneration of the directors on an individual
basis.
In Hong Kong, there are mandatory items to be
disclosed in the annual report relating to, among
other things, corporate governance practices,
remuneration of directors, directors securitiestransactions and auditor’s remuneration. There
are also recommended items to be included such
as share interests of senior management, internal
controls and investor relations.
Compliance with UK and Hong Kong corporate governance practices
The Directors confirm that throughout 2009 the Company complied with all of the provisions of the
UK Financial Reporting Council’s Combined Code on Corporate Governance (the Code) and with
Appendix 14 of the Hong Kong Listing Rules, save one exception: under the Code, all non-executive
directors are formally required to meet major shareholders as part of their induction programmes.
However, Rudy Markham, our Senior Independent Director met with a number of institutional
investors and John Peace, our Chairman, had regular meetings with institutional shareholders. Our
Board received regular updates on the views of our institutional shareholders and stakeholders
including a presentation from one institutional shareholder on its view of the Company as aninvestment. Our Board openly seek the views of our shareholders and during the year, the Chairman,
Group Chief Executive and Group Finance Director met 23 out of our top 25 investors.
As part of our regulatory obligations, we have in place a code of conduct related to securities
transactions by directors the terms of which are no less exacting than required by Appendix 10 of the
Hong Kong Listing Rules and we can confirm that the directors were in compliance.
Compliance with corporate governance provisions by the Company
In terms of the IDR Listing Agreement, the Company would be required to comply with the
corporate governance provisions as applicable in the UK and Hong Kong. Further, the Companywould file a comparative analysis of the corporate governance provisions that are applicable in the
UK and Hong Kong along with the compliance of the same vis-à-vis the corporate governance
provisions applicable to Indian-listed companies at the time of filing the annual reports with the
Stock Exchanges.
443
c102100pu100Proof7:28.3.10B/LRevision:0OperatorSadK

THE UK SECURITIES MARKET
Overview of the Financial Sector
The financial services sector in the UK includes banking, insurance, asset management, organised and
informal markets, and a wide array of supporting professional services. According to the International
Financial Services London (‘‘IFSL’’), the financial services sector accounted for 8.3% of UK GDP in2007 (most recent official estimate), having risen steadily from 5.3% in 2001. This is slightly higher
than the US share of 7.5% and of Japan 6.7%.
Banks
UK banking industry assets totalled £7,616 billion at the end of 2009 (down 4% on the previous
year). Foreign banks held 51% of the total. The UK remains one of the leading centres for banking.
Its deposits are the third largest in the world after the US and Japan. The 249 foreign banks
physically located in the UK is more than in any other centre. As at June 2009, banks operating in
the UK accounted for 18% of international bank lending and 22% of international bank borrowing.(source: IFSL)
The UK is also one of the most important centres for private and investment banking. According to
the IFSL, UK was the source of 24% of European investment banking fee revenue in 2009, with
around a half of European investment banking activity conducted through London.
The FSA has responsibility for supervising banks in the UK (including UK subsidiaries of foreign
banks). Branches of foreign banks incorporated elsewhere in the EEA that operate in the UK remain
subject to home-country control, but are subject to FSA liquidity requirements. The FSA places
heavy emphasis on consumer information and protection. A deposit protection scheme is administered
by the FSCS which is an independent body set up under the FSMA.
Insurance
The UK insurance industry remains the largest in Europe and third largest in the world after the USand Japan, accounting for 10.5% share of global premium income. Long-term insurance premium
volume was £168.1 billion in 2008, while general insurance premiums were £47.2 billion. UK
insurance companies’ investments totalled nearly £1.5 trillion in 2008, almost double those of any
other European country. (source: IFSL)
There are a number of reasons for the premier position of insurers in the savings and investmentmarket. These include a strong, albeit declining, tradition of employer-funded pension schemes
managed by insurers and a culture among the more affluent of a self-funded retirement provision
through life insurance. Other factors are the use of endowment life policies to fund repayment of the
principal of mortgages at maturity and the requirement by mortgage lenders in a market with high
levels of home ownership that borrowers have life coverage. (source: EIU)
Fund managers
The UK is one of the largest markets in the world for fund management along with the US and
Japan. It has a strong international orientation and attracts significant overseas funds. London is theleading international centre for fund management. Fund management accounted for 0.65% of UK
GDP in 2008. (source: IFSL)
As at January 2010, there were 2,396 investment funds offered by 107 companies, managing £470.1
billion in assets, according to the Investment Management Association. In addition, there were 584
overseas-domiciled funds offered for sale in the UK by 30 companies, with £24.4 billion in assets.
Venture capital and private equity
The UK is the largest and most developed private equity centre in Europe and is second in size
globally only to the US. London is one of the leading international centres for the management of
private equity investments. Many factors contribute to the attraction of the UK as a centre for
private equity such as: the availability of funds to invest; opportunities to make investments; people
with the necessary skills to source, negotiate, structure and manage investments; and the availability
of exit opportunities such as the large equity market. (source: IFSL).
Worldwide investments of UK private equity firms mirrored falls on the global markets and declined
38% in 2008 to £19.5bn according to the British Private Equity & Venture Capital Association
(‘‘BVCA’’) survey of its members. This was considerably below the record £32bn raised in the
previous year but nevertheless is the third-best investment year on record.
444
c102100pu110Proof7:28.3.10B/LRevision:0OperatorSadK
Funds raised in the UK totalled £23.1bn in 2008 down from £29.2bn in the previous year. Overseas
investors generated around three-quarters of funds raised. Investors from North America were the
largest source of funds with 45% followed by investors from the UK with 24% and Continental
Europe with most of the remainder. These figures from the BVCA represent the amount raised byindependent funds only.
Key reforms in the financial sector
A major reform of financial services regulation in the UK was initiated by the Chancellor of the
Exchequer in 1997. That year, the Chancellor announced his decision to merge banking supervisionand investment services regulation into the Financial Services Authority.
The first stage of the reform of financial services regulation was completed in June 1998, whenresponsibility for banking supervision was transferred to the FSA from the Bank of England. In May
2000 the FSA took over the role of UK Listing Authority from the London Stock Exchange. FSMA,
which received Royal Assent in June 2000 and was brought into force on 1 December 2001,
transferred to the FSA the responsibilities of several other organisations: the Building Societies
Commission, the Friendly Societies Commission, the Investment Management Regulatory
Organisation, the Personal Investment Authority, the Register of Friendly Societies and the Securities
and Futures Authority.
In addition, the legislation gave the FSA new responsibilities, in particular taking action to prevent
market abuse. In October 2004, following a decision by the Treasury, the FSA took on responsibility
for mortgage regulation. In January 2005, the FSA implemented the Insurance Mediation Directiveand in accordance with a government announcement in 2004 the FSA took on regulation of general
insurance business (source: FSA).
Given the UK’s membership of the EU, the FSA’s agenda in the area of banking and finance ismainly driven by legislation adopted by the EU as a whole. In the fiscal year April 2007 to March
2008, the implementation of the revised Basel framework via the CRD and of the MiFID were high
on the FSA’s list of priorities (source: EIU).
Further reforms have been proposed by the Basel Committee and the European Commission – see
further ‘‘Banking Sector Overview’’ on page 82.
In April 2009 the Commission published proposals on the regulation of alternative investment fund
managers including, but not limited to, private equity and hedge funds. Under the draft Alternative
Investment Fund Managers directive, Managers of such funds (subject to limited exceptions) will need
to be authorised by their home Member State and will be subject to rules on risk management and
conflicts of interest, among other things. Managers will need to appoint a valuer and an independent
custodian which must satisfy the criteria under Act 17 of the document draft of the directive. The
current proposals require the custodian to be a bank or an investment firm with its registered officein the EU or another category of regulated entity which is eligible to be a depository under Art 23(3)
of EU Directive 2009/65/EC, and will be able to market EU funds on the basis of their home state
authorisation. The proposals have proved controversial among the alternative investment fund
industry. The terms of the directive are currently being negotiated by the Council and the European
Parliament and the final text is likely to differ in several respects from the Commission’s original
proposal.
Securities Market Regulator
The UK’s financial system comes under a single regulator, the FSA. The Bank of England has
responsibility for monetary policy and the stability of payments systems and remains the lender of
last resort. The Banking Act 2009 has provided new powers to deal with failing banks. The
Government consulted in May 2009 on extending these arrangements to investment firms and in
December 2009 announced policy initiatives as part of a further consultation to mitigate the failure ofan investment firm. The FSA is prompt at transposing EU financial services legislation into domestic
law and has direct powers to do this in certain circumstances (source: EIU).
Financial Services Authority
The FSA is the statutory regulator with powers granted under FSMA.
The FSA has been given a wide range of rule-making, investigatory and enforcement powers to meet
its four statutory objectives of:
* market confidence: maintaining confidence in the financial system;
445
c102100pu110Proof7:28.3.10B/LRevision:0OperatorSadK

* public awareness: promoting public understanding of the financial system;
* consumer protection: securing the appropriate degree of protection for consumers; and
* the reduction of financial crime: reducing the extent to which it is possible for a business to be
used for a purpose connected with financial crime.
In July 2009 the Government proposed adding a new financial stability objective.
The FSA regulates financial services markets, exchanges (including the London Stock Exchange) and
firms. It sets the standards that they must meet and can take action against firms if they fail to meet
the required standards.
The FSA as the UKLA is responsible for reviewing applications for admission to listing of securities
to the Official List in the UK and has published listing rules which set out, among other things, the
requirements for listing in the UK.
Although there is no memorandum of understanding between the FSA and the SEBI separately, they
are both signatories to the International Organisation of Securities Commissions Multilateral
Memorandum of Understanding Concerning Consultation and Co-operation and the Exchange of
Information, a global information-sharing arrangement among securities regulators to facilitate co-
operation to combat violations of securities and derivatives laws.
Panel on Takeovers and Mergers
The Panel is an independent body, established in 1968, whose main function is to issue and
administer the City Code and to supervise and regulate takeovers and other matters to which the City
Code applies in accordance with the rules set out in the City Code. The UK Companies Act 2006
placed the Panel on a statutory footing.
The Panel has been designated as the supervisory authority to carry out certain regulatory functions
in relation to takeovers pursuant to the Takeover Directive. Its statutory functions include making
rules to give effect to the EU Takeover Directive and for, or in connection with, the regulation of
takeover bids, merger transactions and other transactions which may have an effect on the ownership
or control of companies. The Panel has a statutory duty to cooperate with the FSA and other similar
regulatory bodies.
History of the London Stock Exchange
The earliest evidence of organised trading in marketable securities in London arose in 1698. In 1773,
a group of brokers and jobbers created ‘‘The Stock Exchange’’. With the deregulation of the marketin 1986, known as the ‘‘Big Bang’’, the exchange became a private limited company and then a public
limited company under the UK Companies Act. More recent developments include the increasing
moves towards electronic trading, the introduction of alternative markets such as the launch of the
AIM in 1995 and demutualisation resulting in the listing of the London Stock Exchange on the Main
Market in 2001 (source: London Stock Exchange).
The London Stock Exchange is a Recognised Investment Exchange and has to satisfy the
requirements detailed in the FSA’s Recognised Investment Exchanges and Recognised Clearing
Houses sourcebook. The London Stock Exchange enforces the Rules of the London Stock Exchange
to ensure an orderly market.
The London Stock Exchange comprises four primary markets:
* the Main Market, a market for large, established companies across all sectors;
* the AIM, an equities market for smaller growing companies;
* the Professional Securities Market, for listed debt and depository receipt securities; and
* the Specialist Fund Market, dedicated to specialised investment entities such as hedge funds,
private equity funds and certain emerging market and specialist property funds.
Trading on the London Stock Exchange occurs from Monday through Friday between 8.00 a.m. and
9.30 p.m. (GMT) (except public holidays).
Shares on the London Stock Exchange are traded on a variety of different electronic trading systems.These include SETS (the London Stock Exchange’s electronic order book) for FTSE 100 securities
and for the most liquid FTSE 250 securities, SETSmm for Main Market mid-cap securities to the
most liquid AIM securities and SETSqx for the less liquid securities quoted on the Main Market.
International trading systems include the International Order Book, the International Bulletin Board
and the International Retail Service. Trades will be executed on the investor’s behalf by a broker.
446
c102100pu110Proof7:28.3.10B/LRevision:0OperatorSadK

Settlement of trading in shares on the London Stock Exchange is through a system called Euroclear
UK and Ireland (formerly CREST) which is a paperless share settlement system. When a trade is
executed, details of the trade are sent by both parties electronically to the settlement system which
matches the messages and checks that there are enough shares in the seller’s account.
There is currently no UK law which restricts foreign ownership of UK securities.
Transactional Costs and Regulatory Approvals
Transfers of chargeable securities in uncertificated form within an electronic transfer system will give
rise to SDRT. The tax is (usually) 0.5% of the amount of the consideration, although higher rates
can be charged for transfers or issues of chargeable securities to a depository or to people operating
clearance services. The tax is payable by the transferee, but is usually collected by the accountable
person (e.g., the broker) who pays it directly to Her Majesty’s Revenue and Customs, although in
transactions made through an electronic settlement system the tax may be calculated and payment
made automatically. In addition, it will be necessary to pay the broker to execute a trade eitherthrough its spread or through paying commission.
Regulatory notifications need to be made and approvals sought if the listed company in which shares
are being acquired is an authorised person (or the controller of an authorised person) under FSMA
and the transaction results in the acquirer acquiring in total 10% or more of the shares or voting
power or significant influence over the management of the company or one of the other higher
thresholds set out in FSMA as amended by the Financial Services and Markets Act 2000(Controllers) Regulations 2009.
Listing Regulations
The listing of securities on the London Stock Exchange is regulated by the UK Listing Rules. The
FSA has the power to suspend listing of an issuer’s securities if the smooth operation of the marketis, or may be, temporarily jeopardised or if it is necessary to protect investors. The FSA may impose
such conditions on the procedure for lifting a suspension of listing as it considers appropriate.
The FSA is also responsible for the Disclosure and Transparency Rules. The Disclosure and
Transparency Rules require, inter alia, a person to notify the company and the FSA if the voting
rights that person holds or is deemed to hold as shareholder or through a direct or indirect holdingof certain financial instruments:
* reaches, exceeds or falls below 3% and each 1% threshold thereafter up to 100% as a result of
an acquisition or disposal of shares or certain financial instruments (or, in the case of a non-UK
issuer, on the basis of thresholds of 5%, 10%, 15%, 20%, 25%, 30%, 50% or 75%); or
* reaches, exceeds or falls below the thresholds stated above as a result of events changing the
breakdown of voting rights and on the basis of the monthly disclosure of the total number of
voting rights and capital by the company.
The listed company itself then has an obligation to make the information it was notified about
public.
A person who holds, directly or indirectly, depository receipts in respect of shares must comply with
the above notification obligations if the depository receipts result in an entitlement to acquire, on
such person’s own initiative alone, under a formal agreement, shares to which voting rights are
attached, already issued, of an issuer. The FSA introduced a disclosure regime for contracts for
differences in 2009.
Dealings in shares in a listed company that is the subject of a takeover bid may also have to be
disclosed under the City Code.
Delisting
A listed company can be delisted under the provisions of the UK Listing Rules which govern
voluntary and mandatory delisting of shares of UK companies from the Official List. The delisting
may be imposed unilaterally by the FSA or may be requested by an issuer of securities.
The FSA may cancel the listing of securities if it is satisfied that there are special circumstances that
preclude normal regular dealings in them. The UK Listing Rules provide non-exhaustive lists of
situations in which the FSA would consider it appropriate to cancel the listing of a security. Thesesituations include:
* where the securities are no longer admitted to trading as required by the UK Listing Rules;
447
c102100pu110Proof7:28.3.10B/LRevision:0OperatorSadK

* where the issuer no longer satisfies its continuing obligations for listing; or
* where the securities listing has been suspended for more than six months.
In addition, the FSA may cancel a listing of securities at the request of the issuer, provided that theissuer complies with the requirements of the UK Listing Rules (principally the passing of a special
resolution of the shareholders to approve the delisting, in the case of equity securities).
An issuer must inform the FSA if its listing has been suspended, cancelled or restored by an overseas
exchange or an overseas authority.
City Code
Mandatory bid obligations for listed and certain other UK companies under English law are governed
by the City Code which prescribes certain thresholds or trigger points that give rise to theseobligations. The City Code is designed principally to ensure that shareholders are treated fairly and
are not denied an opportunity to decide on the merits of a takeover and that shareholders of the
same class are afforded equivalent treatment by an offeror. The City Code provides an orderly
framework within which takeovers are conducted and is designed to promote, in conjunction with
other regulatory regimes, the integrity of the UK financial market. The City Code is under constant
review by the Panel.
The City Code is made and administered by the Panel. The rules of the City Code have statutoryforce in the UK and the Panel has statutory powers in respect of offers and other transactions to
which the City Code applies.
The City Code outlines the conduct to be observed in takeover and merger transactions and dual
holding company transactions. It applies, broadly speaking, to all companies and Societas Europaea
(and, where appropriate, statutory and chartered companies) which have their registered office in the
UK, the Channel Islands or the Isle of Man if any of their securities are admitted to trading on a
regulated market in the UK or on any stock exchange in the Channel Islands or the Isle of Man, as
well as to offers for public companies which do not have securities traded on a regulated market (andcertain private companies), but which are considered by the Panel to be resident in the UK, the
Channel Islands or the Isle of Man. The status or residence of the offeror is immaterial.
The City Code comprises six general principles and 38 rules (as well as numerous notes which aid the
interpretation of the rules). Its underlying objective can be summed up in three principles:
* all shareholders of the same class in a target company must be treated equally and must have
adequate information so that they can reach a properly informed decision;
* a false market must not be created in the securities of the offeror or the target company; and
* the management of the target company must not take any action which would frustrate an offer
without the consent of its shareholders.
The 38 rules, which form the bulk of the City Code, are effectively expansions of the general
principles and contain provisions governing specific aspects of a takeover. Both the spirit as well as
the precise wording of the City Code are required to be observed.
The Panel is not concerned with the financial or commercial advantages or disadvantages of a
takeover, which the Panel regards as matters for the company and its shareholders.
Insider Dealing and Market Abuse
The Criminal Justice Act 1993 provides (subject to certain defences) that an individual commits a
criminal offence if he deals, or encourages another person to deal, in securities of a company on the
basis of inside information which has not been made public and which, if made public, would
significantly affect the price.
The criminal offence of insider dealing is supplemented and extended by the statutory market abuse
regime, breach of which can give rise to civil penalties. Pursuant to FSMA, the FSA has powers toimpose unlimited fines on individuals and firms which commit market abuse. The following types of
behaviour may constitute market abuse within FSMA: (i) insider dealing; (ii) improper disclosure of
inside information (including encouraging); (iii) misuse of information; (iv) manipulative transactions;
(v) dissemination of information which gives a false or misleading impression; and (vi) distortion of
markets.
448
c102100pu110Proof7:28.3.10B/LRevision:0OperatorSadK

Model Code
The UK Listing Rules require listed companies to impose restrictions on directors’ dealings in the
shares of their company in certain circumstances.
The Model Code is a set of guidelines regarded by the FSA as setting a minimum standard of good
practice and with which a listed company must, as a minimum, comply as part of its continuing
obligations. The Model Code covers instances where, even though not expressly prohibited bystatutory provisions, it would be undesirable for a director to buy or sell the company’s securities.
The main prohibitions on dealings under the Model Code are as follows:
* a person discharging management responsibilities (PDMR) must not deal in the company’s
securities unless he has first received clearance (subject to certain exceptions). A director or the
company secretary must seek clearance from the Chairman or another director designated to
issue such a clearance. The Chairman himself, before dealing, must seek clearance from the
Chief Executive or in his absence the senior independent director. PDMRs who are not directorsmust seek clearance from the company secretary or a director designated to issue such a
clearance.
* a PDMR must not be given clearance to deal in the company’s securities on considerations of ashort-term nature;
* a PDMR must not deal in the company’s securities during a ‘‘prohibited period’’. A ‘‘prohibited
period’’ is (1) any close period or (2) any period when there exists any matter which constitutesinside information in relation to the company. A ‘‘close period’’ is the period of 60 days
immediately preceding the preliminary announcement of the company’s annual results or the
publication of its annual financial report or, if shorter, the period from the relevant financial
period end up to the announcement or publication. If the company reports on a half-yearly
basis, the ‘‘close period’’ is the period from the relevant financial period end up to and including
the time of the publication. If the company reports on a quarterly basis, the ‘‘close period’’ is
the period of 30 days immediately preceding the announcement of the quarterly results or, if
shorter, the period from the end of the relevant financial period end up to the announcement.
A person who is not in possession of price-sensitive information in relation to the company may be
given clearance to sell (but not to purchase) securities of the company if he is in severe financial
difficulty or there are other exceptional circumstances. The FSA should be consulted at an early stageregarding any application by a restricted person to deal in such circumstances.
Public Issuance of Securities
Under FSMA, it is unlawful for shares and other transferable securities to be offered to the public in
the UK, or to be admitted to trading on a regulated market situated in the UK, without a
prospectus. The prospectus must contain information specified by the FSA under the prospectus rules
and must be filed with the FSA and made available to the public. A company’s directors may be
subject to civil and criminal liability for misstatements in a prospectus.
All companies, including public limited companies, are required under the UK Companies Act to
prepare, file with the UK Registrar of Companies and circulate to their shareholders audited annual
accounts, which comply with the UK Companies Act and European disclosure requirements andregulations governing their manner of presentation.
Nature of the Securities Trading Market
The London Stock Exchange and its associated market, AIM, historically make up the largest stock
exchange in Europe and the second largest in the world on many indicators, after the New York
Stock Exchange. The London Stock Exchange was also the world’s most international exchange in
2007, according to IFSL which calculated that the London Stock Exchange accounted for 46% oftotal turnover of international companies on all exchanges.
There were 3,251 companies listed on the London Stock Exchange as of 31 May 2008. This included
1,215 companies with their main listing on the London Stock Exchange Main Market. There were336 with a secondary listing in London (i.e. on the International Main Market), 40 companies listed
on the Professional Securities Market, one listed on the Specialist Fund Market and 1,659 listed on
AIM, of which 1,362 were incorporated in the UK. Total market capitalisation of the companies on
the London Stock Exchange Main Market at end-May 2008 was £1.80 trillion. The market
capitalisation of AIM-listed companies was £95.7 billion (source: EIU).
449
c102100pu110Proof7:28.3.10B/LRevision:0OperatorSadK

Notices requiring information about interests in shares
A public company in the United Kingdom has a statutory right to make certain enquiries to establish
who has an interest in its shares. For these purposes, references to ‘‘shares’’ are to the relevantcompany’s issued shares with voting rights, including treasury shares. Temporary suspension of voting
rights does not cause shares to be excluded from this definition.
Section 793 of the UK Companies Act permits a public company to give notice to any person whom
the company knows, or has reasonable cause to believe, is interested in the company’s shares now or
at any time during the previous three years. The notice can require the addressee:
* to confirm or deny their interest in the company’s shares;
* to give particulars of any interests he has or has had during the previous three years;
* if any other person is or has been interested in the same shares, to give ‘‘so far as lies within
his knowledge’’ particulars with respect to that other interest; and
* if he is no longer interested in shares in the company, to give ‘‘so far as lies within his
knowledge’’ particulars of the identity of the person who acquired his interest.
A reply to any notice given by a company under section 793 must be given within ‘‘such reasonable
time as may be specified in the notice’’. What is reasonable in this context will depend on the
circumstances and the UK Companies Act gives no further guidance.
A shareholder, or a group of shareholders acting together, holding at least 10% of the paid-up voting
capital of a public company (excluding treasury shares), has the right to require the company to servea section 793 notice. To be valid, such a request must:
* be authenticated by the registered holder(s) of the shares making up the 10%;
* state that the company is requested to exercise its powers under section 793;
* ‘‘specify the manner in which the company is requested to act’’ (this would likely include the
details of the addressees to whom the shareholder is requesting notices be sent); and
* ‘‘give reasonable grounds for requiring the company to exercise those powers in the manner
specified’’.
If a company fails to comply with a request that has been validly made, the company’s directors and
secretary who fail to comply each commit a criminal offence.
‘‘Interest’’, in this context, has a very broad definition and under the provisions of the UKCompanies Act, ‘‘a reference to an interest in shares includes an interest of any kind whatsoever in
the shares; and … any restraints or restrictions to which the exercise of any right attached to the
interest is or may be subject shall be disregarded’’. Beneficiaries are interested in trust property. Joint
holders are each interested in the whole holding. A person is interested in shares in which his spouse,
civil partner or child is interested. An interest held as a nominee is a relevant interest for these
purposes. A person is also deemed to be ‘‘interested’’ in shares if a body corporate is interested in
them and the directors of that body corporate are accustomed to act on the first person’s
instructions, or the first person is entitled to exercise or control the exercise of one-third of the votingrights of the body corporate in general meeting.
A person is also interested if:
* he has a contract to acquire the shares;
* not being the registered holder, he is entitled to exercise or control the exercise of rights
conferred by the holding of the shares (or has a right or obligation, conditional or
unconditional, which would make him so entitled);
* he has a right to call for delivery of the shares;
* he has a right or obligation to acquire an interest in the shares (conditional or unconditional);
or
* he has, or is entitled to acquire, a right to subscribe for the shares.
An interest in shares may also arise from an agreement or arrangement (including in certain
circumstances non-legally-binding arrangements) that includes provision for the acquisition by any one
or more of its parties of interests in shares in a particular public company, which contains restrictions
on the parties regarding their use, retention or disposal of interests, and pursuant to which the
company’s shares are in fact acquired. Agreements to underwrite or sub-underwrite are, however,
450
c102100pu110Proof7:28.3.10B/LRevision:0OperatorSadK
excluded. In this case, each of the parties to it is deemed to be interested in all the shares in which
each of the other parties is interested.
The failure of a person to respond to a notice under section 793, or responding in a manner which a
person knows to be false or recklessly making a statement that is false in a material particular, is an
offence which may be punished by imprisonment or a fine. In addition, where a person has failed to
respond to a notice within the time specified, the company may apply to the court for an orderdirecting that the shares in question be subject to restrictions. These restrictions relate to the
following:
* any transfer of shares is void;
* no voting rights are exercisable in respect of the shares;
* no further shares may be issued in right of the shares or in pursuance of an offer made to their
holder; and
* except in liquidation, no payment may be made of sums due from the company on the shares,
whether in respect of capital or otherwise.
It is also an offence to attempt to evade restrictions on shares. The court may order that shares
subject to restrictions be sold. It should be noted that a person does not commit an offence by failing
to respond to a section 793 notice if he can prove that the request in the notice was frivolous orvexatious. There is no territorial restriction on the application of these provisions.
Companies are required to maintain registers of notices given and replies received under section 793.
Sections 397 (misleading statements and practices) and 118 (market abuse) of FSMA may also be
relevant where there has been a breach of a person’s obligation of disclosure under the section 793
requirements. In broad terms, section 397, inter alia, imposes criminal sanctions in respect of:
* any false or misleading statement or any dishonest concealment of facts which induces any
person to take or not to take some action with respect to an investment; or
* any act or ‘‘course of conduct’’ which creates a false or misleading impression as to the market
in any investment. It is considered that failure to perform a legal obligation may amount to a
‘‘course of conduct’’.
By section 118 subsections (2)-(8), any behaviour that is likely to give a regular user of the market a
false or misleading impression as to the supply of, or demand for, or as to the price or value of,investments of the kind in question, as well as other prescribed behaviour, may constitute market
abuse. Failure to comply with the disclosure obligations under section 793 might constitute such
behaviour.
451
c102100pu110Proof7:28.3.10B/LRevision:0OperatorSadK

THE HONG KONG SECURITIES MARKET
Overview of the Financial Sector
A wide variety of financial products and services in Hong Kong has given rise to diverse institutions
offering specialised services. Banks and non-bank financial institutions are closely integrated. Many
banks, for example, are also involved in securities dealing and asset management. Some banks also
have insurance subsidiaries. Various types of funds are sold by banks, securities firms and fund-
investment advisers.
Banks
At the end of 2009, there were 146 licensed banks, 26 restricted licensed banks and 28 deposit-taking
companies in business. Of the 146 licensed banks, 123 were incorporated outside Hong Kong (source:
EIU).
The Banking Ordinance provides the legal framework for banking supervision, empowering the
HKMA to ‘‘promote the general stability and effective working of the banking system’’. The HKMAalso seeks to establish a regulatory framework that is fully in line with international standards,
especially those recommended by the Basel Committee on Banking Supervision. The objective is to
devise a prudential supervisory system to help preserve the general stability and effectiveness of the
banking system (source: EIU).
The HKMA carried out a gradual deregulation of the banking sector from 1999 to 2002. InNovember 2001 the HKMA lifted all branch restrictions on foreign banks; since then, overseas-
incorporated banks have been able to set up as many branches in Hong Kong as they wish. In July
2001 all interest rate regulations were lifted, leaving banks free to set their own deposit rates. In May
2002 the HKMA reduced the minimum asset requirement for foreign banks and made it easier for
restricted licence banks and deposit-taking companies to upgrade to licensed-bank status (source:
EIU). See the section titled ‘‘Industry’’ on page 76 of this Draft Red Herring Prospectus for further
details on the Hong Kong banking sector.
Insurance
Hong Kong has one of the most competitive insurance markets in Asia. It had a population of
7.03 million and 171 authorised insurers as at the end of 2009, according to the Office of the
Commissioner of Insurance. Forty-six of these were long-term (mostly life) insurers, 106 were general
insurers and 19 were composite life and non-life insurers. As at 26 February 2010 eighty-nine of the
170 insurers were incorporated in Hong Kong.
Hong Kong’s insurance industry has been growing steadily from the 1990s to 2007, driven by long-
term (mostly life) business. In 2008, total gross premiums (of both general and long-term insurance
business) decreased by 4.4% to HK$188.7 billion from HK$197.3 billion in 2007. The long-term
business accounted for the bulk of total gross premiums – HK$161.9 billion – while general business
accounted for HK$26.7 billion in 2008 (source: EIU).
Asset management
Hong Kong is a major regional financial management centre and has the largest concentration of
international fund managers in Asia. According to an annual Fund Management Activities Survey
released in July 2009 by the SFC, total assets in the fund management business (including asset
management, advisory and other private banking business of SFC-licensed corporations and banks, as
well as assets managed in the form of real estate investment trusts (‘‘REITs’’), decreased by 39.3%, toHK$5,850 billion in 2008 from HK$9,631 billion in 2007. Banks accounted for HK$108 billion, or
2.9% of the total assets, in 2008. The remainder of the fund management business was accounted for
by non-bank asset management and fund advisory companies as well as REITs.
The fund management industry in Hong Kong is characterised by its international appeal and a large
portion of funds under management is derived from non-Hong Kong investors. According to theresults of a survey published by the SFC in July 2009, 64.2% of assets of the non-REIT fund
management business were sourced from overseas investors in 2008. Hong Kong’s ability to attract
capital from non-Hong Kong investors may be attributed to the large number of international
financial institutions, the large pool of investment professionals, a wide variety of investment products
and an established platform for investment.
452
c102100pu110Proof7:28.3.10B/LRevision:0OperatorSadK

Venture capital and private equity
According to the Hong Kong Trade Development Council (‘‘HKTDC’’), as at June 2008, Hong Kong
is the largest venture capital centre in Asia, managing 29% of the total capital pool in the region. Asof June 2008, there were 294 private-equity funds based in Hong Kong, and capital under
management by the industry reached US$57.6 billion, up from US$51.4 billion a year earlier. Hong
Kong had a pool of 619 private-equity professionals, the second highest in Asia after Japan,
according to the HKTDC (source: EIU).
Key reforms in the financial sector
The HKMA was created in 1993 by combining the Office of the Exchange Fund with the Office of
the Commissioner of Banking.
The HKMA is accountable to the Financial Secretary of Hong Kong but it also has a high degree of
autonomy. The HKMA’s policy objectives are: (i) to maintain currency stability, within the
framework of the linked exchange rate system, through sound management of the Exchange Fund,
monetary policy operations and other means deemed necessary; (ii) to promote the safety and stabilityof the banking system through the regulation of banking business and the business of taking deposits,
and the supervision of authorised institutions; and (iii) to enhance the efficiency, integrity and
development of the financial system, particularly payment and settlement arrangements (source:
HKMA).
In 2002, the positions of Secretary for the Treasury and Secretary for Financial Services were mergedto become the Financial Services and the Treasury Bureau. The Bureau’s Financial Services Branch
retained policy responsibility for Hong Kong’s financial markets but market regulatory functions have
since been performed by independent statutory regulators.
The last significant reform of financial services regulation in Hong Kong was completed in 2003 whenthe SFO came into force. The SFO consolidated into one piece of legislation the 10 ordinances that
previously regulated the securities and futures industry in Hong Kong. The SFO changed the licensing
regime, set out disclosure obligations on substantial shareholders and directors of Hong Kong listed
companies, and changed the market misconduct laws. The SFC has also been given more powers of
supervision and investigation under the SFO.
Securities Market Regulator
A three-tiered regulatory regime structures equity activity in Hong Kong. The Financial ServicesBranch of the Financial Services and Treasury Bureau is responsible for facilitating and coordinating
initiatives to upgrade overall market quality and the Legislative Council is responsible for considering
legislative proposals. The SFC was established in 1989 as a market regulator and is responsible for
overseeing the equities and futures markets. The SFC has a statutory role to supervise, monitor and
regulate the listing-related activities of the Hong Kong Stock Exchange as operator of the stock
market. Subsidiary legislation promulgated under the SFO imposes a dual-filing regime that requires
all listing applicants to submit prospectuses to both the SFC and the Hong Kong Stock Exchange for
approval. Criminal liability may be attached to intentional or reckless disclosure of materially false ormisleading information in these documents (source: EIU).
The SFC, an independent, non-governmental statutory body that provides a general regulatory
framework for the securities and futures industries, was established by the Hong Kong government in
1989. The SFC administers certain elements of Hong Kong securities law, including the SFO, which
regulates, among other things, activities in the securities market, requirements and conduct ofintermediaries, investor compensation, market misconduct and disclosure of interests.
The SFO requires the SFC, among other things:
* to take such steps as it considers appropriate to maintain and promote the fairness, efficiency,
competitiveness, transparency and orderliness of the securities and futures industry;
* to suppress illegal, dishonourable and improper practices in, promote public understanding of,recommend reforms of law relating to, and advise the Financial Secretary on matters relating to,
the securities and futures industry;
* to supervise, monitor and regulate:
– the activities carried on by recognised exchange companies, recognised clearing houses,
recognised exchange controllers, recognised investor compensation companies or persons
carrying on activities regulated by the SFC; and
453
c102100pu110Proof7:28.3.10B/LRevision:0OperatorSadK

– such of the activities carried on by registered institutions (banks, deposit-taking companies
and restricted licence banks authorised under the Banking Ordinance and registered with
the SFC under the SFO) as are required to be regulated by the SFC;
* to promote and develop an appropriate degree of self-regulation in the securities and futures
industry;
* to promote, encourage and enforce the proper conduct, competence and integrity of persons
carrying on activities regulated by the SFC, and the adoption of appropriate internal controls
and risk management systems by such persons and in the conduct of activities regulated by theSFC, by registered institutions;
* to encourage the provision of sound, balanced and informed advice regarding transactions or
activities related to financial products, and promote public understanding of the benefits, risks
and liabilities associated with investing in financial products; and
* to take such steps as it considers appropriate to ensure compliance with the relevant provisions
of the SFO.
Although there is no separate memorandum of understanding between the SFC and the SEBI, they
are both signatories to the International Organisation of Securities Commissions Multilateral
Memorandum of Understanding Concerning Consultation and Co-operation and the Exchange of
Information, a global information-sharing arrangement among securities regulators to facilitate
cooperation to combating violations of securities and derivatives laws.
History of the Hong Kong Stock Exchange
There is only one stock exchange in Hong Kong, the Hong Kong Stock Exchange, which commenced
trading on 2 April 1986 and was formed upon the unification of the four stock exchanges then
existing in Hong Kong. On 3 March 1999, the Financial Secretary of Hong Kong announced in his
budget speech a comprehensive reform of the securities and futures markets in Hong Kong, which
included the demutualisation and merger of the five recognised and approved market operators inHong Kong, namely the Hong Kong Stock Exchange, Hong Kong Futures Exchange Limited,
HKSCC, The SEHK Options Clearing House Limited and HKFE Clearing Corporation Limited
under a single holding company (which was subsequently incorporated under the name of Hong
Kong Exchanges and Clearing Limited). The merger became effective on 6 March 2000.
As a result of the merger, the former shareholders of the Hong Kong Stock Exchange and Hong
Kong Futures Exchange Limited effectively exchanged their ownership rights in those two exchangesfor economic interests in the Hong Kong Exchanges and Clearing Limited and the conventional right
to receive dividends, while retaining their existing rights to trade on the two exchanges. At the same
time, certain of the regulatory functions performed by the Hong Kong Stock Exchange were passed
over to the SFC.
Trading on the securities market of the Hong Kong Stock Exchange occurs from Monday through
Friday, from 10 a.m. to 12.30 p.m. and 2.30 p.m. to 4.00 p.m. (pre-opening session: 9.30 a.m. to10.00 a.m.). The Hong Kong Stock Exchange operates on a trading day plus two, or T+2, rolling
settlement system. At the end of the T+2 period, obligations are settled with buyers of securities
paying for and receiving securities, while sellers transfer and receive payment for securities. For
example, trades executed on a Monday would typically be settled on a Wednesday.
Trading on the Hong Kong Stock Exchange is order-based using a computer-assisted trading system
that conveys bid and ask prices for securities. Trades are then effected on a matched trade basisdirectly between buyers and sellers. All securities are traded in board lots. For most companies a
board lot is 1,000 shares or 2,000 shares; odd lots are traded separately, usually at a small discount
to the board lot prices. All trades on the Hong Kong Stock Exchange are generally required to be
settled between broker participants through the CCASS. CCASS is the central depository of share
certificates and provides a computerised book-entry settlement of share transactions between its
participants, which include all broker participants of the Hong Kong Stock Exchange. Share
certificates kept at CCASS are electronically recorded in the stock accounts of its participants.
CCASS also facilitates money settlement between participants. It is also possible for settlement totake place outside CCASS (except in relation to trades between broker participants of the Hong
Kong Stock Exchange). In such a case, share certificates, together with signed instruments of transfer,
must be delivered on the second Business Day following the transaction and will typically be
delivered against payment by cheque or bank cashier orders. Other than certain specified forms of
short selling, short selling of securities at or through the Hong Kong Stock Exchange is currently
454
c102100pu110Proof7:28.3.10B/LRevision:0OperatorSadK

proscribed except in respect of a limited group of securities designated by the Hong Kong Stock
Exchange as eligible for short selling.
There is currently no Hong Kong law which may restrict foreign ownership of Hong Kong securities
(other than in relation to investments in certain telecommunications and broadcasting service
providers).
Currently, there are two stock boards in Hong Kong, the main board and the GEM board. The
latter was set up in 1999 to attract higher-risk growth companies with lower entry criteria and more
disclosure requirements than the main board. The Hong Kong Stock Exchange launched theframework for listing of the depository receipts in Hong Kong in July 2008.
Transactional Costs and Regulatory Approvals
The SFC charges a transaction levy of 0.004% and an investor compensation levy of 0.002% (which
has been suspended pending further notice) of the consideration of each transaction and the HongKong Stock Exchange charges a trading fee of 0.005% of the consideration of each transaction,
payable by both seller and buyer. In addition, member brokers charge brokerage commissions to
either a buyer or a seller which are freely negotiated between such brokers and their clients.
Additional administrative fees are also payable for trades settled through CCASS. Member brokers
are required to make a contract note in respect of each transaction in securities unless permitted
otherwise under the relevant SFC rules. The contract note is required to be stamped with ad valorem
stamp duty, currently charged at 0.1% on the higher of the consideration for or the value of the
shares, which will be payable by each of the purchaser and the seller on every sale and purchase ofshares. The contract note has to be delivered to the client not later than the end of the second
business day following the transaction.
Listing Regulations
Issues of securities in companies are governed by the Companies Ordinance, the SFO and, where the
securities will be listed on the Hong Kong Stock Exchange, the Hong Kong Listing Rules. The Hong
Kong Stock Exchange is responsible for administration of the listing process and certain of the SFC’s
statutory functions, including that of approving prospectuses concerning shares in or debentures of a
corporation, have been transferred to the Hong Kong Stock Exchange. However, the SFC may object
to a listing of securities in certain circumstances, including if disclosure in the listing materials appears
to the SFC to contain false or misleading information.
The listing division of the Hong Kong Stock Exchange oversees listing debuts and may impose
additional requirements or make listing subject to special conditions. It may also waive certain listing
requirements at its discretion.
The SFO, which came into effect on 1 April 2003, imposed a dual-filing regime that requires all
listing applicants to submit prospectuses to both the SFC and the Hong Kong Stock Exchange for
approval. To formalise the new regime, the Hong Kong Stock Exchange and the SFC signed amemorandum of understanding (‘‘MOU’’) in January 2003. Under the MOU, listing applicants and
listed issuers will continue to file their listing applications and disclosure documents to the Hong
Kong Stock Exchange. By using the standard form authorisation letters appended to the MOU, they
can authorise the Hong Kong Stock Exchange to file their documents with the SFC on their behalf.
The Hong Kong Stock Exchange continues to be responsible for vetting draft documents to be made
or issued under the main board and GEM listing rules (source: EIU).
The Hong Kong Stock Exchange promulgates its own rules governing share trading and disclosure of
information to shareholders and investors. Companies listed on the Hong Kong Stock Exchange are
required to comply with the provisions of the listing rules, which provide for, among other things, the
issuance of interim and audited annual accounts to shareholders and the making of prompt public
disclosure of material transactions and developments.
The Hong Kong Stock Exchange imposes a requirement on issuers to keep the Hong Kong Stock
Exchange, the shareholders and other holders of listed securities informed as soon as reasonablypracticable of any information relating to the issuers, including information on any major new
developments which are not public knowledge, which: (1) is necessary to enable them and the public
to appraise the issuer’s position; (2) is necessary to avoid the establishment of a false market in the
issuer’s securities; or (3) might be reasonably expected materially to affect market activity in and the
price of the issuer’s securities.
455
c102100pu110Proof7:28.3.10B/LRevision:0OperatorSadK

There are also requirements under the listing rules to obtain prior shareholders’ approval and/or to
disclose to shareholders details of certain acquisitions or disposals of assets and connected
transactions.
Delisting
The delisting regime under the Hong Kong Listing Rules applies in the same way to both companies
with shares or HDRs listed on the Hong Kong Stock Exchange. An issuer whose primary listing is
on the Hong Kong Stock Exchange and which has an alternative listing on another regulated stock
exchange recognised by the Hong Kong Stock Exchange (including the London Stock Exchange),
may not voluntarily withdraw its listing on the Hong Kong Stock Exchange unless: (1) the prior
approval of shareholders has been obtained by way of an ordinary resolution passed at a dulyconvened meeting of the shareholders of the issuer; (2) if applicable, the prior approval of holders of
any other class of listed securities has been obtained; and (3) the issuer has given its shareholders and
holders of any other class of listed securities (if applicable) at least three months’ notice of the
proposed withdrawal of listing. This minimum notice period runs from the date on which the
shareholders approve the voluntary withdrawal of listing and such notice must include details of how
to transfer securities to and trade those securities on the alternative market.
The Takeovers Code and the Share Repurchase Code
The Hong Kong Takeovers Code and the Share Repurchase Code have been issued by the SFC. The
primary purpose of the codes is to afford fair treatment for shareholders who are affected by
takeovers, mergers and share repurchases. The codes seek to achieve fair treatment by requiring
equality of treatment of shareholders, mandating disclosure of timely and adequate information to
enable shareholders to make an informed decision as to the merits of an offer and ensuring that there
is a fair and informed market in the shares of companies affected by takeovers, mergers and share
repurchases. The codes also provide an orderly framework within which takeovers, mergers and sharerepurchases are to be conducted.
The Hong Kong Takeovers Code and the Share Repurchase Code do not have force of law. They are
framed so far as possible in non-technical language and should not be interpreted as if they arestatutes. They represent a consensus of opinion of those who participate in Hong Kong’s financial
markets and the SFC regarding standards of commercial conduct and behaviour considered
acceptable for takeovers, mergers and share repurchases. This consensus of opinion is reflected in
rulings made by the Hong Kong Takeovers and Mergers Panel when interpreting the codes, given the
diverse range of interests represented by the Hong Kong Takeovers and Mergers Panel’s members.
Nature of the Securities Trading Market
Hong Kong’s securities market ranked seventh in the world by capitalisation at the end of November
2009, and was the third largest in Asia, after Tokyo and Shanghai, according to the World
Federation of Exchanges (source: EIU). As at 31 December 2009, there were 1,145 companies listed
on the main board of the Hong Kong Stock Exchange and the average daily turnover of the main
board of the Hong Kong Stock Exchange in 2009 was HK$62 billion. The market capitalisation of
the Hong Kong Stock Exchange was approximately HK$144,484,329,233 on 28 February 2010.
Hong Kong is an important centre for raising capital for the Chinese mainland. Much of the foreign
money designated for investment in the People’s Republic of China (the ‘‘PRC’’) is still channelled
through Hong Kong’s equity market, although the PRC markets are slowly opening to overseas
investors. Mainland enterprises raised HK$201 billion in IPOs on the Hong Kong Stock Exchange in2009, which represented 83% of total IPO funds raised on the Hong Kong Stock Exchange during
the year, compared with HK$47.7 billion in 2008, which represented 73% of total IPO funds raised
on the Hong Kong Stock Exchange during 2008 (source: EIU). Total funds raised in IPOs on the
main board and the GEM board, including offerings by Hong Kong’s incorporated companies,
increased to HK$248.23 billion in 2009, which is 276% higher than the HK$65.98 billion raised in
2008.
456
c102100pu110Proof7:28.3.10B/LRevision:0OperatorSadK

MAIN PROVISIONS OF THE ARTICLES OF ASSOCIATION
The Company’s activities are regulated by its Memorandum and Articles. The Company’s current
Memorandum and Articles were recently amended by a special resolution of its shareholders passed
on 7 May 2009.
The Memorandum permits the Company to engage in a wide variety of activities, including all of the
activities that the Company is currently engaged in or intends to be engaged in, as well as other
activities that the Company currently has no intention of engaging in.
Changes in Capital or Memorandum and Articles of Association
Subject to the UK Companies Act and the Articles the Company may, by passing an ordinary
resolution or a special resolution, as applicable, at a general meeting:
* increase its authorised or paid-up share capital;
* consolidate all or any part of its shares into a smaller number of shares each with a larger par
value;
* split all or any part of its shares into a larger number of shares each with a smaller par value;
* convert all or any of its paid-up shares into stock, and reconvert any stock into any number of
paid-up shares of any denomination;
* cancel shares which, at the date of passing of the resolution, have not been taken or agreed to
be taken by any person, and diminish the amount of the authorised share capital by the amount
of the shares so cancelled;
* reduce its issued share capital; and
* alter its Memorandum and Articles.
General Meetings of Shareholders
The Articles rely on the UK Companies Act provisions dealing with the calling of general meetings.
The UK Companies Act provides that a general meeting (other than an adjourned meeting) may be
called by notice of at least 21 days in the case of an annual general meeting and at least 14 days in
any other case. The Company must convene its annual general meeting within six months of the end
of each financial year. General meetings may be convened at any time by the Directors at their
discretion or by the Directors at the request of the Company’s shareholders holding in aggregate not
less than 5% of the Company’s paid-up capital. A request by shareholders to convene a generalmeeting must state the general nature of the business to be dealt with at the meeting and may include
the text of a resolution that may properly be moved and is intended to be moved at the meeting. A
notice in writing to convene a general meeting must set out the date, time, place and agenda of the
meeting. The requirement of 21 or 14 days’ notice, as the case may be, may be waived if consent to
shorter notice is received from shareholders having a right to attend and vote at the meeting holding
not less than 95% in nominal value of the shares giving a right to attend and vote at the meeting
(excluding treasury shares).
The annual general meeting deals with all matters prescribed by the Articles and by the UK
Companies Act, including the following:
* the consideration of the Company’s annual financial statements and report of the Company’s
Directors and auditors;
* the election or re-election of Directors;
* the appointment of auditors and the fixing of their remuneration;
* the authorisation of dividends; and
* the transaction of any other business of which notice has been given.
Division of Shares
The UK Companies Act provides that a company may consolidate and sub-divide its share capital
unless prohibited by its articles of association by adopting an ordinary resolution in its generalmeeting.
The Articles allow the Company in a general meeting to consolidate and sub-divide all or any of its
equity shares into a larger or smaller amount.
457
c102100pu110Proof7:28.3.10B/LRevision:0OperatorSadK

Voting Rights
Subject to any special terms as to voting on which any shares may have been issued, every
shareholder who is present in person or by duly appointed proxy and entitled to vote shall, on ashow of hands, have one vote and, on a poll, have one vote for every US$2 nominal value of share
capital of which he is the holder. In the case of joint holders, the vote of the senior of the joint
holders who tenders a vote, whether in person or by proxy, shall be accepted to the exclusion of the
votes of the other joint holders. Seniority is determined by the order in which the names appear in
the register of members in respect of the joint holding.
The holders of any preference shares in issue are not entitled to attend or vote at any general meeting
except (i) when the dividend most recently payable on their shares has not been paid in full; (ii) the
business of the meeting includes a resolution varying or abrogating any of the rights attached to any
such shares (and then in such case only to speak and vote upon any such resolution); or (iii) in such
other circumstances and on such terms a the Board may determine prior to the allotment of such
shares.
Voting is by a show of hands unless before or on the declaration of the result of the show of hands
a poll is ordered by:
(a) the chairman of the meeting, who is generally the chairman of the Board but may be another
director or other person selected by the Board or the shareholders present at the meeting in the
absence of the chairman;
(b) at least three shareholders present and entitled to vote on the resolution;
(c) any shareholder or shareholders present in person or by proxy and representing not less than
one-tenth of the total voting rights of all the shareholders having the right to vote on the
resolution; or
(d) any shareholder or shareholders present in person or by proxy and holding shares conferring a
right to vote on the resolution on which there have been paid up sums in the aggregate equal to
not less than one-tenth of the total sum paid up on all the shares conferring that right.
The chairman of the meeting can also demand a poll before a resolution is put to the vote on a show
of hands. In the case of an equality of votes, whether on a show of hands or on a poll, the chairman
of the meeting shall be entitled to an additional or casting vote. The voting rights of IDR Holders
are subject to the terms of the Deposit Agreement. See ‘‘Terms and Conditions of the Indian
Depository Receipts’’.
At the Company’s annual general meeting the votes are taken by a poll. Given that the nominal
value of each Share is US$0.50, a shareholder needs to hold four Shares in order to register one vote.
A shareholder may appoint any person (whether or not a shareholder) to act as his proxy at any
meeting of shareholders (or of any class of shareholders) in respect of all or a particular number of
the shares held by him. A shareholder may appoint more than one person to act as his proxy and
each such person shall act as proxy for the shareholder for the number of shares specified in the
instrument appointing the person a proxy. The instrument appointing a proxy must be received (a) in
the case of an appointment made in hard copy form, at the Company’s registered office at least 48
hours prior to the meeting and (b) in the case of an appointment made by electronic means, at the
address specified by the Company at least 48 hours prior to the meeting. The instrument appointing aproxy must be received (a) in case of a poll taken more than 48 hours after it was demanded, not
less than 24 hours before the time appointed for taking of the poll and (b) in the case of a poll taken
following the conclusion of a meeting but 48 hours or less after it was demanded, before the end of
the meeting at which it was demanded. The Articles permit a proxy to vote both on a show of hands
as well as on a poll. If a shareholder appoints more than one person to act as his proxy, each
instrument appointing a proxy shall specify the number of shares held by the shareholder for which
the relevant person is appointed as his proxy. A proxy has a right to speak at meetings. A corporate
shareholder is also entitled to nominate one or more representatives to attend and vote on its behalfat general meetings. Such a representative is not considered a proxy and he has the same rights as the
shareholder to vote at a meeting in respect of the number of shares held by the shareholder,
including on a show of hands and a poll. If more than one corporate representative is appointed and
purports to exercise their right to vote, they must all vote the same way; otherwise their votes are
disregarded.
458
c102100pu110Proof7:28.3.10B/LRevision:0OperatorSadK

Quorum
The Articles provide that a quorum for a general meeting is at least five shareholders present in
person or by proxy and entitled to vote. The quorum for an adjourned meeting is one shareholder.
Shareholder Resolutions
An ordinary resolution requires the affirmative vote of a majority of the Company’s shareholders
entitled to vote in person or by proxy at a general meeting.
A special resolution requires the affirmative vote of not less than three-quarters of the shareholders
entitled to vote in person or by proxy at a general meeting.
The UK Companies Act provides that certain amendments, including an amendment of the articles of
association, a reduction of share capital, approval of variation of rights of special classes of shares
and dissolution of the company require a special resolution. A change in the name of a company can
be made by special resolution or whatever other means are provided for by its articles of association.
Dividends
The Company may, by ordinary resolution, declare dividends but no dividend shall exceed the
amount recommended by the Board. The Board may also declare interim dividends that do not needto be approved by the shareholders. The shareholders have the right to decrease but not increase the
dividend amount recommended by the Board. Dividends are generally declared as a percentage of par
value and distributed and paid to shareholders in proportion to the paid-up value of their equity
shares.
Each preference share confers the right to a non-cumulative preferential dividend payable in such
currency, at such rates, on such dates and on such other terms and conditions as may be determined
by the Board prior to allotment.
The preference shares rank for dividend in priority to dividends payable on the Shares and in priority
to, or pari passu with, the holders of any other class of shares in issue, other than shares which by
their terms rank in priority to the preference shares.
Generally, the Board has a discretion whether or not to declare and pay a dividend in the preference
shares in respect if any financial year. Furthermore if, in the opinion of the Board, insufficient
distributable profits are available to cover the payment in full of a dividend to be paid on any
preference shares then either none of the dividend shall be payable or, subject to certain conditions,
such profits, if any, shall be applied pro rata to the extent of the available distributable profits.
No dividend shall be payable if payment would cause a breach of the FSA’s capital adequacy
requirements applicable to the Company or its subsidiaries.
The Company may cease to pay any dividend payable in respect of shares in the Company if, in
respect of at least two consecutive dividends payable on those shares, the means used to pay such
dividends have failed. It may also cease to pay any dividend if, in respect of one dividend payable on
those shares, the means used to pay such dividend has failed and reasonable enquiries have failed to
establish any new postal address or account of the holder. All dividends unclaimed after 12 years
from the date when they were declared or became due for payment shall be forfeited and shall revertto the Company unless the Board decides otherwise.
Under the UK Companies Act, a company may only make distributions out of profits available for
the purpose, being its accumulated, realised profits so far as not previously utilised by distribution orcapitalisation, less its accumulated, realised losses so far as not previously written off in a reduction
or reorganisation of capital duly made.
Distribution of Assets on a Winding-up
In accordance with the Insolvency Act 1986 of the UK (as amended), all surplus assets remaining
after payments are made to employees, statutory creditors, tax and revenue authorities, secured and
unsecured creditors and the holders of any preference shares (though not in that order), shall be
distributed among the Company’s equity shareholders in proportion to the amount paid-up or
credited as paid-up on such Shares at the commencement of the winding-up.
Transfer of Shares
Under the UK Listing Rules, the shares of a UK-listed company must be freely transferable. The
transferor is deemed to remain the holder until the transferee’s name is entered in the register of
459
c102100pu110Proof7:28.3.10B/LRevision:0OperatorSadK

members. In the case of shares held in certificated form, the Company will register any transfers of
equity shares in the register of members upon lodgment of the duly completed share transfer form,
the relevant share certificate or, if there is no certificate, the letter of allotment, in respect of shares to
be transferred together with duly stamped share transfer forms and provided, in the case of a transferto joint holders, the number of joint holders to whom the shares are to be transferred does not
exceed four. In respect of shares held in uncertificated form, any holder may transfer all or any of his
uncertificated shares by means of the electronic settlement system operated by Euroclear.
The Articles provide for certain restrictions on the transfer of equity shares, including granting power
to the Board in certain circumstances to refuse to register or acknowledge a transfer of equity shares
or other securities issued by the Company.
Share Register and Record Dates
The Company maintains a register of members at its registered office in the UK and a branchregister in Hong Kong. All transfers of shares should be notified to the Company at the appropriate
address. The register of members (including the Hong Kong branch register) is open for inspection
during business hours by shareholders without charge and by other persons upon payment of a fee
not exceeding GBP3.50 for each hour or part thereof during which the right of inspection is
exercised.
Only those persons who appear on the register of members (including the Hong Kong branch
register) are recognised as shareholders and the Company does not recognise any person holding any
equity share or part thereof on trust, whether express, implied or constructive, except as permitted by
law.
Under the Articles, the Company or the Board may fix any date as the record date for any dividend,
distribution, allotment or issue. The Company must announce, as soon as possible, the record date
for any dividend or distribution approved by the Board.
Annual Report
At least 21 days before an annual general meeting, the Company must circulate its annual report,
which comprises of either a detailed or abridged version of the audited financial accounts, the
Directors’ report, corporate governance report, and auditor’s report, to the shareholders along with a
notice convening the annual general meeting. Under the UK Listing Rules, the Company must make
public an audited or unaudited half-yearly financial report covering the first six months of the
financial year. Such half-yearly report must be made public as soon as possible, but no later than twomonths, after the end of the period to which it relates. The Company is also required to send copies
of its annual report to the London Stock Exchange and the Hong Kong Stock Exchange. In
addition, under the UK Listing Rules, the Company must make public an interim management
statement during each six-month period of a financial year. Such statement must be made in the
period between ten weeks after the beginning, and six weeks before the end, of the relevant six-month
period. The statement must contain an explanation of material events and transactions and their
impact on the financial position of the Company and a general description of the financial position
and performance of the Company.
Under the UK Companies Act, the Company must file with the UK Registrar of Companies its
annual report and accounts within six months of the end of the account reference period to whichthey relate.
Borrowing Powers
The Directors may raise, borrow or secure the payment of any sums of money for the Company’s
purposes as they deem appropriate without the consent of the shareholders in a general meeting.
Issue of Equity Shares and Pre-emptive Rights
Subject to the provisions of the UK Companies Act and the Articles and to any special rightsattaching to any of the existing shares in the Company, the Company may increase its share capital
by the allotment or issue of new equity shares with preferred, deferred or other special rights or
restrictions regarding dividends, voting, return of capital or other matters as the Company may from
time to time determine by ordinary resolution or, if no such resolution has been passed or so far as
the resolution does not make specific provision, as the Board may decide. The Company may issue
460
c102100pu110Proof7:28.3.10B/LRevision:0OperatorSadK
equity shares that are redeemable or are liable to be redeemed at its option or the option of the
holder in accordance with the Articles.
Under the UK Companies Act, the Company must first offer any new equity shares to existing
shareholders in proportion to the amount they have paid up on their equity shares unless such pre-
emption rights have been disapplied by special resolution. The offer is deemed to include a right
exercisable by the person concerned to renounce the shares offered to him in favour of any other
person.
Capitalisation of Profits and Reserves
The Articles allow Directors, with the approval of the shareholders by ordinary resolution, to
capitalise any part of the amount standing to the credit of any of its reserves or funds (including
retained earnings) whether or not the same is available for distribution. Any sum which is capitalised
shall be appropriated among the Company’s shareholders in the same proportion as if such sum had
been distributed by way of dividend. This sum shall not be paid out in cash and shall be applied in
the following manner:
* paying up any amount remaining unpaid on the shares held by shareholders; or
* issuing to shareholders fully paid bonus equity shares (issued either at par or at a premium).
Purchase of Own Equity Shares
The Company may reduce its capital in accordance with the UK Companies Act and the Articles by
way of a share buy-back out of its distributable reserves or the proceeds of a fresh issue of shares
subject to certain conditions, including a resolution authorising the buy-back to be passed in a
general meeting, being a special resolution in the case of an off-market purchase and an ordinary
resolution in the case of an on-market purchase.
Any equity shares which have been bought back by the Company may be held as treasury shares for
re-sale or cancellation, provided that the aggregate nominal value of the shares of any class held as
treasury shares at any one time does not exceed 10% of the nominal value of the issued share capital
of the shares in that class at that time.
The Company cannot purchase its own shares through its subsidiaries as the UK Companies Act
prohibits a subsidiary from being a member of its holding company.
Rights of Minority Shareholders
Subject to the provisions of the UK Companies Act, if at any time the capital of the Company is
divided into different classes of shares, the rights attached to any class of shares may be varied or
abrogated either with the written consent of the holders of not less than three-quarters in nominal
value of the issued shares of that class, or with the sanction of a special resolution passed at aseparate general meeting of the holders of those shares. The provisions which apply to general
meetings will also apply to such class meeting, except that:
(a) the necessary quorum shall be two persons entitled to vote and holding or representing by proxynot less than one-third in nominal value of the issued shares of the class, or at any adjourned
meeting of such holders, one holder entitled to vote and present in person or by proxy,
whatever the amount of his holding, who shall be deemed to constitute a meeting;
(b) every holder of shares of the class present in person or by proxy and entitled to vote shall be
entitled, on a poll, to one vote for every share of the class held by him; and
(c) any holder of shares of the class present in person or by proxy and entitled to vote maydemand a poll.
The UK Companies Act provides that the holders of not less than 15% of the issued shares of the
class in question (being persons who did not consent or vote in favour of the resolution for the
variation) may apply to the court, within 21 days after the date on which the consent was given orthe resolution was passed, to have the variation cancelled.
Mandatory Bids
The City Code applies to the Company. Under the City Code, if an acquisition of Shares were to
increase the aggregate holding of an acquirer and its concert parties to Shares carrying 30% or more
of the voting rights in the Company, the acquirer and, depending upon the circumstance, its concert
parties, would be required (except with the consent of the Panel) to make a cash offer for the
461
c102100pu110Proof7:28.3.10B/LRevision:0OperatorSadK

outstanding Shares at a price not less than the highest price paid for the Shares by the acquirer or its
concert parties during the previous 12 months. A similar obligation to make such a mandatory offer
would also arise on the acquisition of Shares by a person holding (together with its concert parties)
shares carrying between 30% to 50% of the voting rights in the Company if the effect of suchacquisition were to increase that person’s percentage of the voting rights.
Provisions on Squeeze Out of Minority Shareholders
Under the UK Companies Act, if an offeror were to acquire or unconditionally contract to acquire
90% of the shares to which the offer relates and 90% of the voting rights attached to those shares,
within three months of the last day on which its offer can be accepted, it could compulsorily acquire
the remaining 10%. It would do so by sending a notice to outstanding shareholders telling them thatit would compulsorily acquire their shares and then, six weeks later, it would execute a transfer of the
outstanding shares in its favour and pay the consideration to the Company, which would hold the
consideration on trust for outstanding shareholders. The consideration offered to the shareholders
whose shares are compulsorily acquired under the UK Companies Act must, in general, be the same
as the consideration that was available under the takeover offer.
Sell-out
The UK Companies Act also gives minority shareholders in the Company a right to be bought out in
certain circumstances by an offeror who has made a takeover offer. If a takeover offer relates to all
the Shares and at any time before the end of the period within which the offer could be accepted the
offeror held or had agreed to acquire not less than 90% of the Shares to which the offer relates, any
holder of shares to which the offer related who had not accepted the offer could by a written
communication to the offeror require it to acquire those shares.
The offeror would be required to give any shareholder notice of his right to be bought out within
one month of that right arising. The offeror may impose a time limit on the rights of minority
shareholders to be bought out, but that period cannot end less than three months after the end of the
acceptance period. If a shareholder exercises his or her rights, the offeror is bound to acquire those
shares on the terms of the offer or on such other terms as may be agreed.
Removal of restrictions on the Company’s objects and certain other updating changes to its constitution
At its forthcoming annual general meeting the Company is seeking to remove the objects clause from
its constitutional documents and make certain other updating changes to its constitution. Pursuant to
changes to UK company law, companies now have unrestricted objects unless their constitutional
documents provide otherwise and as a result of these changes the majority of public companies in the
UK are removing their objects clauses. Subject to the relevant resolution being passed at theforthcoming annual general meeting on May 7, 2010, the objects clause will be deleted from the
constitutional documents of the Company and the Company undertakes to make the relevant changes
to the Red Herring Prospectus.
462
c102100pu110Proof7:28.3.10B/LRevision:0OperatorSadK

MATERIAL CONTRACTS AND DOCUMENTS FOR INSPECTION
The following contracts which are or may be deemed material have been entered into or will be
entered into by the Company. These contracts, copies of which have been attached to the copy of the
Red Herring Prospectus delivered to the RoC for registration, and also the documents for inspection
referred to hereunder, may be inspected at the principal office of the Company in India at 90,Mahatma Gandhi Road, Fort, Mumbai, 400 001 from 10.00 a.m. to 4.00 p.m. on Business Days
from the date of the Red Herring Prospectus until the Bid/Issue Closing Date.
Material Contracts to the Issue
1. Issue Agreement dated 30 March 2010 executed among the Company, the BRLMs and
Co-BRLM.
2. Escrow Agreement dated [*] among the Company, the BRLMs, the Escrow Collection Bank(s)
and the Registrar to the Issue.
3. Syndicate Agreement dated [*] among the Company, the BRLMs and the Syndicate Members.
4. Underwriting Agreement dated [*] among the Company, the BRLMs and the Syndicate
Members.
5. Deposit Agreement dated [*] among the Company and the Depository.
6. Custody Agreement dated [*] among the Depository and the Custodian.
7. Registrar Agreement and Transfer Agent Agreement dated [*] and [*] respectively among the
Company, the Depository and the Registrar to the Issue.
8. Deed Poll dated [*] issued by the Company.
Material Documents
1. Memorandum and Articles of the Company as amended at the date hereof.
2. Certificate of incorporation dated 18 November 1969.
3. Resolution of the Board dated 28 October 2008 granting in principle approval for listing ofIDRs, Resolution of the Board dated 15 September 2009 granting in principle approval for
public filing of this Draft Red Herring Prospectus, and Resolution of a committee of the Board
dated 22 March 2010 and 25 March 2010 granting in principle approval for the public filing of
this Draft Red Herring Prospectus and authorising the number of IDRs for the Issue.
4. Copies of annual reports of the Company and its subsidiaries for the past three financial years.
5. Consents of the Auditors, KPMG, for inclusion of their report on the accounts in the form and
context in which they appear in this Draft Red Herring Prospectus.
6. Consents of Auditors, Bankers to the Company, the BRLMs, Syndicate Members, Registrar to
the Issue, the Custodian, the Depository, Banker to the Issue, Tax Advisors to the Company,
Indian Legal Counsel to the Company, Indian Legal Counsel to the Underwriters, English and
Hong Kong Legal Counsel to the Underwriters and English and Hong Kong Counsel to the
Company, as referred to, in their respective capacities.
7. In-principle listing approval dated [*] and [*] from the NSE and the BSE, respectively.
8. Tripartite Agreement among NSDL, the Company and the Registrar to the Issue dated [*].
9. Tripartite Agreement among CDSL, the Company and the Registrar to the Issue dated [*].
10. Deed of Assignment dated [*] issued by the Company to the Depository.
11. Due diligence certificate dated 30 March 2010 to SEBI from the BRLMs.
12. Letters of approval from the RBI for undertaking the Issue dated 7 October 2009, 14 January
2010 and 22 March 2010.
13. SEBI observation letter dated 4 September 2009 and the Company’s reply to the same dated
30 March 2010.
14. Certificate given by Slaughter and May to the Company as set out in the section titled
‘‘Vetting, approvals and securities market regulations’’ on page 464 of this Draft Red Herring
Prospectus.
Any of the contracts or documents mentioned in this Draft Red Herring Prospectus may be amended
or modified at any time if so required in the interest of the Company or if required by the other
parties, without reference to the shareholders, subject to compliance with the provisions of relevant
statutes as applicable to the Company.
463
c102100pu110Proof7:28.3.10B/LRevision:0OperatorSadK

ADDITIONAL INFORMATION
Vetting, approvals and securities market regulations
Slaughter and May has given a certificate to the Company stating as follows: ‘‘the vetting of this
Draft Red Herring Prospectus has been done in accordance with acceptable international practicesand the Company has obtained all necessary approvals for this Issue as per the requirements under
the jurisdiction of incorporation of the Company and, based on disclosures and representations made
to us by the Company and to the best of our knowledge, we believe that the Company has complied
with necessary and applicable securities market regulations in jurisdictions of incorporation and
listing’’.
464
c102100pu110Proof7:28.3.10B/LRevision:0OperatorSadK

SUMMARY DIFFERENCES BETWEEN INDIAN GAAP AND IFRS
The statutory consolidated financial statements of the Group as at and for the years ended
31 December 2009, 2008 and 2007 are prepared in accordance with IFRS, as adopted by the EU. The
Group’s statutory consolidated financial statements also comply with the relevant provisions of the
UK Companies Act and Article 4 of the International Accounting Standards Regulation (‘‘IASRegulation’’).
IFRS differs in certain significant respects from Indian GAAP. Such differences involve methods for
measuring the amounts shown in the financial statements of the Company, as well as additional
disclosures required by Indian GAAP.
Set out below are descriptions of certain accounting differences between IFRS and Indian GAAP that
could have a significant effect on profit attributable to parent company shareholders for the year
ended 31 December 2009 and total parent company shareholders’ equity as of 31 December 2009 asshown under IFRS in the consolidated financial statements as of and for the year ended 31 December
2009. This section does not provide a comprehensive analysis of such differences. In particular, this
description considers only those Indian GAAP pronouncements for which adoption or application is
required in financial statements for years and periods ended on or prior to 31 December 2009. The
Company has not quantified the effect of differences between IFRS and Indian GAAP, nor prepared
consolidated financial statements under Indian GAAP, nor undertaken a reconciliation of IFRS and
Indian GAAP financial statements. Had the Company undertaken any such quantification or
preparation or reconciliation, other potentially significant accounting and disclosure differences mayhave come to its attention which are not identified below.
Accordingly, the Company does not provide any assurance that the differences identified below
represent all the principal differences between IFRS and Indian GAAP relating to the Company.
Furthermore, no attempt has been made to identify future differences between IFRS and Indian
GAAP. Finally, no attempt has been made to identify all differences between IFRS and Indian
GAAP that may affect the financial statements as a result of transactions or events that may occur in
the future.
In making an investment decision, investors must rely upon their own examinations of the Company,
the terms of the offering and the Group’s financial statements. Potential investors should consult their
own professional advisers for an understanding of the differences between IFRS and Indian GAAP
and how those differences may have affected the financial information in the section titled ‘‘Audited
Historical Financial Statements’’ on page 486 of this Draft Red Herring Prospectus.
The summary does not purport to be complete and is subject and qualified in its entirety by reference
to the pronouncements of the IASB, together with the pronouncements of the Indian accountingprofession.
Changes in accounting policy
IFRS
* Changes in accounting policy are applied retrospectively. Comparatives are restated and the
effect of period(s) not presented is adjusted against opening retained earnings of the earliest year
presented. Policy changes made on the adoption of a new standard are made in accordance with
that standard’s transitional provisions.
Indian GAAP
* The cumulative amount of the change is included in the income statement for the period in
which the change is made except as specified in certain standards (transitional provision) where
the change during the transition period resulting from adoption of the standard has to be
adjusted against opening retained earnings and the impact needs to be disclosed.
Functional and presentation currency
IFRS
* Assets and liabilities are translated at the exchange rate at the balance sheet date when the
financial statements are presented in a currency other than the functional currency. Income
statement items are translated at the exchange rate at the date of transaction or at average
rates. The functional currency is the currency of the primary economic environment in which an
entity operates. The presentation currency of the Group is US$.
465
c102100pu110Proof7:28.3.10B/LRevision:0OperatorSadK

Indian GAAP
* There is no concept of functional or presentation currency. Entities in India have to prepare
their financial statements in Rs.
Consolidation
IFRS
* Entities are consolidated when the Group has the power to govern the financial and operatingpolicies so as to obtain benefits. Control is presumed to exist when the Group owns more than
one half of an entity’s voting power. Currently exercisable voting rights should also be taken
into consideration when determining whether control exists.
Indian GAAP
* Similar to IFRS, except that currently exercisable voting rights are not considered in
determining control.
Consolidation of Special Purpose Vehicles
IFRS
* Under the SIC Interpretation 12, an SPE should be consolidated when the substance of the
relationship between an enterprise and the SPE indicates that the SPE is controlled by that
entity. The definition of an SPE includes employee share trusts.
Indian GAAP
* No specific guidance. Employee share trusts are not consolidated.
Business combinations
IFRS
* All business combinations are treated as acquisitions. Assets, liabilities and contingent liabilities
acquired are measured at their fair values. Pooling of interest method is prohibited.
* For acquisitions occurring on or after 1 January 2004, IFRS 3 ‘Business Combinations’ requires
that, when assessing the value of the assets of an acquired entity, certain identifiable intangible
assets must be recognised and, if considered to have a finite life, amortised through the income
statement over an appropriate period. As the Group has not applied IFRS 3, or its predecessor
IAS 22, to transactions that occurred before 1 January 2004, no intangible assets, other than
goodwill, were recognised on acquisitions prior to that date.
* Adjustments to provisional fair values are permitted provided those adjustments are made within
12 months from the date of acquisition, with a corresponding adjustment to goodwill.
* After re-assessment of respective fair values of net assets acquired, any excess of acquirer’s
interest in the net fair values of acquirer’s identifiable assets is recognised immediately in the
income statement.
* Where less than 100% of an entity is acquired, the minority interest is stated at its proportion
of the fair value of the identifiable net assets and contingent liabilities acquired.
Indian GAAP
* Treatment of a business combination depends on whether the acquired entity is held as a
subsidiary, whether it is an amalgamation, or whether it is an acquisition of a business.
* For an entity acquired and held as a subsidiary, the business combination is accounted for as
an acquisition. The assets and liabilities acquired are incorporated at their existing carrying
amounts.
* For an amalgamation of an entity, either pooling of interests or acquisition accounting may be
used. The assets and liabilities amalgamated are incorporated at their existing carrying amounts
or, alternatively, if acquisition accounting is adopted, the consideration can be allocated to
individual identifiable assets (which may include intangible assets) and liabilities on the basis of
their fair values.
* For an acquisition of a business, the acquired assets and liabilities may be incorporated at their
fair values or value of surrendered assets.
466
c102100pu110Proof7:28.3.10B/LRevision:0OperatorSadK

* Adjustments to the value of acquired or amalgamated balances are not permitted after initial
recognition.
* Any excess of acquirer’s interest in the net fair values of acquirer’s identifiable assets isrecognised as capital reserve, which is neither amortised nor available for distribution to
shareholders. However, in case of an amalgamation accounted under the purchase method, the
fair value of intangible assets with no active market is reduced to the extent of capital reserve, if
any, arising on the amalgamation.
* Minority interests arising on the acquisition of a subsidiary are recognised at their share of the
historical book value.
Goodwill
IFRS
* IFRS 3 requires that goodwill arising on all acquisitions by the Group and associated
undertakings is capitalised but not amortised and is subject to an annual review for impairment.Under the transitional provisions of IFRS 1, the Group has not applied IFRS 3, or its
predecessor IAS 22, to transactions that occurred before 1 January 2004, the date of transition
to IFRS. Accordingly, goodwill previously written off to reserves, as permitted under UK
GAAP until the implementation of IFRS 10 ‘Goodwill and intangible assets’ in 1998, has not
been reinstated nor will it be written back on disposal.
* Amortisation of goodwill that has been charged up to 31 December 2003 has not been reversed
and the deemed carrying value of the goodwill on transition to IFRS is equal to the net book
value as at 31 December 2003.
* Goodwill is tested annually for impairment. Any impairment losses recognised may not be
reversed in subsequent accounting periods.
Indian GAAP
* Goodwill arising for amalgamations is capitalised and amortised over useful life not exceeding
five years, unless a longer period can be justified.
* For goodwill arising on acquisition of a subsidiary or a business, there is no specific guidance –in practice there is either no amortisation or amortisation not exceeding 10 years.
* Goodwill is reviewed for impairment whenever an indicator of impairment exists. Impairment
losses recognised may be reversed in subsequent accounting periods through the income
statement.
Acquired and internally generated intangible assets
IFRS
* Intangible assets are recognised if the specific criteria are met. Assets with a finite useful life are
amortised on a systematic basis over their useful life. An asset with an indefinite useful life and
which is not yet available for use should be tested for impairment annually.
Indian GAAP
* Intangible assets are capitalised if specific criteria are met and are amortised over their useful
life, generally not exceeding 10 years. The recoverable amount of an intangible asset that is not
available for use or is being amortised over a period exceeding 10 years should be reviewed at
least at each financial year-end even if there is no indication that the asset is impaired.
Property, plant and equipment
IFRS
* Fixed assets are recorded at cost or revalued amounts. Under the transition rules of IFRS 1, the
Group elected to freeze the value of all its properties held for its own use at their 1 January2004 valuations, their ‘deemed cost’ under IFRS. They will not be revalued in the future.
* Foreign exchange gains or losses relating to the procurement of property, plant and equipment,
under very restrictive conditions, can be capitalised as part of the asset.
* Depreciation is recorded over the asset’s estimated useful life. The residual value and the useful
life of an asset and the depreciation method shall be reviewed at least at each financial year-end.
467
c102100pu110Proof7:28.3.10B/LRevision:0OperatorSadK

* The Group has the option to capitalise borrowing costs incurred during the period that the asset
is getting ready for its intended use.
Indian GAAP
* Fixed assets are recorded at historical costs or revalued amounts.
* Relevant borrowing costs are capitalised if certain criteria are met.
* Depreciation is recorded over the asset’s useful life. Schedule XIV of the Indian Companies Act
and Banking Regulations prescribe minimum rates of depreciation and these are typically used
as the basis for determining useful life.
Recognition and measurement of financial instruments
IFRS
* IAS 39 requires all financial instruments to be initially measured at their fair value, which is
usually the transaction price. In those cases where the initial fair value is based on a valuation
model that uses inputs which are not observable in the market, the difference between the
transaction price and the valuation model is not recognised immediately in the income statement
but is amortised to the income statement until the inputs become observable, the transaction
matures or is terminated.
* At the time of initial recognition, IAS 39 requires all financial assets to be classified as:
* held at fair value through profit or loss (as a trading instrument or as designated by
management), with realised and unrealised gains or losses reflected in profit or loss; or
* available for sale at fair value, with unrealised gains and losses reflected in shareholders’
equity, and recycled to the income statement when the asset is sold or is impaired; or
* held-to-maturity at amortised cost, where there is the intent and the ability to hold them
to maturity; or
* as loans and receivables at amortised cost.
* At the time of initial recognition, IAS 39 requires all financial liabilities to be classified as either:
* held at fair value through profit or loss (as a trading instrument or as designated by
management), with realised and unrealised gains or losses reflected in profit or loss; or
* at amortised cost.
* A financial asset or financial liability, other than one held for trading, can be designated as
being held at fair value through profit or loss if it meets the criteria set out below:
* the designation eliminates or significantly reduces a measurement or recognition
inconsistency that would otherwise arise from measuring assets or liabilities on a differentbasis;
* a group of financial assets and/or liabilities is managed and its performance evaluated on a
fair value basis; or
* assets or liabilities include embedded derivatives and such derivatives are not recognised
separately.
* The designation of a financial instrument as held at fair value through profit or loss is
irrevocable in respect of the financial instruments to which it relates.
* Reclassifications of financial assets, other than as disclosed below, or financial liabilities between
categories are not permitted following initial recognition.
* Held for trading financial assets can be reclassified either to the available-for-sale category
where, in rare circumstances, they are no longer held for the purpose of selling or repurchasing
in the near term; or to the loans and receivables category, where they are no longer held for the
purpose of selling or repurchasing in the near term and they would have met the definition of
loans and receivables at the time of reclassification and where the Group has the intent andability to hold the assets for the foreseeable future or until maturity.
* Available-for-sale financial assets can only be reclassified to the loans and receivables category,
where they would have met the definition of loans and receivables at the time of reclassification
and where the Group has the intent and ability to hold the assets for the foreseeable future or
until maturity.
468
c102100pu110Proof7:28.3.10B/LRevision:0OperatorSadK

* Financial assets reclassified are done so at their fair value on the date of reclassification.
* Changes in the fair value of available-for-sale financial assets resulting from movements in
foreign currency exchange rates are included in the income statement as exchange differences.Foreign currency exchange movements for available-for-sale equity securities is recognised in
reserves.
Indian GAAP
* Investments are categorised as follows:
* current investments, which are those readily realisable and intended to be held for less
than one year, are carried at the lower of cost and fair value, with changes in fair value
taken directly to profit or loss; and
* long-term investments, which are those investments not classified as current, are carried at
cost unless there is a permanent diminution in value, in which case a provision for
diminution is required to be made by the entity.
* For investments, RBI regulations require similar classifications to IFRS, but the classification
criteria and measurement requirements differ from those set out in IFRS.
* Financial liabilities are usually carried at cost.
* There is no ability to designate instruments at fair value.
Measurement of derivative instruments and hedging activities
IFRS
* IAS 39 requires that all derivatives be recognised on balance sheet at fair value. Changes in thefair value of derivatives that are not hedges are reported in the income statement. Changes in
the fair value of derivatives that are designated as hedges are either offset against the change in
fair value of the hedged asset or liability through earnings or recognised directly in equity until
the hedged item is recognised in earnings, depending on the nature of the hedge. The ineffective
portion of the hedge’s change in fair value is immediately recognised in earnings. A derivative
may only be classified as a hedge if an entity meets stringent qualifying criteria in respect of
documentation and hedge effectiveness.
* IAS 39 requires the separation of derivatives embedded in a financial instrument if it is not
deemed to be closely related to the economic characteristics of the underlying host instrument.
Indian GAAP
* Only certain derivatives are recognised on the balance sheet. Foreign exchange contracts held for
trading or speculative purposes are carried at fair value, with gains and losses recognised in the
income statement. Otherwise, the premium or discount is amortised over the life of the contractand the exchange difference is recognised in income when the exchange rate changes.
* Equity options are carried at the lower of cost or market value.
* There is no specific guidance on hedge accounting.
Impairment of financial assets
IFRS
* At each balance sheet date, an assessment is made as to whether there is any objective evidence
of impairment. A financial asset is impaired and impairment losses are incurred if, and only if,there is objective evidence of impairment.
Assets held at amortised cost
* If objective evidence of impairment exists, an assessment is made to determine what, if any,
impairment loss should be recognised. The impairment loss is the difference between the asset’s
carrying amount and its estimated recoverable amount.
* The recoverable amount is determined based on the present value of expected future cash flows,
discounted at the instrument’s original effective interest rate, either individually or collectively.
Individually assessed assets for which there is no objective evidence of impairment are
collectively assessed for impairment.
469
c102100pu110Proof7:28.3.10B/LRevision:0OperatorSadK

Available-for-sale assets
* If objective evidence of impairment exists, the cumulative loss (measured as the difference
between the acquisition cost and the current fair value, less any previously recognisedimpairment) is removed from equity and recognised in the income statement.
* Market recoveries leading to a reversal of an impairment provision for available-for-sale debt
securities are recognised in the income statement. Impairment losses for equity instruments
classified as available-for-sale are not permitted to be reversed through profit or loss.
Indian GAAP
* Long-term investments are written down when there is a decline in fair value which is deemedto be other than temporary. Impairments may be reversed through the income statement in
subsequent periods if the investment rises in value, or the reasons for the impairment no longer
exist.
Derecognition of financial assets
IFRS
* A financial asset is derecognised if substantially all the risks and rewards of ownership have
been transferred. If substantially all the risks and rewards have not been transferred, the asset
will continue to be recognised to the extent of any continuing involvement.
Indian GAAP
* There is limited guidance on the derecognition of financial assets. Securitised financial assets canonly be derecognised if the originator has surrendered control over the assets. Control is not
surrendered where the securitised assets are not beyond the reach of the creditors of the
originator or where the transferee does not have the right to pledge, sell, transfer or exchange
the securitised asset for its own benefit, or where there is an option which entitles the originator
to repurchase the financial assets transferred under a securitisation transaction from the
transferee.
Liabilities and equity
IFRS
* A financial instrument is classified as a liability where there is a contractual obligation to delivereither cash or another financial asset to the holder of that instrument, regardless of the manner
in which the contractual obligation will be settled.
* Preference shares, which carry a mandatory coupon or are redeemable on a specific date or at
the option of the shareholder, are classified as financial liabilities and are presented in otherborrowed funds. The dividends on these preference shares are recognised in the income
statement as interest expense on an amortised cost basis using the effective interest method.
Indian GAAP
* Classification is based on the legal form rather than substance.
* All preference shares are disclosed separately as share capital under shareholders’ funds.
Provisions for liabilities and charges
IFRS
* The amount recognised as a provision is the best estimate at the balance sheet date of the
expenditure required to settle the obligation, discounted using a pre-tax market discount rate if
the effect is material.
Indian GAAP
* Provisions are recognised and measured on a similar basis to IFRS, except that discounting is
not permitted.
470
c102100pu110Proof7:28.3.10B/LRevision:0OperatorSadK

Pension obligations
IFRS
* IAS 19 ‘Employee Benefits’ requires defined benefit pension liabilities to be assessed on the basis
of current actuarial valuations performed on each plan, and pension assets to be measured at
fair value. The net pension surplus or deficit, representing the difference between plan assets and
liabilities, is recognised on the balance sheet.
* The discount rate to be used for determining defined benefit obligations is established by
reference to market yields at the balance sheet date on high quality corporate bonds of a
currency and term consistent with the currency and term of the post-employment benefit
obligations.
* Under the transitional provisions of IFRS 1 ‘First time adoption of International Financial
Reporting Standards’ and in accordance with IAS 19, the Group elected to record all actuarial
gains and losses on the pension surplus or deficit in the year in which they occur within the
‘Consolidated statement of recognised income and expense’.
Indian GAAP
* The liability for defined benefit plans is determined on a similar basis to IFRS.
* The discount rate to be used for determining defined benefit obligations is established byreference to market yields at the balance sheet date on government bonds.
* Actuarial gains or losses are recognised immediately in the statement of income.
Share-based compensation
IFRS
* IFRS 2 ‘Share-based payment’ requires that all share-based payments are accounted for using a
fair value method.
* The fair value of the employee services received in exchange for the grant of the options is
recognised as an expense. For equity-settled awards, the total amount to be expensed over the
vesting period must be determined by reference to the fair value of the options granted(determined using an option pricing model), excluding the impact of any non-market vesting
conditions (for example, profitability and growth targets). Non-market vesting conditions must
be included in assumptions about the number of options that are expected to become
exercisable.
* At each balance sheet date, the Group revises its estimates of the number of options that are
expected to become exercisable. It recognises the impact of the revision of original estimates, if
any, in the income statement, and a corresponding adjustment to equity over the remaining
vesting period. The proceeds received net of any directly attributable transaction costs are
credited to share capital (nominal value) and share premium when the options are exercised.
* Cash-settled awards must be revalued at each balance sheet date on an intrinsic value basis
(being the difference between the market price of the share at the measurement date and the
exercise price) with any changes in fair value charged or credited to staff costs in the income
statement.
* Deferred tax is recognised based on the intrinsic value of the award and is recorded in the
income statement if the tax deduction is less than or equal to the cumulative share-basedcompensation expense or equity if the tax deduction exceeds the cumulative expense.
Indian GAAP
* Entities may either follow the intrinsic value method or the fair value method for determining
the costs of benefits arising from share-based compensation plans. Although the fair value
approach is recommended, entities may use the intrinsic value method and provide fair value
disclosures.
* Deferred tax is not recognised as it is not considered to represent a timing difference.
471
c102100pu110Proof7:28.3.10B/LRevision:0OperatorSadK

Deferred Taxation
IFRS
* Deferred tax is determined based on temporary differences, being the difference between the
carrying amount and tax base of assets and liabilities, subject to certain exceptions.
* Deferred tax assets are recognised if it is probable (more likely than not) that sufficient futuretaxable profits will be available to utilise to deferred tax assets.
Indian GAAP
* Deferred tax is determined based on timing differences, being the difference between accounting
income and taxable income for a period that is capable of reversal in one or more subsequent
periods.
* Deferred tax assets recognised only if virtually certain with entities with tax losses carried
forward or if reasonably certain with entities with no tax losses.
Interest income and expense
IFRS
* Interest income and expense is recognised in the income statement using the effective interest
method. The effective interest rate is the rate that discounts estimated future cash payments or
receipts through the expected life of the financial instrument. When calculating the effective
interest rate, the Group estimates cash flows considering all contractual terms of the financial
instrument but does not consider future credit losses. The calculation includes all fees and points
paid or received between parties to the contract that are an integral part of the effective interest
rate, transaction costs and all other premiums or discounts.
Indian GAAP
* In the absence of a specific effective interest rate requirement, premiums and discounts are
usually amortised on a straight line basis over the term of the instrument.
Dividends
IFRS
* Dividends to holders of equity instruments, when proposed or declared after the balance sheet
date, should not be recognised as a liability on the balance sheet date. A company however isrequired to disclose the amount of dividends that were proposed or declared after the balance
sheet date but before the financial statements were authorised for issue.
Indian GAAP
* Dividends are reflected in the financial statements of the year to which they relate even if
proposed or approved after the year end.
472
c102100pu110Proof7:28.3.10B/LRevision:0OperatorSadK

AUDITOR’S REPORT FOR THE IDR ISSUE AND FINANCIAL INFORMATION
The following is the full text of a report prepared for the purpose of incorporation in this Draft Red
Herring Prospectus received from the independent reporting accountants of the Company, KPMG
Audit Plc, Chartered Accountants, United Kingdom. As described in the chapter entitled ‘‘Material
Contracts and Documents For Inspection’’ in this Draft Red Herring Prospectus, a copy of theaccountants’ report is available for inspection.
The Directors
Standard Chartered PLC
1 Basinghall AvenueLondon EC2V 5DD
30 March 2010
Dear Sirs
We set out below our report on the Compilation and Translation (as defined hereinafter in this
report) in relation to the Financial Information (as defined hereinafter in this report) relating to
Standard Chartered PLC (the ‘‘Company’’) and its subsidiaries (hereinafter collectively referred to asthe ‘‘Group’’), in the Selected Financial Information below, extracted from the audited, consolidated
income statement, consolidated statement of recognised income and expense / consolidated statement
of comprehensive income and the consolidated cash flow statements of the Group along with all
relevant schedules and related notes for each of the years ended 31 December 2007, 2008 and 2009
(the ‘‘Relevant Years’’) and the consolidated balance sheet of the Group as at 31 December 2007,
2008 and 2009 (together, the ‘‘Annual Financial Statements’’), and including the Capitalisation
Statement of the Group as required under clause 12 in Part A of Schedule XIX to the SEBI (Issue of
Capital and Disclosure Requirements) Regulations, 2009, and the amendments thereto (the ‘‘ICDRRegulations’’). The financial information, as required under sub-clause (d), (e), and (f) of clause 14 in
Part A of the ICDR Regulations, extracted and/or computed from the Annual Financial Statements
set out in tabular form in pages 475 to 485 is referred to herein as the ‘‘Financial Information’’. The
Compilation and Translation has been prepared for inclusion in this Draft Red Herring Prospectus of
the Company dated 30 March 2010 (the ‘‘DRHP’’), in connection with the proposed issue of Indian
Depository Receipts (‘‘IDRs’’) by the Company (the ‘‘Issue’’).
This report is given for the sole purpose of complying with Paragraph 6 of the Schedule to the
Companies (Issue of Indian Depository Receipt) Rules, 2004 and amendments thereto (the ‘‘Rules’’)
having regard to sub-clause (d), (e) and (f) of Clause 14 in Part A of Schedule XIX to the ICDR
Regulations and for no other purpose.
As a company incorporated in the United Kingdom and listed on the London Stock Exchange, the
Company prepares Annual Financial Statements and Interim Financial Statements in accordance withapplicable laws and International Financial Reporting Standards (the ‘‘IFRS’’) as adopted by the
European Union.
KPMG Audit Plc is the Company’s auditor appointed under the UK Companies Act 1985 for the
financial years ended 31 December 2007 and 2008 and the UK Companies Act 2006 for the financial
year ended 31 December 2009 to audit the Company’s consolidated financial statements for the
Relevant Years.
Responsibility
The directors of the Company are responsible for:
(i) compiling Financial Information in a tabular form, in compliance with the Rules and
Guidelines, from Annual Financial Statements for the Relevant Years, on pages 475 to 485 for
illustrative purposes only and to provide information for the Issue (the ‘‘Compilation’’); and
(ii) presenting in compliance with the Rules and Guidelines the Financial Information for the
Relevant Years in Indian Rupees by performing an arithmetic conversion at a stated constant
exchange rate (the ‘‘Translation’’).
It is our responsibility to provide an independent report on the Compilation and Translation
conducted as set forth above.
In providing this report we are not updating or refreshing any report or opinion previously issued by
us on any financial information used in the Compilation or Translation.
473
c102100pu110Proof7:28.3.10B/LRevision:0OperatorSadK

Basis:
We compared the Financial Information of the Group with the Annual Financial Statements for the
Relevant Years.
We reperformed the calculation of the following totals and ratios based on information disclosed in
the Annual Financial Statements of the Group for the Relevant Years:
* Debt securities in issue (with less than or up to one year residual maturity)
* Subordinated liabilities and other borrowings (with less than or up to one year residual
maturity)
* Total short term borrowings
* Debt securities in issue (with more than one year residual maturity)
* Subordinated liabilities and other borrowings (with more than one year residual maturity)
* Total long term borrowings
* Total borrowings
* Debt/Equity ratio
* Long term debt/Equity ratio
In addition, we reperformed the calculation of the conversion of the Financial Information of the
Group for the Relevant Years into Indian Rupees at the stated constant exchange rate of INR 45.63:
USD 1.
Report:
On the basis of the procedures set out above, we report that,
(a) the Financial Information of the Group referred to above has been accurately extracted fromthe Annual Financial Statements for the Relevant Years, as applicable;
(b) the following totals and ratios have been accurately calculated on the bases set out in the
Capitalisation Statement:
* Debt securities in issue (with less than or up to one year residual maturity)
* Subordinated liabilities and other borrowings (with less than or up to one year residual
maturity)
* Total short term borrowings
* Debt securities in issue (with more than one year residual maturity)
* Subordinated liabilities and other borrowings (with more than one year residual maturity)
* Total long term borrowings
* Total borrowings
* Debt/Equity ratio
* Long term debt/Equity ratio
(c) the calculation of the conversion of the Financial Information of the Group for the Relevant
Years into Indian Rupees at the stated constant exchange rate set forth above is arithmetically
accurate.
KPMG Audit Plc
Chartered Accountants
United Kingdom30 March 2010
Annexure:
Financial Information (based on Annual Financial Statements prepared in accordance with applicablelaw and International Financial Reporting Standards (the ‘‘IFRS’’) as adopted by the European
Union.
474
c102100pu110Proof7:28.3.10B/LRevision:0OperatorSadK

SELECTED FINANCIAL INFORMATION
The selected historical financial information in relation to the Company in this section has been
extracted without material adjustment, except as noted in the footnotes below, from the Consolidated
Financial Statements in the Annual Reports and Accounts 2007, 2008 and 2009 in respect of the
years ending 31 December 2007, 2008 and 2009 respectively.
The consolidated annual financial statements have been audited by KPMG Audit Plc, independent
auditors.
Consolidated Income Statement
FY2009 FY20081 FY2007
$million $million $million
Interest income 12,926 16,378 16,176
Interest expense (5,303) (8,991) (9,911)
Net interest income 7,623 7,387 6,265
Fees and commission income 3,824 3,420 3,189
Fees and commission expense (454) (479) (528)Net trading income 2,890 2,405 1,261
Other operating income 1301 1,235 880
Non-interest income 7,561 6,581 4,802
Operating income 15,184 13,968 11,067
Staff costs (4,912) (4,737) (3,949)
Premises costs (698) (738) (592)
General administrative expenses (1,822) (1,711) (1,329)
Depreciation and amortisation (520) (425) (345)
Operating expenses (7,952) (7,611) (6,215)
Operating profit before impairment losses and taxation 7,232 6,357 4,852
Impairment losses on loans and advances and (2,000) (1,321) (761)other credit risk provisions
Other impairment (102) (469) (57)
Profit from associates 21 1 1
Profit before taxation 5,151 4,568 4,035
Taxation (1,674) (1,224) (1,046)
Profit for the year 3,477 3,344 2,989
Profit attributable to:
Minority interests 97 103 148
Parent company shareholders 3,380 3,241 2,841
Profit for the year 3,477 3,344 2,989
Earnings per share:
Basic earnings per ordinary share (cents) 167.9 192.1 176.0
Diluted earnings per ordinary share (cents) 165.3 191.1 174.2
1 Amounts have been restated following the early adoption of an amendment to IAS 32 Financial Instruments: Presentation, whichhas reclassified the $233 million gain and associated tax of $66 million in respect of the rights issue option into equity.
475
c102100pu120Proof7:28.3.10B/LRevision:0OperatorSadK

Consolidated Income Statement
FY2009 FY20081 FY2007
Rs million Rs million Rs million
Interest income 589,813 747,328 738,111Interest expense (241,976) (410,259) (452,239)
Net interest income 347,837 337,069 285,872
Fees and commission income 174,489 156,055 145,514
Fees and commission expense (20,716) (21,857) (24,093)
Net trading income 131,871 109,740 57,539
Other operating income 59,365 56,353 40,154
Non-interest income 345,008 300,291 219,115
Operating income 692,846 637,360 504,987
Staff costs (224,135) (216,149) (180,193)
Premises costs (31,850) (33,675) (27,013)General administrative expenses (83,138) (78,073) (60,642)
Depreciation and amortisation (23,728) (19,393) (15,742)
Operating expenses (362,850) (347,290) (283,590)
Operating profit before impairment losses and taxation 329,996 290,070 221,397
Impairment losses on loans and advances and (91,260) (60,277) (34,724)
other credit risk provisions
Other impairment (4,654) (21,400) (2,601)
Profit from associates 958 46 46
Profit before taxation 235,040 208,438 184,117Taxation (76,385) (55,851) (47,729)
Profit for the year 158,656 152,587 136,388
Profit attributable to:Minority interests 4,426 4,700 6,753
Parent company shareholders 154,229 147,887 129,635
Profit for the year 158,656 152,587 136,388
Earnings per share:
Basic earnings per ordinary share (Rs) 76.61 87.66 80.31
Diluted earnings per ordinary share (Rs) 75.43 87.20 79.49
1 Amounts have been restated following the early adoption of an amendment to IAS 32 Financial Instruments: Presentation, whichhas reclassified the Rs.10,632 million gain and associated tax of Rs.3,012 million in respect of the rights issue option into equity.
476
c102100pu120Proof7:28.3.10B/LRevision:0OperatorSadK

Consolidated statement of comprehensive income
FY 2009 FY 20081 FY 2007
US$million US$million US$million
Profit for the year 3,477 3,344 2,989Other comprehensive income:
Exchange differences on translation of foreign operations
Net gains/(losses) taken to equity 600 (2,794) 415
Income on repatriation of branch capital — — (109)
Actuarial losses on retirement benefits (150) (229) 237
Share of other comprehensive income from associates 19 — —
Available-for-sale investments:
Net valuation gains/(losses) taken to equity 455 (738) 675Reclassified to income (580) (198) (252)
Cash flow hedges:
Net gains/(losses) taken to equity 14 (176) 57
Reclassified to income 106 (18) (58)
Taxation relating to components of other comprehensive income 62 218 (99)
Other comprehensive income for the year, net of taxation 526 (3,935) 866
Total comprehensive income for the year 4,003 (591) 3,855
Attributable to:
Minority interests 111 (3) 196Parent company shareholders 3,892 (588) 3,659
4,003 (591) 3,855
1 Amounts have been restated following the early adoption of an amendment ot IAS 32 Financial Instruments: Presentation, whichhas reclassified the $233 million gain and associated tax of $66 million in respect of the rights issue option into equity.
477
c102100pu120Proof7:28.3.10B/LRevision:0OperatorSadK

Consolidated statement of comprehensive income
FY 2009 FY 20081 FY 2007
Rs million Rs million Rs million
Profit for the year 158,656 152,587 136,388Other comprehensive income:
Exchange differences on translation of foreign operations
Net gains/(losses) taken to equity 27,378 (127,490) 18,936
Income on repatriation of branch capital — — (4,974)
Actuarial losses on retirement benefits (6,845) (10,449) 10,814
Share of other comprehensive income from associates 867 — —
Available-for-sale investments:
Net valuation gains/(losses) taken to equity 20,762 (33,675) 30,800Reclassified to income (26,465) (9,035) (11,499)
Cash flow hedges:
Net gains/(losses) taken to equity 639 (8,031) 2,601
Reclassified to income 4,837 (821) (2,647)
Taxation relating to components of other comprehensive income 2,829 9,947 (4,517)
Other comprehensive income for the year, net of taxation 24,001 (179,554) 39,516
Total comprehensive income for the year 182,657 (26,967) 175,904
Attributable to:
Minority interests 5,065 (137) 8,943Parent company shareholders 177,592 (26,830) 166,960
182,657 (26,967) 175,904
1 Amounts have been restated following the early adoption of an amendment ot IAS 32 Financial Instruments: Presentation, whichhas reclassified the Rs.10,632 million gain and associated tax of Rs.3,012 million in respect of the rights issue option into equity.
478
c102100pu120Proof7:28.3.10B/LRevision:0OperatorSadK

Consolidated Balance Sheet
FY2009 FY2008 FY20071
US$million US$million US$million
AssetsCash and balances at central banks 18,131 24,161 10,175
Financial assets held at fair value through profit or loss 22,446 15,425 22,958
Derivative financial instruments 38,193 69,657 26,204
Loans and advances to banks 50,885 46,583 35,365
Loans and advances to customers 198,292 174,178 154,266
Investment securities 75,728 69,342 55,274
Other assets 17,201 20,374 11,011
Current tax assets 203 764 633Prepayments and accrued income 3,241 3,466 3,857
Interests in associates 514 511 269
Goodwill and intangible assets 6,620 6,361 6,374
Property, plant and equipment 4,103 3,586 2,892
Deferred tax assets 1096 660 593
Total assets 436,653 435,068 329,871
Liabilities
Deposits by banks 38,461 31,909 25,880
Customer accounts 251,244 234,008 179,760
Financial liabilities held at fair value through profit or loss 14,505 15,478 14,250
Derivative financial instruments 36,584 67,775 26,270Debt securities in issue 29,272 23,447 27,137
Other liabilities 16,139 17,363 14,742
Current tax liabilities 802 512 818
Accruals and deferred income 4,113 4,132 3,429
Subordinated liabilities and other borrowed funds 16,730 16,986 15,740
Deferred tax liabilities 193 176 33
Provisions for liabilities and charges 184 140 38
Retirement benefit obligations 506 447 322
Total liabilities 408,733 412,373 308,419
Equity
Share capital 1,013 948 705Reserves 26,327 21,192 20,146
Total parent company shareholders’ equity 27,340 22,140 20,851
Minority interests 580 555 601
Total equity 27,920 22,695 21,452
Total equity and liabilities 436,653 435,068 329,871
1 Amounts have been restated as explained in note 53 of the Annual Report of Financial Year 2008.
479
c102100pu120Proof7:28.3.10B/LRevision:0OperatorSadK

Consolidated Balance Sheet
FY2009 FY2008 FY20071
Rs million Rs million Rs million
AssetsCash and balances at central banks 827,318 1,102,466 464,285
Financial assets held at fair value through profit or loss 1,024,211 703,843 1,047,574
Derivative financial instruments 1,742,747 3,178,449 1,195,689
Loans and advances to banks 2,321,883 2,125,582 1,613,705
Loans and advances to customers 9,048,064 7,947,742 7,039,158
Investment securities 3,455,469 3,164,075 2,522,153
Other assets 784,882 929,666 502,432
Current tax assets 9,263 34,861 28,884Prepayments and accrued income 147,887 158,154 175,995
Interests in associates 23,454 23,317 12,274
Goodwill and intangible assets 302,071 290,252 290,846
Property, plant and equipment 187,220 163,629 131,962
Deferred tax assets 50,010 30,116 27,059
Total assets 19,924,476 19,852,153 15,052,014
Liabilities
Deposits by banks 1,754,975 1,456,008 1,180,904
Customer accounts 11,464,264 10,677,785 8,202,449
Financial liabilities held at fair value through profit or loss 661,863 706,261 650,228
Derivative financial instruments 1,669,328 3,092,573 1,198,700Debt securities in issue 1,335,681 1,069,887 1,238,261
Other liabilities 736,423 792,274 672,677
Current tax liabilities 36,595 23,363 37,325
Accruals and deferred income 187,676 188,543 156,465
Subordinated liabilities and other borrowed funds 763,390 775,071 718,216
Deferred tax liabilities 8,807 8,031 1,506
Provisions for liabilities and charges 8,396 6,388 1,734
Retirement benefit obligations 23,089 20,397 14,693
Total liabilities 18,650,487 18,816,580 14,073,159
Equity
Share capital 46,223 43,257 32,169Reserves 1,201,301 966,991 919,262
Total parent company shareholders’ equity 1,247,524 1,010,248 951,431
Minority interests 26,465 25,325 27,424
Total equity 1,273,990 1,035,573 978,855
Total equity and liabilities 19,924,476 19,852,153 15,052,014
1 Amounts have been restated as explained in note 53 of the Annual Report of Financial Year 2008.
480
c102100pu120Proof7:28.3.10B/LRevision:0OperatorSadK

Consolidated statement of changes in equity
Share
capital
Share
premium
account
Capital
reserve and
capital
redemption
reserve1
Merger
reserve
Available-
for-sale
reserve
Cash flow
hedge
reserve
Translation
reserve
Retained
earnings
Parent
Company
Share
holders’
Equity
Minority
interests Total
$million $million $million $million $million $million $million $million $million $million $million
At 1 January 2007 692 3,865 18 3,149 410 51 678 7,990 16,853 542 17,395
Profit for the Year — — — — — — — 2,841 2,841 148 2,989
Other comprehensive income — — — — 340 6 303 169 818 48 866
Distributions — — — — — — — — — (120) (120)
Shares issued, net of expenses 5 856 — — — — — — 861 — 861
Net own shares adjustment — — — — — — — 24 24 — 24
Share option expense and related
taxation — — — — — — — 55 55 — 55
Capitalised on scrip dividend 8 (8) — — — — — — — — —
Dividends, net of scrip — — — — — — — (601) (601) — (601)
Arising on Acquisitions — 3 3
Other increases/(Reductions) — — — — — — — — — (20) (20)
At 31 December 2007 705 4,713 18 3,149 750 57 981 10,478 20,851 601 21,452
Profit for the Year — — — — — — — 3,408 3,408 103 3,511
Other comprehensive income — — — — (755) (140) (2,765) (169)3 (3,829) (106) (3,935)
Distributions — — — — — — — — — (147) (147)
Shares issued, net of expenses 237 36 — 2,468 — — — — 2,741 — 2,741
Rights issue option, net of tax — — — (167) — — — — (167) — (167)
Net own shares adjustment — — — — — — — (67) (67) — (67)
Share option expense and related
taxation — — — — — — — 128 128 — 128
Capitalised on scrip dividend 6 (6) — — — — — — — — —
Dividends, net of scrip — — — — — — — (925) (925) — (925)
Other increases/(Reductions) — — — — — — — — — 104 104
At 31 December 2008 948 4,743 18 5,450 (5) (83) (1,784) 12,853 22,140 555 22,695
Restatement2 — — — 167 — — — (167) — — —
At 31 December 2008 as restated 948 4,743 18 5,617 (5) (83) (1,784) 12,686 22,140 555 22,695
Profit for the Year — — — — — — — 3,380 3,380 97 3,477
Other comprehensive income — — — — (88) 98 599 (97)4 512 14 526
Distributions — — — — — — — — — (87) (87)
Shares issued, net of expenses 44 106 — 1,667 — — — — 1,817 — 1,817
Net own shares adjustment — — — — — — — (81) (81) — (81)
Share option expense and related
taxation — — — — — — — 311 311 — 311
Capitalised on scrip dividend 21 (21) — — — — — — — — —
Dividends, net of scrip — — — — — — — (739) (739) — (739)
Other increases/(Reductions) — — — — — — — — — 1 1
At 31 December 2009 1,013 4,828 18 7,284 (93) 15 (1,185) 15,460 27,340 580 27,920
1 Includes capital reserve of $5 million and capital redemption reserve of $13 million at 1 January 2008, 31 December 2008 and 2009.
2 Amounts have been restated following the early adoption of an amendment to IAS 32 Financial Instruments: Presentation, whichhas reclassified the $233 million gain and associated tax of $66 million in respect of the rights issue option into equity.
3 Comprises actuarial losses, net of taxation.
4 Comprises actuarial losses, net of taxation and minority interests of $116 million, share of comprehensive income from associatesof $19 million.
481
c102100pu120Proof7:28.3.10B/LRevision:0OperatorSadK

Consolidated statement of changes in equity
Share
capital
Share
premium
account
Capital
reserve and
Capital
redemption
reserve1
Merger
reserve
Available-
for-sale
reserve
Cash flow
hedge
reserve
Translation
reserve
Retained
earnings
Parent
Company
Share
holders’
Equity
Minority
interests Total
Rs million Rs million Rs million Rs million Rs million Rs million Rs million Rs million Rs million Rs million Rs million
At 1 January 2007 31,576 176,360 821 143,689 18,708 2,327 30,937 364,584 769,002 24,731 793,734
Profit for the Year — — — — — — — 129,635 129,635 6,753 136,388
Other comprehensive income — — — — 15,514 274 13,826 7,711 37,325 2,190 39,516
Distributions — — — — — — — — — (5,476) (5,476)
Shares issued, net of expenses 228 39,059 — — — — — — 39,287 — 39,287
Net own shares adjustment — — — — — — — 1,095 1,095 — 1,095
Share option expense and related
taxation — — — — — — — 2,510 2,510 — 2,510
Capitalised on scrip dividend 365 (365) — — — — — — — — —
Dividends, net of scrip — — — — — — — (27,424) (27,424) — (27,424)
Arising on Acquisitions — — — — — — — — — 137 137
Other increases / (Reductions) — — — — — — — — — (913) (913)
At 31 December 2007 32,169 215,054 821 143,689 34,223 2,601 44,763 478,111 951,431 27,424 978,855
Profit for the Year — — — — — — — 155,507 155,507 4,700 160,207
Other comprehensive income — — — — (34,451) (6,388) (126,167) (7,711)3(174,717) (4,837) (179,554)
Distributions — — — — — — — — — (6,708) (6,708)
Shares issued, net of expenses 10,814 1,643 — 112,615 — — — — 125,072 — 125,072
Rights issue option, net of tax — — — (7,620) — — — — (7,620) — (7,620)
Net own shares adjustment — — — — — — — (3,057) (3,057) — (3,057)
Share option expense and related
taxation — — — — — — — 5,841 5,841 — 5,841
Capitalised on scrip dividend 274 (274) — — — — — — — — —
Dividends, net of scrip — — — — — — — (42,208) (42,208) — (42,208)
Other increases / (Reductions) — — — — — — — — — 4,746 4,746
At 31 December 2008 43,257 216,423 821 248,684 (228) (3,787) (81,404) 586,482 1,010,248 25,325 1,035,573
Restatement2 — — — 7,620 — — — (7,620) — — —
At 31 December 2008 as restated 43,257 216,423 821 256,304 (228) (3,787) (81,404) 578,862 1,010,248 25,325 1,035,573
Profit for the Year — — — — — — — 154,229 154,229 4,426 158,656
Other comprehensive income — — — — (4,015) 4,472 27,332 (4,426)4 23,363 639 24,001
Distributions — — — — — — — — — (3,970) (3,970)
Shares issued, net of expenses 2,008 4,837 — 76,065 — — — — 82,910 — 82,910
Net own shares adjustment — — — — — — — (3,696) (3,696) — (3,696)
Share option expense and related
taxation — — — — — — — 14,191 14,191 — 14,191
Capitalised on scrip dividend 958 (958) — — — — — — — — —
Dividends, net of scrip — — — — — — — (33,721) (33,721) — (33,721)
Other increases / (Reductions) — — — — — — — — — 46 46
At 31 December 2009 46,223 220,302 821 332,369 (4,244) 684 (54,072) 705,440 1,247,524 26,465 1,273,990
1 Includes capital reserve of Rs.228 million and capital redemption reserve of Rs.593 million at 1 January 2008, 31 December 2008and 2009.
2 Amounts have been restated following the early adoption of an amendment ot IAS 32 Financial Instruments: Presentation, whichhas reclassified the Rs.10,632 million gain and associated tax of Rs.3,012 million in respect of the rights issue option into equity.
3 Comprises actuarial losses, net of taxation.
4 Comprises actuarial losses, net of taxation and minority interests of Rs.5,293 million, share of comprehensive income fromassociates of Rs.867 million.
482
c102100pu120Proof7:28.3.10B/LRevision:0OperatorSadK

Cash Flow Statement
FY 2009 FY 20081 FY 20072
US$million US$million US$million
Cash flows from operating activitiesProfit before taxation 5,151 4,568 4,035
Adjustments for:
Non-cash items included within income statement 1,385 1,995 1,259
Change in operating assets 2,962 -88,103 (38,199)
Change in operating liabilities (11,219) 105,913 53,102
Contributions to defined benefit schemes (124) (95) 16
UK and overseas taxes paid, net of refunds (1,210) (1,400) (1,097)
Net cash (used in)/from operating activities (3,055) 22,878 19,116
Net cash flows from investing activities
Purchase of property, plant and equipment (261) (579) (471)
Disposal of property, plant and equipment 218 73 22
Acquisition of investment in subsidiaries, net of cash acquired (68) 6,209 (85)
Disposal of investment in subsidiaries — 159 —
Purchase of investment securities (129,739) (109,938) (78,292)
Disposal and maturity of investment securities 126,678 97,756 74,457Dividends received from investment in associates 11 — —
Net cash used in investing activities (3,161) (6,320) (4,369)
Net cash flows from financing activities
Issue of ordinary and preference share capital, net of expenses 1,817 2,753 861
Purchase of own shares (103) (76) (15)
Exercise of share options through ESOP 22 9 39
Interest paid on subordinated liabilities (361) (718) (737)Gross proceeds from issue of subordinated liabilities 2,063 3,667 3,051
Repayment of subordinated liabilities (2,440) (1,436) (505)
Dividends paid to minority interests and preference
shareholders net of scrip (188) (257) (148)
Dividends paid to ordinary shareholders net of scrip (638) (815) (573)
Net cash (used in)/from financing activities 172 3,127 1,973
Net (decrease)/increase in cash and cash equivalents (6,044) 19,685 16,720Cash and cash equivalents at beginning of the period 73,699 55,338 38,161
Effect of exchange rate movements on cash and cash
equivalents 418 (1,324) 457
Cash and cash equivalents at end of the period 68,073 73,699 55,338
1 Amounts have been restated as explained in note 50 of the Annual Report of Financial Year 2009.
2 Amounts have been restated as explained in note 53 of the Annual Report of Financial Year 2008.
483
c102100pu120Proof7:28.3.10B/LRevision:0OperatorSadK

Cash Flow Statement
FY 2009 FY 20081 FY 20072
Rs million Rs million Rs million
Cash flows from operating activitiesProfit before taxation 235,040 208,438 184,117
Adjustments for:
Non-cash items included within income statement 63,198 91,032 57,448
Change in operating assets 135,156 (4,020,140) (1,743,020)
Change in operating liabilities (511,923) 4,832,810 2,423,044
Contributions to defined benefit schemes (5,658) (4,335) 730
UK and overseas taxes paid, net of refunds (55,212) (63,882) (50,056)
Net cash (used in)/from operating activities (139,400) 1,043,923 872,263
Net cash flows from investing activities
Purchase of property, plant and equipment (11,909) (26,420) (21,492)
Disposal of property, plant and equipment 9,947 3,331 1,004
Acquisition of investment in subsidiaries, net of cash acquired (3,103) 283,317 (3,879)
Disposal of investment in subsidiaries — 7,255 —
Purchase of investment securities (5,919,991) (5,016,471) (3,572,464)
Disposal and maturity of investment securities 5,780,317 4,460,606 3,397,473Dividends received from investment in associates 502 — —
Net cash used in investing activities (144,236) (288,382) (199,357)
Net cash flows from financing activities
Issue of ordinary and preference share capital, net of expenses 82,910 125,619 39,287
Purchase of own shares (4,700) (3,468) (684)
Exercise of share options through ESOP 1,004 411 1,780
Interest paid on subordinated liabilities (16,472) (32,762) (33,629)Gross proceeds from issue of subordinated liabilities 94,135 167,325 139,217
Repayment of subordinated liabilities (111,337) (65,525) (23,043)
Dividends paid to minority interests and preference
shareholders net of scrip (8,578) (11,727) (6,753)
Dividends paid to ordinary shareholders net of scrip (29,112) (37,188) (26,146)
Net cash (used in)/from financing activities 7,848 142,685 90,028
Net (decrease)/increase in cash and cash equivalents (275,788) 898,227 762,934Cash and cash equivalents at beginning of the period 3,362,885 2,525,073 1,741,286
Effect of exchange rate movements on cash and cash
equivalents 19,073 (60,414) 20,853
Cash and cash equivalents at end of the period 3,106,171 3,362,885 2,525,073
1 Amounts have been restated as explained in note 50 of the Annual Report of Financial Year 2009.
2 Amounts have been restated as explained in note 53 of the Annual Report of Financial Year 2008.
484
c102100pu120Proof7:28.3.10B/LRevision:0OperatorSadK

Capitalisation and indebtedness
The following table sets out the consolidated capitalisation of the Group as at 31 December 2009,
31 December 2008 and 31 December 2007.
31-Dec-09 31-Dec-08 31-Dec-07
US$m Rs m US$m Rs m US$m Rs m
Borrowings
Short term (with less or upto one
year residual maturity)
Debt securities in issue 20,524 936,510 18,369 838,177 22,601 1,031,284
Sub debt and other borrowings 723 32,990 2,149 98,059 502 22,906
Total short term borrowings 21,247 969,501 20,518 936,236 23,103 1,054,190
Long term (with more than one
year residual maturity)
Debt securities in issue 12,735 581,098 8,700 396,981 9,552 435,858
Sub debt and other borrowings 16,007 730,399 14,837 677,012 15,238 695,310
Total long term borrowings 28,742 1,311,497 23,537 1,073,993 24,790 1,131,168
Total borrowings 49,989 2,280,998 44,055 2,010,230 47,893 2,185,358
Equity
Share Capital 1013 46,223 948 43,257 705 32,169
Reserves 26,327 1,201,301 21,192 966,991 20,146 919,262
Total equity 27,340 1,247,524 22,140 1,010,248 20,851 951,431
Debt/Equity 1.8 1.8 2.0 2.0 2.3 2.3
Long term debt/ Equity 1.1 1.1 1.1 1.1 1.2 1.2
Notes
The residual maturity details are extracted from Note 46 of Annual report 2009 and Note 49 of Annual Report 2008.
485
c102100pu120Proof7:28.3.10B/LRevision:0OperatorSadK

AUDITED HISTORICAL FINANCIAL STATEMENTS
The financial information in this section is set out as follows:
AUDITED FINANCIAL INFORMATION FOR THE FINANCIAL YEAR ENDED
31 DECEMBER 2009 487
AUDITED FINANCIAL INFORMATION FOR THE FINANCIAL YEAR ENDED
31 DECEMBER 2008 600AUDITED FINANCIAL INFORMATION FOR THE FINANCIAL YEAR ENDED
31 DECEMBER 2007 707
486
c102100pu130Proof7:28.3.10B/LRevision:0OperatorBeeR

AUDITED FINANCIAL INFORMATIONFOR THE FINANCIAL YEAR ENDED 31 DECEMBER 2009
Statement of directors’ responsibilities in respect of the annual report and the financial statements
The directors are responsible for preparing the Annual Report and the Group and Company financialstatements in accordance with applicable law and regulations.
Company law requires the directors to prepare Group and Company financial statements for each
financial year. Under that law they are required to prepare the Group financial statements inaccordance with IFRSs as adopted by the EU and applicable law and have elected to prepare the
Company financial statements on the same basis.
Under company law the directors must not approve the financial statements unless they are satisfied
that they give a true and fair view of the state of affairs of the Group and Company and of their
profit or loss for that period. In preparing each of the Group and Company financial statements, the
directors are required to:
* select suitable accounting policies and then apply them consistently
* make judgments and estimates that are reasonable and prudent;
* state whether they have been prepared in accordance with IFRSs as adopted by the EU
* prepare the financial statements on the going concern basis unless it is inappropriate to presume
that the Group and the Company will continue in business
The directors are responsible for keeping adequate accounting records that are sufficient to show and
explain the parent Company’s transactions and disclose with reasonable accuracy at any time, thefinancial position of the Company and enable them to ensure that its financial statements comply
with the Companies Act 2006. They have general responsibility for taking such steps as are
reasonably open to them to safeguard the assets of the Group and to prevent and detect fraud and
other irregularities.
Under applicable law and regulations, the directors are also responsible for preparing a Report of the
directors, Directors’ remuneration report and Corporate governance statement that complies with that
law and those regulations.
The directors are responsible for the maintenance and integrity of the corporate and financial
information included on the Company’s website. Legislation in the UK governing the preparation and
dissemination of financial statements may differ from legislation in other jurisdictions.
Directors’ responsibility statement
The directors confirm to the best of their knowledge:
1. the financial statements prepared in accordance with IFRSs as adopted by the EU, give a true
and fair view of the assets, liabilities, financial position and profit of the Company and theundertakings included in the consolidation as a whole
2. the management reports, which are incorporated into the Report of the directors, include a fairreview of the development and performance of the business and the position of the Company
and the undertakings included in the consolidation as a whole, together with the principal risks
and uncertainties they face
By order of the Board
R H Meddings
Group Finance Director
3 March 2010
487
c102100pu130Proof7:28.3.10B/LRevision:0OperatorBeeR

Independent Auditor’s report to the members of Standard Chartered PLC
We have audited the financial statements of the Group (Standard Chartered PLC and its subsidiaries)
and Company (Standard Chartered PLC) (together referred to as the financial statements) for theyear ended 31 December 2009 as set out on pages 112 to 196 of the Annual Report 2009. The
financial reporting framework that has been applied in their preparation is applicable law and
International Financial Reporting Standards (IFRSs) as adopted by the EU and, as regards the
parent company financial statements, as applied in accordance with the provisions of the Companies
Act 2006.
This report is made solely to the Company’s members, as a body, in accordance with Chapter 3 of
Part 16 of the Companies Act 2006. Our audit work has been undertaken so that we might state to
the Company’s members those matters we are required to state to them in an auditors’ report and for
no other purpose. To the fullest extent permitted by law, we do not accept or assume responsibility
to anyone other than the Company and the Company’s members, as a body, for our audit work, for
this report, or for the opinions we have formed.
Respective responsibilities of directors and auditors
As explained more fully in the Directors’ responsibilities statement set out on page 110 of the Annual
Report 2009, the directors are responsible for the preparation of the financial statements and for
being satisfied that they give a true and fair view. Our responsibility is to audit the financial
statements in accordance with applicable law and International Standards on Auditing (UK and
Ireland). Those standards require us to comply with the Auditing Practices Board’s (APB’s) Ethical
Standards for Auditors.
Scope of the audit of the financial statements
A description of the scope of an audit of financial statements is provided on the APB’s web-site at
www.frc.org.uk/apb/scope/UKP
Opinion on financial statements
In our opinion:
* the financial statements give a true and fair view of the state of the Group’s and of the
Company’s affairs as at 31 December 2009 and of the Group s profit for the year then ended
* the Group financial statements have been properly prepared in accordance with IFRSs as
adopted by the EU
* the Company financial statements have been properly prepared in accordance with IFRSs asadopted by the EU and as applied in accordance with the provisions of the Companies Act
2006
* the financial statements have been prepared in accordance with the requirements of the
Companies Act 2006 and, as regards the Group financial statements, Article 4 of the IASRegulation
Opinion on other matters prescribed by the Companies Act 2006
In our opinion:
* the part of the Directors’ remuneration report to be audited has been properly prepared in
accordance with the Companies Act 2006
* the information given in the Directors’ report, which include information presented in the
Chairman’s statement, the Group Chief Executive’s review and the Financial and Business
reviews that are cross referenced from the Report of the directors, for the financial year for
which the financial statements are prepared is consistent with the financial statements; and
* information given in the Corporate governance section set out on pages 82 to 93 of the Annual
Report 2009 with respect to internal control and risk management systems in relation to
financial reporting processes and about share capital structures is consistent with the financial
statements
Matters on which we are required to report by exception
We have nothing to report in respect of the following.
488
c102100pu130Proof7:28.3.10B/LRevision:0OperatorBeeR

Under the Companies Act 2006 we are required to report to you if, in our opinion:
* adequate accounting records have not been kept by the parent company, or returns adequate for
our audit have not been received from branches not visited by us
* the Company financial statements and the part of the Directors’ remuneration report to be
audited are not in agreement with the accounting records and returns
* certain disclosures of directors’ remuneration specified by law are not made
* we have not received all the information and explanations we require for our audit; or
* a Corporate governance statement has not been prepared by the company.
Under the Listing Rules we are required to review:
* the Report of the directors set out on page 76 to 81 of the Annual Report 2009, in relation to
going concern; and
* the part of the Corporate governance section on pages 82 to 93 of the Annual Report 2009
relating to the Company’s compliance with the nine provisions of the June 2008 CombinedCode specified for our review
M StJ Ashley (Senior Statutory Auditor)
for and on behalf of KPMG Audit Plc, Statutory Auditor
Chartered Accountants
London
3 March 2010
489
c102100pu130Proof7:28.3.10B/LRevision:0OperatorBeeR

Consolidated Income Statement
Notes
2009
$million
20081
$million
Interest income 3 12,926 16,378
Interest expense 4 (5,303) (8,991)
Net interest income 7,623 7,387
Fees and commission income 5 3,824 3,420
Fees and commission expense 5 (454) (479)
Net trading income 6 2,890 2,405Other operating income 7 1,301 1,235
Non-interest income 7,561 6,581
Operating income 15,184 13,968
Staff costs 8 (4,912) (4,737)
Premises costs 8 (698) (738)
General administrative expenses 8 (1,822) (1,711)
Depreciation and amortisation 9 (520) (425)
Operating expenses (7,952) (7,611)
Operating profit before impairment losses and taxation 7,232 6,357
Impairment losses on loans and advances and other credit risk
provisions 20 (2,000) (1,321)Other impairment 10 (102) (469)
Profit from associates 21 1
Profit before taxation 5,151 4,568
Taxation 11 (1,674) (1,224)
Profit for the year 3,477 3,344
Profit attributable to:
Minority interests 38 97 103
Parent company shareholders 3,380 3,241
Profit for the year 3,477 3,344
Earnings per share:
Basic earnings per ordinary share (cents) 13 167.9 192.1
Diluted earnings per ordinary share (cents) 13 165.3 191.1
1 Amounts have been restated as explained in note 50.
The notes on pages 119 to 196 of the Annual Report 2009 form an integral part of these financial
statements.
490
c102100pu130Proof7:28.3.10B/LRevision:0OperatorBeeR

Consolidated statement of comprehensive income
Notes
2009
$million
20081
$million
Profit for the year 3,477 3,344
Other comprehensive income:
Exchange differences on translation of foreign operations:
Net gains/(losses) taken to equity 600 (2,794)
Actuarial losses on retirement benefit obligations 36 (150) (229)Share of other comprehensive income from associates 19 —
Available-for-sale investments:
Net valuation gains/(losses) taken to equity 455 (738)
Reclassified to income (580) (198)
Cash flow hedges:
Net gains/(losses) taken to equity 14 (176)
Reclassified to income 106 (18)
Taxation relating to components of other comprehensive income 11 62 218
Other comprehensive income for the year, net of taxation 526 (3,935)
Total comprehensive income for the year 4,003 (591)
Attributable to:
Minority interests 38 111 (3)
Parent Company shareholders 3,892 (588)
4,003 (591)
1 Amounts have been restated as explained in note 50.
The notes on pages 119 to 196 of the Annual Report 2009 form an integral part of these financial
statements.
491
c102100pu130Proof7:28.3.10B/LRevision:0OperatorBeeR
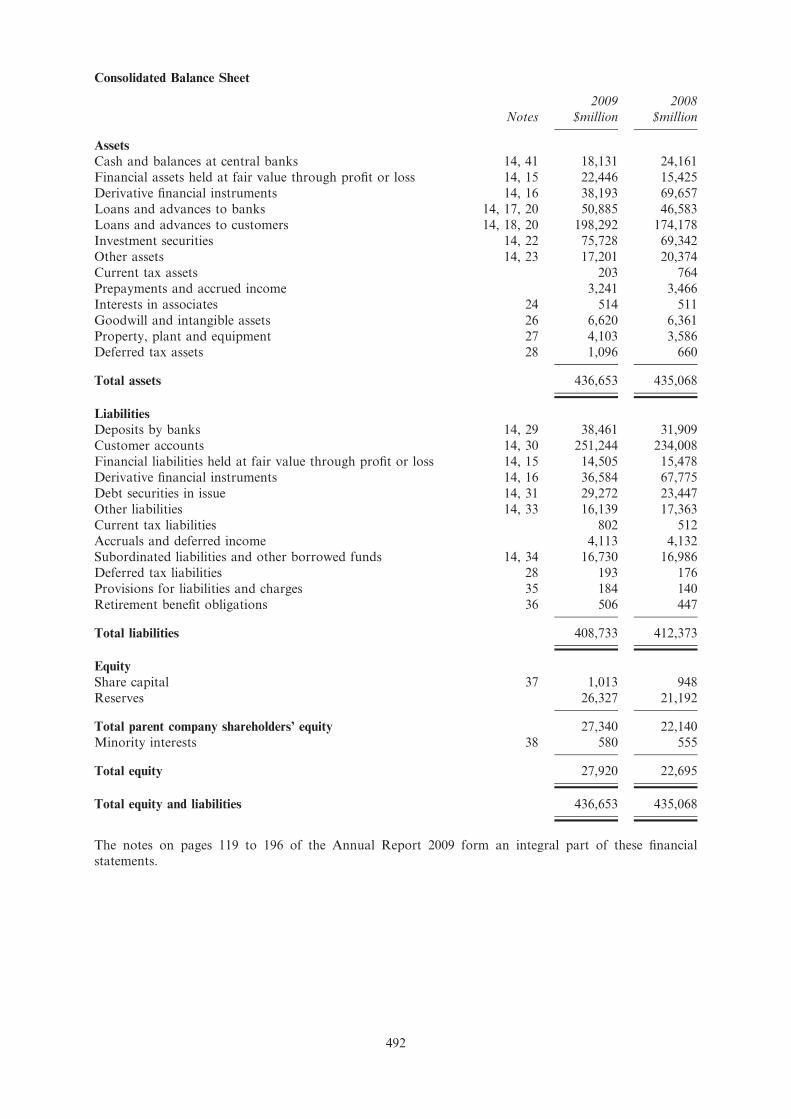
Consolidated Balance Sheet
Notes
2009
$million
2008
$million
Assets
Cash and balances at central banks 14, 41 18,131 24,161
Financial assets held at fair value through profit or loss 14, 15 22,446 15,425
Derivative financial instruments 14, 16 38,193 69,657
Loans and advances to banks 14, 17, 20 50,885 46,583Loans and advances to customers 14, 18, 20 198,292 174,178
Investment securities 14, 22 75,728 69,342
Other assets 14, 23 17,201 20,374
Current tax assets 203 764
Prepayments and accrued income 3,241 3,466
Interests in associates 24 514 511
Goodwill and intangible assets 26 6,620 6,361
Property, plant and equipment 27 4,103 3,586Deferred tax assets 28 1,096 660
Total assets 436,653 435,068
LiabilitiesDeposits by banks 14, 29 38,461 31,909
Customer accounts 14, 30 251,244 234,008
Financial liabilities held at fair value through profit or loss 14, 15 14,505 15,478
Derivative financial instruments 14, 16 36,584 67,775
Debt securities in issue 14, 31 29,272 23,447
Other liabilities 14, 33 16,139 17,363
Current tax liabilities 802 512
Accruals and deferred income 4,113 4,132Subordinated liabilities and other borrowed funds 14, 34 16,730 16,986
Deferred tax liabilities 28 193 176
Provisions for liabilities and charges 35 184 140
Retirement benefit obligations 36 506 447
Total liabilities 408,733 412,373
Equity
Share capital 37 1,013 948
Reserves 26,327 21,192
Total parent company shareholders’ equity 27,340 22,140
Minority interests 38 580 555
Total equity 27,920 22,695
Total equity and liabilities 436,653 435,068
The notes on pages 119 to 196 of the Annual Report 2009 form an integral part of these financialstatements.
492
c102100pu130Proof7:28.3.10B/LRevision:0OperatorBeeR

Consolidated statement of changes in equity
Share
capital
$million
Share
premium
account
$million
Capital and
capital
redemption
reserve1
$million
Merger
reserve
$million
Available-
for-sale
reserve
$million
Cash flow
hedge
reserve
$million
Translation
reserve
$million
Retained
earnings
$million
Parent
company
shareholders
equity
$million
Minority
interests
$million
Total
$million
At 1 January 2008 705 4,713 18 3,149 750 57 981 10,478 20,851 601 21,452Profit for the year — — — — — — — 3,408 3,408 103 3,511Other comprehensive
income — — — — (755) (140) (2,765) (169)3 (3,829) (106) (3,935)Distributions — — — — — — — — — (147) (147)Shares issued, net of
expenses 237 36 — 2,468 — — — — 2,741 — 2,741Rights issue option (net of
tax) — — — (167) — — — — (167) — (167)Net own shares adjustment — — — — — — — (67) (67) — (67)Share option expense, net
of taxation — — — — — — — 128 128 — 128Capitalised on scrip
dividend 6 (6) — — — — — — — — —Dividends, net of scrip — — — — — — — (925) (925) — (925)Other increases — — — — — — — — — 104 104
At 31 December 2008 aspreviously stated 948 4,743 18 5,450 (5) (83) (1,784) 12,853 22,140 555 22,695
Restatement2 — — — 167 — — — (167) — — —
At 31 December 2008 asrestated 948 4,743 18 5,617 (5) (83) (1,784) 12,686 22,140 555 22,695
Profit for the year — — — — — — — 3,380 3,380 97 3,477Other comprehensive
income — — — — (88) 98 599 (97)4 512 14 526Distributions — — — — — — — — — (87) (87)Shares issued, net of
expenses 44 106 — 1,667 — — — — 1,817 — 1,817Net own shares adjustment — — — — — — — (81) (81) — (81)Share option expense, net
of taxation — — — — — — — 311 311 — 311Capitalised on scrip
dividend 21 (21) — — — — — — — — —Dividends, net of scrip — — — — — — — (739) (739) — (739)Other increases — — — — — — — — — 1 1
At 31 December 2009 1,013 4,828 18 7,284 (93) 15 (1,185) 15,460 27,340 580 27,920
1 Includes capital reserve of $5 million and capital redemption reserve of $13 million at 1 January 2008, 31 December 2008 and 2009.
2 Amounts have been restated as explained in note 50.
3 Comprises actuarial losses, net of taxation.
4 Comprises actuarial losses, net of taxation and minority interests of $116 million, share of comprehensive income from associatesof $19 million.
493
c102100pu130Proof7:28.3.10B/LRevision:0OperatorBeeR

Cash Flow Statement
Group Company
Notes
2009
$million
20081
$million
2009
$million
20081
$million
Cash flows from operating activities
Profit before taxation 5,151 4,568 373 2,243
Adjustments for:
Non-cash items included within income
statement 40 1,385 1,995 (228) (2,080)
Change in operating assets 40 2,962 (88,103) (227) 62Change in operating liabilities 40 (11,219) 105,913 3,703 1,295
Contributions to defined benefit schemes (124) (95) — —
UK and overseas taxes (paid)/refunded (1,210) (1,400) (25) 2
Net cash (used in)/from operating activities (3,055) 22,878 3,596 1,522
Net cash flows from investing activities
Purchase of property, plant and equipment (261) (579) — —
Disposal of property, plant and equipment 218 73 — —Acquisition of investment in subsidiaries,
net of cash acquired (68) 6,209 (2,500) —
Disposal of investment in subsidiaries — 159 — —
Purchase of investment securities (129,739) (109,938) (1,800) (925)
Disposal and maturity of investment
securities 126,678 97,756 — —
Dividends received from subsidiaries and
associates 11 — 331 1,880
Net cash (used in)/from investing activities (3,161) (6,320) (3,969) 955
Net cash flows from financing activities
Issue of ordinary and preference share
capital, net of expenses 1,817 2,753 1,817 2,753
Purchase of own shares (103) (76) (103) (76)
Exercise of share options through ESOP 22 9 22 9
Interest paid on subordinated liabilities (361) (718) (129) (185)Gross proceeds from issue of subordinated
liabilities 2,063 3,667 — 960
Repayment of subordinated liabilities (2,440) (1,436) — (640)
Dividends paid to minority interests and
preference shareholders (188) (257) (101) (110)
Dividends paid to ordinary shareholders,
net of scrip (638) (815) (638) (815)
Net cash from financing activities 172 3,127 868 1,896
Net (decrease)/increase in cash and cash
equivalents (6,044) 19,685 495 4,373
Cash and cash equivalents at beginning of
year 73,699 55,338 5,303 930
Effect of exchange rate movements on cash
and cash equivalents 418 (1,324) — —
Cash and cash equivalents at end of year 41 68,073 73,699 5,798 5,303
1 Amounts have been restated as explained in note 50.
The notes on pages 119 to 196 of the Annual Report 2009 form an integral part of these financial
statements.
494
c102100pu130Proof7:28.3.10B/LRevision:0OperatorBeeR

Company balance sheet
Notes
2009
$million
2008
$million
Non-current assets
Investments in subsidiary undertakings 24 12,906 10,406
Current assets
Derivative financial instruments 14, 16 291 —
Debt securities 14, 22 2,725 925Amounts owed by subsidiary undertakings 5,798 5,303
Taxation 38 54
Other assets 23 — 64
8,852 6,346
Current liabilities
Derivative financial instruments 14, 16 25 26
Other creditors 229 79Deferred income 51 18 40
272 145
Net current assets 8,580 6,201
Total assets less current liabilities 21,486 16,607
Non-current liabilities
Subordinated liabilities and other borrowed funds 14, 34 1,751 1,736
Debt securities in issue 14, 31 4,770 1,372
Deferred income 51 91 231
6,612 3,339
Total assets less liabilities 14,874 13,268
Equity
Share capital 37 1,013 948
Reserves 13,861 12,320
Total equity 14,874 13,268
The notes on pages 119 to 196 of the Annual Report 2009 form an integral part of these financial
statements.
495
c102100pu130Proof7:28.3.10B/LRevision:0OperatorBeeR
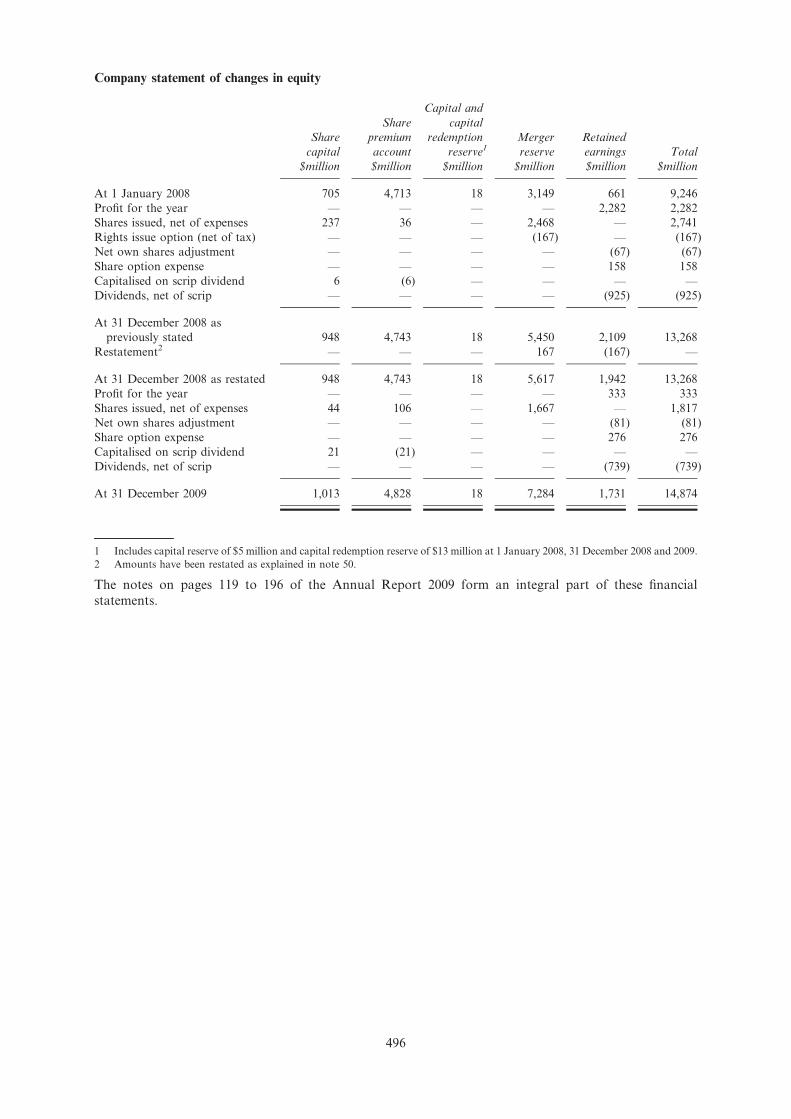
Company statement of changes in equity
Share
capital
$million
Share
premium
account
$million
Capital and
capital
redemption
reserve1
$million
Merger
reserve
$million
Retained
earnings
$million
Total
$million
At 1 January 2008 705 4,713 18 3,149 661 9,246
Profit for the year — — — — 2,282 2,282
Shares issued, net of expenses 237 36 — 2,468 — 2,741
Rights issue option (net of tax) — — — (167) — (167)
Net own shares adjustment — — — — (67) (67)
Share option expense — — — — 158 158
Capitalised on scrip dividend 6 (6) — — — —
Dividends, net of scrip — — — — (925) (925)
At 31 December 2008 as
previously stated 948 4,743 18 5,450 2,109 13,268
Restatement2 — — — 167 (167) —
At 31 December 2008 as restated 948 4,743 18 5,617 1,942 13,268
Profit for the year — — — — 333 333
Shares issued, net of expenses 44 106 — 1,667 — 1,817
Net own shares adjustment — — — — (81) (81)
Share option expense — — — — 276 276
Capitalised on scrip dividend 21 (21) — — — —
Dividends, net of scrip — — — — (739) (739)
At 31 December 2009 1,013 4,828 18 7,284 1,731 14,874
1 Includes capital reserve of $5 million and capital redemption reserve of $13 million at 1 January 2008, 31 December 2008 and 2009.
2 Amounts have been restated as explained in note 50.
The notes on pages 119 to 196 of the Annual Report 2009 form an integral part of these financialstatements.
496
c102100pu130Proof7:28.3.10B/LRevision:0OperatorBeeR

Notes to the financial statements
1. Accounting policies
Statement of compliance
The Group financial statements consolidate those of Standard Chartered PLC (the Company) and its
subsidiaries (together referred to as the Group), equity account the Group’s interest in associates and
proportionately consolidate interests in jointly controlled entities. The parent company financial
statements present information about the Company as a separate entity and not about its group.
Both the parent company financial statements and the Group financial statements have been prepared
and approved by the directors in accordance with International Financial Reporting Standards (IFRS)
and International Financial Reporting Interpretation Committee (IFRIC) Interpretations as adopted
by the EU (together adopted IFRS). In publishing the parent company financial statements togetherwith the Group financial statements, the Company has taken advantage of the exemption in section
408 of the Companies Act 2006 not to present its individual statement of comprehensive income and
related notes that form a part of these approved financial statements.
The disclosures required by IFRS 7 Financial Instruments: Disclosures and the capital disclosureswithin IAS 1 Presentation of Financial Statements are presented within the Risk review on pages 44
to 67 and Capital on pages 68 to 71 of the 2009 Annual Report*, except where indicated as not
audited and in the notes to the financial statements.
New accounting standards adopted
On 1 January 2009 the Group and Company retrospectively adopted IAS 1 Presentation of Financial
Statements (revised 2007). As a result, in the Group’s financial statements certain terminology has
changed and a statement of changes in equity has been included as a primary statement.
On 1 January 2009 the Group retrospectively adopted IFRS 8 Operating Segments which did not
have a material impact on the Group’s financial statements. The Group’s reportable segments, as
disclosed in note 2, continue to be Consumer Banking and Wholesale Banking. In addition, the
Group continues to provide entity-wide geographic financial information.
On 1 January 2009 the Group and Company retrospectively adopted IFRIC 13 Customer Loyalty
Programmes, IFRIC 16 Hedges of a Net Investment in a Foreign Operation, amendments to IFRS 2
Share Based Payment: Vesting Conditions and Cancellations, IAS 23 (revised) Borrowing Costs and
an amendment to IAS 32 Financial Instruments: Presentation, none of which had a material impact
on the the financial statements.
On 1 January 2009 the Group and Company prospectively adopted an amendment to IAS 27
Consolidated and Separate Financial Statements in respect of cost of investment in a subsidiary,
jointly controlled entity or associate, which did not have a material impact on the the financialstatements.
On 1 January 2009 the Group and Company prospectively adopted amendments to IFRS 7 Financial
Instruments: Disclosures, and the required disclosures are presented in notes 14 and 46 to these
financial statements. Where permitted, comparatives have not been provided.
On 1 January 2009, the Group and Company adopted Improvements to IFRSs (2008), a collection of
amendments to a number of IFRSs. The amendments to IAS 19, IAS 20, IAS 28, IAS 31, IAS 32,
and IAS 40 were applied on a prospective basis and the amendments to IAS 1, IAS 7, IAS 16, IAS
19, IAS 23, IAS 27, IAS 29, IAS 36, IAS 38 and IAS 39 were applied on a retrospective basis. Noneof these amendments has had a material impact on the Group’s financial statements. However, the
amendment to IAS 7 resulted in a reclassification in the cash flow statement of cash flows between
investing and operating activities. Further details are provided in note 50.
On 31 December 2009 the Group and Company adopted, on a retrospective basis, the amendment to
IAS 32 Financial Instruments: Presentation in advance of its effective date. This amendment permits a
fixed for fixed rights issue denominated in a currency other than the Company’s functional currency
to be accounted for within equity rather than creating a derivative liability. The impact has been to
reclassify the $233 million gain and associated tax of $66 million recognised in the income statement
497
c102100pu135Proof7:28.3.10B/LRevision:0OperatorBeeR
* This information forms part of the Notes to the Accounts and is disclosed on pages 106 to 110, 146 to 162 and 165 to 176 of thisDraft Red Herring Prospectus. Pages 106 to 110, 146 to 162 and 165 to 176 of this Draft Red Herring Prospectus also includeinformation which is not audited and a full set of audited financial statements can be obtained from www.standardchartered.com.

in respect of the rights issue option in the 2008 annual accounts into equity in these financial
statements.
Basis of preparation
The consolidated financial statements have been prepared under the historical cost convention, as
modified by the revaluation of cash-settled share based payments, available-for-sale assets, and
financial assets and liabilities (including derivatives) at fair value through profit or loss. The Companyfinancial statements have been prepared on an historical cost basis, as modified by cash settled share
based payments and the revaluation of financial assets and liabilities (including derivatives) at fair
value through profit or loss.
The preparation of financial statements in conformity with adopted IFRS requires the use of certain
critical accounting estimates. It also requires management to exercise its judgement in the process of
applying the Group’s accounting policies.
The accounting policies set out below have been applied consistently across the Group and to all
periods presented in these financial statements.
Consolidation
Subsidiaries
Subsidiaries are all entities, including special purpose entities (SPEs), over which the Group has the
power to directly or indirectly govern the financial and operating policies, generally accompanying a
shareholding of more than one half of the voting rights. Subsidiaries are fully consolidated from the
date on which the Group effectively obtains control. They are de-consolidated from the date that
control ceases.
SPEs are consolidated when the substance of the relationship between the Group and its entity
indicates the control by the Group. Potential indicators of control include amongst others, anassessment of risks and benefits in respect of the SPE’s activities.
The purchase method of accounting is used to account for the acquisition of subsidiaries by the
Group. The cost of an acquisition is measured as the fair value of the assets given, equity instruments
issued and liabilities incurred or assumed at the date of exchange, together with costs directly
attributable to the acquisition. Identifiable net assets and contingent liabilities acquired are fair valued
at the acquisition date. The excess of the cost of acquisition over the fair value of the Group’s share
of the identifiable net assets and contingent liabilities acquired is recorded as goodwill. If the cost of
acquisition is less than the fair value of the net assets and contingent liabilities of the subsidiary
acquired, the difference is recognised directly in the income statement. Where the fair values of theidentifiable net assets and contingent liabilities acquired have been determined provisionally, or where
contingent or deferred consideration is payable, any adjustments arising from their subsequent
finalisation are made as of the date of acquisition and amounts restated as appropriate.
Inter-company transactions, balances and unrealised gains and losses on transactions between Group
companies are eliminated in the Group accounts.
Associates
Associates are all entities over which the Group has the ability to significantly influence, but not
control, the financial and operating policies and procedures generally accompanying a shareholding of
between 20% and 50% of the voting rights.
Investments in associates are accounted for by the equity method of accounting and are initially
recognised at cost.
The Group’s investment in associates includes goodwill identified on acquisition (net of any
accumulated impairment loss).
The Group’s share of its associates’ post-acquisition profits or losses is recognised in the income
statement, and its share of post-acquisition movements in other comprehensive income is recognisedin reserves. The cumulative post-acquisition movements are adjusted against the carrying amount of
the investment. When the Group’s share of losses in an associate equals or exceeds its interest in the
associate, including any other unsecured receivables, the Group does not recognise further losses,
unless it has incurred obligations or made payments on behalf of the associate.
Unrealised gains and losses on transactions between the Group and its associates are eliminated to
the extent of the Group’s interest in the associates.
498
c102100pu135Proof7:28.3.10B/LRevision:0OperatorBeeR

Joint ventures
Interests in jointly controlled entities are recognised using proportionate consolidation whereby the
Group’s share of the joint venture’s assets, liabilities, income and expenses are combined line by linewith similar items in the Group’s financial statements.
Investment in subsidiaries, associates and joint ventures
In the Company’s financial statements, investment in subsidiaries, associates and joint ventures are
held at cost less impairment and dividends from pre-acquisition profits received prior to 1 January
2009, if any.
Foreign currency translation
Both the parent company financial statements and the Group financial statements are presented in US
dollars, which is the presentation currency of the Group and the functional and presentation currency
of the Company.
Transactions and balances
Foreign currency transactions are translated into the functional currency using the exchange rates
prevailing at the dates of the transactions. Foreign exchange gains and losses resulting from the
settlement of such transactions, and from the translation at year end exchange rates of monetary
assets and liabilities denominated in foreign currencies, are recognised in the income statement. Non-
monetary assets and liabilities are translated at historical exchange rates if held at historical cost, or
year-end exchange rates if held at fair value, and the resulting foreign exchange gains and losses are
recognised in either the income statement or shareholders’ equity depending on the treatment of thegain or loss on the asset or liability.
Group companies
The results and financial position of all the entities included in the Group financial statements that
have a functional currency different from the Group’s presentation currency are accounted for as
follows:
* assets and liabilities for each balance sheet presented are translated at the closing rate at the
balance sheet date
* income and expenses for each income statement are translated at average exchange rates or at
rates on the date of the transaction where exchange rates fluctuate significantly
* all resulting exchange differences arising since 1 January 2004 are recognised as a separatecomponent of equity
On consolidation, exchange differences arising from the translation of the net investment in foreign
entities, and of borrowings and other currency instruments designated as hedges of such investments,
are taken to other comprehensive income. When a foreign operation is sold or capital repatriated they
are recognised in the income statement as part of the gain or loss on disposal.
Goodwill and fair value adjustments arising on the acquisition of a foreign entity are treated as assets
and liabilities of the foreign entity and translated at the closing rate.
Intangible assets
Goodwill
Goodwill represents the excess of the cost of an acquisition over the fair value of the Group’s share
of the identifiable net assets and contingent liabilities of the acquired subsidiary, associate or joint
venture at the date of acquisition. Goodwill on acquisitions of subsidiaries and joint ventures is
included in ‘Intangible assets’. Goodwill on acquisitions of associates is included in ‘Investments in
associates’. Goodwill included in intangible assets is assessed at each balance sheet date for
impairment and carried at cost less any accumulated impairment losses. Gains and losses on the
disposal of an entity include the carrying amount of goodwill relating to the entity sold. Goodwill isallocated to cash generating units for the purpose of impairment testing. Cash generating units
represent the lowest level within the Group at which the goodwill is monitored for internal
management purposes. These are smaller than the Group’s reportable segments (as set out in note 2)
as the Group views its reportable segments on a global basis. Note 26 sets out the major cash
generating units to which goodwill has been allocated.
499
c102100pu135Proof7:28.3.10B/LRevision:0OperatorBeeR

Acquired intangibles
At the date of acquisition of a subsidiary or associate, intangible assets which are deemed separable
and that arise from contractual or other legal rights are capitalised and included within the netidentifiable assets acquired. These intangible assets are initially measured at fair value, which reflects
market expectations of the probability that the future economic benefits embodied in the asset will
flow to the entity, and are amortised on the basis of their expected useful lives (4 to 16 years). At
each balance sheet date, these assets are assessed for indicators of impairment. In the event that an
asset’s carrying amount is determined to be greater than its recoverable amount, the asset is written
down immediately.
Computer software
Acquired computer software licences are capitalised on the basis of the costs incurred to acquire and
bring to use the specific software. Costs associated with the development of software are capitalised
where it is probable that it will generate future economic benefits in excess of its cost. Computer
software costs are amortised on the basis of expected useful life (three to five years). Costs associated
with maintaining software are recognised as an expense as incurred. At each balance sheet date, these
assets are assessed for indicators of impairment. In the event that an asset’s carrying amount is
determined to be greater than its recoverable amount, the asset is written down immediately.
Property, plant and equipment
Land and buildings comprise mainly branches and offices. All property, plant and equipment is stated
at cost less accumulated depreciation and impairment losses. Cost includes expenditure that is directly
attributable to the acquisition of the assets.
Subsequent costs are included in the asset’s carrying amount or are recognised as a separate asset, as
appropriate, only when it is probable that future economic benefits associated with the item will flow
to the Group and the cost of the item can be measured reliably All other repairs and maintenanceare charged to the income statement during the financial period in which they are incurred.
Freehold land is not depreciated although it is subject to impairment testing. Depreciation on other
assets is calculated using the straight-line method to allocate their cost to their residual values over
their estimated useful lives, as follows:
Buildings up to 50 years
Leasehold improvements life of lease, up to 50 years
Equipment and motor vehicles three to 15 years
The assets’ residual values and useful lives are reviewed, and adjusted if appropriate, at each balance
sheet date. At each balance sheet date, assets are also assessed for indicators of impairment. In the
event that an asset’s carrying amount is determined to be greater than its recoverable amount, the
asset is written down immediately to the recoverable amount.
Gains and losses on disposals are included in the income statement.
Leases
Where a Group company is the lessee
The leases entered into by the Group are primarily operating leases. The total payments made under
operating leases are charged to the income statement on a straight line basis over the period of the
lease.
When an operating lease is terminated before the lease period has expired, any payment required to
be made to the lessor by way of penalty is recognised as an expense in the period in which
termination takes place.
Where the Group is a lessee under finance leases, the leased assets are capitalised and included in
‘Property, plant and equipment’ with a corresponding liability to the lessor recognised in ‘Other
liabilities’. Finance charges payable are recognised over the period of the lease based on the interest
rate implicit in the lease to give a constant periodic rate of return.
Where a Group company is the lessor
When assets are leased to customers under finance leases, the present value of the lease payments is
recognised as a receivable. The difference between the gross receivable and the present value of the
receivable is recognised as unearned finance income. Lease income is recognised over the term of the
500
c102100pu135Proof7:28.3.10B/LRevision:0OperatorBeeR

lease using the net investment method (before tax), which reflects a constant periodic rate of return
ignoring tax cash flows.
Assets leased to customers under operating leases are included within ‘Property, plant and equipment’
and depreciated over their useful lives. Rental income on these leased assets is recognised in the
income statement on a straight line basis unless another systematic basis is more representative.
Cash and cash equivalents
For the purposes of the cash flow statement, cash and cash equivalents comprise cash, on demand
and overnight balances with central banks (unless restricted) and balances with less than three months
maturity from the date of acquisition, including: treasury bills and other eligible bills, loans and
advances to banks, and short-term government securities.
Provisions
Provisions for restructuring costs and legal claims are recognised when: the Group has a present legal
or constructive obligation as a result of past events; it is more likely than not that an outflow of
resources will be required to settle the obligation and the amount can be reliably estimated.
Employee benefits
Pension obligations
The Group operates a number of pension and other post-retirement benefit plans around the world,
including defined contribution plans and defined benefit plans.
For defined contribution plans, the Group pays contributions publicly or privately administered
pension plans on a mandatory, contractual or voluntary basis, and such amounts are charged to
operating expenses. The Group has no further payment obligations once the contributions have been
paid.
For funded defined benefit plans, the liability recognised in the balance sheet is the present value of
the defined benefit obligation at the balance sheet date less the fair value of plan assets. For
unfunded defined benefit plans the liability recognised at the balance sheet date is the present value ofthe defined benefit obligation. The defined benefit obligation is calculated annually by independent
actuaries using the projected unit method. The present value of the defined benefit obligation is
determined by discounting the estimated future cash outflows using an interest rate equal to the yield
on high quality corporate bonds that are denominated in the currency in which the benefits will be
paid, and that have a term to maturity approximating to the term of the related pension liability.
Actuarial gains and losses that arise are recognised in shareholders’ equity and presented in thestatement of other comprehensive income in the period they arise. Past service costs are recognised
immediately to the extent that benefits are vested and are otherwise recognised over the average
period until benefits are vested on a straight line basis. Current service costs and any past service
costs, together with the unwinding of the discount on plan liabilities, offset by the expected return on
plan assets where applicable, are charged to operating expenses.
Share-based compensation
The Group operates equity-settled and cash-settled share-based compensation plans. The fair value of
the employee services received in exchange for the grant of the options is recognised as an expense.
For equity-settled awards, the total amount to be expensed over the vesting period is determined by
reference to the fair value of the options granted, which excludes the impact of any non-market
vesting conditions (for example, profitability and growth targets). The fair value of equity instrumentsgranted is based on market prices, if available, at the date of grant. In the absence of market prices,
the fair value of the instruments is estimated using an appropriate valuation technique, such as a
binomial option pricing model. Non-market vesting conditions are included in assumptions about the
number of options that are expected to vest. At each balance sheet date, the Group revises its
estimates of the number of options that are expected to vest. It recognises the impact of the revision
of original estimates, if any, in the income statement, and a corresponding adjustment to equity over
the remaining vesting period. Forfeitures prior to vesting attributable to factors other than the failure
to satisfy a non-market vesting condition are treated as a cancellation and the remaining unamortisedcharge is debited to the income statement at the time of cancellation.
The proceeds received net of any directly attributable transaction costs are credited to share capital
(nominal value) and share premium when the options are exercised.
501
c102100pu135Proof7:28.3.10B/LRevision:0OperatorBeeR

Cash-settled awards are revalued at each balance sheet date and a liability recognised on the balance
sheet for all unpaid amounts, with any changes in fair value charged or credited to staff costs in the
income statement. Where forfeitures occur prior to vesting that are attributable to factors other than
a failure to satisfy market-based performance conditions, the cumulative charge incurred up to thedate of forfeiture is credited to the income statement.
Taxation
Deferred tax is provided in full, using the liability method, on temporary differences arising between
the tax bases of assets and liabilities and their carrying amounts in the consolidated financialstatements. Deferred income tax is determined using tax rates (and laws) that have been enacted or
substantially enacted as at the balance sheet date, and that are expected to apply when the related
deferred income tax asset is realised or the deferred income tax liability is settled.
Deferred tax assets are recognised where it is probable that future taxable profit will be available
against which the temporary differences can be utilised.
Income tax payable on profits is based on the applicable tax law in each jurisdiction and is
recognised as an expense in the period in which profits arise. The tax effects of income tax lossesavailable for carry forward are recognised as an asset when it is probable that future taxable profits
will be available against which these losses can be utilised.
Current and deferred tax relating to items which are charged or credited directly to equity, is credited
or charged directly to equity and is subsequently recognised in the income statement together with the
current or deferred gain or loss.
Borrowings held at amortised cost
Borrowings are recognised initially at fair value, being their issue proceeds (fair value of consideration
received) net of directly attributable transaction costs incurred. Borrowings are subsequently stated at
amortised cost, with any difference between proceeds net of directly attributable transaction costs and
the redemption value recognised in the income statement over the period of the borrowings using the
effective interest method.
Preference shares which carry a mandatory coupon that represents a market rate of interest at the
issue date, or which are redeemable on a specific date or at the option of the shareholder are
classified as financial liabilities and are presented in other borrowed funds. The dividends on these
preference shares are recognised in the income statement as interest expense on an amortised cost
basis using the effective interest method.
If the Group purchases its own debt, it is removed from the balance sheet, and the difference
between the carrying amount of the liability and the consideration paid is included in other income.
Share capital
Incremental costs directly attributable to the issue of new shares or options are shown in equity as a
deduction, net of tax, from the proceeds.
Dividends on ordinary shares and preference shares classified as equity are recognised in equity in theperiod in which they are declared.
Where the Company or other members of the consolidated Group purchases the Company’s equity
share capital, the consideration paid is deducted from the total shareholders’ equity of the Group
and/or of the Company as treasury shares until they are cancelled. Where such shares are
subsequently sold or reissued, any consideration received is included in shareholders’ equity of the
Group and/or the Company.
Fiduciary activities
The Group commonly acts as trustee and in other fiduciary capacities that result in the holding or
placing of assets on behalf of individuals, trusts, retirement benefit plans and other institutions. The
assets and income arising thereon are excluded from these financial statements, as they are not assets
of the Group.
Financial assets and liabilities (excluding derivatives)
The Group classifies its financial assets into the following measurement categories: a) financial assets
held at fair value through to profit or loss; b) loans and receivables; c) held-to-maturity investments,
502
c102100pu135Proof7:28.3.10B/LRevision:0OperatorBeeR

and available-for-sale financial assets. Financial liabilities are classified as either held at fair value
through profit or loss, or at amortised cost. Management determines the classification of its financial
assets and liabilities at initial recognition or, where appropriate, at the time of reclassification.
(a) Financial assets and liabilities held at fair value through profit or loss
This category has two sub-categories: financial assets and liabilities held for trading, and those
designated at fair value through profit or loss at inception. A financial asset or liability is classified as
trading if acquired principally for the purpose of selling in the short term.
Financial assets and liabilities may be designated at fair value through profit or loss when:
* the designation eliminates or significantly reduces a measurement or recognition inconsistency
that would otherwise arise from measuring assets or liabilities on a different basis; or
* a group of financial assets and/or liabilities is managed and its performance evaluated on a fair
value basis; or
* the assets or liabilities include embedded derivatives and such derivatives are required to be
recognised separately.
(b) Loans and receivables
Loans and receivables are non-derivative financial assets with fixed or determinable payments that are
not quoted in an active market and it is expected that substantiallyall of the initial investment will berecovered, other than because of credit deterioration.
(c) Held-to-maturity
Held-to-maturity assets are non-derivative financial assets with fixed or determinable payments and
fixed maturities that the Group’s management has the positive intention and ability to hold to
maturity.
(d) Available-for-sale
Available-for-sale assets are those non-derivative financial assets intended to be held for an indefinite
period of time, which may be sold in response to liquidity requirements or changes in interest rates,exchange rates, commodity prices or equity prices.
Initial recognition
Purchases and sales of financial assets and liabilities held at fair value through profit or loss, financial
assets held-to-maturity and available-for-sale are initially recognised on trade-date (the date on which
the Group commits to purchase or sell the asset). Loans are recognised when cash is advanced to the
borrowers. Financial assets and financial liabilities are initially recognised at fair value plus, for those
financial assets and liabilities not carried at fair value through profit and loss, directly attributable
transaction costs. In those cases where the initially recognised fair value is based on a valuationmodel that uses inputs which are not observable in the market, the difference between the transaction
price and the valuation model is not recognised immediately in the income statement. The difference
is amortised to the income statement until the inputs become observable, or the transaction matures
or is terminated.
Subsequent measurement
Financial assets and liabilities held at fair value through profit or loss are subsequently carried at fair
value, with gains and losses arising from changes in fair value taken directly to the income statement.
Available-for-sale financial assets are subsequently carried at fair value, with gains and losses arising
from changes in fair value taken to a separate component of equity until the asset is sold, or isimpaired, when the cumulative gain or loss is transferred to the income statement.
Loans and receivables and held-to-maturity financial assets are subsequently carried at amortised costusing the effective interest method.
The fair values of quoted financial assets or financial liabilities in active markets are based on current
prices. If the market for a financial asset or financial liability is not active, and for unlisted securities,
the Group establishes fair value by using valuation techniques. These include the use of recent arm’s
length transactions, discounted cash flow analysis, option pricing models and other valuation
techniques commonly used by market participants.
503
c102100pu135Proof7:28.3.10B/LRevision:0OperatorBeeR

Reclassifications
Reclassifications of financial assets, other than as set out below, or of financial liabilities between
categories are not permitted following their initial recognition.
Held for trading non-derivative financial assets can only be transferred out of the held at fair value
through profit or loss category in the following circumstances: to the available-for-sale category,
where, in rare circumstances, they are no longer held for the purpose of selling or repurchasing in thenear term; or to the loan and receivables category, where they are no longer held for the purpose of
selling or repurchasing in the near term and they would have met the definition of a loan and
receivable at the date of reclassification and the Group has the intent and ability to hold the assets
for the foreseeable future or until maturity.
Financial assets can only be transferred out of the available-for-sale category to the loan and
receivables category, where they would have met the definition of a loan and receivable at the date of
reclassification and the Group has the intent and ability to hold the assets for the foreseeable future
or until maturity.
Held-to-maturity assets must be reclassified to the available-for-sale category if the portfolio becomes
tainted following the sale of other than an insignificant amount of held-to-maturity assets prior to
their maturity.
Financial assets are reclassified at their fair value on the date of reclassification. For financial assets
reclassified out of the available-for-sale category into loans and receivables, any gain or loss on those
assets recognised in shareholders’ equity prior to the date of reclassification is amortised to the
income statement over the remaining life of the financial asset, using the effective interest method.
Renegotiated loans
Loans whose original terms have been modified are considered renegotiated loans. If the
renegotiations are on terms that are not consistent with those readily available on the market, this
provides objective evidence of impairment and the loan is assessed accordingly.
Derecognition
Financial assets are derecognised when the rights to receive cash flows from the financial assets have
expired or where the Group has transferred substantially all risks and rewards of ownership. If
substantially all the risks and rewards have been neither retained nor transferred and the Group has
retained control, the assets continue to be recognised to the extent of the Group’s continuinginvolvement. Financial liabilities are derecognised when they are extinguished.
Income recognition
For available-for-sale assets and financial assets and liabilities held at amortised cost, interest income
and interest expense is recognised in the income statement using the effective interest method.
Gains and losses arising from changes in the fair value of financial instruments at fair value through
profit or loss are included in the income statement in the period in which they arise. Contractual
interest income and expense on financial instruments held at fair value through profit or loss is
recognised within net interest income.
Gains and losses arising from changes in the fair value of available-for-sale financial assets, other
than foreign exchange gains losses from monetary items, are recognised directly in equity, until the
financial asset is derecognised or impaired at which time cumulative gain or loss previously recognised
in equity is recognised in profit or loss.
Dividends on equity instruments are recognised in the income statement within ‘Other income’ when
the Group’s right to receive payment is established.
Impairment of financial assets
The Group assesses at each balance sheet date whether there is objective evidence that a financialasset or group of financial assets is impaired. A financial asset or a group of financial assets is
impaired and impairment losses are incurred if, and only if, there is objective evidence of impairment
as a result of one or more events that occurred after the initial recognition of the asset (a loss event),
and that loss event (or events) has an impact on the estimated future cash flows of the financial asset
or group of financial assets that can be reliably estimated.
504
c102100pu135Proof7:28.3.10B/LRevision:0OperatorBeeR
The following factors are considered in assessing objective evidence of impairment:
* whether the counterparty is in default of principal or interest payments;
* a counterparty files for bankruptcy protection (or the local equivalent) where this would avoid
or delay repayment of its obligation;
* the Group files to have the counterparty declared bankrupt or files a similar order in respect of
a credit obligation;
* the Group consents to a restructuring of the obligation, resulting in a diminished financial
obligation, demonstrated by a material forgiveness of debt or postponement of scheduledpayments;
* the Group sells a credit obligation at a material credit-related economic loss; or
* there is observable data indicating that there is a measurable decrease in the estimated future
cash flows of a group of financial assets, although the decrease cannot yet be identified with
specific individual financial assets.
Assets carried at amortised cost
The Group first assesses whether objective evidence of impairment exists individually for financial
assets that are individually significant, and individually or collectively for financial assets that are not
individually significant.
If the Group determines that no objective evidence of impairment exists for an individually assessed
financial asset, whether significant or not, it includes the asset in a group of financial assets with
similar credit risk characteristics and collectively assesses them for impairment. Assets that are
individually assessed for impairment and for which an impairment loss is or continues to berecognised, are not included in a collective assessment of impairment.
If there is objective evidence that an impairment loss on a loan and receivable or a held-to-maturity
asset has been incurred, the amount of the loss is measured as the difference between the asset’s
carrying amount and the present value of estimated future cash flows (excluding future credit losses
that have not been incurred), discounted at the asset’s original effective interest rate. The carrying
amount of the asset is reduced through the use of an allowance account and the amount of the loss
is recognised in the income statement. If a loan and receivable or held-to-maturity asset has avariable interest rate, the discount rate for measuring any impairment loss is the current effective
interest rate determined under the contract. As a practical expedient, the Group may measure
impairment on the basis of an instrument’s fair value using an observable market price.
The calculation of the present value of the estimated future cash flows of a collateralised financial
asset reflects the cash flows that may result from foreclosure, less costs for obtaining and selling the
collateral, whether or not foreclosure is probable. For the purposes of a collective evaluation of
impairment, financial assets are grouped on the basis of similar credit risk characteristics (i.e. on thebasis of the Group’s grading process which considers asset type, industry, geographic location,
collateral type, past-due status and other relevant factors). These characteristics are relevant to the
estimation of future cash flows for groups of such assets being indicative of the debtors’ ability to
pay all amounts due according to the contractual terms of the assets being evaluated.
Future cash flows in a group of financial assets that are collectively evaluated for impairment are
estimated on the basis of the historical loss experience for assets with credit risk characteristics similar
to those in the group. Historical loss experience is adjusted on the basis of current observable data toreflect the effects of current conditions that did not affect the period on which the historical loss
experience is based, and to remove the effects of conditions in the historical period that do not exist
currently.
To the extent a loan is irrecoverable, it is written off against the related provision for loan
impairment. Such loans are written off after all the necessary procedures have been completed, it is
decided that there is no realistic probability of recovery and the amount of the loss has been
determined. Subsequent recoveries of amounts previously written off decrease the amount of theprovision for loan impairment in the income statement. If, in a subsequent period, the amount of the
impairment loss decreases and the decrease can be related objectively to an event occurring after the
impairment was recognised (such as an improvement in the debtor’s credit rating), the previously
recognised impairment loss is reversed by adjusting the allowance account. The amount of the
reversal is recognised in the income statement.
505
c102100pu135Proof7:28.3.10B/LRevision:0OperatorBeeR

Available-for-sale assets
A significant or prolonged decline in the fair value of an equity security below its cost is considered
amongst other factors in assessing objective evidence of impairment for equity securities. Whereobjective evidence of impairment exists for available-for-sale financial assets, the cumulative loss
(measured as the difference between the amortised cost and the current fair value, less any
impairment loss on that financial asset previously recognised in the income statement) is removed
from equity and recognised in the income statement. If, in a subsequent period, the fair value of a
debt instrument classified as available-for-sale increases and the increase can be objectively related to
an event occurring after the impairment loss was recognised, the impairment loss is reversed through
the income statement. Impairment losses recognised in the income statement on equity instruments are
not reversed through the income statement.
Derivative financial instruments and hedge accounting
Derivatives are categorised as trading unless they are designated as hedging instruments.
Derivative contracts are initially recognised at fair value on the date on which a derivative contract is
entered into and are subsequently remeasured at their fair value. Fair values may be obtained from
quoted market prices in active markets, recent market transactions, and valuation techniques,
including discounted cash flow models and option pricing models, as appropriate. Where the initially
recognised fair value of a derivative contract is based on a valuation model that uses inputs which
are not observable in the market, it follows the same initial recognition accounting policy as for other
financial assets and liabilities. All derivatives are carried as assets when fair value is positive and as
liabilities when fair value is negative.
Certain derivatives embedded in other financial instruments, such as the conversion option in a
convertible bond held, are treated as separate derivatives when their economic characteristics and
risks are not closely related to those of the host contract and the host contract is not carried at fair
value through profit or loss. These embedded derivatives are measured at fair value with changes in
fair value recognised in the income statement.
The method of recognising the resulting fair value gain or loss depends on whether the derivative is
designated as a hedging instrument, and if so, the nature of the item being hedged. The Group
designates certain derivatives as either: a) hedges of the fair value of recognised assets or liabilities or
firm commitments (fair value hedge); b) hedges of highly probable future cash flows attributable to arecognised asset or liability, or a forecasted transaction (cash flow hedge); or c) hedges of the net
investment of a foreign operation (net investment hedges). Hedge accounting is used for derivatives
designated in this way provided certain criteria are met.
The Group documents, at the inception of the transaction, the relationship between hedging
instruments and hedged items, as well as its risk management objective and strategy for undertakingvarious hedge transactions. The Group also documents its assessment, both at hedge inception and on
an ongoing basis, of whether the derivatives that are used in hedging transactions are highly effective
in offsetting changes in fair values or cash flows of hedged items.
(a) Fair value hedge
Changes in the fair value of derivatives that are designated and qualify as fair value hedging
instruments are recorded in the income statement, together with any changes in the fair value of the
hedged asset or liability that are attributable to the hedged risk. If the hedge no longer meets thecriteria for hedge accounting, the adjustment to the carrying amount of a hedged item for which the
effective interest method is used is amortised to the income statement over the period to maturity or
derecognition.
(b) Cash flow hedge
The effective portion of changes in the fair value of derivatives that are designated and qualify as
cash flow hedging instruments is recognised in equity. The gain or loss relating to the ineffectiveportion is recognised immediately in the income statement.
Amounts accumulated in equity are recycled to the income statement in the periods in which the
hedged item affects profit or loss.
When a hedging instrument expires or is sold, or when a hedge no longer meets the criteria for hedge
accounting, any cumulative gain or loss existing in equity at that time remains in equity and is
recognised when the forecast transaction is ultimately recognised in the income statement. When a
506
c102100pu135Proof7:28.3.10B/LRevision:0OperatorBeeR

forecast transaction is no longer expected to occur, the cumulative gain or loss that was reported in
equity is immediately transferred to the income statement.
(c) Net investment hedge
Hedges of net investments in foreign operations are accounted for similarly to cash flow hedges. Any
gain or loss on the hedging instrument relating to the effective portion of the hedge is recognised in
the translation reserve; the gain or loss relating to the ineffective portion is recognised immediately in
the income statement. Gains and losses accumulated in equity are included in the income statement
when the foreign operation is disposed of.
Derivatives that do not qualify for hedge accounting
Changes in the fair value of any derivative instrument that does not qualify for hedge accounting are
recognised immediately in the income statement.
Offsetting financial instruments
Financial assets and liabilities are offset and the net amount reported in the balance sheet when there
is a legally enforceable right to offset the recognised amounts and there is an intention to settle on a
net basis, or to realise the asset and settle the liability simultaneously.
Sale and repurchase agreements
Securities sold subject to repurchase agreements (repos) remain on the balance sheet; the counterparty
liability is included in deposits by banks, or customer accounts, as appropriate. Securities purchased
under agreements to resell (reverse repos) are recorded as loans and advances to other banks or
customers, as appropriate. The difference between sale and repurchase price is treated as interest and
accrued over the life of the agreements using the effective interest method.
Securities lent to counterparties are also retained in the financial statements. Securities borrowed arenot recognised in the financial statements, unless these are sold to third parties, in which case the
purchase and sale are recorded with the gain or loss included in trading income.
Interest income and expense
Interest income and expense is recognised in the income statement using the effective interest method.
The effective interest method is a method of calculating the amortised cost of a financial asset or afinancial liability and of allocating the interest income or interest expense over the relevant period.
The effective interest rate is the rate that discounts estimated future cash payments or receipts
through the expected life of the financial instrument or, when appropriate, a shorter period, to the
net carrying amount of the financial asset or financial liability. When calculating the effective interest
rate, the Group estimates cash flows considering all contractual terms of the financial instrument (for
example, prepayment options) but does not consider future credit losses. The calculation includes all
fees paid or received between parties to the contract that are an integral part of the effective interest
rate, transaction costs and all other premiums or discounts.
Where the estimates of cash flows have been revised, the carrying amount of the financial asset or
liability is adjusted to reflect the actual and revised cash flows, discounted at the instruments original
effective interest rate. The adjustment is recognised as interest income or expense in the period in
which the revision is made.
If the financial asset has been reclassified, subsequent increases in the estimates of future cash receiptsas a result of increased recoverability are recognised as an adjustment to the effective interest rate
from the date of the change in estimate.
Once a financial asset or a group of similar financial assets has been written down as a result of an
impairment loss, interest income is recognised using the rate of interest used to discount the future
cash flows for the purpose of measuring the impairment loss.
Fees and commissions
Fees and commissions are generally recognised on an accrual basis when the service has been
provided or significant act performed. Loan syndication fees are recognised as revenue when the
syndication has been completed and the Group retained no part of the loan package for itself, or
retained a part at the same effective interest rate as for the other participants. Portfolio and other
507
c102100pu135Proof7:28.3.10B/LRevision:0OperatorBeeR

management advisory and service fees are recognised based on the applicable service contracts,
usually on a time-apportionate basis.
2. Segmental information
The Group is organised on a worldwide basis for management and reporting purposes into two mainbusiness segments: Consumer Banking and Wholesale Banking. The products offered by these
segments are summarised under Income by product below. The businesses’ focus is on broadening
and deepening the relationship with customers, rather than maximising a particular product line.
Hence the Group evaluates segmental performance based on overall profit or loss before taxation
(excluding corporate items not allocated) and not individual product profitability. Product revenue
information is used as a way of assessing customer needs and trends in the market place. The
strategies adopted by Consumer Banking and Wholesale Banking need to be adapted to local market
and regulatory requirements, which is the responsibility of country management teams. Whilst not theprimary driver of the business, country performance is an important part of the Group’s matrix
structure and is also used to evaluate performance and reward staff. Corporate items not allocated
are not aggregated into the businesses because of the one-off nature of these items.
The Group’s entity-wide disclosure comprises geographic areas, classified by the location of the
customer.
Transactions between the business segments and geographic areas are carried out on an arms lengthbasis. Apart from the entities that have been acquired in the last two years, Group central expenses
have been distributed between the business segments and geographic areas in proportion to their
direct costs, and the benefit of the Group’s capital has been distributed between segments in
proportion to their average risk weighted assets. In the year in which an acquisition is made, the
Group does not charge or allocate the benefit of the Group’s capital. The distribution of central
expenses is phased in over two years, based on the estimate of central management costs associated
with the acquisition.
By class of business2009 2008
Total Corporate Total Corporate
Consumer Wholesale reportable items not Consumer Wholesale reportable items not
Banking Banking segments allocated3 Total Banking Banking segments allocated4 Total
$million $million $million $million $million $million $million $million $million $million
Internal income (55) 55 — — — (78) 78 — — —
Net interest income 3,876 3,747 7,623 — 7,623 4,224 3,163 7,387 — 7,387
Other income 1,808 5,489 7,297 264 7,561 1,806 4,248 6,054 527 6,581
Operating income 5,629 9,291 14,920 264 15,184 5,952 7,489 13,441 527 13,968
Operating expenses (3,709) (4,185) (7,894) (58) (7,952) (3,843) (3,768) (7,611) — (7,611)
Operating profit before
impairment losses and
taxation 1,920 5,106 7,026 206 7,232 2,109 3,721 5,830 527 6,357
Impairment losses on
loans and advances
and other credit risk
provisions (1,052) (948) (2,000) — (2,000) (937) (384) (1,321) — (1,321)
Other impairment (1) (82) (83) (19) (102) (56) (336) (392) (77) (469)
Profit from associates — — — 21 21 — — — 1 1
Profit before taxation 867 4,076 4,943 208 5,151 1,116 3,001 4,117 451 4,568
Total assets employed1 103,534 331,306 434,840 1,813 436,653 86,402 346,731 433,133 1,935 435,068
Total liabilities employed 144,167 263,571 407,738 995 408,733 129,029 282,656 411,685 688 412,373
Other segment items:
Capital expenditure2 160 901 1,061 — 1,061 375 1,207 1,582 — 1,582
Depreciation 161 151 312 — 312 157 93 250 — 250
Interests in associates1 — — — 514 514 — — — 511 511
Amortisation of
intangible assets 71 137 208 — 208 93 82 175 — 175
1 Interests in associates at 31 December 2008 included $511 million previously allocated by business that has now been included in ‘Corporate items not allocated.’2 Includes capital expenditure in Wholesale Banking of $631 million in respect of operating lease assets (31 December 2008: $852 million).3 Relates to gain on buy-back of subordinated debt, UK payroll tax, impairment of associates and the Group’s share of profit from associates.4 Relates to gain on buy-back of subordinated debt, disposal of businesses, impairment of associates and other strategic investments and the Group’s share of profit from
associates.
508
c102100pu135Proof7:28.3.10B/LRevision:0OperatorBeeR

The following table details entity-wide operating income by product:
2009 2008
$million $million
Consumer BankingCards, Personal Loans and Unsecured Lending 1,992 2,106
Wealth Management and Deposits 2,232 2,789
Mortgage and Auto Finance 1,244 928
Other 161 129
Total operating income by product 5,629 5,952
Wholesale Banking
Lending and Portfolio Management 849 551Transaction Banking 2,537 2,663
Global Markets
Financial Markets 3,311 2,365
Asset and Liability Management (ALM) 963 912
Corporate Finance 1,294 745
Principal Finance 337 253
Total Global Markets 5,905 4,275
Total operating income by product 9,291 7,489
509
c102100pu135Proof7:28.3.10B/LRevision:0OperatorBeeR

Entity-wide information
By geography
The Group manages its reportable business segments on a global basis. The operations are based ineight main geographic areas. The UK is the home country of the Company.
2009
Asia Pacific
Middle
Other East & Americas
Hong Asia Other UK &
Kong Singapore Korea Pacific1 India S Asia Africa Europe2 Total
$million $million $million $million $million $million $million $million $million
Internal income 14 (18) (62) 43 195 (42) 39 (169) —
Net interest income 1,308 782 908 1,505 724 1,134 491 771 7,623
Fees and commissions
income, net 542 291 187 502 546 494 320 488 3,370
Net trading income 456 357 322 502 259 356 221 417 2,890
Other operating income 50 180 199 336 89 136 18 293 1,301
Operating income 2,370 1,592 1,554 2,888 1,813 2,078 1,089 1,800 15,184
Operating expenses (1,168) (801) (953) (1,778) (571) (891) (553) (1,237) (7,952)
Operating profit before
impairment losses and
taxation 1,202 791 601 1,110 1,242 1,187 536 563 7,232
Impairment losses on loans
and advances and other
credit risk provisions (145) (37) (278) (395) (201) (811) (54) (79) (2,000)
Other impairment 10 (40) (1) 26 19 (10) — (106) (102)
(Loss)/profit from associates (5) — — 29 — — — (3) 21
Profit before taxation 1,062 714 322 770 1,060 366 482 375 5,151
Loans and advances to
customers – average 29,194 25,938 32,372 38,972 8,351 18,972 3,316 31,336 188,451
Net interest margins (%) 1.8 1.7 1.8 2.3 3.8 3.7 4.8 1.0 2.3
Loans and advances to
customers – period end 29,973 31,399 36,804 41,992 8,866 18,484 4,029 30,256 201,803
Loans and advances to banks –
period end 19,453 5,085 2,780 7,232 511 1,864 300 15,708 52,933
Total assets employed3 91,739 62,137 63,222 83,191 31,719 44,275 13,633 91,149 481,065
Capital expenditure4 24 164 63 32 49 19 37 673 1,061
1 Other Asia Pacific region (Other APR) includes Malaysia: operating income of $488 million; operating expenses of $(207) million,impairment losses on loans and advances and other credit risk provisions of $(61) million and profit before taxation of $220million. Total assets employed of $13,881 million.
2 Americas UK & Europe includes operating income of $967 million and total assets employed of $76,541 million in respect of theUK, the Company’s country of domicile.
3 Total assets employed includes intra-group items of $45,711 million and excludes tax assets of $1,299 million. Assets held at thecentre have been distributed between geographic areas in proportion to their total assets employed.
4 Includes capital expenditure in Americas, UK & Europe of $631 million in respect of operating lease assets. Other capitalexpenditure comprises additions to property and equipment (note 27) and software related intangibles (note 26) including anypost-acquisition additions made by the acquired entities.
510
c102100pu135Proof7:28.3.10B/LRevision:0OperatorBeeR

20085
Asia Pacific
Middle
East & Americas
Hong Other Asia Other S UK &
Kong Singapore Korea Pacific1 India Asia Africa Europe2 Total
$million $million $million $million $million $million $million $million $million
Internal income 1 105 (109) 25 12 16 2 (52) —
Net interest income 1,296 364 1,234 1,575 724 991 503 700 7,387
Fees and commissions
income, net 507 246 183 501 450 452 227 375 2,941
Net trading income 357 359 162 701 298 182 167 179 2,405
Other operating income 94 243 77 158 210 17 11 425 1,235
Operating income 2,255 1,317 1,547 2,960 1,694 1,658 910 1,627 13,968
Operating expenses (1,030) (664) (955) (1,721) (646) (821) (564) (1,210) (7,611)
Operating profit before
impairment losses and
taxation 1,225 653 592 1,239 1,048 837 346 417 6,357
Impairment releases on loans
and advances and other
credit risk provisions (183) (15) (263) (436) (133) (185) (33) (73) (1,321)
Other impairment (52) (30) — (102) (24) — — (261) (469)
(Loss)/profit from associates (1) — — 4 — — — (2) 1
Profit before taxation 989 608 329 705 891 652 313 81 4,568
Loans and advances to
customers – average 26,610 19,610 34,867 40,116 8,612 16,041 3,091 29,970 178,917
Net interest margin (%) 2.1 1.3 2.3 2.4 3.5 3.7 4.5 1.1 2.5
Loans and advances to
customers – period end 28,004 20,349 31,763 38,366 7,863 17,476 3,642 31,049 178,512
Loans and advances to banks –
period end 18,963 9,283 1,594 5,201 291 1,504 587 10,523 47,946
Total assets employed3 77,627 51,246 64,350 82,193 32,269 34,364 12,104 130,723 484,876
Capital expenditure4 25 140 59 170 178 40 31 939 1,582
1 Other APR includes Malaysia: operating income of $530 million; operating expenses of $(212) million, impairment losses on loansand advances and other credit risk provisions of $(47) million, other impairment of $(21) million and profit before taxation of $250million. Total assets employed of $13,557 million.
2 Americas UK & Europe includes operating income of $849 million and total assets employed of $115,900 million in respect of theUK, the Company’s country of domicile.
3 Total assets employed includes intra-group items of $51,232 million and excludes tax assets of $1,424 million. Assets held at thecentre have been distributed between geographic areas in proportion to their total assets employed.
4 Includes capital expenditure in Americas, UK & Europe of $852 million in respect of operating lease assets. Other capitalexpenditure comprises additions to property and equipment (note 27) and software related intangibles (note 26) including anypost-acquisition additions made by the acquired entities.
5 Restated as explained in note 50.
3. Interest income
2009 2008
$million $million
Balances at central banks 6 32
Treasury bills 656 835
Loans and advances to banks 755 1,382
Loans and advances to customers 9,370 11,397
Listed debt securities 885 1,147
Unlisted debt securities 1,196 1,545
Accrued on impaired assets (discount unwind) 58 40
12,926 16,378
511
c102100pu135Proof7:28.3.10B/LRevision:0OperatorBeeR

Total interest income from financial instruments held at amortised cost in 2009 is $8,195 million
(2008: $10,124 million) and from financial instruments held as available-for-sale is $2,093 million
(2008: $2,820 million).
4. Interest expense
2009 2008
$million $million
Deposits by banks 854 1,268
Customer accounts:
Interest bearing current accounts and savings deposits 785 1,009
Time deposits 2,394 4,328
Debt securities in issue 769 1,338Subordinated liabilities and other borrowed funds:
Wholly repayable within five years 37 389
Other 464 659
5,303 8,991
Total interest expense on financial instruments held at amortised cost in 2009 is $4,065 million (2008:
$7,405 million).
5. Fees and commissions
2009 2008
$million $million
Fee income:
Arising from financial instruments that are not fair valued through profit or
loss 1,480 1,475
Arising from trust and other fiduciary activities 80 113
Other 2,264 1,832
3,824 3,420
Fee expense:
Arising from financial instruments that are not fair valued through profit orloss 142 261
Arising from trust and other fiduciary activities 15 21
Other 297 197
454 479
512
c102100pu135Proof7:28.3.10B/LRevision:0OperatorBeeR

6. Net trading income
2009 2008
$million $million
Gains less losses on instruments held for trading:Foreign currency1 1,830 2,596
Trading securities 329 238
Interest rate derivatives 576 (402)
Credit and other derivatives 35 (30)
2,770 2,402
Gains less losses from fair value hedging:
Gains less losses from fair value hedged items 454 (1,139)
Gains less losses from fair value hedged instruments (462) 1,145(8) 6
Gains less losses on instruments designated at fair value:
Financial assets designated at fair value through profit or loss 22 150
Financial liabilities designated at fair value through profit or loss 70 (118)
Derivatives managed with financial instruments designated at fair value
through profit or loss 36 (35)
128 (3)
2,890 2,405
1 Includes foreign currency gains and losses arising on the translation of foreign currency monetary assets and liabilities.
7. Other operating income
2009 2008
$million $million
Other operating income includes:Gains less losses on available-for-sale financial assets:
On disposal 592 322
Writedowns on asset backed securities (4) (49)
Dividend income 109 203
Gains arising on repurchase of subordinated liabilities 264 384
Gains arising on assets fair valued at acquisition 43 80
Rental income from operating lease assets 156 67
Profit on sale of property, plant and equipment 40 10Recognition of profit on Visa shares — 17
(Loss)/profit on sale of businesses (2) 146
Profit on sale of businesses in 2008 represents the gain on sale of the Group’s Indian asset
management business.
Gains arising on assets fair valued at acquisition primarily relate to recoveries of fair value
adjustments on loans and advances.
513
c102100pu135Proof7:28.3.10B/LRevision:0OperatorBeeR

8. Operating expenses
2009 2008
$million $million
Staff costs:Wages and salaries 3,634 3,793
Social security costs 98 93
Other pension costs (note 36) 138 172
Share based payment costs (note 39) 375 121
Other staff costs 667 558
4,912 4,737
Premises and equipment expenses:
Rental of premises 338 337
Other premises and equipment costs 341 376
Rental of computers and equipment 19 25
698 738
General administrative expenses 1,822 1,711
The following tables summarise the number of employees within the Group as at 31 December 2009
and 31 December 2008 respectively.
2009
Consumer Wholesale Support
Banking Banking Services Total
Period end 47,522 17,379 12,425 77,326Average for the period 47,789 16,612 13,196 77,597
20081
Consumer Wholesale Support
Banking Banking Services Total
Period end 50,660 15,950 13,947 80,557
Average for the period 51,048 14,672 14,330 80,050
1 The period end number of employees for 2008 has been restated to primarily the inclusion of fixed-term contract workers asemployees in line with the definition under the Companies Act 2006.
The Company employed nil staff at 31 December 2009 (2008: nil) and it incurred costs of $3 million
(2008: $3 million).
Directors’ emoluments
Details of directors’ pay and benefits and interests in shares are disclosed in the Directors’
remuneration report on pages 94 to 109 of the 2009 Annual Report. Transactions with directors,
officers and other related parties are disclosed in the related parties note 51.
514
c102100pu135Proof7:28.3.10B/LRevision:0OperatorBeeR

Auditor’s remuneration
Auditor’s remuneration in relation to the Group statutory audit amounts to $4.1 million (2008: $5.0
million). The following fees were payable by the Group to their principal auditor, KPMG Audit Plcand its associates (together KPMG):
2009 2008
$million $million
Audit fees for the Group statutory audit:
Fees relating to the current year 4.1 5.0
Fees payable to KPMG for other services provided to the Group:
Audit of Standard Chartered PLC subsidiaries, pursuant to legislation
Fees relating to the current year 9.1 9.9
Fees relating to prior year — 0.8
Total audit and audit related fees 13.2 15.7
Other services pursuant to legislation 3.4 2.8
Tax services 1.6 1.3
Services relating to information technology — 0.1
Services relating to corporate finance transactions 0.3 1.4
All other services 1.2 3.3
Total fees payable 19.7 24.6
The following is a description of the type of services included within the categories listed above:
* Audit fees are in respect of fees payable to KPMG Audit Plc for the statutory audit of the
consolidated financial statements of the Group and the separate financial statements of Standard
Chartered PLC. It excludes amounts payable for the audit of Standard Chartered PLC’s
subsidiaries and amounts payable to KPMG Audit Plc’s associates. These amounts have been
included in Fees payable to KPMG for other services provided to the Group
* Other services pursuant to legislation include services for assurance and other services that are in
relation to statutory and regulatory filings, including comfort letters and interim reviews
* Tax services include tax compliance services and tax advisory services
* Services relating to information technology include advice on IT security and business
continuity, and performing agreed upon IT testing procedures
* Services related to corporate finance transactions include fees payable to KPMG for transaction
related work irrespective of whether the Group is vendor or purchaser, such as acquisition due
diligence and long-form reports. In 2008 this included $1.3 million in respect of the rights issue
* All other services include other assurance and advisory services such as translation services, ad
hoc accounting advice, reporting accountants work on capital raising and review of financial
models
Expenses incurred during the provision of services and which have been reimbursed by the Group are
included within auditor’s remuneration.
In addition to the above, KPMG estimate they have been paid fees of $0.3 million (2008: $0.3
million) by parties other than the Group but where the Group is connected with the contracting
party and therefore may be involved in appointing KPMG. These fees arise from services such as the
audit of the Group’s pension schemes.
Fees payable to KPMG for non-audit services for Standard Chartered PLC are not separately
disclosed because such fees are disclosed on a consolidated basis for the Group.
515
c102100pu135Proof7:28.3.10B/LRevision:0OperatorBeeR

9. Depreciation and amortisation
2009 2008
$million $million
Premises 119 98
Equipment 193 152
Intangibles:
Software 139 94
Acquired on business combinations 69 81
520 425
10. Other impairment2009 2008
$million $million
Impairment losses on available-for-sale financial assets 123 417
Impairment of investment in associates 19 46
Other 17 6
159 469Recovery of impairment on disposal of equity instruments (57) —
102 469
Impairment losses on available-for-sale financial assets includes $49 million (2008: $315 million) in
relation to impairment of equity investments, $66 million (2008: $41 million) impairment on asset
backed securities, and $8 million (2008: $61 million) on other debt securities. Recoveries of
impairments of $57 million during 2009 are in respect of private and strategic equity investments soldduring 2009 which had impairment provisions raised against them during 2008.
11. Taxation
Analysis of taxation charge in the year:
2009 2008
$million $million
The charge for taxation based upon the profits for the year comprises:
Current tax:United Kingdom corporation tax at 28% (2008: 28.5%):
Current tax on income for the year 893 708
Adjustments in respect of prior periods (including double taxation relief) 398 (135)
Double taxation relief (623) (602)
Foreign tax:
Current tax on income for the year 1,309 1,221
Adjustments in respect of prior periods 48 (117)
2,025 1,075
Deferred tax:
Origination/reversal of temporary differences (192) 89
Adjustments in respect of prior periods (159) 60
(351) 149
Tax on profits on ordinary activities 1,674 1,224
Effective tax rate 32.5% 26.8%
1 Amounts have been restated as explained in note 50.
516
c102100pu135Proof7:28.3.10B/LRevision:0OperatorBeeR

Foreign taxation includes taxation on Hong Kong profits of $151 million (2008: $156 million)
provided at a rate of 16.5% (2008: 16.5%) on the profits assessable in Hong Kong. During 2008, the
UK corporation tax rate was reduced from 30% to 28%, which gave a blended 28.5% tax rate for
2008.
The taxation charge for the year is higher than the standard rate of corporation tax in the UK, 28%.
The differences are explained below:
2009 20081
$million $million
Profit on ordinary activities before taxation 5,151 4,568
Tax at 28% (2008: 28.5%) 1,442 1,302
Effects of:
Tax free income (179) (117)
Lower tax rates on overseas earnings (119) (130)
Higher tax rates on overseas earnings 216 207Adjustments to tax charge in respect of previous periods2 287 (192)
Other items 27 154
Tax on profits on ordinary activities 1,674 1,224
1 Amounts have been restated as explained in note 50.
2 Adjustments to the tax charge in respect of previous periods includes a $192 million (2008 : $nil million) one-off charge resultingfrom a collaborative exercise with the UK tax authority, HM Revenue and Customs, to settle the UK tax position relating to theperiod from 1990 to 2006.
2009 2008
Current
tax
Deferred
tax Total
Current
tax
Deferred
tax Total
$million $million $million $million $million $million
Tax recognised in other comprehensive income
Available-for-sale assets 52 (6) 46 97 7 104
Cash flow hedges — (21) (21) — 54 54
Retirement benefit obligations — 37 37 — 60 60
Other (22) 22 — — — —
30 32 62 97 121 218
Other tax recognised in equity
Share based payments — 35 35 16 (46) (30)
— 35 35 16 (46) (30)
Total tax credit recognised in equity 30 67 97 113 75 188
517
c102100pu135Proof7:28.3.10B/LRevision:0OperatorBeeR

12. Dividends
2009 2008
Cents Cents Cents
Ordinary equity shares per share $million per share $million
Final dividend declared and paid during the
period 42.32 801 42.27 793
Interim dividend declared and paid during the
period 21.23 425 19.301 364
63.55 1,226 61.57 1,157
1 The interim dividend declared in August 2008 was 25.67 cents per share. This has been restated on a post-rights issue basis andadjusted by the ratio of shares outstanding immediately before the rights issue to the number of shares outstanding immediatelyfollowing the rights issue. The total dividend declared for 2007 on a pre-rights issue basis was 79.35 cents per share and on a post-rights issue basis was 59.65 cents per share.
2009 2008
Preference shares $million $million
Non-cumulative irredeemable preference shares: 73/8 % preference shares of £1 each2 11 15
81/4 % preference shares of £1 each2 13 16
Non-cumulative redeemable preference shares: 8.125% preference shares of $5 each2 75 32
7.014% preference shares of $5 each 53 62
6.409% preference shares of $5 each 48 48
2 Dividends on these preference shares are treated as interest expense and accrued accordingly.
Dividends on ordinary equity and those preference shares classified as equity are recorded in the
period in which they are declared and, in respect of the final dividend, have been approved by the
shareholders. Accordingly, the final ordinary equity share dividends set out above relate to the
respective prior years. The 2009 final ordinary equity share dividend of 44.80 cents per share($904 million) will be paid in either pounds sterling, Hong Kong dollars or US dollars on 13 May
2010 to shareholders on the UK register of members at the close of business in the UK on 12 March
2010, and to shareholders on the Hong Kong branch register of members at the opening of business
in Hong Kong (9:00 am Hong Kong time) on 12 March 2010. It is intended that shareholders will be
able to elect to receive shares credited as fully paid instead of all or part of the final cash dividend.
13. Earnings per ordinary share
2009 2008
Profit1
$million
Weighted
average
number
of shares3
(‘000)
Per share
amount
cents
Profit1,4
$million
Weighted
average
number
of shares
(‘000)
Per share
amount4
cents
Basic earnings per ordinary share 3,279 1,952,377 167.9 3,131 1,629,633 192.1
Effect of dilutive potential ordinary shares:
Options2 — 31,632 — — 8,622 —
Diluted earnings per ordinary share 3,279 1,984,009 165.3 3,131 1,638,255 191.1
Normalised earnings per ordinary share
The Group measures earnings per share on a normalised basis. This differs from earnings defined in
IAS 33 ‘Earnings per share’.
518
c102100pu135Proof7:28.3.10B/LRevision:0OperatorBeeR

The table below provides a reconciliation.
2009 2008
$million $million
Profit attributable to ordinary shareholders 3,279 3,1314
Amortisation of intangible assets arising on business combinations 69 81
Profit on sale of property, plant and equipment5 — (10)
Gains arising on repurchase of subordinated liabilities (264) (384)
Loss/(profit) on sale of businesses 2 (146)
Loss on PEM Group structured notes 170 —
Pre-incorporation costs of Korean principal holding company 5 —UK bank payroll tax 58 —
Day one loss on strategic investment — 3
Impairment of associates and other strategic investments 19 77
One-off settlement with the UK tax authority (note 11)6 190 —
Tax on normalised items (17) 98
Normalised earnings 3,511 2,850
Normalised basic earnings per ordinary share (cents) 179.8 174.9
Normalised diluted earnings per ordinary share (cents) 177.0 174.0
1 The profit amounts represent the profit attributable to ordinary shareholders, which is profit for the year after minority interestand the declaration of dividends payable to the holders of the non-cumulative redeemable preference shares classified as equity(see note 12).
2 The impact of anti-dilutive options has been excluded from this amount as required by IAS 33 Earnings Per Share.
3 There were no ordinary shares issued after the balance sheet date that would have significantly affected the number of ordinaryshares used in the above calculation had they been issued prior to the end of the balance sheet date.
4 Amounts have been restated as explained in note 50.
5 In 2009, the Group has prospectively re-evaluated its definition of normalised earnings and as a consequence profits or losses onsale of Consumer Banking branches are no longer considered to be normalising items as they relate to an ongoing programme ofbranch renovation and relocation and as a consequence are considered part of normal business operations.
6 This amount represents $192 million one-off tax settlement with the UK tax authority, net of post tax interest income on taxreceivables $2 million.
14. Financial instruments
Classification
Financial assets are classified between four measurement categories: held at fair value through profit
or loss (comprising trading and designated), available-for-sale, loans and receivables and held-to-
maturity; and two measurement categories for financial liabilities: held at fair value through profit or
loss (comprising trading and designated) and amortised cost. Instruments are classified in the balancesheet in accordance with their legal form, except for instruments that are held for trading purposes
and those that the Group has designated to hold at fair value through the profit and loss account.
The latter are combined on the face of the balance sheet and disclosed as financial assets or liabilities
held at fair value through profit or loss.
519
c102100pu135Proof7:28.3.10B/LRevision:0OperatorBeeR
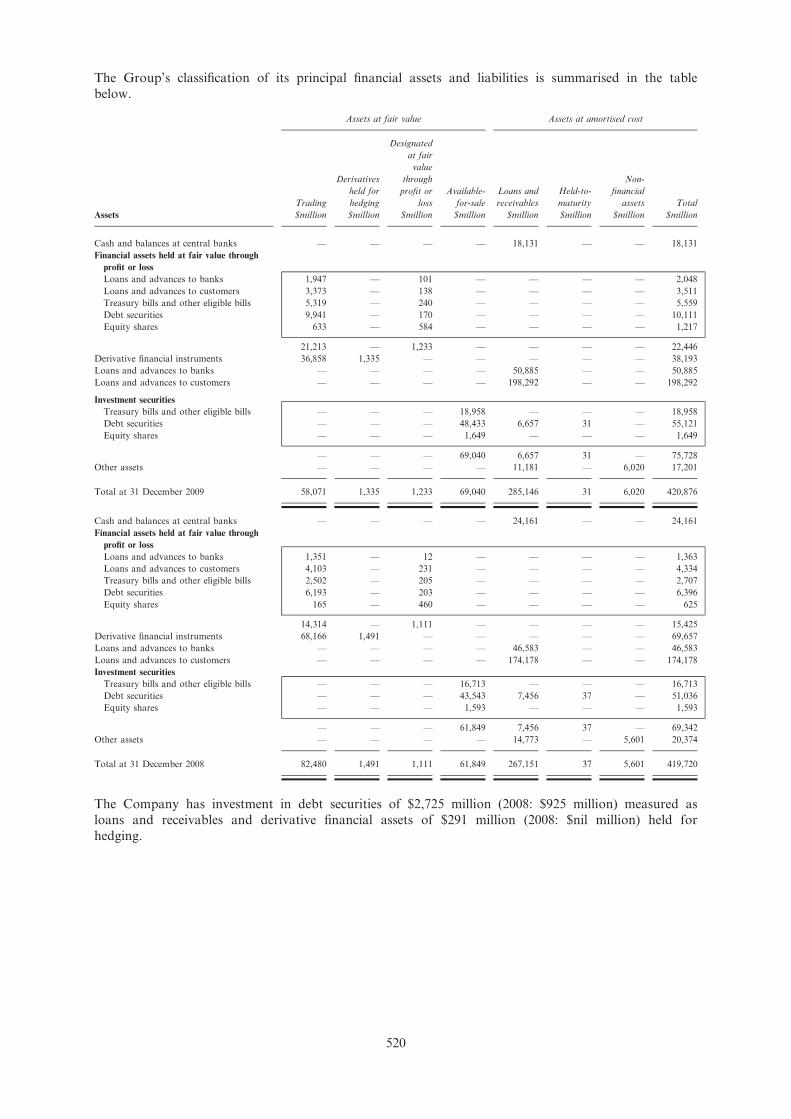
The Group’s classification of its principal financial assets and liabilities is summarised in the table
below.
Assets at fair value Assets at amortised cost
Trading
Derivatives
held for
hedging
Designated
at fair
value
through
profit or
loss
Available-
for-sale
Loans and
receivables
Held-to-
maturity
Non-
financial
assets Total
Assets $million $million $million $million $million $million $million $million
Cash and balances at central banks — — — — 18,131 — — 18,131
Financial assets held at fair value through
profit or loss
Loans and advances to banks 1,947 — 101 — — — — 2,048
Loans and advances to customers 3,373 — 138 — — — — 3,511
Treasury bills and other eligible bills 5,319 — 240 — — — — 5,559
Debt securities 9,941 — 170 — — — — 10,111
Equity shares 633 — 584 — — — — 1,217
21,213 — 1,233 — — — — 22,446
Derivative financial instruments 36,858 1,335 — — — — — 38,193
Loans and advances to banks — — — — 50,885 — — 50,885
Loans and advances to customers — — — — 198,292 — — 198,292
Investment securities
Treasury bills and other eligible bills — — — 18,958 — — — 18,958
Debt securities — — — 48,433 6,657 31 — 55,121
Equity shares — — — 1,649 — — — 1,649
— — — 69,040 6,657 31 — 75,728
Other assets — — — — 11,181 — 6,020 17,201
Total at 31 December 2009 58,071 1,335 1,233 69,040 285,146 31 6,020 420,876
Cash and balances at central banks — — — — 24,161 — — 24,161
Financial assets held at fair value through
profit or loss
Loans and advances to banks 1,351 — 12 — — — — 1,363
Loans and advances to customers 4,103 — 231 — — — — 4,334
Treasury bills and other eligible bills 2,502 — 205 — — — — 2,707
Debt securities 6,193 — 203 — — — — 6,396
Equity shares 165 — 460 — — — — 625
14,314 — 1,111 — — — — 15,425
Derivative financial instruments 68,166 1,491 — — — — — 69,657
Loans and advances to banks — — — — 46,583 — — 46,583
Loans and advances to customers — — — — 174,178 — — 174,178
Investment securities
Treasury bills and other eligible bills — — — 16,713 — — — 16,713
Debt securities — — — 43,543 7,456 37 — 51,036
Equity shares — — — 1,593 — — — 1,593
— — — 61,849 7,456 37 — 69,342
Other assets — — — — 14,773 — 5,601 20,374
Total at 31 December 2008 82,480 1,491 1,111 61,849 267,151 37 5,601 419,720
The Company has investment in debt securities of $2,725 million (2008: $925 million) measured as
loans and receivables and derivative financial assets of $291 million (2008: $nil million) held for
hedging.
520
c102100pu135Proof7:28.3.10B/LRevision:0OperatorBeeR

Liabilities at fair value
Liabilities
Trading
$million
Derivatives
held for
hedging
$million
Designated
at fair
value
through
profit or
loss
$million
Amortised
cost
$million
Non-
financial
liabilities
$million
Total
$million
Financial liabilities held at fair value
through profit or loss
Deposits by banks 432 — 50 — — 482
Customer accounts 1,886 — 3,616 — — 5,502
Debt securities in issue 2,618 — 1,369 — — 3,987
Short positions 4,534 — — — — 4,534
9,470 — 5,035 — — 14,505
Derivative financial instruments 36,007 577 — — — 36,584
Deposits by banks — — — 38,461 — 38,461
Customer accounts — — — 251,244 — 251,244
Debt securities in issue — — — 29,272 — 29,272
Other liabilities — — — 8,513 7,626 16,139
Subordinated liabilities and other
borrowed funds — — — 16,730 — 16,730
Total at 31 December 2009 45,477 577 5,035 344,220 7,626 402,935
Financial liabilities held at fair value
through profit or loss
Deposits by banks1 4,028 — 49 — — 4,077
Customer accounts 1,207 — 3,376 — — 4,583
Debt securities in issue 2,128 — 1,494 — — 3,622
Short positions 3,196 — — — — 3,196
10,559 — 4,919 — — 15,478
Derivative financial instruments 67,212 563 — — — 67,775
Deposits by banks — — — 31,909 — 31,909
Customer accounts — — — 234,008 — 234,008
Debt securities in issue — — — 23,447 — 23,447
Other liabilities — — — 9,401 7,962 17,363
Subordinated liabilities and other
borrowed funds — — — 16,986 — 16,986
Total at 31 December 2008 77,771 563 4,919 315,751 7,962 406,966
1 Trading deposits by banks at 31 December 2008 included $3,093 million in respect of a repo transaction which was eligible fornetting under IAS 32 with balances within trading loans and advances to customers. At 31 December 2009, the net balance of$63 million has been presented within trading loans to customers.
The Company has derivative financial liabilities of $25 million (2008: $26 million) held for hedging,debt securities in issue of $4,770 million (2008: $1,372 million) and subordinated liabilities and other
borrowed funds of $1,751 million (2008: $1,736 million) measured at amortised cost.
Valuation of financial instruments
Instruments held at fair value
Valuation of financial assets and liabilities held at fair value are subject to a review independent of
the business by Valuation Control. For those financial assets and liabilities whose fair value is
determined by reference to externally quoted prices or market observable pricing inputs to valuation
model, an assessment is made against external market data and consensus services. Financialinstruments held at fair value in the balance sheet have been classified into a valuation hierarchy that
reflects the significance of the inputs used in the fair value measurements.
521
c102100pu135Proof7:28.3.10B/LRevision:0OperatorBeeR
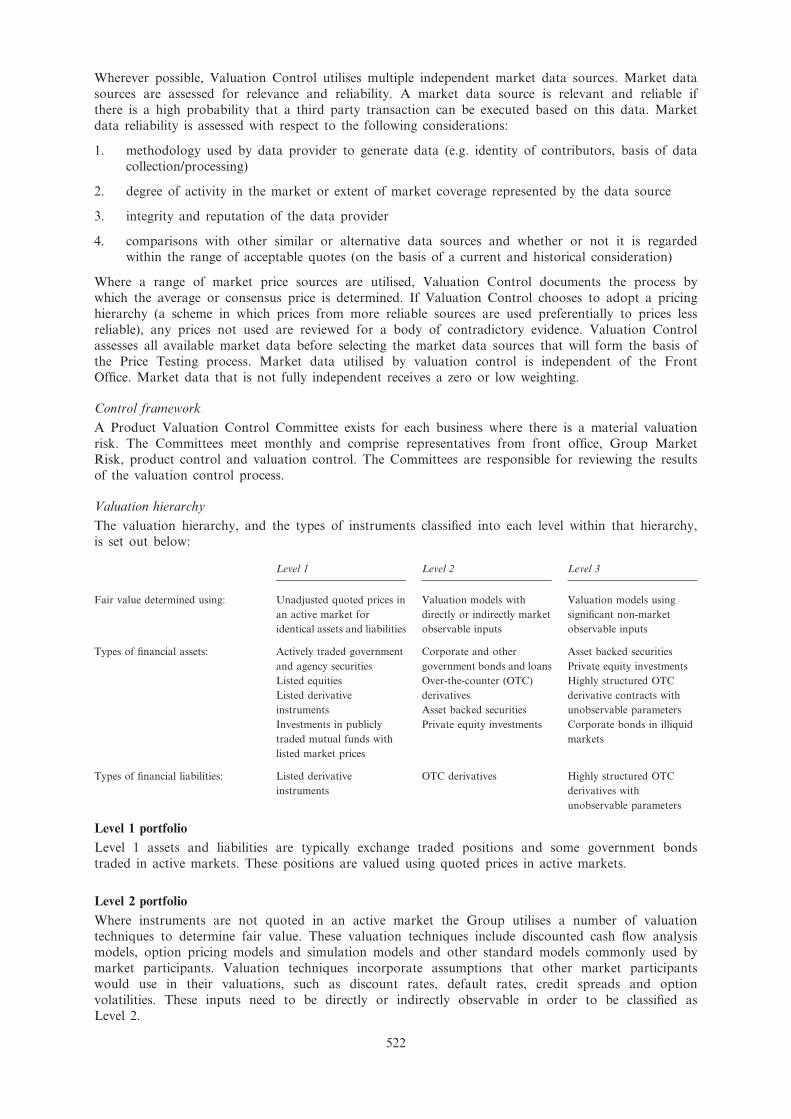
Wherever possible, Valuation Control utilises multiple independent market data sources. Market data
sources are assessed for relevance and reliability. A market data source is relevant and reliable if
there is a high probability that a third party transaction can be executed based on this data. Market
data reliability is assessed with respect to the following considerations:
1. methodology used by data provider to generate data (e.g. identity of contributors, basis of data
collection/processing)
2. degree of activity in the market or extent of market coverage represented by the data source
3. integrity and reputation of the data provider
4. comparisons with other similar or alternative data sources and whether or not it is regarded
within the range of acceptable quotes (on the basis of a current and historical consideration)
Where a range of market price sources are utilised, Valuation Control documents the process by
which the average or consensus price is determined. If Valuation Control chooses to adopt a pricing
hierarchy (a scheme in which prices from more reliable sources are used preferentially to prices less
reliable), any prices not used are reviewed for a body of contradictory evidence. Valuation Control
assesses all available market data before selecting the market data sources that will form the basis of
the Price Testing process. Market data utilised by valuation control is independent of the Front
Office. Market data that is not fully independent receives a zero or low weighting.
Control framework
A Product Valuation Control Committee exists for each business where there is a material valuation
risk. The Committees meet monthly and comprise representatives from front office, Group MarketRisk, product control and valuation control. The Committees are responsible for reviewing the results
of the valuation control process.
Valuation hierarchy
The valuation hierarchy, and the types of instruments classified into each level within that hierarchy,is set out below:
Level 1 Level 2 Level 3
Fair value determined using: Unadjusted quoted prices in
an active market for
identical assets and liabilities
Valuation models with
directly or indirectly market
observable inputs
Valuation models using
significant non-market
observable inputs
Types of financial assets: Actively traded government
and agency securities
Listed equities
Listed derivative
instruments
Investments in publicly
traded mutual funds with
listed market prices
Corporate and other
government bonds and loans
Over-the-counter (OTC)
derivatives
Asset backed securities
Private equity investments
Asset backed securities
Private equity investments
Highly structured OTC
derivative contracts with
unobservable parameters
Corporate bonds in illiquid
markets
Types of financial liabilities: Listed derivative
instruments
OTC derivatives Highly structured OTC
derivatives with
unobservable parameters
Level 1 portfolio
Level 1 assets and liabilities are typically exchange traded positions and some government bonds
traded in active markets. These positions are valued using quoted prices in active markets.
Level 2 portfolio
Where instruments are not quoted in an active market the Group utilises a number of valuation
techniques to determine fair value. These valuation techniques include discounted cash flow analysismodels, option pricing models and simulation models and other standard models commonly used by
market participants. Valuation techniques incorporate assumptions that other market participants
would use in their valuations, such as discount rates, default rates, credit spreads and option
volatilities. These inputs need to be directly or indirectly observable in order to be classified as
Level 2.
522
c102100pu135Proof7:28.3.10B/LRevision:0OperatorBeeR

The Group makes a credit valuation adjustment (CVA) against derivative products, which represents
an estimate of the adjustment to fair value that reflects the possibility that the counterparty may
default such that the Group would not receive the full market value of the transactions. For these
products, the Group uses the Advanced IRB (AIRB) approach to manage its credit risk. All assetsunder the AIRB approach have sophisticated probability of default (PD), loss given default (LGD)
and exposure at default or credit conversion factor models developed to support the credit decision
making process. For CVA, AIRB models are used to calculate the PD and LGD which, together
with the results of the exposure simulation engine, generates a view of expected loss.
In addition to periodic reassessment of the counterparties, credit exposures and external trends which
may impact risk management outcomes are closely monitored. Accounts or portfolios are placed on
Early Alert when they display signs of weakness or financial deterioration, for example where there is
a decline in the customer’s position within the industry, a breach of covenants, non-performance of
an obligation, or there are issues relating to ownership or management. As a result, the reserve
represents a dynamic calculation based on the credit quality of the counterparties, collateral positionsand exposure profiles.
All fair value positions in non-derivative financial instruments are valued at bid (for long positions)
or offer (short) levels. Fair value of derivative positions is initially derived by calculating at mid-market levels. These are then adjusted through bid-offer valuation adjustments to effectively reflect
the long positions at bid and short positions at offer. The resulting valuation is then reflective of the
fair value of that instrument in the market.
In calculating the bid-offer valuation adjustment, reference is usually made to the risk contained
within a similar bucket, for example the interest rate risk is divided in time buckets and a separate
bid-offer valuation adjustment calculated for each one of these. The rationale for following this
methodology is to take account of the different risks that exist for each of the time buckets and the
different hedge transactions that would need to be executed to insulate the gross risk in those
buckets, should the need arise. Similar bucketing also takes place to account for different bid-offer
levels for options which are at the money, out of the money and in the money.
Level 3 portfolio
The primary products classified as Level 3 are as follows:
Investment securities – asset backed securities
The majority of these positions are valued using third party sources. However, due to the severe lack
of liquidity in the market and the prolonged period of time under which many securities have not
traded, obtaining external prices is not a strong enough measure to determine whether an asset has
an observable price or not. Therefore, once external pricing has been verified, the portfolio asset
classes are monitored against market conditions using broker reports in order to establish which assetclasses are seeing some levels of activity and which are completely illiquid. The latter are classified as
Level 3. Where third party pricing is not available, Standard Chartered dealer prices are used with
the asset classified as Level 3.
Equity shares – Private Equity
Unlisted Private Equity investments are generally valued based on earning multiples (Price-to-earnings
(P/E) or Enterprise Value (EV) or Earnings before income tax, Depreciation and Amortisation
(EBITDA)) of comparable listed companies together with the application of a liquidity discount. The
two primary inputs for the valuation of these investments are the actual or forecast earnings of the
investee companies and earning multiples for the comparable listed companies. Even though earning
multiples for the comparable listed companies can be sourced from third party sources (for example,
Bloomberg) and those inputs can be deemed Level 2 inputs, all unlisted investments (excluding those
where some form of observable inputs are available, for example, OTC prices) are classified as Level3 on the grounds that the valuation methods involve significant judgements ranging from determining
comparable companies to liquidity discounts.
Derivatives
These trading derivatives are classified as Level 3 if there are parameters which are unobservable in
the market, such as products where the performance is linked to more than one underlying. Examples
are foreign exchange basket options, equity options based on the performance of two or more
underlying indices and interest rate products with quanto payouts. These unobservable correlation
parameters could only be implied from the market, through methods such as historical analysis and
523
c102100pu135Proof7:28.3.10B/LRevision:0OperatorBeeR

comparison to historical levels or benchmark data. Other derivatives are classified as Level 3 if the
trading is illiquid, such as some emerging market convertible bonds and structured credit products.
The table below shows the classification of financial instruments held at fair value into the valuation
hierarchy set out above as at 31 December 2009.
Level 1 Level 2 Level 3 Total
Assets $million $million $million $million
Financial instruments held at fair value through
profit or loss
Loans and advances to banks 372 1,676 — 2,048
Loans and advances to customers 170 3,341 — 3,511
Treasury bills and other eligible bills 4,537 1,022 — 5,559
Debt securities 5,250 4,732 129 10,111Equity shares 604 37 576 1,217
10,933 10,808 705 22,446
Derivative financial instruments 623 37,432 138 38,193
Investment securitiesTreasury bills and other eligible bills 12,794 6,164 — 18,958
Debt securities 16,366 31,630 437 48,433
Equity shares 595 298 756 1,649
29,755 38,092 1,193 69,040
At 31 December 2009 41,311 86,332 2,036 129,679
Liabilities
Financial instruments held at fair value through
profit or loss
Deposit by banks — 482 — 482
Customer accounts 39 5,463 — 5,502
Debt securities in issue — 3,987 — 3,987Short positions 4,302 232 — 4,534
4,341 10,164 — 14,505
Derivative financial instruments 578 35,856 150 36,584
At 31 December 2009 4,919 46,020 150 51,089
There were no significant transfers between Level 1 and Level 2 in 2009.
As at 31 December 2009, the Company has derivative financial assets of $291 million and derivative
financial liabilities of $25 million classified as Level 2.
524
c102100pu135Proof7:28.3.10B/LRevision:0OperatorBeeR

Level 3 movement tables
Financial assets
Held at fair value through
profit or loss Investment securities
Debt
securities
Equity
shares
Derivative
financial
instruments
Debt
securities
Equity
shares Total
Assets $million $million $million $million $million $million
At 1 January 2009 141 415 260 332 563 1,711
Total (losses)/gains recognised in
income statement (10) 32 (142) (1) (41) (162)
Total gains recognised in other
comprehensive income — 1 12 14 74 101
Purchases — 128 3 307 165 603
Issues — — — — — —
Sales — — (1) (193) (5) (199)
Settlements — — — — — —
Transfers out (2) — — (22) — (24)
Transfers in — — 6 — — 6
At 31 December 2009 129 576 138 437 756 2,036
Total (losses)/gain recognised in
the income statement relating
to assets held at 31 December
2009 (5) 28 39 6 (31) 37
Financial liabilities
Derivative
financial
instruments Total
Liabilities $million $million
At 1 January 2009 181 181
Total gains recognised in income statement (70) (70)
Total losses recognised in other comprehensive income 16 16
Purchases — —
Issues — —
Sales — —
Settlements 23 23Transfers out — —
Transfers in — —
At 31 December 2009 150 150
Total losses recognised in the income statement relating to liabilities held at31 December 2009 (31) (31)
525
c102100pu135Proof7:28.3.10B/LRevision:0OperatorBeeR

There were no significant transfers into or out of Level 3 fair value in 2009.
Sensitivities in respect of the fair values of Level 3 assets and liabilities
Held at fair value through profit or loss Available-for-sale
At 31 December 2009
Net
exposure
$million
Favourable
changes
$million
Unfavourable
changes
$million
Net
exposure
$million
Favourable
changes
$million
Unfavourable
changes
$million
Financial instruments held at fair value
through profit or loss
Debt securities 129 130 126 — — —
Equity shares 576 634 518 — — —
Derivative financial instruments (12) 2 (14) — — —
Investment securities
Debt securities — — — 437 452 427
Equity shares — — — 756 835 676
Total 693 766 630 1,193 1,287 1,103
Where the fair value of financial instruments are measured using valuation techniques that
incorporate one or more insignificant inputs which are based on unobservable market data, the
Company applies stress on these unobservable parameter inputs. A 10% increase or decrease in
correlation and credit sensitivities generates a range of reasonably possible alternative valuations. As
of 31 December 2009, these stresses could have increased fair values of financial instruments held at
fair value through profit or loss by $73 million and available-for-sale by $94 million, or decreased fair
values of financial instruments held at fair value through profit or loss by $63 million and available-
for-sale by $90 million.
Instruments carried at amortised cost
The following table summarises the carrying amounts and fair values of those financial assets and
liabilities not presented on the Group’s balance sheet at fair value. The fair values in the table below
are stated as at 31 December and may be different from the actual amount that will be received/paid
on the settlement or maturity of the financial instrument.
2009 2008
Book
amount Fair value
Book
amount Fair value
$million $million $million $million
Assets
Cash and balances at central banks 18,131 18,131 24,161 24,161
Loans and advances to banks 50,885 50,906 46,583 45,855
Loans and advances to customers 198,292 199,739 174,178 170,410Investment securities 6,688 6,556 7,493 6,729
Other assets 11,181 11,181 14,773 14,773
LiabilitiesDeposits by banks 38,461 38,169 31,909 31,713
Customer accounts 251,244 249,548 234,008 230,558
Debt securities in issue 29,272 27,261 23,447 23,097
Subordinated liabilities and other borrowed funds 16,730 16,687 16,986 13,903
Other liabilities 8,513 8,513 9,401 9,401
526
c102100pu135Proof7:28.3.10B/LRevision:0OperatorBeeR
The following sets out the Group’s basis of establishing fair values of the financial instruments shown
above.
Cash and balances at central banks
The fair value of cash and balances at central banks is their carrying amounts.
Loans and advances to banks and customers
For loans and advances to banks, the fair value of floating rate placements and overnight deposits is
their carrying amounts. The estimated fair value of fixed interest bearing deposits is based on
discounted cash flows using the prevailing money market rates for debts with a similar credit risk andremaining maturity.
The Group’s loans and advances to customers portfolio is well diversified by geography and industry.
Approximately one-third of the portfolio reprices within one month, and over 50% reprices within 12months. The fair value of loans and advances to customers with a residual maturity of less than one
year is their carrying value. Loans and advances are presented net of provisions for impairment. The
estimated fair value of loans and advances with a residual maturity of more than one year represents
the discounted amount of future cash flows expected to be received, including assumptions relating to
prepayment rates and, where appropriate, credit spreads. Expected cash flows are discounted at
current market rates to determine fair value. The Group has a wide range of individual instruments
within its loans and advances portfolio and as a result providing quantification of the key
assumptions used to value such instruments is impractical, with no one assumption being material.
Investment securities
For investment securities that do not have directly observable market values, the Group utilises a
number of valuation techniques to determine fair value. Where available, securities are valued using
inputs proxied from the same or closely related underlying (for example, bond spreads from the same
or closely related issuer) or inputs proxied from a different underlying (for example, a similar bond
but using spreads for a particular sector and rating). Certain instruments cannot be proxied as set outabove, and in such cases the positions are valued using non-market observable inputs. This includes
those instruments held at amortised cost and predominantly relate to asset backed securities. The fair
value for such instruments is usually proxied from internal assessments of the underlying cash flows.
The Group has a wide range of individual investments within the unlisted debt securities portfolio.
Given the number of instruments involved, providing quantification of the key assumptions used to
value such instruments is impractical, with no one assumption being material.
Deposits and borrowings
The estimated fair value of deposits with no stated maturity is the amount repayable on demand. The
estimated fair value of fixed interest bearing deposits and other borrowings without quoted market
prices is based on discounting cash flows using the prevailing market rates for debts with a similar
credit risk and remaining maturity.
Debt securities in issue, subordinated liabilities and other borrowed funds
The aggregate fair values are calculated based on quoted market prices. For those notes where quotedmarket prices are not available, a discounted cash flow model is used based on a current market
related yield curve appropriate for the remaining term to maturity.
Reclassification of financial assets
In 2008 the Group reclassified certain financial assets classified as held for trading into the available-
for-sale (AFS) category as these were no longer considered to be held for the purpose of selling or
repurchasing in the near term. At the time of transfer, the Group identified the rare circumstancespermitting such a transfer as the impact of the ongoing credit crisis in financial markets, particularly
from the beginning of 2008, which significantly impacted the liquidity in certain markets. The Group
also reclassified certain eligible financial assets from trading and AFS categories to loans and
receivables.
527
c102100pu135Proof7:28.3.10B/LRevision:0OperatorBeeR
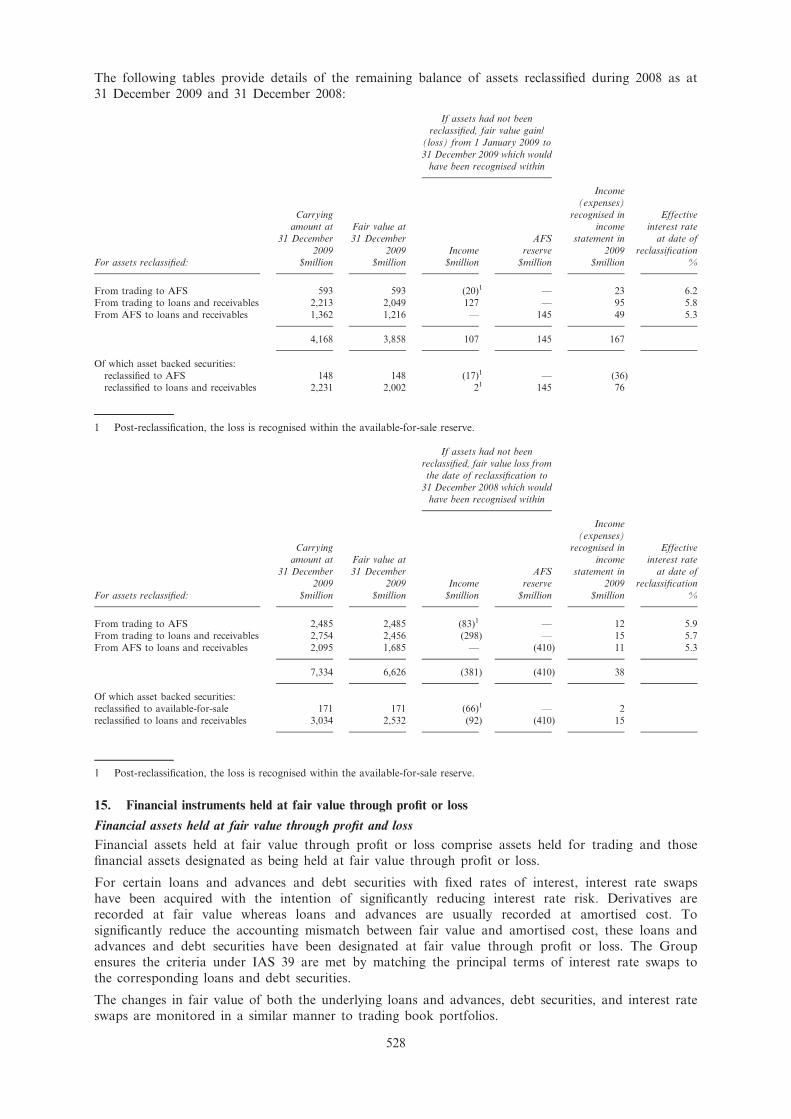
The following tables provide details of the remaining balance of assets reclassified during 2008 as at
31 December 2009 and 31 December 2008:
If assets had not been
reclassified, fair value gain/
(loss) from 1 January 2009 to
31 December 2009 which would
have been recognised within
Carrying
amount at
31 December
2009
Fair value at
31 December
2009 Income
AFS
reserve
Income
(expenses)
recognised in
income
statement in
2009
Effective
interest rate
at date of
reclassification
For assets reclassified: $million $million $million $million $million %
From trading to AFS 593 593 (20)1 — 23 6.2
From trading to loans and receivables 2,213 2,049 127 — 95 5.8
From AFS to loans and receivables 1,362 1,216 — 145 49 5.3
4,168 3,858 107 145 167
Of which asset backed securities:
reclassified to AFS 148 148 (17)1 — (36)
reclassified to loans and receivables 2,231 2,002 21 145 76
1 Post-reclassification, the loss is recognised within the available-for-sale reserve.
If assets had not been
reclassified, fair value loss from
the date of reclassification to
31 December 2008 which would
have been recognised within
Carrying
amount at
31 December
2009
Fair value at
31 December
2009 Income
AFS
reserve
Income
(expenses)
recognised in
income
statement in
2009
Effective
interest rate
at date of
reclassification
For assets reclassified: $million $million $million $million $million %
From trading to AFS 2,485 2,485 (83)1 — 12 5.9
From trading to loans and receivables 2,754 2,456 (298) — 15 5.7
From AFS to loans and receivables 2,095 1,685 — (410) 11 5.3
7,334 6,626 (381) (410) 38
Of which asset backed securities:
reclassified to available-for-sale 171 171 (66)1 — 2
reclassified to loans and receivables 3,034 2,532 (92) (410) 15
1 Post-reclassification, the loss is recognised within the available-for-sale reserve.
15. Financial instruments held at fair value through profit or loss
Financial assets held at fair value through profit and loss
Financial assets held at fair value through profit or loss comprise assets held for trading and those
financial assets designated as being held at fair value through profit or loss.
For certain loans and advances and debt securities with fixed rates of interest, interest rate swaps
have been acquired with the intention of significantly reducing interest rate risk. Derivatives are
recorded at fair value whereas loans and advances are usually recorded at amortised cost. To
significantly reduce the accounting mismatch between fair value and amortised cost, these loans and
advances and debt securities have been designated at fair value through profit or loss. The Group
ensures the criteria under IAS 39 are met by matching the principal terms of interest rate swaps to
the corresponding loans and debt securities.
The changes in fair value of both the underlying loans and advances, debt securities, and interest rate
swaps are monitored in a similar manner to trading book portfolios.
528
c102100pu135Proof7:28.3.10B/LRevision:0OperatorBeeR
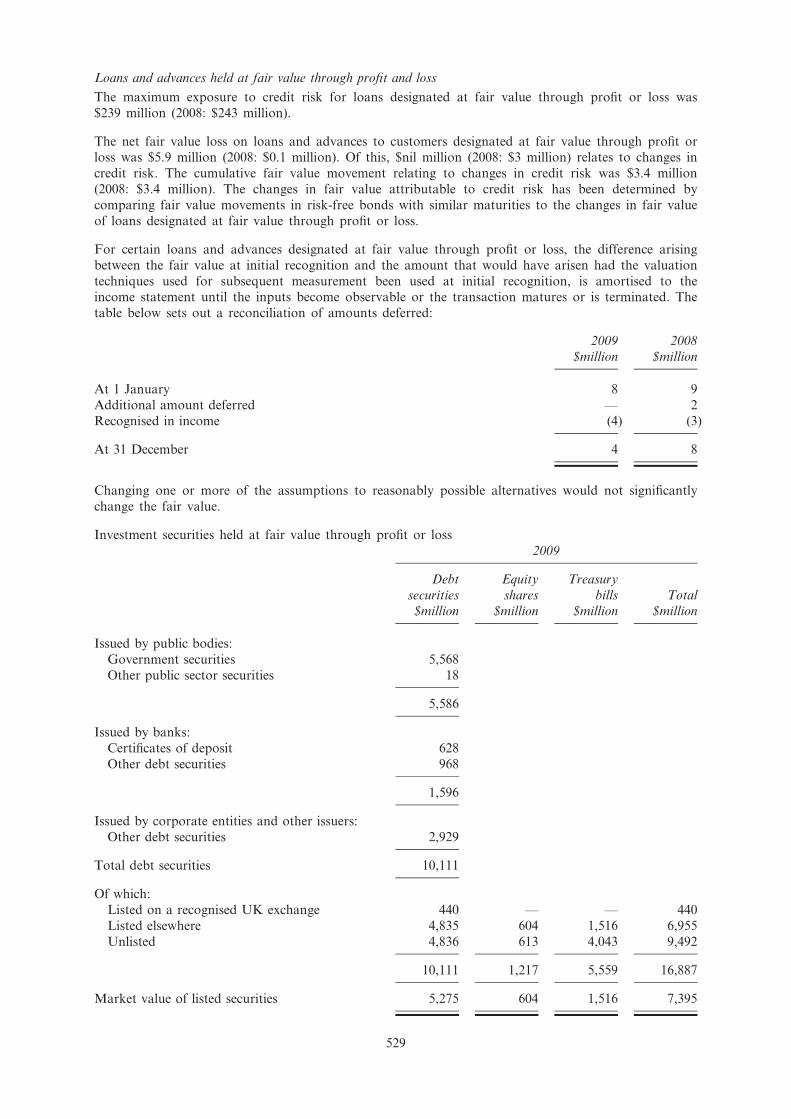
Loans and advances held at fair value through profit and loss
The maximum exposure to credit risk for loans designated at fair value through profit or loss was
$239 million (2008: $243 million).
The net fair value loss on loans and advances to customers designated at fair value through profit orloss was $5.9 million (2008: $0.1 million). Of this, $nil million (2008: $3 million) relates to changes in
credit risk. The cumulative fair value movement relating to changes in credit risk was $3.4 million
(2008: $3.4 million). The changes in fair value attributable to credit risk has been determined by
comparing fair value movements in risk-free bonds with similar maturities to the changes in fair value
of loans designated at fair value through profit or loss.
For certain loans and advances designated at fair value through profit or loss, the difference arising
between the fair value at initial recognition and the amount that would have arisen had the valuation
techniques used for subsequent measurement been used at initial recognition, is amortised to theincome statement until the inputs become observable or the transaction matures or is terminated. The
table below sets out a reconciliation of amounts deferred:
2009 2008
$million $million
At 1 January 8 9
Additional amount deferred — 2
Recognised in income (4) (3)
At 31 December 4 8
Changing one or more of the assumptions to reasonably possible alternatives would not significantly
change the fair value.
Investment securities held at fair value through profit or loss
2009
Debt Equity Treasury
securities shares bills Total
$million $million $million $million
Issued by public bodies:
Government securities 5,568
Other public sector securities 18
5,586
Issued by banks:
Certificates of deposit 628
Other debt securities 968
1,596
Issued by corporate entities and other issuers:
Other debt securities 2,929
Total debt securities 10,111
Of which:
Listed on a recognised UK exchange 440 — — 440
Listed elsewhere 4,835 604 1,516 6,955
Unlisted 4,836 613 4,043 9,492
10,111 1,217 5,559 16,887
Market value of listed securities 5,275 604 1,516 7,395
529
c102100pu135Proof7:28.3.10B/LRevision:0OperatorBeeR

2008
Debt Equity Treasury
securities shares bills Total
$million $million $million $million
Issued by public bodies:
Government securities 4,346
Other public sector securities 17
4,363
Issued by banks:
Certificates of deposit 33
Other debt securities 798
831
Issued by corporate entities and other issuers:
Other debt securities 1,202
Total debt securities 6,396
Of which:
Listed on a recognised UK exchange 14 — — 14
Listed elsewhere 2,216 197 1,085 3,498
Unlisted 4,166 428 1,622 6,216
6,396 625 2,707 9,728
Market value of listed securities 2,230 197 1,085 3,512
Financial liabilities held at fair value through profit and loss
The Group designates certain financial liabilities at fair value through profit or loss where either the
liabilities:
* have fixed rates of interest and interest rate swaps or other interest rate derivatives have been
entered into with the intention of significantly reducing interest rate risk; or
* are exposed to foreign currency risk and derivatives have been acquired with the intention of
significantly reducing exposure to market changes; or
* have been acquired to fund trading asset portfolios or assets, or where the assets and liabilitiesare managed, and performance evaluated, on a fair value basis for a documented risk
management or investment strategy.
Derivatives are recorded at fair value whereas non-trading financial liabilities (unless designated at fairvalue) are recorded at amortised cost. Designation of certain liabilities at fair value through profit or
loss significantly reduces the accounting mismatch between fair value and amortised cost expense
recognition (a criterion of IAS 39). The Group ensures the criteria under IAS 39 are met by matching
the principal terms of derivatives to the corresponding liabilities, either individually or on a portfolio
basis.
The changes in fair value of both the underlying liabilities and derivatives are monitored in a similar
manner to trading book portfolios.
The net fair value gain on liabilities designated at fair value through profit or loss was $70 million
for the year (2008: loss of $118 million). Of this, a gain of $6.0 million (2008: loss of $11.2 million)
relates to changes in credit risk. The cumulative fair value movement relating to changes in credit risk
was a loss of $10.4 million (2008: a loss of $16.4 million).
As at 31 December 2009, the amount the Group is contractually obliged to pay at maturity to the
holders of these obligations was $505 million higher (2008: $407 million higher) than the carrying
amount at fair value.
530
c102100pu135Proof7:28.3.10B/LRevision:0OperatorBeeR

The change in fair value attributable to credit risk was determined by comparing fair value
movements in risk-free debt instruments with similar maturities, to the changes in fair value of
liabilities designated at fair value through profit or loss.
16. Derivatives financial instruments
Derivatives are financial instruments that derive their value in response to changes in interest rates,
financial instrument prices, commodity prices, foreign exchange rates, credit risk and indices. The
types of derivatives used by the Group and Company are set out below. All derivatives are classified
as trading and recognised and subsequently measured at fair value, with all revaluation gains
recognised in profit and loss (except where cash flow or net investment hedging has been achieved, in
which case the effective portion of changes in fair value is recognised within reserves).
The tables below analyse the notional principal amounts and the positive and negative fair values of
the Group’s and Company’s derivative financial instruments. Notional principal amounts are theamount of principal underlying the contract at the reporting date.
The Group and Company limit exposure to credit losses in the event of default by entering into
master netting agreements with certain market counterparties. As required by IAS 32, exposures arenot presented net in these accounts as in the ordinary course of business they are not intended to be
settled net. Details of the amounts available for offset can be found in note 48, under maximum
exposure to credit risk.
The Derivatives and Hedging sections of the Risk review on page 65 of the 2009 Annual Report
explain the Group’s and the Company’s risk management of derivative contracts and application of
hedging.
531
c102100pu135Proof7:28.3.10B/LRevision:0OperatorBeeR

Group
2009 2008
Notional Notional
principal principal
amounts Assets Liabilities amounts Assets Liabilities
Total derivatives $million $million $million $million $million $million
Foreign exchange derivative
contracts
Forward foreign exchange
contracts 701,502 9,052 7,920 832,915 23,096 21,017
Currency swaps and options 448,615 9,753 9,621 528,215 18,760 19,253
Exchange traded futures and
options 774 — — 742 — —
1,150,891 18,805 17,541 1,361,872 41,856 40,270
Interest rate derivative contracts
Swaps 1,210,432 14,230 13,946 1,089,407 21,992 21,451
Forward rate agreements and
options 233,769 2,498 2,472 170,700 1,076 1,451
Exchange traded futures and
options 252,625 83 84 242,694 557 429
1,696,826 16,811 16,502 1,502,801 23,625 23,331
Credit derivative contracts 35,133 835 845 29,033 926 961
Equity and stock index options 3,208 470 613 1,075 219 233
Commodity derivative contracts 19,066 1,272 1,083 16,200 3,031 2,980
Total derivatives 2,905,124 38,193 36,584 2,910,981 69,657 67,775
Company
2009 2008
Notional Notional
principal principal
amounts Assets Liabilities amounts Assets Liabilities
Total derivatives $million $million $million $million $million $million
Foreign exchange derivative
contracts
Currency swaps 3,189 291 — 1,044 — 26
3,189 291 — 1,044 — 26
Interest rate derivative contracts
Swaps 1,539 — 25 — — —
1,539 — 25 — — —
Total derivatives 4,728 291 25 1,044 — 26
532
c102100pu135Proof7:28.3.10B/LRevision:0OperatorBeeR
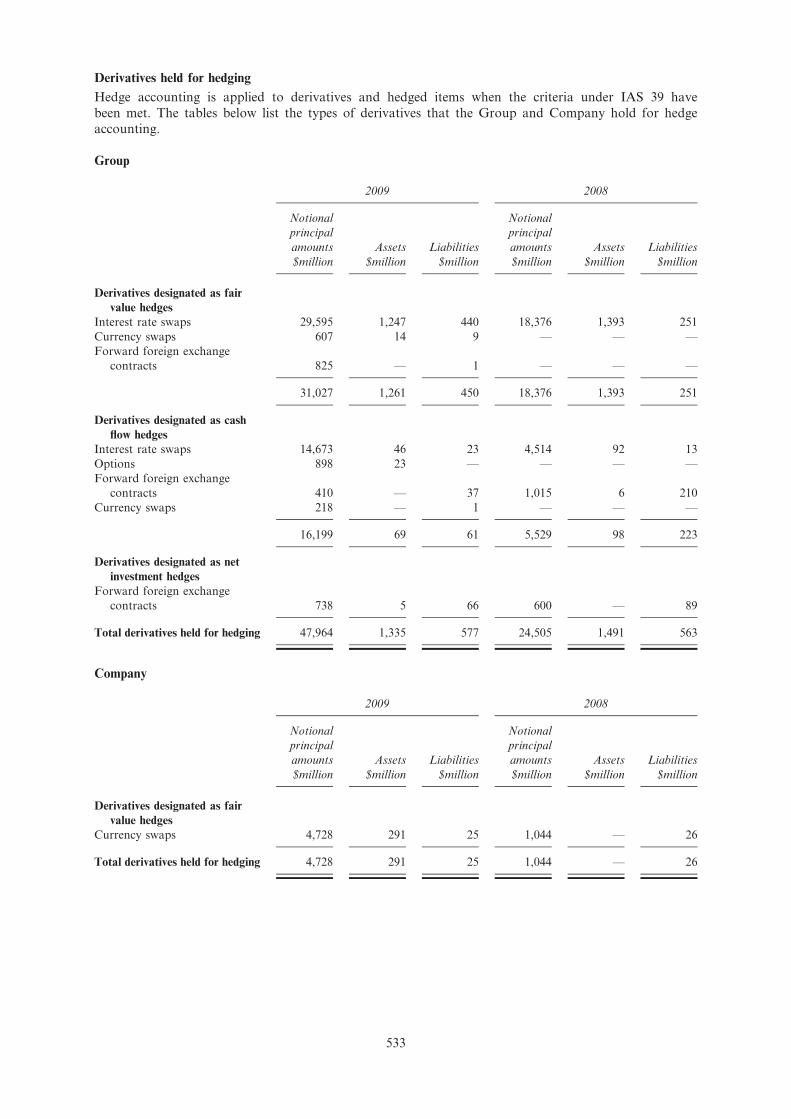
Derivatives held for hedging
Hedge accounting is applied to derivatives and hedged items when the criteria under IAS 39 have
been met. The tables below list the types of derivatives that the Group and Company hold for hedgeaccounting.
Group
2009 2008
Notional
principal
amounts Assets Liabilities
Notional
principal
amounts Assets Liabilities
$million $million $million $million $million $million
Derivatives designated as fair
value hedges
Interest rate swaps 29,595 1,247 440 18,376 1,393 251
Currency swaps 607 14 9 — — —
Forward foreign exchange
contracts 825 — 1 — — —
31,027 1,261 450 18,376 1,393 251
Derivatives designated as cash
flow hedges
Interest rate swaps 14,673 46 23 4,514 92 13
Options 898 23 — — — —
Forward foreign exchange
contracts 410 — 37 1,015 6 210
Currency swaps 218 — 1 — — —
16,199 69 61 5,529 98 223
Derivatives designated as net
investment hedges
Forward foreign exchange
contracts 738 5 66 600 — 89
Total derivatives held for hedging 47,964 1,335 577 24,505 1,491 563
Company
2009 2008
Notional
principal
amounts Assets Liabilities
Notional
principal
amounts Assets Liabilities
$million $million $million $million $million $million
Derivatives designated as fair
value hedges
Currency swaps 4,728 291 25 1,044 — 26
Total derivatives held for hedging 4,728 291 25 1,044 — 26
533
c102100pu135Proof7:28.3.10B/LRevision:0OperatorBeeR
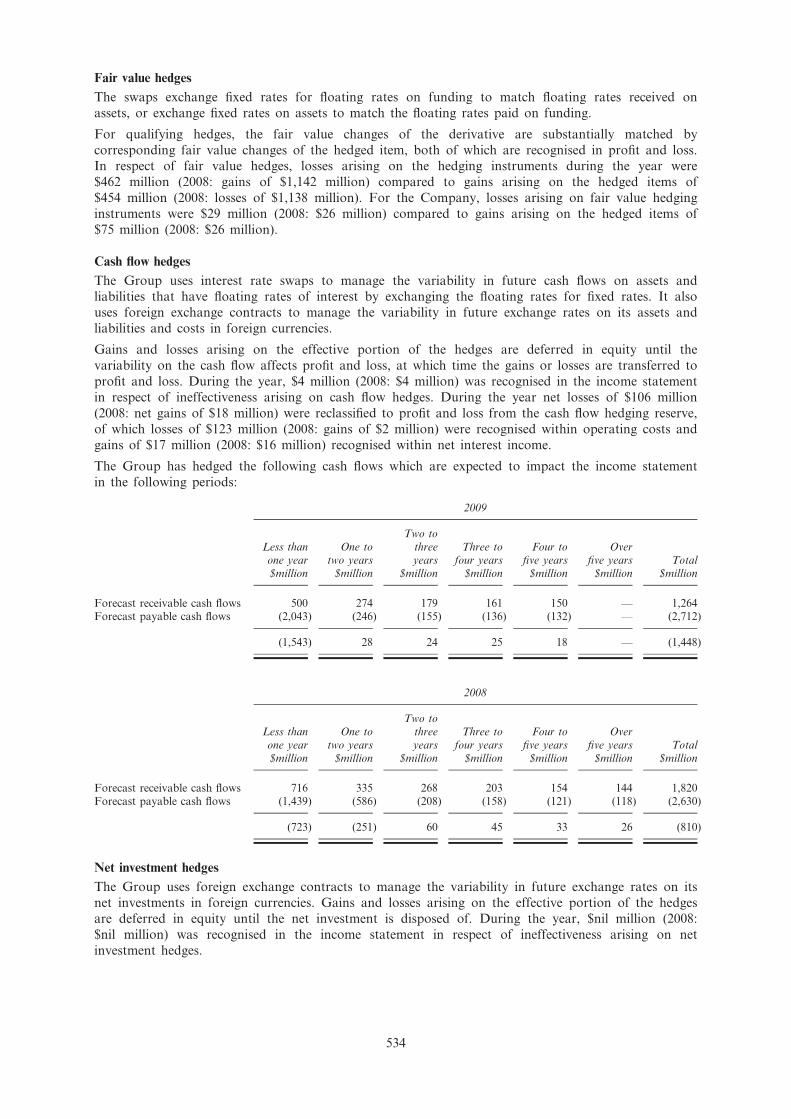
Fair value hedges
The swaps exchange fixed rates for floating rates on funding to match floating rates received on
assets, or exchange fixed rates on assets to match the floating rates paid on funding.
For qualifying hedges, the fair value changes of the derivative are substantially matched by
corresponding fair value changes of the hedged item, both of which are recognised in profit and loss.In respect of fair value hedges, losses arising on the hedging instruments during the year were
$462 million (2008: gains of $1,142 million) compared to gains arising on the hedged items of
$454 million (2008: losses of $1,138 million). For the Company, losses arising on fair value hedging
instruments were $29 million (2008: $26 million) compared to gains arising on the hedged items of
$75 million (2008: $26 million).
Cash flow hedges
The Group uses interest rate swaps to manage the variability in future cash flows on assets andliabilities that have floating rates of interest by exchanging the floating rates for fixed rates. It also
uses foreign exchange contracts to manage the variability in future exchange rates on its assets and
liabilities and costs in foreign currencies.
Gains and losses arising on the effective portion of the hedges are deferred in equity until the
variability on the cash flow affects profit and loss, at which time the gains or losses are transferred to
profit and loss. During the year, $4 million (2008: $4 million) was recognised in the income statement
in respect of ineffectiveness arising on cash flow hedges. During the year net losses of $106 million
(2008: net gains of $18 million) were reclassified to profit and loss from the cash flow hedging reserve,
of which losses of $123 million (2008: gains of $2 million) were recognised within operating costs and
gains of $17 million (2008: $16 million) recognised within net interest income.
The Group has hedged the following cash flows which are expected to impact the income statement
in the following periods:
2009
Two toLess than One to three Three to Four to Overone year two years years four years five years five years Total$million $million $million $million $million $million $million
Forecast receivable cash flows 500 274 179 161 150 — 1,264Forecast payable cash flows (2,043) (246) (155) (136) (132) — (2,712)
(1,543) 28 24 25 18 — (1,448)
2008
Two toLess than One to three Three to Four to Overone year two years years four years five years five years Total$million $million $million $million $million $million $million
Forecast receivable cash flows 716 335 268 203 154 144 1,820Forecast payable cash flows (1,439) (586) (208) (158) (121) (118) (2,630)
(723) (251) 60 45 33 26 (810)
Net investment hedges
The Group uses foreign exchange contracts to manage the variability in future exchange rates on its
net investments in foreign currencies. Gains and losses arising on the effective portion of the hedges
are deferred in equity until the net investment is disposed of. During the year, $nil million (2008:
$nil million) was recognised in the income statement in respect of ineffectiveness arising on net
investment hedges.
534
c102100pu135Proof7:28.3.10B/LRevision:0OperatorBeeR

17. Loans and advances to banks
2009 2008
$million $million
Loans and advances to banks 53,067 47,969
Individual impairment provision (note 20) (132) (17)
Portfolio impairment provision (note 20) (2) (6)
52,933 47,946
Of which: loans and advances held at fair value through profit or loss (note 14) (2,048) (1,363)
50,885 46,583
18. Loans and advances to customers
2009 2008
$million $million
Loans and advances to customers 204,530 180,470
Individual impairment provision (note 20) (1,853) (1,307)Portfolio impairment provision (note 20) (874) (651)
201,803 178,512
Of which: loans and advances held at fair value through profit or loss (note 14) (3,511) (4,334)
198,292 174,178
Loans and advances sold subject to sale and repurchase transactions 231 106
The Group has transferred to third parties by way of securitisation the rights to any collections ofprincipal and interest on customer loan assets with a face value of $3,601 million (2008:
$4,192 million). The Group continues to be exposed to related credit and foreign exchange risk on
these assets. The Group continues to recognise these assets in addition to the proceeds and related
liability of $3,063 million (2008: $4,583 million) arising from the securitisations.
The Group has entered into synthetic credit default swaps for portfolio management purposes,
referencing loan assets with a notional value of $15.4 billion (2008: $15.7 billion). The Group
continues to hold the underlying assets referenced in the synthetic credit default swaps.
The Group has outstanding residential mortgage loans to Korea residents of $20.5 billion (2008: $17.1
billion) and Hong Kong residents of $14.8 billion (2008: $13.0 billion).
19. Assets leased to customers
Finance leases and instalment credit
2009 2008
$million $million
Finance leases 399 468
Instalment credit agreements 706 784
1,105 1,252
The above assets are included within loans and advances to customers. The cost of assets acquired
during the year for leasing to customers under finance leases and instalment credit agreements
amounted to $228 million (2008: $154 million).
535
c102100pu135Proof7:28.3.10B/LRevision:0OperatorBeeR

2009 2008
$million $million
Minimum lease receivables under finance leases falling due:
Within one year 52 47
Later than one year and less than five years 389 354
After five years — 125
441 526
Interest income relating to future periods (42) (58)
Present value of finance lease receivables 399 468
Of which:
Falls due within one year 35 46
Falls due later than one year and less than five years 364 321
Falls due after five years — 101
Operating lease assets
Assets leased to customers under operating leases consist of commercial aircraft which are includedwithin property, plant and equipment in note 27. At 31 December 2009 these assets had a net book
value of $1,606 million (2008: $1,029 million).
2009 2008
$million $million
Minimum lease receivables under operating leases falling due:
Within one year 175 111
Later than one year and less than five years 679 451After five years 386 297
1,240 859
20. Impairment provisions on loans and advances
2009 2008
$million $million
At 1 January 1,981 1,809
Exchange translation differences 70 (179)Acquisitions — 109
Amounts written off (1,332) (1,119)
Recoveries of acquisition fair values (39) (78)
Recoveries of amounts previously written off 191 180
Discount unwind (58) (40)
Other 53 13
New provisions 2,613 1,796
Recoveries/provisions no longer required (618) (510)Net charge against profit 1,995 1,286
Provisions held at 31 December 2,861 1,981
536
c102100pu135Proof7:28.3.10B/LRevision:0OperatorBeeR

The following table reconciles the charge for impairment provisions on loans and advances to the
total impairment charge and other credit commitments:
2009 2008
$million $million
Net charge against profit on loans and advances:
Individual impairment charge 1,799 1,168
Portfolio impairment charge 196 118
1,995 1,286
(Release)/provisions related to credit commitments (2) 27
Impairment charges relating to debt securities classified as loans and
receivables 7 8
Total impairment charge and other credit risk provisions 2,000 1,321
The following table shows impairment provisions on loans and advances by each principal category
of borrowers’ business or industry:
2009 2008
$million $million
Loans to individuals
Mortgages 107 88
Other 201 191Small and medium enterprises 230 263
Consumer Banking 538 542
Agriculture, forestry and fishing 59 39
Construction 36 18
Commerce 425 134
Electricity, gas and water 7 28
Financing, insurance and business services 130 31Mining and quarrying 6 —
Manufacturing 590 458
Commercial real estate 13 21
Transport, storage and communication 24 24
Other 25 12
Wholesale Banking 1,315 765
Individual impairment provision against loans and advances to customers
(note 18) 1,853 1,307Individual impairment provision against loans and advances to banks (note 17) 132 17
Portfolio impairment provision (note 17, 18) 876 657
Total impairment provisions on loans and advances 2,861 1,981
537
c102100pu135Proof7:28.3.10B/LRevision:0OperatorBeeR

21. Individually impaired loans and advances
2009 2008
Wholesale Wholesale Wholesale Wholesale
Banking – Banking – Banking – Banking –
Consumer Loans to Loans to Consumer Loans to Loans to
Banking customers banks Total Banking customers banks Total
$million $million $million $million $million $million $million $million
Individual impaired loans 1,030 2,474 286 3,790 1,062 1,576 35 2,673
Individual impairment
provisions (538) (1,315) (132) (1,985) (543) (764) (17) (1,324)
Net impaired loans 492 1,159 154 1,805 519 812 18 1,349
Estimated fair value of
collateral held 601 557 — 1,158 631 205 — 836
Collateral held as security against impaired loans primarily relates to property, equipment and
guarantees. Where the fair value of collateral held exceeds the outstanding loan, any excess is paid
back to the customers and is not available for offset against other loans.
22. Investment securities
2009
Debt securities
Held-to- Available- Loans and Equity Treasurymaturity for-sale receivables1 shares bills Total$million $million $million $million $million $million
Issued by public bodies:Government securities 31 16,825 392Other public sectorsecurities — 1,530 18
31 18,355 410
Issued by banks:Certificates of deposit — 5,875 1,795Other debt securities — 17,445 1,852
— 23,320 3,647
Issued by corporateentities and otherissuers:Other debt securities — 6,758 2,600
Total debt securities 31 48,433 6,657
Of which:Listed on a recognisedUK exchange — 5,180 — 105 — 5,285Listed elsewhere 29 17,451 1,287 289 5,241 24,297Unlisted 2 25,802 5,370 1,255 13,717 46,146
31 48,433 6,657 1,649 18,958 75,728
Market value of listedsecurities 29 22,631 1,270 394 5,241 29,565
Investment securities soldsubject to sale andrepurchase transactions — 618 — 72 547 1,237
1 Includes debt securities of $850 million which are listed or registered on a recognised UK exchange or elsewhere but the marketsremain illiquid.
538
c102100pu135Proof7:28.3.10B/LRevision:0OperatorBeeR

2008
Debt securities
Held-to- Available- Loans and Equity Treasury
maturity for-sale receivables1 shares bills Total
$million $million $million $million $million $million
Issued by public
bodies:
Government
securities 37 17,849 389
Other public sector
securities — 1,864 —
37 19,713 389
Issued by banks:
Certificates of
deposit — 6,771 1,969
Other debt
securities — 13,597 735
— 20,368 2,704
Issued by corporate
entities and other
issuers:
Other debt
securities — 3,462 4,363
Total debt securities 37 43,543 7,456
Of which:
Listed on a
recognised UK
exchange — 4,096 1,217 35 — 5,348
Listed elsewhere 35 15,479 2,750 586 5,711 24,561Unlisted 2 23,968 3,489 972 11,002 39,433
37 43,543 7,456 1,593 16,713 69,342
Market value of listed
securities 35 19,575 3,903 621 5,711 29,845
Investment securities
subject to sale and
repurchasetransactions — 1,855 — — 1,455 3,310
1 Includes debt securities of $972 million which are listed or registered on a recognised UK exchange or elsewhere but the marketsremain illiquid.
539
c102100pu135Proof7:28.3.10B/LRevision:0OperatorBeeR

Equity shares largely comprised investments in corporates.
The change in the carrying amount of investment securities comprised:
2009 2008
Debt Equity Treasury Debt Equity Treasury
securities shares bills Total securities shares bills Total
$million $million $million $million $million $million $million $million
At 1 January 51,036 1,593 16,713 69,342 40,917 2,690 11,667 55,274
Exchange translation
differences 1,635 20 539 2,194 (3,318) (97) (2,171) (5,586)
Acquisitions — 1 — 1 2,572 4 382 2,958
Additions 86,712 369 42,658 129,739 71,073 933 37,932 109,938
Reclassifications1 — — — — 5,237 (69) 43 5,211
Disposal on sale of business — — — — — (9) — (9)
Maturities and disposals (84,857) (807) (41,014) (126,678) (65,426) (854) (31,476) (97,756)
Impairment, net of
recoveries on disposal (81) 8 — (73) (109) (315) (1) (425)
Changes in fair value
(including the effect of
fair value hedging) 29 465 (53) 441 (106) (687) 140 (653)
Amortisation of discounts
and premiums 647 — 115 762 196 (3) 197 390
At 31 December 55,121 1,649 18,958 75,728 51,036 1,593 16,713 69,342
1 In 2008, reclassifications for equity shares relates to a security held by the Group’s private equity business which became eligible tobe designated at fair value through profit or loss as permitted by IAS 28. The remainder of the reclassifications are in respect ofsecurities reclassified as disclosed in note 14.
In 2008, the Group took advantage of the Term Auction Facility (TAF) introduced by the Federal
Reserve Bank of New York, by borrowing $2,850 million. Under the TAF, no single security was
earmarked as collateral for the borrowing. The value of securities that is considered to be encumbered
in relation to this borrowing was $3,197 million and the borrowing was included as a sale and
repurchase transaction within customer accounts.
At 31 December 2009, unamortised premiums on debt securities held for investment purposes
amounted to $669 million (2008: $271 million) and unamortised discounts amounted to $725 million
(2008: $743 million). Income from listed equity shares amounted to $12 million (2008: $20 million)and income from unlisted equity shares amounted to $97 million (2008: $183 million).
The change in impairment provisions is as follows:
2009 2008
Debt Equity Treasury Debt Equity Treasury
securities shares bills Total securities shares bills Total
$million $million $million $million $million $million $million $million
At 1 January 158 311 1 470 54 22 2 78
Exchange translation
differences 1 1 — 2 (4) — (2) (6)
Amounts written off (49) (68) (1) (118) (1) (26) — (27)
Impairment, net of
recoveries on disposals1 81 (8) — 73 109 315 1 425
At 31 December 191 236 — 427 158 311 1 470
1 Impairment charge includes recoveries of impairment on disposal of equity investment of $57 million (2008: $nil million). Of thenew provisions raised of $130 million (2008: $425 million), $7 million (2008: $8 million) relates to debt securities measured as loansand receivables and is included with impairment losses on loans and advances and other credit provisions, with the balancereported within ‘Other Impairment’
Loans and receivables debt securities held by the Company of $2,725 million (2008: $925 million)
comprises corporate securities issued by Standard Chartered Bank with a fair value of $2,743 million
(2008: $698 million).
540
c102100pu135Proof7:28.3.10B/LRevision:0OperatorBeeR

23. Other assets
2009 2008
$million $million
Financial assets held at amortised cost (note 14)Hong Kong SAR government certificates of indebtedness (note 33) 3,414 3,097
Cash collateral 4,557 9,102
Acceptances and endorsements 3,080 2,574
Other 130 —
11,181 14,773
Non-financial assets
Other assets 6,020 5,601
17,201 20,374
The Hong Kong SAR government certificates of indebtedness are subordinated to the claims of other
parties in respect of bank notes issued.
The Company has $nil million (2008: $64 million) of other assets.
24. Investments in subsidiary undertakings, joint ventures and associates
2009 2008
Investment in subsidiary undertakings $million $million
At 1 January 10,406 10,406
Additions 2,500 —
At 31 December 12,906 10,406
At 31 December 2009, the principal subsidiary undertakings, all indirectly held and principally
engaged in the business of banking and provision of other financial services, were as follows:
Country and place of incorporation or
registration Main areas of operation
Group interest in
ordinary share capital
%
Standard Chartered Bank, England and Wales United Kingdom, Middle
East, South Asia, Asia Pacific,
Americas and, through Groupcompanies, Africa
100
Standard Chartered First Bank Korea Limited,
Korea
Korea 100
Standard Chartered Bank Malaysia Berhad,
Malaysia
Malaysia 100
Standard Chartered Bank (Pakistan) Limited,
Pakistan
Pakistan 98.99
Standard Chartered Bank (Taiwan) Limited,
Taiwan
Taiwan 100
Standard Chartered Bank (Hong Kong)
Limited, Hong Kong
Hong Kong 100
Standard Chartered Bank (China) Limited,
China
China 100
Standard Chartered Bank (Thai) Public
Company Limited, Thailand
Thailand 99.99
541
c102100pu135Proof7:28.3.10B/LRevision:0OperatorBeeR

Country and place of incorporation or
registration Main areas of operation
Group interest in
ordinary share capital
%
Standard Chartered Bank Nigeria Limited Nigeria 100
Standard Chartered Bank Kenya Limited Kenya 74.3
Standard Chartered Private Equity Limited,
Hong Kong
Hong Kong 100
Joint ventures
The Group has a 44.51% interest through a joint venture company which holds a majority investment
in PT Bank Permata Tbk (Permata), in Indonesia. The Group has a 74.9% interest in Standard
Chartered STCI Capital Markets (SC Caps). SC Caps is a retail brokerage and its main operations
are in India. Although the Group’s investment in SC Caps is greater than 50% of the share capital,the Group contractually shares control of the strategic financial and operating policies of SC Caps
and accordingly it is accounted for as a joint venture.
The Group proportionately consolidates its share of the assets, liabilities, income and expense of these
joint ventures on a line by line basis. Contingent liabilities set out in note 44, include $102 million
(2008: $59 million) relating to these joint venture arrangements. These mainly comprise banking
guarantees and irrevocable letters of credit. There are no capital commitments related to the Group’s
investments in these joint ventures. Related party transactions are disclosed in note 51.
The following amounts have been included in the consolidated accounts of the Group:
2009 2008
$million $million
Current assets 1,094 863
Long-term assets 1,759 1,467
Total assets 2,853 2,330
Current liabilities (2,183) (1,722)
Long-term liabilities (151) (233)
Total liabilities (2,334) (1,955)
Net assets 519 375
Income 168 159
Expenses (113) (111)
Impairment (20) (6)
Operating profit 35 42
Tax (13) (16)
Share of post tax result from joint ventures 22 26
Long-term assets are primarily loans to customers and current liabilities are primarily customer
deposits based on contractual maturities.
542
c102100pu135Proof7:28.3.10B/LRevision:0OperatorBeeR

Interests in associates
2009 2008
$million $million
At 1 January 511 269Translation (2) —
Additions 41 306
Disposals (6) —
Dividends (11) (13)
Transfer to subsidiary — (5)
Impairment (19) (46)
At 31 December 514 511
The following amounts represent the total profit, assets and liabilities of the Group’s associated
undertakings:
2009 2008
$million $million
Profit for the year 163 25
Total assets 25,324 14,589
Total liabilities (23,954) (13,319)
Net assets 1,370 1,270
The Group’s principal associates are:
Associate
Main areas of
operation
Group interest in
ordinary share
capital %
China Bohai Bank China 19.9
Fleming Family & Partners Asia 20.0
MCashback Limited UK 30.0Merchant Solutions Limited Hong Kong 44.0
Asia Commercial Bank Vietnam 15.0
The fair value of the investment in Asia Commerical Bank (ACB) at 31 December 2009 is $236
million (2008: $211 million). The Group’s investments in ACB and China Bohai Bank are less than20% but both ACB and China Bohai Bank are considered to be associates because of the significant
influence the Group is able to exercise over the management of these companies and their financial
and operating policies. Significant influence is evidenced largely through the interchange of
management personnel and the provision of expertise. The reporting dates of these associates are
within three months of the Group’s reporting date.
25. Business combinations
2009 acquisitions
On 30 January 2009, the Group acquired 100% of the share capital of Cazenove Asia Limited
(subsequently renamed Standard Chartered Securities (Hong Kong) Limited), a leading Asian equitycapital markets, corporate finance and institutional brokerage business.
On 30 June 2009, the Group acquired the remaining 75% minority interest in First Africa, for a
consideration of $13 million. Goodwill of $5 million was recognised and $5 million of customer
relationship intangibles identified.
During 2009 the Group acquired a further 2% interest in its subsidiary in Ghana for an additional $8
million generating goodwill of $6 million.
543
c102100pu135Proof7:28.3.10B/LRevision:0OperatorBeeR

At 31 December 2009, under the requirements of IFRS 3 ‘Business Combinations’, the Group was
deemed to have paid contingent consideration of $41 million in respect of its 2005 acquisition of
Korea First Bank (subsequently renamed SC First Bank), and consequently additional goodwill of
$41 million has been recognised.
If the acquisitions had occurred on 1 January 2009 the operating income of the Group would havebeen approximately $15,184 million and profit before taxation would have been approximately $5,147
million.
The assets and liabilities arising from the acquisition of Cazenove Asia were as follows:
Fair value
Acquiree’s
carrying
amount
$million $million
Loans and advances to banks 34 34
Investment securities 1 1
Intangibles other than goodwill 9 —Property, plant and equipment 1 1
Other assets 45 45
Total assets 90 81
Other liabilities 39 39
Accruals and deferred income 7 7
Retirement benefit obligations 2 2
Total liabilities 48 48
Net assets acquired 42 33
Purchase consideration settled in cash (73)
Cash and cash equivalents in subsidiary acquired 31
Cash outflow on acquisition (42)
Purchase consideration:
– cash paid 73
Total purchase consideration 73
Less : Fair value of net assets acquired (42)
Goodwill 31
Intangible assets acquired:
Customer relationships 9
Total 9
Contribution from acquisition to 31 December 2009:
Operating income 39
Loss before taxation (3)
Goodwill arising on the acquisitions is attributable to the synergies expected to arise from their
integration with the Group and to those intangibles which are not recognised separately, such as the
acquired workforce.
2008 acquisitions
On 25 February 2008, the Group acquired 100% of the share capital of Yeahreum Mutual Savings
Bank (Yeahreum), a Korean banking company. On 29 February 2008, the Group acquired 100% of
the share capital of American Express Bank Limited (AEB), a financial services company. The Group
544
c102100pu135Proof7:28.3.10B/LRevision:0OperatorBeeR

also entered into a put and call option agreement with American Express Company, exercisable 18
months from the acquisition of AEB, to purchase 100% of American Express International Deposit
Corporation at a purchase price equivalent to its net asset value at the time of exercise. On 27
December 2008, the Group acquired the ‘good bank’ portion of Asia Trust and InvestmentCorporation, a Taiwanese banking company.
If the acquisitions had occurred on 1 January 2008, the operating income of the Group would have
been approximately $14,093 million and profit before taxation would have been approximately $4,576
million.
During 2008, the Group acquired the remaining 20% minority of A Brain Co. Limited for a
consideration of $8 million, generating additional goodwill of $5 million.
The assets and liabilities arising from the acquisitions are as follows:
AEB Other acquisitions
Acquiree’s Acquiree’s
carrying carrying
Fair value amount Fair value amount
$million $million $million $million
Cash and balances at central banks1 1,041 1,041 131 131
Derivative financial instruments 511 511 — —
Loans and advances to banks 7,142 7,143 639 667
Loans and advances to customers 4,781 4,783 233 233
Investment securities 2,864 2,883 87 88
Intangibles other than goodwill 88 4 — —Property, plant and equipment 27 34 30 23
Deferred tax assets 10 — 4 —
Other assets 527 544 21 23
Total assets 16,991 16,943 1,145 1,165
Derivative financial instruments 514 514 — —
Deposits by banks 5,519 5,519 — —
Customer accounts 8,392 8,392 1,192 1,192Other liabilities 1,848 1,829 47 43
Provisions for liabilities and charges 55 — — —
Retirement benefit obligations 46 46 — —
Subordinated liabilities and other borrowed funds 190 190 — —
Total liabilities 16,564 16,490 1,239 1,235
Net assets acquired 427 453 (94) (70)
Purchase consideration settled in cash (823) (161)
Cash and cash equivalents in subsidiary acquired 6,700 551
Cash inflow on acquisition 5,877 390
Purchase consideration:
– cash paid 798 160
– direct costs relating to the acquisition 25 1
Total purchase consideration 823 161
Less: Fair value of net assets (liabilities) acquired
(assumed) 427 (94)
Goodwill 396 255
545
c102100pu135Proof7:28.3.10B/LRevision:0OperatorBeeR

AEB Other acquisitions
Acquiree’s Acquiree’s
carrying carrying
Fair value amount Fair value amount
$million $million $million $million
Intangible assets acquired:
Customer relationships 84 —
Capitalised software 4 —
Total 88 —
Contribution from acquisition to 31 December2008:
Operating income 552 1
Loss before taxation (124) (9)
1 Cash and balances at central banks include amounts subject to regulatory restrictions.
Goodwill arising on the acquisition of AEB is attributable to the significant synergies expected to
arise from their development within the Group and to those intangibles which are not recognised
separately, such as the distribution network and acquired workforce. Goodwill arising on other
acquisitions is attributable to those intangibles which are not recognised separately, such as thedistribution network.
26. Goodwill and intangible assets
2009 2008
Goodwill
Acquired
intangibles Software Total Goodwill
Acquired
intangibles Software Total
$million $million $million $million $million $million
Cost
At 1 January 5,745 490 595 6,830 5,785 477 533 6,795
Exchange translation
differences 188 15 21 224 (752) (75) (24) (851)
Acquisitions 83 14 — 97 712 88 — 800
Additions — — 172 172 — — 163 163
Disposals — — (2) (2) — — (4) (4)
Amounts written off — — (136) (136) — — (73) (73)
At 31 December 6,016 519 650 7,185 5,745 490 595 6,830
Provision for amortisation
At 1 January — 204 265 469 — 160 261 421
Exchange translation
differences — 12 9 21 — (37) (17) (54)
Amortisation for the period — 69 139 208 — 81 94 175
Amounts written off — — (133) (133) — — (73) (73)
At 31 December — 285 280 565 — 204 265 469
Net book value 6,016 234 370 6,620 5,745 286 330 6,361
At 1 January 2008, the net book value was: goodwill, $5,785 million; acquired intangibles, $317million; and software, $272 million.
At 31 December 2009, accumulated goodwill impairment losses incurred from 1 January 2005amounted to $69 million (2008: $69 million).
546
c102100pu135Proof7:28.3.10B/LRevision:0OperatorBeeR

2009 2008
$million $million
Acquired intangibles comprise:
Core deposits 51 68
Customer relationships 117 144
Brand names 60 67
Licences 6 7
Net book value 234 286
Acquired intangibles primarily comprise those recognised as part of the acquisitions of SC First Bank(SCFB), Permata, Union Bank (now amalgamated into Standard Chartered Bank (Pakistan) Limited),
Hsinchu (now amalgamated into Standard Chartered Bank (Taiwan)), Pembroke, Harrison Lovegrove
and AEB. The acquired intangibles are amortised over periods from 4 years to a maximum of 16
years in the case of the customer relationships intangible acquired in SCFB.
Significant items of goodwill arising on acquisitions have been allocated to the following cash
generating units for the purposes of impairment testing:
Goodwill
2009 2008
Acquisition Cash generating unit $million $million
SCFB, A Brain and Yeahreum Korean business 1,700 1,534
Union Bank Pakistan business 312 332
Hsinchu and Asia Trust Taiwan business 1,220 1,192
Manhattan Card Business Credit card and personal loan –
Asia, India & MESA
896 896
Grindlays (India) and SC Caps India business 410 387
Grindlays (MESA) MESA business 363 368
Standard Chartered Bank (Thai) Thailand business 310 298
Permata Group’s share of Permata
(Indonesia business)
163 138
American Express Bank Financial Institutions and private
banking business
396 396
Harrison Lovegrove, Pembroke,
Cazenove Asia and First Africa
Corporate advisory business 64 23
Other 182 181
6,016 5,745
All recoverable amounts were measured based on value in use. The key assumptions and approach todetermining value in use calculations, as set out below, are solely estimates for the purposes of
assessing impairment on acquired goodwill. The calculation for each unit uses cash flow projections
based on budgets and forecasts approved by management covering one year, except for Taiwan
business (four years), Korea business (four years), Thailand business and Permata (four years).
Management forecasts projected revenue growth rates greater than long-term GDP rates but which
are in line with past performance as adjusted to reflect the current economic climate, especially for
2009 and 2010. Cash flow projections are extrapolated forward for periods of up to a further 19
years using steady long-term forecast GDP growth rates and a terminal value determined based onlong-term earning multiples. Where these rates are different from available market data on long-term
rates, that fact is stated below. The cash flows are discounted using a pre-tax discount rate which
reflects current market rates appropriate to the cash generating unit. Management believes that
reasonable possible change in any of the key assumptions on which the recoverable amounts have
been based would not cause the carrying amounts to exceed their recoverable amount.
547
c102100pu135Proof7:28.3.10B/LRevision:0OperatorBeeR

Korea businesses
SCFB, A Brain and Yeahreum were acquired in 2005, 2007 and 2008 respectively with initial goodwill
recognised of $1,891 million and a further $5 million goodwill recognised in 2008 in respect of ABrain. The businesses comprise Consumer and Wholesale Banking operations in Korea.
In assessing impairment of goodwill, the Group has assumed that growth beyond 2013 will take placeat a steady rate of 3.5% (2008: 3.7%) in line with the long-term forecast GDP growth of Korea. A
pre-tax discount rate of 19.9% (2008: 17.2%) was used.
Pakistan business
Union Bank was acquired in September 2006 with initial goodwill recognised of $414 million.Additional goodwill of $17 million arose as a result of a share swap. Together with the Group’s
existing operations, the combined business comprises Consumer and Wholesale Banking operations in
Pakistan.
In assessing impairment of goodwill, the Group has assumed that growth will increase at a steady
rate of 4.3% (2008: 5.6%) in line with the long-term forecast GDP growth of Pakistan. A pre-tax
discount rate of 28.4% (2008: 25.9%) was used.
Taiwan businesses
Hsinchu and Asia Trust were acquired in 2006 and 2008 respectively with initial goodwill recognised
of $1,142 million and a further $34 million of goodwill recognised in 2007 in respect of Hsinchu.
Together with the Group’s existing operation, the combined business comprises Consumer and
Wholesale Banking operations in Taiwan.
In assessing impairment of goodwill, the Group has assumed that growth beyond 2013 will increase
at a steady rate of 3.4% (2008: 4.1%) in line with the long-term forecast GDP growth of Taiwan. A
pre-tax discount rate of 16.7% (2008: 22.3%) was used.
Credit card business
Manhattan Card Business was acquired in 2000 with initial goodwill recognised of $1,061 million.
This was amortised to $892 million under UK GAAP until 31 December 2003. The business
comprises a credit card business and a personal loans business across Asia, India and MESA.
In assessing impairment of goodwill, the Group has assumed that growth will increase at a steady
rate of 3.8% (2008: 3.0%) in line with the long-term forecast global GDP growth. A pre-tax discount
rate of 13.9% (2008: 13.7%) was used.
India businesses
Grindlays (India) was acquired in 2000 with initial goodwill recognised of $446 million. This was
amortised to $366 million under UK GAAP until 31 December 2003. It comprises Consumer and
Wholesale Banking operations in India. In 2008, the Group acquired a 74.9% interest in SC Caps,with initial goodwill recognised of $52 million.
In assessing impairment of goodwill, the Group has assumed that growth will increase at a steadyrate of 7.6% (2008: 6.8%) in line with the long-term forecast GDP growth of India. A pre-tax
discount rate of 18.5% (2008: 18.6%) was used.
MESA business
Grindlays (MESA) was acquired in 2000 with initial goodwill recognised of $446 million. This wasamortised to $366 million under UK GAAP until 31 December 2003. It comprises Consumer and
Wholesale Banking operations in MESA.
In assessing impairment of goodwill, the Group has assumed that growth will increase at a steady
rate of 3.8% (2008: 3.0%) in line with the long term forecast GDP growth of MESA. A pre-tax
discount rate of 20.9% (2008: 19.6%) was used.
Thailand business
75% of Standard Chartered Bank (Thai) was acquired in 1999 with initial goodwill recognised of $222
million. This was amortised to $204 million under UK GAAP until 31 December 2003. In 2005 the
Group acquired the remaining 25%, increasing goodwill to $272 million. The business comprises
Consumer and Wholesale Banking operations in Thailand.
548
c102100pu135Proof7:28.3.10B/LRevision:0OperatorBeeR

In assessing impairment of goodwill, the Group has assumed that growth beyond 2013 will increase
at a steady rate of 4.3% (2008: 4.6%) in line with the long term forecast GDP growth of Thailand. A
pre-tax discount rate of 17.7% (2008: 21.5%) was used.
Group’s share of Permata
31.55% of Permata was acquired in 2004 with initial goodwill recognised of $115 million. A further
12.96% was acquired in September 2006, generating further goodwill of $57 million. This business
comprises Consumer and Wholesale Banking operations in Indonesia.
In assessing impairment of goodwill, the Group has assumed that growth beyond 2013 will increase
at a steady rate of 6.4% (2008: 5.9%) in line with the long-term forecast GDP growth of Indonesia. A
pre-tax discount rate of 27.8% (2008: 24.3%) was used.
Financial institution and private banking business
100% of AEB was acquired in February 2008 with initial goodwill recognised of $396 million. The
business comprises Consumer and Wholesale Banking operations in the Americas, Europe and Asia.
In assessing impairment of goodwill, the Group has assumed that growth will remain at a steady
3.8% (2008: 3.0%), in line with long-term forecast global GDP growth. A pre-tax discount rate of13.9% (2008: 13.7%) was used.
Corporate advisory business
The total goodwill of $64 million generated on the acquisition of Harrison Lovegrove and Pembroke
in 2007 and Cazenove Asia and First Africa in 2009 comprises, oil and gas advisory, aircraft leading,
capital markets and corporate advisory and leverage finance advisory operations in Europe, Asia and
Africa respectively.
In assessing impairment of goodwill, the Group has assumed that growth will remain at a steady
3.8% (2008: 3.0%), in line with long-term forecast global GDP growth. A pre-tax discount rate of
13.9% (2008: 13.7%) was used.
549
c102100pu135Proof7:28.3.10B/LRevision:0OperatorBeeR

27. Property, plant and equipment
2009 2008
Premises Equipment Total Premises Equipment Total
$million $million $million $million $million $million
Cost or valuation
At 1 January 2,576 1,784 4,360 2,711 822 3,533
Exchange translation
differences 82 23 105 (407) (95) (502)
Additions 134 755 889 363 1,068 1,431
Acquisitions — 1 1 38 19 57
Disposals and fullydepreciated assets
written off (197) (98) (295) (11) (74) (85)
Reclassification 5 (5) — (44) 44 —
Transfers from/(to)
assets held for re-
sale 47 — 47 (74) — (74)
At 31 December 2,647 2,460 5,107 2,576 1,784 4,360
Depreciation
Accumulated at
1 January 327 447 774 261 380 641
Exchange translationdifferences 5 15 20 (32) (64) (96)
Charge for the year 119 193 312 98 152 250
Attributable to assets
sold or written off (28) (74) (102) — (21) (21)
Accumulated at
31 December 423 581 1,004 327 447 774
Net book amount at
31 December 2,224 1,879 4,103 2,249 1,337 3,586
At 1 January 2008, the net book value was: premises, $2,450 million and equipment, $442 million.
Equipment includes operating lease assets of $1,606 million (2008: $1,029 million) (see note 19).
Assets held under finance leases have the following net book amount:
2009 2008
Premises Equipment Premises Equipment
$million $million $million $million
Cost 45 16 45 15
Aggregate depreciation (7) (11) (6) (7)
Net book amount 38 5 39 8
The Group’s premises leases include rent review periods, renewal terms and in some cases purchaseoptions.
550
c102100pu135Proof7:28.3.10B/LRevision:0OperatorBeeR

2009 2008
$million $million
Minimum lease payments under finance leases falling due:Within one year 3 5
Later than one year and less than five years 5 7
8 12
Future finance charges on finance leases (1) (2)
Present value of finance lease liabilities 7 10
28. Deferred tax
The following are the major deferred tax liabilities and assets recognised by the Group and
movements thereon during the reporting period:
At Exchange Charge/ Charge/ At
1 January & other Acquisitions/ (credit) (credit) 31 December
2009 adjustments disposals to profit to equity 2009
$million $million $million $million $million $million
Deferred taxation
comprises:
Accelerated taxdepreciation (29) (7) — (157) — (193)
Impairment
provisions on loans
and advances (174) (18) — 61 — (131)
Tax losses carried
forward (145) 3 — (113) (22) (277)
Available-for-sale
assets 63 6 — — 6 75Premises revaluation 17 (2) — (14) — 1
Cash flow hedges (35) 14 — — 21 —
Unrelieved foreign tax (34) — — (19) — (53)
Retirement benefit
obligations (89) (12) — 19 (37) (119)
Share based payments (21) (13) — (80) (35) (149)
Other temporary
differences (37) 28 — (48) — (57)
Net deferred tax
assets (484) (1) — (351) (67) (903)
551
c102100pu135Proof7:28.3.10B/LRevision:0OperatorBeeR

At Exchange Charge/ Charge/ At
1 January & other Acquisitions/ (credit) (credit) 31 December
2008 adjustments disposals to profit to equity 2008
$million $million $million $million $million $million
Deferred taxation
comprises:
Accelerated tax
depreciation (56) (3) 3 27 — (29)
Impairment
provisions on loans
andadvances (275) 12 (3) 92 — (174)
Tax losses carried
forward (52) 9 — (102) — (145)
Available-for-sale
assets 79 — (4) (5) (7) 63
Premises revaluation 17 — — — — 17
Cash flow hedges 20 (1) — — (54) (35)
Unrelieved foreign tax (57) — — 23 — (34)Retirement benefit
obligations (41) (1) — 13 (60) (89)
Share based payments (88) — — 21 46 (21)
Other temporary
differences (107) — (10) 80 — (37)
Net deferred tax
assets (560) 16 (14) 149 (75) (484)
Deferred taxation comprises assets and liabilities as follows:
2009 2008
Total Asset Liability Total Asset Liability
$million $million $million $million $million $million
Deferred taxation
comprises:
Accelerated tax
depreciation (193) (214) 21 (29) (57) 28Impairment
provisions on loans
and advances (131) (227) 96 (174) (249) 75
Tax losses carried
forward (277) (277) — (145) (143) (2)
Available-for-sale
assets 75 61 14 63 32 31
Premises revaluation 1 — 1 17 15 2Cash flow hedges — (3) 3 (35) (42) 7
Unrelieved foreign tax (53) (53) — (34) (34) —
Retirement benefit
obligations (119) (120) 1 (89) (93) 4
Share based payments (149) (140) (9) (21) (21) —
Other temporary
differences (57) (123) 66 (37) (68) 31
(903) (1,096) 193 (484) (660) 176
552
c102100pu135Proof7:28.3.10B/LRevision:0OperatorBeeR

2009 2008
$million $million
No account has been taken of the following potential deferred taxation assets/(liabilities):
Unrelieved foreign tax 715 738
Unremitted earnings from overseas subsidiaries1 (296) (484)
Foreign exchange movements on investments in branches (48) (6)
Tax losses 130 38
Held over gains on incorporations of overseas branches (494) (418)
1 Unremitted earnings from overseas subsidiaries includes $296 million (2008: $99 million) witholding tax. No UK tax liability hasbeen recognised on undistributed earnings because it is probable that if such amounts are remitted in the future they would be taxfree as a result of a change in the UK taxation of foreign dividends post 1 July 2009.
29. Deposits by banks
2009 2008
$million $million
Deposits by banks 38,461 31,909
Deposits by banks included within:
Financial liabilities held at fair value through profit or loss (note 14) 482 4,077
38,943 35,986
30. Customer accounts
2009 2008
$million $million
Customer accounts 251,244 234,008
Customer accounts included within:
Financial liabilities held at fair value through profit or loss (note 14#) 5,502 4,583
256,746 238,591
Included in customer accounts were deposits of $1,109 million (2008: $1,299 million) held as collateralfor irrevocable commitments under import letters of credit.
553
c102100pu135Proof7:28.3.10B/LRevision:0OperatorBeeR

31. Debt securities in issue
2009 2008
Certificates
of
Certificates
of
deposit of Other debt deposit of Other debt
$ 100,000 securities $ 100,000 securities
or more in issue Total or more in issue Total
$million $million $million $million $million $million
Debt securities in issue 10,611 18,661 29,272 13,284 10,163 23,447
Debt securities in issue
included within:
Financial liabilities held at
fair value through profit or
loss (note 14) 865 3,122 3,987 460 3,162 3,622
11,476 21,783 33,259 13,744 13,325 27,069
The Company has other debt securities in issue at 31 December 2009 of $4,770 million (2008: $1,372
million).
32. Structure of deposits
The following tables set out the structure of the Group’s deposits by principal geographic areas as at
31 December 2009 and 31 December 2008:
2009
Asia Pacific
Middle
Other East & Americas
Hong Asia Other UK &
Kong Singapore Korea Pacific1 India S Asia Africa Europe Total
$million $million $million $million $million $million $million $million $million
Non-interest bearing
current and demand
accounts 6,220 6,343 81 4,393 2,779 6,571 2,274 1,911 30,572
Interest bearing current
accounts and savings
deposits 42,493 16,544 16,663 24,480 2,051 3,093 3,386 18,016 126,726
Time deposits 22,964 20,731 13,840 27,855 5,101 11,086 1,694 30,611 133,882
Other deposits 73 52 458 1,048 1,291 408 146 1,033 4,509
Total 71,750 43,670 31,042 57,776 11,222 21,158 7,500 51,571 295,689
Deposits by banks 2,898 1,972 8,287 6,673 620 1,353 294 16,846 38,943
Customer accounts 68,852 41,698 22,755 51,103 10,602 19,805 7,206 34,725 256,746
71,750 43,670 31,042 57,776 11,222 21,158 7,500 51,571 295,689
Debt securities in issue 145 679 12,608 1,695 520 45 326 17,241 33,259
Total 71,895 44,349 43,650 59,471 11,742 21,203 7,826 68,812 328,948
1 Other APR includes Malaysia: Deposits by banks $710 million; customer accounts $9,365 million; debt securities in issue $386million
554
c102100pu135Proof7:28.3.10B/LRevision:0OperatorBeeR

2008
Asia Pacific
Middle
Other East & Americas
Hong Asia Other UK &
Kong Singapore Korea Pacific1 India S Asia Africa Europe Total
$million $million $million $million $million $million $million $million $million
Non-interest bearing
current and demand
accounts 4,947 3,550 64 3,299 2,215 5,313 2,031 2,776 24,195
Interest bearing current
accounts and savings
deposits 27,131 9,340 14,094 22,030 1,634 2,888 2,632 13,343 93,092
Time deposits 31,471 20,875 13,187 32,725 5,313 9,574 1,335 30,726 145,206
Other deposits 52 92 1,079 727 677 1,320 75 8,062 12,084
Total 63,601 33,857 28,424 58,781 9,839 19,095 6,073 54,907 274,577
Deposits by banks 1,140 1,701 8,478 4,748 254 1,687 193 17,785 35,986
Customer accounts 62,461 32,156 19,946 54,033 9,585 17,408 5,880 37,122 238,591
63,601 33,857 28,424 58,781 9,839 19,095 6,073 54,907 274,577
Debt securities in issue 530 1,291 12,656 1,849 622 29 145 9,947 27,069
Total 64,131 35,148 41,080 60,630 10,461 19,124 6,218 64,854 301,646
1 Other APR includes Malaysia: Deposits by banks $593 million; customer accounts $8,665 million; debt securities in issue $617million.
The debt securities in issue held by the Company of $4,770 million (2008: $1,372 million) are within
Americas, UK & Europe.
33. Other liabilities
2009 2008
$million $million
Financial liabilities held at amortised cost (note 14)Notes in circulation 3,414 3,097
Acceptances and endorsements 2,963 2,539
Cash collateral 2,136 3,765
8,513 9,401
Non-financial liabilities
Cash-settled share based payments 104 31
Other liabilities 7,522 7,931
16,139 17,363
Hong Kong currency notes in circulation of $3,414 million (2008: $3,097 million) which are secured
by the Hong Kong SAR government certificates of indebtedness of the same amount included in
other assets (note 23).
555
c102100pu135Proof7:28.3.10B/LRevision:0OperatorBeeR

34. Subordinated liabilities and other borrowed funds
2009 2008
$million $million
Subordinated loan capital – issued by subsidiary undertakings
£675 million 5.375% undated Step Up Subordinated Notes (Callable and
floating rate from 2020) 658 1,064
£600 million 8.103% Step Up Callable Perpetual Preferred Securities (Callable
and floating rate from 2016) 1,164 1,085
£700 million 7.75% Subordinated Notes 2018 1,201 1,090
£300 million 6.0% Subordinated Notes 2018 (Callable and floating rate from
2013) 530 486
£300 million 6.75% Subordinated Notes 2009 — 390
£200 million 7.75% undated Step Up Subordinated Notes (Callable and
floating rate from 2022) 390 360
£30 million Floating Rate Subordinated Notes 2009 — 44
c1,100 million 5.875% Subordinated Notes 2017 1,701 1,609
c750 million 3.625% Subordinated Notes 2017 (Callable and floating rate from2012) 1,113 1,066
c675 million Floating Rate Subordinated Notes 2018 (Callable 2013) 972 951
c600 million 5.375% Subordinated Notes 2009 — 755
c500 million 8.16% non-cumulative Trust Preferred Securities (Callable 2010) 723 711
$1.5 billion 9.5% Step Up Perpetual Preferred Securities (Callable 2014) 1,509 —
$1 billion 6.4% Subordinated Notes 2017 1,101 1,203
$700 million 8.0% Subordinated Notes 2031 574 1,022
$500 million Floating Rate Subordinated Notes 2016 (Callable 2011) 499 499
$500 million Floating Rate Subordinated Notes 2015 (Callable 2010) 499 499
$350 million 4.375% Subordinated Notes 2014 (Floating rate from 2009) — 358
$300 million Floating Rate Subordinated Notes 2017 (Callable 2012) 298 297
$100 million Floating Rate Subordinated Notes 2018 (Callable 2013) 100 100
$22 million 9.75% fixed to floating rate note 2021 (Callable 2016) 22 —
BWP 75 million Floating Rate Subordinated Notes 2017 (Callable 2012) 11 10
BWP 50 million Floating Rate Subordinated Notes 2015 (Callable 2010) 8 7
HKD 670 million Floating Rate Notes 2014 — 77
HKD 500 million 3.5% Notes 2014 (Floating rate from 2009) — 66
IDR 500 billion Floating Rate Notes 2016 22 20
JPY 10 billion 3.35% Subordinated Note 2023 (Callable 2018) 116 116
KRW 300 billion 7.05% Subordinated debt 2019 259 —
KRW 260 billion 6.08% Subordinated debt 2018 227 219
KRW 205 billion 6.01% Subordinated debt 2009 — 158
KRW 90 billion 6.05% Subordinated debt 2018 78 81
KRW 30 billion Floating Rate Subordinated debt 2011 26 24
KRW 3 billion 6.11% Subordinated debt 2011 2 2
MYR 500 million 4.28% Subordinated Bonds 2017 (Callable 2012) 149 150
PKR 1 billion Floating Rate Notes 2013 12 13
PKR 750 million Floating Rate Notes 2011 6 9
SGD 450 million 5.25% Subordinated Notes 2023 325 334
TWD 10 billion undated Floating Rate Notes 312 305
TWD 10 billion 2.9% Subordinated debt 2019 (Callable 2014) 310 —
TZS 8 billion Floating Rate Subordinated Notes 2015 6 6
14,923 15,186
556
c102100pu135Proof7:28.3.10B/LRevision:0OperatorBeeR

2009 2008
$million $million
Subordinated loan capital – issued by company:
Primary capital floating rate notes
$400 million 58 58
$300 million (Series 2) 82 82
$400 million (Series 3) 84 84
$200 million (Series 4) 52 52
£150 million 242 217
Other borrowings – issued by company1, 2 1,289 1,307
1,807 1,800
Total for Group 16,730 16,986
Total for Company 1,751 1,736
1 In the balance sheet of the Company the amount recognised is $1,233 million (2008: $1,243 million) with the difference being theeffect of hedge accounting achieved on a Group basis.
2 Other borrowings comprise irredeemable sterling preference shares and US dollar non-cumulative redeemable preference shares.
All subordinated liabilities described above are unsecured, unguaranteed and subordinated to theclaims of other creditors including without limitation, customer deposits and deposits by banks. The
Group has the right to settle these debt instruments in certain circumstances as set out in the
contractual agreements.
Of the total subordinated liabilities and other borrowings, $11,564 million is at fixed interest rates
(2008: $11,865 million).
On 21 April 2009, Standard Chartered First Bank Korea Limited (SCFB) issued KRW300 billion
Lower Tier 2 Notes with a coupon of 7.05% maturing due 2019, callable 2014.
During 2009, Standard Chartered Bank (SCB) repurchased a total of $193 million of its 8%
subordinated notes due May 2031.
On 27 April 2009, £281 million fixed to floating step up subordinated notes callable 14 July 2020
issued by SCB were exchanged for £198 million senior notes due 2014 issued by Standard Chartered
PLC.
On 15 June 2009, SCB issued $1.5 billion 9.5% Step up Perpetual Preferred Securities, callable 2014.
On 17 June 2009, PT Bank Permata Tbk issued $100 million subordinated notes with a coupon of9.75% maturing June 2021, callable June 2016. The Group subscribed for $50 million of these notes.
As PT Bank Permata TBk is a joint venture of the Group, on a proportionately consolidated basis,
$22 million is treated as a liability for the Group.
On 28 October 2009, Standard Chartered Bank (Taiwan) Limited issued TWD10 billion subordinated
notes with a fixed coupon rate of 2.9% for the first five years, 3.4% for the remaining 5 years,
maturing 2019, callable 2014.
On 4 December 2009, Standard Chartered Bank (Hong Kong) Limited exercised the call option on its
$350 million 4.375% subordinated notes due December 2014; HKD 500 million 3.5% subordinated
notes due December 2014 and HKD 670 million floating rate notes due December 2014.
During 2009, £30 million floating rate notes, c600 million 5.375% notes, £300 million 6.75% notes
and KRW205 billion subordinated debt matured.
On 30 December 2009, SCB announced the intention to redeem in full the c500 million 8.16% non-
cumulative trust preferred securities on the first call date of 23 March 2010.
On 4 February 2010, SCB exercised its right to redeem its $500 million subordinated floating rate
note in full on the first optional date.
557
c102100pu135Proof7:28.3.10B/LRevision:0OperatorBeeR

35. Provisions for liabilities and charges
Provision
for credit
commitments
Other
provisions Total
$million $million $million
At 1 January 2009 26 114 140
Exchange translation differences 1 1 2
Acquisitions — — —
Charge against profit (2) 264 262
Provisions utilised (3) (217) (220)
At 31 December 2009 22 162 184
Provision for credit commitments comprises those undrawn contractually committed facilities where
there is doubt as to the borrowers’ ability to meet their repayment obligations. Other provisions
charged against profit include a provision of $170 million (2008: $nil million) for the buy back of
structured notes issued by the PEM Group in Taiwan and sold by Hsinchu International Bank (HIB)
prior to its acquisition by the Group in 2006, which were fully utlised during the year following thebuy-back of the affected notes.
36. Retirement benefit obligations
Retirement benefit obligations comprise:2009 2008
$million $million
Defined benefit schemes obligation 498 433
Defined contribution schemes obligation 8 14
Net book amount 506 447
2009 2008
$million $million
At 1 January 447 322
Exchange translation differences 17 (55)Acquisitions 2 47
Charge against profit (net of finance income) 138 172
Change in other comprehensive income 150 229
Net payments (248) (268)
At 31 December 506 447
Retirement benefit charge comprises:
2009 2008
$million $million
Defined benefit schemes 30 45
Defined contribution schemes 108 127
Charge against profit (note 8) 138 172
UK Fund
The financial position of the Group’s principal retirement benefit scheme, the Standard Chartered
Pension Fund (the Fund) (a defined benefit scheme), is assessed in the light of the advice of an
independent qualified actuary. The most recent actuarial assessment of the Fund for the purpose of
558
c102100pu135Proof7:28.3.10B/LRevision:0OperatorBeeR

funding was performed as at 31 December 2008 by A Zegelman, Fellow of the Faculty of Actuaries,
of Towers Watson Actuaries, using the projected unit method. As part of the 31 December 2008
actuarial valuation, the Trustee reviewed the life expectancy assumptions adopted. The assumptions
having the most significant effect on the outcome of this valuation were:
Return from gilts 3.85% per annumReturn from return seeking assets 6.05% per annum
General increase in salaries 2.80% per annum
Rate of price inflation 2.80% per annum
Increase in pensions:
In deferment (where applicable) 2.80% per annum
In payment1 (pre April 1997 service) 2.60% per annum
In payment (post April 1997 service) 2.00 – 2.80% per annum
1 Applies to discretionary increases and some guaranteed increases.
Applying these assumptions, at the valuation date the market value of the assets of the Fund ($1,228
million) was sufficient to cover 89.3% of the benefits that had accrued to members. Additional
contributions of $6 million were paid during 2009. Total contributions of $68 million are payable
over the four years to 31 December 2013.
Contributions paid to the Fund during 2009 were $21 million (2008: $18 million) and regular
contributions were set at 28% of pensionable salary for all members. With effect from 1 July 1998 the
Fund was closed to new entrants and new employees have subsequently been offered membership of
a defined contribution scheme. Due to the closure of the Fund to new entrants, the current service
cost will increase as a percentage of pensionable pay as the members approach retirement.
Overseas Schemes
The principal overseas defined benefit arrangements operated by the Group are in Germany, Hong
Kong, India, Jersey, Korea, Taiwan and the US.
All Schemes
The disclosures required under IAS 19 have been calculated by qualified independent actuaries based
on the most recent full actuarial valuations updated, where necessary, to 31 December 2009. Pensioncosts for the purpose of these accounts were assessed using the projected unit method and the
assumptions set out below were based on market data at the date of calculation.
Employer contributions to defined benefit plans over 2010 are expected to be $133 million.
Separate figures are disclosed for the UK Fund, Overseas Funded Defined Benefit, Post-retirement
Medical and Other Unfunded Schemes.
The financial assumptions used at 31 December 2009 were:
Funded defined benefit schemes
UK Fund1 Overseas Schemes2
2009 2008 2009 2008
% % % %
Price inflation 3.50 2.90 1.50-4.50 1.50-4.50
Salary increases 3.50 4.40 3.50-5.00 3.50-6.00
Pension increases 3.30 2.90 0.00-3.30 0.00-2.90Discount rate 5.70 6.40 1.50-7.50 1.20-7.50
Post-retirement medical trend rate N/A N/A N/A N/A
1 The assumptions for life expectancy for the UK Fund assumes that a male member currently aged 60 will live for 26 years (2008:27 years) and a female member 29 years (2008: 30 years) and a male member currently aged 40 will live for 29 years (2008: 28 years)and a female member 31 years (2008: 31 years) after their 60th birthday.
2 The range of assumptions shown is for the main funded defined benefit overseas schemes in Germany, Hong Kong, India, Jersey,Korea, Taiwan and the US. These comprise over 87% of the total liabilities of funded overseas schemes.
559
c102100pu135Proof7:28.3.10B/LRevision:0OperatorBeeR

Unfunded schemes
Post-retirement medical1 Other2
2009 2008 2009 2008
% % % %
Price inflation 3.10 2.70 1.50-7.50 1.50-9.50
Salary increases 3.10 4.00 3.50-9.00 3.50-11.00
Pension increases N/A N/A 0.00-3.30 0.00-2.90
Discount rate 5.75 5.50 1.50-10.00 2.00-13.00
Post-retirement medical rate 10% in 2009 8% in 2008 N/A N/A
reducingby 1%
reducingby 1%
per annum to per annum to
5% in 2014 5% in 2011
1 The post-retirement medical plan is in the US.
2 The range of assumptions shown is for the main Unfunded Schemes in Austria, India, Indonesia, Taiwan, UAE, UK and the US.
The assets and liabilities of the schemes, attributable to defined benefit members, at 31 December
2009 were:
Funded defined benefit schemes Unfunded schemes
UK Fund Overseas schemes Post-retirement medical Other
Expected Expected Expected Expected
return on Value return on Value return on Value return on Value
At 31 December 2009 assets % $million assets % $million assets % $million assets % $million
Equities 8.00 347 8.00-9.00 225 N/A N/A N/A N/A
Bonds 3.85 872 2.75-7.50 184 N/A N/A N/A N/A
Property N/A — 7.00 1 N/A N/A N/A N/A
Others 8.00 259 0.50-7.50 121 N/A N/A N/A N/A
Total market value of
assets 1,478 531 N/A N/A
Present value of the
schemes’ liabilities (1,704) (649) (20) (134)
Net pension liability (226) (118) (20) (134)
Funded defined benefit schemes Unfunded schemes
UK Fund Overseas schemes Post-retirement medical Other
Expected Expected Expected Expected
return on Value return on Value return on Value return on Value
At 31 December 2008 assets % $million assets % $million assets % $million assets % $million
Equities 8.00 269 8.00-8.75 158 N/A N/A N/A N/A
Bonds 3.75 787 5.25-5.75 166 N/A N/A N/A N/A
Property N/A — N/A 1 N/A N/A N/A N/A
Others 8.00 176 1.20-5.30 164 N/A N/A N/A N/A
Total market value of
assets 1,232 489 N/A N/A
Present value of the
schemes’ liabilities (1,296) (693) (12) (153)
Net pension liability (64) (204) (12) (153)
560
c102100pu135Proof7:28.3.10B/LRevision:0OperatorBeeR

Funded defined benefit schemes Unfunded schemes
UK Fund
Overseas
schemes
Post-
retirement
medical Other
Value Value Value Value
At 31 December 2007 $million $million $million $million
Total market value of assets 1,913 575 N/A N/A
Present value of the schemes’ liabilities (1,931) (602) (11) (257)
Net pension liability (18) (27) (11) (257)
At 31 December 2006
Total market value of assets 1,822 517 N/A N/A
Present value of the schemes’ liabilities (1,982) (542) (9) (347)
Net pension liability (160) (25) (9) (347)
At 31 December 2005
Total market value of assets 1,550 380 N/A N/APresent value of the schemes’ liabilities (1,785) (403) (11) (196)
Net pension liability (235) (23) (11) (196)
The expected return on plan assets is set by reference to historical returns in each of the main asset
classes, current market indicators such as long-term bond yields and the expected long-term strategic
asset allocation of each plan.
The pension cost for defined benefit schemes was:
Funded defined benefit
schemes Unfunded schemes
UK Fund
Overseas
schemes
Post-
retirement
medical Other Total
Year ending 31 December 2009 $million $million $million $million $million
Current service cost 9 61 1 15 86
Past service cost 3 — — (57) (54)
Gain on settlements and curtailments — (5) — (6) (11)
Expected return on pension scheme assets (83) (29) — — (112)
Interest on pension scheme liabilities 87 26 1 7 121
Total charge/(credit) to profit before
deduction of tax 16 53 2 (41) 30
Gain on assets against expected return1 (76) (38) — — (114)
Experience loss/(gain) on liabilities 236 (4) 7 25 264
Total loss/(gain) recognised directly in
statement of comprehensive income
before tax 160 (42) 7 25 150
Deferred taxation (41) 4 — — (37)
Total loss/(gain) after tax 119 (38) 7 25 113
1 The actual return on the UK fund assets was $159 million and on overseas scheme assets was $67 million.
561
c102100pu135Proof7:28.3.10B/LRevision:0OperatorBeeR

The total cumulative amount recognised directly in the statement of comprehensive income before tax
to date is a loss of $194 million (2008: loss of $43 million).
Funded defined benefit
schemes Unfunded schemes
UK Fund
Overseas
schemes
Post-
retirement
medical Other Total
Year ending 31 December 2008 $million $million $million $million $million
Current service cost 12 58 — 18 88
Past service cost 3 1 — 1 5
Loss/(gain) on settlements and curtailments 1 — — (55) (54)
Expected return on pension scheme assets (104) (36) — — (140)
Interest on pension scheme liabilities 103 30 1 12 146
Total charge/(credit) to profit before
deduction of tax 15 53 1 (24) 45
Loss on assets against expected return1 203 130 — — 333
Experience (gain)/loss on liabilities (143) 35 — 4 (104)
Total loss recognised directly in statement of
comprehensive income before tax 60 165 — 4 229
Deferred taxation (16) (44) — — (60)
Total loss after tax 44 121 — 4 169
1 The actual return on the UK fund assets was $99 million and on overseas scheme assets was $94 million.
562
c102100pu135Proof7:28.3.10B/LRevision:0OperatorBeeR

Funded defined benefit
schemes Unfunded schemes
UK Fund
Overseas
schemes
Post-
retirement
medical Other Total
Year ending 31 December 2007 $million $million $million $million $million
Gain on assets in excess of expected return1 (28) (2) — — (30)
Experience (gain)/loss on liabilities (113) 12 2 (108) (207)
Total (gain)/loss recognised directly in
statement of comprehensive income
before tax (141) 10 2 (108) (237)
Deferred taxation 44 — — 27 71
Total (gain)/loss after tax (97) 10 2 (81) (166)
Year ending 31 December 2006
Gain on assets in excess of expected return2 (23) (27) — — (50)
Experience (gain)/loss on liabilities (90) 20 (2) 18 (54)
Total (gain)/loss recognised directly in
statement of comprehensive Income
before tax (113) (7) (2) 18 (104)
Deferred taxation 34 3 — 1 38
Total (gain)/loss after tax (79) (4) (2) 19 (66)
Year ending 31 December 2005
Gain on assets in excess of expected return3 (91) (20) — — (111)
Experience loss on liabilities 256 5 — — 261
Total loss/(gain) recognised directly in
statement of comprehensive income
before tax 165 (15) — — 150
Deferred taxation (50) 5 — — (45)
Total loss/(gain) after tax 115 (10) — — 105
1 The actual return on the UK fund assets was $128 million and on overseas scheme assets was $34 million.
2 The actual return on the UK fund assets was $116 million and on overseas scheme assets was $50 million.
3 The actual return on the UK fund assets was $184 million and on overseas scheme assets was $48 million.
563
c102100pu135Proof7:28.3.10B/LRevision:0OperatorBeeR

Movement in the defined benefit pension schemes and post-retirement medical deficit during the year
comprise:
Funded defined benefit
schemes Unfunded schemes
Post-
Overseas retirement
UK Fund schemes medical Other Total
Year ending 31 December 2009 $million $million $million $million $million
Deficit at 1 January 2009 (64) (204) (12) (153) (433)
Contributions 21 103 1 9 134
Current service cost (9) (61) (1) (15) (86)
Past service cost (3) — — 57 54Settlement/curtailment costs — 5 — 6 11
Other finance income/(charge) (4) 2 (1) (6) (9)
Actuarial loss/(gain) (160) 42 (7) (25) (150)
Acquisitions — (2) — — (2)
Exchange rate adjustment (7) (3) — (7) (17)
Deficit at 31 December 2009 (226) (118) (20) (134) (498)
Funded defined benefit
schemes Unfunded schemes
Post-
Overseas retirement
UK Fund schemes medical Other Total
Year ending 31 December 2008 $million $million $million $million $million
Deficit at 1 January 2008 (18) (27) (11) (257) (313)
Contributions 23 72 — 54 149
Current service cost (12) (58) — (18) (88)Past service cost (3) (1) — (1) (5)
Settlement/curtailment costs (1) — — 55 54
Other finance income/(charge) 1 6 (1) (12) (6)
Actuarial loss (60) (165) — (4) (229)
Acquisitions — (43) — (4) (47)
Exchange rate adjustment 6 12 — 34 52
Deficit at 31 December 2008 (64) (204) (12) (153) (433)
564
c102100pu135Proof7:28.3.10B/LRevision:0OperatorBeeR

Movement in pension schemes and post-retirement medical gross assets and obligations during the
year comprise:
Assets Obligations Total
Year ending 31 December 2009 $million $million $million
Deficit at 1 January 2009 1,721 (2,154) (433)
Contributions 134 — 134
Current service cost — (86) (86)
Past service cost — 54 54
Settlement/curtailment costs — 11 11
Interest cost — (121) (121)Expected return on scheme assets 112 — 112
Benefits paid out (227) 227 —
Actuarial gain/(loss) 114 (264) (150)
Acquisitions 7 (9) (2)
Exchange rate adjustment 148 (165) (17)
Deficit at 31 December 2009 2,009 (2,507) (498)
Assets Obligations Total
Year ending 31 December 2008 $million $million $million
Deficit at 1 January 2008 2,488 (2,801) (313)
Contributions 149 — 149
Current service cost — (88) (88)
Past service cost — (5) (5)
Settlement/curtailment costs — 54 54Interest cost — (146) (146)
Expected return on scheme assets 140 — 140
Benefits paid out (185) 185 —
Actuarial (loss)/gain (333) 104 (229)
Acquisitions 22 (69) (47)
Exchange rate adjustment (560) 612 52
Deficit at 31 December 2008 1,721 (2,154) (433)
37. Share capital, reserves and own shares
Share capital
The authorised share capital of the Company at 31 December 2009 was $6,118 million (2008: $4,933
million) made up of 3,632 million ordinary shares of $0.50 each, 500 million non-cumulative
irredeemable preference shares of £1 each, 300 million non-cumulative redeemable preference shares of
$5 each and one million non-cumulative redeemable preference shares of c1,000 each, 100 million
Non-Cumulative Preference Shares of AED 1.00 each, 100 million Non-Cumulative Preference Shares
of HKD 1.00 each, 100 million Non-Cumulative Preference Shares of INR 10.00 each, 100 millionNon-Cumulative Preference Shares of KRW 5,000.00 each and 100 million Non-Cumulative
Preference Shares of SGD 1.00 each.
The available profits of the Company are distributed to the holders of the issued preference shares in
priority to payments made to holders of the ordinary shares and in priority to, or pari passu with,
any payments to the holders of any other class of shares in issue. On a winding up, the assets of the
Company are applied to the holders of the preference shares in priority to any payment to theordinary shareholders and in priority to, or pari passu with, the holders of any other shares in issue,
for an amount equal to any dividends accrued and/or payable and the nominal value of the shares
together with any premium as determined by the Board. The redeemable preference shares are
redeemable at the paid up amount (which includes premium) at the option of the Company in
accordance with the terms of the shares. The holders of the preference shares are not entitled to
565
c102100pu135Proof7:28.3.10B/LRevision:0OperatorBeeR

attend or vote at any general meeting except where any relevant dividend due is not paid in full or
where a resolution is proposed varying the rights of the preference shares.
As at 31 December 2009, 477,500 $5 non-cumulative redeemable preference shares were in issue, of
which 462,500 are classified within subordinated liabilities and other borrowed funds and whichincludes a premium of $923 million. The irredeemable preference shares of £1 each are also classified
as other borrowed funds as required by IAS 32. None of the other classes of preference shares which
form part of the Company’s authorised share capital have been issued.
Group and Company
Number of
ordinary
shares
millions
Ordinary
share
capital
$million
Preference
share
capital
$million
Total
$million
At 1 January 2008 1,410 705 — 705
Capitalised on scrip dividend 11 6 — 6
Shares issued 475 237 — 237
At 31 December 2008 1,896 948 — 948
Capitalised on scrip dividend 41 21 — 21
Shares issued 88 44 — 44
At 31 December 2009 2,025 1,013 — 1,013
2009
On 15 May 2009 the Company issued 32,270,731 new ordinary shares instead of the 2008 final
dividend. On 8 October 2009 the Company issued 9,157,053 new ordinary shares instead of the 2009
interim dividend.
During 2009, 12,594,749 ordinary shares were issued under the employee share plans at prices
between nil and 1088 pence.
On 4 August 2009 the Company announced an issue of 75,000,000 ordinary shares by way of anaccelerated book build. The shares were issued at a price of 1360 pence through which the Company
raised $1.7 billion net of expenses. The middle market price on 4 August 2009 was 1328 pence. The
proceeds will be used in the ordinary course of business by the Group. The share issue used a cash
box structure involving a Jersey subsidiary (JerseyCo) which was 89% owned by the Company prior
to the transaction. In return for an issue of shares by the Company to the investors, the net proceeds
of the share issue were paid to JerseyCo. Pursuant to the issue of those shares, the Company
acquired the remaining share capital of JerseyCo, being all of its redeemable preference shares and
the 11% of the ordinary shares it did not own. Under this structure merger relief applies underSection 612 of the Companies Act 2006 which provides relief from the requirements under Section
610 of the Companies Act 2006 to create a share premium account. JerseyCo then redeemed its
redeemable shares in exchange for the share issue proceeds.
2008
On 16 May 2008, the Company issued 8,142,490 new ordinary shares instead of the 2007 final
dividend. On 9 October 2008, the Company issued 2,940,049 new ordinary shares instead of the 2008
interim dividend.
On 24 November 2008, the Company announced the issue of 470,014,830 new ordinary shares by way
of rights to qualifying shareholders at 390 pence per new ordinary share. The issue was on the basisof 30 ordinary shares for every 91 ordinary shares held on 24 November 2008. The rights issue raised
$2.7 billion in additional capital for the Company. The rights issue used the same cash box structure
as described above.
The middle market price on 17 December 2008 was 766 pence. The proceeds of the issue of ordinary
shares was used in the ordinary course of business.
During 2008, 5,410,537 ordinary shares were issued under the Company’s employee share plans at
prices between nil and 1243 pence.
566
c102100pu135Proof7:28.3.10B/LRevision:0OperatorBeeR
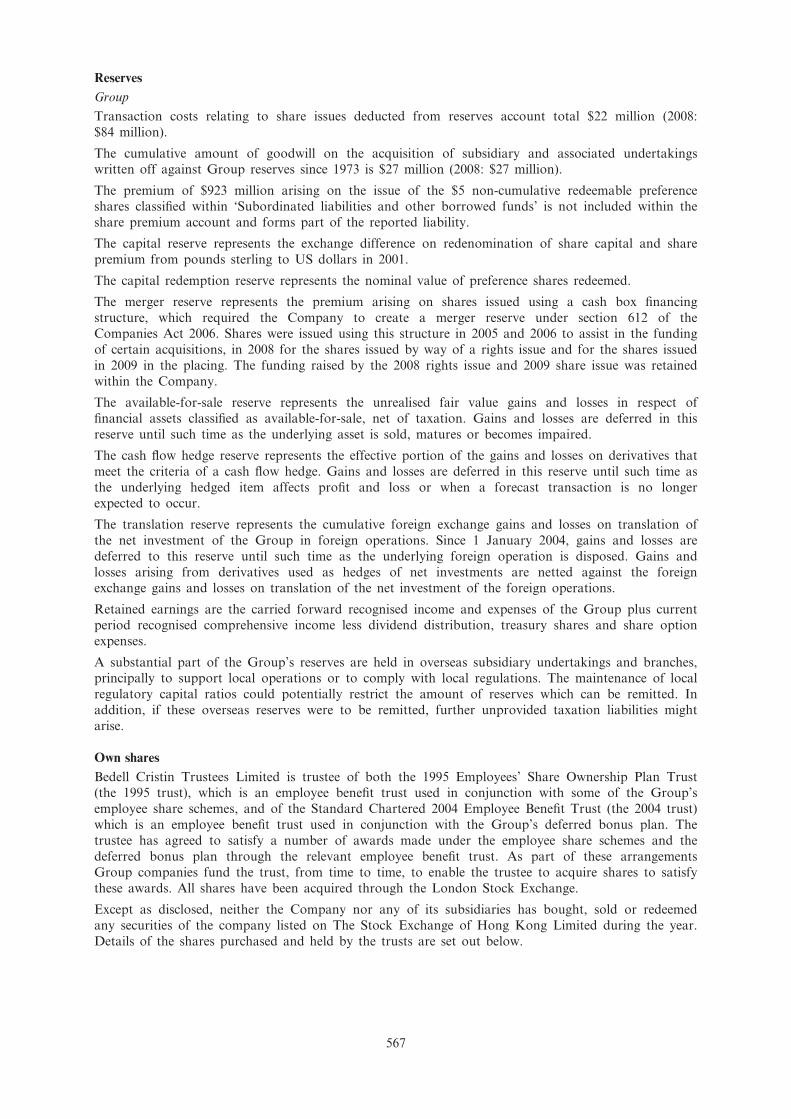
Reserves
Group
Transaction costs relating to share issues deducted from reserves account total $22 million (2008:
$84 million).
The cumulative amount of goodwill on the acquisition of subsidiary and associated undertakingswritten off against Group reserves since 1973 is $27 million (2008: $27 million).
The premium of $923 million arising on the issue of the $5 non-cumulative redeemable preferenceshares classified within ‘Subordinated liabilities and other borrowed funds’ is not included within the
share premium account and forms part of the reported liability.
The capital reserve represents the exchange difference on redenomination of share capital and share
premium from pounds sterling to US dollars in 2001.
The capital redemption reserve represents the nominal value of preference shares redeemed.
The merger reserve represents the premium arising on shares issued using a cash box financing
structure, which required the Company to create a merger reserve under section 612 of theCompanies Act 2006. Shares were issued using this structure in 2005 and 2006 to assist in the funding
of certain acquisitions, in 2008 for the shares issued by way of a rights issue and for the shares issued
in 2009 in the placing. The funding raised by the 2008 rights issue and 2009 share issue was retained
within the Company.
The available-for-sale reserve represents the unrealised fair value gains and losses in respect of
financial assets classified as available-for-sale, net of taxation. Gains and losses are deferred in this
reserve until such time as the underlying asset is sold, matures or becomes impaired.
The cash flow hedge reserve represents the effective portion of the gains and losses on derivatives that
meet the criteria of a cash flow hedge. Gains and losses are deferred in this reserve until such time as
the underlying hedged item affects profit and loss or when a forecast transaction is no longer
expected to occur.
The translation reserve represents the cumulative foreign exchange gains and losses on translation of
the net investment of the Group in foreign operations. Since 1 January 2004, gains and losses are
deferred to this reserve until such time as the underlying foreign operation is disposed. Gains and
losses arising from derivatives used as hedges of net investments are netted against the foreignexchange gains and losses on translation of the net investment of the foreign operations.
Retained earnings are the carried forward recognised income and expenses of the Group plus currentperiod recognised comprehensive income less dividend distribution, treasury shares and share option
expenses.
A substantial part of the Group’s reserves are held in overseas subsidiary undertakings and branches,principally to support local operations or to comply with local regulations. The maintenance of local
regulatory capital ratios could potentially restrict the amount of reserves which can be remitted. In
addition, if these overseas reserves were to be remitted, further unprovided taxation liabilities might
arise.
Own shares
Bedell Cristin Trustees Limited is trustee of both the 1995 Employees’ Share Ownership Plan Trust(the 1995 trust), which is an employee benefit trust used in conjunction with some of the Group’s
employee share schemes, and of the Standard Chartered 2004 Employee Benefit Trust (the 2004 trust)
which is an employee benefit trust used in conjunction with the Group’s deferred bonus plan. The
trustee has agreed to satisfy a number of awards made under the employee share schemes and the
deferred bonus plan through the relevant employee benefit trust. As part of these arrangements
Group companies fund the trust, from time to time, to enable the trustee to acquire shares to satisfy
these awards. All shares have been acquired through the London Stock Exchange.
Except as disclosed, neither the Company nor any of its subsidiaries has bought, sold or redeemed
any securities of the company listed on The Stock Exchange of Hong Kong Limited during the year.
Details of the shares purchased and held by the trusts are set out below.
567
c102100pu135Proof7:28.3.10B/LRevision:0OperatorBeeR

1995 Trust 2004 Trust Total
Number of shares 2009 2008 2009 2008 2009 2008
Shares purchased:
– 9 March 2009 — — 357,909 — 357,909 —
– 25 June 2009 4,025,000 — — — 4,025,000 —
– 13 November 2009 560,000 — — — 560,000 —
– 17 December 2009 203,000 — — — 203,000 —
Total 4,788,000 — 357,909 — 5,145,909 —
Shares purchased:
– 6 March 2008 — — — 307,849 — 307,849
– 9 March 2008 — 1,650,000 — — — 1,650,000
– 9 October 2008 — 375,000 — — — 375,000
– 18 December 2008 (rights issue) — 731,296 — 119,049 — 850,345
Total — 2,756,296 — 426,898 — 3,183,194
Market price of shares purchased ($million) 99 66 4 10 103 76
Shares held at the end of the year 7,589,615 2,949,563 498,127 480,166 8,087,742 3,429,729
Maximum number of shares held during year 7,589,615 499,865 8,089,480 3,429,729
38. Minority interests
$300m 7.267%
Hybrid Other minority
Tier 1 Securities interests Total
$million $million $million
At 1 January 2008 330 271 601
Expenses in equity attributable to minorityinterests — (106) (106)
Other profits attributable to minority interests 19 84 103
Recognised income and expense 19 (22) (3)Distributions (22) (125) (147)
Other increases1 — 104 104
At 31 December 2008 327 228 555
Income in equity attributable to minority
interests — 14 14
Other profits attributable to minority interests 19 78 97
Recognised income and expense 19 92 111
Distributions (22) (65) (87)
Other increases — 1 1
At 31 December 2009 324 256 580
1 Other increases primarily relate to the consolidation of a private equity investment.
39. Share based payments
The Group operates a number of share based payment schemes for its directors and employees.
The total charge for the year relating to employee share based payment plans was $375 million (2008:
$121 million) of which $275 million (2008: $152 million) relates to equity-settled awards, and
$100 million (2008: $31 million credit) relates to cash-settled awards. After deferred tax, the total
568
c102100pu135Proof7:28.3.10B/LRevision:0OperatorBeeR

charge to the income statement was $340 million (2008: $89 million). The scheme lives referred to
below relate to the remaining period in which options may be granted under the schemes.
1994 Executive Share Option Scheme (closed)
No awards have been made under this scheme since August 1999 as the scheme was replaced by the
2000 Executive Share Option Scheme. Awards made under this scheme are not subject to the
valuation criteria of IFRS 2, as all awards were granted prior to 7 November 2002, and were all
vested as at that date. Executive share options to purchase ordinary shares in the Company are
exercisable after the third, but before the tenth anniversary of the date of grant. The exercise price is
the share price at the date of grant and options can only be exercised if EPS increases by at least
15% over three consecutive years. There are no outstanding options in this scheme.
2000 Executive Share Option Scheme
The 2000 scheme is designed to be internationally competitive and focus executive directors and their
senior management teams on delivering long-term performance. An EPS performance criterion must
be met before options can be exercised. Executive share options to purchase ordinary shares in the
Company are exercisable after the third, but before the tenth, anniversary of the date of grant. The
exercise price per share is the share price at the date of grant and options can only be exercised if aperformance condition is satisfied. The remaining life of the scheme is one year, after which options
will not be granted under this scheme.
2001 Performance Share Plan
The Performance Share Plan is designed to be an intrinsic part of total remuneration for the Group’s
executive directors and for a small number of the Group’s most senior executives. It is an
internationally competitive long-term incentive plan that focuses executives on meeting and exceedingthe long-term performance targets of the Group. The performance criteria which need to be met are
set out in the Directors’ remuneration report on page 99 of the 2009 Annual Report. Awards of nil
price options to acquire shares are granted to the executives and will normally be exercisable between
three and ten years after the date of grant if the individual is still employed by the Group. There is
provision for earlier exercise in certain limited circumstances. The remaining life of the scheme is two
years.
1997/2006 Restricted Share Scheme (RSS)
The RSS is used as a vehicle for deferring part of annual performance awards for certain employees
and as an incentive plan to motivate and retain high performing staff. Except where used for bonus
deferral purposes, executive directors are not generally eligible to participate in the RSS. However,
upon recruitment to the Group, awards may be made on an exceptional basis, for example to newly
appointed directors to compensate for share awards forfeited on leaving their previous employer.
Under the RSS, the value of shares awarded in any year to any individual may not exceed two times
their base salary. Generally half of the award vests two years after the date of grant and the balanceafter three years. However, the deferred element of the 2009 annual performance award will vest in
three equal tranches over one, two and three years with the RSS used wherever possible for the
portion of the award vesting after two and three years. The remaining life of the scheme is seven
years.
2007 Supplementary Restricted Share Scheme
The Group operates a Supplementary Restricted Share Scheme which is similar to the RSS. Thisscheme is principally used for Global Market employees but is also used to defer one third of an
employee’s deferred annual performance award which vests after one year. Otherwise half of the
award vests two years after the date of grant and the balance after three years. Executive directors
are specifically prohibited from the plan; no new shares can be issued to satisfy awards; and there is
no individual annual limit. The remaining life of the scheme is eight years.
2004 Deferred Bonus Plan
Under the 2004 Deferred Bonus Plan, shares are conditionally awarded instead of all or part of the
executive directors’ and certain senior executives’ annual cash bonus. Further details are contained in
the Directors’ remuneration report on page 94 of the 2009 Annual Report. The remaining life of the
plan is five years.
569
c102100pu135Proof7:28.3.10B/LRevision:0OperatorBeeR

All Employee Sharesave schemes
No awards have been made under the 1994 UK Sharesave and 1996 International Sharesave schemes
since 2003, as these were replaced by the 2004 UK and International Sharesave schemes. In 2008 anew Irish Sharesave scheme was introduced for all employees of the Group in the Republic of
Ireland. Under these Sharesave schemes, employees have the choice of opening a three year or five
year savings contract. Within a period of six months after the third or fifth anniversary, as
appropriate, employees may purchase ordinary shares in the Company. The price at which they may
purchase shares is at a discount of up to 20% on the share price at the date of invitation. There are
no performance conditions attached to options granted under all the employee Sharesave schemes.
In some countries in which the Group operates, it is not possible to operate Sharesave schemes,
typically because of securities law, regulatory or other similar restrictions. In these countries the
Group offers an equivalent cash-based scheme to its employees. The remaining life of the scheme is
six years.
1994 Executive Share Option Scheme (1994 ESOS)
A reconciliation of option movements over the year to 31 December 2009 and 2008 is shown below:
2009 2008
Weighted Weighted
average average
No. of
shares
exercise
price
No. of
shares
exercise
price
Outstanding at 1 January — — 10,806 £6.20
Lapsed — — — —
Exercised — — (10,806) £6.20
Outstanding at 31 December — — — —
The weighted average share price at the time the options were exercised in 2008 was £17.23.
2000 Executive Share Option Scheme (2000 ESOS)
No share awards were granted during 2009 or 2008.
A reconciliation of option movements over the year to 31 December 2009 and 2008 is shown below:
2009 2008
Weighted Weighted
average average
No. of
shares
exercise
price
No. of
shares
exercise
price
Outstanding at 1 January 7,485,925 £7.18 8,575,209 £8.28
Additional shares for rights issue — — 937,283 —
Lapsed (5,253) £8.19 (3,348) £6.05
Exercised (4,076,707) £7.08 (2,023,219) £7.47
Outstanding at 31 December 3,403,965 £7.29 7,485,925 £7.18
Exercisable at 31 December 3,403,965 £7.29 7,485,925 £7.18
570
c102100pu135Proof7:28.3.10B/LRevision:0OperatorBeeR

2009 2008
Weighted Weighted
Weighted average Weighted average
average remaining average remaining
Range of exercise price for options outstanding
exercise
price
contractual
life
exercise
price
contractual
life
£6.05/£9.10 (2008: £6.05/£9.10) £7.29 3.2 years £7.18 4.0 years
The intrinsic value of vested 2000 ESOS cash-settled awards as at 31 December 2009 was $3 million
(2008: $0.8 million). The weighted average share price at the time the options were exercised during
2009 was £14.28 (2008: £17.23).
2001 Performance Share Plan (2001 PSP)
Valuation
The fair value of awards is based on the market value less an adjustment to take into account the
expected dividends over the vesting period. The same fair value is applied for awards made to both
the directors and employees of the Group. As set out in the Directors’ remuneration report, half the
award is dependent on a TSR performance condition and half is dependent on an EPS performance
condition. The fair value of the TSR component is derived by discounting 50% of the award that is
subject to the TSR condition by the loss of expected dividends over the performance period, together
with the probability of meeting the TSR condition, which is calculated by the area under the TSR
vesting schedule curve. The EPS fair value is derived by discounting 50% of the award by the loss ofexpected dividends over the performance period. In respect of the EPS component only, the number
of shares expected to vest is adjusted for actual performance when calculating the charge for the year.
2009 2008
Grant date 3 December 15 September 23 June 11 March 16 September 24 April 11 March
Share price at grant date £15.51 £14.44 £11.75 £8.10 £13.86 £17.82 £16.26
Vesting period (years) 3 3 3 3 3 3 3
Expected dividend yield (%) 3.43 3.43 3.41 3.41 2.60 2.60 2.60
Fair value (EPS) (£) 7.13 6.63 5.40 3.73 12.83 16.50 15.06
Fair value (TSR) (£) 2.81 2.61 2.13 1.46 5.04 6.49 5.89
The expected dividend yield is based on the historical dividend yield over the three years prior to
grant.
A reconciliation of option movements over the year to 31 December 2009 and 2008 is shown below:
2009 2008
Weighted Weighted
average average
No. of
shares
exercise
price
No. of
shares
exercise
price
Outstanding at 1 January 8,458,895 — 5,885,597 —
Granted 4,583,187 — 2,625,696 —
Additional shares for rights issue — — 1,067,755 —
Lapsed (528,627) — (105,828) —
Exercised (1,737,903) — (1,014,325) —
Outstanding at 31 December 10,775,552 — 8,458,895 —
Exercisable at 31 December 938,782 — 683,870 —
Of the 2,475,008 options granted in 2007 and outstanding as at 31 December 2009, the EPS condition
is not expected to be met on 557,372 options. As a result, it is considered that these options will not
vest.
571
c102100pu135Proof7:28.3.10B/LRevision:0OperatorBeeR

2009 2008
Weighted Weighted
Weighted average Weighted average
average remaining average remaining
Range of exercise price for options outstanding
exercise
price
contractual
life
exercise
price
contractual
life
2009 2008
Weighted Weighted
Weighted average Weighted average
average remaining average remaining
Range of exercise price for options outstanding
exercise
price
contractual
life
exercise
price
contractual
life
n/a — 8.2 years — 8.1 years
The intrinsic value of vested cash-settled awards as at 31 December 2009 was $2 million (2008:
$0.3 million).
The weighted average share price at the time the options were exercised during 2009 was £11.48
(2008: £15.74).
1997/2006 Restricted Share Scheme (1997/2006 RSS)
Valuation
For awards, the fair value is based on the market value less an adjustment to take into account the
expected dividends over the vesting period. The same fair value is applied for awards made to both
the directors and employees of the Group.
2009 2008
Grant date 3 December 28 September 15 September 23 June 11 March 16 September 24 April 11 March
Share price at grant date £15.51 £14.98 £14.44 £11.75 £8.10 £13.86 £17.82 £16.26
Vesting period (years) 2/3 2/3 2/3 2/3 2/3 3 3 3
Expected dividend yield (%) 3.45 3.45 3.45 3.73 3.73 2.40 2.40 2.40
Fair value (£) 14.25 13.76 13.27 10.72 7.39 8.25 8.25 8.25
The expected dividend yield is based on the historical dividend for three years prior to grant.
A reconciliation of option movements over the year to 31 December 2009 and 2008 is shown below:
2009 2008
Weighted Weighted
average average
No. of
shares
exercise
price
No. of
shares
exercise
price
Outstanding at 1 January 7,285,927 — 6,275,898 —
Granted 12,675,994 — 2,137,992 —
Additional shares for rights issue — — 925,127 —
Lapsed (528,860) — (294,595) —
Exercised (2,155,899) — (1,758,495) —
Outstanding at 31 December 17,277,162 — 7,285,927 —
Exercisable at 31 December 1,986,203 — 1,900,102 —
572
c102100pu135Proof7:28.3.10B/LRevision:0OperatorBeeR

The weighted average share price at the time the options were exercised during 2009 was £11.98
(2008: £15.69).
2009 2008
Weighted Weighted
Weighted average Weighted average
average remaining average remaining
Range of exercise price for options outstanding
exercise
price
contractual
life
exercise
price
contractual
life
n/a — 5.6 years — 5.0 years
The intrinsic value of vested 1997/2006 RSS cash-settled awards as at 31 December 2009 was
$12 million (2008: $3 million).
2007 Supplementary Restricted Share Scheme (2007 SRSS)
Valuation
The first awards under this scheme were made on 12 March 2007. For awards, the fair value is based
on the market value less an adjustment to take into account the expected dividends over the vesting
period. The same fair value is applied for awards made to both the directors and employees of the
Group.
2009 2008
Grant date 3 December 15 September 23 June 11 March 16 September 11 March
Share price at grant date £15.51 £14.44 £11.75 £8.10 £13.86 £16.26
Vesting period (years) 2/3 2/3 2/3 2/3 2/3 2/3
Expected dividend yield (%) 3.45 3.45 3.73 3.73 2.4 2.4
Fair value (£) 14.25 13.27 10.72 7.39 13.06 12.41
The expected dividend yield is based on the historical dividend for three years prior to grant. A
reconciliation of option movements over the year to 31 December 2009 is shown below:
2009 2008
Weighted Weighted
average average
No. of
shares
exercise
price
No. of
shares
exercise
price
Outstanding at 1 January 2,442,096 — 187,602 —
Granted 5,172,293 — 2,020,181 —
Additional shares for rights issue — — 307,805 —
Lapsed (51,909) — (45,549) —
Exercised (147,948) — (27,943) —
Outstanding at 31 December 7,414,532 — 2,442,096 —
Exercisable at 31 December 53,580 — — –
573
c102100pu135Proof7:28.3.10B/LRevision:0OperatorBeeR

2009 2008
Weighted Weighted
Weighted average Weighted average
average remaining average remaining
Range of exercise price for options outstanding
exercise
price
contractual
life
exercise
price
contractual
life
n/a — 5.9 years — 6.2 years
The weighted average share price at the time the options were exercised during 2009 was £14.62
(2008: £nil).
1994/1996 UK and International Sharesave Scheme
Grants made under these schemes which had not vested as at 7 November 2002 are fair valued under
IFRS 2. A reconciliation of option movements over the year to 31 December 2009 and 2008 is shown
below:
2009 2008
Weighted Weighted
average average
No. of
shares
exercise
price
No. of
shares
exercise
price
Outstanding at 1 January 162,982 £5.61 561,107 £5.82
Additional shares for rights issue — — 36,060 —
Lapsed — — (227,613) £4.92
Exercised (127,062) £5.61 (206,572) £5.35
Outstanding at 31 December 35,920 £5.61 162,982 £5.61
Exercisable at 31 December 35,920 £5.61 162,982 £5.61
2009 2008
Weighted Weighted
Weighted average Weighted average
average remaining average remaining
Range of exercise price for options outstanding
exercise
price
contractual
life
exercise
price
contractual
life
£5.61 £5.61 0 years £5.61 0.3 years
The weighted average share price at the time the options were exercised was £10.86 (2008: £13.89) for
1994 UK Sharesave Schemes and £10.28 (2008: £13.89) for 1996 International Sharesave schemes.
The intrinsic value of vested 1994/1996 UK and International Sharesave cash-settled awards as at
31 December 2009 was $nil million (2008: $0.1 million).
574
c102100pu135Proof7:28.3.10B/LRevision:0OperatorBeeR

2008 Irish Sharesave Scheme
The first awards under this scheme were made on 29 September 2008.
Valuation
Options are valued using a binomial option-pricing model. The same fair value is applied for awards
made to both the directors and employees of the Group. The fair value per option granted and the
assumptions used in the calculation are as follows:
2009 2008
Grant date 5 October 29 September
Share price at grant date £14.92 £14.52Exercise price £11.46 £11.62
Vesting period (years) 3/5 3/5
Expected volatility (%) 52.9/42.6 39.6/48.7
Expected option life (years) 3.33/5.33 3.33/5.33
Risk free rate (%) 1.8/2.5 2.32/2.53
Expected dividend yield (%) 3.3/3.2 2.5/2.73
Fair value (£) 5.9/5.8 2.99/3.04
The expected dividend yield is based on the historical dividend for three years prior to grant. A
reconciliation of option movements over 2009 and 2008 is shown below:
2009 2008
Weighted Weighted
average average
No. of
shares
exercise
price
No. of
shares
exercise
price
Outstanding at 1 January 14,290 £10.18 — —
Granted 4,581 £11.46 12,510 £10.18
Additional shares for rights issue — — 1,780 —
Lapsed — — — —Exercised — — — —
Outstanding at 31 December 18,871 £10.48 14,290 £10.18
Exercisable at 31 December — — — —
2009 2008
Weighted Weighted
Weighted average Weighted average
average remaining average remaining
Range of exercise price for options outstanding
exercise
price
contractual
life
exercise
price
contractual
life
£10.18 – £11.46 £10.48 3.6 years £10.18 5.3 years
575
c102100pu135Proof7:28.3.10B/LRevision:0OperatorBeeR

2004 UK and International Sharesave Schemes
Valuation
Options are valued using a binomial option-pricing model. The same fair value is applied for awards
made to both the directors and employees of the Group. The fair value per option granted and the
assumptions used in the calculation are as follows:
2009 2008
Grant date 9 October 5 October 3 October 16 September
Share price at grant date £15.57 £14.92 £14.52 £14.52
Exercise price £11.46 £11.46 £11.62 £11.62
Vesting period (years) 3/5 3/5 3/5 3/5Expected volatility (%) 52.9/43.7 52.9/42.6 39.6/48.7 39.6/48.7
Expected option life (years) 3.33/5.33 3.33/5.33 3.33/5.33 3.33/5.33
Risk free rate (%) 1.8/2.5 1.8/2.5 2.32/2.53 2.32/2.53
Expected dividend yield (%) 3.3/3.2 3.3/3.2 2.5/2.73 2.5/2.73
Fair value (£) 6.4/6.2 5.9/5.8 2.99/3.04 2.99/3.04
The expected volatility is based on historical volatility over the last three to five years, or three to five
years prior to grant. The expected life is the average expected period to exercise. The risk free rate of
return is the yield on zero-coupon UK government bonds of a term consistent with the assumed
option life. The expected dividend yield is based on historical dividend for three years prior to grant.
Where two amounts are shown for volatility, risk free rates, expected dividend yield and fair values,
the first relates to a three year vesting period and the second to a five year vesting period.
A reconciliation of option movements over the year to 31 December 2009 and 2008 is shown below:
2009 2008
Weighted Weighted
average average
No. of
shares
exercise
price
No. of
shares
exercise
price
Outstanding at 1 January 20,229,858 £9.69 14,266,731 £10.91
Granted 3,881,940 £11.46 6,241,929 £10.18
Additional shares rights issue — — 2,579,391 —
Lapsed (2,160,450) £10.26 (2,574,039) £10.14Exercised (4,484,911) £8.81 (284,154) £7.04
Outstanding at 31 December 17,466,437 £10.28 20,229,858 £9.69
Exercisable at 31 December 2,018,787 £9.17 3,588,924 £9.69
2009 2008
Weighted Weighted
Weighted average Weighted average
average remaining average remaining
Range of exercise price for options
outstanding
exercise
price
contractual
life
exercise
price
contractual
life
£6.51/£11.46 £10.28 2.2 years £9.69 1.9 years
The weighted average share price at the time the options were exercised during 2009 was £14.16
(2008: £13.92) for the UK Sharesave Scheme and £12.73 (2008: £13.92) for the International
Sharesave Scheme.
The intrinsic value of vested UK and International Sharesave cash-settled awards as at 31 December
2009 was $7 million (2008: $0.4 million).
576
c102100pu135Proof7:28.3.10B/LRevision:0OperatorBeeR

2004 Deferred Bonus Plan
Under this plan shares are issued directly to participants upon vesting.
A reconciliation of share movements over the year to 31 December 2009 and 2008 is shown below:
2009 2008
No. of
shares
No. of
shares
Outstanding at 1 January 352,857 351,340
Shares vested (347,836) (324,002)
Shares awarded 352,633 307,760
Additional shares for rights issue — 43,756
Shares lapsed (7,073) (25,997)
Outstanding at 31 December 350,581 352,857
Notes:
a) The market value of shares on the date of awards (6 March 2009) was £6.98 (2008: £16.45).
b) The shares vest one year after the date of award.
c) A notional scrip dividend accrues on the shares held in the Trust. The dividend is normally delivered in the form of shares and isreleased on vesting.
40. Cash flow statement
Adjustment for non-cash items and other accounts
Group Company
2009 20081 2009 20081
$million $million $million $million
Depreciation and amortisation 520 425 — —Gain on disposal of property, plant and
equipment (40) (10) — —
Gain on disposal of investment securities and loan
and receivable financial assets (592) (322) — —
Gain arising on repurchase of subordinated
liabilities (264) (384) — (384)
Gain arising on initial recognition and partial sale
of Visa Inc. shares — (17) — —Writedowns relating to asset backed securities 4 49 — —
Movement in fair value hedges on available-for-
sale assets 6 26 — —
Amortisation of discounts and premiums of
investment securities (762) (390) — —
Pension costs for defined benefit schemes 30 45 — —
Impairment losses on loans and advances and
other credit risk provisions 2,000 1,321 — —Dividend income from subsidiaries — — (331) (1,880)
Other impairment 102 469 — —
Profit from associates (21) — — —
Loss/(gain) on sale of businesses 2 (146) — —
Recoveries of acquisition fair values and discount
unwind (101) (120) — —
Interest expense on subordinated liabilities 501 1,049 103 184
Total 1,385 1,995 (228) (2,080)
1 Amounts have been restated as explained in note 50.
577
c102100pu135Proof7:28.3.10B/LRevision:0OperatorBeeR

Change in operating assets
Group Company
2009 20081 2009 2008
$million $million $million $million
Decrease/(increase) in derivative financial
instruments 32,293 (47,138) (291) —
Net (increase)/decrease in debt securities, treasury
bills and equity shares held at fair
value through profit or loss (6,331) 7,590 — —
Net increase in loans and advances to banks and
customers (21,801) (39,160) — —Decrease in pre-payments and accrued income 286 213 2 —
(Increase)/decrease in other assets (1,485) (9,608) 62 62
Total 2,962 (88,103) (227) 62
1 Amounts have been restated as explained in note 50.
Change in operating liabilities
Group Company
2009 20081 2009 2008
$million $million $million $million
(Decrease)/increase in derivative financial
instruments (31,941) 44,943 (1) 26
Net increase in deposits from banks, customer
accounts, debt securities in issue, Hong Kong
notes in circulation and short positions 21,398 59,798 3,398 1,372(Decrease)/increase in accruals and deferred
income (121) 1,025 (12) (63)
(Decrease)/increase in other liabilities (555) 147 318 (40)
Total (11,219) 105,913 3,703 1,295
1 Amounts have been restated as explained in note 50.
578
c102100pu135Proof7:28.3.10B/LRevision:0OperatorBeeR

41. Cash and cash equivalents
For the purposes of the cash flow statement, cash and cash equivalents comprise the following
balances with less than three months maturity from the date of acquisition. Restricted balancescomprise minimum balances required to be held at central banks.
Group Company
2009 2008 2009 2008
$million $million $million $million
Cash and balances at central banks 18,131 24,161 — —
Less restricted balances (4,971) (4,615) — —
Treasury bills and other eligible bills 7,748 9,303 — —
Loans and advances to banks 37,127 33,913 — —Trading securities 10,038 10,937 — —
Amounts owed by and due to subsidiary
undertakings — — 5,798 5,303
Total 68,073 73,699 5,798 5,303
42. Capital commitments
Capital expenditure approved by the directors but not provided for in these accounts amounted to:
2009 2008
$million $million
Contracted 36 46
43. Operating lease commitments
2009 2008
Premises Equipment Premises Equipment
$million $million $million $million
Commitments under non-cancellable operatingleases expiring:
Within one year 271 8 258 2
Later than one year and less than five years 477 11 470 2
After five years 487 — 509 —
1,235 19 1,237 4
During the year $277 million (2008: $240 million) was recognised as an expense in the income
statement in respect of operating leases. The Group leases various premises and equipment undernon-cancellable operating lease agreements. The leases have various terms, escalation clauses and
renewal rights. The total future minimum sublease payments expected to be received under non-
cancellable subleases at 31 December 2009 is $4 million (2008: $5 million).
579
c102100pu135Proof7:28.3.10B/LRevision:0OperatorBeeR

44. Contingent liabilities and commitments
The table below shows the contract or underlying principal amounts and risk weighted amounts of
unmatured off-balance sheet transactions at the balance sheet date. The contract or underlyingprincipal amounts indicate the volume of business outstanding and do not represent amounts at risk.
The risk weighted amounts have been calculated in accordance with the FSA guidelines implementingthe Basel Accord on capital adequacy, after taking account of collateral and guarantees received.
2009 2008
$million $million
Contingent liabilities1
Guarantees and irrevocable letters of credit 28,731 28,051
Other contingent liabilities 9,927 11,494
38,658 39,545
Commitments1
Documentary credits and short term trade-related transactions 6,695 5,270
Forward asset purchases and forward deposits placed 874 40
Undrawn formal standby facilities, credit lines and other commitments to lend:
One year and over 20,616 14,450Less than one year 20,729 14,903
Unconditionally cancellable 45,344 42,388
94,258 77,051
Risk weighted amount:
Contingent liabilities 13,422 12,8272
Commitments 8,856 6,9672
1 Includes amounts relating to the Group’s share of its joint ventures.
2 Amounts have been adjusted to present consistency with 2009, as a result of continuing refinements in Basel II. This has not hadan impact on the Group’s total risk weighted assets.
Contingent liabilities
Where the Group undertakes to make a payment on behalf of its customers for guarantees issued,
such as for performance bonds or as irrevocable letters of credit as part of the Group’s transaction
banking business for which an obligation to make a payment has not arisen at the reporting date, it
is included in these financial statements as a Contingent liability.
Other contingent liabilities primarily include revocable letters of credit and bonds issued on behalf of
customers to customs officials, for bids or offers and as shipping guarantees.
Commitments
Where the Group has confirmed its intention to provide funds to a customer or on behalf of a
customer in the form of loans, overdrafts, future guarantees whether cancellable or not or letters of
credit and the Group has not made payments at the balance sheet date, those instruments are
included in these financial statements as commitments.
580
c102100pu135Proof7:28.3.10B/LRevision:0OperatorBeeR

45. Repurchase and reverse repurchase agreements
The Group enters into collateralised reverse repurchase and repurchase agreements and securities
borrowing and lending transactions. It also receives securities as collateral for commercial lending.
Balance sheet assets
2009 2008
Reverse Reverse
repurchase repurchase
agreements agreements
$million $million
Banks 1,192 1,578Customers 1,603 4,833
2,795 6,411
Under reverse repurchase and securities borrowing arrangements, the Group obtains securities on
terms which permit it to repledge or resell the securities to others. Amounts on such terms are:
2009 2008
$million $million
Securities and collateral which can be repledged or sold (at fair value) 2,624 5,707
Thereof repledged/transferred to others for financing activities, to satisfy
commitments under short sale transactions or liabilities under sale and
repurchase agreements (at fair value) 1,696 4,030
Balance sheet liabilities
2009 2008
Repurchase Repurchase
agreements agreements
$million $million
Banks 1,567 5,053
Customers 380 5,177
1,947 10,230
Collateral pledged against these liabilities is disclosed in note 18 and note 22. The terms and
conditions relating to the collateral pledged typically permits the collateral to be sold or repledged,
subject to the obligation to return the collateral at the end of the agreement.
581
c102100pu135Proof7:28.3.10B/LRevision:0OperatorBeeR

46. Liquidity risk
This table analyses assets and liabilities into relevant maturity groupings based on the remaining
period to the contractual maturity date as at the balance sheet date, on a discounted basis.Contractual maturities do not necessarily reflect actual repayments or cash flow.
The Risk review on pages 44 to 67 of the 2009 Annual Report explains the Group’s and Company’srisk management with respect to asset and liability management.
2009
Between Between
Three three one year
months months and and More than
or less one year five years five years Total
$million $million $million $million $million
Assets
Cash and balances at central banks 13,160 — — 4,971 18,131Derivative financial instruments 9,891 7,508 16,207 4,587 38,193
Loans and advances to banks1 37,127 14,182 1,289 335 52,933
Loans and advances to customers1 63,162 34,939 44,406 59,296 201,803
Investment securities1 18,939 30,185 32,967 10,524 92,615
Other assets 5,755 710 49 26,464 32,978
Total assets 148,034 87,524 94,918 106,177 436,653
Liabilities
Deposits by banks1 34,721 2,967 1,140 115 38,943
Customer accounts1 230,332 22,198 3,971 245 256,746
Derivative financial instruments 8,644 7,969 15,757 4,214 36,584
Debt securities in issue1 11,390 9,134 11,059 1,676 33,259Other liabilities 13,182 1,089 178 12,022 26,471
Subordinated liabilities and other
borrowed funds 723 — 562 15,445 16,730
Total liabilities 298,992 43,357 32,667 33,717 408,733
Net liquidity gap (150,958) 44,167 62,251 72,460 27,920
1 Amounts include financial instruments held at fair value through profit or loss (see note 14).
582
c102100pu135Proof7:28.3.10B/LRevision:0OperatorBeeR

2008
Between Between
Three three one year
months months and and More than
or less one year five years five years Total
$million $million $million $million $million
Assets
Cash and balances at central banks 19,546 — — 4,615 24,161
Derivative financial instruments 13,791 18,743 27,821 9,302 69,657
Loans and advances to banks2 33,913 11,749 2,132 152 47,946
Loans and advances to customers2 63,829 27,541 38,044 49,098 178,512Investment securities2 20,736 28,137 21,758 8,439 79,070
Other assets 12,791 1,231 27 21,673 35,722
Total assets 164,606 87,401 89,782 93,279 435,068
Liabilities
Deposits by banks2 31,168 3,382 1,359 77 35,986
Customer accounts2 210,449 21,674 4,824 1,644 238,591
Derivative financial instruments 15,004 18,207 25,430 9,134 67,775
Debt securities in issue2 12,568 5,801 5,695 3,005 27,069
Other liabilities 12,163 1,707 503 11,593 25,966
Subordinated liabilities and other
borrowed funds 845 1,304 2,189 12,648 16,986
Total liabilities 282,197 52,075 40,000 38,101 412,373
Net liquidity gap (117,591) 35,326 49,782 55,178 22,695
2 Amounts include financial instruments held at fair value through profit or loss (see note 14).
The Company has financial assets of $2,475 million (2008 : $925 million) and financial liabilities of
$1,504 million (2008: $2,835 million) maturing in five years or more.
Within the tables above cash and balances with central banks, loans and advances to banks, treasury
bills and debt securities classified as trading, held at fair value or available for sale included within
investment securities are used by the Group principally for liquidity management purposes.
583
c102100pu135Proof7:28.3.10B/LRevision:0OperatorBeeR

Behavioural maturity of financial liabilities on a discounted basis
As discussed in the Risk review on pages 44 to 67 of the 2009 Annual Report the Group seeks to
manage its liabilities both on a contractual and behavioural basis primarily by matching the maturityprofiles of assets and liabilities. The cash flows presented in the tables above reflect the cash flows
which will be contractually payable over the residual maturity of the instruments. In practice,
however, certain liability instruments behave differently from their contractual terms and typically, for
short term customer accounts, extend to a longer period than their contractual maturity. The Group’s
expectation of when such liabilities are likely to become payable is provided in the table below:
20091
Between Between
Three three one year
months months and and More than
or less one year five years five years Total
Group $million $million $million $million $million
Deposits by banks 34,764 3,252 812 115 38,943
Customer accounts 128,958 53,844 44,032 29,912 256,746
Total 163,722 57,096 44,844 30,027 295,689
1 As permitted by IFRS 7: Financial Instruments: Disclosure no comparatives have been presented.
Financial liabilities excluding derivative financial instruments on an undiscounted basis
The following table analyses the contractual cash flows payable for the Group’s financial liabilities by
remaining contractual maturities on an undiscounted basis. The financial liability balances in the table
below will not agree to the balances reported in the consolidated balance sheet as the table
incorporates all contractual cash flows, on an undiscounted basis, relating to both principal andinterest payments.
Within the ‘More than five years’ maturity band are undated financial liabilities of $3,583 million
(2008: $4,309 million), all of which relate to subordinated debt, on which interest payments are notincluded as this information would not be meaningful. Interest payments on these instruments are
included within the maturities up to five years.
2009 2008
Between Between Between Between
Three three one year Three three one year
months or months and and five More than months or months and and More than
Group less one year years five years less one year five years five years
$million $million $million $million $million $million $million $million
Deposits by banks 34,548 2,930 982 84 28,449 3,612 1,160 205
Customer accounts 219,763 25,469 4,351 536 208,355 22,792 4,698 1,628
Financial liabilities at fair
value 8,763 2,644 2,508 1,676 9,396 2,212 3,438 1,885
Debt securities in issue 9,012 6,976 5,893 5,336 12,572 5,870 4,921 6,405
Subordinated liabilities and
other borrowed funds 1,437 985 7,072 22,851 156 2,353 6,046 20,876
Other liabilities 14,838 1,046 387 7,991 13,258 1,903 170 7,065
Total liabilities 288,361 40,050 21,193 38,474 272,186 38,742 20,433 38,064
Gross loan commitments 45,910 12,751 18,552 539 40,005 9,871 13,265 1,053
584
c102100pu135Proof7:28.3.10B/LRevision:0OperatorBeeR

2009 2008
Between Between Between Between
Three three one year Three three one year
months or months and and five More than months or months and and More than
Company less one year years five years less one year five years five years
$million $million $million $million $million $million $million $million
Debt securities in issue 52 206 1,083 4,405 — 54 90 1,317
Subordinated liabilities and
other
borrowed funds 2 109 670 1,957 — 118 723 1,940
Other liabilities — — — 138 863 — — —
Total liabilities 54 315 1,753 6,500 863 172 813 3,257
Derivative financial instruments on an undiscounted basis
Derivative financial instruments include those net settled derivative contracts in a net liability position,
together with the pay leg of gross settled contracts regardless of whether the overall contract is in an
asset or liability position. The receive leg is not shown in this table and as a result the derivative
amounts in this table are inflated by their exclusion.2009 2008
Between Between Between Between
Three three one year Three three one year
months or months and and five More than months or months and and More than
Group less one year years five years less one year five years five years
$million $million $million $million $million $million $million $million
Derivative financial
instruments 224,831 119,179 119,009 17,328 529,175 251,250 138,445 17,593
2009 2008
Between Between Between Between
Three three one year Three three one year
months or months and and five More than months or months and and More than
Company less one year years five years less one year five years five years
$million $million $million $million $million $million $million $million
Derivative financial
instruments 12 36 279 — 26 — — —
47. Currency risk
Foreign exchange risk is managed and measured as set out in the Market risk section of the Risk
review on pages 62 to 65 of the 2009 Annual Report.
Foreign exchange risk arising within the non-trading portfolio, excluding structural positions, is
minimised by match funding assets and liabilities in the same foreign currency.
Structural foreign exchange risks arise from net investments in currencies other than US dollars. The
Group has made net investments in Group undertakings in a number of currencies.
The resulting foreign exchange exposures are managed on an individual basis, and are assessed
regularly taking account of foreign exchange rate expectations. The positions are treated as long-term
embedded exposures, and are not treated as trading positions. Hedges of the foreign exchangeexposures may be considered in certain limited cases.
At 31 December 2009, the Group had taken net investment hedges of $644 million (2008: $600million) to partly cover its exposure to Korean won and $94 million (2008: $nil million) to partly
cover its exposure to Taiwanese dollars.
585
c102100pu135Proof7:28.3.10B/LRevision:0OperatorBeeR

The table below sets out the principal structural foreign exchange exposures (net of investment
hedges) of the Group at 31 December 2009 and 2008:
2009 2008
$million $million
Hong Kong dollar 5,852 4,985
Korean won 5,133 4,469
Indian rupee 2,828 2,369
Taiwanese dollar 2,071 2,112
Thai baht 1,291 991
UAE dirham 1,008 1,075
Singapore dollar 986 532
Malaysian ringgit 834 731Chinese yuan 795 883
Indonesian rupiah 595 428
Pakistani rupee 562 563
Other 2,293 1,985
24,248 21,123
An analysis has been performed on these exposures to assess the impact of a one% fall in the US
dollar exchange rates adjusted to incorporate the impacts of correlations between different currencies.The impact on the positions above would be an increase of $176 million (2008: $143 million).
Changes in the valuations of these positions are taken to reserves.
The Company’s assets and liabilities are mainly in US dollars. It has assets of $4,309 million (2008:
$1,633 million) and liabilities of $4,270 million (2008: $782 million) denominated in currencies other
than US dollars.
48. Credit risk
Maximum exposure to credit risk
The tables below present the Group and Company’s maximum exposure to credit risk of theirbalance sheet and off-balance sheet financial instruments at 31 December 2009, before taking into
account any collateral held or other credit enhancements. For on-balance sheet instruments, the
maximum exposure to credit risk is the carrying amount reported on the balance sheet. For off-
balance sheet instruments, the maximum exposure to credit risk represents the contractual nominal
amounts.
As set out in note 18, the Group has entered into synthetic loan securitisations and synthetic trade
receivable securitisations on which it has mitigated certain of the credit risks. In respect of derivative
financial instruments, $30,539 million (2008: $45,896 million) is available for offset as a result of
master netting agreements which do not, however, meet the criteria under IAS 32 to enable these
balances to be presented on a net basis in the financial statements as in the ordinary course of
business they are not intended to be settled net.
Collateral is held to mitigate the credit risk exposures primarily in respect of loans and advances, and
consisting of residential, commercial and industrial properties, securities and other assets such as plantand machinery. Further details of the credit risk mitigation undertaken by the Group are contained
within the Risk review on page 52 of the 2009 Annual Report.
The Group’s maximum exposure to credit risk has increased by $21 billion compared to 2008,
primarily due to growth in lending to banks and customers and credit commitments, offset by a
decline in derivatives. Growth in lending of $28.4 billion was split between loans to banks, which
increased $4.9 billion, Consumer Banking, which increased by $13.9 billion compared to 2008 as
mortgage balances increased, and Wholesale Banking, which increased $9.6 billion largely through
increased lending to the Transport and Commerce sectors. Credit commitments increased $12.0 billion
as corporate credit lines were increased. Offsetting this, derivatives declined $31.5 billion, driven by
reduced volatility as notionals remained largely flat.
586
c102100pu135Proof7:28.3.10B/LRevision:0OperatorBeeR

2009 2008
Group $million $million
Financial assets held at fair value through profit or loss1 21,229 14,800Derivative financial instruments 38,193 69,657
Loans and advances to banks and customers 249,177 220,761
Investment securities1 74,079 67,749
Contingent liabilities 38,658 39,545
Undrawn irrevocable standby facilities, credit lines and other commitments to
lend 41,345 29,353
462,681 441,865
1 Excludes equity shares.
2009 2008
Company $million $million
Derivative financial instruments 291 —
Debt Securities 2,725 925
Amounts owed by subsidiary 5,798 5,303
8,814 6,228
Summary analysis of the loan portfolio
2009 2008
Loans to
banks
Loans to
customers –
Consumer
Banking
Loans to
customers –
Wholesale
Banking
Total loans
to
customers
Loans to
banks
Loans to
customers –
Consumer
Banking
Loans to
customers –
Wholesale
Banking
Total loans
to
customers
$million $million $million $million $million $million $million $million
Individually impaired
loans, net of provisions 154 492 1,159 1,651 18 519 812 1,331
Past due but not impaired
loans 2 3,389 538 3,927 53 4,391 791 5,182
Neither past due nor
impaired loans 52,779 90,702 106,397 197,099 47,881 75,754 96,896 172,650
Total loans and advances 52,935 94,583 108,094 202,677 47,952 80,664 98,499 179,163
Portfolio impairment
provision (2) (519) (355) (874) (6) (449) (202) (651)
52,933 94,064 107,739 201,803 47,946 80,215 98,297 178,512
Of which:
Loans and advances held
at fair value 2,048 — 3,511 3,511 1,363 — 4,334 4,334
The Company has loans neither past due nor impaired of $5,798 million (2008: $2,706 million) and
has no individually impaired or past due but not impaired loans. Details of loan loss provisions and
individually impaired loans are disclosed in notes 20 and 21.
Loans and advances past due but not individually impaired
The following table sets out the ageing of loans and advances which are past due and for which noindividual impairment provision has been raised. A loan is considered to be past due when the
counterparty has failed to make a principal or interest payment when contractually due. Past due
does not necessarily mean that a loan is impaired.
Individual impairment provisions are generally raised at 90 days past due, with the exception of
mortgages in Consumer Banking, where individual impairment provisions are raised after 150 days
past due. Individual impaired loans for Consumer Banking will therefore not equate to those loans
reported as non-performing on page 57 of the 2009 Annual Report. As described on page 56 of the
587
c102100pu135Proof7:28.3.10B/LRevision:0OperatorBeeR

2009 Annual Report prior to the raising of an individual impairment provision, impairment on these
loans is captured within the portfolio impairment provision.
2009 2008
Loans to
banks
Loans to
customers –
Consumer
Banking
Loans to
customers –
Wholesale
Banking
Total loans
to
customers
Loans to
banks
Loans to
customers –
Consumer
Banking
Loans to
customers –
Wholesale
Banking
Total
loans to
customers
$million $million $million $million $million $million $million $million
Up to 30 days past due 2 2,522 369 2,891 44 3,268 566 3,834
Between 31 – 60 days past
due — 406 98 504 — 515 75 590
Between 61 – 90 days past
due — 239 71 310 — 283 150 433
Between 91 – 150 days past
due — 222 — 222 9 325 — 325
2 3,389 538 3,927 53 4,391 791 5,182
Estimated fair value of
collateral held — 1,980 458 2,438 — 1,961 185 2,146
Collateral held against Consumer Banking loans and Wholesale Banking loans largely comprises
residential and commercial property and property and securities respectively. Where the fair value ofcollateral held exceeds the outstanding loan, any excess is paid back to the customers and is not
available for offset against other loans.
Loans and advances neither past due nor impaired
The following table sets out an analysis of loans and advances by internal credit grading which are
not past due and for which no individual impairment provision has been raised. The credit gradings
set out in the table below are based on a probability of default measure as set out in the Risk
Review on page 51 of the 2009 Annual Report. The banding reflects management’s segmentation ofthe credit risk grades.
The increase in loans and advances to banks compared to 2008 is a result of the placement of excessliquidity with high quality sovereign and bank counterparties: the credit grade profile of this portfolio
is largely unchanged from 2008 to 2009.
The credit grade profile of Consumer Banking loans to customers has improved since 2008, with alarger proportion of the portfolio in credit grades 1 to 5. This is primarily a result of the business
strategy to focus on high quality client segments for new bookings. The increase in grade 12 loans is
as a result of higher rates of credit grade migration experienced on the existing book which was a
feature of slowing economic conditions.
There was also some credit grade migration amongst Wholesale banking customers in 2009, as the
impact of the economic recession became more evident in the Company’s footprint markets; however
the pace of grade migration slowed in the latter part of the year. The $1.6 billion increase in credit
grade 12 loans was largely concentrated in the Middle East.
588
c102100pu135Proof7:28.3.10B/LRevision:0OperatorBeeR

2009 2008
Total loans and advances
neither past due or
impaired
Loans to
banks
Loans to
customers –
Consumer
Banking
Loans to
customers –
Wholesale
Banking
Total
loans to
customers
Loans to
banks
Loans to
customers –
Consumer
Banking
Loans to
customers –
Wholesale
Banking
Total
loans to
customers
$million $million $million $million $million $million $million $million
Grades 1 – 5
– at amortised cost 45,342 44,158 41,719 85,877 41,864 33,212 41,134 74,346
– at fair value 1,192 — 2,092 2,092 710 — 3,888 3,888
Grades 6 – 8
– at amortised cost 4,630 21,570 37,505 59,075 4,066 19,969 35,604 55,573
– at fair value 855 — 870 870 649 — 239 239
Grades 9 – 11
– at amortised cost 729 22,728 21,628 44,356 575 21,294 15,400 36,694
– at fair value 1 — 549 549 4 — 207 207
Grade 12
– at amortised cost 30 2,246 2,034 4,280 13 1,279 424 1,703
Total – at amortised cost 50,731 90,702 102,886 193,588 46,518 75,754 92,562 168,316
Total – at fair value 2,048 — 3,511 3,511 1,363 — 4,334 4,334
Grand Total 52,779 90,702 106,397 197,099 47,881 75,754 96,896 172,650
Of which: renegotiated
loans — 687 1,397 2,084 — 682 365 1,047
Loans and advances neither past due nor impaired continued
Renegotiated loans in the above table represent the carrying amount of loans that would otherwise be
past due or impaired if their terms had not been renegotiated. Although not considered to be non-
performing in nature, these loans continue to be monitored in the same way as non-performing loansuntil a minimum number of payments have been received under the new terms.
Within Wholesale Banking, renegotiated loans increased by $1 billion compared to 2008, primarilyarising in the Middle East within the financing and real estate sectors.
Collateral and other credit enhancements possessed or called upon
During the year, the Group obtained assets by taking possession of collateral or calling upon other
credit enhancements (such as guarantees) as detailed in the table below. Repossessed properties are
sold in an orderly fashion. Where the proceeds are excess of the outstanding loan balance they are
returned to the borrower. Certain of the equity securities acquired continue to be held by the Group
for investment purposes and are classified as available-for-sale, and the related loan derecognised.
2009 2008
Consumer Wholesale Consumer Wholesale
Banking Banking Total Banking Banking Total
$million $million $million $million $million $million
Property 135 7 142 150 1 151
Debt securities and
equity shares — 2 2 2 4 6
Guarantees 25 — 25 28 — 28
Other 91 42 133 54 1 55
251 51 302 234 6 240
589
c102100pu135Proof7:28.3.10B/LRevision:0OperatorBeeR

Debt securities and treasury bills
Debt securities and treasury bills are analysed as follows:
2009 2008
Debt Treasury Debt Treasury
securities bills Total securities bills Total
$million $million $million $million $million $million
Impaired securities 231 — 231 185 106 291
Impairment
provisions (191) — (191) (158) (1) (159)
Net impaired
securities 40 — 40 27 105 132Securities neither past
due nor impaired 65,192 24,517 89,709 57,405 19,315 76,720
65,232 24,517 89,749 57,432 19,420 76,852
Of which:
Held at fair value 10,111 5,559 15,670 6,396 2,707 9,103
The Company has $2,725 million (2008: $925 million) of debt securities, issued by Standard CharteredBank, a wholly owned subsidiary undertaking.
Movements in provisions on impaired securities are disclosed in note 22. The impaired debt securities
largely include the Group’s holdings of ABS CDOs, on which a $73 million (2008: $41 million)
impairment charge was taken in 2009.
Collateral is held against impaired securities and primarily consist of properties. The undiscounted fair
value of collateral held relating to impaired securities is estimated at $30 million (2008: $22 million).
Where the fair value of collateral held exceeds the outstanding securities obligations, any excess is
paid back to the customers and is not available for offset against other securities obligations.
Securities neither past due nor impaired
The following table analyses debt securities and treasury bills which are neither past due nor impaired
by external credit rating. The standard credit ratings used by the Group are those used by Standard
& Poors or their equivalent. Debt securities held which have a short-term rating are reported against
the long-term rating of the issuer. For securities which are unrated, the Group applies an internal
credit rating as described under Loans and Advances.
2009 2008
Debt Treasury Debt Treasury
securities bills Total securities bills Total
$million $million $million $million $million $million
AAA 10,706 630 11,336 9,551 18 9,569
AA- to AA+ 21,246 9,618 30,864 22,522 5,269 27,791
A- to A+ 17,770 10,757 28,527 14,361 10,862 25,223
BBB- to BBB+ 7,243 1,930 9,173 4,939 2,246 7,185
Lower than BBB- 2,422 1,193 3,615 2,367 615 2,982
Unrated 5,805 389 6,194 3,665 305 3,970
65,192 24,517 89,709 57,405 19,315 76,720
Unrated securities primarily relate to corporate issues. Using internal credit ratings, $5,674 million
(2008: $3,525 million) of these securities are considered to be investment grade and $520 million
(2008: $445 million) sub-investment grade.
590
c102100pu135Proof7:28.3.10B/LRevision:0OperatorBeeR

Derivative financial instruments
The Group measures all derivatives at fair value with the gains or losses on derivatives taken to
income, except where derivatives are used as hedging instruments for cash flow hedges where theeffective portion of the hedge is taken through to cash flow hedge reserve. The credit quality of
derivative assets is assessed and monitored on a regular basis. The Group mitigates credit risk on
derivative assets where possible through netting arrangements as set out on page 52 of the 2009
Annual Report. Where netting agreements are not in place the Group obtains collateral from counter
parties depending on the nature of transaction or the credit worthiness of the counter party.
Collateral obtained is normally cash or liquid government securities.
49. Special purpose entities
The Group uses special purpose entities (SPEs) in the normal course of business across a variety of
activities. SPEs are established for specific limited purposes and take a number of legal forms. The
main types of activities for which the Group utilises SPEs cover synthetic credit default swaps for
portfolio management purposes, managed investment funds (including specialised principal finance
funds) and structured finance.
SPEs are consolidated into the Group’s financial statements where the Group bears the majority of
the residual risk or reward. Most of the Group’s consolidated SPEs are in respect of the Group’s
securitised portfolios of residential mortgages (see note 18).
The total assets of unconsolidated SPEs in which the Group has an interest are set out below.
2009 2008
Total Maximum Total Maximum
assets exposure assets exposure
$million $million $million $million
Portfolio management vehicles 1,694 339 1,694 252
Principal Finance Funds1 988 130 898 124
AEB Funds — — 2,487 4
Structured Finance — — 290 —
2,682 469 5,369 380
1 Committed capital for these funds is $375 million (2008: $375 million) of which $130 million (2008: $124 million) has been drawndown net of provisions for impairment of $33 million (2008: $nil million).
For the purposes of portfolio management, the Group has entered into synthetic credit default swaps
with note-issuing SPEs. The referenced assets remain on the Group’s balance sheet as the credit risk
is not transferred to these SPEs. The Group’s exposure arises from (a) the capitalised start-up costs inrespect of the swap vehicles and (b) interest in the first loss notes and investment in a minimal
portion of the mezzanine and senior rated notes issued by the note-issuing SPEs. The proceeds of the
notes issuance are typically invested in AAA rated Government securities, which are used to
collateralise the SPE’s swap obligations to the Group, and to repay the principal to investors at
maturity. The SPEs reimburse the Group on actual losses incurred, through the realisation of the
collateral security. Correspondingly, the SPEs write down the notes issued by an equal amount of the
losses incurred, in reverse order of seniority. All the funding is committed for the life of these vehicles
and hence the Group has no indirect exposure in respect of the vehicles’ liquidity position.
Following the acquisition of AEB, the Group was also the investment manager for a number of
AEB’s investment funds, in which it had a limited amount of capital invested. During 2009 thesefunds were sold and at 31 December 2009 the Group had no capital invested in these funds.
The Group has reputational risk in respect of certain portfolio management vehicles and investmentfunds either because the Group is the arranger and lead manager or because the SPEs have Standard
Chartered branding.
591
c102100pu135Proof7:28.3.10B/LRevision:0OperatorBeeR

50. Restatement of prior periods
None of the following restatements impacted the Group balance sheet as at 1 January 2008 and
accordingly no balance sheet has been presented for that period.
At 31 December 2009 the Group has early adopted the amendment to IAS 32 Financial Instruments
in advance of its effective date as explained in note 14.
The impact of this change has been to reclassify the $233 million gain and associated tax of $66
million in respect of the rights issue option recognised in the income statement in the 2008 Annual
Report into equity in these financial statements. Details of the restatement are set out below:
As
reported Restated
at 2008 Adjustment at 2008
$million $million $million
Group
Income statement
Profit before taxation 4,801 (233) 4,568
Taxation 1,290 (66) 1,224Profit attributable to parent company shareholders 3,408 (167) 3,241
Profit attributable to ordinary shareholders 3,298 (167) 3,131
Basic earnings per share (cents) 202.4 (10.3) 192.1
Diluted earnings per share (cents) 201.3 (10.2) 191.1
Statement of changes in equity
Merger reserve 5,450 167 5,617
Retained earnings 12,853 (167) 12,686
Cash flow statementProfit before taxation 4,801 (233) 4,568
Non-cash items in income statement 1,762 233 1,995
Company
Statement of changes in equity
Merger reserve 5,450 167 5,617
Retained Earnings 2,109 (167) 1,942
Cash flow statement
Profit before taxation 2,476 (233) 2,243
Non-cash items in income statement (2,313) 233 (2,080)
Cash flow statement
Following an amendment to IAS 7 Cash flow statements, cash paid to acquire assets leased to
customers is required to be presented as part of cash flow from operating activities and not cash
flows from investing activities. In addition, the contribution to defined benefit schemes has beenpresented separately. Details of the representation are set out below:
As
reported Restated
at 2008 Adjustment at 2008
$million $million $million
Change in operating assets (87,251) (852) (88,103)
Purchase of property, plant and equipment (1,431) 852 (579)
Change in operating liabilities 105,810 103 105,913Contributions to defined benefit schemes 8 (103) (95)
Entity-wide information
By Geography
In 2009 the Group has re-aligned its geographic reporting with underlying organisational changes to
better reflect asset and income distribution and management. In order to facilitate a more meaningful
comparison, the 2008 numbers in the geography segmental information have been restated so as to be
on a consistent basis with 2009. The Group has a Global Booking Unit (GBU) within its Wholesale
592
c102100pu135Proof7:28.3.10B/LRevision:0OperatorBeeR

Banking business which comprises the private equity portfolio, portfolio management and some
Financial Markets (FM) products. In 2008 income and expenses related to the private equity portfolio
were reported in the geography of the underlying investment and the remainder of the GBU was
reported within Americas, UK & Europe. In 2009, the income and expenses on both the privateequity portfolio and FM products in the GBU have been allocated, the latter to geographies where
dealers are based. Portfolio management continues to be reported within Americas, UK & Europe.
In addition, the Group has changed the basis of reporting total assets employed. In 2008, the ‘total
assets employed’ included both the balances between the entities within the same geography (intra-
geography) as well as those across geographies (inter-geography). In 2009, the intra-geography
balances are eliminated. The 2008 total assets employed have therefore been restated to be consistent.
As a result of the change the distribution of assets held centrally to geographies also changed. The
2008 margins have been restated utilising the revised assets employed.
Reported at 31 December 2008
Asia Pacific
Middle
East & Americas
Hong Other Asia Other UK &
Kong Singapore Korea Pacific India S Asia Africa Europe Total
$million $million $million $million $million $million $million $million $million
Net trading income 369 468 191 694 350 258 166 (91) 2,405
Other income 1,898 958 1,385 2,259 1,396 1,476 743 1,448 11,563
Operating income 2,267 1,426 1,576 2,953 1,746 1,734 909 1,357 13,968
Operating expenses (1,017) (637) (955) (1,721) (646) (813) (564) (1,258) (7,611)
Operating profit before
impairment losses and taxation 1,250 789 621 1,232 1,100 921 345 99 6,357
Impairment losses and share of
profits from associates (236) (45) (263) (534) (157) (185) (33) (336) (1,789)
Profit before taxation 1,014 744 358 698 943 736 312 (237) 4,568
Net interest margin (%) 2.1 0.8 2.5 2.4 3.4 3.0 4.4 0.4 2.5
Total assets employed 76,162 57,422 70,438 82,667 31,362 38,194 12,154 147,934 516,333
Restatement
Asia Pacific
Middle
East & Americas
Hong Other Asia Other UK &
Kong Singapore Korea Pacific India S Asia Africa Europe Total
$million $million $million $million $million $million $million $million $million
Net trading income (12) (109) (29) 7 (52) (76) 1 270 —
Operating income (12) (109) (29) 7 (52) (76) 1 270 —
Operating expenses (13) (27) — — — (8) — 48 —
Profit before taxation (25) (136) (29) 7 (52) (84) 1 318 —
Net interest margin (%) — 0.5 (0.2) — 0.1 0.7 0.1 0.7 —
Total assets employed 1,465 (6,176) (6,088) (474) 907 (3,830) (50) (17,211) (31,457)
593
c102100pu135Proof7:28.3.10B/LRevision:0OperatorBeeR

Restated at 31 December 2008
Asia Pacific
Middle
East & Americas
Hong Other Asia Other UK &
Kong Singapore Korea Pacific India S Asia Africa Europe Total
$million $million $million $million $million $million $million $million $million
Net trading income 357 359 162 701 298 182 167 179 2,405
Other income 1,898 958 1,385 2,259 1,396 1,476 743 1,448 11,563
Operating income 2,255 1,317 1,547 2,960 1,694 1,658 910 1,627 13,968
Operating expenses (1,030) (664) (955) (1,721) (646) (821) (564) (1,210) (7,611)
Operating profit before
impairment losses and taxation 1,225 653 592 1,239 1,048 837 346 417 6,357
Impairment losses and share of
profits from associates (236) (45) (263) (534) (157) (185) (33) (336) (1,789)
Profit before taxation 989 608 329 705 891 652 313 81 4,568
Net interest margin (%) 2.1 1.3 2.3 2.4 3.5 3.7 4.5 1.1 2.5
Total assets employed 77,627 51,246 64,350 82,193 32,269 34,364 12,104 130,723 484,876
None of these restatements impacted the Group balance sheet as at 1 January 2008.
51. Related party transactions
Directors and officers
Directors’ emoluments
Details of directors’ pay and benefits and interests in shares are disclosed in the Directors’
remuneration report on pages 94 to 109 of the 2009 Annual Report.
IAS 24 Related party disclosures requires the following additional information for key management
compensation. Key management comprises non-executive directors and members of the Group
Management Committee, which includes all executive directors.
2009 2008
$million $million
Salaries, allowances and benefits in kind 16 20
Pension contributions 6 6Bonuses paid or receivable 9 18
Share based payments 37 25
68 69
Transactions with directors, officers and others
At 31 December 2009, the total amounts to be disclosed under the Companies Act 2006 (the Act)
and the Listing Rules of the Hong Kong Stock Exchange Limited (HK Listing Rules) about loans todirectors and officers were as follows:
2009 2008
Number $ 000 Number $ 000
Directors 1 13 2 635
Officers1 5 7,240 3 7,898
1 For this disclosure, the term ‘Officers’ means the members of the Group Management Committee, other than those who aredirectors of Standard Chartered PLC, and the Company Secretary.
594
c102100pu135Proof7:28.3.10B/LRevision:0OperatorBeeR

Mr Sunil Mittal, who was an independent non-executive director of Standard Chartered PLC until
31 July 2009, is Chairman and Group CEO of the Bharti Enterprises Group. Due to his significant
voting power in the Bharti Enterprises Group, it was a related party of Standard Chartered PLC
until 31 July 2009. As at 31 July 2009, the Group had loans to the Bharti Enterprises Group of $59million (31 December 2008: $137 million), guarantees of $35 million (31 December 2008: $39 million)
and foreign exchange deals with a notional value of $102 million (31 December 2008: $103 million).
As at 31 December 2009, Standard Chartered Bank had created a charge over $31 million (2008: $24
million) of cash assets in favour of the independent trustees of its employer financial retirement
benefit schemes.
Other than as disclosed in this Annual Report and Accounts, there were no other transactions,
arrangements or agreements outstanding for any director, connected person or officer of the
Company which have to be disclosed under the Act, the rules of the UK Listing Authority or the
HK Listing Rules.
Associates
The Group has amounts due from Merchant Solutions totalling $32 million at 31 December 2009
(2008: $nil million). Except as disclosed, the Group did not have any amounts due to or from
associate investments.
Joint ventures
The Group has loans and advances to PT Bank Permata Tbk totalling $3 million at 31 December
2009 (2008: $5 million), and deposits of $16 million (2008: $16 million). The Group has loans and
advances with SC Caps totalling $12 million (2008: $12 million). The Group has investments insubordinated debt issued by PT Bank Permata Tbk of $50 million (2008: $nil million).
Company
The Company has received $171 million (2008: $105 million) of interest income from Standard
Chartered Bank. The Company issues debt externally and lends the proceeds to Group companies. At
31 December 2009, it had loans to and debt instruments issued by Standard Chartered Bank of
$5,038 million (2008: $3,036 million), derivative financial assets of $291 million (2008: $nil million)
and derivative financial liabilities of $25 million (2008: $26million) with Standard Chartered Bank,
loans of $1,737 million (2008: $1,724 million) to Standard Chartered Holdings Limited, and loans of
$27 million (2008: $1 million) to other subsidiaries.
In 2006, the Company licensed intellectual property rights related to the Company’s main brands to
an indirect wholly owned subsidiary, Standard Chartered Strategic Brand Management Limited
(SCSBM), the income from which is held on the Company’s balance sheet and released over the term
of licence, which expires in 2015. Effective 1 January 2009, the Company agreed to pay a rebate of
$144 million to SCSBM relating to the unamortised portion of the license in respect of the licensing
rights for certain jurisdictions, which were withdrawn by the Company. At 31 December 2009, $109
million (2008: $271 million) has been included as deferred income in the Company balance sheet in
relation to this licence. On 1 January 2009 the Company re-issued the rights to license thesejurisdictions to Standard Chartered Bank for a nominal consideration.
The Company has an agreement with Standard Chartered Bank that in the event of Standard
Chartered Bank defaulting on its debt coupon interest payments, where the terms of such debt
requires it, the Company shall issue shares as settlement for non-payment of the coupon interest.
52. Significant accounting estimates and judgements
In determining the carrying amounts of certain assets and liabilities, the Group makes assumptions of
the effects of uncertain future events on those assets and liabilities at the balance sheet date. The
Group’s estimates and assumptions are based on historical experience and expectation of future events
and are reviewed periodically. This disclosure excludes uncertainty over future events and judgementsin respect of measuring financial instruments. Further information about key assumptions concerning
the future, and other key sources of estimation uncertainty, are set out in the notes.
Loan loss provisioning
The Group’s loan loss provisions are established to recognise incurred impairment losses either on
specific loan assets or within a portfolio of loans and receivables.
595
c102100pu135Proof7:28.3.10B/LRevision:0OperatorBeeR

Impairment losses for specific loan assets are assessed either on an individual or on a portfolio basis.
Individual impairment losses are determined as the difference between the carrying value and the
present value of estimated future cash flows, discounted at the loans’ original effective interest rate.
Impairment losses determined on a portfolio basis are assessed based on the probability of defaultinherent within the portfolio of impaired loans or receivables.
Estimating the amount and timing of future recoveries involves significant judgement, and considers
the level of arrears as well as the assessment of matters such as future economic conditions and the
value of collateral, for which there may not be a readily accessible market.
Loan losses that have been incurred but have not been separately identified at the balance sheet date
are determined on a portfolio basis, which takes into account past loss experience as a result of
uncertainties arising from the economic environment, and defaults based on portfolio trends. Actual
losses identified could differ significantly from the impairment provisions reported as a result of
uncertainties arising from the economic environment.
The total amount of the Group’s impairment allowances is inherently uncertain, being sensitive to
changes in economic and credit conditions across the geographies that the Group operates in.
Economic and credit conditions are interdependent within each geography and as a result there is no
single factor to which the Group’s loan impairment allowances as a whole are sensitive. It is possible
that actual events over the next year differ from the assumptions built into the model resulting in
material adjustments to the carrying amount of loans and advances.
Fair value of financial instruments
Fair value is the amount for which an asset could be exchanged, or a liability settled, between
knowledgeable, willing parties in an arm’s length transaction.
All financial instruments are initially recognised at fair value, which is normally the transaction price.
In certain circumstances, the initial fair value may be based on a valuation technique, which may lead
to the recognition of profits or losses at the time of initial recognition. However, these profits or
losses can only be recognised when the valuation technique used is based solely on observable market
inputs. Subsequent to initial recognition, some of the Group’s financial instruments are carried at fair
value, with changes in fair value either reported within the income statement or within equity until
the instrument is sold or becomes impaired.
Details of the type and classification of the Group’s financial instruments are set out in notes 14 and
15 to the accounts and the accounting policy set out in note 1 to the accounts. In addition to these
instruments, the carrying value of a financial instrument carried at amortised cost that is the hedged
item in a qualifying fair value hedge relationship is adjusted by the fair value gain or loss attributable
to the hedged risk.
The fair values of quoted financial instruments in active markets are based on current prices. If the
market for a financial instrument, and for unlisted securities, is not active, the Group establishes fair
value by using valuation techniques. These include the use of recent arm’s length transactions,
discounted cash flow analysis, option pricing models and other valuation techniques commonly used
by market participants.
Where representative prices are unreliable because of illiquid markets, the determination of fair value
may require estimation of certain parameters, which are calibrated against industry standards and
observable market data, or the use of valuation models that are based on observable market data.
The fair value for the majority of the Group’s financial instruments is based on observable market
prices or derived from observable market parameters. The most significant element of Group assets inwhich observable prices are not available relates to certain instruments held within the asset backed
securities portfolio. At 31 December 2009, Level 3 assets with a market value of $2,036 million were
held in respect of which there was no observable market data. For these instruments, a sensitivity
analysis is presented in note 14 in respect of reasonably possible changes to the valuation
assumptions.
Equity investments that do not have an observable market price are fair valued by applying various
valuation techniques, such as earnings multiples, net assets multiples, discounted cash flows, and
industry valuation benchmarks. These techniques are generally applied prior to any initial public
offering, after which an observable market price becomes available. Disposal of such investments are
generally by market trades or private sales.
596
c102100pu135Proof7:28.3.10B/LRevision:0OperatorBeeR

Goodwill impairment
An annual assessment is made, as set out in note 26, as to whether the current carrying value of
goodwill is impaired. Detailed calculations are performed based on discounting expected pre-tax cashflows of the relevant cash generating units and discounting these at an appropriate discount rate, the
determination of which requires the exercise of judgement.
Pensions
Actuarial assumptions are made in valuing future defined benefit pension obligations as set out in
note 36 and are updated periodically. The principal assumptions relate to the rate of inflation and the
discount rate. The assumed rate of inflation affects the rate at which salaries grow and therefore thesize of the pensions that employees receive on retirement. The discount rate is equal to the yield on
high quality corporate bonds which have a term to maturity approximating that of the related
liability, and is potentially subject to significant variation. As a result, there is uncertainty that these
assumptions will continue in the future. For example, if the discount rate for the UK fund increased
by 25 basis points, the liability would reduce by approximately $55 million, and vice versa. Whilst
changes in other assumptions would have an impact, the effect would not be as significant.
Taxes
Determining income tax provisions involves judgement on the tax treatment of certain transactions.
Deferred tax is recognised on tax losses not yet used and on temporary differences where it is
probable that there will be taxable revenue against which these can be offset. Management has made
judgements as to the probability of future taxable revenues being generated against which tax losses
will be available for offset.
Provisions for liabilities and charges
The Group receives legal claims against it in the normal course of business. Management has made
judgements as to the likelihood of any claim succeeding in making provisions. The time of concluding
legal claims is uncertain, as is the amount of possible outflow of economic benefits. Timing and cost
ultimately depends on the due process in respective legal jurisdictions.
Share based payments
Equity-settled share awards are recognised as an expense based on their fair value at date of grant.
The fair value of equity-settled share options is estimated through the use of option valuation models– which require inputs such as the risk-free interest rate, expected dividends, expected volatility and
the expected option life – and is expensed over the vesting period. Some of the inputs used, such as
the expected option life, are not market observable and are based on estimates derived from available
data, such as employee exercise behaviour. The models utilised, such as the binomial option pricing
model, are intended to value options traded in active markets. The share options issued by the
Group, however, have a number of features that make them incomparable to such traded options.
Using different input estimates or models could produce different option values, which would result
in the recognition of a higher or lower expense. For example, if the volatility assumption wasincreased by 5% (or decreased by 5%), the fair values for options granted under the Sharesave
schemes in 2009 would increase by approximately £0.37 for three year grants, and by £0.43 for five
year grants (or decrease by approximately £0.37 for three year grants, and by £0.43 for five year
grants).
597
c102100pu135Proof7:28.3.10B/LRevision:0OperatorBeeR

53. Recently issued accounting pronouncements
The following pronouncements relevant and applicable to the Group and Company were issued as at
31 December 2009 but have effective dates for periods beginning after 31 December 2009. The use ofIFRSs and certain IFRIC Interpretations that have yet to be endorsed by the European Union is not
permitted.
The full impact of these IFRSs and IFRIC Interpretations is currently being assessed by the Group;
other than IFRS 9 – Financial Instruments none of these pronouncements are expected to result in
any material adjustments to the financial statements. The Group continues to evaluate the potentialimpact on its financial statements in respect of IFRS 9.
Pronouncement Description of impact
Latest effective date
for the Group and
Company
Amendment to IAS 27
Consolidated and
Separate Financial
Statements
This amendment changes the treatment for part
disposals, both when control is retained (which is
accounted for as an equity transaction, generating no
profit or loss in the income statement) and whencontrol is lost (where the residual holding is measured
at fair value with any changes reflected in income).
1 January 2010
IFRS 3 Revised BusinessCombinations
IFRS 3 Revised requires acquisition costs to beexpensed and not capitalised; an estimate of cash
contingent consideration to be made at the date of
acquisition, with any future changes recognised in
income; provides the option to recognise 100% of the
goodwill of an acquired entity in a partial acquisition.
1 January 2010
Amendment to IFRS 2Share-based Payment
The amendments clarify that where employees in asubsidiary are given share options in the parent
company’s shares the subsidiary would account for
those options as equity settled in its separate financial
statements.
1 January 2010
Amendment to IAS 39 –
Financial Instruments:
Hedging
The amendment clarifies the ‘portions’ of cash flows
or fair values that can be hedged.
1 January 2010
Improvements (issued
2009)1Amendments to IFRS 2 (scope), IFRS 8 (disclosure
about segment assets), IAS 1 (current/non-current
classification of convertible instruments), IAS 7
(classification of land and buildings), IAS 18
(principal or agent), IAS 39 (treating loan
prepayment penalties as closely related embeddedderivatives), and IFRIC 16 (any entity within the
Group that can hold hedging instruments including
the foreign operation that is itself being hedged).
These amendments are to be applied retrospectively.
1 January 2010
Amendments to IFRS 5 (disclosure of non-current
assets held for sale), IAS 36 (unit of account for
goodwill impairment), IAS 38 (measuring fair value
of intangible acquired in a business combination),
and IFRIC 9 (scope). These amendments are to be
applied prospectively.
Amendment to IAS 24:
Related party
Change to IAS 24 to clarify the definition of related
parties and to provide exemption from the disclosure
1 January 2011
598
c102100pu135Proof7:28.3.10B/LRevision:0OperatorBeeR

Pronouncement Description of impact
Latest effective date
for the Group and
Company
transactions1, 2 of certain transactions with government entities.
IFRS 9 – Financial
Instruments1, 2IFRS 9 replaces certain elements of IAS 39 in respect
of the classification and measurement of financialassets. The standard requires all financial assets to be
classified as fair value or amortised cost. Amortised
cost classification is only permitted where the asset is
held within a business model whose objective is to
hold assets in order to collect contractual cash flows
and where these contractual cash flows are solely
payment of principal and interest. Gains or losses on
assets measured at fair value are recognised in theincome statement unless the asset is an equity
investment and the Group has elected to present such
gains or losses in other comprehensive income.
1 January 2013
1 This IFRS or IFRIC Interpretation has not yet been endorsed by the EU.
2 Subject to endorsement of the EU the Group has not yet made a final decision as to whether it will apply in the 2010 financialstatements those pronouncements marked in the table above.
54. UK and Hong Kong accounting requirements
As required by the HK Listing Rules, an explanation of the differences in accounting practices
between EU endorsed IFRS and Hong Kong Financial Reporting Standards is required to bedisclosed. There would be no significant differences had these accounts been prepared in accordance
with Hong Kong Financial Reporting Standards. As set out in note 53, EU endorsed IFRS may
differ from IFRSs published by the International Accounting Standards Board if a standard has not
been endorsed by the EU.
599
c102100pu135Proof7:28.3.10B/LRevision:0OperatorBeeR

AUDITED FINANCIAL INFORMATIONFOR THE FINANCIAL YEAR ENDED 31 DECEMBER 2008
Statement of director’s responsibilities in respect of the Annual Report and Financial Statements
The directors are responsible for preparing the annual report and the Group and Company financialstatements in accordance with applicable law and regulations.
Company law requires the directors to prepare Group and Company financial statements for each
financial year. Under that law they are required to prepare the Group financial statements inaccordance with IFRSs as adopted by the EU and applicable law and have elected to prepare the
Company financial statements on the same basis.
The Group and Company financial statements are required by law and IFRSs as adopted by the EU
to present fairly the financial position of the Group and Company and the performance of the Group
for that period; the Companies Act 1985 provides in relation to such financial statements that
references in the relevant part of that Act to financial statements giving a true and fair view are
references to their achieving a fair presentation.
In preparing each of the Group and Company financial statements, the directors are required to:
* select suitable accounting policies and then apply them consistently;
* make judgements and estimates that are reasonable and prudent;
* state whether they have been prepared in accordance with IFRSs as adopted by the EU; and
* prepare the financial statements on the going concern basis unless it is inappropriate to presume
that the Group and the Company will continue in business.
The directors are responsible for keeping proper accounting records that disclose, with reasonable
accuracy at any time, the financial position of the Company and enable them to ensure that its
financial statements comply with the Companies Act 1985. They have general responsibility for takingsuch steps as are reasonably open to them to safeguard the assets of the Group and to prevent and
detect fraud and other irregularities.
Under applicable law and regulations, the directors are also responsible for preparing a Report of the
directors, Directors’ remuneration report and the Corporate governance statement that comply with
that law and those regulations.
The directors are responsible for the maintenance and integrity of the corporate and financial
information included on the Company’s website. Legislation in the UK governing the preparation and
dissemination of financial statements may differ from legislation in other jurisdictions.
Directors’ responsibility statement
The directors confirm to the best of their knowledge:
1. the financial statements prepared in accordance with IFRSs as adopted by the EU, give a true
and fair view of the assets, liabilities, financial position and profit of the Company and the
undertakings included in the consolidation as a whole; and
2. the management reports, which are incorporated into the Report of the directors, include a fair
review of the development and performance of the business and the position of the Companyand the undertakings included in the consolidation as a whole, together with the principal risks
and uncertainties they face.
By order of the board
R H Meddings
Group finance director
3 March 2009
600
c102100pu135Proof7:28.3.10B/LRevision:0OperatorBeeR

Independent Auditor’s report to the members of Standard Chartered PLC
We have audited the Group (Standard Chartered PLC and its subsidiaries) and Company (Standard
Chartered PLC) financial statements (together referred to as the ‘financial statements’) for the yearended 31 December 2008 which comprise the Group Income Statement, the Group and Company
Balance Sheets, the Group and Company Cash Flow Statements, the Group and Company
Statements of Recognised Income and Expense, and the related notes. These financial statements have
been prepared under the accounting policies set out therein. We have also audited the information in
the Directors’ Remuneration Report that is described as having been audited.
This report is made solely to the Company’s members, as a body, in accordance with section 235 of
the UK Companies Act 1985. Our audit work has been undertaken so that we might state to the
Company’s members those matters we are required to state to them in an auditor’s report and for no
other purpose. To the fullest extent permitted by law, we do not accept or assume responsibility to
anyone other than the Company and the Company’s members as a body, for our audit work, for this
report, or for the opinions we have formed.
Respective responsibilities of directors and auditor
The directors’ responsibilities for preparing the Annual Report, the Directors’ Remuneration Report
and the financial statements in accordance with applicable law and International Financial ReportingStandards (IFRSs) as adopted by the EU are set out in the Statement of Directors’ Responsibilities
on page 94 of the 2008 Annual Report.
Our responsibility is to audit the financial statements and the part of the Directors’ Remuneration
Report to be audited in accordance with relevant legal and regulatory requirements and International
Standards on Auditing (UK and Ireland).
We report to you our opinion as to whether the financial statements give a true and fair view and
whether the financial statements and the part of the Directors’ Remuneration Report to be audited
have been properly prepared in accordance with the UK Companies Act 1985 and, as regards the
Group financial statements, Article 4 of the IAS Regulation. We also report to you whether in our
opinion the information given in the Report of the Directors is consistent with the financialstatements. The information given in the Report of Directors includes information presented in the
Chairman’s statement, the Group Chief Executive’s Review and the Financial and Business Reviews
that are cross referenced from the Report of the Directors. In addition we report to you if the
Company has not kept proper accounting records, if we have not received all the information and
explanations we require for our audit, or if information specified by law regarding directors’
remuneration and other transactions are not disclosed.
We review whether the Corporate Governance Statement reflects the Company’s compliance with the
nine provisions of the 2006 FRC Combined Code specified for the Company’s review by the Listing
Rules of the Financial Services Authority, and we report if it does not. We are not required to
consider whether the Board’s statements on internal control cover all risks and controls, or form an
opinion on the effectiveness of the Group’s corporate governance procedures or its risk and control
procedures.
We read other information contained in the Annual Report and considers whether it is consistent
with the audited financial statements. We consider the implications for our report if we become aware
of any apparent misstatements or material inconsistencies with the financial statements. Our
responsibilities do not extend to any other information.
Basis of audit opinion
We conduct our audit in accordance with International Standards on Auditing (UK and Ireland)
issued by the Auditing Practices Board. An audit includes examination, on a test basis, of evidencerelevant to the amounts and disclosures in the financial statements and the part of the Directors’
Remuneration Report to be audited. It also includes an assessment of the significant estimates and
judgements made by the directors in the preparation of the financial statements, and of whether the
accounting policies are appropriate to the Group’s and Company’s circumstances, consistently applied
and adequately disclosed.
We planned and performed our audit so as to obtain all the information and explanations which we
considered necessary in order to provide us with sufficient evidence to give reasonable assurance that
the financial statements and the part of the Directors’ Remuneration Report to be audited are free
from material misstatement, whether caused by fraud or other irregularity or error. In forming our
601
c102100pu160Proof7:28.3.10B/LRevision:0OperatorBeeR

opinion we also evaluated the overall adequacy of the presentation of information in the financial
statements and the part of the Directors’ Remuneration Report to be audited.
Opinion
In our opinion:
* the Group financial statements give a true and fair view, in accordance with IFRSs as adopted
by the EU, of the state of the Group’s affairs as at 31 December 2008 and of its profit for the
year then ended;
* the Company financial statements give a true and fair view, in accordance with IFRSs as
adopted by the EU as applied in accordance with the provisions of the UK Companies Act
1985, of the state of the Company’s affairs as at 31 December 2008;
* the financial statements and the part of the Directors’ Remuneration Report to be audited have
been properly prepared in accordance with the UK Companies Act 1985 and, as regards the
Group financial statements, Article 4 of the IAS Regulation; and
* the information given in the Report of the Directors is consistent with the financial statements.
KPMG Audit Plc
LondonChartered Accountants
Registered Auditor
3 March 2009
602
c102100pu160Proof7:28.3.10B/LRevision:0OperatorBeeR

Consolidated income statement
For the year ended 31 December 2008
Notes
2008
US$million
2007
US$million
Interest income 3 16,378 16,176
Interest expense 4 (8,991) (9,911)
Net interest income 7,387 6,265
Fees and commission income 5 3,420 3,189
Fees and commission expense 5 (479) (528)
Net trading income 6 2,405 1,261
Other operating income 7 1,235 880
Total non-interest income 6,581 4,802
Operating income 13,968 11,067
Staff costs 8 (4,737) (3,949)
Premises costs 8 (738) (592)
General administrative expenses 8 (1,711) (1,329)
Depreciation and amortisation 9 (425) (345)
Operating expenses (7,611) (6,215)
Operating profit before impairment losses and taxation 6,357 4,852
Impairment losses on loans and advances and other credit risk
provisions 21 (1,321) (761)
Other impairment 10 (469) (57)
Profit from associates 24 1 1
Operating profit 4,568 4,035Rights issue option 11 233 —
Profit before taxation 4,801 4,035
Taxation 12 (1,290) (1,046)
Profit for the year 3,511 2,989
Profit attributable to:
Minority interests 41 103 148
Parent company shareholders 3,408 2,841
Profit for the year 3,511 2,989
Earnings per share:
Basic earnings per ordinary share (cents){
14 202.4 176.0
Diluted earnings per ordinary share (cents){
14 201.3 174.2
1 As required by IAS 33 ‘Earnings per share’ the impact of the bonus element included within the rights issue has been includedwithin the calculation of the basic and diluted earnings per share for the year and prior periods have been re-presented on thisbasis.
603
c102100pu160Proof7:28.3.10B/LRevision:0OperatorBeeR

Consolidated balance sheet
As at 31 December 2008
Notes
2008
US$million
2007*
US$million
Assets
Cash and balances at central banks 44 24,161 10,175
Financial assets held at fair value through profit or loss 16 15,425 22,958
Derivative financial instruments 17 69,657 26,204
Loans and advances to banks 18, 21 46,583 35,365
Loans and advances to customers 19, 21 174,178 154,266Investment securities 23 69,342 55,274
Interests in associates 24 511 269
Goodwill and intangible assets 26 6,361 6,374
Property, plant and equipment 27 3,586 2,892
Current tax assets 764 633
Deferred tax assets 28 660 593
Other assets 29 20,374 11,011
Prepayments and accrued income 3,466 3,857
Total assets 435,068 329,871
Liabilities
Deposits by banks 30 31,909 25,880Customer accounts 31 234,008 179,760
Financial liabilities held at fair value through profit or loss 32 15,478 14,250
Derivative financial instruments 17 67,775 26,270
Debt securities in issue 33 23,447 27,137
Current tax liabilities 512 818
Deferred tax liabilities 28 176 33
Other liabilities 35 17,363 14,742
Accruals and deferred income 4,132 3,429Provisions for liabilities and charges 36 140 38
Retirement benefit obligations 37 447 322
Subordinated liabilities and other borrowed funds 38 16,986 15,740
Total liabilities 412,373 308,419
Equity
Share capital 39 948 705
Reserves 40 21,192 20,146
Total parent company shareholders’ equity 22,140 20,851
Minority interests 41 555 601
Total equity 22,695 21,452
Total equity and liabilities 435,068 329,871
* Amounts have been restated as explained in note 53.
These financial statements were approved by the board of directors and authorised for issue on
3 March 2009 and signed on its behalf by:
J W Peace P A Sands R H Meddings
Acting chairman Group chief executive Group finance director
604
c102100pu160Proof7:28.3.10B/LRevision:0OperatorBeeR

Statement of recognised income and expense
For the year ended 31 December 2008
Group Company
Notes
2008
US$million
2007
US$million
2008
US$million
2007
US$million
Exchange differences on translation
of foreign operations:
Net (losses)/gains taken to equity (2,794) 415 — —
Transferred to income onrepatriation of branch capital — (109) — —
Actuarial (losses)/gains on
retirement benefit obligations 37 (229) 237 — —
Available-for-sale investments:
Net valuation (losses)/gains taken
to equity (738) 675 — —
Transferred to income (198) (252) — —
Cash flow hedges:Net (losses)/gains taken to equity (176) 57 — —
Net gains transferred to income (18) (58) — —
Taxation on items recognised
directly in equity 218 (99) — —
Net (expense)/income recognised in
equity (3,935) 866 — —
Profit for the year 3,511 2,989 2,282 349
Total recognised income and
expense for the year (424) 3,855 2,282 349
Attributable to:
Minority interests 41 (3) 196 — —Parent company shareholders 40 (421) 3,659 2,282 349
(424) 3,855 2,282 349
605
c102100pu160Proof7:28.3.10B/LRevision:0OperatorBeeR

Cash flow statement
For the year ended 31 December 2008
Group Company
Notes2008
US$million2007
US$million2008
US$million2007*
US$million
Cash flows from operating activitiesProfit before taxation 4,801 4,035 2,476 310Adjustments for:
Non-cash items included within incomestatement 43 1,762 1,259 (2,313) (259)
Change in operating assets 43 (87,251) (38,199) 62 —Change in operating liabilities 43 105,810 53,102 1,295 (964)Net return from defined benefit schemes 8 16 — —UK and overseas taxes (paid)/refunded (1,400) (1,097) 2 14
Net cash from/(used in) operatingactivities 23,730 19,116 1,522 (899)
Net cash flows from investing activitiesPurchase of property, plant and
equipment (1,431) (471) — —Disposal of property, plant and
equipment 73 22 — —Acquisition of investment in
subsidiaries, net of cash acquired 6,209 (85) — (750)Disposal of investment in subsidiaries 159 — — —Purchase of investment securities (109,938) (78,292) (925) —Disposal and maturity of investment
securities 97,756 74,457 — —Dividends received from investment in
subsidiaries — — 1,880 385
Net cash (used in)/from investingactivities (7,172) (4,369) 955 (365)
Net cash flows from financing activitiesIssue of ordinary and preference share
capital, net of expenses 2,753 861 2,753 861Purchase of own shares (76) (15) (76) (15)Exercise of share options throughESOP 9 39 9 39Interest paid on subordinated liabilities (718) (737) (185) (118)Gross proceeds from issue of
subordinated liabilities 3,667 3,051 960 —Repayment of subordinated liabilities (1,436) (505) (640) —Dividends paid to minority interests
and preference shareholders (257) (148) (110) (28)Dividends paid to ordinary
shareholders (815) (573) (815) (573)
Net cash from financing activities 3,127 1,973 1,896 166
Net increase/(decrease) in cash and cashequivalents 19,685 16,720 4,373 (1,098)Cash and cash equivalents at beginning
of year 55,338 38,161 930 2,028Effect of exchange rate movements on
cash and cash equivalents (1,324) 457 — —
Cash and cash equivalents at end of year 44 73,699 55,338 5,303 930
* Amounts have been re-presented as explained in note 53.
606
c102100pu160Proof7:28.3.10B/LRevision:0OperatorBeeR

Company balance sheet
As at 31 December 2008
Notes
2008
US$million
2007
US$million
Non-current assets
Investments in subsidiary undertakings 24 10,406 10,406
Current assets
Debt securities 23 925 —
Amounts owed by subsidiary undertakings 5,303 2,019Taxation 54 183
Other 64 127
6,346 2,329
Current liabilities
Derivative financial instruments 17 26 —
Debt securities in issue 33 1,372 —
Amounts owed to subsidiary undertakings — 1,089Other creditors, including taxation 79 102
Deferred income 40 40
1,517 1,231
Net current assets 4,829 1,098
Total assets less current liabilities 15,235 11,504
Non-current liabilities
Subordinated liabilities and other borrowed funds 38 1,736 1,987Deferred income 231 271
13,268 9,246
EquityShare capital 39 948 705
Reserves 40 12,320 8,541
Total equity 13,268 9,246
These financial statements were approved by the board of directors and authorised for issue on
3 March 2009 and signed on its behalf by:
J W Peace P A Sands R H Meddings
Acting chairman Group chief executive Group finance director
607
c102100pu160Proof7:28.3.10B/LRevision:0OperatorBeeR

Notes to the financial statements
1. Accounting policies
Statement of compliance
The Group financial statements consolidate those of the Company and its subsidiaries (together
referred to as the ‘‘Group’’), equity account the Group’s interest in associates and proportionately
consolidate interests in jointly controlled entities. The parent company financial statements present
information about the Company as a separate entity and not about its group.
Both the parent company financial statements and the Group financial statements have been prepared
and approved by the directors in accordance with International Financial Reporting Standards (IFRS)
and International Financial Reporting Interpretation Committee (IFRIC) Interpretations as adopted
by the EU (together ‘adopted IFRS’). In publishing the parent company financial statements together
with the Group financial statements, the Company has taken advantage of the exemption in section230 of the UK Companies Act 1985 not to present its individual income statement and related notes
that form a part of these approved financial statements.
The Group has retrospectively adopted IFRIC 11 ‘IFRS 2: Group and Treasury Share Transactions’,
and prospectively adopted IFRIC 14 ‘IAS 19 – The Limit on Defined Benefit Asset Minimum
Funding Requirements and their Interaction’, neither of which had an impact on the Group’s
consolidated financial statements.
The Group has adopted the amendments to IAS 39 ‘Financial Instruments: Recognition and
Measurement’ and IFRS 7 ‘Financial Instruments: Disclosures’ in respect of the reclassification of
financial assets, which was effective from 1 July 2008 for those assets identified and approved by
management for reclassification on or before 31 October 2008. The details of the assets reclassified
and the amounts involved are set out in note 15.
The disclosures required by IFRS 7 ‘Financial Instruments Disclosures’ and the capital disclosures
within IAS 1 ‘Presentation of Financial Statements’ are presented within the ‘Risk Review’ on pages
43 to 63 of the 2008 Annual Report and ‘Capital’ on pages 64 to 65 of the 2008 Annual Report*,except where indicated as not audited, and in the notes to the financial statements.
The consolidated balance sheet at 31 December 2007 has been restated as explained in note 53 to (a)reflect the revised fair values of the assets and liabilities acquired on the acquisitions of Pembroke
and Harrison Lovegrove; and (b) to reflect the re-presentation of current and deferred tax balances.
The Company cash flow statement has been re-presented as explained in note 53.
Basis of preparation
The consolidated financial statements have been prepared under the historical cost convention, as
modified by the revaluation of cash-settled share based payments, available-for-sale assets, andfinancial assets and liabilities (including derivatives) at fair value through profit or loss. The Company
financial statements have been prepared on an historical cost basis, as modified by the revaluation of
financial assets and liabilities (including derivatives) at fair value through profit or loss.
The preparation of financial statements in conformity with adopted IFRS requires the use of certain
critical accounting estimates. It also requires management to exercise its judgement in the process of
applying the Group’s accounting policies.
The accounting policies set out below have been applied consistently across the Group and to all
periods presented in these financial statements.
Consolidation
Subsidiaries
Subsidiaries are all entities, including special purpose entities (SPEs), over which the Group has the
power to directly or indirectly govern the financial and operating policies, generally accompanying a
shareholding of more than one half of the voting rights. Subsidiaries are fully consolidated from the
date on which the Group effectively obtains control. They are de-consolidated from the date that
control ceases.
608
c102100pu160Proof7:28.3.10B/LRevision:0OperatorBeeR
* This information forms part of the Notes to the Accounts and is disclosed on pages 205 to 226 and 228 to 235 of this Draft RedHerring Prospectus. Pages 205 to 226 and 228 to 235 of this Draft Red Herring Prospectus also include information which is notaudited and a full set of audited financial statements can be obtained from www.standardchartered.com.

SPEs are consolidated when the substance of the relationship between the Group and its entity
indicates control by the Group. Potential indicators of control include amongst others, an assessment
of risks and benefits in respect of the SPE’s activities.
The purchase method of accounting is used to account for the acquisition of subsidiaries by theGroup. The cost of an acquisition is measured as the fair value of the assets given, equity instruments
issued and liabilities incurred or assumed at the date of exchange, together with costs directly
attributable to the acquisition. Identifiable net assets and contingent liabilities acquired are fair valued
at the acquisition date, irrespective of the extent of any minority interest. The excess of the cost of
acquisition over the fair value of the Group’s share of the identifiable net assets and contingent
liabilities acquired is recorded as goodwill. If the cost of acquisition is less than the fair value of the
net assets and contingent liabilities of the subsidiary acquired, the difference is recognised directly in
the income statement. Where the fair values of the identifiable net assets and contingent liabilitiesacquired have been determined provisionally, or where contingent or deferred consideration is
payable, any adjustments arising from their subsequent finalisation are made as of the date of
acquisition and amounts restated as appropriate.
Inter-company transactions, balances and unrealised gains on transactions between Group companies
are eliminated in the Group accounts. Unrealised losses are also eliminated unless the transaction
provides evidence of impairment of the asset transferred.
Associates
Associates are all entities over which the Group has the ability to significantly influence, but notcontrol, the financial and operating policies and procedures generally accompanying a shareholding of
between 20% and 50% of the voting rights. Investments in associates are accounted for by the equity
method of accounting and are initially recognised at cost.
The Group’s investment in associates includes goodwill identified on acquisition (net of any
accumulated impairment loss).
The Group’s share of its associates’ post-acquisition profits or losses is recognised in the income
statement, and its share of post-acquisition movements in reserves is recognised in reserves. The
cumulative post-acquisition movements are adjusted against the carrying amount of the investment.
When the Group’s share of losses in an associate equals or exceeds its interest in the associate,including any other unsecured receivables, the Group does not recognise further losses, unless it has
incurred obligations or made payments on behalf of the associate.
Unrealised gains on transactions between the Group and its associates are eliminated to the extent of
the Group’s interest in the associates. Unrealised losses are also eliminated unless the transaction
provides evidence of an impairment of the asset transferred.
Joint ventures
Interests in jointly controlled entities are recognised using proportionate consolidation whereby theGroup’s share of the joint venture’s assets, liabilities, income and expenses are combined line by line
with similar items in the Group’s financial statements.
Investment in subsidiaries, associates and joint ventures
In the Company’s financial statements, investments in subsidiaries, associates and joint ventures are
held at cost less impairment and dividends from pre-acquisition profits received, if any.
Foreign currency translation
Both the parent company financial statements and the Group financial statements are presented in US
Dollars, which is the presentation currency of the Group and the functional and presentation
currency of the Company.
Transactions and balances
Foreign currency transactions are translated into the functional currency using the exchange ratesprevailing at the dates of the transactions. Foreign exchange gains and losses resulting from the
settlement of such transactions, and from the translation at year-end exchange rates of monetary
assets and liabilities denominated in foreign currencies, are recognised in the income statement. Non-
monetary assets and liabilities are translated at historical exchange rates if held at historical cost, or
year-end exchange rates if held at fair value, and the resulting foreign exchange gains and losses are
609
c102100pu160Proof7:28.3.10B/LRevision:0OperatorBeeR

recognised in either the income statement or shareholders’ equity depending on the treatment of the
gain or loss on the asset or liability.
Group companies
The results and financial position of all the entities included in the Group financial statements thathave a functional currency different from the Group’s presentation currency are accounted for as
follows:
* assets and liabilities for each balance sheet presented are translated at the closing rate at the
balance sheet date;
* income and expenses for each income statement are translated at average exchange rates or at
rates on the date of the transaction where exchange rates fluctuate significantly; and
* all resulting exchange differences arising since 1 January 2004 are recognised as a separate
component of equity.
On consolidation, exchange differences arising from the translation of the net investment in foreign
entities, and of borrowings and other currency instruments designated as hedges of such investments,
are taken to shareholders’ equity. When a foreign operation is sold or capital repatriated they are
recognised in the income statement as part of the gain or loss on disposal.
Goodwill and fair value adjustments arising on the acquisition of a foreign entity are treated as assets
and liabilities of the foreign entity and translated at the closing rate.
Intangible assets
Goodwill
Goodwill represents the excess of the cost of an acquisition over the fair value of the Group’s share
of the identifiable net assets and contingent liabilities of the acquired subsidiary or associate at the
date of acquisition. Goodwill on acquisitions of subsidiaries is included in ‘Intangible assets’.
Goodwill on acquisitions of associates is included in ‘Investments in associates’. Goodwill is assessed
at each balance sheet date for impairment and carried at cost less any accumulated impairment losses.
Gains and losses on the disposal of an entity include the carrying amount of goodwill relating to the
entity sold. Goodwill is allocated to cash-generating units for the purpose of impairment testing.
Acquired intangibles
At the date of acquisition of a subsidiary or associate, intangible assets which are deemed separable
and that arise from contractual or other legal rights are capitalised and included within the net
identifiable assets acquired. These intangible assets are initially measured at fair value, which reflects
market expectations of the probability that the future economic benefits embodied in the asset will
flow to the entity, and are amortised on the basis of their expected useful lives (four to 16 years). At
each balance sheet date, these assets are assessed for indicators of impairment. In the event that an
asset’s carrying amount is determined to be greater than its recoverable amount, the asset is written
down immediately.
Computer software
Acquired computer software licences are capitalised on the basis of the costs incurred to acquire and
bring to use the specific software. Costs associated with the development of software are capitalised
where it is probable that it will generate future economic benefits in excess of its cost. Computer
software costs are amortised on the basis of expected useful life (three to five years). Costs associated
with maintaining software are recognised as an expense as incurred. At each balance sheet date, these
assets are assessed for indicators of impairment. In the event that an asset’s carrying amount is
determined to be greater than its recoverable amount, the asset is written down immediately.
Property, plant and equipment
Land and buildings comprise mainly branches and offices. All property, plant and equipment is stated
at cost less accumulated depreciation and impairment losses. Cost includes expenditure that is directly
attributable to the acquisition of the assets.
Subsequent costs are included in the asset’s carrying amount or are recognised as a separate asset, as
appropriate, only when it is probable that future economic benefits associated with the item will flow
to the Group and the cost of the item can be measured reliably. All other repairs and maintenance
are charged to the income statement during the financial period in which they are incurred.
610
c102100pu160Proof7:28.3.10B/LRevision:0OperatorBeeR

Freehold land is not depreciated although it is subject to impairment testing. Depreciation on other
assets is calculated using the straight-line method to allocate their cost to their residual values over
their estimated useful lives, as follows:
Buildings up to 50 years
Leasehold improvements life of lease, up to 50 years
Equipment and motor vehicles three to 15 years
The assets’ residual values and useful lives are reviewed, and adjusted if appropriate, at each balance
sheet date. At each balance sheet date, assets are also assessed for indicators of impairment. In the
event that an asset’s carrying amount is determined to be greater than its recoverable amount, the
asset is written down immediately to the recoverable amount.
Gains and losses on disposals are included in the income statement.
Leases
Where a Group company is the lessee
The leases entered into by the Group are primarily operating leases. The total payments made under
operating leases are charged to the income statement on a straight-line basis over the period of the
lease.
When an operating lease is terminated before the lease period has expired, any payment required to
be made to the lessor by way of penalty is recognised as an expense in the period in which
termination takes place.
Where the Group is a lessee under finance leases, the leased assets are capitalised and included in
‘Property, plant and equipment’ with a corresponding liability to the lessor recognised in ‘Other
liabilities’. Finance charges payable are recognised over the period of the lease based on the interest
rate implicit in the lease to give a constant periodic rate of return.
Where a Group company is the lessor
When assets are leased to customers under finance leases, the present value of the lease payments is
recognised as a receivable. The difference between the gross receivable and the present value of the
receivable is recognised as unearned finance income. Lease income is recognised over the term of the
lease using the net investment method (before tax), which reflects a constant periodic rate of return
ignoring tax cash flows.
Assets leased to customers under operating leases are included within ‘Property, plant and equipment’
and depreciated over their useful lives. Rental income on these leased assets is recognised in the
income statement on a straight-line basis unless another systematic basis is more representative.
Cash and cash equivalents
For the purposes of the cash flow statement, cash and cash equivalents comprise balances with less
than three months’ maturity from the date of acquisition, including: cash and balances at central
banks (unless restricted), treasury bills and other eligible bills, loans and advances to banks, and
short-term government securities.
Provisions
Provisions for restructuring costs and legal claims are recognised when: the Group has a present legal
or constructive obligation as a result of past events; it is more likely than not that an outflow of
resources will be required to settle the obligation and the amount can be reliably estimated.
Employee benefits
Pension obligations
The Group operates a number of pension and other post-retirement benefit plans around the world,
including defined contribution plans and defined benefit plans.
For defined contribution plans, the Group pays contributions to publicly or privately administered
pension plans on a mandatory, contractual or voluntary basis, and such amounts are charged to
operating expenses. The Group has no further payment obligations once the contributions have been
paid.
For defined benefit plans, the liability recognised in the balance sheet is the present value of the
defined benefit obligation at the balance sheet date less the fair value of plan assets. The defined
611
c102100pu160Proof7:28.3.10B/LRevision:0OperatorBeeR

benefit obligation is calculated annually by independent actuaries using the projected unit method.
The present value of the defined benefit obligation is determined by discounting the estimated future
cash outflows using an interest rate equal to the yield on high-quality corporate bonds that are
denominated in the currency in which the benefits will be paid, and that have a term to maturityapproximating to the term of the related pension liability.
Actuarial gains and losses that arise are recognised in shareholders’ equity and presented in the
statement of recognised income and expense in the period they arise. Past service costs are recognised
immediately to the extent that benefits are vested and are otherwise recognised over the average
period until benefits are vested on a straight-line basis. Current service costs and any past service
costs, together with the unwinding of the discount on plan liabilities, offset by the expected return on
plan assets, are charged to operating expenses.
Share-based compensation
The Group operates equity-settled and cash-settled share-based compensation plans. The fair value of
the employee services received in exchange for the grant of the options is recognised as an expense.
For equity-settled awards, the total amount to be expensed over the vesting period is determined by
reference to the fair value of the options granted, which excludes the impact of any non-market
vesting conditions (for example, profitability and growth targets). The fair value of equity instruments
granted is based on market prices, if available, at the date of grant. In the absence of market prices,
the fair value of the instruments is estimated using an appropriate valuation technique, such as a
binomial option pricing model. Non-market vesting conditions are included in assumptions about the
number of options that are expected to vest. At each balance sheet date, the Group revises its
estimates of the number of options that are expected to vest. It recognises the impact of the revisionof original estimates, if any, in the income statement, and a corresponding adjustment to equity over
the remaining vesting period. For forfeitures prior to vesting attributable to factors other than failure
to satisfy market-based performance conditions, the cumulative charge incurred is credited to the
income statement.
The proceeds received net of any directly attributable transaction costs are credited to share capital
(nominal value) and share premium when the options are exercised.
Cash-settled awards are revalued at each balance sheet date and a liability recognised on the balance
sheet for all unpaid amounts, with any changes in fair value charged or credited to staff costs in the
income statement.
Taxation
Deferred tax is provided in full, using the liability method, on temporary differences arising between
the tax bases of assets and liabilities and their carrying amounts in the consolidated financial
statements. Deferred income tax is determined using tax rates (and laws) that have been enacted or
substantially enacted as at the balance sheet date, and that are expected to apply when the related
deferred income tax asset is realised or the deferred income tax liability is settled.
Deferred tax assets are recognised where it is probable that future taxable profit will be available
against which the temporary differences can be utilised.
Income tax payable on profits is based on the applicable tax law in each jurisdiction and is
recognised as an expense in the period in which profits arise. The tax effects of income tax losses
available for carry forward are recognised as an asset when it is probable that future taxable profits
will be available against which these losses can be utilised.
Current and deferred tax relating to items which are charged or credited directly to equity, is credited
or charged directly to equity and is subsequently recognised in the income statement together with the
current or deferred gain or loss.
Borrowings
Borrowings are recognised initially at fair value, being their issue proceeds (fair value of consideration
received) net of directly attributable transaction costs incurred. Borrowings are subsequently stated at
amortised cost, with any difference between proceeds net of directly attributable transaction costs and
the redemption value recognised in the income statement over the period of the borrowings using the
effective interest method.
612
c102100pu160Proof7:28.3.10B/LRevision:0OperatorBeeR
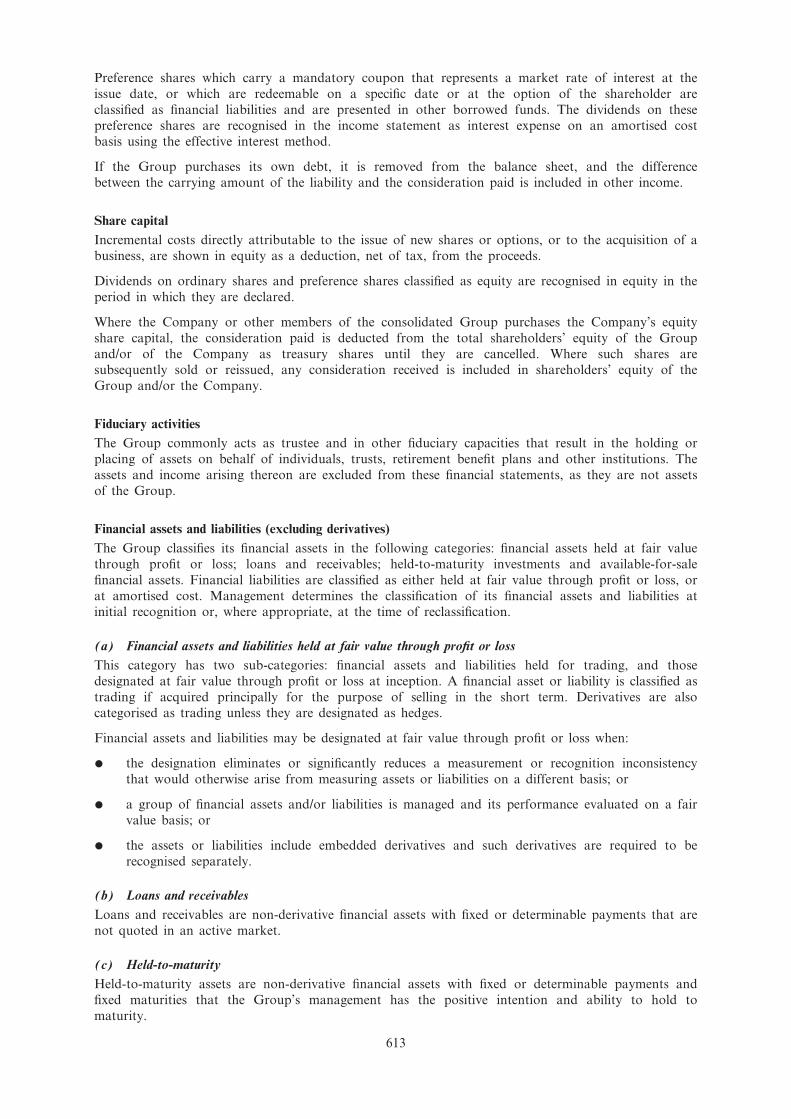
Preference shares which carry a mandatory coupon that represents a market rate of interest at the
issue date, or which are redeemable on a specific date or at the option of the shareholder are
classified as financial liabilities and are presented in other borrowed funds. The dividends on these
preference shares are recognised in the income statement as interest expense on an amortised costbasis using the effective interest method.
If the Group purchases its own debt, it is removed from the balance sheet, and the difference
between the carrying amount of the liability and the consideration paid is included in other income.
Share capital
Incremental costs directly attributable to the issue of new shares or options, or to the acquisition of a
business, are shown in equity as a deduction, net of tax, from the proceeds.
Dividends on ordinary shares and preference shares classified as equity are recognised in equity in the
period in which they are declared.
Where the Company or other members of the consolidated Group purchases the Company’s equity
share capital, the consideration paid is deducted from the total shareholders’ equity of the Group
and/or of the Company as treasury shares until they are cancelled. Where such shares aresubsequently sold or reissued, any consideration received is included in shareholders’ equity of the
Group and/or the Company.
Fiduciary activities
The Group commonly acts as trustee and in other fiduciary capacities that result in the holding or
placing of assets on behalf of individuals, trusts, retirement benefit plans and other institutions. The
assets and income arising thereon are excluded from these financial statements, as they are not assets
of the Group.
Financial assets and liabilities (excluding derivatives)
The Group classifies its financial assets in the following categories: financial assets held at fair value
through profit or loss; loans and receivables; held-to-maturity investments and available-for-sale
financial assets. Financial liabilities are classified as either held at fair value through profit or loss, or
at amortised cost. Management determines the classification of its financial assets and liabilities atinitial recognition or, where appropriate, at the time of reclassification.
(a) Financial assets and liabilities held at fair value through profit or loss
This category has two sub-categories: financial assets and liabilities held for trading, and those
designated at fair value through profit or loss at inception. A financial asset or liability is classified as
trading if acquired principally for the purpose of selling in the short term. Derivatives are alsocategorised as trading unless they are designated as hedges.
Financial assets and liabilities may be designated at fair value through profit or loss when:
* the designation eliminates or significantly reduces a measurement or recognition inconsistency
that would otherwise arise from measuring assets or liabilities on a different basis; or
* a group of financial assets and/or liabilities is managed and its performance evaluated on a fair
value basis; or
* the assets or liabilities include embedded derivatives and such derivatives are required to be
recognised separately.
(b) Loans and receivables
Loans and receivables are non-derivative financial assets with fixed or determinable payments that are
not quoted in an active market.
(c) Held-to-maturity
Held-to-maturity assets are non-derivative financial assets with fixed or determinable payments and
fixed maturities that the Group’s management has the positive intention and ability to hold to
maturity.
613
c102100pu160Proof7:28.3.10B/LRevision:0OperatorBeeR

(d) Available-for-sale
Available-for-sale assets are those non-derivative financial assets intended to be held for an indefinite
period of time, which may be sold in response to liquidity requirements or changes in interest rates,exchange rates, commodity prices or equity prices.
Initial recognition
Purchases and sales of financial assets and liabilities held at fair value through profit or loss, financial
assets held-to-maturity and available-for-sale are initially recognised on trade-date (the date on whichthe Group commits to purchase or sell the asset). Loans are recognised when cash is advanced to the
borrowers. Financial assets and financial liabilities are initially recognised at fair value plus, for those
financial assets and liabilities not carried at fair value through profit and loss, directly attributable
transaction costs. In those cases where the initially recognised fair value is based on a valuation
model that uses inputs which are not observable in the market, the difference between the transaction
price and the valuation model is not recognised immediately in the income statement. The difference
is amortised to the income statement until the inputs become observable, or the transaction matures
or is terminated.
Subsequent measurement
Financial assets and liabilities held at fair value through profit or loss are subsequently carried at fair
value, with gains and losses arising from changes in fair value taken directly to the income statement.
Available-for-sale financial assets are subsequently carried at fair value, with gains and losses arisingfrom changes in fair value taken to a separate component of equity until the asset is sold, or is
impaired, when the cumulative gain or loss is transferred to the income statement.
Loans and receivables and held to maturity financial assets are subsequently carried at amortised cost
using the effective interest method.
The fair values of quoted financial assets or financial liabilities in active markets are based on current
prices. If the market for a financial asset or financial liability is not active, and for unlisted securities,
the Group establishes fair value by using valuation techniques. These include the use of recent arm’slength transactions, discounted cash flow analysis, option pricing models and other valuation
techniques commonly used by market participants.
Reclassifications
Reclassifications of financial assets, other than as disclosed below, or of financial liabilities betweencategories are not permitted following their initial recognition.
Held for trading non-derivative financial assets can only be transferred out of the held at fair value
through profit or loss category in the following circumstances: (i) to the available-for-sale category,
where, in rare circumstances, they are no longer held for the purpose of selling or repurchasing in the
near term; or (ii) to the loan and receivables category, where they are no longer held for the purpose
of selling or repurchasing in the near term and they would have met the definition of a loan and
receivable on initial recognition and the Group has the intent and ability to hold the assets for the
foreseeable future or until maturity.
Financial assets can only be transferred out of the available-for-sale category to the loan and
receivables category, where they would have met the definition of a loan and receivable on initial
recognition and the Group has the intent and ability to hold the assets for the foreseeable future or
until maturity.
Held-to-maturity assets are reclassified to the available-for-sale category if the portfolio becomes
tainted following the sale of other than an insignificant amount of held-to-maturity assets prior to
their maturity.
Financial assets reclassified are done so at their fair value on the date of reclassification. For financial
assets reclassified out of the available-for-sale category into loans and receivables, any gain or loss on
those assets recognised in shareholders’ equity prior to the date of reclassification is amortised to the
income statement over the remaining life of the financial asset, using the effective interest method.
Renegotiated loans
Loans whose original terms have been modified are considered renegotiated loans. If the renegotiation
occurs before a customer is either past due or impaired and the revised terms are consistent with
those readily available in the market, the account will not be considered past due. If the
614
c102100pu160Proof7:28.3.10B/LRevision:0OperatorBeeR

renegotiations are on terms that are not consistent with those readily available on the market, this
provides objective evidence of impairment and the loan is assessed accordingly. If the account was
past due or impaired prior to the renegotiation, the loan will remain past due until the customer
complies with the revised terms for 12 months.
Derecognition
Financial assets are derecognised when the rights to receive cash flows from the financial assets have
expired or where the Group has transferred substantially all risks and rewards of ownership. Ifsubstantially all the risks and rewards have been neither retained nor transferred and the Group has
retained control, the assets continue to be recognised to the extent of the Group’s continuing
involvement. Financial liabilities are derecognised when they are extinguished.
Income recognition
For available-for-sale assets and financial assets and liabilities held at amortised cost, interest income
and interest expense is recognised in the income statement using the effective interest method.
Gains and losses arising from changes in the fair value of financial instruments at fair value through
profit or loss are included in the income statement in the period in which they arise. Contractual
interest income and expense on financial instruments designated at fair value through profit or loss is
recognised within net interest income. For trading financial instruments, interest income and expense
is recognised within net interest income using the effective interest method.
Gains and losses arising from changes in the fair value of available-for-sale financial assets, other
than foreign exchange gains and losses from monetary items, are recognised directly in equity, until
the financial asset is derecognised or impaired at which time the cumulative gain or loss previously
recognised in equity is recognised in profit or loss.
Dividends on equity instruments are recognised in the income statement within ‘Other income’ when
the Group’s right to receive payment is established.
Impairment of financial assets
Assets carried at amortised cost
The Group assesses at each balance sheet date whether there is objective evidence that a financial
asset or group of financial assets is impaired. A financial asset or a group of financial assets isimpaired and impairment losses are incurred if, and only if, there is objective evidence of impairment
as a result of one or more events that occurred after the initial recognition of the asset (a ‘loss
event’), and that loss event (or events) has an impact on the estimated future cash flows of the
financial asset or group of financial assets that can be reliably estimated.
The following factors are considered in assessing objective evidence of impairment:
* whether the customer is more than 90 days past due;
* a customer files for bankruptcy protection (or the local equivalent) where this would avoid or
delay repayment of its obligation;
* the Group files to have the customer declared bankrupt or files a similar order in respect of a
credit obligation;
* the Group consents to a restructuring of the obligation, resulting in a diminished financial
obligation, demonstrated by a material forgiveness of debt or postponement of scheduled
payments;
* the Group sells a credit obligation at a material credit-related economic loss; or
* there is observable data indicating that there is a measurable decrease in the estimated future
cash flows of a group of financial assets, although the decrease cannot yet be identified with
specific individual financial assets.
The Group first assesses whether objective evidence of impairment exists individually for financial
assets that are individually significant, and individually or collectively for financial assets that are not
individually significant.
If the Group determines that no objective evidence of impairment exists for an individually assessed
financial asset, whether significant or not, it includes the asset in a group of financial assets with
similar credit risk characteristics and collectively assesses them for impairment. Assets that are
615
c102100pu160Proof7:28.3.10B/LRevision:0OperatorBeeR
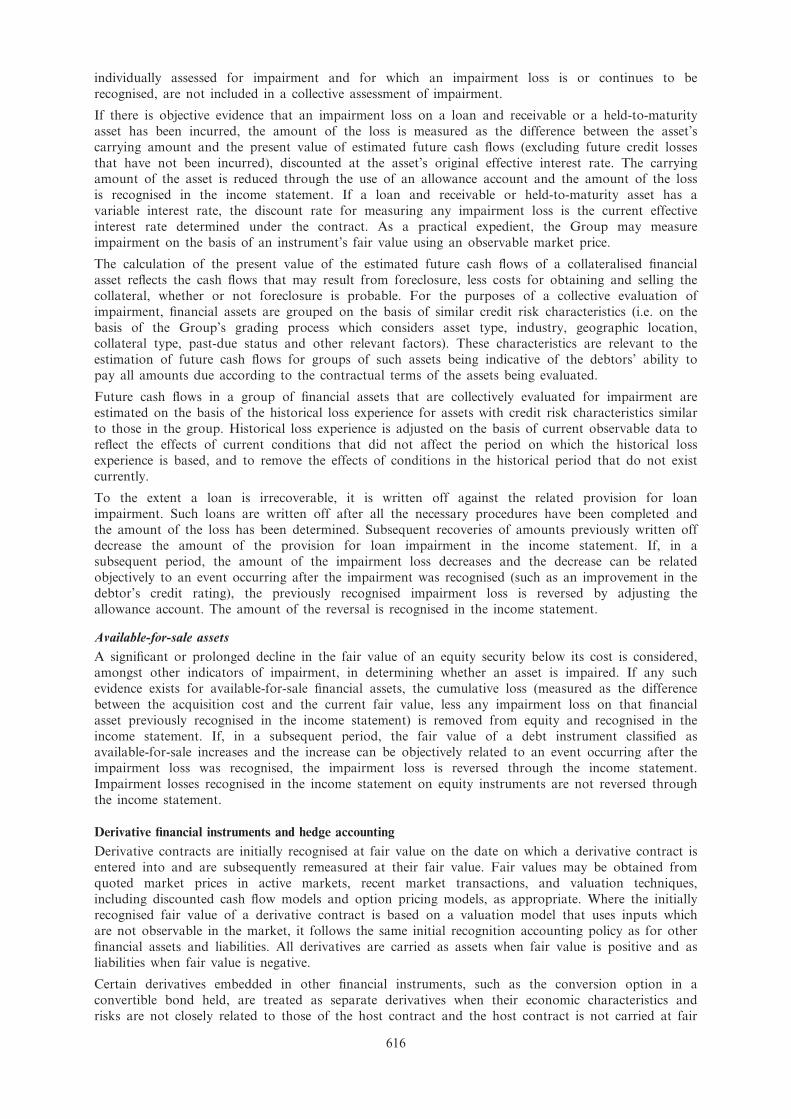
individually assessed for impairment and for which an impairment loss is or continues to be
recognised, are not included in a collective assessment of impairment.
If there is objective evidence that an impairment loss on a loan and receivable or a held-to-maturity
asset has been incurred, the amount of the loss is measured as the difference between the asset’s
carrying amount and the present value of estimated future cash flows (excluding future credit losses
that have not been incurred), discounted at the asset’s original effective interest rate. The carryingamount of the asset is reduced through the use of an allowance account and the amount of the loss
is recognised in the income statement. If a loan and receivable or held-to-maturity asset has a
variable interest rate, the discount rate for measuring any impairment loss is the current effective
interest rate determined under the contract. As a practical expedient, the Group may measure
impairment on the basis of an instrument’s fair value using an observable market price.
The calculation of the present value of the estimated future cash flows of a collateralised financial
asset reflects the cash flows that may result from foreclosure, less costs for obtaining and selling the
collateral, whether or not foreclosure is probable. For the purposes of a collective evaluation of
impairment, financial assets are grouped on the basis of similar credit risk characteristics (i.e. on the
basis of the Group’s grading process which considers asset type, industry, geographic location,collateral type, past-due status and other relevant factors). These characteristics are relevant to the
estimation of future cash flows for groups of such assets being indicative of the debtors’ ability to
pay all amounts due according to the contractual terms of the assets being evaluated.
Future cash flows in a group of financial assets that are collectively evaluated for impairment are
estimated on the basis of the historical loss experience for assets with credit risk characteristics similar
to those in the group. Historical loss experience is adjusted on the basis of current observable data to
reflect the effects of current conditions that did not affect the period on which the historical loss
experience is based, and to remove the effects of conditions in the historical period that do not exist
currently.
To the extent a loan is irrecoverable, it is written off against the related provision for loan
impairment. Such loans are written off after all the necessary procedures have been completed and
the amount of the loss has been determined. Subsequent recoveries of amounts previously written offdecrease the amount of the provision for loan impairment in the income statement. If, in a
subsequent period, the amount of the impairment loss decreases and the decrease can be related
objectively to an event occurring after the impairment was recognised (such as an improvement in the
debtor’s credit rating), the previously recognised impairment loss is reversed by adjusting the
allowance account. The amount of the reversal is recognised in the income statement.
Available-for-sale assets
A significant or prolonged decline in the fair value of an equity security below its cost is considered,
amongst other indicators of impairment, in determining whether an asset is impaired. If any such
evidence exists for available-for-sale financial assets, the cumulative loss (measured as the difference
between the acquisition cost and the current fair value, less any impairment loss on that financial
asset previously recognised in the income statement) is removed from equity and recognised in the
income statement. If, in a subsequent period, the fair value of a debt instrument classified asavailable-for-sale increases and the increase can be objectively related to an event occurring after the
impairment loss was recognised, the impairment loss is reversed through the income statement.
Impairment losses recognised in the income statement on equity instruments are not reversed through
the income statement.
Derivative financial instruments and hedge accounting
Derivative contracts are initially recognised at fair value on the date on which a derivative contract is
entered into and are subsequently remeasured at their fair value. Fair values may be obtained from
quoted market prices in active markets, recent market transactions, and valuation techniques,
including discounted cash flow models and option pricing models, as appropriate. Where the initiallyrecognised fair value of a derivative contract is based on a valuation model that uses inputs which
are not observable in the market, it follows the same initial recognition accounting policy as for other
financial assets and liabilities. All derivatives are carried as assets when fair value is positive and as
liabilities when fair value is negative.
Certain derivatives embedded in other financial instruments, such as the conversion option in a
convertible bond held, are treated as separate derivatives when their economic characteristics and
risks are not closely related to those of the host contract and the host contract is not carried at fair
616
c102100pu160Proof7:28.3.10B/LRevision:0OperatorBeeR

value through profit or loss. These embedded derivatives are measured at fair value with changes in
fair value recognised in the income statement.
The method of recognising the resulting fair value gain or loss depends on whether the derivative is
designated as a hedging instrument, and if so, the nature of the item being hedged. The Group
designates certain derivatives as either: (1) hedges of the fair value of recognised assets or liabilities or
firm commitments (fair value hedge); or, (2) hedges of highly probable future cash flows attributableto a recognised asset or liability, or a forecasted transaction (cash flow hedge). Hedge accounting is
used for derivatives designated in this way provided certain criteria are met.
The Group documents, at the inception of the transaction, the relationship between hedginginstruments and hedged items, as well as its risk management objective and strategy for undertaking
various hedge transactions. The Group also documents its assessment, both at hedge inception and on
an ongoing basis, of whether the derivatives that are used in hedging transactions are highly effective
in offsetting changes in fair values or cash flows of hedged items.
(a) Fair value hedge
Changes in the fair value of derivatives that are designated and qualify as fair value hedges arerecorded in the income statement, together with any changes in the fair value of the hedged asset or
liability that are attributable to the hedged risk. If the hedge no longer meets the criteria for hedge
accounting, the adjustment to the carrying amount of a hedged item for which the effective interest
method is used is amortised to profit or loss over the period to maturity.
(b) Cash flow hedge
The effective portion of changes in the fair value of derivatives that are designated and qualify as
cash flow hedges is recognised in equity. The gain or loss relating to the ineffective portion is
recognised immediately in the income statement.
Amounts accumulated in equity are recycled to the income statement in the periods in which the
hedged item affects profit or loss.
When a hedging instrument expires or is sold, or when a hedge no longer meets the criteria for hedgeaccounting, any cumulative gain or loss existing in equity at that time remains in equity and is
recognised when the forecast transaction is ultimately recognised in the income statement. When a
forecast transaction is no longer expected to occur, the cumulative gain or loss that was reported in
equity is immediately transferred to the income statement.
(c) Net investment hedge
Hedges of net investments in foreign operations are accounted for similarly to cash flow hedges. Any
gain or loss on the hedging instrument relating to the effective portion of the hedge is recognised in
the translation reserve; the gain or loss relating to the ineffective portion is recognised immediately in
the income statement. Gains and losses accumulated in equity are included in the income statement
when the foreign operation is disposed of.
Derivatives that do not qualify for hedge accounting
Changes in the fair value of any derivative instrument that does not qualify for hedge accounting are
recognised immediately in the income statement.
Offsetting financial instruments
Financial assets and liabilities are offset and the net amount reported in the balance sheet when thereis a legally enforceable right to offset the recognised amounts and there is an intention to settle on a
net basis, or to realise the asset and settle the liability simultaneously.
Sale and repurchase agreements
Securities sold subject to repurchase agreements (repos) remain on the balance sheet; the counterpartyliability is included in deposits by banks, or customer accounts, as appropriate. Securities purchased
under agreements to resell (reverse repos) are recorded as loans and advances to other banks or
customers, as appropriate. The difference between sale and repurchase price is treated as interest and
accrued over the life of the agreements using the effective interest method.
Securities lent to counterparties are also retained in the financial statements. Securities borrowed are
not recognised in the financial statements, unless these are sold to third parties, in which case the
purchase and sale are recorded with the gain or loss included in trading income.
617
c102100pu160Proof7:28.3.10B/LRevision:0OperatorBeeR

Interest income and expense
Interest income and expense is recognised in the income statement using the effective interest method.
The effective interest method is a method of calculating the amortised cost of a financial asset or a
financial liability and of allocating the interest income or interest expense over the relevant period.
The effective interest rate is the rate that discounts estimated future cash payments or receiptsthrough the expected life of the financial instrument or, when appropriate, a shorter period, to the
net carrying amount of the financial asset or financial liability. When calculating the effective interest
rate, the Group estimates cash flows considering all contractual terms of the financial instrument (for
example, prepayment options) but does not consider future credit losses. The calculation includes all
fees and points paid or received between parties to the contract that are an integral part of the
effective interest rate, transaction costs and all other premiums or discounts.
Where the estimates of cash flows have been revised, the carrying amount of the financial asset or
liability is adjusted to reflect the actual and revised cash flows. The adjustment
is recognised as interest income or expense in the period in which the revision is made.
If the financial asset has been reclassified, subsequent increases in the estimates of future cash receipts
as a result of increased recoverability are recognised as an adjustment to the effective interest rate
from the date of the change in estimate.
Once a financial asset or a group of similar financial assets has been written down as a result of an
impairment loss, interest income is recognised using the rate of interest used to discount the future
cash flows for the purpose of measuring the impairment loss.
Fees and commissions
Fees and commissions are generally recognised on an accrual basis when the service has been
provided. Loan syndication fees are recognised as revenue when the syndication has been completed
and the Group retained no part of the loan package for itself, or retained a part at the same effective
interest rate as for the other participants. Portfolio and other management advisory and service fees
are recognised based on the applicable service contracts, usually on a time-apportionate basis.
Hyperinflation
Where the Group has operations in countries that experience hyperinflation, the financial statements
are restated for changes in general purchasing power of the local currency.
618
c102100pu160Proof7:28.3.10B/LRevision:0OperatorBeeR
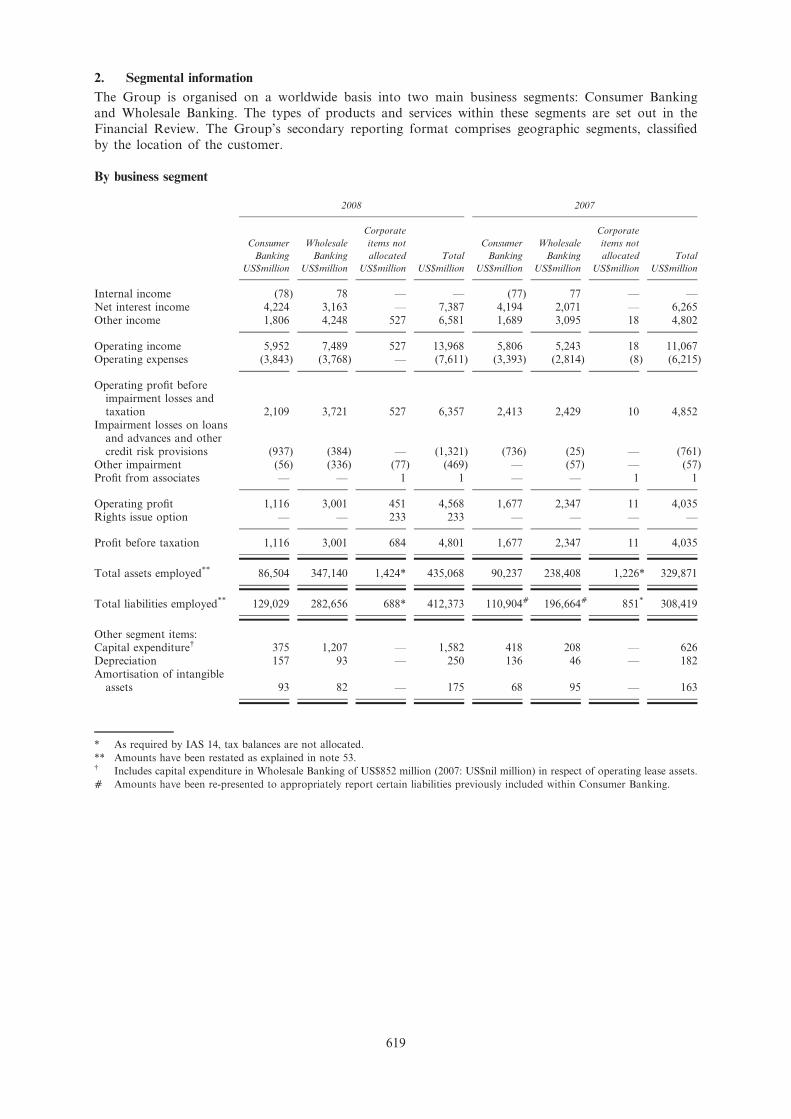
2. Segmental information
The Group is organised on a worldwide basis into two main business segments: Consumer Banking
and Wholesale Banking. The types of products and services within these segments are set out in theFinancial Review. The Group’s secondary reporting format comprises geographic segments, classified
by the location of the customer.
By business segment
2008 2007
Consumer
Banking
US$million
Wholesale
Banking
US$million
Corporate
items not
allocated
US$million
Total
US$million
Consumer
Banking
US$million
Wholesale
Banking
US$million
Corporate
items not
allocated
US$million
Total
US$million
Internal income (78) 78 — — (77) 77 — —Net interest income 4,224 3,163 — 7,387 4,194 2,071 — 6,265Other income 1,806 4,248 527 6,581 1,689 3,095 18 4,802
Operating income 5,952 7,489 527 13,968 5,806 5,243 18 11,067Operating expenses (3,843) (3,768) — (7,611) (3,393) (2,814) (8) (6,215)
Operating profit beforeimpairment losses andtaxation 2,109 3,721 527 6,357 2,413 2,429 10 4,852
Impairment losses on loansand advances and othercredit risk provisions (937) (384) — (1,321) (736) (25) — (761)
Other impairment (56) (336) (77) (469) — (57) — (57)Profit from associates — — 1 1 — — 1 1
Operating profit 1,116 3,001 451 4,568 1,677 2,347 11 4,035Rights issue option — — 233 233 — — — —
Profit before taxation 1,116 3,001 684 4,801 1,677 2,347 11 4,035
Total assets employed** 86,504 347,140 1,424* 435,068 90,237 238,408 1,226* 329,871
Total liabilities employed** 129,029 282,656 688* 412,373 110,904a 196,664a 851* 308,419
Other segment items:Capital expenditure{ 375 1,207 — 1,582 418 208 — 626Depreciation 157 93 — 250 136 46 — 182Amortisation of intangible
assets 93 82 — 175 68 95 — 163
* As required by IAS 14, tax balances are not allocated.
** Amounts have been restated as explained in note 53.{ Includes capital expenditure in Wholesale Banking of US$852 million (2007: US$nil million) in respect of operating lease assets.
a Amounts have been re-presented to appropriately report certain liabilities previously included within Consumer Banking.
619
c102100pu160Proof7:28.3.10B/LRevision:0OperatorBeeR
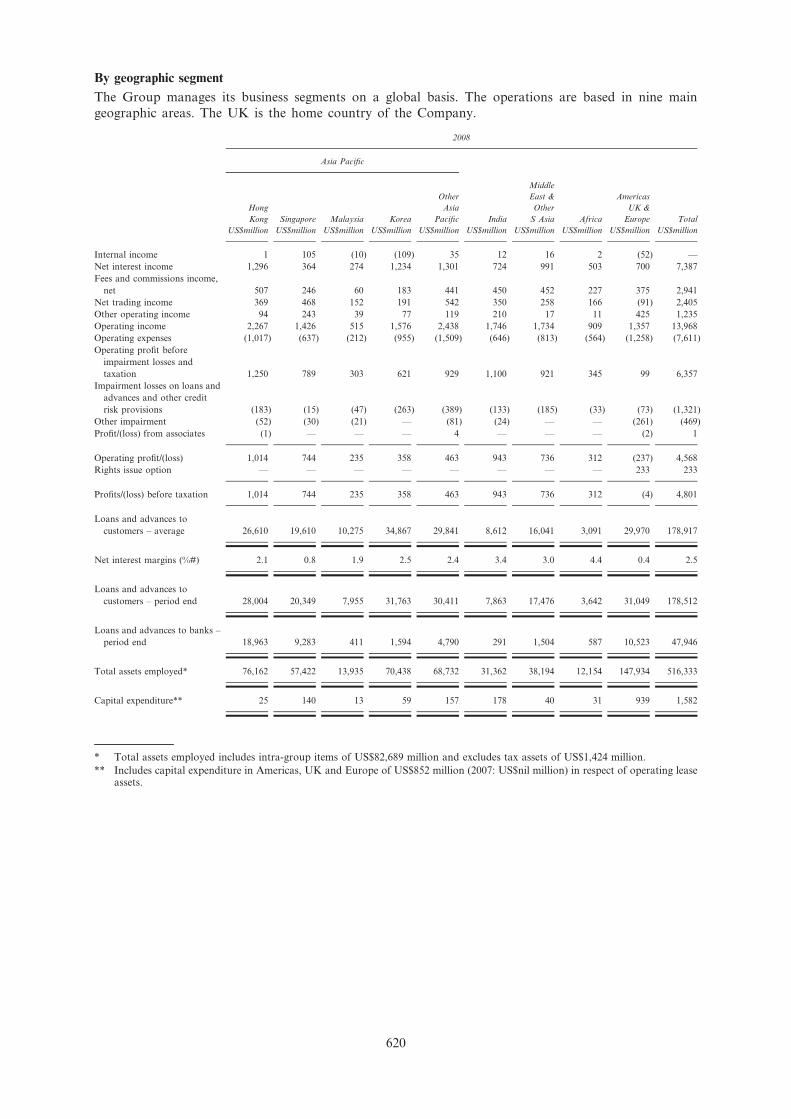
By geographic segment
The Group manages its business segments on a global basis. The operations are based in nine main
geographic areas. The UK is the home country of the Company.
2008
Asia Pacific
Hong
Kong
US$million
Singapore
US$million
Malaysia
US$million
Korea
US$million
Other
Asia
Pacific
US$million
India
US$million
Middle
East &
Other
S Asia
US$million
Africa
US$million
Americas
UK &
Europe
US$million
Total
US$million
Internal income 1 105 (10) (109) 35 12 16 2 (52) —
Net interest income 1,296 364 274 1,234 1,301 724 991 503 700 7,387
Fees and commissions income,
net 507 246 60 183 441 450 452 227 375 2,941
Net trading income 369 468 152 191 542 350 258 166 (91) 2,405
Other operating income 94 243 39 77 119 210 17 11 425 1,235
Operating income 2,267 1,426 515 1,576 2,438 1,746 1,734 909 1,357 13,968
Operating expenses (1,017) (637) (212) (955) (1,509) (646) (813) (564) (1,258) (7,611)
Operating profit before
impairment losses and
taxation 1,250 789 303 621 929 1,100 921 345 99 6,357
Impairment losses on loans and
advances and other credit
risk provisions (183) (15) (47) (263) (389) (133) (185) (33) (73) (1,321)
Other impairment (52) (30) (21) — (81) (24) — — (261) (469)
Profit/(loss) from associates (1) — — — 4 — — — (2) 1
Operating profit/(loss) 1,014 744 235 358 463 943 736 312 (237) 4,568
Rights issue option — — — — — — — — 233 233
Profits/(loss) before taxation 1,014 744 235 358 463 943 736 312 (4) 4,801
Loans and advances to
customers – average 26,610 19,610 10,275 34,867 29,841 8,612 16,041 3,091 29,970 178,917
Net interest margins (%#) 2.1 0.8 1.9 2.5 2.4 3.4 3.0 4.4 0.4 2.5
Loans and advances to
customers – period end 28,004 20,349 7,955 31,763 30,411 7,863 17,476 3,642 31,049 178,512
Loans and advances to banks –
period end 18,963 9,283 411 1,594 4,790 291 1,504 587 10,523 47,946
Total assets employed* 76,162 57,422 13,935 70,438 68,732 31,362 38,194 12,154 147,934 516,333
Capital expenditure** 25 140 13 59 157 178 40 31 939 1,582
* Total assets employed includes intra-group items of US$82,689 million and excludes tax assets of US$1,424 million.
** Includes capital expenditure in Americas, UK and Europe of US$852 million (2007: US$nil million) in respect of operating leaseassets.
620
c102100pu160Proof7:28.3.10B/LRevision:0OperatorBeeR

2007
Asia Pacific
Hong
Kong
US$million
Singapore
US$million
Malaysia
US$million
Korea
US$million
Other
Asia
Pacific
US$million
India
US$million
Middle
East
& Other
S Asia
US$million
Africa
US$million
Americas
UK &
Europe
US$million
Total
US$million
Internal income (81) 119 11 (58) 16 23 (15) 20 (35) —
Net interest income 1,288 182 225 1,289 1,118 608 873 444 238 6,265
Fees and commissions income,
net 539 233 83 227 466 353 436 194 130 2,661
Net trading income 180 80 63 (72) 330 145 100 121 314 1,261
Other operating income 142 278 77 178 171 179 34 16 (195) 880
Operating income 2,068 892 459 1,564 2,101 1,308 1,428 795 452 11,067
Operating expenses (825) (430) (185) (1,146) (1,213) (528) (694) (468) (726) (6,215)
Operating profit before
impairment losses and
taxation 1,243 462 274 418 888 780 734 327 (274) 4,852
Impairment (losses)/releases on
loans and advances and other
credit risk provisions (50) (16) (38) (94) (318) (90) (143) (27) 15 (761)
Other impairment — — — — — — — (2) (55) (57)
Profit/(loss) from associates — — — — 2 — — — (1) 1
Profit/(loss) before taxation 1,193 446 236 324 572 690 591 298 (315) 4,035
Loans and advances to
customers – average 23,712 14,897 9,518 41,962 23,545 7,611 10,679 2,437 17,059 151,420
Net interest margin (%) 2.3 1.0 1.8 2.1 2.8 4.3 4.1 5.6 0.2 2.5
Loans and advances to
customers – period end 23,364 17,172 10,027 40,229 26,049 7,656 12,646 3,330 16,509 156,982
Loans and advances to banks –
period end 15,156 2,531 928 1,504 4,866 552 1,406 371 10,365 37,679
Total assets employed*,** 61,348 39,362 14,614 67,244 55,890 23,210 28,616 11,132 85,891 387,307
Capital expenditure 39 131 9 53 116 138 88 45 7 626
* Amounts have been restated as explained in note 53.
** Total assets employed includes intra-group items of US$58,662 million and excludes total tax assets of US$1,226 million.
621
c102100pu160Proof7:28.3.10B/LRevision:0OperatorBeeR

Apart from the entities that have been acquired in the last two years, Group central expenses have
been distributed between segments in proportion to their direct costs, and the benefit of the Group’s
capital has been distributed between segments in proportion to their average risk weighted assets. In
the year in which an acquisition is made the Group does not charge or allocate the benefit of theGroup’s capital. The distribution of central expenses is phased in over two years, based on an
estimate of central management costs associated with the acquisition.
In 2008, corporate items not allocated to businesses relate to profits on disposal of the Indian asset
management business, the gain on repurchase of subordinated liabilities, impairment of associates and
other strategic investments, and the Group’s share of profits from associates.
Assets held at the centre have been distributed between geographic segments in proportion to their
total assets employed.
Capital expenditure comprises additions to property and equipment (note 27) and software related
intangibles (note 26) including any post-acquisition additions made by the acquired entities.
3. Interest income
2008
US$million
2007
US$million
Balances at central banks 32 39
Treasury bills 835 884Loans and advances to banks 1,382 1,975
Loans and advances to customers 11,397 10,746
Listed debt securities 1,147 1,081
Unlisted debt securities 1,545 1,385
Accrued on impaired assets (discount unwind) 40 66
16,378 16,176
Total interest income from financial instruments held at amortised cost in 2008 is US$10,124 million
(2007: US$11,070 million) and from financial instruments held as available-for-sale is US$2,820
million (2007: US$2,390 million).
4. Interest expense
2008
US$million
2007
US$million
Deposits by banks 1,268 1,497
Customer accounts:Interest bearing current accounts and savings deposits 1,009 1,508
Time deposits 4,328 4,552
Debt securities in issue 1,338 1,543
Subordinated liabilities and other borrowed funds:
Wholly repayable within five years 389 245
Other 659 566
8,991 9,911
Total interest expense on financial instruments held at amortised cost in 2008 is US$7,405 million
(2007: US$8,347 million).
622
c102100pu160Proof7:28.3.10B/LRevision:0OperatorBeeR
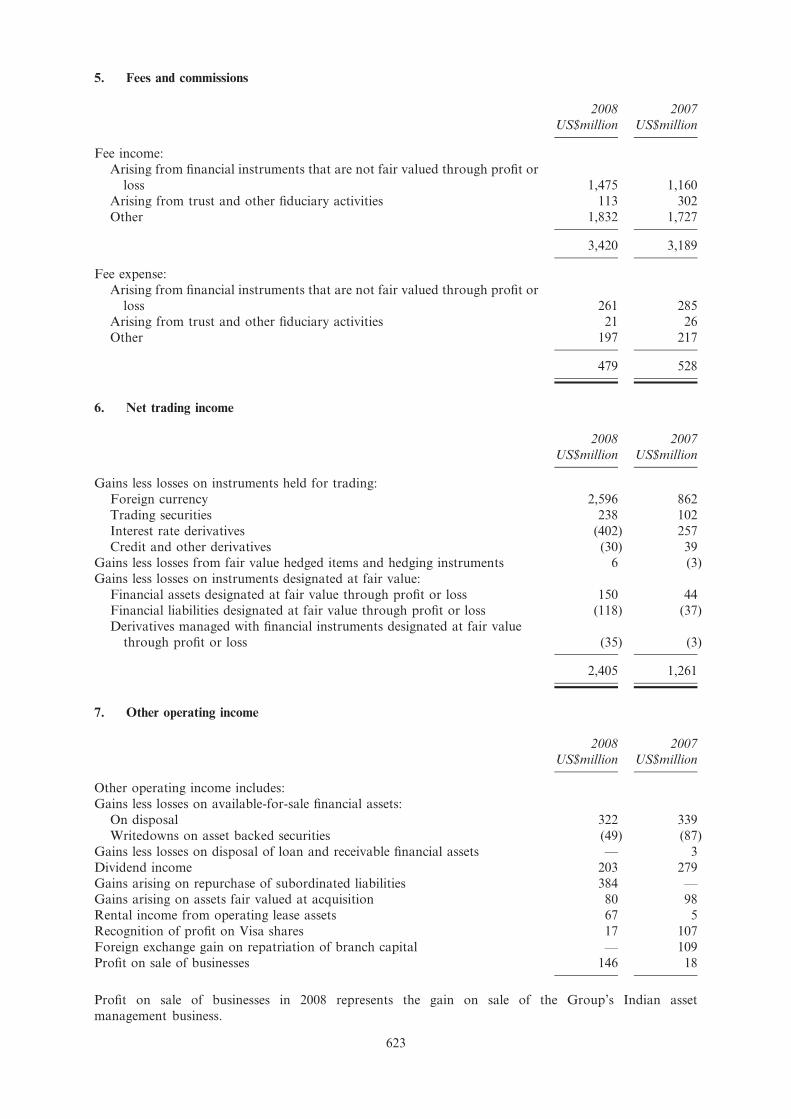
5. Fees and commissions
2008
US$million
2007
US$million
Fee income:Arising from financial instruments that are not fair valued through profit or
loss 1,475 1,160
Arising from trust and other fiduciary activities 113 302
Other 1,832 1,727
3,420 3,189
Fee expense:
Arising from financial instruments that are not fair valued through profit or
loss 261 285Arising from trust and other fiduciary activities 21 26
Other 197 217
479 528
6. Net trading income
2008
US$million
2007
US$million
Gains less losses on instruments held for trading:
Foreign currency 2,596 862
Trading securities 238 102
Interest rate derivatives (402) 257
Credit and other derivatives (30) 39
Gains less losses from fair value hedged items and hedging instruments 6 (3)
Gains less losses on instruments designated at fair value:
Financial assets designated at fair value through profit or loss 150 44Financial liabilities designated at fair value through profit or loss (118) (37)
Derivatives managed with financial instruments designated at fair value
through profit or loss (35) (3)
2,405 1,261
7. Other operating income
2008
US$million
2007
US$million
Other operating income includes:
Gains less losses on available-for-sale financial assets:
On disposal 322 339
Writedowns on asset backed securities (49) (87)
Gains less losses on disposal of loan and receivable financial assets — 3
Dividend income 203 279
Gains arising on repurchase of subordinated liabilities 384 —Gains arising on assets fair valued at acquisition 80 98
Rental income from operating lease assets 67 5
Recognition of profit on Visa shares 17 107
Foreign exchange gain on repatriation of branch capital — 109
Profit on sale of businesses 146 18
Profit on sale of businesses in 2008 represents the gain on sale of the Group’s Indian asset
management business.
623
c102100pu160Proof7:28.3.10B/LRevision:0OperatorBeeR

Gains arising on assets fair valued at acquisition primarily relate to recoveries of fair value
adjustments on loans and advances.
8. Operating expenses
2008US$million
2007US$million
Staff costs:Wages and salaries 3,793 2,970Social security costs 93 67Other pension costs (note 37) 172 213Other staff costs 679 699
4,737 3,949
Premises and equipment expenses:Rental of premises 337 259Other premises and equipment costs 376 307Rental of computers and equipment 25 26
738 592
General administrative expenses 1,711 1,329
Wages and salaries include share based payments – see note 42.
The Group employed 73,802 staff at 31 December 2008 (2007: 69,612).
The Company employed nil staff at 31 December 2008 (2007: nil) and it incurred costs of US$3
million (2007: US$7 million).
Directors’ emoluments
Details of directors’ pay and benefits and interests in shares are disclosed in the directors’
remuneration report on pages 89 to 93 of the 2008 Annual Report.
Transactions with directors, officers and other related parties are disclosed in note 56.
Auditor’s remuneration
Auditor’s remuneration in relation to the Group statutory audit amounts to US$5.0 million (2007:US$6.0 million). The following fees were payable by the Group to their principal auditor, KPMG
Audit Plc and its associates (together ‘KPMG’):
2008US$million
2007*US$million
Audit fees for the Group statutory audit:Fees relating to the current year 5.0 5.4Fees relating to prior year — 0.6
Fees payable to KPMG for other services provided to the Group:Audit of Standard Chartered PLC subsidiaries, pursuant to legislation
Fees relating to the current year 9.9 8.1Fees relating to prior year 0.8 —
Other services pursuant to legislation 2.8 3.0Tax services 1.3 0.4Services relating to information technology 0.1 0.1Services relating to corporate finance transactions 1.4 0.8All other services 3.3 0.3
Total fees payable 24.6 18.7
* In 2007, US$1.6 million in respect of audit fees for the Group statutory audit was included in fees payable for the audit ofStandard Chartered PLC subsidiaries which has now been appropriately allocated.
624
c102100pu160Proof7:28.3.10B/LRevision:0OperatorBeeR

The following is a description of the type of services included within the categories listed above:
* Audit fees are in respect of fees payable to KPMG Audit Plc for the statutory audit of the
consolidated financial statements of the Group and the separate financial statements of StandardChartered PLC. It excludes amounts payable for the audit of Standard Chartered PLC’s
subsidiaries and amounts payable to KPMG Audit Plc’s associates. These amounts have been
included in ‘Fees payable to KPMG for other services provided to the Group’.
* Other services pursuant to legislation include services for assurance and other services that are in
relation to statutory and regulatory filings, including comfort letters and interim reviews.
* Tax services include tax compliance services and tax advisory services.
* Services relating to information technology include advice on IT security and business
continuity, and performing agreed upon IT testing procedures.
* Services related to corporate finance transactions include fees payable to KPMG for transaction
related work irrespective of whether the Group is vendor or purchaser, such as acquisition due
diligence and long-form reports.
* All other services include other assurance and advisory services such as translation services, ad-
hoc accounting advice, reporting accountants work on capital raising and review of financial
models.
Expenses incurred during the provision of services and which have been reimbursed by the Group areincluded within auditor’s remuneration.
In addition to the above, KPMG estimate they have been paid fees of US$0.3 million (2007: US$0.3
million) by parties other than the Group but where the Group is connected with the contracting
party and therefore may be involved in appointing KPMG. These fees arise from services such as the
audit of the Group’s pension schemes.
Fees payable to KPMG for non-audit services for Standard Chartered PLC are not separately
disclosed because such fees are disclosed on a consolidated basis for the Group.
9. Depreciation and amortisation
2008
US$million
2007
US$million
Premises 98 78Equipment 152 104
Intangibles:
Software 94 86
Acquired on business combinations 81 77
425 345
10. Other impairment
2008
US$million
2007
US$million
Intangible assets — 17
Impairment losses on available-for-sale financial assets 417 40
Impairment of investment in associates 46 —
Other 6 —
469 57
Impairment losses on available-for-sale financial assets includes US$315 million (2007: US$nil million)
in relation to impairment of equity investments, US$41 million (2007: US$35 million) impairment on
asset backed securities, and US$61 million (2007: US$5 million) on other debt securities. In 2007,
impairment of intangible assets related to the write-off of a customer relationship asset relating to
Whistlejacket, a structured investment vehicle previously sponsored by the Group.
625
c102100pu160Proof7:28.3.10B/LRevision:0OperatorBeeR
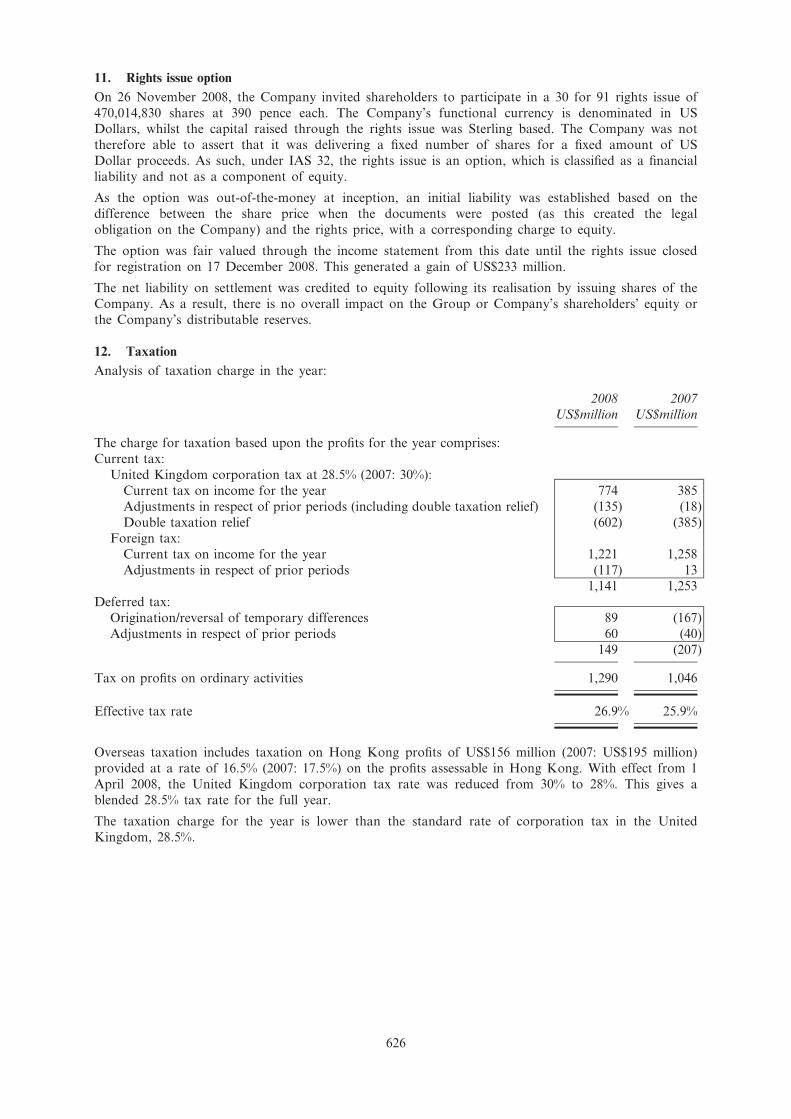
11. Rights issue option
On 26 November 2008, the Company invited shareholders to participate in a 30 for 91 rights issue of
470,014,830 shares at 390 pence each. The Company’s functional currency is denominated in USDollars, whilst the capital raised through the rights issue was Sterling based. The Company was not
therefore able to assert that it was delivering a fixed number of shares for a fixed amount of US
Dollar proceeds. As such, under IAS 32, the rights issue is an option, which is classified as a financial
liability and not as a component of equity.
As the option was out-of-the-money at inception, an initial liability was established based on the
difference between the share price when the documents were posted (as this created the legal
obligation on the Company) and the rights price, with a corresponding charge to equity.
The option was fair valued through the income statement from this date until the rights issue closed
for registration on 17 December 2008. This generated a gain of US$233 million.
The net liability on settlement was credited to equity following its realisation by issuing shares of the
Company. As a result, there is no overall impact on the Group or Company’s shareholders’ equity or
the Company’s distributable reserves.
12. Taxation
Analysis of taxation charge in the year:
2008
US$million
2007
US$million
The charge for taxation based upon the profits for the year comprises:
Current tax:
United Kingdom corporation tax at 28.5% (2007: 30%):
Current tax on income for the year 774 385
Adjustments in respect of prior periods (including double taxation relief) (135) (18)
Double taxation relief (602) (385)Foreign tax:
Current tax on income for the year 1,221 1,258
Adjustments in respect of prior periods (117) 13
1,141 1,253
Deferred tax:
Origination/reversal of temporary differences 89 (167)
Adjustments in respect of prior periods 60 (40)
149 (207)
Tax on profits on ordinary activities 1,290 1,046
Effective tax rate 26.9% 25.9%
Overseas taxation includes taxation on Hong Kong profits of US$156 million (2007: US$195 million)
provided at a rate of 16.5% (2007: 17.5%) on the profits assessable in Hong Kong. With effect from 1
April 2008, the United Kingdom corporation tax rate was reduced from 30% to 28%. This gives a
blended 28.5% tax rate for the full year.
The taxation charge for the year is lower than the standard rate of corporation tax in the United
Kingdom, 28.5%.
626
c102100pu160Proof7:28.3.10B/LRevision:0OperatorBeeR

The differences are explained below:
2008
US$million
2007
US$million
Profit on ordinary activities before taxation 4,801 4,035
Tax at 28.5% (2007: 30%) 1,368 1,211
Effects of:
Tax free income (117) (203)
Lower tax rates on overseas earnings (130) (176)
Higher tax rates on overseas earnings 207 222
Adjustments to tax charge in respect of previous periods (192) (45)
Other items 154 37
Tax on profits on ordinary activities 1,290 1,046
Tax recognised directly in equity:
2008
US$million
2007
US$million
Current tax:
Share based payments 16 38
Available-for-sale assets 97 —
Rights issue option 66 —179 38
Deferred tax:
Available-for-sale assets 7 (38)
Cash flow hedges 54 7
Retirement benefit obligations 60 (71)
Share based payments (46) (61)
Other items — (1)
75 (164)
Total tax credit/(charge) recognised in equity 254 (126)
13. Dividends
2008 2007
Ordinary equity shares
Post-rights
cents per
share*
Pre-rights
cents per
share US$million
Post-rights
cents per
share*
Pre-rights
cents per
share US$million
Final dividend declaredand paid during the
period 42.27 56.23 793 37.74 50.21 695
Interim dividend declared
and paid during the
period 19.30 25.67 364 17.38 23.12 324
61.57 81.90 1,157 55.12 73.33 1,019
* On a post-rights basis, the dividend has been adjusted by the ratio of shares outstanding immediately before the rights issue to thenumber of shares outstanding immediately following the rights issue. The total dividend for 2007 on a post-rights basis is 59.65cents per share (2006: 53.40 cents per share).
627
c102100pu160Proof7:28.3.10B/LRevision:0OperatorBeeR

Preference shares
2008
US$million
2007
US$million
Non-cumulative irredeemablepreference shares: 73/8 % preference shares of £1 each{ 15 15
81/4 % preference shares of £1 each{ 16 16
Non-cumulative redeemable
preference shares: 8.125% preference shares of US$5 each{ 32 —
7.014% preference shares of US$5 each 62 —
6.409% preference shares of US$5 each 48 28
{ Dividends on these preference shares are treated as interest expense and accrued accordingly.
Dividends on ordinary equity and those preference shares classified as equity are recorded in theperiod in which they are declared and, in respect of the final dividend, have been approved by the
shareholders. Accordingly, the final ordinary equity share dividends set out above relate to the
respective prior years. The 2008 final ordinary equity share dividend of 42.32 cents per share (US$801
million) will be paid in either Sterling, Hong Kong Dollars or US Dollars on 15 May 2009 to
shareholders on the UK register of members at the close of business in the UK (10.00 pm UK time)
on 13 March 2009, and to shareholders on the Hong Kong branch register of members at the
opening of business in Hong Kong (9:00 am Hong Kong time) on 13 March 2009. It is intended that
shareholders will be able to elect to receive shares credited as fully paid instead of all or part of thefinal cash dividend.
14. Earnings per ordinary share
2008 2007
Profit*
US$million
Weighted
average
number of
shares
(‘000)
Per
share
amount
cents
Profit*
US$million
Weighted
average
number of
shares
(’000)
Per
share
amount
cents
Basic earnings per
ordinary share — — — 2,813 1,398,747 201.1
Pre-rights issue bonusearnings per
ordinary share 3,298 1,418,117 232.6 — — —
Impact of rights issue
bonus — 211,516 — — 199,237 —
Post-rights issue
bonus basic
earnings perordinary share 3,298 1,629,633 202.4 2,813 1,597,984 176.0
Effect of dilutive
potential ordinary
shares:
Options** — 8,622 — — 17,048 —
Diluted earnings per
ordinary share 3,298 1,638,255 201.3 2,813 1,615,032 174.2{
{ On 24 November 2008 the Company announced the issue of 470,014,830 New Ordinary shares by way of rights to qualifyingshareholders at 390 pence per share. The issue was on the basis of 30 shares for every 91 held on 24 November 2008. As requiredby IAS 33 ‘Earnings per share’ the impact of the bonus element included within the rights issue has been included within thecalculations of the basic and diluted earnings per share for the year and prior periods have been re-presented on this basis.
* The profit amounts represent the profit attributable to ordinary shareholders and is therefore after the declaration of dividendspayable to the holders of the non-cumulative redeemable preference shares (see note 13).
** The impact of anti-dilutive options has been excluded from this amount as required by IAS 33 ‘Earnings Per Share’.
628
c102100pu160Proof7:28.3.10B/LRevision:0OperatorBeeR

There were no ordinary shares issued after the balance sheet date that would have significantly
affected the number of ordinary shares used in the above calculations had they been issued prior to
the end of the balance sheet period.
Normalised earnings per ordinary share
The Group measures earnings per share on a normalised basis. This differs from earnings defined in
IAS 33 ‘Earnings per share’. The table below provides a reconciliation.
2008
US$million
2007
US$million
Profit attributable to ordinary shareholders* 3,298 2,813
Amortisation of intangible assets arising on business combinations 81 77
Impairment of customer relationship intangible — 17Profit on sale of property, plant and equipment (10) (1)
Pre-incorporation costs in China — 8
Gains arising on repurchase of subordinated liabilities (384) —
Foreign exchange gain on repatriation of branch capital — (109)
Profit on sale of businesses (146) (18)
Day one loss on strategic investment 3 —
Impairment of associates and other strategic investments 77 —
Rights issue option (note 11) (233) —Tax on normalised items 164 (23)
Normalised earnings 2,850 2,764
Normalised basic earnings per ordinary share (cents){ 174.9 173.0
Normalised diluted earnings per ordinary share (cents){ 174.0 171.1
* The profit amounts represent the profit attributable to ordinary shareholders and is therefore after the declaration of dividendspayable to the holders of the non-cumulative redeemable preference shares (see note 13).
{ As required by IAS 33 ‘Earnings per share’ the impact of the bonus element included within the rights issue has been includedwithin the calculation of the basic and diluted earnings per share for the year and prior periods have been re-presented on thisbasis.
15. Financial instruments classification summary
Financial instruments are classified between four categories: held at fair value through profit or loss
(comprising trading and designated), available-for-sale, held-to-maturity, loans and receivables, and
for financial liabilities, amortised cost. The face of the balance sheet combines financial instruments
that are held at their fair value, and subdivided between those assets and liabilities held for trading
purposes and those that the Group has elected to hold at fair value.
The Group’s classification of its principal financial assets and liabilities (excluding derivatives which
are classified as trading and are disclosed in note 17) is summarised in the table below. Cash and
balances at central banks of US$24,161 million (2007: US$10,175 million) is deemed to be held at
amortised cost.
629
c102100pu160Proof7:28.3.10B/LRevision:0OperatorBeeR

Assets
Trading
US$million
Designated
at fair value
through
profit or
loss
US$million
Available-
for-sale
US$million
Loans and
receivables
US$million
Held-to-
maturity
US$million
Total
US$million
Loans and advances to
banks 1,351 12 — 46,583 — 47,946
Loans and advances to customers 4,103 231 — 174,178 — 178,512
Treasury bills and other eligible
bills 2,502 205 16,713 — — 19,420
Debt securities 6,193 203 43,543 7,456 37 57,432
Equity shares 165 460 1,593 — — 2,218
Total at 31 December 2008 14,314 1,111 61,849 228,217 37 305,528
Loans and advances to banks 2,314 — — 35,365 — 37,679
Loans and advances to customers 1,978 738 — 154,266 — 156,982
Treasury bills and other eligible
bills 2,942 453 11,667 — — 15,062
Debt securities 13,829 334 38,098 2,719 100 55,080
Equity shares 108 262 2,690 — — 3,060
Total at 31 December 2007 21,171 1,787 52,455 192,350 100 267,863
Liabilities
Trading
US$million
Designated
at fair
value
through
profit or
loss
US$million
Amortised
cost
US$million
Total
US$million
Deposits by banks 4,028 49 31,909 35,986
Customer accounts 1,207 3,376 234,008 238,591
Debt securities in issue 2,128 1,494 23,447 27,069
Short positions 3,196 — — 3,196
Total at 31 December 2008 10,559 4,919 289,364 304,842
Deposits by banks 2,532 173 25,880 28,585
Customer accounts 772 2,064 179,760 182,596Debt securities in issue 2,665 2,351 27,137 32,153
Short positions 3,693 — — 3,693
Total at 31 December 2007 9,662 4,588 232,777 247,027
630
c102100pu160Proof7:28.3.10B/LRevision:0OperatorBeeR

Reclassification of financial assets
The Group has reclassified certain financial assets classified as held for trading into the available-for-
sale (AFS) category as these were no longer considered to be held for the purpose of selling orrepurchasing in the near term. At the time of transfer, the Group identified the rare circumstances
permitting such a transfer as the impact of the ongoing credit crisis in financial markets, particularly
from the beginning of 2008, which significantly impacted liquidity in certain markets. The Group also
reclassified certain eligible financial assets from trading and available-for-sale categories to loans and
receivables as set out below. In total, assets with a notional value of US$8.3 billion were reclassified.
The following table provides details of the assets reclassified in 2008 as at and up to the date of
reclassification:
Fair value gain or (loss)
from 1 January 2008 to the
reclassification date
recognised within:
Fair value loss
to 31 December 2007
recognised within:
For assets reclassified:
Carrying
amount
reclassified
US$million
Income
US$million
AFS reserve
US$million
Income
US$million
AFS
reserve
US$million
Effective
interest
rate
%
Estimated
amounts of
expected
cash flows
US$million
From trading to AFS
– asset backed securities 248 (23) — (7) — 8.2 277
– other financial assets 2,558 5 — (6) — 5.9 2,799
2,806 (18) — (13) — 3,076
From trading to loans and
receivables
– asset backed securities 1,009 (61) — (30) — 5.7 1,017
– other financial assets 1,821 (117) — (1) — 4.9 2,040
2,830 (178) — (31) — 3,057
From AFS to loan and receivables
– asset backed securities 2,105 — (231) — (86) 5.5 2,307
7,741 (196) (231) (44) (86) 8,440
The reclassified assets were included in the following lines on the Group’s balance sheet:
From
trading to
available-
for-sale
US$million
From
trading to
loans and
receivables
US$million
From
available-
for-sale to
loans and
receivables
US$million
Total
US$million
Debt securities and treasury bills 2,796 2,484 2,105 7,385
Loans to banks — 91 — 91
Loans and advances to customers 10 255 — 265
2,806 2,830 2,105 7,741
631
c102100pu160Proof7:28.3.10B/LRevision:0OperatorBeeR
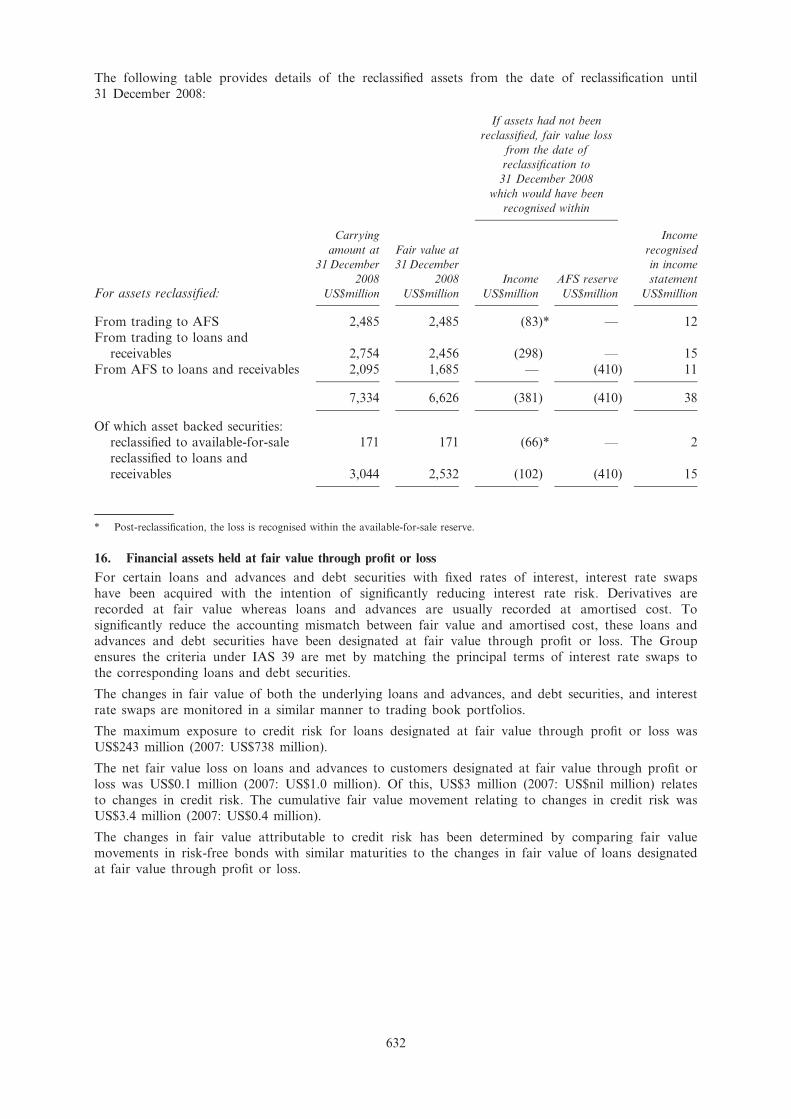
The following table provides details of the reclassified assets from the date of reclassification until
31 December 2008:
If assets had not been
reclassified, fair value loss
from the date of
reclassification to
31 December 2008
which would have been
recognised within
For assets reclassified:
Carrying
amount at
31 December
2008
US$million
Fair value at
31 December
2008
US$million
Income
US$million
AFS reserve
US$million
Income
recognised
in income
statement
US$million
From trading to AFS 2,485 2,485 (83)* — 12
From trading to loans and
receivables 2,754 2,456 (298) — 15
From AFS to loans and receivables 2,095 1,685 — (410) 11
7,334 6,626 (381) (410) 38
Of which asset backed securities:reclassified to available-for-sale 171 171 (66)* — 2
reclassified to loans and
receivables 3,044 2,532 (102) (410) 15
* Post-reclassification, the loss is recognised within the available-for-sale reserve.
16. Financial assets held at fair value through profit or loss
For certain loans and advances and debt securities with fixed rates of interest, interest rate swaps
have been acquired with the intention of significantly reducing interest rate risk. Derivatives are
recorded at fair value whereas loans and advances are usually recorded at amortised cost. To
significantly reduce the accounting mismatch between fair value and amortised cost, these loans andadvances and debt securities have been designated at fair value through profit or loss. The Group
ensures the criteria under IAS 39 are met by matching the principal terms of interest rate swaps to
the corresponding loans and debt securities.
The changes in fair value of both the underlying loans and advances, and debt securities, and interest
rate swaps are monitored in a similar manner to trading book portfolios.
The maximum exposure to credit risk for loans designated at fair value through profit or loss was
US$243 million (2007: US$738 million).
The net fair value loss on loans and advances to customers designated at fair value through profit or
loss was US$0.1 million (2007: US$1.0 million). Of this, US$3 million (2007: US$nil million) relates
to changes in credit risk. The cumulative fair value movement relating to changes in credit risk was
US$3.4 million (2007: US$0.4 million).
The changes in fair value attributable to credit risk has been determined by comparing fair value
movements in risk-free bonds with similar maturities to the changes in fair value of loans designated
at fair value through profit or loss.
632
c102100pu160Proof7:28.3.10B/LRevision:0OperatorBeeR
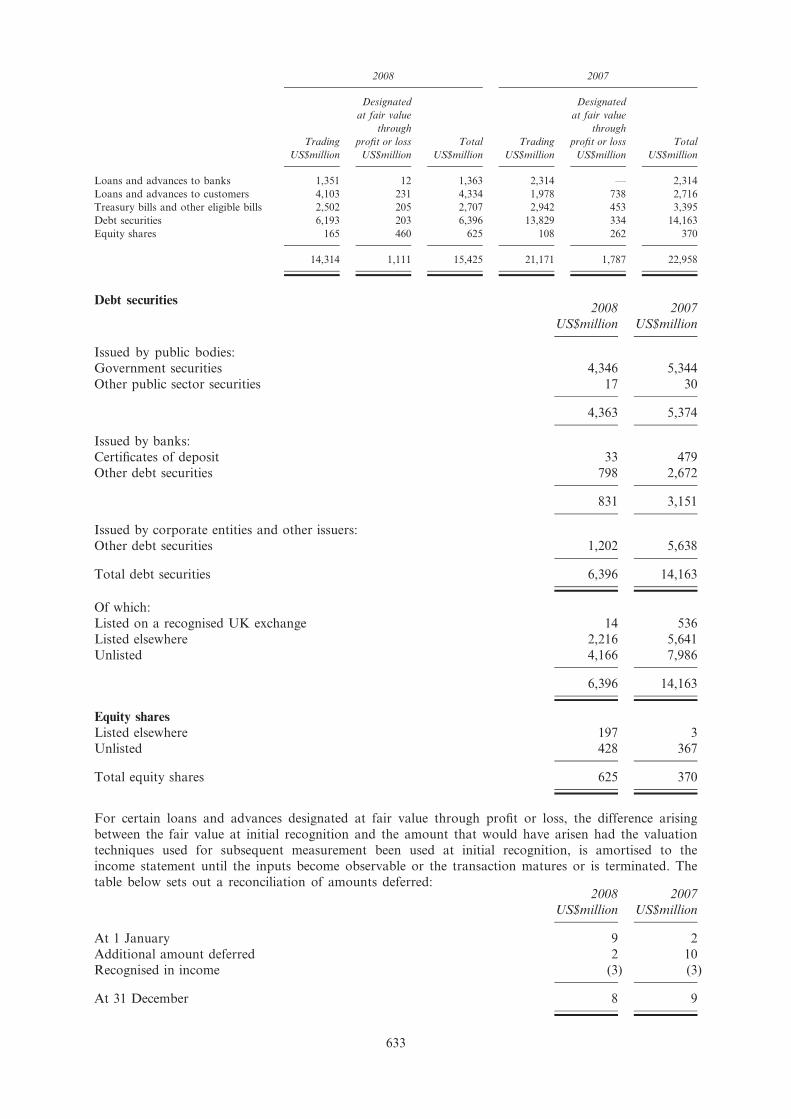
2008 2007
Trading
US$million
Designated
at fair value
through
profit or loss
US$million
Total
US$million
Trading
US$million
Designated
at fair value
through
profit or loss
US$million
Total
US$million
Loans and advances to banks 1,351 12 1,363 2,314 — 2,314
Loans and advances to customers 4,103 231 4,334 1,978 738 2,716
Treasury bills and other eligible bills 2,502 205 2,707 2,942 453 3,395
Debt securities 6,193 203 6,396 13,829 334 14,163
Equity shares 165 460 625 108 262 370
14,314 1,111 15,425 21,171 1,787 22,958
Debt securities2008
US$million
2007
US$million
Issued by public bodies:
Government securities 4,346 5,344
Other public sector securities 17 30
4,363 5,374
Issued by banks:
Certificates of deposit 33 479
Other debt securities 798 2,672
831 3,151
Issued by corporate entities and other issuers:
Other debt securities 1,202 5,638
Total debt securities 6,396 14,163
Of which:
Listed on a recognised UK exchange 14 536
Listed elsewhere 2,216 5,641
Unlisted 4,166 7,986
6,396 14,163
Equity shares
Listed elsewhere 197 3
Unlisted 428 367
Total equity shares 625 370
For certain loans and advances designated at fair value through profit or loss, the difference arising
between the fair value at initial recognition and the amount that would have arisen had the valuation
techniques used for subsequent measurement been used at initial recognition, is amortised to the
income statement until the inputs become observable or the transaction matures or is terminated. The
table below sets out a reconciliation of amounts deferred:2008
US$million
2007
US$million
At 1 January 9 2
Additional amount deferred 2 10Recognised in income (3) (3)
At 31 December 8 9
633
c102100pu160Proof7:28.3.10B/LRevision:0OperatorBeeR

Changing one or more of the assumptions to reasonably possible alternatives would not significantly
change the fair value.
17. Derivative financial instruments
Derivatives are financial instruments that derive their value in response to changes in interest rates,
financial instrument prices, commodity prices, foreign exchange rates, credit risk and indices. The
types of derivatives used by the Group and Company are set out below.
All derivatives are classified as trading and recognised and subsequently measured at fair value, with
all revaluation gains recognised in profit and loss (except where cash flow hedging has been achieved,
in which case the effective portion of changes in fair value go through reserves).
These tables analyse the notional principal amounts and the positive and negative fair values of the
Group’s and Company’s derivative financial instruments. Notional principal amounts are the amount
of principal underlying the contract at the reporting date.
The Group and Company limits its exposure to credit losses in the event of default by entering into
master netting agreements with certain market counterparties. As required by IAS 32, exposures are
not presented net in these accounts as in the ordinary course of business they are not intended to be
settled net. Details of the amounts available for offset can be found in note 51, under maximum
exposure to credit risk.
The Derivatives and Hedging sections of the Risk review on page 61 of the 2008 Annual Report
explains the Group’s and the Company’s risk management of derivative contracts.
Group
2008 2007
Total derivatives
Notional
principal
amounts
US$million
Assets
US$million
Liabilities
US$million
Notional
principal
amounts
US$million
Assets
US$million
Liabilities
US$million
Foreign exchange derivative contracts:
Forward foreign exchange contracts 832,915 23,096 21,017 775,663 7,376 7,852
Currency swaps and options 528,957 18,760 19,253 512,833 8,955 8,516
1,361,872 41,856 40,270 1,288,496 16,331 16,368
Interest rate derivative contracts:
Swaps 1,089,407 21,992 21,451 979,727 8,473 8,365
Forward rate agreements and options 170,700 1,076 1,451 166,563 556 745
Exchange traded futures and options 242,694 557 429 322,520 336 282
1,502,801 23,625 23,331 1,468,810 9,365 9,392
Credit derivative contracts 29,033 926 961 21,035 165 160
Equity and stock index options 1,075 219 233 1,057 58 106
Commodity derivative contracts 16,200 3,031 2,980 16,971 285 244
Total derivatives 2,910,981 69,657 67,775 2,796,369 26,204 26,270
Company
2008 2007
Total derivatives
Notional
principal
amounts
US$million
Assets
US$million
Liabilities
US$million
Notional
principal
amounts
US$million
Assets
US$million
Liabilities
US$million
Foreign exchange derivative contracts:
Currency swaps 1,044 — 26 — — —
Total derivatives 1,044 — 26 — — —
634
c102100pu160Proof7:28.3.10B/LRevision:0OperatorBeeR

The Group and Company use derivatives primarily to mitigate interest rate and foreign exchange risk.
Hedge accounting is applied to derivatives and hedged items when the criteria under IAS 39 have
been met. The tables below list the types of derivatives that the Group and Company holds for hedge
accounting.
Group
2008 2007
Derivatives held for hedging
Notional
principal
amounts
US$million
Assets
US$million
Liabilities
US$million
Notional
principal
amounts
US$million
Assets
US$million
Liabilities
US$million
Derivatives designated as fair value
hedges:
Swaps 18,376 1,393 251 13,392 352 161
18,376 1,393 251 13,392 352 161
Derivatives designated as cash flow
hedges:
Swaps 4,514 92 13 5,120 35 13
Forward foreign exchange contracts 1,015 6 210 1,414 37 19
5,529 98 223 6,534 72 32
Derivatives designated as net
investment hedges:
Forward foreign exchange contracts 600 — 89 81 1 —
Total derivatives held for hedging 24,505 1,491 563 20,007 425 193
Company
2008 2007
Derivatives held for hedging
Notional
principal
amounts
US$million
Assets
US$million
Liabilities
US$million
Notional
principal
amounts
US$million
Assets
US$million
Liabilities
US$million
Derivatives designated as fair value
hedges:
Currency swaps 1,044 — 26 — — —
Total derivatives held for hedging 1,044 — 26 — — —
Fair value hedges
The Group uses interest rate swaps to manage fixed rates of interest. The swaps exchange fixed rates
for floating rates on funding to match floating rates received on assets, or exchange fixed rates on
assets to match the floating rates paid on funding. The Company uses currency swaps to manage
foreign exchange exposures. For qualifying hedges, the fair value changes of the derivative are
substantially matched by corresponding fair value changes of the hedged item, both of which are
recognised in profit and loss.
In respect of fair value hedges, gains arising on the hedging instruments during the year wereUS$1,142 million (2007: gains of US$49 million) compared to losses arising on the hedged items of
US$1,138 million (2007: losses of US$52 million).
For the Company losses arising on fair value hedging instruments were US$26 million compared to
gains arising on the hedged items of US$26 million. There was no fair value hedging in the Company
in 2007.
Cash flow hedges
The Group uses interest rate swaps to manage the variability in future cash flows on assets and
liabilities that have floating rates of interest by exchanging the floating rates for fixed rates. It also
uses foreign exchange contracts to manage the variability in future exchange rates on its assets and
635
c102100pu160Proof7:28.3.10B/LRevision:0OperatorBeeR

liabilities and costs in foreign currencies. Gains and losses arising on the effective portion of the
hedges are deferred in equity until the variability on the cash flow affects profit and loss, at which
time the gains or losses are transferred to profit and loss.
The Group has hedged the following cash flows which are expected to impact the income statement
in the following periods:2008
Less than
one year
US$million
One to two
years
US$million
Two to three
years
US$million
Three to
four years
US$million
Four to five
years
US$million
Over five
years
US$million
Total
US$million
Forecast receivable
cash flows 716 335 268 203 154 144 1,820
Forecast payable cash
flows (1,439) (586) (208) (158) (121) (118) (2,630)
(723) (251) 60 45 33 26 (810)
2007
Less than
one year
US$million
One to two
years
US$million
Two to three
years
US$million
Three to
four years
US$million
Four to five
years
US$million
Over five
years
US$million
Total
US$million
Forecast receivable
cash flows 315 249 165 142 80 59 1,010
Forecast payable cash
flows (941) (873) (148) (111) (81) (58) (2,212)
(626) (624) 17 31 (1) 1 (1,202)
During the year, US$4 million (2007: US$nil million) was recognised in the income statement in
respect of ineffectiveness arising on cash flow hedges.
During the year US$18 million (2007: US$58 million) was removed from the cash flow hedging
reserve and included in profit and loss, of which, US$2 million (2007: US$58 million) was recognised
within operating costs and the remaining US$16 million (2007: US$nil million) within income.
Net investment hedges
The Group uses foreign exchange contracts to manage the variability in future exchange rates on its
net investments in foreign currencies. Gains and losses arising on the effective portion of the hedges
are deferred in equity until the net investment is disposed of. During the year, US$nil million (2007:US$nil million) was recognised in the Income statement in respect of ineffectiveness arising on net
investment hedges.
18. Loans and advances to banks
2008
US$million
2007
US$million
Loans and advances to banks 47,969 37,682
Individual impairment provision (note 21) (17) (2)Portfolio impairment provision (note 21) (6) (1)
47,946 37,679
Of which: loans and advances held at fair value through profit or loss (note 16) (1,363) (2,314)
46,583 35,365
636
c102100pu160Proof7:28.3.10B/LRevision:0OperatorBeeR

19. Loans and advances to customers2008
US$million
2007
US$million
Loans and advances to customers 180,470 158,788
Individual impairment provision (note 21) (1,307) (1,271)
Portfolio impairment provision (note 21) (651) (535)
178,512 156,982Of which: loans and advances held at fair value through profit or loss (note 16) (4,334) (2,716)
174,178 154,266
The Group has transferred to third parties by way of securitisation the rights to any collections of
principal and interest on customer loan assets with a face value of US$4,192 million (2007: US$5,742
million). The Group continues to be exposed to related credit and foreign exchange risk on these
assets. The Group continues to recognise these assets in addition to the proceeds and related liabilityof US$4,583 million (2007: US$5,155 million) arising from the securitisations.
The Group has entered into synthetic credit default swaps for portfolio management purposes,
referencing loan assets with a notional value of US$15.7 billion (2007: US$24.4 billion). The Group
continues to hold the underlying assets referenced in the synthetic credit default swaps.
The Group’s exposure to credit risk is concentrated in Hong Kong, Korea, Singapore, Other Asia
Pacific region and Americas, UK & Europe. The Group is affected by the general economicconditions in the territories in which it operates. The Group sets limits on the exposure to any
counterparty and credit risk is spread over a variety of different personal and commercial customers.
The Group has outstanding residential mortgage loans to Korea residents of US$17.1 billion (2007:
US$22.6 billion) and Hong Kong residents of US$13.0 billion (2007: US$11.8 billion).
20. Assets leased to customers
Finance leases and instalment credit
2008
US$million
2007
US$million
Finance leases 468 506
Instalment credit agreements 784 1,127
1,252 1,633
The above assets are included within loans and advances to customers.
The cost of assets acquired during the year for leasing to customers under finance leases andinstalment credit agreements amounted to US$154 million (2007: US$140 million).
2008
US$million
2007
US$million
Minimum lease receivables under finance leases falling due:
Within one year 47 61
Later than one year and less than five years 354 390
After five years 125 133
526 584
Interest income relating to future periods (58) (78)
Present value of finance lease receivables 468 506
Of which:
Falls due within one year 46 50
Falls due later than one year and less than five years 321 354
Falls due after five years 101 102
637
c102100pu160Proof7:28.3.10B/LRevision:0OperatorBeeR

Operating lease assets
Assets leased to customers under operating leases consist of commercial aircraft which are included
within property, plant and equipment in note 27. At 31 December 2008 these assets had a net bookvalue of US$1,029 million (2007: US$200 million).
2008
US$million
2007
US$million
Minimum lease receivables under operating leases falling due:
Within one year 111 10
Later than one year and less than five years 451 21
After five years 297 5
859 36
21. Impairment provisions on loans and advances
2008
US$million
2007
US$million
At 1 January 1,809 2,225
Exchange translation differences (179) 28
Acquisitions 109 —
Amounts written off (1,119) (1,183)
Recoveries of acquisition fair values (78) (98)Recoveries of amounts previously written off 180 139
Discount unwind (40) (66)
Other 13 10
New provisions 1,796 1,352
Recoveries/provisions no longer required (510) (598)
Net charge against profit 1,286 754
Provisions held at 31 December 1,981 1,809
The following table reconciles the charge for impairment provisions on loans and advances to the
total impairment charge and other credit commitments:
2008
US$million
2007
US$million
Net charge/(release) against profit on loans and advances:
Individual impairment charge 1,168 769
Portfolio impairment charge/(release) 118 (15)
1,286 754Provisions/(releases) related to credit commitments 27 (3)
Impairment charges relating to debt securities classified as loans 8 10
Total impairment charge and other credit risk provisions 1,321 761
638
c102100pu160Proof7:28.3.10B/LRevision:0OperatorBeeR
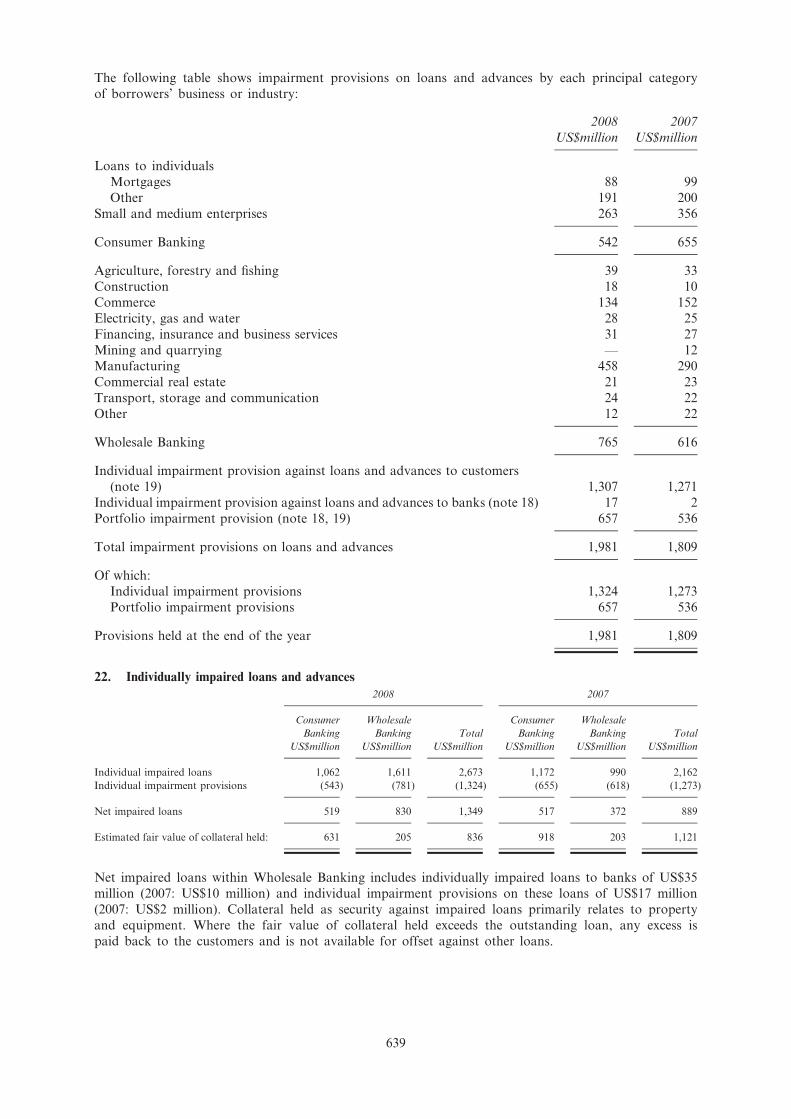
The following table shows impairment provisions on loans and advances by each principal category
of borrowers’ business or industry:
2008
US$million
2007
US$million
Loans to individuals
Mortgages 88 99
Other 191 200
Small and medium enterprises 263 356
Consumer Banking 542 655
Agriculture, forestry and fishing 39 33
Construction 18 10Commerce 134 152
Electricity, gas and water 28 25
Financing, insurance and business services 31 27
Mining and quarrying — 12
Manufacturing 458 290
Commercial real estate 21 23
Transport, storage and communication 24 22
Other 12 22
Wholesale Banking 765 616
Individual impairment provision against loans and advances to customers
(note 19) 1,307 1,271
Individual impairment provision against loans and advances to banks (note 18) 17 2
Portfolio impairment provision (note 18, 19) 657 536
Total impairment provisions on loans and advances 1,981 1,809
Of which:Individual impairment provisions 1,324 1,273
Portfolio impairment provisions 657 536
Provisions held at the end of the year 1,981 1,809
22. Individually impaired loans and advances
2008 2007
Consumer
Banking
US$million
Wholesale
Banking
US$million
Total
US$million
Consumer
Banking
US$million
Wholesale
Banking
US$million
Total
US$million
Individual impaired loans 1,062 1,611 2,673 1,172 990 2,162
Individual impairment provisions (543) (781) (1,324) (655) (618) (1,273)
Net impaired loans 519 830 1,349 517 372 889
Estimated fair value of collateral held: 631 205 836 918 203 1,121
Net impaired loans within Wholesale Banking includes individually impaired loans to banks of US$35
million (2007: US$10 million) and individual impairment provisions on these loans of US$17 million
(2007: US$2 million). Collateral held as security against impaired loans primarily relates to property
and equipment. Where the fair value of collateral held exceeds the outstanding loan, any excess is
paid back to the customers and is not available for offset against other loans.
639
c102100pu160Proof7:28.3.10B/LRevision:0OperatorBeeR

23. Investment securities
Group Company
Held-to-
maturity
US$million
Available-
for-sale
US$million
Loans and
receivables
US$million
Total
US$million
Loans and
receivables
US$million
Treasury and other eligible bills — 16,713 — 16,713 —
Debt securities 37 43,543 7,456 51,036 925
Equity shares — 1,593 — 1,593 —
At 31 December 2008 37 61,849 7,456 69,342 925
Treasury and other eligible bills — 11,667 — 11,667 —
Debt securities 100 38,098 2,719 40,917 —
Equity shares — 2,690 — 2,690 —
At 31 December 2007 100 52,455 2,719 55,274 —
2008
Debt securities
Held-to-
maturity
US$million
Available-
for-sale
US$million
Loans and
receivables
US$million
Equity
shares
US$million
Treasury
bills
US$million
Total
US$million
Issued by public bodies:
Government securities 37 17,849 389
Other public sector securities — 1,864 —
37 19,713 389
Issued by banks:
Certificates of deposit — 6,771 1,969
Other debt securities — 13,597 735
— 20,368 2,704
Issued by corporate entities and other
issuers:
Other debt securities — 3,462 4,363
Total debt securities 37 43,543 7,456
Listed on a recognised UK exchange — 4,096 1,217 35 — 5,348
Listed elsewhere 35 15,479 2,750 586 5,711 24,561
Unlisted 2 23,968 3,489 972 11,002 39,433
37 43,543 7,456 1,593 16,713 69,342
Market value of listed securities 35 19,575 3,903 621 5,711 29,845
640
c102100pu160Proof7:28.3.10B/LRevision:0OperatorBeeR
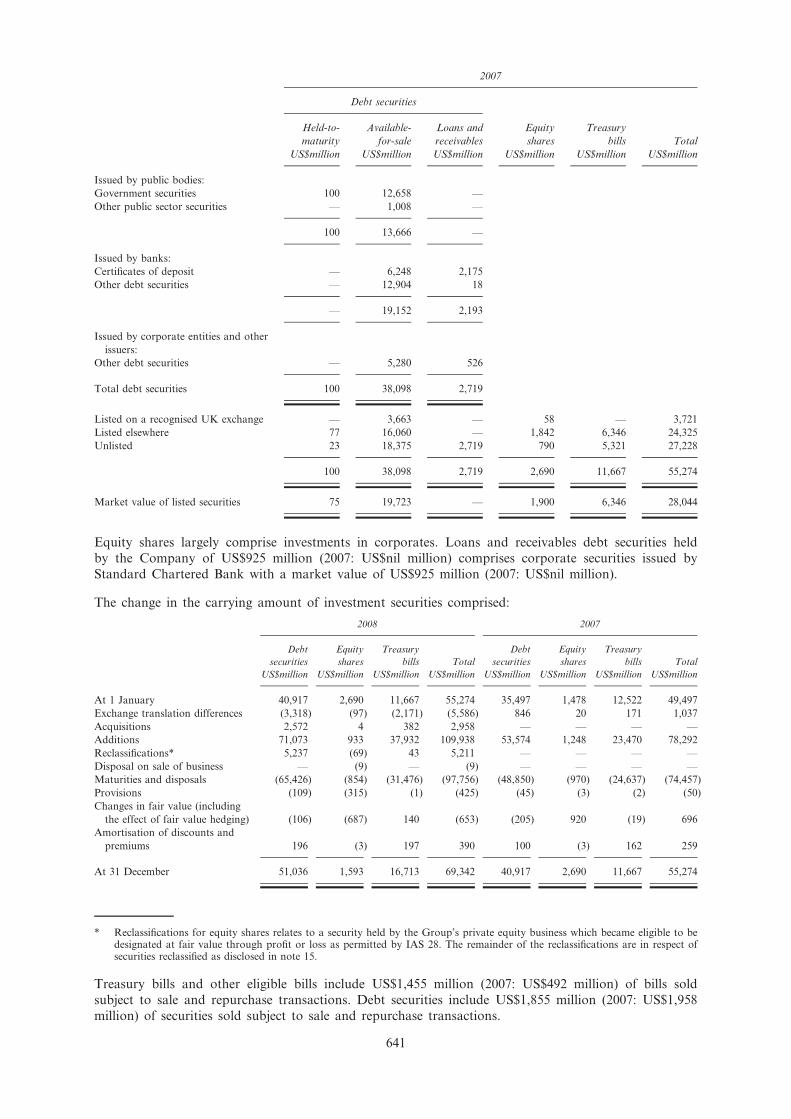
2007
Debt securities
Held-to-
maturity
US$million
Available-
for-sale
US$million
Loans and
receivables
US$million
Equity
shares
US$million
Treasury
bills
US$million
Total
US$million
Issued by public bodies:
Government securities 100 12,658 —
Other public sector securities — 1,008 —
100 13,666 —
Issued by banks:
Certificates of deposit — 6,248 2,175
Other debt securities — 12,904 18
— 19,152 2,193
Issued by corporate entities and other
issuers:
Other debt securities — 5,280 526
Total debt securities 100 38,098 2,719
Listed on a recognised UK exchange — 3,663 — 58 — 3,721
Listed elsewhere 77 16,060 — 1,842 6,346 24,325
Unlisted 23 18,375 2,719 790 5,321 27,228
100 38,098 2,719 2,690 11,667 55,274
Market value of listed securities 75 19,723 — 1,900 6,346 28,044
Equity shares largely comprise investments in corporates. Loans and receivables debt securities held
by the Company of US$925 million (2007: US$nil million) comprises corporate securities issued by
Standard Chartered Bank with a market value of US$925 million (2007: US$nil million).
The change in the carrying amount of investment securities comprised:
2008 2007
Debt
securities
US$million
Equity
shares
US$million
Treasury
bills
US$million
Total
US$million
Debt
securities
US$million
Equity
shares
US$million
Treasury
bills
US$million
Total
US$million
At 1 January 40,917 2,690 11,667 55,274 35,497 1,478 12,522 49,497
Exchange translation differences (3,318) (97) (2,171) (5,586) 846 20 171 1,037
Acquisitions 2,572 4 382 2,958 — — — —
Additions 71,073 933 37,932 109,938 53,574 1,248 23,470 78,292
Reclassifications* 5,237 (69) 43 5,211 — — — —
Disposal on sale of business — (9) — (9) — — — —
Maturities and disposals (65,426) (854) (31,476) (97,756) (48,850) (970) (24,637) (74,457)
Provisions (109) (315) (1) (425) (45) (3) (2) (50)
Changes in fair value (including
the effect of fair value hedging) (106) (687) 140 (653) (205) 920 (19) 696
Amortisation of discounts and
premiums 196 (3) 197 390 100 (3) 162 259
At 31 December 51,036 1,593 16,713 69,342 40,917 2,690 11,667 55,274
* Reclassifications for equity shares relates to a security held by the Group’s private equity business which became eligible to bedesignated at fair value through profit or loss as permitted by IAS 28. The remainder of the reclassifications are in respect ofsecurities reclassified as disclosed in note 15.
Treasury bills and other eligible bills include US$1,455 million (2007: US$492 million) of bills sold
subject to sale and repurchase transactions. Debt securities include US$1,855 million (2007: US$1,958
million) of securities sold subject to sale and repurchase transactions.
641
c102100pu160Proof7:28.3.10B/LRevision:0OperatorBeeR

The Group has taken advantage of the Term Auction Facility (TAF) introduced by the Federal
Reserve Bank of New York, by borrowing US$2,850 million. Under the TAF, no single security is
earmarked as collateral for the borrowing. The value of securities that is considered to be encumbered
in relation to this borrowing is US$3,197 million and the borrowing is included as a sale andrepurchase transaction within customer accounts.
At 31 December 2008, unamortised premiums on debt securities held for investment purposes
amounted to US$271 million (2007: US$46 million) and unamortised discounts amounted to US$743million (2007: US$186 million).
Income from listed equity shares amounted to US$20 million (2007: US$9 million) and income from
unlisted equity shares amounted to US$183 million (2007: US$270 million).
The change in impairment provisions is as follows:
2008 2007
Debt
securities
US$million
Equity
shares
US$million
Treasury
bills
US$million
Total
US$million
Debt
securities
US$million
Equity
shares
US$million
Treasury
bills
US$million
Total
US$million
At 1 January 54 22 2 78 9 23 10 42
Exchange translation differences (4) — (2) (6) — 1 (10) (9)
Amounts written off (1) (26) — (27) — (5) — (5)
New provisions* 109 315 1 425 45 3 2 50
At 31 December 158 311 1 470 54 22 2 78
* Of the new provisions raised of US$425 million (2007: US$50 million), US$8 million (2007: US$10 million) relates to debtsecurities classified as loans and receivables and is included with impairment losses on loans and advances and other creditprovisions, with the balance reported within ‘Other Impairment’.
24. Investments in subsidiary undertakings, joint ventures and associates
Investment in subsidiary undertakings
2008
US$million
2007
US$million
At 1 January 10,406 9,656
Additions — 750
At 31 December 10,406 10,406
At 31 December 2008, the principal subsidiary undertakings, all indirectly held and principally
engaged in the business of banking and provision of other financial services, were as follows:
Country and place of incorporation or registration Main areas of operation
Group interest
in ordinary
share capital
%
Standard Chartered Bank, England and Wales United Kingdom, Middle East, South
Asia, Asia Pacific, Americas and, through
Group companies, Africa
100
Standard Chartered First Bank Korea Limited, Korea Korea 100
Standard Chartered Bank Malaysia Berhad, Malaysia Malaysia 100
Standard Chartered Bank (Pakistan) Limited, Pakistan Pakistan 98.99
Standard Chartered Bank (Taiwan) Limited, Taiwan Taiwan 100
Standard Chartered Bank (Hong Kong) Limited, Hong Kong Hong Kong 100
Standard Chartered Bank (China) Limited, China China 100
Standard Chartered Bank (Thai) Public Company Limited, Thailand Thailand 99.97
Standard Chartered Receivables (UK) Limited, England and Wales United Kingdom 100
Standard Chartered Financial Investments Limited, England and Wales United Kingdom 100
Standard Chartered Debt Trading Limited, England and Wales Hong Kong 100
Standard Chartered Private Equity Limited, Hong Kong Hong Kong 100
Details of all Group companies will be filed with the next annual return of the Company.
642
c102100pu160Proof7:28.3.10B/LRevision:0OperatorBeeR

Joint ventures
The Group has a 44.51% interest through a joint venture company which holds a majority investment
in PT Bank Permata Tbk (Permata), in Indonesia.
On 11 January 2008 the Group acquired a 49% interest in UTI Securities Limited, subsequently
renamed Standard Chartered – STCI Capital Markets Limited (SC Caps), for US$38 milliongenerating goodwill of US$35 million. On 12 December 2008 the Group acquired a further 25.9% for
US$20 million generating additional goodwill of US$17 million.
SC Caps is equity brokerage and its main areas of operation are in India. Although the Group’sinvestment in SC Caps is greater than 50% of the share capital, the Group contractually shares
control of the strategic financial and operating policies of SC Caps and accordingly it is accounted
for as a joint venture.
The Group proportionately consolidates its share of the assets, liabilities, income and expense of these
joint ventures on a line by line basis.
Contingent liabilities set out in note 47, include US$59 million (2007: US$72 million) relating to these
joint venture arrangements. These mainly comprise banking guarantees and irrevocable letters of
credit.
There are no capital commitments related to the Group’s investments in these joint ventures.
Related party transactions are disclosed in note 56.
The following amounts have been included in the consolidated accounts of the Group:
2008
US$million
2007
US$million
Current assets 863 663
Long-term assets 1,467 1,332
Total assets 2,330 1,995
Current liabilities (1,722) (1,484)
Long-term liabilities (233) (140)
Total liabilities (1,955) (1,624)
Net assets 375 371
Income 159 161
Expenses (111) (111)Impairment (6) (17)
Operating profit 42 33
Tax (16) 2
Share of post tax result from joint venture 26 35
Long-term assets are primarily loans to customers and current liabilities are primarily customer
deposits based on contractual maturities.
643
c102100pu160Proof7:28.3.10B/LRevision:0OperatorBeeR

Interests in associates
2008
US$million
2007
US$million
At 1 January 269 218
Additions 293 51
Transfer to subsidiary* (5) —
Impairment (46) —
At 31 December 511 269
Profit for the year 1 1
Total assets 2,614 944
Total liabilities (2,372) (774)
Net assets 242 170
* As at 31 December 2008 the Group has currently exercisable options over a further 40.0% of the share capital of First AfricaHoldings Limited, a leveraged finance advisory boutique company in which it currently holds 25%. This gives the Group controlover the management and financial and operating policies of the company, and accordingly the company is now a subsidiaryundertaking not an associate.
The Group’s principal associates are:
Associate
Main areas of
operation
Group interest
in ordinary
share capital
%
China Bohai Bank Co., Ltd China 19.9
Fleming Family & Partners Asia 20.0
MCashback Limited UK 30.0
Merchant Solutions Limited Hong Kong 44.0
Asia Commercial Bank Vietnam 15.0
mReferral Corporation Limited Hong Kong 33.0
On 2 July 2008 the Group acquired a further 6.16% equity stake in Asia Commercial Bank (ACB)
(including convertible bonds) for US$211 million to bring the total shareholding to 15% and the total
cost of investment to US$298 million. ACB’s main area of operation is in Vietnam. The fair value of
the investment in ACB at 31 December 2008 is US$211 million.
The Group’s investments in ACB and China Bohai Bank Co., Ltd are less than 20% but both ACB
and China Bohai Bank Co., Ltd are considered to be associates because of the significant influencethe Group is able to exercise over the management of these companies and their financial and
operating policies. Significant influence is evidenced largely through the inter-change of management
personnel and the provision of expertise.
The Group acquired a 33% interest in mReferral Corporation Limited for US$4 million as part of its
acquisition of American Express Bank Limited in 2008. mReferral’s main area of operation is Hong
Kong.
The reporting dates of these associates is within three months of the Group’s reporting date.
25. Business combinations
2008 acquisitions
On 25 February 2008, the Group acquired 100% of the share capital of Yeahreum Mutual Savings
Bank (Yeahreum), a Korean banking company.
On 29 February 2008, the Group acquired 100% of the share capital of American Express Bank
Limited (AEB), a financial services company. The Group also entered into a put and call option
agreement with American Express Company, exercisable 18 months from the acquisition of AEB, to
644
c102100pu160Proof7:28.3.10B/LRevision:0OperatorBeeR

purchase 100% of American Express International Deposit Corporation at a purchase price equivalent
to its net asset value at the time of exercise.
On 27 December 2008, the Group acquired the ‘good bank’ portion of Asia Trust and Investment
Corporation, a Taiwanese banking company.
If the acquisitions had occurred on 1 January 2008, the operating income of the Group would have
been approximately US$14,093 million and profit before taxation would have been approximately
US$4,809 million.
During 2008, the Group acquired the remaining 20% minority of A Brain Co. Limited for aconsideration of US$8 million, generating additional goodwill of US$5 million.
The assets and liabilities arising from the acquisitions are as follows:
AEB Other acquisitions
Fair value
US$million
Acquiree’s
carrying
amount
US$million
Fair value
US$million
Acquiree’s
carrying
amount
US$million
Cash and balances at central banks* 1,041 1,041 131 131
Derivative financial instruments 511 511 — —
Loans and advances to banks 7,142 7,143 639 667
Loans and advances to customers 4,781 4,783 233 233
Investment securities 2,864 2,883 87 88
Intangibles other than goodwill 88 4 — —
Property, plant and equipment 27 34 30 23
Deferred tax assets 10 — 4 —Other assets 527 544 21 23
Total assets 16,991 16,943 1,145 1,165
Derivative financial instruments 514 514 — —
Deposits by banks 5,519 5,519 — —
Customer accounts 8,392 8,392 1,192 1,192
Other liabilities 1,848 1,829 47 43
Provisions for liabilities and charges 55 — — —Retirement benefit obligations 46 46 — —
Subordinated liabilities and other borrowed
funds 190 190 — —
Total liabilities 16,564 16,490 1,239 1,235
Net assets acquired 427 453 (94) (70)
Purchase consideration settled in cash (823) (161)
Cash and cash equivalents in subsidiary
acquired 6,700 551
Cash inflow on acquisition 5,877 390
Purchase consideration:
- cash paid 798 160
- direct costs relating to the acquisition 25 1
Total purchase consideration 823 161
Less: Fair value of net assets (liabilities)
acquired (assumed) 427 (94)
Goodwill 396 255
645
c102100pu160Proof7:28.3.10B/LRevision:0OperatorBeeR
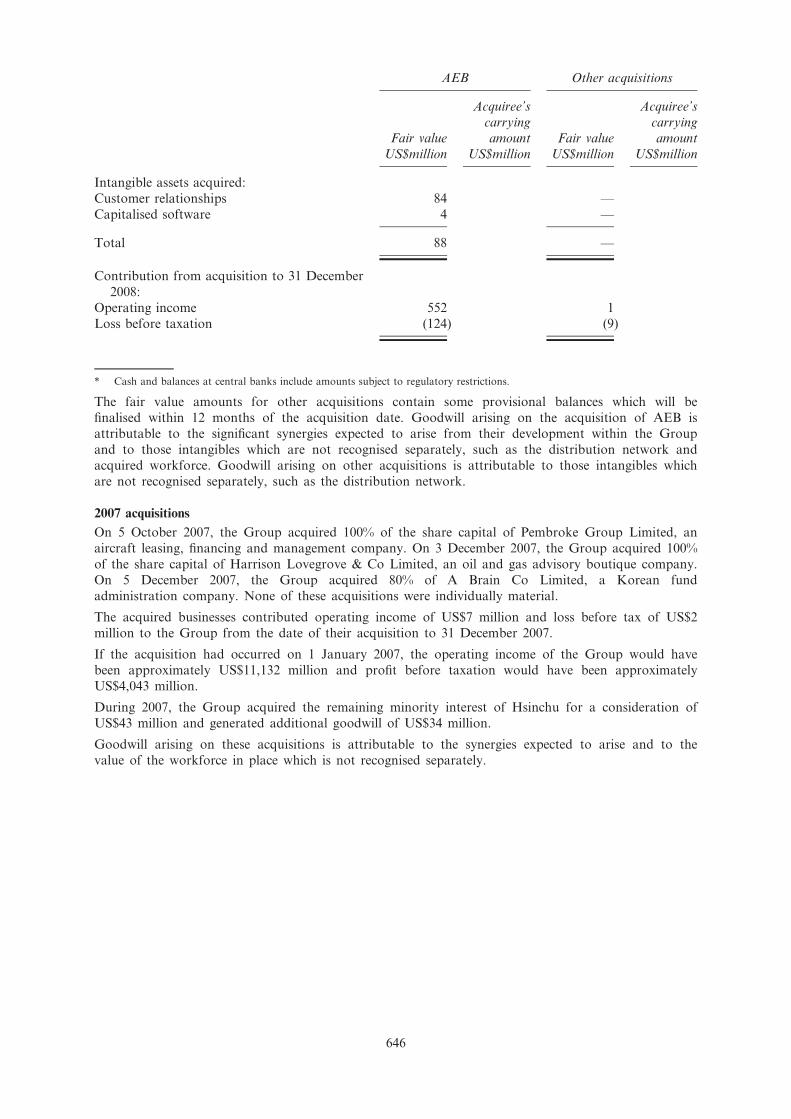
AEB Other acquisitions
Fair value
US$million
Acquiree’s
carrying
amount
US$million
Fair value
US$million
Acquiree’s
carrying
amount
US$million
Intangible assets acquired:
Customer relationships 84 —
Capitalised software 4 —
Total 88 —
Contribution from acquisition to 31 December
2008:
Operating income 552 1
Loss before taxation (124) (9)
* Cash and balances at central banks include amounts subject to regulatory restrictions.
The fair value amounts for other acquisitions contain some provisional balances which will be
finalised within 12 months of the acquisition date. Goodwill arising on the acquisition of AEB is
attributable to the significant synergies expected to arise from their development within the Group
and to those intangibles which are not recognised separately, such as the distribution network and
acquired workforce. Goodwill arising on other acquisitions is attributable to those intangibles which
are not recognised separately, such as the distribution network.
2007 acquisitions
On 5 October 2007, the Group acquired 100% of the share capital of Pembroke Group Limited, an
aircraft leasing, financing and management company. On 3 December 2007, the Group acquired 100%
of the share capital of Harrison Lovegrove & Co Limited, an oil and gas advisory boutique company.
On 5 December 2007, the Group acquired 80% of A Brain Co Limited, a Korean fund
administration company. None of these acquisitions were individually material.
The acquired businesses contributed operating income of US$7 million and loss before tax of US$2
million to the Group from the date of their acquisition to 31 December 2007.
If the acquisition had occurred on 1 January 2007, the operating income of the Group would have
been approximately US$11,132 million and profit before taxation would have been approximately
US$4,043 million.
During 2007, the Group acquired the remaining minority interest of Hsinchu for a consideration of
US$43 million and generated additional goodwill of US$34 million.
Goodwill arising on these acquisitions is attributable to the synergies expected to arise and to the
value of the workforce in place which is not recognised separately.
646
c102100pu160Proof7:28.3.10B/LRevision:0OperatorBeeR

The assets and liabilities arising from the acquisitions are as follows:
Fair value*
US$million
Acquiree’s
carrying
amount
US$million
Cash and balances at central banks** 66 66
Loans and advances to customers 2 2
Intangibles other than goodwill 63 —
Property, plant and equipment 194 152
Deferred tax assets 5 10
Other assets 28 28
Total assets 358 258
Other liabilities 162 162
Total liabilities 162 162
Minority interest 3 —
Net assets acquired 193 96
Purchase consideration settled in cash (151)
Cash and cash equivalents in subsidiary acquired 66
Cash outflow on acquisition (85)
Total purchase consideration*** 224
Fair value of net assets acquired (193)
Goodwill 31
Intangible assets acquired:
Brand names 6
Customer relationships 55
Capitalised software 2
Total 63
* Restated as explained in note 53.
** Cash and balances at central banks include amounts subject to regulatory restrictions.
*** Includes cash paid US$151 million; loan notes issued US$5 million; deferred consideration US$65 million; and cost US$3 million.
26. Goodwill and intangible assets
2008 2007
Goodwill
US$million
Acquired
intangibles
US$million
Software
US$million
Total
US$million
Goodwill*,**
US$million
Acquired
intangibles
US$million
Software
US$million
Total
US$million
Cost
At 1 January** 5,785 477 533 6,795 5,678 439 458 6,575
Exchange translation differences (752) (75) (24) (851) 42 (4) 18 56
Acquisitions 712 88 — 800 65 63 — 128
Additions — — 163 163 — — 155 155
Disposals — — (4) (4) — — (4) (4)
Amounts written off — — (73) (73) — (21) (83) (104)
Other movements — — — — - — (11) (11)
At 31 December 5,745 490 595 6,830 5,785 477 533 6,795
647
c102100pu160Proof7:28.3.10B/LRevision:0OperatorBeeR

2008 2007
Goodwill
US$million
Acquired
intangibles
US$million
Software
US$million
Total
US$million
Goodwill*,**
US$million
Acquired
intangibles
US$million
Software
US$million
Total
US$million
Provision for amortisation
At 1 January — 160 261 421 — 88 240 328
Exchange translation differences — (37) (17) (54) — (1) 7 6
Amortisation for the period — 81 94 175 — 77 86 163
Amounts written off — — (73) (73) — (4) (72) (76)
At 31 December — 204 265 469 — 160 261 421
Net book value 5,745 286 330 6,361 5,785 317 272 6,374
* Amounts have been restated as explained in note 53.
** Goodwill as at 1 January 2007 has been presented net of amortisation US$514 million accumulated prior to the adoption of IFRS.
At 1 January 2007, the net book value was: goodwill, US$5,678 million; acquired intangibles, US$351
million; and software, US$218 million.
At 31 December 2008, accumulated goodwill impairment losses incurred from 1 January 2005amounted to US$69 million (2007: US$69 million).
2008
US$million
2007
US$million
Acquired intangibles comprise:
Core deposits 68 108
Customer relationships 144 103
Brand names 67 102
Licences 7 4
Net book value 286 317
Acquired intangibles primarily comprise those recognised as part of the acquisitions of SC First Bank
(SCFB), Permata, Union Bank, Hsinchu, Pembroke, Harrison Lovegrove and AEB. The acquired
intangibles are amortised over periods from four years to a maximum of 16 years in the case of the
customer relationships intangible acquired in SCFB.
Significant items of goodwill arising on acquisitions have been allocated to the following cash
generating units for the purposes of impairment testing:Goodwill
Acquisition Cash Generating Unit
2008
US$million
2007*
US$million
SCFB, A Brain and Yeahreum Korean business 1,534 1,904
Union Bank Pakistan business 332 431
Hsinchu and Asia Trust Taiwan business 1,192 1,100
Manhattan Card Business Credit card and personal loan – Asia, India & MESA 896 896
Grindlays (India) and SC Caps India business 387 423
Grindlays (MESA) MESA business 368 368
Standard Chartered Bank (Thai) Thailand business 298 307
Permata Group’s share of Permata (Indonesia business) 138 163
American Express Bank Financial Institutions and Private Banking business 396 -
Other 204 193
5,745 5,785
* Amounts have been restated as explained in note 53.
All recoverable amounts were measured based on value in use. The key assumptions and approach to
determining value in use calculations, as set out below, are solely estimates for the purposes of
648
c102100pu160Proof7:28.3.10B/LRevision:0OperatorBeeR

assessing impairment on acquired goodwill. The calculation for each unit uses cash flow projections
based on budgets and forecasts approved by management covering one year, except for Taiwan
business (five years), Korea business (four years) and Thailand business and Permata (five years).
Management forecasts projected revenue growth rates greater than long-term GDP rates but whichare in line with past performance as adjusted to reflect the current economic climate, especially for
2009 and 2010. Cash flow projections are extrapolated forward for periods of up to a further 19
years using steady long-term forecast GDP growth rates and a terminal value determined based on
long-term earning multiples. Where these rates are different from available market data on long-term
rates, that fact is stated below. The cash flows are discounted using a pre-tax discount rate which
reflects current market rates appropriate to the cash generating unit. Management believes that any
reasonable possible change in the key assumptions on which the recoverable amounts have been based
would not cause the carrying amounts to exceed their recoverable amount.
Korea businesses
SCFB, A Brain and Yeahreum were acquired in 2005, 2007 and 2008 respectively with initial goodwill
recognised of US$1,891 million and a further US$5 million goodwill recognised in 2008 in respect of
A Brain. The businesses comprise Consumer and Wholesale Banking operations in Korea.
In assessing impairment of goodwill, the Group has assumed that growth beyond 2012 will increase
at a steady rate of 3.7% (2007: 4.2%) in line with the long-term forecast GDP growth of Korea. A
pre-tax discount rate of 17.2% (2007: 16.4%) was used.
Pakistan business
Union Bank was acquired in September 2006 with initial goodwill recognised of US$414 million.
Additional goodwill of US$17 million arose as a result of a share swap. Together with the Group’s
existing operations, the combined business comprises Consumer and Wholesale Banking operations in
Pakistan.
In assessing impairment of goodwill, the Group has assumed that growth will increase at a steady
rate of 5.6% (2007: 7.4%) in line with the long-term forecast GDP growth of Pakistan. A pre-tax
discount rate of 25.9% (2007: 26.1%) was used.
Taiwan businesses
Hsinchu and Asia Trust were acquired in 2006 and 2008 respectively with initial goodwill recognisedof US$1,142 million and a further US$34 million of goodwill recognised in 2007 in respect of
Hsinchu. Together with the Group’s existing operation, the combined business comprises Consumer
and Wholesale Banking operations in Taiwan.
In assessing impairment of goodwill, the Group has assumed that growth beyond 2013 will increaseat a steady rate of 4.1% (2007: 4.5%) in line with the long-term forecast GDP growth of Taiwan. A
pre-tax discount rate of 22.3% (2007: 14.9%) was used.
Credit card business
Manhattan Card Business was acquired in 2000 with initial goodwill recognised of US$1,061 million.
This was amortised to US$892 million under UK GAAP until 31 December 2003. The business
comprises a credit card business and a personal loans business across Asia, India and MESA.
In assessing impairment of goodwill, the Group has assumed that growth will increase at a steady
rate of 3.0% (2007: 3.8%) in line with the long-term forecast global GDP growth. A pre-tax discount
rate of 13.7% (2007: 13.0%) was used.
India businesses
Grindlays (India) was acquired in 2000 with initial goodwill recognised of US$446 million. This was
amortised to US$366 million under UK GAAP until 31 December 2003. It comprises Consumer and
Wholesale Banking operations in India. In 2008, the Group acquired a 74.9% interest in SC Caps,
with initial goodwill recognised of US$52 million.
In assessing impairment of goodwill, the Group has assumed that growth will increase at a steady
rate of 6.8% (2007: 7.1%) in line with the long-term forecast GDP growth of India. A pre-tax
discount rate of 18.6% (2007: 26.5%) was used.
649
c102100pu160Proof7:28.3.10B/LRevision:0OperatorBeeR

MESA business
Grindlays (MESA) was acquired in 2000 with initial goodwill recognised of US$446 million. This was
amortised to US$366 million under UK GAAP until 31 December 2003. It comprises Consumer andWholesale Banking operations in MESA.
In assessing impairment of goodwill, the Group has assumed that growth will increase at a steadyrate of 3.0% in line with the long term forecast GDP growth of MESA. A pre-tax discount rate of
19.6% (2007: 15.8%) was used.
Thailand business
75% of Standard Chartered Bank (Thai) was acquired in 1999 with initial goodwill recognised of
US$222 million. This was amortised to US$204 million under UK GAAP until 31 December 2003. In
2005 the Group acquired the remaining 25%, increasing goodwill to US$272 million. The business
comprises Consumer and Wholesale Banking operations in Thailand.
In assessing impairment of goodwill, the Group has assumed that growth beyond 2013 will increase
at a steady rate of 4.6% (2007: 5.6%) in line with the long term forecast GDP growth of Thailand. A
pre-tax discount rate of 21.5% (2007: 19.5%) was used.
Group’s share of Permata
31.55% of Permata was acquired in 2004 with initial goodwill recognised of US$115 million. Afurther 12.96% was acquired in September 2006, generating further goodwill of US$57 million. This
business comprises Consumer and Wholesale Banking operations in Indonesia.
In assessing impairment of goodwill, the Group has assumed that growth beyond 2013 will increase
at a steady rate of 5.9% (2007: 5.4%) in line with the long-term forecast GDP growth of Indonesia. A
pre-tax discount rate of 24.3% (2007: 25.9%) was used.
Financial institution and Private Banking business
100% of AEB was acquired in February 2008 with initial goodwill recognised of US$396 million. The
business comprises Consumer and Wholesale Banking operations in the Americas, Europe and Asia.
In assessing impairment of goodwill, the Group has assumed that growth will remain at a steady
3.0%, in line with long-term forecast global GDP growth. A pre-tax discount rate of 13.7% was used.
650
c102100pu160Proof7:28.3.10B/LRevision:0OperatorBeeR

27. Property, plant and equipment
2008 2007
Premises
US$million
Equipment
US$million
Total
US$million
Premises
US$million
Equipment*
US$million
Total
US$million
Cost or valuation
At 1 January 2,711 822 3,533 2,184 509 2,693Exchange translation
differences (407) (95) (502) 71 20 91
Additions 363 1,068 1,431 309 162 471
Acquisitions 38 19 57 — 194 194
Disposals and fully depreciated
assets written off (11) (74) (85) (55) (55) (110)
Reclassification** (44) 44 — 202 (8) 194
Transfers to assets held for re-sale (74) — (74) — — —
At 31 December 2,576 1,784 4,360 2,711 822 3,533
DepreciationAccumulated at 1 January 261 380 641 215 310 525
Exchange translation
differences (32) (64) (96) 5 17 22
Charge for the year 98 152 250 78 104 182
Attributable to assets sold or
written off — (21) (21) (37) (51) (88)
Accumulated at 31 December 327 447 774 261 380 641
Net book amount at 31
December 2,249 1,337 3,586 2,450 442 2,892
* Amounts have been restated as explained in note 53.
** These amounts were reclassified from other assets.
At 1 January 2007, the net book value was: premises, US$1,969 million; and equipment, US$199
million.
Equipment includes operating lease assets of US$1,029 million (2007: US$200 million) (see note 20).
Assets held under finance leases have the following net book amount:
2008 2007
Premises
US$million
Equipment
US$million
Premises
US$million
Equipment
US$million
Cost 45 15 53 13
Aggregate depreciation (6) (7) (6) (5)
Net book amount 39 8 47 8
651
c102100pu160Proof7:28.3.10B/LRevision:0OperatorBeeR

The Group’s premises leases include rent review periods, renewal terms and in some cases purchase
options.
2008
US$million
2007
US$million
Minimum lease payments under finance leases falling due:
Within one year 5 4
Later than one year and less than five years 7 8
12 12
Future finance charges on finance leases (2) (2)
Present value of finance lease liabilities 10 10
28. Deferred tax
The following are the major deferred tax liabilities and assets recognised by the Group and
movements thereon during the reporting period:
At
1 January
2008
US$million
Exchange
& other
adjustments
US$million
Acquisitions/
disposals
US$million
Charge/
(credit) to
profit
US$million
Charge/
(credit) to
equity
US$million
At
31 December
2008
US$million
Deferred taxation comprises:
Accelerated tax depreciation (56) (3) 3 27 — (29)
Impairment provisions on
loans and advances (275) 12 (3) 92 — (174)
Tax losses carried forward (52) 9 — (102) — (145)
Available-for-sale assets 79 — (4) (5) (7) 63
Premises revaluation 17 — — — — 17
Cash flow hedges 20 (1) — — (54) (35)
Unrelieved foreign tax (57) — — 23 — (34)
Retirement benefit obligations (41) (1) — 13 (60) (89)
Share based payments (88) — — 21 46 (21)
Other temporary differences (107) — (10) 80 — (37)
(560) 16 (14) 149 (75) (484)
At
1 January
2007
US$million
Exchange
& other
adjustments
US$million
Acquisitions/
disposals*
US$million
Charge/
(credit)
to profit
US$million
Charge/
(credit) to
equity
US$million
At*
31 December
2007
US$million
Deferred taxation comprises:
Accelerated tax depreciation (10) (9) (3) (34) — (56)
Impairment provisions on
loans and advances (175) (67) — (35) 2 (275)
Tax losses carried forward (53) 1 (1) 1 — (52)
Available-for-sale assets 36 5 — — 38 79
Premises revaluation 17 — — 1 (1) 17
Cash flow hedges 24 3 — — (7) 20
Unrelieved foreign tax (76) — — 19 — (57)
Retirement benefit obligations (174) 60 — 2 71 (41)
Share based payments (131) — — (18) 61 (88)
Other temporary differences 30 7 (1)* (143) — (107)*
(512) — (5) (207) 164 (560)
* Amounts have been restated as explained in note 53.
652
c102100pu160Proof7:28.3.10B/LRevision:0OperatorBeeR

Deferred taxation comprises assets and liabilities as follows:
2008 2007
Total
US$million
Asset
US$million
Liability
US$million
Total*
US$million
Asset*
US$million
Liability*
US$million
Deferred taxation comprises:
Accelerated tax depreciation (29) (57) 28 (56) (79) 23
Impairment provisions on
loans and advances (174) (249) 75 (275) (273) (2)
Tax losses carried forward (145) (143) (2) (52) (52) —
Available-for-sale assets 63 32 31 79 77 2
Premises revaluation 17 15 2 17 15 2
Cash flow hedges (35) (42) 7 20 19 1
Unrelieved foreign tax (34) (34) — (57) (57) —
Retirement benefit obligations (89) (93) 4 (41) (41) —
Share based payments (21) (21) — (88) (88) —
Other temporary differences (37) (68) 31 (107)* (114)* 7*
(484) (660) 176 (560) (593) 33
* Amounts have been restated as explained in note 53.
2008
US$million
2007
US$million
No account has been taken of the following potential deferred taxation assets/
(liabilities):
Unrelieved foreign tax 738 408
Unremitted earnings from overseas subsidiaries (484) (369)Foreign exchange movements on investments in branches (6) (136)
Tax losses 38 56
29. Other assets
2008
US$million
2007
US$million
Hong Kong SAR Government certificates of indebtedness (note 35) 3,097 2,862
Cash collateral 9,102 2,015
Other 8,175 6,134
20,374 11,011
The government of Hong Kong certificates of indebtedness are subordinated to the claims of otherparties in respect of bank notes issued.
30. Deposits by banks
2008
US$million
2007
US$million
Deposits by banks 31,909 25,880
Deposits by banks included within:
Financial liabilities held at fair value through profit or loss (note 32) 4,077 2,705
35,986 28,585
653
c102100pu160Proof7:28.3.10B/LRevision:0OperatorBeeR

31. Customer accounts
2008
US$million
2007
US$million
Customer accounts 234,008 179,760Customer accounts included within:
Financial liabilities held at fair value through profit or loss (note 32) 4,583 2,836
238,591 182,596
Included in customer accounts were deposits of US$1,299 million (2007: US$2,805 million) held as
collateral for irrevocable commitments under import letters of credit.
32. Financial liabilities held at fair value through profit or loss
2008
Trading
US$million
Designated
at fair value
through
profit or loss
US$million
Total
US$million
Deposits by banks 4,028 49 4,077
Customer accounts 1,207 3,376 4,583
Debt securities in issue 2,128 1,494 3,622
Short positions 3,196 — 3,196
10,559 4,919 15,478
2007
Trading
US$million
Designated
at fair value
through
profit or loss
US$million
Total
US$million
Deposits by banks 2,532 173 2,705Customer accounts 772 2,064 2,836
Debt securities in issue 2,665 2,351 5,016
Short positions 3,693 — 3,693
9,662 4,588 14,250
The Group designates certain financial liabilities at fair value through profit or loss where either the
liabilities:
* have fixed rates of interest and interest rate swaps or other interest rate derivatives have been
entered into with the intention of significantly reducing interest rate risk; or
* are exposed to foreign currency risk and derivatives have been acquired with the intention of
significantly reducing exposure to market changes; or
* have been acquired to fund trading asset portfolios or assets, or where the assets and liabilities
are managed, and performance evaluated, on a fair value basis for a documented risk
management or investment strategy.
Derivatives are recorded at fair value whereas non-trading financial liabilities (unless designated at fair
value) are recorded at amortised cost. Designation of certain liabilities at fair value through profit or
654
c102100pu160Proof7:28.3.10B/LRevision:0OperatorBeeR

loss significantly reduces the accounting mismatch between fair value and amortised cost expense
recognition (a criterion of IAS 39). The Group ensures the criteria under IAS 39 are met by matching
the principal terms of derivatives to the corresponding liabilities, either individually or on a portfolio
basis.
The changes in fair value of both the underlying liabilities and derivatives are monitored in a similar
manner to trading book portfolios.
The net fair value loss on liabilities designated at fair value through profit or loss was US$118
million for the year (2007: US$37.3 million). Of this, a loss of US$11.2 million (2007: gain of US$0.2million) relates to changes in credit risk. The cumulative
fair value movement relating to changes in credit risk was a loss of US$16.4 million (2007: a loss of
US$5.2 million).
As at 31 December 2008, the amount the Group is contractually obliged to pay at maturity to the
holders of these obligations was US$407 million higher (2007: US$52 million lower) than the carrying
amount at fair value.
The change in fair value attributable to credit risk was determined by comparing fair value
movements in risk-free debt instruments with similar maturities, to the changes in fair value of
liabilities designated at fair value through profit or loss.
33. Debt securities in issue
2008 2007
Certificates
of deposit of
US$100,000
or more
US$million
Other debt
securities in
issue
US$million
Total
US$million
Certificates
of deposit of
US$100,000
or more
US$million
Other debt
securities in
issue
US$million
Total
US$million
Debt securities in issue 13,284 10,163 23,447 8,502 18,635 27,137
Debt securities in issue
included within:
Financial liabilities held at
fair value through profit or
loss (note 32) 460 3,162 3,622 951 4,065 5,016
13,744 13,325 27,069 9,453 22,700 32,153
The Company has other debt securities in issue at 31 December 2008 of US$1,372 million (2007:
US$nil million).
655
c102100pu160Proof7:28.3.10B/LRevision:0OperatorBeeR

34. Structure of deposits
The following tables set out the structure of the Group’s deposits by principal geographic areas as at
31 December 2008 and 31 December 2007:
2008
Asia Pacific
Hong
Kong
US$million
Singapore
US$million
Malaysia
US$million
Korea
US$million
Other
Asia
Pacific
US$million
India
US$million
Middle
East &
Other
S Asia
US$million
Africa
US$million
Americas
UK &
Europe
US$million
Total
US$million
Non-interest bearing current and
demand accounts 4,947 3,550 1,168 64 2,131 2,215 5,313 2,031 2,776 24,195
Interest bearing current accounts
and savings deposits 27,131 9,340 2,485 14,094 19,545 1,634 2,888 2,632 13,343 93,092
Time deposits 31,471 20,875 5,488 13,187 27,237 5,313 9,574 1,335 30,726 145,206
Other deposits 52 92 117 1,079 610 677 1,320 75 8,062 12,084
Total 63,601 33,857 9,258 28,424 49,523 9,839 19,095 6,073 54,907 274,577
Deposits by banks 1,140 1,701 593 8,478 4,155 254 1,687 193 17,785 35,986
Customer accounts 62,461 32,156 8,665 19,946 45,368 9,585 17,408 5,880 37,122 238,591
63,601 33,857 9,258 28,424 49,523 9,839 19,095 6,073 54,907 274,577
Debt securities in issue 530 1,291 617 12,656 1,232 622 29 145 9,947 27,069
Total 64,131 35,148 9,875 41,080 50,755 10,461 19,124 6,218 64,854 301,646
2007
Asia Pacific
Hong
Kong
US$million
Singapore
US$million
Malaysia
US$million
Korea
US$million
Other
Asia
Pacific
US$million
India
US$million
Middle
East &
Other
S Asia
US$million
Africa
US$million
Americas
UK &
Europe
US$million
Total
US$million
Non-interest bearing current and
demand accounts 3,838 2,310 639 91 1,818 2,569 2,915 1,768 1,189 17,137
Interest bearing current accounts
and savings deposits 22,971 8,062 2,598 13,287 18,658 1,843 5,600 2,784 7,730 83,533
Time deposits 21,734 10,892 6,608 12,172 19,529 4,757 6,929 1,380 20,912 104,913
Other deposits 32 20 208 1,223 815 317 593 452 1,938 5,598
Total 48,575 21,284 10,053 26,773 40,820 9,486 16,037 6,384 31,769 211,181
Deposits by banks 1,128 1,548 883 6,964 5,464 585 2,039 568 9,406 28,585
Customer accounts 47,447 19,736 9,170 19,809 35,356 8,901 13,998 5,816 22,363 182,596
48,575 21,284 10,053 26,773 40,820 9,486 16,037 6,384 31,769 211,181
Debt securities in issue 545 2,065 792 19,701 2,830 1,556 22 141 4,501 32,153
Total 49,120 23,349 10,845 46,474 43,650 11,042 16,059 6,525 36,270 243,334
The debt securities in issue held by the Company of US$1,372 million (2007: US$nil million) are
within Americas, UK and Europe.
656
c102100pu160Proof7:28.3.10B/LRevision:0OperatorBeeR

35. Other liabilities
2008
US$million
2007
US$million
Notes in circulation 3,097 2,862Acceptances and endorsements 2,539 2,242
Cash collateral 3,765 1,086
Cash-settled share based payments 31 73
Other liabilities 7,931 8,479
17,363 14,742
Hong Kong currency notes in circulation of US$3,097 million (2007: US$2,862 million) which aresecured by the government of Hong Kong SAR certificates of indebtedness of the same amount
included in other assets (note 29).
36. Provisions for liabilities and charges
Provision
for credit
commitments
US$million
Other
provisions
US$million
Total
US$million
At 1 January 2008 18 20 38
Exchange translation differences (3) (2) (5)Acquisitions 1 55 56
Charge against profit 27 76 103
Provisions utilised (17) (35) (52)
At 31 December 2008 26 114 140
Provision for credit commitments comprises those undrawn contractually committed facilities where
there is doubt as to the borrowers’ ability to meet their repayment obligations. Other provisionsinclude contingent business related provisions, the amount and timing of which is uncertain.
37. Retirement benefit obligations
Retirement benefit obligations comprise:
2008
US$million
2007
US$million
Defined benefit schemes obligation 433 313
Defined contribution schemes obligation 14 9
Net book amount 447 322
2008
US$million
2007
US$million
At 1 January 322 553
Exchange translation differences (55) 7
Acquisitions 47 1
Charge against profit (net of finance income) 172 213
Change in net liability (39) (452)
At 31 December 447 322
657
c102100pu160Proof7:28.3.10B/LRevision:0OperatorBeeR

Retirement benefit charge comprises:
2008
US$million
2007
US$million
Defined benefit schemes 45 110Defined contribution schemes 127 103
Charge against profit (note 8) 172 213
The 2008 charge is presented net and includes a finance charge of US$6 million (2007: US$11
million).
UK Fund
The financial position of the Group’s principal retirement benefit scheme, the Standard Chartered
Pension Fund (the ‘Fund’) (a defined benefit scheme), is assessed in the light of the advice of an
independent qualified actuary. The most recent actuarial assessment of the Fund for the purpose of
funding was performed as at 31 December 2005 by M. Slack, Fellow of the Institute of Actuaries, of
Lane, Clark and Peacock Actuaries, using the projected unit method. The assumptions having the
most significant effect on the outcome of this valuation were:
Return from gilts 3.95% per annum
Return from return seeking assets 5.70% per annum
General increase in salaries 4.40% per annumRate of price inflation 2.90% per annum
Increase in pensions:
In deferment (where applicable) 2.90% per annum
In payment* (pre April 1997 service) 2.70% per annum
In payment (post April 1997 service) 2.20 – 2.90% per annum
* Applies to discretionary increases and some guaranteed increases.
Applying these assumptions, at the valuation date the market value of the assets of the Fund
(US$1,772 million) was sufficient to cover 99.5% of the benefits that had accrued to members.
Additional contributions of US$8.4 million were paid during 2007 and US$5.6 million in 2008.
Additional contributions of US$1.8 million are payable in each of 2009 and 2010.
Contributions paid to the Fund during 2008 were US$18 million (2007: US$24 million) and regular
contributions were set at 32.5% of pensionable salary for all members. With effect from 1 July 1998
the Fund was closed to new entrants and new employees have subsequently been offered membership
of a defined contribution scheme. Due to the closure of the Fund to new entrants, the current service
cost will increase as a percentage of pensionable pay as the members approach retirement.
Pension costs for the purpose of these accounts were assessed using the projected unit method, and
the assumptions set out below were based on market data at the date of calculation.
Overseas Schemes
The principal overseas defined benefit arrangements operated by the Group are in Germany, Hong
Kong, India, Jersey, Korea, Switzerland, Taiwan and the United States.
The disclosures required under IAS 19 have been calculated by qualified independent actuaries based
on the most recent full actuarial valuations updated, where necessary, to 31 December 2008.
Separate figures are disclosed for the UK Fund, Overseas Funded Defined Benefit, Post-retirement
Medical and Other Unfunded Schemes.
658
c102100pu160Proof7:28.3.10B/LRevision:0OperatorBeeR

The financial assumptions used at 31 December 2008 were:
Funded defined benefit schemes
UK Fund* Overseas Schemes**
2008
%
2007
%
2008
%
2007
%
Price inflation 2.90 3.20 1.50 – 4.50 1.50 – 4.50
Salary increases 4.40 4.70 3.50 – 6.00 3.50 – 6.00
Pension increases 2.90 3.10 0.00 – 2.90 0.00 – 3.10
Discount rate 6.40 5.90 1.20 – 7.50 2.50 – 8.00
Post-retirement medical trend rate N/A N/A N/A N/A
* The assumptions for life expectancy for the UK Fund assumes that a male member currently aged 60 will live for 27 years (2007:27 years) and a female member 30 years (2007: 30 years) and a male member currently aged 40 will live for 28 years (2007: 28 years)and a female member 31 years (2007: 31 years) after their 60th birthday.
** The range of assumptions shown is for the main funded defined benefit overseas schemes in Germany, Hong Kong, India, Jersey,Korea, Switzerland, Taiwan and the United States. These comprise over 92% of the total liabilities of funded overseas schemes.
Unfunded schemes
Post-retirement medical* Other
2008
%
2007
%
2008
%
2007
%
Price inflation 2.70 2.70 1.50 – 9.50 1.50 – 7.00Salary increases 4.00 4.00 3.50 – 11.00 3.50 – 9.00
Pension increases N/A N/A 0.00 – 2.90 0.00 – 3.10
Discount rate 5.50 6.00 2.00 – 13.00 2.75 – 10.00
Post-retirement medical rate* 8% in 2008
reducing by 1%
per annum to
5% in 2011
8% in 2007
reducing by 1%
per annum to
5% in 2010
N/A N/A
* The Post-retirement Medical plan is in the United States.
The assets and liabilities of the schemes, attributable to defined benefit members, at 31 December2008 were:
Funded defined benefit schemes Unfunded schemes
UK Fund Overseas schemes Post-retirement medical Other
At 31 December 2008
Expected
return on
assets %
Value
US$million
Expected
return on
assets %
Value
US$million
Expected
return on
assets %
Value
US$million
Expected
return on
assets %
Value
US$million
Equities 8.00 269 8.00 – 8.75 158 N/A N/A N/A N/A
Bonds 3.75 787 5.25 – 5.75 166 N/A N/A N/A N/A
Property N/A — N/A 1 N/A N/A N/A N/A
Others 8.00 176 1.20 – 5.30 164 N/A N/A N/A N/A
Total market value of assets 1,232 489 N/A N/A
Present value of the
schemes’ liabilities (1,296) (693) (12) (153)
Net pension liability (64) (204) (12) (153)
659
c102100pu160Proof7:28.3.10B/LRevision:0OperatorBeeR

Funded defined benefit schemes Unfunded schemes
UK Fund Overseas schemes Post-retirement medical Other
At 31 December 2007
Expected
return on
assets %
Value
US$million
Expected
return on
assets %
Value
US$million
Expected
return on
assets %
Value
US$million
Expected
return on
assets %
Value
US$million
Equities 8.50 628 8.30 – 13.00 224 N/A N/A N/A N/A
Bonds 4.80 1,188 4.25 – 10.00 186 N/A N/A N/A N/A
Property N/A — 5.90 – 11.00 3 N/A N/A N/A N/A
Others 4.80 97 2.50 – 8.00 162 N/A N/A N/A N/A
Total market value of assets 1,913 575 N/A N/A
Present value of the
schemes’ liabilities (1,931) (602) (11) (257)
Net pension liability (18) (27) (11) (257)
Funded defined benefit
schemes Unfunded schemes
UK Fund
Overseas
schemes
Post-
retirement
medical Other
At 31 December 2006
Value
US$million
Value
US$million
Value
US$million
Value
US$million
Total market value of assets 1,822 517 N/A N/A
Present value of the schemes’ liabilities (1,982) (542) (9) (347)
Net pension liability (160) (25) (9) (347)
At 31 December 2005
Total market value of assets 1,550 380 N/A N/A
Present value of the schemes’ liabilities (1,785) (403) (11) (196)
Net pension liability (235) (23) (11) (196)
At 31 December 2004
Total market value of assets 1,596 317 N/A N/A
Present value of the schemes’ liabilities (1,679) (338) (11) (45)
Net pension liability (83) (21) (11) (45)
The range of assumptions shown is for the main Overseas Schemes in Germany, Hong Kong, India,
Jersey, Korea, Switzerland, Taiwan and the United States. The expected return on plan assets is set
by reference to historical returns in each of the main asset classes, current market indicators such aslong term bond yields and the expected long term strategic asset allocation of each plan.
660
c102100pu160Proof7:28.3.10B/LRevision:0OperatorBeeR

The pension cost for defined benefit schemes was:
Funded defined benefit
schemes Unfunded schemes
Year ending 31 December 2008
UK Fund
US$million
Overseas
schemes
US$million
Post-
retirement
medical
US$million
Other
US$million
Total
US$million
Current service cost 12 58 — 18 88
Past service cost 3 1 — 1 5
Loss/(gain) on settlements and curtailments 1 — — (55) (54)Expected return on pension scheme assets (104) (36) — — (140)
Interest on pension scheme liabilities 103 30 1 12 146
Total charge/(credit) to profit before deduction
of tax 15 53 1 (24) 45
Loss on assets below expected return* 203 130 — — 333
Experience (gain)/loss on liabilities (143) 35 — 4 (104)
Total loss recognised directly in Statement of
Recognised Income and Expense before tax 60 165 — 4 229
Deferred taxation (16) (44) — — (60)
Total loss after tax 44 121 — 4 169
* The actual return on the UK fund assets was US$99 million and on overseas scheme assets was US$94 million.
The total cumulative amount recognised directly in the Statement of Recognised Income and Expensebefore tax to date is a loss of US$43 million (2007: gain of US$186 million).
Funded defined benefit
schemes Unfunded schemes
Year ending 31 December 2007
UK Fund
US$million
Overseas
schemes
US$million
Post-
retirement
medical
US$million
Other
US$million
Total
US$million
Current service cost 18 52 — 25 95
Past service cost 1 4 — 2 7
Gain on settlements and curtailments — — — (3) (3)
Expected return on pension scheme assets (100) (32) — — (132)
Interest on pension scheme liabilities 100 24 1 18 143
Total charge to profit before deduction of tax 19 48 1 42 110
Gain on assets in excess of expected return* (28) (2) — — (30)
Experience (gain)/loss on liabilities (113) 12 2 (108) (207)
Total (gain)/loss recognised directly in
Statement of Recognised Income and
Expense before tax (141) 10 2 (108) (237)Deferred taxation 44 — — 27 71
Total (gain)/loss after tax (97) 10 2 (81) (166)
* The actual return on the UK fund assets was US$128 million and on overseas scheme assets was US$34 million.
661
c102100pu160Proof7:28.3.10B/LRevision:0OperatorBeeR

Funded defined benefit
schemes Unfunded schemes
Year ending 31 December 2006
UK Fund
US$million
Overseas
schemes
US$million
Post-
retirement
medical
US$million
Other
US$million
Total
US$million
Gain on assets in excess of expected return* (23) (27) — — (50)
Experience (gain)/loss on liabilities (90) 20 (2) 18 (54)
Total loss/(gain) recognised directly inStatement of Recognised Income and
Expense before tax (113) (7) (2) 18 (104)
Deferred taxation 34 3 — 1 38
Total loss/(gain) after tax (79) (4) (2) 19 (66)
Year ending 31 December 2005
Gain on assets in excess of expected return** (91) (20) — — (111)
Experience loss on liabilities 256 5 — — 261
Total loss/(gain) recognised directly in
Statement of Recognised Income and
Expense before tax 165 (15) — — 150
Deferred taxation (50) 5 — — (45)
Total loss/(gain) after tax 115 (10) — — 105
Year ending 31 December 2004
Gain on assets in excess of expected return*** (20) (2) — — (22)
Experience gain on liabilities — (1) (1) — (2)
Loss/(gain) on change of assumptions 23 7 — (1) 29
Total loss/(gain) recognised directly in
Statement of Recognised Income and
Expense before tax 3 4 (1) (1) 5
Deferred taxation (1) — — — (1)
Total loss/(gain) after tax 2 4 (1) (1) 4
* The actual return on the UK fund assets was US$116 million and on overseas scheme assets was US$50 million.
** The actual return on the UK fund assets was US$184 million and on overseas scheme assets was US$48 million.
*** The actual return on the UK fund assets was US$111 million and on overseas scheme assets was US$31 million.
662
c102100pu160Proof7:28.3.10B/LRevision:0OperatorBeeR

Movement in the pension schemes and post-retirement medical deficit during the year comprise:
Funded defined benefit
schemes Unfunded schemes
Year ending 31 December 2008
UK Fund
US$million
Overseas
schemes
US$million
Post-
retirement
medical
US$million
Other
US$million
Total
US$million
Deficit at 1 January 2008 (18) (27) (11) (257) (313)
Contributions 23 72 — 54 149
Current service cost (12) (58) — (18) (88)
Past service cost (3) (1) — (1) (5)Settlement/curtailment costs (1) — — 55 54
Other finance income/(charge) 1 6 (1) (12) (6)
Actuarial loss (60) (165) — (4) (229)
Acquisitions — (43) — (4) (47)
Exchange rate adjustment 6 12 — 34 52
Deficit at 31 December 2008 (64) (204) (12) (153) (433)
Funded defined benefit
schemes Unfunded schemes
Year ending 31 December 2007
UK Fund
US$million
Overseas
schemes
US$million
Post-
retirement
medical
US$million
Other
US$million
Total
US$million
Deficit at 1 January 2007 (160) (25) (9) (347) (541)
Contributions 24 58 1 26 109
Current service cost (18) (52) — (25) (95)
Past service cost (1) (4) — (2) (7)
Settlement/curtailment costs — — — 3 3
Other finance income/(charge) — 8 (1) (18) (11)Actuarial gain/(loss) 141 (10) (2) 108 237
Acquisitions — — — (1) (1)
Exchange rate adjustment (4) (2) — (1) (7)
Deficit at 31 December 2007 (18) (27) (11) (257) (313)
663
c102100pu160Proof7:28.3.10B/LRevision:0OperatorBeeR

Movement in the pension schemes and post-retirement medical gross assets and obligations during the
year comprise:
Year ending 31 December 2008
Assets
US$million
Obligations
US$million
Total
US$million
Deficit at 1 January 2008 2,488 (2,801) (313)Contributions 149 — 149
Current service cost — (88) (88)
Past service cost — (5) (5)
Settlement/curtailment costs — 54 54
Interest cost — (146) (146)
Expected return on scheme assets 140 — 140
Benefits paid out (185) 185 —
Actuarial (loss)/gain (333) 104 (229)Acquisitions 22 (69) (47)
Exchange rate adjustment (560) 612 52
Deficit at 31 December 2008 1,721 (2,154) (433)
Year ending 31 December 2007
Assets
US$million
Obligations
US$million
Total
US$million
Deficit at 1 January 2007 2,339 (2,880) (541)
Contributions 109 — 109
Current service cost — (95) (95)
Past service cost — (7) (7)Settlement/curtailment costs — 3 3
Interest cost — (143) (143)
Expected return on scheme assets 132 — 132
Benefits paid out (146) 146 —
Actuarial gain 30 207 237
Acquisitions — (1) (1)
Exchange rate adjustment 24 (31) (7)
Deficit at 31 December 2007 2,488 (2,801) (313)
664
c102100pu160Proof7:28.3.10B/LRevision:0OperatorBeeR
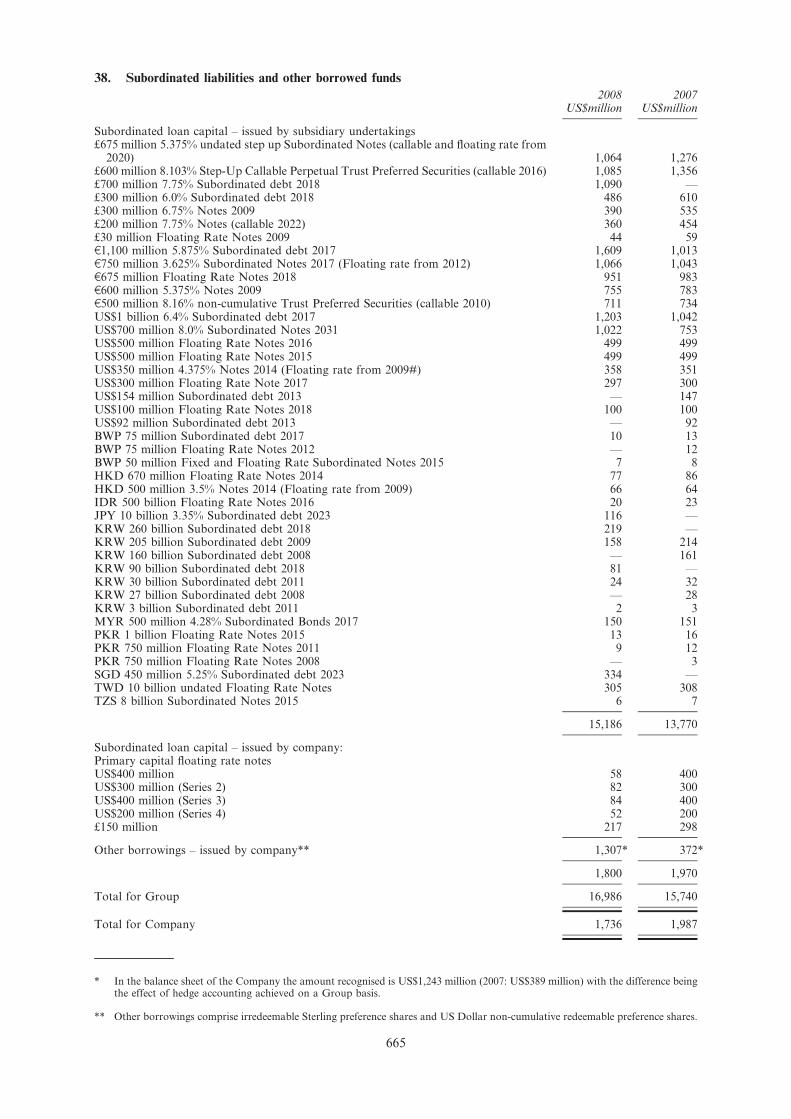
38. Subordinated liabilities and other borrowed funds
2008US$million
2007US$million
Subordinated loan capital – issued by subsidiary undertakings£675 million 5.375% undated step up Subordinated Notes (callable and floating rate from
2020) 1,064 1,276£600 million 8.103% Step-Up Callable Perpetual Trust Preferred Securities (callable 2016) 1,085 1,356£700 million 7.75% Subordinated debt 2018 1,090 —£300 million 6.0% Subordinated debt 2018 486 610£300 million 6.75% Notes 2009 390 535£200 million 7.75% Notes (callable 2022) 360 454£30 million Floating Rate Notes 2009 44 59c1,100 million 5.875% Subordinated debt 2017 1,609 1,013c750 million 3.625% Subordinated Notes 2017 (Floating rate from 2012) 1,066 1,043c675 million Floating Rate Notes 2018 951 983c600 million 5.375% Notes 2009 755 783c500 million 8.16% non-cumulative Trust Preferred Securities (callable 2010) 711 734US$1 billion 6.4% Subordinated debt 2017 1,203 1,042US$700 million 8.0% Subordinated Notes 2031 1,022 753US$500 million Floating Rate Notes 2016 499 499US$500 million Floating Rate Notes 2015 499 499US$350 million 4.375% Notes 2014 (Floating rate from 2009#) 358 351US$300 million Floating Rate Note 2017 297 300US$154 million Subordinated debt 2013 — 147US$100 million Floating Rate Notes 2018 100 100US$92 million Subordinated debt 2013 — 92BWP 75 million Subordinated debt 2017 10 13BWP 75 million Floating Rate Notes 2012 — 12BWP 50 million Fixed and Floating Rate Subordinated Notes 2015 7 8HKD 670 million Floating Rate Notes 2014 77 86HKD 500 million 3.5% Notes 2014 (Floating rate from 2009) 66 64IDR 500 billion Floating Rate Notes 2016 20 23JPY 10 billion 3.35% Subordinated debt 2023 116 —KRW 260 billion Subordinated debt 2018 219 —KRW 205 billion Subordinated debt 2009 158 214KRW 160 billion Subordinated debt 2008 — 161KRW 90 billion Subordinated debt 2018 81 —KRW 30 billion Subordinated debt 2011 24 32KRW 27 billion Subordinated debt 2008 — 28KRW 3 billion Subordinated debt 2011 2 3MYR 500 million 4.28% Subordinated Bonds 2017 150 151PKR 1 billion Floating Rate Notes 2015 13 16PKR 750 million Floating Rate Notes 2011 9 12PKR 750 million Floating Rate Notes 2008 — 3SGD 450 million 5.25% Subordinated debt 2023 334 —TWD 10 billion undated Floating Rate Notes 305 308TZS 8 billion Subordinated Notes 2015 6 7
15,186 13,770
Subordinated loan capital – issued by company:Primary capital floating rate notesUS$400 million 58 400US$300 million (Series 2) 82 300US$400 million (Series 3) 84 400US$200 million (Series 4) 52 200£150 million 217 298
Other borrowings – issued by company** 1,307* 372*
1,800 1,970
Total for Group 16,986 15,740
Total for Company 1,736 1,987
* In the balance sheet of the Company the amount recognised is US$1,243 million (2007: US$389 million) with the difference beingthe effect of hedge accounting achieved on a Group basis.
** Other borrowings comprise irredeemable Sterling preference shares and US Dollar non-cumulative redeemable preference shares.
665
c102100pu160Proof7:28.3.10B/LRevision:0OperatorBeeR

All subordinated liabilities described above are unsecured, unguaranteed and subordinated to the
claims of other creditors including without limitation, customer deposits and deposits by banks. The
Group has the right to settle these debt instruments in certain circumstances as set out in the
contractual agreements.
Of the total subordinated liabilities and other borrowings, US$11,865 million is at fixed interest rates
(2007: US$10,166 million).
On 19 March 2008, Standard Chartered First Bank Korea Limited (SCFB) issued KRW90 billion
Lower Tier 2 Notes with a coupon of 6.05% maturing March 2018.
On 2 April 2008 and 18 April 2008 Standard Chartered Bank issued two tranches of Lower Tier 2
Notes for £500 million and £200 million respectively, with a maturity date of April 2018, and a
coupon of 7.75%. The Notes were consolidated and formed a single series with effect from 29 May
2008.
On 10 April 2008 and 18 April 2008, Standard Chartered Bank issued two tranches of Lower Tier 2
Notes for SGD200 million and SGD250 million respectively, with a coupon of 5.25%. The Notes
have a maturity date of April 2023, and an issuer’s call option in April 2018. The Notes were
consolidated and form a single series with effect from 18 April 2008.
On 18 April 2008, Standard Chartered Bank issued c400 million Lower Tier 2 Notes, due 2017, with
a coupon of 5.875%, as a tap on the c700 million Lower Tier 2 Notes issued in September 2007. The
two issues were consolidated and formed a single series with effect from 29 May 2008.
On 18 April 2008, Standard Chartered Bank issued JPY10 billion Lower Tier 2 Fixed Rate Notes,
due 2023 with an issuer’s call option after ten years, with a coupon of 3.35%.
On 25 May 2008, SCFB issued KRW260 billion Lower Tier 2 Fixed Rate Notes, due 2018 with an
issuer’s call option after five years, with a coupon of 6.08%.
On 27 May 2008, the Company issued US$675 million non-cumulative redeemable preference shares
of US$5 each, with a coupon of 8.125% and with an issuer’s call option in November 2013, at a
premium of US$1,995 per share.
On 19 September 2008, the Company issued US$250 million 8.125% non-cumulative redeemable
preference shares of US$5 each with an issuer’s call option in November 2013, at a premium of
US$1,995 per share. From 27 November 2008, the shares were consolidated to form a single series
with the US$675 million 8.125% non-cumulative redeemable preference shares issued on 27 May 2008.
On 19 November 2008 the Company launched a tender offer for all Primary Capital Floating Rate
Notes denominated in US Dollars for repurchase at 62.5% of their par value. US$1,024 million Notes
were redeemed, generating a profit of US$384 million.
39. Share capital
The authorised share capital of the Company at 31 December 2008 was US$4,933 million (2007:US$5,269 million) made up of 2,632 million ordinary shares of US$0.50 each, 500 million non-
cumulative irredeemable preference shares of £1 each, 300 million non-cumulative redeemable
preference shares of US$5 each and one million non-cumulative redeemable preference shares of
c1,000 each.
The available profits of the company are distributed to the holders of the issued preference shares in
priority to payments made to holders of the ordinary shares and in priority to, or pari passu with,
any payments to the holders of any other class of shares in issue. On a winding up, the assets of the
Company are applied to the holders of the preference shares in priority to any payment to the
ordinary shareholders and in priority to, or pari passu with, the holders of any other shares in issue,
for an amount equal to any dividends accrued and/or payable and the nominal value of the shares
together with any premium as determined by the board. The redeemable preference shares areredeemable at the paid up amount (which includes premium) at the option of the Company in
accordance with the terms of the shares. The holders of the preference shares are not entitled to
attend or vote at any general meeting except where any relevant dividend due is not paid in full or
where a resolution is proposed varying the rights of the preference shares.
As at 31 December 2008, 477,500 US$5 non-cumulative redeemable preference shares were in issue, of
which 462,500 are classified within subordinated liabilities and other borrowed funds and which
includes a premium of US$923 million. The irredeemable preference shares of £1 each are also
classified as other borrowed funds as required by IAS 32.
666
c102100pu160Proof7:28.3.10B/LRevision:0OperatorBeeR

Group and Company
Number of
ordinary
shares
(millions)
Ordinary
share
capital
US$million
Preference
share
capital
US$million
Total
US$million
At 1 January 2007 1,384 692 — 692
Capitalised on scrip dividend 16 8 — 8
Share repurchased — — — —Shares issued 10 5 — 5
At 31 December 2007 1,410 705 — 705
Capitalised on scrip dividend 11 6 — 6
Shares issued 475 237 — 237
At 31 December 2008 1,896 948 — 948
On 16 May 2008, the Company issued 8,142,490 new ordinary shares instead of the 2007 final
dividend. On October 2008, the Company issued 2,940,049 new ordinary shares instead of the 2008interim dividend.
On 24 November 2008 the Company announced the issue of 470,014,830 new ordinary shares by wayof rights to qualifying shareholders at 390 pence per new ordinary share. The issue was on the basis
of 30 ordinary shares for every 91 ordinary shares held on 24 November 2008. The rights issue raised
US$2.7 billion in additional capital for the Company. The rights issue used a cash box structure
involving a Jersey subsidiary (JerseyCo) which was 89% owned by the Company prior to the
transaction. In return for an issue of shares by the Company to the placees, the net proceeds of the
placing were paid to JerseyCo. Pursuant to the issue of those shares, the Company acquired the
remaining share capital of JerseyCo, being all of its redeemable preference shares and the 11% of the
ordinary shares it did not own. Under this structure merger relief applies under Section 131 of theUK Companies Act 1985 which provides relief from the requirements under Section 130 of the UK
Companies Act 1985 to create a share premium account. JerseyCo then redeemed its redeemable
shares in exchange for the placing proceeds.
The middle market price on 17 December 2008 was 766 pence. The proceeds of the issue of ordinary
shares was used in the ordinary course of business.
During 2008, 5,410,537 ordinary shares were issued under the Company’s employee share plans at
prices between nil and 1243 pence.
During 2007, 9,012,891 ordinary shares were issued under the Company’s employee share plans at
prices between nil and 1064 pence.
On 10 May 2007, the Company issued 12,765,274 new ordinary shares instead of the 2006 final
dividend. On 10 October 2007, the Company issued 3,163,466 new ordinary shares instead of the
2007 interim dividend.
On 25 May 2007, the Company issued 7,500 non-cumulative redeemable preference shares of US$5
each at a placing price of US$100,000 each. The shares are redeemable at the option of the Company
in accordance with the terms of the shares at the paid up amount (which includes premium), have
discretionary dividend payments and are accordingly classified as equity as required by IAS 32. The
shares were issued to fund the continuing business of the Group.
The holding of Standard Chartered PLC shares for the beneficiaries of the Group’s share based
award schemes is set out in note 40.
667
c102100pu160Proof7:28.3.10B/LRevision:0OperatorBeeR

40. Reserves
GroupShare
premium
account*
US$million
Capital
reserve
US$million
Capital
redemption
reserve
US$million
Merger
reserve
US$million
Available-
for-sale
reserve
US$million
Cash flow
hedge
reserve
US$million
Translation
reserve
US$million
Retained
earnings
US$million
Total
US$million
At 1 January 2007 3,865 5 13 3,149 410 51 678 7,990 16,161
Recognised income and
expense — — — — 340 6 303 3,010 3,659
Capitalised on scrip
dividend (8) — — — — — — — (8)
Shares issued, net of
expenses 856 — — — — — — — 856
Net own shares adjustment — — — — — — — 24 24
Share option expense and
related taxation — — — — — — — 55 55
Dividends, net of scrip — — — — — — — (601) (601)
At 31 December 2007 4,713 5 13 3,149 750 57 981 10,478 20,146
Recognised income and
expense — — — — (755) (140) (2,765) 3,239 (421)
Capitalised on scrip
dividend (6) — — — — — — — (6)
Shares issued, net of
expenses 36 — — 2,468 — — — — 2,504
Rights issue option, net of
tax — — — (167) — — — — (167)
Net own shares adjustment — — — — — — — (67) (67)
Share option expense and
related taxation — — — — — — — 128 128
Dividends, net of scrip — — — — — — — (925) (925)
At 31 December 2008 4,743 5 13 5,450 (5) (83) (1,784) 12,853 21,192
* The premium of US$923 million arising on the issue of the US$5 non-cumulative redeemable preference shares classified within‘Subordinated liabilities and other borrowed funds’ is not included within the share premium account and forms part of thereported liability.
Transaction costs relating to share issues deducted from reserves account total US$84 million (2007:US$5 million).
The cumulative amount of goodwill on the acquisition of subsidiary and associated undertakings
written off against Group reserves since 1973 is US$27 million (2007: US$27 million).
The capital reserve represents the exchange difference on redenomination of share capital and share
premium from Sterling to US Dollars in 2001.
The capital redemption reserve represents the nominal value of preference shares redeemed.
The merger reserve represents the premium arising on shares issued using a cash box financing
structure as detailed in note 39, which required the Company to create a merger reserve under section
131 of the UK Companies Act 1985. Shares were issued using this structure in 2005 and 2006 to
assist in the funding of certain acquisitions and in 2008 for the shares issued by way of a rights issue.
The funding raised by the 2008 rights issue was retained within the Company.
Available-for-sale reserve is the fair value movement of financial assets classified as available-for-sale.
Gains and losses are deferred to this reserve until such time as the underlying asset is sold or
matures.
Cash flow hedge reserve is the fair value movement of derivatives that meet the criteria of a cash flow
hedge. Gains and losses are deferred to this reserve until such time as the underlying hedged item
affects profit and loss.
Translation reserve represents the cumulative foreign exchange gains and losses on translation of the
net investment of the Group in foreign operations. Since 1 January 2004, gains and losses are
deferred to this reserve until such time as the underlying foreign operation is disposed. Gains and
losses arising from derivatives used as hedges of net investments are netted against the foreign
exchange gains and losses on translation of the net investment of the foreign operations.
668
c102100pu160Proof7:28.3.10B/LRevision:0OperatorBeeR

Retained earnings are the carried forward recognised income and expenses of the Group plus current
period recognised income and expenses less dividend distribution, treasury shares and share option
expenses.
A substantial part of the Group’s reserves are held in overseas subsidiary undertakings and branches,
principally to support local operations or to comply with local regulations. The maintenance of local
regulatory capital ratios could potentially restrict the amount of reserves which can be remitted. Inaddition, if these overseas reserves were to be remitted, further unprovided taxation liabilities might
arise.
Shares of the Group held for the beneficiaries of the Group’s share based payment schemes
Bedell Cristin Trustees Limited is trustee of both the 1995 Employees’ Share Ownership Plan Trust
(the 1995 trust), which is an employee benefit trust used in conjunction with some of the Group’s
employee share schemes, and of the Standard Chartered 2004 Employee Benefit Trust (the 2004 trust)which is an employee benefit trust used in conjunction with the Group’s deferred bonus plan. The
trustee has agreed to satisfy a number of awards made under the employee share schemes and the
deferred bonus plan through the relevant employee benefit trust. As part of these arrangements
Group companies fund the trust, from time to time, to enable the trustee to acquire shares to satisfy
these awards. All shares have been acquired through the London Stock Exchange.
Except as disclosed, neither the Company nor any of its subsidiaries has bought, sold or redeemed
any securities of the company listed on The Stock Exchange of Hong Kong Limited during the year.
Details of the shares purchased and held by the trusts are set out below.
1995 Trust 2004 Trust Total
Number of shares 2008 2007 2008 2007 2008 2007
Shares purchased: 190,600 351,340 541,940– 6 March 2008 — — 307,849 — 307,849 —
– 9 March 2008 1,650,000 — — — 1,650,000 —
– 9 October 2008 375,000 — — — 375,000 —
– 18 December 2008
(rights issue) 731,296 — 119,049 — 850,345 —
Total 2,756,296 190,600 426,898 351,340 3,183,194 541,940
Market price of shares
purchased
(US$million) 66 5 10 10 76 15
Shares held at the end of
the year 2,949,563 261,495 480,166 377,270 3,429,729 638,765
Maximum number of
shares held during year 3,429,729 2,526,144
669
c102100pu160Proof7:28.3.10B/LRevision:0OperatorBeeR

Company
Share
premium
account*
US$million
Capital
reserve
US$million
Capital
redemption
reserve
US$million
Merger
reserve
US$million
Retained
earnings
US$million
Total
US$million
At 1 January 2007 3,865 5 13 3,149 811 7,843Recognised income and
expenses — — — — 349 349Capitalised on scrip dividend (8) — — — — (8)Shares issued, net of expenses 856 — — — — 856Net own shares adjustment — — — — 24 24Share option expense and
related taxation — — — — 78 78Dividends, net of scrip — — — — (601) (601)
At 31 December 2007 4,713 5 13 3,149 661 8,541Recognised income and
expenses — — — — 2,282 2,282Capitalised on scrip dividend (6) — — — — (6)Shares issued, net of expenses 36 — — 2,468 — 2,504Rights issue option, net of
tax — — — (167) — (167)Net own shares adjustment — — — — (67) (67)Share option expense and
related taxation — — — — 158 158Dividends, net of scrip — — — — (925) (925)
At 31 December 2008 4,743 5 13 5,450 2,109 12,320
* The premium of US$923 million arising on the issue of the US$5 non-cumulative redeemable preference shares classified within‘Subordinated liabilities and other borrowed funds’ is not included within the share premium account and forms part of thereported liability.
41. Minority interestsUS$300m
7.267%
Hybrid Tier
1 Securities
US$million
Other
minority
interests
US$million
Total
US$million
At 1 January 2007 333 209 542Arising on acquisitions — 3 3
Income in equity attributable to minority interests — 48 48
Other profits attributable to minority interests 19 129 148
Recognised income and expense 19 177 196
Distributions (22) (98) (120)Reductions — (20) (20)
At 31 December 2007 330 271 601
Expenses in equity attributable to minority interests — (106) (106)
Other profits attributable to minority interests 19 84 103
Recognised income and expense 19 (22) (3)
Distributions (22) (125) (147)
Other increases* — 104 104
At 31 December 2008 327 228 555
* Other increases primarily relate to the consolidation of a private equity investment.
670
c102100pu160Proof7:28.3.10B/LRevision:0OperatorBeeR

42. Share based payments
The Group operates a number of share based payment schemes for its directors and employees.
The total charge for the year relating to employee share based payment plans was US$121 million
(2007: US$117 million) of which US$152 million (2007: US$78 million) relates to equity-settledawards, and a credit of US$31 million (2007: US$39 million charge) relates to cash-settled awards.
After deferred tax, the total charge to the income statement was US$89 million (2007: US$99
million).
1994 Executive Share Option Scheme (closed)
No awards have been made under this scheme since August 1999 as the scheme was replaced by the
2000 Executive Share Option Scheme. Executive share options to purchase ordinary shares in the
Company are exercisable after the third, but before the tenth anniversary of the date of grant. The
exercise price is the share price at the date of grant and options can only be exercised if EPSincreases by at least 15% over three consecutive years.
2000 Executive Share Option Scheme
The 2000 scheme is designed to be internationally competitive and focus executive directors and their
senior management teams on delivering long-term performance. An EPS performance criterion must
be met before options can be exercised.
Executive share options to purchase ordinary shares in the Company are exercisable after the third,
but before the tenth, anniversary of the date of grant. The exercise price per share is the share price
at the date of grant and options can only be exercised if a performance condition is satisfied. The
remaining life of the scheme is two years.
2001 Performance Share Plan
The Performance Share Plan is designed to be an intrinsic part of total remuneration for the Group’s
executive directors and for a small number of the Group’s most senior executives. It is an
internationally competitive long-term incentive plan that focuses executives on meeting and exceeding
the long-term performance targets of the Group. The performance criteria which need to be met are
set out in the Directors’ remuneration report on pages 84 to 85 of the 2008 Annual Report. Awards
of nil price options to acquire shares are granted to the executives and will normally be exercisable
between three and ten years after the date of grant if the individual is still employed by the Group.There is provision for earlier exercise in certain limited circumstances. The remaining life of the
scheme is three years.
1997/2006 Restricted Share Scheme
The Restricted Share Scheme (RSS) is used as an incentive plan to motivate and retain high
performing staff at any level of the organisation. It is also used as a vehicle for deferring part of
bonuses of certain employees. Except where used for bonus deferral purposes, executive directors are
not generally eligible to participate in the RSS. However upon recruitment to the Group, awards may
be made on an exceptional basis, for example to newly appointed directors to compensate for shareawards forfeited on leaving their previous employer. 50% of the award vests two years after the date
of grant and the balance after three years. The awards can be exercised within seven years of the
grant date. The value of shares awarded in any year to any individual may not exceed two times
their base salary. The remaining life of the scheme is eight years.
2006 Supplementary Restricted Share Scheme
In addition, the Group operates a Supplementary Restricted Share Scheme which can be used to
defer part of an employee’s annual bonus in shares. The plan is principally used for employees in the
global markets area and is similar to the RSS outlined above except for three important factors:executive directors are specifically prohibited from the plan; no new shares can be issued to satisfy
awards; and there is no individual annual limit. The remaining life of the scheme is eight years.
2004 Deferred Bonus Plan
Under the 2004 DBP, shares are conditionally awarded instead of all or part of the executive
directors’ and certain senior executives’ annual cash bonus. Further details are contained in the
671
c102100pu160Proof7:28.3.10B/LRevision:0OperatorBeeR

Directors’ remuneration report on pages 83 to 93 of the 2008 Annual Report. The remaining life of
the plan is six years.
All Employee Sharesave Schemes
No awards have been made under the 1994 UK Sharesave and 1996 International Sharesave schemes
since 2003, as these were replaced by the 2004 UK and International Sharesave schemes. During the
year a new Irish sharesave scheme was introduced for all employees of the Group in the Republic of
Ireland. Under these Sharesave schemes, employees have the choice of opening a three-year or five-
year savings contract. Within a period of six months after the third or fifth anniversary, asappropriate, employees may purchase ordinary shares in the Company. The price at which they may
purchase shares is at a discount of up to 20% on the share price at the date of invitation. There are
no performance conditions attached to options granted under all the employee sharesave schemes.
In some countries in which the Group operates, it is not possible to operate Sharesave schemes,
typically because of securities law, regulatory or other similar restrictions. In these countries the
Group offers an equivalent cash-based scheme to its employees. The remaining life of the scheme is
six years.
1994 Executive Share Option Scheme (1994 ESOS)
Awards made under this scheme are not subject to the valuation criteria of IFRS 2, as all awards are
granted prior to 7 November 2002, and are all vested as at that date.
A reconciliation of option movements over the year to 31 December 2008 and 2007 is shown below:
2008 2007
No. of
shares
Weighted
average
exercise
price
No. of
shares
Weighted
average
exercise
price
Outstanding at 1 January 10,806 £6.20 359,207 £8.18
Lapsed — — (18,250) £8.09
Exercised (10,806) £6.20 (330,151) £8.26
Outstanding at 31 December — — 10,806 £6.20
Exercisable at 31 December — — 10,806 £6.20
2008 2007
Range of exercise price for options
outstanding
Weighted
average
exercise
price
Weighted
average
remaining
contractual
life
Weighted
average
exercise
price
Weighted
average
remaining
contractual
life
£6.20 — — £6.20 0.7 years
The intrinsic value of vested 1994 ESOS cash-settled awards as at 31 December 2008 was US$nilmillion (2007: US$nil million).
The weighted average share price at the time the options were exercised during 2008 was £17.23(2007: £15.34).
672
c102100pu160Proof7:28.3.10B/LRevision:0OperatorBeeR

2000 Executive Share Option Scheme (2000 ESOS)
No share awards were granted during 2008 or 2007.
A reconciliation of option movements over the year to 31 December 2008 and 2007 is shown below:
2008 2007
No. of
shares
Weighted
average
exercise
price*
No. of
shares
Weighted
average
exercise
price
Outstanding at 1 January 8,575,209 £8.28 14,974,196 £8.37
Additional shares for rights issue* 937,283 — — —Lapsed (3,348) £6.05 (282,650) £9.04
Exercised (2,023,219) £7.47 (6,116,337) £8.47
Outstanding at 31 December 7,485,925 £7.18 8,575,209 £8.28
Exercisable at 31 December 7,485,925 £7.18 7,931,565 £8.16
* The exercise prices for grants awarded prior to the announcement of the rights issue on 24 November 2008 which have not beenexercised or lapsed, have been decreased by 14.2% and the number of shares granted have been increased to ensure option holderswere compensated for the dilutive impact of the rights issue.
2008 2007
Range of exercise price for options outstanding
Weighted
average
exercise
price
Weighted
average
remaining
contractual
life
Weighted
average
exercise
price
Weighted
average
remaining
contractual
life
£6.05/£9.10 (2007: £6.905/£10.395) £7.18 4.0 years £8.28 5.2 years
The intrinsic value of vested 2000 ESOS cash-settled awards as at 31 December 2008 was US$0.8
million (2007: US$9 million).
The weighted average share price at the time the options were exercised during 2008 was £17.23
(2007: £14.36).
2001 Performance Share Plan (2001 PSP)
Valuation
For awards, the fair value is based on the market value less an adjustment to take into account the
expected dividends over the vesting period. The same fair value is applied for awards made to both
the directors and employees of the Group.
2008 2007
Grant date 16 September 24 April 11 March 17 September 12 March
Share price at grant date £13.86 £17.82 £16.26 £14.69 £14.51Vesting period (years) 3 3 3 3 3
Expected dividend yield (%) 2.6 2.6 2.6 2.9 2.8
Fair value (EPS) (£) 12.83 16.50 15.06 6.74 6.68
Fair value (TSR) (£) 5.04 6.49 5.89 2.92 2.89
The expected dividend yield is based on the historical dividend yield over the three years prior to
grant. The EPS and TSR fair value relates to the performance criteria to be satisfied as explained in
the Directors’ remuneration report. The TSR fair value is derived by discounting 50% of the award
which is subject to the TSR condition by the loss of expected dividends yield over the performance
673
c102100pu160Proof7:28.3.10B/LRevision:0OperatorBeeR

period, and the likelihood of meeting the TSR condition which is calculated by the area under the
TSR vesting schedule curve. The EPS fair value is derived by discounting 50% of the award by the
loss of expected dividends over the performance period and is adjusted for actual performance when
calculating the charge for the year.
A reconciliation of option movements over the year to 31 December 2008 and 2007 is shown below:
2008 2007
No. of
shares
Weighted
average
exercise
price
No. of
shares
Weighted
average
exercise
price
Outstanding at 1 January 5,885,597 — 4,976,599 —
Granted 2,625,696 — 2,487,273 —
Additional shares for rights issue* 1,067,755 — — —
Lapsed (105,828) — (490,718) —Exercised (1,014,325) — (1,087,557) —
Outstanding at 31 December 8,458,895 — 5,885,597 —
Exercisable at 31 December 683,870 — 279,028 —
* For grants awarded prior to the announcement of the rights issue on 24 November 2008 which have not been exercised or lapsed,the number of shares granted have been increased by 14.2% to ensure option holders were compensated for the dilutive impact ofthe rights issue.
Of the 2,196,271 PSP grants made in 2006 and outstanding as at 31 December 2008, the TSR
performance conditions are not expected to be met on 356,240 options. As a result, it is consideredthat these options will not vest.
2008 2007
Range of exercise price for options outstanding
Weighted
average
exercise
price
Weighted
average
remaining
contractual
life
Weighted
average
exercise
price
Weighted
average
remaining
contractual
life
n/a — 8.1 years — 8.3 years
The intrinsic value of vested 2001 cash-settled awards as at 31 December 2008 was US$0.3 million
(2007: US$1 million).
The weighted average share price at the time the options were exercised during 2008 was £15.74
(2007: £14.98).
674
c102100pu160Proof7:28.3.10B/LRevision:0OperatorBeeR

1997/2006 Restricted Share Scheme (1997/2006 RSS)
Valuation
For awards, the fair value is based on the market value less an adjustment to take into account the
expected dividends over the vesting period. The same fair value is applied for awards made to both
the directors and employees of the Group.
2008 2007
Grant date 24 April 16 September 11 March 17 September 12 March
Share price at grant date £17.82 £13.86 £16.26 £14.69 £14.51
Vesting period (years) 3 3 3 2/3 2/3
Expected dividend yield (%) 2.4 2.4 2.4 2.9 2.8
Fair value (£) 8.25 8.25 8.25 13.49 13.36
The expected dividend yield is based on the historical dividend for three years prior to grant.
A reconciliation of option movements over the year to 31 December 2008 and 2007 is shown below:
2008 2007
No. of
shares
Weighted
average
exercise
price
No. of
shares
Weighted
average
exercise
price
Outstanding at 1 January 6,275,898 — 6,298,386 —
Granted 2,137,992 — 2,546,148 —
Additional shares for rights issue* 925,127 — — —
Lapsed (294,595) — (689,603) —
Exercised (1,758,495) — (1,879,033) —
Outstanding at 31 December 7,285,927 — 6,275,898 —
Exercisable at 31 December 1,900,102 — 1,597,255 —
* For grants awarded prior to the announcement of the rights issue on 24 November 2008 which have not been exercised or lapsed,the number of shares granted have been increased by 14.2% to ensure option holders were compensated for the dilutive impact ofthe rights issue.
The weighted average share price at the time the options were exercised during 2008 was £15.69
(2007: £15.42).
2008 2007
Range of exercise price for options outstanding
Weighted
average
exercise
price
Weighted
average
remaining
contractual
life
Weighted
average
exercise
price
Weighted
average
remaining
contractual
life
n/a — 5.0 years — 4.3 years
The intrinsic value of vested 1997/2006 RSS cash-settled awards as at 31 December 2008 was US$3
million (2007: US$9 million).
2006 Supplementary Restricted Share Scheme (2006 SRSS)
Valuation
The first awards under this scheme were made on 12 March 2007. For awards, the fair value is based
on the market value less an adjustment to take into account the expected dividends over the vesting
675
c102100pu160Proof7:28.3.10B/LRevision:0OperatorBeeR

period. The same fair value is applied for awards made to both the directors and employees of the
Group.
2008 2007
Grant date 16 September 11 March 17 September 12 March
Share price at grant date £13.86 £16.26 £14.69 £14.51
Vesting period (years) 2/3 2/3 2/3 2/3
Expected dividend yield (%) 2.4 2.4 2.9 2.9
Fair value (£) 13.06 12.41 13.49 13.06
The expected dividend yield is based on the historical dividend for three years prior to grant. A
reconciliation of option movements over the year to 31 December 2008 is shown below:
2008 2007
No. of
shares
Weighted
average
exercise
price
No. of
shares
Weighted
average
exercise
price
Outstanding at 1 January 187,602 — — —Granted 2,020,181 — 187,602 —
Additional shares for rights issue* 307,805 — — —
Lapsed (45,549) — — —
Exercised (27,943) — — —
Outstanding at 31 December 2,442,096 — 187,602 —
Exercisable at 31 December — — — —
* For grants awarded prior to the announcement of the rights issue on 24 November 2008 which have not been exercised or lapsed,the number of shares granted have been increased by 14.2% to ensure option holders were compensated for the dilutive impact ofthe rights issue.
2008 2007
Range of exercise price for options outstanding
Weighted
average
exercise
price
Weighted
average
remaining
contractual
life
Weighted
average
exercise
price
Weighted
average
remaining
contractual
life
n/a — 6.2 years — 6.5 years
There are no vested 2006 SRSS cash-settled awards as at 31 December 2008 and 2007.
676
c102100pu160Proof7:28.3.10B/LRevision:0OperatorBeeR

1994/1996 UK and International Sharesave Scheme
Grants made under these schemes which had not vested as at 7 November 2002 are fair valued under
IFRS 2. A reconciliation of option movements over the year to 31 December 2008 and 2007 is shownbelow:
2008 2007
No. of
shares
Weighted*
average
exercise
price
No. of
shares
Weighted
average
exercise
price
Outstanding at 1 January 561,107 £5.82 1,543,784 £6.12
Additional shares for rights issue* 36,060 — — —Lapsed (227,613) £4.92 (412,878) £6.75
Exercised (206,572) £5.35 (569,799) £5.81
Outstanding at 31 December 162,982 £5.61 561,107 £5.82
Exercisable at 31 December 162,982 £5.61 297,272 £5.60
* The exercise prices for grants awarded prior to the announcement of the rights issue on 24 November 2008 which have not beenexercised or lapsed, have been decreased by 14.2% and the number of shares granted have been increased to ensure option holderswere compensated for the dilutive impact of the rights issue.
2008 2007
Range of exercise price for options outstanding
Weighted
average
exercise
price
Weighted
average
remaining
contractual
life
Weighted
average
exercise
price
Weighted
average
remaining
contractual
life
£4.90/£5.90 £5.61 0.3 years £5.82 0.8 years
The weighted average share price at the time the options were exercised was £13.89 (2007: £18.35) for
1994 UK Sharesave schemes and £13.89 (2007: £17.56) for 1996 International Sharesave schemes.
The intrinsic value of vested 1994/1996 UK and International Sharesave cash-settled awards as at31 December 2008 was US$0.1 million (2007: US$2 million).
2008 Irish Sharesave Scheme
The first awards under this scheme were made on 29 September 2008.
Valuation
Options are valued using a binomial option-pricing model. The same fair value is applied for awards
made to both the directors and employees of the Group. The fair value per option granted and the
assumptions used in the calculation are as follows:
Grant date
2008
29 September
Share price at grant date £14.52
Exercise price £11.62
Vesting period (years) 3/5Expected volatility (%) 39.6/48.7
Expected option life (years) 3.33/5.33
Risk free rate (%) 2.32/2.53
Expected dividend yield (%) 2.5/2.73
Fair value (£) 2.99/3.04
677
c102100pu160Proof7:28.3.10B/LRevision:0OperatorBeeR
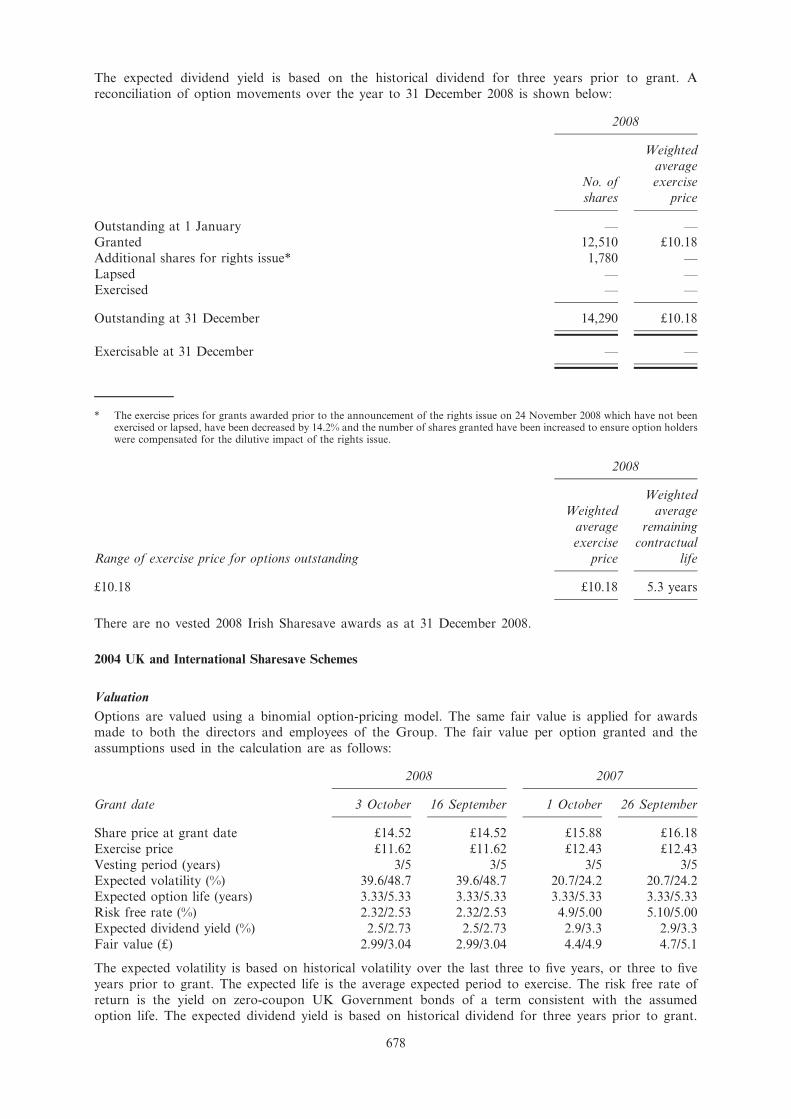
The expected dividend yield is based on the historical dividend for three years prior to grant. A
reconciliation of option movements over the year to 31 December 2008 is shown below:
2008
No. of
shares
Weighted
average
exercise
price
Outstanding at 1 January — —
Granted 12,510 £10.18
Additional shares for rights issue* 1,780 —
Lapsed — —
Exercised — —
Outstanding at 31 December 14,290 £10.18
Exercisable at 31 December — —
* The exercise prices for grants awarded prior to the announcement of the rights issue on 24 November 2008 which have not beenexercised or lapsed, have been decreased by 14.2% and the number of shares granted have been increased to ensure option holderswere compensated for the dilutive impact of the rights issue.
2008
Range of exercise price for options outstanding
Weighted
average
exercise
price
Weighted
average
remaining
contractual
life
£10.18 £10.18 5.3 years
There are no vested 2008 Irish Sharesave awards as at 31 December 2008.
2004 UK and International Sharesave Schemes
Valuation
Options are valued using a binomial option-pricing model. The same fair value is applied for awardsmade to both the directors and employees of the Group. The fair value per option granted and the
assumptions used in the calculation are as follows:
2008 2007
Grant date 3 October 16 September 1 October 26 September
Share price at grant date £14.52 £14.52 £15.88 £16.18
Exercise price £11.62 £11.62 £12.43 £12.43
Vesting period (years) 3/5 3/5 3/5 3/5
Expected volatility (%) 39.6/48.7 39.6/48.7 20.7/24.2 20.7/24.2Expected option life (years) 3.33/5.33 3.33/5.33 3.33/5.33 3.33/5.33
Risk free rate (%) 2.32/2.53 2.32/2.53 4.9/5.00 5.10/5.00
Expected dividend yield (%) 2.5/2.73 2.5/2.73 2.9/3.3 2.9/3.3
Fair value (£) 2.99/3.04 2.99/3.04 4.4/4.9 4.7/5.1
The expected volatility is based on historical volatility over the last three to five years, or three to five
years prior to grant. The expected life is the average expected period to exercise. The risk free rate of
return is the yield on zero-coupon UK Government bonds of a term consistent with the assumed
option life. The expected dividend yield is based on historical dividend for three years prior to grant.
678
c102100pu160Proof7:28.3.10B/LRevision:0OperatorBeeR

Where two amounts are shown for volatility, risk free rates, expected dividend yield and fair values,
the first relates to a three year vesting period and the second to a five year vesting period.
A reconciliation of option movements over the year to 31 December 2008 and 2007 is shown below:
2008 2007
No. of
shares
Weighted
average
exercise
price*
No. of
shares
Weighted
average
exercise
price
Outstanding at 1 January 14,266,731 £10.91 11,155,911 £9.76
Granted 6,241,929 £10.18 5,207,207 £12.43
Additional shares rights issue* 2,579,391 — — —
Lapsed (2,574,039) £10.14 (884,620) £10.04
Exercised (284,154) £7.04 (1,211,767) £7.43
Outstanding at 31 December 20,229,858 £9.69 14,266,731 £10.91
Exercisable at 31 December 3,588,924 £9.69 235,616 £7.43
* The exercise prices for grants awarded prior to the announcement of the rights issue on 24 November 2008 which have not beenexercised or lapsed, have been decreased by 14.2% and the number of shares granted have been increased to ensure option holderswere compensated for the dilutive impact of the rights issue.
2008 2007
Range of exercise price for options outstanding
Weighted
average
exercise
price
Weighted
average
remaining
contractual
life
Weighted
average
exercise
price
Weighted
average
remaining
contractual
life
£6.51/£10.90 £9.69 1.9 years £10.91 2.7 years
The weighted average share price at the time the options were exercised during 2008 was £13.92
(2007: £18.59) for the UK Sharesave scheme and £13.92 (2007: £18.72) for the International Sharesavescheme.
The intrinsic value of vested 2004 UK and International Sharesave cash-settled awards as at
31 December 2008 was US$0.4 million (2007: US$2 million).
679
c102100pu160Proof7:28.3.10B/LRevision:0OperatorBeeR

2004 Deferred Bonus Plan
Under this plan shares are issued directly to participants upon vesting.
A reconciliation of share movements over the year to 31 December 2008 and 2007 is shown below:
2008
No. of
shares
2007
No. of
shares
Outstanding at 1 January 351,340 301,952
Shares vested (324,002) (285,227)
Shares awarded 307,760 351,340Additional shares for rights issue* 43,756 —
Shares lapsed (25,997) (16,725)
Outstanding at 31 December 352,857 351,340
* For grants awarded prior to the announcement of the rights issue on 24 November 2008 which have not been exercised or lapsed,the number of shares granted have been increased by 14.2% to ensure option holders were compensated for the dilutive impact ofthe rights issue.
Notes:
a) Market value of shares on date of awards (6 March) was £16.43 (2007: £13.95).
b) The shares vest one year after the date of award.
43. Cash flow statement
Adjustment for non-cash items and other accounts
Group Company
2008
US$million
2007
US$million
2008
US$million
2007
US$million
Depreciation and amortisation 425 345 — —Gain on disposal of property, plant and
equipment (10) (1) — —
Gain on disposal of investment securities and loan
and receivable financial assets (322) (342) — —
Rights issue option (233) — (233) —
Gain arising on repurchase of subordinated-
liabilities (384) — (384) —
Gain arising on initial recognition and partial saleof Visa Inc. shares (17) (107) — —
Writedowns relating to asset backed securities 49 87 — —
Movement in fair value hedges on available-for-
sale assets 26 (21) — —
Amortisation of discounts and premiums of
investment securities (390) (259) — —
Pension costs for defined benefit schemes 45 110 — —
Impairment losses on loans and advances andother credit risk provisions 1,321 761 — —
Dividend income from subsidiaries — — (1,880) (385)
Other impairment 469 57 — —
Profit on sale of businesses (146) (18) — —
Gains arising on acquisition fair values and
discount unwind (120) (164) — —
Interest expense on subordinated liabilities 1,049 811 184 126
Total 1,762 1,259 (2,313) (259)
680
c102100pu160Proof7:28.3.10B/LRevision:0OperatorBeeR

Change in operating assets
Group Company
2008
US$million
2007
US$million
2008
US$million
2007
US$million
Increase in derivative financial instruments (47,138) (12,610) — —
Net (increase)/decrease in debt securities, treasury
bills and equity shares held at fair value
through profit or loss 7,590 (3,691) — —
Net increase in loans and advances to banks and
customers (39,160) (14,983) — —
(Increase)/decrease in pre-payments and accruedincome 213 (519) — —
(Increase)/decrease in other assets (8,756) (6,396) 62 —
Total (87,251) (38,199) 62 —
Change in operating liabilities
Group Company
2008
US$million
2007
US$million
2008
US$million
2007
US$million
Increase in derivative financial instruments 44,943 12,144 26 —
Net increase in deposits from banks, customer
accounts and debt securities in issue 60,295 36,135 1,372 —
Increase/(decrease) in accruals and deferred
income 1,025 289 (63) (1,051)
Increase/(decrease) in other liabilities (453) 4,534 (40) 87
Total 105,810 53,102 1,295 (964)
44. Cash and cash equivalents
For the purposes of the cash flow statement, cash and cash equivalents comprise the following
balances with less than three months maturity from the date of acquisition. Restricted balances
comprise minimum balances required to be held at central banks.
Group Company
2008
US$million
2007
US$million
2008
US$million
2007
US$million
Cash and balances at central banks 24,161 10,175 — —
Less restricted balances (4,615) (4,846) — —
Treasury bills and other eligible bills 9,303 6,203 — —
Loans and advances to banks 33,913 32,464 — —
Trading securities 10,937 11,342 — —
Amounts owed by and due to subsidiary
undertakings — — 5,303 930
Total 73,699 55,338 5,303 930
681
c102100pu160Proof7:28.3.10B/LRevision:0OperatorBeeR

45. Capital commitments
Capital expenditure approved by the directors but not provided for in these accounts amounted to:
2008
US$million
2007
US$million
Contracted 46 29
46. Operating lease commitments
2008 2007
Premises
US$million
Equipment
US$million
Premises
US$million
Equipment
US$million
Commitments under non-cancellable operatingleases expiring:
Within one year 258 2 179 3Later than one year and less than five years 470 2 434 2After five years 509 — 491 1
1,237 4 1,104 6
During the year US$240 million (2007: US$159 million) was recognised as an expense in the income
statement in respect of operating leases. The Group leases various premises and equipment under
non-cancellable operating lease agreements. The leases have various terms, escalation clauses andrenewal rights. The total future minimum sublease payments expected to be received under non-
cancellable subleases at 31 December 2008 is US$5 million (2007: US$17 million).
47. Contingent liabilities and commitments
The table below shows the contract or underlying principal amounts and risk weighted amounts of
unmatured off-balance sheet transactions at the balance sheet date. The contract or underlying
principal amounts indicate the volume of business outstanding and do not represent amounts at risk.
The risk weighted amounts have been calculated in accordance with the FSA guidelines implementing
the Basel Accord on capital adequacy, after taking account of collateral and guarantees received.
2008US$million
2007US$million
Contingent liabilities*Guarantees and irrevocable letters of credit 28,051 25,681Other contingent liabilities 11,494 8,038
39,545 33,719
Commitments*Documentary credits and short term trade-related transactions 5,270 6,504Forward asset purchases and forward deposits placed 40 64Undrawn formal standby facilities, credit lines and other commitments to lend:
One year and over 14,450 13,888Less than one year 14,903 18,260Unconditionally cancellable 42,388 45,279
77,051 83,995
Risk weighted amount:Contingent liabilities 19,625 16,385{
Commitments 7,258 7,194{
* Includes amounts relating to the Group’s share of its joint ventures.{ On a Basel I basis.
682
c102100pu160Proof7:28.3.10B/LRevision:0OperatorBeeR

48. Repurchase and reverse repurchase agreements
The Group enters into collateralised reverse repurchase and repurchase agreements and securities
borrowing and lending transactions. It also receives securities as collateral for commercial lending.
Balance sheet assets
2008
Reverse
repurchase
agreements
US$million
2007
Reverse
repurchase
agreements
US$million
Banks 1,578 1,349Customers 4,833 1,068
6,411 2,417
Balance sheet liabilities
2008
Repurchase
agreements
US$million
2007
Repurchase
agreements
US$million
Banks 5,053 2,150
Customers 5,177 364
10,230 2,514
Collateral pledged against these liabilities is disclosed in note 23. The terms and conditions relating to
the collateral pledged typically permits the collateral to be sold or repledged, subject to the obligation
to return the collateral at the end of the agreement.
Under reverse repurchase and securities borrowing arrangements, the Group obtains securities on
terms which permit it to repledge or resell the securities to others. Amounts on such terms are:
2008
US$million
2007
US$million
Securities and collateral which can be repledged or sold (at fair value) 5,707 2,410
Thereof repledged/transferred to others for financing activities, to satisfy
commitments under short sale transactions or liabilities under sale and
repurchase agreements (at fair value) 4,030 1,714
49. Liquidity risk
This table analyses assets and liabilities into relevant maturity groupings based on the remainingperiod to the contractual maturity date as at the balance sheet date, on a discounted basis.
Contractual maturities do not necessarily reflect actual repayments or cash flow.
The Risk Review on pages 43 to 63 of the 2008 Annual Report explains the Group’s and Company’s
risk management with respect to asset and liability management.
683
c102100pu160Proof7:28.3.10B/LRevision:0OperatorBeeR

2008
Three
months
or less
US$million
Between
three
months and
one year
US$million
Between
one
year and
five years
US$million
More than
five years
US$million
Total
US$million
Assets
Cash and balances at central banks 19,546 — — 4,615 24,161
Derivative financial instruments 13,791 18,743 27,821 9,302 69,657
Loans and advances to banks* 33,913 11,749 2,132 152 47,946
Loans and advances to customers* 63,829 27,541 38,044 49,098 178,512
Investment securities* 20,736 28,137 21,758 8,439 79,070Other assets 12,791 1,231 27 21,673 35,722
Total assets 164,606 87,401 89,782 93,279 435,068
LiabilitiesDeposits by banks* 31,168 3,382 1,359 77 35,986
Customer accounts* 210,449 21,674 4,824 1,644 238,591
Derivative financial instruments 15,004 18,207 25,430 9,134 67,775
Debt securities in issue* 12,568 5,801 5,695 3,005 27,069
Other liabilities 12,163 1,707 503 11,593 25,966
Subordinated liabilities and other
borrowed funds 845 1,304 2,189 12,648 16,986
Total liabilities 282,197 52,075 40,000 38,101 412,373
Net liquidity gap (117,591) 35,326 49,782 55,178 22,695
* Amounts include financial investments held at fair value through profit or loss (see note 16 and note 32).
684
c102100pu160Proof7:28.3.10B/LRevision:0OperatorBeeR

2007
Three
months
or less
US$million
Between
three
months and
one year
US$million
Between
one
year and
five years
US$million
More than
five years
US$million
Total
US$million
Assets
Cash and balances at central banks 5,329 — — 4,846 10,175
Derivative financial instruments 6,228 7,042 9,740 3,194 26,204
Loans and advances to banks** 32,461 3,613 1,269 336 37,679
Loans and advances to customers** 51,010 28,334 29,921 47,717 156,982
Investment securities** 18,526 21,269 20,034 13,373 73,202Other assets* 7,139 1,025 322 17,143 25,629
Total assets 120,693 61,283 61,286 86,609 329,87
LiabilitiesDeposits by banks** 25,524 2,361 540 160 28,585
Customer accounts** 160,925 15,883 3,791 1,997 182,596
Derivative financial instruments 6,810 7,024 9,716 2,720 26,270
Debt securities in issue** 10,964 11,637 6,363 3,189 32,153
Other liabilities* 9,533 1,357 739 11,446 23,075
Subordinated liabilities and other
borrowed funds — 502 6,092 9,146 15,740
Total liabilities 213,756 38,764 27,241 28,658 308,419
Net liquidity gap (93,063) 22,519 34,045 57,951 21,452
* Amounts have been restated as explained in note 53.
** Amounts include financial instruments held at fair value through profit or loss (see note 16 and note 32).
The Company has financial liabilities of US$2,835 million (2007: US$1,987 million) maturing in five
years or more.
The following table analyses the contractual cash flows payable for the Group’s financial liabilities by
remaining contractual maturities on an undiscounted basis. The financial liability balances in the table
below will not agree to the balances reported in the consolidated balance sheet as the table
incorporates all contractual cash flows, on an undiscounted basis, relating to both principal andinterest payments.
Within the ‘More than five years’ maturity band are undated financial liabilities of US$4,309 million(2007: US$5,640 million), all of which relate to subordinated debt, on which interest payments are
not included as this information would not be meaningful. Interest payments on these instruments are
included within the maturities up to five years.
685
c102100pu160Proof7:28.3.10B/LRevision:0OperatorBeeR

Group
2008 2007
Three
months or
less
US$million
Between
three
months and
one year
US$million
Between
one
year and
five years
US$million
More than
five years
US$million
Three
months or
less
US$million
Between
three
months and
one year
US$million
Between
one
year and
five years
US$million
More than
five years
US$million
Deposits by banks 28,449 3,612 1,160 205 22,752 1,880 526 133
Customer accounts 208,355 22,792 4,698 1,628 158,937 15,896 3,183 1,888
Financial liabilities at fair value 9,396 2,212 3,438 1,885 3,662 3,407 2,463 1,767
Derivative financial instruments 529,175 251,250 138,445 17,593 420,884 260,597 91,272 22,962
Debt securities in issue 12,572 5,870 4,921 6,405 10,535 10,594 6,242 2,436
Subordinated liabilities and other
borrowed funds 156 2,353 6,046 20,876 305 1,190 5,476 20,247
Other liabilities 13,258 1,903 170 7,065 10,645 663 437 9,120
Total liabilities 801,361 289,992 158,878 55,657 627,720 294,227 109,599 58,533
Gross loan commitments 40,005 9,871 13,265 1,053 20,207 14,215 3,446 293
The cash flows presented in the above table reflect the cash flows which will be contractually payableover the residual maturity of the instruments. In practice, however, the liability instruments behave
differently from their contractual terms and typically, for short term customer accounts, extend to a
longer period than their contractual maturity.
Derivative financial instruments include those net settled derivative contracts in a net liability position,
together with the pay leg of gross settled contracts regardless of whether the overall contract is in an
asset or liability position. The receive leg is not shown in this table and as a result the derivative
amounts in this table are inflated by their exclusion.
Company
2008 2007
Three
months or
less
US$million
Between
three
months and
one year
US$million
Between
one
year and
five years
US$million
More than
five years
US$million
Three
months or
less
US$million
Between
three
months and
one year
US$million
Between
one
year and
five years
US$million
More than
five years
US$million
Derivative financial instruments 26 — — — — — — —
Debt securities in issue — 54 90 1,317 — — — —
Subordinated liabilities and other
borrowed funds — 118 723 1,940 15 101 466 2,553
Other liabilities 863 — — — 1,089 — — 77
Total liabilities 889 172 813 3,257 1,104 101 466 2,630
50. Currency risk
Foreign exchange risk is managed and measured as set out in the Market risk section of the Risk
review on pages 59 to 61 of the 2008 Annual Report.
Foreign exchange risk arising within the non-trading portfolio, excluding structural positions, is
minimised by match funding assets and liabilities in the same foreign currency.
Structural foreign exchange risks arise from net investments in currencies other than US Dollars. The
Group has made net investments in Group undertakings in a number of currencies.
The resulting foreign exchange exposures are managed on an individual basis, and are assessedregularly taking account of foreign exchange rate expectations. The positions are treated as long-term
embedded exposures, and are not treated as trading positions. Hedges of the foreign exchange
exposures may be considered in certain limited cases. At 31 December 2008, the Group had taken a
net investment hedge of US$600 million (2007: US$nil million) to partly cover its exposure to Korean
won.
686
c102100pu160Proof7:28.3.10B/LRevision:0OperatorBeeR
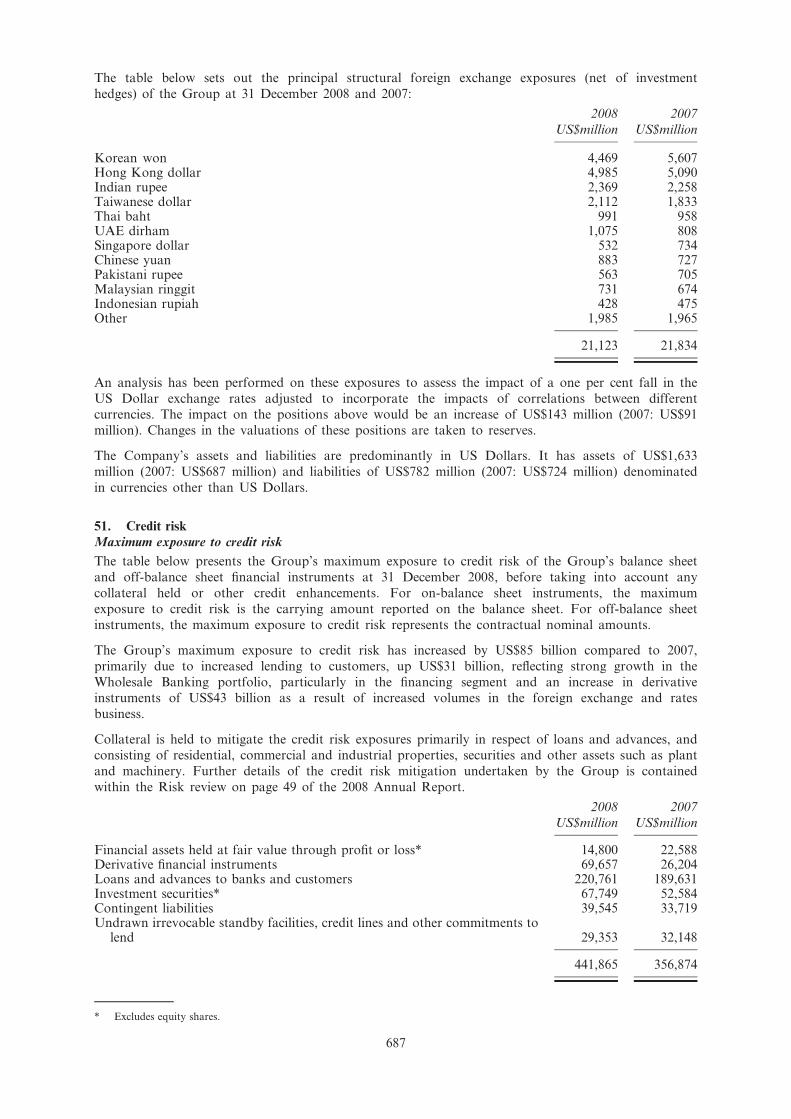
The table below sets out the principal structural foreign exchange exposures (net of investment
hedges) of the Group at 31 December 2008 and 2007:
2008
US$million
2007
US$million
Korean won 4,469 5,607Hong Kong dollar 4,985 5,090Indian rupee 2,369 2,258Taiwanese dollar 2,112 1,833Thai baht 991 958UAE dirham 1,075 808Singapore dollar 532 734Chinese yuan 883 727Pakistani rupee 563 705Malaysian ringgit 731 674Indonesian rupiah 428 475Other 1,985 1,965
21,123 21,834
An analysis has been performed on these exposures to assess the impact of a one per cent fall in the
US Dollar exchange rates adjusted to incorporate the impacts of correlations between differentcurrencies. The impact on the positions above would be an increase of US$143 million (2007: US$91
million). Changes in the valuations of these positions are taken to reserves.
The Company’s assets and liabilities are predominantly in US Dollars. It has assets of US$1,633
million (2007: US$687 million) and liabilities of US$782 million (2007: US$724 million) denominated
in currencies other than US Dollars.
51. Credit riskMaximum exposure to credit risk
The table below presents the Group’s maximum exposure to credit risk of the Group’s balance sheet
and off-balance sheet financial instruments at 31 December 2008, before taking into account any
collateral held or other credit enhancements. For on-balance sheet instruments, the maximum
exposure to credit risk is the carrying amount reported on the balance sheet. For off-balance sheet
instruments, the maximum exposure to credit risk represents the contractual nominal amounts.
The Group’s maximum exposure to credit risk has increased by US$85 billion compared to 2007,
primarily due to increased lending to customers, up US$31 billion, reflecting strong growth in the
Wholesale Banking portfolio, particularly in the financing segment and an increase in derivativeinstruments of US$43 billion as a result of increased volumes in the foreign exchange and rates
business.
Collateral is held to mitigate the credit risk exposures primarily in respect of loans and advances, andconsisting of residential, commercial and industrial properties, securities and other assets such as plant
and machinery. Further details of the credit risk mitigation undertaken by the Group is contained
within the Risk review on page 49 of the 2008 Annual Report.
2008
US$million
2007
US$million
Financial assets held at fair value through profit or loss* 14,800 22,588Derivative financial instruments 69,657 26,204Loans and advances to banks and customers 220,761 189,631Investment securities* 67,749 52,584Contingent liabilities 39,545 33,719Undrawn irrevocable standby facilities, credit lines and other commitments to
lend 29,353 32,148
441,865 356,874
* Excludes equity shares.
687
c102100pu160Proof7:28.3.10B/LRevision:0OperatorBeeR

As set out in note 19, the Group has entered into synthetic loan securitisations and synthetic trade
receivable securitisations on which it has mitigated certain of the credit risks. In respect of derivative
financial instruments, US$45,896 million (2007: US$17,282 million) is available for offset as a result
of master netting agreements which do not, however, meet the criteria under IAS 32 to enable thesebalances to be presented on a net basis in the financial statements as in the ordinary course of
business they are not intended to be settled net.
The maximum exposure to credit risk of the Company is US$5,303 million (2007: US$2,019 million),
which relates to amounts owed by subsidiary undertakings.
Summary analysis of the loan portfolio
2008 2007
Loans to
banks
US$million
Loans to
customers –
Consumer
Banking
US$million
Loans to
customers –
Wholesale
Banking
US$million
Total
loans to
customers
US$million
Loans to
banks
US$million
Loans to
customers –
Consumer
Banking
US$million
Loans to
customers –
Wholesale
Banking
US$million
Total
loans to
customers
US$million
Individually impaired loans, net of
provisions 18 519 812 1,331 8 517 364 881
Past due but not impaired loans 53 4,391 791 5,182 10 4,589 422 5,011
Neither past due nor impaired
loans 47,881 75,754 96,896 172,650 37,662 77,156 74,469 151,625
Total loans and advances 47,952 80,664 98,499 179,163 37,680 82,262 75,255 157,517
Portfolio impairment provision (6) (449) (202) (651) (1) (412) (123) (535)
47,946 80,215 98,297 178,512 37,679 81,850 75,132 156,982
Of which: Loans and advances
held at fair value 1,363 — 4,334 4,334 2,314 — 2,716 2,716
The Company has loans neither past due nor impaired of US$2,706 million (2007: US$2,019 million)
and has no individually impaired or past due but not impaired loans. Details of loan loss provisions
and individually impaired loans are disclosed in notes 21 and 22.
Loans and advances past due but not individually impaired
The following table sets out the ageing of loans and advances which are past due and for which noindividual impairment provision has been raised. A loan is considered to be past due when the
counterparty has failed to make a principal or interest payment when contractually due. Past due
does not necessarily mean that a loan is impaired.
For Consumer Banking loans, individual impairment provisions are generally raised at 150 days past
due.
For Wholesale Banking, individual impairment provisions are generally raised only when interest and/
or principal payments are deemed uncollectible.
688
c102100pu160Proof7:28.3.10B/LRevision:0OperatorBeeR

2008 2007
Loans to
banks
US$million
Loans to
customers –
Consumer
Banking
US$million
Loans to
customers –
Wholesale
Banking
US$million
Total
loans to
customers
US$million
Loans to
banks
US$million
Loans to
customers –
Consumer
Banking
US$million
Loans to
customers –
Wholesale
Banking
US$million
Total
loans to
customers
US$million
Up to 30 days past due 44 3,268 566 3,834 — 3,559 239 3,798
Between 31 – 60 days past due — 515 75 590 — 536 38 574
Between 61 – 90 days past due — 283 150 433 10 342 143 485
Between 91 – 150 days past due 9 325 — 325 — 152 2 154
53 4,391 791 5,182 10 4,589 422 5,011
Estimated fair value of collateral
held — 1,961 185 2,146 — 4,419 157 4,576
Collateral held against Consumer Banking loans and Wholesale Banking loans largely comprisesresidential and commercial property and property and securities respectively.
Where the fair value of collateral held exceeds the outstanding loan, any excess is paid back to thecustomers and is not available for offset against other loans.
Loans and advances neither past due nor impaired
The following table sets out an analysis of loans and advances by internal credit grading which are
not past due and for which no individual impairment provision has been raised. The credit gradings
set out in the table below are based on a probability of default measure as set out on page 48 of the
Risk review in the 2008 Annual Report. The banding reflects management’s segmentation of the
credit risk grades.
The increase in loans to banks compared to 2007 is as a result of the placement of excess liquidity
with high quality bank counterparties, resulting in an improvement in the proportion lent to
counterparties within credit grades one to five. Within loans to customers, the proportion of the loan
book falling within credit grades one to five has decreased from 46 to 45%. The proportion of grade12 loans was maintained at one per cent of the loans to customer portfolio.
2008 2007
Total loans and advances neither past
due nor impaired
Loans to
banks
US$million
Loans to
customers –
Consumer
Banking
US$million
Loans to
customers –
Wholesale
Banking
US$million
Total
loans to
customers
US$million
Loans to
banks
US$million
Loans to
customers –
Consumer
Banking
US$million
Loans to
customers –
Wholesale
Banking
US$million
Total
loans to
customers
US$million
Grades 1 – 5
– at amortised cost 41,864 33,212 41,134 74,346 32,388 32,824 35,210 68,034
– at fair value 710 — 3,888 3,888 1,686 — 1,789 1,789
Grades 6 – 8
– at amortised cost 4,066 19,969 35,604 55,573 2,602 19,339 26,236 45,575
– at fair value 649 — 239 239 629 — 784 784
Grades 9 – 11
– at amortised cost 575 21,294 15,400 36,694 349 23,810 10,080 33,890
– at fair value 4 — 207 207 — — 153 153
Grade 12
– at amortised cost 13 1,279 424 1,703 8 1,183 217 1,400
– at fair value — — — — — — — —
Total – at amortised cost 46,518 75,754 92,562 168,316 35,347 77,156 71,743 148,899
Total – at fair value 1,363 — 4,334 4,334 2,315 — 2,726 2,726
Grand Total 47,881 75,754 96,896 172,650 37,662 77,156 74,469 151,625
Of which: renegotiated loans — 682 365 1,047 — 425 341 766
689
c102100pu160Proof7:28.3.10B/LRevision:0OperatorBeeR

Renegotiated loans which would otherwise be past due or impaired, continue to be accounted for as
non-performing (but still considered whether past due for impaired) until a minimum number of
payments have been received under the new terms, after which they are considered to be performing
loans.
Loans which are renegotiated to include concessions that the Group would not ordinarily make will
usually be impaired and therefore excluded from this disclosure.
Collateral and other credit enhancements possessed or called upon
During the year, the Group obtained assets by taking possession of collateral or calling upon other
credit enhancements (such as guarantees) as detailed in the table below. Repossessed properties are
sold in an orderly fashion. Where the proceeds are excess of the outstanding loan balance they are
returned to the borrower. Certain of the equity securities acquired continue to be held by the Group
for investment purposes and are classified as available-for-sale, and the related loan derecognised.
2008 2007
Consumer
Banking
US$million
Wholesale
Banking
US$million
Total
US$million
Consumer
Banking
US$million
Wholesale
Banking
US$million
Total
US$million
Property 150 1 151 135 69 204
Debt securities and
equity shares 2 4 6 — — —
Guarantees 28 — 28 35 5 40
Other 54 1 55 9 58 67
234 6 240 179 132 311
Debt securities and treasury bills
Debt securities and treasury bills are analysed as follows:
2008 2007
Debt
securities
US$million
Treasury
bills
US$million
Total
US$million
Debt
securities
US$million
Treasury
bills
US$million
Total
US$million
Impaired securities 185 106 291 71 17 88Impairment
provisions (158) (1) (159) (54) (2) (56)
Net impaired
securities 27 105 132 17 15 32
Securities neither past
due nor impaired 57,405 19,315 76,720 55,063 15,047 70,110
57,432 19,420 76,852 55,080 15,062 70,142
Of which:
Held at fair value 6,396 2,707 9,103 14,163 3,395 17,558
690
c102100pu160Proof7:28.3.10B/LRevision:0OperatorBeeR

Movements in provisions on impaired securities are disclosed in note 23. The impaired debt securities
largely include the Group’s holdings of ABS CDOs, on which a US$41 million (2007: US$35 million)
impairment charge and other writedowns of US$49 million (2007: US$87 million) were taken in 2008.
Further details of these writedowns are set out on page 57 of the Risk review in the 2008 AnnualReport.
Collateral is held against impaired securities and primarily consist of properties. The undiscounted fairvalue of collateral held relating to impaired securities is estimated at US$22 million (2007: US$24
million).
Where the fair value of collateral held exceeds the outstanding securities obligations, any excess is
paid back to the customers and is not available for offset against other securities obligations. The
Company has US$925 million of debt securities, issued by a subsidiary undertaking.
Securities neither past due nor impaired
The following table analyses debt securities and treasury bills which are neither past due or impaired
by external credit rating. The standard credit ratings used by the Group are those used by Standard
& Poors or their equivalent. Debt securities held which have a short-term rating are reported against
the long-term rating of the issuer. For securities which are unrated, the Group applies an internal
credit rating as described under Loans and Advances.
2008 2007
Debt
securities
US$million
Treasury
bills
US$million
Total
US$million
Debt
securities
US$million
Treasury
bills
US$million
Total
US$million
AAA 9,551 18 9,569 12,364 570 12,934
AA- to AA+ 22,522 5,269 27,791 16,426 3,216 19,642
A- to A+ 14,361 10,862 25,223 14,358 7,788 22,146
BBB- to BBB+ 4,939 2,246 7,185 6,341 1,822 8,163Lower than BBB- 2,367 615 2,982 2,586 1,357 3,943
Unrated 3,665 305 3,970 2,988 294 3,282
57,405 19,315 76,720 55,063 15,047 70,110
Unrated securities primarily relate to corporate issues. Using internal credit ratings, US$3,525 million
(2007: US$2,606 million) of these securities are considered to be investment grade and US$445 million
(2007: US$676 million) sub-investment grade.
52. Fair value of financial assets and liabilities
The following table summarises the carrying amounts and fair values of those financial assets and
liabilities not presented on the Group’s balance sheet at fair value.
2008 2007
Book
amount
US$million
Fair value
US$million
Book
amount
US$million
Fair value
US$million
AssetsCash and balances at central banks 24,161 24,161 10,175 10,175
Loans and advances to banks 46,583 45,855 35,365 35,316
Loans and advances to customers 174,178 170,410 154,266 153,828
Investment securities 7,493 6,729 2,819 2,779
Liabilities
Deposits by banks 31,909 31,713 25,880 25,844
Customer accounts 234,008 230,558 179,760 179,694
Debt securities in issue 23,447 23,097 27,137 27,072Subordinated liabilities and other borrowed funds 16,986 13,903 15,740 15,029
691
c102100pu160Proof7:28.3.10B/LRevision:0OperatorBeeR

The following sets out the Group’s basis of establishing fair values of the financial instruments shown
above and those financial assets classified as available-for-sale and financial assets and liabilities held
at fair value through profit and loss as disclosed within notes 15, 16, 18, 19, 23, 30, 31, 32 and 33.
The Group’s basis for establishing the fair value of financial assets and liabilities held at fair valuethrough profit or loss and of derivatives is set out in note 1.
Cash and balances at central banks
The fair value of cash and balances at central banks is their carrying amounts.
Loans and advances to banks
The fair value of floating rate placements and overnight deposits is their carrying amounts. The
estimated fair value of fixed interest bearing deposits is based on discounted cash flows using the
prevailing money-market rates for debts with a similar credit risk and remaining maturity.
Loans and advances to customers
Loans and advances are presented net of provisions for impairment. The estimated fair value of loans
and advances represents the discounted amount of future cash flows expected to be received, including
assumptions relating to prepayment rates and where appropriate, credit spreads. Expected cash flowsare discounted at current market rates to determine fair value. The Group’s loan portfolio is well
diversified by geography and industry and is in markets that have had little contagion so far from the
turmoil brought about by the dislocation and disruption in financial markets. Approximately one-
third of the portfolio reprices within one month, and over 50% reprices within 12 months.
Investment securities
Investment securities with observable market prices, including debt and equity securities, are fairvalued using that information. Debt securities that do not have observable market data are fair
valued by either discounting cash flows using the prevailing market rates for debts with a similar
credit risk and remaining maturity, or using quoted market prices for securities with similar credit,
maturity and yield characteristics.
Deposits and borrowings
The estimated fair value of deposits with no stated maturity is the amount repayable on demand. The
estimated fair value of fixed interest bearing deposits and other borrowings without quoted marketprices is based on discounting cash flows using the prevailing market rates for debts with a similar
credit risk and remaining maturity.
Debt securities in issue, subordinated liabilities and other borrowed funds
The aggregate fair values are calculated based on quoted market prices. For those notes where quoted
market prices are not available, a discounted cash flow model is used based on a current market
related yield curve appropriate for the remaining term to maturity.
53. Restatement of prior periods
Acquisitions
In the consolidated balance sheet as at 31 December 2007, the fair value amounts in relation to the
acquisitions of Pembroke, Harrison Lovegrove and A Brain contained some provisional balances.
During the year to 31 December 2008, certain of these balances have been revised. In accordance
with IFRS 3 ‘Business Combinations’, the adjustments to the provisional balances have been made asat the date of acquisition and the 2007 balance sheet amounts restated, with a corresponding
adjustment to goodwill, reducing goodwill on acquisitions by US$6 million. The adjustments primarily
relate to a reassessment of the value property, plant and equipment, together with associated deferred
tax. The income statement for 2007 has not been restated, because any effect is immaterial.
692
c102100pu160Proof7:28.3.10B/LRevision:0OperatorBeeR

As
reported at
2007
US$million
Adjustment
US$million
Restated at
2007
US$million
Goodwill and intangible assets 6,380 (6) 6,374
Property, plant and equipment 2,887 5 2,892
Deferred tax assets 559 1 560
Other balance sheet adjustments
A re-presentation was made within the Group’s balance sheet at 31 December 2007 in respect of the
current tax creditor and deferred tax asset to show the current tax and deferred tax asset and liability
separately. Details of the re-presentation are set out below:
As reported at
2007
US$million
Re-
presentation
US$million
Restated at
2007
US$million
Current tax assets — 633 633
Current tax liabilities 185 633 818
Deferred tax assets 560 33 593
Deferred tax liabilities — 33 33
Company cash flow statement
The Company cash flow statement has been represented to appropriately identify the purchase of own
shares and the exercise of share options through ESOP. The net impact of the representation is set
out below:
As reported at
2007
US$million
Re-
presentation
US$million
Restated at
2007
US$million
Change in operating assets 111 (24) 87
Net cash from operating activities (875) (24) (899)
Purchase of own shares — (15) (15)
Exercise of share options through ESOP — 39 39
Net cash from financing activities 142 24 166
54. Special purpose entities
The Group uses Special Purpose Entities (SPEs) in the normal course of business across a variety of
activities. SPEs are established for specific limited purposes and take a number of legal forms. The
main types of activities for which the Group utilises SPEs cover synthetic credit default swaps for
portfolio management purposes, managed investment funds (including specialised principal financefunds) and structured finance. SPEs are consolidated into the Group’s financial statements where the
Group bears the majority of the residual risk or reward. Most of the Group’s consolidated SPEs are
in respect of the Group’s securitised portfolios of residential mortgages (see note 19).
693
c102100pu160Proof7:28.3.10B/LRevision:0OperatorBeeR

The total assets of unconsolidated SPEs in which the Group has an interest are set out below.
2008 2007
Total
assets
US$million
Maximum
exposure
US$million
Total
assets
US$million
Maximum
exposure
US$million
Portfolio management vehicles 1,694 252 1,279 176
Principal Finance Funds* 898 124 150 15
Global Liquidity Fund — — 1,325 251
AEB Funds 2,487 4 — —
Structured Finance 290 — 290 —
5,369 380 3,044 442
* Committed capital for these funds is US$375 million (2007: US$150 million) of which US$124 million (2007: US$15 million) hasbeen drawn down.
Since December 2007, the Group has had no capital investment in Whistlejacket Capital Limited, astructured investment vehicle (SIV) previously sponsored by the Group, which entered into
administration on 11 February 2008. Other than the relationship it had with Whistlejacket, the Group
has no exposures or commitments to SIVs or SIV-lites.
For the purposes of portfolio management, the Group has entered into synthetic credit default swaps
with note-issuing SPEs. The referenced assets remain on the Group’s balance sheet as the credit risk
is not transferred to these SPEs. The Group’s exposure arises from (a) the capitalised start-up costs in
respect of the swap vehicles and (b) interest in the first loss notes and investment in a minimal
portion of the mezzanine and senior rated notes issued by the note issuing SPEs. The proceeds of the
notes issuance are typically invested in AAA-rated government securities, which are used to
collateralise the SPE’s swap obligations to the Group, and to repay the principal to investors atmaturity. The SPEs reimburse the Group on actual losses incurred, through the realisation of the
collateral security. Correspondingly, the SPEs write down the notes issued by an equal amount of the
losses incurred, in reverse order of seniority. All the funding is committed for the life of these vehicles
and hence the Group has no indirect exposure in respect of the vehicles’ liquidity position.
The remainder of the Group’s exposure represents committed or invested capital in unleveraged
investment funds. Standard Chartered Bank was the Investment Manager and Distributor of the US
Dollar Liquidity Fund, the single sub fund of Standard Chartered Global Liquidity Funds p.l.c.,
which closed on 7 July 2008.
Following the acquisition of AEB, the Group is also the investment manager for a number of AEB’s
investment funds, although the Group’s investment in such funds represents approximately 0.2% of
those funds’ total assets.
The Group has reputational risk in respect of certain portfolio management vehicles and investment
funds either because the Group is the arranger and lead manager or because the SPEs have Standard
Chartered branding.
55. Post balance sheet events
On 13 November 2008, the Group announced that it had entered an agreement to acquire 100% of
Cazenove Asia Limited, a leading Asia equity capital markets, corporate finance and institutional
brokerage business, from JPMorgan Cazenove. The acquisition completed on 30 January 2009. The
initial accounting for this acquisition has not yet been fully completed.
694
c102100pu160Proof7:28.3.10B/LRevision:0OperatorBeeR

56. Related party transactions
Directors and officers
Directors’ emoluments
Details of directors’ pay and benefits and interests in shares are disclosed in the Directors’
remuneration report on pages 88 to 93 of the 2008 Annual Report.
IAS 24 ‘Related party disclosures’ requires the following additional information for key management
compensation. Key management comprises non-executive directors and members of the Group
Management Committee, which includes all executive directors.
2008
US$million
2007
US$million
Salaries, allowances and benefits in kind 20 19
Pension contributions 6 6
Bonuses paid or receivable 18 23
Share based payments 25 22
69 70
Transactions with directors, officers and others
At 31 December 2008, the total amounts to be disclosed under the UK Companies Act 1985 (the
Act) and the Listing Rules of the Hong Kong Stock Exchange Limited (HK Listing Rules) about
loans to directors and officers were as follows:
2008 2007
Number US$000 Number US$000
Directors 2 635 1 14
Officers* 3 7,898 4 7,090
* For this disclosure, the term ‘Officers’ means the members of the Group Management Committee, other than those who aredirectors of Standard Chartered PLC, and the company secretary.
Mr Sunil Mittal, appointed as an independent non-executive director of Standard Chartered PLC with
effect from 1 August 2007, is Chairman and Group CEO of the Bharti Enterprises Group. Due to his
significant voting power in the Bharti Enterprises Group, it is a related party of Standard Chartered
PLC. As at 31 December 2008, the Group had loans to the Bharti Enterprises Group of US$137
million (2007: US$123 million), guarantees of US$39 million (2007: US$47 million) and foreign
exchange deals with a notional value of US$103 million (2007: US$52 million).
As at 31 December 2008, Standard Chartered Bank had created a charge over US$24 million (2007:
US$24 million) of cash assets in favour of the independent trustees of its employer financialretirement benefit schemes.
Other than as disclosed in this Annual Report 2008, there were no other transactions, arrangementsor agreements outstanding for any director, connected person or officer of the Company which have
to be disclosed under the Act, the rules of the UK Listing Authority or the HK Listing Rules.
Joint ventures
The Group has loans and advances to PT Bank Permata Tbk totalling US$5 million at 31 December
2008 (2007: US$4 million), and deposits of US$16 million (2007: US$7 million).
The Group has loans and advances with SC Caps totalling US$12 million (2007: US$nil million).
Associates
On 2 July 2008 the Group acquired a further 6.16% equity stake in Asia Commercial Bank (including
convertible bonds) for US$211 million to bring the total shareholding to 15%.
695
c102100pu160Proof7:28.3.10B/LRevision:0OperatorBeeR

Open ended investment company
Standard Chartered Global Liquidity Funds p.l.c. was an open-ended investment company which was
closed on 7 July 2008. At 31 December 2008 the Group held an investment in shares of the fund ofUS$nil million (31 December 2007: US$251 million).
Company
The Company has received US$105 million (2007: US$95 million) of interest income from Standard
Chartered Bank. The Company issues debt externally and lends the proceeds to Group companies. At
31 December 2008, it had loans to and debt instruments issued by Standard Chartered Bank of
US$3,036 million (2007: US$343 million), loans of US$1,724 million (2007: US$77 million) to
Standard Chartered Holdings Limited, and loans of US$1 million (2007: US$1 million) to other
subsidiaries.
In 2006, the Company licensed intellectual property rights related to the Company’s main brands toan indirect wholly owned subsidiary, Standard Chartered Strategic Brand Management Limited
(SCSBM), the income from which is held on the Company’s balance sheet and released over the term
of licence, which expires in 2015. At 31 December 2008, US$271 million (2007: US$311 million) has
been included as deferred income in the Company balance sheet in relation to this licence.
The Company has an agreement with Standard Chartered Bank that in the event of Standard
Chartered Bank defaulting on its debt coupon interest payments, where the terms of such debt
requires it, the Company shall issue shares as settlement for non-payment of the coupon interest.
57. Significant accounting estimates and judgements
In determining the carrying amounts of certain assets and liabilities, the Group makes assumptions of
the effects of uncertain future events on those assets and liabilities at the balance sheet date. TheGroup’s estimates and assumptions are based on historical experience and expectation of future events
and are reviewed periodically. This disclosure excludes uncertainty over future events and judgements
in respect of measuring financial instruments. Further information about key assumptions concerning
the future, and other key sources of estimation uncertainty, are set out in the notes.
Loan loss provisioning
The Group’s loan loss provisions are established to recognise incurred impairment losses either on
specific loan assets or within a portfolio of loans and receivables.
Impairment losses for specific loan assets are assessed either on an individual or on a portfolio basis.
Individual impairment losses are determined as the difference between the carrying value and thepresent value of estimated future cash flows, discounted at the loans’ original effective interest rate.
Impairment losses determined on a portfolio basis are assessed based on the probability of default
inherent within the portfolio of impaired loans or receivables.
Estimating the amount and timing of future recoveries involves significant judgement, and considers
the level of arrears as well as the assessment of matters such as future economic conditions and the
value of collateral, for which there may not be a readily accessible market.
Loan losses that have been incurred but have not been separately identified at the balance sheet dateare determined on a portfolio basis, which takes into account past loss experience as a result of
uncertainties arising from the economic environment, and defaults based on portfolio trends. Actual
losses identified could differ significantly from the impairment provisions reported as a result of
uncertainties arising from the economic environment.
Fair value of financial instruments
Fair value is the amount for which an asset could be exchanged, or a liability settled, between
knowledgeable, willing parties in an arm’s length transaction.
All financial instruments are initially recognised at fair value, which is normally the transaction price.
In certain circumstances, the initial fair value may be based on a valuation technique which may lead
to the recognition of profits or losses at the time of initial recognition. However, these profits orlosses can only be recognised when the valuation technique used is based solely on observable market
inputs.
Subsequent to initial recognition, some of the Group’s financial instruments are carried at fair value,
with changes in fair value either reported within the income statement or within equity until the
696
c102100pu160Proof7:28.3.10B/LRevision:0OperatorBeeR

instrument is sold or becomes impaired. Details of the type and classification of the Group’s financial
instruments are set out in notes 15 and 17 to the accounts and the accounting policy set out in note
1 to the accounts. In addition to these instruments, the carrying value of a financial instrument
carried at amortised cost that is the hedged item in a qualifying fair value hedge relationship isadjusted by the fair value gain or loss attributable to the hedged risk.
The fair values of quoted financial instruments in active markets are based on current prices. If the
market for a financial instrument is not active, and for unlisted securities, the Group establishes fair
value by using valuation techniques. These include the use of recent arm’s length transactions,
discounted cash flow analysis, option pricing models and other valuation techniques commonly used
by market participants.
Where representative prices are unreliable because of illiquid markets, the determination of fair valuemay require estimation of certain parameters, which are calibrated against industry standards and
observable market data, or the use of valuation models that are based on observable market data.
The fair value for the majority of the Group’s financial instruments is based on observable market
prices or derived from observable market parameters. The most significant element of Group assets in
which observable prices are not available relates to certain instruments held within the asset backed
securities portfolio. At 31 December 2008, assets with a market value of US$2.3 billion were held in
respect of which there was no observable market data, of which US$1.8 billion was held at amortisedcost. For these instruments, changing one or more of the assumptions used to reasonably possible
alternatives would not significantly change their fair value.
Equity investments that do not have an observable market price are fair valued by applying various
valuation techniques, such as earnings multiples, net assets multiples, discounted cash flows, and
industry valuation benchmarks. These techniques are generally applied prior to any initial public
offering, after which an observable market price becomes available. Disposal of such investments are
generally by market trades or private sales.
Goodwill impairment
An annual assessment is made, as set out in note 26, as to whether the current carrying value of
goodwill is impaired. Detailed calculations are performed based on discounting expected pre-tax cash
flows of the relevant cash generating units and discounting these at an appropriate discount rate, the
determination of which requires the exercise of judgement.
Acquired intangible assets
Acquired intangible assets are those that derive their value from contractual customer relationships orthat can be separated and sold, and are amortised over their estimated useful lives. They comprise
customer relationships, core deposits, brands and acquired licences. The valuation and estimated
useful lives of customer relationships, core deposits and brands is dependent on a number of
assumptions and judgements, such as expected cash flows, customer attrition, royalty rates and
applicable costs, variations in which could produce different values and/or useful lives.
For example, if the attrition rates per annum were doubled (or halved) the value of the customer
relationships acquired in the acquisitions in 2008 would decrease by approximately US$12 million (or
increase by approximately US$12 million).
Acquired licences are valued at their purchase price and amortised over the period of the licence.
Pensions
Actuarial assumptions are made in valuing future defined benefit pension obligations as set out in
note 37 and are updated periodically. The principal assumptions relate to the rate of inflation and the
discount rate. The assumed rate of inflation affects the rate at which salaries grow and therefore the
size of the pensions that employees receive on retirement. The discount rate is equal to the yield onhigh-quality corporate bonds which have a term to maturity approximating that of the related
liability, and is potentially subject to significant variation. As a result, there is uncertainty that these
assumptions will continue in the future. For example, if the discount rate for the UK fund increased
by 25 basis points, the liability would reduce by approximately US$46 million, and vice versa. Whilst
changes in other assumptions would have an impact, the effect would not be as significant.
697
c102100pu160Proof7:28.3.10B/LRevision:0OperatorBeeR

Taxes
Determining income tax provisions involves judgement on the tax treatment of certain transactions.
Deferred tax is recognised on tax losses not yet used and on temporary differences where it isprobable that there will be taxable revenue against which these can be offset. Management has made
judgements as to the probability of future taxable revenues being generated against which tax losses
will be available for offset.
Provisions for liabilities and charges
The Group receives legal claims against it in the normal course of business. Management has made
judgements as to the likelihood of any claim succeeding in making provisions. The time of concluding
legal claims is uncertain, as is the amount of possible outflow of economic benefits. Timing and cost
ultimately depends on the due process in respective legal jurisdictions.
Share based payments
Equity-settled share awards are recognised as an expense based on their fair value at date of grant.
The fair value of equity-settled share options is estimated through the use of option valuation models
– which require inputs such as the risk-free interest rate, expected dividends, expected volatility and
the expected option life – and is expensed over the vesting period. Some of the inputs used, such as
the expected option life, are not market observable and are based on estimates derived from available
data, such as employee exercise behaviour. The models utilised, such as the binomial option pricing
model, are intended to value options traded in active markets. The share options issued by the
Group, however, have a number of features that make them incomparable to such traded options.Using different input estimates or models could produce different option values, which would result
in the recognition of a higher or lower expense. For example, if the volatility assumption was
increased by five per cent (or decreased by five per cent), the fair values for options granted under
the Sharesave schemes in 2008 would increase by approximately £0.28 for three year grants, and by
£0.33 for five year grants (or decrease by approximately £0.28 for three year grants, and by £0.33 for
five year grants).
58. Recently issued accounting pronouncements
The following pronouncements relevant and applicable to the Group and Company were issued as at
31 December 2008 but have effective dates for periods beginning after 31 December 2008. The use ofIFRSs and certain IFRIC Interpretations that have yet to be endorsed by the European Union is not
permitted. Those IFRSs and IFRIC Interpretations listed below that have been endorsed by the EU,
and whose use is therefore permitted, have not been applied in preparing these financial statements.
The full impact of these IFRSs and IFRIC Interpretations is currently being assessed by the Group;none of these pronouncements are expected to result in any material adjustments to the financial
statements.
Pronouncement Description of impact
Latest effective
date for the
Group and
Company
IFRS 8 Operating Segments IFRS 8 supersedes IAS 14 ‘Segment Reporting’
and requires the reporting of operating segmentson the same basis as is used internally for
evaluating performance.
1 January 2009
IFRIC 13 Customer Loyalty
Programmes
IFRIC 13 clarifies that consideration received for
the sale of services for which customer loyalty
awards are awarded is allocated between the
service delivered and the award credit, based on
the fair value of the credit awarded.
1 January 2009
IAS 23 Revised Borrowing Costs IAS 23 has been revised to remove the option toexpense borrowing costs incurred in respect of the
construction and development of qualifying assets.
Such costs will now be capitalised as a part of the
cost of the asset.
1 January 2009
IAS 1 Revised Presentation of IAS 1 Revised provides the option to either 1 January 2009
698
c102100pu160Proof7:28.3.10B/LRevision:0OperatorBeeR

Pronouncement Description of impact
Latest effective
date for the
Group and
Company
Financial Statements disclose all non-owner changes in equity in one
statement of Comprehensive Income or continue
to disclose two statements. The standard alsorequires an additional balance sheet to be
presented at the beginning of the earliest
comparative period when a change in accounting
policy is applied retrospectively or a retrospective
restatement is made.
Amendment to IAS 27Consolidated and Separate
Financial Statements*
This amendment changes the treatment for partdisposals, both when control is retained (which is
accounted for as an equity transaction, generating
no profit or loss in the income statement) and
when control is lost (where the residual holding is
measured at fair value with any changes reflected
in income).
1 January2010**
IFRS 3 Revised Business
Combinations*
IFRS 3 Revised requires acquisition costs to be
expensed and not capitalised; an estimate of cash
contingent consideration to be made at the date of
acquisition, with any future changes recognised in
income; provides the option to recognise 100% of
the goodwill of an acquired entity in a partial
acquisition. The Standard can be applied early, on
a prospective basis, for annual periods beginningon or after 30 June 2007.
1 January
2010**
Amendment to IFRS 2 Share-
based Payment: Vesting
Conditions and Cancellations
The amendments clarify the definition of vesting
conditions and the accounting treatment of
cancellations by employees, whereby such
cancellations will immediately result in the
recognition of the amount of the expense thatwould otherwise have been recognised over the
remainder of the vesting period.
1 January 2009
Amendment to IAS 32 Financial
Instruments: Presentation
This amendment is in respect of the balance sheet
classification of puttable financial instruments and
obligations arising only on liquidation. Some
financial instruments that currently meet thedefinition of a financial liability may be classified
as equity if they represent the last residual interest
in the net assets of an entity.
1 January 2009
IFRIC 16 Hedges of a Net
Investment in a Foreign
Operation*
The amendment clarifies that foreign exchange
risk differences between a parent’s functional
currency and those of subsidiaries can be hedgedand the hedging instruments can be held by any
entity or entities within the Group.
1 January
2010**
IFRIC 17 Distributions of Non-
cash Assets for Owners*
IFRIC 17 clarifies the timing of recognising a
liability for dividends, the value to be used at
initial measurement i.e. the fair value of net assets
given. It states that a profit or loss impact wouldarise should the net assets distributed and dividend
payable be different from each other.
1 January 2009
699
c102100pu160Proof7:28.3.10B/LRevision:0OperatorBeeR

Pronouncement Description of impact
Latest effective
date for the
Group and
Company
Improvements to IFRSs (2007) Amendments to IAS 1, IAS 16, IAS 19, IAS 20,
IAS 23, IAS 27, IAS 28, IAS 29, IAS 31, IAS 36,
IAS 38, IAS 39, IAS 40.
1 January 2009
Amendment to IFRS 5. 1 January
2010**
* This IFRS or IFRIC Interpretation has not yet been endorsed by the EU.
** Subject to endorsement of the European Union the Group has not yet made a final decision as to whether it will apply in the 2009financial statements those pronouncements marked (**) in the table above.
59. UK and Hong Kong accounting requirements
As required by the HK Listing Rules, an explanation of the differences in accounting practices
between EU endorsed IFRS and Hong Kong Financial Reporting Standards is required to be
disclosed. There would be no significant differences had these accounts been prepared in accordance
with Hong Kong
Financial Reporting Standards. As set out in note 58, EU endorsed IFRS may differ from IFRSs
published by the International Accounting Standards Board if a standard has not been endorsed by
the EU.
Average balance sheets and yield
The following tables set out the average balances and yields for the Group’s assets and liabilities forthe years ended 31 December 2008 and 31 December 2007. For the purpose of the following table,
average balances have generally been determined on the basis of daily balances, except for certain
categories, for which balances have been determined less frequently.
The Group does not believe that the information presented in this table would be significantly
different had such balances been determined on a daily basis.
2008
Average
non-
interest
earning
balance
US$million
Average
interest
earning
balance
US$million
Interest
income
US$million
Gross
yield
%
Assets
Cash and balances at central banks 6,796 4,563 32 0.7Gross loans and advances to banks 2,805 40,860 1,382 3.4
Gross loans and advances to customers 57 182,582 11,436 6.3
Impairment provisions against loans and advances
to banks and customers (379) (1,289) — —
Investment securities 4,495 72,523 3,528 4.9
Property, plant and equipment and intangible
assets 3,219 — — —
Prepayments, accrued income and other assets 90,866 — — —
Total average assets 107,859 299,239 16,378 5.5
700
c102100pu160Proof7:28.3.10B/LRevision:0OperatorBeeR

2007
Average
non-
interest
earning
balance
US$million
Average
interest
earning
balance
US$million
Interest
income
US$million
Gross yield
%
AssetsCash and balances at central banks 5,910 3,087 39 1.3
Gross loans and advances to banks 2,602 31,446 1,975 6.3
Gross loans and advances to customers 1,324 152,555 10,812 7.1
Impairment provisions against loans and advances
to banks and customers (157) (1,472) — —
Investment securities 2,666 66,131 3,350 5.1
Property, plant and equipment and intangible
assets 3,263 — — —Prepayments, accrued income and other assets 36,996 — — —
Total average assets 52,604 251,747 16,176 6.4
2008
Average
non-
interest
bearing
balance
US$million
Average
interest
bearing
balance
US$million
Interest
expense
US$million
Rate paid
%
Liabilities
Non-interest bearing current and demand
accounts 17,489 — — —
Interest bearing current accounts and savings
deposits 102 84,490 1,231 1.5
Time and other deposits 6,711 146,680 5,373 3.7Debt securities in issue 2,594 28,189 1,338 4.7
Accruals, deferred income and other liabilities 82,114 — — —
Subordinated liabilities and other borrowed funds — 16,637 1,049 6.3
Minority interests 619 — — —
Shareholders’ funds 21,473 — — —
Total average liabilities and shareholders’ funds 131,102 275,996 8,991 3.3
Net yield 2.2
Net interest margin 2.5
701
c102100pu160Proof7:28.3.10B/LRevision:0OperatorBeeR

2007
Average
non-
interest
bearing
balance
US$million
Average
interest
bearing
balance
US$million
Interest
expense
US$million
Rate paid
%
Liabilities
Non-interest bearing current and demand
accounts 18,004 — — —
Interest bearing current accounts and savings
deposits — 65,718 1,508 2.3
Time and other deposits 547 112,616 6,049 5.4
Debt securities in issue 1,302 26,637 1,543 5.8
Accruals, deferred income and other liabilities 46,566 — — —
Subordinated liabilities and other borrowed funds — 14,220 811 5.7
Minority interests 425 — — —
Shareholders’ funds 18,316 — — —
Total average liabilities and shareholders’ funds 85,160 219,191 9,911 4.5
Net yield 1.9
Net interest margin 2.5
Volume and price variances
The following table analyses the estimated change in the Group’s net interest income attributable to
changes in the average volume of interest-earning assets and interest-bearing liabilities, and changes in
their respective interest rates for the periods presented. Volume and rate variances have been
determined based on movements in average balances and average exchange rates over the period and
changes in interest rates on average interest-earning assets and average interest-bearing liabilities.Variances caused by changes in both volume and rate have been allocated to changes in volume.
2008 versus 2007
Increase/(decrease) in
interest due to:
Net
increase/
(decrease)
in interest
US$million
Volume
US$million
Rate
US$million
Interest earning assets
Cash and unrestricted balances at central banks 10 (17) (7)
Loans and advances to banks 318 (911) (593)
Loans and advances to customers 1,970 (1,346) 624
Investment securities 311 (133) 178
Total interest earning assets 2,609 (2,407) 202
Interest bearing liabilities
Subordinated liabilities and other borrowed funds 381 (143) 238
Interest bearing current accounts and savings deposits 283 (560) (277)
Time and other deposits 1,077 (1,753) (676)
Debt securities in issue (122) (83) (205)
Total interest bearing liabilities 1,619 (2,539) (920)
702
c102100pu160Proof7:28.3.10B/LRevision:0OperatorBeeR

2007 versus 2006
Increase/(decrease) in
interest due to:
Net
increase/
(decrease)
in interest
US$million
Volume
US$million
Rate
US$million
Interest earning assets
Cash and unrestricted balances at central banks 27 (17) 10
Loans and advances to banks 498 300 798
Loans and advances to customers 1,724 39 1,763
Investment securities 378 240 618
Total interest earning assets 2,627 562 3,189
Interest bearing liabilities
Subordinated liabilities and other borrowed funds 86 82 168
Interest bearing current accounts and savings deposits 294 (353) (59)
Time and other deposits 762 1,024 1,786
Debt securities in issue 118 239 357
Total interest bearing liabilities 1,260 992 2,252
Risk weighted assets
Segmental information by business
2008 2007
Consumer
Banking
US$million
Wholesale
Banking
US$million
Corporate
items not
allocated
US$million
Total
US$million
Consumer
Banking
US$million
Wholesale
Banking
US$million
Corporate
items not
allocated
US$million
Total
US$million
Total risk weighted assets and
contingents (Basel I) — — — — 63,516 108,317 — 171,833
Total risk weighted assets (Basel II) 52,124 136,697 — 188,821 53,636 131,718 — 185,354
Segmental information by geography
2008
Asia Pacific
Hong Kong
US$million
Singapore
US$million
Malaysia
US$million
Korea
US$million
Other Asia
Pacific
US$million
India
US$million
Middle
East &
Other S
Asia
US$million
Africa
US$million
Americas
UK &
Europe
US$million
Total
US$million
Total risk
weighted assets
(Basel II)* 21,072 15,064 6,314 27,020 30,739 15,578 22,070 7,247 51,744 196,848
* Total risk weighted assets include US$8,027 million of intra-group balances which are netted in calculating capital ratios.
703
c102100pu160Proof7:28.3.10B/LRevision:0OperatorBeeR

2007
Asia Pacific
Hong Kong
US$million
Singapore
US$million
Malaysia
US$million
Korea
US$million
Other Asia
Pacific
US$million
India
US$million
Middle East
& Other S
Asia
US$million
Africa
US$million
Americas
UK &
Europe
US$million
Total
US$million
Total risk
weighted assets
(Basel I),* 25,330 15,008 5,324 37,167 26,024 12,377 16,104 3,927 37,524 178,785
1 Comparative numbers for Basel II risk weighted assets have not been included as it is not considered practicable to restate the dataon this basis.
* Total risk weighted assets and contingents include US$6,952 million of intra-group balances which are netted in calculating capitalratios.
Continuing connected transactions
As noted in the Report of the directors on page 70 of the 2008 Annual Report the Group is required
to include in this Annual Report information regarding certain transactions with Temasek.
On 10 January 2008, the Company and HSBC Institutional Trust Services (Singapore) Limited, as
trustee of CapitaCommercial Trust (CCT) (a Temasek associate), entered into a Framework
Agreement for three years ending 11 January 2011 in relation to continuing connected transactions
for the leasing of premises. For the years ended 31 December 2006 and 2007, the rental and licence
fees paid to CCT under relevant leases and licences amounted to US$6.4 million and US$7.6 millionrespectively. Pursuant to the Framework Agreement, the Group will continue to enter into leases and
licence agreements with CCT provided that the maximum aggregate annual value to be paid under
such leases and licences shall not exceed S$70 million. The maximum aggregate annual value has been
calculated based on a significant increase in the rental rate in line with market conditions and
projections of new space that the Group could secure between 2008 and 2010.
During the year to 31 December 2008, members of the Group have entered into certain non-exempt
continuing connected transactions (as defined by reference to the HK Listing Rules) with Temasek or
its associates in the ordinary and usual course of its business and on normal commercial terms (and
with reference to prevailing market rates as applicable) or in accordance with the practice commonly
adopted in the market (where applicable). These transactions are detailed in the tables on page 174 of
the 2008 Annual Report. Additional details are provided on page 70 of the Report of the directors inthe 2008 Annual Report.
Year to 31 December 2008
Transaction Category Notes
Aggregate
notional
value/
principal
amounts
during the
year
US$million
Notional
value of
outstanding
transactions
or principal
amounts as at
31 December
2008
US$million
Fair value of
outstanding
transactions
as at 31
December
2008
US$million
Total number
of
transactions
during the
year
Total number
of Temasek
associates
with whom
transactions
were entered
Foreign exchange i 323,940 15,386 (553) 29,147 89
Derivatives ii 94,402 53,910 (141) 6,848 39
Capital markets dealing iii 8,403 — — 2,177 7
Physical commodity dealing iv — — — — —
Financial assistance by non-
banking licensed subsidiaries v 378 350 — 5 1
704
c102100pu160Proof7:28.3.10B/LRevision:0OperatorBeeR

Year to 31 December 2007
Transaction Category Notes
Aggregate
notional
value/
principal
amounts
during the
year
US$million
Notional
value of
outstanding
transactions
or principal
amounts as at
31 December
2007
US$million
Fair value of
outstanding
transactions
as at 31
December
2007
US$million
Total number
of
transactions
during the
year
Total number
of Temasek
associates
with whom
transactions
were entered
Foreign exchange i 145,160 5,843 (9) 17,157 83
Derivatives ii 66,734 21,467 (530) 5,294 29
Capital markets dealing iii 1,665 — — 832 12
Physical commodity dealing iv 18 — — 8 2
Financial assistance by non-
banking licensed subsidiaries v 16 — — 1 1
Year to 31 December 2008* Year to 31 December 2007
Transaction Category Notes
Gross fee
revenue to the
Group
US$million
Total number
of Temasek
associates
with
whom
transactions
were entered
Gross fee
revenue to the
Group
US$million
Total number
of Temasek
associates
with
whom
transactions
were entered
Securities services vi 3.4 16 4.0 18
Cash management services vii 0.5 120 0.7 111
Trade services viii 3.2 67 2.9 74
Advisory and arranging services xi 37.9 12 1.5 10
* This data reflects transactions with Temasek or its associates (as defined by the HK Listing Rules) which the Group was able toidentify within the extensive Temasek group of companies as at 17 December 2008.
i Foreign exchange includes spot, forward and foreign exchange swap transactions.
ii Derivatives includes over-the-counter derivatives (including swaps, forwards, options and combinations thereof) on currencies,interest rates, commodities, credit risk, bonds, equities and any other classes of underlying prices, rates, indices or instruments.
iii Capital markets dealing includes sales, purchases and participations of securities, loans and other financial instruments.
iv Physical commodity dealing relates to financing transactions, such as inventory finance in which a member of the Group takes titleto the relevant commodities, and have the benefit of the financial assistance exemptions in the HK Listing Rules. However,transactions entered into for hedging purposes in connection with commodity derivatives and some other transactions in physicalcommodities are not connected with a financing and are not, therefore, exempt under the HK Listing Rules.
v Financial assistance by non-banking subsidiaries includes the granting of credit, lending money, providing security for orguaranteeing a loan and transactions of a similar nature or directly related to the same, by members of the Group which are notlicensed as banking companies which would otherwise have allowed them to benefit from the exemption for such transactions as isavailable to licensed banking companies under the HK Listing Rules.
vi Securities services includes custody, escrow agency, receiving bank, trustee, transfer agency, paying agency and fundsadministration services, derivatives clearing services and facilities for custody clients to lend their securities.
vii Cash management services includes account services (payments and collections), liquidity management services and clearingservices.
viii Trade services includes trade services not involving credit exposure, such as export bills collection, advising of letters of credit,document preparation, processing and checking services and safekeeping of documents.
xi Advisory and arranging services includes corporate finance advisory services, arranging and advising on loans from third partylenders and public and private placements of securities (where the Group does not participate as lender, underwriter orsubscriber).
705
c102100pu160Proof7:28.3.10B/LRevision:0OperatorBeeR

Five year summary
2008
US$million
2007*
US$million
2006
US$million
2005
US$million
2004**
US$million
Operating profit before impairment
losses and taxation 6,357 4,852 3,824 3,050 2,533
Impairment losses on loans and
advances and other credit risk
provisions (1,321) (761) (629) (319) (214)Other impairment (469) (57) (15) (50) (68)
Profit before taxation 4,801 4,035 3,178 2,681 2,251
Profit attributable to shareholders 3,408 2,841 2,278 1,946 1,578
Loans and advances to banks1 46,583 35,365 19,724 21,701 16,687
Loans and advances to customers1 174,178 154,266 139,300 111,791 72,019
Total assets 435,068 329,871 266,102 215,096 147,124
Deposits by banks1 31,909 25,880 26,233 18,834 15,162
Customer accounts1 234,008 179,760 147,382 119,931 85,093Shareholders’ equity 22,140 20,851 16,853 11,882 9,105
Total capital resources2 39,681 37,192 30,096 22,682 16,837
Information per ordinary share
Basic earnings per share{ 202.4c 176.0c 148.0c 130.0c 113.4c
Normalised earning per share3 { 174.9c 173.0c 149.4c 134.5c 109.1c
Dividends per share {{ 61.62c 59.65c 53.40c 48.1c 43.2c
Net asset value per share 1,091.1c 1,374.2c 1,208.5c 897.3c 719.0c
Ratios
Post-tax return on ordinary
shareholders’ equity – normalised
basis3 15.2% 15.6% 16.9% 18.0% 18.6%
Basic cost-income ratio 54.5% 56.2% 55.6% 55.5% 52.9%
Cost-income ratio – normalised
basis3 56.1% 56.0% 55.2% 54.5% 54.0%
Capital ratios:Tier 1 capitala {{{ 10.1% 8.8% 8.3% 7.7% 8.6%
Total capitala {{{ 15.6% 15.2% 14.2% 13.6% 15.0%
1 Excludes amounts held at fair value through profit or loss.
2 Shareholders’ funds, minority interests and subordinated loan capital.
3 Results on a normalised basis reflect the Group’s results, excluding amortisation and impairment of intangible assets, profits andlosses of a capital nature, and profits and losses on repurchase of subordinated liabilities.
* Amounts have been restated as explained in note 53 on pages 692 to 693.
** IFRS (excluding IAS 32 and 39).
a Unaudited.{ As required by IAS 33 ‘Earnings per share’ the impact of the bonus element included within the rights issue has been included
within the calculation of the basic and diluted earnings per share for the year and prior periods have been represented on this basis.{{ Dividends per share in respect of prior periods has been restated for the impact of the rights issue to provide a more meaningful
comparison.{{{ For 2008 and 2007, on a Basel II basis, 2004-2006, on a Basel I basis.
706
c102100pu160Proof7:28.3.10B/LRevision:0OperatorBeeR

AUDITED FINANCIAL INFORMATIONFOR THE FINANCIAL YEAR ENDED 31 DECEMBER 2007
Statement of directors’ responsibilities in respect of the Annual Report and the financial statements
The directors are responsible for preparing the Annual Report and the Group and Company financialstatements in accordance with applicable law and regulations.
Company law requires the directors to prepare Group and Company financial statements for each
financial year. Under that law they are required to prepare the Group financial statements inaccordance with IFRSs as adopted by the EU and applicable law and have elected to prepare the
Company financial statements on the same basis.
The Group and Company financial statements are required by law and IFRSs as adopted by the EU
to present fairly the financial position of the Group and Company and the performance of the Group
for that period; the Companies Act 1985 provides in relation to such financial statements that
references in the relevant part of that Act to financial statements giving a true and fair view are
references to their achieving a fair presentation.
In preparing each of the Group and Company financial statements, the directors are required to:
* select suitable accounting policies and then apply them consistently;
* make judgements and estimates that are reasonable and prudent;
* state whether they have been prepared in accordance with IFRSs as adopted by the EU; and
* prepare the financial statements on the going concern basis unless it is inappropriate to presume
that the Group and the Company will continue in business.
The directors are responsible for keeping proper accounting records that disclose, with reasonable
accuracy at any time, the financial position of the Company and enable them to ensure that its
financial statements comply with the Companies Act 1985. They have general responsibility for takingsuch steps as are reasonably open to them to safeguard the assets of the Group and to prevent and
detect fraud and other irregularities.
Under applicable law and regulations, the directors are also responsible for preparing a Directors’
Report, Directors’ Remuneration Report and the Corporate Governance Statement that comply with
that law and those regulations.
The directors are responsible for the maintenance and integrity of the corporate and financial
information included on the Company’s website. Legislation in the UK governing the preparation and
dissemination of financial statements may differ from legislation in other jurisdictions.
707

Independent Auditor’s Report to the members of Standard Chartered PLC
We have audited the Group (Standard Chartered PLC and its subsidiaries) and Company (Standard
Chartered PLC) financial statements (together referred to as the ‘financial statements’) for the yearended 31 December 2007 which comprise the Group Income Statement, the Group and Company
Balance Sheets, the Group and Company Cash Flow Statements, the Group and Company
Statements of Recognised Income and Expense, and the related notes. These financial statements have
been prepared under the accounting policies set out therein. We have also audited the information in
the Directors’ Remuneration Report that is described as having been audited.
This report is made solely to the Company’s members, as a body, in accordance with section 235 of
the UK Companies Act 1985. Our audit work has been undertaken so that we might state to the
Company’s members those matters we are required to state to them in an auditor’s report and for no
other purpose. To the fullest extent permitted by law, we do not accept or assume responsibility toanyone other than the Company and the Company’s members as a body, for our audit work, for this
report, or for the opinions we have formed.
Respective responsibilities of directors and auditor
The directors’ responsibilities for preparing the Annual Report, the Directors’ Remuneration Report
and the financial statements in accordance with applicable law and International Financial ReportingStandards (IFRSs) as adopted by the EU are set out in the Statement of Directors’ Responsibilities
on page 86 of the 2007 Annual Report.
Our responsibility is to audit the financial statements and the part of the Directors’ Remuneration
Report to be audited in accordance with relevant legal and regulatory requirements and International
Standards on Auditing (UK and Ireland).
We report to you our opinion as to whether the financial statements give a true and fair view and
whether the financial statements and the part of the Directors’ Remuneration Report to be audited
have been properly prepared in accordance with the UK Companies Act 1985 and, as regards the
Group financial statements, Article 4 of the IAS Regulation. We also report to you whether in our
opinion the information given in the Report of the Directors is consistent with the financialstatements. The information given in the Report of Directors includes information presented in the
Chairman’s statement, the Group Chief Executive’s Review and the Financial and Business Reviews
that are cross referenced from the Report of the Directors. In addition we report to you if the
Company has not kept proper accounting records, if we have not received all the information and
explanations we require for our audit, or if information specified by law regarding directors’
remuneration and other transactions is not disclosed.
We review whether the Corporate Governance Statement reflects the Company’s compliance with the
nine provisions of the 2006 FRC Combined Code specified for the Company’s review by the ListingRules of the Financial Services Authority, and we report if it does not. We are not required to
consider whether the Board’s statements on internal control cover all risks and controls, or form an
opinion on the effectiveness of the Group’s corporate governance procedures or its risk and control
procedures.
We read other information contained in the Annual Report and considers whether it is consistent
with the audited financial statements. We consider the implications for our report if we become aware
of any apparent misstatements or material inconsistencies with the financial statements. Our
responsibilities do not extend to any other information.
Basis of audit opinion
We conduct our audit in accordance with International Standards on Auditing (UK and Ireland)
issued by the Auditing Practices Board. An audit includes examination, on a test basis, of evidence
relevant to the amounts and disclosures in the financial statements and the part of the Directors’
Remuneration Report to be audited. It also includes an assessment of the significant estimates and
judgements made by the directors in the preparation of the financial statements, and of whether the
accounting policies are appropriate to the Group’s and Company’s circumstances, consistently appliedand adequately disclosed.
We planned and performed our audit so as to obtain all the information and explanations which we
considered necessary in order to provide us with sufficient evidence to give reasonable assurance that
the financial statements and the part of the Directors’ Remuneration Report to be audited are free
from material misstatement, whether caused by fraud or other irregularity or error. In forming our
708

opinion we also evaluated the overall adequacy of the presentation of information in the financial
statements and the part of the Directors’ Remuneration Report to be audited.
Opinion
In our opinion:
* the Group financial statements give a true and fair view, in accordance with IFRSs as adopted
by the EU, of the state of the Group’s affairs as at 31 December 2007 and of its profit for the
year then ended;
* the Company financial statements give a true and fair view, in accordance with IFRSs as
adopted by the EU as applied in accordance with the provisions of the UK Companies Act1985, of the state of the Company’s affairs as at 31 December 2007;
* the financial statements and the part of the Directors’ Remuneration Report to be audited havebeen properly prepared in accordance with the UK Companies Act 1985 and, as regards the
Group financial statements, Article 4 of the IAS Regulation; and
* the information given in the Report of the Directors is consistent with the financial statements.
KPMG Audit Plc
London
Chartered Accountants
Registered Auditor
26 February 2008
709

Consolidated Income Statement
For the year ended 31 December 2007
2007 2006
Notes US$million
Excluding
acquisitions
US$million
Acquisitions
US$million
Total
US$million
Interest income 3 16,176 12,810 177 12,987
Interest expense 4 (9,911) (7,576) (83) (7,659)
Net interest income 6,265 5,234 94 5,328
Fees and commission income 5 3,189 2,232 43 2,275
Fees and commission expense 5 (528) (392) (2) (394)
Net trading income 6 1,261 914 6 920
Other operating income 7 880 485 6 491
4,802 3,239 53 3,292
Operating income 11,067 8,473 147 8,620
Staff costs 8 (3,949) (2,873) (40) (2,913)
Premises costs 8 (592) (439) (5) (444)
General administrative expenses 8 (1,329) (1,144) (27) (1,171)
Depreciation and amortisation 9 (345) (249) (19) (268)
Operating expenses (6,215) (4,705) (91) (4,796)
Operating profit before
impairment losses and taxation 4,852 3,768 56 3,824
Impairment losses on loans and
advances and other credit
risk provisions 20 (761) (611) (18) (629)
Other impairment 10 (57) (15) — (15)
Profit/(loss) from associates 23 1 (2) — (2)
Profit before taxation 4,035 3,140 38 3,178
Taxation 11 (1,046) (812) (12) (824)
Profit for the year 2,989 2,328 26 2,354
Profit attributable to:
Minority interests 40 148 75 1 76
Parent company shareholders 2,841 2,253 25 2,278
Profit for the year 2,989 2,328 26 2,354
Basic earnings per ordinary share 13 201.1c 169.0c
Diluted earnings per ordinary
share 13 198.7c 167.0c
710
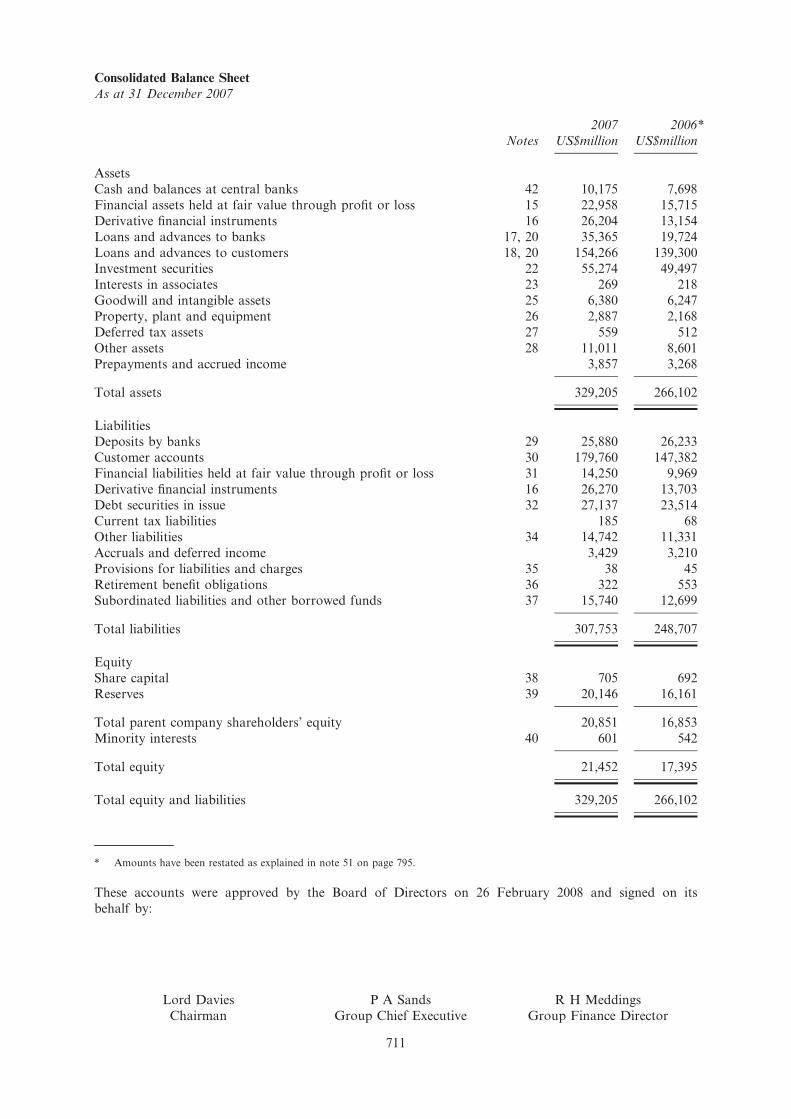
Consolidated Balance Sheet
As at 31 December 2007
Notes
2007
US$million
2006*
US$million
Assets
Cash and balances at central banks 42 10,175 7,698
Financial assets held at fair value through profit or loss 15 22,958 15,715
Derivative financial instruments 16 26,204 13,154
Loans and advances to banks 17, 20 35,365 19,724
Loans and advances to customers 18, 20 154,266 139,300Investment securities 22 55,274 49,497
Interests in associates 23 269 218
Goodwill and intangible assets 25 6,380 6,247
Property, plant and equipment 26 2,887 2,168
Deferred tax assets 27 559 512
Other assets 28 11,011 8,601
Prepayments and accrued income 3,857 3,268
Total assets 329,205 266,102
Liabilities
Deposits by banks 29 25,880 26,233
Customer accounts 30 179,760 147,382Financial liabilities held at fair value through profit or loss 31 14,250 9,969
Derivative financial instruments 16 26,270 13,703
Debt securities in issue 32 27,137 23,514
Current tax liabilities 185 68
Other liabilities 34 14,742 11,331
Accruals and deferred income 3,429 3,210
Provisions for liabilities and charges 35 38 45
Retirement benefit obligations 36 322 553Subordinated liabilities and other borrowed funds 37 15,740 12,699
Total liabilities 307,753 248,707
EquityShare capital 38 705 692
Reserves 39 20,146 16,161
Total parent company shareholders’ equity 20,851 16,853
Minority interests 40 601 542
Total equity 21,452 17,395
Total equity and liabilities 329,205 266,102
* Amounts have been restated as explained in note 51 on page 795.
These accounts were approved by the Board of Directors on 26 February 2008 and signed on its
behalf by:
Lord Davies
Chairman
P A Sands
Group Chief Executive
R H Meddings
Group Finance Director
711

Statement of Recognised Income and Expense
For the year ended 31 December 2007
Group Company
Notes
2007
US$million
2006
US$million
2007
US$million
2006
US$million
Exchange differences on translation
of foreign operations:
Net gains taken to equity 415 670 — —
Transferred to income onrepatriation of branch capital (109) — — —
Actuarial gains on retirement
benefit obligations 36 237 104 — —
Available-for-sale investments:
Net valuation gains taken to
equity 675 682 — —
Transferred to income (252) (190) — —
Cash flow hedges:Net gains taken to equity 57 79 — —
Net (gains)/losses transferred to
income for the year (58) 20 — —
Taxation on items recognised
directly in equity (99) (131) — —
Other — 7 — (3)
Net income/(expense) recognised in
equity 866 1,241 — (3)Profit for the year 2,989 2,354 349 686
Total recognised income and
expense for the year 3,855 3,595 349 683
Attributable to:
Minority interests 40 196 111 — —
Parent company shareholders 39 3,659 3,484 349 683
3,855 3,595 349 683
712
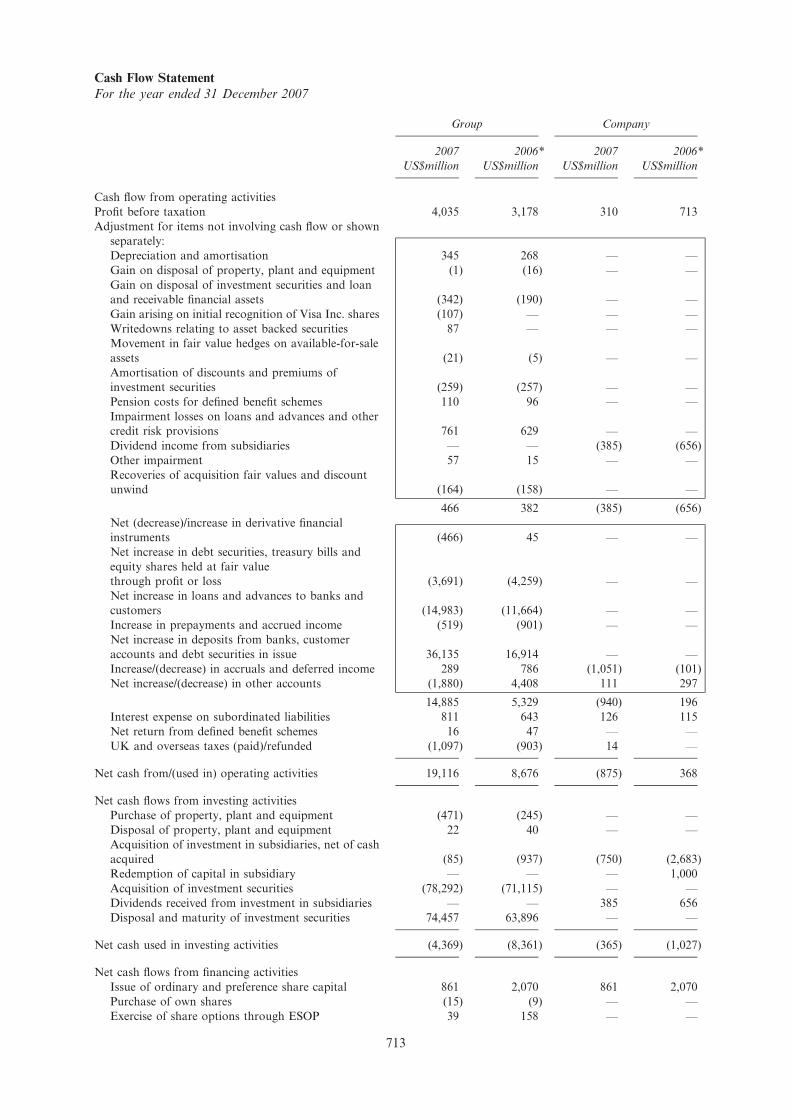
Cash Flow Statement
For the year ended 31 December 2007
Group Company
2007
US$million
2006*
US$million
2007
US$million
2006*
US$million
Cash flow from operating activities
Profit before taxation 4,035 3,178 310 713
Adjustment for items not involving cash flow or shown
separately:
Depreciation and amortisation 345 268 — —
Gain on disposal of property, plant and equipment (1) (16) — —
Gain on disposal of investment securities and loan
and receivable financial assets (342) (190) — —
Gain arising on initial recognition of Visa Inc. shares (107) — — —
Writedowns relating to asset backed securities 87 — — —
Movement in fair value hedges on available-for-sale
assets (21) (5) — —
Amortisation of discounts and premiums of
investment securities (259) (257) — —
Pension costs for defined benefit schemes 110 96 — —
Impairment losses on loans and advances and other
credit risk provisions 761 629 — —
Dividend income from subsidiaries — — (385) (656)
Other impairment 57 15 — —
Recoveries of acquisition fair values and discount
unwind (164) (158) — —
466 382 (385) (656)
Net (decrease)/increase in derivative financial
instruments (466) 45 — —
Net increase in debt securities, treasury bills and
equity shares held at fair value
through profit or loss (3,691) (4,259) — —
Net increase in loans and advances to banks and
customers (14,983) (11,664) — —
Increase in prepayments and accrued income (519) (901) — —
Net increase in deposits from banks, customer
accounts and debt securities in issue 36,135 16,914 — —
Increase/(decrease) in accruals and deferred income 289 786 (1,051) (101)
Net increase/(decrease) in other accounts (1,880) 4,408 111 297
14,885 5,329 (940) 196
Interest expense on subordinated liabilities 811 643 126 115
Net return from defined benefit schemes 16 47 — —
UK and overseas taxes (paid)/refunded (1,097) (903) 14 —
Net cash from/(used in) operating activities 19,116 8,676 (875) 368
Net cash flows from investing activities
Purchase of property, plant and equipment (471) (245) — —
Disposal of property, plant and equipment 22 40 — —
Acquisition of investment in subsidiaries, net of cash
acquired (85) (937) (750) (2,683)
Redemption of capital in subsidiary — — — 1,000
Acquisition of investment securities (78,292) (71,115) — —
Dividends received from investment in subsidiaries — — 385 656
Disposal and maturity of investment securities 74,457 63,896 — —
Net cash used in investing activities (4,369) (8,361) (365) (1,027)
Net cash flows from financing activities
Issue of ordinary and preference share capital 861 2,070 861 2,070
Purchase of own shares (15) (9) — —
Exercise of share options through ESOP 39 158 — —
713

Group Company
2007
US$million
2006*
US$million
2007
US$million
2006*
US$million
Redemption of preference share capital — (328) — (328)
Interest paid on subordinated liabilities (737) (562) (118) (124)
Gross proceeds from issue of subordinated liabilities 3,051 1,591 — —
Repayment of subordinated liabilities (505) (390) — —
Dividends paid to minority interests and preference
shareholders (148) (80) (28) (25)
Dividends paid to ordinary shareholders (573) (496) (573) (496)
Net cash from financing activities 1,973 1,954 142 1,097
Net increase/(decrease) in cash and cash equivalents 16,720 2,269 (1,098) 438
Cash and cash equivalents at beginning of year 38,161 35,226 2,028 1,590
Effect of exchange rate movements on cash and cash
equivalents 457 666 — —
Cash and cash equivalents at end of year (note 42) 55,338 38,161 930 2,028
* Amounts have been re-presented as explained in note 51 on page 795.
714

Company Balance Sheet
As at 31 December 2007
Notes
2007
US$million
2006
US$million
Non-current assets
Investments in subsidiary undertakings 23 10,406 9,656
Current assets
Amounts owed by subsidiary undertakings 2,019 3,181
Taxation 183 158Other 127 103
2,329 3,442
Current liabilities
Amounts owed to subsidiary undertakings 1,089 1,153
Other creditors, including taxation 102 71
Deferred income 40 154
1,231 1,378
Net current assets 1,098 2,064
Total assets less current liabilities 11,504 11,720
Non-current liabilities
Subordinated liabilities and other borrowed funds 37 1,987 1,977
Deferred income 271 1,208
9,246 8,535
Equity
Share capital 38 705 692
Reserves 39 8,541 7,843
Total equity 9,246 8,535
These accounts were approved by the Board of Directors on 26 February 2008 and signed on its
behalf by:
Lord Davies
Chairman
P A Sands
Group Chief Executive
R H Meddings
Group Finance Director
715

Notes to the Accounts
1. Accounting Policies
Statement of compliance
The Group financial statements consolidate those of the Company and its subsidiaries (together
referred to as the ‘‘Group’’), equity account the Group’s interest in associates and proportionately
consolidate interests in jointly controlled entities. The parent company financial statements presentinformation about the Company as a separate entity and not about its group.
Both the parent company financial statements and the Group financial statements have been prepared
and approved by the directors in accordance with International Financial Reporting Standards
(‘IFRS’) and International Financial Reporting Interpretation Committee (‘IFRIC’) Interpretations asadopted by the EU (together ‘adopted IFRS’). In publishing the parent company financial statements
together with the Group financial statements, the Company has taken advantage of the exemption in
section 230 of the UK Companies Act 1985 not to present its individual income statement and
related notes that form a part of these approved financial statements.
The Group has retrospectively adopted IFRIC 7 ‘Applying the Restatement Approach under IAS 29
Financial Reporting in Hyperinflationary Economies’, IFRIC 8 ‘Scope of IFRS 2’, IFRIC 9
‘Reassessment of Embedded Derivatives’ and IFRIC 10 ‘Interim Financial Reporting and
Impairment’, none of which had an impact on the Group’s consolidated financial statements.
The Group has also adopted IFRS 7 ‘Financial Instruments: Disclosures’ and the Amendment to IAS1 ‘Presentation of Financial Statements – Capital Disclosures’ and the disclosures required are
presented within the ‘Risk Review’ on pages 43 to 59 of the 2007 Annual Report and ‘Capital’ on
pages 60 to 61 of the 2007 Annual Report*, except where indicated as not audited, and the notes to
the accounts.
The consolidated balance sheet at 31 December 2006 has been restated as explained in note 51 on
page 795 to reflect the revised fair values of the assets and liabilities acquired on the acquisitions of
Union Bank and Hsinchu. Certain items in the Group and Company cash flow statements for the
year ended 31 December 2006 have been re-presented as explained in note 51.
Basis of preparation
The consolidated financial statements have been prepared under the historical cost convention, as
modified by the revaluation of cash-settled share based payments, available-for-sale assets, andfinancial assets and liabilities (including derivatives) at fair value through profit or loss.
The preparation of financial statements in conformity with adopted IFRS requires the use of certain
critical accounting estimates. It also requires management to exercise its judgement in the process of
applying the Group’s accounting policies.
The accounting policies set out below have been applied consistently across the Group and to all
periods presented in these financial statements.
Consolidation
Subsidiaries
Subsidiaries are all entities (including special purpose entities) over which the Group has the power to
directly or indirectly govern the financial and operating policies, generally accompanying a
shareholding of more than one half of the voting rights. Subsidiaries are fully consolidated from the
date on which the Group effectively obtains control. They are de-consolidated from the date thatcontrol ceases.
The purchase method of accounting is used to account for the acquisition of subsidiaries by the
Group. The cost of an acquisition is measured as the fair value of the assets given, equity instruments
issued and liabilities incurred or assumed at the date of exchange, together with costs directlyattributable to the acquisition. Identifiable net assets and contingent liabilities acquired are fair valued
at the acquisition date, irrespective of the extent of any minority interest. The excess of the cost of
acquisition over the fair value of the Group’s share of the identifiable net assets and contingent
liabilities acquired is recorded as goodwill. If the cost of acquisition is less than the fair value of the
net assets and contingent liabilities of the subsidiary acquired, the difference is recognised directly in
716
c102100pu180Proof7:28.3.10B/LRevision:0OperatorBeeR
* This information forms part of the Notes to the Accounts and is disclosed on pages 205 to 226 and 228 to 235 of this Draft RedHerring Prospectus. Pages 205 to 226 and 228 to 235 of this Draft Red Herring Prospectus also include information which is notaudited and a full set of audited financial statements can be obtained from www.standardchartered.com.

the income statement. Where the fair values of the identifiable net assets and contingent liabilities
acquired have been determined provisionally or where contingent or deferred consideration is payable,
any adjustments arising from their subsequent finalisation are made as of the date of acquisition and
amounts restated as appropriate.
Inter-company transactions, balances and unrealised gains on transactions between Group companies
are eliminated in the Group accounts. Unrealised losses are also eliminated unless the transaction
provides evidence of impairment of the asset transferred.
Associates
Associates are all entities over which the Group has the ability to significantly influence the financial
and operating policies and procedures, but not control, generally accompanying a shareholding of
between 20% and 50% of the voting rights. Investments in associates are accounted for by the equity
method of accounting and are initially recognised at cost.
The Group’s investment in associates includes goodwill identified on acquisition (net of any
accumulated impairment loss).
The Group’s share of its associates’ post-acquisition profits or losses is recognised in the income
statement, and its share of post-acquisition movements in reserves is recognised in reserves. The
cumulative post-acquisition movements are adjusted against the carrying amount of the investment.
When the Group’s share of losses in an associate equals or exceeds its interest in the associate,
including any other unsecured receivables, the Group does not recognise further losses, unless it hasincurred obligations or made payments on behalf of the associate.
Unrealised gains on transactions between the Group and its associates are eliminated to the extent of
the Group’s interest in the associates. Unrealised losses are also eliminated unless the transaction
provides evidence of an impairment of the asset transferred.
Joint ventures
Interests in jointly controlled entities are recognised using proportionate consolidation whereby the
Group’s share of the joint venture’s assets, liabilities, income and expenses are combined line by line
with similar items in the Group’s financial statements.
Investment in subsidiaries, associates and joint ventures
In the Company’s financial statements, investment in subsidiaries, associates and joint ventures are
held at cost less impairment and dividends from pre-acquisition profits received, if any.
Foreign currency translation
Both the parent company financial statements and the Group financial statements are presented in USDollars, which is the presentation currency of the Group and the functional and presentation
currency of the Company.
Transactions and balances
Foreign currency transactions are translated into the functional currency using the exchange rates
prevailing at the dates of the transactions. Foreign exchange gains and losses resulting from the
settlement of such transactions, and from the translation at year-end exchange rates of monetary
assets and liabilities denominated in foreign currencies, are recognised in the income statement. Non-
monetary assets and liabilities are translated at historical exchange rates if held at historical cost, oryear-end exchange rates if held at fair value, and the resulting foreign exchange gains and losses are
recognised in either the income statement or shareholders’ equity depending on the treatment of the
gain or loss on the asset or liability.
Group companies
The results and financial position of all the entities included in the Group financial statements that
have a functional currency different from the presentation currency are accounted for as follows:
* assets and liabilities for each balance sheet presented are translated at the closing rate at the
balance sheet date;
* income and expenses for each income statement are translated at average exchange rates or at
rates on the date of the transaction where exchange rates fluctuate significantly; and
* all resulting exchange differences arising since 1 January 2004 are recognised as a separate
component of equity.
717
c102100pu180Proof7:28.3.10B/LRevision:0OperatorBeeR

On consolidation, exchange differences arising from the translation of the net investment in foreign
entities, and of borrowings and other currency instruments designated as hedges of such investments,
are taken to shareholders’ equity. When a foreign operation is sold or capital repatriated they are
recognised in the income statement as part of the gain or loss on disposal.
Goodwill and fair value adjustments arising on the acquisition of a foreign entity are treated as assets
and liabilities of the foreign entity and translated at the closing rate.
Intangible assets
Goodwill
Goodwill represents the excess of the cost of an acquisition over the fair value of the Group’s share
of the identifiable net assets and contingent liabilities of the acquired subsidiary or associate at the
date of acquisition. Goodwill on acquisitions of subsidiaries is included in ‘Intangible assets’.Goodwill on acquisitions of associates is included in ‘Investments in associates’. Goodwill is assessed
at each balance sheet date for impairment and carried at cost less any accumulated impairment losses.
Gains and losses on the disposal of an entity include the carrying amount of goodwill relating to the
entity sold. Goodwill is allocated to cash-generating units for the purpose of impairment testing.
Acquired intangibles
At the date of acquisition of a subsidiary or associate, intangible assets which are deemed separable
and that arise from contractual or other legal rights are capitalised and included within the net
identifiable assets acquired. These intangible assets are initially measured at fair value, which reflects
market expectations of the probability that the future economic benefits embodied in the asset willflow to the entity, and are amortised on the basis of their expected useful lives (four to sixteen years).
At each balance sheet date, these assets are assessed for indicators of impairment. In the event that
an asset’s carrying amount is determined to be greater than its recoverable amount, the asset is
written down immediately.
Computer software
Acquired computer software licenses are capitalised on the basis of the costs incurred to acquire and
bring to use the specific software. Costs associated with the development of software are capitalised
where it is probable that it will generate future economic benefits in excess of its cost. Computersoftware costs are amortised on the basis of expected useful life (three to five years). Costs associated
with maintaining software are recognised as an expense as incurred. At each balance sheet date, these
assets are assessed for indicators of impairment. In the event that an asset’s carrying amount is
determined to be greater than its recoverable amount, the asset is written down immediately.
Property, plant and equipment
Land and buildings comprise mainly branches and offices. All property, plant and equipment is stated
at cost less accumulated depreciation and impairment losses. Cost includes expenditure that is directly
attributable to the acquisition of the assets.
Subsequent costs are included in the asset’s carrying amount or are recognised as a separate asset, as
appropriate, only when it is probable that future economic benefits associated with the item will flow
to the Group and the cost of the item can be measured reliably. All other repairs and maintenance
are charged to the income statement during the financial period in which they are incurred.
Land is not depreciated although it is subject to impairment testing. Depreciation on other assets iscalculated using the straight-line method to allocate their cost to their residual values over their
estimated useful lives, as follows:
Buildings up to 50 years
Leasehold improvements life of lease, up to 50 years
Equipment and motor vehicles 3 to 15 years
The assets’ residual values and useful lives are reviewed, and adjusted if appropriate, at each balance
sheet date. At each balance sheet date, assets are also assessed for indicators of impairment. In theevent that an asset’s carrying amount is determined to be greater than its recoverable amount, the
asset is written down immediately.
Gains and losses on disposals are included in the income statement.
718
c102100pu180Proof7:28.3.10B/LRevision:0OperatorBeeR

Leases
Where a Group company is the lessee
The leases entered into by the Group are primarily operating leases. The total payments made under
operating leases are charged to the income statement on a straight-line basis over the period of the
lease.
When an operating lease is terminated before the lease period has expired, any payment required to
be made to the lessor by way of penalty is recognised as an expense in the period in which
termination takes place.
Where the group is a lessee under finance leases, the leased assets are capitalised and included in‘Property, plant and equipment’ with a corresponding liability to the lessor recognised in ‘Other
liabilities’. Finance charges payable are recognised over the period of the lease based on the interest
rate implicit in the lease to give a constant periodic rate of return.
Where a Group company is the lessor
When assets are held subject to a finance lease, the present value of the lease payments is recognised
as a receivable. The difference between the gross receivable and the present value of the receivable is
recognised as unearned finance income. Lease income is recognised over the term of the lease using
the net investment method (before tax), which reflects a constant periodic rate of return ignoring tax
cash flows.
Assets leased to customers under operating leases are included within ‘Property, plant and equipment’
and depreciated over their useful lives. Rental income on these leased assets is recognised in the
income statement on a straight-line basis unless another systematic basis is more representative.
Cash and cash equivalents
For the purposes of the cash flow statement, cash and cash equivalents comprise balances with less
than three months’ maturity from the date of acquisition, including: cash and balances at central
banks (unless restricted), treasury bills and other eligible bills, loans and advances to banks, and
short-term government securities.
Provisions
Provisions for restructuring costs and legal claims are recognised when: the Group has a present legal
or constructive obligation as a result of past events; it is more likely than not that an outflow of
resources will be required to settle the obligation and the amount can be reliably estimated.
Employee benefits
Pension obligations
The Group operates a number of pension and other post-retirement benefit plans around the world,
including defined contribution plans and defined benefit plans.
For defined contribution plans, the Group pays contributions to publicly or privately administered
pension plans on a mandatory, contractual or voluntary basis, and such amounts are charged to
operating expenses. The Group has no further payment obligations once the contributions have been
paid.
For defined benefit plans, the liability recognised in the balance sheet is the present value of the
defined benefit obligation at the balance sheet date less the fair value of plan assets. The definedbenefit obligation is calculated annually by independent actuaries using the projected unit method.
The present value of the defined benefit obligation is determined by discounting the estimated future
cash outflows using an interest rate equal to the yield on high-quality corporate bonds that are
denominated in the currency in which the benefits will be paid, and that have a term to maturity
approximating to the term of the related pension liability.
Actuarial gains and losses that arise are recognised in shareholders’ equity and presented in thestatement of recognised income and expense in the period they arise. Past service costs are recognised
immediately to the extent that benefits are vested and are otherwise recognised over the average
period until benefits are vested on a straight-line basis. Current service costs and any past service
costs, together with the unwinding of the discount on plan liabilities, offset by the expected return on
plan assets, are charged to operating expenses.
719
c102100pu180Proof7:28.3.10B/LRevision:0OperatorBeeR

Share-based compensation
The Group operates equity-settled and cash-settled share-based compensation plans. The fair value of
the employee services received in exchange for the grant of the options is recognised as an expense.
For equity-settled awards, the total amount to be expensed over the vesting period is determined by
reference to the fair value of the options granted, excluding the impact of any non-market vesting
conditions (for example, profitability and growth targets). The fair value of equity instrumentsgranted is based on market prices, if available, at the date of grant. In the absence of market prices,
the fair value of the instruments is estimated using an appropriate valuation technique, such as a
binomial option pricing model. Non-market vesting conditions are included in assumptions about the
number of options that are expected to vest. At each balance sheet date, the Group revises its
estimates of the number of options that are expected to vest. It recognises the impact of the revision
of original estimates, if any, in the income statement, and a corresponding adjustment to equity over
the remaining vesting period. For forfeitures prior to vesting attributable to factors other than failure
to satisfy market-based performance conditions, the cumulative charge incurred is credited to theincome statement.
The proceeds received net of any directly attributable transaction costs are credited to share capital
(nominal value) and share premium when the options are exercised.
Cash-settled awards are revalued at each balance sheet date and a liability recognised on the balance
sheet for all unpaid amounts, with any changes in fair value charged or credited to staff costs in the
income statement.
Taxation
Deferred tax is provided in full, using the liability method, on temporary differences arising between
the tax bases of assets and liabilities and their carrying amounts in the consolidated financial
statements. Deferred income tax is determined using tax rates (and laws) that have been enacted or
substantially enacted as at the balance sheet date and that are expected to apply when the related
deferred income tax asset is realised or the deferred income tax liability is settled.
Deferred tax assets are recognised where it is probable that future taxable profit will be available
against which the temporary differences can be utilised.
Income tax payable on profits, based on the applicable tax law in each jurisdiction, is recognised as
an expense in the period in which profits arise. The tax effects of income tax losses available for
carry forward are recognised as an asset when it is probable that future taxable profits will be
available against which these losses can be utilised.
Current and deferred tax relating to items which are charged or credited directly to equity, is credited
or charged directly to equity and is subsequently recognised in the income statement together with the
current or deferred gain or loss.
Borrowings
Borrowings are recognised initially at fair value, being their issue proceeds (fair value of consideration
received) net of directly attributable transaction costs incurred. Borrowings are subsequently stated at
amortised cost, with any difference between proceeds net of directly attributable transaction costs and
the redemption value recognised in the income statement over the period of the borrowings using theeffective interest method.
Preference shares which carry a mandatory coupon that represents a market rate of interest at the
issue date, or which are redeemable on a specific date or at the option of the shareholder, are
classified as financial liabilities and are presented in other borrowed funds. The dividends on thesepreference shares are recognised in the income statement as interest expense on an amortised cost
basis using the effective interest method.
If the Group purchases its own debt, it is removed from the balance sheet, and the differencebetween the carrying amount of the liability and the consideration paid is included in other income.
Share capital
Incremental costs directly attributable to the issue of new shares or options, or to the acquisition of a
business, are shown in equity as a deduction, net of tax, from the proceeds.
Dividends on ordinary shares are recognised in equity in the period in which they are declared.
720
c102100pu180Proof7:28.3.10B/LRevision:0OperatorBeeR

Where the Company or other members of the consolidated Group purchases the Company’s equity
share capital, the consideration paid is deducted from the total shareholders’ equity of the Group (but
not of the Company) as treasury shares until they are cancelled. Where such shares are subsequently
sold or reissued, any consideration received is included in shareholders’ equity of the Group (but notof the Company).
Fiduciary activities
The Group commonly acts as trustee and in other fiduciary capacities that result in the holding or
placing of assets on behalf of individuals, trusts, retirement benefit plans and other institutions. The
assets and income arising thereon are excluded from these financial statements, as they are not assets
of the Group.
Financial assets and liabilities (excluding derivatives)
The Group classifies its financial assets in the following categories: financial assets held at fair value
through profit or loss; loans and receivables; held-to-maturity investments and available-for-sale
financial assets. Financial liabilities are classified as either held at fair value through profit or loss, or
at amortised cost. Management determines the classification of its financial assets and liabilities at
initial recognition.
(a) Financial assets and liabilities held at fair value through profit or loss
This category has two sub-categories: financial assets and liabilities held for trading, and those
designated at fair value through profit or loss at inception. A financial asset or liability is classified as
trading if acquired principally for the purpose of selling in the short term. Derivatives are also
categorised as trading unless they are designated as hedges.
Financial assets and liabilities may be designated at fair value through profit or loss when:
* the designation eliminates or significantly reduces a measurement or recognition inconsistency
that would otherwise arise from measuring assets or liabilities on a different basis; or
* a group of financial assets and/or liabilities is managed and its performance evaluated on a fair
value basis; or
* the assets or liabilities include embedded derivatives and such derivatives are required to be
recognised separately.
(b) Loans and receivables
Loans and receivables are non-derivative financial assets with fixed or determinable payments that are
not quoted in an active market.
(c) Held-to-maturity
Held-to-maturity assets are non-derivative financial assets with fixed or determinable payments and
fixed maturities that the Group’s management has the positive intention and ability to hold to
maturity. Were the Group to sell other than an insignificant amount of held-to-maturity assets, the
entire category would be tainted and reclassified as available-for-sale.
(d) Available-for-sale
Available-for-sale assets are those non-derivative financial assets intended to be held for an indefinite
period of time, which may be sold in response to liquidity requirements or changes in interest rates,
exchange rates or equity prices.
Initial recognition
Purchases and sales of financial assets and liabilities held at fair value through profit or loss, financial
assets held-to-maturity and available-for-sale are initially recognised on trade-date (the date on which
the Group commits to purchase or sell the asset). Loans are recognised when cash is advanced to the
borrowers. Financial assets and financial liabilities are initially recognised at fair value plus, for those
financial assets and liabilities not carried at fair value through profit and loss, directly attributabletransaction costs. In those cases where the initially recognised fair value is based on a valuation
model that uses inputs which are not observable in the market, the difference between the transaction
price and the valuation model is not recognised immediately in the income statement. The difference
is amortised to the income statement until the inputs become observable, or the transaction matures
or is terminated.
721
c102100pu180Proof7:28.3.10B/LRevision:0OperatorBeeR
Subsequent measurement
Available-for-sale financial assets and financial assets and liabilities held at fair value through profit
or loss are subsequently carried at fair value. Loans and receivables and held-to-maturity investmentsare carried at amortised cost using the effective interest method.
The fair values of quoted financial assets or financial liabilities in active markets are based on current
prices. If the market for a financial asset or financial liability is not active, and for unlisted securities,
the Group establishes fair value by using valuation techniques. These include the use of recent arm’s
length transactions, discounted cash flow analysis, option pricing models and other valuation
techniques commonly used by market participants.
Renegotiated loans
Loans whose original terms have been modified are considered renegotiated loans. If the renegotiation
occurs before a customer is either past due or impaired and the revised terms are consistent with
those readily available in the market, the account will not be considered past due. If the
renegotiations are on terms that are not consistent with those readily available on the market, thisprovides objective evidence of impairment and the loan is assessed accordingly. If the account was
past due or impaired prior to the renegotiation, the loan will remain past due until the customer
complies with the revised terms for 12 months.
Derecognition
Financial assets are derecognised when the rights to receive cash flows from the financial assets have
expired or where the Group has transferred substantially all risks and rewards of ownership. If
substantially all the risks and rewards have been neither retained nor transferred and the Group has
retained control, the assets continue to be recognised to the extent of the Group’s continuing
involvement. Financial liabilities are derecognised when they are extinguished.
Income recognition
For available-for-sale assets and financial assets and liabilities held at amortised cost, interest income
and interest expense is recognised in the income statement using the effective interest method.
Gains and losses arising from changes in the fair value of financial instruments at fair value through
profit or loss are included in the income statement in the period in which they arise. Contractual
interest income and expense on financial instruments designated at fair value through profit or loss is
recognised within net interest income. For trading financial instruments, interest income and expense
is recognised within net interest income using the effective interest method.
Gains and losses arising from changes in the fair value of available-for-sale financial assets, other
than foreign exchange gains and losses from monetary items, are recognised directly in equity, until
the financial asset is derecognised or impaired at which time the cumulative gain or loss previously
recognised in equity is recognised in profit or loss.
Dividends on equity instruments are recognised in the income statement within ‘Other income’ when
the Group’s right to receive payment is established.
Impairment of financial assets
Assets carried at amortised cost
The Group assesses at each balance sheet date whether there is objective evidence that a financialasset or group of financial assets is impaired. A financial asset or a group of financial assets is
impaired and impairment losses are incurred if, and only if, there is objective evidence of impairment
as a result of one or more events that occurred after the initial recognition of the asset (a ‘loss
event’), and that loss event (or events) has an impact on the estimated future cash flows of the
financial asset or group of financial assets that can be reliably estimated.
The following factors are considered in assessing objective evidence of impairment:
* whether the customer is more than 90 days past due;
* a customer files for bankruptcy protection (or the local equivalent) where this would avoid or
delay repayment of its obligation;
* the Group files to have the customer declared bankrupt or files a similar order in respect of a
credit obligation;
722
c102100pu180Proof7:28.3.10B/LRevision:0OperatorBeeR

* the Group consents to a restructuring of the obligation, resulting in a diminished financial
obligation, demonstrated by a material forgiveness of debt or postponement of scheduled
payments;
* the Group sells a credit obligation at a material credit-related economic loss; or
* there is observable data indicating that there is a measurable decrease in the estimated future
cash flows of a group of financial assets, although the decrease cannot yet be identified with
specific individual financial assets.
The Group first assesses whether objective evidence of impairment exists individually for financial
assets that are individually significant, and individually or collectively for financial assets that are notindividually significant.
If the Group determines that no objective evidence of impairment exists for an individually assessed
financial asset, whether significant or not, it includes the asset in a group of financial assets with
similar credit risk characteristics and collectively assesses them for impairment. Assets that are
individually assessed for impairment and for which an impairment loss is or continues to be
recognised, are not included in a collective assessment of impairment.
If there is objective evidence that an impairment loss on a loan and receivable or a held-to-maturity
asset has been incurred, the amount of the loss is measured as the difference between the asset’s
carrying amount and the present value of estimated future cash flows (excluding future credit losses
that have not been incurred), discounted at the asset’s original effective interest rate. The carrying
amount of the asset is reduced through the use of an allowance account and the amount of the loss
is recognised in the income statement. If a loan and receivable or held-to-maturity asset has a
variable interest rate, the discount rate for measuring any impairment loss is the current effective
interest rate determined under the contract. As a practical expedient, the Group may measureimpairment on the basis of an instrument’s fair value using an observable market price.
The calculation of the present value of the estimated future cash flows of a collateralised financial
asset reflects the cash flows that may result from foreclosure, less costs for obtaining and selling the
collateral, whether or not foreclosure is probable. For the purposes of a collective evaluation of
impairment, financial assets are grouped on the basis of similar credit risk characteristics (i.e. on the
basis of the Group’s grading process which considers asset type, industry, geographic location,
collateral type, past-due status and other relevant factors). These characteristics are relevant to theestimation of future cash flows for groups of such assets being indicative of the debtors’ ability to
pay all amounts due according to the contractual terms of the assets being evaluated.
Future cash flows in a group of financial assets that are collectively evaluated for impairment are
estimated on the basis of the historical loss experience for assets with credit risk characteristics similar
to those in the group. Historical loss experience is adjusted on the basis of current observable data to
reflect the effects of current conditions that did not affect the period on which the historical loss
experience is based, and to remove the effects of conditions in the historical period that do not exist
currently.
To the extent a loan is irrecoverable, it is written off against the related provision for loan
impairment. Such loans are written off after all the necessary procedures have been completed and
the amount of the loss has been determined. Subsequent recoveries of amounts previously written off
decrease the amount of the provision for loan impairment in the income statement. If, in a
subsequent period, the amount of the impairment loss decreases and the decrease can be related
objectively to an event occurring after the impairment was recognised (such as an improvement in the
debtor’s credit rating), the previously recognised impairment loss is reversed by adjusting theallowance account. The amount of the reversal is recognised in the income statement.
Available-for-sale assets
A significant or prolonged decline in the fair value of a security below its cost is considered, amongst
other indicators of impairment, in determining whether an asset is impaired. If any such evidence
exists for available-for-sale financial assets, the cumulative loss (measured as the difference betweenthe acquisition cost and the current fair value, less any impairment loss on that financial asset
previously recognised in the income statement) is removed from equity and recognised in the income
statement. If, in a subsequent period, the fair value of a debt instrument classified as available-for-sale
increases and the increase can be objectively related to an event occurring after the impairment loss
was recognised, the impairment loss is reversed through the income statement. Impairment losses
723
c102100pu180Proof7:28.3.10B/LRevision:0OperatorBeeR

recognised in the income statement on equity instruments are not reversed through the income
statement.
Derivative financial instruments and hedge accounting
Derivative contracts are initially recognised at fair value on the date on which a derivative contract is
entered into and are subsequently remeasured at their fair value. Fair values may be obtained fromquoted market prices in active markets, recent market transactions, and valuation techniques,
including discounted cash flow models and option pricing models, as appropriate. Where the initially
recognised fair value of a derivative contract is based on a valuation model that uses inputs which
are not observable in the market, it follows the same initial recognition accounting policy as for other
financial assets and liabilities. All derivatives are carried as assets when fair value is positive and as
liabilities when fair value is negative.
Certain derivatives embedded in other financial instruments, such as the conversion option in a
convertible bond, are treated as separate derivatives when their economic characteristics and risks are
not closely related to those of the host contract and the host contract is not carried at fair value
through profit or loss. These embedded derivatives are measured at fair value with changes in fair
value recognised in the income statement.
The method of recognising the resulting fair value gain or loss depends on whether the derivative is
designated as a hedging instrument, and if so, the nature of the item being hedged. The Group
designates certain derivatives as either: (1) hedges of the fair value of recognised assets or liabilities or
firm commitments (fair value hedge); or, (2) hedges of highly probable future cash flows attributable
to a recognised asset or liability, or a forecasted transaction (cash flow hedge). Hedge accounting is
used for derivatives designated in this way provided certain criteria are met.
The Group documents, at the inception of the transaction, the relationship between hedging
instruments and hedged items, as well as its risk management objective and strategy for undertaking
various hedge transactions. The Group also documents its assessment, both at hedge inception and on
an ongoing basis, of whether the derivatives that are used in hedging transactions are highly effective
in offsetting changes in fair values or cash flows of hedged items.
(a) Fair value hedge
Changes in the fair value of derivatives that are designated and qualify as fair value hedges arerecorded in the income statement, together with any changes in the fair value of the hedged asset or
liability that are attributable to the hedged risk. If the hedge no longer meets the criteria for hedge
accounting, the adjustment to the carrying amount of a hedged item for which the effective interest
method is used is amortised to profit or loss over the period to maturity.
(b) Cash flow hedge
The effective portion of changes in the fair value of derivatives that are designated and qualify as
cash flow hedges is recognised in equity. The gain or loss relating to the ineffective portion is
recognised immediately in the income statement.
Amounts accumulated in equity are recycled to the income statement in the periods in which the
hedged item affects profit or loss.
When a hedging instrument expires or is sold, or when a hedge no longer meets the criteria for hedge
accounting, any cumulative gain or loss existing in equity at that time remains in equity and isrecognised when the forecast transaction is ultimately recognised in the income statement. When a
forecast transaction is no longer expected to occur, the cumulative gain or loss that was reported in
equity is immediately transferred to the income statement.
(c) Net investment hedge
Hedges of net investments in foreign operations are accounted for similarly to cash flow hedges. Any
gain or loss on the hedging instrument relating to the effective portion of the hedge is recognised in
the translation reserve; the gain or loss relating to the ineffective portion is recognised immediately in
the income statement. Gains and losses accumulated in equity are included in the income statementwhen the foreign operation is disposed of.
Derivatives that do not qualify for hedge accounting
Changes in the fair value of any derivative instrument that does not qualify for hedge accounting are
recognised immediately in the income statement.
724
c102100pu180Proof7:28.3.10B/LRevision:0OperatorBeeR

Offsetting financial instruments
Financial assets and liabilities are offset and the net amount reported in the balance sheet when there
is a legally enforceable right to offset the recognised amounts and there is an intention to settle on anet basis, or to realise the asset and settle the liability simultaneously.
Sale and repurchase agreements
Securities sold subject to repurchase agreements (‘repos’) remain on the balance sheet; the
counterparty liability is included in amounts due to other banks, deposits from banks, other deposits
or deposits due to customers, as appropriate. Securities purchased under agreements to resell (‘reverse
repos’) are recorded as loans and advances to other banks or customers, as appropriate. The
difference between sale and repurchase price is treated as interest and accrued over the life of the
agreements using the effective interest method.
Securities lent to counterparties are also retained in the financial statements. Securities borrowed are
not recognised in the financial statements, unless these are sold to third parties, in which case the
purchase and sale are recorded with the gain or loss included in trading income.
Interest income and expense
Interest income and expense is recognised in the income statement using the effective interest method.
The effective interest method is a method of calculating the amortised cost of a financial asset or afinancial liability and of allocating the interest income or interest expense over the relevant period.
The effective interest rate is the rate that discounts estimated future cash payments or receipts
through the expected life of the financial instrument or, when appropriate, a shorter period, to the
net carrying amount of the financial asset or financial liability. When calculating the effective interest
rate, the Group estimates cash flows considering all contractual terms of the financial instrument (for
example, prepayment options) but does not consider future credit losses. The calculation includes all
fees and points paid or received between parties to the contract that are an integral part of the
effective interest rate, transaction costs and all other premiums or discounts.
Where the estimates of cash flows have been revised, the carrying amount of the financial asset or
liability is adjusted to reflect the actual and revised cash flows. The adjustment is recognised asinterest income or expense in the period in which the revision is made.
Once a financial asset or a group of similar financial assets has been written down as a result of an
impairment loss, interest income is recognised using the rate of interest used to discount the futurecash flows for the purpose of measuring the impairment loss.
Fees and commissions
Fees and commissions are generally recognised on an accrual basis when the service has been
provided. Loan syndication fees are recognised as revenue when the syndication has been completed
and the Group retained no part of the loan package for itself, or retained a part at the same effective
interest rate for the other participants. Portfolio and other management advisory and service fees are
recognised based on the applicable service contracts, usually on a time-apportionate basis.
Hyperinflation
Where the Group has operations in countries that experience hyperinflation, the financial statementsare restated for changes in general purchasing power of the local currency.
2. Segmental Information
The Group is organised on a worldwide basis into two main business segments: Wholesale Banking
and Consumer Banking. The types of products and services within these segments are set out in the
Financial Review. The Group’s secondary reporting format comprises geographic segments, classified
by the location of the customer.
725
c102100pu180Proof7:28.3.10B/LRevision:0OperatorBeeR

By Class of Business
2007 2006
Consumer
Banking
US$million
Wholesale
Banking
US$million
Corporate
items not
allocated
US$million
Total
US$million
Consumer
Banking
US$million
Wholesale
Banking
US$million
Corporate
items not
allocated
US$million
Total
US$million
Internal income (77) 77 — — (75) 75 — —
Net interest income 4,194 2,071 — 6,265 3,545 1,783 — 5,328
Other income 1,689 3,095 18 4,802 1,214 2,065 13 3,292
Operating income 5,806 5,243 18 11,067 4,684 3,923 13 8,620
Operating expenses (3,393) (2,814) (8) (6,215) (2,641) (2,151) (4) (4,796)
Operating profit before
impairment losses and
taxation 2,413 2,429 10 4,852 2,043 1,772 9 3,824
Impairment (losses)/releases on
loans and advances and
other credit risk provisions (736) (25) — (761) (721) 92 — (629)
Other impairment — (57) — (57) — (15) — (15)
Profit/(loss) from associates — — 1 1 — — (2) (2)
Profit before taxation 1,677 2,347 11 4,035 1,322 1,849 7 3,178
Total assets employed** 90,238 238,408 559* 329,205 86,902 178,688 512* 266,102
Total liabilities employed** 120,213 187,355 185* 307,753 107,165 141,474 68* 248,707
Total risk weighted assets and
contingents** 63,516 108,317 — 171,833 60,380 93,053 — 153,433
Other segment items:
Capital expenditure 418 208 — 626 209 150 — 359
Depreciation 136 46 — 182 100 35 — 135
Amortisation of intangible
assets 68 95 — 163 52 81 — 133
* As required by IAS 14, tax balances are not allocated.
** Amounts have been restated as explained in note 51 on page 795. In addition, certain assets have been reallocated betweenConsumer Banking and Wholesale Banking to present on a consistent basis.
726
c102100pu180Proof7:28.3.10B/LRevision:0OperatorBeeR

By Geographic Segment
The Group manages its business segments on a global basis. The operations are based in nine main
geographic areas. The UK is the home country of the parent.
2007
Asia Pacific
Hong
Kong
US$million
Singapore
US$million
Malaysia
US$million
Korea
US$million
Other
Asia
Pacific
US$million
India
US$million
Middle
East &
Other
S Asia
US$million
Africa
US$million
Americasa
UK &
Europe
US$million
Total
US$million
Internal income (81) 119 11 (58) 16 23 (15) 20 (35) —
Net interest income 1,288 182 225 1,289 1,118 608 873 444 238 6,265
Fees and commissions
income, net 539 233 83 227 466 353 436 194 130 2,661
Net trading income 180 80 63 (72) 330 145 100 121 314 1,261
Other operating income 142 278 77 178 171 179 34 16 (195) 880
Operating income 2,068 892 459 1,564 2,101 1,308 1,428 795 452 11,067
Operating expenses (825) (430) (185) (1,146) (1,213) (528) (694) (468) (726) (6,215)
Operating profit/(loss)
before impairment
losses and taxation 1,243 462 274 418 888 780 734 327 (274) 4,852
Impairment (losses)/
releases on loans and
advances and other
credit risk provisions (50) (16) (38) (94) (318) (90) (143) (27) 15 (761)
Other impairment — — — — — — — (2) (55) (57)
Profit/(loss) from
associates — — — — 2 — — — (1) 1
Profit/(loss) before
taxation 1,193 446 236 324 572 690 591 298 (315) 4,035
Loans and advances to
customers – average 23,712 14,897 9,518 41,962 23,545 7,611 10,679 2,437 17,059 151,420
Net interest margins (%) 2.3 1.0 1.8 2.1 2.8 4.3 4.1 5.6 0.2 2.5
Loans and advances to
customers – period
end 23,364 17,172 10,027 40,229 26,049 7,656 12,646 3,330 16,509 156,982
Loans and advances to
banks – period end 15,156 2,531 928 1,504 4,866 552 1,406 371 10,365 37,679
Total assets employed* 61,348 39,362 14,614 67,246 55,890 23,209 28,617 11,132 85,890 387,308
Total risk weighted assets
and contingents 25,330 15,008 5,324 37,167 26,024 12,377 16,104 3,927 37,524 178,785
Capital expenditure 39 131 9 53 116 138 88 45 7 626
* Total assets employed includes intra-group items of US$58,662 million and excludes deferred tax assets of US$559 million.
# Americas, UK & Europe was previously Americas, UK & Group Head Office. The business captured within this segment has notbeen changed, the title has been revised to more appropriately describe the segment.
727
c102100pu180Proof7:28.3.10B/LRevision:0OperatorBeeR

2006
Asia Pacific
Hong
Kong
US$million
Singapore
US$million
Malaysia
US$million
Korea
US$million
Other
Asia
Pacific
US$million
India
US$million
Middle
East &
Other
S Asia
US$million
Africa
US$million
Americas
UK &
Europe
US$million
Total
US$million
Internal income (14) 3 (2) 50 17 (17) (7) (10) (20) —
Net interest income 1,115 345 242 1,097 788 445 660 396 240 5,328
Fees and commissions
income, net 406 159 50 152 302 204 296 160 152 1,881
Net trading income 74 56 60 64 166 101 115 91 193 920
Other operating income 34 59 21 159 111 84 6 3 14 491
Operating income 1,615 622 371 1,522 1,384 817 1,070 640 579 8,620
Operating expenses (720) (294) (164) (972) (785) (375) (514) (413) (559) (4,796)
Operating profit before
impairment losses and
taxation 895 328 207 550 599 442 556 227 20 3,824
Impairment (losses)/
releases on loans and
advances and other
credit risk provisions (7) (39) (29) (96) (384) (39) (53) (26) 44 (629)
Other impairment — — — — (3) — — (9) (3) (15)
(Loss)/profit from
associates — — — — (4) — — — 2 (2)
Profit before taxation 888 289 178 454 208 403 503 192 63 3,178
Loans and advances to
customers – average 22,859 12,976 8,671 38,986 12,261 5,876 9,531 2,397 10,415 123,972
Net interest margin (%) 2.3 1.3 2.1 1.9 3.0 3.4 3.8 5.7 0.3 2.5
Loans and advances to
customers – period
end* 22,037 14,626 9,199 40,029 22,851 6,242 10,516 2,536 12,458 140,494
Loans and advances to
banks – period end 6,474 939 161 1,753 4,462 477 1,058 387 5,353 21,064
Total assets employed*# 49,845 25,400 11,849 64,178 46,886 14,386 18,118 7,794 65,918 304,374
Total risk weighted assets
and contingents* 23,784 13,681 5,315 35,330 24,874 8,450 13,564 3,287 28,282 156,567
Capital expenditure 78 65 3 35 49 22 37 13 57 359
* Amounts have been restated as explained in note 51 on page 795.
# Total assets employed includes intra-group items of US$38,784 million and excludes deferred tax assets of US$512 million.
Apart from the entities that have been acquired in the last two years, Group central expenses have
been distributed between segments in proportion to their direct costs, and the benefit of the Group’s
capital has been distributed between segments in proportion to their average risk weighted assets. In
the year in which an acquisition is made the Group does not charge or allocate the benefit of the
Group’s capital. The distribution of central expenses is phased in over two years, based on an
estimate of central management costs associated with the acquisition.
In 2007, corporate items not allocated to businesses relate to profits on disposal of businesses, pre-
incorporation costs in China and profits from associates.
Assets held at the centre have been distributed between geographic segments in proportion to their
total assets employed.
Total risk weighted assets and contingents include US$6,952 million (2006: US$3,134 million) of
balances which are netted in calculating capital ratios.
728
c102100pu180Proof7:28.3.10B/LRevision:0OperatorBeeR

Capital expenditure comprises additions to property and equipment (note 26) and software related
intangibles (note 25) including any post-acquisition additions made by acquired entities.
3. Interest Income
2007
US$million
2006
US$million
Balances at central banks 39 29
Treasury bills 884 746
Loans and advances to banks 1,975 1,177Loans and advances to customers 10,746 8,997
Listed debt securities 1,081 855
Unlisted debt securities 1,385 1,131
Accrued on impaired assets (discount unwind) 66 52
16,176 12,987
Total interest income from financial instruments held at amortised cost in 2007 is US$11,070 million
(2006: US$8,738 million) and from financial instruments held as available-for-sale is US$2,390 million(2006: US$2,027 million).
4. Interest Expense
2007
US$million
2006
US$million
Deposits by banks 1,497 1,122
Customer accounts:
Interest bearing current accounts and savings deposits 1,508 1,567
Time deposits 4,552 3,141
Debt securities in issue 1,543 1,186
Subordinated liabilities and other borrowed funds:
Wholly repayable within five years 245 227
Other 566 416
9,911 7,659
Total interest expense on financial instruments held at amortised cost in 2007 is US$8,347 million
(2006: US$6,948 million).
5. Fees and Commissions
2007
US$million
2006
US$million
Fee income:
Arising from financial instruments that are not fair valued through profit or
loss 1,160 1,145
Arising from trust and other fiduciary activities 302 155
Other 1,727 975
3,189 2,275
Fee expense:
Arising from financial instruments that are not fair valued through profit or
loss 285 253
Arising from trust and other fiduciary activities 26 14
Other 217 127
528 394
729
c102100pu180Proof7:28.3.10B/LRevision:0OperatorBeeR

6. Net Trading Income
2007
US$million
2006
US$million
Gains less losses on instruments held for trading:
Foreign currency 862 645
Trading securities 102 109
Interest rate derivatives 257 151
Credit and other derivatives 39 40
Gains less losses from fair value hedged items and hedging instruments (3) 14
Gains less losses on instruments designated at fair value:
Financial assets designated at fair value through profit or loss 44 —
Financial liabilities designated at fair value through profit or loss (37) (37)
Derivatives managed with financial instruments designated at fair value
through profit or loss (3) (2)
1,261 920
7. Other Operating Income
2007
US$million
2006
US$million
Other operating income includes:
Gains less losses on available-for-sale financial assets:
On disposal 339 185
Writedowns on asset backed securities (87) —
Gains less losses on disposal of loan and receivable financial assets 3 5
Dividend income 279 77Gains arising on assets fair valued at acquisition 98 106
Recognition of profit on Visa shares 107 —
Income on repatriation of branch capital 109 —
Gain on effective part disposal of Pakistan branches — 17
Profit on part disposal of merchant acquiring business 15 —
Net profit on sale of businesses 3 —
8. Operating Expenses
2007
US$million
2006
US$million
Staff costs:
Wages and salaries 2,970 2,278
Social security costs 67 74
Other pension costs (note 36) 213 166
Other staff costs 699 395
3,949 2,913
Premises and equipment expenses:
Rental of premises 259 215
Other premises and equipment costs 307 208
Rental of computers and equipment 26 21
592 444
General administrative expenses 1,329 1,171
730
c102100pu180Proof7:28.3.10B/LRevision:0OperatorBeeR

Wages and salaries include share based payments – see note 41.
The Group employed 69,612 staff at 31 December 2007 (2006: 59,205).
The Company employed nil staff at 31 December 2007 (2006: nil) and it incurred costs of US$7
million (2006: US$2 million).
Directors’ emoluments
Details of directors’ pay and benefits and interests in shares are disclosed in the directors’remuneration report on pages 73 to 85 of the 2007 Annual Report.
Transactions with directors, officers and other related parties are disclosed in the related parties note
52 on pages 795 to 797.
Auditor’s remuneration
Auditor’s remuneration in relation to the Group statutory audit amounts to US$4.4 million (2006:
US$3.3 million). The following fees were payable by the Group to their principal auditor, KPMG
Audit Plc and its associates (together ‘KPMG’):
2007
US$million
2006
US$million
Audit fees for the Group statutory audit:
Fees relating to the current year 3.8 3.3
Fees relating to prior year 0.6 —
Fees payable to KPMG for other services provided to the Group:
Audit of Standard Chartered PLC subsidiaries, pursuant to legislation 9.7 7.6Other services pursuant to legislation 3.0 1.6
Tax services 0.4 1.0
Services relating to information technology 0.1 0.1
Services relating to corporate finance transactions 0.8 1.4
All other services 0.3 0.2
Total fees payable 18.7 15.2
The following is a description of the type of services included within the categories listed above:
* Audit fees are in respect of fees payable to KPMG Audit Plc for the statutory audit of the
consolidated financial statements of the Group and the separate financial statements of StandardChartered PLC. It excludes amounts payable for the audit of Standard Chartered PLC’s
subsidiaries and amounts payable to KPMG Audit Plc’s associates. These amounts have been
included in ‘Fees payable to KPMG for other services provided to the Group’.
* Other services pursuant to legislation include services for assurance and other services that are in
relation to statutory and regulatory filings, including comfort letters and interim reviews.
* Tax services include tax compliance services and tax advisory services.
* Services relating to information technology include advice on IT security and business
continuity, and performing agreed upon IT testing procedures.
* Services related to corporate finance transactions include fees payable to KPMG for transaction
related work irrespective of whether the Group is vendor or purchaser, such as acquisition due
diligence and long-form reports.
* All other services include other assurance and advisory services such as translation services, ad-
hoc accounting advice and review of financial models.
Expenses incurred during the provision of services and which have been reimbursed by the Group are
included within auditor’s remuneration.
In addition to the above, KPMG estimate they have been paid fees of US$0.3 million (2006: US$0.2
million) by parties other than the Group but where the Group are connected with the contracting
party and therefore may be involved in appointing KPMG. These fees arise from services such as the
audit of the Group’s pension schemes.
Fees payable to KPMG for non-audit services for Standard Chartered PLC are not disclosed because
such fees are disclosed on a consolidated basis for the Group.
731
c102100pu180Proof7:28.3.10B/LRevision:0OperatorBeeR

9. Depreciation and Amortisation
2007
US$million
2006
US$million
Premises 78 57
Equipment 104 78
Intangibles:
Software 86 81
Acquired on business combinations 77 52
345 268
10. Other Impairment
2007
US$million
2006
US$million
Intangible assets 17 —
Impairment losses on available-for-sale financial assets 40 15
57 15
Impairment of intangible assets consists of the write-off of a customer relationship asset relating to
Whistlejacket. Impairment losses on available-for-sale financial assets includes US$35 million (2006:
US$nil million) impairment on asset backed securities.
11. Taxation
Analysis of taxation charge in the year:
2007
US$million
2006
US$million
The charge for taxation based upon the profits for the year comprises:
United Kingdom corporation tax at 30% (2006: 30%):
Current tax on income for the year 385 229
Adjustments in respect of prior periods (including double taxation relief)* (18) (244)
Double taxation relief (385) (208)Foreign tax:
Current tax on income for the year 1,258 868
Adjustments in respect of prior periods* 13 33
Total current tax 1,253 678
Deferred tax:
Origination/reversal of temporary differences (167) 57
Adjustments in respect of prior periods* (40) 89
Total deferred tax (207) 146
Tax on profits on ordinary activities 1,046 824
Effective tax rate 25.9% 25.9%
* Re-presented to identify separately all adjustments in respect of prior periods for United Kingdom, and foreign and deferredtaxation.
Overseas taxation includes taxation on Hong Kong profits of US$195 million (2006: US$166 million)
provided at a rate of 17.5% (2006: 17.5%) on the profits assessable in Hong Kong. With effect from 1
April 2008, the United Kingdom corporation tax rate is to be reduced from 30% to 28%. As a result,
732
c102100pu180Proof7:28.3.10B/LRevision:0OperatorBeeR

deferred tax assets and liabilities have been re-measured at the reduced tax rate where the asset or
liability is settled after 1 April 2008.
The taxation charge for the year is lower than the standard rate of corporation tax in the United
Kingdom, 30%.
The differences are explained below:
2007
US$million
2006
US$million
Profit on ordinary activities before taxation 4,035 3,178
Tax at 30% (2006: 30%) 1,211 953
Effects of:
Tax free income (203) (52)Lower tax rates on overseas earnings (176) (191)
Higher tax rates on overseas earnings 222 173
Adjustments to tax charge in respect of previous periods (45) (122)
Other items 37 63
Tax on profits on ordinary activities 1,046 824
Tax recognised directly in equity:
2007
US$million
2006
US$million
Current tax credit on share based payments 38 18
Current tax credit on available-for-sale assets — 5Total current tax recognised in equity 38 23
Deferred tax charge on available-for-sale assets (38) (70)
Deferred tax charge on pensions (71) (38)
Deferred tax (charge) on share based payments (61) 29
Deferred tax credit/(charge) on cash flow hedges 7 (25)
Deferred tax on other items (1) 8
Total deferred tax recognised in equity (164) (96)
Total tax recognised in equity (126) (73)
12. Dividends
2007 2006
Ordinary Equity Shares
Cents
per share US$million
Cents
per share US$million
Final dividend declared and paid during the
period 50.21 695 45.06 595
Interim dividend declared and paid during the
period 23.12 324 20.83 277
73.33 1,019 65.89 872
733
c102100pu180Proof7:28.3.10B/LRevision:0OperatorBeeR

Preference Shares
2007
US$million
2006
US$million
Non-cumulative irredeemable preference shares: 73/8 % preference shares
of £1 each* 15 14
81/4 % preference shares
of £1 each* 16 15
Non-cumulative redeemable preference shares: 8.9% preference sharesof US$5 each — 22
6.409% preference shares
of US$5 each 28 3
* Dividends on these preference shares are treated as interest expense and accrued accordingly.
Dividends on ordinary equity and redeemable preference shares are recorded in the period in which
they are declared and, in respect of the final dividend, have been approved by the shareholders.
Accordingly, the final ordinary equity share dividends set out above relate to the respective prior
years. The 2007 final ordinary equity share dividend of 56.23 cents per share (US$793 million) will be
paid in either Sterling, Hong Kong Dollars or US Dollars on 16 May 2008 to shareholders on the
UK register of members at the close of business in the UK (5.00 pm GMT) on 7 March 2008, and
to shareholders on the Hong Kong branch register of members at the opening of business in Hong
Kong (9:00 am Hong Kong time) on 7 March 2008. It is intended that shareholders will be able toelect to receive shares credited as fully paid instead of all or part of the final cash dividend. Details
of this dividend will be sent to shareholders on or around 27 March 2008.
13. Earnings Per Ordinary Share
2007 2006
Profit*
US$million
Weighted
average
number of
shares
(‘000)
Per
share
amount
cents
Profit*
US$million
Weighted
average
number of
shares
(‘000)
Per
share
amount
cents
Basic earnings per ordinary
share 2,813 1,398,747 201.1 2,253 1,332,985 169.0
Effect of dilutive potential
ordinary shares:
Options — 17,048 — 16,050
Diluted earnings per share 2,813 1,415,795 198.7 2,253 1,349,035 167.0
There were no ordinary shares issued after the balance sheet date that would have significantly
affected the number of ordinary shares used in the above calculations had they been issued prior to
the end of the balance sheet period.
734
c102100pu180Proof7:28.3.10B/LRevision:0OperatorBeeR
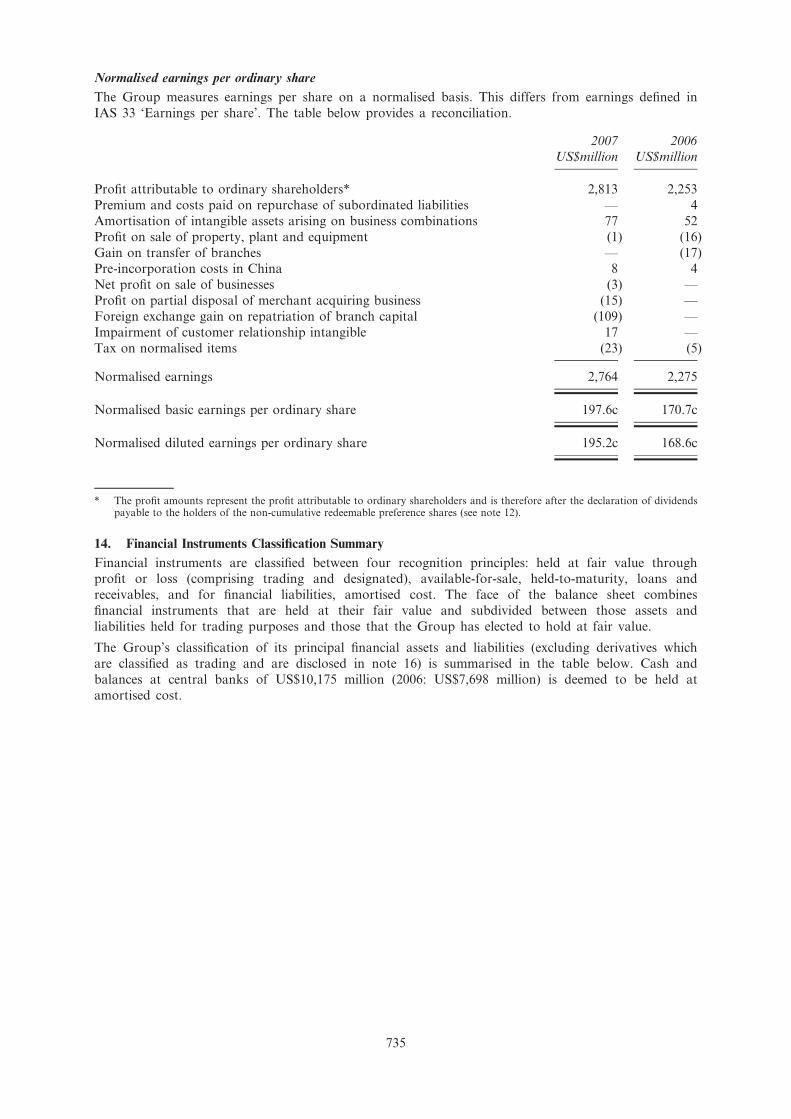
Normalised earnings per ordinary share
The Group measures earnings per share on a normalised basis. This differs from earnings defined in
IAS 33 ‘Earnings per share’. The table below provides a reconciliation.
2007
US$million
2006
US$million
Profit attributable to ordinary shareholders* 2,813 2,253
Premium and costs paid on repurchase of subordinated liabilities — 4
Amortisation of intangible assets arising on business combinations 77 52
Profit on sale of property, plant and equipment (1) (16)
Gain on transfer of branches — (17)Pre-incorporation costs in China 8 4
Net profit on sale of businesses (3) —
Profit on partial disposal of merchant acquiring business (15) —
Foreign exchange gain on repatriation of branch capital (109) —
Impairment of customer relationship intangible 17 —
Tax on normalised items (23) (5)
Normalised earnings 2,764 2,275
Normalised basic earnings per ordinary share 197.6c 170.7c
Normalised diluted earnings per ordinary share 195.2c 168.6c
* The profit amounts represent the profit attributable to ordinary shareholders and is therefore after the declaration of dividendspayable to the holders of the non-cumulative redeemable preference shares (see note 12).
14. Financial Instruments Classification Summary
Financial instruments are classified between four recognition principles: held at fair value throughprofit or loss (comprising trading and designated), available-for-sale, held-to-maturity, loans and
receivables, and for financial liabilities, amortised cost. The face of the balance sheet combines
financial instruments that are held at their fair value and subdivided between those assets and
liabilities held for trading purposes and those that the Group has elected to hold at fair value.
The Group’s classification of its principal financial assets and liabilities (excluding derivatives which
are classified as trading and are disclosed in note 16) is summarised in the table below. Cash and
balances at central banks of US$10,175 million (2006: US$7,698 million) is deemed to be held at
amortised cost.
735
c102100pu180Proof7:28.3.10B/LRevision:0OperatorBeeR

Trading
US$million
Designated
at fair value
through
profit or
loss
US$million
Available-
for-sale
US$million
Loans and
receivables
US$million
Held-to-
maturity
US$million
Total
US$million
Loans and advances to banks 2,314 — — 35,365 — 37,679
Loans and advances to
customers 1,978 738 — 154,266 — 156,982
Treasury bills and other
eligible bills 2,942 453 11,667 — — 15,062
Debt securities 13,829 334 38,098 2,719 100 55,080
Equity shares 108 262 2,690 — — 3,060
Total at 31 December 2007 21,171 1,787 52,455 192,350 100 267,863
Loans and advances to banks 1,340 — — 19,724 — 21,064
Loans and advances to
customers* 1,000 194 — 139,300 — 140,494
Treasury bills and other
eligible bills 2,722 696 12,522 — — 15,940
Debt securities* 8,906 695 32,711 2,649 137 45,098
Equity shares 162 — 1,478 — — 1,640
Total at 31 December 2006 14,130 1,585 46,711 161,673 137 224,236
* Amounts have been restated as explained in note 51 on page 795.
Trading
US$million
Designated
at fair
value
through
profit or
loss
US$million
Amortised
cost
US$million
Total
US$million
Deposits by banks 2,532 173 25,880 28,585
Customer accounts 772 2,064 179,760 182,596
Debt securities in issue 2,665 2,351 27,137 32,153
Short positions 3,693 — — 3,693
Total at 31 December 2007 9,662 4,588 232,777 247,027
Deposits by banks 1,286 603 26,233 28,122
Customer accounts 485 1,421 147,382 149,288Debt securities in issue 1,514 1,771 23,514 26,799
Short positions 2,889 — — 2,889
Total at 31 December 2006 6,174 3,795 197,129 207,098
15. Financial Assets Held at Fair Value through Profit or Loss
For certain loans and advances and debt securities with fixed rates of interest, interest rate swaps
have been acquired with the intention of significantly reducing interest rate risk. Derivatives are
recorded at fair value whereas loans and advances are usually recorded at amortised cost. Tosignificantly reduce the accounting mismatch between fair value and amortised cost, these loans and
advances and debt securities have been designated at fair value through profit or loss. The Group
ensures the criteria under IAS 39 are met by matching the principal terms of interest rate swaps to
the corresponding loans and debt securities.
736
c102100pu180Proof7:28.3.10B/LRevision:0OperatorBeeR

The changes in fair value of both the underlying loans and advances and debt securities and interest
rate swaps are monitored in a similar manner to trading book portfolios.
The maximum exposure to credit risk for loans designated at fair value through profit or loss was
US$738 million (2006: US$194 million).
The fair value loss on loans and advances to customers designated at fair value through profit or loss
was US$1.0 million (2006: US$4.7 million). Of this, US$nil million (2006: US$0.4 million) relates to
changes in credit risk. The cumulative fair value movement relating to changes in credit risk was
US$0.4 million (2006: US$0.4 million).
The changes in fair value attributable to credit risk was determined by comparing fair value
movements in risk-free bonds with similar maturities to the changes in fair value of loans designatedat fair value through profit or loss.
2007 2006
TradingUS$million
Designatedat fair
valuethrough
profit orloss
US$millionTotal
US$millionTrading
US$million
Designatedat fair
valuethrough
profit orloss
US$millionTotal
US$million
Loans and advances
to banks 2,314 — 2,314 1,340 — 1,340
Loans and advancesto customers 1,978 738 2,716 1,000 194 1,194
Treasury bills and
other eligible bills 2,942 453 3,395 2,722 696 3,418
Debt securities 13,829 334 14,163 8,906 695 9,601
Equity shares 108 262 370 162 — 162
21,171 1,787 22,958 14,130 1,585 15,715
737
c102100pu180Proof7:28.3.10B/LRevision:0OperatorBeeR

Debt securities
2007
US$million
2006
US$million
Issued by public bodies:
Government securities 5,344 2,321
Other public sector securities 30 45
5,374 2,366
Issued by banks:
Certificates of deposit 479 405
Other debt securities 2,672 2,082
3,151 2,487
Issued by corporate entities and other issuers:
Other debt securities 5,638 4,748
Total debt securities 14,163 9,601
Of which:
Listed on a recognised UK exchange 536 418
Listed elsewhere 5,641 2,819
Unlisted 7,986 6,364
14,163 9,601
Equity sharesListed elsewhere 3 36Unlisted 367 126
Total equity shares 370 162
For certain loans and advances designated at fair value through profit or loss, the difference arising
between the fair value at initial recognition and the amount that would have arisen had the valuation
techniques used for subsequent measurement been used at initial recognition is amortised to the
income statement until the inputs become observable or the transaction matures or is terminated. The
table below sets out a reconciliation of amounts deferred:
2007
US$million
2006
US$million
At 1 January 2 —
Additional amount deferred 10 2
Recognised in income (3) —
At 31 December 9 2
Changing one or more of the assumptions to reasonably possible alternatives would not significantly
change the fair value.
16. Derivative Financial Instruments
Derivatives are financial instruments that derive their value in response to changes in interest rates,
financial instrument prices, commodity prices, foreign exchange rates, credit risk and indices. The
types of derivatives used by the Group are set out below.
All derivatives are classified as trading and recognised and subsequently measured at fair value, with
all revaluation gains recognised in profit and loss (except where cash flow hedging has been achieved,
in which case the effective portion of changes in fair value go through reserves).
738
c102100pu180Proof7:28.3.10B/LRevision:0OperatorBeeR

These tables analyse the notional principal amounts and the positive and negative fair values of the
Group’s derivative financial instruments. Notional principal amounts are the amount of principal
underlying the contract at the reporting date.
The Group limits its exposure to credit losses in the event of default by entering into master netting
agreements with certain market counterparties. As required by IAS 32, exposures are not presented
net in these accounts as in the ordinary course of business they are not intended to be settled net.Details of the amounts available for offset can be found in note 49, under maximum exposure to
credit risk.
The Derivatives and Hedging sections of the Risk Review on pages 57 and 58 of the 2007 Annual
Report explain the Group’s risk management of derivative contracts.
2007 2006
Total derivatives
Notionalprincipalamounts
US$millionAssets
US$millionLiabilities
US$million
Notionalprincipalamounts
US$millionAssets
US$millionLiabilities
US$million
Foreign exchange derivativecontracts:
Forward foreign exchangecontracts 775,663 7,376 7,852 434,569 3,805 4,165
Currency swaps and options 512,833 8,955 8,516 295,845 4,698 4,793
1,288,496 16,331 16,368 730,414 8,503 8,958
Interest rate derivativecontracts:
Swaps 979,727 8,473 8,365 653,283 4,353 4,348Forward rate agreements and
options 166,563 556 745 94,244 138 195Exchange traded futures and
options 322,520 336 282 260,182 42 47
1,468,810 9,365 9,392 1,007,709 4,533 4,590
Credit derivative contracts 21,035 165 160 22,195 49 70
Equity and stock indexoptions 1,057 58 106 699 18 44
Commodity derivativecontracts 16,971 285 244 2,469 51 41
Total derivatives 2,796,369 26,204 26,270 1,763,486 13,154 13,703
The Group uses derivatives primarily to mitigate interest rate and foreign exchange risk. Hedge
accounting is applied to derivatives and hedged items when the criteria under IAS 39 have been met.The table below lists the types of derivatives that the Group holds for hedge accounting.
739
c102100pu180Proof7:28.3.10B/LRevision:0OperatorBeeR

2007 2006
Derivatives held for hedging
Notionalprincipalamounts
US$millionAssets
US$millionLiabilities
US$million
Notionalprincipalamounts
US$millionAssets
US$millionLiabilities
US$million
Derivatives designated as fairvalue hedges:
Swaps 13,392 352 161 10,570 589 464
13,392 352 161 10,570 589 464
Derivatives designated ascash flow hedges:
Swaps 5,120 35 13 5,596 17 21Forward foreign exchange
contracts 1,414 37 19 921 61 2
6,534 72 32 6,517 78 23
Total derivatives held forhedging 19,926 424 193 17,087 667 487
Fair value hedges
The Group uses interest rate swaps to manage fixed rates of interest. The swaps exchange fixed ratesfor floating rates on funding to match floating rates received on assets, or exchanges fixed rates on
assets to match the floating rates paid on funding. For qualifying hedges, the fair value changes of
the derivative are substantially matched by corresponding fair value changes of the hedged item, both
of which are recognised in profit and loss.
In respect of fair value hedges, gains arising on the hedging instruments during the year were US$49
million (2006: losses of US$218 million) compared to losses arising on the hedged items of US$52
million (2006: gains of US$232 million).
Cash flow hedges
The Group uses swaps to manage the variability in future interest cash flows on assets and liabilities
that have floating rates of interest by exchanging the floating rates for fixed rates. It also uses foreign
exchange contracts to manage the variability in future exchange rates on its assets and liabilities andcosts in foreign currencies. Gains and losses arising on the hedges are deferred in equity until the
variability on the cash flow affects profit and loss, at which time the gains or losses are transferred to
profit and loss.
The Group has hedged the following cash flows which are expected to impact the income statement
in the following periods:
2007
Less thanone year
US$million
One to twoyears
US$million
Two tothree yearsUS$million
Three tofour years
US$million
Four tofive years
US$million
Over fiveyears
US$millionTotal
US$million
Forecast receivablecash flows 98 82 31 36 2 1 250
Forecast payable cashflows (724) (706) (14) (5) (3) — (1,452)
(626) (624) 17 31 (1) 1 (1,202)
740
c102100pu180Proof7:28.3.10B/LRevision:0OperatorBeeR

2006
Less thanone year
US$million
One to twoyears
US$million
Two tothree yearsUS$million
Three tofour years
US$million
Four to fiveyears
US$million
Over fiveyears
US$millionTotal
US$million
Forecast receivablecash flows 101 82 51 18 32 — 284
Forecast payable cashflows (721) (335) (55) (13) (3) — (1,127)
(620) (253) (4) 5 29 — (843)
During the year, US$nil million (2006: US$nil million) was recognised in the income statement in
respect of ineffectiveness arising on cash flow hedges.
During the period US$58 million (2006: US$20 million) was removed from the cash flow hedging
reserve and included in profit and loss. The whole US$58 million (2006: US$20 million) wasrecognised within operating costs.
17. Loans and Advances to Banks2007
US$million
2006
US$million
Loans and advances to banks 37,682 21,074
Individual impairment provision (note 20) (2) (9)Portfolio impairment provision (note 20) (1) (1)
37,679 21,064
Of which: loans and advances held at fair value through profit or loss (note 15) (2,314) (1,340)
35,365 19,724
18. Loans and Advances to Customers
2007
US$million
2006*
US$million
Loans and advances to customers 158,788 142,709
Individual impairment provision (note 20) (1,271) (1,673)
Portfolio impairment provision (note 20) (535) (542)
156,982 140,494Of which: loans and advances held at fair value through profit or loss (note 15) (2,716) (1,194)
154,266 139,300
* Amounts have been restated as explained in note 51 on page 795.
The Group has transferred to third parties by way of securitisation the rights to any collections of
principal and interest on customer loan assets with a face value of US$5,742 million (2006: US$3,935
million). The Group continues to be exposed to related credit and foreign exchange risk on these
assets. The Group continues to recognise these assets in addition to the proceeds and related liability
of US$5,155 million (2006: US$3,519 million) arising from the securitisations.
The Group has entered into synthetic loan securitisations of US$11.7 billion (2006: US$5.6 billion)
and synthetic trade receivable securitisations of US$12.7 billion (2006: US$1.5 billion). The assetsremain on the Group’s balance sheet and the Group continues to be exposed to some credit risks and
foreign exchange risks on these assets.
The Group’s exposure to credit risk is concentrated in Hong Kong, Korea, Singapore and the Other
Asia Pacific region. The Group is affected by the general economic conditions in the territories in
741
c102100pu180Proof7:28.3.10B/LRevision:0OperatorBeeR

which it operates. The Group sets limits on the exposure to any counterparty and credit risk is
spread over a variety of different personal and commercial customers. The Group has outstanding
residential mortgage loans to Korea residents of US$22.6 billion (2006: US$24.0 billion) and Hong
Kong residents of approximately US$11.8 billion (2006: US$11.2 billion).
19. Assets Leased to Customers
Finance leases and instalment credit2007
US$million
2006
US$million
Finance leases 506 639
Instalment credit agreements 1,127 1,019
1,633 1,658
The above assets are included within loans and advances to customers.
The cost of assets acquired during the year for leasing to customers under finance leases and
instalment credit agreements amounted to US$140 million (2006: US$720 million).
2007
US$million
2006
US$million
Minimum lease receivables under finance leases falling due:
Within one year 61 88
Later than one year and less than five years 511 496After five years 12 157
584 741
Interest income relating to future periods (78) (102)
Present value of finance lease receivables 506 639
Operating lease assets
Assets leased to customers under operating leases consist of commercial aircraft which are included
within property, plant and equipment in note 26. At 31 December 2007 these assets had a net book
value of US$200 million (2006: US$nil million).2007
US$million2006
US$million
Minimum lease receivables under operating leases falling due:Within one year 10 —Later than one year and less than five years 21 —After five years 5 —
36 —
742
c102100pu180Proof7:28.3.10B/LRevision:0OperatorBeeR

20. Impairment Provisions on Loans and Advances
2007US$million
2006*US$million
At 1 January 2,225 1,754Exchange translation differences 28 74Acquisitions — 743Amounts written off (1,183) (962)Recoveries of acquisition fair values (98) (106)Recoveries of amounts previously written off 139 128Discount unwind (66) (52)Other 10 12New provisions 1,352 1,131
Recoveries/provisions no longer required (598) (497)Net charge against profit** 754 634
Provisions held at 31 December# 1,809 2,225
* Amounts have been restated as explained in note 51 on page 795.
** The net charge of US$754 million (2006: US$634 million) comprises US$769 million (2006: US$604 million) individualimpairment charge and US$(15) million (2006: US$30 million) portfolio impairment (release)/charge. It excludes provisionreleases of US$3 million (2006: US$11 million) for credit commitments (note 35) and impairment charges of US$10 million (2006:US$6 million) relating to debt securities designated as loans and receivables (note 22).
# The provision of US$1,809 million held at 31 December 2007 (2006: US$2,225 million) comprises US$1,273 million (2006:US$1,682 million) individual impairment provision and US$536 million (2006: US$543 million) portfolio impairment provision.
The following table shows impairment provisions by each principal category of borrowers’ business or
industry:2007
US$million2006*
US$million
Loans to individualsMortgages 99 132Other 200 226
Small and medium enterprises 356 494
Consumer Banking 655 852
Agriculture, forestry and fishing 33 23Construction 10 4Commerce 152 169Electricity, gas and water 25 6Financing, insurance and business services 27 20Mining and quarrying 12 36Manufacturing 290 507Commercial real estate 23 12Transport, storage and communication 22 31Other 22 13
Wholesale Banking 616 821
Individual impairment provision against loans and advances to customers(note 18) 1,271 1,673
Individual impairment provision against loans and advances to banks (note 17) 2 9Portfolio impairment provision (note 17, 18) 536 543
Total impairment provisions on loans and advances 1,809 2,225
* Amounts have been restated as explained in note 51 on page 795.
743
c102100pu180Proof7:28.3.10B/LRevision:0OperatorBeeR

21. Individually Impaired Loans and Advances
2007 2006
Consumer
Banking
US$million
Wholesale
Banking
US$million
Total
US$million
Consumer
Banking
US$million
Wholesale
Banking
US$million
Total
US$million
Individual impaired
loans 1,172 990 2,162 1,761 1,368 3,129
Individual
impairmentprovisions (655) (618) (1,273) (852) (830) (1,682)
Net impaired loans 517 372 889 909 538 1,447
Net impaired loans within Wholesale Banking includes individually impaired loans to banks of US$10
million (2006: US$18 million) and individual impairment provisions on these loans of US$2 million
(2006: US$9 million). Collateral held as security against impaired loans primarily relates to property
and equipment. The fair value of collateral held against impaired loans is estimated at US$1,121
million (2006: US$1,466 million), of which US$918 million (2006: US$1,068 million) relates toConsumer Banking and US$203 million (2006: US$398 million) to Wholesale Banking. Where the fair
value of collateral held exceeds the outstanding loan, any excess is paid back to the customers and is
not available for offset against other loans.
22. Investment Securities
Held-to-maturity
US$million
Available-for-sale
US$million
Loans andreceivablesUS$million
TotalUS$million
Treasury and other eligible bills — 11,667 — 11,667Debt securities 100 38,098 2,719 40,917Equity shares — 2,690 — 2,690
At 31 December 2007 100 52,455 2,719 55,274
Treasury and other eligible bills — 12,522 — 12,522Debt securities* 137 32,711 2,649 35,497Equity shares — 1,478 — 1,478
At 31 December 2006 137 46,711 2,649 49,497
* Amounts have been restated as explained in note 51 on page 795.
744
c102100pu180Proof7:28.3.10B/LRevision:0OperatorBeeR

2007
Debt securities
Held-to-
maturity
US$million
Available-
for-sale
US$million
Loans and
receivables
US$million
Equity
shares
US$million
Treasury
bills
US$million
Total
US$million
Issued by public bodies:
Government securities 100 12,658 —
Other public sector securities — 1,008 —
100 13,666 —
Issued by banks:
Certificates of deposit — 6,248 2,175
Other debt securities — 12,904 18
19,152 2,193
Issued by corporate entities
and other issuers:Other debt securities — 5,280 526
Total debt securities 100 38,098 2,719
Listed on a recognised UK
exchange — 3,663 — 58 — 3,721Listed elsewhere 77 16,060 — 1,842 6,346 24,325
Unlisted 23 18,375 2,719 790 5,321 27,228
100 38,098 2,719 2,690 11,667 55,274
Market value of listed
securities 75 19,723 — 1,900 6,346 28,044
745
c102100pu180Proof7:28.3.10B/LRevision:0OperatorBeeR

2006
Debt securities
Held-to-
maturity
US$million
Available-
for-sale
US$million
Loans and
receivables
US$million
Equity
shares
US$million
Treasury
bills
US$million
Total
US$million
Issued by public bodies:Government securities 137 10,379 —Other public sector securities — 1,403 —
137 11,782 —
Issued by banks:Certificates of deposit — 8,433 2,280Other debt securities — 9,505 178
— 17,938 2,458
Issued by corporate entitiesand other issuers:
Other debt securities — 2,991 191
Total debt securities 137 32,711 2,649
Listed on a recognised UKexchange — 6,679 — 38 — 6,717
Listed elsewhere 113 10,183 132 795 7,027 18,250Unlisted 24 15,849 2,517 645 5,495 24,530
137 32,711 2,649 1,478 12,522 49,497
Market value of listedsecurities 109 16,862 130 833 7,027 24,961
* Amounts have been restated as explained in note 51 on page 795.
Equity shares largely comprise investments in corporates.
The change in the carrying amount of investment securities comprised:
2007 2006
Debt
securities
US$million
Equity
shares
US$million
Treasury
bills
US$million
Total
US$million
Debt
securities*
US$million
Equity
shares
US$million
Treasury
bills
US$million
Total
US$million
At 1 January 35,497 1,478 12,522 49,497 26,710 954 10,199 37,863
Exchange translation
differences 846 20 171 1,037 949 9 528 1,486
Acquisitions — — — — 1,155 21 842 2,018
Additions 53,574 1,248 23,470 78,292 47,411 328 23,376 71,115
Maturities and disposals (48,850) (970) (24,637) (74,457) (40,909) (337) (22,650) (63,896)
Provisions (45) (3) (2) (50) (6) (4) (16) (26)
Changes in fair value (including
the effect of fair value
hedging) (205) 920 (19) 696 142 510 28 680
Amortisation of discounts and
premiums 100 (3) 162 259 45 (3) 215 257
At 31 December 40,917 2,690 11,667 55,274 35,497 1,478 12,522 49,497
* Amounts have been restated as explained in note 51 on page 795.
Treasury bills and other eligible bills include US$492 million (2006: US$393 million) of bills sold
subject to sale and repurchase transactions. Debt securities include US$1,958 million (2006: US$896
million) of securities sold subject to sale and repurchase transactions.
746
c102100pu180Proof7:28.3.10B/LRevision:0OperatorBeeR

At 31 December 2007, unamortised premiums on debt securities held for investment purposes
amounted to US$46 million (2006: US$39 million) and unamortised discounts amounted to US$186
million (2006: US$112 million).
Income from listed equity shares amounted to US$9 million (2006: US$4 million) and income from
unlisted equity shares amounted to US$270 million (2006: US$73 million).
The change in impairment provisions is as follows:
2007 2006
Debt
securities
US$million
Equity
shares
US$million
Treasury
bills
US$million
Total
US$million
Debt
securities*
US$million
Equity
shares
US$million
Treasury
bills
US$million
Total
US$million
At 1 January 9 23 10 42 4 30 16 50
Exchange translation
differences — 1 (10) (9) — 1 (15) (14)
Amounts written off — (5) — (5) (1) (12) (7) (20)
New provisions* 45 3 2 50 6 4 16 26
At 31 December 54 22 2 78 9 23 10 42
* Of the new provisions raised of US$50 million (2006: US$26 million), US$10 million (2006: US$6 million) relates to debt securitiesclassified as loans and receivables and is included with impairment losses on loans and advances and other credit provisions, withthe balance reported within ‘Other Impairments’.
23. Investments in Subsidiary Undertakings, Joint Ventures and Associates
Investment in subsidiary undertakings
2007
US$million
2006
US$million
At 1 January 2007 9,656 7,973
Additions 750 2,683
Redemption of capital — (1,000)
At 31 December 2007 10,406 9,656
747
c102100pu180Proof7:28.3.10B/LRevision:0OperatorBeeR

At 31 December 2007, the principal subsidiary undertakings, all indirectly held and principally
engaged in the business of banking and provision of other financial services, were as follows:
Country and place of incorporation or registration Main areas of operation
Group
interest in
ordinary
share
capital
Standard Chartered Bank, England and Wales United Kingdom, Middle East,
South Asia, Asia Pacific,Americas and, through Group
companies, Africa
100%
Standard Chartered First Bank Korea Limited, Korea Korea 100%
Standard Chartered Bank Malaysia Berhad, Malaysia Malaysia 100%
Standard Chartered Bank (Pakistan) Limited, Pakistan Pakistan 99.0%
Standard Chartered Bank (Taiwan) Limited, Taiwan* Taiwan 100%
Standard Chartered Bank (Hong Kong) Limited, Hong
Kong
Hong Kong 100%
Standard Chartered Bank (China) Limited, China China 100%
Standard Chartered Bank (Thai) Public Company
Limited, Thailand
Thailand 99.97%
Standard Chartered Capital Management (Jersey) LLC,
United States
United States 100%
Standard Chartered Receivables (UK) Limited,
England and Wales
United Kingdom 100%
Standard Chartered Financial Investments Limited,England and Wales
United Kingdom 100%
Standard Chartered Debt Trading Limited, England
and Wales
Hong Kong 100%
* Formerly Hsinchu International Bank.
Details of all Group companies will be filed with the next annual return of the Company.
Joint venture
The Group has a 44.51% interest through a joint venture company which holds a majority investment
in PT Bank Permata Tbk (‘Permata’), in Indonesia. The Group proportionately consolidates its share
of the assets, liabilities, income and expense of Permata on a line by line basis.
Contingent liabilities set out in note 45, include US$72 million (2006: US$24 million) relating to this
joint venture arrangement. These mainly comprise banking guarantees and irrevocable letters of credit.
There are no capital commitments related to the Group’s investment in Permata.
Related party transactions are disclosed in note 52.
748
c102100pu180Proof7:28.3.10B/LRevision:0OperatorBeeR

The following amounts have been included in the consolidated accounts of the Group:
2007
US$million
2006
US$million
Current assets 663 549
Long-term assets 1,332 1,472
Total assets 1,995 2,021
Current liabilities (1,484) (1,580)
Long-term liabilities (140) (81)
Total liabilities (1,624) (1,661)
371 360
Income 161 100
Expenses (111) (73)Impairment (17) (17)
Operating profit 33 10
Tax 2 (2)
Share of post tax result from joint venture 35 8
Long-term assets are primarily loans to customers and current liabilities are primarily customer
deposits based on contractual maturities.
Interests in associates
2007
US$million
2006
US$million
At 1 January 218 128
Additions 51 90
At 31 December 269 218
Profit/(loss) for the year 1 (2)
Total assets 944 355
Total liabilities (774) (216)
170 139
The Group’s principal associates are:
Associate
Main areas
of operation
Group interest in
ordinary share
capital
China Bohai Bank Co., Ltd China 19.9%
Fleming Family & Partners Asia 20.0%
First Africa Holdings Africa 25.0%
MCashback Limited UK 30.0%
Merchant Solutions Limited Hong Kong 44.0%
The Group’s investment in China Bohai Bank Co., Ltd is less than 20% but is considered to be an
associate because of the significant influence the Group is able to exercise over the company’s
management, financial and operating policies.
749
c102100pu180Proof7:28.3.10B/LRevision:0OperatorBeeR

On 9 February 2007, the Group acquired a 30% interest in MCashback Limited, for US$36 million.
In October 2007, the Group obtained a 44% interest in Merchant Solutions Limited. The reporting
dates of these associates are within three months of the Group’s reporting date.
24. Business Combinations
2007 acquisitions
On 5 October 2007, the Group acquired 100% of the share capital of Pembroke Group Limited, an
aircraft leasing, financing and management company. On 3 December 2007, the Group acquired 100%
of the share capital of Harrison Lovegrove & Co Limited, an oil and gas advisory boutique company.
On 5 December 2007, the Group acquired 80% of A Brain Limited, a Korean fund administrationcompany. None of these acquisitions were individually material.
The acquired businesses contributed operating income of US$7 million and loss before tax of US$2
million to the Group from the date of their acquisition to 31 December 2007.
If the acquisition had occurred on 1 January 2007, the operating income of the Group would have
been approximately US$11,132 million and profit before taxation would have been approximatelyUS$4,043 million.
During 2007, the Group acquired the remaining minority interest of Hsinchu for a consideration ofUS$43 million and generated additional goodwill of US$34 million.
US$million
Details of net assets acquired and goodwill are as follows:
Purchase consideration:
– cash paid 151
– loan notes issued 5
– deferred consideration 65– direct costs relating to the acquisitions 3
Total purchase consideration 224
Fair value of net assets acquired 187
Goodwill 37
Deferred consideration is payable between 6 months and 36 months after the date of acquisition.
Goodwill arising on these acquisitions is attributable to the synergies expected to arise and to the
value of the workforce in place which is not recognised separately.
750
c102100pu180Proof7:28.3.10B/LRevision:0OperatorBeeR
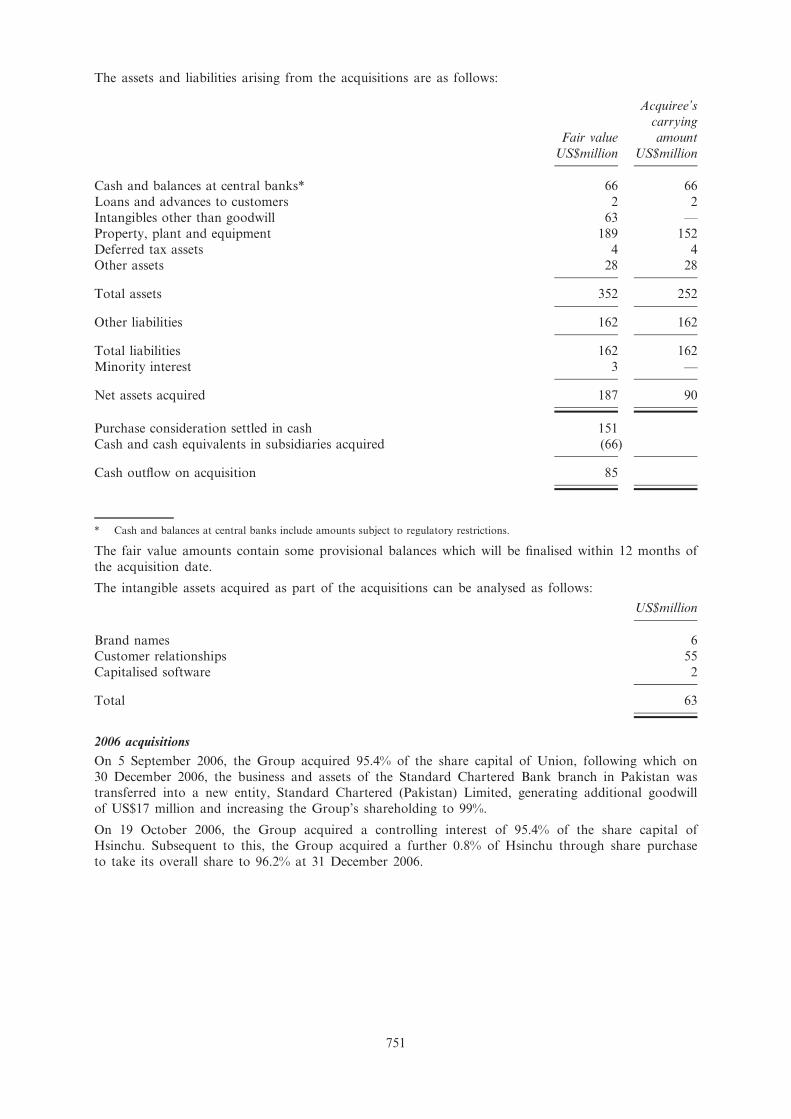
The assets and liabilities arising from the acquisitions are as follows:
Fair value
US$million
Acquiree’s
carrying
amount
US$million
Cash and balances at central banks* 66 66
Loans and advances to customers 2 2
Intangibles other than goodwill 63 —
Property, plant and equipment 189 152
Deferred tax assets 4 4Other assets 28 28
Total assets 352 252
Other liabilities 162 162
Total liabilities 162 162
Minority interest 3 —
Net assets acquired 187 90
Purchase consideration settled in cash 151
Cash and cash equivalents in subsidiaries acquired (66)
Cash outflow on acquisition 85
* Cash and balances at central banks include amounts subject to regulatory restrictions.
The fair value amounts contain some provisional balances which will be finalised within 12 months of
the acquisition date.
The intangible assets acquired as part of the acquisitions can be analysed as follows:
US$million
Brand names 6Customer relationships 55
Capitalised software 2
Total 63
2006 acquisitions
On 5 September 2006, the Group acquired 95.4% of the share capital of Union, following which on
30 December 2006, the business and assets of the Standard Chartered Bank branch in Pakistan wastransferred into a new entity, Standard Chartered (Pakistan) Limited, generating additional goodwill
of US$17 million and increasing the Group’s shareholding to 99%.
On 19 October 2006, the Group acquired a controlling interest of 95.4% of the share capital ofHsinchu. Subsequent to this, the Group acquired a further 0.8% of Hsinchu through share purchase
to take its overall share to 96.2% at 31 December 2006.
751
c102100pu180Proof7:28.3.10B/LRevision:0OperatorBeeR

The assets and liabilities arising from the acquisitions are as follows:
Union Hsinchu
Fair value*US$million
Acquiree’scarryingamount
US$millionFair value*US$million
Acquiree’scarryingamount
US$million
Cash and balances at central banks 148 148 481 481Financial assets held at fair value through profit or
loss — — 563 563Loans and advances to banks 104 104 440 440Loans and advances to customers 1,118 1,206 9,225 9,352Investment securities 404 411 1,614 1,609Intangibles other than goodwill 55 3 122 —Property, plant and equipment 44 28 287 307Deferred tax assets 43 1 162 151Other assets 48 61 212 213
Total assets 1,964 1,962 13,106 13,116
Deposits by banks 425 425 988 988Customer accounts 1,320 1,309 10,709 10,709Debt securities in issue — — 532 532Other liabilities 97 96 48 41Retirement benefit obligations — — 116 27Subordinated liabilities and other borrowed funds 40 41 545 545
Total liabilities 1,882 1,871 12,938 12,842Minority interest 7 7 8 10
Net assets acquired 75 84 160 264
Purchase consideration settled in cash 489 1,201Cash and cash equivalents in subsidiary acquired (164) (589)
Cash outflow on acquisition 325 612
Total purchase consideration 489 1,201Fair value of net assets acquired 75 160
Goodwill 414 1,041
Intangible assets acquired:Brand names 6 24Customer relationships 13 43Core deposits 33 55Capitalised software 3 —
Total 55 122
* During 2007 certain of the provisionally determined fair value amounts have been finalised and in accordance with IFRS 3Business Combinations, the adjustments have been made as at the date of acquisition and the 2006 balance sheet amountsrestated. Details of these adjustments are explained in note 51.
Goodwill arising on the acquisitions of Union and Hsinchu is attributable to the significant synergies
expected to arise from their development within the Group and to those intangibles which are not
recognised separately, such as the branch networks and, for Hsinchu, a workforce in place with
Mandarin speaking capabilities.
752
c102100pu180Proof7:28.3.10B/LRevision:0OperatorBeeR
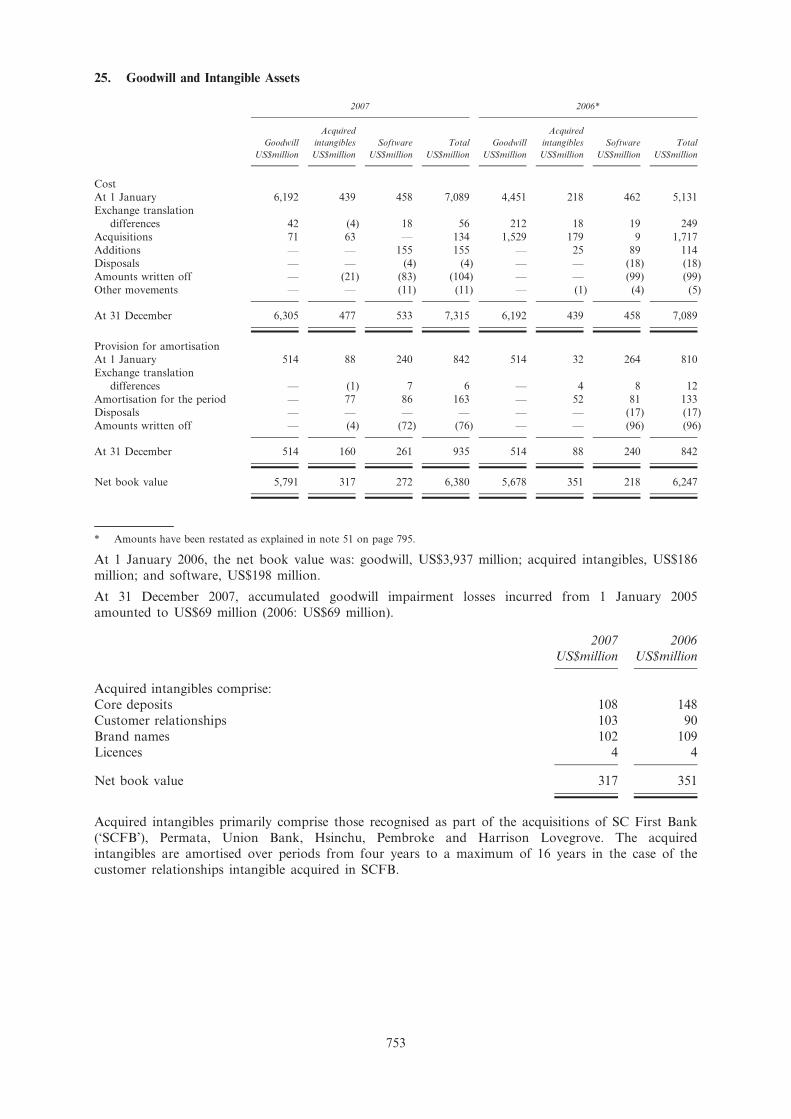
25. Goodwill and Intangible Assets
2007 2006*
Goodwill
US$million
Acquired
intangibles
US$million
Software
US$million
Total
US$million
Goodwill
US$million
Acquired
intangibles
US$million
Software
US$million
Total
US$million
Cost
At 1 January 6,192 439 458 7,089 4,451 218 462 5,131
Exchange translation
differences 42 (4) 18 56 212 18 19 249
Acquisitions 71 63 — 134 1,529 179 9 1,717
Additions — — 155 155 — 25 89 114
Disposals — — (4) (4) — — (18) (18)
Amounts written off — (21) (83) (104) — — (99) (99)
Other movements — — (11) (11) — (1) (4) (5)
At 31 December 6,305 477 533 7,315 6,192 439 458 7,089
Provision for amortisation
At 1 January 514 88 240 842 514 32 264 810
Exchange translation
differences — (1) 7 6 — 4 8 12
Amortisation for the period — 77 86 163 — 52 81 133
Disposals — — — — — — (17) (17)
Amounts written off — (4) (72) (76) — — (96) (96)
At 31 December 514 160 261 935 514 88 240 842
Net book value 5,791 317 272 6,380 5,678 351 218 6,247
* Amounts have been restated as explained in note 51 on page 795.
At 1 January 2006, the net book value was: goodwill, US$3,937 million; acquired intangibles, US$186
million; and software, US$198 million.
At 31 December 2007, accumulated goodwill impairment losses incurred from 1 January 2005
amounted to US$69 million (2006: US$69 million).
2007
US$million
2006
US$million
Acquired intangibles comprise:
Core deposits 108 148
Customer relationships 103 90
Brand names 102 109
Licences 4 4
Net book value 317 351
Acquired intangibles primarily comprise those recognised as part of the acquisitions of SC First Bank
(‘SCFB’), Permata, Union Bank, Hsinchu, Pembroke and Harrison Lovegrove. The acquired
intangibles are amortised over periods from four years to a maximum of 16 years in the case of the
customer relationships intangible acquired in SCFB.
753
c102100pu180Proof7:28.3.10B/LRevision:0OperatorBeeR

Significant items of goodwill arising on acquisitions have been allocated to the following cash
generating units for the purposes of impairment testing:
Acquisition Cash Generating Unit
Goodwill
US$million
SCFB Korean business 1,904
Union Pakistan business 431
Hsinchu Taiwan business 1,100
Manhattan Card Business Credit card and personal loan – Asia, India & MESA 896
Grindlays (India) India business 423
Grindlays (MESA) MESA business 368
Standard Chartered Bank (Thai) Thailand business 307
Permata Group’s share of Permata 163Other 199
5,791
All recoverable amounts were measured based on value in use. The key assumptions and approach to
determining value in use calculations, as set out below, are solely estimates for the purposes of
assessing impairment on acquired goodwill. The calculation for each unit uses cash flow projections
based on budgets and forecasts approved by management covering one year, except for Permata (five
years). These are then extrapolated for periods of up to a further 19 years using steady long-termforecast GDP growth rates and a terminal value determined based on long-term earning multiples.
Where these rates are different from available market data on long-term rates, that fact is stated
below. The cash flows are discounted using a pre-tax discount rate which reflects current market rates
appropriate to the cash generating unit. Management believes that any reasonable possible change in
the key assumptions on which the recoverable amounts have been based would not cause the carrying
amounts to exceed their recoverable amount.
SCFB
SCFB was acquired in April 2005 with initial goodwill recognised of US$1,738 million. The business
comprises Consumer and Wholesale Banking operations in Korea.
In assessing impairment of goodwill, the Group assumed that growth would increase at a steady rate
of 4.2% in line with the long-term forecast GDP growth of Korea. A pre-tax discount rate of 16.4%
was used.
Union
Union was acquired in September 2006 with initial goodwill recognised of US$414 million. Additional
goodwill of US$17 million arose as a result of a share swap. The business comprises Consumer andWholesale Banking operations in Pakistan.
In assessing impairment of goodwill, the Group assumed that growth would increase at a steady rate
of 7.4% in line with the long-term forecast GDP growth of Pakistan. A pre-tax discount rate of
26.1% was used.
Hsinchu
Hsinchu was acquired in October 2006 with initial goodwill recognised of US$1,041 million and a
further US$34 million in 2007. The business comprises Consumer and Wholesale Banking operations
in Taiwan.
In assessing impairment of goodwill, the Group assumed that growth would increase at a steady rateof 4.5% in line with the long-term forecast GDP growth of Taiwan. A pre-tax discount rate of 14.9%
was used.
Manhattan Card Business
Manhattan Card Business was acquired in 2000 with initial goodwill recognised of US$1,061 million.
This was amortised to US$892 million under UK GAAP until 31 December 2003. The business
comprises a credit card business and a personal loans business across Asia, India and MESA.
754
c102100pu180Proof7:28.3.10B/LRevision:0OperatorBeeR

In assessing impairment of goodwill, the Group assumed that growth would increase at a steady rate
of 3.8% in line with the long-term forecast global GDP growth. A pre-tax discount rate of 13.0% was
used.
Grindlays (India)
Grindlays (India) was acquired in 2000 with initial goodwill recognised of US$446 million. This was
amortised to US$366 million under UK GAAP until 31 December 2003. It comprises Consumer and
Wholesale Banking operations in India.
In assessing impairment of goodwill, the Group assumed that growth would increase at a steady rate
of 7.1% in line with the long-term forecast GDP growth of India. A pre-tax discount rate of 26.5%
was used.
Grindlays (MESA)
Grindlays (MESA) was acquired in 2000 with initial goodwill recognised of US$446 million. This was
amortised to US$366 million under UK GAAP until 31 December 2003. It comprises Consumer andWholesale Banking operations in MESA.
In assessing impairment of goodwill, the Group assumed that growth would increase at a steady rateof 3.8% in line with the long term forecast GDP growth of MESA. A pre-tax discount rate of 15.8%
was used.
Standard Chartered Bank (Thai)
75% of Standard Chartered Bank (Thai) was acquired in 1999 with initial goodwill recognised of
US$222 million. This was amortised to US$204 million under UK GAAP until 31 December 2003. In
2005 the Group acquired the remaining 25%, increasing goodwill to US$272 million. The business
comprises Consumer and Wholesale Banking operations in Thailand.
In assessing impairment of goodwill, the Group assumed that growth would increase at a steady rate
of 5.6% in line with the long term forecast GDP growth of Thailand. A pre-tax discount rate of
19.5% was used.
Permata
31.55% of Permata was acquired in 2004 with initial goodwill recognised of US$115 million. A
further 12.96% was acquired in September 2006 with goodwill of US$57 million. This business
comprises Consumer and Wholesale Banking operations in Indonesia.
In assessing impairment of goodwill, the Group assumed that growth would increase at a steady rate
of 5.4% in line with the long-term forecast GDP growth of Indonesia. A pre-tax discount rate of
25.9% was used.
755
c102100pu180Proof7:28.3.10B/LRevision:0OperatorBeeR

26. Property, Plant and Equipment
2007 2006*
Premises
US$million
Equipment
US$million
Total
US$million
Premises
US$million
Equipment
US$million
Total
US$million
Cost or valuation
At 1 January 2,184 509 2,693 1,694 414 2,108Exchange translation
differences 71 20 91 106 10 116
Additions 309 162 471 146 99 245
Acquisitions — 189 189 288 47 335
Disposals and fully
depreciated assets
written off (55) (55) (110) (47) (64) (111)
Reclassification** 202 (8) 194 (3) 3 —
At 31 December 2,711 817 3,528 2,184 509 2,693
Depreciation
Accumulated at1 January 215 310 525 177 287 464
Exchange translation
differences 5 17 22 6 7 13
Charge for the year 78 104 182 57 78 135
Attributable to assets
sold or written off (37) (51) (88) (25) (62) (87)
Accumulated at
31 December 261 380 641 215 310 525
Net book amount at
31 December 2,450 437 2,887 1,969 199 2,168
* Amounts have been restated as explained in note 51 on page 795.
** Reclassified from other assets.
At 1 January 2006, the net book value was: premises, US$1,517 million; and equipment, US$127
million.
Assets held under finance leases have the following net book amount:
2007 2006
Premises
US$million
Equipment
US$million
Premises
US$million
Equipment
US$million
Cost 53 13 47 4
Aggregate depreciation (6) (5) (4) (2)
Net book amount 47 8 43 2
The Group’s premises leases include rent review periods, renewal terms and in some cases purchase
options.
756
c102100pu180Proof7:28.3.10B/LRevision:0OperatorBeeR

2007
US$million
2006
US$million
Minimum lease payments under finance leases falling due:
Within one year 4 1
Later than one year and less than five years 8 2
12 3Future finance charges on finance leases (2) —
Present value of finance lease liabilities 10 3
27. Deferred Tax
The following are the major deferred tax liabilities and assets recognised by the Group and
movements thereon during the reporting period:
At
1 January
2007
US$million
Exchange
& other
adjustments
US$million
Acquisitions/
disposals*
US$million
Charge/
(credit)
to profit
US$million
Charge/
(credit)
to equity
US$million
At
31 December
2007
US$million
Deferred taxation comprises:
Accelerated tax depreciation (10) (9) (3) (34) — (56)
Impairment provisions on loans and
advances (175) (67) — (35) 2 (275)
Tax losses carried forward (53) 1 (1) 1 — (52)
Available-for-sale assets 36 5 — — 38 79
Premises revaluation 17 — — 1 (1) 17
Cash flow hedges 24 3 — — (7) 20
Unrelieved foreign tax (76) — — 19 — (57)
Retirement benefit obligations (174) 60 — 2 71 (41)
Share based payments (131) — — (18) 61 (88)
Other temporary differences 30 7 — (143) — (106)
(512) — (4) (207) 164 (559)
At
1 January
2006
US$million
Exchange
& other
adjustments
US$million
Acquisitions/
disposals*
US$million
Charge/
(credit)
to profit
US$million
Charge/
(credit)
to equity
US$million
At
31 December
2006
US$million
Deferred taxation comprises:
Accelerated tax depreciation (34) 30 (10) 4 — (10)
Impairment provisions on loans and
advances (185) (27) (123) 160 — (175)
Tax losses carried forward (7) — (22) (24) — (53)
Available-for-sale assets (32) (2) — — 70 36
Premises revaluation 12 — — 5 — 17
Cash flow hedges (1) — — — 25 24
Unrelieved foreign tax — — — (76) — (76)
Retirement benefit obligations (160) (12) (32) (8) 38 (174)
Share based payments (101) — — (1) (29) (131)
Other temporary differences 10 (40) (18) 86 (8) 30
(498) (51) (205) 146 96 (512)
757
c102100pu180Proof7:28.3.10B/LRevision:0OperatorBeeR

Deferred taxation comprises assets and liabilities as follows:
2007 2006*
Total
US$million
Asset
US$million
Liability
US$million
Total
US$million
Asset
US$million
Liability
US$million
Deferred taxation comprises:
Accelerated tax depreciation (56) (79) 23 (10) (42) 32
Impairment provisions on loans and
advances (275) (273) (2) (175) (238) 63
Tax losses carried forward (52) (52) — (53) (53) —
Available-for-sale assets 79 77 2 36 15 21
Premises revaluation 17 15 2 17 16 1
Cash flow hedges 20 19 1 24 23 1
Unrelieved foreign tax (57) (57) — (76) (76) —
Retirement benefit obligations (41) (41) — (174) (165) (9)
Share based payments (88) (88) — (131) (131) —
Other temporary differences (106) (108) 2 30 37 (7)
(559) (587) 28 (512) (614) 102
* Amounts have been restated as explained in note 51 on page 795.
2007
US$million
2006
US$million
No account has been taken of the following potential deferred taxation assets/
(liabilities):
Unrelieved foreign tax 408 222
Unremitted earnings from overseas subsidiaries (369) (282)Foreign exchange movements on investments in branches (136) (41)
Tax losses 56 34
28. Other Assets
2007
US$million
2006
US$million
Hong Kong SAR Government certificates of indebtedness (note 34) 2,862 2,605
Other 8,149 5,996
11,011 8,601
The government of Hong Kong certificates of indebtedness are subordinated to the claims of other
parties.
29. Deposits by Banks
2007
US$million
2006
US$million
Deposits by banks 25,880 26,233
Deposits by banks included within:
Financial liabilities held at fair value through profit or loss (note 31) 2,705 1,889
28,585 28,122
758
c102100pu180Proof7:28.3.10B/LRevision:0OperatorBeeR

30. Customer Accounts
2007
US$million
2006
US$million
Customer accounts 179,760 147,382
Customer accounts included within:
Financial liabilities held at fair value through profit or loss (note 31) 2,836 1,906
182,596 149,288
Included in customer accounts were deposits of US$2,805 million (2006: US$1,724 million) held ascollateral for irrevocable commitments under import letters of credit.
31. Financial Liabilities Held at Fair Value through Profit or Loss
2007
Trading
US$million
Designated
at fair
value
through
profit or
loss
US$million
Total
US$million
Deposits by banks 2,532 173 2,705
Customer accounts 772 2,064 2,836
Debt securities in issue 2,665 2,351 5,016
Short positions 3,693 — 3,693
9,662 4,588 14,250
2006
Trading
US$million
Designated
at fair
value
through
profit or
loss
US$million
Total
US$million
Deposits by banks 1,286 603 1,889
Customer accounts 485 1,421 1,906
Debt securities in issue 1,514 1,771 3,285
Short positions 2,889 — 2,889
6,174 3,795 9,969
The Group designates certain financial liabilities at fair value through profit or loss where either the
liabilities:
* have fixed rates of interest and interest rate swaps or other interest rate derivatives have beenentered into with the intention of significantly reducing interest rate risk; or
* are exposed to foreign currency risk and derivatives have been acquired with the intention of
significantly reducing exposure to market changes; or
* have been acquired to fund trading asset portfolios or assets, or where the assets and liabilities
are managed, and performance evaluated, on a fair value basis for a documented risk
management or investment strategy.
759
c102100pu180Proof7:28.3.10B/LRevision:0OperatorBeeR

Derivatives are recorded at fair value whereas non-trading financial liabilities (unless designated at fair
value) are recorded at amortised cost. Designation of certain liabilities at fair value through profit or
loss significantly reduces the accounting mismatch between fair value and amortised cost expense
recognition (a criterion of IAS 39). The Group ensures the criteria under IAS 39 are met by matchingthe principal terms of derivatives to the corresponding liabilities, either individually or on a portfolio
basis.
The changes in fair value of both the underlying liabilities and derivatives are monitored in a similar
manner to trading book portfolios.
The fair value loss on liabilities designated at fair value through profit or loss was US$37.3 million
for the year (2006: US$31.2 million). Of this, a gain of US$0.2 million (2006: loss of US$3.7 million)
relates to changes in credit risk. The cumulative fair value movement relating to changes in credit risk
was a loss of US$5.2 million (2006: a loss of US$5.4 million).
As at 31 December 2007, the amount the Group is contractually obliged to pay at maturity to the
holders of these obligations was US$52 million (2006: US$68 million) lower than the carrying amount
at fair value.
The change in fair value attributable to credit risk was determined by comparing fair value
movements in risk-free debt instruments with similar maturities, to the changes in fair value of
liabilities designated at fair value through profit or loss.
32. Debt Securities in Issue2007 2006
Certificates of
deposit of
US$100,000 or
more
US$million
Other debt
securities in
issue
US$million
Total
US$million
Certificates of
deposit of
US$100,000 or
more
US$million
Other debt
securities in
issue
US$million
Total
US$million
Debt securities in issue 8,502 18,635 27,137 10,939 12,575 23,514Debt securities in issue included
within:Financial liabilities held at fairvalue through profit or loss (note 31) 951 4,065 5,016 1,154 2,131 3,285
9,453 22,700 32,153 12,093 14,706 26,799
33. Structure of Deposits
The following tables set out the structure of the Group’s deposits by principal geographic areas as at
31 December 2007 and 31 December 2006:2007
Asia Pacific
Hong
Kong
US$million
Singapore
US$million
Malaysia
US$million
Korea
US$million
Other
Asia
Pacific
US$million
India
US$million
Middle
East &
Other
S Asia
US$million
Africa
US$million
Americas
UK &
Europe
US$million
Total
US$million
Non-interest bearingcurrent anddemand accounts 3,838 2,310 639 91 1,818 2,569 2,915 1,768 1,189 17,137
Interest bearing currentaccounts andsavings deposits 22,971 8,062 2,598 13,287 18,658 1,843 5,600 2,784 7,730 83,533
Time deposits 21,734 10,892 6,608 12,172 19,529 4,757 6,929 1,380 20,912 104,913Other deposits 32 20 208 1,223 815 317 593 452 1,938 5,598
Total 48,575 21,284 10,053 26,773 40,820 9,486 16,037 6,384 31,769 211,181
Deposits by banks 1,128 1,548 883 6,964 5,464 585 2,039 568 9,406 28,585Customer accounts 47,447 19,736 9,170 19,809 35,356 8,901 13,998 5,816 22,363 182,596
48,575 21,284 10,053 26,773 40,820 9,486 16,037 6,384 31,769 211,181Debt securities in issue 545 2,065 792 19,701 2,830 1,556 22 141 4,501 32,153
Total 49,120 23,349 10,845 46,474 43,650 11,042 16,059 6,525 36,270 243,334
760
c102100pu180Proof7:28.3.10B/LRevision:0OperatorBeeR
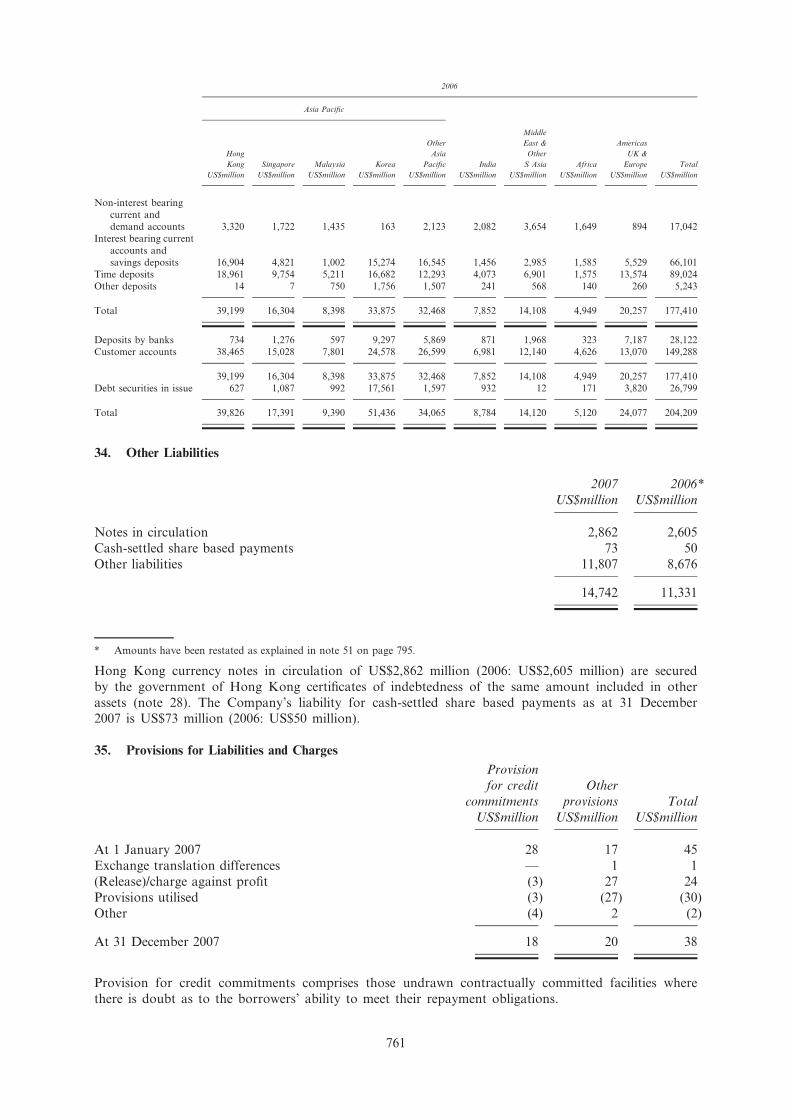
2006
Asia Pacific
Hong
Kong
US$million
Singapore
US$million
Malaysia
US$million
Korea
US$million
Other
Asia
Pacific
US$million
India
US$million
Middle
East &
Other
S Asia
US$million
Africa
US$million
Americas
UK &
Europe
US$million
Total
US$million
Non-interest bearing
current and
demand accounts 3,320 1,722 1,435 163 2,123 2,082 3,654 1,649 894 17,042
Interest bearing current
accounts and
savings deposits 16,904 4,821 1,002 15,274 16,545 1,456 2,985 1,585 5,529 66,101
Time deposits 18,961 9,754 5,211 16,682 12,293 4,073 6,901 1,575 13,574 89,024
Other deposits 14 7 750 1,756 1,507 241 568 140 260 5,243
Total 39,199 16,304 8,398 33,875 32,468 7,852 14,108 4,949 20,257 177,410
Deposits by banks 734 1,276 597 9,297 5,869 871 1,968 323 7,187 28,122
Customer accounts 38,465 15,028 7,801 24,578 26,599 6,981 12,140 4,626 13,070 149,288
39,199 16,304 8,398 33,875 32,468 7,852 14,108 4,949 20,257 177,410
Debt securities in issue 627 1,087 992 17,561 1,597 932 12 171 3,820 26,799
Total 39,826 17,391 9,390 51,436 34,065 8,784 14,120 5,120 24,077 204,209
34. Other Liabilities
2007
US$million
2006*
US$million
Notes in circulation 2,862 2,605
Cash-settled share based payments 73 50
Other liabilities 11,807 8,676
14,742 11,331
* Amounts have been restated as explained in note 51 on page 795.
Hong Kong currency notes in circulation of US$2,862 million (2006: US$2,605 million) are secured
by the government of Hong Kong certificates of indebtedness of the same amount included in other
assets (note 28). The Company’s liability for cash-settled share based payments as at 31 December2007 is US$73 million (2006: US$50 million).
35. Provisions for Liabilities and Charges
Provision
for credit
commitments
US$million
Other
provisions
US$million
Total
US$million
At 1 January 2007 28 17 45
Exchange translation differences — 1 1
(Release)/charge against profit (3) 27 24
Provisions utilised (3) (27) (30)
Other (4) 2 (2)
At 31 December 2007 18 20 38
Provision for credit commitments comprises those undrawn contractually committed facilities where
there is doubt as to the borrowers’ ability to meet their repayment obligations.
761
c102100pu180Proof7:28.3.10B/LRevision:0OperatorBeeR

36. Retirement Benefit Obligations
Retirement benefit obligations comprise:
2007
US$million
2006*
US$million
Defined benefit schemes obligation 313 541
Defined contribution schemes obligation 9 12
Net book amount 322 553
* Amounts have been restated as explained in note 51 on page 795.
2007
US$million
2006*
US$million
At 1 January 553 476
Exchange translation differences 7 48
Acquisitions 1 118
Charge against profit (net of finance income) 213 166
Change in net liability (452) (255)
At 31 December 322 553
* Amounts have been restated as explained in note 51 on page 795.
Retirement benefit charge comprises:
2007
US$million
2006
US$million
Defined benefit schemes 110 96
Defined contribution schemes 103 70
Charge against profit (note 8) 213 166
The 2007 charge is presented net and includes a finance charge of US$11 million (2006: US$6
million).
UK Fund
The financial position of the Group’s principal retirement benefit scheme, the Standard Chartered
Pension Fund (the ‘Fund’) (a defined benefit scheme), is assessed in the light of the advice of an
independent qualified actuary. The most recent actuarial assessment of the Fund for the purpose of
funding was performed as at 31 December 2005 by M. Slack, Fellow of the Institute of Actuaries, of
Lane, Clark and Peacock Actuaries, using the projected unit method. The assumptions having the
most significant effect on the outcome of this valuation were:
Return from gilts 3.95% per annum
Return from return seeking assets 5.70% per annum
General increase in salaries 4.40% per annumRate of price inflation 2.90% per annum
Increase in pensions:
In deferment (where applicable) 2.90% per annum
In payment* (pre April 1997 service) 2.70% per annumIn payment (post April 1997 service) 2.20 – 2.90% per annum
* Applies to discretionary increases and some guaranteed increases.
762
c102100pu180Proof7:28.3.10B/LRevision:0OperatorBeeR

Applying these assumptions, at the valuation date the market value of the assets of the Fund
(US$1,772 million) was sufficient to cover 99.5% of the benefits that had accrued to members.
Additional contributions of US$8.4 million were paid during 2007. Additional contributions of
US$5.6 million are payable in 2008 and US$1.8 million in each of 2009 and 2010.
Contributions paid to the Fund during 2007 were US$24 million (2006: US$19 million) and regular
contributions were set at 32.5% of pensionable salary for all members. With effect from 1 July 1998the Fund was closed to new entrants and new employees have subsequently been offered membership
of a defined contribution scheme. Due to the closure of the Fund to new entrants, the current service
cost will increase as a percentage of pensionable pay as the members approach retirement.
Pension costs for the purpose of these accounts were assessed using the projected unit method, and
the assumptions set out below were based on market data at the date of calculation.
Overseas Schemes
The principal overseas defined benefit arrangements operated by the Group are in Hong Kong, India,
Jersey, Korea, Taiwan and the United States.
The disclosures required under IAS 19 have been calculated by qualified independent actuaries based
on the most recent full actuarial valuations updated, where necessary, to 31 December 2007.
Separate figures are disclosed for the UK Fund, Overseas Funded Defined Benefit, Post-retirement
Medical and Other Unfunded Schemes.
The financial assumptions used at 31 December 2007 were:
Funded Defined Benefit Schemes
UK Fund** Overseas Scheme*
2007
%
2006
%
2007
%
2006
%
Price inflation 3.20 3.00 1.50 – 4.50 1.50 – 4.50
Salary increases 4.70 4.50 3.50 – 6.00 3.25 – 5.50
Pension increases 3.10 2.90 0.00 – 3.10 0.00 – 2.90
Discount rate 5.90 5.20 2.50 – 8.00 2.25 – 8.00
Post-retirement medical trend rate N/A N/A N/A N/A
* The range of assumptions shown is for the main funded defined benefit overseas schemes in Hong Kong, India, Jersey, Korea,Taiwan and the United States. These comprise over 90% of the total liabilities of funded overseas schemes.
** The assumption for life expectancy for the UK fund assumes that a male member currently aged 60 will live for 27 years (2006: 26years) and a female member 30 years (2006: 29 years) and a male member currently aged 40 will live for 28 years (2006: 27 years)and a female member 31 years (2006: 30 years) after their 60th birthday.
Unfunded Schemes
Post-retirement Medical* Other
2007
%
2006
%
2007
%
2006
%
Price inflation 2.70 2.70 1.50 – 7.00 2.50 – 7.00
Salary increases 4.00 4.00 3.50 – 9.00 4.00 – 9.00
Pension increases N/A N/A 0.00 – 3.10 0.00 – 2.90
Discount rate 6.00 6.00 2.75 – 10.00 3.00 – 10.50
Post-retirement medical rate* 8% in 2007
reducingby 1% per
annum to
5% in 2010
9% in 2006
reducingby 1% per
annum to
5% in 2010
N/A N/A
* The Post-retirement Medical plan is in the United States.
763
c102100pu180Proof7:28.3.10B/LRevision:0OperatorBeeR

The assets and liabilities of the schemes, attributable to defined benefit members, at 31 December
2007 were:
Funded Defined Benefit Schemes Unfunded Schemes
UK Fund Overseas Schemes Post-retirement Medical Other
At 31 December 2007
Expected
return on
assets %
Value
US$million
Expected return
on assets %
Value
US$million
Expected
return on
assets %
Value
US$million
Expected
return on
assets %
Value
US$million
Equities 8.50 628 8.30 – 13.00 224 N/A N/A N/A N/A
Bonds 4.80 1,188 4.25 – 10.00 186 N/A N/A N/A N/A
Property N/A — 5.90 – 11.00 3 N/A N/A N/A N/A
Others 4.80 97 2.50 – 8.00 162 N/A N/A N/A N/A
Total market value of assets 1,913 575 N/A N/A
Present value of the schemes’
liabilities (1,931) (602) (11) (257)
Net pension liability (18) (27) (11) (257)
Funded Defined Benefit Schemes Unfunded Schemes
UK Fund Overseas Schemes Post-retirement Medical Other*
At 31 December 2006
Expected
return on
assets %
Value
US$million
Expected return
on assets
%
Value
US$million
Expected
return on
assets %
Value
US$million
Expected
return on
assets %
Value
US$million
Equities 7.50 570 8.00 – 14.00 210 N/A N/A N/A N/A
Bonds 4.50 1,144 4.25 – 8.00 155 N/A N/A N/A N/A
Property N/A — 7.00 – 12.00 3 N/A N/A N/A N/A
Others 4.50 108 2.50 – 5.10 149 N/A N/A N/A N/A
Total market value of assets 1,822 517 N/A N/A
Present value of the schemes’
liabilities* (1,982) (542) (9) (347)
Net pension liability (160) (25) (9) (347)
* Amounts have been restated as explained in note 51 on page 795.
Funded Defined Benefit Schemes Unfunded Schemes
UK Fund Overseas Schemes Post-retirement Medical Other
At 31 December 2005
Value
US$million
Value
US$million
Value
US$million
Value
US$million
Total market value of assets 1,550 380 N/A N/A
Present value of the schemes’
liabilities (1,785) (403) (11) (196)
Net pension liability (235) (23) (11) (196)
At 31 December 2004
Total market value of assets 1,596 317 N/A N/A
Present value of the schemes’
liabilities (1,679) (338) (11) (45)
Net pension liability (83) (21) (11) (45)
The range of assumptions shown is for the main Overseas Schemes in Hong Kong, India, Jersey,
Korea, Taiwan and the United States.
764
c102100pu180Proof7:28.3.10B/LRevision:0OperatorBeeR
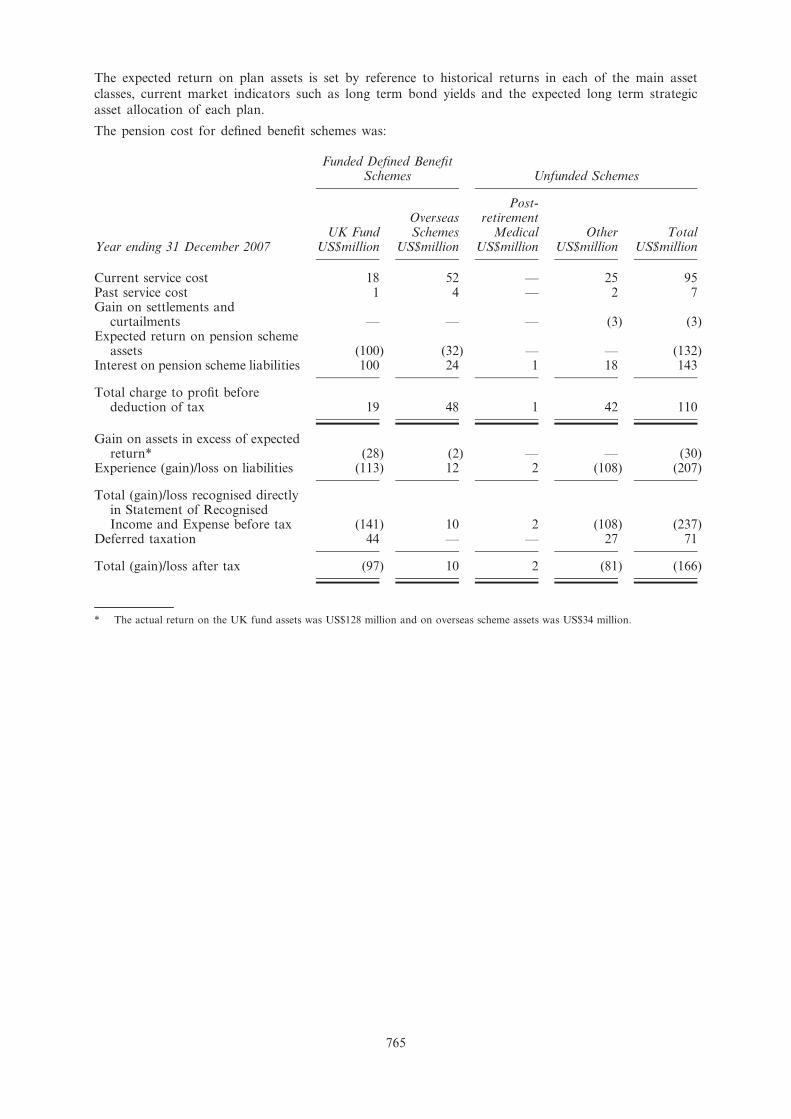
The expected return on plan assets is set by reference to historical returns in each of the main asset
classes, current market indicators such as long term bond yields and the expected long term strategic
asset allocation of each plan.
The pension cost for defined benefit schemes was:
Funded Defined BenefitSchemes Unfunded Schemes
Year ending 31 December 2007UK Fund
US$million
OverseasSchemes
US$million
Post-retirement
MedicalUS$million
OtherUS$million
TotalUS$million
Current service cost 18 52 — 25 95Past service cost 1 4 — 2 7Gain on settlements and
curtailments — — — (3) (3)Expected return on pension scheme
assets (100) (32) — — (132)Interest on pension scheme liabilities 100 24 1 18 143
Total charge to profit beforededuction of tax 19 48 1 42 110
Gain on assets in excess of expectedreturn* (28) (2) — — (30)
Experience (gain)/loss on liabilities (113) 12 2 (108) (207)
Total (gain)/loss recognised directlyin Statement of RecognisedIncome and Expense before tax (141) 10 2 (108) (237)
Deferred taxation 44 — — 27 71
Total (gain)/loss after tax (97) 10 2 (81) (166)
* The actual return on the UK fund assets was US$128 million and on overseas scheme assets was US$34 million.
765
c102100pu180Proof7:28.3.10B/LRevision:0OperatorBeeR

The total cumulative amount recognised directly in the Statement of Recognised Income and Expense
before tax to date is a gain of US$186 million (2006: loss of US$51 million).
Funded Defined Benefit
Schemes Unfunded Schemes
Year ending 31 December 2006
UK Fund
US$million
Overseas
Schemes
US$million
Post-
retirement
Medical
US$million
Other
US$million
Total
US$million
Current service cost 21 42 — 17 80
Past service cost 9 1 — (1) 9
Loss on settlements and
curtailments 1 — — — 1
Expected return on pension scheme
assets (93) (23) — — (116)
Interest on pension scheme liabilities 92 19 1 10 122
Total charge to profit before
deduction of tax 30 39 1 26 96
Gain on assets in excess of expected
return* (23) (27) — — (50)Experience (gain)/loss on liabilities (90) 20 (2) 18 (54)
Total (gain)/loss recognised directly
in Statement of Recognised
Income and Expense before tax (113) (7) (2) 18 (104)
Deferred taxation 34 3 — 1 38
Total (gain)/loss after tax (79) (4) (2) 19 (66)
* The actual return on the UK fund assets was US$116 million and on overseas scheme assets was US$50 million.
766
c102100pu180Proof7:28.3.10B/LRevision:0OperatorBeeR

Funded Defined BenefitSchemes Unfunded Schemes
Year ending 31 December 2005UK Fund
US$million
OverseasSchemes
US$million
Post-retirement
MedicalUS$million
OtherUS$million
TotalUS$million
Gain on assets in excess of expectedreturn* (91) (20) — — (111)
Experience loss on liabilities 256 5 — — 261
Total loss/(gain) recognised directlyin Statement of RecognisedIncome and Expense before tax 165 (15) — — 150
Deferred taxation (50) 5 — — (45)
Total loss/(gain) after tax 115 (10) — — 105
Year ending 31 December 2004Gain on assets in excess of expected
return** (20) (2) — — (22)Experience gain on liabilities — (1) (1) — (2)Loss/(gain) on change of
assumptions 23 7 — (1) 29
Total loss/(gain) recognised directlyin Statement of RecognisedIncome and Expense before tax 3 4 (1) (1) 5
Deferred taxation (1) — — — (1)
Total loss/(gain) after tax 2 4 (1) (1) 4
* The actual return on the UK fund assets was US$184 million and on overseas scheme assets was US$48 million.
** The actual return on the UK fund assets was US$111 million and on overseas scheme assets was US$31 million.
Movement in the pension schemes and post-retirement medical deficit during the year comprise:
Funded Defined BenefitSchemes Unfunded Schemes
Year ending 31 December 2007UK Fund
US$million
OverseasSchemes
US$million
Post-retirement
MedicalUS$million
OtherUS$million
TotalUS$million
Deficit at 1 January 2007 (160) (25) (9) (347) (541)Contributions 24 58 1 26 109Current service cost (18) (52) — (25) (95)Past service cost (1) (4) — (2) (7)Settlement/curtailment costs — — — 3 3Other finance income/(charge) — 8 (1) (18) (11)Actuarial gain/(loss) 141 (10) (2) 108 237Acquisitions — — — (1) (1)Exchange rate adjustment (4) (2) — (1) (7)
Deficit at 31 December 2007 (18) (27) (11) (257) (313)
767
c102100pu180Proof7:28.3.10B/LRevision:0OperatorBeeR

Funded Defined BenefitSchemes Unfunded Schemes
Year ending 31 December 2006UK Fund
US$million
OverseasSchemes
US$million
Post-retirement
MedicalUS$million
Other*US$million
Total*US$million
Deficit at 1 January 2006 (235) (23) (11) (196) (465)Contributions 19 51 1 11 82Current service cost (21) (42) — (17) (80)Past service cost (9) (1) — 1 (9)Settlement/curtailment costs (1) — — — (1)Other finance income/(charge) 1 4 (1) (10) (6)Actuarial gain/(loss) 113 7 2 (18) 104Acquisitions — (25) — (93) (118)Exchange rate adjustment (27) (3) — (18) (48)Reclassifications — 7 — (7) —
Deficit at 31 December 2006 (160) (25) (9) (347) (541)
* Amounts have been restated as explained in note 51 on page 795.
Movement in the pension schemes and post-retirement medical gross assets and obligations during the
year comprise:
Year ending 31 December 2007
Assets
US$million
Obligations
US$million
Total
US$million
Deficit at 1 January 2007 2,339 (2,880) (541)Contributions 109 — 109Current service cost — (95) (95)Past service cost — (7) (7)Settlement/curtailment costs — 3 3Interest cost — (143) (143)Expected return on scheme assets 132 — 132Benefits paid out (146) 146 —Actuarial gain 30 207 237Acquisitions — (1) (1)Exchange rate adjustment 24 (31) (7)
Deficit at 31 December 2007 2,488 (2,801) (313)
Year ending 31 December 2006
Assets
US$million
Obligations*
US$million
Total*
US$million
Deficit at 1 January 2006 1,930 (2,395) (465)Contributions 82 — 82Current service cost — (80) (80)Past service cost — (9) (9)Settlement/curtailment costs — (1) (1)Interest cost — (122) (122)Expected return on scheme assets 116 — 116Benefits paid out (119) 119 —Actuarial gain 50 54 104Acquisitions 48 (166) (118)Exchange rate adjustment 232 (280) (48)
Deficit at 31 December 2006 2,339 (2,880) (541)
* Amounts have been restated as explained in note 51 on page 795.
768
c102100pu180Proof7:28.3.10B/LRevision:0OperatorBeeR

37. Subordinated Liabilities and Other Borrowed Funds
2007
US$million
2006
US$million
Subordinated loan capital – issued by subsidiary undertakings
£675 million 5.375% undated step up Subordinated Notes (callable and floating
rate from 2020) 1,276 1,252
£600 million 8.103% Step-Up Callable Perpetual Trust Preferred Securities
(callable 2016) 1,356 1,342
£300 million 6.0% Subordinated debt 2018 610 —
£300 million 6.75% Notes 2009 535 526
£200 million 7.75% Notes (callable 2022) 454 454
£30 million Floating Rate Notes 2009 59 58
c750 million 3.625% Subordinated Notes 2017 (Floating rate from 2012) 1,043 946
c700 million 5.875% Subordinated debt 2017 1,013 —
c675 million Floating Rate Notes 2018 983 885
c600 million 5.375% Notes 2009 783 710
c500 million 8.16% non-cumulative Trust Preferred Securities (callable 2010) 734 674
US$1 billion 6.4% Subordinated debt 2017 1,042 —
US$700 million 8.0% Subordinated Notes 2031 753 724
US$500 million Floating Rate Notes 2016 499 498
US$500 million Floating Rate Notes 2015 499 499
US$350 million 4.375% Notes 2014 (Floating rate from 2009) 351 340
US$300 million Floating Rate Note 2017 300 —
US$154 million Subordinated debt 2013 147 148
US$100 million Floating Rate Notes 2018 100 100
US$92 million Subordinated debt 2013 92 92
BWP 75 million Subordinated debt 2017 13 —
BWP 75 million Floating Rate Notes 2012 12 13
BWP 50 million Fixed and Floating Rate Subordinated Notes 2015 8 8
HKD 670 million Floating Rate Notes 2014 86 80
HKD 500 million 3.5% Notes 2014 (Floating rate from 2009) 64 63
IDR 500 billion Floating Rate Notes 2016 23 24
KRW 205 billion Subordinated debt 2009 214 218
KRW 160 billion Subordinated debt 2008 161 167
KRW 136 billion Subordinated debt 2007 — 146
KRW 104 billion Subordinated debt 2007 — 109
KRW 30 billion Subordinated debt 2011 32 32
KRW 27 billion Subordinated debt 2008 28 29
KRW 3 billion Subordinated debt 2011 3 3
MYR 500 million 4.28% Subordinated Bonds 2017 151 —
PKR 1 billion Floating Rate Notes 2015 16 17
PKR 750 million Floating Rate Notes 2011 12 12
PKR 750 million Floating Rate Notes 2008 3 11
TWD 10 billion undated Floating Rate Notes 308 306
TWD 8 billion Floating Rate Notes 2007 — 246
TZS 8 billion Subordinated Notes 2015 7 6
13,770 10,738
769
c102100pu180Proof7:28.3.10B/LRevision:0OperatorBeeR

2007
US$million
2006
US$million
Subordinated loan capital – issued by Company: Primary Capital Floating Rate
Notes
US$400 million 400 400
US$300 million (Series 2) 300 300
US$400 million (Series 3) 400 400
US$200 million (Series 4) 200 200
£150 million 298 294
Other borrowings – issued by Company 372* 367*
1,970 1,961
Total for Group 15,740 12,699
Total for Company 1,987 1,977
* In the balance sheet of the Company the amount recognised is US$389 million (2006: US$383 million) with the difference beingthe effect of hedge accounting achieved on a Group basis.
All subordinated liabilities described above are unsecured, unguaranteed and subordinated to the
claims of other creditors including without limitation, customer deposits and deposits by banks. The
Group has the right to settle these debt instruments in certain circumstances as set out in the
contractual agreements.
Of the total subordinated liabilities and other borrowings, US$10,166 million is at fixed interest rates
(2006: US$5,118 million).
On 12 April 2007, Standard Chartered Bank (Hong Kong) Limited issued Lower Tier 2 capital in the
form of US$300 million Floating Rate Notes, which have a maturity of 10 years, with an issuer’s calloption after five years.
On 26 April 2007, the Group issued £300 million Lower Tier 2 Step-Up Dated Subordinated notes,
which have a maturity of 11 years, with an issuer’s call option after six years.
On 26 September 2007, the Group issued US$1,000 million Lower Tier 2 Notes with a coupon of
6.4% maturing September 2017, and c700 million Lower Tier 2 Notes with a coupon of 5.875%,
maturing September 2017.
On 15 November 2007 Standard Chartered Bank Malaysia Berhad issued MYR500 million Lower
Tier 2 Subordinated Unsecured Floating Rate Notes due 2017, with an issuer’s call option after five
years.
On 27 November 2007, Standard Chartered Bank Botswana Limited issued BWP75 million
Subordinated Unsecured Floating Rate Notes due 2017, with an issuer’s call option after five years.
38. Share Capital
The authorised share capital of the Company at 31 December 2007 was US$5,269 million (2006:
US$5,113 million) made up of 2,632 million ordinary shares of US$0.50 each, 500 million non-
cumulative irredeemable preference shares of £1 each, 300 million non-cumulative redeemable
preference shares of US$5 each and one million non-cumulative redeemable preference share of
c1,000 each.
The available profits of the Company are distributed to the holders of the issued preference shares in
priority to payments made to holders of the ordinary shares and in priority to, or pari passu with,
any payments to the holders of any other class of shares in issue. On a winding up, the assets of the
Company are applied to the holders of the preference shares in priority to any payment to theordinary shareholders and in priority to, or pari passu with, the holders of any other shares in issue,
for an amount equal to any dividends accrued and/or payable and the nominal value of the shares
together with any premium as determined by the Board. The redeemable preference shares are
redeemable at the paid up amount (which includes premium) at the option of the Company in
accordance with the terms of the shares. The holders of the preference shares are not entitled to
770
c102100pu180Proof7:28.3.10B/LRevision:0OperatorBeeR

attend or vote at any general meeting except where any relevant dividend due is not paid in full or
where a resolution is proposed varying the rights of the preference shares.
As at 31 December 2007, 15,000 US$5 non-cumulative redeemable preference shares were in issue.
The irredeemable preference shares of £1 each are classified as other borrowed funds as required by
IAS 32.
Group and Company
Number of
ordinary
shares
(millions)
Ordinary
share
capital
US$million
Preference
share
capital
US$million
Total
US$million
At 1 January 2006 1,316 658 2 660
Capitalised on scrip dividend 15 7 — 7
Shares repurchased — — (2) (2)
Shares issued 53 27 — 27
At 31 December 2006 1,384 692 — 692
Capitalised on scrip dividend 16 8 — 8
Shares issued 10 5 — 5
At 31 December 2007 1,410 705 — 705
On 12 January 2006, the Company issued 3,401,290 new ordinary shares at an average price of 1301
pence per share representing approximately 0.3% of the Company’s existing issued ordinary sharecapital. The middle market price on 12 January 2006 was 1323 pence. The issue of ordinary shares
was used to acquire 20% of Fleming Family & Partners Limited.
On 2 October 2006, the Company repurchased the remaining 328,388 8.9% non-cumulative preferenceshares. The preference shares were repurchased at a premium of US$326 million and were cancelled.
On 4 October 2006, the Company issued 48,500,000 ordinary shares of US$0.50 each at a placing
price of 1375 pence per share representing approximately 3.7% of the Company’s existing issuedordinary share capital. The middle market price on 4 October 2006 was 1363 pence. The proceeds of
the issue of ordinary shares was used to acquire Hsinchu. The placing used a cash box structure
involving a Jersey subsidiary (‘JerseyCo’) which was 89% owned by the Company prior to the
transaction. In return for an issue of shares by the Company to the placees, the net proceeds of the
placing were paid to JerseyCo. Pursuant to the issue of those shares, the Company acquired the
remaining share capital of JerseyCo, being all of its redeemable preference shares and the 11% of the
ordinary shares it did not own. Under this structure merger relief applies under Section 131 of the
UK Companies Act 1985 which provides relief from the requirements under Section 130 of the UKCompanies Act 1985 to create a share premium account. JerseyCo then redeemed its redeemable
shares in exchange for the placing proceeds.
On 8 December 2006, the Company issued 7,500 non-cumulative redeemable preference shares ofUS$5 each at a placing price of US$100,000 each. The shares are redeemable at the option of the
Company in accordance with the terms of the shares at their paid up amount (which includes
premium) and have discretionary dividend payments and are accordingly classified as equity as
required by IAS 32. The shares were issued to fund the continuing business of the Group.
On 10 May 2007, the Company issued 12,765,274 new ordinary shares instead of the 2006 final
dividend. On 10 October 2007, the Company issued 3,163,466 new ordinary shares instead of the
2007 interim dividend.
On 25 May 2007, the Company issued 7,500 non-cumulative redeemable preference shares of US$5
each at a placing price of US$100,000 each. The shares are redeemable at the option of the Company
in accordance with the terms of the shares at the paid up amount (which includes premium) and have
discretionary dividend payments and are accordingly classified as equity as required by IAS 32. The
shares were issued to fund the continuing business of the Group.
During the year, 9,012,891 ordinary shares were issued under the Company’s employee share plans at
prices between nil and 1064 pence.
771
c102100pu180Proof7:28.3.10B/LRevision:0OperatorBeeR

The holding of Standard Chartered PLC shares for the beneficiaries of the Group’s share based
award schemes is set out in note 39.
39. Reserves
Group
Share
premium
account*
US$million
Capital
reserve
US$million
Capital
redemption
reserve
US$million
Merger
reserve
US$million
Available-
for-sale
reserve
US$million
Cash flow
hedge
reserve
US$million
Translation
reserve
US$million
Retained
earnings
US$million
Total
US$million
At 1 January 2006 3,034 5 11 1,944 23 (20) 6 6,219 11,222
Recognised income and
expense — — — — 387 71 672 2,354 3,484
Capitalised on scrip
dividend (7) — — — — — — — (7)
Shares issued, net of
expenses 838 — — 1,205 — — — — 2,043
Shares repurchased* — — 2 — — — — (328) (326)
Net own shares adjustment — — — — — — — 149 149
Share option expense and
related taxation — — — — — — — 115 115
Dividends, net of scrip — — — — — — — (519) (519)
At 31 December 2006 3,865 5 13 3,149 410 51 678 7,990 16,161
Recognised income and
expense — — — — 340 6 303 3,010 3,659
Capitalised on scrip
dividend (8) — — — — — — — (8)
Shares issued, net of
expenses 856 — — — — — — — 856
Net own shares adjustment — — — — — — — 24 24
Share option expense and
related taxation — — — — — — — 55 55
Dividends, net of scrip — — — — — — — (601) (601)
At 31 December 2007 4,713 5 13 3,149 750 57 981 10,478 20,146
* The premium paid on the 8.9% non-cumulative preference shares redeemed in 2006 has been reclassified as a deduction fromretained earnings rather than a deduction from the share premium account. Subsequently it has been deemed not appropriate toapply the relief given in section 160(2) of the UK Companies Act 1985 that allows a premium payable on redemption to be paidout of the proceeds of a fresh issue of shares made for the purpose of the redemption. This is because the fresh issue of sharescontemplated for the redemption was not complete at the date of the redemption.
Transaction costs relating to share issues deducted from reserves account total US$5 million (2006:US$20 million).
The cumulative amount of goodwill on the acquisition of subsidiary and associated undertakings
written off against Group reserves since 1973 is US$27 million (2006: US$27 million).
Capital reserves represent the exchange difference on redenomination of share capital and share
premium from Sterling to US Dollars in 2001.
Capital redemption reserve represents the nominal value of the repurchase of preference shares
redeemed.
The merger reserve represents the premium arising on the shares issued to assist in the funding of
certain of the Group’s acquisitions. The issues were made using a financing structure which required
the Company to create a merger reserve under section 131 of the UK Companies Act 1985.
Available-for-sale reserve is the fair value movement of financial assets classified as available-for-sale.Gains and losses are deferred to this reserve until such time as the underlying asset is sold or
matures.
Cash flow hedge reserve is the fair value movement of derivatives that meet the criteria of a cash flow
hedge. Gains and losses are deferred to this reserve until such time as the underlying hedged item
affects profit and loss.
772
c102100pu180Proof7:28.3.10B/LRevision:0OperatorBeeR

Translation reserve represents the cumulative foreign exchange gains and losses on translation of the
net investment of the Group in foreign operations. Since 1 January 2004, gains and losses are
deferred to this reserve until such time as the underlying foreign operation is disposed. Gains and
losses arising from derivatives used as hedges of net investments are netted against the foreignexchange gains and losses on translation of the net investment of the foreign operations.
Retained earnings are the carried forward recognised income and expenses of the Group plus currentperiod recognised income and expenses less dividend distribution, treasury shares and share option
expenses.
A substantial part of the Group’s reserves are held in overseas subsidiary undertakings and branches,
principally to support local operations or to comply with local regulations. The maintenance of local
regulatory capital ratios could potentially restrict the amount of reserves which can be remitted. In
addition, if these overseas reserves were to be remitted, further unprovided taxation liabilities might
arise.
Shares of the Group held for the beneficiaries of the Group’s share based payment schemes
Bedell Cristin Trustees Limited is trustee of both the 1995 Employees’ Share Ownership Plan Trust
(‘the 1995 trust’), which is an employee benefit trust used in conjunction with some of the Group’s
employee share schemes, and of the Standard Chartered 2004 Employee Benefit Trust (‘the 2004trust’) which is an employee benefit trust used in conjunction with the Group’s deferred bonus plan.
The trustee has agreed to satisfy a number of awards made under the employee share schemes and
the deferred bonus plan through the relevant employee benefit trust. As part of these arrangements
Group companies fund the trust, from time to time, to enable the trustee to acquire shares to satisfy
these awards. All shares have been acquired through the London Stock Exchange.
During 2007, the 1995 trust acquired 190,600 shares at a market price of US$5 million (2006: nil). At
31 December 2007, the 1995 trust held 261,495 (2006: 2,148,874) shares. The shares are held in a pool
for the benefit of participants under the Group’s Restricted Share Scheme, Supplementary Restricted
Share Scheme, Performance Share Plan and Executive Share Option Schemes. The purchase of these
shares has been fully funded by the Group.
During the current year the 2004 trust has acquired, at market value, 351,340 (2006: 301,952) shares
of the Company for an aggregate price of US$10 million (2006: US$9 million), which are held in apool for the benefit of participants under the Group’s deferred bonus plan. The purchase of these
shares has been fully funded by the Group. At 31 December 2007, the 2004 trust held 377,270 (2006:
311,157) shares of the Company, of which none (2006: none) have vested unconditionally.
Own shares held total 638,765 at 31 December 2007 (2006: 2,460,031). The maximum number of
shares held during the year was 2,526,144 (2006: 14,040,907). Except as disclosed above, neither the
Company nor any of its subsidiaries has bought, sold or redeemed any securities of the Company
listed on The Stock Exchange of Hong Kong Limited during the year ended 31 December 2007.
773
c102100pu180Proof7:28.3.10B/LRevision:0OperatorBeeR

CompanyShare
premiumaccount
US$million
Capitalreserve
US$million
Capitalredemption
reserveUS$million
Mergerreserve
US$million
Retainedearnings
US$millionTotal
US$million
At 1 January 2006 3,034 5 11 1,944 759 5,753Recognised income
and expenses — — — — 683 683Capitalised on scrip
dividend (7) — — — — (7)Shares issued, net of
expenses 838 — — 1,205 — 2,043Net own shares
adjustment — — — — 149 149Shares repurchased* — — 2 — (328) (326)Share option expense
and relatedtaxation — — — — 67 67
Dividends, net ofscrip — — — — (519) (519)
At 31 December 2006as revised 3,865 5 13 3,149 811 7,843
Recognised incomeand expenses — — — — 349 349
Capitalised on scripdividend (8) — — — — (8)
Shares issued, net ofexpenses 856 — — — — 856
Shares repurchased — — — — — —Net own shares
adjustment — — — — 24 24Share option expense
and relatedtaxation — — — — 78 78
Dividends, net ofscrip — — — — (601) (601)
At 31 December 2007 4,713 5 13 3,149 661 8,541
* The premium paid on the 8.9% non-cumulative preference shares redeemed in 2006 has been reclassified as a deduction fromretained earnings rather than a deduction from the share premium account. Subsequently it has been deemed not appropriate toapply the relief given in section 160(2) of the UK Companies Act 1985 that allows a premium payable on redemption to be paidout of the proceeds of a fresh issue of shares made for the purpose of the redemption. This is because the fresh issue of sharescontemplated for the redemption was not complete at the date of the redemption.
774
c102100pu180Proof7:28.3.10B/LRevision:0OperatorBeeR
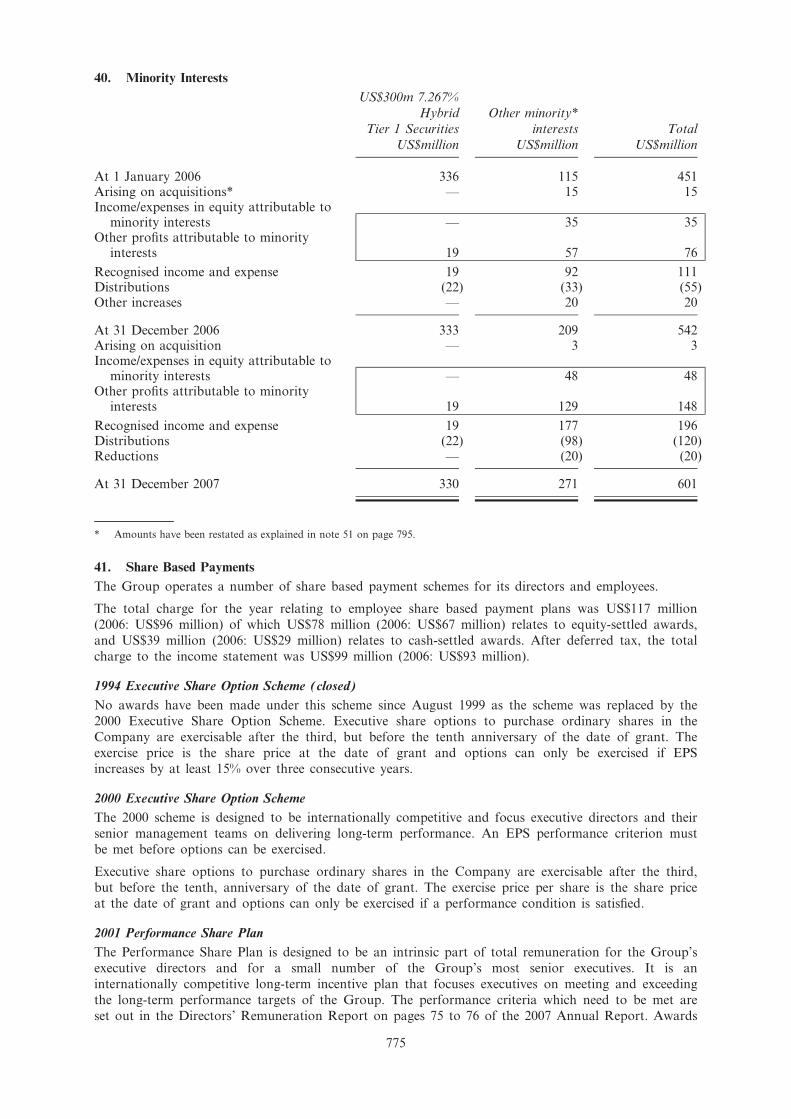
40. Minority Interests
US$300m 7.267%
Hybrid
Tier 1 Securities
US$million
Other minority*
interests
US$million
Total
US$million
At 1 January 2006 336 115 451Arising on acquisitions* — 15 15Income/expenses in equity attributable to
minority interests — 35 35Other profits attributable to minority
interests 19 57 76
Recognised income and expense 19 92 111Distributions (22) (33) (55)Other increases — 20 20
At 31 December 2006 333 209 542Arising on acquisition — 3 3Income/expenses in equity attributable to
minority interests — 48 48Other profits attributable to minority
interests 19 129 148
Recognised income and expense 19 177 196Distributions (22) (98) (120)Reductions — (20) (20)
At 31 December 2007 330 271 601
* Amounts have been restated as explained in note 51 on page 795.
41. Share Based Payments
The Group operates a number of share based payment schemes for its directors and employees.
The total charge for the year relating to employee share based payment plans was US$117 million
(2006: US$96 million) of which US$78 million (2006: US$67 million) relates to equity-settled awards,
and US$39 million (2006: US$29 million) relates to cash-settled awards. After deferred tax, the total
charge to the income statement was US$99 million (2006: US$93 million).
1994 Executive Share Option Scheme (closed)
No awards have been made under this scheme since August 1999 as the scheme was replaced by the
2000 Executive Share Option Scheme. Executive share options to purchase ordinary shares in the
Company are exercisable after the third, but before the tenth anniversary of the date of grant. The
exercise price is the share price at the date of grant and options can only be exercised if EPSincreases by at least 15% over three consecutive years.
2000 Executive Share Option Scheme
The 2000 scheme is designed to be internationally competitive and focus executive directors and their
senior management teams on delivering long-term performance. An EPS performance criterion must
be met before options can be exercised.
Executive share options to purchase ordinary shares in the Company are exercisable after the third,
but before the tenth, anniversary of the date of grant. The exercise price per share is the share priceat the date of grant and options can only be exercised if a performance condition is satisfied.
2001 Performance Share Plan
The Performance Share Plan is designed to be an intrinsic part of total remuneration for the Group’s
executive directors and for a small number of the Group’s most senior executives. It is an
internationally competitive long-term incentive plan that focuses executives on meeting and exceeding
the long-term performance targets of the Group. The performance criteria which need to be met are
set out in the Directors’ Remuneration Report on pages 75 to 76 of the 2007 Annual Report. Awards
775
c102100pu180Proof7:28.3.10B/LRevision:0OperatorBeeR

of nil price options to acquire shares are granted to the executives and will normally be exercisable
between three and ten years after the date of grant if the individual is still employed by the Group.
There is provision for earlier exercise in certain limited circumstances.
1997/2006 Restricted Share Scheme
The Group operates a discretionary Restricted Share Scheme (‘RSS’) for high performing and high
potential staff at any level of the organisation whom the Group wishes to motivate and retain.
Except upon appointment when an executive director may be granted an award of restricted shares,the RSS is not applicable to executive directors, as it has no performance conditions attached to it.
50% of the award vests two years after the date of grant and the balance after three years. The
awards can be exercised within seven years of the grant date. The value of shares awarded in any
year to any individual may not exceed two times their base salary.
2006 Supplementary Restricted Share Scheme
In addition, the Group operates a Supplementary Restricted Share Scheme which can be used to
defer part of an employee’s annual bonus in shares. The plan is principally used for employees in the
global markets area and is similar to the RSS outlined above except for three important factors:
executive directors are specifically prohibited from the plan; no new shares can be issued to satisfy
awards; and there is no individual annual limit.
2004 Deferred Bonus Plan
Under the 2004 DBP, shares are conditionally awarded instead of all or part of the executive
directors’ and certain senior executives’ annual cash bonus. Further details are contained in the
Directors’ Remuneration Report on pages 73 to 85 of the 2007 Annual Report.
All Employee Sharesave Schemes
No awards have been made under the 1994 UK Sharesave and 1996 International Sharesave schemes
since 2003, as these were replaced by the 2004 UK and International Sharesave schemes. Under these
Sharesave schemes, employees have the choice of opening a three-year or five-year savings contract.Within a period of six months after the third or fifth anniversary, as appropriate, employees may
purchase ordinary shares in the Company. The price at which they may purchase shares is at a
discount of up to 20% on the share price at the date of invitation. There are no performance
conditions attached to options granted under all the employee sharesave schemes.
In some countries in which the Group operates, it is not possible to operate Sharesave schemes,
typically because of securities law, regulatory or other similar restrictions. In these countries the
Group offers an equivalent cash-based scheme to its employees.
1994 Executive Share Option Scheme (‘1994 ESOS’)
Awards made under this scheme are not subject to the valuation criteria of IFRS 2, as all awards are
granted prior to 7 November 2002, and are all vested as at that date.
A reconciliation of option movements over the year to 31 December 2007 and 2006 is shown below:
2007 2006
No. of
shares
Weighted
average
exercise
price
No. of
shares
Weighted
average
exercise
price
Outstanding at 1 January 359,207 £8.18 1,114,542 £7.64
Lapsed (18,250) £8.09 (4,830) £7.29
Exercised (330,151) £8.26 (750,505) £7.39
Outstanding at 31 December 10,806 £6.20 359,207 £8.18
Exercisable at 31 December 10,806 £6.20 359,207 £8.18
776
c102100pu180Proof7:28.3.10B/LRevision:0OperatorBeeR

2007 2006
Range of exercise price for options outstanding
Weighted
average
exercise
price
Weighted
average
remaining
contractual
life
Weighted
average
exercise
price
Weighted
average
remaining
contractual
life
2007 2006
Range of exercise price for options outstanding
Weighted
average
exercise
price
Weighted
average
remaining
contractual
life
Weighted
average
exercise
price
Weighted
average
remaining
contractual
life
£6.20 £6.20 0.7 years — —
£6.20/£8.88 — — £8.18 1.1 years
The intrinsic value of vested 1994 ESOS cash-settled awards as at 31 December 2007 was US$nil
million (2006: US$0.3 million).
The weighted average share price at the time the options were exercised during 2007 was £15.34
(2006: £14.20).
2000 Executive Share Option Scheme (‘2000 ESOS’)
No share awards were granted during 2007 or 2006.
A reconciliation of option movements over the year to 31 December 2007 and 2006 is shown below:
2007 2006
No. of
shares
Weighted
average
exercise
price
No. of
shares
Weighted
average
exercise
price
Outstanding at 1 January 14,974,196 £8.37 23,634,660 £8.08Lapsed (282,650) £9.04 (204,514) £9.77
Exercised (6,116,337) £8.47 (8,455,950) £7.52
Outstanding at 31 December 8,575,209 £8.28 14,974,196 £8.37
Exercisable at 31 December 7,931,565 £8.16 8,758,519 £7.63
2007 2006
Range of exercise price for options outstanding
Weighted
average
exercise
price
Weighted
average
remaining
contractual
life
Weighted
average
exercise
price
Weighted
average
remaining
contractual
life
£6.905/£10.395 £8.28 5.2 years £8.37 6.2 years
The intrinsic value of vested 2000 ESOS cash-settled awards as at 31 December 2007 was US$9million (2006: US$6 million).
The weighted average share price at the time the options were exercised during 2007 was £14.36
(2006: £14.63).
777
c102100pu180Proof7:28.3.10B/LRevision:0OperatorBeeR

2001 Performance Share Plan (‘2001 PSP’)
Valuation
For awards, the fair value is based on the market value less an adjustment to take into account the
expected dividends over the vesting period.
2007 2006
Grant date 17 September 12 March 12 September 11 May 14 March
Share price at grant date £14.69 £14.51 £13.17 £14.60 £14.35
Vesting period (years) 3 3 3 3 3
Expected dividends (yield) (%) 2.9 2.8 3.2 3.0 3.0Fair value (EPS) (£) 6.74 6.68 6.00 6.67 6.56
Fair value (TSR) (£) 2.92 2.89 2.60 2.89 2.84
The expected dividend yield is based on the historical dividend yield over the last three years or thethree years prior to grant. The EPS and TSR fair value relates to the performance criteria to be
satisfied as explained in the Directors’ Remuneration Report. The TSR fair value is derived by
discounting 50% of the award which is subject to the TSR condition by the loss of expected
dividends over the performance period, and the likelihood of meeting the TSR condition which is
calculated by the area under the TSR vesting schedule curve. The EPS fair value is derived by
discounting 50% of the award by the loss of expected dividends over the performance period and is
adjusted for actual performance as appropriate.
A reconciliation of option movements over the year to 31 December 2007 and 2006 is shown below:
2007 2006
No. of
shares
Weighted
average
exercise
price
No. of
shares
Weighted
average
exercise
price
Outstanding at 1 January 4,976,599 — 3,919,726 —
Granted 2,487,273 — 2,125,493 —
Lapsed (490,718) — (101,878) —Exercised (1,087,557) — (966,742) —
Outstanding at 31 December 5,885,597 — 4,976,599 —
Exercisable at 31 December 279,028 — 405,798 —
2007 2006
Range of exercise price for options outstanding
Weighted
average
exercise
price
Weighted
average
remaining
contractual
life
Weighted
average
exercise
price
Weighted
average
remaining
contractual
life
n/a — 8.3 years — 8.3 years
The intrinsic value of vested 2001 cash-settled awards as at 31 December 2007 was US$1 million
(2006: US$nil million).
The weighted average share price at the time the options were exercised during 2007 was £14.98
(2006: £14.69).
778
c102100pu180Proof7:28.3.10B/LRevision:0OperatorBeeR

1997/2006 Restricted Share Scheme (‘1997/2006 RSS’)
Valuation
For awards, the fair value is based on the market value less an adjustment to take into account the
expected dividends over the vesting period.
2007 2006
Grant date 17 September 12 March 12 September 11 May 14 March
Share price at grant date £14.69 £14.51 £13.17 £14.60 £14.35
Vesting period (years) 2/3 2/3 2/3 2/3 2/3
Expected dividends (yield) (%) 2.9 2.8 3.2 3.0 3.0Fair value (£) 13.49 13.36 12.00 13.34 13.12
The expected dividend yield is based on the historical dividend yield over the last three years or the
three years prior to grant.
A reconciliation of option movements over the year to 31 December 2007 and 2006 is shown below:
2007 2006
No. of
shares
Weighted
average
exercise
price
No. of
shares
Weighted
average
exercise
price
Outstanding at 1 January 6,298,386 — 6,410,044 —
Granted 2,546,148 — 1,691,508 —
Lapsed (689,603) — (312,453) —
Exercised (1,879,033) — (1,490,713) —
Outstanding at 31 December 6,275,898 — 6,298,386 —
Exercisable at 31 December 1,597,255 — 1,330,250 —
The weighted average share price at the time the options were exercised during 2007 was £15.42
(2006: £14.35).
2007 2006
Range of exercise price for options outstanding
Weighted
average
exercise
price
Weighted
average
remaining
contractual
life
Weighted
average
exercise
price
Weighted
average
remaining
contractual
life
n/a — 4.3 years — 4.9 years
The intrinsic value of vested 1997/2006 RSS cash-settled awards as at 31 December 2007 wasUS$9 million (2006: US$5 million).
779
c102100pu180Proof7:28.3.10B/LRevision:0OperatorBeeR

2006 Supplementary Restricted Share Scheme (‘2006 SRSS’)
Valuation
The first awards under this scheme were made on 12 March 2007.
For awards, the fair value is based on the market value less an adjustment to take into account the
expected dividends over the vesting period.
2007
Grant date 17 September 12 March
Share price at grant date £14.69 £14.51
Vesting period (years) 2/3 2/3
Expected dividends (yield) (%) 2.9 2.8
Fair value (£) 13.49 13.36
The expected dividend yield is based on the historical dividend yield over the last three years or the
three years prior to grant.
A reconciliation of option movements over the year to 31 December 2007 is shown below:
2007
No. of
shares
Weighted
average
exercise
price
Outstanding at 1 January — —
Granted 187,602 —
Lapsed — —
Exercised — —
Outstanding at 31 December 187,602 —
Exercisable at 31 December — —
2007
Range of exercise price for options outstanding
Weighted
average
exercise
price
Weighted
average
remaining
contractual
life
n/a — 6.5 years
There are no vested 2006 SRSS cash-settled awards as at 31 December 2007.
780
c102100pu180Proof7:28.3.10B/LRevision:0OperatorBeeR

1994/1996 UK and International Sharesave Scheme
Grants made under these schemes which had not vested as at 7 November 2002 are fair valued under
IFRS 2.
A reconciliation of option movements over the year to 31 December 2007 and 2006 is shown below:
2007 2006
No. of
shares
Weighted
average
exercise
price
No. of
shares
Weighted
average
exercise
price
Outstanding at 1 January 1,543,784 £6.12 3,167,779 £6.17
Lapsed (412,878) £6.75 (155,845) £6.22Exercised (569,799) £5.81 (1,468,150) £6.22
Outstanding at 31 December 561,107 £5.82 1,543,784 £6.12
Exercisable at 31 December 297,272 £5.60 462,721 £6.63
2007 2006
Range of exercise price for options outstanding
Weighted
average
exercise
price
Weighted
average
remaining
contractual
life
Weighted
average
exercise
price
Weighted
average
remaining
contractual
life
£5.60/£6.84 £5.82 0.8 years — —
£3.34/£7.23 — — £6.12 1.2 years
The weighted average share price at the time the options were exercised was £18.35 (2006: £14.64) for1994 UK Sharesave schemes and £17.56 (2006: £14.56) for 1996 International Sharesave schemes.
The intrinsic value of vested 1994/1996 UK and International Sharesave cash-settled awards as at31 December 2007 was US$2 million (2006: US$6 million).
2004 UK and International Sharesave Schemes
Valuation
Options are valued using a binomial option-pricing model. The fair value per option granted and the
assumptions used in the calculation are as follows:
2007 2006
Grant date 1 October 26 September 12 September 8 September
Share price at grant date £15.88 £16.18 £13.17 £13.03
Exercise price £12.43 £12.43 £10.64 £10.64
Vesting period (years) 3/5 3/5 3/5 3/5
Expected volatility (%) 20.7/24.2 20.7/24.2 20.5/28.9 20.5/29.6
Expected option life (years) 3.33/5.33 3.33/5.33 3.33/5.33 3.33/5.33Risk free rate (%) 4.9/5.00 5.10/5.00 4.9/4.8 4.8/4.7
Expected dividends (yield) (%) 2.9/3.3 2.9/3.3 3.1/3.5 3.1/3.5
Fair value (£) 4.4/4.9 4.7/5.1 3.35/4.07 3.31/4.05
The expected volatility is based on historical volatility over the last three to five years, or three to five
years prior to grant. The expected life is the average expected period to exercise. The risk free rate of
return is the yield on zero-coupon UK government bonds of a term consistent with the assumed
option life. The expected dividend yield is based on historical dividend yield over the last three years
or three years prior to grant. Where two amounts are shown for volatility, risk free rates, expected
781
c102100pu180Proof7:28.3.10B/LRevision:0OperatorBeeR

dividends yield and fair values, the first relates to a three year vesting period and the second to a five
year vesting period.
A reconciliation of option movements over the year to 31 December 2007 and 2006 is shown below:
2007 2006
No. of
shares
Weighted
average
exercise
price
No. of
shares
Weighted
average
exercise
price
Outstanding at 1 January 11,155,911 £9.76 7,892,513 £9.24
Granted 5,207,207 £12.43 4,035,972 £10.64
Lapsed (884,620) £10.04 (756,606) £9.07
Exercised (1,211,767) £7.43 (15,968) £7.95
Outstanding at 31 December 14,266,731 £10.91 11,155,911 £9.76
Exercisable at 31 December 235,616 £7.43 — —
2007 2006
Range of exercise price for options outstanding
Weighted
average
exercise
price
Weighted
average
remaining
contractual
life
Weighted
average
exercise
price
Weighted
average
remaining
contractual
life
£7.43/£12.43 £10.91 2.7 years — —
£7.43/£10.64 — — £9.76 3.0 years
The weighted average share price at the time the options were exercised during 2007 was £18.59
(2006: £13.98) for the UK Sharesave scheme and £18.72 (2006: £13.87) for the International Sharesave
scheme.
The intrinsic value of vested 2004 UK and International Sharesave cash-settled awards as at31 December 2007 was US$2 million (2006: US$nil million).
2004 Deferred Bonus Plan
Under this plan shares are issued directly to participants upon vesting.
A reconciliation of share movements over the year to 31 December 2007 and 2006 is shown below:
2007 2006
No. of
shares
No. of
shares
Outstanding at 1 January 301,952 408,742
Shares vested (285,227) (399,537)
Shares awarded 351,340 301,952
Shares lapsed (16,725) (9,205)
Outstanding at 31 December 351,340 301,952
Notes:
(1) Market value of shares on date of awards (6 March) was £13.95 (2006: £15.12).
(2) The shares vest one year after the date of award.
782
c102100pu180Proof7:28.3.10B/LRevision:0OperatorBeeR

42. Cash and Cash Equivalents
For the purposes of the cash flow statement, cash and cash equivalents comprise the following
balances with less than three months maturity from the date of acquisition. Restricted balancescomprise minimum balances required to be held at central banks.
Group Company
2007
US$million
2006
US$million
2007
US$million
2006
US$million
Cash and balances at central banks 10,175 7,698 — —
Less restricted balances (4,846) (3,958) — —Treasury bills and other eligible bills 6,203 6,233 — —
Loans and advances to banks 32,464 16,084 — —
Trading securities 11,342 12,104 — —
Amounts owed by and due to subsidiary
undertakings — — 930 2,028
Total 55,338 38,161 930 2,028
43. Capital Commitments
Capital expenditure approved by the directors but not provided for in these accounts amounted to:
2007
US$million
2006
US$million
Contracted 29 19
44. Operating Lease Commitments
2007 2006
Premises
US$million
Equipment
US$million
Premises
US$million
Equipment
US$million
Commitments under non-cancellable operating
leases expiring:Within one year 179 3 156 3
Later than one year and less than five years 434 2 358 4
After five years 491 1 529 —
1,104 6 1,043 7
During the year US$159 million (2006: US$155 million) was recognised as an expense in the income
statement in respect of operating leases.
The Group leases various premises and equipment under non-cancellable operating lease agreements.
The leases have various terms, escalation clauses and renewal rights.
The total future minimum sublease payments expected to be received under non-cancellable subleases
at 31 December 2007 is US$17 million (2006: US$17 million).
783
c102100pu180Proof7:28.3.10B/LRevision:0OperatorBeeR

45. Contingent Liabilities and Commitments
The table below shows the contract or underlying principal amounts, credit equivalent amounts and
risk weighted amounts of unmatured off-balance sheet transactions at the balance sheet date. Thecontract or underlying principal amounts indicate the volume of business outstanding and do not
represent amounts at risk.
The credit equivalent and risk weighted amounts have been calculated in accordance with the
Financial Services Authority guidelines implementing the Basel Accord on capital adequacy, after
taking account of collateral and guarantees received.
. 2007 2006
Contract or
underlying
principal
amount
US$million
Credit
equivalent
amount
US$million
Risk
weighted
amount
US$million
Contract or
underlying
principal
amount
US$million
Credit
equivalent
amount
US$million
Risk
weighted
amount
US$million
Contingent liabilities*
Guarantees and irrevocable
letters of credit 25,681 17,629 11,909 18,344 12,784 9,398
Other contingent liabilities 8,038 6,058 4,476 9,046 7,139 5,418
33,719 23,687 16,385 27,390 19,923 14,816
Commitments*
Documentary credits and
short term trade-related
transactions 6,504 1,301 1,102 5,029 1,006 845
Forward asset purchases and
forward deposits placed 64 64 13 31 31 10
Undrawn formal standby
facilities, credit lines and
other commitments to
lend:
One year and over 13,888 6,944 6,079 14,083 7,042 3,693
Less than one year 18,260 — — 20,543 — —
Unconditionally
cancellable 45,279 — — 29,858 — —
83,995 8,309 7,194 69,544 8,079 4,548
* Includes amounts relating to the Group’s share of its joint ventures.
784
c102100pu180Proof7:28.3.10B/LRevision:0OperatorBeeR

46. Repurchase and Reverse Repurchase Agreements
The Group enters into collateralised reverse repurchase and repurchase agreements and securities
borrowing and lending transactions. It also receives securities as collateral for commercial lending.
Balance sheet assets
2007
Reverse
repurchase
agreements
US$million
2006
Reverse
repurchase
agreements
US$million
Banks 1,349 1,359
Customers 1,068 630
2,417 1,989
Balance sheet liabilities
2007
Repurchase
agreements
US$million
2006
Repurchase
agreements
US$million
Banks 2,150 1,449
Customers 364 681
2,514 2,130
Collateral pledged against these liabilities is disclosed in note 21 on page 744. The terms and
conditions relating to the collateral pledged typically permits the collateral to be sold or repledged,
subject to the obligation to return the collateral at the end of the agreement.
Under reverse repurchase and securities borrowing arrangements, the Group obtains securities on
terms which permit it to repledge or resell the securities to others. Amounts on such terms are:
2007
US$million
2006
US$million
Securities and collateral which can be repledged or sold (at fair value) 2,410 1,379
Thereof repledged/transferred to others for financing activities or to satisfy
commitments under short sale transactions (at fair value) 1,714 866
785
c102100pu180Proof7:28.3.10B/LRevision:0OperatorBeeR

47. Liquidity Risk
This table analyses assets and liabilities into relevant maturity groupings based on the remaining
period to the contractual maturity date as at the balance sheet date, on a discounted basis.Contractual maturities do not necessarily reflect actual repayments or cash flow.
The Risk Review on pages 43 to 59 of the 2007 Annual Report explain the Group’s and Company’srisk management with respect to asset and liability management.
2007
Three
months
or less
US$million
Between
three
months
andone
year
US$million
Between
one year
and
five years
US$million
More than
five years
US$million
Total
US$million
Assets
Cash and balances at central banks 5,329 — — 4,846 10,175
Derivative financial instruments 6,228 7,042 9,740 3,194 26,204
Loans and advances to banks 32,461 3,613 1,269 336 37,679
Loans and advances to customers 51,010 28,334 29,921 47,717 156,982
Investment securities 18,526 21,269 20,034 13,373 73,202Other assets 7,139 392 322 17,110 24,963
Total assets 120,693 60,650 61,286 86,576 329,205
Liabilities
Deposits by banks 25,524 2,361 540 160 28,585Customer accounts 160,925 15,883 3,791 1,997 182,596
Derivative financial instruments 6,810 7,024 9,716 2,720 26,270
Debt securities in issue 10,964 11,637 6,363 3,189 32,153
Other liabilities 9,533 724 739 11,413 22,409
Subordinated liabilities and other
borrowed funds — 502 6,092 9,146 15,740
Total liabilities 213,756 38,131 27,241 28,625 307,753
Net liquidity gap (93,063) 22,519 34,045 57,951 21,452
786
c102100pu180Proof7:28.3.10B/LRevision:0OperatorBeeR

2006*
Three
months
or less
US$million
Between
three
months and
one year
US$million
Between
one year
and
five years
US$million
More than
five years
US$million
Total
US$million
Assets
Cash and balances at central banks 3,740 — — 3,958 7,698
Derivative financial instruments 2,710 4,178 4,190 2,076 13,154
Loans and advances to banks 16,214 2,305 2,403 142 21,064Loans and advances to customers 44,062 23,590 28,771 44,071 140,494
Investment securities 19,311 20,141 18,207 5,016 62,675
Other assets 1,316 509 789 18,403 21,017
Total assets 87,353 50,723 54,360 73,666 266,102
Liabilities
Deposits by banks 24,109 3,360 621 32 28,122
Customer accounts 125,790 19,061 3,233 1,204 149,288
Derivative financial instruments 2,766 5,278 4,006 1,653 13,703
Debt securities in issue 8,382 9,216 8,231 970 26,799
Other liabilities 2,533 523 887 14,153 18,096
Subordinated liabilities and otherborrowed funds — 501 2,440 9,758 12,699
Total liabilities 163,580 37,939 19,418 27,770 248,707
Net liquidity gap (76,227) 12,784 34,942 45,896 17,395
* Amounts have been restated as explained in note 51 on page 795.
The Company has financial liabilities of US$1,987 million (2006: US$1,977 million) maturing in five
years or more.
The following table analyses the contractual cash flows payable for the Group’s financial liabilities by
remaining contractual maturities on an undiscounted basis. The financial liability balances in the table
below will not agree to the balances reported in the consolidated balance sheet as the tableincorporates all contractual cash flows, on an undiscounted basis, relating to both principal and
interest payments.
Within the ‘More than five years’ maturity band are undated financial liabilities of US$5,640 million
(2006: US$5,515 million), all of which relate to subordinated debt, on which interest payments are
not included as this information would not be meaningful. Interest payments on these instruments are
included within the maturities up to five years.
787
c102100pu180Proof7:28.3.10B/LRevision:0OperatorBeeR

2007 2006
Three
months or
less
US$million
Between
three
months and
one year
US$million
Between
one and
five years
US$million
More than
five years
US$million
Three
months or
less
US$million
Between
three
months and
one year
US$million
Between
one and
five years
US$million
More than
five years
US$million
Deposits by banks 22,752 1,880 526 133 23,039 3,000 780 192
Customer accounts 158,937 15,896 3,183 1,888 126,458 18,550 3,767 2,051
Financial liabilities at fair
value 3,662 3,407 2,463 1,767 2,079 2,451 2,424 892
Derivative financial
instruments 420,884 260,597 91,272 22,962 258,936 211,952 63,932 23,773
Debt securities in issue 10,535 10,594 6,242 2,436 7,738 7,983 8,825 900
Subordinated liabilities and
other borrowed funds 305 1,190 5,476 20,247 205 1,154 5,683 15,447
Other liabilities 10,645 663 437 9,120 7,057 930 354 8,011
Total liabilities 627,720 294,227 109,599 58,533 425,512 246,020 85,765 51,266
Gross loan commitments 20,207 14,215 3,446 293 9,488 16,801 2,570 136
The cash flows presented in the above table reflect the cash flows which will be contractually payableover the residual maturity of the instruments. In practice, however, the liability instruments behave
differently from their contractual terms and typically, for short term customer accounts, extend to a
longer period than their contractual maturity.
Derivative financial instruments include those net settled derivative contracts in a net liability position,
together with the pay leg of gross settled contracts regardless of whether the overall contract is in an
asset or liability position. The receive leg is not shown in this table and as a result the derivative
amounts in this table are inflated by their exclusion.
The Company has financial liabilities payable on an undiscounted basis of US$4,655 million (2006:
US$5,751 million), of which US$1,104 million (2006: US$1,167 million) matures in three months or
less, US$101 million (2006: US$103 million) matures between three months and one year, US$543
million (2006: US$528 million) matures between one to five years, and US$2,554 million (2006:
US$2,555 million) matures in more than five years.
48. Currency Risk
Foreign exchange risk is managed and measured as set out in the Market risk section of the Risk
Review on pages 56 to 57 of the Annual Report and Accounts 2007.
Foreign exchange risk arising within the non-trading portfolio, excluding structural positions, is
minimised by match funding assets and liabilities in the same foreign currency.
Structural foreign exchange risks arise from net investments in currencies other than US Dollars. The
Group has made net investments in Group undertakings in a number of currencies. The subsequent
foreign exchange exposures are managed on an individual basis, and are assessed regularly for
significant foreign exchange rate expectations. The positions are treated as long-term embedded
exposures, and are not treated as trading positions, so hedges are considered in certain limited cases.
788
c102100pu180Proof7:28.3.10B/LRevision:0OperatorBeeR

The table below sets out the principal structural foreign exchange exposures of the Group at
31 December 2007 and 2006:
2007
US$million
2006
US$million
Korean won 5,607 5,225Hong Kong dollar 5,090 4,743Indian rupee 2,258 1,682Taiwanese dollar 1,833 1,397Thai baht 958 824UAE dirham 808 655Singapore dollar 734 1,129Chinese yuan 727 549Pakistani rupee 705 668Malaysian ringgit 674 696Indonesian rupiah 475 475Other 1,965 1,518
21,834 19,561
An analysis has been performed on these exposures to assess the impact of a one per cent fall in the
US Dollar exchange rates adjusted to incorporate the impacts of correlations. The impact of these on
the positions above would be an increase of US$91 million (2006: US$60 million). Changes in the
valuations of these positions are taken to reserves.
The Company’s assets and liabilities are predominantly in US Dollars. It has assets of US$687
million (2006: US$732 million) and liabilities of US$724 million (2006: US$738 million) other than
US Dollars.
49. Credit Risk
Maximum exposure to credit risk
The table below presents the Group’s maximum exposure to credit risk of the Group’s balance sheet
and off-balance sheet financial instruments at 31 December 2007, before taking into account anycollateral held or other credit enhancements. For on-balance sheet instruments, the maximum
exposure to credit risk is the carrying amount reported on the balance sheet. For off-balance sheet
instruments, the maximum exposure to credit risk represents the contractual nominal amounts.
The Group’s maximum exposure to credit risk has increased by US$59 billion compared to 2006,
primarily due to increased lending to banks, up US$16.6 billion, reflecting the Group’s strongliquidity and US$16.5 billion increase in Wholesale lending portfolios. Derivative instruments
increased by US$13.0 billion as a result of increased volumes in the foreign exchange and rates
business.
Collateral is held to mitigate the credit risk exposures primarily in respect of loans and advances, and
consisting of residential, commercial and industrial properties, securities and other assets such as plant
and machinery. Further details of the credit risk mitigation undertaken by the Group is containedwithin the Risk Review on page 46 of the 2007 Annual Report.
2007
US$million
2006
US$million
Financial assets held at fair value through profit or loss* 22,588 15,553Derivative financial instruments 26,204 13,154Loans and advances to banks and customers 189,631 159,024Investment securities* 52,584 48,019Contingent liabilities 33,719 27,390Undrawn irrevocable standby facilities, credit linesand other commitments to lend 32,148 34,626
356,874 297,766
* Excludes equity shares.
789
c102100pu180Proof7:28.3.10B/LRevision:0OperatorBeeR
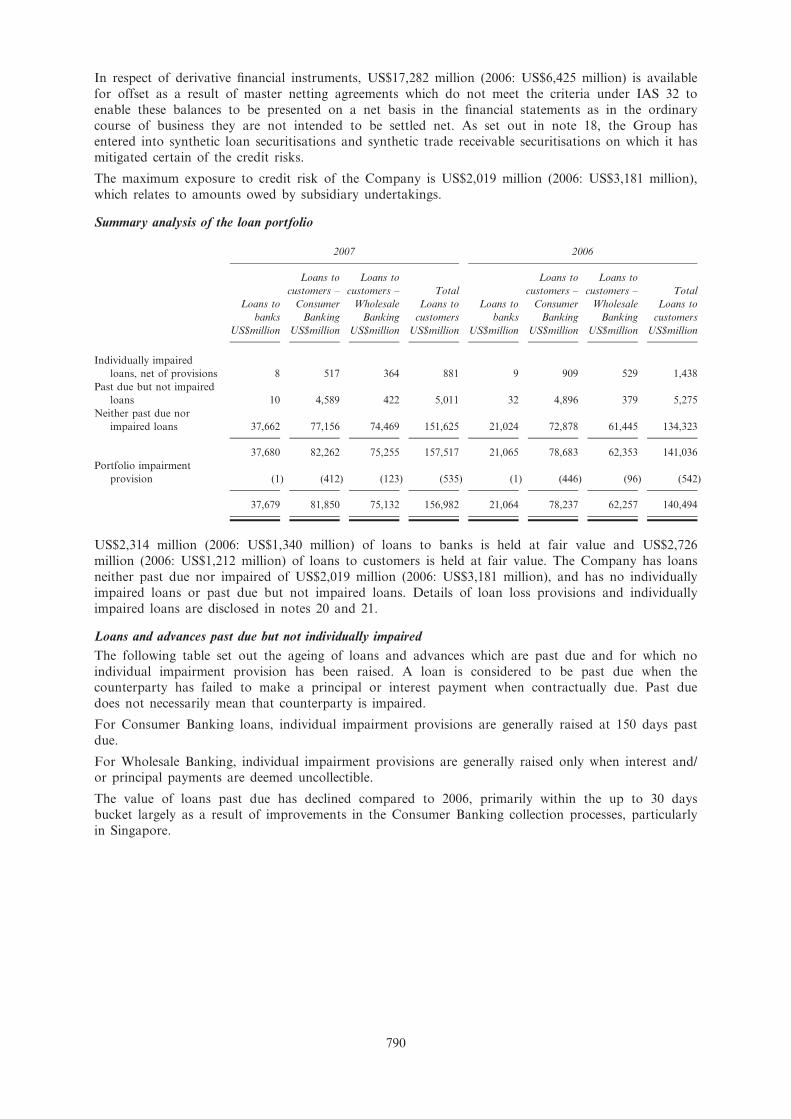
In respect of derivative financial instruments, US$17,282 million (2006: US$6,425 million) is available
for offset as a result of master netting agreements which do not meet the criteria under IAS 32 to
enable these balances to be presented on a net basis in the financial statements as in the ordinary
course of business they are not intended to be settled net. As set out in note 18, the Group hasentered into synthetic loan securitisations and synthetic trade receivable securitisations on which it has
mitigated certain of the credit risks.
The maximum exposure to credit risk of the Company is US$2,019 million (2006: US$3,181 million),
which relates to amounts owed by subsidiary undertakings.
Summary analysis of the loan portfolio
2007 2006
Loans to
banks
US$million
Loans to
customers –
Consumer
Banking
US$million
Loans to
customers –
Wholesale
Banking
US$million
Total
Loans to
customers
US$million
Loans to
banks
US$million
Loans to
customers –
Consumer
Banking
US$million
Loans to
customers –
Wholesale
Banking
US$million
Total
Loans to
customers
US$million
Individually impaired
loans, net of provisions 8 517 364 881 9 909 529 1,438
Past due but not impaired
loans 10 4,589 422 5,011 32 4,896 379 5,275
Neither past due nor
impaired loans 37,662 77,156 74,469 151,625 21,024 72,878 61,445 134,323
37,680 82,262 75,255 157,517 21,065 78,683 62,353 141,036
Portfolio impairment
provision (1) (412) (123) (535) (1) (446) (96) (542)
37,679 81,850 75,132 156,982 21,064 78,237 62,257 140,494
US$2,314 million (2006: US$1,340 million) of loans to banks is held at fair value and US$2,726
million (2006: US$1,212 million) of loans to customers is held at fair value. The Company has loans
neither past due nor impaired of US$2,019 million (2006: US$3,181 million), and has no individually
impaired loans or past due but not impaired loans. Details of loan loss provisions and individually
impaired loans are disclosed in notes 20 and 21.
Loans and advances past due but not individually impaired
The following table set out the ageing of loans and advances which are past due and for which no
individual impairment provision has been raised. A loan is considered to be past due when thecounterparty has failed to make a principal or interest payment when contractually due. Past due
does not necessarily mean that counterparty is impaired.
For Consumer Banking loans, individual impairment provisions are generally raised at 150 days past
due.
For Wholesale Banking, individual impairment provisions are generally raised only when interest and/or principal payments are deemed uncollectible.
The value of loans past due has declined compared to 2006, primarily within the up to 30 daysbucket largely as a result of improvements in the Consumer Banking collection processes, particularly
in Singapore.
790
c102100pu180Proof7:28.3.10B/LRevision:0OperatorBeeR

2007 2006
Loans to
banks
US$million
Loans to
customers –
Consumer
Banking
US$million
Loans to
customers –
Wholesale
Banking
US$million
Total
Loans to
customers
US$million
Loans to
banks
US$million
Loans to
customers –
Consumer
Banking
US$million
Loans to
customers –
Wholesale
Banking
US$million
Total
Loans to
customers
US$million
Up to 30 days past due — 3,559 239 3,798 32 3,911 200 4,111
Between 31 – 60 days past
due — 536 38 574 — 553 71 624
Between 61 – 90 days past
due 10 342 143 485 — 284 78 362
Between 91 – 150 days past
due — 152 2 154 — 148 30 178
10 4,589 422 5,011 32 4,896 379 5,275
Within loans to banks past due balance, US$nil million (2006: US$nil million) is held at fair value.
Within the Consumer Banking loans to customers past due balance, US$nil million (2006: US$nilmillion) is held at fair value; and within the Wholesale Banking loans to customers past due balance,
US$nil million (2006: US$nil million) is held at fair value.
The fair value of collateral held against past due but not impaired Consumer Banking loans is
US$4,419 million (2006: US$3,444 million) and largely comprises residential and commercial property.
The fair value of collateral held against past due but not impaired Wholesale Banking loans is
US$157 million (2006: US$161 million) and largely comprises property and securities.
Where the fair value of collateral held exceeds the outstanding loan, any excess is paid back to the
customers and is not available for offset against other loans.
Loans and advances neither past due nor impaired
The following table set out an analysis of loans and advances by internal credit grading which are
not past due and for which no individual impairment provision has been raised. The credit gradings
set out in the table below are based on a probability of default measure as set out on pages 46 and
47 of the Risk Review in the 2007 Annual Report. The banding reflects management’s segmentationof the credit risk grades.
The increase in loans to banks compared to 2006 is as a result of the placement of excess liquidity
with high quality bank counterparties, resulting in an improvement in the proportion lent tocounterparties within credit grades 1 to 5. Within loans to customers, the proportion of the loan
book falling within credit grades 1 to 5 has increased from 44 to 46%, which is largely as a result of
an increase in the proportion of high quality lending in the Wholesale Banking portfolio. Within
Consumer Banking, the proportion of lending within grades 6 to 8 has decreased, and grades 9 to 11
has increased, as changes in methodology led to the re-grading of certain portfolios, largely shifting
them from grade 8 to grade 9. The proportion of grade 12 loans was maintained at 1% of the loans
to customer portfolio.
2007 2006
Loans to
banks
US$million
Loans to
customers –
Consumer
Banking
US$million
Loans to
customers –
Wholesale
Banking
US$million
Total
Loans to
customers
US$million
Loans to
banks
US$million
Loans to
customers –
Consumer
Banking
US$million
Loans to
customers –
Wholesale
Banking
US$million
Total
Loans to
customers
US$million
Grades 1 – 5 34,074 32,824 36,999 69,823 17,748 31,428 27,752 59,180
Grades 6 – 8 3,231 19,339 27,020 46,359 2,790 21,806 22,902 44,708
Grades 9 – 11 349 23,810 10,233 34,043 479 18,340 10,323 28,663
Grade 12 8 1,183 217 1,400 7 1,304 468 1,772
37,662 77,156 74,469 151,625 21,024 72,878 61,445 134,323
791
c102100pu180Proof7:28.3.10B/LRevision:0OperatorBeeR

With Loans to banks, US$2,314 million (2006: US$1,340 million) is held at fair value, of which
US$1,686 million (2006: US$909 million) is within Grades 1 – 5; and US$629 million (2006: US$431
million) within Grades 6 – 8. Within Loans to customers – Consumer – US$nil million (2006: US$nil
million) is held at fair value. Within Loans to customers – Wholesale – US$2,726 million (2006:US$1,212 million) is held at fair value, of which US$1,789 million (2006: US$1,032 million) is within
Grades 1 – 5; US$784 million (2006: US$134 million) within Grades 6 – 8; and US$153 million
(2006: US$46 million) in Grades 9 – 11.
Renegotiated loans
Loans renegotiated which would otherwise be past due or impaired, continue to be accounted for as
non-performing until a minimum number of payments have been received under the new terms, after
which they are considered to be performing loans. Loans which are renegotiated to include
concessions that the Group would not ordinarily make will usually be impaired and therefore
excluded from this disclosure.
Of the Group’s total loans and advances to banks which are neither past due nor impaired, loans
which have been renegotiated (either during the year or in previous years) is US$nil million (2006:US$5 million).
Within the Group’s total loans and advances to customers which are neither past due nor impaired,
loans which have been renegotiated (either during the year or in previous years) total US$1,014
million (2006: US$917 million), of which US$341 million (2006: US$150 million) relates to Wholesale
Banking customers and US$1,015 million (2006: US$767 million) to Consumer Banking customers.
Collateral and other credit enhancements possessed or called upon
During the year, the Group obtained assets by taking possession of collateral or calling upon other
credit enhancements (such as guarantees) as detailed in the table below. Repossessed properties are
sold in an orderly fashion. Where the proceeds are in excess of the outstanding loan balance they are
returned to the borrower. Certain of the equity securities acquired continue to be held by the Group
for investment purposes and are classified as available-for-sale, and the related loan derecognised.
2007 2006
Consumer
Banking
US$million
Wholesale
Banking
US$million
Total
US$million
Consumer
Banking
US$million
Wholesale
Banking
US$million
Total
US$million
Property 135 69 204 140 9 149
Debt securities andequity shares — — — 9 — 9
Guarantees 35 5 40 13 3 16
Other 9 58 67 86 1 87
179 132 311 248 13 261
Debt securities, equity shares and treasury bills
Debt securities, equity shares and treasury bills can be analysed as follows:
2007 2006
Debt
securities
US$million
Equity
shares
US$million
Treasury
bills
US$million
Total
US$million
Debt
securities
US$million
Equity
shares
US$million
Treasury
bills
US$million
Total
US$million
Impaired securities 71 30 17 118 18 34 30 82
Impairment provisions (54) (22) (2) (78) (9) (23) (10) (42)
Net impaired securities 17 8 15 40 9 11 20 40
Securities neither past due
nor impaired 55,063 3,052 15,047 73,162 45,089 1,629 15,920 62,638
55,080 3,060 15,062 73,202 45,098 1,640 15,940 62,678
792
c102100pu180Proof7:28.3.10B/LRevision:0OperatorBeeR

US$3,395 million (2006: US$3,418 million) of treasury bills and US$14,163 million (2006: US$9,601
million) of debt securities are held at fair value.
Movements in provisions on impaired securities are disclosed in note 22. The impaired debt securities
largely include the Group’s holdings of ABS CDOs, on which a US$35 million impairment charge
and other writedowns of US$87 million were taken in 2007. Further details of these writedowns are
set out on page 54 of the Risk Review in the 2007 Annual Report.
Collateral is held against impaired securities and primarily consists of properties. The undiscounted
fair value of collateral held relating to impaired securities is estimated at US$24 million (2006: US$21million).
The Company has no debt securities, equity shares or treasury bills other than investments insubsidiary undertakings.
Where the fair value of collateral held exceeds the outstanding securities obligations, any excess is
paid back to the customers and is not available for offset against other securities obligations.
Securities neither past due nor impaired
The following table analyses debt securities and treasury bills which are neither past due or impaired
by external credit rating. The standard credit ratings used by the Group are those used by Standard
& Poors or their equivalent. Debt securities held which have a short-term rating are reported against
the long-term rating of the issuer. For securities which are unrated, the Group applies an internal
credit rating as described under Loans and Advances.
2007 2006
Debt
securities
US$million
Treasury
bills
US$million
Total
US$million
Debt
securities
US$million
Treasury
bills
US$million
Total
US$million
AAA 12,364 570 12,934 6,685 644 7,329
AA- to AA+ 16,426 3,216 19,642 14,992 3,125 18,117
A- to A+ 14,358 7,788 22,146 13,517 9,986 23,503
BBB- to BBB+ 6,341 1,822 8,163 4,834 852 5,686
Lower than BBB- 2,586 1,357 3,943 3,225 1,072 4,297
Unrated 2,988 294 3,282 1,836 241 2,077
55,063 15,047 70,110 45,089 15,920 61,009
Unrated securities primarily relate to corporate investments. Using internal credit ratings, US$2,606
million (2006: US$1,353 million) of these securities are considered to be investment grade and US$676
million (2006: US$724 million) sub-investment grade.
The increase in AAA debt securities compared to 2006 has largely been driven by the asset backed
securities acquired from Whistlejacket following the ‘vertical’ slice transactions. Further details of
these transactions are set out in note 52 and within the Risk Review on page 54 of the 2007 Annual
Report.
793
c102100pu180Proof7:28.3.10B/LRevision:0OperatorBeeR

50. Fair Value of Financial Assets and Liabilities
The following table summarises the carrying amounts and fair values of those financial assets and
liabilities not presented on the Group’s balance sheet at fair value.
2007 2006
Book
amount
US$million
Fair value
US$million
Book
amount*
US$million
Fair value*
US$million
Assets
Cash and balances at central banks 10,175 10,175 7,698 7,698
Loans and advances to banks 35,365 35,316 19,724 19,727Loans and advances to customers 154,266 153,828 139,300 139,654
Investment securities 2,819 2,779 2,786 2,754
Liabilities
Deposits by banks 25,880 25,844 26,233 26,184
Customer accounts 179,760 179,694 147,382 147,492
Debt securities in issue 27,137 27,072 23,514 23,518
Subordinated liabilities and other borrowed funds 15,740 15,029 **12,699 12,877
* Amounts have been restated as explained in note 51 on page 795.
** The book amount includes adjustments as a result of fair value hedging relationships.
The following sets out the Group’s basis of establishing fair values of the financial instruments shown
above and those financial assets classified as available-for-sale and financial assets and liabilities held
at fair value through profit and loss as disclosed within notes 14, 15, 17, 18, 22 and 31. The Group’sbasis for establishing the fair value of financial assets and liabilities held at fair value through profit
or loss and of derivatives is set out in note 1.
Cash and balances at central banks
The fair value of cash and balances at central banks is their carrying amounts.
Loans and advances to banks
The fair value of floating rate placements and overnight deposits is their carrying amounts. The
estimated fair value of fixed interest bearing deposits is based on discounted cash flows using the
prevailing money-market rates for debts with a similar credit risk and remaining maturity.
Loans and advances to customers
Loans and advances are net of provisions for impairment. The estimated fair value of loans and
advances represents the discounted amount of future cash flows expected to be received, including
assumptions relating to prepayment rates. Expected cash flows are discounted at current market ratesto determine fair value. The Group’s loan portfolio is well diversified by geography and industry and
is in markets that have had little contagion from the turmoil brought about by the sub-prime
mortgage crisis in the United States. Approximately half of the portfolio reprices within one month,
and over 80% reprices within 12 months. The fair value of loans and advances to customers is
therefore close to the book amount.
Investment securities
Investment securities with observable market prices, including debt and equity securities, are fair
valued using that information. Debt securities that do not have observable market data are fair
valued by either discounting cash flows using the prevailing market rates for debts with a similar
credit risk and remaining maturity or using quoted market prices for securities with similar credit,maturity and yield characteristics.
Deposits and borrowings
The estimated fair value of deposits with no stated maturity is the amount repayable on demand. The
estimated fair value of fixed interest bearing deposits and other borrowings without quoted market
prices is based on discounting cash flows using the prevailing market rates for debts with a similar
credit risk and remaining maturity.
794
c102100pu180Proof7:28.3.10B/LRevision:0OperatorBeeR

Debt securities in issue, subordinated liabilities and other borrowed funds
The aggregate fair values are calculated based on quoted market prices. For those notes where quoted
market prices are not available, a discounted cash flow model is used based on a current marketrelated yield curve appropriate for the remaining term to maturity.
51. Restatement of Prior Periods
Acquisitions
In the consolidated balance sheet as at 31 December 2006, the fair value amounts in relation to the
acquisitions of Union and Hsinchu contained some provisional balances. During the year to
31 December 2007, certain of these balances have been revised. In accordance with IFRS 3 ‘Business
Combinations’, the adjustments to the provisional balances have been made as at the date of
acquisition and the 2006 balance sheet amounts restated, with a corresponding adjustment to
goodwill, increasing goodwill on acquisition relating to Union and Hsinchu respectively by US$8
million to US$414 million and by US$93 million to US$1,041 million. The adjustments primarilyrelate to a reassessment of the value of certain loan assets, investment debt securities and retirement
benefit obligations, together with associated deferred tax. The income statement for 2006 has not been
restated, because any effect is immaterial.
As
reported
at 2006
US$million
Fair value
adjustment
to Union
US$million
Fair value
adjustment
to Hsinchu
US$million
Reclassi-
fication
US$million
Restated
at 2006
US$million
Loans and advances to customers 139,330 (10) (20) — 139,300
Investment securities 49,487 — 10 — 49,497
Goodwill and intangible assets 6,146 8 93 — 6,247
Property, plant and equipment 2,168 (1) 1 — 2,168Deferred tax assets 538 3 7 (36) 512
Retirement benefit obligations 472 — 89 (8) 553
Other liabilities 11,355 — 4 (28) 11,331
Minority interests 544 — (2) — 542
Cash Flow Statement
The following items have been re-presented in the Group and Company cash flow statements for the
year ended 31 December 2006:
* net cash flow from operating activities increased by US$254 million, and net cash from financing
activities decreased by US$254 million, following the separate identification of the outflow on
the redemption of the preference shares of US$328 million and the inflow from certain of the
proceeds from the issues of ordinary share capital of US$74 million, both of which were
previously included in other movements within net cash flow from operating activities;
* in the Group cash flow statement only, a reclassification within cash flow from operating
activities of US$782 million between ‘Other accounts’ and ‘Assets written off, net of recoveries’.The remaining balance of US$158 million represents the non-cash income statement items
relating to recoveries of acquisition fair values and discount unwind and has been re-named
accordingly as ‘Recoveries of acquisition fair values and discount unwind’; and
* in the Group cash flow statement only, the purchase of own shares and the inflow from the
exercise of share options has been presented on a gross basis within net cash from financing
activities.
The net increase in cash and cash equivalents in the Group and Company cash flow statements has
been unaffected by these reclassifications.
52. Related Party Transactions
Directors and Officers
Directors’ emoluments
Details of directors’ pay and benefits and interests in shares are disclosed in the directors’
remuneration report on pages 73 to 85 of the 2007 Annual Report.
795
c102100pu180Proof7:28.3.10B/LRevision:0OperatorBeeR

IAS 24 ‘Related party disclosures’ requires the following additional information for key management
compensation. Key management comprises members of the Group Management Committee, which
includes all executive and non-executive directors.
2007
US$million
2006
US$million
Salaries, allowances and benefits in kind 19 14
Pension contributions 6 5
Bonuses paid or receivable 23 17
Share based payments 22 16
70 52
Transactions with directors, officers and others
At 31 December 2007, the total amounts to be disclosed under the UK Companies Act 1985 (the
Act) and the HK Listing Rules about loans to directors and officers were as follows:
2007 2006
Number US$000 Number US$000
Directors 1 14 — —
Officers* 4 7,090 2 203
* For this disclosure, the term ‘Officers’ means the members of the Group Management Committee, other than those who aredirectors of Standard Chartered PLC, and the Company Secretary.
Mr Sunil Mittal, appointed as an independent non-executive director of Standard Chartered PLC with
effect from 1 August 2007, is Chairman and Group CEO of the Bharti Enterprises Group. Due to his
significant voting power in the Bharti Enterprises Group, it is a related party of Standard Chartered
PLC. As at 31 December 2007, the Group has loans to the Bharti Enterprises Group of US$123
million, guarantees of US$47 million and foreign exchange deals with a notional value of US$52
million.
As at 31 December 2007, Standard Chartered Bank had created a charge over US$24 million (2006:US$5 million) of cash assets in favour of the independent trustees of its employer financial retirement
benefit schemes.
Other than as disclosed in this Annual Report and Accounts, there were no other transactions,
arrangements or agreements outstanding for any director, connected person or officer of the
Company which have to be disclosed under the Act, the rules of the UK Listing Authority or the
HK Listing Rules.
Joint ventures
The Group has loans and advances to PT Bank Permata Tbk totalling US$4 million at 31 December2007 (2006: US$8 million), and deposits of US$7 million (2006: US$nil million).
Associates
During 2007, the Group acquired a 30% holding in MCashback Limited for US$36 million.
During 2007, the Group contributed US$11 million to the establishment of Merchant Solutions
Limited.
At 31 December 2007, the Group has loans and advances to China Bohai Bank Co., Ltd of US$nil
million (2006: US$54 million).
Structured investment vehicles
Whistlejacket Capital Limited (‘Whistlejacket’) is a structured investment vehicle sponsored by the
Group. In November and December 2007, the Group entered into two vertical slice transactions to
acquire a portfolio of Whistlejacket’s securities, settled by a cash payment, which is net of the
redemption value of the capital notes invested by the Group in the vehicle. The capital notes were
redeemed at net asset value, crystallising a loss for the Group of US$116 million, which is reported
796
c102100pu180Proof7:28.3.10B/LRevision:0OperatorBeeR

within ‘Other operating income’. The portfolio of debt securities acquired totalled US$3.4 billion and
has been classified as available-for-sale. In addition to these transactions, the Group acquired US$1.7
billon of assets, some of which were subsequently sold, without any significant profit and loss impact.
Open ended investment company
Standard Chartered Global Liquidity Funds p.l.c. is an open-ended investment company domiciled in
Ireland and has a single sub-fund, the US Dollar Liquidity Fund. The Fund is a Treasury Style
Institutional Money Market Fund that holds a Aaa/MR1+ rating from Moody’s Investor services and
is managed to maximise current income consistent with the preservation of capital and liquidity andis structured to maintain a stable net asset value per share of US$1.00 with the income distributed in
the form of dividends. As at 31 December 2007, the Fund had US$1,325 million in assets under
management. Standard Chartered Bank is the Investment Manager and Distributor of the Fund and
has an investment in the shares of US$251 million.
Company
The Company has received US$95 million of interest income from Standard Chartered Bank. The
Company issues debt externally and lends the proceeds to Group companies. At 31 December 2007, it
has loans to and debt instruments issued by Standard Chartered Bank of US$343 million (2006:
US$3,180 million), loans of US$77 million (2006: US$nil million) to Standard Chartered Holdings
Limited and loans of US$1 million (2006: US$1 million) to other subsidiaries.
At 31 December 2007, the Company had no amounts owed to Standard Chartered Holdings Limited(2006: US$1,151 million).
In 2006, the Company licensed intellectual property rights related to the Company’s main brands to
an indirect wholly owned subsidiary, Standard Chartered Strategic Brand Management Limited
(‘SCSBM’), the income for which is held on the Company’s balance sheet and released as income
over the term of the license. The Company entered into an agreement to pay a partial rebate of the
initial licence value to SCSBM in January 2008. This amounted to US$1,089 million, which has beenincluded as amounts owed to subsidiary undertakings at 31 December
2007. As a consequence, in the year ended 31 December 2007, the Company has written back US$192
million of income recognised in prior years. At the year end US$311 million (2006: US$1,362 million)
has been included as deferred income in the Company balance sheet in relation to this license.
The Company has an agreement with Standard Chartered Bank that in the event of the Bankdefaulting on its debt coupon interest payments, where the terms of such debt requires it, the
Company shall issue shares as settlement for non-payment of the coupon interest.
53. Post Balance Sheet Events
Group
The Group announced, on 18 September 2007, the acquisition of American Express Bank Limited
(‘AEB’), from American Express Company for a total cash consideration equal to the net asset valueof AEB at completion plus US$300 million. The transaction will complete on 29 February 2008.
On 11 January 2008, the Group completed the acquisition of a 49% stake in UTI Securities Limited,
an equity brokerage firm in India.
On 11 January 2008, the Group announced the acquisition of a Korean mutual savings bank,
Yeahreum Mutual Savings Bank which was completed on 25 February 2008.
On 31 January 2008, the Group announced that it intended to provide liquidity to Whistlejacket
subject to certain pre-conditions, one of which was that enforcement proceedings had not commenced.
On 11 February 2008, Whistlejacket advised that it had breached its capital note Net Asset Value
(‘NAV’) trigger of 50%. The breach of the trigger was an enforcement event, which required the
security trustee, BNY Corporate Trustee Service, to appoint a receiver to manage Whistlejacket. As a
result, the proposal announced on 31 January 2008 lapsed. However, the Group continued to discusswith the receiver alternative arrangements to provide liquidity. Subsequently on 20 February 2008, the
Group announced that it had withdrawn the conditional proposals made to the receiver as a result of
a number of factors, including the pace of continuing deterioration in the market for certain assets
classes and the impracticality of completing any proposal within the confines of the receivership as it
has evolved.
797
c102100pu180Proof7:28.3.10B/LRevision:0OperatorBeeR

54. Significant Accounting Estimates and Judgements
In determining the carrying amounts of certain assets and liabilities, the Group makes assumptions of
the effects of uncertain future events on those assets and liabilities at the balance sheet date. TheGroup’s estimates and assumptions are based on historical experience and expectation of future events
and are reviewed periodically. This disclosure excludes uncertainty over future events and judgements
in respect of measuring financial instruments. Further information about key assumptions concerning
the future, and other key sources of estimation uncertainty, are set out in the notes.
Loan loss provisioning
The Group’s loan loss provisions are established to recognise incurred impairment losses either on
specific loan assets or within a portfolio of loans and receivables.
Impairment losses for specific loan assets are assessed either on an individual or on a portfolio basis.
Individual impairment losses are determined as the difference between the carrying value and the
present value of estimated future cash flows, discounted at the loans’ original effective interest rate.
Impairment losses determined on a portfolio basis are assessed based on the probability of default
inherent within the portfolio of impaired loans or receivables.
Estimating the amount and timing of future recoveries involves significant judgement, and considers
the level of arrears as well as the assessment of matters such as future economic conditions and the
value of collateral, for which there may not be a readily accessible market.
Loan losses that have been incurred but have not been separately identified at the balance sheet date
are determined on a portfolio basis, which takes into account past loss experience as a result ofuncertainties arising from the economic environment, and defaults based on portfolio trends. Actual
losses identified could differ significantly from the impairment provisions reported as a result of
uncertainties arising from the economic environment.
Fair value of financial instruments
Fair value is the amount for which an asset could be exchanged, or a liability settled, between
knowledgeable, willing parties in an arm’s length transaction.
All financial instruments are initially recognised at fair value, which is normally the transaction price.
In certain circumstances, the initial fair value may be based on a valuation technique which may leadto the recognition of profits or losses at the time of initial recognition. However, these profits or
losses can only be recognised when the valuation technique used is based solely on observable market
inputs.
Subsequent to initial recognition, some of the Group’s financial instruments are carried at fair value,
with changes in fair value either reported within the income statement or within equity until theinstrument is sold or becomes impaired. Details of the type and classification of the Group’s financial
instruments are set out in notes 14 and 16 to the accounts and the accounting policy set out in note
1 to the accounts. In addition to these instruments, the carrying value of a financial instrument
carried at amortised cost that is the hedged item in a qualifying fair value hedge relationship is
adjusted by the fair value gain or loss attributable to the hedged risk.
The fair values of quoted financial instruments in active markets are based on current prices. If the
market for a financial instrument is not active, and for unlisted securities, the Group establishes fair
value by using valuation techniques. These include the use of recent arm’s length transactions,
discounted cash flow analysis, option pricing models and other valuation techniques commonly used
by market participants.
Where representative prices are unreliable because of illiquid markets, the determination of fair value
may require estimation of certain parameters, which are calibrated against industry standards and
observable market data, or the use of valuation models that are based on observable market data.
The fair value for the majority of the Group’s financial instruments is based on observable market
prices or derived from observable market parameters. The most significant element of Group assets inwhich observable prices are not available relates to certain instruments held within the Asset Backed
Securities portfolio. At 31 December 2007, assets with a market value of US$1.5 billion were held in
respect of which there was no observable market data. For these instruments, changing one or more
of the assumptions used to reasonably possible alternatives would not significantly change their fair
value.
798
c102100pu180Proof7:28.3.10B/LRevision:0OperatorBeeR

Equity investments that do not have an observable market price are fair valued by applying various
valuation techniques, such as earnings multiples, net assets multiples, discounted cash flows, and
industry valuation benchmarks. These techniques are generally applied prior to any initial public
offering, after which an observable market price becomes available. Disposal of such investments aregenerally by market trades or private sales.
Goodwill impairment
An annual assessment is made, as set out in note 25, as to whether the current carrying value of
goodwill is impaired. Detailed calculations are performed based on discounting expected pre-tax cash
flows of the relevant cash generating units and discounting these at an appropriate discount rate, thedetermination of which requires the exercise of judgement.
Acquired intangible assets
Acquired intangible assets are those that derive their value from contractual customer relationships or
that can be separated and sold, and are amortised over their estimated useful lives. They comprise
customer relationships, core deposits, brands and acquired licences. The valuation and estimated
useful lives of customer relationships, core deposits and brands is dependent on a number ofassumptions and judgements, such as expected cash flows, customer attrition, royalty rates and
applicable costs, variations in which could produce different values and/or useful lives.
For example, if the royalty rates were increased by one per cent per annum (or decreased by one per
cent per annum) the value of the brand names acquired in the acquisitions in 2007 would increase by
approximately US$3 million (or decrease by US$3 million). Likewise, if the attrition rates wereincreased by four per cent per annum (or decreased by four per cent per annum) the value of the
customer relationships acquired in the acquisitions in 2007 would decrease by approximately US$10
million (or increase by approximately US$10 million).
Acquired licences are valued at their purchase price and amortised over the period of the licence.
Pensions
Actuarial assumptions are made in valuing future defined benefit pension obligations as set out in
note 36 and are updated periodically. The principal assumptions relate to the rate of inflation and the
discount rate. The assumed rate of inflation affects the rate at which salaries grow and therefore the
size of the pensions that employees receive on retirement. The discount rate is equal to the yield on
high-quality corporate bonds which have a term to maturity approximating that of the related
liability, and is potentially subject to significant variation. As a result, there is uncertainty that theseassumptions will continue in the future. For example, if the discount rate for the UK fund increased
by 25 basis points, the liability would reduce by approximately US$66 million, and vice versa. Whilst
changes in other assumptions would have an impact, the effect would not be as significant.
Taxes
Determining income tax provisions involves judgement on the tax treatment of certain transactions.
Deferred tax is recognised on tax losses not yet used and on temporary differences where it isprobable that there will be taxable revenue against which these can be offset. Management has made
judgements as to the probability of tax losses being available for offset at a later date.
Provisions for liabilities and charges
The Group receives legal claims against it in the normal course of business. Management has made
judgements as to the likelihood of any claim succeeding in making provisions. The time of concluding
legal claims is uncertain, as is the amount of possible outflow of economic benefits. Timing and costultimately depends on the due process in respective legal jurisdictions.
Share based payments
Equity-settled share awards are recognised as an expense based on their fair value at date of grant.
The fair value of equity-settled share options is estimated through the use of option valuation models
– which require inputs such as the risk-free interest rate, expected dividends, expected volatility andthe expected option life – and is expensed over the vesting period. Some of the inputs used, such as
the expected option life, are not market observable and are based on estimates derived from available
data, such as employee exercise behaviour. The models utilised, such as the binomial option pricing
model, are intended to value options traded in active markets. The share options issued by the
Group, however, have a number of features that make them incomparable to such traded options.
799
c102100pu180Proof7:28.3.10B/LRevision:0OperatorBeeR

Using different input estimates or models could produce different option values, which would result
in the recognition of a higher or lower expense. For example, if the volatility assumption was
increased by five per cent (or decreased by five per cent), the fair values for options granted under
the Sharesave schemes in 2007 would increase by approximately £0.28 for 3 year grants, and by £0.39for 5 year grants (or decrease by approximately £0.20 for 3 year grants, and by £0.32 for 5 year
grants).
55. Recently Issued Accounting Pronouncements
The following pronouncements relevant and applicable to the Group and Company were issued as at
31 December 2007 but have effective dates for periods beginning after 31 December 2007. The use ofIFRSs and certain IFRIC Interpretations that have yet to be endorsed by the European Union is not
permitted. Those IFRSs and IFRIC Interpretations listed below that have been endorsed by the
European Union, and whose use is therefore permitted, have not been applied in preparing these
financial statements.
The full impact of these IFRSs and IFRIC Interpretations is currently being assessed by the Group;none of these pronouncements are expected to result in any material adjustments to the financial
statements.
Pronouncement Description of impact
Latest effective date
for the Group and
Company
IFRIC 11 IFRS 2: Group and
Treasury Share Transactions
IFRIC 11 clarifies the treatment in the subsidiary’saccounts for share awards made by the parent to
the employees of a subsidiary.
1 January 2008
IFRS 8 Operating Segments IFRS 8 supersedes IAS 14 ‘Segment Reporting’
and requires the reporting of operating segments
on the same basis as is used internally for
evaluating performance.
1 January 2009**
IFRIC 13 Accounting for
CustomerLoyalty
Programmes*
IFRIC 13 clarifies that consideration received for
the sale of services for which customer loyalty
awards are awarded is allocated between the
service delivered and the award credit, based on
the fair value of the credit awarded.
1 January 2009**
IFRIC 14 IAS 19 – The Limit
on Defined Benefit Asset
Minimum Funding
Requirements and their
Interaction*
IFRIC 14 requires the recognition of defined
benefit assets to the extent that the Group has the
right to an unconditional refund during the life of
the plan, or assuming the gradual settlement of theplan’s liabilities or assuming full settlement of the
plan’s liabilities.
1 January 2008
IAS 23 Revised Borrowing
Costs*
IAS 23 has been revised to remove the option to
expense borrowing costs incurred in respect of the
construction and development of qualifying assets.
Such costs will now be capitalised as a part of the
cost of the asset.
1 January 2009**
IAS 1 Revised Presentation of
Financial Statements*
IAS 1 Revised provides the option to either
disclose all non-owner changes in equity in one
statement of Comprehensive Income or continue
to disclose two statements. The standard also
requires an additional balance sheet to bepresented at the beginning of the earliest
comparative period when a change in accounting
policy is applied retrospectively or a retrospective
restatement is made.
1 January 2009**
Amendment to IAS 27
Consolidated and Separate
Financial Statements*
This amendment changes the treatment for part
disposals, both when control is retained (which is
accounted for as an equity transaction, generating
1 January 2010
800
c102100pu180Proof7:28.3.10B/LRevision:0OperatorBeeR

Pronouncement Description of impact
Latest effective date
for the Group and
Company
no profit or loss in the income statement) and
when control is lost (where the residual holding is
measured at fair value with any changes reflected
in income).
IFRS 3 Revised Business
Combinations*
IFRS 3 Revised requires acquisition costs to be
expensed and not capitalised; an estimate of cash
contingent consideration to be made at the date ofacquisition, with any future changes recognised in
income; provides the option to recognise 100% of
the goodwill of an acquired entity in a partial
acquisition. The Standard can be applied early, on
a prospective basis, for annual periods beginning
on or after 30 June 2007.
1 January 2010
Amendment to IFRS 2
Share-based payment*
The amendments clarify the definition of vesting
conditions and the accounting treatment of
cancellations by employees, whereby such
cancellations will immediately result in therecognition of the amount of the expense that
would otherwise have been recognised over the
remainder of the vesting period.
1 January 2009**
Amendment to IAS 32
Financial Instruments:
Presentation*
This amendment is in respect of the balance sheet
classification of puttable financial instruments and
obligations arising only on liquidation. Some
financial instruments that currently meet the
definition of a financial liability may be classified
as equity if they represent the last residual interest
in the net assets of an entity.
1 January 2009**
* This IFRS or IFRIC Interpretation has not yet been endorsed by the European Union.
** The Group has not yet made a final decision as to whether it will apply in the 2008 financial statements those pronouncementsmarked (**) in the table above.
56. UK and Hong Kong Accounting Requirements
As required by the HK Listing Rules, an explanation of the differences in accounting practices
between EU endorsed IFRS and Hong Kong Financial Reporting Standards is summarised below.
There would be no significant differences had these accounts been prepared in accordance with Hong
Kong Financial Reporting Standards. As set out in note 55, EU endorsed IFRS may differ from
IFRSs published by the International Accounting Standards Board if a standard has not been
endorsed by the European Union.
801
c102100pu180Proof7:28.3.10B/LRevision:0OperatorBeeR

ELIGIBILITY TABLE
Eligibility requirements under the IDR Rules
Rule Content Standard Chartered Compliance
4 Without prejudice to the provisions of the
Securities and Exchange Board of India Act,1992, an issuing company shall not issue IDRs
unless it satisfies the following conditions,
namely:
a. its pre-issue paid-up capital and free reservesare at least US$50 million and it has a
minimum average market capitalisation
(during the last three years) in its parent
country of at least US$100 million;
The Company had pre-issue paid-up capitaland free reserves of US$ 6,879 million as on
31 December 2009.
The average market capitalisation* of the
Company on the London Stock Exchange
for the years 2009, 2008 and 2007 was
US$ 37,924 million, US$ 38,742 million and
US$ 44,764 million.
b. it has a continuous trading record or history
on a stock exchange in its parent country for
at least the three immediately preceding years;
The Company has a continuous trading
record on the London Stock Exchange for
the three immediately preceding years.
c. it has a track record of distributable profits in
terms of section 205 of the Indian Companies
Act, 1956, for at least three out of the
immediately preceding five years;
The Group had profit after tax of US$ 3,477
million, US$ 3,344 million, US$ 2,989 million,
US$ 2,354 million and US$ 1,971 million for
year ending 31 December 2009, 31 December2008, 31 December 2007, 31 December 2006
and 31 December 2005 respectively.
d. it fulfils such other eligibility criteria as may belaid down by the Securities and Exchange
Board of India (SEBI) from time to time in
this behalf.
The company has complied with all eligibilitycriteria as laid down by SEBI in the SEBI
Regulations.
* Average Market Capitalisation has been computed by dividing the sum of closing market capitalisation of the Company on the LSEfor each trading day during the year by number of trading days during the year
Eligibility requirements under Chapter X of the SEBI Regulations
Regulation Content Standard Chartered Compliance
97 An issuing company making an issue of IDRs
shal also satisfy the following:
(i) the issuing company is listed in its home
country;
Yes. It is listed in its home country, the UK as
well as on the Hong Kong Stock Exchange.
(ii) the issuing company is not prohibited from
issuing securities by any regulatory body; and
The Company has not been prohibited to
issue securities by any regulatory body.
(iii) the issuing company has a track record of
compliance with securities market regulations
in its home country.
The Company has a track record with respect
to compliance with securities market
regulations in its home country.
802
c102100pu230Proof7:28.3.10B/LRevision:0OperatorBeeR
DECLARATION
The Company certifies on behalf of the Company that, to the best of the knowledge and belief of the
Company, the Company has taken all reasonable care to ensure that,
(1) all relevant provisions of the Indian Companies Act, 1956, the Companies (Issue of Indian
Depository Receipts) Rules, 2004 and the regulations/guidelines issued by the Securities and
Exchange Board of lndia have been complied with and no statement made in this Draft Red
Herring Prospectus is contrary to the provisions of the Indian Companies Act, the IDR Rules,regulations or guidelines issued, as the case may be, and
(2) this Draft Red Herring Prospectus contains as of its date all material information andstatements and such information and statements are true, correct and adequate.
Signed by full time directors and Chief Financial Officer
P A Sands
Group Chief Executive
R H Meddings
Group Finance Director
J S Bindra
Group Executive Director
S P Bertamini
Group Executive Director
G R Bullock
Group Executive Director
A M G Rees
Group Executive Director
Place: [*]
Date: [*]
803
c102100pu230Proof7:28.3.10B/LRevision:0OperatorBeeR

imprima — C102100