Environmental correlates of population differentiation in Atlantic herring
13
2656 q 2005 The Society for the Study of Evolution. All rights reserved. Evolution, 59(12), 2005, pp. 2656–2668 ENVIRONMENTAL CORRELATES OF POPULATION DIFFERENTIATION IN ATLANTIC HERRING DORTE BEKKEVOLD, 1,2 CARL ANDRE ´ , 3 THOMAS G. DAHLGREN, 3,4 LOTTE A. W. CLAUSEN, 5 ELSE TORSTENSEN, 6 HENRIK MOSEGAARD, 5 GARY R. CARVALHO, 7 TINA B. CHRISTENSEN, 1 ERIKA NORLINDER, 3 AND DANIEL E. RUZZANTE 8 1 Danish Institute for Fisheries Research, Department for Inland Fisheries, 8600 Silkeborg, Denmark 3 Department of Marine Ecology, Go ¨teborg University, Tja ¨rno ¨ Marine Biological Laboratory, S-452 96 Stro ¨mstad, Sweden 5 Danish Institute for Fisheries Research, Department for Marine Fisheries, Charlottenlund, Denmark 6 Institute of Marine Research, Flødevigen, N-4817 His, Norway 7 School of Biological Sciences, University of Wales Bangor, Gwynedd LL57 2UW, United Kingdom 8 Department of Biology, Dalhousie University, Halifax, Nova Scotia B3H 4J1, Canada Abstract. The marine environment is characterized by few physical barriers, and pelagic fishes commonly show high migratory potential and low, albeit in some cases statistically significant, levels of genetic divergence in neutral genetic marker analyses. However, it is not clear whether low levels of differentiation reflect spatially separated populations experiencing gene flow or shallow population histories coupled with limited random genetic drift in large, demo- graphically isolated populations undergoing independent evolutionary processes. Using information for nine micro- satellite loci in a total of 1951 fish, we analyzed genetic differentiation among Atlantic herring from eleven spawning locations distributed along a longitudinal gradient from the North Sea to the Western Baltic. Overall genetic differ- entiation was low (u5 0.008) but statistically significant. The area is characterized by a dramatic shift in hydrography from the highly saline and temperature stable North Sea to the brackish Baltic Sea, where temperatures show high annual variation. We used two different methods, a novel computational geometric approach and partial Mantel correlation analysis coupled with detailed environmental information from spawning locations to show that patterns of reproductive isolation covaried with salinity differences among spawning locations, independent of their geograph- ical distance. We show that reproductive isolation can be maintained in marine fish populations exhibiting substantial mixing during larval and adult life stages. Analyses incorporating genetic, spatial, and environmental parameters indicated that isolating mechanisms are associated with the specific salinity conditions on spawning locations. Key words. Clupea harengus, hybrid-zone, isolation by distance, local adaptation, microsatellite DNA, migration, salinity. Received April 1, 2005. Accepted September 22, 2005. Although the long held view that abundant and widely distributed marine fish are unlikely to exhibit significant ge- netic structure at any but the largest of geographic scales has been shown to be largely inaccurate (e.g., Ruzzante et al. 1996; Nielsen et al. 2003; 2004; O’Reilly et al. 2004; Zardoya et al. 2004), the relative roles of migratory behavior and local differences in environmentally induced selective pressures in effecting such structure remain elusive. Structure has in some cases been explained by ‘‘isolation by distance’’ (Wright 1943), which may occur when the distribution of the species is larger than the dispersal range of individuals. Isolation by distance is evident in a number of pelagic fishes and crus- taceans (e.g., Palumbi 1994; Pogson et al. 2001; O’Reilly et al. 2004) but not in others (Borsa 2002; Hoarau et al. 2002; Knutsen et al. 2003; Stamatis et al. 2004). Oceanographic processes and the topography of the ocean floor have been linked to population structure in a number of species (e.g., Ruzzante et al. 1998; Norris 2000; Knutsen et al. 2004), yet few studies conducted to date have tested specifically for relationships between environmental parameters of adaptive significance and population structuring in marine migratory fish, and even fewer have examined evidence of local ad- aptation (Billerbeck et al. 2001; Yamahira and Conover 2002). To gauge the relative importance of various potential 2 Corresponding author. E-mail: [email protected] 4 Present address: Department of Zoology, Go ¨teborg University, 405 30 Go ¨teborg, Sweden. mechanisms for population structure in marine pelagic fishes it is useful to combine information about levels of gene flow obtained from neutral genetic markers with knowledge about migratory behavior and environmental factors that are likely to be of adaptive significance. Correlation methods have been developed to assess associations between genetic, geograph- ic, and environmental parameters (e.g., Smouse et al. 1986; Legendre and Legendre 1998; Yang 2004). Although such methods provide a means for assessing overall associations, they do not reveal if the strength of associations are uniform over the examined spatial range. An analytical approach based on computational geometry has therefore been devel- oped recently to address this shortcoming (Manni et al. 2004). Here, we apply such an approach to examine population struc- turing in Atlantic herring, Clupea harengus (L.), in relation to environmental heterogeneity across a small geographic, but ecologically diverse, sea area (North Sea to Western Bal- tic). Atlantic herring from the North Sea–Baltic Sea transition zone provide a model system for comparing patterns of mi- gration and gene flow and for testing hypotheses of environ- mentally induced barriers to gene flow in a highly migratory pelagic fish. The Atlantic herring is an iteroparous clupeoid maturing at two to three years. Herring are abundant through- out the North Sea and the Baltic, occurring in feeding and wintering shoals of mixed origin during the majority of the year (ICES 1991). Spawning takes place on rock, gravel, and/ or sandy substrates at 10–50 m, and individual population
Transcript of Environmental correlates of population differentiation in Atlantic herring

2656
q 2005 The Society for the Study of Evolution. All rights reserved.
Evolution, 59(12), 2005, pp. 2656–2668
ENVIRONMENTAL CORRELATES OF POPULATION DIFFERENTIATION INATLANTIC HERRING
DORTE BEKKEVOLD,1,2 CARL ANDRE,3 THOMAS G. DAHLGREN,3,4 LOTTE A. W. CLAUSEN,5 ELSE TORSTENSEN,6
HENRIK MOSEGAARD,5 GARY R. CARVALHO,7 TINA B. CHRISTENSEN,1 ERIKA NORLINDER,3 AND
DANIEL E. RUZZANTE8
1Danish Institute for Fisheries Research, Department for Inland Fisheries, 8600 Silkeborg, Denmark3Department of Marine Ecology, Goteborg University, Tjarno Marine Biological Laboratory, S-452 96 Stromstad, Sweden
5Danish Institute for Fisheries Research, Department for Marine Fisheries, Charlottenlund, Denmark6Institute of Marine Research, Flødevigen, N-4817 His, Norway
7School of Biological Sciences, University of Wales Bangor, Gwynedd LL57 2UW, United Kingdom8Department of Biology, Dalhousie University, Halifax, Nova Scotia B3H 4J1, Canada
Abstract. The marine environment is characterized by few physical barriers, and pelagic fishes commonly show highmigratory potential and low, albeit in some cases statistically significant, levels of genetic divergence in neutral geneticmarker analyses. However, it is not clear whether low levels of differentiation reflect spatially separated populationsexperiencing gene flow or shallow population histories coupled with limited random genetic drift in large, demo-graphically isolated populations undergoing independent evolutionary processes. Using information for nine micro-satellite loci in a total of 1951 fish, we analyzed genetic differentiation among Atlantic herring from eleven spawninglocations distributed along a longitudinal gradient from the North Sea to the Western Baltic. Overall genetic differ-entiation was low (u 5 0.008) but statistically significant. The area is characterized by a dramatic shift in hydrographyfrom the highly saline and temperature stable North Sea to the brackish Baltic Sea, where temperatures show highannual variation. We used two different methods, a novel computational geometric approach and partial Mantelcorrelation analysis coupled with detailed environmental information from spawning locations to show that patternsof reproductive isolation covaried with salinity differences among spawning locations, independent of their geograph-ical distance. We show that reproductive isolation can be maintained in marine fish populations exhibiting substantialmixing during larval and adult life stages. Analyses incorporating genetic, spatial, and environmental parametersindicated that isolating mechanisms are associated with the specific salinity conditions on spawning locations.
Key words. Clupea harengus, hybrid-zone, isolation by distance, local adaptation, microsatellite DNA, migration,salinity.
Received April 1, 2005. Accepted September 22, 2005.
Although the long held view that abundant and widelydistributed marine fish are unlikely to exhibit significant ge-netic structure at any but the largest of geographic scales hasbeen shown to be largely inaccurate (e.g., Ruzzante et al.1996; Nielsen et al. 2003; 2004; O’Reilly et al. 2004; Zardoyaet al. 2004), the relative roles of migratory behavior and localdifferences in environmentally induced selective pressures ineffecting such structure remain elusive. Structure has in somecases been explained by ‘‘isolation by distance’’ (Wright1943), which may occur when the distribution of the speciesis larger than the dispersal range of individuals. Isolation bydistance is evident in a number of pelagic fishes and crus-taceans (e.g., Palumbi 1994; Pogson et al. 2001; O’Reilly etal. 2004) but not in others (Borsa 2002; Hoarau et al. 2002;Knutsen et al. 2003; Stamatis et al. 2004). Oceanographicprocesses and the topography of the ocean floor have beenlinked to population structure in a number of species (e.g.,Ruzzante et al. 1998; Norris 2000; Knutsen et al. 2004), yetfew studies conducted to date have tested specifically forrelationships between environmental parameters of adaptivesignificance and population structuring in marine migratoryfish, and even fewer have examined evidence of local ad-aptation (Billerbeck et al. 2001; Yamahira and Conover2002). To gauge the relative importance of various potential
2 Corresponding author. E-mail: [email protected] Present address: Department of Zoology, Goteborg University,
405 30 Goteborg, Sweden.
mechanisms for population structure in marine pelagic fishesit is useful to combine information about levels of gene flowobtained from neutral genetic markers with knowledge aboutmigratory behavior and environmental factors that are likelyto be of adaptive significance. Correlation methods have beendeveloped to assess associations between genetic, geograph-ic, and environmental parameters (e.g., Smouse et al. 1986;Legendre and Legendre 1998; Yang 2004). Although suchmethods provide a means for assessing overall associations,they do not reveal if the strength of associations are uniformover the examined spatial range. An analytical approachbased on computational geometry has therefore been devel-oped recently to address this shortcoming (Manni et al. 2004).Here, we apply such an approach to examine population struc-turing in Atlantic herring, Clupea harengus (L.), in relationto environmental heterogeneity across a small geographic,but ecologically diverse, sea area (North Sea to Western Bal-tic).
Atlantic herring from the North Sea–Baltic Sea transitionzone provide a model system for comparing patterns of mi-gration and gene flow and for testing hypotheses of environ-mentally induced barriers to gene flow in a highly migratorypelagic fish. The Atlantic herring is an iteroparous clupeoidmaturing at two to three years. Herring are abundant through-out the North Sea and the Baltic, occurring in feeding andwintering shoals of mixed origin during the majority of theyear (ICES 1991). Spawning takes place on rock, gravel, and/or sandy substrates at 10–50 m, and individual population

2657ENVIRONMENTAL CORRELATES IN HERRING
components have traditionally been distinguished based ondifferences in spawning time.
The North Sea–Baltic Sea transition zone represents a ma-jor environmental gradient, as salinity changes from a fullmarine scale at 35‰ in the North Sea to close to zero in theinner parts of the Baltic Sea. Temperatures also differ sub-stantially, as the North Sea confers a more stable climate thanthe Baltic which has shallower waters and more locally in-fluenced temperature regimes with large annual variation.Both temperature and salinity regimes are expected to haveselective impact as low temperatures impede developmentand survival during early larval stages (Johnston et al. 2001)and low salinity decreases fertilization and larval develop-ment success in the closely related C. pallasi (Griffin et al.1998) and in other fishes from the North Sea–Baltic Seatransition area (Nissling and Westin 1997; Nissling et al.2002).
Herring larvae are pelagic and may drift several hundredkilometers over a few months (Johannesen and Moksness1991). Studies on tagging and morphometric character dif-ferences show that larvae spawned in autumn and winteralong the British North Sea coasts drift east across the NorthSea and into the Skagerrak, Kattegat, and inner Danish wa-ters, where they feed for one to three years before returningto spawning locations in the western North Sea (Iles andSinclair 1982). In the eastern North Sea, the Norwegian Sea,the Skagerrak, and the Baltic Sea spawning primarily takesplace in spring, but with smaller autumn and winter spawningpopulation components occurring locally (ICES 1991). Thedensest spawning aggregations in the area occur off the islandof Rugen in the western Baltic, where spawning extends fromMarch to May. Tagging studies have shown that Rugenspawners migrate to feeding areas in the Kattegat, Skagerrak,and the Eastern North Sea (Aro 1989). Both juvenile andadult spring spawning herring perform feeding migrationsinto the Skagerrak and Kattegat (Rosenberg and Palmen1982; Johannesen and Moksness 1991), and spring spawningadults of nonlocal origin are encountered in high densitiesin the eastern North Sea (ICES 1991). Spawning componentsalso occur throughout the Baltic Sea, but these and westernBaltic components show no evidence of mixing (Aro 1989).However, studies also suggest that herring migratory behav-ior can be aberrant. Migration routes are observed to covarywith changes in demography and thus appear to have somedegree of social transmission (Dragesund et al. 1997).
In spite of the extensive mixing of individuals, herringpopulation structure has been described largely from differ-ences in morphology, growth, migration, and spawning be-havior (Iles and Sinclair 1982). However, all of these traitsare influenced by the physical and/or social environment thatindividuals experience early in life, and thus differences maybe the result of phenotypic plasticity rather than of indepen-dent evolutionary trajectories. Molecular studies have pro-vided some evidence for genetic differentiation among dis-crete spawning components (Shaw et al. 1999; Hauser et al.2001; McPherson et al. 2001a; 2004; Jørstad et al. 2004; fora study employing protein markers, see also Ryman et al.1984). In most cases levels of differentiation are estimatedto be low and no study has reconciled patterns of differen-
tiation with hypotheses about gene flow or with differentselective pressures encountered locally.
The objective of this study was to use Atlantic herringsampled from spawning locations from the North Sea, theSkagerrak, and the western Baltic to (1) test the hypothesisthat population structure can be maintained in a highly mi-gratory marine fish with well described migratory patterns,and (2) to test the hypothesis that population structure cor-relates with environmental conditions at spawning locations.Based on highly polymorphic microsatellite DNA markerscombined with detailed information about salinity and tem-perature regimes, we used partial Mantel tests (Legendre andLegendre 1998) and a computational geometry approach byManni et al. (2004) to evaluate hypotheses about selectivelyinduced barriers to gene flow. We discuss the implicationsof our results for predictions of local adaptation in Atlanticherring and other highly migratory marine fishes.
MATERIALS AND METHODS
Sample Collection
Samples of herring (mostly) in spawning condition werecollected from a total of 10 spawning locations from theeastern North Sea to the Western Baltic over a period of twoyears (2002 and 2003) with six of the locations sampled inboth years (Table 1). One of these six locations (Rugen) wassampled repeatedly over three consecutive months in 2002(March, April, May) and two months in 2003 (April–May).This was done to account for the temporally and presumablyreproductively isolated ‘‘spawning waves,’’ which based onmorphological analyses are reported to occur at this location(Rechlin 2000). No spawning herring were found in 2003 atone of the locations sampled in 2002 (Karmoy). A samplepresumably representing the same Norwegian spring spawn-ing population component, was therefore taken in 2003 atthe more northerly location Møre (Fig. 1).
Individuals were aged on the basis of counts of otolith(sagitta) winter rings following the standard procedure de-tailed in ICES (2003). Aging was conducted by the Institutefor Marine Research in Bergen, Norway, for samples fromlocations 6–10, and by the Danish Institute for Fisheries Re-search in Charlottenlund, Denmark, for samples from loca-tions 1–5. Otolith central area microstructure was analyzedby the same laboratories to determine each individual’shatching season (spring, autumn, or winter) following a pro-cedure described in Moksness and Fossum (1991). The per-centage of ripe and running (spawning) herring was above90% for 13 of the 20 samples (Table 1). Two samples, onefrom the Limfjord (2003) and one from the Kolding Fjord(2002), contained only 1% and 8% running fish, respectively.Nonrunning fish constituted a mix of fish that were about tomature and fish that had spawned recently. A sample of her-ring from Trinity Ledge, Nova Scotia, in the northwest At-lantic was included as an out-group for comparison (for fur-ther details about this sample, see McPherson et al. 2004).
Molecular Analyses
DNA was isolated from fin or muscle tissue using a Chelextechnique (Walsh et al. 1991). For a small subset of the

2658 DORTE BEKKEVOLD ET AL.
TABLE 1. Clupea harengus samples. Locality numbers refer to Figure 1. The age distribution of each sample is shown by the numbersof individuals born in different years (19951 indicates fish born in 1995 and earlier). Also given are mean age and percentages ofspawning fish per sample. See McPherson et al. (2004) for further details on the outgroup sample from the northwest Atlantic.
Regional area LocalityLatitude/longitude
(decimal)Sample
dateSample
size
Age class
2000 1999 1998 1997 1996 19951Undeter-
minedAge
(years)
%ripe-and-running
Western Baltic Rugen (1) 54.23N/13.44E 22/03/02 100 — 2 16 24 37 21 — 5.69 10018/04/02 100 — 1 27 14 33 25 — 5.67 10006/05/02 100 — 1 39 9 23 28 — 4.55 10024/04/03 100 — — 14 46 14 26 — 5.72 10006/05/03 100 — 3 31 43 9 14 — 5.12 100
Kattegat andinner Danishwaters
Kolding Fjord (2) 55.49N/09.54E 12/04/02 100 — 32 36 24 2 5 1 4.10 8
05/04/03 70 — 19 26 20 3 2 — 4.10 97Lillebælt (3) 55.66N/09.90E 07/04/03 100 — 1 21 18 19 40 1 5.95 50Kattegat (4) 55.95N/11.61E 06/05/02 44 — 11 29 2 1 1 — 3.91 74
03/04/03 100 — — 46 12 1 3 38 4.40 62Limfjord (5) 57.06N/10.06E 22/05/03 100 37 36 13 9 3 2 — 3.11 1
Skagerrak Flatbrotten (6) 58.10N/11.33E 07/03/02 100 — 22 71 6 — — 1 3.84 10019/03/03 100 — 42 30 25 — 3 — 3.99 93
Maseskar (7) 58.34N/11.27E 19/03/02 100 — 24 67 5 1 — 3 3.82 9614/03/03 100 — 27 23 43 2 3 2 4.23 94
Tjome (8) 59.35N/10.55E 13/03/02 120 — 5 88 16 5 5 1 4.30 9804/03/03 120 — 2 13 62 20 9 14 5.22 100
North Sea Karmøy (9) 59.25N/05.17E 14/03/02 100 — — 3 3 6 80 8 7.96 100Møre (10) 62.78N/06.08E 17/02/03 78 — — — 10 5 60 3 8.31 32
NorthwestAtlantic
Nova Scotia (11) 44.01N/66.31W 27/08/96 75 — — — — — — — 4.95 87
samples, DNA isolation was carried out using a HotSHOTtechnique (Truet et al. 2000). Nine tetranucleotide microsat-ellite loci Cha1017, Cha1020, Cha1027, Cha1202 (McPher-son et al. 2001b), Cpa101, Cpa111, Cpa112, Cpa113 andCpa114 (Olsen et al. 2002) were PCR amplified using stan-dard reagents and annealing temperatures between 508 and608C (exact protocols are available on request). The loci hadbeen chosen based on low expectations for the presence ofnull alleles and linkage disequilibrium (McPherson et al.2001b; Olsen et al. 2002). An additional locus Cpa106 (Olsenet al. 2002) was initially screened but could not be scoredconsistently due to presence of nonspecific peaks and wastherefore omitted from the analysis. DNA fragments werevisualized and genotyped using a BaseStation 51 fragmentanalyzer (MJ Research, Skovlunde, Denmark) in conjunctionwith the software Cartographer, 1.2.6 (MJ Geneworks Inc.,Skovlunde, Denmark) (samples from locations 1–5), and aPharmacia ALF-express automated sequencer in conjunctionwith the Fragment analyzer software (Amersham PharmaciaBiotech, Hillerød, Denmark) (samples 6–11), according tothe recommendations of the manufacturers. Prior to theseanalyses, 10 individuals from each of four sampling locationswere cross-analyzed using both methods to determine scoringconsistency. No genotyping inconsistencies were observedfor any of the nine loci analyzed in these 40 fish. The 40cross-tested individuals were not included in the presentstudy, as none was a ripe-and-running spawner, an importantcondition to ensure correct sampling of individual spawningcomponents. For the present dataset, scoring consistency wascontinuously ascertained by double-analyzing subsets (ca.10%) of individuals for both visualization methods. In ad-dition, every gel included two standard individuals per locus.
These standard individuals were chosen among the 40 cross-tested individuals so that their alleles together spanned theobserved size ranges, which incidentally corresponded wellwith the size ranges observed in the full dataset.
Environmental Data
Ambient salinities and temperatures (average, maximum,and minimum) close to the sea floor (where spawning takesplace and eggs are deposited) were obtained for each of thespawning locations for the month and year of sampling andfor the two consecutive months. This was done to accountfor the time of spawning, the egg phase (7–14 days) and thelarval phase (about two months). To examine the temporalstability of the hydrographic features on spawning locations,we obtained monthly average values over the years 1997–2003. Relationships between environmental parameters wereexamined by a series of correlation analyses using untrans-formed data, when Shapiro-Wilks tests indicated no deviationfrom normality. Environmental data were supplied by theSwedish Meteorological and Hydrological Institute, Gote-borg, Sweden, by the Limfjordsovervagningen, Viborg, Den-mark, and by the Institute for Marine Research, Bergen, Nor-way.
Statistical Analyses
Departure from Hardy Weinberg proportions (HWE) weretested for each locus and sample using GENEPOP (Raymondand Rousset 1995). The same software was used to analyzefor departure from gametic phase equilibrium (linkage dis-equilibrium) between loci by means of ‘‘exact tests.’’ Pop-ulation differentiation was estimated per sample pair and

2659ENVIRONMENTAL CORRELATES IN HERRING
FIG. 1. Sampled Clupea harengus spawning locations (numbers refer to Table 1). Main migratory patterns are indicated by arrows (seetext).
overall using the unbiased estimator u (Weir and Cockerham1984) and statistical significance was examined using per-mutation tests implemented in FSTAT (Goudet 2001). Tem-poral, within-location samples not exhibiting significant dif-ferentiation (at a 5 0.05) in these tests were pooled in sub-sequent analyses. FSTAT was also used to estimate allelicrichness per locus and sample, using rarefaction, and to testfor differences among groups of samples, using permutationtests.
In age-structured populations with overlapping genera-tions, allele frequencies are predicted to differ among ageclasses due to drift, and genetic variance estimates based onvarying contributions from different age classes may there-fore be inflated (Jorde and Ryman 1995). To estimate po-tential age class effects on our results we applied hierarchicalanalysis of molecular variance (AMOVA, following Schnei-der et al. 2000) using allele frequency information from sub-sets of population samples, for which more than 20 multilocusgenotypes were available per age class (cohort).
ViSta 5.6.3 (Young 1996) was used to perform multidi-mensional scaling (MDS) analysis of pairwise u values, andto visualize genetic relationships among samples. We usedthe approach implemented in the software Barrier 2.2 (Manniet al. 2004) to identify shifts in genetic differentiation among
spawning groups. Briefly, the method uses computational ge-ometry and a Monmonier’s maximum-difference algorithmto identify barriers to gene flow. First, a geometric map isobtained from a matrix of geographic coordinates by Voronoıtessellation, which represents the polygonal neighborhood foreach sample (population) constructed so that the borders ofeach neighborhood are closer to the centroid (the samplecoordinate) than to any other sample. A triangulation method(Delauney) is applied to connect neighboring samples into anetwork of triangles, and a Monmonier’s algorithm is usedto first determine which of the borders between neighboringpopulations exhibits the highest genetic differentiation. Abarrier is then constructed by the algorithm continuously lo-cating the largest genetic distance along adjacent borders andextending the barrier in a stepwise manner until reaching theouter edge of the network or another barrier. The user spec-ifies the numbers of barriers drawn, with subsequent barriersdecreasing in order of importance. We computed barriers,first by using a multi-locus u matrix to represent geneticdifferentiation among samples, and second, by using u forthe nine loci separately to determine ‘‘consensus barriers.’’The latter analysis allows for an evaluation of the robustnessof barriers suggested based on the multilocus u, by reporting

2660 DORTE BEKKEVOLD ET AL.
TABLE 2. Clupea harengus pairwise FST-values estimated by u (below diagonal) and P-values (based on 1000 permutations) for pairwisesignificance (above diagonal). Significant FST-values following sequential Bonferroni correction (k 5 76 tests) are indicated by asterisks(a: ***P 5 0.001, **P 5 0.01, *P 5 0.05).
Rugen March 02Rugen Apr–May
02/03Kolding Fjord
02Kolding Fjord
03 Lillebælt 03 Kattegat 02/03
1. Rugen March 02 0.0061 ,0.0001 0.0062 ,0.0001 ,0.00011. Rugen April–May 02/03 0.0045 ,0.0001 ,0.0001 ,0.0001 ,0.00012. Kolding Fjord 02 0.0097*** 0.0056*** ,0.0001 ,0.0001 ,0.00012. Kolding Fjord 03 0.0041 0.0047** 0.0048*** 0.2085 ,0.00013. Lillebælt 03 0.0068*** 0.0025*** 0.0030* 0.0016 0.00154. Kattegat 02/03 0.0066*** 0.0029*** 0.0053*** 0.0033** 0.00545. Limfjord 03 0.0118*** 0.0032*** 0.0055*** 0.0064* 0.0005 0.0040***6. Flatbrotten 02/03 0.0151*** 0.0095*** 0.0088*** 0.0099*** 0.0075*** 0.0062***7. Maseskar 02/03 0.0147*** 0.0102*** 0.0078*** 0.0083*** 0.0069*** 0.0065***8. Tjome 02/03 0.0169*** 0.0108*** 0.0096*** 0.0099*** 0.0086*** 0.0065***9. Karmoy 02 0.0206*** 0.0175*** 0.0137*** 0.0164*** 0.0144*** 0.0123***
10. Møre 03 0.0270*** 0.0194*** 0.0181*** 0.0222*** 0.0182*** 0.0164***11. Outgroup: Nova Scotia 0.0230*** 0.0194*** 0.0169*** 0.0194*** 0.0161*** 0.0164***
the numbers of loci supporting the individual sections of thebarriers.
Relationships among genetic, geographic, and environ-mental differences among spawning components were ana-lyzed using partial Mantel tests (Legendre and Legendre1998) implemented in the software IBD 1.5 (Bohonak 2002).Matrices of genetic (using u/1 2 u), geographic (logarithmicshortest waterway distance, estimated using the GIS softwareArcMap 8.2 supplied by ESRI (http://www.esri.com), andestimates of differences among sampling localities in eachof eight environmental parameters were constructed for allpair wise population comparisons. Environmental parametersbased on estimates over the years 1997 to 2003 were: (1)average salinity in spawning month, (2) minimum salinityencountered at site, (3) maximum salinity encountered at site,(4) daily variance in salinity during spawning month, (5)average temperature in spawning month, (6) minimum tem-perature, (7) maximum temperature, and (8) variance in tem-perature during spawning month. All tests were based on10,000 randomizations and results were sequential Bonfer-roni corrected for multiple tests.
RESULTS
Otolith Analysis: Aging and Hatching Month
The age compositions of the sampled fish are given inTable 1. All fish in the analysis exhibited fidelity betweenthe season they were caught as spawners and the month theyhad hatched (i.e., spring), as determined from the analysis ofotolith structure.
Within Sample and Location Genetic Analysis
Nine microsatellite loci were analyzed in 1951 fish. Scor-ing success overall was high as 97% of all individuals weregenotyped at all nine loci (see Appendix available online athttp://dx.doi.org/10.1554/05-183.1.s1). Repeated analyses ofsubsets of individuals for each of the two sequencing methodsdemonstrated high genotyping consistency across methods,because across loci and samples 98.15% of the alleles werescored consistently. Following correction for 180 multipletests, three Hardy Weinberg proportions tests in three dif-
ferent loci indicated significant deviations (see Appendixavailable online). If a less conservative correction factor ofk 5 20 was applied, significance was indicated for a total ofeight deviations. Because the deviations were distributedacross loci and samples and since none was associated witha large Fis, we do not attribute them to null alleles. No sig-nificant effects of gametic phase disequilibrium were foundacross loci and samples. Of the seven within-location tem-poral comparisons, only the samples from Kolding Fjord ex-hibited significant differentiation (u estimated at 0.0048 [95%CI 5 0.0023–0.0080]). Within the Rugen location, only theMarch 2002 sample exhibited low but significant differen-tiation from any of the other Rugen samples (u ranging be-tween 0.003 and 0.008 in four pairwise comparisons). Thissample was therefore entered separately into subsequent anal-yses, whereas samples from April and May 2002 and 2003were pooled.
Spatial Population Differentiation
Estimates of pairwise population differentiation generatedfor pooled temporal samples ranged between 20.0002 and0.0270 (Table 2), and the overall u was estimated at 0.008(95% CI 5 0.004–0.013, P , 0.001). The Nova Scotia out-group sample was significantly differentiated from all sam-ples, except the two geographically closest North Sea samples(Table 2). An AMOVA incorporating data for 1997, 1998,and 1999 age classes nested within the Rugen, Kolding Fjord,and Tjome sampling locations did not indicate genetic dif-ferences among age classes within locations (20.21% vari-ance explained, P 5 0.998), whereas a highly significantproportion of the genetic variation was explained by differ-entiation among spawning locations (0.93% variance ex-plained, P , 0.001). Allelic richness varied among samplesfor all loci (Appendix 1) and (averaged over loci) decreasedfrom the North Sea and Skagerrak to the Baltic (North Sea[two samples] Rs 5 14.93; Skagerrak [three samples] Rs 515.31, Kattegat and inner Danish waters [five samples] Rs 513.98; Western Baltic Sea [two samples] Rs 5 13.44; P 50.002).
Samples grouped along the first dimension axis in the MDSanalysis in general correspondence with their longitudinal

2661ENVIRONMENTAL CORRELATES IN HERRING
TABLE 2. Extended.
Limfjord 03 Flatbrotten 02/03 Maseskar 02/03 Tjome 02/03 Karmoy 02 Møre 03 Nova Scotia
,0.0001 ,0.0001 ,0.0001 ,0.0001 ,0.0001 ,0.0001 ,0.0001,0.0001 ,0.0001 ,0.0001 ,0.0001 ,0.0001 ,0.0001 ,0.0001,0.0001 ,0.0001 ,0.0001 ,0.0001 ,0.0001 ,0.0001 ,0.0001,0.0001 ,0.0001 ,0.0001 ,0.0001 ,0.0001 ,0.0001 ,0.0001
0.3520 ,0.0001 ,0.0001 ,0.0001 ,0.0001 ,0.0001 ,0.0001,0.0001 ,0.0001 ,0.0001 ,0.0001 ,0.0001 ,0.0001 ,0.0001
,0.0001 ,0.0001 ,0.0001 ,0.0001 ,0.0001 ,0.00010.0073*** 0.0576 0.1306 0.1097 ,0.0001 ,0.00010.0083*** 0.0002 0.2180 0.0257 ,0.0001 ,0.00010.0090*** 0.0002 20.0002 ,0.0001 ,0.0001 ,0.00010.0158*** 0.0005 0.0015 0.0022*** 0.4866 0.02030.0170*** 0.0033*** 0.0046*** 0.0035*** 0.0000 0.00490.0173*** 0.0033*** 0.0033** 0.0036*** 0.0017 0.0037
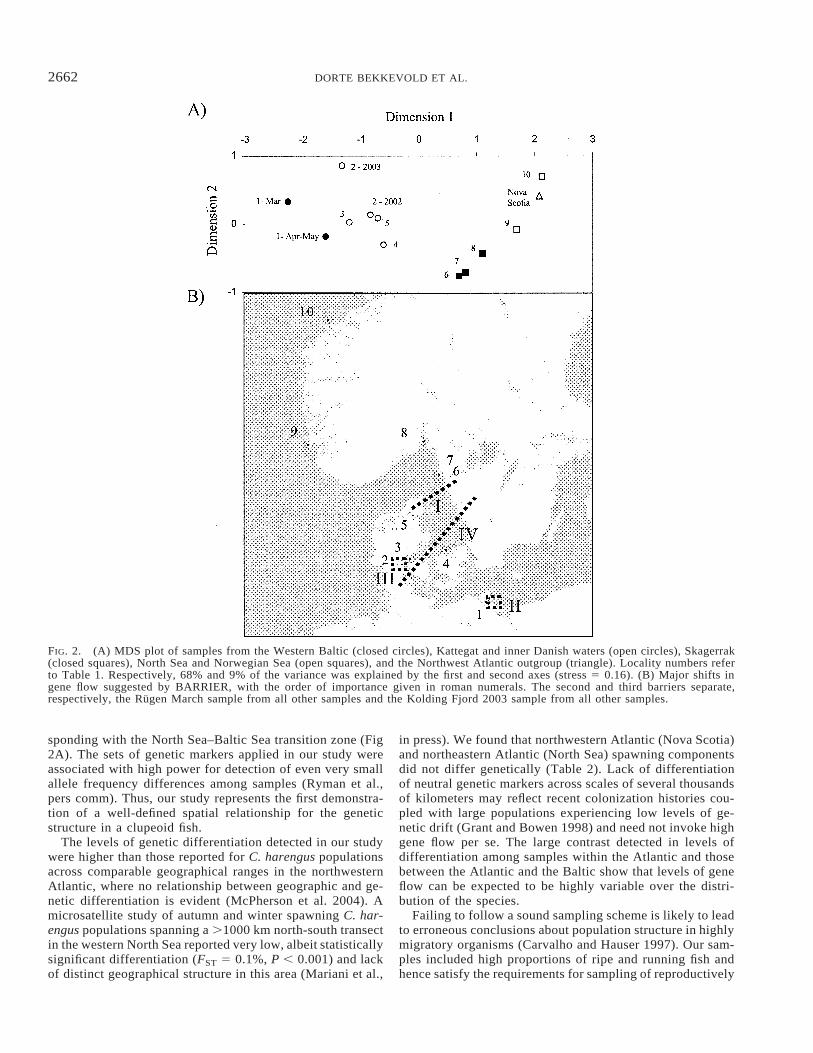
position from the North Sea to the Baltic, except for theNorthwest Atlantic ‘‘outgroup’’ sample which grouped be-tween North Sea samples (Fig. 2A). The first axis explained68% of the variation. The second axis, explaining 9% of thevariation, indicated separation between Skagerrak and NorthSea samples. Subsequent dimensions each explained less than8% of the variance and were not considered further. In theBARRIER analysis the first reproductive barrier, which wassupported by five to eight loci over different sections of thebarrier, separated North Sea and Skagerrak populations fromall other samples (Fig. 2B). The second barrier, supported byfive and six loci, separated the Rugen March sample fromall other samples. The third and fourth barriers, both sup-ported by four to five loci, separated respectively, the KoldingFjord 2003 sample from all other samples, and the Kattegatand Rugen samples from all other samples. Subsequent bar-riers were supported by only two to four loci and not con-sidered further.
Hydrographic Environment and IBD
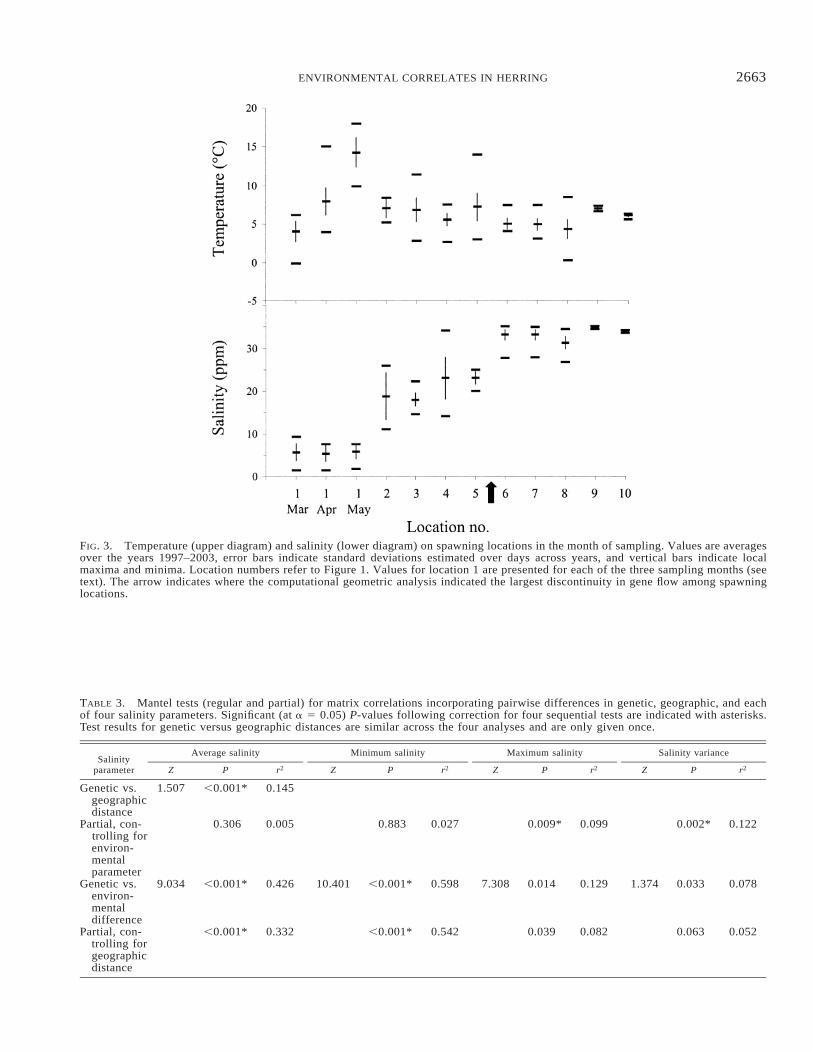
Across the ten sampling locations, strong positive corre-lations were found between average salinity in the first threemonths following spawning (all r . 0.94), indicating thathydrographic differences among locations remained constantduring the egg- and first-larval stages. Lesser but similartrends were found for temperature (all r . 0.56). Positivecorrelations were also observed for both salinity and tem-perature in the year and month of sampling compared toaverages over the years 1997-2003 (rsalinity . 0.97; rtemperature. 0.85), indicating that conditions in the years representedin our samples were similar to those encountered over a sixto seven year period and presumably longer. Figure 3 showstrends in salinities and temperatures in the month of samplingfor the ten locations. Differences among sampling locationsin average salinity, maximum and minimum salinity werecorrelated with each other (all r . 0.94). No other correlationswere detected between any of the other environmental pa-rameters examined.
Mantel tests indicated significant correlations between ge-netic differentiation and average and minimum salinity atspawning locations, which persisted when controlling (partial
Mantel test) for geographic distance, whereas the correlationbetween genetic and geographic distances was nonsignificantor marginally significant when the environmental compo-nents (monthly average, monthly maximum and monthlyminimum salinity ) were controlled for (Table 3). Tests in-cluding maximum salinity, salinity variance, or any of thetemperature parameters gave no evidence of covariance withgenetic differentiation (Tables 3, 4).
DISCUSSION
Differentiation among Spawning Locations
We identified temporally stable differentiation amongspawning locations along an environmental gradient despitethe fact that individuals migrate freely across it. Due to annualvariation in recruitment success our samples varied in agecomposition between the two sampling years (Table 1). Un-equal sampling of potentially differentiated age classes maylead to erroneous conclusions about spatial versus temporalallele frequency variance (Jorde and Ryman 1995), but theAMOVA indicated that no detectable variability was foundamong age classes sampled within locations. Estimates ofpopulation differentiation are commonly almost an order ofmagnitude lower in marine fishes compared to estimates infreshwater fishes and terrestrial organisms. Summarizing es-timates from a range of marine fishes Ward et al. (1994), forexample, reported a median FST of 2%. In comparison, theoverall FST estimated for our population samples was lessthan 1%, whereas between-individual sample estimates cameup to 2.7% (Table 2). Proper interpretation of such low levelsof differentiation requires consideration of the negative re-lationship between maximal attainable FST and level of poly-morphism of the genetic markers used (very high in the lociemployed here; c.f. Appendix 1)(Hedrick 1999). Regardless,it is pertinent to question the biological significance of lowFST values. One way of doing so is to examine whether ob-served patterns are temporally stable (Waples 1998). Wetherefore consider the fact that the observed patterns of ge-netic differentiation were stable across two years of samplingevidence for their biological significance. Moreover, the sam-ples showed a clear grouping along a west-east axis corre-
2662 DORTE BEKKEVOLD ET AL.
FIG. 2. (A) MDS plot of samples from the Western Baltic (closed circles), Kattegat and inner Danish waters (open circles), Skagerrak(closed squares), North Sea and Norwegian Sea (open squares), and the Northwest Atlantic outgroup (triangle). Locality numbers referto Table 1. Respectively, 68% and 9% of the variance was explained by the first and second axes (stress 5 0.16). (B) Major shifts ingene flow suggested by BARRIER, with the order of importance given in roman numerals. The second and third barriers separate,respectively, the Rugen March sample from all other samples and the Kolding Fjord 2003 sample from all other samples.
sponding with the North Sea–Baltic Sea transition zone (Fig2A). The sets of genetic markers applied in our study wereassociated with high power for detection of even very smallallele frequency differences among samples (Ryman et al.,pers comm). Thus, our study represents the first demonstra-tion of a well-defined spatial relationship for the geneticstructure in a clupeoid fish.
The levels of genetic differentiation detected in our studywere higher than those reported for C. harengus populationsacross comparable geographical ranges in the northwesternAtlantic, where no relationship between geographic and ge-netic differentiation is evident (McPherson et al. 2004). Amicrosatellite study of autumn and winter spawning C. har-engus populations spanning a .1000 km north-south transectin the western North Sea reported very low, albeit statisticallysignificant differentiation (FST 5 0.1%, P , 0.001) and lackof distinct geographical structure in this area (Mariani et al.,
in press). We found that northwestern Atlantic (Nova Scotia)and northeastern Atlantic (North Sea) spawning componentsdid not differ genetically (Table 2). Lack of differentiationof neutral genetic markers across scales of several thousandsof kilometers may reflect recent colonization histories cou-pled with large populations experiencing low levels of ge-netic drift (Grant and Bowen 1998) and need not invoke highgene flow per se. The large contrast detected in levels ofdifferentiation among samples within the Atlantic and thosebetween the Atlantic and the Baltic show that levels of geneflow can be expected to be highly variable over the distri-bution of the species.
Failing to follow a sound sampling scheme is likely to leadto erroneous conclusions about population structure in highlymigratory organisms (Carvalho and Hauser 1997). Our sam-ples included high proportions of ripe and running fish andhence satisfy the requirements for sampling of reproductively
2663ENVIRONMENTAL CORRELATES IN HERRING
FIG. 3. Temperature (upper diagram) and salinity (lower diagram) on spawning locations in the month of sampling. Values are averagesover the years 1997–2003, error bars indicate standard deviations estimated over days across years, and vertical bars indicate localmaxima and minima. Location numbers refer to Figure 1. Values for location 1 are presented for each of the three sampling months (seetext). The arrow indicates where the computational geometric analysis indicated the largest discontinuity in gene flow among spawninglocations.
TABLE 3. Mantel tests (regular and partial) for matrix correlations incorporating pairwise differences in genetic, geographic, and eachof four salinity parameters. Significant (at a 5 0.05) P-values following correction for four sequential tests are indicated with asterisks.Test results for genetic versus geographic distances are similar across the four analyses and are only given once.
Salinityparameter
Average salinity
Z P r2
Minimum salinity
Z P r2
Maximum salinity
Z P r2
Salinity variance
Z P r2
Genetic vs.geographicdistance
1.507 ,0.001* 0.145
Partial, con-trolling forenviron-mentalparameter
0.306 0.005 0.883 0.027 0.009* 0.099 0.002* 0.122
Genetic vs.environ-mentaldifference
9.034 ,0.001* 0.426 10.401 ,0.001* 0.598 7.308 0.014 0.129 1.374 0.033 0.078
Partial, con-trolling forgeographicdistance
,0.001* 0.332 ,0.001* 0.542 0.039 0.082 0.063 0.052

2664 DORTE BEKKEVOLD ET AL.
TABLE 4. Mantel tests (regular and partial) for matrix correlations incorporating pairwise differences in genetic, geographic, and eachof four temperature parameters. Significant (at a 5 0.05) P-values following correction for four sequential tests are indicated withasterisks. Results for genetic versus geographic distances are similar across tests and are only given once.
Temperatureparameter
Mean temperature
Z P r2
Minimum temperature
Z P r2
Maximum temperature
Z P r2
Temperature variance
Z P r2
Genetic vs. geo-graphic distance
1.507 ,0.001* 0.145
Partial, controllingfor environmentalparameter
,0.001* 0.156 0.002* 0.127 ,0.001* 0.149 ,0.001* 0.189
Genetic vs. environ-mental difference
1.138 0.156 0.043 1.477 0.082 0.042 1.862 0.239 0.012 1.613 0.954 0.068
Partial, controllingfor geographicdistance
0.126 0.056 0.148 0.021 0.203 0.016 0.989 0.116
coherent components. At the one locality where temporalallele frequency stability was rejected (Kolding Fjord 2002vs. 2003) the sample from 2002 contained only 8% ripe in-dividuals and may not have represented the local spawningcomponent adequately. This sample showed closest similaritywith samples collected at locations outside the fjord (Fig.2A), suggesting that a proportion of the sampled fish origi-nated from neighboring locations. The Limfjord sample alsocontained few ripe and running fish, but the single temporalsample prevented determination of whether fish were localor comprised of migrants originating elsewhere. The mainaccess to the Limfjord is via the eastern mouth of the fjord,and although Limfjord herring are assumed to perform feed-ing migrations into the Kattegat, the relative isolation of thefjord nonetheless suggests that individuals present around thetime of spawning would be of local origin.
We found some indication for reproductive isolation be-tween short-term temporally differentiated ‘‘spawningwaves’’ at the Rugen location. The early (March) sample wassignificantly differentiated from later samples (Table 2), butour samples did not allow tests of annual stability. Within-year samples showed slightly differing age class distributionsbecause older fish tended to spawn earlier than younger fish(Table 1), and tests for differentiation among short-term tem-poral samples using subsets of individuals belonging to thesame age class revealed no evidence for structure (results notshown). Although we could not determine the biological sig-nificance of the short-term genetic differentiation at this lo-cation, our results emphasize the importance of samplingscheme (i.e., equal cohort representation and assuring thatsamples represent spawning individuals) in analyses of tem-poral stability. Failure to recognize local substructure would,for example, be critical to attempts at generating estimatesof effective population size and could lead to severe under-estimation of this evolutionarily important parameter.
Environmental Correlates of Population Structure
Applying Mantel tests we demonstrated a signal of iso-lation by distance, but also that both minimum and averagesalinity exhibited high correlations with genetic differenti-ation. The latter trends persisted when effects of geographicdistance were controlled for using partial Mantel analysis,whereas conversely the trend for isolation by distance dis-
appeared when these environmental parameters were heldconstant (Table 3). Caution should be taken when relation-ships between geographic, population genetic, and environ-mental parameters are examined by means of partial Manteltests (Raufaste and Rousset 2001). Multicollinearity betweenindependent variables, in our case geographic distance andenvironmental parameters, is likely to lower power throughinflated type-I errors in tests of the partial correlation betweenthe environmental parameter and the dependent variable, inthis case genetic differentiation (Castellano and Balletto2002). Nonetheless, the highly significant correlation be-tween salinity and genetic differentiation when controllingfor geographic distance showed that salinity parameters and/or associated factors were correlated with gene flow amongspawning locations, and suggested that salinity differencesrather than distance per se affected levels of reproductiveisolation among spawning components. In the North Sea–Baltic Sea transition zone salinity, or factors correlated withsalinity, may act as cues for homing to spawning grounds.Factors associated with salinity parameters and the timing ofjuvenile and adult migratory behavior may also act to producea strong signal of reproductive isolation being associated withsalinity. We stress that the analysis does not demonstratelocal adaptation to a specific salinity regime (see below) butthat our approach offers a means of comparing genetic andvarious environmental parameters to evaluate the relativemagnitudes of their covariances.
Our analyses allowed us to compare environmental pat-terns with the BARRIER computational geometric approach.The BARRIER analysis indicated that the largest change ingene flow (i.e., the largest reproductive isolation) occurredbetween spawning locations in the Skagerrak and Kattegat(Fig. 2B). Although the statistical significance of this resultcould not be determined directly, the consensus analysisshowed that the barrier was supported by multiple indepen-dent loci. The delimitation between these areas correspondswith a major transition in salinity parameters and a generaltrend for a more stable environment northwest of the barrier,as opposed to more variable local conditions southeast of thesuggested barrier (Fig. 3). The second to fourth identifiedbarriers were supported by fewer loci and only partially cor-responded with environmental changes. The low salinity inthe Baltic relative to the inner Danish waters was, for ex-

2665ENVIRONMENTAL CORRELATES IN HERRING
ample, only partly associated with a signal of reproductiveisolation (compare Fig. 2B with Fig. 3).
The computational geometric approach BARRIER enablesvisualization of hierarchical patterns of differentiation, ir-respective of actual magnitudes of differentiation. Interpre-tation of the biological significance of barriers should there-fore be treated with caution and ideally be combined withother types of evidence for isolating mechanisms, such asbehavioral and environmental factors. A caveat when apply-ing the approach to populations following an isolation-by-distance model occurs when the sampled locations are notequally spaced geographically (Manni et al. 2004). Here, thealgorithm will return a signal of a reproductive barrier be-tween the geographically, and hence genetically most distantneighboring populations. In such cases, it is not possible todetermine whether the constructed barrier reflects a true bar-rier to gene flow or merely that information for intermediatepopulations was not included in the analysis. We identifiedthe largest increase in levels of reproductive isolation in re-gions that were relatively well represented by samples, in-dicating that the identified barrier is unlikely to reflect meresample coverage. Moreover, the area in which the highestlevel of population differentiation was observed encompassedan ecologically meaningful gradient that is likely to impactgrowth and recruitment.
The largest reproductive barrier was estimated betweengroups of samples scored using different genotype visuali-zation techniques and inconsistent scoring between approach-es could potentially have affected this analysis. Our qualitycontrol measures and the high resulting consistency betweentechniques, together with the combined evidence from thespatially explicit distribution of samples shown in Figure 2Aand the fact that the barrier was supported by multiple in-dividual loci strongly suggest that the result is unlikely tohave been caused by technical artifacts.
The barriers to gene flow detected between spawning com-ponents could presumably result from distinct hydrographiccirculation systems that retain larvae and/or adults withinlocal areas, as has been suggested for herring (Iles and Sin-clair 1982) and other species including cod, Gadus morhua(Ruzzante et al. 1998); sea bass, Dicentrarchus labrax (Bahri-Sfar et al. 2000); and marine invertebrates with pelagic larvae(Wares et al. 2001). However, in the herring populationsstudied here, juveniles and adults are not retained within natalareas. The North Sea hydrographic circulation transports au-tumn hatched larvae from the east coast of the United King-dom to juvenile nursery areas in the Skagerrak and the Kat-tegat (Rosenberg and Palmen 1982, Fig. 1), and tagging stud-ies on spring spawning western Baltic herring from the Rugenarea indicate feeding migrations to the same areas (Aro 1989).The proportions of the two major groups in the area of mixinghave previously been based on analyses of differences ingrowth and maturity combined with metrics like vertebraenumbers (ICES 1991). Otolith microstructure analysis hasbeen used to identify the hatching season of mixed individ-uals and has indicated the existence of several subcomponentsamong spring spawners feeding in the Skagerrak-Kattegatarea (Mosegaard and Madsen 1996; Mosegaard et al. 2001),and a genetic study corroborates this (Bekkevold et al., un-publ. ms.). These observations hence refute that the popu-
lation structure reported here is caused solely by physicalisolation between population components, and instead invokea role for active homing and possibly locally differentiatedselection pressures.
The Potential for Local Adaptation in Herring
A number of studies have sought to use divergence inecologically relevant habitat factors as a surrogate of diver-gent selection to examine associations with gene flow (e.g.,Smith et al. 1997; Reusch et al. 2001; Ogden and Thorpe2002). We identified correlations between population differ-entiation and environmental (salinity) parameters associatedwith the spawning, egg, and early larval phase that were ofgreater magnitude than correlations between geographicaland genetic differentiation (Table 3). Whereas such obser-vations do not demonstrate that genetic differentiation ismaintained by selection, salinity parameters are expected toexert strong selective pressures in marine organisms. Fertil-ization and larval developmental success are, for example,reduced at both low and high salinity levels in Pacific herring,C. pallasi, and this species’ optimal salinity range was foundto be higher than that of Baltic herring (Griffin et al. 1998).Baltic herring spawn in coastal low salinity habitats wherelarval retention is high due to limited large-scale hydrograph-ical activity (Lehmann et al. 2002) and therefore developinglarvae have high probability of experiencing a predictableenvironment. Across the North Sea–Baltic Sea transition zonespatially variable but locally predictable environmental con-ditions suggest that herring from different spawning locationsexperience stabilizing selection for different salinity toler-ance optima. Locally differentiated selective pressures wouldconsequently lead to selection against dispersal betweenspawning locations of differing salinity conditions, and mayprovide an adaptive explanation for the homing behavior re-ported in herring tagging studies (reviewed by McQuinn1997). Based on estimates of dispersal between spawninglocations, levels of gene flow have previously been consid-ered to be substantial and to preclude local adaptation inherring (McQuinn 1997). However, gene flow constrains, butneed not preclude, adaptive evolution (e.g., King and Lawson1995; Calsbeek and Smith 2003; Saint-Laurent et al. 2003;Hendry et al. 2004). Moreover, rates of dispersal betweenpopulations cannot be directly translated into realized geneflow, because the reproductive success of dispersers and theiroffspring is influenced by local selective pressures. The rel-ative fitness returns associated with dispersing versus phil-opatric behavior are at present unknown in herring, as inmost other marine fishes. The present study suggests thatsalinity conditions on spawning locations affect the fitnessassociated with different dispersal behaviors. Common gar-den experiments, such as applied by Billerbeck et al. (2001),could be used to evaluate such effects.
Evidence for a Multispecies North Sea–Baltic SeaHybrid Zone?
Clines in neutral genetic markers are often associated withecotone shifts and hybrid zone boundaries (Barton and Hewitt1985). Our study complements genetic studies in other fishesfrom the North Sea–Baltic Sea transition zone. Two recent

2666 DORTE BEKKEVOLD ET AL.
studies identified genetic clines in the western Baltic in At-lantic cod (Nielsen et al. 2003) and turbot, Scopthalamusmaximus (Nielsen et al. 2004). In both species, relatively lowdifferentiation was indicated among samples within both theNorth Sea and the Baltic Sea, and the authors suggested thatgenetic patterns reflect the presence of a hybrid (interaction)zone between ‘‘pure’’ Baltic and North Sea populations. Wesampled single spawning components from the Baltic and theNorth Sea only, and thus were not able to evaluate levels ofdifferentiation within each of these areas. However, two re-cent microsatellite studies reported, respectively, populationstructure in Baltic Sea herring (Jørgensen et al. 2005), andlimited structure in North Sea autumn and winter spawningcomponents (Mariani et al. in press). Presence of a hybridzone can be evaluated by examination of linkage disequilibriathrough the suspected zone of interaction (e.g., Barton 2000).However, the relatively low levels of differentiation detectedin most marine fishes including herring using neutral geneticmarkers requires analysis of large numbers of loci to obtainsufficient statistical power for demonstrating linkage, andwas not attempted here. We evaluated spatial differences ingenetic variability by estimating allelic richness and foundthat variability decreased from the North Sea to the Baltic.A similar trend was reported in Nielsen et al.’s studies ofcod and turbot and in the aquatic plant Zostera marina fromthe same area (Olsen et al. 2004). Such patterns correspondwith founder events following colonization from the NorthSea via the Skagerrak when the Baltic Sea was created fol-lowing glacial retreat about nine thousand years ago. Basedon our data it is not possible to determine whether the ob-served population structure reflects the existence of a hybridzone where selection acts against hybrids (endogenous se-lection), or of multiple reproductively isolated spawningcomponents, each exhibiting maximal fitness in native en-vironments (exogenous selection). Whether the former or lat-ter scenario yields better explanatory power has implicationsto predictions about population fitness curves through thearea, and about the temporal stability of the genetic cline(Dasmahapatra et al. 2002). However, such congruity in thegeographic positioning of the largest reproductive barrier inherring and the distribution of cline centers reported for bothcod and turbot (Nielsen et al. 2003; 2004) (to within a fewhundred kilometers) further suggests that spatial genetic var-iance in these three species is related to selective differencesalong a common ecological gradient, rather than a mere resultof secondary contact between allopatrically differentiatedNorth Sea and Baltic population components, as has beensuggested for Macoma balthica for example (Luttikhuizen etal. 2003).
Conclusions
We have shown that genetic structure can be maintainedin marine fish populations exhibiting substantial mixing dur-ing larval and adult life stages. Analyses incorporating ge-netic, spatial, and environmental parameters indicated thatisolating mechanisms are associated with the specific salinityconditions on spawning locations. Our results do not implya role for linkage between microsatellite DNA loci and traitsunder selection, but that populations experiencing dissimilar
salinity conditions on spawning locations follow differentevolutionary trajectories. This shows that the North Sea–Bal-tic Sea transition zone offers an insightful opportunity forstudying local adaptation in ‘‘classical’’ marine fishes withcontinuous distributions, such as herring, cod, and turbot.Little is yet known about selective patterns in species in-habiting the open sea, although it is evident that geographicseparation and dispersal potential are poor predictors of thespatial scale of the potential for local adaptation in marinesystems. Our approach of combining results from partialMantel tests with the computational geometric approach of-fers a promising means of evaluating relationships betweenbarriers to gene flow and environmental variance across ma-rine fishes and ecosystems, as it can be applied both withinand across species.
ACKNOWLEDGMENTS
The authors are grateful to N. Ryman, L. Laikre, S. Mar-iani, B. Hutchinson, E. Hatfield, R. Stet, and J. Simmondsfor inspiring discussions and comments, to B. Jonsson forassistance in the laboratory, and to the Swedish Meteorolog-ical and Hydrological Institute for providing oceanographicdata. This work is part of the research project HERGEN(http://www.hull.ac.uk/hergen/) funded by the EuropeanUnion within the 5th framework program. C. Andre acknowl-edges support from the Swedish Research Council, FOR-MAS.
LITERATURE CITED
Aro, E. 1989. A review of fish migration patterns in the Baltic.Rapp. P.-v. Reun. Cons. Int. Explor. Mer. 190:72–96.
Bahri-Sfar, L., C. Lemaire, O. K. Ben Hassine, and F. Bonhomme.2000. Fragmentation of sea bass populations in the western andeastern Mediterranean as revealed by microsatellite polymor-phism. Proc. R. Soc. Lond. Biol. Ser. B 267:929–935.
Barton, N. H. 2002. Estimating multilocus linkage disequilibria.Heredity 84:373–389.
Barton, N. H., and G. M. Hewitt. 1985. Analysis of hybrid zones.Annu. Rev. Ecol. Syst. 16:113–148.
Billerbeck, J. M., T. E. Lankford, and D. O. Conover. 2001. Evo-lution of intrinsic growth and energy acquisition rates. I. Trade-offs with swimming performance in Menidia menidia. Evolution55:1863–1872.
Bohonak, A. J. 2002. IBD (Isolation By Distance): a program foranalyses of isolation by distance. J. Hered. 93:153–154.
Borsa, P. 2002. Allozyme, mitochondrial-DNA, and morphometricvariability indicate cryptic species of anchovy (Engraulis en-crasicolus). Biol. J. Linn. Soc. 75:261–269.
Calsbeek, R., and T. B. Smith. 2003. Ocean currents mediate evo-lution in island lizards. Nature 426:552–555.
Carvalho, G. R., and L. Hauser. 1997. Advances in the the molecularanalysis of fish population structure. Ital. J. Zool. 65(Suppl.):21–33.
Castellano, S., and E. Balletto. 2002. Is the partial Mantel testinadequate? Evolution 56:1871–1873.
Dasmahapatra, K. K., M. J. Blum, A. Aiello, S. Hackwell, N. Da-vies, E. P. Bermingham, and J. Mallet. 2002. Inferences from arapidly moving hybrid zone. Evolution 56:741–753.
Dragesund, O., A. Johannessen, and O. Ulltang. 1997. Variation inmigration and abundance of Norwegian spring spawning herring(Clupea harengus L.). Sarsia 82:97–105.
Goudet, J. 2001. FSTAT, a program to estimate and test gene diversitiesand fixation indices (ver. 2.9.3.2). Available from http://www.unil.ch/izea/software/fstat.html.
Grant, W. S., and B. W. Bowen. 1998. Shallow population histories

2667ENVIRONMENTAL CORRELATES IN HERRING
in deep evolutionary lineages of marine fishes: Insights fromsardines and anchovies and lessons for conservation. J. Hered.89:415–426.
Griffin, F. J., M. C. Pillai, C. A. Vines, J. Kaaria, T. Hibbard-Robbins, R. Yanagimachi, and G. N. Cherr. 1998. Effects ofsalinity on sperm motility, fertilization, and development in thePacific herring, Clupea pallasi. Biol. Bull. 194:25–35.
Hauser, L., C. Turan, and G. R. Carvalho. 2001. Haplotype fre-quency distribution and discriminatory power of two mtDNAfragments in a marine pelagic teleost (Atlantic herring, Clupeaharengus). Heredity 87:621–630.
Hedrick, P. W. 1999. Perspective: highly variable loci and theirintepretation in evolution and conservation. Evolution 53:313–318.
Hendry, A. P., E. B. Taylor. 2004. How much of the variation inadaptive divergence can be explained by gene flow? An eval-uation using lake-stream stickleback pairs. Evolution 58:2319–2331.
Hoarau, G., A. D. Rijnsdorp, H. W. Van der Veer, W. T. Stam, andJ. T. Olsen. 2002. Population structure of plaice (Pleuronectesplatessa L.) in northern Europe: microsatellites revealed large-scale spatial and temporal homogeneity. Mol. Ecol. 11:1165–1176.
ICES. 1991. Report of the Herring Assessment Working Group forthe Area South of 628N. International Council for the Explorationof the Seas, CM 1991/Assess: 15.
———. 2003. Report of Herring Assessment Working Group forthe Area South of 628N. International Council for the Explorationof the Seas, CM 2003/ACFM: 17.
Iles, T. D., and M. Sinclair. 1982. Atlantic herring: stock discrete-ness and abundance. Science 215:627–633.
Johannessen, A., and E. Moksness. 1991. Herring larvae (Clupeaharengus) in the Skagerrak area from December 1987 to April1988. Fish. Res. 11:155–170.
Johnston, I. A., V. L. A. Vieira, and G. K. Temple. 2001. Functionalconsequences and population differences in the developmentalplasticity of muscle to temperature in Atlantic herring Clupeaharengus. Mar. Ecol. Prog. Ser. 213:285–300.
Jorde, P. E., and N. Ryman. 1995. Temporal allele frequency changeand estimation of effective size in populations with overlappinggenerations. Genetics 139:1077–1090.
Jørgensen, H. B. H., M. M. Hansen, D. Bekkevold, D. E. Ruzzante,and V. Loeschcke. 2005. Marine landscapes and populationstructure of herring (Clupea harengus L.) in the Baltic Sea. Mol.Ecol. 14:3219–3234.
Jørstad, K. E. 2004. Evidence for two highly differentiated herringgroups at Goose Bank in the Barents Sea and the genetic rela-tionship to Pacific herring, Clupea pallasi. Environ. Biol. Fishes69:211–221.
King, R. B., and R. Lawson. 1995. Color-pattern variation in LakeErie water snakes: the role of gene flow. Evolution 49:885–896.
Knutsen, H., P. E. Jorde, C. Andre, and N. C. Stenseth. 2003. Fine-scaled geographical population structuring in a highly mobilemarine species: the Atlantic cod. Mol. Ecol. 12:385–394.
Knutsen, H., C. Andre, P. E. Jorde, M. Skogen, E. Thuroczy, andN. C. Stenseth. 2004. Influx of North Sea cod larvae into theSkagerrak coast. Proc. R. Soc. Lond. Ser. B 271:1337–1344.
Legendre, P., and L. Legendre. 1998. Numerical ecology: devel-opments in environmental modelling, no. 20. Elsevier, Amster-dam.
Lehmann, A., W. Krauss, and H. H. Hinrichsen. 2002. Effects ofremote and local atmospheric forcing on circulation and up-welling in the Baltic Sea. Tellus Dyn. Meteorol. Oceanogr. 54A:299–316.
Luttikhuizen, P. C., J. Drent, and A. J. Baker. 2003. Disjunct dis-tribution of highly diverged mitochondrial lineage clade andpopulation subdivision in a marine bivalve with pelagic larvaldispersal. Mol. Ecol. 12:2215–2229.
Manni, F., E. Guerard, and E. Heyer. 2004. Geographic patterns of(genetic, morphologic, linguistic) variation: how barriers can bedetected by ‘‘Monmonier’s algorithm’’. Hum. Biol. 76:173–190.
Mariani, S., W. F. Hutchinson, E. M. C. Hatfield, D. E. Ruzzante,E. J. Simmond, T. G. Dahlgren, C. Andre, J. Brigham, E. Tor-
stensen, and G. R. Carvalho. North Sea herring population struc-ture as revealed by microsatellite analysis. Mar. Ecol. Prog. Ser.In press.
McQuinn, I. H. 1997. Metapopulations and the Atlantic herring.Rev. Fish Biol. Fish. 7:297–329.
McPherson, A. A., R. L. Stephenson, P. T. O’Reilly, M. W. Jones,and C. T. Taggart. 2001a. Genetic diversity of coastal NorthwestAtlantic herring populations: implications for management. J.Fish Biol. 59(Suppl. A):356–370.
McPherson, A. A., P. T. O’Reilly, T. L. McParland, M. W. Jones,and P. Bentzen. 2001b. Isolation of nine novel tetranucleotidemicrosatellites in Atlantic herring (Clupea harengus). Mol Ecol.Notes 1:31–32.
McPherson, A. A., P. T. O’Reilly, and C. T. Taggart. 2004. Geneticdifferentiation, temporal stability, and the absence of isolationby distance among Atlantic herring populations. Trans. Am.Fish. Soc. 133:434–446.
Moksness, E., and P. Fossum. 1991. Distinguishing spring- andautumn spawned herring larvae (Clupea herengus L.) by otolithmicrostructure. ICES J. Mar. Sci. 48:61–66.
Mosegaard, H., and K. P. Madsen. 1996. Discrimination of mixedherring stocks in the North Sea using vertebral counts and otolithmicrostructure. ICES C.M. 1996/H:17.
Mosegaard, H., L. A. Worsøe, J. Modin, J. Groeger, T. Grohsler,M. Storr-Paulsen, and M. A. St. John. 2001. EU study report insupport of the DG:XIV: a new sampling regime for resourceassessment of herring in the Skagerrak, Kattegat, and SW Baltic:final report. 98/026. 2001. DIFRES, EU Study Report, Charlot-tenlund, Denmark.
Nielsen, E. E., M. M. Hansen, D. E. Ruzzante, D. Meldrup, and P.Grønkjær. 2003. Evidence of a hybrid-zone in Atlantic cod (Ga-dus morhua) in the Baltic and the Danish Belt Sea, revealed byindividual admixture analysis. Mol. Ecol. 12:1497–1508.
Nielsen, E. E., P. H. Nielsen, D. Meldrup, and M. M. Hansen. 2004.Genetic population structure of turbot (Scophthalmus maximusL.) supports the presence of multiple hybrid zones for marinefishes in the transition zone between the Baltic Sea and the NorthSea. Mol. Ecol. 13:585–595.
Nissling, A., and L. Westin. 1997. Salinity requirements for suc-cessful spawning of Baltic and Belt Sea cod and the potentialfor cod stock interactions in the Baltic Sea. Mar. Ecol Prog. Ser.152:261–271.
Nissling, A., L. Westin, and O. Hjerne. 2002. Reproductive successin relation to salinity for three flatfish species, dab (Limandalimanda), plaice (Pleuronectes platessa), and flounder (Pleuro-nectes flesus), in the brackish water Baltic Sea. ICES J. Mar.Sci. 59:93–108.
Norris, R. D. 2000. Pelagic species diversity, biogeography, andevolution. Paleobiology 26(Suppl. S):236–258.
Ogden, R, and R. S. Thorpe. 2002. Molecular evidence for eco-logical speciation in tropical habitats. Proc. Natl. Acad. Sci. USA99:13612–13615.
Olsen, J. B., C. J. Lewis, E. J. Kretschmer, S. L. Wilson, and J. E.Seeb. 2002. Characterization of 14 tetranucleotide microsatelliteloci derived from Pacific herring. Mol. Ecol. Notes 2:101–103.
Olsen, J. L., W. T. Stam, J. A. Coyer, T. B. H. Reusch, M. Bil-lingham, C. Bostrom, and 12 additional author. 2004. NorthAtlantic phylogeography and large-scale population differenti-ation of the seagrass Zostera marina L. Mol. Ecol. 13:1923–1941.
O’Reilly, P. T., M. F. Canino, K. M. Bailey, P. Bentzen. 2004.Inverse relationship between FST and microsatellite polymor-phism in the marine fish, walleye pollock (Theragra chalco-gramma): implications for resolving weak population structure.Mol. Ecol. 13:1799–1814.
Palumbi, S. R. 1994. Genetic divergence, reproductive isolation,and marine speciation. Ann.
Pogson, G. H., C. T. Taggart, K. A. Mesa, and R. G. Boutilier.2001. Isolation by distance in the Atlantic cod, Gadus morhua,at large and small geographic scales. Evolution 55:131–146.
Raufaste, N., and F. Rousset. 2001. Are partial mantel tests ade-quate? Evolution 55:1703–1705.
Raymond, M., and F. Rousset. 1995. GENEPOP (ver. 1.2): popu-

2668 DORTE BEKKEVOLD ET AL.
lation genetics software for exact tests and ecumenicism. J. Her-ed. 86:248–249.
Rechlin, O. K. W. 2000. Differences in length growth of westernBaltic Sea spring spawning herring. Arch. Fish. Mar. Res. 48:153–160.
Reusch, T. B. H., K. M. Wegner, and M. Kalbe. 2001. Rapid geneticdivergence in postglacial populations of threespine stickleback(Gasterosteus aculeatus): the role of habitat type, drainage andgeographical proximity. Mol. Ecol. 10:2435–2445.
Rosenberg, R., and L.-E. Palmen. 1982. Composition of herringstocks in the Skagerrak-Kattegat and the relations of these stockswith those of the North Sea and adjacent waters. Fish. Res. 1:83–104.
Ruzzante, D. E., C. T. Taggart, D. Cook, and S. Goddard. 1996.Genetic differentiation between inshore and offshore Atlanticcod (Gadus morhua) off Newfoundland: Microsatellite DNA var-iation and antifreeze level. Can. J. Fish. Aquat. Sci. 53:634–645.
Ruzzante, D. E., C. T. Taggart, and D. Cook. 1998. A nuclear DNAbasis for shelf- and bank-scale population structure in northwestAtlantic cod (Gadus morhua): Labrador to Georges Bank. Mol.Ecol. 7:1663–1680.
Ryman, N., U. Lagercrantz, L. Andersson, R. Chakraborty, and R.Rosenberg. 1984. Lack of correspondence between genetic andmorphologic variability patterns in Atlantic herring (Clupea har-engus). Heredity 53:687–704.
Saint-Laurent, R., M. Legault, and L. Bernatchez. 2003. Divergentselection maintains adaptive differentiation despite high geneflow between sympatric rainbow smelt ecotypes (Osmerus mor-dax Mitchill). Mol. Ecol. 12:315–330.
Schneider, S., J.-M. Kueffer, D. Roessli, and L. Excoffier. 2000.Arlequin Ver. 2000. A software for population genetics dataanalysis. Genetics and Biometry Laboratory, University of Ge-neva, Switzerland.
Shaw, P. W., C. Turan, J. M. Wright, M. O’Connell, and G. R.Carvalho. 1999. Microsatellite DNA analysis of populationstructure in Atlantic herring (Clupea harengus), with direct com-parison to allozyme and mtDNA RFLP analyses. Heredity 83:490–499.
Smith, T. B., R. K. Wayne, D. J. Girman, and M. W. Bruford. 1997.
A role for ecotones in generating rainforest biodiversity. Science276:1855–1857.
Smouse, P. E., J. C. Long, and R. R. Sokal. 1986. Multiple re-gression and correlation extensions of the Mantel test of matrixcorrespondence. Syst. Zool. 35:627–632.
Stamatis, C., A. Triantafyllidis, K. A. Moutou, and Z. Mamuris.2004. Mitochondrial DNA variation in northeast atlantic andmediterranean populations of norway lobster, Nephrops norv-egicus. Mol. Ecol. 13:1377–1390.
Truett, G. E., P. Heeger, A. A. Mynatt, J. A. Truett, J. A. Walker,and M. L. Warman. 2000. Preparation of PCR-quality mousegenomic DNA with Hot Sodium Hydroxide and Tris (HotSHOT).Biotechniques 29:52–54.
Walsh, P. S., D. A. Metzger, and R. Higuchi. 1991. Chelex 100 asa medium for simple extraction of DNA for PCR based typingfrom forensic material. Biotechniques 10:506–513.
Waples, R. S. 1998. Separating the wheat from the chaff: patternsof genetic differentiation in high geneflow species. J. Hered. 89:438–450.
Wares, J. P., S. D. Gaines, and C. W. Cunningham. 2001. A com-parative study of asymmetric migration events across a marinebiogeographic boundary. Evolution 55:295–306.
Weir, B. S., and C. C. Cockerham. 1984. Estimating F-statistics forthe analysis of population structure. Evolution 38:1358–1370.
Wright, S. E. 1943. Isolation by distance. Genetics 28:114–138.Yamahira, K., and D. O. Conover. 2002. Intra- vs. interspecific
latitudinal variation in growth: adaptation to temperature or sea-sonality? Ecology 83:1252–1262.
Yang, R.-C. 2004. A likelihood-based approach to estimating andtesting for isolation by distance. Evolution 58:1829–1845.
Young, F. W. 1996. ViSta: the visual statistics system. ResearchMemorandum 94-1(b) 2d. ed. L. L. Thursone Psychometric Lab-oratory, University of North Carolina. Chapel Hill, NC.
Zardoya, R., R. Castilho, C. Grande, L. Favre-Krey, S. Caetano, S.Marcato, G. Krey, and T. Patarnello. 2004. Differential popu-lation structuring of two closely related fish species, the mack-erel (Scomber scombrus) and the chub mackerel (Scomber ja-ponicus), in the Mediterranean Sea. Mol. Ecol. 13:1785–1798.
Corresponding Editor: D. Ayre