
From egg to juvenile in the Bay of Biscay: spatial patterns of anchovy ( Engraulis encrasicolus )...
17
From egg to juvenile in the Bay of Biscay: spatial patterns of anchovy (Engraulis encrasicolus) recruitment in a non-upwelling region XABIER IRIGOIEN,* UNAI COTANO, GUILLERMO BOYRA, MARIA SANTOS, PAULA ALVAREZ, PANTXIKA OTHEGUY, EGOITZ ETXEBESTE, ANDRES URIARTE, LUIS FERRER AND LEIRE IBAIBARRIAGA AZTI – Tecnalia, Herrera Kaia z/g, 20110 Pasaia, Spain ABSTRACT In this study the spatial distribution of eggs, larvae and juveniles of European anchovy (Engraulis encrasicolus) was followed in 2004 and 2005 during three consec- utive cruises each year in spring–summer to test what the limits of retention are in a non-upwelling area. Eggs, small larvae and large juveniles were mainly distributed over the shelf, whereas large larvae and small juveniles were found mainly off the shelf. Although overall distributions were similar, the 2 yr differed in that there was more of a coastal distribution of individuals in 2004, whereas in 2005 more indi- viduals were found off the shelf. There were no sig- nificant differences in the length–weight relationships for individuals found on and off the shelf or between years. The correspondence in circulation patterns and the lack of difference in the length–weight relation- ships suggest that a single population is present, larvae drifting off the shelf due to currents and returning as mobile juveniles. Quantile regression analysis of the long-term recruitment index suggests that transport off the shelf may favour good recruitments. This would suggest that in non-upwelling regions the retention area resulting in good recruitment may not be restricted to the shelf. Key words: anchovy, eddy, egg, juveniles, larva Engraulis encrasicolus, recruitment INTRODUCTION The study of the spatial patterns of fish recruitment presents a challenge to marine science. Recruitment (fish added to the exploitable stock, in the fishing area, each year) is routinely estimated for each population but the mechanisms determining recruitment vari- ability are poorly understood and are generally limited to general concepts such as food concentration or relations with environmental factors without an understanding of the underlying mechanisms (Leggett and Deblois, 1994). In addition to the uncertainty concerning these mechanisms, the spatial distribution of mortality rates is also frequently unknown. A major challenge relates to the nature of the developmental stages, which differ in size, motility and aggregation, from planktonic larvae to actively swimming juveniles in schools. These changes require different sampling strategies and methods. Recruitment studies often focus on the relation between the environment and recruitment time series (e.g. Borja et al., 1998). However, there has always been an ambition to follow recruitment from egg to adult (Cushing, 1985) although the effort required most often surpasses the resources available. Understanding spatial patterns of recruitment is important as these patterns offer dif- ferent combinations of food concentration and pre- dation risk that can be exploited by the fish populations in different ways. These include spawning in areas with high food concentration and retention (Bakun, 1996), spawning in areas with low food con- centration and low predation (Bakun and Broad, 2003; Barbieri et al., 2005) or spawning in areas with high food concentration and drifting towards areas with lower predation intensity (Irigoien et al., 2007). Recent research has suggested that anchovies in the Bay of Biscay may recruit, at least partially, off the shelf (Uriarte et al., 2001; Irigoien et al., 2007). If this were the case, it would make an essential difference to anchovy populations in eastern boundary upwelling regions (Humboldt, Benguela, California, Canaries current). However, it is not clear to what extent the individuals recruited off the shelf are a major or minor component of the total population. Transport off the *Correspondence. e-mail: [email protected] Received 31 May 2008 Revised version accepted 17 September 2008 FISHERIES OCEANOGRAPHY Fish. Oceanogr. 17:6, 446–462, 2008 446 doi:10.1111/j.1365-2419.2008.00492.x ȑ 2008 The Authors.
-
Upload
independent -
Category
Documents
-
view
2 -
download
0
Transcript of From egg to juvenile in the Bay of Biscay: spatial patterns of anchovy ( Engraulis encrasicolus )...

From egg to juvenile in the Bay of Biscay: spatial patternsof anchovy (Engraulis encrasicolus) recruitment in anon-upwelling region
XABIER IRIGOIEN,* UNAI COTANO,GUILLERMO BOYRA, MARIA SANTOS,PAULA ALVAREZ, PANTXIKA OTHEGUY,EGOITZ ETXEBESTE, ANDRES URIARTE,LUIS FERRER AND LEIRE IBAIBARRIAGA
AZTI – Tecnalia, Herrera Kaia z/g, 20110 Pasaia, Spain
ABSTRACT
In this study the spatial distribution of eggs, larvae andjuveniles of European anchovy (Engraulis encrasicolus)was followed in 2004 and 2005 during three consec-utive cruises each year in spring–summer to test whatthe limits of retention are in a non-upwelling area.Eggs, small larvae and large juveniles were mainlydistributed over the shelf, whereas large larvae andsmall juveniles were found mainly off the shelf.Although overall distributions were similar, the 2 yrdiffered in that there was more of a coastal distributionof individuals in 2004, whereas in 2005 more indi-viduals were found off the shelf. There were no sig-nificant differences in the length–weight relationshipsfor individuals found on and off the shelf or betweenyears. The correspondence in circulation patterns andthe lack of difference in the length–weight relation-ships suggest that a single population is present, larvaedrifting off the shelf due to currents and returning asmobile juveniles. Quantile regression analysis of thelong-term recruitment index suggests that transport offthe shelf may favour good recruitments. This wouldsuggest that in non-upwelling regions the retentionarea resulting in good recruitment may not berestricted to the shelf.
Key words: anchovy, eddy, egg, juveniles, larvaEngraulis encrasicolus, recruitment
INTRODUCTION
The study of the spatial patterns of fish recruitmentpresents a challenge to marine science. Recruitment(fish added to the exploitable stock, in the fishing area,each year) is routinely estimated for each populationbut the mechanisms determining recruitment vari-ability are poorly understood and are generally limitedto general concepts such as food concentration orrelations with environmental factors without anunderstanding of the underlying mechanisms (Leggettand Deblois, 1994). In addition to the uncertaintyconcerning these mechanisms, the spatial distributionof mortality rates is also frequently unknown. A majorchallenge relates to the nature of the developmentalstages, which differ in size, motility and aggregation,from planktonic larvae to actively swimming juvenilesin schools. These changes require different samplingstrategies and methods. Recruitment studies oftenfocus on the relation between the environment andrecruitment time series (e.g. Borja et al., 1998).However, there has always been an ambition to followrecruitment from egg to adult (Cushing, 1985)although the effort required most often surpasses theresources available. Understanding spatial patterns ofrecruitment is important as these patterns offer dif-ferent combinations of food concentration and pre-dation risk that can be exploited by the fishpopulations in different ways. These include spawningin areas with high food concentration and retention(Bakun, 1996), spawning in areas with low food con-centration and low predation (Bakun and Broad, 2003;Barbieri et al., 2005) or spawning in areas with highfood concentration and drifting towards areas withlower predation intensity (Irigoien et al., 2007).
Recent research has suggested that anchovies in theBay of Biscay may recruit, at least partially, off theshelf (Uriarte et al., 2001; Irigoien et al., 2007). If thiswere the case, it would make an essential difference toanchovy populations in eastern boundary upwellingregions (Humboldt, Benguela, California, Canariescurrent). However, it is not clear to what extent theindividuals recruited off the shelf are a major or minorcomponent of the total population. Transport off the
*Correspondence. e-mail: [email protected]
Received 31 May 2008
Revised version accepted 17 September 2008
FISHERIES OCEANOGRAPHY Fish. Oceanogr. 17:6, 446–462, 2008
446 doi:10.1111/j.1365-2419.2008.00492.x � 2008 The Authors.

shelf also needs to be evaluated – although transport toa limited distance off the shelf may have beneficialconsequences for the recruits (Irigoien et al., 2007),long-range transport would imply dispersal of the lar-vae and juveniles far from the spawning area. Fur-thermore, modelling exercises have suggested that thewaters off the shelf do not fulfil the conditions forlarvae survival (Allain et al., 2007a, b), which wouldimply that there are no differences with easternboundary upwelling regions.
After several continuous recruitment failures since2001, with the greatest failure occurring in 2004(ICES, 2007), the stock of anchovy in the Bay ofBiscay decreased until it collapsed in 2005 with theconsequent closure of the fishery (Fig. 1). Followingthe already popular fisheries research paradox (Kur-lansky, 2006), the resources allocated to anchovy re-search have increased inversely to the stock decrease.If not completely fulfilling the objective of followingrecruitment from egg to adult (Cushing, 1985), this
increase in resources has permitted successive cruisesin the same year, allowing for a better understandingof the different distributions of the growth phases.
The objective of this study is to provide informa-tion on the distribution of spawning, larvae andjuveniles of anchovy in the Bay of Biscay to provide abetter understanding of the mechanisms underlyinganchovy recruitment in a non-upwelling region. Spe-cifically, we want to investigate whether shelf andretention area should be equated in terms of optimumarea for recruitment.
MATERIALS AND METHODS
Surveys
Six surveys were carried out in 2004 and 2005: eggsurveys in 2–22 May 2004 and 8–28 May 2005; larvaesurveys in 21–29 June 2004 and 4–13 August 2005;and juvenile surveys in 20 September to 8 October2004 and 12 September to 7 October 2005 (Fig. 2).
Figure 1. Spawning biomass and agecomposition of the anchovy populationin the Bay of Biscay from 1987 to 2006.Data from ICES (2007). The arrowsindicate the study period.
Figure 2. Daily sea-surface temperaturemeasurements at the Aquarium of SanSebastian during 2004 and 2005 (datasource Sociedad Oceanografica de Gip-uzkoa; dee Hughes and Holliday, 2007for further information). The horizontalgrey bars indicate the six cruise periods.
Spatial patterns of anchovy recruitment in non-upwelling region 447
� 2008 The Authors, Fish. Oceanogr., 17:6, 446–462.

The sampling period covers the anchovy growthfrom egg (spawning from April to August, peaking inMay) to juvenile (August–October) (Irigoien et al.,2007).
Egg distribution surveys
The egg surveys were carried out on board R ⁄ V Viz-conde de Eza. The area covered was the southeast ofthe Bay of Biscay (Fig. 3a,b), from 43�20¢ to 46�50¢Nand from 1�15¢ to 4�36¢W, which corresponds to themain spawning area of anchovy. Stations were locatedevery 3 nautical miles (nm) along transects 15 nmapart, perpendicular to the coast. A vertical planktonhaul was made at each sampling station, using aPairoVET net with 150-lm mesh (2-CalVET nets,Smith et al., 1985). The net was lowered to a maxi-mum depth of 100 m, or 5 m above the bottom inshallower stations. After allowing 10 s of stabilisationat the maximum depth, the net was lifted back to thesurface at a speed of 1 m s)1. There were 411 Pairo-VET hauls in 2004 and 419 in 2005. Samples werepreserved in 4% formaldehyde buffered with sodiumtetraborate. After 6 h fixation, all egg samples wereanalysed on board. This involved sorting, identifica-tion and counting of the anchovy eggs. Oceanographicdata for the water column were collected at eachsampling station using a CTD profiler.
Larvae distribution surveys
Sampling was carried out from the R ⁄ V Investigadorin the south-eastern part of the Bay of Biscay (limitedto 4�40¢W and 45�30¢N) over a grid of stations dis-tributed in coastal perpendicular transects. Transectswere 15 nm apart and the stations were situated at9-nm intervals (Fig. 3c,d). Ichthyoplankton sampleswere collected with oblique tows to a maximum depthof 70 m, or to 5 m above the bottom in shallowerwaters, using a Bongo net with 40-cm mouth diameterand 335-lm mesh size net (2004 and 2005) and a MIK(Methot Isaac Kidd) with 1-m mouth diameter and1-mm mesh size net (2005). Previously calibratedflowmeters were fitted to the nets to measure the filteredvolume. Single oblique plankton tows were deployed at2–2.5 knots (kn, 1 knot � 0.5 m s)1) vessel speed andretrieving speed was 20 m min)1. The samples werepreserved in buffered 80% ethanol and 4% formal-dehyde until further analyses were carried out.
All anchovy eggs and larvae were sorted out,identified and counted, and abundances were stan-dardised to number of larvae per m2. Anchovy larvaewere measured to the nearest 0.1-mm standard length(N = 2839) and weighed. The standard length (LS)was corrected for shrinkage using Theilacker’s func-tion (Theilacker, 1980). Oceanographic data aboutthe water column were collected at each samplingstation using a CTD profiler.
Juvenile surveys
The juvenile surveys took place on board the charteredpurse seiners Gure Aita Jose (in charge of the acousticsampling with scientific echosounders) and Mater Bi.The latter provided additional fishing hauls. The sam-pling area covered the waters of the Bay of Biscay (thelimits being 6�W and 47�30¢N, Fig. 3e,f). Sampling wasstarted from the southern part of the sampling area, theCantabrian Sea, moving gradually to the north to coverthe waters in front of the French coast. The acousticsampling was performed during the daytime, when thejuveniles are believed to aggregate in schools (Uriarte,2002; FAIR CT 97-3374) and can be distinguished fromplankton structures. The transects, spaced 15 nm apart,were perpendicular to the coast along the sampling area(Fig. 3e,f). Standard transects went 6–10 miles off theshelf. Transects were prolonged as long as fish weredetected and then stopped when more than 6 mileswere covered without any fish school detection.
The acoustic equipment was a split beam echosounder Simrad EY60 (Kongsberg Simrad AS, Kongs-berg, Norway) calibrated using standard procedures(Foote et al., 1987). The water column was sampled todepths of 200 m. A threshold of )80 dB was appliedfor data collection. Acoustic back-scattered energy bysurface unit (sA, MacLennan et al., 2002) was recordedfor each geo-referenced ESDU (EchointegrationSampling Distance Unit) of 0.1 nm (185.2 m). Fishidentity and population size structure were obtainedfrom fishing hauls and echotrace characteristics.Juveniles were captured using a purse seine of about400 m perimeter and 75 m height (10-mm mesh size)to fish the samples to depths of 50 m. Acoustic dataprocessing was performed by layer echo-integration by0.1 nm (sA) of the first 65 m of the water column andthresholded to )60 dB. Data were analysed usingMOVIES + software (IFREMER, Brest, France) after
Figure 3. Sampling stations for the six cruises. Egg surveys: (a) 2–22 May 2004 and (b) 8–28 May 2005, the crosses indicatePairoVET and CTD stations. Larvae surveys: (c) 21–29 June 2004 and (d) 4–13 August 2005, the crosses indicate CTD, Bongoand MIK stations. Juvenile surveys: (e) 20 September to 8 October 2004 and (f) 12 September to 7 October 2005, the crossesindicate CTD stations, the lines acoustic transects and the circles purse seine hauls.
448 X. Irigoien et al.
� 2008 The Authors, Fish. Oceanogr., 17:6, 446–462.

(a) (b)
(c) (d)
(e) (f)
Spatial patterns of anchovy recruitment in non-upwelling region 449
� 2008 The Authors, Fish. Oceanogr., 17:6, 446–462.
noise filtering and bottom correction, increasing ordecreasing this range when the vertical distribution ofjuveniles made it necessary. The hauls were groupedby strata of homogeneous species and size composition.Inside each of these homogeneous strata, the echo-integrated acoustic energy sA was assigned to speciesaccording to the composition of the hauls. Afterwards,the energy corresponding to each species-size wasconverted to biomass and numbers using their corre-sponding conversion factors.
Oceanographic data were collected from the watercolumn at 60 stations using a CTD profiler (Fig. 3e,f).Wind speed and direction and Ekman transport datafor the area were obtained from NOAA (http://las.pfeg.noaa.gov). Current fields were estimated using thehydrodynamic model Regional Ocean Modeling Sys-tem (ROMS, Song and Haidvogel, 1994; Shchepetkinand McWilliams, 2005). The domain used for themodel, in its configuration for the Bay of Biscay,extended from 41�00¢ to 48�00¢N latitude and from13�30¢ to 0�30¢W longitude, with a mean horizontalresolution of 6.6 km (see Ferrer et al., 2007 andGonzalez et al., 2008 for examples of application andvalidation in the Bay of Biscay). Vertically, the watercolumn was divided into 32 sigma coordinate levels;these were concentrated at the surface, where most ofthe variability occurs and to retain a good resolution ofsea-surface processes. The topography of the modelwas obtained by interpolation, following optimisationanalysis, of the ETOPO2 (2-min digital ElevationTopographic model), GEBCO (General BathymetricChart of the Oceans) and IBCM (InternationalBathymetric Chart of the Mediterranean). This ap-proach was adopted to obtain a realistic bathymetry,which was smoothed to ensure stable and accuratesimulations (Haidvogel et al., 2000). The surfaceforcing inputs used in the model were the daily NCEPreanalysis data (NOAA ⁄ OAR ⁄ ESRL PSD, Boulder,CO, USA) for the years 2004 and 2005. The variablesused from this meteorological database were: wind andair temperature at 10 m and 2 m height above sealevel; precipitation rate; relative humidity; and long-and short-wave radiation fluxes. The conditions usedon the western, northern and southern open bound-aries were a combination of outward advection andradiation, together with flow-adaptive nudgingtowards prescribed external conditions (Marchesielloet al., 2001). These external conditions were esti-mated using climatological data (Levitus and Boyer,1994; Levitus et al., 1994); for the initialisation of themodel we used results from the year 2003 simulation.For the tidal forcing, data from the OSUTOPEX ⁄ POSEIDON GLOBAL INVERSE SOLUTION version
5.0 (TPXO.5) have been used (Egbert et al., 1994).The tides are provided as complex amplitudes ofearth–relative sea-surface elevation and tidal currents,for eight primary harmonic constituents (M2, S2, N2,K2, K1, O1, P1, and Q1).
The upwelling index was calculated using ICOADSdata (http://icoads.noaa.gov, reanalysis data 2� · 2�grid) following Borja et al. (1998).
Analysis of historical recruitment data in relation toeast-west transport
The quantile regression approach proposed by Planqueand Buffaz (2008) was used to analyse the relationbetween recruitment and east–west transport.Recruitment for the anchovy population in the Bay ofBiscay has only been measured since 1986, whichlimits its use for recruitment–environment analysis.However, a longer recruitment index time series basedon captures per boat and cohort is available (Borjaet al., 1998). The recruitment index was calculated bysumming up, for each year class, all of the individualscaught per boat (number of fish per cohort per boat,using Spanish purse seiner fleet data) since 1967(Uriarte, 1993). The recruitment index and measuredrecruitment show a good correlation for the years withoverlap (1983–2003 Recruitment index = 116.7,recruitment +298.8, r2 = 0.67, N = 18, P < 0.05),which indicates that the recruitment index used byBorja et al. (1998) is a good proxy for real recruitment.As the fishery was closed in 2004, the recruitmentindex cannot be calculated for the years 2004–2005and the index value has been extrapolated from themeasured recruitment using the previous equation.East–west Ekman transport data for the area wereobtained from NOAA (http://las.pfeg.noaa.gov). Wehave used monthly average data at 2�W, averaging thetransports between 44.5 and 45.5�N, which corre-spond to the main spawning area (Motos et al., 1996).We used the average transport from May to July cor-responding to the peak spawning (Motos et al., 1996).According to the convention used, eastward transportis indicated by positive values and westwestwardtransport by negative values.
The analysis was carried out in R (http://www.r-project.org) using the quantreg library (Koen-ker, 2007).
RESULTS
Wind, transport regime and upwelling
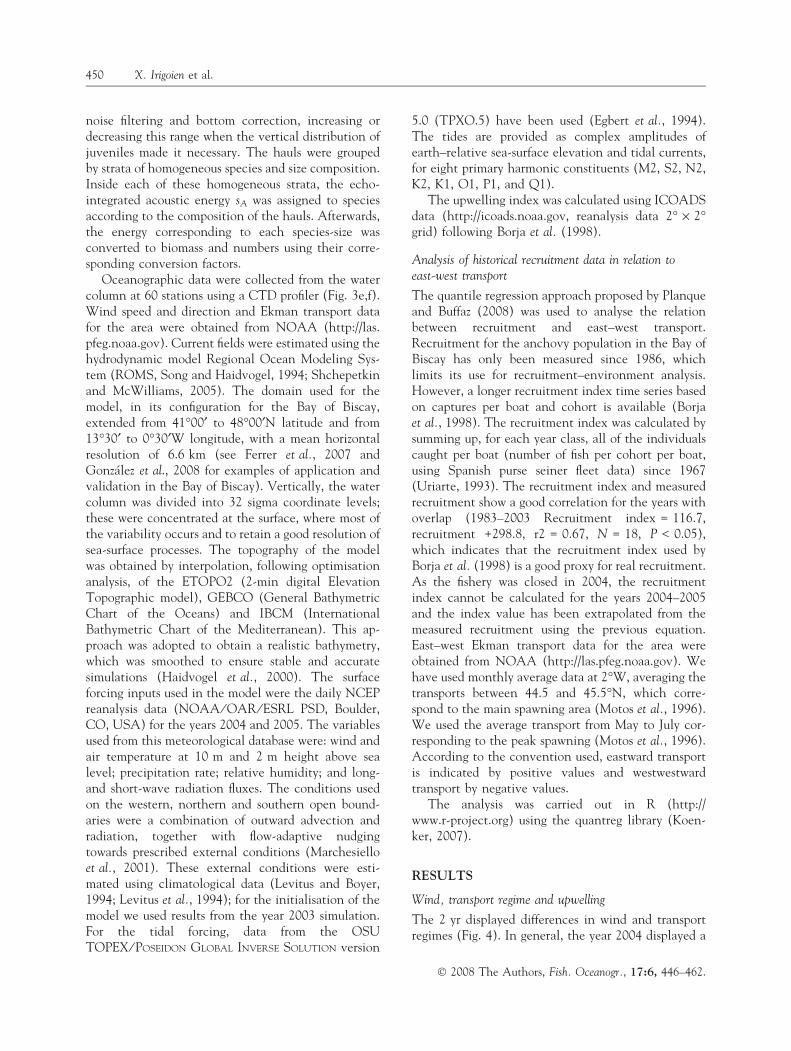
The 2 yr displayed differences in wind and transportregimes (Fig. 4). In general, the year 2004 displayed a
450 X. Irigoien et al.
� 2008 The Authors, Fish. Oceanogr., 17:6, 446–462.
higher component of west–east winds (resulting in moreeastwards transport than in the year 2005). The differ-ences are more evident during August when the direc-tion of the transport is clearly east–southeastwards in2004 and west–northwestwards in 2005 (Fig. 4). This isconfirmed by the modelled currents over the shelf,which show the maximum differences in August withaverage northward–eastward currents in 2004 andwestward-southward average currents in 2005 (Fig. 5).
The interannual differences in transport are alsoreflected by the integrated upwelling index, whichshowed net downwelling in 2004 and net upwelling in2005 (Fig. 6).
Sampling efficiency
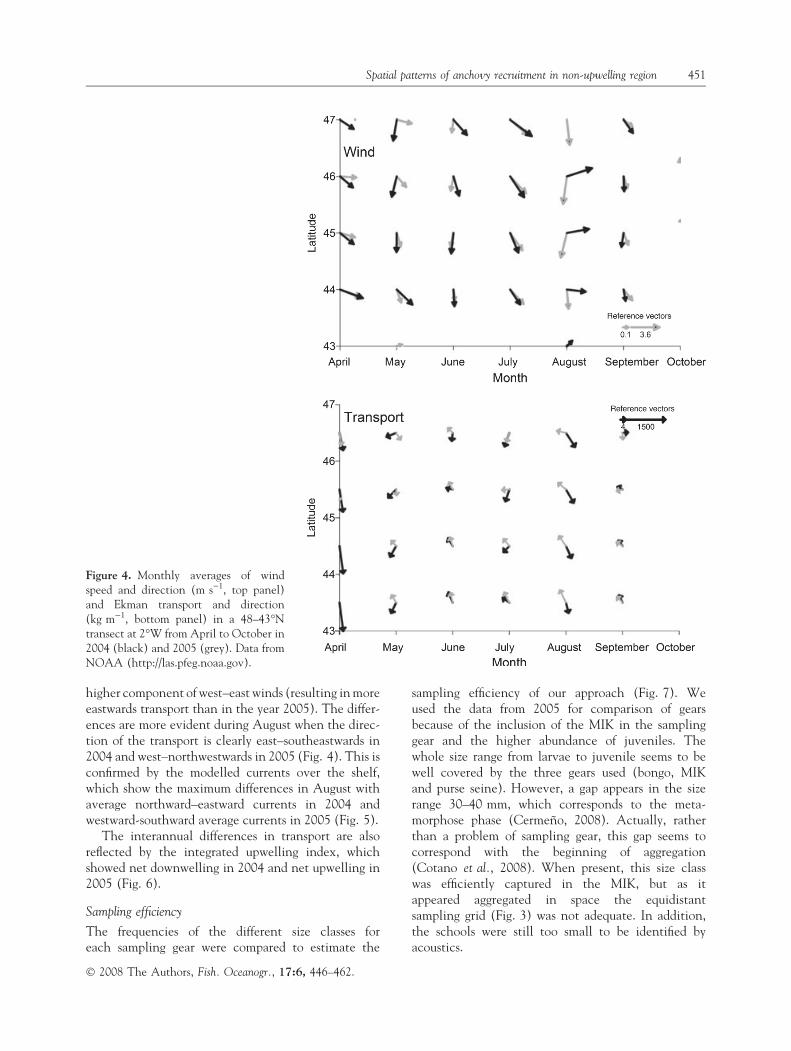
The frequencies of the different size classes foreach sampling gear were compared to estimate the
sampling efficiency of our approach (Fig. 7). Weused the data from 2005 for comparison of gearsbecause of the inclusion of the MIK in the samplinggear and the higher abundance of juveniles. Thewhole size range from larvae to juvenile seems to bewell covered by the three gears used (bongo, MIKand purse seine). However, a gap appears in the sizerange 30–40 mm, which corresponds to the meta-morphose phase (Cermeno, 2008). Actually, ratherthan a problem of sampling gear, this gap seems tocorrespond with the beginning of aggregation(Cotano et al., 2008). When present, this size classwas efficiently captured in the MIK, but as itappeared aggregated in space the equidistantsampling grid (Fig. 3) was not adequate. In addition,the schools were still too small to be identified byacoustics.
Figure 4. Monthly averages of windspeed and direction (m s)1, top panel)and Ekman transport and direction(kg m)1, bottom panel) in a 48–43�Ntransect at 2�W from April to October in2004 (black) and 2005 (grey). Data fromNOAA (http://las.pfeg.noaa.gov).
Spatial patterns of anchovy recruitment in non-upwelling region 451
� 2008 The Authors, Fish. Oceanogr., 17:6, 446–462.

Distribution
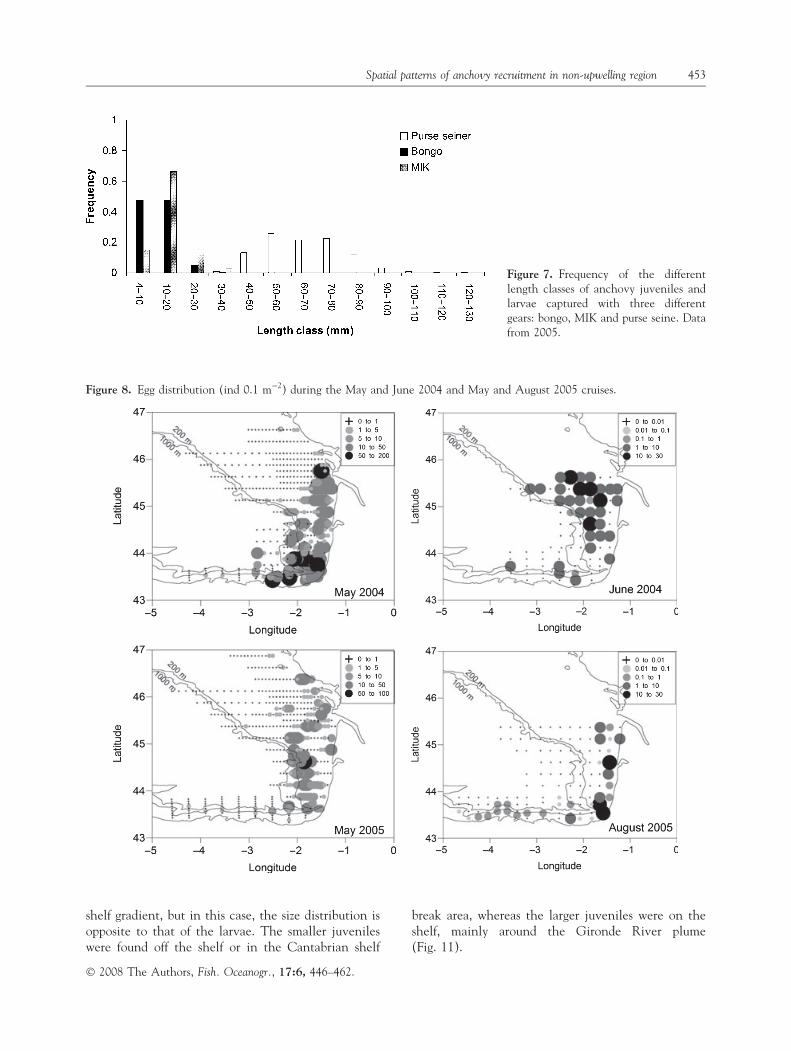
EggsIn May 2004, spawning was concentrated on the shelf,particularly in the southern part of the French shelfinside the 100-m isocline and around the plume of theGironde River (average egg concentration 56 eggsm)2, maximum 1960 eggs m)2, Fig. 8). In June 2004,the highest concentrations of eggs were found fartherto the north, with mid-shelf distributions (average eggconcentration 20 eggs m)2, maximum 219 eggs m)2,Fig. 8), whereas the peaks in the southern area haddisappeared. In May 2005, spawning was concentratedin the southern part of the French shelf between the
100- and 200-m isoclines and around the plume of theGironde River (average egg concentration 23 eggsm)2, maximum 514 eggs m)2, Fig. 8). In August 2005,the distribution was similar to that of May 2005, withthe spawning on the French shelf closer to the coast(average egg concentration 8 eggs m)2, maximum 219eggs m)2, Fig. 8). As expected from the anchovyspawning seasonality in the Bay of Biscay, the eggconcentrations found in August and June were lowerthan in May.
LarvaeIn general, anchovy larvae showed a clear size-dependent distribution. Small larvae were found onthe inner shelf, with higher concentrations found onthe French shelf (Fig. 9). Larger larvae were foundaround the shelf break and off the shelf (Fig. 9). Lar-vae larger than 25 mm were not found in June 2004,but were present in different stations in August 2005.This difference in distribution was confirmed by theMIK sampling in August 2005 (Fig. 10) and isreflected in the weighted mean position of the differ-ent size classes, which shows a shelf–off shelf increas-ing gradient in size (Fig. 9).
JuvenilesIn September 2004, juveniles were very scarce in theentire area, whereas in September 2005 higherabundances were observed (Fig. 11). The juveniledistribution also presents a size-dependent off shelf–
Figure 5. Estimated surface currents (monthly average m s)1) from May to September in 2004 (black arrows) and 2005 (greyarrows) using ROMS. Currents off the shelf are masked for clarity.
Figure 6. Estimated upwelling index in 2004 and 2005. SeeBorja et al. (1998) for calculation details.
452 X. Irigoien et al.
� 2008 The Authors, Fish. Oceanogr., 17:6, 446–462.
shelf gradient, but in this case, the size distribution isopposite to that of the larvae. The smaller juvenileswere found off the shelf or in the Cantabrian shelf
break area, whereas the larger juveniles were on theshelf, mainly around the Gironde River plume(Fig. 11).
Figure 8. Egg distribution (ind 0.1 m)2) during the May and June 2004 and May and August 2005 cruises.
Figure 7. Frequency of the differentlength classes of anchovy juveniles andlarvae captured with three differentgears: bongo, MIK and purse seine. Datafrom 2005.
Spatial patterns of anchovy recruitment in non-upwelling region 453
� 2008 The Authors, Fish. Oceanogr., 17:6, 446–462.

Size–weight
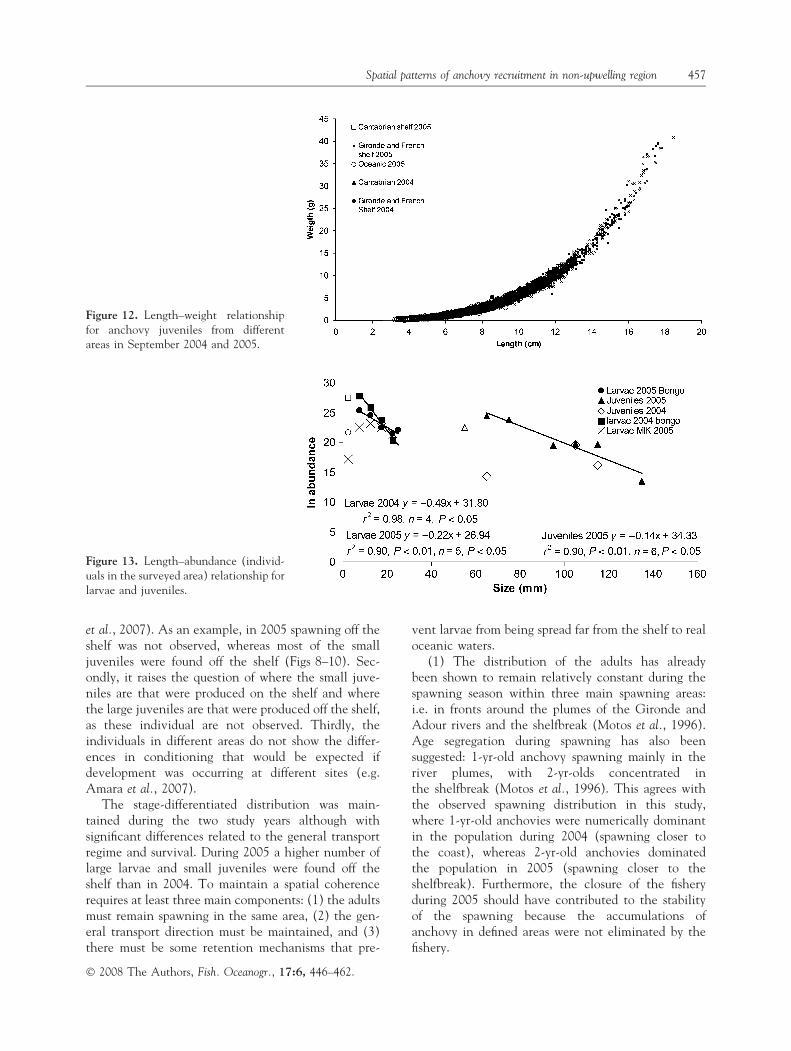
There were no significant differences in the size–weight relationship of juveniles collected in differentareas in the same year, or in the size–weight rela-tionship between years (Fig. 12; ANCOVA P > 0.05).
Size–abundance relationships
The slope of the larvae abundance–size relationship(bongo data) was significantly steeper for the larvaecollected during June 2004 than for the larvae col-lected during August 2005 (ANCOVA, F = 16.2,
(a) (b) (c)
(d) (e) (f)
(g) (h) (i)
(j) (k) (l)
Figure 9. (a–e, g–k) Larvae length class distribution (ind m)2) obtained with Bongo nets during the June 2004 cruise and theAugust 2005 cruise. (f,l) Weighted mean position for the different length classes illustrated in (a–e, g–k).
454 X. Irigoien et al.
� 2008 The Authors, Fish. Oceanogr., 17:6, 446–462.

P < 0.05). Average sea-surface temperature in thecruise area (CTD data) in June 2004 was 21�C, and inAugust 2005 it was 23�C. Considering that larvaegrowth rates at those temperatures are very similar oreven higher at 21�C, the steeper slope suggests thatlarvae mortality was higher in June 2004 than August2005. In both cases the slope of the larvae abundance–size relationship was steeper than that of the juvenileabundance–size relationship (September 2005, notenough juveniles of different sizes in 2004), suggestinghigher mortality for larvae than juveniles (Fig. 13).However, the slopes of the larvae and juvenilesabundance–size relationship in August and September2005 were not significantly different (ANCOVA,F = 0.89, P > 0.05).
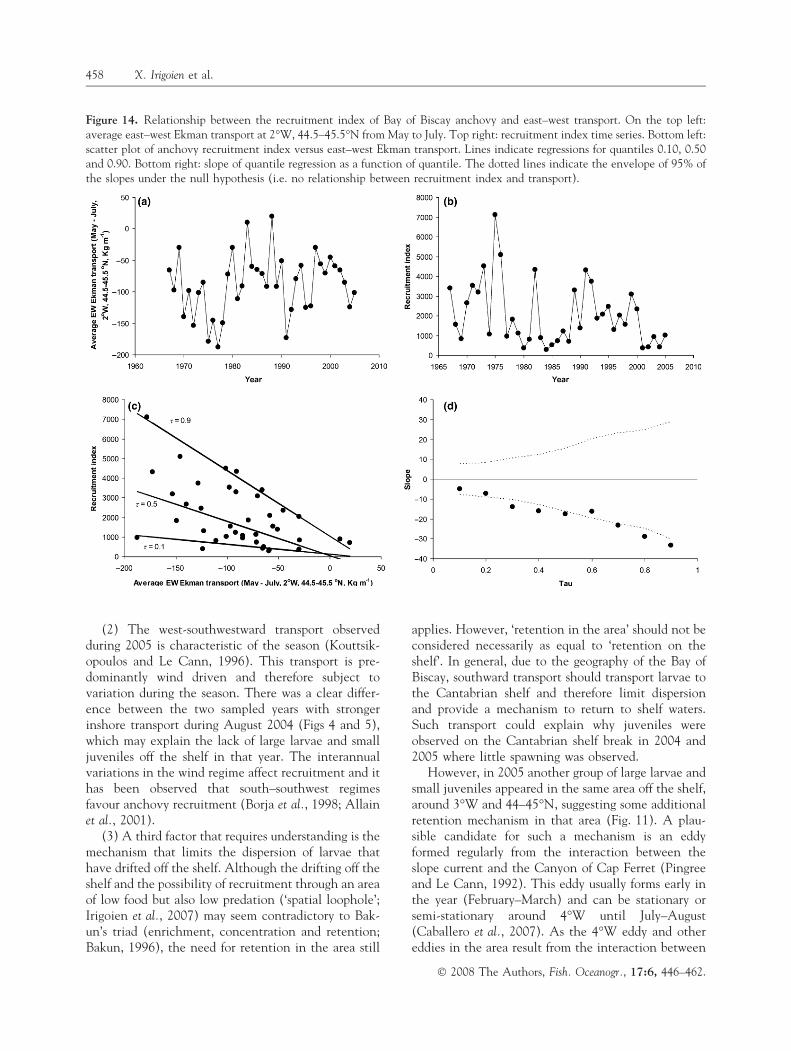
Recruitment index and east–west transport
The slope of the quantile regression between east–westtransport and recruitment index (1966–2005) wasnegative and steepest with increasing quantiles(Fig. 14). The slope became significant at the 0.8quantile (Fig. 14).
DISCUSSION
Following the spatial distribution of anchovy from eggsto juveniles is difficult, particularly in terms of catch-ability and abundance estimation between different
gears. This difficulty is well illustrated where thesmallest juveniles are too aggregated to be quantita-tively sampled in a grid of stations but still too small tobe differentiated by acoustics. However, our studyshows that by combining a number of differentapproaches (each one with its limitations) it is possibleto obtain a broad picture of the spatial distribution ofthe different stages during recruitment.
One of the most interesting results of this study isthe spatial coherence of observations carried out overa period of 5 months (May to September) in adynamic area. Obviously, the small larvae found inAugust are not a product of the eggs observed in May.The population as a whole, however, maintains aspatial coherence during a period of 5 months in adynamic area with the population split across the shelfbreak: spawners, eggs, small larvae and large juvenileson the shelf, and large larvae and small juveniles offthe shelf. This distribution of eggs (May), larvae (Juneand August, only bongo samples) and juveniles (Sep-tember) suggests a general pattern of spawning on theshelf, drifting of larvae off the shelf, and the return ofjuveniles onto the shelf. The distribution of largelarvae and small juveniles in 2005 (Figs 10 and 11)also suggests some partial retention in the area around3�W and 44–45�N.
The alternative hypothesis is that of a significantfraction of the population spawning off the shelf. The
(a) (b) (c)
(d) (e) (f)
Figure 10. (a–e) Larvae length class distribution (ind m)2) obtained with an MIK net during the August 2005 cruise. (f)Weighted mean position for the different length classes illustrated in (a–e).
Spatial patterns of anchovy recruitment in non-upwelling region 455
� 2008 The Authors, Fish. Oceanogr., 17:6, 446–462.

main spawning areas for anchovy in the Bay of Biscayare around the plumes of the rivers Gironde andAdour and on the shelfbreak (Motos et al., 1996).Occasionally, a small fraction of the population doesspawn off the shelf (Motos et al., 1996; Bellier et al.,2007). This mainly occurs when there is a largespawning population (but see also May 2004) and in
the southern area. However, for the juveniles observedoff the shelf to originate from local spawning poses anumber of problems. First, survival off the shelf has tobe much higher than on the shelf, as only a smallfraction of adults spawn off the shelf. Whereasspawning off the shelf occurs in particular years,juveniles off the shelf are regularly observed (Irigoien
(a) (b) (c)
(d) (e) (f)
(g) (h) (i)
(j) (k) (l)
0 to 0.10.1 to 100100 to 10001000 to 10 00010 000 to 100 000100 000 to 1 000 0001000 000 to 10 000 000
0 to 0.10.1 to 100100 to 10001000 to 10 00010 000 to 100 000100 000 to 1 000 0001000 000 to 10 000 000
0 to 0.1
0.1 to 100100 to 10001000 to 10 00010 000 to 100 000100 000 to 1 000 0001000 000 to 10 000 000
0 to 0.10.1 to 100100 to 10001000 to 10 00010 000 to 100 000100 000 to 1 000 0001000 000 to 10 000 000
0 to 0.10.1 to 100100 to 10001000 to 10 00010 000 to 100 000100 000 to 1 000 0001000 000 to 10 000 000
0 to 0.10.1 to 100100 to 10001000 to 10 00010 000 to 100 000100 000 to 1 000 0001000 000 to 10 000 000
0 to 0.10.1 to 100100 to 10001000 to 10 00010 000 to 100 000100 000 to 1 000 0001000 000 to 10 000 000
Figure 11. (a–e, g–k) Juvenile length class distribution (individuals per haul) during the September 2004 and 2005 cruises. (f,l)Weighted average position for the different length classes illustrated in (a–e, g–k).
456 X. Irigoien et al.
� 2008 The Authors, Fish. Oceanogr., 17:6, 446–462.
et al., 2007). As an example, in 2005 spawning off theshelf was not observed, whereas most of the smalljuveniles were found off the shelf (Figs 8–10). Sec-ondly, it raises the question of where the small juve-niles are that were produced on the shelf and wherethe large juveniles are that were produced off the shelf,as these individual are not observed. Thirdly, theindividuals in different areas do not show the differ-ences in conditioning that would be expected ifdevelopment was occurring at different sites (e.g.Amara et al., 2007).
The stage-differentiated distribution was main-tained during the two study years although withsignificant differences related to the general transportregime and survival. During 2005 a higher number oflarge larvae and small juveniles were found off theshelf than in 2004. To maintain a spatial coherencerequires at least three main components: (1) the adultsmust remain spawning in the same area, (2) the gen-eral transport direction must be maintained, and (3)there must be some retention mechanisms that pre-
vent larvae from being spread far from the shelf to realoceanic waters.
(1) The distribution of the adults has alreadybeen shown to remain relatively constant during thespawning season within three main spawning areas:i.e. in fronts around the plumes of the Gironde andAdour rivers and the shelfbreak (Motos et al., 1996).Age segregation during spawning has also beensuggested: 1-yr-old anchovy spawning mainly in theriver plumes, with 2-yr-olds concentrated inthe shelfbreak (Motos et al., 1996). This agrees withthe observed spawning distribution in this study,where 1-yr-old anchovies were numerically dominantin the population during 2004 (spawning closer tothe coast), whereas 2-yr-old anchovies dominatedthe population in 2005 (spawning closer to theshelfbreak). Furthermore, the closure of the fisheryduring 2005 should have contributed to the stabilityof the spawning because the accumulations ofanchovy in defined areas were not eliminated by thefishery.
Figure 12. Length–weight relationshipfor anchovy juveniles from differentareas in September 2004 and 2005.
Figure 13. Length–abundance (individ-uals in the surveyed area) relationship forlarvae and juveniles.
Spatial patterns of anchovy recruitment in non-upwelling region 457
� 2008 The Authors, Fish. Oceanogr., 17:6, 446–462.
(2) The west-southwestward transport observedduring 2005 is characteristic of the season (Kouttsik-opoulos and Le Cann, 1996). This transport is pre-dominantly wind driven and therefore subject tovariation during the season. There was a clear differ-ence between the two sampled years with strongerinshore transport during August 2004 (Figs 4 and 5),which may explain the lack of large larvae and smalljuveniles off the shelf in that year. The interannualvariations in the wind regime affect recruitment and ithas been observed that south–southwest regimesfavour anchovy recruitment (Borja et al., 1998; Allainet al., 2001).
(3) A third factor that requires understanding is themechanism that limits the dispersion of larvae thathave drifted off the shelf. Although the drifting off theshelf and the possibility of recruitment through an areaof low food but also low predation (‘spatial loophole’;Irigoien et al., 2007) may seem contradictory to Bak-un’s triad (enrichment, concentration and retention;Bakun, 1996), the need for retention in the area still
applies. However, ‘retention in the area’ should not beconsidered necessarily as equal to ‘retention on theshelf’. In general, due to the geography of the Bay ofBiscay, southward transport should transport larvae tothe Cantabrian shelf and therefore limit dispersionand provide a mechanism to return to shelf waters.Such transport could explain why juveniles wereobserved on the Cantabrian shelf break in 2004 and2005 where little spawning was observed.
However, in 2005 another group of large larvae andsmall juveniles appeared in the same area off the shelf,around 3�W and 44–45�N, suggesting some additionalretention mechanism in that area (Fig. 11). A plau-sible candidate for such a mechanism is an eddyformed regularly from the interaction between theslope current and the Canyon of Cap Ferret (Pingreeand Le Cann, 1992). This eddy usually forms early inthe year (February–March) and can be stationary orsemi-stationary around 4�W until July–August(Caballero et al., 2007). As the 4�W eddy and othereddies in the area result from the interaction between
Figure 14. Relationship between the recruitment index of Bay of Biscay anchovy and east–west transport. On the top left:average east–west Ekman transport at 2�W, 44.5–45.5�N from May to July. Top right: recruitment index time series. Bottom left:scatter plot of anchovy recruitment index versus east–west Ekman transport. Lines indicate regressions for quantiles 0.10, 0.50and 0.90. Bottom right: slope of quantile regression as a function of quantile. The dotted lines indicate the envelope of 95% ofthe slopes under the null hypothesis (i.e. no relationship between recruitment index and transport).
458 X. Irigoien et al.
� 2008 The Authors, Fish. Oceanogr., 17:6, 446–462.

general circulation and topography, their formation isquite regular (Caballero et al., 2007) and therefore‘predictable’ in evolutionary terms for the population.It is likely that the formation of the eddy itself on theshelf break may contribute to transporting larvae offthe shelf. But, on the other hand, the same eddy for-mation processes at specific points of the shelfbreakarea that take the larvae off the shelf may provideretention for periods long enough for the larvae toremain near the shelfbreak area. Eddies formed at theCap Ferret Canyon take about 8–12 days to form,rotate approximately in a period of 15 days (about thetimescale to be formed), and move westward (whenthey move – and are not trapped by topography) atabout 2 cm s)1, or 1.7 km day)1 (Pingree and LeCann, 1992). Anchovy larvae in the Bay of Biscaytake around 25 days to develop to a size of 20 mm, atwhich time they already begin to aggregate (whichimplies directional swimming; Williams et al., 1996;Bradbury et al., 2003; Cotano et al., 2008) and about35 days to reach the juvenile stage (Naroa Aldanondo,personal communication) with advanced swimmingability. This implies that eddy formation processesprovide a retention mechanism around the shelfbreakfor long enough to enable the larvae to developswimming capacities that allow their return to theshelf. Actually, for Pacific sardine in the coast ofCalifornia it has been shown that ‘survivors’ (spatiallyaggregated larvae ‡18 days old) are more abundantoffshore associated with eddies than inshore, wheremore eggs and food are found (Logerwell and Smith,2001). This is strikingly similar to our observations ofsurviving small juveniles offshore in areas associated toeddies. Combining potential growth with abundance,Logerwell et al. (2001) estimated offshore eddies tohave a higher potential for recruitment than otherregions in the Southern California Bight. The role ofeddies in the Bay of Biscay could be similar, as offshoreeddies present enhanced production (Rodriguez et al.,2003; Fernandez et al., 2004) compared with sur-rounding waters and probably lower predation riskthan shelf waters (Irigoien et al., 2007). The rela-tionship between recruitment and eddy formation inthe Bay of Biscay has not received much attention(though see Segond et al., 2004) and merits furtherresearch. It is probably not the number of eddies that isimportant but the timing and position of their for-mation (see Garcia-Soto et al., 2002 for an example ofthe variability in eddies distribution in summer).
This brings us to an important question. Did theobserved differences in onshore transport and per-centage of large larvae and small juveniles off the shelfresult in a good or a bad recruitment? In answer, 2004
was the worst recruitment on record and resulted in acollapse of the fishery followed by a closure that hascontinued until 2007. On the other hand, therecruitment of the larvae and juveniles during thesummer of 2005, relative to the spawning biomass, wasthe fourth best recruitment in a time series spanning19 yr (Fig. 15). This again is consistent with ourhypothesis that the observed distribution off the shelfin 2005 resulted in a relatively good recruitment. Asimilar situation occurred in 1988–89, 2 yr with lowparental abundances (Fig. 1) and successively a badand good recruitment related to low and strong west-ward transport (Fig. 14). Actually, the quantileregression analysis of the recruitment index relationwith the east–west transport indicates that the previ-ous results can be generalised to different levels ofpopulation abundance. That the slope becomes steeperand significant with increasing quantiles indicates thathigh recruitment can only be found when westwardtransport is strong. Westward (off the shelf) transportin itself does not determine recruitment but it does seta limit to it (Planque and Buffaz, 2008).
This is in apparent contradiction to recent results ofmodel simulations (Allain et al., 2007a, b) in twoaspects: (1) we found high abundances of large larvaeand small juveniles alive off the shelf in 2005, whereasthe model predicts conditions off the shelf to limitgrowth and to result in a very poor survival index (seeFig. 6 in Allain et al., 2007b). Furthermore, the larvaeand juveniles off the shelf did not display differencesin the weight–size relationship to those found on theshelf (Cotano et al., 2008; Fig. 13), which suggeststhat the same growth rates can be attained off theshelf. Also, the higher abundance of large larvae andsmall juveniles off the shelf than of large juveniles onthe shelf (Figs 9 and 11) suggests that survival off theshelf is not anecdotal. (2) The model predicts higher
Figure 15. Recruitment index (recruits divided spawningbiomass) for the Bay of Biscay anchovy population from1987 to 2005. Data from ICES.
Spatial patterns of anchovy recruitment in non-upwelling region 459
� 2008 The Authors, Fish. Oceanogr., 17:6, 446–462.
recruitment for the years with high retention on theshelf, whereas we found that to have strong recruit-ment, high westwards transport (off the shelf) is nee-ded (Fig. 14) and that 2005, with a higher percentageof large larvae and small juveniles found off the shelfthan in 2004, resulted in better recruitment.
The observed differences between the models andobservations might be due to some of the assumptionsof the model, such as the use of otolith data to obtaingrowth parameters. To parameterise the biologicalmodel, hydrodynamic models were used to backtrackindividuals (otoliths) for 100 days and compareotolith growth with the conditions encountered duringthe apparent drifting. However, in the Bay of Biscayanchovies, metamorphosis into juveniles takes place30–40 days after hatching, and as soon as they arejuveniles they swim actively and integrate intoschools. At 100 days anchovies in the Bay of Biscayare 10 cm and therefore two-thirds the adult size(Cermeno, 2008). Environmental conditions duringthe drifting comparison carried out by Allain et al.(2007a) occur during a period when Bay of Biscayanchovies are actively swimming and choosing theirown habitat. Assuming they are passive drifters forbacktracking purposes is not reasonable (Bradburyet al., 2003). This is also a problem in the forecastingsimulations themselves, as Allain et al. (2007a) sim-ulate the drift of the individuals for 100 days, when byday 40 the juveniles are already joining into schoolswhich clearly select their environment.
In addition, Allain et al. (2007a) assumed otolithgrowth to be linearly related to somatic growth but, asfor other clupeoids (Fey, 2001; Folkvord et al., 2004),this may not be true for anchovy (Aldanondo et al.,2008). The relation between otolith growth andsomatic growth is mediated by temperature, withotoliths growing faster than body length at high tem-peratures, which distorts the relations used in Allainet al. (2007a). Therefore the differences between themodel and our observations may be due to the modelassuming individuals to be passive drifters when they arein reality already able to swim vigorously and select theirown habitat. It is possible that a reformulation of themodel considering the real drifting phases will result inbetter agreement between the model and observations.
The quantile regression indicates that westwardtransport sets the limits for recruitment. This is inagreement with the results of Borja et al. (2008) whoobserved recruitment to be limited when the EasternAtlantic index is positive. A positive EasternAtlantic index results in a predominance of south-westerly winds and consequent reduction of thewestward transport. However, other environmental
factors may also determine recruitment in combina-tion with westward transport: e.g., upwelling (Borjaet al., 1998), summer storms (Allain et al., 2001),river flow (Planque and Buffaz, 2008), and parentalpopulation size (ICES, 2007) have been shown toinfluence recruitment. All those factors may affectthe interplay between growth and predation thatdetermines recruitment (Irigoien et al., 2007). Nev-ertheless, during this study, the shelfbreak area andassociated hydrodynamic processes (eddy formation),rather than the inner shelf, appear to be key elementsin understanding anchovy recruitment in the Bay ofBiscay.
ACKNOWLEDGEMENTS
Thanks are due to the captains and crews of R/VVizconde de Eza, Investigador, Aita Jose and Mater Bi.We are also grateful to Paul De Bruyn for his com-ments and correction of the English language and toUdane Martinez for her help with acoustic data. Thisresearch was supported by the research projects Bio-man (Department of Agriculture and Fisheries of theBasque Country Government), Impress (Departmentof Environment of the Basque Country Govern-ment), Juvena (Department of Agriculture andFisheries of the Basque Country Governmentand Spanish Ministry of Agriculture and Fisheries)and UNCOVER (EU VI Framework). This paper iscontribution No. 425 from AZTI-Tecnalia (MarineResearch Unit).
REFERENCES
Aldanondo, N., Cotano, U., Etxebeste, E. et al. (2008) Vali-dation of daily deposition increments in the otoliths ofEuropean anchovy larvae (Engraulis encrasicolus L.) rearedunder different temperature conditions. J. Fish. Res. 93:257–264.
Allain, G., Petitgas, P. and Lazure, P. (2001) The influence ofmeso-scale ocean processes on anchovy (Engraulis encrasico-lus) recruitment in the bay of Biscay estimated using a 3Dhydrodynamic model. Fish. Oceanogr. 10:151–163.
Allain, G., Petitgas, P. and Lazure, P. (2007a) The influence ofenvironment and spawning distribution on the survival ofanchovy (Engraulis encrasicolus) larvae in the Bay of Biscay(NE Atlantic) investigated by biophysical simulations Fish.Oceanogr. 16:506–514.
Allain, G., Petitgas, P. and Lazure Grellier, P. (2007b) Bio-physical modelling of larval drift, growth and survival for theprediction of anchovy (Engraulis encrasicolus) recruitment inthe Bay of Biscay (NE Atlantic) Fish. Oceanogr. 16:489–505.
Amara, R., Meziane, T., Gilliers, C., Hermel, G. and Laffargue,P. (2007) Growth and condition indices in juvenile sole(Solea solea) measured to assess the quality of essential fishhabitat. Mar. Ecol. Prog. Ser. 351:201–208.
460 X. Irigoien et al.
� 2008 The Authors, Fish. Oceanogr., 17:6, 446–462.

Bakun, A. (1996) Patterns in the Ocean: Ocean Processes andMarine Population Dynamics. Calif: Sea Grant Coll. Syst., LaJolla, 323 pp.
Bakun, A. and Broad, K. (2003) Environmental ‘loopholes’ andfish population dynamics: comparative pattern recognitionwith focus on El Nino effects in the Pacific. Fish. Oceanogr.12:458–473.
Barbieri, M. A., Cordova, J., Gerlotto, F. et al. (2005) Spatialspawning strategy of Jack Mackerel (Trachurus symmetricusMurphyi) off the central-south region of Chile. Report of theSPACC meeting on small pelagic fish spawning habitatdynamics and the daily egg production method (DEPM).Globec Report 22, xiv: 73–74.
Bellier, E., Planque, B. and Petitgas, P. (2007) Historicalfluctuations in spawning location of anchovy (Engraulisencrasicolus) and sardine (Sardina pilchardus) in the Bay ofBiscay during 1967–73 and 2000–2004. Fish. Oceanogr.16:1–15.
Borja, A., Fontan, A., Saenz, J. and Valencia, V. (2008) Climate,oceanography, and recruitment: the case of the Bay of Biscayanchovy (Engraulis encrasicolus). Fish. Oceanogr. 17:477–493.
Borja, A., Uriarte, A., Egana, J., Motos, L. and Valencia, V.(1998) Relationships between anchovy (Engraulis encrasico-lus) recruitment and environment in the Bay of Biscay(1967–1996). Fish. Oceanogr. 7:375–380.
Bradbury, I.R., Snelgrove, P.V. R. and Pepin, P. (2003) Passiveand active behavioural contributions to patchiness andspatial pattern during the early life history of marine fishes.Mar. Ecol. Prog. Ser. 257:233–245.
Caballero, A., Pascual, A., Dibarboue, G. and Espino, M. (2007)Sea level and eddy kinetic energy variability in the Bay ofBiscay inferred from satellite altimeter data. J. Mar. Sys.72:116–134.
Cermeno, P. (2008) Analysis of the Microstructure of the Otolithsfor Growing and Recruitment. Application to the EuropeanAnchovy (Engraulis encrasicolus) in the Bay of Biscay. PhD.Leioa, Spain: University of the Basque Country.
Cotano, U., Etxebeste, E., Irigoien, X. et al. (2008) Distributionand survival of early life anchovy (Engraulis encrasicolus L.)in relation to hydrodynamic and trophic environment in theBay of Biscay. J. Plankt. Res. 30:467–481.
Cushing, D.H. (1985) Had I but World Enough and Time…Comm. Meet. Int. Coun. Explor. Sea. Copenhagen, DenmarkICES CM 1985 ⁄ H:71.
Egbert, G.D., Bennett, A.F. and Foreman, M.G.G. (1994)Topex ⁄ Poseidon Tides estimated using a global inversemodel. J. Geophys. Res. 99:24821–24852.
Fernandez, E., Alvarez, F., Anadon, R. et al. (2004) The spatialdistribution of plankton communities in a SlopeWateranticyclonic Oceanic eDDY (SWODDY) in the southernBay of Biscay. J. Mar. Biolog. Assoc. U.K., 84:501–517.
Ferrer, L., Gonzalez, M., Valencia, V. et al. (2007). Operationalcoastal systems in the Basque Country region: modelling andobservations. In: Proceedings of the 17th International Offshore(Ocean) and Polar Engineering Conference, ISOPE 2007. J.S.Chung, M. Kashiwagi, I.J. Losada & L.-K. Chien, (Eds) 1–6July 2007, Lisbon, Portugal: ISOPE, 3, pp. 1736–1743.
Fey, D.P. (2001) Differences in temperature conditions andsomatic growth rate of larval and early juvenile springspawned herring from the Vistula Lagoon, Baltic Sea, man-ifested in the otolith to fish relationship. J. Fish Biol.58:1257–1273.
Folkvord, A., Johannessen, A. and Moksness, E. (2004)Temperature-dependent otolith growth in Norwegian spring-spawning herring (Clupea harengus L.) larvae. Sarsia, 89:297–310.
Foote, K.G., Knudsen, H.P., Vestenes, D.N., MacLennan, D.N.and Simmonds, E.J. (1987) Calibration of acoustic instru-ments for fish density estimation: a practical guide. ICESCooperative Research Report 144:1–69.
Garcia-Soto, C., Pingree, R.D. and Valdes, L. (2002) Navidaddevelopment in the southern Bay of Biscay: climate changeand swoddy structure from remote sensing and in situ mea-surements. J. Geophys. Res. 107: 28 ⁄ 1–28 ⁄ 29.
Gonzalez, M., Ferrer, L., Uriarte, A., Urtizberea, A. andCaballero, A. (2008) Operational Oceanography Systemapplied to the Prestige oil-spillage event. J. Mar. Syst.72:178–188.
Haidvogel, D.B., Arango, H.G., Hedstrom, K.S., Beckmann, A.,Malanotte-Rizzoli, P. and Shchepetkin, A.F. (2000) Modelevaluation experiments in the North Atlantic Basin: simu-lations in nonlinear terrain-following coordinates. Dyn.Atm. Oceans, 32:239–281.
Hughes, S. L. and Holliday, N. P. (Eds) (2007) ICES Report onOcean Climate 2006. ICES Cooperative Research Report No.289, Copenhagen, Denmark, 55 pp.
ICES (2007) Report of the Working Group on the Assessment ofMackerel, Horse Mackerel, Sardine and Anchovy (WGMHSA).4–13 September 2007, Copenhagen: ICES Headquarters.ICES CM 2007 ⁄ ACFM:31.
Irigoien, X., Fiksen, Ø., Cotano, U. et al. (2007) Could BiscayBay anchovy recruit through a spatial loophole? Prog. Oce-anogr. 74:132–148.
Koenker, R. (2007) Quantreg: Quantile Regression. R PackageVersion 4.10. http://www.r-project.org.
Kouttsikopoulos, C. and Le Cann, B. (1996) Physical processesand hydrological structures related to the Bay of Biscayanchovy. Sci. Mar. 60(Suppl. 2):9–19.
Kurlansky, M. (2006) The Big Oyster. History on the Half Shell.New York: Ballantine Books.
Leggett, W.C. and Deblois, E. (1994) Recruitment in marinefishes: Is it regulated by starvation and predation in the eggand larval stages? Neth. J. Sea Res. 32:119–134.
Levitus, S. and Boyer, T. (1994) World Ocean Atlas 1994, Vol. 4:Temperature. NOAA Atlas NESDIS 4. Washington, D.C.:U.S. Government Printing Office.
Levitus, S., Burgett, R. and Boyer, T. (1994) World Ocean Atlas1994, Vol. 3: Salinity. NOAA Atlas NESDIS 3. Washington,D.C.: U.S. Government Printing Office, 99 pp.
Logerwell, E. A. and Smith, P. E. (2001) Mesoscale eddies andsurvival of late stage Pacific sardine (Sardinops sagax) larvae.Fish. Oceanogr. 10:13–25.
Logerwell, E. A., Lavaniegos, B. and Smith, P.E. (2001) Spa-tially-explicit bioenergetics of Pacific sardine in the SouthernCalifornia Bight: are mesoscale eddies areas of exceptionalprerecruit production? Prog. Oceanogr. 49:391–406.
MacLennan, D.N., Fernandes, P.G. and Dalen, J. (2002) Aconsistent approach to definitions and symbols in fisheriesacoustics. ICES J. Mar. Sci. 59:365–368.
Marchesiello, P., McWilliams, J.C. and Shchepetkin, A. (2001)Open boundary conditions for long-term integrations ofregional oceanic models. Ocean Model. 3:1–20.
Motos, L., Uriarte, A. and Valencia, V. (1996) The spawningenvironment of the Bay of Biscay anchovy (Engraulisencrasicolus L.). Sci. Mar. 60(Suppl. 2):117–140.
Spatial patterns of anchovy recruitment in non-upwelling region 461
� 2008 The Authors, Fish. Oceanogr., 17:6, 446–462.
Pingree, RD and Le Cann, B. (1992) Three anticyclonic SlopeWater Oceanic eDDIESS (SWODDIES) in the southern Bayof Biscay in 1990. Deep Sea Res. 39:1147–1175.
Planque, B. and Buffaz, L. (2008) Quantile regression models forfish recruitment-environment relationships - four case stud-ies. Mar. Ecol. Prog. Ser. 357:213–223.
Rodriguez, F., Varela, M, Fernandez, E. and Zapata, M. (2003)Phytoplankton and pigment distributions in an anticyclonicslope water oceanic eddy (SWODDY) in the southern Bay ofBiscay. Mar. Biol. 143:995–1011.
Segond, M., Mahler, S., Robilliard, D., Fonlupt, C., Planque, B.and Lazure, P. (2004) Ant Algorithm for Detection of RetentiveStructures in Coastal Waters. Proceedings of Artificial EvolutionConference 2003, LNCS (Lecture Notes in Computer Sciences).Berlin: Springer Verlag, 2936: 166–176.
Shchepetkin, A.F. and McWilliams, J.C. (2005) The regionaloceanic modeling system (ROMS): a split-explicit, free-sur-face, topography-following-coordinate oceanic model. OceanModel. 9:347–404.
Smith, P.E., Flerx, W. and Hewitt, R.H. (1985) The CalCOFIVertical Egg Tow (CalVET) Net. In: An egg ProductionMethod for Estimating Spawning Biomass of Pelagic Fish:Application to the Northern Anchovy, Engraulis Mordax. R.Lasker (ed). Washington, DC: U.S. Dept. Commer., NOAATech. Rep. NMFS 36, pp. 27–32.
Song, Y.T. and Haidvogel, D.B. (1994) A semi-implicit oceancirculation model using a generalized topography followingcoordinate system. J. Comp. Phys. 115:228–244.
Theilacker, G.H. (1980) Changes in body measurementsof larval northern anchovy, Engraulis mordax, and otherfishes due to handling and preservation. Fish. Bull.76:685–692.
Uriarte, A. (1993) Analysis of the Spanish catches of the Bay ofBiscay anchovy since 1996 and estimate of a recruitmentindex. Annex to final report of the EC FAR project (1991–1993). (Contract no. MA 2495 EF). O. Cendrero (ed.) 1994:Improvement of Stock Assessment by Direct Methods, itsApplication to the Anchovy (Engraulis Encrasicholus) in the Bayof Biscay.
Uriarte, A. (ed) (2002) Experimental Surveys for the Assessment ofJuveniles. Final Report to the European Commission of FAIRProject CT97-3374 (JUVESU).
Uriarte, A., Sagarminaga, Y., Scalabrin, C. et al. (2001) Ecologyof Anchovy Juveniles in the Bay of Biscay 4 Months After PeakSpawning: Do They Form Part of the Plankton. Copenhagen,Denmark, ICES CM ⁄ W:20.
Williams, P.J., Brown, J.A., Gotceitas, V. and Pepin, P. (1996)Developmental changes in escape response performance offive species of marine larval fish. Can. J. Fish. Aquat. Sci.53:1246–1253.
462 X. Irigoien et al.
� 2008 The Authors, Fish. Oceanogr., 17:6, 446–462.