Validation of AATSR Using In Situ Radiometers in the English Channel and Bay of Biscay
11
VALIDATION OF AATSR USING IN SITU RADIOMETERS IN THE ENGLISH CHANNEL AND BAY OF BISCAY Craig Donlon (1) , Werenfrid Wimmer (2) , Ian Robinson (2) , Gary Fisher (2) and David Poulter (2) Gary Corlett (3) (1) Hadley Centre, Met Office, Fitzroy Road, Exeter EX1 3PB United Kingdom (2) National Oceanography Centre, Southampton, European Way, Southampton,SO14 3ZH, United Kingdom (3) Earth Observation Science, Space Research Centre, University of Leicester, Leicester United Kingdom ABSTRACT This paper reports on the validation of ENVISAT Advanced Along Track Scanning Radiometer (AATSR) observations in the English Channel and Bay of Biscay during 2004-2005. A commercial ferry operating between Portsmouth, United Kingdom and Bilbao, Spain has been fully instrumented with oceanographic and meteorological instrumentation for the purpose of AATSR validation. The instrument package includes an Infrared Sea Surface Temperature Autonomous Radiometer (ISAR), three axis sonic anemometer, long-wave and short-wave radiation sensors, humidity and surface pressures sensors, thermosalinograph, hull-mounted thermistor and irregular continuous plankton recorder (CPR) tows. All in situ instrumentation is calibrated regularly to maintain high accuracy. These data have been analysed to validate the skin sea surface temperature (SSTskin) observations reported by the AATSR. In situ observations nearly contemporaneous with ENVISAT AATSR data have been matched together using an automated system that adheres to strict match-up rules. We find that AATSR dual view SST retrievals have a warm bias of 0.2K ±0.33K in March December 2004. However from December 2004-September 2005 the AATSR dual view SST retrievals are practically unbiased (0.065K) with more variability in the summer seasons (March-June 2005: ±0.12K, June-September 2005: ±0.39K). In contrast, the nadir only SST retrievals have a relatively constant warm bias throughout the study period of 0.5K ±0.38K. An assessment of typical errors associated with the end-to-end validation process is presented. Using in situ observations and data from the Met Office Shelf Seas operational model system, we provide an error budget for the ISAR-AATSR validation data set. The largest errors in the validation process are attributed to strong horizontal and vertical temperature gradients in the upper ocean during low wind speed clear sky conditions. These errors can be minimised by choosing ocean areas that are well mixed and wind speed conditions > 6 m/s. We recommend that all satellite SST validation data should be assessed in this way to minimise unnecessary uncertainties in the validation process. 1. INTRODUCTION The Advanced along Track Scanning Radiometer (AATSR) was successfully launched as part of the ENVISAT payload on the 1st March 2002. The primary aim of the AATSR mission is to extend the long-term, global coverage SST record already established by the ATSR-1 and ATSR-2 radiometers measurements, in a consistent manner, for a 15 year period. The AATSR instrument is an imaging radiometer having 7 co-registered spectral channels within the visible and infrared part of the electromagnetic spectrum measuring upwelling radiance from the earth’s surface at a spatial resolution of 1km. AATSR has thermal infrared channels at 3.7, 11 and 12 μm which are used primarily for SSTskin retrievals and four visible channels (0.55, 0.66, 0.87 and 1.6μm) that are used for detecting clouds, atmospheric aerosols and for applications over ice and land. In order to attain the SSTskin accuracy required for climate research and monitoring, the AATSR has several innovative design features that make it a unique satellite infrared radiometer capable of delivering the most accurate Sea Surface Skin Temperature (SSTskin) observations ever recoded from space: • Continuous two-point on-board calibration of the thermal infrared channels based on two temperature controlled black body reference cavities; • An on-board calibration system for the visible channels; • Low-noise infrared detectors, cooled to near-optimum operating temperatures by a solid state Stirling-cycle cooler; • Full 12 bit digitisation of all detector signals; • A multi-spectral atmospheric correction technique and, • A multi view atmospheric correction technique called along-track scanning. Traditional multi-spectral atmospheric correction algorithms developed by regression of instrument brightness temperature (Tb) to contemporaneous in situ observations or to theoretical SST estimates derived via atmospheric transmission modelling [1] have several shortcomings. Those based on the combination of two separate spectral channels assume a fairly homogenous and stationary global atmosphere so that any significant deviations from the ‘standard’ atmospheric structure used to define the algorithm in the first place will lead to errors. The use of a third channel (typically in the 3.5-3.8μm spectral interval) does provide additional information but these channels tend to saturate during the daytime due to solar reflection at the sea surface and are normally only available at night. Some atmospheric constituents have only weak spectral dependences so that the algorithm can be insensitive to certain conditions. Finally, since the algorithm multipliers
-
Upload
esaartscience -
Category
Documents
-
view
1 -
download
0
Transcript of Validation of AATSR Using In Situ Radiometers in the English Channel and Bay of Biscay

VALIDATION OF AATSR USING IN SITU RADIOMETERS IN THE ENGLISH CHANNEL AND BAY OF BISCAY
Craig Donlon (1), Werenfrid Wimmer (2), Ian Robinson (2), Gary Fisher(2) and David Poulter(2) Gary Corlett (3)
(1) Hadley Centre, Met Office, Fitzroy Road, Exeter EX1 3PB United Kingdom (2) National Oceanography Centre, Southampton, European Way, Southampton,SO14 3ZH, United Kingdom (3) Earth Observation Science, Space Research Centre, University of Leicester, Leicester United Kingdom
ABSTRACT This paper reports on the validation of ENVISAT Advanced Along Track Scanning Radiometer (AATSR) observations in the English Channel and Bay of Biscay during 2004-2005. A commercial ferry operating between Portsmouth, United Kingdom and Bilbao, Spain has been fully instrumented with oceanographic and meteorological instrumentation for the purpose of AATSR validation. The instrument package includes an Infrared Sea Surface Temperature Autonomous Radiometer (ISAR), three axis sonic anemometer, long-wave and short-wave radiation sensors, humidity and surface pressures sensors, thermosalinograph, hull-mounted thermistor and irregular continuous plankton recorder (CPR) tows. All in situ instrumentation is calibrated regularly to maintain high accuracy. These data have been analysed to validate the skin sea surface temperature (SSTskin) observations reported by the AATSR. In situ observations nearly contemporaneous with ENVISAT AATSR data have been matched together using an automated system that adheres to strict match-up rules. We find that AATSR dual view SST retrievals have a warm bias of 0.2K ±0.33K in March December 2004. However from December 2004-September 2005 the AATSR dual view SST retrievals are practically unbiased (0.065K) with more variability in the summer seasons (March-June 2005: ±0.12K, June-September 2005: ±0.39K). In contrast, the nadir only SST retrievals have a relatively constant warm bias throughout the study period of 0.5K ±0.38K. An assessment of typical errors associated with the end-to-end validation process is presented. Using in situ observations and data from the Met Office Shelf Seas operational model system, we provide an error budget for the ISAR-AATSR validation data set. The largest errors in the validation process are attributed to strong horizontal and vertical temperature gradients in the upper ocean during low wind speed clear sky conditions. These errors can be minimised by choosing ocean areas that are well mixed and wind speed conditions > 6 m/s. We recommend that all satellite SST validation data should be assessed in this way to minimise unnecessary uncertainties in the validation process.
1. INTRODUCTION The Advanced along Track Scanning Radiometer (AATSR) was successfully launched as part of the ENVISAT payload on the 1st March 2002. The primary aim of the AATSR mission is to extend the long-term, global coverage SST record already established by the ATSR-1 and ATSR-2 radiometers measurements, in a consistent manner, for a 15 year period. The AATSR instrument is an imaging radiometer having 7 co-registered spectral channels within the visible and infrared part of the electromagnetic spectrum measuring upwelling radiance from the earth’s surface at a spatial resolution of 1km. AATSR has thermal infrared channels at 3.7, 11 and 12 µm which are used primarily for SSTskin retrievals and four visible channels (0.55, 0.66, 0.87 and 1.6μm) that are used for detecting clouds, atmospheric aerosols and for applications over ice and land. In order to attain the SSTskin accuracy required for climate research and monitoring, the AATSR has several innovative design features that make it a unique satellite infrared radiometer capable of delivering the most accurate Sea Surface Skin Temperature (SSTskin) observations ever recoded from space:
• Continuous two-point on-board calibration of the thermal infrared channels based on two temperature controlled black body reference cavities;
• An on-board calibration system for the visible channels; • Low-noise infrared detectors, cooled to near-optimum operating temperatures by a solid state Stirling-cycle
cooler; • Full 12 bit digitisation of all detector signals; • A multi-spectral atmospheric correction technique and, • A multi view atmospheric correction technique called along-track scanning.
Traditional multi-spectral atmospheric correction algorithms developed by regression of instrument brightness temperature (Tb) to contemporaneous in situ observations or to theoretical SST estimates derived via atmospheric transmission modelling [1] have several shortcomings. Those based on the combination of two separate spectral channels assume a fairly homogenous and stationary global atmosphere so that any significant deviations from the ‘standard’ atmospheric structure used to define the algorithm in the first place will lead to errors. The use of a third channel (typically in the 3.5-3.8μm spectral interval) does provide additional information but these channels tend to saturate during the daytime due to solar reflection at the sea surface and are normally only available at night. Some atmospheric constituents have only weak spectral dependences so that the algorithm can be insensitive to certain conditions. Finally, since the algorithm multipliers

are typically grater than unity, there is a tendency to amplify any noise in the Tb data. Nevertheless, apart form the unique data set derived from the (A)ATSR instruments, all other satellite infrared radiometer systems use the multi-spectral technique to retrieve SST from space. The real innovation for the (A)ATSR series of sensors is the ability to retrieve Tb in several spectral wavebands from the same area of the sea surface at two different viewing angles. This technique is called along-track scanning and is shown schematically in Figure 1. As the AATSR flies forwards along the sub-satellite track of the ENVISAT platform, a conical scan mechanism allows a view of the sea surface to be made at 55° forward of the vertical nadir view. About 2 minutes later (and some ~1000km in distance) a nadir view of the sea surface is obtained at exactly the same place as the forward view. With this viewing geometry, the AATSR is able to view the sea surface along two different atmospheric path-lengths; where the forward atmospheric path length is about twice that of the nadir atmospheric path length. As a consequence, the integrated atmospheric attenuation along the forward view path is approximately double that of the nadir view. Assuming that the SST and atmospheric structure remain stationary during the short time interval between forward and nadir views, any difference in signal between the forward and nadir channel Tb must be due to the intervening atmosphere. It should be clear that along-track-scanning allows the atmospheric component of the measured signal to be explicitly accounted for by differencing the forward and nadir image data sets (bearing in mind the assumptions of stationairity made above). In addition, the along track scanning technique has a unique capacity to compensate for difficult atmospheric situations including significant aerosol load, Saharan dust and volcanic aerosols [2]. No other satellite infrared radiometer has this capability to maintain calibration is highly variable atmospheric conditions.
Figure 1. The View geometry of the ENVISAT AATSR highlighting the along-track-scanning dual view capability.
The (A)ATSR will form a reference data set for other satellite derived SST products using combined analysis techniques to derive the next generation of Climate Data Record (CDR) [3]. It is therefore essential that the performance of the AATSR is well known across the entire mission lifetime [4]. The AATSR is exceptionally well calibrated based on both pre-launch sensor characterisation and accurate in-flight monitoring of all systems using primary and secondary standards and fundamental engineering and scientific methods. To ensure the quality of the SSTskin products on a continuing basis it is essential that the AATSR instrument calibration is monitored by rigorous surface and in situ measurement programmes. Geophysical product validation studies provide the only measure of uncertainty for the SSTskin products derived from the AATSR based on independent in situ instruments. Only with good calibration and validation can changes in AATSR SSTskin products be ascribed to changes in the instrument or changes in the environment.
This paper presents a validation study using data collected aboard a commercial ship operating between the United Kingdom and Northern Spain during 2004-2005. Part 2 of the paper describes the in situ data set collected which is then matched to AATSR data. Part 3 explains the methodology used to match AATSR and in situ data including a short review of associated errors and assumptions. Part 4 presents our results and part 5 presents our conclusions and further work.
2. DATA COLLECTION Since March 2004, the P&O vessel Pride of Bilbao (PoB) has been used to collect in situ observations in support of ENVISAT AATSR SSTskin validation. The PoB is a large passenger ferry that operates a regular route between Portsmouth UK and Bilbao, Northern Span twice per week. The track of the PoB (shown in Figure 2) allows sampling of a wide range of waters including eutrophic harbours, seasonally stratified water over the narrow shelf, up welling along shelf

break and oligothrophic deep ocean waters (>4000m) in the Bay of Biscay. A particular feature of the ship track is its passage through the Ushant region which is dominated by a strong and characteristic tidal front. Since March 2004 two ISAR systems have been used to collect SSTskin data in a sustained manner aboard the P&O Ferries vessel M/V Pride of Bilbao (PoB) which operates in the English Channel and Bay of Biscay. The PoB makes two return passages per week between Portsmouth (England) and Bilbao (Spain). Figure 3 shows a summary time-line of all ISAR deployments aboard the PoB completed between March 2004 and October 2005 in support of AATSR validation. The ISAR systems were installed on the starboard bridge wing of the PoB with an uninterrupted view of the sea surface free of ship bow wave effects. The height of the instrument above the sea surface was 26m. The ISAR was programmed to view the sea surface at a zenith angle of 25° and an azimuth angle of 155°. For the sea view observation, 40 samples were obtained, for the sky view 10 samples were obtained and 30 samples were taken while looking at each calibration blackbody. The total measurement sequence takes 140 s although the sky view observations are made immediately after the sea view measurements. A value for seawater emissivity was taken from [10] for an angle of 25° appropriately weighted by the ISAR field of view which has an elliptical footprint on the sea surface of ~6.3 x 7.0m. During normal operations, the ship has a speed of ~20 kt. The ISAR instrument functioned without intervention apart from sporadic visits to check the system and download data while the ship was in port. One system remains at sea while the other system is returned to the laboratory for maintenance and calibration. Each ISAR is calibrated both before and after every deployment using a reference water bath blackbody cavity [7].
Figure 2 Cruise track taken by the P&O Ferries vessel Pride of Bilbao in 2004-05. In 2005, only the Portsmouth Bilbao route was operated. The
ship track is coloured according to the SSTskin temperature measured by an ISAR radiometer.
Figure 3. Deployment schedule for ISAR instrument 002 and instrument 003 during 2004 and 2005. Top lines indicate deployment durations,
middle section notes any significant events and the lower section indicates the instrument and laboratory calibrations. In addition to the ISAR instrument, the PoB has been equipped with a suite of ocean and atmospheric instrumentation as indicated in Table 1. These observations are used to interpret the SSTskin validation data sets and to study air-sea

interaction as part of an on-going study to develop better parameterisation schemes for the prediction of diurnal variability, skin temperature deviations and air-sea fluxes of heat and momentum.
Table 1 Summary of in situ instrumentation and measurements made aboard the P&O M/V Prise of Bilbao in support of AATSR validation during 2004/5.
Instrument Name Model Parameter Sample rate Accuracy Status Chelsea Instruments CTD and Fluorimeter
MINIpack CTD-F Temperature Conductivity Depth Fluorescence
1 s Active
Autonomous Sea Surface Temperature Radiometer (ISAR)
ISAR-5C SSTskin Pitch/Roll CMG SMG Magnetic variation Latitude Longitude
5min 1s 1s 1s 1s 1s 1s
+/-0.1K +/-1° 0.1° ~0.06 m/s +/-1.0 uT (up to 70 uT) <10 m <10 m
Active
Kipp&Zonen solarimeter
CM11 Shortwave radiation 1s ISO-9060 Secondary Standard class
Active
Eppley Pyrgeometer Downward long-wave radiation
1s ~5% following laboratory characterisation
Currently in calibration and refurbishment expected back July 2004.
Gill sonic anemometer Wind-master 3 axis sonic anemometer
u,v & z wind components located above the bridge
1s (16 Hz capability)
Depends on corrections applied to data
Active logging @ 1s high resolution sampling expected in June/July 2004
SeaBird hull mounted SST sensor
SBE48 internal hull thermistor
SSTdepth@ 5m (nominal)
1s 0.001K Expected back from calibration June/July 2004
Rain gauge Mini-ORG-115 Precipitation rate (0.1-500 mm/hour) Precipitation accumulation (0.001 to 999.999 mm)
1s Depends on algorithm – currently desire a ‘standard’ rain gauge for comparisons
Active (part of the ISAR system)
Vaisala HMP-240 humidity sensor
Vaisala Air Temperature, Humidity
1s 0.01K <1%
Operational
All data were logged to a Linux workstation via a dedicated data logging package that ensured a common timestamp for all instruments. The Met Office AWS system reported observations via INMARSAT satellite communications every hour. In the future, we hope to provide a real time data communication to all data streams aboard the PoB. During this study, all observations were downloaded from the logger system while the ship was in port and all instrumentation checked every 2-3 weeks. Every 3 months, the ISAR instrument was returned to the laboratory for maintenance and calibration and a completely serviced instrument was deployed in its place. In this way, two ISAR systems are required to provide continuous operations.
Global ATS_NR__2P AATSR data were provided from the UK PAC on CD-ROM and more recently on DVD-ROM. The switch to DVD-ROM was a useful development as the number of CD-ROM’s necessary to store all AATSR data was exceptionally large causing safe storage problems. Delivery delays of 1-3 months from real time were normal for CD-RAM and DVD-ROM data sets. More recently, AATSR data have been accessed directly from operational data servers provided by ESA where data are available for several days in a near real time (NRT) rolling archive configuration. The latter solution is functioning exceptionally well as data are available within a matter of hours from reception and only data corresponding to the area of interest need to be downloaded. We highly recommended the combined use of a NRT data server with DVD-ROM delayed-mode deliveries as the optimal solution for our AATSR validation purposes.
3. UNCERTAINTIES WITHIN THE VALIDATION MATCHUP PROCESS SST is a difficult parameter to define exactly because the upper ocean (~10 m) has a complex and variable vertical temperature structure that is related to ocean turbulence and the air-sea fluxes of heat, moisture and momentum. Definitions of SST provide a necessary theoretical framework that can be used to understand the information content and relationships between measurements of SST made by different satellite and in situ instruments. Figure 4 identifies several different SST definitions [6]. Each SST definition has been carefully considered in order to achieve the closest possible coincidence between what is defined and what can be measured operationally, bearing in mind current scientific knowledge and understanding of how the near surface thermal structure of the ocean behaves in nature.
• The interface SST (SSTint) is a theoretical temperature at the precise air-sea interface. It represents the hypothetical temperature of the topmost layer of the ocean water and could be thought of as an even mix of water and air molecules. SSTint is of no practical use because it cannot be measured using current technology. It is important to note that it is the SSTint that interacts with the atmosphere.

• The skin SST (SSTskin) SSTskin is defined as the radiometric temperature measured by an infrared radiometer operating in the 10-12 micrometer spectral waveband. As such, it represents the actual temperature of the water across a very small depth of approximately 20 micrometers. This definition is chosen for consistency with the majority of infrared satellite and ship mounted radiometer measurements. SSTskin measurements are subject to a large potential diurnal cycle including cool skin layer effects (especially at night under clear skies and low wind speed conditions) and warm layer effects in the daytime (although the latter are not shown in Figure 4).
• The sub-skin SST (SSTsub-skin) represents the temperature at the base of the thermal skin layer. The difference between SSTint and SSTsubskin is related to the net flux of heat through the thermal skin layer. For practical purposes, SSTsubskin can be well approximated to the measurement of surface temperature by a microwave radiometer operating in the 6-11 GHz frequency range, but the relationship is neither direct nor invariant to changing physical conditions or to the specific geometry of the microwave measurements. SSTsubskin is the temperature of a layer ~1mm thick at the ocean surface.
Figure 4 Vertical profile of SST from the surface ocean to a depth of 10m identifying definitions for SST at different depths and typical
measurement techniques. δT indicates a typical timescale for each SST quantity.
• SSTdepth or SST(z) is the terminology adopted to represent an in situ measurement near the surface of the ocean that is typically reported simply as SST or "bulk" SST. For example SST6m would refer to an SST measurement made at a depth of 6m. Without a clear statement of the precise depth at which the SST measurement was made, and the circumstances surrounding the measurement, such a sample lacks the information needed for comparison with, or validation of satellite-derived estimates of SST using other data sources. The terminology has been introduced to encourage the reporting of depth (z) along with the temperature. All measurements of water temperature beneath the SSTsubskin are obtained from a wide variety of sensors such as drifting buoys having single temperature sensors attached to their hull, moored buoys that sometimes include deep thermistor chains at depths ranging from a few meters to a few thousand meters, thermosalinograph (TSG) systems aboard ships recording at a fixed depth while the vessel is underway, Conductivity Temperature and Depth (CTD) systems providing detailed vertical profiles of the thermohaline structure used during hydrographic surveys and to considerable depths of several thousand meters and various expendable bathythermograph systems (XBT). In all cases, these temperature observations are distinct from those obtained using remote sensing techniques and measurements at a given depth arguably should be referred to as 'sea temperature' (ST) qualified by a depth in meters rather than sea surface temperatures. The situation is complicated further when one considers ocean model outputs for which the SST may be the mean SST over a layer of the ocean several tens of meters thick.
• The foundation SST, SSTfnd, is defined as the temperature of the water column free of diurnal temperature variability or equal to the SSTsubskin in the absence of any diurnal signal. It is named to indicate that it is the foundation temperature from which the growth of the diurnal thermocline develops each day. SSTfnd provides a connection with historical “bulk” SST measurements typically used as representative of the oceanic mixed layer temperature. This definition was adopted by GHRSST-PP at the Third GHRSST-PP Workshop (Donlon, 2003b) to provide a more precise, well-defined quantity than previous loosely defined “bulk” temperature quantities and consequently, a better representation of the mixed layer temperature. The SSTfnd product provides an SST that is free of any diurnal variations (daytime warming or nocturnal cooling). In general, SSTfnd will be similar to a night time minimum or pre-dawn value at depths of ~1-5 m, but some differences could exist. Only in situ contact

thermometry is able to measure SSTfnd. SSTfnd cannot be directly measured using either microwave or infrared satellite instruments. Analysis procedures must be used to estimate the SSTfnd from radiometric measurements of SSTskin and SSTsubskin.
The concept of AATSR validation is easy as it simply involves comparing the AATSR SSTskin product temperature with the true SSTskin temperature measured by an infrared radiometer aboard a ship, aircraft or other platform. However, the practice of validation is much more difficult as very rarely are we able to compare the exact same quantities and additional uncertainties are introduced into the validation data set. Uncertainties are introduced because the AATSR SSTskin observations represent the instantaneous average SSTskin over the sensor field of view whereas an in situ measurement is fundamentally different as it provides a point sample SST measurement, at a specific depth, and normally at a time and location differing from the AATSR measurement. Furthermore, there are uncertainties associated with the in situ observations themselves, the AATSR measurements and the time-space criteria used to co-locate satellite and in situ observations together (called matchups). These uncertainties must be considered when properly deriving validation statistics for AATSR SSTskin products. The error in a satellite measurement of SSTskin, εsat, is given by
ννε −= satsat (1) where νsat is the satellite-estimated value and ν is the true value of the ocean variable represented by the satellite view, i.e. its average over the satellite pixel area at the instant of the overpass. In practice ν is not known precisely and instead the in situ measured value, νw, is used. The error of an in situ sample is given by εw where:
ννε −= ww (2) Traditionally, validation statistics (mean bias and standard deviation over a specified time period) for satellite SST products are based on the analysis of a well specified matchup database of near contemporaneous satellite and in situ observations which yields a match-up difference, ΔMDB. Thus for a given sample pair
wsatMDB νν −=Δ (3) This is not the same as the actual satellite measurement error εsat since it includes the error associated with the in situ measurement εw used as a proxy for the true temperature, ν. In order to estimate εsat and validate AATSR SSTskin data, it is necessary to estimate εW and if possible to minimise it. In the case of a ship mounted sensor (either a radiometer or a sub-surface temperature sensor), εW can be separated into several different types of error inherent within the validation process:
WzWsWmWrWtW εεεεεε ++++= (5) where εWt is a temporal mismatch error, εWr is a location mismatch error, εWm is the inherent instrument measurement error, εWs is a point-in-area sampling error and εWz is a sampling depth error (meant to describe the impact of stratification). εWm must be determined independently for each in situ instrument through careful independent sensor calibration obtained before deployment and post deployment although this is not always possible (e.g., drifting buoys, ARGO floats). Often calibration experiments require a bias correction to be applied to the measurement with as associated uncertainty. Random errors in εWm are more of a problem and can be reduced by an increased number of independent observations. In the case of the ISAR instrument used in this study, calibration data have been obtained before and after each deployment aboard the Pride of Bilbao using a reference water bath blackbody cavity [7]. Mean calibration differences of < 60mK are typical following a 3 month deployment of ISAR. εWm has additional components relating to the deployment situation for a given measurement campaign including the deployment geometry used (length of atmospheric path and atmospheric emission/absorbtion and is typically <0.05K,), the impact on errors related to the emissivity of water including errors relating to atmospheric state (humidity, air temperature etc), sea state (ship roll and pitch, deployment geometry), ship reflections at the sea surface, wake contamination and for sub-surface measurements, the impact of the ship platform itself. Other platforms will have different errors that must also be considered e.g., for an aircraft deployment shadowing of the sea surface, large pathway between the aircraft and the sea surface. These types of error are some of the most difficult to establish and will vary according to instrument, deployment platform, season and study area. Errors in the specification of sea water emissivity which depend on the geometry of
deployment must be minimised by using view angles < 40° from nadir view beyond which seawater emissivity in the infrared significantly diminishes. The use of roll/pitch sensors is employed to monitor situations when ship movements are sufficient to introduce errors in the SSTskin determination from the radiometer. However, the most significant measurement error (up to 0.2K in a worst case scenario) is due to a rapidly changing sky when clouds may contaminate the measurements [8]. There is little that can be done to minimise this error except to note that, in the case of satellite SSTskin validation where cloud free conditions are required, the error will be negligible. In summary, we expect the combined uncertainty of ISAR SSTskin retrievals to be ~0.1K for cloud free conditions. εWs arises from using a point sample of ν to represent the spatial average of ν over the pixel field of view. Its magnitude depends on the degree of sub-pixel variability and spatial structures (fronts, stratification, etc) present and is not readily measured. Satellite pixel block assessments over 3x3 7x7 areas can be used to compute useful statistical parameters describing the SST structures (SST gradients, standard deviation of SST) over the area which should ideally be computed form a long-term climatology. The in homogeneity of the atmospheric structure can be investigated with atmospheric soundings of temperature and humidity and clouds estimated from the satellite data themselves, from visual inspection or all-sky camera data. εWs could be estimated from other measurements e.g., the use of high resolution infrared SST observations to characterise the intra-variability within a microwave instrument FoV, the use of fast sampling instrumentation aboard low-flying aircraft or from ocean model outputs. We use output from the United Kingdom National Centre for Ocean Forecasting (NCOF) Atlantic Margins Model (AMM) to characterise the typical gradients of SST in the Bay of Biscay, Western approaches and English channel. Gradients of >1 K km-1 are typical in the Ushant area and in the Western Approaches but negligible in the Biscay area as shown in Figure 5. Clearly validation matchup data obtained in regions of high SST gradients must be closely matched in space and time is significant εWs are to be avoided.
Figure 5. SST variability in the study area. (a) Mean daily SST in March 4th 2005 (b) Corresponding SST gradients. Note the strong gradients in
the Ushant area and western approaches typical of the dynamic SST structures in this region characterised by strong baroclinic flows in the western approaches. The region heavily stratifies to the west of Plymouth with strong frontal boundaries in the region of the Ushant front and
lesser gradients in the central channel © Met Office 2005. εWz arises when in situ SSTdepth measurements are used to validate SSTskin, SSTsubskin or SSTfoundation temperatures and can be minimised by comparing like observation types. Uncertainties arise due incorrectly reported measurement depths e.g., in situ drifting buoy observations are perceived to measure the SST1m but are often located at different depths, the depth of ship observations changes with the draught of the ship – a function of the day to day cargo loading. While there is scope for applying adjustments for vertical stratification as a means to reduce εWz, such techniques require their own error estimate to be added into the error budget for εWz. Often data likely to be affected by diurnal stratification are removed from the validation analysis based on wind speed and solar radiation measurements. εWt is the time displacement error caused by the mismatch in time, tdif , between the in situ sample and the satellite overpass. It can be estimated as
ttdiffWt ∂
∂=
νε (6)
tdiff could be due to timing errors (normally small) but arises more significantly from trying to maximise the number of available matchups when satellite and in situ sampling is sparse (e.g., prevented by clouds, limited in situ infrastructure,
etc). εWr is the spatial displacement error caused when the in situ sample is displaced from the matched image pixel by a distance Δr. It can be estimated as
rrWr ∂∂
Δ=νε (7)
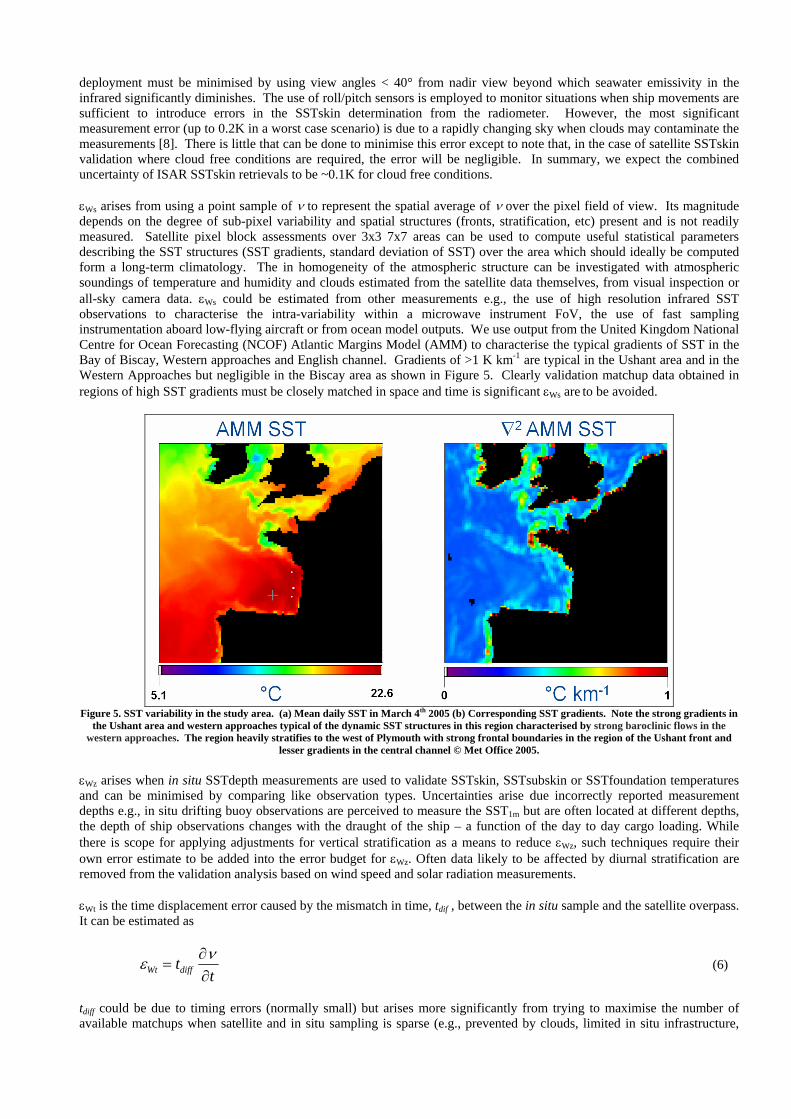
Δr could be due to location error (normally small) but arises more significantly from trying to maximise the number of matchups when satellite sampling is sparse (e.g., prevented by clouds, limited in situ infrastructure, etc). εWt and εWr can be minimised by providing more in situ observations and is a more significant problem for infrared sensors where cloud and aerosol contamination prevent a useful SST retrieval. εWs, εWz, εWt and εWr are all primarily a function of vertical and horizontal ocean temperature gradients and be minimal in open ocean regions far from temperature fronts and tidal influences, at night-time (free of solar radiation) and under moderate wind speed conditions (> 5m/s) - the latter which prevents diurnal stratification or significant skin temperature deviation from forming due to wind induced mixing [6]. Figure 6 shows a number of validation scenarios that consider the choice of match-up criteria for buoy and underway sampled in situ data. Cases (a) and (b) consider the choice when comparing a fixed buoy measurement to a satellite measurement and cases (c) and (d) the choices when comparing observations obtained from a moving platform (e.g., a ship, aircraft or drifting buoy). In this Figure, Tdiff sets the maximum allowed time discrepancy between overpass and in situ sample, N sets the maximum search radius or swath such that Δr < N Δx, Δt, the sensor sampling interval or integration time and M which sets the time window of tdiff = ± M Δt. The use of search radius/swath allows a greater sample to be obtained, minimising the error in εWs but at the potential cost of increasing εWt and εWr. In open ocean conditions far from horizontal temperature gradients, at night with a moderate wind speed this may be the most appropriate validation strategy but in order to determine suitable values for N and M, the MDB must contain a satellite observations over a spatial area. Furthermore, as N and M are expected to change in magnitude as the environmental conditions (cloud, wind, SSI etc) change, the MDB should also include other measurements and parameters over a similar spatial area and as in situ measurements.
Figure 6. Examples of match-up situations encountered in the construction of a match-up database. (a) Point sample when there is no cloud.
Match the in situ sample closest to the time of the overpass to the pixel in which it lies. Time and space errors are minimal with small SST gradients, at night with a moderate wind stress. (b) Point sample obscured by cloud. Match the in situ sample closest to the time of the overpass to the closest cloud-free pixel. The search radius needs to be limited to N pixels. In this case, a search radius must be employed to overcome the
problems of clouds obscuring the most appropriate pixel and establish a match-up pair. Representation errors are increased (c) Along-track sensor such as ISAR in cloud free conditions. Match the in situ sample closest to the time of the overpass to the pixel in which it lies. In the case of a moving ship with regular samples time mismatch errors are present, although small in this particular case (d) Along-track sensor in cloudy conditions. Time and space errors are present in this case and displacement errors are potentially large and must be constrained by appropriate
boundaries. The size of the match-up dataset depends on the definition of data coincidence used in the matchup process. If the requirement is too severe then very few high quality matchup data records will be generated. If coincidence criteria are

weakly defined then a large number data records will be generated but of reduced quality depending on the horizontal temperature gradients and dynamical character of the validation region as discussed above. We have adopted an approach which specifies four different grades of matchup criteria that relate to a search radius, NΔx, for spatial coincidence and the time window, MΔt, for temporal matching, as illustrated in Figure 6 We match the ISAR record to the corresponding AATSR image datasets according to a set of criteria specified as follows:
Grade-1 Coincidence of ISAR and AATSR sample within ± 2000 s time window and ±1 km search radius in space. This corresponds to the closest coincidence considered feasible for a satellite sensor having a FoV or ~1 km, within 1 km spatially and about half an hour in time, and effectively yields a match to the pixel containing the ship at the time of the overpass. εWs, εWz, εWt and εWr will be minimal in this case. Improvements might be made by using an even smaller temporal window although errors in εWs may increase. Grade-2A Temporal match within ± 2000 s and spatial match within ± 20 km. This allows a match to the nearest cloud free pixel to the ship track within a radius of 20 km and in regions of low SST gradient, will yield a useful data record. In regions of high SST gradient, εWs, εWz, εWt and εWr will impact the validity of the matchup record. Grade-2B Temporal match within ± 2 hrs and spatial match within ± 1 km. This grade limits the search radius to 1 km but allows a match to an earlier or later part of the ship track within a time window of 2 hours either side. εWs, εWz, εWt and εWr may be large in some cases. Grade-3 Temporal match within ± 2 hrs and spatial match within ± 20 km. allows matches with both the wider spatial search radius and the extended time window. This corresponds to typical international practice for the calibration of other SST sensors against, for example, buoy temperatures. εWs, εWz, εWt and εWr may be large in some cases.
An automatic processing system which operates automatically without human intervention has been developed to create matchup data records of near contemporaneous in situ and AATSR SSTskin observations. An autonomous system ensures that no subjective decisions are made which might bias the matching and thus the validation process. Given a file(s) containing the calibrated record of an ISAR deployment, and access to the AATSR data files covering the same period of time as the deployment, the validation process must find the matched pairs for different grades of coincidence criteria, and then evaluate the mean and standard deviation of the differences for all matched pairs corresponding to a particular grade. Our automated validation approach nearly always leads to multiple matches for a given satellite overpass. In these cases, the AATSR-ISAR differences are averaged across all of the individual matched pairs to yield a single validation match-up for that overpass and validation grade. The matching algorithm rejects any matches found at locations corresponding to the ship being in port, or close to port, where it is unlikely that the ISAR and AATSR are properly viewing the sea surface temperature. The associated uncertainty error for each validation data set depends on its location, time of day, environmental conditions at the time of overpass, atmospheric structure and calibration of the ISAR radiometer. The likely range of errors is summarised in Table 2 for the PoB validation data summarised in this paper.
Table 2 Summary of uncertainty errors associated with AATSR validation in the Bay of Biscay/Western Approaches area using an ISAR radiometer.
Error Comments Best case Worst case εWm 1. ISAR instrument calibration
2. SSTskin measurement technique (assuming correct emissivity) due to rapidly changing clouds impacting the SST measurement
1. 0.06K 2. 0.05K
1. 0.1K 2. 0.2K
εWz Only a major issue if using SSTdepth sensors to validate AATSR SSTskin measurements.
• If a radiometer is used to validate AATSR the error is 0K
• If an SSTdepth sensor is used then under strong winds at night a permanent cool skin of -0.17K is expected that must be accounted for. Otherwise the error is 0K.
• If a radiometer is used to validate AATSR the error is 0K
• If an SSTdepth sensor is used in weak winds during the daytime (warm stratification) errors of 4.0K are expected. Under weak winds at night in clear sky conditions errors associated with cool skin deviations of up to -1.0 K can be expected
εWs Depends on spatial and temporal characteristics of the SST gradients in the validation area.
1. In open ocean areas (Bay of Biscay):<0.1K
2. In shelf and Western approaches:0.1K
3. In Region of Ushant and coastal zone: 0.2K
1. In open ocean areas (Bay of Biscay): <0.3K 2. In shelf and Western approaches: 0.7K 3. In Region of Ushant and coastal
zone:>1.0K
εWt Depends on εWs and allowable tdif Grade-1 (± 0.5hr mis-match): <0.1K Grade-3 (± 2 hrs mis-match): could be >>1K in strong diurnal warming conditions
εWr Depends on εWs and allowable Δr Grade-1 (±1 km mis-match): <0.1K Grade-3 (± 20 km mis-match): >1.0K in Ushant region but could be much greater with diurnal variability.
4. RESULTS Validation data were obtained at all points of the ship track shown in Figure 2 and data obtained in or close to Portsmouth and Bilbao have been removed from the analysis due to the strong temperature gradients characteristic of these regions

introducing additional uncertainty into the analysis. Table3 provides a summary of the Grade-1 validation data set that was collected during 2004/5 using the ISAR radiometer deployed on the M/V Pride of Bilbao. In general, Grade-2 validation data were in most cases similar to Grade 1 but with some notable exceptions. Grade 2a tended to show more consistency than Grade 2b validations suggesting that, in these cases, time displacement errors are more significant that space displacement errors. However a more detailed investigation is required in order to draw firm conclusions. Grade-3 validations were inconsistent with Grade-1 and Grade-2 validations of the dual view SSTskin retrieval highlighting that reduced space (±20km) and time (±2 hours) co-location criteria are inappropriate for AATSR validation studies. A total of 143 co-located data pairs from 27 separate AATSR satellite overpasses were obtained for dual-view SSTskin Grade-1 validation. A total of 248 co-located data pairs from 27 separate AATSR satellite overpasses were obtained for nadir-only-view SSTskin Grade-1 validation.
Table 3 Summary results for Grade-1 validation of AATSR using the ISAR radiometer system deployed aboard the P&O M/V Pride of Bilbao during 2004/5.
Dual view SST retrieval Nadir view SST retrieval
Set Date Bias (K) SD (K) Number overpasses
Number of points Bias (K) SD (K) Number
overpasses Number of
points D1-4 Mar-Dec 2004 0.2 0.33 17 92 0.55 0.39 17 163 D5 Jan – Mar 2005 - - 0 - - 0 D6 Mar-Jun 2005 0.06 0.12 3 16 0.60 0.39 3 25 D7 Jun –Sep 2005 0.07 0.39 7 35 0.51 0.34 7 60
Results for the Nadir-only SSTskin retrieval algorithm show a consistent warm bias (0.55K) and standard deviation (±0.4K) for the entire data set. Given the uncertainties highlighted in section 3, it is surprising that the variability of the data set is so low (~0.4K) and we suggest that this is close to the geophysical limit possible when co-locating spatial average satellite and point source in situ data sets. However, the same is not true for the dual-view retrieval which shows reduction in bias from 0.2K for deployments D1-4 (March – December 2004) to 0.065K for deployments D6 and D7 (March – September 2005). This is unexpected as independent collocations with in situ buoy observations made operationally at the Met Office [9] do not show a significant change in bias from 2004 to 2005 and suggests that either the ISAR radiometer data are incorrect or there is a problem with the AATSR data in this region (anomalous atmosphere, problems with geolocation, calibration etc). The ISAR radiometer calibrations before and after all D1-D2 deployments indicate that the radiometer data are correct. The difference in bias between D1-4 and other deployments prompted a further investigation which revealed a lot of cloud y pixels in the match-up data set. From 150 cases at night, there are only 12 cases where an 11x11 pixel area centred over the mean ship position is completely clear. In addition, the SST variability even over a few km was quite significant in all cases indicating that validation matchup criteria must be the most stringent (Geade-1). Considering the night time match-ups only for D6 and D7 deployments the bias is 0.1 K although there are only 3 match-ups at night which is more consistent with the D1-D4 cases. The consistency of the nadir only validation compared to the dual view SST may be due in part to limitations when co-registering AATSR nadir and forward view data. In the Nadir view case, the geolocation of the AATSR is exceptionally good. However, co-registration between the forward and nadir views may be no better than 1 pixel as the slant view of the ocean surface in is actually seeing ~ 2 km x 2km at the centre of the swath (i.e. is actually seeing 4 times more ocean than the nadir). This scenario highlights the benefit of an on-going in situ validation campaign to maintain the overall quality of AATSR data products. In summary, validation of night time dual view AATSR SSTs using ISAR in the Bay of Biscay suggest AATSR has a warm bias of 0.1-0.2 K. Similar biases are seen for day time dual view AATSR SSTs, but known algorithm limitations do not allow more quantitative conclusions to be drawn at this point. Validation of night time nadir AATSR SSTs show a higher warm bias of 0.2-0.35 K, showing the benefits of the dual view. The consistency of the nadir validation over time is better than that observed for the dual view validation, which is attributed to the large SST gradients found in the Bay of Biscay and to co-registration errors between the AATSR forward and nadir views. 5. CONCLUSIONS AND FURTHER WORK SSTskin measurements obtained from the ENVISATR AATSR have been validated using in situ SSTskin observations derived from an Infrared SST Autonomous Radiometer (ISAR) deployed on a ship of opportunity in the Bay of Biscay and Western Approaches of the English Channel during 2004 and 2005. This region is characterised by cool SST’s and provides a unique data set relative to other SSTskin validation data collected in support of AATSR validation in the tropics and sub-tropics.. A mature and regular program of in situ data collection is now in operation that will be sustained until 2008 which will include a near real time reporting capability. Regular calibration of the ISAR instrument both before and after each deployment ensures the accuracy of all in situ SSTskin observations. Additional ocean and atmosphere observations are used to place validation measurements into context and to help understand the uncertainty associated with each SSTskin observation. ISAR validation results are consistent across the record with co-locations between ISAR and AATSR automatically generated based on robust reproducible procedure-based criteria. The AATSR SSTskin product is performing exceptionally well and between March 2004 – September 20th 2005 the Dual view SSTskin retrieval has a small warm bias of 0.1-02K. The Nadir only SSTskin retrieval shows a more significant bias of 0.55K (±0.38K). We find that validation

data collected using weakly constrained space and time co-location criteria (±2 hours, ±20km) are inconsistent. The consistency of the nadir validation over time is better than that observed for the dual view validation, which is attributed to the large SST gradients found in the Bay of Biscay and to co-registration errors between the AATSR forward and nadir views. Finally we provide a basic framework to evaluate uncertainties in the validation data set embodied within a matchup database for a particular region. This methodology considers time and space mismatch errors together with the natural variability of the ocean and atmosphere (e.g., SST gradients, quasi-permanent frontal features etc) which will be further developed in future work to make use of auxiliary ocean and atmosphere data including wind speed, underway SST5m and solar radiation. The mean standard deviation of our AATSR validation matchups suggest that using Grade-1 validation criteria (match-up co-locations made within 0.5 hours of satellite overpass and within 1km), our results are approaching the lower limit of uncertainty and are close to the geophysical limit of variability in this study region. 6. REFERENCES 1. Barton, I.J., Satellite-derived sea surface temperatures: Current status. J. Geophys.. Res., 100: 8777-8790, 1995. 2. Merchant C.J., A.R. Harris, M.J. Murray, A.M. Zavody, Toward the elimination of bias in satellite retrievals of sea
surface temperature 1. Theory, modelling and inter-algorithm comparison, J. Geophys. Res., 104 (C10), 23565-23578, 1999
3. Donlon, C J., Proceedings of the sixth GHRSST-PP Science Team Meeting, Met Office Exeter, 16-23rd May, available from the International GHRSST-PP Project Office, Met Office, Exeter, UK, 2005.
4. WMO TD 1219, The implementation plan for the global observing system for climate in support of the UNFCCC, GCOS-92, available from the WMO, Geneva, Switzerland, 2004.
5. Donlon, C.J. M.R Reyonds, I.S. Robinson, G. Fisher, R. Edwards, F. Wimmer, T. J. Nightingale, The Infrared SST Autonomous Radiometer (ISAR): An autonomous self calibrating infrared radiometer for sustained satellite sea surface skin temperature validation, submitted to the J. Atmos.Oceanic Tech, 2005.
6. Donlon, C. J., P. Minnett, C. Gentemann, T. J. Nightingale, I. J. Barton, B. Ward and, J. Murray, Towards Improved Validation of Satellite Sea Surface Skin Temperature Measurements for Climate Research, J. Climate, Vol. 15, No. 4, 353-369, 2002.
7. Donlon, C. J, G. J Fisher and W. Wimmer, A second Generation CASOTS water bath reference blackbody cavity, In preparation, 2005.
8. Donlon, C. J. and T. J. Nightingale, The effect of atmospheric radiance errors in radiometric sea surface temperature measurements, Applied Optics, 39, 2397-2392, 2000.
9. O’Caroll, Anne and R Saunders, Met Office AATSR monitoring real-time data plots comparison between AATSR and in situ buoy observations at http://www.metoffice.gov.uk/research/nwp/satellite/infrared/aatsr/index.html. 2005.
10. Bertie, J.E., and Z.D. Lan, Infrared intensities of liquids XX: The intensity of the OH stretching band of liquid water revisited, and the best current values of the optical constants of H2O(l) at 25°C between 15,000 and 1 cm-1, Applied Spectroscopy, 50, 1047--1057, 1996.