Predicting suitable habitat for the European lobster ( Homarus gammarus), on the Basque continental...
12
ecological modelling 220 ( 2 0 0 9 ) 556–567 available at www.sciencedirect.com journal homepage: www.elsevier.com/locate/ecolmodel Predicting suitable habitat for the European lobster (Homarus gammarus), on the Basque continental shelf (Bay of Biscay), using Ecological-Niche Factor Analysis Ibon Galparsoro ∗ , Ángel Borja, Juan Bald, Pedro Liria, Guillem Chust AZTI-Tecnalia, Marine Research Division, Herrera Kaia, Portualdea s/n, 20110 Pasaia, Spain article info Article history: Received 3 August 2008 Received in revised form 10 November 2008 Accepted 13 November 2008 Published on line 30 December 2008 Keywords: Habitat suitability Multibeam echosounder GIS Ecological-Niche Factor Analysis European lobster abstract Predicting species distribution and habitat suitability (HS) modelling, across broad spatial scales, is now a major challenge in marine ecology. The resulting knowledge is of consider- able use in supporting the implementation of environmental legislation, integrated coastal zone management and ecosystem-based fisheries management. This contribution consid- ers the identification of seafloor morphological characteristics, together with wave energy conditions, that determine the presence of European lobster (Homarus gammarus); and it predicts suitable habitats over the Basque continental shelf (Bay of Biscay), in summer. The results obtained, by applying Ecological-Niche Factor Analysis (ENFA), indicate that lobster habitat differs considerably from the mean environmental condition over the study area; likewise, that it is restrictive in terms of the range of conditions in which they dwell. The best of the environmental predictors found to be: distance to the rock substrate; Benthic Position Index; wave flux over the seafloor; and the underlying bathymetry. A habitat suit- ability map was produced, with a high model quality (Boyce index: 0.98 ± 0.06). The most suitable habitat for European lobster are locations at the boundary between sedimentary- and rocky-bottoms, coincident with seafloor depressions with a steep slope, with medium to high wave energy conditions, and located within a range of water depths of 35–40 m. This approach demonstrates the applicability of the method in case studies where only presence data are available, together with the inclusion of environmental variables obtained from different sources. © 2008 Elsevier B.V. All rights reserved. 1. Introduction Natural resource management requirements (e.g., ecosystem- based approaches, marine protected areas, fishing, habitat identification), have led to the increasing use of species habitat modelling. Different statistical and mathematical techniques have been applied to develop predictive habitat distribution models (Guisan and Zimmermann, 2000). Amongst these, envelope-based approaches, such as Ecological-Niche Factor ∗ Corresponding author. Tel.: +34 943 00 48 00; fax: +34 943 00 48 01. E-mail address: [email protected] (I. Galparsoro). Analysis (ENFA), are considered particularly advantageous; this is because, with respect to more standard techniques, it does not require absence data. In ENFA, presence data is used instead, to compare with environmental conditions (Hirzel et al., 2002; Braunisch et al., 2008). ENFA has been applied more frequently to terrestrial habitat modelling (Estrada-Pena and Venzal, 2007; Vina et al., 2008), however, recently, it has been used also in the marine environment (Oviedo, 2007; Praca and Gannier, 2008; Skov et al., 2008). 0304-3800/$ – see front matter © 2008 Elsevier B.V. All rights reserved. doi:10.1016/j.ecolmodel.2008.11.003
Transcript of Predicting suitable habitat for the European lobster ( Homarus gammarus), on the Basque continental...

e c o l o g i c a l m o d e l l i n g 2 2 0 ( 2 0 0 9 ) 556–567
avai lab le at www.sc iencedi rec t .com
journa l homepage: www.e lsev ier .com/ locate /eco lmodel
Predicting suitable habitat for the European lobster(Homarus gammarus), on the Basque continental shelf(Bay of Biscay), using Ecological-Niche Factor Analysis
Ibon Galparsoro ∗, Ángel Borja, Juan Bald, Pedro Liria, Guillem ChustAZTI-Tecnalia, Marine Research Division, Herrera Kaia, Portualdea s/n, 20110 Pasaia, Spain
a r t i c l e i n f o
Article history:
Received 3 August 2008
Received in revised form
10 November 2008
Accepted 13 November 2008
Published on line 30 December 2008
Keywords:
Habitat suitability
Multibeam echosounder
GIS
Ecological-Niche Factor Analysis
European lobster
a b s t r a c t
Predicting species distribution and habitat suitability (HS) modelling, across broad spatial
scales, is now a major challenge in marine ecology. The resulting knowledge is of consider-
able use in supporting the implementation of environmental legislation, integrated coastal
zone management and ecosystem-based fisheries management. This contribution consid-
ers the identification of seafloor morphological characteristics, together with wave energy
conditions, that determine the presence of European lobster (Homarus gammarus); and it
predicts suitable habitats over the Basque continental shelf (Bay of Biscay), in summer. The
results obtained, by applying Ecological-Niche Factor Analysis (ENFA), indicate that lobster
habitat differs considerably from the mean environmental condition over the study area;
likewise, that it is restrictive in terms of the range of conditions in which they dwell. The
best of the environmental predictors found to be: distance to the rock substrate; Benthic
Position Index; wave flux over the seafloor; and the underlying bathymetry. A habitat suit-
ability map was produced, with a high model quality (Boyce index: 0.98 ± 0.06). The most
suitable habitat for European lobster are locations at the boundary between sedimentary-
and rocky-bottoms, coincident with seafloor depressions with a steep slope, with medium
to high wave energy conditions, and located within a range of water depths of 35–40 m. This
approach demonstrates the applicability of the method in case studies where only presence
data are available, together with the inclusion of environmental variables obtained from
different sources.
frequently to terrestrial habitat modelling (Estrada-Pena and
1. Introduction
Natural resource management requirements (e.g., ecosystem-based approaches, marine protected areas, fishing, habitatidentification), have led to the increasing use of species habitatmodelling. Different statistical and mathematical techniques
have been applied to develop predictive habitat distributionmodels (Guisan and Zimmermann, 2000). Amongst these,envelope-based approaches, such as Ecological-Niche Factor∗ Corresponding author. Tel.: +34 943 00 48 00; fax: +34 943 00 48 01.E-mail address: [email protected] (I. Galparsoro).
0304-3800/$ – see front matter © 2008 Elsevier B.V. All rights reserved.doi:10.1016/j.ecolmodel.2008.11.003
© 2008 Elsevier B.V. All rights reserved.
Analysis (ENFA), are considered particularly advantageous;this is because, with respect to more standard techniques, itdoes not require absence data. In ENFA, presence data is usedinstead, to compare with environmental conditions (Hirzel etal., 2002; Braunisch et al., 2008). ENFA has been applied more
Venzal, 2007; Vina et al., 2008), however, recently, it has beenused also in the marine environment (Oviedo, 2007; Praca andGannier, 2008; Skov et al., 2008).
g 2 2
trZhiitswicottsbacpK2
(sTsbFt1(A
gtkmieag(sts
tdt
2
2
TB(o
e c o l o g i c a l m o d e l l i n
Habitat distribution models statistically link field observa-ions, to a set of environmental variables or spatial predictors,eflecting some key characteristics of the niche (Guisan andimmermann, 2000; Hirzel and Guisan, 2002). Specifically,abitat suitability (HS) modelling has been used successfully
n understanding species niche requirements and predict-ng potential species distribution, e.g., it has been appliedo the spiny lobster (Panulirus argus), using satellite data inhallow water (Bello et al., 2005), to gorgonian corals in deep-ater (Bryan and Metaxas, 2007), to squat lobster distribution
n deep-water (Wilson et al., 2007), mapping macrobenthicommunities (Degraer et al., 2008), and predictive mappingf fish species richness (Pittman et al., 2007). The applica-ion of such methods to marine species, linked closely tohe benthic environment, requires reliable information oneabed characteristics. Multibeam echosounders (MBES) areecoming a standard tool for seafloor mapping, due to theirbility to provide high-resolution data sets and extensiveoverage; they are especially valuable for benthic habitat map-ing and shellfish resource studies (Edwards et al., 2003;ostylev et al., 2003; Orpin and Kostylev, 2006; Ryan et al.,007).
In the particular case of shellfish, the American lobsterHomarus americanus) fishery is well known, on the basis ofeveral studies (Incze et al., 2000; Rowe, 2002; Smith andremblay, 2003; Wahle, 2003). Conversely, for the European lob-ter (Homarus gammarus), most of the present knowledge haseen derived from aquaculture studies (Van der Meeren, 2005).ishery studies have been undertaken only in northern coun-ries, such as the United Kingdom (Bannister and Howard,991; Smith et al., 2001; Lizarraga-Cubedo et al., 2003), IrelandBrowne et al., 2001; Tully et al., 2001) or Norway (Tveite, 1979;gnalt et al., 2007).
In the Basque Country, a marine habitat mapping pro-ramme started in 2004 (Galparsoro et al., 2008), where one ofhe objectives was to determine habitat suitability for someey species, including the economically important H. gam-arus. Although along the Basque coast this fishery is limited,
n terms of number of fishing vessels or catches, its socio-conomic importance in some ports is very high (Arregi etl., 2004). However, there is a lack of information on the H.ammarus fishery and on the official registration of catchesBorja, 1987), leading to an underestimate of the populationize (Puente, 2002). This lack of information makes it difficulto understand the stock and its management to maintain austainable fishery.
The objectives of the present contribution are (i) to definehe main seafloor features and wave energy conditions thatetermine the presence of H. gammarus and (ii) to predict habi-at suitability for the lobster, using ENFA.
. Materials and methods
.1. Study area and lobster sampling
he study area is located in the inner continental shelf of theasque Country, in the southeastern part of the Bay of Biscay
Fig. 1). The main lobster fishing ports within the area are thosef San Sebastian and Pasaia.
0 ( 2 0 0 9 ) 556–567 557
H. gammarus is distributed along the eastern Atlantic, fromLofoten Islands (Norway) in the North Atlantic, to Morocco andthe Black Sea in the Mediterranean (Holthuis, 1991). The lob-ster is territorial, with nocturnal activity (Smith et al., 1998); itfeeds on a range of benthic invertebrates (Smith et al., 2001),mainly crustaceans and bivalve molluscs. The lobster appearsusually in the infralittoral and the circalittoral (20–60 m waterdepth), over seabeds incorporating rock blocks and sandygalleries (Templado et al., 2004). Cooper and Uzmann (1980)have described how lobsters tend to excavate holes or tun-nels with one or more exits below rocks, with there being arelationship between hole size and the size of the individual.Moreover, Howard (1980) has established a significant relation-ship between the size of individuals and substrate type.
Lobster sampling surveys were undertaken between 7 Juneand 10 August 2007, with a professional lobster fishing boat.The survey was carried out during the permitted period forfishing, in summer. A total of 17 lobster pot lines were laid,near the ports of San Sebastian and Pasaia (Fig. 1). Each linewas 650 m long, including 60 pots. The initial, middle (or bear-ing change) and final positions of the lines were recorded,using GPS. In all cases, the pots were located at the limitbetween a rock bed and the presence of sand patches, basedupon the experience of the fishermen. Pots were deployed inthe afternoon and recovered in the morning, taking advantageof the night activity of the lobsters. For each line, the num-ber of lobsters, their sex and morphometric measurements(carapace length and width) were recorded (Bald et al., 2008).
2.2. Multibeam echosounder data
Ship-borne MBES data were acquired, as part of the continen-tal shelf characterisation and habitat mapping programmesurvey, between 2005 and 2006. Bathymetric and seafloorbackscatter information were acquired, using high-resolutionSeaBat 7125 and SeaBat 8125 MBES. Both sets of equipmenthad similar characteristics (RESON, 2002, 2006).
Most of the work was carried out using the SeaBat 7125model; its operational frequency is 400 kHz, producing 256beams in a 128◦ angle swath and using up to 50 swaths persecond. The beam width is 0.5◦ along-track and 1◦ across-track, producing very small footprints; these, in turn, resultin high horizontal resolution digital elevation models (DEM).The MBES was coupled with an Agp132 (TRIMBLE) global posi-tion system, receiving differential corrections. An OCTANSIII (IXSEA) gyrocompass and motion sensor was utilised, tocompensate for the movement of the vessel. Furthermore, aportable SVP 15 (RESON) was used, to measure sound velocityprofiles throughout the entire water column (Ernstsen et al.,2006). The software package PDS2000 was used to integratethe MBES data, with the information from all the auxiliarysensors during the surveys—data acquisition and synchro-nization. This software was used in real-time, as well as inthe post-processing of the integrated data. Tidal correctionwas applied using the nearest tide gauge and 1 m resolu-tion seafloor DEM was produced in projected coordinate UTM,
Zone 30 N (WGS84). The DEM was generalised into a 5 m grid,in order to increase the speed of computational processing;finally, it was exported into ESRI grid format and integratedinto a Geographic Information System (ArcGIS; ESRI). The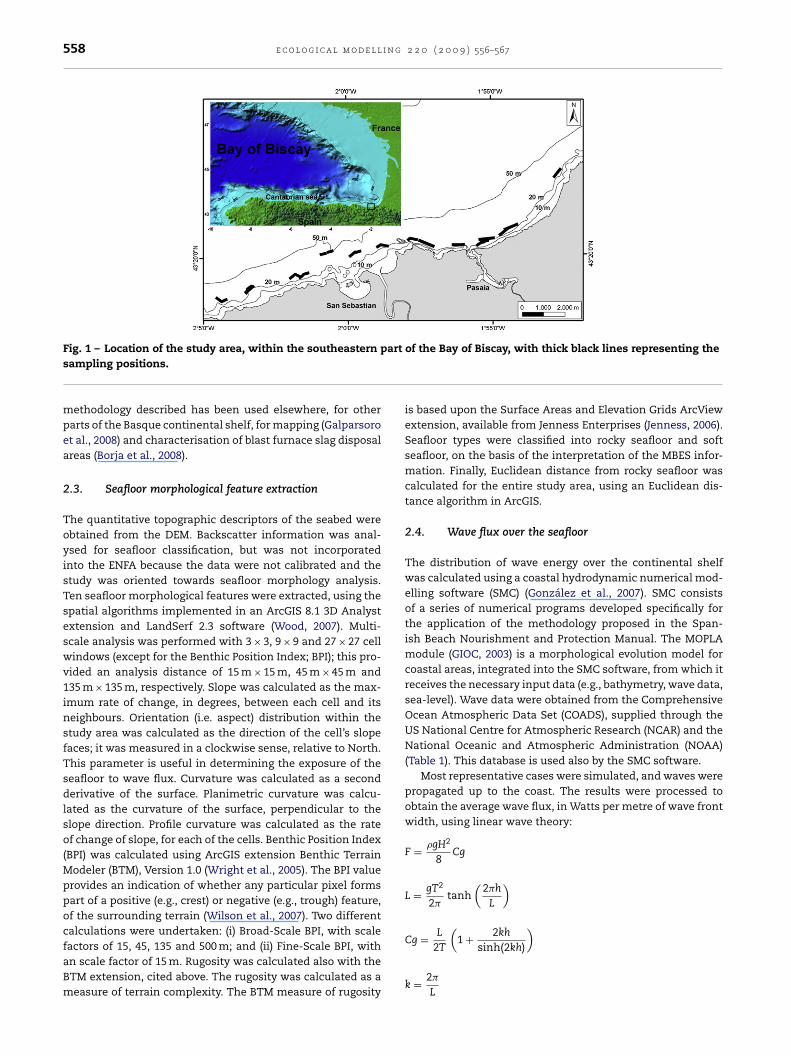
558 e c o l o g i c a l m o d e l l i n g 2 2 0 ( 2 0 0 9 ) 556–567
part
Fig. 1 – Location of the study area, within the southeasternsampling positions.methodology described has been used elsewhere, for otherparts of the Basque continental shelf, for mapping (Galparsoroet al., 2008) and characterisation of blast furnace slag disposalareas (Borja et al., 2008).
2.3. Seafloor morphological feature extraction
The quantitative topographic descriptors of the seabed wereobtained from the DEM. Backscatter information was anal-ysed for seafloor classification, but was not incorporatedinto the ENFA because the data were not calibrated and thestudy was oriented towards seafloor morphology analysis.Ten seafloor morphological features were extracted, using thespatial algorithms implemented in an ArcGIS 8.1 3D Analystextension and LandSerf 2.3 software (Wood, 2007). Multi-scale analysis was performed with 3 × 3, 9 × 9 and 27 × 27 cellwindows (except for the Benthic Position Index; BPI); this pro-vided an analysis distance of 15 m × 15 m, 45 m × 45 m and135 m × 135 m, respectively. Slope was calculated as the max-imum rate of change, in degrees, between each cell and itsneighbours. Orientation (i.e. aspect) distribution within thestudy area was calculated as the direction of the cell’s slopefaces; it was measured in a clockwise sense, relative to North.This parameter is useful in determining the exposure of theseafloor to wave flux. Curvature was calculated as a secondderivative of the surface. Planimetric curvature was calcu-lated as the curvature of the surface, perpendicular to theslope direction. Profile curvature was calculated as the rateof change of slope, for each of the cells. Benthic Position Index(BPI) was calculated using ArcGIS extension Benthic TerrainModeler (BTM), Version 1.0 (Wright et al., 2005). The BPI valueprovides an indication of whether any particular pixel formspart of a positive (e.g., crest) or negative (e.g., trough) feature,of the surrounding terrain (Wilson et al., 2007). Two differentcalculations were undertaken: (i) Broad-Scale BPI, with scale
factors of 15, 45, 135 and 500 m; and (ii) Fine-Scale BPI, withan scale factor of 15 m. Rugosity was calculated also with theBTM extension, cited above. The rugosity was calculated as ameasure of terrain complexity. The BTM measure of rugosityof the Bay of Biscay, with thick black lines representing the
is based upon the Surface Areas and Elevation Grids ArcViewextension, available from Jenness Enterprises (Jenness, 2006).Seafloor types were classified into rocky seafloor and softseafloor, on the basis of the interpretation of the MBES infor-mation. Finally, Euclidean distance from rocky seafloor wascalculated for the entire study area, using an Euclidean dis-tance algorithm in ArcGIS.
2.4. Wave flux over the seafloor
The distribution of wave energy over the continental shelfwas calculated using a coastal hydrodynamic numerical mod-elling software (SMC) (González et al., 2007). SMC consistsof a series of numerical programs developed specifically forthe application of the methodology proposed in the Span-ish Beach Nourishment and Protection Manual. The MOPLAmodule (GIOC, 2003) is a morphological evolution model forcoastal areas, integrated into the SMC software, from which itreceives the necessary input data (e.g., bathymetry, wave data,sea-level). Wave data were obtained from the ComprehensiveOcean Atmospheric Data Set (COADS), supplied through theUS National Centre for Atmospheric Research (NCAR) and theNational Oceanic and Atmospheric Administration (NOAA)(Table 1). This database is used also by the SMC software.
Most representative cases were simulated, and waves werepropagated up to the coast. The results were processed toobtain the average wave flux, in Watts per metre of wave frontwidth, using linear wave theory:
F = �gH2
8Cg
L = gT2
2�tanh
(2�h
L
)
( )
Cg = L2T1 + 2kh
sinh(2kh)
k = 2�
L
e c o l o g i c a l m o d e l l i n g 2 2 0 ( 2 0 0 9 ) 556–567 559
Table 1 – Mean annual wave distribution offshore, along the Basque coast. Data extracted from the SMC softwaredatabase (for details, see text).
Swell Sea Calm
Significant height (m) 3 2.1
315
wCp
lt
wp
o
F
wgttoioc
assidabe(
2s
Tstwtmeorprtb
Peak period (s) 13Peak direction (◦) 297Percentage of occurrence 22
here � = 1025 kg m−3, g = 9.81 m s−2, H = wave height (in m),g = group celerity (in m s−1), L = wavelength (in m), T = waveeriod (in s) and h = water depth (in m).
The vertical distribution of the flux of the energy (using theinear theory of waves) has a distribution which is proportionalo
cosh2[k(h + z)]cosh(kh) sinh(kh)
here z is the vertical position related to the mean level, withositive values lying upwards.
Thereafter, the average wave energy flux in the first metrever the seafloor is given by
= 1100
(Fswell
TpswellPswell + Fsea
TpseaPsea + Pcalm
)
here Fswell is the energy flux at the sea bed, for a certaineographical location and for an average swell wave, Fsea ishe energy flux at the sea bed, for a certain geographical loca-ion and for an average sea wave, Tpswell is the peak periodf a swell wave, Tpsea is the peak period of a sea wave, Pswell
s the percentage occurrence of swell, Psea is the percentageccurrence of sea waves, and finally Pcalm is the percentage ofalms.
Mean wave flux, per metre of fetch over the first metrebove the seafloor was calculated, for all of the continentalhelf, using a 20 m grid cell size. Finally, the grid was re-ampled to the same resolution as the remainder of the grids,.e. 5 m. This procedure does not increase the resolution of theata; besides, it was undertaken to homogenise and to oper-te between different layers in the software. Similar tools haveeen used previously in investigating the influence of wavenergy, on other benthic species such as in Pollicipes pollicipesBorja et al., 2006).
.5. Ecological-Niche Factor Analysis and habitatuitability map production
he ENFA approach, developed by Hirzel et al. (2002) computesuitability functions by comparing the species distribution inhe eco-geographical variables (EGVs) space, with that of thehole set of cells. For this, independent EGVs describe, quan-
itatively, some characteristics for each of the cells. The EGVay represent topographical features (e.g., altitude, slope),
cological data (e.g., seagrass cover, nitrate concentration),r human structures, e.g., distance to the nearest coastline,oad density. With respect to more standard techniques, a
articular advantage in the use of ENFA is that it does notequire ‘absence data’. The factor analysis method is applied,o transform several correlated variables into the same num-er of uncorrelated factors. As these factors explain the sameSum of all directions that are not capableof wave propagation, up to the coast
886.6 21.4
amount of the total variance, subsequent analyses may berestricted to the few important factors, e.g., those explain-ing the largest part of the variance, without losing significantinformation. Prior to applying the ENFA a covariance matrixand a correlation tree were computed, in order to identify thehighly correlated variables, as such to remove them from lateranalysis, as they are considered redundant. Following ENFA,the criterion adopted for the selection of the number of factorswas carried out using the ‘broken-stick distribution’ (Hirzel etal., 2002). The factor analysis may permit the extraction oflinear combinations of the original variables, on which thefocal species shows most of its Marginality (M) and Special-ization (S). M represents the ecological distance between thespecies optimum and the mean habitat within the referencearea (Hirzel et al., 2002). It is defined as the absolute differencebetween global mean (mG) and species mean (mS), divided by1.96 standard deviations (ıG) of the global distribution:
M = 〈mG − mS〉1.96ıG
M will lie mostly between zero and one. A large value (close toone) means that the species lives in a very particular habitat,relative to the reference set. The equation is used mainly toexplain the principle of the method. The operational definitionof Marginality, implemented in the Biomapper 3.2 software, isprovided by an equation which is a multivariate extension ofthe above equation. Similarly, S is defined as the ratio of thestandard deviation of the global distribution (∂G), to that of thefocal species (∂S):
S = ∂G
∂S
A randomly selected set of cells may be anticipated to havea Specialization of one; any value exceeding unity indicatessome form of Specialization. In order to establish which spatialscale was performing best, the ENFA was applied indepen-dently to each analysis scale. After selecting the best analysisscale, in relation to the resulting Marginality and Specializa-tion, a HS map was produced. The resulting HS map is definedas a composition of cells, or pixels, whose quantitative valuesrange from 0 to 1 (Hirzel et al., 2006). These values indicate howclose the local environment is to the species’ optimal condi-tions; as such, higher values are associated with more suitableareas.
The HS was calculated using the Medians Algorithm. Asno independent data were available, the predictive accu-racy of the suitability maps was evaluated by a Jack-knifeArea-Adjusted Frequency Cross-Validation procedure; it was
applied with 10 partitions, together with a random seed,following the method described by Boyce et al. (2002). Thisapproach produces a confidence interval (of between 0 and 1),around the predicted accuracy of the habitat model (Skov et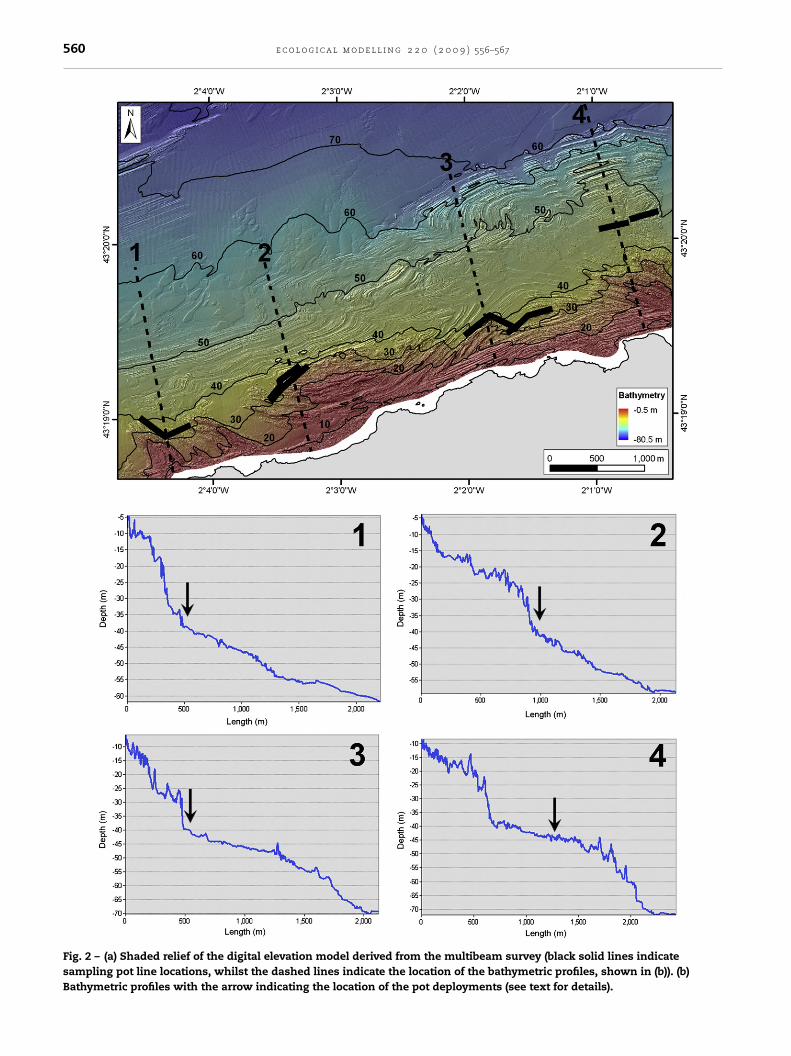
560 e c o l o g i c a l m o d e l l i n g 2 2 0 ( 2 0 0 9 ) 556–567
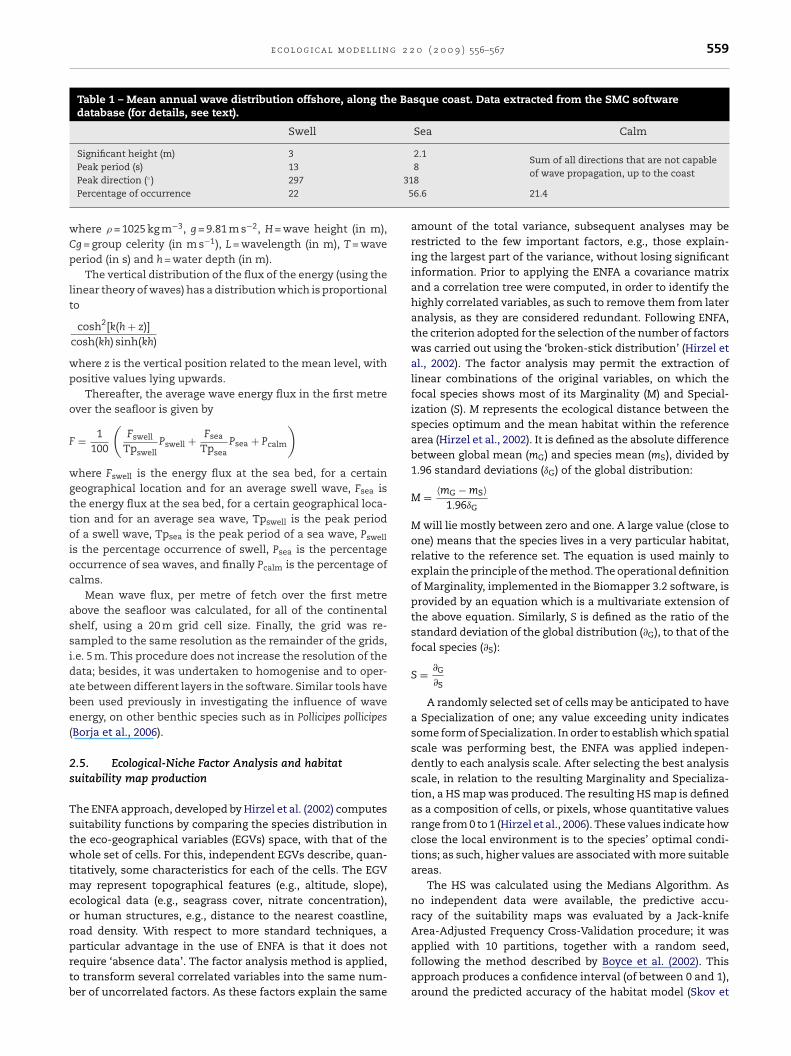
Fig. 2 – (a) Shaded relief of the digital elevation model derived from the multibeam survey (black solid lines indicatesampling pot line locations, whilst the dashed lines indicate the location of the bathymetric profiles, shown in (b)). (b)Bathymetric profiles with the arrow indicating the location of the pot deployments (see text for details).
e c o l o g i c a l m o d e l l i n g 2 2 0 ( 2 0 0 9 ) 556–567 561
metr
amioracs
3
3
T3lgsi6
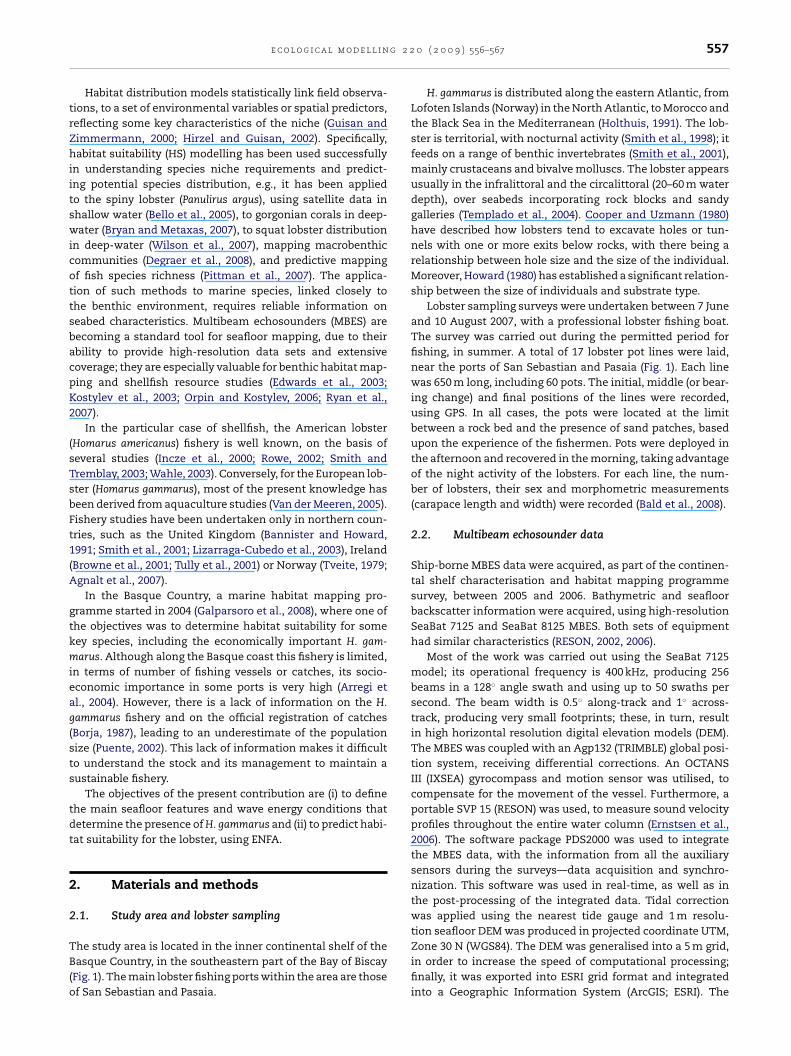
Fig. 3 – Wave flux distribution in the first
l., 2008). Values lying close to 0 indicate low confidence of theodel, whereas 1 indicates the best confidence. The Boyce
ndex provides a predicted-to-expected ratio curve, whichffers further insights into the model quality: robustness, HSesolution, and deviation from randomness. Such informationssists in reclassifying predicted maps, into meaningful HSlasses. Thus, the continuous Boyce index is a reliable mea-ure of ‘presence-only’ based predictions (Hirzel et al., 2006).
. Results
.1. Seafloor morphology
he total area of the seabed characterized was 84.9 km2, with,358,221 cells. In terms of seafloor morphology, eustatic sea-evel changes are highly relevant in controlling the present
eomorphology of the area. The water depth range over thetudy area lay between 0.5 and 89.3 m, with slope values rang-ng from 0◦, for a sedimentary seabed, up to a steep slope of5.5◦, for certain rocky beds. A shallow and high roughnessTable 2 – Lobster sampling data obtained in June–August 2007,number of lobsters fished and the water depth.
Date Hour Initial latitude(north)
Initial longitude(west)
Final(nort
2007/06/07 8:33 43.31685 −2.07619 432007/06/07 9:13 43.32161 −2.05412 432007/06/07 9:34 43.32430 −2.03369 432007/06/08 7:56 43.32679 −2.02217 432007/06/08 9:59 43.32165 −2.05518 432007/06/12 7:50 43.33712 −1.98339 432007/06/12 9:40 43.34056 −1.91513 432007/06/13 8:26 43.34001 −1.95912 432007/06/13 10:41 43.34154 −1.91262 432007/06/14 6:51 43.34009 −1.95943 432007/06/14 8:24 43.33575 −1.99212 432007/06/20 11:12 43.33787 −1.93242 432007/06/20 12:48 43.34633 −1.90155 432007/06/29 7:23 43.36947 −1.87644 432007/06/29 8:39 43.33963 −1.91857 432007/08/10 7:51 43.33598 −2.00817 432007/08/10 8:45 43.33493 −2.01207 43
e of the water column above the seabed.
bedrock belt, associated with coastal topography, is dominant;it has a slope of approximately 10%, following an inflex-ion point at around 32–40 m water depth (Fig. 2). Thereafter,the platform extends offshore, with a milder slope (rangingbetween 1.5% and 2%). Over this area, the seafloor roughness islower and sand patches occur commonly between the exposedrock strata. In very shallow waters, blocks originating fromcoastal cliff erosion processes appear.
The seafloor slopes in all directions, but the westerly com-ponent (226◦) dominates in response to the reshaping actionof waves, over the sedimentary bottom. In terms of seafloortypes, 16.2 km2 were classified as being rocky (18.1%, of thetotal surface), with 67.7 km2 as a sedimentary bottom (75.8%,of the total surface). The maximum Euclidean distance to rock,for the entire study area, was 1400 m.
The wave flux over the first metre from the seafloor var-
ied from 0 kW h m−1 (i.e. areas without wave influence) to9 kW h m−1 (Fig. 3). The most energetic areas were (i) thoseoriented towards the NW (main wave front orientation) and(ii) locations where the water depth decreased dramaticallyincluding the initial and final position of each pot line, the
latitudeh)
Final longitude(west)
Number oflobsters
Depth (m)
.31608 −2.06955 3 −40.9
.31820 −2.05909 2 −39.7
.32486 −2.02661 11 −39.7
.32533 −2.02655 4 −35.5
.31844 −2.05928 8 −40.0
.33756 −1.97621 6 −34.8
.33994 −1.92449 14 −38.6
.33714 −1.94993 5 −30.6
.34479 −1.90688 3 −38.0
.33987 −1.96548 5 −35.4
.33325 −1.99912 9 −33.7
.33787 −1.94000 12 −36.5
.34393 −1.90983 3 −31.8
.36556 −1.88077 1 −34.2
.33725 −1.92585 0 −34.2
.33522 −2.01197 4 −49.5
.33432 −2.01600 2 −44.6
562 e c o l o g i c a l m o d e l l i n g 2 2 0 ( 2 0 0 9 ) 556–567
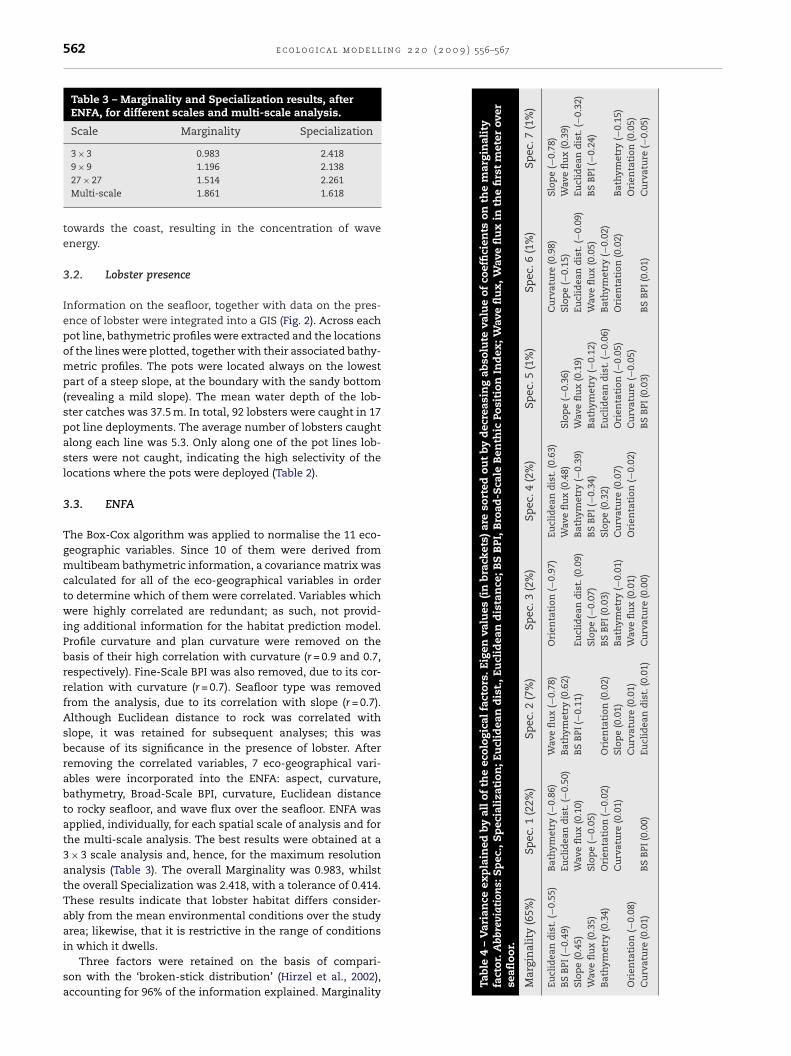
Table 3 – Marginality and Specialization results, afterENFA, for different scales and multi-scale analysis.
Scale Marginality Specialization
3 × 3 0.983 2.418
Var
ian
ceex
pla
ined
byal
lof
the
ecol
ogic
alfa
ctor
s.Ei
gen
valu
es(i
nbr
ack
ets)
are
sort
edou
tby
dec
reas
ing
abso
lute
valu
eof
coef
fici
ents
onth
em
argi
nal
ity
brev
iati
ons:
Sp
ec.,
Sp
ecia
liza
tion
;Eu
clid
ean
dis
t.,E
ucl
idea
nd
ista
nce
;BS
BPI
,Bro
ad-S
cale
Ben
thic
Posi
tion
Ind
ex;W
ave
flu
x,W
ave
flu
xin
the
firs
tm
eter
over
ty(6
5%)
Spec
.1(2
2%)
Spec
.2(7
%)
Spec
.3(2
%)
Spec
.4(2
%)
Spec
.5(1
%)
Spec
.6(1
%)
Spec
.7(1
%)
ist.
(−0.
55)
Bat
hym
etry
(−0.
86)
Wav
efl
ux
(−0.
78)
Ori
enta
tion
(−0.
97)
Eucl
idea
nd
ist.
(0.6
3)C
urv
atu
re(0
.98)
Slop
e(−
0.78
)49
)Eu
clid
ean
dis
t.(−
0.50
)B
ath
ymet
ry(0
.62)
Wav
efl
ux
(0.4
8)Sl
ope
(−0.
36)
Slop
e(−
0.15
)W
ave
flu
x(0
.39)
Wav
efl
ux
(0.1
0)B
SB
PI(−
0.11
)Eu
clid
ean
dis
t.(0
.09)
Bat
hym
etry
(−0.
39)
Wav
efl
ux
(0.1
9)Eu
clid
ean
dis
t.(−
0.09
)Eu
clid
ean
dis
t.(−
0.32
)0.
35)
Slop
e(−
0.05
)Sl
ope
(−0.
07)
BS
BPI
(−0.
34)
Bat
hym
etry
(−0.
12)
Wav
efl
ux
(0.0
5)B
SB
PI(−
0.24
)(0
.34)
Ori
enta
tion
(−0.
02)
Ori
enta
tion
(0.0
2)B
SB
PI(0
.03)
Slop
e(0
.32)
Eucl
idea
nd
ist.
(−0.
06)
Bat
hym
etry
(−0.
02)
Cu
rvat
ure
(0.0
1)Sl
ope
(0.0
1)B
ath
ymet
ry(−
0.01
)C
urv
atu
re(0
.07)
Ori
enta
tion
(−0.
05)
Ori
enta
tion
(0.0
2)B
ath
ymet
ry(−
0.15
)(−
0.08
)C
urv
atu
re(0
.01)
Wav
efl
ux
(0.0
1)O
rien
tati
on(−
0.02
)C
urv
atu
re(−
0.05
)O
rien
tati
on(0
.05)
0.01
)B
SB
PI(0
.00)
Eucl
idea
nd
ist.
(0.0
1)C
urv
atu
re(0
.00)
BS
BPI
(0.0
3)B
SB
PI(0
.01)
Cu
rvat
ure
(−0.
05)
9 × 9 1.196 2.13827 × 27 1.514 2.261Multi-scale 1.861 1.618
towards the coast, resulting in the concentration of waveenergy.
3.2. Lobster presence
Information on the seafloor, together with data on the pres-ence of lobster were integrated into a GIS (Fig. 2). Across eachpot line, bathymetric profiles were extracted and the locationsof the lines were plotted, together with their associated bathy-metric profiles. The pots were located always on the lowestpart of a steep slope, at the boundary with the sandy bottom(revealing a mild slope). The mean water depth of the lob-ster catches was 37.5 m. In total, 92 lobsters were caught in 17pot line deployments. The average number of lobsters caughtalong each line was 5.3. Only along one of the pot lines lob-sters were not caught, indicating the high selectivity of thelocations where the pots were deployed (Table 2).
3.3. ENFA
The Box-Cox algorithm was applied to normalise the 11 eco-geographic variables. Since 10 of them were derived frommultibeam bathymetric information, a covariance matrix wascalculated for all of the eco-geographical variables in orderto determine which of them were correlated. Variables whichwere highly correlated are redundant; as such, not provid-ing additional information for the habitat prediction model.Profile curvature and plan curvature were removed on thebasis of their high correlation with curvature (r = 0.9 and 0.7,respectively). Fine-Scale BPI was also removed, due to its cor-relation with curvature (r = 0.7). Seafloor type was removedfrom the analysis, due to its correlation with slope (r = 0.7).Although Euclidean distance to rock was correlated withslope, it was retained for subsequent analyses; this wasbecause of its significance in the presence of lobster. Afterremoving the correlated variables, 7 eco-geographical vari-ables were incorporated into the ENFA: aspect, curvature,bathymetry, Broad-Scale BPI, curvature, Euclidean distanceto rocky seafloor, and wave flux over the seafloor. ENFA wasapplied, individually, for each spatial scale of analysis and forthe multi-scale analysis. The best results were obtained at a3 × 3 scale analysis and, hence, for the maximum resolutionanalysis (Table 3). The overall Marginality was 0.983, whilstthe overall Specialization was 2.418, with a tolerance of 0.414.These results indicate that lobster habitat differs consider-ably from the mean environmental conditions over the studyarea; likewise, that it is restrictive in the range of conditions
in which it dwells.Three factors were retained on the basis of compari-son with the ‘broken-stick distribution’ (Hirzel et al., 2002),accounting for 96% of the information explained. Marginality
Tabl
e4
–fa
ctor
.Ab
seafl
oor.
Mar
gin
ali
Eucl
idea
nd
BS
BPI
(−0.
Slop
e(0
.45)
Wav
efl
ux
(B
ath
ymet
ry
Ori
enta
tion
Cu
rvat
ure
(
e c o l o g i c a l m o d e l l i n g 2 2 0 ( 2 0 0 9 ) 556–567 563
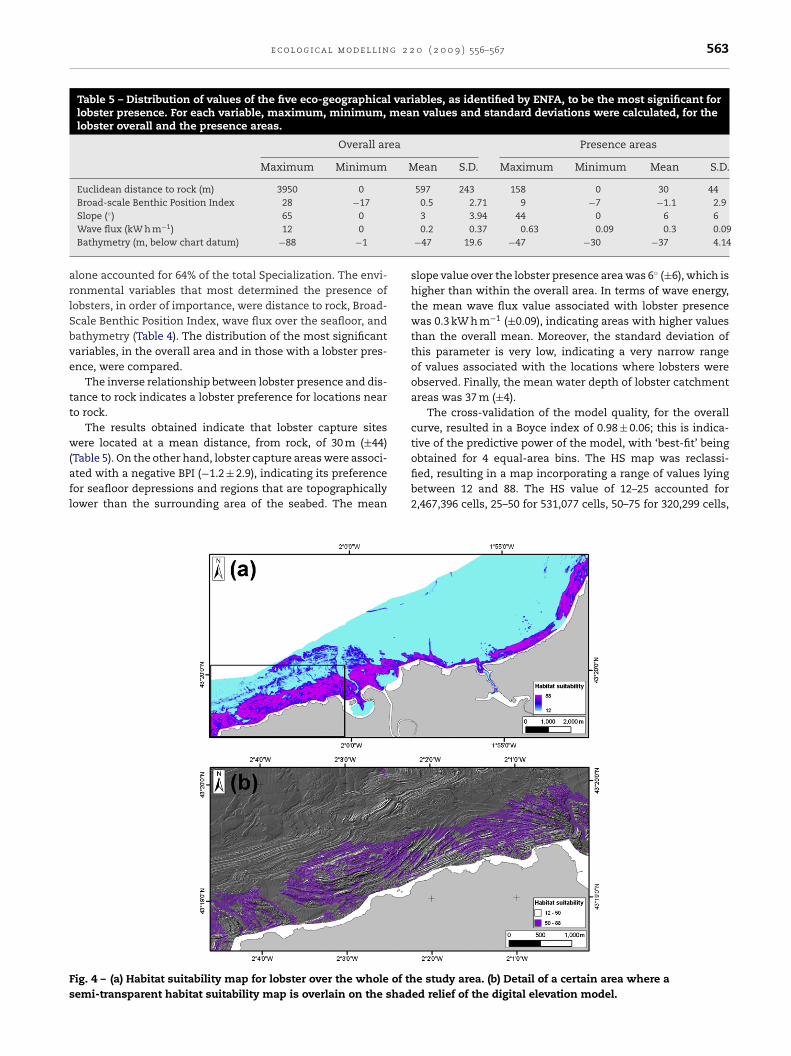
Table 5 – Distribution of values of the five eco-geographical variables, as identified by ENFA, to be the most significant forlobster presence. For each variable, maximum, minimum, mean values and standard deviations were calculated, for thelobster overall and the presence areas.
Overall area Presence areas
Maximum Minimum Mean S.D. Maximum Minimum Mean S.D.
Euclidean distance to rock (m) 3950 0 597 243 158 0 30 44Broad-scale Benthic Position Index 28 −17 0.5 2.71 9 −7 −1.1 2.9
arlSbve
tt
w(afl
Fs
Slope (◦) 65 0Wave flux (kW h m−1) 12 0Bathymetry (m, below chart datum) −88 −1
lone accounted for 64% of the total Specialization. The envi-onmental variables that most determined the presence ofobsters, in order of importance, were distance to rock, Broad-cale Benthic Position Index, wave flux over the seafloor, andathymetry (Table 4). The distribution of the most significantariables, in the overall area and in those with a lobster pres-nce, were compared.
The inverse relationship between lobster presence and dis-ance to rock indicates a lobster preference for locations nearo rock.
The results obtained indicate that lobster capture sitesere located at a mean distance, from rock, of 30 m (±44)
Table 5). On the other hand, lobster capture areas were associ-ted with a negative BPI (−1.2 ± 2.9), indicating its preferenceor seafloor depressions and regions that are topographicallyower than the surrounding area of the seabed. The mean
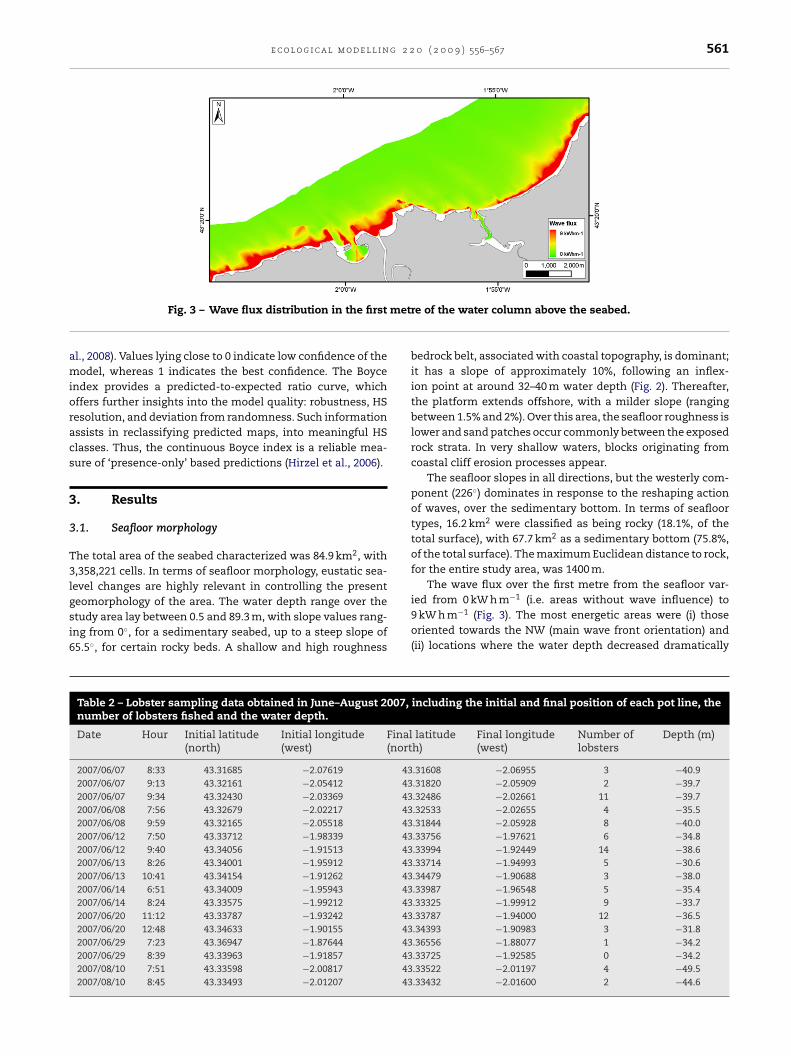
ig. 4 – (a) Habitat suitability map for lobster over the whole of themi-transparent habitat suitability map is overlain on the shad
3 3.94 44 0 6 60.2 0.37 0.63 0.09 0.3 0.09
−47 19.6 −47 −30 −37 4.14
slope value over the lobster presence area was 6◦ (±6), which ishigher than within the overall area. In terms of wave energy,the mean wave flux value associated with lobster presencewas 0.3 kW h m−1 (±0.09), indicating areas with higher valuesthan the overall mean. Moreover, the standard deviation ofthis parameter is very low, indicating a very narrow rangeof values associated with the locations where lobsters wereobserved. Finally, the mean water depth of lobster catchmentareas was 37 m (±4).
The cross-validation of the model quality, for the overallcurve, resulted in a Boyce index of 0.98 ± 0.06; this is indica-tive of the predictive power of the model, with ‘best-fit’ being
obtained for 4 equal-area bins. The HS map was reclassi-fied, resulting in a map incorporating a range of values lyingbetween 12 and 88. The HS value of 12–25 accounted for2,467,396 cells, 25–50 for 531,077 cells, 50–75 for 320,299 cells,e study area. (b) Detail of a certain area where aed relief of the digital elevation model.

i n g
564 e c o l o g i c a l m o d e l land 75–88 for 17,795,658 cells. This pattern corresponds to73.9%, 15.9%, 9.6% and 0.6% of the total surface of the studyarea, respectively (Fig. 4).
4. Discussion
The most suitable habitat for the European lobster, within theBasque coast, are locations lying at the boundary betweensedimentary and rocky bottoms. Such areas are coincidentwith seafloor depressions with a steep slope, located in waterdepths ranging between 35 and 40 m, subjected to mediumto high wave energy. These results are comparable to thoseobtained by Wilson et al. (2007) for the squat lobster Munidasp. in terms of the seafloor morphological characteristics thatbest explain the presence of the lobster. The most suitablehabitat was found to be on mound summits, covered withcoral rubble. The BPI, together with the mean curvature, werethe main eco-geographic factors contributing to the Marginal-ity of the species. The eco-geographical variables multi-scaleENFA approach was identified as providing better results thanthe one-scale analysis. In contrast, for the present study, themaximum resolution scale has been identified as resulting inthe best results. This could be explained by the fact that thestudy area is very irregular, especially for the rocky seafloor;thus, increasing the analysis window appears to homogenisethe seafloor features that are representative of the habitat ofthe lobster.
The results indicate that the distribution of the Europeanlobster is limited to depressions within the seabed, near torocky outcrops. This limitation appears to operate becauselobsters need to avoid currents, created by tidal and waveaction (Howard and Nunny, 1983). European lobsters are dis-tributed in shallower water depths than the squat lobster. Infact, the food-gathering activity of lobsters is limited to cur-rents of <25 cm s−1, although they occur commonly in areaswhere near-bed currents reach, at least, twice this particu-lar value (Shelton et al., 1981). This observation suggests thatbottom topography is important, not only in providing shel-ter from predators, thereby reducing natural mortality, butalso increasing the availability of food and the potential forgrowth and reproduction (Shelton et al., 1981). This latterauthor states that Scottish fishermen found that their potsfished best on the sides of what they identified as peaks onthe echosounder; this is because lobsters feed most activelyon the lee side of the ridges. Such an observation is consistentwith the findings of the present investigation.
Karnofsky et al. (1989) have described, for the Americanlobster, that rocky areas (incorporating creeks and crevices)appear to be adequate for refuge-finding. Lobster is a shelter-dwelling animal, which spends more than 95% of the time inshelter, whenever possible, this expresses significant fidelityto one particular shelter (Paille et al., 2002). Hence, the physi-cal structure of the habitat is a key factor in determining boththe size and number of its inhabitants (Linnane et al., 2000).Similarly, spiny lobster density has been found elsewhere to be
highest in channels, followed by hard bottom and patch reefs(Eggleston and Dahlgren, 2001). This association is becausethey provide abundant refuges, together with a likely corridorfor migrating juveniles. The presence of sand on the surround-2 2 0 ( 2 0 0 9 ) 556–567
ing seabed can facilitate shelter-digging under rocks, also forthe active hunting of buried prey (Karnofsky et al., 1989).
The most significant eco-geographical variables are indica-tive of other ecological variables, which induce the presenceof the lobster. For example, Lawton and Lavalli (1995) con-cluded that seagrass is a highly complex habitat, providingrefuge from predators and supporting the high abundances ofmany organisms, which may serve as food for lobsters. Belloet al. (2005) found that coral-dominated seabed contained thelargest proportion of the preferential habitat, as well as thehighest lobster densities in summer. However, in winter, fish-ing effort extended to deeper areas of the reef, due to thediminution of the resource in shallow located areas; this indi-cates migratory movements of this specie. In turn, Europeanlobster exhibits low migratory patterns, as demonstrated in anexperiment undertaken by Smith et al. (2001). These investi-gations found that 95% of the recaptured lobsters moved lessthan 3.8 km, from their original release positions, over periodsof up to 862 days. The directional distribution of the move-ments appeared to be related to the spatial configuration ofthe local lobster habitat, with a marked tendency for offshoremovement (Smith et al., 2001).
For the present study, the quality of the derived modelcould be considered as being good according to the acceptedstatistical test (e.g., Boyce index (Boyce et al., 2002)). Nonethe-less, special care should be taken in the representativenessof the lobster sampling. The presence of lobster is basedupon the location of the lobster fishing areas; thus, in turn,was undertaken because it was not possible to fish out ofthe allocated period. The bias in sampling (i.e. using fishery-dependent data, from pots located in similar environments)could influence the resulting predictive map. In future, arandom deployment of pots would permit patterns to be estab-lished across a broader range of seascape types; as such, anyabsence data would have been reliable and useful to enhancethe model calibration (Brotons et al., 2004).
The ENFA was created to predict faunal distributions sus-ceptible to erroneous or ‘false’ absences, due to an animal’sability to disperse or hide during field surveys (Hirzel et al.,2002); in study, this situation could be comparable to the‘catchability’ of the lobster. Hence, the ENFA is an alternativeapproach to modelling species potential distributions, whenthere is no reliable absence data (Zaniewski et al., 2002). Dif-ferences in the lobster captures can be related to three factors:(i) the availability of the resource, (ii) empirical knowledge offishermen, about lobster habitat, and (iii) the effort needed tocatch the lobsters (Bello et al., 2005). In our case, the experi-ence of fishermen has demonstrated good knowledge of thepreferred lobster habitats. The presence of lobster is restrictedto certain areas, with particular environmental characteris-tics that have been delimited and described, on the basis ofENFA.
Some authors have determined habitat suitability for fishand invertebrate species, including American lobster in termsof surface area, based upon GIS approaches (Brown et al., 2000).Nonetheless, the use of approaches such as ENFA permits the
inclusion of other environmental variables, making the anal-ysis more powerful; the abundance and population structureof lobsters appeared, elsewhere, to be determined largely byenvironmental conditions and HS (Pulfrich et al., 2003).
g 2 2
efmb(
ebim2mdcumbs
5
TEgeaws
tltwFwr
fkemftmafa
A
TaFMoaHi
r
e c o l o g i c a l m o d e l l i n
Future studies include random sampling for model qualitystimation and the application of other statistical techniquesor the comparison of results. The inclusion of new environ-
ental variables should be considered, such as, calibratedackscatter information and other oceanographic variables
water currents, temperature or wind).Habitat models are important tools for understanding the
cological niche of a particular species. However, these muste considered carefully if they are intended to represent real-
ty, providing information on the need for improved resourceanagement and habitat conservation (Etnoyer and Morgan,
007). As highlighted by Butler (2005), fishery and environ-ental managers are faced with multiple, often conflicting,
emands of resource users, politicians and scientists, whenonsidering strategies for resource management. Hence, these of ‘envelope-based’ approaches, such as the ENFA, per-its the integration of environmental and biological data, to
etter understand benthic resource distribution and habitatuitability.
. Conclusions
he Marginality and Specialization values obtained from theNFA indicate that the presence of the European lobster (H.ammarus) is determined by a range of environmental param-ters; which differ from the mean conditions over the studyrea. The preferred habitat lies adjacent to the rocky seafloorith depressions, characterized by steeply sloping seabed in
hallow waters and subjected to medium–high wave energy.To the knowledge of the authors, this is the first occasion
hat habitat modelling has been carried out for the Europeanobster. Likewise, that shallow water high-resolution seabedopographic information has been used, in combination withave flux over the seafloor, for lobster habitat modelling.
uture work will focus upon the realisation of specific surveys,ith random sampling, in order to quantify statistically the
eliability of the lobster distribution model.The increase in the availability of high-resolution and
ull coverage seabed information, together with an improvednowledge of the species biology and behavioural knowl-dge, demonstrate that multiparametric analysis is a valuableethod for the discrimination of specific areas. These areas
ulfil certain combinations of characteristics, which increasehe probability of the presence of the lobster. Such infor-
ation is essential for integrated coastal zone managementnd for decision-makers, as well as for the basic knowledgeor the adoption of ecosystem-based resource managementctions.
cknowledgments
his project was supported by the Department of Environmentnd Land Use and the Department of Agriculture, Fish andood of the Basque Government. We wish to thank Professorichael Collins (School of Ocean and Earth Science, University
f Southampton (UK) and AZTI-Tecnalia (Spain)), for kindlydvising us on some details of the manuscript; Alexandreirzel, for his comments and advice on the application and
nterpretation of the ENFA results; and colleagues of AZTI-
0 ( 2 0 0 9 ) 556–567 565
Tecnalia who collaborated in the acquisition and processingof MBES data.
This paper is contribution number 435 from AZTI-Tecnalia(Marine Research Division).
e f e r e n c e s
Agnalt, A.-L., Kristiansen, T.S., Jørstad, K.E., 2007. Growth,reproductive cycle, and movement of berried Europeanlobsters (Homarus gammarus) in a local stock off southwesternNorway. ICES J. Mar. Sci. 64 (2), 288–297.
Arregi, L., Bilbao, A., Galparsoro, I., Puente, E., 2004. Descripciónde la tipología de oficios de pesca actuales de la pescaartesanal costera. Informe inédito para Departamento deIndustria Comercio y Turismo del Gobierno Vasco, Vitoria,Spain, 117 pp.
Bald, J., Rodríguez, J.G., Arregi, L., Galparsoro, I., Borja, A., 2008. Lapesca artesanal de los crustáceos decápodos mediante artesmenores en el País Vasco. Informes Técnicos Gobierno Vasco.111, 143 pp.
Bannister, R.C.A., Howard, A.E., 1991. A large-scale experiment toenhance a stock of lobster (Homarus gammarus L.) on theEnglish east coast. ICES Mar. Sci. Symp. 192, 99–107.
Bello, P.J., Rios, L.V., Liceaga, C.M.A., Zetina, M.C., Cervera, C.K.,Arceo, B.P., Hernandez, N.H., 2005. Incorporating spatialanalysis of habitat into spiny lobster (Panulirus argus) stockassessment at Alacranes reef, Yucatan, Mexico. Fish. Res. 73(1–2), 37–47.
Borja, A., 1987. La población de nécora Liocarcinus puber en lacosta vasca. Informes Técnicos del Gobierno Vasco, Vitoria,Spain, 76 pp.
Borja, A., Liria, P., Muxika, I., Bald, J., 2006. Relationships betweenwave exposure and biomass of the goose barnacle (Pollicipespollicipes, Gmelin, 1790) in the Gaztelugatxe Marine Reserve(Basque Country, northern Spain). ICES J. Mar. Sci. 63 (4),626–636.
Borja, A., Tueros, I., Belzunce, M.J., Galparsoro, I., Garmendia, J.M.,Revilla, M., Solaun, O., Valencia, V., 2008. Investigativemonitoring within the European Water Framework Directive:a coastal blast furnace slag disposal, as an example. J.Environ. Monit. 10, 453–462.
Boyce, M.S., Vernier, P.R., Nielsen, S.E., Schmiegelow, F.K.A., 2002.Evaluating resource selection functions. Ecol. Model. 157 (2–3),281–300.
Braunisch, V., Bollmann, K., Graf, R.F., Hirzel, A.H., 2008. Living onthe edge—Modelling habitat suitability for species at the edgeof their fundamental niche. Ecol. Model. 214 (2–4), 153–167.
Brotons, L., Thuiller, W., Araújo, M.B., Hirzel, A.H., 2004.Presence-absence versus presence-only modelling methodsfor predicting bird habitat suitability. Ecography 27 (4),437–448.
Brown, S.K., Buja, K.R., Jury, S.H., Monaco, M.E., Banner, A., 2000.Habitat suitability index models for eight fish andinvertebrate species in Casco and Sheepscot Bays, Maine. N.Am. J. Fish. Manage. 20 (2), 408–435.
Browne, R.M., Mercer, J.P., Duncan, M.J., 2001. An historicaloverview of the Republic of Ireland’s lobster (Homarusgammarus Linnaeus) fishery, with reference to European andNorth American (Homarus americanus Milne Edwards) lobsterlandings. Hydrobiology 465 (1–3), 49–62.
Bryan, T.L., Metaxas, A., 2007. Predicting suitable habitat fordeep-water gorgonian corals on the Atlantic and Pacific
Continental Margins of North America. Mar. Ecol. Prog. Ser.330, 113–126.Butler, M.J., 2005. Benthic fisheries ecology in a changingenvironment: unraveling process to achieve prediction. Aquat.Liv. Resour. 18 (3), 301–311.
i n g
566 e c o l o g i c a l m o d e l lCooper, R.A., Uzmann, J.R., 1980. Ecology of juvenile and adultHomarus. In: Cobb, J.S., Phillips, B.F. (Eds.), The Biology andManagement of Lobsters, vol. II. Academic Press, New York,pp. 97–142.
Degraer, S., Verfaillie, E., Willems, W., Adriaens, E., Vincx, M., VanLancker, V., 2008. Habitat suitability modelling as a mappingtool for macrobenthic communities: an example from theBelgian part of the North Sea. Cont. Shelf Res. 28 (3), 369–379.
Edwards, B.D., Dartnell, P., Chezar, H., 2003. Characterizingbenthic substrates of Santa Monica Bay with seafloorphotography and multibeam sonar imagery. Mar. Environ.Res. 56 (1–2), 47–66.
Eggleston, D.B., Dahlgren, C.P., 2001. Distribution and abundanceof Caribbean spiny lobsters in the Key West National WildlifeRefuge: relationship to habitat features and impact of anintensive recreational fishery. Mar. Freshwater Res. 52 (8),1567–1576.
Ernstsen, V., Noormets, R., Hebbeln, D., Bartholomé, A.,Flemming, B., 2006. Precision of high-resolution multibeamecho sounding coupled with high-accuracy positioning in ashallow water coastal environment. Geo-Mar. Lett. 26 (3),141–149.
Estrada-Pena, A., Venzal, J.M., 2007. Climate niches of tick speciesin the Mediterranean region: modeling of occurrence data,distributional constraints, and impact of climate change. J.Med. Entomol. 44, 1130–1138.
Etnoyer, P., Morgan, E., 2007. Predictive habitat model for deepgorgonians needs better resolution: comment on Bryan &Metaxas (2007). Mar. Ecol. Prog. Ser. 339, 311–312.
Galparsoro, I., Chust, G., Hernández, C., Borja, A., del Campo, A.,Uriarte, A., 2008. Seafloor cartography and habitat mapping ofthe Basque inner continental shelf. In: Proceedings of the XIInternational Symposium on Oceanography of the Bay ofBiscay, AZTI-Tecnalia, San Sebastian.
GIOC, 2003. 2DH-morphodynamic evolution model for near shoreareas (MOPLA). State Coastal Office-Spanish EnvironmentalMinistry and University of Cantabria, 262 pp.
González, M., Medina, R., Gonzalez-Ondina, J., Osorio, A.,Mendez, F.J., Garcia, E., 2007. An integrated coastal modellingsystem for analyzing beach processes and beach restorationprojects. SMC Comp. Geosci. 33 (7), 916–931.
Guisan, A., Zimmermann, N., 2000. Predictive habitat distributionmodels in ecology. Ecol. Model. 135 (2–3), 147–186.
Hirzel, A., Guisan, A., 2002. Which is the optimal samplingstrategy for habitat suitability modelling. Ecol. Model. 157(2–3), 331–341.
Hirzel, A., Hausser, J., Chessel, D., Perrin, N., 2002. Ecological-Niche Factor Analysis: how to compute habitat-suitabilitymaps without absence data? Ecology 83 (7), 2027–2036.
Hirzel, A., Le Lay, G., Helfer, V., Randin, C., Guisan, A., 2006.Evaluating the ability of habitat suitability models to predictspecies presences. Ecol. Model. 199 (2), 142–152.
Holthuis, L.B., 1991. Marine lobsters of the world. An annotatedand illustrated catalogue of species of interest to fisheriesknown to date. FAO Fish. Synop. 13 (125), 292.
Howard, A.E., 1980. Substrate controls on the size composition oflobster (Homarus gammarus) populations. ICES J. Mar. Sci. 39(2), 130–133.
Howard, A.E., Nunny, R.S., 1983. Effects of near-bed currentspeeds on the distribution and behaviour of the lobsterHomarus gammarus (L.). J. Exp. Mar. Biol. Ecol. 71 (1), 27–42.
Incze, L.S., Wahle, R.A., Palma, A.T., 2000. Advection andsettlement rates in a benthic invertebrate: recruitment to firstbenthic stage in Homarus americanus. ICES J. Mar. Sci. 57 (2),
430–437.Jenness, J., 2006. Topographic Position Index (tpi jen.avx)extension for ArcView 3.x 1.3a. Jenness Enterprises.www.jennessent.com/arcview/tpi.htm.
2 2 0 ( 2 0 0 9 ) 556–567
Karnofsky, E.B., Atema, J., Elgin, R.H., 1989. Natural dynamics ofpopulation structure and habitat use of the lobster, Homarusamericanus, in a shallow cove. Biol. Bull. 176 (3),247–256.
Kostylev, V.E., Courtney, R.C., Robert, G., Todd, B.J., 2003. Stockevaluation of giant scallop (Placopecten magellanicus) usinghigh-resolution acoustics for seabed mapping. Fish. Res. 60(2–3), 479–492.
Lawton, P., Lavalli, K.L., 1995. Postlarval, juvenile, adolescent, andadult ecology. In: Factor, J.R. (Ed.), Biology of the Lobster.Academic Press, San Diego, pp. 47–88.
Linnane, A., Mazzoni, D., Mercer, J.P., 2000. A long-termmesocosm study on the settlement and survival of juvenileEuropean lobster Homarus gammarus L. in four naturalsubstrata. J. Exp. Mar. Biol. Ecol. 249 (1), 51–64.
Lizarraga-Cubedo, H.A., Tuck, I., Bailey, N., Pierce, G.J., Kinnear,J.A.M., 2003. Comparisons of size at maturity and fecundity oftwo Scottish populations of the European lobster, Homarusgammarus. Fish. Res. 65 (1–3), 137–152.
Orpin, A.R., Kostylev, V.E., 2006. Towards a statistically validmethod of textural sea floor characterization of benthichabitats. Mar. Geol. 225 (1–4), 209–222.
Oviedo, L., 2007. Dolphin sympatric ecology in a tropical ford:habitat bathymetry and topography as a strategy to coexist. J.Mar. Biol. Assoc. U.K. 87, 1327–1335.
Paille, N., Sainte-Marie, B., Brethes, J.C., 2002. Behavior, growthand survival of stage V lobsters (Homarus americanus) inrelation to shelter availability and lobster density. Mar.Freshwater Behav. Physiol. 35 (4), 203–219.
Pittman, S.J., Christensen, J.D., Caldow, C., Menza, C., Monaco,M.E., 2007. Predictive mapping of fish species richness acrossshallow-water seascapes in the Caribbean. Ecol. Model. 204(1–2), 9–21.
Praca, E., Gannier, A., 2008. Ecological niches of threeteuthophageous odontocetes in the northwesternMediterranean Sea. Ocean Sci. 4 (1), 49–59.
Puente, E., 2002. Estudio técnico-pesquero y socio-económico delas pesquerías artesanales costeras del País Vasco. ColecciónItsaso 25, 152.
Pulfrich, A., Parkins, C.A., Branch, G.M., 2003. The effects ofshore-based diamond-diving on intertidal and subtidalbiological communities and rock lobsters in southernNamibia. Aquat. Conserv. Mar. Freshwater Ecosyst. 13 (3),233–255.
RESON, 2002. SeaBat 8125 Operator’s Manual. Version 3.01, pp.1–134.
RESON, 2006. SeaBat 7125 Operator’s Manual. Version 3.0, pp.1–89.
Rowe, S., 2002. Population parameters of American lobster insideand outside no-take reserves in Bonavista Bay,Newfoundland. Fish. Res. 56 (2), 167–175.
Ryan, D.A., Brooke, B.P., Collins, L.B., Kendrick, G.A., Baxter, K.J.,Bickers, A.N., Siwabessy, P.J.W., Pattiaratchi, C.B., 2007. Theinfluence of geomorphology and sedimentary processes onshallow-water benthic habitat distribution: Esperance Bay,Western Australia. Estuar. Coast. Shelf Sci. 72 (1–2),379–386.
Shelton, P.M.J., Shelton, R.G.J., Richards, P.R., 1981. Eyedevelopment in relation to molt stage in the European lobsterHomarus gammarus (L). J. Conseil 39 (3), 239–243.
Skov, H., Humphreys, E., Garthe, S., Geitner, K., Gremillet, D.,Hamer, K.C., Hennicke, J., Parner, H., Wanless, S., 2008.Application of habitat suitability modelling to tracking data ofmarine animals as a means of analyzing their feeding
habitats. Ecol. Model. 212 (3–4), 504–512.Smith, I.P., Collins, K.J., Jensen, A.C., 1998. Movement and activitypatterns of the European lobster, Homarus gammarus, revealedby electromagnetic telemetry. Mar. Biol. 132 (4), 611–623.
g 2 2
S
S
T
T
T
V
http://dusk.geo.orst.edu/esri04/p1433 ron.html.
e c o l o g i c a l m o d e l l i n
mith, I.P., Jensen, A.C., Collins, K.J., Mattey, E.L., 2001. Movementof wild European lobsters Homarus gammarus in naturalhabitat. Mar. Ecol. Prog. Ser. 222, 177–186.
mith, S.J., Tremblay, M.J., 2003. Fishery-independent trap surveysof lobsters (Homarus americanus): design considerations. Fish.Res. 62 (1), 65–75.
emplado, J., Calvo, M., Garvía, A., Luque, A.A., Maldonado, M.,Moro, L., 2004. Guía de invertebrados y peces marinosprotegidos por la legislación nacional e internacional.Ministerio de Medio Ambiente y Consejo Superior deInvestigaciones Científicas, 214 pp.
ully, O., Roantree, V., Robinson, M., 2001. Maturity, fecundity andreproductive potential of the European lobster (Homarusgammarus) in Ireland. J. Mar. Biol. Assoc. U.K. 81 (1), 61–68.
veite, S., 1979. Catch and effort data of the lobster fishery in
Southeastern Norwegian waters during 1928 to 1975. Rapp.P.-v. Réun. Cons. int. Explor. Mer. 175, 123–126.an der Meeren, G.I., 2005. Potential of ecological studies toimprove survival of cultivated and released European lobsters,Homarus gammarus. N. Z. J. Mar. Freshwater Res. 39, 399–424.
0 ( 2 0 0 9 ) 556–567 567
Vina, A., Bearer, S., Zhang, H.M., Ouyang, Z.Y., Liu, J.G., 2008.Evaluating MODIS data for mapping wildlife habitatdistribution. Remote Sens. Environ. 112 (5), 2160–2169.
Wahle, R.A., 2003. Revealing stock–recruitment relationships inlobsters and crabs: is experimental ecology the key? Fish. Res.65 (1–3), 3–32.
Wilson, M.F.J., O’Connell, B., Brown, C., Guinan, J.C., Grehan, A.,2007. Multiscale terrain analysis of multibeam bathymetrydata for habitat mapping on the continental slope. Mar. Geod.30, 3–35.
Wood, J., 2007. Landserf Version 2.3 (www.landserf.org).Wright, D.J., Lundblad, E.R., Larkin, E.M., Rinehart, R.W., 2005.
Benthic Terrain Modeller Toolbar. Oregon State UniversityDavey Jones Locker Seafloor Mapping/Marine GIS Lab.
Zaniewski, A.E., Lehmann, A., Overton, J.M., 2002. Predictingspecies spatial distributions using presence-only data: a casestudy of native New Zealand ferns. Ecol. Model. 157 (2–3),261–280.