Structuring dynamic models of exploited ecosystems from trophic mass-balance assessments
Upload
independentCategory
view
0download
0
An ecosystem approach for the assessment of fisheries impactson marine top predators: the Bay of Biscay case study
Geraldine Lassalle1*, Didier Gascuel2, Francois Le Loc’h3, Jeremy Lobry4, Graham John Pierce5,Vincent Ridoux1,6, Maria Begona Santos7, Jerome Spitz1, and Nathalie Niquil1
1Littoral Environnement et Societes, UMR 7266 CNRS-Universite de La Rochelle, 2 rue Olympe de Gouges, La Rochelle Cedex 17042, France2Agrocampus Ouest, Pole halieutique/Fisheries and Aquatic Sciences Center, Universite europeenne de Bretagne, UMR ecologie et sante desecosystemes, 65 rue de Saint Brieuc, CS 84215, Rennes Cedex 35042, France3IRD, UMR 212 Ecosystemes Marins Exploites, IRD-IFREMER-Universite Montpellier 2, Avenue Jean Monnet, BP 171, Sete Cedex 34203, France4Irstea, Research Institute of Science and Technology for Environment and Agriculture, UR EPBX, 50 avenue de Verdun, Cestas Cedex 33612, France5School of Biological Sciences, University of Aberdeen, Zoology Building, Tillydrone Avenue, Aberdeen AB25 2TZ, UK6Centre de Recherche sur les Mammiferes Marins, UMS 3419 CNRS-Universite de La Rochelle, La Rochelle 17071, France7Centro Oceanografico de Vigo, Instituto Espanol de Oceanografıa, PO Box 1552, Vigo 36200, Spain
*Corresponding author: tel: +33 5 46 50 76 46; fax: +33 5 46 50 76 63; e-mail: [email protected].
Lassalle, G., Gascuel, D., Le Loc’h, F., Lobry, J., Pierce, G. J., Ridoux, V., Santos, M. B., Spitz, J., and Niquil, N. 2012. An ecosystem approach for theassessment of fisheries impacts on marine top predators: the Bay of Biscay case study. – ICES Journal of Marine Science, 69: 925–938.
Received 8 November 2011; accepted 29 February 2012; advance access publication 28 March 2012.
A number of marine mammal populations is currently threatened by their interactions with fisheries. The present study aimed toprovide insights into the severity of potential impacts of operational and biological interactions between top predators and fisheries,in the Bay of Biscay region. Our approach was to modify an Ecopath with Ecosim (EwE) model describing the overall structure andfunction of the ecosystem by including landings and discards of exploited stocks and estimations of the bycatch of non-target com-partments. Second, a set of ecological indices and a trophic level (TL)-based model (EcoTroph, ET) were derived from the EwE model.ET was used to simulate the effects of increasing fishing pressure on the ecosystem and, more particularly, on top predators. The Bay ofBiscay was demonstrated to be not far from overexploitation at the current fishing rate, this phenomenon being particularly noticeablefor the highest TLs. Within the toothed cetacean community, bottlenose dolphins appeared the most sensitive to resource depletion,whereas common dolphins and harbour porpoises were most impacted by their incidental captures in fishing gears. This study pro-vides a methodological framework to assess the impacts of fisheries on ecosystems for which EwE, or other ecosystem models, alreadyexist.
Keywords: Ecopath, ecosystem modelling, EcoTroph, fisheries impacts, marine mammals, trophic level.
IntroductionAssessing the actual impact of a fishery on marine mammal popu-lations has been achieved in only a very few cases. Fisheries canimpact these top predators directly, through incidental capturesin fishing gear and ship strikes (operational interaction; Lewisonet al., 2004), but also indirectly, through modifications of preyabundance, size structure, and behaviour on those occasionswhen both top predators and fisheries occupy the same “niche-space” [biological interaction: DeMaster et al., 2001; seeNorthridge (1991) and Goni (1998) for reviews of fisheriesimpacts]. Among the non-target organisms incidentally caughtin fisheries, marine mammals have received the greatest public at-tention, with mortality due to fishery bycatch being considered the
main anthropogenic threat for many cetacean populations inEuropean waters (Tregenza et al., 1997; Morizur et al., 1999;Lopez et al., 2003; ICES, 2011). Particular cases where fisherybycatch is considered to be unsustainable include the mortalityof common dolphins (Delphinus delphis) in pelagic trawls target-ing albacore tuna and sea bass in the Northeast Atlantic(Morizur et al., 1999) and the bycatch of harbour porpoises(Phocoena phocoena) in set-nets (Tregenza et al., 1997). To miti-gate and monitor the level of bycatch taking place, the EuropeanCommission (EC) passed Council Regulation No. 812/2004 thatspecifically required Member States (MS) to implementon-board observer programmes to monitor bycatches in certainfisheries and to report annually on the results. Information
# 2012 International Council for the Exploration of the Sea. Published by Oxford University Press. All rights reserved.For Permissions, please email: [email protected]
ICES Journal of
Marine ScienceICES Journal of Marine Science (2012), 69(6), 925–938. doi:10.1093/icesjms/fss049
at Centre N
ational Universitaire de D
ocumentation Scientifique et T
echnique on June 25, 2012http://icesjm
s.oxfordjournals.org/D
ownloaded from

collected by each MS on the incidental captures and killing of cet-acean in fisheries was made available from 2005 to 2008 (ICES,2010a, b). However, to be able to assess the impact on a populationof incidental mortality in fishing gear, the status and dynamics ofthe population need to be known with a level of detail that is notcurrently available for many marine mammals (Murphy et al.,2009). Much effort has therefore been directed at obtaining un-biased abundance estimates of cetacean in European waters, andrecent examples include SCANS-II (Small Cetaceans in theEuropean Atlantic and North Sea in July 2005) and CODA(Cetacean Offshore Distribution and Abundance in July 2007).
Many species of fish and shellfish preyed upon by marinemammals are also exploited by fisheries. At a global scale, the re-source overlap, defined as the extent to which both players exploitthe same resources in the same areas, was demonstrated to be rela-tively moderate and to be essentially a problem of local concern(Kaschner et al., 2001; Karpouzi et al., 2007; Morissette, 2007).This exploitation of the same resources has led to growing con-cerns over potential competition between fisheries and these pre-dators in both directions, i.e. the hypothesis of prey depletion as aresult of fishing pressure (Bearzi et al., 2008) and the“whales-eat-fish” conflict (Morissette et al., 2010b). In theformer case, because most marine mammals depend on an abun-dant supply of local food, fishing may negatively affect their sur-vival by reducing the availability of prey or by inducing itsdispersal. Adding to this, “fishing down the foodweb” is prevalentamong marine ecosystems worldwide (Pauly et al., 1998) and ismost commonly caused not by serial replacement of fisheries asfirst thought, but rather by addition of new fisheries targetinglower trophic levels (TLs; Essington et al., 2006). This phenom-enon of “fishing through the foodweb” is symptomatic ofincreased impacts of fisheries on high-trophic-level species overrecent decades.
Despite growing concern about this topic, previous studies thathave tried to evaluate the impacts of interactions between fisheriesand top predators in the Bay of Biscay have concentrated on eitheroperational or biological interactions and have assessed them onlypartially. Goujon (1996) and Morizur et al. (1999) stated that thetotal number of by-caught cetaceans in fishing gear could be bio-logically significant in the area. When looking at biological inter-actions, Pusineri et al. (2004) identified diet overlap betweenfisheries and small delphinids in the neritic area of the Bay ofBiscay. According to their results, only the common dolphinshowed a quantitative impact of a similar order to that of the fish-eries on their shared resources.
The main aim of this study was to analyse, for the continentalshelf of the Bay of Biscay, the impact of the fisheries on toothedcetaceans while taking all other components of the ecosysteminto account. A threefold approach was used: (i) a mass-balancedmodel describing the overall structure and function of the Bay ofBiscay continental shelf ecosystem was developed, fishery landingsand discards affecting the exploited and non-exploited compart-ments being detailed, (ii) a set of ecological indices derived fromthe ecosystem model was then used to evaluate the degree towhich fisheries and top predators interact at steady state, and,finally, (iii) using a TL-based model also derived from the ecosys-tem model, various non-dynamic simulations were conductedwith different levels of fishing effort targeting different TLs. Thislast step used EcoTroph (ET) software (http://sirs.agrocampus-ouest.fr/EcoTroph/), which has two key features. ET deals withthe continuous distribution of the biomass in an ecosystem as a
function of continuous TLs. Second, the trophic functioning ofmarine ecosystems is modelled as a continuous flow of biomasssurging up the foodweb, from lower to higher TLs, through preda-tion and ontogenic processes (Gascuel and Pauly, 2009; Gascuelet al., 2009).
Material and methodsPre-existing Ecopath modelAn Ecopath model (Polovina, 1984; Christensen and Pauly, 1992)was constructed for the Bay of Biscay continental shelf foodweb,specifically the part of this shelf extending between the 30- and150-m isobaths and falling within French waters [Table 1; a full de-scription of the model, including the diet composition matrix, canbe found in Lassalle et al. (2011)]. A novel metric based on ecosys-tem production depicted an ecosystem not far from being over-exploited (L-index; Libralato et al., 2008). This index relies onthe assumption that the export of secondary production due tofisheries reduces the energy available for upper ecosystem levels,thus resulting in a loss of secondary production. This findingregarding the status of the Bay of Biscay was not entirely consistentacross all indicators, demonstrating the need for further analysesbased on simulations. The study area encompassed most of theICES Subdivisions VIIIa and b (www.ices.dk; Figure 1). Themodel represented a typical year between 1994 and 2005, i.e.before the collapse of the European anchovy (Engraulis encrasico-lus) and the subsequent 5-year closure of the fishery for thisspecies. Biomasses came from scientific surveys covering thewhole study area for top predators, demersal fish, anchovy,sardine (Sardina pilchardus), and sprat (Sprattus sprattus), andtwo categories of zooplankton. For other compartments, only asubset of the continental shelf was investigated.
For the two migratory species, mackerel (Scomber scombrus)and horse mackerel (Trachurus trachurus), estimates werederived from stock assessment results. As stock assessmentextended beyond ICES Divisions VIIIa and b, a simple pro ratabiomass allocation was applied based on landings. Values for thewhole stock and for detailed ICES Divisions were required forthis calculation (see Table 2 for a summary).
Ecotrophic efficiencies EE were preferentially fixed to 0.95 forboth groups of cephalopods, as assessments of their abundancein the Bay were lacking, and for zooplanktonic compartments asexisting estimations of their P/B were not accurate. EE corre-sponds to the fraction of the production of each group that isused in the foodweb. This value as high as 0.95 for cephalopodswas justified by their commercial exploitation in the ecosystem.A sensitivity analysis revealed that the main results concerningthe functioning of the ecosystem were not affected by the valuesof EE for zooplankton.
Quantitative information on diet composition was gatheredfrom two main sources: stomach contents and stable isotope ana-lyses performed on organisms captured/stranded in the area.Stable isotopes were mainly used to differentiate, among benthicorganisms, those feeding on surface-layer particulate organicmatter (POM) and those eating bottom POM (Le Loc’h andHily, 2005; Le Loc’h et al., 2008). Expert knowledge and datafrom similar ecosystems helped to fill gaps in data on birds’dietary regimes. Usually, P/B and Q/B estimates for higher TLswere derived from empirical equations, whereas estimates wereobtained from literature sources for other compartments. Whenvalues obtained for one of these two parameters seemed doubtful,
926 G. Lassalle et al.
at Centre N
ational Universitaire de D
ocumentation Scientifique et T
echnique on June 25, 2012http://icesjm
s.oxfordjournals.org/D
ownloaded from
P/Q when available or EE were preferentially entered into themodel.
Marine mammals were included in the form of five mono-specific groups representing the most frequently encountered smalltoothed cetaceans in the area. Small toothed cetaceans were repre-sented by common dolphin, striped dolphin (Stenella coeruleoalba),bottlenose dolphin (Tursiops truncatus), long-finned pilot whale(Globicephala melas), and harbour porpoise (Certain et al., 2008).
Since the intent is to provide a general overview of the impactsof fishing on this marine ecosystem, fisheries were not segmentedby fishing gear types. Landings were obtained from the reports ofthe relevant ICES Working Groups for assessed stocks, i.e.WGMHSA for pelagic fish (ICES, 2005b), WGHMM for demersalfish and Norwegian lobster (ICES, 2008), and WGCEPH forcephalopods (ICES, 2005a). For multispecies fish groups, capturesof species not covered by ICES reports were taken from theEuroStat/ICES database on catch statistics (ICES, 2010a, b,c—Copenhagen). For mackerel and horse mackerel, landingswere estimated from the EuroStat/ICES database, which provideddata by ICES Divisions, whereas stock assessment reports providedsummed landings over the ICES Divisions VII and VIII. Landings
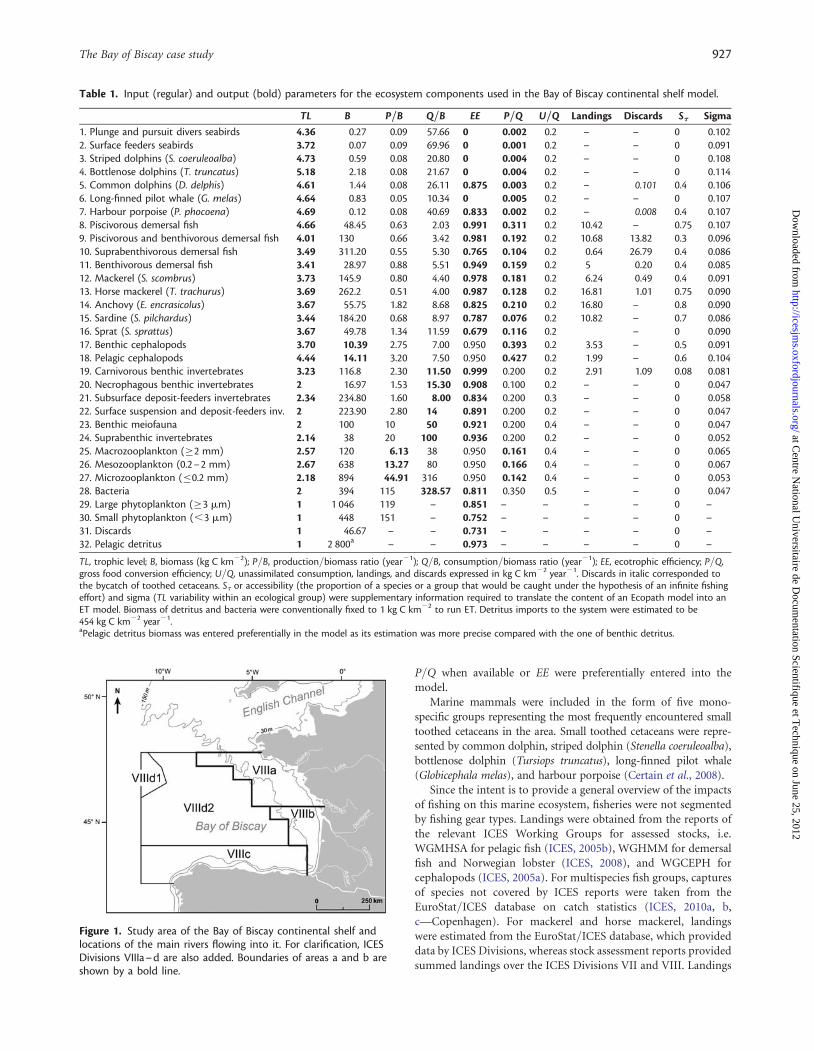
Table 1. Input (regular) and output (bold) parameters for the ecosystem components used in the Bay of Biscay continental shelf model.
TL B P/B Q/B EE P/Q U/Q Landings Discards St Sigma
1. Plunge and pursuit divers seabirds 4.36 0.27 0.09 57.66 0 0.002 0.2 – – 0 0.1022. Surface feeders seabirds 3.72 0.07 0.09 69.96 0 0.001 0.2 – – 0 0.0913. Striped dolphins (S. coeruleoalba) 4.73 0.59 0.08 20.80 0 0.004 0.2 – – 0 0.1084. Bottlenose dolphins (T. truncatus) 5.18 2.18 0.08 21.67 0 0.004 0.2 – – 0 0.1145. Common dolphins (D. delphis) 4.61 1.44 0.08 26.11 0.875 0.003 0.2 – 0.101 0.4 0.1066. Long-finned pilot whale (G. melas) 4.64 0.83 0.05 10.34 0 0.005 0.2 – – 0 0.1077. Harbour porpoise (P. phocoena) 4.69 0.12 0.08 40.69 0.833 0.002 0.2 – 0.008 0.4 0.1078. Piscivorous demersal fish 4.66 48.45 0.63 2.03 0.991 0.311 0.2 10.42 – 0.75 0.1079. Piscivorous and benthivorous demersal fish 4.01 130 0.66 3.42 0.981 0.192 0.2 10.68 13.82 0.3 0.09610. Suprabenthivorous demersal fish 3.49 311.20 0.55 5.30 0.765 0.104 0.2 0.64 26.79 0.4 0.08611. Benthivorous demersal fish 3.41 28.97 0.88 5.51 0.949 0.159 0.2 5 0.20 0.4 0.08512. Mackerel (S. scombrus) 3.73 145.9 0.80 4.40 0.978 0.181 0.2 6.24 0.49 0.4 0.09113. Horse mackerel (T. trachurus) 3.69 262.2 0.51 4.00 0.987 0.128 0.2 16.81 1.01 0.75 0.09014. Anchovy (E. encrasicolus) 3.67 55.75 1.82 8.68 0.825 0.210 0.2 16.80 – 0.8 0.09015. Sardine (S. pilchardus) 3.44 184.20 0.68 8.97 0.787 0.076 0.2 10.82 – 0.7 0.08616. Sprat (S. sprattus) 3.67 49.78 1.34 11.59 0.679 0.116 0.2 – 0 0.09017. Benthic cephalopods 3.70 10.39 2.75 7.00 0.950 0.393 0.2 3.53 – 0.5 0.09118. Pelagic cephalopods 4.44 14.11 3.20 7.50 0.950 0.427 0.2 1.99 – 0.6 0.10419. Carnivorous benthic invertebrates 3.23 116.8 2.30 11.50 0.999 0.200 0.2 2.91 1.09 0.08 0.08120. Necrophagous benthic invertebrates 2 16.97 1.53 15.30 0.908 0.100 0.2 – – 0 0.04721. Subsurface deposit-feeders invertebrates 2.34 234.80 1.60 8.00 0.834 0.200 0.3 – – 0 0.05822. Surface suspension and deposit-feeders inv. 2 223.90 2.80 14 0.891 0.200 0.2 – – 0 0.04723. Benthic meiofauna 2 100 10 50 0.921 0.200 0.4 – – 0 0.04724. Suprabenthic invertebrates 2.14 38 20 100 0.936 0.200 0.2 – – 0 0.05225. Macrozooplankton (≥2 mm) 2.57 120 6.13 38 0.950 0.161 0.4 – – 0 0.06526. Mesozooplankton (0.2–2 mm) 2.67 638 13.27 80 0.950 0.166 0.4 – – 0 0.06727. Microzooplankton (≤0.2 mm) 2.18 894 44.91 316 0.950 0.142 0.4 – – 0 0.05328. Bacteria 2 394 115 328.57 0.811 0.350 0.5 – – 0 0.04729. Large phytoplankton (≥3 mm) 1 1 046 119 – 0.851 – – – – 0 –30. Small phytoplankton (,3 mm) 1 448 151 – 0.752 – – – – 0 –31. Discards 1 46.67 – – 0.731 – – – – 0 –32. Pelagic detritus 1 2 800a – – 0.973 – – – – 0 –
TL, trophic level; B, biomass (kg C km22); P/B, production/biomass ratio (year21); Q/B, consumption/biomass ratio (year21); EE, ecotrophic efficiency; P/Q,gross food conversion efficiency; U/Q, unassimilated consumption, landings, and discards expressed in kg C km22 year21. Discards in italic corresponded tothe bycatch of toothed cetaceans. St or accessibility (the proportion of a species or a group that would be caught under the hypothesis of an infinite fishingeffort) and sigma (TL variability within an ecological group) were supplementary information required to translate the content of an Ecopath model into anET model. Biomass of detritus and bacteria were conventionally fixed to 1 kg C km22 to run ET. Detritus imports to the system were estimated to be454 kg C km22 year21.aPelagic detritus biomass was entered preferentially in the model as its estimation was more precise compared with the one of benthic detritus.
Figure 1. Study area of the Bay of Biscay continental shelf andlocations of the main rivers flowing into it. For clarification, ICESDivisions VIIIa–d are also added. Boundaries of areas a and b areshown by a bold line.
The Bay of Biscay case study 927
at Centre N
ational Universitaire de D
ocumentation Scientifique et T
echnique on June 25, 2012http://icesjm
s.oxfordjournals.org/D
ownloaded from

were averaged over the 1998–2003 period for all compartments(Table 1).
In pelagic fisheries, discarding occurs in a sporadic way com-pared with demersal fisheries. Discard estimates are still not avail-able for sardine and anchovy; however, given their high economicvalue, discard levels are thought to be low. Discard data for cepha-lopods are still not homogeneously collected by EU MemberCountries (Pierce et al., 2010). For these compartments, discardswere set to zero in the model. Discards for benthic and demersalspecies were obtained from direct observations on Nephrops traw-lers operating in the Bay of Biscay, 69 hauls being sampled over thewhole 1998 year (Tables 1 and 2; French ministry programmeOBSMER).
Bycatch estimates for the common dolphin and the harbourporpoise derived from the most recently available observations
of incidental captures of cetaceans and seabirds in Europeanwaters (data from National Reports on the implementation ofRegulation 812/2004; ICES, 2010a, b) and were entered as discardsin the model. The term “catches” when used in the manuscriptrefers to landings plus discards.
Mass-balanced ecosystem indices of fisheries–toppredator interactionsTo investigate the effects of fisheries on top predators, various eco-logical metrics can be directly derived from the Ecopath modelconstructed for the Bay of Biscay continental shelf. The primaryproduction required to sustain the food intake by top predators(PPR) and the total catches were compared (after Pauly andChristensen, 1995).
Table 2. Campaigns and years of the biomass data for each of the 32 compartments.
Campaigns Periods
1. Plunge and pursuit divers seabirds ROMER/ATLANCET 2001–20042. Surface feeders seabirds
3. Striped dolphins (S. coeruleoalba) ROMER/ATLANCET 2001–20054. Bottlenose dolphins (T. truncatus) SCAN5. Common dolphins (D. delphis) PELGAS6. Long-finned pilot whale (G. melas)7. Harbour porpoise (P. phocoena)
8. Piscivorous demersal fish EVHOE 1998–20039. Piscivorous and benthivorous demersal fish10. Suprabenthivorous demersal fish11. Benthivorous demersal fish
12. Mackerel (S. scombrus) Stock assessment 1998–200313. Horse mackerel (T. trachurus)
14. Anchovy (E. encrasicolus) PELGAS 2000–200315. Sardine (S. pilchardus)16. Sprat (S. Sprattus)
17. Benthic cephalopods EE fixed to 0.9518. Pelagic cephalopods
19. Carnivorous benthic invertebrates INTRIGAS II 200120. Necrophagous benthic invertebrates21. Subsurface deposit-feeders invertebrates22. Surface suspension and deposit-feeders inv.23. Benthic meiofauna24. Suprabenthic invertebrates
25. Macrozooplankton (≥2 mm) BIOMAN 1999–200226. Mesozooplankton (0.2–2 mm)
27. Microzooplankton (≤0.2 mm) MICRODYN/PELGAS 2003–2005
28. Bacteria PNOCAT May 199429. Large phytoplankton (≥3 mm) BIOMET 1 May 199530. Small phytoplankton (,3 mm) BIOMET 2 January 199832. Pelagic detritus BIOMET 3 March 1998
PEGASE June 1998PLAGIA 1 February 1999PLAGIA 2 April 1999PLAGIA 3 May 1999PLAGIA 4 June 1999PLAGIA 5 July 1999PLAGIA 6 October 1999GASPROD April 2002PELGAS May 2000PELGAS May 2001
31. Discards OBSMER programme (Nephrops trawlers) 1998
The 14 Ifremer campaigns used to estimate phytoplankton, bacteria, and detritus parameters in the Bay of Biscay continental shelf model were given in full.PNOCAT, BIOMET, and PLAGIA were localized in the Gironde plume, GASPROD in the Loire plume, and PELGAS over the continental shelf.
928 G. Lassalle et al.
at Centre N
ational Universitaire de D
ocumentation Scientifique et T
echnique on June 25, 2012http://icesjm
s.oxfordjournals.org/D
ownloaded from

Then, the extent of the overlap in terms of resource use betweendifferent top predator functional groups and fisheries (catches)was calculated using an ecological niche overlap index proposedby Morissette et al. (2010a). This index considers, at the sametime, the similarity of resource utilization [first term ofEquation (1)] and the relative importance of fisheries vs. top pre-dators as consumers within a given ecosystem [second term ofEquation (1)]. It ranges from 0 (no overlap) to 0.25 (identical re-source) and is calculated as follows:
a fm = 2∑
pmkp fk∑p2
mk +∑
p2fk
( )× Qm
Qm + Cf× Cf
Qm + Cf
( ), (1)
where afm is the quantitative overlap between a top predator groupm and a fishery f in the ecosystem, with pmk and pfk representingthe proportions of group k in the diet of top predator m or inthe catch by fishery f, Qm the proportion of total food consump-tion by top predator m, and Cf the proportion of total intake byfishery f.
Finally, the computation of the mixed trophic impact (MTI)matrix implemented as a routine in Ecopath indicates the effectthat a small increase in the biomass of one (impacting) groupwill have on the biomass of other (impacted) groups, taking intoaccount both direct and indirect trophic relationships(Ulanowicz and Puccia, 1990). In the present study, the analysiswas performed with two versions of the same model that differedin their integration of toothed cetacean bycatch estimates. As a firststep, only the effect of food depletion on apex predators washypothesized to be the major factor in causing these variations.Then, both the reduction in prey numbers and the increase in in-cidental captures were considered to operate simultaneously.
ET modelET is a modelling approach articulated around the idea that anecosystem can be represented by its biomass distribution acrossTLs (Gascuel and Pauly, 2009; Gascuel et al., 2009). Such an ap-proach, wherein species as such disappear, may be regarded asthe ultimate stage in the use of the TL metric for ecosystem mod-elling. By concentrating on biomass flow as a quasi-physicalprocess, it allows aspects of ecosystem functioning to be exploredthat are complementary to Ecopath with Ecosim (EwE). It pro-vides users with simple tools to quantify the impacts of fishingat an ecosystem scale and a new way of looking at ecosystems.To apply ET to specific ecosystems, an observed biomass trophicspectrum and a biomass flow trophic spectrum have to be built.In this context, a spectrum can be defined as the continuous dis-tribution of ecological properties over TLs. One obvious way thiscan be done is when an Ecopath model has already been built forthe ecosystem under consideration. In such cases, resourcesrequired for the construction of an ET model are minimal. Assuch, ET may be seen as a complementary module of EwE, enab-ling a quick and simple exploration of various fishing scenarios(including the estimation of the biomass spectrum of the unex-ploited state; Gascuel et al., 2009). ET is now freely available as aplug-in module for EwE version 6 (Christensen et al., 2008) andas an R package (ET version 1.0). The increasing complementaritybetween the versions of Ecopath and ET has led to successful appli-cations of the TL-based approach to various case studies includingthe Port-Cros national park in France (Valls, 2009), the Bamboungmarine protected area in Senegal (Colleter, 2010), the Southern
Benguela upwelling system in Southern Africa (Gasche et al.,2012), the Guinean shelf (Gascuel et al., 2011), and the worldwideocean (Tremblay-Boyer et al., 2011).
In the present study, analyses were performed with R 2.12.0 (RFoundation Core Team, 2011). The ET-Transpose subroutineallows translation of the content of an Ecopath model into anET model to produce biomass and catch trophic spectra, theoutputs being stored in the format required for simulations. TheET-Diagnosis subroutine is used to simulate the effects of (i) in-creasing (or decreasing) fishing pressures on ecosystem function-ing or (ii) preferentially targeting different TLs. This provides aglobal diagnosis of ecosystem state, as well as simple forecasts oftotal catches and biomass for a range of fishing effort multipliers.The corresponding R functions were, respectively, “create.ETmain” and “create.ETdiagnosis”, as well as their companion“plot” functions.
For ecological or technological reasons, only a fraction of theecosystem biomass is usually accessible to fisheries. As a conse-quence, an accessibility parameter (St) expressing, for eachEcopath group, the fraction of the biomass that can be caught sup-posing an infinite fishing effort was added manually by the user tothe table returned by the Ecopath routine (Table 1). This table,used as the basis for the “create.ETmain” function, contains thegroup name, TL, biomass, production rates, and catches. The ac-cessibility of each group was fixed according to two main criteria:the ratio between the species distribution area and the study area,and the presence of sheltering habitats in the study area. When ne-cessary, values were corrected according to the proportion ofspecies that are caught and by-caught in the group. This param-eter, also known as selectivity, was fixed to zero for species orgroups of species that are not by-caught or targeted by fisheriesand to 0.4 for top predators that are accidentally capturedduring fishing operations, the maximum value being1. Information was taken from the available literature (mostlyICES Working Group publications for species distribution and ex-ploitation levels) and expert knowledge. Moreover, convertingdata pertaining to specific taxa or functional groups into data bytrophic classes requires an estimation of TL variability withineach group. The underlying assumption is that all individuals ina trophic group are not identical and therefore do not share thesame TL but on the contrary occupy a range of TLs aroundthe group’s mean TL. This information was specified in the“create.ETmain” function via the “sigmaLN” argument thatdefines the shape of the group’s distribution. In the presentstudy, we assumed that TL variability within an ecological groupincreases log-linearly with the mean TL of the group (Gascuelet al., 2009):
sigma(TL) = smooth × ln(TL − 0.05) (2)
where TL is the mean trophic level of the group and the smoothparameter representing the slope of this increase, fixed to thedefault value of 0.07 (Table 1). In addition, a set of three coeffi-cients, all varying between 0 and 1 and the first two beingrelated to a top–down effect, must be entered into the“create.ETdiagnosis” function. The TopD coefficient expressesthe top–down control, i.e. the fraction of the natural mortalitywhich depends on predator abundance. A value of zero pertainsto a situation dominated by bottom–up processes, and wherechanges in predator abundances have no effects on their prey.The FormD coefficient defines the functional relationship
The Bay of Biscay case study 929
at Centre N
ational Universitaire de D
ocumentation Scientifique et T
echnique on June 25, 2012http://icesjm
s.oxfordjournals.org/D
ownloaded from

between prey and predators. The value 1 relates to a situationwhere predator abundance has a linear effect on the speed of theflow of their prey and therefore on prey abundance. The Beta co-efficient refers to the origin of the secondary production. Thevalue zero relates to an ecosystem where all secondary productionoriginates from grazing on primary producers and the value 1 to amajor contribution of detritus and recruitment. Default values forTopD, FormD, and Beta were fixed in ET to 0.4, 0.5, and 0, respect-ively, for all TLs. The Ecopath network analysis of the Bay of Biscaycontinental shelf model strongly indicated a mature, bottom–upregulated, and detritus-based foodweb (Lassalle et al., 2011).According to Odum (1969), ecosystems tend to increase thecontrol of, or homeostasis with, the physical environment, in thesense of achieving maximum protection from its perturbation.ET gives the opportunity to convert this valuable informationregarding the functioning of marine ecosystems into model para-meters. The TopD coefficient was derived from the top–downeffects contributing to the keystoneness index (KS) of mesozoo-plankton, identified as the compartment with the highest KSvalue. As no information exists for the FormD coefficient, it wasfixed to its default value. The Beta coefficient was set equal tothe system herbivory to detritivory ratio that quantifies the flowalong grazing and detrital foodwebs. As such, these three coeffi-cients characterizing the ecosystem functioning were set to 0.2,0.5, and 0.76 for this continental shelf ecosystem.
Testing scenarios of increasing fishing pressuresIn ET, two parameters provide a synthetic overview of the ecosys-tem exploitation at the current state: fishing mortality (F) andfishing loss rate (F). Fishing mortality measures the probabilityof one fish being caught and the fishing mortality spectrum reflectswhich TLs are currently exploited in the ecosystem. The fishingloss rate measures the proportion of the production caught eachyear and the corresponding trophic spectrum reflects the level ofimpact of fishing on the ecosystem.
Then, in the table obtained from the Ecopath routine, officiallandings and discards were summed together (Table 1). As forthe MTI analysis, simulations of the effects of increasing fishingpressure on the system were performed with (targeted) catchonly, then with the catch and bycatch of common dolphins andharbour porpoises, to finally compare the simulation results. Inthe “create.ETdiagnosis” function, the reference fishing effortwas multiplied by values within the 0 to 3 range, with smallerintervals in the range 0–1, and ecosystem properties for eachnew fishing state were recalculated. Values between 0 and 1 corres-pond to decreases in the fishing mortality and values above 1increases in the fishing mortality. Along the trophic continuum,predators in ET conventionally refer to species with TLs ≥3.5.In the present study, focusing the analysis of fisheries impacts onTLs of ≥4.5 allows us, to some extent, to focus on marinemammals. Indeed, six compartments of the Ecopath model hada mean TL above this value; this included the five toothed cetaceanboxes.
Sensitivity analyses have been performed on both the currentstate of the ecosystem and on the simulated states using both ver-sions of the model, i.e. with and without bycatches of toothed ceta-ceans. The tested parameters are modified one by one, within therealistic ranges of values, and all other parameters remaining con-stant. The effects of these changes on the simulated biomass andcatch trophic spectra were investigated for TL 4.7, which corre-sponds to the mean TL of the marine mammal community. The
effects of varying the TopD, Beta, and smooth (St) parameterswere tested. The accessibility of by-caught marine mammals(common dolphins and harbour porpoises) was modified andthen the accessibility of all compartments in the model (seeTable 3 for details of values applied during sensitivity analysis).
Values presented were those extracted from the model versionincluding by-caught toothed cetaceans, except when the contrarywas stipulated.
ResultsSteady-state ecological indices of fishery–marinemammal interactionsTotal prey biomass consumed annually by toothed cetaceans (con-sumption matrix in EwE) was of a similar magnitude to catches byfisheries (fishery matrix in EwE), i.e. 110.4 vs. 129.4 kg C km22,respectively. Consumption of the two forage fish species bycommon dolphins was similar in magnitude to the fisherycatches for these two species, i.e. 25.4 and 27.6 kg C km22, re-spectively. Demersal fish were the most important component offishery catches and of estimated total prey biomass consumed an-nually by the local bottlenose dolphin population, i.e. 33.5 and67.6 kg C km22, respectively.
Values for primary production required to sustain marinemammal consumption, and fisheries catches were also similar, at16.8 and 19.7%, respectively. In terms of the percentage of thePPR required by the toothed cetacean community, bottlenose dol-phins required the most primary production (65.5%), followed bycommon dolphins (21.3%; Table 4). For fishery catches, the valuecan be decomposed by taxonomic categories as follows: 59.6% fordemersal fish, 18.8% for pelagic fish, 18.6% for toothed cetaceans,2.7% for cephalopods, and 0.5% for crustaceans.
The calculated resource overlap afm between toothed cetaceansand fishery catches varied among species and could be summar-ized into two broad categories: (i) no direct overlap, as was thecase with striped dolphins, harbour porpoises, and long-finnedpilot whales, and (ii) direct overlap, as was the case with bottlenoseand common dolphins (both with a medium to low degree ofdirect overlap with fisheries). When toothed cetaceans were con-sidered as a single category, the mean overlap index, weighted bythe biomass of each species, was equal to 30% of the maximumvalue [afm (%); Table 4].
Considering only landings and discards of exploited stocks, thefishery had an overall negative MTI on the upper trophic foodweb(arithmetic sum of impacts ¼ 20.9), particularly marked for thepiscivorous demersal fish, the bottlenose dolphin, and the
Table 3. Details on sensitivity analysis of biomass and catch toparametrization and model used as input.
TopD Beta Smooth
St
Marine mammals Global
Range 0–1 0–0.9 0.05–0.1 250, 220, 210, 0, +10, +20,+50
Increment 0.1 0.1 0.01Model values 0.2 0.76 0.07 0.4 see Table 1
For example, TopD varied from 0 to 1 with a step increment of 0.1; thisparameter being originally set in the model to 0.2. Regarding the smoothparameter, the realistic range of variation that was tested during sensitivityanalysis was determined by judging the ecological relevance of the biomasstrophic spectrum obtained for marine mammals’ compartments only.
930 G. Lassalle et al.
at Centre N
ational Universitaire de D
ocumentation Scientifique et T
echnique on June 25, 2012http://icesjm
s.oxfordjournals.org/D
ownloaded from
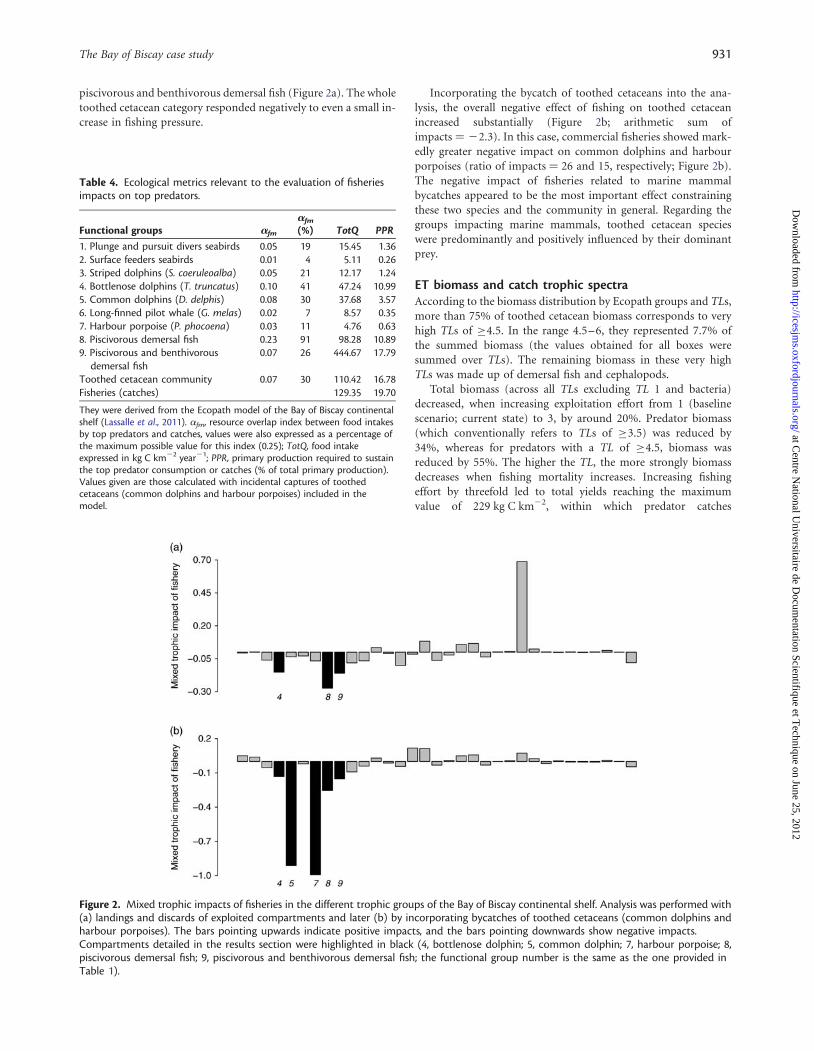
piscivorous and benthivorous demersal fish (Figure 2a). The wholetoothed cetacean category responded negatively to even a small in-crease in fishing pressure.
Incorporating the bycatch of toothed cetaceans into the ana-lysis, the overall negative effect of fishing on toothed cetaceanincreased substantially (Figure 2b; arithmetic sum ofimpacts ¼ 22.3). In this case, commercial fisheries showed mark-edly greater negative impact on common dolphins and harbourporpoises (ratio of impacts ¼ 26 and 15, respectively; Figure 2b).The negative impact of fisheries related to marine mammalbycatches appeared to be the most important effect constrainingthese two species and the community in general. Regarding thegroups impacting marine mammals, toothed cetacean specieswere predominantly and positively influenced by their dominantprey.
ET biomass and catch trophic spectraAccording to the biomass distribution by Ecopath groups and TLs,more than 75% of toothed cetacean biomass corresponds to veryhigh TLs of ≥4.5. In the range 4.5–6, they represented 7.7% ofthe summed biomass (the values obtained for all boxes weresummed over TLs). The remaining biomass in these very highTLs was made up of demersal fish and cephalopods.
Total biomass (across all TLs excluding TL 1 and bacteria)decreased, when increasing exploitation effort from 1 (baselinescenario; current state) to 3, by around 20%. Predator biomass(which conventionally refers to TLs of ≥3.5) was reduced by34%, whereas for predators with a TL of ≥4.5, biomass wasreduced by 55%. The higher the TL, the more strongly biomassdecreases when fishing mortality increases. Increasing fishingeffort by threefold led to total yields reaching the maximumvalue of 229 kg C km22, within which predator catches
Table 4. Ecological metrics relevant to the evaluation of fisheriesimpacts on top predators.
Functional groups afm
afm
(%) TotQ PPR
1. Plunge and pursuit divers seabirds 0.05 19 15.45 1.362. Surface feeders seabirds 0.01 4 5.11 0.263. Striped dolphins (S. coeruleoalba) 0.05 21 12.17 1.244. Bottlenose dolphins (T. truncatus) 0.10 41 47.24 10.995. Common dolphins (D. delphis) 0.08 30 37.68 3.576. Long-finned pilot whale (G. melas) 0.02 7 8.57 0.357. Harbour porpoise (P. phocoena) 0.03 11 4.76 0.638. Piscivorous demersal fish 0.23 91 98.28 10.899. Piscivorous and benthivorous
demersal fish0.07 26 444.67 17.79
Toothed cetacean community 0.07 30 110.42 16.78Fisheries (catches) 129.35 19.70
They were derived from the Ecopath model of the Bay of Biscay continentalshelf (Lassalle et al., 2011). afm, resource overlap index between food intakesby top predators and catches, values were also expressed as a percentage ofthe maximum possible value for this index (0.25); TotQ, food intakeexpressed in kg C km22 year21; PPR, primary production required to sustainthe top predator consumption or catches (% of total primary production).Values given are those calculated with incidental captures of toothedcetaceans (common dolphins and harbour porpoises) included in themodel.
Figure 2. Mixed trophic impacts of fisheries in the different trophic groups of the Bay of Biscay continental shelf. Analysis was performed with(a) landings and discards of exploited compartments and later (b) by incorporating bycatches of toothed cetaceans (common dolphins andharbour porpoises). The bars pointing upwards indicate positive impacts, and the bars pointing downwards show negative impacts.Compartments detailed in the results section were highlighted in black (4, bottlenose dolphin; 5, common dolphin; 7, harbour porpoise; 8,piscivorous demersal fish; 9, piscivorous and benthivorous demersal fish; the functional group number is the same as the one provided inTable 1).
The Bay of Biscay case study 931
at Centre N
ational Universitaire de D
ocumentation Scientifique et T
echnique on June 25, 2012http://icesjm
s.oxfordjournals.org/D
ownloaded from

corresponded to 95.3% of total catch on average. The mean TLs ofthe total biomass and catch were reduced by around 0.1 whencompared with those calculated for the current effort values(from 2.77 to 2.68 and from 3.68 to 3.61, respectively; Table 5),this value of 0.1 being generally considered as not negligible instudies of fishing down marine foodwebs.
Non-dynamic ET simulations of increasing fishingpressureHere, fishing mortality exhibited a bell-shaped curve, starting atTL 2.8 and reaching a maximum of 0.19 year21 at TL 4.8; 67%of the total biomass at this TL being composed of piscivorous de-mersal fish (Figure 3a). This curve showed that fisheries mainlytarget predatory species (conventionally referred to species withTLs ≥ 3.5 in ET) and can remove every year as much as about one-fifth of the total biomass of these species. The fishing loss rate fol-lowed a monotonic increasing curve, reaching a value of0.26 year21 at TL 5.5, 71% of the biomass at this TL being pisciv-orous demersal fish. In other words, at the 1994–2005 level offishing, a quarter of the production of TL 5.5 is fished yearly.This confirms that high TLs are the most impacted by thefishery. Representing the biomass trophic spectrum for eachfishing effort multiplier confirmed that the decrease in biomasswas especially pronounced for the highest TLs (space betweenlines increased throughout the continuum; Figure 3b). When plot-ting the relative change in biomass (B/Bref) according to thefishing effort for several exploited trophic classes (TL ¼ 3, 3.5, 4,4.5, and 5), steepest slopes were observed between the currentstate (mE ¼ 1) and a doubling of the fishing rate (mE ¼ 2), andthe decline in biomass was especially strong for the highesttrophic classes (Figure 3c). Relative catches (Y/Yref) increasedwith fishing effort for trophic classes 3 and 3.5 and tendedtowards a maximum value for trophic class 4. Full exploitationwas, however, reached for TL 4.5 with mE ¼ 2 and for TL 5 withmE ¼ 1; the values of Y/Yref then decreased in a trend of increasingfishing effort (Figure 3d). These trophic classes are exhibiting signsof overexploitation at the current fishing mortality or would do soafter a realistic increase in fishing pressure. Along the gradient ofincreasing fishing effort, total catches represented between 5 and
8% of the total biomass, excluding TL 1 and bacteria, andbetween 13 and 28% of the predator biomass (TL ≥ 3.5; Table 5).
Sensitivity analysis on ET parametersThe intra-group variability in TLs is the only parameter tested towhich biomass and catch of TL 4.7 were shown to be sensitive(Figure 4). Changes were investigated for TL 4.7 because it corre-sponds to the mean TL of the marine mammal community. Foreach value of this parameter between 0.05 and 0.1, the biomassalong the increasing gradient of fishing pressure declined monot-onously; absolute values being modified by as much as 25%. In re-lation to catches at TL 4.7, the shape of the curve and the diagnosisvaried markedly with the smoothing parameter. Values above thedefault setting of 0.07 led to an early decrease in catches with in-creasing fishing effort, depicting a more severe exploitationstatus of the ecosystem. The response of catches to variations ofthe smoothing parameter must be put in the context of thebiomass distribution across TLs, which influences the proportionof biomass accessible to fisheries.
Inclusion of the bycatch of common dolphins and harbourporpoises did not modify the results at the ecosystem scale pre-sented above.
DiscussionBycatch estimates and population structureFor the Bay of Biscay continental shelf ecosystem, significant nega-tive effects of fisheries appeared for the common dolphin and theharbour porpoise, when the MTI analysis included the bycatch oftoothed cetaceans. The estimated ecotrophic efficiency of 0.833 forthe harbour porpoise indicates that a large proportion of the pro-duction is used in the system. In the model, given the fact that themortality caused by predators is null for this upper trophic-levelspecies, the mortality is as such non-natural and due to incidentalcaptures. In reality, probably a very few porpoises may be eaten bysharks, or even killer whales, and there may also be other kinds ofanthropogenic mortality. In the past, concern has been expressedover the level of negative operational interactions between fisheriesand the harbour porpoise in the northern part of its distributionrange (Tregenza et al., 1997; Rogan and Mackey, 2007).However, the deleterious impact of bycatch for this species inthe present model must be interpreted with caution for twomain reasons. The Bay of Biscay is at the southern margin of theharbour porpoise distribution in European waters. There areharbour porpoises also in Galicia (Northwest Spain) and northernPortuguese waters, but these are considered to be a separate popu-lation differing from the Northeast Atlantic stock. An isolatedpopulation also exists in the Black Sea (Fontaine et al., 2010).The same authors demonstrated that porpoises in the centraland eastern North Atlantic probably represent a single continuouspopulation that extends thousands of kilometres from the Frenchcoasts of the Bay of Biscay northwards to the Arctic waters ofNorway and Iceland. Second, the absolute abundance estimatesin this area were lacking until recently, and the best estimate forthe number of individuals present has changed markedly overthe last two decades from a number below the limit of detectabilitybased on aerial surveys to thousands of individuals as estimatedduring the first SCANS survey in 1994 (Hammond et al., 2002;Marine Mammal Research Centre, http://crmm.univ-lr.fr/, un-published data). Data from the SCANS-II survey in 2005 suggestan absolute abundance estimate of 386 000 individuals for the
Table 5. Summary statistics for the ecosystem (i.e. summed overTLs . 1 and without bacteria), for each fishing effort multiplier,including the absolute and relative values compared with thebaseline scenario (mE ¼ 1).
mE TotB PredB Y R_TotB R_PredB R_Y TL_TotB TL_Y
0.2 4 112 1 540 54 1.13 1.22 0.32 2.82 3.740.4 3 977 1 461 95 1.10 1.16 0.57 2.80 3.720.6 3 853 1 388 126 1.06 1.10 0.75 2.79 3.700.8 3 737 1 321 149 1.03 1.05 0.89 2.78 3.691 3 630 1 258 167 1 1 1 2.77 3.682 3 198 1 008 214 0.88 0.80 1.28 2.72 3.643 2 894 832 229 0.80 0.66 1.37 2.68 3.61
TotB and R_TotB, total biomass and relative total biomass in kg C km22;PredB and R_PredB, predator biomass and relative predator biomass (TL ≥3.5) in kg C km22; Y and R_Y, catches and relative catches inkg C km22 year21; TL_TotB and TL_Y, mean trophic level of the totalbiomass and the catch. Relative values were expressed by regarding thecurrent state as the reference. Values given are those calculated withincidental captures of toothed cetaceans (common dolphins and harbourporpoises) included in the model.
932 G. Lassalle et al.
at Centre N
ational Universitaire de D
ocumentation Scientifique et T
echnique on June 25, 2012http://icesjm
s.oxfordjournals.org/D
ownloaded from

entire European Atlantic and North Sea area, with �2646 indivi-duals frequenting the survey block that comprises waters aroundsouthwestern France, Spain, and Portugal (http://biology.st-and.ac.uk/scans2/; SCANS-II final report). Allowable bycatch limitssimulated under a series of management procedures and underthe conservation objective of allowing the populations to recoverto and/or maintain 80% of carrying capacity in the long term,based solely on the SCANS-II estimates, never exceeded ten indi-viduals per year in the waters around southwestern France,Portugal, and Spain. This figure is far lower than the value esti-mated from observations and entered into the current model(ICES, 2010a, b).
The same reservation should be applied to conclusions regard-ing the common dolphin. Although results from genetic studies(Amaral et al., 2007; Luca et al., 2009) and skull morphometricanalysis (Murphy et al., 2006) support the existence of a singlecommon dolphin population in the Northeast Atlantic, rangingfrom waters off Scotland to Portugal, three separate managementunits were proposed by Caurant et al. (2009) based on the analysisof several ecological tracers. Each methodology has its own time-scale: generation to evolutionary time-scale for genetic and mor-phometric studies and day to lifetime for ecological tracers. Assuch, in the northeastern Atlantic, ecological tracers were pre-sented as useful to refine management units on a finer time-scale
Figure 3. (a) Exploitation pattern at the current state of the ecosystem: fishing loss rate (V) and fishing mortality (F ) for the total biomass; (b)for the simulated ecosystem, biomass trophic spectrum (biomass distribution over TLs); (c) relative biomass (B/Bref) for trophic classesexpressed as a function of the multiplier of the current fishing mortality (mE ¼ 1); and (d) relative catch (Y/Yref) for trophic classes expressedas a function of the multiplier of the current fishing mortality calculated for different effort multipliers [from an unexploited state (mE ¼ 0) toa threefold increase in fishing pressure (mE ¼ 3)]. The solid line represents the current situation. Values given are those calculated withincidental captures of toothed cetaceans (common dolphins and harbour porpoises) included in the model.
The Bay of Biscay case study 933
at Centre N
ational Universitaire de D
ocumentation Scientifique et T
echnique on June 25, 2012http://icesjm
s.oxfordjournals.org/D
ownloaded from
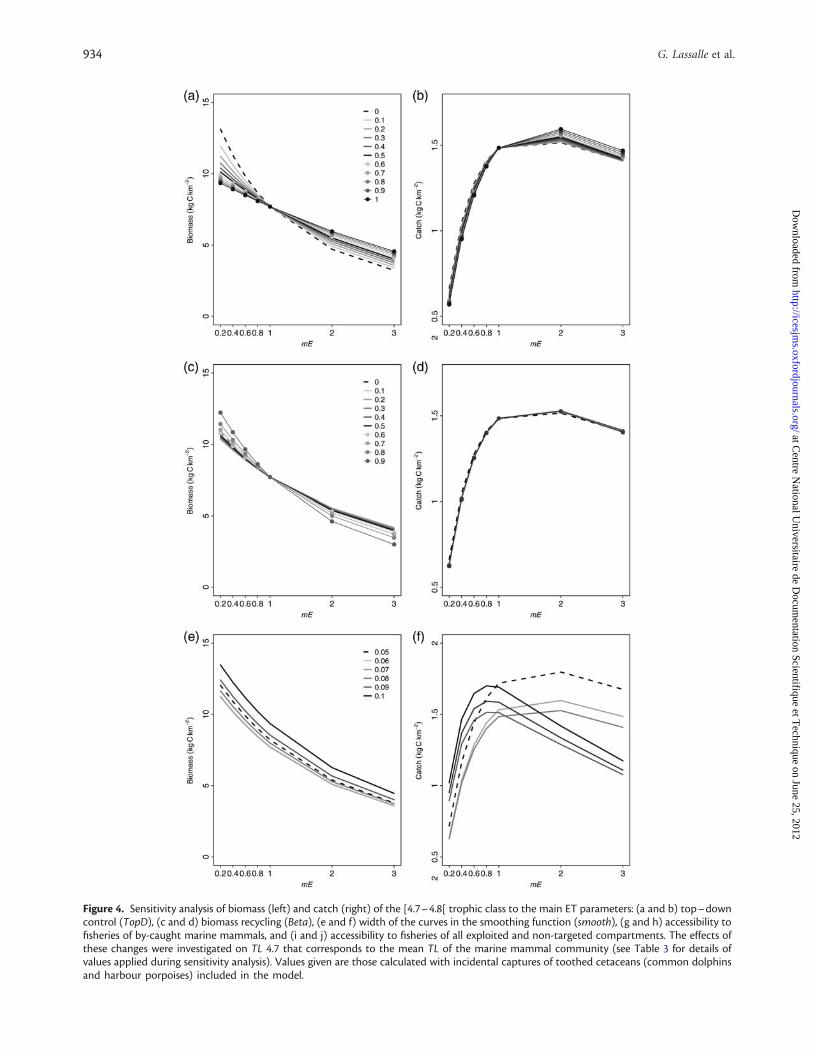
Figure 4. Sensitivity analysis of biomass (left) and catch (right) of the [4.7–4.8[ trophic class to the main ET parameters: (a and b) top–downcontrol (TopD), (c and d) biomass recycling (Beta), (e and f) width of the curves in the smoothing function (smooth), (g and h) accessibility tofisheries of by-caught marine mammals, and (i and j) accessibility to fisheries of all exploited and non-targeted compartments. The effects ofthese changes were investigated on TL 4.7 that corresponds to the mean TL of the marine mammal community (see Table 3 for details ofvalues applied during sensitivity analysis). Values given are those calculated with incidental captures of toothed cetaceans (common dolphinsand harbour porpoises) included in the model.
934 G. Lassalle et al.
at Centre N
ational Universitaire de D
ocumentation Scientifique et T
echnique on June 25, 2012http://icesjm
s.oxfordjournals.org/D
ownloaded from

that may be more relevant to management issues (ICES, 2010c).These ecological tracers indicated a segregation with restrictedinterchange of individuals between oceanic, northern neritic,and southern neritic regions (the Bay of Biscay and the north-eastern Iberian Peninsula), which implies that effective populationsizes are smaller than previously thought, and the impact ofbycatch on individual populations consequently greater(Caurant et al., 2009).
Competition for food and resource overlapThe present study and that of Pusineri et al. (2004) provided evi-dence for a significant direct overlap between the diet compositionof the two commonest dolphin species in the region (in number ofindividuals and biomass) and fishery catches. Pusineri et al. (2004)studied the dietary overlap between fisheries and small delphinidsin the Bay of Biscay by applying the original Pianka niche overlapindex (Pianka, 1973) to data quite similar in their origin to thosepresented in the current study (stomachs of stranded dolphins col-lected along the coasts of the Bay). In the neritic area of the Bay,the Pianka index value for overlap with fisheries was found to behigh for common dolphins, low for striped dolphins, and
intermediate for both bottlenose dolphins and harbour porpoises.In the present study, the index proposed by Morissette et al.(2010a), which differed from the Pianka index by the inclusionof a weighting factor accounting for the total quantity of resourceconsumed, was used. As the total food intake of marine mammalswas low compared with the biomass removed by the fisheries, thecalculated degree of common resource utilization was temperedand appeared as such to be medium to low. It should be acknowl-edged as well that overlap estimates for the toothed cetacean com-munity were probably smoothed by the inclusion of fisheries as asingle average fleet and were likely to have been slightly underesti-mated. Adding to this, the MTI analysis including direct and indir-ect trophic linkages provided the strongest evidence ofcompetition between bottlenose dolphins and fisheries, asdietary overlap alone does not prove competition given the factthat resources could be adequate to support both species. The in-crease in landings and discards of exploited compartments in theMTI routine resulted in a significant direct decrease in food avail-able to bottlenose dolphins.
At the community scale, overlap “hot spots” in the NorthAtlantic (calculated using an index similar to the one used here)
Figure 4. Continued
The Bay of Biscay case study 935
at Centre N
ational Universitaire de D
ocumentation Scientifique et T
echnique on June 25, 2012http://icesjm
s.oxfordjournals.org/D
ownloaded from

occurred mainly on, or along, the edges of shelves in the North Seaand adjacent waters but with almost no overlap between toothedwhales (sperm and beaked whales, porpoises and dolphins) andfisheries detected (Kaschner et al., 2001). Specific results for thecommunity of the Bay of Biscay tended in the same direction(global afm ¼ 0.07), meaning that the availability of food is notconstrained much by competition, but food could theoreticallystill be scarce in absolute terms.
Ecosystem models are useful for generating hypotheses aboutpotential impacts of fisheries on marine ecosystems but conclu-sions can be biased by the uncertainty in input parameters andinfluenced by the model structure. Indeed, foodwebs with lowercomplexity in the community structure (fewer trophic links)tend to have higher overlap values (Hall and Raffaelli, 1993;Morissette, 2007). In the present study, the global omnivoryvalue of 0.20 (SOI) is a relatively “intermediate” value when com-pared with those obtained for other shelf ecosystems in the worldand with outputs from previous Bay of Biscay models (Lassalleet al., 2011), but it is a relatively “high” value when the comparisonextends to a broader set of marine ecosystems (Morissette et al.,2010b). So, the low level of prey aggregation in our model,which is made up of several mono-specific boxes, could be partof the explanation for the restricted community overlap foundin the system.
A TL-based assessment of fisheries impactsResults from the simulations of fishery impacts on the Bay ofBiscay continental shelf ecosystem presented the same patternsto catches and ecosystem biomass obtained with virtual ecosystemssubmitted to increasing fishing pressure (Gascuel et al., 2011). Theecosystem under study combined three characteristics that,according to these theoretical simulations, amplify sensitivity tofishing activities, i.e. bottom–up regulation, biomass inputcontrol (detritus-based), and high transfer efficiencies (meantransfer efficiency was 15.7%). In this direction, signs of overex-ploitation, i.e. decreasing catches for the highest exploitationrates, rapidly appeared for predator classes during simulations.Further evidence of overexploitation at ecosystem scale, i.e. declin-ing mean TL of the catch with increased fishing effort, was none-theless moderate. This picture of an ecosystem not far from beingoverexploited at the current level of fishing pressure strengthenedprevious findings derived from trophodynamic indicators(L-index; Libralato et al., 2008) in this area (Lassalle et al.,2011). However, in the present work, the biomass decompositiondid not allow us to associate a specific trophic class with marinemammals (other species occupy the same levels as dolphins), aswe first thought might be possible. This highlights the fact thatsome targeted fishes also play a top predator role within the eco-system. As a consequence, the response of marine mammals tofisheries could not be isolated. Similarly, inclusion of thebycatch of toothed cetaceans did not change the diagnosis pro-duced by ET. Indeed, the related additional bycatch mortality islow and only impacts a small fraction of the high TLs’ biomass.Therefore, the potential effects of fisheries bycatch on marinemammals were masked by the response to increasing fishing pres-sure of other biological elements that composed the trophic class4.5. Nevertheless, this TL-based analysis of fisheries impacts wasuseful to supply a general context to more species-specificresults presented in the two previous sections and to provide im-portant novel insights on the ecosystem functioning.
From a methodological point of view, the sensitivity analysesshowed that the key ET parameter, impacting our diagnosis, isthe estimation of the sigma of the lognormal function. This par-ameter is critical to produce continuous distributions ofbiomass, production, and catch (Gascuel and Pauly, 2009;Gascuel et al., 2009). The omnivory index (OI) estimated fromEcopath models at first appeared to be the candidate measure ofdispersion to use in ET. However, its values refer in fact to the vari-ability between the different prey of a given predator and not ne-cessarily to the variability between various predators constituting amodel compartment. Additionally, these values can be underesti-mated by the inclusion of “imports” and “discards” in the diet offunctional groups, as it was the case here. Adding to this, Libralatoand Solidoro (2010) who presented various methods for the con-struction of trophic spectra concluded that OI was a weak measureof the distribution of energy flow. According to these authors, OIdoes not integrate the cascade propagation of the dispersion ofprey items along the ecological network. ET developers are cur-rently working on the definition of a reference smoother with aunique and fixed value [see Equation (2), M. Colleter, pers.comm.]. Ultimately, the theoretical model with the default param-etrization was used as the best compromise in the present study.
ConclusionsTo our knowledge, this is the first extensive study of fisheries–marine mammal interactions at the ecosystem scale in the Bay ofBiscay. Fisheries, in addition to causing significant bycatch mortal-ities on the common dolphin and harbour porpoise (operationalinteractions), were demonstrated to affect the bottlenose dolphinthrough direct, and most probably indirect, competition forfood (biological interactions). Adding to this, the exploitationstatus of this ecosystem as a whole was determined through non-dynamic simulations performed with ET, a new statistical tech-nique. The Bay of Biscay continental shelf appeared not far frombeing overexploited, this view being consistent with previous butpartial conclusions obtained from ecological network analysis.This phenomenon seemed even more pronounced when focusingon high TL organisms. This paper provides a concrete illustrationof how the joint utilization of Ecopath and ET allowed aneasy-to-implement assessment of fisheries impacts at the ecosys-tem scale, and more particularly, on compartments which are bio-logically and culturally important and reinforced the importanceof durably gathering long-term series on marine mammal bycatch.
AcknowledgementsThis research has been supported by EU FP7 grant FACTS (ForageFish Interactions), grant agreement no. 244966, and by theEuropean project REPRODUCE (EratNet-Marifish, WP7). MBSwas supported by the Spanish Ministry of Education, ProgramaNacional de Movilidad de Recursos Humanos de Investigacion(PR -2010-0518).
ReferencesAmaral, A., Sequeira, M., Martınez-Cedeira, J., and Coelho, M. 2007.
New insights on population genetic structure of Delphinus delphisfrom the Northeast Atlantic and phylogenetic relationships withinthe genus inferred from two mitochondrial markers. MarineBiology, 151: 1967–1976.
Bearzi, G., Agazzi, S., Gonzalvo, J., Costa, M., Bonizzoni, S., Politi, E.,Piroddi, C., et al. 2008. Overfishing and the disappearance of short-
936 G. Lassalle et al.
at Centre N
ational Universitaire de D
ocumentation Scientifique et T
echnique on June 25, 2012http://icesjm
s.oxfordjournals.org/D
ownloaded from

beaked common dolphins from western Greece. EndangeredSpecies Research, 5: 1–12.
Caurant, F., Chouvelon, T., Lahaye, V., Mendez-Fernandez, P., Rogan,E., Spitz, J., and Ridoux, V. 2009. The use of ecological tracers fordiscriminating dolphin population structure: the case of the short-beaked common dolphin Delphinus delphis in European Atlanticwaters. The International Whaling Commission’s 61 AnnualMeeting, International Whaling Commission: IWC61.
Certain, G., Ridoux, V., Van Canneyt, O., and Bretagnolle, V. 2008.Delphinid spatial distribution and abundance estimates over theshelf of the Bay of Biscay. ICES Journal of Marine Science, 65:656–666.
Christensen, V., and Pauly, D. 1992. ECOPATH II—a software for bal-ancing steady-state ecosystem models and calculating networkcharacteristics. Ecological Modelling, 61: 169–185.
Christensen, V., Walters, C. J., Pauly, D., and Forrest, R. 2008. Ecopathwith Ecosim version 6: user guide. Fisheries Centre, the Universityof British Columbia, Vancouver, Canada. 235 pp.
Colleter, M. 2010. Analyse de l’impact d’une Aire Marine Protegee(AMP) sur le fonctionnement trophique d’un ecosysteme: modeli-sation Ecopath/EcoTroph de la reserve du bolong de Bamboung,Senegal. Rapport de Master, Halieutique, Agrocampus Ouest(Institut de Recherche pour le Developpement, LaboratoireRAP), Rennes, France. 41 pp.
DeMaster, D. P., Fowler, C. W., Perry, S. L., and Richlen, M. F. 2001.Predation and competition: the impact of fisheries on marine-mammal populations over the next one hundred years. Journalof Mammalogy, 82: 641–651.
Essington, T. E., Beaudreau, A. H., and Wiedenmann, J. 2006. Fishingthrough marine food webs. Proceedings of the National Academyof Sciences of the USA, 103: 3171–3175.
Fontaine, M. C., Tolley, K. A., Michaux, J. R., Birkun, A., Ferreira, M.,Jauniaux, T., Llavona, A., et al. 2010. Genetic and historic evidencefor climate-driven population fragmentation in a top cetaceanpredator: the harbour porpoises in European water. Proceedingsof the Royal Society of London, Series B: Biological Sciences,277: 2829–2837.
Gasche, L., Gascuel, D., Shannon, L., and Shin, Y. J. 2012. Global as-sessment of the fishing impacts on the Southern Benguela ecosys-tem using an EcoTroph modelling approach. Journal of MarineSystems, 90: 1–12.
Gascuel, D., Guenette, S., and Pauly, D. 2011. The trophic-level-basedecosystem modelling approach: theoretical overview and practicaluses. ICES Journal of Marine Science, 68: 1403–1416.
Gascuel, D., and Pauly, D. 2009. EcoTroph: modelling marine ecosys-tem functioning and impact of fishing. Ecological Modelling, 220:2885–2898.
Gascuel, D., Tremblay-Boyer, L., and Pauly, D. 2009. EcoTroph (ET): atrophic level based software for assessing the impacts of fishing onaquatic ecosystems. Fisheries Centre Research Reports, FisheriesCentre, 17(1). University of British Columbia, Vancouver,Canada. 82 pp.
Goni, R. 1998. Ecosystem effects of marine fisheries: an overview.Ocean and Coastal Management, 40: 37–64.
Goujon, M. 1996. Captures accidentelles du filet maillant derivant etdynamique des populations de dauphins au large du Golfe deGascogne. These de Doctorat, Halieutique, ENSA, Rennes,France. 227 pp.
Hall, S. J., and Raffaelli, D. G. 1993. Food webs: theory and reality. InAdvances in Ecological Research, pp. 187–239. Ed. by M. Begon,and A. H. Fitter, Academic Press, London, U.K.
Hammond, P. S., Berggren, P., Benke, H., Borchers, D. L., Collet, A.,Heide-Jorgensen, M. P., Heimlich, S., et al. 2002. Abundance ofharbour porpoise and other cetaceans in the North Sea and adja-cent waters. Journal of Applied Ecology, 39: 361–376.
ICES. 2005a. Report of the Working Group on Cephalopod Fisheriesand Life History (WGCEPH). ICES Document CM 2005/G: 14. 59pp.
ICES. 2005b. Report of the Working Group on the Assessment ofMackerel, Horse Mackerel, Sardine and Anchovy (WGMHSA).ICES Document CM 2005/ACFM: 08. 487 pp.
ICES. 2008. Report of the Working Group on the Assessment ofSouthern Shelf Stocks of Hake, Monk and Megrim (WGHMM).ICES Document CM 2008/ACOM: 07. 613 pp.
ICES. 2010a. Report of the ICES Advisory Committee, 2010—Book 1:Introduction, Overview and Special Requests. ICES Advice 2010.255 pp.
ICES. 2010b. Report of the Study Group on Bycatch of ProtectedSpecies (SGBYC). ICES Document CM 2010/ACOM: 25. 123 pp.
ICES. 2010c. Report of the Working Group on Marine MammalEcology (WGMME). ICES Document CM 2010/ACOM: 24. 212pp.
ICES. 2011. Report of the Working Group on Bycatch of ProtectedSpecies (WGBYC 2011). ICES Document CM 2011/ACOM: 26.75 pp.
Karpouzi, V. S., Watson, R., and Pauly, D. 2007. Modelling andmapping resource overlap between seabirds and fisheries on aglobal scale: a preliminary assessment. Marine Ecology ProgressSeries, 343: 87–99.
Kaschner, K., Watson, R., Christensen, V., Trites, A. W., and Pauly, D.2001. Modeling and mapping trophic overlap between marinemammals and commercial fisheries in the North Atlantic. InFisheries Impacts on North Atlantic Ecosystems: Catch, Effort andNational/Regional Datasets, pp. 35–45. Ed. by D. Zeller, D. Pauly,and R. Watson. Fisheries Centre Research, Vancouver, Canada.
Lassalle, G., Lobry, J., Le Loc’h, F., Bustamante, P., Certain, G., Delmas,D., Dupuy, C., et al. 2011. Lower trophic levels and detrital biomasscontrol the Bay of Biscay continental shelf food web: implicationsfor ecosystem management. Progress in Oceanography, 91: 61–75.
Le Loc’h, F., and Hily, C. 2005. Stable carbon and nitrogen isotopeanalysis of Nephrops norvegicus / Merluccius merluccius fishinggrounds in the Bay of Biscay (Northeast Atlantic). CanadianJournal of Fisheries and Aquatic Sciences, 62: 123–132.
Le Loc’h, F., Hily, C., and Grall, J. 2008. Benthic community and foodweb structure on the continental shelf of the Bay of Biscay (NorthEastern Atlantic) revealed by stable isotopes analysis. Journal ofMarine Systems, 72: 17–34.
Lewison, R. L., Crowder, L. B., Read, A. J., and Freeman, S. A. 2004.Understanding impacts of fisheries bycatch on marine megafauna.Trends in Ecology and Evolution, 19: 598–604.
Libralato, S., Coll, M., Tudela, S., Palomera, I., and Pranovi, F. 2008.Novel index for quantification of ecosystem effects of fishing asremoval of secondary production. Marine Ecology ProgressSeries, 355: 107–129.
Libralato, S., and Solidoro, C. 2010. Comparing methods for buildingtrophic spectra of ecological data. ICES Journal of Marine Science,67: 426–434.
Lopez, A., Pierce, G. J., Santos, M. B., Gracia, J., and Guerra, A. 2003.Fishery by-catches of marine mammals in Galician waters: resultsfrom on-board observations and an interview survey of fishermen.Biological Conservation, 111: 25–40.
Luca, M., Andrew, W., Emer, R., Patricia, R., Andrew, R., Jamie, C.,and Tom, C. 2009. Population structure of short-beakedcommon dolphins (Delphinus delphis) in the North AtlanticOcean as revealed by mitochondrial and nuclear genetic markers.Marine Biology, 156: 821–834.
Morissette, L. 2007. Complexity, cost and quality of ecosystem modelsand their impact on ecosystem resilience: a comparative analysis,with emphasis on marine mammals and the Gulf of St Lawrence.PhD Thesis, Zoology, University of British Columbia. 260 pp.
The Bay of Biscay case study 937
at Centre N
ational Universitaire de D
ocumentation Scientifique et T
echnique on June 25, 2012http://icesjm
s.oxfordjournals.org/D
ownloaded from

Morissette, L., Kaschner, K., and Gerber, L. R. 2010a. Ecosystemmodels clarify the trophic role of whales off Northwest Africa.Marine Ecology Progress Series, 404: 289–302.
Morissette, L., Kaschner, K., and Gerber, L. R. 2010b. ‘Whales eat fish’?Demystifying the myth in the Caribbean marine ecosystem. Fishand Fisheries, 11: 388–404.
Morizur, Y., Berrow, S. D., Tregenza, N. J. C., Couperus, A. S., andPouvreau, S. 1999. Incidental catches of marine-mammals inpelagic trawl fisheries of the Northeast Atlantic. FisheriesResearch, 41: 297–307.
Murphy, S., Herman, J. S., Pierce, G. J., Rogan, E., and Kitchener, A. C.2006. Taxonomic status and geographical cranial variation ofcommon dolphins (Delphinus) in the eastern North Atlantic.Marine Mammal Science, 22: 573–599.
Murphy, S., Winship, A., Dabin, W., Jepson, P. D., Deaville, R., Reid,R. J., Spurrier, C., et al. 2009. Importance of biological parametersin assessing the status of Delphinus delphis. Marine EcologyProgress Series, 388: 273–291.
Northridge, S. P. 1991. An updated world review of interactionsbetween marine mammals and fisheries. FAO Fisheries TechnicalPaper, 251(Suppl. 1). FAO, Rome, Italy. 58 pp.
Odum, E. P. 1969. The strategy of ecosystem development. Science,164: 262–270.
Pauly, D., and Christensen, V. 1995. Primary production required tosustain global fisheries. Nature, 374: 255–257.
Pauly, D., Christensen, V., Dalsgaard, J., Froese, R., and Torres, F. 1998.Fishing down marine food webs. Science, 279: 860–863.
Pianka, E. R. 1973. The structure of lizard communities. AnnualReview of Ecology and Systematics, 4: 53–74.
Pierce, G. J., Allcock, L., Bruno, I., Bustamante, P., Gonzalez, A.,Guerra, A., Jereb, P., et al. 2010. Cephalopod biology and fisheriesin Europe. ICES Cooperative Research Report, 303. 175 pp.
Polovina, J. J. 1984. Model of coral reef ecosystem I. The Ecopathmodel and its application to French Frigate Shoals. Coral Reefs,3: 1–11.
Pusineri, C., Meynier, L., Spitz, J., and Ridoux, V. 2004. Study ofdietary overlap between small cetaceans and fisheries in the Bayof Biscay from stomach content analysis. CIESM WorkshopMonographs, 25: 59–67.
R foundation core team. 2011. R: a language and environment for stat-istical computing, version 2.13.0. R Foundation for StatisticalComputing, Vienna, Austria.
Rogan, E., and Mackey, M. 2007. Megafauna bycatch in drift nets foralbacore tuna (Thunnus alalunga) in the NE Atlantic. FisheriesResearch, 86: 6–14.
Tregenza, N. J. C., Berrow, S. D., Hammond, P. S., and Leaper, R. 1997.Harbour porpoise (Phocoena phocoena L.) by-catch in set gillnets inthe Celtic Sea. ICES Journal of Marine Science, 54: 896–904.
Tremblay-Boyer, L., Gascuel, D., Watson, R., Christensen, V., andPauly, D. 2011. Modelling the effects of fishing on the biomass ofthe world’s oceans from 1950-2006. Marine Ecology ProgressSeries, 442: 169–185.
Ulanowicz, R. E., and Puccia, C. J. 1990. Mixed trophic impacts in eco-systems. Coenoses, 5: 7–16.
Valls, A. 2009. Evaluation de l’efficacite des AMP par modelisation dufonctionnement trophique de l’ecosysteme : cas du parc nationalde Port-Cros, en Mediterranee. Rapport de Master, Halieutique,Agrocampus Ouest (Universite de Nice Sophia Antipolis,Laboratoire Environnement Marin Littoral), Rennes, France. 35 pp.
Handling editor: Howard Browman
938 G. Lassalle et al.
at Centre N
ational Universitaire de D
ocumentation Scientifique et T
echnique on June 25, 2012http://icesjm
s.oxfordjournals.org/D
ownloaded from
Copyright © 2022 FDOKUMEN