Fault Tip Displacement Gradients and Process Zone Dimensions
Upload
independentCategory
view
4download
0
Hydrobiologia 369/370: 27–43, 1998. 27M. Alvarez-Cobelas, C. S. Reynolds, P. Sanchez-Castillo & J. Kristiansen (eds), Phytoplankton and Trophic Gradients.c 1998Kluwer Academic Publishers. Printed in Belgium.
Summer phytoplankton assemblages across trophic gradientsin hard-water reservoirs
M. J. Dası, M. R. Miracle, A. Camacho, J. M. Soria & E. VicenteDepartament de Microbiologia i Ecologia, Facultat de Biologia, Universitat de Valencia, E-46100 Burjassot,Spain
Key words:phytoplankton, trophic level, reservoirs, hypertrophic ecosystems, nutrients, diversity
Abstract
Summer phytoplankton assemblages are described and characterised according to their prevalence in a series of hard-water reservoirs of eastern Spain that had been classified in trophic categories on OECD criteria.Distribution patternsof phytoplankton species were ordinated statistically by principal components analysis (PCA). The first componentwas strongly related to trophic gradient and it particularly discriminated the eutrophic and hypertrophic reservoirs.The second component segregated life-forms, so that (1), on the oligo-mesotrophic side, large dinoflagellates were
separated from small centric diatoms, unicellular chrysophytes and filamentous ullotrichales and, on the eu-hypertrophic side (2), colonial greens and large desmids were separated from unicellular volvocales and smallcentric diatoms.
The large differences between eutrophic and hypertrophic reservoirs were also clearly identified in a second PCA,in which physical and chemical factors were used with the principal components solved from the phytoplanktondata. From these results, a new trophic category was discerned, for which we propose the name ‘holotrophic’.This category applies to water bodies having the following main features: (1) concentrations of chorophyll, total Pand total N in the range of the hypertrophic systems, but with much higher concentrations of dissolved phospho-rus and ammonia and (2) phytoplankton predominantly composed by unicellular green flagellates (Pteromonas,Chlamydomonas) and chlorococcales (Scenedesmus), without cyanobacterial blooms.
Introduction
Ortiz-Casas & Pena (1984) showed that OECD crite-ria (OECD, 1982), relating nutrient load to eutroph-ication responses, are valid for Spanish reservoirs.When broad-scale patterns of phytoplankton distrib-ution were explored in a set of more than 100 Spanishreservoirs, trophic level was also an important explana-tory factor (Margalef et al., 1982; Sabater & Nolla,1991; Riera et al., 1992). However the resulting ordi-nations of the reservoirs shown in these works, basedon phytoplankton species composition, consistentlymatched ordinations based on physical and chemicalvarables, in which two types of reservoirs, accordingto siliceous and calcareous rock dominance, were firstestablished (Margalef et al., 1976). In the western partof the Iberian Peninsula, watersheds lie on igneous
rocks or slates, which are responsible for the low alka-linities of reservoir waters in the region (less than 1 meql�1). In contrast, watersheds in the eastern part, lie onlimestone and sedimentary soils and reservoirs gener-ally have high alkalinities. Subgroups within these twosets of reservoirs were then distinguished by troph-ic level (indicated mainly by Chlorophyll-a), whichbecame a clearer descriptor when only summer datawas used (Estrada, 1975; Riera et al., 1992).
Phytoplankton composition has been shown to beinfluenced by two composite factors: water hardnessand trophic status. The outcome of their interaction wasrecognised long ago (Moss, 1973). The important roleof these two main variables (essentially, pH-inorganicC availability, on the one hand; the nutrients, N andP, on the other) in regulating phytoplankton composi-tion has also been revealed in field experiments (e.g.
GSB/prepr: Pipsnr. 159487; Ordernr.:7011636-avg BIO2KAPhydrma25.tex; 10/08/1998; 15:58; v.7; p.1

28
Reynolds, 1986; Shapiro, 1989; Sommer, 1989). Thefirst composite factor is more related to geology andclimate; the second to anthropogenic influences. Thus,in this exploration of the validity of the trophic spec-trum, illustrated by data from fifteen hard-water reser-voirs, it was necessary to suppress all other sources ofvariation as far as possible, especially the alkalinity-hardness factor. The reservoirs are located within anarea of quite uniform geography, hydrography andmesomediterranean-dry climate. Moreover, the studywas confined to a summer period, because between-site differences in trophic state are most apparent dueto rainfall is least and, so sewage-enriched inflows arepoorly diluted. The aim of this paper is to explorestatistically the relationships between the phytoplank-ton communities of these high-alkalinity reservoirs andtheir various nutrient inputs. We then seek to com-pare these patterns with those detected in other region-al studies, in Spain and elsewhere in the Mediter-ranean (Naselli-Flores & Barone, 1994) as well asthose observed in other types of lake (Reynolds, 1982,1984a), especially at the hypertrophic end of the spec-trum (Alvarez-Cobelas & Jacobsen, 1992).
Material and methods
Study sites
Spanish Mediterranean climate is characterised by theirregularity of rains, resulting in a scarcity of waterresources. Because of this, a great number of reservoirshas been built, mostly during this century, to meetwater needs. There are now more than one thousandlarge dams in Spain, in contrast to the small number oflakes in the country. Water supply, irrigation and floodcontrol are the main uses of these reservoirs.
We studied the main reservoirs of the centralMediterranean hydrographic zone of Spain, namedafter its main river drainage area, the basin of the riv-er Jucar (Figure 1). This river and its main tributary,Cabriel, feed the largest reservoirs of the zone, viz.,Alarcon, Contreras and Tous. Their water volumes atthe time of the study, summer 1995, represented only avery small percentage (3–5%) of their capacities. Thesmaller reservoirs then stored 10–30% of their capaci-ties. The smaller Forata Reservoir is located on the sec-ond main tributary of the Jucar, the Magro. The largereservoir, Benageber, is on the second most importanttributary, the Turia, which also has the small head-water reservoir, Arquillo. Three medium-sized reser-
Figure 1. Geographic location of the studied reservoirs and theircorresponding main river courses. The hydrographic zone of riverJucar is indicated in black. Abbreviations of reservoirs as in table 1.
voirs (Loriguilla, Arenos and Sichar) on the third mostimportant tributary (the Millares) were included. Theother resevoirs are relatively small, on short streamsdraining lesser subcatchments. Beniarres and Rega-jo both receive urban wastewater and neither were asbelow capacity as the others (50% full by volume).
Most of the reservoirs studied were constructedbetween 1955 and 1967, except for Contreras, Arenosand Tous, which are more recent. They are hard-water reservoirs with alkalinities varying between 2and 4 meq l�1 at the end of summer. Calcite precipita-tion, which usually takes place during summer, is moreintense in the more eutrophic reservoirs.Then, in MariaCristina Reservoir, alkalinity was lowered down to aseasonal minimum of 1.7 meq l�1. In this case, pH isexceptionally high, reaching 10, whereas all the othermeasured values were in the range pH 8–9. Conductiv-ities in these reservoirs varied from 0.5 to 1 mS cm�1
and, in most of them, sulphate concentrations (meql�1) exceeded bicarbonate alkalinity (Group III watersin the typology of Armengol et al., 1991).
hydrma25.tex; 10/08/1998; 15:58; v.7; p.2
29
The anthropogenic influence is very differentbetween reservoirs. Some of them receive waterswith only agricultural contamination (Tous, Contreras,Guadalest, Arenos and Arquillo), while others, such asSichar, Amadorio, Benageber and Loriguilla, receivediluted wastewater from villages. The reservoirs, Fora-ta, Beniarres and Maria Cristina, all receive importantsewage loads of both industrial and domestic wastewa-ter with a high content in organic matter and inorganicnutrients. Buseo reservoir is still heavily affected bythe massive input of ash and woody debris receivedas a consequence of the forest fire which extendedthroughout the catchment in 1994.
Methods
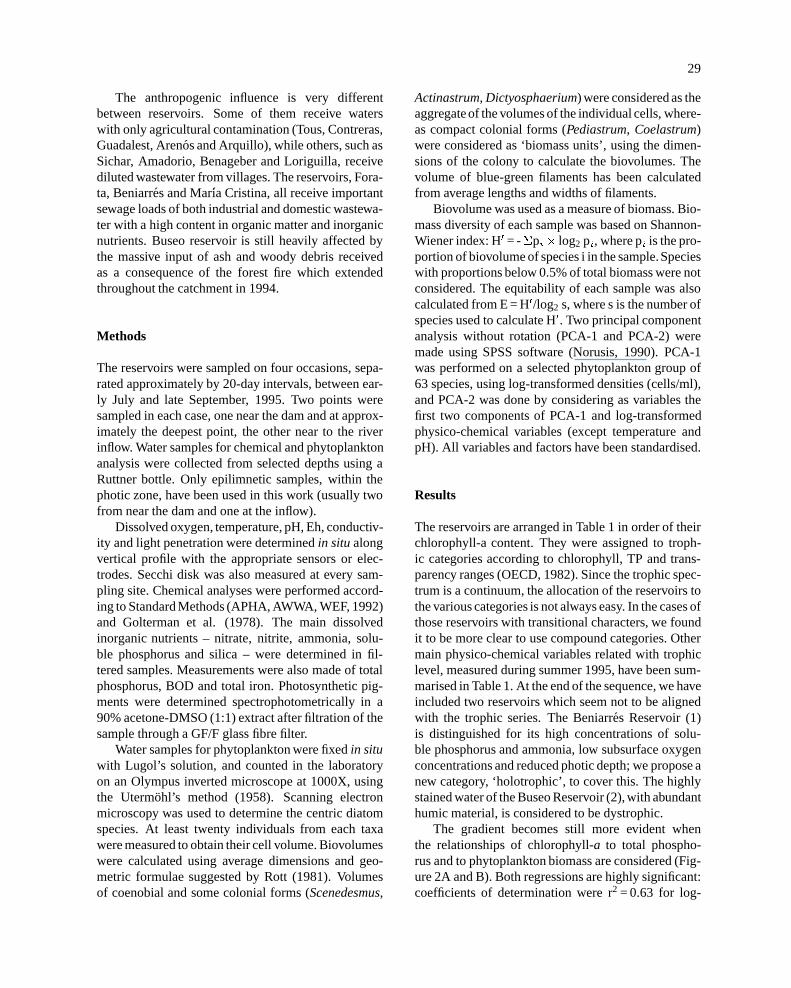
The reservoirs were sampled on four occasions, sepa-rated approximately by 20-day intervals, between ear-ly July and late September, 1995. Two points weresampled in each case, one near the dam and at approx-imately the deepest point, the other near to the riverinflow. Water samples for chemical and phytoplanktonanalysis were collected from selected depths using aRuttner bottle. Only epilimnetic samples, within thephotic zone, have been used in this work (usually twofrom near the dam and one at the inflow).
Dissolved oxygen, temperature, pH, Eh, conductiv-ity and light penetration were determinedin situalongvertical profile with the appropriate sensors or elec-trodes. Secchi disk was also measured at every sam-pling site. Chemical analyses were performed accord-ing to Standard Methods (APHA, AWWA, WEF, 1992)and Golterman et al. (1978). The main dissolvedinorganic nutrients – nitrate, nitrite, ammonia, solu-ble phosphorus and silica – were determined in fil-tered samples. Measurements were also made of totalphosphorus, BOD and total iron. Photosynthetic pig-ments were determined spectrophotometrically in a90% acetone-DMSO (1:1) extract after filtration of thesample through a GF/F glass fibre filter.
Water samples for phytoplankton were fixedin situwith Lugol’s solution, and counted in the laboratoryon an Olympus inverted microscope at 1000X, usingthe Utermohl’s method (1958). Scanning electronmicroscopy was used to determine the centric diatomspecies. At least twenty individuals from each taxawere measured to obtain their cell volume. Biovolumeswere calculated using average dimensions and geo-metric formulae suggested by Rott (1981). Volumesof coenobial and some colonial forms (Scenedesmus,
Actinastrum, Dictyosphaerium) were considered as theaggregateof the volumes of the individual cells, where-as compact colonial forms (Pediastrum, Coelastrum)were considered as ‘biomass units’, using the dimen-sions of the colony to calculate the biovolumes. Thevolume of blue-green filaments has been calculatedfrom average lengths and widths of filaments.
Biovolume was used as a measure of biomass. Bio-mass diversity of each sample was based on Shannon-Wiener index: H0 = -�pi� log2 pi, where pi is the pro-portion of biovolume of species i in the sample.Specieswith proportions below 0.5% of total biomass were notconsidered. The equitability of each sample was alsocalculated from E = H0/log2 s, where s is the number ofspecies used to calculate H0. Two principal componentanalysis without rotation (PCA-1 and PCA-2) weremade using SPSS software (Norusis, 1990). PCA-1was performed on a selected phytoplankton group of63 species, using log-transformed densities (cells/ml),and PCA-2 was done by considering as variables thefirst two components of PCA-1 and log-transformedphysico-chemical variables (except temperature andpH). All variables and factors have been standardised.
Results
The reservoirs are arranged in Table 1 in order of theirchlorophyll-a content. They were assigned to troph-ic categories according to chlorophyll, TP and trans-parency ranges (OECD, 1982). Since the trophic spec-trum is a continuum, the allocation of the reservoirs tothe various categories is not always easy. In the cases ofthose reservoirs with transitional characters, we foundit to be more clear to use compound categories. Othermain physico-chemical variables related with trophiclevel, measured during summer 1995, have been sum-marised in Table 1. At the end of the sequence, we haveincluded two reservoirs which seem not to be alignedwith the trophic series. The Beniarres Reservoir (1)is distinguished for its high concentrations of solu-ble phosphorus and ammonia, low subsurface oxygenconcentrations and reduced photic depth; we propose anew category, ‘holotrophic’, to cover this. The highlystained water of the Buseo Reservoir (2),with abundanthumic material, is considered to be dystrophic.
The gradient becomes still more evident whenthe relationships of chlorophyll-a to total phospho-rus and to phytoplankton biomass are considered (Fig-ure 2A and B). Both regressions are highly significant:coefficients of determination were r2 = 0.63 for log-
hydrma25.tex; 10/08/1998; 15:58; v.7; p.3

30
Table 1. Physical and chemical features of studied reservoirs, ordered according to trophic status. Concentrations (means and ranges) areonly given for the photic epilimnetic zone. The two last reservoirs are differentiated from the main sequence ordered by mean chlorophyll.Abbreviations used for reservoirs in the graphs are indicated in brackets, next to the corresponding names. Thickness of the anoxic layercorrespond to its heigth from the bottom near the dam, at the time of its measured maximum and the total depth at this point and time is justby indicated.
Reservoir Epilimnetic Total phosphorus Dissolved oxygen Photic depth Maximum anoxic
Chlorophylla (�g l�1) (�M) (% saturation) (1% light) (m) hypolimnion (m)
Mean Min-Max. Mean Min-Max. at surface at 2 m depth Minimum Maximum Thickness Depth
of anoxia at dam
Oligo-mesotrophic
Tous (To) 1.9 1.1–2.2 0.49 0.29–0.68 100�9 98�8 8 12.5 3.5 15
Contreras (C) 2.0 0.7–3.7 0.61 0.35–1.00 96�13 94�13 10 15 5 28.5
Guadalest (G) 2.5 1.4–3.4 0.81 0.68–1.10 100�15 100�12 8 12 0 24
Arenos (As) 5.6 1.2–8.8 0.75 0.51–0.96 101�8 101�7 6.8 10.2 0 20
Arquillo (Ar) 6.9 2.9–10.6 1.10 0.61–1.54 84�14 81�16 4.6 6.5 2.5 9
Meso-eutrophic
Sichar (S) 7.9 4.6–14.5 1.11 0.71–1.90 102�9 100�10 4.5 5.7 7 12
Amadorio (Am) 10.4 6.3–14.8 1.35 0.80–2.41 105�15 104�20 3.5 7.2 9 14.2
Benageber (Bg) 18.7 8.5–34.3 1.39 0.90–2.26 119�26 111�17 4 10 6.5 17.5
Loriguilla (L) 20.2 12.3–28.6 1.29 0.74–1.74 144�29 132�32 4.5 7.5 3.5 15.5
Eutrophic
Alarcon (Al) 19.9 13.9–39.0 2.28 0.77–4.10 112�18 112�17 4.2 5.0 0 12
Regajo (R) 40.9 9.6–50.2 2.22 1.41–4.84 136�28 120�18 3.3 6.5 5 12
Hypertrophic
Forata (F) 42.9 7.1–190.7 7.41 1.42–12.62 131�52 106�23 2.5 6.5 3.5 14.5
M. Cristina (M) 250.0 57.7–439.6 11.61 8.52–16.23 161�31 153�37� Bottom Bottom 0 1.5
Holotrophic
Beniarres (Be) 122.0 20.7–232.8 11.28 7.94–18.00 200�88 83�42 1.3 2 6.5 13.6
Dystrophic
Buseo (Bu) 25.8 12.0–46.4 4.66 1.58–11.03 108�26 78�20 1.3 2.2 3 8.4
Reservoir Soluble Phosphate Soluble Silica Total inorganic Nitrate (�M) Nitrite (�M) Ammonia (�M)
Mean Min-Max. Minimum Maximum Minimum Maximum Minimum Maximum Minimum Maximum Minimum Maximum
Oligo-mesotrophic
Tous (To) 0.08<0.03–0.14 64.3 116.0 31.0 116.6 29.1 115.8 0.23 0.58 0.2 1.6
Contreras (C) 0.04<0.03–0.09 25.8 77.6 41.2 53.8 34.4 53.1 0.02 2.68<0.1 4.8
Guadalest (G) 0.08<0.03–0.18 84.7 127.1 39.6 57.8 31.9 56.3 0.02 0.58<0.1 7.1
Arenos (As) 0.05<0.03–0.08 107.9 135.8 69.2 79.4 62.1 73.7 0.86 1.10 4.7 7.4
Arquillo (Ar) 0.06 <0.03–0.53 52.0 105.2 7.8 15.6 0.3 7.7<0.01 0.14 3.5 14.4
Meso-eutrophic
Sichar (S) 0.11<0.03–0.28 98.8 127.5 1.9 7.7 <0.03 4.0 0.06 0.84 1.6 5.2
Amadorio (Am) 0.06<0.03–0.24 53.4 130.7 1.3 26.3 0.04 23.5<0.01 0.15 0.8 22.0
Benageber (Bg) 0.08<0.03–0.14 60.9 91.7 26.6 80.5 25.8 56.1 0.24 2.16 0.1 23.0
Loriguilla (L) 0.09 <0.03–0.21 51.2 85.7 46.6 76.1 37.0 71.8 0.07 0.82 0.7 13.6
Eutrophic
Alarcon (Al) 0.08 <0.03–0.21 8.67 9.6 <0.2 30.8 0.05 22.2 <0.01 0.11 <0.1 15.0
Regajo (R) 0.11<0.03–0.24 27.6 79.1 1.00 21.5 0.1 6.0 0.01 0.10 0.4 21.2
Hypertrophic
Forata (F) 0.17< 0.03–0.47 0.35 2.2 <0.2 56.1 <0.03 39.0 0.02 4.27 <0.1 15.6
M. Cristina (M) 0.15<0.03–0.24 0.19 4.8 3.6 9.5 0.1 6.1 0.07 1.36 2.0 3.8
Holotrophic
Beniarres (Be) 3.00 0.51–11.91 47.9 148.0 1.0 106.7<0.03 31.2 0.02 28.39 0.8 65.4
Dystrophic
Buseo (Bu) 0.22<0.03–0.47 43.7 108.2 17.4 43.5 8.3 40.3 0.02 0.35 2.6 19.6
� At 1 meter depth.
hydrma25.tex; 10/08/1998; 15:58; v.7; p.4

31
Figure 2. Linear regressions between trophic indicators in the samples from the photic zone of each reservoir. Horizontal lines indicate the mostfrequently given boundary values (see Reynolds, 1980) for Chlorophyll-a and biomass to separate oligotrophic, in one end, and hypertrophicreservoirs, in the opposite end. a) Chla:TP b) Chla: Biomass.
transformed Chlorophyll-a and TP, and r2 = 0.76 forlog-transformed Chlorophyll-a and biomass). Someoverlap appears between the reservoirs allocated in themeso-eutrophic and eutrophic categories, however thedelimiting values given by Reynolds (1980) for totalcell volume to define trophic categories (< 2 �g l�1
for oligotrophic and> 20�g l�1 for hypertrophic) areapproximately met.
Transparency (Table 1) is less well correlated, inmany cases due to the interference from calcite precip-itation. Tables 2(a–e) show the various assemblagesof phytoplankton present in each trophic category, byreference to the most representative species on thebasis of total biomass. Oligo-mesotrophic reservoirs(Table 2a) must be strongly limited by phosphorus,whereas nitrate, the dominant form of inorganic nitro-gen, shows high concentrations. They have short res-idence times and their sediments become anoxic onlyduring short periods of high thermal stability. In thesereservoirs, species achieving> 20% biomass in earlysummer areCyclotellaspp. andCeratium hirundinel-la. At the end of summer the dinoflagellatePeridini-um cinctumis also important. In one reservoir (Tous),
probably due to earlier mixing,Fragillaria crotonen-sis was abundant, but thenC. hirundinellawas notfound. Cryptophyte species were important during allsummer;Dinobryonwas also a characteristic of thesereservoirs. We included Arquillo in a subgroup of thesereservoirs: its position is to the mesotrophic side, sinceit has only slightly higher Chlorophyll-a concentra-tions and experiences oxygen depletion in the bottomwaters. It has occasionally moderate phosphorus con-centrations, but usually this nutrient was also limiting.Inorganic N did not reach such high concentrationsas in the other four reservoirs and ammonia is oftenthe inorganic N compound with higher concentrations.Phytoplankton in Arquillo differed, becauseCeratiumwas not present andCyclotella spp. diminished at theend of summer, when there was an increasing percent-age ofFragillaria ulna var. acus. The abundance ofchrysophytes is the main characteristic of this reser-voir, although, as a result of their small cell size theirbiomass percentage is not high.
The group of meso-eutrophic reservoirs (Table 2b)have low phosphate concentrations but they are higherthan those of the first group. Two subgroups could
hydrma25.tex; 10/08/1998; 15:58; v.7; p.5
32
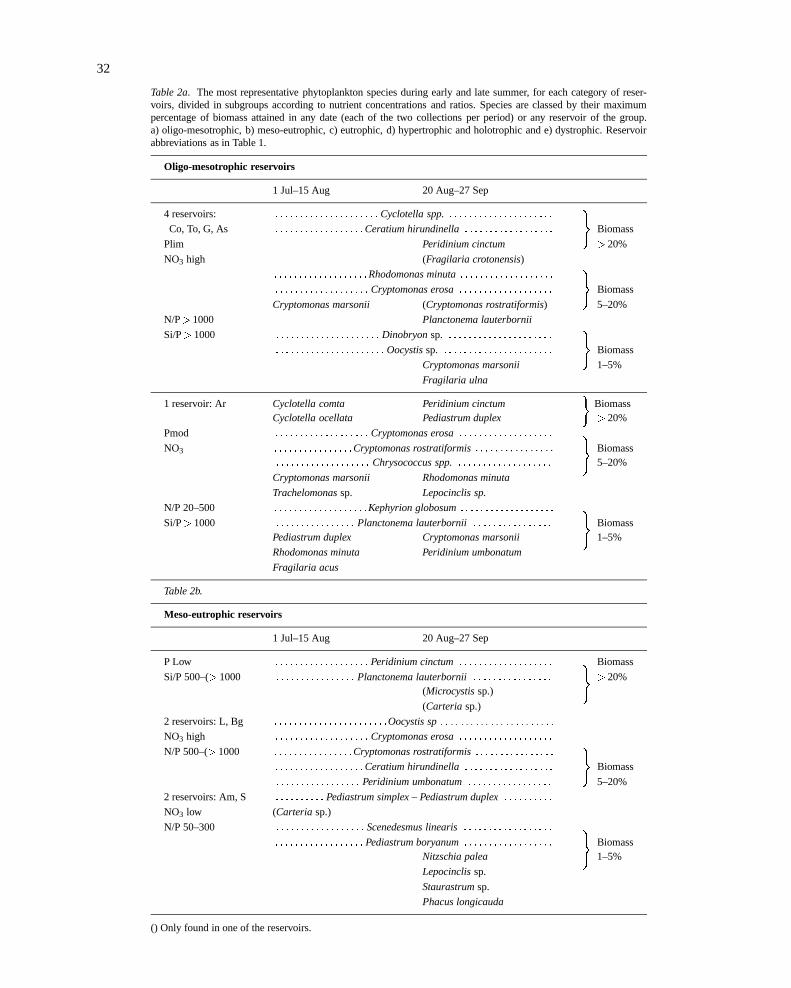
Table 2a. The most representative phytoplankton species during early and late summer, for each category of reser-voirs, divided in subgroups according to nutrient concentrations and ratios. Species are classed by their maximumpercentage of biomass attained in any date (each of the two collections per period) or any reservoir of the group.a) oligo-mesotrophic, b) meso-eutrophic, c) eutrophic, d) hypertrophic and holotrophic and e) dystrophic. Reservoirabbreviations as in Table 1.
Oligo-mesotrophic reservoirs
1 Jul–15 Aug 20 Aug–27 Sep
4 reservoirs: : : : : : : : : : : : : : : : : : : : : :Cyclotella spp.: : : : : : : : : : : : : : : : : : : : :
Co, To, G, As : : : : : : : : : : : : : : : : : :Ceratium hirundinella: : : : : : : : : : : : : : : : : :
)Biomass
Plim Peridinium cinctum >20%
NO3 high (Fragilaria crotonensis)
: : : : : : : : : : : : : : : : : : :Rhodomonas minuta: : : : : : : : : : : : : : : : : : :
: : : : : : : : : : : : : : : : : : : Cryptomonas erosa: : : : : : : : : : : : : : : : : : :
)Biomass
Cryptomonas marsonii (Cryptomonas rostratiformis) 5–20%
N/P>1000 Planctonema lauterbornii
Si/P>1000 : : : : : : : : : : : : : : : : : : : : : Dinobryonsp. : : : : : : : : : : : : : : : : : : : : :
: : : : : : : : : : : : : : : : : : : : : : Oocystissp. : : : : : : : : : : : : : : : : : : : : : :
)Biomass
Cryptomonas marsonii 1–5%
Fragilaria ulna
1 reservoir: Ar Cyclotella comta Peridinium cinctum Biomass�
Cyclotella ocellata Pediastrum duplex >20%
Pmod : : : : : : : : : : : : : : : : : : : Cryptomonas erosa: : : : : : : : : : : : : : : : : : :
NO3 : : : : : : : : : : : : : : : :Cryptomonas rostratiformis: : : : : : : : : : : : : : : : Biomass)
: : : : : : : : : : : : : : : : : : : Chrysococcus spp.: : : : : : : : : : : : : : : : : : : 5–20%
Cryptomonas marsonii Rhodomonas minuta
Trachelomonassp. Lepocinclis sp.
N/P 20–500 : : : : : : : : : : : : : : : : : : :Kephyrion globosum: : : : : : : : : : : : : : : : : : :
Si/P>1000 : : : : : : : : : : : : : : : : Planctonema lauterbornii: : : : : : : : : : : : : : : : Biomass
)Pediastrum duplex Cryptomonas marsonii 1–5%
Rhodomonas minuta Peridinium umbonatum
Fragilaria acus
Table 2b.
Meso-eutrophic reservoirs
1 Jul–15 Aug 20 Aug–27 Sep
P Low : : : : : : : : : : : : : : : : : : : Peridinium cinctum: : : : : : : : : : : : : : : : : : : Biomass
Si/P 500–(> 1000 : : : : : : : : : : : : : : : : Planctonema lauterbornii: : : : : : : : : : : : : : : : >20%
)(Microcystissp.)
(Carteria sp.)
2 reservoirs: L, Bg : : : : : : : : : : : : : : : : : : : : : : :Oocystis sp: : : : : : : : : : : : : : : : : : : : : : :
NO3 high : : : : : : : : : : : : : : : : : : : Cryptomonas erosa: : : : : : : : : : : : : : : : : : :
N/P 500–(> 1000 : : : : : : : : : : : : : : : :Cryptomonas rostratiformis: : : : : : : : : : : : : : : :
: : : : : : : : : : : : : : : : : :Ceratium hirundinella: : : : : : : : : : : : : : : : : :
)Biomass
: : : : : : : : : : : : : : : : : Peridinium umbonatum: : : : : : : : : : : : : : : : : 5–20%
2 reservoirs: Am, S : : : : : : : : : : Pediastrum simplex – Pediastrum duplex: : : : : : : : : :
NO3 low (Carteria sp.)
N/P 50–300 : : : : : : : : : : : : : : : : : : Scenedesmus linearis: : : : : : : : : : : : : : : : : :
: : : : : : : : : : : : : : : : : : Pediastrum boryanum: : : : : : : : : : : : : : : : : : Biomass
)Nitzschia palea 1–5%
Lepocinclissp.
Staurastrumsp.
Phacus longicauda
() Only found in one of the reservoirs.
hydrma25.tex; 10/08/1998; 15:58; v.7; p.6

33
Table 2c.
Eutrophic reservoirs
1 Jul–15 Aug 20 Aug–27 Sep
1 reservoir: Al Microcystissp. Cryptomonas erosa Biomass�
Pediastrum duplex >20%
Pmod : : : : : : : : : : : : : : : : : : : Peridinium cinctum: : : : : : : : : : : : : : : : : : :
NO3>NH4 : : : : : : : : : : : : : : : :Cryptomonas rostratiformis: : : : : : : : : : : : : : : :
Cryptomonas erosa Ceratium hirundinella
Oocystissp. Pediastrum simplex Biomass)
Cyclotella atomus Staurastrumsp. 5–20%
Scenedesmus acuminatus
Coelastrum astroideum
N/P 300–(> 1000) : : : : : : : : : : : : : : : : : :Cryptomonas marsonii: : : : : : : : : : : : : : : : : :
Si/P 200–(>1000) : : : : : : : : : : : : : : : : : : Pediastrum boryanum: : : : : : : : : : : : : : : : : :
Pediastrumsp. Oocystissp.
Staurastrumsp. Rhodomonas minuta
)Biomass
Aulacoseirasp. Scenedesmus acuminatus 1–5%
Gomphosphaeriasp. Stephanodiscus minutulus
Tetraedron caudatum Carteriasp.
1 reservoir: R Carteria sp. Pediastrum simplex Biomass�
Merismopediasp. (simplex + echinulatum) >20%
Pmod : : : : : : : : : : : : : : : : : : : Cryptomonas erosa: : : : : : : : : : : : : : : : : : :
NO3<NH4 : : : : : : : : : : : : : : : : : : Peridinium palatinum: : : : : : : : : : : : : : : : : :
: : : : : : : : : : : : : : : : : : : : :Staurastrumsp. : : : : : : : : : : : : : : : : : : : : : Biomass
): : : : : : : : : : : : : : : : : : : : Cosmarium spp.: : : : : : : : : : : : : : : : : : : : 5–20%
Oocystissp. Ceratium hirundinella
Merismopediasp.
: : : : : : : : : : : : : : : : : : Pediastrum boryanum: : : : : : : : : : : : : : : : : :
N/P 30–200 : : : : : : : : : : : : : : : : : : : Trachelomonassp. : : : : : : : : : : : : : : : : : : :
Si/P 200–500 : : : : : : : : : : : : : : : : :Scenedesmus acuminatus: : : : : : : : : : : : : : : : : Biomass
): : : : : : : : : : : : : : : : : Coelastrum astroideum: : : : : : : : : : : : : : : : : 1–5%
Cyclotella ocellata Peridinium umbonatum
Coelastrum reticulatum Oocystissp.
Table 2d.
Hypertrophic reservoirs
1 Jul–15 Aug 20 Aug–27 Sep
1 reservoir: F : : : : : : : : : : : : : : : : : : : : : : Carteria sp. : : : : : : : : : : : : : : : : : : : : : :
Oocystissp. Cryptomonas erosa Biomass)
Pmod Pediastrum boryanum Pediastrum simplex >20%
N high (simplex + sturnii)
Pediastrum simplex Stephanodiscus cf. hantzschii Biomass
Staurastrumsp.
�5–20%
Phormidiumsp.
N/P 3–(> 400) Ceratium hirundinella Rhodomonas minuta
Si/P 3–1000 Microcystissp. Pediastrum duplex
Euglenasp. Pediastrum boryanum Biomass)
Merismopediasp. Coelastrum astroideum 1–5%
Staurastrumsp.
Phacotus lenticularis
hydrma25.tex; 10/08/1998; 15:58; v.7; p.7
34
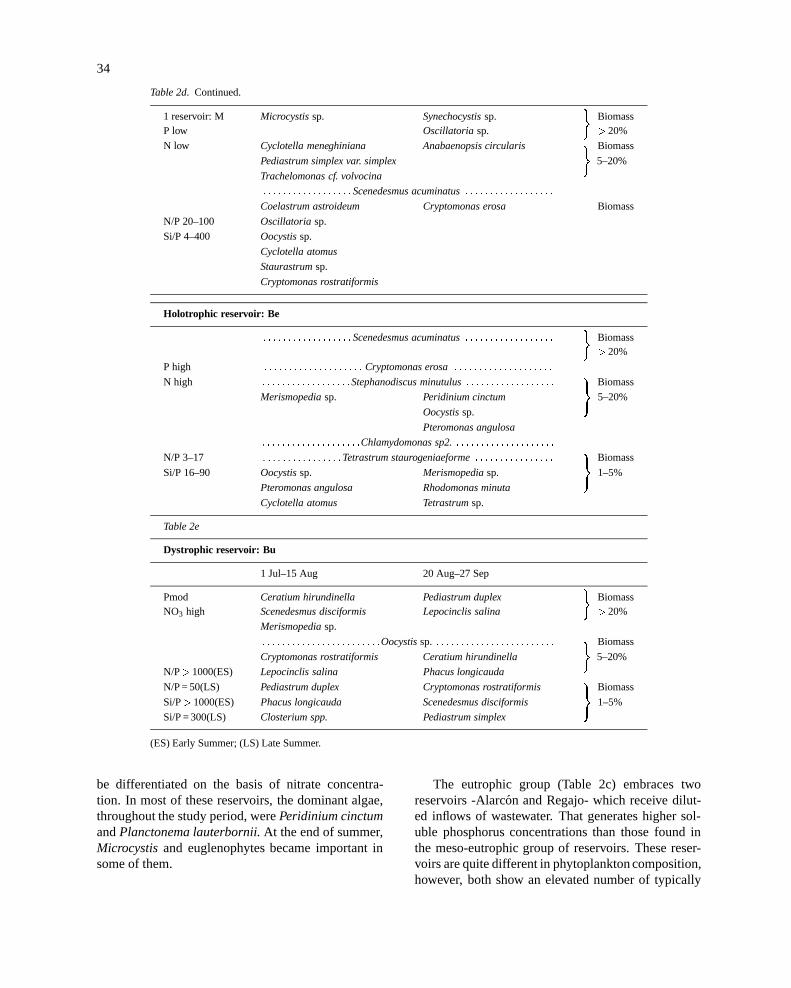
Table 2d. Continued.
1 reservoir: M Microcystissp. Synechocystissp. Biomass�
P low Oscillatoria sp. >20%
N low Cyclotella meneghiniana Anabaenopsis circularis Biomass
Pediastrum simplex var. simplex
�5–20%
Trachelomonas cf. volvocina
: : : : : : : : : : : : : : : : : :Scenedesmus acuminatus: : : : : : : : : : : : : : : : : :
Coelastrum astroideum Cryptomonas erosa Biomass
N/P 20–100 Oscillatoria sp.
Si/P 4–400 Oocystissp.
Cyclotella atomus
Staurastrumsp.
Cryptomonas rostratiformis
Holotrophic reservoir: Be
: : : : : : : : : : : : : : : : : :Scenedesmus acuminatus: : : : : : : : : : : : : : : : : : Biomass�
>20%
P high : : : : : : : : : : : : : : : : : : : : Cryptomonas erosa: : : : : : : : : : : : : : : : : : : :
N high : : : : : : : : : : : : : : : : : :Stephanodiscus minutulus: : : : : : : : : : : : : : : : : : Biomass
Merismopediasp. Peridinium cinctum
)5–20%
Oocystissp.
Pteromonas angulosa
: : : : : : : : : : : : : : : : : : : :Chlamydomonas sp2.: : : : : : : : : : : : : : : : : : : :
N/P 3–17 : : : : : : : : : : : : : : : :Tetrastrum staurogeniaeforme: : : : : : : : : : : : : : : : Biomass
Si/P 16–90 Oocystissp. Merismopediasp.
)1–5%
Pteromonas angulosa Rhodomonas minuta
Cyclotella atomus Tetrastrumsp.
Table 2e
Dystrophic reservoir: Bu
1 Jul–15 Aug 20 Aug–27 Sep
Pmod Ceratium hirundinella Pediastrum duplex Biomass�
NO3 high Scenedesmus disciformis Lepocinclis salina >20%
Merismopediasp.
: : : : : : : : : : : : : : : : : : : : : : : :Oocystissp. : : : : : : : : : : : : : : : : : : : : : : : : Biomass
Cryptomonas rostratiformis Ceratium hirundinella
�5–20%
N/P>1000(ES) Lepocinclis salina Phacus longicauda
N/P = 50(LS) Pediastrum duplex Cryptomonas rostratiformis Biomass
Si/P>1000(ES) Phacus longicauda Scenedesmus disciformis
)1–5%
Si/P = 300(LS) Closterium spp. Pediastrum simplex
(ES) Early Summer; (LS) Late Summer.
be differentiated on the basis of nitrate concentra-tion. In most of these reservoirs, the dominant algae,throughout the study period, werePeridinium cinctumandPlanctonema lauterbornii.At the end of summer,Microcystisand euglenophytes became important insome of them.
The eutrophic group (Table 2c) embraces tworeservoirs -Alarcon and Regajo- which receive dilut-ed inflows of wastewater. That generates higher sol-uble phosphorus concentrations than those found inthe meso-eutrophic group of reservoirs. These reser-voirs are quite different in phytoplankton composition,however, both show an elevated number of typically
hydrma25.tex; 10/08/1998; 15:58; v.7; p.8

35
eutrophic chlorococcal species. The dominants werespecies ofPediastrum, Cryptomonasand cyanobacte-ria, usually different species in each reservoir.
At the upper end of the trophic series, there werethree very different reservoirs (Table 2d). Forata water-shed intercepts irregular, short but intense rain events,which caused big fluctuations in nutrient availability.It has been included in the hypertrophic reservoirs:although very close to the eutrophic group, the reser-voir supports larger biomass concentrations. Some-times cyanobacteria were abundant, but after summerstormsPediastrum simplexwas predominant altogeth-er with flagellate species. On some occasions notabledensities of centric diatoms, together with marked Si-depletion, were observed.
Marıa Cristina proved to be a typically hypertrophicsystem, with absolute dominance of cyanobacteria, lowconcentrations of dissolved nutrients (N, P, alkalinity)and high pH. During the study, inflows were lack-ing except for a short and meagre rain event in itswatershed at the end of summer; thus internal loads ofnutrients from the sediment played a major role. Silicaalso became limiting in this reservoir in early summer,coinciding with centric diatom growth, simultaneous-ly with some cyanobacteria and chlorococcales. At theend of summer, 95% of the phytoplanktonbiomass wasmade up by three cyanobacterial species.
Finally, the phytoplankton of Beniarres is much dif-ferent from the rest of reservoirs.Scenedesmus acumi-natusis the algae which showed the highest percentageof total biomass, however in this reservoir unicellu-lar volvocales of the generaPteromonasandChlamy-domonasreached very high densities, which due to itssmall size are not so well represented when biomassis used. Dominance in number of individuals of thesegenera, as well as the abundance of the same mainspecies in Table 2d have been observed in all seasons,since spring of 1994 to autumn 1995 (from our owndata on bimonthly samples). This persuade us to pro-pose a new ‘holotrophic’ category for such systems,where nutrients – phosphorus and ammonia (Table 1)– are always at high concentrations due to high inputsand easy mixing of the bottom anoxic waters.
The dystrophic Buseo reservoir, may be included inthe eutrophic group, even though the composition of itsphytoplankton was quite different, with an abundanceof euglenophyta, likely attributable to the high levelsof dissolved organic carbon present (Table 2e).
The graphic representation of diversity as a func-tion of average biomass (Figure 3) shows a hump-backed relationship. Diversity is low at low biomass,
gradually increases with increasing biomass in theoligo-mesotrophic reservoirs and it decreases again atthe higher biomasses towards the category of hyper-trophic reservoirs. Diversity reached highest values inthe eutrophic reservoirs. However, it was unexpectedlylow in the meso-eutrophic reservoirs.
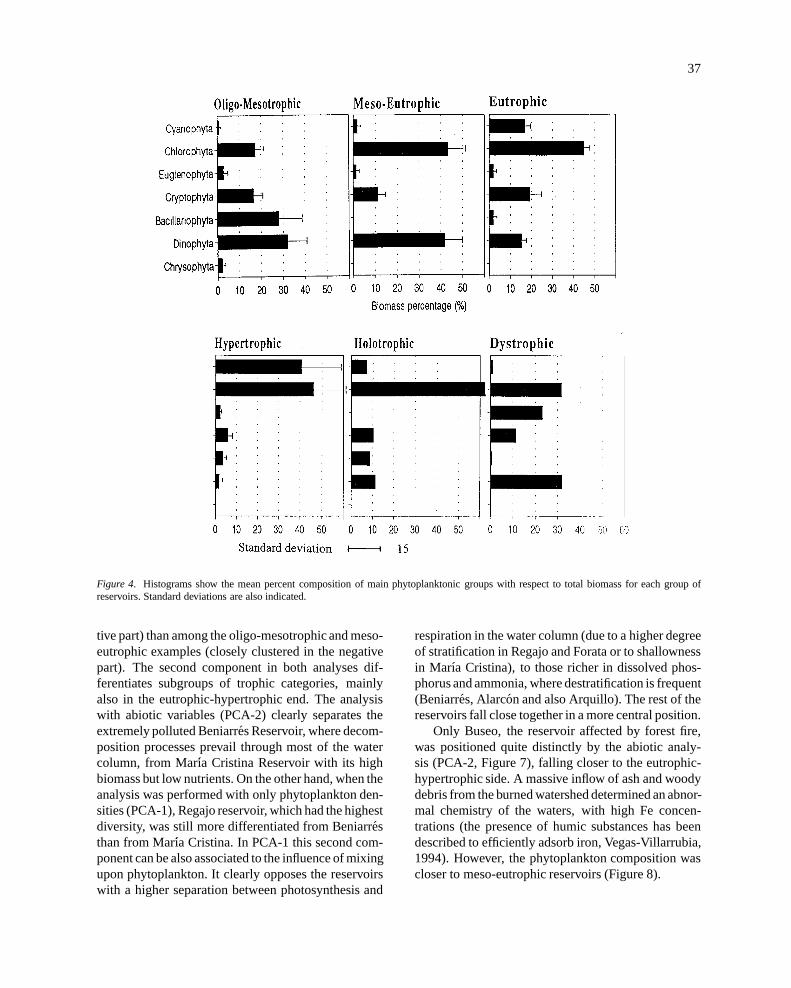
The average percentage biomass represented byeach of the main algal groups, together with standarddeviation, is represented by histograms in Figure 4.In the oligo-mesotrophic reservoirs, dinophytes andbacillariophytes are the most important taxa and theproportion of chrysophytes is distinctly higher than inthe other reservoirs, while that of cyanobacteria is low.In meso-eutrophic reservoirs, chlorophyta and dino-phyta are clearly the most important phytoplanktongroups. In eutrophic reservoirs chlorophyta is the dom-inant group, but other groups, such as cyanophyta arealso well represented. Both chorophyta and cyanophy-ta had the higher biomass percentage in hypertrophicreservoirs. However the ‘holotrophic’ reservoir wascharacterised by an absolute predominance of chloro-phyta. Euglenophyta had a high contribution to bio-mass exclusively in the dystrophic Buseo reservoir.
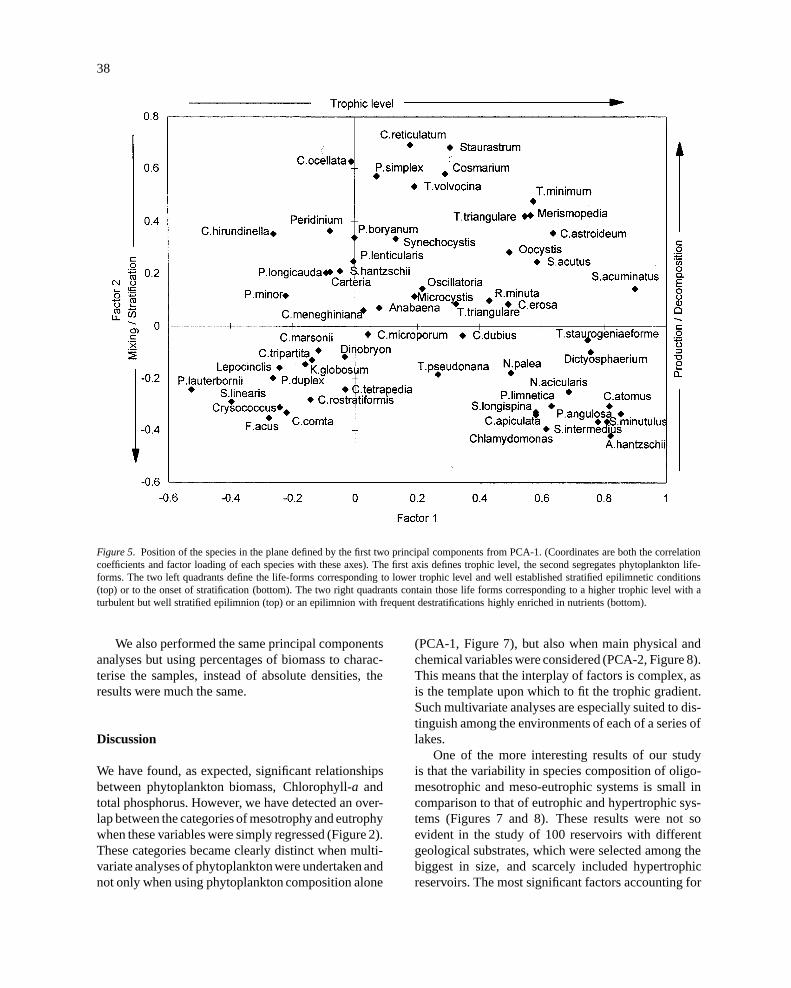
Figure 5 shows the distribution of phytoplanktonspecies against the axes of the first two principal com-ponents (of PCA-1). The two components togetheraccounted for 30.3% of the total variance. The firstcomponent (20% of total variance) indicates troph-ic level. At the negative extreme of this axis, thedinoflagellateCeratium hirundinellaand the filamen-tous ullotrichalPlanctonema lauterborniiare found,while at the positive end there are eutrophy indica-tors, as several species ofScenedesmus(S. acumi-natus, S. acutum, S. intermedius), unicellular volvo-cals (Chlamydomonas, Pteromonas) and some cen-tric bacillariophyte species (Cyclotella atomusandStephanodiscus minutulus). On the other hand, prin-cipal component 2, segregates life forms: so, wefound large desmids (Staurastrum, Cosmarium), colo-nial greens (Coelastrumspp,Pediastrum simplex) andlarge dinoflagellates in the positive part, while neg-atively correlated are diatoms (Fragillaria ulna var.acusand small centrics) and small unicellular flagel-lates (chrysophytes and volvocales). Very important isthe presence of large cells and colonial algae (Coelas-trum, Dictyosphaerium, PediastrumandStaurastrumspecies) in eutrophic and hypertrophic reservoirs, dur-ing late summer. These life forms may be the resultof selective grazing pressure from herbivorous zoo-planktonic species. Some of them are also favouredby destratification after late summer storms. On the
hydrma25.tex; 10/08/1998; 15:58; v.7; p.9

36
Figure 3. Relationship between biomass (biovolume in logarithmic scale) and Shannon-Wiener diversity index of phytoplankton speciesbiomass. Both variables are the corresponding averages for samples of the photic zone in each of the reservoirs, during early and late summer,indicated respectively by 1 and 2 just after reservoir initials. Diversity is calculated with biovolume data, withdrawing spp<0.5% of thebiovolume. The equitability is indicated in the vertical line over each point.
other hand in oligo-mesotrophic reservoirs, sequen-tial replacement of species due to nutrient deficienciesand grazing activities as summer advances, leads to animportantgrowth ofCeratiumandPeridinium, becausethese genera can survive with lower nutrient concen-trations (Reynolds, 1984a) and are inedible by filterfeeding grazers. It is also quite clear that congenericor phylogenetically close species fall at extreme posi-tions in the graph, e.g. species of the genusCyclotella,Scenedesmus, PediastrumandCryptomonas.
To confirm the interpretation of these two first prin-cipal components, a second analysis, PCA-2, was per-formed with these two components from PCA-1, asvariables together with the measured physico-chemicalvariables. Figure 6 shows the distribution of these vari-ables in the space of the first two components of PCA-2. It confirms the relationship between the first com-ponent derived from phytoplankton abundance (Phy1) and trophic indicators (Chlorophyll, TP, suspend-ed solids, turbidity, BOD) and the relation with otherabiotic variables more or less associated with primaryproduction (pH. oxygen, temperature). At the other endof this axis, Eh and Margalef pigment index is found,aswell as nitrates (which are consumed by algae and nitri-fying bacteria)and silica (which is consumed in diatomgrowth). The second component derived from phyto-plankton abundance (Phy 2) is related to the second line
of variation of physical and chemical parameters; thatis, the contrast between (1) photic waters in which pro-duction processes greatly exceed decomposition ones,with high oxygen concentrations and nutrient deple-tion (mainly phosphate, and silica) and (2) the photicwaters of other reservoirs in which decomposition isimportant or the waters can be easily mixed vertically;thus becoming undersaturated in oxygen and rich innutrients (phosphate, ammonia, nitrite and silica). Fehas a high correlation with this second source of vari-ation, opposite to that of phosphate. In high trophiclevel reservoirs, rich in sulphate, like most those stud-ied here, a sulfide-rich anoxic hypolimnion developssulfide can precipitate as ferrous sulfide but phosphateis left in solution.
The means and standard deviations of the PCA-1and PCA-2 factor scores for each reservoir are present-ed in Figures 7 and 8 respectively. The calculated fac-tor score variances within reservoirs were consistentlyhigher in respect of abiotic factors (PCA-2) than thosewith species abundance (PCA-1) except for Beniarresand Alarcon reservoirs.
Reservoirs became ordered, along the first princi-pal component in both analyses (PCA-1 and PCA-2)according to their trophic level, with a much higherdifferentiation among the eutrophic and hypertrophicreservoirs (which were widely distributed in the posi-
hydrma25.tex; 10/08/1998; 15:58; v.7; p.10
37
Figure 4. Histograms show the mean percent composition of main phytoplanktonic groups with respect to total biomass for each group ofreservoirs. Standard deviations are also indicated.
tive part) than among the oligo-mesotrophic and meso-eutrophic examples (closely clustered in the negativepart). The second component in both analyses dif-ferentiates subgroups of trophic categories, mainlyalso in the eutrophic-hypertrophic end. The analysiswith abiotic variables (PCA-2) clearly separates theextremely polluted Beniarres Reservoir, where decom-position processes prevail through most of the watercolumn, from Maria Cristina Reservoir with its highbiomass but low nutrients. On the other hand, when theanalysis was performed with only phytoplankton den-sities (PCA-1), Regajo reservoir, which had the highestdiversity, was still more differentiated from Beniarresthan from Maria Cristina. In PCA-1 this second com-ponent can be also associated to the influence of mixingupon phytoplankton. It clearly opposes the reservoirswith a higher separation between photosynthesis and
respiration in the water column (due to a higher degreeof stratification in Regajo and Forata or to shallownessin Marıa Cristina), to those richer in dissolved phos-phorus and ammonia, where destratification is frequent(Beniarres, Alarcon and also Arquillo). The rest of thereservoirs fall close together in a more central position.
Only Buseo, the reservoir affected by forest fire,was positioned quite distinctly by the abiotic analy-sis (PCA-2, Figure 7), falling closer to the eutrophic-hypertrophic side. A massive inflow of ash and woodydebris from the burned watershed determined an abnor-mal chemistry of the waters, with high Fe concen-trations (the presence of humic substances has beendescribed to efficiently adsorb iron, Vegas-Villarrubia,1994). However, the phytoplankton composition wascloser to meso-eutrophic reservoirs (Figure 8).
hydrma25.tex; 10/08/1998; 15:58; v.7; p.11
38
Figure 5. Position of the species in the plane defined by the first two principal components from PCA-1. (Coordinates are both the correlationcoefficients and factor loading of each species with these axes). The first axis defines trophic level, the second segregates phytoplankton life-forms. The two left quadrants define the life-forms corresponding to lower trophic level and well established stratified epilimnetic conditions(top) or to the onset of stratification (bottom). The two right quadrants contain those life forms corresponding to a higher trophic level with aturbulent but well stratified epilimnion (top) or an epilimnion with frequent destratifications highly enriched in nutrients (bottom).
We also performed the same principal componentsanalyses but using percentages of biomass to charac-terise the samples, instead of absolute densities, theresults were much the same.
Discussion
We have found, as expected, significant relationshipsbetween phytoplankton biomass, Chlorophyll-a andtotal phosphorus. However, we have detected an over-lap between the categories of mesotrophy and eutrophywhen these variables were simply regressed (Figure 2).These categories became clearly distinct when multi-variate analyses of phytoplanktonwere undertaken andnot only when using phytoplankton composition alone
(PCA-1, Figure 7), but also when main physical andchemical variables were considered (PCA-2, Figure 8).This means that the interplay of factors is complex, asis the template upon which to fit the trophic gradient.Such multivariate analyses are especially suited to dis-tinguish among the environments of each of a series oflakes.
One of the more interesting results of our studyis that the variability in species composition of oligo-mesotrophic and meso-eutrophic systems is small incomparison to that of eutrophic and hypertrophic sys-tems (Figures 7 and 8). These results were not soevident in the study of 100 reservoirs with differentgeological substrates, which were selected among thebiggest in size, and scarcely included hypertrophicreservoirs. The most significant factors accounting for
hydrma25.tex; 10/08/1998; 15:58; v.7; p.12

39
Figure 6. Position of physical and chemical variates and the first two principal components PHY1 and PHY2 from PCA-1 in the plane defined bythe first two principal components of PCA-2. (Cond: conductivity), turbid: inverse of Secchi depth, A433/A665: absorbances ratio of Margalefpigment index, T–P: total P, T-Fe: total Fe, Temp: temperature, SS: suspended solids).
Figure 7. Position of the different reservoirs relative to the first two principal components from PCA-1. Each point is the mean of the factor scorescorresponding to the samples from each reservoir. The standard variation is also plotted at each side of the corresponding mean. Abbreviationsfor each reservoir are indicated in Table 1. Reservoirs are ordered by trophic level in the first axis and the second axis is interpreted as the degreeof separation between the zone where photosynthesis predominates and the zone were decomposition predominates.
the variability of the data, according to these authors,were firstly the alkalinity and mineralization of water,then eutrophy and with much smaller weight mixingdegree (Margalef et al., 1982; Sabater & Nolla, 1991;Riera et al., 1992). The compact group of low andintermediate trophy in our results is quite similar tothe group described previously by these authors forEastern Spanish reservoirs, which have in common a
high abundance of centric diatoms (Cyclotella spp.)and dinophyta (Ceratium, Peridinium), and also a highproportion of the Ulotrichal,P. lauterbornii(Table 2aand b, Figure 5). In our PCA results, we again foundtrophic level and the physical mixing of the water col-umn to be the main factors influencing phytoplanktoncomposition.
hydrma25.tex; 10/08/1998; 15:58; v.7; p.13

40
Figure 8. Position of the different reservoirs relative to the first two principal components from PCA-2. Each point is the mean of the factor scorescorresponding to the samples from each reservoir. The standard variation is also plotted at each side of the corresponding mean. Abbreviaturesfor each reservoir are indicated in Table 1.
In our analyses, the reservoirs with higher trophiclevels showed the most important differences. Simi-lar results were reported from Sicilian reservoirs byNaselli-Flores & Barone (1994), who used cluster andnodal analysis of data from a large number of eutroph-ic and hypertrophic reservoirs; they found, in con-trast, that mesotrophic reservoirs showed a rather morehomogeneous phytoplankton structure. The speciescomposition of these reservoirs was often quite sim-ilar to our findings. Another similarity between East-ern Spanish reservoirs and the hard-water reservoirs ofSicily was their diversity patterns (Barone & Naselli-Flores, 1990). In the reservoirs of both areas, temporalvariability of species abundance is much higher in theeutrophic group of reservoirs. They also showed highervalues of the diversity index than in most of our oligo-mesotrophic and meso-eutrophic reservoirs (Figure 3).
A factor that could account for the homogeneityand low diversity of the studied oligo-mesotrophic andmeso-eutrophic reservoirs is their extremely calcare-ous hard-waters and so the low trophic level in mostof them is maintained by phosphate precipitation. Cal-cite precipitation could be also intense during summerand essential micronutrients may also co-precipitatewith it. All these could limit growth of a more diversephytoplankton with more requirements.
On the other hand, the plankton of lakes ofhigher trophic status are characterised by an ele-vated number of chlorococcal species (Coelastrum,
Scenedesmus, Pediastrum, Oocystis, Tetraedron, andDictyosphaerium) which are considered typical ofeutrophic-hypertrophic waters in other Mediterraneanreservoirs (Sabater & Nolla, 1991; Naselli-Flores &Barone, 1994; Mohammed et al., 1989) as well as innorth-European reservoirs (Reynolds, 1984a; Abdul-Hussein & Mason, 1988), specially during the summerperiod. The important growth of this algal group seemsto be directly related to the availability of soluble reac-tive phosphorus. Reynolds (1984b) point out that ahighly-enriched water is a necessary precondition tothe occurrence of large summer-peaks of Chlorococ-cales.
Another characteristic of Mediterranean reservoirs,or reservoirs in a dry climate, is that they are subject-ed to severe filling/draining manipulations. This pro-duces instabilities that may maintain a high numberof species surviving in temporally heterogeneous andnutrient-rich environments, explaining the high diver-sity values found in our eutrophic reservoirs. All thismight be linked to the intermediate disturbance hypoth-esis applied by other authors to phytoplankton ecology(Rojo & Alvarez-Cobelas 1993).
However, phytoplankton assemblages could begood descriptors also in perturbed systems, such asthe studied reservoirs. The results of our analysesshow that the dispersion of samples from the samereservoir is smaller when phytoplankton abundanceare used than when physical and chemical data are
hydrma25.tex; 10/08/1998; 15:58; v.7; p.14
41
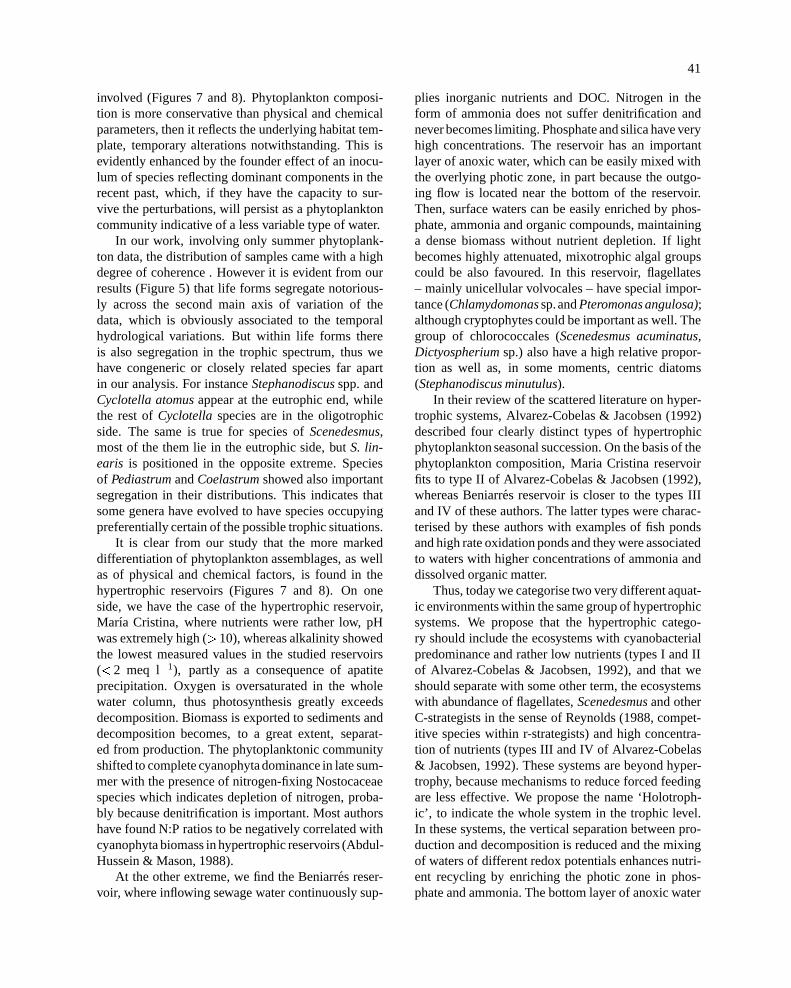
involved (Figures 7 and 8). Phytoplankton composi-tion is more conservative than physical and chemicalparameters, then it reflects the underlying habitat tem-plate, temporary alterations notwithstanding. This isevidently enhanced by the founder effect of an inocu-lum of species reflecting dominant components in therecent past, which, if they have the capacity to sur-vive the perturbations, will persist as a phytoplanktoncommunity indicative of a less variable type of water.
In our work, involving only summer phytoplank-ton data, the distribution of samples came with a highdegree of coherence . However it is evident from ourresults (Figure 5) that life forms segregate notorious-ly across the second main axis of variation of thedata, which is obviously associated to the temporalhydrological variations. But within life forms thereis also segregation in the trophic spectrum, thus wehave congeneric or closely related species far apartin our analysis. For instanceStephanodiscusspp. andCyclotella atomusappear at the eutrophic end, whilethe rest ofCyclotella species are in the oligotrophicside. The same is true for species ofScenedesmus,most of the them lie in the eutrophic side, butS. lin-earis is positioned in the opposite extreme. Speciesof PediastrumandCoelastrumshowed also importantsegregation in their distributions. This indicates thatsome genera have evolved to have species occupyingpreferentially certain of the possible trophic situations.
It is clear from our study that the more markeddifferentiation of phytoplankton assemblages, as wellas of physical and chemical factors, is found in thehypertrophic reservoirs (Figures 7 and 8). On oneside, we have the case of the hypertrophic reservoir,Marıa Cristina, where nutrients were rather low, pHwas extremely high (>10), whereas alkalinity showedthe lowest measured values in the studied reservoirs(<2 meq l�1), partly as a consequence of apatiteprecipitation. Oxygen is oversaturated in the wholewater column, thus photosynthesis greatly exceedsdecomposition. Biomass is exported to sediments anddecomposition becomes, to a great extent, separat-ed from production. The phytoplanktonic communityshifted to complete cyanophytadominance in late sum-mer with the presence of nitrogen-fixing Nostocaceaespecies which indicates depletion of nitrogen, proba-bly because denitrification is important. Most authorshave found N:P ratios to be negatively correlated withcyanophyta biomass in hypertrophic reservoirs (Abdul-Hussein & Mason, 1988).
At the other extreme, we find the Beniarres reser-voir, where inflowing sewage water continuously sup-
plies inorganic nutrients and DOC. Nitrogen in theform of ammonia does not suffer denitrification andnever becomes limiting. Phosphate and silica have veryhigh concentrations. The reservoir has an importantlayer of anoxic water, which can be easily mixed withthe overlying photic zone, in part because the outgo-ing flow is located near the bottom of the reservoir.Then, surface waters can be easily enriched by phos-phate, ammonia and organic compounds, maintaininga dense biomass without nutrient depletion. If lightbecomes highly attenuated, mixotrophic algal groupscould be also favoured. In this reservoir, flagellates– mainly unicellular volvocales – have special impor-tance (Chlamydomonassp.andPteromonas angulosa);although cryptophytes could be important as well. Thegroup of chlorococcales (Scenedesmus acuminatus,Dictyospheriumsp.) also have a high relative propor-tion as well as, in some moments, centric diatoms(Stephanodiscus minutulus).
In their review of the scattered literature on hyper-trophic systems, Alvarez-Cobelas & Jacobsen (1992)described four clearly distinct types of hypertrophicphytoplankton seasonal succession. On the basis of thephytoplankton composition, Maria Cristina reservoirfits to type II of Alvarez-Cobelas & Jacobsen (1992),whereas Beniarres reservoir is closer to the types IIIand IV of these authors. The latter types were charac-terised by these authors with examples of fish pondsand high rate oxidation ponds and they were associatedto waters with higher concentrations of ammonia anddissolved organic matter.
Thus, today we categorise two very different aquat-ic environments within the same group of hypertrophicsystems. We propose that the hypertrophic catego-ry should include the ecosystems with cyanobacterialpredominance and rather low nutrients (types I and IIof Alvarez-Cobelas & Jacobsen, 1992), and that weshould separate with some other term, the ecosystemswith abundance of flagellates,Scenedesmusand otherC-strategists in the sense of Reynolds (1988, compet-itive species within r-strategists) and high concentra-tion of nutrients (types III and IV of Alvarez-Cobelas& Jacobsen, 1992). These systems are beyond hyper-trophy, because mechanisms to reduce forced feedingare less effective. We propose the name ‘Holotroph-ic’, to indicate the whole system in the trophic level.In these systems, the vertical separation between pro-duction and decomposition is reduced and the mixingof waters of different redox potentials enhances nutri-ent recycling by enriching the photic zone in phos-phate and ammonia. The bottom layer of anoxic water
hydrma25.tex; 10/08/1998; 15:58; v.7; p.15
42
prevents the total export of phosphorus to the sedi-ment, moreover ammonia does not denitrify or nitrify,because oxygen is involved in processes with organicmatter and the electrochemical system does not reachenough (redox) potential for nitrification. The diver-gence between hypertrophic and holotrophic has to beviewed in terms of processes, an eutrophic reservoircould develop to an hypertrophic or to an holotroph-ic one, depending on amount and quality of nutrients,itself a function of redox potential of the waters.
References
Abdul-Hussein, M. M. & C. F. Mason, 1988. The phytoplanktoncommunity of a eutrophic reservoir. Hydrobiologia 169: 265–277.
Alvarez-Cobelas, M. & B. A. Jacobsen, 1992. Hypertrophic phyto-plankton: an overview. Freshwat. Forum 2: 184–199.
APHA – AWWA – WEF, 1992. Standard methods for the exami-nation of water and wastewater. 18th edition. American PublicHealth Association. Washington D.C.
Armengol, J., J. L. Riera & J. A. Morgui, 1991. Major ionic com-position in the Spanish reservoirs. Verh. int. Ver. Limnol. 24:1363–1366.
Barone, R. & L. Naselli Flores, 1990. Osservazioni sulle comunitaplanctonique dei laghi artificiali siciliani: relazioni diversita –biomassa. Naturalista sicil. 14 (suppl.): 35–48.
Barone, R. & L. Naselli Flores, 1994. Phytoplankton dynamics ina shallow, hypertrophic reservoir Lake Arancio, Sicily. Hydrobi-ologia 289: 199–214.
Estrada, M., 1975. Statistical consideration of some limnologicalparameters in Spanish reservoirs. Verh. int. Ver. Limnol. 19:1849–1859.
Golterman, H. L., R. S. Clymo & M. A. M. Ohnstad, 1978. Methodsfor physical and chemical analysis of fresh waters. IBP Handbookno. 8. Blackwell Sci. Pub., Oxford, U.K.
Margalef, R., M. D. Planas, J. Armengol, A. Vidal, N. Prat,A. Guisset, J. Toja & M. Estrada, 1976. Limnologia de losembalses espanoles. Direccion General de Obras Hidraulicas.MOP. Madrid. Pub. 123, 422 pp.
Margalef, R., M. Mir, & M. Estrada, 1982. Phytoplankton composi-tion and distribution as an expression of properties of reservoirs.Can. W. Res. J. 7: 26–50.
Mohammed, A. A., A. M. Ahmed & A. M. El-Otify, 1989. Fieldand laboratory studies on Nile phytoplankton in Egypt. IV Phy-toplankton of Aswan High Dam Lake (Lake Nasser). Int. Revueges. Hydrobiol. 74: 549–578.
Moss, B., 1973. The influence of environmental factors on the dis-tribution of freshwater algae: experimental study. IV. Growth oftest species in natural lake waters and conclusion. J. Ecol. 61:193–211.
Naselli Flores, L. & R. Barone, 1994. Relationship between troph-ic state and plankton community structure in 21 Sicilian damreservoirs. Hydrobiologia 275/276: 197–205.
Norusis, M. J., 1990. SPSS Base System User’s Guide. SPSS Inc.Chicago, 520 pp.
OECD, 1982. Eutrophication of Waters. Monitoring, Assessment,and Control. OECD, Paris, 154 pp.
Ortiz Casas, J. L. & R. Pena, 1984. Applicability of the OECDeutrophication models to Spanish reservoirs. Verh. int. Ver. Lim-nol. 22: 1521–1535.
Reynolds, C. S., 1980. Phytoplankton assemblages and the period-icity in stratifying lake ecosystems. Holarct. Ecol. 3: 141–159.
Reynolds, C. S., 1982. Phytoplankton periodicity: its motivation,mechanisms and manipulation. Report of the Freshwater Biolog-ical Association 50: 60–75.
Reynolds, C. S., 1984a. Phytoplankton periodicity: the interactionsof form, function and environmental variability. Freshwat. Biol.14: 111–142.
Reynolds, C. S., 1984b. The ecology of freshwater phytoplankton.Cambridge University Press, 384 pp.
Reynolds, C. S., 1986. Experimental manipulations of the phyto-plankton periodicity in large, limnetic enclosures in BlelhamTarn, English Lake District. Hydrobiologia 138: 43–64.
Reynolds, C. S., 1988. Functional morphology and the adaptativestrategies of freshwater phytoplankton. In Sandgren, C. D. (ed),Growth and survival strategies of freshwater phytoplankton. Cam-bridge University Press: 388–433.
Riera, J. L., D. Jaume, J. De Manuel, J. A. Morgui & J. Armengol,1992. Patterns of variation in the limnology of Spanish reservoirs:a regional study. Limnetica 8: 111–124.
Rojo, C. & M. Alvarez-Cobelas, 1993. Hypertrophic phytoplanktonand the intermediate disturbance hypothesis. Hydrobiologia 249:43–57.
Rott, E., 1981. Some results from phytoplankton counting intercali-brations. Schweiz. Z. Hydrol. 43: 34–62.
Sabater, S. & J. Nolla, 1991. Distribution patterns of phytoplanktonin Spanish reservoirs: first results and comparison after fifteenyears. Verh. int. Ver. Limnol. 24: 1371–1375.
Shapiro, J., 1989. Current beliefs regarding dominance by blue-greens: The case of the importance of CO2 and pH. Verh. int. Ver.Limnol. 24: 38–54.
Sommer, U., 1989. Nutrient status and nutrient competition of phy-toplankton in a shallow, hypertrophic lake. Limnol. Oceanogr.34: 1162–1173.
Utermohl, H., 1958. Zur Vervollkommnung der quantitativenPhytoplankton-Methodik. Mitt. int. Ver. Theor. Angew. Limnol.9: 38 pp.
Vegas Vilarrubia, T., 1994. Water chemistry of the Guri reservoir(rainy season 1989) – relationships between humic colour andaqueous iron and their limnological importance. Arch. Hydrobiol.132: 69–94.
hydrma25.tex; 10/08/1998; 15:58; v.7; p.16

43
Appendix. List of planktonic algae, with authorities, used in the PCA, with their corresponding mean densities (ind/ml) in the photic zome of eachreservoir during summer.
hydrma25.tex; 10/08/1998; 15:58; v.7; p.17
Copyright © 2022 FDOKUMEN