environmental gradients in a shelf sea
46
Moore et al. Photoacclimation in shelf seas 1 Phytoplankton photo-acclimation and photo-adaptation in response to environmental gradients in a shelf sea. C. Mark Moore 1 *, David J. Suggett 2 , Anna E. Hickman 1 , Young-Nam Kim 1 , Jonathan Sharples 3 , Richard J. Geider 2 and Patrick M. Holligan 1 1 Southampton Oceanography Centre, European Way, Southampton, SO14 3ZH, U.K. 2 Department of Biological Sciences, University of Essex, Colchester, CO4 3SQ, U.K. 3 Proudman Oceanographic Laboratory, Bidston Observatory, Birkenhead, CH43 7RA U.K. * corresponding author ([email protected]) C. Mark Moore, Southampton Oceanography Centre, European Way, Southampton, SO14 3ZH, UK. Tel. +44 (0)23 8059 6446 Fax. +44 (0)23 8059 3059 Running head: Photoacclimation in shelf seas
Transcript of environmental gradients in a shelf sea

Moore et al. Photoacclimation in shelf seas
1
Phytoplankton photo-acclimation and photo-adaptation in response to
environmental gradients in a shelf sea.
C. Mark Moore1*, David J. Suggett2, Anna E. Hickman1, Young-Nam Kim1, Jonathan
Sharples3, Richard J. Geider2 and Patrick M. Holligan1
1 Southampton Oceanography Centre, European Way, Southampton, SO14 3ZH, U.K.
2 Department of Biological Sciences, University of Essex, Colchester, CO4 3SQ, U.K.
3 Proudman Oceanographic Laboratory, Bidston Observatory, Birkenhead, CH43 7RA U.K.
* corresponding author ([email protected])
C. Mark Moore,
Southampton Oceanography Centre,
European Way,
Southampton,
SO14 3ZH, UK.
Tel. +44 (0)23 8059 6446
Fax. +44 (0)23 8059 3059
Running head: Photoacclimation in shelf seas

Moore et al. Photoacclimation in shelf seas
2
Acknowledgements
The authors wish to thank E. Le Floch, G. Harris, M. Lucas, H. Thomas and J. Tweddle for
assistance with data collection at sea and M. Zubkov for assistance with the flow cytometry
analysis. S. Laney kindly provided software and contributed to many useful discussions on
the analysis of raw FRR fluorometer data. Thanks to the officers and crew of the R.R.S.
James Clark Ross for their assistance during cruise JR98. This work was supported by the
Natural Environment Research Council, UK (NER/A/S/2000/01237 to RJG) and
(NER/A/S/2001/00449 to PMH/JS).
Moore et al. Photoacclimation in shelf seas
3
Abstract
Two sources of variability in the photosynthetic performance of natural phytoplankton
communities are the taxonomic composition and the physiological acclimation of these taxa
to environmental conditions. We assessed these sources of variability at contrasting sites
within a temperate shelf sea region. Physiological parameters relating to the structure of the
photosystem II (PSII) antenna and processes downstream from PSII were evaluated using a
combination of fast repetition rate (FRR) fluorescence, oxygen flash yields, spectral
fluorescence and 14C photosynthesis vs. irradiance measurements. Parameters related to
electron transport rates (ETRs) downstream of PSII, including the maximum ETR (1/τPSII),
the chlorophyll specific maximum rate of carbon fixation (P*max) and the light saturation
intensity (Ek), largely varied as an acclimation response to the vertical light gradient in
stratified waters. Conversely, parameters relating to PSII antenna structure, specifically the
functional absorption cross section (σPSII) and the reaction centre to chlorophyll ratio,
principally varied as a result of horizontal taxonomic variability. Perhaps counter-intuitively,
phytoplankton populations within fully mixed water columns, characterised by low mean
irradiance, were acclimated and/or adapted to relatively high irradiance. The primary
photoacclimation response was interpreted in terms of changes in the ratio of PSII reaction
centres to carbon fixation capacity. Phenotypic plasticity in the size of the PSII light
harvesting antenna appears to be limited and observed variability in σPSII is largely taxon
specific. Hence, for the system studied, changes in numbers of photosynthetic units
dominated acclimation to the vertical light gradient, while the size of the photosynthetic unit
represented a taxonomic trait with potential adaptive significance for different ecological
settings.

Moore et al. Photoacclimation in shelf seas
4
Introduction
Photoacclimation describes the phenotypic response of algae to changes in irradiance
at the organism level (Falkowski and LaRoche, 1991) and is assessed by measuring
differences in the photosynthetic physiology or biochemistry of a given taxon (genotype) in
response to growth at a range of light intensities. Photoacclimation involves compensatory
changes in a number of components of the photosynthetic apparatus (see reviews by
Falkowski, 1980; Falkowski and LaRoche, 1991; MacIntyre et al. 2002). In particular
acclimation to decreased irradiance is accompanied by an increase in cellular photosynthetic
pigment content across all taxa (MacIntyre et al. 2002).
In contrast, photoadaptation describes the genotypic response of algae to irradiance
that has arisen during evolution. Photoadaptation is assessed by measuring differences in
photosynthetic physiology and/or biochemistry of different taxa (different genotypes) when
grown under identical environmental conditions. At the ecological level, species-specific
traits influence the photosynthetic performance of phytoplankton via interactions between the
community of genotypes and the environment.
Distinguishing between photoacclimation and photoadaptation is important for
understanding the mechanisms that regulate primary production in natural communities. A
better knowledge of the environmental factors that influence the functional relationship
between photosynthesis and irradiance (the P vs. E curve) in natural communities is also
needed for improving estimates of oceanic productivity (Behrenfeld and Falkowski, 1997;
Sakshaug et al. 1997; Behrenfeld et al. 2004). Specifically, ascribing changes in the P vs. E
relationship to physiological mechanisms or adaptive variability underlies our ability to
predict aquatic production under altered environmental forcing.

Moore et al. Photoacclimation in shelf seas
5
The response of the molecular structure of the photosynthetic apparatus to changing
irradiance varies between species (Fig 1). Some taxa can acclimate to decreased irradiance by
increasing the size of the light harvesting antenna associated with each reaction centre (Fig
1a). Conversely other taxa acclimate by increasing the number of cellular reaction centres
whilst the antenna size remains relatively constant (Fig 1b) (Falkowski and Owens 1980;
Perry et al. 1981; Dubinsky et al. 1986). These different acclimation responses represent two
different adaptive traits (Falkowski and Owens 1980). The amount of accessory pigment
within the antenna, the amount of chlorophyll per reaction centre and the maximum capacity
for carbon fixation can also vary between taxa (Falkowski and Raven 1997).
Shelf seas, with strong horizontal gradients in the degree of water column mixing, are
characterised by dynamic ecosystems (e.g. Moore et al. 2003). In stratified waters, the
thermocline represents a barrier on transport between high light surface waters and the low
light sub-surface chlorophyll maximum (SCM) (Sharples et al. 2001). Conversely mixed
water columns are characterised by rapid movement of phytoplankton between high and low
light (Moore et al. 2003). In order to understand the interactions of physical forcing and
biological response in these systems, observations of phytoplankton physiology need to be
made at high vertical, horizontal and temporal resolution. This requirement has led to the
growing use of in situ active fluorescence techniques such as Fast Repetition Rate
fluorometry (FRRf) for assessment of physiological state and estimation of photosynthetic
electron transport rates (Kolber et al. 1990; Moore et al. 2003; Smyth et al. 2004). The FRRf
technique is capable of measuring a number of parameters that relate to photoacclimation and
adaptation, including the functional absorption cross section of photosystem II (PSII) and the
turnover time of the primary PSII electron acceptor (Qa) (Kolber et al. 1998).
The functional absorption cross section (σPSII) is the product of absorption by the suite
of PSII antenna pigments and the probability that an exciton within the antenna will cause a

Moore et al. Photoacclimation in shelf seas
6
photochemical reaction (Mauzerall and Greenbaum, 1989). The amount of pigment associated
with each PSII reaction centre (RCII) will therefore govern much of the variability in σPSII
(Kolber et al. 1988; Suggett et al. 2004). Taxon-dependent differences in antenna accessory
pigment, or acclimation responses that alter the ratio of pigment:RCII, thus result in
variability of σPSII within natural populations (Fig 1a).
The rate of Qa reoxidation (1/τQa) should be an upper limit to the rate of whole chain
electron transport (1/τPSII). Irradiance-dependent changes in the ratio of RCIIs to carbon
fixation capacity (or per cell) appear to control 1/τPSII during photoacclimation (Sukenik et al.
1987) (Fig 1b). A change in the number of reaction centres, rather than in the size of the
antenna, can potentially alter 1/τQa. However such a response will depend on the degree of
downstream control of Qa reoxidation (Cleland, 1998), the extent of cyclic electron flow
(Prasil et al. 1996) and differing pathways of reductant use (Behrenfeld et al. 2004).
Parameters measured by the FRRf can thus potentially differentiate between the two structural
forms of photoacclimation, as well as other adaptive traits.
At high irradiances, damage to RCII can occur, potentially leading to a reduction in
photosynthetic rate (photoinhbition) (Prasil et al. 1992; Falkowski et al. 1994; Long et al.
1994). The probability of RCII damage can be modulated by both σPSII and the redox state of
Qa, the latter being governed by the rates of both light absorption and forward electron
transport (Park et al. 1997; Baroli and Melis, 1998). Thus photoacclimation and
photodamage/inhibition are coupled processes which require joint consideration (Behrenfeld
et al. 1998; Marshall et al. 2000).
Recent models of photoacclimation suggest that the alteration of cellular pigment is a
mechanism for balancing the energy captured by light absorption, with the energy demand for
growth (Geider et al. 1996, 1998). These models are conceptually consistent with the redox
state of the plastoquinone (PQ) pool providing the controlling signal for photoacclimation

Moore et al. Photoacclimation in shelf seas
7
(Escoubas et al. 1995; Pfannschmidt et al. 2003). However, there are limits to the extent to
which a given taxon can modulate pigment content relative to carbon fixation capacity
(MacIntyre et al. 2002), and thus on its ability to compete in a given light environment.
Presumably, the taxonomic composition of the phytoplankton responds to different
environments through selection of genotypes that are better adapted to the prevailing light and
nutrient environment. Therefore, interpretation of natural variability in phytoplankton
photosynthetic performance requires an understanding of the relative importance of
acclimation and adaptation in an ecological setting.
In the current study, we investigated photoacclimation and photoadaptation of natural
populations in a shelf sea region during summer. We provide the first demonstration that,
within the natural system studied, marked vertical gradients in acclimation state primarily
result from changes in the number of PSII reaction centres per cell. In contrast observed
spatial (horizontal) variability in the PSII antenna size was primarily driven by changes in
accessory pigmentation related to taxonomic gradients. These results are discussed in the
context of current physiological models, the balance of electron transport and carbon fixation
and the ecological setting of the natural populations.
Methods
General
Data were collected in July-August 2003 during a cruise of the RRS James Clark Ross
(JR98). Sites were occupied in the stratified region of the Celtic Sea shelf and shelf break and
at a mixed site within the Irish Sea (Fig. 2). Incident surface solar irradiance from 400-700 nm
was recorded continuously. Hydrographic data at each site were collected using a SeaBird 911
CTD interfaced with a Chelsea Instruments Aquatracka MKIII in situ chlorophyll
fluorometer. Two Chelsea Instruments Fastracka FRR fluorometers, each interfaced with a 2π

Moore et al. Photoacclimation in shelf seas
8
PAR sensor, were also deployed in situ on the CTD frame. The diffuse attenuation coefficient
for PAR (kd) and the optical depth (kd z) were calculated from vertical irradiance profiles.
Water was sampled using 10l Niskin bottles. Four of the sites, CS1, CS2, CS3 and IS1
(Fig. 2) were occupied for 24hr periods on 31st July, 29th July, 5th August and 2nd August
respectively. This enabled the collection of multiple samples of both surface and deeper
phytoplankton populations throughout the photoperiod. Additionally the CS1 and CS3 sites
were re-sampled on 10th and 11th August respectively. Four additional sites were only
sampled with a single CTD cast, typically at two depths (Fig. 2).
Phytoplankton community structure
Taxonomic variability was assessed using a combination of HPLC (see below), size
fractionated chlorophyll, flow cytometry and microscopic identification and enumeration of
preserved samples. Flow cytometry data was used to estimate the contribution of small
eukaryotes and cyanobacteria (Synechococcus) to total autotrophic community biovolume and
the fluorescence to biovolume ratio (F/Cell vol).
FRRf measurements and analysis
To eliminate the influence of short-term kinetic responses including non-photochemical
quenching and state transitions, active fluorescence measurements were principally performed
on discrete samples. Samples were left in the dark for >30 minutes in a temperature controlled
environment before measurement. The FRR fluorometer was programmed to deliver
sequences of 100 1.1 µs saturation flashes at 2.8 µs intervals followed by 20 1.1 µs relaxation
flashes at 98.8 µs intervals. Non-linearity in instrument response was characterised using
extracts of chlorophyll a (Laney, 2003). Blanks were run on filtrates from each sample
(Cullen and Davis, 2003). Correction for the contribution of the blank had no significant

Moore et al. Photoacclimation in shelf seas
9
influence on values of σPSII or 1/τQa, these parameters being dependent on rates of change of
fluorescence and thus insensitive to the baseline (Fig. 3).
Induction curves were averaged over 160 individual sequences in order to minimise
error (Suggett et al. 2004). The fluorescence transient (f) at time t was then fitted to the
following biophysical model (Kolber et al. 1998):
(1)
where p is a connectivity parameter and F0 and Fm are the minimum and maximum
fluorescence yields respectively. The fraction of closed reaction centres (C(t)) was determined
iteratively using:
(2)
where i(t) is the flash intensity (Kolber et al. 1998). Eqns 1 & 2 were used to define both the
saturation and relaxation parts of the fluorescence induction curve simultaneously with
custom software run in MATLAB based on original codes provided by S. Laney (Laney
2003). A revised version of the software was required as the asymptotic value reached during
the relaxation part of the curve (Fig. 3), which is given by the steady state solution of Eqn. 2
(see Kolber et al. 1998 their Eqn. 15), provides a more robust estimate of τQa. Due to the
constant delay between relaxation flashlets for the commercial instrument used in this study,
only one component of the rate of Qa re-oxidation could be measured (Kolber et al. 1998).
The relaxation protocol was ~2 ms duration (Fig. 3) and allowed an estimate of 1/τQa for the
mean value of transport from Qa through the plastiquinone (PQ) pool (Crofts et al. 1993;
−−−+=
ptC
ptCFFFtf m )(1
1)()()( 00
QaPSII
C
Cp
Cti
dt
tdC
τσ −
−−=
1
1)(
)(

Moore et al. Photoacclimation in shelf seas
10
Falkowski and Raven, 1997). Hereafter the term 1/τQa→PQ is used to represent the estimate of
electron transport rate directly obtained by FRRf.
Estimates of RCII abundance
In order to obtain a sample of sufficient density for measurements of RCII abundance, natural
phytoplankton populations were concentrated under a gentle vacuum onto 47mm diameter,
0.2 µm pore size polycarbonate filters. Material collected onto the filters was re-suspended in
4-5 ml of filtrate. The maximum PSII photochemical efficiency (Fv/Fm) was measured using
the FRR fluorometer before and after concentration. Samples with a significantly lower Fv/Fm
following concentration were discarded. Oxygen flash yields were measured according to
Suggett et al. (2003, 2004) using a Hansatech Instruments Clarke-type electrode housed
within a DW1 liquid-phase oxygen electrode chamber and a single turnover saturation flash
system. The time consuming concentration step provided few measurable suspensions from
surface water samples. Resolution of depth variability in RCII abundance was therefore not
possible. The ratio of PSII reaction centres to chlorophyll a are reported throughout as the
product of O2 (Chl a)-1 and 4 mol RCII (mol O2)-1 giving mol RCII:mol Chl.
Spectral absorption, fluorescence and pigments
Spectral absorption was routinely measured onboard using samples filtered through 25mm
Whatman GF/F filters following the method of Tassan and Ferrari (1995) using a Hitachi U-
3000 spectrophotometer fitted with a φ60 integrating sphere. Spectra were measured before
and after de-pigmentation using 1-2% NaClO. Concentrated suspensions were used to derive
wavelength dependent path-length amplification factors (β) for each site. Absorption was
normalised to chlorophyll a in order to derive the chlorophyll specific absorption spectra
(a*(λ)). Fluorescence excitation spectra at 730 nm (F730) were also measured using a Perkin

Moore et al. Photoacclimation in shelf seas
11
Elmer LS50B on the same suspension as that used for RCII abundance, using methods
described previously (Suggett et al. 2004).
HPLC samples were filtered through 25mm Whatman GF/F filters and stored at -
80°C. Pigments were extracted into 90% acetone and analysed on return to the laboratory
according to the method of Barlow et al. (1997) on a Thermo Separation products HPLC.
Pigments were identified by retention time and on-line diode array spectroscopy. Absorption
by total pigments (a*pig(λ)) including chlorophylls a,b & c, photosynthetic carotenoids (PC)
and non-photosynthetic carotenoids (NPC) were reconstructed using the method of Bidigare
et al. (1990) as described in Suggett et al. (2004). Absorption by photosynthetic pigments
(a*pspig(λ)) was reconstructed in a similar manner excluding the contribution of NPCs. Optical
absorption (a*(λ)) was weighted by the ratio of a*pspig(λ)/a*pig(λ) to obtain a measure of the
optical absorption by photosynthetic pigments (a*ps(λ)) (Fig. 4). To derive a value of
absorption directly comparable to that of σPSII, a*(ps)(λ) was also weighted by the emission
spectrum of the FRR fluorometer to derive a*(ps) 478 (Fig. 4) (Suggett et al. 2004):
(3)
14C P vs. E curves
The irradiance dependence of photosynthetic carbon fixation was measured at in situ
temperature using short-term (2-4hr) P vs. E incubations in a photosynthetron. Data from P
vs. E experiments, normalised to the chlorophyll a concentration, were used to calculate the
maximal chlorophyll specific photosynthetic carbon fixation rate (P*max), the maximum light
utilisation coefficient (α*) and the light saturation parameter (Ek = P*max/α*). Photosynthetic
parameters measured by independent techniques required adjustment for differences in
∑
∑
−
−=
nm
nmps
ps E
Eaa
700400
700400)(
478)( )(
)()(**
λ
λλ

Moore et al. Photoacclimation in shelf seas
12
excitation spectra (Suggett et al. 2001,2004). Values of Ek have thus been scaled to account
for spectral differences between the FRR fluorometer and photosynthetron spectra Ephot(λ)
using:
(4)
Reported values of Ek are, on average, a factor of 0.47 (range 0.41 – 0.60) lower than
measured values. Corrections performed using absorption spectra with the contribution of
NPCs removed were around 20% higher with a mean of 0.57.
The rate of whole chain electron transport from charge separation to carbon fixation
(1\τPSII) was calculated from the product of the spectrally corrected 14C estimates of Ek and
the FRRf estimates of σPSII (Falkowski, 1992; Behrenfeld et al. 1998), i.e:
(5)
Results
Hydrographic setting and taxonomy
Hydrographic conditions were typical of summer in the study region (Fig. 5). Strong thermal
stratification was observed throughout most of the Celtic Sea, with weaker stratification at the
shelf edge and fully mixed conditions due to strong tides in the Irish Sea. A sub-surface
chlorophyll maximum (SCM) was observed at all the stratified sites. The peak of the SCM
was typically situated at a depth corresponding to around 5% of surface irradiance (Fig. 5 e-
h). As previously observed (Sharples et al. 2001), considerable patchiness in SCM
chlorophyll concentration was apparent at the stations occupied for 24hrs.
PSIIkPSII E στ =/1
∑ ∑
∑∑
− −
−−=
nm nmphotFRR
nmFRR
nmphot
kk EEa
EEameasuredEE
700400 700400
700400700400
)()()(*
)()()(*)(
λλλ
λλλ

Moore et al. Photoacclimation in shelf seas
13
A more detailed analysis of phytoplankton community structure will be presented
elsewhere. Phytoplankton cells <5 µm in diameter dominated over most of the region (Table
1). Flow cytometry data indicated that small eukaryotes dominated total community
biovolume at all stations apart from CS3 where Synechococcus numbers reached >100 × 106
L-1 in and above the SCM, contributing 50-80% of the total autotrophic biomass. The
importance of the cyanobacteria was apparent in fluorescence and absorption spectra obtained
at CS3 that displayed peaks or shoulders from 500-550nm due to the presence of
phycobiliproteins (Fig. 4b). Maker pigment ratios suggested that flagellates belonging to the
prymnesiophytes and pelagophytes comprised much of the eukaryotic population, the latter
group becoming more important towards the shelf edge (Table 1). Light microscopy indicated
that the higher fucoxanthin:chlorophyll a ratio observed at CS2 resulted from the presence of
pennate diatoms.
PSII Antenna characteristics
Physiological parameters relating to the makeup of the PSII antenna for the four main sites
are presented in Table 2. Estimates of the RCII:Chl a ratio for natural populations were within
the range reported for cultures (e.g. Dubinsky et al. 1986; Suggett et al. 2004). Values at
eukaryote dominated sites were around 0.0014-0.0016 (Table 2). Prokaryotes typically have
higher RCII:Chl a ratios (Kolber and Falkowski, 1993; Suggett et al. 2004) and a significantly
higher value of 0.0019 was observed for the Synechococcus dominated mixed community at
CS3 (Tables 1 & 2).
The photosynthetic carotenoid-to-chlorophyll a ratio (PC:Chl a) varied markedly
between stations with a general decrease from the shelf edge through the stratified waters to
the mixed station (Tables 1 & 2). Inter-site differences in PC:Chl a were dominated by
variability in accessory pigment composition and were thus ascribed to taxonomic differences

Moore et al. Photoacclimation in shelf seas
14
(Table 1). Vertical differences in PC:Chl a were only significant at CS2. Both surface and
deeper populations were collected from a deeper optical depth (lower within the photic zone)
at CS2 (Fig. 5). Deeper populations were sampled below the SCM and 1% light level at this
station, complicating direct comparison of vertical physiological variability with the other
stratified sites.
In contrast to the PC:Chl a ratios, NPC:Chl a varied little between sites. A significant
increase in NPC was observed in the surface at strongly stratified sites as would be expected
given a photoprotectant role for these pigments (Table 2). Inter site variability in PC:Chl a
and RCII:Chl a resulted in a decrease in PC:RCII from the shelf edge towards the mixed
water. The optical absorption cross section (a*478) did not vary significantly between sites but
increased towards the surface in stratified waters.
Values of σPSII measured using the FRR fluorometer were significantly higher at the
shelf edge than on-shelf, with lowest values at the mixed site. The functional absorption cross
section was typically invariant with depth within and above the SCM (Table 2). Lower σPSII
below the SCM at site CS2 was confirmed by in situ FRRf profile data, with similar decreases
observed below the thermocline and photic zone at the other stratified sites (not shown).
Much of the variability in σPSII throughout the study region could be explained by changes in
accessory pigmentation. In particular the ratio of 19′-butanoyloxyfucoxanthin to chlorophyll a
was highly positively correlated to σPSII (r2 = 0.636, n = 31, p < 0.001) (Fig. 6a) as was the
ratio of 19′-hexanoyloxyfucoxanthin to chlorophyll a (r2 = 0.452, n = 31, p < 0.001) (not
shown). Measured PSII cross sections thus largely reflected the relative dominance of
flagellate populations. The ratio PC:Chl a explained 45% of the variance in σPSII (p < 0.001).
For a reduced data set (n = 13) where RCII:Chl a estimates were available, the PC:RCII and
PC:Chl a ratios could each explain around 60% of the variance in σPSII (not shown). As
previously noted (Moore et al. 2005), such co-variability is expected since the FRR

Moore et al. Photoacclimation in shelf seas
15
fluorometer used in this study delivers excitation energy at a wavelength overlapping the
absorption band of the photosynthetically active carotenoids.
Using the spectral fluorescence, absorption and RCII:Chl a data, an independent
estimate of σPSII can be derived from (Suggett et al. 2004):
(6)
where 0.5 F730:a* is the proportion of absorbed light which is transferred to PSII, estimated by
scaling the measured fluorescence excitation spectrum to the absorption spectrum (Johnsen &
Sakshaug 1993; Suggett et al. 2004).
The ratio F730:a* dropped from around 1 at CS1, CS2 and IS1 to 0.8 at CS3. Hence
half the absorbed energy at 478nm was transferred to PSII at the eukaryote dominated stations
(Table 2), with significantly less (~40%) transferred to PSII at the Synechococcus dominated
CS3 station, again consistent with laboratory data (Suggett et al. 2004). For populations (n =
13) where spectral fluorescence and estimates of RCII:Chl a were available, measured values
of σPSII and those estimated using Eqn. 6 were well correlated (r2 = 0.558, p < 0.005) and of
comparable magnitude (Fig. 6b). Close correspondence between the two independent
estimates provided confidence in ascribing observed gradients in σPSII to changes in the
photosynthetic pigment:RCII ratio, the transfer term (F730:a*) being of secondary importance
for the populations sampled (Table 2, Fig. 6b). The data also provide confidence in the
techniques used and extend the results of Suggett et al. (2004) obtained for cultures covering a
wide range of taxa, to field populations.
Light saturation and electron transport
aChlRCII
aFa psPSII :
*:5.0* 730478)(=σ

Moore et al. Photoacclimation in shelf seas
16
Rates of Qa re-oxidation as estimated using FRRf were similar for the three main shelf sites
and slightly lower at CS2 (Table 3). Differences between sites were minimal in all other
photosynthetic parameters related to light saturation or maximum rates of electron transport or
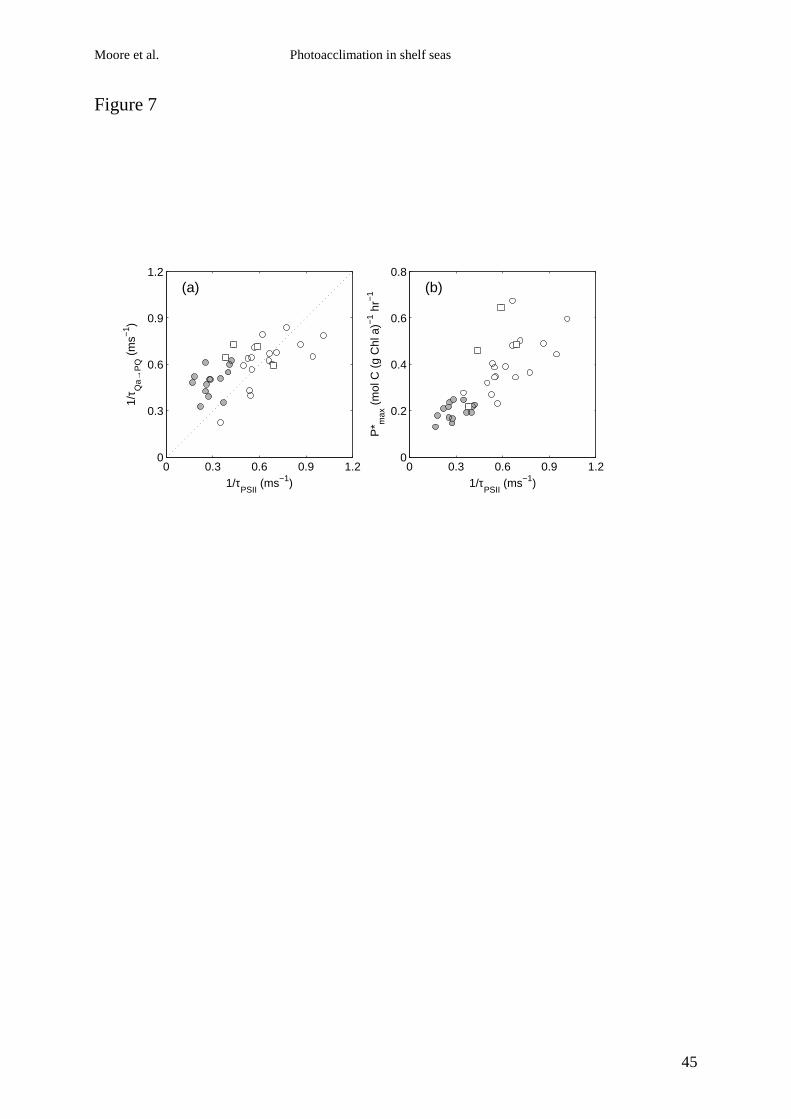
carbon fixation, however a marked depth dependence was observed (Table 3). The
parameters, 1/τQa→PQ, Ek and P*max, were higher at the surface (OD<2) than at depth (OD>2)
for the stratified sites (Fig. 7), these differences being significant where sufficient data was
available to perform statistical tests (Table 3). Variability in P*max was dominated by changes
of similar magnitude in Ek (r2 = 0.666, n = 35, p < 0.001, not shown) with mean surface
values being more than double those of deep (SCM) samples. In contrast no correlation was
observed between P*max and α*. Hence changes in P vs. E parameters within the system
studied were dominated by ‘Ek – dependent’ variability with minimal ‘Ek – independent’
variability (Behrenfeld et al. 2004).
Measured values of 1/τQa→PQ using FRRf were significantly correlated with
independent estimates of 1/τPSII calculated using Eqn. 5 for the complete data set (Fig 7a). Re-
arrangement of Eqn. 5 and substitution of τQa→PQ for τPSII also allowed calculation of the light
saturation intensity of electron transport (Ek,ETR) purely from FRR derived parameters. A
significant correlation between Ek,ETR and the 14C derived estimates of Ek was also found (r2 =
0.416, n = 35, p < 0.001, not shown). To our knowledge, these data represent the first reported
comparison of 1/τQa→PQ using FRRf with other independently derived and related
physiological parameters for natural communities.
The maximum chlorophyll specific rate of carbon fixation should be related to the rate
of whole chain electron transport and the RCII:Chl a ratio according to (Herron and
Mauzerall, 1971; Falkowski and Raven, 1997):
Moore et al. Photoacclimation in shelf seas
17
(7)
Vertical gradients in 1\τPSII accounted for >60% of the variance in P*max (Fig. 7b). Although
this relationship contained a degree of circularity, as derivation of 1\τPSII depends on
measurement of Ek and hence P*max (c.f. Eqns. 5 & 7), it reinforces our observation of a low
(~1.5 fold) range of variation in RCII:Chl a (Table 2) and indicates that changes of in
maximal electron transport rates dominate the >4 fold range in P*max. Similarly vertical
gradients in 1/τQa→PQ explained a significant proportion of the variance in P*max (r2 = 0.296, n
= 35, p < 0.001).
Relationship of Ek to irradiance
A highly significant correlation of Ek with optical depth was found for the sub set of data
collected at stratified stations (r2 = 0.749 (0.780 for log transformed Ek), n = 31, p < 0.001,
not shown). The lack of vertical variability in σPSII (Fig. 8b) indicated that changes in Ek were
dominated by changes in 1\τPSII (Eqn. 5) (Fig. 8a). Additionally over 50% of the variance in
Ek could be explained by differences in 1/τQa→PQ.
The mean irradiance experienced for each population was estimated by modelling the
light history over the previous 24hrs using the observed surface irradiance, diffuse attenuation
coefficients and sampling depths. For samples within the surface mixed layer or at IS1 it was
assumed that turbulent mixing cycled cells through the layer on time-scales short enough that
the mean irradiance within the layer was representative. Confidence in such an approximation
at IS1 is provided by previous estimates of mixing time-scales at other similar sites (Moore et
al. 2003). The potential peak daily irradiance experienced was estimated in a similar manner.
PSII
aChlRCIIP
τ:
* max =

Moore et al. Photoacclimation in shelf seas
18
The measured Ek strongly correlated with estimated mean daily irradiance for the
stratified stations (Fig. 8c). At the mixed station (IS1) no vertical gradient was observed in
any of the physiological parameters, implying that the mixing time-scale was shorter than the
photoacclimation time scale (Lewis et al. 1984; Moore et al. 2003). Given a kd of 0.167 and a
77m water depth, the mean irradiance experienced at the mixed station was 7-8% of surface
values, equivalent to that at the SCM at stratified stations (Fig. 8a). However, the
phytoplankton population at IS1 had values of 1/τQa→PQ, Ek and P*max that were similar to
those observed for the surface populations in the stratified water (Table 3). This suggests that
the IS1 population was adapted or acclimated to the highest irradiance experienced during
mixing, not to the mean irradiance of the deep-mixed layer. Peak daily irradiances were up to
6 times higher than Ek for surface stratified and fully mixed populations, but were
approximately equal to Ek for SCM populations.
Discussion
Antenna structure and taxonomy
In keeping with other recent field data (Moore et al. 2005), species composition appeared to
dominate the observed spatial variability in σPSII. Additionally, the lack of vertical gradients
within the euphotic zone argues against interpreting changes in σPSII as an acclimation
mechanism for these populations (Table 2, Fig. 8b). We conclude that the functional
absorption cross section is an adaptive parameter within the system at the time of year
studied. This conclusion is consistent with a recent extensive laboratory study that showed
large interspecific variability and small intraspecific variability of σPSII across a range of taxa
(Suggett et al. 2004). The result suggests that caution should be applied when attributing
variability in natural communities to acclimative physiological variability or nutrient stress
(e.g. Moore et al. 2003; Suzuki et al. 2004). Differences in σPSII amongst taxa appears to be

Moore et al. Photoacclimation in shelf seas
19
principally related to the proportion and type of accessory pigment within the PSII antenna,
with package effects probably also important for larger cells (Suggett et al. 2004; Moore et al.
2005).
Changes in other parameters related to antenna structure could also be interpreted in
terms of taxonomic shifts. Both the RCII:Chl a ratio and the proportion of absorbed irradiance
transferred to PSII was determined largely by the relative proportion of eukaryotes and
prokaryotes within the community.
It is not clear to what extent the selective pressure responsible for the taxonomic
variability observed in the current study is related to changes in antenna structure. Although
multiple factors will govern species competition, given the diversity of marine autotrophs
(Falkowski and Raven, 1997), it is likely that the structure of the light harvesting complex
could play some role. For any given total cellular light absorption, a species with a larger
PC:Chl a ratio and hence higher σPSII (Table 2, Fig. 6) will require fewer RCIIs. Selective
pressure between groups with different σPSII may thus be related to the availability of
resources for the production of large antenna pigment-protein complexes versus the greater
resources required for synthesis of reaction centres (Behrenfeld et al. 1998). Higher values of
σPSII for shelf break flagellate populations (Tables 1 & 2, Fig. 6) may have represented an
adaptation to conditions of lower resource availability for reaction centre synthesis.
Electron turnover and acclimation
Correlated changes in Ek and P*max as a function of optical depth for stratified stations were
consistent with physiological acclimation to differing irradiance (MacIntyre et al. 2002). The
lack of significant differences in the relationships between Ek (or P*max) and optical depth
(OD) between sites, despite some taxonomic variability, argues for these vertical gradients
primarily resulting from acclimation. The acclimation mechanism was likely an increase of
Moore et al. Photoacclimation in shelf seas
20
photosynthetic pigment per cell in the SCM compared to the surface. The ratio of red
(chlorophyll) fluorescence to cell volume (F/Cell vol) was a factor of 2.1 ± 0.3 and 3 ± 0.8
larger for the SCM as opposed to the surface at stations CS1 and CS3 respectively. These
differences were of comparable magnitude to the changes in Ek (Table 3), supporting
adjustment of Chl:Cell and Chl:C ratios as the factor responsible for the acclimation response
(MacIntyre et al. 2002).
Variability in 1\τPSII, rather than σPSII, dominated changes in Ek (and P*max), strongly
suggesting that acclimation to low light involved an increase in the number of reaction
centres, as opposed to an increase in antenna size (Figs. 7 & 8). It is proposed that the
increased numbers of reaction centres for the SCM populations resulted in a higher ratio of
RCII:Cell (or RCII to carbon fixation capacity) and hence slower turnover rates, as previously
observed for Dunaliella tertiolecta (Sukenik et al. 1987).
Similar magnitudes and significant correlations between estimates of 1/τPSII and
1/τQa→PQ indicated a balance between processes downstream and upstream of the plastiquinol
(PQ) pool (Fig. 7a). The achieved Qa re-oxidation rate appeared to be governed by
downstream processes and ultimately constrained by the capacity for carbon fixation to re-
oxidise the PQ pool, which then oxidises Qa (Kolber and Falkowski, 1993; Cleland, 1998;
Kaňa et al. 2002). Photoacclimation thus appeared to change both 1/τQa→PQ and 1/τPSII, which
is consistent with recent models (Kana et al. 1997; Geider et al. 1998), particularly if the
signal for this process resides within the redox state of the PQ pool (Escoubas et al. 1995;
Pfannschmidt et al. 2003). A degree of balance between electron transport and carbon fixation
supports the potential use of active fluorescence for productivity estimation (Kolber and
Falkowski, 1993; Suggett et al. 2001; Smyth et al. 2004). Electron transport appeared to be a
reasonable indicator of carbon fixation in this system where photoacclimation was the
dominant cause of variability in the P vs. E curve. This is the so-called ‘Ek-dependent’

Moore et al. Photoacclimation in shelf seas
21
behaviour identified by Behrenfeld et al. (2004). Electron transport and carbon fixation may
be less tightly coupled in a system where ‘Ek – independent’ variability is large (Behrenfeld et
al. 2004).
It is reasonable to assume that the maximum achievable (i.e. intrinsic) rate of Qa
through PQ electron transport, ~1-1.6 ms-1 (Crofts and Wraight, 1983), would not be affected
by an acclimation mechanism involving synthesis of RCIIs. The achieved rate of Qa re-
oxidation (1/τQa→PQ, Fig. 7a) of ~0.3 to 0.9 ms-1 was below this maximum value for many of
the populations studied, suggesting that there was an excess PSII capacity (Behrenfeld et al.
1998; Kaňa et al. 2002). Given the use of FRRf for estimation of primary productivity
(Kolber and Falkowski, 1993; Suggett et al. 2001; Smyth et al. 2004), further work is clearly
desirable to investigate the co-variation of τQa→PQ and τPSII under a variety of growth
conditions.
Photoacclimation and environmental forcing
The optimal light harvesting strategy depends on balancing light absorption with carbon
fixation, while minimising the potential loss of photosynthetic performance due to photo-
damage. Photoacclimation reduced cellular pigment and increased 1/τPSII in the surface
relative to the SCM. This mechanism was effective in shifting the value of Ek (c.f. Eqn. 5) to
partially track changes in ambient irradiance (Fig. 8c). For SCM populations Ek was typically
higher than the estimated mean daily irradiance while for surface populations these two
values were approximately equal. Thus, peak irradiances significantly exceeded Ek for surface
populations, indicating a greater potential for RCII damage and hence photoinhbition.
Dissipation of excess excitation energy via non-photochemical quenching (NPQ)
mechanisms can potentially limit photodamage. In situ profiles using the submersible FRR
fluorometer indicated significant antenna NPQ, as evidenced by midday decreases of around

Moore et al. Photoacclimation in shelf seas
22
30-40% in surface values of the functional absorption cross section (σPSII’) relative to the dark
adapted value (σPSII) (e.g. Olaizola et al. 1994; Vassiliev et al. 1994). A greater capacity for
antenna NPQ in surface populations was consistent with the higher NPC:Chl a ratio (Table 2).
Although decreased σPSII’ could thus have increased the in situ value of Ek by 40-70% (Eqn.
5), peak irradiances would still exceed Ek (Olaizola et al. 1994). As outlined above, excess
PSII capacity, which can raise 1/τPSII and thus Ek further (Eqn. 5), could have maintained
maximum carbon fixation rates even if some of the RCIIs were photoinhibited (Behrenfeld et
al. 1998; Kaňa et al. 2002).
The acclimation or adaptation to relatively high light that we observed at the mixed
station in the Irish Sea (IS1) contrasts with the field data of Behrenfeld et al. (1998) indicating
acclimation to irradiances below the mean value in a shallow (i.e. optically thin) mixed layer.
Behrenfeld et al. (1998) point out that acclimation to lower irradiance can result in a lower
initial 1/τPSII and hence a higher excess PSII capacity. However, a lower 1/τPSII may
correspond to lower 1/τQa→PQ (Fig. 7a), increasing the probability of any individual RCII
being reduced in bright light and thus increasing the potential for photodamage (Baroli and
Melis 1998).
Observed reversible antenna NPQ was minimal at IS1 with σPSII’ <10% lower than
σPSII, despite relatively high levels of NPC (Table 2). Lower antenna quenching in situ may
result from mixing being faster than the time-scale for complete NPQ induction or relaxation
(Moore et al. 2003). The lowest values of σPSII were observed at the IS1 station (Table 2, Fig.
6a) consistent with the phytoplankton at this site being adapted to minimise over-excitation of
PSII and potential photodamage (Park et al. 1997; Baroli and Melis 1998; Behrenfeld et al.
1998). Such adaptation would be particularly important if reversible antenna NPQ is not an
effective strategy in this vigorously mixed environment (Moore et al. 2003). Additionally a
lower σPSII allows for a lower 1/τPSII at any given Ek (Eqn. 5), consistent with observations in

Moore et al. Photoacclimation in shelf seas
23
the mixed and surface stratified waters (Figs. 7a & 8c). Lower 1/τPSII combined with an
adaptively lower σPSII, could result in a larger excess PSII capacity, without a corresponding
increase in the probability RCII photodamage. Effectively the lower σPSII may offset the
greater chance of encountering a reduced RCII at low 1/τPSII (Baroli and Melis 1998). Thus,
the lower functional absorption cross sections in phytoplankton adapted to deep mixed coastal
waters may reduce the potential for photodamage to adversely affect carbon fixation (Park et
al. 1997; Baroli and Melis 1998; Behrenfeld et al. 1998). For the region studied, mixed waters
are also characterised by excess resources, including both micro- and macro- nutrients. High
nutrient availability potentially negates any disadvantage incurred by taxa with lower σPSII
having to synthesise greater numbers of RCIIs for a given amount of total cellular absorption.
The energetic cost of repairing damaged RCIIs may be less than that of not
acclimating to low light under many conditions (Raven, 1994). However, given sufficiently
vigorous mixing, the rapid transport of photodamaged cells from the surface to low irradiance
at depth may increase the cost of photoinhibition to the point where acclimation or adaptation
to high light becomes the optimal strategy (Behrenfeld et al. 1998). Understanding
photoacclimation and adaptation strategies in mixed layers is likely to require knowledge of
the time-scales for NPQ induction and relaxation and for vertical cell movements by turbulent
motion. Mechanistic understanding of interactions between NPQ, photoinhibition and
photoacclimation may also be required (Marshall et al. 2000). These remain formidable
research objectives.
Summary and conclusions
Environmental forcing can drive a phenotypic response and generate selective pressure on the
genotypes present within an ecosystem. Gradients in forcing can thus be accompanied by
changes in both acclimation state and community composition. This study provides new

Moore et al. Photoacclimation in shelf seas
24
insights into the functioning of the shelf sea ecosystem in terms of both acclimation and
adaptation. Photosynthetic parameters related to the makeup of the pigment antenna,
specifically the PSII antenna, showed most variation in the horizontal, largely as a result of
changes in community composition within the shelf sea region studied. Conversely changes in
parameters related to rates of maximum electron transport, carbon fixation, or light saturation
intensity, varied in the vertical as a result of photoacclimation to the light gradient in stratified
waters. This acclimation response was dominated by changes in RCII:Cell rather than PSII
antenna size. Within fully mixed water columns phytoplankton appeared to be acclimated
and/or adapted to high light. Such a strategy is likely to represent a trade-off between
maximising light harvesting and minimising photoinhibition given the rapid changes in
irradiance experienced under turbulent conditions.

Moore et al. Photoacclimation in shelf seas
25
References
Barlow RG, Cummings DG and Gibb SW (1997) Improved resolution of mono- and divinyl
chlorophylls a and b and zeaxanthin and lutein in phytoplankton extracts using reverse phase
C-8 HPLC. Mar Ecol Prog Ser 161 303-307
Baroli, I and Melis, A., (1998) Photoinhibitory damage is modulated by the rate of
photosynthesis and by the photosystem II light-harvesting chlorophyll antenna size. Planta
205 288-296
Behrenfeld, M.J. and Falkowski, P.G., (1997) Photosynthetic rates derived from satellite-
based chlorophyll concentration. Limnol. Oceanogr. 42 1-20
Behrenfeld, M.J., Prasil, O., Kolber, Z.S., Babin, M. and Falkowski, P.G., (1998)
Compensatory changes in Photosystem II electron turnover rates protect photosynthesis from
photoinhibition. Photosyn. Res. 58 259-268
Behrenfeld, M.J., Prasil, O., Babin, M. and Bruyant, F. (2004) In search of a physiological
basis for covariations in light-limited and light saturated photosynthesis. J. Phycol. 40 4-25
Bidigare, R.R., Ondrusek, M.E., Morrow, J.H., Kiefer, D.A., 1990. In vivo absorption
properties of algal pigments. SPIE, 1302 (Ocean Optics X): 289-302.
Cleland, R.E., (1998) Voltammetric measurement of the plastoquinone redox state in isolated
thylakoids. Photosyn. Res. 58 183-192

Moore et al. Photoacclimation in shelf seas
26
Crofts, A.R. and Wraight, C.A., (1983) The electrochemical domain of photosynthesis.
Biochim. Biophys. Acta 726 149-185
Crofts, A.R., Baroli, I., Kramer, D. and Taoka, S. (1993) Kinetics of electron-transfer between
Q(A) and Q(B) in wild-type and herbicide-resistant mutants of Chlamydomonas reinhardtii Z.
Naturforsch. 48c 259-266
Cullen, J.J. and Davis, R.F., (2003) The blank can make a big difference in oceanographic
measurements. Limnol. Oceanogr, Bull. 12 29-35
Dubinsky, Z., Falkowski, P.G. and Wyman, K., (1986) Light harvesting and utilisation by
phytoplankton. Plant Cell Physiol. 27 1335-1349
Escoubas, J., Lomas, M., LaRoche, J. and Falkowski, P.G., (1995) Light intensity regulation
of cab gene expression is signalled by the redox state of the plastiquinone pool. Proc. Natl.
Acad. Sci. USA 92 10237-10241
Falkowski, P.G., (1980) Light-shade adaptation in marine phytoplankton, in Primary
productivity in the sea, P.G. Falkowski, Ed. Plenum Press, New York, 531pp
Falkowski, P.G. and Owens, T.G., (1980) Light shade adaptation: two strategies in marine
phytoplankton. Plant Physiol. 66 632-635

Moore et al. Photoacclimation in shelf seas
27
Falkowski, P.G. and LaRoche, J., (1991) Acclimation to spectral irradiance in algae. J.
Phycol. 27 8-14
Falkowski PG (1992) Molecular ecology of phytoplankton photosynthesis. Pp47-67. In
Falkowski PG and Woodhead A (eds), Primary productivity and biogeochemical cycles in the
Sea. Plenum Press, New York. 550pp
Falkowski, P.G. and Raven, J.A., (1997) Aquatic Photosynthesis Blackwell Science U.K.
375pp
Geider, R.J., MacIntyre, H.L. and Kana, T.M., (1996) A dynamic model of photoadaptation in
phytoplankton. Limnol. Oceanogr. 41 1-15
Geider, R.J., MacIntyre, H.L. and Kana, T.M., (1998) A dynamic regulatory model of
phytoplankton acclimation to light nutrients and temperature. Limnol. Oceanogr. 43 679-694
Johnsen, G., and Sakshaug. E., (1993) Bio-optical characteristics and photoadaptive responses
in the toxic and bloom-forming dinoflagellates Gyrodinium aureolum, Gymnodinium
galatheanum and two strains of Prorocentrum minimum. J. Phycol. 29 627-642.
Kana, T.M., Geider, R.J. and Critchley, C., (1997) Regulation of photosynthetic pigments in
micro-algae by multiple environmental factors: a dynamic balance hypothesis. New Phytol.
137 629-638

Moore et al. Photoacclimation in shelf seas
28
Kaňa, R., Lazár, D., Prášil, O., Nauš J., (2002) Experimental and theoretical studies on the
excess capacity of photosystem II. Photosyn. Res. 72 271-284
Kolber Z, Zehr J and Falkowski PG (1988) Effects of growth irradiance and nitrogen
limitation on photosynthetic energy conversion in photosystem II. Plant Physiol 88 923-929
Kolber Z, Wyman KD and Falkowski PG (1990) Natural variability in photosynthetic energy
conversion efficiency; A field study in the Gulf of Maine. Limnol Oceanogr 35 72-79
Kolber Z and Falkowski PG (1993) Use of active fluorescence to estimate phytoplankton
photosynthesis in situ. Limnol Oceanogr 38 1646-1665
Kolber ZS, Prášil O and Falkowski PG (1998) Measurements of variable chlorophyll
fluorescence using fast repetition rate techniques: defining methodology and experimental
protocols. Biochim Biophys Acta 1367 88-106
Laney, S.R., (2003). Assessing the error in photosynthetic properties determined by fast
repetition rate fluorometry. Limnol. Oceanogr. 48 2234-2242
Lewis MR, Horne EPW, Cullen JJ, Oakey NS and Platt T, (1984) Turbulent motions may
control phytoplankton photosynthesis in the upper ocean. Nature 311 49-50
Long, S.P., Humphries, S. and Falkowski, P.G., (1994) Photoinhibition of photosynthesis in
nature. Annu. Rev. Plant Physiol. Plant Mol. Biol. 45 633-662

Moore et al. Photoacclimation in shelf seas
29
MacIntyre, H.L., Kana, T.M., Anning, T. and Geider, R.J., (2002) Photoacclimation of
photosynthesis irradiance response curves and photosynthetic pigments in microalgae and
cyanobacteria. J. Phycol. 38 17-38
Marshall, H.L., Geider, R.J. and Flynn, K.J., (2000) A mechanistic model of photoinhibition.
New Phytol. 145 347-359
Mauzerall, D., Greenbaum, N.L., 1989. The absolute size of a photosynthetic unit.
Biochimica et Biophysica Acta, 974 119-140.
Moore, C.M., Suggett, D., Holligan, P.M., Sharples, J., Abraham, E.R., Lucas, M.I., Rippeth,
T.P., Fisher, N.R., Simpson, J.H. and Hydes, D.J. (2003) Physical controls on phytoplankton
physiology and production at a shelf sea front: a fast repetition-rate fluorometer based field
study. Mar. Ecol. Prog. Ser. 259 29-45
Moore, C.M. Lucas, M.I., Sanders, R. and Davidson, R. (2005) Basin-scale variability of
phytoplankyton bio-optical characteristics in relation to bloom state and community structure
in the Northeast Atlantic. Deep Sea Res. I. In press
Olaizola, M., LaRoche, J., Kolber, Z. and Falkowski, P.G., (1994) Non-photochemical
quenching and the diadinoxanthin cycle in a marine diatom. Photosynth. Res. 41 357-370
Park, Y.I., Chow, W.S. and Anderson, J.M., (1997) Antenna size dependency of
photoinactivation of photosystem II in light-acclimated leaves. Plant Physiol. 115 151-157

Moore et al. Photoacclimation in shelf seas
30
Perry, M.J., Talbot, M.C. and Alberte, R.S., (1981) Photoadaptation in marine phytoplankton:
Response of the photosynthetic unit. Mar. Biol. 62 91-101
Pfannschmidt, T., (2003) Chloroplast redox signals: how photosynthesis controls its own
genes. Trends Plant Sci. 8 33-41
Prášil, O., Adir, N. and Ohad, I., (1992) Dynamics of photosystem II: mechanism of
photoinhibition and recovery process. In Barber J (ed) The photosystems: structure, function
and molecular biology. Elsevier Science Publishers, Amsterdam, pp 295-348
Prášil, O., Kolber, Z., Berry, J. and Falkowski, P.G., (1996) Cyclic electron flow around PSII
in vivo. Photosyn. Res. 48 395-410
Raven, J. (1994) The cost of photoinhibition to plant communities. In: Baker, N.R. and
Bowyer, J.R., (eds) Photoinhibition of photosynthesis: From molecular mechanisms to the
field. BIOS Scientific Publishers, Oxford.
Sakshaug, E., Bricuad, A., Dandonneau, Y., Falkowski, P.G., Kiefer, D.A., Legendre, L.,
Morel, A., Parslow, J. and Takahashi, M., (1997) Parameters of photosynthesis: definitions,
theory and interpretation of results. J. Plankt. Res. 19 1637-1670
Sharples J, Moore CM, Rippeth TP, Holligan PM, Hydes DJ, Fisher NR and Simpson JH
(2001) Phytoplankton distribution and survival in the thermocline. Limnol Oceanogr 46 486-
496

Moore et al. Photoacclimation in shelf seas
31
Smyth, T.J., Pemberton, K.L., Aiken, J. and Geider, R.J. (2004) A methodology to determine
primary production and phytoplankton photosynthetic parameters from Fast Repetition Rate
Fluorometry. J. Plankt. Res. 26 1337:1350
Suggett D, Kraay G, Holligan P, Davey M, Aiken J, Geider R (2001) Assessment of
photosynthesis in a spring cyanobacterial bloom by use of a fast repetition rate fluorometer.
Limnol Oceanogr 46:802-810
Suggett, D. J., Oxborough, K., Baker, N.R., MacIntyre, H.L., Kana, T.M. and Geider, R.J.,
(2003) Fast repetition rate and pulse amplitude modulation chlorophyll a fluorescence
measurements for assessment of photosynthetic electron transport in marine phytoplankton.
Eur. J. Phycol. 38 371-384
Suggett, D.J., MacIntyre, H.L. and Geider, R.J., (2004) Evaluation of biophysical and optical
determinations of light absorption by photosystem II in phytoplankton. Limnol. Oceanogr.
Methods 2 316-332
Sukenik, A., Bennett, J. and Falkowski, P.G., (1986) Light-saturated photosynthesis-
limitation by electron transport or carbon fixation? Biochim. Biophys. Acta. 891 205-215
Suzuki, K., Liu, H., Saino, T., Obata, H., Takano, M., Okamura, K., Sohrin, Y., Fujishima,
Y., (2002) East-west gradients in the photosynthetic potential of phytoplankton and iron
concentration in the subarctic Pacific Ocean during early summer. Limnol. Oceanogr. 47
1581-1594

Moore et al. Photoacclimation in shelf seas
32
Tassan S and Ferrari GM (1995) An alternative approach to absorption measurements of
aquatic particles retained on filters. Limnol Oceanogr 40 1358-1368
Vassiliev, I.R., Prasil, O., Wyman, K., Kolber, Z., Hanson, A.K., Prentice, J. and Falkowski,
P.G., (1994) Inhibition of PSII photochemistry by PAR and UV radiation in natural
phytoplankton communities. Photosyn. Res. 42 51:64

Moore et al. Photoacclimation in shelf seas
33
Tables
N9 CS2 N1 U2 CS1 D2 CS3 IS1 % Chl <5µµµµm
n.d. 46 ± 7
59 ± 4
61 ± 10
77 ± 3
n.d. 81 ± 4
66 ± 4
Syn (×106 L-1)
34 ± 13
21 ± 11
38 ± 4
13 ± 10
35 ± 4
38 105 ± 14
6.3 ± 0.7
Euk (×106 L-1)
8.0 ± 3
8.4 ± 2
3.0 ± 1.3
5.4 ± 3
7.8 ± 0.5
2 12 ± 1
5.6 ± 0.7
But:Chl (g:g)
0.18 ± 0.05
0.18 ± 0.03
0.10 ± 0.01
0.05 ± 0.01
0.09 ± 0.004
0.05 ± 0.002
0.08 ± 0.003
0.02 ± 0.002
Hex:Chl (g:g)
0.40 ± 0.05
0.34 ± 0.04
0.38 ± 0.05
0.31 ± 0.07
0.36 ± 0.03
0.28 ± 0.01
0.32 ± 0.008
0.12 ± 0.01
Fuco:Chl (g:g)
0.21 ± 0.06
0.40 ± 0.02
0.18 ± 0.02
0.17 ± 0.07
0.23 ± 0.02
0.28 ± 0.10
0.21 ± 0.01
0.28 ± 0.02
Table 1 Taxonomic and pigment data collected in Celtic and Irish Seas during summer
2003 sites are ordered from left (shelf edge) to right (mixed water) (Fig. 2). Mean values (± 1
se) of size fractionated chlorophyll, cell numbers (Syn – Synechococcus, Euk – eukaryotes)
and marker pigment to chlorophyll a ratios are presented. Maker pigments and likely group:
19′-butanoyloxyfucoxanthin (But, Pelagophytes), 19′-hexanoyloxyfucoxanthin (Hex,
Prymnesiophytes), fucoxanthin (Fuco, Diatoms), together these three pigments comprised
>80% of the photosynthetic carotenoid present in all the samples. n.d. indicates no data
available.

Moore et al. Photoacclimation in shelf seas
34
CS2 CS1 CS3 IS1 RCII :Chl a × 10-4
14.2 ± 0.3 a
14.0 ± 0.3 a
19.0 ± 0.2 b
15.9 ± 0.1 a
Surface 1.12 ± 0.03 0.74 ± 0.04 0.61 ± 0.017 PC:Chl a
(g:g) Deep 0.82 a, ***
0.75 ± 0.03 b,c
0.68 ± 0.025 b,c,d
0.52 ± 0.004
c,d
Surface 0.18 ± 0.02 0.29 ± 0.02 0.29 ± 0.02 NPC:Chl a (g:g) Deep 0.17
a 0.18 ± 0.003
a,b, *** 0.21 ± 0.01
b, *
0.24 ± 0.02
a,b PC:RCII g µmol-1
0.73 ± 0.012 a
0.50 ± 0.006 b
0.33 ± 0.002 c
0.29 ± 0.004 c
Surface 3.6 ± 0.4 4.8 ± 0.8 4.6 ± 0.7 2.8 ± 0.3 a*478
× 10-2 m2 (mg chl a)-1
Deep 3
2.2 ± 0.5 *
3.8 ± 0.1
Surface 1083 ± 27 896 ± 14 937 ± 27 σσσσPSII
× 10-20 m2 quanta-1
Deep 912 ± 28 a, *
900 ± 11 b
893 ± 28 b
729 ± 18 c
0.5 F730:a* 0.48 ± 0.01
a 0.49 ± 0.01
a 0.40 ± 0.01
b 0.51 ± 0.01
a
Table 2 Physiological parameters related to antenna structure for principal stations.
Values are quoted as mean (± 1 se). Surface samples were taken as being above an optical
depth of 2 and deep samples as being below an optical depth of 2. For the majority of
stratified sites the ‘deep’ samples were collected within the subsurface chlorophyll maximum
(SCM), the exception being at CS2 where samples were collected below the SCM. Mean
values of all parameters showed significant differences between sites (ANOVA) excepting
a*478. Letters in italics (a-d) indicate sites specific means indistinguishable at 99% confidence
level (Tukey-Kramer test). Mean values between surface and DCM compared by t-test,
marked *, ** or *** where significant (p < 0.05, 0.01, 0.001 respectively).

Moore et al. Photoacclimation in shelf seas
35
CS2 CS1 CS3 IS1
Surface 0.40 ± 0.06 0.66 ± 0.02 0.69 ± 0.04 1/ττττQa→→→→PQ (ms-1) Deep 0.37 ± 0.06 0.46 ± 0.03
*** 0.56 ± 0.03
**
0.66 ± 0.03
Surface 74 ± 5 101 ± 2 128 ± 13 Ek
(µmol photons m-2 s-1)
Deep 37
45 ± 4 ***
58 ± 8 **
117 ± 14
Surface 0.35 ± 0.03 0.28 ± 0.03 0.44 ± 0.05 P*max
(mol C (g Chl a)-1 hr-1)
Deep 0.21 0.18 ± 0.02 *
0.21 ± 0.02 **
0.45 ± 0.08
Table 3 Parameters related to light saturation and rates of photosynthetic electron
transport for principal stations. Surface samples were taken as being above an optical depth of
2 and deep samples as being below an optical depth of 2. There were no significant
differences at 99% confidence level between sites excepting lower 1/τQa at the shelf edge
(ANOVA). The latter result may have resulted from deeper optical depths being sampled at
this station. Mean values between surface and DCM compared by t-test, marked *, ** or ***
where significant (p < 0.05, 0.01, 0.001 respectively).

Moore et al. Photoacclimation in shelf seas
36
Figure legends
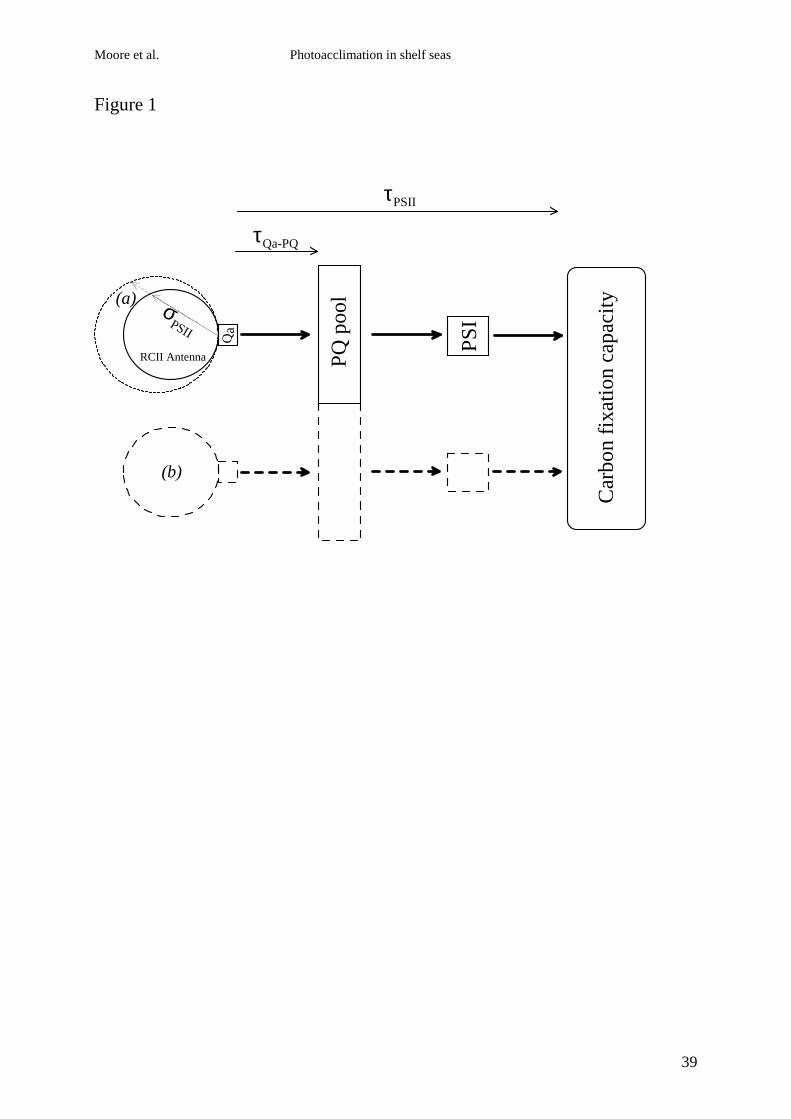
Figure 1 Simplified schematic of photosynthetic apparatus as related to
photoacclimation and photosystem II. (a) Functional absorption cross section of PSII (σPSII) is
related to the amount of PSII antenna pigment transferring energy to active reaction centres.
Acclimation processes that alter the ‘size’ of the PSII antenna alter σPSII. Taxa with higher
amounts of chlorophyll or accessory pigment per RCII will also tend to have an adaptively
higher σPSII (Suggett et al. 2004). (b) Acclimation that involves altering the number of PSIIs
for a given carbon fixation capacity will leave σPSII unchanged and decrease the maximum
rate of whole chain electron transport (1/τPSII). For simplicity it is assumed that the ratio of
PSII:PQ:PSI remains constant during the acclimation process as observed in Dunaliella
tertiolecta (Sukenik et al. 1987). The relationship between 1/τQa-PQ and 1/τPSII will depend on
the extent to which downstream processes limit the re-oxidation of PSII (Kolber and
Falkowski, 1993).
Figure 2 Map of study area and stations. Solid lines indicate 200 m and 2000 m depth
contours, dotted line indicates approximate position of a tidal mixing front marking the
boundary between fully mixed and seasonally stratified waters. Open squares indicate
positions of the four principal sampling stations.
Figure 3 Example fluorescence saturation-relaxation curves. Data are from samples
collected at two depths at site N1, open symbols 2m, closed symbols 27m. Dotted lines are
fits to Eqns. 1 & 2. The fluorescence yield f(t) does not return to the F0 level but rather
asymptotes to a value, which in the simple case of zero connectivity is given by: f(t) = F0 +

Moore et al. Photoacclimation in shelf seas
37
(Fm – F0) i(t) σPSII τQa. This is a result of the re-closure of a proportion of the open reaction
centres by the excitation energy (i) provided by each relaxation flash.
Figure 4 (a - c) Examples of 730nm fluorescence excitation spectrum (thick line),
chlorophyll specific optical absorption (a*) (thin solid line) and a* corrected for absorption by
non-photosynthetic pigments (a*pp) from station CS1 (a), CS3 (b) and IS1 (c). (d) FRRf (thick
line) and photosynthetron (thin line) excitation spectra.
Figure 5 Vertical distributions of temperature (°C) and in situ fluorescence and
chlorophyll (mg m-3) from stations CS2 (a & e), CS1 (b & f), CS3 (c & g) and IS1 (d & h). (a-
d) Profiles of temperature (thick line) and chlorophyll (thin line) against depth. (e-h) Profiles
of chlorophyll against optical depth. Symbols in (e-h) indicate chlorophyll concentrations
measured on the samples collected from a number of different CTD profiles for determination
of FRRf and 14C physiological parameters. Considerable variability in the chlorophyll
concentration observed at the thermocline was observed during the 24hrs spent at each
station.
Figure 6 (a) Relationship between σPSII and the 19′-butanoyloxyfucoxanthin:Chl a ratio
(r2 = 0.636, n = 31, p < 0.001). (b) Comparison of σPSII as directly measured using FRRf and
independently estimated using Eqn. 6 (r2 = 0.558, n = 13, p < 0.005), neglecting the transfer
term in Eqn. 6 (F730:a*) reduced the variance explained by <2%. Symbols correspond to sites;
with open symbols indicating sites towards shelf edge. Dotted line in (b) indicates 1:1
relationship.

Moore et al. Photoacclimation in shelf seas
38
Figure 7 Relationships of rate of whole chain electron transport (1/τPSII) as calculated
using Eqn. 5 to (a) 1/τQa→PQ measured by FRRf (r2 = 0.425, n = 35, p <0.001) and (b) P*max
measured by 14C P vs. E incubation (r2 = 0.624, n = 35, p <0.001). Squares indicate the mixed
station (IS1), circles indicate stratified stations, open – OD<2, filled, OD>2. Dotted line in (a)
indicates 1:1 relationship.
Figure 8 Relationship of photosynthetic parameters to optical depth (OD) and estimated
mean 24hr irradiance. (a) 1\τPSII vs. OD (significant correlation observed for stratified sites, r2
= 0.725 (0.761 for log transformed 1\τPSII), n = 31, p < 0.001). (b) σPSII vs. OD, no significant
relationship found. (c) Ek from 14C PE data as a function of estimated mean daily irradiance
(E) (For stratified stations, r2 = 0.702, n = 31, p < 0.001).
Moore et al. Photoacclimation in shelf seas
39
Figure 1
PQ
poo
l
Car
bon
fixa
tion
cap
acity
Qa
RCII Antenna
σPSII
τPSII
τQa-PQ
(b)
(a)
PS
I

Moore et al. Photoacclimation in shelf seas
40
Figure 2
Longitude
Latit
ude
12oW 10oW 8oW 6oW 4oW 47oN
48oN
49oN
50oN
51oN
52oN
53oN
IS1
CS3 D2
CS1
U2
N1CS2
N9

Moore et al. Photoacclimation in shelf seas
41
Figure 3
0 0.5 1 1.5 2 2.50
0.2
0.4
0.6
0.8
1
Time (ms)
(f(t
) −
Fo)/
(Fm
− F
o)

Moore et al. Photoacclimation in shelf seas
42
Figure 4
400 500 600 7000
0.01
0.02
0.03
0.04
0.05
F o
r a*
(m
2 (m
g C
hl a
)−1 )
λ (nm)
CS1
(a)
400 500 600 7000
0.01
0.02
0.03
0.04
0.05
λ (nm)F
or
a* (
m2 (
mg
Chl
a)−
1 )
CS3
(b)
400 500 600 7000
0.01
0.02
0.03
0.04
0.05
λ (nm)
F o
r a*
(m
2 (m
g C
hl a
)−1 )
IS1
(c)
400 500 600 7000
0.2
0.4
0.6
0.8
1
λ (nm)
Ex
(a.u
.)
(d)
a* a*
pp
F

Moore et al. Photoacclimation in shelf seas
43
Figure 5
0 1 2−80
−70
−60
−50
−40
−30
−20
−10
0
Chlorophyll (mg m−3)
Dep
th (
m)
10 12 14 16 18
Temperature (oC)
(a)
0 1 2−80
−70
−60
−50
−40
−30
−20
−10
0
Chlorophyll (mg m−3)
10 12 14 16 18
Temperature (oC)
(b)
0 1 2−80
−70
−60
−50
−40
−30
−20
−10
0
Chlorophyll (mg m−3)
10 12 14 16 18
Temperature (oC)
(c)
0 1 2−80
−70
−60
−50
−40
−30
−20
−10
0
Chlorophyll (mg m−3)
10 12 14 16 18
Temperature (oC)
(d)
0 1 2−9
−8
−7
−6
−5
−4
−3
−2
−1
0
Chlorophyll (mg m−3)
Opt
ical
Dep
th
(e)
0 1 2−9
−8
−7
−6
−5
−4
−3
−2
−1
0
Chlorophyll (mg m−3)
(f)
0 1 2−9
−8
−7
−6
−5
−4
−3
−2
−1
0
Chlorophyll (mg m−3)
(g)
0 1 2−9
−8
−7
−6
−5
−4
−3
−2
−1
0
Chlorophyll (mg m−3)
(h)

Moore et al. Photoacclimation in shelf seas
44
Figure 6
0 0.1 0.2 0.3500
700
900
1100
1300
σ PS
II (x1
0−20
m2 q
uant
a−1 )
19 But:Chlorophyll a500 700 900 1100 1300 1500
500
700
900
1100
1300
Predicted σPSII
CS1CS3U2D2IS1CS2N1N9
(a) (b)
Moore et al. Photoacclimation in shelf seas
45
Figure 7
0 0.3 0.6 0.9 1.20
0.3
0.6
0.9
1.2
1/τPSII
(ms−1)
1/τ Q
a→P
Q (
ms−
1 )
(a)
0 0.3 0.6 0.9 1.20
0.2
0.4
0.6
0.8
1/τPSII
(ms−1)
P* m
ax (
mol
C (
g C
hl a
)−1 h
r−1 (b)

Moore et al. Photoacclimation in shelf seas
46
Figure 8
0.1 0.3 0.6 1.2
−8.4
−5
−4
−3
−2
−1
0
1/τPSII
(ms−1)
Opt
ical
Dep
th
(a)
500 1000 1500
−8.4
−5
−4
−3
−2
−1
0
σPSII
(x10−20 m2 quanta−1)
(b) 0 50 100 150 2000
50
100
150
200
E (µ mol photons m−2 s−1)
Ek (
µ m
ol p
hoto
ns m
−2 s
−1 )
(c)
Stratified Mixed