The Shelf-Edge Frontal Structure in the Central East China Sea and Its Impact on Low-Frequency...
21
IEEE JOURNAL OF OCEANIC ENGINEERING, VOL. 29, NO. 4, OCTOBER 2004 1011 The Shelf-Edge Frontal Structure in the Central East China Sea and Its Impact on Low-Frequency Acoustic Propagation Steven R. Ramp, Ching-Sang Chiu, Frederick L. Bahr, Yiquan Qi, Peter H. Dahl, James Miller, James F. Lynch, Senior Member, IEEE, Renhe Zhang, and Jixun Zhou Abstract—Two field programs, both parts of the Asian Seas International Acoustics Experiment (ASIAEX), were carried out in the central East China Sea (28 to 30 N, 126 to 128 E) during April 2000 and June 2001. The goal of these programs was to study the interactions between the shelf edge environment and acoustic propagation at a wide range of frequencies and spatial scales. The low-frequency across-slope propagation was studied using a synthesis of data collected during both years including con- ductivity-temperature-depth (CTD) and mooring data from 2000, and XBT, thermistor chain, and wide-band source data from 2001. The water column variability during both years was dominated by the Kuroshio Current flowing from southwest to northeast over the continental slope. The barotropic tide was a mixed diurnal/semidiurnal tide with moderate amplitude compared to other parts of the Yellow and East China Sea. A large amplitude semidiurnal internal tide was also a prominent feature of the data during both years. Bursts of high-frequency internal waves were often observed, but these took the form of internal solitons only once, when a rapid off-shelf excursion of the Kuroshio coincided with the ebbing tide. Two case studies in the acoustic transmission loss (TL) over the continental shelf and slope were performed. First, anchor station data obtained during 2000 were used to study how a Kuroshio warm filament on the shelf induced variance in the transmission loss (TL) along the seafloor in the NW quadrant of the study region. The corresponding modeled single-frequency TL structure explained the significant fine-scale variability in time primarily by the changes in the multipath/multimode interference pattern. The interference was quite sensitive to small changes in the phase differences between individual paths/modes induced by the evolution of the warm filament. Second, the across-slope sound speed sections from 2001 were used to explain the observed phe- nomenon of abrupt signal attenuation as the transmission range lengthened seaward across the continental shelf and slope. This abrupt signal degradation was caused by the Kuroshio frontal gradients that produced an increasingly downward-refracting sound-speed field seaward from the shelf break. This abrupt signal dropout was explained using normal mode theory and was Manuscript received December 17, 2003; revised July 23, 2004. S. R. Ramp, C.-S. Chiu, and F. Bahr are with the Department of Oceanog- raphy, Naval Postgraduate School, Monterey, CA 93943 USA. Y. Qi is with the South China Sea Institute of Oceanology, Guanzhou, PR China. P. H. Dahl is with the Applied Physics Laboratory, University of Washington, Seattle, WA 98195 USA. J. Miller is with the Department of Ocean Engineering, University of Rhode Island, Narragansett, RI 02882 USA. J. F. Lynch is with the Woods Hole Oceanographic Institution, Woods Hole, MA 02543 USA. Renhe Zhang is with the Institute of Acoustics, Chinese Academy of Sci- ences, Beijing, China. Jixun Zhou is with the Georgia Institute of Technology, Atlanta, GA 30332 USA. Digital Object Identifier 10.1109/JOE.2004.840842 predictable and source depth dependent. For a source located above the turning depth of the highest-order shelf-trapped mode, none of the propagating modes on the shelf were excited, causing total signal extinction on the shelf. Index Terms—Environmental acoustics, internal waves, Kuroshio current, shelf circulation. I. INTRODUCTION T WO major field programs were conducted during 2000–2001 near the continental shelf break in the central East China Sea (ECS) under the auspices of the Office of Naval Research (ONR) Asian Seas International Acoustics Experiment (ASIAEX) program. The primary ECS boundary interaction study, conducted during May–June 2001, was a three-ship operation involving the U.S. research vessel MELVILLE, and the PRC vessels SHI YAN 2 and SHI YAN 3. The entire experiment is summarized in several other papers [1], and elements of it are described here as necessary. Leading up to the 2001 experiment was a pilot study, conducted from the R/V REVELLE during 8 April to 2 May 2000. In this paper, elements of both experiments are combined to provide a detailed description of the multi-scale physical oceanographic variability at the ECS shelf edge, followed by two illustrations of how the mesoscale physical features can influence low-fre- quency sound transmission. The internationally approved study area for both field programs was a box bounded by 28 to 30 N, 126 30 to 128 E which included a flat section of the continental shelf in the NW corner (95–150 m deep), the shelf break running diagonally across the middle from SW to NE, and a portion of the slope and deep basin ( m deep) in the SE quadrant (see Fig. 1). About 75% of the pilot study cruise time was spent mapping the bottom and sub-bottom with water guns, chirp sonars, and sediment cores [2]. This required the ship to steam very slowly (4 knots) along closely-spaced transects over the shelf. Underway physical oceanographic data were collected con- currently, and also during the remaining four days: An anchor CTD station was conducted the evening of April 10; and two CTD/ADCP transects were run across the shelf break on 18 and 24 April (see Fig. 2). Advanced Doppler sonars unique to the REVELLE were also operated continuously [3]. Oceano- graphic moorings were deployed at two sites at the beginning of the cruise and recovered near the end (see Fig. 2). All the moored instrumentation at the shallower site (Site 1) was lost to intense fishing activity. 0364-9059/$20.00 © 2004 IEEE
-
Upload
independent -
Category
Documents
-
view
1 -
download
0
Transcript of The Shelf-Edge Frontal Structure in the Central East China Sea and Its Impact on Low-Frequency...

IEEE JOURNAL OF OCEANIC ENGINEERING, VOL. 29, NO. 4, OCTOBER 2004 1011
The Shelf-Edge Frontal Structure in the Central EastChina Sea and Its Impact on Low-Frequency
Acoustic PropagationSteven R. Ramp, Ching-Sang Chiu, Frederick L. Bahr, Yiquan Qi, Peter H. Dahl, James Miller,
James F. Lynch, Senior Member, IEEE, Renhe Zhang, and Jixun Zhou
Abstract—Two field programs, both parts of the Asian SeasInternational Acoustics Experiment (ASIAEX), were carried outin the central East China Sea (28 to 30 N, 126 30 to 128 E)during April 2000 and June 2001. The goal of these programs wasto study the interactions between the shelf edge environment andacoustic propagation at a wide range of frequencies and spatialscales. The low-frequency across-slope propagation was studiedusing a synthesis of data collected during both years including con-ductivity-temperature-depth (CTD) and mooring data from 2000,and XBT, thermistor chain, and wide-band source data from 2001.The water column variability during both years was dominatedby the Kuroshio Current flowing from southwest to northeastover the continental slope. The barotropic tide was a mixeddiurnal/semidiurnal tide with moderate amplitude compared toother parts of the Yellow and East China Sea. A large amplitudesemidiurnal internal tide was also a prominent feature of the dataduring both years. Bursts of high-frequency internal waves wereoften observed, but these took the form of internal solitons onlyonce, when a rapid off-shelf excursion of the Kuroshio coincidedwith the ebbing tide. Two case studies in the acoustic transmissionloss (TL) over the continental shelf and slope were performed.First, anchor station data obtained during 2000 were used to studyhow a Kuroshio warm filament on the shelf induced variance inthe transmission loss (TL) along the seafloor in the NW quadrantof the study region. The corresponding modeled single-frequencyTL structure explained the significant fine-scale variability in timeprimarily by the changes in the multipath/multimode interferencepattern. The interference was quite sensitive to small changes inthe phase differences between individual paths/modes induced bythe evolution of the warm filament. Second, the across-slope soundspeed sections from 2001 were used to explain the observed phe-nomenon of abrupt signal attenuation as the transmission rangelengthened seaward across the continental shelf and slope. Thisabrupt signal degradation was caused by the Kuroshio frontalgradients that produced an increasingly downward-refractingsound-speed field seaward from the shelf break. This abruptsignal dropout was explained using normal mode theory and was
Manuscript received December 17, 2003; revised July 23, 2004.S. R. Ramp, C.-S. Chiu, and F. Bahr are with the Department of Oceanog-
raphy, Naval Postgraduate School, Monterey, CA 93943 USA.Y. Qi is with the South China Sea Institute of Oceanology, Guanzhou, PR
China.P. H. Dahl is with the Applied Physics Laboratory, University of Washington,
Seattle, WA 98195 USA.J. Miller is with the Department of Ocean Engineering, University of Rhode
Island, Narragansett, RI 02882 USA.J. F. Lynch is with the Woods Hole Oceanographic Institution, Woods Hole,
MA 02543 USA.Renhe Zhang is with the Institute of Acoustics, Chinese Academy of Sci-
ences, Beijing, China.Jixun Zhou is with the Georgia Institute of Technology, Atlanta, GA 30332
USA.Digital Object Identifier 10.1109/JOE.2004.840842
predictable and source depth dependent. For a source locatedabove the turning depth of the highest-order shelf-trapped mode,none of the propagating modes on the shelf were excited, causingtotal signal extinction on the shelf.
Index Terms—Environmental acoustics, internal waves,Kuroshio current, shelf circulation.
I. INTRODUCTION
TWO major field programs were conducted during2000–2001 near the continental shelf break in the
central East China Sea (ECS) under the auspices of the Officeof Naval Research (ONR) Asian Seas International AcousticsExperiment (ASIAEX) program. The primary ECS boundaryinteraction study, conducted during May–June 2001, wasa three-ship operation involving the U.S. research vesselMELVILLE, and the PRC vessels SHI YAN 2 and SHI YAN3. The entire experiment is summarized in several other papers[1], and elements of it are described here as necessary. Leadingup to the 2001 experiment was a pilot study, conducted fromthe R/V REVELLE during 8 April to 2 May 2000. In thispaper, elements of both experiments are combined to provide adetailed description of the multi-scale physical oceanographicvariability at the ECS shelf edge, followed by two illustrationsof how the mesoscale physical features can influence low-fre-quency sound transmission. The internationally approved studyarea for both field programs was a box bounded by 28 to30 N, 126 30 to 128 E which included a flat section of thecontinental shelf in the NW corner (95–150 m deep), the shelfbreak running diagonally across the middle from SW to NE,and a portion of the slope and deep basin ( m deep) inthe SE quadrant (see Fig. 1).
About 75% of the pilot study cruise time was spent mappingthe bottom and sub-bottom with water guns, chirp sonars,and sediment cores [2]. This required the ship to steam veryslowly (4 knots) along closely-spaced transects over the shelf.Underway physical oceanographic data were collected con-currently, and also during the remaining four days: An anchorCTD station was conducted the evening of April 10; and twoCTD/ADCP transects were run across the shelf break on 18and 24 April (see Fig. 2). Advanced Doppler sonars unique tothe REVELLE were also operated continuously [3]. Oceano-graphic moorings were deployed at two sites at the beginningof the cruise and recovered near the end (see Fig. 2). All themoored instrumentation at the shallower site (Site 1) was lostto intense fishing activity.
0364-9059/$20.00 © 2004 IEEE

1012 IEEE JOURNAL OF OCEANIC ENGINEERING, VOL. 29, NO. 4, OCTOBER 2004
Fig. 1. Location of the ASIAEX East China Sea study region, showing the bottom bathymetry and relationships to the larger-scale surroundings.
Fig. 2. The ASIAEX 2000 field configuration superimposed on a satellite SSTimage from 17 April 2000. Black pixels indicate contamination by clouds or lowhaze. The blue line indicates the across-shelf CTD transect referenced later. Thecolor represents temperature in C as indicated in the legend. The shelf wateris indicated by the blue tones (12–13 C) and the Kuroshio surface water by theyellow and olive tones (21–24 C).
The primary 2001 data of interest to this paper were col-lected during the period of June 3–5, when operations from theMELVILLE were coordinated with those from the SHI YAN 2and SHI YAN 3. Broadband acoustic propagation experimentswere conducted over a twenty four hour period, during whichthe SHI YAN 2 deployed 38-g and 1-kg explosive sources ata depth of 50 m, at specified locations between 0.5 and 100km from the MELVILLE and SHI YAN 3 (see Fig. 3). Datawere recorded on various arrays deployed from the MELVILLEand SHI YAN 3, and operated by the Institute of Acoustics inBeijing, the Georgia Institute of Technology, the Harbin En-gineering University, and the APL/UW and URI team. Soundspeed measurements were made throughout the course of theexperiment using CTD casts deployed from the MELVILLE, athermistor chain and more CTD casts deployed from the SHIYAN 3, and XBT casts deployed from the SHI YAN 2.
The goals of this paper are as follows.1) To summarize the physical oceanographic conditions at
the ASIAEX ECS site as they pertained to the wide va-riety of acoustical studies conducted there during 2001[1], [2], [4]. This includes principally the internal waves,tides, and Kuroshio variability.
2) To study specifically the impact of small filaments spunoff from the Kuroshio on acoustic transmission loss onthe continental shelf.
3) To understand the low-frequency acoustic propagationacross the north wall of the Kuroshio Current in the East

RAMP et al.: SHELF-EDGE FRONTAL STRUCTURE IN THE CENTRAL EAST CHINA SEA 1013
Fig. 3. Deployment patterns for the 38-g (small dots) and 1000-g (large dots) explosive charges used as broadband sources during the ASIAEX 2001 fieldprogram, as deployed by the Chinese ship SHI YAN 2. Fifteen Expendable Bathythermographs (XBTs) were also utilized along the line between waypoints M andH (diamonds). The listening arrays were deployed from the MELVILLE and SHI YAN 3 whose positions were near waypoint M at the center of the circle. Thebathymetry data shown are from National Geophysical Data Center 5-Minute Gridded Elevation Data (ETOPO-5).
China Sea using a combination of observations and mod-eling.
The hydrographic and sound speed conditions during the 2000REVELLE cruise will be described using an anchor-stationCTD time series on the continental shelf and two CTD sectionsacross the shelf and slope which spanned the strong temperatureand salinity front on the north side of the Kuroshio Current.Some estimation of the variability of these parameters willbe made using current and temperature data from a singleoceanographic mooring at 125 m on the continental shelf.Then, under the assumption that there was little interannualvariability inthe deeper Kuroshio T/S relations, the 2000 CTDdata over the slope and the 2001 Melville CTD data over theshelf are utilized in conjunction with a cross-shelf XBT sectionduring 2001 to estimate the across-slope hydrographic (andsound speed) conditions during 2001. The acoustic model runs[5] will examine both the temporal variability on the shelf and
the Kuroshio frontal impacts, using the data sets describedunder 2) and 3) above.
This paper is organized as follows: Some background mate-rial on the physical oceanography of the ASIAEX ECS studyregion is presented in Section II. The data and methods for both2000 and 2001 are presented in Section III. The oceanographicresults from 2000 and 2001 are presented in Sections IV and Vrespectively, followed by the acoustic modeling in Section VI.The summary and conclusions section ends the paper.
II. BACKGROUND
The dominant oceanographic feature in the ASIAEX ECSbox is the Kuroshio Current (hereafter KS). The KS enters theECS between Taiwan and Yonakuni-jima, follows the conti-nental slope very closely through most of the sea, separatesfrom the slope near 30 N, and exits through the Tokara Strait.The entry point is quite complicated where the initially deep

1014 IEEE JOURNAL OF OCEANIC ENGINEERING, VOL. 29, NO. 4, OCTOBER 2004
Fig. 4. Time series of eight satellite SST images of the ASIAEX region from 8–24 April 2000. All images have the same scale ( C) as indicated by the color baron the right-hand side. Black pixels indicate contamination by clouds or low haze. All frames are 2� 2 degree lat/lon boxes bounded by 28–30 N, 126–128 E.The surface manifestation of the Kuroshio front is indicated approximately by the green-to-yellow (or brown) boundary. The anchor station conducted on April 9is indicated by the red dot in the 8 and 11 April images.
KS collides with the continental shelf NE of Taiwan [6]–[9].There is initially some overshoot, and a shallow “branch cur-rent” forms on the shelf with current speeds of only 15–20 cms [9] while most of the transport turns and follows the slope.Imagery suggests the branch current rejoins the main current ashort distance downstream [6]. The flow along the slope in thecentral ECS is quite steady with little variation in the volumetransport, which averages about Sv in this region [10].Ichikawa and Beardsley [10] found using 39 occupations of 6across-shelf sections in the ECS that 75% of the transport isbarotropic, and thus difficult to discern without direct currentobservations. The point where the KS separates from the con-tinental slope is fairly constant, but may show some variationwith volume transport, separating sooner during periods of highvolume transport. This occurs during summer, when the trans-port may sometimes reach 40 Sv. The salient point with respectto this paper is that the current is always over the continentalslope in the ASIAEX box, making this a good place to study theacross-frontal acoustic propagation. With respect to the analo-gous Gulf Stream (GS) off South Carolina, the continental shelfis deeper and the edge of the KS much farther up over the shelfthan in the GS case (James et al., 1999). This makes it easier tospan the KS front with acoustic sources than the GS. After sep-aration, the current retroflects and exits the ECS via the TokaraStrait, where the volume transport increases dramatically due tothe contribution from outside the Ryukyu Islands. The exit pathof the KS is bimodal, with most of the current passing througheither the northern or southern Tokara Strait, varying with a timescale of about 100 days [11].
Historical across-shelf sections of the temperature, velocity,and potential vorticity structure in the ECS show several featuresof interest to ASIAEX. From a section actually in the ASIAEXbox, very close to the across-shelf acoustic propagation path,a double-thermocline structure has been observed, centered on20 C and 15 C with a thermostad in between in the 17–18 Crange [12]. The lower thermocline extends up onto the conti-nental shelf and seems to be upwelled from deeper within theKS itself, forming a warm, salty layer along the bottom. Thisupwelling and upslope transport of Kuroshio water also appears
in the tracer distributions from numerical models [13] and is pre-sumably due to boundary layer effects beneath the KS. Severalauthors [14], [15] have observed a counter-current over the con-tinental slope in this region, centered near 300 m with currentspeeds of 15–20 cm s toward the southwest. This contrastswith maximum current speeds of about 110 cm s toward theNE in the KS itself. Like most of the Gulf Stream, the mean po-tential vorticity gradients change sign across the KS, indicatingthe potential for baroclinic instability [14].
The above description of the steady state does not reflectthe fact that the Kuroshio is an active western boundary cur-rent with propagating meanders, detached eddies, and warm fil-aments as it flows through the East China Sea. Using satelliteand in-situ data, Qiu et al. [6] found 100–150 km wavelengths,14–20 day periods, and downstream propagation speeds rangingfrom 20–26 cm s for the KS meanders along the shelf breakin the East China Sea. A dynamical study of the KS meandersusing both observations and a numerical model [15] quantifiedmany characteristics of the KS meanders. Using an array ofseven moored inverted echo sounders (IES), they found spec-tral peaks at 7, 11, and 16 days with the 11–day peak being themost persistent. The 11–day peak was also the most unstable(fastest growth rate) in the numerical model. The wavelengthrange was 195–265 km, about like the Gulf Stream, but the GShas a dominant period of only 5.4 days and the meanders traveldownstream much faster (order 40 cm s vs. 20 cm s ) thanin the Kuroshio. James et al. [15] attribute this to: 1) Positionof the KS relative to the shelf break (10 km farther onshore);2) Deeper continental shelf (165 vs. 50 m) in the ECS vs. thesoutheast U.S. continental shelf; and 3) Advection by the GS it-self, which has a much higher transport (33 versus 20 Sv) off thesoutheast U.S. than the Kuroshio in the ECS. Basically, the GulfStream is more unstable due to greater shear across the front.
There are many other strong fronts in the Yellow and EastChina Sea [16] but none of them are likely to be observed inthe ASIAEX box. The frontal positions in the region were com-piled from satellite data using automatic processing algorithms[16]. Most of the ECS fronts are due to tidal mixing [17], in-cluding the Yangtze Bank front extending toward the SE over
RAMP et al.: SHELF-EDGE FRONTAL STRUCTURE IN THE CENTRAL EAST CHINA SEA 1015
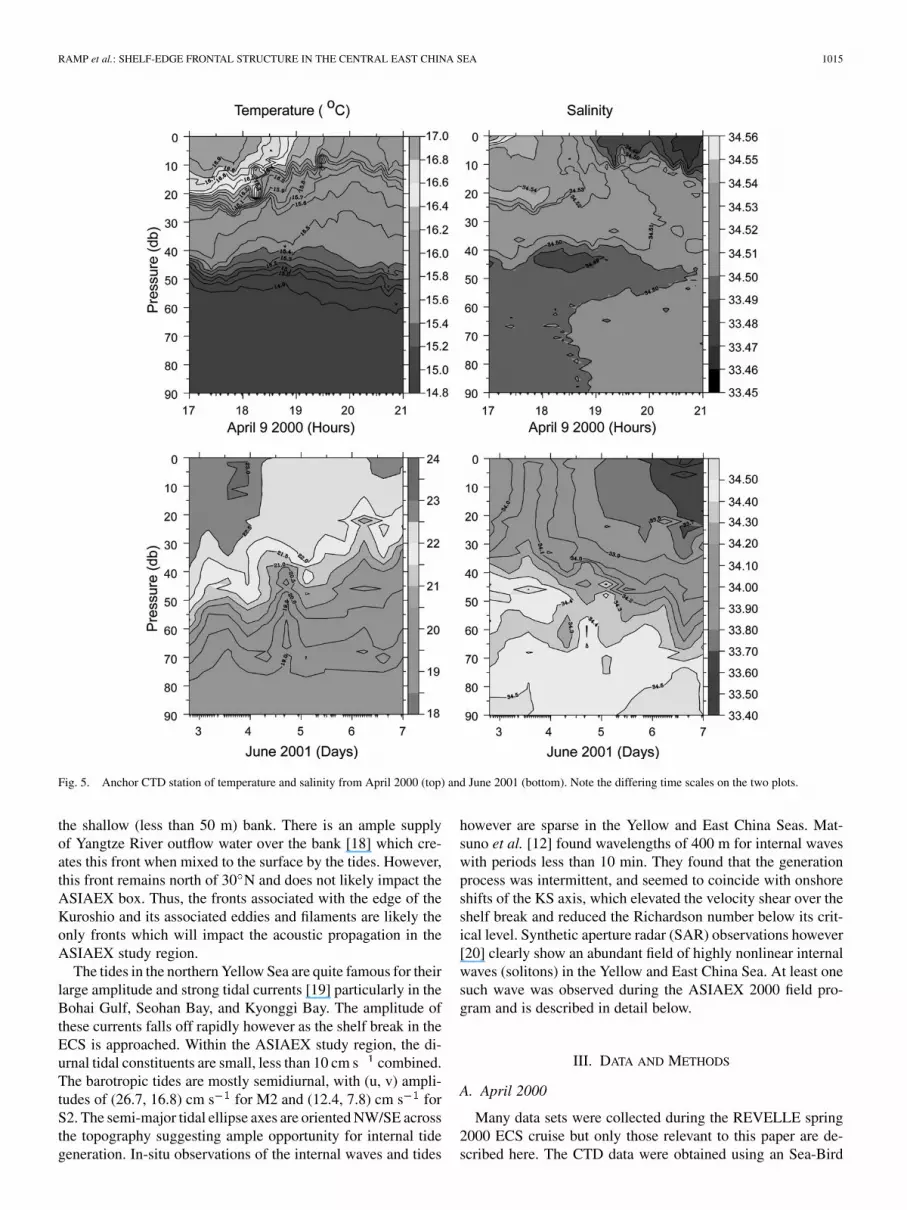
Fig. 5. Anchor CTD station of temperature and salinity from April 2000 (top) and June 2001 (bottom). Note the differing time scales on the two plots.
the shallow (less than 50 m) bank. There is an ample supplyof Yangtze River outflow water over the bank [18] which cre-ates this front when mixed to the surface by the tides. However,this front remains north of 30 N and does not likely impact theASIAEX box. Thus, the fronts associated with the edge of theKuroshio and its associated eddies and filaments are likely theonly fronts which will impact the acoustic propagation in theASIAEX study region.
The tides in the northern Yellow Sea are quite famous for theirlarge amplitude and strong tidal currents [19] particularly in theBohai Gulf, Seohan Bay, and Kyonggi Bay. The amplitude ofthese currents falls off rapidly however as the shelf break in theECS is approached. Within the ASIAEX study region, the di-urnal tidal constituents are small, less than 10 cm s combined.The barotropic tides are mostly semidiurnal, with (u, v) ampli-tudes of (26.7, 16.8) cm s for M2 and (12.4, 7.8) cm s forS2. The semi-major tidal ellipse axes are oriented NW/SE acrossthe topography suggesting ample opportunity for internal tidegeneration. In-situ observations of the internal waves and tides
however are sparse in the Yellow and East China Seas. Mat-suno et al. [12] found wavelengths of 400 m for internal waveswith periods less than 10 min. They found that the generationprocess was intermittent, and seemed to coincide with onshoreshifts of the KS axis, which elevated the velocity shear over theshelf break and reduced the Richardson number below its crit-ical level. Synthetic aperture radar (SAR) observations however[20] clearly show an abundant field of highly nonlinear internalwaves (solitons) in the Yellow and East China Sea. At least onesuch wave was observed during the ASIAEX 2000 field pro-gram and is described in detail below.
III. DATA AND METHODS
A. April 2000
Many data sets were collected during the REVELLE spring2000 ECS cruise but only those relevant to this paper are de-scribed here. The CTD data were obtained using an Sea-Bird

1016 IEEE JOURNAL OF OCEANIC ENGINEERING, VOL. 29, NO. 4, OCTOBER 2004
Fig. 6. Underway sea surface temperature ( C, top) and ADCP velocity averaged over 41–57 m (bottom) as obtained from the R/V REVELLE during 10–20April 2000. The vertical red bar represents a temporal discontinuity in the data collection, while the ship did other things.
Electronics, Inc., SBE 911 CTD which was provided, main-tained, and calibrated by the Scripps Institution of Oceanog-raphy. The instrument sampled at 24 Hz and was lowered at30 m min in shallow ( m) water and through strongvertical gradients and 60 m min otherwise. The data wererun through now standard processing algorithms to align the re-sponse times for the temperature and conductivity sensors andaveraged to 1 dBar bins for presentation. Bottle salinity sam-ples were collected at each station and run onboard using a
Guildline salinometer to maintain calibration. The CTD sam-pling was conducted as follows: 1) an anchor station consistingof 30 consecutive stations requiring roughly 20 minutes each lo-cated at 29 58 N, 126 32 E; 2) at each gravity core location;and 3) two occupations of a transect extending across the conti-nental shelf from 29 55 N, 126 37 E to 29 18 N, 127 54 E(Fig. 2). During the first occupation on 18 April, 15 stations 9.2km (5 nautical miles) apart were occupied along the transect.The second time during April 24, the station spacing was the

RAMP et al.: SHELF-EDGE FRONTAL STRUCTURE IN THE CENTRAL EAST CHINA SEA 1017
Fig. 7. (a) Time series of alongshore (red line, positive 30 east of true north) and across- shore (blue line, positive toward 120 east of true north) velocity fromthree current meters at 22, 50, and 100 m depth on the continental shelf in the East China Sea. The mooring location is as indicated by the red “X” in Fig. 2. Thedata are unfiltered and contain all frequencies of motion. (b) Contour plot of temperature ( C) data from the same mooring as the velocity components shown inFig. 9(a). The data were contoured from temperature time series collected at 25, 37, 52, 75, 100, and 120 m depth.
Fig. 8. Tidal ellipses for the diurnal (left) and semidiurnal (right) tidal bands from 22 m (solid line), 50 m (dashed line), and 100 m (dotted line) depth. Theellipses were calculated using harmonic analysis and the time series depicted in Fig. 7.
same but the three shallowest stations and the deepest offshorestation were not occupied due to time considerations.
A hull-mounted RD Instruments, Inc., 150 kHz narrow-bandacoustic Doppler current profiler (ADCP) was operated con-tinuously throughout the cruise to collect vertical profiles of
horizontal ocean currents. The basic data set consisted of5-minute averaged profiles sampled in 8-m bins from 17 mto nominally 350 m depth depending on sea conditions. Thenavigational input was from a Trimble GPS unit and an AshtechDGPS unit to fine-tune ship’s heading, pitch, and roll. The

1018 IEEE JOURNAL OF OCEANIC ENGINEERING, VOL. 29, NO. 4, OCTOBER 2004
(a)
Fig. 9. (a) Temperature (top left), salinity (top right), density anomaly (bottom left), and sound speed (bottom right) along a section across the continental shelfin the ASIAEX region of the East China Sea on April 18, 2000. The data were collected along the section shown by the red line in Fig. 2.
data were processed onboard using the University of Hawaii’sCODAS ADCP processing software which allows for rigorousquality control, navigation, compensation for transducer headoffset, choice of reference layer, computation of absolutevelocities, and data display.
Two sites were outfitted with moored instrumentation duringASIAEX 2000: The first, located near 29 55 N, 126 37 E in 90m of water, was completely lost to fishing activity. The second,deployed at 29 37.2 N, 127 13.5 E on the 125 m isobath re-turned four days of good data from 19–23 April. The subsurfacetaut-wire mooring had three Aanderaa RCM-8 ducted paddle-wheel current meters sampling at 1-min intervals at 22, 50, and100 m depth. Four Sea-Bird Electronics Inc. SBE-37 MicroCATinstruments also sampled at 1-min intervals at 25, 52, 75, and120 m depth. A single mini-Starmon T-pod was moored at 37m to fill in between the 25 m and 52 m MicroCATs. The instru-ments were all set to the maximum sampling rate to observe theinternal wave field which could induce acoustical fluctuations.The location near the continental shelf break (see Fig. 2) and
just inshore of the Kuroshio front was ideal for this purpose.The current data were rotated 30 degrees clockwise, in line withthe local shelf break bathymetry, to translate the east and northvelocity components into an along- and across-shore basis.
The East China Sea satellite sea surface temperature (SST)data from the NOAA polar orbiting satellites were locally down-loaded at 1-km resolution by the National Consortium for OceanResearch (NCOR) of Taiwan, ROC. The data were calibratedand navigated at NCOR and made available to the general publicvia their web site. Visibility was excellent during April 2000 andnine clear images were obtained to locate the Kuroshio frontand other large-scale features during the experiment. Visibilityduring 2001 was quite poor and only a few small glimpses ofthe ocean were obtained.
B. June 2001
The three research vessels on scene collected myriad datasets during 2001 but with greater emphasis on the short-range(boundary interaction) problem than the across-slope (volume
RAMP et al.: SHELF-EDGE FRONTAL STRUCTURE IN THE CENTRAL EAST CHINA SEA 1019
(b)
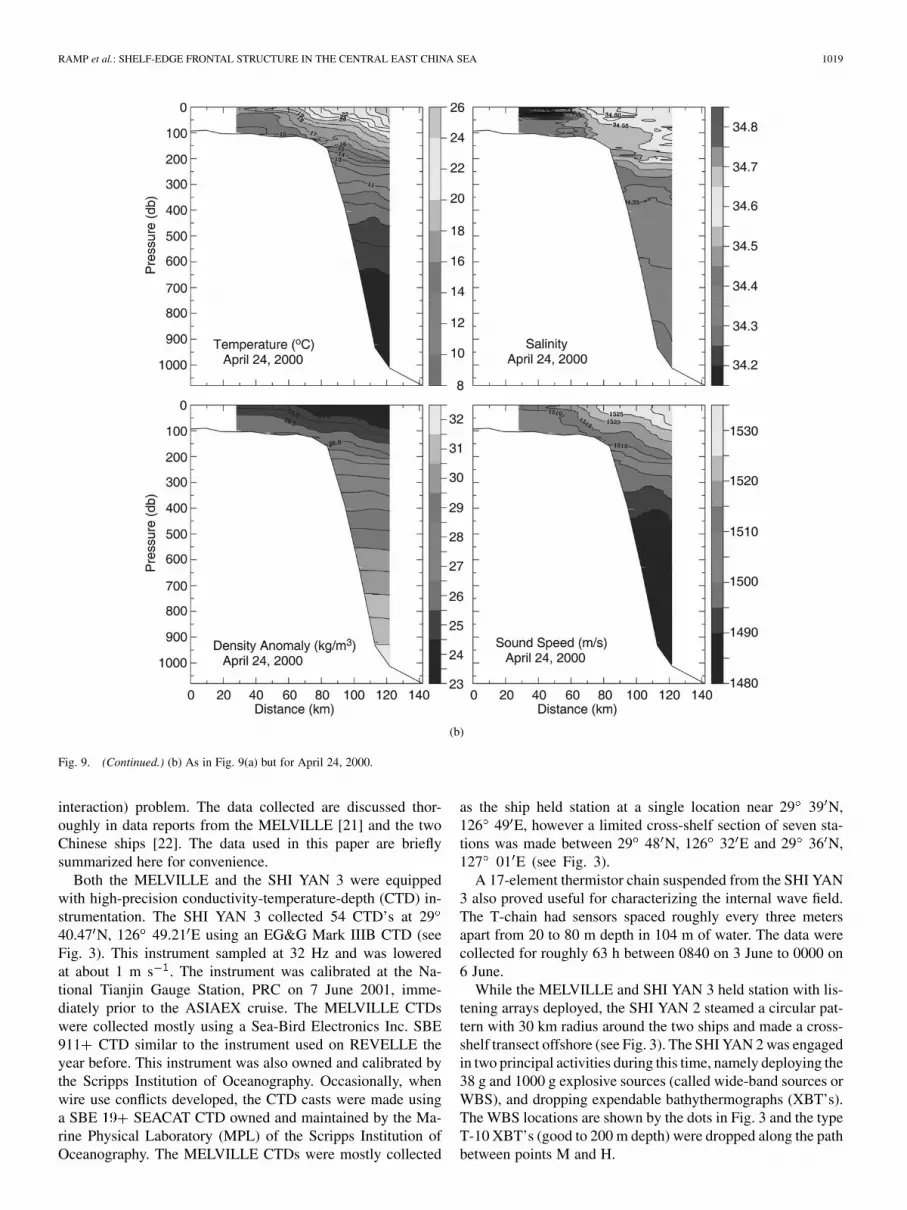
Fig. 9. (Continued.) (b) As in Fig. 9(a) but for April 24, 2000.
interaction) problem. The data collected are discussed thor-oughly in data reports from the MELVILLE [21] and the twoChinese ships [22]. The data used in this paper are brieflysummarized here for convenience.
Both the MELVILLE and the SHI YAN 3 were equippedwith high-precision conductivity-temperature-depth (CTD) in-strumentation. The SHI YAN 3 collected 54 CTD’s at 2940.47 N, 126 49.21 E using an EG&G Mark IIIB CTD (seeFig. 3). This instrument sampled at 32 Hz and was loweredat about 1 m s . The instrument was calibrated at the Na-tional Tianjin Gauge Station, PRC on 7 June 2001, imme-diately prior to the ASIAEX cruise. The MELVILLE CTDswere collected mostly using a Sea-Bird Electronics Inc. SBE911 CTD similar to the instrument used on REVELLE theyear before. This instrument was also owned and calibrated bythe Scripps Institution of Oceanography. Occasionally, whenwire use conflicts developed, the CTD casts were made usinga SBE SEACAT CTD owned and maintained by the Ma-rine Physical Laboratory (MPL) of the Scripps Institution ofOceanography. The MELVILLE CTDs were mostly collected
as the ship held station at a single location near 29 39 N,126 49 E, however a limited cross-shelf section of seven sta-tions was made between 29 48 N, 126 32 E and 29 36 N,127 01 E (see Fig. 3).
A 17-element thermistor chain suspended from the SHI YAN3 also proved useful for characterizing the internal wave field.The T-chain had sensors spaced roughly every three metersapart from 20 to 80 m depth in 104 m of water. The data werecollected for roughly 63 h between 0840 on 3 June to 0000 on6 June.
While the MELVILLE and SHI YAN 3 held station with lis-tening arrays deployed, the SHI YAN 2 steamed a circular pat-tern with 30 km radius around the two ships and made a cross-shelf transect offshore (see Fig. 3). The SHI YAN 2 was engagedin two principal activities during this time, namely deploying the38 g and 1000 g explosive sources (called wide-band sources orWBS), and dropping expendable bathythermographs (XBT’s).The WBS locations are shown by the dots in Fig. 3 and the typeT-10 XBT’s (good to 200 m depth) were dropped along the pathbetween points M and H.
1020 IEEE JOURNAL OF OCEANIC ENGINEERING, VOL. 29, NO. 4, OCTOBER 2004
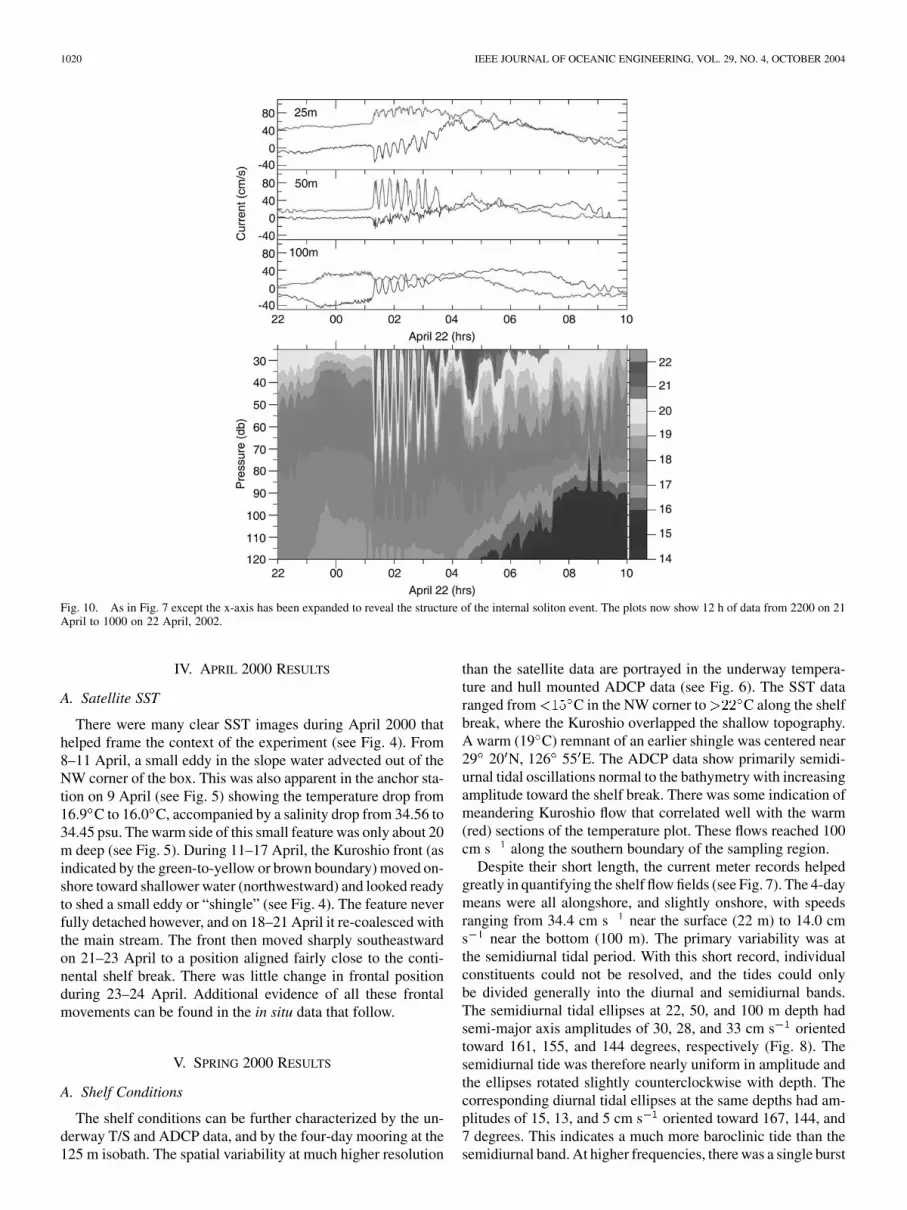
Fig. 10. As in Fig. 7 except the x-axis has been expanded to reveal the structure of the internal soliton event. The plots now show 12 h of data from 2200 on 21April to 1000 on 22 April, 2002.
IV. APRIL 2000 RESULTS
A. Satellite SST
There were many clear SST images during April 2000 thathelped frame the context of the experiment (see Fig. 4). From8–11 April, a small eddy in the slope water advected out of theNW corner of the box. This was also apparent in the anchor sta-tion on 9 April (see Fig. 5) showing the temperature drop from16.9 C to 16.0 C, accompanied by a salinity drop from 34.56 to34.45 psu. The warm side of this small feature was only about 20m deep (see Fig. 5). During 11–17 April, the Kuroshio front (asindicated by the green-to-yellow or brown boundary) moved on-shore toward shallower water (northwestward) and looked readyto shed a small eddy or “shingle” (see Fig. 4). The feature neverfully detached however, and on 18–21 April it re-coalesced withthe main stream. The front then moved sharply southeastwardon 21–23 April to a position aligned fairly close to the conti-nental shelf break. There was little change in frontal positionduring 23–24 April. Additional evidence of all these frontalmovements can be found in the in situ data that follow.
V. SPRING 2000 RESULTS
A. Shelf Conditions
The shelf conditions can be further characterized by the un-derway T/S and ADCP data, and by the four-day mooring at the125 m isobath. The spatial variability at much higher resolution
than the satellite data are portrayed in the underway tempera-ture and hull mounted ADCP data (see Fig. 6). The SST dataranged from C in the NW corner to C along the shelfbreak, where the Kuroshio overlapped the shallow topography.A warm (19 C) remnant of an earlier shingle was centered near29 20 N, 126 55 E. The ADCP data show primarily semidi-urnal tidal oscillations normal to the bathymetry with increasingamplitude toward the shelf break. There was some indication ofmeandering Kuroshio flow that correlated well with the warm(red) sections of the temperature plot. These flows reached 100cm s along the southern boundary of the sampling region.
Despite their short length, the current meter records helpedgreatly in quantifying the shelf flow fields (see Fig. 7). The 4-daymeans were all alongshore, and slightly onshore, with speedsranging from 34.4 cm s near the surface (22 m) to 14.0 cms near the bottom (100 m). The primary variability was atthe semidiurnal tidal period. With this short record, individualconstituents could not be resolved, and the tides could onlybe divided generally into the diurnal and semidiurnal bands.The semidiurnal tidal ellipses at 22, 50, and 100 m depth hadsemi-major axis amplitudes of 30, 28, and 33 cm s orientedtoward 161, 155, and 144 degrees, respectively (Fig. 8). Thesemidiurnal tide was therefore nearly uniform in amplitude andthe ellipses rotated slightly counterclockwise with depth. Thecorresponding diurnal tidal ellipses at the same depths had am-plitudes of 15, 13, and 5 cm s oriented toward 167, 144, and7 degrees. This indicates a much more baroclinic tide than thesemidiurnal band. At higher frequencies, there was a single burst
RAMP et al.: SHELF-EDGE FRONTAL STRUCTURE IN THE CENTRAL EAST CHINA SEA 1021
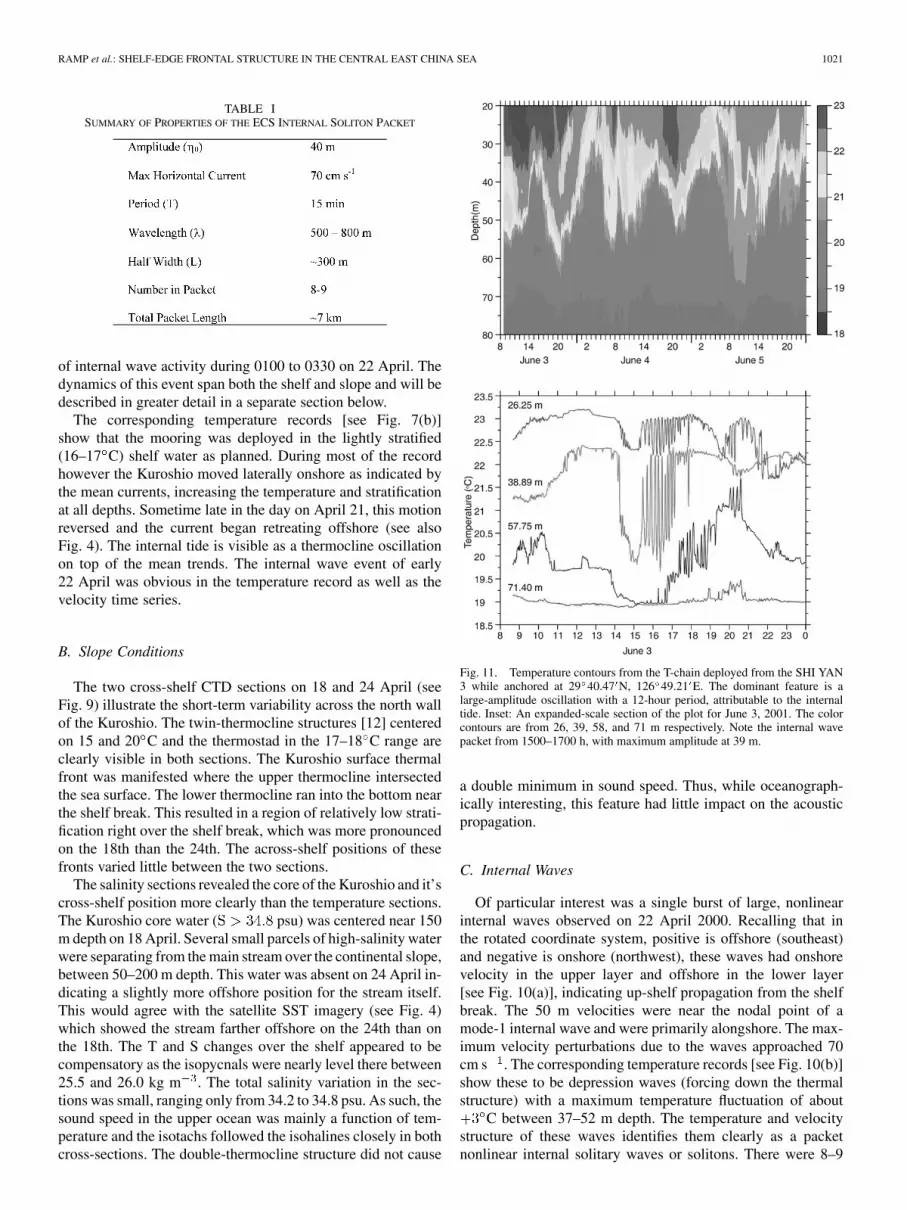
TABLE ISUMMARY OF PROPERTIES OF THE ECS INTERNAL SOLITON PACKET
of internal wave activity during 0100 to 0330 on 22 April. Thedynamics of this event span both the shelf and slope and will bedescribed in greater detail in a separate section below.
The corresponding temperature records [see Fig. 7(b)]show that the mooring was deployed in the lightly stratified(16–17 C) shelf water as planned. During most of the recordhowever the Kuroshio moved laterally onshore as indicated bythe mean currents, increasing the temperature and stratificationat all depths. Sometime late in the day on April 21, this motionreversed and the current began retreating offshore (see alsoFig. 4). The internal tide is visible as a thermocline oscillationon top of the mean trends. The internal wave event of early22 April was obvious in the temperature record as well as thevelocity time series.
B. Slope Conditions
The two cross-shelf CTD sections on 18 and 24 April (seeFig. 9) illustrate the short-term variability across the north wallof the Kuroshio. The twin-thermocline structures [12] centeredon 15 and 20 C and the thermostad in the 17–18 C range areclearly visible in both sections. The Kuroshio surface thermalfront was manifested where the upper thermocline intersectedthe sea surface. The lower thermocline ran into the bottom nearthe shelf break. This resulted in a region of relatively low strati-fication right over the shelf break, which was more pronouncedon the 18th than the 24th. The across-shelf positions of thesefronts varied little between the two sections.
The salinity sections revealed the core of the Kuroshio and it’scross-shelf position more clearly than the temperature sections.The Kuroshio core water ( psu) was centered near 150m depth on 18 April. Several small parcels of high-salinity waterwere separating from the main stream over the continental slope,between 50–200 m depth. This water was absent on 24 April in-dicating a slightly more offshore position for the stream itself.This would agree with the satellite SST imagery (see Fig. 4)which showed the stream farther offshore on the 24th than onthe 18th. The T and S changes over the shelf appeared to becompensatory as the isopycnals were nearly level there between25.5 and 26.0 kg m . The total salinity variation in the sec-tions was small, ranging only from 34.2 to 34.8 psu. As such, thesound speed in the upper ocean was mainly a function of tem-perature and the isotachs followed the isohalines closely in bothcross-sections. The double-thermocline structure did not cause
Fig. 11. Temperature contours from the T-chain deployed from the SHI YAN3 while anchored at 29 40.47 N, 126 49.21 E. The dominant feature is alarge-amplitude oscillation with a 12-hour period, attributable to the internaltide. Inset: An expanded-scale section of the plot for June 3, 2001. The colorcontours are from 26, 39, 58, and 71 m respectively. Note the internal wavepacket from 1500–1700 h, with maximum amplitude at 39 m.
a double minimum in sound speed. Thus, while oceanograph-ically interesting, this feature had little impact on the acousticpropagation.
C. Internal Waves
Of particular interest was a single burst of large, nonlinearinternal waves observed on 22 April 2000. Recalling that inthe rotated coordinate system, positive is offshore (southeast)and negative is onshore (northwest), these waves had onshorevelocity in the upper layer and offshore in the lower layer[see Fig. 10(a)], indicating up-shelf propagation from the shelfbreak. The 50 m velocities were near the nodal point of amode-1 internal wave and were primarily alongshore. The max-imum velocity perturbations due to the waves approached 70cm s . The corresponding temperature records [see Fig. 10(b)]show these to be depression waves (forcing down the thermalstructure) with a maximum temperature fluctuation of about
C between 37–52 m depth. The temperature and velocitystructure of these waves identifies them clearly as a packetnonlinear internal solitary waves or solitons. There were 8–9

1022 IEEE JOURNAL OF OCEANIC ENGINEERING, VOL. 29, NO. 4, OCTOBER 2004
Fig. 12. (Top left) XBT section across the shelf and slope made by SHI YAN 2 during the WBS runs (see Fig. 3 for locations). (Top right) T/S relation used withthe XBT data to compute the density section at lower left. (Bottom left) Density section computed using temperature from the XBT section and salinity from theT/S relation at upper right. (Bottom right) The synthesized sound speed section used to compute the model propagation loss across the shelf and slope during June2001, computed from the density section at bottom left.
waves in the packet, spaced very regularly with a period ofalmost exactly 15 min. The wave amplitudes were calculated as
(1)
where are the temperature fluctuations at 37 m due tothe wave and the vertical temperature gradient wascomputed as the difference between the smoothed temperaturerecords at 25 and 52 m. Mooring motion was less than 1 m forthis short mooring and was not a factor in the calculations. Thefirst five waves in the packet had nearly equal amplitudes ofabout 40 m, with slightly less amplitude in the trailing three.Theoretically, soliton packets some distance from the sourceare rank ordered in space and time due to dispersion amongthe waves comprising the packet [23]. The fact that the firstfive waves were not rank ordered indicates that the mooringwas very close to the generation region, i.e., the shelf break.With only one mooring and no SAR imagery available, thewavelength of the wave was not directly observed. It is possible,however, to make some estimate based on the REVELLE sonarimagery from the day before when a similar wave packet wasobserved and similar stratification prevailed (Luc Rainville,personal communication). The REVELLE crossed a group offour wave depressions in about 9, 9, and 6 min while transitingat 2.9 m s , indicating separations of 1.6, 1.6, and 1.0 km,respectively. The ship however was transiting at an angle of 68relative to the wave crests, which would actually indicate shorter
normal separations ranging from 500–800 m, not consideringthe propagation speed of the wave itself. Internal solitons alsohave the well-known property of creating alternating bands ofsmooth (slicks) and rough water on the sea surface above them[24]. These surface features were easily visible from the R/VREVELLE, and their spacing was consistent with the 500–800m estimate above.
The soliton packet can also be approximated theoreticallyusing simple 2-layer KdV theory [25], [26]. From Figs. 9(b)and 10, the upper and lower layer thickness and were 50and 75 m respectively. The upper and lower layer densitiesand were1024.5 and 1025.7 kg m respectively, leading toa of 1.2 kg m and reduced gravitym s . The linear phase speed , quadratic nonlinear coeffi-cient , nonlinear phase speed c, dispersion coefficient , andhalf-amplitude width L for the solitons are then given by [26]:
(2)
(3)
(4)
(5)
(6)

RAMP et al.: SHELF-EDGE FRONTAL STRUCTURE IN THE CENTRAL EAST CHINA SEA 1023
Substituting the values above and using m from thedata yields a linear and nonlinear phase speed of 59 and 83 cms respectively. The nonlinear phase speed in conjunction withthe well-observed wave frequency of s gives a wave-length estimate of about 750 m. This is not inconsistent withthe estimate of 500–800 m based on the somewhat anecdotalobservational evidence. The characteristic half-amplitude widthfrom (6) m, compared to about 300 m from the data. Thedata estimate was computed using the displacement of the 20 Cisotherm, with the time axis in Fig. 10(b) converted to spaceusing an assumed constant phase speed 83 cm s e.g., [27].Thus, the waves were somewhat wider than the 2-layer KdVtheory would suggest. This suggests that higher-order (EKdV)nonlinearity may be a factor, as this tends to produce waveswhich are somewhat broader than the KdV theory in shallowwater [26], [28].
The defining properties of the observed soliton packed aresummarized in Table I. The waves were shorter , smaller
, higher frequency (f) and less dispersed than the Sulu Seawaves [23], [29]. or the South China Sea waves [30], [31]. Thisis sensible as these other waves were generated at a remote silland propagated large distances through deep water before beingobserved. The wave character is more in keeping with wavesgenerated at the shelf break on the east coast of the United States[27], [32] as might be expected given the similar generationmechanism. The ECS waves had similar periods but much largeramplitude than the New England Shelfbreak PRIMER waves[27] possibly due to the stratification induced by the intrudingedge of the Kuroshio Current.
How was this wave packet generated? Shelf-edge solitons aregenerally formed when the velocity of the off-shelf flow ex-ceeds the free-wave speed and a hydraulic jump is formed [33].On continental shelves in the ocean this generally occurs on theebbing (off-shelf) tide. The jump thus formed is then released asan internal tidal bore when the tide turns, which quickly evolvesinto a packet of solitary waves. During the April 2000 ECSstudy, the free wave speed in the weakly stratified shelf waterand near the bottom beneath the edge of the Kuroshio was about42 cm s . The total tidal current, i.e., the sum of the semidi-urnal and diurnal ellipses (Fig. 8) was only about 38 cm s , i.e.,the off-shelf flow was sub-critical most of the time. During theearly morning hours of 22 April, the Kuroshio shifted offshore,resulting in a total near-bottom off-shelf flow of about 50 cm s[see Fig. 7(bottom panel)]. The waves were released on the floodtide immediately following this event, which was apparently theonly time during this short record when the off-shelf flow wasstrong enough to form a hydraulic jump and generate solitons.We conclude that both the tides and the Kuroshio meanderingmust both be favorable to generate solitons in this region of theEast China Sea.
VI. JUNE 2001 RESULTS
The SHI YAN 3 was anchored at 29 40.47 N, 126 9.21 Eduring the experiment to allow maximum quieting for the acous-tics observations. The CTD data sampled at this location during3–7 June (Fig. 5(bottom)) show that the shelf water near thesurface was significantly warmer and fresher than during April2000. These changes can both be explained as seasonal effects:
The warmer temperatures in June (22–23 C) were likely due tosolar insolation in late spring and summer. Salinities in the upper25 m of the water column ranged from 33.6 to 34.0 psu as op-posed to 34.45 to 34.56 psu the previous April (see Fig. 5). Thebottom layer salinity was about the same during both years at34.5 psu. The upper layer freshening was likely due to the sea-sonal southward spreading of the Yangtze River Plume whichreaches its maximum in July [18], [34]. Thus fresher waters areexpected over this region of the shelf during June than in April.
The T-chain data from the SHI YAN 3 provide some informa-tion on the temporal variability (see Fig. 11). The semidiurnalinternal tide oscillating vertically on the strong, shallow ther-mocline was the dominant signal observed in this record, whichlooks much different than the 2000 data. This strong thermo-cline had not yet developed over the continental shelf duringApril 2000. The internal tide sometimes elevated 19 C waterall the way to the surface as for instance during 0000–1200 onJune 5, 2001. This created very strong horizontal fronts in themixed layer at this time which would likely influence acousticpropagation. The internal tide therefore represents a significantsource of uncertainty when using mean across-shelf sections tocompute the spatial structure of the acoustic propagation.
Also of interest is the structure of the high frequency in-ternal waves. There were two bursts of internal wave activityrecorded, the strongest one between 1500–1700 hours on June3, 2001 [see Fig. 11(bottom panel)]. These waves were oscilla-tory with a period of about 10 minutes. They did not resemblethe strongly nonlinear internal solitons observed during April2000. Thus, it appears quite special conditions must exist at theshelf break for the nonlinear waves to be generated. The linearinternal waves observed during June 2001 caused fluctuationsof 2 C in the thermocline (corresponding to an amplitude dis-placement of less than 10 m) as opposed to C and am-plitude m during April 2000.
The XBT section (to 210 m depth) collected by the SHI YAN2 during the WBS run across the continental shelf and slope dida good job of depicting the across-slope position of the Kuroshiofront [see Fig. 12(top left)]. The surface front was located overabout the 150 m isobath, similar to April 2000. The thermoclinefluctuations were likely due to the internal tide as shown by theT-chain data. There appeared to be an upwelling feature overthe shelf break below the inshore edge of the Kuroshio, sim-ilar but more pronounced than during spring 2000. There wasa two-layer structure over the continental shelf, with a strongthermocline at about 38 m. The surface and bottom boundarylayers were both about 20 m thick and well mixed. The bottomboundary layer was almost exactly 19 C at 34.5 psu and thesurface layer between 22.0–22.5 C with varying salinities. Theinshore end of the XBT section shows a thermal inversion with18.5 C water above the 19.0 C water in the BBL. This featurewas also observed at the inshore end of the MELVILLE CTDsection near the same location (not shown). The water columnwas statically stable due to the strong salinity gradient withmuch fresher water over the 34.5 psu water. This thermal in-version may be a common feature during the summer monthsnear the southern extremity of the Yangtze River Plume.
The lack of salinity data along the WBS transect was aproblem, since the salinity variations may be important when

1024 IEEE JOURNAL OF OCEANIC ENGINEERING, VOL. 29, NO. 4, OCTOBER 2004
Fig. 13. Modeled warm filament-induced temporal fluctuations in the TL along the seafloor for a 1-kHz CW transmission, showing large standard deviations.Source depth in the synthesis is 20 m. The input sound speed fields were derived from the CTD time series shown in the top panels of Fig. 5, and the standarddeviations were estimated from the modeled TL time series spanning a period of four hours.
determining the absolute sound speed across the shelf andslope, particularly up on the continental shelf. To determine theacross-shelf sound speed structure, a T/S relation was needed tosynthesize salinity profiles from the XBT temperature profiles.These synthetic “CTD casts” could then be used to computethe sound speed variability along the WBS transmission paths,a primary input necessary for the propagation loss modeling.Two data sets were used to compute this T/S relation: In theoffshore Kuroshio water, there was a reasonably tight T/S curveavailable from the 2000 pilot study cruise on the REVELLE[see Fig. 12(top right)]. The assumption was made that thisT/S relation had little inter-annual variation between 2000 and2001 and these data were used to compute the salinity profilesin water deeper than 145 m. Over the shelf, the T/S relationfrom the 2001 data from the short MELVILLE across-shelfsection was used (Fig. 12(top right)). The bottom layer waterhad a salinity near 34.5 psu, similar to the year before. Thesurface layer salinity decreased onshore from 33.5 near the 125m isobath to less than 32.8 psu at the inshore end of the section.
This combined T/S relation was used to compute the den-sity and across-shore sound speed structure during June 2001[see Fig. 12(bottom)]. This sound speed section is the one ac-tually used for the acoustic propagation loss modeling. Sincethe section was terminated at the receiving arrays located at thecenter of the circle, and the thermal inversion was only observedNE of there, the inversion does not appear in the final transect.The model-predicted propagation loss was calculated along the
transect and the results were compared with the observed prop-agation loss from the WBS drops as the SHI YAN 2 steamedoffshore. These results are discussed in detail in the followingsection of the paper.
VII. ACOUSTIC MODELING
The purpose of this paper is to provide a detailed descrip-tion of the multi-scale physical oceanographic variability in theECS shelf edge and to illustrate the impact of the mesoscalevariability on low-frequency sound transmission. The acousticinfluences of the internal tides and waves are not discussed here.Readers who are interested in those finer-scale effects are re-ferred to other papers on the subject in this issue.
Specifically, the acoustic studies presented in this paper weredesigned to investigate the following.
• The variance induced by the observed warm filamentsshed by the Kuroshio Current in the transmission loss(TL) along the seafloor in the NW quadrant of the ECSASIAEX box where the reverberation experiment tookplace. We believe that an understanding of this inducedTL variance is important to the interpretation of the rever-beration data, for example, in obtaining accurate estimatesof the bottom scattering strengths.
• The observed phenomenon of abrupt signal loss as thetransmission range lengthens seaward, passing the shelfbreak, in a cross-front transmission. This abrupt and
RAMP et al.: SHELF-EDGE FRONTAL STRUCTURE IN THE CENTRAL EAST CHINA SEA 1025
Fig. 14. Standard deviation of TL versus signal bandwidth computed frommodel simulations. The curve shown is for a range of 15 km on the seafloor.
severe signal degradation is caused by the Kuroshiofrontal gradients that produce an increasingly down-ward-refracting sound-speed field seaward from the shelfbreak. We shall explain this abrupt signal dropout usingnormal-mode theory, and show that the range where thisoccurs is predictable and is source depth dependent.
A. TL Variance
Is acoustic propagation in the NW quadrant of the ASIAEXbox robust to mesoscale volume variability? To answer thisquestion, the CTD yoyo data collected in the pilot experi-ment were used to quantify the variances in the TL throughacoustic modeling. Note that all the acoustic calculationsdiscussed in this paper were performed using the couplednormal-mode model of Chiu et al. [5]. The CTD anchor station[see Fig. 5(top)] has captured the temporal variations of temper-ature and salinity in the water-column caused by the movementof a warm filament in the NW quadrant over a period of severalhours. The observed temperature variations are mild, onlyabout 1 C in the upper 30 m in 4 hrs. This temperature changecorresponds to a change in sound speed of approximately 3 ms over the same period.
In synthesizing the TL fluctuations and their statistics, asource depth of 20 m and a center frequency of 1 kHz wereused. The rationale behind picking a frequency of 1 kHz for thesynthesis was that the primary sound source planned for themain bottom interaction experiment was small explosives thatwould emit a dominant portion (80%) of the signal energy inthe low-frequency band below 1 kHz. Since the variance of TLgenerally increases as frequency increases, the 1-kHz resultswould correspond to a conservative, upper bound estimate. The20-m source depth was also picked for the same reason to es-tablish a worst case, since this depth is at approximately wherethe observed sound speed exhibits the most fluctuations. Ad-ditionally in the synthesis, we assumed that the water-columnsound-speed field, derived from the CTD time series using anempirical formula, is a function of time and depth only, i.e.,range-independent, over the distance considered. The modeledpropagation path is 20 km in length and has a north-southorientation. The bottom depths used were extracted fromecho-sounding data. The depths only change slightly from 94
to 100 m over the entire path. The sediment was assumed to bea homogenous layer with a sound speed of 1620 m s , densityof 1900 kg m and attenuation rate of 0.1 dB m kHz .These numbers correspond to average values deduced from thecore measurements [2]. A more precise sediment model wasnot available at the time of this study. However, these simplifiedsediment parameters should be adequate for investigating TLfluctuations caused by volume variability.
Transmission loss is a relative measure of power loss for peri-odic signals, and of energy loss for pulsed (broadband or band-passed) signals, during their transmission from the source to thereceiver. Given transmitted signal , i.e., sound pressure at1 m from the source, and received signal , whose Fouriertransforms are and , respectively, the transmissionloss is defined in general as
(7)
where the integration time T is either the signal period for a pe-riodic signal transmission, or the duration of the received signalfor a pulsed transmission. For a modeled (i.e., known) soundchannel transfer function that is dependent on frequency ,source position and receiver position , TL can be evaluatedas
(8)
Using the above equation, we shall first examine the TL vari-ances along the seafloor in the modeled CW transmission. Ex-amination of the TL variances associated with a bandpassedsignal with increasing bandwidth shall then follow.
For a CW signal, is a delta function and hence TL re-duces simply to where is the car-rier frequency. This modeled single-frequency TL structure isseen to consist of significant fine-scale variability in time causedprimarily by the changes in the multipath/multimode interfer-ence pattern (see Fig. 13). The interference is quite sensitiveto small changes in the phase differences between individualpaths/modes induced by the evolution of the warm filament. Theresultant standard deviations at various ranges are about 4–5 dB.Considering the mildness of the volume variability, this result isquite alarming and it warrants an exploration on possible vari-ance reduction through an increased bandwidth.
For the case of a bandpassed (i.e., pulsed) signal with a flatsource signal spectrum over its bandwidth , (2) reduces to
(9)
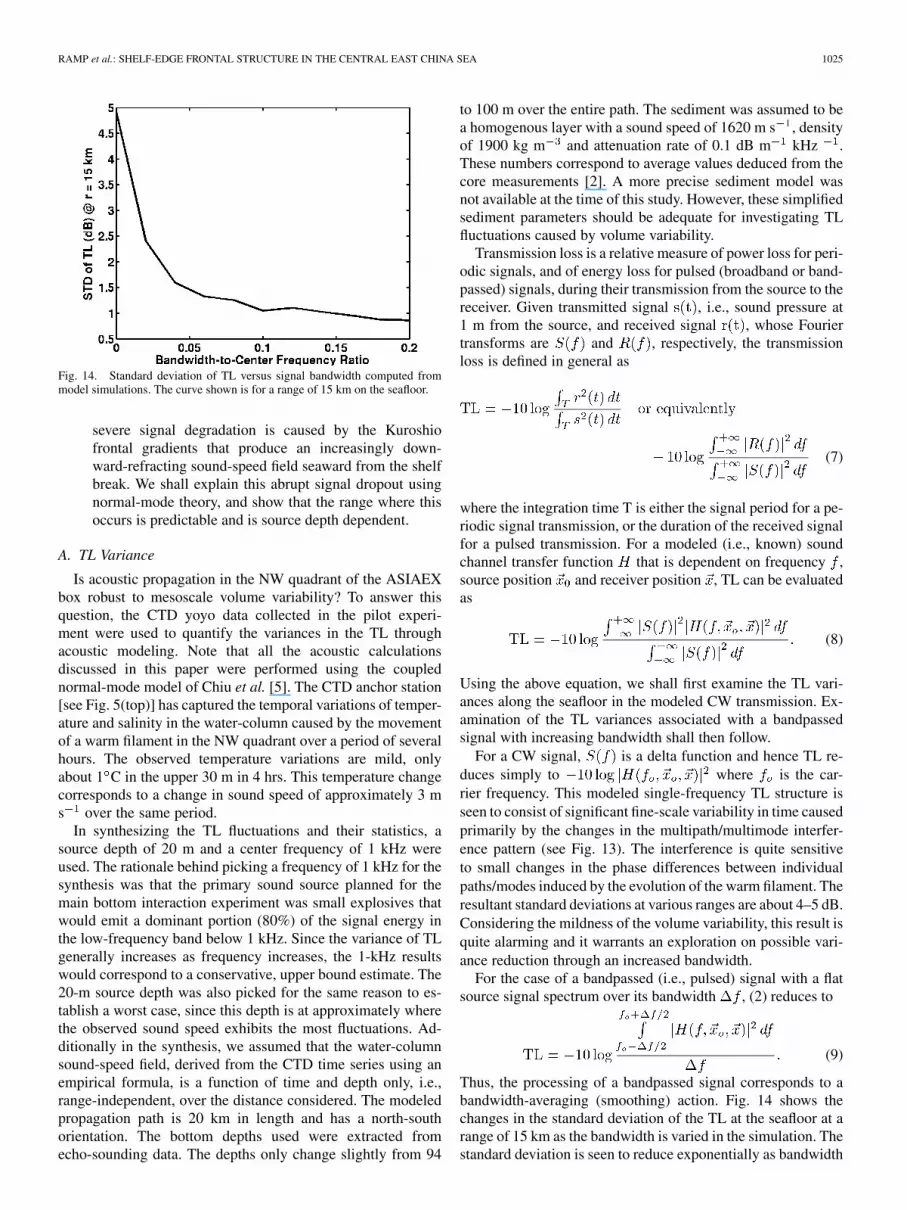
Thus, the processing of a bandpassed signal corresponds to abandwidth-averaging (smoothing) action. Fig. 14 shows thechanges in the standard deviation of the TL at the seafloor at arange of 15 km as the bandwidth is varied in the simulation. Thestandard deviation is seen to reduce exponentially as bandwidth

1026 IEEE JOURNAL OF OCEANIC ENGINEERING, VOL. 29, NO. 4, OCTOBER 2004
Fig. 15. Explosive signals recorded by the hydrophone at a depth of 83 m on the shelf for various source ranges during the cross-front propagation experiment in2001. Data shown have been bandpass-filtered to improve SNR. The pass-band used is 100–300 Hz.
increases and it drops to less than 1 dB at a width of 200 Hzor 20% of the carrier frequency. All other ranges exhibit sim-ilar variance reductions in the TL. This is an interesting re-sult in that it suggests: Even without adequate monitoring ofthe volume variability in the NW quadrant, accurate analysis ofthe boundary reverberation in this designated area is achievablethrough the use of bandpassed signals in large enough bands.
This numerical result is entirely consistent with the the-oretical results of Dyer [35] and Makris [36]. Consideringphase-random multipaths in saturated propagation, Dyershowed theoretically that TL (aside from a multiplicativeconstant) should exhibit fluctuation statistics that obey theexponential-gamma distribution [35]. Dyer then went on toshow that for a single tone, this distribution has two degreesof freedom and a standard deviation of 5.6 dB, and that asthe number of degrees of freedom (which is twice the numberof independent tones L) increases, the distribution narrows asits standard deviation asymptotically approaches zero. Refor-mulating the theory but in terms of the number of coherencecells in the integration time (i.e., the intrinsic time-band-width-product), Makris arrived at the same distribution and thesame dependence of the standard deviation if and L were
interchanged [36]. This is not surprising since both and Lcarry the same meaning, in a statistical sense, as the numberof independent random variables/intensities. A comparison ofthe numerical results displayed (see Fig. 14) to the theoreticalcurve derived by either Dyer or Makris reveals that the numberof independent intensities increases from one to about twentyas the bandwidth increases from zero to 200 Hz for the modeledshelf sound channel consisting of filament-induced fluctuations.
B. Abrupt Signal Loss
During the 2001 experiment, a set of 38-g explosive widebandsources were systematically deployed seaward across the conti-nental shelf and slope from a vertical hydrophone array (VLA)stationed on the shelf (see Fig. 3). The array having 14 equallyspaced hydrophones occupying the depths from 35 to 87 m wastethered from R/V MELVILLE near Waypoint M, and the ex-plosive sources were cast from R/V SHI YAN 2 as she steamedtoward Waypoint H. The depths of detonation were reported byPeng et al.[22] to be 50 m, who also provided a reliable esti-mate of the source level including its variability as a functionof frequency based on seven independent detonations in closeproximity to a calibrated receiver. The seven realizations show
RAMP et al.: SHELF-EDGE FRONTAL STRUCTURE IN THE CENTRAL EAST CHINA SEA 1027
small standard deviations of 0.5 dB or less in the octave bandlevels up to 1 kHz and higher, indicating that the signals pro-duced by these explosives were highly repeatable.
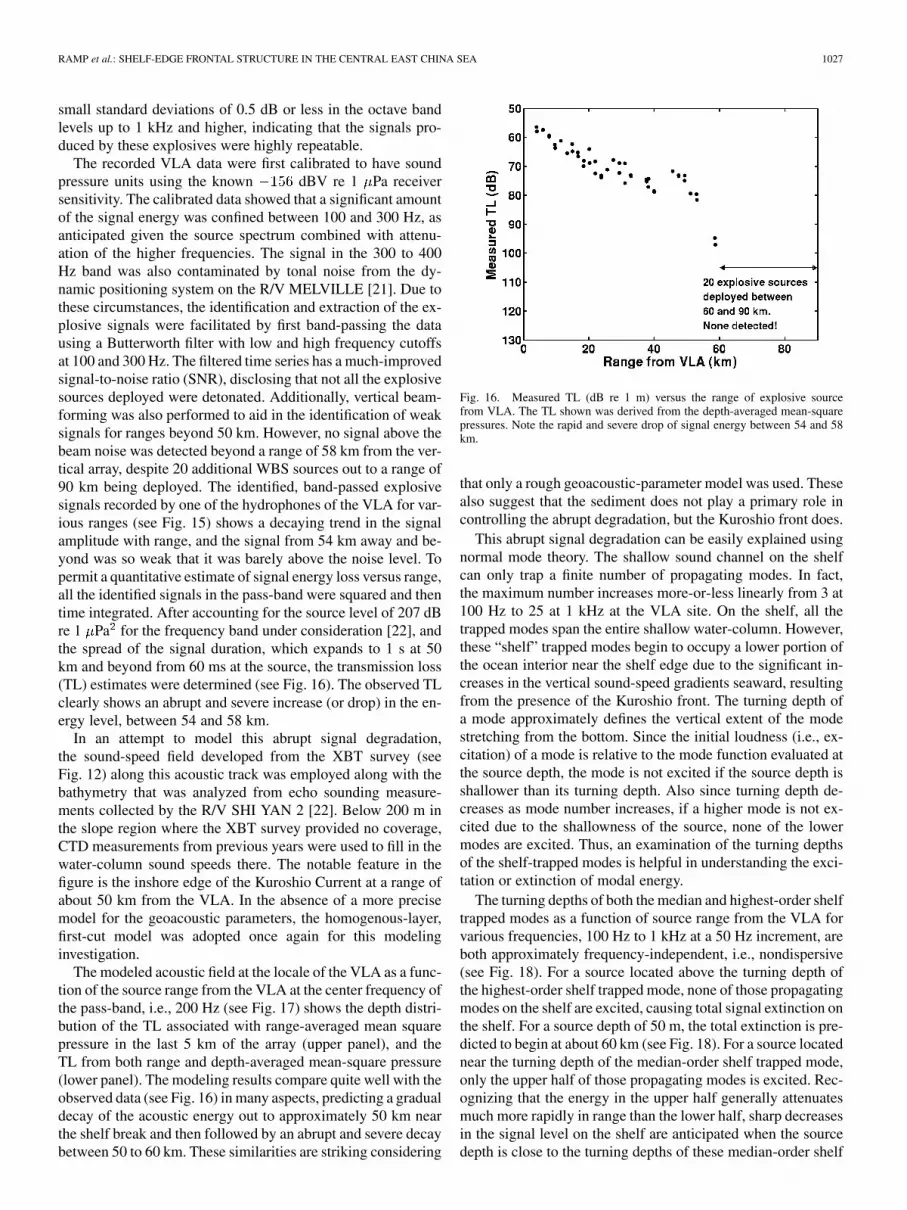
The recorded VLA data were first calibrated to have soundpressure units using the known dBV re 1 Pa receiversensitivity. The calibrated data showed that a significant amountof the signal energy was confined between 100 and 300 Hz, asanticipated given the source spectrum combined with attenu-ation of the higher frequencies. The signal in the 300 to 400Hz band was also contaminated by tonal noise from the dy-namic positioning system on the R/V MELVILLE [21]. Due tothese circumstances, the identification and extraction of the ex-plosive signals were facilitated by first band-passing the datausing a Butterworth filter with low and high frequency cutoffsat 100 and 300 Hz. The filtered time series has a much-improvedsignal-to-noise ratio (SNR), disclosing that not all the explosivesources deployed were detonated. Additionally, vertical beam-forming was also performed to aid in the identification of weaksignals for ranges beyond 50 km. However, no signal above thebeam noise was detected beyond a range of 58 km from the ver-tical array, despite 20 additional WBS sources out to a range of90 km being deployed. The identified, band-passed explosivesignals recorded by one of the hydrophones of the VLA for var-ious ranges (see Fig. 15) shows a decaying trend in the signalamplitude with range, and the signal from 54 km away and be-yond was so weak that it was barely above the noise level. Topermit a quantitative estimate of signal energy loss versus range,all the identified signals in the pass-band were squared and thentime integrated. After accounting for the source level of 207 dBre 1 Pa for the frequency band under consideration [22], andthe spread of the signal duration, which expands to 1 s at 50km and beyond from 60 ms at the source, the transmission loss(TL) estimates were determined (see Fig. 16). The observed TLclearly shows an abrupt and severe increase (or drop) in the en-ergy level, between 54 and 58 km.
In an attempt to model this abrupt signal degradation,the sound-speed field developed from the XBT survey (seeFig. 12) along this acoustic track was employed along with thebathymetry that was analyzed from echo sounding measure-ments collected by the R/V SHI YAN 2 [22]. Below 200 m inthe slope region where the XBT survey provided no coverage,CTD measurements from previous years were used to fill in thewater-column sound speeds there. The notable feature in thefigure is the inshore edge of the Kuroshio Current at a range ofabout 50 km from the VLA. In the absence of a more precisemodel for the geoacoustic parameters, the homogenous-layer,first-cut model was adopted once again for this modelinginvestigation.
The modeled acoustic field at the locale of the VLA as a func-tion of the source range from the VLA at the center frequency ofthe pass-band, i.e., 200 Hz (see Fig. 17) shows the depth distri-bution of the TL associated with range-averaged mean squarepressure in the last 5 km of the array (upper panel), and theTL from both range and depth-averaged mean-square pressure(lower panel). The modeling results compare quite well with theobserved data (see Fig. 16) in many aspects, predicting a gradualdecay of the acoustic energy out to approximately 50 km nearthe shelf break and then followed by an abrupt and severe decaybetween 50 to 60 km. These similarities are striking considering
Fig. 16. Measured TL (dB re 1 m) versus the range of explosive sourcefrom VLA. The TL shown was derived from the depth-averaged mean-squarepressures. Note the rapid and severe drop of signal energy between 54 and 58km.
that only a rough geoacoustic-parameter model was used. Thesealso suggest that the sediment does not play a primary role incontrolling the abrupt degradation, but the Kuroshio front does.
This abrupt signal degradation can be easily explained usingnormal mode theory. The shallow sound channel on the shelfcan only trap a finite number of propagating modes. In fact,the maximum number increases more-or-less linearly from 3 at100 Hz to 25 at 1 kHz at the VLA site. On the shelf, all thetrapped modes span the entire shallow water-column. However,these “shelf” trapped modes begin to occupy a lower portion ofthe ocean interior near the shelf edge due to the significant in-creases in the vertical sound-speed gradients seaward, resultingfrom the presence of the Kuroshio front. The turning depth ofa mode approximately defines the vertical extent of the modestretching from the bottom. Since the initial loudness (i.e., ex-citation) of a mode is relative to the mode function evaluated atthe source depth, the mode is not excited if the source depth isshallower than its turning depth. Also since turning depth de-creases as mode number increases, if a higher mode is not ex-cited due to the shallowness of the source, none of the lowermodes are excited. Thus, an examination of the turning depthsof the shelf-trapped modes is helpful in understanding the exci-tation or extinction of modal energy.
The turning depths of both the median and highest-order shelftrapped modes as a function of source range from the VLA forvarious frequencies, 100 Hz to 1 kHz at a 50 Hz increment, areboth approximately frequency-independent, i.e., nondispersive(see Fig. 18). For a source located above the turning depth ofthe highest-order shelf trapped mode, none of those propagatingmodes on the shelf are excited, causing total signal extinction onthe shelf. For a source depth of 50 m, the total extinction is pre-dicted to begin at about 60 km (see Fig. 18). For a source locatednear the turning depth of the median-order shelf trapped mode,only the upper half of those propagating modes is excited. Rec-ognizing that the energy in the upper half generally attenuatesmuch more rapidly in range than the lower half, sharp decreasesin the signal level on the shelf are anticipated when the sourcedepth is close to the turning depths of these median-order shelf

1028 IEEE JOURNAL OF OCEANIC ENGINEERING, VOL. 29, NO. 4, OCTOBER 2004
Fig. 17. Modeled 200-Hz TL (dB re 1 m) at the locale of the VLA as a function of source range. The upper panel shows the depth distribution of the TL calculatedfrom range-averaged mean-square pressure in the last 5 km of the array. The lower panel shows the TL from both range and depth-averaged mean-square pressure.
Fig. 18. Turning depths of both the median and highest-order trapped modeson the shelf as a function of source range from the VLA. The curves in eachcluster are for various frequencies, 100 Hz to 1 kHz at a 50 Hz increment.
trapped modes. Thus, for a source depth of 50 m, severe signaldegradation is predicted to occur around 55 km (see Fig. 18).
What would happen if the profiles were less downward re-fracting, mimicking a situation when the front has moved sea-
ward? It has been shown that the range at which abrupt signalloss occurs depends primarily on the local upper turning depthsof the shelf trapped modes relative to the depth of the source.Weaker vertical gradients would cause the turning depths to risenear the shelfbreak and on the slope. This would essentially re-sult in a translation of the curves in Fig. 18 to the right. There-fore, the range of abrupt loss would increase accordingly as thefront translates seaward.
VIII. SUMMARY AND CONCLUSIONS
Data from two field experiments are combined to evaluatethe impact of the East China Sea shelf-edge environment onlow-frequency acoustic propagation. These are the ASIAEXpilot study during April 2000 and the primary ASIAEXboundary interaction study from May–June 2001, both con-ducted in the central East China Sea in the region bounded by28 to 30 N, 126 30 to 128 E. During April 2000, an anchorstation and two across-shelf CTD sections were obtained, aswell as a short, five-day mooring record and hull-mountedADCP data. Extensive geology and geophysics observationswere collected as well, including mapping the bottom andsub-bottom with water guns, chirp sonars, and sediment cores.
RAMP et al.: SHELF-EDGE FRONTAL STRUCTURE IN THE CENTRAL EAST CHINA SEA 1029
In terms of the 2001 study, this paper focuses only on thebroadband acoustic propagation measurements made duringJune 3–5 and incorporates a subset of the 2001 environmentalobservations in the form of CTD and XBT data collected duringthe same period.
A broad range of space and time scales were apparent inthe environmental observations. The dominant mesoscale fea-ture during both years was the Kuroshio current that closelyfollows the continental slope in this region. The inshore (NW)edge of the current was quite pronounced and extended overthe edge of the shelf break and up onto the shelf. The edge ofthe current translated onshore during the first part of the 2000experiment then moved offshore during the last few days. Thecurrent also spawned some small, shallow filaments or “shin-gles” that extended still farther up onto the continental shelfcausing anomalously warm, salty conditions there. The internaltide was also quite prominent in the time series data duringboth 2000 and 2001, causing 3 C thermal fluctuations semidiur-nally at mid-depth. Internal waves were also evident both years,but quite different in their respective structure. During 2000, apacket of nonlinear internal solitons was spawned at the shelfbreak during a period when the Kuroshio was translating off-shore, causing the off-shelf flow to become supercritical. Thisnever happened during 2001 and an energetic field of ordinaryoscillatory internal waves was present instead. In terms of themean fields, the ECS study region over the shelf was warmerand fresher during June 2001 than during April 2000. This wasdue to increased seasonal warming later in the year during 2001combined with a more southward extension of the Yangtze Riverplume.
Two case studies in the acoustic transmission loss (TL)over the continental shelf and slope were performed. First, theanchor station data obtained during 2000 was used to studythe acoustic variance induced by a warm filament shed bythe Kuroshio Current in the transmission loss (TL) along theseafloor in the NW quadrant of the ECS ASIAEX box. Thismodeled single-frequency TL structure consisted of significantfine-scale variability in time caused primarily by the changes inthe multipath/multimode interference pattern. The interferencewas quite sensitive to small changes in the phase differencesbetween individual paths/modes induced by the evolution ofthe warm filament. The resultant standard deviations at variousranges were about 4–5 dB, but could be reduced exponentiallyby using bandpassed signals in wide enough bands.
Second, the environmental data from both years were com-bined to obtain a “best picture” of the across-shelf T/S structureduring June 2001, which was used to explain the observedphenomenon of abrupt signal extinction as the transmissionrange lengthened seaward. This abrupt and severe signaldegradation was caused by the Kuroshio frontal gradients thatproduced an increasingly downward-refracting sound-speedfield seaward from the shelf break. This abrupt signal dropoutwas explained using normal mode theory and was predictableand source depth dependent. For a source located above theturning depth of the highest-order shelf trapped mode, none ofthe propagating modes on the shelf were excited, causing totalsignal extinction on the shelf.
ACKNOWLEDGMENT
The ASIAEX project was carried out under sustained multi-year funding provided by the Ocean Acoustics Program of theOffice of Naval Research, whose support is gratefully acknowl-edged. The authors thank the officers and crew of the researchvessels ROGER REVELLE, MELVILLE, SHI YAN 2, and SHIYAN 3 for their assistance and skill in executing the work atsea. The hard work of the technical support staffs of the Ap-plied Physics Laboratory/University of Washington, the MarinePhysical Laboratory/Scripps Institution of Oceanography, theWoods Hole Oceanographic Institution, and the Naval Postgrad-uate School is much appreciated by all the principal investiga-tors. The authors also wish to thank Phil Abbot who providedhelpful advice on how to estimate absolute TL from explosivesources.
REFERENCES
[1] P. H. Dahl, R. Zhang, J. Miller, L. Bartek, Z. Peng, S. Ramp, J.-X. Zhou,C.-S. Chiu, J. Lynch, J. Simmen, and R. C. Spindel, “Overview of Re-sults from the Asian Seas International Acoustics Experiment in the EastChina Sea,” IEEE J. Oceanic Eng., vol. 29, pp. 920–928, Oct. 2004.
[2] J. H. Miller, L. R. Bartek, G. R. Potty, D. Tang, J. Y. Na, and Y. Qi,“Sediment properties in the East China Sea,” IEEE J. Oceanic Eng., vol.29, pp. 940–951, Oct. 2004.
[3] L. Rainville and R. Pinkel, “Observations of energetic high-wavenumber internal waves in the Kuroshio,” J. Phys. Oceanogr., vol. 34,pp. 1495–1505, 2004.
[4] Z. Peng, J.-X. Zhou, P. H. Dahl, and R. Zhang, “Seabed acoustic param-eters from dispersion analysis and transmission loss in the East ChinaSea,” IEEE J. Oceanic Eng., vol. 29, pp. 1038–1045, Oct. 2004.
[5] C.-S. Chiu, J. H. Miller, and J. F. Lynch, “Forward coupled-mode propa-gation modeling for coastal acoustic tomography,” J. Acoust. Soc. Amer.,vol. 99, pp. 793–802, 1996.
[6] B. Qui, T. Toda, and N. Imasato, “On kuroshio front fluctuations in theEast China Sea using satellite and in situ observational data,” J. Geophys.Res., vol. 95, pp. 18 191–18 204, 1990.
[7] Y. Hsueh, J. Wang, and C. S. Chern, “The intrusion of the Kuroshioacross the continental shelf northeast of Taiwan,” J. Geophys. Res., vol.97, pp. 14 323–14 330, 1992.
[8] Y. Hsueh, C. S. Chern, and J. Wang, “Blocking of the Kuroshio by thecontinental shelf northeast of Taiwan,” J. Geophys. Res., vol. 98, pp. 12351–12 359, 1993.
[9] O. Katoh, K. Morinaga, and N. Nakagawa, “Current distributions in thesouthern East China Sea in summer,” J. Geophys. Res., vol. 105, pp.8565–8574, 2000.
[10] H. Ichikawa and R. C. Beardsley, “Temporal and spatial variability ofvolume transport of the Kuroshio in the East China Sea,” Deep-Sea Res.,vol. 40, pp. 583–605, 1993.
[11] M. Feng, H. Mitsudera, and Y. Yoshikawa, “Structure and variability ofthe Kuroshio current in the Tokara Strait,” J. Phys. Oceanogr., vol. 30,pp. 2257–2276, 2000.
[12] T. Matsuno, T. Hibiya, S. Kanari, and C. Kobayashi, “Small scale in-ternal waves and turbulent fluctuations near the continental shelf breakin the East China Sea,” J. Oceanogr., vol. 53, pp. 259–269, 1997.
[13] G. A. Jacobs, H. B. Hur, and S. K. Reidlinger, “Yellow and East ChinaSeas response to winds and currents,” J. Geophys. Res., vol. 105, pp. 21947–21 968, 2000.
[14] C. Chen, R. C. Beardsley, and R. Limeburner, “The structure of theKuroshio southwest of Kyushu: Velocity, transport, and potential vor-ticity fields,” Deep-Sea Res., vol. 39, pp. 245–268, 1992.
[15] C. James, M. Wimbush, and H. Ichikawa, “Kuroshio meanders in theEast China Sea,” J. Phys. Oceanogr., vol. 29, pp. 259–272, 1999.
[16] R. Hickox, I. Belkin, P. Cornillon, and Z. Shan, “Climatology and sea-sonal variability of ocean fronts in the East China, Yellow, and BohaiSeas from satellite SST data,” Geophys. Res. Lett., 2001.
[17] S.-H. Lee and R. C. Beardsley, “Influence of stratification on residualtidal currents in the Yellow Sea,” J. Geophys. Res., vol. 104, pp. 15679–15 701, 1999.

1030 IEEE JOURNAL OF OCEANIC ENGINEERING, VOL. 29, NO. 4, OCTOBER 2004
[18] R. C. Beardsley, R. Limeburner, H. Yu, and G. A. Cannon, “Dischargeof the Changjiang (Yangtze River) into the East China Sea,” Cont. ShelfRes., vol. 4, pp. 57–76, 1985.
[19] L. H. Larsen, G. A. Cannon, and B. H. Choi, “East China Sea tide cur-rents,” Cont. Shelf Res., vol. 4, pp. 77–103, 1985.
[20] M.-K. Hsu, A. K. Liu, and C. Liu, “A study of internal waves in theChina Seas and Yellow Sea using SAR,” Cont. Shelf Res., vol. 20, pp.389–410, 2000.
[21] P. Dahl, “ASIAEX East China Sea: Cruise Report of the Activities of theR/V MELVILLE, 29 May to 9 June, 2001,” Applied Physics Laboratory,University of Washington, Tech. Memorandum TM 7-01, July, 2001.
[22] Z. Peng, R. Zhang, and J. Zhou, “ASIAEX, East China Sea. Overview ofthe Activities and Data Measure of SHIYAN-2 and SHIYAN-3, June 2 toJune 7, 2001,” National Laboratory of Acoustics, Institute of Acoustics,Chinese Academy of Sciences, Tech. Rep. NL-ME-02-01, 2002.
[23] J. R. Apel, J. R. Holbrook, A. K. Liu, and J. J. Tsai, “The Sulu Seainternal soliton experiment,” J. Phys. Oceanogr., vol. 15, pp. 1625–1651,1985.
[24] M.-K. Hsu and A. K. Liu, “Nonlinear internal waves in the South ChinaSea,” Canadian J. Remote Sensing, vol. 26, pp. 72–81, 2000.
[25] A. R. Osborne and T. L. Burch, “Internal solitons in the Andaman Sea,”Science, vol. 208, pp. 451–460, 1980.
[26] J. Small, “A nonlinear model of the shoaling and refraction of interfa-cial solitary waves in the ocean. Part I: Development of the model andinvestigations of the shoaling effect,” J. Phys. Oceanogr., vol. 31, pp.3163–3183, 2001.
[27] J. A. Colosi, R. C. Beardsley, J. F. Lynch, G. Gawarkiewicz, C.-S. Chiu,and A. Scotti, “Observations of nonlinear internal waves on the outerNew England continental shelf during the summer shelfbreak primerstudy,” J. Geophys. Res., vol. 106, pp. 9587–9601, 2001.
[28] T. P. Stanton and L. A. Ostrovsky, “Observations of highly nonlinearinternal solitons over the continental shelf,” Geophys. Res. Lett., vol. 25,pp. 2695–2698, 1998.
[29] A. K. Liu, J. R. Holbrook, and J. R. Apel, “Nonlinear internal waveevolution in the Sulu Sea,” J. Phys. Oceanogr., vol. 15, pp. 1613–1624,1985.
[30] S. R. Ramp, T.-Y. Tang, C.-S. Chiu, J. F. Lynch, A. K. Liu, and Y.-J.Yang, “Internal solitons in the northeastern South China Sea Part I:Sources and deep water propagation,” IEEE J. Oceanic Eng., vol. 29,pp. 1157–1181, Oct. 2004.
[31] A. K. Liu, T.-Y. Tang, Y. Zhao, and S. R. Ramp, “A case study of soli-tary internal wave propagation during ASIAEX-2001,” IEEE J. OceanicEng., vol. 29, pp. 1144–1156, Oct. 2004.
[32] J. R. Apel, M. Badiey, C.-S. Chiu, S. Finette, R. Headrick, J. Kemp,J. F. Lynch, A. Newhall, M. H. Orr, B. H. Pasewark, D. Tielbuerger,A. Turgut, K. von der Heydt, and S. Wolf, “An overview of the 1995SWARM Shallow-water internal wave acoustic scattering experiment,”IEEE J. Oceanic Eng., vol. 22, pp. 465–500, 1997.
[33] A. Scotti and R. C. Beardsley, “Large internal waves in MassachusettsBay. Part 1: Modeling generation, propagation, and shoaling,” J. Geo-phys. Res., submitted for publication.
[34] C. Chen, R. C. Beardsley, R. Limeburner, and K. Kim, “Comparison ofwinter and summer hydrographic observations in the Yellow and EastChina Seas and adjacent Kuroshio during 1986,” Cont. Shelf Res., vol.14, pp. 909–929, 1994.
[35] I. Dyer, “Statistics of sound propagation in the ocean,” J. Acoust. Soc.Amer., vol. 48, pp. 337–345, 1970.
[36] N. C. Makris, “The effect of saturated transmission scintillation on oceanacoustic intensity measurements,” J. Acoust. Soc. Amer., vol. 100, pp.769–783, 1996.
Steven R. Ramp received the M.S. degree inphysical oceanography from the University ofWashington, Seattle, in 1976 and the Ph.D. degreein physical oceanography from the University ofRhode Island, Narragansett, in 1986.
Since 1986, he has been with the U.S. Navyas a Professor at the Naval Postgraduate School,Monterey, CA, and a Program Officer at the Officeof Naval Research, Arlington, VA. Prior to this,he spent time at the National Marine FisheriesService, Woods Hole, MA. His research specialty
is ocean observations from both ships and oceanographic moorings, and hehas organized major expeditions to the Japan Sea, East China Sea, and SouthChina Sea. He was the International Scientific Coordinator for the Asian SeasInternational Acoustics Experiment (ASIAEX).
Ching-Sang Chiu received the B.S. degree inelectrical engineering from Northeastern University,Boston, MA, in 1979 and the Sc.D. degree inoceanographic engineering from the MassachusettsInstitute of Technology, Cambridge/Woods HoleOceanographic Institution, Woods Hole, MA, jointprogram in 1985.
He is a Professor of oceanography at the NavalPostgraduate School, Monterey, CA. His research in-terests include ocean acoustics, acoustical oceanog-raphy, and coastal ocean processes and their influence
on acoustic prediction. He has authored or coauthored more than 40 refereedpublications in those subject areas.
Dr. Chiu is a Fellow of the Acoustical Society of America and Editor-in-Chiefof the Journal of Computational Acoustics.
Frederick L. Bahr received the M.S. degree in phys-ical oceanography from Oregon State University in1991.
He was with Oregon State University for twoyears, where he worked for for Dr. Clayton Paulson.He then moved to Bermuda and was with theBermuda Biological Station for Research for fiveyears as part of the Bermuda Atlantic Time-Series(BATS) project and the Hydrostation S time series.He has been with the Oceanography Department,Naval Postgraduate School, Monterey, CA, for the
past six years.
Yiquan Qi received Doctor of Science degree inphysical oceanography from Ocean University ofQingdao, China, in 1998.
Since 1992, he has been a member of the faculty ofthe Key Laboratory of the Tropical Marine Environ-mental Dynamics (LED) at the South China Sea In-stitute of Oceanology, Chinese Academy of Sciences,Beijing, China. He has more than 30 publications inthe area of remote sensing and its application in phys-ical oceanography.
Peter H. Dahl received the Ph.D. degree in oceanengineering from the Massachusetts Institute ofTechnology, Cambridge/Woods Hole OceanographicInstitution, Woods Hole, MA, Joint Program inOceanography and Oceanographic Engineering in1989.
He currently is a Principal Engineer at the AppliedPhysics Laboratory, University of Washington,Seattle, where he has been since 1989, and conductsexperimental and theoretical research in underwateracoustics. He also is a Research Associate Professor
in the Mechanical Engineering Department, University of Washington. In2002, he was a Guest Professor with the Department of Physics, University ofBergen, Norway.
Dr. Dahl served as an Associate Editor for the IEEE JOURNAL OF OCEANIC
ENGINEERING from 1997 to 2003 and has served as Guest Editor for this Spe-cial Issue on Asian Marginal Seas. He is a Fellow of the Acoustical Society ofAmerica (ASA) and currently is Chair of the ASA Technical Committee on Un-derwater Acoustics. He was the U.S. Chief Scientist for ASIAEX East ChinaSea.

RAMP et al.: SHELF-EDGE FRONTAL STRUCTURE IN THE CENTRAL EAST CHINA SEA 1031
James H. Miller (S’83–M’87) received the B.S.degree in electrical engineering from WorcesterPolytechnic Institute, Worcester MA, in 1979, theM.S. degree in electrical engineering from StanfordUniversity, Stanford, CA, in 1981, and the Ph.D.degree in oceanographic engineering from the Mass-achusetts Institute of Technology, Cambridge/WoodsHole Oceanographic Institution, Woods Hole, MA,joint program in 1987.
He was a Member of the Faculty, Department ofElectrical and Computer Engineering, Naval Post-
graduate School (NPS), Monterey, CA, from 1987 to 1995. Since 1995, he hasbeen a Member of the Faculty, Department of Ocean Engineering, University ofRhode Island (URI), Narragansett, where he holds the rank of Professor. He isa Founder of FarSounder, Inc., Providence, RI, a startup company that developsforward-looking sonar for vessels, underwater vehicles, and divers. He hasauthored more than 100 publications in the areas of acoustical oceanography,signal processing, and marine bioacoustics. He has served as Associate Editorfor Underwater Sound for the Journal of the Acoustical Society of America,responsible for scattering, inverse methods, and fish acoustics.
Dr. Miller was elected a Fellow of the Acoustical Society of America in 2003and is a Member of Sigma Xi, Tau Beta Pi, Eta Kappa Nu, the Acoustical Societyof America, and the Marine Technology Society. From 2001 to 2003, he was aMember of the National Academy of Sciences Panel on Noise in the Ocean. Heserves on the National Marine Fisheries Service Panel on Acoustic Criteria forMarine Mammals. He also serves on the Marine Mammal Commission Sub-committee on the Impacts of Acoustics on Marine Mammals. He received theNPS Menneken Faculty Award for Excellence in Scientific Research and theURI Marshall Award for Faculty Excellence in Engineering in 1993 and 1999,respectively.
James F. Lynch (M’96–SM’03) was born in JerseyCity, NJ, on June 3, 1950. He received the B.S. de-gree in physics from Stevens Institute of Technology,Hoboken, NJ, in 1972 and the Ph.D. degree in physicsfrom the University of Texas, Austin, in 1978.
He was with the Applied Research Laboratories,University of Texas at Austin (ARL/UT) from 1978to 1981, after which he joined the scientific staff atthe Woods Hole Oceanographic Institution (WHOI),Woods Hole, MA. He has been with WHOI since thenand currently holds the position of Senior Scientist in
the Applied Ocean Physics and Engineering Department. His research specialtyareas are ocean acoustics and acoustical oceanography, but he also greatly en-joys occasional forays into physical oceanography, marine geology, and marinebiology.
Dr. Lynch is a Fellow of the Acoustical Society of America and Editor-in-Chief of the IEEE JOURNAL OF OCEANIC ENGINEERING.
Renhe Zhang was born in Chongqing, China. Hegraduated from the Department of Physics, BeijingUniversity, Beijing, China, in 1958.
From 1990 to 2000, he was the Director of theNational Laboratory of Acoustics at the ChineseAcademy of Sciences (CAS), Beijing, China. He isnow an Academician at Institute of Acoustics, CAS.
Prof. Zhang is a Chairman of the Western PacificCommission for Acoustics and a Member of Inter-national Acoustic Commission. He has received ZhuKezheng, Rao Yutai, Guanghua, and Heliang Heli
awards for contributions to ocean acoustics in China.
Ji-Xun Zhou graduated from the Physics Depart-ment, Nanjing University, Nanjing, China, witha five-year degree in 1963 and graduated fromthe Graduate School of the Chinese Academy ofSciences (CAS), Beijing, China, associated with theInstitute of Acoustics (IOA), for a four-year degreein1967.
He started his research on shallow-water acousticswith the IOA and was promoted to Full Professor.Since April 1989, he was officially appointed as aVisiting Professor and, later, as a Principal Research
Scientist with the Georgia Institute of Technology (Georgia Tech), Atlanta,where he has been advising postdoctoral fellows and Ph.D./M.S. students andvisiting scholars. In recent years, his main areas of research have includedacoustic interactions with internal waves, sea-bottom geoacoustic inversion,and reverberation and signal spatial coherence in shallow water.
Prof. Zhou was twice awarded the China Natural Science Award (both were2nd place), as a coauthor, in 1982 and 1989 due to his contributions to shallow-water acoustics.