Rates of nitrification and ammonium dynamics in northeastern Chukchi Sea shelf waters
9
Rates of nitrification and ammonium dynamics in northeastern Chukchi Sea shelf waters Afonso C. Souza n , Wayne S. Gardner, Kenneth H. Dunton Marine Science Institute, The University of Texas at Austin, 750 channel View Dr., Port Aransas, TX 78373, USA article info Available online 21 January 2014 Keywords: N-cycling Chukchi Sea Ammonium regeneration and uptake Nitrification abstract Nutrient concentrations are often depleted in surface waters during the late summer open-water period in the northern Chukchi Sea. Yet the rate of re-supply of nutrients to the pelagic environment controls phytoplankton community abundance and productivity, which in turn influences the benthic compo- nents of this relatively shallow ecosystem. We measured nitrogen cycling rates at four experimental stations on the northeastern Chukchi Sea shelf in the western arctic. At each station, rates for net NH 4 þ regeneration, actual NH 4 þ uptake, and nitrification were measured using 15 N isotope enrichment methods with 24-h bottle incubations under both light and dark conditions. Net NH 4 þ regeneration rates throughout the water column ranged between 0.25 and 0.23 μmol N L 1 h 1 , with highest net positive regeneration occurring under light exposure in surface waters. Actual uptake rates ranged between 0.41 and 0.01 μmol N L 1 h 1 . Nitrification rates (measured at two stations) were generally highest in the sediment overlying waters, ranging between 0.14 and 0.67 μmol N L 1 h 1 , and appear to account for most NH 4 þ uptake. Calculations of turnover time indicate that N is recycled within one day throughout the water column under natural conditions in the northern Chukchi Sea. Our findings confirm the results of previous studies that suggest a significant portion of surface nutrients on the Chukchi Shelf are products of horizontal advection through the Anadyr Current but also highlight the role of sediment regenerated N in supporting water-column primary production. & 2014 Published by Elsevier Ltd. 1. Introduction Water-column ammonium (NH þ 4 ) regeneration in aquatic eco- systems reflects the combined nitrogen (N) dynamics of eukaryotic and microbial organisms. Variability in the supply of nutrients to the pelagic environment controls phytoplankton community abundance and productivity, which in turn, influences the benthic ecosystem (Egge, 1998; Dunton et al., 2005; Walsh et al., 2005; Popova et al., 2010). In addition to autochthonous N sources, nutrients are advected into the Chukchi Sea by three main water masses (Anadyr, Alaska Coastal and Bering Shelf) flowing north- ward through the Bering Strait (Coachman and Aagaard, 1988). The Alaska Coastal Water and intermediate Bering Shelf Water are considered nutrient poor, while the Anadyr Water is characterized by high nutrient concentrations (Springer and McRoy, 1993). The Anadyr Water replenishes the Chukchi shelf with nutrients that fuel primary production (Mathis et al., 2009). Nutrient concentrations vary seasonally within the Chukchi Sea region. Nitrate (NO 3 ) is often depleted in surface waters during the late summer open-water period due to heterotrophic and photoautotrophic activity (Cota et al., 1996). The relative impor- tance of microbial remineralization of organic matter (OM) in producing NH 4 þ , as a N source for the pelagic community, increases with the depletion of external sources of N. Hetero- trophic bacterial regeneration of NH 4 þ is significant when labile organic substrates are available (Allen et al., 2002). However, heterotrophic competition with phytoplankton for N increases as nutrient concentrations decrease to levels below phytoplankton uptake capacity (Smith and Harrison, 1991). Thus, the depletion of nutrients leads to decreased primary production, changes in phytoplankton community structure, and an increased reliance on regenerated N for phytoplankton growth (Cota et al., 1996; Sukhanova et al., 2009). Regeneration and uptake of NH 4 þ are important to benthic food web studies. Stable carbon and nitrogen isotopes are com- monly used to categorize a benthic consumer’s trophic position and define its food sources (Fry and Sherr, 1984; Post, 2002). The broad range of sediment OM isotope values in the Chukchi Sea shelf complicates this process because the source signal of inor- ganic N used by autotrophs affects the N-isotopic composition of the organic matter synthesized in the water column (Sigman et al., 1999; Naidu et al., 2000). The isotopic signature of phytoplankton, for example, varies according to the isotopic value of the NO 3 and NH 4 þ pools (Doi et al., 2004; Needoba et al., 2004), which are Contents lists available at ScienceDirect journal homepage: www.elsevier.com/locate/dsr2 Deep-Sea Research II 0967-0645/$ - see front matter & 2014 Published by Elsevier Ltd. http://dx.doi.org/10.1016/j.dsr2.2013.12.017 n Corresponding author. Tel.: þ1 361 749 6773; fax: þ1 361 749 6777. E-mail address: [email protected] (A.C. Souza). Deep-Sea Research II 102 (2014) 68–76
-
Upload
independent -
Category
Documents
-
view
0 -
download
0
Transcript of Rates of nitrification and ammonium dynamics in northeastern Chukchi Sea shelf waters

Rates of nitrification and ammonium dynamics in northeasternChukchi Sea shelf waters
Afonso C. Souza n, Wayne S. Gardner, Kenneth H. DuntonMarine Science Institute, The University of Texas at Austin, 750 channel View Dr., Port Aransas, TX 78373, USA
a r t i c l e i n f o
Available online 21 January 2014
Keywords:N-cyclingChukchi SeaAmmonium regeneration and uptakeNitrification
a b s t r a c t
Nutrient concentrations are often depleted in surface waters during the late summer open-water periodin the northern Chukchi Sea. Yet the rate of re-supply of nutrients to the pelagic environment controlsphytoplankton community abundance and productivity, which in turn influences the benthic compo-nents of this relatively shallow ecosystem. We measured nitrogen cycling rates at four experimentalstations on the northeastern Chukchi Sea shelf in the western arctic. At each station, rates for net NH4
þ
regeneration, actual NH4þ uptake, and nitrification were measured using 15N isotope enrichment
methods with 24-h bottle incubations under both light and dark conditions. Net NH4þ regeneration rates
throughout the water column ranged between �0.25 and 0.23 μmol N L�1 h�1, with highest net positiveregeneration occurring under light exposure in surface waters. Actual uptake rates ranged between�0.41 and �0.01 μmol N L�1 h�1. Nitrification rates (measured at two stations) were generally highestin the sediment overlying waters, ranging between 0.14 and 0.67 μmol N L�1 h�1, and appear to accountfor most NH4
þ uptake. Calculations of turnover time indicate that N is recycled within one daythroughout the water column under natural conditions in the northern Chukchi Sea. Our findingsconfirm the results of previous studies that suggest a significant portion of surface nutrients on theChukchi Shelf are products of horizontal advection through the Anadyr Current but also highlight therole of sediment regenerated N in supporting water-column primary production.
& 2014 Published by Elsevier Ltd.
1. Introduction
Water-column ammonium (NHþ4 ) regeneration in aquatic eco-
systems reflects the combined nitrogen (N) dynamics of eukaryoticand microbial organisms. Variability in the supply of nutrients tothe pelagic environment controls phytoplankton communityabundance and productivity, which in turn, influences the benthicecosystem (Egge, 1998; Dunton et al., 2005; Walsh et al., 2005;Popova et al., 2010). In addition to autochthonous N sources,nutrients are advected into the Chukchi Sea by three main watermasses (Anadyr, Alaska Coastal and Bering Shelf) flowing north-ward through the Bering Strait (Coachman and Aagaard, 1988). TheAlaska Coastal Water and intermediate Bering Shelf Water areconsidered nutrient poor, while the Anadyr Water is characterizedby high nutrient concentrations (Springer and McRoy, 1993). TheAnadyr Water replenishes the Chukchi shelf with nutrients thatfuel primary production (Mathis et al., 2009).
Nutrient concentrations vary seasonally within the Chukchi Searegion. Nitrate (NO3
� ) is often depleted in surface waters duringthe late summer open-water period due to heterotrophic and
photoautotrophic activity (Cota et al., 1996). The relative impor-tance of microbial remineralization of organic matter (OM) inproducing NH4
þ , as a N source for the pelagic community,increases with the depletion of external sources of N. Hetero-trophic bacterial regeneration of NH4
þ is significant when labileorganic substrates are available (Allen et al., 2002). However,heterotrophic competition with phytoplankton for N increases asnutrient concentrations decrease to levels below phytoplanktonuptake capacity (Smith and Harrison, 1991). Thus, the depletion ofnutrients leads to decreased primary production, changes inphytoplankton community structure, and an increased relianceon regenerated N for phytoplankton growth (Cota et al., 1996;Sukhanova et al., 2009).
Regeneration and uptake of NH4þ are important to benthic
food web studies. Stable carbon and nitrogen isotopes are com-monly used to categorize a benthic consumer’s trophic positionand define its food sources (Fry and Sherr, 1984; Post, 2002). Thebroad range of sediment OM isotope values in the Chukchi Seashelf complicates this process because the source signal of inor-ganic N used by autotrophs affects the N-isotopic composition ofthe organic matter synthesized in the water column (Sigman et al.,1999; Naidu et al., 2000). The isotopic signature of phytoplankton,for example, varies according to the isotopic value of the NO3
�
and NH4þ pools (Doi et al., 2004; Needoba et al., 2004), which are
Contents lists available at ScienceDirect
journal homepage: www.elsevier.com/locate/dsr2
Deep-Sea Research II
0967-0645/$ - see front matter & 2014 Published by Elsevier Ltd.http://dx.doi.org/10.1016/j.dsr2.2013.12.017
n Corresponding author. Tel.: þ1 361 749 6773; fax: þ1 361 749 6777.E-mail address: [email protected] (A.C. Souza).
Deep-Sea Research II 102 (2014) 68–76

not conservative. In particular, isotope fractionation is introducedby nitrification, in which preferential uptake of 14NH4
þ leaves thenutrient pool relatively enriched in 15NH4
þ and produces 15Ndepleted nitrification products (Sigman et al., 2008). The increas-ing use of regenerated NH4
þ by phytoplankton, as nitrate becomesdepleted in surface waters during the late spring and summer,may result in a mixture of phytodetritus with different isotopicsignatures.
The availability of nitrogen often controls primary productivityin surface ocean waters. High primary production is often linked tothe supply of NO3
� and NH4þ . Estimates of ‘new” and “regener-
ated” production rely on the knowledge of source and fraction thatthese forms of inorganic-N are taken up by phytoplankton. Forexample, phytoplankton production derived from the uptake ofallochthonous NO3
� is referred as “new” production (Dugdale andGoering, 1967; Hansell et al., 1993). Estimates of production aretherefore compromised by microbial processes that produceNO3
� . Nitrification, for example, transforms regenerated NH4þ
into NO3� and consumes oxygen. Consequently, nitrification
influences the supply of NO3� to phytoplankton in the
euphotic zone.Inaccuracy of new and regenerated production occurs when a
portion of NO3� phytoplankton uptake is produced by nitrification
within the euphotic zone (Wankel et al., 2007). Knowledge of theNH4
þ turnover time can help to describe the contributions ofautochthonous NH4
þ assimilated by phytoplankton, which isestimated from total NH4
þ production rates. Furthermore, estab-lishing the role of microbial activity on the regeneration anddistribution of nutrients in the mixed layer negates thecommonly-used assumption that regeneration of nutrients innutrient depleted waters is insignificant (Cota et al., 1996). There-fore, if total NH4
þ production rates are not measured, net NH4þ
production plus nitrification rates must be considered together toestimate “new” production rates (Wassmann, 1990).
Primary production is a crucial component of the benthicecosystem in the Chukchi Sea. The coupling betweenwater columnprimary production and secondary production of benthic fauna andits relationship to the surrounding environmental conditions is wellunderstood in the region (Bates et al., 2005). However, the role ofprokaryotes on inorganic nitrogen regeneration and utilization is stillunder-studied in the Arctic, and our understanding of nitrification inthe offshore waters of the Chukchi Sea is very limited.
The purpose of this work was to quantify actual NH4þ
production and uptake rates in addition to nitrification rates inthe water column and sediment overlying water (OLW) during latesummer. We consider that net NH4
þ regeneration measurementsunderestimate actual rates because NH4
þ production and uptakeprocesses occur simultaneously (Tupas et al., 1994). The hypoth-eses tested are that (1) light favors rates of NH4
þuptake but notregeneration, (2) regeneration rates are higher than uptake rates inthe water immediately overlying the sediments because of poten-tially lower photosynthetic rates and the effects of additionalmicrobial activity fueled by organic matter associated with sus-pended sediments, and (3) nitrification accounts for most of theNH4
þ uptake in subsurface waters. Additionally, measurements ofNH4
þ demand (AD), estimated from the difference betweenpotential and actual uptake rates (Lin et al., 2011), providedinsights into the degree of potential N limitation within the watercolumn for both microbial and phytoplankton communities.
2. Materials and methods
Water-column N cycling rates were measured during a cruise tothe northeastern Chukchi Sea in summer 2010 as part of the“Chukchi Sea Offshore Monitoring in Drilling Area: Chemical and
Benthos (COMIDA CAB) project. The objectives of this study wereto measure under natural light and dark conditions “actual”regeneration and “potential” uptake rates for NH4
þ by measuringthe dilution rates of added 15N isotopes. We also comparedregeneration and uptake rates to “net” production rates of NH4
þ
without isotope addition at four water depths at four stations.Nitrification rates were measured at two sites, and the rates ofthese processes were determined in bottle experiments by mea-suring the dilution rates of added 15N isotopes, including 15NH4
þ
for ammonium cycling experiments (Blackburn, 1979) and 15NO3�
for nitrification experiments (Carini et al., 2010).
2.1. Sampling stations and field measurements
Temperature, salinity, water column background concentra-tions of NO3
� , PO43� and NH4
þ , and rates of NH4þ regeneration,
NH4þ uptake, and nitrification were examined at four depths (4 m,
20–30 m, 1 m over the sediment surface, and sediment overlyingwater) at four stations (Station 103, 65.7241N, 168.9571W; Station9, 70.6711N, 167.0831W; Station 1015, 70.8401N, 163.2911W andStation 48, 71.3771N, 159.4681W) distributed longitudinally withinthe COMIDA CAB region during the summer field season aboardthe R/V Moana Wave (July–August 2010; Fig. 1).
Temperature (T) and salinity (S) were measured using a YSI-650-MDS Sonde (YSI Inc, Yellow Springs, OH), resolving at 0.01 para-meter units and an accuracy of 70.15 1C and 70.001 milli S cm�1,for T and S respectively. The salinity probe was calibrated withconductivity/TDS 50,000 micromhos cm�1 (30.300 ppm as NaCl)standard solution (Ricca Chemical Co. part# 2248-32).
Water column samples were collected at three different depths(4 m, 20–30 m, and 1 m above sediment) with a peristaltic pumpand transferred to respective 1-L bottles. Sediment overlying water(OLW) was collected into a 1-L bottle by siphoning overlying waterfrom relatively undisturbed sediment cores collected using aHYPOX coring device (Gardner et al., 2009).
Background NO3� and PO4
3� concentrations were measuredin water samples collected at each depth. Samples were filtered(nylon syringe filter, 0.2 μm pore size) and filtrates transferred intoone 15-mL centrifuge tube per nutrient (n¼1) and frozen untillater analysis with a Lachat Quikchem 8000 Flow injection analysissystem. Each sample was analyzed twice. The coefficients ofvariation for replicate NO3
� and PO43� standard solutions were
less than 1%.Net NH4
þ regeneration was determined from the change inbackground NH4
þ concentration in bottle-enclosed unamended
170oW 165oW 160oW
69o N
70o N
71o N
72o N
o
Fig. 1. Location of the four sampling stations (encircled) occupied in the northeasternChukchi Sea.
A.C. Souza et al. / Deep-Sea Research II 102 (2014) 68–76 69
control samples incubated over a 24-h period. Actual NH4þ
regeneration and potential uptake rates were determined in15NH4
þ isotope addition experiments based on changes in bothNH4
þ concentration and 15NH4þ isotope ratios according to a new
approach detailed by Lin et al. (2011), which expands on calcula-tions for total regeneration and uptake rates according toBlackburn (1979). Actual NH4
þ uptake rates, expressed in absolutenegative values, represent the difference between net regenera-tion (positive or negative values) and actual regeneration rates(absolute positive values). For this measurement it is assumed thatnet regeneration occurs at the same rate in both isotope amendedand unamended control treatments. Ammonium demand wasdetermined from the difference between potential and actualuptake rates (Lin et al., 2011). Nitrification rates were measuredusing the protocol for a 15NO3
� isotope dilution techniquedescribed comprehensively by Carini et al. (2010).
2.1.1. Ammonium regeneration and uptake experimentsInitial water samples were handled the same for both NH4
þ
and nitrification experiments. However, water samples for NH4þ
experiments were spiked with 15NH4Cl and those of nitrificationwith K15NO3
� to a final concentration of 8 μM for each isotopeaddition. Unfiltered water samples were transferred quickly fromthe peristaltic pump into 1-L polycarbonate bottles. The sampleswere then divided into two separate 500-mL bottles to hold a 500-mLaliquot of unamended controls and 500-mL aliquots water spikedwith the respective isotopes. Subsequently, 30-mL aliquots, fromeach 500-mL control and spiked subsamples were transferred intovarious 60-mL polycarbonate media bottles with septa caps (n¼2for each water column depth interval), for incubation of control,15NH4
þ , and 15NO3� fortified samples. Thirty-mililiter aliquots of
unamended controls and spiked samples were incubated simulta-neously for 24 h in a water bath fed continuously with surfaceseawater under incoming natural light and dark (aluminum-foilwrapped) conditions.
The initial and final time-point samples were collected for each60-mL media bottle prior to freezing and storage at �20 1C. Ten-mililiter aliquots were filtered (nylon syringe filter 0.2 μm poresize) from each bottle. The first 3 mL were discarded after the filterwas rinsed and the remaining 7 mL of filtrate were stored frozen in8-mL Wheaton vials. Samples were analyzed at The Universityof Texas Marine Science Institute by high performance liquidchromotography (HPLC) for both background 14NH4
þ concentra-tions and atom % 15N of NH4
þ (Gardner et al., 1993, 1995). All
experimental values for nitrogen rate measurements are expressedas mean71 SE.
2.1.2. Nitrification experimentNitrification rates were also determined using HPLC by measuring
the dilution of an added 15NO3� pool by 14NOX (NO3
� þNO2� ).
The 14NO3� pool was produced from in situ 14NH4
þ during incuba-tion. Changes in isotopic ratios and concentrations of the NOX poolover time were used to calculate 14NOX production rates�nitrifica-tion rates (Carini et al., 2010). Each sample was analyzed in triplicate.This HPLC method can measure NH4
þ concentrations as low as0.2 μM and yields a detection limit for nitrification rates as low as0.008 μmol N h�1 (Carini et al., 2010).
2.2. Statistical analysis
Using MINITAB 15 software, Spearman rank correlation, a non-parametric test alternative to Pearson correlation was performedto evaluate the strength of association between two variables. Thedifference between rates of two parameters was determined byMood’s median test, analogous to one-way ANOVA for non-normaldata or Mann–Whitney test.
3. Results
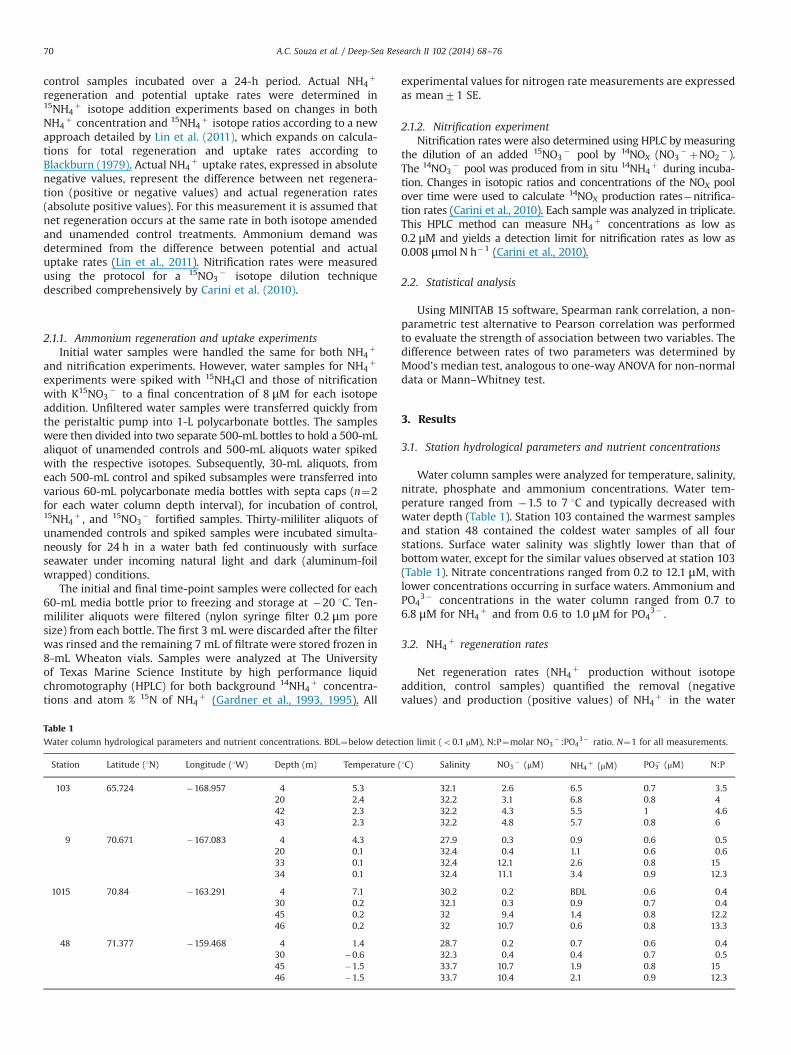
3.1. Station hydrological parameters and nutrient concentrations
Water column samples were analyzed for temperature, salinity,nitrate, phosphate and ammonium concentrations. Water tem-perature ranged from �1.5 to 7 1C and typically decreased withwater depth (Table 1). Station 103 contained the warmest samplesand station 48 contained the coldest water samples of all fourstations. Surface water salinity was slightly lower than that ofbottomwater, except for the similar values observed at station 103(Table 1). Nitrate concentrations ranged from 0.2 to 12.1 μM, withlower concentrations occurring in surface waters. Ammonium andPO4
3� concentrations in the water column ranged from 0.7 to6.8 μM for NH4
þ and from 0.6 to 1.0 μM for PO43� .
3.2. NH4þ regeneration rates
Net regeneration rates (NH4þ production without isotope
addition, control samples) quantified the removal (negativevalues) and production (positive values) of NH4
þ in the water
Table 1
Water column hydrological parameters and nutrient concentrations. BDL¼below detection limit (o0.1 μM), N:P¼molar NO3� :PO4
3� ratio. N¼1 for all measurements.
Station Latitude (1N) Longitude (1W) Depth (m) Temperature (1C) Salinity NO3� (μM) NH4
þ (μM) PO3� (μM) N:P
103 65.724 �168.957 4 5.3 32.1 2.6 6.5 0.7 3.520 2.4 32.2 3.1 6.8 0.8 442 2.3 32.2 4.3 5.5 1 4.643 2.3 32.2 4.8 5.7 0.8 6
9 70.671 �167.083 4 4.3 27.9 0.3 0.9 0.6 0.520 0.1 32.4 0.4 1.1 0.6 0.633 0.1 32.4 12.1 2.6 0.8 1534 0.1 32.4 11.1 3.4 0.9 12.3
1015 70.84 �163.291 4 7.1 30.2 0.2 BDL 0.6 0.430 0.2 32.1 0.3 0.9 0.7 0.445 0.2 32 9.4 1.4 0.8 12.246 0.2 32 10.7 0.6 0.8 13.3
48 71.377 �159.468 4 1.4 28.7 0.2 0.7 0.6 0.430 �0.6 32.3 0.4 0.4 0.7 0.545 �1.5 33.7 10.7 1.9 0.8 1546 �1.5 33.7 10.4 2.1 0.9 12.3
A.C. Souza et al. / Deep-Sea Research II 102 (2014) 68–7670

column. At station 103, NH4 net regeneration rates in lightincubations was negative (�0.2370.01 μmol N L�1 h�1) at 4 mbut relatively neutral (�0.0170.01 μmol N L�1 h�1) in the OLW(Fig. 2A). At station 9, net regeneration in the light at mid-water(20 m) exhibited a low of 0.0170.01 μmol N L�1 h�1, with netpositive rates of 0.2370.03 μmol N L�1 h�1 and 0.1570.01 μmolN L�1 h�1 at 4 and 33 m, respectively. Rates decreased to0.0670.01 μmol N L�1 h�1 in the OLW. At station 1015, ratesdecreased from 0.1870.01 μmol N L�1 h�1 at 4 m to 0.0170.01
μmol N L�1 h�1 at 30 m and 0.0370.01 μmol N L�1 h�1 at 45 m.Net negative values of �0.0170.01 μmol N L�1 h�1 occurred in theOLW. At station 48, rates decreased from 0.0670.01 μmol N L�1 h�1
at 4 m to 0.0170.01 μmol N L�1 h�1 in the OLW.Rates of net regeneration in dark bottle incubations varied with
depth at each station in the same pattern as those in the light-bottle incubations. In general, net regeneration was higher in lightexposed samples. Rate differences ranged from o0.1 (most sta-tions and depths) to 0.22 μmol N L�1 h�1 (4 m depth at station 9).
( moles L-1 h-1) ( moles L-1 h-1)
( moles L-1 h-1) ( moles L-1 h-1)
( moles L-1 h-1)
Fig. 2. Vertical profiles of (A) net regeneration rates, (B) “actual” regeneration rates, (C) “actual” uptake rates, (D) “potential” uptake rates, and (E) NH4þ demand. Data are
shown for light and dark incubations and their calculated rate differences (light minus dark) for each station. A dashed line for values of zero is provided for reference. Ratesare expressed in μmol N L�1 h�1 and error bars are presented as one standard error of the mean. Net regeneration values appeared as negative or positive, indicating thatbackground 14NH4
þ decreased or increased during the incubation period.
A.C. Souza et al. / Deep-Sea Research II 102 (2014) 68–76 71

Consequently, overall rates of each station did not differ signifi-cantly (Mood median test, P40.05), except for station 9 (Moodmedian test, P¼0.01) where net regeneration was higher in light.
Actual regeneration rates (measured by the dilution rate of15NH4
þ ) in light incubations did not vary consistently across thestudy area with depth because each station was characterized by itsown distinct vertical profile. At station 103 actual regeneration rates of0.1870.01 μmol N L�1 h�1, observed in the sediment OLW in thelight, were roughly 3 times higher than rates in the overlying watercolumn (Fig. 2B). At station 9, peak rates in the light occurred at 4 m(0.1170.01 μmol N L�1 h�1) and 33m (0.2670.02 μmol N L�1 h�1)as compared to lower rates at 20 m (0.0270.01 μmol N L�1 h�1) andthe OLW (0.0470.01 μmol N L�1 h�1). At station 1015, ratesincreased three-fold with depth from 0.0270.01 μmol N L�1 h�1
at 4 m to 0.0770.01 μmol N L�1 h�1 at 46 m before dropping to0.0370.01 μmol N L�1 h�1 in the OLW. At station 48, rates increasedwith depth from 0.0370.01 μmol N L�1 h�1 at 4 m to 0.0770.01 μmol N L�1 h�1 at 45 m, peaking at 0.2870.01 μmol N L�1 h�1
in the OLW.Actual regeneration rates in dark incubations varied within the
same range of values as those under light incubations. The largestdifferences between rates in light and dark were at 20 m(�0.11 μmol N L�1 h�1) and 33 m (0.23 μmol N L�1 h�1) at station9 and at the OLW (�0.18 μmol N L�1 h�1) at station 48. However,the differences between light and dark incubations at each stationwere not significant (P40.05) with the exception of station 1015(P¼0.01) where “actual” regeneration was higher in the light.
3.3. NH4þ uptake rates
Actual uptake rates (obtained from the difference between netregeneration and actual regeneration; Lin et al., 2011) varied withdepth differently at each station (Fig. 2C). In the light, maximumuptake at station 103 was �0.2870.01 μmol N L�1 h�1 at 4 m and�0.3070.02 μmol N L�1 h�1 at 20 m. Lower uptake rates occurredat 42 m (�0.0970.01 μmol N L�1 h�1) than in the OLW (�0.1970.01 μmol N L�1 h�1). At station 9, rates were highest at 4 m(�0.1270.03 μmol N L�1 h�1) and 33m (�0.1170.02 μmol N L�1
h�1). Lower rates occurred at 20 m (�0.0170.01 μmol N L�1 h�1)and the OLW (�0.0370.01 μmol N L�1 h�1). Rates at station 1015were �0.1570.01 μmol N L�1 h�1 at 4 m and between �0.02 and�0.05 μmol N h�1 throughout the remaining water column. In con-trast to station 1015, rates within the water column at station 48remained within the range of �0.02 to �0.05 μmol N L�1 h�1, butincreased to �0.2770.01 μmol N L�1 h�1 in the OLW. Actual uptakerates in the dark varied within the same range of values as thoseunder natural light conditions. Differences in rates between light and
dark conditions per depth within each station did not show consistentpatterns. Higher uptake rates in dark conditions were found at station48 (Moodmedian test, P¼0.01), but overall actual uptake rates did notdiffer significantly among stations (Mood median test, P40.05).
Potential uptake rates (determined from the 15NH4þ amended
samples) estimate the capacity of the community to use NH4þ .
The highest rates under light conditions were measured in theOLW of station 48 (�1.1270.02 μmol N L�1 h�1; Fig. 2D). Lowerrates were measured throughout the water column at station 1015,with values ranging from �0.02 to �0.07 μmol N L�1 h�1. A mid-depth trough was detected at stations 103 and 9, where rates werelower at 20 m (�0.0370.01 and �0.0470.01 μmol N L�1 h�1)than at the other depth intervals. Difference in rates under lightand dark conditions varied in a nonspecific pattern. The largestdifference between light and dark conditions (�0.39 μmolN L�1 h�1) occurred at 33 m at station 9. Incubation rates wereabout 0.2 μmol N L�1 h�1 higher in the dark than in the light at20 m for station 103 and in the OLW at station 48. In general, overallrates at each station were not significantly different (Mood mediantest, P40.05) with the exception of station 9 where potential uptakerates were higher in light (Mood median test, P¼0.01).
Ammonium demand, or the difference between potential andactual uptake rates that reflect potential N limitation for the micro-bial and phytoplankton communities, differed between light anddark incubations within a range of �0.3 to 0.16 μmol N L�1 h�1.Negative values reflect demand, and our data show that potentialuptake rates were higher than actual uptake at stations 9 and 48,ranging between �0.01 and �0.87 μmol N L�1 h�1 (Fig. 2E).In general, demand throughout the mid-water column was low withvalues ranging from �0.01 to �0.37 μmol N L�1 h�1. Highestdemand (ca. �0.85 μmol N L�1 h�1) for light and dark incubationswas found in the OLW at station 48.
3.4. Nitrification rates
Vertical rate-profiles of nitrification rates were measuredat stations 9 and 48 (Fig. 3). Higher rates occurred in the OLWabove the sediments relative to surface and mid-water depthsat both stations. At station 48, OLW nitrification rates were0.6770.03 μmol N L�1 h�1 under dark conditions and 0.1570.01 μmol N L�1 h�1 under light exposure. At station 9, OLWrates were 0.1470.04 μmol N L�1 h�1 in the light and 0.2870.07 μmol N L�1 h�1 in the dark. Nitrification under dark condi-tions correlated significantly with actual NH4
þ uptake rates atstation 48 (rs¼�0.99, Po0.001) but not at station 9 (rs¼0.4,Po0.6). Correlations in light incubations were not significant ateither station 9 (rs¼�0.20, P-value¼0.8) or 48 (rs¼�0.80, P¼0.2).
0.20.0-0.2-0.4-0.6
Difference (Light - Dark)
0.80.60.40.20.0
Nitrification Dark
(µmol N L-1 h-1)
Stations depth (m)
sta48
sta9
50
40
30
20
10
0
50
40
30
20
10
0
0.30.20.10.0
Nitrification Light
Fig. 3. Vertical profiles of nitrification rates and difference in rates between light and dark incubations. Rates are expressed in μmol N L�1 h�1 and error bars are presentedas one standard error of the mean.
A.C. Souza et al. / Deep-Sea Research II 102 (2014) 68–7672

The overall median for all measurements of nitrification rates inlight (0.12 μmol N L�1 h�1) were not higher (Mann–Whitney test,Po0.14) than those of actual regeneration (0.06 μmol N L�1 h�1).However, median values for overall nitrification rates in dark(0.17 μmol N L�1 h�1) were higher (Mann–Whitney test, Po0.05) than those of actual regeneration (0.05 μmol N L�1 h�1).
4. Discussion
4.1. Ammonium regeneration and uptake
Isotope-dilution of 15NH4þ added to near-surface, mid-water
depth, bottom water, and sediment overlying water of fourstations on the eastern Chukchi Sea shelf was examined over24-h periods to quantify community cycling rates of NH4
þ . Actualregeneration rates correlated positively (rs¼0.73, Po0.001 andrs¼0.78, Po0.001) with potential uptake rates for both dark andlight conditions, respectively. Coupling between these processeshave also been observed in other systems (Mengesha et al., 1998;Gardner et al., 2004; Johnson et al., 2006).
Close coupling between potential uptake and actual regenera-tion supports our first hypothesis that NH4
þ is turned over quicklyin this system. Incubation experiments demonstrated that ammo-nium was re-assimilated rapidly by primary producers andmicrobes. Ammonium regeneration and uptake rates were highrelative to concentrations in summer photic surface waters. Thequick turnover of N may favor small cells that rely on NH4
þ overlarger cells that depend more on NO3
� (Lee et al., 2007). Suchcoupling between regenerated NH4
þ and the production of smallcells may occur in Chukchi Sea surface waters during late summerwhen nutrient concentrations are low and the phytoplanktonassemblage is dominated by smaller individuals (Walsh et al.,2005; Lee et al., 2009). In addition to the observed net positiveregeneration, values of NH4
þ demand estimated in this studywere relatively low. These results indicate that either the currentsupply of NH4
þ satisfies the community N requirement, or anadditional source of N, such as urea, is utilized widely by bothphytoplankton and heterotrophs (Solomon et al., 2010).
Actual regeneration rates were at the lower range of valuesmeasured in other coastal environments (Gardner et al., 2006).Actual regeneration rates are derived from the change in isotopicratio in spiked samples due to the increase of the 14NH4
þpool,thus it quantifies NH4
þ production directly. Despite low produc-tion rates, water column NH4
þ concentrations can increase whenactual NH4
þ uptake rates by phytoplankton are low. This scenariooccurred in waters at stations 9 and 1015 where net regenerationrates were comparable to uptake rates ranging from 0.01–0.10μmol N L�1 h�1 measured in Northern Gulf of Mexico and FloridaBay waters (Gardner et al., 2009; McCarthy et al., 2009). The extentof actual regeneration may relate to the amount of labile organicmatter available for microbial decomposition (Haga et al., 1995;Miller et al., 1995) and zooplankton grazing (Kirchman, 2000).Microbial use of organic matter decreased seasonally from summerto winter in the western arctic (Nikrad et al., 2012). In addition,dissolved organic nitrogen released during photosynthesis andgrazing are major sources of N for bacteria (Gardner et al., 1996;Bronk and Ward, 1999; Hasegawa et al., 2001). Primary productionis generally low in the late summer in the Arctic (Harrison and Cota,1991). As a result, the supply of reactive phytoplankton exudates tothe microbial community is likely insufficient to maintain signifi-cant microbial nutrient regeneration. Likewise, zooplankton grazingis reduced when primary production is low, which limits theexcretion or leaking of organic material from “sloppy feeding”(Kirchman, 2000).
Our data also fail to support the hypothesis that actualregeneration rates are high in the OLW relative to the watercolumn above and that regeneration rates are higher than uptakerates in the OLW. These hypotheses were based on the assumptionthat photosynthetic rates are lower in waters overlying thesediments and that additional benthic microbes and organicmatter are associated with suspended sediments in the OLW.Considering only dark incubations of stations 1015 and 48, actualregeneration rates at the OLW were generally higher than ratesclose to the surface at 4 m. However, depending on the station,regeneration rates at mid-water depths were sometimes higherthan those in the OLW. Elevated regeneration rates at mid-waterdepths from OM decomposition could lower the amount of labileOM that reaches the sediment surface, resulting in lower regen-eration rates in the OLW. This result may be attributed to thepresence of a thermocline around 20 m (data not shown). Thepresence of a water density gradient due to typical stratificationevents during summer months in the Chukchi Sea may facilitateaccumulation of sinking organic material along the thermocline.
A comparison between actual regeneration and actual uptakerates within the OLW showed that rates of regeneration anduptake were generally comparable. The highest rates of bothuptake and regeneration in the OLW were found at station 48.Intense activity at this station is likely related to the proximity ofBarrow Canyon, where organic-rich material from the shelf down-slope deposits onto the sediments (Grebmeier and Cooper., 1994).These deposits serve to enhance benthic biomass (Grebmeier andDunton, 2000) and microbial activity (Devol et al., 1997). Further-more, the complexity of the Chukchi Sea system is magnified bythe dynamic motion of water masses (Codispoti et al., 2005) andthe variable abundance and quality of OM advected into the shelfregion (Belikcka et al., 2004).
4.2. Effects of light versus dark conditions on ammonium cyclingrates
The results of the light and dark incubation experiments, designedto differentiate autotrophic from heterotrophic processes, do notcompletely support our hypothesis that light favors rates of NH4
þ
uptake but not regeneration. The effect of light on actual NH4þ
regeneration and uptake rates was inconclusive, but suggest thatindirect as well as direct effects need to be considered. For example,higher NH4
þ regeneration may occur in the presence of light dueto the release of labile organic nitrogen during photosynthesis (Coleet al., 1982; Gardner et al., 1997) and zooplankton grazing activity(Strom and Strom, 1996). Our results indicate that the larger differ-ences between regeneration rates under light vs. dark conditionswere specific to a particular depth. For example, the differences in netregeneration rates were consistently higher in light than in darknessat 4 m, potentially due to reduction of autotrophic uptake fornutrient-depleted waters and nutrient-limited photosynthetic activityat this depth. Nevertheless, photosynthetic labile carbon may be moreavailable under light.
Light appears to influence uptake rates in surface waters at stations9, 1015, and 48 where NH4
þ recycling rates were net positive andbackground concentrations of NO3
� and NH4þ were low. This result
is interesting because with the exception of station 103, NH4þ and
NO3� concentrations were o1 μM at these locations. This nutrient
depletion suggests that phytoplanktonmay be N limited (Harrison andCota, 1991). However, in the Bering Sea and other polar environmentscharacterized by low NO3
� concentrations, the regenerated NH4þ is
consumed quickly and is sufficient to maintain primary production(Harrison et al., 1990; Bode et al., 2002; Rho and Whitledge, 2007).
It is possible that bacteria may have had access to additionalautochthonous sources of organic matter. Low N:P ratios observedin surface waters suggest that phytoplankton were experiencing
A.C. Souza et al. / Deep-Sea Research II 102 (2014) 68–76 73

N-limiting conditions. However, nitrogen depletion relative tophosphorous may favor the growth of phototrophic diazotrophs,which fix dissolved N2 in surface waters. Diazotroph metabolismproduces organic matter rich in N (C331 N50 P1; Karl and Letelier,2008), which heterotrophs can use and regenerate as NH4
þ . Theecology and N-fixation contribution of diazotrophs in the Arcticwarrants further investigation (Codispoti, 2007). The Chukchi Seaoffers an ideal environment for such an investigation, as nitrateconcentrations oscillate predictably throughout the annual arcticlight period. Still, according to NH4
þ demand in the water column,regeneration was not sufficient to fulfill the community NH4
þ
uptake capacity at some locations.Ammonium turnover time, defined as the ratio of water NH4
þ
concentrations to actual regeneration rates, was generally shorterunder light exposure than in dark at all depths and stations, butaveraged about one day at northern Chukchi stations 9, 1015, and48 at NH4
þ concentrations ranging from undetectable to 3.4 μM(Table 1). Calculated turnover at station 103, just north of theBering Strait, can be longer (1–4 days) because of higher NH4
þ
concentrations (5.5–6.8 μM). This rapid turnover in the COMIDACAB study area provides further evidence that regeneration anduptake of NH4
þ are tightly coupled. The turnover time at the 4 mdepth slowed under dark conditions at all stations, which suggeststhat phytoplankton uptake rates may influence N turnover time.For example, phytoplankton cells in the Barents Sea typicallyconsume NH4
þ at rates close to 0.005 μmol N L�1 h�1 whenwater NO3
� reaches concentrations below 1 μM (Kristiansenet al., 1994). If this rate were to occur in the Chukchi Sea it wouldbe significantly lower than that of regeneration, implying thatNH4
þ regeneration potentially maintains primary production inlow nutrient waters of the Chukchi Sea during late summer.
The light and dark results for the potential uptake ofNH4
þ contrasted to studies using similar methodologies in othersystems. For example, in the northern Gulf of Mexico, bothpotential uptake and regeneration rates were higher under lightconditions (Gardner et al., 1996, 1997), as were NH4
þ cycling ratesin the Chesapeake Bay (Glibert et al., 1991). Our results at stations9 and 1015 agree with observations collected in freshwatersystems where light affected potential uptake more than regen-eration (Gardner et al., 2004; McCarthy et al., 2007). The higheruptake rates at these two stations under light conditions may beattributed to the contribution of phytoplankton activity to totaluptake (bacterial plus phytoplankton in light). Assuming thedifference between uptake rates in light and dark were due tophytoplankton, the uptake rate fractions attributable to phyto-plankton in water column samples from stations 1015 and 9 wouldrepresent an autotrophic uptake of 40% and 93% respectively.
Establishing the dominance of autotrophic metabolism oncommunity NH4
þ uptake at stations 9 and 1015 may be prematurebecause concurrent information on phytoplankton abundance orphotosynthetic activity is not available. Nevertheless, some indica-tion of photosynthesis could be inferred from dissolved oxygenpercent saturation values obtained from Sonde measurements.Dissolved oxygen values above saturation (102–114%) wereobserved at two nearby stations (15 and 1014; both within18 km of station 1015) and values from 102–112% saturation werefound at station 10, located just 5 nm southeast of station 9 (datanot shown). The overall results, however, showed that the differ-ences between potential uptake rates in light and dark varied bystation.
4.3. Nitrification
Nitrification rates were measured in each water sample bymonitoring the dilution of an added 15NO3
� pool from 14NOX
produced during the 24-h incubations. The addition of a reaction
end-product in place of a substrate is a distinct advantage of theisotope dilution method over comparable tracer methods withadded NH4
þ (Carini et al., 2010). Only trace amounts of addedNH4
þ are used in tracer methods that utilize the addition oflabeled 15NH4
þ and measurement of 15NO3� production (Carini
and Joye, 2008; Sigman et al., 2008). The use of trace amounts ofNH4
þ are intended to minimize impacts on the natural nutrientpool and prevents stimulation of the microbial community. How-ever, they may stimulate production in cases where the addition ofthe “tracer” is actually higher than actual concentrations in thewater. An additional potential problem with tracer enrichment ofNH4
þ is that the actual nitrification rates would be underesti-mated if the tracer levels of added ammonium are removedquantitatively from the water before the first sampling time point(Gardner et al., 2004). In contrast, addition of the end product, asused in the isotope dilution approach, should have little effect onthe reaction rates.
The oxidation of NH4þ to nitrate has been identified as a
ubiquitous process in marine systems (Francis et al., 2005;Ward, 2011). Nitrification rates measured here (ranging between3.6–16 μmol N L�1 d�1) were comparable to those measured inthe Northern Gulf of Mexico (3.6 μmol N L�1 d�1; Carini et al.,2010) and higher than rates measured in the NW MediterraneanSea (0.07–0.14 μmol N L�1 d�1; Bianchi et al., 1999). However,nitrification rates of 16 μmol N L�1 d�1 under dark conditionsand 3.6 μmol N L�1 d�1 under light exposure measured at station48 were significantly higher than rates observed in shallowwaters of the nearshore Barrow, AK region (0.0002–0.004μmol N L�1 d�1; Christman et al., 2011). These differences canpossibly be attributed to either higher competition for NH4
þ byphytoplankton or other microorganisms (e.g. nitrifying bacteria inshallow and productive nearshore waters), photoinhibition ofnitrification, or the differences in methodology employed by thetwo studies (Enokson, 1986).
Nitrification can be photoinhibited (Olson, 1981), but this studydid not document a consistent influence of light on nitrification.In particular, nitrification rates in light incubations were about 50%higher than those measured in the dark at station 48 (4 m) andstation 9 (20 m and 33 m). It is possible that higher nitrificationrates in total darkness were comparable to rates under naturallight, but phytoplankton uptake of NO3
� under light conditionspotentially interfered with the nitrifiers’ signal.
The elevated rates of nitrification measured in the OLW aremost likely associated with the availability of NH4
þ and the lack ofphotoinhibition in the OLW. This hypothesis is supported by anobserved increase in NH4
þ concentrations with water depth(Table 1) and the tendency of nitrification to increase at thebottom of the photic zone (Ward et al., 1989), and by the fact thatnitrification rates correlated with NH4
þ regeneration rates in theOLW. Regenerated NO3
� , derived from nitrification in sedimentOLW, may constitute a significant portion of bottom water NO3
�
that is produced and supports denitrification. The bottom waternitrate concentration at stations 9, 1015, and 48 was roughly10 μM, and if nitrification rates around 0.67 μmol L�1 h�1 wereassumed, the NH4
þ pool would be depleted at these stationswithin 15 h. The observed time frame, however, is longer sincewater NH4
þ regeneration supplies N at a rate of 50% of what isconsumed by nitrification. Since the bottom water NO3
� concen-tration was relatively high, the contribution of benthic metabolismto the bottom water nutrient concentration must be significant.Conceivably, water nitrification and benthic efflux of regeneratednitrate could account for the remaining nitrate concentrations ofthe bottom water mass (Souza et al., 2014), which doubles whenmoving northwards from station 103 to station 9.
Our results support the hypothesis that nitrification accountsfor most NH4
þ uptake in the water column. A significant positive
A.C. Souza et al. / Deep-Sea Research II 102 (2014) 68–7674

correlation between actual NH4þ uptake and nitrification in dark
conditions occurred at station 48. On average, nitrification accountedfor 290% of actual uptake rates at station 9 and 448% at station 48,suggesting that water column nitrification was a significant sourceof regenerated NO3
� during the late summer. Overall, nitrificationrates were higher than the overall actual NH4
þ regeneration ratesmeasured in the water column in dark and slightly higher in light.These results indicate that nitrifiers have a quantifiable ability toconvert regenerated NH4
þ into the NO3� pool, which supports the
argument that “new” production may not be equated indiscrimi-nately to export production in this arctic ecosystem.
These findings confirm previous observations on the ChukchiSea Shelf that (1) a significant portion of surface nutrients areproducts of horizontal advection through the Anadyr Current(Springer and McRoy, 1993) and (2) the vertical advection ofsediment regenerated N throughout the water column. The pau-city of nitrification data for the Chukchi Sea, along with the fewmeasurements acquired during this study, highlight the need foradditional measurements. In particular, we need data on theoccurrence and magnification of nitrification with respect to thephysical factors that potentially regulate coupled nitrification anddenitrification processes. Future work should strive for higherspatial (regionally and with depth) and biogeochemical resolutionto understand the mechanisms involved in N-cycling and carbontransfer to benthic fauna. It is apparent that N-dynamics in thisregion of the Chukchi Sea shelf are extremely complex. Physicaltransport and biogeochemical rates of nitrogen transformationprocesses must be fully considered in developing realistic con-ceptual and mathematical models that describe cycling andtransformation of N in arctic ecosystems.
Acknowledgments
We thank Captain J. Seville and the crew of the R/V Moana Wavefor their research support in summer 2010. We thank Xiao Lin andtwo anonymous reviewers for valuable comments and suggestions.Study design, oversight, and funding were provided by the U.S.Department of the Interior, Bureau of Ocean Energy Management,Regulation and Enforcement, Environmental Studies Program andAlaska OCS Region, Anchorage, AK under Contract M08PC20056for the COMIDA CAB program, under the leadership of D. Prentki.We thank M. Macrander for supporting a collaborative study thatprovided funding from Shell Exploration and Production Companyfor ship operations.
References
Allen, A.E., Howard-Jones, M.H., Booth, M.G., Frischer, M.E., Verity, P.G., Bronk, D.A.,Sandernson, M.P, 2002. Importance of heterotrophic bacterial assimilation ofammonium and nitrate in the Barents Sea during summer. J. Mar. Syst. 38,93–108.
Bates, N.R., Best, M.H.P., Hansell, D.A., 2005. Spatio-temporal distribution ofdissolved inorganic carbon and net community production in the Chukchiand Beaufort Seas. Deep-Sea Res. II 52, 3303–3323.
Belikcka, L.L., Macdonald, R.W., Yunker, M.B., Harvey, R., 2004. The role ofdepositional regime on carbon transport and preservation in Arctic Oceansediments. Mar. Chem. 86, 65–88.
Bianchi, M., Fosset, C., Conan, P., 1999. Nitrification rates in the NW MediterraneanSea. Aquat. Microb. Ecol. 17, 267–278.
Blackburn, T.H., 1979. Method for measuring rates of NH4þ turnover in anoxic marine
sediments using a 15N–NH4þ dilution technique. Appl. Environ. Microbiol. 37,
760–765.Bode, A., Castro, C.G., Doval, M.D., Varela, M., 2002. New and regenerated
production and ammonium regeneration in the western Bransfield Strait region(Antarctica) during phytoplankton bloom conditions in summer. Deep-Sea Res. II49, 787–804.
Bronk, D.A., Ward, B.B., 1999. Gross and net nitrogen uptake and DON release in theeuphotic zone of Monterey Bay, California. Limnol. Oceanogr. 44, 573–585.
Carini, S.A., McCarthy, J.M., Gardner, W.S., 2010. An isotope dilution method tomeasure nitrification rates in the northern Gulf of Mexico and other eutrophicwaters. Cont. Shelf Res. 30 (17), 1795–1801.
Carini, S.A., Joye, S.B.., 2008. Nitrification in Mono Lake, California: activity andcommunity composition during contrasting hydrological regimes. Limnol.Oceanogr. 53, 2546–2557.
Christman, G.D., Cottrell, M.T., Popp, B.N., Gier, E., Kirchman, D.L, 2011. Abundance,Diversity, and Activity of Ammonia-Oxidizing Prokaryotes in the Coastal ArcticOceanin Summer and Winter. Appl. Eviron. Microbiol. 7796, 2026–2034.
Coachman, L.K., Aagaard, K., 1988. Transport through Bering Strait: annual andinterannual variability. J. Geophy. Res. 93, 15535–15540.
Codispoti, L.A., 2007. An oceanic fixed nitrogen sink exceeding 400 Tg N a�1 vs theconcept of homeostasis in the fixed-nitrogen inventory. Biogeosciences 4, 233–253.
Codispoti, L., Flagg, C., Kelly, V., 2005. Hydrographic conditions during the 2002 SBIprocess experiments. Deep-Sea Res. II 52, 3303–3323.
Cole, J.J., Likens, G.E., Strayer, D.L., 1982. Photosynthetically produced dissolvedorganic carbon: an important carbon source for planktonic bacteria. Limnol.Oceanogr. 27, 1080–1090.
Cota, G.F., Pomeroy, L.R., Harrison, W.G., Jones, E.P., Peters, F., Sheldon, W.M.,Weingartner, T.R., 1996. Nutrients, primary production and microbial hetero-trophy in the southeastern Chukchi Sea: arctic summer nutrient depletion andheterotrophy. Mar. Ecol. Prog. Ser. 135, 247–258.
Devol, A.H., Codispoti, L.A., Christensen, J.P., 1997. Summer and winter denitrifica-tion rates in western Arctic shelf sediments. Cont. Shelf. Res. 17 (9), 1029–1050.
Doi, H., Kikuchi, E., Shikano, S., Takagi, S., 2004. A study of the nitrogen stableisotope dynamics of phytoplankton in a simple natural ecosystem. Aquat.Microb. Ecol. 36, 285–291.
Dugdale, R.C., Goering, J.J., 1967. Uptake of new and regenerated forms of nitrogenin primary productivity. Limnol. Oceanogr. 12, 196–206.
Dunton, K.H., Goodall, J.L., Schonberg, S.V., Grebmeier, J.M., Maidment, D.R., 2005.Multi-decadal synthesis of benthic-pelagic coupling in the western arctic: roleof cross-shelf advective processes. Deep-Sea Res. II 52, 3462–3477.
Egge, J.K., 1998. Are diatoms poor competitors at low phosphate concentrations?J. Mar. Syst. 16, 191–198.
Enokson, V., 1986. Nitrification Rates in the Baltic Sea: comparison of three isotopetechniques. Appl. Environ. Microbiol. 50 (2), 244–250.
Fry, B., Sherr, E.B., 1984. δ13C measurements as indicators of carbon flow in marineand freshwater ecosystems. Control. Mar. Sci. 27, 13–47.
Francis, C.A., Roberts, K.J., Beman, J.M., Santoro, A.E., Oakley, B.B., 2005. Ubiquityand diversity of ammonia-oxidizing archaea in water columns and sediments ofthe ocean. Proc. Natl. Acad. Sci. 102 (41), 14683–14688.
Gardner, W.S., McCarthy, M.J., Carini, S.A., Souza, A.C., Lijun, H., McNeal, K.S.,Puckett, M.K., Pennigton, J., 2009. Collection of intact sediment cores withoverlying water to study nitrogen- and oxygen-dynamics in regions withseasonal hypoxia. Cont. Shelf Res. 29, 2207–2213.
Gardner, W.S., McCarthy, M.J., Soonmo, A., Sobolev, D., 2006. Nitrogen fixation anddissimilatory nitrate reduction to ammonium (DNRA) support nitrogendynamics in Texasestuaries Limnol. Oceanogr. 51 (1), 558–568.
Gardner, W.S., Lavrentyev, P.J., Cavaletto, J.F., McCarthy, M.J., Eadie, B.J., Johenger, T.H.,Cotner, J., 2004. Distribution and dynamics of nitrogen and microbial plankton insouthern Lake Michigan during spring transition 1999–2000. J. Geophys. Res.109, C03007.
Gardner, W.S., Cavaletto, J.F., Cotner, J.B., Johnson, J.R., 1997. Effects of natural lighton nitrogen cycling rates in theMississippi River plume. Limnol. Ocenanogr. 42 (2),273–281.
Gardner, W.S., Benner, R., Amon, R.M.W., Cotner, J.B., Cavaletto, J.F., Johnson, J.R.,1996. Effects of high molecular weight dissolved organic matter on nitrogendynamics in the Mississippi River plume. Mar. Ecol. Prog. Ser. 133, 287–297.
Gardner, W.S., Bootsma, H.A., Evans , C., John, P., 1995. Improved chromatographicanalysis of 15N:14N ratios in ammonium or nitrate for isotope additionexperiments. Mar. Chem. 48, 271–282.
Gardner, W.S., Cotner, J.B., Herche, L.R., 1993. Chromatographic measurement ofnitrogen mineralization rates in marine coastal waters with 15N. Mar. Ecol. Prog.Ser. 93, 65–73.
Grebmeier, J.M., Dunton, K.H., 2000. Benthic processes in the northern Bering/Chukchi seas: status and global change, pp. 61–71. Impacts of Changes in Seaand other Environmental parameters in the Arctic. Report of the MarineMammal Commission Workshop, 15–17.
Grebmeier, J.M., Cooper., L.W., 1994. A decade of benthic research on thecontinental shelves of the northern Bering and Chukchi Seas: lessons learned.In: Meehan, R.H., Sergienko, V., Weller, G. (Eds.), Bridges of Science betweenNorth America and the Russian Far East. American Association for theAdvancement of Science, Arctic Division, Fairbanks, Alaska, pp. 87–98
Glibert, P.M., Garside, C., Fuhrman, J.A., Roman, M.R., 1991. Time dependentcoupling of inorganic and organic nitrogen uptake and regeneration in theplume of the Chesapeake Bay estuary and its regulation by large heterotrophs.Limnol. Oceanogr. 36, 895–909.
Haga, H., Nagata, T., Sakamoto, M., 1995. Size-fractionated NHþ regeneration in thepelagic environments of two mesotrophic lakes. Limnol. Oceanogr. 40,1091–1099.
Hansell, D.A, Whitledge, T.E., Goering, J., 1993. Patterns of nitrate utilization andnew production over the Bering and Chukchi shelf. Cont. Shelf Res. 13 (5–6),601–627.
Harrison, W.G., Cota, G.F., 1991. Primary production in polar waters: relation tonutrient availability. Polar Res. 10, 87–104.
A.C. Souza et al. / Deep-Sea Research II 102 (2014) 68–76 75

Harrison, W.G., Cota, G.F., Smith, R.E.H., 1990. Nitrogen utilization in ice algalcommunities of Barrow Strait, Northwest Territories, Canada. Mar. Ecol. Prog.Ser. 67, 275–283.
Hasegawa, T., Koike, I., Mukai, H., 2001. Release of dissolved organic nitrogen bya planktonic community in Akkeshi Bay. Aquat. Microb. Ecol. 2499-107.
Johnson, M., Sanders, R., Avgoustidi, V., Lucas, M., Brown, L., Hansell, D., Moore, M.,Gibb, S., Liss, P., Jickells, T., 2006. Ammonium accumulation during a silicate-limited diatom bloom indicates the potential for ammonia emission events.Mar. Chem. 106 (1-2), 63–75.
Karl, D.M., Letelier, M., 2008. Nitrogen fixation-enhanced carbon sequestration inlow nitrate, low chlorophyll seascapes. Mar. Ecol. Prog. Ser. 364, 257–268.
Kirchman, D.L., 2000. Uptake and regeneration of inorganic nutrients by marineheterotrophic bacteria. In: Kirchman, D.L. (Ed.), Microbial Ecology of theOceans. Wiley Series in Ecological and Applied Microbiology. Wiley, New York,pp. 261–289
Kristiansen, S., Farbrot, T., Wheeler, P.A., 1994. Nitrogen cycling in the Barents Sea –
seasonal dynamics of new and regenerated production in the marginal icezone. Limnol. Oceanogr. 39 (7), 1630–1642.
Lee, H.S., Kim, K., Whitledge, T.E., 2009. High incorporation of carbon into proteinsby the phytoplankton of the Bering Strait and Chukchi Sea. Cont. Shelf Res. 29,1689–1696.
Lee, S.H., Whitledge, T.E., Kang, S.H., 2007. Recent carbon and nitrogen uptake ratesof phytoplankton in Bering Strait and the Chukchi Sea. Cont. Shelf. Res. 27,2231–2249.
Lin, X., McCarthy, M.J., Carini, S.A., Gardner, W.S., 2011. Net, actual, and potentialsediment–water interface NH4
þfluxes in the northern Gulf of Mexico
(NGOMEX): Evidence for NH4þ limitation of microbial dynamics. Cont. Shelf
Res. 31, 120–128.Mathis, J.T., Bates, N.R., Hansell, D.A., Babilia, T., 2009. Net community production in
the northeast Chukchi Sea. Deep-Sea Res. II 56 (17), 1213–1222.McCarthy, M.J., Gardner, W.S., Lavrentyev, P.J., Jochem, F.J., Williams, C.J., 2009.
Water column nitrogen cycling and microbial plankton in Florida Bay. Control.Mar. Sci. 38, 49–62.
McCarthy, M.J., Lavrentyev, P.J., Yang, L, Zhang, L., Chen, Y., Qin, B., Gardner, W.S.,2007. Nitrogen dynamics and microbial food web structure during a summercyanobacterial bloom in a subtropical, shallow, well-mixed, eutrophic lake(Lake Taihu, China). Hydrobiologia 581, 195–207.
Mengesha, S., Dehairs, F., Fiala, M., Elskens, M., Goeyens, L., 1998. Seasonal variationof phytoplankton community structure and nitrogen uptake regime in theIndian Sector of the Southern Ocean. Polar Biol 20, 259–272.
Miller, C.A., Penry, D.L, Glibert, I.L., 1995. The impact of trophic interactions on ratesof nitrogen regeneration and grazing in Chesapeake Bay. Limnol. Oceanogr. 40,1005–1011.
Naidu, A.S., Cooper, L.W., Finney, B.P., Mcdonald, R.W., Alexander, C., Similetov, I.P.,2000. Organic carbon isotope ratios (δ13C) of Arctic Amerasian Continentalshelf sediments. Int. J. Earth Sci. 89, 522–532.
Needoba, J.A., Sigman, D.M., Harrison, P.J, 2004. The mechanism of isotopefractionation during algal nitrate assimilation as illuminated by the 15N/14N ofintracellular nitrate. J. Phycol. 40, 517–522.
Nikrad, M.P., Cottrell, M.T., Kirchman, D.L., 2012. Abundance and single-cell activityof heterotrophic bacterial groups in the Western Arctic Ocean in summer andwinter. Appl. Eviron. Microbiol. 78 (7), 2402–2409.
Olson, R.J., 1981. 15N tracer studies of the primary nitrite maximum. J. Mar. Res. 39,203–226.
Popova, E.E., Yool, A., Coward, A.C., Aksenov, Y.K., Alderson, S.G., de Cuevas, B.A.,Anderson, T.R., 2010. Control of primary production in the Arctic by nutrientsand light: insights from a high resolution ocean general circulation model.Biogeosci. Discuss 7, 5557–5620.
Post, D.M., 2002. Using stable isotopes to estimate trophic position: models,methods, and assumptions. Ecology 83, 703–718.
Rho, T., Whitledge, T.E., 2007. Characteristics of seasonal and spatial variations ofprimary production over the southeastern Bering Sea shelf. Cont. Shelf Res. 27,2556–2569.
Sigman, D.M., Karsh, K.L., Casiotti, K.L., 2008. Nitrogen isotopes in the ocean, SecondEdition Encyclopedia of Ocean Sciences, pp. 40–54
Sigman, D.M., Albert, M.A., McCorkle, D.C., Francois, R., Fisher, G., 1999. The 15N ofnitrate in the Southern Ocean: consumption of nitrate in surface waters. GlobalBiogeochem. Cycle 13, 1149–1166.
Smith , W.O., Harrison, W.G., 1991. New production in polar regions. The role ofenvironmental controls. Deep-Sea Res. II 38, 1463–1479.
Solomon, C.M., Collier, J.L., Berg, G.M., Gilbert, P.M., 2010. Role of urea in microbialmetabolism in aquatic systems: a biochemical and molecular review. Aquat.Microb. Ecol. 59, 67–88.
Springer, A.M., McRoy, C.P., 1993. The paradox of pelagic food webs in the northernBering Sea. Patterns of primary production. Cont. Shelf Res. 13, 575–579.
Souza, A.C., Kim, I., Gardner, W.S., Dunton, K.H., 2014. Dinitrogen, oxygen, andnutrient fluxes at the sediment-water interface and bottom water physicalmixing on the Eastern Chukchi Sea shelf. Deep-Sea Res II 102, 77–83.
Strom, S.L., Strom, M.W., 1996. Microplankton growth, grazing, and communitystructure in the northern Gulf of Mexico. Mar. Ecol. Prog. Ser. 130, 229–240.
Sukhanova, J,N., Flint, V.M., Pautova, L.A., Stockwell, D.A., Grebmeier, J.M., Serveeva, V.M.,2009. Phytoplankton of western Arctic in the spring and summer of 2002: structureand seasonal changes. Deep-Sea Res. II 56, 1223–1236.
Tupas, L.M., Koike, I., Karl, D.M., Holmhansen, O., 1994. Nitrogen metabolism byheterotrophic bacterial assemblages in Antarctic coastal waters. Polar Biol. 14,195–204.
Walsh, J.J., Dieterle, D.A, Maslowski, W., Grebmeier, J.M., Whitledge, T.E., Flint, M,Sukanova, I.N., Bate, N., Cota, G.F., Stockwell, D., Moran, S.B., Hansen, D.A.,McRoy, P.C., 2005. A numerical model of seasonal primary production withinthe Chukchi/Beaufort Seas. Deep-Sea Res. II 52, 3541–3576.
Wankel, S.D., Kendall, C., Pennington, T., Chavez, F., Paytan, A., 2007. Nitrification inthe euphotic zone as evidenced by nitrate dual isotopic composition: observa-tions from Monterey Bay, California. Global Biogeochem. Cycles 21, GB2009.
Ward, B.B., 2011. Measurement and distribution of nitrification rates in the oceans.Methods Enzymol. 486, 307–323.
Ward, B.B., Kilpatrick, K.A., Renger, E.H., Eppley, R.W., 1989. Biological nitrogencycling in the nitracline. Limnol. Oceanogr. 34, 496–513.
Wassmann, P., 1990. Relationship between primary and export production in theboreal coastal zone of the North Atlantic. Limnol. Oceanogr. 35 (2), 464–471.
A.C. Souza et al. / Deep-Sea Research II 102 (2014) 68–7676