Design of a pilot plant for the recovery of ammonium salts from ...
94
Doble màster en Enginyeria Industrial i Enginyeria Química Design of a pilot plant for the recovery of ammonium salts from WWTP residual water MASTER THESIS Author: Director: Co-director: Cristina López de la Torre Jose Luis Cortina Pallas Mònica Reig i Amat 04 2018 Escola Tècnica Superior d’Enginyeria Industrial de Barcelona Call:
-
Upload
khangminh22 -
Category
Documents
-
view
1 -
download
0
Transcript of Design of a pilot plant for the recovery of ammonium salts from ...
Doble màster en Enginyeria Industrial
i Enginyeria Química
Design of a pilot plant for the recovery
of ammonium salts from WWTP
residual water
MASTER THESIS
Author:
Director:
Co-director:
Cristina López de la Torre
Jose Luis Cortina Pallas
Mònica Reig i Amat 04 2018
Escola Tècnica Superior d’Enginyeria Industrial de Barcelona
Call:
Page 1 Design of a pilot plant for the recovery of ammonium salts from WWTP residual water
During this project, the removal of ammonia from wastewater generated in WWTP using
Hollow Fibre membrane contactors was studied. The objective of this study was to
demonstrate at lab scale the possibility of obtaining concentrated ammonia solution with acid
phosphoric able to be used as fertilizer combining the HFMC with a previous concentration
step using zeolites. With that information, a pilot plant for the technology upscale was
designed considering several requirements.
Theoretical studies were reviewed to create a model for the mass transport through the
hydrophobic membrane. Experimental work was done with synthetic water and real samples
to determine if any component of the real sample could cause interferences with the expected
mass transport. In the experimental work concentrations of ammonia between 1.5 to 5 g/l
were used as feed solution in a contactor (Liqui-Cel 2.5x80 EXT) in a complete recycling
operation in close loop.
The feed and acid initial volume was 60l and 0.5l respectively, with the aim of obtaining a
solution as concentrated as possible. A peristaltic pump was used at 0.45l/min in both shell
and lumen side. The pH was maintained constant using concentrated phosphoric acid (85%),
which was poured according to the required amount of acid. Several experiments were
performed with different initial concentrations and synthetic and real samples.
A model was developed in COMSOL software using the theoretical model and including the
membrane design parameters to obtain a tool that allowed studying the influence of several
parameters of the system. The same model was used for the simulation of different possible
configurations and operation conditions to obtain a final design.
It was demonstrated that the concentration or volume of the acid tank do not influence the
mass transfer. However, the salt concentrations does influence the final concentration since
some water was transported through the membrane, diluting the final product.
The obtained design for the liquid fertilizer production is able to produce 5200l/year and treats
140 m3/year, considering 3000h/year of production time. With the estimated capex, opex and
selling prize, a NPV value of 47.237€ was obtained in an horizon of 5 year with a payback of
3.06 years and IRR of 19%. 23.8 kg of ammonia per year can be successfully inserted in the
Circular Economy thanks to the developed system.
Abstract

Page 3 Design of a pilot plant for the recovery of ammonium salts from WWTP residual water
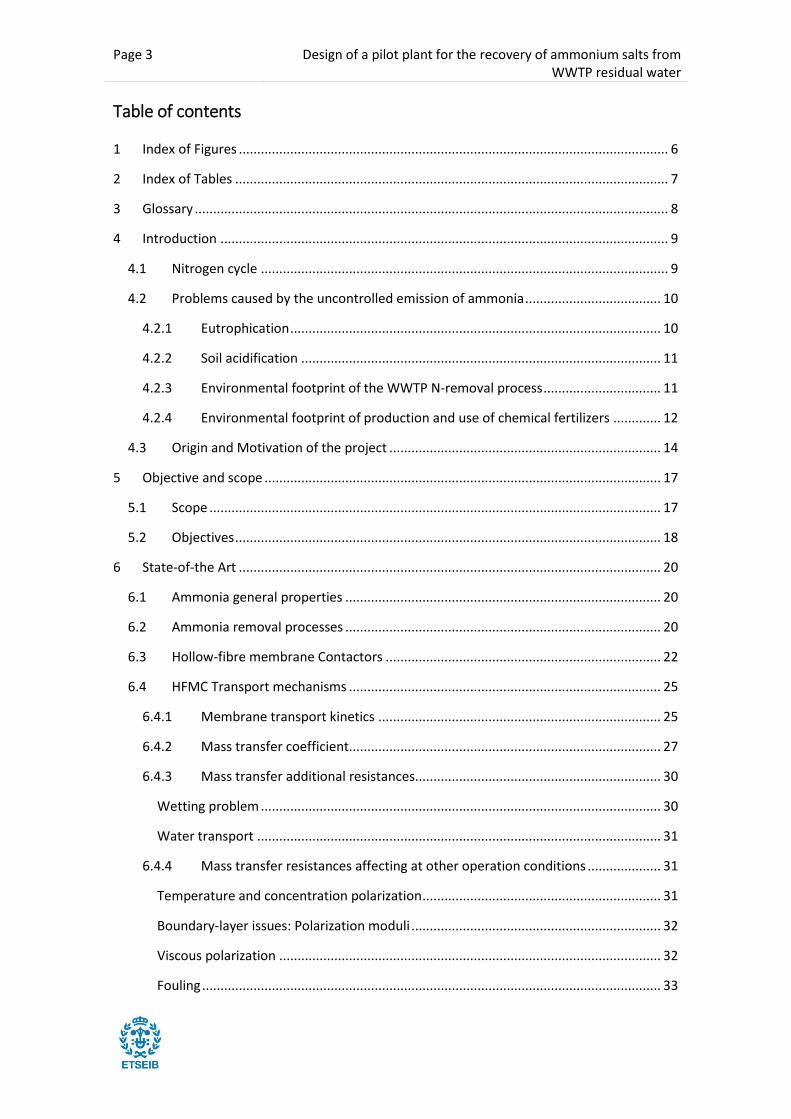
Table of contents
1 Index of Figures ..................................................................................................................... 6
2 Index of Tables ...................................................................................................................... 7
3 Glossary ................................................................................................................................. 8
4 Introduction .......................................................................................................................... 9
4.1 Nitrogen cycle ............................................................................................................... 9
4.2 Problems caused by the uncontrolled emission of ammonia ..................................... 10
4.2.1 Eutrophication ..................................................................................................... 10
4.2.2 Soil acidification .................................................................................................. 11
4.2.3 Environmental footprint of the WWTP N-removal process ................................ 11
4.2.4 Environmental footprint of production and use of chemical fertilizers ............. 12
4.3 Origin and Motivation of the project .......................................................................... 14
5 Objective and scope ............................................................................................................ 17
5.1 Scope ........................................................................................................................... 17
5.2 Objectives .................................................................................................................... 18
6 State-of-the Art ................................................................................................................... 20
6.1 Ammonia general properties ...................................................................................... 20
6.2 Ammonia removal processes ...................................................................................... 20
6.3 Hollow-fibre membrane Contactors ........................................................................... 22
6.4 HFMC Transport mechanisms ..................................................................................... 25
6.4.1 Membrane transport kinetics ............................................................................. 25
6.4.2 Mass transfer coefficient..................................................................................... 27
6.4.3 Mass transfer additional resistances................................................................... 30
Wetting problem ............................................................................................................. 30
Water transport .............................................................................................................. 31
6.4.4 Mass transfer resistances affecting at other operation conditions .................... 31
Temperature and concentration polarization ................................................................. 31
Boundary-layer issues: Polarization moduli .................................................................... 32
Viscous polarization ........................................................................................................ 32
Fouling ............................................................................................................................. 33
Design of a pilot plant for the recovery of ammonium salts from WWTP residual water
Page 4
6.5 Fertilizers ..................................................................................................................... 33
7 Methodology ....................................................................................................................... 36
7.1 Initial conditions .......................................................................................................... 36
7.2 Pretreatment process ................................................................................................. 37
Crystallization of struvite ................................................................................................ 38
Ultrafiltration................................................................................................................... 38
Zeolites ............................................................................................................................ 38
7.3 Experimental methodology ......................................................................................... 40
7.3.1 Samples extraction .............................................................................................. 43
7.3.2 Performed tests ................................................................................................... 43
7.3.3 Analysis of results ................................................................................................ 44
7.4 Numeric simulation ..................................................................................................... 47
7.4.1 Mass balances ..................................................................................................... 48
7.4.2 Simulations performed ........................................................................................ 50
Experiment 4 ................................................................................................................... 52
Experiment 7 ................................................................................................................... 53
7.4.3 Analysis of results ................................................................................................ 54
7.5 Identification of influencing parameters .................................................................... 56
7.5.1 Flow rate .............................................................................................................. 56
7.5.2 Fiber length ......................................................................................................... 57
7.5.3 Feed tank volume ................................................................................................ 58
7.5.4 Stripping solution volume ................................................................................... 60
7.6 Design calculations ...................................................................................................... 61
7.6.1 Production requirements .................................................................................... 61
7.6.2 Scenarios ............................................................................................................. 63
7.6.3 Results ................................................................................................................. 63
7.7 Designed configuration ............................................................................................... 68
8 Economic and environmental global analysis ..................................................................... 70
9 Conclusions ......................................................................................................................... 73
10 Bibliography .................................................................................................................... 75

Page 5 Design of a pilot plant for the recovery of ammonium salts from WWTP residual water
11 Annex............................................................................................................................... 79
11.1 Ammonia general properties ...................................................................................... 79
11.2 Ammonia removal processes ...................................................................................... 80
11.2.1 Introduction to Membrane Distillation ............................................................... 81
11.2.2 Introduction to Osmotic Distillation .................................................................... 85
11.3 Technical specifications of Liqui-Cel HFMC ................................................................. 87
11.4 Material compatibility table ........................................................................................ 89
11.5 HFMC Operation recommendations ........................................................................... 90
11.6 Technical specifications of zeolites columns ............................................................... 91
11.7 Flow diagram ............................................................................................................... 93
Design of a pilot plant for the recovery of ammonium salts from WWTP residual water
Page 6
1 Index of Figures
Fig. 4.1 Simplified nitrogen cycle [2]. ............................................................................................................ 9
Fig. 4.2. Aluminium concentration depending on the soil pH. (Source: [10]) ............................................. 11
Fig. 4.3 Global shares of anthropogenic greenhouse gas emissions along the agri-food supply chain with
breakdown by gas and also for High-GDP and Low-GDP countries (FAO 2011) ......................................... 13
Fig. 6.1 Technologies available for TAN removal from wastewaters. ........................................................ 20
Fig. 6.2. Membrane separation classification. ............................................................................................ 21
Fig. 6.3. Hollow Fibre Membrane Contactor (Source: Liqui-Cel). ................................................................ 22
Fig. 6.4. Transport mechanisms for separation of NH3 through the HFMC [24]. ....................................... 23
Fig. 6.5. Analogous electrical circuit presenting the different transport mechanisms in the dusty gas
model [29]. ................................................................................................................................................. 27
Fig. 6.6 Fertilizer nutrient consumption in the European Union 27. Source: EFMA, 2009. ......................... 35
Fig. 7.1. General diagram flow. (Source: LIFE Enrich Consortium.) ............................................................ 37
Fig. 7.2 Experimental Lay-out of the Liqui-Cel membrane contactor (Source: EQ Department). ............... 41
Fig. 7.3. HFMC used for the experimental tests. ......................................................................................... 42
Fig. 7.4. Linear regression of the mass transfer coefficient with the experimental data. .......................... 44
Fig. 7.5. Regression of the experimental values of added acid (g) vs ammonia transported (g) of
experiments 4, 5 and 7. .............................................................................................................................. 45
Fig. 7.6. Correlation of water transported vs ammonia in experiment 4. .................................................. 46
Fig. 7.7. Determination of the influence of feed volumes during the experiment. ..................................... 47
Fig. 7.8 Variation of the Ammonia concentration at lumen in experiment 4. ............................................ 52
Fig. 7.9 Variation of the Ammonia concentration at lumen in experiment 7. ............................................ 53
Fig. 7.10 Simulated Ammonia concentration at lumen in experiment 7 at time=0, 10 min, 5h. ................ 54
Fig. 7.11. Determination of the influence of the flow rate in the mass transfer. ....................................... 56
Fig. 7.12. Variation of concentration depending on fiber length................................................................ 57
Fig. 7.13. Variation of ammonia concentration in FT according to different values of FT volume (m3) ..... 58
Fig. 7.14. Variation of ammonia transported moles in FT according to different values of FT volume (m3).
.................................................................................................................................................................... 59
Fig. 7.15. Influence of AT volume (m3) in the FT concentration. ................................................................. 60
Fig. 7.16. Influence of AT volume (m3) in product concentration. .............................................................. 60
Fig. 7.17. Design flow rate limitations. ....................................................................................................... 61
Fig. 7.18. Operation parameters of the scenario 2. .................................................................................... 66
Fig. 7.19. Operation parameters of the scenario 4. .................................................................................... 67
Fig. 11.1 Ammonium and ammonia distribution as a function of pH. [43] ............................................... 79
Fig. 11.2. Membrane configurations [47]. .................................................................................................. 82
Fig. 11.3. Membrane distillation mass transport [48]. ............................................................................... 82
Page 7 Design of a pilot plant for the recovery of ammonium salts from WWTP residual water
2 Index of Tables
Table 4.1. N fertilizer applied (kg/ha) for the major UK crops.[2] .............................................................. 13
Table 4.2. Council Directive 91/271/EEC of 21 May 1991 phosphorus and ammonia discharge limits. .... 14
Table 4.3. Discharge limits for industrial waters. (Environment Protection Act 2002, General Notice No.
44. of 2003) ................................................................................................................................................ 15
Table 6.1. Operational requirements of HFMC (Taylor, 2013). .................................................................. 24
Table 6.2. N fertilizers source. .................................................................................................................... 34
Table 6.3. Fertilizer Spanish market data. (Source: ANFFE). ....................................................................... 35
Table 7.1. Inlet waste water composition. ................................................................................................. 37
Table 7.2. Operative conditions of the experiments performed. ................................................................ 42
Table 7.3. 3M Liqui-Cel specifications......................................................................................................... 42
Table 7.4. Mass transfer coefficients obtained. On experiment 1-10 ......................................................... 44
Table 7.5. Weight variations in AT, concentrated acid tank. ...................................................................... 45
Table 7.6. Calculated average values of Km depending on the volume ratio. ............................................. 47
Table 7.7. Parameters introduced in COMSOL® software. ......................................................................... 50
Table 7.8. Sensitivity analysis of the influence of flow rate. ....................................................................... 56
Table 7.9. Sensitivity analysis of the fiber length parameter. .................................................................... 57
Table 7.10. Sensitivity analysis of the Feed tank volume parameter.......................................................... 59
Table 7.11. Sensitivity analysis of the AT volume parameter regarding the concentration in both tanks. 60
Table 7.12. Commercially available contactors studied. ............................................................................ 62
Table 7.13. Results obtained for Option 1 design. ...................................................................................... 64
Table 7.14. Results obtained for Option 2 design. ...................................................................................... 64
Table 7.15. Results obtained for Option 3 design. ...................................................................................... 65
Table 7.16. Results obtained for Option 4 design. ...................................................................................... 65
Table 8.1. Economic feasibility study of the scenario 2 pilot plant in a 5 years horizon. ............................ 70
Table 8.2. Economic feasibility study of the scenario 4 pilot plant in a 5 years horizon. ............................ 71
Table 8.2. Engineering costs [44]. ............................................................................................................... 71
Table 11.1. General properties of Ammonia. ............................................................................................. 79
Table 11.2. Comparative of Membrane distillation with forward osmosis. ............................................... 83
Design of a pilot plant for the recovery of ammonium salts from WWTP residual water
Page 8
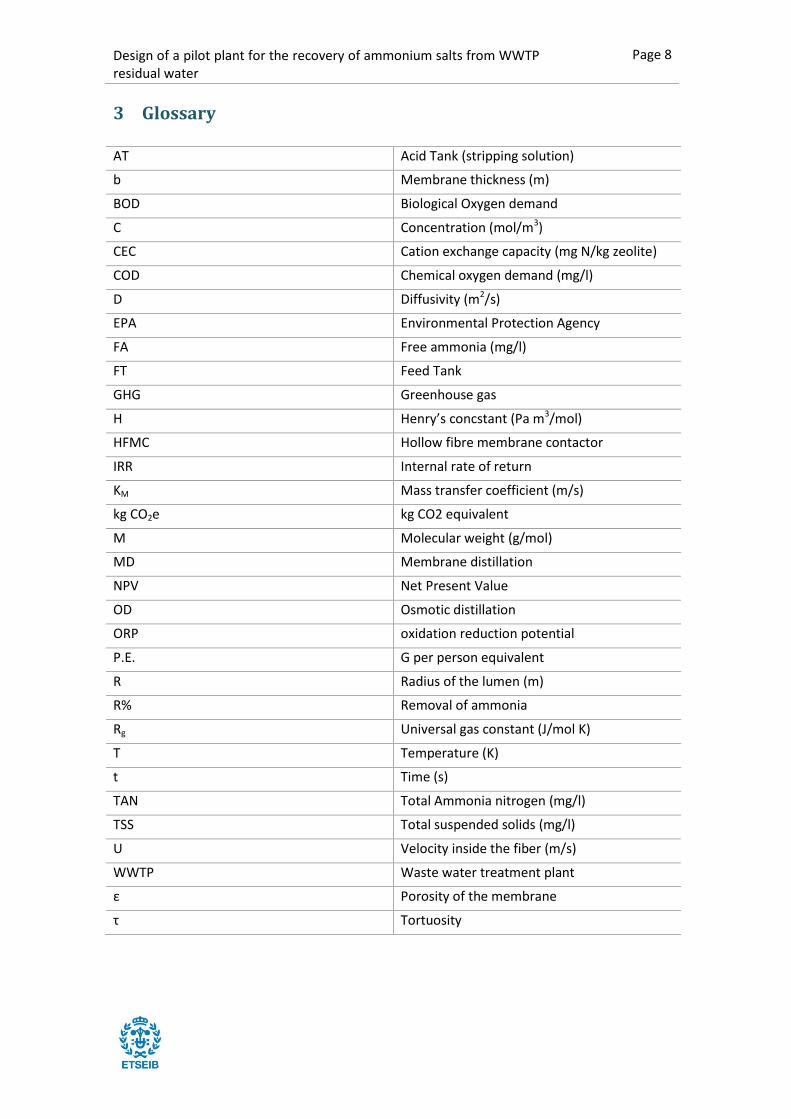
3 Glossary
AT Acid Tank (stripping solution)
b Membrane thickness (m)
BOD Biological Oxygen demand
C Concentration (mol/m3)
CEC Cation exchange capacity (mg N/kg zeolite)
COD Chemical oxygen demand (mg/l)
D Diffusivity (m2/s)
EPA Environmental Protection Agency
FA Free ammonia (mg/l)
FT Feed Tank
GHG Greenhouse gas
H Henry’s concstant (Pa m3/mol)
HFMC Hollow fibre membrane contactor
IRR Internal rate of return
KM Mass transfer coefficient (m/s)
kg CO2e kg CO2 equivalent
M Molecular weight (g/mol)
MD Membrane distillation
NPV Net Present Value
OD Osmotic distillation
ORP oxidation reduction potential
P.E. G per person equivalent
R Radius of the lumen (m)
R% Removal of ammonia
Rg Universal gas constant (J/mol K)
T Temperature (K)
t Time (s)
TAN Total Ammonia nitrogen (mg/l)
TSS Total suspended solids (mg/l)
U Velocity inside the fiber (m/s)
WWTP Waste water treatment plant
ε Porosity of the membrane
τ Tortuosity
Page 9 Design of a pilot plant for the recovery of ammonium salts from WWTP residual water
4 Introduction
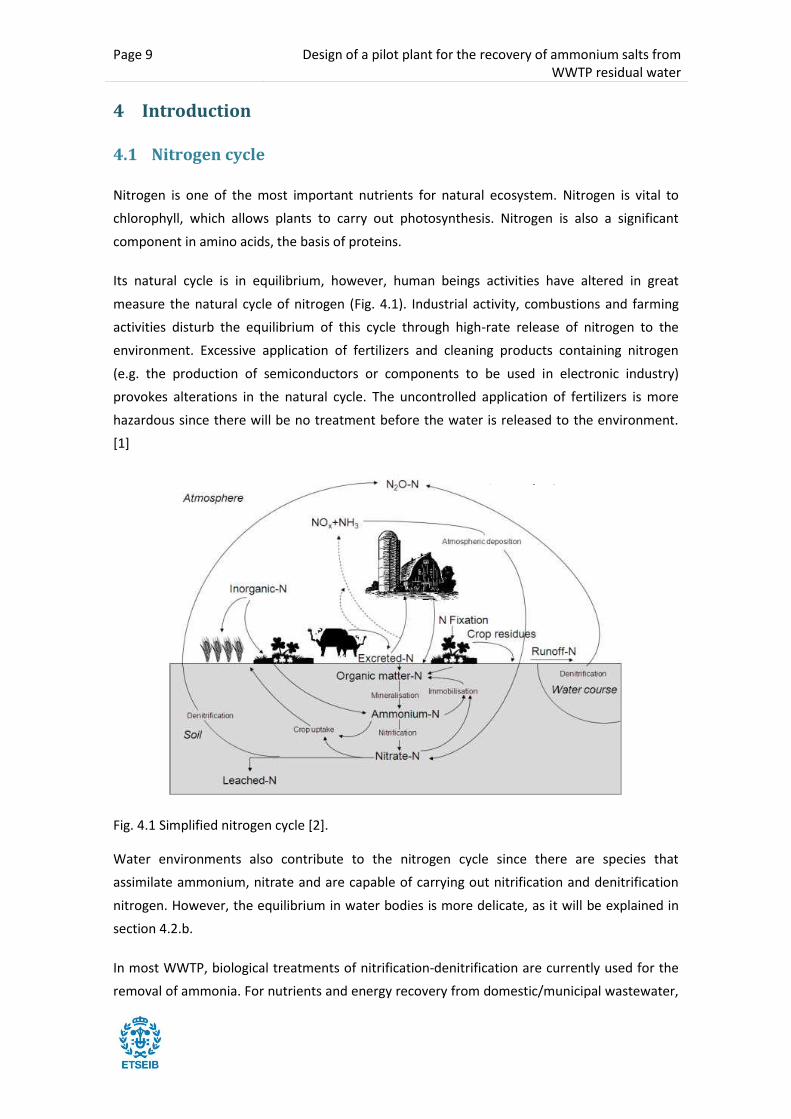
4.1 Nitrogen cycle
Nitrogen is one of the most important nutrients for natural ecosystem. Nitrogen is vital to
chlorophyll, which allows plants to carry out photosynthesis. Nitrogen is also a significant
component in amino acids, the basis of proteins.
Its natural cycle is in equilibrium, however, human beings activities have altered in great
measure the natural cycle of nitrogen (Fig. 4.1). Industrial activity, combustions and farming
activities disturb the equilibrium of this cycle through high-rate release of nitrogen to the
environment. Excessive application of fertilizers and cleaning products containing nitrogen
(e.g. the production of semiconductors or components to be used in electronic industry)
provokes alterations in the natural cycle. The uncontrolled application of fertilizers is more
hazardous since there will be no treatment before the water is released to the environment.
[1]
Fig. 4.1 Simplified nitrogen cycle [2].
Water environments also contribute to the nitrogen cycle since there are species that
assimilate ammonium, nitrate and are capable of carrying out nitrification and denitrification
nitrogen. However, the equilibrium in water bodies is more delicate, as it will be explained in
section 4.2.b.
In most WWTP, biological treatments of nitrification-denitrification are currently used for the
removal of ammonia. For nutrients and energy recovery from domestic/municipal wastewater,
NO
3-
NO2
-
NH
4+
4-
Atmospheric
N2
4-
Design of a pilot plant for the recovery of ammonium salts from WWTP residual water
Page 10
a major barrier is the low-strength nature of wastewater, which significantly impacts its
recovery efficiency and cost-effectiveness.
Obtaining a concentrate with high concentration of chemical oxygen demand (COD) and
nutrients such as nitrogen and phosphorus at a competitive price would make economically
feasible methods for its recovery instead of its removal.
4.2 Problems caused by the uncontrolled emission of ammonia
4.2.1 Eutrophication
The excessive and uncontrolled release of ammonia can cause eutrophication, which means
well nourished. This process can affect both aquatic and terrestrial ecosystems. Around 33% of
European monitoring stations in rivers and lakes show signs of eutrophication, as well as some
coastal waters [3], [4].
In the case of aquatic eutrophication, the excessive growth of plant and algae due to the
excess of nutrients reduces light penetration, reducing growth and causing die-offs of plants.
After the dense algal blooms die, microbial decomposition severely depletes dissolved oxygen,
creating a hypoxing or anoxic ‘dead zone’ depriving fish and other organisms of oxygen [5], [6].
Also, some algal blooms produce noxious toxins (e.g. microcystin and anatoxin-a)[7]. The
natural ecosystem is almost irreversible altered.
In effluents from a livestock production, N is present in organic form (amino acids, proteins
and urea). The degradation of this organic N at low oxidation reduction potential results in
NH4+ / NH3, also known as N mineralization. One of the main conversion reactions of organic N
to inorganic occurred by urea hydrolysis generating NH3 due to catalysis by an enzyme called
urease.
(Eq. 4.1)
Total ammonia nitrogen (TAN) should be handled to avoid environmental degradation. When
effluents with TAN are disposed in water bodies, the first adverse effect is the dissolved
oxygen depletion in the water due to its high nitrogenous oxygen demand for TAN oxidation to
NO3-.
(Eq. 4.2)
(Eq. 4.3)
Oxidized species of N nitrite NO2- and NO3
- may also affect the environment due to the toxicity
of these ions as nitrosamines generation and as a methaemoglobinemie [8].
Page 11 Design of a pilot plant for the recovery of ammonium salts from WWTP residual water
4.2.2 Soil acidification
As active chemical species, ammonia in atmosphere oxidizes and when it is washed out by rain,
it forms nitric and nitrous acid. The acid acts as a proton donor in the soil. As a consequence,
acidic rains increase acidification problem in soil and ground water.
Ammonium based fertilizers are major contributors to this problem. When applying these
fertilizers, ammonium nitrogen is readily converted to nitrate and hydrogen ions in the soil. If
the nitrate is not taken-up by plants in the same velocity, it can leach away from the root zone
leaving behind hydrogen ions, increasing soil acidity [1], [9].
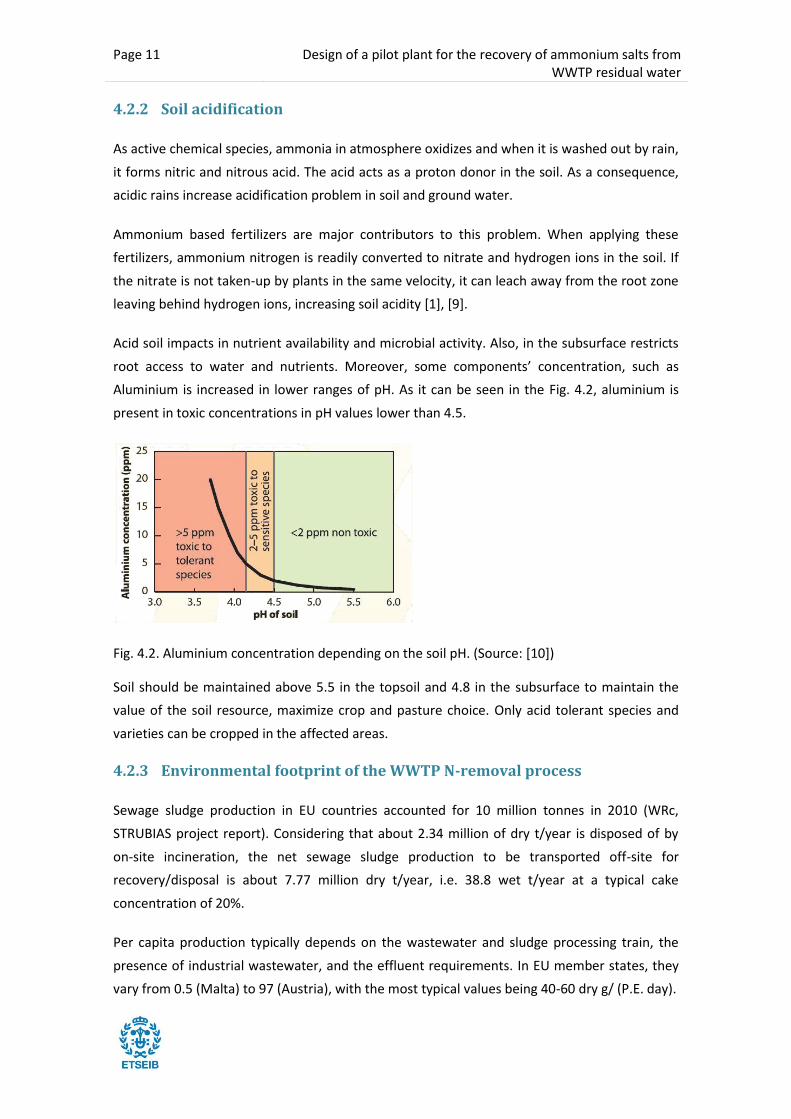
Acid soil impacts in nutrient availability and microbial activity. Also, in the subsurface restricts
root access to water and nutrients. Moreover, some components’ concentration, such as
Aluminium is increased in lower ranges of pH. As it can be seen in the Fig. 4.2, aluminium is
present in toxic concentrations in pH values lower than 4.5.
Fig. 4.2. Aluminium concentration depending on the soil pH. (Source: [10])
Soil should be maintained above 5.5 in the topsoil and 4.8 in the subsurface to maintain the
value of the soil resource, maximize crop and pasture choice. Only acid tolerant species and
varieties can be cropped in the affected areas.
4.2.3 Environmental footprint of the WWTP N-removal process
Sewage sludge production in EU countries accounted for 10 million tonnes in 2010 (WRc,
STRUBIAS project report). Considering that about 2.34 million of dry t/year is disposed of by
on-site incineration, the net sewage sludge production to be transported off-site for
recovery/disposal is about 7.77 million dry t/year, i.e. 38.8 wet t/year at a typical cake
concentration of 20%.
Per capita production typically depends on the wastewater and sludge processing train, the
presence of industrial wastewater, and the effluent requirements. In EU member states, they
vary from 0.5 (Malta) to 97 (Austria), with the most typical values being 40-60 dry g/ (P.E. day).
Design of a pilot plant for the recovery of ammonium salts from WWTP residual water
Page 12
Taking into account the large amount of sludge generated by the different EU countries, it is
advisable to increase the recirculation of nutrients in our society. It is essential to provide data
justifying the long-term benefits of organic matter in soil and especially, to conscious users
(farmers and the fertilizer industry).
Controlled Struvite precipitation leads to an improvement in dewaterability of the digested
sludge, which eventually leads to lower volumes of dewatered sludge that need to be disposed
[11]. The same author reported an increase of dryness of the dewatered sludge can be
improved with at least 2% (from 22 to 24%). For a WWTP similar than Murcia Este (500,000
PE), this would represent 5,700 tonnes of sludge/year avoided.
The average carbon footprint of Biological N-removal is around 4 kg CO2/kg N. The produced
by-product is N2 which is directly released to the environment. Also, this system is very
sensitive to operation conditions such as pH, T and requires of high adaptation in the transient
stage when starting-up the reactors [12].
The carbon footprint analysis for WWTP using Anaerobic Digestion results in a total emission
of approx. 36 kg CO2e/P.E./year. The impact of indirect CO2e emission caused by the electricity
consumption of the WWTP is much lower compared to direct N2O emission (16 vs 43% of the
total emission), resulting from the biological nitrogen removal processes. Additionally, there
are some direct emissions of CO2 from the secondary biological treatment process as a result
of respiration of organic matter.
In the case of WWTP with Simultaneous aerobic sludge stabilization, the carbon footprint is
slightly lower (24 kg CO2e/P.E./year). 60% of the CO2e emission is caused by electricity
consumption. Since higher degree of total nitrogen is removed, the direct N2O emission is
much lower (1.3 kg CO2e/P.E./year). CH4 emissions arising from the long term storage of
dewatered biosolids contribute with 19% of the total emission [13].
The integration of alternative processes for the nitrogen recovery could have a positive impact
on the WWTPs’ carbon footprint by reducing the direct and indirect emissions resulting of the
secondary biological treatment process, to contribute to the achievement of the Water
Framework Directive requirements, including the Urban Waste Water Treatment Directive
(91/271/EEC).
4.2.4 Environmental footprint of production and use of chemical fertilizers
Mineral nutrient demand worldwide stood for 117.9, 45.7 and 33.5 million tons of N,
phosphate (P2O5) and potash (K2O) respectively during 2017 [14]. The average carbon footprint
for AN-based fertilizers is between 3-3.2 t CO2 e/t N [15]. Thus, the fertilizer production
approximately releases up to 575 million tons CO2 e/year [16].
Page 13 Design of a pilot plant for the recovery of ammonium salts from WWTP residual water
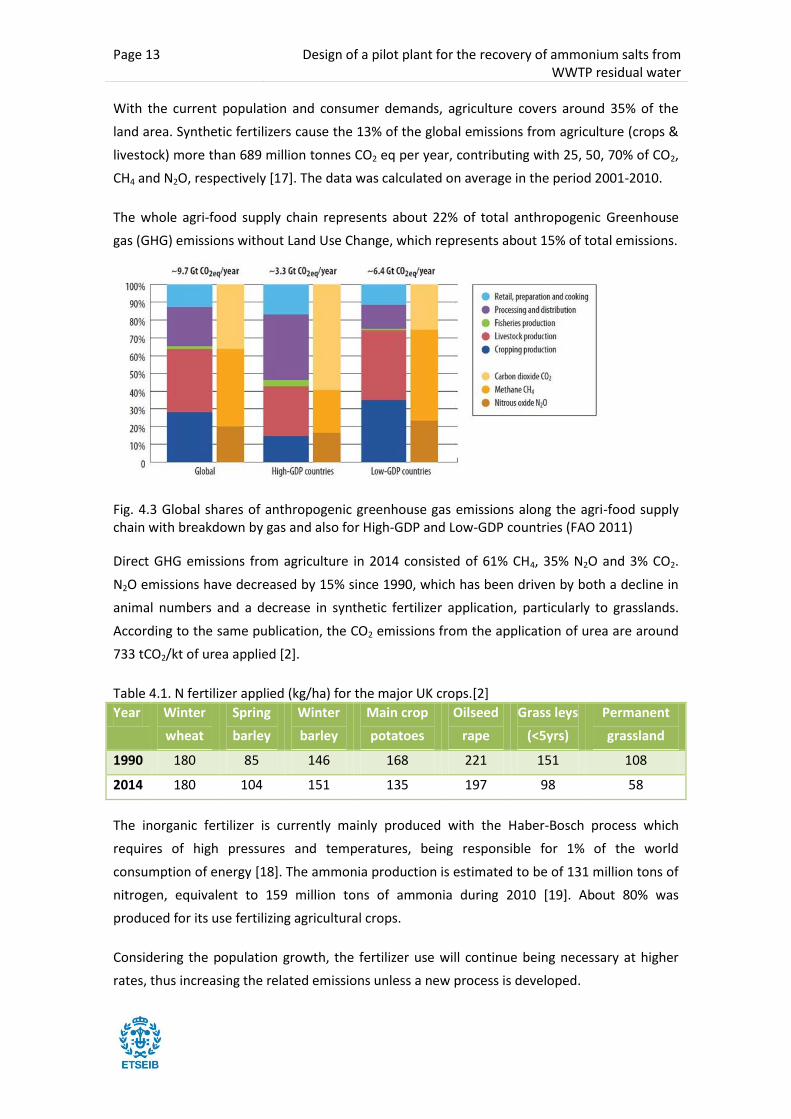
With the current population and consumer demands, agriculture covers around 35% of the
land area. Synthetic fertilizers cause the 13% of the global emissions from agriculture (crops &
livestock) more than 689 million tonnes CO2 eq per year, contributing with 25, 50, 70% of CO2,
CH4 and N2O, respectively [17]. The data was calculated on average in the period 2001-2010.
The whole agri-food supply chain represents about 22% of total anthropogenic Greenhouse
gas (GHG) emissions without Land Use Change, which represents about 15% of total emissions.
Fig. 4.3 Global shares of anthropogenic greenhouse gas emissions along the agri-food supply chain with breakdown by gas and also for High-GDP and Low-GDP countries (FAO 2011)
Direct GHG emissions from agriculture in 2014 consisted of 61% CH4, 35% N2O and 3% CO2.
N2O emissions have decreased by 15% since 1990, which has been driven by both a decline in
animal numbers and a decrease in synthetic fertilizer application, particularly to grasslands.
According to the same publication, the CO2 emissions from the application of urea are around
733 tCO2/kt of urea applied [2].
Table 4.1. N fertilizer applied (kg/ha) for the major UK crops.[2]
Year Winter
wheat
Spring
barley
Winter
barley
Main crop
potatoes
Oilseed
rape
Grass leys
(<5yrs)
Permanent
grassland
1990 180 85 146 168 221 151 108
2014 180 104 151 135 197 98 58
The inorganic fertilizer is currently mainly produced with the Haber-Bosch process which
requires of high pressures and temperatures, being responsible for 1% of the world
consumption of energy [18]. The ammonia production is estimated to be of 131 million tons of
nitrogen, equivalent to 159 million tons of ammonia during 2010 [19]. About 80% was
produced for its use fertilizing agricultural crops.
Considering the population growth, the fertilizer use will continue being necessary at higher
rates, thus increasing the related emissions unless a new process is developed.
Design of a pilot plant for the recovery of ammonium salts from WWTP residual water
Page 14
4.3 Origin and Motivation of the project
The current system for the treatment of waste water implies a great loss and uncontrolled
emission of nutrients in the nature. At the same time, the intensive agriculture demands
fertilizers rich in nutrients to maximize production of different crops. Both practices could be
avoided by the efficient recovery of certain nutrients and its transformation in fertilizers.
Introduction of Circular Economy principles with double benefit: savings in raw material and as
a required contribution to the water treatment.
In order to mitigate the anthropogenic impact on the environment, the eutrophication
problem is addressed in two European directives: the Urban Wastewater Treatment Directive
(91/271/EEC), which limits the municipal wastewater discharges, and the Nitrates Directive
(91/676/EEC), which deals with diffuse pollution of nitrogen from agriculture.
New and more restrictive environmental controls and/or regulations may come into being,
which increases the need for effective and affordable systems for ammonia removal from
fluids used in industrial processes. In Netherlands the limits are even more restrictive (5 and
0.5 mg/L for nitrogen and phosphorus respectively). The suggested acceptable total
phosphorus concentration in lakes should not exceed 0.05mg/l[6], [20]. United States
Environmental Protection Agency (EPA) has already applied numeric nutrient criteria specific
for each state limiting total phosphorus and ammonia limits in lakes and other waterbodies1.
According to the Council Directive 91/271/EEC of 21 May 1991 concerning urban waste-water
treatment, there is a special requirement for discharges from urban waste water treatment
plants that applies to discharges in sensitive areas subject to eutrophication. One or both
parameters may be applied depending on the situation. The same limits of emission are
regulated by the Royal Decree-Lay 11/95 and Royal Decree 509/96 at Spanish level.
Table 4.2. Council Directive 91/271/EEC of 21 May 1991 phosphorus and ammonia discharge limits.
Parameter Concentration Minimum % of
reduction Reference method of measurement
Total phosphorus
2mg/l P (10,000-100,000 P.E.2) 1 mg/l P (more than 100,000 P.E.)
80 Molecular absorption spectophotometry
1The specific limits applied to each state can be consulted in this link: https://www.epa.gov/nutrient-
policy-data/state-progress-toward-developing-numeric-nutrient-water-quality-criteria 2 1 p.e. (population equivalent) means the organic biodegradable load having a five-day biochemical
oxygen demand (BOD5) of 60 g of oxygen per day.
Page 15 Design of a pilot plant for the recovery of ammonium salts from WWTP residual water
Total nitrogen
15 mg/l N (10 000-100 000 P.E.) 10 mg/l N (more than 100 000 P.E.)3
70-80 Molecular absorption spectophotometry
The reduction is measured in relation to the load of the influent. The total nitrogen is
calculated as the sum of total Kjeldahl-nitrogen (organic N+NH4), nitrate (NO3-) nitrogen and
nitrite (NO2-) nitrogen.
The locations described as sensitive area are fresh water lakes and other fresh water such as
estuary and coastal waters that could suffer eutrophication. Also, surface fresh water that
could be used for the production of drinking water that could achieve a nitrate concentration
above 50 mg/l is classified as sensitive areas. Finally, the same limit levels are applied to waters
that need a second treatment to meet the law requirements.
The primary treatment by physical and/or chemical treatment achieves a reduction of BOD5 of
20% and the TSS of 50%. The secondary treatment would be any additional treatment that is
needed in order to meet the requirements.
Regarding the industrial waters, the Standards for Effluent Discharge Regulations (The
Environment Protection Act 2002, General Notice No. 44. of 2003) also established limitations
for the effluents discharged (Table 4.3).
Table 4.3. Discharge limits for industrial waters. (Environment Protection Act 2002, General Notice No. 44. of 2003)
Parameter Units Concentration
Ammoniacal Nitrogen mg/l 1
Nitrate as N mg/l 10
Total Kjeldahl Nitrogen (TKN) mg/l 25
Nitrite as N mg/l 1
Due to the importance of this issue, the Nitrated Directive launched by the European
Commission establishes discharge concentration limits at 170 kg nitrogen per hectare per year
from livestock manure.
Using fertilizers recovered from wastewater at WWTPs, like the struvite and other nitrogen-
based fertilizers, could help reduce the emissions related to agricultural activities. A shift
3 Alternatively, the daily average must not exceed 20mg/l N. This requirement referes to a water
temperature of 12ºC or more during the operation of the biological reactor of the WWTP. As a substitute for the condition concerning the temperature, it is possible to apply a limited time of operation, which takes into account the regional climatic conditions. This alternative applies if it can be shown that paragraph 1 of Annex I.D is fulfilled.
Design of a pilot plant for the recovery of ammonium salts from WWTP residual water
Page 16
towards fertiliser production from organic or secondary raw materials would also reduce CO2
emissions, hence contributing towards a low carbon economy and the sustainability of the
fertilisers sector (Directive 2006/116).
Although several technological alternatives are available for ammonia recovery (steam and air
stripping, electrochemical recovery), N-recovery costs (around 4€/kgN) exceed today N-
removal costs (around 1€/kgN) by a factor of 4 (internal studies in Cetaqua). Within this
context, membrane contactors appear as a promising technology to reduce N-recovery costs
as operation at moderate pH and ambient temperatures is possible [21].
Therefore, the motivation to carry out this project is to provide a pilot plant that allows the
demonstration of a new efficient and competitive process to recover Ammonia from Waste
Water Treatment Plants and valorise those nutrients as fertilizer for its use in agriculture.

Page 17 Design of a pilot plant for the recovery of ammonium salts from WWTP residual water
5 Objective and scope
5.1 Scope
This project is a part of the LIFE ENRICH European Project which intends to demonstrate at
pilot scale a process to recover both phosphor and ammonia from the centrates of WWTP and
the supernatant out-coming from the Anaerobic Digester. The Phosphorus recovery unit will
be formed by a crystallization unit which will crystallize Struvite. This unit will not be a part of
this project. However, the process influences the N-recovery since the out-coming flow of the
crystallization unit is the flow that will be used for this process. Thus, its characteristics will be
taken as input variable.
This project is focused in the recovery of ammonia using zeolites columns combined with
membrane contactors. The zeolites process was already tested at pilot-scale in a previously
developed project: LIFE Necovery (treatment capacity 1m3/h), demonstrating ammonium
adsorption with efficiencies over 99%. Thus, the main objective will be to integrate the
membrane contactors technology which is the main separation step.
The pilot plant design will be implemented in Murcia Este WWTP. Produced liquid fertilizer will
be tested in Field tests in order to prove in different conditions its safety and effect in the
productivity in different European Mediterranean crops.
Greenhouse tests. The experiments will be done in a passively ventilated multi-span single-
layer polyethylene greenhouse with 250m2 of surface are. The water and nutrient supply
will be made via fertiirrigation with 2L/h drip emitters, while attempting to keep the
leachate levels at around 30-40%.
Open air tests. Experiments will be done at open field with a surface area of 300m2 at a
plant density of 7 plants/m2. The experiment will be randomized block design with three
replicates per treatment, resulting in 6 plots of about 42m2 each.
For the greenhouse tests around 300kg of fertilizer will be required for each year of testing.
Regarding open air tests, about 100 kg of fertilizer will be used per year.
The performance of the developed fertilizers will serve as precedent and proof of the fertilizer
efficiency and safety and product analytical procedures in order to favour the certification of
these products to overcome the regulatory barrier. The aim of introducing the membrane
contactors technology is to demonstrate a process that is profitable to provide an
economically attractive recovery of the nutrients present in wastewater.
Design of a pilot plant for the recovery of ammonium salts from WWTP residual water
Page 18
5.2 Objectives
The general objective is the design of a pilot plant for the demonstration of the LIFE ENRICH
technology for the recovery of the Ammonia present in waste water flow to produce fertilizer.
This objective will be achieved by obtaining the following objectives:
- Validating the performance of a HFMC in liquid-liquid operation in the desired range of
initial concentration (up to 4gN/l) using phosphoric acid as stripping solution with
experimental data.
- Critical review of the available literature to select the applicable theoretical model
description of mass transfer phenomena.
- Creating a model that allows the simulation and theoretical study of the desired
process.
- Validate the model cross-checking the data with laboratory experimental data using
HFMCs.
- Analyse the influencing parameters that determine the separation process
performance.
- Simulate with the model the ammonia recovery as a function o the main process
parameters.
- Design the equipment and flow diagram required to satisfy the required production
(around 400 kg of fertilizer 5-14-0 of N: P2O5: K2O per year). The pilot plant will be
located in the facilities of Murcia Este WWTP.
- Regarding the ammonia recovery, the following specific objectives for the pilot plant
performance should be remarked:
o Achieve target elimination: >90-95% of N coming from zeolites.
o Concentrate NH3 for the production of fertilizer: >5-10%
o One of the essential parameters to achieve this objective is the use of highly
pure acid (85% H3PO4)
o Reduce and minimize the transport of vapour water through the hydrophobic
porous membranes
o Evaluation of recirculation protocols to reduce membrane area foot-print:
o Evaluation of membrane contactors in series: a first step could be from 1800
to 1300, 1300 to 700 and 700 to 200.
o Parallel: from 1800 to 600 with two contactors.
Amongst the solution of liquid nitrogen (NH3 (l), 40g/l N2O4, 3,5g/l NH3) a certain amount of
nitrogen is available in gas phase, which will go through the porous membrane to dissolve
again in the acid (NH4H2PO4, 200-500g/l).
Page 19 Design of a pilot plant for the recovery of ammonium salts from WWTP residual water
The expected objectives to be achieved when applying the LIFE ENRICH technologies to the
WWTP are the following:
- Recovery of at least 15% of N of the whole WWTP and an 80% of P of the whole WWTP
(>50% as struvite).
- Total OPEX are expected to decrease a 10% considering the savings on:
Energy for aeration (15% of reduction in aeration requirements (associated to
N and P biological removal) are expected.
Sludge disposal. 15% of sludge disposal could be avoided by the controlled
struvite precipitation.
Uncontrolled precipitation could be greatly reduced, with a reduction in
maintenance costs of more than 50%.
Reduction of 80-90% of the emissions associated to the conventional N-
fertilizer production processes, which range between 1.0 and 8.5 kg CO2 eq/kg
fertilizer (depending on the product and the source).
25% reduction of N2O emissions by an efficient strategy of fertilizer
management, in relation to actual practices.

Design of a pilot plant for the recovery of ammonium salts from WWTP residual water
Page 20
6 State-of-the Art
6.1 Ammonia general properties
Nitrogen in liquid phase may be present in different forms from a much reduced state (-3) e.g.:
NH3, to a highly oxidized form (+5) e.g.: NO3-.The presence or absence of these forms is a
function of oxidation reduction potential (ORP) of the effluent and pH. At anaerobic conditions
at low ORP, the reduced N form is prevalent as NH4+ and/or NH3, expressed as Total
Ammoniacal Nitrogen (TAN: NH3+ NH4+) [8]. More information can be found in section 11.1.
6.2 Ammonia removal processes
Several technologies are available for TAN removal from wastewaters (Fig. 6.1, section 0). The
factors that should be reviewed to select the best procedure to remove ammonia from
wastewater effluents are the following: contamination level of the wastewater to be treated,
plant safety and regulatory considerations, boundary conditions of wastewater and plant site
(pH level, composition, availability of waste heat source and chemicals to perform separation
process).
As it has been previously introduced, currently most of the WWTP remove ammonia instead of
recovering because no feasible technology has been proved that was also economically
feasible. Conventional methods currently used include lime treatment and aeration, stripping
can be costly and inefficient. The used air cannot be discharged before another treatment
stage.
Fig. 6.1 Technologies available for TAN removal from wastewaters.
During this project, the membrane separation methods have been reviewed. Membrane based
gas absorption/stripping processes present attractive advantages compared to the traditional
TAN removal processes alternatives
Biological
Fixed film Suspended
biomass
Chemical
Breakpoint chlorination
Precipitation
Physical
Ammonia Stripping
Membrane separation
Page 21 Design of a pilot plant for the recovery of ammonium salts from WWTP residual water
methods. These provide larger interfacial area per unit volume without dispersion of both
phases and more controllable gas and liquid flow rates. There is no convective flow through
the pores. These membrane separation processes are being studied but are not popular
commercially.
The separation process performed with hydrophobic membranes is named membrane
distillation or osmotic distillation (Annex 19.2) since the objective is the separation of a gas
from a liquid solution. Membrane distillation (MD) is a separation process in which a liquid
mixture containing a volatile component is contacted with a microporous, non-liquid-wettable
membrane whose opposite surface is exposed to a second liquid phase capable of absorbing
that volatile component.
Osmotic distillation (OD) is referred as an isothermal technology used to remove water from
aqueous solutions (i.e., concentration of wastewaters and recovery of valuable components)
using a porous and hydrophobic membrane that separates the feed solution.
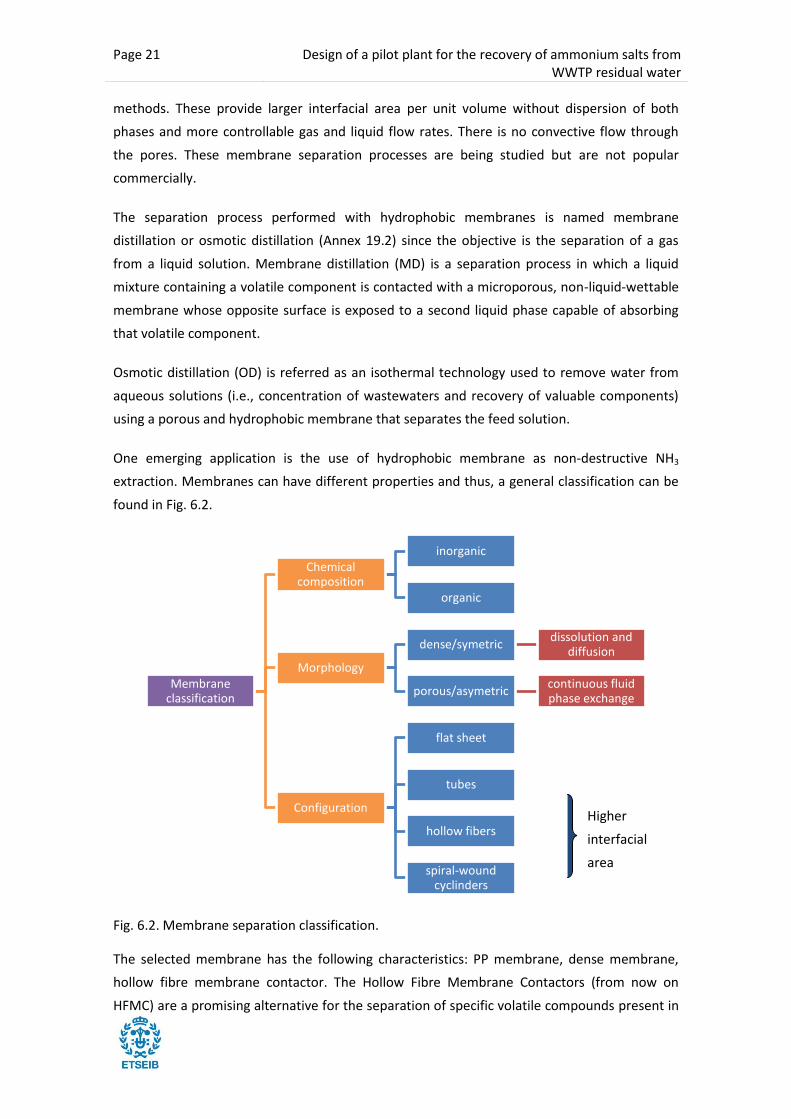
One emerging application is the use of hydrophobic membrane as non-destructive NH3
extraction. Membranes can have different properties and thus, a general classification can be
found in Fig. 6.2.
Fig. 6.2. Membrane separation classification.
The selected membrane has the following characteristics: PP membrane, dense membrane,
hollow fibre membrane contactor. The Hollow Fibre Membrane Contactors (from now on
HFMC) are a promising alternative for the separation of specific volatile compounds present in
Membrane classification
Chemical composition
inorganic
organic
Morphology
dense/symetric dissolution and
diffusion
porous/asymetric continuous fluid phase exchange
Configuration
flat sheet
tubes
hollow fibers
spiral-wound cyclinders
Higher
interfacial
area
Design of a pilot plant for the recovery of ammonium salts from WWTP residual water
Page 22
an aqueous solution with low operational costs. In the developed flow diagram, the HFMC are
fed with the regeneration stream of the zeolite columns, offering the possibility of recovering
the ammonia in a concentrated flow in the form of salts.
6.3 Hollow-fibre membrane Contactors
Hollow-fibre membrane contactors are used to bring two fluid phases (two liquid phases or a
gas and a liquid) into contact to effect separation and/or transfer of one or more components
from one fluid to the other without mixing. Both sides of the membrane are in contact with
the membrane that avoids direct contact. The driving force of the separation is the difference
of concentration[22].
These membranes are hydrophobic, thus only allowing the transfer of the volatile substances
present in the flows. Only volatile species that have a high concentration gradient will have
enough driving force to be separated. Among the benefits of this property, it should be noted
that this device allows the separation in completely miscible to immiscible solutions.
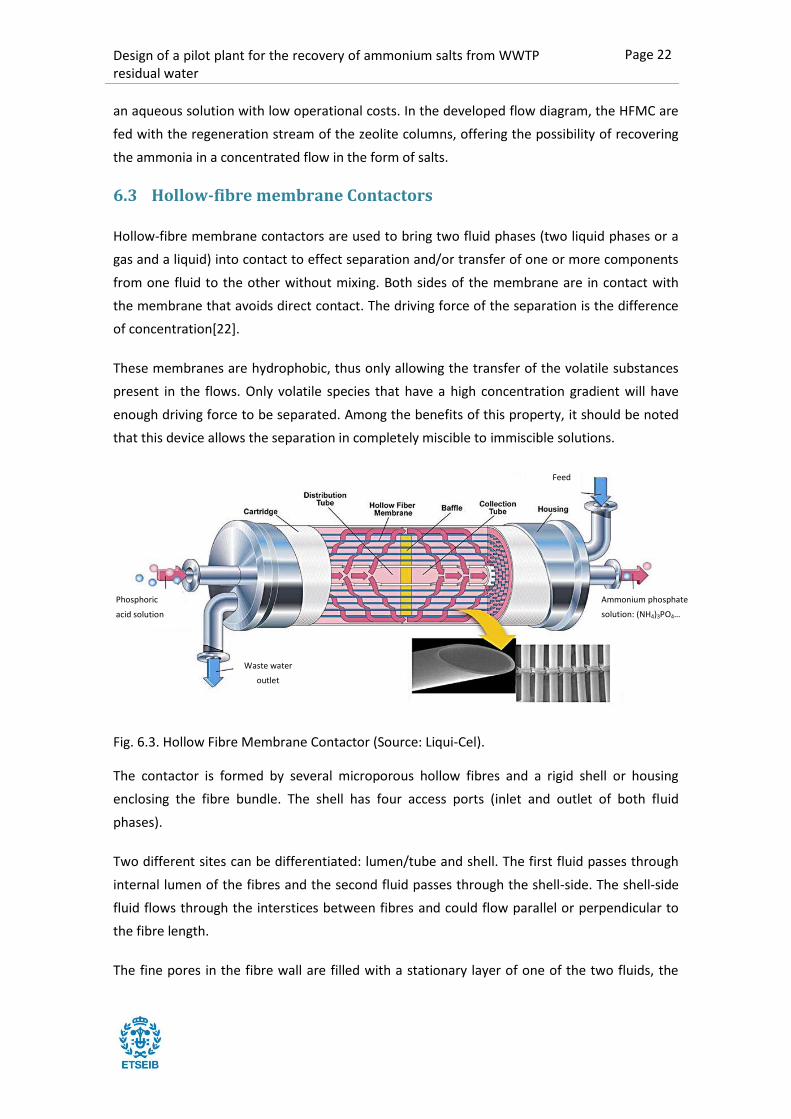
Fig. 6.3. Hollow Fibre Membrane Contactor (Source: Liqui-Cel).
The contactor is formed by several microporous hollow fibres and a rigid shell or housing
enclosing the fibre bundle. The shell has four access ports (inlet and outlet of both fluid
phases).
Two different sites can be differentiated: lumen/tube and shell. The first fluid passes through
internal lumen of the fibres and the second fluid passes through the shell-side. The shell-side
fluid flows through the interstices between fibres and could flow parallel or perpendicular to
the fibre length.
The fine pores in the fibre wall are filled with a stationary layer of one of the two fluids, the
Ammonium phosphate
solution: (NH4)3PO4…
Phosphoric
acid solution
Feed
Waste water
outlet
Page 23 Design of a pilot plant for the recovery of ammonium salts from WWTP residual water
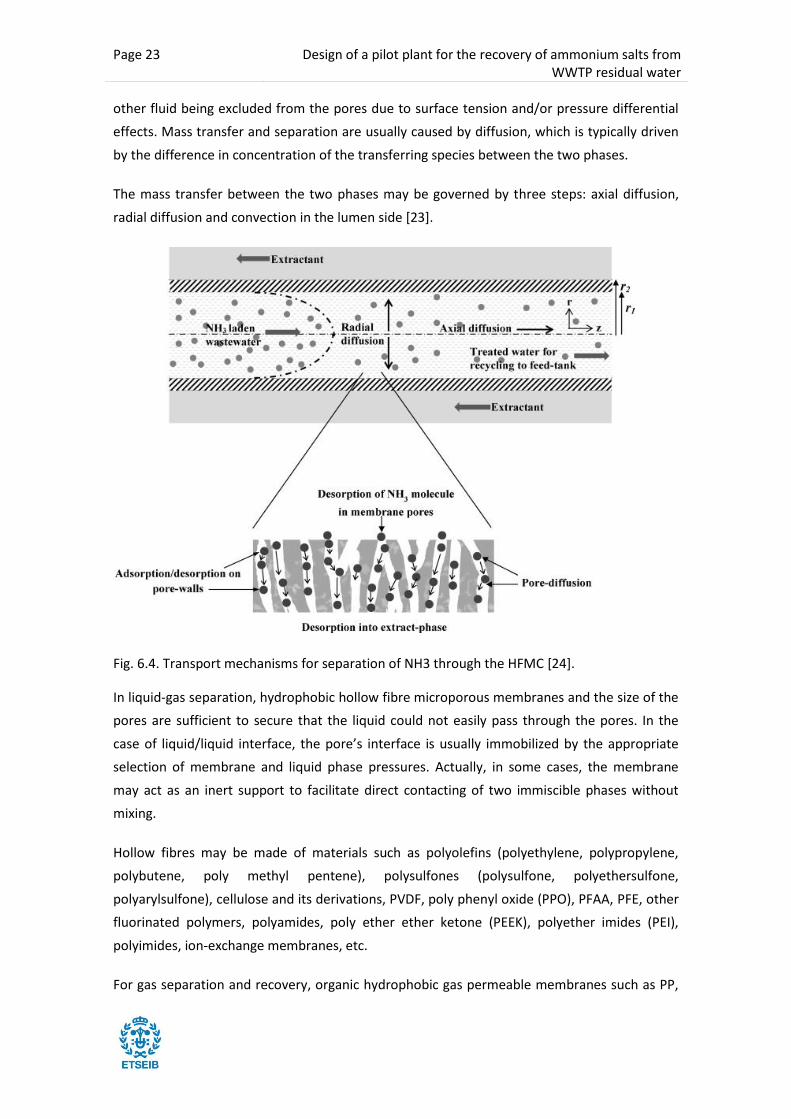
other fluid being excluded from the pores due to surface tension and/or pressure differential
effects. Mass transfer and separation are usually caused by diffusion, which is typically driven
by the difference in concentration of the transferring species between the two phases.
The mass transfer between the two phases may be governed by three steps: axial diffusion,
radial diffusion and convection in the lumen side [23].
Fig. 6.4. Transport mechanisms for separation of NH3 through the HFMC [24].
In liquid-gas separation, hydrophobic hollow fibre microporous membranes and the size of the
pores are sufficient to secure that the liquid could not easily pass through the pores. In the
case of liquid/liquid interface, the pore’s interface is usually immobilized by the appropriate
selection of membrane and liquid phase pressures. Actually, in some cases, the membrane
may act as an inert support to facilitate direct contacting of two immiscible phases without
mixing.
Hollow fibres may be made of materials such as polyolefins (polyethylene, polypropylene,
polybutene, poly methyl pentene), polysulfones (polysulfone, polyethersulfone,
polyarylsulfone), cellulose and its derivations, PVDF, poly phenyl oxide (PPO), PFAA, PFE, other
fluorinated polymers, polyamides, poly ether ether ketone (PEEK), polyether imides (PEI),
polyimides, ion-exchange membranes, etc.
For gas separation and recovery, organic hydrophobic gas permeable membranes such as PP,
Design of a pilot plant for the recovery of ammonium salts from WWTP residual water
Page 24
PVDF and PTFE are preferred due to lesser mass transfer resistance. For NH3 extraction, PTFE
(C2F4)n and its expanded form, ePTFE, are preferred due to their hydrophobic characteristics,
excellent organic resistance and chemical stability with organic solvents, acidic and alkaline
solutions. In section 11.4 the material compatibility with different solvents can be found.
These membrane contactors can be used for different purposes including the removal of
entrained gases from liquids, de-bubbling liquids, filtering liquids and adding a gas to a liquid.
It could even be used for in-line pH adjustment of water [25]. Other possible applications could
be the desalination, concentration of beverages and other liquid foodstuffs, concentration of
aqueous solutions of thermally labile pharmaceutical products and biological and/or similar.
There are many advantages for the use of this device: it has the ability of concentrating solutes
at high rates without implying thermal or mechanical damage or loss of the solutes. Also, this
means that the operating costs will be significantly lower than other separation processes.
Another possible application could be the removal of ethanol from wine and other ferments
using water as extracting solvent with minimal losses of volatile flavour and fragrance
components.
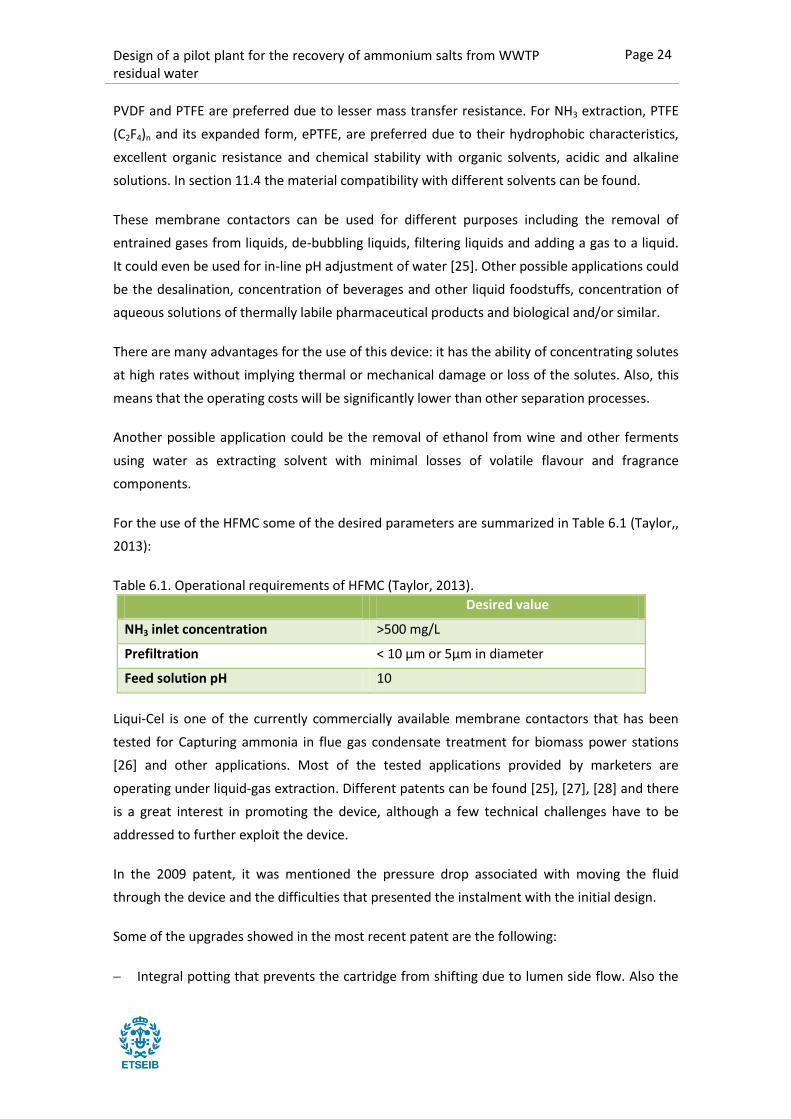
For the use of the HFMC some of the desired parameters are summarized in Table 6.1 (Taylor,,
2013):
Table 6.1. Operational requirements of HFMC (Taylor, 2013).
Desired value
NH3 inlet concentration >500 mg/L
Prefiltration < 10 μm or 5μm in diameter
Feed solution pH 10
Liqui-Cel is one of the currently commercially available membrane contactors that has been
tested for Capturing ammonia in flue gas condensate treatment for biomass power stations
[26] and other applications. Most of the tested applications provided by marketers are
operating under liquid-gas extraction. Different patents can be found [25], [27], [28] and there
is a great interest in promoting the device, although a few technical challenges have to be
addressed to further exploit the device.
In the 2009 patent, it was mentioned the pressure drop associated with moving the fluid
through the device and the difficulties that presented the instalment with the initial design.
Some of the upgrades showed in the most recent patent are the following:
Integral potting that prevents the cartridge from shifting due to lumen side flow. Also the
Page 25 Design of a pilot plant for the recovery of ammonium salts from WWTP residual water
differential pressure does not longer affect the contactor
High lumen side pressure capacity.
Relatively short fibre lengths. This feature has been included since heat is lost through
both conduction and vapour transport in a membrane distillation process, thus reducing
the distillation driving force.
Wide temperature operation range
Low cost. This is especially important for the current application, since the ammonia is
removed from a residue.
Ability to change fibre variant to adapt the material for each application.
Cross-flow design.
Acid resistance. The materials used such as PP, ABS, PVC, Noryl TM and others provide the
required acid resistance for the ammonia removal.
6.4 HFMC Transport mechanisms
Transport mechanism is based on putting into contact two different streams preventing its
mixing, by maintaining the hydrophobicity of the membrane. Liquid is thus prevented from
penetration into the pores to avoid mixing of feed and strip solutions. However, volatile
species present in the streams will cross the membrane according to the difference of partial
pressure of both phases.
This is achieved with a sufficiently hydrophobic membrane surface that avoid capillary forces
into the pores, which requires an angle of contact between the liquid and solid phases greater
than 90º.
The surface tensions of the liquid phases should be sufficiently high to ensure that the capillary
penetration pressure of liquid into a pore is well in excess of the maximum pressure difference
across the membrane that might be encountered in operation.
6.4.1 Membrane transport kinetics
This hydrophobicity implies that only free NH3 will cross the membrane. To maximize the free
ammonia (FA), the chemical equilibrium must be shifted to alkaline side and pH must be
controlled and buffered. This is important because during NH3 extraction, pH of the NH3 side
(feed, alkaline solution) decreases due to accumulation of H+ ions that will consume alkalinity.
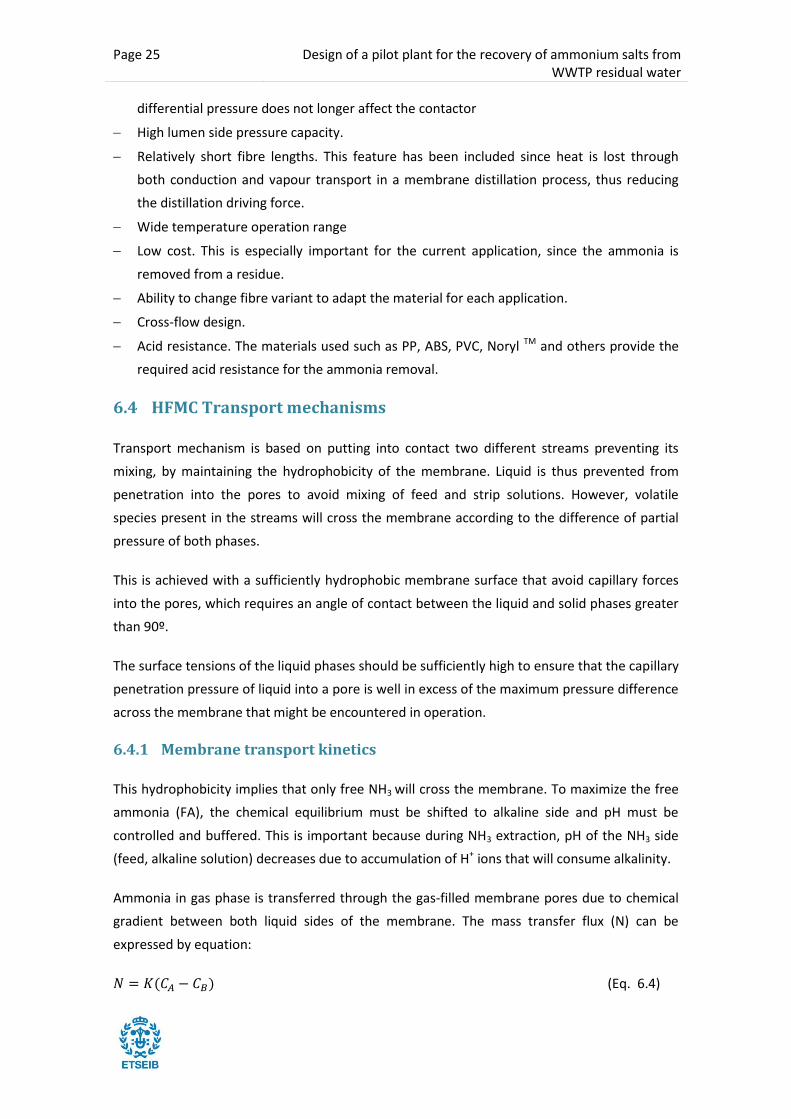
Ammonia in gas phase is transferred through the gas-filled membrane pores due to chemical
gradient between both liquid sides of the membrane. The mass transfer flux (N) can be
expressed by equation:
(Eq. 6.4)

Design of a pilot plant for the recovery of ammonium salts from WWTP residual water
Page 26
Where K is the overall mass transference coefficient (ms-1), CA is the concentration of NH3 in
feed alkaline solution side of the membrane (kgm-3) and CB is the concentration of NH3 in acid
solution side of the membrane (kgm-3)
The removal efficiency is calculated as follows:
(Eq. 6.5)
Where, Co and Ct are ammonia concentration at the start of the experiment and after time t.
The separation factor is a qualitative tool required to measure separation degree of the
ammonia removal process.
(Eq. 6.6)
Where, C is ammonia and water molar concentrations at permeate side, p and at the feed side,
f.
In the membrane side containing the acid solution, NH3 will react with acid to form NH4+ to
form non-volatile specie. This reaction suggests that mass transfer of the acid solution
resistance is very low and can be neglected. pH of the solution has to be under control to avoid
the regeneration of NH3 that contributes to the reduction of efficiency of mass transfer form
side A to B of the membrane.
According to Henry’s law, FA in liquid solution can be converted to gas phase following the
chemical equilibrium between NH3 in liquid and gaseous forms. The chemical equilibrium
depends on temperature and can be represented by the following equation:
(Eq. 6.7)
In the liquid phase, NH4+/NH3 are in equilibrium and can be described by Ka and determined
according to equation:
(Eq. 6.8)
Partial pressure of NH3 can be obtained from these chemical equilibriums:
(Eq. 6.9)
Page 27 Design of a pilot plant for the recovery of ammonium salts from WWTP residual water
(Eq. 6.10)
Thus the concentration of NH3 in gas phase can be determined according to the ideal gas law:
(Eq. 6.11)
Where is the gaseous ammonia concentration (kg/m3), is NH3 partial pressure
(Pa), is ammonia molecular mass (kg/mol), R universal gas constant (8.314 Pam3K-1mol-1),
T is temperature (K), is the and concentration ratio ion solution.
6.4.2 Mass transfer coefficient
Due to the high similarities of the mass transfer process between HFMC and Heat Exchangers,
many studies suggest that the same resistance analogy can be applied.
In the current system, three different resistances in series can be differentiated: convection
though the fibre, diffusion through the pores and convection in lumen side.
The mass transfer resistance at the lumen/permeate side is usually considered negligible in
since the transported ammonia is expected to react immediately to form different salts, thus
not affecting the mass transport. The overall mass transfer resistance can be considered as the
sum of the feed side boundary layer resistance and the membrane resistance:
(Eq. 6.12)
Where Kf and Km are the feed and membrane mass transfer coefficients.
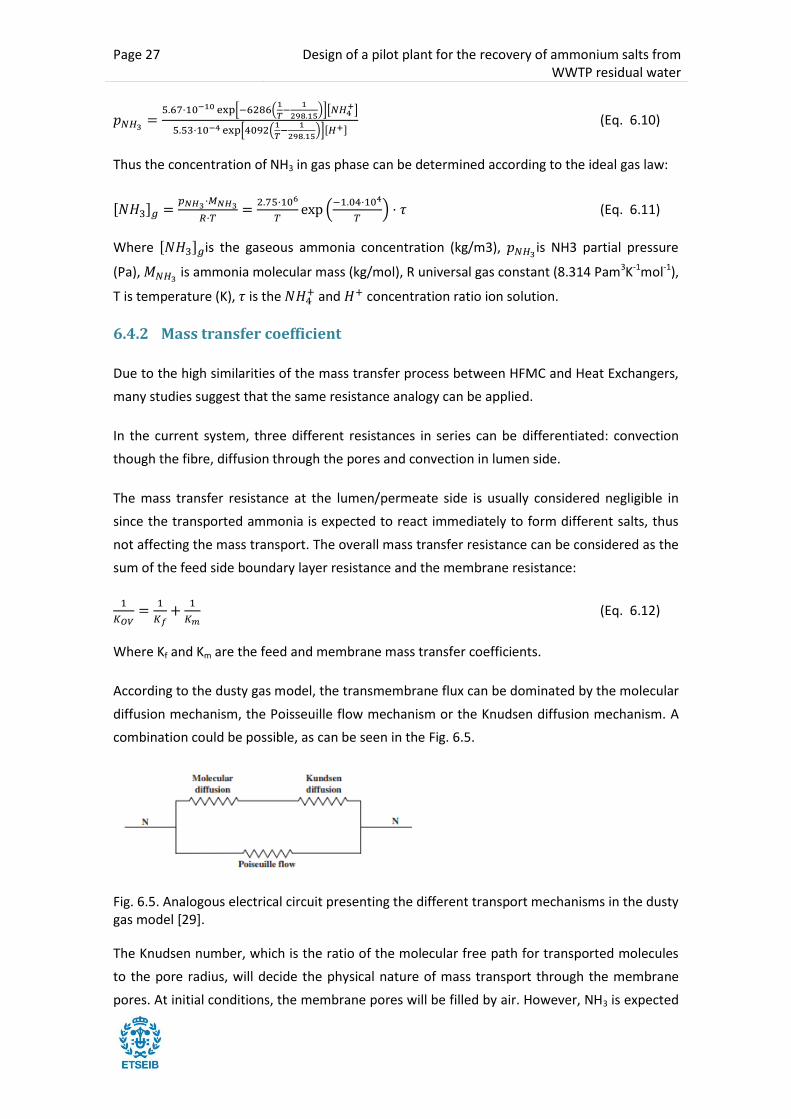
According to the dusty gas model, the transmembrane flux can be dominated by the molecular
diffusion mechanism, the Poisseuille flow mechanism or the Knudsen diffusion mechanism. A
combination could be possible, as can be seen in the Fig. 6.5.
Fig. 6.5. Analogous electrical circuit presenting the different transport mechanisms in the dusty gas model [29].
The Knudsen number, which is the ratio of the molecular free path for transported molecules
to the pore radius, will decide the physical nature of mass transport through the membrane
pores. At initial conditions, the membrane pores will be filled by air. However, NH3 is expected
Design of a pilot plant for the recovery of ammonium salts from WWTP residual water
Page 28
to fill the pores displacing the air to become the new stationary solution. Therefore, the mass
transfer resistance can be neglected and the membrane mass transfer coefficient can be
calculated as following.
(Eq. 6.13)
Where is the mass transfer coefficient as function of Knudsen diffusion and Poisseuille
flow mechanism, the term
accounts for the effective membrane porosity, is the
membrane porosity, is the membrane thickness, is the tortuosity, is the average pore
readius, Pm the average pressure within the membrane pores, R the universal gas constant, M
the molecular weight of the transported molecules, its vistosity and T the absolute
temperature.
Because of the small pore sizes and due to low pressures and ambient temperature, the
Poisseuille flow mechanisms may be ignored. In that case, the membrane’s mass transfer
coefficient can be expressed as:
(Eq. 6.14)
The rate equation for such transport is approximated by:
(Eq. 6.15)
Where dn/Adθ is the molar flux of vapour (mol/cm2s) with n being the number of moles, A the
area, and ∆θ the time interval; ∆p is the vapour pressure difference across the membrane, M
the molecular weight of the vapour, R the gas constant, T the absolute temperature, ε the
membrane porosity, τ the pore tortuosity, and t the membrane thickness.
However, it should be noted that in practice, both the feed and brine strip will be saturated
with air at ambient temperature. Under these conditions, there will be air at atmospheric
pressure in the membrane pore space. The Knudsen diffusion condition would no longer apply,
because gas/gas collisions dominate over gas/wall collisions. Also, despite the hydrophobicity,
water vapour will transfer the pores by simple Fickian diffusion.
Thus, the main mass transfer will proceed due to a concentration difference across membrane
and could be represented by Fick’s law. The theory that describes process is the solution-
diffusion model that assumes that the pressure within a membrane is uniform and the
chemical potential gradient is related to the concentration gradient [8].
(Eq. 6.16)

Page 29 Design of a pilot plant for the recovery of ammonium salts from WWTP residual water
Where D is the diffusion coefficient (m2s-1, c is the concentration in mol/m3 and x is the
position or length (m). The diffusion coefficient is a combination of Knudsen diffusion and
molecular diffusion. The Knudsen diffusion occurs when collision between molecule and the
pore wall is more frequent than the molecular interactions (membrane pore diameter –
dp<0.1.um). When the interaction between molecules becomes more significant (dp>10um) the
corresponding diffusion coefficient can be calculated from the kinetic gas theory and the
molecular diffusion mechanism is predominant. Both processes can occur between the two
pore sizes.
As a consequence, with the presence of air at atmospheric pressure, the water transport will
be significantly lower (by a factor of two to three) than the predicted according to Knudsen
relation although it becomes independent of pore radius.
It should be noted that additional resistance by thermal and concentration boundary layers
adjacent to membrane surfaces can contribute to the overall mass transfer resistance. These
phenomena are called Temperature and concentration polarization coefficient (TPC, CPC). TPC
is more pronounced in systems applying heat in the feed flow. However, CPC may be of
considerable effect when more than one volatile component exists.
It is advisable to work under operating temperatures and downstream pressures that favour
vaporization of high ammonia portion of the aqueous feed solution and less water vapour
molecules.
Also, with experimental data it was found that the overall mass transfer coefficient can be
approximated by equation 6.17 [1].:
(Eq. 6.17)
Where V is the initial liquid volume of the feed solution, A the membrane area and C are the
ammonia solution concentration at the start and time t. However, this approximation does not
take into account possible influencing parameters such as temperature, flow velocity, fibre
radius, pore radius or others.
Design of a pilot plant for the recovery of ammonium salts from WWTP residual water
Page 30
6.4.3 Mass transfer additional resistances
Wetting problem
The wetting characteristic is very important for the TAN separation. A membrane is considered
wet when the pores are completely filled with a solvent. Different liquids separated by a
hydrophobic membrane cannot mix together unless the pressure across membrane wall is
more than the membrane-surface expels pressure.
The wetting or saturation of membrane pores depends upon molecular forces within the liquid
(cohesive), and between the membrane surface and the liquid (adhesive) contacting it. The
surface wetting can be predicted form the contact angle formed between liquid drop and the
membrane surface.
A contact angle greater than 90º indicates that the liquid dissociates from the solid surface
having a non-wetting trend. When the angle is zero, complete wetting of the porous
membrane occurs. The wetting pressure or critical penetration pressure can be obtained by
using La-place Young equation:
(Eq. 6.18)
Where ∆p is the pore-entry pressure, is the surface tension at liquid/gas interface (Nm-1),
is the contact angle between liquid phase and membrane (º) and is the membrane pore
radius (m).
Liquids with low surface tension tend to increase membrane wetting, increasing resistance for
mass transference across membrane walls.
Most concentrated aqueous solutions of mineral salts have far higher surface tension than
pure water so intrusion of such solutions into microporous hydrophobic membranes is unlikely
at any reasonable pressures.
Presence of amphiphilic solutes may depress the surface tension and reduce the wetting angle
on hydrophobic surfaces. Amphiphilic molecules are those that present hydrophilic extreme
and hydrophobic extreme, causing especial behaviours in solutions. In this case, membranes
made from materials with high contact angles with respect to water and sufficiently small pore
size could overcome the limitation.
Transmembrane pressure differences are usually in the range of 140 kPa therefore knowing
the surface tension of the liquid (dynes/cm) and the contact angle provided by the material,
the maximum tolerable pore radius to prevent penetration can be calculated.
Page 31 Design of a pilot plant for the recovery of ammonium salts from WWTP residual water
Suitable materials can be apolar polymers with low surface free energies, including polyolefin
(polyethylelne and polypropylene), polytetrafluorethylene (PTFE) and polyvinylidene difluoride
(PVDF). Small diameter, hollow-fibre membranes with thin walls are best candidates, offering
high area/volume ratios and not requiring supports and spacers.
Water transport
Unimpeded vapour-phase transport of volatile components from feed to strip solution can
occur. The water transport process across the membrane takes place in three consecutive
steps due to the different osmotic pressures of the flows on both sides of the membrane [30].
1. Evaporation of water at the liquid meniscus at a pore entry. This process requires the
supply of latent heat of vaporization at the upstream meniscus as sensible heat via
conduction or convection form the bulk stream or via conduction across the solid phase
comprising the membrane.
2. Diffusional or convective transport of water molecules as vapour through the membrane
pore
3. Condensation of water vapour on the brine-side liquid meniscus at the pore exit. This
process requires removal of the heat of condensation by the same mechanisms.
The thermal conductance of the membrane is sufficient to provide a low temperature gradient
enough to supply the energy of vaporization. The gradient seldom overpasses 2ºC between the
liquids on both sides of the membrane, thus, the process can be considered isothermal.
However, the difference of partial pressure due to the salt composition of the streams can
cause a driving force that is sufficient to cause the mass transport through the membrane
pores.
6.4.4 Mass transfer resistances affecting at other operation conditions
The mass transfer resistance phenomena described in this section are not affecting HFMC for
ammonia separation because of the specifications of the use case. However, it was considered
that they should be briefly mentioned to offer a best overview of the HFMC.
Temperature and concentration polarization
Temperature and concentration polarizations within feed boundary layer proved to have a
significant influence on mass transport when operating in OD operations [1] High feed flow
velocity is an important tool decreasing temperature and concentration polarization effects.
The resistance to mass transfer is found to switch from being predominantly located in the
feed side at low feed temperatures and flow velocities to be nearly located within the
membrane pores at 55.7ºC and reasonably higher feed flow velocity of 0.84m/s. Although high

Design of a pilot plant for the recovery of ammonium salts from WWTP residual water
Page 32
feed temperatures and low downstream pressures increase remarkably the total
transmembrane flux and the ammonia removal rate, the corresponding ammonia separation
factors were decreased. Ammonia removal efficiencies higher than 90% with separation factor
of more than 8 were achieved.
Boundary-layer issues: Polarization moduli
The polarization moduli, ratios of the solute concentration at the membrane surface to that in
the adjacent bulk liquid are dependent of the transmembrane volume flux of liquid solvent
across the membrane to the mass-transfer coefficient of the solute in the feed and strip
channels. Because fluxes are low and therefore high membrane area per unit volume are used,
polarization is less important as an additional resistance to interphase transport than in MF,
UF, and RO [30].
Polarization on either side of the membrane has little effect on the vapour pressure difference
across the membrane and thus on the OD flux also because of the thermodynamic
consequence of changing solute concentration on solvent vapour pressure. Vapour pressure of
water over an aqueous solution is determined by Raoult’s Law, being the vapour pressure
directly proportional to the mole fraction of water in the mixture. Since water is the major
component in aqueous solutions and is the lowest-molecular-weight component, the effect of
changes in solute concentration over moderate ranges is quite small.
Viscous polarization
For the application of highly concentrated products such as juices and beverages, where 90%
of water is removed and sugars, polysaccharides and proteins can be found highly
concentrated, high viscosities are achieved and can reduce the process performance
significantly.
This problem can be overcome by ‘proper fluid management of the feed-side channel of the
membrane contactor’. Normal stresses contribute to mixing the viscous boundary layer with
lower viscosity fluid moving over it. Liqui-Cel module provides a shell-side fluid channel
arrangement for the feed solution to flow normal to the long axis of a hollow membrane fibre.
The membrane fibres firsts are woven into a brick consisting of a warp of parallel hollow fibres
held in fixed position by a woof of small-diameter and widely spaced monofilaments. The
spaces in between are similar to external fibre diameter. The fabric is spirally wound around a
perforated tube or mandrel to yield a cylinder whose central tube is the distribution for feed
entrance and exit. Thus, fibres are placed parallel to the cylinder axis, occupying 50% of the
volume of the annulus.
That is, operating either in continuous feed-side recycle mode, where the rise in solute
Page 33 Design of a pilot plant for the recovery of ammonium salts from WWTP residual water
concentration per pass can be held to modest levels or in batch –recycle mode where the
increase in concentration per pass is also small but the average solute concentration is allowed
to rise to the desired final value. This strategies are only applied when the concentration
increases to levels around 50 wt. % for most sugars, where the viscosity rises with
concentration.
Fouling
In all the membrane technologies (membrane distillation (MD), osmotic distillation (OD) and
osmotic membrane distillation (OMD)) that use porous and hydrophobic membranes for
production of distilled water and/or concentration of wastewaters for recovery and recycling
of valuable compounds the fouling can hamper the efficiency.
The fouling is the accumulation of organic/inorganic deposits including biological matter on
the membrane surface and/or in the membrane pores. Apart from blocking the pores, the
greatest problem is that it increases the risk of membrane pore wetting, thus reducing the
efficiency of the process. Among the different detected fouling types we can differentiate
organic fouling, inorganic fouling and biofouling. Methods of fouling reduction include
pretreatment, membrane modification, membrane cleaning and antiscalants application [31].
6.5 Fertilizers
Fertilizers are classified in organic or inorganic. Inorganic fertilizers are usually called NPK
fertilizers, since they contain one or more of these compounds. It should be noted that the
values in which the concentration of a fertilizer is used is the following: %N, %P2O5, %K2O.
Specialty fertilizers, or fertilizers formulated to suit the unique nutrient needs of a particular
location or crop, are also becoming more popular.
Nowadays, other micronutrients are being incorporated into the blend. For example, NPKS has
been gaining popularity in response to the sulphur deficient soils resulting from the Acid Rain
Act[14], [32].
As mentioned before, the final product obtained by the developed process will be a liquid
solution that could be sold as fertilizer. Each crop has different necessities regarding inorganic
nutrients, so different concentration fertilizers are found in the market.
Along the main advantages of the application of fertilizer in liquid form the following should be
mentioned [33]:
Mobility. Nutrients in liquid fertilizer get closer to plant roots since they are more mobile
in the soil water solution.

Design of a pilot plant for the recovery of ammonium salts from WWTP residual water
Page 34
Roots often steer away from a band of granular fertilizers due to the hardness of its
composition. Liquids are better used as “starters” and in-season application.
The composition in the liquid solution is more homogeneous.
The composition can be blended and applied mixed with the crop protection products.
Amongst the drawbacks of its use, the following should be mentioned:
Equipment has to be adapted for its use.
Liquid fertilizer is usually more expensive in bulk amounts.
It can settle out over time or salt out in cold weather, so its storing conditions require
more care than granular products.
Granular fertilizer is more efficient for heavy pre-plant applications
Liquid fertilizer does not allow a slow-release option (polymer-coated urea).
According to a study for the US cereal yields [34], it was estimated that without nitrogen,
average yields for corn declined by a staggering 41%, rice by 37%, barley by 19%, and wheat by
16%.
For the current project, the estimated obtained NPK fertilizer is 5-14-0.
In fertilizers, N can be found in organic and inorganic compounds in NPK Blends. The main
examples of N fertilizers are summarized on Table 6.2:
Table 6.2. N fertilizers source.
Inorganic Organic
Urea
Urea Ammonium Nitrate
Anhydrous Ammonia
Manure
Compost
Blood Meal
Feather Meal
Phosphorus usually comes either in phosphate rock or organic compounds similar to N.
The role of the different N,P,K fertilizer forms in terms of total European consumption of
fertilizer can be observed in the Fig. 6.6.

Page 35 Design of a pilot plant for the recovery of ammonium salts from WWTP residual water
Fig. 6.6 Fertilizer nutrient consumption in the European Union 27. Source: EFMA, 2009.
In Table 6.3, some information regarding the fertilizer market in Spain can be found.
Table 6.3. Fertilizer Spanish market data. (Source: ANFFE).
NIT
RO
GEN
Ammonium nitrate: total production 112 kton, 18 kton are exported and 67 are
imported. Consumption in 2013 was around 35 kton. No ammonium nitrate is being
produced from recycled nutrients.
Ammonium sulphate: Spain is both an import and an export of (NH4)2SO4 with higher
exports than imports. Total production in 2013 was of 501 kton, while consumption
accounted for 35 kton. It is mainly used for NPK production. No ammonium sulphate
is being produced from recycled nutrients.
NP
FER
TILI
ZER
S
Ammonium phosphate can come in the form of Mono-ammonium phosphate (MAP)
or Di-ammonium phosphate (DAP) for commercialization. Spain imports all the DAP
needed for both direct application and NPK blending. Nevertheless, the consumption
of DAP was 360 kton in 2013.
Struvite is currently not marketed in Spain, although there is one WWTP producing it.
Design of a pilot plant for the recovery of ammonium salts from WWTP residual water
Page 36
7 Methodology
As it has been mentioned in the previous section, there are some evidences of the possibility
of recovering ammonia in a concentrated liquid solution from liquid streams. However, most
of these studies have only performed experimental work at lower initial concentrations. Also,
HFMC commercially available only recommend its use for gas extraction in liquid-gas
operation.
In order to be able to design the HFMC it was necessary to perform some tests at lab scale
with different conditions and initial concentrations to validate the available simulation models.
Afterwards, the simulation of the performance with COMSOL® program was foreseen in order
to compare the experimental performance with the expected model. It was proved that the
existing models did not achieve a good representation of the real performance. Once the
model is adjusted and validated, different real conditions were simulated to define the design.
Since the possibilities were restricted to commercially available modules, two different
contactors were selected to be simulated. The first possibility was to use two smaller
contactors (2,5x8 Liqui-Cel® Membrane Contactor) in series and the second was to use one
larger contactor with longer fibres (8x20 Liqui-Cel® Membrane Contactor).
It should be mentioned that the units of crystallizer, ultrafiltration and zeolites were already
available in the WWTP so only the connections and location were adapted for the current
purpose.
7.1 Initial conditions
In order to set up the context, the general scheme of the WWTP is presented in Fig. 7.1. The
initial water composition of both streams are summarized in Table 7.1. Also, the parameters of
the HFMC inlet are showed, to include an overview of the pretreatment effect both with the
ultrafiltration and zeolites. It should be noted that part of ammonia is present in the Struvite
so the concentration is not as high as it could be.
As it can be observed in Table 7.1, the composition of the F1 from the anaerobic digester is
more appropriate for its treatment in the N-recovery unit. Different tests will be performed
during the pilot plant deployment testing the performance with different mixes to reach higher
concentrations in the final fertilizer.
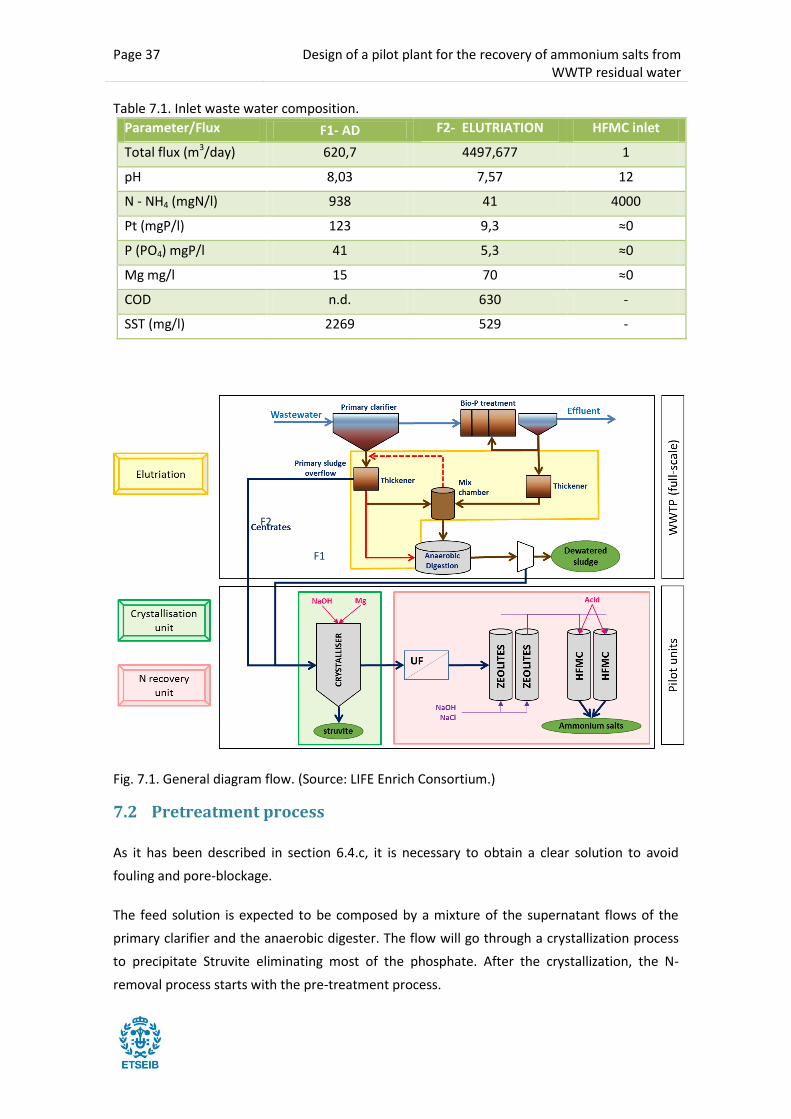
Page 37 Design of a pilot plant for the recovery of ammonium salts from WWTP residual water
Table 7.1. Inlet waste water composition.
Parameter/Flux F1- AD F2- ELUTRIATION HFMC inlet
Total flux (m3/day) 620,7 4497,677 1
pH 8,03 7,57 12
N - NH4 (mgN/l) 938 41 4000
Pt (mgP/l) 123 9,3 ≈0
P (PO4) mgP/l 41 5,3 ≈0
Mg mg/l 15 70 ≈0
COD n.d. 630 -
SST (mg/l) 2269 529 -
Fig. 7.1. General diagram flow. (Source: LIFE Enrich Consortium.)
7.2 Pretreatment process
As it has been described in section 6.4.c, it is necessary to obtain a clear solution to avoid
fouling and pore-blockage.
The feed solution is expected to be composed by a mixture of the supernatant flows of the
primary clarifier and the anaerobic digester. The flow will go through a crystallization process
to precipitate Struvite eliminating most of the phosphate. After the crystallization, the N-
removal process starts with the pre-treatment process.
F1
F2
Design of a pilot plant for the recovery of ammonium salts from WWTP residual water
Page 38
Crystallization of struvite
During the crystallization, a chemical reaction of precipitation takes place[35]. According to the
inlet composition, the limiting flow will be PO4, thus Mg will be added until the required
concentration plus a % of excess. Around 95% of phosphate will be separated approximately.
NH+4 + HnPO4
3-n + Mg+2 ↔MgNH4PO4 ·6H2O(s) +nH+ (Eq. 7.19)
The crystallizer is out of the scope of the present Project, which is focused on the Ammonia
recovery. However, it should be noted that as Struvite contains Ammonia the unit of N-
recovery will be affected by its performance.
Ultrafiltration
Ultrafiltration membranes are required to protect both the zeolites used in the second pre-
treatment step and in HFMC. Particulates will be removed.
Zeolites
In order to purify the solution where the ammonia is diluted and to concentrate the ammonia
the use of zeolites will be studied. Zeolites are minerals with hydrated aluminosilicate
tetrahedral structure which act as ion exchangers. Along the structure, ion exchange sites are
charged with Na2+. Since Zeolite has more affinity for the NH4+
(Cs>NH4+>Pb+2>K+>Na2+>Ca2+>Mg2+>Ba2+>Cu2+>Zn2+ ), these ions will substitute Na2+.
Once the active sites are saturated the outer flow will show presence of Ammonium again and
the column will have to be regenerated. Co-current regeneration with NaOH 4% was found out
to be the best conditions to improve the N recovered ratio. The regeneration solution, N-rich
eluate, will the the feed solution to be entered in the HFMC.
Despite the regeneration operations, chemical regeneration should be done with NaCl (0.6-
1M) every 10-20 cycles in order to fully recover the initial active sites. With this salt, the
precipitated particles and other ions will be removed. However, the exposure to these
solutions could damage the column if the indicated concentrations are surpassed.
One of the most suitable zeolite for ammonia recovery is clinoptilolite (K2,Na2,
Ca)3Al6Si30O72·21H2O), a selective aluminosilicate of volcanic provenance, which shows an
ammonium exchange capacity in the range 0.94–21.5 gNH4+-N kg-1.
Different researchers and industries are developing better materials by performing physical
and chemical modifications in the structure of the mineral. For example, MesoLite claims to
have achieved greater performance: ion exchange capacity >51 gNH4+-N kg-1, operating

Page 39 Design of a pilot plant for the recovery of ammonium salts from WWTP residual water
capacity of 27-36 gNH4+-N kg-1.
MesoLite ion exchange medium is produced by the chemical modification of clay minerals and
other aluminium-bearing minerals. The resulting material is characterised by a predominance
of tetrahedrally coordinated Al3+, which has resulted from the chemical modification of
octahedrally coordinated Al3+ in the parent mineral. This modification results in the availability
of more exchange sites than would be in the parent mineral, giving the material a high ion
exchange capacity [36].
When these IEX zeolites are used it is recommended to pre-treat the flow with ceramic
medium filters to remove solids and particulates in order to prevent excessive fouling and
lowering head loss. Thus, the need of backwashing of the zeolites will be diminished.
It should be noted that most studies do not operate in the project’s expected concentration
range. During the development of LIFE Necovery project different experiments were done with
zeolites. The results obtained demonstrated high concentration factor (20-30) and CEC values
around 10 g N/kg zeolite, obtaining an effluent where other contaminants were removed until
concentrations below 1ppm.
However, these results were obtained with inlet concentrations of 50 mg N/L, so it is expected
that with higher concentration the recovery of N will be higher but the concentration factor
will decrease. It is nevertheless promising applying this process in order to purify the incoming
flow to the HFMC.
The zeolites can be used as concentration and purification processes for the ammonia
recovery. Experimental results of the LIFE Necovery project using 50mg N/l as inlet effluent
provided the following results:
The wastewater flow achieved concentrations lower than 1mgN/l,
Cation exchange capacity (CEC) was of 10 mg N/kg zeolite for 7-10 cycles.
N recovered was less than 50%
High concentration factor achieved (20-30 times).
Regeneration process showed better results using co-current NaOH 4%(w/w) solution.
During LIFE Necovery project, the total cost of recovery of Nitrogen was compared to the total
cost of removal by nitrification-denitrification common technology, obtaining a result of 3€/kg
N and 1,8 €/kg N respectively. In order to achieve an economically attractive operation, the
OPEX costs should be lowered and the product obtained should acquire higher values. With
the current project it is expected to achieve a greater valorization by means of producing high
quality liquid fertilizer.
Design of a pilot plant for the recovery of ammonium salts from WWTP residual water
Page 40
The feed solution was basic (pH>10, 50ºC) to favour the ions NH4+ to be available as free
ammonia gas to allow TMCS. The sulphuric acid solution (pH<1.5-2.0) flowed counter-current
through the lumen side (inside) of the hollow fibre at 1/3 water flow.
During the experiments described, inlet NH3 concentration of 100-1000 mg/L was reduced 85-
98% obtaining an outlet value of 15 mg/L.
Regeneration:
NaCl solution achieves better Nitrogen recovery, while NaOH provides for a better
regeneration of the column. One of the reasons is that Calcium Carbonate is formed,
blocking the zeolite active centers affecting its performance.
Due to the high pH during the elution, some species could precipitate inside the
zeolites: Ca(OH)2, Mg(OH)2, MgCO3, CaCO3, CaHPO4. These precipitates lower the
efficiency of the zeolites by blocking surface area.
An acid solution could solubilise and extract the precipitates. Since the zeolites can be
dissolved in nitric acid, a correct and optimum solution should be provided to
compromise both aspects.
In order to recirculate NaOH a quality indicator will be required. The method of
recirculation could involve the renewal of a % and thus purging a % or renewing its
totality after X cycles.
7.3 Experimental methodology
A set of experiments were carried out by Chemical Engineering (EQ) Department members. It
was considered necessary to perform some experimental work in order to obtain data of the
operation parameters at higher concentration values.
The experimental flow diagram can be found below (Fig. 7.2). The feed tank had a total volume
of 60L, whereas the acid stripping tank had a capacity of 0.5L.
The used membrane was the Liqui-Cel® HFMC X-50 (Fig. 7.3), tested in counter-current flow
arrangement. This contactor is marketed as a device to add or remove gasses from aqueous
solutions, even tough for the moment is being especially indicated to remove O2 and CO2. Both
the housing and membranes are of PP and the technical data can be found in the section 0.
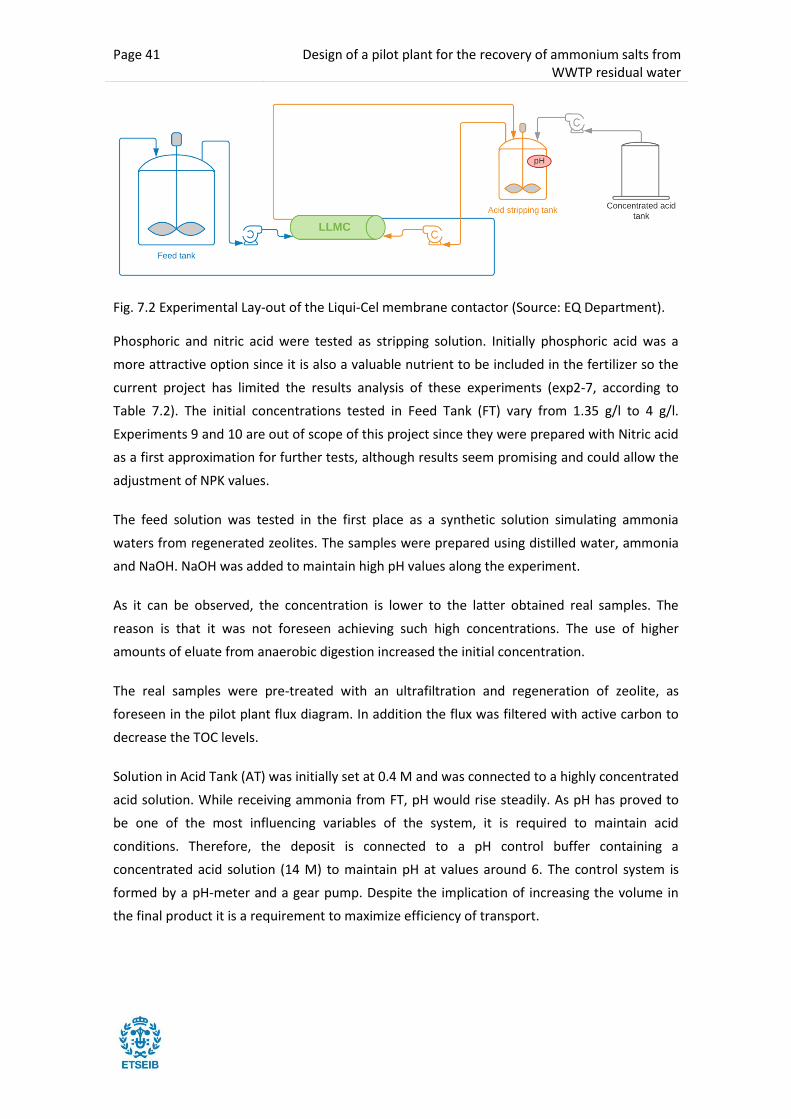
Page 41 Design of a pilot plant for the recovery of ammonium salts from WWTP residual water
Fig. 7.2 Experimental Lay-out of the Liqui-Cel membrane contactor (Source: EQ Department).
Phosphoric and nitric acid were tested as stripping solution. Initially phosphoric acid was a
more attractive option since it is also a valuable nutrient to be included in the fertilizer so the
current project has limited the results analysis of these experiments (exp2-7, according to
Table 7.2). The initial concentrations tested in Feed Tank (FT) vary from 1.35 g/l to 4 g/l.
Experiments 9 and 10 are out of scope of this project since they were prepared with Nitric acid
as a first approximation for further tests, although results seem promising and could allow the
adjustment of NPK values.
The feed solution was tested in the first place as a synthetic solution simulating ammonia
waters from regenerated zeolites. The samples were prepared using distilled water, ammonia
and NaOH. NaOH was added to maintain high pH values along the experiment.
As it can be observed, the concentration is lower to the latter obtained real samples. The
reason is that it was not foreseen achieving such high concentrations. The use of higher
amounts of eluate from anaerobic digestion increased the initial concentration.
The real samples were pre-treated with an ultrafiltration and regeneration of zeolite, as
foreseen in the pilot plant flux diagram. In addition the flux was filtered with active carbon to
decrease the TOC levels.
Solution in Acid Tank (AT) was initially set at 0.4 M and was connected to a highly concentrated
acid solution. While receiving ammonia from FT, pH would rise steadily. As pH has proved to
be one of the most influencing variables of the system, it is required to maintain acid
conditions. Therefore, the deposit is connected to a pH control buffer containing a
concentrated acid solution (14 M) to maintain pH at values around 6. The control system is
formed by a pH-meter and a gear pump. Despite the implication of increasing the volume in
the final product it is a requirement to maximize efficiency of transport.
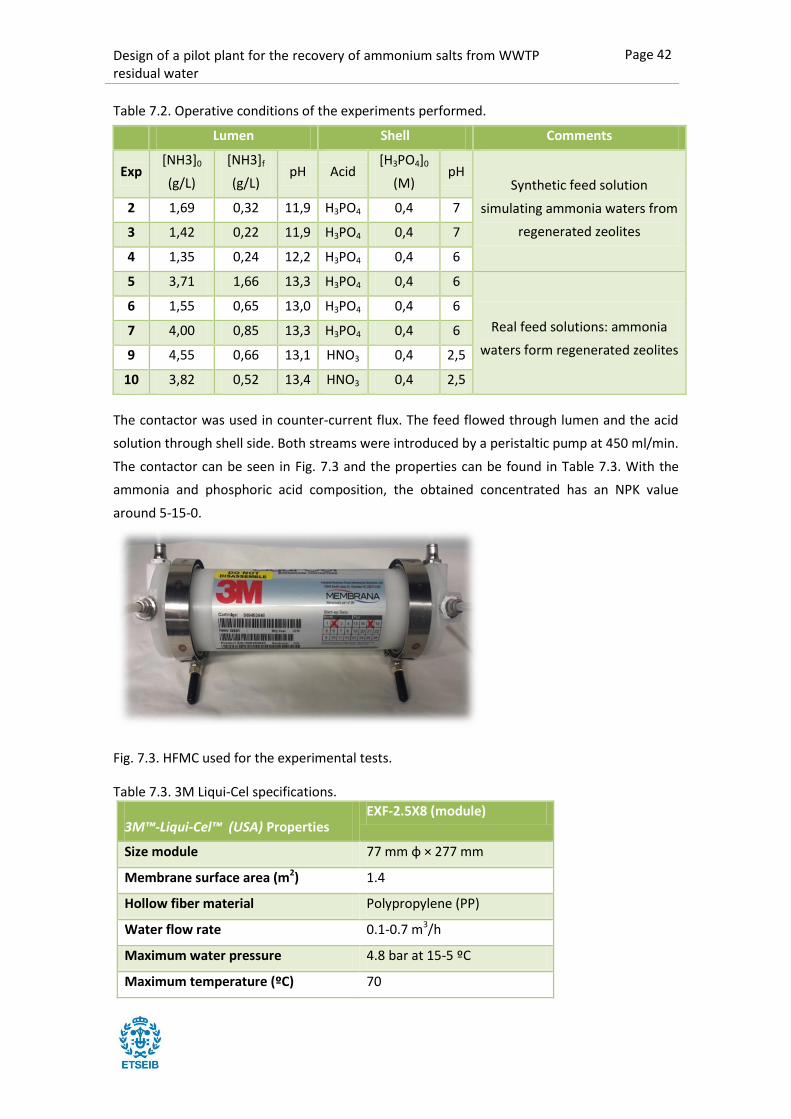
Design of a pilot plant for the recovery of ammonium salts from WWTP residual water
Page 42
Table 7.2. Operative conditions of the experiments performed.
Lumen Shell Comments
Exp [NH3]0
(g/L)
[NH3]f
(g/L) pH Acid
[H3PO4]0
(M) pH
Synthetic feed solution
simulating ammonia waters from
regenerated zeolites
2 1,69 0,32 11,9 H3PO4 0,4 7
3 1,42 0,22 11,9 H3PO4 0,4 7
4 1,35 0,24 12,2 H3PO4 0,4 6
5 3,71 1,66 13,3 H3PO4 0,4 6
Real feed solutions: ammonia
waters form regenerated zeolites
6 1,55 0,65 13,0 H3PO4 0,4 6
7 4,00 0,85 13,3 H3PO4 0,4 6
9 4,55 0,66 13,1 HNO3 0,4 2,5
10 3,82 0,52 13,4 HNO3 0,4 2,5
The contactor was used in counter-current flux. The feed flowed through lumen and the acid
solution through shell side. Both streams were introduced by a peristaltic pump at 450 ml/min.
The contactor can be seen in Fig. 7.3 and the properties can be found in Table 7.3. With the
ammonia and phosphoric acid composition, the obtained concentrated has an NPK value
around 5-15-0.
Fig. 7.3. HFMC used for the experimental tests.
Table 7.3. 3M Liqui-Cel specifications.
3M™-Liqui-Cel™ (USA) Properties EXF-2.5X8 (module)
Size module 77 mm φ × 277 mm
Membrane surface area (m2) 1.4
Hollow fiber material Polypropylene (PP)
Water flow rate 0.1-0.7 m3/h
Maximum water pressure 4.8 bar at 15-5 ºC
Maximum temperature (ºC) 70
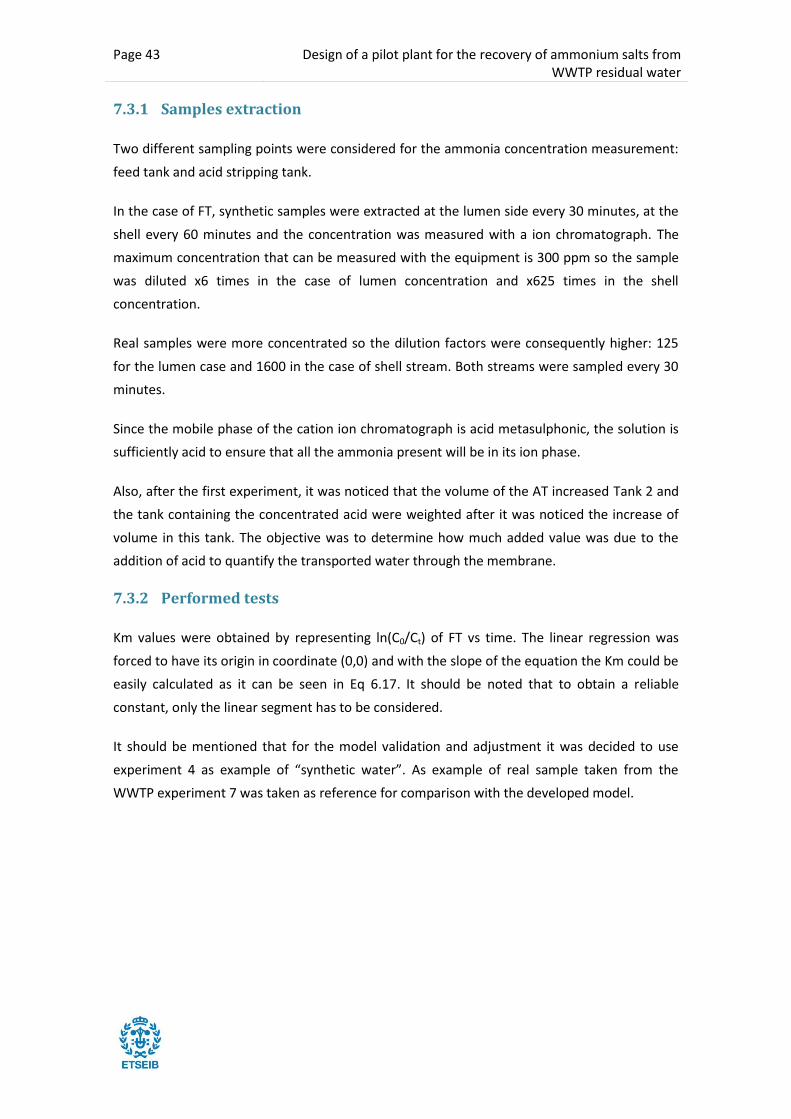
Page 43 Design of a pilot plant for the recovery of ammonium salts from WWTP residual water
7.3.1 Samples extraction
Two different sampling points were considered for the ammonia concentration measurement:
feed tank and acid stripping tank.
In the case of FT, synthetic samples were extracted at the lumen side every 30 minutes, at the
shell every 60 minutes and the concentration was measured with a ion chromatograph. The
maximum concentration that can be measured with the equipment is 300 ppm so the sample
was diluted x6 times in the case of lumen concentration and x625 times in the shell
concentration.
Real samples were more concentrated so the dilution factors were consequently higher: 125
for the lumen case and 1600 in the case of shell stream. Both streams were sampled every 30
minutes.
Since the mobile phase of the cation ion chromatograph is acid metasulphonic, the solution is
sufficiently acid to ensure that all the ammonia present will be in its ion phase.
Also, after the first experiment, it was noticed that the volume of the AT increased Tank 2 and
the tank containing the concentrated acid were weighted after it was noticed the increase of
volume in this tank. The objective was to determine how much added value was due to the
addition of acid to quantify the transported water through the membrane.
7.3.2 Performed tests
Km values were obtained by representing ln(C0/Ct) of FT vs time. The linear regression was
forced to have its origin in coordinate (0,0) and with the slope of the equation the Km could be
easily calculated as it can be seen in Eq 6.17. It should be noted that to obtain a reliable
constant, only the linear segment has to be considered.
It should be mentioned that for the model validation and adjustment it was decided to use
experiment 4 as example of “synthetic water”. As example of real sample taken from the
WWTP experiment 7 was taken as reference for comparison with the developed model.
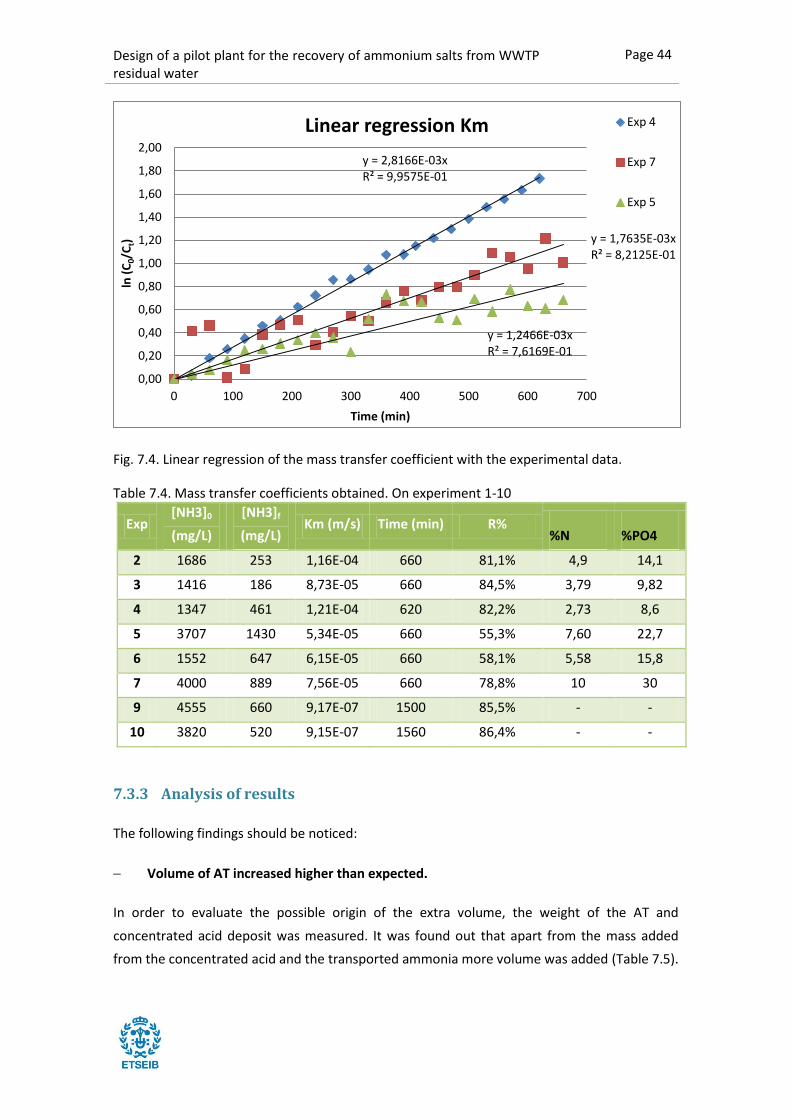
Design of a pilot plant for the recovery of ammonium salts from WWTP residual water
Page 44
Fig. 7.4. Linear regression of the mass transfer coefficient with the experimental data.
Table 7.4. Mass transfer coefficients obtained. On experiment 1-10
Exp [NH3]0
(mg/L)
[NH3]f
(mg/L) Km (m/s) Time (min) R%
%N %PO4
2 1686 253 1,16E-04 660 81,1% 4,9 14,1
3 1416 186 8,73E-05 660 84,5% 3,79 9,82
4 1347 461 1,21E-04 620 82,2% 2,73 8,6
5 3707 1430 5,34E-05 660 55,3% 7,60 22,7
6 1552 647 6,15E-05 660 58,1% 5,58 15,8
7 4000 889 7,56E-05 660 78,8% 10 30
9 4555 660 9,17E-07 1500 85,5% - -
10 3820 520 9,15E-07 1560 86,4% - -
7.3.3 Analysis of results
The following findings should be noticed:
Volume of AT increased higher than expected.
In order to evaluate the possible origin of the extra volume, the weight of the AT and
concentrated acid deposit was measured. It was found out that apart from the mass added
from the concentrated acid and the transported ammonia more volume was added (Table 7.5).
y = 2,8166E-03x R² = 9,9575E-01
y = 1,7635E-03x R² = 8,2125E-01
y = 1,2466E-03x R² = 7,6169E-01
0,00
0,20
0,40
0,60
0,80
1,00
1,20
1,40
1,60
1,80
2,00
0 100 200 300 400 500 600 700
ln (
C0/
Ct)
Time (min)
Linear regression Km Exp 4
Exp 7
Exp 5
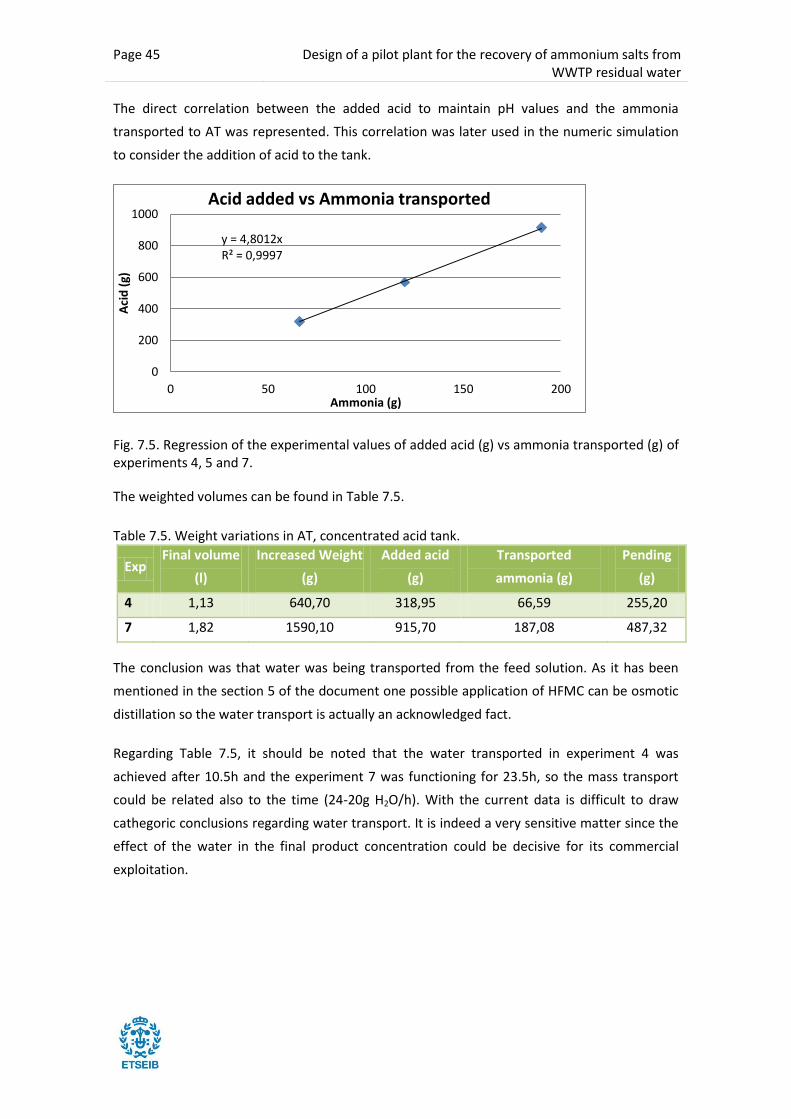
Page 45 Design of a pilot plant for the recovery of ammonium salts from WWTP residual water
The direct correlation between the added acid to maintain pH values and the ammonia
transported to AT was represented. This correlation was later used in the numeric simulation
to consider the addition of acid to the tank.
Fig. 7.5. Regression of the experimental values of added acid (g) vs ammonia transported (g) of experiments 4, 5 and 7.
The weighted volumes can be found in Table 7.5.
Table 7.5. Weight variations in AT, concentrated acid tank.
Exp Final volume
(l)
Increased Weight
(g)
Added acid
(g)
Transported
ammonia (g)
Pending
(g)
4 1,13 640,70 318,95 66,59 255,20
7 1,82 1590,10 915,70 187,08 487,32
The conclusion was that water was being transported from the feed solution. As it has been
mentioned in the section 5 of the document one possible application of HFMC can be osmotic
distillation so the water transport is actually an acknowledged fact.
Regarding Table 7.5, it should be noted that the water transported in experiment 4 was
achieved after 10.5h and the experiment 7 was functioning for 23.5h, so the mass transport
could be related also to the time (24-20g H2O/h). With the current data is difficult to draw
cathegoric conclusions regarding water transport. It is indeed a very sensitive matter since the
effect of the water in the final product concentration could be decisive for its commercial
exploitation.
y = 4,8012x R² = 0,9997
0
200
400
600
800
1000
0 50 100 150 200
Aci
d (
g)
Ammonia (g)
Acid added vs Ammonia transported

Design of a pilot plant for the recovery of ammonium salts from WWTP residual water
Page 46
Fig. 7.6. Correlation of water transported vs ammonia in experiment 4.
Vapor transport [37] can be modeled in a similar way to the methodology presented in section
6.4 for the ammonia transport. However, it should be noted that for the current project only
the estimation according to the experimental data will be taken into account in order to work
with a straightforward model.
As it can be detected from the values of the Table 7.4 the Km values are not constant but differ
depending on the conditions. A multi-variable linear regression was intended with the set of
experiences described in Table 7.4 but the variety of influencing factors and the relatively
small amount of experiments it was not possible to extract the influence of each variable.
The KM values obtained with different Vfeed in previously performed tests were represented
with the same contactor in similar conditions. The represented values can be found in Fig. 7.7.
Determination of the influence of feed volumes during the experiment.Fig. 7.7.
As a result, we can conclude that according to experimental studies, it seems to be a
correlation between the volume and the Km. By calculating a Km average value for both Vfeed
values, the current set of experiments (set 1) is 6 times smaller than set 2.
y = 0,0886x2 - 2,312x R² = 0,9921
-50
0
50
100
150
200
250
300
0 10 20 30 40 50 60 70
Tran
spo
rte
d w
ate
r (g
)
Transported ammonia (g)
Correlation water transported vs ammonia
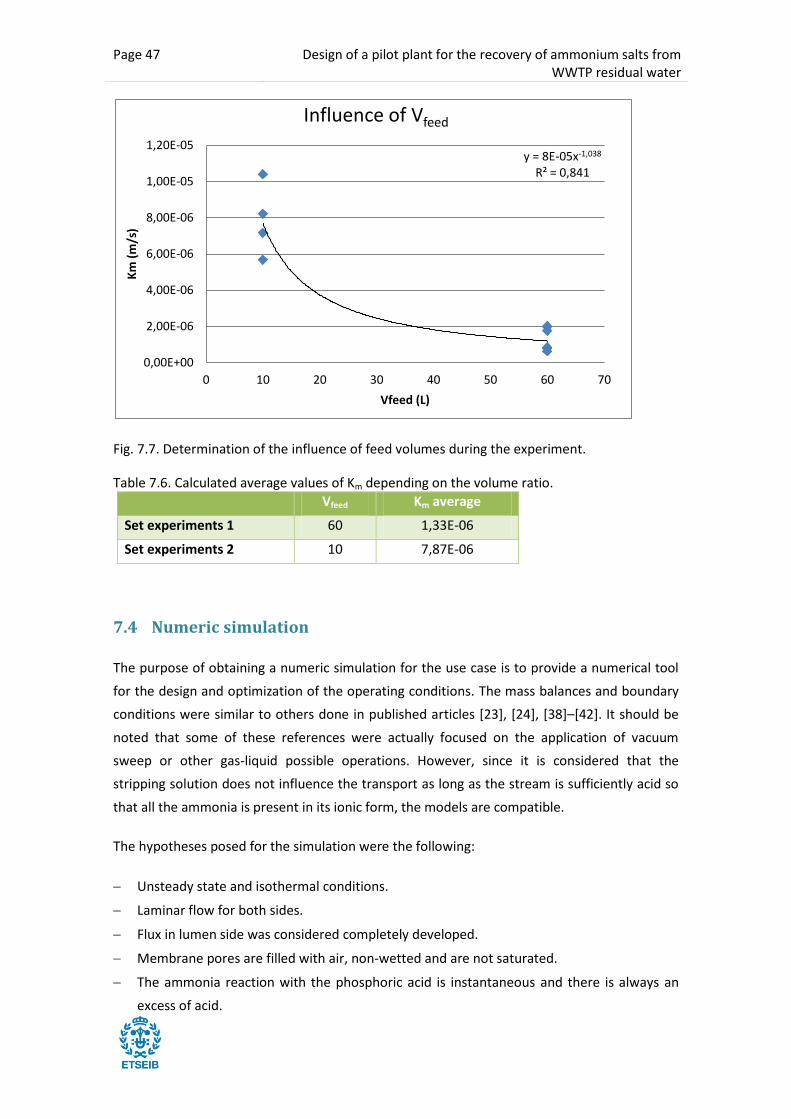
Page 47 Design of a pilot plant for the recovery of ammonium salts from WWTP residual water
Fig. 7.7. Determination of the influence of feed volumes during the experiment.
Table 7.6. Calculated average values of Km depending on the volume ratio.
Vfeed Km average
Set experiments 1 60 1,33E-06
Set experiments 2 10 7,87E-06
7.4 Numeric simulation
The purpose of obtaining a numeric simulation for the use case is to provide a numerical tool
for the design and optimization of the operating conditions. The mass balances and boundary
conditions were similar to others done in published articles [23], [24], [38]–[42]. It should be
noted that some of these references were actually focused on the application of vacuum
sweep or other gas-liquid possible operations. However, since it is considered that the
stripping solution does not influence the transport as long as the stream is sufficiently acid so
that all the ammonia is present in its ionic form, the models are compatible.
The hypotheses posed for the simulation were the following:
Unsteady state and isothermal conditions.
Laminar flow for both sides.
Flux in lumen side was considered completely developed.
Membrane pores are filled with air, non-wetted and are not saturated.
The ammonia reaction with the phosphoric acid is instantaneous and there is always an
excess of acid.
y = 8E-05x-1,038 R² = 0,841
0,00E+00
2,00E-06
4,00E-06
6,00E-06
8,00E-06
1,00E-05
1,20E-05
0 10 20 30 40 50 60 70
Km
(m
/s)
Vfeed (L)
Influence of Vfeed
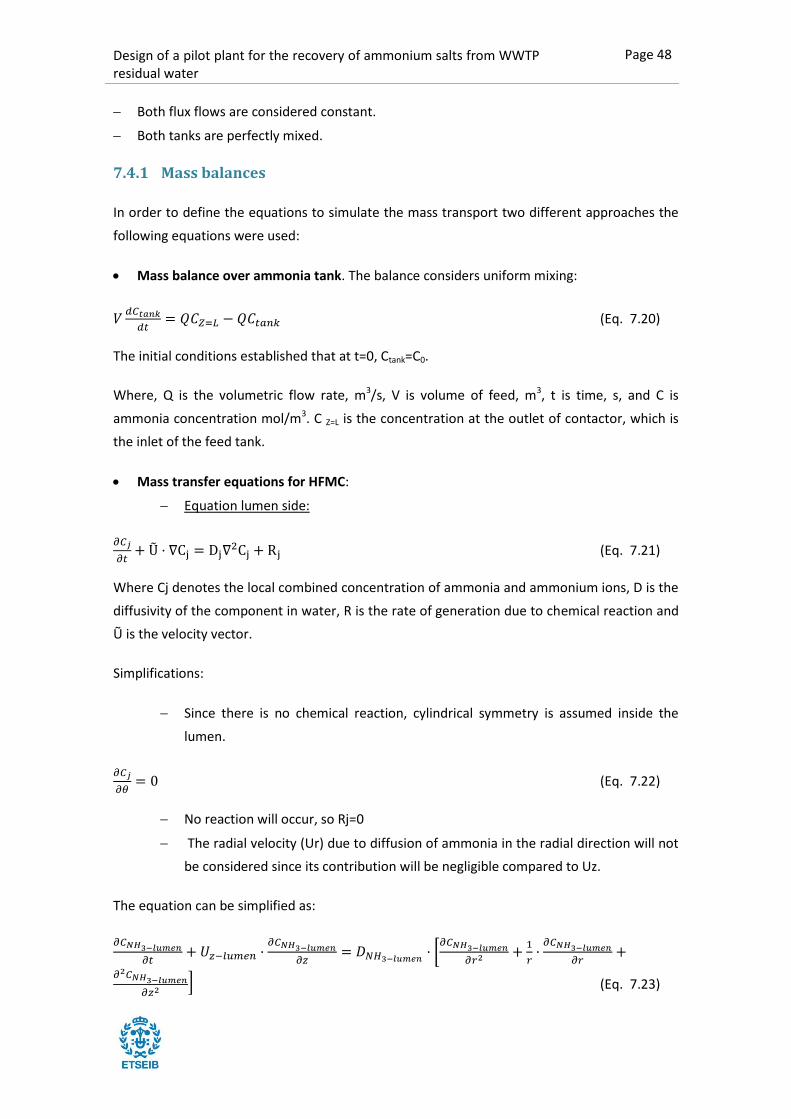
Design of a pilot plant for the recovery of ammonium salts from WWTP residual water
Page 48
Both flux flows are considered constant.
Both tanks are perfectly mixed.
7.4.1 Mass balances
In order to define the equations to simulate the mass transport two different approaches the
following equations were used:
Mass balance over ammonia tank. The balance considers uniform mixing:
(Eq. 7.20)
The initial conditions established that at t=0, Ctank=C0.
Where, Q is the volumetric flow rate, m3/s, V is volume of feed, m3, t is time, s, and C is
ammonia concentration mol/m3. C Z=L is the concentration at the outlet of contactor, which is
the inlet of the feed tank.
Mass transfer equations for HFMC:
Equation lumen side:
(Eq. 7.21)
Where Cj denotes the local combined concentration of ammonia and ammonium ions, D is the
diffusivity of the component in water, R is the rate of generation due to chemical reaction and
Ũ is the velocity vector.
Simplifications:
Since there is no chemical reaction, cylindrical symmetry is assumed inside the
lumen.
(Eq. 7.22)
No reaction will occur, so Rj=0
The radial velocity (Ur) due to diffusion of ammonia in the radial direction will not
be considered since its contribution will be negligible compared to Uz.
The equation can be simplified as:
(Eq. 7.23)
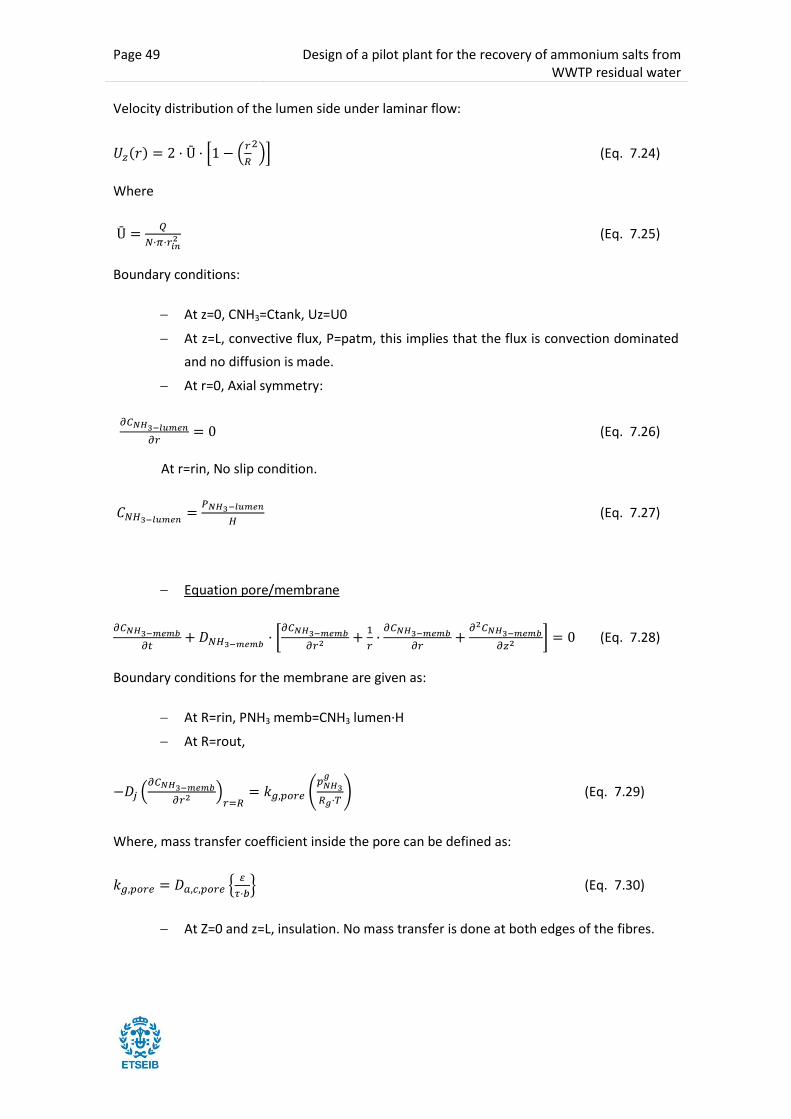
Page 49 Design of a pilot plant for the recovery of ammonium salts from WWTP residual water
Velocity distribution of the lumen side under laminar flow:
(Eq. 7.24)
Where
(Eq. 7.25)
Boundary conditions:
At z=0, CNH3=Ctank, Uz=U0
At z=L, convective flux, P=patm, this implies that the flux is convection dominated
and no diffusion is made.
At r=0, Axial symmetry:
(Eq. 7.26)
At r=rin, No slip condition.
(Eq. 7.27)
Equation pore/membrane
(Eq. 7.28)
Boundary conditions for the membrane are given as:
At R=rin, PNH3 memb=CNH3 lumen·H
At R=rout,
(Eq. 7.29)
Where, mass transfer coefficient inside the pore can be defined as:
(Eq. 7.30)
At Z=0 and z=L, insulation. No mass transfer is done at both edges of the fibres.
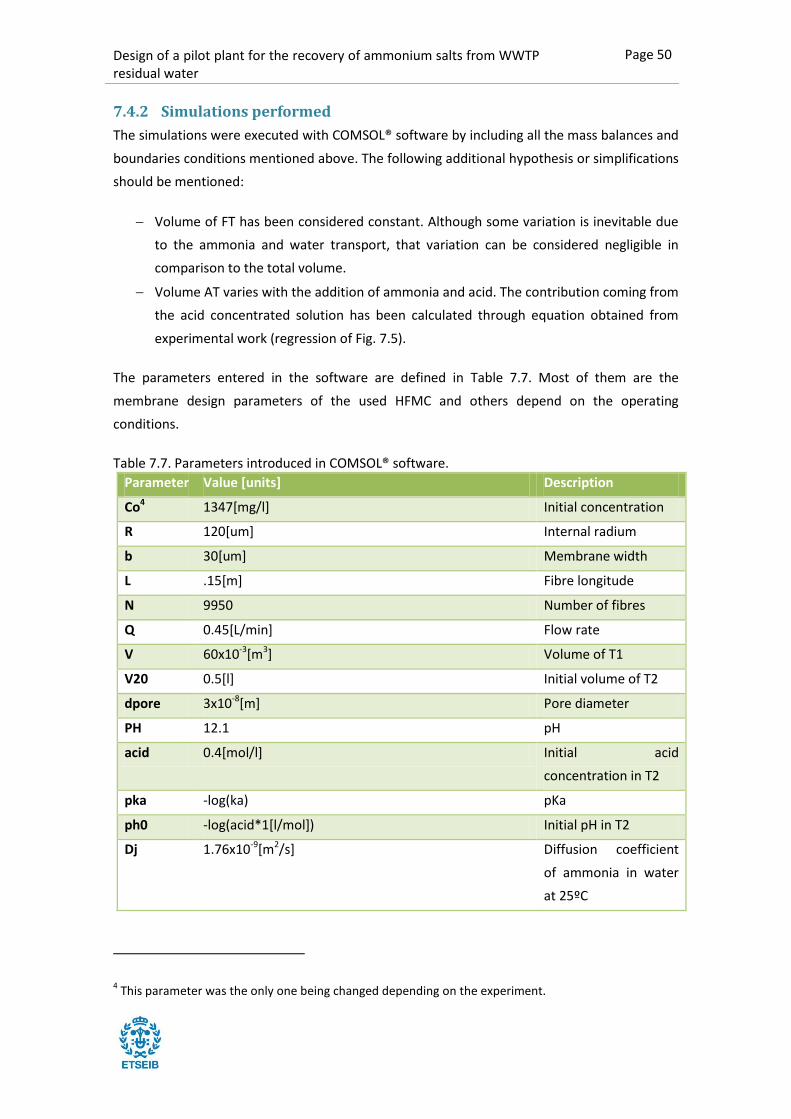
Design of a pilot plant for the recovery of ammonium salts from WWTP residual water
Page 50
7.4.2 Simulations performed
The simulations were executed with COMSOL® software by including all the mass balances and
boundaries conditions mentioned above. The following additional hypothesis or simplifications
should be mentioned:
Volume of FT has been considered constant. Although some variation is inevitable due
to the ammonia and water transport, that variation can be considered negligible in
comparison to the total volume.
Volume AT varies with the addition of ammonia and acid. The contribution coming from
the acid concentrated solution has been calculated through equation obtained from
experimental work (regression of Fig. 7.5).
The parameters entered in the software are defined in Table 7.7. Most of them are the
membrane design parameters of the used HFMC and others depend on the operating
conditions.
Table 7.7. Parameters introduced in COMSOL® software.
Parameter Value [units] Description
Co4 1347[mg/l] Initial concentration
R 120[um] Internal radium
b 30[um] Membrane width
L .15[m] Fibre longitude
N 9950 Number of fibres
Q 0.45[L/min] Flow rate
V 60x10-3[m3] Volume of T1
V20 0.5[l] Initial volume of T2
dpore 3x10⁻⁸[m] Pore diameter
PH 12.1 pH
acid 0.4[mol/l] Initial acid
concentration in T2
pka -log(ka) pKa
ph0 -log(acid*1[l/mol]) Initial pH in T2
Dj 1.76x10⁻⁹[m2/s] Diffusion coefficient
of ammonia in water
at 25ºC
4 This parameter was the only one being changed depending on the experiment.
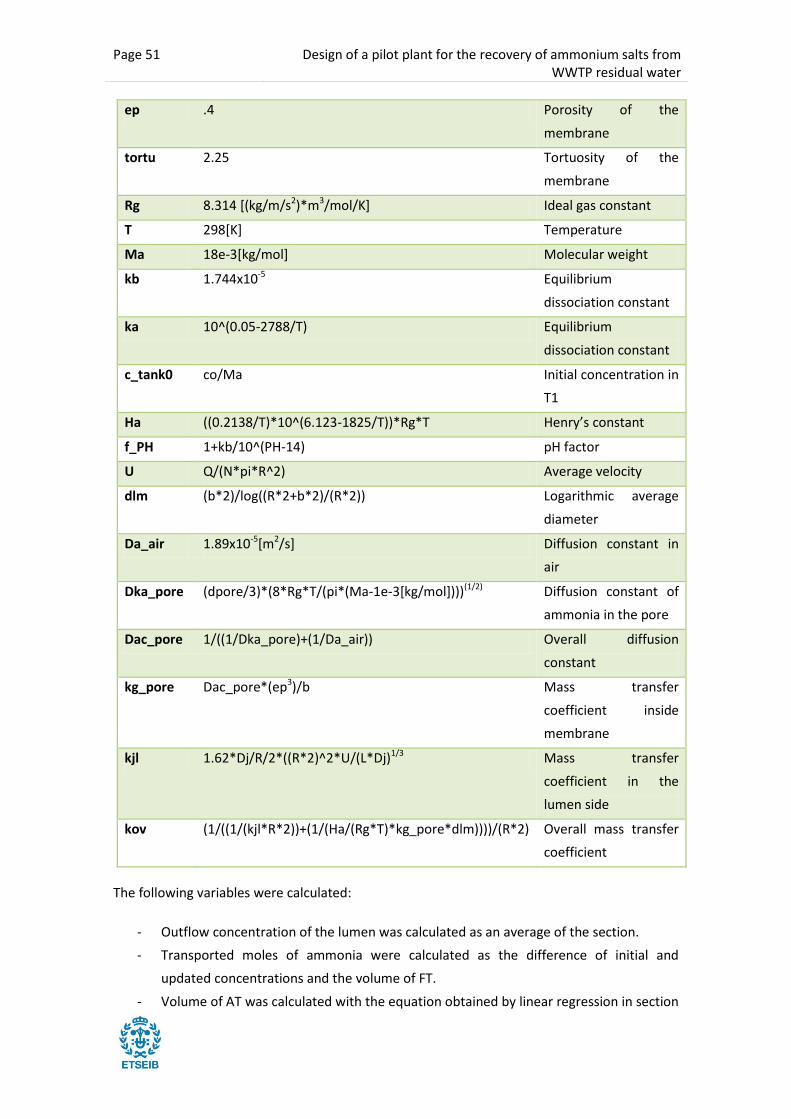
Page 51 Design of a pilot plant for the recovery of ammonium salts from WWTP residual water
ep .4 Porosity of the
membrane
tortu 2.25 Tortuosity of the
membrane
Rg 8.314 [(kg/m/s2)*m3/mol/K] Ideal gas constant
T 298[K] Temperature
Ma 18e-3[kg/mol] Molecular weight
kb 1.744x10⁻⁵ Equilibrium
dissociation constant
ka 10^(0.05-2788/T) Equilibrium
dissociation constant
c_tank0 co/Ma Initial concentration in
T1
Ha ((0.2138/T)*10^(6.123-1825/T))*Rg*T Henry’s constant
f_PH 1+kb/10^(PH-14) pH factor
U Q/(N*pi*R^2) Average velocity
dlm (b*2)/log((R*2+b*2)/(R*2)) Logarithmic average
diameter
Da_air 1.89x10⁻⁵[m2/s] Diffusion constant in
air
Dka_pore (dpore/3)*(8*Rg*T/(pi*(Ma-1e-3[kg/mol])))(1/2) Diffusion constant of
ammonia in the pore
Dac_pore 1/((1/Dka_pore)+(1/Da_air)) Overall diffusion
constant
kg_pore Dac_pore*(ep3)/b Mass transfer
coefficient inside
membrane
kjl 1.62*Dj/R/2*((R*2)^2*U/(L*Dj)1/3 Mass transfer
coefficient in the
lumen side
kov (1/((1/(kjl*R*2))+(1/(Ha/(Rg*T)*kg_pore*dlm))))/(R*2) Overall mass transfer
coefficient
The following variables were calculated:
- Outflow concentration of the lumen was calculated as an average of the section.
- Transported moles of ammonia were calculated as the difference of initial and
updated concentrations and the volume of FT.
- Volume of AT was calculated with the equation obtained by linear regression in section

Design of a pilot plant for the recovery of ammonium salts from WWTP residual water
Page 52
7.2.
Experiment 4
The experiment to be used for the validation of the model was done with synthetic water since
it was expected a more adjusted behaviour with less interferences caused by other species:
Fig. 7.8 Variation of the Ammonia concentration at lumen in experiment 4.
As it can be seen in the Fig. 7.8, different data is presented:
Experimental data: is the measured concentration of the experimental data.
Expected model: numeric calculation done with the boundaries conditions and mass
transfer coefficient calculated considering the models described in different literature
sources [23], [24], [38]–[42].
Expected model considering AT. At a first approach the effect of the permeate side’s
ammonia concentration was not considered, following the hypothesis that the
ammonia would almost instantly form salt compounds and would not influence the
mass transport. It was tested its inclusion in order to determine if that was the reason
of the divergence between the model and the experimental data.
0
10
20
30
40
50
60
70
80
90
100
0 5000 10000 15000 20000 25000
C(m
ol/
m3
)
Time (s)
Ammonia concentration at Lumen. Exp 4
Experimental
Adjusted
Expected model
Expected model considering AT

Page 53 Design of a pilot plant for the recovery of ammonium salts from WWTP residual water
Adjusted. Since it was observed that the current conditions did not represent the
experimental conditions during the test, the volume ratio demonstrated in Fig. 7.7 was
applied. The adjusted numbers fit perfectly with the experimental values.
A possible explanation for that fact is that it is not the volume ratio as such, but the difference
of volumes or the height of the deposits. Higher feed deposit could be increasing the pressure
differential causing a saturation or blockage of the pores or contributing to the water
transport. Also, a different possibility is that the pressure effect added to the fact that the
initial concentrations of these set of experiments was higher than the other set of experiments
could cause a saturation of the pores, affecting the diffusion through the pores.
However, since there are various differential parameters between both sets of experiments it
is not possible to clearly identify which causes the difference. More experiments should be
done at different Feed volumes between the 10-60l to clarify if that is the most influencing
factor in the decrease of KM.
As it can be seen in the Fig. 7.8, the effect of the permeate side’s ammonia concentration
does not affect in a great measure the mass transfer.
Experiment 7
Following this adjustment of the HFMC performance, it was studied the behaviour of the real
samples.
Fig. 7.9 Variation of the Ammonia concentration at lumen in experiment 7.
As it can be seen in Fig. 7.9, the model follows the trend despite the fact that there is still a
minor divergence.
0
50
100
150
200
250
0,00 20000,00 40000,00 60000,00 80000,00 100000,00
C N
H3
(mo
l/m
3 )
Time (s)
Ammonia concentration at Lumen. Exp 7
Experimental
Adjusted Model
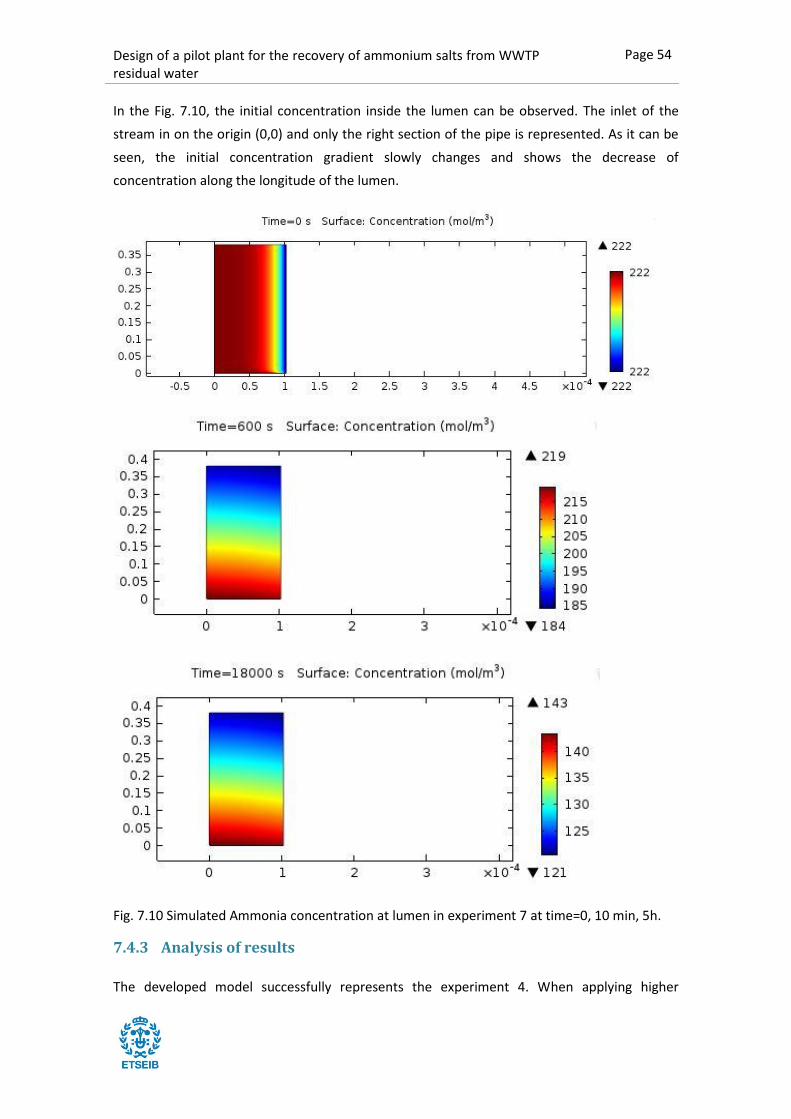
Design of a pilot plant for the recovery of ammonium salts from WWTP residual water
Page 54
In the Fig. 7.10, the initial concentration inside the lumen can be observed. The inlet of the
stream in on the origin (0,0) and only the right section of the pipe is represented. As it can be
seen, the initial concentration gradient slowly changes and shows the decrease of
concentration along the longitude of the lumen.
Fig. 7.10 Simulated Ammonia concentration at lumen in experiment 7 at time=0, 10 min, 5h.
7.4.3 Analysis of results
The developed model successfully represents the experiment 4. When applying higher
Page 55 Design of a pilot plant for the recovery of ammonium salts from WWTP residual water
concentrations, some divergences seem to appear between the experimental data and the
model. Among the possible explanations, the raised hypotheses could be having an influence
in the performance.
During the experimental tests, it was proved that some water vapor was transported through
the membrane. There is evidence that its transport is related to the concentration of dissolved
gases and vapor pressure. Although the volume increase in AT has been taken into account in
the model, it has not been considered the possible pore-wetting or influence of vapor particles
inside the pore and how it affects the ammonia transport and its diffusion through the pore.
Also, it has been considered that the pore does not saturate at any point. The concentration in
experiment 7 is 2.9 times higher than experiment 4, so it could be possible that higher
concentrations cause a decrease in transport velocity.
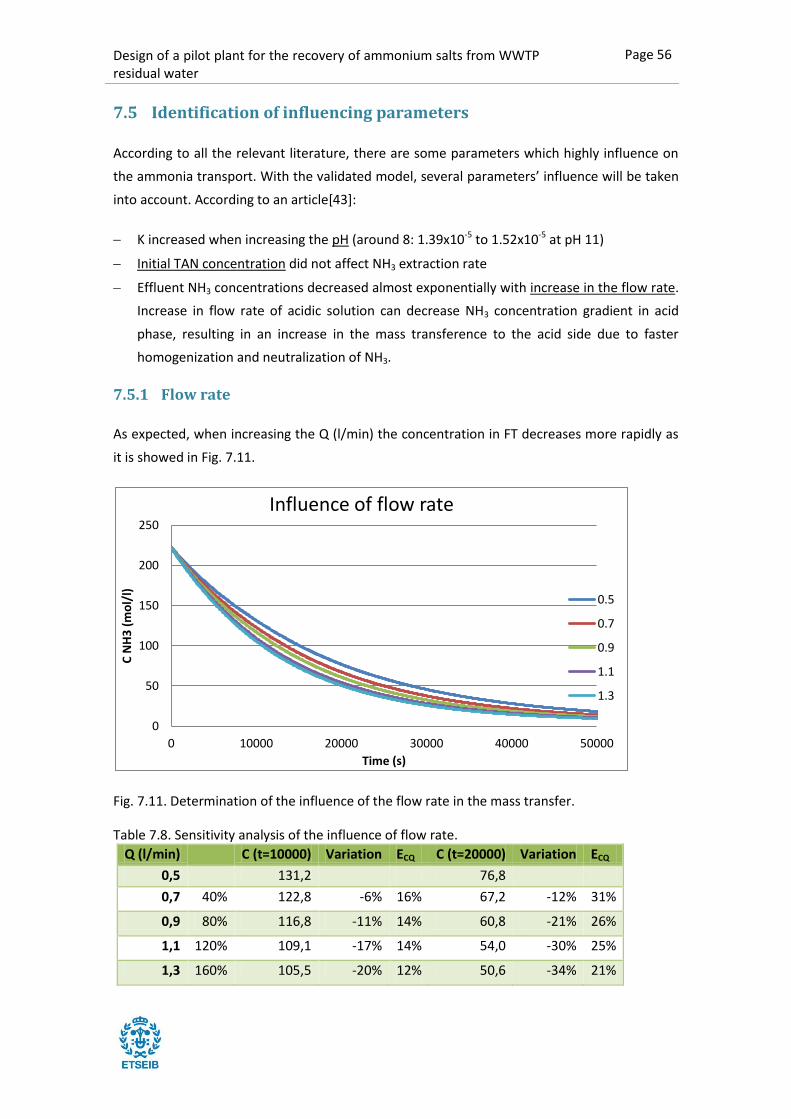
Design of a pilot plant for the recovery of ammonium salts from WWTP residual water
Page 56
7.5 Identification of influencing parameters
According to all the relevant literature, there are some parameters which highly influence on
the ammonia transport. With the validated model, several parameters’ influence will be taken
into account. According to an article[43]:
K increased when increasing the pH (around 8: 1.39x10⁻⁵ to 1.52x10⁻⁵ at pH 11)
Initial TAN concentration did not affect NH3 extraction rate
Effluent NH3 concentrations decreased almost exponentially with increase in the flow rate.
Increase in flow rate of acidic solution can decrease NH3 concentration gradient in acid
phase, resulting in an increase in the mass transference to the acid side due to faster
homogenization and neutralization of NH3.
7.5.1 Flow rate
As expected, when increasing the Q (l/min) the concentration in FT decreases more rapidly as
it is showed in Fig. 7.11.
Fig. 7.11. Determination of the influence of the flow rate in the mass transfer.
Table 7.8. Sensitivity analysis of the influence of flow rate.
Q (l/min) C (t=10000) Variation ECQ C (t=20000) Variation ECQ
0,5 131,2 76,8
0,7 40% 122,8 -6% 16% 67,2 -12% 31%
0,9 80% 116,8 -11% 14% 60,8 -21% 26%
1,1 120% 109,1 -17% 14% 54,0 -30% 25%
1,3 160% 105,5 -20% 12% 50,6 -34% 21%
0
50
100
150
200
250
0 10000 20000 30000 40000 50000
C N
H3
(m
ol/
l)
Time (s)
Influence of flow rate
0.5
0.7
0.9
1.1
1.3
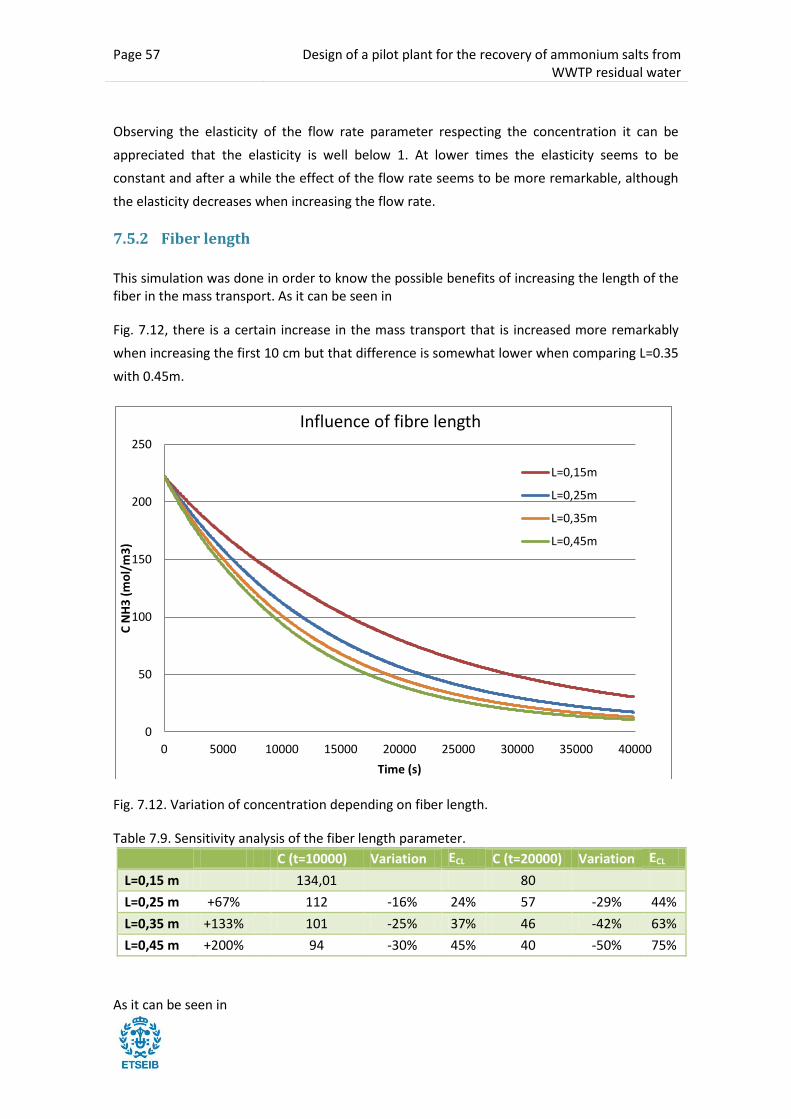
Page 57 Design of a pilot plant for the recovery of ammonium salts from WWTP residual water
Observing the elasticity of the flow rate parameter respecting the concentration it can be
appreciated that the elasticity is well below 1. At lower times the elasticity seems to be
constant and after a while the effect of the flow rate seems to be more remarkable, although
the elasticity decreases when increasing the flow rate.
7.5.2 Fiber length
This simulation was done in order to know the possible benefits of increasing the length of the fiber in the mass transport. As it can be seen in
Fig. 7.12, there is a certain increase in the mass transport that is increased more remarkably
when increasing the first 10 cm but that difference is somewhat lower when comparing L=0.35
with 0.45m.
Fig. 7.12. Variation of concentration depending on fiber length.
Table 7.9. Sensitivity analysis of the fiber length parameter.
C (t=10000) Variation ECL C (t=20000) Variation ECL
L=0,15 m 134,01
80
L=0,25 m +67% 112 -16% 24% 57 -29% 44%
L=0,35 m +133% 101 -25% 37% 46 -42% 63%
L=0,45 m +200% 94 -30% 45% 40 -50% 75%
As it can be seen in
0
50
100
150
200
250
0 5000 10000 15000 20000 25000 30000 35000 40000
C N
H3
(m
ol/
m3
)
Time (s)
Influence of fibre length
L=0,15m
L=0,25m
L=0,35m
L=0,45m
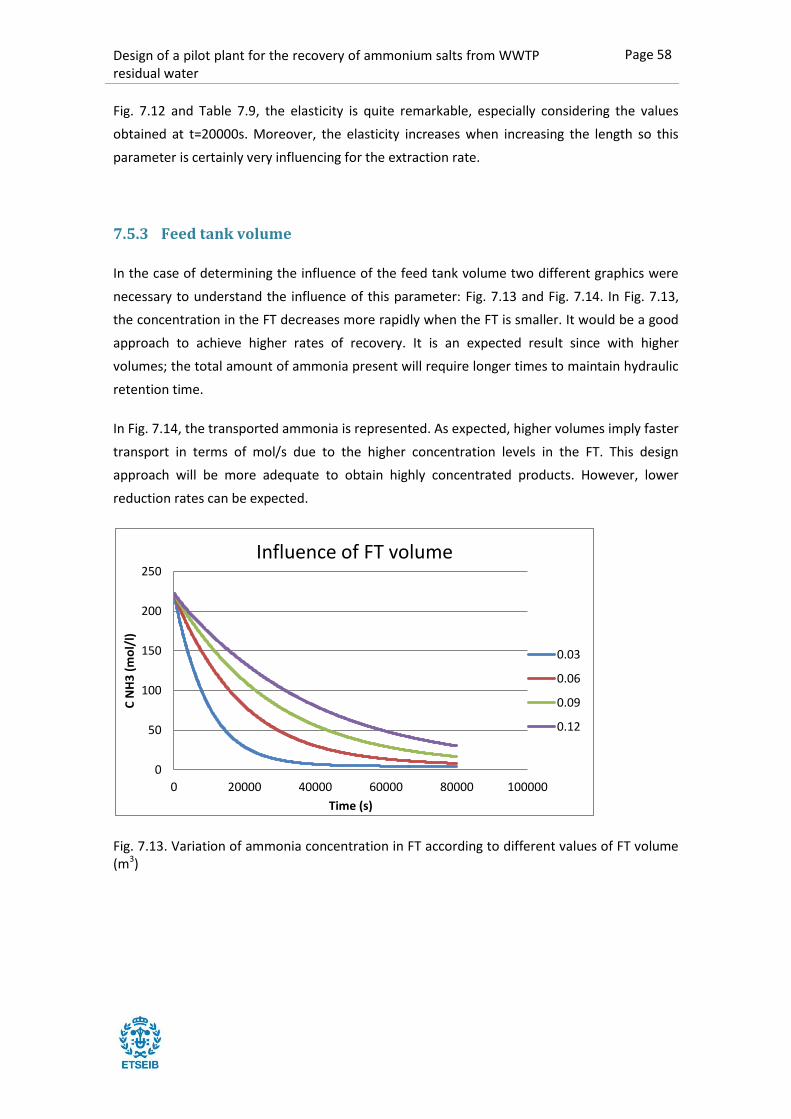
Design of a pilot plant for the recovery of ammonium salts from WWTP residual water
Page 58
Fig. 7.12 and Table 7.9, the elasticity is quite remarkable, especially considering the values
obtained at t=20000s. Moreover, the elasticity increases when increasing the length so this
parameter is certainly very influencing for the extraction rate.
7.5.3 Feed tank volume
In the case of determining the influence of the feed tank volume two different graphics were
necessary to understand the influence of this parameter: Fig. 7.13 and Fig. 7.14. In Fig. 7.13,
the concentration in the FT decreases more rapidly when the FT is smaller. It would be a good
approach to achieve higher rates of recovery. It is an expected result since with higher
volumes; the total amount of ammonia present will require longer times to maintain hydraulic
retention time.
In Fig. 7.14, the transported ammonia is represented. As expected, higher volumes imply faster
transport in terms of mol/s due to the higher concentration levels in the FT. This design
approach will be more adequate to obtain highly concentrated products. However, lower
reduction rates can be expected.
Fig. 7.13. Variation of ammonia concentration in FT according to different values of FT volume (m3)
0
50
100
150
200
250
0 20000 40000 60000 80000 100000
C N
H3
(m
ol/
l)
Time (s)
Influence of FT volume
0.03
0.06
0.09
0.12

Page 59 Design of a pilot plant for the recovery of ammonium salts from WWTP residual water
Fig. 7.14. Variation of ammonia transported moles in FT according to different values of FT volume (m3).
Table 7.10. Sensitivity analysis of the Feed tank volume parameter.
V=0,03 m3 V=0,06 m3 V=0,09 m3 V=0,12 m3
100% 200% 300%
C (t=10000s) 79,357 134,01 157,79 172,46
Variation 69% 99% 117%
ECV 69% 49% 39%
N (t=10000s) 4,28589 5,2926 5,7987 5,9712
Variation 23% 35% 39%
ECN 23% 18% 13%
C (t=20000s) 28,979 80,145 111,5 134,47
Variation 177% 285% 364%
ECV 177% 142% 121%
N (t=20000s) 5,79723 8,5245 9,9648 10,53
Variation 47% 72% 82%
ECN 47% 36% 27%
The Feed Tank proves to be an elastic parameter regarding the concentration at the tank.
However, its elasticity seems to decrease remarkably after surpassing the volume 0.06m3.
Regarding N, the parameter is inelastic and also decreases after increasing the volume.
0
5
10
15
20
25
0 20000 40000 60000 80000 100000
N (
mo
l)
Time (s)
Influence of FT volume
0.03
0.06
0.09
0.12
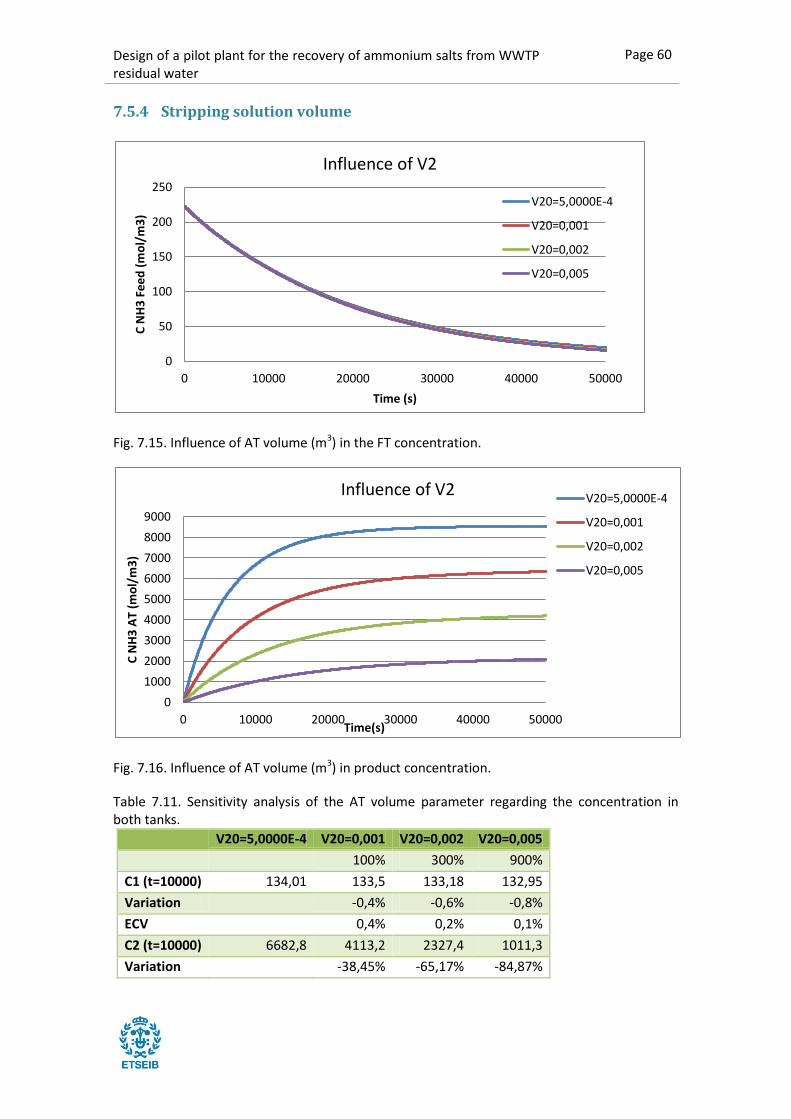
Design of a pilot plant for the recovery of ammonium salts from WWTP residual water
Page 60
7.5.4 Stripping solution volume
Fig. 7.15. Influence of AT volume (m3) in the FT concentration.
Fig. 7.16. Influence of AT volume (m3) in product concentration.
Table 7.11. Sensitivity analysis of the AT volume parameter regarding the concentration in both tanks.
V20=5,0000E-4 V20=0,001 V20=0,002 V20=0,005
100% 300% 900%
C1 (t=10000) 134,01 133,5 133,18 132,95
Variation -0,4% -0,6% -0,8%
ECV 0,4% 0,2% 0,1%
C2 (t=10000) 6682,8 4113,2 2327,4 1011,3
Variation -38,45% -65,17% -84,87%
0
50
100
150
200
250
0 10000 20000 30000 40000 50000
C N
H3
Fe
ed
(m
ol/
m3
)
Time (s)
Influence of V2
V20=5,0000E-4
V20=0,001
V20=0,002
V20=0,005
0
1000
2000
3000
4000
5000
6000
7000
8000
9000
0 10000 20000 30000 40000 50000
C N
H3
AT
(mo
l/m
3)
Time(s)
Influence of V2 V20=5,0000E-4
V20=0,001
V20=0,002
V20=0,005
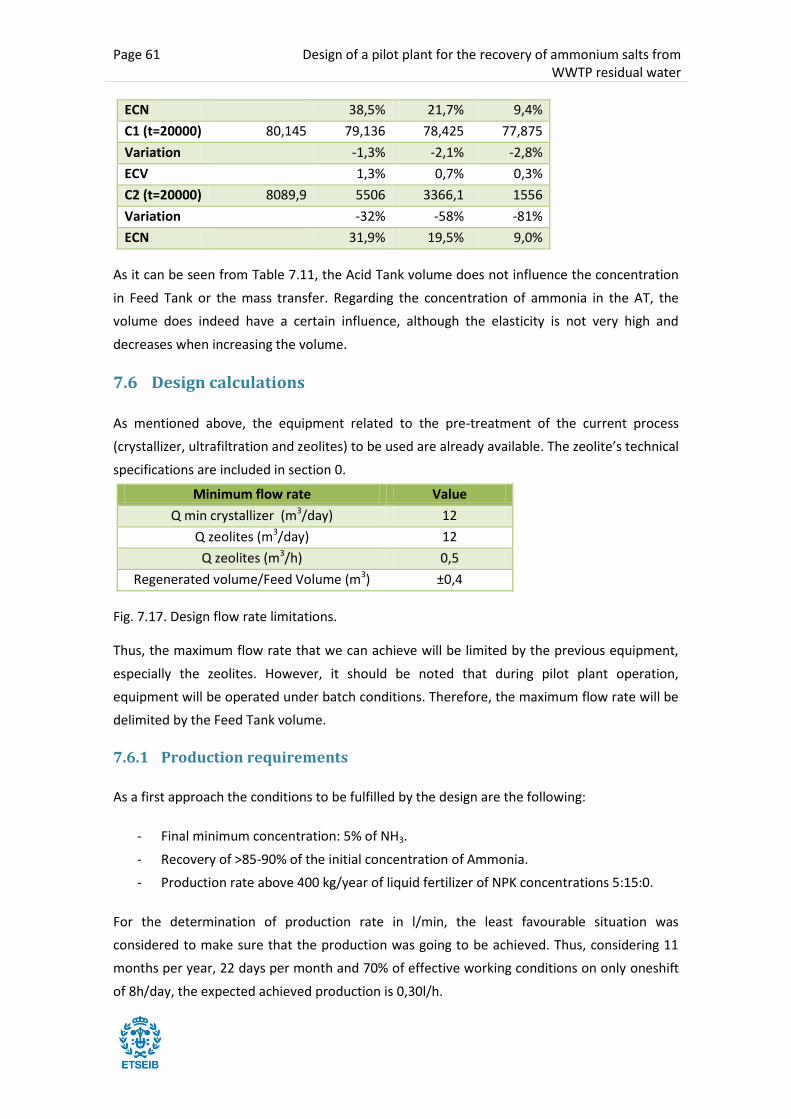
Page 61 Design of a pilot plant for the recovery of ammonium salts from WWTP residual water
ECN 38,5% 21,7% 9,4%
C1 (t=20000) 80,145 79,136 78,425 77,875
Variation -1,3% -2,1% -2,8%
ECV 1,3% 0,7% 0,3%
C2 (t=20000) 8089,9 5506 3366,1 1556
Variation -32% -58% -81%
ECN 31,9% 19,5% 9,0%
As it can be seen from Table 7.11, the Acid Tank volume does not influence the concentration
in Feed Tank or the mass transfer. Regarding the concentration of ammonia in the AT, the
volume does indeed have a certain influence, although the elasticity is not very high and
decreases when increasing the volume.
7.6 Design calculations
As mentioned above, the equipment related to the pre-treatment of the current process
(crystallizer, ultrafiltration and zeolites) to be used are already available. The zeolite’s technical
specifications are included in section 0.
Minimum flow rate Value
Q min crystallizer (m3/day) 12
Q zeolites (m3/day) 12
Q zeolites (m3/h) 0,5
Regenerated volume/Feed Volume (m3) ±0,4
Fig. 7.17. Design flow rate limitations.
Thus, the maximum flow rate that we can achieve will be limited by the previous equipment,
especially the zeolites. However, it should be noted that during pilot plant operation,
equipment will be operated under batch conditions. Therefore, the maximum flow rate will be
delimited by the Feed Tank volume.
7.6.1 Production requirements
As a first approach the conditions to be fulfilled by the design are the following:
- Final minimum concentration: 5% of NH3.
- Recovery of >85-90% of the initial concentration of Ammonia.
- Production rate above 400 kg/year of liquid fertilizer of NPK concentrations 5:15:0.
For the determination of production rate in l/min, the least favourable situation was
considered to make sure that the production was going to be achieved. Thus, considering 11
months per year, 22 days per month and 70% of effective working conditions on only oneshift
of 8h/day, the expected achieved production is 0,30l/h.
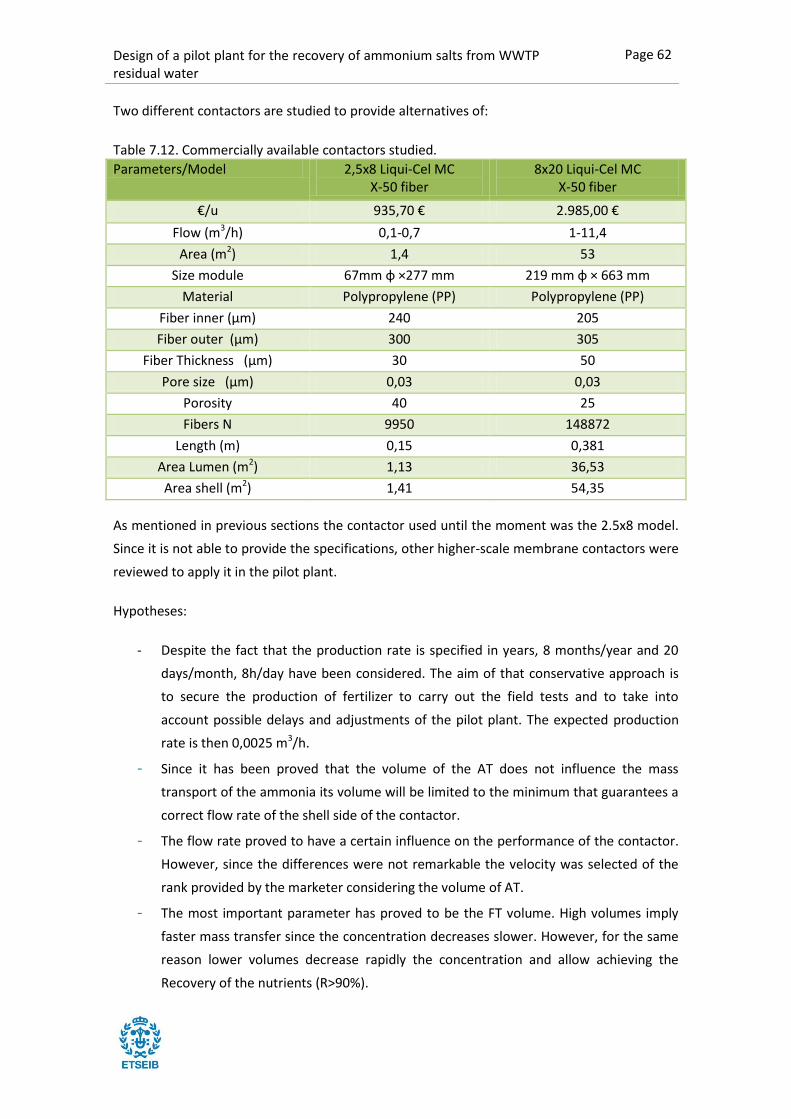
Design of a pilot plant for the recovery of ammonium salts from WWTP residual water
Page 62
Two different contactors are studied to provide alternatives of:
Table 7.12. Commercially available contactors studied.
Parameters/Model 2,5x8 Liqui-Cel MC X-50 fiber
8x20 Liqui-Cel MC X-50 fiber
€/u 935,70 € 2.985,00 €
Flow (m3/h) 0,1-0,7 1-11,4
Area (m2) 1,4 53
Size module 67mm φ ×277 mm 219 mm φ × 663 mm
Material Polypropylene (PP) Polypropylene (PP)
Fiber inner (µm) 240 205
Fiber outer (µm) 300 305
Fiber Thickness (µm) 30 50
Pore size (µm) 0,03 0,03
Porosity 40 25
Fibers N 9950 148872
Length (m) 0,15 0,381
Area Lumen (m2) 1,13 36,53
Area shell (m2) 1,41 54,35
As mentioned in previous sections the contactor used until the moment was the 2.5x8 model.
Since it is not able to provide the specifications, other higher-scale membrane contactors were
reviewed to apply it in the pilot plant.
Hypotheses:
- Despite the fact that the production rate is specified in years, 8 months/year and 20
days/month, 8h/day have been considered. The aim of that conservative approach is
to secure the production of fertilizer to carry out the field tests and to take into
account possible delays and adjustments of the pilot plant. The expected production
rate is then 0,0025 m3/h.
- Since it has been proved that the volume of the AT does not influence the mass
transport of the ammonia its volume will be limited to the minimum that guarantees a
correct flow rate of the shell side of the contactor.
- The flow rate proved to have a certain influence on the performance of the contactor.
However, since the differences were not remarkable the velocity was selected of the
rank provided by the marketer considering the volume of AT.
- The most important parameter has proved to be the FT volume. High volumes imply
faster mass transfer since the concentration decreases slower. However, for the same
reason lower volumes decrease rapidly the concentration and allow achieving the
Recovery of the nutrients (R>90%).

Page 63 Design of a pilot plant for the recovery of ammonium salts from WWTP residual water
7.6.2 Scenarios
Two possible situations have been considered:
- Using 2.5x8modules: Option 1, 2.
- Using 8x20 industrial modules: Option 3, 4.
In order to fulfil the requirements described in Section 7.6.1 one flow diagram was presented.
The reasons to have proposed the same flow diagram is because one only contactor cannot
reach the recovery of 95% and achieve such low concentration in only one step. Since the mass
transfer velocity decreases when decreasing the concentration in the feed side, it is necessary
to accelerate the process. That is the reason why it was considered simulating two steps and
the second step formed by two parallel contactors. The flow diagram can be observed in 11.7.
In order to simulate two parallel contactors, the real tank volume has been divided by two in
order to simulate the decreasing rate of the tank concentration.
Different conditions were simulated in order to get a wider knowledge on the different factors
that affect the mass transfer.
7.6.3 Results
In the next tables, the results obtained are shown below. Total production has been calculated
as the sum of volumes divided by the longer separation process time. Since it is expected to
mix the outlet of both flows the ammonia concentration, as shown by the flow diagram in
11.7, the resulting concentration is presented.
In Table 7.13, higher flow rate than experimental studies were set. The greater difference
compared to lab experiments was the feed volume. In the table the final concentration of the
feed and acid tank are shown, as well as the final acid volume and the production rate
obtained.
In Table 7.14, greater flow rates and initial volumes are shown with considerably adequate
results. All the requirements are fulfilled.
In Table 7.15, a bigger contactor was used for the simulation. The design parameters were
introduced in the model and the simulation was run obtaining the detailed results. It should be
remarked that the production rate is indeed quite larger than previous scenarios. However,
due to some hypothesis included in the model, the concentration obtained is not sufficiently
high. It should be noted that larger volume additions are difficult to compute to obtain the
concentration. Also, the water transport was calculated using the same regression than
experiment 7, which was under very different conditions.
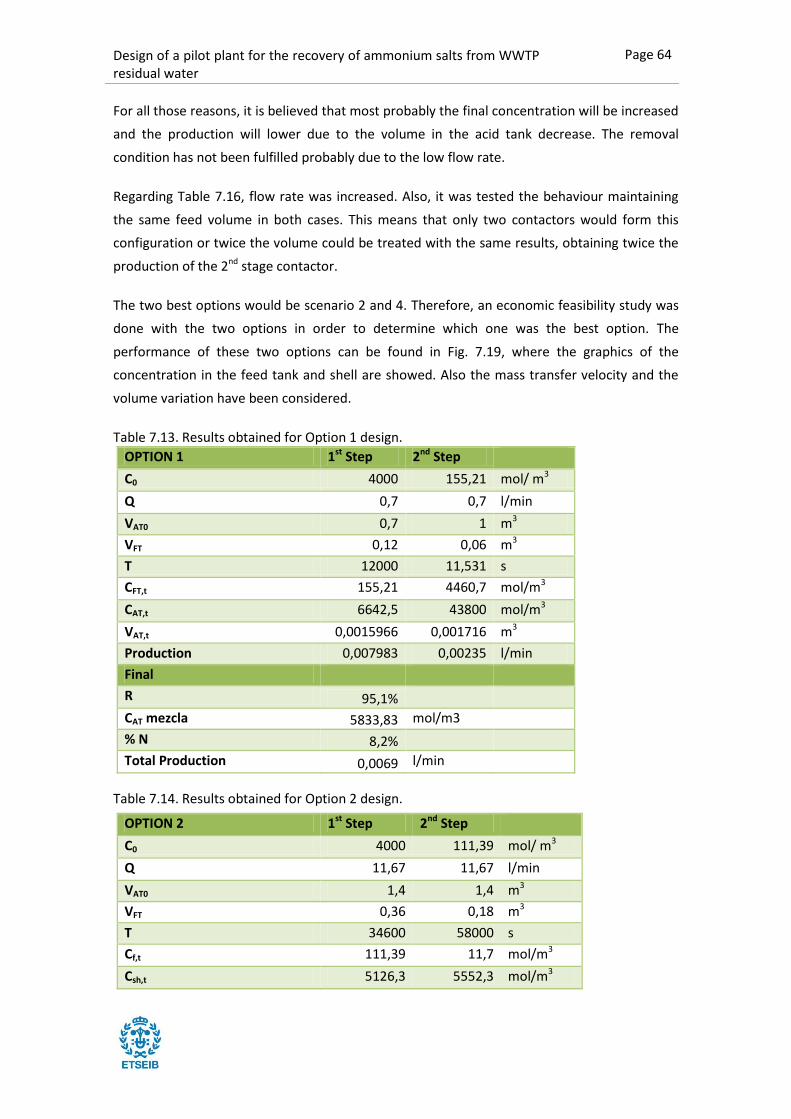
Design of a pilot plant for the recovery of ammonium salts from WWTP residual water
Page 64
For all those reasons, it is believed that most probably the final concentration will be increased
and the production will lower due to the volume in the acid tank decrease. The removal
condition has not been fulfilled probably due to the low flow rate.
Regarding Table 7.16, flow rate was increased. Also, it was tested the behaviour maintaining
the same feed volume in both cases. This means that only two contactors would form this
configuration or twice the volume could be treated with the same results, obtaining twice the
production of the 2nd stage contactor.
The two best options would be scenario 2 and 4. Therefore, an economic feasibility study was
done with the two options in order to determine which one was the best option. The
performance of these two options can be found in Fig. 7.19, where the graphics of the
concentration in the feed tank and shell are showed. Also the mass transfer velocity and the
volume variation have been considered.
Table 7.13. Results obtained for Option 1 design.
OPTION 1 1st Step 2nd Step
C0 4000 155,21 mol/ m3
Q 0,7 0,7 l/min
VAT0 0,7 1 m3
VFT 0,12 0,06 m3
T 12000 11,531 s
CFT,t 155,21 4460,7 mol/m3
CAT,t 6642,5 43800 mol/m3
VAT,t 0,0015966 0,001716 m3
Production 0,007983 0,00235 l/min
Final
R 95,1%
CAT mezcla 5833,83 mol/m3
% N 8,2%
Total Production 0,0069 l/min
Table 7.14. Results obtained for Option 2 design.
OPTION 2 1st Step 2nd Step
C0 4000 111,39 mol/ m3
Q 11,67 11,67 l/min
VAT0 1,4 1,4 m3
VFT 0,36 0,18 m3
T 34600 58000 s
Cf,t 111,39 11,7 mol/m3
Csh,t 5126,3 5552,3 mol/m3
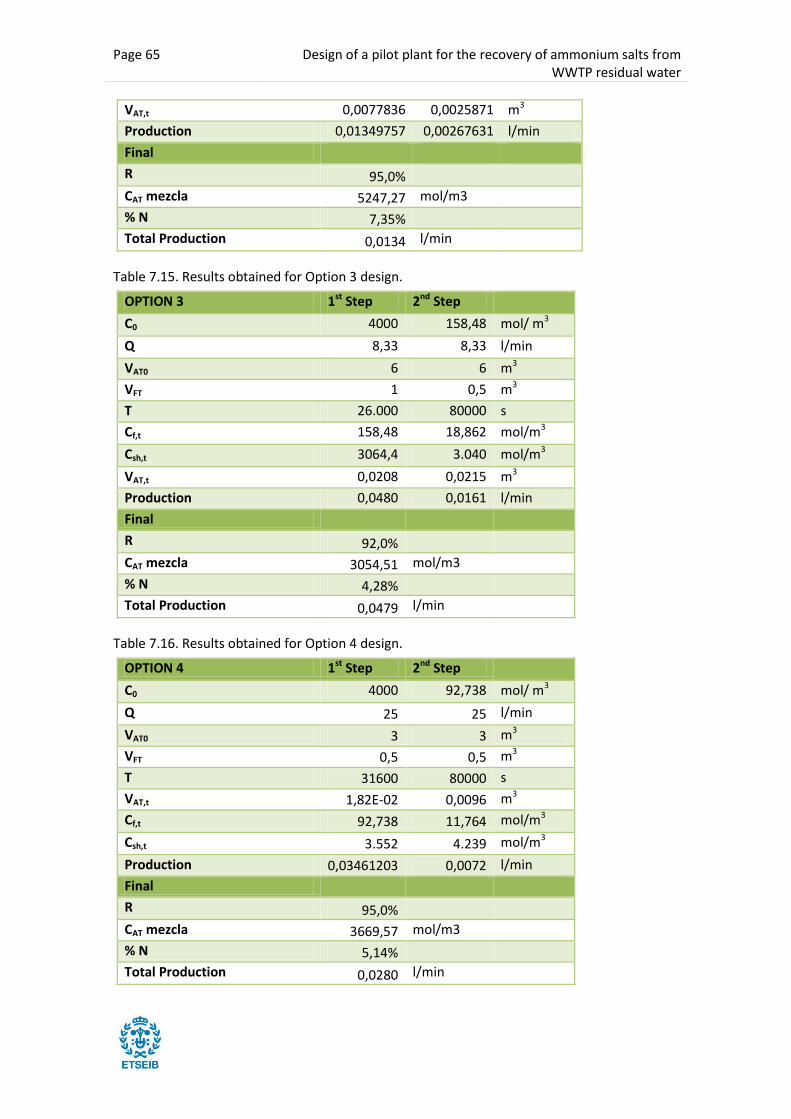
Page 65 Design of a pilot plant for the recovery of ammonium salts from WWTP residual water
VAT,t 0,0077836 0,0025871 m3
Production 0,01349757 0,00267631 l/min
Final
R 95,0%
CAT mezcla 5247,27 mol/m3
% N 7,35%
Total Production 0,0134 l/min
Table 7.15. Results obtained for Option 3 design.
OPTION 3 1st Step 2nd Step
C0 4000 158,48 mol/ m3
Q 8,33 8,33 l/min
VAT0 6 6 m3
VFT 1 0,5 m3
T 26.000 80000 s
Cf,t 158,48 18,862 mol/m3
Csh,t 3064,4 3.040 mol/m3
VAT,t 0,0208 0,0215 m3
Production 0,0480 0,0161 l/min
Final
R 92,0%
CAT mezcla 3054,51 mol/m3
% N 4,28%
Total Production 0,0479 l/min
Table 7.16. Results obtained for Option 4 design.
OPTION 4 1st Step 2nd Step
C0 4000 92,738 mol/ m3
Q 25 25 l/min
VAT0 3 3 m3
VFT 0,5 0,5 m3
T 31600 80000 s
VAT,t 1,82E-02 0,0096 m3
Cf,t 92,738 11,764 mol/m3
Csh,t 3.552 4.239 mol/m3
Production 0,03461203 0,0072 l/min
Final
R 95,0%
CAT mezcla 3669,57 mol/m3
% N 5,14%
Total Production 0,0280 l/min
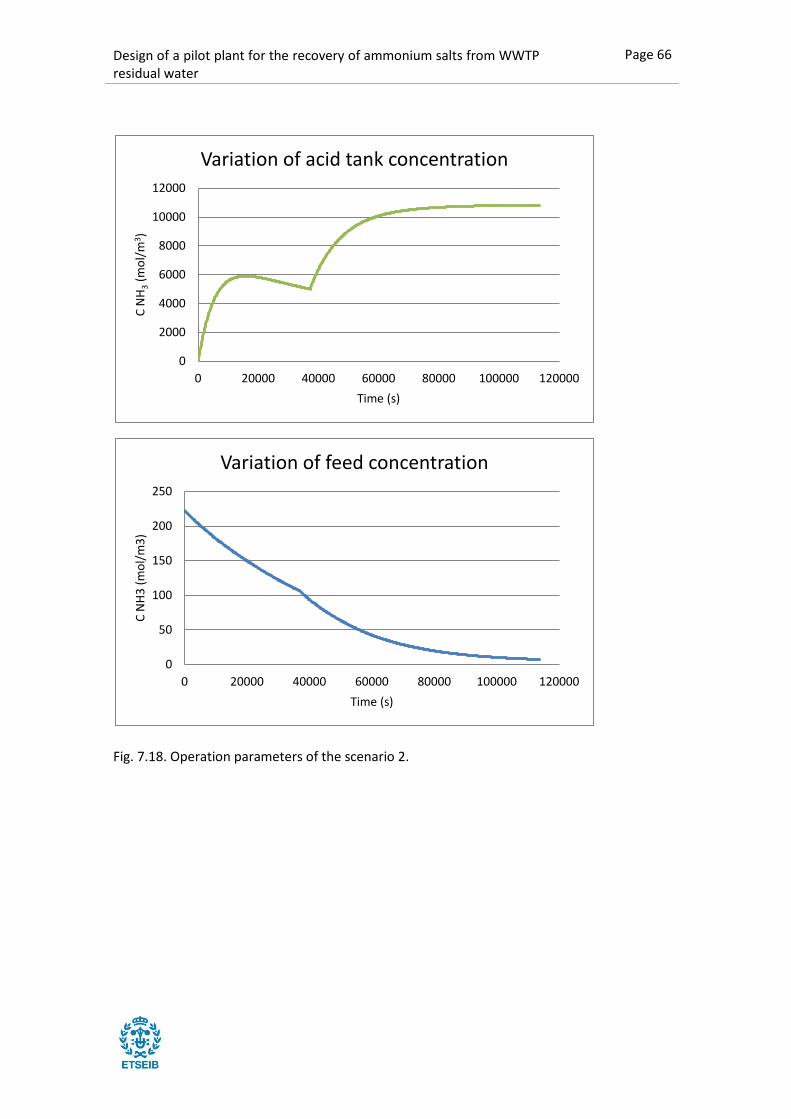
Design of a pilot plant for the recovery of ammonium salts from WWTP residual water
Page 66
Fig. 7.18. Operation parameters of the scenario 2.
0
2000
4000
6000
8000
10000
12000
0 20000 40000 60000 80000 100000 120000
C N
H3
(mo
l/m
3 )
Time (s)
Variation of acid tank concentration
0
50
100
150
200
250
0 20000 40000 60000 80000 100000 120000
C N
H3
(m
ol/
m3
)
Time (s)
Variation of feed concentration
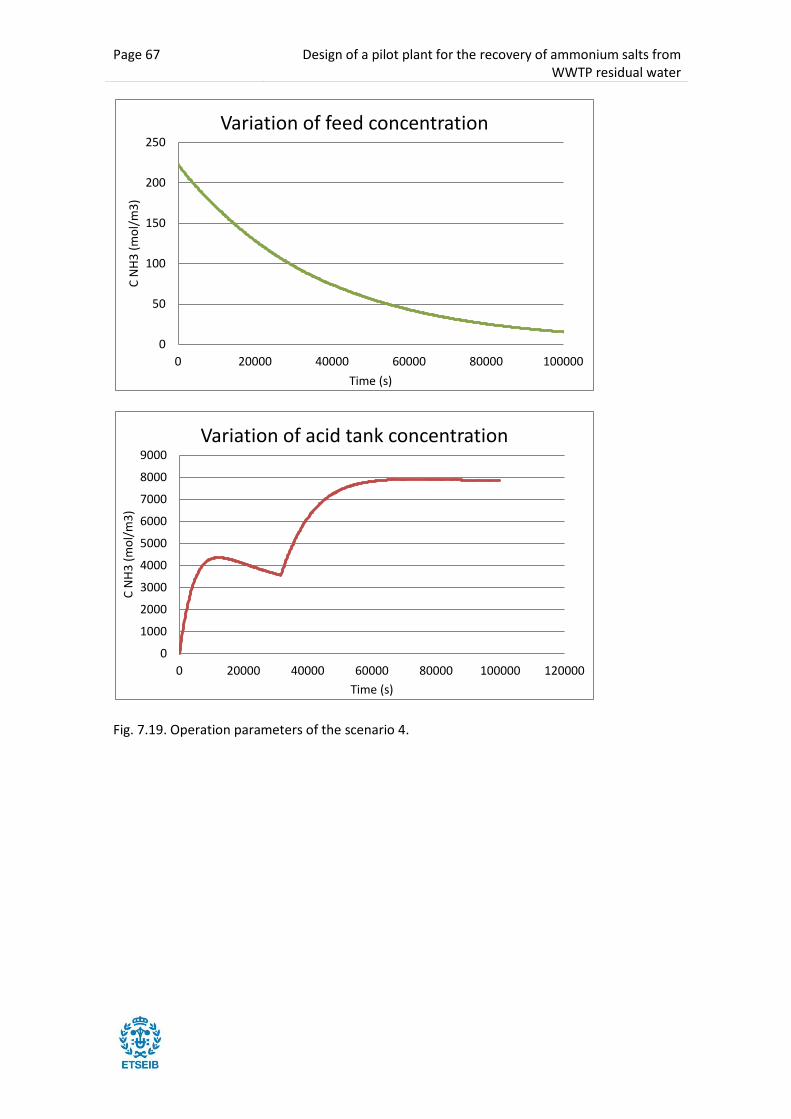
Page 67 Design of a pilot plant for the recovery of ammonium salts from WWTP residual water
Fig. 7.19. Operation parameters of the scenario 4.
0
50
100
150
200
250
0 20000 40000 60000 80000 100000
C N
H3
(m
ol/
m3
)
Time (s)
Variation of feed concentration
0
1000
2000
3000
4000
5000
6000
7000
8000
9000
0 20000 40000 60000 80000 100000 120000
C N
H3
(m
ol/
m3
)
Time (s)
Variation of acid tank concentration
Design of a pilot plant for the recovery of ammonium salts from WWTP residual water
Page 68
7.7 Designed configuration
The Flow diagram with the design can be found in 11.7. Along all the necessities detected for
the pilot plant that were considered for the configuration design the following should be
remarked:
It should allow the development of all the desired different trials, so the plant should
allow the adaptation of the flow diagram.
All tanks should have discharge points.
All the influent variables of the process will be measured, so sampling points in the
feed tank, acid tank, treated water with zeolites and others are be included.
The pilot plant should effectively simulate the behaviour of an industrial facility so that
the results obtained during the trials can be transferred.
The design of flow diagram should allow the study of the influence of each variable
that condition the process.
Different fertilizer mixtures will need to be produced so that the tests with crops of
interest can be done with a range of values.
Therefore, the equipment should enable sufficient flexibility to permit a different range of
working conditions.
Having all the considerations in mind, the developed solution contains the following elements:
Nº of
units
Abbreviation/P&ID
Agitated tanks (2)
• Feed tank (2) 2 FT-1, FT-2
• Acid stripping tank (2) 2 AT-1, AT-2
• Final product 1 FERT
• Not agitated tanks (4)
• Acid concentrated tank 1 AC-1
• Water for cleaning tank 1 ID-3
• Water after cleaning tank 1 ID-5
• Ammonium sensors: feed, acid stripping and spend feed
tanks
3
• pH-meter: feed, acid stripping, spend feed, water for
cleaning and water after cleaning tanks
5
• Phosphate sensor: acid stripping tank 1
• Level sensor: feed, acid stripping, spend feed, water for
cleaning and water after cleaning tanks
5
Page 69 Design of a pilot plant for the recovery of ammonium salts from WWTP residual water
• Flow meters: operation streams 8
• Pressure sensors: operation streams 8
• Conductivity sensors: operation streams 8
• Temperature sensors: operation streams 8
It should be mentioned that some washing streams have not been shown in order to make
more understandable the flow diagram of the process. ID-3 is the tank with the washing water
and ID-5 will contain used washing water.
Other present equipments and diagrams not mentioned in the list above are not mentioned
because they form part of the previously available LIFE NECOVERY project.
Also, the following list of chemicals will be required.
• Concentrated H3PO4 (85 %)
• NaClO/NaOH for chemical cleaning
• Water for cleaning
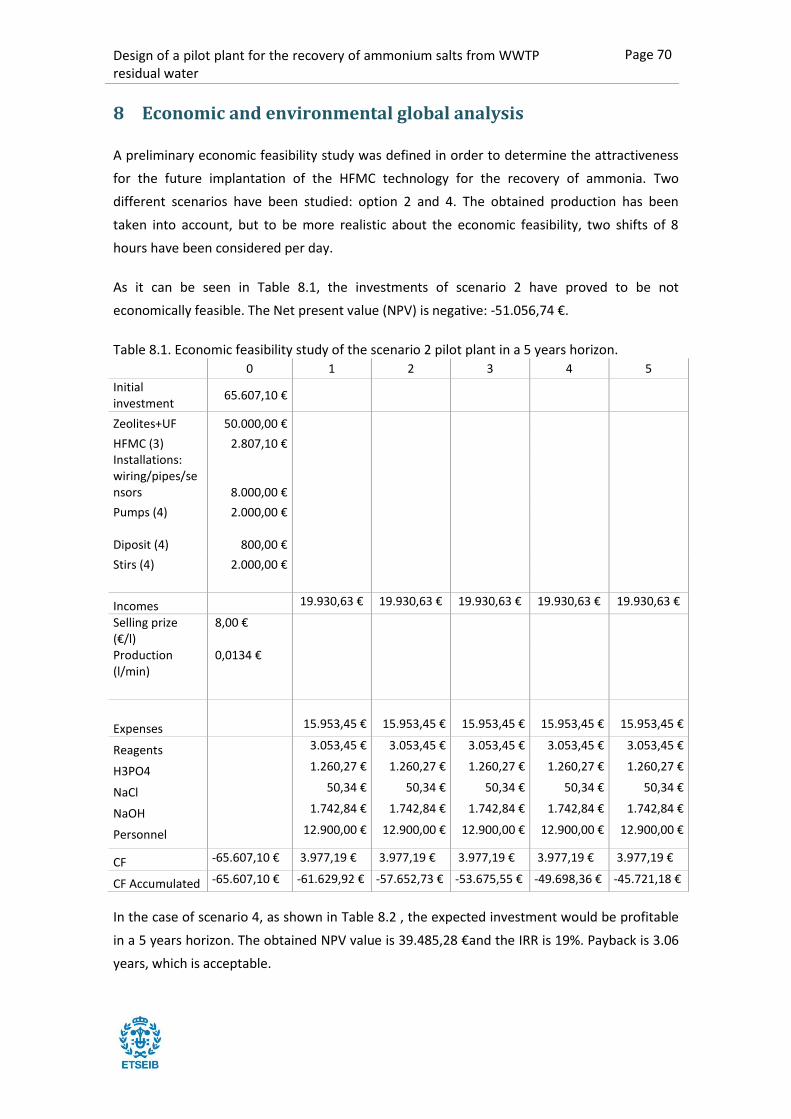
Design of a pilot plant for the recovery of ammonium salts from WWTP residual water
Page 70
8 Economic and environmental global analysis
A preliminary economic feasibility study was defined in order to determine the attractiveness
for the future implantation of the HFMC technology for the recovery of ammonia. Two
different scenarios have been studied: option 2 and 4. The obtained production has been
taken into account, but to be more realistic about the economic feasibility, two shifts of 8
hours have been considered per day.
As it can be seen in Table 8.1, the investments of scenario 2 have proved to be not
economically feasible. The Net present value (NPV) is negative: -51.056,74 €.
Table 8.1. Economic feasibility study of the scenario 2 pilot plant in a 5 years horizon.
0 1 2 3 4 5
Initial investment
65.607,10 €
Zeolites+UF 50.000,00 € HFMC (3) 2.807,10 € Installations: wiring/pipes/sensors 8.000,00 €
Pumps (4) 2.000,00 €
Diposit (4)
800,00 €
Stirs (4) 2.000,00 €
Incomes 19.930,63 € 19.930,63 € 19.930,63 € 19.930,63 € 19.930,63 €
Selling prize (€/l)
8,00 €
Production (l/min)
0,0134 €
Expenses
15.953,45 € 15.953,45 € 15.953,45 € 15.953,45 € 15.953,45 €
Reagents
3.053,45 € 3.053,45 € 3.053,45 € 3.053,45 € 3.053,45 €
H3PO4
1.260,27 € 1.260,27 € 1.260,27 € 1.260,27 € 1.260,27 €
NaCl
50,34 € 50,34 € 50,34 € 50,34 € 50,34 €
NaOH
1.742,84 € 1.742,84 € 1.742,84 € 1.742,84 € 1.742,84 €
Personnel
12.900,00 € 12.900,00 € 12.900,00 € 12.900,00 € 12.900,00 €
CF -65.607,10 € 3.977,19 € 3.977,19 € 3.977,19 € 3.977,19 € 3.977,19 €
CF Accumulated -65.607,10 € -61.629,92 € -57.652,73 € -53.675,55 € -49.698,36 € -45.721,18 €
In the case of scenario 4, as shown in Table 8.2 , the expected investment would be profitable
in a 5 years horizon. The obtained NPV value is 39.485,28 €and the IRR is 19%. Payback is 3.06
years, which is acceptable.
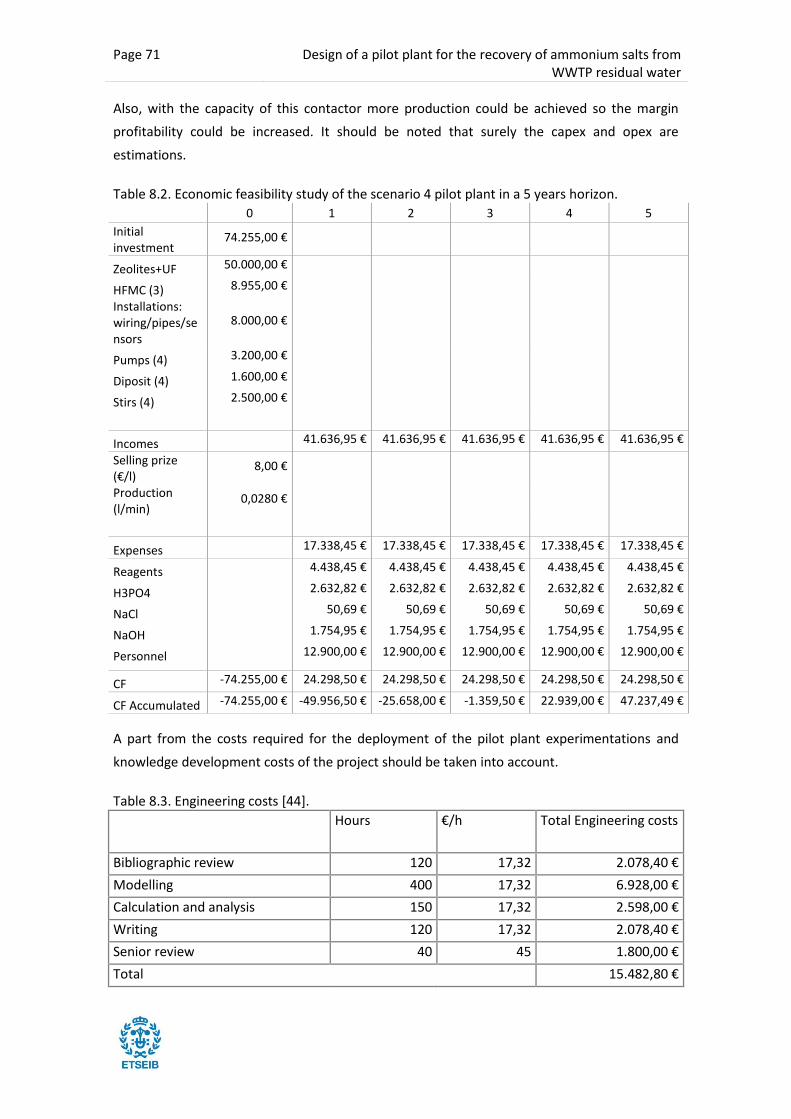
Page 71 Design of a pilot plant for the recovery of ammonium salts from WWTP residual water
Also, with the capacity of this contactor more production could be achieved so the margin
profitability could be increased. It should be noted that surely the capex and opex are
estimations.
Table 8.2. Economic feasibility study of the scenario 4 pilot plant in a 5 years horizon.
0 1 2 3 4 5
Initial investment
74.255,00 €
Zeolites+UF 50.000,00 €
HFMC (3) 8.955,00 €
Installations: wiring/pipes/sensors
8.000,00 €
Pumps (4) 3.200,00 €
Diposit (4) 1.600,00 €
Stirs (4) 2.500,00 €
Incomes 41.636,95 € 41.636,95 € 41.636,95 € 41.636,95 € 41.636,95 €
Selling prize (€/l)
8,00 €
Production (l/min)
0,0280 €
Expenses 17.338,45 € 17.338,45 € 17.338,45 € 17.338,45 € 17.338,45 €
Reagents 4.438,45 € 4.438,45 € 4.438,45 € 4.438,45 € 4.438,45 €
H3PO4 2.632,82 € 2.632,82 € 2.632,82 € 2.632,82 € 2.632,82 €
NaCl 50,69 € 50,69 € 50,69 € 50,69 € 50,69 €
NaOH 1.754,95 € 1.754,95 € 1.754,95 € 1.754,95 € 1.754,95 €
Personnel 12.900,00 € 12.900,00 € 12.900,00 € 12.900,00 € 12.900,00 €
CF -74.255,00 € 24.298,50 € 24.298,50 € 24.298,50 € 24.298,50 € 24.298,50 €
CF Accumulated -74.255,00 € -49.956,50 € -25.658,00 € -1.359,50 € 22.939,00 € 47.237,49 €
A part from the costs required for the deployment of the pilot plant experimentations and
knowledge development costs of the project should be taken into account.
Table 8.3. Engineering costs [44].
Hours €/h Total Engineering costs
Bibliographic review 120 17,32 2.078,40 €
Modelling 400 17,32 6.928,00 €
Calculation and analysis 150 17,32 2.598,00 €
Writing 120 17,32 2.078,40 €
Senior review 40 45 1.800,00 €
Total 15.482,80 €

Design of a pilot plant for the recovery of ammonium salts from WWTP residual water
Page 72
Regarding the cost of the experimental work, the experiments were carried out by EQ
Department at EEBE Faculty. The used material was already available so only the reagents
(NH3, NaOH, H3PO4) were direct expenses of the project. However, the low amounts required
make the economic and environmental impact negligible.The real samples were ceded by
WWTP Murcia Este.
COMSOL ® software’s license was already owned by EEBE Faculty and was made available to
carry out the simulations.
Regarding the environmental impact, the process achieves a recovery of 95% of the ammonia.
The expected treated flow

Page 73 Design of a pilot plant for the recovery of ammonium salts from WWTP residual water
9 Conclusions
A critical review of the literature was done to select the theoretical model description of mass
transfer. With the appropriate theoretical description of the performance, a model was done
with COMSOL® software and was compared to the experimental data.
The performance of HFMC in liquid-liquid extraction of ammonia was successfully achieved
using phosphoric acid. The ammonia present in the feed solution in its gas phase was indeed
transported through the membrane. However, a certain amount of water was transported due
to the differential concentration of salts. This caused an unexpected increase in AT, which
slightly diluted the final concentration of the solution.
Values obtained of KM were compared with different experiments and results obtained during
previous research projects. There were considerable differences between the values, as it can
be seen in Table 7.6 hypothetically due to the volume of the tank. More experiments should be
done in intermediate volume values in order to prove this hypothesis.
The most influencing parameters in mass transfer were the Feed Tank volume and in a smaller
extent the fibre length and the flow speed. Sensitivity studies were conducted to quantify the
contribution to the mass transfer of each parameter. FT volume has such an influence because
it has a direct impact in the total ammonia available. The larger the volume the more available
ammonia and the decrease in concentration is slower, maintaining optimal conditions that
maintain the mass transfer velocity.
On the other hand, lower volumes imply a faster decrease in the feed concentration. This
behaviour caused the decision of the final design.
Also, pH is critical for the availability of NH3 in the feed side and the reaction of ammonium
with the salts in the acid side. In the set of experiments the pH values were maintained
constant at 12 and 6 during the whole performance. Highly pure phosphoric acid (85%) was
used in order to maintain the solution as concentrated as possible.
A possible approach when implementing this technological solution in large-scale could be to
directly add flakes in the solution to avoid having to introduce more volume.
The vapour transport remains to be an obstacle to achieve higher concentration factors. A
possible solution would be to compensate the salt concentration on both sides of the
membrane (with Na, Cl or others) so that there is not an ionic gradient.
Different simulations were carried out to obtain different approaches to the pilot plant design,
both of them including two different steps. The first step was done by one contactor and the
second step was done with two contactors in parallel. Obtaining acceptable production rates
Design of a pilot plant for the recovery of ammonium salts from WWTP residual water
Page 74
and achieving the target of recovering 95% of N was achieved according to the simulations
performed.
Two scenarios showed better results: scenario 2 and scenario 4. Both fulfilled the
requirements of minimum production rate and recovery of 95% of initial ammonia. Since both
achieved the environmental objectives, the economic feasibility study of them was carried out
to choose the final design. The chosen design was scenario 4 with Liqui-Cel 8x20 contactor.
The flow diagram was defined for the identification of all the required equipment and
connexions.
The pilot plant is able to produce around 5600 l/year of fertilizer 5-14-0 of N: P2O5: K2O per
year. The concentrated obtained was limited at around 7%N of concentration, being a 17%
more concentrated.
The water solution coming from zeolites is afterwards used for cleaning purposes and also the
water after its treatment in contactors can be sent back to the WWTP with low enough
concentration levels of nitrogen.
Page 75 Design of a pilot plant for the recovery of ammonium salts from WWTP residual water
10 Bibliography
[1] M. S. EL-Bourawi, M. Khayet, R. Ma, Z. Ding, Z. Li, and X. Zhang, “Application of vacuum membrane distillation for ammonia removal,” J. Memb. Sci., vol. 301, no. 1–2, pp. 200–209, 2007.
[2] P. Brown, Broomfield M, Buys G, L. Cardenas, Kilroy E, MacCarthy J, Murrells T, Pang Y, Passant N, Ramirez Garcia J, Thistlethwaite G, and Webb N, UK Greenhouse Gas Inventory, 1990 to 2014. Annual Report for Submission under the Framework Convention on Climate Change, no. April. 2016.
[3] EU legislation, EU Nitrates Directive. European Commission, 2010.
[4] M. SØNDERGAARD, E. JEPPESEN, T. L. LAURIDSEN, C. SKOV, E. H. VAN NES, R. ROIJACKERS, E. LAMMENS, and R. PORTIELJE, “Lake restoration: successes, failures and long-term effects,” J. Appl. Ecol., vol. 44, no. 6, pp. 1095–1105, Aug. 2007.
[5] M. Lehtiniemi, J. Engström-Öst, and M. Viitasalo, “Turbidity decreases anti-predator behaviour in pike larvae, Esox lucius,” Environ. Biol. Fishes, vol. 73, no. 1, pp. 1–8, May 2005.
[6] D. W. Schindler, “Recent advances in the understanding and management of eutrophication,” Limnol. Oceanogr., vol. 51, no. 1part2, pp. 356–363, Jan. 2006.
[7] I. Chorus and J. Bartram, “Toxic Cyanobacteria in Water: A guide to their public health consequences, monitoring and management Determination of Organic Compounds in Natural and Treated Waters,” E FN Spon, 1999.
[8] A. Kunz and S. Mukhtar, “Hydrophobic Membrane Technology for Ammonia Extraction From Wastewaters,” Eng. Agrícola, vol. 36, no. 2, pp. 377–386, 2016.
[9] A. Wallace, “Soil acidification from use of too much fertilizer,” Commun. Soil Sci. Plant Anal., vol. 25, no. 1–2, pp. 87–92, Jan. 1994.
[10] Pauline Gazey, “Soil Acidity | Fact Sheets | soilquality.org.au,” Soil Quality Pty Ltd, 2018. [Online]. Available: http://soilquality.org.au/factsheets/soil-acidity. [Accessed: 25-Apr-2018].
[11] B. J. C. Bergmans, A. M. Veltman, M. C. M. Van Loosdrecht, J. B. Van Lier, and L. C. Rietveld, “Struvite formation for enhanced dewaterability of digested wastewater sludge,” Environ. Technol. (United Kingdom), vol. 35, no. 5, pp. 549–555, 2014.
[12] Bluetec (Ammonia Stripping), “Membrane contactors for a sustainable water future,” 2017.
[13] V. Parravicini, K. Svardal, and J. Krampe, “Greenhouse Gas Emissions from Wastewater Treatment Plants,” Energy Procedia, vol. 97, pp. 246–253, Nov. 2016.
[14] Food and Agriculture Organization of United Nations (FAO), “World fertilizer trends and outlook to 2018,” 2015.
[15] Y. Hesq and J.-P. Fossum, “Calculation of Carbon Footprint of Fertilizer Production,”
Design of a pilot plant for the recovery of ammonium salts from WWTP residual water
Page 76
2014.
[16] S. J. Vermeulen, B. M. Campbell, and J. S. I. Ingram, “Climate Change and Food Systems,” Annu. Rev. Environ. Resour., vol. 37, no. 1, pp. 195–222, Nov. 2012.
[17] S. A. Montzka, E. J. Dlugokencky, and J. H. Butler, “Non-CO 2 greenhouse gases and climate change,” Nature, vol. 476, no. 7358. pp. 43–50, 2011.
[18] M. Kitano, Y. Inoue, Y. Yamazaki, F. Hayashi, S. Kanbara, S. Matsuishi, T. Yokoyama, S. W. Kim, M. Hara, and H. Hosono, “Ammonia synthesis using a stable electride as an electron donor and reversible hydrogen store,” Nat. Chem., vol. 4, no. 11, pp. 934–940, 2012.
[19] U.S. Geological Survey, “Mineral Commodity Summaries 2011,” 2011.
[20] D. W. Schindler, S. R. Carpenter, S. C. Chapra, R. E. Hecky, and D. M. Orihel, “Reducing Phosphorus to Curb Lake Eutrophication is a Success,” Environ. Sci. Technol., vol. 50, no. 17, pp. 8923–8929, Sep. 2016.
[21] B. Norddahl, V. G. Horn, M. Larsson, J. H. du Preez, and K. Christensen, “A membrane contactor for ammonia stripping, pilot scale experience and modeling,” Desalination, vol. 199, no. 1–3, pp. 172–174, 2006.
[22] A. K. Pabby and A. M. Sastre, “State-of-the-art review on hollow fibre contactor technology and membrane-based extraction processes,” J. Memb. Sci., vol. 430, pp. 263–303, 2013.
[23] A. Mandowara and P. K. Bhattacharya, “Simulation studies of ammonia removal from water in a membrane contactor under liquid-liquid extraction mode,” J. Environ. Manage., vol. 92, no. 1, pp. 121–130, 2011.
[24] G. K. Agrahari, S. K. Shukla, N. Verma, and P. K. Bhattacharya, “Model prediction and experimental studies on the removal of dissolved NH3 from water applying hollow fiber membrane contactor,” J. Memb. Sci., vol. 390–391, pp. 164–174, 2012.
[25] A. Taylor, Gareth P. ; Sengupta, “A wafer-shaped hollow fiber module for in-line use in a piping system,” 2009.
[26] Membrana-Charlotte, “Capturing Ammonia in Flue Gas Condensate Treatment for Biomass Power Stations with Liqui-Cel ® Membrane Contactors,” TechBrief, vol. 2015, no. Ix.
[27] G. P. Taylor and A. Sengupta, “Membrane contactors and systems for membrane distillation or ammonia removal and related methods,” 2014.
[28] A. Taylor, Gareth P. ; Sengupta, “Membrane contactors and systems for membrane distillation or ammonia removal and related methods,” 2013.
[29] H. Fan and Y. Peng, “Application of PVDF membranes in desalination and comparison of the VMD and DCMD processes,” Chem. Eng. Sci., vol. 79, pp. 94–102, 2012.

Page 77 Design of a pilot plant for the recovery of ammonium salts from WWTP residual water
[30] P. A. Hogan, R. P. Canning, P. A. Peterson, R. A. Johnson, and A. S. Michaels, “ON THE HORIZON A New Option :,” no. July, 1998.
[31] M. Laqbaqbi, J. Sanmartino, M. Khayet, C. García-Payo, and M. Chaouch, “Fouling in Membrane Distillation, Osmotic Distillation and Osmotic Membrane Distillation,” Appl. Sci., vol. 7, no. 4, p. 334, 2017.
[32] Fercampo, “Liquid Fertilizers Catalogue.” [Online]. Available: http://www.fercampo.com/plantaliquidos.html#organicos. [Accessed: 11-Mar-2018].
[33] J. (Michigan S. U. Isleib, “Pros and cons of granular and liquid fertilizers | MSU Extension,” Michigan State University Extension, 2016. [Online]. Available: http://msue.anr.msu.edu/news/pros_and_cons_of_granular_and_liquid_fertilizers. [Accessed: 22-Mar-2018].
[34] W. M. Stewart, D. W. Dibb, A. E. Johnston, and T. J. Smyth, “The contribution of commercial fertilizer nutrients to food production,” Agron. J., vol. 97, no. 1, pp. 1–6, 2005.
[35] L. S. Rivas, S. B. Prieto, G. G. T. Romero, and J. M. G. Fernández, “Recuperación de fósforo mediante cristalización de estruvita en efluente de industria de productos congelados marinos,” Tecnol. del Agua, vol. 31, no. 335, pp. 26–35, 2011.
[36] A. Thornton, P. Pearce, and S. A. Parsons, “Ammonium removal from digested sludge liquors using ion exchange,” Water Res., vol. 41, no. 2, pp. 433–439, 2007.
[37] Z. Wang, J. Zheng, J. Tang, X. Wang, and Z. Wu, “A pilot-scale forward osmosis membrane system for concentrating low-strength municipal wastewater: performance and implications,” Sci. Rep., vol. 6, no. 1, p. 21653, Apr. 2016.
[38] A. Mandowara and P. K. Bhattacharya, “Membrane contactor as degasser operated under vacuum for ammonia removal from water: A numerical simulation of mass transfer under laminar flow conditions,” Comput. Chem. Eng., vol. 33, no. 6, pp. 1123–1131, 2009.
[39] E. E. Licon Bernal, A. Alcaraz, S. Casas, C. Valderrama, and J. L. Cortina, “Trace ammonium removal by liquid–liquid membrane contactors as water polishing step of water electrolysis for hydrogen production from a wastewater treatment plant effluent,” J. Chem. Technol. Biotechnol., vol. 91, no. 12, pp. 2983–2993, 2016.
[40] E. Licon-bernal, “Contactores de membrana para la recuperación de nitrógeno en corrientes líquidas residuales : efecto de la temperatura y limpieza,” pp. 2–10, 2017.
[41] Z. Ding, L. Liu, Z. Li, R. Ma, and Z. Yang, “Experimental study of ammonia removal from water by membrane distillation (MD): The comparison of three configurations,” J. Memb. Sci., vol. 286, no. 1–2, pp. 93–103, 2006.
[42] M. Rezakazemi, S. Shirazian, and S. N. Ashrafizadeh, “Simulation of ammonia removal from industrial wastewater streams by means of a hollow-fiber membrane contactor,” Desalination, vol. 285, pp. 383–392, 2012.
[43] S. Kunz, Airton; Mucktar, “Hydrophobic membrane technology for ammonia extraction
Design of a pilot plant for the recovery of ammonium salts from WWTP residual water
Page 78
from wastewaters,” J. Brazilian Assoc. Agric. Eng., vol. 4430, no. 49, pp. 377–386, 2016.
[44] B. (CC. O. . López Martínez, F. (CC. O. . Fernández Relinque, E. (UGT) Herreros Andrés, J. L. (TECNIBERIA); Jiménez García, J. (TECNIBERIA) Linaza la Calle, A. (TECNIBERIA) Martínez Álvarez, and Á. (TECNIBERIA) Galán Zarabozo, XVIII CONVENIO COLECTIVO NACIONAL DE EMPRESAS DE INGENIERIA Y OFICINAS DE ESTUDIOS TÉCNICOS. .
[45] R. Klaassen, P. H. M. Feron, and a. E. Jansen, “Membrane Contactors in Industrial Applications,” Chem. Eng. Res. Des., vol. 83, no. 3, pp. 234–246, 2005.
[46] M. S. El-Bourawi, Z. Ding, R. Ma, and M. Khayet, “A framework for better understanding membrane distillation separation process,” J. Memb. Sci., vol. 285, no. 1–2, pp. 4–29, 2006.
[47] V. Karanikola, A. F. Corral, P. Mette, H. Jiang, R. G. Arnoldand, and W. P. Ela, “Solar membrane distillation: Desalination for the navajo nation,” Rev. Environ. Health, vol. 29, no. 1–2, pp. 67–70, 2014.
[48] S. Adnan, M. Hoang, H. Wang, and Z. Xie, “Commercial PTFE membranes for membrane distillation application: Effect of microstructure and support material,” Desalination, vol. 284, pp. 297–308, 2012.
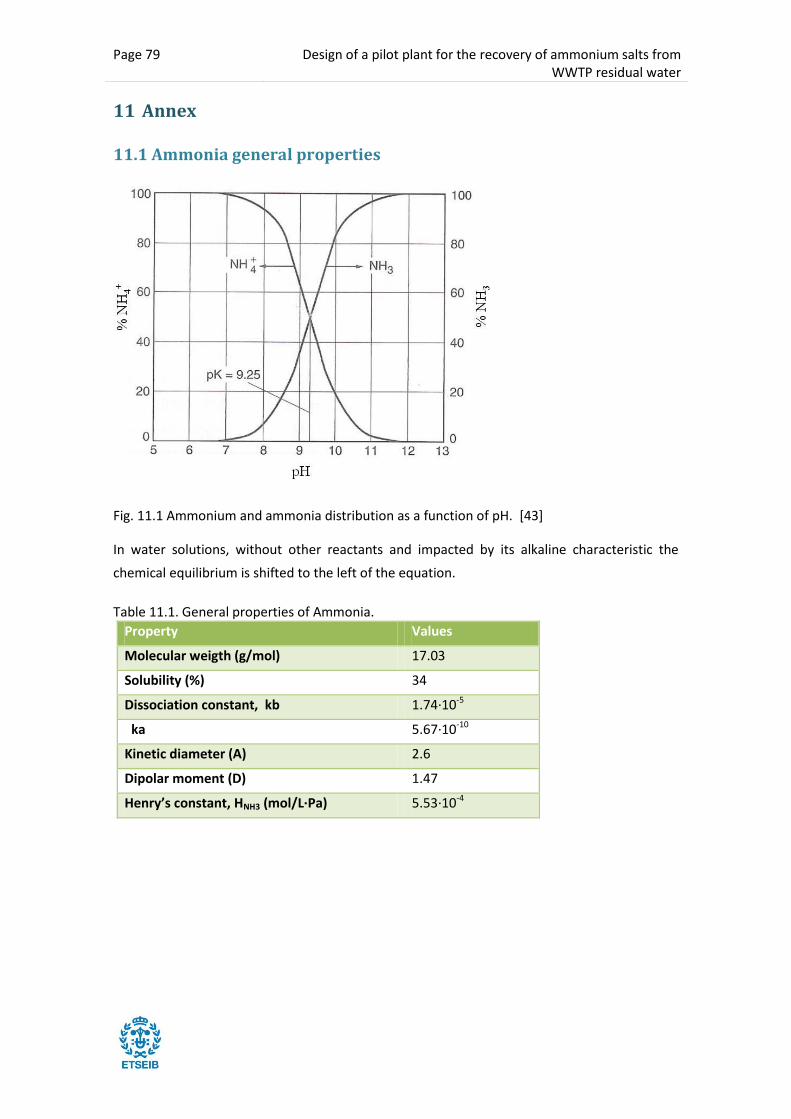
Page 79 Design of a pilot plant for the recovery of ammonium salts from WWTP residual water
11 Annex
11.1 Ammonia general properties
Fig. 11.1 Ammonium and ammonia distribution as a function of pH. [43]
In water solutions, without other reactants and impacted by its alkaline characteristic the
chemical equilibrium is shifted to the left of the equation.
Table 11.1. General properties of Ammonia.
Property Values
Molecular weigth (g/mol) 17.03
Solubility (%) 34
Dissociation constant, kb 1.74·10-5
ka 5.67·10-10
Kinetic diameter (A) 2.6
Dipolar moment (D) 1.47
Henry’s constant, HNH3 (mol/L·Pa) 5.53·10-4
Design of a pilot plant for the recovery of ammonium salts from WWTP residual water
Page 80
11.2 Ammonia removal processes
Biologically it can be removed by using nitrification/denitrification, chemically by struvite
precipitation or chlorination, and physically by stripping or membrane technologies. The use of
physical methods to remove NH3 is not as effective as biological or chemical processes, but it
allows for its extraction and use as a fertilizer.
Biologically based ammonia removal methods require large tanks, long retention times, tightly
controlled operating conditions and long recovery times to regenerate the specialized bacteria
in the set-up and, thus, OPEX is a concern.
When using membrane technologies as MF, dialysis and reverse osmosis, a good pre-
treatment is required to avoid reduced efficiency due to fouling on the membrane surface that
could reduce membrane life.
The separation methods such as MF, UF, NF RO using pressure differences as driving force
require expensive and/or complex process controls to avoid loss of efficiency due to fouling.
For gas separation, the membrane technology may be more appropriate than filtration thus
avoiding the use of pressure and other sophisticated process controllers due to lesser mass
transfer resistance in gas phase compared to liquid phase.
Membrane gas absorption installation for ammonia recovery. An industrial ammonia
membrane gas absorption (MGA) unit for ammonia recovery has been installed at an Aliachem
dye intermediate production plant in Pardubice (Czech Republic)[45].
The MGA installation converts the absorbed ammonia into an ammonium salt solution. The
installation is equipped with the necessary controls to ensure a constant composition of the
ammonium salt solution. This allows reuse of the ammonium salt as a product. The membrane
contactor equipped with PP membranes is on the top of the installation. The large grey tank on
the back of the installation is the storage tank for the ammonium salt solution that the unit
produces. The ammonia-recovery MGA installation is designed for ammonia removal
efficiencies 499%. That this goal has been met is clear from Fig. 14, which shows the ammonia-
removal efficiency as a function of the air flow rate through the MGA installation. The MGA
installation has an ammonia recovery capacity of 83 t yr1 .

Page 81 Design of a pilot plant for the recovery of ammonium salts from WWTP residual water
11.2.1 Introduction to Membrane Distillation
Membrane Distillation process has not yet fulfilled the demonstration at laboratory scale of its
superiority over other already well-established technologies [46]. A warm solution to be
concentrated is separated via a microporous membrane from a cold liquid into which
condensation is to occur. A membrane of very low thermal conductance would be necessary to
prevent heat flow by conduction from the warm to the cold liquid stream.
There are two different scenarios: either a solution is concentrated by removing a certain
amount of water or a volatile compound is solely extracted and concentrated in a different
solution.
The separation method is a thermally driven process, in which only vapour molecules are
transported through porous hydrophobic membranes. The liquid feed to be treated by MD
must be in direct contact with one side of the membrane and does not penetrate inside the
dry pores of the membranes. The hydrophobic nature of the membrane prevents liquid
solutions from entering its mores due to the surface tension forces. As a result, liquid/vapour
interfaces are formed at the entrances of the membrane pores. The driving force is the
transmembrane vapour pressure difference that may be maintained with one of the four
following possibilities:
DCMD: Direct contact membrane distillation. The temperature difference introduces a
vapour pressure difference. Volatile molecules cross the membrane and condense in the
cold liquid/vapour interface inside the membrane module. The most studied configuration
is the DCMD since it is easier to handle the condensation step inside the membrane
module.
AGMD: Air gap membrane distillation. A stagnant air gap is between the membrane and
the condensation surface.
SGMD: Sweeping gas membrane distillation. A cold inert gas sweeps the permeate side of
the membrane carrying the vapour molecules and condensation takes place outside the
membrane module.

Design of a pilot plant for the recovery of ammonium salts from WWTP residual water
Page 82
VMD: Vacuum membrane distillation. The applied vacuum pressure is lower than the
saturation pressure of volatile mole.
Fig. 11.2. Membrane configurations [47].
MD is a thermally-driven separation process, in which only vapour molecules are transported
through a microporous hydrophobic membrane. The MD driving force is the transmembrane
vapour pressure difference that causes transport phenomena (Jv). This difference of water
vapour pressure can be caused by a difference of temperatures or for the composition of the
solution. Thus, one possible measure of efficiency would be
Fig. 11.3. Membrane distillation mass transport [48].
According to the MD operating conditions (feed temperature, distillate temperature) the mass
flow will vary. Whereas, the effect on the MD flux of the operating variables such as feed and
permeate temperatures and flow velocities have been widely investigated and corroborated
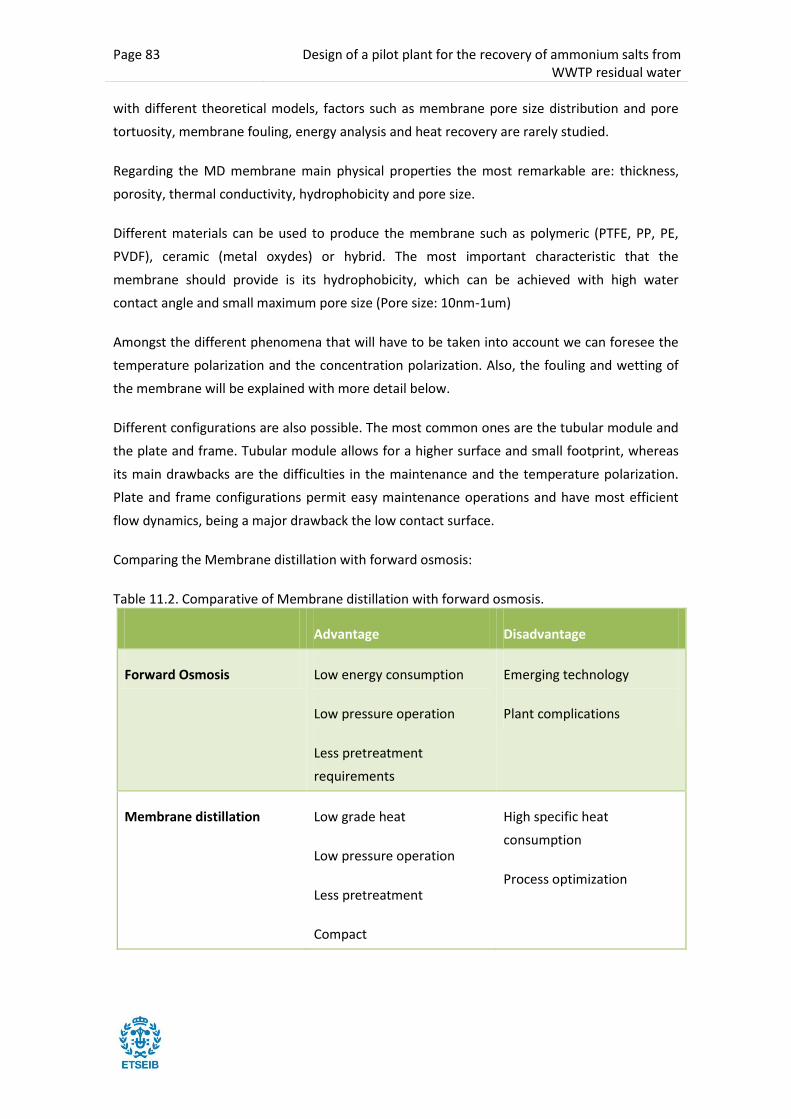
Page 83 Design of a pilot plant for the recovery of ammonium salts from WWTP residual water
with different theoretical models, factors such as membrane pore size distribution and pore
tortuosity, membrane fouling, energy analysis and heat recovery are rarely studied.
Regarding the MD membrane main physical properties the most remarkable are: thickness,
porosity, thermal conductivity, hydrophobicity and pore size.
Different materials can be used to produce the membrane such as polymeric (PTFE, PP, PE,
PVDF), ceramic (metal oxydes) or hybrid. The most important characteristic that the
membrane should provide is its hydrophobicity, which can be achieved with high water
contact angle and small maximum pore size (Pore size: 10nm-1um)
Amongst the different phenomena that will have to be taken into account we can foresee the
temperature polarization and the concentration polarization. Also, the fouling and wetting of
the membrane will be explained with more detail below.
Different configurations are also possible. The most common ones are the tubular module and
the plate and frame. Tubular module allows for a higher surface and small footprint, whereas
its main drawbacks are the difficulties in the maintenance and the temperature polarization.
Plate and frame configurations permit easy maintenance operations and have most efficient
flow dynamics, being a major drawback the low contact surface.
Comparing the Membrane distillation with forward osmosis:
Table 11.2. Comparative of Membrane distillation with forward osmosis.
Advantage Disadvantage
Forward Osmosis Low energy consumption
Low pressure operation
Less pretreatment
requirements
Emerging technology
Plant complications
Membrane distillation Low grade heat
Low pressure operation
Less pretreatment
Compact
High specific heat
consumption
Process optimization
Design of a pilot plant for the recovery of ammonium salts from WWTP residual water
Page 84
As mentioned in the Table above, there are several advantages that have major impact in the
OPEX such as the lower operating temperature and the low hydrostatic pressure. The
membrane does not need to be selective, the only technical requirement is that it should not
be wetted and only vapour and non-condensable gases should be present within its pores.
Another of the advantages of MD over pressure-driven membrane concentration for producing
highly concentrated products is that the strip solution is undergoing dilution while the product
stream is being concentrating. Hence if the membrane contactor is operated in counterflow
mode, the product streams encounter increasingly concentrated strip solution as it flows
through the contactor, it is possible to maintain the vapour-pressure driving force for water
transport across the membrane (and, thus the transmembrane flux) large and nearly constant
throughout the contactor [30], [31].
Regarding its disadvantages: it has not yet been implemented in industry because of several
barriers to commercial implementation:
Low permeate flow compared to other separation techniques such as reverse osmosis,
Permeate flow decay caused by concentration and temperature polarization effects,
membrane fouling, total or partial pore wetting.
Membrane and module design for MD
High Thermal energy consumption
Operating variables
According to a series of experiments done with VMD (Vacuum membrane distillation) for the
removal of ammonia, high feed temperature, low downstream pressures and high initial feed
concentrations and pH levels enhance ammonia removal efficiency. pH is found to be the most
dominant factor [1].
Operating variables such as feed temperature, feed flow velocity and downstream pressure
are found to remarkably influence the removal process efficiency. Higher feed temperature
and lower permeate pressure increase the ammonia removal efficiency and the total
transmembrane flux, but resulted in lower ammonia separation factor.
Feed flow
Within the range of feed flow velocities examined (0.28-0.84m/s) [1]; increasing the feed flow
velocity resulted in higher ammonia removal efficiency, higher transmembrane flux and better
ammonia separation factor.
The resistance imposed by the thermal and viscous boundary layers (TPC and CPC) are found

Page 85 Design of a pilot plant for the recovery of ammonium salts from WWTP residual water
to have a significant influence, especially at low feed velocities.
The mass transfer coefficients of feed and membrane are found to be of the same order of
magnitude indicating further the important role that each resistance can play on the mass
transport process [1]. The mass transfer resistance is found to switch from being
predominately located at the feed side at low feed temperature, low flow velocities and high
downstream pressures, to be partially located within the membrane pores at higher feed
temperatures, higher feed flow velocities and lower downstream pressures.
Working at lower pressure downstream favors the separation since the driving force is the
vapour pressure difference across both sides of the membrane pores. However, when
lowering the pressure lower than 6kPa, water vapour molecules are increasingly transported
to the permeate side affecting to the separation factor.
Temperature
Decrease of ammonia separation factor with temperature, this is due to the increased water
vapour pressure at higher temperatures.
Feed Concentration
According to a series of experiments under operating conditions of 50ºC, P=8.3kPa v=0.15m/s,
feed concentration 0.65M resulted in optimum ammonia removal efficiency (Membrane pore
size 0.23 um, effective membrane porosity 916.2m-1. 2kW heating bath). Less concentration
could imply more ammonia species becoming available at the feed side as the concentration
increases. More concentration could cause in increase of the viscosity, affecting the feed flow
regime, causing a reduction of the Reynolds number. Higher viscosity can influence the rate of
diffusion and the rate of mass transfer of the volatile compounds.
11.2.2 Introduction to Osmotic Distillation
Contrary to DCMD, osmotic distillation (OD) is an isothermal technology used to remove water
from aqueous solutions (i.e., concentration of wastewaters and recovery of valuable
components) using a porous and hydrophobic membrane that separates the feed solution to
be treated and an osmotic solution (i.e., a draw solution having high osmotic pressure and low
water chemical potential).
Generally NaCl, CaCl2, MgCl2, MgSO4, K2HPO4 KH2PO4 and some organic liquids like glycerol or
polyglycols were considered to prepared the osmotic solution. One of the advantages of the
OD process is the less energy required compared to MD. It was generally applied for
concentrating liquid foods, such as milk, fruit and vegetable juices [31].

Design of a pilot plant for the recovery of ammonium salts from WWTP residual water
Page 86
Osmotic distillation (OD) is an isothermal membrane distillation [30]: a separation process in
which a liquid mixture containing a volatile component is contacted with a microporous, non-
liquid-wettable membrane whose opposite surface is exposed to a second liquid phase capable
of absorbing that component for its concentration. Usually the average OD water fluxes are in
the range of 0.2-3L/m2h.
OD is a membrane transport process in which a liquid phase (aqueous solution) containing one
or more volatile components is allowed to contact one surface of a microporous membrane
whose pores are not wetted by the liquid, while the opposing surface is in contact with a
second non-wetting liquid phase (also, usually an aqueous solution) in which the volatile
components are soluble or miscible. The membrane, thus acts as a vapour gap where the
volatile component is free to migrate by convection of diffusion.
The driving potential for the transport is the difference in vapour pressure of each component
over each of the contacting liquid phases.
Among its many benefices, the most important one is its athermal process, which makes it an
advantageous alternative for the separation and concentration of thermally labile
pharmaceutical products and biological and volatile solutes from aqueous solutions (e.g.
ethanol from wine and other ferments, selective removal of water without depletion of
important flavor/fragrance components for the concentration of food such as fruit and
vegetable juices and vegetable extracts such as tea or coffee) using water as extracting solvent
and without causing damage to the main product.
In the first application is the volatile compound the one that flows through the membrane,
whereas in the selective removal of water is the water the one that flows through the
membrane. This is caused by the low solubility of the lipophilic solutes in concentrated saline
solutions than in pure water, thus the vapour pressure of the solutes when present in any
given concentration in such a solution are higher than over water at the same concentration.
Also, the molecular weights of these solutes are far higher than those of water, causing the
diffusive permeabilities through the membrane to be much lower.
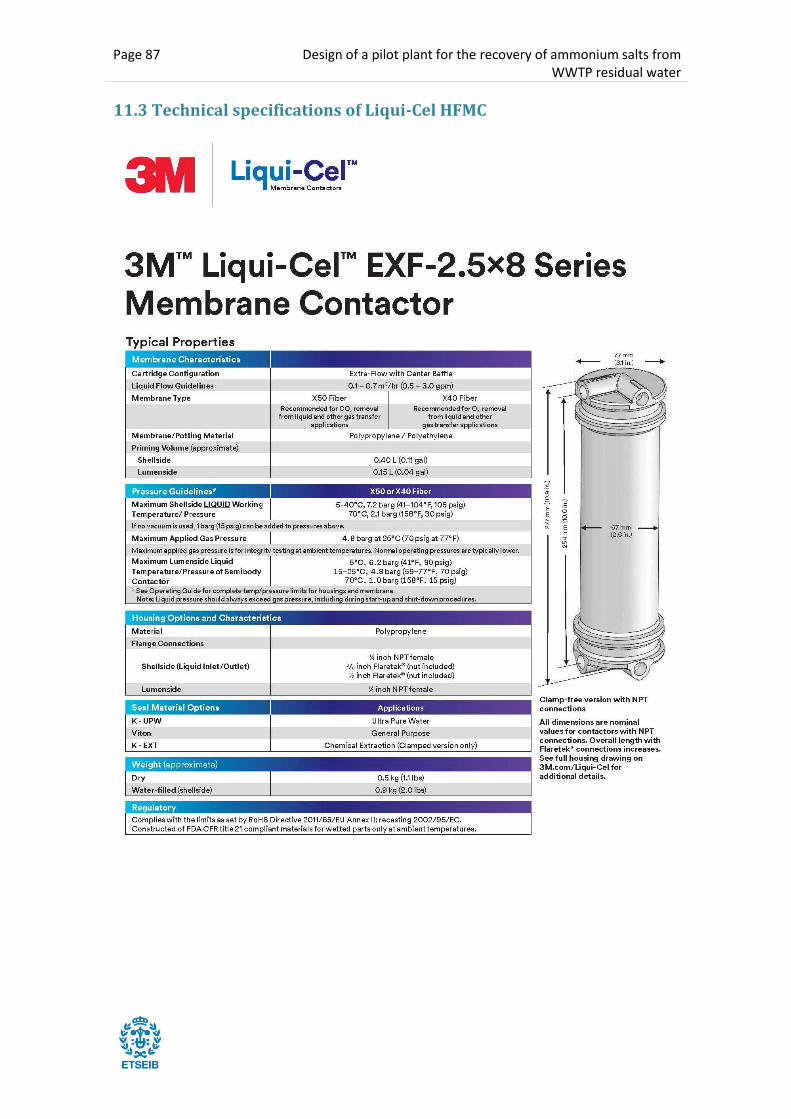
Page 87 Design of a pilot plant for the recovery of ammonium salts from WWTP residual water
n
i
.)
9
(
1
0
m
m
2
7
7
i
n
)
(
1
0
.
0
m
m
2
5
4
11.3 Technical specifications of Liqui-Cel HFMC
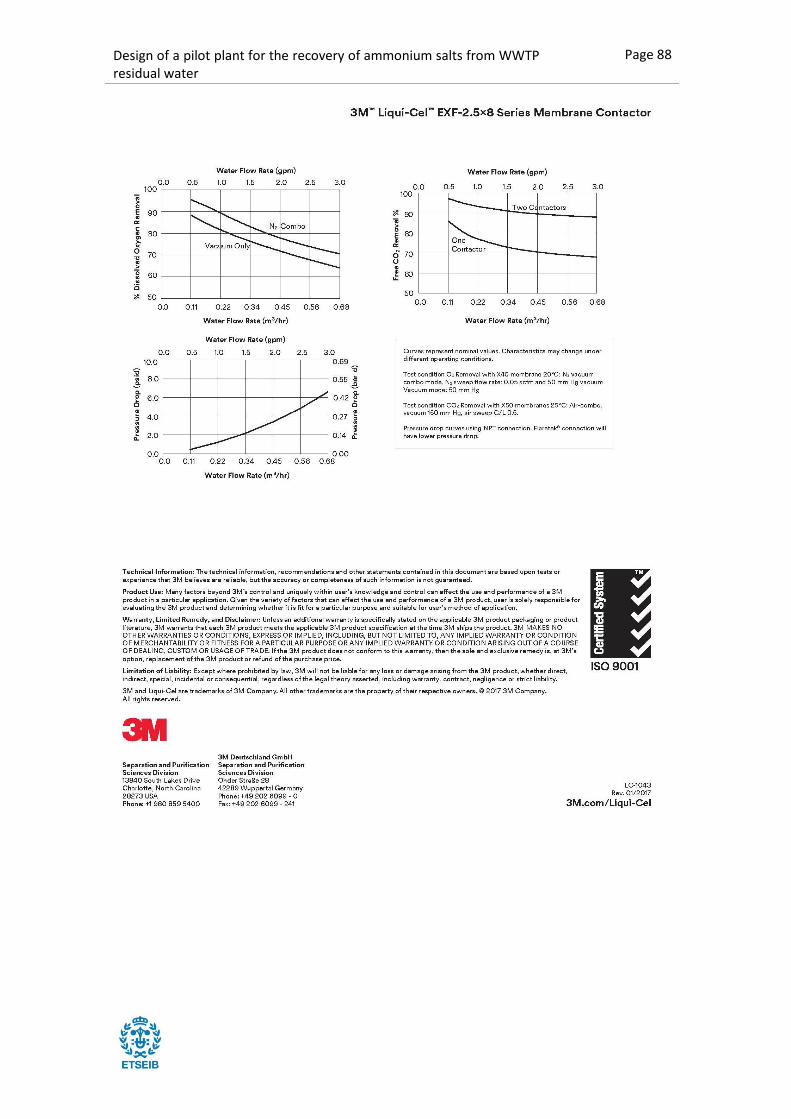
Design of a pilot plant for the recovery of ammonium salts from WWTP residual water
Page 88
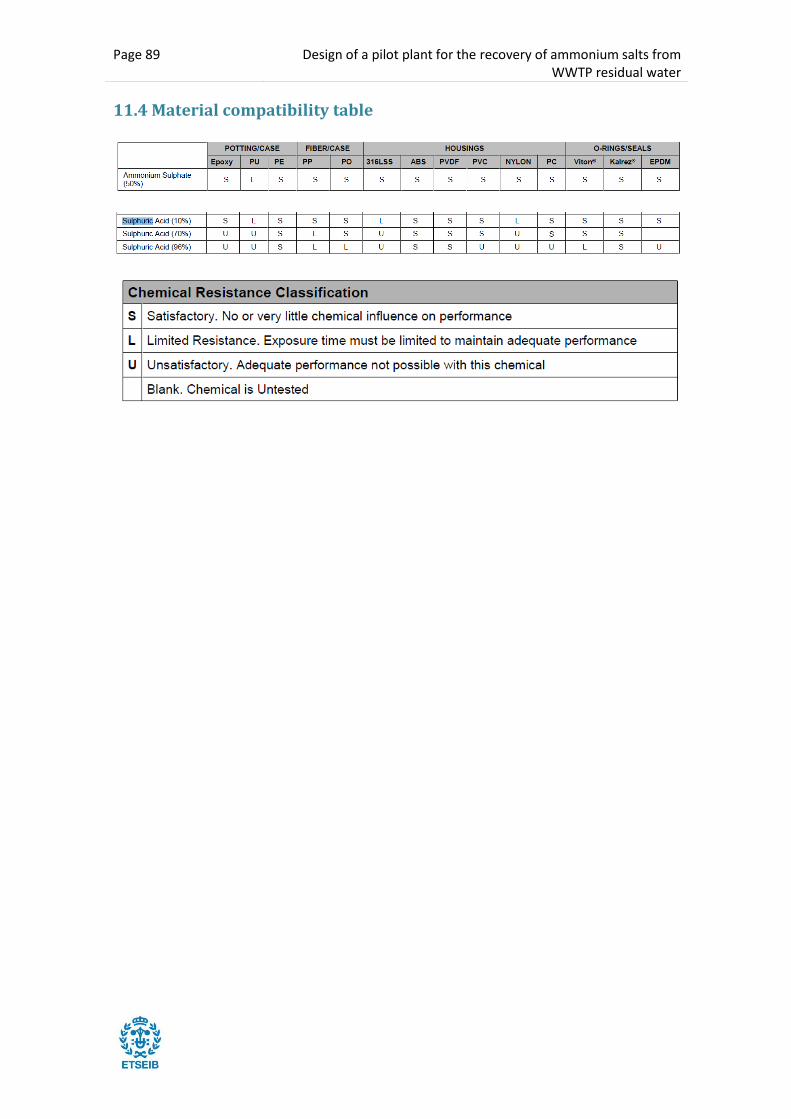
Page 89 Design of a pilot plant for the recovery of ammonium salts from WWTP residual water
11.4 Material compatibility table
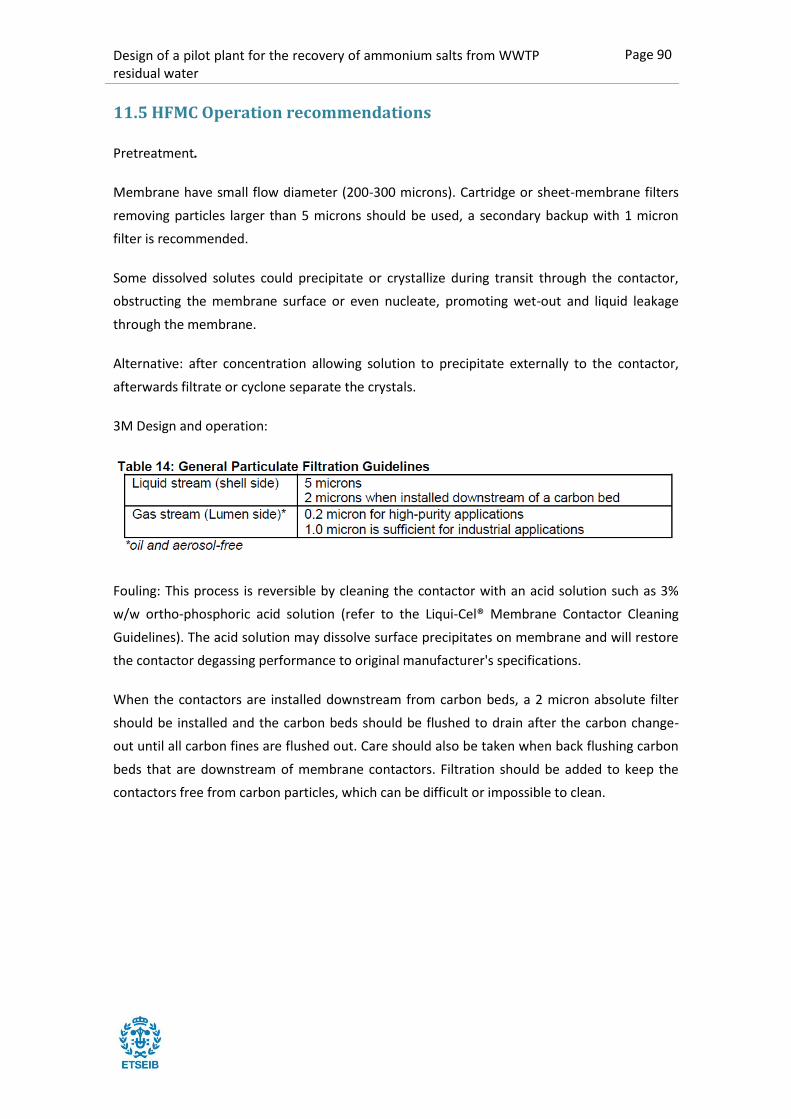
Design of a pilot plant for the recovery of ammonium salts from WWTP residual water
Page 90
11.5 HFMC Operation recommendations
Pretreatment.
Membrane have small flow diameter (200-300 microns). Cartridge or sheet-membrane filters
removing particles larger than 5 microns should be used, a secondary backup with 1 micron
filter is recommended.
Some dissolved solutes could precipitate or crystallize during transit through the contactor,
obstructing the membrane surface or even nucleate, promoting wet-out and liquid leakage
through the membrane.
Alternative: after concentration allowing solution to precipitate externally to the contactor,
afterwards filtrate or cyclone separate the crystals.
3M Design and operation:
Fouling: This process is reversible by cleaning the contactor with an acid solution such as 3%
w/w ortho-phosphoric acid solution (refer to the Liqui-Cel® Membrane Contactor Cleaning
Guidelines). The acid solution may dissolve surface precipitates on membrane and will restore
the contactor degassing performance to original manufacturer's specifications.
When the contactors are installed downstream from carbon beds, a 2 micron absolute filter
should be installed and the carbon beds should be flushed to drain after the carbon change-
out until all carbon fines are flushed out. Care should also be taken when back flushing carbon
beds that are downstream of membrane contactors. Filtration should be added to keep the
contactors free from carbon particles, which can be difficult or impossible to clean.

Page 91 Design of a pilot plant for the recovery of ammonium salts from WWTP residual water
11.6 Technical specifications of zeolites columns
Zeolites will be regenerated using the following reagents:
- NaOH. We will use 4% NaOH directly (it will be bought diluted to avoid complexity in the
installation).
- NaCl. We will use 26% NaCl, but it will be necessary to dilute it. To do that, we propose the
use of the same product-water of zeolites or ultra-filtered water.
- Mix NaOH & NaCl. The system must be conditioned to do a mixing of both reagents if
necessary.
Parameter Value Units
%Porosity 24-32% Kg/L
Density 2,2-2,4 g N/kg zeolite
Experimental CEC 6,2
Column volume: 200 L
% volume of zeolite 60%
Zeolite volume 120 l
Zeolite mass 276 kg
H column: 1.6 (1 m zeolite) m
Minimum H zeolite required: 80 cm
Diameter 40 cm
Flowrate range in each column: 50-250
0.4 – 2.1
L/H,
BV/h
Nominal flowrate service in each column
200
1,7
L/H,
BV/h
HRT - EBCT 40-8 (nominal 10) min
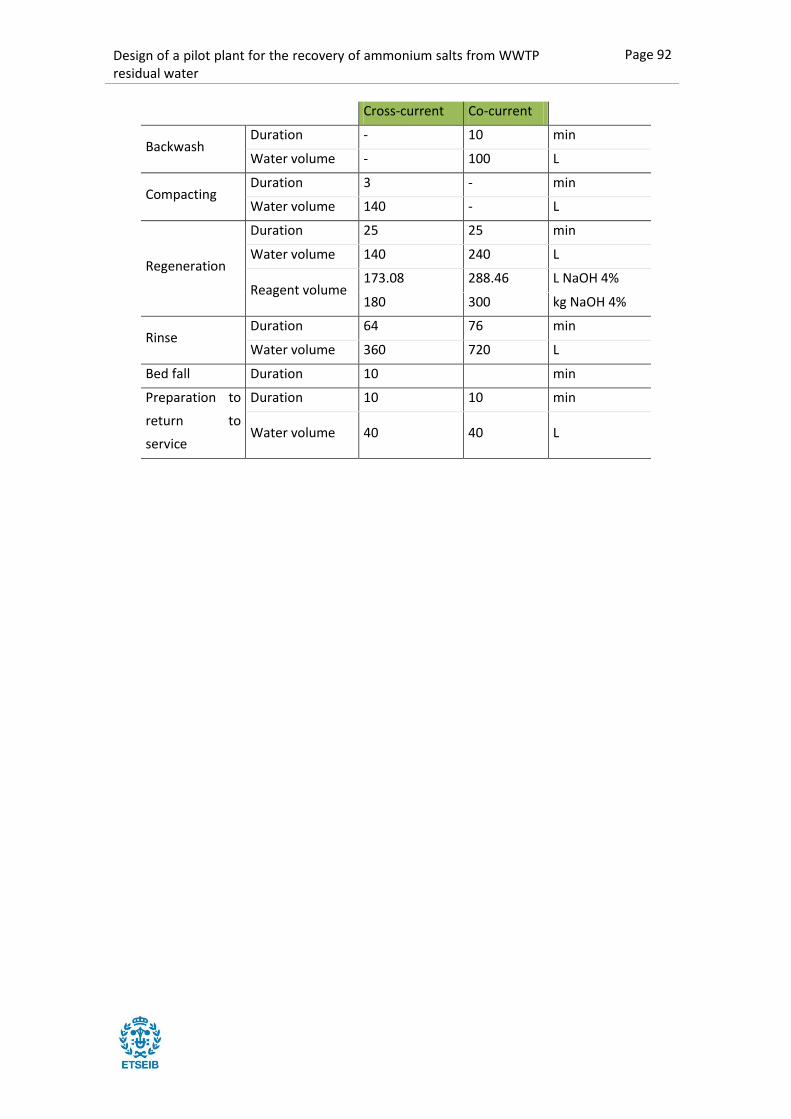
Design of a pilot plant for the recovery of ammonium salts from WWTP residual water
Page 92
Cross-current Co-current
Backwash Duration - 10 min
Water volume - 100 L
Compacting Duration 3 - min
Water volume 140 - L
Regeneration
Duration 25 25 min
Water volume 140 240 L
Reagent volume 173.08 288.46 L NaOH 4%
180 300 kg NaOH 4%
Rinse Duration 64 76 min
Water volume 360 720 L
Bed fall Duration 10 min
Preparation to
return to
service
Duration 10 10 min
Water volume 40 40 L
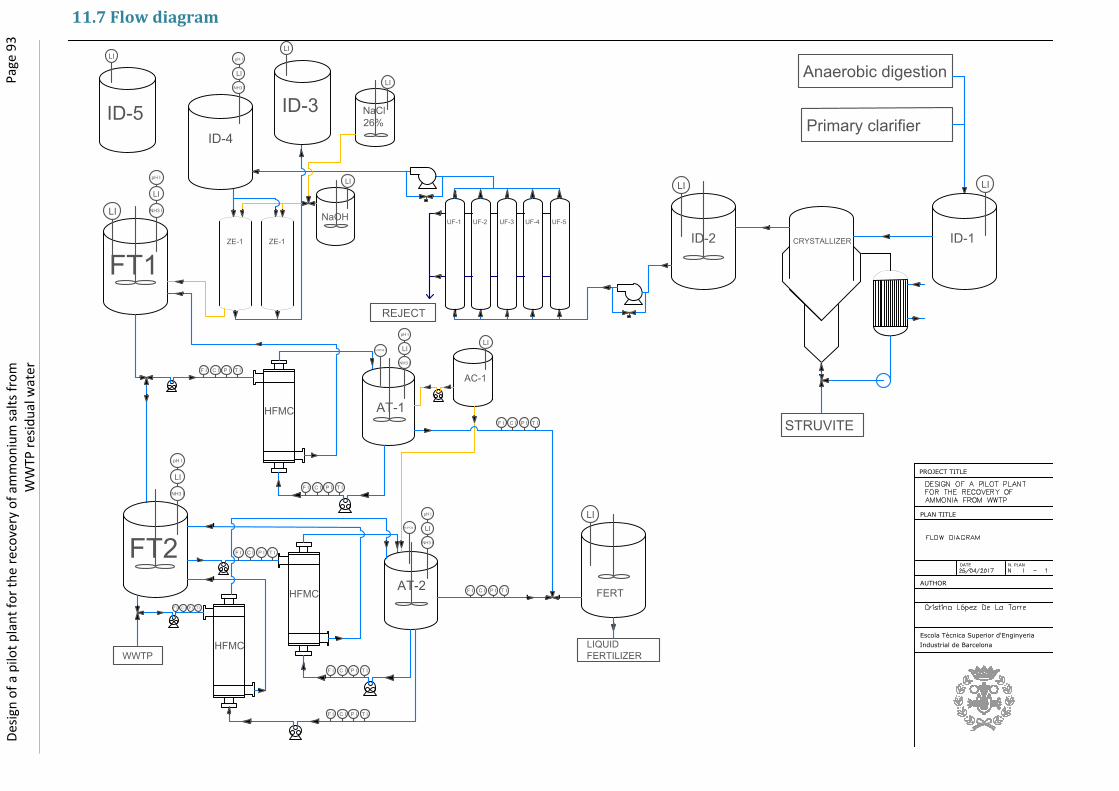
Anaerobic digestion
Primary clarifier
UF-1 UF-2 UF-3 UF-4 UF-5
ZE-1 ZE-1
ID-1ID-2
FT1
CRYSTALLIZER
LI
LI
LI
AT-1
AC-1
LI
HFMC
LI
FERT
DATE
PLAN TITLE
N. PLAN
PROJECT TITLE
AUTHOR
Escola Tècnica Superior d'Enginyeria
Industrial de Barcelona
ID-4
ID-3
NaOH
LI
LI
NaCl
26%
FT2
LI
HFMC
AT-2
STRUVITE
REJECT
LIQUID
FERTILIZER
HFMC
WWTP
NH3 I
pH I
LI
NH3 I
pH I
LI
NH3 I
pH I
LI
NH3 I
pH I
H3PO4 I
H3PO4 I
LI
NH3 I
pH I
LI
F I C I P I T I
F I C I P I T I
F I C I P I T I
F I C I P I T I
F I C I P I T I
F I C I P I T I
F I C I P I T I
F I C I P I T I
ID-5
LI
Pag
e 9
3
Des
ign
of
a p
ilot
pla
nt
for
the
reco
very
of
amm
on
ium
sal
ts f
rom
W
WTP
res
idu
al w
ater
11.7 Flow diagram
AutoCAD SHX Text
A3:1/200
AutoCAD SHX Text
N 1 - 1
AutoCAD SHX Text
25/04/2017
AutoCAD SHX Text
FLOW DIAGRAM
AutoCAD SHX Text
DESIGN OF A PILOT PLANT FOR THE RECOVERY OF AMMONIA FROM WWTP
AutoCAD SHX Text
Cristina López De La Torre