
Pilot Energy Limited
233
Pilot Energy Limited ABN 86 115229 984 Level 12, 225 George Street Sydney, NSW 2000 26 April 2021 ASX ANNOUCEMENT- ADDITION OF RISC REPORT DOCUMENT TO NOTICE OF GENERAL MEETING Pilot Energy Limited (ASX: PGY) (Pilot or Company) advises that the RISC report called “Independent Technical Specialist Report Pilot Energy Ltd- Australian Exploration Assets” was not included in the Consolidated Notice of Meeting documents released on Friday 23 April 2021. Accordingly, the Company has released today the updated Consolidated Notice of Meeting documents which now include the Australian Exploration Assets RISC report. This announcement has been authorised for release by the Board of Pilot. For further information contact: Sally McDow Company Secretary [email protected]
-
Upload
khangminh22 -
Category
Documents
-
view
0 -
download
0
Transcript of Pilot Energy Limited

Pilot Energy Limited ABN 86 115229 984 Level 12, 225 George Street Sydney, NSW 2000
26 April 2021
ASX ANNOUCEMENT- ADDITION OF RISC REPORT DOCUMENT TO NOTICE OF GENERAL MEETING
Pilot Energy Limited (ASX: PGY) (Pilot or Company) advises that the RISC report called “Independent
Technical Specialist Report Pilot Energy Ltd- Australian Exploration Assets” was not included in the
Consolidated Notice of Meeting documents released on Friday 23 April 2021.
Accordingly, the Company has released today the updated Consolidated Notice of Meeting documents
which now include the Australian Exploration Assets RISC report.
This announcement has been authorised for release by the Board of Pilot.
For further information contact:
Sally McDow
Company Secretary

PILOT ENERGY LIMITED
ABN 86 115 229 984
NOTICE OF GENERAL MEETING
EXPLANATORY MEMORANDUM, INDEPENDENT EXPERT REPORT
AND
PROXY FORM
Date of Meeting: Friday, 28 May 2021
Time of Meeting: 11:00am (AEST)
Place of Meeting: the offices of Squire Patton Boggs (AU) Level 17, 88 Phillip Street, Sydney 2001. The meeting will also be held virtually via Lumi Online Platform

2 |
NOTICE OF GENERAL MEETING
Notice is given that a General Meeting (GM or Meeting) of shareholders of Pilot Energy Limited (Company or Pilot) will be held at 11:00am (AEST) on Friday, 28 May 2021.
The Explanatory Memorandum to this Notice of Meeting provides additional information on matters to be considered at the GM. The Explanatory Memorandum and the Proxy Form are part of this Notice of Meeting.
Terms and abbreviations used in this Notice of Meeting and/or the Explanatory Memorandum will, unless the context otherwise requires, have the same meaning given to them in the Definitions contained in the back of the Explanatory Memorandum.
The Directors have determined under Regulation 7.11.37 of the Corporations Regulations 2001 (Cth) that the persons eligible to vote at the Meeting are those who are registered Shareholders of the Company at 7:00pm (AEST) on Wednesday, 26 May 2021.
ATTENDING THE GM VIRTUALLY
• The temporary modifications to the Corporations Act 2001 (Cth) introduced by the Commonwealth Treasurer as a temporary COVID-19 measure, to allow the Notice of Meeting and other information regarding the GM to be provided electronically and to allow Shareholders to participate in the GM using the online facility which facilitates direct voting and questions have now expired. Consequently, the Meeting will be held physically at the address notified in this Notice of Meeting. In addition, pursuant to section 13.7 of Pilot’s Constitution the Company may also “hold a meeting of members at two or more venues using any technology that gives the members as a whole a reasonable opportunity to participate.” Accordingly, Pilot also offers a virtual meeting option for this Meeting.
• The Company has arranged for virtual attendance at the Meeting via the Lumi online platform (Lumi).
Shareholders will be able to view the meeting presentations and listen to the meeting live, submit questions to the Chairman in real time and vote on Resolutions through Lumi.
Shareholders who wish to participate in the GM online may do so:
a. from their computer, by entering the URL http://web.lumiagm.com/387092324 into their browser.
b. from their mobile device by either entering the URL http://web.lumiagm.com/387092324 in their
browser:
If you choose to participate in the Meeting online, you can log in to the meeting by entering: 1. Your username, which is your Voting Access Code (VAC), which can be located on the first page of
your proxy form or Notice of Meeting email.
2. Your password, which is the postcode registered to your holding if you are an Australian shareholder.
Overseas shareholders should refer to the user guide for their password details.
3. If you have been nominated as a third party proxy, please contact Boardroom on 1300 737 760.
Attending the meeting online enables Shareholders to view the Meeting live and to also ask questions and cast direct votes at the appropriate times whilst the meeting is in progress.
More information regarding participating in the GM online can be found in the guide appended to the end of this notice.

3 |
Ordinary Business
Resolution 1: Issue of the Consideration Shares to Royal Vendors
To consider and, if thought fit, pass with or without amendment, the following resolution as an ordinary resolution:
That, subject to the Royal Resolutions being passed, for the purposes of item 7 of section 611 of the Corporations Act and all other purposes, approval is given for the Company to issue 136,363,636 Shares (Consideration Shares) in aggregate to the Royal Vendors causing the Royal Vendors to acquire a Relevant Interest in the Company’s Shares such that Voting Power of the Royal Vendors increases to a maximum of up to 38.3%1 pursuant to the terms of the Royal Acquisition and as more fully described in the Explanatory Memorandum.
See the Explanatory Memorandum accompanying this Notice for further information about this Resolution. Shareholders should carefully consider the Independent Expert’s Report prepared for the purposes of Shareholder approval required under item 7 of section 611 of the Corporations Act for this Resolution. The Independent Expert’s Report comments on the fairness and reasonableness of the Royal Acquisition to Non-Associated Shareholders. The Independent Expert has concluded that the Royal Acquisition, as set out in the Explanatory Statement and in the Independent Expert’s Report annexed to this Notice, is not fair but reasonable to Non-Associated Shareholders.
A Voting Exclusion Statement for Resolutions 1 & 2 is set out below.
Resolution 2: Approval of Issue of Advisor Shares to RFC Ambrian Limited
To consider and, if thought fit, to pass, with or without amendment, the following resolution as an ordinary resolution:
That, subject to the Royal Resolutions being passed, for the purposes of ASX Listing Rule 7.1 and for all other purposes, approval is given for the Company to issue up to 7,575,758 Shares (Advisor Shares) to RFC Ambrian Limited (or its nominee), and otherwise on the terms and conditions as more fully described in the Explanatory Memorandum.
See the Explanatory Memorandum accompanying this Notice for further information about this Resolution.
A Voting Exclusion Statement for Resolutions 1 & 2 is set out below.
Resolution 3: Election of Director – Mr Anthony James Strasser
To consider, and, if thought fit, to pass, with or without amendment, the following resolution as an ordinary resolution:
That, subject to the Royal Resolutions being passed, Mr Anthony James Strasser, being an eligible candidate for election as a director of the Company under ASX Listing Rule 3.5(a)(ii) of the Company’s Constitution, be elected as a director of the Company in accordance with rule 3.4 of the Company’s Constitution subject to, and with effect on and from, First Completion under the Royal Acquisition.
See the Explanatory Memorandum accompanying this Notice for further information about this Resolution.
Resolution 4: Election of Director – Mr Bruce Gordon
To consider, and, if thought fit, to pass, with or without amendment, the following resolution as an ordinary resolution:
That, subject to the Royal Resolutions being passed, Mr Bruce Gordon, being an eligible candidate for election as a director of the Company under rule 3.5(a)(ii) of the Company’s Constitution, be elected as a director of the Company in accordance with rule 3.4 of the Company’s Constitution subject to, and
1 Voting power assessed on the basis of the number of new shares issued pursuant to Resolutions 1 and 2,and assumes that the remainder of the Contractor Shares are issued following approval of the Royal Resolutions and excludes any options on issue in the Company and no other equity securities are issued in the Company.

4 |
with effect on and from, First Completion under the Royal Acquisition.
See the Explanatory Memorandum accompanying this Notice for further information about this Resolution.
Resolution 5: Ratification of SPP Shortfall Shares
To consider and, if thought fit, to pass, with or without amendment, the following resolution as an ordinary resolution:
That, for the purposes of ASX Listing Rule 7.4 and for all other purposes, Shareholders approve and ratify the prior issue by the Company of 11,651,514 Shares (SPP Shortfall Shares) under ASX Listing Rules 7.1 at an issue price of $0.033 per Share, to those recipients set out in and otherwise on the terms and conditions as more fully described in the Explanatory Memorandum.
See the Explanatory Memorandum accompanying this Notice for further information about this Resolution.
A Voting Exclusion Statement for Resolution 5 is set out below.
VOTING EXCLUSION STATEMENT
Resolutions 1 and 2
In accordance with Listing Rule 14.11 the Company will disregard any votes cast in favour of Resolutions 1 and 2 by:
• a person who is to receive or is expected to receive the securities the subject of the relevant Resolution, and any other person who will receive a material benefit as a result of the proposed issue of the securities (except a benefit solely by reason of being a holder of ordinary securities in the Company); and
• any associate of those recipients or person who will receive a material benefit as a result of the proposed issue of the securities.
However, this does not apply to a vote cast in favour of the relevant Resolution by:
• a person as proxy or attorney for a person who is entitled to vote on the relevant Resolution, in accordance with directions given to the proxy or attorney to vote on the relevant Resolution in that way; or
• the chair of the Meeting as proxy or attorney for a person who is entitled to vote on the relevant Resolution, in accordance with a direction given to the chair to vote on the relevant Resolution as the chair decides; or
• a holder acting solely in a nominee, trustee, custodial or other fiduciary capacity on behalf of a beneficiary provided the following conditions are met:
- the beneficiary provides written confirmation to the holder that the beneficiary is not excluded from voting, and is not an associate of the person excluded from voting, on the relevant Resolution; and
- the holder votes on the relevant Resolution in accordance with directions given by the beneficiary to the holder to vote in that way.
Resolution 5
In accordance with Listing Rule 14.11, the Company will disregard any votes cast in favour of Resolution 5 by:
• a person who participated in the issue being approved by the relevant Resolution 5; and
• any associate of those recipients.
However, this does not apply to a vote cast in favour of the relevant Resolution by:
• a person as proxy or attorney for a person who is entitled to vote on the relevant Resolution, in accordance with directions given to the proxy or attorney to vote on the relevant Resolution in that way; or
• the chair of the Meeting as proxy or attorney for a person who is entitled to vote on the relevant Resolution, in accordance with a direction given to the chair to vote on the relevant Resolution as the chair decides; or

5 |
• a holder acting solely in a nominee, trustee, custodial or other fiduciary capacity on behalf of a beneficiary provided the following conditions are met:
- the beneficiary provides written confirmation to the holder that the beneficiary is not excluded from voting, and is not an associate of the person excluded from voting, on the relevant Resolution; and
- the holder votes on the relevant Resolution in accordance with directions given by the beneficiary to the holder to vote in that way.
By Order of the Board
Sally McDow Company Secretary Dated: 27 April 2021

6 |
E NT I T L E ME NT T O ATT E N D AND V O T E
The Company may specify a time, not more than 48 hours before the Meeting, at which a “snap-shot” of Shareholders will be taken for the purposes of determining Shareholder entitlements to vote at the GM. The Company’s Directors have determined that all Shares of the Company that are quoted on ASX at 7:00pm (AEST) on Wednesday, 26 May 2021 shall, for the purposes of determining voting entitlements at the GM, be taken to be held by the persons registered as holding the Shares at that time.
VOTING IN PERSON
To vote in person, attend the Meeting at the time, date and place set out above.
VOTING BY PROXY
To vote by proxy, please complete and sign the enclosed Proxy Form and return by the time and in accordance with the instructions set out on the Proxy Form.
In accordance with section 249L of the Corporations Act, Shareholders are advised that:
(a) each Shareholder has a right to appoint a proxy;
(b) the proxy need not be a member of the Company; and
(c) a Shareholder who is entitled to cast two or more votes may appoint two proxies and may specify the proportion or number of votes each proxy is appointed to exercise. If the member appoints two proxies and the appointment does not specify the proportion or number of the member’s votes, then in accordance with section 249X(3) of the Corporations Act, each proxy may exercise one-half of the votes.
The enclosed Proxy Form provides further details on appointing proxies and lodging Proxy Forms.
CORPORATE REPRESENTATIVE
Body corporate Members may attend and vote during the meeting via corporate representative by using the Lumi website or the Lumi app using the Voting Access Code found on the Proxy Form. Only one login per body corporate with voting rights will be permitted and any other people from the body corporate wishing to attend should register as guests to attend the meeting. By entering the body corporate’s Voting Access Code, you will be taken to have certified pursuant to section 250D of the Corporations Act that you have been validly appointed as the body corporate’s representative to exercise all or any of the powers the body corporate may exercise at the AGM.
ENQUIRIES
Shareholders are invited to contact the Company Secretary, Sally McDow on 1300 737 760 if they have any queries in respect of the matters set out in this document.

7 |
PILOT ENERGY LIMITED
ABN 86 115 229 984
EXPLANATORY MEMORANDUM
This Explanatory Memorandum is intended to provide Shareholders with sufficient information to assess the merits of the Resolutions contained in the accompanying Notice.
The Directors recommend Shareholders read this Explanatory Memorandum and Independent Expert Report in full before making any decision in relation to the Resolutions.
The Independent Expert Report accompanies this Notice of Meeting and has been lodged with ASIC at the same time as this Notice of Meeting. The Company recommends that all Shareholders read the Independent Expert Report carefully and in conjunction with this Notice of Meeting.
The Meeting will be held both physically, at the offices of Squires Patton Boggs (AU) Level 17, 88 Phillip Street, Sydney and virtually, via the Lumi online platform (see instructions for access in the Notice of Meeting).
1. PROPOSED TRANSACTIONS
1.1 Background
Pilot Energy Limited (Company) is an ASX listed company engaged in the exploration and production of oil and gas. The Company holds interests in five oil and gas exploration permits located offshore and onshore Western Australia.
The Company announced to ASX an updated Board endorsed strategy on 13 May 2020. This strategy involves leveraging management’s extensive energy experience and its existing assets to supply firm energy into the Australian market from an expanding and diversified portfolio of oil and gas exploration and production, energy storage and renewable projects.
The Company further announced to the ASX on 17 August 2020 that, in addition to the renewal of offshore Exploration Permit WA-481-P (WA-481-P), the Company was considering a number of corporate transactions and organic growth opportunities leveraging existing asset positions. Accordingly, as announced by the Company on ASX:
• On 25 September 2020, the Company has entered into the Royal Share Sale Agreement in respect of the Royal Acquisition as outlined in section 1.3 below.
• On 6 October 2020, the Company and Key Petroleum Limited (Key) entered into the Sale Agreement – WA-481-P under which Pilot is acquiring Key’s 40% interest (Key Interest) in WA 481 P (Key Transaction). The transaction has completed and Pilot currently holds a 100% beneficial interest in WA 481-P. Following final transfer of the Key Interest, Pilot will hold 100% registered and beneficial interest in WA-481-P.
• On 9 November 2020, the Company and Triangle Energy (Global) Ltd (Triangle) entered into the WA 481-P Sale and Purchase Deed under which Pilot will transfer a 78.75% interest in WA 481-P (Triangle Sale Interest) to Triangle (Triangle Transaction) and Pilot and Triangle propose to collaborate for the purpose of assessing the feasibility and potential development of large-scale wind and solar project centred around Cliff Head Oil Field offshore facilities.
The Triangle Transaction remains subject to the following conditions being satisfied or waived prior to completion:
• approval and registration of the transfer of the Key Interest to Pilot; and
• Pilot and Triangle have agreed execution versions of the formation and facilitation agreements for WA-481-P Joint Venture and the Cliff Head Wind and Solar Joint Venture comprising:
o WA-481-P Joint Operating Agreement;
o Cliff Head Wind and Solar Project Joint Venture Operating Agreement;
o Cliff Head Wind and Solar Project Access and Coordination Deed; and

8 |
o Cliff Head and Arrowsmith Facilities Access Deed;
On 18 December 2020, the Company announced that Pilot and Energy Resources Limited had agreed to rationalise the ownership of two South Perth Basin onshore petroleum exploration permits with Pilot acquiring the 40% interest held by Energy Resources Limited in both – EP 416 and EP 480. This transaction has completed and Pilot now holds a 100% legal and beneficial interest in EP 416 and EP 480.
On completing these corporate initiatives, the Company will hold the following interests and be responsible for the following expenditure:
Project Pilot Interest
WA 481–P Joint Venture 21.25%
EP 416 & EP 480 Joint Venture 100% and Operator
EP 437 Joint Venture 13.058%
1.2 Information about the Mid West feasibility study
On 4 September 2020, the Company announced that it was to undertake a detailed feasibility study (Mid West feasibility study) considering the development of an offshore wind and onshore wind and solar power project to be located along the offshore/onshore coast of the Mid West Region of Western Australia. In order to facilitate the Company progressing with the proposed feasibility study, the Company has accepted the following conditions, imposed by ASX under ASX Listing Rule 11.1. Any work done by the Company in connection with the feasibility of the Mid West Integrated Renewables and Hydrogen Project which exceed the limitations imbedded in these conditions may constitute a change in the nature or scale of the Company’s activities and will require shareholder approval and re-compliance with the requirements of Chapters 1 and 2 of the ASX Listing Rules.
• Pilot must continue to fund its existing oil and gas projects and the Royal oil and gas projects in accordance with the information previously provided by the Company to ASX.
• Until 30 September 2022, Pilot must disclose in each quarterly activities report the proportion of total expenditure incurred in relation to exploration and evaluation on the oil and gas projects, and the Mid West Wind and Solar Project.
• Pilot must disclose, as separate line items in each quarterly cash flow report until 30 September 2022, expenditure incurred in relation to the exploration and evaluation expenditure on the oil and gas projects and the Mid West Wind and Solar Project.
In addition, ASX have advised that proceeding beyond the feasibility study stage of the Mid West Wind and Solar Project (or incurring expenditure in excess of the $1,200,000 in relation to the Mid West Wind and Solar Project) constitutes a change in the nature and scale of Pilot’s activities in terms of ASX Listing Rule 11.1.
1.3 Information about Royal and the proposed Royal Acquisition
The following provides a general overview of the Royal Acquisition and the Royal assets. The Directors recommend shareholders review the Independent Expert Report for further information on Royal’s assets and Independent Expert’s assessment of the acquisition.
In line with its stated objectives, on 25 September 2020 the Company entered into a share sale agreement (Royal Share Sale Agreement) with the Royal Vendors to acquire 100% of the issued share capital of Royal Energy Pty Limited (ACN 606 335 282) (Royal) in exchange for the issue of 143,939,394 Shares (Royal Acquisition). Of that, 136,363,636 Shares are to be issued to Royal Vendors and a further 7,575,758 Shares issued to the corporate advisers for the transaction, RFC Ambrian.
9 |
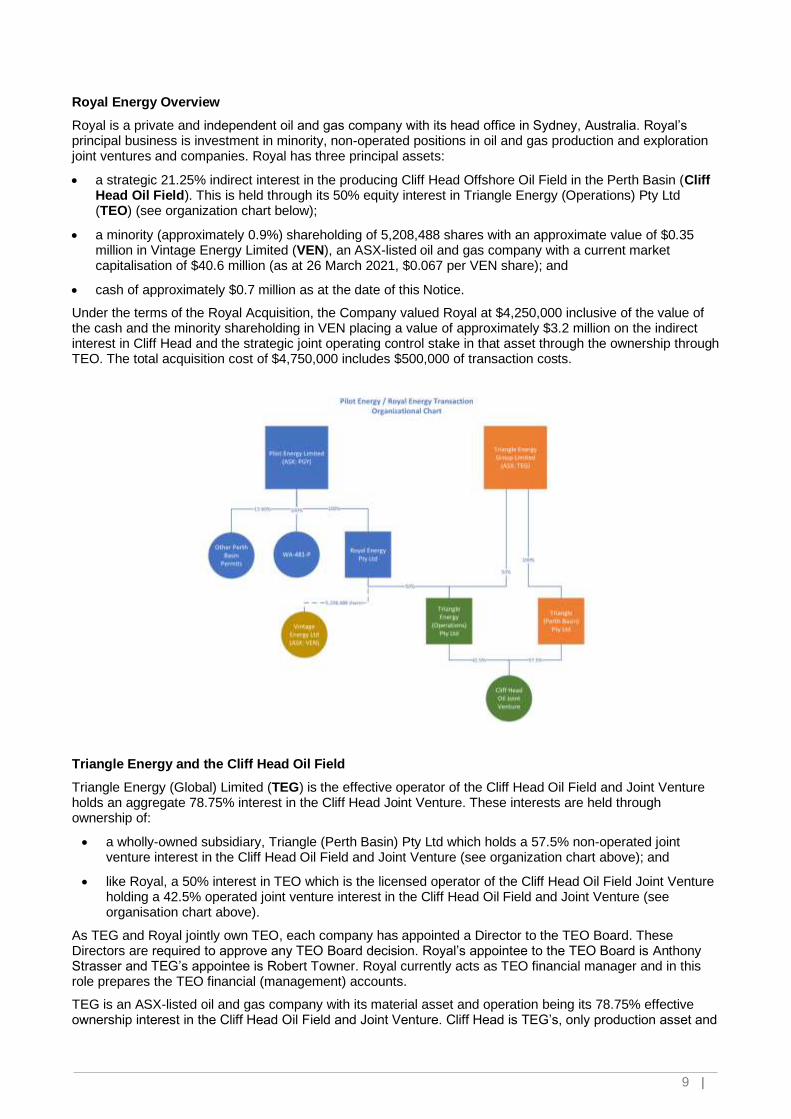
Royal Energy Overview
Royal is a private and independent oil and gas company with its head office in Sydney, Australia. Royal’s principal business is investment in minority, non-operated positions in oil and gas production and exploration joint ventures and companies. Royal has three principal assets:
• a strategic 21.25% indirect interest in the producing Cliff Head Offshore Oil Field in the Perth Basin (Cliff Head Oil Field). This is held through its 50% equity interest in Triangle Energy (Operations) Pty Ltd (TEO) (see organization chart below);
• a minority (approximately 0.9%) shareholding of 5,208,488 shares with an approximate value of $0.35 million in Vintage Energy Limited (VEN), an ASX-listed oil and gas company with a current market capitalisation of $40.6 million (as at 26 March 2021, $0.067 per VEN share); and
• cash of approximately $0.7 million as at the date of this Notice.
Under the terms of the Royal Acquisition, the Company valued Royal at $4,250,000 inclusive of the value of the cash and the minority shareholding in VEN placing a value of approximately $3.2 million on the indirect interest in Cliff Head and the strategic joint operating control stake in that asset through the ownership through TEO. The total acquisition cost of $4,750,000 includes $500,000 of transaction costs.
Triangle Energy and the Cliff Head Oil Field
Triangle Energy (Global) Limited (TEG) is the effective operator of the Cliff Head Oil Field and Joint Venture holds an aggregate 78.75% interest in the Cliff Head Joint Venture. These interests are held through ownership of:
• a wholly-owned subsidiary, Triangle (Perth Basin) Pty Ltd which holds a 57.5% non-operated joint venture interest in the Cliff Head Oil Field and Joint Venture (see organization chart above); and
• like Royal, a 50% interest in TEO which is the licensed operator of the Cliff Head Oil Field Joint Venture holding a 42.5% operated joint venture interest in the Cliff Head Oil Field and Joint Venture (see organisation chart above).
As TEG and Royal jointly own TEO, each company has appointed a Director to the TEO Board. These Directors are required to approve any TEO Board decision. Royal’s appointee to the TEO Board is Anthony Strasser and TEG’s appointee is Robert Towner. Royal currently acts as TEO financial manager and in this role prepares the TEO financial (management) accounts.
TEG is an ASX-listed oil and gas company with its material asset and operation being its 78.75% effective ownership interest in the Cliff Head Oil Field and Joint Venture. Cliff Head is TEG’s, only production asset and

10 |
sole source of operating cash flow.
Since the Cliff Head Oil Field and Joint Venture are the material assets of TEG, there is a significant amount of publicly available information on the Cliff Head Oil Field and the Joint Venture. This information is readily available through the ASX platform.
Cliff Head Offshore Oil Field
The Cliff Head Field is located 10 kms off the coast of Western Australia (see map below) and resided in the Production Licence WA-31-L which covers 72km². Cliff Head Field is located at a water depth of 15 to 20 metres.
Source: Pilot Energy Limited
Cliff Head was the first commercial oil discovery developed in the offshore Perth Basin. The development cost of the field was A$327 million with first oil production commencing in May 2006. To-date the field has produced over 14.8 million barrels and continues to produce at above originally forecast rates.
Set out below a brief history of the ownership of Cliff Head Field.
• In June 2016 Triangle acquired 57.5% interest in the Cliff Head Field from AWE Limited.
• TEO took over as operator of Cliff Head Field in May 2017 following the purchase of 42.5% interest from Roc Oil. Triangle purchased the asset via a 50/50 share purchase agreement, in partnership with Royal Energy.
• Triangle Energy now holds 78.75% interest in Cliff Head Field with Royal Energy holding an interest of 21.25%
Cliff Head Oil Field Facilities
Cliff Head’s infrastructure is the only offshore and operational onshore infrastructure in the Perth Basin and accordingly have strategic value for all surrounding exploration and development projects. TEG announced an asset life extension program in 2018 which is aiming to upgrade the onshore and offshore infrastructure to support future expected increase in oil production.
The Cliff Head facilities consist of an unmanned platform in 15m to 20m of water with a 14km pipeline which

11 |
carries the crude oil to a dedicated stabilisation processing plant at Arrowsmith and then the oil is trucked to BP refinery in Kwinana.
The facilities include the offshore Cliff Head Alpha Offshore Production Platform and onshore Arrowsmith Stabilisation Plant and associated pipelines. Oil is produced via five production wells at the offshore Cliff Head A Production Platform. The platform is connected to the onshore Arrowsmith Stabilisation Plant by twin 14km production and injection pipelines. In addition to the Cliff Head A Offshore Production Platform, the Cliff Head Oil Field production facilities are comprised of:
• an unmanned offshore production wellhead platform supporting six production wells and two water injection wells, with capability for two additional wells;
• five oil production wells drilled to approximately 1,260 m deep;
• an offshore pipeline with a nominal internal diameter of 300 mm to carry produced hydrocarbons and water to shore for processing;
• a return offshore pipeline with a nominal internal diameter of 300 mm to carry produced water back to the platform for reinjection;
• an electrical umbilical line and small umbilical lines to supply corrosion and emulsion inhibitors to the production wells and hydraulic fluid (water) by which to remotely operate the platform equipment;
• two directionally drilled pipeline shore crossings under the beach and foredune;
• parallel production and water return pipelines across the secondary dunes and heathland of Beekeepers’ Nature Reserve and under the railway to the Arrowsmith Separation Plant; and
• the Arrowsmith Separation Plant which was constructed on the previous industrial site of the former Westlime plant some 3 km inland from the coast.
The Arrowsmith Separation Plant has a production capacity of 15,000 BOPD and separates the produced fluids into gas, oil and water and serves as the control centre for the operation. The gas is used as fuel gas in the processing train, the oil is the product and the water will be sent by return pipeline for reinjection into the producing formation. Make-up water is drawn from a saline aquifer to maintain reservoir pressure. Makeup fuel as required is supplied from the existing supply line to the Westlime site. Stabilised crude oil storage of approximately 6,360 m3 (40,000 barrels) is provided on site. Crude oil production is delivered daily by road train tankers from the Arrowsmith Plant to the BP refinery in Kwinana, south of Perth.
Cliff Head Production 2C Resources
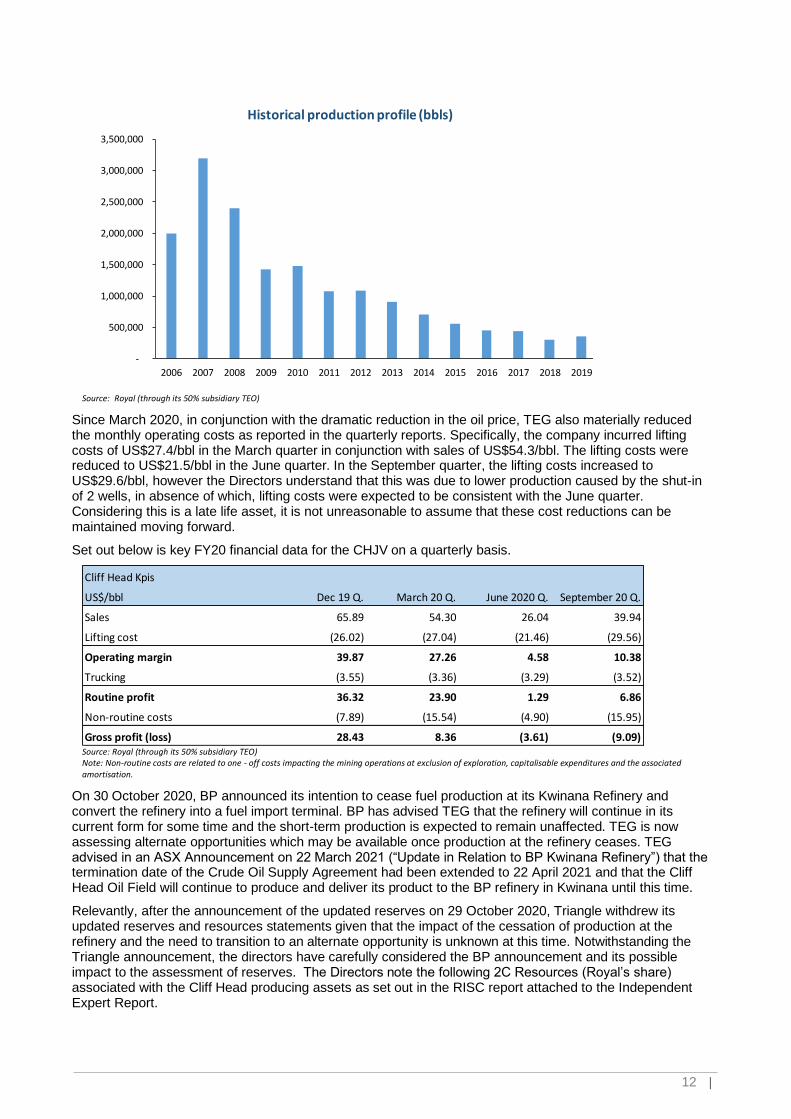
Production from Cliff Head in FY20 was mostly from four wells out of the five existing producing wells. The CHJV total production in FY20 was 276,452 bbls generating sales of A$21.30 million at an annual average production rate of 755 bopd. Well 13 was offline until December 2019 while wells 6 and 7 were shut-in in the last few weeks of the financial year. The field can produce approximately 960 stbd when on full production. The CHJV continue to invest in workovers to replace failed ESP’s with CH-07H and CH-06. CH-07H is back on line whilst CH-06 remains shut in awaiting further activities to remove the ESP.
Set out in the graph below is historical annual production.
12 |
Source: Royal (through its 50% subsidiary TEO)
Since March 2020, in conjunction with the dramatic reduction in the oil price, TEG also materially reduced the monthly operating costs as reported in the quarterly reports. Specifically, the company incurred lifting costs of US$27.4/bbl in the March quarter in conjunction with sales of US$54.3/bbl. The lifting costs were reduced to US$21.5/bbl in the June quarter. In the September quarter, the lifting costs increased to US$29.6/bbl, however the Directors understand that this was due to lower production caused by the shut-in of 2 wells, in absence of which, lifting costs were expected to be consistent with the June quarter. Considering this is a late life asset, it is not unreasonable to assume that these cost reductions can be maintained moving forward.
Set out below is key FY20 financial data for the CHJV on a quarterly basis.
Source: Royal (through its 50% subsidiary TEO) Note: Non-routine costs are related to one - off costs impacting the mining operations at exclusion of exploration, capitalisable expenditures and the associated amortisation.
On 30 October 2020, BP announced its intention to cease fuel production at its Kwinana Refinery and convert the refinery into a fuel import terminal. BP has advised TEG that the refinery will continue in its current form for some time and the short-term production is expected to remain unaffected. TEG is now assessing alternate opportunities which may be available once production at the refinery ceases. TEG advised in an ASX Announcement on 22 March 2021 (“Update in Relation to BP Kwinana Refinery”) that the termination date of the Crude Oil Supply Agreement had been extended to 22 April 2021 and that the Cliff Head Oil Field will continue to produce and deliver its product to the BP refinery in Kwinana until this time.
Relevantly, after the announcement of the updated reserves on 29 October 2020, Triangle withdrew its updated reserves and resources statements given that the impact of the cessation of production at the refinery and the need to transition to an alternate opportunity is unknown at this time. Notwithstanding the Triangle announcement, the directors have carefully considered the BP announcement and its possible impact to the assessment of reserves. The Directors note the following 2C Resources (Royal’s share) associated with the Cliff Head producing assets as set out in the RISC report attached to the Independent Expert Report.
-
500,000
1,000,000
1,500,000
2,000,000
2,500,000
3,000,000
3,500,000
2006 2007 2008 2009 2010 2011 2012 2013 2014 2015 2016 2017 2018 2019
Historical production profile (bbls)
Cliff Head Kpis
US$/bbl Dec 19 Q. March 20 Q. June 2020 Q. September 20 Q.
Sales 65.89 54.30 26.04 39.94
Lifting cost (26.02) (27.04) (21.46) (29.56)
Operating margin 39.87 27.26 4.58 10.38
Trucking (3.55) (3.36) (3.29) (3.52)
Routine profit 36.32 23.90 1.29 6.86
Non-routine costs (7.89) (15.54) (4.90) (15.95)
Gross profit (loss) 28.43 8.36 (3.61) (9.09)

13 |
Resources
Total Crude Oil
Mmstb 1C 2C 3C
0.125 0.272 0.383
Source: RISC: Cliff Head Independent reserves report; Royal Energy Pty Ltd 16 April 2021
The Directors also note the following statements by RISC regarding the requirements to re-classify the Cliff Head 2C resources as 2P reserves2:
“The only contingency relating to the contingent volumes is securing an export route once the Kwinana refinery closes. Subject to refreshing the commercial terms for the new export route the volumes would be reclassified as reserves. It is reasonable to use the 2C production profiles, operating and capital costs, in this report for valuation purposes provided associated risks are considered. Whilst it is expected the commercial conditions for a new export route will differ from those used for the existing route RISC considers the 1C to 3C range captures the related export route uncertainty.
We understand that the Cliff Head JV has, in the past, investigated several export and domestic markets for its product and will continue these efforts. We are aware that there are various alternative commercial arrangements that the JV are pursuing to sell the Cliff Head crude.”
TEG, on behalf of the CHJV, recently announced that it had identified three attractive drilling targets which, if successful, could extend the Cliff Head asset life to 2030 and beyond:
• West High appraisal on a western extension of the field;
• SE Nose development updip of the Cliff Head 1 discovery well;
• Mentelle Updip exploration which was recently reviewed with a focus on the reservoir interpretation. Best estimate prospective resources have been upgraded to 5.44 MMstb from 3.3 MMstb previously.
The West High and SE Nose opportunities are considered low risk appraisal/development opportunities that can be immediately completed for production. The Mentelle Updip prospect is considered mature to justify drilling. The planning for exploration well to test the Mentelle Updip prospect has commenced. This prospect has the potential to materially increase the life of the CH Field.
Set out below is a summary of the contingent resources released by TEG on 29 October 2020.
2 Source: RISC: Cliff Head Independent reserves report; Royal Energy Pty Ltd 16 April 2021

14 |
Sources: Triangle ASX Release” Cliff Head Reserves Update and Commencement of Farmout Campaign” 29 October 2020
TEG, on behalf of the CHJV, has commenced a farm-out campaign for the purpose of seeking interested party to participate in a drilling program in relation to the opportunities above. It has commence well planning for SE Nose, West High and Mentelle Updip targeting a drilling campaign during the first half of 2022.
Sources: Triangle ASX Release “Quarterly Activities Report and Appendix 5B” 29 January 2021
Benefits of Royal Energy Acquisition
The Royal Acquisition has several benefits for the Company both in terms of: (1) the future development opportunity of the significant prospects identified in WA-481-P, many of which are in close proximity to the Cliff Head A Offshore Production Platform; and (2) the potential for streamlining the process of the potential development of a significant offshore wind project and a carbon capture and storage project, anchored upon its utilisation of and integration into the existing Cliff Head Oil Field offshore and onshore
Cliff Head - Gross resources
MMstb Oil
Resources 1C 2C 3C
SE Nose 0.49 0.81 1.25
West High - 1.06 1.94
West Flank - 0.79 -
Far North - 0.41 -
Cliff Head Field Life Extension - 0.70 -
Total Resources 0.49 3.77 3.19
Prospective Resources Low Best High
Mentelle Updip 1.98 5.44 9.96
Catts 0.35 0.83 1.42
South Cliff Head - 3.00 -
Total Prospective Resources 2.33 9.27 11.38
15 |
facilities and operations.
In addition to these advantages, the Royal acquisition diversifies the Company’s business away from a pure upstream oil and gas exploration model and provides diversification of activities into lower risk production operations and development opportunities, which are expected to provide Company with continuing cash flow and lower risk growth potential.
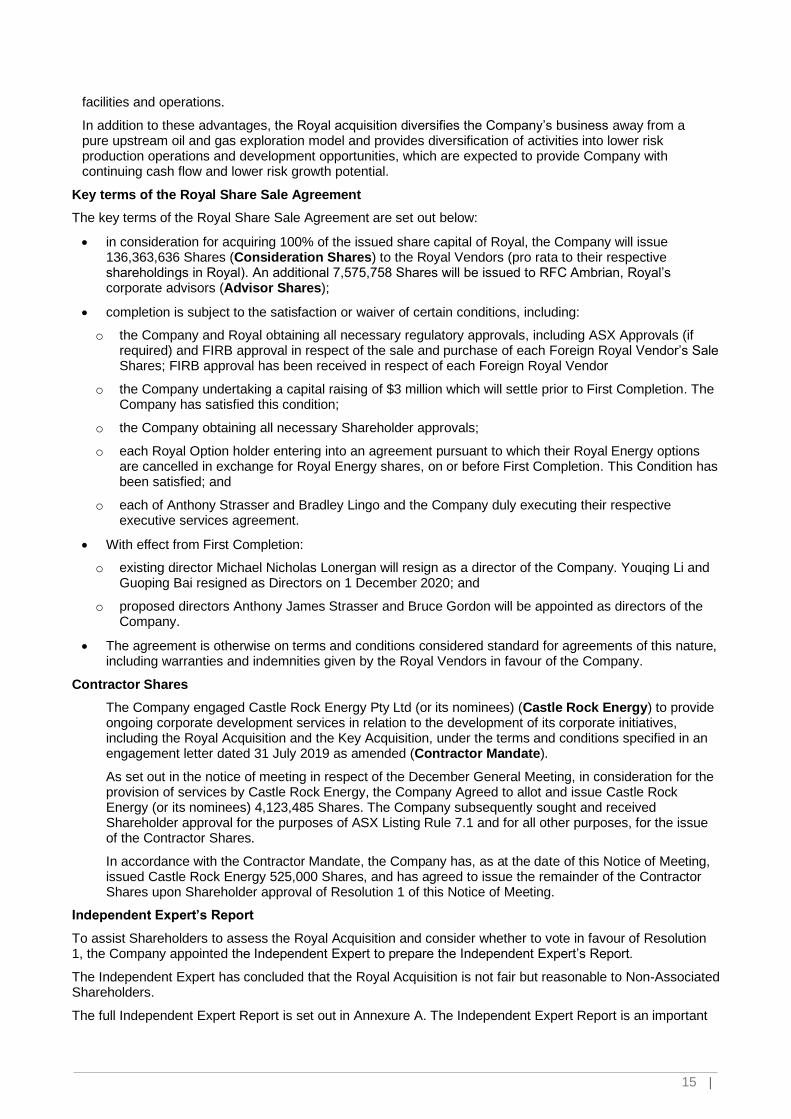
Key terms of the Royal Share Sale Agreement
The key terms of the Royal Share Sale Agreement are set out below:
• in consideration for acquiring 100% of the issued share capital of Royal, the Company will issue 136,363,636 Shares (Consideration Shares) to the Royal Vendors (pro rata to their respective shareholdings in Royal). An additional 7,575,758 Shares will be issued to RFC Ambrian, Royal’s corporate advisors (Advisor Shares);
• completion is subject to the satisfaction or waiver of certain conditions, including:
o the Company and Royal obtaining all necessary regulatory approvals, including ASX Approvals (if required) and FIRB approval in respect of the sale and purchase of each Foreign Royal Vendor’s Sale Shares; FIRB approval has been received in respect of each Foreign Royal Vendor
o the Company undertaking a capital raising of $3 million which will settle prior to First Completion. The Company has satisfied this condition;
o the Company obtaining all necessary Shareholder approvals;
o each Royal Option holder entering into an agreement pursuant to which their Royal Energy options are cancelled in exchange for Royal Energy shares, on or before First Completion. This Condition has been satisfied; and
o each of Anthony Strasser and Bradley Lingo and the Company duly executing their respective executive services agreement.
• With effect from First Completion:
o existing director Michael Nicholas Lonergan will resign as a director of the Company. Youqing Li and Guoping Bai resigned as Directors on 1 December 2020; and
o proposed directors Anthony James Strasser and Bruce Gordon will be appointed as directors of the Company.
• The agreement is otherwise on terms and conditions considered standard for agreements of this nature, including warranties and indemnities given by the Royal Vendors in favour of the Company.
Contractor Shares
The Company engaged Castle Rock Energy Pty Ltd (or its nominees) (Castle Rock Energy) to provide ongoing corporate development services in relation to the development of its corporate initiatives, including the Royal Acquisition and the Key Acquisition, under the terms and conditions specified in an engagement letter dated 31 July 2019 as amended (Contractor Mandate).
As set out in the notice of meeting in respect of the December General Meeting, in consideration for the provision of services by Castle Rock Energy, the Company Agreed to allot and issue Castle Rock Energy (or its nominees) 4,123,485 Shares. The Company subsequently sought and received Shareholder approval for the purposes of ASX Listing Rule 7.1 and for all other purposes, for the issue of the Contractor Shares.
In accordance with the Contractor Mandate, the Company has, as at the date of this Notice of Meeting, issued Castle Rock Energy 525,000 Shares, and has agreed to issue the remainder of the Contractor Shares upon Shareholder approval of Resolution 1 of this Notice of Meeting.
Independent Expert’s Report
To assist Shareholders to assess the Royal Acquisition and consider whether to vote in favour of Resolution 1, the Company appointed the Independent Expert to prepare the Independent Expert’s Report.
The Independent Expert has concluded that the Royal Acquisition is not fair but reasonable to Non-Associated Shareholders.
The full Independent Expert Report is set out in Annexure A. The Independent Expert Report is an important

16 |
document and Shareholders are encouraged to read it in full before deciding whether to vote in favour of Resolution 1.
1.4 Acquisition of 40% interest in WA-481-P
As announced to ASX on 8 September 2020, the Company and Key agreed to rationalise the ownership of WA-481-P with the Company to acquire the remaining 40% interest in Offshore Exploration License WA-481-P (Key Acquisition).
As further announced by the Company on ASX on 6 October 2020, Pilot and Key executed the WA-481-P Sale and Purchase Agreement. Subject to completion of the WA-481-P Sale and Purchase Agreement between the Company and Key, the Company will hold 100% of WA-481-P.
Further details about WA-481-P are included in section 1.1 and in the Company’s announcement to the ASX on 8 September 2020.
The Company has issued 21 million Shares to Key in two tranches as consideration for the 40% interest in WA-481-P, and now holds a 100% beneficial interest and operatorship of WA-481-P. The first tranche of 4,276,703 Shares was issued to Key on 7 October 2020 (Tranche 1 Key Consideration Shares) and the second tranche of 16,723,297 Shares was issued to Key (Tranche 2 Key Consideration Shares) on 18 December 2020.
1.5 Capital Raising
The Company has also undertaken a capital raising of approximately $3.0 million (before costs) to support and provide sufficient working capital for undertaking the Mid West feasibility study, WA-481-P and the Cliff Head Oil Field.
The $3.0 million equity raising comprised:
• a two-tranche placement to sophisticated, professional and institutional investors of 75,757,576 new Shares to raise $2.5 million (Placement);
• the issue of 37,878,769 free-attaching new unlisted Options, being one Option for every two new Shares acquired under the Placement exercisable at $0.066 on or before the Option Expiry Date (Attaching Placement Options);
• the issue of 15,151,508 new Shares to existing eligible shareholders (SPP Shares) in an underwritten securities purchase plan which raised a further $500,000 (SPP); and
• the issue of 7,575,757 free-attaching new unlisted Options, being one Option for every two SPP Shares acquired under the SPP exercisable at $0.066 on or before the Option Expiry Date (SPP Options),
(together, the Placement, Attaching Placement Options, SPP and SPP Options being the Capital Raising).
1.6 Indicative timetable
Event Date Announcement of Royal Acquisition 25 September 2020 Notice of Meeting sent to Shareholders 27 April 2021 GM to approve the Resolutions 28 May 2021 First Completion of the Royal Acquisition
1 June 2021
Issue of Consideration Shares to the Royal Vendors
1 June 2021
Proposed Directors appointed to the Board
28 May 2021
Note: The dates shown in the table above are indicative only and may vary subject to the Corporations Act, the Listing Rules and other applicable laws. The Company reserves the right to vary these dates without notice.

17 |
1.7 Pro forma capital structure
The table below shows the capital structure of the Company at the date of this Notice and upon completion of the Royal Acquisition and assumes all other Resolutions are passed.
Capital Structure Existing Completion Total
Existing Shares at date of Notice 214,171,369 214,171,369
Royal Vendors 3,666,689 136,363,636
140,030,325
Advisor Shares - 7,575,758 7,575,758
Contractor Shares 525,000 3,598,485 4,123,485
Pro forma Shares on issue 218,363,058 147,537,879 365,900,937
Total Options on Issue 65,454,526 - 65,454,526
Note: Assumes that no additional Shares are issued between the date of this Notice (unless otherwise provided for in the Notice) and completion of the Royal Acquisition, including pursuant to an exercise of existing Options.
1.8 Ownership structure post completion of the Royal Acquisition
On completion of the Royal Acquisition:
• Royal will become wholly owned by Pilot; and
• 136,363,636 Pilot Shares will be issued to the Royal Vendors, which will give them a combined Voting Power in the Company of 38.3% at the point in time when the Consideration Shares are issued (this assumes that the Advisor Shares and the remainder of the Contractor Shares are issued following approval of the Royal Resolutions and no other equity securities are issued in the Company).
The table below shows how Shareholders will be affected by the issue of the Consideration Shares to the Royal Vendors on completion of the Royal Acquisition:
Voting Power: Pre completion of the Royal Acquisition
Voting Power *: Post completion of the Royal Acquisition *
Shareholder Number of Pilot Shares
% of total Number of Pilot Shares
% of total
Existing Shareholders at date of Notice
214,171,369 98.1% 214,171,369 58.5%
Royal Vendors 3,666,689 1.7% 140,030,325 38.3%
Advisor Shares 7,575,758 2.1%
Contractor Shares 525,000 0.2% 4,123,485 1.1%
Total 218,363,058 100.0% 365,900,937 100.0%
Notes:
* Voting power post completion of the Royal Acquisition is assessed on the basis of the number of new shares issued pursuant to Resolutions 1 and 2 and assumes that the remainder of the Contractor Shares are issued following approval of the Royal Resolutions and excludes any options on issue in the Company and no other equity securities are issued in the Company.
1.9 Reasons to vote in favour of the Royal Resolutions and the Royal Acquisition
The Directors are of the view that the following non-exhaustive list of advantages may be relevant to a Shareholder’s decision on how to vote on the Resolutions:
Strategic benefit for the development of the Mid West Integrated Renewables and Hydrogen Project
• In addition to progressing oil and gas exploration across its exploration permits, Pilot is currently focused

18 |
on conducting feasibility studies in relation to the potential development of the Mid West Integrated Renewables and Hydrogen Project in the onshore and offshore areas of and adjacent to WA 481 P.
• The Mid West feasibility study will include assessing the feasibility of accessing and utilising existing offshore and onshore oil and gas infrastructure at Cliff Head. Access to the Cliff Head infrastructure will be facilitated by both the sale of the 78.75% interest and transfer of operatorship of WA 481 P to Triangle and the Royal Acquisition. The Pilot and Royal business at completion of the Royal Acquisition (the Combined Group) and Triangle will create a substantial alignment between the newly created WA 481 P joint venture and the existing CH joint venture.
• In addition, Pilot and Triangle will also form the Cliff Head Wind and Solar Project Joint Venture which is a subset of the broader Mid West Integrated Renewables and Hydrogen Project, with Pilot 80% owner and operator and Triangle 20%. As part of the proposed new joint venture arrangement, Pilot and Triangle will negotiate an access and co-ordination agreement to establish the basis for providing access to the existing Cliff Head platform, the offshore/onshore pipeline, right of way from the platform and to the onshore Arrowsmith Separation and Processing Facilities. This may enable the existing offshore production facilities to be multi-tasked in the future and potentially extend the useful life of the Cliff Head Field which should further benefit the Combined Group.
• The Company believes that the potential integration synergies and cost savings both in the development and operation of the offshore wind project are likely to be significant and have the potential to materially improve the projects overall economic attractiveness. Further, multitasking the Cliff Head facilities to allow concurrent oil and gas production with offshore wind farm operations should result in the fixed costs being materially reduced which may assist in extending the economic life of the field.
Synergies from the consolidation of corporate overheads and operations
• Both Pilot and Royal currently incur overhead expenses including but not limited to audit, directors’ fees, insurance, accounting, renting and administration. Following completion of the Royal Acquisition, it is expected that substantially all corporate costs of Royal will be reduced.
Combined expertise and skills of the Management Teams
• The Combined Group will enable Pilot and Royal to combine the expertise and skills of both sets of management teams and enable the deployment of the most qualified personnel and skills across the two companies’ portfolio of assets.
Ability for Pilot Shareholders to continue to participate in the future growth of the Combined Group
• Pilot Shareholders will continue to be exposed to the underlying business and growth opportunities of Pilot in the enlarged Combined Group to the extent that they continue to hold shares in the Combined Group. Cliff Head may also provide pathway to market for any discoveries in WA-481-P as well as potentially lowering the economic threshold for development of WA-481-P discoveries.
Likelihood to receive a premium for control in the future
• Given the structure of the Combined Group, no shareholder will be able to exert a significant influence over the strategic and operational decisions
Improved liquidity of the Company’s Shares
• A larger market capitalisation and enhanced Shareholder base resulting from the Royal Acquisition may provide a more liquid market for the Company’s Shares than what exists prior to completion of the Royal Acquisition.
The Independent Expert has concluded that the Royal Acquisition is not fair but reasonable to Non-Associated Shareholders
• The Royal Acquisition has been reviewed by the Independent Expert, who after considering the quantitative and qualitative factors, has concluded that the Royal Acquisition is not fair but reasonable to Non-Associated Shareholders in the absence of a superior alternative proposal.
1.10 Reasons why you may consider voting against the Royal Resolutions and the Royal Acquisition:
The Directors are of the view that the following non-exhaustive list of disadvantages may be relevant to a Shareholder’s decision on how to vote on the Resolutions:
Disagree with the recommendation of the Board

19 |
• Despite the unanimous recommendation of the Board to vote in favour of the Royal Resolutions, you may believe that the Royal Acquisition is not in your best interests.
The risk profile of the Company will change
• Shareholders are currently exposed to certain risks by virtue of having an equity interest in the Company. If the Royal Acquisition proceeds, Shareholders will maintain a level of exposure to these risks and will become exposed to additional risks specific to the Royal Acquisition and of Pilot post completion of the Royal Acquisition.
• Changes in economic conditions, general market risks and changes in the regulatory and legal environment may negatively impact Pilot post completion of the Royal Acquisition.
• Reliance on information provided by the Royal Vendors, the assumption of Royal liabilities, demand risk, commercial and operational risks, industry competition, reliance on key personnel, loss of reputation or brand risk, litigation and legal risk, and risks relating to the existence of significant shareholders may also negatively impact the Pilot post completion of the Royal Acquisition.
2C resource of Royal
• Royal has 2C resources which have been considered in the valuation assessment based on the discounted cash flows methodology. However, the Cliff Head Field is a late stage asset and reserve estimation for late life assets can easily fall to zero in case of depressed oil prices, appetite of stakeholders to recover from unplanned events and the unplanned events themselves.
Refinery
• The Cliff Head facilities consist of an unmanned platform in 15m to 20m of water with a 14km pipeline which carries the crude oil to a dedicated stabilisation processing plant at Arrowsmith with a production capacity of 15,000 bopd which is then trucked to BP refinery in Kwinana. However, on 30 October 2020, BP announced its intention to cease fuel production at its Kwinana Refinery and convert the refinery into a fuel import terminal. The Directors note that after the announcement of the updated reserves on 29 October 2020, Triangle withdrew its updated reserves and resources statements. The Directors note Triangle’s ASX announcement on 22 March 2021 which set out that the termination date of the Crude Oil Supply Agreement had been extended to 22 April 2021 and that the Cliff Head Oil Field will continue to produce and deliver its product to the BP refinery in Kwinana until this time. Triangle also noted that it is in continuing discussions regarding alternative offtake arrangements.
Volatile market conditions
• The outbreak of the COVID-19 pandemic caused the global economy to fall into a deep recession which significantly impacted energy prices. Crude oil prices experienced a drastic reduction in March 2020 and April 2020 as a result of the outbreak of COVID-19 and the significantly reduced consumptions. Afterwards, prices recovered in May 2020 and June 2020 as a result of a sharp reduction in production and a modest recovery in consumption as lockdown measures were eased. Global consumption of crude oil also plummeted in 2020 as a result of COVID-19 lockdown measures and reduced mobility. Volatile oil prices and challenging market conditions may have an adverse impact over the Combined Group’s ability to pursue oil production operations and they may represent an impediment to the Cliff Head Field to achieve growth opportunities in terms of 2C resources and extending the life of the field.
Royal Shareholder’s increase in voting power and dilution for voting rights for existing Shareholders
• The Royal Acquisition will result in the interests of non-associated Shareholders in the Company being diluted. The Voting Power of existing shareholders (as at the date of this Notice), Royal Vendors and Other Shareholders (Contractor Shares and Advisor Shares) upon completion of the Royal Acquisition will be approximately:
▪ Existing Shareholders at the date of this Notice: 58.5%
▪ Royal Vendors: 38.3%
▪ Other Shareholders: 3.2%
• This will in turn reduce the Voting Power of each non-associated Shareholder and may therefore reduce its influence on the Company
You may believe there is a preferable option or acquisition than the Royal Acquisition
• You may believe that there is potential for an alternative option or acquisition than the Royal Acquisition

20 |
which is preferable to any solution which the Board have been able to identify.
Risk factors specific to Royal and its business
• The Company and its advisers have undertaken analyses in respect of Royal in order to determine its attractiveness to Pilot and whether to pursue the Royal Acquisition. It is possible that such analysis, and the best estimate assumptions made by Pilot and its advisers, draw conclusions which are inaccurate, or which are not realised in due course (whether because of flawed methodology, misinterpretation of economic or other circumstances or otherwise). To the extent the actual results achieved by Royal are weaker than those indicated by Pilot’s analysis, there is a risk that there may be an adverse impact on the performance of Pilot.
Exposure to decommissioning liabilities
• The Royal Acquisition will expose the Company to future decommissioning liabilities associated with the Cliff Head Oil Field and associated infrastructure.
You may disagree with the Independent Expert’s conclusion
• You may disagree with the conclusion of the Independent Expert, who has concluded that the Royal Acquisition is not fair but reasonable to Non-Associated Shareholders in the absence of a superior alternative proposal.
1.11 Key risks in relation to the Royal Resolutions and the Royal Acquisition
This section discusses some of the key risks that existing Shareholders may be exposed to if the Royal Acquisition is implemented, as well as the general risks that may also apply:
Operational risks
• The business of hydrocarbon exploration, project development and production contains elements of significant risk with no guarantee of success. There is no assurance that any exploration on current or future interests will result in the discovery of an economic hydrocarbon project. Even if an apparently viable deposit is identified, there is no guarantee that it can be economically developed. The operations of the Company and the operator of the assets in which it has or may have interests may be affected by various factors, including failure to achieve predicted volumes in exploration and drilling, operational and technical difficulties encountered in drilling, poor data acquisition, difficulties in commissioning and operating plant and equipment, mechanical failure or plant breakdown, unanticipated problems which may affect extraction costs, adverse weather conditions, industrial and environmental accidents, industrial disputes and unexpected shortages or increases in the costs of labour, consumables, spare parts, plant and equipment.
Future capital needs
• The funding of any further ongoing capital requirements will depend upon a number of factors including the extent of the Company's ability to generate income from activities which the Company cannot forecast with any certainty. Any additional equity financing will be dilutive to shareholders, and debt financing, if available, may involve restrictions on financing and operating activities. If the Company is unable to obtain additional funding as needed, it may not be able to take advantage of opportunities or develop projects. Further, the Company may be required to reduce the scope of its operations or anticipated expansion and it may affect the Company's ability to continue as a going concern.
Price of oil and gas currency volatility
• Royal revenue from Cliff Head is derived through the sale of oil and gas, which exposes the potential income of the Company to commodity price and exchange rate risks. The demand for, and price of oil and gas is highly dependent on a variety of factors, including international supply and demand, the level of consumer product demand, actions taken by governments and major petroleum corporations, global economic and political developments and other factors all of which are beyond the control of the Company. International petroleum prices fluctuate and at times the fluctuations can be quite wide. A material decline in the price of oil and gas may have a material adverse effect on the economic viability of a project. Examples of such uncontrollable factors that can affect oil price are unrest and political instability in countries that have increased concern over supply. Oil is principally sold throughout the world in US dollars. As a result, any significant and/or sustained fluctuations in the exchange rate between the Australian dollar and the US dollar oil and gas prices could have a materially adverse effect on the Company's operations.

21 |
Compliance Risk
• The leases and permits, which the Company will have post completion of the Royal Acquisition, are subject to ongoing obligations to satisfy minimum drilling and expenditure obligations. If these obligations were not satisfied, the relevant lease may expire or be forfeited, which would result in a loss of the reserves attributable to the Company’s interest in the lease.
Reserves and Resources estimates
• Reserves and Resource estimates are expressions based on available data, knowledge, experience, and industry practice. Estimates which were originally valid may undergo significant changes when new information or techniques become available. Reserve and Resource estimates, by definition, are imprecise and depend upon interpretations which may prove to be inaccurate. The estimates are likely to change due to further information becoming available through fieldwork and analysis and subsequent analysis redefining the reserves and resources. No assurance can be given that resources or reserves will be detected in economic quantities during exploration work. Any updates to Reserves and Resources will likely alter the development and drilling plans, which in turn will affect the Company’s operations and performance. Investors should be aware that significant changes may materially affect the value of these Resources and Reserves.
Joint venture operations
• Royal is exposed to the financial risk of its joint venture partner in the Cliff Head Oil Field. Failure of agreement or alignment with joint venture partners could have a material effect on Royal’s business. The failure of joint venture partners to meet funding commitments may result in increased costs to Royal. The Company is unable to predict the risk or financial failure of joint venture partners.
Contractual and counterparty risk
• Through its 50% equity interest in Triangle Energy (Operations) Pty Ltd, Royal is a party to various contracts related to the operation of the Cliff Head Oil Field. Non-performance of contractual counterparties may lead to Royal seeking legal remedy and lead to adverse effects of Royal’s operations. The Company is unable to predict the risk of non-performance of obligations by contractual counterparties.
Decommissioning Risk
• Decommissioning costs will be incurred by Royal at the end of the operating life of its assets. The exact decommissioning costs are uncertain and can vary due to a number of factors, including changes to legal requirements, new restoration techniques or experience at other sites. The timing, extent and amount of expenditure is subject to change which requires significant estimates and assumptions to determine the provisions for decommissioning.
Production Risks
• Actual future production may vary from targets and projects due to limited information available for the asset. Less available information will likely result in greater variation in performance between actual and estimated production. Production risks associated with marketability and commerciality of oil and gas to be produced include but are not limited to reservoir characteristics, market fluctuations, proximity and capacity of oil and gas pipelines and process equipment, government regulations and the market price of oil and gas. Decreases of production or stoppages may result from fluctuations in permeability and flowrates, impurities in the product, facility shut-downs, natural decline, mechanical or technical failures, subsurface complications or other unforeseeable events outside the control of the Company.
Licensing Risks
• Royal and its joint venture partner require licensing approval to operate oil and gas properties in Australia. If these approvals are revoked then Royal may be unable to fulfill its operational objectives which will likely have a material adverse effect.
Environmental Risks
• Royal’s operations are subject to environmental risks that are inherent in the hydrocarbon industry. Royal is subject to environmental laws and regulations in connection with any operations that it may pursue. Royal conducts all its activities in an environmentally responsible manner and in accordance with all relevant laws. However, accidents, breaches, non-compliance or unforeseen circumstances could result in the Company facing penalties, revocation of permits or extensive liabilities for damages,

22 |
clean-up costs and/or penalties relating to environmental damage. The Company’s operations are subject to environmentally related approvals for its operations which are likely to impact the environment. Additionally, Climate Change risk is becoming increasingly relevant to the hydrocarbon industry including new or changing regulation, introduction of carbon taxes, consumer, investor and community action. Climate change may also cause physical and environmental risks that cannot be predicted such as increased severity of weather patterns and incidents of extreme weather events. The company is not able to accurately predict the effect of changes to environmental laws and regulations and the effect they would have on the cost of doing business.
Country Risk
• There are varying risks associated with exploration and production that are dependent on the country of operations that may affect the profitability and ongoing success of the Company. These risks include changes in government policies, regulation, economic changes, civil instability, attitudes towards foreigners and foreign businesses. Land access and environmental regulation varies across countries which could potentially impact upon Royal. Currently Royal Energy’s assets and headquarters are located within Australia, so many of these risks are reduced.
Changes in legislation and government regulation
• Government legislation in Australia or any other relevant jurisdiction may affect future earnings and the ongoing success of the Company. Amongst other things, taxation including carbon taxes, permitting and licenses, environmental laws, and labour laws are all affected by legislation and regulation and may have an adverse impact upon the Company and the value of its Securities.
1.12 Royal Annual Reports
Annual reports of Royal are available to Shareholders on written request to the Company. Alternatively, Shareholders can access the reports from the Royal website http://www.royalenergy.com.au/investor-information/

23 |
RESOLUTION 1: ISSUE OF CONSIDERATION SHARES TO ROYAL VENDORS
General
The Company will issue the Consideration Shares in consideration for the Royal Acquisition.
Takeover prohibition
Section 606 of the Corporations Act prohibits a person from acquiring a Relevant Interest in the issued voting shares of a listed company if the acquisition would result in that person’s (or another person’s) Voting Power in the company increasing:
• from 20% or below to more than 20%; or
• from a starting point that is above 20% and below 90%.
Voting Power
The Voting Power of a person in a company is determined in accordance with section 610 of the Corporations Act. It is aimed at grouping together and counting the percentage of all voting shares in a company that are controlled by a person and its associates (i.e. their Relevant Interests).
Relevant Interests
Section 608(1) of the Corporations Act provides that a person has a Relevant Interest in securities if that person:
• is the holder of the securities;
• has power to exercise, or control the exercise of, a right to vote attached to the securities; or
• has power to dispose of, or exercise control over the disposal of, the securities.
It is immaterial whether the power or control is direct or indirect, and it does not matter how remote the Relevant Interest is or how it arises. If two or more people can jointly exercise one of these powers, each of them is taken to have that power.
In addition, section 608(3) of the Corporations Act provides that, if a body corporate has a Relevant Interest in securities, a person will also have a Relevant Interest in those securities if:
• the person has Voting Power in the body which is above 20%; or
• the person controls the body.
Associates
In determining who is an associate for the purposes of calculating a person’s Voting Power, section 12(2) of the Corporations Act provides that:
• the following entities are associates of a body corporate:
o another body corporate which it controls;
o another body corporate which controls it; and
o another body corporate that is controlled by the same entity which controls it;
• a person will be an associate of another person if they have, or propose to enter into, a relevant agreement for the purpose of controlling or influencing:
o the composition of a body’s board; or
o the conduct of a body’s affairs; and
• a person will be an associate of another person if they are acting, or propose to act, in concert in relation to the affairs of a body.
Item 7 of section 611 of the Corporations Act
Item 7 of section 611 of the Corporations Act provides an exception to the prohibition in section 606 where the acquisition of the Relevant Interest has been approved by shareholders in a general meeting, provided that:
• no votes are cast in favour of the resolution by the person proposing to make the acquisition or their

24 |
associates; and
• shareholders are given all information known to the acquirer or the company that was material to the decision on how to vote.
The acquisition of Shares by the Royal Vendors as a result of being issued Shares at completion of the Share Sale Agreement will result in each Royal Vendor acquiring a Relevant Interest in the Company’s Shares which will increase the combined Voting Power of the Royal Vendors from below 20% to more than 20%.
The Royal Vendors do not consider that they will be associates with respect to their interests in the Company following completion of the Share Sale Agreement. However, under section 12(2)(b) and (c) of the Corporations Act, the Royal Vendors may be considered associates due to the Share Sale Agreement constituting a relevant agreement which will control or influence the conduct of the Company’s affairs and the composition of the Company’s board given the Share Sale Agreement provides for the appointment of Anthony Strasser and Bruce Gordon to the Pilot board, and due to the Royal Vendors acting in concert in relation to the Company’s affairs through their common understanding and intentions with respect to the Royal Acquisition and by all agreeing to sell their shares in Royal to the Company.
Because of this potential associate relationship, at the point in time when the Consideration Shares are issued, the Royal Vendors will have a maximum combined Voting Power in the Company of 38.3% (this assumes that the Consideration Shares, Advisor Shares and the remaining Contractor Shares are issued and no other equity securities are issued in the Company and excludes any options on issue in the Company). Completion of the Share Sale Agreement will effectively bring an end to the rights, obligations and circumstances of the parties that may be said to create an associate relationship. Accordingly, immediately following completion, any associate relationship between the Royal Vendors with respect to the Company will no longer exist, and their respective Voting Powers will cease to be aggregated. Instead, the Voting Power of each Royal Vendor will be determined on an individual basis, as set out in Schedule 1.
In light of the above, the Company is seeking the approval of Shareholders under item 7 of section 611 of the Corporations Act for the Royal Vendors to acquire a Voting Power in the Company in excess of 20% for the purposes of section 606 of the Corporations Act.
Prescribed information
The following information is required to be provided to Shareholders under the Corporations Act and ASIC Regulatory Guide 74: Acquisitions approved by members for the purposes of obtaining approval under item 7 of section 611 of the Corporations Act.
Identity of the acquirers and their associates
The Consideration Shares to be issued under Resolution 1 will be issued to the Royal Vendors as consideration for all of the issued share capital in Royal. The Royal Vendors and their respective shareholdings in Royal are set out in Schedule 1.
No Royal Vendor is a related party of the Company.
Effect on the acquirers’ Voting Power
As at the date of this Notice, the Company has 218,363,058 Shares on issue. Assuming all Shares are issued pursuant to the Royal Resolutions and the remaining Contractor Shares are issued and no other Shares are issued, the capital structure of the Company upon completion of the Royal Acquisition will consist of 365,900,937 Shares. See section 1.7 for the pro forma capital structure table.
Assuming all Shares are issued pursuant to the Resolutions and that the remaining Contractor Shares are issued and no other Shares are issued, the Royal Vendors’ and its associates’ combined ordinary shareholding and voting power will increase from approximately 1.7% to approximately 38.3%. The level of the Royal Vendors’ combined voting power may vary if Share issues are made at a later time.
The maximum voting power of each Royal Vendor is set out in Schedule 1.
Reasons for the proposed acquisition
The Consideration Shares are being issued to the Royal Vendors under the Share Sale Agreement as consideration for 100% of the Royal Vendors’ shares in Royal. Upon completion of the Share Sale Agreement, the Company will wholly own Royal.
The Royal Acquisition was one of two potential production asset acquisitions that was under consideration by the Company. The combination of the Royal assets and interest in the Cliff Head production asset and

25 |
infrastructure have a significant value impact on Pilot’s existing 100% ownership of the contiguous offshore exploration permit WA-481-P which contains multiple exploration prospects located immediately adjacent to the Cliff Head Oil Field Production License and offshore production infrastructure. When both production acquisitions were reviewed, the Directors formed the view that the alternative proposal would have likely resulted in further time and expense and greater uncertainty.
The reasons for the Royal Acquisition are described in section 1.9 of this Explanatory Memorandum.
Timing of the proposed acquisition
The Royal Vendors will acquire the Consideration Shares at First Completion or Second Completion (as applicable) under the Share Sale Agreement. First Completion is anticipated to occur on or about 1 June 2021 while Second Completion is to occur by the sunset date which is 80 days from the Date of Pilot Shareholder approval. The indicative timetable for the Royal Acquisition is set out in section 1.6.
Material terms of the proposed acquisition
Details of the Royal Acquisition is set out in section 1 and a summary of the key terms of the Share Sale Agreement is set out in section 1.3.
Other relevant agreements
Other than as disclosed in this Explanatory Memorandum, there are no material agreements that are relevant to the Royal Acquisition.
Acquirers’ intentions regarding the future of the Company
Other than as disclosed elsewhere in this Notice, the Royal Vendors:
• have no current intention of making any changes to the business of the Company;
• some of which participated in the Company’s capital raise as described above;
• do not propose to inject further capital into the Company;
• do not intend to change the employment arrangements of the Company;
• do not propose to transfer any assets between the Company and the Royal Vendors, or their associates;
• have no intention to otherwise redeploy the fixed assets of the Company; and
• do not intend to change the financial or dividend distribution policies of the Company.
These intentions are based on information concerning the Company, its business and the business environment which is known to the Royal Vendors at the date of this Notice. Final decisions regarding these matters will only be made by the Royal Vendors in light of material information and circumstances at the relevant time. Accordingly, the statements set out above are statements of current intention only, which may change as new information becomes available to them or as circumstances change.
Directors’ interests and recommendations
No Director has a personal interest in the outcome of Resolution 1, other than in their capacity as Shareholders or economic beneficiaries of a Shareholder on the same basis as all other non-associated Shareholders.
The Directors’ Relevant Interests in Pilot Shares as at the date of this Notice are as follows:
Director Number of Shares Existing Voting Power
Number of Options
Mr Bradley Lingo 0 0 10,000,000
Mr Michael Lonergan 0 0 0
Mr Daniel Chen 5,000,000 2.29% 0
Each of the Directors’ who hold or control Shares intend to vote their Shares in favour of the Royal Resolutions.
Each of the Directors recommends that Shareholders vote for the Royal Resolutions.
Independent Experts Report as to whether the issue of the Consideration Shares to the Royal Vendors is fair and reasonable

26 |
The Independent Expert has prepared a report on the question of whether the issue of the Consideration Shares to the Royal Vendors is fair and reasonable to Non-Associated Shareholders. The Independent Expert’s Report is Annexure A to this Notice.
Details about people who are intended to become directors if members approve the Royal Acquisition
Anthony Strasser and Bruce Gordon are intended to become directors of the Company if members approve the Royal Acquisition (Proposed Directors). The appointment of the Proposed Directors will become effective from First Completion under the Royal Acquisition.
The qualifications, relevant professional and commercial experience of the Proposed Directors are is set out in the Explanatory Memorandum for Resolutions 3 and 4.
The Proposed Directors are shareholders and directors of Royal.
The Proposed Directors have no personal interest in the outcome of Resolution 1, other than as set out in the Explanatory Memorandum and as in their capacity as shareholders of Royal and or economic beneficiaries of a shareholder of Royal on the same basis as all other non-associated shareholders of Royal.
The Proposed Directors’ Relevant Interests in Pilot Shares are as follows:
Proposed Director No. of Consideration Shares to be issued
Voting Power*
Anthony Strasser 21,766,136 5.95%
Bruce Gordon 4,287,189 1.17%
Notes
* Voting power assessed on the basis of the number of new shares issued pursuant to Resolutions 1 and 2 and assumes that the remaining Contractor Shares are issued following approval of the Royal Resolutions and excludes any options on issue in the Company and no other equity securities are issued in the Company.
No additional approval under ASX Listing Rule 7.1
ASX Listing Rule 7.1 provides that a company must not, subject to specified exceptions, issue or agree to issue more equity securities during any 12-month period than that amount which represents 15% of the number of fully paid ordinary shares on issue at the commencement of that 12-month period.
This restriction does not apply in certain circumstances, including in relation to an issue of securities approved for the purpose of item 7 of section 611 of the Corporations Act.
If Shareholders approve the issue Consideration Shares, then separate approval will not be required under ASX Listing Rule 7.1 given that approval is already being obtained under item 7 of section 611 of the Corporations Act.
Accordingly, the issue of Consideration Shares will not count towards the Company’s 15% placement capacity.
Directors’ recommendation
Based on the information available including the information set out in this Notice and the Independent Expert Report, the Directors consider that the Royal Acquisition is in the best interest of the Company and unanimously recommend that Shareholders vote in favour of the Royal Resolutions. The Directors have unanimously approved the proposal to put the Royal Resolutions to Shareholders.
Each of the Directors’ who hold or control Shares intend to vote their Shares in favour of the Royal Resolutions.
All of the Directors voted in favour of the proposal to put Resolution 1 to Shareholders and approve the contents of the document.
The Directors recommend that Shareholders vote in favour of Resolution 1 for the reasons set out in section 1.9. The Directors consider that the potential advantages and upside discussed in section 1.9 justify the potential disadvantages in section 1.10 and 1.11.

27 |
RESOLUTION 2: APPROVAL OF ISSUE OF ADVISOR SHARES TO RFC AMBRIAN LIMITED
General
Royal engaged RFC Ambrian Limited (RFC Ambrian) to provide corporate advisory services in relation to Royal, including the Royal Acquisition, under the terms and conditions set out in an engagement letter dated 21 August 2019 (Advisor Mandate).
In consideration of the provision of the services by RFC Ambrian to Royal, the Company has agreed to allot and issue to RFC Ambrian (or its nominees) up to 7,575,758 Shares at a price per Share of $0.033 (Advisor Shares). This Resolution seeks Shareholder approval to issue and allot the Advisor Shares under ASX Listing Rule 7.1. RFC Ambrian Limited is not a related party of the Company.
ASX Listing Rule 7.1
ASX Listing Rule 7.1 provides that a company must not, subject to specified exceptions, issue or agree to issue more equity securities during any 12 month period than that amount which represents 15% of the number of fully paid ordinary securities on issue at the commencement of that 12 month period.
The proposed issue of the Advisor Shares does not fall within any of the exceptions to ASX Listing Rule 7.1 and such an issue would otherwise exceed the Company’s ASX Listing Rule 7.1 capacity. It therefore requires the approval of Shareholders under ASX Listing Rule 7.1. If this Resolution is passed, the Company will be able to proceed to issue of the Advisor Shares. In addition, the Advisor Shares will be excluded in calculating the Company’s 15% limit in Listing Rule 7.1 to issue equity securities without Shareholder approval over the 12 month period following the date on which the Advisor Shares are issued.
If this Resolution is not passed, then the Company will not be able to issue the Advisor Shares. The Company may in the future be able to proceed with the issue of the Advisor Shares as capacity becomes available with the passage of time under ASX Listing Rule 7.1, if required, without the need to obtain Shareholder approval.
Information Required by Listing Rule 7.3
The following information in relation to these Advisor Shares is provided to Shareholders for the purposes of ASX Listing Rule 7.3:
(a) The Advisor Shares will be issued and allotted to RFC Ambrian Limited (or its nominee).
(b) The maximum number of Advisor Shares to be issued is 7,575,758 at an issue price of $0.033 per Share.
(c) The Advisor Shares issued will be fully paid ordinary shares in the capital of the Company issued on the same terms and conditions as the Company’s existing Shares.
(d) The purpose of the issue of the Advisor Shares is in consideration for the provision of corporate advisory services provided to Royal by RFC Ambrian in relation to the Royal Acquisition, Accordingly, no funds will be raised from the issue of the Advisor Shares as the issue is to be made in lieu of cash fees for services rendered.
(e) The Advisor Shares will be issued within 3 months of Shareholder approval being obtained by the Company (or otherwise, as determined by the ASX in the exercise of their discretion).
(f) The Advisor Shares are being issued to RFC Ambrian under the Advisor Mandate. Royal must also pay $50,000 on announcement of a proposed transaction between Royal and a target company and in the event of a transaction which is not subject to relisting requirements of the target $50,000 on dispatch of a notice of meeting to a target company shareholder. The terms of the Advisor Mandate provide that the Advisor Mandate may be terminated by either RFC Ambrian or Royal by notice in writing at any time and otherwise is considered by Pilot to be on market standard terms.
(g) The Advisor Shares are not being issued under or to fund a reverse takeover.
(h) A voting exclusion statement for Resolution 2 is included in the Notice of Meeting preceding this Explanatory Memorandum.
Directors’ Recommendation
The Board of Directors recommend that the Shareholders vote in favour of this Resolution.

28 |
RESOLUTIONS 3 TO 4: ELECTION OF DIRECTORS
General
Resolutions 3 and 4 are ordinary resolutions that seek Shareholder approval to the appointment of Anthony Strasser and Bruce Gordon as directors of the Company (Proposed Directors). In accordance with the Royal Share Sale Agreement, the Proposed Directors are nominees of Royal.
Rules 3.4 and 3.5(a)(ii) of the Company’s constitution provides that a person may be elected to the office of a director at a general meeting by the Board’s recommendation.
The appointment of the Anthony Strasser and Bruce Gordon will become effective from First Completion under the Royal Acquisition.
Proposed Directors’ profiles
Anthony Strasser
Managing Director
Mr Anthony Strasser is an executive director at Royal. Anthony is a qualified accountant with extensive experience in corporate finance and advisory services over 20 years. He was formerly the Chief Financial Officer and co-founder of Sydney-based Bridgeport Energy Limited. Previously, he was Chief Financial Officer and Company Secretary at the Anzon Group. He has held senior positions with boutique investment and advisory firms in Sydney, focusing on financial management, due diligence assignments, mergers and acquisitions and private and public capital raisings. He began his career in the taxation division of Arthur Andersen and then worked in a senior management level position with Coopers & Lybrand in their Corporate Finance division
Bruce Gordon
Non-Executive Director
Mr Bruce Gordon is non-executive Chairman of Royal. Bruce has over 25 years of corporate finance and audit experience and was formerly the partner in charge of the BDO National Corporate Finance and Natural Resources teams. Bruce has provided corporate advisory services and financial advice to publicly listed companies, growing private company groups and subsidiaries of large multinationals and overseas companies. Bruce has significant experience in the areas of valuations, mergers and acquisitions and transaction support. Bruce has also had experience on overseas capital markets including AIM (sub-market of the London Stock Exchange), the Toronto and NY Stock Exchange. Bruce is a Chartered Accountant and Fellow of the Australian Institute of Company Directors.
Directors’ Recommendation
The Board of Directors recommend that the Shareholders vote in favour of these Resolutions.
RESOLUTION 5: RATIFICATION OF SPP SHORTFALL SHARES
General
As part of the Capital Raising and as outlined in section 1.5, the Company completed the SPP by issuing a total of 3,499,994 Shares to eligible Shareholders. As announced to the ASX on 18 November 2020, the Company entered into an underwriting agreement with Bridge Street to underwrite the SPP up to $500,000 (Underwriting Agreement) by subscribing for all the remaining shares not otherwise subscribed by existing shareholders under the SPP (Shortfall). Under the Underwriting Agreement, Bridge Street could appoint any sub-underwriters for the Shortfall.
Pursuant to the terms of the Underwriting Agreement, on 15 January 2021 the Company issued 11,651,514 Shares at an issue price of $0.033 per Share (SPP Shortfall Shares).
ASX Listing Rules 7.1
This Resolution proposes that Shareholders of the Company approve and ratify the prior issue and allotment of 11,651,514 SPP Shortfall Shares, which were issued on 15 January 2021 (SPP Shortfall Shares Issue Date).
Broadly speaking, ASX Listing Rule 7.1 provides that a company must not, subject to specified exceptions, issue or agree to issue more equity securities during any 12 month period than that amount which represents 15% of the number of fully paid ordinary securities on issue at the commencement of that 12 month period.

29 |
The issue of the SPP Shortfall Shares did not fit within any of the exceptions (to ASX Listing Rules 7.1) and, as it has not been approved by the Company’s Shareholders, it effectively uses up part of the expanded 15% limit in ASX Listing Rule 7.1, reducing the Company’s capacity to issue further equity securities without Shareholder approval under ASX Listing Rule 7.1 for the 12 month period following the Issue Date.
ASX Listing Rule 7.4 sets out an exception to ASX Listing Rule 7.1. It provides that where a company in a general meeting subsequently approves the previous issue of securities made pursuant to ASX Listing Rule 7.1 (and provided that the previous issue did not breach ASX Listing Rule 7.1) those securities will be deemed to have been made with shareholder approval for the purpose of ASX Listing Rule 7.1.
By approving this issue, the Company will retain the flexibility to issue equity securities in the future up to the 15% annual placement capacity set out in ASX Listing Rule 7.1 without the requirement to obtain prior Shareholder approval.
Accordingly, the Company wishes to retain as much flexibility as possible to issue additional equity securities into the future without having to obtain Shareholder approval for such issues under ASX Listing Rule 7.1.
To this end, this Resolution seeks Shareholder approval to subsequently approve the issue of the SPP Shortfall Shares for the purposes of Listing Rule 7.4.
If this Resolution is passed, the issue of SPP Shortfall Shares will be excluded in calculating the Company’s 15% capacity to issue equity securities under ASX Listing Rules 7.1 without Shareholder approval over the 12 month period following the SPP Shortfall Shares Issue Date.
If this resolution is not passed, the issue of SPP Shortfall Shares will be included in calculating the Company’s 15% capacity to issue equity securities under ASX Listing Rules 7.1 without Shareholder approval over the 12 month period following the SPP Shortfall Shares Issue Date.
Information required by ASX Listing Rule 7.5
The following information is provided to Shareholders for the purposes of ASX Listing Rule 7.5:
(a) The SPP Shortfall Shares were issued to the sub-underwriters appointed by Bridge Street in accordance with the terms of the Underwriting Agreement.
(b) The Company issued 11,651,514 SPP Shortfall Shares.
(c) The SPP Shortfall Shares issued were all fully paid and ranked equally in all respects with all existing ordinary shares in the capital of the Company.
(d) The SPP Shortfall Shares were issued on the SPP Shortfall Shares Issue Date.
(e) The SPP Shortfall Shares were issued at an issue price of $0.033 per share
(f) The SPP Shortfall Shares were issued pursuant to the Underwriting Agreement and the sub-underwriting arrangements between Bridge Street and the sub-underwriters, which are subject to customary terms and warranties.
(g) A voting exclusion statement for this Resolution is included in the Notice of Meeting preceding this Explanatory Memorandum.
Directors’ Recommendation
The Board of Directors recommend that the Shareholders vote in favour of this Resolution.

30 |
Definitions
Advisor Options means 10,000,000 unlisted Options with an exercise price of $0.066 expiring on expiry Date and otherwise on the terms as set out in the December General Meeting.
Advisor Shares means 7,575,758 Shares to be issued to RFC Ambrian.
AEDT means Australian Eastern Daylight Time (Sydney, NSW, Australia).
ASX means ASX Limited (ACN 008 624 691) or the Australian Securities Exchange, as the context requires.
ASX Listing Rules means the Listing Rules of ASX.
Associate has the meaning given to that term in the Listing Rules.
Attaching Placement Options means the issue of 37,878,783 free-attaching new unlisted Options, being one Option for every two new Shares acquired under the Placement exercisable at $0.066 on or before the Option Expiry Date.
Capital Raising means the Placement, Attaching Placement Options, SPP and SPP Options.
Cliff Head means Cliff Head Offshore Oil Field in the Perth Basin.
Company means Pilot Energy Limited ABN 86 115 229 984.
Combined Group means the Pilot and Royal business at completion of the Royal Acquisition.
Consideration Shares means the 136,363,636 Shares to be issued to the Royal Vendors under the Royal Acquisition.
Contractor Shares means 4,123,485 Shares proposed to be issued to Castle Rock Energy Pty Ltd ABN 41 619 648 869 (or its nominee), a contractor of the Company as approved by Shareholders at the December General Meeting.
Corporations Act means the Corporations Act 2001 (Cth).
December General Meeting means the general meeting of the Company scheduled to be held on Thursday, 10 December 2020.
Directors means the current directors of the Company.
Explanatory Memorandum means this explanatory memorandum accompanying the Notice.
First Completion means the first completion of and in accordance with the Share Sale Agreement, anticipated to occur on or about 1 June 2021.
First Completion Vendor means a Royal Vendor.
General Meeting or Meeting means the meeting convened by this Notice.
Independent Expert means Grant Thornton Corporate Finance Pty Ltd (ABN 59 003 265 987).
Independent Expert Report means the report produced by the Independent Expert set out Annexure A to this Notice.
Key means Key Petroleum Limited (ACN 120 580 618).
Key Acquisition means the acquisition by the Company of the remaining 40% interest in WA-481-P following which the Company will become the 100% owner/operator of WA-481-P.
Mid West Integrated Renewables and Hydrogen Project means the offshore wind and onshore wind and solar power and hydrogen production project to be located along the offshore/onshore coast of the Mid West Region of Western Australia.
Non-Associated Shareholders means Pilot Shareholders non-associated with the Royal Vendors.
Notice or Notice of Meeting or Notice of General Meeting means this notice of General Meeting including the Explanatory Memorandum, Directors’ Report and the Proxy Form.
New Option means an option over a Share on the terms and conditions as set out in Schedule 2.
Option Expiry Date means the date that is 24 months from the date of issue of the option.
Placement means both of the Tranche 1 Placement and Tranche 2 Placement for the issue of a total of

31 |
75,757,576 new Shares to raise approximately $2.5 million.
Proxy Form means the Proxy Form accompanying the Notice.
Relevant Interest has the meaning given in the Corporations Act.
Resolutions means the resolutions set out in the Notice, or any one of them, as the context requires.
Royal means Royal Energy Pty Limited (ACN 606 335 282).
Royal Acquisition means the acquisition by the Company of 100% of the issued share capital of Royal Energy Pty Limited ACN 606 335 282.
Royal Resolutions means Resolutions 1, 2, 3 and 4.
Royal Share Sale Agreement means share sale agreement entered into between the Royal Vendors and the Company on 25 September 2020 in respect of the Royal Acquisition.
Royal Vendors means the shareholders of Royal Energy Pty Limited as at the date of this Notice.
Royal Vendors Shares includes the shares of the Royal Vendors as set out in Schedule 1.
Second Completion means the second completion of and in accordance with the Share Sale Agreement, which is to occur by the sunset date which is 80 days from the date of Shareholder approval of the Royal Resolutions.
Share or Ordinary Share means a fully paid ordinary share in the capital of the Company.
Shareholder means a holder of a Share.
Share Sale Agreement means the share sale agreement between the Company and the Royal Vendors dated 24 September 2020.
SPP means the issue of 15,151,508 SPP Shares in the underwritten securities purchase plan to raise approximately $0.5 million.
SPP Options means the issue of approximately 7,575,757 free-attaching new unlisted Options, being one Option for every two SPP Shares acquired under the SPP exercisable at $0.066 on or before the Option Expiry Date.
SPP Shares means 15,151,508 new Shares to existing eligible Shareholders under the SPP.
Tranche 1 Key Consideration Shares means the first tranche of 4,276,703 Shares issued to Key on 7 October 2020 in consideration for the Key Acquisition.
Tranche 1 Placement means 15,909,097 Shares that were issued by the Company to sophisticated, professional and institutional investors on 1 October 2020 at an issue price of $0.033 that raised $0.5 million and were issued using the Company’s ASX Listing Rule 7.1 and 7.1A placement capacity.
Tranche 2 Key Consideration Shares means the second tranche of 16,723,297 Shares to be issued to Key subject to Shareholder approval in consideration for the Key Acquisition.
Tranche 2 Placement means 59,848,479 Shares at an issue price of $0.033 to raise approximately $2.0 million, the issue of which are subject to shareholder approval.
Underwriting Agreement means the underwriting agreement between the Company and Bridge Street dated on 18 November 2020.
Voting Power has the meaning given in the Corporations Act.
WA-481-P means offshore Exploration Permit WA-481-P.
WA-481-P Sale and Purchase Agreement means the sale and purchase agreement entered into between Pilot and Key on 6 October 2020 in respect of the Key Acquisition.

32 |
Instructions for Completing ‘Appointment of Proxy’ Form
1. Appointing a Proxy: A member with two or more votes entitled to attend and vote at the GM is entitled to appoint not more than two proxies to attend and vote on a poll on their behalf. The appointment of a second proxy must be done on a separate copy of the Proxy Form. Where more than one proxy is appointed, such proxy must be allocated a proportion of the member’s voting rights. If a member appoints two proxies and the appointment does not specify this proportion, each proxy may exercise half the votes. A duly appointed proxy need not be a member of the Company.
2. Proxy vote if appointment specifies way to vote: Section 250BB(1) of the Corporations Act provides that an appointment of a proxy may specify the way the proxy is to vote on a particular resolution and, if it does:
(a) the proxy need not vote on a show of hands, but if the proxy does so, the proxy must vote that way (i.e. as directed);
(b) if the proxy has 2 or more appointments that specify different ways to vote on the resolution - the proxy must not vote on a show of hands;
(c) if the proxy is the chair of the meeting at which the resolution is voted on – the proxy must vote on a poll, and must vote that way (i.e. as directed); and
(d) if the proxy is not the chair – the proxy need not vote on the poll, but if the proxy does so, the proxy must vote that way (i.e. as directed).
3. Transfer of non-chair proxy to chair in certain circumstances: Section 250BC of the Corporations Act provides that, if:
(a) an appointment of a proxy specifies the way the proxy is to vote on a particular resolution at a meeting of the Company's members;
(b) the appointed proxy is not the chair of the meeting;
(c) at the meeting, a poll is duly demanded on the resolution; and
(d) either of the following applies:
(i) the proxy is not recorded as attending the meeting; or
(ii) the proxy does not vote on the resolution,
the chair of the meeting is taken, before voting on the resolution closes, to have been appointed as the proxy for the purposes of voting on the resolution at the meeting.
4. Signing Instructions:
(a) Individual: Where the holding is in one name, the member must sign.
(b) Joint Holding: Where the holding is in more than one name, all of the members should sign.
(c) Power of Attorney: If you have not already provided the Power of Attorney with the registry, please attach a certified photocopy of the Power of Attorney to this form when you return it.
(d) Companies: Where the company has a sole director who is also the sole company secretary, that person must sign. Where the company (pursuant to Section 204A of the Corporations Act) does not have a company secretary, a sole director can also sign alone. Otherwise, a director jointly with either another director or a company secretary must sign. Please sign in the appropriate place to indicate the office held.
5. Attending the Meeting: Completion of a Proxy Form will not prevent individual members from attending the GM in person if they wish. Where a member completes and lodges a valid Proxy Form and attends the GM in person, then the proxy’s authority to speak and vote for that member is suspended while the member is present at the GM.
6. Voting in person:
(a) A Shareholder that is an individual may attend and vote in person at the Meeting. If you wish to attend the Meeting, please bring the attached proxy form to the Meeting to

33 |
assist in registering your attendance and number of votes. Please arrive 15 minutes prior to the start of the Meeting to facilitate this registration process.
(b) A Shareholder that is a corporation may appoint an individual to act as its representative to vote at the Meeting in accordance with Section 250D of the Corporations Act. The appropriate “Certificate of Appointment of Corporate Representative” should be produced prior to admission. A form of the Certificate is enclosed with this Notice of Meeting
7. Return of Proxy Form: To vote by proxy, please complete and sign the enclosed Proxy Form and return the Proxy Form (and any Power of Attorney under which it is signed):
(a) by mail to Boardroom Pty Limited, GPO Box 3993, Sydney NSW 2001, Australia.
(b) by fax to +61 2 9290 9655.
so that it is received by 11:00am (AEST) on Wednesday, 26 May 2021. Proxy Forms received later than this time will be invalid.

34 |
Schedule 1 – Royal Vendor Shares and Voting Power
Royal Vendor
No. Pilot
Shares held prior to Issue of
Consideration Shares
Current Voting
Power*
No. of Royal Shares held
No. of
Consideration Shares to be issued to
Royal Vendors
Total Pilot shares after Royal
completion
Voting Power**
Breakout Holdings Pty Ltd ACN 111 759 267 as trustee for the Way
Superannuation Fund ***
3,030,302 1.41% 6,250,000 24,419,343 27,449,645 7.50%
Mandaton Holdings Pty Ltd ACN 139 077 311 as
trustee for The Gadz Investment Trust
5,000,000 19,535,474 19,535,474 5.34%
Magees Superfund Pty Ltd
ACN 160 640 620 as trustee for the Magees Supermarket
Superannuation Fund
3,000,000 11,721,285 11,721,285 3.20%
G.C. Bass Nominees Pty Ltd ACN 008 891 905 as
trustee for the Bass Super Fund Account
2,500,000 9,767,737 9,767,737 2.67%
P A D Pty Ltd ABN 33 000 412 975 as trustee for the Gordon Super Fund
1,097,283 4,287,189 4,287,189 1.17%
John David McLean and Lyn McLean as trustee for
the John and Lyn McLean Family Superannuation Fund
636,387 0.30% 1,000,000 3,907,095 4,543,482 1.24%
Michael Norman Arnett 1,047,283 4,091,834 4,091,834 1.12%
Jennifer Frances Piva as trustee for the DP & JF Girgenti Family Trust
787,500 3,076,837 3,076,837 0.84%
Jenny Louise Stout as trustee for the BA & JL Stout Family Trust
787,500 3,076,837 3,076,837 0.84%
KTPC Pty Ltd ACN 105 104 103 as
trustee for the Peter Illes Family Trust
500,000 1,953,547 1,953,547 0.53%
Cindy Smith 500,000 1,953,547 1,953,547 0.53%
Strassfamily Pty Ltd
ACN 164 842 666 as trustee for the Strasser Superfund
570,926 2,230,662 2,230,662 0.61%
Antoinette Jenkins as trustee for The Jenkins Family Trust
450,000 1,758,193 1,758,193 0.48%
Mayburys Pty Ltd ABN 59 060 738 749
250,000 976,774 976,774 0.27%
Oil & Gas Worx Pty Ltd ABN 48 083 311 273 as trustee for The Taylor Total
Trust
250,000 976,774 976,774 0.27%
Breakout Holdings Pty Ltd ACN 111 759 267 as
trustee for the Breakout Family Trust
225,000 879,097 879,097 0.24%
Marilei International Ltd 2,500,000 9,767,737 9,767,737 2.67%
Omnia SA 2,500,000 9,767,737 9,767,737 2.67%
Sochrastem SAS 2,500,000 9,767,737 9,767,737 2.67%
Potezna Gromadka Ltd 2,000,000 7,814,190 7,814,190 2.14%
Ekong Investment Holdings Pte Ltd
1,000,000 3,907,095 3,907,095 1.07%
Gordon Ramsay 47,283 184,739 184,739 0.05%

35 |
Vialetta Gerikh 138,767 542,176 542,176 0.15%
Total Royal Shareholder Shares
2,151,538 34,901,542 136,363,636 138,515,174 37.86%
Notes:
* Voting power assessed on the basis of the number of Shares held by the Royal Vendors as of the date of this notice
**Voting power assessed on the basis of the number of new shares issued pursuant to Resolutions 1 and 2 and assumes that the remaining Contractor Shares are issued following approval of the Royal Resolutions and excludes any options on issue in the Company and no other equity securities are issued in the Company.
*** For the purposes of presenting Royal Vendors Existing interest, 1,515,151 Shares current held by Mr Christopher James Way have been consolidated with the Existing shareholding held by Breakout Holdings Pty Ltd ACN 111 759 267 as trustee for the Way Superannuation Fund.

36 |
Annexure A – Independent Expert’s Report

#4998177v1
Pilot Energy Limited Acquisition of Royal Energy Pty Ltd
21 April 2021

2
#4998177v1
Grant Thornton Corporate Finance
Pty Ltd Level 17 383 Kent Street Sydney NSW 2000 Locked Bag Q800 Queen Victoria Building NSW 1230
T +61 2 8297 2400
Dear Directors
Independent Expert’s Report and Financial Services Guide
Introduction
Pilot Energy Ltd (“Pilot” or “the Company”) is engaged in the exploration and development of oil and gas
and renewable energy projects located offshore and onshore in Western Australia. The flagship asset is a
current 100% interest with operatorship rights of WA-481-P offshore north Perth Basin. Recently, the
Company announced that it would proceed with a detailed feasibility study to pursue the development of
an offshore wind and onshore wind and solar power project leveraging its existing position in the Offshore
Exploration Permit WA 481 P with the aim of connecting into the existing electricity transmission facilities
adjacent to the permit (“Mid-West Integrated Renewables and Hydrogen Project”).
Royal Energy Pty Ltd (“Royal Energy” or “Royal”) is privately owned Australian oil and gas company whose
main assets are:
A strategic indirect 21.25% interest in the Cliff Head Oil Field Joint Venture (“CHJV”) through a 50%
interest of Triangle Energy (“Operations) Pty Ltd (“TEO”) which is the operator of the CHJV and owner
of a 42.5% interest in the Cliff Head Oil Field (“Cliff Head” or “CH Field”). Effectively, via its 50%
ownership of TEO, Royal holds joint operational control of the CHJV. Triangle Energy (Global) Ltd1
owns directly and indirectly an aggregate interest of 78.75% interest in the CHJV. Cliff Head is an
offshore oil project which produced circa 750 barrel of oil per day (“bopd”) in FY202 with existing
strategic offshore and Pilot proposed Mid-West Integrated Renewables and Hydrogen Project.
Holding of 5,208,488 shares of ASX listed Vintage Energy Ltd (“Vintage”).
Combined cash and cash equivalent resources of circa A$0.7 million as at 31 December 2020.
On 25 September 2020, Pilot announced that it would acquire 100% of the issued share capital of Royal
for a scrip consideration of 136,363,6363 pilot shares (“Pilot Shares” or “Shares”) to be issued to the Royal
vendors pro rata to their respective shareholdings (“Royal Acquisition” or “Proposed Transaction”).
Following completion of the Royal Acquisition, the Royal vendors will collectively own 38.3%4 of the
enlarged share capital of the Pilot (“Combined Group” or “Merged Entity”).
1 ASX listed entity. 2 TEG quarterly report. 3 In addition, the Company will issue 7,575,758 Pilot Shares to Royal’s financial advisers. 4 Based on the number of shares on issue as at 15 January 2021 and on no further share being issue prior to the completion of the Proposed Merger,
The Independent Directors
Pilot Energy Limited
Level 12, 225 George Street,
Sydney NSW 2009
21 April 2021

3
#4998177v1
Shortly after announcing the Royal Acquisition, Pilot restructured the ownership of WA-481-P by entering
into an agreement with Triangle Energy (Global) Limited (“Triangle”) to sell a 78.75% interest and
operatorship of WA-481-P for up-front cash consideration of A$0.3 million and 100% free carry of Pilot
through the completion of the year 1 to year 3 minimum WA-481-P work programme of A$5.5 million
(“Triangle Agreement”). As a condition precedent to completion of the Triangle Transaction, Pilot and
Triangle have agreed to form the Cliff Head Wind and Solar Project Joint Venture (“CHWSP JV”) with Pilot
holding an 80% operating interest and Triangle the remaining 20%. The CHWSP JV will assess the
feasibility of the development of a large-scale wind and solar project centred on Cliff Head Oil Field
Facilities. The Cliff Head Wind and Solar Project is located within the area of the Mid-West Integrated
Renewables and Hydrogen Project. The Triangle Agreement is expected to complete at the end of March
2021 and it is subject the completion of the Royal Acquisition plus a number of other conditions precedent
as discussed in Section 1.
If the Royal Acquisition and the Triangle Agreement complete, Pilot and Triangle have created substantial
alignment between the newly created CHWSP JV and the existing CHJV in which Pilot would acquire an
effective 21.25% interest upon completion of the Royal Acquisition. To further facilitate this alignment,
Triangle has agreed that Pilot’s share in any oil and gas discoveries in WA-481-P developed and produced
through the Cliff Head Oil Field facilities will have access to these facilities on the same basis as Triangle.
Over the last few months, the Company has also announced a number of other transactions (“Ancillary
Transactions”). A summary of the Ancillary Transactions is outlined below:
The Company and Key Petroleum rationalised the ownership of WA-481-P and on 6 October 2020
they announced that the Pilot will acquire the remaining 40% interest in WA-481-P which it does not
own (“Key Acquisition”) for a total scrip consideration of 21,000,000 Pilot Shares5. The Key Acquisition
completed at the end of 2020.
An equity raising of A$3 million comprising A$2.5 million placement (“Placement” or “Capital Raising”)
and a fully underwritten share purchase plan (“SPP”) to raise $0.5 million. Pilot Shares under the
Placement and the SPP were issued at 3.3 cents per share with one free option for every two new
Shares acquired6. The Capital Raising was completed on 15 January 2021 with the issue of the
underwritten SPP shares.
On 18 December 2020, Pilot announced the acquisition of the 40% held by En Res in both EP416 and
EP480 for a nominal consideration. Pilot already owned the balance 60% interest in both permits.
Given the several changes in the ownership structure of WA 481 P over the last few months, we have set
out below a graphical illustration to assist Pilot shareholders (“Pilot Shareholders”).
5 4,276,703 Pilot Shares were issued immediately and 16,723,297 shares will be issued after Pilot’s Shareholders approval at the EGM on 10 December 2020. 6 The Options are exercisable at 6.6 cents on or before the expiry which is 24 months from the date of issue.

4
#4998177v1
Source: Pilot announcements
The Royal Acquisition is subject to Pilot Shareholders approval as well as other customary conditions
precedent as discussed in Section 1.
Subject to no superior proposal emerging, the Directors have unanimously recommended that the Non-
Associated Shareholders7 vote in favour of the Royal Acquisition and they have advised that, subject to the
same qualification, all Directors intend to vote, or procure the voting of, all Pilot Shares held or controlled
by them in favour of the Royal Acquisition.
Purpose of the report
The Royal Acquisition requires Pilot Shareholders’ approval under Item 7 of Section 611 of the
Corporations Act given that the Royal vendors, in aggregate, will hold an interest in the Company of 38.3%
on of undiluted issued capital, however, no individual shareholders of Royal will hold greater than 20% of
the issued capital. Accordingly, the Directors of Pilot have engaged Grant Thornton Corporate Finance to
prepare an Independent Expert’s report to express an opinion on whether the Royal Acquisition is fair and
reasonable to Non-Associated Shareholders for the purposes of Item 7 of Section 611 of the Corporations
Act.
For the purposes of this report, Grant Thornton Corporate Finance has engaged RISC Advisory Pty Ltd
(“RISC”) to review and opine on the reasonableness of the technical assumptions adopted for the Cliff
Head oil field and update the valuation assessment of the Pilot’s permits8. RISC’s review was completed in
accordance with the requirements of RG111 and it is attached in Appendix G (“RISC Report”).
7 Pilot Shareholders non-associated with the Royal Acquisition (“Non-Associated Shareholders”). 8 RISC prepared a full report on the Pilot’s permits in 2017.
Ownership analysis 14-Aug-20 8-Sep-20 25-Sep-20 9-Nov-20
Permit License Renewal Key Agreement Royal Acquisition Triangle agreement
WA-481-P
Pilot 60.00% 100.00% 100.00% 21.25%
Key 40.00% - - -
Triangle - - - 78.75%
Operator Pilot Pilot Triangle Triangle
CHWSP
Pilot 80%
Triangle 20%
Operator Pilot
CHJV
Pilot (Combined Group) - - 21.25% -
Royal 21.25% 21.25% - 21.25%
Triangle 78.75% 78.75% 78.75% 78.75%
Operator Triangle Triangle Triangle Triangle
Status Completed Completed In progress In progress

5
#4998177v1
Summary of opinion
Grant Thornton Corporate Finance has concluded that the Royal Acquisition is NOT FAIR BUT
REASONABLE to the Non-Associated Shareholders.
In forming our opinion, Grant Thornton Corporate Finance has considered whether the Royal Acquisition is
fair and reasonable to the Non-Associated Shareholders and other quantitative and qualitative
considerations.
Fairness Assessment
In accordance with the requirements of the ASIC RG 111, in forming our opinion in relation to the fairness
of the Proposed Acquisition, Grant Thornton Corporate Finance has compared the value per Pilot share
before the Royal Acquisition (on a control basis) to the assessed value per share of the combined Pilot
and Royal (“Combined Group” or “Combined Entity” or “Merged Entity”) on a minority basis.
The valuation assessment of both Pilot and of the Combined Group presents a number of challenges
which are difficult to mitigate or address with standard valuation techniques. In relation to the valuation
assessment of Pilot before the Royal Acquisition, we note the following:
Underlying fair market value – WA 481 P is the flagship asset of Pilot and the key focus of the
Company. In addition, Pilot owns 4 additional early stage exploration permits but the Company has
not materially advanced any of them over the last few years due to limited cash resources and the
decision to focus and prioritise WA 481 P. RISC has estimated the fair market value the exploration
permits held by Pilot, including WA 481 P, between A$0.4 million and A$5.8 million as set out in the
RISC Report. If we adopt this value range in our assessment of the fair market value of Pilot before
the Royal Acquisition, we obtain a value per share between 0.45 cents and 2.81 cents. The low-end of
this range is materially below the trading prices of Pilot before the announcement of the Royal
Acquisition which ranged between 3 cents and 4 cents per share.
Pilot trading prices – In relation to the trading prices of Pilot, we observed a significant difference
between the ‘bid’ and ‘ask’ price with a spread between 20% and 30% up to August 2020 which then
stabilised to around 10% in the months following the renewal of the permit for WA 481 P9 and the
Placement which seemed to provide a more objective reference point for the share market trading.
Placement – We also explored whether or not we could rely on the issue price of the Placement and
the SPP as representative of the fair market value of the Company before the Proposed Transaction.
We note that Pilot issued 90,909,084 Pilot Shares at 3.3 cents per share10 to raise circa A$3 million.
However, the Placement was announced at the same time of the Royal Acquisition and Pilot clearly
articulated in the announcement that the raising was in conjunction with the Royal Acquisition and
also a large component of the proceeds was allocated to the development of the Cliff Head oil field
(Royal asset) and the Mid-West Wind and Solar Project in combination with the onshore and offshore
infrastructure that Royal will contribute to the Combined Group. Accordingly, we are of the opinion that
we cannot rely on the Placement price of 3.3 cents as the fair market value of Pilot before the
Proposed Acquisition.
9 Which occurred in August 2020. 10 With one free option for every two shares.
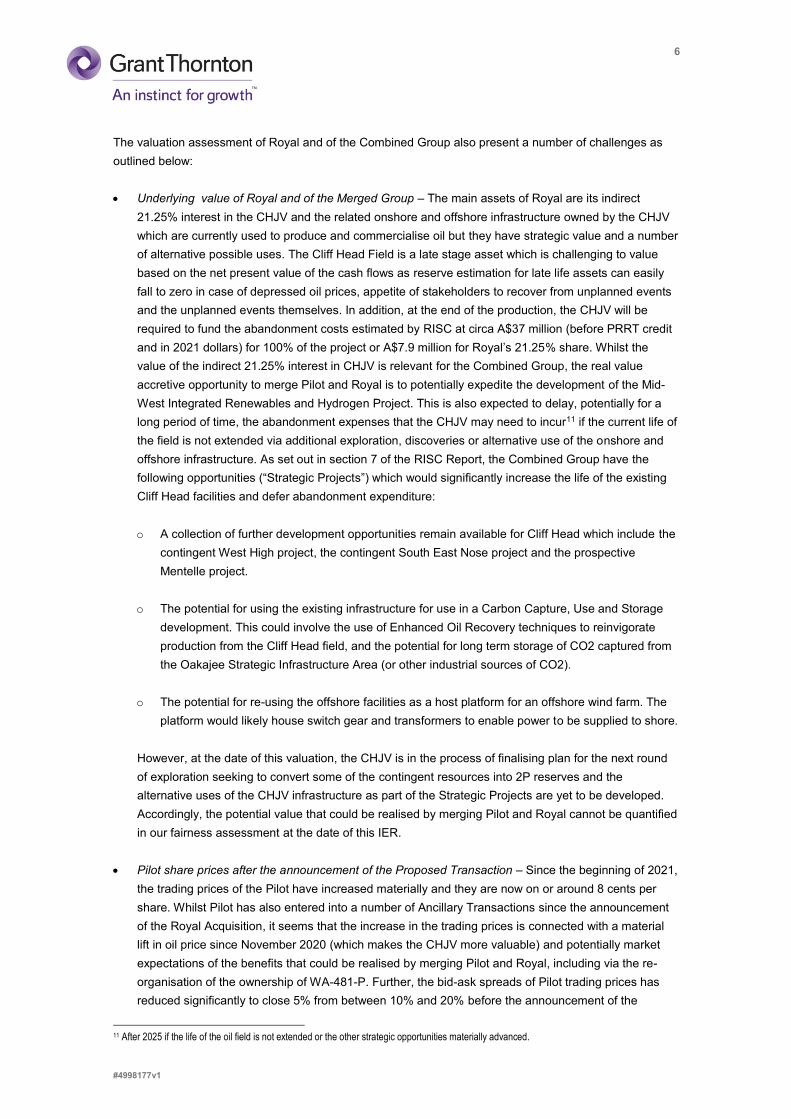
6
#4998177v1
The valuation assessment of Royal and of the Combined Group also present a number of challenges as
outlined below:
Underlying value of Royal and of the Merged Group – The main assets of Royal are its indirect
21.25% interest in the CHJV and the related onshore and offshore infrastructure owned by the CHJV
which are currently used to produce and commercialise oil but they have strategic value and a number
of alternative possible uses. The Cliff Head Field is a late stage asset which is challenging to value
based on the net present value of the cash flows as reserve estimation for late life assets can easily
fall to zero in case of depressed oil prices, appetite of stakeholders to recover from unplanned events
and the unplanned events themselves. In addition, at the end of the production, the CHJV will be
required to fund the abandonment costs estimated by RISC at circa A$37 million (before PRRT credit
and in 2021 dollars) for 100% of the project or A$7.9 million for Royal’s 21.25% share. Whilst the
value of the indirect 21.25% interest in CHJV is relevant for the Combined Group, the real value
accretive opportunity to merge Pilot and Royal is to potentially expedite the development of the Mid-
West Integrated Renewables and Hydrogen Project. This is also expected to delay, potentially for a
long period of time, the abandonment expenses that the CHJV may need to incur11 if the current life of
the field is not extended via additional exploration, discoveries or alternative use of the onshore and
offshore infrastructure. As set out in section 7 of the RISC Report, the Combined Group have the
following opportunities (“Strategic Projects”) which would significantly increase the life of the existing
Cliff Head facilities and defer abandonment expenditure:
o A collection of further development opportunities remain available for Cliff Head which include the
contingent West High project, the contingent South East Nose project and the prospective
Mentelle project.
o The potential for using the existing infrastructure for use in a Carbon Capture, Use and Storage
development. This could involve the use of Enhanced Oil Recovery techniques to reinvigorate
production from the Cliff Head field, and the potential for long term storage of CO2 captured from
the Oakajee Strategic Infrastructure Area (or other industrial sources of CO2).
o The potential for re-using the offshore facilities as a host platform for an offshore wind farm. The
platform would likely house switch gear and transformers to enable power to be supplied to shore.
However, at the date of this valuation, the CHJV is in the process of finalising plan for the next round
of exploration seeking to convert some of the contingent resources into 2P reserves and the
alternative uses of the CHJV infrastructure as part of the Strategic Projects are yet to be developed.
Accordingly, the potential value that could be realised by merging Pilot and Royal cannot be quantified
in our fairness assessment at the date of this IER.
Pilot share prices after the announcement of the Proposed Transaction – Since the beginning of 2021,
the trading prices of the Pilot have increased materially and they are now on or around 8 cents per
share. Whilst Pilot has also entered into a number of Ancillary Transactions since the announcement
of the Royal Acquisition, it seems that the increase in the trading prices is connected with a material
lift in oil price since November 2020 (which makes the CHJV more valuable) and potentially market
expectations of the benefits that could be realised by merging Pilot and Royal, including via the re-
organisation of the ownership of WA-481-P. Further, the bid-ask spreads of Pilot trading prices has
reduced significantly to close 5% from between 10% and 20% before the announcement of the
11 After 2025 if the life of the oil field is not extended or the other strategic opportunities materially advanced.

7
#4998177v1
Proposed Transaction.
With the above backdrop and challenges, we have undertaken our fairness assessment based on the
following:
Pilot before the Proposed Transaction on a control basis – We have had regard to the mid to high-end
of RISC valuation assessment of the underlying exploration assets plus other assets and liabilities on
the balance sheet as at 31 December 2020 and the trading prices before the announcement of the
Proposed Transaction (after the application of a premium for control between 20% and 30%). Whilst
both these approaches have limitations as discussed before, in the absence of other applicable
valuation methodologies, we have relied on them.
Pilot after the Proposed Transaction on a minority basis – In the valuation assessment of the
Combined Group, we have relied on a number of scenarios as outlined below:
o Scenario 1 – (“As-Is Scenario”) – We have aggregate fair market value of Pilot before the
Proposed Transaction on a minority basis plus the value of Royal. The valuation assessment of
Royal under this scenario is only based on the net present value of the cash flows expected to be
realised from the producing resources of Cliff Head project assessed by RISC without considering
the value of any Strategic Projects, including the value of being able to defer the abandonment
costs. We are of the opinion that this scenario is potentially punitive for Royal and the Combined
Group as it does not attributes any value to the strategic infrastructure assets held by the CHJV,
alternative projects at the end of the life of the field or potential conversion of resources in
reserves. Nonetheless it is relevant to include this value point in our fairness assessment as it
provides an indication of the value of the Combined Group if it fails to successfully realise any of
the Strategic Projects. Under these circumstances, the CHJV will be required to fund the
abandonment costs of the Cliff Head project estimated by RISC at A$37 million (before PRRT
credit) for 100% of the project or A$7.9 million (before PRRT credit) for Royal’s share.
o Scenario 2 – As-Is plus deferral of the abandonment costs – Under this scenario, we have
assumed that the Company is successful in developing one of the Strategic Projects and
accordingly the abandonment costs are deferred for a long period of time. We note that whilst the
value of Royal under this scenario increases materially as the abandonment costs are deferred,
the valuation assessment does not include any potential uplift for the Strategic Projects as they
are not quantifiable at this point in time.
o Scenario 3 – Trading prices (“Trading Prices Scenario”) – Under this scenario, we have
considered the trading prices of Pilot close to the date of this report as a proxy for the value of the
Combined Group.

8
#4998177v1
Our fairness assessment is summarised in the table below.
Source: GTCF analysis
Our assessment of the fair market value of Pilot on a control basis before the Proposed Transaction is
higher than our assessment of Pilot on a minority basis after the Proposed Transaction. Accordingly, we
have concluded that the Proposed Transaction is NOT FAIR to the Non-Associated Shareholders.
Non-Associated Shareholders should be aware of the following in relation to the fairness assessment:
There is a significant discrepancy between the trading prices of Pilot before the Proposed Transaction
and the underlying value of the permits assessed by RISC in particular at the low-end of RISC’s
valuation assessment. Whilst this is not uncommon for early stage exploration assets, the market
seems to attribute significant value of the development of the Mid-West Integrated Renewables and
Hydrogen Project which is currently not quantified in our fairness assessment given that the feasibility
study is in the early stage of development.
The valuation assessment of Pilot after the Royal Acquisition is based on average values under the
three different scenarios discussed earlier in the executive summary which produce vastly different
underlying values of the Combined Group. Whilst we are of opinion that averaging the three scenarios
is a reasonable approach as we believe it strikes the right balance of the value that could be attributed
to the Strategic Projects and the combination of Royal and Pilot versus the underlying risks, there
remain significant risks and uncertainties in particular under Scenario 112 and Scenario 213. However,
we are of the opinion that the equal weighting adopted for the three scenarios to value the Combined
Group is validated and supported by the following:
o Pilot Shares have been trading between 4c and 8c per share since the beginning of February
which reflect the market’s view of the value of the Combined Group.
o Pilot raised circa A$3 million at 3.3 cents to support the Royal Acquisition and the Mid-West Wind
and Solar Project in combination with the onshore and offshore infrastructure that Royal will
contribute to the Combined Group. The Placement price which represents a proxy for the value of
the Merged Entity is substantially in line with the high-end of our valuation assessment of the
Combined Group.
We note that our assessment of the value per Pilot Share post the Proposed Transaction does not reflect
the price at which Pilot Shares will trade if the Proposed Transaction is completed. The price at which Pilot
Shares will ultimately trade depends on a range of factors including the liquidity of Pilot Shares, macro-
economic conditions, oil prices, the underlying performance of the Pilot business and the advancement of
12 No value attributed to the Strategic Projects with the abandonment costs considered in full. 13 No value attributed to the Strategic Projects with the abandonment deferred.
Fairness assessment Section
Cents Reference Low High
Value of Pilot before the Proposed Transaction (control) 8 2.92 4.33
Value of Combined Group on a minority basis (excluding Strategic Value) 9 2.62 3.31
Premium/(Discount) (0.30) (1.02)
Premium/(Discount) (10.3%) (23.6%)
Fairness NOT FAIR

9
#4998177v1
the Strategic Projects.
Reasonableness Assessment
RG111 establishes that an offer is reasonable if it is fair. It might also be reasonable if, despite being not
fair, there are sufficient reasons for the security holders to accept the offer in the absence of any superior
proposal. In assessing the reasonableness of the Proposed Transaction, we have considered the following
advantages, disadvantages and other factors.
Advantages
Strategic benefit for the development of the Mid-West Integrated Renewables and Hydrogen Project
Pilot is currently focused on conducting feasibility studies in relation to the potential development of the
Mid-West Integrated Renewables and Hydrogen Project in the onshore and offshore areas of and adjacent
to WA 481 P and connecting to the electricity transmission facilities of the South West Integrated System.
The Directors believe that the Mid West Coastal region of WA contains both world-class offshore and
onshore wind resources and onshore solar resources as it has been documented by the World Bank,
CSIRO, ABARE, Geoscience Australia and ARENA.
The Company intends to develop the Mid-West Integrated Renewables and Hydrogen Project to assess
the feasibility of accessing and utilising existing offshore and onshore oil and gas infrastructure at Cliff
Head. Access to the Cliff Head infrastructure will be facilitated by both the sale of the 78.75% interest and
transfer of operatorship of WA 481 P to Triangle and the Royal Acquisition. The Combined Group and
Triangle will create a substantial alignment between the newly created WA 481 P joint venture and the
existing CH joint venture.
In addition, Pilot and Triangle will also form the Cliff Head Wind and Solar Project Joint Venture which is a
subset of the broader Mid-West Integrated Renewables and Hydrogen Project, with Pilot 80% owner and
operator and Triangle 20%. As part of the proposed new joint venture arrangement, Pilot and Triangle will
negotiate an access and co-ordination agreement to establish the basis for providing access to the existing
Cliff Head platform, the offshore/onshore pipeline, right of way from the platform and to the onshore
Arrowsmith Separation and Processing Facilities. This will also enable the existing offshore production
facilities to be multi-tasked and potentially extend the useful life of the Cliff Head Field which should further
benefit the Merged Entity.
The Company has estimated that by utilising the existing Cliff Head facilities to develop the Cliff Head
Wind and Solar Project, it may generate significant capital cost savings.
The Company believes that the potential integration synergies and cost savings both in the development
and operation of the offshore wind project are likely to be significant and have the potential to materially
improve the projects overall economic attractiveness. Further, multitasking the Cliff Head facilities to allow
concurrent oil and gas production with offshore wind farm operations should result in the fixed costs being
materially reduced which may assist in extending the economic life of the field.
None of the above opportunities is captured in our valuation assessment of the underlying value of the
Combined Group.

10
#4998177v1
Carbon Capture, Use and Storage development.
Pilot has also identified that the economic life of Cliff Head Oil Field and the utilisation Cliff Head facilities
may also be enhanced and extended through the implementation of a carbon capture utilisation and
storage (“CCUS”) CO2 enhanced oil recovery project or as carbon capture and storage project (“CCS”)
which are both currently under investigations.
CCUS is a proven form of enhanced oil recovery which may enhance and extend the utilisation Cliff Head
facilities. This could involve the use of Enhanced Oil Recovery techniques to reinvigorate production from
the Cliff Head field. Implementation of such a project at the Cliff Head Oil Field would, if successful,
generate both an additional and continuing revenue stream from the production of the additional oil and
also defer the decommissioning expenses
Pilot has also identified that Cliff Head may also support a CCS project utilising the Cliff Head Oil Field
reservoir and the offshore and onshore facilities to operate a CO2 carbon capture and storage geo-
sequestration operation. The operation of Cliff Head field and facilities as a CCS project would also extend
the life of the operation and defer decommissioning expenses. This may also generate an additional
revenue stream from the reduction of CO2 emissions if it qualifies under the Commonwealth Emissions
Reduction Fund or similar Government incentive.
Assessment on a like for like basis
Our valuation assessment of Pilot before the Proposed Acquisition is on a 100% basis and incorporates
the application of a premium for control in accordance with the requirements of RG111. Specifically, ASIC
requires the Independent Expert to treat the issue of shares under Section 611(7) of the Corporations Act
as if it was a scrip takeover bid. However, we note that whilst the Royal vendors in aggregate will hold
circa 38.3% of the issued capital of the Combined Group, none of them individually will hold more than
7.50% of the issue capital and they are not considered associates in accordance with the Corporations
Act.
Given the above, we believe it is appropriate to illustrate to the Non-Associated Shareholders a
comparison of the value per share of Pilot before and after the Proposed Acquisition on a like-for-like basis
(i.e. minority basis).
Source: GTCF analysis
As outlined above, the value of Pilot after the Proposed Acquisition (but excluding the value of the
Strategic Projects) mostly overlap with the value of Pilot before the Proposed Transaction on like for like
basis.
Fairness assessment - Like for like basis Section
Cents Reference Low High
Value of Pilot before the Proposed Transaction (minority) 8 2.43 3.33
Value of Combined Group on a minority basis (excluding Strategic Value) 9 2.62 3.31
Premium/(Discount) 0.19 (0.02)
Premium/(Discount) 7.7% (0.7%)

11
#4998177v1
Share price after the announcement of the Proposed Transaction
As set out below, following the announcement of the Proposed Transaction, the trading prices of Pilot have
increased materially which seems to indicate good support from investors for the Proposed Transaction
and perceived low risk of the Proposed Transaction not being implemented. We also note that the Brent oil
prices have increased substantially in the last three months from circa US$45 in mid-November 2020 to
circa US$60 around mid-February which would make the CHJV more valuable (all other things being the
same).
Pilot trading share price since the announcement of the Proposed Transaction
Source: S&P Global, GTCF analysis
We note that Pilot has requested and obtained a trading suspension from the ASX on 11 February 2021
and the Company has been in voluntary trading suspension since then.
In the absence of the Proposed Transaction, it is likely that the trading prices of Pilot will reduce from the
current level, at least in the short term.
Ability for Pilot Shareholders to continue to participate in the future growth of the Combined Group
Pilot Shareholders will continue to be exposed to the underlying business and growth opportunities of Pilot
in the enlarged Combined Group to the extent that they continue to hold shares in the Combined Group.
Disadvantages
Reserves & Resources of Royal and abandonment costs
Royal has an effective 21.25% interest in the producing Cliff Head oilfield. The Cliff Head Field is a late
stage asset and resource estimation for late life assets can easily fall to zero in case of depressed oil
prices, appetite of stakeholders to recover from unplanned events and the unplanned events themselves.
Suspension of production at Cliff Head may have a negative impact on the value and future potential to
develop WA 481 P 2C and prospective resources.
-
1,000,000
2,000,000
3,000,000
4,000,000
5,000,000
6,000,000
7,000,000
8,000,000
-
0.020
0.040
0.060
0.080
0.100
0.120
20 S
ep 2
0
27 S
ep 2
0
04 O
ct 2
0
11 O
ct 2
0
18 O
ct 2
0
25 O
ct 2
0
01 N
ov 2
0
08 N
ov 2
0
15 N
ov 2
0
22 N
ov 2
0
29 N
ov 2
0
06 D
ec 2
0
13 D
ec 2
0
20 D
ec 2
0
27 D
ec 2
0
03 J
an 2
1
10 J
an 2
1
17 J
an 2
1
24 J
an 2
1
31 J
an 2
1
07 F
eb
21
14 F
eb
21
VolumeShare price (A$)
Volume Share price
25 September 20 - Annoucement of the Proposed Transaction
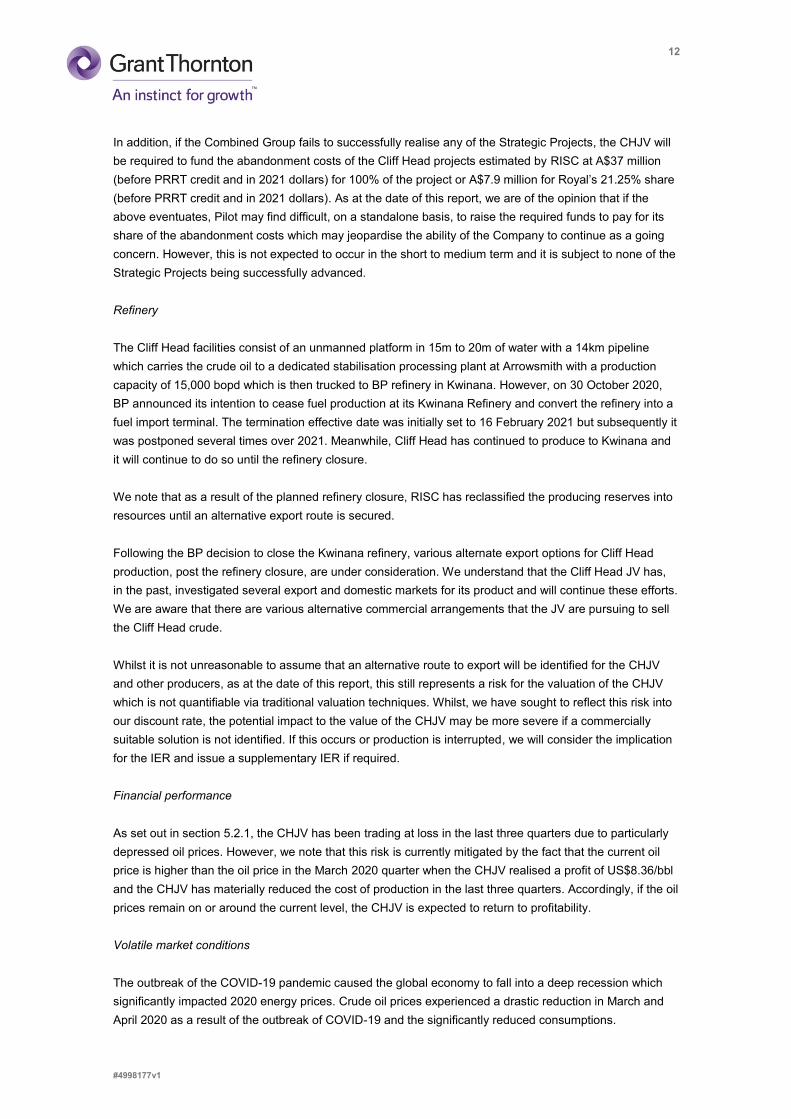
12
#4998177v1
In addition, if the Combined Group fails to successfully realise any of the Strategic Projects, the CHJV will
be required to fund the abandonment costs of the Cliff Head projects estimated by RISC at A$37 million
(before PRRT credit and in 2021 dollars) for 100% of the project or A$7.9 million for Royal’s 21.25% share
(before PRRT credit and in 2021 dollars). As at the date of this report, we are of the opinion that if the
above eventuates, Pilot may find difficult, on a standalone basis, to raise the required funds to pay for its
share of the abandonment costs which may jeopardise the ability of the Company to continue as a going
concern. However, this is not expected to occur in the short to medium term and it is subject to none of the
Strategic Projects being successfully advanced.
Refinery
The Cliff Head facilities consist of an unmanned platform in 15m to 20m of water with a 14km pipeline
which carries the crude oil to a dedicated stabilisation processing plant at Arrowsmith with a production
capacity of 15,000 bopd which is then trucked to BP refinery in Kwinana. However, on 30 October 2020,
BP announced its intention to cease fuel production at its Kwinana Refinery and convert the refinery into a
fuel import terminal. The termination effective date was initially set to 16 February 2021 but subsequently it
was postponed several times over 2021. Meanwhile, Cliff Head has continued to produce to Kwinana and
it will continue to do so until the refinery closure.
We note that as a result of the planned refinery closure, RISC has reclassified the producing reserves into
resources until an alternative export route is secured.
Following the BP decision to close the Kwinana refinery, various alternate export options for Cliff Head
production, post the refinery closure, are under consideration. We understand that the Cliff Head JV has,
in the past, investigated several export and domestic markets for its product and will continue these efforts.
We are aware that there are various alternative commercial arrangements that the JV are pursuing to sell
the Cliff Head crude.
Whilst it is not unreasonable to assume that an alternative route to export will be identified for the CHJV
and other producers, as at the date of this report, this still represents a risk for the valuation of the CHJV
which is not quantifiable via traditional valuation techniques. Whilst, we have sought to reflect this risk into
our discount rate, the potential impact to the value of the CHJV may be more severe if a commercially
suitable solution is not identified. If this occurs or production is interrupted, we will consider the implication
for the IER and issue a supplementary IER if required.
Financial performance
As set out in section 5.2.1, the CHJV has been trading at loss in the last three quarters due to particularly
depressed oil prices. However, we note that this risk is currently mitigated by the fact that the current oil
price is higher than the oil price in the March 2020 quarter when the CHJV realised a profit of US$8.36/bbl
and the CHJV has materially reduced the cost of production in the last three quarters. Accordingly, if the oil
prices remain on or around the current level, the CHJV is expected to return to profitability.
Volatile market conditions
The outbreak of the COVID-19 pandemic caused the global economy to fall into a deep recession which
significantly impacted 2020 energy prices. Crude oil prices experienced a drastic reduction in March and
April 2020 as a result of the outbreak of COVID-19 and the significantly reduced consumptions.

13
#4998177v1
Afterwards, prices recovered in May and June 2020 as a result of a sharp reduction in production and a
modest recovery in consumption as lockdown measures were eased. Global consumption of crude oil also
plummeted in 2020 as a result of COVID-19 lockdown measures and reduced mobility. However, oil prices
have recently experienced a significant recovery with Brent price increasing from US$45 per barrel in
November 2020 to circa US$60 per barrel as at the date this report. Volatile oil prices and challenging
market conditions may have an adverse impact over the Combined Group’s ability to pursue the Strategic
Projects.
Other factors
Prospect of a superior offer or alternative transaction
Given the benefits expected to be realised by the Combined Group in relation to the development of the
Mid-West Integrated Renewables and Hydrogen Project, we are of the opinion that it is unlikely that a
superior or alternative transaction will emerge. Nonetheless, the transaction process may act as a catalyst
for potentially interested parties to assess the merits of potential alternative transactions.
Likelihood to receive a premium for control in the future
Given the structure of the Combined Group, no shareholder will be able to exert a significant influence
over the strategic and operational decisions of the Combined Group or block/prevent the Combined Group
from receiving a premium for control in the future.
Implications if the Proposed Transaction is not implemented
If the Proposed Transaction is not implemented, it would be the current Directors’ intention to continue
operating Pilot in line with its objectives. Pilot Shareholders who retain their shares would continue to
share in any benefits and risks in relation to Pilot’s ongoing business. However, we note the following:
The advancement of the development of the Cliff Head Wind and Solar project may be affected.
Pilot may need to enter into alternative commercial arrangements with the Cliff Head project to
facilitate parts of its Mid-West Integrated Renewables and Hydrogen Project strategy which currently
interact with the Cliff Head assets (outside of the access rights which are granted under the access
deeds)
We are also of the opinion that the trading prices may fall from the current level at least in the short term.
Directors’ recommendations and intentions
As set out in the Notice of Meeting and Explanatory Memorandum, the Directors of Pilot have
recommended that the Non-Associated Shareholders vote in favour of the Proposed Transaction.
Reasonableness conclusion
Based on the qualitative factors identified above, it is our opinion that the Proposed Acquisition is
REASONABLE to the Non-Associated Shareholders.
14
#4998177v1
Overall conclusion
After considering the abovementioned quantitative and qualitative factors, Grant Thornton Corporate
Finance has concluded that the Proposed Acquisition is NOT FAIR BUT REASONABLE to the Non-
Associated Shareholders in the absence of a superior alternative proposal emerging.
Other matters
Grant Thornton Corporate Finance has prepared a Financial Services Guide in accordance with the
Corporations Act. The Financial Services Guide is set out in the following section.
The decision of whether or not to vote in favour of the Proposed Transaction is a matter for each Pilot
Shareholder to decide based on his or her own views of value of Pilot and expectations about future
market conditions, Pilot’s performance, risk profile and investment strategy. If Pilot Shareholders are in
doubt about the action they should take in relation to the Proposed Transaction, they should seek their
own professional advice.
Yours faithfully,
GRANT THORNTON CORPORATE FINANCE PTY LTD
ANDREA DE CIAN JANNAYA JAMES
Director Director

15
#4998177v1
21 April 2021
Financial Services Guide
1 Grant Thornton Corporate Finance Pty Ltd
Grant Thornton Corporate Finance carries on a business, and has a registered office, at Level 17, 383
Kent Street, Sydney NSW 2000. Grant Thornton Corporate Finance holds Australian Financial Services
Licence No 247140 authorising it to provide financial product advice in relation to securities and
superannuation funds to wholesale and retail clients.
Grant Thornton Corporate Finance has been engaged by Pilot to provide general financial product advice
in the form of an Independent Expert’s Report in relation to the Proposed Transaction. This report is
included in Pilot’s notice of meeting.
2 Financial Services Guide
This Financial Services Guide (“FSG”) has been prepared in accordance with the Corporations Act, 2001
and provides important information to help retail clients make a decision as to their use of general financial
product advice in a report, the services we offer, information about us, our dispute resolution process and
how we are remunerated.
3 General financial product advice
In our report we provide general financial product advice. The advice in our report does not take into
account your personal objectives, financial situation or needs.
Grant Thornton Corporate Finance does not accept instructions from retail clients. Grant Thornton
Corporate Finance provides no financial services directly to retail clients and receives no remuneration
from retail clients for financial services. Grant Thornton Corporate Finance does not provide any personal
retail financial product advice directly to retail investors nor does it provide market-related advice directly to
retail investors.
4 Remuneration
When providing the report, Grant Thornton Corporate Finance’s client is the Company. Grant Thornton
Corporate Finance receives its remuneration from the Company. In respect of the report, Grant Thornton
Corporate Finance will receive fees from Pilot in the order of A$80,000 plus GST, which is based on
commercial rates plus reimbursement of out-of-pocket expenses for the preparation of the report. Our
directors and employees providing financial services receive an annual salary, a performance bonus or
profit share depending on their level of seniority.
Except for the fees referred to above, no related body corporate of Grant Thornton Corporate Finance, or
any of the directors or employees of Grant Thornton Corporate Finance or any of those related bodies or
any associate receives any other remuneration or other benefit attributable to the preparation of and
provision of this report.
5 Independence
Grant Thornton Corporate Finance is required to be independent of Pilot and Open Office Group in order
to provide this report. The guidelines for independence in the preparation of an independent expert’s report
are set out in Regulatory Guide 112 Independence of experts issued by the Australian Securities and
Investments Commission (“ASIC”) (“RG 112”). The following information in relation to the independence of
Grant Thornton Corporate Finance is stated below.
“Grant Thornton Corporate Finance and its related entities do not have at the date of this report, and have
not had within the previous two years, any shareholding in or other relationship with Pilot or Royal Energy

16
#4998177v1
(and associated entities) that could reasonably be regarded as capable of affecting its ability to provide an
unbiased opinion in relation the Proposed Transaction.
Grant Thornton Corporate Finance has no involvement with, or interest in the outcome of the transaction,
other than the preparation of this report.
Grant Thornton Corporate Finance will receive a fee based on commercial rates for the preparation of this
report. This fee is not contingent on the outcome of the transaction. Grant Thornton Corporate Finance’s
out of pocket expenses in relation to the preparation of the report will be reimbursed. Grant Thornton
Corporate Finance will receive no other benefit for the preparation of this report.
We note that in November 2020, Grant Thornton Corporate Finance was engaged by the Directors of Pilot
to assist the Directors with the factual elements of the Directors’ Report. However as set out in our letter of
engagement,
The preparation of the Directors’ Report remained the solely responsibility of the Directors.
Grant Thornton did not provide consent to be named in the Directors’ Report or the Notice of Meeting
and explanatory memorandum and in any discussions with the regulators or investors.
Grant Thornton was not responsible for the valuation assessment of Pilot, Royal and the merged entity
included in the Directors’ Report which remain the solely responsibility of the Directors.
Whilst we assisted the Directors in drafting the factual parts of the Directors’ Report and the mechanical
elements of the valuations, Grant Thornton Corporate Finance was not involved in the assessment of the
key assumptions and valuation approach which have an impact on the fair market value of Pilot, Royal and
of the Combined Group. Accordingly, we consider ourselves independent.
Grant Thornton Corporate Finance considers itself to be independent in terms of Regulatory Guide 112
“Independence of expert” issued by the ASIC.”
6 Complaints process
Grant Thornton Corporate Finance has an internal complaint handling mechanism and is a member of the
Financial Ombudsman Service (membership no. 11800). All complaints must be in writing and addressed
to the Chief Executive Officer at Grant Thornton Corporate Finance. We will endeavour to resolve all
complaints within 30 days of receiving the complaint. If the complaint has not been satisfactorily dealt with,
the complaint can be referred to the Financial Ombudsman Service who can be contacted at:
PO Box 579 – Collins Street West
Melbourne, VIC 8007
Telephone: 1800 335 405
Grant Thornton Corporate Finance is only responsible for this report and FSG. Complaints or questions
about the Target’s Statement should not be directed to Grant Thornton Corporate Finance. Grant Thornton
Corporate Finance will not respond in any way that might involve any provision of financial product advice
to any retail investor.
7 Compensation arrangements
Grant Thornton Corporate Finance has professional indemnity insurance cover under its professional
indemnity insurance policy. This policy meets the compensation arrangement requirements of section
912B of the Corporations Act 2001.

17
#4998177v1
Contents
Page
1 Royal Acquisition and the Ancillary Transactions 18
2 Purpose and scope of the report 22
3 Industry overview 26
4 Profile of Pilot 29
5 Profile of Royal Energy 37
6 Profile of the Merged Group 45
7 Valuation methodologies 46
8 Valuation assessment of Pilot before the Royal Transaction 48
9 Valuation assessment of the Combined Group 53
10 Sources of information, disclaimer and consents 68
Appendix A – Valuation methodologies 70
Appendix B – Comparable companies Royal 71
Appendix C – Discount rate 72
Appendix D – Glossary 78
Appendix E – RISC Report 79

#4998177v118
1 Royal Acquisition and the Ancillary Transactions
1.1 Royal Acquisition
The key terms of the Royal Acquisition are set out below:
Pilot will acquire 100% of the issued share capital of Royal for a scrip consideration of 136,363,636
Pilot Shares (“Consideration Shares”) to be issued to the Royal vendors pro rata to their respective
shareholdings in Royal. An additional 7,575,758 Shares will be issued to RFC Ambrian, Royal’s
corporate advisors. The Royal Vendors will collectively own 38.3% of the enlarged share capital of the
Combined Group.
Completion is subject to the satisfaction or waiver of certain conditions, including:
o The Company and Royal obtaining all necessary regulatory approvals, including the necessary
ASX Approvals and Foreign Investment Review Board approval;
o Each Royal Option holder entering into an agreement pursuant to which their Royal Energy
options are cancelled in exchange for Royal Energy shares; and
o Each of Anthony Strasser and Bradley Lingo and the Company duly executing their respective
executive services agreement.
With effect from completion:
Existing director Michael Nicholas Lonergan will resign as director of the Company; and
Proposed directors Anthony James Strasser and Bruce Gordon will be appointed as directors of the
Company.
The agreement is otherwise on terms and conditions considered standard for a transaction of this
nature, including warranties and indemnities.
1.2 Acquisition of 40% interest in WA-481-P
As announced to ASX on 8 September 2020, the Company and Key Petroleum Ltd (“Key”) agreed to
rationalise the ownership of WA-481-P with the Company to acquire the remaining 40% interest in WA-
481-P which it does not own (“Key Acquisition”).
On 6 October 2020, Pilot and Key executed the legal document in relation to the Key Acquisition. The
Company will issue a total 21,000,000 Shares to Key as a consideration for the acquisition in two tranches:
The first tranche of 4,276,703 Shares was issued to Key on 7 October 2020; and
The issue of the second tranche of 16,723,297 Shares occurred after Pilot Shareholders meeting on
10 December 2020.
Post-completion of the Key Acquisition, the Company is required to obtain approval & registration of the
transfer of WA-481-P from NOPTA, however prior to registration on title Key will transfer (on completion)

#4998177v119
its entire beneficial interest in WA-481-P to Pilot. Risk and possession of WA-481-P will pass to Pilot on
the date of completion of the Key Acquisition and title passes on the date of registration by NOPTA.
The WA-481-P Sale and Purchase Agreement contains the usual warranties & indemnities as to
ownership, legal standing and ability to transact.
The Key Acquisition was completed on 18 December 2020 and the transfer process in underway as at the
date of this report.
1.3 Capital Raising
The Company has recently completed a capital raising of up to approximately $3.0 million (before costs) to
finance the feasibility study in relation to the Mid-West Integrated Renewables and Hydrogen Project
(including the Cliff Head Wind and Solar Project), invest in Pilot tenements and provide sufficient working
capital to cover corporate costs. In addition, some investment will be made in production enhancement of
the CH Field if the Royal Acquisition is completed.
The $3.0 million equity raising comprises:
A two-tranche placement to sophisticated, professional and institutional investors of 75,757,576 new
Pilot Shares to raise $2.5 million at a price of 3.3 cents per share;
The issue of 37,878,783 free-attaching new unlisted options (“Placement Options”), being one option
for every two new Shares acquired under the Placement exercisable at 6.6 cents on or before the
expiry which is 24 months from the date of issue of the Placement Option;
The issue of 15,151,508 Shares at 3.3 cents per share to existing eligible shareholders under a fully
underwritten share purchase plan to raise A$0.5 million; and
The issue of 7,575,757 free-attaching options exercisable at 6.6 cents on or before the expiry date of
24 months from the date of issue (“SPP Options” and collectively with the Placement Options referred
to as the “Capital Raising Options”).
(the above transactions are collectively referred to as the “Capital Raising”).
We have set out below a summary of the current capital structure of Pilot (excluding options) before the
Royal Acquisition.
Source: Pilot Management, GTCF analysis
Pilot - shares mov ements Ex isting Shares before Shares issued Ex isting Share before
Ancillary Transactions Before Roy al Acq. Roy al Acq.
Number of shares as at 30 June 2020 105,928,974 105,928,974
1st Tranche acquisition of WA-481-P 4,276,703 4,276,703
1st Tranche Placement Shares 15,909,097 15,909,097
2nd Tranche acquisition of WA-481-P 16,723,297 16,723,297
2nd Tranche Placement of Shares 59,848,479 59,848,479
Contractor's shares 525,000 525,000
SPP shares 15,151,508 15,151,508
Total 105,928,974 112,434,084 218,363,058
#4998177v120
1.4 Triangle Agreement
On 9 November 2020, subject to completion of the Key Acquisition, Pilot announced that it had entered
into an agreement with Triangle to sell a 78.75% interest and transfer operatorship of offshore Perth Basin
exploration permit WA-481-P for the following consideration:
A$0.3 million in cash payable at completion; and
100% free carry of Pilot’s 21.25% interest through the completion of the year 1 to year 3 minimum
work programme of A$5.5 million which requires Triangle to fund Pilot’s pro-rata share of $1.23
million.
On completion, Pilot and Triangle will enter into a traditional joint operating agreement with Triangle as the
operator (the “WA-481-P Joint Venture”) to manage the permit. Under this arrangement Pilot will be the
designated operator’s representative in connection with all matters relating to the interface with any
potential offshore wind development affecting the WA-481-P permit area. Triangle has agreed that Pilot’s
share in any oil and gas discoveries in WA-481-P developed and produced through the Cliff Head Oil Field
facilities will have access to these facilities on the same basis as Triangle.
The structure of the transaction has been designed in order to ensure alignment with the CHJV where
Triangle owns 78.75% and it is the operator of the Cliff Head Offshore Oil Field (located in the Offshore
Production License WA-31-L) and the onshore Arrowsmith Separation and Processing Facilities and in
which Pilot will acquire an effective 21.25% interest upon the completion of the Royal Acquisition.
Through the sale of the 78.75% interest and transfer of operatorship of WA 481 P, Pilot (post the Royal
Acquisition) and Triangle will create a substantial alignment between the newly create WA 481 P JV and
the existing CHJV.
In addition, Pilot and Triangle will also form the Cliff Head Wind & Solar Project Joint Venture with Pilot
holding an 80% operating interest and Triangle holding a 20% non-operating interest. The CHWSP JV
will assess the feasibility of development of a large-scale wind and solar project centred around Cliff Head
Oil Field Facilities. Pilot will free carry Triangle on the cost of the Wind & Solar Project feasibility study. As
part of the new joint venture agreement, Pilot and Triangle will negotiate an access and co-ordination
agreement to establish the basis for providing accessing to the existing Cliff Head platform, the
offshore/onshore pipeline right of way from the platform and to the onshore Arrowsmith Separation and
Processing Facilities.
The sale of the 78.75% interest to Triangle is also conditional on:
The registration of the transfer of interest in WA 481 P from Key to Pilot in relation to the Key
Acquisition is granted.
Triangle and Pilot have agreed an execution version of the WA-481-P JOA.
Triangle and Pilot have agreed an execution version of the CHWSP JVOA.
Triangle and Pilot have facilitated negotiations to enable Triangle and CHWSP Joint Venture to agree
to an execution version of the CHWSP Access and Coordination Deed.

#4998177v121
Triangle and Pilot have facilitated negotiations to enable Triangle and the WA-481-P Joint Venture to
agree an execution version of the Cliff Head and Arrowsmith Facilities Access Deed.
Pilot having obtained the consent in writing of Murphy Oil to the transfer of the tile in accordance with
the Net Profit Interest dated 9 August 2016 between Pilot and Murphy Oil; and
Other condition precedents customary for an agreement of this type.
#4998177v122
2 Purpose and scope of the report
Item 7 of Section 611 of the Corporations Act
Section 606 of the Corporations Act prohibits the acquisition of a relevant interest in the issued voting
shares of a company if the acquisition results in the person’s voting power in the company increasing from
either below 20% to more than 20%, or from a starting point between 20% and 90%, without making an
offer to all shareholders of the company.
Item 7 of Section 611 of the Corporations Act allows the shareholders not associated with the acquiring
company (i.e. the Non-Associated Shareholders) to waive this prohibition by passing a resolution at a
general meeting. RG 74 and RG 111 set out the view of ASIC on the operation of Item 7 of Section 611 of
the Corporations Act.
RG 74 requires that shareholders approving a resolution pursuant to Item 7 of Section 611 of the
Corporations Act be provided with a comprehensive analysis of the proposal, including whether or not the
proposal is fair and reasonable to the Non-Associated Shareholders. The Directors may satisfy their
obligations to provide such an analysis by either:
Commissioning an independent expert’s report; or
Undertaking a detailed examination of the proposal themselves and preparing a report for the Non-
Associated Shareholders.
If the Royal Acquisition is approved then the Royal Vendors in aggregate will hold an interest in the
Company of 38.3% on a undiluted basis and 32.5% on a fully diluted basis.
Based on the above, the Directors have engaged Grant Thornton to prepare this Independent Expert’s
Report.
2.1 Basis of assessment
In preparing our report, Grant Thornton Corporate Finance has had regard to the Regulatory Guides
issued by ASIC, particularly RG 111, which states that an issue of shares requiring approval under Item 7
of Section 611 of the Corporations Act should be analysed as if it were a takeover bid. Accordingly, we
have assessed the Proposed Acquisition with reference to Section 640 of the Corporations Act. RG 111
states that:
An offer is considered fair if the value of the offer price or consideration is equal to or greater than the
value of the securities that are the subject of the offer. The comparison should be made assuming
100% ownership of the target company irrespective of whether the consideration offered is scrip or cash
and without consideration of the percentage holding of the offeror or its associates in the target
company.
An offer is considered reasonable if it is fair. If the offer is not fair it may still be reasonable after
considering other significant factors which justify the acceptance of the offer in the absence of a higher
bid. ASIC has identified the following factors which an expert might consider when determining whether
an offer is reasonable:

#4998177v123
- The offeror’s pre-existing entitlement, if any, in the shares of the target company.
- Other significant shareholding blocks in the target company.
- The liquidity of the market in the target company’s securities.
- Taxation losses, cash flow or other benefits through achieving 100% ownership of the target
company.
- Any special value of the target company to the offeror.
- The likely market price if the offer is unsuccessful.
- The value to an alternative offeror and likelihood of an alternative offer being made.
Grant Thornton Corporate Finance has determined whether the Proposed Acquisition is fair to the Non-
Associated Shareholders by comparing the fair market value of Pilot before the Proposed Acquisition on a
100% and control basis with the fair market value of Pilot after approval of the Proposed Acquisition on a
fully diluted and minority basis.
In considering whether the Proposed Acquisition is reasonable to the Non-Associated Shareholders, we
have considered a number of factors, including:
Whether the Proposed Acquisition is fair.
The implications to Pilot and the Non-Associated Shareholders if the Proposed Acquisition is not
approved.
Other likely advantages and disadvantages associated with the Proposed Acquisition as required by
RG111.
Other costs and risks associated with the Proposed Acquisition that could potentially affect the Non-
Associated Shareholders.
2.2 Independence
Prior to accepting this engagement, Grant Thornton Corporate Finance (a 100% subsidiary of Grant
Thornton Australia Limited) considered its independence with respect to the Proposed Acquisition with
reference to the ASIC RG 112.
Grant Thornton Corporate Finance has no involvement with, or interest in, the outcome of the approval of
the Proposed Acquisition other than that of an independent expert. Grant Thornton Corporate Finance is
entitled to receive a fee based on commercial rates and including reimbursement of out-of-pocket
expenses for the preparation of this report.
Except for these fees, Grant Thornton Corporate Finance will not be entitled to any other pecuniary or
other benefit, whether direct or indirect, in connection with the issuing of this report. The payment of this
fee is in no way contingent upon the success or failure of the Proposed Acquisition.

#4998177v124
We note that in November 2020, Grant Thornton Corporate Finance was engaged by the Directors of Pilot
to assist the Directors with the factual elements of the Directors’ Report. However as set out in our letter of
engagement”
The preparation of the Directors’ Report remained the solely responsibility of the Directors.
Grant Thornton did not provide consent to be named in the Directors’ Report or the Notice of Meeting
and explanatory memorandum and in any discussions with the regulators or investors.
Grant Thornton was not responsible for the valuation assessment of Pilot, Royal and the merged entity
included in the Directors’ Report which remain the solely responsibility of the Directors.
Whilst we assisted the Directors in drafting the factual parts of the Directors’ Report and the mechanical
elements of the valuations, Grant Thornton Corporate Finance was not involved in the assessment of the
key assumptions and approach which have an impact on the fair market value of Pilot, Royal and of the
Combined Group. Accordingly, we consider ourselves independent.
Between December 2020 and January 2021 the Directors elected not to proceed with presenting the
Directors’ Report to Pilot Shareholders and instead engaged Grant Thornton Corporate Finance to prepare
this IER.
2.3 Consent and other matters
Our report is prepared for the exclusive purpose of assisting the Non-Associated Shareholders in their
consideration of the Proposed Acquisition. This report should not be used for any other purpose.
Grant Thornton Corporate Finance consents to the issue of this report in its form and context and consents
to its inclusion in the Notice of General Meeting and Explanatory Memorandum proposed to be sent to the
Pilot Shareholders by the end of May 2021.
This report constitutes general financial product advice only and in undertaking our assessment, we have
considered the likely impact of the Proposed Transaction to the Non-Associated Shareholders as a whole.
We have not considered the potential impact of the Proposed Transaction on individual Non-Associated
Shareholders. Individual shareholders have different financial circumstances and it is neither practicable
nor possible to consider the implications of the Proposed Transaction on individual shareholders. The
decision of whether or not to approve the Proposed Transaction is a matter for each Non-Associated
Shareholder based on their own views of value of Pilot and expectations about future market conditions,
Pilot’s performance, risk profile and investment strategy. If the Non-Associated Shareholders are in doubt
about the action they should take in relation to the Proposed Acquisition, they should seek their own
professional advice.
2.4 Compliance with APES 225 Valuation Services
This report has been prepared in accordance with the requirements of the professional standard APES
225 Valuation Services (“APES 225”) as issued by the Accounting Professional & Ethical Standards
Board. In accordance with the requirements of APES 225, we advise that this assignment is a Valuation
Engagement as defined by that standard as follows:

#4998177v125
“An Engagement or Assignment to perform a Valuation and provide a Valuation Report where the Member
is free to employ the Valuation Approaches, Valuation Methods, and Valuation Procedures that a
reasonable and informed third party would perform taking into consideration all the specific facts and
circumstances of the Engagement or Assignment available to the Member at that time.”

#4998177v126
3 Industry overview
3.1 Crude Oil price
Over the previous 12 months the oil price has experienced a significant level of volatility. The outbreak of
the COVID-19 pandemic caused the global economy to fall into a deep recession which significantly
impacted energy prices. Crude oil prices experienced a drastic reduction in March and April 2020 as a
result of the outbreak of COVID-19 and the significantly reduced consumptions. However, they have
recovered strongly since min-November 2020. We have set out below the historical crude oil prices over
the previous 2 years.
Brent Oil historical spot prices
Source: GTCF analysis
Prices fell below US$20 a barrel in early April, as global production exceeded global consumption by
around 25 million barrels a day which was equivalent to around 25 per cent of average production in 2019.
Later in April, prices began to recover, propped up by the 12 April OPEC+ announcement that member
countries would reduce production in May and June 2020 by a record 9.7 million barrels a day. Between
June 2020 and September 2020, prices hovered around US$40 a barrel, as consumption growth was
constrained by COVID-19 containment measures.
Over the last quarter of 2020, prices were affected by rising Northern Hemisphere COVID-19 cases and
promising COVID-19 vaccine trial announcements. Prices fell by 13 per cent between 20 October and 30
October, as the resurgence of Covid-19 cases in Europe prompted new national lockdowns in France,
Germany, Italy, Spain and Greece. On 9 November 2020, the pharmaceutical company Pfizer announced
that it had developed a Covid-19 vaccine with 90% effectiveness. Upon the released of the news, stock
markets around the globe rose sharply with the USA, French, German and British markets up by over 4%.
Similarly, the crude oil futures rose sharply in line with a steep rally in share price of airlines, cruise
companies and car manufactures. Over November 2020, prices increased by 24 per cent to reach US$47
a barrel, in response to promising COVID-19 vaccine trial announcement.
More recently, oil prices have been relatively more stable and above US$50/bbl, the highest level since
February 2020, as vaccination drives fuel hope that the global economy can rebound from the pandemic in
0
10
20
30
40
50
60
70
80
09 J
an 1
9
11 F
eb
19
16 M
ar 1
9
18 A
pr 1
9
21 M
ay 1
9
23 J
un 1
9
26 J
ul 1
9
28 A
ug 1
9
30 S
ep 1
9
02 N
ov 1
9
05 D
ec 1
9
07 J
an 2
0
09 F
eb
20
13 M
ar 2
0
15 A
pr 2
0
18 M
ay 2
0
20 J
un 2
0
23 J
ul 2
0
25 A
ug 2
0
27 S
ep 2
0
30 O
ct 2
0
02 D
ec 2
0
04 J
an 2
1
06 F
eb
21
US
$/b
bl

#4998177v127
2021. Further price support has come from the supply side as a deadlock of the latest round of OPEC talks
saw Saudi Arabia decide to unilaterally cut output by 1MMbbls a day in February and March 2021.
Moving forward, oil prices are expected to increase gradually as COVID-19 containment measures ease
and consumption recovers. The graph below illustrates the mean consensus average derived across
established brokers in the markets.
Oil price forecast consensus
Source: Energy & Metals consensus forecast
3.2 Global consumption of crude oil
Global consumption of crude oil plummeted in 2020 as a result of COVID-19 lockdown measures and
reduced mobility. The fall in consumption was primarily driven by jet fuel demand which fell more than 60
percent as a result of the collapse in air travel. Diesel consumption was the least affected transport fuel
given its main use is to transport goods by road and ships although it still declined by nearly one-quarter.
Gasoline and diesel have seen a relatively robust recovery as goods shipments and passenger journeys
have rebounded. Weakness in jet fuel consumption is expected to be significantly more persistent because
of sharply reduced air travel.
The fall in demand was broad-based, with particularly large declines in EU countries. A notable exception
was China, where oil consumption fell slightly in the first quarter of 2020 but has since recovered.
Global crude oil and natural gas liquids consumption in 2020 is expected to have fallen by an estimated
9.1 per cent to 91 million barrels a day. This would be the first decline since 2009, and the largest historical
decline in volume terms. In 2021, demand for both gasoline and diesel is projected to return to 97-99% of
their 2019 levels14.
EIA estimates that the world consumed 93.9 million bod of petroleum and liquid fuels in January 2021,
which is down 2.8 million bod from January 2020. EIA forecasts that global consumption of petroleum and
liquid fuels will average 97.7 million b/d for all of 2021, which is up by 5.4 million bod from 2020. EIA
14 IEA Oil Market report December 2020
0
10
20
30
40
50
60
70
80
2020 2021 2022 2023 2024 2025 2026 2027 2028 2029 2030
US
$/b
bl
Forecast annnual average (nominal) Forecast long term annual average (nominal)

#4998177v128
forecasts that consumption of petroleum and liquid fuel will increase by 3.5 million bod in 2022 to average
101.2 million bod.
In the long term, the likely permanent changes that the outbreak of COVID-19 has brought to transport and
the workplace are expected to overlay with pre-existing structural demand shift already underway. More
than 120 countries have now committed to net zero carbon emissions by 2050, solar and wind are now
more competitive with fossil fuels, battery technologies are improving rapidly and electric vehicles and the
infrastructure required to make them are starting to penetrate the market. Australia is also experiencing a
rapid transition to an energy landscape predominantly supplied by renewable energy and the Company is
seeking to take advantage of this opportunity with the Mid-West Integrated Renewables and Hydrogen
Project.
3.3 Global production of crude oil
Global oil production plummeted by 12 percent in May, falling from 100 million barrels of oil per day to 88
million barrels of oil per day, and has only gradually increased since. Production is now lower than
consumption, which has led to a drop in inventories, although they remain at high levels. The fall was
driven by large production cuts by OPEC and their non-OPEC partners (OPEC+), who collectively agreed
to production cuts of 9.7 million barrels of oil per day —a reduction of more than 20% of their “baseline”
levels before gradually tapering production cuts to 7.7 million barrels of oil per day until December 2020
and by 5.8 million barrels of oil per day until April 2022. It is expected that global oil demand will recover to
the pre-pandemic levels only in 2023.
Production among non-OPEC countries has also declined rapidly, led by the United States and Canada.
Individual producers cut production amid plummeting demand and prices, with concerns that excess
supply would overwhelm on-land storage capacity. Landlocked producers, notably many U.S. shale
producers, are particularly vulnerable to this as they are less able to access floating storage on tankers. As
a result, US crude oil production is estimated to have reduced by 5.3 per cent to 16 million barrels a day in
2020. In the first half of 2020, US producers reduced capital expenditure and their oil rig count. In
combination with declining production from existing wells, this is expected to keep US production low in
2021. US oil production may also be affected by the ongoing legal challenge on the Dakota Access
Pipeline.

#4998177v129
4 Profile of Pilot
4.1 Company overview
Pilot is engaged in the exploration and development of oil and gas and renewable energy projects via the
holding of five oil and gas exploration permits located offshore and onshore in Western Australia as
outlined below:
WA-481-P – Offshore north Perth Basin, the Company is the operator and currently holds a 100%
interest which is expected to reduce to 21.25% upon completion of the Triangle Agreement.
EP416 & EP480 – Onshore South Perth Basin exploration permits. The Company is the operator and
became the 100% owner in December 2020 by acquiring the remaining 40%. EP416 covers an area
of circa 620 km2 and EP480 of circa 968 km2. The permit for EP416 expiries on 13 October 2024 and
the Company has a minimum work requirement of circa A$6 million. Similar, EP480 expiries on 21
March 2023 and the minimum work requirement is circa A$5.7 million, On June 2020, Pilot obtained
the suspension and extension of the permits for which it had applied due to difficulties with land
access which had prevented expenditure commitments to be completed in due course. However,
subsequently to become 100% owner in December 2020, the Company has stated the intention to re-
start the exploration activities.
EP437 – Onshore North Perth Basin. The Company owns a 13.058% interest in the project. In 2020,
following the emergence of COVID-19, Key, the operator at the time, was granted a 12 month
suspension/extension of the exploration commitment which is now required to be drilled by the end of
May 2021. On 29 January 2021, Triangle announced that it had entered into a sale purchase
agreement and royalty deed to acquire Key interest over the permit becoming the operator of the field
and holding 86.94% interest. Triangle has agreed to assume all of Key’s ongoing work program
commitments within EP 437 and it started a 3D Seismic Survey.
WA 503 P – We note that the Company also owned until recently an 80% operating interest in WA
503 P. However, following the failure to obtain regulatory approval for the transfer of the permit to a
third party in November 2019, NOPTA advised in September 2020 that it was initiating cancellation
proceedings for the permit which has been completed as at the date of this report.
4.2 WA 481 P and the development of the Mid-West Integrated Renewables and Hydrogen
Project
WA-481-P is located offshore in the Northern Perth Basin and it covers a large area of approximately
8,600 km2. The developed offshore Cliff Head oil field and the onshore Woodada, Dongara and Waitsia
gas fields and the Hovea oil field adjacent to the permit provide local infrastructure that can be used for
future developments.
The permit covers a large area over the offshore extension of the Northern Perth Basin and it is covered
by both 3D and 2D seismic data which have confirmed the presence of fourteen structural prospects
across a variety of geological plays, three of which have been identified as priority targets for future
exploration.
The Company acquired 100% interest in the permit in July 2016 from Murphy Oil in return for assigning a
net profit interest of 10% after tax to Murphy Oil on any future hydrocarbon production in the permit.
Shortly after the acquisition, Key Petroleum exercise their option to acquire a 40% interest in the permit.

#4998177v130
As previously discussed, the Company has recently entered into the following transactions, which, subject
to Shareholders’ approvals, will change the legal ownership of the permit:
On 6 October 2020, Pilot exchanged on the acquisition of Key’s 40% interest in WA 481-P for a
consideration equivalent to 21,000,000 Pilot Shares to be issued in two tranches. The transaction
completed at the end of 2020.
In advance and subject to completing the Key Acquisition, on 9 November 2020, Pilot announced that
it had entered into an agreement to sell to Triangle a 78.75% interest in and transfer operatorship of
WA-481-P.
WA-481-P Offshore Exploration Permit has recently been renewed by NOPTA for an additional 5-year
term with a minimum work commitments under the permit over the first 3-years of approximately A$5.75
million.
In September 2020, the Company announced that it would proceed with a detailed feasibility study to
pursue the development of the Mid-West Integrated Renewables and Hydrogen Project. The focus is
leveraging the Company’s existing position in the Offshore Exploration Permit WA 481 P and connecting
into the electricity transmission facilities of the South West Integrated System. We understand that the
Directors believe that the Mid West Coastal region of WA contains both world-class offshore and onshore
wind resources and onshore solar resources as it has been documented by the World Bank, CSIRO,
ABARE, Geoscience Australia and ARENA.
As part of the proposed Mid-West Integrated Renewables and Hydrogen Project, Pilot is seeking to
develop the Cliff Head Wind and Solar project, a major offshore wind farm located in the offshore are of
the permit combined with the development of an onshore solar farm to deliver a combined wind and solar
project. The Company intends to develop the project in such a way to assess the feasibility of accessing
and utilising existing offshore and onshore gas infrastructure at Cliff Head which should be significantly
facilitate once the Royal Acquisition is completed. Further, the Company is also assessing as a part of the
feasibility study a new carbon service business which will provide CO2 to the CHJV.
The Company anticipates to spend circa A$1.2 million on the feasibility study for the Mid-West Integrated
Renewables and Hydrogen Project. ASX has confirmed that Pilot will be required under ASX Listing Rule
11.1.3 to comply with all of the requirements of Chapters 1 and 2 of the ASX Listing Rules before it
proceeds beyond the feasibility study or incurs expenditure in excess of the A$1.2 million on the Mid-West
Integrated Renewables and Hydrogen Project. Refer to the announcement released on the ASX on 4
September 2020 for further details.
4.3 Financial information
4.3.1 Financial performance
The table below illustrates the Company’s consolidated statements of comprehensive income. Pilot adopts
30 September as end of financial year.

#4998177v131
Source: Company’s annual financial reports
Regarding the above we note:
Pilot financial performance is a reflection of the early stage exploration and development of the
underlying assets with no revenue being generated and costs mainly comprising of exploration and
administration expenses.
The joint venture receipts are a result of the Pilot joint ventures partners paying for their share of
exploration costs.
Exploration and evaluation costs in FY20 are mainly related to oil and gas exploration permits.
4.3.2 Financial position
The table below illustrates the Company’s consolidated statements of financial position.
Consolidated statement of profit or loss FY18 FY19 FY20
A$ Audited Audited Audited
Joint venture receipts 400,642 321,545 355,606
R & D tax refund 74,603 - -
Administrative expenses (199,191) (71,562) (71,383)
Employee benefit expenses (671,436) (294,333) (79,890)
Professional fees (270,796) (172,094) (403,171)
Exploration & Evaluation costs expensed (495,816) (430,399) (668,719)
Finance expenses - (3,787) (6,938)
Other expenses (784) (11,010) (14,893)
Loss before income tax (1,162,778) (661,640) (889,388)
Income tax expense - - -
Loss for after tax (1,162,778) (661,640) (33,078)
Foreign currency translation difference - - -
Total comprehensive loss (1,162,778) (661,640) (32,781)

#4998177v132
Source: Company’s financial reports
Regarding the above we note:
As at 31 March 2020, other liabilities include convertible notes of circa A$0.3 million which have since
been converted.
Intangibles assets as at 30 September 2020 as a result to the adoption of AASB16 and associated
with right of use assets
As at 30 September 2020, other liabilities include mainly accrued consulting fees of A$0.7 million.
The Company had a minimal cash balance as at 30 September 2020. However, we note that since
then the following has occurred:
o At the end of September, Pilot announced a placement of circa A$2.5 million before transaction
costs, of which A$0.5 million received on 1 October 2020 and the balance in December 2020
following the approval of Pilot Shareholders.
o The Company also launched the SPP that is fully underwritten raising an additional A$0.5 million.
The SPP was completed on January 2020.
We note that as at 31 December 2020, Pilot had circa A$1.5 million cash balance and a net asset position
of circa A$0.7 million.
Consolidated statement of financial position 31-Mar-20 30-Sep-20
A$ Reviewed Audited
Current assets
Cash and cash equivalent 66,074 7,317
Trade and other receivables 60,103 35,212
Total current assets 126,177 42,529
Non current assets
Trade and other receivables 29,092 41,742
Intangible assets - 74,723
Total non current assets 29,092 116,465
Total assets 155,269 158,994
Current liabilities
Trade and other payables 9,255 493,446
Employee benefits 2,653 11,959
Other liabilities 817,980 721,400
Unearned revenue -
Financial liabilities - 53,335
Total current liabilities 829,888 1,280,140
Non current liabilities - 34,080
Total liabilities 829,888 1,314,220
Net assets/ (net liabilities) (674,619) (1,155,226)
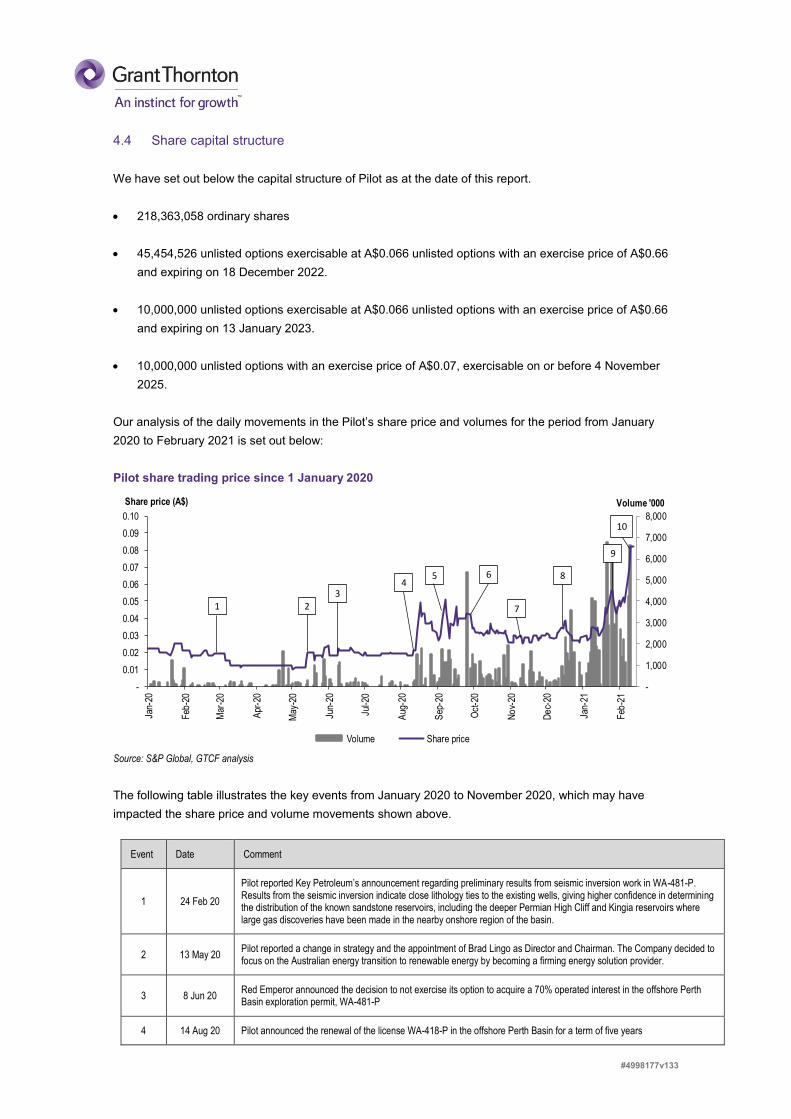
#4998177v133
4.4 Share capital structure
We have set out below the capital structure of Pilot as at the date of this report.
218,363,058 ordinary shares
45,454,526 unlisted options exercisable at A$0.066 unlisted options with an exercise price of A$0.66
and expiring on 18 December 2022.
10,000,000 unlisted options exercisable at A$0.066 unlisted options with an exercise price of A$0.66
and expiring on 13 January 2023.
10,000,000 unlisted options with an exercise price of A$0.07, exercisable on or before 4 November
2025.
Our analysis of the daily movements in the Pilot’s share price and volumes for the period from January
2020 to February 2021 is set out below:
Pilot share trading price since 1 January 2020
Source: S&P Global, GTCF analysis
The following table illustrates the key events from January 2020 to November 2020, which may have
impacted the share price and volume movements shown above.
Event Date Comment
1 24 Feb 20
Pilot reported Key Petroleum’s announcement regarding preliminary results from seismic inversion work in WA-481-P. Results from the seismic inversion indicate close lithology ties to the existing wells, giving higher confidence in determining the distribution of the known sandstone reservoirs, including the deeper Permian High Cliff and Kingia reservoirs where large gas discoveries have been made in the nearby onshore region of the basin.
2 13 May 20 Pilot reported a change in strategy and the appointment of Brad Lingo as Director and Chairman. The Company decided to focus on the Australian energy transition to renewable energy by becoming a firming energy solution provider.
3 8 Jun 20 Red Emperor announced the decision to not exercise its option to acquire a 70% operated interest in the offshore Perth Basin exploration permit, WA-481-P
4 14 Aug 20 Pilot announced the renewal of the license WA-418-P in the offshore Perth Basin for a term of five years
-
1,000
2,000
3,000
4,000
5,000
6,000
7,000
8,000
-
0.01
0.02
0.03
0.04
0.05
0.06
0.07
0.08
0.09
0.10
Jan-
20
Feb
-20
Mar
-20
Apr
-20
May
-20
Jun-
20
Jul-2
0
Aug
-20
Sep
-20
Oct
-20
No
v-20
De
c-20
Jan-
21
Feb
-21
Volume '000
Th
ou
san
ds
Share price (A$)
Volume Share price
1 23
45 6 8
10
7
9

#4998177v134
Event Date Comment
5 4-8 Sep 20
- Pilot announced the commencing of a detailed feasibility study to pursue the development of an offshore wind and onshore wind and solar power project to be located along the offshore/onshore coast of the Mid West Region of Western Australia.
- Pilot and Key Petroleum Ltd announced the rationalisation of the ownership of WA 481- P with Pilot Energy to acquire a 40% interest in Offshore Petroleum Exploration License WA-481-P
6 25 Sep 20 Pilot announced the Royal Acquisition and the Capital Raising.
7 9 -19 Nov 20 On 9 November 2020, Pilot announced the sale of the 78.75% interest in WA 481 P to Triangle. On 10 November 202, Pilot release the Notice of Meeting the General Meeting to be hold on 10 of December 2020, for the Pilot Shareholder to vote on the acquisition of WA 481 P and the related issuance of new Pilot Shares
8 10 December
2020 Pilot Shareholder approved all the resolutions at the General Meeting. As a result, circa 90 million of new Pilot Shares and 65 million of unlisted Pilot options have been issued.
9 29 January
2021
Pilot released the quarterly activity report confirming the completion ot A$3 million equity capital raising and the major restructure and the ownership of the tenants WA-481-P. Further, the Company reported the submission of expression of interest to Oakajee Strategic Industrial Area Renewable Hydrogen Project to the Government of West Australia providing comprehensive renewable energy, hydrogen and carbon management solutions.
10 17 February
2021
Pilot requested an extension of the voluntary suspension of trading in its securities effective from the commencement of trading on Wednesday, 17 February 2021. It is expected that the voluntary suspension will last until the commencement of trading on Monday, 22 February 2021, or Pilot releasing an announcement to the market responding to the ASX Query Letter, whichever occurs earlier.

#4998177v135
The monthly share price performance of Pilot since January 2020 is summarised below:
Source: S&P Global, GTCF analysis
4.4.1 Top shareholders
We have set out below the top shareholders of Pilot:
Pilot Energy Limited Average
High Low Close
weekly
volume
$ $ $ 000'
Month ended
Jan 2020 31/01/2020 0.025 0.018 0.021 820
Feb 2020 29/02/2020 0.021 0.017 0.019 141
Mar 2020 31/03/2020 0.015 0.011 0.012 280
Apr 2020 30/04/2020 0.015 0.010 0.012 763
May 2020 31/05/2020 0.026 0.010 0.023 1,050
Jun 2020 30/06/2020 0.026 0.018 0.018 947
Jul 2020 31/07/2020 0.020 0.018 0.019 267
Aug 2020 31/08/2020 0.057 0.018 0.032 1,792
Sep 2020 30/09/2020 0.069 0.026 0.034 3,898
Oct 2020 31/10/2020 0.040 0.026 0.026 2,612
Nov 2020 0.031 0.024 0.030 1,682
Dec 2020 0.044 0.026 0.029 3,467
Jan 2021 0.057 0.027 0.043 11,822
Week ended
30 Oct 2020 2020 0.035 0.026 0.026 4,033
6 Nov 2020 2020 0.030 0.026 0.028 469
13 Nov 2020 2020 0.030 0.025 0.029 1,687
20 Nov 2020 2020 0.031 0.024 0.030 3,208
27 Nov 2020 2020 0.030 0.027 0.030 1,702
4 Dec 2020 2020 0.031 0.029 0.029 480
11 Dec 2020 2020 0.032 0.028 0.031 1,118
18 Dec 2020 2020 0.044 0.033 0.033 5,456
25 Dec 2020 2020 0.033 0.026 0.027 6,608
1 Jan 2021 2020 - - 0.029 -
8 Jan 2021 2020 0.035 0.027 0.035 7,550
15 Jan 2021 2020 0.037 0.030 0.030 8,839
22 Jan 2021 2020 0.052 0.031 0.048 17,201
29 Jan 2021 2020 0.057 0.043 0.043 13,699
5 Feb 2021 2020 0.056 0.036 0.049 8,429
12 Feb 2021 2020 0.092 0.049 0.082 11,606
Share Price

#4998177v136
Source: S&P Global, GTCF analysis
Pilot capital structure before the Proposed Transaction
Rank Name No. of Shares Interest (%)
1 West Energy Pty Ltd 21,458,332 9.8%
2 Key Perth Basin Investment Pty Ltd 21,000,000 9.6%
3 GS Energy Pty Ldt 15,894,128 7.3%
4 Pine Street Pty Ltd 14,814,940 6.8%
5 Billion Power Capital Investment Limited 12,900,000 5.9%
Total top 5 Shareholders 86,067,400 39.4%
Remaining shareholders 132,295,658 60.6%
Total Shares 218,363,058 100.0%

#4998177v137
5 Profile of Royal Energy
5.1 Company overview
Royal is a private, independent, oil and gas company with its head office in Sydney, Australia. Royal’s
principal business is investment in minority, non-operated positions in oil and gas production and
exploration joint ventures and companies. Royal has three principal assets:
A 21.25% indirect interest in the producing Cliff Head Offshore Oil Field in the Perth Basin which is
held through its 50% equity interest in TEO. TEO is the operator of the CHJV and the owner of a
42.5% interest. The balance of the CHJV is owned directly by Triangle itself (listed entity). Given TEO
is jointly owned by TEG and Royal, each company has the right to appoint a Director to the TEO
Board, with both Directors required to approve any TEO Board decision. Effectively, via it 50%
ownership of TEO, Royal holds joint operational control of the CHJV. Triangle owns directly and
indirectly a 78.75% interest in the CHJV.
A minority shareholding of 5,208,488 shares with approximate to circa 1.4% of the issued capital of
Vintage Energy Limited (VEN), an ASX-listed oil and gas company with a current market capitalisation
of $36.21 million as at 18 February 2020.
Cash of approximately A$0.7 million as at 31 December 2021.
5.2 Cliff Head Offshore Oil Field
5.2.1 Operations
The Cliff Head field is located in licence area WA-31-L in the Perth Basin, 10 km offshore Western
Australia in 15-20 m of water. The field comprises a main NW-SE trending horst, with a continuous large
fault to the north, and a combination of overall dip closure and several fault segments to the south. Oil
within the Cliff Head structure is contained within a stacked series of sands sealed by the Early Triassic
Kockatea Shale.
Source: Triangle announcement

#4998177v138
Cliff Head was the first commercial oil discovery developed in the offshore Perth Basin. The development
cost of the field was A$327 million with first oil production commencing in May 2006. To-date the field has
produced over 14.8 million barrels and continues to produce at above originally forecast rates.
We have set out below a brief history of the ownership of CH Field.
In June 2016 Triangle acquired 57.5% interest in the Cliff Head Field from AWE Limited.
TEO took over as operator of Cliff Head Field in May 2017 following the purchase of 42.5% interest
from Roc Oil. Triangle purchased the asset via a 50/50 share purchase agreement, in partnership with
Royal Energy.
Triangle now holds 78.75% interest in Cliff Head Field with Royal Energy holding an interest of
21.25%
As announced on the ASX on 29 October 2020, Triangle has estimated that Cliff Head contains 3 to 8
years of continued commercial life which results in 0.74 (1P) to 1.44 (2P) MMstb of crude oil being
produced. We note that after the announcement of the updated reserves on 29 October 2020, Triangle
withdrew its updated reserves and resources statements. Royal and then Grant Thornton have separately
commissioned RISC to provide an independent review of the hydrocarbon resources in the Cliff Head
Field.
As a result of the planned closure of the Kwinana refinery, announced on 30 November 2020, RISC has
reclassified the producing reserves into resources until an alternative export route is secured.
RISC has independently evaluated the Cliff Head production forecasts. The methods deployed by RISC
confirm the operator’s production forecasting is fit for purpose and can be used to forecast a suitable 1C to
3C contingent resource range. The only contingency identified by RISC relating to the contingent volumes
is securing an export route once the Kwinana refinery closes. Subject to refreshing the commercial terms
for the new export route the volumes would be reclassified as reserves. Whilst RISC expects the
commercial conditions for a new export route will differ from those used for the existing route, RISC
considers the 1C to 3C range captures the related export route uncertainty. Further RISC has confirmed
that the 2C production profile and cost forecasts within the RISC report can be used for cashflow forecasts
provided associated risks are considered. Refer to Appendix E for the RISC report and the resources set
out in the following table.
Source: RISC advisory
RISC noted in the report that the only contingency relating to the contingent volumes is securing an export
route once the Kwinana refinery closes. Subject to refreshing the commercial terms for the new export
route the volumes would be reclassified as reserves.
Production in FY20 was mostly from four wells out of the five wells. The CHJV total production in FY20
was 276,452 bbls generating sales of A$21.30 million at an annual average production rate of 755 bopd.
Well 13 was offline until December 2019 while wells 6 and 7 were shut-in in the last few weeks of the
financial year. The field can produce approximately 960 stbd when on full production. Over the last quarter
Cliff Head - Resource net of Royal interest (21.25%)
1C 2C 3C
Resources (MMstb) 0.125 0.272 0.383

#4998177v139
of CY20, Triangle continued to invest in workovers to replace failed ESP’s with CH-07H and CH-06. On 1
December 2020, CH-7 was brought back to production while the CH-06 workover has been moved to June
2021.
We have set out in the graph below historical annual production.
Cliff Heads historical production - Bbls
Source: Triangle presentation released on the ASX
Since March 2020, in conjunction with the significant reduction in the oil price, Triangle also materially
reduced the monthly operating costs as reported in the quarterly reports. Specifically, the company
incurred lifting costs of US$27.4/bbl in the March quarter in conjunction with sales of US$54.3/bbl. The
lifting costs were reduced to US$21.5/bbl in the June quarter. In the September quarter, the lifting costs
increased to US$29.6/bbl, however we understand that this was due to lower production caused by the
shut-in of 2 wells, in absence of which, lifting costs were expected to be consistent with the June quarter.
In the December quarter, lifting costs reverted back to circa US$26.9/bbl.
We note that the CHJV has incurred a loss in the December quarter of US$2.72/bbl driven by the low oil
prices. Whilst this is consistent across a number of producing fields in the industry, it does nonetheless
represent a risk for Pilot Shareholders. However, we note that with oil prices above US$50/bbl (current
Brent price is above US$60/bbl), the CHJV is expected to generate a profit.
We have set out below the last year KPIs for the CHJV on a quarterly basis.
Source: Triangle quarterly activity reports
-
500,000
1,000,000
1,500,000
2,000,000
2,500,000
3,000,000
3,500,000
2006 2007 2008 2009 2010 2011 2012 2013 2014 2015 2016 2017 2018 2019
Cliff Head Kpis
US$/bbl Mar20 Q. Jun 20 Q. Sep 20 Q. Dec 20 Q.
Sales 54.30 26.04 39.94 42.39
Lifting cost (27.04) (21.46) (29.56) (26.92)
Operating margin 27.26 4.58 10.38 15.47
Trucking (3.36) (3.29) (3.52) (3.53)
Routine profit 23.90 1.29 6.86 11.94
Non-routine costs (15.54) (4.90) (15.95) (14.66)
Gross profit (loss) 8.36 (3.61) (9.09) (2.72)

#4998177v140
The Cliff Head facilities consist of an unmanned platform in 15m to 20m of water with a 14km pipeline
which carries the crude oil to a dedicated stabilisation processing plant at Arrowsmith with a production
capacity of 15,000 bopd which is then trucked to BP refinery in Kwinana. Cliff Head’s infrastructure is the
only offshore and operational onshore infrastructure in the Perth Basin and accordingly have strategic
value for all surrounding exploration and development projects. Triangle announced an asset life extension
program in 2018 which is aiming to upgrade the onshore and offshore infrastructure to support future
expected increase in oil production.
On 30 October 2020, BP announced its intention to cease fuel production at its Kwinana Refinery and
convert the refinery into a fuel import terminal. Triangle has received a formal notice of termination from BP
under the Crude Oil Supply Agreement with the initial termination effective date set to 16 February 2021.
However, since the announcement of the planned closure of the refinery, the effective termination date has
been postponed several times over 2021. Meanwhile, Cliff Heads has continued to produce to Kwinana
and it will continue to do so until the refinery closure.
Following the BP decision to close the Kwinana refinery, various alternate export options for Cliff Head
production, post the Kwinana refinery closure, are under consideration. We understand that Cliff Head JV
has, in the past, investigated several export and domestic markets for its product and will continue these
efforts. We are aware that there are various alternative commercial arrangement that the JV are pursuing
to sell the Cliff Head crude.
We note that after the announcement of the updated reserves on 29 October 2020, Triangle withdrew its
updated reserves and resources statements given that the impact of the cessation of production at the
refinery and the need to transition to an alternate opportunity is unknown at this time.
Triangle, on behalf of the CHJV, recently announced that it had identified three attractive drilling targets
which, if successful, could extend the Cliff Head asset life to 2030 and beyond:
West High appraisal on a western extension of the field;
SE Nose development updip of the Cliff Head 1 discovery well;
Mentelle Updip exploration which was recently reviewed with a focus on the reservoir interpretation.
Best estimate prospective resources have been upgraded to 5.44 MMstb from 3.3 MMstb previously.
The West High and SE Nose opportunities are considered low risk appraisal/development opportunities
that can be immediately completed for production. The Mentelle Updip prospect is considered mature to
justify drilling. The planning for exploration well to test the Mentelle Updip prospect has commenced. This
prospect has the potential to materially increase the life of the CH Field.
Set out below is a summary of the WA-31-L contingent resources released by Triangle on 29 October
2020 which are incremental to the Cliff Head contingent resources referred to in the RISC report. The 2C
resources below should be taken with caution as they have not been independently reviewed and they are
not part of the RISC report.

#4998177v141
Source: Triangle ASX announcement dated 29 October 2020
Triangle, on behalf of the CHJV, has started with the preparation for a farm-out campaign for the purpose
of seeking interested party to participate in a drilling program in relation to the opportunities above. It has
commence well planning for SE Nose, West High and Mentelle Updip targeting a drilling campaign during
the first half of 2022.
5.3 Financial information
5.3.1 Financial performance
The table below illustrates Royal’s consolidated management statements of comprehensive income15.
15 Royal is categorised as a small proprietary company and hence it is not required to report audited accounts. Royal financial statements are independently review financial statements prepared in accordance with the Corporations Act and Australian Accounting Standards.
Cliff Head - Contingent Resources (100% interest)
MMstb Oil
Resources 1C 2C 3C
SE Nose 0.49 0.81 1.25
West High - 1.06 1.94
West Flank - 0.79 -
Far North - 0.41 -
Cliff Head Field Life Extension - 0.70 -
Total Resources 0.49 3.77 3.19
Prospective Resources Low Best High
Mentelle Updip 1.98 5.44 9.96
Catts 0.35 0.83 1.42
South Cliff Head - 3.00 -
Total Prospective Resources 2.33 9.27 11.38

#4998177v142
Source: Royal Management Note: YTD up to December 2020
In relation to the above, we note the following:
Unrealised gain on investment refers to the accounting of non-cash movements related to the value of
Royal’s interest in Vintage shares.
The Company successfully applied for the Federal Government’s JobKeeper and was assessed as
eligible on 20 May 2020 with payment backdated to 30 March 2020. The last benefit will be received in
March 2021.
Share of equity accounted profit/(loss) from TEO includes significant items of non-cash accounting
adjustment. For the years ended 30 June 2018, 2019 and 2020, non-cash adjustments to the TEO
profit/(loss) was A$1.66 million, A$0.62 million and A$1.32 million respectively.
Interest in the CHJV is equity accounted and accordingly Royal records on its profit and loss its share
of the profit or loss from the CHJV as set out below.
Employment costs are in relation to corporate cost incurred by the Royal executives. These costs are
net of fees charged to TEO for accounting services in relation to the CHJV.
Office expenses will not be incurred in the Merged Entity as Pilot and Royal will use common
premises.
Directors fee will not be incurred in the Merged Entity as Royal will become a wholly owned subsidiary
of Pilot.
Consolidated statement of financial performance FY18 FY19 FY20 YTD FY21
A$ Management Management Management Management
Interest received 8,136 5,327 1,301 215
Unrealised gain on investment - 100,000 (253,328) (15,626)
Share of equity accounted profit/(loss) from TEO (435,161) 218,886 (54,672) (333,229)
Government stimulus - - 62,000 84,800
Total income (427,025) 324,213 (244,699) (263,839)
Expenses
Employment costs (329,760) (276,257) (330,316) (170,126)
Share based payment (875) (102,158) (134,256) Na
Office expense (35,803) (47,764) (31,205) (15,091)
Depreciation (1,052) (1,670) (1,627) (791)
Professional fees (78,278) (33,587) (17,524) (126,742)
Travel (2,029) (21,780) (14,992) (851)
Insurance (7,933) (4,671) (3,781) (2,266)
Director's fees (75,000) (82,500) (84,500) (30,000)
Forex gain - (27,728) - -
Total expenses (530,730) (598,115) (618,201) (345,866)
Loss before tax (957,755) (273,902) (862,900) (609,705)
Income tax benefit 143,542 143,542 185,966 91,804
Loss for the period (814,213) (130,360) (676,934) (517,901)

#4998177v143
We have also set out below an abstract of the account to TEO in relation to Royal’s 50% share of TEO
which represents a 21.25% interest in CHJV.
Source: Royal Management Note: YTD up to December 2020
In relation to the above, we note the following:
The corporate costs in FY20 include A$0.51 million of impairment write off as a result of impairment
of Cliff Head assets due to the plunge of the oil prices.
Finance costs refer to unwinding of the provision for rehabilitation expenses.
5.3.2 Financial position
The table below illustrates Royal’s consolidated statements of financial position.
Consolidated statement of financial performance FY18 FY19 FY20 YTD FY21
A$ Management Management Management Management
Total oil production (bbls) 69,443 52,890 57,746 23,638
Average BOPD 190 145 158 129
Revenue 5,053,613 4,887,972 4,551,861 1,298,319
Operating costs (3,932,144) (3,754,143) (3,386,461) (1,576,323)
Net Revenue 1,121,469 1,133,829 1,165,400 (278,004)
Other income 149,630 158,763 254,788 269,101
Corporate costs (128,031) (150,908) (667,685) (94,874)
EBITDA 1,143,068 1,141,683 752,503 (103,777)
Amortisation (361,946) (207,947) (322,329) (203,631)
EBIT 781,122 933,736 430,174 (307,407)
Finance cost (249,627) (192,804) (92,447) (46,008)
Profit before tax 531,496 740,932 337,727 (353,415)
Tax benefit / (expense) (966,657) (522,045) (392,398) 20,187
Profit (loss) for the period (435,161) 218,886 (54,671) (333,229)

#4998177v144
Source: Royal Management
In relation to the above, we note the following:
Investment in associates represent the 50% interest in TEO.
Available for sale investment is the market value of the minority investment in Vintage.
Deferred tax assets includes timing differences and a portion of the value of the accumulated tax
losses.
Loans from associate means a loan from TEO to Royal which is repayable in 2028. A similar loan
under the same term was also provide by TEO to Triangle Energy. The loan was a way of distributing
cash to both Royal and Triangle Energy. The loans will ultimately be eliminated upon Royal and TEG
participation in future capex programmes and invest funds in TEO (effectively CHJV).
Consolidated statement of financial position 31-Dec-20
Management
Current Assets
Cash and cash equivalents 735,026
Trade and other receivables 181,451
Prepayments 6,212
Total Current Assets 922,689
Non - Current Assets
Investment in associate 737,999
Available for sale investment 338,552
Other 1,860
Deferred tax assets 591,897
Total Non - Current Assets 1,670,308
Total Assets 2,592,996
Current Liabilities
Trade and other payables 218,581
Total Current Liabilities 218,581
Non - Current Liabilities
Loans - associate company 860,967
Deferred tax liability 13,750
Total Non - Current Liabilities 874,717
Total Liabilities 1,093,298
Net Assets 1,499,699

#4998177v145
6 Profile of the Merged Group
We have set out below the key assets of the Combined Group (assuming completion of the Triangle
Agreement):
A 21.25% indirect strategic interest in the producing CH Field.
A 21.25% interest in WA 481 P which is aligned with the interest in CH Field and it is expected to
assist in facilitating the development of the Cliff Head Wind and Solar Project, a subset of the broader
Mid-West Integrated Renewables and Hydrogen Project.
A minority shareholding of 1.4% in the issued capital of Vintage, worth circa A$0.3 million based on
the current trading prices (please refer to section 9.1.2.2 for further details).
100% interest in EP416 & EP480 and a 13.058% interest in EP437.
Combined cash resources of approximately A$2.3 million before transaction cost, as detailed in the
table below:
Source: Royal and Pilot Management Note: Before transaction costs
6.1 Capital Structure and shareholders
The acquisition of Royal will result in the issue of circa 143,939,394 new Pilot Shares after completion of
the Ancillary Transactions. Following the implementation of the transaction, the shareholders of Pilot
immediately prior to completion of the Ancillary Transactions will retain circa 29.0% of the Combined
Group while the Royal Shareholders will collective hold 38.3%.
We have set out below the capital structure of the Combined Group.
Source: Pilot Management
Combined Group - Cash Position
A$
Pilot cash and cash equivalent as at 31 December 2020 1,549,537
Royal cash and cash equivalent as at 31 December 2020 735,026
Combined Group cash postion as at 31 December 2020 2,284,563
Combined Group - Capital Structure
N. of shares (%)
Exisitng Pilot Sareholders as at 15 January 2021 214,171,369 58.5%
Royal Energy Shareholders 140,030,325 38.3%
Contractor's shares 4,123,485 1.1%
Advisors' shares 7,575,758 2.1%
Total Combined Group Shares 365,900,937 100.0%

#4998177v146
7 Valuation methodologies
7.1 Introduction
As part of assessing whether or not the Proposed Acquisition is fair to the Non-Associated Shareholders,
Grant Thornton Corporate Finance has compared:
Fair market value of Pilot Shares before the Proposed Acquisition on a control basis.
Fair market value of the Combined Group after the Proposed Acquisition on a minority basis.
In each case, Grant Thornton Corporate Finance has assessed the value using the concept of fair market
value. Fair market value is commonly defined as:
“the price that would be negotiated in an open and unrestricted market between a knowledgeable, willing
but not anxious buyer and a knowledgeable, willing but not anxious seller acting at arm’s length.”
Fair market value excludes any special value. Special value is the value that may accrue to a particular
purchaser. In a competitive bidding situation, potential purchasers may be prepared to pay part, or all, of
the special value that they expect to realise from the acquisition to the seller.
We note, RG111 requires the fairness assessment to be made assuming 100% ownership of the target
company and irrespective of whether the consideration offered is scrip or cash and without consideration
of the percentage holding of the offeror or its associates in the target company.
7.2 Valuation methodologies
RG 111 outlines the appropriate methodologies that a valuer should generally consider when valuing
assets or securities for the purposes of, amongst other things, approval of an issue of shares using item 7
of s611 of the Corporations Act, share buy-backs, selective capital reductions, schemes of arrangement,
takeovers and prospectuses. These include:
Discounted cash flow (“DCF”) method and the estimated realisable value of any surplus assets.
Application of earnings multiples to the estimated future maintainable earnings or cash flows of the
entity, added to the estimated realisable value of any surplus assets.
Amount available for distribution to security holders on an orderly realisation of assets.
Quoted price for listed securities, when there is a liquid and active market.
Any recent genuine offers received by the target for any business units or assets as a basis for
valuation of those business units or assets.
Further details on these methodologies are set out in Appendix A to this report. Each of these
methodologies is appropriate in certain circumstances.
RG111 does not prescribe the above methodologies as the method(s) that an expert should use in
preparing their report. The decision as to which methodology to use lies with the expert based on the

#4998177v147
expert’s skill and judgement and after considering the unique circumstances of the entity or asset being
valued. In general, an expert would have regard to valuation theory, the accepted and most common
market practice in valuing the entity or asset in question and the availability of relevant information.
7.3 Selected valuation methods
In the valuation assessment of Pilot before the Proposed Transaction, we have adopted the following
valuation methodologies:
Market value of net assets as the primary method based on the pro-forma balance sheet as at 31
December 2020 plus the market value of the exploration and development assets held by Pilot as
assessed by RISC.
We have also considered the trading prices of Pilot before the announcement of the Proposed
Transaction.
In the valuation of Royal and of the Combined Group, we have adopted the following approach:
Royal – DCF approach to assess the market value of the Cliff Head based on the review undertaken
by RISC and taking into account a number of scenarios as discussed in the executive summary, plus
the value of the investment in Vintage based on the trading prices plus the book value of the other
assets and liabilities on the balance sheet as at 31 December 2020.
Combined Group – Sum of parts based on the valuation of Pilot before the Proposed Transaction on a
minority basis plus the underlying value assessment of Royal and trading prices of Pilot after the
announcement of the Proposed Transaction.

#4998177v148
8 Valuation assessment of Pilot before the Royal Transaction
8.1 Valuation summary
We have set out below a summary of our valuation assessment of Pilot before the Proposed Acquisition
on a control basis based on the value of the underlying assets having regard to RISC assessment and the
quoted security prices.
Source: GTCF analysis
8.2 Market value of net assets
A summary of our valuation assessment of Pilot before the Royal Acquisition based on the market value of
net assets is outlined below.
Source: RISC Report, Pilot and GTCF analysis
Note 1 – RISC undertook an update of the valuation assessment of the exploration permits held by Pilot16
and it has assessed the value range between A$0.4 million and A$5.8 million. The value range of the
exploration permits assessed by RISC is wide as it reflects the early stage nature of the underlying assets.
However, the adoption of the low-end of this range would result in an implied value of Pilot Shares which
would only be a fraction of the trading prices before the announcement of the Proposed Transaction.
Accordingly, for the purpose of our valuation assessment at the low end of the range we have adopted the
mid-point of the RISC valuation assessment which is also not inconsistent with the valuation assessment
of WA-481-P based on the recently announced sale of the 78.75% interest to Triangle which implies a
value for 100% of circa A$2 million17.
16 RISC undertook a full valuation assessment and report back in 2017. 17 Based on a consideration payable by Triangle of A$0.3 million cash upfront plus Pilot being free carried for his share of the minimum exploration commitment for Year 1 to Year 3 estimated at A$1.23 million (value to Pilot)
Valuation assessment summary Section
Cents per share Reference Low High
Underly ing Value (control basis) 8.2 1.63 2.81
Quoted Security Price Method (control basis) 8.3 4.20 5.85
Assessed fair market value per share (average) 2.92 4.33
Pilot - Market v alue of net assets
A$ '000 Notes Low High
RISC assessment
WA-481-P 400 3,700
EP-416 & EP-480 - 1,900
EP-437 - 200
Total Pilot petroleum assets Note 1 400 5,800
Less: Net assets at 31 December 2020 Note 2 740 740
Add: Cash from SPP Note 3 204.5 204.5
Less: Options Note 4 (351) (609)
Pilot fully diluted basis 993 6,135
Number of shares Note 5 218,363 218,363
Pilot value per share on fully diluted basis (cents) 0.45 2.81
Adopted value (cents) Note 1 1.63 2.81

#4998177v149
Note 2 – It refers to the other assets and liabilities on the balance sheet as at 31 December 2020.
Note 3 – Circa A$0.2 million raised from the SPP were received by the Company after 31 December 2020.
Note 5 – Pilot has 55,454,526 options on issue following completion of the Placement and the SPP.
options issued for the Placement have an exercise price of 6.6 cents and expiry date of 24 month from the
date of issue of each option. We have valued the options based on the Black Scholes model having regard
to the following assumptions:
Underlying share price of 3.3 cents based on the Placement Price.
Exercise price of 6.6 cents.
Expiry date of 24 months.
Volatility of between 60% and 80% based on a benchmark of listed peers.
In addition to the above Capital Raising Options, Pilot will issued also 10,000,000 options to the Chairman
Mr Brad Lingo. These options have an exercise price of 7 cents and expiry date of 4 November 2025. We
have valued these options based on the same Black Scholes model and consistent assumptions
Note 6 – The number of shares on issue immediately after implementation of the Ancillary Transactions is
outlined in the table below.
Source: Pilot Management
8.3 Pilot before the Proposed Transaction – Quoted share price
Grant Thornton has also considered the quoted security price of Pilot Shares for the purpose of our
valuation assessment.
We have analysed below the liquidity of Pilot Shares by considering the trading volume from January 2020
through to November 2020 as a percentage of the total shares outstanding as well as free float shares
outstanding, as outlined in the table below.
Pilot - shares mov ements Ex isting Shares before Shares issued Ex isting Share before
Ancillary Transactions Before Roy al Acq. Roy al Acq.
Number of shares as at 30 June 2020 105,928,974 105,928,974
1st Tranche acquisition of WA-481-P 4,276,703 4,276,703
1st Tranche Placement Shares 15,909,097 15,909,097
2nd Tranche acquisition of WA-481-P 16,723,297 16,723,297
2nd Tranche Placement of Shares 59,848,479 59,848,479
Contractor's shares 525,000 525,000
SPP shares 15,151,508 15,151,508
Total 105,928,974 112,434,084 218,363,058

#4998177v150
Source: S&P Global, GTFC analysis
The level of free float for Pilot is high at circa 66.5%. From January 2020 to January 2021, circa 90.1% of
the free float shares were traded with an average monthly volume of 7.51% of the total free float shares.
We note that the relatively higher trading volume between November 2020 and January 2021 are justified
by the Capital Raising instead of an increased trading activity from potential and existing shareholders.
Whilst the volume of shares traded is substantial, the value of the shares traded is limited given the low
share price of the Company. This usually leads to high volatility of trading prices. In addition, we note that
Pilot is not covered by any investment analysts who usually provide regular market updates to investors
which assist in estimating the fair market value.
Where a company‘s stock is not heavily traded or is relatively illiquid, the market typically observes a
difference between the ‘bid’ and ‘ask’ price for the stock as there may be a difference in opinion between
the buyer and seller on the underlying value. The historical difference between the bid and ask price has
been consistently high since January 2020 as set out in the graph below.
Month end
Volume
traded
('000)
Monthly
VWAP
($)
Total value of
shares traded
($'000)
Volume traded
as % of total
shares
Cumulative
Volume traded
as % of total
shares
Volume traded
as % of free float
shares
Cumulative
Volume traded
as % of free float
shares
Feb 2020 0.7% 0.7% 1.5% 1.5%
Mar 2020 1.5% 2.3% 3.2% 4.6%
Apr 2020 4.2% 6.5% 8.7% 13.3%
May 2020 5.6% 12.0% 11.4% 24.8%
Jun 2020 3.9% 16.0% 8.1% 32.9%
Jul 2020 1.2% 17.1% 2.4% 35.3%
Aug 2020 7.1% 24.2% 14.6% 49.9%
Sep 2020 16.2% 40.4% 33.3% 83.2%
Oct 2020 9.4% 49.9% 19.4% 102.6%
Nov 2020 5.6% 55.5% 11.5% 114.2%
Dec 2020 11.8% 67.2% 24.2% 138.4%
Jan 2021 22.9% 90.1% 47.1% 185.5%
Min 0.71% 1.46%
Average 7.51% 15.46%
Median 5.58% 11.48%
Max 22.88% 47.09%

#4998177v151
Bid-ask spread since January 2020
Source: S&P Global, GTCF analysis
As set out in the graph above, the spread between the bid and ask price was between 20% and 30% up to
August 2020 and then it stabilised around 10% in the months following the renewal of the permit for WA
481 P and the Capital Raising announced by the Company which provided a more objective reference
point for the trading.
Based on the historical volatility of the trading prices in conjunction with small trading value and the spread
between the bid and ask price, Grant Thornton has considered the trading prices with caution in the
valuation assessment of Pilot before the Royal Acquisition.
Set out below is a summary of the VWAP of Pilot Share before the announcement of the Royal Acquisition
and of the Capital Raising.
Sources: S&P Global and GTCF analysis
Whilst the trading prices above have some limitations due to the high spread between bid and ask price
and the fact that after the announcement of the Royal Acquisition, Pilot announced a number of Ancillary
Transactions, as discussed in the executive summary, we are of the opinion that it is still relevant to rely on
the trading prices for the purpose of our valuation assessment.
Based on the above discussions and analysis, we have assessed the fair market value of Pilot Shares
based on the trading price between 3.5 cents and 4.5 cents on a minority basis. We are of the opinion that
this takes into account the performance before and after the announcement of the Royal Acquisition and
the Placement.
0.0%
5.0%
10.0%
15.0%
20.0%
25.0%
30.0%
35.0%
40.0%
45.0%
50.0%
0.000
0.010
0.020
0.030
0.040
0.050
0.060
0.070
0.080
0.090Ja
n 20
Feb
20
Mar
20
Apr
20
May
20
Jun
20
Jul 2
0
Aug
20
Sep
20
Oct
20
No
v 20
De
c 20
Jan
21
Feb
21
Bid
Ask
Sp
read
(%)
Sha
re p
rice
(A$)
Bid Ask Spread (%) Share Price
Pilot VWAP
VWAP - A$ Low High VWAP
Up to 25 September 2020
5 day 0.036 0.069 0.052
10 day 0.028 0.069 0.048
1 month 0.026 0.069 0.043

#4998177v152
We have set out below the historical share price of Pilot in the 1 month before and 2 month after the
announcement of the Royal Acquisition when the Ancillary Transactions were also announced.
Pilot share trading price 1 month before and 2 month after the announcement of the Proposed
Transaction
Source: S&P Global, GTCF analysis
The trading prices presented above reflect the value of Pilot on a minority basis and thus do not include a
premium for control. Evidence from studies suggests that successful takeovers in Australia have
completed based on premium for control in the range of 20% to 40%. In our assessment, we have applied
a premium for control between 20% and 30% as set out in the table below.
Source: S&P Global, GTCF analysis
-
1,000,000
2,000,000
3,000,000
4,000,000
5,000,000
6,000,000
7,000,000
8,000,000
-
0.010
0.020
0.030
0.040
0.050
0.060
25 J
ul 2
0
01 A
ug 2
0
08 A
ug 2
0
15 A
ug 2
0
22 A
ug 2
0
29 A
ug 2
0
05 S
ep 2
0
12 S
ep 2
0
19 S
ep 2
0
26 S
ep 2
0
03 O
ct 2
0
10 O
ct 2
0
17 O
ct 2
0
24 O
ct 2
0
31 O
ct 2
0
07 N
ov 2
0
14 N
ov 2
0
21 N
ov 2
0
VolumeShare price (A$)
GT Selected range between A$0.035 and A$0.045 Volume Share price
25 September 20 - Annoucement of the Proposed Transaction
Quoted Security Price Method Section
Cents per share Reference Low High
Value per share on a minority basis 3.50 4.50
Control premium 20.0% 30.0%
Value per share (on a control basis) 4.20 5.85

#4998177v153
9 Valuation assessment of the Combined Group
In this section of the report, Grant Thornton has estimated the fair market value of the shares in Pilot after
Royal Acquisition by aggregating the following:
the value of Pilot before the Royal Acquisition as assessed in section 8;
the market value of Royal;
value of expected synergies to be realised as a result of the merger; and
Merged Entity’s pro-forma net cash at completion.
As discussed in the executive summary, in the valuation assessment of Pilot after the Proposed
Transaction, Grant Thornton has adopted three scenarios as outlined below:
Scenario 1 As-Is Scenario – Under this scenario, our valuation assessment of Royal in the Combined
Group is only based on the net present value of the cash flows expected to be realised from the
producing resources of Cliff Head project without considering the value of any Strategic Projects,
including the value of being able to defer the abandonment costs. The value of Pilot is based on our
valuation assessment before the Royal Acquisition on a minority basis.
Scenario 2 Deferral of the abandonment costs Scenario – As Scenario 1 but assuming that the
Company is successful in developing one of the Strategic Projects and accordingly the abandonment
costs are deferred for a long period of time.
Scenario 3 – the valuation assessment of the Combined Group is based on the trading prices after the
announcement of the Royal Acquisition.
We have set out below a summary of our valuation assessment.
Source: GTCF analysis
The value of the Combined Group has been estimated as the average of the three scenarios. We are of
the opinion that this is a reasonable approach as it strikes the right balance of the value that could be
attributed to the Strategic Projects and the combination of Royal and Pilot versus the underlying risks.
Combined Group - Valuation Summary (Share price post Merger) Section
Cents Reference Low High
Sceario 1 - As-Is Royal plus Pilot pre on a minority basis 9.1 1.34 1.86
9.2 2.01 2.56
Scenario 3 - Trading prices post announcement 9.3 4.50 5.50
Overall Value (Average) 2.62 3.31
Sceario 2 - As-Is Royal excl. abandonment costs plus Pilot pre on a minority
basis

#4998177v154
9.1 Valuation summary of Pilot under Scenario 1
We have set out below a summary of our valuation assessment.
Source: S&P Global and GTCF analysis
9.1.1 Valuation of Pilot after the Royal Acquisition
The valuation assessment of Pilot after the Royal Acquisition is in-line with the value assessed in section 9
after having removed the premium for control. Our valuation assessment is summarised below.
Source: S&P Global and GTCF analysis
9.1.2 Valuation of Royal on As-Is basis
Grant Thornton has set out below a summary of the valuation assessment of Royal under the As-Is
Scenario.
Source: S&P Global and GTCF analysis
9.1.2.1 21.25% interest in CHJV
For the purpose of our valuation assessment of Royal’s interest in the CHJV, Grant Thornton Corporate
Finance has engaged RISC to review and express an opinion on the technical assumptions included in the
forecast cash flows in relation to, amongst other things, reserves and resources, production profiles,
operating costs and capital expenditures.
Combined Group - Valuation Summary Scenario 1 Section
A$ '000 Reference Low High
Value of Pilot after the Merger (minority basis) 9.1.1 5,306 7,273
Value of Royal under the As-Is Scenario 9.1.2 (408) (476)
Total value Combined Group (100%) basis 4,899 6,796
Combined Group number of shares ('000) 6.1 365,901 365,901
Combined Group value per share (cents) 1.34 1.86
Equity v alue of Pilot before the Proposed Transaction on a minority basis Section
Reference Low High
Assessed fair market v alue per share (Cents) on a control basis 8.3 2.92 4.33
Minority discount implied in the premium for control (%) 8.3 16.7% 23.1%
Fair v alue of Pilot before the Proposed Transaction on a minority basis (Cents) 2.43 3.33
Number of shares on issue (No.) 4.4 218,363,058 218,363,058
Implied equity value ($) 5,306,346 7,272,780
Royal Energy - Summary of values - As-Is Scenario Section
A$ '000 (except where stated otherwise) Reference Low High
Cliff Head (21.25% Interest) 9.1.2.1 (1,426) (1,531)
Investment in Vintage Energy Limited 9.1.2.2 313 349
Total Enterprise Value (Minority basis) (1,114) (1,182)
Add: Net residual value as at 30 September 2020 9.1.2.3 706 706
Equity value (Minority basis) (408) (476)

#4998177v155
Based on RISC’s review, Grant Thornton Corporate Finance has assessed the net present value using
nominal, ungeared, post-tax cash flows, having regard to Grant Thornton Corporate Finance’s assessment
of the oil prices, exchange rates, inflation and discount rate.
Production and sales of CH Developed Producing reserves and resource
On 29 October 2020, Triangle announced that it had undertaken a detailed review of the reserves for the
CHJV which was validated by independent expert RISC Advisory and assumed oil sales would continue
via the BP refinery in Kwinana. The reserves review also included an assessment of the lifecycle and
economic life of the CH Field which was expected to produce 1.44 MMstb between June 2020 and June
2026. However, on 30 October 2020, BP announced its intention to cease fuel production at its Kwinana
Refinery and convert the refinery into a fuel import terminal. Grant Thornton understand that BP has
advised Triangle that the refinery will continue in its current form for some time, and in the short term, the
existing contractual arrangements with BP will remain unaffected. We note that the termination effective
date, initially set to 16 February 2021, has been postponed several times over 2021.
We note that after the announcement of the updated reserves on 29 October 2020, Triangle withdrew its
updated Cliff Head reserves statement in response to the announced closure of the BP Kwinana facility.
Royal and Grant Thornton have separately commissioned RISC to provide an independent review of the
hydrocarbon resources in the Cliff Head Field. Refer to Appendix B for the RISC report. RISC noted in the
report that the only contingency relating to the contingent volumes is securing an export route once the
Kwinana refinery closes. Subject to refreshing the commercial terms for the new export route the volumes
would be reclassified as reserves. In this regard, RISC have confirmed that it is reasonable to use 2C
Resources production profile, capital and operating costs within the RISC report for valuation purposes.
Cliff Head is a production field and it is currently producing out of those resources that RISC has
categorised as contingent. Usually contingent resources are associated with early stage development
assets where the level of confidence with the resources is low. This is clearly not the case for the previous
2P now categorised 2C Cliff Head resources. The level of confidence in the resources is high given that
they are currently being extracted. As outlined in the RISC Report, RISC has confirmed that it is
reasonable to use the combined 2C production profile, opex and capex for valuation purpose. The only
reasons why the 2P resources have been reclassified as 2C contingent is because the CHJV is in the
process of finalising an export route after the closure of the BP Refinery. To this end, we note that as set
out in various announcements released by Triangle on the ASX, BP was prepared to extend the Crude Oil
Supply Agreement for a number of times in order to allow the parties to finalise alternative arrangements.
We have set out a graphical representation of the production profile adopted in the valuation assessment.

#4998177v156
Cliff Head production profile
Source: RISC advisory
For the purpose of forming a view on the appropriate forecast oil prices to adopt for the valuation, Grant
Thornton has had regard to the current spot prices’ futures contract prices and the forecast prices of
various brokers based.
The forecast oil price assumptions adopted for the valuation reflect the expectation that in the long run oil
prices will be influenced by a number of factors, including:
Brent oil prices are trading between US$50 - 60/bbl.
Market participants are of the opinion that oil price below US$50/bbl is not sustainable as it is below a
break-even level for the shale oil industry in the US (estimated at between US$50 and US$55 bbl).
In 2020, the 23 OPEC and non-OPEC oil-producing countries took decisive actions in the Declaration
of Cooperation (DoC) in response to the market challenges resulting from the pandemic-related
economic downturn by committing to the largest and longest-ever oil production adjustments which is
expected to restore market stability.
In the medium/long term, oil demand will be adversely affected by lower demand from passenger
vehicles due to greater market penetration of energy efficient vehicles and the greater take-up of
electric vehicles. Contributing to this trend is also China’s recent energy policies which are more
biased towards renewables.
Depending on the performance of oil prices, the US is expected to become a net exporter of oil during
this decade which is expected to put downward pressure on long term oil prices.
We have set out in the graph below the historical Brent oil price, consensus forecast for the period 2021 to
2025 and long term consensus (2026-2030).
0.00
5.00
10.00
15.00
20.00
25.00
30.00
1-M
ar-2
1
1-Ju
n-2
1
1-S
ep-
21
1-D
ec-2
1
1-M
ar-2
2
1-Ju
n-2
2
1-S
ep-
22
1-D
ec-2
2
1-M
ar-2
3
1-Ju
n-2
3
1-S
ep-
23
1-D
ec-2
3
1-M
ar-2
4
1-Ju
n-2
4
1-S
ep-
24
1-D
ec-2
4
1-M
ar-2
5
1-Ju
n-2
5
1-S
ep-
25
1-D
ec-2
5
1-M
ar-2
6
1-Ju
n-2
6
Bb
ls '0
00

#4998177v157
Oil price analysis
Source: GTCF analysis, Energy and Resources Consensus Economics
Below we have summarised the consensus forecast collected from the brokers:
Sources: Energy and Resources Consensus Economics
Based on the above, Grant Thornton has adopted for the first quarter of CY21 the price of US$55/bbl to
reflect the current price at which the oil is trading at and subsequently we have adopted the consensus
mean across the brokers.
In the future cash flows, the US$ revenues are converted in A$ revenue by adopting a nominal exchange
rate of AUD/USD 0.75, which is based on the consensus forecast across the brokers as at January 2021
Source: Brokers, GTCF analysis
The operating and capital expenses are already incurred in A$.
Capex and Opex
0
10
20
30
40
50
60
70
80
2020 2021 2022 2023 2024 2025 2026
US
$/b
bl (
No
min
al)
GT selected range Historic spot price Forecast consensus average
Brent Crude Oil - Consensus forecast (Nominal US$/barrel) Long Term
Mar-21 Jun-21 Sep-21 Dec-21 Mar-22 Jun-22 Sep-22 Dec-22 2023 2024 2025 2026-2030
High 60.00 67.67 67.50 69.00 67.50 70.00 73.00 72.00 66.50 74.00 70.50 74.29
Consensus Mean 54.59 56.88 58.55 59.62 60.05 60.19 60.34 60.05 59.05 60.84 61.27 66.94
Consensus Median 55.00 58.00 60.00 60.00 60.00 60.00 59.50 60.00 58.86 60.00 60.48 67.00
Low 47.50 47.00 48.00 48.00 50.00 53.00 54.00 52.48 47.50 52.00 51.00 58.76
Standard Deviation 4.12 5.17 5.50 5.72 4.61 4.57 4.72 5.06 4.31 5.75 5.91 5.56
Number of Forecasts 33 33 33 33 30 30 30 30 26 21 20 10
AUD/USD forecast (nominal)
2021 2022 2023 2024 2025 Long term
High 0.81 0.82 0.8 0.8 0.81 0.81
Consensus Mean 0.75 0.76 0.76 0.76 0.76 0.75
Consensus Median 0.75 0.75 0.75 0.75 0.76 0.75
Low 0.65 0.62 0.72 0.72 0.73 0.72
Number of Forecasts 24 23 12 12 4 12

#4998177v158
The forecast capital and operating expenditure associated with the selected production case is set out
below.
Opex and maintenance costs
Sources: RISC advisory
We note the following in relation the opex and capex costs:
The operating costs are expected to increase from the current level and then plateau in the long term
due the additional wells relying in the existing platform and the Company consequently reaching
economies of scales. Operating costs stop on or around 2026 in conjunction with the depletion of the
resources adopted in the cash flows in the absence of additional exploration or conversion.
Trucking costs vary in conjunction with the increase in the daily production.
Regarding the abandonment costs, which are not presented in the graph above, we have adopted the
following assumptions
RISC has reviewed the operator’s abandonment cost provision including the history of abandonment
studies undertaken by both the current and previous operator. RISC has assessed the abandonment
costs at A$37 million.
Based on discussions with Management, we have been instructed to assume that the CHJV will be
able to offset circa 40% of the abandonment costs as a result of the PRRT credit, which we have
included in our valuation assessment.
RISC has assumed abandonment will be carried out as a 2-year project starting 12 month after the
cessation of production.
Other assumptions
The other key assumptions adopted in the valuation are summarised below:
0.00
0.50
1.00
1.50
2.00
2.50
3.00
3.50
4.00
4.50
1-M
ar-2
1
1-Ju
n-2
1
1-S
ep-
21
1-D
ec-2
1
1-M
ar-2
2
1-Ju
n-2
2
1-S
ep-
22
1-D
ec-2
2
1-M
ar-2
3
1-Ju
n-2
3
1-S
ep-
23
1-D
ec-2
3
1-M
ar-2
4
1-Ju
n-2
4
1-S
ep-
24
1-D
ec-2
4
1-M
ar-2
5
1-Ju
n-2
5
1-S
ep-
25
1-D
ec-2
5
1-M
ar-2
6
1-Ju
n-2
6
A$
mill
ion

#4998177v159
Corporate costs – Royal incurs limited corporate costs which are not expected to continue in the
Combined Group.
Tax rate – Royal is not expected to pay any tax until towards the end of the field life due to pre-
existing tax losses.
Inflation – We have adopted a 2.4% inflation based on the Royal Bank of Australia inflation target
between 2.0% and 3.0% and IMF forecasting 2.4% inflation rate by 2025 in Australia.
Working capital – Movements in working capital have been included in the Financial Model based on
a debtor days assumption of 30 days for revenue and creditor days assumption of 45 days for
operating and capital costs as advised by Management.
Discount rate – The cash flows have been prepared on a nominal, ungeared and post-tax basis.
Accordingly, we have applied a real, post-tax weighted average cost of capital (“WACC”) of between
10.8% and 11.4% for the current production case based on the following assumptions:
o Risk free rate of 3% which is based on 10 years average of the 5 years Government Bonds.
o Beta factor of between 1.2 and 1.3 based on the average beta of 1.0 and 1.5 among comparable
companies over 2 and 5 years respectively.
o Market risk premium of 6%.
o Specific risk premium of 2.0% for the current production case to take into account the risk
attached to a late stage oil field and the uncertainty in relation to the distribution pathway.
o Debt as a proportion of the total capital of 20% based on comparable companies.
Minority discount – In the valuation assessment of Royal to be included in the value of Pilot after the
Royal Acquisition, We have not applied a minority discount due to the following:
o The legal form of the CHJV has been structured as an unincorporated joint venture. Accordingly,
Royal (through its 50% equity interest in TEO) is entitled to its share of the oil extracted from the
CH Field and its rights and obligations (including ability to sell its interest) are not linked on the
percentage owned of the CHJV.
o Royal’s 21.25% indirect interest is held through its 50% equity interest in TEO which is the
operator of the CH Field. As TEO is jointly owned by TEG and Royal, each company has
appointed a Director to the TEO Board, with both Directors required to approve any TEO Board
decision. Accordingly, Royal effectively share operational control over the CH Field.
o The market value of the investment in Vintage is already reflective of minority position as it is
based on the trading prices.
o The balance of the value is represented by cash resources.

#4998177v160
9.1.2.2 Investment in Vintage
Royal currently holds 5,208,488 ordinary shares in ASX listed Vintage Energy which is an early stage oil
and gas company with a market capitalisation of circa A$36.2 million in mid-February. Royal’s interest is
equivalent to circa 1% of the issued capital. This investment is considered non-core by the Combined
Group.
In the assessment of the fair value, Grant Thornton has considered the following:
The average monthly trading volumes of Vintage are equivalent to circa 7% of the total shares on
issue over the last six months. This would allow the Combined Group to sell Royal’s investment in
Vintage in a relatively short period of time without a material adverse impact on the trading prices.
Vintage has recently completed a capital raising during the quarter ending December 2020, raising
gross proceeds of A$15.2 million. The capital raising consisted of placement to institutional and
sophisticated investors at an issue price of A$0.06 per share for A$3.1 million, and a partially
underwritten non-renounceable entitlement offer also at A$0.06 per share, on a 1 for 2 basis, for
A$12.1 million.
Since the announcement of the entitlement offer, the shares have traded between 6 cents and 8 cents
per share.
Grant Thornton has set out below the assessment of the market value of the Vintage investment adopting
a trading prices between 6 cents and 6.7 cents per share.
Source: S&P Global, GTCF analysis
We note that Royal is not expected to incur any tax liability on the disposal of the Vintage investment given
pre-existing tax losses.
9.1.2.3 Other assets and liabilities
We have set out below the other assets and liabilities on the balance sheet as at 31 December 2021.
Valuation in Vintage
A$ '000 Low High
Number of share hold by Royal (000) 5,208 5,208
Assessed value per share 0.060 0.067
Total value 313 349
Capital gain 0 0
Total value after capital gains 313 349
Royal residual value as at 31 December 2020
A$
Cash and cash equivalents 735,026
Trade and other receivables 181,451
Prepayments 6,212
Other non current assets 1,860
Trade and other payables (218,581)
Total residual value 705,967

#4998177v161
Source: Royal Management, GTCF analysis
In April 2020, the CHVJ provided two loans to Royal and Triangle of A$871,000 each and in equal terms.
These loans are a way for the joint ventures partners to provide the funds required by the oil production
operation of Cliff Head through the repayment of the outstanding balance. As a result of the nature of the
loan, the related cash flow has been already captured in the financial model of Cliff Head operation and
accordingly, the outstanding balance of A$860,000 as at 30 September 2020 has been excluded from the
above computation.
9.2 Valuation Summary of Pilot under Scenario 2 – As-Is Scenario but excluding
abandonment costs
We have set out below a summary of our valuation assessment.
Source: GTCF analysis
9.2.1 Valuation of Royal under As-Is Scenario but excluding abandonment costs
Grant Thornton has set out below a summary of the valuation assessment of Royal under the As-Is
Scenario but excluding the abandonment expenses.
Source: S&P Global, GTCF analysis
9.2.1.1 21.25% interest in CHJV excluding abandonment costs
Under this scenario, we have adopted the same assumptions under Scenario 1, but we have excluded
abandonment costs from the valuation assessment. As discussed in the executive summary, the real value
accretive opportunity to merge Pilot and Royal is to potentially expedite the development of the Mid-West
Integrated Renewables and Hydrogen Project and delay, potentially for a long period of time, the
abandonment expenses that the CHJV may need to incur.
The Combined Group have the following Strategic Projects which would significantly increase the life of
the existing Cliff Head facilities and defer abandonment expenditure:
Combined Group - Valuation Summary Scenario 2 Section
A$ '000 Reference Low High
Value of Pilot after the Merger (minority basis) 9.1.1 5,306 7,273
Value of Royal under As-Is but deferring abondonment costs 9.2.1 2,057 2,102
Total value Combined Group (100%) basis 7,364 9,375
Combined Group number of shares ('000) 6.1 365,901 365,901
Combined Group value per share (cents) 2.01 2.56
Roy al Energy - Summary of v alues - As-Is Scenario (ex cluding abandonment) Section
A$ '000 Reference Low High
Cliff Head JV (21.25% Interest) - ex cluding abandonment 9.2.2.1 1,039 1,047
Inv estment in Vintage Energy Limited 9.1.2.2 313 349
Total Enterprise Value (Minority basis) 1,351 1,396
Add: Net residual v alue as at 30 September 2020 9.1.2.3 706 706
Equity value (Minority basis) 2,057 2,102

#4998177v162
The WA-31-L project has significant 2C resources which have the potential to materially increase the
life of the field. Specifically, we note the following:
o Triangle, on behalf of the CHJV, has commenced farm-out discussion for potential parties to
participate in the drilling of the priority targets of West High, SE Nose and Mentelle Updip.
o The abandonment costs for the CH Field are significant. It is reasonable to assume that before
these costs are incurred, the CHJV will seek to monetise other growth opportunities in relation to
CH Field, WA-31-L 2C Resources or adjacent permits. No value has been attributed to the
existing infrastructure in the assessment of the abandonment costs.
o The existing onshore and offshore infrastructure of the CH Field has significant strategic value
and present several potential monetisation opportunities with the many development projects
currently undertaken by other players on or around the CH Field. This value is not captured in the
future cash flows.
o The Directors believe that Royal Acquisition will enhance the possibilities of the Cliff Head Wind
and Solar Project being developed as it will create an alignment in the ownership and strategic
objectives between WA 481 P project and the CH Field project and allow the CH Field
infrastructure to be considered for the renewable project development and used for a longer
period of time. However, this potential value accretion for Pilot Shareholders is not currently
quantifiable given the early stage nature of the Mid-West Integrated Renewables and Hydrogen
Project and the Cliff Head Wind and Solar Project.
The potential for using the existing infrastructure for use in a Carbon Capture, Use and Storage
development. This could involve the use of Enhanced Oil Recovery techniques to reinvigorate
production from the Cliff Head field, and the potential for long term storage of CO2 captured from the
Oakajee Strategic Infrastructure Area (or other industrial sources of CO2).
The potential for re-using the offshore facilities as a host platform for an offshore wind farm. The
platform would likely house switch gear and transformers to enable power to be supplied to shore.
However, at the date of this valuation, the CHJV is in the process of finalising plan for the next round of
exploration seeking to convert some of the contingent resources into 2P reserves and the alternative uses
of the CHJV infrastructure are yet to be developed. Accordingly, the real potential value that could be
realised by merging Pilot and Royal cannot be quantified in our fairness assessment at the date of this
IER. As a result, we are of the opinion that it is not unreasonable to undertake a valuation assessment
where it is assumed that at least one of the above opportunities is advanced and the abandonment costs
are deferred.
9.2.2 Sensitivity analysis
We note that the assumptions adopted in the valuation assessment of Royal’s interest in the CHJV are
inherently subject to considerable uncertainty and there is significant scope for differences in opinion. It
should be noted that the value of Royal could vary materially based on changes in certain key
assumptions in particular in relation to oil prices; exchange rates and operating and capital costs.
Accordingly, we have conducted certain sensitivity analysis below to highlight the impact on the valuation
caused by movements in these key assumptions.

#4998177v163
Source: GTCF analysis
9.2.3 Valuation cross check – Resource Multiples
We have undertaken a high level cross check18 of the value of CHJV under Scenario 219 having regard to
the resource multiples implied in the valuation assessment as set out below.
Sources: RISC, GTCF analysis Note: (1) The enterprise value adopted is derived by the As-Is scenario excluding abandonment costs (2) The 2C reported reflect the total 2P of the company before Triangle withdrawing the resource assessment on 3 November 2020
In relation to the selected resources, we note that we have considered the 2C resources. As set out in the
RISC Report, the only contingency identified by RISC is in relation to the contingent volumes is securing
an export route once the Kwinana refinery closes. Subject to refreshing the commercial terms for the new
export route the volumes would be reclassified as reserves. The level of contingency of the 2C resources
is significantly reduced compared with the typical 2C resources of comparable companies.
We have set out in the table below the Resource Multiples of listed peers which may vary significantly
between the different listed comparable companies due to the size of the reservoir, the breakdown
between 2P and 2C resources and between developed and undeveloped reserves, the availability of
infrastructure, the cost structure and stage of development. The Resources Multiples of listed peers are
set out below.
18 We have refer to a high level cross check given that the level of comparability of the listed peers is limited and accordingly we have only relied on this methodology for direction evidence of the value assessed. 19 We note that the value under Scenario 1 is negative as it does not include the Strategic Projects or the deferral of the abandonment costs.
Sensitivity analysis Cliff Heads
A$ '000 Low High Low High
Cliff Head - Scenario 1 (1,426) (1,531)
Cliff Head - Scenario 2 1,039 1,047
Exchange rate decreased by 2%
Cliff Head - Scenario 1 (1,204) (1,306) 15.6% 14.7%
Cliff Head - Scenario 2 1,261 1,273 21.4% 21.5%
Exchange rate increased by 2%
Cliff Head - Scenario 1 (1,642) (1,751) (15.1%) (14.3%)
Cliff Head - Scenario 2 823 828 (20.8%) (20.9%)
Oil price decreased by 5%
Cliff Head - Scenario 1 (2,007) (2,121) (40.7%) (38.5%)
Cliff Head - Scenario 2 458 458 (55.9%) (56.3%)
Oil price increased by 5%
Cliff Head - Scenario 1 (856) (952) 40.0% 37.8%
Cliff Head - Scenario 2 1,610 1,627 54.9% 55.3%
% change
Implied Reserve multiple
A$ '000 Low High
Royal enterprise value - As Is Scenario excluding abandoment costs1 1,039 1,047
2C Resources 272 272
Implied multiple 3.8x 3.9x

#4998177v164
Sources: RISC, GTCF analysis, Company announcement.
In relation to the listed comparable companies above we have put greater reliance on the companies with
the enterprise value below A$100 million being company with a similar size of operation to the CHJV. The
analysis above should be considered with caution as several of the listed peers have low liquidity and
accordingly the trading prices may not necessarily be reflective of fair market value. In addition, under
Scenario 2, the Cliff Head field is a relatively short life asset whereas some of the assets held by the listed
peers have a much more extended life.
In particular, we note the following:
Cue Energy – the company has three operating oil and gas projects in Indonesia and a number of
exploration permits in Australia. It has recently commenced production at the Mahato PSC and it has
a large cash balance of A$26 million. Notwithstanding depressed oil and gas prices in 2020, it was still
able to generate a profit which indicates that it is better positioned than the CHJV on the cost curve
and with greater ability to withstand market volatility.
Vintage Energy – It has recently raised A$15.2 million to advance two potential production and cash
generating projects being the Vali Field pipeline connection to the Moomba gathering system and the
testing of the Nangwarry CO2 discovery. Funds will also be used to increase production at the Vali
Field through drilling two further wells as well as drilling the nearby Odin prospect. Vintage is hopeful
that gas produced from the Vali Field will be much greater than the 2P figure estimated by the
competent person. It is more focussed on gas production and exploration, so we have not particularly
relied on the resource multiple.
Bengal Energy – Bengal Energy is a junior Canadian TSX listed company with its main asset base in
South West Queensland. The Company is focused on petroleum exploration in the offshore and
onshore Cooper/Eromanga Basin, Timor Sea Vulcan Sub Basin, Perth Basin, and Carnarvon Basin of
Resource multiples EV Reserves and resources (MMstb Oil) Multiples
Company name Country ($m) Status 2P 2C 2P + 2C 2P 2P + 2C
Tier 1: < $100m EV
Cue Energy Resources Limited Australia 30.12 Producing 7.86 6.70 14.56 3.8x 2.1x
Vintage Energy Limited Australia 23.65 Producing 16.60 - 1.4x na
Bengal Energy Canada 47.88 Producing 5.86 - - 8.2x na
Triangle Energy Australia 13.22 Producing 1.13 2.97 4.10 11.7x 3.2x
Winchester Energy Limited Australia 11.82 Producing 0.30 4.35 4.65 40.1x 2.5x
Bass Oil Australia 13.35 Producing 0.57 0.23 0.80 23.5x 16.7x
Lion Energy Australia 7.02 Producing 0.11 0.34 0.45 64.4x 15.6x
Average - Tier 1 21.9x 8.0x
Median - Tier 1 11.7x 3.2x
Tier 2: > $100m EV
Karoon Energy Ltd Australia 950.49 Producing 39.20 101.00 140.20 24.2x 6.8x
Central Petroleum Limited Australia 121.68 Producing 26.31 39.33 65.64 4.6x 1.9x
Armour Energy Limited Australia 93.48 Producing 24.57 74.63 99.19 3.8x 0.9x
Average - Tier 2 10.9x 3.2x
Median - Tier 2 4.6x 1.9x
Average - Total 18.6x 6.2x
Median - Total 9.9x 2.9x

#4998177v165
Australia. The company over FY20 generated circa C$7.8 million in revenue while over the 9 month
up to 31 December 2020 (FY21) the total revenue amounted to only C$3.4 million as a result of the oil
price and the COViD19 outbreak.
Triangle Energy – Whilst Triangle Energy is considered the most comparable company being the
operator of the CHJV, the liquidity in the trading prices is limited and we are of the opinion that the
trading prices are not representative of the underlying fair market value. We note for example that the
trading prices have moved within a narrow range over the last few months notwithstanding that the oil
price has materially increase and the share price of State Gas, in which Triangle is major shareholder
with a 32.7% interest, has increased from circa A$0.50 at the beginning of November to circa A$0.60
in middle March 2021. Accordingly, we have put limited reliance on it.
Winchester Energy – The company engages in the acquisition and exploration of oil and gas
properties in the United States and Australia. The Company has an established oil production within
its (approx.) 18,400 net acre leasehold position on the eastern shelf of the Permian Basin in Texas,
the largest oil producing basin in the USA. Production during the December 2020 quarter averaged
187 bopd which was consistent with the previous quarter. Net oil & gas revenue in the reporting period
was AUD$671,299 while the average sale price of oil increased 40% from the preceding June 2020
quarter. On 16 March 2021, the company published a reserves and resource update as at 31
December 2020 reporting a decline in 2P reserves of circa 65%. Further, the company announced
2021 work program to take advantage of the recovery in oil prices.
Bass Oil – It is an Australian-listed Indonesian oil producer with a 55% operator interest in the Tangai-
Sukananti licence in the prolific South Sumatra Basin. Production for the March 21 quarter averaged
431 barrels of oil per day (bopd) down 25% from the December quarter with oil price received
averaged US$56.73 for the quarter up 45%.
Lion Energy – The Company focuses on exploration and production of oil and gas in Indonesia,
specifically on the Seram Island where it holds 60% and 2.5% interest over 2 conventional production
sharing contracts. For the December 2020 quarter, the net production to Lion was circa 40 bopd for a
total production of 3,77 bbl. Between 29 December 20 and 6 January 2020 the share price of the
company rose by 268% without the company making any price sensitive announcement and
generating accordingly a query from ASX. As reported by the company in the answer to ASX, the
increase in the share price could be associated with the increase in the oil and gas prices that could
have generated a speculative interest in Lion. On 13 April 2021 the company announced a reserve
and contingent resource update reporting an increase in 2P reserves of 203% in the Onseil Field.
Overall, whilst none of the listed peers are particularly comparable with the CHJV, we note that the
resource multiples implied in our valuation assessment of the CHJV under Scenario 2 is below the
average reserve and resource multiples of the listed peers which appears conservative.
9.3 Valuation Summary of Pilot under Scenario 3 – Trading prices after the announcement of
the Royal Acquisition
As set out below, following the announcement of the Proposed Transaction, the trading prices of Pilot have
increased materially which seems to indicate good support from investors for the Proposed Transaction
and perceived low risk of the Proposed Transaction not being implemented. We also note that the Brent oil
prices have increased substantially in the last three months from circa US$45 in mid-November 2020 to
circa US$60 around mid-February. This price increases is expected to have a greater impact on Royal

#4998177v166
assets given that they are currently in production rather than the early stage exploration permits held by
Pilot.
Pilot trading share price since the announcement of the Proposed Transaction
Source: S&P Global, GTCF analysis
We note that Pilot has requested and obtained a trading suspension from the ASX on 11 February 2021
and the Company has been in voluntary trading suspension since then.
We have also noticed that the spread between the bid and ask price has materially reduced to circa 5%
since the beginning of the year as set out in the graph below.
Pilot bid-ask spread since 1 January 2021
Source: S&P Global, GTCF analysis
Set out below is a summary of the VWAP of Pilot Share after the announcement of the Royal Acquisition
and of the Capital Raising.
-
1,000,000
2,000,000
3,000,000
4,000,000
5,000,000
6,000,000
7,000,000
8,000,000
-
0.020
0.040
0.060
0.080
0.100
0.120
20 S
ep 2
0
27 S
ep 2
0
04 O
ct 2
0
11 O
ct 2
0
18 O
ct 2
0
25 O
ct 2
0
01 N
ov 2
0
08 N
ov 2
0
15 N
ov 2
0
22 N
ov 2
0
29 N
ov 2
0
06 D
ec 2
0
13 D
ec 2
0
20 D
ec 2
0
27 D
ec 2
0
03 J
an 2
1
10 J
an 2
1
17 J
an 2
1
24 J
an 2
1
31 J
an 2
1
07 F
eb
21
14 F
eb
21
VolumeShare price (A$)
Volume Share price
25 September 20 - Annoucement of the Proposed Transaction
0.0%
5.0%
10.0%
15.0%
20.0%
25.0%
30.0%
35.0%
40.0%
45.0%
50.0%
0.000
0.010
0.020
0.030
0.040
0.050
0.060
0.070
0.080
0.090
03 J
an 2
1
05 J
an 2
1
07 J
an 2
1
09 J
an 2
1
11 J
an 2
1
13 J
an 2
1
15 J
an 2
1
17 J
an 2
1
19 J
an 2
1
21 J
an 2
1
23 J
an 2
1
25 J
an 2
1
27 J
an 2
1
29 J
an 2
1
31 J
an 2
1
02 F
eb
21
04 F
eb
21
06 F
eb
21
08 F
eb
21
10 F
eb
21
Bid
Ask
Sp
read
(%)
Sha
re p
rice
(A$)
Bid Ask Spread (%) Share Price

#4998177v167
Based on the above, we have selected a range between 4.5 cents and 5.5 cents for our valuation
assessment of Pilot after the Proposed Transaction based on the trading prices.
Pilot VWAP
VWAP - A$ Low High VWAP
Up to 9 Feb 2021
5 day 0.045 0.092 0.061
10 day 0.036 0.092 0.055
1 month 0.030 0.092 0.048
From the announcement of the Transaction 25 Sep 2020 0.024 0.092 0.042

#4998177v168
10 Sources of information, disclaimer and consents
10.1 Sources of information
In preparing this report Grant Thornton Corporate Finance has used various sources of information,
including:
Draft sales and purchase agreement (“SPA”).
Annual reports/consolidated.
Management projections
Minutes of Board meetings.
RISC Report
Transaction databases such S&P Global Capital IQ and Mergermarket.
IBISWorld industry reports.
Various industry and broker reports.
Press releases and announcements
Other publicly available information.
In preparing this report, Grant Thornton Corporate Finance has also held discussions with, and obtained
information from, Management of Pilot and Royal.
10.2 Limitations and reliance on information
This report and opinion is based on economic, market and other conditions prevailing at the date of this
report. Such conditions can change significantly over relatively short periods of time.
Grant Thornton Corporate Finance has prepared this report on the basis of financial and other information
provided by the Company, and publicly available information. Grant Thornton Corporate Finance has
considered and relied upon this information. Grant Thornton Corporate Finance has no reason to believe
that any information supplied was false or that any material information has been withheld. Grant Thornton
Corporate Finance has evaluated the information provided by the Company through inquiry, analysis and
review, and nothing has come to our attention to indicate the information provided was materially
misstated or would not afford reasonable grounds upon which to base our report. Nothing in this report
should be taken to imply that Grant Thornton Corporate Finance has audited any information supplied to
us, or has in any way carried out an audit on the books of accounts or other records of the Company.
This report has been only been prepared in accordance with the requirements of Section 611, item 7 of the
Corporations Act in relation to the issue of the scrip consideration to the Royal vendors. This report should
not be used for any other purpose.
Pilot has indemnified Grant Thornton Corporate Finance, its affiliated companies and their respective
officers and employees, who may be involved in or in any way associated with the performance of services
contemplated by our engagement letter, against any and all losses, claims, damages and liabilities arising
out of or related to the performance of those services whether by reason of their negligence or otherwise,
excepting gross negligence and wilful misconduct, and which arise from reliance on information provided
by the Company, which the Company knew or should have known to be false and/or reliance on

#4998177v169
information, which was material information the Company had in its possession and which the Company
knew or should have known to be material and which did not provide to Grant Thornton Corporate
Finance. The Company will reimburse any indemnified party for all expenses (including without limitation,
legal expenses) on a full indemnity basis as they are incurred.

#4998177v170
Appendix A – Valuation methodologies
Capitalisation of future maintainable earnings
The capitalisation of future maintainable earnings multiplied by appropriate earnings multiple is a suitable
valuation method for businesses that are expected to trade profitably into the foreseeable future.
Maintainable earnings are the assessed sustainable profits that can be derived by a company’s business
and excludes any abnormal or “one off” profits or losses.
This approach involves a review of the multiples at which shares in listed companies in the same industry
sector trade on the share market. These multiples give an indication of the price payable by portfolio
investors for the acquisition of a parcel shareholding in the company.
Discounted future cash flows
An analysis of the net present value of forecast cash flows or DCF is a valuation technique based on the
premise that the value of the business is the present value of its future cash flows. This technique is
particularly suited to a business with a finite life. In applying this method, the expected level of future cash
flows are discounted by an appropriate discount rate based on the weighted average cost of capital. The
cost of equity capital, being a component of the WACC, is estimated using the Capital Asset Pricing
Model.
Predicting future cash flows is a complex exercise requiring assumptions as to the future direction of the
company, growth rates, operating and capital expenditure and numerous other factors. An application of
this method generally requires cash flow forecasts for a minimum of five years.
Orderly realisation of assets
The amount that would be distributed to shareholders on an orderly realisation of assets is based on the
assumption that a company is liquidated with the funds realised from the sale of its assets, after payment
of all liabilities, including realisation costs and taxation charges that arise, being distributed to
shareholders.
Market value of quoted securities
Market value is the price per issued share as quoted on the ASX or other recognised securities exchange.
The share market price would, prima facie, constitute the market value of the shares of a publicly traded
company, although such market price usually reflects the price paid for a minority holding or small parcel
of shares, and does not reflect the market value offering control to the acquirer.
Comparable market transactions
The comparable transactions method is the value of similar assets established through comparative
transactions to which is added the realisable value of surplus assets. The comparable transactions method
uses similar or comparative transactions to establish a value for the current transaction.
Comparable transactions methodology involves applying multiples extracted from the market transaction
price of similar assets to the equivalent assets and earnings of the company. The risk attached to this
valuation methodology is that in many cases, the relevant transactions contain features that are unique to
that transaction and it is often difficult to establish sufficient detail of all the material factors that contributed
to the transaction price.

71
#4998177v1
Appendix B – Comparable companies Royal
Company Description
Cooper Energy Limited
Cooper Energy Limited, an upstream oil and gas exploration and production company, engages in securing, finding, developing, producing, and selling of hydrocarbons to south-east Australia. It explore and evaluates oil and gas; and produces and sells crude oil in Cooper basin. The company also produces offshore gas from the Sole gas field in the Gippsland Basin, Victoria; and offshore gas and gas liquids from the Casino, Henry, Netherby gas fields in the Otway Basin, Victoria. As of June 30, 2020, the company had proved and probable reserves of approximately 49.9 million barrels of oil equivalent, and contingent resources of approximately 34.9 million barrels of oil equivalent. Cooper Energy Limited was incorporated in 2001 and is headquartered in Adelaide, Australia.
Karoon Energy Ltd Karoon Energy Ltd operates as an oil and gas exploration and production company in Australia, Brazil, and Peru. The company holds 100% interest in the Santos Basin consisting of 5 off-shore blocks located in the State of Sáo Paulo, Brazil; 50% interest in the Carnarvon Basin covering an area of area of approximately 6,748 square kilometers located in the north Western Australia; and 40% interest in the Tumbes Basin covering an area of approximately 4,875 square kilometers located in northern Peru. The company was formerly known as Karoon Gas Australia Ltd and changed its name to Karoon Energy Ltd in December 2018. Karoon Energy Ltd was incorporated in 2003 and is headquartered in Southbank, Australia.
Senex Energy Limited
Senex Energy Limited, together with its subsidiaries, engages in the exploration, development, and production of oil and gas resources in Australia. It primarily holds oil and gas assets in the Cooper-Eromanga Basin located in South Australia; and the Surat Basin located in Queensland. The company was formerly known as Victoria Petroleum NL and changed its name to Senex Energy Limited in 2010. Senex Energy Limited was incorporated in 1980 and is headquartered in Brisbane, Australia.
Helios Energy Limited
Helios Energy Limited operates as an onshore oil and gas exploration company in the United States. It primarily holds a 70% working interest in the Presidio Oil project covering an area of 59,980 net acres located in Texas, the United States. The company was formerly known as New Horizon Coal Limited and changed its name to Helios Energy Limited in April 2017. Helios Energy Limited is headquartered in West Perth, Australia.
Galilee Energy Limited
Galilee Energy Limited, through its subsidiaries, engages in the exploration and production of oil and gas properties in Australia, the United States, and Chile. It primarily explores for coal seam gas. The company’s flagship project is the Glenaras gas project located within the ATP 2019 permit, which covers an area of approximately 4000 square kilometers in western Queensland’s Galilee Basin. Galilee Energy Limited was incorporated in 1994 and is headquartered in Brisbane, Australia.
Cue Energy Resources Limited
Cue Energy Resources Limited explores for, develops, and produces petroleum. It explores for oil and gas through its projects located in Indonesia, Australia, and New Zealand. The company was founded in 1981 and is headquartered in Melbourne, Australia.
Central Petroleum Limited
Central Petroleum Limited engages in the development, production, processing, and marketing of hydrocarbons in Australia. It holds interests in various oil and gas properties comprising 181,875 square kilometers of exploration area located in the Amadeus, Southern Georgina, Wiso, and Surat Basins. The company was founded in 1998 and is headquartered in Brisbane, Australia.
Armour Energy Limited
Armour Energy Limited, together with its subsidiaries, focuses on the discovery, development, and production of natural gas and associated liquid resources in Australia. The company operates in two segments, Exploration, Evaluation, and Appraisal activities; and Production and Development. It holds interests in a portfolio of projects located in Surat Basin, Isa Superbasin, McArthur Basin, Cooper Basin, and Southern Basins. In addition, the company produces and sells petroleum products, including oil, gas, LPG, and condensate in the Surat Basin. Armour Energy Limited was founded in 2009 and is headquartered in Brisbane, Australia.
Buru Energy Limited Buru Energy Limited engages in the exploration, development, and production of oil and gas resources in Western Australia. The company operates through Oil, Gas, and Exploration segments. It holds interests in a portfolio of petroleum exploration permits covering an area of approximately 5.5 million gross acres located in Canning basin in the southwest Kimberley region of Western Australia. The company's principal property is the Ungani oil field project located onshore in the Canning Basin. Buru Energy Limited was founded in 2008 and is headquartered in Perth, Australia.
Vintage Energy Limited
Vintage Energy Limited acquires, explores for, and develops oil and gas properties in Australia. The company owns 100% interests in the Block CO2019-E located in the Cooper / Eromanga Basins; GSEL 672 located in Otway Basin; and EP 126 located in Bonaparte Basin. Vintage Energy Limited was incorporated in 2015 and is based in Goodwood, Australia.
Norwest Energy NL Norwest Energy NL explores for hydrocarbon resources in Australia. It owns 20% interest in EP368; 22.22% interest in EP426 license; 25% interest in TP/15 license; and 27.945% interest in EP413 license located in Australia. The company was founded in 1997 and is based in West Perth, Australia.
Triangle Energy (Global) Limited
Triangle Energy (Global) Limited engages in the exploration and production of oil and gas properties in Australia. It holds a 78.75% interest in Cliff Head Oil Field with a production license covering 72 square kilometers and the oil field covering 6 square kilometers, located in Perth Basin, Western Australia. The company also holds a 45% interest in the Xanadu-1 oil field and a 50% interest in the Mt Horner Production licence located in the Perth Basin, as well as an operating interest in the Reids Dome production licence in Queensland. Triangle Energy (Global) Limited is headquartered in West Perth, Australia.
Winchester Energy Limited
Winchester Energy Limited, together with its subsidiaries, engages in the acquisition and exploration of oil and gas properties in the United States and Australia. As of March 31, 2019, it had 17,402 net acres within leases located in the Eastern Shelf of the Permian Basin in Texas. The company was founded in 2014 and is based in West Perth, Australia.
Bounty Oil & Gas NL Bounty Oil & Gas NL engages in the exploration, production, and marketing of oil and gas in Australia and Tanzania. It also invests in listed shares and securities. The company was founded in 1999 and is based in North Sydney, Australia.
Fitzroy River Corporation Limited
Fitzroy River Corporation Limited operates as an oil and gas, and mineral investment holding company in Western Australia and the Gulf of Mexico. The company focuses on non-operational assets, such as royalties, free carried interests, and equity investments. It holds royalty interests in various permits in the onshore Canning Superbasin, Western Australia. The company was incorporated in 1996 and is based in Sydney, Australia.
High Peak Royalties Limited
High Peak Royalties Limited, together with its subsidiaries, engages in the acquisition of royalty and exploration interests in oil and gas assets. It has royalties over 20 oil and gas permits in Australia and over 2,000 wells in the United States. The company was incorporated in 2006 and is based in Sydney, Australia.
Bengal Energy Ltd. Bengal Energy Ltd. engages in the exploration, development, and production of oil and gas reserves in Australia. It principally holds interests in the Barrolka, Cuisinier, Tookoonooka, ATP 934, and other petroleum licenses situated within an area of the Cooper Basin. The company was formerly known as Avery Resources Inc. and changed its name to Bengal Energy Ltd. in July 2008. Bengal Energy Ltd. is headquartered in Calgary, Canada.

72
#4998177v1
Appendix C – Discount rate
Introduction
The cash flow assumptions underlying the DCF approach are on a nominal, ungeared and post-tax basis.
Accordingly, we have assessed a range of nominal post-tax discount rates for the purpose of calculating
the net present value of the cash flows.
The discount rates were determined using the WACC formula. The WACC represents the average of the
rates of return required by providers of debt and equity capital to compensate for the time value of money
and the perceived risk or uncertainty of the cash flows, weighted in proportion to the market value of the
debt and equity capital provided. However, we note that the selection of an appropriate discount rate is
ultimately a matter of professional judgment.
Under a classical tax system, the nominal WACC is calculated as follows:
Where:
Re = the required rate of return on equity capital;
E = the market value of equity capital;
D = the market value of debt capital;
Rd = the required rate of return on debt capital; and
t = the statutory corporate tax rate.
Required rate of return on equity capital
We have used the CAPM, which is commonly used by practitioners, to calculate the required return on
equity capital.
The CAPM assumes that an investor holds a large portfolio comprising risk-free and risky investments.
The total risk of an investment comprises systematic risk and unsystematic risk. Systematic risk is the
variability in an investment’s expected return that relates to general movements in capital markets (such as
the share market) while unsystematic risk is the variability that relates to matters that are unsystematic to
the investment being valued.
The CAPM assumes that unsystematic risk can be avoided by holding investments as part of a large and
well-diversified portfolio and that the investor will only require a rate of return sufficient to compensate for
the additional, non-diversifiable systematic risk that the investment brings to the portfolio. Diversification
cannot eliminate the systematic risk due to economy-wide factors that are assumed to affect all securities
in a similar fashion.
Accordingly, whilst investors can eliminate unsystematic risk by diversifying their portfolio, they will seek to
be compensated for the non-diversifiable systematic risk by way of a risk premium on the expected return.
The extent of this compensation depends on the extent to which the company’s returns are correlated with
the market as a whole. The greater the systematic risk faced by investors, the larger the required return on
capital will be demanded by investors.
ED
ERt1
ED
DRWACC ed
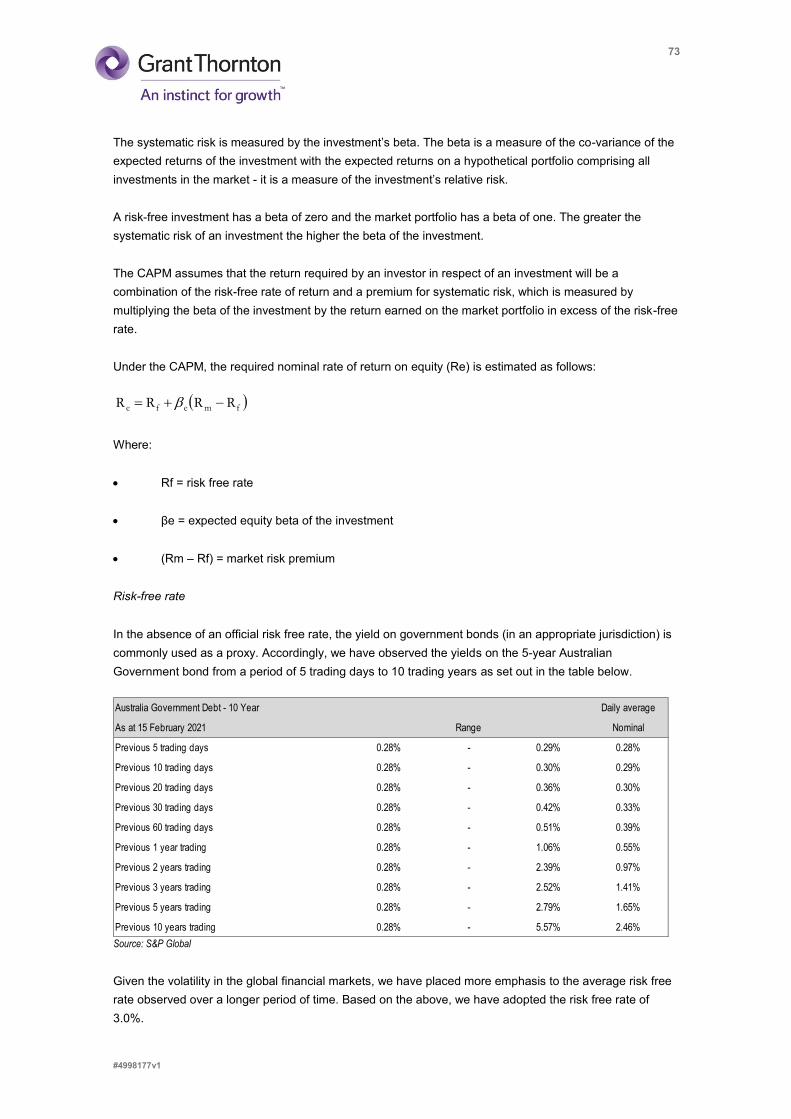
73
#4998177v1
The systematic risk is measured by the investment’s beta. The beta is a measure of the co-variance of the
expected returns of the investment with the expected returns on a hypothetical portfolio comprising all
investments in the market - it is a measure of the investment’s relative risk.
A risk-free investment has a beta of zero and the market portfolio has a beta of one. The greater the
systematic risk of an investment the higher the beta of the investment.
The CAPM assumes that the return required by an investor in respect of an investment will be a
combination of the risk-free rate of return and a premium for systematic risk, which is measured by
multiplying the beta of the investment by the return earned on the market portfolio in excess of the risk-free
rate.
Under the CAPM, the required nominal rate of return on equity (Re) is estimated as follows:
fmefe RRRR
Where:
Rf = risk free rate
βe = expected equity beta of the investment
(Rm – Rf) = market risk premium
Risk-free rate
In the absence of an official risk free rate, the yield on government bonds (in an appropriate jurisdiction) is
commonly used as a proxy. Accordingly, we have observed the yields on the 5-year Australian
Government bond from a period of 5 trading days to 10 trading years as set out in the table below.
Source: S&P Global
Given the volatility in the global financial markets, we have placed more emphasis to the average risk free
rate observed over a longer period of time. Based on the above, we have adopted the risk free rate of
3.0%.
Australia Government Debt - 10 Year Daily average
As at 15 February 2021 Range Nominal
Previous 5 trading days 0.28% - 0.29% 0.28%
Previous 10 trading days 0.28% - 0.30% 0.29%
Previous 20 trading days 0.28% - 0.36% 0.30%
Previous 30 trading days 0.28% - 0.42% 0.33%
Previous 60 trading days 0.28% - 0.51% 0.39%
Previous 1 year trading 0.28% - 1.06% 0.55%
Previous 2 years trading 0.28% - 2.39% 0.97%
Previous 3 years trading 0.28% - 2.52% 1.41%
Previous 5 years trading 0.28% - 2.79% 1.65%
Previous 10 years trading 0.28% - 5.57% 2.46%

74
#4998177v1
Market risk premium
The market risk premium represents the additional return an investor expects to receive to compensate for
additional risk associated with investing in equities as opposed to assets on which a risk free rate of return
is earned. However, given the inherent high volatility of realised rates of return, especially for equities, the
market risk premium can only be meaningfully estimated over long periods of time. In this regard, Grant
Thornton studies of the historical risk premium over periods of 20 to 80 years suggest a risk premium of
6.0% for the Australia markets.
For the purpose of the WACC assessment, Grant Thornton Corporate Finance has adopted a market risk
premium of 6.0%.
Equity beta
The beta measures the expected relative risk of the equity in a company. The choice of the beta requires
judgement and necessarily involves subjective assessment as it is subject to measurement issues and a
high degree of variation.
An equity beta includes the effect of gearing on equity returns and reflects the riskiness of returns to equity
holders. However, an asset beta excludes the impact of gearing and reflects the riskiness of returns on the
asset, rather than returns to equity holders. Asset betas can be compared across asset classes
independent of the impact of the financial structure adopted by the owners of the business.
Equity betas are typically calculated from historical data. These are then used as a proxy for the future
which assumes that the relative risk of the past will continue into the future. Therefore, there is no right
equity beta and it is important not to simply apply historical equity betas when calculating the cost of
equity.
For the purpose of the report, we have had regards to the observed betas (equity betas) of comparable
listed companies operating in the oil and gas industry as outlined in the following table.

75
#4998177v1
Source: S&P Global and GTCF calculations Note (1): Equity betas are calculated using data provided by S&P Global. The betas are based on a two-year and five-year period with weekly and monthly observations respectively, based on the MSCI index. Betas have been degeared based on the average gearing ratio (i.e. net debt divided by shareholders' equity based on market values).
It should be noted that the above betas are drawn from the actual and observed historical relationship
between risk and returns. From these actual results, the expected relationship is estimated generally on
the basis of extrapolating past results. Despite the arbitrary nature of the calculations it is important to
assess their commercial reasonableness. That is, to assess how closely the observed relationship is likely
to deviate from the expected relationship.
Consequently, while measured equity betas of the listed comparable companies provide useful
benchmarks against which the equity beta used in estimating the cost of equity for the predevelopment
assets, the selection of an unsystematic equity beta requires a level of judgement.
The asset betas of the selected companies are calculated by adjusting the equity betas for the effect of
gearing to obtain an estimate of the business risk of the comparable companies, a process commonly
referred as de-gearing. We have then recalculated the equity beta based on an assumed ‘optimal’ capital
structure deemed appropriate for the business (regearing). This is a subjective exercise, which carries a
significant possibility of estimation error.
We used the following formula to undertake the de-gearing and regearing exercise:
2 years weekly betas 5 years monthly betas
Beta analysis Market cap Equity RGearing Ung. Reg. Final Equity RGearing Ung. Reg Final
Company A$m Beta squared Ratio Beta Beta Beta Beta squared Ratio Beta Beta Beta
Pilot Energy Limited 18 0.70 0.00 10.5% 0.66 0.73 Nmf 1.54 0.03 (8.1%) 1.54 1.72 1.72
Cooper Energy Limited 497 0.90 0.26 17.4% 0.81 0.90 0.90 0.92 0.11 (8.4%) 0.92 1.02 1.02
Karoon Energy Ltd 620 1.61 0.25 (74.7%) 1.61 1.79 1.79 1.70 0.15 Nmf 1.70 1.89 1.89
Senex Energy Limited 505 1.69 0.42 38.2% 1.33 1.48 1.48 2.28 0.41 6.6% 2.18 2.42 2.42
Helios Energy Limited 240 0.43 0.02 (1.6%) 0.43 0.47 0.47 0.74 0.03 (7.1%) 0.74 0.82 0.82
Galilee Energy Limited 242 0.35 0.01 (12.0%) 0.35 0.39 Nmf (0.41) 0.00 (22.5%) (0.41) (0.45) Nmf
Cue Energy Resources Limited 51 0.73 0.05 (29.0%) 0.73 0.82 0.82 0.93 0.06 (33.1%) 0.93 1.03 1.03
Central Petroleum Limited 94 0.75 0.12 58.6% 0.53 0.59 0.59 0.40 0.01 75.6% 0.26 0.29 Nmf
Armour Energy Limited 50 1.89 0.20 116.6% 1.04 1.16 1.16 0.46 0.01 92.9% 0.28 0.31 Nmf
Buru Energy Limited 60 0.69 0.06 (38.4%) 0.69 0.76 0.76 1.16 0.13 (31.7%) 1.16 1.29 1.29
Vintage Energy Limited 34 0.94 0.07 (20.6%) 0.94 1.04 1.04 1.86 0.31 (37.8%) 1.86 2.07 2.07
Norwest Energy NL 30 0.71 0.02 (8.5%) 0.71 0.78 Nmf 1.37 0.03 (9.4%) 1.37 1.52 1.52
Triangle Energy (Global) Limited 18 0.43 0.01 (14.0%) 0.43 0.48 Nmf (0.01) 0.00 (12.5%) (0.01) (0.01) Nmf
Winchester Energy Limited 17 1.27 0.06 (21.9%) 1.27 1.41 1.41 1.40 0.04 (17.6%) 1.40 1.56 1.56
Bounty Oil & Gas NL 33 (0.46) 0.00 (14.8%) (0.46) (0.52) Nmf 0.72 0.01 (14.3%) 0.72 0.80 Nmf
Fitzroy River Corporation Limited 14 0.22 0.01 (1.7%) 0.22 0.25 Nmf 0.88 0.08 (14.8%) 0.88 0.97 0.97
High Peak Royalties Limited 15 (0.02) 0.00 8.2% (0.02) (0.02) Nmf 0.29 0.01 0.4% 0.29 0.32 Nmf
Bengal Energy Ltd. 7 0.41 0.01 233.0% 0.15 0.17 Nmf 2.70 0.25 154.0% 1.27 1.41 1.41
Low 0.47 0.82
Median 0.97 1.41
Average 1.04 1.45
High 1.79 2.42
t
E
Dae 11

76
#4998177v1
Where:
βe = Equity beta
βa = Asset beta
t = corporate tax rate
The betas are de-geared using the average historical gearing levels of those respective companies over
several years. We note that most comparable companies had net cash positions. We then re-geared
based on a gearing ratio of 10% debt to 90% equity (see Capital Structure Section below for further
discussions).
For the purposes of our valuation, we have selected a beta between 1.2 and 1.3
Specific risk premium
Specific risk premium (“SRP”) represents the additional return an investor expects to receive to
compensate for country, size and project related risks not reflected in the beta of the observed comparable
companies.
We have assumed a SRP in the range of 2.0% given the size of the Company and the operational risks
not directly reflected in the cash flows.
Cost of debt
For the purpose of estimating the cost of debt applicable to Royal, Grant Thornton Corporate Finance has
considered the following:
The weighted average interest rate on credit outstanding for large businesses over the last one to five
years as published by the Reserve Bank of Australia.
Expectations of the yield curve.
Based on the above, Grant Thornton Corporate Finance has adopted a cost of debt of 5.0% to 6.0% on a
pre-tax basis.
Capital Structure
Grant Thornton Corporate Finance has considered the gearing ratio which a hypothetical purchaser of the
business would adopt in order to generate a balanced return given the inherent risks associated with debt
financing. Factors which a hypothetical purchaser may consider include the shareholders’ return after
interest payments, and the business’ ability to raise external debt.
The appropriate level of gearing that is utilised in determining WACC for a particular company should be
the “target” gearing ratio, rather than the actual level of gearing, which may fluctuate over the life of a
company. The target or optimal gearing level can therefore be derived based on the trade-off theory which
stipulates that the target level of gearing for a project is one at which the present value of the tax benefits
from the deductibility of interest are offset by present value of costs of financial distress. In practice, the
target level of gearing is evaluated based on the quality and variability of cash flows. These are
determined by:

77
#4998177v1
the quality and life cycle of a company;
the quality and variability of earnings and cash flows;
working capital;
level of capital expenditure; and
the risk profile of the assets.
In determining the appropriate capital structure, we have had regard to the current capital structure of the
broadly comparable companies. For the purpose of the valuation, Grant Thornton Corporate Finance has
adopted a debt-to-enterprise ratio of 20% debt and 80% equity.
Tax rate
For the purpose of our valuation assessment we have assumed a nil tax rate since the Company will not
pay any taxes due to the tax losses balance.
Discount rate summary
The selected discount is summarised below:
Source: S&P Global, GTCF analysis
WACC calculation Low High
Cost of equity
Risk free rate 3.0% 3.0%
Beta 1.20 1.30
Market risk premium 6.0% 6.0%
Specific risk premium 2.0% 2.0%
Cost of equity 12.2% 12.8%
Cost of debt
Cost of debt (pre tax) 5.0% 6.0%
Tax 0.0% 0.0%
Cost of debt (post tax) 5.0% 6.0%
Capital structure
Proportion of debt 20% 20%
Proportion of equity 80% 80%
100% 100%
Nominal WACC (post tax) 10.8% 11.4%

78
#4998177v1
Appendix D – Glossary
A$ Australian Dollar
1H FYxx 1st half of FYxx
AASB16 Australian Accounting Standard Board 16 "Leases"
ACCC Australian Competition and Consumer Commission
AEMC Australian Energy Market Commission
AEMO Australian Energy Market Operator
APES Accounting Professional and Ethical Standards
APES225 Accounting Professional and Ethical Standard 225 "Valuation Services"
ASIC Australian Securities and Investments Commission
ASX Australian Securities Exchange
ATO Australian Taxation Office
Combined Group Pilot with Royal Energy as wholly-owned subsidiary.
Corporations Act Corporations Act 2001
Royal Energy or Royal Energy
Royal Energy Holdings Limited
DCF Method Discounted Cash Flow and the estimated realisable value of any surplus assets
EV Enterprise Value
Exchange Ratio 1 Royal Energy Share in exchange for 2.9 Pilot Share
FIRB Foreign Investment Review Board
FME Method Application of earnings multiples to the estimated future maintainable earnings or cash flows of the entity, added to the estimated realisable value of any surplus assets
FSG Financial Services Guide
GDP Gross Domestic Product
GST Goods and Services Tax
IPO Initial public offering
NA Not Available
NM Not Meaningful
Quoted Security Price Method
Quoted price for listed securities, when there is a liquid and active market
RG Regulatory Guide
RG111 ASIC Regulatory Guide 111 “Contents of expert reports”
RG112 ASIC Regulatory Guide 112 “Independence of experts”
USA United States of America
Pilot Directors Directors of Pilot
Pilot Enterprise or Enterprise
Pilot Enterprise product
Pilot or the Company Pilot Energy Limited
Pilot Share 1 outstanding ordinary share in Pilot
Pilot Shareholder An individual/entity beneficially holding Pilot share(s)
VWAP Volume Weighted Average Price
WHO World Health Organisation

79
#4998177v1
Appendix E – RISC Report

80
#4998177v1
ABN-59 003 265 987 ACN-003 265 987 AFSL-247140
Grant Thornton Corporate Finance Pty Ltd ABN 59 003 265 987 ACN 003 265 987 (holder of Australian Financial Services Licence No. 247140), a subsidiary or related entity of Grant Thornton Australia Limited ABN 41 127556 389. ‘Grant Thornton’ refers to the brand under which the Grant Thornton member firms provide assurance, tax and advisory services to their clients and/or refers to one or more member firms, as the context requires. Grant Thornton Australia Limited is a member firm of Grant Thornton International Ltd (GTIL). GTIL and the member firms are not a worldwide partnership. GTIL and each member firm is a separate legal entity. Services are delivered by the member firms. GTIL does not provide services to clients. GTIL and its member firms are not agents of, and do not obligate one another and are not liable for one another’s acts or omissions. In the Australian context only, the use of the term ‘Grant Thornton’ may refer to Grant Thornton Australia Limited ABN 41 127 556 389 and its Australian subsidiaries and related entities. Liability limited by a scheme approved under Professional Standards Legislation.
www.grantthornton.com.au

Cover Letter to GT 19022021 1
P. +61 8 9420 6660 | F. +61 8 9420 6690 2/1138 Hay Street, West Perth WA 6005
PO Box 275, West Perth WA 6872 RISC Advisory Pty Ltd | ABN: 19 150 789 030
www.riscadvisory.com
19 February 2021 Andrea De Cian Director Grant Thornton Corporate Finance Pty Ltd Level 17, 383 Kent Street Sydney, NSW 2000
Via email:
Dear Andrea
Independent Technical Reports – Pilot Energy Ltd and Royal Energy Ltd
As agreed on 22 January, RISC has now completed our independent technical expert work.
Please find attached the following documents:
▪ A resource report for the Cliff Head Asset reflecting Royal Energy’s position. As agreed, this is based on the previous report issued to Triangle Energy in 2020 and reflects a resource position as of 01/07/2020.
▪ An excel spreadsheet containing production and cost forecasts to enable Grant Thornton to carry out a DCF analysis of Cliff Head. Note this includes resources post 16 February 2021, which are currently classified as contingent resources pending resolution of an export route for the Cliff Head oil.
▪ A report valuing the exploration assets for Pilot Energy. As agreed, this is based on a previous valuation report provided to Pilot Energy in 2018.
Impact of post issue transaction 29 January 2021
RISC issued its valuation report of Pilot Energy assets on 29 January 2021. On the same day Triangle Energy issued an announcement to the market stating that it had entered into a Sale and Purchase Agreement and Royalty Deed to acquire several assets from Key Petroleum, including a majority 86.94% interest in EP 437 in which Pilot Energy holds the remaining 13.06%. Pilot Energy’s holding in this permit remained unchanged.
RISC has reviewed our report that values the exploration assets of Pilot Energy and concluded that there is no impact on our valuation from this recent transaction.
Consent to include in IER
RISC consents to the reports being referred to and included as appendices in the IER.

Cover Letter to GT 19022021 2
Independence
RISC confirms that it is independent of both Pilot Energy and Royal Energy, and that RISC is unaware of any circumstances which may compromise our independence.
Yours sincerely
Martin Wilkes Managing Director

Cliff Head independent resources report Royal Energy Pty Ltd
1 March 2021 Private and Confidential

2021 04 16 Cliffhead Resource Report Ver 1.docx Page 1
1. Executive Summary Royal Energy Pty Ltd (‘Royal’) and Triangle Energy (Global) Ltd (‘Triangle’, ‘operator’) continue to manage the late life challenges of Cliff Head with innovation and determination. Cliff Head began producing oil in 2006 and benefitted from higher oil prices than initially forecast. The current period of suppressed oil price and lower production levels has turned the emphasis to cost management which is now a focus for the JVP along with securing a long-term export route for future production. Cliff Head could also continue to contribute to the local energy picture through use of the infrastructure for future third party discoveries. BP’s announcement of their intent to close the Kwinana refinery, the Cliff Head crude oil export route, means that Cliff Head volumes are classified as contingent resources until an alternative export route is secured. Cliff Head will continue to produce to Kwinana until its closure which has been postponed several times during 2021.
Cliff Head potentially has a further 2.5 to 7.5 years of continued commercial life which would result in 0.125 to 0.383 MMstb of crude oil being produced. Costs and oil price are a key consideration in the profit margins to be realised from resources during this time. The use of tubing conveyed ESPs, only recently deployed in Cliff Head, could provide extended run times for Cliff Head wells which will be of benefit if production can be extended beyond the 2C indicated in which indicates a potential June 2026 end of field life.
This scope of work was commissioned to independently validate the Cliff Head resource estimates provided by the operator which RISC endorses. However, RISC is obliged to comment on the sensitivity of resource estimation for late life assets which under PRMS definitions can fall to zero with very few intermediate steps based on commodity prices, any unplanned events, and the JVP appetite to recover from these unplanned events.
RISC has independently evaluated the Cliff Head production forecasts using multiple decline methods to validate the WOR decline method used by the operator in their forecasting. The methods deployed by RISC confirm the operator’s production forecasting is fit for purpose and can be used to forecast a suitable 1C to 3C contingent resource range. Our report complies with SPE PRMS 2018, except where stated, and contains an effective audit trail to our conclusions.
The report contains our expert opinion together with the resource volumes independently endorsed by RISC. Our views and observations of opportunities or risks have been included throughout the report. RISC strongly considers that export route, cost and commodity price forecasts are principal drivers of the contingent resource outcome for Cliff Head.
The only contingency relating to the contingent volumes is securing an export route once the Kwinana refinery closes. Subject to refreshing the commercial terms for the new export route the volumes would be reclassified as reserves. It is reasonable to use the 2C production profiles, operating and capital costs, in this report for valuation purposes provided associated risks are considered. Whilst it is expected the commercial conditions for a new export route will differ from those used for the existing route RISC considers the 1C to 3C range captures the related export route uncertainty.
We understand that the Cliff Head JV has, in the past, investigated several export and domestic markets for its product and will continue these efforts. We are aware that there are various alternative commercial arrangements that the JV are pursuing to sell the Cliff Head crude.

2021 04 16 Cliffhead Resource Report Ver 1.docx Page 2
The net oil resource attributable to Royal Energy Pty Ltd is summarised in Table 1-1
Table 1-1: Cliff Head Field, in Block WA-31-L, resources net to Royal Energy Pty Ltd as at 28/02/2021
Crude Oil Unit Contingent Resources
1C 2C 3C
Total Crude Oil3 MMstb 0.125 0.272 0.383
Notes: 1. Royal Energy Pty Ltd contingent resources are stated at its working interest of 21.25%. 2. Deterministic evaluation methods have been used. 3. Resources comply with PRMS 2018
a. The PRMS (Section 3.1.3.5) accounts for the current production of contingent resources by moving crude volumes directly to produced without being declared a reserve.
4. Fuel is imported, no production is consumed in operations

2021 04 16 Cliffhead Resource Report Ver 1.docx Page 3
Table of contents
1. Executive Summary ..................................................................................................................................... 1 2. Introduction ................................................................................................................................................. 6
2.1. Asset description ................................................................................................................................. 6
2.2. Terms of reference .............................................................................................................................. 8 3. Cliff Head ..................................................................................................................................................... 9
3.1.1. Fluid properties ........................................................................................................................... 9 3.1.2. Well testing .................................................................................................................................. 9
4. Resources .................................................................................................................................................. 10 4.1. Reservoir Development Plan ............................................................................................................. 10 4.2. Production Forecasts ......................................................................................................................... 11
4.2.1. CH-06 ......................................................................................................................................... 13 4.2.2. CH-07H ....................................................................................................................................... 17 4.2.3. CH-10 ......................................................................................................................................... 21 4.2.4. CH-12 ......................................................................................................................................... 24 4.2.5. CH-13 ......................................................................................................................................... 28
4.3. Field Analysis ..................................................................................................................................... 32 4.4. Comparison of RISC and operator’s production forecasts ................................................................ 32 4.5. Resource summary ............................................................................................................................ 33
5. Capital and Operating Costs ...................................................................................................................... 35 5.1.1. Capital costs ............................................................................................................................... 35 5.1.2. Operating costs .......................................................................................................................... 35 5.1.3. Abandonment costs ................................................................................................................... 39
6. Commercial ................................................................................................................................................ 41 6.1. Economic assumptions ...................................................................................................................... 41 6.2. Economic modelling .......................................................................................................................... 43
7. Opportunities and risks ............................................................................................................................. 45
8. Declarations ............................................................................................................................................... 47 8.1. Terms of Engagement........................................................................................................................ 47 8.2. Qualifications ..................................................................................................................................... 47 8.3. Standard ............................................................................................................................................ 47
8.4. Limitations ......................................................................................................................................... 47 8.5. Independence .................................................................................................................................... 48 8.6. Copyright ........................................................................................................................................... 48
9. List of terms ............................................................................................................................................... 49

2021 04 16 Cliffhead Resource Report Ver 1.docx Page 4
List of figures Figure 2-1: Location map ..................................................................................................................................... 6
Figure 4-1: Field production history .................................................................................................................. 11 Figure 4-2: ESP run life history .......................................................................................................................... 12 Figure 4-3: CH-06 production history ................................................................................................................ 13 Figure 4-4: CH-06 1C (red), 2C (green) and 3C (blue) decline analysis .............................................................. 14
Figure 4-5: EUR comparison of CH-06 rate vs cum and log WOR vs cum- High side ........................................ 15 Figure 4-6: EUR comparison of CH-06 rate vs cum and oil cut vs cum – Low side ............................................ 16 Figure 4-7: CH-07H production history ............................................................................................................. 17 Figure 4-8: CH-07H 1C (red), 2C (green) and 3C (blue) decline analysis ........................................................... 18
Figure 4-9: EUR comparison of CH-07H rate vs cum and log WOR vs cum- High side ...................................... 19 Figure 4-10: EUR comparison of CH-07H rate vs cum and oil cut vs cum – Low side ....................................... 20 Figure 4-11: CH-10 production history .............................................................................................................. 21 Figure 4-12: CH-10 1C (red), 2C (green) and 3C (blue) decline analysis ............................................................ 22 Figure 4-13: EUR comparison of CH-10 rate vs cum and log WOR vs cum- High side ...................................... 23
Figure 4-14: EUR comparison of CH-10 rate vs cum and oil cut vs cum – Low side .......................................... 23 Figure 4-15: CH-12 production history .............................................................................................................. 24 Figure 4-16: CH-12 1C (red), 2C(green) and 3C(blue) decline analysis.............................................................. 25 Figure 4-17: EUR comparison of CH-12 rate vs cum and log WOR vs cum- High side ...................................... 26
Figure 4-18: EUR comparison of CH-12 rate vs cum and oil cut vs cum – Low side .......................................... 27 Figure 4-19: CH-13 production history .............................................................................................................. 28 Figure 4-20: CH-13 1C (red), 2C (green) and 3C (blue) decline analysis ............................................................ 29 Figure 4-21: EUR comparison of CH-13 rate vs cum and log WOR vs cum- High side ...................................... 30
Figure 4-22: EUR comparison of CH-13 rate vs cum and oil cut vs cum – Low side .......................................... 31 Figure 4-23: RISC full field decline analysis (orange) vs sum of individual well analysis(green) ....................... 32 Figure 4-24: RISC (dashed line) vs Triangle (solid lines) 1C, 2C and 3C production forecast comparison ........ 33 Figure 5-1: CHJV operational expenditure and BP oil price .............................................................................. 36
Figure 5-2: Cliff Head monthly opex and average monthly Brent oil price from March to August 2020 ......... 37 Figure 5-3: Cliff Head crude trucking rates over time ....................................................................................... 38 Figure 5-4: Operator Cliff Head annual opex forecast ...................................................................................... 39 Figure 6-1: Triangle Brent oil price forecast ...................................................................................................... 41 Figure 6-2: CHJV realised crude price vs. dated Brent price ............................................................................. 42
Figure 6-3: 1C cashflow curve............................................................................................................................ 43 Figure 6-4: 2C cashflow curve............................................................................................................................ 43 Figure 6-5: 3C cashflow curve............................................................................................................................ 44

2021 04 16 Cliffhead Resource Report Ver 1.docx Page 5
List of tables
Table 1-1: Cliff Head Field, in Block WA-31-L, resources net to Royal Energy Pty Ltd as at 28/02/2021 ........... 2 Table 2-1: Asset summary ................................................................................................................................... 7 Table 3-1: Observed fluid properties in Cliff Head crude oil ............................................................................... 9
Table 4-1: Cutoffs used for different methods .................................................................................................. 12 Table 4-2: Royal Energy Pty Ltd resources as at 01/03/2021 ............................................................................ 34 Table 6-1: Economic and fiscal assumptions ..................................................................................................... 42
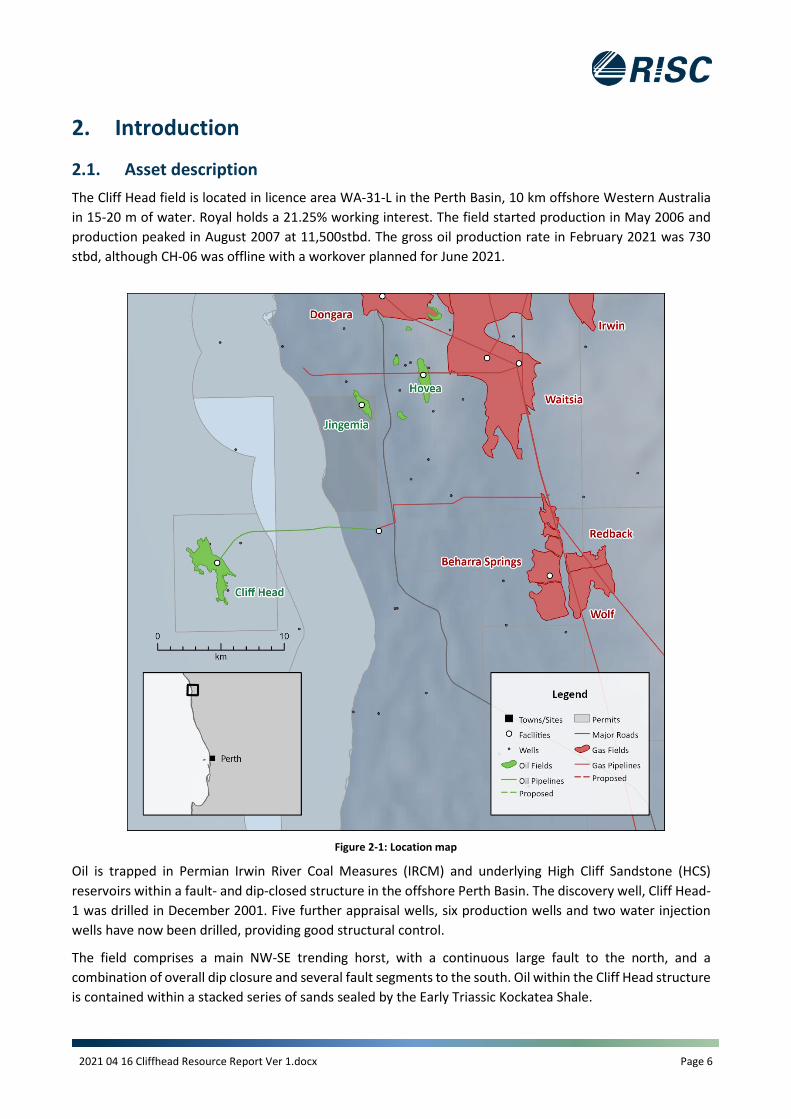
2021 04 16 Cliffhead Resource Report Ver 1.docx Page 6
2. Introduction
2.1. Asset description The Cliff Head field is located in licence area WA-31-L in the Perth Basin, 10 km offshore Western Australia in 15-20 m of water. Royal holds a 21.25% working interest. The field started production in May 2006 and production peaked in August 2007 at 11,500stbd. The gross oil production rate in February 2021 was 730 stbd, although CH-06 was offline with a workover planned for June 2021.
Figure 2-1: Location map
Oil is trapped in Permian Irwin River Coal Measures (IRCM) and underlying High Cliff Sandstone (HCS) reservoirs within a fault- and dip-closed structure in the offshore Perth Basin. The discovery well, Cliff Head-1 was drilled in December 2001. Five further appraisal wells, six production wells and two water injection wells have now been drilled, providing good structural control.
The field comprises a main NW-SE trending horst, with a continuous large fault to the north, and a combination of overall dip closure and several fault segments to the south. Oil within the Cliff Head structure is contained within a stacked series of sands sealed by the Early Triassic Kockatea Shale.

2021 04 16 Cliffhead Resource Report Ver 1.docx Page 7
The seismic data over the Cliff Head field consists of a loose grid of 2D lines, of variable coverage and quality, and a 3D dataset acquired in late 2003. The Cliff Head 3D seismic data was reprocessed during 2H 2019 using velocity interpretation and Pre-Stack Depth Migration (PSDM) technology. A PSDM volume has been used to define the structure. A single oil water contact at 1,260 m TVDSS has been estimated from pressure gradient data.
The average net-to-gross ratio of the reservoir is about 87%, with average porosity about 18%. Permeabilities vary widely, from 1 mD to over 1,000 mD. Open fractures are reported from cored lower units of the Irwin River Coal Measures.
Table 2-1: Asset summary
Asset Operator Royal Working
Interest Status Comments Country Block
Australia WA-31-L Triangle Energy Ltd 21.25% Producing

2021 04 16 Cliffhead Resource Report Ver 1.docx Page 8
2.2. Terms of reference Pilot Energy Ltd (‘Client’) and Royal Energy Pty Ltd. (‘Royal’) commissioned RISC Advisory Pty Ltd (‘RISC’) to provide an independent review of the hydrocarbon resources of Royal in the Cliff Head Field, Block WA-31-L, offshore Western Australia, as shown in Figure 2-1 and Table 2-1.
RISC has relied upon the information provided by Royal Energy Pty Ltd and has undertaken the evaluation based on a review and audit of existing interpretations and assessments as supplied, making adjustments that in our judgment were necessary. Our assessment for the producing assets is based on production data to 15 February 2021.
RISC has reviewed the resources in accordance with the Society of Petroleum Engineers internationally recognised 2018 Petroleum Resources Management System (PRMS).
RISC’s methodology was to review a deterministic resource evaluation carried out by Triangle, test those evaluations using our own independent methods and modify as required. Details of the findings of our review and the resource estimation process are presented in this report.
We have reviewed the production forecasts, development plans and costs prepared by Triangle for our evaluation. The resources presented in this report are based on Triangle’s long term oil price projections which have been used for the economic cut off for resources.
Unless otherwise stated, all resources presented in this report are gross (100%) quantities with an effective date of 1 March 2021. All costs are in US$ real terms 2020.
We have not conducted a site visit of the offshore or onshore sites.

2021 04 16 Cliffhead Resource Report Ver 1.docx Page 9
3. Cliff Head Cliff Head has been producing since 2006 and resources relating to existing infrastructure are adequately estimated using performance methods, specifically decline curve analysis. Contingent resources relating to field extension using existing infrastructure have been included. Since these resources are not sensitive to geological interpretation, opinions and understanding of the geological details of the asset are not documented in this report.
Contingent resources related to new wells and as yet untapped areas, would require analysis and understanding of the geological interpretation and sensitivities. These resources are not covered in this report.
3.1.1. Fluid properties Table 3-1: Observed fluid properties in Cliff Head crude oil
Property Unit
Pressure Psig 1881
Temperature deg C 73
Formation volume factor (Boi) rb/stb 1.05
Gas oil ratio (Rsi) scf/stb 34
Oil viscosity cP 5.9
Stock tank oil gravity deg API 32.1
Pour Point deg C 34
Cloud Point (Wax Appearance Temperature) deg C 50
3.1.2. Well testing
Initially online testing was performed with dedicated Multi-Phase Flow Meters (MPFM) for each well. In recent years the accuracy of the MPFM’s has been in question and these results are now supplemented with regular physical sampling to confirm the water cut from each well.
Intake pressures are available from the ESP’s which allows continued monitoring and analysis of flowing pressures. The distance of the pressure gauges from the reservoir and flow within the horizontal wells prevents detailed pressure transient analysis (PTA). However, in RISC’s opinion PTA is not critical for such mature wells.

2021 04 16 Cliffhead Resource Report Ver 1.docx Page 10
4. Resources RISC has independently determined the basis of resource for the Cliff Head asset using a variety of techniques and concludes the operator’s estimation methods are reasonable.
4.1. Reservoir Development Plan The Cliff Head development plan has remained unchanged since first oil, although continued improvement and operational efficiencies have occurred as required. The original development plan contained 4 horizontal production wells, 2 vertical production wells, 2 vertical water injection wells drilled from a normally unmanned platform and an onshore source water well. The development contains dry trees on a normally unmanned platform, approximately 14 km of production pipeline, 14 km of produced water injection pipeline, the Arrowsmith Stabilisation Plant (ASP) and truck loading facility.
One of the initial production wells, CH-09H, produced water almost immediately, the cause of which is generally considered to be due to a highly conductive connection to the aquifer (fault/fracture), and it was later turned into a water injection well to assist with reservoir flood conformance. All the production wells were originally produced using coiled tubing deployed Electrical Submersible Pumps (ESPs), these are now being replaced by tubing conveyed ESPs as opportunity allows. The original ESPs were replaced with larger capacity pumps as required and the wells now produce to the overall liquid capacity limits of the ASP. Injected water was initially sourced from the onshore water well, but as the produced watercut increased produced water replaced the onshore source. Injected water is now exclusively reinjected produced water. A combination of water injection and aquifer influx has been very effective at maintaining reservoir pressure with minimal loss in observed pressure through time. RISC considers the Cliff Head field to be fully developed. However, Triangle continues to assess the potential for undeveloped volumes on the license.
The JVP continue to invest in workovers to replace failed ESPs with CH-06 being scheduled for replacement in June 2021.

2021 04 16 Cliffhead Resource Report Ver 1.docx Page 11
4.2. Production Forecasts
Figure 4-1: Field production history
Triangle conducted decline curve analysis for 1C, 2C and 3C production profiles based on water-oil ratio of individual wells or pools. A pool decline analysis was applied on CH06, CH07H and CH13H with CH10 and CH 12 analysed individually. RISC has performed decline analysis at the field level and on each well individual.
Given the extensive production history in the field, RISC finds decline curve analysis to reasonably estimate the future performance of the field. RISC has undertaken an independent production decline analysis of the producing wells, using exponential (b=0), hyperbolic (0<b<1) and harmonic (b=1) decline rates fitted to stable oil production history to estimate the range of resource. Oil-cut and water-oil ratio versus cumulative production were also used as confirmatory methods for low and high side ultimate recoveries demonstrated by oil rate versus cumulative production. All methods compare EUR at comparable cutoffs1. Table 4-1 summarises the 1C and 3C cutoffs used in each method for each well. Well cutoffs did not influence the basis of resource which is curtailed through an economic cutoff.
1 For the 3P cases it was necessary to increase the 1P cut off due to the harmonic solution not approaching the cut-off within a reasonable time.
0
5000
10000
15000
20000
25000
30000
35000
0
2000
4000
6000
8000
10000
12000
14000
Wat
er R
ate
(stb
/d)
Oil
Rate
(stb
/d)
Field Production History
CH-06 CH-07H CH-09H CH-10 CH-12 CH-13 Field Water rate

2021 04 16 Cliffhead Resource Report Ver 1.docx Page 12
Table 4-1: Cutoffs used for different methods
Well Name Liquid rate
(stbd)
Oil rate cutoff (stbd) WOR at 3C cutoff (bbl/stb)
Oil cut at 1C cutoff (%) 1C 3C
CH-06 392 3 3 129 0.8
CH-07H 3,400 3 10 332 0.1
CH-10 5,900 3 10 587 0.1
CH-12 14,400 3 10 1,428 0.02
CH-13 6,900 5 5 1,428 0.1
RISC conducted decline analysis on monthly oil rates with forecast uptime assumptions used to generate future production profiles. Triangle suggested uptime of 95% for 1C and 2C, which includes major unplanned failures in line with historical frequency and 97% for 3C with no major failures. ESP failures and scheduled shutdowns are modelled explicitly in production profile on top of the mentioned uptimes.
Figure 4-2: ESP run life history
RISC finds the uptimes reasonable and in line with historical production and therefore used these uptimes for 1C, 2C and 3C production forecasting.

2021 04 16 Cliffhead Resource Report Ver 1.docx Page 13
4.2.1. CH-06
CH-06 has been online since 2006 with an ESP used as artificial lift. The production peaked at 325 stb/d at the end of 2007 and started to decline with increased water cut. The ESP failed in 2009 which was replaced, and the well was back online in early 2010. The ESP failed again in June 2020 causing the well to shut down. A workover to replace the ESP is planned for June 2021. Prior to shutdown production was 120 stb/d and 84% water cut, Figure 4-3.
Figure 4-3: CH-06 production history

2021 04 16 Cliffhead Resource Report Ver 1.docx Page 14
RISC conducted decline analysis on oil rate vs cumulative oil in intervals with stable liquid rate and water cut using a b factor of 0 (exponential), 0.5 and 0.9 for low, mid and high performance respectively. Since the well is currently shutdown, RISC estimated a range of initial rate and shifted the decline fitted to the production data to the estimated rates, Figure 4-4.
Figure 4-4: CH-06 1C (red), 2C (green) and 3C (blue) decline analysis

2021 04 16 Cliffhead Resource Report Ver 1.docx Page 15
Figure 4-5 illustrates the 3C decline from oil rate versus oil cumulative and WOR analysis on a logarithmic scale as a quality check for the rate versus cum method. Water-oil ratio (expressed as log WOR versus cumulative production) has been used to estimate recovery under late-life, high water cut production as a high side cross check. The high performance forecast from oil rate vs cumulative production decline analysis shows reasonable straight line fit to the historic trend of WOR (Logarithmic scale) vs cumulative production.
Figure 4-5: EUR comparison of CH-06 rate vs cum and log WOR vs cum- High side

2021 04 16 Cliffhead Resource Report Ver 1.docx Page 16
Figure 4-6 illustrates the low performance exponential decline from oil rate versus oil cumulative fitted to a stable production period. For the oil cut analysis, the decline trend from the diagnostic lines are shifted to the latest data. The EUR from oil cut analysis is similar to the EUR from the rate versus cum method.
Figure 4-6: EUR comparison of CH-06 rate vs cum and oil cut vs cum – Low side

2021 04 16 Cliffhead Resource Report Ver 1.docx Page 17
4.2.2. CH-07H
CH-07H has been online since 2006 with an ESP used as artificial lift. The production peaked at 2,700 stbd and started to decline with increased water cut. The ESP failed late 2017 and was replaced in January 2019. The well was worked over in November 2020 to repair a hole in the production tubing which allowed replacement of the ESP with a tubing deployed assembly, Figure 4-7.
Figure 4-7: CH-07H production history

2021 04 16 Cliffhead Resource Report Ver 1.docx Page 18
RISC conducted a decline analysis on oil rate vs cumulative oil during stable production periods using a b factor of 0 (exponential), 0.5 and 0.9 for low, mid and high performance respectively, Figure 4-8.
Figure 4-8: CH-07H 1C (red), 2C (green) and 3C (blue) decline analysis

2021 04 16 Cliffhead Resource Report Ver 1.docx Page 19
Figure 4-9 illustrates the high-performance decline from oil rate versus oil cumulative compared to WOR analysis on logarithmic scale. Water-oil ratio has been used to estimate recovery under late-life, high water cut production as a high side cross check. The high-performance forecast from oil rate vs cumulative production decline analysis shows reasonable straight line fit to the historic trend of WOR (Logarithmic scale) vs cumulative production.
Figure 4-9: EUR comparison of CH-07H rate vs cum and log WOR vs cum- High side
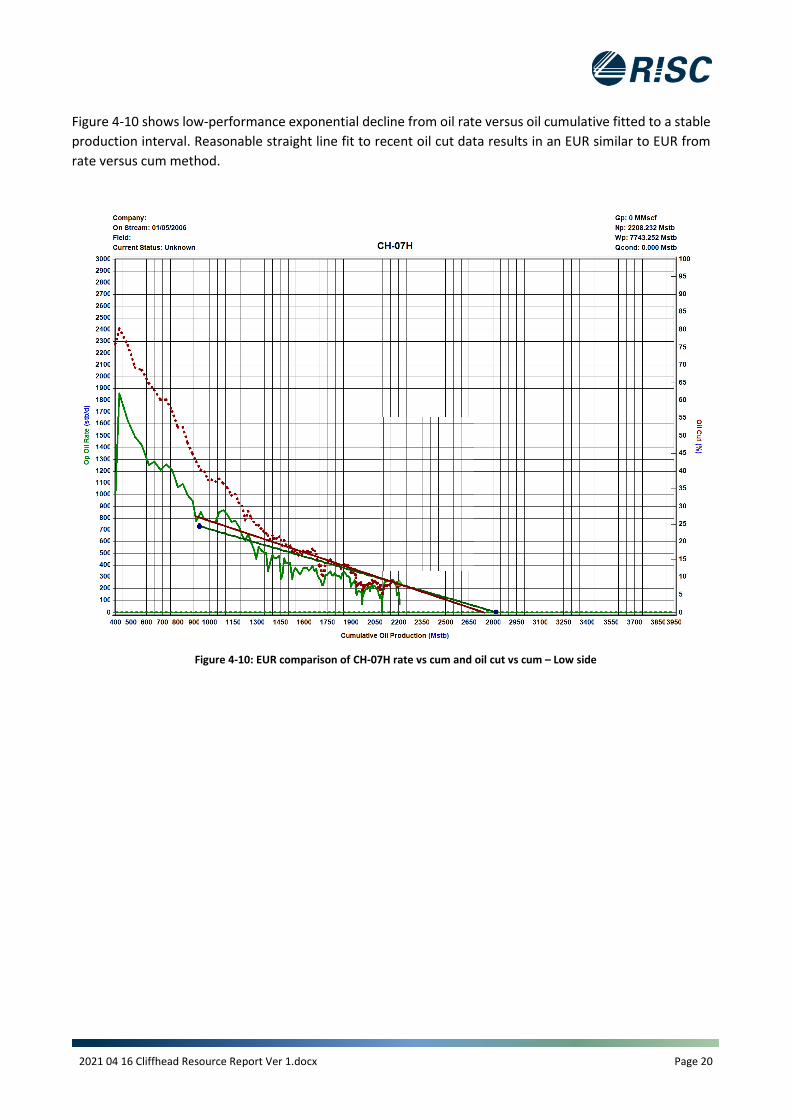
2021 04 16 Cliffhead Resource Report Ver 1.docx Page 20
Figure 4-10 shows low-performance exponential decline from oil rate versus oil cumulative fitted to a stable production interval. Reasonable straight line fit to recent oil cut data results in an EUR similar to EUR from rate versus cum method.
Figure 4-10: EUR comparison of CH-07H rate vs cum and oil cut vs cum – Low side

2021 04 16 Cliffhead Resource Report Ver 1.docx Page 21
4.2.3. CH-10
CH-10 started producing in 2006 with average rate of 1200 stbd. The ESP was installed in 2009 which doubled the oil rate to 2400 stbd in January 2010. ESP has been running for over 10 years now, and oil rate is on a steady decline since installation of the ESP.
Figure 4-11: CH-10 production history

2021 04 16 Cliffhead Resource Report Ver 1.docx Page 22
Decline curve analysis for CH-10 is based on production data since late 2018, when a change in well measurement method occurred. The previous method, Coriolis metering, historically proved to be unreliable at high water cut wells (>95%). The well is a low performing well and does not contribute significantly to resources. Figure 4-12 illustrates the low, mid and high-performance decline analysis for CH-10, physical testing of watercut began at approximately 3,625 Mstb indicated by the sudden change to allocated production.
Figure 4-12: CH-10 1C (red), 2C (green) and 3C (blue) decline analysis

2021 04 16 Cliffhead Resource Report Ver 1.docx Page 23
Figure 4-13 and Figure 4-14 show the EUR for high side and low side cross checked with WOR (log) and oil cut (linear) analysis respectively.
Figure 4-13: EUR comparison of CH-10 rate vs cum and log WOR vs cum- High side
Figure 4-14: EUR comparison of CH-10 rate vs cum and oil cut vs cum – Low side

2021 04 16 Cliffhead Resource Report Ver 1.docx Page 24
4.2.4. CH-12
CH-12 started production in 2006 with peak production of 5500 stbd. The well was part of the Liquid Acceleration Program (LAP) to increase ESP offtake volumes in 2011. The pump failed in 2018 and was replaced, Figure 4-15.
Figure 4-15: CH-12 production history
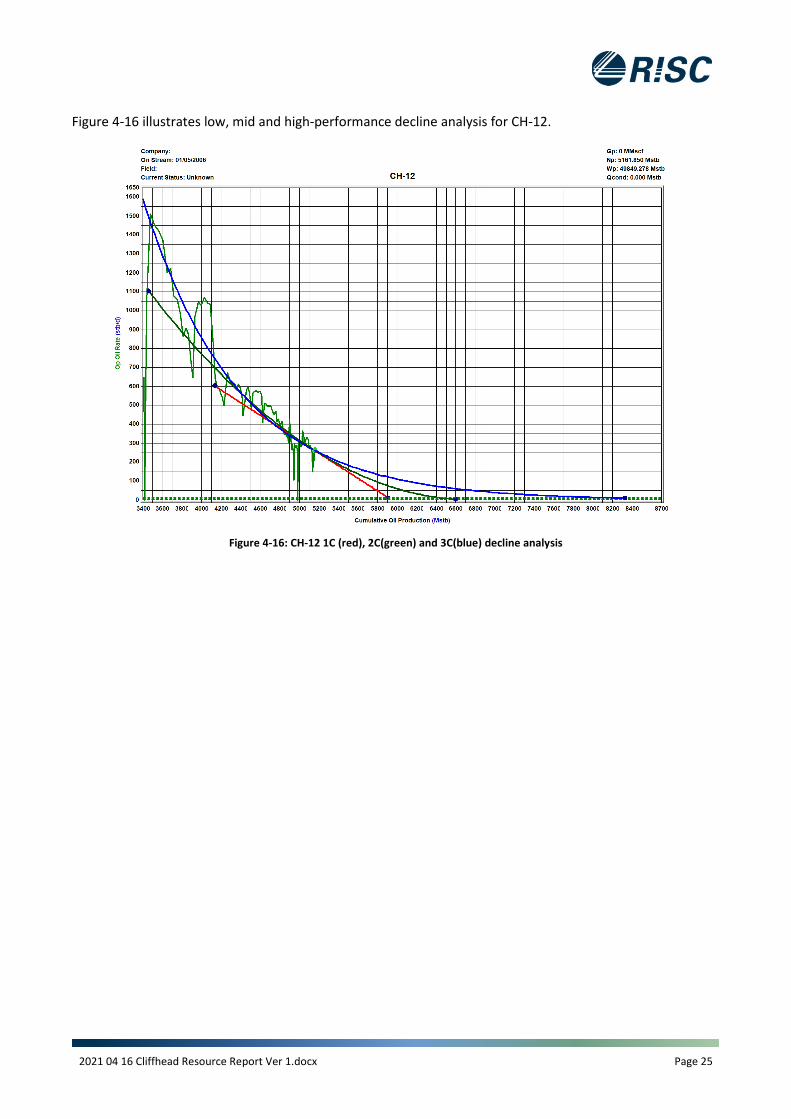
2021 04 16 Cliffhead Resource Report Ver 1.docx Page 25
Figure 4-16 illustrates low, mid and high-performance decline analysis for CH-12.
Figure 4-16: CH-12 1C (red), 2C(green) and 3C(blue) decline analysis

2021 04 16 Cliffhead Resource Report Ver 1.docx Page 26
Figure 4-17 illustrates the high side oil rate and WOR analysis. Oil rate decline analysis is based on harmonic decline through data after the LAP where liquid rates are stable. However, WOR analysis is based on straight line fit through most of the historic data as increases in liquid rate does not affect the WOR analysis. Both methods are approaching similar EURs.
Figure 4-17: EUR comparison of CH-12 rate vs cum and log WOR vs cum- High side

2021 04 16 Cliffhead Resource Report Ver 1.docx Page 27
Figure 4-18 contains the low performance oil rate decline analysis by using exponential decline through the production data after LAP. Low side EUR is confirmed by straight line fitted to the oil cut vs cumulative data on linear scale.
Figure 4-18: EUR comparison of CH-12 rate vs cum and oil cut vs cum – Low side

2021 04 16 Cliffhead Resource Report Ver 1.docx Page 28
4.2.5. CH-13
CH-13 started producing in 2006 and production peaked in 2007 at a rate of 4,800 stbd. The ESP has failed three times since 2006 when production started, in 2014, 2016 and 2019, Figure 4-19.
Figure 4-19: CH-13 production history

2021 04 16 Cliffhead Resource Report Ver 1.docx Page 29
Figure 4-20 contains the low, mid and high-performance decline curves using exponential, hyperbolic and harmonic decline for CH-13.
Figure 4-20: CH-13 1C (red), 2C (green) and 3C (blue) decline analysis

2021 04 16 Cliffhead Resource Report Ver 1.docx Page 30
The 3C decline from oil rate versus cumulative is compared to the EUR from WOR analysis in Figure 4-21. Oil rate decline is passed through recent stable production data. The EUR from WOR analysis is estimated using a reasonable straight line fit through most of the historic data. The EUR from both methods are approaching a similar value.
Figure 4-21: EUR comparison of CH-13 rate vs cum and log WOR vs cum- High side

2021 04 16 Cliffhead Resource Report Ver 1.docx Page 31
Figure 4-22 illustrates low performance decline from oil rate versus cumulative oil using an exponential fit through the most recent production data, compared to the oil cut analysis using a straight line fit through production data after 2010. Both methods are approaching similar EUR.
Figure 4-22: EUR comparison of CH-13 rate vs cum and oil cut vs cum – Low side

2021 04 16 Cliffhead Resource Report Ver 1.docx Page 32
4.3. Field Analysis RISC also conducted a full field analysis as an additional check to the sum of individual wells. For low performance, RISC used exponential decline on rate versus cum through production data with stable online wells and liquid rates, confirmed by field oil cut analysis. For high performance, RISC used harmonic decline for oil rate versus cumulative oil, confirmed by full field WOR analysis. Full field analysis and sum of individual wells are in good agreement.
Figure 4-23: RISC full field decline analysis (orange) vs sum of individual well analysis(green)
4.4. Comparison of RISC and operator’s production forecasts RISC has applied uptime of 95% for 1C and 2C and 97% for 3C on each well’s production forecast to address unplanned downtime. In addition, ESP failures and planned downtime are modelled explicitly as below for each well:
ESP failures: every 5, 6 and 7 years in 1C, 2C and 3C, respectively. ESPs each require 5 months to be repaired.
Major shutdowns: On advice from Triangle’s operation team, the field will be shut down for 4 days in February each year.

2021 04 16 Cliffhead Resource Report Ver 1.docx Page 33
RISC applied well and facility uptime to each well’s production forecast and compared the final 1C, 2C and 3C field production forecast with the operator’s. Figure 4-24 shows although RISC has a wider range of estimates compared to the operator, the differences are in an acceptable range. RISC accepts the Triangle production profiles as reasonable.
Figure 4-24: RISC (dashed line) vs Triangle (solid lines) 1C, 2C and 3C production forecast comparison
4.5. Resource summary RISC has independently evaluated the Cliff Head resources and accepts the operators production forecast methods as reasonable based on the 2018 PRMS. We have addressed the sensitivity of the mid performance forecast to reasonable variation in operating costs and price premium/discount to the combined EIA short term forecast and Bloomberg long term oil price forecast used by the operator. Cliff Head will require continued JVP support for ESP replacements to support the technical forecast. Material changes (-10%) in the oil price will have an impact on the resource estimate.
RISC notes that under 2018 PRMS section 3.1.3.5 “In some situations, entities may choose to initiate production below or continue production past the economic limit. Production must be economic to be considered as Reserves, and the intent to or act of producing sub-economic resources does not confer Reserves status to those quantities. In these instances, the production represents a movement from Contingent Resources to Production. However, once produced such quantities can be shown in the reconciliation process for production and revenue accounting as a positive technical revision to Reserves. No future sub-economic production can be Reserves.” This guideline defines the nature of production that

2021 04 16 Cliffhead Resource Report Ver 1.docx Page 34
occurs whilst the export route remains in doubt. It is reconciled by a contingent volume moving to production.
No allowance is required for fuel and flare since fuel requirements are met by imported gas.
Table 4-2: Royal Energy Pty Ltd resources as at 01/03/2021
Field Unit Gross (100%) Net (Royal 21.25%)
1C 2C 3C 1C 2C 3C
Economic limit of contingent resource Date June
2023 June 2026
June 2028
June 2023
June 2026
June 2028
Contingent resource MMstb 0.586 1.279 1.804 0.125 0.272 0.383
Notes: 1. Deterministic evaluation methods have been used. 2. Resources comply with PRMS 2018
a. The PRMS (Section 3.1.3.5) accounts for the current production of contingent resources by moving crude volumes directly to produced without being declared a reserve.
3. Fuel is imported, no production is consumed in operations

2021 04 16 Cliffhead Resource Report Ver 1.docx Page 35
5. Capital and Operating Costs RISC has reviewed the costs in the economic models supplied by the operator and consider them to be reasonable. Production volumes are classified as a contingent resource. RISC has used current price and cost forecasts to determine the economic limits of the contingent resource volumes. However, once an alternative commercial arrangement has been agreed the economics and economic cut-off will need to be adjusted when the contingent resource is re-categorised as a reserve.
5.1.1. Capital costs
No future capital costs are scheduled. The Cliff Head oil field is a late life asset and no future development is planned. Expenditure instead focuses on well interventions to continue production from existing wells which is classified as a separate opex item by the operator. This is accepted by RISC.
5.1.2. Operating costs
RISC has reviewed the operator’s estimate of operating costs which is based on the FY2021 budget and includes a Late Life Opex (LLO) reduction model. This estimate does not include well interventions, which are modelled separately. Overall, we consider the methodology to be appropriate, however, we caution that there is risk associated with the scheduled timing of the LLO model in each resource case. RISC’s experience indicates it is challenging to gain full advantage of LLO reduction strategies since investment options are often available that delay commitment to the strategy.
The annual fixed opex is estimated to be A$14.85 million (A$1.24 million per month), based on the FY2021 budget. This estimate is applied in the low, mid and high forecast cases across each year that is not covered under the LLO reduction model. Figure 5-1 shows the Cliff Head monthly opex performance over the last three years compared to the Brent oil price. As can be seen the monthly opex dropped significantly with oil price from April 2020. While it is expected that costs are lowered in an oil price downturn, this strategy is often not sustainable over the long term as the oil price recovers. The forecast monthly opex of A$1.24 million is in line with the low oil price operating strategy and is low compared to the average over the last three years.

2021 04 16 Cliffhead Resource Report Ver 1.docx Page 36
Figure 5-1: CHJV operational expenditure and BP oil price
RISC was provided with the monthly opex breakdown from March to August 2020 which is shown in Figure 5-2 compared to the average Brent oil price. The March 2020 total of A$1.63 million included costs of ~A$140,000 that were associated with the CHA electrical incident. Without considering the extra incident costs the total opex of approximately A$1.5 million is comparable to the historical average. The August 2020 total was the highest since March at A$1.15 million with an average Brent oil price of US$45.28/bbl. The main cost reductions compared to March were within the “general studies and improvements”, “regulatory licenses and fees”, and “non-routine capex” sub sections. Considering this is a late life asset RISC can accept that these cost reductions can be maintained moving forward and notes that there is approximately A$100,000 more in the forecast monthly budget to allow for non-routine capex or opex events. Furthermore, RISC performed sensitivities on the fixed monthly opex and found that it can increase to A$1.60mm and the maximum cumulative cashflow will remain positive at the mid performance estimated end of field life (EoFL) of June 2026. As a result, RISC accepts the forecast annual fixed opex of A$14.85 million (A$1.24 million/month) as reasonable.
Forecast monthly opex A$1.24mm

2021 04 16 Cliffhead Resource Report Ver 1.docx Page 37
Figure 5-2: Cliff Head monthly opex and average monthly Brent oil price from March to August 2020
Non-routine well intervention costs have been modelled as a separate opex item in the cashflow model. The two main projects in the forecast include completion conversions from coiled tubing deployed Electrical Submersible Pumps (ESP’s) to tubing conveyed ESP’s, and replacement of ESP’s that have already undergone conversion. These two projects are estimated to cost A$2.40 million and A$1.35 million, respectively. The higher conversion cost is based on actual observed costs from previous jobs and the AFEs for the upcoming workover of CH-06. The A$1.35 million cost of tubing conveyed ESP replacements are based on the mid-case forecast cost for the entire operation, including inventory restocking. RISC consider these estimates to be reasonable. As discussed in section 4.1 the ESPs are scheduled to be replaced every five, six and seven years in the low, mid and high forecasts, respectively. Considering the historical ESP runtime, RISC accepts the ESP replacement model to be reasonable for planning purposes.
The variable opex is fixed across the model at A$4.96/bbl and consists solely of trucking costs. The value is based on the current rate charged by the trucking contractor. As shown in Figure 5-3, the rate of A$4.96/bbl is representative of the last two years of rates charged and is accepted by RISC (noting that this is likely to change with a different export route option)

2021 04 16 Cliffhead Resource Report Ver 1.docx Page 38
Figure 5-3: Cliff Head crude trucking rates over time
The LLO model was constructed for the cash flow modelling to account for the expected opex reduction towards the end of field life. The annual opex estimate for this model is A$12.65 million (~A$1.05 million per month) and involves minimal capex and opex spend for the final two years of field life. The operator advises that the Cliff Head operations team has communicated to them that a LLO model will only be sustainable for two years from the date of implementation. Beyond this time major inspection and maintenance costs will be required to continue safe operation of the facilities. The reduced late life opex of A$1.05 million per month is supported by the performance for April to August 2020 (Figure 5-2). RISC notes that the average monthly opex for this period was A$1.06 million. Considering the two-year limit placed on this reduced opex model RISC can accept the annual estimate of A$12.65 million as reasonable.
The mid performance opex forecast to the estimated EoFL can be seen in Figure 5-4.

2021 04 16 Cliffhead Resource Report Ver 1.docx Page 39
Figure 5-4: Operator Cliff Head annual opex forecast
Although the annual estimate for the LLO model is acceptable, RISC cautions that there is risk associated with the scheduled timing of the model. The EoFL for the 1C, 2C and 3C contingent resource cases occurs when the field has reached the maximum cumulative cashflow. This point can also be defined by an ESP failure. This is when the replacement of an ESP is not economically justified by the remaining production of the field. The LLO model in each resource case is scheduled to be implemented two years before the economic cut-off. While the economic cut-off is determined by sound logic and forecasting, there is inherent risk in planning important operational strategies around such long-term forecasts. A portion of the higher net positive cashflow could be missed if the JVP implement the LLO model two years before the predicted EoFL and an ESP fails earlier than expected. Conversely implementation of the LLO model may cause EoFL due to lower maintenance activity.
5.1.3. Abandonment costs
RISC has reviewed the operator’s Abandonment provisioning including the history of abandonment studies undertaken by both the current (Triangle) and previous operator (Roc).
Abandonment estimates over the past decade range from a low of A$25 million (the current estimate from 2018) up to a high of A$49 million in 2015 (previous operator estimate).
We note that the current Triangle estimate does not include any costs for the decommissioning and rehabilitation of the Arrowsmith onshore processing plant which is part of the JVP obligations and should be included.
RISC’s own high-level estimate falls within the range indicated above and aligns most closely with both the previous operator’s estimate from 2014 and the independent review carried out by DecomRem in 2017.
Late life opex model applied to the final two years

2021 04 16 Cliffhead Resource Report Ver 1.docx Page 40
RISC recommends using an estimate of A$35-40 million for the decommissioning, abandonment and rehabilitation costs of the Cliffhead and Arrowsmith production facilities.
RISC has assumed that abandonment will be carried out as a 2-year project following cessation of production (CoP), with well abandonment occurring approximately 12 months following CoP and abandonment of the facilities shortly after the wells. We recognise that there are potential developments that might extend the facilities (and field) life, and several options to re-use the facilities which may result in deferral of abandonment. These are outlined in section 7.

2021 04 16 Cliffhead Resource Report Ver 1.docx Page 41
6. Commercial The operator has constructed cash flow models for the 1C, 2C and 3C performance cases to determine the economic cut-off of the field for these scenarios. As mentioned in the previous section the contingent EoFL occurs when the field has reached its maximum value. The cash flow models use the production and opex forecasts described in this report.
6.1. Economic assumptions The Brent oil price forecast used in the financial modelling is based on the Bloomberg long term forecast combined with the near-term price (to end 2020) from the Short Term Energy Outlook (STEO), estimated by the United States Energy Information Agency (EIA). The forecast can be seen in Figure 6-1.
Figure 6-1: Triangle Brent oil price forecast
The Cliff Head Joint Venture (CHJV) crude traded on parity with Brent until the oil price crash of 2014 (Figure 6-2). Onwards from there the CHJV realised price remained well below the Brent price with average price differential from the last six years being -US$3.48. However, the differential decreased in the last two years, partly because the lower sulphur content has attracted a premium. The average price differential in the last two years has been -US$1.04. RISC examined the sensitivity to the price index used and concludes the cashflow remains positive at the 2C estimated EoFL using the Bloomberg long term forecast, Figure 6-1.

2021 04 16 Cliffhead Resource Report Ver 1.docx Page 42
Figure 6-2: CHJV realised crude price vs. dated Brent price
The remaining economic and fiscal assumptions are summarised in Table 6-1. These parameters are constant across in the entirety of the financial model and are the same in all resource cases.
Table 6-1: Economic and fiscal assumptions
Economic or fiscal parameter Value used in financial modelling
Foreign exchange rate (USD/AUD) 0.72
Consumer price index (CPI) rate (% p.a.) 2.4%
Long-term bond rate (% p.a.) 3%
Corporate income tax rate 30%
Petroleum resource rent tax (PRRT) rate 40%

2021 04 16 Cliffhead Resource Report Ver 1.docx Page 43
6.2. Economic modelling The 1C 2C and 3C cashflow curves for the Cliff Head oil development can be seen in Figure 6-3, Figure 6-4 and Figure 6-5 respectively.
Figure 6-3: 1C cashflow curve
Figure 6-4: 2C cashflow curve

2021 04 16 Cliffhead Resource Report Ver 1.docx Page 44
Figure 6-5: 3C cashflow curve

2021 04 16 Cliffhead Resource Report Ver 1.docx Page 45
7. Opportunities and risks As an asset committed to late life management methods the Cliff Head resource position is currently defined by strategies that refine and improve on the operating margin. RISC notes that whilst late life cost-out opportunities can reliably improve on diminishing margins, late life risks tend to be more volatile in nature being related to equipment failures and sensitive to commodity price. Individual events may trigger cessation of production and cessation of production at any point in time may be interpreted differently by involved parties which can have implications on future project approvals. This in turn could trigger end of field life.
Regionally there have been some examples of decommissioning liabilities not being met by permit owners which has met with a regulator response to protect the government in the future. Whilst we consider it unlikely that legislative changes will be retrospective, thereby not presenting a risk, the uncertain regulatory conditions could frustrate transactions of late life assets.
A collection of further development opportunities remain available for Cliff Head which include:
The contingent West High project which requires a well to be drilled from the Cliff Head Alpha (CHA) platform.
The contingent South East Nose project which requires a well to be drilled from the CHA platform. The prospective Mentelle project which could be tied back to CHA.
These would result in increased production levels and a probable deferral of abandonment beyond the currently identified timeframe.
Beyond these we understand that there is potential for re-use of the facilities. These include:
The potential for using the existing infrastructure for use in a Carbon Capture, Use and Storage development. This could involve the use of Enhanced Oil Recovery techniques to reinvigorate production from the Cliff Head field, and the potential for long term storage of CO2 captured from the Oakajee Strategic Infrastructure Area (or other industrial sources of CO2).
The potential for re-using the offshore facilities as a host platform for an offshore wind farm. The platform would likely house switch gear and transformers to enable power to be supplied to shore.
The use of CO2 in Enhanced Oil Recovery programs is well understood and there are many applications of CO2 EOR projects worldwide, particularly in the USA. EOR programs can increase both production rates and ultimate recovery of oil from suitable fields. If proven, a successful EOR project at Cliff Head could increase production and extend field life.
RISC is also aware of several studies into the re-use of existing offshore platforms. Offshore windfarms require transformer and inverter stations to enable them to supply electricity into the distribution network. Generally, these structures are smaller than conventional oil and gas platforms and RISC is aware of several that have been built in the North Sea by traditional Oil and Gas contractors.
Neptune Energy is also piloting a project in the North Sea to convert the Q13a platform into an offshore hydrogen production facility using offshore wind power.
RISC is of the view that the Cliff Head platform could be modified to accommodate:
CO2 injection facilities to allow for EOR and/or Carbon storage, and/or Electrical substation and control facilities for an offshore wind farm.
Either of these options would increase the life of the existing facilities and defer abandonment expenditure.

2021 04 16 Cliffhead Resource Report Ver 1.docx Page 46
There are several opportunities identified above, each with different investment requirements and risks. Any one of these projects, if successful, could defer some or all the abandonment obligations of the CHJV significantly. These opportunities are not currently capable of being valued because they are either in an early stage of planning (alternative use of the facilities) or additional work has not been undertaken (contingent and prospective projects of Cliff Head).
The strategic value of these opportunities is yet to be demonstrated. As such it would not be unreasonable to undertake a valuation scenario where the abandonment costs are delayed for a number of years, providing the risks associated with this are taken into account.

2021 04 16 Cliffhead Resource Report Ver 1.docx Page 47
8. Declarations
8.1. Terms of Engagement This report, any advice, opinions or other deliverables are provided pursuant to the Engagement Contract agreed to and executed by the Client and RISC.
8.2. Qualifications RISC is an independent oil and gas advisory firm. All the RISC staff engaged in this assignment are professionally qualified engineers, geoscientists or analysts, each with many years of relevant experience and most have in excess of 20 years.
RISC was founded in 1994 to provide independent advice to companies associated with the oil and gas industry. Today the company has approximately 40 highly experienced professional staff at offices in Perth, Brisbane, Jakarta and London. We have completed over 2,000 assignments in 70+ countries for nearly 500 clients. Our services cover the entire range of the oil and gas business lifecycle and include:
Oil and gas asset valuations, expert advice to banks for debt or equity finance; Exploration/portfolio management; Field development studies and operations planning; Reserves assessment and certification, peer reviews; Gas market advice; Independent Expert/Expert Witness; Strategy and corporate planning.
The preparation of this report has been managed by Mr Bill Billingsley who is an employee of RISC. Mr Billingsley is a member of the Society of Petroleum Engineers and holds a BSc (Chemistry), Bristol, 1994 and an MSc (Petroleum Engineering), Imperial College, 1995. Mr Billingsley has over 25 years' experience in the sector and is a qualified petroleum reserves and resources evaluator (QPRRE) as defined by ASX listing rules.
8.3. Standard Reserves and resources are reported in accordance with the definitions of reserves, contingent resources and prospective resources and guidelines set out in the Petroleum Resources Management System (PRMS) prepared by the Oil and Gas Reserves Committee of the Society of Petroleum Engineers (SPE) and reviewed and jointly sponsored by the American Association of Petroleum Geologists (AAPG), World Petroleum Council (WPC), Society of Petroleum Evaluation Engineers (SPEE), Society of Exploration Geophysicists (SEG), Society of Petrophysicists and Well Log Analysts (SPWLA) and European Association of Geoscientists and Engineers (EAGE), revised June 2018.
8.4. Limitations The assessment of petroleum assets is subject to uncertainty because it involves judgments on many variables that cannot be precisely assessed, including reserves/resources, future oil and gas production rates, the costs associated with producing these volumes, access to product markets, product prices and the potential impact of fiscal/regulatory changes.
2021 04 16 Cliffhead Resource Report Ver 1.docx Page 48
The statements and opinions attributable to RISC are given in good faith and in the belief that such statements are neither false nor misleading. While every effort has been made to verify data and resolve apparent inconsistencies, neither RISC nor its servants accept any liability, except any liability which cannot be excluded by law, for its accuracy, nor do we warrant that our enquiries have revealed all matters which an extensive examination may disclose. In particular, our assessment for the producing assets is based on production data to 30 June 2020. Since publishing the original report, the Kwinana refinery, the export route for the crude oil, has announced it will close. We have not independently verified property title, encumbrances or regulations that apply to these assets.
RISC has also not audited the opening balances at the valuation date of past recovered and unrecovered development and exploration costs, undepreciated past development costs and tax losses.
Our review was carried out only for the purpose referred to above and may not have relevance in other contexts.
8.5. Independence RISC makes the following disclosures:
RISC is independent with respect to Royal Energy Pty Ltd and Triangle Global Energy Ltd and confirms that there is no conflict of interest with any party involved in the assignment.
Under the terms of engagement between RISC and Royal Energy Pty Ltd, RISC will receive a time-based fee, with no part of the fee contingent on the conclusions reached, or the content or future use of this report. Except for these fees, RISC has not received and will not receive any pecuniary or other benefit whether direct or indirect for or in connection with the preparation of this report.
Neither RISC Directors nor any staff involved in the preparation of this report have any material interest in Royal Energy Pty Ltd or in any of the properties described herein.
8.6. Copyright This document is protected by copyright laws. Any unauthorised reproduction or distribution of the document or any portion of it may entitle a claim for damages. Neither the whole nor any part of this report nor any reference to it may be included in or attached to any prospectus, document, circular, resolution, letter or statement without the prior consent of RISC.

2021 04 16 Cliffhead Resource Report Ver 1.docx Page 49
9. List of terms The following lists, along with a brief definition, abbreviated terms that are commonly used in the oil and gas industry and which may be used in this report.
Term Definition
1P Equivalent to Proved reserves or Proved in-place quantities, depending on the context.
1Q 1st Quarter
2P The sum of Proved and Probable reserves or in-place quantities, depending on the context.
2Q 2nd Quarter
2D Two Dimensional
3D Three Dimensional
4D Four Dimensional – time lapsed 3D in relation to seismic
3P The sum of Proved, Probable and Possible Reserves or in-place quantities, depending on the context.
3Q 3rd Quarter
4Q 4th Quarter
AFE Authority for Expenditure
Bbl US Barrel
BBL/D US Barrels per day
BCF Billion (109) cubic feet
BCM Billion (109) cubic metres
BFPD Barrels of fluid per day
BOPD Barrels of oil per day
BTU British Thermal Units
BOEPD US barrels of oil equivalent per day
BWPD Barrels of water per day
°C Degrees Celsius
Capex Capital expenditure
CAPM Capital asset pricing model
CGR Condensate Gas Ratio – usually expressed as bbl/MMscf
Contingent Resources
Those quantities of petroleum estimated, as of a given date, to be potentially recoverable from known accumulations by application of development projects but which are not currently considered to be commercially recoverable due to one or more contingencies. Contingent Resources are a class of discovered recoverable resources as defined in the SPE-PRMS.
CO2 Carbon dioxide
CP Centipoise (measure of viscosity)
CPI Consumer Price Index
DEG Degrees
DHI Direct hydrocarbon indicator
Discount Rate The interest rate used to discount future cash flows into a dollars of a reference date
DST Drill stem test
E&P Exploration and Production
EG Gas expansion factor. Gas volume at standard (surface) conditions/gas volume at reservoir conditions (pressure and temperature)
EIA US Energy Information Administration
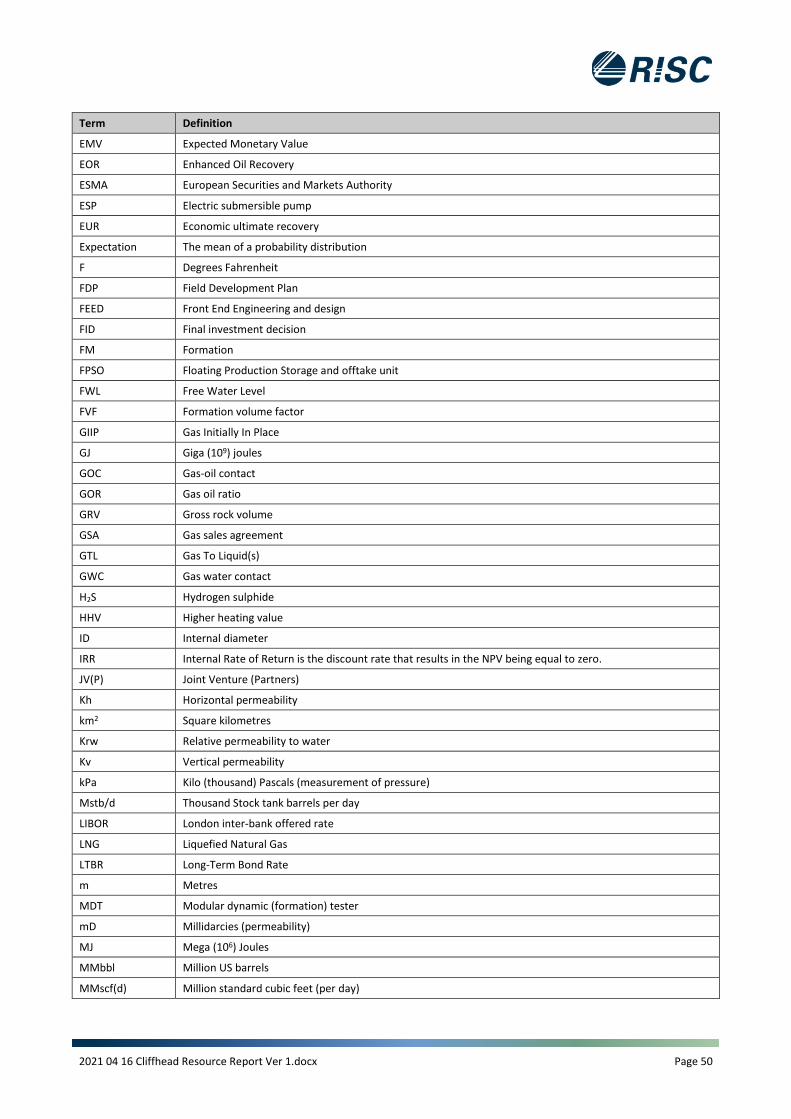
2021 04 16 Cliffhead Resource Report Ver 1.docx Page 50
Term Definition
EMV Expected Monetary Value
EOR Enhanced Oil Recovery
ESMA European Securities and Markets Authority
ESP Electric submersible pump
EUR Economic ultimate recovery
Expectation The mean of a probability distribution
F Degrees Fahrenheit
FDP Field Development Plan
FEED Front End Engineering and design
FID Final investment decision
FM Formation
FPSO Floating Production Storage and offtake unit
FWL Free Water Level
FVF Formation volume factor
GIIP Gas Initially In Place
GJ Giga (109) joules
GOC Gas-oil contact
GOR Gas oil ratio
GRV Gross rock volume
GSA Gas sales agreement
GTL Gas To Liquid(s)
GWC Gas water contact
H2S Hydrogen sulphide
HHV Higher heating value
ID Internal diameter
IRR Internal Rate of Return is the discount rate that results in the NPV being equal to zero.
JV(P) Joint Venture (Partners)
Kh Horizontal permeability
km2 Square kilometres
Krw Relative permeability to water
Kv Vertical permeability
kPa Kilo (thousand) Pascals (measurement of pressure)
Mstb/d Thousand Stock tank barrels per day
LIBOR London inter-bank offered rate
LNG Liquefied Natural Gas
LTBR Long-Term Bond Rate
m Metres
MDT Modular dynamic (formation) tester
mD Millidarcies (permeability)
MJ Mega (106) Joules
MMbbl Million US barrels
MMscf(d) Million standard cubic feet (per day)

2021 04 16 Cliffhead Resource Report Ver 1.docx Page 51
Term Definition
MMstb Million US stock tank barrels
MOD Money of the Day (nominal dollars) as opposed to money in real terms
MOU Memorandum of Understanding
Mscf Thousand standard cubic feet
Mstb Thousand US stock tank barrels
MPa Mega (106) pascal (measurement of pressure)
mss Metres subsea
MSV Mean Success Volume
mTVDss Metres true vertical depth subsea
MW Megawatt
NPV Net Present Value (of a series of cash flows)
NTG Net to Gross (ratio)
ODT Oil down to
OGIP Original Gas In Place
OOIP Original Oil in Place
Opex Operating expenditure
OWC Oil-water contact
P90, P50, P10 90%, 50% & 10% probabilities respectively that the stated quantities will be equalled or exceeded. The P90, P50 and P10 quantities correspond to the Proved (1P), Proved + Probable (2P) and Proved + Probable + Possible (3P) confidence levels respectively.
PBU Pressure build-up
PJ Peta (1015) Joules
POS Probability of Success
Possible Reserves
As defined in the SPE-PRMS, an incremental category of estimated recoverable volumes associated with a defined degree of uncertainty. Possible Reserves are those additional reserves which analysis of geoscience and engineering data suggest are less likely to be recoverable than Probable Reserves. The total quantities ultimately recovered from the project have a low probability to exceed the sum of Proved plus Probable plus Possible (3P) which is equivalent to the high estimate scenario. When probabilistic methods are used, there should be at least a 10% probability that the actual quantities recovered will equal or exceed the 3P estimate.
Probable Reserves
As defined in the SPE-PRMS, an incremental category of estimated recoverable volumes associated with a defined degree of uncertainty. Probable Reserves are those additional Reserves that are less likely to be recovered than Proved Reserves but more certain to be recovered than Possible Reserves. It is equally likely that actual remaining quantities recovered will be greater than or less than the sum of the estimated Proved plus Probable Reserves (2P). In this context, when probabilistic methods are used, there should be at least a 50% probability that the actual quantities recovered will equal or exceed the 2P estimate.
Prospective Resources
Those quantities of petroleum which are estimated, as of a given date, to be potentially recoverable from undiscovered accumulations as defined in the SPE-PRMS.
Proved Reserves
As defined in the SPE-PRMS, an incremental category of estimated recoverable volumes associated with a defined degree of uncertainty Proved Reserves are those quantities of petroleum, which by analysis of geoscience and engineering data, can be estimated with reasonable certainty to be commercially recoverable, from a given date forward, from known reservoirs and under defined economic conditions, operating methods, and government regulations. If deterministic methods are used, the term reasonable certainty is intended to express a high degree of confidence that the quantities will be recovered. If probabilistic methods are used, there should be at least a 90% probability that the quantities actually recovered will equal or exceed the estimate. Often referred to as 1P, also as “Proven”.
PSC Production Sharing Contract
PSDM Pre-stack depth migration
PSTM Pre-stack time migration

2021 04 16 Cliffhead Resource Report Ver 1.docx Page 52
Term Definition
psia Pounds per square inch pressure absolute
p.u. Porosity unit e.g. porosity of 20% +/- 2 p.u. equals a porosity range of 18% to 22%
PVT Pressure, volume & temperature
QA/QC Quality Assurance/ Control
rb/stb Reservoir barrels per stock tank barrel under standard conditions
RFT Repeat Formation Test
Real Terms (RT) Real Terms (in the reference date dollars) as opposed to Nominal Terms of Money of the Day
Reserves
RESERVES are those quantities of petroleum anticipated to be commercially recoverable by application of development projects to known accumulations from a given date forward under defined conditions. Reserves must further satisfy four criteria: they must be discovered, recoverable, commercial, and remaining (as of the evaluation date) based on the development project(s) applied. Reserves are further categorised in accordance with the level of certainty associated with the estimates and may be sub-classified based on project maturity and/or characterized by development and production status.
RT Measured from Rotary Table or Real Terms, depending on context
SC Service Contract
scf Standard cubic feet (measured at 60 degrees F and 14.7 psia)
Sg Gas saturation
Sgr Residual gas saturation
SRD Seismic reference datum lake level
SPE Society of Petroleum Engineers
SPE-PRMS
Petroleum Resources Management System, prepared by the Oil and Gas Reserves Committee of the Society of Petroleum Engineers (SPE) and reviewed and jointly sponsored by the American Association of Petroleum Geologists (AAPG), World Petroleum Council (WPC), Society of Petroleum Evaluation Engineers (SPEE), Society of Exploration Geophysicists (SEG), Society of Petrophysicists and Well Log Analysts (SPWLA) and European Association of Geoscientists and Engineers (EAGE), revised June 2018.
s.u. Fluid saturation unit. e.g. saturation of 80% +/- 10 s.u. equals a saturation range of 70% to 90%
stb Stock tank barrels
STOIIP Stock Tank Oil Initially In Place
Sw Water saturation
TCM Technical committee meeting
Tcf Trillion (1012) cubic feet
TJ Tera (1012) Joules
TLP Tension Leg Platform
TRSSV Tubing retrievable subsurface safety valve
TVD True vertical depth
US$ United States dollar
US$ million Million United States dollars
WACC Weighted average cost of capital
WHFP Well Head Flowing Pressure
Working interest
A company’s equity interest in a project before reduction for royalties or production share owed to others under the applicable fiscal terms.
WPC World Petroleum Council
WTI West Texas Intermediate Crude Oil

Report title Report subtitle
Independent Technical Specialist Report Pilot Energy Ltd – Australian Exploration Assets
January 2021 Private and Confidential

Pilot Energy Exploration Valuation January 2021 Page 1
1. Executive Summary Grant Thornton Corporate Finance Pty Ltd (“Grant Thornton”) has engaged RISC Advisory Pty Ltd (“RISC”) to
provide an update to its April 2018 Independent Technical Specialist Report (“ITSR”) of Pilot Energy Ltd
(“Pilot”) Australian exploration assets.
In 2020, Pilot announced that it was to acquire Royal Energy Pty Ltd (“Royal”) though an all-scrip
arrangement. Royal is a privately owned Australian oil and gas company which holds an indirect 21.25%
interest in the producing Cliff Head oilfield through its part ownership of the Cliff Head operating company.
In addition, Pilot has announced a share placement and a share purchase plan to secure additional working
capital. To assist with these corporate activities, Pilot has appointed Grant Thornton.
This document comprises an update to the draft April 2018 ITSR with the only changes being the removal of
the WA-503-P Exploration Permit from Pilot’s interests, changes in Pilot’s working interest in WA-481-P, EP
480 and EP 416 and amendments reflecting the renewal of the WA-481-P Exploration Permit in 2020.
Pilot’s Australian permits are detailed in Table 1-1. All the permits are located in the Perth Basin (Figure 2-1),
with WA-481-P located offshore in the northern Perth Basin, the adjacent permits EP 416 and EP 480 located
in the onshore southern Perth Basin and EP 437 located in the onshore northern Perth Basin.
Table 1-1: Pilot Energy Tenement Summary
Permit Name Type Granted Date Expiry Date Area Pilot Interest
Operator km2 %
WA-481-P Exploration 12/8/2012 12/8/2025 8,605 21.25* Triangle
EP 480 Exploration 6/6/2012 31/3/2023 1,591
100 Pilot
EP 416 Exploration 14/10/2016 13/10/2021 100 Pilot
EP 437 Exploration 27/11/2019 27/5/2023 716 13.058 Key Petroleum
* Pilot announced on 9 November 2020 a sale of 78.75% interest to Triangle Energy. Sale has not currently completed.
Contingent Resources
Pilot added Contingent Resources to its portfolio when it acquired WA-481-P from Murphy Oil in July 2016.
Two discoveries have been made in the permit; the Dunsborough oil discovery and the Frankland gas
discovery, neither are currently commercially viable on a standalone basis.
Pilot has estimated the gas and oil Contingent Resources using probabilistic methods. RISC has reviewed
Pilot’s methods and considers the estimates reasonable. The Contingent Resource estimates are shown in
Table 1-2 and Table 1-3.

Pilot Energy Exploration Valuation January 2021 Page 2
Table 1-2: Pilot’s WA-481-P Contingent Oil Resources as at 31 January 2021
Accumulation Contingent Resources MMbbl
1C 2C 3C
Dunsborough Total Gross (100%) 3.3 6.0 9.8
Net attributable to Pilot (21.25% WI) 0.7 1.3 2.1
Notes:
1. “Gross” is 100% of the resources attributable to the licence.
2. “Net attributable to Pilot (21.25% WI)" based on Pilot's current working interest assumign the sale to Triangle is completed.
3. Note arithmetic aggregation of the Resources in the Dongara and IRCM reservoirs, as a result RISC cautions that the 1C aggregate quantities may be very conservative estimates and the 3C aggregate quantities may be very optimistic due to portfolio effects.
Table 1-3: Pilot’s WA-481-P Contingent Gas Resources as at 31 January 2021
Accumulation Contingent Resources Bcf
1C 2C 3C
Frankland Total Gross (100%) 29.4 41.6 58.9
Net attributable to Pilot (21.25% WI) 6.2 8.8 12.5
Notes:
1. "Gross" are 100% of the resources attributable to the licence.
2. "Net attributable to Pilot (21.25% WI)" based on Pilot's current working interest.
3. Note arithmetic aggregation of the Resources in the Dongara and IRCM reservoirs, as a result RISC cautions that the 1C aggregate quantities may be very conservative estimates and the 3C aggregate quantities may be very optimistic due to portfolio effects.
Prospective Resources
RISC has carried out a review of the independent prospective resource estimates for the offshore and
onshore permits in the Perth Basin by Pilot Energy and we consider them to be reasonable.
The estimated total unrisked Best estimate oil prospective resources net to Pilot is 48.2 MMbbl (Table 1-4)
and the total unrisked Best estimate gas prospective resources net to Pilot is 735 Bcf (Table 1-5). The majority
of the net prospective oil resources are in WA-481-P (48 MMbbls) and the majority of the net prospective
gas resources are in adjacent onshore permits EP 416 and EP 480 (725 Bcf).

Pilot Energy Exploration Valuation January 2021 Page 3
Table 1-4: Oil Portfolio Unrisked Prospective Resources as at 31 January 2021
Permit Gross (100%) MMbbl Net to Pilot MMbbl
Low Best High Low Best High
WA-481-P 124 224 388 26 48 82
EP 437 0.2 1.4 6.1 0.0 0.2 0.8
Total 120.2 225.4 394.1 26 48.2 82.8
1. Probabilistic methods have been used. Totals may differ due to rounding.
2. For WA-481-P the quoted prospective resources are the arithmetic sum of nine leads and prospects identified and estimated by Pilot and provided for RISC to review for this report.
3. EP 437 Prospective Resources have been provided by the operator, Key Petroleum and RISC has not been able to verify the accuracy of these estimates. They are insignificant in the portfolio.
4. The aggregate Low estimate may be a very conservative estimate and the aggregate High estimate may be a very optimistic estimate due to the portfolio effects of arithmetic summation.
5. The Prospective Resources are unrisked. Prospective Resources carry with them discovery and commercialisation risks.
6. The volumes are rounded to the nearest million barrels.
Table 1-5: Gas Portfolio Unrisked Prospective Resources as at 31 January 2021
Permit Gross (100%) Bcf Net Pilot Bcf
Low Best High Low Best High
WA-481-P 28 46 70 6 10 15
EP 416/EP 480 270 725 1,595 270 725 1,595
Total 298 771 1,665 276 735 1,610
1. Probabilistic methods have been used. Totals may differ due to rounding.
2. For WA-481-P the quoted prospective resources are the arithmetic sum of the two prospects with two reservoirs identified and estimated by Pilot, Frankland NE and Frankland NE2.
3. For EP 416/480 the quoted prospective resources are the arithmetic sum of the two reservoirs within the Leschenault Prospect identified by Pilot and have been audited by RISC in October 2016.
4. The aggregate Low estimate may be a very conservative estimate and the aggregate high estimate may be a very optimistic estimate due to the portfolio effects of arithmetic summation.
5. The Prospective Resources are unrisked. Prospective Resources carry with them discovery and commercialisation risks.
6. The volumes are rounded to the nearest Bcf.

Pilot Energy Exploration Valuation January 2021 Page 4
Valuation
As indicated above RISC considers the Pilot Energy Contingent Resources to be uncommercial, and therefore
we assign no current value.
The other Pilot permits are all early-stage exploration properties. RISC has therefore used the notional farm-
in and comparable transaction methods to estimate a market value under the requirements of the VALMIN
code. The values have been benchmarked by comparable transactions, where they exist.
Notional farm-in values are based on the promote/premium an incoming party (the farminee) is prepared to
pay the farminor for their equity. For example, a promote factor of 2 for 1 implies a 100% premium on the
farminor’s equity share of the future exploration costs and carries the farminor through those exploration
costs. The market value, therefore to the farminor, is the value of the share of its costs that are being carried
by the farminee. In the current depressed market RISC has generally used a range of 1.15 - 1.75 to 1 promote
on drilling expenditures (15%-75% uplift) and up to 4 to 1 for the initial lower cost exploration costs that give
an option to participate in a well at 1 for 1 (no promote).
Recent transactions in Pilot’s properties have been utilised by RISC to estimate low and mid case valuations
for WA-481-P, EP 416 and EP 480. Notional farm-in value method has been utilised for the EP 437 permit for
low, mid and high case valuations.
A range of values of the permits have been estimated. As the low and high values of the exploration assets
portfolio are derived by the arithmetic addition of the individual asset low and high values, respectively, they
represent the possible extremes of the exploration value envelop. While farminees into the individual
permits could value the assets at either end of the value range assessed, it is unlikely that potential buyers
of the exploration asset portfolio would value all of the assets at either all of the low or all of the high
estimated extremes. Their own assessments of individual permits will span the low, mid or high outcomes
based on factors including: their strategic objectives and region or geological basin focus; assessment of an
asset’s prospectivity and associated geological risks; the fiscal and regulatory framework applicable to the
asset; accessibility of commercialisation routes, including markets and infrastructure, for each asset; equity
interests, operator capability and joint venture partners in each asset.
RISC has estimated the low and high values of the portfolio of the exploration assets at an estimated one
standard deviation from the total mid value of the portfolio.
Table 1-6: Pilot Exploration Assets Valuation Summary
Exploration Assets Equity Interest % Valuation (A$ million)
Low Mid High
WA-481-P 21.25% 0.4 1.6 3.7
EP 416 & EP 480 100% 0.0 0.0 1.9
EP 437 13.058% 0.0 0.1 0.2
Total Pilot Permit Value 0.4 1.7 5.8
Pilot Early-Stage Exploration Portfolio Valuation Range 0.8 1.7 2.6

Pilot Energy Exploration Valuation January 2021 Page 5
Table of contents
1. Executive Summary ..................................................................................................................................... 1
2. Introduction ................................................................................................................................................. 9
2.1. Asset/ portfolio description ................................................................................................................. 9
2.2. Terms of reference ............................................................................................................................ 10
2.3. Exploration permit valuation ............................................................................................................. 11
2.3.1. Comparable Transaction Metrics .............................................................................................. 11 2.3.2. Farm-in Promotion Factors ........................................................................................................ 11 2.3.3. Work Program ........................................................................................................................... 11 2.3.4. Expected Monetary Value (EMV) .............................................................................................. 12
2.4. Resource Classification ...................................................................................................................... 12
3. WA-481-P (21.25% WI) .............................................................................................................................. 15
3.1. Overview ............................................................................................................................................ 15
3.2. WA-481-P Discoveries ....................................................................................................................... 17
3.2.1. Dunsborough Oil Discovery ....................................................................................................... 17 3.2.2. Frankland Gas Discovery............................................................................................................ 18 3.2.3. Perseverance Gas Discovery ...................................................................................................... 20
3.3. WA-481-P Prospects and Leads ......................................................................................................... 20
3.3.1. Cliff Head Area Prospects .......................................................................................................... 20 3.3.2. Leander Reef Leads .................................................................................................................... 22 3.3.3. Dunsborough Area Leads .......................................................................................................... 23 3.3.4. Frankland Prospects .................................................................................................................. 25 3.3.5. High Cliff / Kingia Play ................................................................................................................ 25
3.4. WA-481-P Contingent Resources ...................................................................................................... 27
3.5. WA-481-P Prospective Resources ..................................................................................................... 28
3.6. Status of the Committed Program .................................................................................................... 28
3.7. Exploration Program Costs ................................................................................................................ 31
3.8. WA-481-P Valuation .......................................................................................................................... 31
4. EP 416 and EP 480 (100% WI and Operator) ............................................................................................. 32
4.1. Overview ............................................................................................................................................ 32
4.2. Leschenault Prospect ......................................................................................................................... 33
4.3. EP 416 and EP 480 Prospective Resources ........................................................................................ 35
4.4. Status of Committed Program ........................................................................................................... 35
4.5. Exploration Program Costs ................................................................................................................ 37
4.6. EP 416 and EP 480 Valuation ............................................................................................................. 37
5. EP 437 (13.058% WI) ................................................................................................................................. 38
5.1. Overview ............................................................................................................................................ 38
5.2. EP 437 Prospects and Leads .............................................................................................................. 41

Pilot Energy Exploration Valuation January 2021 Page 6
5.2.1. Wye Knot Prospect .................................................................................................................... 41 5.2.2. Becos Lead ................................................................................................................................. 42 5.2.3. Conder South Lead .................................................................................................................... 43
5.3. EP 437 Prospective Resources ........................................................................................................... 44
5.4. Status of Committed Program ........................................................................................................... 44
5.5. Exploration Program Costs ................................................................................................................ 45
5.6. EP 437 Valuation ................................................................................................................................ 45
6. Valuation ................................................................................................................................................... 46
6.1. Methodology ..................................................................................................................................... 46
6.2. Transaction value .............................................................................................................................. 46
6.3. Notional Farm-in terms ..................................................................................................................... 47
6.4. Valuation summary ........................................................................................................................... 48
7. Declarations ............................................................................................................................................... 50
7.1. Terms of Engagement........................................................................................................................ 50
7.2. Qualifications ..................................................................................................................................... 50
7.3. Standard ............................................................................................................................................ 50
7.4. Limitations ......................................................................................................................................... 50
7.5. Independence .................................................................................................................................... 51
7.6. Copyright ........................................................................................................................................... 51
7.7. Authorisation for Release .................................................................................................................. 52
8. List of terms ............................................................................................................................................... 53

Pilot Energy Exploration Valuation January 2021 Page 7
List of figures
Figure 2-1: Location Map – Pilot’s Perth Basin exploration permits ................................................................... 9
Figure 2-2: Resources classification framework ................................................................................................ 12
Figure 3-1: Location Map – WA-481-P .............................................................................................................. 15
Figure 3-2: Offshore Northern Perth Basin Stratigraphy ................................................................................... 16
Figure 3-3: Dunsborough Top Dongara Sandstone Depth Map ........................................................................ 17
Figure 3-4: Dunsborough Wireline Log and Pressure Data ............................................................................... 18
Figure 3-5: Frankland Top Dongara Sandstone Depth Map .............................................................................. 19
Figure 3-6: Frankland-1 Wireline Log Data ........................................................................................................ 19
Figure 3-7: Cliff Head Prospects, Depth Map at Top Dongara Sandstone ........................................................ 21
Figure 3-8: Cliff Head Prospects, Composite Seismic Line ................................................................................ 21
Figure 3-9: Leander Reef-1, 2D Seismic Line ..................................................................................................... 22
Figure 3-10: Leander Reef Prospects, Depth Map at Top Dongara Sandstone ................................................. 23
Figure 3-11: Dunsborough Prospects, Depth Map at Top Dongara Sandstone ................................................ 24
Figure 3-12: Dunsborough Prospects, Composite Seismic Line ........................................................................ 25
Figure 3-13: Frankland Prospects, Depth Map at Top Dongara Sandstone ...................................................... 26
Figure 3-14: Frankland Prospects, Seismic tie line ............................................................................................ 26
Figure 4-1: Location Map – EP416 and EP480 ................................................................................................... 32
Figure 4-2: Southern Perth Basin Stratigraphy .................................................................................................. 33
Figure 4-3: EP 416 and EP 480 Leschenault Prospect ........................................................................................ 34
Figure 5-1: Location Map EP437 ........................................................................................................................ 38
Figure 5-2: EP437 Prospect and Lead Location Map ......................................................................................... 39
Figure 5-3: Northern Perth Basin Stratigraphy .................................................................................................. 40
Figure 5-4: Wye Knot Prospect .......................................................................................................................... 41
Figure 5-5: Becos Prospect ................................................................................................................................ 42
Figure 5-6: Conder South Prospect.................................................................................................................... 43

Pilot Energy Exploration Valuation January 2021 Page 8
List of tables
Table 1-1: Pilot Energy Tenement Summary ....................................................................................................... 1
Table 1-2: Pilot’s WA-481-P Contingent Oil Resources as at 31 January 2021 ................................................... 2
Table 1-3: Pilot’s WA-481-P Contingent Gas Resources as at 31 January 2021 .................................................. 2
Table 1-4: Oil Portfolio Unrisked Prospective Resources as at 31 January 2021 ................................................ 3
Table 1-5: Gas Portfolio Unrisked Prospective Resources as at 31 January 2021 ............................................... 3
Table 1-6: Pilot Exploration Assets Valuation Summary ..................................................................................... 4
Table 2-1: Pilot Energy Tenement Summary ..................................................................................................... 10
Table 2-2: Prospective Resources Definition ..................................................................................................... 13
Table 3-1: Pilot’s WA-481-P Contingent Oil Resources as at 31 January 2021 ................................................. 27
Table 3-2: Pilot’s WA-481-P Contingent Gas Resources as at 31 January 2021 ................................................ 27
Table 3-3: Pilot’s WA-481-P Unrisked Prospective Oil Resources as at 31 January 2021 ................................. 29
Table 3-4: Pilot’s WA-481-P Prospective Gas Resources as at 31 January 2021 ............................................... 30
Table 3-5: WA-481-P Permit Details and Work program .................................................................................. 30
Table 4-1: Pilot’s EP 416 and EP480 Prospective Resources (RISC) as at 31st October 2016 ............................ 35
Table 4-2: EP 416 Permit Details and Work Program ........................................................................................ 36
Table 4-3: EP 480 Permit Details and Work program ........................................................................................ 36
Table 5-1: EP 437 Prospective Resources for Wye Knot (Key Petroleum) as of 21st April 2017 ....................... 44
Table 5-2: EP 437 Permit Details and Work program ........................................................................................ 44
Table 6-1: Valuation Summary .......................................................................................................................... 48

Pilot Energy Exploration Valuation January 2021 Page 9
2. Introduction
2.1. Asset/ portfolio description
The location of Pilot’s Australian permits are shown in Figure 2-1 and detailed in Table 2-1. All the permits
are located in the Perth Basin, with WA-481-P located offshore in the northern Perth Basin, the adjacent
permits EP 416 and EP 480 located in the onshore southern Perth Basin and EP 437 located in the onshore
northern Perth Basin.
Figure 2-1: Location Map – Pilot’s Perth Basin exploration permits
The WA-481-P offshore permit covers a large portion of the offshore extension of the North Perth Basin, on
trend with the Cliff Head oil field and numerous onshore oil and gas discoveries. The permit is lightly explored
and contains discovered resources at Frankland (gas) and Dunsborough (oil). A previous Joint Venture with
Murphy Oil Australia as Operator acquired extensive 3D seismic and drilled the Koel-1, Cisticola-1 and
Munia-1 exploration wells in 2015. The permit was renewed in 2020 with a mandatory 50% relinquishment
of the original area.

Pilot Energy Exploration Valuation January 2021 Page 10
Table 2-1: Pilot Energy Tenement Summary
Permit Name Type Granted Date Expiry Date Area Pilot Interest
Operator km2 %
WA-481-P Exploration 12/8/2012 12/8/2025 8,605 21.25* Triangle
EP 480 Exploration 6/6/2012 31/3/2023 1,591
100 Pilot
EP 416 Exploration 14/10/2016 13/10/2021 100 Pilot
EP 437 Exploration 27/11/2019 27/5/2023 716 13.058 Key Petroleum
* Pilot announced on 9 November 2020 a sale of 78.75% interest to Triangle Energy. Sale has not currently completed.
The onshore northern Perth Basin EP 437 permit has had more drilling but the vast majority of the
exploration drilling was for very shallow targets of less than 1,000 m, drilled in the 1960’s and 1980’s. The
Dunnart-2 well is the most recent drilling in 2014 but again the total depth of the well was less than 1,000 m
at 657 metres.
The onshore southern Perth Basin permits EP 416 and EP 480 are sparsely explored with three wells in the
southern Perth Basin permits, Pinjara-1 (1965) and Preston-1 (1966) drilled by WAPET and GSWA Harvey-1
(2012) drilled by the Geological Survey of WA.
2.2. Terms of reference
RISC is acting as an independent technical specialist to Grant Thornton as defined in the Code for Technical
Assessment and Valuation of Mineral and Petroleum Assets and Securities for Independent Expert Reports,
as amended (the VALMIN Code, 2015 Edition).
Grant Thornton has requested that RISC update its April 2018 Independent Technical Specialist Report
(“ITSR”) of Pilot Energy Ltd (“Pilot”) Australian exploration assets, to include:
▪ A review the exploration licenses and their hydrocarbon potential and form a view on the fair market
value of the Assets by:
- Reviewing the general prospectivity and identified leads and prospects and their prospective
resources estimates and the range of uncertainty attributable to the estimates and their risking;
- Reviewing the status of the committed work programs, variations sought to the work programs,
outstanding liabilities and farmout intentions;
- Reviewing exploration program costs for seismic and wells;
▪ An estimate of fair market value of the Company's interest in the Assets taking into account
commitments, recent relevant transaction data, market factors and project risks.
The data and information used in the preparation of this report were provided by Pilot and supplemented
by public domain information. RISC has relied upon the information provided and has undertaken the
evaluation on the basis of a review and audit of existing interpretations and assessments as supplied making
adjustments that in our judgment were necessary.
RISC has reviewed the prospective and contingent resources in accordance with the Society of Petroleum
Engineers internationally recognised Petroleum Resources Management System (SPE-PRMS).
Unless otherwise stated, all costs and values are in A$ real terms with a reference date of 31 January 2021.

Pilot Energy Exploration Valuation January 2021 Page 11
2.3. Exploration permit valuation
The valuation is based on the concept of “market value” (Value) as defined by the VALMIN Code.
The VALMIN Code defines Value as the estimated amount of money (or the cash equivalent of some other
consideration) for which the Mineral Asset should exchange on the date of Valuation between a willing buyer
and a willing seller in an arm’s length transaction wherein the parties each acted knowledgeably, prudently
and without compulsion. For the purposes of this report, we have applied these definitions to petroleum
properties.
A range of oil and gas industry accepted practices in relation to petroleum properties has been considered
to determine value, which are described below.
2.3.1. Comparable Transaction Metrics
The Value of exploration properties can be estimated using recent comparable transactions. Such
transactions may provide relevant metrics such as Value per unit of reserves, contingent or prospective
resources and price paid per unit area of the permit or % interest. The VALMIN Code advises Value must also
take into account risk and premium or discount relating to market, strategic or other considerations.
2.3.2. Farm-in Promotion Factors
An estimate of Value can be based on an estimation of the share of future costs likely to be borne by a
reasonable farminee under prevailing market conditions. A premium or promotion factor may be paid by the
farminee. The promotion factor is defined as the ratio of the proportion of the activity being paid for and the
amount of equity being earned.
The nominal permit value is defined as the amount spent by the farminee divided by the interest earned.
The premium value for the permit is the difference between the nominal value and the equity share of the
cost of the activity divided by the equity interest being earned.
The premium or promotion factor will be dependent upon the perceived prospectivity of the property,
competition and general market conditions. The premium value is equivalent to the farminee paying the
farminor a cash amount in return for the acquisition of the interest in the permit and is the fair market value.
Farm-in transactions may have several stages. For example, a farminee may acquire an initial interest by
committing to a future cost in the first stage of the transaction, but has an option to acquire an additional
interest or interests in return to committing to funding a further work program or programs.
Farm-in agreements can also include re-imbursement of past costs and bonus payments once certain
milestones are achieved, for example declaration of commerciality, or achieving threshold reserves volumes.
Depending on their conditionality, such future payments may contribute to Value. However, they may need
to be adjusted for the time value of money and probability of occurring.
2.3.3. Work Program
The costs of a future work program may also be used to estimate Value. The work program valuation relies
on the assumption that unless there is evidence to the contrary the permit is worth what a company will
spend on it. This method is relevant for permits in the early stages of exploration and for expenditure which
is firmly committed as part of a venture budget or as agreed with the government as a condition of holding
the permit. There may need to be an adjustment for risk and the time value of money.

Pilot Energy Exploration Valuation January 2021 Page 12
2.3.4. Expected Monetary Value (EMV)
EMV is the risked NPV of a prospect. EMV is calculated as the success case NPV times the probability of
success less the NPV of failure multiplied by the probability of failure. The NPV may be estimated using DCF
methods. The EMV method provides a more representative estimate of Value in areas with a statistically
significant number of mature prospects within proven commercial hydrocarbon provinces where the chance
of success and volumes can be assessed with a reasonable degree of predictability.
The EMV valuation can also be used as a relative measure for ranking exploration prospects within a portfolio
to make drilling decisions, assessing commercial potential and to demonstrate the commercial attractiveness
of a permit, which may influence a buyer or seller.
2.4. Resource Classification
RISC has used the internationally recognised Petroleum Resources Management System (PRMS)1 to define
resource classification and volumes. The classification of resources is shown in Figure 2-2.
Figure 2-2: Resources classification framework
1. Each project is classified according to its maturity or status (broadly corresponding to its chance of
commerciality) using three main classes, with the option to subdivide further using subclasses. The three
classes are Reserves, Contingent Resources, and Prospective Resources.
2. Pilot now have Contingent and Prospective Resources in their portfolio according to this classification.
1 SPE/WPC/AAPG/SPEE 2007 Petroleum Resources Management System

Pilot Energy Exploration Valuation January 2021 Page 13
3. For projects that satisfy the requirements for Prospective Resources the terms low estimate, best
estimate, and high estimate are used.
4. Under the PRMS guidelines, the range of uncertainty in potentially recoverable volumes may be
represented by either deterministic scenarios or by a probability distribution derived from the
probabilistic simulation of input variables. RISC has reviewed resource volumes that were calculated
probabilistically.
5. The PRMS guidelines indicate that when the range of uncertainty is represented by a probability
distribution, a low, best, and high estimate shall be provided such that:
- There should be at least a 90% probability (P90) that the quantities actually recovered equal or
exceed the low estimate;
- There should be at least a 50% probability (P50) that the quantities actually recovered equal or
exceed the best estimate;
- There should be at least a 10% probability (P10) that the quantities actually recovered equal or
exceed the high estimate.
6. The probabilistically derived resource volumes for multiple reservoirs or multiple prospects can be
combined probabilistically or, as is the case in this report can be summed arithmetically. In summing
probabilistically derived resources the aggregate Low estimate may be a very conservative estimate and
the aggregate high estimate may be a very optimistic estimate due to the portfolio effects of arithmetic
summation.
7. Prospective Resources can be subdivided into Prospect, Lead or Play. The definitions from the PRMS
guidelines are given in Table 2-2.
Table 2-2: Prospective Resources Definition

Pilot Energy Exploration Valuation January 2021 Page 14
Prospective Resources have both an associated chance of discovery and an additional chance of commercial
development. By implication, not all discovered volumes are necessarily commercial. For the present study
when evaluating the prospective resources RISC has restricted its statement to a view of the chance of
discovery – equivalent to the geological probability of success (GPOS).
GPOS is used to reflect the chance of encountering a significant volume of recoverable hydrocarbons. In this
context, ‘significant’ implies that there is evidence of a sufficient quantity of petroleum to justify estimating
the in-place volume demonstrated by the well(s) and for evaluating the potential for economic recovery
(PRMS).
Note that there is an additional chance to reach a specific volume, such as a commercial volume.
Risking methodology specific to the leads and prospects is discussed further in the report.

Pilot Energy Exploration Valuation January 2021 Page 15
3. WA-481-P (21.25% WI)
3.1. Overview
WA-481-P is located offshore in the northern Perth Basin, in shallow water adjacent to the Western
Australian towns of Dongara and Geraldton (Figure 3-1). The large permit covers 8,605 km2 and has been
sparsely explored with some encouraging results (sub-commercial oil discovery at Dunsborough-1 and a sub-
commercial gas discovery at Frankland-1). The developed offshore Cliff Head oil field and the onshore
Woodada, Dongara and Waitsia gas fields and Hovea oil field lie adjacent to the permit and provide local
infrastructure that could be used in the event of a discovery in WA-481-P.
Figure 3-1: Location Map – WA-481-P

Pilot Energy Exploration Valuation January 2021 Page 16
On 27 July 2016, Pilot announced that it had acquired a 100% interest in WA-481-P from Murphy Australia
WA-481-P Oil Pty Ltd in return for assigning a Net Profits Interest of 10% after tax to Murphy Oil on any
future hydrocarbon production in the permit. Key Petroleum Limited (“Key”), who had worked in co-
operation with Pilot on the acquisition, exercised their option to acquire 40% of the permit on 29 July 2016.
On 8 September 2020, Pilot announced that it was acquiring the Key equity, assuming 100% working interest.
Subsequently on 9 November 2020 Pilot announced the sale of 78.75% working interest to Triangle Energy
Limited (“Triangle”), aligning working interest across Wa-481-P and the Cliff Head production license.
Triangle assumed Operatorship of WA-481-P.
WA-481-P benefitted from considerable prior exploration investment by Murphy Oil (2D and 3D seismic and
wells) such that there is a $65.6 million Petroleum Resource Rent Tax (PRRT) credit attached to the permit
and split 60% to Pilot and 40% to Key. PRRT is levied at a rate of 40% on profits from future developments
which will be reduced by the compounded value of the credit, significantly enhancing the value of the permit
and its prospects.
The permit was renewed on 13 August 2020 for a new five-year term after a mandatory 50% relinquishment
of the original permit area. The permit is now 8,605 km2 from the original 17,745 km2 area, with the Joint
Venture electing to retain the inboard prospective area.
The primary objectives in the offshore North Perth Basin are the Permian Dongara Sandstone, the underlying
Irwin River Coal Measures which reservoir the oil in the Cliff Head Field and the High Cliff / Kingia Formation
sandstones (Figure 3-2).
Figure 3-2: Offshore Northern Perth Basin Stratigraphy

Pilot Energy Exploration Valuation January 2021 Page 17
The Cliff Head field has estimated oil ultimate recovery of 18 MMbbls and is close to the end of its field life
having produced about 15 MMbbls. Pilot has identified a number of similar sized prospects close to Cliff
Head that if successful could be developed by a tie back to the Cliff Head facilities making the initial
investment much more economic than a standalone development.
3.2. WA-481-P Discoveries
Three discoveries have been made in the existing permit; Dunsborough-1 (ROC 2008) oil and gas discovery,
Frankland-1 (ROC 2008) gas discovery, and the Perserverance-1 (ROC 2009) high CO2 gas discovery.
3.2.1. Dunsborough Oil Discovery
The Dunsborough-1 oil discovery well was drilled into the crest of a tilted fault block trap and discovered a 9
m gas column and a 25 m oil column down to -1,470 m TVDss. Dunsborough-2 was drilled to appraise the
discovery on the southern flank and confirmed the oil column in the Bookara Member/Dongara Sandstone
and the Irwin River Coal Measures (“IRCM”).
Figure 3-3: Dunsborough Top Dongara Sandstone Depth Map
The bulk of the oil is reservoired in high net to gross (75-87%) Bookara/Dongara sandstone which has an
average porosity of 18%. The underlying IRCM has a lower net to gross but a similar average porosity.

Pilot Energy Exploration Valuation January 2021 Page 18
Figure 3-4: Dunsborough Wireline Log and Pressure Data
Pilot have calculated gross Contingent Resources of 6 MMbbls of recoverable oil in the P50 case for
Dunsborough and RISC considers this a reasonable estimate (see full Contingent Resource Table 3-1). The
gas cap (<0.5 Bcf) is considered commercially insignificant. On a standalone basis at current oil prices,
Dunsborough is not economic to develop but if drilling of other prospects in the area were successful a
development may be feasible in the future.
3.2.2. Frankland Gas Discovery
The Frankland-1 gas discovery well was drilled on a north-northwest-south-southeast trending fault block
near the crest of the structure and found gas at the Bookara/Dongara Sandstone level at -1,943 mTVDss. Gas
samples were recovered from the Bookara/Dongara Sandstone and the IRCM but pressure data shows that
they are not in communication. The IRCM appears to have a number of isolated pools of gas rather than a
single gas column making it difficult to produce. A second well on the structure immediately to the north,
Frankland-2, came in 50 m low to prognosis and reduced the overall volume of gas from that predicted.
Pilot have calculated P50 case gross Contingent Resources of 33 Bcf in the Bookara/Dongara Sandstone and
9 Bcf in the IRCM (Table 3-2). RISC considers the Pilot calculations are reasonable and on a standalone basis,
development of Frankland is not economically feasible.

Pilot Energy Exploration Valuation January 2021 Page 19
Figure 3-5: Frankland Top Dongara Sandstone Depth Map
Figure 3-6: Frankland-1 Wireline Log Data
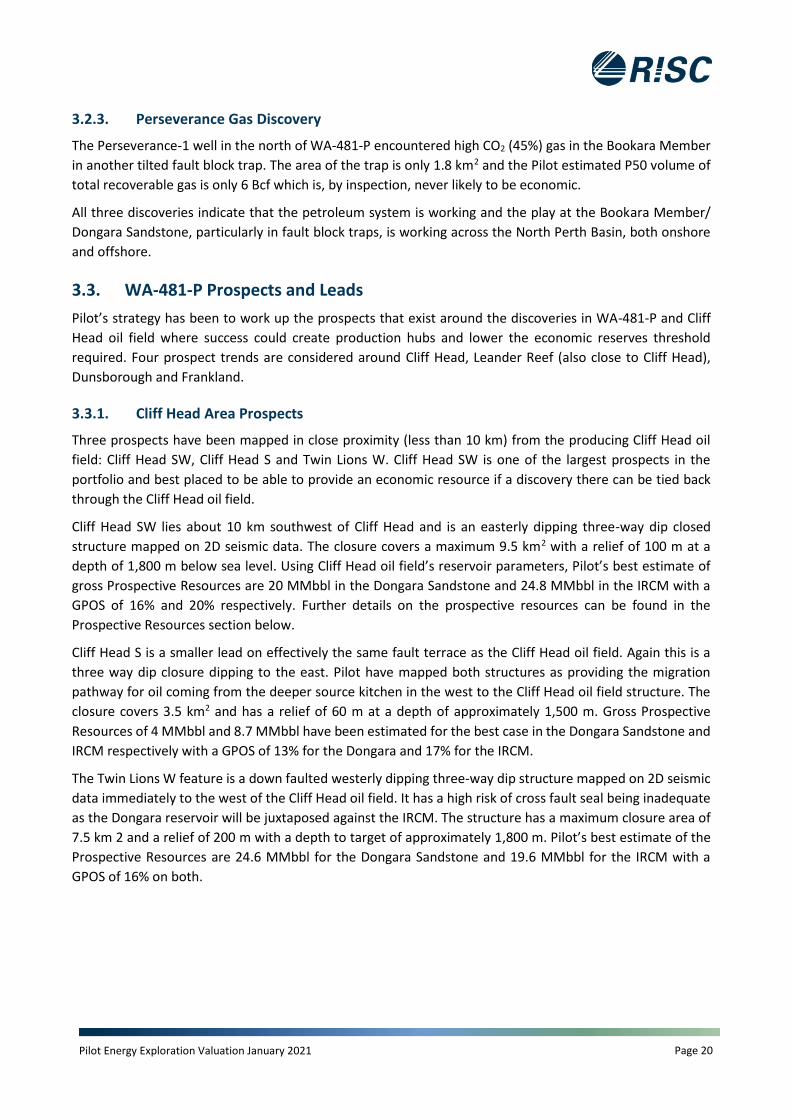
Pilot Energy Exploration Valuation January 2021 Page 20
3.2.3. Perseverance Gas Discovery
The Perseverance-1 well in the north of WA-481-P encountered high CO2 (45%) gas in the Bookara Member
in another tilted fault block trap. The area of the trap is only 1.8 km2 and the Pilot estimated P50 volume of
total recoverable gas is only 6 Bcf which is, by inspection, never likely to be economic.
All three discoveries indicate that the petroleum system is working and the play at the Bookara Member/
Dongara Sandstone, particularly in fault block traps, is working across the North Perth Basin, both onshore
and offshore.
3.3. WA-481-P Prospects and Leads
Pilot’s strategy has been to work up the prospects that exist around the discoveries in WA-481-P and Cliff
Head oil field where success could create production hubs and lower the economic reserves threshold
required. Four prospect trends are considered around Cliff Head, Leander Reef (also close to Cliff Head),
Dunsborough and Frankland.
3.3.1. Cliff Head Area Prospects
Three prospects have been mapped in close proximity (less than 10 km) from the producing Cliff Head oil
field: Cliff Head SW, Cliff Head S and Twin Lions W. Cliff Head SW is one of the largest prospects in the
portfolio and best placed to be able to provide an economic resource if a discovery there can be tied back
through the Cliff Head oil field.
Cliff Head SW lies about 10 km southwest of Cliff Head and is an easterly dipping three-way dip closed
structure mapped on 2D seismic data. The closure covers a maximum 9.5 km2 with a relief of 100 m at a
depth of 1,800 m below sea level. Using Cliff Head oil field’s reservoir parameters, Pilot’s best estimate of
gross Prospective Resources are 20 MMbbl in the Dongara Sandstone and 24.8 MMbbl in the IRCM with a
GPOS of 16% and 20% respectively. Further details on the prospective resources can be found in the
Prospective Resources section below.
Cliff Head S is a smaller lead on effectively the same fault terrace as the Cliff Head oil field. Again this is a
three way dip closure dipping to the east. Pilot have mapped both structures as providing the migration
pathway for oil coming from the deeper source kitchen in the west to the Cliff Head oil field structure. The
closure covers 3.5 km2 and has a relief of 60 m at a depth of approximately 1,500 m. Gross Prospective
Resources of 4 MMbbl and 8.7 MMbbl have been estimated for the best case in the Dongara Sandstone and
IRCM respectively with a GPOS of 13% for the Dongara and 17% for the IRCM.
The Twin Lions W feature is a down faulted westerly dipping three-way dip structure mapped on 2D seismic
data immediately to the west of the Cliff Head oil field. It has a high risk of cross fault seal being inadequate
as the Dongara reservoir will be juxtaposed against the IRCM. The structure has a maximum closure area of
7.5 km 2 and a relief of 200 m with a depth to target of approximately 1,800 m. Pilot’s best estimate of the
Prospective Resources are 24.6 MMbbl for the Dongara Sandstone and 19.6 MMbbl for the IRCM with a
GPOS of 16% on both.

Pilot Energy Exploration Valuation January 2021 Page 21
Figure 3-7: Cliff Head Prospects, Depth Map at Top Dongara Sandstone
Figure 3-8: Cliff Head Prospects, Composite Seismic Line

Pilot Energy Exploration Valuation January 2021 Page 22
3.3.2. Leander Reef Leads
Three untested structures located between 7 and 15 km west of Cliff Head oil field surround the Leander
Reef-1 well which Pilot interpret as having missed the reservoir section of the Dongara Sandstone by drilling
through the bounding fault of the upthrown structure (Figure 3-9).
Figure 3-9: Leander Reef-1, 2D Seismic Line
Ideally a 3D seismic survey would be required to confirm this interpretation, but the Leander Reef leads
provide another economically positive target for successful development through the Cliff Head oil field.
The Leander Reef Upthrown lead covers an area of 23 km2 with 100 m of relief at a depth of approximately
2,700 m below sea level. Best estimate Prospective Resources for the Dongara Sandstone are 46 MMbbl with
a GPOS of 15%.
Leander Reef Downthrown has a mapped closure of 19.3 km2 with a relief of 100 m at a depth of 2,800 m.
Pilot’s Best estimate gross Prospective Resources for the Dongara Sandstone are 38 MMbbl with a GPOS of
8%.
Leander Reef West is a separate westerly dipping up-thrown three-way dip structure with a mapped closure
area of 7 km2, a vertical relief of 100 m at a depth of 2,760 m below sea level. Best estimate gross Prospective
Resources are 14 MMbbl in the Dongara Sandstone with a GPOS of 15% according to Pilot.
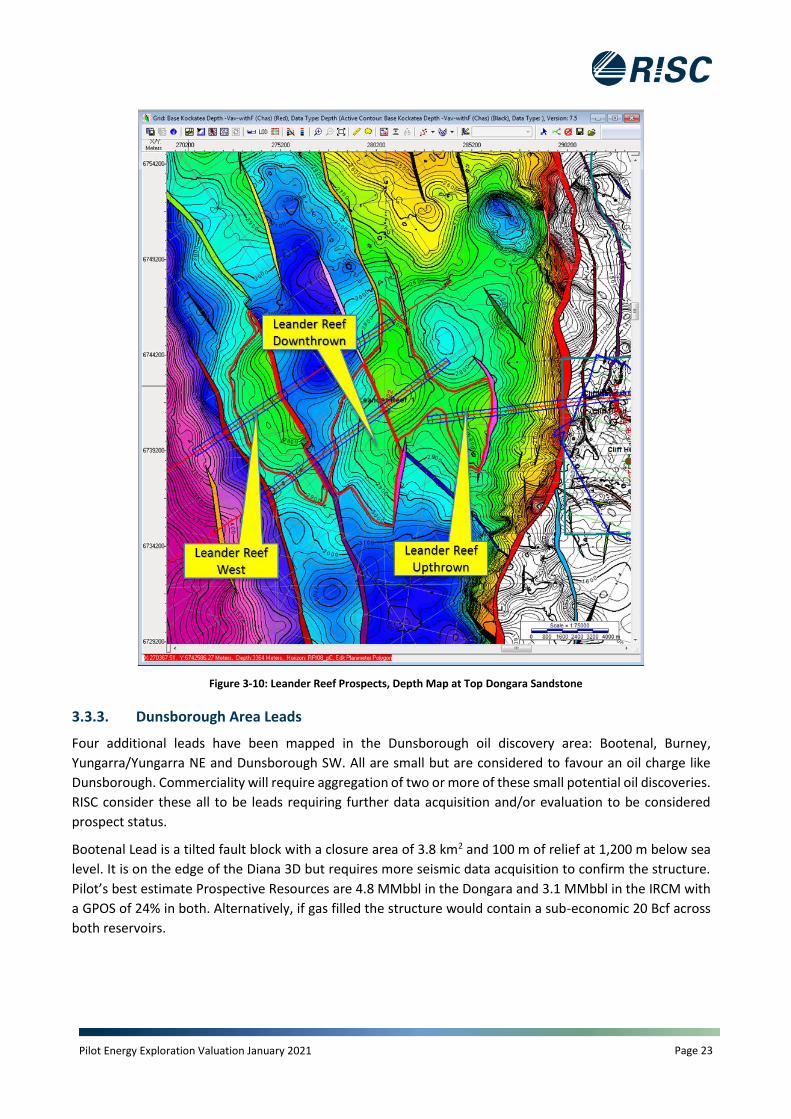
Pilot Energy Exploration Valuation January 2021 Page 23
Figure 3-10: Leander Reef Prospects, Depth Map at Top Dongara Sandstone
3.3.3. Dunsborough Area Leads
Four additional leads have been mapped in the Dunsborough oil discovery area: Bootenal, Burney,
Yungarra/Yungarra NE and Dunsborough SW. All are small but are considered to favour an oil charge like
Dunsborough. Commerciality will require aggregation of two or more of these small potential oil discoveries.
RISC consider these all to be leads requiring further data acquisition and/or evaluation to be considered
prospect status.
Bootenal Lead is a tilted fault block with a closure area of 3.8 km2 and 100 m of relief at 1,200 m below sea
level. It is on the edge of the Diana 3D but requires more seismic data acquisition to confirm the structure.
Pilot’s best estimate Prospective Resources are 4.8 MMbbl in the Dongara and 3.1 MMbbl in the IRCM with
a GPOS of 24% in both. Alternatively, if gas filled the structure would contain a sub-economic 20 Bcf across
both reservoirs.

Pilot Energy Exploration Valuation January 2021 Page 24
The Burney Lead is located in the Diana 3D and is a slightly more complex tilted fault block with a maximum
closure of 3.4 km2 and 70 m of relief at 1,200 m depth. Pilot’s best estimate of gross Prospective Resources
are 2.7 MMbbl in the Dongara and 1.4 MMbbl in the IRCM with a GPOS of 24% for both. This RISC considers
is too small to be considered as an economically viable drilling target and will not appear in the Prospective
Resources table.
The Yungarra Lead is a fault block and Yungarra NE is an adjacent four-way closure which expands the up-
dip Yungarra Lead in area from 2 km2 to 3.3 km2 in the high side case. Pilot’s best estimate gross Prospective
Resources are 6.3 MMbbl for the Dongara sandstone and 1.6 MMbbl for the IRCM again with a GPOS of 24%.
Figure 3-11: Dunsborough Prospects, Depth Map at Top Dongara Sandstone
Key Petroleum released on 24 February 2020 a Prospective Resource assessment for the Dunsborough SW
Lead. Pilot has not undertaken its own assessment of the lead. Key’s best estimate gross Prospective
Resources are 11.6 MMbbl across the Cattamarra Coal Measures, Dongara sandstone and the IRCM with a
GPOS of 24 – 36 %.
RISC has been unable to verify these prospective resources, however the range appears to capture the likely
size of a prospect covering this area with potentially stacked reservoirs. The Cattamarra Coal Measures are
an unproven reservoir in this area of the Perth Basin and RISC has therefore excluded it from the Prospective
Resources table.
Dunsborough SW Prospect
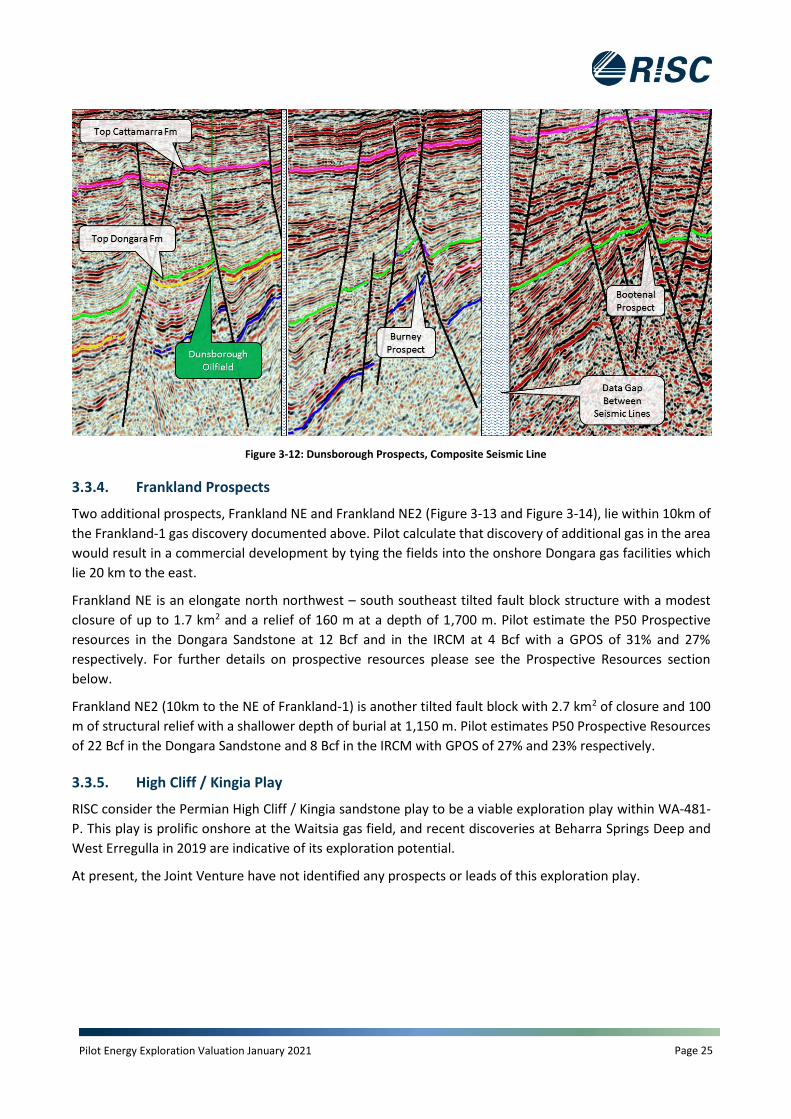
Pilot Energy Exploration Valuation January 2021 Page 25
Figure 3-12: Dunsborough Prospects, Composite Seismic Line
3.3.4. Frankland Prospects
Two additional prospects, Frankland NE and Frankland NE2 (Figure 3-13 and Figure 3-14), lie within 10km of
the Frankland-1 gas discovery documented above. Pilot calculate that discovery of additional gas in the area
would result in a commercial development by tying the fields into the onshore Dongara gas facilities which
lie 20 km to the east.
Frankland NE is an elongate north northwest – south southeast tilted fault block structure with a modest
closure of up to 1.7 km2 and a relief of 160 m at a depth of 1,700 m. Pilot estimate the P50 Prospective
resources in the Dongara Sandstone at 12 Bcf and in the IRCM at 4 Bcf with a GPOS of 31% and 27%
respectively. For further details on prospective resources please see the Prospective Resources section
below.
Frankland NE2 (10km to the NE of Frankland-1) is another tilted fault block with 2.7 km2 of closure and 100
m of structural relief with a shallower depth of burial at 1,150 m. Pilot estimates P50 Prospective Resources
of 22 Bcf in the Dongara Sandstone and 8 Bcf in the IRCM with GPOS of 27% and 23% respectively.
3.3.5. High Cliff / Kingia Play
RISC consider the Permian High Cliff / Kingia sandstone play to be a viable exploration play within WA-481-
P. This play is prolific onshore at the Waitsia gas field, and recent discoveries at Beharra Springs Deep and
West Erregulla in 2019 are indicative of its exploration potential.
At present, the Joint Venture have not identified any prospects or leads of this exploration play.

Pilot Energy Exploration Valuation January 2021 Page 26
Figure 3-13: Frankland Prospects, Depth Map at Top Dongara Sandstone
Figure 3-14: Frankland Prospects, Seismic tie line

Pilot Energy Exploration Valuation January 2021 Page 27
3.4. WA-481-P Contingent Resources
WA-481-P contains Contingent Oil Resources in Dunsborough oil field and Contingent Gas Resources in the
Frankland gas field. Neither are currently commercially viable as standalone developments but could
potentially be developed if other future discoveries are made in the area or other inducements were offered
by the government.
Pilot has calculated the Contingent Resources using a probabilistic method that RISC has also followed and
found that Pilot’s estimates are reasonable.
Table 3-1: Pilot’s WA-481-P Contingent Oil Resources as at 31 January 2021
Oil (MMbbl) Contingent Resources
1C 2C 3C
Dunsborough – Dongara Sandstone 2.4 4.2 6.8
Dunsborough - IRCM 0.9 1.8 3.0
Dunsborough Total Gross (100%) 3.3 6.0 9.8
Net attributable to Pilot (21.25% WI) 0.7 1.3 2.1
Notes:
1. "Gross" are 100% of the resources attributable to the licence.
2. "Net attributable to Pilot (21.25% WI)" based on Pilot's current working interest.
3. Note arithmetic aggregation of the Resources in the Dongara and IRCM reservoirs, as a result RISC cautions that the 1C aggregate quantities may be very conservative estimates and the 3C aggregate quantities may be very optimistic due to portfolio effects.
Table 3-2: Pilot’s WA-481-P Contingent Gas Resources as at 31 January 2021
Gas (Bcf) Contingent Resources
1C 2C 3C
Frankland – Dongara Sandstone 23.4 33.0 46.1
Frankland - IRCM 6.0 8.6 12.8
Frankland Total Gross (100%) 29.4 41.6 58.9
Net attributable to Pilot (21.25% WI) 6.2 8.8 12.5
Notes:
1. "Gross" are 100% of the resources attributable to the licence.
2. "Net attributable to Pilot (21.25% WI)" based on Pilot's current working interest.
3. Note arithmetic aggregation of the Resources in the Dongara and IRCM reservoirs, as a result RISC cautions that the 1C aggregate quantities may be very conservative estimates and the 3C aggregate quantities may be very optimistic due to portfolio effects.

Pilot Energy Exploration Valuation January 2021 Page 28
3.5. WA-481-P Prospective Resources
WA-481-P contains Prospective Resources of both oil and gas as described in the sections above. RISC has
reviewed the inputs and methodologies employed by Pilot to arrive at the probabilistic ranges of prospective
resources in each prospect and has found them to be reasonable. Table 3-3 and Table 3-4 summarize the
Prospective Resources for oil and gas in WA-481-P.
3.6. Status of the Committed Program
WA-481-P was awarded to Murphy Oil subsidiary, Murphy Australia WA-481-P Oil Pty Ltd, on 20 August 2012.
On 27 July 2016 Murphy Oil assigned its 100% interest to Pilot Energy Limited and on the 29 July 2016 Pilot
assigned 40% interest to Key Petroleum Limited.
The Joint Venture completed the Year 4 and 5 work program consisting of geological and geophysical studies
and 3D and 2D seismic reprocessing. For the Year 6 work program, the Joint Venture negotiated a farm-in
option with Red Emperor Resources NL (“Red Emperor”) in return for funding the work program
commitment of geological and geophysical studies, seismic inversion and fluid modelling studies. Following
completion of the Year 6 work program Red Emperor announced on 8 June 2020 that it was not exercising
its option for a 40% working interest.
The permit was renewed on 13 August 2020 for a new five-year term after a mandatory 50% relinquishment
of the original permit area. The permit is now 8,605 km2 from the original 17,745 km2 area, with the Joint
Venture electing to retain the inboard prospective area.
WA-481-P is currently in Year 1, which runs to 12 August 2021, of a five-year renewal term. The firm work
program for the primary term consisting Years 1 to 3 is for 2D seismic reprocessing, new 2D and 3D
acquisition and processing as well as geological and geophysical studies. The indicative expenditure for the
work program is A$5.75 million. There is an exploration drilling commitment in Year 6. The secondary term
consisting of Years 5 and 6 are not obligatory and the Joint Venture can elect to seek a variation of the work
program, or surrender the permit.
On 8 September 2020, Pilot announced that it was acquiring the Key equity, assuming 100% working interest.
Subsequently on 9 November 2020 Pilot announced the sale of 78.75% working interest to Triangle, aligning
working interest across WA-481-P and the Cliff Head production license. Triangle assumes Operatorship of
WA-481-P.
RISC has relied on Pilot’s documentation of applications and permit awards in addition to publicly available
information to ascertain the permit status.
Pilot and their joint venture partner intend to farm down their equity to fund exploration drilling and have
commenced a farmout process.
The WA-481-P permit details and work program are shown in Table 3-5.

Pilot Energy Exploration Valuation January 2021 Page 29
Table 3-3: Pilot’s WA-481-P Unrisked Prospective Oil Resources as at 31 January 2021
Oil Prospects / Leads
Gross (100%) on block MMbbl
Net Pilot (21.25%) on block MMbbl GPOS
(%) Low Best High Low Best High
Cliff Head SW - Dongara 11.0 20.0 35.0 2.3 4.3 7.4 16%
Cliff Head SW - IRCM 14.0 24.8 43.4 3.0 5.3 9.2 20%
Cliff Head SW Total 25.0 44.8 78.4 5.3 9.5 16.7
Cliff Head S - Dongara 2.1 4.0 7.3 0.4 0.9 1.6 13%
Cliff Head S - IRCM 4.8 8.7 15.4 1.0 1.8 3.3 17%
Cliff Head S Total 6.9 12.7 22.7 1.5 2.7 4.8
Twin Lions W - Dongara 13.0 24.6 43.4 2.8 5.2 9.2 16%
Twin Lions W - IRCM 11.5 19.6 32.4 2.4 4.2 6.9 16%
Twin Lions W Total 24.5 44.2 75.8 5.2 9.4 16.1
Leander Reef Upthrown 26.5 46.1 78.1 5.6 9.8 16.6 15%
Leander Reef Downthrown 21.4 38.0 66.3 4.5 8.1 14.1 8%
Leander Reef West 8.0 14.0 23.6 1.7 3.0 5.0 15%
Bootenal - Dongara 2.3 4.8 9.1 0.5 1.0 1.9 24%
Bootenal - IRCM 1.8 3.1 5.0 0.4 0.7 1.1 24%
Bootenal Total 4.1 7.9 14.1 0.9 1.7 3.0
Yungarra - Dongara 3.0 6.3 11.9 0.6 1.3 2.5 24%
Yungara - IRCM 0.9 1.6 2.7 0.2 0.3 0.6 24%
Yungara Total 3.9 7.9 14.6 0.8 1.7 3.1
Dunsborough SW - Dongara 1.6 4.2 7.2 0.3 0.9 1.5 24%
Dunsborough SW - IRCM 1.64 5.4 10.9 0.3 1.1 2.3 24%
Dunsborough SW Total 3.9 7.9 14.6 0.8 1.7 3.1
Total 124.2 223.5 388.2 26.4 47.5 82.5
1. Probabilistic methods have been used.
2. The prospective resources are unrisked. Prospective resources carry with them discovery and commercialisation risks.
3. Note the totals are derived by arithmetic aggregation of the Prospective Resources, as a result RISC cautions that the Low Estimate aggregate quantities may be very conservative estimates and the High Estimate aggregate quantities may be very optimistic due to portfolio effects.

Pilot Energy Exploration Valuation January 2021 Page 30
Table 3-4: Pilot’s WA-481-P Prospective Gas Resources as at 31 January 2021
Gas Prospects / Leads
Gross (100%) on block Bcf
Net Pilot (21.25%) on block Bcf GPOS
(%) Low Best High Low Best High
Frankland NE - Dongara 7.4 12.0 18.6 1.6 2.6 4.0 31%
Frankland NE - IRCM 2.3 3.8 6.0 0.5 0.8 1.3 27%
Frankland NE Total 9.7 15.8 24.6 2.1 3.4 5.2
Frankland NE2 - Dongara 13.5 21.8 33.5 2.9 4.6 7.1 27%
Frankland NE2 - IRCM 4.8 8.0 12.2 1.0 1.7 2.6 23%
Frankland NE2 Total 18.3 29.8 45.7 3.9 6.3 9.7
Total 28.0 45.6 70.3 6.0 9.7 14.9
1. Probabilistic methods have been used.
2. The prospective resources are unrisked. Prospective resources carry with them discovery and commercialisation risks.
3. Note the totals are derived by arithmetic aggregation of the Resources, as a result RISC cautions that the Low Estimate aggregate quantities may be very conservative estimates and the High Estimate aggregate quantities may be very optimistic due to portfolio effects.
Table 3-5: WA-481-P Permit Details and Work program
Permit Operator Interest Status Permit Expiry Date
Work Commitments
WA-481-P Triangle Pilot
21.25%
Triangle
Energy
78.75%
Exploration
Permit
12 August
2025
Year 1 – 3
2,000km 2D reprocessing (A$0.2
million)
350km2 3D acquisition & processing
(A$5 million)
200km 2D acquisition & processing
(A$0.4 million)
G&G studies (A$0.15 million)
Year 4
G&G studies and well planning
(A$0.45 million)
Year 5
One exploration well (A$15 million)

Pilot Energy Exploration Valuation January 2021 Page 31
3.7. Exploration Program Costs
The indicative expenditure for the firm Year 1 -3 work program of the renewal term is A$5.75 million (Table
3-5). The largest component of this work program and expenditure is the seismic acquisition and processing.
RISC has reviewed these costs and find that they are reasonable.
RISC has reviewed the dry hole well cost estimate for a Year six well and concludes that a well in 20 metres
water depth that will be drilled with a jack-up rig of convenience to minimise mobilisation costs to a depth
of 1,900 m would cost US$15 - 20 million based on prevailing jack-up rig rates.
3.8. WA-481-P Valuation
RISC has derived the potential value range to Pilot of its WA-481-P equity based on recent transaction history
and a potential farm out to a third party who will pick up a proportion of a Year 6 well to explore the permit
at a premium to their earned interest cost.
While it is recognized that the permit contains discovered resources, these are expected to be currently
sub-economic, but may potentially become economic in the future. In view of the relatively modest
contingent resources and the current market, we would not expect a farminee to pay for the discovered
resources. They may be prepared to pay a contingent fee should they become economic in future or
alternatively be prepared to pay a higher promote in recognition of the proven petroleum potential of the
permit that the discoveries demonstrate. In this case, we have adopted a higher promote to value the permit.
For a low-case valuation RISC has assumed the transactional value of the October 2020 acquisition of Key’s
WA-481-P working interest by Pilot, valuing Pilots working interest at A$0.4 million.
In the mid-case RISC has assumed the transactional value of the November 2020 sale of 78.75% working
interest to Triangle, who will free-carry Pilot through the Year 1 – 3 firm work program. This values Pilot’s
working interest at A$1.6 million.
For the high-case valuation, RISC have assumed that the Joint Venture farm out the Year 6 well for a 1.75:1
carry on a well costing US$17 million. This values Pilot’s 21.25% at A$ 3.7 million. RISC sees the attraction of
the proximity of Cliff Head infrastructure as creating a greater likelihood that WA-481-P will achieve a
reasonable promote on an exploration well.

Pilot Energy Exploration Valuation January 2021 Page 32
4. EP 416 and EP 480 (100% WI and Operator)
4.1. Overview
The EP 416 and EP 480 permits are located in the southern Perth Basin, on the coast of Western Australia
between the towns of Mandurah and Bunbury (Figure 4-1). The contiguous permits have a combined area
of 2,310 km2 and have only been sparsely explored with only two wells drilled in the 1960’s and one recent
well, GSWA Harvey-1, drilled by the Government as part of the carbon geosequestration study in 2012.
Figure 4-1: Location Map – EP416 and EP480
Pilot farmed into both permits in 2015 under an agreement with Empire Oil Limited (“Empire”). Pilot funded
the cost of an airborne geophysical survey acquired over the permits by Empire. Pilot earned a 60% interest
in EP 416 and EP 480 and assumed operatorship of both permits. On 18 December 2020 Pilot announced
that it has assumed 100% equity in the permits, acquiring Energy Resources Limited (“EnRes”) 40% working
interest that it held after it acquired Empire in 2017.
Exploration in the Perth Basin in the past has been focused in the northern part of the basin with the southern
part only lightly explored. The limited drilling in the two permits has confirmed the presence of a Permian
petroleum system with the primary reservoir target being the Permian Sue Group sandstones and the Triassic
age Lesueur sandstones. It is proposed that gas will be generated from mature Permian coal measures
(Figure 4-2) located in kitchens within the permits.

Pilot Energy Exploration Valuation January 2021 Page 33
Figure 4-2: Southern Perth Basin Stratigraphy
4.2. Leschenault Prospect
Existing 2D seismic data confirms the Leschenault Prospect which is a large faulted anticlinal structure
straddling both permits, with up to 240 km2 of mapped areal closure at the Top Permian Sue Group
sandstone level (Figure 4-3). The reservoir target is currently at a depth of 2,250 – 2,500 m but has previously
been buried deeper with an estimated 600 m of uplift occurring during the Jurassic rifting making the quality
of the reservoir target a minor concern. The porosity of the Sue Group is as low as 3% in Lake Preston-1 and
about 5% in Whicher Range, both deeper than predicted at Leschenault. Pilot have analysed the pre-uplift
average depth of burial of the Leschenault Prospect target to be 3,350 metres providing an average 7%
porosity from the calibrated porosity depth curve with good evidence from the Harvey-1 well that it could
be higher.

Pilot Energy Exploration Valuation January 2021 Page 34
The top seal is provided by the Eneabba Formation which over lies the Lesueur Sandstone and is 209 m thick
at Lake Preston-1. Top seal and cross-fault seal are the major risk for the prospect.
The regional gravity data shows the presence of a depocentres in the northeastern and eastern part of the
permit. The prospect is located updip of these possible “gas kitchens” on the flank of a regional gravity high.
The Sue Coal Measures are known to be a source for gas in the basin with TOC up to 54%. They are likely to
be generating at the present day but not as well as they have done before the Jurassic uplift.
Figure 4-3: EP 416 and EP 480 Leschenault Prospect

Pilot Energy Exploration Valuation January 2021 Page 35
4.3. EP 416 and EP 480 Prospective Resources
RISC was commissioned by Pilot Energy Ltd (“Pilot”) to audit their prospective resource assessment of the
Leschenault Prospect in October 2016. Pilot Energy has a 100% interest and is Operator of both permits.
The Leschenault Prospect Prospective Resource estimates are given in Table 4-1.
It is anticipated that there would be a local market for gas in the event of success as EP 480 and EP 416 are
close to the Dampier to Bunbury Natural Gas Pipeline (“DBNGP”) which runs through the permits.
Table 4-1: Pilot’s EP 416 and EP480 Prospective Resources (RISC) as at 31st October 2016
Leschenault Prospect Reservoir
Gross (100%) Bcf Net Pilot Bcf (100%) GPOS (%)
Low Best High Low Best High
Lesueur Sandstone 150 435 970 150 435 970 5%
Sue Sandstone 120 290 625 120 290 625 10%
Total 270 725 1,595 270 725 1,595
1. Probabilistic methods have been used.
2. The Leschenault Prospect is prospective for gas.
3. The prospective resources are unrisked. Prospective resources carry with them discovery and commercialisation risks.
4. The volumes are rounded to the nearest 5 Bcf
The key primary target is the Sue Sandstone. The nearby Whicher Range field is a direct analogue for this
reservoir, although the reservoir is shallower in the Leschenault Prospect.
The prospect is in an underexplored area of Southern Perth Basin, and is therefore high-risk. The key risk is
seal (top and cross-fault). Given the limited data, it is hard to quantify the probability of success, but we
expect it to lie around 5% for the Lesueur sandstone and around 10% for the Sue sandstone. Pilot plan to
carry out surface geochemical surveys to detect signs of hydrocarbons. If successful, this will decrease the
source risk of the prospect.
4.4. Status of Committed Program
The EP 416 permit was renewed on 14 October 2016. The permit is currently in Year 2. The permit has been
extended by three years and Year’s 1 and 2 along with the work program commitment has been extended
to 13 April 2021 and 13 October 2021 respectively.
The work program has geochemical surveying and AGG processing in permit year 1, G&G studies in Years 2
to 3, and an exploration well in Year 4. (Table 4-2). RISC has relied on Government documentation of previous
approvals and permit awards provided by Pilot in addition to publicly available information to ascertain the
permit status.

Pilot Energy Exploration Valuation January 2021 Page 36
Table 4-2: EP 416 Permit Details and Work Program
Permit Operator Interest Status Permit Expiry Date
Proposed Renewal Work Program
EP 416 Pilot Pilot
100%
Exploration
Permit
13 October
2024
Year 1: Geochem Survey A$0.10 million
Gravity Processing, A$0.10 million
G&G studies, A$0.15 million
Year 2: G&G Studies, A$0.20 million
Year 3: G&G Studies, A$0.40 million
Year 4: 1 well A$5.00 million
Year 5: G&G studies, A$0.20 million
The EP 480 permit was originally granted on 6 June 2012. The six-year permit work program details are given
in Table 4-3. The permit is currently in Year 3, which has been extended to 13 April 2021 to provide sufficient
time for commencement of the geochemical survey that was approved as a replacement for the previous 2D
seismic work commitment.
RISC has relied on Government documentation of approvals and permit awards provided by Pilot and publicly available to ascertain the permit status.
Table 4-3: EP 480 Permit Details and Work program
Permit Operator Interest Status Permit Expiry Date
Work Program
EP 480 Pilot Pilot
100%
Exploration
Permit
31 March
2023
Year 1: G&G studies A$0.25 million
Year 2: Geophysical survey A$0.27
million
Year 3: Geochem Survey A$0.10 million
Gravity Processing A$0.10 million
G&G studies A$0.15 million
Year 4: G&G studies A$0.15 million
Year 5: 1 well A$4.50 million
Year 6: G&G studies A$0.10 million
Pilot Energy Exploration Valuation January 2021 Page 37
4.5. Exploration Program Costs
Well costs to drill a 3,000 m well in this area are likely to be in the US$5-8 million range on a dry hole basis.
In 2012 Harvey-1 was drilled to a total depth of 2,945 m in 44 days. The geochemical survey is expected to
cost approximately A$160,000.
4.6. EP 416 and EP 480 Valuation
RISC has derived the potential value range to Pilot of its EP 416 and EP 480 equity based on recent transaction
history and a potential farm out to a third party who will pick up a proportion of an exploration well to
explore the permits at a premium to their earned interest cost.
In the low and mid-case we have assumed the transactional value of the December 2020 acquisition of
EnRes’s working interest in both permits, valuing Pilots working interest at A$0 million.
In the high case the carry on a well is based on a 1.5:1 promote and free carry (Pilot retaining 35% working
interest) on a well costing US$8 million (A$11 million) valuing Pilot’s equity at A$1.9 million.

Pilot Energy Exploration Valuation January 2021 Page 38
5. EP 437 (13.058% WI)
5.1. Overview
The EP 437 permit is located in the northern Perth Basin, on the coast of, Western Australia between the
towns of Geraldton and Dongara (Figure 5-1). Past exploration in the area has discovered the commercial
gas field at Dongara and the oil fields at Jingemia/Hovea and Mt Horner. The offshore Cliff Head oil field is
located 28 km to the south. The permit has an area of 720 km2 and has a moderate level of exploration
drilling, especially in the south of the permit.
Figure 5-1: Location Map EP437
Pilot acquired its 13.058% interest in EP 437 through an agreement with Caracal Exploration Pty Ltd. The
Operator is Key with 86.94% working interest.
EP 437 provides Pilot with participation in a low-cost onshore oil and gas play, in a permit in which past
drilling has established a working petroleum system and prospects have been mapped on trend with
adjacent oil and gas discoveries. The proximity to infrastructure in this part of the Perth Basin enables even
small discoveries to potentially be commercialized.

Pilot Energy Exploration Valuation January 2021 Page 39
Preliminary interpretation by Pilot of existing well and seismic data has matured three; shallow prospects,
all up-dip from the Dunnart-1 and 2 wells which both had oil shows (Figure 5-2). The primary reservoir targets
are the early Triassic Arranoo Member sandstones and the Late Permian Bookara Member sandstones
(Figure 5-3).
Figure 5-2: EP437 Prospect and Lead Location Map

Pilot Energy Exploration Valuation January 2021 Page 40
Figure 5-3: Northern Perth Basin Stratigraphy

Pilot Energy Exploration Valuation January 2021 Page 41
5.2. EP 437 Prospects and Leads
5.2.1. Wye Knot Prospect
The Wye Knot Prospect is a follow up to the Wye-1 well drilled in 1996 which tested gas at 4.4 MMscfd in
the Bookara Sandstone and 2.4 MMscfd in the Arranoo Sandstone. Wye Knot is a downdip exploration
opportunity looking for a possible oil leg. Evidence of an oil leg comes from good oil shows in these reservoirs
indicating that gas may have displaced the oil downwards. An added complication was the high (300 ppm)
H2S content in the gas from the Bookara Sandstone and the depletion on test in the Arranoo Sandstone. The
prospect is small and extends across the permit boundary into permit L 7 R1. The reservoir, seal and gas
source are proven by Wye-1 but the prospect is high risk for oil.
Figure 5-4: Wye Knot Prospect

Pilot Energy Exploration Valuation January 2021 Page 42
5.2.2. Becos Lead
The Becos Lead is a downthrown dip closure against an east-west fault that separates the Wye/Wye Knot
structure from a dry down dip well, Allanooka-1 which tested water. RISC consider Becos as a lead, requiring
additional data acquisition and evaluation to become prospect status.
The lead is dependent on success of Wye Knot-1 finding oil in either the Bookara or Arranoo sandstones and
relies on the concept that Allanooka-1 narrowly missed an oil column. The lead is small and more than half
of the area that it covers is outside the permit boundary. It is also high risk on oil charge, seal and trap.
Figure 5-5: Becos Prospect
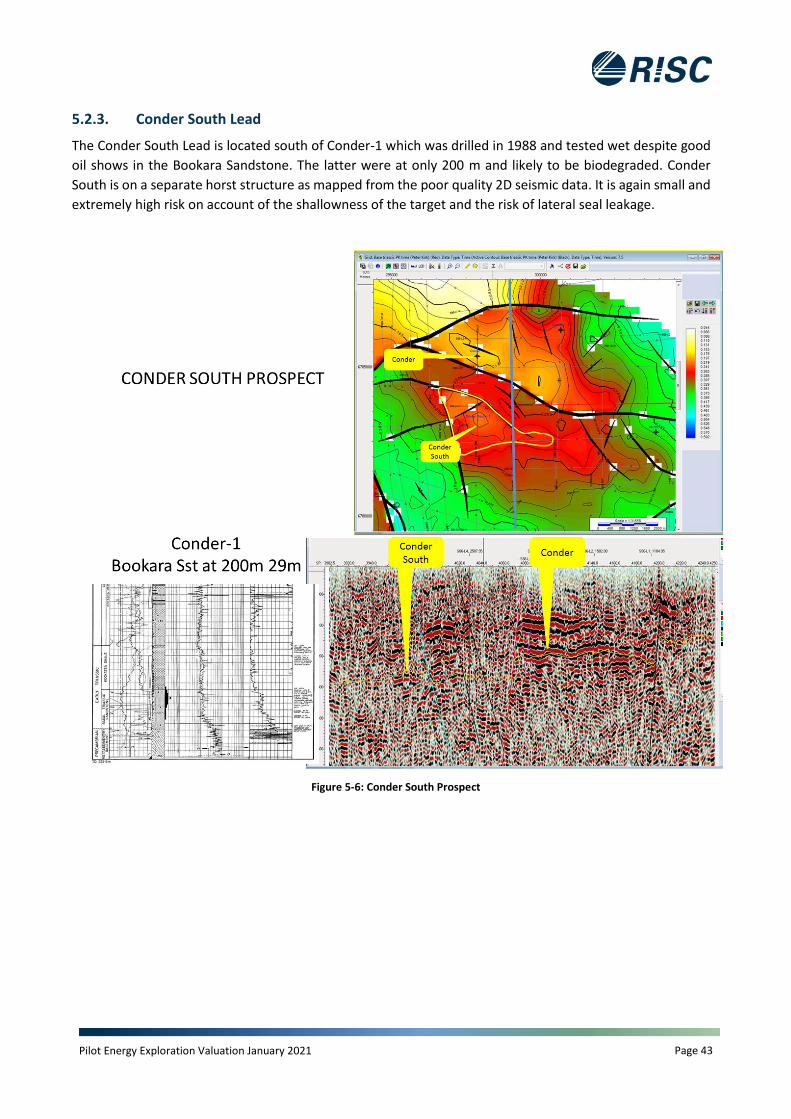
Pilot Energy Exploration Valuation January 2021 Page 43
5.2.3. Conder South Lead
The Conder South Lead is located south of Conder-1 which was drilled in 1988 and tested wet despite good
oil shows in the Bookara Sandstone. The latter were at only 200 m and likely to be biodegraded. Conder
South is on a separate horst structure as mapped from the poor quality 2D seismic data. It is again small and
extremely high risk on account of the shallowness of the target and the risk of lateral seal leakage.
Figure 5-6: Conder South Prospect

Pilot Energy Exploration Valuation January 2021 Page 44
5.3. EP 437 Prospective Resources
Operator Key Petroleum Limited’s (“Key”) assessment of prospective resources for the Wye Knot Prospect
are provided in Table 5-1 below. Key has released these Prospective Resources for the Triassic Aranoo
Sandstone in an ASX announcement on 19 December 2016. RISC has been unable to verify these prospective
resources, however the range appears to capture likely size of prospect covering this area and the volumes
are not significant to Pilot. The prospect is shallow and can be drilled at a low cost.
Table 5-1: EP 437 Prospective Resources for Wye Knot (Key Petroleum) as of 21st April 2017
Oil Prospects
Gross (100%) on block MMbbl
Net Pilot (13.058%) on block MMbbl GPOS
(%) Low Best High Low Best High
Wye Knot, Aranoo Sandstone 0.16 1.4 6.1 0.02 0.18 0.80 10%
1. Resources reported by Key Petroleum in an ASX release dated 19 December 2016 titled EP 437 Work Program and Budget Approved (http://www.keypetro leum.com.au/announcements /2016 )
2. The prospective resources are unrisked. Prospective resources carry with them discovery and commercialisation risks.
5.4. Status of Committed Program
The EP 437 permit was granted on the 6 June 2012 for a 5-year term and expires on 27 May 2023 due to
approved extensions. The five-year permit work program details are given in Table 5-2. The permit is
currently in Year 3 with a commitment to drill an exploration well. Permit Year 3 has been extended to 27
May 2022.
The Joint Venture has approved drilling of an exploration well since 2017. The Joint Venture has also applied
for and been granted $200,000 funding from the Western Australian Department of Mines and Petroleum
as part of the Exploration Incentive Scheme.
RISC has relied on government documentation of approvals and permit awards provided by Pilot and publicly
available to ascertain the permit status.
Table 5-2: EP 437 Permit Details and Work program
Permit Operator Interest Status Permit Expiry Date
Work Program
EP 437 Key Petroleum
Pilot 13.058%
Key Petroleum 86.942%
Exploration Permit
27 May 2023
Year 1: Production test A$0.85 million
Year 2: G&G studies A$0.2 million
Year 3: 1 well A$1.5 million
Year 4: G&G studies A$0.1 million
Year 5: 1 well A$1.5 million

Pilot Energy Exploration Valuation January 2021 Page 45
5.5. Exploration Program Costs
Exploration costs are low in EP 437. Key Petroleum announced that a budget of A$1.9 million (US$1.44
million) has been approved by the Joint Venture for the 2017 calendar year which included the drilling of the
Wye Knot-1 well.
5.6. EP 437 Valuation
RISC has used the potential value to Pilot of EP 437 being farmed out to a third party who will pick up a
proportion of future costs to explore the permit at a promote to their earned interest cost.
In the low case we have assumed that a farminee will pay a 1.15:1 carry of the full cost of the well (US$1.44
million, A$1.9 million). This values Pilot’s 13.058% share at A$0.04 million.
In the mid case RISC has assumed Pilot farm out the well for a 1.25:1 carry on the same well cost. This values
Pilot’s share at A$0.06 million.
In the high case the carry on the well is increased to 1.75:1 valuing Pilot’s equity at A$0.19 million.

Pilot Energy Exploration Valuation January 2021 Page 46
6. Valuation
6.1. Methodology
The Pilot permits are all early-stage exploration properties. RISC has therefore used notional farm-in terms
by a farminee into the assets to estimate a fair value under the requirements of the VALMIN code and
comparable transactions, where they exist. Valuation using an Expected Monetary Value (EMV) approach is
not considered relevant for these assets due to their low level of maturity even where Contingent Resources
are attributable to Pilot in WA-481-P. The value of these small Contingent Resources is reflected in the higher
farmin promote for the mid-value case for WA-481-P.
The values of the permits have been estimated at low, mid and high values. As the low and high values of
the exploration assets portfolio are derived by the arithmetic addition of the individual asset low and high
values, respectively, they represent the possible extremes of the exploration value envelop.
While farminees into the individual permits could value the assets at either end of the value range assessed,
it is unlikely that potential buyers of the exploration asset portfolio would value all of the assets at either all
of the low or all of the high estimated extremes. Their own assessments of individual permits will span the
low, mid or high outcomes based on factors including: their strategic objectives and region or geological
basin focus; assessment of an asset’s prospectivity and associated geological risks; the fiscal and regulatory
framework applicable to the asset; accessibility of commercialisation routes, including markets and
infrastructure, for each asset; equity interests, operator capability and joint venture partners in each asset.
RISC has estimated the low and high values of the portfolio of exploration assets at an estimated one
standard deviation from the total mid value of the portfolio.
6.2. Transaction value
Pilot acquired their interests through transactions, which in conjunction with subsequent transactions
provide the most relevant analogue transactions with which to value these current interests.
In September 2015, Pilot executed an agreement to farmin to Empire Oil & Gas (NL) permits EP 416 and
EP 480. Under the terms of the agreement, Pilot paid A$0.45 million on satisfaction of regulatory
requirements which occurred in 2016. In consideration, Pilot earned a 60% interest in each of the permits
and assumed operatorship. On 18 December 2020 Pilot announced that it has assumed 100% equity in the
permits, acquiring Energy Resources Limited (“EnRes”) 40% working interest that it held after it acquired
Empire in 2017 for a nominal consideration of A$1 per permit.
100% of WA-481-P was assigned to Pilot from Murphy oil in July 2016 in return for a 10% Net Profit Interest
on future production from discoveries that are made in the permit. Murphy Oil were in the process of
withdrawing from the permit after drilling three unsuccessful wells in the outboard area and saw little value
in the shallow water exploration which Pilot is focused on and which, for a company of their small size, may
indeed have value.
In October 2020 Pilot acquired Key’s working interest in WA-481-P by issuing Key 21 million Pilot ordinary
shares over two tranches. RISC values this transaction at A$680,000. Subsequent to this, in November 2020
Pilot announced that Triangle Energy was acquiring a 78.75% working interest in WA-481-P. Triangle paid
Pilot A$300,000 and will free carry Pilot through to completion of the Year 1 -3 firm work program to a value
of A$5.5 million. This work program consists of seismic reprocessing, 350km2 3D seismic acquisition and
processing, and 200km 2D seismic acquisition and processing.

Pilot Energy Exploration Valuation January 2021 Page 47
6.3. Notional Farm-in terms
In our experience, farm-in terms typically attract promote factors of 1:1 to 3:1 with potentially a
reimbursement of past costs and/or bonus payments. The promote factors refer to the share of a farminor’s
costs that a farminee might carry. A promote factor of 1:1 implies that the farminee will only pay for its
acquired interest share of specified future costs (“ground floor”); while a 2:1 promote indicates that the
farminee will pay in addition to its acquired interest share of costs, an equal amount of the farminor’s costs.
This implies a 100% uplift or premium to the farminor’s equity share of the future exploration costs. The
market value, therefore to the farminor, is the value of the share of its costs that are being carried by the
farminee.
As an example in June 2014, Rey Resources farmed-in to EP 437, earning 43.47% by funding 86.94% of the
Dunnart-2 well costs capped at A$1.7 million implying a 2:1 promote. In light of current market conditions,
RISC considers a 1.75:1 promote the high end of the permit value with a mid and low-range value based on
a 1.5:1 to a 1.25:1 promote respectively. The low end of the value range is supported by Pilot’s November
2015 acquisition of Caracal’s 13.058% interest for A$15,000 cash, 20 million shares and 20 million options.

Pilot Energy Exploration Valuation January 2021 Page 48
6.4. Valuation summary
The Pilot Australian permits have been evaluated using the methods described in Section 2.3 and are summarised below:
Table 6-1: Valuation Summary
Exploration Assets
Equity Interest
%
Gross Notional farm-in entry program
A$M
Valuation (A$ million) Comments
Low Mid High
WA-481-P 21.25%
2D & 3D seismic acquisition $5.5 million
Drill one well at $23 million
0.4 1.6 3.7
Low-case based on 2020 Key transaction, Mid-case based on 2020 Triangle transaction and carry, and High-case based on a 1.75:1 carry on a well of US$17M (A$23MM) gross.
EP 416 & EP 480 100% Drill one well at $8 mill 0.0 0.0 1.9 Low and Mid-case based on 2020 EnRes transaction. High-case based on a 1.5:1 carries on a well of US$8M (A$11MM) gross. Assumed Pilot retain 35%.
EP 437 13.058% Drill one well $1.44 mill 0.0 0.1 0.2
Low, Mid and High-case based on 1.15:1, 1.25:1 and 1.75:1 carries on a well of US$1.44 million (A$1.9 million) gross. Low-case is equivalent to Pilot’s original acquisition of Caracal 13.058% interest.
Total Pilot Permit Value 0.4 1.7 5.8
Pilot Early Stage Exploration Portfolio Valuation Range 0.8 1.7 2.6 Rounded to one standard deviation

Pilot Energy Exploration Valuation January 2021 Page 49
RISC has recognised that the farmout market has remained soft and has lowered its expectations since April
2018 when we last reviewed the value of Pilot. We consider that exploration projects are very difficult to
farmout at the traditional 2:1 carry for major expenditures such as wells and have set the maximum carry at
1.75:1 to reflect this.
For low and mid case valuations of WA-481-P, EP 416 and EP 480 we have used recent transactional values
as guidance.
We have assumed for the high case valuations for all assets that a farminee is willing to pay a premium by
means of a promoted interest on the drilling of an exploration well. We have assumed 1.75:1 promote on a
WA-481-P well, reflecting the prospectivity of the permit and its proximity to the Cliff Head oil field
infrastructure, and 1.5:1 for an EP 416 and EP 480 well.

Pilot Energy Exploration Valuation January 2021 Page 50
7. Declarations
7.1. Terms of Engagement
This report, any advice, opinions or other deliverables are provided pursuant to the Engagement Contract
agreed to and executed by the Client and RISC.
7.2. Qualifications
RISC is an independent oil and gas advisory firm. All of the RISC staff engaged in this assignment are
professionally qualified engineers, geoscientists or analysts, each with many years of relevant experience
and most have in excess of 20 years.
RISC was founded in 1994 to provide independent advice to companies associated with the oil and gas
industry. Today the company has approximately 40 highly experienced professional staff at offices in Perth,
Brisbane, Jakarta and London. We have completed over 2,000 assignments in 70+ countries for nearly 500
clients. Our services cover the entire range of the oil and gas business lifecycle and include:
▪ Oil and gas asset valuations, expert advice to banks for debt or equity finance;
▪ Exploration/portfolio management;
▪ Field development studies and operations planning;
▪ Reserves assessment and certification, peer reviews;
▪ Gas market advice;
▪ Independent Expert/Expert Witness;
▪ Strategy and corporate planning.
The preparation of this report has been managed by Mr Adam Craig who is an employee of RISC. Mr Craig is
a member of PESA (2021 WA Branch President), AAPG, EAGE, AICD, a Fellow of the Geological Society and a
Certified Practising Geologist of the AAPG (#6446). He holds a BSc Geology (Honours) from Curtin University,
Perth, Australia. Mr Craig has over 30-years' experience in the sector and is a qualified petroleum reserves
and resources evaluator (QPRRE) as defined by ASX listing rules.
7.3. Standard
Reserves and resources are reported in accordance with the definitions of reserves, contingent resources
and prospective resources and guidelines set out in the Petroleum Resources Management System (PRMS)
prepared by the Oil and Gas Reserves Committee of the Society of Petroleum Engineers (SPE) and reviewed
and jointly sponsored by the American Association of Petroleum Geologists (AAPG), World Petroleum
Council (WPC), Society of Petroleum Evaluation Engineers (SPEE), Society of Exploration Geophysicists (SEG),
Society of Petrophysicists and Well Log Analysts (SPWLA) and European Association of Geoscientists and
Engineers (EAGE), revised June 2018.
This Report has been prepared in accordance with the Australian Securities and Investment Commission
(ASIC) Regulatory Guides 111 and 112.
7.4. Limitations
The assessment of petroleum assets is subject to uncertainty because it involves judgments on many
variables that cannot be precisely assessed, including reserves/resources, future oil and gas production rates,

Pilot Energy Exploration Valuation January 2021 Page 51
the costs associated with producing these volumes, access to product markets, product prices and the
potential impact of fiscal/regulatory changes.
The statements and opinions attributable to RISC are given in good faith and in the belief that such
statements are neither false nor misleading. While every effort has been made to verify data and resolve
apparent inconsistencies, neither RISC nor its servants accept any liability, except any liability which cannot
be excluded by law, for its accuracy, nor do we warrant that our enquiries have revealed all of the matters,
which an extensive examination may disclose. In particular, we have not independently verified property
title, encumbrances or regulations that apply to these assets. RISC has also not audited the opening balances
at the valuation date of past recovered and unrecovered development and exploration costs, undepreciated
past development costs and tax losses.
Our review was carried out only for the purpose referred to above and may not have relevance in other
contexts.
7.5. Independence
RISC makes the following disclosures:
▪ RISC is independent with respect to Pilot Energy Ltd and confirms that there is no conflict of interest with
any party involved in the assignment.
▪ Under the terms of engagement between RISC and Pilot Energy Ltd, RISC will receive a time-based fee,
with no part of the fee contingent on the conclusions reached, or the content or future use of this report.
Except for these fees, RISC has not received and will not receive any pecuniary or other benefit whether
direct or indirect for or in connection with the preparation of this report.
▪ Neither RISC Directors nor any staff involved in the preparation of this report have any material interest
in Pilot Energy Ltd or in any of the properties described herein.
7.6. Copyright
This document is protected by copyright laws. Any unauthorised reproduction or distribution of the
document or any portion of it may entitle a claim for damages. Neither the whole nor any part of this report
nor any reference to it may be included in or attached to any prospectus, document, circular, resolution,
letter or statement without the prior consent of RISC.

Pilot Energy Exploration Valuation January 2021 Page 52
7.7. Authorisation for Release
This Report is authorised for release by Mr. Adam Craig, RISC Principal Advisor dated 29 January 2021.
Adam Craig
Principal Advisor

Pilot Energy Exploration Valuation January 2021 Page 53
8. List of terms The following lists, along with a brief definition, abbreviated terms that are commonly used in the oil and
gas industry and which may be used in this report.
Term Definition
1P Equivalent to Proved reserves or Proved in-place quantities, depending on the context.
1Q 1st Quarter
2P The sum of Proved and Probable reserves or in-place quantities, depending on the context.
2Q 2nd Quarter
2D Two Dimensional
3D Three Dimensional
4D Four Dimensional – time lapsed 3D in relation to seismic
3P The sum of Proved, Probable and Possible Reserves or in-place quantities, depending on the context.
3Q 3rd Quarter
4Q 4th Quarter
AFE Authority for Expenditure
Bbl US Barrel
BBL/D US Barrels per day
BCF Billion (109) cubic feet
BCM Billion (109) cubic metres
BFPD Barrels of fluid per day
BOPD Barrels of oil per day
BTU British Thermal Units
BOEPD US barrels of oil equivalent per day
BWPD Barrels of water per day
°C Degrees Celsius
Capex Capital expenditure
CAPM Capital asset pricing model
CGR Condensate Gas Ratio – usually expressed as bbl/MMscf
Contingent Resources
Those quantities of petroleum estimated, as of a given date, to be potentially recoverable from known accumulations by application of development projects but which are not currently considered to be commercially recoverable due to one or more contingencies. Contingent Resources are a class of discovered recoverable resources as defined in the SPE-PRMS.
CO2 Carbon dioxide
CP Centipoise (measure of viscosity)
CPI Consumer Price Index
DEG Degrees
DHI Direct hydrocarbon indicator
Discount Rate The interest rate used to discount future cash flows into a dollars of a reference date
DST Drill stem test
E&P Exploration and Production
EG Gas expansion factor. Gas volume at standard (surface) conditions/gas volume at reservoir conditions (pressure and temperature)
EIA US Energy Information Administration

Pilot Energy Exploration Valuation January 2021 Page 54
Term Definition
EMV Expected Monetary Value
EOR Enhanced Oil Recovery
ESMA European Securities and Markets Authority
ESP Electric submersible pump
EUR Economic ultimate recovery
Expectation The mean of a probability distribution
F Degrees Fahrenheit
FDP Field Development Plan
FEED Front End Engineering and design
FID Final investment decision
FM Formation
FPSO Floating Production Storage and offtake unit
FWL Free Water Level
FVF Formation volume factor
GIIP Gas Initially In Place
GJ Giga (109) joules
GOC Gas-oil contact
GOR Gas oil ratio
GRV Gross rock volume
GSA Gas sales agreement
GTL Gas To Liquid(s)
GWC Gas water contact
H2S Hydrogen sulphide
HHV Higher heating value
ID Internal diameter
IRR Internal Rate of Return is the discount rate that results in the NPV being equal to zero.
JV(P) Joint Venture (Partners)
Kh Horizontal permeability
km2 Square kilometres
Krw Relative permeability to water
Kv Vertical permeability
kPa Kilo (thousand) Pascals (measurement of pressure)
Mstb/d Thousand Stock tank barrels per day
LIBOR London inter-bank offered rate
LNG Liquefied Natural Gas
LTBR Long-Term Bond Rate
m Metres
MDT Modular dynamic (formation) tester
mD Millidarcies (permeability)
MJ Mega (106) Joules
MMbbl Million US barrels
MMscf(d) Million standard cubic feet (per day)

Pilot Energy Exploration Valuation January 2021 Page 55
Term Definition
MMstb Million US stock tank barrels
MOD Money of the Day (nominal dollars) as opposed to money in real terms
MOU Memorandum of Understanding
Mscf Thousand standard cubic feet
Mstb Thousand US stock tank barrels
MPa Mega (106) pascal (measurement of pressure)
mss Metres subsea
MSV Mean Success Volume
mTVDss Metres true vertical depth subsea
MW Megawatt
NPV Net Present Value (of a series of cash flows)
NTG Net to Gross (ratio)
ODT Oil down to
OGIP Original Gas In Place
OOIP Original Oil in Place
Opex Operating expenditure
OWC Oil-water contact
P90, P50, P10 90%, 50% & 10% probabilities respectively that the stated quantities will be equalled or exceeded. The P90, P50 and P10 quantities correspond to the Proved (1P), Proved + Probable (2P) and Proved + Probable + Possible (3P) confidence levels respectively.
PBU Pressure build-up
PJ Peta (1015) Joules
POS Probability of Success
Possible Reserves
As defined in the SPE-PRMS, an incremental category of estimated recoverable volumes associated with a defined degree of uncertainty. Possible Reserves are those additional reserves which analysis of geoscience and engineering data suggest are less likely to be recoverable than Probable Reserves. The total quantities ultimately recovered from the project have a low probability to exceed the sum of Proved plus Probable plus Possible (3P) which is equivalent to the high estimate scenario. When probabilistic methods are used, there should be at least a 10% probability that the actual quantities recovered will equal or exceed the 3P estimate.
Probable Reserves
As defined in the SPE-PRMS, an incremental category of estimated recoverable volumes associated with a defined degree of uncertainty. Probable Reserves are those additional Reserves that are less likely to be recovered than Proved Reserves but more certain to be recovered than Possible Reserves. It is equally likely that actual remaining quantities recovered will be greater than or less than the sum of the estimated Proved plus Probable Reserves (2P). In this context, when probabilistic methods are used, there should be at least a 50% probability that the actual quantities recovered will equal or exceed the 2P estimate.
Prospective Resources
Those quantities of petroleum which are estimated, as of a given date, to be potentially recoverable from undiscovered accumulations as defined in the SPE-PRMS.
Proved Reserves
As defined in the SPE-PRMS, an incremental category of estimated recoverable volumes associated with a defined degree of uncertainty Proved Reserves are those quantities of petroleum, which by analysis of geoscience and engineering data, can be estimated with reasonable certainty to be commercially recoverable, from a given date forward, from known reservoirs and under defined economic conditions, operating methods, and government regulations. If deterministic methods are used, the term reasonable certainty is intended to express a high degree of confidence that the quantities will be recovered. If probabilistic methods are used, there should be at least a 90% probability that the quantities actually recovered will equal or exceed the estimate. Often referred to as 1P, also as “Proven”.
PSC Production Sharing Contract
PSDM Pre-stack depth migration
PSTM Pre-stack time migration

Pilot Energy Exploration Valuation January 2021 Page 56
Term Definition
psia Pounds per square inch pressure absolute
p.u. Porosity unit e.g. porosity of 20% +/- 2 p.u. equals a porosity range of 18% to 22%
PVT Pressure, volume & temperature
QA/QC Quality Assurance/ Control
rb/stb Reservoir barrels per stock tank barrel under standard conditions
RFT Repeat Formation Test
Real Terms (RT) Real Terms (in the reference date dollars) as opposed to Nominal Terms of Money of the Day
Reserves
RESERVES are those quantities of petroleum anticipated to be commercially recoverable by application of development projects to known accumulations from a given date forward under defined conditions. Reserves must further satisfy four criteria: they must be discovered, recoverable, commercial, and remaining (as of the evaluation date) based on the development project(s) applied. Reserves are further categorised in accordance with the level of certainty associated with the estimates and may be sub-classified based on project maturity and/or characterized by development and production status.
RT Measured from Rotary Table or Real Terms, depending on context
SC Service Contract
scf Standard cubic feet (measured at 60 degrees F and 14.7 psia)
Sg Gas saturation
Sgr Residual gas saturation
SRD Seismic reference datum lake level
SPE Society of Petroleum Engineers
SPE-PRMS
Petroleum Resources Management System, prepared by the Oil and Gas Reserves Committee of the Society of Petroleum Engineers (SPE) and reviewed and jointly sponsored by the American Association of Petroleum Geologists (AAPG), World Petroleum Council (WPC), Society of Petroleum Evaluation Engineers (SPEE), Society of Exploration Geophysicists (SEG), Society of Petrophysicists and Well Log Analysts (SPWLA) and European Association of Geoscientists and Engineers (EAGE), revised June 2018.
s.u. Fluid saturation unit. e.g. saturation of 80% +/- 10 s.u. equals a saturation range of 70% to 90%
stb Stock tank barrels
STOIIP Stock Tank Oil Initially In Place
Sw Water saturation
TCM Technical committee meeting
Tcf Trillion (1012) cubic feet
TJ Tera (1012) Joules
TLP Tension Leg Platform
TRSSV Tubing retrievable subsurface safety valve
TVD True vertical depth
US$ United States dollar
US$ million Million United States dollars
WACC Weighted average cost of capital
WHFP Well Head Flowing Pressure
Working interest
A company’s equity interest in a project before reduction for royalties or production share owed to others under the applicable fiscal terms.
WPC World Petroleum Council
WTI West Texas Intermediate Crude Oil

Online Voting User Guide
Getting Started ILumi AGM can be accessed using any web browser on a PC, tablet or smartphone device. To use this
method, please go to https://web.lumiagm.com.
To log in to the portal, you will need the following information:
Meeting ID: 387-092-324
Australian
Residents
Username - Voting Access Code (VAC*) and Password (postcode of your registered
address) *Voting Access Code (VAC) can be located on the first page of your proxy form or
on your notice of meeting email)
Overseas
Residents
Username - Voting Access Code (VAC*) and Password (three character country code e.g. New Zealand – NZL. A full list of country codes can be found at the end of this guide.)
*Voting Access Code (VAC) can be located on the first page of your proxy form or on your
notice of meeting email). A full list of country codes can be found at the end of this guide.
Appointed
Proxy
To receive your Username and Password, please contact our share registry, Boardroom Pty
Ltd on 1300 737 760 or +61 2 9290 9600 between 8:30am to 5:30pm (Sydney Time)
Monday to Friday the day before the meeting.
To join the meeting, you will be required to enter the above unique 9 digit meeting ID and select ‘Join’. To
proceed to registration, you will be asked to read and accept the terms and conditions.

If you are not a Shareholder, select ‘I am a guest’. You will be asked to enter your name and email details, then select ‘Enter’. Please note, guests are not able to ask questions at the meeting.
Navigating
Once you select to view the
webcast from a smartphone it can
take up to approximately 30
seconds for the live feed to appear
on some devices. If you attempt to
log into the website before the
Meeting commences, a dialog box
will appear.
NOTE: We recommend once you
have logged in, you keep your
browser open for the duration of
the meeting. If you close your
browser you will be asked to
repeat the log in process.
If you are a Shareholder, select 'I have a login' and enter your Username VAC (Voting Access Code) and Password
(postcode or country code). If you are a Proxyholder you will need to enter the unique Username and Password
provided by Boardroom and select ‘Login’.
Once you have registered, you will be taken to the homepage which displays your name and meeting information.
To activate the webcast, please click on the Broadcast bar at the bottom of the screen. If prompted you may have to
click the play button in the window to initiate the broadcast.

To ask a Question
1. Select the question icon
2. Compose your question.
3. Select the send icon
4. You will receive confirmation that your
question has been received.
The Chair will give all Shareholders a reasonable opportunity
to ask questions and will endeavor to answer all questions at
the Meeting.
To Vote
1. When the Chair declares the polls open, the resolutionsand voting choices will appear.
2. Press the option corresponding with the way in whichyou wish to vote.
3. Once the option has been selected, the vote will appearin blue.
4. If you change your mind and wish to change your vote,you can simply press the new vote or cancel your vote atany time before the Chair closes the polls.
5. Upon conclusion of the meeting the home screen will beupdated to state that the meeting is now closed.
Need help? If you require any help using this system prior to or during the Meeting, please call 1300 737 760
or +61 2 9290 9600 so we can assist you
If you would like to ask a question:
If you would like to cast a vote:
Country CodesFor overseas shareholders, select your country code from the list below and enter it into the password field.
ABW Aruba
AFG Afghanistan
AGO Angola
AIA Anguilla
ALA Aland Islands
ALB Albania
AND Andorra
ANT Netherlands Antilles
ARE United Arab Emirates
ARG Argentina
ARM Armenia
ASM American Samoa
ATA Antarctica
ATF French Southern
ATG Antigua & Barbuda
AUS Australia
AUT Austria
AZE Azerbaijan
BDI Burundi
BEL Belgium
BEN Benin
BFA Burkina Faso
BGD Bangladesh
BGR Bulgaria
BHR Bahrain
BHS Bahamas
BIH Bosnia & Herzegovina
BLM St Barthelemy
BLR Belarus
BLZ Belize
BMU Bermuda
BOL Bolivia
BRA Brazil
BRB Barbados
BRN Brunei Darussalam
BTN Btn
BUR Burma
BVT Bouvet Island
BWA Botswana
CAF Central African Republic
CAN Canada
CCK Cocos (Keeling) Islands
CHE Switzerland
CHL Chile
CHN China
CIV Cote D’ivoire
CMR Cameroon
COD Democratic Republic of Congo
COK Cook Islands
COL Colombia
COM Comoros
CPV Cape Verde
CRI Costa Rica
CUB Cuba
CYM Cayman Islands
CYP Cyprus
CXR Christmas Island
CZE Czech Republic
DEU Germany
DJI Djibouti
DMA Dominica
DNK Denmark
DOM Dominican Republic
DZA Algeria
ECU Ecuador
EGY Egypt
ERI Eritrea
ESH Western Sahara
ESP Spain
EST Estonia
ETH Ethiopia
FIN Finland
FJI Fiji
FLK Falkland Islands (Malvinas)
FRA France
FRO Faroe Islands
FSM Micronesia
GAB Gabon
GBR United Kingdom
GEO Georgia
GGY Guernsey
GHA Ghana
GIB Gibraltar
GIN Guinea
GLP Guadeloupe
GMB Gambia
GNB Guinea-Bissau
GNQ Equatorial Guinea
GRC Greece
GRD Grenada
GRL Greenland
GTM Guatemala
GUF French Guiana
GUM Guam
GUY Guyana
HKG Hong Kong
HMD Heard & Mcdonald Islands
HND Honduras
HRV Croatia
HTI Haiti
HUN Hungary
IDN Indonesia
IMN Isle Of Man
IND India
IOT British Indian Ocean Territory
IRL Ireland
IRN Iran Islamic Republic of
IRQ Iraq
ISM British Isles
ISL Iceland
ISR Israel
ITA Italy
JAM Jamaica
JEY Jersey
JOR Jordan
JPN Japan
KAZ Kazakhstan
KEN Kenya
KGZ Kyrgyzstan
KHM Cambodia
KIR Kiribati
KNA St Kitts And Nevis
KOR Korea Republic of
KWT Kuwait
LAO Lao Pdr
LBN Lebanon
LBR Liberia
LBY Libyan Arab Jamahiriya
LCA St Lucia
LIE Liechtenstein
LKA Sri Lanka
LSO Lesotho
LTU Lithuania
LUX Luxembourg
LVA Latvia
MAC Macao
MAF St Martin
MAR Morocco
MCO Monaco
MDA Republic Of Moldova
MDG Madagascar
MDV Maldives
MEX Mexico
MHL Marshall Islands
MKD Macedonia Former Yugoslav Rep
MLI Mali
MLT Mauritania
MMR Myanmar
MNE Montenegro
MNG Mongolia
MNP Northern Mariana Islands
MOZ Mozambique
MRT Mauritania
MSR Montserrat
MTQ Martinique
MUS Mauritius
MWI Malawi
MYS Malaysia
MYT Mayotte
NAM Namibia
NCL New Caledonia
NER Niger
NFK Norfolk Island
NGA Nigeria
NIC Nicaragua
NIU Niue
NLD Netherlands
NOR Norway Montenegro
NPL Nepal
NRU Nauru
NZL New Zealand
OMN Oman
PAK Pakistan
PAN Panama
PCN Pitcairn Islands
PER Peru
PHL Philippines
PLW Palau
PNG Papua New Guinea
POL Poland
PRI Puerto Rico
PRK Korea Dem Peoples Republic of
PRT Portugal
PRY Paraguay
PSE Palestinian Territory Occupied
PYF French Polynesia
QAT Qatar Re
REU Reunion
ROU Romania
RUS Russian Federation
RWA Rwanda
SAU Saudi Arabia Kingdom Of
SDN Sudan
SEN Senegal
SGP Singapore
SGS Sth Georgia & Sth Sandwich Isl
SHN St Helena
SJM Svalbard & Jan Mayen
SLB Solomon Islands
SCG Serbia & Outlying
SLE Sierra Leone
SLV El Salvador
SMR San Marino
SOM Somalia
SPM St Pierre And Miquelon
SRB Serbia
STP Sao Tome And Principe
SUR Suriname
SVK Slovakia
SVN Slovenia
SWE Sweden
SWZ Swaziland
SYC Seychelles
SYR Syrian Arab Republic
TCA Turks & Caicos Islands
TCD Chad
TGO Togo
THA Thailand
TJK Tajikistan
TKL Tokelau
TKM Turkmenistan
TLS East Timor
TMP East Timor
TON Tonga
TTO Trinidad & Tobago
TUN Tunisia
TUR Turkey
TUV Tuvalu
TWN Taiwan
TZA Tanzania United Republic of
UGA Uganda
UKR Ukraine
UMI United States Minor
URY Uruguay
USA United States of America
UZB Uzbekistan
VNM Vietnam
VUT Vanuatu
WLF Wallis & Futuna
WSM Samoa
YEM Yemen
YMD Yemen Democratic
YUG Yugoslavia Socialist Fed Rep
ZAF South Africa
ZAR Zaire
ZMB Zambia
ZWE Zimbabwe