Nitrification Inhibitors for Agriculture, Health, and the Environment
Upload
binghamtonCategory
view
0download
0
Preliminary investigations on nitrification coupled to
photosynthetic oxygenation
Daniel de Deus Cunha
MSc Thesis ES 10.40 May 2010
UNESCO-IHE
INSTITUTE FOR WATER EDUCATION
NITRIFICATION


Preliminary investigations on nitrification coupled to
photosynthetic oxygenation
Master of Science Thesis by
Daniel de Deus Cunha
Supervisors C. M. Hooijmans, PhD (UNESCO-IHE) P. van der Steen, PhD (UNESCO-IHE) Prof. P. N. Lens, PhD (UNESCO-IHE)
Examination committee C. M. Hooijmans, PhD (UNESCO-IHE) Prof. P. N. Lens, PhD (UNESCO-IHE)
R. Bosma, PhD (Wageningen University)
This research is done for the partial fulfilment of requirements for the Master of Science degree at the
UNESCO-IHE Institute for Water Education, Delft, the Netherlands
Delft
May 2010

The findings, interpretations and conclusions expressed in this study do neither
necessarily reflect the views of the UNESCO-IHE Institute for Water Education, nor of
the individual members of the MSc committee, nor of their respective employers.
Here's the soap that will set you free, cleaning up your visions of reality. And all the
salesmen will agree: surround sound DVD is ecstasy. Life can be sweet with those
candy-bars. Increase your ego with that brand new car. Insure your safety, buy this lie,
and buy and buy and buy and buy. Turn the prism on its side. Through its faces shines
the light. Puncture what illusions hide. Don't be taken for a ride. Fast food burgers
slim your time. Send a present to your Valentine. Get your airmiles travel free. In
September start your Christmas shopping spree. It's in the stars, be a
millionaire. Conquer the world with new underwear. You're so free, you can buy the
lie, and lie and lie and lie and lie. Keep on track with the digital fun. Book in time for
the winter sun. Get a free cell-phone, call all day. The next great prey is on its
way. Turn the prism on its side. Through its faces shines the light. Puncture what
illusions hide. Don't be taken for a ride.
The Ex, Prism song
The ecological crisis in itself, in spite of its extreme gravity, is only a symptom. I hate
the word “environment”. Important things are not around us, but in us. We do not
destroy nature because we hate it: what would this mean? We destroy it because we
hate each other. In a duel, often third innocents, who were only passing by, are hit the
hardest. Destruction of nature and the intestine violence of men feed themselves
mutually (...). “Sustainable development” and “green growth” are slogans for those
who still believe they can solve the squaring of the circle.
Jean-Pierre Dupuy
Freedom can only consist in socialised man, the associated producers, rationally
regulating their interchange with Nature, bringing it under their common control,
instead of being ruled by blind forces; and achieving this with the least expenditure of
energy and under conditions most favourable to, and worthy of, their human nature.
Karl Marx, Das kapital
If the completion of the technological project involves a break with the prevailing
technological rationality, the break in turn depends on the continued existence of the
technical base itself. For it is this base which has rendered possible the satisfaction of
needs and the reduction of toil – it remains the very base of all forms of human freedom.
The qualitative change rather lies in the reconstruction of this base – that is, in its
development with a view of different ends. (...)This does not mean the revival of
“values”, spiritual or other, which are to supplement the scientific and technological
transformation of man and nature. On the contrary, the historical achievement of
science and technology has rendered possible the translation of values into technical
tasks – the materialization of values.
Herbert Marcuse, One-dimensional man


i
Abstract
Nutrient removal in wastewater treatment is dominated by activated sludge.
The activated sludge process needs intensive artificial aeration, what makes
it an energy intensive process in a world that is possibly facing an energy
crisis in the next years.
Photosynthetic oxygenation would be an alternative to achieve nitrification
without artificial aeration. Although research with photobioreactors is not
new, coming at least since the works of William J. Oswald in the 1950’s,
comprehensive analysis of the potentiality for photosynthetic oxygenation
for nitrification are scarce.
This work shows with experiments and mathematical modelling that
nitrification with photosynthetic oxygenation is a promising technology for
wastewater treatment. However, it is shown that nitrification in
photobioreactors is strongly dependent on operational conditions, as
incident irradiance and hydraulic retention time. This is because nitrification
in such systems is subject to stoichiometric and kinetic constraints. A
strategy is developed to overcome this constraints, in order to achieve
controlled nitrification with photosynthetic oxygenation.
This work also discusses conceptually the integration of photobioreactors
for nitrification in wastewater treatment plants, including the problem of
denitrification. Therefore, this thesis provides the first steps towards
wastewater treatment with nitrification coupled to photosynthetic
oxygenation followed by denitrification; more research is needed to confirm,
complement or correct the findings here presented.
Keywords: photobioreactors, nitrification, algae, nitrifiers, modelling

ii

iii
Acknowledgements
Many thanks
to my family and Maria Alejandra Liendo, for understanding;
to my workmates at Ministério Público do Estado do Rio Grande do Sul, especially
Alencar Heidrich, for the support;
to my mentors and supervisor, Tineke Hooijmans, Peter van der Steen and Piet Lens, for
the discussions and advices;
to the laboratory staff (Fred Kruis, Frank Wiegman, Lyzette Robbemont, Peter Heerings,
Ferdi Battes, Don van Galen), for all the help with the laboratory work;
to Carlos Manuel López Vázquez, for kindly borrowing laboratory equipment;
to Mattheus Mimpen, for kindly providing an enriched culture of nitrifiers;
to classmates and friends from all over the world who made my stay in Holland a great
experience.

iv

v
Table of Contents
Abstract .......................................................................................................................... i
Acknowledgements ..................................................................................................... iii
List of symbols ............................................................................................................ ix
1. Introduction .......................................................................................... 1
1.1 Objectives ......................................................................................................... 3
2 Literature review .................................................................................. 4
2.1 Algae-bacteria systems ..................................................................................... 4
2.2 Photobioreactors ............................................................................................... 5
2.3 Harvesting of algae ........................................................................................... 6
2.4 Factors affecting algae growth ......................................................................... 7
2.5 Selection and adaptation of algae and bacteria ................................................. 7
2.6 Nitrification ...................................................................................................... 7
2.7 Models .............................................................................................................. 8
2.8 Controlled nitrification in photobioreactors ..................................................... 8
2.9 Post-treatment of UASB effluents .................................................................... 9
2.10 Denitrification ................................................................................................... 9
3 Methodology ........................................................................................ 11
3.1 Experimental setup and analytical methods ................................................... 11
3.1.1 Experimental setup ................................................................................. 11
3.1.2 Physico-chemical analysis ...................................................................... 12
3.2 Modelling ....................................................................................................... 13
3.2.1 Overview ................................................................................................ 13
3.2.2 Processes and stoichiometry ................................................................... 14
3.2.3 Kinetics ................................................................................................... 15
3.2.4 Limitations of the model ........................................................................ 19
3.2.5 Input parameters and operational strategy .............................................. 21
4 Results .................................................................................................. 26
4.1 Experimental results ....................................................................................... 26
4.1.1 Phase 1: growth of nitrifiers ................................................................... 26
4.1.2 Phase 2: addition of algae and SRT control ........................................... 27
4.1.3 Phase 3: increased SRT .......................................................................... 28
4.1.4 Phase 4: uncontrolled SRT ..................................................................... 29
4.1.5 Phase 5: decreased influent ammonia concentration .............................. 29
4.1.6 Phase 6: increased settling time .............................................................. 30
4.1.7 General observations .............................................................................. 30
4.2 Model results .................................................................................................. 31
4.2.1 Input parameters and initial conditions .................................................. 31
4.2.2 Base results ............................................................................................. 33
4.2.3 Effect of irradiation ................................................................................ 37
4.2.4 Effect of hydraulic retention time (HRT) ............................................... 44
4.2.5 Control of nitrification coupling HRT to incident irradiance ................. 48
4.2.6 Control of nitrification manipulating hydraulic retention time, biomass
retention time and irradiation ................................................................................. 50
4.2.7 Effect of C/N ratio .................................................................................. 51
vi
4.2.8 Effect of reactor width ............................................................................ 53
4.2.9 The role of alkalinity .............................................................................. 54
4.2.10 Treatment of sewage with higher substrate content ............................... 56
4.2.11 Denitrification ......................................................................................... 57
5 Discussion ............................................................................................ 58
5.1 Experiments .................................................................................................... 58
5.2 Modelling ....................................................................................................... 58
5.3 Integration of experimental and model results ............................................... 61
5.4 Enclosed photobioreactors in wastewater treatment plants ............................ 61
6 Main conclusions and suggestions for further research ................. 66
References .................................................................................................. 67
7 Appendix: AQUASIM file ................................................................. 73

vii
List of tables
Table 1: medium composition ........................................................................................ 11
Table 2: trace element solution composition .................................................................. 11
Table 3: stoichiometry table of the model ...................................................................... 18
Table 4: rate equations of the model .............................................................................. 21
Table 5: kinetic comparison of microorganisms ............................................................ 22
Table 6: parameters of the model ................................................................................... 23
Table 7: Sewage as characterized in Nieuwe Waterweg, The Netherlands (Roeleveld
and van Loodsdrecht, 2002) ........................................................................................... 31
Table 8: Input parameters and initial conditions ............................................................ 32
Table 9: distribution of nitrogen in the effluent ............................................................. 37
Table 10: nitrogen in liquid phase .................................................................................. 37
Table 11: steps applied on irradiance (increasing irradiance) ........................................ 38
Table 12: steps applied on irradiance (decreasing irradiance) ....................................... 41
Table 13: steps applied on HRT (decreasing HRT) ....................................................... 44
Table 14: steps applied on HRT (increasing HRT) ........................................................ 46
Table 15: series of steps using optimal combinations of irradiance and HRT ............... 49
Table 16: series of steps using optimal combinations of irradiance, HRT and recycled
biomass ........................................................................................................................... 50
Table 17: ......................................................................................................................... 53
Table 18: Sewage as characterized in Nieuwgraaf, The Netherlands (Roeleveld and van
Loodsdrecht, 2002) ......................................................................................................... 56
Table 19: stoichiometric potential of sewage to denitrification, according to sewage
characterization by Roeleveld and van Loodsdrecht (2002) .......................................... 63
List of figures
Figure 1: algal bacterial symbiosis in sewage treatment (source: Oswald & Gotaas 1955)
.......................................................................................................................................... 1 Figure 2: algal bacterial symbiosis in sewage treatment (adapted from Oswald & Gotaas
1955) ................................................................................................................................. 2 Figure 3: simplified diagram of the model, showing main growth processes ................ 14 Figure 4: ammoium nitrogen concentration during in effluent in nitrifiers culture during
Phase 1 ............................................................................................................................ 26 Figure 5: concentration of nitrogen species in the medium during one cycle in Phase 1
........................................................................................................................................ 27
Figure 6: nitrate and ammonium nitrogen concentrations in the effluent during Phase 2
........................................................................................................................................ 28 Figure 7: dissolved oxygen in medium and transmitted light intensity through the
reactor during Phase 2 .................................................................................................... 28 Figure 8: nitrate and ammonia nitrogen in effluent and transmitted light intensity during
Phase 3 ............................................................................................................................ 29
Figure 9: nitrate nitrogen in effluent and transmitted light intensity during Phase 4 ..... 29 Figure 10: transmitted light intensity through the reactor during Phase 5 ..................... 30 Figure 11: nitrogen species in effluent and transmitted light intensity during Phase 6.. 30 Figure 12: layer of biomass that was on top of the magnetic stirrer fell upside down,
showing two distinct layers ............................................................................................ 31

viii
Figure 13: layer of biomass rolled over itself, showing two distinct layers (green on top,
brownish-grey on bottom). ............................................................................................. 31 Figure 14: biomass in the reactor ................................................................................... 34
Figure 15: nutritional limitation for algae ...................................................................... 34 Figure 16: nutritional limitation for heterotrophs ........................................................... 35 Figure 17: nutritional limitation for nitrifiers ................................................................. 35 Figure 18: growth rate of nitrifiers ................................................................................. 36 Figure 19: oxygen concentration in the reactor .............................................................. 36
Figure 20: main nitrogen forms in the effluent............................................................... 37 Figure 21: nitrate concentration in the effluent with a series of steps in irradiance ....... 39 Figure 22: carbon dioxide concentration in reactor ........................................................ 39 Figure 23: nutritional limitation for nitrifiers with a series of steps in irradiance.......... 40 Figure 24: nutritional limitation for algae with a series of steps in irradiance ............... 40
Figure 25: biomass in reactor with a series of steps in irradiance .................................. 41
Figure 26: nitrate concentration in the effluent with a series of steps in irradiance ....... 42 Figure 27: oxygen concentratio in reactor ...................................................................... 42
Figure 28: nutritional limitation for nitrifiers with a series of steps in irradiance.......... 43 Figure 29: nutritional limitation for heterotrophs with a series of steps in irradiance ... 43 Figure 30: biomass in reactor with a series of steps in irradiance .................................. 44
Figure 31: nitrate concentration in the effluent with a series of steps applied on HRT . 45 Figure 32: nutritional limitation for nitrifiers with a series of steps on HRT ................. 45 Figure 33: nutritional limitation for heterotrophs with a series of steps on HRT .......... 46
Figure 34: biomass in reactor with a series of steps on HRT ......................................... 46 Figure 35: nitrate concentration in the effluent with a series of steps applied on HRT . 47
Figure 36: nutritional limitation for nitrifiers with a series of steps on HRT ................. 47 Figure 37: nutritional limitation for algae with a series of steps on HRT ...................... 48 Figure 38: biomass in reactor with a series of steps on HRT ......................................... 48
Figure 39: nitrate in effluent with a series of steps in irradiance and HRT .................... 49
Figure 40: nutritional limitation for nitrifiers with a series of steps in irradiance and
HRT ................................................................................................................................ 50 Figure 41: control of nitrification with different combinations of irradiance, HRT and
SRT ................................................................................................................................. 51
Figure 42 ......................................................................................................................... 52 Figure 43: nitrogen in the effluent with high organic content wastewater ..................... 52 Figure 44: nutrient limitation for nitrifiers with high organic content wastewater ........ 53 Figure 45 ......................................................................................................................... 54 Figure 46: ........................................................................................................................ 55
Figure 47: ........................................................................................................................ 55 Figure 48: ........................................................................................................................ 56 Figure 49: nitrogen forms in the effluent with wastewater with high organic content .. 57
Figure 50: optimized hydraulic and sludge retention time for photobioreactor
(nitrification of around 60% of influent NH3-N) with 10 cm of width and other
parameters described in tables 6 and 7 ........................................................................... 59 Figure 51: optimized hydraulic and sludge retention time for photobioreactor
(nitrification of around 65% of influent NH3-N, slightly decreasing as HRT decreases)
with data based on tables 6, 7 and 14 ............................................................................. 60 Figure 52: photobioreactor for sewage treatment ........................................................... 62 Figure 53: photobioreactor for post-treatment of UASB effluents ................................ 64

ix
List of symbols

x

Daniel de Deus Cunha 1
1. Introduction
Activated sludge is a well established method of wastewater treatment especially in case
of nutrient removal. It is a mature technology, with numerous and reliable models
available. How efficient it may be, it might not be up to the challenges of our times: it is
an energy intensive process in an energy scarce world.
William J. Oswald and his co-workers (Oswald et al 1953) proposed the concept of
“photosynthetic oxygenation”, that is, the use of algae to provide the oxygen needed for
natural biodegradation of organic matter, in an algal-bacterial symbiosis, so that
artificial aeration and the related energy consumption would be unnecessary (Fig. 1).
Oswald later expanded his concept to close the nutrient cycle: algae grown in
wastewater treatment plants should be harvested and used as animal feed (Oswald 1995).
The result would be a basically solar-driven technology that in one system treats
wastewaters and recovers nutrients.
Figure 1: algal bacterial symbiosis in sewage treatment (source: Oswald & Gotaas 1955)
Quite surprisingly, the system was already proposed in 1953, during the hey-days of
fordism, mass production and unconcerned energy and natural resources consumption.
Maybe it was ahead of its time, and activated sludge overwhelmingly dominated the
scene of wastewater nutrient removal during the whole of the 20th century (Wanner
1994).
The first attempts of photosynthetic oxygenation were carried out in open
photobioreactors, or high-rate algal ponds. Today there are relatively few of these in
operation. Oswald himself tried unsuccessfully to develop an enclosed photobioreactor
– called “symbiocon” (Oswald et al 1953). Nowadays they are a reality not only in
laboratory, but also in full scale. These reactors, however, are designed for the mass
production of algae in itself (not related to wastewater treatment). A renovated interest
in photosynthetic oxygenation in enclosed photobioreactors for wastewater treatment
arouse recently, but always focusing on algae mass production, harvesting and recycling.

2 MSc thesis
Although assimilation by algae is certainly the most sustainable approach, considering
that synthetic nitrogen fertilizers are derived from fossil fuels, using the Haber-Bosch
process (Pierzinsky et al 2005), there are some reasons for a different approach, namely,
to nitrify the nitrogen, instead of let it be assimilated by algae (although a certain extent
of assimilation is unavoidable). Harvesting of algae is still costly and might become an
operational burden; the application of biomass far away from where it is harvested
could cause more environmental impacts than the environmental benefits brought by
nutrients recycling (due to transportation emissions, etc.); and the large scale application
of the integrated approach requires an also integrated community planning which,
unfortunately, is not yet a reality.
In between the main line of nutrient removal from wastewater – activated sludge – and
the alternative proposed by Oswald – photosynthetic oxygenation with massive algae
harvesting – opens up a field of research to a great extent unexplored: the use of
photosynthetic oxygenation for nitrification (Fig. 2).
Figure 2: algal bacterial symbiosis in sewage treatment (adapted from Oswald & Gotaas 1955)
Artificial aeration accounts for 45 to 75% of the energy consumption in wastewater
treatment plants (Stenstrom and Rosso 2008). Considering that we are possibly facing
an energy crisis in the next years due to the depletion of oil reserves (Tsoskounoglou et
al 2008, Hall et al 2008, Kjärstad and Johnsson 2009), the development of alternative
technologies that save energy have an important social role. The potentiality of
technology reconfiguration as means and end of social change cannot be overestimated.
Illich argues that above a certain threshold of per capita energy consumption it is
impossible to have an egalitarian society (Illich 1974); Marcuse claims that technology
embeds values, and that an effective social change is dependent on the "materialization
of values", i. e., the "translation of values into technical tasks", (Marcuse 1964). This
work deals with the technical task of investigating the feasibility of nitrification with
photosynthetic oxygenation.
NITRIFICATION

Daniel de Deus Cunha 3
1.1 Objectives
The goal of this research is to carry out preliminary investigations on the feasibility of
nitrification coupled to algae photosynthetic oxygenation in wastewater treatment. To
achieve this goal, the following resources will be used:
a) experiments: experimental work will be carried out trying to demonstrate the
possibility of coexistence of algae, heterotrophs and nitrifiers in a stirred reactor,
in steady state;
b) modelling: a mathematical model will be developed, trying to demonstrate the
feasibility, key factors and best operational conditions for nitrification in
enclosed photobioreactors;
c) conceptual process analysis: making use of characteristics of wastewaters,
different treatment systems and simple stoichiometric calculations, the use of
enclosed photobioreactors for nitrification will be contextualized, in order to
explore its potential uses, including denitrification and post-treatment of UASB
effluents.

4 MSc thesis
2 Literature review
This literature review will outline the main subjects covered in this work, covering
general aspects on algae-bacteria systems, photobioreactors and nitrification as well as
modelling and specific issues that should be considered when planning the potential role
of enclosed photobioreactors in wastewater treatment plants, i. e., denitrification, post-
treatment of UASB effluents and harvesting of algae.
2.1 Algae-bacteria systems
“Photosynthetic oxygenation” was proposed in the fifties by Oswald et al (1953). It was
realized that two phases were identifiable in an oxidation pond treating sewage: a first
bacterial phase where bacteria decompose organic matter, depleting dissolved oxygen
and generating, among other species, ammonia and carbon dioxide, part of it escaping to
the atmosphere; and a second phase where algae promote photosynthetic oxygenation,
taking up, among other species, carbon dioxide and nitrogen, possibly resulting in
supersaturation of dissolved oxygen and consequent emission to the atmosphere. The
two phases are subsequent in time and space, occurring in different sections in the pond.
The authors point out that the efficiency of this system is very low; both oxygen and
carbon are wasted. They propose then the “integration of bacterial and algal phases”,
that is an “algal bacterial symbiosis”, where algae uses the products of bacterial activity
as nutrients (carbon dioxide, nitrogen) and bacteria uses the products of algal activity
(oxygen). These authors performed experiments in closed and open continuous systems
with algal-bacterial symbiosis (Oswald et al 1953). Closed systems – called
“symbiocon” – were found extremely difficult to obtain a dynamic equilibrium. In open
systems, equilibrium was readily obtained, and the authors identified as main variables
affecting the symbiosis the retention period, sewage strength, light intensity and
periodicity, temperature and the bacterial and algae species and activity. The same
authors (Oswald et al 1953b) also studied the growth of Chlorella in sewage and found
that in continuous cultures, with varying retention time, there is a maximum in yield
(productivity) that correspond to a relatively low cell density. It was also found that
varying retention times, i.e., varying the age of cells, their morphology and physiology
changes. Based on these previous studies, the basic design parameters of high-rate algal
ponds were established (Oswald & Gotaas 1955).
It has been proposed that algae ponds could be used to close the nutrient cycle, i.e., that
algae should be harvested and used either as fertilizer or animal food. That would
configure a solar-driven sustainable system of “controlled photosynthesis”, integrating
wastewater treatment and nutrient recovery, suitable for times facing superpopulation
and food insecurity; under this paradigm the goal would be to produce as much algae as
possible under the given conditions (Oswald & Gotaas 1955; Oswald 1962; Oswald
1995; Oswald 2003). Another alternative is the use of algae biomass for anaerobic
energy production (Muñoz & Guieysse 2006).
McGriff Jr. and McKinney (1972) describe an open system of algal-bacterial symbiosis
in which the MLSS (mixed-liquor suspended solids) could be controlled, that, in
analogy with the activated sludge process, is called “activated algae”. These authors

Daniel de Deus Cunha 5
showed that removal efficiencies of a system like this could reach 97% of BOD, 87%
COD, 92% nitrogen and 74% phosphorous. Nitrification was detected, but in very low
levels; it should be noted then that most of the nitrogen removal was represented by
algal uptake. More recently the interest in photobioreactors as a means of algae
production has increased. Many configurations of enclosed photobioreactors have been
proposed and or developed. Concerning the biomass physical distribution, three basic
configurations can be identified: suspended growth (Muñoz and Guieysse 2006),
immobilized microalgae (Moreno-Garrido 2008; Mallick 2008) and biofilm systems
(Muñoz et al 2009).
2.2 Photobioreactors
Several recent studies show the applicability of photobioreactors for wastewater
treatment, and specifically for nitrogen removal, under their specific configurations and
operating conditions. Nitrogen removal by Chlorella pyreneidosa and Scenedesmus sp.
in consortia with heterotrophs was shown by Tam & Young (1989). Aziz & Ng (1992)
showed removals above 60% of ammonium nitrogen in activated algae systems treating
domestic sewage, and pretreated piggery and oil mill wastewater; Muñoz et al (2003)
were able to promote the degradation of sodium salycilate using a consortium of
Chlorella sorokiniana and Ralstonia brasiliensis, and established the dependence of
biodegradation on microalgal concentration, light intensity and temperature. Gutzeit et
al (2005) showed that in a sequencing batch reactor it is possible to develop a
bioflocculent algal-bacterial biomass and were able to use the system to treat synthetic
wastewater. Muñoz et al (2005) successfully used an algal-bacterial consortium for
combined carbon and nitrogen removal from acetonitrile, and reported nitrification of
12% of the theoretically produced ammonium nitrogen. Muñoz et al (2005) achieved
33% of nitrogen removal in a pilot scale symbiotic consortium degrading acetonitrile.
Essam et al (2006) used an experimental design having as parameters the presence of
algae, bacteria, light and carbon source (phenol) to show the effectiveness of the algal-
bacterial symbiosis, which was able to degrade phenol from coke factory wastewater
after detoxification. Using a tubular biofilm photobioreactor, González et al (2008)
showed an efficient nutrient removal from swine manure using an algae-bacteria
consortium. The consortia consisted of Chlorella sorokiniana and a mixed bacterial
culture from an activated sludge process. The authors report 82% of ammonium-
nitrogen assimilated and 13% nitrified. Godos et al (2009a) again showed simultaneous
nutrients and carbon removal from pretreated slurry in a tubular biofilm photobioreactor.
Depending on the wastewater load, nitrifications of 7, 23 and 8% were reported.
Additionally, denitrification was reported with a high wastewater load.
Nitrification was also reported in open photobioreactors, or high-rate algal ponds
(HRAP) (Evans et al 2005; Godos et al 2009; Barthel et al 2008; Ip et al 1982, Cromar
et al 1997). The percentage of nitrogen converted to nitrate in HRAP was independent
of the loading rate and improved with retention time, and it was suggested that it is due
to the low growth rate of nitrifying bacteria, especially Nitrosomonas sp; nitrification
was also favored by lower C:N:P ratios (Cromar & Fallowfield 1997). In HRAP’s
treating piggery wastewater with varying dilutions, up to 86% of TKN was removed via
nitrification, and denitrification was also reported (Godos et al 2009b). In experiments
with HRAP’s specifically designed to evaluate nitrification and denitrification, it was
shown that the percentage of nitrification presents a maximum as COD loading rate

6 MSc thesis
varies, and that at high COD loading rates nitrification may be limited by lack of
oxygen; varying retention time and depth also influenced results (Evans et al 2005).
However, nitrification in open photobioreactors is not a rule (Craggs 2005; El Hafiane
et al 2003); it has been observed in the treatment of high strength wastewaters (Craggs
2005) and appears to occur seasonally in temperate climates, especially in the winter,
when due to decreased algal productivity there is less ammonia nitrogen assimilation by
algae and reduced ammonia volatilization because of lower pH (Pearson 2005). Higher
light intensity in the summer may also be a factor, as nitrifying bacteria are sensible to
sunlight (Pearson 2005). It is important to realize that open photobioreactors such as
HRAP’s have important differences when compared to closed photobioreactors (that is,
closed to the atmosphere and possibly with pure algal cultures), such as the occurrence
of ammonia volatilization (Craggs 2005) or changing composition of algae population
(Godos et al 2009b).
2.3 Harvesting of algae
In the suspended growth activated algae configuration, special attention should be given
to harvesting, as it is necessary to ensure good effluent quality and prevent cell washout
(Muñoz & Guieysse 2006). Common industrial approaches of filtration, centrifugation,
microstraining, etc. are not economical and therefore not suitable for large-scale
microalgae removal (Muñoz & Guieysse 2006). Flocculation followed by gravity
sedimentation is the most common harvesting technique, but this approach is not always
efficient, especially in the case of small and rapidly growing Chlorella or Scenedesmus
sp. (Muñoz & Guieysse 2006). Multicellular cyanobacteria of the genus Spirulina or the
self-aggregating Phormidium have been applied (Muñoz & Guieysse 2006), and in
high-rate algal ponds (HRAP’s) mixing promotes the growth of non-motile colonial
microalgal species such as Scenedesmus and Micractinium, which unlike free
swimming algae like Chlorella produce extracellular polymers and flocculate and
therefore are more easily settled (Craggs 2005; Pearson 2005). The selection of settling
algae-bacteria aggregates of Chlorella and wastewater bacteria was achieved making
use of an SBR reactor with continuous discharge of the supernatant, resulting in
bioflocs with good settling characteristics after four weeks of operation (Gutzeit et al
2005). The addition of chemical flocculants (alum, lime or polyferric sulfate) is efficient
and reliable but still expensive (Muñoz & Guieysse 2006). Some commercial
flocculants as Zetag 63 and CF 400 may also be efficient (Buelna et al 1990); on the
other hand, anionic and non-ionic polymer seems to be ineffective for algal-bacterial
flocculation (Tilton et al 1972). Chitosan, on the other hand, is biodegradable and cheap
and can be used for algae harvesting (Muñoz & Guieysse 2006, Divakaran 2002,
Lertsutthiwong et al 2009, Morales et al 1985, Lubián 1989, Buelna et al 1990), but the
flocculation efficiency is highly dependent on pH (Divakaran 2002, Lertsutthiwong et al
2009, Morales et al 1985, Lubián 1989). A method involving pH adjustment between
10 and 10.6 plus addition of flocculant was also proposed for marine algae (Knuckey et
al 2006). Other methods of harvesting have been proposed, as those making use of
ultrasound (Bosma et al 2003), which has the advantage of, being a physical process, to
not interfere in chemical and biological properties of the cultivated media, and
electrolytic flocculation (Poelman et al 1997; Alfafara et al 2002), the latter with
production of oxygen in the process of electrolysis.

Daniel de Deus Cunha 7
2.4 Factors affecting algae growth
Several factors affect algae growth. In high-rate oxidation ponds (open photobioreactors)
they can be classified in abiotic, biotic and operational (Borowitzka 1998). Abiotic
factors are light (quality and quantity), temperature, nutrient concentration (especially
nitrogen, phosphorous and organic carbon), oxygen and carbon dioxide, pH, salinity,
toxic chemical. Biotic factors are pathogens (bacteria, fungi, viruses), predation by
zooplankton, competition. Operational factors are mixing, dilution rate, depth, addition
of bicarbonate and harvest frequency (Borowitzka 1998). Cell concentration also plays a
prominent role (Richmond 2004). In both open and enclosed photobioreactors algae
productivity reaches a maximum in a specific population density, above or below
which productivity decreases (Borowitzka 1998; Richmond 2004); this is valid also for
algae grown in sewage (Oswald et al 1953b). It was reported that salicylate
decomposition by an algal-bacterial consortium in an enclosed photobioreactor
increased 44% when biomass concentration increased from 0.4 to 0.6 gL-1, but
decreased 15% when biomass increased further from 0.6 to 1.3 gL-1. This phenomena
might be caused by self-shading and dark-respiration by algae (Muñoz et al 2006), but
algae aging may also be an explanation (Oswald et al 1953b). Algae have to capacity to
adjust its chlorophyll content according to the irradiance, a process called
photoadaptation. The process encompasses a fast (seconds) and a slow (hours)
dynamics (Kmet et al 1993). Photoadaptation (or photoacclimation) can manifest itself
through changes in cell morphology, changes in pigment content and changes in the PI
(photosynthesis-irradiance) curve (Zonneveld 1998).
2.5 Selection and adaptation of algae and bacteria
The microbial selection for the photobioreactors is determined by several parameters.
Microalgae have to be tolerant to the pollutant to be treated (Muñoz & Guieysse 2006).
It has been reported that algae are sensitive to a high ammonia concentration
(reference!). Microbial interactions have to evaluated, as algae-bacterial relationship
may not only be one of symbiosis but also of competition (Muñoz & Guieysse 2006).
Microbial growth rates can influence in the final performance of the photobioreactor, as
microalgae generally grow at slower rates than heterotrophic bacteria; therefore, in these
systems pollutant removal is often limited by oxygen production by algae (Muñoz &
Guieysse 2006); however, carbon limitation was also reported. Microalgae
predominance in principle should not be a problem in enclosed photobioreactors
(Muñoz & Guieysse 2006). Inoculation can be done with raw sewage or activated
sludge, allowing co-selection and compatibility of bacteria and algae; isolation with
specific strains is also possible (for easier harvesting, for example), but in this case
interaction effects and stability should be carefully investigated (Muñoz & Guieysse
2006).
2.6 Nitrification
Nitrification is the process whereby free and saline ammonia is oxidized to nitrite and
nitrate. Nitrifying bacteria are chemoautotrophic, using carbon dioxide as carbon source
and the oxidation of ammonium nitrogen as energy source (Ekama and Wentzel, 2008).

8 MSc thesis
Stoichiometrically, 4.6 miligrams of oxygen are necessary per miligram of ammonia
nitrogen oxidized (Ekama & Wentzel, 2008; Bitton 2005), or 4.3 miligrams of oxygen if
ammonia used for cell synthesis is considered (Ekama & Wentzel, 2008). The
nitrification process is influenced by several factors: the magnitude of the specific
growth rate of nitrifiers, as it is dependent on the wastewater; temperature; unaerated
zones in the reaction media, because nitrifiers are obligate aerobes; dissolved oxygen
concentration; cyclic flow and load conditions; pH, because the maximum specific
growth rate of nitrifiers is strongly suppressed when pH is outside the 7 to 8 range
(Ekama & Wentzel, 2008); ammonia and nitrite concentration, as growth of nitrifiers
follow Monod’s kinetics; and BOD5/TKN ratio, as the fraction of nitrifiers decreases
when the BOD5/TKN ratio increases (Bitton 2005). According to the present literature
review, experimental works focused on nitrification in enclosed photobioreactors have
never been published.
2.7 Models
Models for photobioreactors are not abundant. A dynamic mechanistic model for HRAP
was proposed, but it does not account for light limitation and neither nitrification (Buhr
& Miller). Another model for HRAP was proposed based on River Water Quality
Model 1 (RWQM1), this time accounting for nitrifiers growth. For biofilm
photobioreactor the dynamic mechanistic PHOBIA model was developed which
includes nitrification (Wanner & Reichert 1995; Wolf et al 2007). A mechanistic
stationary model was developed in the case of decomposition of toxic pollutant in an
enclosed photobioreactor, not taking nitrification into account (Bordel et al 2009). Other
models aim at predicting algal productivity based on optical parameters (Eilers &
Peeters 1988; Kroon et al 1989). Artificial neural networks were also used to model a
continuous stirred tank photobioreactor (Arranz et al 2008). For nitrification, the most
widely accepted model is the activated sludge model (ASM), in its several versions
(Henze et al, 2000), on which the previously cited PHOBIA model was based for
nitrifiers and heterotrophs stoichiometry and kinetics.
2.8 Controlled nitrification in photobioreactors
Several authors reported the occurrence of nitrification in photobioreactors (section 2.2).
However, works on the best conditions for nitrification are scarce. Abeliovitch (1985),
using an irradiated chemostat inoculated with oxidation pond effluent, showed
experimentally that nitrification varies with the hydraulic retention time. Evans et al
(2005) showed that in pilot high-rate algal ponds (open photobioreactors) hydraulic
retention time, depth of the pond, loading rate and oxygen availability influenced the
extent of nitrification. Finally, using the PHOBIA model for biofilm photobioreactors,
Wolf et al (2007) found that nitrifiers growth was insignificant due to competition for
inorganic carbon with algae (CO2 limitation).
Daniel de Deus Cunha 9
2.9 Post-treatment of UASB effluents
UASB reactor is an efficient process for the removal of organic material and suspended
solids from sewage, depending on the temperature. However, it has little effect on the
concentration of macronutrients (nitrogen and phosphorous) and pathogens (van
Haandel and Lettinga, 1994). Therefore, post-treatment of UASB effluents is necessary.
Among the post-treatment methods used are stabilisation ponds, activated sludge,
rotating biological contactors, submerged aerated filters, trickling filters, wetlands,
dissolved air flotation (van Haandel and Lettinga 1994, Foresti et al 2006).
2.10 Denitrification
Denitrification is normally done with readily biodegradable organic substrate as electron
donor (Ekama and Wentzel 2008). More recently, it has been proposed that methane can
be used for denitrification (Modin et al 2007; Raghoebarsing et al 2006; Thalasso et al
1997; Islas-Lima et al 2004; Costa et al 2000). Denitrification using methane could be
anaerobic or aerobic. In the aerobic process, methanotrophs oxidise methane, producing
organic substrate as by-product, that in its turn is assimilated by heterotrophs for
denitrification. In anaerobic denitrification with methane, methane is used directly as
electron donor (Modin et al 2007). A microbial consortium culture that couples
anaerobic methane oxidation to denitrification was recently enriched (Raghoebarsing et
al 2006). However, the growth rate of this microbial consortium is very slow (Modin et
al 2007). Denitrification using methane could be useful in the case of post-treatment of
anaerobic reactors (Foresti et al 2006). It has been reported that oxidation of methane
occurs preferentially over ammonium oxidation in an aerobic environment (Hatamoto et
al 2010).

10 MSc thesis

Daniel de Deus Cunha 11
3 Methodology
3.1 Experimental setup and analytical methods
3.1.1 Experimental setup
A reactor, cylindrical in shape, with transparent glass walls and open to the atmosphere,
with a volume of 1 liter, was operated as a sequencing batch reactor (SBR), with 50%
dilution and cycle time of 24 hours. The cycle was comprised of 1.5 hours of settling
time (except for the last experiment, when settling time was increased to 5 hours), 20
minutes for effluent withdrawal and 5 minutes for reactor filling, and the remaining
time for reaction. pH was controlled and kept between 7.0 and 8.0, and temperature was
kept at 30oC +/-2. The composition of the medium was according to tables 1 and 2,
except for Phase 6 of the experiment, when ammonium nitrate was reduced from 400 to
50 mg/L, all other species reduced proportionally. The liquid phase was constantly
aerated and stirred. When reactor contained algae, it was continuously illuminated (no
light-dark cycles) with a lamp Philips E27 ES, positioned 0.5 cm from the reactor wall.
The light intesity at this distance was measured as 700 μEm-2s-1. Samples were filtered
with GF/C filters and, when necessary, stored on the fridge (maximum 4 ºC) prior to
analysis. When biomass retention time was controlled, a fixed fraction of the media was
withdrawn in suspension (stirrer turned on). Here the biomass was settled and the
remaining medium volume was withdrawn, up to 50% of the total reactor volume.
Table 1: medium composition
Species Medium concentration
(mg/L)
(NH4)2SO4 1891.7
KH2PO4 33.3
MgSO4.7H2O 33.3
CaCl2.2H2O 50
FeSO4.7H2O 4.17
Trace element sol. 0.33 (mL/L)
Yeast extract 0.33
Table 2: trace element solution composition
Species Concentration
(mg/L)
EDTA 15
ZnSO4.7H2O 0.43
CoCl2.6H2O 0.24
MnCl2.4H2O 1
CuSO4.5H2O 0.25
(NH4)6Mo7O24.4H2O 0.22
NiCl2.6H2O 0.2
H3BO3 0.15
KI 0.18

12 MSc thesis
The biomass inoculated consisted in an enriched culture of nitrifiers provided by
Kluyver Laboratory at TU Delft and the algae used was Scenedesmus sp., cultured at
UNESCO-IHE laboratory.
3.1.2 Physico-chemical analysis
3.1.2.1 Ammonia nitrogen
The ammonia nitrogen analysis was performed following the spectroscopic method
according to NEN 6472. Salicylate and dichloroisocyanurate reagents were previously
prepared. Salicylate reagent was prepared dissolving 130 g of sodiumsalicylate and 130
g sodiumcitrateehydrat and 0.970 g disodiumpentacyano in 1,000 L deminralyzed water.
Dichloroisocyanurate reagent was prepared dissolving 32.0 g of NaOH in 500 ml of
demineralized water. After cooling down to room temperature, 2.00 g of
sodiumdichloroisocyanurete was added, and volume was completed to 1000 mL.
Standard NH4 was prepared with 10 gN per mL. A calibration curve was built with
several volumes of standard solution added to 4 mL of each reagent, in flasks of 50 mL
completed with demineralized water. Absorbance was measured in spectrophotometer at
655 nm beween 1 and 3 hours after preparation of solutions.
3.1.2.2 Nitrate nitrogen
Nitrate nitrogen was determined via ion cromatography. The equipment used was a
Dionex ICS-1000.
3.1.2.3 Chlorophyll-a
Chlorophyll-a was determined according to NEN 6520. Samples were filtered with GF6
filter. The filter was transferred to Schott GL 18 COD tubes with 25 mL of 80% ethanol.
Chlorophyll was extracted in water at 75oC for 5 minutes with agitation. Tubes were
then cooled in ice and centrifuged for 10 minutes at 3000 rpm. Absorbance was
measured at 750 nm (E0) and 665 nm (Ex) against 80% ethanol. 0.10 mL HCl was added
to 10.0 mL extract and after 30 minutes absorption was measured again at 750 nm (E0a)
and 665 nm (Exa). The chlorophyll-a content was determined according to the
expressions:
pV
EEVaChl
EEE
EEE
an
axaa
xn
0
1
0
0
296
where the number 296 is a correction factor based on specific absorption coefficient of
Chl-a, V1 is the volume of 80% ethanol added to the filter with algae (in mL), V0 is the
sample volume which is filtered (in L) and p is the path length of the cuvette (in mm).

Daniel de Deus Cunha 13
3.1.2.4 Light intensity
Light intensity was used as indirect fast measurement of biomass. With light source and
stirrer turned on, a photometer LI-COR model LI-250A was positioned directly pointing
to the light source, on the opposite side of the reactor, touching its wall, so that it detects
the photosynthetically active radiation (PAR) that is transmitted through the reactor
(including light reflected on its walls). Therefore, an increased light intensity
measurement means that a decreased biomass is present inside the reactor.
3.1.2.5 Dissolved oxygen
A sensor WTW Oxi 340 was positioned inside of the stirred medium in the reactor.
3.2 Modelling
3.2.1 Overview
The model presented here is not meant to represent the experimental setup previously
described, as it has a different hydraulic regime, different geometry of the reactor and
different influent characteristics. It was based on three existing models: ASM1, for
nitrifiers and heterotrophs kinetics and stoichiometry, PHOBIA for algae stoichiometry
and kinetics (except light limitation) and the algae light limitation model proposed by
Molina Grima et al (1999). The main assumptions of the model are:
Reactor is continously stirred, with ideal mixing.
Reactor is enclosed (no gaseous exchange with atmosphere).
Reactor is constantly irradiated (no light-dark cycles).
Reactor can be considered either as a flat plate with orthogonally oriented
spatially uniform irradiation, or cylindrically shaped, in which an external
cylinder containing the reaction medium and an internal cylinder containing a
linear light source. Both configurations allow for the same mathematical
modelling of light intensity in the reactor.
Constant temperature (25oC).
Constant pH (neutral).
No accumulation of nitrite.
Light is considered to be qualitatively uniform and adequate to algae growth (no
spectral variability in space or time).
The model was implemented in AQUASIM software. A simplified diagram of the main
growth processes involved is presented in Fig. 3.

14 MSc thesis
Figure 3: simplified diagram of the model, showing main growth processes
3.2.2 Processes and stoichiometry
The model includes the following processes:
Algae growth on carbon dioxide and ammonia
Algae growth on carbon dioxide and nitrate
Heterotrophs growth
Nitrifiers growth
Algae decay
Heterotrophs decay
Nitrifiers decay
Denitrification (heterotrophs anoxic growth on nitrate)
Carbon dioxide/bicarbonate equilibrium
The stoichiometry used was adapted from PHOBIA model (Wolf et al 2007), which in
its turn, for heterotrophs and nitrifers processes, is based on ASM1, and is shown in
Table 3. From the PHOBIA stoichiometry table the processes of algae growth on
bicarbonate and nitrate, algae growth on bicarbonate and ammonia, algae respiration,
and extra-cellular polymeric substances hydrolysis were removed, as they were not
considered relevant in a suspended growth model; and, for algae growth processes, the
mass of internal polyglucose and extra-cellular polymeric substances were considered to
be zero, as in this model dark respiration and biofilm formation are not considered.

Daniel de Deus Cunha 15
3.2.3 Kinetics
An overview of kinetic expressions is given on Table 4. The following sections clarify
some relevant aspects of the kinetic modelling.
3.2.3.1 Growth rates
Growth rates of microorganisms assume the form described by Wolf et al (2007):
ji ffff ,...,,,min 321max,
where max,i is the maximum growth rate, i are the species (algae, heterotrophs, nitrifiers)
and f are the limitation terms for the nutrients. As stated in the equation, the growth rate
will be determined by and only by the most limiting nutrient. Limitation terms, with the
exception of light, assume a Monod type:
jij
j
jKS
Sf
where Kji is the half-saturation constant for a given nutrient and microorganism.
The uptake (or release) of chemical species (oxygen, ammonia, carbon dioxide, nitrate)
by microorganisms is thus expressed as
iijiij XYUptake
where Yij is the stoichiometric yield of microorganism i for the chemical species j in a
given biological process and Xi is the biomass of species i.
3.2.3.2 Light limitation
The modelling of light limitation is dependent on the shape of the reactor. Unlike
chemical species, light cannot be “mixed”, so that there is a gradient of irradiance along
the irradiation path through the cells, with a certain light extinction coefficient. The
approach of the model is the following:
choose a specific shape for the reactor
calculate light gradient using the Beer-Lambert expression, considering
unidimensional light flux (no scattering, etc.)
calculate the average irradiance on the reactor and consider this average as the
“well mixed irradiance”, i. e., that the whole reactor is irradiated uniformly by
this irradiance
The shape of the reactor was chosen considering simplification of the mathematical
formulation: a flat-plate. Alternatively, it can be considered as an internally illuminated
photobioreactor, with an internal cylinder where a linear light source is located and an
external cylinder where the biomass and medium flow (the reactor itself). Both

16 MSc thesis
configurations allow the calculation of light extinction and average irradiance using the
following expressions:
zXkII Tt exp0
where I0 is the incident irradiance on the face of the plate (or on the internal face of the
external cylinder) of the photobioreactor, kt is the light extinction coefficient, XT is the
total particulates concentration and z is the distance from the surface of the reactor.
The average irradiance on the reactor (Iavg) can be calculated integrating the previous
equation over the width (or the diameter), which results in:
LXkLXk
II Tt
Tt
avg
exp10
where L is either the total width of the flat-plate or the external minus internal diameter
in the cylindrical reactor.
As in the case of the photobioreactor not only algae biomass is present, but also
heterotrophs and nitrifiers, as well as organic and inert particulates, we consider XT as
the total particulates concentration. However, we consider that algae light extinction is
much higher (as their cellular machinery is especially adapted for light absorption), so
that XT is assumed as:
ISNHAT XXXXXX 1.01.01.01.0
Where XA is the algae biomass, XH is the heterotrophs biomass, XN is the nitrifiers
biomass, XS is the slowly degradable substrate and XI represents the particulate inerts.
The other particulates were assumed to have one tenth of the light extinction than that of
algae, considering that the last has a cellular machinery specifically adapted for light
absorption.
The mathematical expression used for light limitation was that proposed by Molina
Grima et al (1999), which accounts for both light saturation and inhibition:
0
0
0
0
max
1 I
cb
avg
I
cb
a
i
k
I
cb
avg
IK
II
I
where Ik is the light affinity of the algae, Ki is the photoinhibition constant and a, b and
c are adjustment parameters. This equation was considered suitable for this model, as it
accounts for light extinction without the need of using profiles (average irradiance) and
a set of the parameters is available for an outdoor culture of P. tricornutum (Molina
Grima et al 1999).

Daniel de Deus Cunha 17

18 MSc thesis
Table 3: stoichiometry table of the model Particulates Solubles Rates
Process
XA
kg
(COD)
/m3
XH
kg
(COD)
/m3
XN
kg
(COD)
/m3
XS
kg
(COD)
/m3
XI
kg
(COD)/
m3
SNH3
kmol/m3
SO2
kmol/m3
SCO2
kmol/ m3
SS
kg
(COD
)/m3
SI
kg
(COD)/
m3
SNO3
kmol/ m3
SHC
O3
kmo
l/ m3
Algae growth on
ammonia
1 -0.111 1.5864 -2.18 r1
Algae growth on
nitrate
r2
Heterotrophs
growth
1 6.33
2.0
03125.0
32
1
HY
02976.0
32
1
HY
HY
1
r3
Heterotrophs
anoxic growth
(denitrification)
1 02976.032
1
HY
HY
1
02857.032
8.0
HY
r4
Nitrifiers growth 1
NY14
1000593.0
32
1
7
1
NY
6.33
1
NY14
1
r5
Algae decay
-1 r6
Heterotrophs
decay
-1 XIf1 XIf
14
1083.0 ,, XIXINXIXSN fifi
r7
Nitrifiers decay
-1 XIf1 XIf
14
1083.0 ,, XIXINXIXSN fifi
r8
Hydrolysis
-1 14
,, SISINXSN fii SIf1
SIf r9
Alkalinity
equilibrium
-1 1 r10

Daniel de Deus Cunha 19
3.2.3.3 Decay
Decay of biomass is modeled as a first-order process. The equations take the form:
idii Xkdecay
iijdiij XYkrelease
Where kdi is the decay rate for microorganism i.
3.2.3.4 Bicarbonate/carbon dioxide equilibrium
As effluent from anaerobic treatment have high levels of alkalinity and carbon dioxide
bill be both produced (by heterotrophs) and consumed (by algae) in the system, it is
important to model the bicarbonate/carbon dioxide equilibrium. We use the same
expressions as Wolf et al (2007):
1
.. 3
2
2
K
SSSk
dt
dS HHCO
COAB
CO
where kAB is the rate constant for the equilibrium and K1 the dissociation constant.
Other alkalinity related equilibria are not included in the model because they are not
significant in neutral pH (e. g., formation of carbonate).
3.2.3.5 Recirculation
In simulations, both chemostat and “activated algae” configurations were used.
“Activated algae” means that part of the biomass is recirculated, in analogy with the
activated algae process. When biomass recirculation is used the settler is modelled as an
“ideal settler”, i. e., only biomass and biodegradable and inert particulates are
recirculated (no liquid stream) at a specified fraction of the total biomass outflow.
Recirculation is considered to be in the same fraction for all particulates (algae,
heterotrophs, nitrifiers, slowly biodegradable substrate and inert particulates).
3.2.4 Limitations of the model
Several processes are not considered in the model. The most important of them are:
Ammonia/ammonium equilibrium: as the system was considered to have a
constant controlled pH, it was not considered to be relevant; therefore, in this
work “ammonia nitrogen” and “ammonium nitrogen” can be used
interchangeably;
Temperature variation
pH variation
20 MSc thesis
Algae growth on bicarbonate, considered less important as carbon
dioxide/bicarbonate equilibrium is very fast and there are no diffusion
constraints (stirred reactor).
Dark respiration of algae, not modelled considering that nitrification does not
take place in this system the absence of photosynthesis.
Photoadaptation of algae
Nitrite accumulation and toxicity: as in ASM1, the kinetics of nitrification is
lumped in one single rate constant. It might, however, be important in this
system, especially in case nitrite is toxic to algae.
Toxicity of high dissolved oxygen content.

Daniel de Deus Cunha 21
Table 4: rate equations of the model
Rates r1 Algae growth on ammonia
AAI
NHASNH
NH
COASCO
CO
A XfKS
S
KS
S.,,min. ,
3,,3
3
2,,2
2
max,
r2 Algae growth on nitrate
AAI
NHAinhNH
NHAinh
NHASNH
NO
COASCO
CO
A XfKS
K
KS
S
KS
S.,,,min. ,
3,,3
3,,
3,,3
3
2,,2
2
max,
r3 Heterotrophs growth
H
SHSS
S
NHHSNH
NH
OHSO
O
H XKS
S
KS
S
KS
S.,,min.
,,3,,3
3
2,,2
2
max,
r4 Heterotrophs anoxic growth
H
CODHSS
S
NHHSNH
NH
NOHSNO
NO
OHinhO
OHinh
DNH XKS
S
KS
S
KS
S
KS
K.,,,min.
,,3,,3
3
3,,3
3
2,,2
2,,
,max,
r5
Nitrifiers growth
N
CONSCO
CO
NHNSNH
NH
ONSO
O
N XKS
S
KS
S
KS
S.,,min.
2,,2
2
3,,3
3
2,,2
2
max,
r6
Algae decay AAd Xk .,
r7
Heterotrophs decay
HHd Xk .,
r8
Nitrifiers decay
NNd Xk .,
r9
Hydrolysis
H
HSXhS
HS
h XXXK
XXk
,,
.
R10
Alkalinity equilibrium
1
.. 3
2K
SSSk HHCO
COAB
3.2.5 Input parameters and operational strategy
A strategy for optimization of nitrification coupled with photosynthetic oxygenation can
be figured out from the stoichiometric and kinetic parameters of the model. It can be
noticed that nitrification in the modelled system presents several constraints, both of
stoichiometric as well as of kinetic nature. The stoichiometric constraint is due to the
fact that the oxygen consumed in nitrification comes exclusively from algae
photosynthesis, but this photosynthesis also requires nitrogen assimilation by algae;
therefore, there is a theoretical maximum stoichiometric nitrification, that can be
calculated from Table 3. For each 1 mol of ammonia nitrified, 0.31 mol of ammonia is
assimilated by algae for the production of the required oxygen, what gives a theoretical
maximum of 76% of nitrification, not considering the uptake of oxygen and ammonia
by heterotrophs. Kinetic constraints are those arising from the different growth rates and

22 MSc thesis
efficiencies of nutrient assimilation of the organisms, which regulate the outcome of
competition for nutrients. The parameters that define these competitions are
summarized in Table 5.
Table 5: kinetic comparison of microorganisms
Nitrifiers
max = 1 d-1
Algae
max = 1.512 d-1
NH3 KNH3,N = 7.14 x 10⁻⁵ mol/L
KNH3,A = 1.2 x 10⁻⁶ mol/L
CO2 KCO2,N = 1 x 10⁻⁴ mol/L
KCO2,A = 1 x 10⁻⁴ mol/L
Heterotrophs
max = 5.5 d-1
NH3 KNH3,N = 7.14 x 10⁻⁵ mol/L
KNH3,H = 1 x 10⁻¹⁰ mol/L
O2 KO2,N = 1.56 x 10⁻⁵ mol/L
KO2,H = 6.25 x 10⁻⁶ mol/L
As can be seen in Table 5, in every possible competition for nutrients nitrifiers tend to
be outcompeted, as its maximum growth rate is lower and its half-saturation coefficients
are higher in all cases, with the exception of the half-saturation constant for carbon
dioxide, which is the same as that of algae. That means that the competitors grow
potentially faster and are more efficient in nutrient assimilation, i. e., if grown in the
same medium (same concentration of nutrient), nitrifiers will always be outcompeted by
either algae or heterotrophs. It implies that the operational strategy for nitrification
optimization should ensure that nitrifiers are not directly competing for nutrients with
either algae or heterotrophs. Considering this, the operational strategy comes out
straightfowardly:
algae should be light-limited, so that they produce enough oxygen for
nitrification, but do not uptake most of the ammonia-nitrogen;
heterotrophs should be substrate (COD) limited, so that they do not uptake most
of the oxygen necessary for nitrification;
to ensure an adequate supply of inorganic carbon for algae, even though
heterotrophs might not produce enough due to substrate limitation, the influent
should have a high alkalinity;
the influent that best suits the desired characteristics – a high ammonia content
for nitrification, a low COD content and high alkalinity content is the one
coming from anaerobic treatment of sewage, that needs a post-treatment for
nutrients removal; however, effluent from anaerobic treatment contains
dissolved methane that could be a constraint for nitrification; therefore,
treatment of sewage will also be investigated.
The influent composition to be used will be according to Roeleveld and van
Loodsdrecht (2002), who presented data for Dutch wastewater treatment plants
according to the ASM1 model, i. e., in terms of SS, SI, XS and XI. As ammonium
nitrogen concentration is not mentioned in this compilation, it will be assumed to be
equal to 40 mg/L NH4-N.
As the alkalinity of sewage is not mentioned in Roeleveld and van Loodsdrecht (2002),
it will be assumed that it is equal to 5 meq/L, both for sewage and anaerobically treated

Daniel de Deus Cunha 23
sewage. According to van Haandel and Lettinga (1994) the alkalinity of sewage varies
between 5 and 10 meq/L, and tends to increase with anaerobic treatment, so that the
assumption is conservative.
Table 6: parameters of the model
Model parameter Symbol Value Unit Reference
Maximum
specific growth
rate algae
μmax,A 1.512 d-1 Molina-
Grima et al
(1999)
Maximum
specific growth
rate heterotrophs
μmax,H 5.5 d-1 Wolf et al
(2007)
Maximum
specific anoxic
growth rate
heterotrophs
μmax,H,DN 1.6 d-1 Wolf et al
(2007)
Maximum
specific growth
rate nitrifiers
μmax,N 1 d-1 Wolf et al
(2007)
CO2 half-
saturation
constant algae
KS,A,CO2 10-4 kmol (CO2) m-3 Wolf et al
(2007)
NH3 half-
saturation
constant algae
KS,A,NH3 1.2 x 10⁻⁶ kmol (NH3) m-3 Wolf et al
(2007)
O2 half-saturation
constant
heterotrophs
KS,H,O2 6.25 x 10⁻⁶ kmol (O2) m-3 Wolf et al
(2007)
NH3 half-
saturation
constant
heterotrophs
KS,H,NH3 10-10 kmol (NH3) m-3 Wolf et al
(2007)
Readily
degradable
organic substrate
half-saturation
constant
heterotrophs
KS,H,S 0.004 kg (COD) m-3 Wolf et al
(2007)
O2 half-saturation
constant nitrifiers
KS,N,O2 1.56 x 10⁻⁵ kmol (O2) m-3 Wolf et al
(2007)
CO2 half-
saturation
constant nitrifiers
KS,N,CO2 10-4 kmol (CO2) m-3 Wolf et al
(2007)
NH3 half-
saturation
constant nitrifiers
KS,N,NH3 7.14 x 10⁻⁵ kmol (NH3) m-3 Wolf et al
(2007)
NO3 half-
saturation
constant
heterotrophs
KS,H,NO3 3.6 x 10⁻⁵ kmol (NO3) m-3 Wolf et al
(2007)
Particulate COD KS,h,X 0.1 kg (COD) / kg Wolf et al
24 MSc thesis
half-saturation
constant
(COD) (2007)
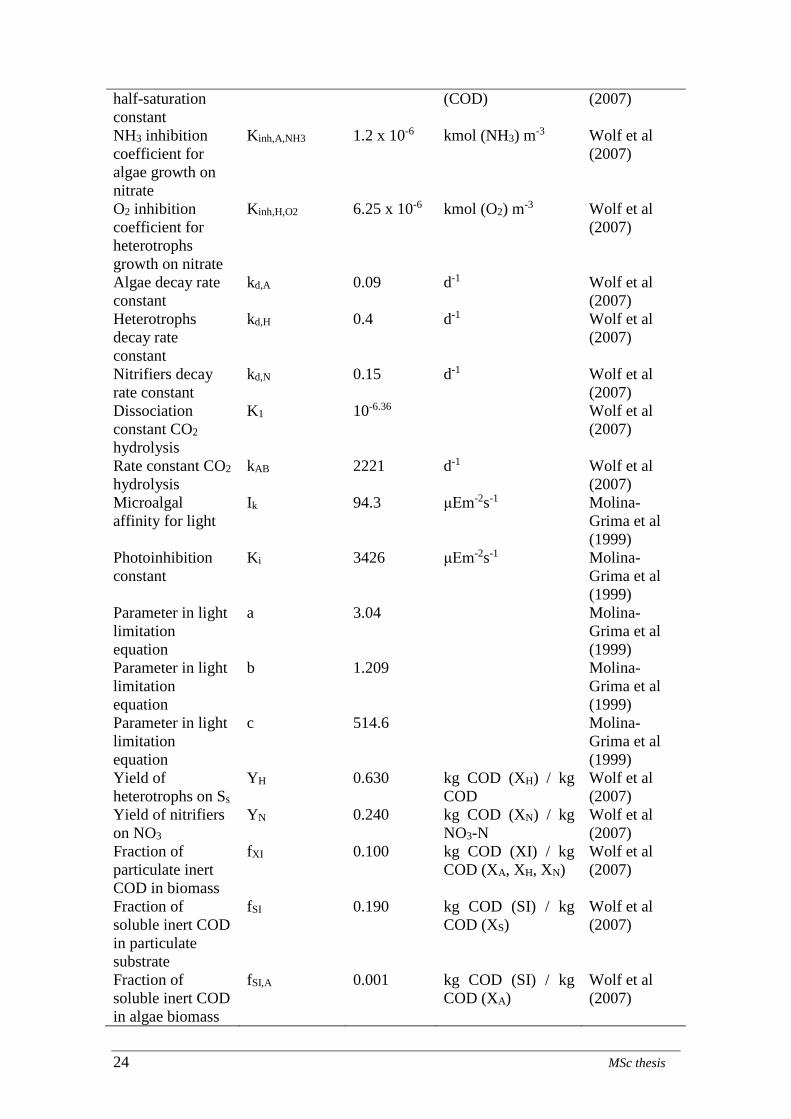
NH3 inhibition
coefficient for
algae growth on
nitrate
Kinh,A,NH3 1.2 x 10⁻⁶ kmol (NH3) m-3 Wolf et al
(2007)
O2 inhibition
coefficient for
heterotrophs
growth on nitrate
Kinh,H,O2 6.25 x 10⁻⁶ kmol (O2) m-3 Wolf et al
(2007)
Algae decay rate
constant
kd,A 0.09 d-1 Wolf et al
(2007)
Heterotrophs
decay rate
constant
kd,H 0.4 d-1 Wolf et al
(2007)
Nitrifiers decay
rate constant
kd,N 0.15 d-1 Wolf et al
(2007)
Dissociation
constant CO2
hydrolysis
K1 10-6.36 Wolf et al
(2007)
Rate constant CO2
hydrolysis
kAB 2221 d-1 Wolf et al
(2007)
Microalgal
affinity for light
Ik 94.3 μEm-2s-1 Molina-
Grima et al
(1999)
Photoinhibition
constant
Ki 3426 μEm-2s-1 Molina-
Grima et al
(1999)
Parameter in light
limitation
equation
a 3.04 Molina-
Grima et al
(1999)
Parameter in light
limitation
equation
b 1.209 Molina-
Grima et al
(1999)
Parameter in light
limitation
equation
c 514.6 Molina-
Grima et al
(1999)
Yield of
heterotrophs on Ss
YH 0.630 kg COD (XH) / kg
COD
Wolf et al
(2007)
Yield of nitrifiers
on NO3
YN 0.240 kg COD (XN) / kg
NO3-N
Wolf et al
(2007)
Fraction of
particulate inert
COD in biomass
fXI 0.100 kg COD (XI) / kg
COD (XA, XH, XN)
Wolf et al
(2007)
Fraction of
soluble inert COD
in particulate
substrate
fSI 0.190 kg COD (SI) / kg
COD (XS)
Wolf et al
(2007)
Fraction of
soluble inert COD
in algae biomass
fSI,A 0.001 kg COD (SI) / kg
COD (XA)
Wolf et al
(2007)

Daniel de Deus Cunha 25
Fraction of N in
slowly degradable
particulate organic
matter
iN,XS 0.043 kg N / kg COD (XS) Wolf et al
(2007)
Fraction of N in
particulate inert
organic matter
iN,XI 0.040 kg N / kg COD (XI) Wolf et al
(2007)
Fraction of N in
soluble inert
organic matter
iN,SI 0.010 kg N / kg COD (SI)
or kg N / kg COD
(SI,A)
Wolf et al
(2007)

26 MSc thesis
4 Results
4.1 Experimental results
Experimental results will be presented according to its five different phases,
schematically presented below along with its main defining characteristic in relation
with the others:
Phase 1: growth of nitrifiers
Phase 2: addition of algae and SRT control
Phase 3: increased SRT
Phase 4: uncontrolled SRT
Phase 5: decreased influent ammonia concentration
Phase 6: increased settling time
4.1.1 Phase 1: growth of nitrifiers
In this phase nitrifiers were cultured alone in the media, without SRT control. Nitrifers
were able to nitrify 400 mg/L of ammonia nitrogen after approximately 3 weeks.
Results for ammonia concetration in the effluent can be seen in Fig. 4. In the first days
ammonia nitrogen concentration in the effluent was higher than in the influent. Due to
an unintentional pH shock on December 18th, most of the biomass died, but was able to
recovered without additional inoculation. Analysis during one cycle indicated that there
is nitrite accumulation in the media..
Figure 4: ammoium nitrogen concentration during in effluent in nitrifiers culture during Phase 1

Daniel de Deus Cunha 27
Figure 5: concentration of nitrogen species in the medium during one cycle in Phase 1
4.1.2 Phase 2: addition of algae and SRT control
In phase 2 (Fig. 6), after ammonia nitrogen concentration in the effluent came to zero,
algae was inoculated in the reactor. Due to unintentional operational problems with pH
control, reactor flooded and most of biomass was lost. After that, algae grew and reactor
presented a dark green color. During this period light transmission through the reactor
was very low (below 0.5 mol μEm-2s-1). After about ten days nitrifiers started to grow
exponentially, as shown by nitrate concentration, and a decreased in algae biomass was
detected with a decrease in chlorophyll-a and an increase in light trasmission. On
February 8th SRT started to be controlled, subtracting 10% of biomass in each cycle,
intending to have an SRT of 10 days. After that, algae was washed out from the reactor,
as detected both visually (absence of green color) and with light transmission
measurements that indicated a sharp increase (Fig. 7). Nitrifiers biomass decreased
sharply, as indicated by nitrate concentration, that dropped to 25 mg/L.

28 MSc thesis
Figure 6: nitrate and ammonium nitrogen concentrations in the effluent during Phase 2
Figure 7: dissolved oxygen in medium and transmitted light intensity through the reactor during Phase 2
4.1.3 Phase 3: increased SRT
In phase 3 (Fig. 8) the intended SRT was increased to 20 days, i. e, 5% of reactor media
was removed with the stirrer switched on in each cycle. Once more, algae tended to be
washed out from the reactor. Nitrifiers activity was decreasing. Analysis of chlorophyll-
a content in the effluent and in the media withdrawn for SRT control o March 12th
indicated 0.074 and 0.37 mg/L, respectively. As the corresponding volumes were of 50
mL and 450 mL, it indicated that, due to inefficient settling, at this moment SRT was
actually half of the intended. This phase of the experiment was then interrupted.

Daniel de Deus Cunha 29
Figure 8: nitrate and ammonia nitrogen in effluent and transmitted light intensity during Phase 3
4.1.4 Phase 4: uncontrolled SRT
In this phase SRT was left uncontrolled, so that it would be the outcome of growth rates
and withdrawal with the effluent (as settling was inefficient). Once more, algae was
visually washed out from the reactor (Fig. 9). Nitrifiers were growing steadily.
Figure 9: nitrate nitrogen in effluent and transmitted light intensity during Phase 4
4.1.5 Phase 5: decreased influent ammonia concentration
To evaluate a possible effect of nitrite toxicity on algae, influent ammonia nitrogen
concentration was decreased to 50 mg/L, all other nutrient concentrations decreased
proportionally. Algae tended to be washed out (Fig. 10).
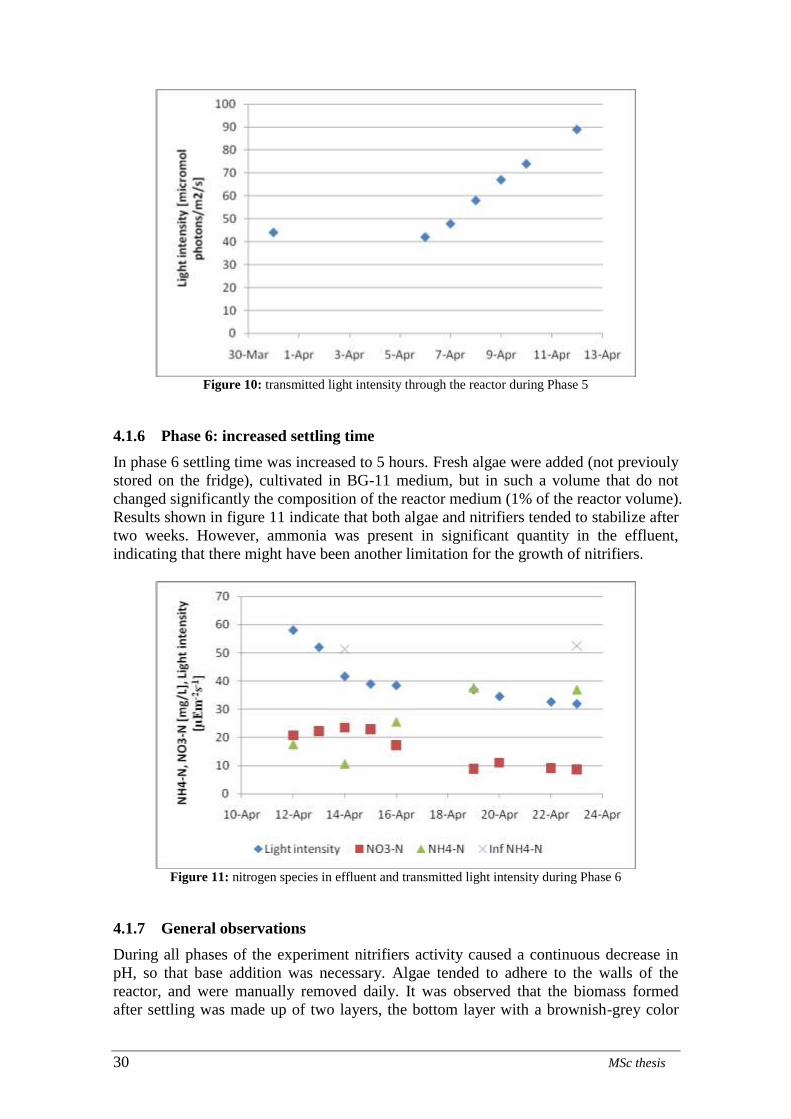
30 MSc thesis
Figure 10: transmitted light intensity through the reactor during Phase 5
4.1.6 Phase 6: increased settling time
In phase 6 settling time was increased to 5 hours. Fresh algae were added (not previouly
stored on the fridge), cultivated in BG-11 medium, but in such a volume that do not
changed significantly the composition of the reactor medium (1% of the reactor volume).
Results shown in figure 11 indicate that both algae and nitrifiers tended to stabilize after
two weeks. However, ammonia was present in significant quantity in the effluent,
indicating that there might have been another limitation for the growth of nitrifiers.
Figure 11: nitrogen species in effluent and transmitted light intensity during Phase 6
4.1.7 General observations
During all phases of the experiment nitrifiers activity caused a continuous decrease in
pH, so that base addition was necessary. Algae tended to adhere to the walls of the
reactor, and were manually removed daily. It was observed that the biomass formed
after settling was made up of two layers, the bottom layer with a brownish-grey color

Daniel de Deus Cunha 31
and the upper layer with a green color. In fig. X and Y it is possible to see photos taken
when this layer was disturbed during the filling phase of the reactor, so that part of the
layer turned upside down. In figure X the biomass layer that was on top of the magnetic
stirrer dropped upside down, and in fig Y the biomass layer rolled over itself.
Figure 12: layer of biomass that was on top of the
magnetic stirrer fell upside down, showing two
distinct layers
Figure 13: layer of biomass rolled over itself,
showing two distinct layers (green on top,
brownish-grey on bottom).
4.2 Model results
4.2.1 Input parameters and initial conditions
The initial input parameters and initial conditions are listed in Table 6 (sewage
parameters according to ASM1) and 7 (other parameters). The sewage chosen was that
with the lowest organic matter content in the list presented by Roeleveld and van
Loodsdrecht (2002). Whenever one or more parameter is modified in the simulations it
will be explicitly mentioned.
Table 7: Sewage as characterized in Nieuwe Waterweg, The Netherlands (Roeleveld and van
Loodsdrecht, 2002)
Symbol Parameter Value Unit
SS,IN Influent readily degradable COD
concentration
0.086 kg (COD)/m3
SI,IN Influent soluble inert COD
concentration
0.027 kg (COD)/m3
XS,IN Influent slowly degradable COD
concentration
0.108 kg (COD)/m3
XI,IN Influent particulate inert COD
concentration
0.209 kg (COD)/m3

32 MSc thesis
Table 8: Input parameters and initial conditions
Symbol Parameter Value Unit
SNH3-N,IN Influent ammonia-nitrogen
concentration
0.002857 kmol/m3
SHCO3,IN Influent bicarbonate concentration 0.005 kmol/m3
SCO2,IN Influent dissolved carbon dioxide
concentration
0.0009 kmol/m3
SO2,IN Influent dissolved oxygen concentration 0 kmol/m3
SNO3,IN Influent nitrate concentration 0 kmol/m3
SN2,IN Influent dissolved dinitrogen
concentration
0 kmol/m3
XA,ini Initial algae biomass in reactor 0.01 kg (COD)/m3
XH,ini Initial heterotrophs biomass in reactor 0.01 kg (COD)/m3
XN,ini Initial nitrifiers biomass in reactor 0.01 kg (COD)/m3
I0 Irradiance on surface of reactor 500 Em-2s-1
HRT Hydraulic retention time 6.67 d
r Fraction of recycled biomass 0 adimensional
L Width of the reactor 0.3 m
In the presentation of results, "limitation factor" or "nutrient limitation" is here
understood as the outcome of the Monod-type expression with the form
ijj
j
ijKS
Sf
Where fij is the limitation factor for microorganism i in relation to species j, Sj is the
concentration of the species j in the medium and Kij is the half-saturation constant for
assimilation of species i by microorganism j. In the case of light limitation, the
expression developed by Molina Grima is used (Molina Grima et al 1999):
0
0
0
0
,
1 I
cb
avg
I
cb
a
i
k
I
cb
avg
lightA
IK
II
If
“Nitrification” in the results is defined as the ratio of effluent nitrate nitrogen and
influent ammonia nitrogen, i. e:

Daniel de Deus Cunha 33
nitrification = SNO3 / SNH3,IN
4.2.2 Base results
Results obtained with inputs from tables 6 and 7 are shown in figures 14-20. In Figure
14 it is shown that the biomass of the three microorganisms grows. Initially, algae and
heterotrophs grow together, strongly coupled (Fig. 14), and oxygen concentration is
close to zero (Fig. 19). Heterotrophs are thus assimilating most of the oxygen produced
by algae, and nitrifiers growth is limited to around 10% of their maximum growth rate
(Fig. 17). Heterotrophs biomass in the reactor suddenly stops growing after around 5
days, while algae biomass keeps growing (Fig. 14); this is due to the fact that
heterotrophs became COD-limited (Fig. 16). Soon after that, oxygen concentration
sharply increases (Fig. 19), followed by nitrate concentration (Fig. 20), as now
nitrification is feasible due to the available oxygen that was previously missing. With
nitrification taking place, oxygen comes again close to zero around day 10 (Fig. 19).
Nitrifiers growth is limited by oxygen and subsequently by ammonium, and then
stabilizes (Fig. 17). Between days 10 and 20 oxygen is depleted (Fig. 19) and nitrate is
available in the system (Fig. 20), so that denitrification starts to take place, as seen by
the growing concentration of dinitrogen (Fig. 20). However, with the depletion of
ammonium (Fig. 20) algae starts growing partially on nitrate (Fig. 18; an inflection in
algae biomass curve can be seen on Fig. 14 around day 20 due to this switch to growth
on nitrate) and denitrification decreases (Fig. 20). During the whole process algae
growth was limited by light (Fig. 15).
In Fig. 20 and Table 8 it can be seen that 54% of the nitrogen in the effluent is in the
nitrate form, followed by nitrogen assimilated by algae (29%) and heterotrophs (16%).
In the liquid phase, around 98% of nitrogen is in the nitrate form. Nitrification, as
defined here, was of 65%.

34 MSc thesis
Figure 14: biomass in the reactor
Figure 15: nutritional limitation for algae

Daniel de Deus Cunha 35
Figure 16: nutritional limitation for heterotrophs
Figure 17: nutritional limitation for nitrifiers

36 MSc thesis
Figure 18: growth rate of nitrifiers
Figure 19: oxygen concentration in the reactor

Daniel de Deus Cunha 37
Figure 20: main nitrogen forms in the effluent
Table 9: distribution of nitrogen in the effluent
Fraction %N in effluent
NO3-N 54
Algae assimilation 29
Heterotrophs assimilation 16
Table 10: nitrogen in liquid phase
Fraction Conc [mg/L]
Influent NH3-N 40
Effluent NH3-N 0.45
Effluent NO3-N 25.9
4.2.3 Effect of irradiation
In order to show the effect of incident irradiation on nitrification, a series of steps in this
input was applied, according to tables 10 (increasing irradiance intensity) and 11
(decreasing irradiance intensity), with all other parameters constant. In Fig. 10 it can be
seen that incident irradiance has a strong effect on the level of nitrification in the system,
coming from a maximum until no nitrification when irradiance deviates considerably
from an optimum irradiation intensity. When irradiation is too high (650 Em-2s-1) or
too low (300 Em-2s-1), nitrifiers are washed out. In-between this two levels of
irradiance, nitrification takes place with varying degrees, presenting a maximum with an
incident irradiance of around 500 Em-2s-1.
In the case high irradiance, nitrifiers are washed out due to competition for carbon
dioxide with algae, as can be seen in Fig. 21-24. As the inicident irradiance increases
stepwise, algae biomass increases also stepwise (Fig. 24), and, as a consequence, carbon

38 MSc thesis
dioxide decreases stepwise (Fig. 22), up to the point that it becomes the limiting nutrient
for nitrifiers (Fig. 21). When carbon dioxide becomes the limiting nutrient for nitrifiers
and algae simultaneously (Fig. 23 and Fig. 24, from day 250 on), nitrification stops
completely (Fig. 21, from day 250 on).
It can be seen that when nitrifiers are oxygen limited (Fig. 28, between days 0 and 100)
increasing incident irradiation causes an increase in nitrification (Table 10, Fig. 20
between days 0 and 100). That is because increasing light intensity causes increase in
biomass of algae (Fig. 23) and consequently in oxygen production. When nitrifiers
became ammonia-limited (Fig. 21, between days 100 and 200), increasing light
intensity caused a decrease in nitrification (Table 10, Fig. 20 between days 100 and
200). That happens because, as already mentioned, increasing irradiance causes and
increase in algae biomass. In this case, however, the dominant effect is not the extra
production of oxygen, but the extra ammonia assimilation, as now nitrifiers are
ammonia-limited. When nitrifiers are limited by carbon dioxide (Fig. 21, between days
200 and 250) but algae are limited by light (Fig. 22, between days 200 and 250),
nitrification still takes place (Fig. 20, between days 200 and 250). However, when both
nitrifiers and algae are simultaneously limited by inorganic carbon (Fig. 21 and 22,
between days 250 and 300), nitrifiers are washed out but algae remains on the system
(Fig. 23), showing that algae outcompetes nitrifiers when competing for this nutrient. In
the last two steps on incident irradiance, however, algae biomass does not grow, as it is
already considerably light limited (due to higher biomass and consequently higher light
extinction) and thereafter becomes limited by inorganic carbon (Fig. 25, days 200-300).
Table 11: steps applied on irradiance (increasing irradiance)
Time (d) Irradiation (E/m2/s)
0-50 400
50-100 450
100-150 500
150-200 550
200-250 600
300-350 650

Daniel de Deus Cunha 39
Figure 21: nitrate concentration in the effluent with a series of steps in irradiance
Figure 22: carbon dioxide concentration in reactor

40 MSc thesis
Figure 23: nutritional limitation for nitrifiers with a series of steps in irradiance
Figure 24: nutritional limitation for algae with a series of steps in irradiance

Daniel de Deus Cunha 41
Figure 25: biomass in reactor with a series of steps in irradiance
In the case low incident irradiance, nitrifiers are washed out due to competition for
oxygen with heterotrophs, as can be seen in Fig. 25-29. As the inicident irradiance
decreases stepwise, algae biomass decreases also stepwise (Fig. 28), and, as a
consequence, oxygen concentration also decreases stepwise (Fig. 29), up to the point
that it becomes the limiting nutrient for nitrifiers (Fig. 27, from day 100). When oxygen
becomes the limiting nutrient for nitrifiers and heterotrophs simultaneously (Fig. 27 and
Fig. 28, from day 250 on), nitrification stops completely (Fig. 26, from day 250 on).
It can be seen that when nitrifiers are limited by ammonia (Fig. 28, between days 0 and
100) decreasing incident irradiation causes an increase in nitrification (Table 11, Fig. 26
between days 0 and 100). That is because decreasing light intensity causes a decrease in
biomass of algae (Fig. 30) and consequently a decrease in oxygen production. When
nitrifiers became limited by oxygen (Fig. 28, between days 100 and 200), decreasing
light intensity caused a decrease in nitrification (Table 11, Fig. 28 between days 100
and 300). That happens because, as already mentioned, decreasing irradiance causes a
decrease in algae biomass. As nitrifiers became limited by oxygen, this effects
dominates over the decreased ammonia assimilation by algae. When nitrifiers are
limited by oxygen (Fig. 28, between days 100 and 250) but heterotrophs are limited by
COD (Fig. 29, between days 100 and 250), nitrification still takes place (Fig. 26,
between days 100 and 250). However, when both nitrifiers and heterotrophs are
simultaneously limited by oxygen (Fig. 28 and 29, between days 250 and 300), nitrifiers
are washed out but heterotrophs remains on the system (Fig. 30), showing that
heterotrophs outcompete nitrifiers when competing for this nutrient.
Table 12: steps applied on irradiance (decreasing irradiance)
Time (d) Irradiation (E/m2/s)
0-50 550
50-100 500
100-150 450

42 MSc thesis
150-200 400
200-250 350
300-350 300
Figure 26: nitrate concentration in the effluent with a series of steps in irradiance
Figure 27: oxygen concentratio in reactor

Daniel de Deus Cunha 43
Figure 28: nutritional limitation for nitrifiers with a series of steps in irradiance
Figure 29: nutritional limitation for heterotrophs with a series of steps in irradiance

44 MSc thesis
Figure 30: biomass in reactor with a series of steps in irradiance
4.2.4 Effect of hydraulic retention time (HRT)
In order to show the effect of hydraulic retention time (HRT) on nitrification, a series of
steps in this input was applied, according to tables 12 (increasing HRT) and 13
(decreasing HRT). In Fig. 31-38 it can again be seen that HRT a strong effect on the
level of nitrification in the system. The effect is analogous to that of incident irradiance,
coming from a maximum until no nitrification when HRT deviates considerably from
an optimum HRT; increasing HRT, algae biomass increases. When HRT is too low
(around 1.67 days), nitrifiers are washed out due to competition for oxygen with
heterotrophs (figures 32 and 33). When HRT is too high (around 20 days), nitrifiers are
washed out due to competition for inorganic carbon with algae. Near the optimum HRT,
once more algae are limited by light, heterotrophs are limited by organic substrate and
nitrifiers are limited by ammonium. The dynamics of nutrient limitations for
microorganisms are analogous to that found varying incident irradiation intensity.
Table 13: steps applied on HRT (decreasing HRT)
Time (d) HRT (d)
0-50 10
50-100 5
100-150 3.33
150-200 2.5
200-250 2
300-350 1.67

Daniel de Deus Cunha 45
Figure 31: nitrate concentration in the effluent with a series of steps applied on HRT
Figure 32: nutritional limitation for nitrifiers with a series of steps on HRT
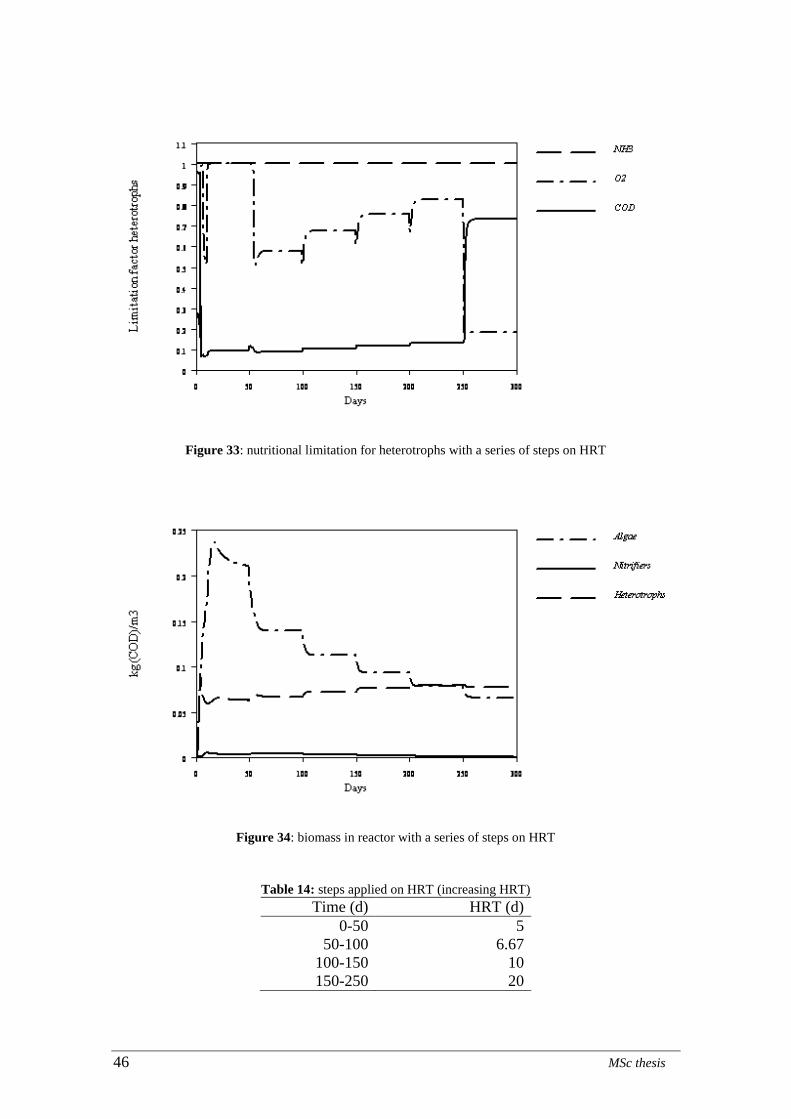
46 MSc thesis
Figure 33: nutritional limitation for heterotrophs with a series of steps on HRT
Figure 34: biomass in reactor with a series of steps on HRT
Table 14: steps applied on HRT (increasing HRT)
Time (d) HRT (d)
0-50 5
50-100 6.67
100-150 10
150-250 20

Daniel de Deus Cunha 47
Figure 35: nitrate concentration in the effluent with a series of steps applied on HRT
Figure 36: nutritional limitation for nitrifiers with a series of steps on HRT

48 MSc thesis
Figure 37: nutritional limitation for algae with a series of steps on HRT
Figure 38: biomass in reactor with a series of steps on HRT
4.2.5 Control of nitrification coupling HRT to incident irradiance
As incident irradiance and HRT have analogous effects on nitrification, it is possible to
manipulate one of this variables when the other changes, so that the same (high) level of
nitrification can be maintained. The adequate combination of incident irradiance and
HRT, therefore, allows controlled nitrification. A series of steps is applied with pairs of
incident irradiance and HRT that optimize nitrification, as listed in Table 15, and the
output of nitrate, ammonia and dinitrogen concentration is shown in Fig. 39; in this

Daniel de Deus Cunha 49
figure it is possible to see that nitrification is kept in high levels, although operational
changes were applied, since incident irradiance and hydraulic retention time were
optimally coupled. At lower HRT's, however, nitrate concentration tends to decrease
and more ammonia tends to remain in the effluent, indicating that nitrifiers start to be
washed out.
There is a limit to the HRT-incident irradiance applied that keeps nitrification, as when
irradiance is higher than 1200 Em-2s-1 (and the correspondent HRT is lower than 1.53
days) inorganic carbon limitation inhibits the increase in growth rate of nitrifiers that
would be necessary to keep them in a system with a lower HRT (Fig. 40).
Table 15: series of steps using optimal combinations of irradiance and HRT
Time (d) I0 HRT (d)
0-50 500 6.67
50-100 600 4
100-150 700 2.85
150-200 800 2.22
200-250 900 2
250-300 1000 1.73
300-350 1100 1.57
350-400 1200 1.53
Figure 39: nitrate in effluent with a series of steps in irradiance and HRT

50 MSc thesis
Figure 40: nutritional limitation for nitrifiers with a series of steps in irradiance and HRT
4.2.6 Control of nitrification manipulating hydraulic retention time, biomass
retention time and irradiation
Recycling of biomass makes possible the use of lower HRT’s (and correspondingly
higher incident irradiances) and avoids the increase of ammonium in the effluent with
low HRT’s. A series of steps was applied according to Table 16, and the resulting
nitrogen compounds concentrations in the liquid phase is shown in Fig. 41, showing that
nitrification is kept at high levels, without decreasing at higher HRT’s.
Table 16: series of steps using optimal combinations of irradiance, HRT and recycled biomass
Time (d) I0 (Em-2s-1) HRT (d) Fraction of recycled
biomass
0-50 500 6.67 0
50-100 1000 1.73 0.15
100-150 1500 1.53 0.70
150-200 2000 1.53 0.90
200-250 2500 1.18 0.90
250-300 3000 0.91 0.70

Daniel de Deus Cunha 51
Figure 41: control of nitrification with different combinations of irradiance, HRT and SRT
4.2.7 Effect of C/N ratio
With the parameters defined in tables 6 and 7, changing the ammonia concentration
while keeping organic substrate constant will change the results for nitrification. With
an influent with 60 mg NH3-N and additional oxygen production with an incident
irradiance of 580 Em-2s-1, nitrification improves to 67% (Fig. 42). However, with NH3-
N of 80 mg/L the extra oxygen production by algae cannot be achieved due to carbon
limitation, so that nitrification is poorer and about one fourth of ammonia nitrogen is
neither nitrified nor assimilated by algae (Fig. 43-44). In this case the maximum
nitrification achieved is of 51%, plus 5% denitrification.

52 MSc thesis
Figure 42
Figure 43: nitrogen in the effluent with high organic content wastewater
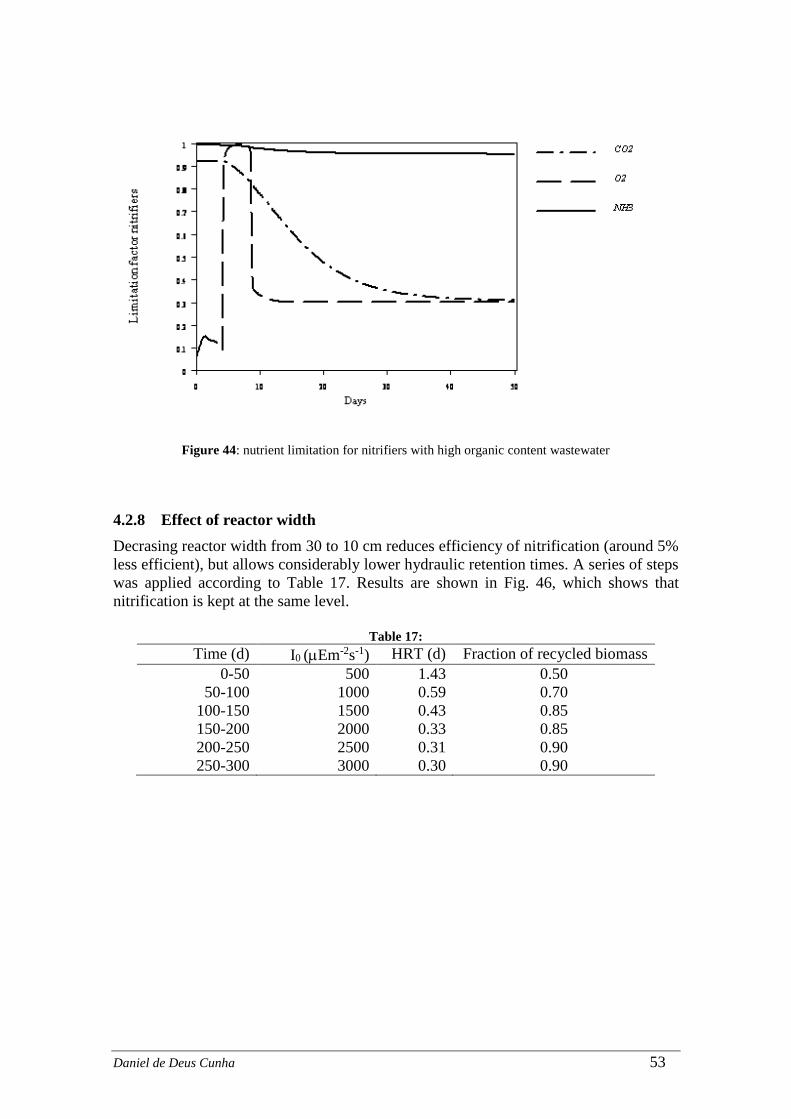
Daniel de Deus Cunha 53
Figure 44: nutrient limitation for nitrifiers with high organic content wastewater
4.2.8 Effect of reactor width
Decrasing reactor width from 30 to 10 cm reduces efficiency of nitrification (around 5%
less efficient), but allows considerably lower hydraulic retention times. A series of steps
was applied according to Table 17. Results are shown in Fig. 46, which shows that
nitrification is kept at the same level.
Table 17:
Time (d) I0 (Em-2s-1) HRT (d) Fraction of recycled biomass
0-50 500 1.43 0.50
50-100 1000 0.59 0.70
100-150 1500 0.43 0.85
150-200 2000 0.33 0.85
200-250 2500 0.31 0.90
250-300 3000 0.30 0.90

54 MSc thesis
Figure 45
4.2.9 The role of alkalinity
The model shows that alkalinity works as a “buffer” of inorganic carbon in the system.
In the absence of alkalinity, nitrification might not take place due to limitation either of
inorganic carbon (with higher algae biomass) or of oxygen (with lower algae biomass);
in this case, strong coupling of algae and heterotrophs inhibit nitrifiers growth.
Alkalinity might be regarded as an additional degree of freedom in this system, as it
substitutes the role of heterotrophs (production of inorganic carbon) without consuming
oxygen.
To illustrate this, in Fig. 47 it is shown the step response in day 50 of the system as
described in Tables 6 and 7, when the concentration of bicarbonate is divided by 2.
Nitrification stops completely. That happens due to inorganic carbon limitation and
competition with algae, as can be seen in figures 48 and 49. Increasing organic substrate
in the influent in order increase inorganic carbon production by heterotrophs would
probably not compensate for alkalinity, as then algae must assimilate more ammonia.
This will be shown in the next section.

Daniel de Deus Cunha 55
Figure 46:
Figure 47:

56 MSc thesis
Figure 48:
4.2.10 Treatment of sewage with higher substrate content
Using as wastewater the concentrations indicated by Roeleveld and van Loodsdrecht
(2002) for Nieuwgraaf (Table 18), with higher organic load, and fixing HRT as 6.67
days, it is found that maximum nitrification occurs with an incident irradiance of 560
Em-2s-1. It is observed that nitrification is less efficient than that for Nieuwe Waterweg
(compare Fig. 50 with figure 20). Nitrification was of 65% with wastewater from
Nieuwe Waterweg, while it is of 43% with wastewater from Nieuwgraaf. In Fig. 50 it
can be seen that this is due to higher ammonia assimilation by algae, which has to
produce additional oxygen for the degradation of the increased organic matter by
heterotrophs, that assilate oxygen before (i. e. more efficiently than) nitrifiers.
Table 18: Sewage as characterized in Nieuwgraaf, The Netherlands (Roeleveld and van Loodsdrecht,
2002)
Input Parameter Value Unit
SS,in 0.258 kg COD/m3
SI,in 0.039 kg COD/m3
XS,in 0.086 kg COD/m3
XI,in 0.230 kg COD/m3

Daniel de Deus Cunha 57
Figure 49: nitrogen forms in the effluent with wastewater with high organic content
4.2.11 Denitrification
When there is nitrification in the system limited by oxygen (and not by ammonia),
oxygen concentration is depleted and denitrification takes place. However,
denitrification is not significant, accounting for a maximum of around 5% of nitrogen in
the effluent.

58 MSc thesis
5 Discussion
5.1 Experiments
Some difficulties in the experiments showed that the operation of photobioreactors are
complex and subject to several constraints and limitations. It seems that in an SBR,
besides stoichiometric and kinetic constraints (discussed in next section), settling of
algae as well as nitrite accumulation might play important roles. However, settling
alone might not be the only reason for the washing out of algae in phases 2-5, as in the
beginning of phase 2, when nitrifiers were still not growing, algae could grow well. This
two factors should be carefully investigated. It is possible that chlorophyll sampling
during phase 2 (50 and 20 mL) contributed to washing out algae. In case nitrite
accumulation significantly limits algae growth due to toxicity, as suggested by the fact
that algae were washed out after nitrifiers grew during phase 2, it might be that an SBR
is not the best configuration for this system, as nitrite concentration would always have
a cyclic behaviour, depending on the phase of the cycle and on the temperature; a
chemostat or a biofilm reactor would be more indicated. However, a biofilm reactor
might limit controllability, as the hydraulic retention time of algae could not be
controlled.
In Phase 6 of the experiments it seems that it was possible to keep stable populations of
nitrifiers, algae and heterotrophs (although the influent did not contain organic substrate,
decay products are a source of nutrients for heterotrophs). This confirmed what has
already been published in the literature. The fact that in this phase ammonia was
available in significant levels in the effluent without being nitrified seems to indicate
that there was another limitation for nitrifiers. One possible explanation is that there was
inorganic carbon limitation, taking into consideration that it came exclusively from
aeration and that nitrifiers competed with algae for this nutrient. Otherwise, there might
be a limitation of another micronutrient.
The conditions of the last phase of the experiment might be a good starting point for
further studies, e. g., adding organic substrate and bicarbonate in the media, and trying
to experimentally confirm the effect of light intensity on nitrification.
5.2 Modelling
The model shows that there are several constraints in an enclosed photobioreactor for
nitrification process. These constraints are both stoichiometric and kinetic.
Stoichiometrically, nitrification is limited to a maximum theoretical threshold, due to
the fact that algae also assimilate ammonium nitrogen to produce oxygen. Kinetic
constraints arise because both algae and heterotrophs grow faster and are more efficient
to assimilate nutrients than nitrifiers, and therefore outcompete them when these
nutrients are limited. However, the model showed that with a proper strategy, that
involves keeping algae light-limited and heterotrophs substrate-limited, nitrification can
indeed take place.

Daniel de Deus Cunha 59
The model also shows that nitrification can be controlled with the manipulation of
incident irradiance, hydraulic retention time and/or biomass retention time, in such a
way that nitrification is kept near the theoretical stiochiometric maximum. This
behaviour qualifies nitrification in enclosed photobioreactors as an optimisation
problem.
The choice of reactor width can influence the range of operability of the reactor, in
terms of stability and range of light intensity and hydraulic retention time. Reactor
width could be used as a design parameter according to local irradiation characteristics.
For example, in a location where natural irradiances between 2000 and 3000 μEm-2s-1
are common, a reactor with 10 cm of width would provide good controllability, as in
this range of irradiance nitrification is not very sensitive to changes in light intensity
(Fig 46, using data from Table 16). When natural light intensity falls below these values,
complementary artificial illumination could be used. Another location where the usual
irradiance falls between 900 and 1200 μEm-2s-1 would rather operate as depicted in Fig.
47.
Figure 50: optimized hydraulic and sludge retention time for photobioreactor (nitrification of around 60%
of influent NH3-N) with 10 cm of width and other parameters described in tables 6 and 7

60 MSc thesis
Figure 51: optimized hydraulic and sludge retention time for photobioreactor (nitrification of around 65%
of influent NH3-N, slightly decreasing as HRT decreases) with data based on tables 6, 7 and 14
Differently than the PHOBIA model, developed for biofilm photobioreactors, this
model shows that significant nitrification can take place in suspended stirred
photobioreactors. Two reasons might be the cause for this difference: as said by the
developers of PHOBIA, the biofilm photobioreactor imposes diffusion limitations
(Wolf et al 2007) that are absent in the suspended biomass configuration; another
possible reason might be that the alkalinity used in simulations with PHOBIA was
significantly lower than the ones used in this work, based on typical sewage alkalinity.
As Abeliovitch (1985) showed experimentally, nitrification is dependent on hydraulic
retention time; however, the model does not show two peaks of nitrification as in his
experimental work, but only one. The finding of Evans et al (2005) that nitrification on
HRAP's is dependent on pond depth might perhaps be better explained as a dependancy
on average light intensity, as increased depth means increased light extinction,
considering constant concentrations in the water column.
The model developed does not account for some processes that might play a role in the
system. One of them is nitrite accumulation, but in a chemostat configuration it should
be only a transitory state. Dark respiration could be important in systems without
artificial irradiation. One phenomena that might make nitrification more difficult is
photoadaptation. If algae can significantly change the chlorophyll content according to
the irradiance they receive, that could be a difficulty for the effective control as
discussed in this work. However, this photoadaptation is very likely bounded to limits;
on the other hand, it would require a stable condition, so that, in case it is a problem,
intentional oscillations of the operating conditions could avoid it. Temperature effects
might also modify the optimal operating conditions in case microorganisms increase or
decrease their growth rates in different proportions.
A sensitivity analysis of the model was not yet carried out. However, it is conceptually
possible to identify some critical parameters in the model. One of these is the inhibition
constant for algae growth on nitrate. If there is not a strong preference of algae for
growth on ammonia instead of nitrate, results of the model could change significantly,
as growth on nitrate could considerably decrease the efficiency of nitrification, even
though the process of nitrification itself is taking place. Another issue is the light

Daniel de Deus Cunha 61
extinction coefficients of other particulates besides algae. Should algae cells have a light
extinction not so much higher than other particulates as modelled here (as 10% of algae
light extinction), higher light intensities should be necessary to achieve the same results,
due to increased extinction.
Finally, it must be said that some inconsistencies might arise in the model due to the
fact that the kinetic parameters used were derived for algae species P. tricornutum,
while the stoichiometric parameters were derived for algae species xxxx. However,
considering that different species of algae have similar functional properties, so that
biofilm development is reproducible with different species (Wolf et al 2007), one might
perhaps assume that the same is valid for algae cultured in suspension.
5.3 Integration of experimental and model results
The model was developed for a different situation than the experimental setup presented
here, so direct inferences cannot be made. However, one important finding was that
biomass seems to grow separately, as two layers were formed in the bottom of the
reactor after settling. That is an indication that the kinetic parameters of ASM1 are valid
in this system. If phenomena such as adsorption took place, it might be that those
parameters changed, due to e. g. diffusional limitations. The model also indicates that it
might be that a better experimental strategy might be adding bicarbonate to the medium,
instead of using aeration; in this case nitrifiers growth would be more clearly coupled to
photosynthetic oxygenation, and bicarbonate would simulated the role of alkalinity (e. g.
of sewage).
5.4 Enclosed photobioreactors in wastewater treatment plants
Enclosed photobioreactors would not be used alone in a wastewater treatment plant. The
effluent should certainly be previously treated for the removal of course solids, for
example. Another issue is the removal of nitrate. Denitrification seems to be possible in
a pre-anoxic tank, as suggested by the composition of sewage reported by Roeveled and
van Loodsdrecht (2002). The readily biodegradable substrate is stoichiometrically
sufficient for denitrifying nitrate, as shown in table 18. However, in this case, to ensure
anoxic conditions, either algae should be removed in the recycling stream, or the reactor
should be "dark", so that photosynthsis does not take place. Therefore, one can imagine
a system as qualitatively outlined in Fig. 46, with pretreatment, pre-anoxic tank for
denitrification and a photobioreactor.

62 MSc thesis
Figure 52: photobioreactor for sewage treatment
According to the stoichiometry table for denitrification (Table 3), with the appropriate
unit conversions, one finds that for each mol of NO3-N denitrified a stoichiometric
amount of 1.66 mg of readily degradable substrate is necessary. In Table 18 are listed
the concentrations of readily degradable substrate of wastewater in Dutch wastewater
treatment plants (Roeleveld and van Loodsdrecht 2002), together with the
stoichiometric potential for denitrification. As it can be seen, the readily degradable
substrate concentration seems to be enough for the denitrification. Besides, this pre-
anoxic tank would improve nitrification in the photobioreactor, as algae would not have
to produce extra oxygen for de oxydation of organic substrate and therefore would
assimilate less ammonia, and heterotrophs would also assimilate less ammonia, and
nitrification of high organic load wastewater would be more efficient.
NO3-
Algae
Algae
N2
Pre-treatment Anoxic
tank
NO3-
Effluent
Algae
harvesting
COD
NH3
TKN

Daniel de Deus Cunha 63
Table 19: stoichiometric potential of sewage to denitrification, according to sewage characterization by
Roeleveld and van Loodsdrecht (2002)
WWTP Ss (mg /L) NO3-N potentially
denitrified (mg/L)
Geestmarambacht 105 63.2
Niedorpen 115 69.3
Stolpen 170 102.4
Ursem 202 121.7
Wieringermeer 104 62.6
Wieringen 203 122.3
Deventer 97 58.4
Nijmegen 129 77.7
Franeker 65 39.1
Gouda 149 89.7
Venlo 204 122.9
Appeldoorn 165 99.4
Boxtel 140 84.3
Nieuwgraaf 258 155.4
Groote Lucht 129 77.7
Nieuwe Waterweg 86 51.8
Haarlem-WP 97 58.4
Alphen KenZ 118 71.1
Groesbeek 153 92.2
Hardenberg 185 111.4
Papendrecht 102 61.4
Photobioreactors could also be used in post-treatment of effluent from anaerobic
reactors (e. g. UASB reactors), that have low organic substrate but high ammonium
nitrogen content. One difficulty to treat effluent coming from this system in an enclosed
photobioreactor for nitrification is that the effluent coming from the anaerobic reactor
would contain dissolved methane - up to 16 mg/L, the methane solubility at 300 K (van
Haandel and Lettinga 1994), and methanotrophs might outcompete nitrifiers (Hatamoto
et al 2010), reducing the efficiency of nitrification. Another difficulty is that UASB
effluent has low organic substrate content, so that external electron donor should be
added. However, it might be that this system also offers the solution to this problem,
that would be using methane as electron donor in a pre-anoxic tank for denitrification.
This way, the pre-anoxic tank would have the double funcion of removing nitrate and
methane previously to feeding the wastewater in the photobioreactor. According to
Modin et al (2007), for each mol of NO3-N denitrified, the correspondent
stoichiometric ammount of methane is 0.625 mol, or a requirement of 0.71 mg CH4/mg
NO3-N. It means that with 16 mg/L of CH4 a total of 22.5 mg of NO3-N could be
stoichiometrically denitrified. This seems to be enough for denitrification with a
wastewater with 40 mg/L NH4-N and 60-70% of nitrification, admitting that 10 mg/L
NO3-N is allowed in the effluent. In case it is not enough due to stoichiometric or
kinetic reasons, gaseous methane from the anaerobic reactor could be added to the
reactor; alternatively, a fraction of the wastewater could be partly bypassed directly to
the anoxic tank (addition of readily degradable substrate).

64 MSc thesis
Biogas from the anaerobic reactor could be used for electricity production to provide
artificial (complementary) illumination to the photobioreactor. In a treatment plant for a
population of 200 000, 300 kW of useful power could be generated (van Haandel and
Lettinga 1994) and the excess algae harvested in the effluent could be fed back into the
anaerobic reactor. A system like this is outlined in Fig. 47. The artificial illumination
would make the process more controllable, and besides would allow the operation
during the night or during periods when solar irradiation is less intense. The main
difficulties for such a system seem to be algae harvesting and the denitrification process
with methane as electron donor. This last process was found recently, and it seems that
anaerobic denitrification with methane has a very slow growth rate (Modin et al 2007).
Algae harvesting might be still more difficult than in reported in the literature, because
it should be carried out selectively (not together with nitrifiers). Different settling or
other physical properties of the microorganism might be used for this goal.
Figure 53: photobioreactor for post-treatment of UASB effluents
The two process configurations qualitatively outlined above would encompass
nitrification and denitrification without any artificial aeration. Some of the ammonia
nitrogen would be assimilated by the algae, but this would be used as energy source to
provide (complementary) artificial illumination. Nevertheless, more quantitative
analysis is necessary in order to assess the feasibility of these systems, including the
removal of other pollutants such as phosphorous, as well as basic research, e. g. in the
fields of algae harvesting and denitrification with methane as electron donor. To the best
of the author's knowledge, this is the first time that a controllable nitrification-
denitrification system coupled to photosynthetic oxygenation and without any artificial
aeration and/or external electron donor addition is proposed.
NO3-
Algae
COD
TKN
NH3
CH4
UASB
NO3-
Algae
NH3
Biogas
Turbine
N2
Pre-treatment Anoxic
tank
Effluent
Algae
harvesting

Daniel de Deus Cunha 65

66 MSc thesis
6 Main conclusions and suggestions for further research
Based on the model and experiments, the main conclusions of this work are:
1. Enclosed photobioreactors are a promising alternative for wastewater treatment
with nitrification coupled to photosynthetic oxygenation.
2. Nitrification in enclosed photobioreactors is strongly dependent on the operating
conditions, and can be characterized as an optimization problem.
3. Enclosed photobioreactors might be integrated in wastewater treatment plants in
such a way that nitrification and denitrification could be carried out without
artificial aeration, i. e., exclusevely based on photosynthetic oxygenation.
To achieve this, however, more research is needed. It is suggested that the following
studies are carried out:
1. Sensitivity analysis, calibration and validation of the model.
2. Demonstrate experimentally the dependence of nitrification on irradiance.
3. Investigate nitrite toxicity to algae.
4. Experimentally determine the light extinction coefficient for nitrifiers,
heterotrophs and other particulates present in wastewater.
5. Consider the use of a method to improve algae settling, e. g., chitosan as
flocculant or ultrasound.
6. Modelling of photoadaptation and dark respiration
7. Modelling temperature effects
8. In-depth quantitative research and modelling of complete wastewater treatment
plants with nitrification and denitrification coupled to photosynthetic
oxygenation.
Daniel de Deus Cunha 67
References
Abeliovich A (1985), Nitrification of ammonia in wastewater, Water Res 19 (9) 1097-
1099.
Alfafara CG, Nakno K, Nomura N, Igarashi T, Matsumura M (2002), Operating and
scale-up factors for the electrolytic removal of algae from eutrophied lakewater, J
Chem Technol Biotechnol 77:871-876.
Arranz A, Bordel S, Villaverde S, Zamarreño JM, Guieysse B, Muñoz R (2008),
Modeling photosynthetically oxygenated biodegradation process using artificial neural
networks, Journal of Hazardous Materials 155: 51-57.
Aziz MA, Ng WJ (1992), Feasibility of wastewater treatment using the activated algae
process, Bioresource Technology 40, 205-208.
Barthel L, Oliveira PAV, Costa RHR, Plankton biomass in secondary ponds treating
piggery waste, Brazilian Archives of Biology and Technology 51 (6): 1287-1298.
Bitton G (2005), Wastewater microbiology, Wyley-Liss, Third Edition.
Borowitzka MA (1998), Limits to growth, In: Wong Y-S, Tam NFY (Ed.), Wastewater
treatment with algae, Springer, Berlin.
Bordel S, Guieysse B, Muñoz R, (2009) Mechanistic model for the reclamation of
industrial wastewaters using algal-bacterial photobioreactors, Environ.. Sci. Technol.
43: 3200-3207.
Bosma R, van Spronsen, WA, Tramper J, Wijffels RH (2003), Ultrasound, a new
separation technique to harvest microalgae, Journal of Applied Phycology 15: 143-153.
Buelna G, Bhattarai KK, de la Noue J, Taiganides EP (1990), Evaluation of various
flocculants for the recovery of algal biomass grown on pig-waste, Biological Wastes 31:
211-222.
Buhr HO, Miller SB (1983), A dynamic model of the high-rate algal-bacterial
wastewater treatment pond, Water Res 17: 29-37.
Costa C, Dijkema C, Friedrich M, García-Encina P, Fernández-Polanco F, Stams AJM
(2000), Denitrification with methane as electron donor in oxygen-limited bioreactors,
Appl Microbiol Biotechnol 53: 754-762.
Craggs R (2005), Advanced integrated wastewater ponds, In: Shilton A (Ed.), Pond
treatment technology, IWA Publishing, London.
Cromar NJ, Fallowfield HJ (1997), Effect of nutrient loading and retention time on
performance of high rate algal ponds, Journal of Applied Phycology 9: 301-309.

68 MSc thesis
Divakaran R, Pillai VNS (2002), Flocculation of algae using chitosan, Journal of
Applied Phycology 14: 419-422.
Eilers PHC, Peeters JCH (1988), A model for the relationship between light intensity
and the rate of photosynthesis in phytoplankton, Ecological Modelling 42: 199-215.
El Hafiane F, Rami A, El Hamouri B (2003), Mécanismes d’élimination de l’azote et du
phosphore dans un chenal algal à haut rendement, Revue des Sciences de l’Eau 16 (2):
157-172
Ekama GA, Wentzel MC (2008), Nitrogen removal, In: Henze M, van Loodsdrecht
MCM, Ekama GA, Brdjanovic D, Biological wastewater treatment, IWA Publishing,
London.
Essam T, Amin MA, El Tayeb O, Mattiasson B, Guieysse B (2006), Biological
treatment of industrial wastes in a photobioreactor, Water Science and Technology 53
(11): 117-125.
Evans RA, Cromar NJ, Fallowfield HJ (2005), Performance of a pilot-scale high rate
algal pond system treating abattoir wastewater in rural South Australia: nitrification
and denitrification, Water Science & Technology 51 (12): 117-124.
Foresti E, Zaiat M, Vallero M (2006), Anaerobic processes as the core technology for
sustainable domestic wastewater treatment: consolidated applications, new trends,
perspectives, and challenges, Reviews in Environmental Science and Biotechnology 5:
3-19.
Godos I, González C, Becares E, García-Encina PA, Muñoz R (2009a), Simultaneous
nutrient and carbon removal during pretreated swine slurry degradation in a tubular
biofilm photobioreactor, Appl Microbiol Biotechnol 82: 187-194.
Godos I, Blanco S, García-Encina PA, Becares E, Muñoz R. (2009b), Long-term
operation of high rate algal ponds for the bioremediation of piggery wastewaters at
high loading rates, Bioresource Technology 100: 4332-4339.
González C, Marciniak J, Villaverde S, León C, García PA, Muñoz R, Efficient nutrient
removal from swine manure in a tubular biofilm photobioreactor using algae-bacteria
consortia, Water Science and Technology 58 (1): 95-102.
Gutzeit G, Lorch D, Weber A, Engels M, Neis U (2005), Bioflocculent algal-bacterial
biomass improves low-cost wastewater treatment, Water Science and Technology, 52
(12): 9-18.
Hall CAS, Powers R, Schoenberg W (2008), Peak oil, EROI, investments and the
economy in an uncertain future. In: Pimentel D (2008), Biofuels, solar and wind as
renewable energy systems, Springer Science.
Hatamoto M, Yamamoto H, Kindaichi T, Ozaki N, Ohashi A (2010), Biological
oxidation of dissolved methane in effluents from anaerobic reactors using a down-flow
hanging sponge reactor, Water Research 44: 1409-1418.

Daniel de Deus Cunha 69
Henze M, Gujer W, Mino T, van Loodsdrecht M (2000), Activated sludge models ASM1,
ASM2, ASM2d and ASM3, Scientific Report No 9, IWA Publishing.
Illich I (1974), Energy and equity, Harper & Row, New York.
Islas-Lima S, Thalasso F, Gémez-Hernandez J (2004), Evidence of anoxic methane
oxidation coupled to denitrification, Water Research 38: 13-16.
Jupsin H, Praet E, Vasel JL (2003), Dynamic mathematical model of high rate algal
ponds (HRAP), Water Sci Technol 48 (2): 197-204.
Kjärstad J, Johnsson F (2009), Resources and future supply of oil, Energy Policy 37:
441-464.
Kmet T, Straskraba M, Mauersberger P (1993), A mechanistic model of the adaptation
of phytoplankton photosynthesis, Bulletin of Mathematical Biology 55 (2): 259-275.
Knuckey RM, Brown MR, Robert R, Frampton DMF (2006), Production of microalgal
concentrates by flocculation and their assessment as aquaculture feeds, Aquacultural
Engineering 35: 300-313.
Kroon BMA, Ketelaars HAM, Fallowfield HJ, Mur LR (1989), Modelling microalgal
productivity in a high-rate algal pond based on wavelength dependent optical
properties, Journal of Applied Phycology 1: 247-256.
Lertsutthiwong P, Sutti S, Powtongsook S (2009), Optimization of chitosan flocculation
for phytoplankton removal in shrimp culture ponds (in press), Aquacult. Eng.,
doi:10.1016/j.aquaeng.2009.07.006
Lubián LM (1989), Concentrating cultured marine microalgae with chitosan,
Aquacultural Engineering 8: 257-265.
Mahmoud N, Zeeman G, Gijzen H, Lettinga G (2004), Anaerobic treatment in a one-
stage UASB reactor and a combined UASB-Digester system, Water Research 38: 2348-
2358.
Mallick N (2002), Biotechnological potential of immobilized algae for wastewater P, N
and metal removal: a review, Biometals 15: 377-390.
Marcuse H (1964), One-dimensional man, Beacon Press.
McGriff Jr E, McKinney RE (1972), The removal of nutrients and organics by activated
algae, Water Research 6: 1155-1164.
Tsoskounoglou M, Ayerides G, Tritopoulou E (2008), The end of cheap oil: current
status and prospects, Energy Policy 36: 3797-3806.
Modin O, Fukushi K, Yamamoto K, (2007), Denitrification with methane as external
carbon source, Water Research 41: 2726-2738.

70 MSc thesis
Molina Grima E, Acién Fernández FG, García Camacho F, Chisti Y (1999),
Photobioreactors: light regime, mass transfer, and scaleup, Journal of Biotechnology
70: 231-247.
Morales J, de la Noüe J, Picard G (1985), Harvesting marine microalgae species by
chitosan flocculation, Aquacultural Engineering 4: 257-270.
Moreno-Garrido I (2008), Microalgae immobilization: current techniques and uses,
Bioresource Technology 99: 3949-3964.
Muñoz R, Guieysse B (2006), Algal-bacterial processes for the treatment of hazardous
contaminants: a review, Water Research 40: 2799-2815.
Muñoz R, Köllner C, Guieysse B (2009), Biofilm photobioreactors for the treatment of
industrial wastewaters, Journal of Hazardous Materials 161: 20-34.
Muñoz R, Köllner C, Guieysse B, Mattiasson B (2004), Photosynthetically oxygenated
salicylate biodegradation in a continuous stirred tank photobioreactor, Biotechnology
and Bioengineering, 87 (6): 797-803.
Muñoz R, Rolvering C, Guieysse B, Mattiasson B, Photosyntheticaly oxygenated
acetonitrile biodegradation by an algal-bacterial microcosm: a pilot-scale study, Water
Science and Technology, Vol 51 (12): 261-265.
Oswald WJ, Gotaas HB, Ludwig HF, Lynch V (1953), Algae symbiosis in oxidation
ponds III Photosynthetic oxygenation, Sewage and Industrial Wastes, Vol. 25, No. 6.
Oswald WJ, Gotaas HB, Ludwig HF, Lynch V (1953b), Algae symbiosis in oxidation
ponds II Growth characteristics of Chlorella pyreneidosa cultured in sewage, Sewage
and Industrial Wastes, Vol. 25, No. 1.
Oswald WJ, Gotaas HB (1955), Photosynthesis in sewage treatment, Transactions of
the American Society of Civil Engineers, Paper no. 2849.
Oswald WJ (1962), The coming industry of controlled photosynthesis, American
Journal of Public Health, 52 (2): 235-242.
Oswald WJ (1995), Ponds in the twenty-first century, Wat. Sci. Tech. 31 (12): 1-8.
Oswald WJ (2003), My sixty years in applied algology, Journal of Applied Phycology
15: 99-106.
Pearson H (2005), Microbiology of waste stabilization ponds, In: Shilton A (Ed.), Pond
treatment technology, IWA Publishing, London.
Pierzynski GM, Sims JT, Vance GF (2005), Soils and environmental quality, CRC
Press.
Poelman E, De Pauw N, Jeurissen B (1997), Potential of electrolytic flocculation for
recovery of microalgae, Resources, Conservation and Recycling 19: 1-10.

Daniel de Deus Cunha 71
Raghoebarsing AA, Pol A, van de Pas-Schoonen KT, Smolders AJP, Ettwig KF,
Rijpstra WIC, Schouten S, Damsté JSS, op den Camp HJM, Jetten MSM, Strous M
(2006), A microbial consortium couples anaerobic methane oxidation to denitrification,
Nature 440: 918-921.
Richmond A (2004), Biological principles of mass cultivation, In: Richmond A (Ed.),
Handbook of microalgal culture¸ Blackwell Publishing.
Roeleveld PJ, van Loodsdrecht MCM (2002), Experience with guidelines for
wastewater characterisation in the Netherlands, Water Science and Technology 45 (6):
77-87.
Stenstrom MK, Rosso D (2008), Aeration and mixing, In: Henze M, van Loodsdrecht
MCM, Ekama GA, Brdjanovic D, Biological wastewater treatment, IWA Publishing,
London.
Tam NFY, Wong YS, Wastewater nutrient removal by Chlorella pyrenoidosa and
Scenedesmus sp., Environmental Pollution 58: 19-34.
Thalasso F, Vallecillo A, García-Encina P, FDZ-Polanco F (1997), The use of methane
as a sole carbon source for wastewater denitrification, Water Research 31 (1): 55-60.
Tilton RC, Murphy J, Dixon JK (1972), The flocculation of algae with synthetic
polymeric flocculants, Water Research, 6:155-164.
Wanner J (1994), Activated sludge bulking and foaming control, Lewis Publishers.
Wanner O, Reicher P (1996), Mathematical modeling of mixed-culture biofilms,
Biotechnology and Bioengineering 49: 172-184.
Wolf G, Picioreanu C, van Loodsdrecht MCM (2007), Kinetic modeling of phototrophic
biofilms: the PHOBIA model, Biotechnology and Bioengineering, 97 (5): 1064-1079.
Zonneveld C (1998), Photoinhibition as affected by photoacclimation in phytoplankton
a model approach, Journal of Theoretical Biology 193: 115-123.

72 MSc thesis

Daniel de Deus Cunha 73
7 Appendix: AQUASIM file
Copyright © 2022 FDOKUMEN