RuBP Limitation of Photosynthetic Carbon Fixation ... - NCBI
Upload
khangminh22Category
view
0download
0
THE EFFECT OF TEMPERATURE QN PHOTOSYNTHETIC AND PHOTORESPIRATORY METABOLISM
by
Maria Celeste Moreira Nabeiro Correia Arrabaca /
Thesis submitted to the UNIVERSITY OF LONDON for the degree of DOCTOR OF PHILOSOPHY
Department of Botany Rothamsted Experimental Station
Harpenden Herts
April 1981

2 -
ABSTRACT
The effect of oxygen on net photosynthesis by wheat leaf segments was studied at three temperatures, 10, 20 and 35°C, and two C02 concentrations, 315 and 380 vpm. Generally oxygen inhibited photosynthesis but at 10°C with 380 vpm C02 photosynthesis was stimulated by increasing oxygen concentration from 2 to 21%, Under these conditions it might appear that photorespiration was not a significant factor limiting photosynthesis. In general the effects of decreased oxygen concentration on photosynthesis rates were less than would be predicted from the known properties of RuBP carboxylase/oxygenase. It is proposed that some other reaction in photosynthetic metabolism becomes limiting at low temperature that is not inhibited by oxygen in the range 2 to 21%, By studying the products of photosynthesis in 14C02 in wheat leaf segments, it was shown that photorespiratory metabolism was significant below 20°C even though it was not limiting photosynthetic capacity. However, ll*c accumulated in hexose monophosphates at 5 and 10°C, suggesting that there may be a rate-limiting step in the further metabolism of these intermediates. It is unlikely that the transport of phosphate esters from the chloroplast is limiting since increased amounts were found at low temperature in a cytoplasmic cell fraction as well as in the chloroplasts. For this experiment the hexose monophosphates were measured by a specific enzyme method which showed that the hexose monophosphate increased in absolute amounts in the leaf segments as well as becoming more radioactive at

3
low temperatures. The main uses of hexose monophosphates in photosynthesis are to regenerate RuBP and for sucrose synthesis. The levels of RuBP at low temperature were not low. It seems likely that the limiting step was in sucrose synthesis and that there is a feed-back effect of hexose monophosphates limiting carboxylation.

4
CONTENTS
Page
ABSTRACT 2
LIST OF TABLES 10
LIST OF FIGURES " 14
ABBREVIATIONS 18
INTRODUCTION 19
A, INCREASED EFFECT OF PHOTORESPIRATION ON PHOTOSYNTHESIS WITH INCREASED TEMPERATURE 20 1. CO2 compensation point 21 2. Post-illumination outburst . . 22 3. Rate of CO2 evolution into C02-free air 23 4. Studies with inhibitors of photorespiration 23
B, EFFECT OF OXYGEN ON PHOTOSYNTHESIS 24 1. Effects of the concentration of carbon
dioxide 26 2. The effect of temperature 28 3. Effect of light intensity on photosynthesis
and photorespiration and its relationship to oxygen, carbon dioxide and temperature 30
4. Mechanisms of oxygen inhibition 33 C, PHOTORESPIRATION AND GLYCOLATE PATHWAY 39
1. C02 evolution in light 39
2. Glycolate pathway or photorespiratory carbon oxidation cycle (PCO) 45
3. Carbon flow through the glycolate pathway 50

5
page
4, Sucrose synthesis from PCO 53 5. The significance of photorespiration 58
D. SUMMARY 60
MATERIAL AND METHODS 62
A. EXPERIMENTS WITH DETACHED LEAVES 62
1. Plant material > 62 2. Leaf samples 63
a. From flag leaves 63 b. From second leaves of 13 day old plants 63
3. Measurement of area of leaf segments 64 4. Leaf chambers 64 5. Preparation and supply of gas mixtures 67 6. Illumination 70 7. Killing and extraction of leaf segments
after photosynthesis in 14C02 70 8. Two dimensional thin-layer chromatography (TLC) 71
a. Preparation of the plates 71 b. Autoradiography 72
9. Measurement of radioactivity 73 a. Counting equipment 73 b. Measurement of 14C in solutions 73 c. Measurement of 14C on thin layer
chromatograms 78
d. Measurement of insoluble 14C in extracted residues 82
10. Measurement of CO2 exchange 82
11. Distribution of phosphates between chloroplasts and other cell fractions 83

6
page
a. Non aqueous fractionation of leaf tissue 83 1. Freeze drying of leaves 83 2. Isolation of chloroplasts 84
i. Preparation of the non-aqueous liquids 84
ii. Fractionation procedure 85 b. Chlorophyll determination 87 c. Extraction of phosphates 87
1. Using 20% perchloric acid 87 2. Using aqueous trichloroacetic acid 88 3. Using 50% ethanol 89
d. Purification of sugar phosphates by paper chromatography 89 1, Descending paper chromatography 90
2. Ascending paper chromatography 90
e. Final method 95
1. Chlorophyll extraction 95
2. Extraction of soluble phosphates 95
3. Determination of inorganic phosphate and total soluble phosphate 96
4. Determination of sugar phosphates G6P and F6P 96
5. Method for determination of the amount of RuBP 97
6. Calculations 98 B. EXPERIMENTS WITH ATTACHED LEAVES 99
1. Effect of CO2 concentration on the concentration of Ribulose-1,5-bisphosphate
(RuBP) in leaves 99

7
page
a. Plant material 99
b. Treatment of leaves 99 c. Gas mixtures 101 d. Killing of the leaves 101
e. Extraction of RuBP 101
RESULTS 103 A. EXPERIMENTS WITH DETACHED LEAVES 103
1. Effect of temperature and carbon dioxide concentration on the inhibition of photosynthesis by oxygen 103
2. Effects of temperature on incorporation of radioactivity into various.compounds during steady state photosynthesis at 350 vpm CO2 and 21% oxygen Preliminary experiments 107 a. Using the cylindrical chamber and
flag leaves 107
b. Using the rectangular chamber and flag leaves 114
3. Effects of temperature on incorporation of radioactivity into various compounds during steady state photosynthesis at 200 vpm CO2 and 21% oxygen — Main experiments with leaves from young plants in the rectangular leaf chamber 118 a. Distribution of 1 hC among products after
15 min photosynthesis in 1 tfC02 120
b. Effects of temperature on photorespiration 122 i. Flushing-out in light with 1000 vpm CO2 122

8
page
1, Flow of C through the glycolate pathway 122
2. Flow of C through the glycolate pathway as compared with net photosynthesis 129
ii. Flushing-out in darkness 130
1. Flow of C through the glycolate pathway 130
2. Flow of C through the glycolate pathway as compared with net photosynthetic assimilation 133
c. Effect of carbon dioxide and temperature on the flow of carbon into sucrose during the first minute flushing-out compared with the decay of radioactivity in fructose-6-phosphate and glucose-6-phosphate 134
4. Distribution of phosphates (G6P, F6P, P^ and total soluble phosphates) between chloroplasts and other cell fractions 136 a. Effect of temperature and carbon dioxide
concentration 136 5. Determination of the concentration of RuBP 144
B. EXPERIMENTS WITH ATTACHED LEAVES 147 1, Effect of carbon dioxide concentration on
the levels of RuBP 147

9
• page
DISCUSSION 153 A. EFFECT OF TEMPERATURE AND CARBON DIOXIDE
CONCENTRATION ON THE INHIBITION OF PHOTOSYNTHESIS BY OXYGEN 153
B. EFFECT OF TEMPERATURE AND CARBON DIOXIDE CONCENTRATION ON PHOTOSYNTHETIC C02 UPTAKE AND PHOTORESPIRATORY C02 EVOLUTION 167
C. EFFECT OF TEMPERATURE AND CARBON DIOXIDE. CONCENTRATION ON THE CARBON FLOW THROUGH THE GLYCOLATE PATHWAY 172
D. STOICHIOMETRY OF PHOTOSYNTHETIC AND PHOTORESPIRATORY METABOLISM WHEN PR = 0.15 APS IN AIR (350 VPM C02/ 21% 02) AND AT 20°C 176
E. CONCLUSIONS . 179
ACKNOWLEDGEMENTS 181
REFERENCES 182

10
LIST OF TABLES
Table 1, Amount of G6P. and F6P present in C + CDT
after extraction with ethanol 50%
followed by paper chromatography in
different solvents.
Page
94
Table 2, Photosynthetic rates at three temperatures, two carbon dioxide concentrations and two oxygen concentrations measured using the IRGA. 105
Table 3. The percentage inhibition of photosynthesis
by O2 shown by data in Table 2. 105
Table 4, U C in various products during steady-state photosynthesis in air with 350 vpm ^CC^ and subsequently in 350 vpm 12C02 in the dark or in 1000 vpm C02 in light,
Temperature - 25°C. 108
Table 5, llfC in various products during steady-state photosynthesis in air with 350 vpm lIfC02 and subsequently in 350 vpm 12C02 in dark .or 1000 vpm C02 in light. Temperaure - 10°C. 109
Table 6. Radioactivity in various compounds after
photosynthesis in 350 vpm llfC02 and after
subsequent flushing-out in air in the dark. 115

11
page
Table 7. Radioactivity in various compounds in 350 vpm ll*C02 and after subsequent flushing-out in 1000 vpm C02 in the light,. 116
Table 8, Photosynthetic rates obtained after 15 min i H
in 350 vpm C02 calculated from Tables 4, 5, 6 and 1. 117
Table 9. Radioactivity in various compounds (dpm x10"3
per sample) after 15 min photosynthesis in 14CO2 and after flushing-out in light for 1 min at 1000 vpm at three temperatures and two C02 concentrations. 119
Table 10. Percentage of total 1IfC assimilated, after 15 min photosynthesis, taken from Table 9. 121.
Table 11. Radioactivity in various compounds (dpm x10"3
per sample) after 15 min photosynthesis in 14C02 and flushing-out in darkness for 1 min at the same C02 concentration as before. 123
Table 12. Percentage of total 1assimilated after 15 min photosynthesis in 1^002 , taken from Table 11. 124
Table 13. The flow of C from glycine into serine and
CO2 compared to net photosynthesis calculated from data in Table 9 (flushing—out in the light in 1000 vpm 12C02. 126

12
' page Table 14. The flow of C from glycine into serine and
CO2 compared to net photosynthesis calculated from data in Table 11 (flushing-out in darkness). 132
Table 15, Distribution of phosphates between chloroplasts (CHL) and the other cell fractions (NCHL) — effect of temperature and carbon dioxide concentration. 138
Table 16. Effect of temperature and carbon dioxide concentration on the level of RuBP. 147
Table 17. Data taken from the graphs of Badger and Collatz (1977) . 155
Table 18. The percentage inhibition of photosynthesis by O2 calculated from the kinetic constants for the enzyme RuBP carboxylase/oxygenase measured by Badger and Collatz (1977). 156
Table 19. Separation of the total percentage inhibition of photosynthesis by O2 calculated from the kinetic constants of the enzyme RuBP carboxylase/oxygenase into percentage inhibition due to photorespiration. 160
Table 20. 14C02 flushed from leaf chambers without leaves present at several collection times. 168
Table 21. Effect of carbon dioxide concentration and temperature on photosynthetic CO2 uptake

13
page
and photorespiratory CO2 evolution in 1 min
in light and 1000 vpm C02 (from Tables 9 and 13). 169
Table 22. Effect of C02 concentration and temperature on photorespiratory C02 evolution in 1 min in the dark (from Tables 11 and 14). 170
Table 23, Comparison between the results of Kumarasinghe (1975) (A) and the results in this thesis (B). 173

14
LIST OF FIGURES
Page Fig. 1, Tentative scheme for the conversion of
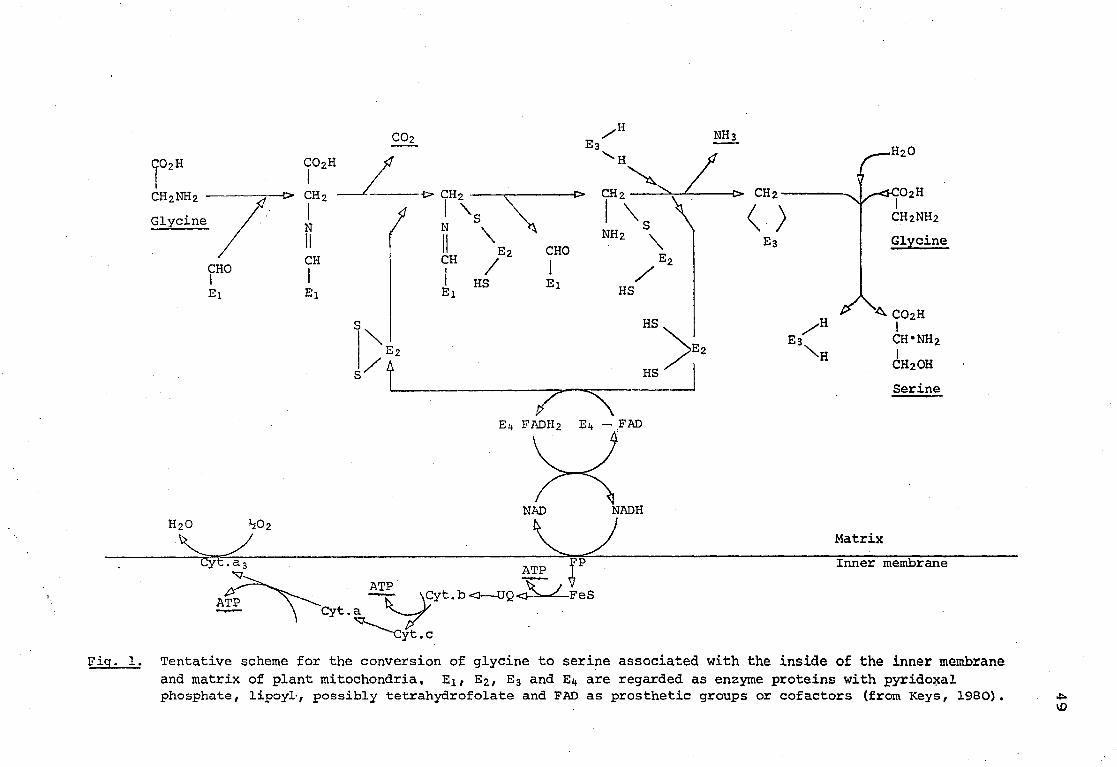
glycine to serine associated with the inside of the inner membrane and matrix of plant mitochondria. E2, E2, E3 and E^ are regarded as enzyme proteins with pyridoxal phosphate, . lipoyl, possibly tetrahydrofolate and FAD as prosthetic groups or cofactors (from Keys, 1980). 49
Fig. 2, Cylindrical leaf chamber. 65
Fig. 3. Rectangular leaf chamber. 66
Fig. 4. Diagram of apparatus used for supplying gas mixtures to leaf segments. 68
Fig. 5. Bag attached to scintillation vial to collect ll*C02 during the flushing-out period. 69
Fig. 6, Map showing the position of different compounds separated by thin layer chromatography. 74
Fig. 7. Autoradiograph showing the distribution of radioactivity in various compounds after photosynthesis in 200 vpm 14C02 for 15 min at 5°C. 75

15
page
Fig. 8. Distribution of radioactivity in various compounds after photosynthesis in 200 vpm ll*C02 for 15 min at 10°C, 76
Fig. 9. Distribution of radioactivity in various compounds after photosynthesis in 200 vpm ltfC02 for 15 min at 20°C. 77
Fig. 10. Distribution of radioactivity in various compounds after photosynthesis in 350 vpm ltfC02 for 15 min at 10°C. 79
Fig. 11. Distribution of radioactivity in various compounds after photosynthesis in 350 vpm 14C02 for 15 min at 20°C. 80
Fig. 12. Distribution of radioactivity in various compounds after photosynthesis in 350 vpm ll*C02 for 15 min at 35°C. 81
Fig. 13. Ascending paper chromatography. Separation of the band with sugar phosphate from the • fluorescent bands seen by ultraviolet light. 91
Fig. 14. Trough with water to elute the band with
sugar phosphates from Fig. 13. 92
Fig. 15. Rectangular Perspex chamber ( «100cm3)
for attached leaves. 100
Fig. 16. Relation between the concentration of glucose-
6-phosphate and carbon dioxide at different
temperatures. 139

16
page
Fig. 17. Relation between the concentration of fructose-6-phosphate and carbon dioxide at different temperatures. 140
Fig. 18. Distribution of glucose-6-phosphate between the chloroplast and the rest of the cell at various carbon dioxide concentrations and two temperatures. 142
Fig. 19. Distribution of fructose-6-phosphate between the chloroplast and the rest of the cell at various carbon dioxide concentrations and two temperatures. 143
Fig. 20. Effect of carbon dioxide concentration on the rate of net photosynthesis at 8°C. 148
Fig, 21, Effect of carbon dioxide concentration on the rate of net photosynthesis at 20°C. 149
Fig. 22. Effect of carbon dioxide concentration on
the levels of RuBP at 8°C. 150
Fig. 23. Effect of carbon dioxide concentration on the levels of RuBP at 20°C. 151
Fig, 24. Effects of temperature and C02 concentration
on the carbon deficit caused by the inhibitory effect of 18.8% 0 2 on apparent photosynthesis. Data are for excised wheat shoots exposed to 1,6 *105erg cm~2sec~1 radiant flux density (From Jolliffe and Tregunna, 1973). 154

17
page Fig, 25, Interaction between photosynthesis and
photorespiration when PR = 0.15 APS, for 20 C and 350 vpm CO2 in air. The arrows
indicate the possible points of regulation of the carbon metabolism by temperature, ' 1 7 7

18
ABBREVIATIONS
ADP ATP E4P F6P FBP FBPase GIP G6P G3P aHPMS INH NAD NADP NADPH
PCRC PEP Pi P Pi 3 PGA Ru5P RuBP SBP SBPase UDP UDPG UTP
Xu5P
. Adenosine diphosphate
. Adenosine triphosphate
. Erythrose-4r*phosphate
. Fructose-6-phosphate
. Fructose-1,6-bisphosphate
. Fructose-1,6-bisphosphatase
. Glucose-l-phosphate
. Glucose-6-phosphate
. Glyceraldehyde-3-phosphate
. aHydroxy-2-pyridine-methaSlulfonic acid
. Isonicotinyl hydrazide
. Nicotinamide-adenine dinucleotide
. Nicotinamide-adenine dinucleotide phosphate
. Nicotinamide-adenine dinucleotide phosphate, reduced form
. Photosynthetic carbon reduction cycle
. Phosphoenol-pyruvate
. Inorganic phosphate
. Inorganic pyrophosphate
. 3-phosphoglyceric acid , Ribulose-5-phosphate . Ribulose-1,5-bisphosphate . Sedoheptulose-1,7-bisphosphate . Sedoheptulose-1,7-bisphosphatase „ Uridine diphosphate . Uridinine diphosphate glucose , Uridine triphosphate
. Xylulose-5-phosphate

19
INTRODUCTION
Higher plants which fix C02 by the C3 pathway of photosynthesis (Calvin cycle) have two simultaneous carbon exchange processes occurring in the light. Firstly, photosynthesis, in which atmospheric carbon dioxide and water are converted to carbohydrates and oxygen, and, secondly, photorespiration in which there is an oxidation of photosynthetic intermediates to glycolate and, in the subsequent metabolism of glycolate, evolution of CO2. An essential role for photorespiration has not been proven and some consider it a wasteful process decreasing photosynthetic potential by between 30 and 50%. Thus, an increase in the ratio of photosynthesis to photorespiration could considerably increase agricultural productivity.
On the other hand, the only naturally occurring plants with low rates of photorespiration have the Ci+ mechanism of photosynthesis and have evolved mainly in the warm climates. It is natural, therefore, to look for a possible adaptation to cooler climates associated with photorespiration in C3
plants. This is the reason for investigating further the relative effects of temperature on photosynthesis and photorespiration.
Photorespiration is decreased, and hence the potential for net photosynthesis increased in an atmosphere in which the oxygen concentration is decreased from 21% to 2%. In

20
the laboratory this effect has usually been demonstrated at temperatures above 20°C but a few experiments have been conducted at lower temperatures (Jolliffe and Tregunna, 1968* 1973; Machler and NcSsberger, 1978); these latter experiments show that photorespiration may not be such a significant factor limiting photosynthesis in cool conditions. Photorespiration can also be decreased and photosynthesis increased by enrichment of the atmosphere with carbon dioxide. However, light intensity and gas phase diffusion resistances affect the concentration, of C02 inside the leaf relative to that supplied outside. Hence it is necessary to consider interactions of light intensity and carbon dioxide concentrations as well as oxygen concentration and temperature to account for the relative effects on photosynthesis and phptorespiration.
A. INCREASED EFFECT OF PHOTORESPIRATION ON PHOTOSYNTHESIS
WITH INCREASED TEMPERATURE
In many C3 plants, including wheat, the maximum
photosynthetic rate achieved is about 20% greater than the
minimum in the range of temperatures between 10°C and 35°C
(Zelitch, 1971) . This suggests that photorespiration must
increase with temperature to a greater extent than the
increase of gross photosynthesis. In contrast in C^ plants,
such as maize that have low photorespiration, net
photosynthesis nearly doubles for every 10°C rise between
15°C and 35°C. Bird, Cornelius and Keys (1977) compared
photosynthesis by maize and wheat, grown at various
21
temperatures { over a range of temperatures from 13°C to 28°C. The main difference in photosynthetic rate between the two species occurred above 18°C, Irrespective of the temperature for growth, the optimum temperature for photosynthesis was higher for maize (23°C or above) than for wheat (13°C to 18°C) . Furthermore, in spite of maize having low rates of photorespiration, the photosynthetic rates in wheat were equal or faster than in maize at 13°C and 18°C. This led the authors to the conclusion that either photorespiration in wheat is not sufficiently rapid to affect net photosynthesis or that other processes, possibly common to both C3 and C4 plants, become limiting at lower temperatures.
Evidence that increasing the temperature differentially increases the rate of photorespiration relative to photosynthesis comes from observations of the following types: CO2 compensation point, post-illumination CO2 outburst, rate of C02 evolution in C02-free air and studies with inhibitors of photorespiration.
A.l. CO? compensation point
If a leaf is placed in a closed system, at constant light intensity, C02 is assimilated until an ambient CO2
concentration is reached at which there is no net gas exchange. This concentration is called the C02 compensation point and results from the fact that the rate of gross photosynthesis equals the rate of respiratory C02 production. Plants with higher rates of photorespiration have higher CO2 compensation points. Zelitch (1966) found that the C02 compensation point for tobacco leaf discs increased from

22
48 vpm at 25°C to 80 vpm at 35°C. At a light intensity of 10,000 lux, Jolliffe andTregunna (1968) found an increase in compensation point for wheat shoots with increasing temperature from 2°C to 43°C, both in 2% oxygen and 21% oxygen. However, the main increase occurred above 20°C in 21% oxygen, being 32 vpm at 20°C, 55 vpm at 30°C and 100 vpm at 40°C. The C02 compensation point was directly proportional to oxygen concentrations at temperatures beiow 35°C. Above 35°C this relationship did not hold due either to a decrease in the true rate of photosynthesis or to an increase in the rate of C02 production in light. Lately it has been established that C02 compensation point increased with temperature from 13°C to 40°C and oxygen concentration from 0% to 100% (Jolliffe and Tregunna, 1973). Similar conclusions were reached by Laing et-al, (1974) for soybean leaf cells.
A,2. Post-illumination outburst
When plants with the C3 mechanism of photosynthesis are transferred from light to darkness there is a short period when the rate of C02 evolution is rapid before it decreases to a steady value characteristic of dark respiration. This suggests that photorespiration diminishes more slowly than photosynthesis after the light is turned off (Zelitch, 1971) . Decker (1959) found that the initial rate of C02 production in tobacco leaves increased about three times for every 10°C rise in temperature, between 17.5°C and 33.5°C.

23
A.3. Rate of CO? evolution into CO?-free air
When a C3 leaf is swept with C02-free air, there is a net efflux of C02 in the light. Studies with sunflower leaves by Hew, Krotkov and Canvin (1969b) showed a value for Qio (20-30°) of the rate of C02 evolution in light of 1.45 whereas that of true photosynthesis was 0.92 and apparent photosynthesis 0.82. Also in wheat leaves the rates of C02
evolution into C02-free air ranged from 38% of the net photosynthesis at 13°C to 69% at 28°C (Keys, Sampaio, Cornelius and Bird, 1977) . Zelitch (1966) showed that tobacco leaves infiltrated with [l-ll*c] glycolate released 1£fC02 in light into C02-free air fourfold faster at 35°C than at 25°C.
A.4. Studies with inhibitors of photorespiration
The earliest experiments using inhibitors were those of Zelitch (1966). He studied the effect of an inhibitor of glycolate oxidase, aHPMS, on short-term photosynthesis by tobacco leaf discs. At 35°C the inhibitor stimulated photosynthetic l l*C02 uptake at least three times, whereas at 25°C the photosynthetic ll*C02 uptake did not change. In maize leaves the inhibitor did not increase 14C02 uptake at either temperatures.
Thus, a variety of ways of measuring photorespiration
show an increase in photorespiration relative to
photosynthesis with increasing temperature.

24
B. EFFECT OF OXYGEN ON PHOTOSYNTHESIS
Oxygen markedly inhibits net photosynthesis by C3 plants. This is in part due to stimulation of photorespiratory metabolism and studies of the influence of oxygen concentration on photosynthesis have been an effective means of analysing the importance of photorespiration, Ci» plants, which have a lower rate of photorespiration, show a smaller sensitivity to oxygen inhibition.
The inhibitory effect of oxygen on photosynthesis was discovered by Warburg (1920) using Chlorella and is often called the "Warburg effect". The inhibition is rapidly reversible by very low levels of oxygen, Tamiya and Huzisige (1949), In the same alga, experiments using radioactive carbon dioxide showed that raising the oxygen concentration increased the production of glycolate, glycine and serine. Bassham and Kirk (1962)- reported that the formation of [14c] glycolate after feeding Chlorella with 14C02, was greatest in 100% oxygen, less in 21% and least in 0%. Also Whittingham, Coombs and Marker (1967) reported that the accumulation of 14C in glycolate in Chlovella
during photosynthesis at air levels of 14C02, was 32% in 100% oxygen, but only 2% When the atmosphere was 2% oxygen. Oxygen also inhibits photosynthesis and stimulates glycolate formation in other algae, e. g. Chlamydomonas reinhardii
(Bowes and Berry, 1971) .
In many higher plants, oxygen in the normal atmosphere
inhibits photosynthesis at all light intensities and

25
decreases the quantum yield (CO2 uptake/absorbed quantum) significantly (Ehleringer and Bjorkman, 1977). Forrester, Krotkov and Nelson (1966) and Ludwig and Canvin (1971) found 40 to 45 percentage inhibition of photosynthesis by oxygen in air in soybean and sunflower leaves. Laing, Ogren and Hageman (1974) found similar inhibitions of photosynthesis in soybean; in the absence of oxygen, net photosynthesis was increased by 43% compared to air. In isolated leaf cells, Servaites and Ogren (1978) found a 27% inhibition of photosynthesis by 21% oxygen with a bicarbonate concentration equivalent to about 340 vpm C02. Inhibition of photosynthesis by oxygen was also found with mesophyll protoplasts isolated from leaves of Hordeum vulgare and Triticum aestivum (Huber and Edwards, 1975) . Gibbs, Ellyard and Latzko (1968) observed the Warburg effect also in isolated chloroplasts and showed that the rate of C02
fixation in 21% oxygen was only 10% of the rate in nitrogen.
The inhibition of photosynthesis by oxygen causes decreased plant growth. Thus, Bjorkman, Hiesey, Nobs, Nicholson and Hart (1966) showed that the dry weights of Phaseolus vulgaris and MimUlus cardinalis after growth for several days at 2.5% or 5% oxygen were approximately double the dry weights of similar plants grown in 21% oxygen.
Although the Warburg effect is a general occurrence in plants with the C3 mechanism of photosynthesis, the degree of sensitivity to oxygen concentration is determined by species (Bjorkman, Gauhl and Nobs, 1969), plant age (Salin and Homann, 1971; Canvin, 1978) as well as such environmental

26
conditions as the ratio of oxygen and carbon dioxide
concentrations, light intensity and temperature (Tregunna,
Krotkov and Nelson, 1966; Jolliffe and Tregunna, 1968, 1973;
Canvin, 1978; Ku and Edwards, 1977a, b, 1978).
B.1. Effects of the concentration of carbon dioxide
Increasing the concentration of carbon dioxide largely overcomes the inhibitory effect of oxygen on apparent photosynthesis. This has been most clearly established in observations with algae. The situation with higher plants is less clear.
Tamiya and Huzisige (1949) in Chlorella reported that the inhibition of photosynthesis by pure oxygen varied from 5% at high C02 concentrations (1700 xlo" 6moles• 1) to 85% at 1 x10 6moles*& 1. Similar results were obtained also with Chlorella by Coombs and Whittingham (1966). Ku, Edwards and Tanner (1977) found that inhibition of photosynthesis in potato leaves by 21% oxygen was nearly overcome by a twofold increase in atmospheric levels of CO2.
At low concentrations of C02, glycolic acid excretion by algae is maximal. Pritchard, Griffin and Whittingham (1962) found a 60% decrease in glycolate synthesis in Chlorella when the CO2 concentration was increased from 0.1% to 0.2%. In isolated leaf cells at low bicarbonate concentration (< 2mM), increasing the oxygen concentration from 2 to 100% greatly increased the synthesis of glycine, serine, glycolate and glycerate and slightly increased the phosphate esters at the expense of synthesis of sucrose and

27
starch (Servaites and Ogren, 1978), Increasing the bicarbonate concentration to above 5mM largely overcame the effect of oxygen so that the major products of photosynthesis were similar at both oxygen concentrations.
Studies on the effect of atmospheric C02 concentration on the magnitude of photorespiration are conflicting. In detached soybean leaves, Forrester et al, (1966) reported an increased oxygen inhibition of apparent photosynthesis as the C02 concentration increased from compensation point to about 400 vpm. However, Ludwig and Canvin (1971) showed that the rate of C02 evolution in light, measured as the difference between true and net photosynthesis, was not affected by C02 concentration up to 300 vpm. Only a slight effect of C02 concentration on photorespiration was observed by Fock, Klug and Canvin (1979). Similar results were obtained by Zelitch (1971) using tobacco leaves, the C02
outburst was essentially unchanged whether the leaves had been previously maintained at the C02 compensation point, 45 vpm, or in air at 300 vpm. However, the C02 outburst by Rumex acetosa was greater when the leaves were in light at 400 vpm C02 than below 5 vpm, suggesting a depression of photorespiration at C02 concentrations near zero (Holmgren and Jarvis, 1967), At a C02 concentration of 1200 vpm the C02 outburst was completely eliminated (Zelitch, 1971). More recently some authors have reported that in higher plants, at saturating COz concentrations, not only is the oxygen effect on photosynthesis overcome but there is an increased C02 assimilation in 21% compared to .2% oxygen (VIIL et al,, 1972, 1977; Jolliffe and Tregunna, 1973; Canvin,

28
1978). This stimulatory effect of oxygen was however only a transient effect and may be attributed to adjustment of pool sizes,
B.2. The effect of temperature
The extent to which net photosynthesis is decreased by oxygen is greater the higher the temperature in the range 25°C to 40°C,
In Cklorellcif at lower C02 concentrations (1 x 10~6moles • i Tamiya and Huzisige (1949) found no effect of temperature on oxygen inhibition of photosynthesis from 4°C to 25°C. The percentage depression of C02 uptake caused by pure oxygen was 86% at 4°C and 87% at 25°C. Since at very high C02
concentrations (1700 *10~6moles•I *) there was no inhibition by oxygen at either temperature, it was suggested that oxygen inhibited the carboxylation reaction by combining with the carboxylating enzyme. Similar results between 20°C and 30°C were reported by Turner and Brittain (1962) with the moss Funaria. However, in higher plants, inhibition of apparent photosynthesis by oxygen was shown to increase with increased temperature from 20°C to 40°C.
Hesketh (1967) has studied the rate of C02 assimilation of twelve species at 30°C and 40°C in 21% oxygen and 0% oxygen. For Zea mays, three tropical grasses and one dicotyledonous species, Amaranthus palmeri, all Ct» plants, the absence of oxygen did not enhance C02 assimilation at either temperature. For all the C3 species studied including Tviticum aestivum, the C02 assimilation was enhanced by 20

29
to 50% when oxygen was decreased at 30°C but by 85% at 40°C. For wheat and tobacco leaves, Zelitch (1971) reported an increase in photosynthetic rate in 2% oxygen of about 40% at temperatures up to 30°C, but between 35°C and 40°C the increase varied from 70 to 100%,
Bjorkman and Gauhl (1966), using Marohantia polymorpha,
showed a strong increase in the rate of photosynthesis upon decreasing the oxygen from 20% to 2% at from 10°C to 30°C. However, below 10°C with 320 vpm C02, enhancement of photosynthesis by low oxygen was absent. Similar results were obtained by Jolliffe and Tregunna (1968) with wheat shoots. Below 13°C/ with more than 300 vpm C02 and bright light, there was no significant difference between apparent rates of photosynthesis at 21% oxygen or 3% oxygen. However, between 13°C and 43°C the photosynthetic rate was always higher in 2% oxygen. In 21% oxygen maximum photosynthesis was achieved between 20°C and 26°C while in 3% oxygen the maximum was between 30°C and 3 6°C. Jolliffe and Tregunna (1973) found no stimulation of photosynthesis by wheat shoots, by decreased oxygen below 20°C and above 300 vpm C02. Indeed at 13°C there was an inhibition of photosynthesis by decreased oxygen, a phenomenon also observed at 10°C and 320 vpm C02 by Machler and Nosberger (1978) with Trifolium repens L. However, Keys et at. (1977) with attached wheat leaves at 350 vpm C02 and 500yE m 2sec~1 observed increased rates of photosynthesis at 2% when compared to 21% oxygen at all temperatures studied, 13°C, 18°C, 23°C and 28°C, the increases in the rates of net photosynthesis being from 32% at 13°C to 54% at 28°C. . It was suggested that the finding of inhibition

30
of photosynthesis by oxygen at 13°C was due to higher diffusion resistances compared to those of Jolliffe and Tregunna (1968, 1973), so that the internal C02 concentration in the leaf was limiting photosynthesis. Thus, the inhibitory effect of oxygen.depends greatly on the conditions in which plants are grown relative to conditions in which measurements are made. Also, in air, if diffusive resistances are not limiting, the inhibitory effect of oxygen on the apparent rate of photosynthesis can be absent at low temperature.
B.3. Effect of light intensity on photosynthesis and photorespiration and its relationship to oxygen, carbon dioxide and temperature
A distinction between Ci* and C3 plants is that tHe
photosynthesis inYlatter saturates at relatively lower light intensities. Consequently at high light intensities photorespiration is increasingly significant in determining the net rate of photosynthesis.
In tomato plants, a threefold increase in light from 0.7 xlO4 to 2.2 x 10⁴ ergs cm'^ec"1 resulted in a doubling of photosynthetic rate in 330 vpm C02, and an increase by a factor of 2.4 in 1000 vpm C02 (Bishop and Whittingham, 1968) . An increase in photosynthesis with irradiance up to 85nE cm~2sec~1 was found for potato leaves by Ku, Edwards and Tanner (1977).
Heath, Meidner and Spanner (1967) working with lettuce and Hew et al. (1969a) with sunflower found that the C02
compensation point increased below 5,000 lux and remained

31
constant from 5,000 to 15,000 lux at both 15°C and 25°C. This suggests that above 5,000 lux the relationship between photosynthesis and photorespiration remained constant. Also, Zelitch (1971) observed a considerable increase in CO2 compensation point at low light intensity in wheat leaves as well as in maize. However, in maize the CO2 compensation point was not changed with changes in oxygen concentration indicating the presence of only dark respiration in this plant. An increase in CO2 compensation point at both 14°C and 34°C was observed with increased light from 400 lux to 10,000 lux by Jolliffe and Tregunna (1968). A progressive increase in photorespiration (C02 outburst) and photosynthesis up to 40,000 lux was also found by Tregunna, Krotkov and Nelson (1961). Measurements of CO2 evolution in light, in sunflower, by extrapolation from photosynthetic CO2 response curves, showed that an increase in CO2 evolution occurred when light intensity was increased from 5,000 to 10,000 lux. This was accompanied by an increase in the apparent rate of photosynthesis, although this rate was limited by C02 concentration below 200 vpm (Hew et al., 1969a). Similar results were described by Tregunna et al. , 1966) with tobacco leaves. As proposed by Hew and Krotkov (1968), the effect of light on CO2 evolution was not due to an increase in the supply of "substrate as a result of increased C02 assimilation but to a direct effect of light on CO2 evolution. In attached and detached spruce shoots, Poskuta, Nelson and Krotkov (1967) reported that, at atmospheric levels of CO 2 and 02, changing the light intensity from 15,000 to 60,000 lux increased the rate of apparent photosynthesis from 40.2

32
to 96.Qjjg CO2 min^g fr wt""1 and C02 evolution in light from
6.3 to 20.2.
Increased excretion of glycolate to the medium, by Chlorella was reported by Whittingham and Pritchard (1963), when light intensity was increased above 1,500 lux. Below this value, a small amount of glycolic acid was excreted to the medium although photosynthesis was half saturated with light. However, increasing light intensities beyond the value needed to saturate photosynthesis increased glycolate production. Chollet and Ogren (1975) proposed a light activation for oxygenase similar to that observed for RuBP carboxylase (Walker, 1973; Buchanan and Schurmann, 1973).
Tregunna, Krotkov and Nelson (1966) have studied the relation of light intensity with oxygen concentration using detached tobacco leaves. High light intensity was able to overcome the depressing effect of oxygen on carboxylation efficiency (apparent photosynthesis (APS)/CO2 concentration -CO2 compensation point). At 108,000 lux the carboxylation efficiency began to decrease between 21 and 47% 02, whereas at 65,000 lux the decrease began between 12 and 21% O2. There was a critical ratio between light intensity (lux) and oxygen concentration (% by vol.) of 500, above which carboxyla'tion efficiency was high and constant and below which it decreased. Also the post-illumination C02 outburst was observed only following a light period where the ratio of light intensity/oxygen concentration exceeded 450. This value agrees with the value 500 found above. Tregunna, Krotkov and Nelson (1966) concluded that when light

33
intensity becomes limiting for photosynthesis (expressed by carboxylation efficiency). it also becomes limiting for photorespiration measured by post-illumination C02 outburst.
B.4. Mechanisms of oxygen inhibition
Inhibition of photosynthesis by oxygen may be partly due to effects on the photosynthetic electron transport chain, but its main influence is probably on photosynthetic carbon metabolism. The most direct effect arises because the enzyme which catalyses the carboxylation of RuBP also acts as an oxygenase (Bowes, Ogren and Hageman, 1971). Oxygenation results in P-glycolate formation (Bowes et al. , 1971; Andrews, Lorimer and Tolbert, 1973) and thus regulates photorespiration (Ogren and Bowes, 1971)(1)
( 1 ) RuBP + C02 + H20 • 2 PGA RuBP + 02 y 1 PGA + P-glycolate
Laing et al, (1974) showed that oxygen is a competitive inhibitor of RuBP carboxylase with respect to C02 and C02
is a competitive inhibitor of the oxygenase reaction with respect to oxygen. The K (C02) in the carboxylase reaction m
was identical to K^(C02)- in the oxygenase reaction and Km(02) in the oxygenase reaction was identical to the K^-(02) in the carboxylase reaction. The Km (RuBP) was the same for the carboxylase and oxygenase reactions. This equality of kinetic constants is consistent with the suggestion that a single protein catalyses both reactions (Bowes et al. , 1971; Andrews et al., 1973) and that oxygen and carbon dioxide compete for the same catalytic site of the enzyme. In soybean

34
leaf cells, Servaites and Ogren (1978) identified oxygen as a competitive inhibitor of photosynthesis with respect to C02/
since it increased the apparent K^iCOz) for photosynthesis, but did not alter V m a x, Analysis of the inhibition by these authors, and by Ludwig and Canvin (1971) for sunflower indicates that photorespiration, i, ef, evolution of CO2,
accounts for 1/3 of the total apparent inhibition of true photosynthesis caused by oxygen in air in the presence of 300 vpm CO2 at 25°C; competitive inhibition of photosynthesis by oxygen, calculated from the Km and Kx values accounted for the remaining 2/3.
Laing et at. (1974) obtained similar results with soybean and concluded that competitive inhibition of photosynthesis by oxygen, the major portion of total inhibition, is due to competitive inhibition of RuBP carboxylase.
Thus, the modification of RuBP carboxylase in a way in which more RuBP is carboxylated and less oxygenated seems to be the most direct way of decreasing photorespiration in a C3 plant. From the properties of the enzyme RuBP carboxylase/ oxygenase in relation to temperature and carbon dioxide (Laing et al., 1974) it is evident that lowering temperature and increasing CO2 concentration would decrease photorespiration.
The higher sensitivity of photosynthesis to oxygen with increasing temperature has been attributed recently to differential effects of temperature on the kinetic properties of the enzyme RuBP carboxylase/oxygenase. Using crude leaf extracts, Badger and Andrews (1974) found that, the activation energy from 0°C to 3 0°C of RuBP oxygenation was higher than that of RuBP carboxylation, i. e., a relatively greater

35
increase occurred with temperature in V m a x of the oxygenase compared with the carboxylase reaction. By contrast Laing et at. (1974), using purified enzyme, found identical activation energies for the two reactions from 15°C to 35°C so that the ratio V m a x carboxylase/Vmax oxygenase was constant. However, the ratio of Km(C>2) for oxygenase activity to the Km(CO2) for carboxylase activity decreased, due to an increase in Km(C02). Similar results regarding V m a x
carboxylase and V m a x oxygenase were obtained by Badger and Collatz (1977), using purified enzyme, but they found an increased Km(02) with temperature and a larger increase of Km(CO2). They pointed out that the different results obtained by Badger and Andrews (1974) could have resulted from the use of crude extracts.
Ku and Edwards (1977a) pointed out the importance of calculating the oxygen and carbon dioxide concentrations at the carboxylation site, allowing for diffusive resistances and the known solubility coefficients of the gases in aqueous solutions. The solubilities of C02 and 02 both decrease with increasing temperature from 0°C to 45°C but the decrease in solubility of oxygen is relatively less than that of C02
(Hodgman, Weast and Selby, 1958), hence the solubility ratio of 02/C02 increases with increasing temperature. This effect, and the concomitant increase of stomatal resistance with temperature, would considerably decrease the internal C02
concentration in leaves (Ku and Edwards, 1977a). When the solubility ratio: 02/C02 in leaves was maintained constant at various leaf temperatures, by adjusting the' ambient C02
or 02 concentrations, the percentage inhibition of

36
photosynthesis by oxygen in some C3 species including wheat remained constant at different temperatures. The increase in the solubility ratio of 02/C02 with temperature would favour an increased percentage inhibition of photosynthesis by oxygen. Furthermore Ku and Edwards (1977b) reported that an increase in temperature from 25°C to 35°C caused only a slight increase in Km(C02) and Ki(02) for wheat leaves and the ratio Ki(02)/Km(C02) was similar at the three temperatures studied, 25°C, 30°C and 35°C. Thus the increased solubility ratio 02/C02 in the leaf appeared to be responsible for the increased percentage inhibition of photosynthesis and decreased quantum yield, with increasing temperature (Ku and Edwards, 1978).
Experiments with isolated soybean leaf cells by Servaites and Ogren (1978) support the conclusion of Laing et al. (1974) rather than those of Ku and Edwards (1978). The decreased quantum yield of C3 photosynthesis as the temperature is increased (Ehleringer and Bjorkman, 1977; Ku and Edwards, 1978) was explained by Servaites and Ogren (1978) in terms of the differential effect of temperature on Km(CO2) and Ki(02) of RuBP carboxylase. The affinity of the enzyme for C02 decreases as the temperature increases whereas the affinity for oxygen is unchanged. An Arrhenius plot of the effect of temperature from 15°C to 35°C on the change in quantum yield of photosynthesis from 21% to 2% oxygen in a C3 plant reveals an apparent activation energy (EA) of 8.1 Kcal mole"1 (Ehleringer and Bjorkman, 1977). From the temperature dependence of the affinity of soybean leaf cells for C02 between 15°C and 35°C, Servaites and
37
Ogren (.1978) calculated an EA of 10 Kcal mole"1 , Also calculation from the temperature dependence of the Km(C02) either for soybean leaf cells or purified soybean RuBP carboxylase, using Km(C02) values published by Laing et at.
(1974) gave Servaites and Ogren (1978) values of 8 Kcal mole"1
for both systems. The effect of temperature on the depression of the quantum yield by oxygen for C3 photosynthesis was therefore consistent with the effect of temperature on the affinity of the cells for C02 which was due in turn to the effect of temperature on the Km(C02) of RuBP carboxylase. Furthermore, Servaites and Ogren (1978) used the Arrhenius equation to measure the temperature dependence of the 02/C02
solubility ratio between 15°C and 35°C, and found this equivalent to an activation energy of 1.8 Kcal mole-1. Thus some of the increased inhibition of photosynthesis by oxygen at higher temperatures could be attributed to the change in 02/C02/ but this was a minor component of the effect. Neither
the results of Laing et al. (1974) and Servaites and Ogren (1978), nor the properties of the carboxylase alone predict a temperature where there is no inhibitory effect of oxygen on photosynthesis at natural C02 concentrations (Jolliffe and Tregunna, 1968) or where there is a stimulatory effect (Jolliffe and Tregunna, 1973? Machler and Nosberger, 1978). Also, the transient stimulation of photosynthesis by oxygen at C02
concentrations above 320 vpm (VIIL et al. , 1977; Canvin, 1978) cannot be explained either by the properties of RuBP carboxylase or by stomatal changes, since stomatal aperture is not affected by oxygen concentration in this range (Gauhl and Bjorkman, 1969? VTIL et al < , 1977) . Further the changes in photosynthesis

38
are more rapid then changes in stomatal aperture (Meidner and Mansfield, 1968), Thus, VJIL et al, (1977) and Canvin (1978) attributed the inhibitory effect of decreased oxygen to a transient decrease in regeneration of RuBP. VIIL et al. (1977) suggested that oxygen was needed for pseudocyclic phosphorylation to maintain ATP levels. If glyceraldehyde phosphate dehydrogenase is working at saturation, and its capacity is lower than that of non-cyclic electron flow, NADP will become limiting. Oxygen may then accept electrons from reduced ferrodoxin (Fewson, Black and Gibbs, 1963) or from an earlier reduced component of the electron transport chain (Mathieu, Maginiac-Maslow and Remy, 1970) resulting in pseudocyclic photophosphorylation. The ATP produced may lead to more RuBP formation and increased C02 assimilation.
Concluding, it is generally accepted that in C3 plants the normal oxygen concentration in the atmosphere inhibits photosynthesis by about 40-4 5%, partly by stimulating photorespiratory metabolism and partly by direct inhibition of C02 fixation. Both effects can be accounted for by the properties of the enzyme RuBP carboxylase/oxygenase namely that C02 and 02 compete with each other for the same catalytic site on the enzyme and are alternative substrates.
The extent to which net photosynthesis is decreased by oxygen is greater the higher the temperature in the range 25°C to 40°C; this is also explained by the properties of the enzyme.
However, the stimulation of photosynthesis by oxygen

39
at saturating CO2 concentrations and low temperature cannot be explained in the same way so some other factor or factors must be involved in these conditions.
C. PHOTORESPIRATION AND GLYCOLATE PATHWAY
C. 1. CO? evolution in light
There is still controversy about the substrate for carbon dioxide evolution from green leaves in light. The fact that the release of C02 in light (photorespiration) was greatly stimulated by high oxygen concentration, whereas C02 evolved in dark (dark respiration) was not affected, led Forrester et at. (1966) to the conclusion that in soybean leaves photorespiration must occur by reactions different from those of dark respiration. Similar conclusions were reached by Goldsworthy (1966) for tobacco leaf segments.
The suggestion that the substrate for photorespiration was an early product of photosynthesis was made by Tregunna et al. (1964) because after supplying tobacco leaves with 1"CO2 at constant specific radioactivity in the light, the ll*COz evolved subsequently in the first minute in dark had a similar specific activity to that of the ^COz assimilated. Ludwig and Canvin (1971) also reported that the C02 evolved, during steady photosynthesis in 11*C02 by attached sunflower leaves soon reached the specific activity of the 1lfC02 supplied. Also, during the first minute of flushing in CC>2-free air, following steady assimilation of 11+C02, the

40
J^002 evolved had the same specific activity as that previously supplied to the plant. However, when the rate of photosynthesis was not adequate because CO2 was limiting, the relative specific activity of lwC0z subsequently evolved was decreased and the amount of the decrease was dependent on the C02 concentration during photosynthesis in 1 UCC>2. The decrease was to about 60% when the previous 14C02 concentration was 335 vpm and to about 30% when it was 150 vpm. Ludwig and Canvin (1971) found that C02 evolution by leaves did not stop completely even after prolonged periods in C02-free air. They concluded that in these conditions recent storage products, including soluble carbohydrates, were used as substrates for photorespiration. Indeed, in C02-free air, 4c] glucose was used by wheat leaf segments to provide substrate for photorespiration and sucrose synthesis (Waidyanatha et al. , 1975b).
Goldsworthy (1966) supplied leaves with llfC02 in the light. Subsequently less 1 k C 0 2 was released into air with 300 vpm C02 than into C02-free air. With lOmM aHPMS (an inhibitor of the oxidation of glycolate to glyoxylate) or lOmM INH (an inhibitor of conversion of glycine to serine) there was a decrease in specific activity of the CO2 released in light to a level similar to that released in dark. Thus much of the CO2 released by the leaf in the light is derived by the oxidation of glycolate.
From experiments in which [l-lt7c] glycolate was fed to detached leaves of barley, Tamas and Bidwell (1971) concluded that glycolate carbon, through some products of its metabolism,

41
enters the chloroplast and is incorporated into the intermediates of the Calvin cycle. Subsequently C02 is derived from these intermediates for photorespiration. Maximum rates of 14C02 evolution were obtained only after saturation of phosphate esters with 14C. The extent of labelling of phosphate esters and 14C02 evolution was less in air than in CO2-free air probably because of the presence of competitive source of carbon to the Calvin cycle. In contrast, Waidyanatha et at. (1975a) did not find increased metabolism of glycolate to C02 and phosphate esters in C02-free air compared with air.
When tobacco leaf discs were fed with [l-14c] glycolate or [2-14c] glycolate, the increased C02 evolution found at 35°C when compared with 25°C was from the carboxyl carbon atom of glycolate (Zelitch, 1966). The 14C02 released from [l-14c] glycolate in light was eightfold greater at 35°C than 25°C, whereas the increased evolution of 14C02 from
glycolate was small for the same temperature change.
Zelitch (1966) suggested that the enhanced 14C02
evolution from [l-14c] glycolate at higher temperatures does not represent all the 14C02 produced within the tissue. Marker and Whittingham (1967) reported that when excised leaves of-Pisum sativum were fed with [l-14c] glycolate and [1-14C] glycine, 25.5% and 28.3% respectively of the radioactivity in these compounds was evolved as 14C02. When the feeding was with [2-14c] glycine the production of 14C02
was only 9.5%. They concluded that C02 production during photorespiration must be derived from the carboxyl group of

42
glycolate or glycine, However, Zelitch (1972a) using tobacco leaf discs illuminated and floated in 18mM solution of [l.-14c] glycolate or [l-aifc] glycine, found that 9mM aHPMS blocked C02 production from [l-llfc] glycolate as well as the labelling of glycolate pathway intermediates. On the other hand, INH (9mM) together with [l-ll+c] glycine or [l-ll*c] glycolate severely inhibited the conversion of glycine to serine but had little effect on the 1^002 released. Furthermore, as the rates of photorespiration observed in many species, including tobacco, where too high to be explained by the C02 evolved during the conversion of glycine to serine, he suggested a direct decarboxylation of glyoxylate was more likely to be the main source of photorespiratory C02 . Glyoxylate might react non-enzymically with H202 to produce C02, formate and water (Zelitch, 1966). This non-enzymic oxidation of glyoxylate could be prevented in peroxisomes by the great excess of catalase activity — the enzyme that catalyses the decomposition of H202. This was investigated by Kisaki and Tolbert (1969) when they supplied isolated peroxisomes with glycolate. There was little C02 evolution and an accumulation of glycine.
Grodzinski (1979) found that when peroxisomes were incubated with [l-ll*c] glycolate and glutamate, formate and ll*C02 were produced. Since the rate of production of "available H202" in the step glycolate to glyoxylate was faster than the rate of formate and ltfC02 production, he concluded that these products came from breakdown of glyoxylate under the action of H202. The 1,4e02 evolved in these conditions increased with temperature from 15°C to 35°C.

43
Further, he concluded that the C02 produced during photorespiration arises predominantly from the carboxyl carbon group of glycolate through the breakdown of glycine or glyoxylate, but some C02 arose from the methylene C of glycolate due to further metabolism of serine to an intermediate from which this C group is released as C02.
Contrary results were reported by Waidyanatha et at,
(1975a). When they supplied wheat leaf segments with [l- l l*c] glycolate and INH they inhibited C02 release as well as sucrose synthesis in air and C02-free air. Since INH inhibits conversion of glycine to serine, this result was consistent with the hypothesis that the C02 of photorespiration is derived from the conversion of glycine to serine. Tolbert and Yamasaki (1969) and Kisaki and Tolbert (1969) also suggested C02 production during condensation of two glycine molecules to produce serine. They considered that the decarboxylation of glyoxylate produced such low rates of CO2 evolution that it was not important in photorespiration. Zelitch (197 2b) found that spinach chloroplasts, in the light and with M*\2+, decarboxylated [l-llfc] glyoxylate by an enzymic photooxidation not involving glycine. The reaction was sufficiently rapid to account for the rates of photorespiration reported.
Atkins and Canvin (1971) allowed sunflower leaf discs to photosynthesize in 14C02 for 10 min. Subsequently in the light in C02-free air, evolution of 14C02 was markedly inhibited by low oxygen. The lkC lost from glycine included that appearing in serine but the expected amount

44
of 14CO2 was not evolved. Either lt+C02 was produced and not evolved or no lttC02 was produced in the reaction glycine serine. Also in sunflower leaf discs Fock et at.
(1971) reported that practically no C02 was released to the atmosphere when discs were transferred to 12C02 in 1% 02
after assimilation for 15 min in ltfC02. Similar results were obtained by Kumarasinghe, Keys and Whittingham (1977) when wheat leaf segments were flushed with C02-free air in 1% 02, following 15 min photosynthesis in 150 vpm 1<*C02. Radioactivity in glycine decreased, that in serine and sucrose increased but little 1 ''CCQ was released. Radioactivity in the phosphate esters remained almost constant.
However, when the flushing was in 1% 02 but with 1000 vpm 12C02, there was a rapid loss of radioactivity from glycine, an increase in serine, a rapid evolution of 14C02
and a rapid loss from phosphate esters. This difference between the results in 0 vpm C02 and 1000 vpm C02 was explained as due to strong competition for assimilation between the 1HCO2 produced in the intercellular spaces and 1000 vpm 1 2CO2 . Thus in 1000 vpm 12C02, more l h C 0 z escaped from the leaf and more 12C02 was assimilated, the radioactivity in phosphate esters decreased because less 14C02 was refixed. In 0 vpm C02 almost all lltC02 produced would be reassimilated and ll*C in phosphate esters would be maintained. In 21% 02 as compared with 1% 02, in 0 vpm C02, more 11*C02 was evolved. In conditions where recycling and refixation of 1 02 evolved were minimized, e.' g. (1000 vpm C02 and 1% 02) the ll*C02 released contained 25% of the

45
radioactivity lost from glycine, and serine but not sucrose accumulated radioactivity.
It may be concluded that a large part of the carbon dioxide evolved in photorespiration is produced from the metabolism of glycolate in the conversion of glycine to serine. Although other reactions which could result in the liberation of carbon dioxide may exist, it seems unlikely that they evolve carbon dioxide at a significant rate in the intact leaf. Nevertheless, under special conditions a contribution from these other sources should not be excluded.
C.2. Glycolate pathway or photorespiratory carbon oxidation cycle (PCO)
There is much evidence that P-glycolate is the compound which initiates the photorespiratory carbon oxidation cycle and that it is further metabolized to yield the C02 released in photorespiration.
Zelitch (1965) supplied tobacco leaves with lltC02 for 15 min in the light and found that f1 c] glycolate in the leaf had a higher specific activity than the carboxyl group of 3 PGA. It was suggested therefore that glycolate was synthesized by reductive condensation of two molecules of C02 without involvement of the Calvin cycle. In shorter term exposures of the leaf to l h C 0 2 f Hess and Tolbert (1966) found contradictory results, and pointed out that the results of Zelitch may have been due to dilution of [11+c] PGA by [2 2C] PGA made from 12C during the time it took to kill the tissue (30 sec) after photosynthesis in ll*C02.

46
From studies of JI,C02 assimilation by Saenedeamus, Wilson and Calvin C1955) suggested that glycolate was formed from the pentose phosphates of the Calvin cycle by reactions involving transketolase. Transketolase, a thiamine pyrophosphate-containing enzyme, catalyses the transfer of two-carbon fragments from donors such as xylulose-5-phosphate or fructose^6-phosphate to a suitable acceptor such as ribose-5-phosphate. The active glycolaldehyde or 2-a,3-dihydroxyefhyl thiamine pyrophosphate produced can be oxidized non-enzymically by ferricyanide (Bradbeer and Racker, 1961), by H2O2 (Coombs and whittingham, 1966a) or other oxidizing agents (Chollet and Ogren, 1975) to glycolate and thiamine pyrophosphate. The oxidant H202 could be generated by autooxidation of reduced ferrodoxin formed during the light reactions of photosynthesis (Coombs and Whittingham, 1966a). Several criticisms have been made of this hypothesis. The most serious is based on the fact that 50% or more of the total CO2 fixed flows through the glycolate pathway (Zelitch, 1971; Ludwig and Canvin, 1971) and there is no precedent in biology for such a massive flow of carbon through a non-enzymic pathway (Chollet and Ogren, 1975) .
More recently RuBP is considered the most probable intermediate of the PCRC from which P-glycolate and hence glycolate originates. Thus, Ogren and Bowes (1971); Bowes, Ogren and Hageman (1971) ; Laing et al. (1974) found that RuBP carboxylase acted both as a carboxylase and as oxygenase catalysing the carboxylation of RuBP to give two molecules of PGA and the oxidation of RuBP by molecular oxygen to give a molecule of P-glycolate and one of PGA.

47
This was confirmed by experiments of Lorimer e.t at. (1973) with 1 802 , In the oxygenation one atom of 1 80 was incorporated into a carboxyl oxygen atom of P-glycolate whilst none was detected in 3 PGA. P-glycolate is converted by P-glycolate phosphatase to glycolate in the chloroplast (Richardson and Tolbert, 1961) . Glycolate is oxidized to glyoxylate and H202 by glycolate oxidase (Tolbert, 1973) in the peroxisomes. Peroxisomes are organelles bound by a single membrane and found closely associated with chloroplast and mitochondria in leaf cells of C3 species (Frederick and Newcomb, 1969a, b). Glycolate oxidase was first thought to be associated with the chloroplasts (Tolbert and Cohan, 1953), but Thompson and Whittingham (1968) suggested that this was due to a contamination by cytoplasm. Later, it was shown to be located outside the chloroplast, in peroxisomes by Tolbert et al. (1968). Yamasaki and Tolbert (1970) have also detected catalase, glutamate-glyoxylate aminotransferase, hydroxypyruvate reductase, serine-glyoxylate aminotransferase, NAD-malate dehydrogenase and NADP-isocitric dehydrogenase in the peroxisomes.
Glyoxylate is transaminated to glycine in the presence of glutamate-glyoxylate aminotransferase (Tolbert and Yamasaki, 1969) and glycine is transported from the peroxisomes to the mitochondria. All the reactions from P-glycolate to glycine formation are strongly exergonic.
In the mitochondria, two molecules of glycine are converted to one each of serine, C02 and NH3 (Miflin et at.,
1966) in a reaction probably catalysed by no less than four

48
enzymes (.Keys, 1980) with pyridoxal phosphate, a residue containing a disulphide group, FAD and probably tetrahydrofolate as prosthetic groups. A glycine molecule, complexed with Ei through pyridoxal phosphate is oxidatively decarboxylated and deaminated to leave an active methylene group associated with E3 whilst a disulphide group is reduced (see Fig. 1, taken from Keys, 1980). The active methylene group with addition of water becomes a hydroxymethyl group which is added to a second molecule of glycine to form serine. A flavoprotein is involved in the reoxidation of the sulphydryl groups of E2 and in turn is oxidized by the endogenous NAD+ of the mitochondria. Coupling of the conversion of glycine to serine to the mitochondrial electron transport system in this way is established only for plants. It could result in 3 ATP per molecule of serine formed (Bird et al, , 1972; Woo and Osmond, 1976; Douce, Moore and Neuberger, 1977) . The overall reaction can be written as follows (2)
(2) 2 Glycines + HzO > Serine + C02 + NH3 + 2H+ + 2e~
This reaction is considered as the major source of photorespiratory C02 evolution (Chollet and Ogren, 1975) and is essentially irreversible under aerobic conditions (Bird et at., 1972). Because of known rates of photorespiration it follows that the amount of NH3 evolved in reaction (2) must exceed the estimated amount produced in leaves (Brunetti and Hageman, 1976) due to primary NH3
assimilation from NO 7 reduction. Unless this NH3 is recycled (Woo et al., 1977) all the organic nitrogen would be lost.
<y02H
c h 2 n h 2
Glycine
cho
El
h 2 0
c o 2 h
-l> c h 2 -
^02
"Cy t. a 3
atp
n
II ch
I Ei
C02 ,h
\ E2
e 3 \ h
/ -•> c h 2
Y \ -i> c h 2
n
II ch
I ei
\ \
n h 2
/ e 2
hs
cho
I el
\ /
hs
hs
hs
ei* f a d h 2 etf — fad
nad nadh
n h 3
>e2
h 2 o
-i> c h 2
atp
C y t . a - V
atp
Cyt.b <3—UQ<* FeS
M a t r i x
I n n e r membrane
T e n t a t i v e scheme f o r t he c o n v e r s i o n o f g l y c i n e t o s e r i n e a s s o c i a t e d w i t h t h e i n s i d e o f t h e i n n e r membrane and m a t r i x o f p l a n t m i t o c h o n d r i a , E 2 f E 2 / E3 and Ei» a re regarded as enzyme p r o t e i n s w i t h p y r i d o x a l phosphate , l i p o y l - , p o s s i b l y t e t r a h y d r o f o l a t e and FAD as p r o s t h e t i c groups or c o f a c t o r s ( f rom Keys, 1980) .

50
Keys et aZ,(1978) showed that NH3 is normally reassimilated in vivo by glutamine synthetase localized in chloroplasts and cytoplasm (Wallsgrove et al. f 1980) and not in mitochondria as claimed by Jackson et al, (1979).
The series of reactions in the glycolate pathway responsible for the conversion of glycolate to serine do not require light but further metabolism of serine is light dependent (Miflin etal., 1966) . Serine is converted to hydroxypyruvate (Kretovich and Stepanovich, 1963) by the enzyme serine-glyoxylate aminotransferase, found in the peroxisomes. Still in the peroxisomes, hydroxypyruvate is reduced to D glycerate catalysed by NADH-hydroxypyruvate reductase (Tolbert et al,, 1970). Glycerate is phosphorylated by ATP in a reaction catalysed by glycerate Kinase and gives rise to PGA (Hatch and Slack, 1966). 50-70% of the total activity of this enzyme was found in chloroplasts and 30-50% in cytoplasm (Heber et al., 1974). Thus, the formation of PGA from glycerate can take place in cytoplasm as well as in the chloroplast.
One fourth of the carbon metabolized by the glycolate pathway is evolved as CO2 when glycine is converted to serine. The other three quarters is either recycled through PGA and triosephosphates or forms sucrose (Wang and Waygood, 1962; Waidyanatha et al., 1975a).
Ct3t Carbon flow through the alveolate pathway
The rate of C flow through the active pools of several
amino acids was calculated in Chlorella by Smith et al.
(1961) from the maximum slope of the curves for the

51
incorporation of radioactivity between 5 and 16 min after introduction of 1UC02 during steady state photosynthesis. This method was inaccurate, mainly because of the presence of multiple pools of amino acids. Similar experiments in illuminated sunflower leaf discs were conducted by Fock et al, (1971), but they argued that the best estimate of C flow into serine and glycine was obtained from increase in 1!*C
between the first and second minute of exposure to llfC02/ because under these conditions the specific activity of the amino acids and consequently the out-flow of l f |C is relatively low. Also, the efflux of C from amino acids during flushing periods with 12C02 could be calculated providing that the amino acids were saturated with lhc. The values found at .21% 02 were about 12 to 15 yg C min"1 sample"1 (55.4cm2) through glycine and 32 to 40 yg C min""1 sample"1 through serine, when the apparent rate of C assimilation was 52 yg C min""1 sample"1 . Thus the percentage of C through glycine and serine was respectively 23 to 29% and 62 to 77%. Also in sunflower leaf discs, Mahon et al. (1974) reported a flux of carbon from glycine to serine calculated during the 2 to 15 min period in ll*C02, of 71 yg C min-1dm~2. As the rate of C02 evolution was 20 yg C min"Mm"2 there was an accordance with \ of the C from glycine being evolved as CO 2 .
Mahon et al. (1974) also found a similar C flux through the glycolate pathway at 115 vpm C02 as at 400 vpm C02, and this flux was greater than the rates of apparent photosynthesis-At 967 vpm C02 the flux through the glycolate pathway was lower but still 25% of the rate of apparent photosynthesis.

52
Accumulation of l h C in glycine and serine underestimates the true rate of synthesis since when 1,7C02 is entering the leaf segment there is a refixation and recycling involving 12C02 produced from the intermediates already in the leaf. Also there could be a rapid flow of C from small very active pools of glycine and serine to other compounds and therefore undetected.
Due to these facts, Kumarasinghe (1975) and Kumarasinghe, Keys and Whittingham (1977) suggested that the simplest situations in which to measure flux through glycine and serine, and in which to relate the change in these metabolites to 1"CO2 evolved, was when flushing took place in darkness or in light at high CO2 concentrations and low O2.
In darkness the refixation of C02 is stopped as well as recycling of compounds within the glycolate pathway and it was found that whatever 9 a s mixture, glycine lost
radioactivity, lkCOz was released and serine accumulated radioactivity. Furthermore, the 11+C02 released contained 25% of the radioactivity lost from glycine. The same value was found when the flushing took place in light at high CO2 and low O2 concentrations. When the flushing was in . darkness at 0 vpm CO2, following steady-state photosynthesis in 150 vpm CO2, as much as four times the rate of C assimilated from air appeared to be metabolized via glycine to serine and CO2; at 350 vpm CO2 following steady-state photosynthesis at the same CO2 concentration, the flux of carbon from glycine was equal to the rate of net assimilation, Tolbert and Yamasaki (1969); Zelitch (1971);

53
Ludwig arid Canvin (1973) suggested that in a normal leaf in
sunlight more than half the C fixed may be metabolized by
the glycolate pathway.
Oxygen concentration also influences the flow of C through the glycolate pathway. Fock et al. (1971) found that in 21% 02 with 400 vpm C02 the fraction containing amino acids was labelled more quickly than in 2% 02 with the same C02 concentration. During flushing with 12C02
the decrease of radioactivity was much faster in 21% than in 2% oxygen.
C.4. Sucrose synthesis from PCO
PGA formed from glycerate can undergo a series of reactions in the cytoplasm: .to form F6P and thence sucrose (3). Alternatively the PGA can reenter the chloroplast and the Calvin cycle.
(3)
F6P iii G6P G6P -Hi G1P
(3) ATP + UDP UTP + ADP ( 4 )
UTP +G1P -f=k UDPG + PP± ( 5 ) UDPG + F6P sucrose P + UDP (6)
sucrose P sucrose +Pi (1) — isomerase (2) - phosphoglucomutase (3) - UDPKinase (4) — UDPG pyrophosphorylase (5) — UDPG fructose phosphate glycosyltransferase (6) — sucrose phosphatase

54
Similar enzymes to those responsible in the chloroplasts for formation of F6P from PGA have been found in the cytoplasm. For example, NAD dependent glyceraldehyde phosphate dehydrogenase was equally distributed between chloroplast and cytoplasm (Heber, Kirk, Gimler and Schafer, 1974). High activities of aldolase and triosephosphate isomerase in chloroplast and cytoplasm were reported by Stocking (1959) and Heber (1960). Similar results for fructose bisphosphatase were described by Smillie (1960) and Latzko and Gibbs (1968) . Smillie (1963) reported that the enzyme responsible for the conversion of G6P to G1P is associated mainly with cytoplasm and Bird, Cornelius, Keys and Whittingham (1974) reported that the main enzymes of sucrose synthesis, UDPG pyrophosphorylase and UDPG fructose-6-phosphate glucosyl transferase were also in the cytoplasm.
The formation of sucrose from intermediates of glycolate pathway has been demonstrated by several authors using specifically labelled substrates. Jimenez, Baldwin, Tolbert and Wood (1962), after feeding young soybean leaves with [1-14C] glycolate found that the hexose formed was labelled predominantly in C3 and C4 . In wheat leaves the predominance was less marked and in both plants there was a certain degree of randomization between the C atoms of glucose. Similar results in wheat leaves were found by Wang and Waygood (1962). [l-
l l tc] glycine gave rise to hexose in which carbon 3 and 4
retained the most isotope, but from glycine the carbon atoms 3 and 4 retained the least percentage of isotope. There appears to be a higher degree of randomization between

55
C2 and C5 and C3 and C4 in glucose made from [l-^c] glycine than from [2—1 t*c] glycine. It was concluded that the hexose moieties were formed by the condensation of two 3-C compounds derived from serine. These results are not consistent with those of Miflin et at, (1966) who used excised leaves of Visum sativum. [l-ll*c] glycolate led to an even distribution of isotope within the glucose molecule, whereas [2-a c] glycine gave rise to glucose units predominantly labelled in the C atoms 1, 2, 5 and 6. Also, Marker and Whittingham (1967) using the same species found that after supplying the leaves in light with [l-llfc] glycine and [l-^c] glycolic acid, the main product of their metabolism was sucrose in which hexose was labelled almost uniformly. [2-1 lfc] glycine and [2-1 c] glyoxylic acid were metabolized to hexose essentially labelled in 1, 2, 5 and 6 C atoms. They suggested two explanations for the randomization of radioactivity in C atoms of the hexose formed from the carboxyl labelled compounds.
1 - A complete oxidation of glycolate or glycine followed by refixation of the 14C02 evolved. The hexose derived would be labelled randomly in a long term experiment independently of the labelling in Ci or C2 . However, since the 1"C02 refixed would be uniformly distributed between the C atoms of hexose one should expect a heavier labelling in C4 and C3 instead of a uniform distribution.
The second suggestion was that the deamination of serine to glycerate took place in the chloroplast and PGA formed entered the Calvin cycle. [l-1 4c] serine formed from [l-ll*C]

56
glycine will form carboxyl labelled PGA. A continuous recycling of the system leads to a randomization of the C throughout the PGA molecule and hexose molecule. This suggestion cannot explain why Kandler and Gibbs (1959) found that 1 C entering the cycle in the a and 8 position of PGA will form'l, 2, 5, 6 C position of the hexose and why these positions are not also extensively randomized.
Tamas and Bidwell (1971) fed detached leaves of barley with [l-1 glycolate and, because labelling in sucrose reached maximum rates before saturation of phosphate esters with llfC, they suggested that synthesis of sucrose took place without participation of the Calvin cycle. Added 1 2C02 decreased the amount of 1 C in phosphate esters but increased the amount of 1 i n sucrose. Kumarasinghe (1975) found that in wheat leaves fed with 1 hCOz for 15 min after a period of equilibration with 12C02 for 80 min, that either in 80 vpm C02 or 150 vpm C02, the incorporation of radioactivity into sucrose showed a lag compared with glycine and serine. . This suggests that carbon for sucrose synthesis is probably derived from glycine and serine.
Waidyanatha, Keys and Whittingham (1975a) and Reimer (1970) reported that the metabolism of glycolate, glycine or serine .to sucrose in light was almost totally suppressed in absence of C02 partly by decreased metabolism of glycolate and partly by accumulation of 14C in serine. Synthesis of sucrose from glycerate and glucose was less dependent on C02 . The absence of C02 caused a partial block to the further metabolism of added serine. In C02-free air

57
metabolism of intermediates before serine in the glycolate pathway was unchanged whilst the ones subsequent to serine were used partly to supply substrate to be recycled through the glycolate pathway, resulting in a loss of C as C02 by photorespiration and conversion to glycine and serine probably by way of sugar phosphates. Also in absence of CO2, sugar reserves can be used to make sugar phosphates and glycolate which can be metabolized to serine.
Use of INH, which inhibits the conversion of glycine to serine, inhibited sucrose synthesis from jl —1Hc] glycolate in air and CO2-free air (Whittingham, Hiller and Birmingham, 1963? Kumarasinghe, 1975; Waidyanatha et al. , 1975a). Furthermore there was an optimum C02 concentration in atmosphere for sucrose synthesis from added glycine in light of 200 vpm (Waidyanatha et al., 1975a). Wang and Waygood (1962) suggested that the metabolism of serine was not affected by presence or absence of C02? however, the proportion converted to sucrose was less than 1/3 in CO2-free air compared to in air.
Waidyanatha et al. (1975b) fed wheat leaf segments in light with 1HC labelled serine or glucose in the presence of 350 vpm C02. Sucrose synthesis from serine decreased when oxygen concentration increased from 20% to 80% and more C02 was evolved. Sucrose synthesis from serine increased to an optimum at 20% 02 but C02 production increased up to 100% 02, The same change in oxygen concentration did not affect sucrose synthesis from glucose. Also, in 80% 0 2 / radioactivity from [1 M ] serine was incorporated
58
into glycine. This does not happen for glucose feedings. Thus glucose provided a substrate for sucrose synthesis but not for photorespiration whereas serine was used for both sucrose synthesis and photorespiration. At all oxygen concentrations in C02-free air, more glucose than serine was converted to sucrose. The amount of [^c] glucose converted to sucrose was less in CC>2-free air than in air and now some 1^002 was produced, suggesting that products of glucose metabolism, probably phosphate esters, are available to the chloroplast and in the absence of CO2, provide substrate for glycolate synthesis and photorespiration.
C.5. The significance of photorespiration
Since plants can grow satisfactorily under conditions where photorespiration is largely suppressed it appears unlikely that photorespiration is essential for plant growth. Some accept the view that photorespiration is merely an inevitable consequence of the structure of the carboxylase enzyme and the presence of significant amounts of oxygen in the atmosphere. Others, however, believe it is unlikely that such a process would continue to exist unless it had some beneficial effect, at least under certain circumstances. Possible beneficial effects which photorespiration might bestow have, included the following:
a. The dissipation of excess photochemical energy under conditions of limited carbon dioxide supply (Andrews and Lorimer, 1978). Under natural conditions this may become particularly important when stomata are-closed due to water stress and when in bright light a considerable

.59
accumulation of reducing equivalents might occur if the photorespiratory oxidative cycle were not present to dissipate them.
b. Photorespiration may also constitute a sequence of reactions by which carbon is moved from the chloroplast to other parts of the cell. It has, however, been pointed out that the formation of carbohydrates through the release of glycolate and its subsequent reduction to form sucrose is extremely wasteful in energetic terms (Goldsworthy, 1976). There are other mechanisms which could be utilized for the translocation of carbon out of the chloroplast, e. g. the export of triosephosphate which would be less energetically expensive.
c. The photorespiratory oxidative cycle might be cou pled to the formation of energy-rich phosphate bonds so that these bonds were generated outside the chloroplast indirectly as a result of light absorption by the chloroplast. Since, however, at the present time experiments have shown the potential to generate only three molecules of ATP accompanying the oxidation of glycine to serine the net effect of the photorespiratory sequence results in a loss of ATP molecules rather than a net gain.
d. The photorespiratory oxidative cycle may be regarded as a necessary process to conserve carbon loss from the Calvin cycle under conditions where oxygenation greatly exceeds carboxylation.
It may be concluded that at the present time there is no convincing role for photorespiration in the photosynthetic

60
metaholism of the leaves of C3 plants. Certainly this would
appear to be the case where the conditions of growth do not
put the plant under extreme conditions of carbon dioxide shortage.
D. SUMMARY
In the first part of the Introduction, certain anomalous results relating to the effect of oxygen on the rate of photosynthesis have been summarized. In particular measurements of gas exchange of leaves at lower temperatures at certain concentrations of carbon dioxide do not appear to be totally consistent with our present understanding of the mechanism of photorespiration. Whilst the properties of the enzyme RuBP carboxylase/oxygenase are in good qualitative agreement with observations on intact leaves, it is still not clear whether some other reactions may play a significant role in the influence of oxygen on photosynthesis.
In this thesis the absence of inhibition of photosynthesis by oxygen at lower temperatures under certain specific conditions has been confirmed. By the use of radioactive carbon dioxide to study the flow of carbon through the glycolate pathway an attempt has been made to establish whether the inhibition observed can be explained solely in terms of changes in photorespiration. Such studies should lead to an increased understanding of the

61
factors which, regulate carbon metabolism over a range of temperatures characteristic of those experienced by plants grown under natural conditions.

62
MATERIAL AND METHODS
A. EXPERIMENTS WITH DETACHED LEAVES
1. Plant material
Two varieties of wheat, Triticum aestivum, viz. Kolibri and Highbury were used.
For the earlier experiments, the plants were grown in a glasshouse under natural illumination supplemented in winter with artificial light from high pressure mercury vapour lamps to give 16 hours photoperiod. The plants were used just before .the ears emerged and were moved to the laboratory on the day of the experiment. Flag leaves were cut from the plants under water.
For the later experiments, as well as the experiment with IRGA, wheat seeds selected for uniformity in size and soundness were sown in 13cm plastic pots containing a commercial compost (75% peat and 25% sand) enriched with inorganic fertilizer. Twelve seeds equally distributed were sov/n per pot. The plants were grown in a growth room under artificial illumination of about 10,000 lux (165yEnf2
sec~1/PAR) at the level of the leaves, supplied by a mixture of fluorescent and tungsten lamps for 16 hours each day. The temperature was maintained at 20 ± 2°C.
The day before each experiment, at 17.00 h., 13 day old plants were transferred from the growth room to a dark room where they were kept until the experiment was begun at 10.00 h.

63
the next day. Therefore the plants had a dark period of 17 hours just prior to experiments. From these plants, second leaves of comparable size were cut under water in dull light.
2. Leaf samples
2,a. From flag leaves
The bases of the leaf blades of flag leaves (4cm) were discarded and four pieces of leaf (0.5cm x 4cm) were cut under water with the long edges parallel to the midribs of the leaves, using a scalpel and a template.
2.b. From second leaves of 13 day old plants
Segments (4cm long) were cut under water with a sharp blade discarding the tips of the leaves and 2cm at the base. The segments were carefully stored with their cut bases under water to prevent wilting.
Three or five leaf segments were quickly arranged in Perspex racks with their cut bases in water. They were held in an upright position by a wire frame (Figs. 2 and 3) of the apparatus (Fig. 4).

64
3. Measurement of leaf segments area of 13 day old plants
The area of five leaf segments (each 4cm long) from 13 day old plants had been determined by Kumarasinghe (1975) and was found to be * 0. 1dm2. The total area now was determined by measuring the mean width of each individual leaf section, multiplying by length and summing for all segments in the sample.
4. Leaf chambers
For the earlier experiments with radioactive C02 a cylindrical glass leaf chamber (vol 21cm3) was used (Fig. 2) .
Two glass tubes fitted in a rubber bung provided the inlet and outlet for the gas mixtures. The Perspex rack carrying three leaf segments was introduced into the chamber.
For the later experiments with H C 0 2 as well as for all the other experiments using detached leaf samples a rectangular Perspex leaf chamber (vol «10cm3) was used (Fig. 3).
Besides being smaller, this chamber had the advantage that five leaf segments instead of three could be used. Furthermore, instead of a rubber bung this chamber was closed by a spring-loaded Perspex lid, somewhat larger than the leaf chamber aperture, to which was stuck a piece of soft rubber sheet to form a seal. Gas mixtures entered the chamber by a series of metal tubes through the water jacket (Fig. 4) . The outlet was provided by a single Perspex tube. The series of metal tubes allowed heat exchange and a more uniform

65
gas gas out in
Fig. 2, Cylindrical leaf chamber. The chamber was surrounded by a water jacket.

66
Fig, 3. Rectangular leaf chamber. This chamber was surrounded by water jacket.

67
distribution of gas in the chamber. A small tube attached to each Perspex rack directed into the trough allowed addition of extra water during the experiment.
Both types of leaf chambers were surrounded by water jackets, the temperature of which was kept constant by circulating water from a thermostated bath.
5. Preparation and supply of gas mixtures
Gas mixtures were prepared in cylinders (Kumarasinghe, 1975) and supplied to the leaf chambers through the apparatus illustrated in Fig. 4.
The flow rate of the mixtures through the system was maintained at 450m£/min by flowstats (G. A. Platon Ltd. or Jenccls, Scientific Ltd.). In experiments involving the IRGA the flow rate was set at 480m£/min and frequently checked using a soap bubble flow-meter.
The gas mixtures were selected by a three-way tap between the leaf chamber and the flowstats. The change over from one gas mixture to another did not take more than 1-2 sec. Another three-way tap, connected to the outlet of the leaf chamber, directed gas leaving the chamber either to a tower of soda-lime (to absorb the li+C02 so that the laboratory would not be contaminated) or to a bag made of laminated aluminium foil and plastic film (24 x 14.5cm) attached to a scintillation vial containing 200y£ of a 2.ON NaOH (Fig. 5). Thus the 1hQ02
released by the plant during flushing out could be collected at appropriate periods during the experiments.-

68
Fig. 4. Diagram of apparatus used for supplying gas mixtures to leaf segments.
Frontal view
VI
Lateral view
1
X
o
- 4
14- 6 - -
8 - - -
T d>0-
-9
5 0
CO;
12 11
O - 1 0
13
1. flow meter 2. soda lime 3. GaCl2 (Anhydrous) 4. three-way taps 5. flow control 6 . leaf chamber 7. metal tubes
(heat-exchanger) 8. water jacket 9. aluminium foil
10. tank with water 11. water in 12. water out 13. tungsten lamp 14. leaf segments 15. cylinders 16. bag to collect 14C02

69
A column of anhydrous calcium chloride dried the gas stream before it passed through, the flow-meters, to prevent condensation inside the meters and so maintain accurate measurement of flow rate. The volume of the plastic tubes, glass tubes and the leaf chamber between the two three-way taps was kept to a minimum to decrease the time taken to flush each gas mixture from this part of the system.
--gas in
- roller clamp
— laminated plastic aluminium foil bag
scintillation vial
NaOH
Fig. 5, Bag attached to scintillation vial to collect llfC02 during the flushing-out period.

70
6. Illumination
Illumination of segments was by a 1500 watt tungsten Halogen lamp (GEC) from one side of the leaf chamber. A light intensity of 47,500 lux was obtained inside the leaf chamber by placing the lamp 65cm away. The light intensity was measured with a LI-170 Quantum/Radiometer/Photometer — (Lambda Instruments) with a Lambda quantum sensor measuring photosynthetically active radiation.
To prevent excessive heating of leaf samples, a glass tank (19 x 56 x 29cm) with a continuous flow of cold water through it was placed between the leaf chambers and the lamp.
7. Killing and extraction of leaf segments after photosynthesis in lttCp?
After the experimental treatment, two flat metal plates fitted to the gripping end of a pair of forceps facilitated the rapid removal of all five leaf segments at a time from the leaf chamber, The leaf segments were cut rapidly in two and dropped into 4m&, 50% boiling ethanol. This procedure did not take more.than 10-12 sec.
After boiling for 2 min the extract was decanted into a graduated centrifuge tube (10m&). A further 2m& of 50% ethanol was added to the segments and this was boiled again for 2 min. This extract was added to the first. The hot extraction was repeated three times. The extracts were combined together and the total volume made to 10m& with 50% ethanol.

71
8, Two dimensional thin—layer chromatography (TLC)
8.a. Preparation of the plates
A suspension of cellulose powder (Whatman thin layer chromadia CCm) was made by vigorously shaking a mixture of 40g of powder with 90m£ of 1% (w/v) soluble starch (Soluble Starch — Hopkins and Williams) for 1.5 min, in a conical flask (500m£) fitted with a ground glass stopper.
The starch solution was made by boiling 0.9g of starch in the distilled water.
Five plates (20 x 20cm) were placed edge to edge on the bed of a spreader (Quickfit and Quartz Ltd.) and the slurry spread over them using the setting giving a layer thickness of 0.5mm. When the free liquid had evaporated and the surface of the layer appeared rough by reflected light, powder was removed from the edges and plates were transferred to racks. The plates in the racks were dried at room temperature by blowing air over them, overnight. The edges of the layer were straightened when necessary, by scraping away cellulose with a spatula.
Samples of extract (lm£) were dried down overnight in a vacuum desiccator, over anhydrous calcium chloride. To the residues 0.1m& of 50% ethanol was added and the solid dissolved by thorough mixing. 10]i£ of this solution were applied near one corner of a TLC plate using disposable micro-pipettes (Microcaps; Druramond Scientific Co.). Over 98% of the total radioactivity in the original extract was normally recovered after concentration (Kumarasinghe, 1975).

72
Shandon thin layer tanks were used to develop the chromatograms in two directions. For the first direction the solvent used was n-propanol : ammonia s.g. 0.88 : water (6:3:1 by vol.) containing 2g EDTA per litre. For the second direction the solvent was n-propylacetate : formic acid : water (11 : 5 : 3 by vol.) . These solvents were those used by Bieleski (1965), Waidyanatha (1973) and Kumarasinghe (1975).
The plates were developed twice in each direction. The developing time was 2 hours with the first solvent and 1 hour with the second.
The plates were dried using a fan in a fume cupboard for 1 hour, between developments in the same solvent and for at least 3 hours between solvents and before autoradiography.
After development in the first direction 0.5cm of the layer was removed from the top and bottom of each plate before turning it through 90° for development in the second direction.
8.b. Autoradiography
Small self-adhesive labels were stuck to opposite edges of the plates, both were marked with radioactive ink: one with the number of the experiment and the other with a cross to facilitate the subsequent superimposition of the autoradiograms. Plates were exposed to Kodak X-ray film (Industex CCR 54) usually for two to three weeks.
The films were placed on the cellulose layers. The plates with films stacked one above the other and fastened together

4 73
with rubber bands. To avoid any damage to the topmost film and cellulose layer by the rubber bands, a blank plate was placed at the top of the stack.
The films were developed using Kodak processing unit P3
and dried using Kodak drying cabinet (model B).
The positions of the compounds separated on the chromatograms were compared with those found by Kumarasinghe (1975) for the same plant material and are shown in Fig. 6. The autoradiographs showing the separation of 1^C-labelled compounds by two dimensional TLC are presented from Figs. 7 to 12. The separation was satisfactory but the amounts of RuBP and FBP were always very small.
9. Measurement of radioactivity
9.a. Counting equipment
Measurement of 1^C was made by liquid scintillation counting using a Packard Tri-Carb liquid scintillation spectrometer (Model 3320) or an Intertechnique SL 4000 liquid scintillation counter.
The scintillator solution contained 0.4% PPO (2.5-diphenylcxazole) and 0.1% dimethyl POPOP (1, 4-bis- [2- (4-Methyl-5-Phenyl-oxazolyl)-]-Benzene in AR Toluene.
9.b. Measurement of ^ C in solutions
For estimation of radioactivity in solutions, the scintillator solution was mixed with the surfactant Triton X-100 (2 : 1 v/v), Patterson and Greene (1965).

74
c CM 0 « •H •P O cn <1> ffi •H
X 4J o U) u rH Px a
5 4 3 2 1
o
15 00 12 11
13
20 19
© 21 2nd direction
Glycolate Alanine Glycerate Glycine Serine Sucrose Malate
nPrOAc : HCOOH : H 20
8 Glutamate 9 Aspartate 10 Glutamine 11 PEP 12 Phosphoglycolate 13 PGA 14 F6P
15 G6P 16 UDPG' 17 Raffinose 18 Maltose 19 RuBP 20 FBP 21 Origin
Fig, 6. Map showing the position of different compounds separated by thin layer chromatography.

§ . .; +J u <ll $.I . .;
rc1
+J U)
,....,.j
• 21
16
6
18
17
14 15
20 19
2nd direction
4 3 2 5
10 7 9
8
12 11 13
Fig. 7. Autoradiograph showing the distribution of radioactivity in various compounds after photosynthesis in 200 vprn 14 co 2 for 15 min at 5°C.
75
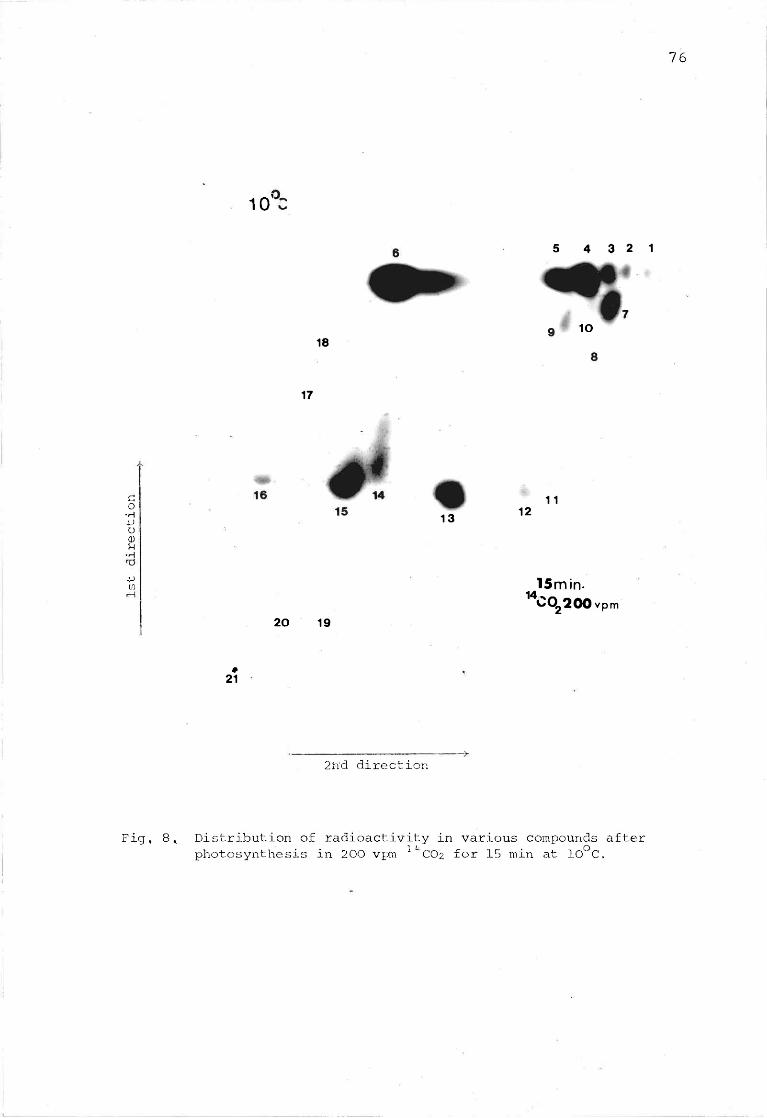
76
10'
5 4 3 2 1
c o •H 4-J O 0) u •H
-V-l to
18
17
20 19
» 21
13
10
11 12
15min-> 2 2 0 0 v p m 1400o200
2hd direction
Fig, 8, Distribution of radioactivity in various compounds after photosynthesis in 200 vpm 1UCO2 for 15 min at 10°C.

77
17
16 14 11 15 13 12
14 15 min C 0^200 v p m
20 19
21
— —
2nd direction
Fig. 9. Distribution of radioactivity in various compounds after photosynthesis in 200 vpm 14C02 for 15 min at 20°C.

78
To count total radioactivity in the extracts an aliquot of 10jj& was mixed in a scintillation vial with lmJL of water and 10m£ of toluene-triton (2 : 1 v/v) solution of scintillator. Vials were capped, shaken vigorously and placed in the counter. Blanks vials, with water and toluene-triton solution only, were always counted in order to measure the background. The efficiency of counting was determined by the use of [1Ifc]-toluene of known radioactivity. Efficiency was usually about 80% with a gain setting of 17 and a window setting of 50 to 1000 (Packard 3320).
The radioactivity due to 1 4C02 absorbed in 2N NaOH (200y£) was estimated after 24 hours by mixing it with lm£ water and 10m£ of toluene-triton mixture (2:1 v/v).
9.c. Measurement of JttC on thin layer chromatoqrams
For measurements of radioactivity separated by thin layer chromatography, areas of cellulose layer containing the radioactive compounds were removed by a method essentially similar to that of Caballero and Cossins (1970). A solution (~40m&) containing 1% of pyroxylin (cellulose nitrate, BDH chemicals) in equal volumes of absolute ethanol and diethyl ether was spread uniformly over the surface of the chromatograms. This was achieved using a glass rod with pieces of wire 1mm thick wrapped round 19cm apart. Before the plate was completely dry again the autoradiograph was superimposed, e. g., with the marks made by radioactive ink exactly coincident with the corresponding images on the autoradiograph. The areas occupied by radioactive compounds were marked by running a ball point pen firmly round the images caused on the film so that an

c o •H -P U CD P -H t P U)
io°c
18
17
I 16
15 14
20 19
21
13
79
5 4 2 1
f t * '
, I
11 12
14, 15min C02350vpm
2nd direction
Fig. 10. Distribution of radioactivity in various compounds after photosynthesis in 350 vpm 1,fC02 for 15 min at 10°C.

20°C
18
17
80
3 ^ 1
7
C o -H •U O CD P -H •O -P
W
16 15 1 4
13
11 12
15 min 1 4C0 2350vpm
20 19
21
2nd direction
Fig, 11, Distribution of radioactivity in various compounds after photosynthesis in 350 vpm 1HC02 for 15 min at 20°C.
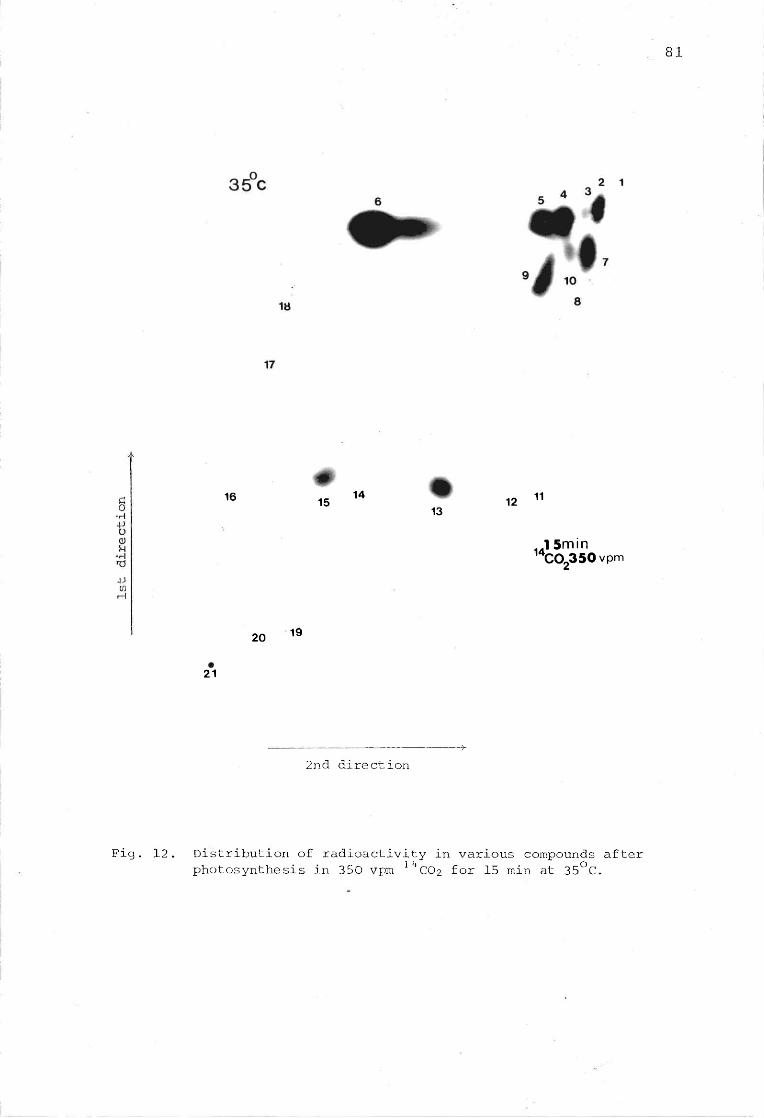
.81
16 15 14 13 12 11
14, 1 5m i n C02350vpm
20 19
21
— — >• 2nd direction
Fig. 12. Distribution of radioactivity in various compounds after photosynthesis in 350 vpm li+C02 for 15 min at 35°C.

.82
impression was made on the layer of cellulose. The film was removed and the marked areas were cut from the cellulose/ pyroxylin layer with a scalpel and transferred to scintillation vials containing lOmil of toluene scintillator solution without Triton X-100. The efficiency was estimated by applying 5\iH of a solution containing a known amount of radioactive serine to a blank area of each TLC plate, before treating with pyroxylin. . This area was cut out and counted as above. The efficiency was usually 70 to 75%.
The pieces of cellulose layer were subsequently removed from the vials and the scintillator solution was recovered by filtration, for use in subsequent experiments.
9,d. Measurement of insoluble lt*C in extracted residues
Extracted segments were wrapped in lens cleaning tissue (Whatman 105), placed in a "Combusto-cone" and covered with a "Combusto-pad" and oxidized in a TRI-CARB SAMPLE OXIDIZER (Packard Instrument Company, Caveasham Beaks. Model 306). The 1/1CO2 absorbed in the recommended mixture of carbosorb and Permafluor was counted with the gain set to 17 and the window 50 to 1000 (Packard 3320). The efficiency was measured by combusting and counting a known amount of f1£tc] standard under identical conditions to those used for the leaf segments or by adding a known amount of llfC to a sample blank,
101 Measurement of CO? exchange
Measurements of photosynthesis (P) were made in an open gas-exchange system in which the leaf chamber in Fig. 4 was connected to an IRGA-(URAS 2-Hartmann & Brawn, Me B-und

.83
Regeltechnik), The cylinder with 14C02 in Fig. 4 was replaced by one with 12C02 in 2% oxygen. The IRGA was calibrated using standard gas mixtures of known C02
concentration. The IRGA readings were of volume per million (vpm or yJl To calculate rates as mg COz
dm~2h"1 the flow rate of gas through the system (480m£/min) was expressed as litres per hour and corrected to MTP. This value was multiplied by the depletion of C02 as vpm converted to mg per litre and by a factor to give the rate per 100cm2
of leaf.
P s Flow, (myrnin), 2 d e D l e t i o n x 44 1_ x 100 1000 T+t 2 ? P f * 22.4 1000 AREA (cm2)
(vpm)
11* Distribution of phosphates between chloroplasts and other cell fractions
11.a. Non-aqueous fractionation of leaf tissue
11,a.l. Freeze drying of leaves
Triticum aestivum var. Highbury was used in these experiments. Plants 13 day old were kept in the dark for 17 hours before each experiment. After that time segments (0.5 x 4cm) were cut under water as before and were allowed to photosynthesize for a period of 90 min at either 5°C or 20°C and at one of the three C02 concentrations, 314, 328 and 393 vpm.
Following this the segments were quickly frozen in liquid nitrogen (-195°C).
The leaf samples were homogenized in liquid nitrogen.

.84
using a Sorval Omnimixer set at the maximum speed for 1.5 min. The operation was repeated twice and a powder mixed with liquid nitrogen was obtained.
Meanwhile a freeze drying apparatus formed by a glass vacuum system connected to a sample flask was placed in a deep-freezer at -25°C for some hours.
The leaf powder was put in the sample flask where the temperature was allowed to rise to -25°C. The condenser of the glass vacuum system was cooled to -80°C by immersion in solid C02 and acetone. This freeze drying apparatus was replaced in some experiments by a desiccator charged with anhydrous calcium chloride and cooled to -25°C in the deep-freezer. The leaf powder suspended in liquid nitrogen was poured into petri-dishes which were placed in the desiccator.
Both the freeze drier and desiccator were continuously evacuated with a vacuum pump for a period of about 24 hours until the pressure was reduced to 0.05mm of mercury. At the end of this time they were removed from the deep-freezer and allowed to warm to room temperature. Air was then admitted and the dried tissue stored in a vacuum desiccator over P2O5 at room temperature.
''v. 11.a,2. Isolation of chloroplasts
i. Preparation of the non-aqueous liquids
Since water-soluble intermediates of photosynthesis are lost during isolation of chloroplasts in aqueous media, carton tetrachloride (ANALAR) and hexane (fraction from petroleum

.85
boiling in the range 67 to 70°C) mixtures were used in the isolation of the chloroplasts in proportions to give liquids with specific gravities of 1,05, 1.32 and 1.34 as measured with hydrometers (A. Gallenkampy & Co. Ltd., London) at room temperature,
Composition of the mixtures:
Specific gravity C C I h Hexane 1.05 200g 89.12g 1,32 200g 33.90g 1,34 200g 30.60g
The various mixtures were placed in stoppered bottles over anhydrous sodium sulphate and stored at 0-4°C. To reduce condensation, leading to introduction of water during the fractionation, all the operations involving the subsequent use of these mixtures were carried out at 0-4°C.
ii. Fractionation procedure
The technique described was based on that of Stocking (1959), Bird et alA1965) and Keys (1968). The freeze dried powder (80mg) was placed in a Ten broek hand model tissue grinder (Model 4288E, A. H. Thomas & Co., Philadelphia, U.S.A.), together with 10m£ of Hexane/CC14 mixture of specific gravity 1.34. The plunger of the grinder was operated until it was possible to introduce it to the fullest extent; after that 20 full strokes of the plunger were given. The suspension was placed in cellulose nitrate ultracentrifuge tubes of 35m£ nominal capacity. The tissue grinder was washed with a further 5m£ of the Hexane/CClt* mixture (s.g. = 1.34) and the washings

.86
were combined with the first 10m£ of suspension. Over the 15m£ of s.g. 1.34 in the centrifuge tube, a lighter layer consisting of 7m£ of hexane/CCl4 s.g. 1.32 was added. To avoid disturbing the lower layer, this mixture was added using a glass plunger which was half introduced into the suspension. The 7m£ mixture s.g. 1.32 was then added and the glass plunger was slowly removed.
Finally the very much lighter mixture (s.g. 1.05) was added with a Pasteur pipette until the centrifuge tube was filled to within 0.5cm of the top.
The centrifugation was carried out in an Ultracentrifuge (Beckman L2-65B) using the SW27 swinging-bucket rotor, at 10,000 r.p.m. for 15 min at 3°C.
After centrifugation a band of dark green material was obtained between the mixtures of s.g. 1.32 and s.g. 1.05. This band, the chloroplast enriched fraction, was recovered from the two tubes using a Pasteur pipette with a bent tip and transferred directly to a weighed glass centrifuge tube.
The remaining tissue (chloroplast depleted tissue) was mainly in a pellet at the bottom of the centrifuge tube. It was resuspended with a glass red.and the suspension from the two tubes was also transferred to a weighed glass centrifuge tube.
Both, chloroplast and chloroplast depleted tissue suspensions were mixed with an equal volume of hexane, centrifuged at 2000g for 5 min and the clear supernatant fluid decanted. The pellets were freed from solvent by placing the

.87
tubes in a vacuum desiccator over P205 and evacuating several times.
After drying overnight under vacuum, the glass tubes were weighed again and the weight of the chloroplast fraction and the remaining tissue calculated. The chloroplasts isolated by this method are not devoid of contamination by cytoplasm; however, the extent of this contamination is considered to be less than 10% of the total cytoplasm, Stocking and Ongum (196 2) or 15% of the cytoplasm, Bird et al. (1973).
The yield of chloroplast fraction was normally about 20mg dry weight per lOOmg dry tissue homogenized.
11.b. Chlorophyll determination
The chlorophyll content of the.fractions .was determined either by extraction into 95% acetone (Arnon, 1949) or, in the later experiments, into 96% alcohol (Wintermans and de Mots, 1965) . The percentage of chlorophyll found in the dry chloroplast fraction was between 4 and 5% w/w.
11-c. Extraction of phosphates
Three main methods were used.
ll.c.l. Using 20% perchloric acid
This method was based on that of Latzko and Gibbs (1972) . To the dried residue of chloroplasts (C) and chloroplast depleted tissue (CDT) was added respectively lm£ and 5m£ of 20% (w/v) perchloric acid at 0°C. The tubes were kept in ice for 15 min, with repeated stirring of the suspension which
.88
was then treated at full power with a sonic desintegrator (MSE type MT20) for 30 sec. After centrifugation at 7000g for 5 min the supernatant liquid was titrated potentiometrically with 5M K2CO3 to pH 5.5. This method was also applied to C and CDT dried after extraction of chlorophyll with 95% acetone,
11.c.2. Using aqueous trichloroacetic acid
This procedure was similar to that described by Isherwood and Barrett (1967), but before starting the extraction, 10m£ and. 25m& acetone 95% was added respectively to the C and CDT to remove chlorophyll.
To the colourless powder was added TCA 10% with 0.15% (w/v) 8-hydroxyquinoline. This suspension was homogenized using a Virtis "60" Homogenizer (Virtis Company; Gardiner, N.Y. 12525) at 40,000 r.p.m. for 30 sec. The Virtis vessel 16-235-1 was surrounded with a mixture of crushed ice. The suspension was then centrifugated at 18,000 for 15 min at 3°C. The clear supernatant liquid was decanted and the precipitate extracted again with ice-cold aq. 5% (w/v) TCA containing 0.15% (w/v) 8-hydroxyquinoline. It was blended again and centrifuged as before. The supernatant liquids were combined. To remove the TCA the extracts were shaken six times with ether saving the aqueous phase. This phase was used for sugar phosphates measurements before and after passing through a small column of Polyclar (Poly-N-vinyl pyrrolidon) insoluble. The column was equilibrated and eluted with distilled water.
The same extraction was applied directly to freeze-dried leaf powders without fractionation and the polyclar column

.89
was equilibrated and eluted either with water as before or
with 0.01N HCl.
A column of polyclar previously washed with acid before
equilibrating with water was also tried and a column of
Amberlite XAD equilibrated and eluted with water.
11.c.3. Using 50% ethanol
After extraction of chlorophyll with acetone 95%, ethanol 50% was added followed by boiling for 2 min. The addition of 50% alcohol was repeated three times, with centrifugation at 3000 r.p.m. for 3 min between each treatment. The supernatants were combined and dried in a vacumm desiccator. Instead of using these crude extracts directly for measurements in the spectrophotometer, paper chromatography was applied trying to separate the sugar phosphates from the yellow materials that
caused high backgroung^light absorption in assays with /
specific enzymes.
11.d. Purification of sugar phosphates by paper chromatography
Extracts made with 5 0% ethanol were evaporated to dryness in a vacuum desiccator over anhydrous calcium chloride. To the dried residues a small amount of 50% ethanol was added and the resulting suspension was transferred to a band (4.5cm width x1.5cm deep) for chloroplast fraction and (6cm width x 1.5cm deep) for chloroplast depleted tissue fraction on a 20cm x 20cm sheet of Whatman3MM chromatography paper. On the same chromatogram adjacent to the extracts, markers of Glucose-6-phosphate (G6P) and Fructose-6-phosphate (F6P),

.90
lymole each were applied.
ll.d.l. Descending paper chromatography
This was carried out in a Shandon tank (57 x 30 * 22cm) using the solvent propanol/NH3/H20 (6:3:1 by vol.), that was allowed to run for 15 hours.
11.d.2. Ascending paper chromatography
The chromatogram was suspended at the middle of a Shandon thin layer glass tank (25 x 24 x 8cm) from the lid.
Four solvents were tried: Solvent I - Butanol/Acetic acid/water (12 : 3 : 5 by vol.) Solvent II - Absolute ethanol Solvent III - Methanol/1M ammonium acetate pH 7.5 (9 : 1 by vol.) Solvent IV - Methanol/Formic acid 90 or 100% (19 : 1 by vol.)
The solvents were placed in the bottom of the tanks and the chromatogram was allowed to develop for 6 hours in solvent I or 2 hours in solvents II, III or IV. The chromatograms were.air dried. The strip of paper with the markers, G6P and F6P, was separated from the rest of the chromatogram and sprayed with p-anisidine reagent (Bieleski and Young, 1963).
By comparison with the positions of the markers the sugar phosphates were found to be in a band very near the origin when either of the first three solvents were used, but with the fourth solvent they were displaced beyond the origin. The bands were sharply separated when the solvent I was used (Fig. 13) . The band with sugar phosphates was cut and eluted with distilled water in a water-saturated environment (Fig. 14).

.91
o >
>1 xi in cn CM
O CVJ EC
•H O < o •H - P 0) u < r-\ o c rd 4J
CQ
Fig. 13 . Ascending paper chromatography. Separation of the band with sugar phosphates from the fluorescent bands seen by ultraviolet light.

.92
Fig. 14. Trough, with water to elute the band with sugar phosphates from Fig. 13.

.93
The eluate was collected in small test tubes and the amount of G6P and F6P in solution estimated spectrophotometrically.
The first method (20% perchloric acid) gave coloured extracts with big background absorbancy. Furthermore, the amounts of shgar phosphates found were low compared to amounts expected from experiments with 14C. After preliminary-extraction of chlorophyll, the perchloric acid extracts were not so coloured but there was no improvement in the amount of sugar phosphates found.
The second method (10% TCA), although providing extracts that were less coloured than the first, still gave poor estimation of sugar phosphates. To check if this was due to loss of these compounds during fractionation, the method was applied directly to freeze dried powder. There was no improvement in the results.
The third method of extraction (ethanol 50%) coupled with descending chromatography using the solvent propanol/ammonia/ water gave improved amounts of G6P but almost no F6P (Table 1) . Better results were obtained by ascending chromatography. However, the values of sugar phosphates, especially F6P, were still low. The best values were found with the solvent butanol/acetic acid/H20, so it was decided to use this solvent.
To improve the recovery of sugar phosphates, ethanol 96% instead of acetone 95% was used for chlorophyll extraction and boiling 50% ethanol plus 0,1% EDTA was used to extract C and CDT. The EDTA prevents precipitation of phosphorus compounds by calcium and magnesium (Cole and Ross, 1966) and

. 94
Table 1. Amount of G6P and F6P present in C + CDT after extraction with ethanol 50% followed by paper chromatography in different solvents.
G6P F6P
>i £ ft rd
Cn U b Cn •H na b <D o w CD
o -p rd 6 o b rG
P u
nmoles • mg dry wt -1 Solvents
Propano1/NH 3/H 2 O (6:3:1 by vol)
0.91 o.oa
Butanol/Acetic Acid/H20 >1 (12 : 3 : 5 by vol) 1 , 1 0 °*22 ,b ft rd
tn Cn Metanol/IM Ammonium Acetate | | (9:1 by vol) °'76 °*11 b e <u o U M ^ Metanol/Formic Acid
(19:1 by vol) ^ ^ 0" 1 8

.95
the use of boiling 50% ethanol inactivates the phosphatases. Bieleski (1964) and Ullrich (1963) showed that plant phosphatases can remain active in cold aqueous ethanol mixtures even with up to 80% ethanol.
11.e. Final method
ll.e.l. Chlorophyll extraction
The C and CDT fractions were extracted respectively with (4 x im£, 1x0.5m&) and (1 x 3ml, 3 x 2mz, 1 x imJfc, 2x0.8m£)of 96% ethanol. After each addition the mixture was shaken well, before being centrifuged at 2000 r.p.m. for 3 min. The total volumes of the extracts were made to 5m£ and 10m£, for C and CDT respectively. Chlorophyll in the extracts was measured by
the method of Wintermans and Mots (1965).
11.e.2. Extraction of soluble phosphates
After extraction of chlorophyll,2 and 4m& respectively of boiling 50% ethanol + 0.1% EDTA pH 6.7 was added to the C and CDT fractions. Boiling was continued for 3 min by immersion of tubes in a water bath at 100°C. The suspension was centrifuged at 2000g for 3 min and the supernatant liquid decanted. Extraction with boiling solvent was repeated followed by two further extractions adding cold solvent. The four supernatant solutions were combined and made up to 5m£ (C fraction) or 8m£ (CDT fraction) with 50% ethanol +0.1% EDTA. Samples composing one tenth of the total volume of each extract were taken to measure the inorganic phosphate (Pi.) and total soluble phosphate. The remaining 4.5m£ (C) and 7.2m£ (CDT) was used to measure the G6P, F6P and RuBP.

.96
All four samples, either to measure inorganic and total phosphate or to measure the sugar phosphates were dried down overnight in a vacuum desiccator over anhydrous calcium chloride.
ll.e.3. Determination of inorganic phosphate . (Pi) and total soluble phosphate
Residues to measure inorganic and total phosphate were dissolved in 2m£ and 6m£ of water for the extracts of C and CDT fractions respectively. Pi and total soluble phosphate in the solutions were determined by the method of Hurst (1964) .
11.e.4. Determination of sugar phosphates (G6P and F6P)
The dried residues for measuring sugar phosphates were suspended in a small volume of 50% ethanol (between 500y£ and 800u&) . The liquid was applied as a streak to Whatman 3MM chromatography paper as described previously in 11.d. and the chromatogram was developed using butanol/acetic acid/H20 (12 : 3 : 5 by vol.), followed by elution of the strip containing the sugar phosphates, with water as described in 11.d.2..
This eluate was used either to calculate the amount of G6P and F6P or to calculate the amount of RuBP in the fractions.
The enzymatic assay was based on the reaction of NADP with G6P (Latzko and Gibbs, 1972).
G6P + NADP • ^ _ h- 6Pgluconate + NADPH G6Pdehydrogenase ^
In a final volume of lm£, the following solutions were

.97
mixed in a 1mA quartz cuvette with 1cm light path: 0.10mA Tris-HCl 1M pH 8.5 0.39mA H20 0.02mA MgCl2 0.5M 0.02mA EDTA 0.1M 0.02mA G6Pdehydrogenase (50 units/mA) 0.40mA extract
The reaction was started by adding 0.05mA of 0.005M NADP and its reduction then measured by change in absorbance at 340nm. When all the G6P was consumed, so that a steady reading was reached, hexose phosphate isomerase 0.02mA (50 units/mA) was added and the amount of F6P was estimated from the further increase in absorbance. In the blank cuvette the NADP was replaced by water. The molar absorbance for reduced NADP at 340nm was taken as 6.22 x 10³ . The amounts of G6P and F6P were estimated as nmoles in the chloroplast and chloroplast depleted tissue.
11.e.5. Method for determination of the amount of Ribulose-1,5-bisphosphate (RuBP)
RuBP in the solution was reacted with 1^C02, provided by added NaH1 03 in the presence of RuBP carboxylase, and excess NaH1 ''COs and 1 **C02 were removed by acidification and evaporation. The [llfc] PGA was counted.
Freeze-dried RUBP carboxylase from wheat leaves was a gift from M. J. Cornelius and A, J. Keys. It had been purified by ammonium sulphate fractionation, density gradient centrifugation and DEAE cellulose chromatography. The enzyme

.98
(3.2mg/m£) was activated (Machler et al., 1980) in a stoppered flask at 45°C in presence of 0.2M Bicine-NaOH pH 8.2, 0.04M MgCl2 and 0.02M NaH14C03 for 25 min.
From the previous eluate 0.25m£ was taken and dried down under vacuum. The reaction was started by adding 100y& of the solution of activated enzyme. After vigorously shaking, the reaction was allowed to continue for 20 min at 25°C. It was stopped by addition of 2 0 0 0 , 2 N formic acid. The solution was dried down over NaOH and CaCl2 (anhydrous) under vacuum. The residue was dissolved and counted by liquid scintillation.
RuBP was estimated by comparison with a standard curve made from counts measured following reaction of known amounts of RuBP with 1 02 in the same system.
11.e.6, Calculations
The calculations were made assuming the chloroplast fraction to be pure.
To the amount (x) of each compound found in the chloroplast fraction has to be added the amount of each compound present in chloroplasts remaining in the CDT. Expressing amounts per mg chlorophyll in the chloroplast fraction and multiplying this value by the amount of chlorophyll found in the CDT gives values for (y) corresponding to the amounts of each compound in the CDT.
Thus, y = r r x, • i - — : x mg chlorophyll in CDT. ' u mg chlorophyll m C ^ 2
The total amount of each compound in the qhloroplast fraction is given by x + y. The amount of each compound in the

.99
norwchloroplast part of the cell is that in CDT less y. Dividing the amounts in chloroplast and non-chloroplast fraction by the total weight of the freeze dried powder that was fractionated we have the values expressed in nmoles,mg dry wt "1 whole tissue (Table 1) ,
B. EXPERIMENT WITH ATTACHED LEAVES
1. Effect of CO7 concentration on the concentration of Ribulose-1,5^bisphosphate (RuBP) in leaves
l.a. Plant material
Triticum aestivum, viz, Highbury was grown in a growth room at a day/night temperature of 23°C/18°C, a light intensity of 450-500yE m'^ec* 1 and a photoperiod of 16 hours.
Pots with 13 day old plants were taken from the growth room as required, just before treatments were begun.
1.b. Treatment of leaves
Four attached second leaves 10cm long) were enclosed in a rectangular Perspex leaf chamber (Fig. 15) approximately 100cm3 in volume. A fan at one end circulated air inside the chamber and the temperature was kept constant by a water jacket supplied from a thermostated bath. The leaves were sealed into the chamber by soft rubber strips.
The leaf chamber was connected to a gas circuit including an IRGA (Lawlor and Young, unpublished), so photosynthetic

.100
Lateral view
o o - - -
Top view
1. lamp 2. fan 3. aluminium foil 4. air out 5. water out 6. rubber seal 7. attached leaf 8. air in 9. water in
Fig. 15. Rectangular Perspex chamber (-10 0cm3.) for attached leaves.

.101
rates could be measured. The flow of air was 600m£/min and two temperatures (8°C and 20°C) were used.
Leaves were illuminated during each treatment at HOOyE m *2sec""1 supplied by two mercury vapour lamps NBFR/U Kolor lux 1000 watt.
I.e. Gas mixtures
Air with different C02 concentrations, from 100 vpm to 600 vpm was prepared from pure C02 and C02-free air obtained from gas cylinders using three Wosthoff pumps (SA 18/3F; SA 27/3? SA 27/3F).
l.d. Killing of the leaves
The leaves were illuminated for about 30 min in the appropriate gas mixture until steady photosynthesis was achieved. The leaves were then cut and immediately dropped in liquid nitrogen.
Leaf samples were freeze dried in an FTS system, Dura-dry freeze-drier.
I.e. Extraction of RuBP
The dried leaf samples were.weighed, cut in small pieces (2mm wide) and dropped in 6m£ boiling 50% ethanol + 0.1% EDTA. After boiling for 2 min, the liquid was decanted and the extraction was repeated three more times with respectively 6m£, 4m£ and 4m£ of 50% ethanol + 0,1% EDTA, The extracts were combined together, centrifuged at 2000 r.p.m. for 5 min and the supernatant liquid dried down under vacuum over

.102
anhydrous calcium chloride.
Residues were dissolved in 2m£ of water and from the solutions obtained 0.25mJ£ samples, were taken for estimations of the amount of RuBP, as described in A.1I.e.5..

.103
R E S U L T S
A. EXPERIMENTS WITH DETACHED LEAVES
Except where stated otherwise, Triticum aestivum, var. Kolibri, was used, and five leaf segments, each 4cm long and 0.5cm wide, cut from the second leaves of five 13 day old plants, formed a sample.
1. Effect of temperature and carbon dioxide concentration on the inhibition of photosynthesis by oxygen
The effect of photorespiration on apparent photosynthesis at various temperatures and carbon dioxide concentrations was examined by measuring net CO2 exchange in 2% and 21% oxygen in an open gas flow system using an infra-red gas analyser. The reason for measuring photosynthesis at 2% oxygen instead of 0% oxygen is that the stomata of wheat are unstable in an 02-free atmosphere (Akita and Miyasaka, 1969) and some oxygen is necessary for both opening and closing of wheat stomata (Akita and Moss, 1973) . The flow rate was kept constant at 480m£/min. Two C02 concentrations, 314.5 vpm and 380.0 vpm C02, and three temperatures, 10°C, 20°C and 35°C, were used. The light intensity during measurements was 47,500 lux. The samples of leaf segments were allowed to photosynthesize for 60 min in air at 314.5 vpm C02 at the required temperature to establish steady-state photosynthesis. The gas mixture was then changed to one with 314.5 vpm C02 in 2% oxygen followed by 380.0 vpm C02 in air and then 380.0 vpm C02 in 2% oxygen. Each gas mixture was supplied to the

.104
leaf sample for 10 min to allow a new steady rate of photosynthesis to be attained. The results are shown in Table 2.
As found by Tregunna et al. (1966), Jolliffe and Tregunna (1968, 1973) and Canvin (1978), the apparent rate of photosynthesis was rapidly and reversibly responsive to changes in oxygen concentrations. The photosynthetic rate was significantly decreased at both C02 concentrations in 21% compared to 2% 02 when the temperatures were 20°C and 35°C and also at the lower C02 concentration when the temperature was 10°C. However, at 10°C in 380 vpm C02, 21% oxygen stimulated rather than inhibited the rate of net photosynthesis but this stimulation was not statistically significant (P = 0.05). The fastest rates of apparent photosynthesis for each combination of oxygen and carbon dioxide concentration were at 20°C. Jolliffe and Tregunna (1968), using wheat shoots at 300 vpm C02, found that the optimum temperature for photosynthesis increased from 20-26°C to 30-36°C when the oxygen concentration was decreased from 21% to 3%.
The lowest photosynthetic rate (Table 2) was at 21% oxygen, 314.5 vpm C02 and 35°C, i. e., at the highest oxygen concentration, the lowest C02 concentration and the highest temperature. Table 3 shows the percentage inhibition of photosynthesis by oxygen calculated from the data in Table 1, using the equation of Bjorkman (1966) ,
A P S 2 % 0 9 ~ A P S 2 1 % 0 o
% I ~ — — f - r*2" X 100 2 % 0 2
where APS2%0^ is the apparent rate of photosynthesis in 2%

.105
Table 2. . Photosynthetic rates at three temperatures, two carbon dioxide concentrations and two oxygen concentrations measured using the IRGA.
Rates of apparent photosynthesis (mq CO? d m " 2 h " 1 )
TEMP, °C 10 20 35
OXYGEN % 2 21 2 21 2 21
21«93 (6) 17«28 <6> 29.70 (4) 22.92 (6) 22.08 (5) 13.50 (5) vpm lu2
380 0 19'78 22-63 ^ 28.58 (4 ) 25.40 (6 ) 24.09 ( 4) 15.68 ( 4) vpm lu2
Standard error per observation from analysis of variance =3.78
To calculate standard error of means account must be taken of the differing number of replicates shown in parenthesis after
3.78 each mean I i. e /~rT
Table 3. The percentage inhibition of photosynthesis by 02
shown by data in Table 2.
co2
314,5 vpm 380.0 vpm
10°C 21% -14% 20°C 23% 11% 35°C 39% 35%

.106
oxygen and A P S 2 1^o 2 i s t h e aPP a r e n t rate of photosynthesis
in 21% oxygen.
Inhibition by oxygen was decreased by increasing the CO2 concentration and decreasing temperature. Increased CO2
concentrations can often overcome the inhibitory effect of oxygen on apparent photosynthesis (Coombs and Whittingham, 1966? Jolliffe and Tregunna, 1968, 1973; Ku, Edwards and Tanner, 1977) . Indeed as in Table 2 a small stimulation of net photosynthesis by oxygen at lower temperatures was reported by Jolliffe and Tregunna (1968, 1973) in wheat shoots and Machler and Nosberger (1978) in Trifolium repens L.. However, in Tables 2 and 3, higher C02 concentrations and lower temperatures were necessary to achieve such a result. Keys et al. (1977), using attached wheat leaves at 350 vpm CO2, observed an increase in the rate of photosynthesis at 2% when compared with 21% oxygen at all the temperatures they studied (13°C, 18°C, 23°C and 28°C). However, as in Tables 2 and 3, the increase was less as the temperature decreased. The amount of inhibition by oxygen probably depends greatly on the conditions in which measurements are made. Since lowering the oxygen from 21% to 2% did not increase photosynthesis at 10°C and 380 vpm CO2 it seemed important to establish whether there is a temperature below which photorespiratory metabolism is not operating. This was investigated using photosynthesis in 1 1 +cc> 2 .
In preliminary experiments, two temperatures, 10 C and 25°C, were used whereas in the main experiments four temperatures were used, 5°C, 10°C, 20°C and 35°C.

.107
2, Effects of temperature on incorporation of radioactivity into various compounds during steady-state photosynthesis at 350 vpm COz and 21% oxygen — Preliminary experiments
2.a. Using the cylindrical chamber and flag leaves
The plants for this experiment were grown in a glass-house. Three pieces, each 0.5cm x 4cm, were cut from flag leaves, to form samples.
The samples were enclosed in the cylindrical leaf chamber (Fig. 2), with the cut basal ends immersed in distilled water. Samples were illuminated from one side at 47,500 lux while a gas containing 350 vpm C02 and 21% 0 2
flowed through the chambers at 450m£/min. After 60 min the gas supply to the chamber was changed to 350 vpm llfC02 in air for 5, 10 or 15 min (Tables 4 and 5). Samples were either removed and extracted immediately after the exposure to lltC02 or after 15 min in llfC02 followed by 1, 2, 3, 5 and 10 min in 350 vpm 12C02 in darkness or in 1000 vpm 12C02 in light. The results presented in the tables are corrected so that the sum of 1HC in the individual products recovered is in proportion to a mean of actual sums for groups of samples exposed to 1 for 15 min. This mean is also shown with the S,D, at the foot of the tables.,The reason for the high S,D, is thought to be the small number of leaf pieces per sample. After 5 min photosynthesis in 14C02 at 25°C (Table 4) the same percentage of the total radioactivity was found in the sugar phosphates (PGA, F6P, G6P, UDPG, PEP) and glycine, i. e., 13%, whereas 9% and 50% were found respectively

Table 4. ltfC in various products during steady-state photosynthesis in air with 350 vpm 1I+C02 and subsequently in 350 vpm 12C02 in the dark or in 1000 vpm'c02 in light. Temperature - 25°Ct
350 vpm lt+C02 350 vpm 1 2C0 2 in darkness 1000 vpm 1 2C0 2 in light
TIME (min)
NO, SAMPLES (3).
10
C3)
15
(3) (2) (1) (1) (1)
10
(2) (1) (2)
1 4C in various compounds (dpm x10 3) corrected to give a total equal to the mean at the foot of the columns.
(2)
5
(2)
10
(2)
Glycolate 22 22 30 20 23 20 19 21 22 19 19 15 19 Malate 114 252 268 307 448 428 424 354 ' 316 187 196 178 227 Amino acids 264 307 290 397 483 454 564 651 159 210 249 218 436 Glycerate 97 126 169 174 175 128 165 156 91 137 181 107 42 Glycine 455 589 787 442 443 317 287 158 299 141 131 73 141 Serine 301 318 324 1032 620 721 772 720 298 317 279 138 126 Sucrose 1730 4705 7752 7401 7543 7610 7586 7943 9675 10171 10207 10685 10456 Sugar phosphates 451 509 700 470 568 595 396 299 641 306 223 77 28 MALT + RAF 4 17 18 30 33 . 28 30 39 36 37 36 58 41 .Others 4 24 14 6 - - - - - - - - -
Residue 43 102 104 97 - - - - 177 181 179 155 180
co 2 80 120 155 213 . H 5 43 41 47 43 51
Mean total l l tC per sample after 15 min 10456 ± 2481 11747 ±1072 in ll+C02 ± S.D.

Table 5. ll*C in various products during steady-state photosynthesis in air with 350 vpm ll*C02 and subsequently in 350 vpm 12CC>2 in dark or 1000 vpm CO2 in light. Temperature - 10°C.
350 vpm J t fC0 2 350 vpm 1 2C02 i n darkness 12 1000 vpm C02 i n l i g h t
TIME (min) 10 15 10 10
NO. SAMPLES (3) (3) (3) (2) (1) (1) (1) (2) (1) (1) (1) (1) (1)
C i n v a r i o u s compounds (dpmxiO*" 3 ) c o r r e c t e d t o g i v e a t o t a l equa l t o t h e mean g i v e n a t t he f o o t o f the column.
Glycolate 15 22 22 6 10 12 7 5 16 16 13 11 21 Malate 30 66 95 139 93 74 95 115 . 148 154 116 129 117 Amino acids 42 85 111 134 151 150 183 240 146 165 182 226 300 Glycerate 49 70 71 102 119 139 132 109 141 .131 133 178 127 Glycine 432 629 636 749 494 452 299 119 515 344 199 165 182 Serine 128 182 201 479 551 807 683 569 455 490 413 407 380 Sucrose 1183 3046 5186 4778 4875 4670 4979 5358 6934 7127 7477 7520 7592 Sugar phosphates 416 524 599 484 601 581 523 351 439 362 243 132 73 MALT + RAF - 6 - - . - - 13 13 13 13 17 -Others 1 2 3 5 5 4 7 - - - - -
Residue 32 29 52 50 42 51 41 70 2 5 18 21 46 co 2 - - t" 57 40 40 35 25 29 31 31 32 -
Mean t o t a l l l f C pe r sample 6981 ±2647 8838 ±2463 a f t e r 15 min i n l l tC02 ± S.D.

.110
in serine and sucrose? at 10°C (Table 5), 18%, 19% and 6% of
radioactivity were found in sugar phosphates, glycine and
serine respectively, with 51% in sucrose.
After 15 min photosynthesis in lhC0z, at 25°C, the percentage of 1 in sugar phosphates, glycine and serine was 7%, 8% and 3% respectively, whereas 1 hc in sucrose increased to 74%, At 10°C, after 15 min 1IfC02, lhc found in sugar phosphates, glycine and serine was 9%, 9% and 3% respectively with 74% in sucrose. These results suggest that at both temperatures the radioactivity in sucrose is derived not only from the radioactivity in sugar phosphates but also from that in the intermediates of the glycolate pathway, glycine and serine. Formation of sucrose from these intermediates as well as intermediates of the Calvin cycle was demonstrated by Tamas and Bidwell (1971), Kumarasinghe (1975) and Waidyanatha et al. (1975a).
After 5 min photosynthesis in l hC0zf radioactivity in the amino acids (aspartate, alanine, glutamine and glutamate) at 25°C is 8% whereas at 10°C it is.only 2% of the total carbon fixed. After 15 min 14C02 the percentage of 1 hC in the amino acids decreased to 3% at 25°C and was unchanged at 10°C. This may suggest that the formation of amino acids, e. g, thexdiversion of 14C to formation of amino acids, as well as the further metabolism of these compounds is greater at 25°C when compared with 10°C. Also, at the lower temperature, the proportion of 1IfC in sugar phosphates and glycine is higher.
As a percentage of the total 1£*C in the sample after

Ill
15 rain photosynthesis in ll*C02, more radioactivity was found in sugar phosphates and less in the amino acids at 10°C when compared with 25°C, The percentage of in sucrose was the same for both temperatures.
Glycine and serine are essentially saturated with 1!|C in 15 min (Atkins, Canvin and Fock, 1971; Kumarasinghe, 1975), although the data in Table 4 taken alone are not convincing on this point. However, saturation of glycine and serine was observed after 15 min with 1£fC02 when the temperature was 10°C (Table 5),
When the atmosphere was changed to 1000 vpm 12C02 in light following 15 min photosynthesis in ll*C02 (Tables 4 and 5) , because of the increased photosynthetic rates at this higher C02 concentration, the intermediates of the Calvin cycle were rapidly saturated with 12C with a consequent rapid decrease in radioactivity in sugar phosphates. After 10 min flushing in 1000 vpm C02 the observed decrease in radioactivity in sugar phosphates was higher at 25°C than at 10°C.because the photosynthetic rate is higher at 25°C. The percentage of the radioactivity in sugar phosphates after 10 min in 1000 vpm C02 is higher at 10°C than at 25°C. Also, due to the increased uptake of 12C02 that competes strongly for available energy and reducing power the recycling of llfC in serine already in the tissue, through the chloroplastic pools, will decrease. Therefore 1 **C may accumulate in serine because of decreased metabolism of this compound.
Kumarasinghe (1975) found an accumulation* of ll*C in o k serine at 25 C after the first minute of fluslng-out in

.112
1000 vpm CO2 but subsequently observed a loss. The results in Table 4 are not consistent with this observation, since serine decreased during the first minute of flushing-out in 1000 vpm CO2 and after that time accumulates until 2 min. However, this is the result of only one experiment, which has not been repeated.
At 10°C there was an increase in 14C in serine during the first and second minutes. From that time up to 10 min of flushing-out the radioactivity in serine declined at both temperatures, this decline being greater at 25°C, suggesting that the further metabolism of serine had not been suppressed completely.
Since the intermediates of the Calvin cycle provide the substrate for the glycolate pathway and since these intermediates were rapidly saturated with 1 2C, little new [-14c] glycine will be made during the flushing-out period and a decrease in the radioactivity of glycine will be expected. The observed decrease in radioactivity in glycine was greater at 25°C than at 10°C.
At the end of 10 min flushing radioactivity had increased only in sucrose and amino acids. The greater increase of 14C in the amino acids at 25°C agrees with the fact that at higher temperatures the diversion of radioactivity from the Calvin cycle intermediates to these compounds is higher, perhaps due to a higher requirement of the cell. The percentage accumulation in sucrose is greater at 25°C and the decrease in sugar phosphates is almost enough to account for the increase in sucrose. At 10°C the

.113
decrease in sugar phosphates is not enough to account for
the increase in sucrose.
In Tables 4 and 5 data for flushing-out in darkness at 350 vpm C02 following 15 min photosynthesis in 350 vpm 1 **CO2 is also included. In darkness, while photosynthesis ceases almost instantaneously, photorespiratory metabolism may continue for a short while utilizing the substrate produced immediately before darkening. Radioactivity in the sugar phosphates decreased at both temperatures but more slowly than when the flushing-out was in light in 1000 vpm C02. The decrease was faster at 25°C. At both temperatures, this decrease could account for the increase in sucrose.
Since photorespiration continues for a short while, a decrease would be expected in 1hC in glycine on darkening, and, since light is required for further metabolism of serine (Miflin et al., 1966? Waidyanatha et al., 1975a), an increase in l h C in serine would be expected. This general trend is evident at both temperatures but the data show inconsistencies. Thus, whereas the H C in glycine decreased at 25°C, at 10°C there was an increase of radioactivity in glycine during the first minute flushing-out followed by a decrease.
In darkness, as during flushing-out in the light, there was an increase in radioactivity in the amino acids and this increase was greater at 25°C.
Some inconsistencies were found in these results that
should be pointed out:
1 — A discrepancy between the results in Table 4,

.114
concerning the saturation of glycine and serine pools after 15 rain photosynthesis in 14CC>2, with those of Atkins et al.
(1971), Kumarasinghe (1975).
2 - The observed changes of 1hC in glycine and serine were not completely consistent with those of Kumarasinghe (1975).
3 - There was a considerable variation in total 1 4C assimilated in 15 min photosynthesis in 14CC>2.
In view of these anomalies it was concluded that a bigger sample of leaves was needed with more replications. It was also evident that further experience with the technique was needed to improve accuracy.
2 ,b. Using the rectangular chamber and flag leaves
The rectangular chambers already described were used so that samples of five pieces of flag leaves instead of three could be evenly illuminated. To decrease the number of analyses, pairs of samples were taken after 15 min exposure to 350 vpm 14C02 and after 15 min in 14CC>2 plus 1 min in the dark at the same C02 concentration or plus 1 min in light at 1000 vpm 12CC>2. Each treatment was replicated six times when flushing-out was in darkness (Table 6) but only 2 or 4 replicates were made for flushing-out in 1000 vpm 12CC>2 (Table 7) , The same two temperatures, 10°C and 25°C, were used as before.
The higher relative radioactivity in sugar phosphates at 10°C compared to 25°C and in the amino acids at 25°C

.115
Table 6. Radioactivity,in various compounds after 15 photosynthesis in 350 vpm 14C02 and after subsequent flushing-out in air in the dark.
25°c io°c 1^C in various compounds (dpm 10 3)
TIME (min) 15 1 t|C02 1 (Dark-Air) 15 ll*C02 1 (Dark
NO. SAMPLES (6) (6) (6) (6)
Glycolate 60 18 52 12 Maiate 439 447 240 233 Amino acids 483 419 260 275 Glycerate 111 238 76 103 Glycine 907 477 678 444 Serine 900 1254 684 859 Sucrose 12280 12466 8780 8819 Sugar phosphates 1057 876 1137 941 MALT + RAF 44 40 15 . 19 Others 130 101 43 16
TOTAL (means ± S.D.)
16411 ±1630 16336 ±1278 11965 ± 1624 11721 ± 1505

.116
Table 7. Radioactivity in various compounds in 350 vpm 1 CC^ and after subsequent flushing-out in 1000 vpm C02 in the light.
25°C lo°C U C in various compounds (dpm 10~3)
TIME (min) 15
NO. SAMPLES (4)
Glycolate 66 Malate 400 Amino acids 464 Glycerate 98 Glycine 772 Serine 974 Sucrose 9193 Sugar: phosphates . 1045 MALT + RAF 48 Others 59
C02 1 (1000 vpm light)
(4)
27 390 515 193 527
1131 11165
618 48 81
15 1 4C0 2
(2)
42 133 183 56 660 614
5652 696 11 23
1 (lOOO vpm light)
(2)
14 218
274 67
592 775
8081
618
12
35
TOTAL (Means ± S,D.)
13119 ±1956 14695 ±1025 8070 ±373 10686 ±136 0

.117
compared to 10°C was observed again. The loss of 1UC from glycine and increase in serine during 1 min of flushing-out was a consistent feature at 10°C and 25°C suggesting photorespiratory metabolism at both temperatures. Photosynthetic rates (Table 8) in mgC dm"2h~J were calculated from data in Tables 4, 5, 6 and 7 using the following formula:
d x 1 x 1 12 1 60 p specific activity 2 . 2 2 x i o 6 1000 leaf area 15
in yCi/ymole (dm2)
Table 8. Photosynthetic rates obtained after 15 min in 350 vpm 1IfC02 calculated from Tables 4, 5, 6, and 7.
Cylindrical chamber Rectangular chamber
mg C dm"2h~1
25°C 10°C 25°C 10°C
4.70 3.36 3.85 2.70
The specific activity of' l l i C 0 2 = 0.85 yCi/ymole
The photosynthetic rates obtained with the rectangular chambers were not higher than with the cylindrical one (Table 8) and the results were not regarded as sufficiently

.118
reproducible for accurate calculations of C flux to be made. It was therefore decided to make a further modification and use leaves from young wheat plants instead of flag leaves.
3, Effects of temperature on incorporation of radioactivity into various compounds during steady state photosynthesys at 200 vpm CO? and 350 vpm CO? and 21% oxygen Main experiments with leaves from young plants in the rectangular leaf chamber
Segments of leaves of 13 day old wheat plants gave reproducible results (Kumaransinghe, 1975) , so plants of this age were used in further studies. The plants were grown in a growth room where the conditions, especially the temperature, were more constant than in the greenhouse. As in the previous experiments, after steady photosynthesis was attained, lltC02 was supplied for 15 min, but now at 200 vpm as well as 350 vpm C02 at three temperatures, 10°C, 20°C and 35°C (Table 9) or 5°C, 10°C and 20°C (Table 11). For each set of experiments it was necessary to prepare several cylinders containing lltC02. These varied slightly in the concentration of C02 present. For the purpose of the main results it was assumed that the concentrations were 200 and 350 vpm.
v'x
Samples were taken after 15 min in ll*C02 and after 15 min in ll*C02 plus 1 min in light at 1000 vpm C02 or plus 1 min in darkness in 200 vpm or 350 vpm C02.
For each compound in Tables 9 and 11 an analysis of variance was made for values of JltC present after 15 min and

Table 9. Radioactivity in various compounds (dpm x10*"3 per sample) after 15 min photosynthesis in 1 4C0 2 and after flushing-out in light for 1 min at 1000 vpm at three temperatures and two C02 concentrations.
[002]
TEMPERATURE 200 vpm 350 vpm
10°C 20°C 35 C 10° C 20°C 35 C *S.E,
TIME 15 16 15 16 15 16 15 16 15 16 15 16 PLICATES 6 5 7 6 6 6 12 10 6 6 12 12
Glycolate 43 17 44 24 38 24 50 25 72 37 45 34 12 Malate 338 305 507 471 380 453 424 472 752 702 571 509 151 Glycerate 118 115 122 138 70 159 431 450 375 395 84 136 67 Glycine 1702 1371 2017 1553 1285 1125 1351 988 2126 1532 1020 798 274 Serine 560 732 684 981 742 993 829 1113 919 1339 950 1113 ' 141 Sucrose 4494 4620 5331 5491 3957 4949 10092 11203 13488 13768 6344 7326 1518 PEP 8 9 10 10 10 11 33 30 37 29 21 16 6 P-glycolate 3 2 2 1 2 1 15 5 20 7 10 6 7 F-6-P 185 127 133 70 84 53 450 287 333 155 121 78 34 G-6-P 392 310 267 193 182 155 981 737 657 389 270 200 78 UDPG 28 21 34 27 42 27 41 35 54 35 60 41 9 PGA 120 79 135 90 114 60 617 422 624 363 258 115 98 MALT + RAF 7 6 15 16 24 31 23 26 41 45 40 46 6 RuBP+ FBP 1 1 1 0 1 0 23 13 24 13 13 7 8 Aspartate 132 159 196 234 252 304 284 332 330 413 498 575 81 Alanine 61 68 61 99 106 163 116 138 132 214 453 453 61 Glu. +Glu,NH2 107 95 160 144 132 143 145 136 273 251 202 202 32 Others 120 103 159 151 187 218 294 319 300 277 258 281 60 C02 - 99 - 164 - 204 - 134 - 207 - 160 35 Residue 502 375 584 500 709 650 742 705 966 915 778 760 231
TOTAL 8921 8614 10462 10357 8317 9723 16941 17570 21523 21086 11996 12856 2146
•S tandard e r r o r ? t h i s i s a pooled e s t i m a t e of t h e s t anda rd e r r o r of a s i n g l e o b s e r v a t i o n . To c a l c u l a t e s t anda rd e r r o r s of means account must be taken of t he differing numbers of replicates.

.120
a separate analysis of variance of 14C present after 15 min plus 1 min flushing -out.
3. a. Distribution of J ''C among products after 15 min photosynthesis in 1 4C0?
As in the previous experiments, it was found that there was a relative increase in radioactivity in phosphate esters, especially in F6P and G6P at lower temperatures. After 15 min with 14COz the percentage of total radioactivity present in F6P at 10°C, 20°C and 35°C was respectively 2.07, 1.27 and 1.01 for 200 vpm CO2 and 2.66, 1.55 and 1.01 for 350 vpm C02 (see Table 10). The percentage of total 14C present in G6P for the same temperatures was respectively 4.39, 2.55 and 2.19 for 200 vpm and 5.79, 3.05 and 2.25 for 350 vpm C02.
The increased percentage of 14C in F6P and G6P at the lower temperatures is not accompanied by an increase in radioactivity in UDPG and sucrose.
Contrary to effects on F6P and G6P the percentage of 14C present in the amino acids, especially alanine, glutamate +glutamine and aspartate, decreased as temperature decreased. At 350 vpm CO2, compared with 200 vpm CO2, the percentage of radioactivity accumulated in F6P, G6P and sucrose was greater, whereas the accumulation in glycine and serine was lower. This is consistent with the results of Bishop and Whittingham (1968) and Lee and Whittingham (1974) for tomato plants, but not with the report of Snyder and Tolbert (1974) .

.121
Table 10. Percentage of total Jassimilated, after 15 min photosynthesis in 14C02, taken from Table 9.
[C02 ]
TEMPERATURE 10° C
200 vpm
20°C 35°C 10°C
350 vpm
20°C 35°C
F6P 2, 07 1. .27 1, ,01 2. .66 1. .55 . 1. ,01.
G6P 4, ,39 2. .55 2. .19 5. .79 3. ,05 2. ,25
UDPG 0. .31 O. .32 0, .50 0. .24 0. .25 0. .50
Sucrose 50, ,38 50, .96 47, ,58 59. .57 62. .67 52. .88 G lyc ine 19. .08 19. .28 15. .45 7. .97 9. .88 8. .50 Ser ine 6, .28 6, .54 8. .92 4. .89 4. .27 7. .92
A lan ine 0, ,68 0, .58 1, ,27 0. .68 0. .61 3. .78 Glu.+Glu,NH2 1. .20 1, .53 1, .58 0. .86 1. .27 1. .68
Aspar ta te 1, .48 1, .87 3. ,03 1, .68 1. .53 4. .15
Others 14, .13 15 .10 18 .47 15, .66 14, .92 17. .33

.122
The percentage of 1 4C accumulated in glutamate +glutamine was higher at the lower CO2 concentrations for 10°C and 20°C, whereas the percentage in alanine did not change. The percentage of a 4C in aspartate increased at 350 vpm C02 between 10°C and 20°C but decreased from 20°C to 35°C. At the highest temperature, 35°C, alanine, glutamate +glutamine and aspartate increased with C02 concentration.
Similar results after 15 min photosynthesis in 200 vpm or 350 vpm 14C02 are shown in Tables 11 and 12 where the lower temperature of 5°C was used with 200 vpm C02. At 5°C the percentage of radioactivity in the sugar phosphates was further increased compared to 10°C.
Again in this experiment, the increased percentage of radioactivity in F6P and G6P is not accompanied by an increase of 14C in sucrose. The small discrepancy between Tables 10 and 12 concerning the amount of 14C accumulated in the different compounds mainly at 200 vpm C02 may be due to the fact that for the latter a different variety of wheat, namely Highbury, was used.
3.b. Effects of temperature on photorespiration
3eb,i, Flushing-out in light with 1000 vpm CO?
1? Flow of carbon through the glycolate pathway
Upon changing from 200 vpm 1 4CQ2 or 350 vpm 1 '•CO;, to 1000 vpm 1 2CO2 , one would expect (a) the formation of little new f1 4c] glycine due to a rapid saturation of the intermediates of the Calvin

Table 11. Radioactivity in various compounds (dpmxio'3 per sample) after 15 min photosynthesis in 1I+C02 and flushing-out in darkness for 1 min at the same C02 concentration as before.
[C02]
TEMPERATURE
+200 vpm 350 vpm
*S.E. [C02]
TEMPERATURE / 5°C 10°C 20°C 10°C 20°C 35 °C *S.E.
TIME 15 16 15 16 15 16 15 16 15 16 15 16
NO. REPLICATES 9 9 9 9 9 9 9 9 9 9 9 9
Glycolate 34 14 48 21 44 24 50 27 69 37 44 30 4 Malate 90 109 274 312 536 574 382 353 812 795 523 512 42 Glycerate 91 121 129 167 146 183 561 524 588 573 163 231 25 Glycine 860 830 1800 1433 2130 1790 1064 862 2135 1555 1179 699 102 Serine 284 435 500 751 815 1219 1088 1359 1284 1775 1258 1492 66 Sucrose 2938 3503 5511 5913 7102 7381 10841 11109 15185 15793 9085 8628 600 PEP 24 .62 33 73 29 83 34 60 36 87 32 69 3 P-glycolate 13 6 10 8 9 5 6 5 9 6 12 7 2 F-6-P 328 249 291 172 232 113 496 259 338 166 155 79 13 G-6-P 774 673 627 463 477 333 1202 892 784 554 342 237 30 UDPG 32 34 48 40 64 51 45 39 52 43 62 55 3 PGA 373 447 527 481 606 569 596 563 675 597 429 360 30 MALT + RAF 6 9 18 20 22 25 34 38 50 54 89 100 4 RuBP + FBP 39 26 26 17 20 9 17 10 19 7 24 14 3 Aspartate 39 56 94 109 213 195 345 332 492 418 636 586 29 Alanine 31 46 76 68 104 116 112 128 250 198 399 404 24
. Glu,+Glu.NH2 35 44 91 90 131 131 126 122 238 235 237 287 14 Others 94 93 159 131 203 178 461 444 460 382 351 304 24 CO 2 - 56 111 - 186 - 131 - 241 - 190 10 Residue - - - - - - 1142 1064 1533 1418 1088 1056 89
TOTAL 6085 6813 10262 10380 12883 13165 18602 18321 25009 24934 16108 15340
+For this experiment at 200 vpm C02 a new variety of wheat was used? Triticm aestivum viz. Highbury. *S,E. of the means.

.124
Table 12. Percentage of total 1^c assimilated after 15 min photosynthesis in lltCC>2, taken from Table 11.
[C02] *200 vpm 350 vpm
TEMPERATURE 5 °C 1C »°C 20°C 10°C 20°C 35 °C
F6P 5 . 40 2 . 84 1 .80 2 .67 1 .35 0. 96
G6P 12. 72 6 . 11 3 .70 6 .46 3 .13 2. 12
UDPG 0 . 53 0 . 47 0 .50 O .24 0 .21 0. 38
Sucrose 48. 28 53. 71 55 .13 58 .28 60 .72 56. 40 G lyc ine 14. 13 17. 54 16 .53 5 .72 8 .54 7 . 32
Ser ine 4 . 67 4 . 87 6 .33 5 .85 5 .13 7. 81
A lan ine 0. 51 0. 74 0 .81 0 .60 1 .00 2 . 48
G lu . + Glu.NH2 0. 58 0. 89 1 .02 0 .68 0 .95 1. 47
Aspar ta te O. 64 0. 92 1 .65 1 .85 •1 .97 3. 95
Others 12. ,54 11. 91 12 .53 17 .89 17 .00 17. 11
*Triticum aestivvm v i z . H ighbury .

.125
cycle wtth } 2C (Bassham and Kirk, 1962), (b) a decreased formation of glycolate (Bishop and Whittingham, 1968; Lee and Whittingham, 19741, (c) no stimulation of conversion of glycine to serine (Kumarasinghe, 1975), (d) decreased metabolism of serine. Thus, during 1 min in 1000 vpm CO2, a decrease of radioactivity in glycine should occur, at the same time as an increase in serine and evolution of 14C02-Because of the 14C02 in tubes and leaf chamber at the moment flushing-out begins it was decided to discard gas for the first twelve seconds of flushing-out. If the intermediates of photorespiratory metabolism, glycine and serine, are saturated after 15 min photosynthesis in 14C02, the rate of loss of 14C from glycine during flushing-out may be used to calculate the rate of conversion of glycine to serine. The value obtained may be assumed to apply to the preceding steady state and to be. a measure of the flow of carbon through the glycolate pathway. The formula applied to calculate the fluxes in mg carbon•dm"2•h~1 was:
(dpm at 15 min 14C02-dpm at 15 min 1 4C02+1) x — r ™ r ~ e * 1 ;• x 6 0 . 2.22x10 Specific 1000 leaf
activity area (yci/ymole) (dm2)
The results are shown in Table 13. For both C02 concentrations, the most rapid fluxes of carbon from glycine were at 20°C. The flow at 35°C is less even than at 10°C.
If two molecules of glycine are converted to one each of serine and CO2 (see Eq. 2 in Introduction) and the CO2 evolved in photorespiration is mainly due to this reaction (Goldsworthy, 1966; Kisaki and Tolbert, 1970; Bird et al. ,

.126
Table 13. The flow of C from glycine into serine and C02
compared to net photosynthesis calculated from data in Table 9 (flushing-out in the light in 1000 vpm 1 2C0 2 t
[002]
Temperature
F l u x of C f rom G lyc i ne
10°C
1,07
200 vpm
1 .50
350 vpm
20°C *35°C 10°C 20°C *35°C
Flow o f C (mg dm""2*!"1)
0152 1.18 1.93 0.72
F lux o f C i n t o Ser ine
0.56 0.96 0 ,81 0,92 1.36 0 .53
F lux o f C i n t o CO 2
0,32 0,53 0.66 0,43 0.67 0.52
Net pho tosyn thes i s 1 ,90 2,25 1.95 3.73 4 .61 2.69
S p e c i f i c a c t i v i t y o f t he 1 4C02 s u p p l i e d = lyCi/vtmole
*At 35°C t h e r e i s a b i g d i sc repancy between mean t o t a l s of 1,+ C02
recovered be fo re and a f t e r t he f lush ing^-ou t (see Table 9) e s p e c i a l l y
f o r t he data a t 200 vpm C02 where each mean was de r i ved from 6
r e p l i c a t e s ; , means o f t o t a l s were i n b e t t e r agreement where t h e r e
were 12 r e p l i c a t e s a t 350 vpm C02 . However, because the cause o f
the d isc repancy i s not known we would d i s rega rd t he f l u x e s c a l c u l a t e d
f o r 35°C,

.127
1972) 25% of C-flux from glycine should be evolved as C02 in photorespiration and 75% should appear in serine.
At 200 vpm C02, the measured values of C02 evolved as a percentage of carbon flux from glycine were 30% and 35% at 10WC and 20 C respectively. The corresponding values for 350 vpm C02 are 36% and 35% of carbon flux from glycine. For the same temperatures the values for 14C entering serine as a percentage of carbon flow from glycine were 52% and 64% at 200 vpm C02 and 78% and 70% at 350 vpm C02. Thus, at 10°C and 20°C at both C02 concentrations, more 14C02 is evolved than would be expected from the rate of loss of 14C from glycine. Also less 14C goes into serine at 200 vpm C02
than the expected 75%. Kumarasinghe (1975) also found a. rate of C02 evolution faster than expected from the loss in glycine. Indeed 14C02 was being produced when there was no longer a decrease of 14C in glycine. Kumarasinghe (1975) suggested that part of the extra 14C02 evolved into the atmosphere at 1000 vpm C02 was caused by recycling of carbon from serine by way of glycolate pathway. Dark respiration could also be responsible for additional C02 evolved. From a study of the effect of light on the tricarboxylic acid cycle metabolism in leaves, Chapman and Graham (1974) concluded that dark respiration proceeds at an equal rate in light and darkness. Similar conclusions have been proposed by Stepanova and Boranova (1972) from experiments In which succinate or 4c] acetate were fed in light
or dark for 30 min to rhubarb or tobacco leaves. Also, evidences that dark respiration continues in light were provided by Zelitch (1971, 1973) and Raven (1972a, b) .
.128
M^ngat et C1974). found that dark respiration occurs in light but at only 25% of the rate in the dark. Fock, Klug and Canvin (.19791 argued on the basis of a high relative . specific activity of photorespiratory CO2 and very little 1 C label in Krebs^cycle intermediates during illumination (Przybylla and Fock, 1976), that dark respiration seems to be inhibited in the light.
Lately, it was concluded by Graham and Chapman (1979) from biochemical experiments, that initially in the light the tricarboxylic acid cycle (TCA) is inhibited, but subsequently it can operate at a rate comparable with that in dark. Further, they concluded that it was possible that such a situation occurs in younger, growing tissues while in mature tissues the TCA cycle may function at a lower rate and be subject to greater inhibition in the light. Tables 4, 5, 7 and 9, all show radioactivity in malate, and other intermediates of the Krebs cycle. Hence the existence of dark respiration in light must be recognized in attempts to calculate photorespiratory rates from l hC changes in the leaf.
The fact that at 10°C and 20°C less [ l kc] serine is formed than expected from the fluxes of carbon from glycine, mainly at 200 vpm C02, may be due to some further metabolism of serine. At 350 vpm C02 approximately the expected increase in serine was obseryed, the value at 20°C being slightly lower and that at 10°C slightly higher.
At 35°C, 1000 vpm 12C02 may be less effective in slowing glycine production and recycling of serine than at 10°C and

.129
2Q°C, because the solubility of CO2 in the liquid phase of the leaf will be less (Ku and Edwards, 1977b) . This could explain the very low apparent flux from glycine and the relatively high rate of C02 production at this temperature. The apparent flux of C into serine is too high when compared with the flux from glycine especially at 200 vpm C02, and flux into serine is not three times the C02 evolved. This may be due to the fact that at 35°C serine continues to be metabolized. It should be pointed out that the data at 35°C showed a discrepancy similar to that in Table 7. The total 14C measured, including 14C02 evolved for the samples flushed for 1 min, was less in the sample taken at the end of 15 min in 14C02, This cannot be explained by retention of dissolved 14C02 in the leaf sample, and further assimilation of this 14C02 during the flushing period since the difference is too large. Thus, fluxes calculated from 14C in glycine and serine after the flushing-out, at 3 5°C cannot be unequivocally explained.
2. Flow of C through the glycolate pathway
as compared with net photosynthesis
The- rate of 14C loss from glycine (Table 13) can be used as a measure of the proportion of carbon fixed in photosynthesis which is metabolized by way of the glycolate pathway.
Net photosynthetic rates were calculated from the sums
of 1 4C in the individual products (Table 9) including 14C02
lost during flushing-outt

.130
At 2Q0 vpm C02, the percentages of carbon assimilated that were metabolized by the glycolate pathway were 56%, 67% and 27% at 10°C, 20°C and 35°C respectively. At 350 vpm C02
the corresponding values were 32%, 42% and 27%. At both carbon dioxide concentrations the highest percentage of carbon flowing through glycine was at 20°C. At 10°C the percentage of carbon passing through the glycolate pathway was higher in 200 than 350 vpm C02. At 35°C the values were the same at both carbon dioxide concentrations. Thus, decreasing the temperature and increasing the carbon dioxide concentration decreases the percentage of carbon flowing through the photorespiratory pathway.
3.b.ii. Flushing-out in darkness
1. Flow of C through the glycolate pathway
In darkness following a light period, photosynthesis stops more quickly than photorespiration (Zelitch, 1971) so preventing significant refixation of photorespired C02. Extrapolation of the rate of C02 evolution to the instant of darkening has been used to estimate the rate of photorespiration. This would provide an underestimate since photosynthesis does not in fact cease immediately (Bassham and Calvin, 1957), and some llfC02 evolved would be refixed. The rate of C02 evolution thus measured is faster than dark respiration and is responsible for the post-illumination burst,
Conversion of glycine to serine is not known to be affected by darkness but light is required for further

.131
metabolism of serine (Miflin et alt( 1966; Waidyanatha et
alx t 1975a),
Flushing-out in darkness for 1 min in 200 vpm and 350 vpm -1 *C02, following a light period with the same concentration resulted in a decrease in the radioactivity in glycine, with an increase in serine and evolution of some 1 ** C02 (Table 11), Fluxes calculated from these data are shown in Table 14. At 200 vpm C02 the flux of C from glycine is almost the same at 10°C and 20°C, contrary to the conclusion in Table 13 where the flux at 20°C appeared much higher than at 10°C. The very low flux of carbon from glycine at 5°C accompanied by a high flow into serine and into C02 would mean that the formation of glycine in darkness must be greater at this temperature. This can be explained only if there are larger pools of glycine percursors at 5°C.
At 350 vpm CO2 the most rapid flux from iglycine was at 20°C as in Table 13 and the values do not differ much between the two tables. However, at 10°C the flux was lower when the flushing-out was in darkness. This could mean that 1000 vpm C02 is more efficient in stopping the formation of new glycine at this temperature. At 35°C there is a higher flux from glycine during flushing-out in darkness. In light and 1000 vpm C02 the value was very low maybe due to the lower solubility of C02 at 35°C and consequently low effectiveness In slowing glycine production.
The measured values of C02 evolved at 200 vpm C02 were 180%, 30% and 55% of the carbon flow from glycine at 5°C, 10°C.and 20°C respectively. At 350 vpm C02 the corresponding

.132
Table 14. The flow of C from glycine into serine and CO 2 compared to net photosynthesis calculated from data in Table 11 (flushing-out in darkness).
[C02J 2 0 0 vpm 350 vpm
Temperature . 5 C 10 C 20 C 10 C 20 C 35 C
Flow of C (mg dm~2hT1)
F lux o f C f rom 0 .10 1.19 1 .10 0 .70 2.03 1.68 G lyc ine
F lux o f C i n t o 0.49 0 . 8 1 1 .31 0.95 1.72 0.82 Ser ine
F lux o f C i n t o 0.18 0 .36 0.60 0.46 0.85 0 .67 CO2
Net pho tosyn thes i s 1.39 2.23 2.82 4.25 5.74 3.62
S p e c i f i c a c t i v i t y o f 200 vpm 14C02
S p e c i f i c a c t i v i t y o f 350 vpm 1 4C0 2
= l yC i / ymo le
= 0 .94yc i / ymo le

.133
values were 66%, 42% and 40% at 10°C, 20°C and 35°C, The ^ C entering serine as a percentage of carbon flow from glycine in 20Q vpm C02 was 490%, 68% and 119% respectively at 5°C, 10°C and 20°C, and for 350 vpm C02 136%, 85% and 49% at 10°C, 20°C and 35°C, The results show clearly that carbon from glycine could not account for the ^ C flux into serine and C02 except at 10°C and 200 vpm C02 and at 35°C, 350 vpm C02,
Furthermore, the ratio llfc entering serine to 1£fC02 evolved is always less than the value 3 : 1 that is expected, decreasing with an increase in carbon dioxide and the increase in temperature. Either further metabolism of serine took place in darkness or another source of C02, possibly the oxidative pentose phosphate cycle (Kaiser and Bassham, 1979) or mitochondrial respiration.
2. Flow of C through the qlycolate pathway
as compared with net photosynthetic
assimilation
The rate of loss of carbon from glycine 1 min of
flushing was used as a measure of the proportion of net carbon assimilated that is metabolized by the way of glycolate pathway. At 200 vpm C02 (Table 14) the values found were 7%, 53% and 39% at 5°C, 10°C and 20°C respectively. At 350 vpm C02 the corresponding values at 10°C, 20°C and 35°C were respectively 17%, 35% and 46%, Lower percentages at 350 vpm C02 than at 200 vpm C02 for 10°C and 20°C are in agreement with the results in Table 13.

.134
Estimates of carbon flux from flushing-out in the light in 1QQQ vpm 1 2CO2 (Table 13) can be compared to estimates from flushing^out in darkness (Table 14) . In 350 vpm CO2 at 2Q°C and 35°C, and in 200 vpm at 10°C, flushing-out in darkness gives the fastest flux values. Both sets of data confirm considerable fluxes of carbon from glycine at 10°C. The situation at 5°C has to be judged from data obtained by flushing in darkness only and here the slow flux from glycine is not consistent with the flux into serine in terms of conversion of glycine to serine and C02-(Eq. 2 in Introduction).
3.c. Effect of carbon dioxide and temperature on the flow of carbon into sucrose during the first minute flushing-out compared with the decay of radioactivity in fructose-6-phosphate and glucose-6-phosphate
Sucrose can be formed either directly from the Calvin cycle intermediates or from carbon metabolized by the glycolate pathway (Wang and Waygood, 1962; Kumarasinghe, 1975 and the dat^ in Tables 4 and 5). However, during the flushing-out in darkness, or in 1000 vpm 12C02 in light, the further metabolism of serine is supposed to be stopped, so any increase of radioactivity in sucrose should be due to a decrease of 14C in the sugar phosphates (fructose-6-phosphate and glucose-6-phosphate) .
In Table 9, at 35Q vpm C02 in 1 min flushing-out, the decrease of radioactivity in the sugar phosphates as a percentage of total 14C was 2.6%, 2.0% and 1.1% respectively at 10°C, 20°C and 35°C. The corresponding increase of 14C

.135
in sucrose for the same temperatures was 4,2%, 2.6% and 4.1%. At 2QQ vpm CO2 the percentage decrease in sugar phosphates at 1Q°C, 2Q°C and 35°C was 1.4%, 1.3% and 1.1% respectively whereas the increase in sucrose for the same temperatures was 3 ,.3%, 2,1% and 3.3%, When the flushing-out was in darkness for 1 min (Table 11) the decrease in sugar phosphates at 350 vpm C02 was 2.8%, 1,6% and 1.0% at 10°C, 20°C and 3 5°C respectively whereas the correspondent increase in sucrose was 2,-4%, 2,6% and 0%. At 200 vpm C02
and 5°C, 10°C and 20°C the increase in sucrose was 3.1%, 3.3% and 0.90% respectively and the correspondent decrease in sugar phosphates was 4.6%, 2.8% and 2.1%.
Thus, whether the flushing-out was in light or in darkness, the increase of radioactivity in sucrose and the decrease in sugar phosphates is greater at the lower temperatures for both C02 concentrations. When the flushing-out is in light the decrease in sugar phosphates does not account for the increase in sucrose at any temperature. In darkness the decrease in sugar phosphates accounts for the increase in sucrose except for 350 vpm C02, 20°C and 200 vpm C02, 10°C. Also more radioactivity accumulated in sucrose in the light than in darkness during the 10 min flushing-out period. Possibly in light, since the reductive pentose phosphate cycle is operational in the chloroplast and can provide the cell with alternative carbon skeletons, the sucrose may not be so quickly degraded.

.136
4. Distribution of phosphates (G6P, F6P, Pi and total soluble phosphate) between chloroplasts and other cell fractions
a. Effect of temperature and carbon dioxide concentration
Photorespiration clearly operates at lower temperatures, as shown both by the flux through glycine and by 1 4C02
evolved during flushing-out in 1000 vpm 12C02 in light or in dark (Tables 13 and 14). However, it is probably not a major factor limiting photosynthesis at lower temperatures (Tables 2 and 3), This leaves the question as to what does impose the limit on photosynthesis at cooler temperatures?
The observed increase in sugar phosphates as products of photosynthesis at lower temperatures is undoubtedly partly due to a lower rate of photorespiration relative to carbon assimilation, but one may question why the result is not an increased flow into sucrose. Inorganic phosphate (P^) could play an important regulatory role. During steady-state photosynthesis, triose phosphate is exported to the cytosol in exchange for inorganic phosphate which may be made available mainly by sucrose synthesis or glycolysis.
At 4°C the V m a x for uptake of inorganic phosphate and triose phosphate into chloroplasts is about one fifth that at 20°C (Fliege and Heldt, unpubl,, see Heldt, 1976). A lower rate of exchange of triose phosphate and of inorganic phosphate could lead to an accumulation of sugar phosphates inside the chloroplast, These sugar phosphates would not be available for sucrose synthesis since the process takes

.137
place in the. cytosol (Bird et alxt 1974). Consequently a shortage of inorganic phosphate in the chloroplast would slow assimilation of carbon dioxide (Walker and Robinson, 1978) ,
Accordingly the distribution of phosphates between chloroplasts and other cell fraction was investigated. Leaf segments of Tritioum aestivum var. Highbury were allowed to photo synthesize at two temperatures, 5°C and 20°C, and three CO2 concentrations, 314, 3 28 and 393 vpm, for a period of 90 min. After this time the segments were quickly frozen and homogenized in liquid nitrogen and freeze-dried. The powders obtained were fractionated by density gradient centrifugation in non-aqueous liquids (Stocking, 1959) and various phosphates extracted from the fractions were measured.
Table 15 shows that the accumulation of glucose-6-phosphate and fructose-6-phosphate at lower temperatures was not limited to the chloroplasts.
Since the two hexose phosphates were measured by enzymic assay, the results in Table 15 show an increased concentration
4
in the leaf with decreased temperature not merely increased production in photosynthesis shown by ^CCQ. Also since the relative distribution between the chloroplast and the remaining part of the leaf cells does not change with the temperature, the accumulation of fructose-6-phosphate and glucose—6-phosphate at lower temperatures is not caused by slow transport through the chloroplast membrane. There is an increase in the amount of glucose-6-phosphate as the C02 concentration increased. Figure 16 includes values from

Table 15, Distribution of phosphates between chloroplasts (CHL) and the other cell fractions (NCHL) effect of temperature and carbon dioxide concentration.
(°C) (vpml REPL G6P F6P G6P+F6P Pi soluble Org.P CHL NCHL CHL NCHL . CHL NCHL CHL NCHL CHL NCHL CHL NCHL
314 (3} 0 ,98±0.06 1,33±0.19 0.82±0.04 0.31±0.07 1 . 8 0 1 .64 37±6 16.8±26 55± 5 160±19 18 - 8
5 328 (2) 1 .71±0 ,01 1,50±0..02 1.08±0.02 0 .2910 ,01 2.79 1 .79 36±1 125± 1 62± 4 133± 1 26 8
393 (2). 2 .17±0.19 2.47±0.23 1.23±0.05 0.55±0.08 3 .39 3.03 5115 182± 7 85± 2 188±12 34 6
314 C2) 0 .7310.04 0 .82±0.06 0 .5810 .01 0 ,2210.02 1 .31 1 .04 4814 171118 651 1 164113 17 - 7
20 328 (2) 0 .6410 .01 1 .0210.04 0 .7210 .01 0 .2510 .01 1.36 1 .27 2712 124111 511 3 1291 8 '24 5
393 (2). 0 .9610,06 1 .2610,02 0 .8210 .01 0 .3110 .01 1.78 1 .57 5615 160± 6 86110 1681 4 30 8
Figures are means 1S.D.

.139
1 4 -P *
£
>i
fd e 3
P4 vJD O W Q) i—I O
200 250 300 350 [CO 2]
400 vpm
Fig. 16. Relation between the concentration of glucose-6-phosphate and carbon dioxide at different temperatures.

.140
2.0
•P £
L I S
Di e & 1.0 VO Ch
to 0 rH O § 0.5
20°C
o 35°C
200 250 300 350 400 vpm [C02]
Fig. 17. Relation between the concentration of fructose-6-phosphate and carbon dioxide at different temperatures.

.141
Table 15 and calculated values from results used to compile Tables 9 and .11 assuming saturation with JI*C in 15 min. The amount of glucose-6-phosphate did not differ much between 200 vpm and 300 vpm C02t However, at carbon dioxide concentrations between 300 vpm and 380 vpm C02 there was a sharp increase at 5 C and 10 C; at 20 C and 35 C the increase was less evident.
Figure 17 shows that changes in fructose-6-phosphate with C02 concentration at the various temperatures are essentially parallel to those for glucose-6-phosphate (Fig. 16) . Fructose-6-phosphate remained constant between 200 vpm and 300 vpm C02 for each temperature studied. Between 300 vpm and 390 vpm C02 there was no increase at 35°C, the increase at 20°C was small but the increase at 5°C and 10°C was marked and was most evident at the lowest temperature.
The relative distribution of these compounds between the chloroplast and the rest of the leaf cell was not much affected by the carbon dioxide concentration (Fig. 18 and 19) .
Table 15 includes measurements of the orthophosphate (P^ total and organic phosphate (Org.P) in cell fractions.
No consistent trend in levels of Pi is evident either in response to temperature or to C02. Organic phosphate in the chloroplast fraction appears to increase with increase in carbon dioxide concentrations to an extent greater than corresponds to the increases in glucose-6-phosphate plus f ructose-r-6-phosphate,

.142
2.5
V 2.0 4J £
I* u Tl
Oi 1 - 5 6
ft VD o to d) rH O e g
1.0
0.5
20°C
300 325 350 375 [C0z]
400 vpm
Fig. 18. Distribution of glucose^6-^phosphate between the chloroplast and the rest of the cell at various carbon dioxide concentrations and two temperatures.
O OUTSIDE CHLOROPLAST A INSIDE CHLOROPLAST

.143
1.25
J1 1.00 •P £
u
Di 0,75 E
(i ID h 0.50 w (1)
0,25
300 325 350 375
o 2 0° c
400 vpm [ C 0 2 ]
Fig. 19. Distribution of fructose-6-phosphate between the chloroplast and the rest of the cell at various carbon dioxide concentrations and two temperatures,
O OUTSIDE CHLOROPLAST A INSIDE CHLOROPLAST

.144
In Table 15 at both temperatures, there was more fructose-6-phosphate inside the chloroplast relative to glucose-6-phosphate. The equilibrium constant of the reaction converting glucose-6-phosphate to fructose-6-phosphate for 25°C and pH 8.5 is 0,27 (Boyer, 1972), but is known to be lower the lower the temperature. The calculated ratios of F6P/G6P at 20°G are 0.79, 1.13 and 0.85 in the chloroplast fraction and 0.27, 0.25 and 0.25 in the non— chloroplast fraction, in 314 vpm, 328 vpm and 393 vpm C02
respectively. At 5°C, for the same C02 concentrations, the values are 0.84, 0.63 and 0.57 for the chloroplast fraction and 0.23, 0.19 and 0.22 for the non-chloroplast fraction. At both temperatures and all carbon dioxide concentrations the ratio in the non-chloroplast fraction agreed with the equilibrium values given in the literature. 'However, inside the chloroplast the ratio is much higher. This can probably be explained by the absence from chloroplasts, or at least from the chloroplast stroma, of phosphohexose isomerase, the enzyme responsible for the conversion of fructose-6-phosphate -—»- glucose-6-phosphate,
5, Determination of the concentration of RuBP
An attempt was made to explain why the hexose monophosphates accumulated at lower temperature and higher carbon dioxide concentration. Two mechanisms could be the cause of this accumulation;
al a rate limitation on the conversion of F6P or Xu5P to Ru5P
b) a rate limitation on the conversion of Ru5P to RuBP due to lack of ATP.

.145
a). During steady-state photosynthesis, several different reactions have been identified as likely to be rate-limiting in the Calvin cycle. These are the carboxylation catalysed by RuBP carboxylase, the conversion of FBP and SBP to their respective monophosphates by FBPase and SBPase and the conversion of Ru5P to RuBP by phosphoribulokinase (Bassham, 1973). Peterkofsky and Racker (1961), working with Chlorella
adapted to growth at 38°C or at 23°C found that Xu5P epimerase was present in excess amounts at 38°C but may be limiting at 23°C. Transketolase also had a lower activity
in cells adapted to 23°C. Further, the reported equilibrium constants of the reaction Xu5P + E4P F6P + G3P, catalysed by transketolase, are 11.9 at 25°C (Datta and Racker, 1961) and 1.0 at 38°C (Horecker et al., 1956), thus favouring accumulation of F6P and G3P at lower temperatures with a corresponding decrease in the percursors of RuBP. If these observations are relevant to wheat leaves they could explain the accumulation of fructose-6-phosphate and glucose-6-phosphate at lower temperatures and they would be a limitation on regeneration of RuBP.
b) The terminal enzyme of the photosynthetic electron transport pathway, namely ferrodoxin NADP reductase, is sensitive to temperature (Shneyour et al., 1973), so a decrease in the rate of electron transfer at chilling temperature is to be expected, leading to decreased phosphorylation of ATP. Evidence for a decrease in ATP production at lower temperatures in mitochondria was also obtained. Jensen and Bassham (1968) have shown about the- same

.146
level of RuBP In isolated spinach chloroplasts by adding ATP in the dark, as was achieved in light. The ATP stimulated the conversion of Ru5P to RuBP, Decreases of ATP could affect the Calvin cycle at two points, the formation of Ru5P and the formation of triose phosphate, however the Km of phosphoribulokinase for ATP is 28xiO""4M (Long, 1961) whereas the Km of phosphoglycerate kinase for ATP is 1.1 x10~4M (Long, 1961) . The Km of both enzymes for Ru5P and PGA respectively is 2 xio~4M (Long, 1961). Since the affinity for ATP, of phosphoglycerate kinase is higher than that of phosphoribulokinase there should be a greater effect of shortages of ATP on the reaction leading to the formation of RuBP. If the formation of RuBP was limited at lower temperatures increased concentrations of sugar phosphates between triose phosphate and Ru5P might be expected. Only increases in F6P and G6P were observed. Therefore, measurement of the level of RuBP at different temperatures should give an indication of the regulation by temperature of the enzymes between F6P and RuBP. The levels of RuBP were measured in the same extracts that were assayed for F6P, G6P, P£ and total soluble phosphate. RuBP was found essentially only inside the chloroplast and the results are shown in Table 16, At 314 vpm and 328 vpm C02 the concentration of RuBP was higher at 20°C when compared with 5°C, but for 392 vpm C02 it was approximately the same at both temperatures. The increase in the concentration of RuBP as C02 concentration increased at both temperatures is not in accordance with results of Collatz (1978) for spinach leaf cells. Collatz found a decrease in the concentration

,147.
Table 16. Effect of temperature and carbon dioxide concentration on the level of RuBP.
TEMPERATURE 5°C 20°C
nmoles RuBP • mg dry wt -1 314 0.41 ± 0.07 0.68 ±0.02
M 328 0.45 ± 0.02 0.81 ±0.01 (vpm)
392 1.05 ±0.01 0.91±0.09
The figures are means ±S.D., for two experiments.
of RuBP as carbon dioxide concentration increased from OpM to 160yM. So, to have a better understanding of the effect of C02 concentration on the the levels of RuBP in leaf segments a wider range of C02 concentrations was studied using attached leaves.
B. EXPERIMENTS WITH ATTACHED LEAVES
1, Effect of carbon dioxide concentration on the levels of RuBP
Carbon dioxide concentrations from 100 to 600 vpm were supplied in light to attached leaves as described previously. Two temperatures (8 C and 20 C) were used and photosynthetic rates as well as RuBP concentrations were measured after

.148
[C02]
Fig. 20. Effect of carbon dioxide concentration on the rate of net photosynthesis at 8°G,
Points are means ± SD of three experiments, for C02
concentration between 300 and 400 vpm.
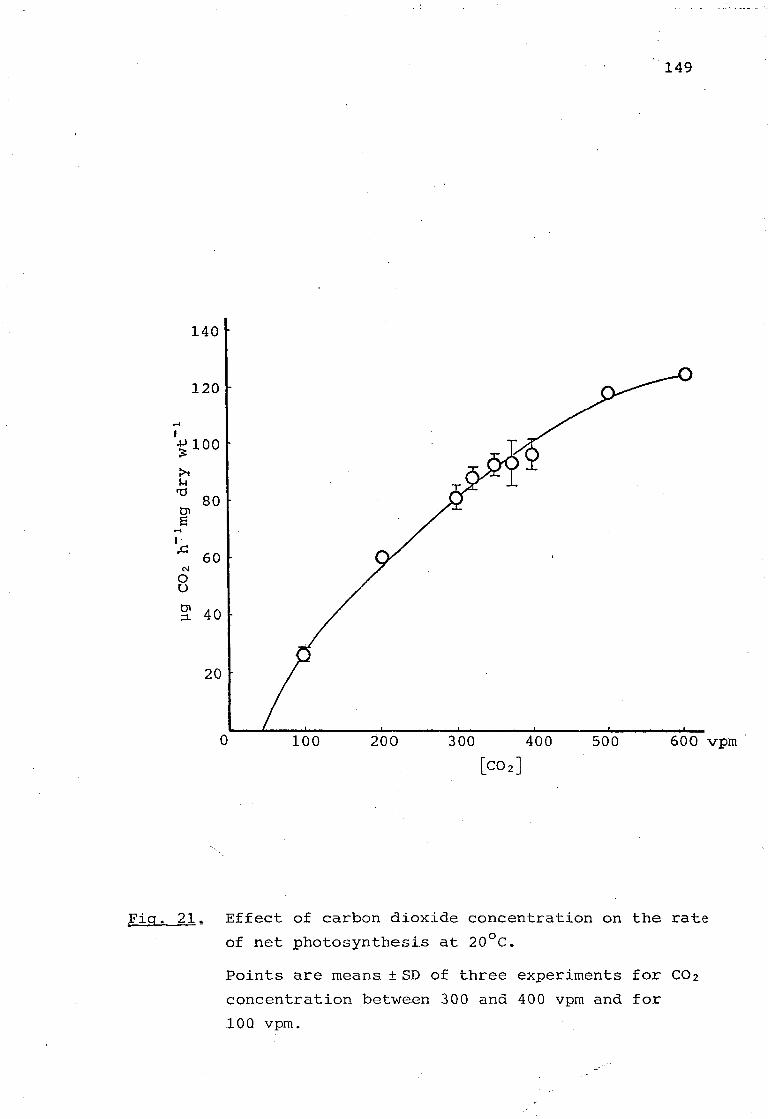
.149
[CO z]
Fig. 21. Effect of carbon dioxide concentration on the rate of net photosynthesis at 20°C. Points are means ±SD of three experiments for C02
concentration between 300 and 400 vpm and for 10Q vpm.
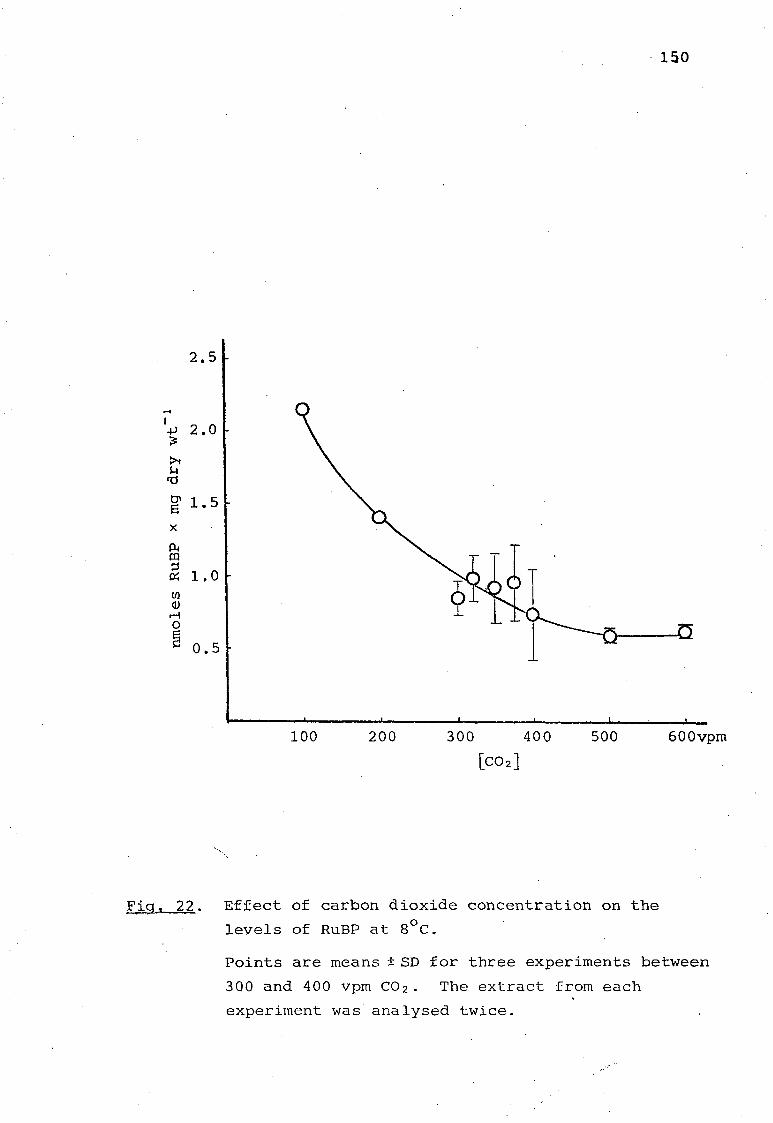
.150
•p £ u no Cn B
Ox CQ P & (/) Q)
rH o
2.5
2.0
1.5
1.0
0.5
100 200 300 400 [C02]
500 6 0 0 v p m
Fig, 22. Effect of carbon dioxide concentration on the levels of RuBP at 8°C. Points are means ±SD for three experiments between 300 and 400 vpm C02. The extract from each experiment was analysed twice.
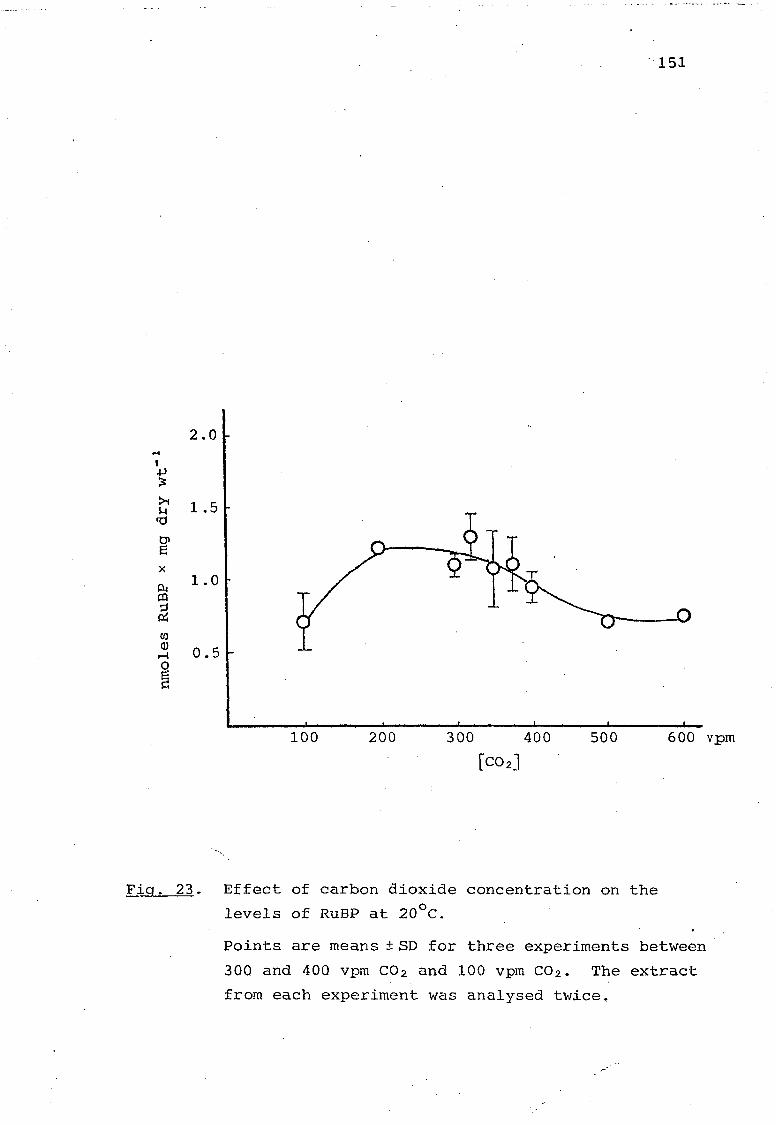
.151
>i u
e
ft ft d ft w CD
2 . 0
1 .5
1.0
0.5
100 200 300 400 500 600 vpm [ c o 2 ]
Fig. 23. Effect of carbon dioxide concentration on the levels of RuBP at 20°C. Points are means ± SD for three experiments between 30Q and 40Q vpm C02 and 100 vpm C02. The extract from each experiment was analysed twice.

.152
3Q mjtn photosynthesis. The results for photosynthetic rates are expressed in Figs. 20 and 21. Three experiments were made for each of the values between 300 and 400 vpm C02 at both temperatures and for 100 vpm C02 at 20°C. Saturation of photosynthesis by C02 was reached for 8°C at 400 vpm C02
whereas for 20°C it was not saturated even at 600 vpm.
Concentrations of RuBP were calculated for each level of C02 and the results are shown in Figures 22 and 23. Analysis of each extract was repeated, so the values between 300 vpm and 400 vpm C02 and 100 vpm C02 at 20°C are the mean of six values. The standard deviation are shown on the graphs.
At 20°C there is almost no change in the concentration of RuBP as C02 concentration increases from 100 vpm to 600 vpm whereas at 8°C there is a decrease in the concentration of RuBP as the carbon dioxide concentration increases.
From 300 vpm C02 to 600 vpm C02 the concentration of RuBP approaches a value at 8°C similar to that at 20°C.
These experiments with attached leaves do not show an increase in RuBP with C02 between 300 vpm and 400 vpm like that found with detached leaves in Table 16.

.153
D I S C U S S I O N
A. EFFECT OF TEMPERATURE AND CARBON DIOXIDE CONCENTRATION ON THE INHIBITION OF PHOTOSYNTHESIS BY OXYGEN
The results shown in Tables 2 and 3 indicate that the inhibition of apparent photosynthesis by oxygen in young wheat leaves is less at lower temperatures and higher carbon dioxide concentrations. In 380 vpm C02 at 10°C there was a stimulation instead of an inhibition of photosynthesis by oxygen. This stimulation, however, was not statistically significant. These results are consistent with those of Jolliffe and Tregunna (1973) for wheat shoots. They plotted (see Fig. 24) C02 concentration and temperature against carbon deficit (D) (defined by the expression D = PL - PN, where P L is the photosynthetic rate (mg C • dm~2 -h""1) in the absence of inhibitory concentrations of oxygen and PN is the apparent rate of photosynthesis (mg C dm~2h_1) in the presence of inhibitory concentrations of oxygen)» Below 25°C and above 300 vpm C02 no carbon deficit was observed.
With wheat leaf segments (Tables 2 and 3) a higher C02 concentration was necessary to prevent inhibition of photosynthesis (carbon deficit) by 21% oxygen than in the experiments of Jolliffe and Tregunna (1973). Inhibition rather than stimulation of photosynthesis by 2% compared to 21% oxygen (Tables 2 and 3) was found also by Canvin (1978) in castor oil plants, Canvin found at 20°C that inhibition in 2% oxygen only occurred at saturating carbon dioxide

.154
i a C4
u Or> £
E-i h U H ft Q z o o
Fjq. 24. Effects of temperature and C02 concentration on the carbon deficit caused by the inhibitory effect of 20.8% 02 on apparent photosynthesis. Data are for excised wheat shoots exposed to 1.6 x10⁵ erg
radiant flux density, (From Jolliffe and cm _ 2 -1
Tregunna, 1973) ,

.155
concentrations (aboye 400 vpm) and was transient, the photosynthettc rate being restored in about 15 min. As the temperature was increased the effect was only observed at higher concentrations of carbon dioxide.
Inhibition of. photosynthesis by oxygen is generally considered to be due to an effect on the RuBP carboxylase/ oxygenase. Kinetic constants with their temperature dependence have been published for this enzyme from several species and it is of interest to see whether the results for the whole plant can be quantitatively explained in terms of the properties of the purified enzyme.
Table 18 shows the percentage inhibition of photosynthesis by oxygen calculated using the kinetic constants for RuBP carboxylase/oxygenase from Atviplex
glabriuscula measured by Badger and Collatz (1977) (Table 17), It is probable that RuBP carboxylase/oxygenase from many species of higher plants has similar characteristics (Andrews and Lorimer, 1978).
Table 17. Data taken from the graphs of Badger and Collatz (1977).
T Km(CO2) K^COz) V m a x carboxylase V m a x oxygenase K±(O2) (°C) yVlair (m£/lair) pmoles •min"1 «mg protein"1 (m£/l)
1Q 213 148 0.314 0.0722 157 20 597 204 1.053 0,214 265 35 1988 390 3 .846 0.627 545

.156
Tahle 18. The percentage inhibition of photosynthesis by 02
calculated from the kinetic constants for the enzyme RuBP carboxylase/oxygenase measured by Badger and Collatz (1977)t
PN(2% 02) - PN(21% 02) % I = x 100
P N ( 2 % 0 2 )
314 vpm CO2 380 vpm C02
10° 35 32 20° 36 32 35° 32 30

.157
The calculation assumes that inhibition of photosynthesis by oxygen results only from effects on this
•k one enzyme and that1"acts as a competitive substrate with C02
(Laing et al., 1974; Berry and Farquhar, 1977). It is further assumed that the site of carboxylation is saturated with C02 to an extent determined by the solubility coefficient and the external C02 concentration. No allowance has been made for gas phase diffusion resistances as recommended by Tenhunen, Weber, Yocum and Gates (1979).
It was also assumed that rate saturating concentrations of RuBP were present at all temperatures, carbon dioxide and oxygen concentrations and that values of K^(C02) were the same as for Km(C02).
To calculate the velocity of carboxylation (vc) and velocity of oxygenation (vQ), the following equations from Laing et al. (1974) and Berry and Farquhar (1977) were used.
V m a x carboxylase x [co2] ^ [CO*] + Kmco2 X +
Vmax oxygenase x [o2] V ° " [ O . ] • K m 0 2 X + J ^ g l ) ( 2 )
Net photosynthesis (PN) was calculated by the equation PN - vc - 0.50 vG; for each two moles of oxygen consumed in the oxygenation reaction two moles of glycolate are produced and hence one C02 (see Fig. 25).
From the net photosynthetic rates at 2% oxygen and 21% oxygen, the percentage inhibition of photosynthesis was

.158
calculated by the equation of Bjorkman (1966). Table 18
shows larger percentage inhibition by oxygen than was found
experimentally at 10°C and 20°C (Table 3).
Besides a direct competitive inhibition of carboxylation by oxygen a stimulation by oxygen of glycolate synthesis and consequently photorespiratory oxidation of glycolate to glycine, serine and C02 (Ludwig and Canvin, 1971; Laing et
al., 1974; Ku and Edwards, 1977b) is another factor involved.
Using the kinetic constants in Table 17 and the following equations 3, 4 and 5 from Ku and Edwards (1977b) various rates of photosynthesis were simulated and from them a model for dividing the total oxygen inhibition of photosynthesis, (equation 6) into competitive'and photorespiratory components (equations 7 and 8) was devised.
True photosynthesis at 0% 02
(TPS0%0 ) 0 % 0 2
Vmax x [C02] Km + [C02]
V m a x * [CO 2]
(3)
(4) True photosynthesis at 21% 0 2 = (TPS21%02)
Apparent photosynthesis x [co2 - r]
at 21% 0 2 (5)
Values for the C02 compensation point (T) at different
temperatures were taken from the paper of Jolliffe and
Tregunna (1968),
TPSb%o2 - APS2i%o ~ T o t a l inhibition by 21% 02 , (6)

.159
TP£b%C)2 - TPS2i% o 2 1=1 C o m P e t i t i v e inhibition by 21% 02 (7)
TP^ 1 % 0 2- ApS2i%o2 ~ Inhibition due to apparent (8) photorespiration
The results at three temperatures, for 314.5 vpm C02 and 380 vpm C02, are presented in Table 19. The small difference in the total percentage inhibition by 21% oxygen shown between this table and Table 18 arises because in Table 18 APS 2 % Q 2 was taken as being equivalent to TpS0%02. In Table 19 the percentage total inhibition predicted is much higher at 10°C and 20°C than was found experimentally (Table 3). Also, inhibition due to photorespiration is lower in Table 19 at 10°C and 20°C than indicated in the experiments reported in Tables 13 and 14. Competitive inhibition appears independent of temperature below 20°C. Between 20°C and 35°C the big increase found experimentally in the total inhibition by 21% oxygen (Table 3) is perhaps due to a big increase in photorespiration since the percentage inhibition due to competitive inhibition decreases at 3 5°C, At lower temperatures the percentage inhibition by oxygen is calculated to be mainly due to competitive inhibition (Table 19).
If an allowance is made for stomatal and mesophyll resistances the C02 concentration at the carboxylation site would be less than that calculated from the solubility coefficient and the external C02 concentration alone. Hence the calculated inhibition by 21% oxygen would be increased to a value larger than in Table 18 rather than.less as required by the experimental measurements.

.160
Table 19. . Separation of the total percentage inhibition of photosynthesis by 02 calculated from the kinetic constants of the enzyme RuBP carboxylase/oxygenase into percentage competitive inhibition and percentage inhibition due to photorespiration.
Total percentage [CO2] TEMP I n h i b , by 21% 0 2
(vpm) °C
Percentage I n h i b . due t o c o m p e t i t i v e I n h i b ,
Percentage I nh ib . due t o
p h o t o r e s p i r a t i o n
3 1 4 . 5 10 20 35
38 39 41
35 34 21
5 8
21
3 8 0 . 0 10 20
35
34 37 37
32 33 24
4 6
17

.161
A further discrepancy may arise if the concentration of RuBP at the carboxylation site is not saturating. Farquhar (1979) and Farquhar, von Caemmerer and Berry (1980) estimate the concentration of RuBP carboxylase active sites in the chloroplast stroma to be 4mM and the total concentration of RuBP can be more or less than this depending on external conditions. Since the Michaelis constant for RuBP is of the order of 20yM most of the RuBP present may be bound to the enzyme. Hence, modified equations are proposed for calculation of the rates of carboxylation and oxygenation. In effect the values for vc and vQ from the equations 1 and 2 must be multiplied by a factor R/R + K'a
where R is the concentration of free unbound RuBP and K' a a
is the effective Michaelis constant for RuBP, As in spinach leaf cells (Collatz, 1978) it is expected that RuBP would increase when oxygen is decreased because less would be oxygenated. This would increase R/R + K' a and hence vc would be greater than suggested by the equations already used.
Again this tends to increase the difference between calculated and experimental values for percentage inhibition by oxygen. The value of K1
a is shown by Farquhar (1979) to be a function of oxygen concentration.
Kab'B Kac-C Kb
+ K j + Kia K'a = — (9)
B C Kb + Kc
Assuming that the reactions of the enzyme RuBP carboxylase with its substrates are ordered and RuBP binds

.162
first, the reaction sequence may be represented (Farquhar,
19791 as B
K: Kjl K:
I<i
P+Q
K 5
E EAB
EAC
E
E
K 6 K 7 K 8
C 2 (P)
where E, A, B, C, P and Q represent enzyme site, RuBP, 02, C02/ 3 PGA and Pglycolate respectively. EA, EAB and EAC are intermediate complexes. Ki to K8 are the rate constants of the various reaction steps.
Thus, K a b , K a c , K b and K c in equation (9) are Michaelis constants equal to K 5 / K i , K s / K x , K 4 + K 5 / K 3 and K 7 + K 8 / K G
respectively. K i a is the dissociation constant for the EA complex and is equal to K 2 / K i ,
If CO2 concentration (C) in equation (9) is held constant only the oxygen concentration (B) varies and one can calculate K'a for 2 and 21% oxygen at 10°C knowing the constants Kab, Kac, Kb, Kc and Kia. Badger and Collatz (1977) give a value for Kac (-KmRuBP) of 12yM at both 5°C and 15°C, and it may be assumed this applies to 10°C also. From Kac, the value of K a b was calculated as described by Farquhar (1979) and was found to be 2.76. Values of Kb (—Km02) and Kc (-KmC02) were taken from Table 17. The value of Kia
= 5 was obtained from Badger and -Collatz (1977) The carbon dioxide concentration (C) was taken as 380y&/£

.163
and oxygen concentration (B) as either 210 * 103qiA/A or 21 x 103 jj .
Substituting these values in the equation (9) gives K 1
a = 9.17yM (in 2% 02 at 10°C) and K'a = 7.22yM (in 21% 02
at 10°C).
R This means the factor ' would be slightly smaller a in 2% 02 than in 21% 02. Bearing in mind the likely increase in RuBP in 2% 02 that would increase the ratio, the overall effect of allowing for RuBP concentration effects is small.
Without a more detailed knowledge of levels of RuBP and RuBP carboxylase in the leaves it is not possible to calculate rates of carboxylation and oxygenation exactly for both 2 and 21% oxygen. Also there is no measure of gas phase diffusion resistances that can be applied. Bauwe, Apel and Peisker (1980) consider the mesophyll resistance to be insignificant in the calculations but stomatal resistance would not be negligible.
It may be concluded that the known kinetic constants and properties of RuBP carboxylase do not explain why net photosynthesis is not stimulated when oxygen is decreased from 21% to 2% at 10°C and in 380 vpm CO2 (Table 2).
Information concerning an alternative reaction in photosynthetic metabolism that might limit photosynthetic rate was sought in the results of experiments using 14C02. The results confirm that photorespiration (v0) is considerable at 10°C but also show that hexose' monophosphates tend to accumulate at low temperatures especially when the

.164
CO concentration is slightly increased above ambient (Tables 2
9 and 11, Figs. 16 and 17). This accumulation of hexose monophosphates was not restricted to the chloroplasts (Table 15) and is not therefore considered to be the result of inadequate rates of transport.
The accumulation of sugar monophosphates was accompanied by a lower rate of photorespiration relative to carbon assimilation but also by a lower rate of carbon assimilation. Furthermore the increase in hexose monophosphates was not accompanied by an increase of 14C in UDPG or sucrose.
The accumulation of F6P and G6P at lower temperatures and high carbon dioxide concentration could be due to regulation by temperature of the enzyme transketolase or Xu5P epimerase even if the level of RuBP is only slightly lower at lower temperatures (Figs. 22 and 23). As the concentration of F6P is much higher under these conditions a higher concentration of RuBP might have been expected unless there is regulation of enzymes involved in RuBP synthesis by temperature.
Two other mechanisms are suggested which might cause the accumulation of F6P and G6P at lower temperatures: a. Rate limitation on the conversion of hexose monophosphates to sucrose in cytoplasm b. Regulation by temperature of the enzyme fructose-1,6-bisphosphatase.
a. If the level of ATP is decreased when temperature decreases there should also be a decrease in the level of

.165
UTP resulting in a reduced rate of conversion of glucose monophosphate to UDPG, the initial reaction in sucrose hiosynthesis (Bassham, 19731 , Alternatively there is the possibility of a decrease in activity of the enzymes responsible for the synthesis of sucrose from UDPG and F6P.
b. The activity of the enzyme fructose-1,6-bisphosphatase was measured in wheat plants grown at 23°C/18°C and 13°C/10°C (Boyle, F, A. and Keys, A. J. personal communication). The activity of this enzyme expressed in nmoles P^-min""1 •cm""2
of leaf was higher in the plants grown at lower temperature. Although the conditions of experiments in this thesis are different it is possible that the activity of FBPase increased at lower temperature leading to accumulation of F6P and G6P,
The results reported here do not permit an unequivocal explanation why additional hexose monophosphates are not converted to sucrose or why carbon assimilation is decreased. The rate of the carboxylation reaction should be determined by the concentration of the substrates RuBP and C02 as well as by various cofactors. Since the concentration of C02 was not limiting the reaction, this could be limited by the amount of RuBP. RuBP concentrations were found to become limiting for photosynthetic carbon dioxide fixation in chloroplasts at 15 20nmoles RuBP x mg chlorophyll"1 (Sicher and Jensen, 1979). The concentration of RuBP found (Figs. 22 and 23) is, at any C02 concentration, far beyond the levels of limitation suggested by Sicher and Jensen (1979) and cannot account for the decreased assimilation at lower

.166
temperature. The potential rates of photosynthesis associated with RuBP carboxylase and RuBP concentrations have already been considered,
A feed-back effect of the accumulated hexose monophosphates on the activity of the enzyme RuBP carboxylase may exist. Results concerning the effects of these compounds on the carboxylation reaction have been published by several authors. Carboxylase activity was stimulated and oxygenase activity inhibited by fructose-6-phosphate (Zelitch, 1975; Ryan and Tolbert, 1975; Buchanan and Schurmann, 1972, 1973). However, Bucke, Walker and Baldry (1966) in isolated chloroplasts, found a very small increase of carboxylation caused by fructose-6-phosphate and Chu and Bassham (1972, 1975) found no stimulation of C02 assimilation by this compound,
In 2% oxygen the level of RuBP increased (Collatz, 1978) and consequently the level of F6P might increase and would intensify the feed-back effect on carboxylation. This could explain the slight inhibition (not significant P=0.05) of net photosynthesis by 2% oxygen (Table 3).

16.7
B. EFFECT OF-TEMPERATURE AND CARBON DIOXIDE CONCENTRATION
ON PHOTOSYNTHETIC CO2 UPTAKE AND PHOTORESPIRATORY CO? EVOLUTION
In this section the rate of photorespiration is measured as the rate of evolution of ltfC02 immediately after a steady rate of photosynthesis from 1I+C02 is interrupted by a period of darkness in air or of light in 1000 vpm 12C02. This is not an easy.measurement to make. First a time allowance has to be made for 1 ''CO? remaining in the leaf chamber and the connecting tubes to be swept out. The absorption of gas has to be accomplished so that ll*C02 can eventually be absorbed in an alkaline medium that will mix with scintillation fluid. Kumarasinghe (1975) absorbed the gas by bubbling it through 2.5M sodium hydroxide. This causes some back pressure and affects conditions in the leaf chambers. Also, only a small proportion of the total ltfC02 could conveniently be transferred to a scintillation vial because the volume of sodium hydroxide solution was large. The method involving bags (Fig. 5) used in the present work is potentially more useful because with a suitable manifold fitted with 3-way taps, samples can easily be collected over different periods. In this way it was possible to examine the time course of flushing llfC02 from the rectangular leaf chambers without leaves present. This is shown in Table 20 (from A, J. Keys, unpublished results).
These results suggested that a minimum error would occur if the sample was collected from 13 sec to 60 sec after the change from the steady state. The method is subject still to

.168
Table 2Q. J,*C02 flushed from leaf chambers without leaves present, at several collection times.
Bag Collection dpm in each bag Percentage of total dpm time (mean of six experiments) in each bag
1 0- 6 sec 673503 90.56 2 6-12 sec 53695 7.22 3 12-60 sec 11939 1.61 4 1- 2 min 2915 0.39 5 2- 3 min 987 0.13 6 3- 4 min 681 0.09
Total 743720
some uncertainties, especially as to the effect the presence of the leaves would have on the rate of removal of 1I+C02 from the chamber and tubes. There were also some technical problems with the bags that had to be completely free from leaks and yet have provision for sealing to one side^a scintillation vial.
An increase in C02 concentration from 200 vpm to 350 vpm led to an increase in the apparent rate of photosynthesis (APS) (Tables 21 and 22) in agreement with the results of Tregunna et al, (.1966) and Hew et al. (1969a) . . Twice the rate of apparent photosynthesis was found at 20°C and 10°C at the higher C02 concentration. Apparent photosynthesis (Tables 21 and 22) was lower at 35°C than at 20°C or 10°C at

.169
Table 21. Effect of carbon dioxide concentration and temperature on photosynthetic CO2 uptake and photorespiratory C02 evolution in 1 min in light and 1000 vpm C02 (from Tables 9 and 13).
[co2] (vpm)
TEMP (°C)
APS mg C02
PR drrT*2h~1
PR/APS
10 6.97 1.17 0.17 200 20 8.25 1.94 0.24
35 7.15 2.42 0.34
10 13,68 1.58 0.12 350 20 16.90 2.46 0.15
35 9.86 1.91 0.19
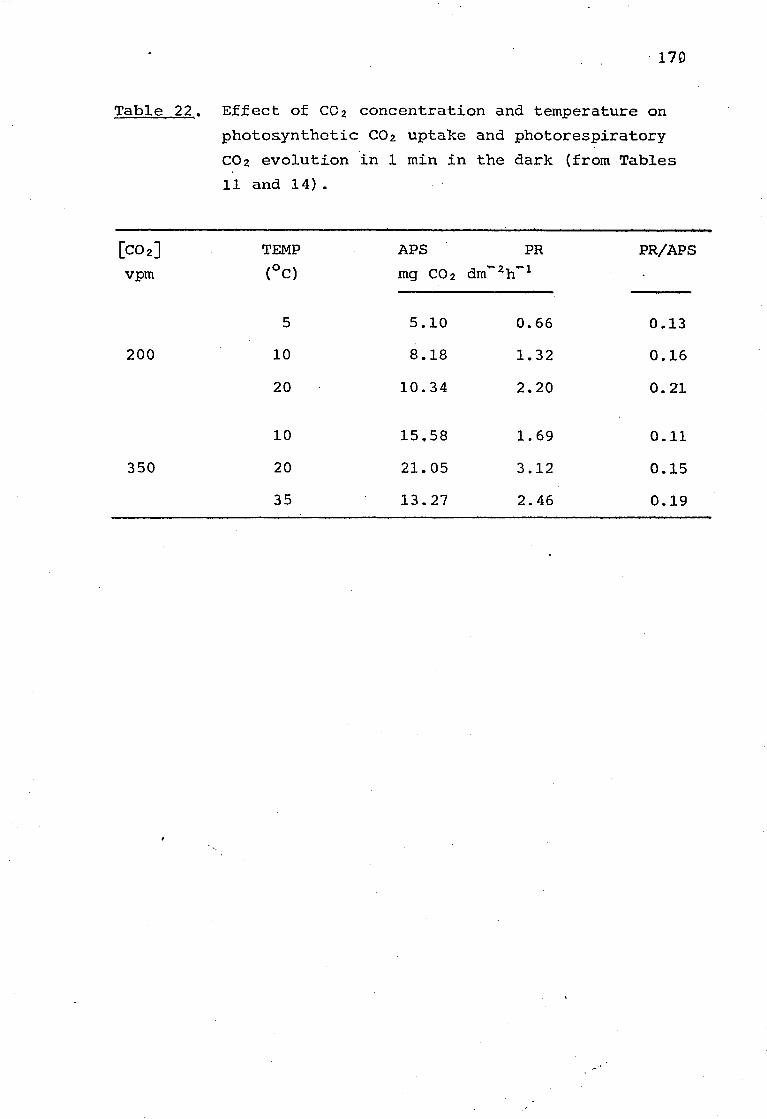
.170
Table 22. Effect of CO2 concentration and temperature on photoaynthetic CO2 uptake and photorespiratory CO2 evolution in 1 min in the dark (from Tables 11 and 14).
[CO 2] TEMP APS PR PR/APS vpm (°c) mg CO 2
5 5.10 0.66 0.13 200 10 8.18 1.32 0.16
20 10.34 2.20 0.21
10 15.58 1.69 0.11 350 20 21.05 3.12 0.15
35 13.27 2.46 0.19

.171
both concentrations of C02 , However, the lowest value was obtained at 5°C in 200 vpm C02.
The effect of carbon dioxide concentration on PR (measured by 1I+C02 released in light) is not so marked as on APS? the photorespiratory rate was increased with C02
concentration for all the temperatures (Tables 21 and 22) except at 35°C (Table 21) where a decrease was observed. These results are consistent with those of Fock et al,
(1979) , Photorespiratory rate increased with temperature at 200 vpm C02, but at 350 vpm C02, PR was higher at 20°C than at 35°C.
As described by Keys et al, (1977) and Hew et al, (1969b) increasing the temperature increased the rate of photorespiration relative to photosynthesis and this is confirmed in the increase in the relation PR/APS with temperature (shown in Tables 21 and 22). Photorespiration is a factor that affects photosynthesis most at higher temperatures and lower C02 concentrations.
The percentage of net carbon assimilation lost as C02 (PR/APS) at the different carbon dioxide concentration and temperature is similar whether photorespiration is measured during 1 min flushing-rout in light (Table 21) or 1 min in darkness (Table 22) .

.172
C. EFFECT OF TEMPERATURE AND CARBON DIOXIDE CONCENTRATION ON THE CARBON FLOW THROUGH THE GLYCOLATE PATHWAY
Fluxes of carbon through the glycolate pathway are shown in Tables 13 and 14, At each temperature the fluxes are lower at lower CO2 concentration. Lower fluxes in 150 vpm compared with 350 vpm CO2 were found by Kumarasinghe (1975) and Kumarasinghe et al. (1977) for wheat leaf segments. However, Mahon, Fock and Canvin (1974) reported similar fluxes through the glycolate pathway in sunflower leaf discs at 115 vpm C02 and 400 vpm C02. Kumarasinghe (1975) showed fluxes through glycine higher than the rate of net carbon assimilation at 25°C. Lower fluxes of carbon through the glycolate pathway, but still more than half the rate of carbon fixation, were found by Tolbert and Yamasaki (1969), Zelitch (1971) and Ludwig and Canvin (1971) at normal C02
concentrations in the air.
The results reported in this thesis, obtained by flushing-out in light or in darkness at 10°C and 20°C (Tables 13 and 14), show that more than half the carbon fixed by photosynthesis in 200 vpm C02 is metabolized through the glycolate pathway. However, at 350 vpm C02 the carbon metabolized through the glycolate pathway was always less than 50% of net photosynthesis.
In Table 23 the results from Tables 13 and 14 are compared with data of Kumarasinghe (1975). The amount of carbon metabolized through the glycolate pathway observed by Kumarasinghe, measured in the light either- by the flux, through glycine or by evolution of C02, was greater than in

.173
Table 23. Comparison between the results of Kumarasinghe (1975) (A) and the results in this thesis (B) .
After 1 min flushing-out After 1 min flushing-out
in light and 1000 vpm C0 2 in darkness
A (25°C) B (20°C) A (25°C) B (20°C)
mg C dm ^h 2-u"" 1
[C02] 150 325 200 350 325 350 (vpm)
PN 2.01 3.79 2.25 4.61 . 2.60 5.39
Flux of C 4,11 4.50 1.50 1.93 2.18 1.98 from glycine
Flux of C 1.55 1.28 0,96 1.36 1.72 1.67 into serine
Flux of C 1.18 1.48 0.53 0.67 0.58 0.82 into C02

.174
the present work. The flux of carbon into serine was lower than expected from the flux from glycine/ this was attributed to the fact that some serine was simultaneously further metabolized. The results in Tables 13 and 14 indicate that further metabolism of serine during the 1 min flushing-out was almost stopped but both sets of results show a larger evolution of ll*C02 than expected from equation (2) in the Introduction,. This has been already discussed in the Results section.
There are smaller differences between Kumarasinghe's data and those reported in this thesis when flushing-out is in the dark. In this particular experiment of Kumarasinghe the rate of net photosynthesis was very low.
Kumarasinghe (1975) found that the percentage of net carbon assimilated lost as C02 during flushing-out after photosynthesis in 325 vpm C02 (Table 23) was different in light (39%) than in darkness (22%). In this thesis the values found were the same, approximately 15%. Consistent with this latter value, rates of photorespiration equal to about 1/6 the rate of net photosynthesis in normal air at 25°C were found by Canvin and Fock (1972), Jackson and Volk (1970), Laing et al, (1974) and Fock et al. (1979).
Explanation for the faster relative flux through the glycolate pathway observed by Kumarasinghe (1975) may lie in differences in material and technique.
Kumarasinghe (1975) used equal illumination from both sides of leaf chambers, whereas here (Fig, 4) the more

.175
natural situation of unilateral illumination occurred. It can also be argued that the boundary layer resistance is likely to be smaller in the present rectangular chamber (Fig. 31 than in the cylindrical chamber of Kumarasinghe. The age of leaf used was also different; Kumarasinghe used the first leaf of 13 day old plants which was already fully expanded but in the present work the second leaf was used and was therefore much younger. Salin and Homann (1971) found that in tobacco leaves photorespiratory activity, measured by the capability to produce glycolate, increased from a low value in young leaves to much higher values in fully expanded leaves. Canvin (1978) also found that photorespiration was fastest in the oldest leaves of sunflower and El-Sharkawy, Loomis and Williams (1968) showed that age and growth conditions affected photorespiration by Amaranthus edulis.
In the present work, only at 20°C was there any approximation to the simple relation between flow out of glycine and flow into serine and CO2 observed by Kumarasingle (1975) , For other temperatures invariably the decrease in [llfc] in glycine plus glycolate was insufficient to account for the increased radioactivity in serine and CO2. It is assumed that additional C02 came from sugar phosphates in the dark from Kreb's cycle activity. On the other hand the difficulty in accurate measurement of 14C02 lost in 1 min has already been mentioned and should not be overlooked.
From the results it is quite clear that flux through glycine did occur at 10°C, It may not therefore be part of

.176
the explanation of the failure to stimulate photosynthesis at 10°C by decreased oxygen, that photorespiration was not taking place. On the other hand experiments with 14C02 at rather higher carbon dioxide concentration may show a more significant decline in glycolate metabolism.
D.. STOICHIOMETRY OF PHOTOSYNTHETIC AND PHOTORESP.IRATORY METABOLISM WHEN PR = 0.15 APS IN AIR (350 VPM CO?, 21% O?) AND AT 20°C
Fig, 25 shows the interaction between photosynthetic and photorespiratory metabolism at 350 vpm C02/ 21% 0 2 and 20°C, when PR =0.15 APS. This is approximately the situation suggested by results in Tables 13 and 14.
The scheme is based on those of Laing et at. (1974), Kumarasinghe (1975) and Kumarasinghe et al. (1977).
If approximately one molecule of RuBP is oxygenated for every four molecules carboxylated, and if the main source of C02 evolved by photorespiration is the reaction glycine to serine, twenty-four carbons are accumulated for 3.6 evolved as C02, e. g., 15% of the carbon accumulated is evolved. In the scheme about 50% of the carbon assimilated is metabolized through the glycolate pathway which is more than the values of 35 and 40% found in Tables 13 and 14.
Allowing for ATP formation in the reaction glycine to serine (Bird et al. f 1972) approximately 50 ATP and 35. NADPH2

.177
Fig. 25. Caption on next page.

.178
Fig. 25. Interaction between photosynthesis and photorespiration when PR =0.15 APS, for 20°C and 350 vpm C02 in air. The arrowscn£>indicate the possible points of regulation of the carbon metabolism by temperature.

.179
will he necessary for each, mulecule of sucrose, compared with 37 ATP and 24 NADPH2 necessary when photorespiration Is zero. Also, without photorespiration, 35 carbons could be accumulated instead of 24 carbons, an increase of 46%. This is in accordance with results of experiments at 35°C, but not at 10°C and 20°C, It is suggested that temperature can regulate carbon metabolism at several points as shown in Fig. 25.
E. CONCLUSIONS
1. A stimulation of photosynthesis normally results from lowering the oxygen concentration in the atmosphere to 2%, because of decreased photorespiration. Its magnitude is dependent on CO2 concentration and temperature. No stimulation was observed at 10°C in 380 vpm C02.
2. Photorespiratory metabolism, measured either by the flux of carbon from glycine or by CO2 evolution was observed at 10°C in 350 vpm C02.
As a percentage of net photosynthesis the flux of carbon through the glycolate pathway was greater in 200 vpm than in 350 vpm C02 and at 20°C than at either 10°C or 35°C. The percentage of carbon fixed that was evolved by photorespiration was also greater in 200 vpm C02 but increased with the temperature from 5°C to 35°C.
3. During photosynthesis at lower temperature an
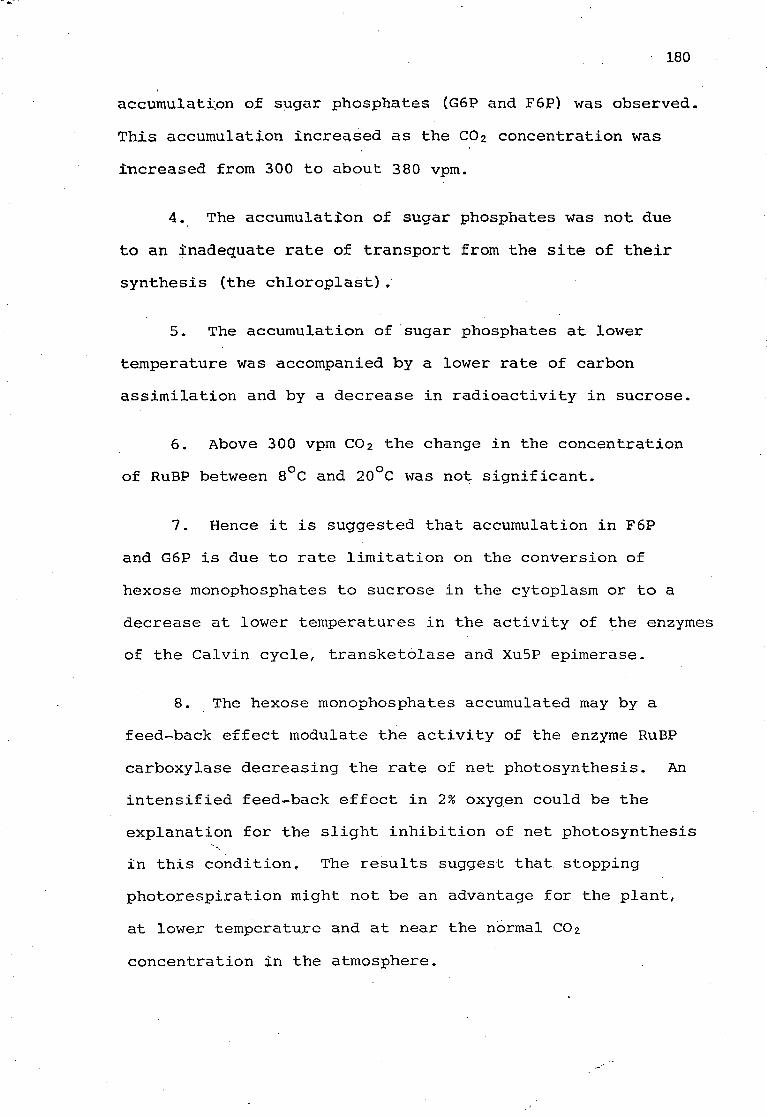
.180
accumulation of sugar phosphates (G6P and F6P) was observed. This accumulation increased as the C02 concentration was increased from 300 to about 380 vpm.
4. The accumulation of sugar phosphates was not due to an inadequate rate of transport from the site of their synthesis (the chloroplast).
5. The accumulation of sugar phosphates at lower temperature was accompanied by a lower rate of carbon assimilation and by a decrease in radioactivity in sucrose.
6. Above 300 vpm C02 the change in the concentration of RuBP between 8°C and 20°C was not significant.
7. Hence it is suggested that accumulation in F6P and G6P is due to rate limitation on the conversion of hexose monophosphates to sucrose in the cytoplasm or to a decrease at lower temperatures in the activity of the enzymes of the Calvin cycle, transketolase and Xu5P epimerase.
8. The hexose monophosphates accumulated may by a feed-back effect modulate the activity of the enzyme RuBP carboxylase decreasing the rate of net photosynthesis. An intensified feed-back effect in 2% oxygen could be the explanation for the slight inhibition of net photosynthesis in this condition. The results suggest that, stopping photorespiration might not be an advantage for the plant, at lower temperature and at near the normal C02 concentration in the atmosphere.

.181
A C K N G W L E G E M E N T S
I should like to express my gratitude to Dr. C. P. Whittingham for supervision, valuable suggestions and interest in this work and to Dr. J. W. Hannay who acted as my Director of studies at Imperial College of Science and Technology, London.
I am greatly indebted to Dr. A. J. Keys for his advice, encouragement and forbearance with which he has steered me through more than three years of research. His friendship and interest at all times are greatly appreciated.
I wish to thank Mr. R. W. Soffe and Mr. K. Plumb for sowing countless pots of wheat and Mrs. Hilary Harding for clean glassware.
Thanks are also due to Mr. M.. J. Cornelius and Mr. A. T. Young for technical help and Mrs. M. I. Ferreira for efficient typing of this dissertation.
I must also thank Mr. J. Wood for help with statistical analysis.
Finally I should like to thank Joao, husband and colleague/ without whose sacrifice and understanding this work would not be possible.
I wish to express my appreciation to the Instituto Nacional de Investigagao Cientlfica - Portugal for the award of a scholarship. The research was pursued whilst on overseas study leave from the University of Lisbon - Faculty of Science.

.182
R E F E R E N C E S
Akita, S. and Miyasaka, A, (1969) Proc. Crop. Sci, Soc, Jap, ,38, 525.
Akita, S. and Moss, D. N. (1973) Plant Physiol, 52, 601.
Andrews, T. J. and Lorimer, G. H. (1978) FEBS Lett, .90, 1.
Andrews, T. J., Lorimer, G. H. and Tolbert, N. E. (1973) Biochemistry 12, 11.
Arnon, D. I. (1949) Plant Physiol, 24, 1.
Atkins, C. A. and Canvin, D. T. (1971) Can. J. Bot. 49, 1225.
Atkins, C. A., Canvin, D. T. and Fock, H. (1971) In: Photosynthesis and Photorespiration (Hatch, M. D.,
Osmond, C. B. and Slatyer, R. O. eds) p. 497. Wiley, New York.
Badger, M. R. and Andrews, T. J. (1974) Biochem. Biophy.s, Res. Commun. 60., 204.
Badger, M. R. and Collatz, G. J. (1977) Carnegie Inst. Wash. Year-book 77, 355. .
Bassham, J. A. (1973) In; "Symp. Soc. Exp. Biol. XXVII, Rate Control•of Biological
Processes". p. 461. Cambridge Univ. Press, Cambridge.

.183
Bassham, J. A. and Calvin, M. (1957)
In: "The path of carbon in photosynthesis". Prentice-Hall,
Englewood Cliffs, New Jersey.
Bassham, J. A. and Kirk, M. (1962)
Biochem. Biophys. Res. Commun. .9, 376.
Bauwe, H., Apel, P. and Peisker, M. (1980)
Photosynthetica 14550.
Berry, J. and Farquhar, F. (1977) In: Proa. IV Intern. Congr. Photosynthesis (Hall, D.
Coombs, J. and Goodwin, T. W. eds) p. 119. Biochemical Society, London.
Bieleski, R. L. (1964)
Anal. Biochem. 9., 431.
Bieleski, R. L. (1965) Anal. Biochem. 12., 230.
Bieleski, R. L. and Young, R. E. (1963) Anal. Biochem. 6, 54.
Bird, I. F,, Cornelius, M. J., Dyer, T. A. and Keys, A. J. (1973) J, Exp. Bot. 24, 211.
Bird, I. F., Cornelius, M. J. and Keys, A. J. (1977) Jt Exp. Bot. 28, 519.
Bird, I. F., Cornelius, M. J., Keys, A. J. and Whittingham, C. P. (1972) Phytochemistry 11, 1587.

.184
Bird, I. F., Cornelius, M. J., Keys, A. J. and Whittingham, C. P. (1974) Phy to chemistry 1_3, 59.
Bird, I. F., Porter, H. K. and Stocking, C. R. (1965) Biochem. Biophys. Acta 100, 366.
Bishop, P. M. and Whittingham, C. P. (1968) Photo synthetic a 2., 31.
Bjorkman, O. (1966) Physiol. Plant. 19., 618.
Bjorkman, O. and Gauhl, E. (1966) Carnegie Inst. Wash. Year-book 67, 479.
Bjorkman, O., Gauhl, E. and Nobs, M. A. (1969) Carnegie Inst. Wash. Year-book 68, 620.
ii
Bjorkman, O.. Hiesey, W. M., Nobs, M., Nicholson, F. and Hart, R. W. (1966) Carnegie Inst. Wash. Year-book 66, 228.
Bowes, G. and Berry, J. A. (1971) Carnegie Inst. Wash. Year-book 71, 148.
Bowes, G., Ogren, W. L. and Hageman, R. W. (1971) Biochem. Biophys. Res. Commun. 45., 716.
Boyer, P. D. (1972) "The enzymes", vol. VI 3rd ed. (Boyer, P. D. ed) p. 292. Academic Press, New York and London.
Bradbeer, J. W. and Racker, E. (1961) Fedn. Proc. Fedn. Am. Socs. Exp. Biol., 20., A-88d.

Brunetti, N. and Hageman, R. H. (1976) Plant Physiol, 58., 583.
Buchanan, B, B. and Shurmann, P. (1972)
FEBS Lett. 23, 157.
Buchanan, B. B. and Shiirmann, P. (1973)
J. Biol. Chem. 248, 4956.
Bucke, C.,.Walker, D. A. and Baldry, C. W. (1966)
Biochem* J. 101, 636.
Caballero, A. and Cossins, E. A. (1970)
Can. J. Bot. 48, 1191.
Canvin, D. T. (1978)
In: "Photosynthetic carbon assimilation" (Siegelman, , H.
and Hind, G. eds) p. 61. Plenum Press, New York.
Canvin, D. T. and Fock, H. (1972) Methods in Enzymology 24., 246.
Chapman, F, A. and Graham D. (1974)
Plant Physio 1. 53., 879.
Chollet, R, and Ogren, W. L. (1975)
Bot. Rev.. 41, 137,
Chu, D, K.' and Bassham, J. A. (1972)
Plant Physiol. 50., 224.
Chu, D. K. and Bassham, J, A. (1975) Plant Physiol. 55., 720.
Cole, C. V. and Ross, C. (1966)
Anal. Biochem. 17., 526.

. . 186
Coliatz, G. J. (1978)
Carnegie Inst. Wash, Year-book 77, 248.
Coombs, J. and Whittingham, C. P. (1966)
Phyto chemistry 5., 643.
Coombs, J. and Whittingham, C. P. (1966a)
Proo. Roy. Soc. London. Ser. B 164, 511.
Datta, A. G. and Racker, E. (1961) J. Biol. Chem. 236, 617.
Decker, J. P. (1959)
Plant Physiol. 34_* 100.
Douce, R., Moore, A, L. and Neuberger, M. (1977)
Plant Physiol. 60., 625.
Ehleringer, J. and Bjorkman, O. (1977)
Plant Physiol. 59., 86.
El-Sharkawy, M. A,, Loomis, R. S. and Williams, W. A. (1968) J. Appl. Ecol. 5., 243.
Farquhar, G, D. (1979) Arch. Biochem. Biophys. 193, 456.
Farquhar, G. D, von Caemmerer, S, and Berry, J. A. (1980) Planta 149, 78.
Fewson, C. A., Black, C. C. and Gibbs, M. (1963)
Plant Physiol, 38., 680.
Fock, H,, Hohler, T., Canvin, D. T. and Grant,. B. R. (1971)
Proc. II Int. Congr. Photosynthesis Res. (Forti, G., Avron,
Melandri, A. eds) p. 1183. W. Junk, N. V., The Hague.

.187
Fock, H., Klug, K. and Canvin, D. T. (1979) Planta 145, 219.
Forrester, M. L., Krotkov, G. and Nelson, C. D. (1966)
Plant Physiol. 41,, 422.
Frederick, S. E. and Newcomb, E. H. (1969a) Science 163, 1353.
Frederick, S. E. and Newcomb, E. H. (1969b)
J, Cell Biol. 43., 343.
Gauhl, E. and Bjorkman, O. (1969)
Planta 88/ 187.
Gibbs, M., Ellyard, P. W. and Latzko, E. (1968)
In: "Comparative Biochemistry and Biophysics of
Photosynthesis" (Shibata, K., Takamaya, A., Jagendorf, A. T.,
Fuller, R. C. eds), p. 3 87. Univ. Tokyo Press, Tokyo.
Goldsworthy, A. (1966) Phy to chemistry .5., 1013.
Goldsworthy, A. (1976)
Photorespiration, -80.. Carolina Biology Readers.
Graham, D. and Chapman, E. A. (1979)
In: Encyclopedia of Plant Physiol. New Series, Vol. 6. Photosynthesis II (Gibbs. M. and Latzko, E. eds) p. 150. Springer—Verlag, New York.
Grodzinski, B. (1979) Plant Physiol. 63., 289.

.188
Hatch, M. D. and Slack, C. R. (1966) Biochem. J. 101, 103
Heath, O. V. S., Meidner, H. and Spanner, D. C. (1967) J. Exp. Bot. 18., 746.
Heber, U. (1960) Z. Eaturforsch 15b, 100.
Heber, U., Kirk, M. R., Gimmler, H. and Schafer, G. (1974) Planta 120, 34.
Heldt, H. W. (1976) In: "The Intact Chloroplast" (Barber, J. ed) p. 215.
Elsevier/North-Holland Biomedical Press. Netherlands-
Hesketh, J. D. (1967) Planta 76., 371.
Hess, J. L. and Tolbert, N. E. (1966) J, Biol. Chem. 241, 5705.
Hew, C. S. and Krotkov, G. (1968) Plant Physiol. 43, 464.
Hew, C. S., Krotkov, G. and Canvin, D. T. (1969a) Plant Physiol. 44, 662.
Hew, C. S., Krotkov, G. and Canvin, D. T. (1969b) Plant Physiol. 44., 671.
Hodgman, C. D., Weast, R. C., Selby, S. M. eds (1958) Handbook of Chemistry and Physics, Ed. 40. Chemical Rubber
Publishing Co., Cleveland, Ohio.

.189
Holmgren, P. and Jarvis, P. G. (1967)
Physiol. Plant. 20, 1045.
Horecker, B. L., Smyrniotis, P. Z. and Hurwitz, G. (1956)
J, Biol, Chem. 223, 1009.
Huber, S. and Edwards, G. (1975)
Biochem, Biophys, Res, Commun. 67, 28.
Hurst, R. O. (1964) J. Biochem. 42, 287.
Isherwood, F. A. and Barret, F. C. (1967)
Biochem. J. 104, 922.
Jackson, C. Dench, J. E., Morris, P., Luid, S. C., Hall, D. 0.,
Moore, A. L. (1979) Biochem. Soc. Trans. 1_, 1122.
Jackson, W. A. and Volk, R. J. (1970)
Annu. Rev. Plant Physiol. 2JL, 385.
Jensen, R. G. and Bassham, J. A. (1968) Biochem. Biophys. Acta 153, 227.
Jimenez, E,, Baldwin, R. L., Tolbert, N. E. and Wood. W. A. (1962) Arch. Biochem. Biophys. 98, 172.
Jolliffe, P. A. and Tregunna, E. B. (1968)
Plant Physiol. 43., 902.
Jolliffe, P. A. and Tregunna, E. B. (1973) Can. J. Bot. 51., 841.

.190
Kaiser, W. M. and Bassham, J. A. (1979) Planta 144, 193.
Kandler, O. and Gibbs, M. (1959) Z. Naturforsch 14b, 8.
Keys, A. J. (1968) Biochem. J, 108, 1.
Keys, A. J. (1980) In: "The Biochemistry of Plants" vol. 5 (Stumpf, P. K.,
Conn, E. E. eds) p. 359. Academic Press.
Keys, A. J+ , Sampaio, E. V. S. B., Cornelius, M. J. and Bird, It F. (.1977) J. Exp. Bot. .28, 525.
Keys, A. J., Bird. I. F., Cornelius, M. J., Lea, P. J., Wallsgrove, R. M. and Miflin, B. J. (1978) llature 215, 741.
Kisaki, T. and Tolbert, N, E. (1969) Plant Physiol. 44., 242.
Kisaki, T. and Tolbert, N. E. (1970) Plant Cell Physiol. 11, 247.
Kretovich, V. Lr and Stepanovich, K. M. (1963) Dokl. Akad. Bank. SSSR 148, 939.
Ku, Sun-Ben and Edwards, G. E. (1977a) Plant Physiol. 59, 986.
Ku, Sun-Ben and Edwards, G. E. (1977b) Plant Physiol. .59, 991.

.191
Ku, Sun-Ben and Edwards, G, E. (1978) Planta 140, 1.
Ku, Sun-Ben, Edwards, G, E, and Tanner, C. B. (1977) Plant Physiol, 59., 868.
Kumarasinghe, K. S. (1975) Ph.D. Thesis, University of London.
Kumarasinghe, K. S., Keys, A. J. and Whittingham, C. P.(1977) J, Exp. Bot, 28, 1247.
Laing, A., Ogren, W. L. and Hageman, R. H. (1974) Plant Physiol. 54, 678.
Latzko, E. and Gibbs, M. (1968) Z. Pflanzenphysiol. .59, 184.
Latzko, E. and Gibbs, M. (1972) In: "Methods in Enzymology", 24.. Photosynthesis and
Nitrogen fixation. Part B (San Pietro, A. ed) p. 261.
Lee, R. B. and Whittingham, C. P. (1974) J. Exp, Bot. 25, 277.
Long, C. (1961) In: Biochemists' Handbook (King, E. J. and Sperry, M. M. consult, eds) p. 400. Ed. Cyril Long.
Lorimer, G. H., Andrews, T. J, and Tolbert, N. E. (1973) Biochemistry 12., 18.
Ludwig, L. J. and Canvin, D. T. (1971) Plant Physiolt 48, 712.

.192
Mactiler, F, and Nbsberger, J. (1978) Oecologia (Berl.) 3_5, 267.
MSchler, F., Keys, A. J. and Cornelius, M. J. (1980)
J, Exp. Bot, 3JL, 7.
Mahon, J, D., Fock, H, and Canvin, D. T. (1974)
Planta 120, 245.
Mangat, B. S., Levin, W. B. and Bidwell, R. G. S. (1974)
Can. J, Bott 52., 673.
Marker, A. F. H, and Whittingham, C. P. (1967) J, Exp, Bot. 18., 732.
Mathieu, Y,, Miginiac-Maslow, M., and Remy, R. (1970) Biochem. Biophys, 4cta 205., 95,
Meidner, H. and Mansfield, T, A. (1968)
Physiology of Stomata. MC Graw-Hill, New York.
Miflin, B. J., Marker, A. F. H. and Whittingham, C. P. (1966) Biochem. Biophys. Acta 120, 266.
Ogren, W. L. and Bowes, G, (1971)
Nature New Biol. 230, 159.
Patterson, M. S. and Greene, R. C. (1965) Anal. Chem. 37., 854,
Peterkofsky, A. and Racker, E. (1961) Plant Physiol. 36., 409.
Poskuta, G., Nelson, C. D. and Krotkov, G. (19.67) PZarct Physiol. 42., 1187.

.193
Pritchard, G. G., Griffin, W. J. and Whittingham, C. P. (1962) J% Exp. Bot. 13., 176.
Przybylla, K.-R. and Fock, H. (1976) Ber. Deutsch. Bot. Ges. 89, 651.
Raven, J. A. (1972a)
New Phytol. JLr 2 2 7•
Raven, J, A, (1972b) New Phytol. 71^ 995.
Reimer, R. B. (1970)
M.Sc. Thesis, University of London.
Richardson, K, E. and Tolbert, N. E. (1961)
J. Biol. Chem. 236, 1285.
Ryan, F. J. and Tolbert, N. E. (1975) Jt Biol. Chem. 250, 4234.
Salin, M. L. and Homann, P. H. (1971)
Plant Physiol. 48, 193.
Servaites, J. C. and Ogren, W. L. (1978) Plant Physiol. 61, 62.
Shneyour, A., Raison, J, K. and Smillie, R. M. (1973)
Biochem. Biophys. Acta 292, 152.
Sicher, R. C. and Jensen, R. G. (1979) Plant Physiol. 64, 880.
Smillie, R. M. (1960) Plant Physiol. 3J5, suppl. XX.

.194
Smillie, R. M. (1963) Can. J. Bot. 4JL, 123.
Smith, D. C., Bassham, J. A. and Kirk, M. (1961) Biochem. Biophys. Acta 48., 299.
Snyder, F. W, and Tolbert, N. E. (1974) Plant Physiol. S3, 514.
Stepanova, A. M, and Baranova, Ar A. (1972) Biokhimiya 37., 520.
Stocking, C, R. (1959) Plant Physiol. 34., 56.
Stocking, C. R. and Ongutv, A. (1962) Am. J. Bot. 49., 284.
Tamas, I. A. and Bidwell, R. G. S. (1971) Can. J. Bot. 49., 299.
Tamiya, H. and Huzisige, H. (1949) Stud. Tokugawa Inst. 6., 83.
Tenhunen, J. D., Weber, J, A., Yocum, C. S. and Gates, D, M. (1979) Plant Physiol. 63., 916.
Thompson, C. M. and Whittingham, C. P. (1968) Biochem. Biophys. Acta 153, 260.
Tolbert, N. E. (1973) In: Symp. Soc. Exp. Biol. XXVII. Rate Control of Biological
Processes. p. 215. Cambridge Univ. Press, Cambridge.

.195
Tolbert, N. E. and Cohan, M. S, (1953) J. Biol. Chem. 204, 639.
Tolbert, N. E., Oeser, A., Kisaki, T., Hageman, R. H. and Yamasaki, R. K. (1968) J. Biol. Chem. 243, 5179.
Tolbert, N. E. and Yamasaki, R, K. (1969) Ann. N. Y. Acad. Sot. 168, 325.
Tolbert, N. E., Yamasaki, R. K. and Oeser, A. (1970) J. Biol. Chem. 245, 5129.
Tregunna, E. B., Krotkov, G. and Nelson, C. D. (1961) Can. J. Bot. 39, 1045.
Tregunna, E. B., Krotkov, G. and Nelson, C. D. (1964) Can, J. Bot. 42, 989.
Tregunna, E. B., Krotkov, G. and Nelson, C. D. (1966) Physiol. Plant. 19., 723.
Turner, J. S. and Brittain, E. G. (1962) Biol. Rev. 32, 130.
Ullrich, J. (1963) Biochem. Biophys. Acta 7JL/ 589.
VllL, J., Laisk, A., Oja, V. and Parnik, T. (1972) Dokl, Akad. Rank. SSSR (Engl, transl. of bot. sci. sect.) 204, 86.
VIIL, J., Laisk, A., Oja, V. and Parnik, T. (1977) Photo synthetica 1JL, 251.

.196
Waidyanatha, U. P. de S. (1973) Ph.D. Thesis, University of London.
Waidyanatha, U. P. de S., Keys, A* J. and Whittingham, C. P. (1975a) J, Exp. Bot. 26., 15,
Waidyanatha, U. P. de S., Keys, A. K. and Whittingham, C. P. (1975b) J. Exp. Bot. 26., 27.
Walker, D. A, (1973) New Phytol. 72., 209.
Walker, D. A. and Robinson, S. P. (1978) In: "Photosynthetic Carbon Assimilation" (Siegelman, H. K.
and Hind,;.G. eds) p. 43. Plenum Press, New York.
Wallsgrove, R. M., Keys, A. J., Bird, I. F., Cornelius, M. J., Lea, P. J. and Miflin, B. J. (1980) J. Exp. Bot. 31., 1005..
Wang, D, and Waygood, E. R. (1962) Plant Physiol. .37, 826.
Warburg, O. (1920) Biochem. Z. 103, 108.
Whittingham, C. P., Coombs, I. and Marker, A. F. H. (1967) In: "Biochemistry of chloroplasts" Vol. II (Goodwin, T.W. ed)
p. 155. Academic Press, London.
Whittingham, C. P., Hiller, R. G. and Birmingham, M. (1963) In: "Photosynthetic Mechanisms of Green Plants". Publ. 1145.
Natl. Acad, Sci., Washington D.C., 452.

.197
Whittingham, C. P. and Pritchard, G. G. (1963) Proc. Royt Soc, London, B 157, 366.
Wilson, A. T. and Calvin, M. (1955) J. Am. Chem. Soc. 77, 5948,
Wintermans, J. F, G. M. . and de Mots, A. (1965) Biochem. Biophys. 4c£a 109, 448.
Woo, K, C., Berry, J. A., Osmond, C. B. and Lorimer, G. H.(1977)
Abstr. IV Int. Congr. on Photosynthesis, Reading, U.K., 415.
Woo, K. C, and Osmond, C. D. (1976)
Aust. J. Plant Physiol. 3., 771.
Yamasaki, R. K. and Tolbert, N. E. (1970) J. Biol. Chem. 245, 5137,
Zelitch, I. (1965) J. Biol. Chem. 240, 1869.
Zelitch, I. (1966)
Plant Physiol. 4JL, 1623,
Zelitch, I, (1971) Photosynthesis, Photorespiration and Plant Productivity -
Academic Press, New York and London
Zelitch, i": (1972a) Plant Physiol. 50., 109.
Zelitch, I. (1972b) Arch. Biochem. Biophys. 150, 698.

Zelitch, I. (1973) Proc. Natl. Acad. S c i . , U.S.A. 70, 579.
Zelitch, I. (1975) Annu. Rev. Plant Physiol. 44., 123.
Copyright © 2022 FDOKUMEN