forward calorimetry in alice and high multiplicity physics in ...
Upload
independentCategory
view
1download
0
ABSTRACT Differential scanning calorimetry is an efficient tool to study and thermodynamically describe biological macromolecules, proteins and lipids, and complex biological systems. It has been applied in investigations of thylakoid membranes and membrane fragments since the 80s, but only recently an attempt has been made to describe the sequence of the thermally induced events. Herein, we further elaborate this approach by reviewing the results obtained on intact thylakoids from wild type plants and the chlorophyll b-less mutant chlorina f2, isolated lamellar aggregates of the major light-harvesting complex of photosystem II, grana and stroma membranes. The comparison of the revealed thermal transitions allowed the assignment of the calorimetric features associated with the melting of the major photosynthetic complexes in thylakoid membranes. This basic knowledge will be of great help to follow and compare the thermal stability of photosynthetic complexes under stress conditions and in a variety of mutants. The thermal behavior of another type of an energy-producing membrane, the purple membrane of Haloarchaea, is also reviewed. Although it represents a much more simple membrane system, it exhibits a complex melting profile that resembles the one found for the major light-harvesting complex of photosystem II.
Differential scanning calorimetry of photosynthetic membranes: Resolving contributions of the major photosynthetic complexes to the sequential thermal transitions
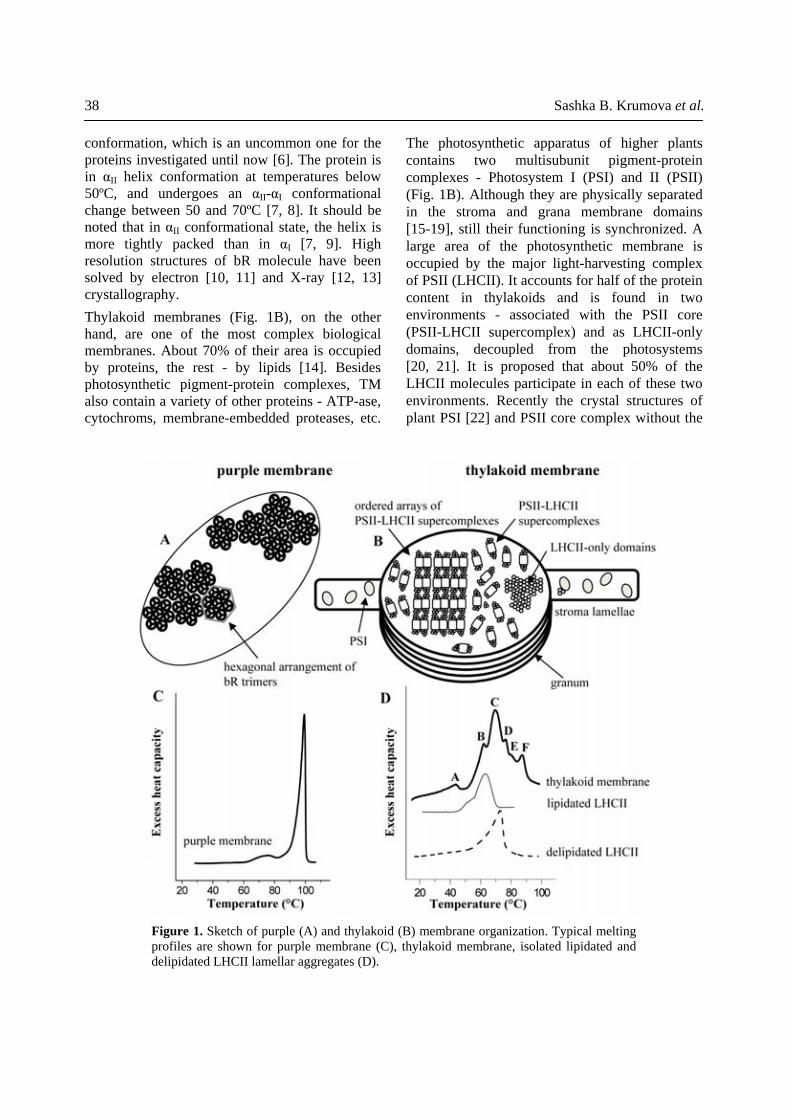
KEYWORDS: differential scanning calorimetry, thylakoid membranes, chlorina f2, major light-harvesting complex of photosystem II, photo-system I, photosystem II, purple membrane, bacteriorhodopsin INTRODUCTION Biological membranes are unique inhomogeneous spatial structures, consisting of proteins embedded in a lipid matrix, with architecture and stability being strongly related to their functions. In this review we deal with photosynthetic membranes, which are evolutionary-optimized for high photochemical efficiency and high thermal stability, especially regarding the purple membrane (PM) from Halobacterium salinarum. In particular the thermodynamic behavior of the two types of membranes capable of energy transduction by two different mechanisms, both of which however are light-driven (i.e. the processes of photosynthesis in thylakoid membranes (TM) and proton pumping in PM), is discussed. Purple membranes (Fig. 1A) contain only one protein, the lipid membrane-embedded retinal-containing 7-α helix protein bacteriorhodopsin (bR) [1]. bR operates as a light energy converter and unidirectionally pumps protons upon absorption of light [2, 3]. bR molecules are packed in trimers, dividing the lipid bilayer into two discontinuous compartments and forming a 2D hexagonal membrane crystal array [4, 5] (Fig. 1A). bR has an open, naturally stable
Institute of Biophysics, Bulgarian Academy of Sciences, Acad. G. Bonchev Str., Bl. 21, Sofia 1113, Bulgaria
Sashka B. Krumova, Svetla J. Todinova, Anelia G. Dobrikova, and Stefka G. Taneva*
*Corresponding author [email protected]
T r e n d s i n Photochemistry & P h o t o b i o l o g y
Vol. 12, 2010
38 Sashka B. Krumova et al.
The photosynthetic apparatus of higher plants contains two multisubunit pigment-protein complexes - Photosystem I (PSI) and II (PSII) (Fig. 1B). Although they are physically separated in the stroma and grana membrane domains [15-19], still their functioning is synchronized. A large area of the photosynthetic membrane is occupied by the major light-harvesting complex of PSII (LHCII). It accounts for half of the protein content in thylakoids and is found in two environments - associated with the PSII core (PSII-LHCII supercomplex) and as LHCII-only domains, decoupled from the photosystems [20, 21]. It is proposed that about 50% of the LHCII molecules participate in each of these two environments. Recently the crystal structures of plant PSI [22] and PSII core complex without the
conformation, which is an uncommon one for the proteins investigated until now [6]. The protein is in αII helix conformation at temperatures below 50ºC, and undergoes an αII-αI conformational change between 50 and 70ºC [7, 8]. It should be noted that in αII conformational state, the helix is more tightly packed than in αI [7, 9]. High resolution structures of bR molecule have been solved by electron [10, 11] and X-ray [12, 13] crystallography. Thylakoid membranes (Fig. 1B), on the other hand, are one of the most complex biological membranes. About 70% of their area is occupied by proteins, the rest - by lipids [14]. Besides photosynthetic pigment-protein complexes, TM also contain a variety of other proteins - ATP-ase, cytochroms, membrane-embedded proteases, etc.
Figure 1. Sketch of purple (A) and thylakoid (B) membrane organization. Typical melting profiles are shown for purple membrane (C), thylakoid membrane, isolated lipidated and delipidated LHCII lamellar aggregates (D).

Microcalorimetry of photosynthetic membranes 39
have been extensively reviewed. DSC has also found applications in the field of biomolecular interactions/biological recognition [39], biotech-nology [45] and more recently in drug-membrane interactions [46, 47]. Importantly, this technique permits evaluation of very high binding constants, not possible with other techniques, studying the effect of ligand binding to a protein on its thermal transition shape and transition temperature (see references in [39]). The temperature-scanning calorimetry directly determines thermally induced conformational (order-disorder) transitions of biological macro-molecules, quantitatively describes the thermal stability of proteins by the Gibbs energy of unfolding and provides all thermodynamic parameters of a conformational transition. DSC measures the excess heat capacity (cP) of the molecule as a function of temperature. The calorimetric signal (thermogram) is a sharp, usually, endothermic peak with maximum value of cP occurring at Tm, i.e. the temperature of the maximum of the excess heat capacity curve. The calorimetric enthalpy ∆H is calculated by the integral of the excess heat capacity function
(u
o
T
PT
H c dT∆ = ∫ , where To and Tu are the
temperatures of the onset and completion of the transition, respectively). The width at half-height of the peak Tm1/2 is a measure of the cooperativity of the transition from folded to unfolded state. Scanning rate dependence of thermal transitions The scanning of macromolecules in solution can be performed in both heating and cooling directions, and the reversibility of the unfolding can be tested by a second scanning after the first one. Thermodynamic analysis of DSC data requires the unfolding to be a reversible equilibrium process. Most proteins, however, denature/unfold irreversibly frequently accompanied with an irreversible loss of their functional activity. In some cases the transitions are scanning rate dependent, suggesting kinetically controlled denaturation [48-50]. To analyse an irreversible unfolding process it is necessary to obtain a set of thermograms at various scanning rates and apply
CP43 subunit [23, 24] have been determined at 4.4 Å and at 8 Å resolution, respectively. The heterogeneous structure of PSII-LHCII super-complexes from plants, however at lower resolution of 24 Å [25, 26], has also been solved. Both PSI and PSII are composed of a core complex and a membrane-associated antenna moiety constituted of light-harvesting complex (LHC) polypeptides which bind pigment molecules – chlorophyll (chl) a, chl b and xanthophylls (for overview see [19]). PSI of higher plants is found to be in a monomeric state, whereas PSII is mainly dimeric [20, 25, 26]. PSI binds heterodimers of LHCI proteins (Lhca1-Lhca4, and probably Lhca5) asymmetrically [22, 27, 28], while PSII binds antennae proteins (Lhcb1-Lhcb6) both in monomeric and trimeric forms [25, 26]. The Lhca1-Lhca4 proteins are organized in two subcomplexes present in equal amounts in PSI: LHCI-680, composed of the subpopulations Lhca2 and Lhca3, and LHCI-730, composed of Lhca1 and Lhca4 proteins [29-32]. Trimeric complexes of Lhcb1-Lhcb3 form the major PSII antenna, LHCII and monomeric Lhcb4-Lhcb6 form the minor antenna of PSII [33]. The PSI core complex is composed of more than 14 subunits [22] and that of PSII contains about 20 intrinsic and extrinsic proteins [33]. Despite the above mentioned data about the structure and oligomerization state of the two photosystems, a lot of details about their function and adaptation to stress conditions remain to be clarified. With respect to the thermal stability there are evidences that PSI is more stable than PSII [34]. Our own data are also in support to this statement (Krumova et al., to be published). Therefore, in this review we compare the thermal stability of the core and light-harvesting antennae complexes of the two photosystems and show that PSI and PSII follow different degradation patterns. Differential scanning calorimetry The use of differential scanning calorimetry (DSC) in problems related to protein folding and stability, and the basic thermodynamic formalism [35-40], phase transitions in lipids [41], lipid membrane assemblies [42, 43], protein and peptide induced domain formation in membranes [44]

40 Sashka B. Krumova et al.
transition (pretransition) at ca. 80°C, attributed to restructuring of the crystal lattice [67, 68] and an irreversible transition at ca. 100°C associated with partial thermal unfolding of bR [67, 69-71]. The denaturation transition is cooperative suggesting that the protein denatures as a trimer rather than as a monomer [72]. It has been estimated that trimer formation and/or trimers’ association stabilize bR with about 5 kcal/mol [73]. Bacteriorhodopsin also displays complex thermochromic features promising different technical applications [74]. It is well established that in general, the interaction of membrane proteins with the lipid matrix has an important effect on their stability, secondary and tertiary structure. In the case of bR the intertrimer interactions, mediated by lipids, appear to be crucial not only for the protein stability, but also for the assembly of bR molecules in the crystal array. We have found that after delipidation bR denatures at approximately the same Tm, but with higher cooperativity, as in native membranes, whereas no pretransition was visible in the DSC profile [70]. The shift of the pretransition to higher temperatures revealed by FTIR spectroscopy [75] confirms our suggestion that it overlaps with the denaturation transition in delipidated membranes [70]. The thermal behaviour of PM/bR is strongly pH-dependent [70, 76], bR exhibiting higher stability to acidification-induced denaturation [70]. Asp85 residue, together with several other residues, form the hydrogen bonding domain of the extracellular part of bR proton channel and interacts with a Ca2+ ion bound to bR with high affinity. Replacement of Asp85 by Thr, or protonation at low pH, changes the ionic specificity and the direction of the transport in bR, converting the protein into a chloride pump (see references in [77]). We have found that this single amino acid mutation not only changes bR function, but also alters its overall conformation, which in turn leads to destabilization of the protein to thermal denaturation as indicated by the decrease of both Tm (93.5±0.2°C) and ∆Hcal (88±4 kcal/mol) in D85T mutant compared to the wild type bR (Tm=97.0±0.5°C and ∆Hcal=110±10 kcal/mol) [77]. In an attempt to explain the DSC profile of PM, Shnyrov and Mateo [64] decomposed the profile
an appropriate kinetic model for data analysis. Mathematical expressions were derived to calculate the activation energy (Ea) of the denaturation transition [48-50], using diverse experimental information from the calorimetric transition. In some cases an irreversible protein denaturation can be described by a simplified “two-state irreversible” kinetic model [48, 51] assuming that only the native/folded and denatured/unfolded states are significantly populated during the denaturation. This model has described the unfolding of bacteriorhodopsin ([52], see below), rhodopsin [53], nucleoplasmin [54], plastocyanin [55], LHCII ([56], see below) and some other proteins [57-60]. Though accepted, this model cannot describe all cases of irreversible protein denaturation [61]. Successive annealing procedure The application of the thermodynamic formalism to complex biomacromolecular systems, multi-domain proteins and particularly to biological membranes, is a complicated matter. Individual components contribute to the overall thermogram of a complex system in a manner proportional to their concentration. The sum of the transitions of individual, not interacting between themselves, components might be close to the observed thermogram [62]. Successive annealing procedure has been elaborated to analyse complex multi-component systems that have complicated thermograms with overlapping transitions ([63-65], discussed also in the next paragraph). To decompose the overall complex thermogram, the transition curves of the individual components are registered by successively heating samples to different temperatures slightly higher (by ca. 1-2°C) than the Tms of the observed transitions. By subtracting every scan from the previous one, the ascending part of the successive transition is obtained, afterwards by extrapolation the descending part is yielded. This approach was successfully applied to PM [64, 65], TM [66], LHCII [56] and other biological systems (see references in [61]). DSC of purple membranes/bacteriorhodopsin The thermal behaviour of PM is characterized by two phase transitions (Fig. 1C), a small reversible

Microcalorimetry of photosynthetic membranes 41
certain pH value) has been deduced from DSC studies [52]. Following the structural changes in bR by means of infrared spectroscopy, quasi-elastic light scattering and electrokinetic technique we found that bR denaturation proceeds along a given pathway presenting a structural evidence for the kinetically controlled denaturation [71]. Another important detail is that a large proportion of ordered structure is maintained even above the Tm of bR, meaning a “compact denaturation state” of bR [71], as found for a number of membrane proteins [83-85]. This has been confirmed by X-ray scattering study of bR in denatured state also yielding that the partial unfolding of the transmembrane helices is associated with alteration in the short-range lateral structure [86]. DSC of thylakoid membranes and membrane fragments Thylakoid membranes have much more complicated thermal behavior compared to PM, due to the multitude of protein subunits and protein-protein interactions in these membranes. Typical DSC scan of pea thylakoid membranes is shown in Fig. 2A and its deconvolution in Fig. 2B. For comparison the scan for barley thylakoids is shown in Fig. 3A (and in Fig. 1D). The thermal transitions are similar to the ones reported by [87-89] and occur at 43.6ºC (A), 58.7ºC (B1), 63.2ºC (B2), 70.7ºC (C), 75.1ºC (D), 82.8ºC (E) and 90.3ºC (F) (nomenclature adopted from [87]). Their transition temperatures and
in up to five successive transitions, applying an annealing procedure, however no straightforward assignment was given for all transitions. It was suggested that the first irreversible one is related to molecular rearrangements and less compact protein-lipid packing in the membrane, whereas the second one corresponds to the reversible pretransition previously reported by Jackson and Sturtevant [67] and confirmed by X-ray diffraction [68, 78]. In terms of heat destabilization bR is an unusual protein, it shows an unexpected thermal stabilization/destabilization in the presence of chaotropes/kosmotropes [79]. In contrast to the usually observed Hoffmeister effect on protein conformation [80], chaotropes were found to shift the pretransition of PM to higher temperatures (i.e. they have a stabilizing effect and shift the αII-αI transition) as compared to neutral Hoffmeister ions, while kosmotropes shift the pretransition to lower temperatures indicating a destabilizing effect on the open αII protein conformation [79]. This unusual phenomenon was described by a phenomenological theory based on salt-induced changes of the hydrophobic/hydrophilic properties of protein-water interfaces. The thermal denaturation of bR is irreversible, a common feature of membrane proteins attributed to some perturbations and/or aggregation in the unfolded state not permitting the back-folding of the proteins [81, 82]. The kinetically controlled character of bR irreversible denaturation (at a
20 30 40 50 60 70 80 90 100
0.0
0.5
1.0
1.5
Temperature (°C)
c Pex (m
cal/d
eg m
g pr
otei
n)
Temperature (°C)
A
20 30 40 50 60 70 80 90 100
0.0
0.5
1.0
1.5
B
Figure 2. DSC thermogram of pea thylakoid membranes (A) registered with scanning rate 1°C/min. The mathematical deconvolution of the scan is presented in (B). Membranes were suspended in 10 mM Tricine (pH 7.6) and 250 mM sucrose.

42 Sashka B. Krumova et al.
(CD) data showed that indeed at this temperature a disassembly of chiral macrodomains (exhibiting specific CD signal, ψ-type CD) occurs. As established in earlier works the disassembly of macrodomains is preceded by the unstacking of the thylakoid membrane [90]. This process, although occurring at a much lower temperature than in PM, resembles very much the lattice melting in PM, indicating weaker intermacro-domain interactions in TM than intertrimer interactions in PM. In both cases there is a highly ordered structure (2D hexagonal lattice in PM and extended semicrystalline arrays of PSII-LHCII supercomplexes and LHCII-only macrodomains in TM). Thus, similarly to the PM where heating leads to random arrangement of bR trimers, in thylakoids there is a heat-induced destacking and randomization of the pigment-protein complexes. At this point we should note that the exact molecular organization of the LHCII-macro-domains in vivo is still unclear. But CD data on thylakoids do indicate chirally organized domains of LHCII, moreover electron microscopy studies revealed the existence of LHCII-heptamers in partially solubilized photosystem II membranes, though reported to be in rather low amount (about 7%, [91]). Dobrikova et al. [66] also show that transition A is sensitive to preillumination of thylakoids with white light and the extent of diminishment of
enthalpies vary somewhat with the investigated plant species (data shown for barley and pea thylakoids, Table 1), but follow the same trend and their assignment will be discussed below.
Low-temperature thermal transition in thylakoid membranes: Thylakoid membrane destacking and chiral macrodomain disassembly The first broad low-temperature transition (denoted A, Fig. 1D) has been shown to be thermally irreversible and sensitive to trypsin digestion, and at least partially correlated to the inhibition of the O2 evolution by the oxygen evolving complex (OEC, a large complex, peripherally associated with PSII) [87]. Later on we have demonstrated that this transition is strongly dependent on the ionic strength and preillumination [66]. We have revealed a strict correlation between variation of the MgCl2 concentration and the shift in transition A - clearly higher MgCl2 amount resulted in higher transition temperature, Tm. It has also been established that the enthalpy changes associated with this transition are considerably smaller than those associated with the higher temperature bands. Thus, we proposed that transition A does not represent protein melting but a structural rearrangement of the protein complexes in the membrane. Complementary circular dichroism
20 30 40 50 60 70 80 90 1000.0
0.4
0.8
1.2
1.6 A
20 30 40 50 60 70 80 90 1000.0
0.2
0.4
0.6
0.8
Temperature (°C)Temperature (°C)
c Pex (m
cal/d
eg m
g pr
otei
n)
B
Figure 3. DSC thermogram of chlorina f2 (A) and its deconvolution (B). The thermogram of wild type barley thylakoids (dotted line) is shown for comparison (A). The scanning rate and the buffer are as in Fig. 2.

Microcalorimetry of photosynthetic membranes 43
temperatures in grana membrane preparations (BBY, Fig. 4) which are devoid of LHCII-chiral macrodomains and has different origin, since there is no randomization of the complexes upon destacking [93] and (3) it is not found in stroma membrane preparations (PSI vesicles, Fig. 4) free of PSII-LHCII supercomplexes and LHCII only domains. However, it should be pointed out that additional overlapping low-enthalpy transitions with Tms similar to the one of transition A are apparently not resolved but are known to occur. These are for example the rearrangements in the
transition A differs with the time of illumination and the temperature at which the treatment is performed. This is explained in terms of thermo-optic mechanism (see also [92]) and supports the statement that the main origin of transition A is the macrodomain disassembly. Further indication for the assignment of this transition to lateral rearrangements in the membrane is given by the following facts: (1) it is not found in thylakoid membrane preparations of the chl b-less mutant chlorina f2, clo-f2 (Fig. 3A, B), devoid of LHCII macrodomains; (2) it is shifted to higher
Table 1. Thermodynamic parameters (transition temperatures (Tm (°C)) and calorimetric enthalpies (∆Hcal (mcal/mg protein)) derived by mathematical deconvolution of the endotherms of thylakoids and submembrane fragments. Mean values and standard errors were obtained from 3 to 4 independent experiments. Data for barley thylakoids [66] are shown for comparison.
Peak A B1 B2 C D E F
Pea thylakoids Tm ∆Hcal
43.6 2.28
(±0.04)
58.7 5.47
(±0.36)
63.2 8.22
(±0.18)
70.7 3.82
(±0.29)
75.1 7.35
(±0.37)
82.8 2.76
(±0.13)
90.3 2.15
(±0.12) BBY - MgCl2
Tm ∆Hcal
51 1.26
(±0.14)
55.5 5.06
(±0.15)
62.4 5.13
(±0.03)
66.8 2.50
(±0.02)
- - -
BBY + MgCl2 Tm ∆Hcal
46.8 3.15
(±0.12)
56.6 5.84
(±0.22)
62.4 8.04
(±0.14)
68.9 4.15
(±0.18)
- 80.9 1.07
(±0.04)
-
PSI vesicles Tm ∆Hcal
- 57.3 1.34
(±0.5)
65.6 1.55
(±0.3)
72.4 0.75
(±0.14)
- - 89.3 1.08
(±0.22) Barley thylakoids
Tm ∆Hcal
43.0 1.33
(±0.26)
59.0 2.37
(±0.17)
61.8 1.83
(±0.45)
69.8 12.6
(±0.33)
76.6 1.23
(±0.11)
80.4 2.0
(±0.36)
86.6 3.3
(±0.44) Clo-f2 thylakoids
Tm ∆Hcal
- 58 4.89
(±0.25)
60.9 0.79
(±0.14)
71 4.34
(±0.12)
76.8 1.20
(±0.05)
83.3 2.05
(±0.08)
-

44 Sashka B. Krumova et al.
environment. Here we address the thermal stability of LHCII in these two localizations by comparing the DSC profiles of isolated grana membranes and lamellar LHCII aggregates as model systems. The thermogram of PSII membranes (at pH 7.5, in presence of MgCl2) was first published by Thompson et al. [98, 99]. Although the presented thermograms were not deconvoluted and hence the different transitions are not well-resolved, three main transitions centered at 47.5°C, 54°C, and 66°C and two less pronounced ones at 50°C and 59.5°C were observed. By detergent separation of PSII membranes into PSII core and LHCII fractions the authors showed that the transition at 66°C appears in the LHCII fraction, whereas the peaks at 54°C and 60°C are found in the PSII core fraction. Nolan et al. [89] have observed nine endothermic transitions in grana membranes (separated by Yeda press) and have assigned four of them (centered at 56°C, 73°C, 77°C and 91°C) to PSII components, whereas the transitions at 63°C and 81°C were ascribed to PSI. In BBY preparations, isolated according the procedure of Berthold et al. [100], we have revealed less transitions, centered at 46.8°C, 56.6°C, 62.4°C, 68.9°C and 80.9°C (Fig. 4, Table 1), most probably due to the more pure preparation devoid of PSI components. They correspond to transitions A, B1, B2, C and E in thylakoids. Our data are in accordance with those of Thompson et al. [99] and Shutilova et al. [101] with the exception of the transition at about 81°C (transition E), observed by us in presence of Mg2+ ions, whose nature is still to be clarified. Apparently the first transition (A, 46.8°C) is due to two events - the OEC degradation [99, 101] and PSII core monomerization [97]. As mentioned above in BBY there is no contribution from lateral rearrangements due to destacking of the membranes [93]. It was suggested that PSII components contribute to transitions B and C [99, 101, 102], whereas transitions C and D are due to LHCII [88,101]. Later spectroscopic works showed that when isolated the PSII core complex degrades at 42°C [103], whereas at 55-65°C when embedded in the PSII membrane fragments [104]. Thus, the 56.6°C transition in BBY can be attributed to the PSII core denaturation. The nature
lipid bilayer, a broad 10-40°C endotherm assigned to lipid melting in TM ([94], see also [95, 96] and references therein) and the monomerization of the PSII core complex [97]. DSC of PS II and PS I containing membrane fragments: Contributions of PSII and PSI components to the thermal transitions
Transitions involving PSII components In vivo PSII-LHCII supercomplexes have been shown to adopt heterogeneous composition with respect to the number of bound LHCII and their binding positions [26]. This was suggested to be of high importance for the response of plants towards light and stress conditions, by providing different routes of excitation energy transfer. About half of the LHCII in the membrane is present in LHCII-only domains and faces PSII-LHCII supercomplexes in the opposite membrane layer [21]. Since the molecular structure of LHCII is the same when embedded in the PSII-LHCII supercomplexes and in the LHCII-only domains the question arises whether its structural properties are also the same or are modified by its micro-
20 30 40 50 60 70 80 90 1000.0
0.4
0.8
1.2
1.6
2.0
2.4
2.8
c Pex (m
cal/d
eg m
g pr
otei
n)
Temperature (°C)
Figure 4. DSC thermograms of grana (BBY, thin solid line) and stroma (PSI vesicles, dashed line) membranes isolated from pea leaves. For comparison the thermo-gram of pea thylakoids is also plotted (thick solid line). BBY and PSI vesicles were stored at -20ºC until measured. For DSC experiments BBY preparations were suspended in 10 mM Tricine (pH 7.6), 250 mM sucrose and 5 mM MgCl2, and PSI vesicles in 20 mM Tricine (pH 7.6), 250 mM sucrose, 25 mM KCl, 25 mM NaCl and 5 mM MgCl2. The scanning rate as in Fig. 2.

Microcalorimetry of photosynthetic membranes 45
nature of LHCII denaturation [56]. A shoulder of the main transition of LHCII is observed at 50°C and 58°C for the delipidated and lipidated LHCII, respectively. The asymmetric thermograms might be due to several reasons: (1) heterogeneity of the LHCII-trimers; it is known that they are constituted of three types of proteins (Lhcb1-3), which are in different ratio in the different trimeric fractions [113]; (2) presence of two structural lutein 1 and lutein 2 domains [114]; it was suggested that the lutein 2-domain controls the conformation of the lutein 1-domain. Probably the two structural domains have different thermal stability or their thermal destabilization might occur consecutively; (3) the proteins, constituting LHCII-trimers might have close and overlapping transitions; (4) melting of the protein lattice or (5) structural changes such as monomerization of the complexes. We have performed several studies on the stability of isolated LHCII and when embedded in the TM [56, 66, 92, 115]. It was established that lipidated LHCII possesses some characteristics very similar to those of native TM [116]. By complementing the DSC measurements with CD and native “green” gel electrophoresis we have revealed that the 50-58°C pretransition of LHCII in both TM and lipidated LHCII lamellae is mainly due to the trimer-to-monomer transition of the protein. The degradation of the protein occurs also at similar temperatures in lipidated LHCII lamellae [112] and in TM [66], i.e. at ca. 64°C and 70°C, respectively. Interestingly these two transitions, at ca. 58°C and 70°C, are also observed in BBY but no accumulation of LHCII monomers could be detected by CD and green gel electrophoresis [105]. Thus in this case LHCII complexes denature as trimers, again in similarity with bR, although with significantly lower cooperativity. We have observed the same behaviour of LHCII when embedded in delipidated LHCII lamellae, where the pretransition is not correlated with the protein monomerization but probably represents melting of the microcrystal lattice. The different thermal behavior of LHCII in distinct lipid environments might be correlated with the balance between its two specific functions - to capture efficiently the light energy directing it towards the reaction center of PSII and to regulate the excess
of the 62.4°C transition is not yet clear, however our CD data on heat-treated BBY particles reveal that it is correlated with the degradation of complexes containing both chl a and b [105]. Thus, this should be a population of LHC proteins, either the minor LHCs or the LHCII complexes. Shi et al. [104] show that the denaturation of LHCII begins at 65°C and can be ascribed to the DSC transition at 68.9°C in BBY. Further evidences for this hypothesis are given in the next paragraph. This also means that the peak at 62.4°C most probably represents the degradation of the minor LHCs. By its macroorganization and trimers formation in the lipid matrix in vivo, LHCII resembles bR. LHCII hexagons were found to be present in TM but in a rather low amount [91]. Nevertheless it was demonstrated that upon mixing with one of the major thylakoid lipids (monogalactosyl diacyl-glycerol) the scattering profile of reconstituted LHCII lamellae is characterized with hexagonal symmetry of long-range order [106]. It was also established that specific lipid species are responsible for the 2D protein arrangement of both proteins [107-109]. Like bR, the transition temperature of isolated LHCII (prepared according [110]) has been shown to be dependent on the pH and cation concentration. By lowering the pH from 7.5 to 6.5 and by adding Mg2+ the Tm of the transition centered at 75°C (attributed to LHCII) shifts to 70.6°C [88]. However, our measurements at pH 5.4 reveal an opposite effect, i.e. thermal stabilization of LHCII (Krumova et al., in preparation). Thus, LHCII might also possess complex behaviour with respect to pH treatment as already observed for bR [70]. Our previous study has also demonstrated that the characteristic Tm of LHCII is strongly dependent on the lipid content of the sample (Fig. 1D). The strongly delipidated LHCII lamellar aggregates (further denoted delipidated LHCII), obtained according to the protocol described by Krupa et al. [110] using 1% Triton X-100, have Tm higher by nearly 10°C as compared to LHCII isolated with smaller concentration of Triton X-100 (0.7%) [111] and further on denoted as lipidated LHCII [112]. Interestingly, we have demonstrated that the denaturation temperature depends on the scanning rate indicating the kinetic

46 Sashka B. Krumova et al.
Transitions involving the PSI components DSC scan of stroma membranes (prepared by Yeda press) was first reported by Nolan et al. [89]. Eight transitions were resolved but their nature was not discussed. Here we present DSC scan of more pure PSI preparation (without contamination from PSII components, Fig. 4), applying the protocol of Peters et al. [123]. Four endothermic transitions between 57°C and 90°C are resolved (57.3°C, 65.6°C, 72.4°C and 89.3°C). The transition temperatures of the successive transitions coincide with some of the transitions observed in isolated TM, namely those denoted as B1 (57.3°C), B2 (65.6°C), C (72.4°C) and F (89.3°C). Some of the transitions present in TM, in particular the one taking place below 60°C (transition A, Tm ~ 45°C) and those with Tm ~ 75°C (D) and Tm ~ 83°C (E), are absent in the thermogram of PSI. Complementary CD measurements revealed that the first thermal transition at 57°C is due to LHCI detachment from the PSI core and its denaturation (Krumova et al., to be published). The second one (with Tm ~ 65.6°C) involves carotenoid-containing structures and the last two high-temperature transitions (72.4°C and 89.3°C) are due to PSI core degradation. The total enthalpy of the PSI endotherm is significantly lower than the one of BBY membranes, which might result from different specific heat capacities of the proteins constituting the two photosystems. As shown in the previous paragraph transition F is absent in clo-f2. Since it is PSI-core-related, this strongly indicates modified PSI core structure in clo-f2, however structural studies are missing. Thus, clo-f2 appears to be a good system to investigate the thermal stability of PSI core with reduced LHCI antennae. Noteworthy, the sum of the thermograms of BBY and PSI fractions (not shown) resembles the typical ones of thylakoid membranes, with exception of the peak centered around 70°C attributed to denaturation of LHCII. The source of the difference may be interactions between the pigment-protein complexes when assembled in the lipid matrix of thylakoids and their different content and stoichiometry in isolated membrane fragments and when embedded in the thylakoid membrane.
of light energy in the processes of non-photochemical quenching [117-119] and state transitions [120, 121]. Alternatively, since BBY particles are isolated patches from grana membranes, there is not enough space for the proteins to undergo large-scale structural changes (which might be induced under the monomerization of LHCII complexes in thylakoids), hence the information extracted from BBY as a model system cannot be directly extrapolated to the in vivo situation. Though functional studies are beyond the scope of the present review, it should be noted that the distinction of LHCII participating in different macrostructures under in vivo conditions is still a challenge for the photosynthetic community. It is clear that the DSC scans of thylakoid membranes must contain contributions of LHCII from the above mentioned two types of environments – PSII-LHCII supercomplexes and LHCII only domains. It should also be noted that the thermograms of thylakoids are dominated by the LHCII-related transitions due to the very high LHCII amount in thylakoids. In order to gain more insight into the thermal stability of the other thylakoid proteins we have studied the chl b deficient mutant of barley, clo-f2, which has strongly reduced amount of LHCII [122]. The thermogram, and its deconvolution, of clo-f2 (Fig. 3A, B) solidifies further the statement that the main transition C (Tm ~70°C) in thylakoids is due to LHCII since its enthalpy is greatly reduced in this mutant as compared to the wild type (Table 1). As pointed out above such a high denaturation temperature for LHCII is found in delipidated LHCII lamellae, where LHCII trimers denature without monomerization. However, LHCII in thylakoids does form monomers upon heating resembling the thermotropic behavior of lipidated LHCII lamellae (Tm ~ 60°C). Thus, both the lipidated and delipidated LHCII lamella posses some characteristics of the LHCII in thylakoid membranes but these two model systems cannot exactly describe its properties in vivo. For transitions D and E in clo-f2 the Tms and the respective calorimetric enthalpies remain roughly the same as in the wild type, whereas transition F fully disappears in the mutant. These effects will be discussed further in the next paragraphs.
architecture of photosynthetic membranes is important for elucidation of the energetics/ structure/function relationship of the photo-systems as well as for application purposes. This review demonstrates the strength of the micro-calorimetry as a tool for screening of the thermal properties of photosynthetic pigment-protein complexes in isolated state and close to in vivo in thylakoids. The stability of nanoscale biological systems such as bR, PSI and PSII, that can be used in creation of photosynthetically-based molecular superstructures for application in biomolecular electronics, is of a particular interest. The application of DSC can further be expanded significantly to characterization of the thermal stability of a variety of plant mutants and isolated photosynthetic complexes under different experimental conditions, relevant to their capacity for use in bioelectronics, biophotonics, biofuel production and other practical purposes. ACKNOWLEDGEMENTS The authors thank Dr. Mira Busheva for the help with isolation of membrane fragments and Dr. Milena Georgieva for the valuable comments on the manuscript. ABBREVIATIONS bR, bacteriorhdopsin; chl, chlorophyll; CD, circular dichroism; clo-f2, chlorophyll b deficient mutant of barley; DSC, differential scanning calorimetry; LHCII, major light harvesting complex of photosystem II; PSI, photosystem I; PSII, photosystem II; PM, purple membrane; TM, thylakoid membranes REFERENCES 1. Stoeckenius, W., Lozier, R. H., and
Bogomolni, R. 1979, Biochim. Biophys. Acta, 505, 215.
2. Ebrey, T. G. 1993, Thermodynamics of Membranes, Receptors and Channels, Jackson, M. (Ed.), CRC, Boca Raton, FL, 353.
3. Lanyi, J. K. 1993, Biochim. Biophys. Acta, 1183, 241.
4. Henderson, R., Baldwin, J. M., Ceska, T. A., Zemlin, F., Beckmann, E., and Downing, K. H. 1990, J. Mol. Biol., 213, 899.
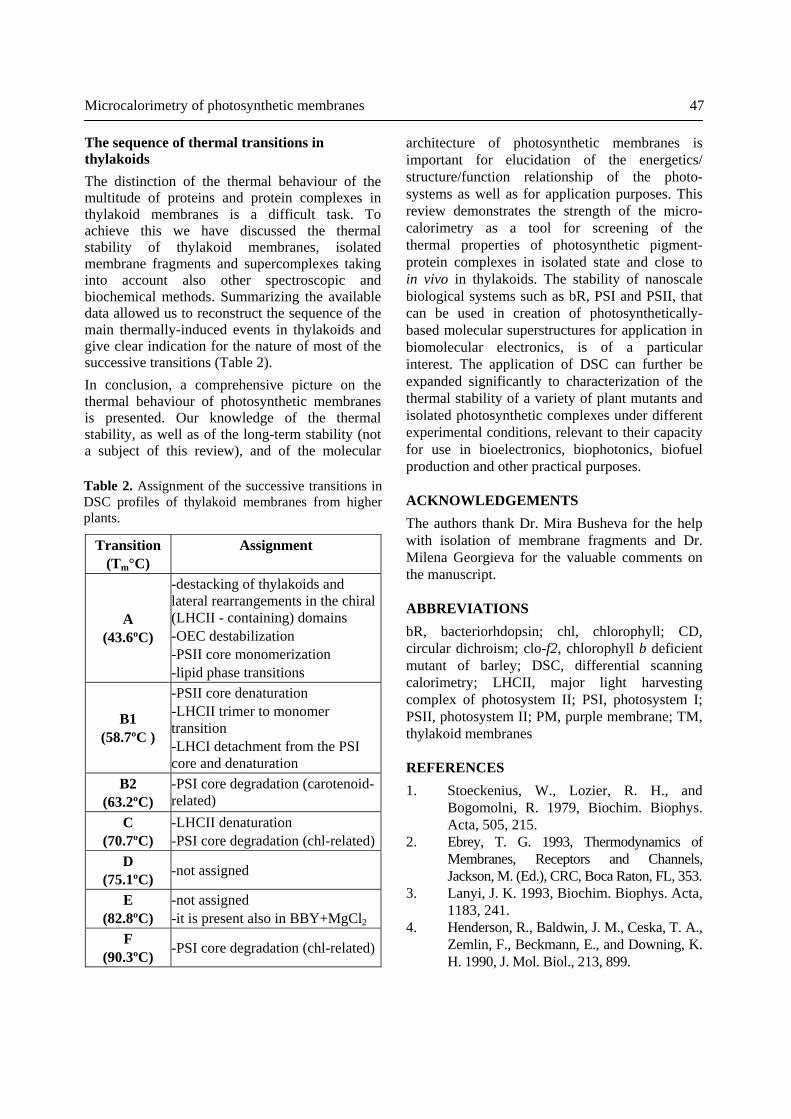
The sequence of thermal transitions in thylakoids The distinction of the thermal behaviour of the multitude of proteins and protein complexes in thylakoid membranes is a difficult task. To achieve this we have discussed the thermal stability of thylakoid membranes, isolated membrane fragments and supercomplexes taking into account also other spectroscopic and biochemical methods. Summarizing the available data allowed us to reconstruct the sequence of the main thermally-induced events in thylakoids and give clear indication for the nature of most of the successive transitions (Table 2). In conclusion, a comprehensive picture on the thermal behaviour of photosynthetic membranes is presented. Our knowledge of the thermal stability, as well as of the long-term stability (not a subject of this review), and of the molecular
Microcalorimetry of photosynthetic membranes 47
Table 2. Assignment of the successive transitions in DSC profiles of thylakoid membranes from higher plants.
Transition (Tm°C)
Assignment
A (43.6ºC)
-destacking of thylakoids and lateral rearrangements in the chiral (LHCII - containing) domains -OEC destabilization -PSII core monomerization -lipid phase transitions
B1 (58.7ºC )
-PSII core denaturation -LHCII trimer to monomer transition -LHCI detachment from the PSI core and denaturation
B2 (63.2ºC)
-PSI core degradation (carotenoid-related)
C (70.7ºC)
-LHCII denaturation -PSI core degradation (chl-related)
D (75.1ºC) -not assigned
E (82.8ºC)
-not assigned -it is present also in BBY+MgCl2
F (90.3ºC) -PSI core degradation (chl-related)
48 Sashka B. Krumova et al.
26. Boekema, E. J., van Roon, H., Calkoen, F., Bassi, R., and Dekker, J. P. 1999, Biochemistry, 38, 2233.
27. Jansson, S. 1994, Biochim. Biophys. Acta, 1184, 1.
28. Boekema, E. J., Jensen, P. E., Schlodder, E., van Breemen, J. F. L, van Roon, H., Scheller, H. V., and Dekker, J. P. 2001, Biochemistry, 40, 1029.
29. Green, B. R. and Durnford, D. G. 1996, Annu. Rev. Plant Physiol. Plant Mol. Biol., 47, 685.
30. Scheller, H. V., Naver, H., and Moller, B. L. 1997, Physiol. Plantarum, 100, 842.
31. Scheller, H. V., Jensen, P. E., Haldrup, A., Lunde, C., and Knoetzel, J. 2001, Biochim. Biophys. Acta, 1507, 41.
32. Croce, R., Morosinotto, T., Castelletti, S., Breton, J., and Bassi, R. 2002, Biochim. Biophys. Acta, 1556, 29.
33. Hankamer, B., Barber, J., and Boekema, E. J. 1997, Annu. Rev. Plant Physiol. Plant Mol. Biol., 48, 541.
34. Tracey, S., Takeuchi, A. B., and Thornber, J. P. 1994, Aust. J. Plant Physiol., 21, 759.
35. Sturtevant, J. M. 1987, Ann. Rev. Phys. Chem., 38, 463.
36. Freire, E. 1994, Meth. Enzymol., 240, 502. 37. Freire, E. 1995, Meth. Mol. Biol., 40, 191. 38. Makhatadze, G. I. and Privalov, P. L.
1995, Adv. Protein Chem., 47, 307. 39. Jelesarov, I. and Bosshard, H. R. 1999,
J. Mol. Recognit., 12, 3. 40. Lopez, M. M. and Makhatadze, G. I. 2002,
Methods Mol. Biol., 173, 113. 41. Lewis, R. N., Mannock, D. A., and
McElhaney, R. N. 2007, Methods Mol. Biol., 400, 171.
42. Mason, J. T. 1998, Methods Enzymol., 295, 468.
43. Huang, C. and Li, S. 1999, Biochem. Biophys. Acta, 1422, 273.
44. Epand, R. M. 2007, Biophys. Chem., 126, 197.
45. Gummadi, S. N. 2003, Biotech. Bioproc. Eng., 8, 9.
46. Mavromoustakos, T. M. 2007, Methods Mol. Biol., 400, 587.
47. Demetzos, C. 2008, J. Liposome Res., 18, 159.
5. Essen, L. -O., Siegert, R., Lehmann, W. D., and Oesterhelt, D. 1998, PNAS, 95, 11673.
6. Cacace, M. G., Landau, E. M., and Ramsden, J. J. 1997, Q. Rev. Biophys., 30, 241.
7. Krimm, S. and Dwivedi, A. M. 1982, Science, 216, 407.
8. Wang, J. and El-Sayed, M. 2000, Biophys. J., 78, 2031.
9. Barnett, S. M., Edwards, C. M., Butler, I. S., and Levin, I. W. 1997, J. Phys. Chem. B, 101, 9421.
10. Grigorieff, N., Ceska, T. A., Downing, K. H., Baldwin, J. M., and Henderson, R. 1996, J. Mol. Biol., 259, 393.
11. Kimura, Y., Vassylyev, D. G., Miyazawa, A., Kidera, A., Matsushima, M., Mitsuoka, K., Murata, K., Hirai, T., and Fujuyoshi, Y. 1997, Nature, 389, 206.
12. Pebay-Peyroula, E., Rummel, G., Rosenbusch, J. P., and Landau, E. M. 1997, Science, 277, 1676.
13. Luecke, H., Richter, H. T., and Lanyi, J. K. 1998, Science, 280, 1934.
14. Kirchhoff, H., Mukherjee, U., and Galla, H. -J. 2002, Biochemistry, 41, 4872.
15. Andersson, B. and Anderson, J. M. 1980, Biochim. Biophys. Acta, 593, 427.
16. Albertsson, P. -A. 2001, Trends Plant Sci., 6, 349.
17. Rojdestvenski, I., Ivanov, A. G., Cottam, M. G., Borodich, A., Huner, N. P. A., and Öquist, G. 2002, Biophys. J., 82, 1719.
18. Mustárdy L. and Garab, G. 2003, Trends Plant Sci., 8, 117.
19. Dekker, J. P. and Boekema, E. J. 2005, Biochim. Biophys. Acta, 1706, 12.
20. Peter, G. F. and Thornber, J. P. 1991, Plant Cell Physiol., 32, 1237.
21. Boekema, E. J., van Breemen, J. F. L., van Roon, H., and Dekker, J. P. 2000, J. Mol. Biol., 301, 1123.
22. Ben-Shem, A., Frolow, F., and Nelson, N. 2003, Nature, 426, 630.
23. Rhee, K. -H., Morris, E. P., Zheleva, D., Hankamer, B., Kühlbrandt, W., and Barber, J. 1997, Nature, 389, 522.
24. Rhee, K. -H., Morris, E. P., Barber, J., and Kühlbrandt, W. 1998, Nature, 396, 283.
25. Boekema, E. J., Hankamer, B., Bald, D., Kruip, J., Nield, J., Boonstra, A. F., Barber, J., and Rögner, M. 1995, PNAS, 92, 175.

48. Sánchez-Ruiz, J. M., López-Lacomba, J. L., Cortijo, M., and Mateo, P. L. 1988, Biochemistry, 27, 1648.
49. Sánchez-Ruiz, J. M., 1992, Biophys. J., 61, 921.
50. Kurganov, B. I, Lyubarev, A. E., Sanchez-Ruiz, J. M., and Shnyrov, V. L. 1997, Biophys. Chem., 69, 175.
51. Freire, E., Murphy, K. P., Sánchez-Ruiz, J. M., Galisteo, M. L., and Privalov, P. L. 1992, Biochemistry, 31, 250.
52. Galisteo, M. L. and Sanchez-Ruiz, J. M. 1993, Eur. Biophys. J., 22, 25.
53. Landin, J. S., Katragadda, M., and Albert, A. D. 2001, Biochemistry, 40, 11176.
54. Taneva, S. G., Muñoz, I. G, Franco, G., Falces, J., Arregi, I., Muga, A., Montoya, G., Urbaneja, M. A., and Bañuelos, S. 2008, Biochemistry, 47, 13897.
55. Milardi, D., La Rosa, C., Grasso, D., Guzzi, R., Sportelli, L., and Fini, C. 1998, Eur. Biophys. J., 27, 273.
56. Krumova, S. B., Todinova, S. J., Busheva, M. C., and Taneva, S. G. 2005, J. Photochem. Photobiol., 78, 165.
57. Milardi, D., La Rosa, C., and Grasso, D. 1994, Biophys. Chem., 52, 183.
58. Vogl, T., Jatzke, C., Hinz, H. -J., Benz, J., and Huber, R. 1997, Biochemistry, 36, 1657.
59. Guzzi, R., Sportelli, L., La Rosa, C., Milardi, D., Grasso, D., Verbeet, M. P., and Canters, G. W. 1999, Biophys. J., 77, 1052.
60. Meijberg, W., Schuurman-Wolters, G. K., Boer, H., Scheck, R. M., and Robillard, G. T. 1998, J. Biol. Chem., 273, 20785.
61. Lubarev, A. E. and Kurganov, B. I. 2001, Recent. Res. Devel. Biophys. Chem., 2, 141.
62. Garbett, N. C., Mekmaysy, C. S., Helm, C. W., Jenson, A. B., and Chaires, J. B. 2009, Exp. Mol. Pathol., 86, 186.
63. Shnyrov, V. L., Zhadan, G. G., and Akoev, I. G. 1984, Bioelectromagnetics, 5, 411.
64. Shnyrov, V. L. and Mateo, P. S. 1993, FEBS Lett., 324, 237.
65. Shnyrov, V. L. 1994, Biochem. Mol. Biol. Int., 34, 281.
66. Dobrikova, A. G., Várkonyi, Z., Krumova, S. B., Kovács, L., Kostov, G. K., Todinova, S. J., Busheva, M. C., Taneva, S. G., and Garab, G. 2003, Biochemistry, 42, 11272.
67. Jackson, M. B. and Sturtevant, J. M. 1978, Biochemistry, 17, 911.
68. Hiraki, K., Hamanaka, T., Mitsui, T., and Kito, Y. 1981, Biochim. Biophys. Acta, 647, 18.
69. Brouillette, C. G., Muccio, D. P., and Finney, T. K. 1987, Biochemistry, 26, 7431.
70. Taneva, S. G., Koynova, R., and Tenchov, B. 1994, FEBS Lett., 345, 154.
71. Taneva, S. G., Caaveiro, J. M. M., Muga, A., and Goñi, F. M. 1995, FEBS Lett., 367, 297.
72. Kahn, T. W., Sturtevant, J. M., and Engleman, D. M. 1992, Biochemistry, 31, 8829.
73. Krebs, M. P. and Isenbarger, T. A. 2000, Biochim. Biophys. Acta, 1460, 15.
74. Neeble, M., Rhinow, D., Schromczyk, N., and Hampp, N. A. 2008, J. Phys. Chem. B, 112, 6946.
75. Heyes, C. D. and El-Sayed, M. A. 2002, J. Biol. Chem., 277, 29437.
76. Kresheck, G. C., Liu, C. T., Williams, L. N., Mason, W. R., Jang, D. -J., and El-Sayed, M. A. 1990, J. Photochem. Photobiol. B, 7, 289.
77. Taneva, S. G., Goñi, F. M., Tuparev, N. P., Petkanchin, I., Dér, A., and Muga, A. 2002, Coll. Surf. A, 209, 193.
78. Koltover, I., Raedler, J. O, Salditt, T., Rothshild, K. J., and Safinya, C. R. 1999, Phys. Rev. Lett., 82, 3184.
79. Dér. A., Kelemen, L., Fábián, L., Taneva, S. G., Fodor, E., Páli, T., Cupane, A., Cacace, M. G., and Ramsden, J. J. 2007, J. Phys. Chem. B, 111, 5344.
80. Pradeep, L. and Udgaonkar, J. B. 2002, J. Mol. Biol., 324, 331.
81. Sánchez-Ruiz, J. M. and Mateo, P. L. 1987, Revis. Biol. Celular, 11, 15.
82. Ruiz-Sanz, J., Ruiz-Cabello, J., Mateo, P. L., and Cortijo, M. 1992, Eur. Biophys. J., 21, 71.
Microcalorimetry of photosynthetic membranes 49

83. Arrondo, J. L. R., Cartesana, J., Valpuesta, J. M., and Goñi, F. M. 1994, Biochemistry, 33, 11650.
84. Haltia, T., Semo, N., Arrondo, J. L. R., Goñi, F. M., and Freire, E. 1994, Biochemistry, 33, 9731.
85. Seshadri, S., Oberg, K. A., and Fink, A. L. 1994, Biochemistry, 33, 1351.
86. Müller, J., Münster, C., and Salditt, T. 2000, Biophys. J., 78, 3208.
87. Cramer, W. A., Whitmarch, J., and Low, P. S. 1981 Biochemistry, 20, 157.
88. Smith, K. A., Ardelt, B. K., Huner, N. P. A., Krol, M., Myscich, E., and Low, P. S. 1989, Plant Physiol., 90, 492.
89. Nolan, W. G., Hopkins, H. P, and Kalini, S. A. M. 1992, Arch. Biochem. Biophys., 297,19.
90. Garab, G. and Mustárdy, L. 1999, Aus. J. Plant Physiol., 26, 649.
91. Dekker, J. P., van Roon, H., and Boekema, E. J. 1999, FEBS Lett., 449, 211.
92. Garab, G., Cseh, Z., Kovács, L. Rajagopal, S., Várkonyi, Z., Wentworth, M., Mustárdy, L., Dér, A., Ruban, A., Papp, E., Horton, P., and Holzenburg, A. 2002, Biochemistry, 41, 15121.
93. Kirchhoff, H., Borinski, M., Lenhert, S., Chi, L., and Büchel, C. 2004, Biochemistry, 43, 14508.
94. Low, P. S., Ort, D. R., Cramer, W. A., Whitmarsh, J., and Martin, B. 1984, Arch. Biochem. Biophys., 231, 336.
95. Krumova, S. B., Dijkema, C., de Waard, P., As, H. V., Garab, G., and van Amerongen, H. 2008, Biochim. Biophys. Acta, 1778, 997.
96. Krumova, S. B., Koehorst, R. B. M., Bóta, A., Páli, T., van Hoek, A., Garab, G., and van Amerongen, H. 2008, Biochim. Biophys. Acta, 1778, 2823.
97. Lípová, L., Krchňák, P., Komenda, J., and Ilík, P. 2010, Biochim. Biophys. Acta, 1797, 63.
98. Thompson, L. K., Sturtevant, J. M., and Brudvig, G. W. 1986, Biochemistry, 25, 6161.
99. Thompson, L. K., Blaylock, R., Sturtevant, J. M., and Brudvig, G. W. 1989, Biochemistry, 28, 6686.
100. Berthold, D. A., Babcock, G. T., and Yocum, C. F. 1981, FEBS Lett., 134, 231.
101. Shutilova, N., Semenova, G., Klimov, V., and Shnyrov, V. 1995, Biochem. Mol. Biol. Int., 35, 1233.
102. Smith, K. A. and Low, P. S. 1989, Plant Physiol., 90, 575.
103. De Las Rivas, J. and Barber, J. 1997, Biochemistry, 36, 8897.
104. Shi, H., Xiong, L., Yang, K., Tang, C., Kuang, T., and Zhao, N. 1998, J. Mol. Str., 446, 137.
105. Krumova, S. 2006, PhD thesis, Bulgarian Academy of Sciences.
106. Simidjiev, I., Stoylova, S., Amenitsch, H., Jávorfi, T., Mustárdy, L., Laggner, P., Holzenburg, A., and Garab, G. 2000, PNAS, 97, 1473.
107. Nussberger, S., Dörr, K., Wang, D. N., and Kühlbrandt, W. 1993, J. Mol. Biol., 234, 347.
108. Corcelli, A., Lattanzio, V. M. T., Mascolo, G., Papadia, P., and Fanizzi, F. 2002, J. Lipid Res., 43, 132.
109. Cartailler, J. -P. and Luecke, H. 2003, Ann. Rev. Biophys. Biomol. Str., 32, 285.
110. Krupa, Z., Huner, N. P. A., Williams, J. P., Maissan, E., and James, D. R. 1987, Plant Physiol., 84, 19.
111. Simidjiev, I., Barzda, V., Mustárdy, L., and Garab, G. 1997, Anal. Biochem., 250, 169.
112. Holm, J. K., Krumova, S. B., Várkonyi, Z., Todinova, S. J., Rajagopal, S., Posselt, D., Taneva, S. G., and Garab, G. 2004, Photosynthesis: Fundamental Aspects to Global Perspectives, van der Est, A. and Bruce, D. (Eds), 579.
113. Jackowski, G. and Pelucha, K. 2001, J. Photochem. Photobiol., 64, 45.
114. Wentworth, M., Ruban, A. V., and Horton, P. 2004, Biochemistry, 43, 501.
115. Taneva, S. G., Simidjiev, I., Garab, G., and Muga, A. 1998, Photosynthesis: Mechanisms and Effects I, Garab, G. (Ed.), Kluwer Academic Publishers, Dordrecht, Boston, London, 325.
116. Lambrev, P. H., Várkonyi, Z., Krumova, S., Kovács, L., Miloslavina, Y., Holzwarth, A. R.,
50 Sashka B. Krumova et al.
120. Allen, J. F. and Forsberg, J. 2001, Trends Plant Sci., 6, 317.
121. Chuartzman, S. G., Nevo, R., Shimoni, E., Charuvi, D., Kiss, V., Ohad, I., Brumfeld, V., and Reicha, Z. 2008, The Plant Cell, 20, 1029.
122. Preiss, S. and Thornber, J. P. 1995, Plant Physiol., 107, 709.
123. Peters, F. A. J., van Wielink, J. E., Sang, W. F., Pevries, S., and Krayenhof, R. 1983, Biochim. Biophys. Acta, 722, 460.
and Garab, G. 2007, Biochim. Biophys. Acta, 1767, 847.
117. Pascal, A. A., Liu, Z., Broess, K., van Oort, B., van Amerongen, H., Wang, C., Horton, P., Robert, B., Chang, W., and Ruban, A. 2005, Nature, 436, 134.
118. Horton, P., Wentworth, M., and Ruban, A. 2005, FEBS Lett., 579, 4201.
119. Johnson, M. P., Perez-Bueno, M. L., Zia, A., Horton, P., and Ruban, A. V. 2009, Plant Physiol., 149, 1061.
Microcalorimetry of photosynthetic membranes 51
Copyright © 2022 FDOKUMEN