Effects of urea on growth and photosynthetic metabolism of ...
9
Aquatic Botany 140 (2017) 69–77 Contents lists available at ScienceDirect Aquatic Botany jou rn al hom ep age: www.elsevier.com/locate/aquabot Effects of urea on growth and photosynthetic metabolism of two aquatic plants (Cabomba caroliniana A. Gray and Elodea nuttallii (Planch.) H. St. John) Wenmin Huang a,1 , Hui Shao a,b,1 , Wei Li a , Hongsheng Jiang a,b , Yuanyuan Chen a,∗ a Key Laboratory of Aquatic Botany and Watershed Ecology, Wuhan Botanical Garden, Chinese Academy of Sciences, Wuhan 430074, China b University of Chinese Academy of Sciences, Beijing 100049, China a r t i c l e i n f o Article history: Received 2 February 2015 Received in revised form 31 March 2016 Accepted 14 April 2016 Available online 20 April 2016 Keywords: Urea Cabomba caroliniana Elodea nuttallii Growth Photosynthetic apparatus Chlorophyll fluorescence a b s t r a c t Increasing urea import into freshwaters is known to have a negative impact on aquatic ecosystems, however, few data exist about the effects of urea on the physiology and ecology of aquatic plants. In the present study, two submersed aquatic plants, Cabomba caroliniana A. Gray and Elodea nuttallii (Planch.) H. St. John were cultured with urea-enriched solution for 16 days and the effects of urea on the two species’ physiology were determined on day 6 and day 16, respectively. The growth and photosynthetic metabolism of the two species were promoted after 16 days of treatment with 1 and 5 mg urea-N L −1 , as indicated by the increase of relative growth rates (RGR), chlorophyll synthesis and elevated rates of net photosynthesis (P N ). However, 10 mg urea-N L −1 markedly inhibited the growth of C. caroliniana and E. nuttallii by 14 and 28%, respectively. Moreover, obvious decline of photosystem II activity and photosynthetic rate in E. nuttallii were found after 6 days of 10 mg urea-N L −1 treatment, which appeared earlier than those in C. caroliniana on day 16. All the urea treatments did not cause any damage to photosystem I in the two species. In addition, malondialdehyde (MDA) significantly increased while soluble carbohydrates (SC) markedly decreased in 10 mg urea-N L −1 treated two species. Moreover, the decrease of SC in C. caroliniana was not induced to the extent of that in E. nuttallii. In conclusion, high urea concentration in water column may hamper the growth of aquatic plants. Furthermore, E. nuttallii may be more sensitive and vulnerable to urea than C. caroliniana when they inhabit the eutrophic water with high urea availability. © 2016 Elsevier B.V. All rights reserved. 1. Introduction Global increases in total nitrogen fertilizer use in recent decades are well documented (Galloway and Cowling, 2002), and there is ample evidence for the detrimental effects of these increases on aquatic ecosystems (Nosengo, 2003). Recently, dramatic changes in the composition of nitrogen-based fertilizers have occurred throughout most of the world. In particular, because of its high N content, relative stability and low production costs, worldwide This article is part of a special feature entitled: “Macrophytes in freshwater habitats—Perspectives from Asia. Proceeding of the second International Sympo- sium of Aquatic Plant Biology (MACROPHYTE 2014, Wuhan, China)” published at the journal Aquatic Botany 140C. ∗ Corresponding author at: Laboratory of Aquatic Plant Biology, Wuhan Botanical Garden, Chinese Academy of Sciences, Wuhan, Hubei 430074, China. E-mail address: [email protected] (Y. Chen). 1 These authors contributed equally to this work. use of urea as a nitrogen fertilizer applied for agricultural crop pro- duction and feed additive has increased more than 100-fold in the past few decades, particularly in developing countries (Glibert et al., 2006; Finlay et al., 2010). Although urea fertilizer is commonly assumed to be retained in soils, there is growing evidence of urea transport to sensitive waters (Glibert et al., 2005). Urea is free to move with water by leaching, erosion and runoff because of its high solubility in water and disso- ciation with soil particles, which finally results in a concentration range of urea-N from 0.25 to 1.0 mg L −1 in natural water (Finlay et al., 2010). The importance of urea as a nitrogen source is generally well known for phytoplankton (Solomon et al., 2010). There is mount- ing evidence that urea differentially stimulates the growth of some types of phytoplankton in natural waters and under some condi- tions promote a shift in phytoplankton species composition (Glibert et al., 2005). Recent research further focused on the physiological responses of phytoplankton to urea to gain a better understand- http://dx.doi.org/10.1016/j.aquabot.2016.04.003 0304-3770/© 2016 Elsevier B.V. All rights reserved.
-
Upload
khangminh22 -
Category
Documents
-
view
0 -
download
0
Transcript of Effects of urea on growth and photosynthetic metabolism of ...
Ea(
Wa
b
a
ARRAA
KUCEGPC
1
aaaitN
hst
G
h0
Aquatic Botany 140 (2017) 69–77
Contents lists available at ScienceDirect
Aquatic Botany
jou rn al hom ep age: www.elsev ier .com/ locate /aquabot
ffects of urea on growth and photosynthetic metabolism of twoquatic plants (Cabomba caroliniana A. Gray and Elodea nuttalliiPlanch.) H. St. John)�
enmin Huanga,1, Hui Shaoa,b,1, Wei Lia, Hongsheng Jianga,b, Yuanyuan Chena,∗
Key Laboratory of Aquatic Botany and Watershed Ecology, Wuhan Botanical Garden, Chinese Academy of Sciences, Wuhan 430074, ChinaUniversity of Chinese Academy of Sciences, Beijing 100049, China
r t i c l e i n f o
rticle history:eceived 2 February 2015eceived in revised form 31 March 2016ccepted 14 April 2016vailable online 20 April 2016
eywords:reaabomba carolinianalodea nuttalliirowthhotosynthetic apparatushlorophyll fluorescence
a b s t r a c t
Increasing urea import into freshwaters is known to have a negative impact on aquatic ecosystems,however, few data exist about the effects of urea on the physiology and ecology of aquatic plants. In thepresent study, two submersed aquatic plants, Cabomba caroliniana A. Gray and Elodea nuttallii (Planch.)H. St. John were cultured with urea-enriched solution for 16 days and the effects of urea on the twospecies’ physiology were determined on day 6 and day 16, respectively. The growth and photosyntheticmetabolism of the two species were promoted after 16 days of treatment with 1 and 5 mg urea-N L−1,as indicated by the increase of relative growth rates (RGR), chlorophyll synthesis and elevated rates ofnet photosynthesis (PN). However, 10 mg urea-N L−1 markedly inhibited the growth of C. carolinianaand E. nuttallii by 14 and 28%, respectively. Moreover, obvious decline of photosystem II activity andphotosynthetic rate in E. nuttallii were found after 6 days of 10 mg urea-N L−1 treatment, which appearedearlier than those in C. caroliniana on day 16. All the urea treatments did not cause any damage tophotosystem I in the two species. In addition, malondialdehyde (MDA) significantly increased while
−1
soluble carbohydrates (SC) markedly decreased in 10 mg urea-N L treated two species. Moreover, thedecrease of SC in C. caroliniana was not induced to the extent of that in E. nuttallii. In conclusion, highurea concentration in water column may hamper the growth of aquatic plants. Furthermore, E. nuttalliimay be more sensitive and vulnerable to urea than C. caroliniana when they inhabit the eutrophic waterwith high urea availability.© 2016 Elsevier B.V. All rights reserved.
. Introduction
Global increases in total nitrogen fertilizer use in recent decadesre well documented (Galloway and Cowling, 2002), and there ismple evidence for the detrimental effects of these increases onquatic ecosystems (Nosengo, 2003). Recently, dramatic changes
n the composition of nitrogen-based fertilizers have occurredhroughout most of the world. In particular, because of its highcontent, relative stability and low production costs, worldwide
� This article is part of a special feature entitled: “Macrophytes in freshwaterabitats—Perspectives from Asia. Proceeding of the second International Sympo-ium of Aquatic Plant Biology (MACROPHYTE 2014, Wuhan, China)” published athe journal Aquatic Botany 140C.∗ Corresponding author at: Laboratory of Aquatic Plant Biology, Wuhan Botanicalarden, Chinese Academy of Sciences, Wuhan, Hubei 430074, China.
E-mail address: [email protected] (Y. Chen).1 These authors contributed equally to this work.
ttp://dx.doi.org/10.1016/j.aquabot.2016.04.003304-3770/© 2016 Elsevier B.V. All rights reserved.
use of urea as a nitrogen fertilizer applied for agricultural crop pro-duction and feed additive has increased more than 100-fold in thepast few decades, particularly in developing countries (Glibert et al.,2006; Finlay et al., 2010).
Although urea fertilizer is commonly assumed to be retained insoils, there is growing evidence of urea transport to sensitive waters(Glibert et al., 2005). Urea is free to move with water by leaching,erosion and runoff because of its high solubility in water and disso-ciation with soil particles, which finally results in a concentrationrange of urea-N from 0.25 to 1.0 mg L−1 in natural water (Finlayet al., 2010).
The importance of urea as a nitrogen source is generally wellknown for phytoplankton (Solomon et al., 2010). There is mount-ing evidence that urea differentially stimulates the growth of sometypes of phytoplankton in natural waters and under some condi-
tions promote a shift in phytoplankton species composition (Glibertet al., 2005). Recent research further focused on the physiologicalresponses of phytoplankton to urea to gain a better understand-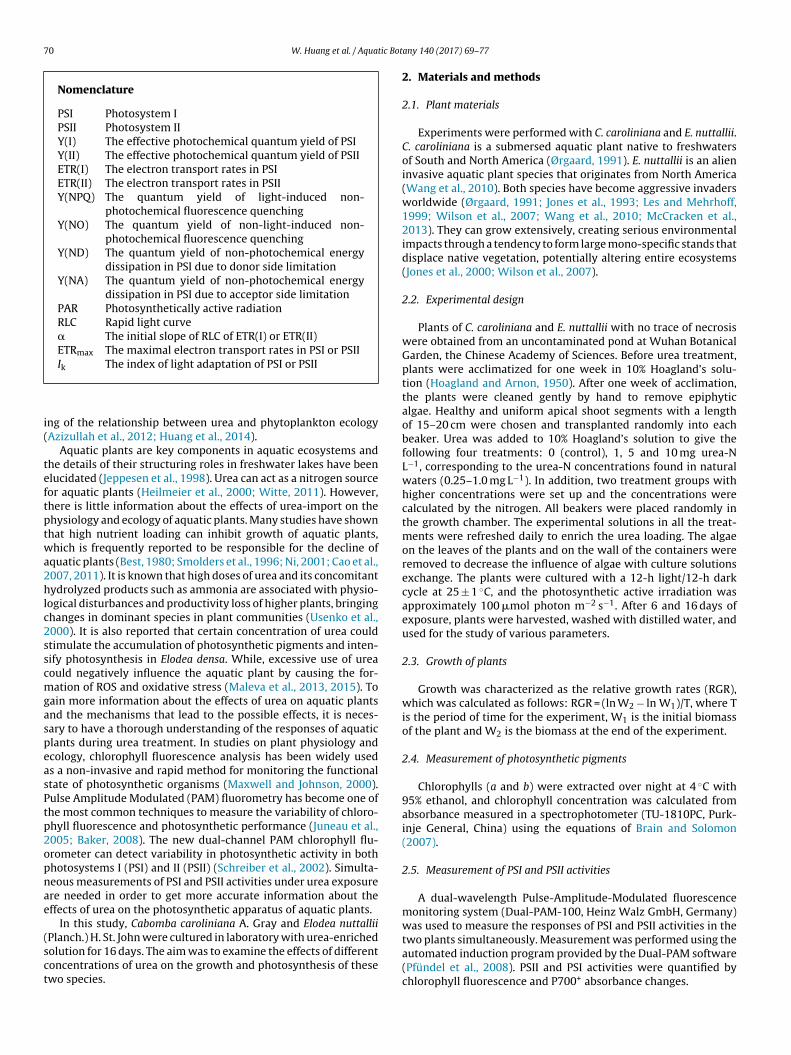
70 W. Huang et al. / Aquatic Bot
Nomenclature
PSI Photosystem IPSII Photosystem IIY(I) The effective photochemical quantum yield of PSIY(II) The effective photochemical quantum yield of PSIIETR(I) The electron transport rates in PSIETR(II) The electron transport rates in PSIIY(NPQ) The quantum yield of light-induced non-
photochemical fluorescence quenchingY(NO) The quantum yield of non-light-induced non-
photochemical fluorescence quenchingY(ND) The quantum yield of non-photochemical energy
dissipation in PSI due to donor side limitationY(NA) The quantum yield of non-photochemical energy
dissipation in PSI due to acceptor side limitationPAR Photosynthetically active radiationRLC Rapid light curve� The initial slope of RLC of ETR(I) or ETR(II)ETRmax The maximal electron transport rates in PSI or PSII
i(
teftptwa2hlc2sscmgaspeasPtp2opnae
(sct
two plants simultaneously. Measurement was performed using the
Ik The index of light adaptation of PSI or PSII
ng of the relationship between urea and phytoplankton ecologyAzizullah et al., 2012; Huang et al., 2014).
Aquatic plants are key components in aquatic ecosystems andhe details of their structuring roles in freshwater lakes have beenlucidated (Jeppesen et al., 1998). Urea can act as a nitrogen sourceor aquatic plants (Heilmeier et al., 2000; Witte, 2011). However,here is little information about the effects of urea-import on thehysiology and ecology of aquatic plants. Many studies have shownhat high nutrient loading can inhibit growth of aquatic plants,hich is frequently reported to be responsible for the decline of
quatic plants (Best, 1980; Smolders et al., 1996; Ni, 2001; Cao et al.,007, 2011). It is known that high doses of urea and its concomitantydrolyzed products such as ammonia are associated with physio-
ogical disturbances and productivity loss of higher plants, bringinghanges in dominant species in plant communities (Usenko et al.,000). It is also reported that certain concentration of urea couldtimulate the accumulation of photosynthetic pigments and inten-ify photosynthesis in Elodea densa. While, excessive use of ureaould negatively influence the aquatic plant by causing the for-ation of ROS and oxidative stress (Maleva et al., 2013, 2015). To
ain more information about the effects of urea on aquatic plantsnd the mechanisms that lead to the possible effects, it is neces-ary to have a thorough understanding of the responses of aquaticlants during urea treatment. In studies on plant physiology andcology, chlorophyll fluorescence analysis has been widely useds a non-invasive and rapid method for monitoring the functionaltate of photosynthetic organisms (Maxwell and Johnson, 2000).ulse Amplitude Modulated (PAM) fluorometry has become one ofhe most common techniques to measure the variability of chloro-hyll fluorescence and photosynthetic performance (Juneau et al.,005; Baker, 2008). The new dual-channel PAM chlorophyll flu-rometer can detect variability in photosynthetic activity in bothhotosystems I (PSI) and II (PSII) (Schreiber et al., 2002). Simulta-eous measurements of PSI and PSII activities under urea exposurere needed in order to get more accurate information about theffects of urea on the photosynthetic apparatus of aquatic plants.
In this study, Cabomba caroliniana A. Gray and Elodea nuttalliiPlanch.) H. St. John were cultured in laboratory with urea-enriched
olution for 16 days. The aim was to examine the effects of differentoncentrations of urea on the growth and photosynthesis of thesewo species.any 140 (2017) 69–77
2. Materials and methods
2.1. Plant materials
Experiments were performed with C. caroliniana and E. nuttallii.C. caroliniana is a submersed aquatic plant native to freshwatersof South and North America (Ørgaard, 1991). E. nuttallii is an alieninvasive aquatic plant species that originates from North America(Wang et al., 2010). Both species have become aggressive invadersworldwide (Ørgaard, 1991; Jones et al., 1993; Les and Mehrhoff,1999; Wilson et al., 2007; Wang et al., 2010; McCracken et al.,2013). They can grow extensively, creating serious environmentalimpacts through a tendency to form large mono-specific stands thatdisplace native vegetation, potentially altering entire ecosystems(Jones et al., 2000; Wilson et al., 2007).
2.2. Experimental design
Plants of C. caroliniana and E. nuttallii with no trace of necrosiswere obtained from an uncontaminated pond at Wuhan BotanicalGarden, the Chinese Academy of Sciences. Before urea treatment,plants were acclimatized for one week in 10% Hoagland’s solu-tion (Hoagland and Arnon, 1950). After one week of acclimation,the plants were cleaned gently by hand to remove epiphyticalgae. Healthy and uniform apical shoot segments with a lengthof 15–20 cm were chosen and transplanted randomly into eachbeaker. Urea was added to 10% Hoagland’s solution to give thefollowing four treatments: 0 (control), 1, 5 and 10 mg urea-NL−1, corresponding to the urea-N concentrations found in naturalwaters (0.25–1.0 mg L−1). In addition, two treatment groups withhigher concentrations were set up and the concentrations werecalculated by the nitrogen. All beakers were placed randomly inthe growth chamber. The experimental solutions in all the treat-ments were refreshed daily to enrich the urea loading. The algaeon the leaves of the plants and on the wall of the containers wereremoved to decrease the influence of algae with culture solutionsexchange. The plants were cultured with a 12-h light/12-h darkcycle at 25 ± 1 ◦C, and the photosynthetic active irradiation wasapproximately 100 �mol photon m−2 s−1. After 6 and 16 days ofexposure, plants were harvested, washed with distilled water, andused for the study of various parameters.
2.3. Growth of plants
Growth was characterized as the relative growth rates (RGR),which was calculated as follows: RGR = (ln W2 − ln W1)/T, where Tis the period of time for the experiment, W1 is the initial biomassof the plant and W2 is the biomass at the end of the experiment.
2.4. Measurement of photosynthetic pigments
Chlorophylls (a and b) were extracted over night at 4 ◦C with95% ethanol, and chlorophyll concentration was calculated fromabsorbance measured in a spectrophotometer (TU-1810PC, Purk-inje General, China) using the equations of Brain and Solomon(2007).
2.5. Measurement of PSI and PSII activities
A dual-wavelength Pulse-Amplitude-Modulated fluorescencemonitoring system (Dual-PAM-100, Heinz Walz GmbH, Germany)was used to measure the responses of PSI and PSII activities in the
automated induction program provided by the Dual-PAM software(Pfündel et al., 2008). PSII and PSI activities were quantified bychlorophyll fluorescence and P700+ absorbance changes.
ic Botany 140 (2017) 69–77 71
Pmeiaats
(mdacuEooEcf
2
2icsgoboTrr
2
am3hs1mC
2
e(sW
2
tCwlD
Fig. 1. Effects of different concentrations of urea-N on growth rate in C. caroliniana
W. Huang et al. / Aquat
Slow induction curve was recorded with the routine of the Dual-AM software. The actinic light was applied at 100 �mol photon−2 s−1. A saturating pulse with duration of 300 ms was applied
very 20 s after the onset of the actinic light to determine the max-mum fluorescence signal and maximum P700+ signal under thectinic light. The slow induction curve was recorded for 300 s tochieve the steady state of the photosynthetic apparatus, and thenhe actinic light was turned off. The data derived after the finalaturating pulse was used for analysis of activities of PSI and PSII.
After recording the slow induction curve, the rapid light curvesRLCs) of ETR(I) and ETR(II) were recorded in the rapid light curve
ode (RLC mode) with the routine of the Dual-PAM software toetect the response of the activities of electron transport in PSInd PSII to increasing illumination under exposure to different con-entrations of urea. ETR(I) and ETR(II) were defined and calculatedsing the Dual-PAM software. Descriptive parameters of ETR(I) andTR(II) during the light response reaction, the initial slope of RLCf ETR(I) or ETR(II) (�), the maximal electron transport rates in PSIr PSII (ETRmax) and the index of light adaptation of PSI or PSII (Ik,TRmax/�) were derived from the RLCs, which were automaticallyalculated by the Dual-PAM software according to the exponentialunction described by Platt et al. (1980).
.6. Rates of net photosynthesis (PN)
Rates of net photosynthesis were measured as O2 evolution at5 ◦C at a photon irradiance of 120 �mol photon m−2 s−1 accord-
ng to the method of Zhang et al. (2014b). The apical shoots wereollected and placed in a 120 mL glass and Perspex chamber with aolution of 20 mM Tricine (pH 7.0) plus 0.1 mM Na/KHCO3. Nitro-en was bubbled briefly in the solution prior to measurements, inrder to reduce the concentration of dissolved oxygen. The cham-er was sealed and the O2 concentration measured with an opticalxygen electrode (YSI Pro ODO Yellow Spring Instruments, USA).he output of the electrode was logged on a computer and linearegressions of concentration against time were used to calculateates of oxygen exchange.
.7. Lipid peroxidation
Lipid peroxidation was determined by estimation of malondi-ldehyde (MDA) concentration, which was detected following theethod of Xing et al. (2010). Plant material was homogenized with
mL 0.5% thiobarbituric acid in 20% trichloroacetic acid (w/v). Theomogenate was incubated at 100 ◦C for 30 min and reaction wastopped in ice or cooled water. The samples were centrifuged at0,000g for 10 min and absorbance was measured spectrophoto-etrically at 450, 532 and 600 nm (TU-1810PC, Purkinje General,
hina).
.8. Determination of soluble carbohydrates
The powdered sample (200 mg) was extracted in 2 mL 80%thanol at 80 ◦C for 30 min and centrifuged at 10,000g for 15 minCao et al., 2009). The content of soluble carbohydrates (SC) in theupernatant was qualified by the anthrone method (Yemm and
illis, 1954).
.9. Statistical analyses
All data presented in this study are the mean ± SD based onhree replicates. The data were analyzed using SPSS 16.0 (SPSS Inc.,
hicago, IL, USA). Treatment significance was determined with two-ay ANOVA and one-way ANOVA and means denoted by differentowercase letters were significantly different at P < 0.05 based onuncan’s post hoc test.
and E. nuttallii. All the values are mean ± SD of three replicates. Duncan’s multiplerange test was used to determine the significant difference between treatments,means with different lowercase letters are significantly different at P < 0.05.
3. Results
3.1. Effect on growth
Compared with the control, 1 and 5 mg urea-N L−1 significantlypromoted the growth of the two species. However, 10 mg urea-NL−1 inhibited the growth of C. caroliniana and E. nuttallii by 14% and28%, respectively (P < 0.05, Fig. 1).
3.2. Effect on photosynthetic pigments
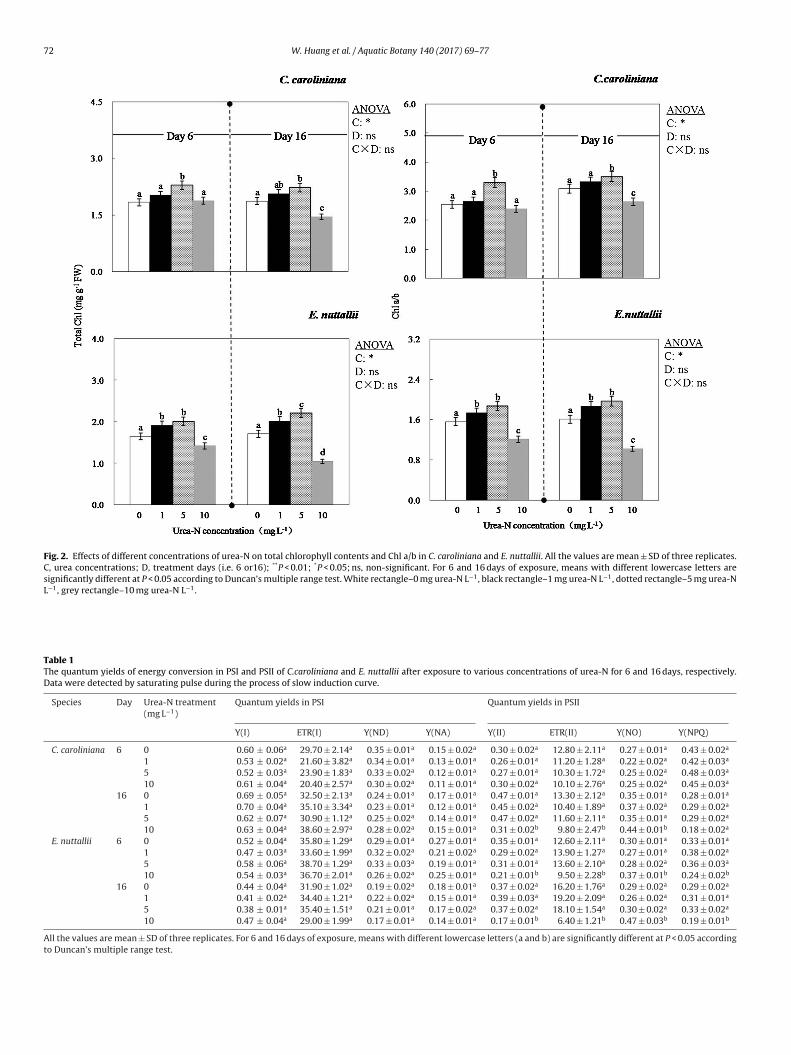
For C. caroliniana, total chlorophyll (Chl) in 5 mg urea-N L−1
treatment was significantly greater than the control on day 6(P < 0.05, Fig. 2), no differences were detected between the con-trol and other urea-N treatments (P > 0.05). Likewise, Chl a/b ratiowas greater in 5 mg urea-N L−1 treatment than that of control inC. caroliniana on day 6. Regarding E. nuttallii, after 6 days of treat-ment, total Chl was greater than the control in 1 and 5 mg urea-NL−1 treatments (P < 0.05, Fig. 2), but was lower by 13.9% in 10 mgurea-N L−1 compared with the control (P < 0.05). Chl a/b showedthe same trend as total Chl in E. nuttallii on day 6.
On day 16, total Chl in 1 and 5 mg urea-N L−1 treatments wassignificantly higher than that of the control in both species (P < 0.05,Fig. 2). In contrast, total Chl in 10 mg urea-N L−1 treatment declinedover time in both species and on day 16 was 21.9% and 38.6% ofthe control for C. caroliniana and E. nuttallii, respectively. Chl a/bratio was significantly lower than the control in 10 mg urea-N L−1
treatment for both species.
3.3. Effect on PSI and PSII activities
3.3.1. Effect on quantum yields of energy conversion in PSI and
PSIIQuantum yields of energy conversion in PSI and PSII of C. car-oliniana and E. nuttallii were detected at steady state from the slowinduction curve after exposure to various concentrations of urea
72 W. Huang et al. / Aquatic Botany 140 (2017) 69–77
Fig. 2. Effects of different concentrations of urea-N on total chlorophyll contents and Chl a/b in C. caroliniana and E. nuttallii. All the values are mean ± SD of three replicates.C, urea concentrations; D, treatment days (i.e. 6 or16); **P < 0.01; *P < 0.05; ns, non-significant. For 6 and 16 days of exposure, means with different lowercase letters aresignificantly different at P < 0.05 according to Duncan’s multiple range test. White rectangle–0 mg urea-N L−1, black rectangle–1 mg urea-N L−1, dotted rectangle–5 mg urea-NL−1, grey rectangle–10 mg urea-N L−1.
Table 1The quantum yields of energy conversion in PSI and PSII of C.caroliniana and E. nuttallii after exposure to various concentrations of urea-N for 6 and 16 days, respectively.Data were detected by saturating pulse during the process of slow induction curve.
Species Day Urea-N treatment(mg L−1)
Quantum yields in PSI Quantum yields in PSII
Y(I) ETR(I) Y(ND) Y(NA) Y(II) ETR(II) Y(NO) Y(NPQ)
C. caroliniana 6 0 0.60 ± 0.06a 29.70 ± 2.14a 0.35 ± 0.01a 0.15 ± 0.02a 0.30 ± 0.02a 12.80 ± 2.11a 0.27 ± 0.01a 0.43 ± 0.02a
1 0.53 ± 0.02a 21.60 ± 3.82a 0.34 ± 0.01a 0.13 ± 0.01a 0.26 ± 0.01a 11.20 ± 1.28a 0.22 ± 0.02a 0.42 ± 0.03a
5 0.52 ± 0.03a 23.90 ± 1.83a 0.33 ± 0.02a 0.12 ± 0.01a 0.27 ± 0.01a 10.30 ± 1.72a 0.25 ± 0.02a 0.48 ± 0.03a
10 0.61 ± 0.04a 20.40 ± 2.57a 0.30 ± 0.02a 0.11 ± 0.01a 0.30 ± 0.02a 10.10 ± 2.76a 0.25 ± 0.02a 0.45 ± 0.03a
16 0 0.69 ± 0.05a 32.50 ± 2.13a 0.24 ± 0.01a 0.17 ± 0.01a 0.47 ± 0.01a 13.30 ± 2.12a 0.35 ± 0.01a 0.28 ± 0.01a
1 0.70 ± 0.04a 35.10 ± 3.34a 0.23 ± 0.01a 0.12 ± 0.01a 0.45 ± 0.02a 10.40 ± 1.89a 0.37 ± 0.02a 0.29 ± 0.02a
5 0.62 ± 0.07a 30.90 ± 1.12a 0.25 ± 0.02a 0.14 ± 0.01a 0.47 ± 0.02a 11.60 ± 2.11a 0.35 ± 0.01a 0.29 ± 0.02a
10 0.63 ± 0.04a 38.60 ± 2.97a 0.28 ± 0.02a 0.15 ± 0.01a 0.31 ± 0.02b 9.80 ± 2.47b 0.44 ± 0.01b 0.18 ± 0.02a
E. nuttallii 6 0 0.52 ± 0.04a 35.80 ± 1.29a 0.29 ± 0.01a 0.27 ± 0.01a 0.35 ± 0.01a 12.60 ± 2.11a 0.30 ± 0.01a 0.33 ± 0.01a
1 0.47 ± 0.03a 33.60 ± 1.99a 0.32 ± 0.02a 0.21 ± 0.02a 0.29 ± 0.02a 13.90 ± 1.27a 0.27 ± 0.01a 0.38 ± 0.02a
5 0.58 ± 0.06a 38.70 ± 1.29a 0.33 ± 0.03a 0.19 ± 0.01a 0.31 ± 0.01a 13.60 ± 2.10a 0.28 ± 0.02a 0.36 ± 0.03a
10 0.54 ± 0.03a 36.70 ± 2.01a 0.26 ± 0.02a 0.25 ± 0.01a 0.21 ± 0.01b 9.50 ± 2.28b 0.37 ± 0.01b 0.24 ± 0.02b
16 0 0.44 ± 0.04a 31.90 ± 1.02a 0.19 ± 0.02a 0.18 ± 0.01a 0.37 ± 0.02a 16.20 ± 1.76a 0.29 ± 0.02a 0.29 ± 0.02a
1 0.41 ± 0.02a 34.40 ± 1.21a 0.22 ± 0.02a 0.15 ± 0.01a 0.39 ± 0.03a 19.20 ± 2.09a 0.26 ± 0.02a 0.31 ± 0.01a
5 0.38 ± 0.01a 35.40 ± 1.51a 0.21 ± 0.01a 0.17 ± 0.02a 0.37 ± 0.02a 18.10 ± 1.54a 0.30 ± 0.02a 0.33 ± 0.02a
10 0.47 ± 0.04a 29.00 ± 1.99a 0.17 ± 0.01a 0.14 ± 0.01a 0.17 ± 0.01b 6.40 ± 1.21b 0.47 ± 0.03b 0.19 ± 0.01b
All the values are mean ± SD of three replicates. For 6 and 16 days of exposure, means with different lowercase letters (a and b) are significantly different at P < 0.05 accordingto Duncan’s multiple range test.
W. Huang et al. / Aquatic Botany 140 (2017) 69–77 73
Table 2Descriptive parameters of the light response reaction derived from the rapid light curves (RLCs) of ETR(I) and ETR(II) measured after exposure of C. carolinianaand E. nuttalliitovarious concentrations of urea-N for 6 and 16 days, respectively.
Species Day Urea-N treatment(mg L−1)
Parameters of RLCs of ETR(I) Parameters of RLCs of ETR(II)
� (e− photon−1) ETRmax (�mol e−
m−2 s−1)Ik (�mol photonm−2 s−1)
� (e− photon−1) ETRmax
(�mol e− m−2 s−1)Ik (�molphotonm−2 s−1)
C.caroliniana 6 0 0.26 ± 0.05a 71.70 ± 10.16a 256.20 ± 21.35a 0.22 ± 0.04a 21.70 ± 0.28a 95.80 ± 9.83a
1 0.22 ± 0.04a 69.00 ± 8.69a 320.20 ± 21.48a 0.20 ± 0.03a 18.60 ± 0.17a 92.60 ± 6.64a
5 0.28 ± 0.06a 61.50 ± 6.85a 220.10 ± 23.75a 0.20 ± 0.02a 14.40 ± 0.26a 66.90 ± 8.77a
10 0.26 ± 0.04a 68.60 ± 8.52a 260.40 ± 9.19a 0.23 ± 0.04a 18.60 ± 0.35a 78.20 ± 9.25a
16 0 0.25 ± 0.01a 79.90 ± 8.72a 322.80 ± 20.12a 0.30 ± 0.02a 32.90 ± 1.16a 107.00 ± 2.24a
1 0.24 ± 0.02a 78.00 ± 8.16a 325.70 ± 18.92a 0.29 ± 0.02a 22.00 ± 0.65a 75.20 ± 3.19a
5 0.30 ± 0.01a 89.80 ± 6.23a 294.10 ± 19.91a 0.33 ± 0.01a 27.50 ± 0.45a 84.80 ± 4.25a
10 0.27 ± 0.01a 84.60 ± 7.71a 310.60 ± 29.76a 0.20 ± 0.02b 14.10 ± 1.22b 69.40 ± 3.33b
E. nuttallii 6 0 0.29 ± 0.02a 82.30 ± 5.23a 279.30 ± 15.87a 0.29 ± 0.01a 24.70 ± 0.34a 82.40 ± 6.76a
1 0.23 ± 0.03a 80.40 ± 6.76a 336.40 ± 24.67a 0.31 ± 0.02a 26.10 ± 1.67a 85.70 ± 3.12a
5 0.27 ± 0.03a 87.10 ± 6.12a 317.80 ± 29.44a 0.27 ± 0.01a 27.30 ± 1.12a 100.20 ± 4.67a
10 0.21 ± 0.02a 73.30 ± 4.65a 346.50 ± 20.76a 0.28 ± 0.01a 17.40 ± 0.98a 58.60 ± 3.19b
16 0 0.26 ± 0.02a 92.10 ± 5.65a 359.90 ± 30.12a 0.31 ± 0.01a 34.70 ± 1.98a 105.60 ± 4.56a
1 0.22 ± 0.03a 91.20 ± 9.02a 409.40 ± 22.85a 0.28 ± 0.02a 43.10 ± 0.53a 153.30 ± 4.24a
5 0.29 ± 0.02a 85.00 ± 5.87a 290.80 ± 27.45a 0.30 ± 0.01a 38.40 ± 0.97a 128.40 ± 5.87a
10 0.25 ± 0.02a 66.10 ± 6.46a 276.40 ± 25.42a 0.18 ± 0.02b 12.10 ± 1.02b 66.60 ± 2.15b
All the values are mean ± SD of three replicates. For 6 and 16 days of exposure, means with different lowercase letters (a and b) are significantly different at P < 0.05 accordingto Duncan’s multiple range test.
Table 3Results of ANOVA for chlorophyll fluoresence parameters in C. caroliniana and E. nuttallii, with concentration and day as factors.
Species Dependent variable Source df F Species Dependent variable Source df F
C. caroliniana �(I) concentration 3 1.34 E. nuttallii �(I) concentration 3 2.71day 1 0.22 day 1 0.08concentration × day 3 0.11 concentration × day 3 0.78
ETRmax(I) concentration 3 0.18 ETRmax(I) concentration 3 7.74day 1 23.49 day 1 0.89concentration × day 3 2.15 concentration × day 3 2.19
Ik(I) concentration 3 1.20 Ik(I) concentration 3 0.83day 1 3.97 day 1 0.17concentration × day 3 0.39 concentration × day 3 1.19
�(II) concentration 3 1.20 �(II) concentration 3 4.46day 1 10.83 day 1 1.71concentration × day 3 2.79 concentration × day 3 3.79
ETRmax(II) concentration 3 10.04 ETRmax(II) concentration 3 36.36day 1 16.45 day 1 29.87concentration × day 3 7.92 concentration × day 3 10.04
Ik(II) concentration 3 2.15 Ik(II) concentration 3 12.23day 1 0.01 day 1 18.54concentration × day 3 0.93 concentration × day 3 2.96
Y(I) concentration 3 4.07 Y(I) concentration 3 2.80day 1 37.67 day 1 40.67concentration × day 3 3.93 concentration × day 3 4.15
ETR(I) concentration 3 1.67 ETR(I) concentration 3 2.32day 1 70.92 day 1 8.75concentration × day 3 7.67 concentration × day 3 2.13
Y(ND) concentration 3 0.07 Y(ND) concentration 3 2.90day 1 25.18 day 1 43.10concentration × day 3 1.77 concentration × day 3 0.16
Y(NA) concentration 3 4.39 Y(NA) concentration 3 2.77day 1 5.25 day 1 30.15concentration × day 3 1.82 concentration × day 3 2.36
Y(II) concentration 3 6.43 Y(II) concentration 3 18.91day 1 108.30 day 1 3.72concentration × day 3 10.61 concentration × day 3 2.71
ETR(II) concentration 3 2.55 ETR(II) concentration 3 11.51day 1 0.05 day 1 4.94concentration × day 3 0.31 concentration × day 3 2.76
Y(NO) concentration 3 1.15 Y(NO) concentration 3 15.39day 1 38.09 day 1 1.99concentration × day 3 1.39 concentration × day 3 2.15
Y(NPQ) concentration 3 2.34 Y(NPQ) concentration 3 12.15day 1 97.21 day 1 7.27concentration × day 3 2.72 concentration × day 3 0.24
74 W. Huang et al. / Aquatic Botany 140 (2017) 69–77
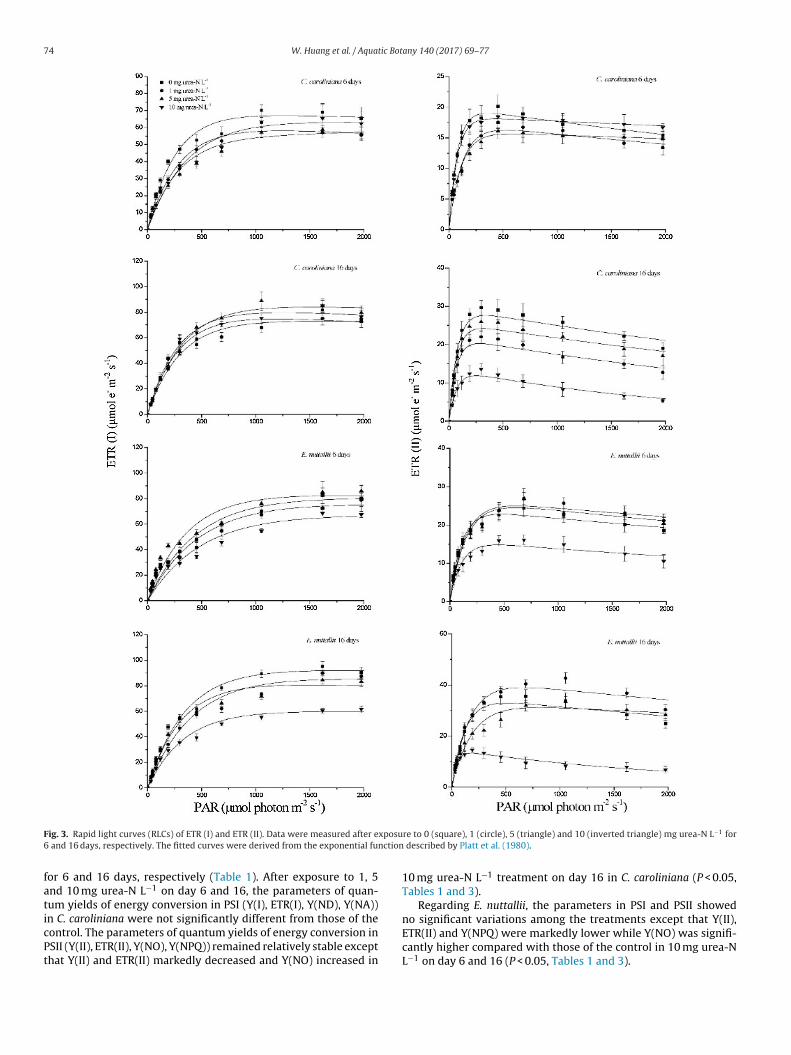
F xposu6 nction
faticPt
ig. 3. Rapid light curves (RLCs) of ETR (I) and ETR (II). Data were measured after e and 16 days, respectively. The fitted curves were derived from the exponential fu
or 6 and 16 days, respectively (Table 1). After exposure to 1, 5nd 10 mg urea-N L−1 on day 6 and 16, the parameters of quan-um yields of energy conversion in PSI (Y(I), ETR(I), Y(ND), Y(NA))n C. caroliniana were not significantly different from those of the
ontrol. The parameters of quantum yields of energy conversion inSII (Y(II), ETR(II), Y(NO), Y(NPQ)) remained relatively stable excepthat Y(II) and ETR(II) markedly decreased and Y(NO) increased inre to 0 (square), 1 (circle), 5 (triangle) and 10 (inverted triangle) mg urea-N L−1 for described by Platt et al. (1980).
10 mg urea-N L−1 treatment on day 16 in C. caroliniana (P < 0.05,Tables 1 and 3).
Regarding E. nuttallii, the parameters in PSI and PSII showedno significant variations among the treatments except that Y(II),
ETR(II) and Y(NPQ) were markedly lower while Y(NO) was signifi-cantly higher compared with those of the control in 10 mg urea-NL−1 on day 6 and 16 (P < 0.05, Tables 1 and 3).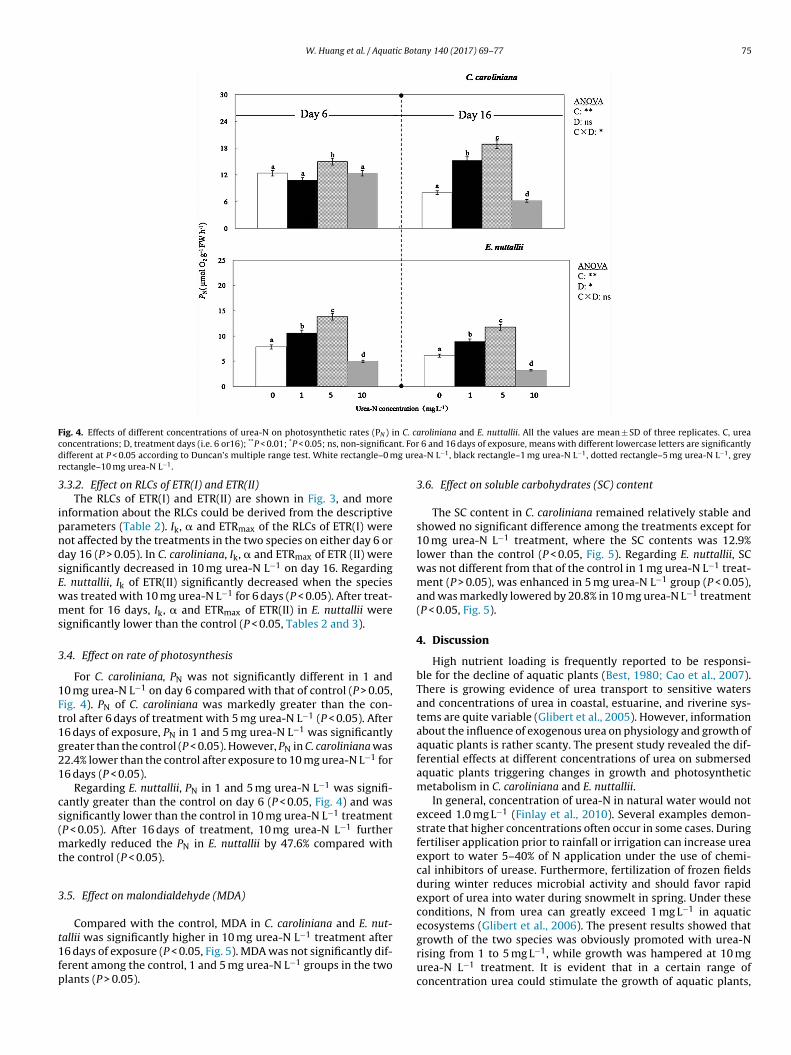
W. Huang et al. / Aquatic Botany 140 (2017) 69–77 75
F n C. cc nt. Ford g urer
3
ipndsEwms
3
1Ft1g21
cs(mt
3
t1fp
ig. 4. Effects of different concentrations of urea-N on photosynthetic rates (PN ) ioncentrations; D, treatment days (i.e. 6 or16); **P < 0.01; *P < 0.05; ns, non-significaifferent at P < 0.05 according to Duncan’s multiple range test. White rectangle–0 mectangle–10 mg urea-N L−1.
.3.2. Effect on RLCs of ETR(I) and ETR(II)The RLCs of ETR(I) and ETR(II) are shown in Fig. 3, and more
nformation about the RLCs could be derived from the descriptivearameters (Table 2). Ik, � and ETRmax of the RLCs of ETR(I) wereot affected by the treatments in the two species on either day 6 oray 16 (P > 0.05). In C. caroliniana, Ik, � and ETRmax of ETR (II) wereignificantly decreased in 10 mg urea-N L−1 on day 16. Regarding. nuttallii, Ik of ETR(II) significantly decreased when the speciesas treated with 10 mg urea-N L−1 for 6 days (P < 0.05). After treat-ent for 16 days, Ik, � and ETRmax of ETR(II) in E. nuttallii were
ignificantly lower than the control (P < 0.05, Tables 2 and 3).
.4. Effect on rate of photosynthesis
For C. caroliniana, PN was not significantly different in 1 and0 mg urea-N L−1 on day 6 compared with that of control (P > 0.05,ig. 4). PN of C. caroliniana was markedly greater than the con-rol after 6 days of treatment with 5 mg urea-N L−1 (P < 0.05). After6 days of exposure, PN in 1 and 5 mg urea-N L−1 was significantlyreater than the control (P < 0.05). However, PN in C. caroliniana was2.4% lower than the control after exposure to 10 mg urea-N L−1 for6 days (P < 0.05).
Regarding E. nuttallii, PN in 1 and 5 mg urea-N L−1 was signifi-antly greater than the control on day 6 (P < 0.05, Fig. 4) and wasignificantly lower than the control in 10 mg urea-N L−1 treatmentP < 0.05). After 16 days of treatment, 10 mg urea-N L−1 further
arkedly reduced the PN in E. nuttallii by 47.6% compared withhe control (P < 0.05).
.5. Effect on malondialdehyde (MDA)
Compared with the control, MDA in C. caroliniana and E. nut-
allii was significantly higher in 10 mg urea-N L−1 treatment after6 days of exposure (P < 0.05, Fig. 5). MDA was not significantly dif-erent among the control, 1 and 5 mg urea-N L−1 groups in the twolants (P > 0.05).aroliniana and E. nuttallii. All the values are mean ± SD of three replicates. C, urea 6 and 16 days of exposure, means with different lowercase letters are significantlya-N L−1, black rectangle–1 mg urea-N L−1, dotted rectangle–5 mg urea-N L−1, grey
3.6. Effect on soluble carbohydrates (SC) content
The SC content in C. caroliniana remained relatively stable andshowed no significant difference among the treatments except for10 mg urea-N L−1 treatment, where the SC contents was 12.9%lower than the control (P < 0.05, Fig. 5). Regarding E. nuttallii, SCwas not different from that of the control in 1 mg urea-N L−1 treat-ment (P > 0.05), was enhanced in 5 mg urea-N L−1 group (P < 0.05),and was markedly lowered by 20.8% in 10 mg urea-N L−1 treatment(P < 0.05, Fig. 5).
4. Discussion
High nutrient loading is frequently reported to be responsi-ble for the decline of aquatic plants (Best, 1980; Cao et al., 2007).There is growing evidence of urea transport to sensitive watersand concentrations of urea in coastal, estuarine, and riverine sys-tems are quite variable (Glibert et al., 2005). However, informationabout the influence of exogenous urea on physiology and growth ofaquatic plants is rather scanty. The present study revealed the dif-ferential effects at different concentrations of urea on submersedaquatic plants triggering changes in growth and photosyntheticmetabolism in C. caroliniana and E. nuttallii.
In general, concentration of urea-N in natural water would notexceed 1.0 mg L−1 (Finlay et al., 2010). Several examples demon-strate that higher concentrations often occur in some cases. Duringfertiliser application prior to rainfall or irrigation can increase ureaexport to water 5–40% of N application under the use of chemi-cal inhibitors of urease. Furthermore, fertilization of frozen fieldsduring winter reduces microbial activity and should favor rapidexport of urea into water during snowmelt in spring. Under theseconditions, N from urea can greatly exceed 1 mg L−1 in aquaticecosystems (Glibert et al., 2006). The present results showed that
growth of the two species was obviously promoted with urea-Nrising from 1 to 5 mg L−1, while growth was hampered at 10 mgurea-N L−1 treatment. It is evident that in a certain range ofconcentration urea could stimulate the growth of aquatic plants,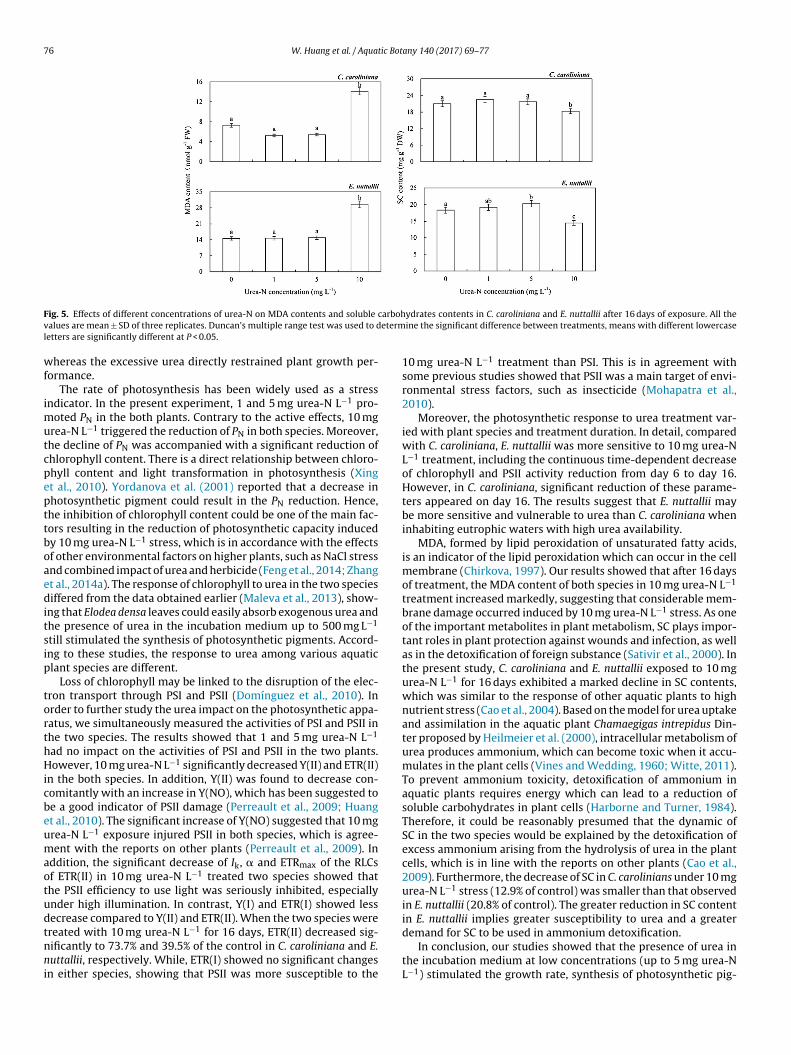
76 W. Huang et al. / Aquatic Botany 140 (2017) 69–77
F carbohv eterml
wf
imutcpepttboaeditsip
torthHicbeumaotudtnni
ig. 5. Effects of different concentrations of urea-N on MDA contents and soluble
alues are mean ± SD of three replicates. Duncan’s multiple range test was used to detters are significantly different at P < 0.05.
hereas the excessive urea directly restrained plant growth per-ormance.
The rate of photosynthesis has been widely used as a stressndicator. In the present experiment, 1 and 5 mg urea-N L−1 pro-
oted PN in the both plants. Contrary to the active effects, 10 mgrea-N L−1 triggered the reduction of PN in both species. Moreover,he decline of PN was accompanied with a significant reduction ofhlorophyll content. There is a direct relationship between chloro-hyll content and light transformation in photosynthesis (Xingt al., 2010). Yordanova et al. (2001) reported that a decrease inhotosynthetic pigment could result in the PN reduction. Hence,he inhibition of chlorophyll content could be one of the main fac-ors resulting in the reduction of photosynthetic capacity inducedy 10 mg urea-N L−1 stress, which is in accordance with the effectsf other environmental factors on higher plants, such as NaCl stressnd combined impact of urea and herbicide (Feng et al., 2014; Zhangt al., 2014a). The response of chlorophyll to urea in the two speciesiffered from the data obtained earlier (Maleva et al., 2013), show-
ng that Elodea densa leaves could easily absorb exogenous urea andhe presence of urea in the incubation medium up to 500 mg L−1
till stimulated the synthesis of photosynthetic pigments. Accord-ng to these studies, the response to urea among various aquaticlant species are different.
Loss of chlorophyll may be linked to the disruption of the elec-ron transport through PSI and PSII (Domínguez et al., 2010). Inrder to further study the urea impact on the photosynthetic appa-atus, we simultaneously measured the activities of PSI and PSII inhe two species. The results showed that 1 and 5 mg urea-N L−1
ad no impact on the activities of PSI and PSII in the two plants.owever, 10 mg urea-N L−1 significantly decreased Y(II) and ETR(II)
n the both species. In addition, Y(II) was found to decrease con-omitantly with an increase in Y(NO), which has been suggested toe a good indicator of PSII damage (Perreault et al., 2009; Huangt al., 2010). The significant increase of Y(NO) suggested that 10 mgrea-N L−1 exposure injured PSII in both species, which is agree-ent with the reports on other plants (Perreault et al., 2009). In
ddition, the significant decrease of Ik, � and ETRmax of the RLCsf ETR(II) in 10 mg urea-N L−1 treated two species showed thathe PSII efficiency to use light was seriously inhibited, especiallynder high illumination. In contrast, Y(I) and ETR(I) showed lessecrease compared to Y(II) and ETR(II). When the two species were
−1
reated with 10 mg urea-N L for 16 days, ETR(II) decreased sig-ificantly to 73.7% and 39.5% of the control in C. caroliniana and E.uttallii, respectively. While, ETR(I) showed no significant changesn either species, showing that PSII was more susceptible to the
ydrates contents in C. caroliniana and E. nuttallii after 16 days of exposure. All theine the significant difference between treatments, means with different lowercase
10 mg urea-N L−1 treatment than PSI. This is in agreement withsome previous studies showed that PSII was a main target of envi-ronmental stress factors, such as insecticide (Mohapatra et al.,2010).
Moreover, the photosynthetic response to urea treatment var-ied with plant species and treatment duration. In detail, comparedwith C. caroliniana, E. nuttallii was more sensitive to 10 mg urea-NL−1 treatment, including the continuous time-dependent decreaseof chlorophyll and PSII activity reduction from day 6 to day 16.However, in C. caroliniana, significant reduction of these parame-ters appeared on day 16. The results suggest that E. nuttallii maybe more sensitive and vulnerable to urea than C. caroliniana wheninhabiting eutrophic waters with high urea availability.
MDA, formed by lipid peroxidation of unsaturated fatty acids,is an indicator of the lipid peroxidation which can occur in the cellmembrane (Chirkova, 1997). Our results showed that after 16 daysof treatment, the MDA content of both species in 10 mg urea-N L−1
treatment increased markedly, suggesting that considerable mem-brane damage occurred induced by 10 mg urea-N L−1 stress. As oneof the important metabolites in plant metabolism, SC plays impor-tant roles in plant protection against wounds and infection, as wellas in the detoxification of foreign substance (Sativir et al., 2000). Inthe present study, C. caroliniana and E. nuttallii exposed to 10 mgurea-N L−1 for 16 days exhibited a marked decline in SC contents,which was similar to the response of other aquatic plants to highnutrient stress (Cao et al., 2004). Based on the model for urea uptakeand assimilation in the aquatic plant Chamaegigas intrepidus Din-ter proposed by Heilmeier et al. (2000), intracellular metabolism ofurea produces ammonium, which can become toxic when it accu-mulates in the plant cells (Vines and Wedding, 1960; Witte, 2011).To prevent ammonium toxicity, detoxification of ammonium inaquatic plants requires energy which can lead to a reduction ofsoluble carbohydrates in plant cells (Harborne and Turner, 1984).Therefore, it could be reasonably presumed that the dynamic ofSC in the two species would be explained by the detoxification ofexcess ammonium arising from the hydrolysis of urea in the plantcells, which is in line with the reports on other plants (Cao et al.,2009). Furthermore, the decrease of SC in C. carolinians under 10 mgurea-N L−1 stress (12.9% of control) was smaller than that observedin E. nuttallii (20.8% of control). The greater reduction in SC contentin E. nuttallii implies greater susceptibility to urea and a greater
demand for SC to be used in ammonium detoxification.In conclusion, our studies showed that the presence of urea inthe incubation medium at low concentrations (up to 5 mg urea-NL−1) stimulated the growth rate, synthesis of photosynthetic pig-
ic Bot
mhiamtbcIctaoau
A
CaBTt
R
Ø
A
B
B
B
B
C
C
C
C
C
D
F
F
GG
G
HH
H
frutescens. Photosynthetica 52, 456–463.Zhang, Y.Z., Yin, L.Y., Jiang, H.S., Li, W., Gontero, B., Maberly, S.C., 2014b.
Biochemical and biophysical CO2 concentrating mechanisms in two species offreshwater macrophyte within the genus Ottelia (Hydrocharitaceae).
W. Huang et al. / Aquat
ents, and photosynthetic rate of the two species. On the otherand, 10 mg urea-N L−1 was harmful. Although the urea levels used
n this study inhibiting the two submersed aquatic plants growthre higher than those normally encountered in natural water, theyay be reached in the future and multiple stresses may lower
he thresholds for an effect. Furthermore, for some special waterodies, such as fishery reservoirs, the maximum permissible con-entration of urea is 80 mg L−1 (Bespamyatnov and Krotov, 1985).n this case, likelihood of field exposure to damagingly high con-entrations is then increased. Hence, more information is neededo predict the potential of increasing urea to affect aquatic plantsbundance, growth, and community composition. Moreover, inrder to reduce the quantity of urea in runoff and prevent theccumulation of urea in surface waters, controlling the agriculturalsage of urea fertilizer and mitigating measures are needed.
cknowledgments
We are grateful to Yuan Xiao at Institute of Hydrobiology, thehinese Academy of Sciences for helping with Dual-PAM-100 oper-tion. We also gratefully thank Wei Xing, Stephen C. Maberly andrigitte Gontero for their valuable suggestions on the manuscript.he study was supported by the National Natural Science Founda-ion of China (31100340, 31370479).
eferences
rgaard, M., 1991. The genus Cabomba (Cabombaceae)—a taxonomic study. Nord.J. Bot. 11, 179–203.
zizullah, A., Richter, P., Häder, D.P., 2012. Responses of morphological,physiological, and biochemical parameters in Euglena gracilis to 7-daysexposure to two commonly used fertilizers DAP and urea. J. Appl. Phycol. 24,21–33.
aker, N.R., 2008. Chlorophyll fluorescence: a probe of photosynthesis in vivo.Annu. Rev. Plant Biol. 59, 89–113.
espamyatnov, G.P., Krotov, Y.A., 1985. PDK khimicheskikh veshchestv vokruzhayushchei srede: spravochnik (Maximum Allowable Concentrations ofChemical Substances in the Environment: Reference Book). Khimiya Leningrad,pp. 585.
est, E.P.H., 1980. Effects of nitrogen on the growth and nitrogenous compounds ofCeratophyllum demersum. Aquat. Bot. 8, 197–206.
rain, R.A., Solomon, K.R., 2007. A protocol for conducting 7-day daily renewaltests with Lemna gibba. Nat. Protoc. 2, 979–987.
ao, T., Ni, L.Y., Xie, P., 2004. Acute biochemical responses of a submergedmacrophyte Potamogeton crispus L., to high ammonium in anaquariumexperiment. J. Freshw. Ecol. 19, 279–284.
ao, T., Xie, P., Ni, L.Y., Wu, A.P., Zhang, M., Wu, S.K., Smolders, A.J.P., 2007. The roleof NH4
+ toxicity in the decline of the submersed macrophyte Vallisneria natansin lakes of the Yangtze River basin. China. Mar. Freshw. Res. 58, 581–587.
ao, T., Xie, P., Ni, L.Y., Zhang, M., Xu, J., 2009. Carbon and nitrogen metabolism ofan eutrophication tolerative macrophyte Potamogeton crispus, under NH4
+
stress and low light availability. Environ. Exp. Bot. 66, 74–78.ao, T., Ni, L.Y., Xie, P., Xu, J., Zhang, M., 2011. Effects of moderate ammonium
enrichment on three submersed macrophytes under contrasting lightavailability. Freshw. Biol. 56, 1620–1629.
hirkova, T.V., 1997. Cell membrane and plant resistance to stresses. Russ. J. PlantPhysiol. 9, 12–17.
omínguez, D., García, F., Raya, A., Santiago, R., 2010. Cadmium-induced oxidativestress and the response of the antioxidative defense system in Spartinadensiflora. Physiol. Plant 139, 289–302.
eng, Z.T., Deng, Y.Q., Fan, H., Sun, Q.J., Sui, N., Wang, B.S., 2014. Effects of NaClstress on the growth and photosynthetic characteristics of Ulmus pumila L.seedlings in sand culture. Photosynthetica 52, 313–320.
inlay, K., Patoine, A., Donald, D.B., Bogard, M.J., Leavitt, P.R., 2010. Experimentalevidence that pollution with urea can degrade water quality inphosphorus-rich lakes of the Northern Great Plains. Limnol. Oceanogr 55,1213–1230.
alloway, J.N., Cowling, E.B., 2002. Nitrogen and the world. Ambio 31, 64–71.libert, P.M., Seitzinger, S., Heil, C.A., Burkholder, J.A., Parrow, M.W., Codispoti, L.A.,
Kelly, V., 2005. The role of eutrophication in the global proliferation of harmfulalgal blooms: new perspectives and approaches. Oceanography 18, 196–207.
libert, P.M., Harrison, J., Heil, C., Seitzinger, S., 2006. Escalating worldwide use ofurea—a global change contributing to coastal eutrophication. Biogeochemistry77, 441–463.
arborne, J.B., Turner, B.L., 1984. Plant Chemosystematics. Academic Press, London.eilmeier, H., Ratcliffe, R.G., Hartung, W., 2000. Urea: a nitrogen source for the
aquatic resurrection plant Chamaegigas intrepidus Dinter. Oecologia 123, 9–14.oagland, D.R., Arnon, D.I., 1950. The water-culture method for growing plants
without soil. Calif. Agric. Exp. Sta. Circ. 347, 39–42.
any 140 (2017) 69–77 77
Huang, W., Zhang, S.B., Cao, K.F., 2010. Stimulation of cyclic electron flow duringrecovery after chilling-induced photoinhibition of PSII. Plant Cell Physiol. 51,1922–1928.
Huang, W.M., Bi, Y.H., Hu, Z.Y., 2014. Effects of fertilizer-urea on growth:photosynthetic activity and microcystins production of Microcystis aeruginosaisolated from Dianchi Lake. Bull. Environ. Contam. Toxicol. 92, 514–519.
Jeppesen, E., Sondergaard, M., Sondergaard, M., Christoffersen, K. (Eds.), 1998. TheStructuring Role of Submerged Macrophytes in Lakes. Springer-Verlag, NewYork.
Jones, J.I., Eaton, J.W., Hardwick, K., 1993. Physiological plasticity in Elodea nuttallii(Planch) St-John. J. Aquat. Plant Manag. 31, 88–94.
Jones, J.I., Eaton, J.W., Hardwick, K., 2000. The effect of changing environmentalvariables in the surrounding water on the physiology of Elodea nuttallii. Aquat.Bot. 66, 115–129.
Juneau, P., Green, B.R., Harrison, P.J., 2005. Simulation ofPulse-Amplitude-Modulated (PAM) fluorescence. Limitations of somePAM-parameters in studying environmental stress effects. Photosynthetica 43,75–83.
Les, D., Mehrhoff, L., 1999. Introduction of nonindigenous aquatic vascular plantsin southern New England: a historical perspective. Biol. Invasions 1, 281–300.
Maleva, M., Borisova, G., Chukina, N., Nekrasova, G., Prasad, M.N.V., 2013. Influenceof exogenous urea on photosynthetic pigments 14CO2 uptake, and ureaseactivity in Elodea densa—environmental implications. Environ. Sci. Pollut. Res.20, 6172–6177.
Maleva, M., Borisova, G., Chukina, N., Prasa, M.N.V., 2015. Urea-induced oxidativedamage in Elodea densa leaves. Environ. Sci. Pollut. Res. 22 (17), 13556–13563.
Maxwell, K., Johnson, G.N., 2000. Chlorophyll fluorescence—a practical guide. J.Exp. Bot. 51, 659–668.
McCracken, A., Bainard, J.D., Miller, M.C., Husband, B.C., 2013. Pathways ofintroduction of the invasive aquatic plant Cabomba caroliniana. Ecol. Evol. 3,1427–1439.
Mohapatra, P.K., Khillar, R., Hansdah, B., Mohanty, R.C., 2010. Photosynthetic andfluorescence responses of Solanum melangena L: to field application ofdimethoate. Ecotoxicol. Environ. Saf. 73, 78–83.
Ni, L.Y., 2001. Stress of fertile sediment on the growth of submersed macrophytesin eutrophic waters. Acta Hydrobiol. Sin. 25, 399–405.
Nosengo, N., 2003. Fertilized to death. Nature 425, 894–895.Perreault, F., Ait Ali, N., Saison, C., Popovic, R., Juneau, P., 2009. Dichromate effect
on energy dissipation of photosystem II and photosystem I in Chlamydomonasreinhardtii. J. Photochem. Photobiol. B 96, 24–29.
Pfündel, E., Klughammer, C., Schreiber, U., 2008. Monitoring the effects of reducedPS II antenna size on quantum yields of photosystems I and II using theDual-PAM-100 measuring system. PAM Appl. Notes 1, 21–24.
Platt, T., Gallegos, C.L., Harrison, W.G., 1980. Photoinhibition of photosynthesis innatural assemblages of marine phytoplankton. J. Mar. Res. 38, 687–701.
Sativir, K.A., Gupta, K., Kaur, N.K., 2000. Effect of GA3: kinetin and indol acetic acidon carbohydrate metabolism in chickpea seedlings germinating under waterstress. Plant Growth Regul. 30, 61–70.
Schreiber, U., Muller, J.F., Haugg, A., Gademann, R., 2002. New type of dual-channelPAM chlorophyll fluorometer for highly sensitive water toxicity biotests.Photosynth. Res. 74, 317–330.
Smolders, A.J.P., denHartog, C., vanGestel, C.B.L., Roelofs, J.G.M., 1996. The effects ofammonium on growth: accumulation of free amino acids and nutritional statusof young phosphorus deficient Stratiotes aloides plants. Aquat. Bot. 53, 85–96.
Solomon, C.M., Collier, J.L., Berg, G.M., Glibert, P.M., 2010. Role of urea in microbialmetabolism in aquatic systems: a biochemical and molecular review. Aquat.Microb. Ecol. 59, 67–88.
Usenko, O.M., Sakevich, A.E., Klochenko, P.D., 2000. The participations ofphotosynthetic hydrobionts in urea degradation. Uk Hidrobiol. J. 36, 20–29.
Vines, H.M., Wedding, R.T., 1960. Some effects of ammonia on the plant metabolismand a possible mechanism for ammonia toxicity. Plant Physiol. 35, 820–825.
Wang, Q., Li, Z., Cheng, S.P., Wu, Z.B., 2010. Effects of humic acids onphytoextraction of Cu and Cd from sediment by Elodea nuttallii. Chemosphere78, 604–608.
Wilson, C.E., Darbyshire, S.J., Jones, R., 2007. The biology of invasive alien plants inCanada: 7. Cabomba caroliniana A. Gray. Can. J. Plant Sci. 87, 615–638.
Witte, C.P., 2011. Urea metabolism in plants. Plant Sci. 180, 431–438.Xing, W., Li, D.H., Liu, G.H., 2010. Antioxidative responses of Elodea nuttallii
(Planch:) H. St. John to short-term iron exposure. Plant Physiol. Biochem. 48,873–878.
Yemm, E.W., Willis, A.J., 1954. The estimation of carbohydrates in plant extracts byanthrone. Biochem. J. 57, 508–514.
Yordanova, E., Georgieva, K., Gorinova, N., Yordanov, Y., 2001. Influence of theherbicide chlortoluron on photosynthetic activity in transgenic tobacco plants.Photosynthetica 39, 313–316.
Zhang, J.H., Guo, S.J., Guo, P.Y., Wang, X., 2014a. The interacting effect of urea andfenoxaprop-P-ethyl on photosynthesis and chlorophyll fluorescence in Perilla
Photosynth. Res. 121, 285–297.