impact of neem-coated urea on production - Punjab ...
68
AERC STUDY No. 39 IMPACT OF NEEM-COATED UREA ON PRODUCTION, PRODUCTIVITY AND SOIL HEALTH IN PUNJAB D K GROVER J M SINGH SANJAY KUMAR JASDEV SINGH Study sponsored by Ministry of Agriculture and Farmers Welfare Agro-Economic Research Centre Department of Economics and Sociology Punjab Agricultural University Ludhiana December, 2016
-
Upload
khangminh22 -
Category
Documents
-
view
0 -
download
0
Transcript of impact of neem-coated urea on production - Punjab ...

AERC STUDY No. 39
IMPACT OF NEEM-COATED UREA ON PRODUCTION, PRODUCTIVITY AND SOIL HEALTH IN PUNJAB
D K GROVER J M SINGH
SANJAY KUMAR JASDEV SINGH
Study sponsored by Ministry of Agriculture and Farmers Welfare
Agro-Economic Research Centre Department of Economics and Sociology
Punjab Agricultural University Ludhiana
December, 2016
DATA COLLECTION/COMPILATION TEAM
SATWINDER SINGH
PARMINDER SINGH
TEJINDER KAUR DHALIWAL

TABLE OF CONTENT
Sr. No. Chapter Page No. 1 Preamble 1-8 1.1 Background of the study 1 1.2 Review of Literature 2 1.3 Need for the Study 7 1.4 Objectives of the Study 7 1.5 Limitation of the study 7 1.6 Data and Methodology 8 1.7 Organisation of the Report 8 2 Trends in Urea Consumption in the State 9-15 2.1 Trends in Urea consumption and Price Variation 9 2.2 Trends in distribution of NCU (district-wise analysis) 14 3 Socio-economic Characteristics of Sample Households 16-23 3.1 Socio-economic characteristics of the sample households 16 3.2 Details of operational land holdings 17 3.3 Cropping pattern and sources of irrigation 18 3.4 Purchasing pattern and sources of purchasing 19 3.5 Usage inputs and profitability of paddy crop 20 3.6 Details of agriculture credit availed 22 3.7 Training Programmes Attended on Fertilizers Application 23 4 Status of Awareness and Application of Neem-Coated Urea 24-30 4.1 Awareness & sources of information on NCU 24 4.2 Status of Application of Urea versus NCU 24 4.3 Perception of Farmers about NCU and its Benefits compared to Urea 27 4.4 Diversions of NU & NCU other than crop purposes 29 4.5 Constraints and suggestions about NCU and its adoption 29 5 Awareness and Adoption Level of Soil Testing Technology 31-37
5.1 Soil health related programmes and schemes - Implementation and performance in the state 31
5.2 Awareness on soil testing 32 5.3 Details of soil testing 32 5.4 Reasons for soil testing or not testing 33
5.5 Adoption of recommended doses of fertilizer application based on soil test report 35
6 Impact of NCU Application on Crop Production and Soil Health 38-42 6.1 Background 38 6.2 Impact on crop productivity 38 6.3 Fertilizer use efficiency 38 6.4 Impact of NCU application on production and marketing of paddy 39 6.5 Impact on Cost of cultivation of paddy crop 39 6.6 Economic feasibility of NCU using partial budgeting 40 6.6 Impact on soil heath and crop growth 41 7 Summary, Conclusions and Policy Suggestions 43-56 7.1 Background 43 7.2 Summary of findings 43 7.2.1 Trends in urea consumption and prices 45
7.2.2 Socio-economic characteristics of sample households 45
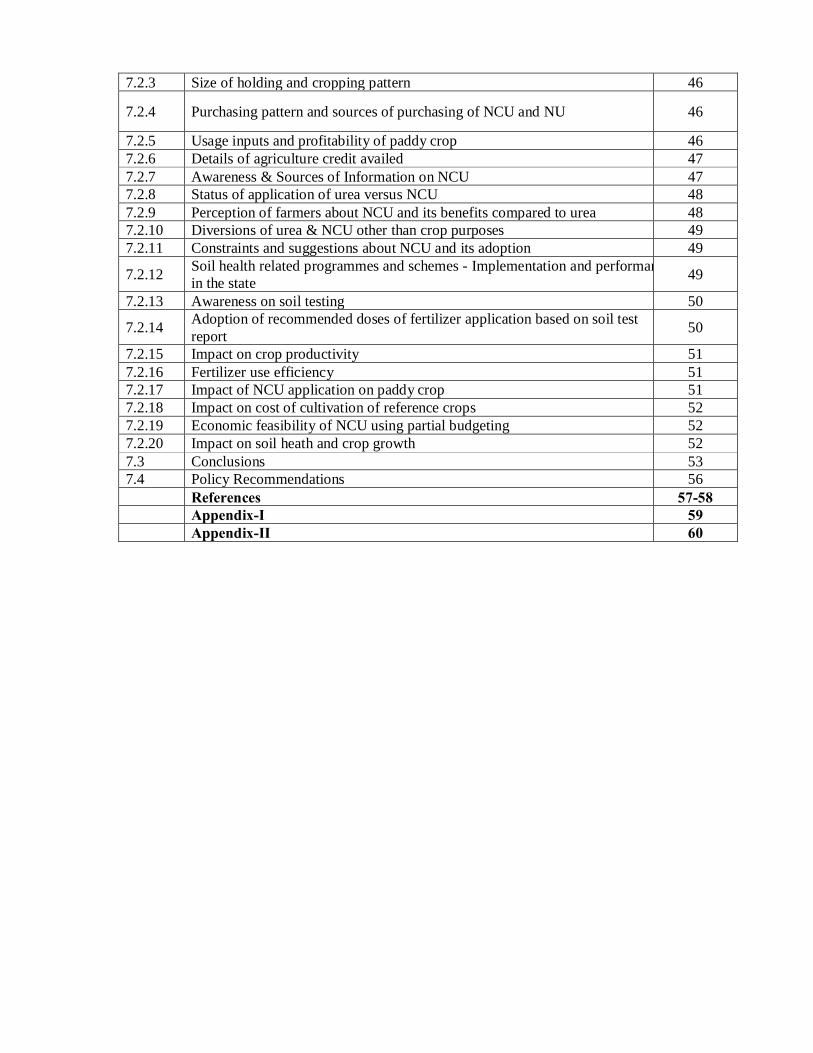
7.2.3 Size of holding and cropping pattern 46
7.2.4 Purchasing pattern and sources of purchasing of NCU and NU 46
7.2.5 Usage inputs and profitability of paddy crop 46 7.2.6 Details of agriculture credit availed 47 7.2.7 Awareness & Sources of Information on NCU 47 7.2.8 Status of application of urea versus NCU 48 7.2.9 Perception of farmers about NCU and its benefits compared to urea 48 7.2.10 Diversions of urea & NCU other than crop purposes 49 7.2.11 Constraints and suggestions about NCU and its adoption 49
7.2.12 Soil health related programmes and schemes - Implementation and performance in the state 49
7.2.13 Awareness on soil testing 50
7.2.14 Adoption of recommended doses of fertilizer application based on soil test report 50
7.2.15 Impact on crop productivity 51 7.2.16 Fertilizer use efficiency 51 7.2.17 Impact of NCU application on paddy crop 51 7.2.18 Impact on cost of cultivation of reference crops 52 7.2.19 Economic feasibility of NCU using partial budgeting 52 7.2.20 Impact on soil heath and crop growth 52 7.3 Conclusions 53 7.4 Policy Recommendations 56 References 57-58 Appendix-I 59 Appendix-II 60

LIST OF TABLES
Table No. Title Page
No. 2.1a District-wise trends in consumption/sale of urea in Punjab, 2007-08 to 2015-16 10
2.1b District-wise relative share in consumption/sale of urea in Punjab, 2007-08 to 2015-16 11
2.2 Trends in prices of Urea, 1981-82 to 2015-16 12 2.3 Compound growth rate of prices of urea, 1980-81 to 2015-16 13
2.4 District-wise distribution/consumption/sale of neem coated urea/normal urea in Punjab, 2015-16 14
3.1 General characteristics of sample households in Punjab, 2015-16 16 3.2 Education level of sample respondents in Punjab, 2015-16 16
3.3 Distribution of sample households based on their caste category in Punjab, 2015-16 17
3.4 Occupational distribution of the sample households in Punjab, 2015-16 17 3.5 Average operational land holdings of the sample households in Punjab, 2015-16 17 3.6 Sources of irrigation on the sample households in Punjab, 2015-16 18 3.7 Cropping pattern of respondents during kharif season in Punjab, 2015-16 18 3.8 Purchase pattern of NCU per household during 2015-16 in Punjab 19 3.9 Sources of purchase of NCU/Normal Urea in Punjab, 2015-16 19 3.10 Input use, output and returns realized by Paddy farmers in Punjab 20 3.11 Input use, output and returns realized by Paddy farmers in Punjab 21 3.12 Credit details of farmers during 2015-16 in Punjab 22 3.13 Purpose of borrowing loans by farmers during 2015-16 in Punjab 23
3.14 Trainings/ lecture(s) attended on application of fertilizers for paddy crop by respondents in Punjab, 2015-16 23
4.1 Awareness and sources of information about Neem Coated Urea among the respondents in Punjab, 2015-16 24
4.2 Factors from which farmers differentiate NCU compared to Normal Urea in Punjab, 2015-16 25
4.3 Application of NCU across different seasons by paddy respondents in Punjab, 2015-16 25
4.4 Method of Application of NCU/Normal Urea in paddy in Punjab, 2015-16 26 4.5 Split doses of NCU / Normal Urea application by respondents in Punjab, 2015-16 26
4.6 Comparative Benefits of NCU over Normal Urea in case of Paddy in Punjab, 2015-16 27
4.7 Perception about NCU versus Normal Urea in Punjab 28 4.8 Usage of NCU for other than crop production purposes in Punjab, 2015-16 29 4.9 Major problems faced in adoption of NCU fertilizer in Punjab, 2015-16 29 4.10 Major suggestions for improving the NCU fertilizers usage in Punjab, 2015-16 30
5.1 Sources of soil sample collection and the details of soil health cards among respondents in Punjab 31
5.2 Sources of information about soil testing and soil sample collection on sample farms in Punjab 32
5.3 Details of soil testing by the respondents during study period (2013-14 to 2015-16) and before in Punjab 33
5.4 Places of soil testing of the sample farmers in Punjab 33 5.5 Reasons for Soil testing by the respondents in Punjab, 2015-16 34 5.6 Reasons for not testing soil by the respondents in Punjab, 2015-16 34

5.7 Elucidation of Recommended Doses of Fertilizers (RDF) on paddy crop in Punjab, 2015-16 35
5.8 Farmers perception on fertilizers use and recommended doses based on soil test to paddy crop in Punjab, 2015-16 36
5.9 Major problems faced in soil testing by farmers in Punjab, 2015-16 36 5.10 Major suggestion for improving the soil health card scheme in Punjab, 2015-16 36 6.1 Comparative use of NCU versus Normal Urea in paddy crop in Punjab, 2015-16 38
6.2 Impact of Neem Coated Urea (NCU) on production and marketing of Paddy in Punjab, 2015-16 39
6.3 Impact of Neem Coated Urea (NCU) on input cost of Paddy in Punjab, 2015-16 40 6.4 Economic feasibility of NCU in Paddy, using partial budgeting framework 41 6.5 Qualitative benefits of NCU on paddy growth in Punjab, 2015-16 42 6.6 Qualitative benefits in terms of soil health improvement in Punjab, 2015-16 42

PREFACE
Chemical fertilizers are one of the important input constituents for plant growth and
development. In Punjab, the monoculture of paddy-wheat has resulted in macro/ micro-
nutrient(s) deficiencies in the soils which are often ameliorated by the application of these
fertilizers. It has been verified over the years that a big chunk of conventional urea/ nitrogen
applied is not assimilated by the plants and leaches into the soil, causing extensive ground
water contamination. According to recent research, the ‘sustained release’ nature of neem-
coated urea has been beneficial for rice and wheat productivity enhancement. The neem-
coating also preludes malpractices of the subsidized fertilizer being diverted for use in the
chemical industry. It has become mandatory for all the indigenous manufacturers to produce
neem-coated urea 2015 onwards. Various stakeholders in agricultural sector have been
advocating the better results of NCU over normal urea (NU). Though farmers the ultimate
users are the better judge while proving the new farm technology yet its excessive use and
diversion should be closely monitored.
Since soils vary considerably in their capability to meet plants nutrient needs depending on
factors such as soil parent material, texture, structure and current growing conditions, the soil
test based application of such fertilizers in the form of ‘Soil Health Card’ is gaining
importance. The need based use of fertilizers in the fields/ soil can result in significant cost
saving/ profit increasing at the farmers level.
In view of the cited benefits of NCU and soil testing, the present study was
undertaken with emphasis on the adoption of NCU, recommended doses of fertilizers by the
farmers on soil test basis and their impact on cost reduction and yield improvements if any.
This attempt would definitely be useful for further framing suitable policies for the benefit of
the society in general and peasantry in particular.
We express our gratitude to Directorate of Economics and Statistics, Ministry of
Agriculture and Farmers Welfare, Government of India, New Delhi for financial support to
take up this study. We are also thankful to Agriculture Development & Rural Transformation
Unit, Institute for Social and Economic Change (ISEC), Bangalore for very well coordination
of this study.
Authors

IMPACT OF NEEM-COATED UREA (NCU) ON PRODUCTION, PRODUCTIVITY AND SOIL HEALTH IN PUNJAB
Abstract
Punjab state is known for advent of green revolution in India but with the passage of time, the rice-wheat cropping system resulted in development of various agro-ecological problems. The excessive use of chemical fertilizers is one such issue which needs urgent attention in spite of the fact that the chemical fertilizers are the important source of nutrients for plant growth. From the year May, 2015 the entire production of urea has been converted as neem coated urea (NCU) to check its misuse in industries and benefits accrued in terms of increased production of crops. The present study was undertaken with the objectives; to analyze the trends in usage and prices of Urea versus NCU in Punjab, to analyze the adoption behavior of NCU among selected farmers in irrigated tracts, to analyze the impact of adoption of NCU on crop productivity and farmers' income, to document the status and implementation of soil health card scheme and to suggest suitable policy measures for adoption of NCU. The data were collected from randomly selected 200 farmers from four blocks of Ludhiana and Patiala districts where paddy is a major kharif crop which requires adequate doses of urea for its growth. The results of the study revealed that the consumption/ sale of urea in Punjab during the year 2007-08 was 2646.44 th. MT which rose to 3086.05 th. MT during the period 2007-08 to 2015-16 at an annual growth rate of 1.64 per cent. The urea prices increased significantly at the highest growth of 5.21 per cent per annum during the decade 1990-91 to 1999-2000 while during the period 1980-81 to 2015-16 the growth in urea prices was 3.33 per cent per annum. The analysis of the primary data revealed that the majority of the respondent farmers purchased NCU and NU from co-operative societies followed by private fertilizer dealers while the cost per bag of NCU, including transportation cost, worked out to be Rs. 289.69 while it was Rs. 276.58 per bag in case of NU. There was marginal increase in the productivity of paddy crop during the year 2015-16 as compared to the year 2014-15, however, it can’t only be attributed to the application of NCU because there are numerous factors influencing the yield of a crop The net returns per acre were estimated to be Rs. 31401 during the year 2015-16 and Rs. 29530 in 2014-15. As far as awareness about NCU was concerned, almost all the selected farmers were aware about the NCU and major source of awareness was co-operative societies. The major sign from which respondent farmers differentiated NCU from NU was leaf figure on bag. There was a significant increase in the application of NCU after 2015-16 in crops such as; paddy, wheat, basmati, sugarcane, potato, maize, sunflower and vegetables. Due to the application of NCU, only 5.29 per cent farmers reported about the increase in paddy yield while the cost of pest and disease control declined by 21 per cent. All the respondent farmers reported no decline in the cost of other fertilizers, improvement in the soil health, quality of grain and market acceptability of grains due to the application of NCU. Majority of the farmers reported about the quality of NCU being good, adequate, timely available, accessible in the market, its non-solidification and evenly distribution at the time of application being good points. It was found that none of the selected farmers reported about the use of NCU for other purposes such as; silage making, mixing with weedicides and for fishery feed preparation. There was increase in productivity of paddy crop where neem coated urea (NCU) was applied on the sample farms. Also, the NCU usage on the sample farms increased while cost of pest and disease control measures declined. The partial budgeting technique brought out that there were added returns of Rs. 718 per acre by application of NCU on the sample farms. It was also revealed by all the respondents that there was no change in the texture of the soil, soil moisture retention capacity, water infiltration rate, soil softness and decline in the compaction of the soil due to application of NCU but there was higher retention of nitrate in the soil and thereby its slow release to the crop. High price of NCU, inadequate/ shortage of supply during peak season and poor quality of NCU in some of the co-operative societies were the major problems reported by the respondents. Major suggestions were; assured/ timely and adequate supply of NCU to co-operative societies and organising training camps for spreading awareness. The information on soil health card revealed that only five farmers, out of 45 farmers who got their soils tested, received soil test report/ soil health card. It was found that 8.89 per cent of the sample farmers, who tested their soils, got information about soil testing from Agriculture Department. The most important reason of soil testing, as revealed by 31.11 per cent farmers, was ‘to understand fertilizer requirement for the crop’ while most important reason for not testing soil by 72.26 per cent farmers was that ‘soil testing not required for my field as crop yield is good’. It was observed that 91.11 per cent of the farmers, who got their soils tested, were not aware about the recommended dose of fertilizers (RDF) for paddy crop but were applying fertilizers based on their own perception while just 8.89 per cent of the farmers were actually aware about RDF on the basis of soil test report. Major problems faced in soil testing by the farmers was proper reports not being delivered and poor extension services while important suggestions were to deliver the soil health card on time and organizing awareness camps regarding soil testing. Major policy issue suggested was to lay emphasis on ensuring good quality, adequate quantity and timely supply of NCU along with bringing its price at par with NU. Besides, organising training camps for educating the farmers about benefits of soil testing and involving Gram panchayats in soil testing campaigns can be a few steps for better implementation of SHC scheme.

1
Chapter I
Preamble
1.1 Background of the study
Punjab state is well known for adoption of new farm technology which resulted in advent of
green revolution thereby increasing dramatically the productivity and production of crops
especially paddy and wheat. With the passage of time, rice-wheat cropping pattern resulted in
appearance of macro and micro-nutrients deficiencies in the soil, resulting into an excessive
application of chemical fertilizers as source of nutrients for plant growth. The total
consumption of nitrogenous (N), phosphatic (P) potassic (K) fertilizers in the Punjab state
increased from 2.13 lakh tonnes in 1970-71 to 17.14 lakh tonnes in 2013-14 (Anonymous,
2014). The per hectare consumption of these fertilizers in the state has increased merely from
43.12 Kg.N, 7.75 Kg. P and 1.73 Kg. K in 1970-71 to 329.15 Kg. N, 78.31 Kg. P and 5.54
Kg. K during the year 2013-14.The increased consumption of chemical fertilizers, which was
a boon for increase in agricultural productivity in the state, has now become a bane due to the
problems associated with its excessive use.
India is the second largest consumer of fertilizer in the world next to China and third largest
producer of nitrogenous fertilizer behind China and USA. In terms of Nutrients, it stands
second in consumption of N and P with the quantity of 16.75 million tonnes and 5.63 million
tonnes, respectively. Total consumption of NPK fertilizers in the country during 2013 was
24.48 million tonnes (IFA, 2015). Urea is the most common nitrogen fertilizer used
uniformly throughout the world. The wide acceptance of urea is because of its agronomic
acceptability and relatively lower cost as compared to other fertilizers. Besides being widely
used as an excellent fertilizer for plant growth, it can also be used among numbers of
products such as animal feed, commercial products, glue, resin, cosmetics, pharmaceuticals,
dish soaps, hair conditioners, tooth whiteners, etc.
With the increased cost of urea fertilizer and concern about its adverse environmental impact
of nitrogen losses, there has been a great interest in improving the Nitrogen Use Efficiency
(NUE) through optimization of nitrogen use. By doing so, higher yields can be achieved with
less negative impacts like nitrogen leaching (Agostini et al., 2010; Burns, 2006; Neeteson et
al, 1999; Rahn, 2002).
Keeping in view the low NUE, it has been felt to find out the use of some indigenous
material and coating process for reducing the nitrogen losses from urea. In this endeavor,

2
National Fertilizer Limited (NFL) standardized the techniques for production of Neem
Coated Urea (NCU) in the year 2002. Since then many changes have been made in the
process and applicant solution to have uniform and consistent coating of neem oil on urea
prills and to maintain the concentration of Neem oil content as per the specification
prescribed in Fertilizer Control Order (FCO), 1985. The use of NCU has been found to
improve the uptake of N, P and K significantly. Based upon the results of extensive field
trials, NCU was found to be agronomically superior to normal prilled urea. Thus, NFL
became the first company in India which was granted the permission to produce and market
the NCU, vide Government of India Notification No S.O.807 (E) dated 9 July 2004. In the
initial years, the total production of NCU was limited up to 35 per cent. Later, from March
2015, the Department of Fertilizer (DOF) has made it mandatory for all indigenous
producers of urea to produce 75 per cent of their production as NCU and from 25th May,
2015 the cap was increased to 100 per cent. Neem acts as a nitrification inhibitor and its
coating over urea minimizes loss due to leaching. Coating urea with neem prevents its
misuse as well as puts the fertiliser in slow release mode thereby nourishing the saplings for
a longer period. Thus avoids the repeated use of fertilizer and economize the quantity of urea
required by crops (enhancing Nitrogen-Use Efficiency (NUE)). Besides, coating of neem oil
also reduces the leaching of nitrates into the groundwater aquifers and thus, help in reducing
its pollution.
1.2 Review of literature
In this section, various research studies undertaken on NCU has been reviewed and discussed
in chronological order as under:
Singh and Singh (1989) conducted a study to compare the efficiency of neem oil
coated urea (NOCU) with sulphur coated urea (SCU), lac coated urea (LUC) and neem cake
blended urea (NCBU) on grain yield of nitrogen uptake and per cent recovery of N by wheat
on a calcareous (23.7% CaCO3) soil. Significant increases in grain yield, nitrogen uptake and
recovery of applied nitrogen were observed on application of these materials. Among the four
modified materials, NOCU, SCU and LCU were equally effective. The NOCU, SCU and
LCU maintained higher amounts of NO3-N in the soil throughout the growth period of wheat
as compared to urea and NCBU. N recovery by wheat from these materials was 30.8, 31.1
and 27.7 % for SCU, NOCU and LCU, respectively.
Tomar et al (1991) carried out a trial on a deep black vertisol in the year 1988-89 in
wet season in Rajasthan. Rice variety Jaya was given 90, 120 or 150 kg N/ha as prilled urea

3
(PU) or neem extract-coated urea (NECU). Half of the PU was incorporated before
transplanting and the remainder in equal top dressings at tillering and panicle initiation.
Similarly, NECU was applied 50% before transplanting and 50% at tillering stage. Grain
yields ranged from 3.6 t/ha in 1988 and 3.5 t in 1989. Also, there was a positive correlation
between number of productive tillers and grain yield.
Kumar and Thakur (1993) conducted a field experiment on silty clay soil in 1990 at
Pusa, Bihar. Rice variety cv. Rajshree was given 30 or 60 kg N/ha as Mussoorie phos-coated
urea (MRPU), neem coated urea (NCU), gypsum coated urea (GCU), nimin coated urea
(NMCU) or prilled urea (PU). 30 or 60 kg N was applied at transplanting or 60 kg N was
applied in 2 equal splits at transplanting and maximum tillering. Split application of 60 kg N
gave the highest grain yield of 4.51 t. Grain yields from the N sources were: MRPU, 4.02 t;
NCU, 4.45 t; GCU, 4.21 t; NMCU, 4.38 t; and PU, 3.74 t. Thus, NCU gave highest grain
yield.
Hooda and Srivastava (1998) assessed the impact of neem [Azadirachta indica] coated
urea (NCU) and potash on the incidence of rice blast (Magnaporthe grisea) in Hisar during
the crop year 1992-93. All 3 levels of NCU used (30, 60, 90 kg N/ha) were effective in
reducing the disease. However, for neck and node blast incidence, NCU at 30 kg N/ha had no
effect compared with controls. NCU at 60 and 90 kg N/ha significantly reduced disease
compared with controls. Significant increases in yield were also produced by NCU rates of
60 and 90 kg N/ha. NCU affected biochemical constituents (cellulose, hemicellulose, lignin,
silica, total proteins and total phenols) of the host plants. These changes were significant at
60 and 90 kg N/ha applied through NCU as compared with plain urea. The highest
cost:benefit ratio was recorded for NCU at 60 kg N/ha, followed by 90 kg N/ha. The 3 rates
of potash used (15, 30 and 45 K2O/ha) had no effect on the incidence of rice blast or yields.
Upadhyay and Tripathi (2000) conducted a field experiment during the kharif season
of 1997 in Raipur, Madhya Pradesh, India. The application of neem extract coated urea
(NCU) 50% basal + 25% at tillering + 25% at panicle initiation (PI) stage recorded the
maximum grain (39.60 q/ha) and straw (63.90 q/ha) yield, grain (1.26%) and straw (0.19%)
N concentration and uptake (62.04 kg/ha), nitrogen use efficiency (62.04 kg/ha) and nitrogen
recovery (46.96%).
Sirisena et al (2003) evaluated the relative efficiency of granular urea, soil mixed urea
and neem coated urea fertilizers compared with prilled urea on irrigated, transplanted paddy
in Sri Lanka. It was found that among the tested urea sources, granular urea produced the best
paddy yields (5.56 and 6.8 t/ha) during the study period. It also efficiently increased N use

4
efficiency of paddy (29.2 kg/ha). Although, granular urea performed well than prilled urea,
use of prilled urea is still suggested when granular urea is not available.
Mangat and Narang (2004) have assessed the agronomical efficiency of NCU using
rice and wheat as test crops during kharif and rabi seasons of 2002-2003 in Punjab and
Haryana. Results indicated that high crop yield could be obtained in paddy and wheat when
NCU was applied at 100% recommended level of N application. Even at 80% level of
recommended dose urea application through NCU in paddy crop, the yield obtained were
comparable when urea was applied at 100% level of recommended dose through normal
prilled urea, i.e., urea dose can be reduced by 50 kg per hectare with marginal, non-
significant reduction in yield when NCU was used. NCU, when applied at 100% level of
recommended levels, gave significantly higher yield in wheat crop in Haryana but when NCU
was applied at 80% level, the yield was reduced significantly.
Purakayastha and Katyal (2006) reported that urea was the most popular nitrogenous
fertilizer among the Indian farmers because of its low cost and easy availability. However,
the major disadvantage of urea was its high solubility in water, and it was very much
susceptible to nitrogen loss through various pathways like leaching, ammonia volatilization,
nitrification and denitrification. Among these, ammonia volatilization happens to be the
dominant loss mechanism because of conventional methods of fertilizer application (wet soil
surface broadcasting) and farmers encourage it. Modification of urea has been experimented
extensively in India to increase its use efficiency by various crops. Nevertheless, different
fertilizer application methods also have been attempted for the same purpose. In heavy
textured soil, dry soil application followed by irrigation and puddling in rice crop could
substantially decrease nitrogen loss vis-à-vis N use efficiency by rice. Neem cake and
elemental sulphur has been used extensively as coating materials for modifying urea
fertilizer. However, neem-coated or sulphur-coated urea could not succeed mainly because of
inconsistent results and high costs involved particularly in the latter fertilizer material.
Therefore, alternative chemical amendments, e.g. ammonium chloride, zinc sulphate,
phosphogypsum, copper sulphate and potassium chloride etc., which are otherwise used as
fertilizers by the farmers have been tried for making compacted urea fertilizers through dry
compaction and granulation. Among these amendments, zinc sulphate, copper sulphate,
potassium chloride and phosphogypsum proved to be effective in decreasing ammonia
volatilization loss and N use efficiency by rice. This approach of dry compaction and
granulation is very promising as it does not involve much cost; the only thing is to provide

5
every village a tablet machine so that the compacted urea fertilizers are to be available at the
farmer's door step in the appropriate time.
Venkatesan and Veemaraj (2006) conducted a field experiment to study the effects of
dicyandiamide (DCD) and neem coated urea (NCU, a slow release N fertilizer) on the unease
activity of tea soils in Anamallais, Tamil Nadu, India. The treatments comprised N (urea) at
recommended concentration, NK (urea and muriate of potash, MOP) at recommended
concentrations of 1:1 and 4:1, N as urea-MOP along with DCD, and NCU+MOP at
recommended concentration of 4:3. Soil samples were drawn on the 6th, 10th, 18th, 28th,
39th, 49th and 60th day after imposing the treatments and analysed for urease activity.
Application of DCD along with urea-MOP and NCU along with MOP showed considerable
activity till the 49th day, while in the other treatments; the activity reached the minimum
level on the 39th day. This indicated that the interval between 2 successive fertilizer
applications could be enhanced to 6-8 weeks when the NCU or DCD-blended urea was used.
Bhalla and Prasad (2008) reported the significant increase in the growth of paddy
plant parts by halving the urea used and pelleting the remaining with neem cake prior to
application. Results on a non-averaged dataset showed significant increase in leaf length,
number of leaves, number of panicles, number of tillers and greenness of leaves. Averaged
data showed similar results barring the number of panicles, which were not significantly
different from the control. The results point to a higher availability of nitrogen in the
treatment, even though half the amount of urea was applied as opposed to the control. This
could be attributed to inhibition of de-nitrifying bacteria by neem as well as a slower
continuous release of nitrogen when urea is pelleted with neem than when it is applied
directly. The study makes a strong case for cutting down on nitrogen application in paddy
using low-cost, readily available materials, without compromising on the yield.
Thind et al (2010) observed that modifications in fertilizer source and/or management
can lead to reduced losses of N, high wheat yields and increased fertilizer N-use efficiency.
Relative performance of neem (Azadirachta indica A Juss)-coated urea vis-à-vis ordinary
urea applied to wheat (Triticum aestivum C. emend Fiori & Paol.) was studied when applied
at different levels (48, 96 and 120 kg N/ha), drilled in between rows as a single dose of 96 kg
N/ha and when applied in 3 split doses (48, 48 and 24 kg N/ha). The field experiments were
carried out at 2 locations, i e Ludhiana-sandy loam soil and Gurdaspur - clay loam soil during
2005-08. When nitrogen was applied in 2 equal split doses at the time of sowing and first
irrigation, the neem coated urea did not out perform urea in increasing grain yield at any level
of N application at both the locations. Performance of neem coated urea @ 96 kg N/ha drilled

6
during sowing of wheat was better than neem-coated urea applied @ 120 kg N/ha in 2 split
doses at Ludhiana. Better performance of urea and neem-coated urea applied in 3 rather than
2 split doses only in coarse-textured soil at Ludhiana suggests that losses of applied N via
leaching can be substantial as compared to in the fine textured soil at Gurdaspur. This study
suggests that neem-coated urea can lead to improved N-use efficiency when applied either in
3 split doses or drilled between rows as a single dose in coarse-textured soils rather than in
fine-textured ones.
Sunita and Narang (2012) carried out an agronomical trial on rice and wheat crops
with Neem Coated Urea (NCU) as source of nitrogen. It was observed that NCU applied field
has produced significantly higher yields at research and farm level. Looking into the potential
of Neem Coated Urea and its acceptance by the farmers, Ministry of Agriculture in July
2004, included the Neem Coated Urea in FCO. The use of Neem Coated Urea has been found
to improve the uptake of N, P and K significantly. Since 2008 the, Ministry of Chemicals and
Fertilizers allowed Neem Coated Urea manufacturer to sell NCU at 5% above the MRP, to
recover the cost of coating, however cost of neem oil and production as such of Neem Coated
Urea has increased significantly.
Sanjaykumar et al (2015) conducted a field experiment in Zonal Agricultural
Research Station, Navile, Shivamogga to know the impact of different compost enrichment
methods on productivity and NPK use efficiency and their uptake by maize. The different
compost enrichment methods adopted were: compost alone, recommended package of
practice (RPP), compost enriched with NPK fertilizers, compost enriched with neem oil
coated urea (NOCU) + PK fertilizers and compost enriched with neem cake+PK fertilizers.
Compost+NOCU+PK fertilizers recorded significantly higher grain yield (8626 kg ha-1) and
also higher N (210.8 kg ha-1), P (65.4 kg ha-1) and K (205.8 kg ha-1) uptake by maize. The
highest N, P and K use efficiency of 34.5, 59.9 and 118.1 kg grain per kg N, P and K applied
respectively, was recorded in the compost+NOCU+PK fertilizers treatment. Compost+neem
cake+PK fertilizers enrichment method recorded significantly higher available N (192.5 kg
ha-1), available P (37.6 kg ha-1) and available K (182.2 kg ha-1) in soil over RPP (154.8 kg
ha-1, 33.7 kg ha-1 and 161.4 kg ha-1 available N, P and K, respectively).
Most of the studies cited above revealed that neem coated urea (NCU) has been
performing well over normal urea. It was observed that the grain yield of wheat, paddy,
maize etc were significantly increased with the application of NCU over NC under different
conditions by conducting number of experiments on trial fields in research station all over the
states of India. Keeping in view the benefits of NCU, government of India has drawn back

7
the restriction cap of NCU production and allowed 100 per cent production and supply of
neem coated urea to all the states w.e.f. 25-5-2015 in the interest of the farming community.
1.3 Need for the study
Punjab state being called food bowl of the country is also one of the largest consumer of
chemical fertilizers in the country. But now it has been observed by agricultural scientists
that the use of N fertilizers is proportionately higher than P and K fertilizers as compared to
recommended level of N:P:K ratio for various crops. So, it is necessary to lay emphasis on
judicious use of fertilizers especially urea. The Government of India included neem-coated
urea, a slow release fertilizer, in the Fertilizer (Control) Order, 1985 and made it mandatory
for all the indigenous producers of urea to produce their whole production of subsidized
urea as NCU from 2015. Further, it has taken various steps to promote NCU, with a view to
improve soil health status and also realise higher crop yield. There is a need to assess the
impact of NCU on the production and productivity of major crops in Punjab. Therefore, the
present study was undertaken to examine the coverage of NCU, its adoption behaviour and
impact on yield of paddy crop in the state.
1.4 Objectives of the study
The specific objectives of the study are as follows:
1. To analyze the trends in usage and prices of Urea versus NCU in Punjab.
2. To analyze the adoption behavior of NCU among selected farmers in irrigated tracts
of Punjab.
3. To analyze the impact of adoption of NCU on crop productivity and farmers'
income.
4. To document the status and implementation of soil health card scheme.
5. To suggest suitable policy measures for adoption of NCU.
1.5 Limitation of the study
The present study relied on primary data collected from the farmers. In the process of data
collection it was found that information on highly scientific parameters concerning soil
health/ characteristics viz. soil texture, soil water/ moisture retention capacity/ infiltration
rate, soil softness etc. regarding which farmer’s perception had to be obtained. Even after
enquiring minutely, farmers were unable to identify/ pinpoint changes in soil characteristics
due to the application of NCU. So, it was a challenge to identify any change in the soil health
due to the application NCU from the farmer’s perspective.

8
1.6 Data and methodology
The present study relied on both primary and secondary data collected from various sources.
The reference period for the study was kharif, 2015. Paddy crop in kharif season having
highest use of urea in Punjab was selected for the study. Two districts namely Ludhiana and
Patiala were selected based on the urea usage in paddy crop in the central belt of the state.
From each selected district, two blocks were selected again based on the same criterion.
Thus, Jagraon and Machhiwara blocks from district Ludhiana and Nabha and Rajpura blocks
from district Patiala were selected for the study. Further from each block, two cluster of
villages comprising 3-4 villages were selected for conducting the survey. A sample of 50
farmers from each block, which added up to 100 farmers in each district, totalling to 200
farmers for both the selected districts. Households were selected randomly for assessing the
use of NCU fertiliser and its impact on crop production. While selecting the households,
special care was taken to have the representation of the farmers with full use of NCU, part
use of NCU and no use of NCU (those who have used simple urea). Thus, a total number of
200 NCU/partial NCU and Urea user farmers for paddy crop were interviewed. Adequate
representation was given to different farm size groups classified based on operational land
holding size. Hence, the sample includes 68 marginal/small, 117 medium and 15 large farm
size groups.
1.7 Organisation of the report
The present report has been divided into seven chapters. First chapter relates to the
background information related to importance of fertilizers, need for the study, review of
literature, objectives and methodology undertaken. Second chapter is concentrated on the
trends in urea consumption, price variation and distribution of NCU. Third chapter includes
the socio economic characters of the respondent farmers, operational holding, cropping
pattern, purchasing pattern and source of credit, input use and profitability from paddy crop.
Fourth chapter relates to status of awareness and application of NCU while fifth chapter deals
with awareness and adoption level of soil testing technology along with status of soil health
related programmes and schemes. The impact of NCU application on crop production and
soil health has been included in chapter sixth. Seventh chapter contains summary along with
conclusions and policy suggestions.

9
Chapter II
Trends in Urea Consumption in the State
2.1 Trends in urea consumption and price variation
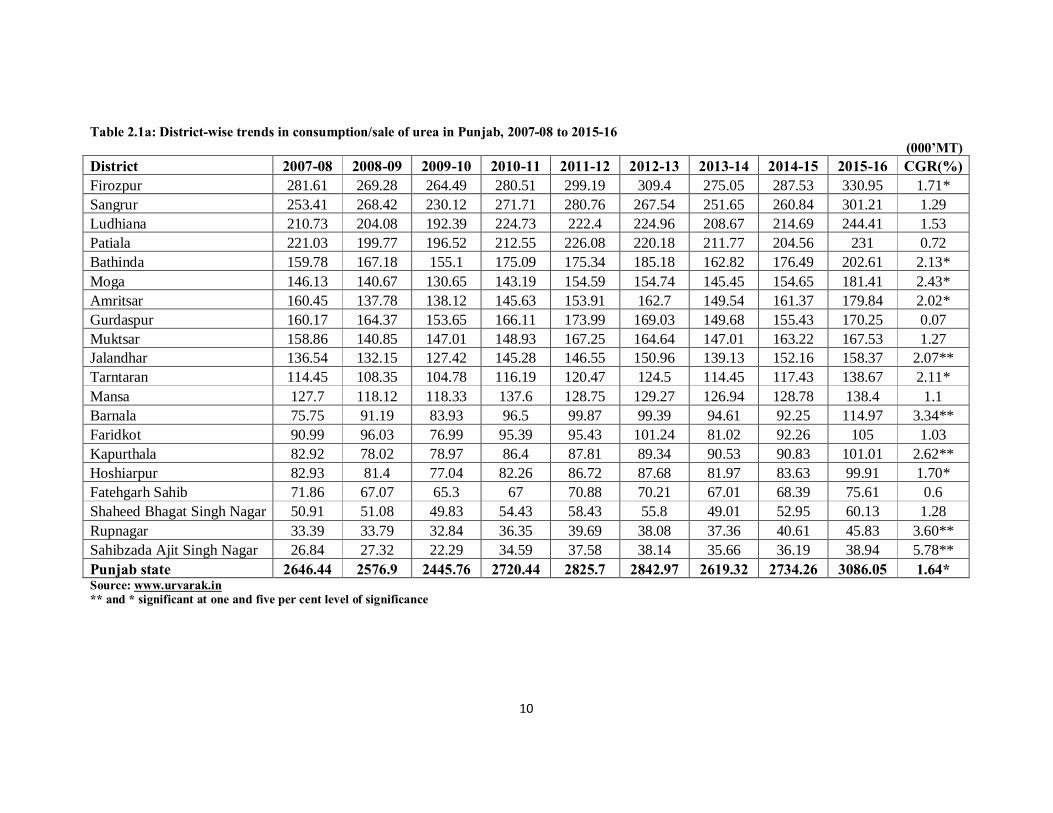
The district wise trends in consumption/ sale of urea in Punjab have been given in Table 2.1a.
It was observed that during the year 2007-08 the consumption of urea was 2646.44 th. MT
which rose to 3086.05 th. MT during the period 2007-08 to 2015-16 at an annual growth rate
of 1.64 per cent. As far as district-wise analysis is concerned, the annual growth in urea
consumption was 5.78 per cent in S.A.S., Nagar followed by 3.60 per cent in Rupnagar, 3.34
per cent in Barnala, 2.43 per cent in Moga, 2.62 per cent in Kapurthala, 2.11 per cent in
Tarntaran, 2.07 per cent in Jalandhar, 2.02 per cent in Amritsar and 1.71 per cent in Firozpur
and it was also statistically significant. In rest of the districts, although there was also growth
in urea consumption but it was not significant statistically. So, it is clear from the analysis
that growth in urea consumption was higher in those districts where mostly paddy-wheat crop
rotation is followed by the farmers. These crops require sufficient doses of urea along with
other fertilizers for overall plant growth and good productivity. In relative terms (Table 2.1b)
the consumption/ sale of urea was 10.72 per cent of total consumption in district Firozpur
during 2015-16 followed by other major consuming districts i.e. Sangrur (9.76%), Ludhiana
(7.92%), Patiala (7.49%) and Bathinda (6.57%).
The trends in urea prices since 1981-82 to 20015-16 have been given in Table 2.2. A perusal
of the table reveals that during the year 1980-81 the price of urea was Rs. 2350 per tonne
which declined to Rs. 2150 per tonne in 1982-83 and again rose to Rs. 2350 per tonne during
1985-86. After remaining at this level for continuous four years the price of urea again shoot
up to Rs. 3227 per tonne in 1990-91 but again declined to Rs. 2760 per tonne in the
subsequent year and remained at this level for next four years i.e. up to the year 1995-96.
From the year 1996-97, the price of urea increased to Rs. 3660 per tonne and remained
increasing for next three years and was Rs. 4600 per tonne during the year 2000-01 and
further increased to Rs. 4830 in the subsequent year. The price of urea remained at the level
of Rs. 5070 per tonne from 2002-03 to 2008-09 and increased to Rs. 5310 per tonne in 2009-
10 and remained at the same level for the next year. Again, urea price increased to Rs. 5360
per tonne in 2011-12 and remained same for the next three years and increased to Rs. 5628
per tonne in the year 2015-16.
10
Table 2.1a: District-wise trends in consumption/sale of urea in Punjab, 2007-08 to 2015-16 (000’MT)
District 2007-08 2008-09 2009-10 2010-11 2011-12 2012-13 2013-14 2014-15 2015-16 CGR(%) Firozpur 281.61 269.28 264.49 280.51 299.19 309.4 275.05 287.53 330.95 1.71* Sangrur 253.41 268.42 230.12 271.71 280.76 267.54 251.65 260.84 301.21 1.29 Ludhiana 210.73 204.08 192.39 224.73 222.4 224.96 208.67 214.69 244.41 1.53 Patiala 221.03 199.77 196.52 212.55 226.08 220.18 211.77 204.56 231 0.72 Bathinda 159.78 167.18 155.1 175.09 175.34 185.18 162.82 176.49 202.61 2.13* Moga 146.13 140.67 130.65 143.19 154.59 154.74 145.45 154.65 181.41 2.43* Amritsar 160.45 137.78 138.12 145.63 153.91 162.7 149.54 161.37 179.84 2.02* Gurdaspur 160.17 164.37 153.65 166.11 173.99 169.03 149.68 155.43 170.25 0.07 Muktsar 158.86 140.85 147.01 148.93 167.25 164.64 147.01 163.22 167.53 1.27 Jalandhar 136.54 132.15 127.42 145.28 146.55 150.96 139.13 152.16 158.37 2.07** Tarntaran 114.45 108.35 104.78 116.19 120.47 124.5 114.45 117.43 138.67 2.11* Mansa 127.7 118.12 118.33 137.6 128.75 129.27 126.94 128.78 138.4 1.1 Barnala 75.75 91.19 83.93 96.5 99.87 99.39 94.61 92.25 114.97 3.34** Faridkot 90.99 96.03 76.99 95.39 95.43 101.24 81.02 92.26 105 1.03 Kapurthala 82.92 78.02 78.97 86.4 87.81 89.34 90.53 90.83 101.01 2.62** Hoshiarpur 82.93 81.4 77.04 82.26 86.72 87.68 81.97 83.63 99.91 1.70* Fatehgarh Sahib 71.86 67.07 65.3 67 70.88 70.21 67.01 68.39 75.61 0.6 Shaheed Bhagat Singh Nagar 50.91 51.08 49.83 54.43 58.43 55.8 49.01 52.95 60.13 1.28 Rupnagar 33.39 33.79 32.84 36.35 39.69 38.08 37.36 40.61 45.83 3.60** Sahibzada Ajit Singh Nagar 26.84 27.32 22.29 34.59 37.58 38.14 35.66 36.19 38.94 5.78** Punjab state 2646.44 2576.9 2445.76 2720.44 2825.7 2842.97 2619.32 2734.26 3086.05 1.64* Source: www.urvarak.in ** and * significant at one and five per cent level of significance

11
Table 2.1b: District-wise relative share in consumption/sale of urea in Punjab, 2007-08 to 2015-16
(% to total) District 2007-08 2008-09 2009-10 2010-11 2011-12 2012-13 2013-14 2014-15 2015-16 Firozpur 10.64 10.45 10.81 10.31 10.59 10.88 10.50 10.52 10.72 Sangrur 9.58 10.42 9.41 9.99 9.94 9.41 9.61 9.54 9.76 Ludhiana 7.96 7.92 7.87 8.26 7.87 7.91 7.97 7.85 7.92 Patiala 8.35 7.75 8.04 7.81 8.00 7.74 8.08 7.48 7.49 Bathinda 6.04 6.49 6.34 6.44 6.21 6.51 6.22 6.45 6.57 Moga 5.52 5.46 5.34 5.26 5.47 5.44 5.55 5.66 5.88 Amritsar 6.06 5.35 5.65 5.35 5.45 5.72 5.71 5.90 5.83 Gurdaspur 6.05 6.38 6.28 6.11 6.16 5.95 5.71 5.68 5.52 Muktsar 6.00 5.47 6.01 5.47 5.92 5.79 5.61 5.97 5.43 Jalandhar 5.16 5.13 5.21 5.34 5.19 5.31 5.31 5.56 5.13 Tarntaran 4.32 4.20 4.28 4.27 4.26 4.38 4.37 4.29 4.49 Mansa 4.83 4.58 4.84 5.06 4.56 4.55 4.85 4.71 4.48 Barnala 2.86 3.54 3.43 3.55 3.53 3.50 3.61 3.37 3.73 Faridkot 3.44 3.73 3.15 3.51 3.38 3.56 3.09 3.37 3.40 Kapurthala 3.13 3.03 3.23 3.18 3.11 3.14 3.46 3.32 3.27 Hoshiarpur 3.13 3.16 3.15 3.02 3.07 3.08 3.13 3.06 3.24 Fatehgarh Sahib 2.72 2.60 2.67 2.46 2.51 2.47 2.56 2.50 2.45 Shaheed Bhagat Singh Nagar 1.92 1.98 2.04 2.00 2.07 1.96 1.87 1.94 1.95 Rupnagar 1.26 1.31 1.34 1.34 1.40 1.34 1.43 1.49 1.49 Sahibzada Ajit Singh Nagar 1.01 1.06 0.91 1.27 1.33 1.34 1.36 1.32 1.26 Punjab state 100.00 100.00 100.00 100.00 100.00 100.00 100.00 100.00 100.00

12
Table 2.2: Trends in prices of urea, 1980-81 to 2015-16 Year Price (Rs/tonne) 1980-81 2350 1981-82 2350 1982-83 2150 1983-84 2150 1984-85 2150 1985-86 2350 1986-87 2350 1987-88 2350 1988-89 2350 1989-90 2350 1990-91 3227 1991-92 2760 1992-93 2760 1993-94 2760 1994-95 2760 1995-96 2760 1996-97 3660 1997-98 3910 1998-99 4000 1999-2000 4600 2000-01 4600 2001-02 4830 2002-03 5070 2003-04 5070 2004-05 5070 2005-06 5070 2006-07 5070 2007-08 5070 2008-09 5070 2009-10 5310 2010-11 5310 2011-12 5360 2012-13 5360 2013-14 5360 2014-15 5360 2015-16 5628 CGR (%) 3.33
Source : www.indiastat.com

13
Figure-2.1 The compound growth rate of urea prices from 1980-81 to 2015-16 has been shown in Table
2.3. It was observed that the prices of urea increased at an annual growth rate of 0.49 per cent
during the period 1980-81 to 1989-90 but this increase was not significant. It can be seen that
prices of urea increased significantly at a growth rate of 5.21 per cent per annum during the
period 1990-91 to 1999-2000. Also, from the year 2000-01 to 2015-16 prices of urea
increased significantly at an annual growth of 0.92 per cent per annum. In overall, the prices
of urea increased significantly at an annual growth rate of 3.33 per cent during the period
1980-81 to 2015-16.
Table 2.3: Compound growth rate of prices of urea, 1980-81 to 2015-16
Period Compound growth rate (% per annum) 1980-81 to 1989-90 0.49 1990-91 to 1999-00 5.21** 2000-01 to 2015-16 0.92** 1980-81 to 2015-16 3.33** **Significant at one per cent level of significance
0
1000
2000
3000
4000
5000
6000
7000
Trends in prices (Rs) of urea, 1980-81 to 2015-16

14
2.2 Trends in distribution of NCU (district-wise analysis)
The district-wise distribution of NCU/ NU has been given in Table 2.4. A perusal of the table
reveals that largest share of 10.72 per cent NCU/ NU was distributed in Firozpur district of
Punjab followed by Sangrur (9.76%), Ludhiana (7.92%), Patiala (7.49%), Bathinda (6.57%),
Moga (5.88%), Amritsar (5.83%), Gurdaspur (5.52%) and Jalandhar (5.13%). In district
Tarntaran the per cent share of NCU distribution was 4.49 per cent of total distributed in
Punjab followed by Mansa (4.48%), Barnala (3.73%), Faridkot (3.40%), Kapurthala (3.27%),
Hoshiarpur (3.24%), Fatehgarh Sahib (2.45%), SBS Nagar (1.95%), Rupnagar (1.49%) and
SAS, Nagar (1.26%).
Table 2.4: District-wise distribution/consumption/sale of neem coated urea/normal urea in Punjab, 2015-16
(000MT)
District Neem coated urea/ normal urea % to total
Firozpur 330.95 10.72 Sangrur 301.21 9.76 Ludhiana 244.41 7.92 Patiala 231.00 7.49 Bathinda 202.61 6.57 Moga 181.41 5.88 Amritsar 179.84 5.83 Gurdaspur 170.25 5.52 Muktsar 167.53 5.43 Jalandhar 158.37 5.13 Tarntaran 138.67 4.49 Mansa 138.40 4.48 Barnala 114.97 3.73 Faridkot 105.00 3.40 Kapurthala 101.01 3.27 Hoshiarpur 99.91 3.24 Fatehgarh Sahib 75.61 2.45 Shaheed Bhagat Singh Nagar 60.13 1.95 Rupnagar 45.83 1.49 Sahibzada Ajit Singh Nagar 38.94 1.26 Punjab 3086.05 100.00

15
Figure-2.2
38.94
45.83
60.13
75.61
99.91
101.01
105
114.97
138.4
138.67
158.37
167.53
170.25
179.84
181.41
202.61
231
244.41
301.21
330.95
S A S Nagar
Rupnagar
S B S Nagar
Fatehgarh Sahib
Hoshiarpur
Kapurthala
Faridkot
Barnala
Mansa
Tarntaran
Jalandhar
Muktsar
Gurdaspur
Amritsar
Moga
Bathinda
Patiala
Ludhiana
Sangrur
Firozpur
District-wise distribution of neem-coated/ normal urea in Punjab (000 MT)

16
Chapter III
Socio-economic Characteristics of Sample Households
3.1 Socio-economic characteristics of sample households
Socio-economic characters of the respondents play an important role in adopting the new
farm technology for betterment of farming community. General characteristics of sample
households in Punjab have been shown in Table 3.1. A perusal of the table reveals that all
respondents were males with average age of 46.83 years and average farming experience of
25.74 years. The average family members engaged fully in farming were 1.90 and average
family size was 6.82. Thus, mostly respondent farmers were middle-aged having adequate
farming experience to face new farm related challenges.
Table 3.1: General characteristics of sample households in Punjab, 2015-16
Particulars Average age of respondents (Years) 46.83 Male respondents (%) 100.00 Average family members engaged fully in farming (No.) 1.90 Average farming experience (Years) 25.74 Average family size (No.) 6.82 The education level of the respondent farmers is also an indicator of the pioneers in following
new agricultural practices. The education level of the respondent farmers in Punjab has been
given in Table 3.2. It can be seen from the table that 14.50 per cent of the respondent farmers
were illiterate while 30.50 per cent were educated up to higher primary level followed by
26.50 per cent being matriculate and 25 per cent educated up to pre-university and above
level. Mere 3.50 per cent farmers were educated up to primary level only.
Table 3.2: Education level of sample respondents in Punjab, 2015-16 Education level (% ) Illiterates 14.50 Primary (1 to 4) 3.50 Higher primary (5 to 9) 30.50 Matriculation (10) 26.50 Pre University (10+2) & above 25.00 Total 100.00 The distribution of sample farmers in Punjab based on their caste category has been given in
Table 3.3. A perusal of the table reveals that 84.50 per cent of the respondents belonged to
general caste category followed by 10.50 per cent from other backward classes (OBC)
category and five per cent from scheduled castes (SC) category. Thus, most of the respondent
farmers belonged to the general castes category.

17
Table 3.3: Distribution of sample households based on their caste category in Punjab, 2015-16 Particulars (%) General 84.50 OBC 10.50 SC 5.00 Total 100.00 The occupational distribution of the sample households in Punjab has been shown in Table
3.4. It is quite obvious from the table that 92.50 per cent of respondents were engaged in
agriculture and allied activities while three per cent were having salaried work and another
three per cent were tiny shopkeepers, getting foreign remittances etc. Also, just one per cent
respondents worked as agricultural labourers and a half per cent was self employed in small
scale industries. Thus, a large majority of the respondent framers were engaged in agriculture
and allied activities.
Table 3.4: Occupational distribution of the sample households in Punjab, 2015-16 Particulars (%) Agriculture & allied 92.50 Agricultural labour 1.00 Self employed in small scale industries 0.50 Salaried work 3.00 Other (Tiny shopkeeper, foreign remittance etc.) 3.00 Total 100.00 3.2 Details of operational land holdings
The details of average holding size of the sample households have been depicted in Table 3.5.
A perusal of the table reveals that net operational area on the sample farms was 3.13 acre on
marginal and small, 12.28 acre on medium, 36.70 acre on large and 11.00 acre in total. The
leased-in land in total was 3.76 acre as compared to leased-out land which was just 0.02 acre on
the sample farms. The entire operational area on the sample farms was irrigated and rental
Table 3.5: Average operational land holdings of the sample households in Punjab, 2015-16 (acre)
Particulars Marginal & Small Medium Large Overall
Owned land 2.84 8.17 20.17 7.26 Leased-in 0.35 4.10 16.53 3.76 Leased-out 0.06 0.00 0.00 0.02 Operational Area 3.13 12.28 36.70 11.00 % Irrigated 100.00 100.00 100.00 100.00 Rental value of leased-in land (Rs/acre) 37667 37063 37115 37134
Rental value of leased-out land (Rs/acre) 40000 - - 40000

18
value of leased-in land was Rs. 37134 per acre in total while it was slightly higher (Rs. 37667)
on marginal and small farms as compared medium and large farm categories. The rental value
of leased-out land was Rs. 40000 per acre on the sample farms.
3.3 Cropping pattern and sources of irrigation
The sources of irrigation on the sample households in Punjab have been shown in Table 3.6.
A perusal of the table reveals that on 79 per cent farms, the source of irrigation was only tube
well/ bore well while on the remaining 21 per cent farms both tube well and canal irrigation
was available.
Table 3.6: Sources of irrigation on the sample households in Punjab, 2015-16 Particulars % Bore well/ Tube well only 79.00 Both tube well and canal 21.00 Total 100.00 The cropping pattern of the paddy respondents during kharif season in Punjab has been
depicted in Table 3.7. It can be seen from the table that 81.99 per cent of the operational
holdings on marginal and small farms was under paddy crop while it was 85.37 per cent on
medium and 86.19 per cent on large farms. Another major crop grown on the sample farms
was basmati occupying 6.18 per cent of the operational holding on large farms followed by
4.66 per cent on medium and 1.76 per cent on marginal and small farms. Considerable area
was under kharif fodder i.e. 14.27 per cent of total operational area on marginal and small
Table 3.7: Cropping pattern of respondents during kharif season in Punjab, 2015-16 (Acre)
Crops Marginal & Small Medium Large Overall
Paddy 2.56 (81.99)
10.49 (85.37)
31.64 (86.19)
9.38 (85.25)
Basmati 0.055 (1.76)
0.57 (4.66)
2.27 (6.18)
0.52 (4.76)
Maize 0.004 (0.12)
0.03 (0.28)
0.00 (0.00)
0.02 (0.19)
Sugarcane 0.00 (0.00)
0.04 (0.31)
1.03 (2.91)
0.10 (0.93)
Kharif Fodder 0.45 (14.27)
0.92 (7.50)
1.29 (3.45)
0.79 (7.15)
Vegetables 0.058 (1.86)
0.23 (1.88)
0.07 (0.18)
0.16 (1.45)
Others (poplar) - - 0.40 (1.09)
0.03 (0.27)
Total Sown Area (Acres) 3.13 (100.00)
12.28 (100.00)
36.70 (100.00)
11.00 (100.00)
Figures in parentheses are percentages of total sown area

19
farms, 7.50 per cent on medium and 3.45 per cent on large farms was under kharif fodder.
Other important crops grown on the sample farms were; maize, sugarcane and vegetables.
Thus, major share in operational area of crops grown during kharif season was under paddy
and basmati crops.
3.4 Purchasing pattern and sources of purchasing
The purchase pattern of NCU on the sample farms for the year 2015-16 in Punjab has been
depicted in Table 3.8. It can be seen from the table that NCU quantity bought by the selected
households was quite high i.e. it was 1216 kg of NCU and 108 kg of NU. The price of NCU
Table 3.8: Purchase pattern of urea per household during 2015-16 in Punjab Particular NCU NU
Quantity bought (Kgs) 1216 108 Price Rs per bag of 50kg 285 271 Distance from farm (Kms) 2.70 2.98 Transport cost (Rs per bag of 50kg) 4.69 4.95 Total cost (Rs per bag of 50kg) 289.69 276.58 was Rs. 285 per 50 kg bag while it was Rs. 271 per bag in case of NU. The distance covered
by the households to fetch NCU was less i.e. 2.70 kms. for NCU and 2.98 kms. for NU
which showed the availability of NCU at a nearby place than NU. The transportation cost
incurred per bag (50 kg.) for NCU was Rs. 4.69 while it was Rs. 4.95 in case of NU. Thus,
the total cost per bag of NCU worked out to be Rs. 289.69 while it was Rs. 276.58 per bag in
case of NU.
The source of purchase of NCU/ NU in Punjab has been shown in Table 3.9. A perusal of the
table reveals that 69.18 per cent of respondents purchased NCU from co-operative societies,
23.90 per cent from both private dealers and co-operative societies while 6.92 per cent
Table 3.9: Sources of purchase of NCU/Normal Urea in Punjab, 2015-16
Particulars % farmers
NCU (N=159)
NU (N=11)
Both (N=30)
Private fertilizer dealers 6.92 9.09 0.00 Co-operative societies 69.18 90.91 53.33 Both private dealers and co-operative societies 23.90 0.00 46.67 Total 100.00 100.00 100.00 purchased exclusively from private fertilizer dealers. On the other hand, in case of NU, 90.91 per
cent respondents purchased it from co-operative societies and 9.09 per cent from private fertilizer
dealers. There were 53.33 per cent farmers who purchased both NCU & NU fertilizers from co-
operative societies and remaining 46.67 per cent from both private dealers and co-operative societies.

20
Thus, majority of the respondent farmers purchased NCU and NU from co-operative societies
followed by private fertilizer dealers.
3.5 Usage inputs and profitability of paddy crop
The input use, output and returns per acre realized by paddy farmers in Punjab have been
depicted in Table 3.10. It can be seen from the table that during the year 2015, the hired
Table 3.10: Input use, output and returns realized by Paddy farmers in Punjab (Rs./ acre)
Particular 2015-16 2014-15
Marginal & Small Medium Large Overall Marginal
& Small Medium Large Overall
Input use/ costs Ploughing and sowing charges (only machinery)
2415 2317 2177 2340 2286 2191 2080 2215
Seed cost/ purchase of seedlings 284 286 271 284 251 279 241 266
Organic/FYM 131 53 - 76 113 43 - 64 Urea/NCU 726 756 700 741 720 785 724 758 Chemical fertilizers (Other than Urea/NCU)
627 636 753 642 548 594 674 584
Plant protection chemicals 1785 1989 1963 1918 1735 1982 1967 1897
Irrigation charges 353 503 565 457 508 785 778 690 Harvesting & threshing charges 1024 1029 1013 1026 974 979 977 977
Hired labour charges ( including ploughing charges till planting, cost or sowing/ transplanting )
2379 2387 2567 2385 2216 2226 2233 2224
Imputed value of family labour 121 54 14 74 132 54 14 78
Hired labour (amount paid) 227 315 389 291 229 292 349 275
Maintenance costs on assets used for the reference crop
102 261 138 198 84 240 162 181
Total paid-out costs including imputed value of own labour
10174 10586 10550 10432 9796 10451 10199 10209
Returns Output (Main product) (Qtls) 28.62 28.85 29.87 28.85 27.84 28.53 29.73 28.39
By product - - - - - - - - Gross returns 41496 41839 43307 41833 38976 39942 41627 39740 Net returns 31321 31253 32756 31401 29180 29491 31427 29530

21
labour charges, which included ploughing charges till planting and transplanting charges of
paddy, was found to be Rs. 2385 per acre while it was Rs.2224 during the year 2014.Second
major cost component was ploughing and sowing charges (only machinery) which worked
out to be Rs. 2340 during the year 2015 and Rs 2215 in 2014. Expenses on plant protection
measures being another constituent of total paid out costs, was estimated to be Rs. 1918 per
acre during the year 2015 and Rs. 1897 in 2014 while for urea/ NCU the corresponding costs
were estimated to be Rs.741 during 2015 and Rs. 758 in the year 2014 and harvesting charges
for paddy crop worked out to be Rs. 1026 during 2015 and Rs. 977 in the year 2014,
respectively. The output of the paddy crop was estimated to be 28.85 quintals per acre in
2015 while it was 28.39 quintals during the year 2014. Gross returns from paddy crop worked
out to be Rs 41833 per acre during the year 2015 while it was Rs. 39740 in 2014. The net
returns from paddy were estimated to be Rs. 31401 during the year 2015 and Rs. 29530 in
2014 on the sample farms.
The input use, output and returns per acre realized by paddy farmers in Punjab has been
given in Table 3.11 A perusal of the table reveals that the quantity of urea/ NCU used per
acre for paddy crop was 135.98 kg. during the year 2014 while its use declined during the
year 2015 and was 130.88 kg. per acre on the sample farms. On the other hand, there was
Table 3.11: Input use, output and returns realized by Paddy farmers in Punjab (Rs./ acre)
Particular 2014-15 2015-16 Qty Value Qty Value
Input use and their costs Ploughing and sowing charges (only machinery) - 2215 2340 Seed cost/ purchase of seedlings (Kg) 6.29 266 6.34 284 Organic/FYM - 64 - 76 Urea & NCU (Kg) 135.98 758 130.88 741 Chemical fertilizers (Other than Urea/NCU) (Kg) 20.07 584 22.77 642 Plant protection chemicals - 1897 1918 Irrigation charges - 690 457 Harvesting & threshing charges - 977 1026 Hired labour charges ( including ploughing charges till planting, cost or sowing/ transplanting ) - 2224 2385
Imputed value of family labour - 78 74 Hired labour (amount paid) - 275 291 Maintenance costs on assets used for paddy crop - 181 198 Total paid-out costs including imputed value of own labour - 10209 10432 Returns Output (Main product) (Qtls) 28.39 39740 28.85 41833 By product - - - - Gross returns - 39740 - 41833 Net returns - 29530 - 31401

22
increase in the quantity of other fertilizers used in paddy crop which was 20.07 kg. in 2014
and 22.77 kg. per acre during the year 2015. There was also slight increase in the output of
the paddy crop during the year 2015 as compared to the year 2014 which can not only be
attributed to the application of NCU because there are numerous factors influencing the yield
of a crop.
3.6 Details of agriculture credit availed
The credit detail of respondent farmers during 2015-16 has been given in Table 3.12 It can be
seen from the table that total credit taken by the farmers during the year 2015-16 was Rs.
318565 per household. As far as institutional source of credit was concerned, commercial
banks (Rs. 177500 per household) were the major source of credit followed by co-operative
societies (Rs. 100755 per household). Traders/ commission agents (Rs. 36435 per household)
were the main non-institutional sources of credit for the farmer households followed by
friends and relatives (Rs. 3875 per household). Thus, commercial banks and co-operative
societies were the major source of credit for the sample households.
Tables 3.12 Credit details of farmers during 2015-16 in Punjab (Rs. / household)
Sources Amount Institutional sources: Commercial Banks 177500 Co-operative societies 100755 Regional Rural Bank - Non-Institutional sources: Money lenders - Friends & relatives 3875 Traders/commission agent 36435 Total 318565 The purpose of borrowing loans by sample households has been shown in Table 3.13 A
perusal of the table reveals that seasonal crop cultivation was the purpose for which all the
respondents have taken credit and the amount spent per household was 80.66 per cent of the
total amount borrowed. For consumption expenditure, 14 per cent farmers have taken loan
and share of consumption loan in total borrowed amount per household worked out to be 1.57
per cent. For purchase of tractor/ implements, 9.50 per cent farmers have taken loan which
was 14.40 per cent of total loan amount while in case of purchase of livestock, 3.50 per cent
farmers took credit which constituted 3.37 per cent of total loan taken per household.
Therefore, seasonal crop cultivation was the major purpose for which majority of the farmers
has taken credit followed by consumption expenditure, marriage/ social ceremonies.

23
Table 3.13: Purpose of borrowing loans by farmers during 2015-16 in Punjab
Purpose % farmers (Multiple response)
% amount
Production Loan:
Seasonal crop cultivation 100.00 80.66 Purchase of tractor and other implements 9.50 14.40 Purchase of livestock 3.50 3.37 Non-farm activity - - Consumption expenditure, marriage/ social ceremonies 14.00 1.57 3.7 Training Programmes Attended on Fertilizers Application
Table 3.14 reveals that 70 per cent sample farmers attended training/ lecture(s) regarding
application of fertilizers to paddy crop from the Department of Agriculture or State
Agricultural University. Although, it was seen that 63 per cent of the farmers attended the
training/ lecture(s) organised by the Department of Agriculture in which information regarding
Table 3.14: Trainings/ lecture(s) attended on application of fertilizers for paddy crop by respondents in Punjab, 2015-16
(% of farmers)
Sl. No Name of the Organizer Duration of training/
lecture(s) (days) No. %
1 State Agriculture Department 1 126 63.00
2 Punjab Agricultural University (FASC/ KVK)* 1 14 7.00
*Farm Advisory Service Centre/ Krishi Vigyan Kendra
judicious use of fertilizers was given by the agricultural scientists. Also, seven per cent
farmers attended training/ lecture(s) organised by the Punjab Agricultural University (FASC/
KVK). However, no farmer attended any long duration training on application of fertilizers.
24
Chapter IV
Status of Awareness and Application of Neem-Coated Urea
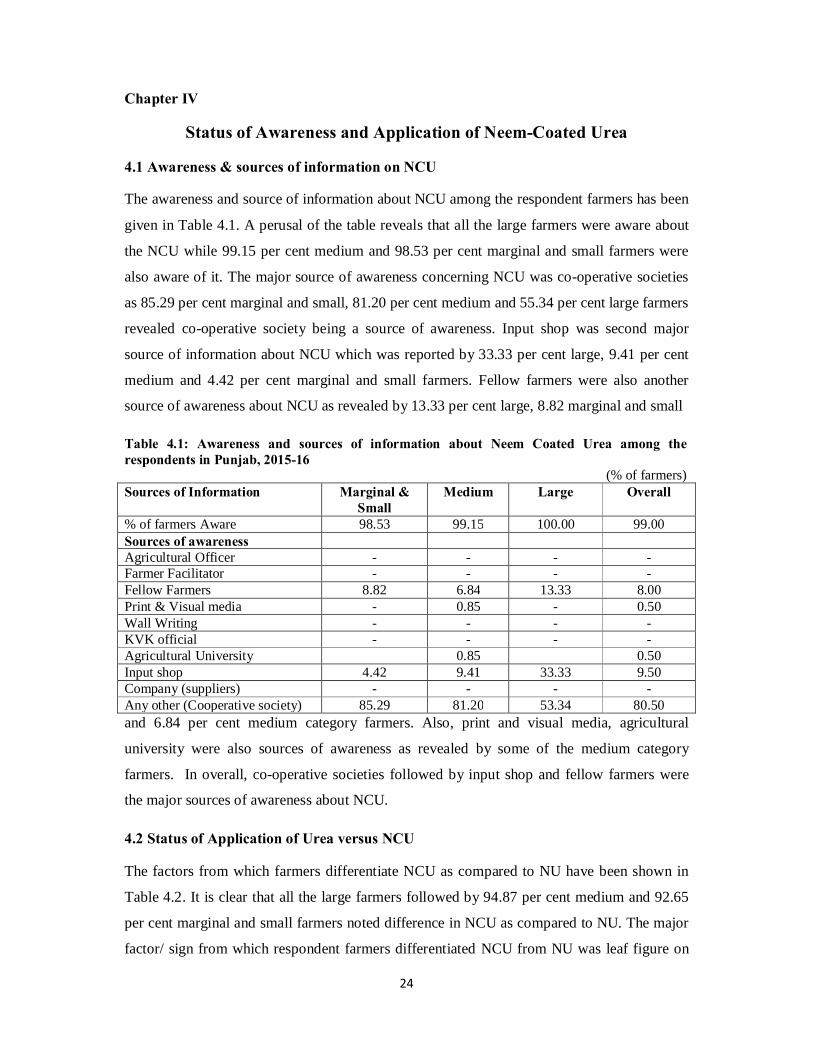
4.1 Awareness & sources of information on NCU
The awareness and source of information about NCU among the respondent farmers has been
given in Table 4.1. A perusal of the table reveals that all the large farmers were aware about
the NCU while 99.15 per cent medium and 98.53 per cent marginal and small farmers were
also aware of it. The major source of awareness concerning NCU was co-operative societies
as 85.29 per cent marginal and small, 81.20 per cent medium and 55.34 per cent large farmers
revealed co-operative society being a source of awareness. Input shop was second major
source of information about NCU which was reported by 33.33 per cent large, 9.41 per cent
medium and 4.42 per cent marginal and small farmers. Fellow farmers were also another
source of awareness about NCU as revealed by 13.33 per cent large, 8.82 marginal and small
Table 4.1: Awareness and sources of information about Neem Coated Urea among the respondents in Punjab, 2015-16
(% of farmers) Sources of Information Marginal &
Small Medium Large Overall
% of farmers Aware 98.53 99.15 100.00 99.00 Sources of awareness Agricultural Officer - - - - Farmer Facilitator - - - - Fellow Farmers 8.82 6.84 13.33 8.00 Print & Visual media - 0.85 - 0.50 Wall Writing - - - - KVK official - - - - Agricultural University 0.85 0.50 Input shop 4.42 9.41 33.33 9.50 Company (suppliers) - - - - Any other (Cooperative society) 85.29 81.20 53.34 80.50 and 6.84 per cent medium category farmers. Also, print and visual media, agricultural
university were also sources of awareness as revealed by some of the medium category
farmers. In overall, co-operative societies followed by input shop and fellow farmers were
the major sources of awareness about NCU.
4.2 Status of Application of Urea versus NCU
The factors from which farmers differentiate NCU as compared to NU have been shown in
Table 4.2. It is clear that all the large farmers followed by 94.87 per cent medium and 92.65
per cent marginal and small farmers noted difference in NCU as compared to NU. The major
factor/ sign from which respondent farmers differentiated NCU from NU was leaf figure on

25
bag which was reported by 64.96 per cent medium, 54.42 per cent marginal and small and
40.0 per cent large farmers. Also, 55.33 per cent large, 29.41 per cent marginal and small and
23.93 per cent medium category farmers revealed that smell of neem in NCU differentiated it
from NU and thus can easily be identified. The difference in price of NCU and NU was also
one of the factors differentiating both and it was revealed by 8.82 per cent marginal and
small, 6.67 per cent large and 5.98 per cent medium category farmers. Thus, in overall leaf
figure on the bag and smell of neem in NCU were the major factors differentiating it from
NU.
Table 4.2: Factors from which farmers differentiate NCU compared to Normal Urea in Punjab, 2015-16 (% of farmers) Sources of Information Marginal &
Small Medium Large Overall
% of farmers noticed difference in NCU 92.65 94.87 100.00 94.50 Factors Colour difference 0.00 0.00 0.00 0.00 Price difference 8.82 5.98 6.67 7.00 Leaf figure on the bag 54.42 64.96 40.00 59.50 Any other (Smell) 29.41 23.93 53.33 28.00 The application of NCU across different seasons by paddy respondents in Punjab has been shown in
Table 4.3. It can be seen from the table that there was a significant increase in the application of NCU
during 2015-16. In the year 2014-15 there were 81.50 per cent respondents who applied NCU to their
paddy crop while during 2015-16 this number increased to 94.50 per cent on the sample farms.
Similarly, in case of wheat crop, only 20 per cent farmers applied NCU during 2014-15 while this
Table 4.3: Application of NCU across different seasons by paddy respondents in Punjab, 2015-16 (% of farmers)
Name of the crops 2014-15 2015-16 No % No %
Kharif season: Paddy 163 81.50 189 94.50 Basmati 1 0.50 22 11.00 Sugarcane 3 1.50 5 2.50 Maize 0 0.00 4 2.00 Rabi season: Wheat 40 20.00 192 96.00 Potato 6 3.00 13 6.50 Sunflower 0 0.00 1 0.50 Vegetables 7 3.50 19 9.50 Agro-forestry: Poplar 0 0.00 1 0.50 number swelled to 96 per cent in the year 2015-16. In case of other crops such as; basmati,
sugarcane, potato, maize, sunflower and vegetables also the number/ per cent of respondents applying

26
NCU has also increased as revealed by the respondent farmers. Thus, in aggregate the application of
NCU to almost all the crops sown on the sample farms has increased.
Method of application of NCU/ NU has been shown in Table 4.4. It is clear from the table
that all the selected respondents applied NCU/NU to the paddy crop by broadcasting and
none of the farmers sprayed, drilled and applied urea through fertigation.
Table 4.4: Method of Application of NCU/Normal Urea in paddy in Punjab, 2015-16 (Kgs/Acre)
Method of application NCU qty % NU
qty %
Broadcasting 116.50 100.00 14.25 100.00 Spraying - - - - Fertigation - - - - Drilling - - - - Total - - - - The split doses of NCU and NU application has been shown in Table 4.5. It was observed on
the sample farms that no basal application of NCU/ NU to paddy crop was applied by the
sample farmers and the entire dose of urea was applied in with-in 45 days of the
transplantation of the crop. Hence, 33 per cent of NCU and NU was applied to paddy crop
after application of weedicide within two days of transplantation of crop and remaining 67
per cent of NCU and NU was applied during the vegetative growth of the crop. In aggregate,
116.50 kg. of NCU and 14.25 kg. of NU per acre was applied to paddy crop on the sample
farms.
Table 4.5: Split doses of NCU / Normal Urea application by respondents in Punjab, 2015-16 (Kgs/Acre)
Crop Stages NCU % NU %
Basal application - - - - After weeding 38.45 33.00 4.70 33.00 Vegetative growth 78.05 67.00 9.55 67.00 Maturity - - - - Any other - - - - Total 116.50 100.00 14.25 100.00 The comparative benefits of NCU over NU can be seen from Table 4.6. It is quite obvious
that only 5.29 per cent of the sample farmers reported about the increase in paddy yield up to
the extent of 2.40 per cent due to application of NCU while 94.71 per cent sample farmers
revealed no change in the paddy yield. The cost of pest and disease control declined by 21 per
cen by application of NCU, as revealed by 13.76 per cent respondents, while 86.24 per cent
realized no change in cost on pest control. All the respondents reported no change in weed
management due to application of NCU. Cost of NCU application was higher as compared to

27
urea, it was revealed by 89.42 per cent farmers and extent of increase was six per cent. On the
contrary, 10.58 per cent farmers reported about the decline in cost of NCU due to application
of lower doses of NCU as compared to urea and extent of decline was 14 per cent. All the
respondent farmers revealed no decline in the cost of other fertilizers, improvement in the soil
health, quality of grain and market acceptability of grains due to the application of NCU.
Table 4.6: Comparative Benefits of NCU over Normal Urea in case of Paddy in Punjab, 2015-16 (% of farmers)
Particulars Increased Decreased No change
Extent of Increase
(%)
Extent of Decrease
(%)
Yield (quintals) 5.29 0.00 94.71 2.40 - Cost of pest and disease control (Rs) 0.00 13.76 86.24 - 21.00
Weed management (Rs) 0.00 0.00 100.00 - - Cost of NCU compared to normal Urea (Rs) 89.42 10.58 0.00 6.00 14.00
Cost of other fertilizers (Rs) 0.00 0.00 100.00 - - Improvement in soil health 0.00 0.00 100.00 - - Quality of grain 0.00 0.00 100.00 - - Market acceptability of grain 0.00 0.00 100.00 - - 4.3 Perception of Farmers about NCU and its Benefits compared to Urea
The perception about NCU versus NU has been shown in Table 4.7. A perusal of the table
reveals that 79.37 per cent of the farmers reported about NCU quality being good followed by
10.58 per cent revealed no change in the quality of NCU vis-a-vis NU while 8.47 per cent
reported NCU quality being bad. Only 1.58 per cent farmers revealed about NCU quality
being very good. Regarding NCU availability, 69.84 per cent farmers reported its availability
being adequate, 28.57 revealed it as inadequate and 1.59 per cent revealed no change in the
NCU availability vis-a-vis NU. Also, 73.02 per cent farmers reported timely availability of
NCU while remaining 26.98 per cent revealed availability of NCU not on time. Regarding
price of NCU, 97.71 per cent farmers reported it to be high while 5.29 per cent revealed the
price to be very high. Concerning benefits of NCU in terms of total fertilizer and urea usage,
it was disclosed by 89.42 per cent farmers that there is no change in fertilizer and urea usage
while 10.58 per cent revealed the decrease in fertilizer and urea usage due to application of
NCU. Regarding pest and disease attack, 86.24 per cent farmers reported no change while
13.76 per cent farmers revealed that there was decline in pest and disease attack due to
application of NCU. Another reason of preference of NCU by 46.03 per cent farmers was its
non-solidification while 45.50 per cent reported about its evenly distribution while

28
broadcasting in the field. Also, 67.72 per cent farmers revealed about more easily
accessibility of NCU while other 32.28 per cent farmers denied it.
Table 4.7: Perception about NCU versus Normal Urea in Punjab (N= 189) Particulars No. % Neem Coated Urea quality Very good 3 1.58 Good 150 79.37 Bad 16 8.47 No change 20 10.58 Neem Coated Urea availability Adequate 132 69.84 Inadequate 54 28.57 No change 3 1.59 Timely availability of Neem Coated Urea Yes 138 73.02 No 51 26.98 Neem Coated Urea Price Very high 0 0.00 High 179 94.71 Not very high 10 5.29 Same as urea 0 0.00 Benefits of NCU in terms of total fertilizer usage Increased 0 0.00 Decreased 20 10.58 No Change 169 89.42 Benefits of NCU in terms of Urea usage Increased 0 0.00 Decreased 20 10.58 No Change 169 89.42 Pest and diseases attack Increased 0 0.00 Decreased 26 13.76 No Change 163 86.24 Any others (mention) No solid form 87 46.03 Evenly distributed 86 45.50 No comments 16 8.47 NCU is more easily accessible in the market compared to normal Urea
Yes (reason) 128 67.72 No 61 32.28 Thus, majority of the farmers reported about the quality of NCU being good, adequate, timely
available, accessible in the market, its non-solidification and evenly distribution at the time of
application found out to be positive points. On the other hand, NCU price being high along
with no significant decline in fertilizer usage, urea usage and no change in pest/ disease
incidence on the crop were other points to be looked into.

29
4.4 Diversions of NU & NCU other than crop purposes
All the selected farmers were asked about the usage of NCU for other than crop production
purposes (Table 4.8). It was found during the survey that none of the selected farmers
reported about the use of NCU for other purposes such as; silage making, mixing with
weedicides and for fishery feed preparation.
Table 4.8: Usage of NCU for other than crop production purposes in Punjab, 2015-16 Purpose % of farmers % of total amount
Used Silages (Feed preparation of animals) - - Mixed with weedicides - - Fishery feed preparation - - Others - - 4.5 Constraints and suggestions about NCU and its adoption
Major problems faced in the adoption of NCU fertilizer have been shown in Table 4.9. A
perusal of the table reveals that 1.50 per cent farmers did not report any problem in adoption
of NCU fertilizer. However, 94.71 per cent revealed high price of NCU fertilizer being major
constraint in its adoption while 27 per cent reported inadequate/ shortage of supply during
Table 4.9: Major problems faced in adoption of NCU fertilizer in Punjab, 2015-16 (Multiple response)
Problems (% of farmers) No problem 1.50 High prices 94.71 Inadequate/shortage of supply during peak season 27.00 Poor quality* 8.50 Not aware about the uses and its benefits 5.50 Problems in application (very pungent smell during application) 5.00 *Powdery form (Manufacturing fault in a lot)
peak season as another problem. Poor quality of NCU available in co-operative societies was
another problem revealed by 8.50 per cent farmers while 5.50 per cent farmers were not
aware about the uses and benefits of NCU. Another problem about NCU fertilizer
application, reported by five per cent farmers, was extremely pungent smell emanating during
its broadcasting in the field.
Major suggestions for improving the NCU fertilizer usage have been given in Table 4.10. It
can be seen that 27 per cent farmers suggested assured/ timely and adequate supply of quality
NCU during peak season to co-operative societies for improving the NCU fertilizer usage.
Also, 7.50 per cent farmers suggested about organising training camps for spreading
awareness regarding NCU uses/ benefits among the farming community. Other suggestions

30
Table 4.10: Major suggestions for improving the NCU fertilizers usage in Punjab, 2015-16 (Multiple response)
Suggestions (% of farmers) Assured/ timely and adequate supply of quality NCU during peak season 27.00
Training camps regarding awareness of NCU uses and benefits should be organized 7.50
Quality of NCU should be improved 9.50 Decreasing the price of NCU 74.50 No response 1.50
were regarding improving the quality of NCU (9.50%) and decreasing the price of NCU
(74.50%) for increasing its usage. However, there was no response by 1.50 per cent farmers
when asked for giving suggestions for improving the NCU fertilizer usage.

31
Chapter V
Awareness and Adoption Level of Soil Testing Technology
5.1 Soil health related programmes and schemes - Implementation and performance in the state
The sources of soil sample collection and the details of soil health card among respondents
have been shown in Table 5.1. It can be seen from the table that all the respondent farmers,
who got their soils tested, were aware of correct method of soil sampling. The training source
of soil sample collection, as revealed by 42.22 per cent farmers, was Agricultural Officer
while 42.22 per cent farmers reported fellow farmers followed by farmer facilitator (8.89%)
and getting training while attending PAU Kisan Mela (6.67%) as training source of soil
Table 5.1: Sources of soil sample collection and the details of soil health cards among respondents in Punjab ( % of farmers who got tested their soil)
(n=45) Particulars No. % Sample size 200 - No. of soil tested farmers 45 - Before 2013-14 12 26.67 2013-14 6 13.33 2014-15 11 24.44 2015-16 16 35.56 % of farmers aware of correct method of soil sampling 45 100.00 Training sources of soil sample collection i. Agricultural Officer 19 42.22 ii Farmer Facilitator 4 8.89 iii.Fellow Farmers 19 42.22 iv. Others (PAU Kisan Mela) 3 6.67 Information on soil health card i. Number of farmers received soil health card 5 11.11 ii. Number of farmers possessing soil health card till now 5 11.11 iii. Number of farmers possessing SHC understand the information given in the soil health card 4 8.89
iv. Number of persons did not understand the information given in the soil health card for the reasons 1 2.22
a) Cannot read 0 0.00 b) Can read, but not able to understand the information given 1 2.22 % of farmers who were verbally explained about soil health card details 40 88.89
Sources of education on soil health card (n=5) i. Agriculture Officer 4 8.89 1i. KVK/PAU - -

32
sample collection. The information regarding soil health card revealed that only five farmers
i.e.11.11 per cent, out of 45 farmers who got their soils tested, received soil health cards.
Further, it was found that all the farmers possess soil health card when asked to produce by
the field survey team. Also, only four farmers (8.89%) were able to understand the
information given in the soil health card while one farmer (2.22%) was unable to understand
the information provided in the card. Out of total number of farmers, who got their soils
tested, 88.89 per cent were verbally explained about the soil health card details by the
concerned department officials. Also, major source of education on soil health card was
Agriculture Officer as revealed by 8.89 per cent farmers who received soil health card out of
total number of farmers who got their soils tested.
5.2 Awareness on soil testing
The awareness of the sample farmers on soil testing from different sources has been given in
Table 5.2. It is quite clear from the table that 75.56 per cent of the sample farmers, who tested
their soils, got information about soil testing from Agriculture Department followed by 17.78
per cent from Punjab Agricultural University (PAU) and 6.66 per cent from private
companies. The soil samples were collected themselves by 91.11 per cent farmers while 4.45
per cent farmers reported that soil samples were collected by the agricultural officials and
4.44 per cent revealed farm facilitator as the source who collected the soil sample.
Table 5.2: Sources of information about soil testing and soil sample collection on sample farms in Punjab
(n=45= 100%) (% of farmers who got tested their soil)
Sources for soil testing % Punjab Agricultural University (PAU) 17.78
Private Companies 6.66
Agriculture Department 75.56
Who collected the soil
Self 91.11
Agricultural Officials 4.45
Farmer Facilitator 4.44 5.3 Details of soil testing
The details of soil testing by the respondent farmers have been shown in Table 5.3. It was
observed that during the period 2013-14 to 2015-16, about 73 per cent of the farmers got their
soils tested while before 2013-14 nearly 17 per cent farmers tested their soils. All the
respondents got soils tested only once in these years. Cost of soil testing under subsidy

33
scheme by the Dept. of Agriculture was only Rs 1.00 per sample while from Punjab
Agricultural University it was Rs. 20 per soil sample. The cost of each sample tested within
three years was Rs. 2.73 per sample while it was Rs. 3.33 for the samples taken before three
years. The average distance of field to soil testing lab was 9.88 Kms for the samples collected
during 2013-14 to 2015-16 while it was 9.54 Kms. for the samples taken before this period.
The average soil samples taken were 6.27 with area covered being 6.48 acres for the samples
taken from 2013-14 to 2015-16 while it was 2.83 and 7.88 acres for the samples taken before
these years. Thus, during the last three years, more number of farmers got the soils of their
fields tested with higher number of soil samples taken as compared to before three years.
Table 5.3: Details of soil testing by the respondents during study period (2013-14 to 2015-16) and before in Punjab
(n=45) (% of farmers who got tested their soil)
Particulars During 2013-14 to 2015-16
Before 2013-14
% of farmers done soil testing 73.33 26.67 Number of times soil testing done once once Cost of soil testing (Rs/sample)* 2.73 3.33 Distance from field to soil testing lab (Kms)** 9.88 9.54 Samples taken for soil testing (Average Nos) 6.27 2.83 Area covered under soil test (all plots) (Average Acres) 6.48 7.88 *Range of cost of soil testing (Nil to Rs. 20 per sample), **Range of distance of soil testing lab (From 1Km to 40 Km)
The sources from which the farmers got their soils tested have been depicted in Table 5.4. It
was observed that 60 per cent of the farmers got soil testing done from the State Department
Table 5.4: Places of soil testing of the sample farmers in Punjab (n=45)
(% of farmers who got tested their soil) Particulars % farmers Punjab Agricultural University (PAU) 11.11 Agriculture department/ District laboratories 60.00 Others (Soil testing through IFFCO) 28.89 of Agriculture while 11.11 per cent from the Punjab Agricultural University and 28.89 per
cent through IFFCO either from the Punjab Agricultural University or Department of
Agriculture.
5.4 Reasons for soil testing or not testing
The reasons of soil testing by the respondents have been shown in Table 5.5. A perusal of the
table reveals that most important reason of soil testing as revealed by 31.11 per cent farmers

34
was ‘to understand fertilizer requirement for the crop’ followed by ‘motivation from village
demonstration/training/exposure visits to places with best farming practices’ by 20 per cent
and ‘for availing benefit under subsidy schemes’ by 17.78 per cent farmers. ‘Poor crop yield’
was reported by 95.56 per cent farmers as least important reason of soil testing followed by
‘For availing benefit under subsidy schemes’ by 77.78 per cent ‘Peer farmers' group pressure’
by 73.33 per cent farmers. Also, 77.50 per cent of the total sampled farmers were not aware
of anything about soil testing and its use.
Table 5.5: Reasons for Soil testing by the respondents in Punjab, 2015-16 (n= 45)
(% of farmers who got tested their soil) Reasons Most
imp important least
imp Not aware of anything about Soil testing and its use = 155 (77.50%) For availing benefit under subsidy schemes 17.78 4.44 77.78
Poor crop yield 2.22 2.22 95.56
Motivation from village demonstration/training/exposure visits to places with best farming practices
20.00 40.00 40.00
Peer farmers' group pressure 6.67 20.00 73.33 To understand fertilizer requirement for the crop 31.11 33.33 35.56
The reasons for not testing soil by the respondents have been given in Table 5.6. It was seen
that 72.26 per cent of the respondents did not undertake soil testing as they thought that ‘soil
testing not required for my field as crop yield is good’ while 7.74 per cent revealed ‘soil
testing laboratories are located far away’ as the reason and 7.10 per cent reported ‘do not
Table 5.6: Reasons for not testing soil by the respondents in Punjab, 2015-16 (n= 155)
(% of farmers who did not got tested their soil) Reasons Most imp Important Least imp Farmers who not tested their soil =155 (77.50%) Do not know whom to contact for details on testing 7.10 34.84 58.06 Do not know how to take soil samples 0.00 9.03 90.97 Soil testing laboratories are located far away 7.74 14.19 78.07 Soil testing not required for my field as crop yield is good
72.26 10.32 17.42
know whom to contact for details on testing’ as the reason for not testing soil. So, majority of
the farmers did not get the soils of their fields tested as they thought it not being necessary
since they were getting good yield for their crops.

35
5.5 Adoption of recommended doses of fertilizer application based on soil test report
The explanation about recommended doses of fertilizers (RDF) for paddy crop (Table 5.7)
was given by the Department of Agriculture to 60 per cent farmers, who got tested their soils,
followed by 11.35 per cent from the Punjab Agricultural University/ KVK. Also, 27.65 per
cent farmers came to know about RDF from co-operative societies through training
programmes / camps organised by IFFCO.
Table 5.7: Elucidation of Recommended Doses of Fertilizers on paddy crop in Punjab, 2015-16
(n=45) (% cent of farmers who got tested their soil)
Who explained to you % farmers Department of Agriculture 60.00 Punjab Agricultural University/KVK 11.35 Others (From co-operative societies through IFFCO) 27.65 Note : RDF(Recommended Doses of fertilizer)
The recommended doses of fertilizers adopted by the respondents have been given in Table
5.8. It was seen that 91.11 per cent of the farmers, who got their soils tested, were not aware
about the recommended dose of fertilizers (RDF) for paddy crop but revealed about it on the
basis of their own perception while just 8.89 per cent of the farmers were actually aware
about RDF on the basis of soil test report. FYM application on the basis of farmer perception
as well as per soil test report was 0.40 tonnes per acre. According to farmers perception
123.17 kg per acre of urea was applied to paddy crop while on the basis of soil test report it
was 110 kg. per acre which shows 13.17 per cent higher use of urea as per farmers
perception. Similarly, 11.22 kg. of di-ammonium phosphate (DAP), 0.95 kg. of Muriate of
Potash (MOP) per acre was applied to paddy crop as per farmers perception while as per soil
test report there was no recommendation of DAP and 11.75 kg. MOP was recommended dose
for paddy crop. As per farmer’s perception, 6.00 kg zinc sulphate and no ferrous sulphate was
applied to the paddy crop but as per soil test report, 8.75 kg. zinc sulphate and no ferrous
sulphate was recommended dose. So, as per farmers perception higher dose of urea, DAP and
lower dose of MOP and ZnSO4 was applied to paddy crop as compared to soil test report
based recommendations.

36
Table 5.8: Farmers perception on fertilizers use and recommended doses based on soil test to paddy crop in Punjab, 2015-16
(% of farmers who got their soils tested) (n=45)
Particulars Farmers
perception (n=41)
As per Soil Test Report
(n=4) % deviation
% of farmers aware of RDF* 91.11 8.89 - FYM (ton/ac) 0.12 0.40 0.28 Urea(kg/ac) 123.17 110.00 -13.17 DAP(Kg/ac) 11.22 0.00 - MOP (Kg/ac) 0.95 11.75 10.80 MgSO4 (Kg/ac) - - - ZnSO4 (kg/ac) 6.00 8.75 2.75 FeSo4 (kg/ac) - - - Others(kg/ac) 0.37 1.13 0.76 *Recommended dose of fertilizer
The major problems faced in soil testing by the farmers (Table 5.9) was proper report not
delivered as reported by 80 per cent farmers while 55.50 per cent revealed problem of poor
extension services and 7.50 per cent complained about the soil test lab being far away. Also,
five per cent farmers reported no problem in soil testing.
Table 5.9: Major problems faced in soil testing by farmers in Punjab, 2015-16 (% of farmers)
(Multiple response) Problems % Poor extension services 55.50 Soil test lab is far away 7.50 Proper report not delivered 80.00 Not aware 0.00 No problem 5.00 Major suggestion as revealed by 86 per cent farmers was that soil health cards should be
delivered to the farmers followed by 54.50 per cent farmers emphasising on improving the
extension contacts while 45 per cent asked for organising awareness camps regarding soil test
and 7.50 suggested that soil test labs should be near the village.
Table 5.10: Major suggestions for improving the soil health card scheme in Punjab, 2015-16 (% of farmers)
(Multiple response) Suggestions % Awareness camp regarding soil test should be organized 45.00 Extension contacts should be improved 54.50 Soil health report card should be delivered 86.00 Soil test lab should be near the village 7.50

37
Thus, major suggestions by the farmers was to the agricultural department officials and allied
departments to have better extension activities in order to improve their contact with farmers
and also gave emphasis on delivering soil health card for proper implementation of soil health
card scheme.

38
Chapter VI
Impact of NCU Application on Crop Production and Soil Health
6.1 Background
It is necessary to see the impact of NCU application on crop production and soil health.
Although NCU was being produced since long but its use was meagre. Now it has almost
replaced the NU just because of its better application and advocacy of positive impact on soil
health by agricultural scientists, although it was also necessary to check urea misuse in many
industries. Although there are so many factors which are responsible for improving the soil
health but due to intensive cropping, especially in the green revolution belt of the country,
NCU can be one of the important ingredients for increasing the production of crops,
sustaining the soil health and controlling the incidence of pests/ diseases if any.
6.2 Impact on crop productivity
Productivity of paddy (Table 6.1) due to application of NCU was 2845 kg. per acre in 2014-
15 while it increased to 2900 kg. per acre in the year 2015-16. Also, there was increase in
productivity from 2786 kg. per acre in 2014-15 to 2872 kg. per acre in the year 2015-16 due
to the application of NU. Hence, there was increase in productivity of paddy crop during
2015-16 where NCU as well as NU was applied on the sample farms. Although, yield was
more on the farms where NCU was applied as compared to NU during these years.
6.3 Fertilizer use efficiency
The comparative use of NCU versus normal urea (NU) in paddy crop has been shown in
Table 6.1. A perusal of the table reveals that NCU quantity applied per acre was 95.50 kg. per
Table 6.1: Comparative use of NCU versus Normal Urea in paddy crop in Punjab, 2015-16 (Kgs/acre)
Particulars Year
2014-15 2015-16 % deviation
NCU quantity applied 95.50 116.50 21.99 NU quantity applied 40.48 14.38 -64.48 Total 135.98 130.88 -3.75 Productivity of NCU 2845 2900 1.93 Productivity of NU 2786 2872 3.09 Output per unit of NCU 29.79 24.89 - acre during the year 2014-15 while it increased to 116.50 kg. per acre in 2015-16. There was
increase in NCU usage by 21.99 per cent in 2015-16 as compared to 2014-15 in case of
paddy crop. Similarly, the NU quantity applied declined from 40.48 kg. per acre in 2014-15

39
to 14.38 kg per acre in 2015-16 and this decrease was to the extent of 64.48 per cent. In
aggregate there was decline in total urea (NCU+NU) by 3.75 per cent. Thus, there was
considerable increase in the application of NCU and decline in NU usage in paddy crop.
Fertilizer use efficiency or output per unit of NCU was 29.79 kg in 2014-15 and 24.89 in
2015-16. Decline in NCU fertilizer use efficiency was due to higher NCU usage despite
increase in paddy productivity by 1.93 per cent.
6.4 Impact of NCU application on production and marketing of paddy
The impact of NCU on production and marketing of paddy has been given in Table 6.2. The
impact in terms of increased main product yield was observed on the farms where exclusively
NCU was applied to paddy crop. Paddy yield obtained was 29 quintals per acre for the
farmers exclusively using NCU while it was 28.72 quintals per acre for NU and 28.53
quintals for the farmers who applied both NCU and NU to their paddy crop. Thus, paddy
yield was just 0.97 per cent higher on the farms exclusively using NCU as compared to NU
but this difference was statistically non-significant. On the marketing front, there was no
difference in the price received for the produce obtained while using NCU, NU or both since
same minimum support price (MSP) of Rs. 1450 per quintal was received by the farmers. So,
there was impact of NCU usage in terms of increased productivity of paddy and thereby
increase in production also.
Table 6.2: Impact of Neem Coated Urea (NCU) on production and marketing of Paddy in Punjab, 2015-16
Qty (quintals)
Particular NCU (n=159)
Normal Urea
(n=11)
% deviation
Mean difference t-statistic
Both (NCU and
Normal Urea)
(N=30) Main product yield 29.00 28.72 0.97 0.28 0.246NS 28.53 By product Yield - - - - Price of main product
1450 1450 - 1450
Price of by product - - - - NS: Non-significant
6.5 Impact on Cost of cultivation of paddy crop
The impact of NCU on input cost of paddy can be observed in Table 6.3. A perusal of the
table reveals that the cost of pest and disease control in paddy was Rs. 1518 per acre on the
farms where NCU was exclusively used while it was Rs. 1755 per acre for NU and Rs. 1412

40
for the farms where both NCU and NU were used. Similarly, cost of weed management was
Rs. 411 for exclusively NCU using farms, Rs. 435 for NU using and Rs. 403 for using both
Table 6.3: Impact of Neem Coated Urea (NCU) on input cost of Paddy in Punjab, 2015-16 (Rs./ acre)
Particular NCU (N=159)
Normal Urea
(N=11)
% deviation
Mean difference t-statistic
Both (NCU and Normal
Urea) (N=30)
Cost of pest and disease control 1518 1755 -13.50 237 2.350* 1412
Cost of weed management 411 435 -5.52 24 1.543 NS 403
Cost of urea 742 652 13.80 90 2.059* 514 Cost of other fertilizers 678 653 3.83 25 0.128 NS 464
*Significant at five percent level of probability; NS: Non-significant NCU and NU. Cost of NCU for the farms using it exclusively was Rs. 742 per acre which
was higher than Rs. 652 for the farms using only NU while it was Rs. 514for the farms using
both NCU and NU for their paddy crop. The cost of other fertilizers used was Rs. 678 on
farms using NCU and Rs. 653 on farms using NU and Rs. 464 for the farms using both NCU
and NU. Thus, there was decline in the cost of pest and disease control by 13.50 per cent and
weed management by 5.52 per cent where NCU was exclusively applied to paddy crop as
compared to NU but cost was least on the farms where NCU along with NU was applied. But
only decrease in cost of pest and disease control and increase in cost of urea were found to be
statistically significant. Although cost of NCU was more than NU but its impact was
reflected in terms of lower cost of pest, disease control and weed management practices.
6.6 Economic feasibility of NCU using partial budgeting
The economic feasibility of NCU in paddy using partial budgeting framework has been given
in Table 3.11(a). It can be seen from the table that there were numerous costs which were
comparatively higher on the farms where exclusively NCU as compared to NU was applied
by the farmers. These added costs were estimated at Rs. 326 per acre while there was also
cost reduction on the farms where NCU was applied as compared to NU. The cost reduction
was to the tune of Rs. 711 per acre. Thus, there was net cost reduction of Rs.385 per acre. On
the other hand there were also higher gross returns on the farms using NCU as compared to
NU. Added returns due to NCU amounted to Rs. 333. Therefore, there were added returns of
Rs. 718 per acre by application of NCU on the sample farms and B:C ratio worked out to be
3.20.

41
Table 6.4: Economic feasibility of NCU in Paddy, using partial budgeting framework (Rs/ acre )
A B
SlNo Added cost due to NCU
Costs (Rs.) SlNo Reduced cost due to NCU Costs (Rs.)
1 Ploughing Charges till planting
67 1 Cost of sowing/transplantation
86
2 Seed cost/ purchase of seedlings
18 2 Organic/Bio fertilizer/Manure/ City Compost/ Neem Cake
245
3 Neem Coated Urea 90 3 Irrigation Cost 87
4 Cost of other fetrilizers
25 4 Pesticides/Insecticides 236
5 Harvesting 18 5 Weedicide 24
6 Maintenance cost of tractor, thresher, pump set
106 6 Labour cost Owned
33
7 Labour cost Hired 2 - -
Added cost 326 Reduced cost 711
Net cost reduction = 711- 326 = Rs.385
SlNo Reduced return Due to NCU
Costs (Rs.)
SlNo Added returns due to NCU
Returns (Rs.)
1 - - 1 Gross returns 333 2 - - 2 - - Total (A) 326 Total (B) 1044
B-A 718
Additional return from NCU is About Rs.333 per acre
An added return per acre is Rs. 718
Benefit Cost Ratio B:C Ratio= B/A=.3.20
6.7 Impact on soil heath and crop growth
All the selected respondents were unanimous in giving their mind on the qualitative benefits
of NCU on paddy growth in Punjab. It was revealed by all the respondents (Table 6.5) that
there was neither improvement in the quality of paddy grain nor market acceptability due to
better colour. Also, there was no change (Table 6.6) in the texture of the soil, soil moisture
retention capacity, water infiltration rate, soil softness and decline in the compaction of the
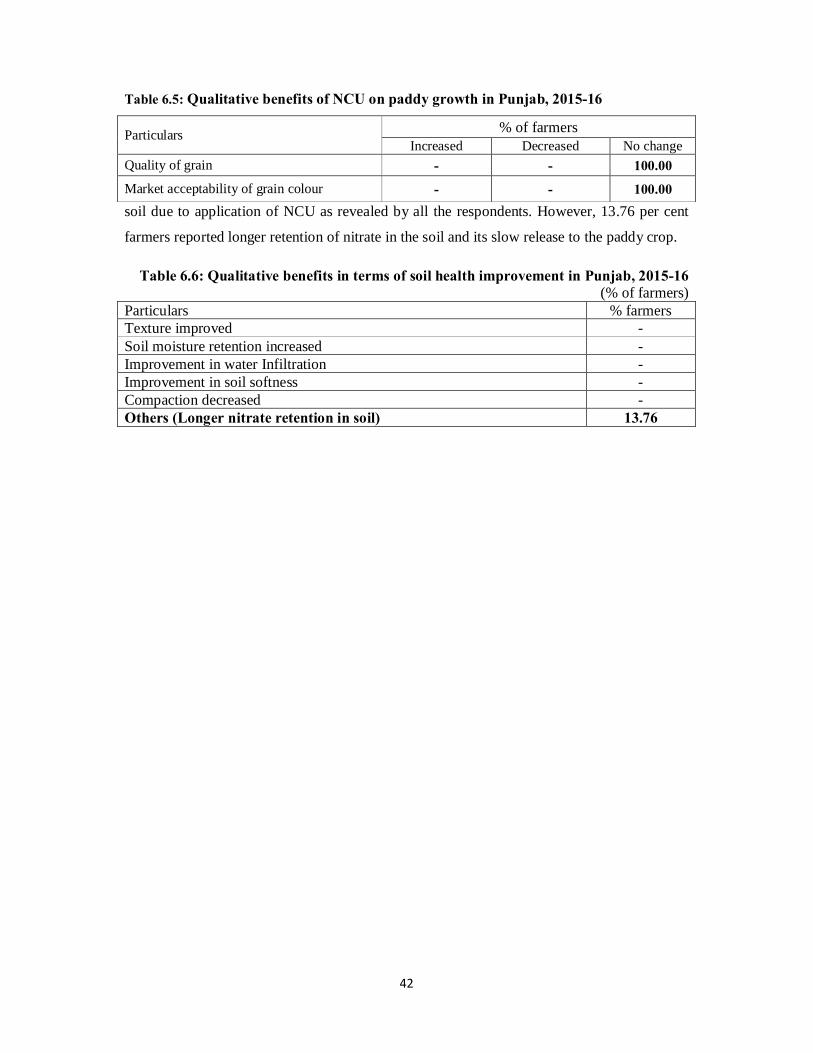
42
Table 6.5: Qualitative benefits of NCU on paddy growth in Punjab, 2015-16
Particulars % of farmers Increased Decreased No change
Quality of grain - - 100.00
Market acceptability of grain colour - - 100.00 soil due to application of NCU as revealed by all the respondents. However, 13.76 per cent
farmers reported longer retention of nitrate in the soil and its slow release to the paddy crop.
Table 6.6: Qualitative benefits in terms of soil health improvement in Punjab, 2015-16 (% of farmers)
Particulars % farmers Texture improved - Soil moisture retention increased - Improvement in water Infiltration - Improvement in soil softness - Compaction decreased - Others (Longer nitrate retention in soil) 13.76

43
Chapter VII Summary, Conclusions and Policy Suggestions
7.1 Background
Nitrogenous (N) fertilizer consumption especially NCU has increased considerably since it
has become mandatory for all the indigenous producers of urea to produce their whole
production of subsidized urea as NCU from 2015. Although agricultural scientists/ extension
workers often advocate the better results shown by NCU as compared to NU yet it is
necessary to verify this fact from the farmer’s perspective. It is a well known fact that farmers
are better judge while proving the new farm technology developed from time to time.
Importance of new farm inputs in agricultural development is vital in the present scenario of
Indian agriculture in general and Punjab in particular.
7.2 Summary of findings
Punjab state is well known for adoption of new farm technology but with the passage of time,
the rice-wheat cropping system resulted in appearance of macro and micro-nutrient
deficiencies. The excessive use of chemical fertilizers is another problem which needs urgent
attention of the various stakeholders in agricultural development, in spite of the fact that the
chemical fertilizers are the important source of nutrients for plant growth. The total
consumption of N, P, K fertilizers in the Punjab state increased from 2.13 lakh tonnes in
1970-71 to 17.14 lakh tonnes in 2013-14 (Anonymous, 2014). The per hectare consumption
of these fertilizers in the state have increased merely from 43.12 Kg. N, 7.75 Kg. P and 1.73
Kg. K in 1970-71 to 329.15 Kg. N, 78.31 Kg. P and 5.54 Kg. K during the year 2013-14 . So,
the increased consumption of chemical fertilizers especially nitrogenous (N) one had to be
looked into to bring the N:P:K ratio to the recommendation level as per the requirement of
various type of soils.
India is the second largest consumer of fertilizer in the world next to China, while it is the
third largest producer of nitrogenous fertilizer in the world behind China and USA. In terms
of Nutrient-wise also, it stands second in the consumption of N and P with the quantity of
16.75 million tonnes and 5.63 million tonnes, respectively. Total consumption of NPK
fertilizers in the country in 2013 was 24.48 million tonnes (IFA, 2015). Urea is the most
common nitrogen fertilizer used uniformly throughout the world. The wide acceptance of
Urea is because of its agronomic acceptability and relatively lower cost as compared to other
fertilizers. Besides being widely used as an excellent fertilizer for plant growth, it can also be
44
used among numbers of products such as animal feed, commercial products, glue, resin,
cosmetics, pharmaceuticals, dish soaps, hair conditioners, tooth whiteners .
With the increased cost of urea fertilizer and concern about its adverse environmental impact
of Nitrogen losses, there has been a great interest in improving the Nitrogen Use Efficiency
(NUE) through optimization of nitrogen use. By doing so, higher yields can be achieved with
less negative impacts (for eg. Nitrogen leaching) (Agostini et al., 2010; Burns,
2006; Neeteson et al, 1999; Rahn, 2002).
Keeping in view the low NUE, it has been felt to find out the use of some indigenous
material and coating process for reducing the nitrogen losses from urea. In this endeavor,
National Fertilizer Limited (NFL) standardized the techniques for production of NCU in the
year 2002. Since then many changes have been made in the process and applicant solution,
to have uniform and consistent coating of Neem oil on urea prills, to maintain the
concentration of Neem oil content as per the specification prescribed in Fertilizer Control
Order (FCO), 1985. The use of NCU has been found to improve the uptake of N, P and K
significantly. Based upon the results of extensive field trials, NCU was found to be
agronomically superior to normal prilled urea. Neem acts as a nitrification inhibitor and its
coating over urea minimizes loss due to leaching. Coating urea with neem prevents its
misuse as well as puts the fertiliser in slow release mode thereby nourishing the saplings for
a longer period. Thus avoids the repeated use of fertilizer and economize the quantity of urea
required by crops (enhancing Nitrogen-Use Efficiency (NUE)). Besides, coating of neem oil
also reduces the leaching of nitrates into the groundwater aquifers and thus, help in reducing
its pollution.
The objectives of the study were as follows:
1. To analyze the trends in usage and prices of Urea versus NCU in Punjab.
2. To analyze the adoption behavior of NCU among selected farmers in irrigated tracts
of Punjab.
3. To analyze the impact of adoption of NCU on crop productivity and farmers'
income.
4. To document the status and implementation of soil health card scheme.
5. To suggest suitable policy measures for adoption of NCU.

45
Keeping the importance of NCU in view, the present study was undertaken during kharif,
2015 for paddy crop in two districts namely Ludhiana and Patiala where there was maximum
use of urea. A random sample of 50 respondents from two cluster of 2-3 villages, from each
selected block, using NCU, NU and both were selected from four blocks of the selected
districts, representing all the farm categories, thus making a sample of 200 respondents.
7.2.1 Trends in urea consumption and prices
The district wise trends in consumption/ sale of urea in Punjab showed that during the year
2007-08 the consumption of urea was 2646.44 th. MT which rose to 3086.05 th. MT during
the period 2007-08 to 2015-16 at an annual growth rate of 1.64 per cent. As far as district-
wise analysis is concerned, the annual growth in urea consumption during the period 2007-
08 to 2015-16 was 5.78 per cent in S.A.S., Nagar followed by 3.60 per cent in Rupnagar,
3.34 per cent in Barnala, 2.43 per cent in Moga, 2.62 per cent in Kapurthala, 2.11 per cent in
Tarntaran, 2.07 per cent in Jalandhar, 2.02 per cent in Amritsar and 1.71 per cent in Firozpur
and it was also statistically significant. The largest share of NCU in Punjab was distributed
in district Firozpur (10.72%) in the year 2015-16 followed by other major consuming
districts i.e. Sangrur (9.76%), Ludhiana (7.92%), Patiala (7.49%), Bathinda (6.57%), Moga
(5.88%), Amritsar (5.83%), Gurdaspur (5.52%) and Jalandhar (5.13%).
The urea prices increased significantly at the highest growth of 5.21 per cent per annum
during the decade 1990-91 to 1999-2000 while during the period 1980-81 to 2015-16 the
annual growth in urea prices was 3.33 per cent which was also statistically significant.
7.2.2 Socio-economic characteristics of sample households
Socio-economic characters of the respondents play an important role in adopting the new
farm technology. It was found that mostly respondent farmers were middle aged having
adequate farming experience to face new farm challenges. The education level of the
respondent farmers is also an indicator of the pioneers in adopting new agricultural practices.
It was observed that 14.50 per cent of the respondent farmers were illiterate while 30.50 per
cent were educated up to higher primary level, 26.50 per cent up to matric and 25 per cent up
to pre-university and above level. Mostly respondent farmers belonged to the general caste
category. Occupational pattern of the respondents revealed that 92.50 per cent were engaged
in agriculture and allied activities while three per cent were undertaking salaried work and
another three per cent were tiny shopkeepers, getting foreign remittances etc. Also, just one
per cent respondents worked as agricultural labourers and a half per cent was self employed

46
in small scale industries. Thus, majority of the respondents were engaged in agriculture and
allied activities.
7.2.3 Size of holding and cropping pattern
As far as holding size of the respondents is concerned, net operational area on the sample
farms was 3.13 acres on marginal and small, 12.28 acres on medium, 36.70 acres on large
and 11.00 acres in total. The entire operational area on the sample farms was irrigated and
rental value of leased-in land was Rs. 37134 per acre in total. The source of irrigation on the
sample farms was tube well while some area was also irrigated by canals. The cropping
pattern of the respondents showed that about 82 per cent of the operational holdings on
marginal and small farms were under paddy crop while it was 85.37 per cent on medium and
86.19 per cent on large farms. Another major crop grown on the sample farms was basmati
while considerable area was under kharif fodder. Other important crops grown on the sample
farms were; maize, sugarcane and vegetables.
7.2.4 Purchasing pattern and sources of purchasing of NCU and NU
It was observed that 69.18 per cent of the selected respondents purchased NCU from co-
operative societies, 23.90 per cent from both private dealers and co-operative societies while
6.92 per cent purchased exclusively from private fertilizer dealers only. On the other hand, in case
of normal urea (NU), 90.91 per cent purchased from co-operative societies and 9.09 per cent from
private fertilizer dealers. Thus, majority of the respondent farmers purchased NCU and NU from co-
operative societies followed by private fertilizer dealers. The price of NCU was Rs. 285 per 50 kg
bag while it was Rs. 271 per bag in case of NU. Total cost per bag including transportation
cost worked out to be Rs. 289.69 for NCU while it was Rs. 276.58 per bag in case of NU.
7.2.5 Usage inputs and profitability of paddy crop
During the year 2015, the hired labour charges, which included ploughing charges till
planting and transplanting charges of paddy, was found to be Rs. 2385 per acre while it was
Rs.2224 during the year 2014. Second major cost component was ploughing and sowing
charges (only machinery) which worked out to be Rs. 2340 during the year 2015 and Rs 2215
in 2014. Expenses on plant protection measures, being another constituent of total paid out
costs, was estimated to be Rs. 1918 per acre during the year 2015 and Rs. 1897 in 2014 while
for urea/ NCU the corresponding costs were estimated to be Rs.741 during 2015 and Rs. 758
in the year 2014. The harvesting charges for paddy crop worked out to be Rs. 1026 during
2015 and Rs. 977 in the year 2014. The output of the paddy crop was estimated to be 28.85

47
quintals per acre in 2015 while it was 28.39 quintals during the year 2014. Gross returns from
paddy worked out to be Rs 41833 per acre during the year 2015 while it was Rs. 39740 in
2014. Also, the corresponding figures for net returns were estimated to be Rs. 31401 during
the year 2015 and Rs. 29530 in 2014 on the sample farms.
The input use, output and returns per acre realized by paddy farmers in Punjab revealed that
the quantity of urea/ NCU used per acre for paddy crop was 135.98 kg. during the year 2014
while its use declined during the year 2015 and was 130.88 kg. per acre on the sample farms.
On the other hand, there was increase in the quantity of other fertilizers used in paddy crop
which was 20.07 kg. in 2014 and 22.77 kg. per acre during the year 2015. There was also
slight increase in the output of the paddy crop during the year 2015 as compared to the year
2014 which can not only be attributed to the application of NCU because there are numerous
reasons/ factors influencing the yield of a crop.
7.2.6 Details of agriculture credit availed
Total credit taken by the farmers during the year 2015-16 was Rs. 318565 per household. As
far as institutional source of credit was concerned, commercial banks (Rs. 177500 per
household) were the major source of credit followed by co-operative societies (Rs. 100755
per household). Traders/ commission agents (Rs. 36435 per household) were the main non-
institutional sources of credit for the respondents followed by friends and relatives. Seasonal
crop cultivation was the purpose for which all the respondents have taken credit and the
amount spent per household was 80.66 per cent of the total amount borrowed. For purchasing
tractor/ implements, 9.50 per cent farmers have taken loan which constituted 14.40 per cent
of the total loan taken per household. For consumption expenditure, 14 per cent farmers have
taken loan and share of consumption loan in total borrowed amount per household worked
out to be just 1.57 per cent.
7.2.7 Awareness & Sources of Information on NCU
It was found that all the large farmers were aware about the neem coated urea while 99.15 per
cent medium and 98.53 per cent marginal and small farmers were also aware of it. The major
source of awareness concerning NCU was co-operative societies while input shop was second
major source of information about NCU. Besides, fellow farmers, print and visual media,
agricultural university were other sources of awareness.

48
7.2.8 Status of application of urea versus NCU
The major factor/ sign from which respondent farmers differentiated NCU from NU was leaf
figure on bag while farmers also revealed that smell of neem in NCU differentiated it from
NU and thus can easily be identified. The difference in price of NCU and NU was also one of
the factors differentiating both. As far as consumption of NCU is concerned, there was a
significant increase in the application of NCU after 2015-16. Before 2015-16 there were
81.50 per cent respondents who applied NCU to their paddy crop while after 2015-16 this
number increased to 94.50 per cent on the sample farms. In case of other crops such as;
wheat, basmati, sugarcane, potato, maize, sunflower and vegetables, NCU consumption
increased.
The split doses of NCU and NU application showed that no basal application of NCU/ NU to
paddy crop was applied by the sample farmers and the entire dose of urea was applied in
with-in 45 days of the transplantation of the crop. Hence, 33 per cent of NCU and NU was
applied to paddy crop after application of weedicide within two days of transplantation of
crop and remaining 67 per cent of NCU and NU was applied during the vegetative growth of
the crop. In aggregate, 116.50 kg. of NCU and 14.25 kg. of NU per acre was applied to paddy
crop on the sample farms. Due to the application of NCU, only 5.29 per cent farmers reported
about the increase in paddy yield up to the extent of 2.40 per cent while 94.71 per cent
revealed no change in the paddy yield. The cost of pest and disease control declined by 21 per
cent by application of NCU but there was no change in weed management and cost of NCU
application was higher as compared to urea. All the respondent farmers revealed no decline in
the cost of other fertilizers, improvement in the soil health, quality of grain and market
acceptability of grains due to the application of NCU.
7.2.9 Perception of farmers about NCU and its benefits compared to urea
It was seen that majority of the farmers reported about the quality of NCU being good,
adequate, timely available, accessible in the market, its non-solidification and evenly
distribution at the time of application found out to be positive points. On the other hand, NCU
price being high along with no significant decline in fertilizer usage, urea usage and no
change in pest/ disease incidence on the crop were other points to be looked into.

49
7.2.10 Diversions of urea & NCU other than crop purposes
It was found during the survey that none of the selected farmers reported about the use of
NCU for other purposes such as; silage making, mixing with weedicides and for fishery feed
preparation.
7.2.11 Constraints and suggestions about NCU and its adoption
It was found that only 1.5 per cent farmers did not report any problem in adoption of NCU
fertilizer. However, 65.50 per cent revealed high price of NCU fertilizer being major
constraint in its adoption while 27 per cent reported inadequate/ shortage of supply during
peak season as another problem. Poor quality of NCU available in co-operative societies was
another problem revealed by 8.50 per cent farmers while 5.50 per cent farmers were not
aware about the uses and benefits of NCU. Another problem about NCU fertilizer
application, reported by five per cent farmers, was extremely pungent smell emanating during
its broadcasting in the field.
Major suggestions as revealed by 27 per cent farmers was assured/ timely and adequate
supply of quality NCU during peak season to co-operative societies for improving the NCU
fertilizer usage. Also, 7.50 per cent farmers suggested about organising training camps for
spreading awareness regarding NCU uses/ benefits among the farming community. Other
suggestions were regarding improving the quality (9.50%) of NCU and decreasing the price
(74.50%) of NCU for increasing its usage.
7.2.12 Soil health related programmes and schemes - Implementation and performance in the state
The information on soil health card revealed that only five farmers, out of 45 farmers who got
their soils tested, received soil health cards. Further, it was found that all the five farmers
possess soil health card when asked to produce by the field survey team. Also, only four
farmers were able to understand the information given in the soil health card while one farmer
was unable to understand the information provided in the card. Out of total number of
farmers, who got their soils tested, 88.89 per cent were verbally explained about the soil
health card details by the concerned dept. officials while major source of education on soil
health card was Agriculture Officer as revealed by 8.89 per cent farmers who received soil
health card out of total farmers who got their soils tested.

50
7.2.13 Awareness on soil testing
It was found that 75.56 per cent of the sample farmers who tested their soils, got information
about soil testing from Agriculture Department and soil samples were collected by 91.11 per
cent farmers themselves. It was also observed that within the period 2013-14 to 2015-16,
73.33 per cent of the farmers got their soils tested while before 2013-14 only 16.67 per cent
farmers tested their soils. All the respondents got soils tested only once in these years. The
average cost of each sample tested between 2013-14 to 2015-16 period was Rs. 2.73 per
sample while it was Rs. 3.33 for the samples taken before 2013-14. During the period 2013-
14 to 2015-16 more number of farmers got the soil of their fields tested with higher number
of soil samples taken as compared to before 2013-14.
The most important reason of soil testing as revealed by 31.11 per cent farmers was ‘to
understand fertilizer requirement for the crop’ followed by ‘motivation from village
demonstration/training/exposure visits to places with best farming practices’ by 20 per cent
and ‘for availing benefit under subsidy schemes’ by 17.78 per cent farmers. ‘Peer farmers'
group pressure’ was revealed by 73.33 per cent farmers as least important reason for soil
testing undertaken by sample farmers.
The reasons for not testing soil by the respondents was that 72.26 per cent of the respondents
did not undertake soil testing as they thought that ‘soil testing not required for my field as
crop yield is good’ while 7.74 per cent revealed ‘soil testing laboratories are located far
away’ as the reason and 7.10 per cent reported ‘do not know whom to contact for details on
testing’ as the reason for not testing soil.
7.2.14 Adoption of recommended doses of fertilizer application based on soil test report
The explanation about recommended dose of fertilizers (RDF) for paddy crop was given by
the Department of Agriculture to 60 per cent farmers, who got tested their soils, followed by
27.65 per cent from co-operative societies during the training programmes organised by
IFFCO while 11.35 per cent came to know about RDF from the experts of Punjab
Agricultural University.
It was observed that 91.11 per cent of the farmers, who got their soils tested, were not aware
about the recommended dose of fertilizers (RDF) for paddy crop but revealed about it on the
basis of their own perception while just 8.89 per cent of the farmers were actually aware
about RDF on the basis of soil test report. It was found that as per farmer’s perception,
higher dose of urea, DAP and lower dose of MOP and ZnSO4 was applied to paddy crop as
compared to soil test report based recommendation.

51
The major problems faced in soil testing as revealed by 80 per cent farmers was proper
reports not being delivered followed by 55.50 per cent revealing poor extension services and
7.50 per cent complained about the soil test lab being far away. The major suggestions as
revealed by 86 per cent farmers was that soil health cards should be delivered to the farmers
while 54.50 per cent emphasised to improve the extension contacts and 45 per cent asked for
organising awareness camps regarding soil test.
7.2.15 Impact on crop productivity
Productivity of paddy on sample farms due to application of NCU was 2845 kg. per acre in
2014-15 while it increased to 2900 kg. per acre in the year 2015-16. Also, there was increase
in productivity from 2786 kg. per acre in 2014-15 to 2872 kg. per acre in the year 2015-16
due to the application of NU. Hence, there was increase in productivity of paddy crop during
2015-16 where NCU as well as NU was applied on the sample farms.
7.2.16 Fertilizer use efficiency
It was observed that NCU quantity applied per acre was 95.50 kg. per acre during the year
2014-15 while it increased to 116.50 kg. per acre in 2015-16 with an increase of 21.99 per
cent. Similarly, the NU quantity applied declined from 40.48 kg. per acre in 2014-15 to 14.38
kg per acre in 2015-16. Thus, there was considerable increase in the application of NCU and
decline in NU usage in paddy crop. In aggregate, there was decline in use of fertilizer
(NCU+NU) by 3.75 per cent during 2015-16 as compared to 2014-15. Fertilizer use
efficiency or output per unit of NCU was 29.79 kg. in 2014-15 and 24.89 kg. in 2015-16 due
to higher NCU usage in 2015-16 despite higher average yield.
7.2.17 Impact of NCU application on paddy crop
The impact in terms of increased main product yield was seen for the farmers who
exclusively applied NCU to paddy crop. Paddy yield obtained was 29 quintals per acre for the
farmers exclusively using NCU while it was 28.72 quintals per acre for NU and 28.53
quintals for the farmers who applied both NCU and NU to their paddy crop. Thus, paddy
yield was just 0.97 per cent higher on the farms exclusively using NCU as compared to NU
but this difference was statistically non-significant. On the marketing front, there was no
difference in the price received for the produce obtained while using NCU, NU or both since
same minimum support price (MSP) of Rs. 1450 per quintal was received by the farmers. So,

52
there was impact of NCU usage in terms of increased productivity of paddy and thereby
increase in production also.
7.2.18 Impact on cost of cultivation of reference crops
It was observed that the cost of pest and disease control in paddy was Rs. 1518 per acre on
the farms where NCU was exclusively used while it was Rs. 1755 per acre for normal urea
(NU) and Rs. 1412 for the farms where both NCU and NU were used. Similarly, cost of weed
management was Rs. 411 for exclusively NCU using farms, Rs. 435 for NU using and Rs.
403 for using both NCU and NU. Cost of NCU for the farms where it was used exclusively
was Rs. 742 per acre which was higher than Rs. 652 for the farms using only NU while it was
Rs. 514 for the farms using both NCU and NU for their paddy crop. The cost of other
fertilizers used was Rs. 678 on farms using NCU and Rs. 653 on farms using NU and Rs. 464
for the farms using both NCU and NU. Thus, there was decline in the cost of pest, disease
control and weed management where NCU was exclusively applied to paddy crop as
compared to NU but cost was least on the farms where NCU along with NU was applied. But
only decrease in cost of pest and disease control and increase in cost of urea were found to be
statistically significant. Although cost of NCU was more than NU but its impact was
reflected in terms of lower cost of pest, disease control and weed management practices.
7.2.19 Economic feasibility of NCU using partial budgeting
The economic feasibility of NCU in paddy using partial budgeting framework brought out
that added costs were estimated at Rs. 326 per acre while there was also cost reduction to the
tune of Rs. 711 per acre. Thus, there was net cost reduction of Rs.385 per acre. Added returns
due to NCU amounted to Rs. 333. Therefore, there were added returns of Rs. 718 per acre by
application of NCU on the sample farms.
7.2.20 Impact on soil heath and crop growth
All the selected respondents were unanimous in giving their mind on the qualitative benefits
of NCU on paddy growth in Punjab. It was revealed by all the respondents that there was
neither improvement in the quality of paddy grain nor market acceptability due to better
colour. Also, there was no change in the texture of the soil, soil moisture retention capacity,
water infiltration rate, soil softness and decline in the compaction of the soil due to
application of NCU, however, some of the farmers reported longer retention of nitrate in the
soil and its slow release to the paddy crop.

53
7.3 Conclusions
The study brought to the following conclusions:
• The district wise trends in consumption/ sale of urea in Punjab showed that during the
year 2007-08 the consumption of urea was 2646.44 th. MT which rose to 3086.05 th.
MT during the period 2007-08 to 2015-16 at an annual growth rate of 1.64 per cent.
• The urea prices increased significantly at the highest growth of 5.21 per cent per
annum during the decade 1990-91 to 1999-2000 while during the period 1980-81 to
2015-16 the growth in urea prices was 3.33 per cent per annum.
• Total credit taken by the respondent farmers was Rs. 318565 per household. As far as
institutional source of credit was concerned, commercial banks (Rs. 177500) per
household) was the major source of credit followed by co-operative societies (Rs.
100755 per household).
• Traders/ commission agents (Rs. 36435 per household) were the main non-institutional sources of credit for the respondents followed by friends and relatives.
• Majority of the respondent farmers purchased NCU and NU from co-operative
societies followed by private fertilizer dealers.
• Total cost per bag of NCU, including transportation cost, worked out to be Rs. 289.69
while it was Rs. 276.58 per bag in case of NU.
• There was marginal increase in the output/ productivity of paddy crop during the year
2015-16 as compared to the year 2014-15 which can’t only be attributed to the
application of NCU because there are numerous factors/ reasons significantly
influencing the yield of a crop.
• Gross returns from paddy crop worked out to be Rs 41833 per acre during the year
2015-16 while it was Rs. 39740 in the year 2014-15. The corresponding figures for
net returns were estimated to be Rs. 31401 during the year 2015-16 and Rs. 29530 in
2014-15 on the sample farms.
• All the large farmers were aware about the NCU while 99.15 per cent medium and
98.53 per cent marginal and small farmers were also aware of it.

54
• Major source of awareness regarding NCU was co-operative societies while input
shop, fellow farmers, print and visual media and agricultural university were other
sources of awareness.
• Major factor/ sign from which respondent farmers differentiated NCU from NU was
leaf figure on bag while farmers also revealed that smell of neem in NCU
differentiated it from NU and thus can easily be identified.
• As far as consumption of NCU is concerned, there was a significant increase in the
application of NCU during 2015-16 in crops such as; paddy, wheat, basmati,
sugarcane, potato, maize, sunflower and vegetables.
• Due to the application of NCU, only 5.29 per cent farmers reported about the increase
in paddy yield. Also, the cost of pest and disease control declined by 21 per cent due
to the application of NCU but there was no change in weed management.
• All the respondent farmers revealed no decline in the cost of other fertilizers,
improvement in the soil health, quality of grain and market acceptability of grains due
to the application of NCU.
• Majority of the farmers reported about the quality of NCU being good, adequate,
timely available, accessible in the market, its non-solidification and evenly
distribution at the time of application found out to be positive points.
• It was found that none of the selected farmers reported about the use of NCU for other
purposes such as; silage making, mixing with weedicides and for fishery feed
preparation.
• High price of NCU, inadequate/ shortage of supply during peak season and poor
quality of NCU in some of the co-operative societies were the major problems
reported by the respondents.
• Major suggestions for increasing NCU usage were; assured/ timely and adequate
supply of quality NCU during peak season to co-operative societies, organising
training camps for spreading awareness regarding NCU uses/ benefits among the
farming community and decreasing the price of NCU for the benefit of the farmers.
55
• The information on soil health card revealed that only five farmers, out of 45 farmers
who got their soils tested, received soil health cards. It was found that 8.89 per cent of
the sample farmers, who got their soils tested, received information about soil testing
from Agriculture Department.
• The most important reason of soil testing as revealed by nearly 31 per cent farmers
was ‘to understand fertilizer requirement for the crop’ while most important reason
for not testing soil by about 72 per cent farmers was that ‘soil testing not required for
my field as crop yield is good’.
• It was seen that 91.11 per cent of the farmers, who got their soils tested, were not
aware about the recommended dose of fertilizers (RDF) to paddy crop but told about
it on the basis of their own perception while just 8.89 per cent of the farmers were
actually aware about RDF on the basis of soil test report.
• The major problems faced in soil testing by the farmers was proper reports not
delivered as reported by about 80 per cent farmers since soil test reports were not
delivered and suggested for ensuring delivery of soil health cards .
• There was increase in the productivity of paddy crop during the year 2015-16 as
compared to 2014-15 where NCU was applied on the sample farms. Also, the NCU
usage on the sample farms increased during this period while cost of pest/ disease
control measures and weed management declined.
• The partial budgeting framework brought out that there were added returns of Rs. 718
per acre by application of NCU on the sample farms.
• There was neither improvement in the soil health nor change in the quality of paddy
grain and its market acceptability due to the application of NCU.
• It was reported by all the respondents that there was no change in the texture of the
soil, soil moisture retention capacity, water infiltration rate, soil softness and decline
in the compaction of the soil due to the application of NCU. However, there was
longer retention of nitrate in the soil and its slow release to the paddy crop.

56
7.4 Policy Recommendations
The above discussion brought out some policy issues which must be looked into to encourage
the judicious use of NCU and for proper implementation of soil health card scheme:
• Since now whole urea fertilizer produced in the country is neem coated, therefore,
there would not be any problem with regard to its use at the farmers level. But the
major point which should be taken care of is its good quality, adequate quantity,
timely supply of NCU along with bringing its price at par with NU.
• Farmers should be educated about the balanced use of NCU along with other
fertilizers for decreasing the cost of production of crops.
• It should be ensured that soil testing reports/ soil health cards are delivered in time to
the farmers along with laying emphasis on implementation of the SHC
recommendations w.r.t. fertilizer use for amelioration of nutrient deficiencies in the
soils.
• Special training programmes/ camps should be organised by the various stakeholders
in agricultural sector to educate the farmers about the benefits of soil testing,
balanced use of chemical fertilizers and knowledge about SHC recommendations.
• Gram panchayats should be involved in undertaking soil testing campaigns on a war
footing alongside department of agriculture officials for proper and better
implementation of soil health card scheme.

57
References
Anonymous (2014) Statistical Abstract of Punjab, Economics and Statistical Organization,
Chandigarh.
Agostini, F., Tei. F., Silgram, M., Farneselli, M., Benincasa, P., Aller, M.F.(2010). Decreasing N leaching in vegetable crops through improvements in N fertiliser management, Genetic engineering, biofertilisation, soil quality and organic farming, ed Lichtfouse E. (Springer, Dordrecht, The Netherlands) Sustainable Agr. Rev. Vol. 4, pp 147–200.
Bhalla R S and Prasad K V D (2008) Neem cake-urea mixed applications increase growth in paddy Current Science 94 : 1066-1070 Burns, I.G. (2006). Assessing N fertiliser requirements and the reliability of different recommendation systems. Acta Hort. 700: 35–48.
Hooda K S and Srivastava M P (1998) Impact of neem coated urea and potash on the incidence of rice blast Plant Disease Research 13: 28-34 International Fertilizer Industry Association (IFA). (2015), extracted on 14th December, 2015 from http://ifadata.fertilizer.org/ucResult.aspx?temp=20151214103823
Kumar A and Thakur R B (1993) Evaluation of coated-urea fertilizer for nitrogen efficiency in rainfed lowland rice (Oryza sativa) Indian Journal of Agronomy 38: 471-473 Neeteson, J.J., Booij, R., Whitmore, A.P. (1999). A review on sustainable nitrogen management in intensive vegetable production systems. Acta Hort. 506:17–26.
Mangat G S and Narang J K (2004) Agronomical trial for efficacy of NFL Neem Coated Urea Fertiliser Marketing News 35: 1-3, 5, 7 Purakayastha T J and Katyal J C (2006) Promising modified urea fertilisers Indian Journal of Fertilisers 2 : 31-36 Rahn, C. (2002). Management strategies to reduce nutrient losses from vegetables crops. Acta Hort. 571:19–25.
Sanjaykumar V V, Vageesh, T S, Abhiram, G J and Shilpashree Y P (2015) Effect of compost enriched with NPK fertilizers and neem oil coated urea on productivity and nutrient use efficiency in maize Karnataka Journal of Agricultural Sciences 28 : 185-188 Singh Muneshwar and Singh T A (1989) Comparison of neem (Azadirachta indica) oil coated urea with some other coated urea fertilizers on an alkaline calcareous soil Journal of the Indian Society of Soil Science 37: 314-318 Sirisena D N, Wickramasinghe W M A D B and Ranatunge R A N D (2003) Performance of different forms of urea in rice cultivation Annals of the Sri Lanka Department of Agriculture 5 Peradeniya: Department of Agriculture: 341-343

58
Sunita V and Narang J K (2012) Neem coated urea: NFL experience Indian Journal of Fertilisers 8 : 94-97 Thind H S, Singh B, Pannu R P S, Singh Y, Singh V, Gupta R K Singh G, Kumar A and Vashistha M (2010) Managing neem (Azadirachta indica)-coated urea and ordinary urea in wheat (Triticum aestivum) for improving nitrogen-use efficiency and high yields Indian Journal of Agricultural Sciences 80 : 960-964 Tomar S S, Sharma S C and Sharma A (1991) Effect of neem extract-coated urea on rice yield and nitrogen use efficiency of transplanted rice International Rice Research Newsletter 16: 20-21 Upadhyay S K and Tripathi R S (2000) Response of prilled and neem extract coated urea application timings to rice (Oryza sativa) Agricultural Science Digest 20 : 84-86 Venkatesan S and Veemaraj T (2006) Scope of using neem coated urea in tea Newsletter - UPASI Tea Research Foundation 16: 3

59
Appendix I
Coordinator’s Comments on the Draft Report
1. Title of the draft report examined:
Impact of Neem-Coated Urea on Production, Productivity and Soil Health in Punjab
2. Date of receipt of the Draft report: November, 2015
3. Date of dispatch of the comments: December 2016
4. Comments on the Objectives of the study:
All the objectives of the study have been addressed
5. Comments on the methodology
Common methodology proposed for the collection of field data and tabulation of
results has been followed.
6. Comments on analysis, organization, presentation etc.
(i) In chapter II, page 10 seems to be blank, kindly, remove if there is nothing to add.
(ii) Too much of space above and below the tables, specially from page 17-23 looks
distracting, maintain the space at 1.5, kindly align the report as per standard
guidelines.
(iii) In Chapter VII, the sub-headings may be numbered for a better presentation and easy
understanding.
(iv) Kindly, provide policy recommendations point wise instead of paragraph.
(v) Please, do follow and incorporate the partial budgeting technique and respective
tables in the report as followed in Karnataka state report (mail already sent across
AERCs).
(vi) It is suggested to copy edit the report before finalizing.
7. Overall view on acceptability of report
Authors are requested to incorporate all the comments and submit the final report for
consolidation.

60
Appendix II
ACTION TAKEN ON THE COMMENTS BY AERC, LUDHIANA
Impact of Neem Coated Urea on Production, Productivity and Soil Health in Punjab
The report has been revised in the light of the comments/ observations/ suggestions received
from the coordinating centre. Point wise reply is as under:
(i) Needful has been done
(ii) Needful has been done.
(iii) Correction as suggested has been made.
(iv) Needful has been done.
(v) As desired, the partial budgeting technique has been incorporated along with
statistical testing of impact tables
(vi) Report has been copy edited
D.K.Grover
AERC, Ludhiana