Innovative Controlled-Release Polyurethane-Coated Urea ...
19
agronomy Article Innovative Controlled-Release Polyurethane-Coated Urea Could Reduce N Leaching in Tomato Crop in Comparison to Conventional and Stabilized Fertilizers Luca Incrocci 1 , Rita Maggini 1, *, Tommaso Cei 1 , Giulia Carmassi 1 , Luca Botrini 1 , Ferruccio Filippi 1 , Ronald Clemens 2 , Cristian Terrones 2 and Alberto Pardossi 1 1 Department of Agriculture, Food and Environment, University of Pisa, 56124 Pisa, Italy; [email protected] (L.I.); [email protected] (T.C.); [email protected] (G.C.); [email protected] (L.B.); ferruccio.fi[email protected] (F.F.); [email protected] (A.P.) 2 ICL Specialty Fertilizers, 6422 PD Heerlen, The Netherlands; [email protected] (R.C.); [email protected] (C.T.) * Correspondence: [email protected] Received: 28 September 2020; Accepted: 17 November 2020; Published: 20 November 2020 Abstract: Large amounts of fertilizers are being used in agriculture to sustain growing demands for food, especially in vegetable production systems. Soluble fertilizers can generally ensure high crop yields, but excessive leaching of nutrients, mainly as nitrate, can be a major cause of water pollution. Controlled-release fertilizers improve the nutrient use efficiency and lower the environmental hazard, usually without affecting the production. In this study, an innovative controlled-release coated urea fertilizer was compared to conventional nitrogen (N) fertilizers and a soluble ammonium-based fertilizer containing a nitrification inhibitor, in a round table tomato cultivation. Both the water and N balance were evaluated for each treatment, along with the yield and quality of the production. The experiment was repeated in three different seasons (spring, autumn and summer-autumn) in a glasshouse to prevent the effect of uncontrolled rainfall. The results indicated that N leaching decreased by increasing the percentage of coated urea. The application of at least 50% total N as coated urea strongly reduced N leaching and improved N agronomic efficiency in comparison with traditional fertilizers, ensuring at the same time a similar fruit production. Due to reduced leaching, the total N amount commonly applied by growers could be lowered by 25% without detrimental effects on commercial production. Keywords: nitrogen fertilizer; nitrification inhibitor; nitrogen leaching; nitrogen use efficiency; 3,4-dimethylpyrazole phosphate (DMPP) 1. Introduction With the rapid increase of the global population, agriculture is required to satisfy the consequent boost in food demand worldwide. For example, in 2013 the production of primary foodstuffs such as wheat and maize reached 713 and 1018 millions of metric tons, respectively, and it has been estimated that in 2050 the world requirement will be 85% higher than in 2013 [1]. Along with water, considerable amounts of fertilizers have been thus far applied to raise the yield of agricultural crops. Nitrogen (N) is the main plant macronutrient and its concentration in natural soils is often deficient to ensure adequate plant growth and crop yield [2], eventually leading to high rates of N fertilization. Over a four-decade period from 1961 to 2013, the world consumption of N fertilizers has increased from 11.3 Tg N/year to 107.6 Tg N/year [3]. The use of fertilizers has especially increased in the intensive vegetable crop Agronomy 2020, 10, 1827; doi:10.3390/agronomy10111827 www.mdpi.com/journal/agronomy
-
Upload
khangminh22 -
Category
Documents
-
view
0 -
download
0
Transcript of Innovative Controlled-Release Polyurethane-Coated Urea ...

agronomy
Article
Innovative Controlled-Release Polyurethane-CoatedUrea Could Reduce N Leaching in Tomato Crop inComparison to Conventional andStabilized Fertilizers
Luca Incrocci 1 , Rita Maggini 1,*, Tommaso Cei 1, Giulia Carmassi 1 , Luca Botrini 1,Ferruccio Filippi 1, Ronald Clemens 2, Cristian Terrones 2 and Alberto Pardossi 1
1 Department of Agriculture, Food and Environment, University of Pisa, 56124 Pisa, Italy;[email protected] (L.I.); [email protected] (T.C.); [email protected] (G.C.);[email protected] (L.B.); [email protected] (F.F.); [email protected] (A.P.)
2 ICL Specialty Fertilizers, 6422 PD Heerlen, The Netherlands; [email protected] (R.C.);[email protected] (C.T.)
* Correspondence: [email protected]
Received: 28 September 2020; Accepted: 17 November 2020; Published: 20 November 2020 �����������������
Abstract: Large amounts of fertilizers are being used in agriculture to sustain growing demands forfood, especially in vegetable production systems. Soluble fertilizers can generally ensure high cropyields, but excessive leaching of nutrients, mainly as nitrate, can be a major cause of water pollution.Controlled-release fertilizers improve the nutrient use efficiency and lower the environmental hazard,usually without affecting the production. In this study, an innovative controlled-release coated ureafertilizer was compared to conventional nitrogen (N) fertilizers and a soluble ammonium-basedfertilizer containing a nitrification inhibitor, in a round table tomato cultivation. Both the water andN balance were evaluated for each treatment, along with the yield and quality of the production.The experiment was repeated in three different seasons (spring, autumn and summer-autumn) ina glasshouse to prevent the effect of uncontrolled rainfall. The results indicated that N leachingdecreased by increasing the percentage of coated urea. The application of at least 50% total N ascoated urea strongly reduced N leaching and improved N agronomic efficiency in comparison withtraditional fertilizers, ensuring at the same time a similar fruit production. Due to reduced leaching,the total N amount commonly applied by growers could be lowered by 25% without detrimentaleffects on commercial production.
Keywords: nitrogen fertilizer; nitrification inhibitor; nitrogen leaching; nitrogen use efficiency;3,4-dimethylpyrazole phosphate (DMPP)
1. Introduction
With the rapid increase of the global population, agriculture is required to satisfy the consequentboost in food demand worldwide. For example, in 2013 the production of primary foodstuffs such aswheat and maize reached 713 and 1018 millions of metric tons, respectively, and it has been estimatedthat in 2050 the world requirement will be 85% higher than in 2013 [1]. Along with water, considerableamounts of fertilizers have been thus far applied to raise the yield of agricultural crops. Nitrogen (N) isthe main plant macronutrient and its concentration in natural soils is often deficient to ensure adequateplant growth and crop yield [2], eventually leading to high rates of N fertilization. Over a four-decadeperiod from 1961 to 2013, the world consumption of N fertilizers has increased from 11.3 Tg N/yearto 107.6 Tg N/year [3]. The use of fertilizers has especially increased in the intensive vegetable crop
Agronomy 2020, 10, 1827; doi:10.3390/agronomy10111827 www.mdpi.com/journal/agronomy

Agronomy 2020, 10, 1827 2 of 19
production system [4–6]. In China, N fertilization for the cultivation of vegetables exceeds 1000 and3000 kg N/ha year in the open-field and greenhouse conditions, respectively. In the same country,in 2008, 17% of the national input of N fertilizers was devoted to the vegetable cropping system [7].
The conventional fertilizers that are commonly applied by growers are highly soluble salts andare liable up to 70% N losses due to volatilization and leaching [8]. These processes have two mainundesirable effects: (1) a poor fertilization efficiency because the nutrient element is driven off theroot zone, making it unavailable to the plant; (2) a harmful impact on the environment, due to eithergreenhouse gas emissions or surface water pollution by eutrophication. Nitrogen is commonly appliedas nitrate ion, or it is quickly oxidized to this form through nitrification by soil microorganisms.The supply of different N forms or the nitrification process can cause hazardous volatilization losses asammonia, N monoxide or other N oxides that could contribute to the greenhouse effect. In addition,nitrate ion is not retained by the soil and is easily leached [6,9].
Nitrogen leaching is generally more severe with intensive greenhouse cultures than with open-fieldcrops, as plant growth is faster under controlled conditions and N fertilization represents an effectiveand low-cost practice to increase the production yield [6]. In fact, several authors drew attention to theoccurrence of eutrophication and water pollution in the main European districts for protected vegetablecrop production, such as Spain [10], Italy [11], The Netherlands [12], Poland [13] and Greece [14].The environmental impact associated with nitrate leaching has become a major concern all over theworld. In Europe, this has led to the introduction of the Nitrates Directive [15], to limit N pollutionand improve water quality. According to the directive, the Nitrate Vulnerable Zones (NVZs) are landareas where drainage water from agricultural crops can cause contamination of larger water bodies byexcess nitrate [16]. Hence, the limitation of fertilizers application in agriculture represents an effectivemeasure to counteract nitrate pollution of surface water [17]. With N overfertilization, nitrate ion canalso accumulate in the edible parts of several food crops [18]. Human intake of nitrate with the diethas been related to gastric cancer [19–21] and has directed the European Union toward a restriction tothe nitrate content in food as a safety measure for the consumer [22].
Based on the above considerations, many efforts have been made to rationalize N fertilization.The application of enhanced efficiency fertilizers is a functional approach to achieve this purpose bylimiting nutrient amounts in soils and at the same time reducing both N leaching and N volatilizationlosses. Enhanced efficiency fertilizers can be divided into three subgroups [23]: (i) slow-releasefertilizers, (ii) stabilized fertilizers, (iii) controlled-release fertilizers. Slow-release fertilizers contain lowsolubility N compounds that become available to plants only after microbial degradation. Stabilizedfertilizers contain chemical inhibitors, which slow down or stop biological processes. These includeurease inhibitors that hinder the hydrolysis of urea by urease enzyme, or nitrification inhibitors suchas dicyandiamide (DCD), or 3,4-dimethylpyrazole phosphate (DMPP), which prevent the oxidationof ammonium ion [24]. Controlled-release fertilizers are made of an inner core and an outer layer.The former is a water-soluble fertilizer such as urea, ammonium nitrate or potassium nitrate; the latteris a coating material such as sulfur, an alkyd- or polyurethane-like resin, a thermoplastic polymeror a mineral-based inorganic material [25]. Controlled-release fertilizers can also be made by thecombination of sulfur-coated urea with an additional polymer or resin coating [26,27].
Two main limitations to the use of controlled-release fertilizers are their relatively high cost, and thedifficulty to develop an adequate coating for irregularly shaped fertilizers or highly soluble compoundssuch as urea. The controlled-release fertilizer used in this study consisted of polyurethane-coated ureagranules and was manufactured using an innovative polymer coating patented technology (E-MAX)that can be employed in combination with many types of fertilizers, including hygroscopic compoundsor irregularly shaped materials. The release mechanism of coated fertilizers is based on the osmosisphenomenon produced by the diffusion of water through the coating, which leads to the solubilisationof the inner fertilizer. Water transfer through the coating layer is the rate determining step and dependson the chemical structure of the polymer, the thickness of the coating layer and the temperature.Therefore, for a given polymer with a fixed thickness, the release rate should be temperature-dependent

Agronomy 2020, 10, 1827 3 of 19
and should be assessed through the temperature regime experienced by the coated fertilizer [28,29].Thus, the release of nutrients into the soil could be predicted and controlled over time. With the E-MAXcoating technology, the thickness of the polymer layer is well below 100 µm; the coating material isevenly spread and fixed on the whole surface of discrete 2- to 4-mm-diameter particles, degrades slowlyand is essentially inert in the soil after the nutrient has been released. The work was aimed at evaluating:(i) the release curve and the effectiveness of the polyurethane-coated urea in relation to the plant Nrequirements in different climate growing conditions; (ii) the effect of this controlled-release fertilizeron N leaching and on the yield and quality of a soil greenhouse tomato cultivation in comparison withfertilization techniques that employ a nitrification inhibitor or soluble salts.
2. Materials and Methods
Although the controlled-release fertilizer used in this study was being developed and marketedmainly for open field application, three experiments were carried out in a glasshouse at the Universityof Pisa on round-table tomato plants (cultivar Hybrid F1 “OPTIMA”). The use of a greenhouseequipped with lysimeters allowed for the prevention of the negative effects of uncontrolled rainfallevents and made possible to easily collect, measure and analyse water drainage and N leaching,thus enabling reliable computations of both water and N balance in the different treatments. The presentstudy was focused on the time interval of N release by the coated urea (3–4 months) rather than tothe long-term agronomical effects of the treatments. Therefore, the growing period lasted from thetransplanting to the harvesting of the third or fourth truss and was shorter than that of a typicalgreenhouse cultivation of tomato, which is generally conducted until the ripening of the fifth or sixthtruss. However, the growing conditions of the experiments closely resembled those of a real croppingsystem and enabled the evaluation of the yield and quality of the production.
2.1. Experimental Design
Three experiments were performed under different growing conditions: Experiment 1 (spring2015), Experiment 2 (autumn 2015) and Experiment 3 (summer–autumn 2016). In all the experiments,either the stabilized or the controlled-release fertilizer were compared with a conventional treatment(CON). The distinct N treatments and fertilizer addition programs are detailed in Table 1. The same totalN dose was applied in all the treatments using different N sources: (i) the inorganic salts potassiumnitrate KNO3, calcium nitrate Ca(NO3)2, ammonium nitrate NH4NO3 and ammonium sulphate(NH4)2SO4; (ii) a stabilized fertilizer containing 26% total N (7.5% as nitrate and 18.5% as ammonium),with the addition of DMPP as a nitrification inhibitor (ENTEC® 26:0:0 Nitrogen-Phosphorus-Potassium,EuroChem Agro, Cesano Maderno, Italy); (iii) an innovative controlled-release fertilizer, manufacturedusing the E-MAX coating technology and consisting of granules of urea fertilizer coated by a permeableand very thin polyurethane layer (Agrocote® Max; ICL Specialty Fertilizers, Heerlen, The Netherlands;Patent EP 2672813 B1). The stabilized and controlled-release fertilizers will be hereafter indicated asDMPP and CU, respectively.
The total N dose was adapted to the different climate conditions of each experiment and, as plantgrowth is normally slower in autumn, N fertilization was necessarily lower in Experiment 2 than inExperiment 1 (300 kg/ha against 360 kg/ha) to prevent excess leaching. A reduced total N applicationin the cold season is consistent with the growers’ common practice. For this reason, a similar absoluteamount of CU or DMPP applied as base fertilization corresponded to a different percentage of total N.For example, Table 1 shows that the DMPP dose tested in Experiment 1 was 72 kg N/ha (20% of totalN) and was comparable to the DMPP amount applied in Experiment 2 (75 kg N/ha; 25% of total N).Both the N dose and the N percentage are reported in Table 1 for each fertilizer.

Agronomy 2020, 10, 1827 4 of 19
Table 1. Description of the fertilization treatments applied in the three experiments and total cost of fertilizers.
Treatment Short DescriptionTotal N Dose Base Fertilization Top-Dressing (Fertigation) Total Cost of
FertilizersTotal Cost ofN Fertilizers
kg N/ha (% total N)
kg N/ha kg N/ha (% Total N) NH4NO3 Ca(NO3)2 KNO3 €/ha
Experiment 1CON1 Growers’ practice 360 72 (20) as (NH4)2SO4 72 (20) 166 (46) 50 (14) 1887.04 1216.13
DMPP20 DMPP® 26.0.0 360 72 (20) as DMPP® 72 (20) 166 (46) 50 (14) 1874.51 1203.60CU20 CU 360 72 (20) as CU 72 (20) 166 (46) 50 (14) 1875.47 1204.56CU40 CU 360 144 (40) as CU 0 166 (46) 50 (14) 1898.95 1228.04
CU75-1 CU 360 270 (75) as CU 0 90 (25) 0 2002.21 1049.25
Experiment 2CON2 Growers’ practice 300 75 (25) as (NH4)2SO4 90 (30) 75 (25) 60 (20) 1624.54 1010.04
DMPP25 DMPP® 26.0.0 300 75 (25) as DMPP 90 (30) 75 (25) 60 (20) 1611.50 997.00CU50 CU 300 150 (50) as CU 15 (5) 75 (25) 60 (20) 1636.95 1022.45
CU75-2 CU 300 225 (75) as CU 0 75 (25) 0 1606.69 653.73
Experiment 3CON3 Growers’ practice 300 75 (25) as NH4NO3 90 (30) 75 (25) 60 (20) 1624.54 1010.04CUred CU reduced dose 225 150 (67) as CU 0 75 (33) 0 1475.88 522.92
The values between parentheses correspond to percentage of total N dose. CON: conventional treatment; DMPP: treatment with stabilized fertilizer; CU: treatment with coated urea.The total cost of N fertilizers and of all fertilizers were calculated using the following fertilizer prices: (NH4)2SO4: N = 21%, 400 €/ton; NH4NO3 with DMPP (ENTEC 26): N = 26% 450 €/ton;coated urea (Agrocote®Max); N = 44%, 750 €/ton; KH2PO4: P2O5 = 52%, K2O = 34%, 1760 €/ton; K2SO4: K2O = 52%, 880 €/ton; Ca(NO3)2: N = 15.5%, Ca = 26%, 540 €/ton. The fertilizerprices are referred to an end-user located in Tuscany (Italy) in 2018.

Agronomy 2020, 10, 1827 5 of 19
For both conventional and stabilized fertilizers, the high solubility limited the amount that couldbe applied as base fertilization to 75 kg N/ha, to prevent detrimental salinity effects on the crop.In contrast, with the controlled-release CU fertilizer higher doses could be applied, up to 270 kg N/ha.The outcome of Experiment 1 was used to tune the conditions of the subsequent trial and, as in springno significant effect was observed on the production with the CU20 treatment, higher CU doses wereemployed in autumn. In addition, at least 75 kg N/ha was applied in all the treatments as calciumnitrate. This amount was never decreased in the three experiments, to allow a sufficient calcium supplyto the plants and ensure a correct calcium nutrition, preventing the occurrence of the blossom-endrot. For the CUred treatment, which employed a reduced N dose, the above amount of Ca(NO3)2
represented 33% of total N applied (Table 1).In all the experiments, both N and water balance of the tomato culture were evaluated for each
fertilization treatment. Inside the greenhouse, the plants were grown in lysimeters to enable reliabledetermination of water and N status in the growing system. Each lysimeter hosted four plants andconsisted of a 200 L plastic tank (75 × 53 cm, height 50 cm), containing 20 L (5 cm) pumice layerat the bottom to ensure correct drainage. The pumice layer was topped off with 160 L sandy soiland peat (40 cm depth; 60:40 volume ratio; 1.2 kg/L specific weight). Along with the results of soilanalyses, the main climatic parameters of the three experiments are reported in Table 2. The greenhouseheating guaranteed a minimum inner air temperature of 12.5 ◦C. Global radiation, air temperature,soil temperature at 15 cm depth and relative humidity (RH) were recorded every ten minutes by aclimate station equipped with three different probes for soil temperature, connected to a database(Econorma, Treviso, Italy). The recorded values were used to calculate the cumulative radiationand the average daily values of RH, soil temperature and air temperature. The cumulative soiltemperature was obtained by the sum of the values of daily average soil temperature recorded in eachexperimental period.
In each experiment, a zero-N fertilization treatment with the same levels of the other nutrients wasalso included for the assessment of N use efficiency. Although this is normally the control treatmentin agronomic experiments, the main goal of the present study was to evaluate the effect of differentfertilization strategies on the reduction of N leachate as compared with conventional fertilization.For this reason, the conventional treatment rather than the zero-N treatment was regarded as thecontrol in our experiments.
After transplanting and until the end of the experimental period, each treatment was fertigatedwith nutrient solution to ensure a proper supply of all the macro- and micronutrients to the plants.Along with N, all the treatments of the three experiments received the same total amounts of phosphorus(P) and potassium (K), which were 1.4 and 12 g/plant, respectively (equivalent to 96 kg/ha P2O5 and433 kg/ha K2O). These P and K doses are commonly used by the greenhouse growers in Italy and wereeither applied as base fertilizers or supplied by fertigation. The total calcium supply ranged from60 mg/L (that is the concentration in the irrigation water) to 150 mg/L. The latter value was reachedonly when calcium nitrate was used as a N source to prevent the occurrence of the blossom-end rot.The concentrations of the other elements in the nutrient solution were the following (mg/L): Mg 30;Na 230; Cl 320; Fe 2; B 0.27; Cu 0.24; Zn 0.29; Mn 0.55 and Mo 0.05. Depending on the treatment and onthe phenological phase, different amounts of inorganic N fertilizers were added when necessary to thenutrient solution (Table 1) to achieve the same final N dose in each treatment. Specifically, NH4NO3
was supplied from transplanting until the blooming of the second truss, Ca(NO3)2 was employed untilthe ripening of the first truss and KNO3 was added during the ripening stage, until the end of theexperiment. The irrigation was generally applied twice a day, according to the climate conditions andthe canopy development, in the same amount for all the treatments investigated.
The tomato plantlets were transplanted at the stage of six-seven true leaves, which in the threeexperiments corresponded to a different plant age (50–30 days), depending on the thermal growingconditions. Similarly, the end of the experimental period corresponded to the harvest of the fourthtruss in Experiment 1 or to the harvest of the third truss otherwise.

Agronomy 2020, 10, 1827 6 of 19
Table 2. Climate and soil parameters measured in the three experiments. Temperature, humidity andradiation are reported as the average values inside the greenhouse during the whole experimental period.Soil parameters are reported as the initial values immediately before the beginning of each experiment.
Parameter Experiment 1Spring 2015
Experiment 2Autumn 2015
Experiment 3Summer/Autumn 2016
Growing period 20 March–7 July 2015 21 September 2015–28 January 2016 22 August–1 December 2016
Daily mean air temperature (◦C) 22.7 ± 5.5 16.4 ± 3.9 20.4 ± 4.2
Daily mean soil temperature (◦C) 22.4 ± 5.4 17.3 ± 3.9 20.7 ± 4.2
Air and soil temperature range (◦C) 15–32 11–26 14–28
Cumulative average daily soil temperature (◦C) 2459.9 ± 96.7 2245.8 ± 67.4 2079.1 ± 62.3
Relative humidity (%) 62.7 ± 7.7 79.6 ± 10.7 77.9 ± 11.4
Average daily global radiation (MJ/m2·day) 10.5 ± 3.6 2.4 ± 0.7 5.0 ± 1.6
Cumulative global radiation (MJ/m2) 1151.7 ± 43.8 299.9 ± 9.0 506.3 ± 15.2
pH 8.1 ± 0.1 6.8 ± 0.1 7.0 ± 0.1
Electrical Conductivity (mS/cm at 25 ◦C) 0.22 ± 0.08 0.29 ± 0.06 0.39 ± 0.08
Nitrate (mg NO3−/kg) 20 ± 2 28 ± 2 33 ± 4
Ammonium (mg NH4+/kg) 1.2 ± 0.2 7.0 ± 0.2 8.0 ± 0.3
Exchangeable Potassium(mg K2O/kg) 140 ± 7 136 ± 5 129 ± 9
Exchangeable Calcium(mg Ca/kg) 2112 ± 11 2258 ± 13 2295 ± 13
Exchangeable Magnesium (mg Mg/kg) 80 ± 8 110 ± 8 91 ± 7
Assimilable Phosphorous (mg P2O5/kg) 76 ± 6 77 ± 6 70 ± 7
Assimilable Iron (mg Fe/kg) 388 ± 10 334 ± 16 388 ± 15
Assimilable Manganese (mg Mn/kg) 204 ± 8 215 ± 10 226 ± 11
Assimilable Zinc (mg Zn/kg) 6.0 ± 0.1 4.3 ± 0.5 6.2 ± 0.7
Assimilable Copper (mg Cu/kg) 5.9 ± 0.4 2.11 ± 0.02 3.20 ± 0.02
Soluble Boron (mg B/kg) 0.45 ± 0.04 0.21 ± 0.02 0.35 ± 0.04
Organic matter content (%) 2.31 ± 0.12 1.44 ± 0.10 4.15 ± 0.15
C/N 33.6 ± 0.6 14.0 ± 0.4 17.2 ± 0.2
Cationic Exchange Capacity (meq/100 g) 12.8 ± 1.0 11.6 ± 0.5 15.4 ± 1.1
Clay (%) 11.6 ± 0.9 6.2 ± 0.6 7.6 ± 0.8
Silt (%) 20.8 ± 1.2 20.5 ± 1.9 19.9 ± 1.1
Sand (%) 67.6 ± 2.1 73.3 ± 1.1 72.5 ± 2.2
Mean values ± standard deviation. n = 5 in Experiment 1; n = 3 in Experiment 2 and Experiment 3.
2.2. Analyses of Water, Soil, CU Granules and Plant Tissue Samples
The average values of the climate parameters (RH, air and soil temperature, cumulated globalradiation) were recorded daily. Nitrogen was contained as urea in CU granules and in differentchemical forms in water, soil and tissue samples. A summary of N determinations and analyticalassays used can be found in Table 3.
Due to the autumn climate conditions, in both Experiments 2 and 3 the growing cycle waslonger than in spring, while the crop evapotranspiration and the plant growth were stronglyreduced. Therefore, an increase of the water collection period was necessary to maintain thesame number of drainage samplings as Experiment 1. The cumulated drainage water was sampledfrom each container every 7–10 days in Experiment 1 and every 13–15 days in Experiment 2 andExperiment 3. The water samples were filtered on Whatman qualitative filter paper and analysed forthe concentrations of nitrate (salicylic acid method) [30]; ammoniacal N (indophenol method) [31] andureic N (enzymatic assay using a commercial kit; Megazyme International, Wicklow, Ireland). All theabsorbance measurements were carried out using a Lambda35 UV-vis double beam spectrophotometer(Perkin Elmer, Waltham, MA, USA).
The soil samples were dehydrated at 40 ◦C in a ventilated oven and sieved to separate intact CUgranules. The dried soil samples were extracted with water, 1 M KCl, 0.5 N NaHCO3 at pH 8.5 or1 N CH3COONH4 at pH 7.0, respectively, for the spectrophotometric determinations of nitrate [30],ammoniacal N [31] and available P [32] and for the assessment of exchangeable K by atomic absorption

Agronomy 2020, 10, 1827 7 of 19
spectroscopy (AAS) [33]. In all cases, a 1:2 w/v extraction ratio was used. The total organic matter andthe other soil parameters reported in Table 2 were assessed according to official methods the ItalianMinistry of Agriculture and Forestry [34].
Table 3. Analytical assays used to determine nitrogen concentration in samples of water, soil, coatedurea fertilizer and plant tissues in the three experiments.
Sample Fraction of Total N Determination Chemical Form
Cumulated water drainage
Ureic Enzyme kit (urease) Urea
Nitric Spectrophotometric assay(nitrosalycilate method) Nitrate
Ammoniacal Spectrophotometric assay(substituted indophenol method) Ammonium + Ammonia
Soil
Ureic Enzyme kit (urease) Urea
Reduced Kjeldahl method Organic + Ammonium + Ammonia
Nitric Spectrophotometric assay(nitrosalycilate method) Nitrate
Mineral Nitrate + Ammoniacal N Nitrate + Ammonium + Ammonia
Total Reduced + Nitrate Organic + Nitrate + Ammonium + Ammonia
Coated urea fertilizerUreic Enzyme kit (urease) Urea
Ammoniacal Spectrophotometric assay(substituted indophenol method) Ammonium + Ammonia
Plant tissues
Nitric Spectrophotometric assay(nitrosalycilate method) Nitrate
Reduced Kjeldahl method Organic + Ammonium + Ammonia
Organic Reduced − Ammoniacal N-containing organic compounds including urea
Total Reduced + Nitrate Organic + Nitrate + Ammonium + Ammonia
The N amount retained by the coated urea granules was determined in all the CU treatments.At the beginning of each experiment, 2 g aliquots of the coated fertilizer were wrapped in net fabricbefore application to each lysimeter. Every 30 days during the cultivation period (for Experiments1 and 2) and at the end of the cultivation period (for all three experiments), the wrappings wereremoved from the soil to collect the residual granules, which were gently washed with distilled water,oven-dried at 70 ◦C and powdered with mortar and pestle. The powder was dispersed into 200 mLdistilled water and the filtered solution was analysed for the concentration of urea. For each cultivationperiod, the N release by the coated fertilizer was evaluated by the difference between the initial andfinal ureic-N amounts in the net-wrapped granules.
All the plant samples were dried in a ventilated oven at 70 ◦C till constant weight and ground in amill to a fine powder. The crop yield was determined as the number and fresh weight of the fruits,which were picked weekly and divided into marketable and nonmarketable categories. To evaluatethe quality of the production, four fruits from different plants were collected from each lysimeter in themiddle of the harvesting period and were homogenized in a mixer. Part of each homogenized samplewas oven-dried for dry matter determination; the remaining material was centrifuged, and the resultingjuice was analysed for pH, EC, total soluble solids (determined by refractometry and expressed as◦Brix) and total titratable acidity (determined by acid-base titration with 0.1 M sodium hydroxideand expressed as g citric acid in 100 mL juice). The shoot dry biomass production was determinedat the end of each experiment. All the dry tissue samples were analysed for their contents of nitric,ammoniacal and reduced N, as described previously for soil samples.
2.3. Calculation of N and Water Balance Sheet and N Use Efficiency
A balance sheet for both water and N was computed for each treatment and experiment. Waterevapotranspiration was calculated as the difference between water supply and water drainage(both measured); the leaching fraction was computed as the ratio between water drainage and watersupply. The computation of N balance was based on the available amount during cultivation (initiallycontained in the soil or supplied through fertilization) and the amount that was actually removed

Agronomy 2020, 10, 1827 8 of 19
(leached or absorbed by the plants) or remained in the soil at the end of the experiments. The amountsof fertilizers were weighed using a technical balance with 0.1 g precision and 1.0 kg/ha was cautiouslyassumed as the standard deviation for the total N applied. Soil mineral N was evaluated as the sum ofnitric and ammoniacal N (Table 3) and was assessed both at the beginning (prior to base fertilization)and the end of each experiment. The total N amount of the system at the end of the experiment(N output) was evaluated as the sum of the N fractions that were absorbed by the plants, were lost byleaching, remained in the soil as mineral N or remained in the CU granules as residual urea. The finalamount of urea in the soil was negligible (less than 0.1 mg/kg), due to both the controlled release bythe CU fertilizer and to the fast leaching and mineralization processes that urea undergoes in soils [35].The total N amount available during the growing period (N input) was calculated as the sum of theinitial mineral amount in the soil and the amount applied with fertilizers, both as base fertilization andwith fertigation (total N supplied). Based on the results of the zero-N treatments, some nitrogen useefficiency (NUE) indexes were calculated according to [36,37], using the following formulas:
Agronomic Efficiency (AE) = (Y − Y0)/F
Partial Factor Productivity (PFP) = Y/F
Apparent Recovery Efficiency by difference (REC) = (U − U0)/F
Physiological Efficiency (PE) = (Y − Y0)/(U − U0)
where Y and Y0 (g/m2 on a fresh weight basis) are the tomato yields with and without N fertilization,respectively; F is the total N supplied (g N/m2) and U and U0 (g N/m2) are the N contents in fruits withand without N fertilization, respectively.
2.4. Statistical Analysis
A completely randomized design was adopted. As the statistical variability of the data wasinitially unknown, in Experiment 1 five replicates (lysimeters) were prudentially arranged. Based onthe results of the first experiment, the number of replicates could be reasonably reduced to threein the subsequent trials to obtain an adequate statistical discrimination and limit the cost of datacollection. Each replicate consisted of four tomato plants. The collected data were tested for normalityand homoschedasticity by means of the Shapiro–Wilk’s and Levene’s test, respectively. The datawere subjected to one-way ANOVA and the mean values were compared by Tukey test using theStatgraphics Plus 5.1 software (StatPoint, Inc., Herndon, VA, USA).
3. Results
For all the experiments, Table 4 reports the water balance, Table 5 shows the biomass and Ndistribution in different plant tissues and Table 6 reports the data concerning the yield and quality ofthe tomato production obtained with the different treatments. The N balance for the three experimentsis reported in Table 7. Table 8 reports the NUE indexes that were calculated from the tomato yield(Y0; kg/m2 on a fresh weight basis) and the N content of fruits (U0; g N/m2) obtained without Nfertilization (zero-N treatment).
In all the treatments, only negligible amounts of urea and ammonium (0–0.08 g N/m2) weredetected in the drainage water. Thus, N leached from the soil was almost completely in the form ofnitrate ion.
In Experiment 1, the water balance was similar for the CON1, DMPP20 and CU20 treatments,while a higher water drainage and leaching fraction along with a lower evapotranspiration wereobserved for CU40 and CU75-1 treatments (Table 4). Both the dry biomass and the N concentrationin the tissues were affected by N fertilization. Compared with CON1, all the treatments exceptCU20 increased the dry biomass of fruits. In addition, both CU40 and CU75-1 increased the fruit N
Agronomy 2020, 10, 1827 9 of 19
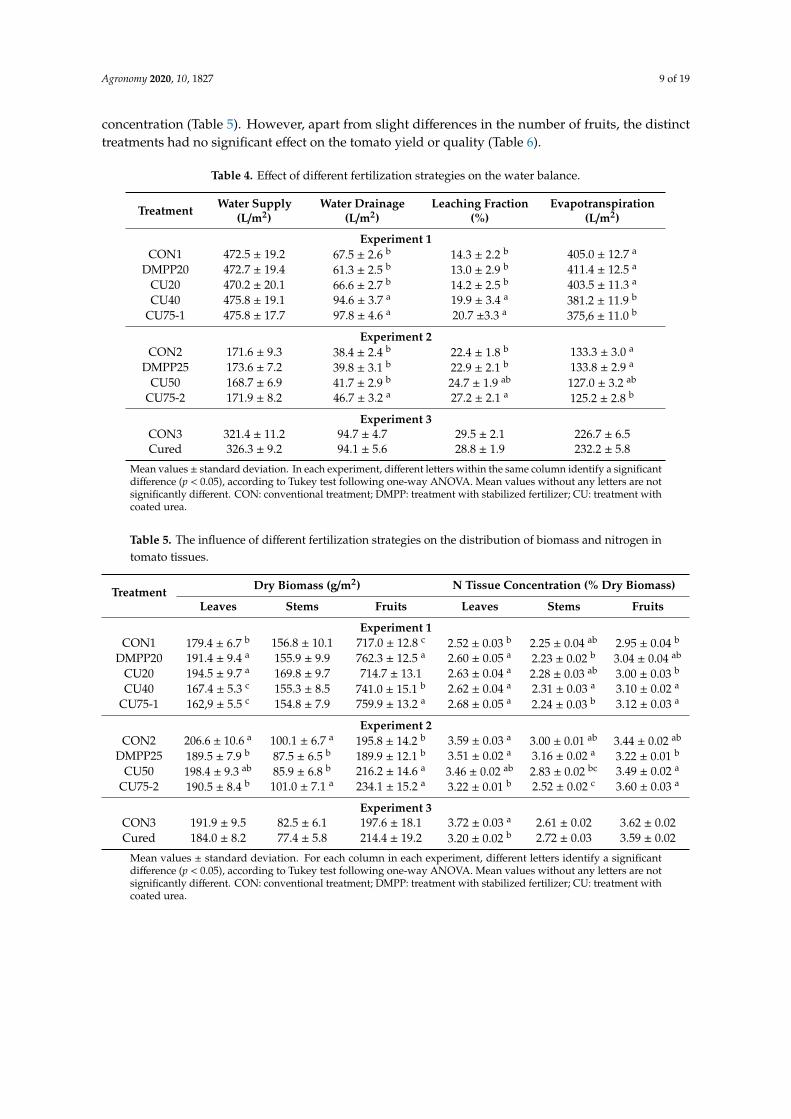
concentration (Table 5). However, apart from slight differences in the number of fruits, the distincttreatments had no significant effect on the tomato yield or quality (Table 6).
Table 4. Effect of different fertilization strategies on the water balance.
Treatment Water Supply(L/m2)
Water Drainage(L/m2)
Leaching Fraction(%)
Evapotranspiration(L/m2)
Experiment 1CON1 472.5 ± 19.2 67.5 ± 2.6 b 14.3 ± 2.2 b 405.0 ± 12.7 a
DMPP20 472.7 ± 19.4 61.3 ± 2.5 b 13.0 ± 2.9 b 411.4 ± 12.5 a
CU20 470.2 ± 20.1 66.6 ± 2.7 b 14.2 ± 2.5 b 403.5 ± 11.3 a
CU40 475.8 ± 19.1 94.6 ± 3.7 a 19.9 ± 3.4 a 381.2 ± 11.9 b
CU75-1 475.8 ± 17.7 97.8 ± 4.6 a 20.7 ±3.3 a 375,6 ± 11.0 b
Experiment 2CON2 171.6 ± 9.3 38.4 ± 2.4 b 22.4 ± 1.8 b 133.3 ± 3.0 a
DMPP25 173.6 ± 7.2 39.8 ± 3.1 b 22.9 ± 2.1 b 133.8 ± 2.9 a
CU50 168.7 ± 6.9 41.7 ± 2.9 b 24.7 ± 1.9 ab 127.0 ± 3.2 ab
CU75-2 171.9 ± 8.2 46.7 ± 3.2 a 27.2 ± 2.1 a 125.2 ± 2.8 b
Experiment 3CON3 321.4 ± 11.2 94.7 ± 4.7 29.5 ± 2.1 226.7 ± 6.5Cured 326.3 ± 9.2 94.1 ± 5.6 28.8 ± 1.9 232.2 ± 5.8
Mean values ± standard deviation. In each experiment, different letters within the same column identify a significantdifference (p < 0.05), according to Tukey test following one-way ANOVA. Mean values without any letters are notsignificantly different. CON: conventional treatment; DMPP: treatment with stabilized fertilizer; CU: treatment withcoated urea.
Table 5. The influence of different fertilization strategies on the distribution of biomass and nitrogen intomato tissues.
Treatment Dry Biomass (g/m2) N Tissue Concentration (% Dry Biomass)
Leaves Stems Fruits Leaves Stems Fruits
Experiment 1CON1 179.4 ± 6.7 b 156.8 ± 10.1 717.0 ± 12.8 c 2.52 ± 0.03 b 2.25 ± 0.04 ab 2.95 ± 0.04 b
DMPP20 191.4 ± 9.4 a 155.9 ± 9.9 762.3 ± 12.5 a 2.60 ± 0.05 a 2.23 ± 0.02 b 3.04 ± 0.04 ab
CU20 194.5 ± 9.7 a 169.8 ± 9.7 714.7 ± 13.1 2.63 ± 0.04 a 2.28 ± 0.03 ab 3.00 ± 0.03 b
CU40 167.4 ± 5.3 c 155.3 ± 8.5 741.0 ± 15.1 b 2.62 ± 0.04 a 2.31 ± 0.03 a 3.10 ± 0.02 a
CU75-1 162,9 ± 5.5 c 154.8 ± 7.9 759.9 ± 13.2 a 2.68 ± 0.05 a 2.24 ± 0.03 b 3.12 ± 0.03 a
Experiment 2CON2 206.6 ± 10.6 a 100.1 ± 6.7 a 195.8 ± 14.2 b 3.59 ± 0.03 a 3.00 ± 0.01 ab 3.44 ± 0.02 ab
DMPP25 189.5 ± 7.9 b 87.5 ± 6.5 b 189.9 ± 12.1 b 3.51 ± 0.02 a 3.16 ± 0.02 a 3.22 ± 0.01 b
CU50 198.4 ± 9.3 ab 85.9 ± 6.8 b 216.2 ± 14.6 a 3.46 ± 0.02 ab 2.83 ± 0.02 bc 3.49 ± 0.02 a
CU75-2 190.5 ± 8.4 b 101.0 ± 7.1 a 234.1 ± 15.2 a 3.22 ± 0.01 b 2.52 ± 0.02 c 3.60 ± 0.03 a
Experiment 3CON3 191.9 ± 9.5 82.5 ± 6.1 197.6 ± 18.1 3.72 ± 0.03 a 2.61 ± 0.02 3.62 ± 0.02Cured 184.0 ± 8.2 77.4 ± 5.8 214.4 ± 19.2 3.20 ± 0.02 b 2.72 ± 0.03 3.59 ± 0.02
Mean values ± standard deviation. For each column in each experiment, different letters identify a significantdifference (p < 0.05), according to Tukey test following one-way ANOVA. Mean values without any letters are notsignificantly different. CON: conventional treatment; DMPP: treatment with stabilized fertilizer; CU: treatment withcoated urea.

Agronomy 2020, 10, 1827 10 of 19
Table 6. The influence of different fertilization strategies on yield and quality of the tomato crop.
Fruit Production Fruit Quality
Treatment Fruit Yield (kg/m2)Fruit Amount(n◦ Fruits/m2)
Average FruitWeight
(gFW/Fruit)
Fruit DryMatter
Content (%)pH EC
(dS/m)
Total SolubleSolids(◦Brix)
TitratableAcidity(g Citric
Acid/100 mL)Total MarketQuality Total Market
Quality
Experiment 1CON1 12.8 ± 0.68 9.8 ± 0.9 59.0 ± 1.4 b 39.5 ± 1.6 ab 247.8 ± 22.1 5.60 ± 0.11 4.17 ± 0.04 5.23 ± 0.20 4.65 ± 0.20 0.57 ± 0.03
DMPP20 13.8 ± 0.79 10.4 ± 1.1 63.2 ± 2.2 ab 39.2 ± 1.5 ab 265.6 ± 28.2 5.52 ± 0.09 4.14 ± 0.03 5.14 ± 0.19 4.62 ± 0.23 0.58 ± 0.04CU20 12.7 ± 0.71 9.8 ± 0.7 59.5 ± 1.8 ab 38.5 ± 1.6 b 255.3 ± 20.5 5.63 ± 0.15 4.14 ± 0.03 5.37 ± 0.24 4.45 ± 0.21 0.57 ± 0.04CU40 13.4 ± 0.82 10.7 ± 0.8 65.7 ± 2.1 a 43.0 ± 2.9 a 248.8 ± 20.5 5.53 ± 0.10 4.16 ± 0.04 5.28 ± 0.21 4.57 ± 0.25 0.58 ± 0.05CU75 13.5 ± 0.87 10.8 ± 0.9 64.6 ± 1.9 a 42.2 ± 3.1 a 254.7 ± 21.1 5.63 ± 0.14 4.15 ± 0.02 5.36 ± 0.25 4.63 ± 0.22 0.59 ± 0.06
Experiment 2CON2 4.21 ± 0.21 b 3.80 ± 0.31 b 33.5 ± 4.1 26.3 ± 2.4 b 144.8 ± 9.7 b 4.65 ± 0.08 4.42 ± 0.03 b 6.22 ± 0.34 b 4.10 ± 0.14 b 0.40 ± 0.03
DMPP25 4.04 ± 0.23 b 3.85 ± 0.41 b 33.8 ± 3.8 25.3 ± 2.5 b 152.5 ± 10.6 ab 4.70 ± 0.11 4.41 ± 0.03 b 6.87 ± 0.32 ab 4.40 ± 0.18 ab 0.45 ± 0.04CU50 4.70 ± 0.31 ab 4.30 ± 0.35 ab 33.8 ± 3.9 27.3 ± 2.9 ab 155.0 ± 10.3 ab 4.60 ± 0.09 4.40 ± 0.04 b 6.65 ± 0.34 b 3.98 ± 0.14 b 0.42 ± 0.03CU75 4.99 ± 0.33 a 4.70 ± 0.35 a 37.2 ± 4.2 30.0 ± 3.1 a 156.7 ± 10.1 a 4.69 ± 0.10 4.52 ± 0.04 a 7.54 ± 0.41 a 4.50 ± 0.15 a 0.41 ± 0.04
Experiment 3CON3 4.39 ± 0.19 3.77 ± 0.28 38.3 ± 3.9 26.3 ± 2.5 143.6 ± 10.9 4.50 ± 0.13 3.90 ± 0.04 5.23 ± 0.25 4.47 ± 0.09 0.73 ± 0.06CUred 4.64 ± 0.18 4.08 ± 0.31 36.0 ± 3.7 28.8 ± 2.6 141.9 ± 11.2 4.62 ± 0.15 3.86 ± 0.05 5.14 ± 0.30 4.49 ± 0.07 0.65 ± 0.07
Mean values ± standard deviation. For each parameter in each experiment, different letters identify a significant difference (p < 0.05), according to Tukey test following one-way ANOVA.Mean values without any letters are not significantly different. CON: conventional treatment; DMPP: treatment with stabilized fertilizer; CU: treatment with coated urea. FW: fresh weight;EC: electrical conductivity.
Agronomy 2020, 10, 1827 11 of 19
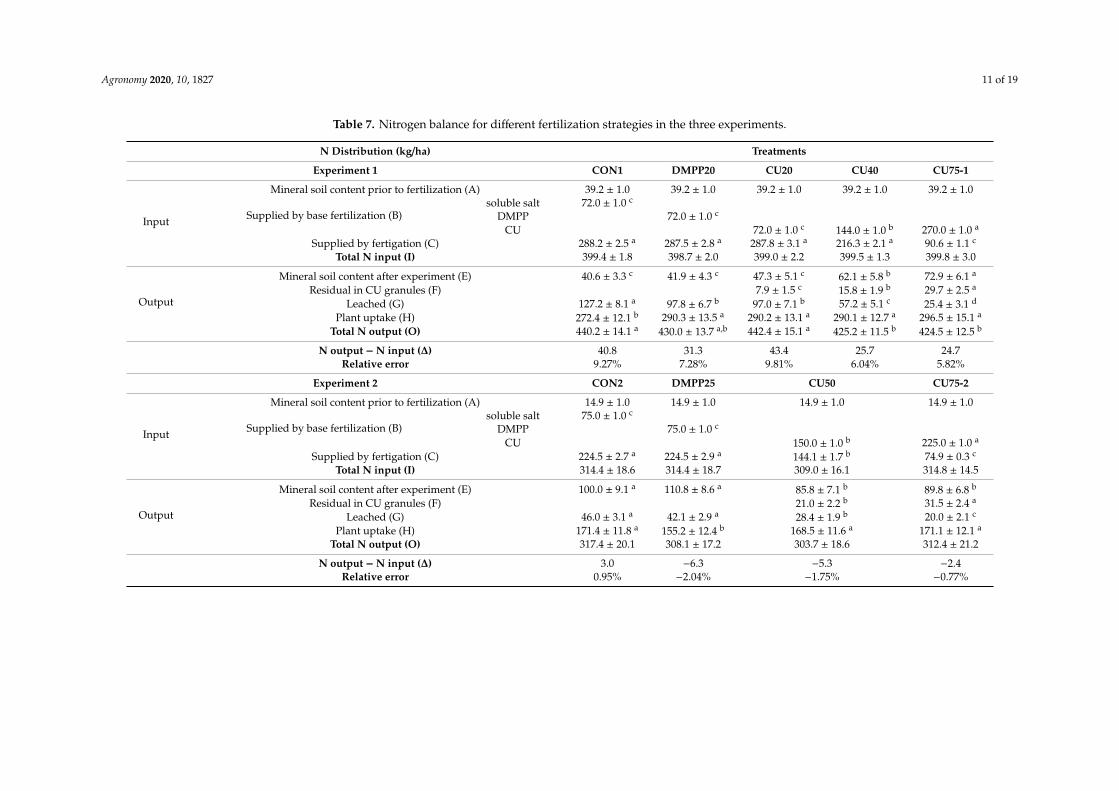
Table 7. Nitrogen balance for different fertilization strategies in the three experiments.
N Distribution (kg/ha) Treatments
Experiment 1 CON1 DMPP20 CU20 CU40 CU75-1
Input
Mineral soil content prior to fertilization (A) 39.2 ± 1.0 39.2 ± 1.0 39.2 ± 1.0 39.2 ± 1.0 39.2 ± 1.0
Supplied by base fertilization (B)soluble salt 72.0 ± 1.0 c
DMPP 72.0 ± 1.0 c
CU 72.0 ± 1.0 c 144.0 ± 1.0 b 270.0 ± 1.0 a
Supplied by fertigation (C) 288.2 ± 2.5 a 287.5 ± 2.8 a 287.8 ± 3.1 a 216.3 ± 2.1 a 90.6 ± 1.1 c
Total N input (I) 399.4 ± 1.8 398.7 ± 2.0 399.0 ± 2.2 399.5 ± 1.3 399.8 ± 3.0
Output
Mineral soil content after experiment (E) 40.6 ± 3.3 c 41.9 ± 4.3 c 47.3 ± 5.1 c 62.1 ± 5.8 b 72.9 ± 6.1 a
Residual in CU granules (F) 7.9 ± 1.5 c 15.8 ± 1.9 b 29.7 ± 2.5 a
Leached (G) 127.2 ± 8.1 a 97.8 ± 6.7 b 97.0 ± 7.1 b 57.2 ± 5.1 c 25.4 ± 3.1 d
Plant uptake (H) 272.4 ± 12.1 b 290.3 ± 13.5 a 290.2 ± 13.1 a 290.1 ± 12.7 a 296.5 ± 15.1 a
Total N output (O) 440.2 ± 14.1 a 430.0 ± 13.7 a,b 442.4 ± 15.1 a 425.2 ± 11.5 b 424.5 ± 12.5 b
N output − N input (∆) 40.8 31.3 43.4 25.7 24.7Relative error 9.27% 7.28% 9.81% 6.04% 5.82%
Experiment 2 CON2 DMPP25 CU50 CU75-2
Input
Mineral soil content prior to fertilization (A) 14.9 ± 1.0 14.9 ± 1.0 14.9 ± 1.0 14.9 ± 1.0
Supplied by base fertilization (B)soluble salt 75.0 ± 1.0 c
DMPP 75.0 ± 1.0 c
CU 150.0 ± 1.0 b 225.0 ± 1.0 a
Supplied by fertigation (C) 224.5 ± 2.7 a 224.5 ± 2.9 a 144.1 ± 1.7 b 74.9 ± 0.3 c
Total N input (I) 314.4 ± 18.6 314.4 ± 18.7 309.0 ± 16.1 314.8 ± 14.5
Output
Mineral soil content after experiment (E) 100.0 ± 9.1 a 110.8 ± 8.6 a 85.8 ± 7.1 b 89.8 ± 6.8 b
Residual in CU granules (F) 21.0 ± 2.2 b 31.5 ± 2.4 a
Leached (G) 46.0 ± 3.1 a 42.1 ± 2.9 a 28.4 ± 1.9 b 20.0 ± 2.1 c
Plant uptake (H) 171.4 ± 11.8 a 155.2 ± 12.4 b 168.5 ± 11.6 a 171.1 ± 12.1 a
Total N output (O) 317.4 ± 20.1 308.1 ± 17.2 303.7 ± 18.6 312.4 ± 21.2
N output − N input (∆) 3.0 −6.3 −5.3 −2.4Relative error 0.95% −2.04% −1.75% −0.77%
Agronomy 2020, 10, 1827 12 of 19
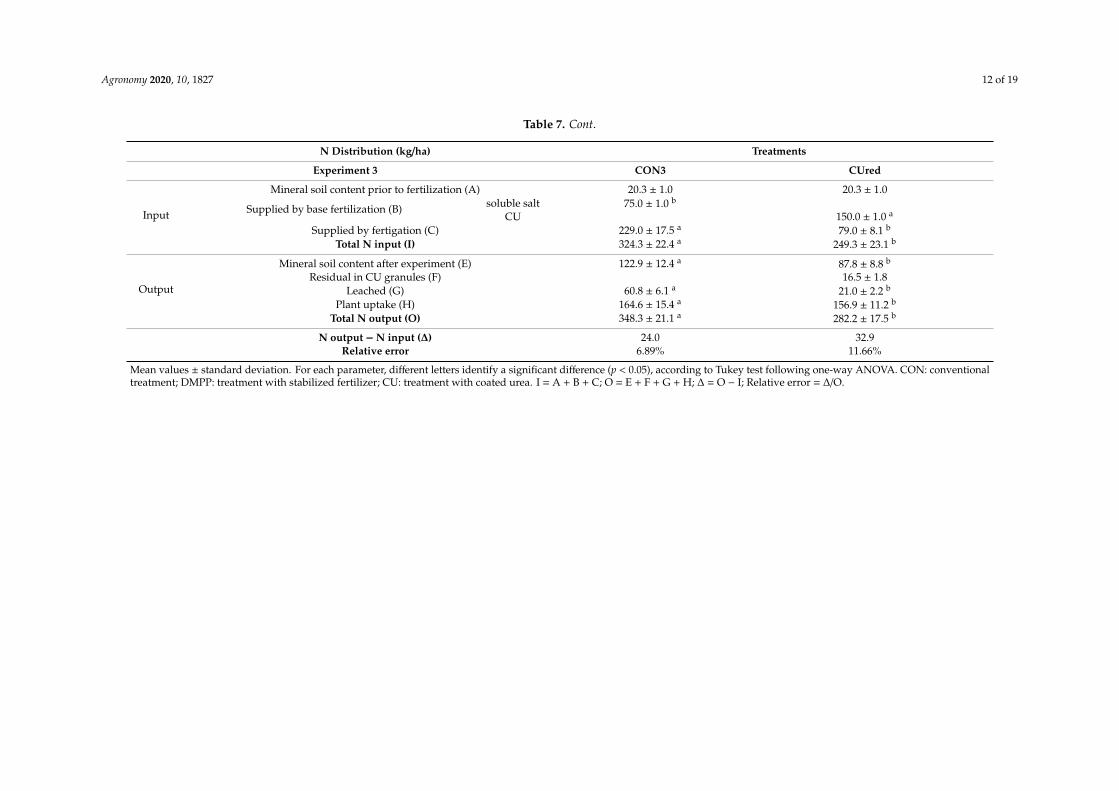
Table 7. Cont.
N Distribution (kg/ha) Treatments
Experiment 3 CON3 CUred
Input
Mineral soil content prior to fertilization (A) 20.3 ± 1.0 20.3 ± 1.0
Supplied by base fertilization (B) soluble salt 75.0 ± 1.0 b
CU 150.0 ± 1.0 a
Supplied by fertigation (C) 229.0 ± 17.5 a 79.0 ± 8.1 b
Total N input (I) 324.3 ± 22.4 a 249.3 ± 23.1 b
Output
Mineral soil content after experiment (E) 122.9 ± 12.4 a 87.8 ± 8.8 b
Residual in CU granules (F) 16.5 ± 1.8Leached (G) 60.8 ± 6.1 a 21.0 ± 2.2 b
Plant uptake (H) 164.6 ± 15.4 a 156.9 ± 11.2 b
Total N output (O) 348.3 ± 21.1 a 282.2 ± 17.5 b
N output − N input (∆) 24.0 32.9Relative error 6.89% 11.66%
Mean values ± standard deviation. For each parameter, different letters identify a significant difference (p < 0.05), according to Tukey test following one-way ANOVA. CON: conventionaltreatment; DMPP: treatment with stabilized fertilizer; CU: treatment with coated urea. I = A + B + C; O = E + F + G + H; ∆ = O − I; Relative error = ∆/O.

Agronomy 2020, 10, 1827 13 of 19
Table 8. Nitrogen use efficiency indexes calculated from the data collected in the three experiments.
FertilizationTreatment
AE(g FW/g N)
PFP(g FW/g N)
REC(g N/g N)
PE(g FW/g N)
Experiment 1CON1 306.7 ± 15.4 355.0 ± 20.3 0.54 ± 0.05 b 568.5 ± 31.9
DMPP20 333.9 ± 20.1 382.2 ± 22.2 0.58 ± 0.04 a,b 576.9 ± 40.2CU20 303.1 ± 15.1 351.4 ± 21.5 0.57 ± 0.03 b 534.1 ± 35.1CU40 323.9 ± 16.2 372.2 ± 26.4 0.59 ± 0.04 a 548.9 ± 21.3
CU75-1 325.3 ± 18.3 373.6 ± 25.1 0.61 ± 0.05 a 532.8 ± 19.2
Experiment 2CON2 102.39 ± 8.6 b 134.3 ± 10.2 b,c 0.19 ± 0.02 b,c 537.7 ± 23.5
DMPP25 96.97 ± 5.9 b 128.9 ± 12.3 c 0.17 ± 0.02 c 568.2 ± 27.2CU50 120.09 ± 12.5 a 152.6 ± 14.1 a,b 0.22 ± 0.03 a,b 544.9 ± 21.1
CU75-2 125.84 ± 10.6 a 157.7 ± 12.0 a 0.24 ± 0.04 a 515.0 ± 20.9
Experiment 3CON3 114.8 ± 10.4 b 144.4 ± 16.1 b 0.21 ± 0.03 b 536.9 ± 21.5CUred 163.3 ± 12.6 a 202.6 ± 20.1 a 0.31 ± 0.04 a 530.5 ± 20.1
Mean values ± standard deviation. For each index and each experiment, a different letter indicates a significantdifference, according to Tukey test following one-way ANOVA (p < 0.05). Mean values without any letters are notsignificantly different. Y0: tomato yield; U0: nitrogen content in fruits; AE: agronomic efficiency; PFP: partial factorproductivity; REC: Apparent recovery efficiency by difference; PE: physiological efficiency; FW: fresh weight; CON:conventional treatment; DMPP: treatment with stabilized fertilizer; CU: treatment with coated urea. The values of Y0(kg FW/m2) and U0 (g N/m2)used for the calculations were, respectively 1.74 ± 0.11 and 1.73 ± 0.15 in Experiment 1;1.00 ± 0.09 and 0.76 ± 0.08 in Experiment 2; 0.90 ± 0.07, and 0.65 ± 0.05 in Experiment 3.
Concerning the N balance (Table 7), the total N plant uptake was lower in CON1 than the othertreatments. The coated fertilizer (CU40 or CU75-1) was able to reduce N leaching by about 55% or 80%as compared to the control. The same effect was observed also for the DMPP20 and CU20 treatments,although to a lower extent (about 24% reduction). The soil contained always more mineral N at theend of the experiment than at the beginning, especially with the CU treatments that decreased N lossby leaching. However, in all the treatments the N output was higher than the N supplied. The RECindex was significantly higher with the CU40 and CU75-1 treatments than with the control, while nosignificant difference was observed for AE and PFP (Table 8).
In Experiment 2, the water balance for the DMPP25 treatment was similar to that of thecontrol. In contrast, both CU treatments exhibited the highest leaching fraction and the lowestevapotranspiration. Moreover, the CU75-2 produced the highest water drainage (Table 4). The differentfertilizers affected the distribution of both dry matter and N content among plant organs, although thedry biomass of the whole plants remained generally unchanged (Table 5). The best results for yieldand fruit quality were obtained with the CU75-2 treatment (Table 6). With the CU fertilizer, the totalN plant uptake resulted similar to that of the control, but higher than that of the DMPP25 treatment.In addition, the coated fertilizer reduced N leaching, determined higher values of all the agronomicalindexes and, in contrast with the outcome of Experiment 1, resulted in a lower final content of mineralN in the soil compared with the other treatments. At the end of Experiment 2, about 14% ureic N wasstill retained by the coated fertilizer (Tables 7 and 8).
The analysis of the CU granules during and at the end of the growing period gave similar resultsin both Experiments 1 and 2 (Figure 1). The N release into the soil by the CU fertilizer was temperature-rather than time-dependent and the whole set of data was fitted by an exponential-type function ofthe cumulative daily average soil temperature (thermal sum, X) with excellent correlation (r2 = 0.99,n = 30). Nevertheless, for N release values below 80%, the relationship could be well described(r2 = 0.95; n = 18) by the linear function (data not shown):
% N release = 3 + 0.05203 × X

Agronomy 2020, 10, 1827 14 of 19
Agronomy 2020, 10, x FOR PEER REVIEW 15 of 21
DMPP25 treatment. In addition, the coated fertilizer reduced N leaching, determined higher values of all the agronomical indexes and, in contrast with the outcome of Experiment 1, resulted in a lower final content of mineral N in the soil compared with the other treatments. At the end of Experiment 2, about 14% ureic N was still retained by the coated fertilizer (Table 7, Table 8).
The analysis of the CU granules during and at the end of the growing period gave similar resultsin both Experiments 1 and 2 (Figure 1). The N release into the soil by the CU fertilizer was temperature- rather than time-dependent and the whole set of data was fitted by an exponential-type function of the cumulative daily average soil temperature (thermal sum, X) with excellent correlation (r2 = 0.99, n = 30). Nevertheless, for N release values below 80%, the relationship could be welldescribed (r2 = 0.95; n = 18) by the linear function (data not shown): % N release 3 0.05203 X
Figure 1. Percentage of N released by the granules of coated urea (CU) in Experiments 1 and 2, as a function of the cumulative daily average soil temperature (thermal sum).
In Experiment 3, the CUred treatment exhibited a similar water balance as the control (Table 4) and produced similar fruit biomass and yield, without affecting the quality parameters or the N content of the fruits (Table 5, Table 6). The amount of N leached was almost 3-fold lower with the coated fertilizer and a decrease was also observed in both plant N uptake and soil mineral N at theend of the experiment. The analysis of the CU granules recovered at the end of the trial revealed that 11% ureic N had not been released into the soil. As in Experiment 2, higher values of AE, PFP and PEindexes were obtained with the coated fertilizer (Table 8).
4. Discussion
All the treatments received the same amount of irrigation water, apart from low dissimilaritiesdue to unavoidable inefficiencies in the irrigation system. The maximum differences in water supply were only 1.2% in Experiment 1, 3.0% in Experiment 2 and 1.5% in Experiment 3. Moreover, theleaching fraction was never lower than 13% (Table 4), which is indicative of a correct irrigation
Figure 1. Percentage of N released by the granules of coated urea (CU) in Experiments 1 and 2, as afunction of the cumulative daily average soil temperature (thermal sum).
In Experiment 3, the CUred treatment exhibited a similar water balance as the control (Table 4)and produced similar fruit biomass and yield, without affecting the quality parameters or the N contentof the fruits (Tables 5 and 6). The amount of N leached was almost 3-fold lower with the coatedfertilizer and a decrease was also observed in both plant N uptake and soil mineral N at the end of theexperiment. The analysis of the CU granules recovered at the end of the trial revealed that 11% ureic Nhad not been released into the soil. As in Experiment 2, higher values of AE, PFP and PE indexes wereobtained with the coated fertilizer (Table 8).
4. Discussion
All the treatments received the same amount of irrigation water, apart from low dissimilarities dueto unavoidable inefficiencies in the irrigation system. The maximum differences in water supply wereonly 1.2% in Experiment 1, 3.0% in Experiment 2 and 1.5% in Experiment 3. Moreover, the leachingfraction was never lower than 13% (Table 4), which is indicative of a correct irrigation regime. With theonly exception of the CUred treatment, all the treatments within the same experiment received thesame total N amount.
4.1. Effect on the Crop (Yield and Quality)
Table 6 shows that in all the experiments the use of the DMPP fertilizer did not significantlyaffect the tomato yield compared with the control treatment. In contrast, both the CU40 and CU75-1treatments in Experiment 1 improved the fruit amount and the CU75-2 treatment in Experiment 2improved both the yield and the tomato quality. Although the differences were not always significant,at the highest urea doses we observed an increasing trend in all the parameters of fruit production inboth Experiments 1 and 2. In each experiment, the different treatments did not affect the dry matterpercentage of the fruits (Table 6) and the dry weight of the whole plants was also generally unaffected(Table 5). On the other hand, a different weight distribution among plant organs was observed withthe different fertilizers; in Experiment 1, the leaf dry biomass was higher for the CON1 than for the

Agronomy 2020, 10, 1827 15 of 19
high dose CU treatments, and the same behaviour was observed in Experiment 2, where also the Nconcentrations of leaf and stem tissues were higher for CON2 than for the CU75-2 treatment (Table 5).This outcome indicated a lower vegetative vigour for the CU-treated plants, which could be due to areduced initial soil N availability and was consistent with a significantly lower evapotranspiration anda higher leaching fraction than those of the control and DMPP treatments (Table 4).
On the other hand, in Experiment 1 the application of coated urea at low concentration (CU20)produced a similar effect as DMPP20; although both treatments significantly lowered N leaching(Table 7), they determined an increase in leaf dry biomass and N concentration compared with CON1(Table 5). Nitrogen is the main constituent responsible for vegetative growth and top dressing wasinitially applied as NH4NO3 with both treatments (Table 1). Hence, this outcome suggested that theplants vegetative behaviour was not effectively limited, due to a ready N availability in the root zoneat the beginning of the growing period. In agreement with our findings, it was reported that in tomatohigh N levels increased plant vigour and delayed flower and fruit formation [38]. Similar results werereported also for different vegetable species, such as zucchini [39].
A limitation of plant vigour by the CU fertilizer was observed also in Experiments 2 and 3.Compared with CON2, the CU75-2 treatment increased both yield and fruit size and determined asimilar N uptake; to a lesser extent, the same behaviour was observed also for the CU50 treatment,thereby suggesting that application of the coated fertilizer did not affect the plants ability to take up Nfrom the soil. In Experiment 3, the reduction of the total N dose determined a strong decrease of Nleaching compared with the control; thus, despite a slightly lower N uptake, the CUred treatment didnot have any effect on the production (Tables 6 and 7).
4.2. N Use Efficiency and Agronomical Implications
In Experiment 1, all the values of the agronomical indexes were higher than the other trials,probably due to high light intensity conditions (approximately 5-fold higher than in Experiment 2)and high fruit yield during the spring season. In agreement with this outcome, [37,40] found that theREC index, which denotes the crop ability to absorb N from the soil, could be increased in processingtomato by good climatic conditions, since the crop could use more efficiently the N fertilizer available.Moreover, the lower ratio between crop N uptake and N supply that occurred in Experiments 2and 3 could have contributed to reduce the NUE indexes as compared with Experiment 1. Severalauthors [37,41,42] reported that the NUE starts to decline when the N supply exceeds the crop Nrequirement. In all the experiments, the physiological index PE was not influenced by the type offertilizer that was supplied to the plants (Table 8), indicating that the distinct treatments did not affectthe physiological processes of N uptake and use. On the other hand, except for the CU20 treatment,in all the experiments the REC index was higher with CU than with the other fertilizers. A similartrend was observed in Experiments 2 and 3 for AE and PFP. The substantial increase of the agronomicalindexes observed with the coated fertilizer can be explained by a higher fruit yield (Table 6), and inExperiment 3, by the reduction of the total N dose (Table 1). Several authors [7,43,44] reported NUEdata for distinct vegetable cropping systems, either under greenhouse or in open-air conditions. With afertilizer dose below 500 kg N/ha, the literature values of REC for greenhouse tomato ranged from 0.21to 0.33 [7], which is in good agreement with those reported in Table 8 for Experiments 2 and 3. It wasfound that, along with yield and quality, the NUE was improved in potato fertilized with controlledrelease urea [45]. Similar results were obtained in wheat [46] and rice [47].
One possible drawback of CU application is the time gap between N release and N plantuptake [26,27]. Generally, the controlled release fertilizers are characterized by a release period,that is the time interval necessary for a fertilizer granule to release 80% of the inner nutrient at afixed temperature (21 ◦C or 25 ◦C). Our study showed that the N release by the CU fertilizer waspositively correlated with the cumulative daily average soil temperature (thermal sum) rather thanwith the time elapsed from transplanting both in spring and in autumn (Figure 1), despite the dailyaverage temperature increased during the growing cycle in Experiment 1 and followed the opposite

Agronomy 2020, 10, 1827 16 of 19
trend in Experiment 2. As expected, the crop development and the N uptake were also increased byhigher temperatures in all the treatments. Therefore, the application of the CU fertilizer enabled usto effectively meet the plants nutritional needs, and our results demonstrated that the CU fertilizercould be used as the predominant N source, with simplification of the fertigation programs. However,to prevent a possible yield reduction due to calcium disorder (blossom-end rot), about 25–33% of thetotal N crop requirements should be beneficially satisfied by the application of calcium nitrate [48].
4.3. Effect on the Environment (N Leaching)
Compared with the conventional treatment, the use of DMPP fertilizer reduced N leaching onlyin Experiment 1 (Table 7), even though the nitrification inhibitor was expected to be less effective athigher temperature [49]. However, some authors [50] reported that the inhibiting efficiency of DMPPis modulated by several soil parameters acting simultaneously.
Both in Experiments 1 and 2, a lower evapotranspiration was observed for the high-dose CUtreatments than for the other treatments. Because of similar irrigation, this was associated with highervalues of water drainage and leaching fraction (Table 4). However, the CU treatments determined alower N leaching (Table 7), in agreement with studies on several species, such as potato and corn [51],bell pepper [52] and rice [53]. This outcome suggested that CU application was effective in limiting Nlosses into drainage water. Following a similar trend with this result, a recent life cycle assessment(LCA) study on the impact of N fertilizers on the environment [8] reported the use of alternative coatedN fertilizers as an effective strategy to reduce water pollution by eutrophication.
A reduced N loss by leaching with the CU fertilizer suggested the possibility to decrease the Ndose commonly applied by growers. This hypothesis was tested in Experiment 3, where the CUredtreatment employed -25% total N compared to the conventional fertilization. The data proved theeffectiveness of the CU fertilizer, which enabled to decrease N leaching by about 65% (Table 7) withoutappreciable differences in tomato yield or quality (Table 6). Moreover, the results of Experiment 3confirmed that with the CUred treatment, the combined effects of lower N supply and lower N lossallowed for the saving of considerable amounts of fertilizer, improving both economic costs andenvironmental impact. Specifically, in Experiment 3 the amount of fertilizer that could be saved withno influence on the production was up to 114.8 kg N/ha, that is about 30% of total N normally appliedin tomato culture.
Concerning the N balance, our results showed that in Experiment 2, the plant growth was lowerthan expected, due to unexpectedly low light intensity in the autumn season (Table 2). In consequence,N input was higher than N output with both the stabilized and the coated fertilizer. On the other hand,both in Experiments 1 and 3, N input was always lower than N output, with a difference ranging from24.0 to 43.4 kg N/ha. However, it is worth noting that the computation of N input reported in Table 7did not include the N supply from soil organic matter mineralization during the growing period.This contribution could be estimated as 23 kg N/ ha in Experiment 1 and 21 kg N/ha in Experiment 3,based on literature data for mineral N release in different types of soils [54]. By adding the estimatedamounts to the N input, the overestimation of N output resulted well below 5% for all the treatments.
5. Conclusions
This study confirmed the effectiveness of the CU fertilizer in reducing N leaching from the soil bothin spring and autumn growing cycles. At the same time, the results showed that with CU applicationboth tomato yield and quality were maintained or even improved compared with conventional orstabilized fertilizers. Therefore, the CU treatments could satisfy the plants N requirement, preventingat the same time excess concentration of the element in the root zone. This outcome is consistent withthe expected performance of controlled-release fertilizers, which should match the nutritional needsof plants better than the soluble or stabilized fertilizers, by providing a gradual N release in the soil.In contrast, with both the CON and DMPP treatments, the high availability of soluble N in the soilpromoted vegetative behaviour, with a consequent increase in water use and a possible blooming delay.
Agronomy 2020, 10, 1827 17 of 19
The experiments indicated that N leaching could be effectively decreased by increasing the percentageof coated fertilizer and that the decrease of N leaching ranged from 9 to 28% of total N applied.
Further work (specifically, a proper validation trial) is needed to extend the results obtained inthe greenhouse to the open field growing conditions. The main outcome of this study was that thelimitation of N losses achieved using the coated fertilizer enabled a reduction of N application by 25%as compared with the growers’ practice, without detrimental effects on the tomato production.
Author Contributions: Conceptualization, L.I., R.C. and A.P.; methodology, L.I. and R.C.; investigation, T.C. andL.B.; data curation, T.C., L.B., G.C. and F.F.; writing—original draft preparation, R.M., L.I. and C.T.; writing—reviewand editing L.I., R.M., A.P. and C.T.; visualization, R.M. and L.I.; supervision, L.I. and R.C. All authors have readand agreed to the published version of the manuscript.
Funding: This research received no external funding.
Acknowledgments: The authors wish to thank Chingoileima Maibam for the final English editing of the text.
Conflicts of Interest: The authors declare no conflict of interest.
References
1. Long, S.P.; Marshall-Colon, A.; Zhu, X.-G. Meeting the Global Food Demand of the Future by EngineeringCrop Photosynthesis and Yield Potential. Cell 2015, 161, 56–66. [CrossRef] [PubMed]
2. Li, X.; Li, Q.; Xu, X.; Su, Y.; Yue, Q.; Gao, B. Characterization, swelling and slow-release properties of a newcontrolled release fertilizer based on wheat straw cellulose hydrogel. J. Taiwan Inst. Chem. Eng. 2016, 60,564–572. [CrossRef]
3. Lu, C.; Tian, H. Global nitrogen and phosphorus fertilizer use for agriculture production in the past halfcentury: Shifted hot spots and nutrient imbalance. Earth Syst. Sci. Data 2017, 9, 181–192. [CrossRef]
4. Martínez-Gaitán, C.; Granados, M.R.; Fernández, M.D.; Gallardo, M.; Thompson, R. Recovery of 15N LabeledNitrogen Fertilizer by Fertigated and Drip Irrigated Greenhouse Vegetable Crops. Agronomy 2020, 10, 741.[CrossRef]
5. Thompson, R.; Incrocci, L.; Van Ruijven, J.; Massa, D. Reducing contamination of water bodies from Europeanvegetable production systems. Agric. Water Manag. 2020, 240, 106258. [CrossRef]
6. Tei, F.; De Neve, S.; De Haan, J.; Kristensen, H.L. Nitrogen management of vegetable crops. Agric. Water Manag.2020, 240, 106316. [CrossRef]
7. Ti, C.; Luo, Y.; Yan, X. Characteristics of nitrogen balance in open-air and greenhouse vegetable croppingsystems of China. Environ. Sci. Pollut. Res. 2015, 22, 18508–18518. [CrossRef]
8. Da Costa, T.P.; Westphalen, G.; Nora, F.B.D.; Silva, B.D.Z.; Da Rosa, G.S.; De Zorzi, B. Technical andenvironmental assessment of coated urea production with a natural polymeric suspension in spouted bed toreduce nitrogen losses. J. Clean. Prod. 2019, 222, 324–334. [CrossRef]
9. Thomson, A.J.; Giannopoulos, G.; Pretty, J.; Baggs, E.M.; Richardson, D.J. Biological sources and sinks ofnitrous oxide and strategies to mitigate emissions. Philos. Trans. R. Soc. B Biol. Sci. 2012, 367, 1157–1168.[CrossRef]
10. Thompson, R.; Martínez-Gaitan, C.; Gallardo, M.; Giménez, C.; Fernández, M. Identification of irrigationand N management practices that contribute to nitrate leaching loss from an intensive vegetable productionsystem by use of a comprehensive survey. Agric. Water Manag. 2007, 89, 261–274. [CrossRef]
11. D’Alessandro, W.; Bellomo, S.; Parello, F.; Bonfanti, P.; Brusca, L.; Longo, M.; Maugeri, R. Nitrate, sulphateand chloride contents in public drinking water supplies in Sicily, Italy. Environ. Monit. Assess. 2012, 184,2845–2855. [CrossRef] [PubMed]
12. Voogt, W.; Beerling, E.A.M.; Blok, C.; van der Maas, A.A.; van Os, E.A. The road to sustainable waterand nutrient management in soil-less culture in Dutch greenhouse horticulture. In Proceedings ofthe NUTRIHORT: Nutrient Management, Nutrient Legislation and Innovative Techniques in IntensiveHorticulture, Ghent, Belgium, 16–18 September 2013; Available online: https://edepot.wur.nl/290253 (accessedon 11 November 2020).
13. Brés, W. Estimation of Nutrient Losses from Open Fertigation Systems to Soil during Horticultural PlantsCultivation. Pol. J. Environ. Stud. 2009, 183, 341–345.

Agronomy 2020, 10, 1827 18 of 19
14. Chartzoulakis, K. Water resources management in the Island of Crete, Greece, with emphasis on theagricultural use. Hydrol. Res. 2001, 3, 193–205. [CrossRef]
15. The European Council. Council Directive 91/676/EEC 12/12/1991 concerning the protection of waters againstpollution caused by nitrates from agricultural sources. Off. J. Eur. Commun. 1991, L375, 1–8.
16. Massa, D.; Incrocci, L.; Maggini, R.; Carmassi, G.; Campiotti, C.A.; Pardossi, A. Strategies to decrease waterdrainage and nitrate emission from soilless cultures of greenhouse tomato. Agric. Water Manag. 2010, 97,971–980. [CrossRef]
17. Van Grinsven, H.J.M.; Berge, H.F.M.T.; Dalgaard, T.; Fraters, B.; Durand, P.; Hart, A.; Hofman, G.;Jacobsen, B.H.; Lalor, S.T.J.; Lesschen, J.P.; et al. Management, regulation and environmental impacts ofnitrogen fertilization in northwestern Europe under the Nitrates Directive; a benchmark study. Biogeosciences2012, 9, 5143–5160. [CrossRef]
18. Wang, Z.; Li, S. Effects of Nitrogen and Phosphorus Fertilization on Plant Growth and Nitrate Accumulationin Vegetables. J. Plant Nutr. 2004, 27, 539–556. [CrossRef]
19. Ahluwalia, A.; Gladwin, M.; Coleman, G.D.; Hord, N.; Howard, G.; Kim-Shapiro, D.B.; Lajous, M.; Larsen, F.J.;Lefer, D.J.; McClure, L.A.; et al. Dietary Nitrate and the Epidemiology of Cardiovascular Disease: Reportfrom a National Heart, Lung, and Blood Institute Workshop. J. Am. Heart Assoc. 2016, 5, e003402. [CrossRef]
20. Umar, S.; Iqbal, M. Nitrate accumulation in plants, factors affecting the process, and human health implications.A review. Agron. Sustain. Dev. 2007, 27, 45–57. [CrossRef]
21. Zhong, W.; Hu, C.; Wang, M. Nitrate and nitrite in vegetables from north China: Content and intake.Food Addit. Contam. 2002, 19, 1125–1129. [CrossRef]
22. The European Commission. Commission Regulation (EU) No. 1258/2011 amending Regulation (EC)No. 1881/2006 as regards maximum levels for nitrates in food stuffs. Off. J. Eur. Union 2011, L320,15–17.
23. Carson, L.C.; Ozores-Hampton, M. Methods for Determining Nitrogen Release from Controlled-releaseFertilizers Used for Vegetable Production. HortTechnology 2012, 22, 20–24. [CrossRef]
24. Chalk, P.M.; Craswell, E.T.; Polidoro, J.C.; Chen, C. Fate and efficiency of 15Nlabelledslow- and controlledrelease fertilizers. Nutr. Cycl. Agroecosyst. 2015, 102, 167–178. [CrossRef]
25. Dubey, A.; Mailapalli, D.R. Zeolite coated urea fertilizer using different binders: Fabrication, materialproperties and nitrogen release studies. Environ. Technol. Innov. 2019, 16, 100452. [CrossRef]
26. Azeem, B.; KuShaari, K.; Man, Z.B.; Basit, A.; Thanh, T.H. Review on materials & methods to producecontrolled release coated urea fertilizer. J. Control. Release 2014, 181, 11–21. [CrossRef]
27. Qiao, D.; Liu, H.; Yu, L.; Bao, X.; Simon, G.P.; Petinakis, E.; Chen, L. Preparation and characterization ofslow-release fertilizer encapsulated by starch-based superabsorbent polymer. Carbohydr. Polym. 2016, 147,146–154. [CrossRef]
28. Guertal, E. Slow-release Nitrogen Fertilizers in Vegetable Production: A Review. HortTechnology 2009, 19,16–19. [CrossRef]
29. Naz, M.Y.; Sulaiman, S.A. Slow release coating remedy for nitrogen loss from conventional urea: A review.J. Control. Release 2016, 225, 109–120. [CrossRef]
30. Cataldo, D.A.; Maroon, M.; Schrader, L.E.; Youngs, V.L. Rapid colorimetric determination of nitrate in planttissue by nitration of salicylic acid. Commun. Soil Sci. Plant Anal. 1975, 6, 71–80. [CrossRef]
31. Kempers, A.; Zweers, A. Ammonium determination in soil extracts by the salicylate method. Commun. SoilSci. Plant Anal. 1986, 17, 715–723. [CrossRef]
32. Olsen, S.R.; Cole, C.V.; Watanabe, F.S.; Dean, L.A. Estimation of Available Phosphorus in Soils by Extraction withNaHCO3, USDA No. 939; U.S. Department of Agriculture: Washington, DC, USA, 1954.
33. Thomas, G.W. Exchangeable Cations. In Methods of Soil Analysis, 2nd ed.; Page, A., Ed.; American Society ofAgronomy, Inc.; Soil Science Society of America, Inc.: Madison, WI, USA, 1982; pp. 159–165. [CrossRef]
34. Ministero delle Politiche Agricole e Forestali. Decreto Ministeriale del 13/09/1999, Approvazione dei “MetodiUfficiali di Analisi Chimica del Suolo”; Gazzetta Ufficiale della Repubblica Italiana Suppl. Ordin. n.248: Rome,Italy, 1999. (In Italian)
35. Omar, L.; Ahmed, O.H.; Majid, N.M.A. Improving Ammonium and Nitrate Release from Urea UsingClinoptilolite Zeolite and Compost Produced from Agricultural Wastes. Sci. World J. 2015, 2015, 574201.[CrossRef] [PubMed]

Agronomy 2020, 10, 1827 19 of 19
36. Pandey, R.K.; Ie, J.W.M.; Bako, Y. Nitrogen fertilizer response and use efficiency for three cereal crops inNiger Commun. Soil Sci. Plan. 2001, 32, 1465–1482. [CrossRef]
37. Elia, A.; Conversa, G. Agronomic and physiological responses of a tomato crop to nitrogen input. Eur. J. Agron.2012, 40, 64–74. [CrossRef]
38. Haque, M.E.; Paul, A.K.; Sarker, J.R. Effect of Nitrogen and Boron on the Growth and Yield of Tomato(Lycopersicum esculentum L.). Int. J. Bio-Resour. Stress Manag. 2011, 2, 277–282.
39. Addae-Kagya, K.; Norman, J.C. The influence of nitrogen levels on local cultivars of eggplant(Solanum integrifolium L.). Acta Hortic. 1977, 2, 397–402. [CrossRef]
40. Tei, F.; Benincasa, P.; Guiducci, M. Critical nitrogen concentration in processing tomato. Eur. J. Agron. 2002,18, 45–55. [CrossRef]
41. Hirel, B.; Lemaire, G. From Agronomy and Ecophysiology to Molecular Genetics for Improving NitrogenUse Efficiency in Crops. J. Crop. Improv. 2006, 15, 213–257. [CrossRef]
42. Greenwood, D.J.; Hunt, J. Effect of nitrogen fertilizer on the nitrate contents of field vegetables grown inBritain. J. Sci. Food Agric. 1986, 37, 373–383. [CrossRef]
43. Jiang, H.M.; Zhang, J.; Yang, J.C.; Liu, Z.H.; Song, X.Z.; Jiang, L.H. Effects of models of N application ongreenhouse tomato N uptake, utilization and soil NO3−N accumulation. J. Agro-Environ. Sci. 2009, 28,2623–2630. Available online: http://en.cnki.com.cn/Article_en/CJFDTOTAL-NHBH200912034.htm (accessedon 10 November 2020). (In Chinese).
44. Min, J.; Zhao, X.; Shi, W.M.; Xing, G.X.; Zhu, Z.L. Nitrogen balance and loss in a greenhouse vegetable systemin South eastern China. Pedosphere 2011, 21, 464–472. [CrossRef]
45. Gao, X.; Li, C.; Zhang, M.; Wang, R.; Chen, B. Controlled release urea improved the nitrogen use efficiency,yield and quality of potato (Solanum tuberosum L.) on silt loamy soil. Field Crop. Res. 2015, 181, 60–68.[CrossRef]
46. Yang, Y.; Zhang, M.; Zheng, L.; Cheng, D.-D.; Liu, M.; Geng, Y.-Q. Controlled Release Urea ImprovedNitrogen Use Efficiency, Yield, and Quality of Wheat. Agron. J. 2011, 103, 479–485. [CrossRef]
47. Shivay, Y.S.; Prasad, R.; Pal, M. Effect of Nitrogen Levels and Coated Urea on Growth, Yields and NitrogenUse Efficiency in Aromatic Rice. J. Plant Nutr. 2015, 39, 875–882. [CrossRef]
48. Taylor, M.; Locascio, S.; Alligood, M. Blossom-end Rot Incidence of Tomato as Affected by Irrigation Quantity,Calcium Source, and Reduced Potassium. HortScience 2004, 39, 1110–1115. [CrossRef]
49. Yu, Q.; Ye, X.; Chen, Y.; Zhang, Z.; Tian, G. Influences of nitrification inhibitor 3,4-dimethyl pyrazolephosphate on nitrogen and soil salt-ion leaching. J. Environ. Sci. 2008, 20, 304–308. [CrossRef]
50. Zerulla, W.; Barth, T.; Dressel, J.; Erhardt, K.; Von Locquenghien, K.H.; Pasda, G.; Rädle, M.; Wissemeier, A.3,4-Dimethylpyrazole phosphate (DMPP)—A new nitrification inhibitor for agriculture and horticulture.Biol. Fertil. Soils 2001, 34, 79–84. [CrossRef]
51. Shoji, S.; Delgado, J.; Mosier, A.; Miura, Y. Use of controlled release fertilizers and nitrification inhibitors toincrease nitrogen use efficiency and to conserve air and water quality. Comm. Soil Sci. Plant Anal. 2001, 32,1051–1070. [CrossRef]
52. Guertal, E.A. Preplant Slow-Release Nitrogen Fertilizers Produce Similar Bell Pepper Yields as SplitApplications of Soluble Fertilizer. Semigroup Forum 2000, 92, 388. [CrossRef]
53. Kiran, J.K.; Khanif, Y.M.; Amminuddin, H.; Anuar, A.R. Effects of Controlled Release Urea on the Yield andNitrogen Nutrition of Flooded Rice. Commun. Soil Sci. Plant Anal. 2010, 41, 811–819. [CrossRef]
54. Baroncelli, P.; Landi, S.; Marzialetti, P.; Scavo, N. Uso Razionale delle Risorse nel Florovivaismo: I Fertilizzanti.In Quaderno ARSIA No. 2; ARSIA—Agenzia Regionale per lo Sviluppo e l’Innovazione nel settoreAgricolo-forestale: Firenze, Italy, 2004; p. 281. (In Italian)
Publisher’s Note: MDPI stays neutral with regard to jurisdictional claims in published maps and institutionalaffiliations.
© 2020 by the authors. Licensee MDPI, Basel, Switzerland. This article is an open accessarticle distributed under the terms and conditions of the Creative Commons Attribution(CC BY) license (http://creativecommons.org/licenses/by/4.0/).