Interactive occlusion and automatic object placement for augmented reality

OPEN
ORIGINAL ARTICLE
Monitoring cerebral oxygenation during balloon occlusion withmultichannel NIRSChristian Rummel1,4, Christoph Zubler1,4, Gerhard Schroth1, Jan Gralla1, Kety Hsieh1, Eugenio Abela1,2, Martinus Hauf1, Niklaus Meier2,Rajeev K Verma1, Robert H Andres3, Arto C Nirkko2,5 and Roland Wiest1,5
We report on oxygenation changes noninvasively recorded by multichannel continuous-wave near infrared spectroscopy (CW-NIRS)during endovascular neuroradiologic interventions requiring temporary balloon occlusion of arteries supplying the cerebralcirculation. Digital subtraction angiography (DSA) provides reference data on the site, timing, and effectiveness of the flowstagnation as well as on the amount and direction of collateral circulation. This setting allows us to relate CW-NIRS findings to brainspecific perfusion changes. We focused our analysis on the transition from normal perfusion to vessel occlusion, i.e., before hypoxiabecomes clinically apparent. The localization of the maximal response correlated either with the core (occlusion of the middlecerebral artery) or with the watershed areas (occlusion of the internal carotid artery) of the respective vascular territories. In onepatient with clinically and angiographically confirmed insufficient collateral flow during carotid artery occlusion, the totalhemoglobin concentration became significantly asymmetric, with decreased values in the ipsilateral watershed area andcontralaterally increased values. Multichannel CW-NIRS monitoring might serve as an objective and early predictive marker ofcritical perfusion changes during interventions—to prevent hypoxic damage of the brain. It also might provide valuable humanreference data on oxygenation changes as they typically occur during acute stroke.
Journal of Cerebral Blood Flow & Metabolism advance online publication, 4 December 2013; doi:10.1038/jcbfm.2013.207
Keywords: angiography; cerebral blood flow measurement; interventional neuroradiology; near infrared spectroscopy;neuroradiology
INTRODUCTIONCerebro-vascular autoregulation, which is effected predominantlyby the peripheral precapillary arterioles, attempts to maintain aconstant blood flow of around 50 mL/100 g per minute (ref. 1)within a wide range of perfusion pressure. If cerebral arteries fail toprovide sufficient perfusion pressure due to shunting withinfistulas or steno-occlusive disease, then the subcortical andcortical collateral artery network has an important role inpreserving blood and oxygen supply via numerous alternativepathways that maintain postocclusive perfusion pressure, therebyredistributing oxygenated blood to the deprived site. The mostimportant collateral pathways encompass the circle of Willis (CoW)with the anterior and posterior communicating arteries (Acom,Pcom), see Figure 1, and pathways via retrograde collaterals of theophthalmic and meningeal branches of the external carotid artery.
Balloon occlusion testing (BOT) by cerebral angiography iscurrently considered as a standard diagnostic test to evaluate theeffectiveness of collateral circulation before therapeutic neuroin-terventional or surgical procedures that require (or carry the riskof) permanent occlusion of the internal carotid artery (ICA).Linskey et al2 showed a decreased risk of ischemic complicationsafter BOT of 13%. However, false negative results may occur, sincesufficient collateral circulation depends not only on anatomicvariations and age, but also on arterial blood pressure and slow
adaptation of middle sized vessel diameter, which may appearwith delay after occlusion. In B80% of patients enrolled forcarotid occlusion, brain perfusion of the affected hemisphere issupported by sufficient collaterals, whereas B20% of patientscarry the risk of permanent ischemic brain injury as a consequenceof carotid occlusion.3 Figure 1 summarizes different perfusionpatterns that are observed during selective vessel occlusion (andas a consequence of spontaneous embolic stroke). Ischemicevents or infarction may manifest as a consequence of permanentcarotid occlusion even in the absence of any clinical signs andwhile stable blood flow and blood velocity measures are observedduring occlusion.4 Since autoregulation may fail to maintain thecerebral perfusion reserve, ischemic events may occur aftercarotid occlusion depending on delayed variation of blood andlocal cerebral perfusion pressure.
The current standard technique for monitoring BOT, apart fromassessing clinical tolerance, is continuous transcranial Doppler(TCD) sonography. The TCD monitoring is based on real-timemeasures of the blood velocities of the middle cerebral artery(MCA) during occlusion.5 Of note, blood velocity monitoring in thesupplying arteries rather reflects territorial, not localized regionalmeasures. Thus, hypoxia in watershed regions may remainundetected by TCD. Further, it may fail to yield interpretableresults at all if no acoustic window is present.
1Support Center for Advanced Neuroimaging (SCAN), University Institute for Diagnostic and Interventional Neuroradiology, Inselspital, University of Bern, Bern, Switzerland;2Department of Neurology, Inselspital, University of Bern, Bern, Switzerland and 3Department of Neurosurgery, Inselspital, University of Bern, Bern, Switzerland. Correspondence:Dr C Rummel, Support Center for Advanced Neuroimaging (SCAN), University Institute for Diagnostic and Interventional Neuroradiology, Inselspital, University of Bern, Bern,Switzerland.E-mail: [email protected] and CZ contributed equally to this work.5ACN and RW share senior authorship.Received 15 April 2013; revised 25 October 2013; accepted 30 October 2013
Journal of Cerebral Blood Flow & Metabolism (2013), 1–10& 2013 ISCBFM All rights reserved 0271-678X/13
www.jcbfm.com

Similar to TCD, near infrared spectroscopy (NIRS) may beconsidered as a bedside test that offers the potential to monitorcerebral concentrations of oxygenated and deoxygenated hemo-globin in real time. It provides a method for noninvasive andtime-continuous assessment of tissue oxygenation6,7 that iscomplementary to velocity or flow information from TCD ordigital subtraction angiography (DSA). The latter mainly visualizesthe degree of contrast inflow to arteries, the capillary bed and itssubsequent outflow into venoles and veins. In BOT, an occlusionballoon is inflated for B20 minutes. During this time, repeatedangiography of all brain supplying arteries is limited (‘snap shot’information) since exposure to radiation and iodinated contrasthas to be minimized. In addition, depending on the usedangiography system it is only possible to obtain informationabout the blood flow in monoplanar or biplanar projections.Often, this does not provide sufficient information about regionalcerebral blood flow in many cortex regions. Angiography of theoccluded vessel only informs about the flow stagnation at theocclusion balloon and does not reveal any information abouttissue oxygenation of the subsequent territory. Therefore, thecrucial information about the tissue at risk cannot be provided byangiography.
As functional magnetic resonance imaging (MRI), see e.g. Kimand Ogawa8 for review, NIRS information is fundamentally relatedto blood oxygenation, although the underlying mechanism isentirely different and also a different vasculature is interrogated.Employing the modified Beer–Lambert law9 continuous-wave(CW) NIRS estimates relative changes in oxy- anddeoxyhemoglobin concentrations from measured changes inlight attenuation in the wavelength range of 650 to 1,000 nmwith subsecond temporal resolution. Because concentrations ofboth states of hemoglobin oxygenation can be assessedindependently, CW-NIRS may provide an additional estimate forblood volume changes through total hemoglobin concentration.
Placement of near infrared light sources and detectors(optodes) on the scalp has lead to two established, mutuallysegregated approaches: (1) transcranial cerebral oxymetry and(2) functional NIRS. Transcranial cerebral oxymetry usuallyemploys a small number (most often only two) of NIRS channelsand often low-time resolution (several seconds) to estimate thecerebral oxygen saturation. In anesthesiology, frontal transcranialcerebral oxymetry is applied routinely to monitor interventions incritical patients, see e.g. ref. 10 for review. Functional NIRS, similarto functional MRI, takes advantage of the effects resulting fromneurovascular coupling to relate observed absorbance changes toneuronal activity changes. Here, often multichannel settings arechosen since they cover large parts of the head and their temporalresolution is in the subsecond range. Functional NIRS has beenapplied in various fields of neuroscience over the last 15 years, seeref.11–13 for reviews.
During neuroangiographic interventions, percutaneous trans-luminal angioplasty (PTA) is needed for stenting of the ICA andrequires short-term occlusion (within the range of seconds) of theartery. Certain embolic protection devices and BOT involvetransient prolonged occlusion (within the range of minutes) ofthe ICA. The fact that these interventions take place undersurveillance with DSA allows reliably assessing the effect ofspecific temporal and regional flow stagnation on hemoglobinconcentration changes in NIRS monitoring. Two-channel transcra-nial cerebral oxymetry during various endovascular neuroangio-graphic interventions has been reported in refs. 14–22. Here, wereport on retrospective analysis of interventions in nine patientsmonitored by multichannel CW-NIRS. We hypothesized that thismethod can be used to study whether sufficient collaterals allowthe cerebral autoregulation to operate within a range of pressuresthat can be compensated, or whether it already operates at orbeyond its limit due to a locally impaired perfusion pressure, thuseffectively indicating ischemic penumbra as known in acuteischemic stroke.
MATERIALS AND METHODSPatientsFrom a total of 35 patients that underwent neuroradiologic interventionswith NIRS monitoring at our institution from July 2012 to July 2013, weselected those nine patients who received transient balloon occlusions ofthe cerebral arteries, see Table 1 for demographics and details of theendovascular interventions. The data were organized in three groupsaccording to the occlusion site and duration: one patient underwent aseries of MCA occlusions distal to the CoW during coil embolization of ananeurysm. The absence of sizable collaterals allows assessment of the‘pure’ effect of ischemia on multichannel CW-NIRS signals, see Figure 1B.Occlusions of ICA in a second group of patients were required during stentplacement and performed proximal to the CoW (which could serve as maincollateral, see Figure 1C). In the third patient group, prolonged occlusionwas performed proximal to the CoW during BOT.
Data AcquisitionNeuroangiological procedures. All interventions were performed on abiplane flat panel angiographic system (Axiom Artis Zee, Siemens,Erlangen, Germany), see Figure 2A. For stenting of the ICA, the stenosiswas first passed by a filter wire. In a second step, the self expandable stentwas placed in the stenosis and postdilated with a PTA balloon, which wasinflated for a short period (seconds, two minutes at maximum) to dilate thestenosis and the stent. Predilatation before stenting was not performed inthis case series. The insufflation leads to flow arrest in the respective vessel,which did not need to be confirmed angiographically in our PTAs.
For BOT, a double lumen balloon occlusion catheter was placed in thecervical segment of the ICA. During the balloon inflation, flow arrest wasconfirmed by injection of contrast agent through the normal lumen of theballoon catheter resulting in flow stagnation distally to the balloon.Collateral flow was visualized by DSA and contrast injection into the
Figure 1. Schematic representation of different possible perfusion scenarios using the example of a patient with low vessel caliber in theAcom and the right Pcom. (A) Brain perfusion under normal conditions. (B) Occlusion of the left middle cerebral artery (MCA). As the occlusionsite is distal to the circle of Willis (CoW), collateral flow could be expected only via usually not sufficient surface leptomeningeal collateralsthrough the watershed areas. Thus, the vascular core territory of the MCA will not be supplied adequately. (C) Occlusion of the left internalcarotid artery (ICA). Collaterals via the Acom and left Pcom are sufficiently strong in this patient to maintain perfusion of all brain regions(‘good’ collaterals, asymptomatic). (D) Occlusion of the right ICA. As the Acom and the right Pcom are not strong enough in this patient, in thissituation the territories of the right ACA and MCA will not be supplied sufficiently (‘bad’ collaterals, symptomatic).
NIRS monitoring of cerebral oxygenation during BOTC Rummel et al
2
Journal of Cerebral Blood Flow & Metabolism (2013), 1 – 10 & 2013 ISCBFM

dominant vertebral artery and the contralateral ICA using a diagnostic 5Fcatheter introduced transfemorally from the contralateral groin.
Near-Infrared Spectroscopy Recordings. A whole-head fiber holder of theFOIRE-3000 CW-NIRS system (Shimadzu, Japan) was mounted duringpreparation of the patients for endovascular intervention. The glass fibersof the optodes cause absorption of X-rays, whereas the plastic parts ofthe holder cap allow the radiation to pass, see Figure 2B. Although in thesubtraction image (Figure 2C) the optodes in general do not reduce thevisibility of cerebral blood vessels, we developed a standardized optodemontage to provide the interventionalist with an unrestricted field of viewof the main cerebral arteries, but still allows NIRS to cover parts of thevascular territories of the middle and anterior cerebral arteries (MCA andACA) in both hemispheres.
To illustrate the vascular territories of the main cerebral arteries and theirmonitoring by CW-NIRS, we have exemplarily applied selective vessel-encoded arterial spin labeling (ASL) in a healthy subject. This techniqueenables noninvasive evaluation of vascular territories and collateral bloodflow.23 Selective ASL was acquired on a Siemens 3T Verio MRI scanner(Siemens, Erlangen, Germany). Tagging duration was 1,375 ms for thetagging pulse train. The post labeling delay was 1,000 ms and recurrenceand echo time were 3,000 ms and 52 ms, respectively. A total of 120images were acquired for a set of 6 cycles. Analysis and computation ofselective ASL maps were performed using Matlab programs (MathWorks,Natick, MA, USA).
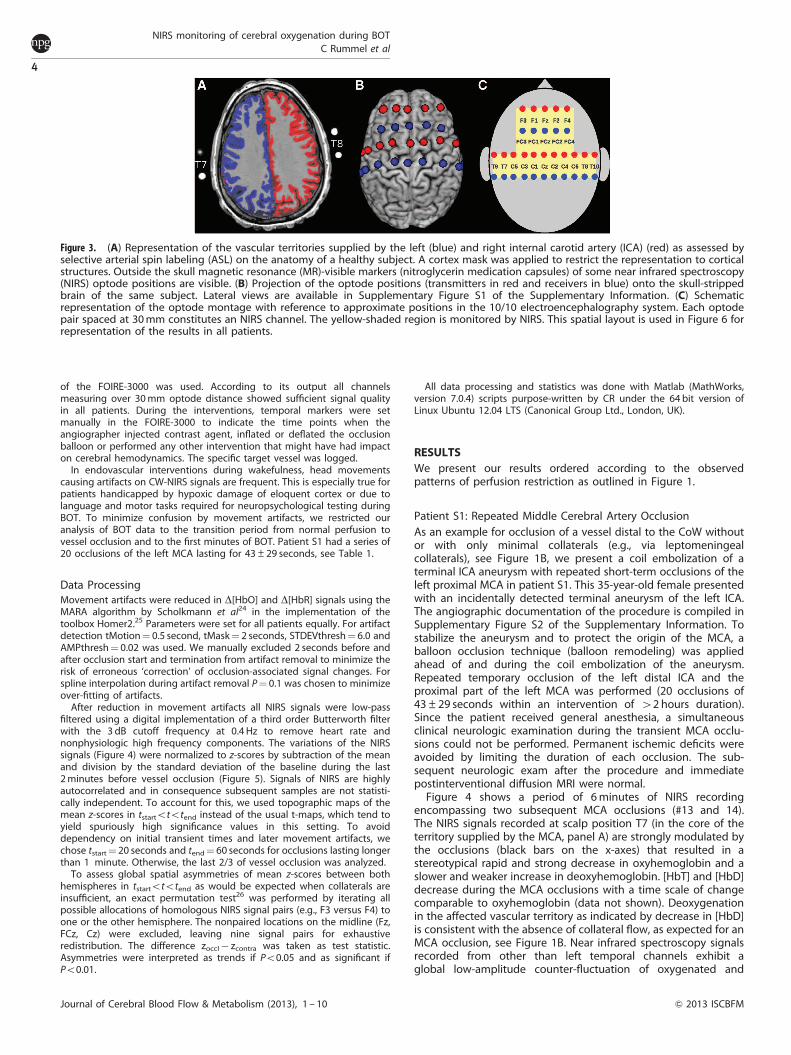
Figure 3A illustrates the vascular territories supplied by the left (blue)and right ICA (red) as an overlay onto an axial slice of the subject’s
structural MRI (overlays from selective labeling of the posterior circulationwere excluded). Thirty-two magnetic resonance-visible surface markers(nitroglycerin medication capsules, four of them visible in the imaging sliceon A) were placed inside the optode holders of the NIRS cap to indicatethe positions of transmitters and receivers. One additional marker wasused to identify the right hemisphere unequivocally. To estimate theoptode positions over the brain, spheres centered at the marker positionswere inflated computationally until they intersected with a binary brainmask of that subject. In Figure 3B, the approximate positions oftransmitters (red) and receivers (blue) on the brain surface are shown.For later reference, we introduce in Figure 3C the spatial layout of the usedoptode montage. The yellow shaded area on the skull is monitored byNIRS. Channels are defined by the shortest distance (30 mm) between onetransmitter and one receiver and indicated by approximate electro-encephalography positions of the 10/10 system.
The FOIRE-3000 measures light attenuation at three wavelengths (780,805, and 830 nm), which were converted to relative concentration changesin oxyhemoglobin D[HbO] and deoxyhemoglobin D[HbR] according to themodified Beer–Lambert law.9 From these, the changes in total hemoglobinD[HbT]¼D[HbO]þD[HbR] and the difference D[HbD]¼D[HbO]�D[HbR]were calculated. [HbT] is proportional to the cerebral blood volume (CBV)and [HbD] is a marker for blood oxygenation. The NIRS data weremeasured with 21 channels at 30 mm optode separation. Thirty-eightadditional signals were recorded over longer distances but not included inthe present analysis. Measurements covering the whole interventionalsessions lasted for 44 to 167 minutes (87±47 min) and the sampling ratewas 10 Hz. After montage of the NIRS optodes, the autocalibration routine
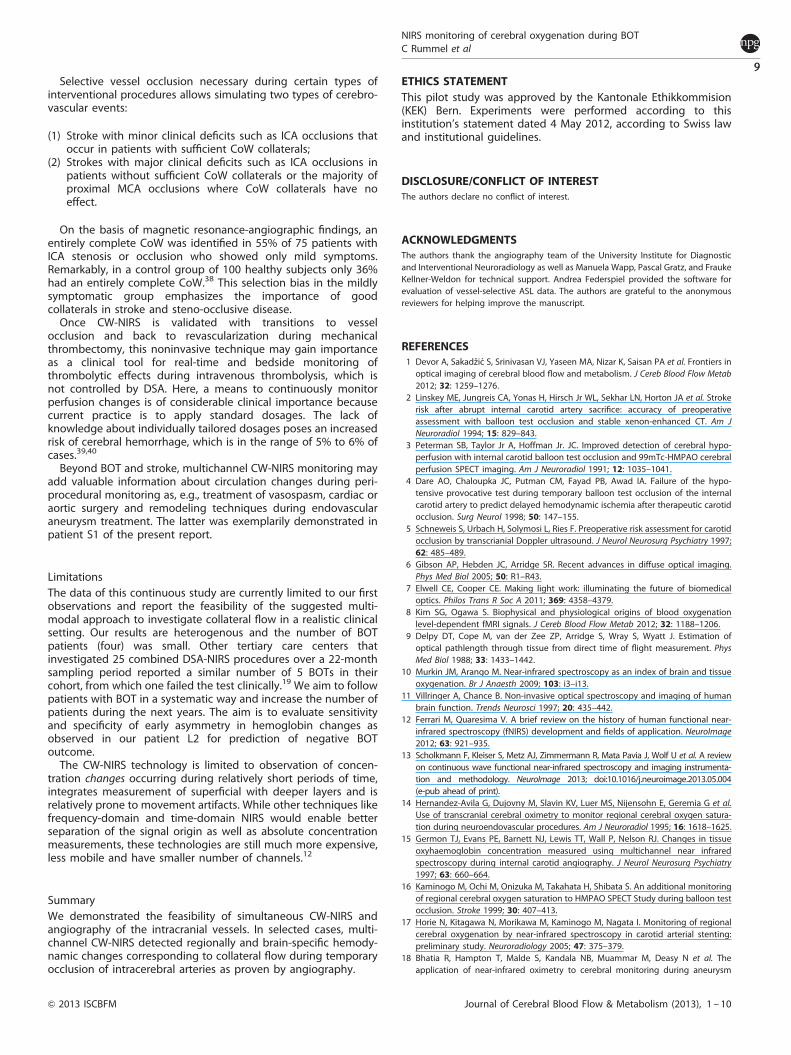
Figure 2. Near infrared spectroscopy (NIRS) measurement during neuroradiologic intervention. (A) Setting in the angiography suite.(B) Cerebral angiography with passage of a contrast agent bolus in patient L2. (C) Digital subtraction angiography of the same data as in panel B.
Table 1. Demographics and etiology as well as background information on performed interventions and NIRS measurements
ID Age(years)
Gender Etiology Intervention NIRSmeasurement
duration(minutes)
Site ofocclusion
Numberof
occlusions
Occlusionduration(seconds)
Anesthesia Remarks
S1 35 F Aneurysm inproximal leftICA
Balloonremodeling
143 Left MCA 20 43±29(range11–105)
General —
S2 80 F Steno-occlusivedisease
PTA 44 Left ICA 1 20 Local Restenosis of left ICA, pseudo-occlusion of right ICA (NASCET 90%)
S3 59 M Steno-occlusivedisease
PTA 70 Left ICA 1 31 Local Stenosis in left (NASCET 57%) andright ICA (NASCET 54%)
S4 81 M Steno-occlusivedisease
PTA 167 Left ICA 1 45 General Pseudo-occlusion of left ICA (NASCET90%), bradycardia during PTA
S5 79 M Steno-occlusivedisease
PTA 75 Right ICA 1 77 Local Stenosis in right (NASCET 70%) andleft ICA (NASCET 65%)
L1 69 M Laryngealcarcinoma right
BOT 38 Right CCA(no rightECA)
1 1,275 Local Nonsymptomatic, stenosis of the leftICA (NASCET 53%)
L2 48 F Giant aneurysmin right ICA
BOT 52 Right ICA 1 626 Local Symptomatic
L3 25 F Neurofibromaat skull base
BOT 65 Right ICA 1 2,060 Local Nonsymptomatic
L4 59 M Laryngealcarcinoma left
BOT 128 Left ICA 1 2,100 Local Nonsymptomatic
BOT, balloon occlusion testing; CCA, common carotid artery; ICA, internal carotid artery; ECA, external carotid artery; PTA, percutaneous transluminalangioplasty; MCA, middle cerebral artery; NASCET, North American Symptomatic Carotid Endarterectomy Trial; NIRS, near infrared spectroscopy.
NIRS monitoring of cerebral oxygenation during BOTC Rummel et al
3
& 2013 ISCBFM Journal of Cerebral Blood Flow & Metabolism (2013), 1 – 10
of the FOIRE-3000 was used. According to its output all channelsmeasuring over 30 mm optode distance showed sufficient signal qualityin all patients. During the interventions, temporal markers were setmanually in the FOIRE-3000 to indicate the time points when theangiographer injected contrast agent, inflated or deflated the occlusionballoon or performed any other intervention that might have had impacton cerebral hemodynamics. The specific target vessel was logged.
In endovascular interventions during wakefulness, head movementscausing artifacts on CW-NIRS signals are frequent. This is especially true forpatients handicapped by hypoxic damage of eloquent cortex or due tolanguage and motor tasks required for neuropsychological testing duringBOT. To minimize confusion by movement artifacts, we restricted ouranalysis of BOT data to the transition period from normal perfusion tovessel occlusion and to the first minutes of BOT. Patient S1 had a series of20 occlusions of the left MCA lasting for 43±29 seconds, see Table 1.
Data ProcessingMovement artifacts were reduced in D[HbO] and D[HbR] signals using theMARA algorithm by Scholkmann et al24 in the implementation of thetoolbox Homer2.25 Parameters were set for all patients equally. For artifactdetection tMotion¼ 0.5 second, tMask¼ 2 seconds, STDEVthresh¼ 6.0 andAMPthresh¼ 0.02 was used. We manually excluded 2 seconds before andafter occlusion start and termination from artifact removal to minimize therisk of erroneous ‘correction’ of occlusion-associated signal changes. Forspline interpolation during artifact removal P¼ 0.1 was chosen to minimizeover-fitting of artifacts.
After reduction in movement artifacts all NIRS signals were low-passfiltered using a digital implementation of a third order Butterworth filterwith the 3 dB cutoff frequency at 0.4 Hz to remove heart rate andnonphysiologic high frequency components. The variations of the NIRSsignals (Figure 4) were normalized to z-scores by subtraction of the meanand division by the standard deviation of the baseline during the last2 minutes before vessel occlusion (Figure 5). Signals of NIRS are highlyautocorrelated and in consequence subsequent samples are not statisti-cally independent. To account for this, we used topographic maps of themean z-scores in tstartototend instead of the usual t-maps, which tend toyield spuriously high significance values in this setting. To avoiddependency on initial transient times and later movement artifacts, wechose tstart¼ 20 seconds and tend¼ 60 seconds for occlusions lasting longerthan 1 minute. Otherwise, the last 2/3 of vessel occlusion was analyzed.
To assess global spatial asymmetries of mean z-scores between bothhemispheres in tstartototend as would be expected when collaterals areinsufficient, an exact permutation test26 was performed by iterating allpossible allocations of homologous NIRS signal pairs (e.g., F3 versus F4) toone or the other hemisphere. The nonpaired locations on the midline (Fz,FCz, Cz) were excluded, leaving nine signal pairs for exhaustiveredistribution. The difference zoccl� zcontra was taken as test statistic.Asymmetries were interpreted as trends if Po0.05 and as significant ifPo0.01.
All data processing and statistics was done with Matlab (MathWorks,version 7.0.4) scripts purpose-written by CR under the 64 bit version ofLinux Ubuntu 12.04 LTS (Canonical Group Ltd., London, UK).
RESULTSWe present our results ordered according to the observedpatterns of perfusion restriction as outlined in Figure 1.
Patient S1: Repeated Middle Cerebral Artery OcclusionAs an example for occlusion of a vessel distal to the CoW withoutor with only minimal collaterals (e.g., via leptomeningealcollaterals), see Figure 1B, we present a coil embolization of aterminal ICA aneurysm with repeated short-term occlusions of theleft proximal MCA in patient S1. This 35-year-old female presentedwith an incidentally detected terminal aneurysm of the left ICA.The angiographic documentation of the procedure is compiled inSupplementary Figure S2 of the Supplementary Information. Tostabilize the aneurysm and to protect the origin of the MCA, aballoon occlusion technique (balloon remodeling) was appliedahead of and during the coil embolization of the aneurysm.Repeated temporary occlusion of the left distal ICA and theproximal part of the left MCA was performed (20 occlusions of43±29 seconds within an intervention of 42 hours duration).Since the patient received general anesthesia, a simultaneousclinical neurologic examination during the transient MCA occlu-sions could not be performed. Permanent ischemic deficits wereavoided by limiting the duration of each occlusion. The sub-sequent neurologic exam after the procedure and immediatepostinterventional diffusion MRI were normal.
Figure 4 shows a period of 6 minutes of NIRS recordingencompassing two subsequent MCA occlusions (#13 and 14).The NIRS signals recorded at scalp position T7 (in the core of theterritory supplied by the MCA, panel A) are strongly modulated bythe occlusions (black bars on the x-axes) that resulted in astereotypical rapid and strong decrease in oxyhemoglobin and aslower and weaker increase in deoxyhemoglobin. [HbT] and [HbD]decrease during the MCA occlusions with a time scale of changecomparable to oxyhemoglobin (data not shown). Deoxygenationin the affected vascular territory as indicated by decrease in [HbD]is consistent with the absence of collateral flow, as expected for anMCA occlusion, see Figure 1B. Near infrared spectroscopy signalsrecorded from other than left temporal channels exhibit aglobal low-amplitude counter-fluctuation of oxygenated and
Figure 3. (A) Representation of the vascular territories supplied by the left (blue) and right internal carotid artery (ICA) (red) as assessed byselective arterial spin labeling (ASL) on the anatomy of a healthy subject. A cortex mask was applied to restrict the representation to corticalstructures. Outside the skull magnetic resonance (MR)-visible markers (nitroglycerin medication capsules) of some near infrared spectroscopy(NIRS) optode positions are visible. (B) Projection of the optode positions (transmitters in red and receivers in blue) onto the skull-strippedbrain of the same subject. Lateral views are available in Supplementary Figure S1 of the Supplementary Information. (C) Schematicrepresentation of the optode montage with reference to approximate positions in the 10/10 electroencephalography system. Each optodepair spaced at 30mm constitutes an NIRS channel. The yellow-shaded region is monitored by NIRS. This spatial layout is used in Figure 6 forrepresentation of the results in all patients.
NIRS monitoring of cerebral oxygenation during BOTC Rummel et al
4
Journal of Cerebral Blood Flow & Metabolism (2013), 1 – 10 & 2013 ISCBFM

deoxygenated hemoglobin representing ultra-low frequencyoscillations in the range of 0.001 Hzofo0.01 Hz. As the data arenot high-pass filtered and the intervention was performed undergeneral anesthesia (minimal movement artifacts), similar oscilla-tions are observable in large parts of the recording and apparentlyunrelated to the vessel occlusions. Color maps of the z-scores ofD[HbO], D[HbR], D[HbT], and D[HbD] with respect to the last120 seconds before the first shown MCA occlusion are displayed inFigure 5 for all NIRS signals. This pattern is very stereotypical for allMCA occlusions in patient S1 and emphasizes the spatially specificcharacter of the occlusion-associated deoxygenation pattern(channels T9, T7, and C5 measuring from the core of the territoryof the left MCA distal to the balloon occlusion) and the globalcharacter of the low frequency oscillations.
The mean z-maps for D[HbT] and D[HbD] over tstartototend
and for all 20 MCA occlusions are shown in Figure 6A. For D[HbO]and D[HbR], the same is given in Supplementary Figure S23 of theSupplementary Information. At electroencephalography positionsT9, T7, and C5 [HbD] decreases (zo� 1), whereas except at T9[HbT] (proportional to regional CBV) is rather stable (� 1ozo0,not visible in the figure). The spatial asymmetry associated withthe apparent higher deoxygenation ipsilateral to the MCA occlu-sions does not reach significance on the global level (P¼ 0.20 forexact permutation test). The interhemispheric permutation testwas designed to detect situations with insufficient collaterals viathe CoW during ICA occlusion by revealing globally asymmetric
changes between both hemispheres. With MCA occlusion, thecore area of the MCA territory is prone to ischemia at the surfacewhich is assessable by NIRS, excluding the watershed areas. Thesecan be supplied by leptomeningeal collaterals arising from theACA territory, which is left patent during MCA occlusion (Figure 1).In consequence, significantly asymmetric changes on global levelcould not be observed in patient S1. An analysis restricted to thecore areas of the MCA territory (T9, T7, C5, C3, FC3, F3, and homolo-gous contralateral positions) yielded trends toward interhemisphericdifferences for D[HbR] and D[HbD] (P¼ 0.031 in both cases).
Group 2: Short-Term Internal Carotid Artery OcclusionsPatients S2 to S5 underwent ICA stenting due to steno-occlusivecarotid disease with diverse comorbidities, see Table 1. Short-termocclusions (duration 43±25 seconds, no significant difference tothe 20 occlusions in patient S1, P¼ 0.62 in a t-test) of the ICA wereperformed during PTA after stent placement. In patients S2, S3,and S5, no neurologic symptoms were present during or after theshort-term occlusions. The intervention in patient S4 wasperformed under general anesthesia, thus neurologic deficitscould not be assessed during the intervention. After theintervention, the neurologic exam was normal. Angiograms ofpatient S3 as well as detailed and temporally resolved NIRS datafor this heterogenous patient group are compiled in theSupplementary Information. Here, we concentrate on the mean
−0.06
−0.03
0
0.03
0.06
Δ[H
bX]
T7
−0.06
−0.03
0
0.03
0.06
Δ[H
bX]
C1
−0.06
−0.03
0
0.03
0.06
Δ[H
bX]
F3
−0.06
−0.03
0
0.03
0.06
Δ[H
bX]
F4
−0.06
−0.03
0
0.03
0.06
Δ[H
bX]
C2
−2 −1 0 1 2 3−0.06
−0.03
0
0.03
0.06
time in minutes
Δ[H
bX]
T8
Figure 4. Temporal evolution of six selected near infrared spectroscopy (NIRS) signals in both hemispheres during two consecutive short-termballoon occlusions of the left middle cerebral artery (MCA) in patient S1. Signals were recorded at the following positions of the 10/10electroencephalography system: (A) T7; (B) C1; (C) F3; (D) F4; (E) C2; and (F) T8. Relative hemoglobin concentration changes (red: D[HbO], blue:D[HbR], unit: mMolar*cm) are shown. All signals were low-pass filtered. Occlusion periods are indicated by black bars on the x-axes.Approximately 15 seconds after the first occlusion a bolus of contrast agent was injected into the left internal carotid artery (ICA). Opposite tothe occlusions the blood dilution due to the bolus injection results in a concomitant short-term decrease in oxygenated and deoxygenatedhemoglobin in the affected vascular territories (A).
NIRS monitoring of cerebral oxygenation during BOTC Rummel et al
5
& 2013 ISCBFM Journal of Cerebral Blood Flow & Metabolism (2013), 1 – 10

z-maps for D[HbT] and D[HbD] in the last 2/3 of the occlusions(Figures 6B to 6E).
A common feature of all patients with short-term occlusions ofthe ICA was a widespread decrease (zo� 1) in oxygenation(measured by [HbD]) and CBV (proportional to [HbT]) withoutpronounced spatial asymmetry. This was most probably related toconcomitant contralateral occlusive pathologies impeding effec-tive collateral flow. Patients S2 and S3 had PTA in the left ICA,while the right ICA was either pseudo-occluded (S2, grading of90% according to the North American Symptomatic CarotidEndarterectomy Trial, NASCET) or stenotic (S3, NASCET 54%). Inpatient S5 who received PTA in the right ICA and had anadditional stenosis in the left ICA (NASCET 65%) the situation wasopposite. The procedures resulted in bilaterally impaired carotidartery flow, leaving only the vertebral arteries as potential maincollateral vessels. As a consequence, the deoxygenation duringtransient ICA occlusion was also visible in central and frontalregions not only over the ipsilateral, but also on the contralateralhemisphere. In all these patients, [HbD] decrease was explained by
a concomitant [HbO] decrease and [HbR] increase (seeSupplementary Figure S23).
Stenting in patient S4 was performed under general anesthesia.The patient developed bradycardia in response to PTA (decreasein heart rate from 45 to 33 b.p.m.) that triggered administration ofatropine. Afterwards, hypertension was reported by the anesthe-sist. We interpret the observed global variation in oxygenationand CBV (see Figure 6D) as a consequence of decreased andreincreased supply of oxygenated blood due to bradycardia andsubsequent hypertonia.
Group 3: Prolonged Internal Carotid Artery OcclusionsBesides short-term occlusions that are mandatory either for vesselstabilization and protection (balloon remodeling) or during stentdilatation (PTA), in BOT the reason for selective arterial occlusion isto explicitly test the efficiency of collateral flow in the CoW, seeFigure 1. During BOT, direction and extent of collateral flow isangiographically confirmed by two contrast injections into all
z(Δ
[HbO
])T9T7C5C3C1
FC3FC1
F3F1Cz
FCzFzC2C4C6T8
T10FC2FC4
F2F4
z(Δ
[HbR
])
T9T7C5C3C1
FC3FC1
F3F1Cz
FCzFzC2C4C6T8
T10FC2FC4
F2F4
z(Δ
[HbT
])
T9T7C5C3C1
FC3FC1
F3F1Cz
FCzFzC2C4C6T8
T10FC2FC4
F2F4
time in minutes
z(Δ
[HbD
])
−2 −1 0 1 2 3
T9T7C5C3C1
FC3FC1
F3F1Cz
FCzFzC2C4C6T8
T10FC2FC4
F2F4 −6
−3
0
3
6
Figure 5. Temporal evolution of the z-scores of the near infrared spectroscopy (NIRS) signals with respect to the baseline of the last120 seconds before temporary occlusion of the left middle cerebral artery (MCA) in patient S1. (A) Oxygenated hemoglobin. (B) Deoxygenatedhemoglobin. (C) Total hemoglobin. (D) Hemoglobin difference. Similar to the usual electroencephalography display, each row represents onesignal. Arrangement is from the left hemisphere over the midline to the right hemisphere (top to bottom) and within the hemispheres fromcentral to frontal, see y-axes for exact positions in the 10/10 system.
NIRS monitoring of cerebral oxygenation during BOTC Rummel et al
6
Journal of Cerebral Blood Flow & Metabolism (2013), 1 – 10 & 2013 ISCBFM

brain supplying vessels at the beginning and later during theocclusion period. In addition, the duration of the occlusion needsto be long enough for possible (transient) neurologic deficitsto become apparent. In the context of our study, this con-stitutes an advantage over the short-term occlusions, wherecollateral flow is not monitored and for patient protectionocclusion times are kept too short for neurologic symptoms tobecome apparent. During BOT, three patients (L2 to L4) under-went ICA occlusion and L1 underwent common carotid arteryocclusion (the ipsilateral external carotid artery was occluded byearlier surgery). Patient L2 developed transient neurologicsymptoms indicating ischemia and BOT was aborted.
Patient L1 presented with an additional stenosis of thecontralateral left ICA (NASCET 53%). We observed widespreadCBV and oxygenation decrease (see Figure 6F as well asSupplementary Figures S15 and S16 of the SupplementaryInformation) during the first minute after vessel occlusion. Thepatient remained asymptomatic during the whole occlusion. Inpatient L2, the decrease in [HbT] and [HbD] was more pronouncedover the affected right hemisphere and especially along thewatershed areas between the right ACA and MCA territories (seechannels F2, F4, and FC4 in Figure 6G; Supplementary Figures S17and S18). This pattern remained stable for a longer period(Supplementary Figure S18) and CBV as measured by [HbT]increased in the contralateral temporal cortex after occlusion.A global increase in [HbT] and a smaller contralateral increase in[HbD] were detected in patient L3. In patient L4, [HbT] decreased
moderately in the ipsilateral left temporal cortex. No consistent orspatially extended changes in oxygenation were observed.
Spatial asymmetry of the mean z-scores in 20 secondsoto60seconds was only significant for D[HbT] in patient L2, whodeveloped neurologic symptoms during BOT (Figure 6G,P¼ 0.0040). Interestingly, this asymmetry was accompanied byincreased contralateral CBV. Without reaching significance onglobal level (P¼ 0.27) also the oxygenation as measured by [HbD]was increased in the contralateral temporal cortex. In theasymptomatic patient L3, spatial asymmetry of D[HbT] was notsignificant (P¼ 0.18).
DISCUSSIONIn the present pilot study, we demonstrated the feasibility ofmultichannel CW-NIRS monitoring as a clinical application inpatients receiving selective short-term (balloon remodeling andPTA) or prolonged occlusions (BOT) of brain supplying vesselsduring neuroangiological interventions. This combination ofprocedures allowed a validation of CW-NIRS signal changes bycerebral angiography (as a current gold standard). MultichannelCW-NIRS monitoring may provide additional information aboutaltered hemodynamics as may occur during neurointerven-tion and other potentially critical procedures. While the short-term occlusions are mandatory during certain endovascularinterventions, the rationale for BOT is to probe maintenance ofsufficient collateral flow along the arteries of the CoW during
Δ [HbT]
pat
. S1
MC
A L
rem
od.
Δ [HbD]
pat
. S2
ICA
L
PT
A
occl
usio
n
ICA
R
pat
. S3
ICA
L
PT
A
ICA
R
pat
. S4
ICA
L
PT
A
brad
ycar
dias
teno
sis
pat
. S5
ICA
R
PT
A
sten
osis
ICA
L
pat
. L1
CC
A R
BO
T
pat
. L2
ICA
R
BO
T
sym
pt.
pat
. L3
ICA
R
BO
T
pat
. L4
ICA
L
BO
T
−6−116
Figure 6. Spatial distribution of mean z-scores of D[HbT] and D[HbD] in 20 secondsoto60 seconds (or the last 2/3 of shorter occlusions) for allpatients. (A) Patient S1. (B) Patient S2. (C) Patient S3. (D) Patient S4. (E) Patient S5. (F) Patient L1. (G) Patient L2. (H) Patient L3. (I) Patient L4. Thespatial layout is the same as introduced in Figure 3C. Channels where |z|o¼ 1 are indicated in light yellow. For patient S1, the mean z-scoreover all 20 vessel occlusions is shown. BOT, balloon occlusion testing; CCA, common carotid artery; ICA, internal carotid artery; PTA,percutaneous transluminal angioplasty; MCA, middle cerebral artery.
NIRS monitoring of cerebral oxygenation during BOTC Rummel et al
7
& 2013 ISCBFM Journal of Cerebral Blood Flow & Metabolism (2013), 1 – 10

transient interruption of blood supply of one carotid arterywithout bearing the risk of acute ischemic complications.
With transient occlusion of blood vessels either distally or proximallyto the CoW, two fundamentally different patterns were observed:
(1) Pattern 1: Repeated occlusion of the MCA in patient S1preserved the perfusion of the ACA and resulted in reducedperfusion exclusively in the territory of the MCA, irrespective ofcollateral flow via the CoW (Acom and Pcom)—in keepingwith the site of occlusion distal to collaterals, see Figure 1B.Occlusion of MCA induced an immediate arrest of arterialinflow, whereas venous outflow was still open. The resultingdecrease in CBV (Figure 5C, obscured in Figure 6A because� 1ozo0 in the last 2/3 of the occlusions) is in keeping withthe initially rapid decrease in [HbT] in the vascular territory ofthe MCA, followed by a prolonged decrease in [HbO](Figure 5A) and a slower increase in [HbR] and [HbD](Figures 5B and 5D). Oxygen is still withdrawn from theremaining stagnant blood due to the continuing metabolicdemands of the tissue. The main effect was detected in thecenter of the MCA territory, with less pronounced effects atthe borders—explained by leptomeningeal collateralizationfrom the adjacent arteries along the watershed areas.
(2) Pattern 2: An occlusion of the ICA may affect both theterritories of the MCA and of the ACA, but allows for collateralcirculation via the CoW depending on the supply by the Acomand Pcom:
(A) In patient L2, collateral circulation was insufficient (‘bad’collaterals, see Figure 1D for one but not the only possibleunderlying vascular anatomy) as indicated by the clinical deficitsand confirmed by DSA. Correspondingly, severe and significantlyasymmetric changes were observed for [HbT] in multiple NIRSchannels that encompassed the territories of the MCA and ACA ofboth hemispheres (Figure 6G). The main decrease in [HbT] and[HbD] was observed along the watershed area between theipsilateral right ACA and MCA, which represents a predilectionarea of hemodynamic infarctions due to carotid artery patholo-gies. Interestingly, [HbT] and [HbD] increased in the contralateralleft temporal cortex, indicating the potential for compensatorycollateral flow, which does not pass the CoW in this patient.(B) In patients L1, L3, and L4, collateral circulation was sufficientto prevent neurologic symptoms (‘good’ collaterals, seeFigure 1C for a possible scenario) both clinically and by DSA.With the exception of patient L1, who had contralateral ICAstenosis, relative changes in all hemoglobin types were lesspronounced and more symmetric, see Figures 6F, 6H, and 6I.
During the short-term occlusions in patients S2 to S5 weobserved modulations in [HbT] and [HbD]. Due to concomitantcontralateral occlusive pathology (patients S2, S3, and S5) orsystemic effects (bradycardia and hypertension, patient S4) thesechanges were rather symmetric between hemispheres. These find-ings indicate that multichannel CW-NIRS is sensitive to hemo-dynamic effects resulting in insufficient collateral flow associatedwith temporary occlusion of cerebral arteries. Our observations inpatients S1 and L2 indicate that these effects are regionally specificin the sense that occlusion-related signal variations depend on theposition of the optodes over the vascular territories of theintracerebral arteries and the watershed regions.
Recently, it has been observed that CW-NIRS may produceresults only poorly related or completely unrelated to neuronalactivity, rather caused by systemic cardio-vascular or extracranialvascular changes.27–35 Several recommendations have beenproposed to minimize the risk of misinterpretations. Systemicquantities as scalp blood flow, heart rate, and arterial bloodpressure should be used as regressors for estimates of hemo-globin concentration changes in CW-NIRS studies. Oxy- and
deoxyhemoglobin should be analyzed simultaneously instead ofoxyhemoglobin alone. In addition, monitoring of pCO2 seems tobe highly important because of its large-gain effect directlymodifying cerebro-vascular autoregulation itself, resulting in flowalterations exceeding 50% readily achievable by voluntary (orinvoluntary) hyperventilation.36
In our setting, we can exclude the alternative explanation thatthe observed signal changes could be mostly due to superficialextracranial vessels, since the intervention selectively occludedbrain supplying vessels (ICA and MCA) and the presence or absenceof intracerebral collateral flow was controlled by simultaneous DSA.In consequence, our observations are also brain specific.
The novelty of our approach is to record D[HbO], D[HbR] andthe derived quantities D[HbT], D[HbD] simultaneously withneurointervention in brain areas covering the cerebral cortexalong widespread cerebro-vascular territories of the MCA andACA. As time resolution of the used CW-NIRS system is in thesubsecond range and optodes were placed at 30 mm spacing, ourset-up is sensitive to fast and regional changes in collateral flow.So far, only a limited number of studies have reported NIRSmonitoring during endovascular neuroradiologic interventions.Hernandez-Avila et al,14 Horie et al,17 Bhatia et al,18 and Mazzeoet al.22 employed different versions of the two-channel cerebraloxymeter INVOS (Somanetics, Troy, MI, USA) placed on theforehead and a sample interval of at least several seconds. Despitetheir limitations in spatial coverage and temporal resolution, allstudies agreed that NIRS monitoring is of diagnostic value for earlydetection of cerebral oxygen desaturation during neuro-angiographic intervention. The NIRS technology was specificallyapplied during BOT in refs. 16,19 and exemplary cases are shownin refs. 20,21. Calderon-Arnulphi et al19 applied a two-channelfrequency-domain NIRS device that allowed absolute measure-ment of hemoglobin concentrations (Oxiplex TS, ISS Inc.,Champaign, IL, USA). The authors concluded that an ipsilateraldecrease in [HbO] discriminated ischemic events best (Po0.03).They observed a contralateral compensatory increase inoxygenation in a patient that developed neurologic symptomsunder BOT. Our observations in patient L2 (Figure 6G;Supplementary Figure S23g) is in keeping with these studies,indicating widespread compensatory remote perfusion changes.Interestingly, the contralateral CBV increase was the only changein our patients that revealed a significantly asymmetric pattern(P¼ 0.0040). Failing to reach significance a similar observation wasmade for the nonsymptomatic patient L3. We thus hypothesizethat asymmetric compensatory perfusion and oxygenationincrease as measured by CW-NIRS could be an early predictor ofBOTs that indicate perfusion-related neurologic symptoms emer-ging at later time frames. Notably, a larger number of sympto-matic patients are required to further support this hypothesis.
Human Stroke ModelAn important added value of CW-NIRS during neuroangiographyis to enable real-time monitoring of cerebral oxygenation changesduring vessel occlusions that resemble the spontaneous patho-physiologic conditions during transient ischemic attacks andstroke. With the exception of continuously monitored surgicalprocedures as cardiac or aortic surgery, where stroke risk isremarkably increased (see e.g. ref. 37 for review), the exact timingof stroke-related cerebral vessel occlusion is unpredictable andthus its onset can usually not be documented by imagingprocedures in practice. The NIRS monitoring of routinelyperformed neurointerventional procedures as short-term vesselocclusion and BOT may provide valuable surrogate data regardingvascular changes that may occur in a similar manner during acutestroke. While changes in oxygenation can be assessed in real timewith CW-NIRS, related clinical symptoms remain transient asocclusions can be stopped within seconds.
NIRS monitoring of cerebral oxygenation during BOTC Rummel et al
8
Journal of Cerebral Blood Flow & Metabolism (2013), 1 – 10 & 2013 ISCBFM
Selective vessel occlusion necessary during certain types ofinterventional procedures allows simulating two types of cerebro-vascular events:
(1) Stroke with minor clinical deficits such as ICA occlusions thatoccur in patients with sufficient CoW collaterals;
(2) Strokes with major clinical deficits such as ICA occlusions inpatients without sufficient CoW collaterals or the majority ofproximal MCA occlusions where CoW collaterals have noeffect.
On the basis of magnetic resonance-angiographic findings, anentirely complete CoW was identified in 55% of 75 patients withICA stenosis or occlusion who showed only mild symptoms.Remarkably, in a control group of 100 healthy subjects only 36%had an entirely complete CoW.38 This selection bias in the mildlysymptomatic group emphasizes the importance of goodcollaterals in stroke and steno-occlusive disease.
Once CW-NIRS is validated with transitions to vesselocclusion and back to revascularization during mechanicalthrombectomy, this noninvasive technique may gain importanceas a clinical tool for real-time and bedside monitoring ofthrombolytic effects during intravenous thrombolysis, which isnot controlled by DSA. Here, a means to continuously monitorperfusion changes is of considerable clinical importance becausecurrent practice is to apply standard dosages. The lack ofknowledge about individually tailored dosages poses an increasedrisk of cerebral hemorrhage, which is in the range of 5% to 6% ofcases.39,40
Beyond BOT and stroke, multichannel CW-NIRS monitoring mayadd valuable information about circulation changes during peri-procedural monitoring as, e.g., treatment of vasospasm, cardiac oraortic surgery and remodeling techniques during endovascularaneurysm treatment. The latter was exemplarily demonstrated inpatient S1 of the present report.
LimitationsThe data of this continuous study are currently limited to our firstobservations and report the feasibility of the suggested multi-modal approach to investigate collateral flow in a realistic clinicalsetting. Our results are heterogenous and the number of BOTpatients (four) was small. Other tertiary care centers thatinvestigated 25 combined DSA-NIRS procedures over a 22-monthsampling period reported a similar number of 5 BOTs in theircohort, from which one failed the test clinically.19 We aim to followpatients with BOT in a systematic way and increase the number ofpatients during the next years. The aim is to evaluate sensitivityand specificity of early asymmetry in hemoglobin changes asobserved in our patient L2 for prediction of negative BOToutcome.
The CW-NIRS technology is limited to observation of concen-tration changes occurring during relatively short periods of time,integrates measurement of superficial with deeper layers and isrelatively prone to movement artifacts. While other techniques likefrequency-domain and time-domain NIRS would enable betterseparation of the signal origin as well as absolute concentrationmeasurements, these technologies are still much more expensive,less mobile and have smaller number of channels.12
SummaryWe demonstrated the feasibility of simultaneous CW-NIRS andangiography of the intracranial vessels. In selected cases, multi-channel CW-NIRS detected regionally and brain-specific hemody-namic changes corresponding to collateral flow during temporaryocclusion of intracerebral arteries as proven by angiography.
ETHICS STATEMENTThis pilot study was approved by the Kantonale Ethikkommision(KEK) Bern. Experiments were performed according to thisinstitution’s statement dated 4 May 2012, according to Swiss lawand institutional guidelines.
DISCLOSURE/CONFLICT OF INTERESTThe authors declare no conflict of interest.
ACKNOWLEDGMENTSThe authors thank the angiography team of the University Institute for Diagnosticand Interventional Neuroradiology as well as Manuela Wapp, Pascal Gratz, and FraukeKellner-Weldon for technical support. Andrea Federspiel provided the software forevaluation of vessel-selective ASL data. The authors are grateful to the anonymousreviewers for helping improve the manuscript.
REFERENCES1 Devor A, Sakadzic S, Srinivasan VJ, Yaseen MA, Nizar K, Saisan PA et al. Frontiers in
optical imaging of cerebral blood flow and metabolism. J Cereb Blood Flow Metab2012; 32: 1259–1276.
2 Linskey ME, Jungreis CA, Yonas H, Hirsch Jr WL, Sekhar LN, Horton JA et al. Strokerisk after abrupt internal carotid artery sacrifice: accuracy of preoperativeassessment with balloon test occlusion and stable xenon-enhanced CT. Am JNeuroradiol 1994; 15: 829–843.
3 Peterman SB, Taylor Jr A, Hoffman Jr. JC. Improved detection of cerebral hypo-perfusion with internal carotid balloon test occlusion and 99mTc-HMPAO cerebralperfusion SPECT imaging. Am J Neuroradiol 1991; 12: 1035–1041.
4 Dare AO, Chaloupka JC, Putman CM, Fayad PB, Awad IA. Failure of the hypo-tensive provocative test during temporary balloon test occlusion of the internalcarotid artery to predict delayed hemodynamic ischemia after therapeutic carotidocclusion. Surg Neurol 1998; 50: 147–155.
5 Schneweis S, Urbach H, Solymosi L, Ries F. Preoperative risk assessment for carotidocclusion by transcrianial Doppler ultrasound. J Neurol Neurosurg Psychiatry 1997;62: 485–489.
6 Gibson AP, Hebden JC, Arridge SR. Recent advances in diffuse optical imaging.Phys Med Biol 2005; 50: R1–R43.
7 Elwell CE, Cooper CE. Making light work: illuminating the future of biomedicaloptics. Philos Trans R Soc A 2011; 369: 4358–4379.
8 Kim SG, Ogawa S. Biophysical and physiological origins of blood oxygenationlevel-dependent fMRI signals. J Cereb Blood Flow Metab 2012; 32: 1188–1206.
9 Delpy DT, Cope M, van der Zee ZP, Arridge S, Wray S, Wyatt J. Estimation ofoptical pathlength through tissue from direct time of flight measurement. PhysMed Biol 1988; 33: 1433–1442.
10 Murkin JM, Arango M. Near-infrared spectroscopy as an index of brain and tissueoxygenation. Br J Anaesth 2009; 103: i3–i13.
11 Villringer A, Chance B. Non-invasive optical spectroscopy and imaging of humanbrain function. Trends Neurosci 1997; 20: 435–442.
12 Ferrari M, Quaresima V. A brief review on the history of human functional near-infrared spectroscopy (fNIRS) development and fields of application. NeuroImage2012; 63: 921–935.
13 Scholkmann F, Kleiser S, Metz AJ, Zimmermann R, Mata Pavia J, Wolf U et al. A reviewon continuous wave functional near-infrared spectroscopy and imaging instrumenta-tion and methodology. NeuroImage 2013; doi:10.1016/j.neuroimage.2013.05.004(e-pub ahead of print).
14 Hernandez-Avila G, Dujovny M, Slavin KV, Luer MS, Nijensohn E, Geremia G et al.Use of transcranial cerebral oximetry to monitor regional cerebral oxygen satura-tion during neuroendovascular procedures. Am J Neuroradiol 1995; 16: 1618–1625.
15 Germon TJ, Evans PE, Barnett NJ, Lewis TT, Wall P, Nelson RJ. Changes in tissueoxyhaemoglobin concentration measured using multichannel near infraredspectroscopy during internal carotid angiography. J Neurol Neurosurg Psychiatry1997; 63: 660–664.
16 Kaminogo M, Ochi M, Onizuka M, Takahata H, Shibata S. An additional monitoringof regional cerebral oxygen saturation to HMPAO SPECT Study during balloon testocclusion. Stroke 1999; 30: 407–413.
17 Horie N, Kitagawa N, Morikawa M, Kaminogo M, Nagata I. Monitoring of regionalcerebral oxygenation by near-infrared spectroscopy in carotid arterial stenting:preliminary study. Neuroradiology 2005; 47: 375–379.
18 Bhatia R, Hampton T, Malde S, Kandala NB, Muammar M, Deasy N et al. Theapplication of near-infrared oximetry to cerebral monitoring during aneurysm
NIRS monitoring of cerebral oxygenation during BOTC Rummel et al
9
& 2013 ISCBFM Journal of Cerebral Blood Flow & Metabolism (2013), 1 – 10

embolization: a comparison with intraprocedural angiography. J NeurosurgAnesthesiol 2007; 19: 97–104.
19 Calderon-Arnulphi M, Alaraj A, Amin-Hanjani S, Mantulin WW, Polzonetti CM,Gratton E et al. Detection of cerebral ischemia in neurovascular surgery usingquantitative frequency-domain near-infrared spectroscopy. J Neurosurg 2007;106: 283–290.
20 Kakihana Y, Matsunaga A, Yasuda T, Imabayashi T, Kanmura Y, Tamura M. Brainoxymetry in the operating room: current status and future directions with parti-cular regard to cytochrome oxidase. J Biomed Opt 2008; 13: 033001.
21 Boas DA, Franceschini MA. Haemoglobin oxygen saturation as a biomarker: theproblem and a solution. Philos Trans R Soc A 2011; 369: 4407–4424.
22 Mazzeo AT, Di Pasquale R, Settineri N, Bottari G, Granata F, Farago G et al.Usefulness and limits of near infrared spectroscopy monitoring during endovas-cular neuroradiologic procedures. Minerva Anaestiol 2012; 78: 35–45.
23 Pavia FF, Tannus A, Silva AC. Measurement of cerebral perfusion territories usingarterial spin labelling. NMR Biomed 2007; 7: 633–642.
24 Scholkmann F, Spichtig S, Muehlemann T, Wolf M. How to detect and reducemovement artifacts in near-infrared imaging using moving standard deviationand spline interpolation. Physiol Meas 2010; 31: 649–662.
25 Huppert TJ, Diamond SG, Franceschini MA, Boas DA. HomER: a review of time-series analysis methods for near-infrared spectroscopy of the brain. Appl Opt2009; 48: D280–D298.
26 Siegel S. Non-Parametric Statistics for the Behavioral Sciences. McGraw-Hill:New York, 1956.
27 Tachtsidis I, Leung TS, Chopra A, Koh PH, Reid CB, Elwell CE. Falsepositives in functional near-infrared topography. Adv Exp Med Biol 2009; 645:307–314.
28 Tachtsidis I, Koh PH, Stubbs C, Elwell CE. Functional optical topography analysisusing statistical parametric mapping (SPM) methodology with and withoutphysiological confounds. Adv Exp Med Biol 2010; 662: 237–243.
29 Minati L, Kress IU, Visani E, Medford N, Critchley HD. Intra- and extra-cranial effectsof transient blood pressure changes on brain near-infrared spectroscopy (NIRS)measurements. J Neurosci Meth 2011; 197: 283–288.
30 Takahashi T, Takikawa Y, Kawagoe R, Shibuya S, Iwano T, Kitazawa S. Influence ofskin blood flow on near-infrared spectroscopy signals measured on the foreheadduring a verbal fluency task. NeuroImage 2011; 57: 991–1002.
31 Patel S, Katura T, Maki A, Tachtsidis I. Quantification of systemicinterference in optical topography data during frontal lobe and motor cortexactivation: an independent component analysis. Adv Exp Med Biol 2011; 915:45–51.
32 Jelzow A, Tachtsidis I, Kirilina E, Niessing M, Bruhl R, Wabnitz H et al. Simultaneousmeasurement of time-domain fNIRS and physiological signals during a cognitivetask. SPIE-Int Soc Opt Eng 2011, Diff. Opt. Imag. III, 8088.
33 Kirilina E, Jelzow A, Heine A, Niessing M, Wabnitz H, Bruhl R et al. The physiolo-gical origin of task-evoked systemic artefacts in functional near infraredspectroscopy. NeuroImage 2012; 61: 70–81.
34 Gagnon L, Cooper RJ, Yucel MA, Perdue KL, Greve DN, Boas DA. Short separationchannel location impacts the performance of short channel regression in NIRS.NeuroImage 2012; 59: 2518–2528.
35 Sato Y, Fukuda M, Oishi M, Fujii Y. Movement-related cortical activation withvoluntary pinch task: simultaneous monitoring of near-infrared spectroscopysignals and movement-related cortical potentials. J Biomed Opt 2012; 17:076011.
36 Markwalder TM, Grolimund P, Seiler RW, Roth F, Aaslid R. Dependency of bloodflow velocity in the middle cerebral artery on end-tidal carbon dioxide partialpressure – a transcranial ultrasound Doppler study. J Cereb Blood Flow Metab1984; 4: 368–372.
37 McKhann GM, Grega MA, Borowicz LM, Baumgartner WA, Selnes OA. Stroke andencephalopathy after cardiac surgery: an update. Stroke 2006; 37: 562–571.
38 Hartkamp MJ, van Der Grond J, van Everdingen KJ, Hillen B, Mali WP. Circle ofWillis collateral flow investigated by magnetic resonance angiography. Stroke1999; 30: 2671–2678.
39 NINDS t-PA Stroke Study Group. Intracerebral hemorrhage after intravenous t-PAtherapy for ischemic stroke. Stroke 1997; 28: 2109–2118.
40 Cucchiara B, Kasner SE, Tanne D, Levine SR, Demchuk A, Messe SR et al. Factorsassociated with intracerebral hemorrhage after thrombolytic therapy for ischemicstroke: pooled analysis of placebo data from the Stroke-Acute Ischemic NXYTreatment (SAINT) I and SAINT II Trials. Stroke 2009; 40: 3067–3072.
This work is licensed under a Creative Commons Attribution 3.0Unported License. To view a copy of this license, visit http://
creativecommons.org/licenses/by/3.0/
Supplementary Information accompanies the paper on the Journal of Cerebral Blood Flow & Metabolism website (http://www.nature.com/jcbfm)
NIRS monitoring of cerebral oxygenation during BOTC Rummel et al
10
Journal of Cerebral Blood Flow & Metabolism (2013), 1 – 10 & 2013 ISCBFM
Copyright © 2022 FDOKUMEN