
The promise of Near-Infrared Spectroscopy (NIRS) for psychological research: A brief review
Upload
khangminh22Category
view
1download
0
WIRELESS DISTRIBUTED ACQUISITIONSYSTEM FOR NEAR INFRAREDSPECTROSCOPY { WDA-NIRS
J. SAFAIE*,§, R. GREBE*, H. ABRISHAMI MOGHADDAM*,‡
and F. WALLOIS*,†
*GRAMFC � Inserm U1105UFR of Medicine of University of Picardie Jules Verne
80036 Amiens, France
†GRAMFC � Inserm U1105EFSN Pediatrique, North Hospital
80056 Amiens, France
‡Faculty of Electrical EngineeringK. N. Toosi University of Technology
16315-1355, Tehran, Iran§[email protected]
Received 2 April 2013Accepted 6 May 2013Published 18 June 2013
The wireless distributed acquisition system for near infrared spectroscopy (WDA-NIRS) is aportable, ultra-compact, continuous wave (CW) NIRS system. Its main advantage is that itallows continuous synchronized multi-site hemodynamic monitoring. The WDA-NIRS systemcalculates online changes in hemoglobin concentration based on modi¯ed Beer�Lambert law andthe tissue oxygenation index based on the spatial-resolved spectroscopy method. It consists of upto seven signal acquisition units, su±ciently small to be easily attached to any part of the body.These units are remotely synchronized by a PC base station for independent acquisition of NIRSsignals. Each acquisition module can be freely adapted to individual requirements such as localskin properties and the microcirculation of interest, e.g., di®erent muscles, brain, skin, etc. Forthis purpose, the light emitted by each LED can be individually, interactively or automaticallyadjusted to local needs. Furthermore, the user can freely create an emitter time-multiplexingprotocol and choose the detector sensitivity most suitable to a particular situation. The potentialdiagnostic value of this advanced device is demonstrated by three typical applications.
Keywords: NIRS; optical spectroscopy; body area network; microcirculation.
This is an Open Access article published by World Scienti¯c Publishing Company. It is distributed under the terms of the CreativeCommons Attribution 3.0 (CC-BY) License. Further distribution of this work is permitted, provided the original work is properlycited.
Journal of Innovative Optical Health SciencesVol. 6, No. 3 (2013) 1350019 (15 pages)#.c The AuthorsDOI: 10.1142/S1793545813500193
1350019-1
J. I
nnov
. Opt
. Hea
lth S
ci. 2
013.
06. D
ownl
oade
d fr
om w
ww
.wor
ldsc
ient
ific
.com
by 1
03.2
40.1
26.9
on
10/2
1/18
. Re-
use
and
dist
ribu
tion
is s
tric
tly n
ot p
erm
itted
, exc
ept f
or O
pen
Acc
ess
artic
les.

1. Introduction
J€obsis was one of the ¯rst to show that the nearinfrared (NIR) range of the light spectrum (650�1000 nm) can be used to monitor certain physiologi-cal phenomena.1 Near infrared spectroscopy (NIRS)is now an innovative clinical method to assess infor-mation concerning local hemodynamic and metab-olism in the brain and muscles.2�7 Three types ofNIRS instruments have been proposed according tothe light source: time-resolving, frequency domainand continuous wave (CW) machines. The simplestand most widely used machines at the present timeuse continuous wave light sources (CW system). Thiskind of instrument measures attenuation of light ofdi®erent wavelengths and can therefore be used todetermine changes in chromophore concentrationssuch as oxygenated (HbO) and deoxygenated (HbR)hemoglobin, induced by local changes of micro-circulation and/or metabolism.
However, light absorption measurements alonecannot be used to determine absolute concentrationsof chromophores; information about the photonpath length is therefore necessary, but is not pro-vided by the CW method. Absolute values can beestimated within certain limits by using multi-wavelength systems or spatial-resolved spectroscopy(SRS).8,9 The advantages of CW NIRS instrumentsare their relatively low price and small size; they caneven be designed as portable clinical devices.
Most of the commercially available NIRSinstruments are relatively expensive, cumbersome,heavy and in°exible in terms of their applications,mainly due to the use of glass ¯bers for light transferand photomultiplier tubes (PMTs) for photondetection. More recent developments now use light-emitting diodes (LEDs) as light sources and siliconphoto-diodes (SPDs) as detectors,10,11 which dras-tically lowers the price, size and complexity of theseinstruments. LEDs o®er numerous advantagescompared to laser diodes (LDs): LEDs can bepositioned directly on the skin, making optical ¯bersobsolete, they are inexpensive and generally notharmful for the patient's eyes, which is very im-portant in the clinical setting.10
Moreover, the light power�current relationshipof LDs is linear for relatively high injection currentsonly. In the low-current mode, required for shortemitter-detector distances (EDDs), there is athreshold, resulting in marked nonlinearity. Incontrast, LEDs have a linear optical power�current
relationship, allowing to drive them also by verylow currents. The replacement of PMTs or ava-lanche photo diodes by SPDs has the advantage ofavoiding the bias of the high voltages required byformer, while providing su±cient sensitivity. Inaddition, there is no need to use optical ¯bers, asSPDs can be applied directly to the skin.
Several teams have tried to develop more °exibleinstruments suitable for brain monitoring. Yurts-ever et al. developed a portable NIRS system basedon a pocket PC as controller and processor unit.They chose LEDs with wavelengths of 730 and850 nm.12 However, probably due to technicallimitations at that time, they were unable to use apocket PC as main station and monitoring system.
Nevertheless, the idea of combining a controllerunit and a base station PC in a new powerful PDAor pocket PC remains a fairly interesting solution.Muehlemann et al. proposed a wireless miniaturizedin vivo NIR imaging system using LEDs withwavelengths of 760 and 870 nm and SPD. Toachieve greater °exibility concerning the patchstructure, they used °exible boards.10 Zhang et al.developed a portable NIRS system based on anembedded system board that can operate autono-mously, but it has the disadvantage of requiring ahigh-capacity battery as power supply, making itlarge and heavy.13
In this paper, we present a new device termedwireless distributed acquisition NIRS (WDA-NIRS).Based on advanced digital circuit design technology,it provides considerable progress in terms of minia-turization and portability, while o®ering:
. Important advancements concerning °exibility inLED-detector con¯guration and modes ofoperation.
. Simultaneous signal acquisition from up to sevenbody positions (even during movement) by inde-pendent low-power battery-operated distributedacquisition modules.
. High dynamic input range of each module viaindividual programmable drivers for each lightsource and programmable gain ampli¯ers (PGA)for each detector.
. Software-driven auto-calibration and adaptivecontrol of light pulse generation and signal ac-quisition allowing adaptation to di®erent exper-imental and environmental conditions.
. High signal-to-noise ratio (SNR) based on indi-vidual alignment of each light source.
J. Safaie et al.
1350019-2
J. I
nnov
. Opt
. Hea
lth S
ci. 2
013.
06. D
ownl
oade
d fr
om w
ww
.wor
ldsc
ient
ific
.com
by 1
03.2
40.1
26.9
on
10/2
1/18
. Re-
use
and
dist
ribu
tion
is s
tric
tly n
ot p
erm
itted
, exc
ept f
or O
pen
Acc
ess
artic
les.
The following studies were conducted to demon-strate the performance and highlight the new fea-tures of WDA-NIRS:
. Validation with a sensitivity mapping phantomusing a home-made liquid phantom was pre-viously presented in Ref. 14.
. Evaluation of our device with NIRO-200NX(cerebral oxygenation measuring system,Hamamatsur) by arterial occlusion experimentson human arm.
. Breath-holding experiments to demonstrate sim-ultaneous acquisition of multiple NIRS signalsfrom di®erent sites, each providing informationfrom di®erent tissue depths.
. Stair negotiation experiments to demonstrate theapplicability of WDA-NIRS for portable dis-tributed signal acquisition even in freely movingsubjects.
2. Methodology
2.1. Instrumentation
TheWDA-NIRS device presented here was designedby applying a ¯eld programmable gate array(FPGA) as central controller/processor. The wholesystem consists of up to seven distributed modules(each module includes a patch, a control and
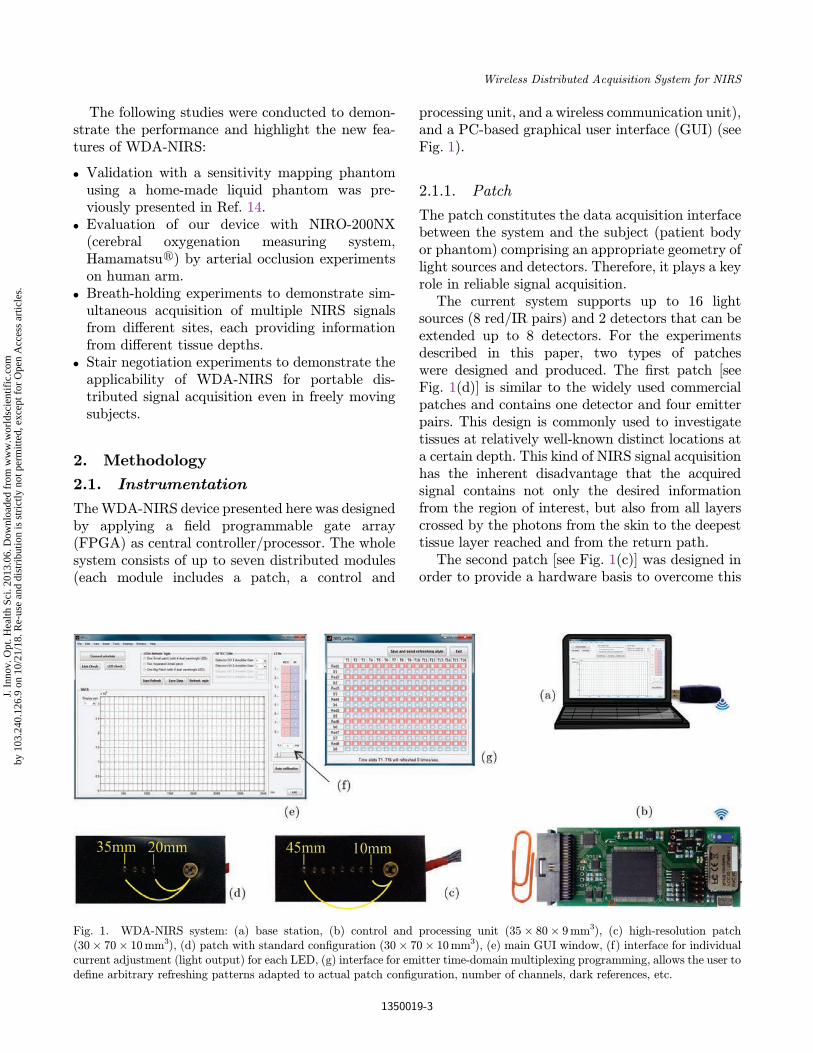
processing unit, and a wireless communication unit),and a PC-based graphical user interface (GUI) (seeFig. 1).
2.1.1. Patch
The patch constitutes the data acquisition interfacebetween the system and the subject (patient bodyor phantom) comprising an appropriate geometry oflight sources and detectors. Therefore, it plays a keyrole in reliable signal acquisition.
The current system supports up to 16 lightsources (8 red/IR pairs) and 2 detectors that can beextended up to 8 detectors. For the experimentsdescribed in this paper, two types of patcheswere designed and produced. The ¯rst patch [seeFig. 1(d)] is similar to the widely used commercialpatches and contains one detector and four emitterpairs. This design is commonly used to investigatetissues at relatively well-known distinct locations ata certain depth. This kind of NIRS signal acquisitionhas the inherent disadvantage that the acquiredsignal contains not only the desired informationfrom the region of interest, but also from all layerscrossed by the photons from the skin to the deepesttissue layer reached and from the return path.
The second patch [see Fig. 1(c)] was designed inorder to provide a hardware basis to overcome this
Fig. 1. WDA-NIRS system: (a) base station, (b) control and processing unit (35� 80� 9mm3), (c) high-resolution patch(30� 70� 10mm3), (d) patch with standard con¯guration (30� 70� 10mm3), (e) main GUI window, (f) interface for individualcurrent adjustment (light output) for each LED, (g) interface for emitter time-domain multiplexing programming, allows the user tode¯ne arbitrary refreshing patterns adapted to actual patch con¯guration, number of channels, dark references, etc.
Wireless Distributed Acquisition System for NIRS
1350019-3
J. I
nnov
. Opt
. Hea
lth S
ci. 2
013.
06. D
ownl
oade
d fr
om w
ww
.wor
ldsc
ient
ific
.com
by 1
03.2
40.1
26.9
on
10/2
1/18
. Re-
use
and
dist
ribu
tion
is s
tric
tly n
ot p
erm
itted
, exc
ept f
or O
pen
Acc
ess
artic
les.
disadvantage. The number of emitters was thereforeincreased to acquire signals containing progressivelyadditional information from deeper tissue layers bystepwise increasing the EDD.14,15 The availabilityof this type of multi-distance signal is the pre-requisite for application of decomposition algor-ithms as already proposed by Zhang et al.16 Speciale®orts have to be taken to allow acquisition of sig-nals from such a wide range of distances in a singlemeasurement, as the light intensity necessary for adistance of 40mm is typically about 1000 timeshigher than that necessary for a distance of 10mmto achieve a su±ciently high SNR for all signals.To meet this requirement, each light source inour device is independently programmed and/orautomatically optimized online.
There are essentially two di®erent types ofcomponents available to generate NIR light pulses;LEDs and LDs. In this device we preferredLEDs. By applying the same maximum permissibleexposure (MPE) criterion for the skin, more NIRphotons (per time and area unit) can be injectedinto the tissue since LEDs create lower power den-sity than equivalent LDs.17 In addition, laser lightsources undergo considerable heating of their semi-conductor junctions, preventing from positioningthem directly on the skin. Optical ¯bers musttherefore be introduced to transfer the light to thetissue, while LEDs can be applied directly on theskin.10 Nevertheless, the potential hazard of NIRlight emitted by LEDs for patient and personneleyes must also be considered, as described inRef. 18.
In the NIR range of the spectrum, photons aremainly scattered in tissues with very low wave-length dependency. In contrast, absorption is highlywavelength dependent and speci¯c for the variousabsorbers. The lower boundary of the optical win-dow (� 650 nm) is determined by the high absorp-tion factor for HbR, and its upper boundary(� 975 nm) is determined by the absorption factorfor water. Around 800 nm (isobestic point), themolar extinction coe±cient is the same for HbO andHbR. To ensure unequivocal di®erentiationbetween changes in HbO and HbR concentrationsand to achieve a su±ciently high SNR, at least twosu±ciently di®erent wavelengths in the NIR bandaround 800 nm are usually applied. Strangmanet al.19 and Uludag et al.20 conducted a detailedanalysis of the most appropriate wavelength.
Following their results and taking into accountthe commercial availability of components, weselected a dual-wavelength LED with 760 and850 nm wavelengths housed in a 3mm package(L760/850 Epitexr, Inc). This LED radiates lightwith a power of up to 17mW with a very goodlinearity between driving current and emitted lightintensity from very low to high current for short tolong EDDs, respectively.
The detector consists of a high-sensitivitymonolithic SPD with integrated ampli¯er (ODA-6WB-500M, Optodioder Co.) and a large activearea (6mm2). The high-gain trans-impedanceampli¯er integrated in this SPD dramaticallyreduces the output noise. Applying a 500M�resistor in the feedback path of this ampli¯er resultsin a light sensitivity higher than 250V/�W. In theversion of the system presented here, the maximaloverall sampling rate is 8 samples/s for each wave-length of each LED, if the user activates all of the16 light sources. Accordingly, for one channel (oneLED�SPD), a sampling rate of 64 samples/s wouldbe possible.
The housing of the emitters and detectors(optodes) plays an important role in NIRS systems,as the quality of the contact between optodes andthe skin directly a®ects the quality of the acquiredsignals. To achieve good contact, the LED/SPDholder must be made of relatively soft and °exiblematerial with a su±ciently hard structure to keepthe LEDs/SPDs in place, o®ering a certain surfaceadhesiveness and preventing any ambient light fromentering the detectors. Liquid polymerizable silicon(Elastosil, Wacker Siliconesr) was found to be themost appropriate solution for this purpose.
Patches were manufactured in three steps: ¯rstly,a relatively thin silicon layer was spread out into amould. After drying, optodes were then positionedand all connections were wire-wrapped to a °atcable. Finally, the assembly was covered with asecond silicon layer, which fused with the ¯rst layerand therefore enclosed all electronic componentsand wires in a °at rectangular silicon cuboidstructure.
Application of the patch on the skin showed thatit was very well adapted to the local surface geo-metry (curvature) and remained in place and shapewith only moderate pressure from an elastic tubularnet bandage (Asterier), due to the intrinsic adhe-siveness between the silicon surface and the skin.
J. Safaie et al.
1350019-4
J. I
nnov
. Opt
. Hea
lth S
ci. 2
013.
06. D
ownl
oade
d fr
om w
ww
.wor
ldsc
ient
ific
.com
by 1
03.2
40.1
26.9
on
10/2
1/18
. Re-
use
and
dist
ribu
tion
is s
tric
tly n
ot p
erm
itted
, exc
ept f
or O
pen
Acc
ess
artic
les.
The 10mm thick silicon patch is also a perfectlight insulator, which is important to reduce thee®ect of extraneous light. This can be easily veri¯edby a simple \all LEDs o® " test at any time duringmeasurement. Time-division multiplexing (TDM)programming allows the user to integrate back-ground light measurements, whenever necessaryduring an experiment. If desired, the patch can alsobe easily covered by light-insulating material (suchas a black fabric), as it does not comprise anyoptical ¯bers or other interfering structures.
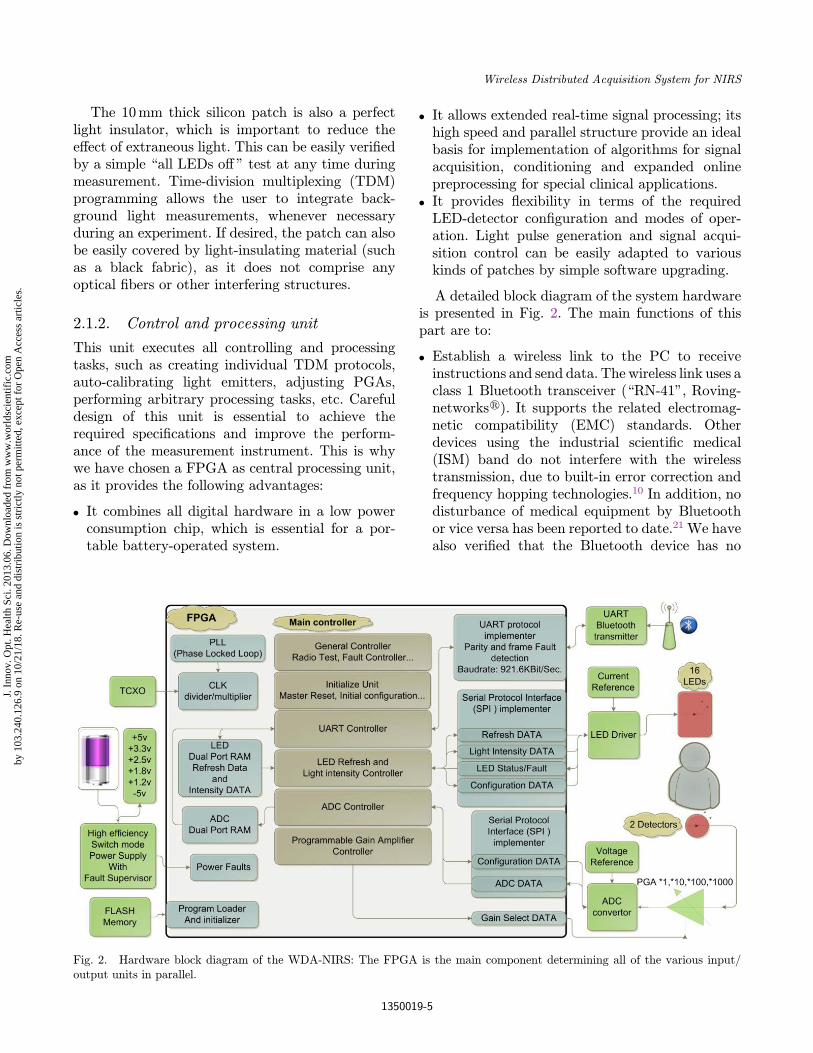
2.1.2. Control and processing unit
This unit executes all controlling and processingtasks, such as creating individual TDM protocols,auto-calibrating light emitters, adjusting PGAs,performing arbitrary processing tasks, etc. Carefuldesign of this unit is essential to achieve therequired speci¯cations and improve the perform-ance of the measurement instrument. This is whywe have chosen a FPGA as central processing unit,as it provides the following advantages:
. It combines all digital hardware in a low powerconsumption chip, which is essential for a por-table battery-operated system.
. It allows extended real-time signal processing; itshigh speed and parallel structure provide an idealbasis for implementation of algorithms for signalacquisition, conditioning and expanded onlinepreprocessing for special clinical applications.
. It provides °exibility in terms of the requiredLED-detector con¯guration and modes of oper-ation. Light pulse generation and signal acqui-sition control can be easily adapted to variouskinds of patches by simple software upgrading.
A detailed block diagram of the system hardwareis presented in Fig. 2. The main functions of thispart are to:
. Establish a wireless link to the PC to receiveinstructions and send data. The wireless link uses aclass 1 Bluetooth transceiver (\RN-41", Roving-networksr). It supports the related electromag-netic compatibility (EMC) standards. Otherdevices using the industrial scienti¯c medical(ISM) band do not interfere with the wirelesstransmission, due to built-in error correction andfrequency hopping technologies.10 In addition, nodisturbance of medical equipment by Bluetoothor vice versa has been reported to date.21 We havealso veri¯ed that the Bluetooth device has no
Fig. 2. Hardware block diagram of the WDA-NIRS: The FPGA is the main component determining all of the various input/output units in parallel.
Wireless Distributed Acquisition System for NIRS
1350019-5
J. I
nnov
. Opt
. Hea
lth S
ci. 2
013.
06. D
ownl
oade
d fr
om w
ww
.wor
ldsc
ient
ific
.com
by 1
03.2
40.1
26.9
on
10/2
1/18
. Re-
use
and
dist
ribu
tion
is s
tric
tly n
ot p
erm
itted
, exc
ept f
or O
pen
Acc
ess
artic
les.
in°uence on the acquired signals by performingidentical experiments with wire and wirelessUART that provided identical experimentalresults. The FPGA contains a high-speed UARTprotocol implementer to drive the Bluetoothtransceiver and to control data throughput anderror handling. It also answers PC radio linkcheck requests. In the event of loss of the radiolink, an alarm is generated on both sides (PC andcontrol and processing unit).
. Drive programmable current sources and prepareauto-calibration. This part (TLC5923, TexasInstrumentsr) contains 16 programmable con-stant current sources, which can each be pro-grammed independently in 128 levels. The user(or the system automatically) can adjust theemitted light individually for each LED accordingto the experimental conditions such as EDD, localskin color, etc. This feature extends themeasurement depth-range, while preserving therequired SNR.
. Implement di®erent types of TDM according toprede¯ned standard refreshing patterns. A speciallook-up table is designed inside the FPGA via adual port RAM, storing information concerningvarious refreshing schedules. These predesignedrefreshing patterns correspond to previouslydesigned patches; an example is presented inFig. 1. They can be selected and manipulated viaa MATLAB GUI. The FPGA also contains aserial protocol interface (SPI) unit for communi-cation with the LED driver unit to control andhandle error conditions such as broken LED oroverheating of the LED driver. In addition, theuser can de¯ne an arbitrary pattern to adapt tothe needs of special experimental conditions, e.g.,by adding a dark state in the refreshing routine(all light sources \o®"), the environmental lightcan be measured and registered continuously tocompensate the e®ect of this light by online (oro®line) processing.
. Acquire and condition analog signals by thehigh-precision PGA (AD8253, Analog Devicesr),and convert them into digital form with the16 bit, 500 kHz analog to digital converter (ADC)(AD7699, Analog Devicesr). The gain of thePGA can be adjusted to four levels: �1;�10;�100 or �1000; the dynamic range of the inputsignal for the ADC can therefore be completelycovered by using this PGA.
. Provide the various voltage sources required froma single 3.6V–1000mAH Li-ion rechargeablebattery using a high-e±ciency switch-mode powersupply. Three kinds of switch-mode power supply(buck, boost and inverting) are used, resulting inreduction of total power consumption. Switchingfrequencies have been chosen much higher thanthe highest frequency of the signal of interest tominimize noise due to the power supply. Ad-ditional techniques including decoupling powersupplies and shielding planes have been applied toimprove the overall SNR.
2.1.3. Wireless communication unit
This unit consists of two class 1 Bluetooth com-ponent, one integrated in the control and processingunit, and the other integrated in a USB key con-nected to the PC. It provides data transfer with arate of up to 921.6Kbits/s over a distance of up to100m. The PC can simultaneously support up toseven channels, corresponding to seven independentacquisition modules (including a patch, a controland processing and a wireless unit) attached sep-arately at arbitrary sites on the patient's body.Standard protocols for error detection and retriev-ing missed data are integrated into these com-ponents to ensure error-free data transfer.
2.1.4. PC-based GUI
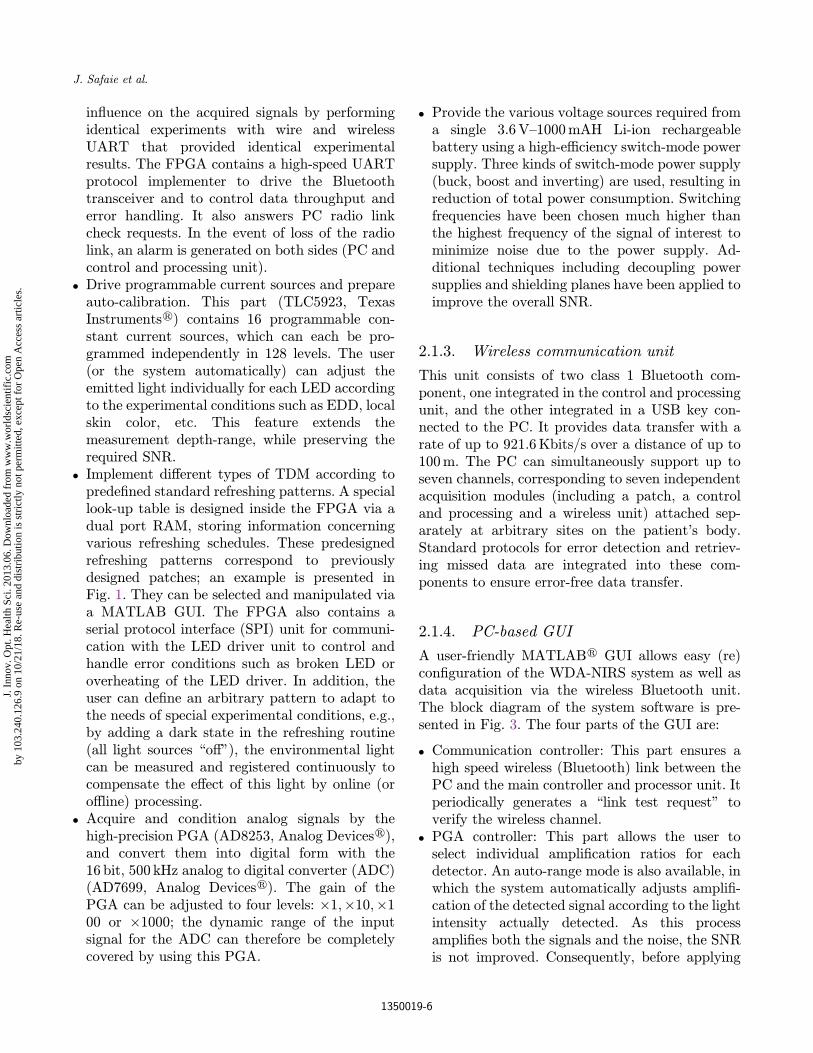
A user-friendly MATLABr GUI allows easy (re)con¯guration of the WDA-NIRS system as well asdata acquisition via the wireless Bluetooth unit.The block diagram of the system software is pre-sented in Fig. 3. The four parts of the GUI are:
. Communication controller: This part ensures ahigh speed wireless (Bluetooth) link between thePC and the main controller and processor unit. Itperiodically generates a \link test request" toverify the wireless channel.
. PGA controller: This part allows the user toselect individual ampli¯cation ratios for eachdetector. An auto-range mode is also available, inwhich the system automatically adjusts ampli¯-cation of the detected signal according to the lightintensity actually detected. As this processampli¯es both the signals and the noise, the SNRis not improved. Consequently, before applying
J. Safaie et al.
1350019-6
J. I
nnov
. Opt
. Hea
lth S
ci. 2
013.
06. D
ownl
oade
d fr
om w
ww
.wor
ldsc
ient
ific
.com
by 1
03.2
40.1
26.9
on
10/2
1/18
. Re-
use
and
dist
ribu
tion
is s
tric
tly n
ot p
erm
itted
, exc
ept f
or O
pen
Acc
ess
artic
les.
this step, the auto-calibration software tries tomaintain a constant PGA gain of �1, andincreases the signal level by adjusting the powerof the emitted light. The signal level is thereforeincreased, while the background noise remainsessentially unchanged, and the overall SNR isimproved. When this correction is not su±cient,the gain of the detector can be increased in astepwise fashion.
. Emitter controller: This part allows free choice oftime multiplexing and current setting for the lightsources. It contains a number of prede¯ned stan-dard settings, but can also be used to createcustomized user-de¯ned formats. For this pur-pose, a special dual port RAM for refreshinginformation was included in the FPGA. A specialstate is designed for each light source and allstates are periodically refreshed. Consequently,by applying the desired value to each state (\on",\o® " or \all o® " for measuring the environmentallight), the user can de¯ne any required sourcemultiplexing according to the speci¯c application.
Furthermore, the power of the emitted light canbe individually selected for each LED with 128-stepresolution, or automatically determined by auto-calibration, in which the emitter current is itera-tively adapted with respect to the detector output
signal. Therefore, all the LEDs are initially poweredo® and the environmental light is measured anddisplayed. The ¯rst LED is then set to half maximaloutput power and the back-scattered light ismeasured. This measurement is used to iterativelyoptimize the intensity in 7 steps (7 bit resolution).
This new feature allows fast and easy adjustmentof light intensity in response to the multitude ofdi®erent in°uences e.g., background light, relatedtissue type, skin color, etc. Settings as determinedfor each channel (LED�SPD combination) and therefreshing style protocol are registered in separate¯les. They are subsequently used to adjust theacquired signals before applying the modi¯edBeer�Lambert law (MBLL).14
. Display and save module: This part o®ers twodi®erent modes, the ¯rst mode displays raw dataand the second mode displays online preprocesseddata. Appropriate algorithms have been devel-oped and implemented to decompose the incom-ing data stream into time sequences for eachchannel and, in parallel, to store the relatedvalues for each PGA ampli¯cation and LEDcurrent. In addition, for each LED the changes inback-scattered light intensity for the two wave-lengths are converted to changes in HbO andHbR concentration by applying the MBLL. Rawand preprocessed data are recorded in parallel forfurther o®line processing.
2.2. Wireless distributed signal
acquisition
The WDA-NIRS system presented here consists of abase station (portable PC) and an arbitrary numberof acquisition modules. The base station providesthe GUI to customize the desired acquisition par-ameters (including the number of modules in thedistributed system and their structure) as well asprogramming, initialization, synchronization, fail-ure detection/handling and data acquisition of allmodules. The system provides programmable mul-tiplexing parameters for each of the seven optionalchannels. Patches with a linear con¯guration, aspresented in Figs. 1(c) and 1(d), are recommendedfor depth-resolving measurements. In the future,appropriate post-processing of the acquired signalswill allow more precise extraction of the data ofinterest. When performing an experiment, therequired number of acquisition modules and their
Fig. 3. WDA-NIRS software structure: A GUI provides accessto three controllers for assisted manipulation of LEDs (emittercontroller), detectors (PGA controller) and communication anddata visualization (displayed data are derived from exper-iments with our \Sensitivity Scanner" phantom).
Wireless Distributed Acquisition System for NIRS
1350019-7
J. I
nnov
. Opt
. Hea
lth S
ci. 2
013.
06. D
ownl
oade
d fr
om w
ww
.wor
ldsc
ient
ific
.com
by 1
03.2
40.1
26.9
on
10/2
1/18
. Re-
use
and
dist
ribu
tion
is s
tric
tly n
ot p
erm
itted
, exc
ept f
or O
pen
Acc
ess
artic
les.
corresponding patches are ¯xed at the measuringsites selected on the body. All modules are initi-alized by the PC station, synchronized signal ac-quisition is launched and data from all modules arerecorded continuously by the PC-base while thesubject is free to move within a distance of 100mfrom the receiver.
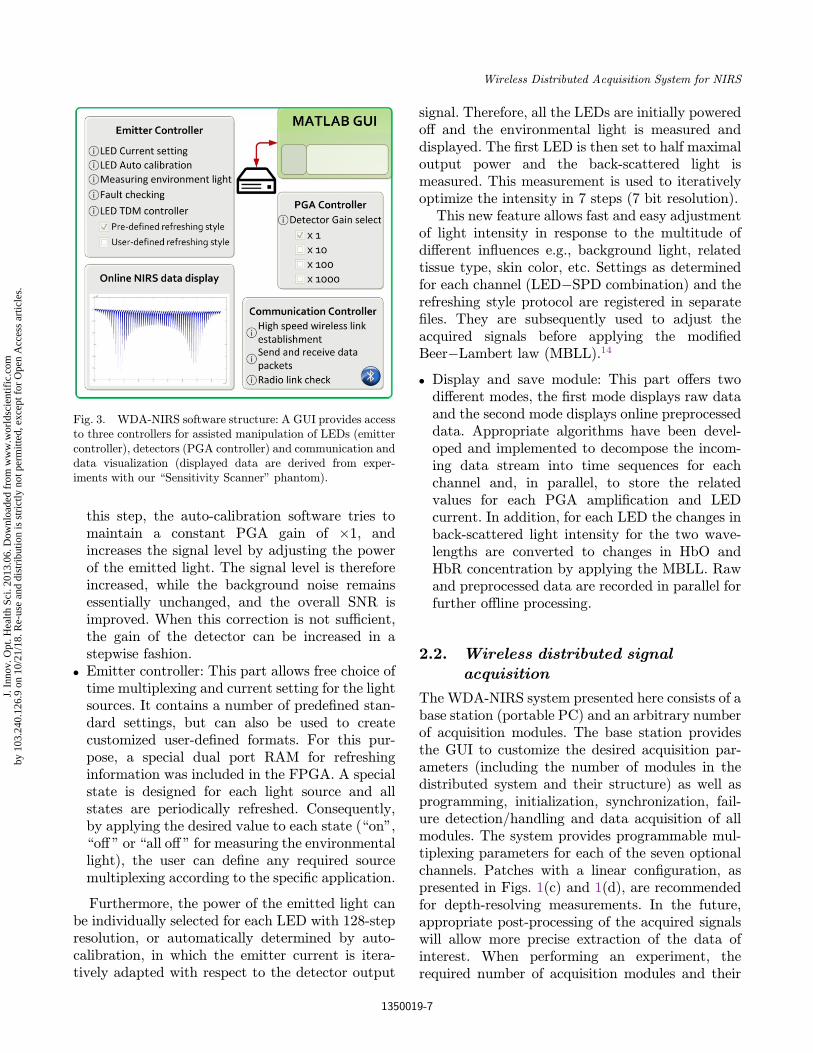
2.3. Phantom: Sensitivity scanner
The scheme of our recently introduced experimentalsetup for sensitivity scanning14 is shown in Fig. 4(a).It consists of ¯ve di®erent parts: (1) Control and dataacquisitionunit, (2) three-dimensional (3D) scanningunit, (3) optical tissue-like dynamic phantom,(4) patch, (5) NIRS main controller-processor boardand (6) perturbation element.
The sensitivity scanner phantom consists of twomajor components, a background optical phantomand an optical perturbation. The background opti-cal phantom is realized as a liquid contained in atransparent tank ð120� 120� 120mm3Þ. The useof a liquid tissue phantom allows for free positioningand movement of the optical perturbation inside thephantom volume. In addition, a liquid phantomo®ers the possibility to change freely optical prop-erties. Ingredients of the liquid phantom are distilledwater, \Medialipider" (B.BRAUN Medical Inc)and \india-ink" (Lefranc & Bourgeoisr). The con-centration of Medialipide and india-ink is chosen to
achieve various optical parameter values as neededfor the experiments mimicking physiological con-ditions (�a ¼ 0:001mm�1 and � 0
s ¼ 0:8mm�1).14
To avoid any sedimentation e®ects, a magneticstirrer is turning continuously throughout the wholeexperiment. The optical perturbation is realized bya liquid-¯lled glass bulb. This home-made glass bulbis thin walled (� 0:2mm thick) and sphericalshaped (2mm diameter). The liquid in the glassbulb can be freely chosen to meet the desired opticalproperties normally with respect to the liquid of thebackground. The glass bulb end is closed usingtransparent silica gel (glass adhesive). It is held inposition using a L-shaped glass tube, which is ¯lledwith the same liquid as used for the backgroundtissue phantom. By integrating a 100� 50mmwindow in the tank wall covered by a 0.1mm PVCtransparent ¯lm, the refraction e®ects on patchemitters/detector due to transparent perspex walls(8mm thickness) have been reduced.
The 3D scanning unit performs the computer-controlled movement of the perturbation throughthe region of interest of the phantom volumeaccording to Fig. 4(b). For this purpose, thevolume of interest is subdivided in a sequence ofvertical parallel lines followed meander wise fromthe front to the back forming thus a page, which isfollowed by the next page in a distance of 1mmbeside. The distance between the scanning lineshad been chosen to 1mm as well. In the presented
(a) (b)
Fig. 4. Sensitivity scanner: (a) Experimental setup with (1) control and data acquisition unit, (2) 3D scanning unit, (3) opticaltissue-like dynamic phantom, (4) patch, (5) NIRS main control and processing unit and (6) perturbation element. (b) The scanningis performed in 60 consecutive pages each of which consisting of 30 lines executed meander wise from the front to the back.
J. Safaie et al.
1350019-8
J. I
nnov
. Opt
. Hea
lth S
ci. 2
013.
06. D
ownl
oade
d fr
om w
ww
.wor
ldsc
ient
ific
.com
by 1
03.2
40.1
26.9
on
10/2
1/18
. Re-
use
and
dist
ribu
tion
is s
tric
tly n
ot p
erm
itted
, exc
ept f
or O
pen
Acc
ess
artic
les.
experiments, every volume consists of 60 pageswith 30 lines each.
All experiments have been carried out in a darkroom to prevent from any signal perturbation byenvironment light. In addition, to compensate allkind of jeopardizing in°uences, as light piping bytransparent ¯lms, the e®ects of glass, etc., we per-formed in any case two experiments one with theactual test medium in the probe and one with theprobe ¯lled with background medium. Then, thedi®erence of the two acquired signals was furtherevaluated.
2.4. Human subject studies
2.4.1. Validation with standard clinicalcerebral oxygenation measuring
system
To verify the appropriate overall functioning of theWDA-NIRS system in human tissue measurements,we performed arterial occlusion experiments. TheNIRO-200NX system was employed as the standardclinical system, since it is used widely for cerebraloxygenation measurements. The patches wereattached at the forearm and a blood pressure cu®was ¯xed at the upper arm. The experiments havebeen done sequentially with the same protocol: after1 min registration in relax state, the cu® was in°a-ted to 250mmHg for 2 min to close arm arteriesand veins and then the monitoring was continuedfor 3 min.
2.4.2. Application demonstrating
the depth-resolving potential
An experiment was conducted to demonstrate theneed for and the feasibility of depth-resolvingexperiments and their importance for interpretationof the acquired data.
We ¯rst investigated the in°uence of a shortperiod of apnea on HbR and HbO concentration inthe frontal scalp and brain compared to the rightforearm skin and pronator muscle. For this purpose,a depth-resolving linear patch with one detectorand eight emitters was placed on the right foreheadin a horizontal plane and over the right forearmpronator muscle. The subject was comfortablyseated during the whole recording while executingthe following protocol: 30 s of relaxation for baselineacquisition, 30 s of end-inspiratory breath-holding,
60 s of relaxation for recovery. The 16 channels werenormalized to the mean value obtained during the¯rst 30 s of acquisition. The relative changes weretherefore determined with respect to baseline,allowing direct comparison of concentration chan-ges in various tissue layers. The signals weredetrended and low-pass ¯ltered (0.8Hz cut-o® fre-quency). The di®erential pathlength factor (DPF)values for 760 and 850 nm wavelength have beendetermined as 6.2 and 5.3, respectively (as eval-uated in Ref. 22).
2.4.3. Application demonstrating
distributed acquisition
We conducted stair negotiation experiments todemonstrate the advantages of a wearable, dis-tributed acquisition system for advanced clinicaldiagnosis.
In the simple example presented here, two unitswere used. One unit was attached over the medialhead of the gastrocnemius muscle, the large pos-terior muscle of the calf that raises the heel andtherefore extends the foot. This muscle thereforeprovides the propelling force for running andjumping and plays a major role in walking up anddown stairs.23�25 The other unit was attachedhorizontally to the middle of the left side of theforehead, thereby acquiring information about themicrocirculation of the skin/scalp via the shortEDD, and information about the microcirculationof the outer frontal part of the cerebrum via largerEDDs. All patches were maintained in place by theelastic tubular net bandage described above.
The corresponding signals were acquired andregistered while the subject executed the followingprotocol: 60 s of rest in the upright position forbaseline acquisition, ascending 10 stairs (1 per s),50 s of recovery, descending 10 stairs (1 per s), 50 sof recovery. The acquired channels were normalizedto the mean value obtained during the ¯rst 60 s ofacquisition.
3. Results
3.1. Validation with a sensitivitymapping phantom
The ¯rst objective validation of this new deviceconsisted of signal acquisition from our sensitivitymapping phantom.A complete 3D scanwas acquired
Wireless Distributed Acquisition System for NIRS
1350019-9
J. I
nnov
. Opt
. Hea
lth S
ci. 2
013.
06. D
ownl
oade
d fr
om w
ww
.wor
ldsc
ient
ific
.com
by 1
03.2
40.1
26.9
on
10/2
1/18
. Re-
use
and
dist
ribu
tion
is s
tric
tly n
ot p
erm
itted
, exc
ept f
or O
pen
Acc
ess
artic
les.
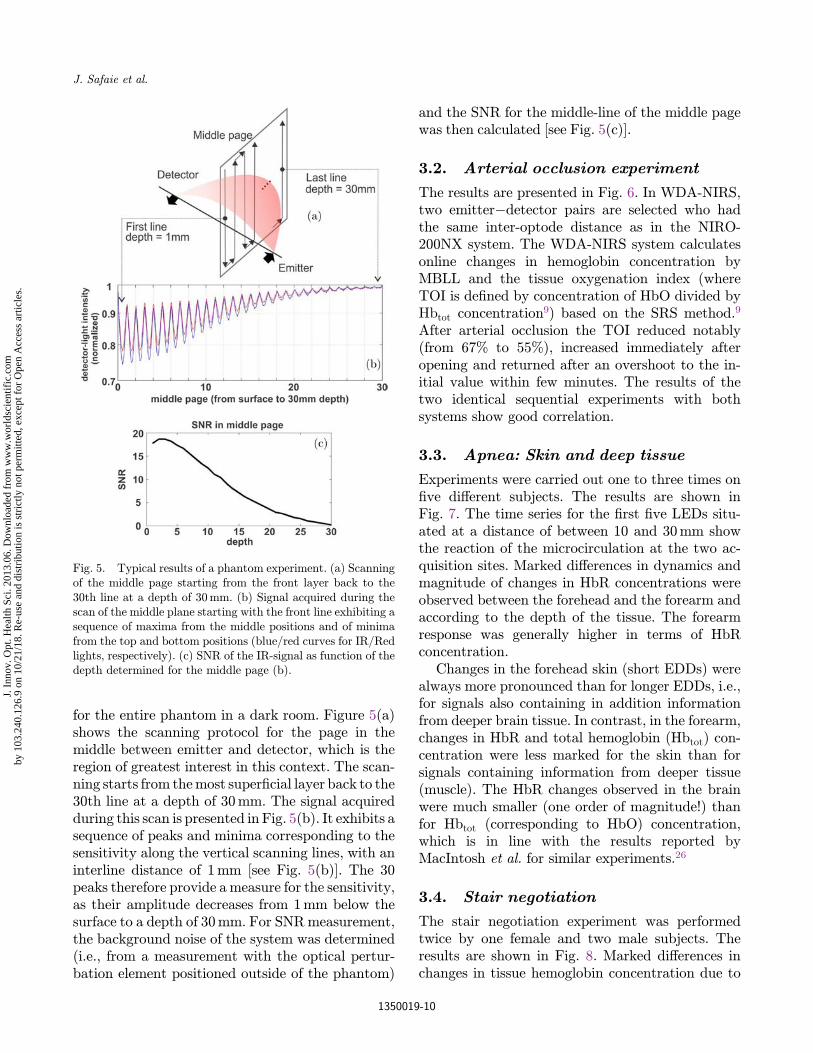
for the entire phantom in a dark room. Figure 5(a)shows the scanning protocol for the page in themiddle between emitter and detector, which is theregion of greatest interest in this context. The scan-ning starts from themost super¯cial layer back to the30th line at a depth of 30mm. The signal acquiredduring this scan is presented in Fig. 5(b). It exhibits asequence of peaks and minima corresponding to thesensitivity along the vertical scanning lines, with aninterline distance of 1mm [see Fig. 5(b)]. The 30peaks therefore provide a measure for the sensitivity,as their amplitude decreases from 1mm below thesurface to a depth of 30mm. For SNRmeasurement,the background noise of the system was determined(i.e., from a measurement with the optical pertur-bation element positioned outside of the phantom)
and the SNR for the middle-line of the middle pagewas then calculated [see Fig. 5(c)].
3.2. Arterial occlusion experiment
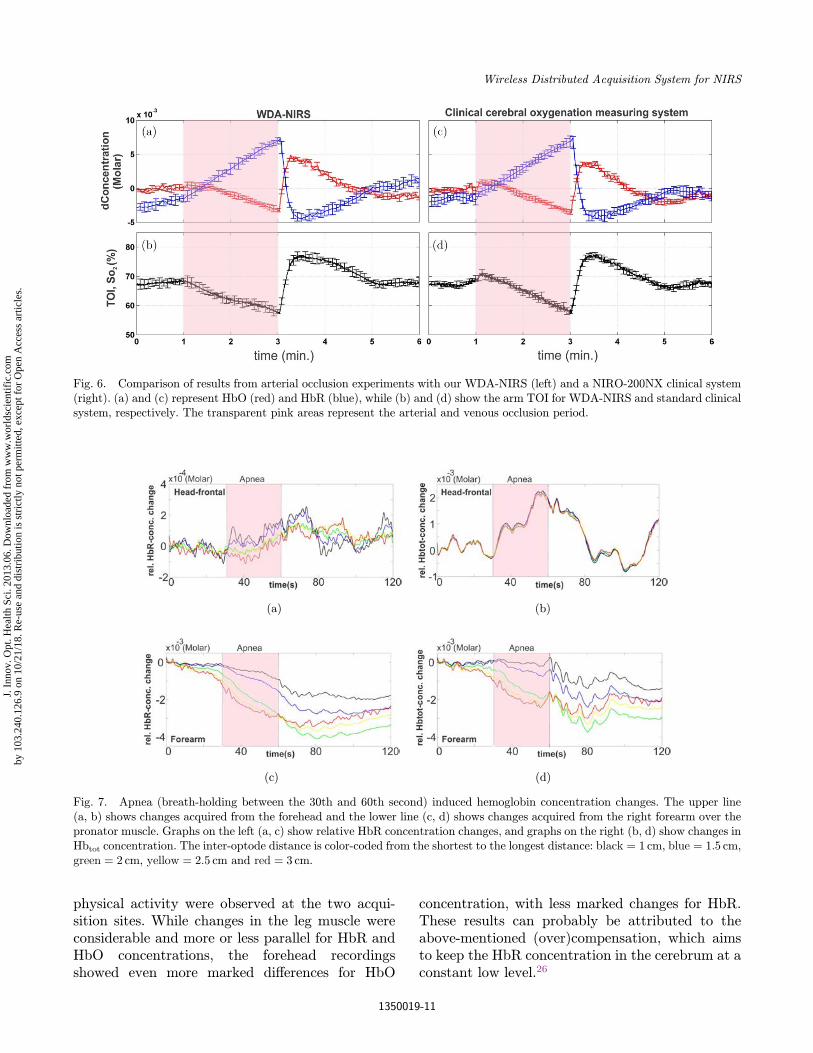
The results are presented in Fig. 6. In WDA-NIRS,two emitter�detector pairs are selected who hadthe same inter-optode distance as in the NIRO-200NX system. The WDA-NIRS system calculatesonline changes in hemoglobin concentration byMBLL and the tissue oxygenation index (whereTOI is de¯ned by concentration of HbO divided byHbtot concentration9) based on the SRS method.9
After arterial occlusion the TOI reduced notably(from 67% to 55%), increased immediately afteropening and returned after an overshoot to the in-itial value within few minutes. The results of thetwo identical sequential experiments with bothsystems show good correlation.
3.3. Apnea: Skin and deep tissue
Experiments were carried out one to three times on¯ve di®erent subjects. The results are shown inFig. 7. The time series for the ¯rst ¯ve LEDs situ-ated at a distance of between 10 and 30mm showthe reaction of the microcirculation at the two ac-quisition sites. Marked di®erences in dynamics andmagnitude of changes in HbR concentrations wereobserved between the forehead and the forearm andaccording to the depth of the tissue. The forearmresponse was generally higher in terms of HbRconcentration.
Changes in the forehead skin (short EDDs) werealways more pronounced than for longer EDDs, i.e.,for signals also containing in addition informationfrom deeper brain tissue. In contrast, in the forearm,changes in HbR and total hemoglobin (Hbtot) con-centration were less marked for the skin than forsignals containing information from deeper tissue(muscle). The HbR changes observed in the brainwere much smaller (one order of magnitude!) thanfor Hbtot (corresponding to HbO) concentration,which is in line with the results reported byMacIntosh et al. for similar experiments.26
3.4. Stair negotiation
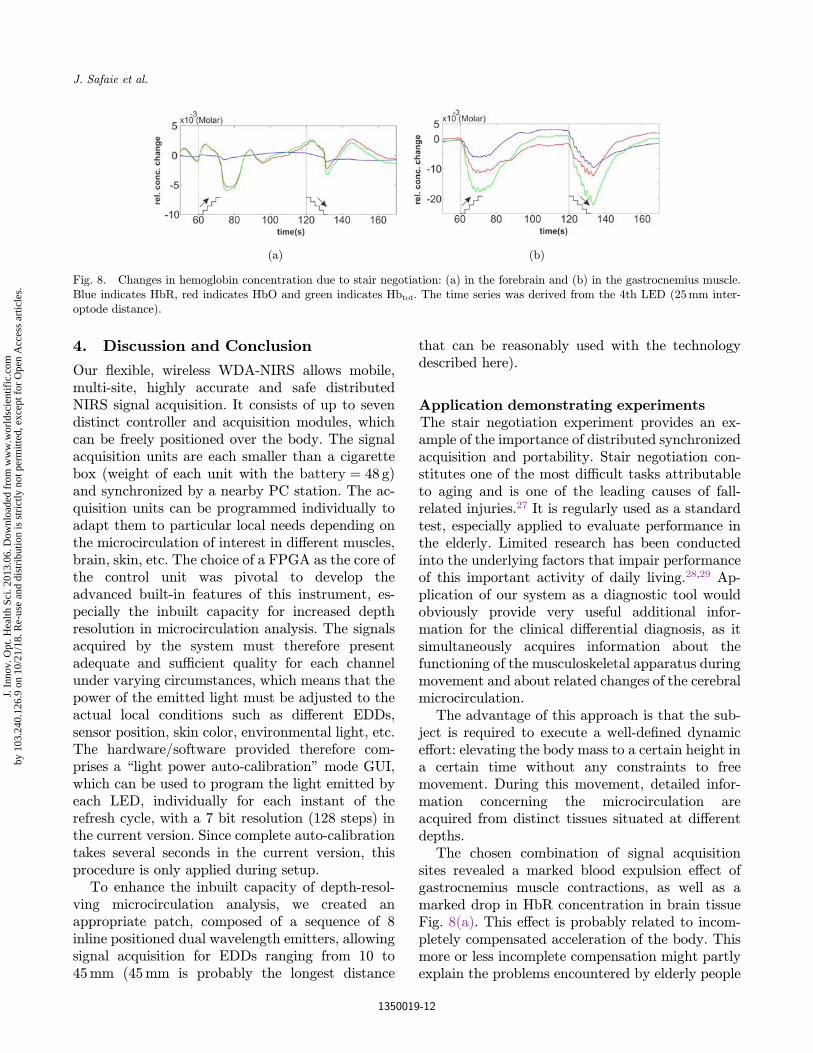
The stair negotiation experiment was performedtwice by one female and two male subjects. Theresults are shown in Fig. 8. Marked di®erences inchanges in tissue hemoglobin concentration due to
Fig. 5. Typical results of a phantom experiment. (a) Scanningof the middle page starting from the front layer back to the30th line at a depth of 30mm. (b) Signal acquired during thescan of the middle plane starting with the front line exhibiting asequence of maxima from the middle positions and of minimafrom the top and bottom positions (blue/red curves for IR/Redlights, respectively). (c) SNR of the IR-signal as function of thedepth determined for the middle page (b).
J. Safaie et al.
1350019-10
J. I
nnov
. Opt
. Hea
lth S
ci. 2
013.
06. D
ownl
oade
d fr
om w
ww
.wor
ldsc
ient
ific
.com
by 1
03.2
40.1
26.9
on
10/2
1/18
. Re-
use
and
dist
ribu
tion
is s
tric
tly n
ot p
erm
itted
, exc
ept f
or O
pen
Acc
ess
artic
les.
physical activity were observed at the two acqui-sition sites. While changes in the leg muscle wereconsiderable and more or less parallel for HbR andHbO concentrations, the forehead recordingsshowed even more marked di®erences for HbO
concentration, with less marked changes for HbR.These results can probably be attributed to theabove-mentioned (over)compensation, which aimsto keep the HbR concentration in the cerebrum at aconstant low level.26
(a) (b)
(c) (d)
Fig. 7. Apnea (breath-holding between the 30th and 60th second) induced hemoglobin concentration changes. The upper line(a, b) shows changes acquired from the forehead and the lower line (c, d) shows changes acquired from the right forearm over thepronator muscle. Graphs on the left (a, c) show relative HbR concentration changes, and graphs on the right (b, d) show changes inHbtot concentration. The inter-optode distance is color-coded from the shortest to the longest distance: black ¼ 1 cm, blue ¼ 1:5 cm,green ¼ 2 cm, yellow ¼ 2:5 cm and red ¼ 3 cm.
Fig. 6. Comparison of results from arterial occlusion experiments with our WDA-NIRS (left) and a NIRO-200NX clinical system(right). (a) and (c) represent HbO (red) and HbR (blue), while (b) and (d) show the arm TOI for WDA-NIRS and standard clinicalsystem, respectively. The transparent pink areas represent the arterial and venous occlusion period.
Wireless Distributed Acquisition System for NIRS
1350019-11
J. I
nnov
. Opt
. Hea
lth S
ci. 2
013.
06. D
ownl
oade
d fr
om w
ww
.wor
ldsc
ient
ific
.com
by 1
03.2
40.1
26.9
on
10/2
1/18
. Re-
use
and
dist
ribu
tion
is s
tric
tly n
ot p
erm
itted
, exc
ept f
or O
pen
Acc
ess
artic
les.
4. Discussion and Conclusion
Our °exible, wireless WDA-NIRS allows mobile,multi-site, highly accurate and safe distributedNIRS signal acquisition. It consists of up to sevendistinct controller and acquisition modules, whichcan be freely positioned over the body. The signalacquisition units are each smaller than a cigarettebox (weight of each unit with the battery ¼ 48 g)and synchronized by a nearby PC station. The ac-quisition units can be programmed individually toadapt them to particular local needs depending onthe microcirculation of interest in di®erent muscles,brain, skin, etc. The choice of a FPGA as the core ofthe control unit was pivotal to develop theadvanced built-in features of this instrument, es-pecially the inbuilt capacity for increased depthresolution in microcirculation analysis. The signalsacquired by the system must therefore presentadequate and su±cient quality for each channelunder varying circumstances, which means that thepower of the emitted light must be adjusted to theactual local conditions such as di®erent EDDs,sensor position, skin color, environmental light, etc.The hardware/software provided therefore com-prises a \light power auto-calibration" mode GUI,which can be used to program the light emitted byeach LED, individually for each instant of therefresh cycle, with a 7 bit resolution (128 steps) inthe current version. Since complete auto-calibrationtakes several seconds in the current version, thisprocedure is only applied during setup.
To enhance the inbuilt capacity of depth-resol-ving microcirculation analysis, we created anappropriate patch, composed of a sequence of 8inline positioned dual wavelength emitters, allowingsignal acquisition for EDDs ranging from 10 to45mm (45mm is probably the longest distance
that can be reasonably used with the technologydescribed here).
Application demonstrating experimentsThe stair negotiation experiment provides an ex-ample of the importance of distributed synchronizedacquisition and portability. Stair negotiation con-stitutes one of the most di±cult tasks attributableto aging and is one of the leading causes of fall-related injuries.27 It is regularly used as a standardtest, especially applied to evaluate performance inthe elderly. Limited research has been conductedinto the underlying factors that impair performanceof this important activity of daily living.28,29 Ap-plication of our system as a diagnostic tool wouldobviously provide very useful additional infor-mation for the clinical di®erential diagnosis, as itsimultaneously acquires information about thefunctioning of the musculoskeletal apparatus duringmovement and about related changes of the cerebralmicrocirculation.
The advantage of this approach is that the sub-ject is required to execute a well-de¯ned dynamice®ort: elevating the body mass to a certain height ina certain time without any constraints to freemovement. During this movement, detailed infor-mation concerning the microcirculation areacquired from distinct tissues situated at di®erentdepths.
The chosen combination of signal acquisitionsites revealed a marked blood expulsion e®ect ofgastrocnemius muscle contractions, as well as amarked drop in HbR concentration in brain tissueFig. 8(a). This e®ect is probably related to incom-pletely compensated acceleration of the body. Thismore or less incomplete compensation might partlyexplain the problems encountered by elderly people
(a) (b)
Fig. 8. Changes in hemoglobin concentration due to stair negotiation: (a) in the forebrain and (b) in the gastrocnemius muscle.Blue indicates HbR, red indicates HbO and green indicates Hbtot. The time series was derived from the 4th LED (25mm inter-optode distance).
J. Safaie et al.
1350019-12
J. I
nnov
. Opt
. Hea
lth S
ci. 2
013.
06. D
ownl
oade
d fr
om w
ww
.wor
ldsc
ient
ific
.com
by 1
03.2
40.1
26.9
on
10/2
1/18
. Re-
use
and
dist
ribu
tion
is s
tric
tly n
ot p
erm
itted
, exc
ept f
or O
pen
Acc
ess
artic
les.
in stair negotiation. These ¯ndings are consistentwith those reported by Szu°adowicz et al. for head-up tilt table tests performed for evaluation of brainfunction during vasovagal syncope with NIRS.These authors found changes in HbR and HbOconcentration in response to tilts similar to thosereported here.30
Depth-resolving potentialThe apnea experiments using the depth-resolvingacquisition available with the hardware indicate thetype of results that can be expected once appro-priate depth-discriminating algorithms are avail-able. For example, in Fig. 7(a) the signal indicatesincrease in HbR concentration in the outer tissuelayer (black line), i.e., the scalp. This informationmakes also part of the red signal containing as wellphotons derived from deeper tissue i.e., cerebrum.With properly eliminating the information stem-ming from the outer surface layers (black signal)from the red signal, the resulting HbR concen-tration change will be less marked in the cerebrum,which would be consistent with the known com-pensatory increase of total blood °ow in the brainduring breath-holding26 as shown in Fig. 7(b).This demonstrates the need for acquisition of multi-distance signals in NIRS and also the need forfurther algorithmic developments for reliable eval-uation of these signals.
With the presented equipment, it will becomepossible to extract the information of interest for aparticular tissue layer. Various methods havealready been proposed for this type of signaldecomposition.31�33 Further research is required todevelop these approaches.
General bene¯tsThese experiments highlight the potential bene¯ts ofdiagnostic investigations in patients and normalsubjects using theWDA-NIRS based on parallel andsynchronized acquisition of valuable physiologicaland clinical information concerning the micro-circulation under various conditions. The resultsshow that the WDA-NIRS system is a reliable toolthat can be used to acquire information that has beenpreviously poorly accessible and that will be ofinterest in medical research and clinical diagnostics.
Limitations and future improvementsIn the current version, complete auto-calibration for16 light sources takes several seconds, which is too
long for repeated controls during a running regis-tration. In future versions, an online auto-controland correction mechanism will be integrated. Thiswill be possible without hardware changes becauseof the in-system FPGA programming facilities.
It turned out that the actual 7 bit resolution(42 dB) is not su±cient to provide the completepower range of emitted light, which is needed fordistances between 1 and 4.5 cm. Only distances ofup to 2.5 cm EDD can be evaluated. Therefore, thedynamic range of LED drivers must be increased to12 bit, which is su±cient to cover the whole rangeneeded for 3.5 cm di®erences.
Major e®orts in terms of algorithm and softwaredevelopment are necessary to put into e®ect thedepth-resolving potential of the instrument. It maytherefore also be necessary to (re)design di®erenttypes of emitter�detector con¯gurations.
Acknowledgments
The ¯nancial support of the UPJV and Region ofPicardie are gratefully acknowledged.
References
1. F. F. J€obsis, J. H. Keizer, J. C. LaManna, M.Rosenthal, \Re°ectance spectrophotometry ofcytochrome aa3 in vivo," J. Appl. Physiol. 43(5),858�872 (1977).
2. F. Wallois, M. Mahmoudzadeh, A. Patil, R. Grebe,\Usefulness of simultaneous EEG-NIRS recording inlanguage studies," Brain Lang 121(2), 110�123(2012).
3. M. Ferrari, V. Quaresima, \A brief review on thehistory of human functional near-infrared spec-troscopy (fNIRS) development and ¯elds ofapplication," Neuroimage 63(2), 921�935 (2012).
4. G. M. Lech, \Using functional near-infrared spec-troscopy to measure cognitive function: When will itbecome an accepted clinical tool for cognitive agingand prodromal dementia screening?" J. Innov. Opt.Health Sci. 4(04), 373�383 (2011).
5. R. V. Maikala, Y. N. Bhambhani, \Near-infraredmonitoring of the lumbar erector spinae muscle inhealthy men and women during static and dynamicendurance work," J. Innov. Opt. Health Sci. 4(02),173�182 (2011).
6. A. C. Merzagora, M. T. Schultheis, B. Onaral,M. Izzetoglu, \Functional near-infrared spectro-scopy�based assessment of attention impairmentsafter traumatic brain injury," J. Innov. Opt. HealthSci. 4(03), 251�260 (2011).
Wireless Distributed Acquisition System for NIRS
1350019-13
J. I
nnov
. Opt
. Hea
lth S
ci. 2
013.
06. D
ownl
oade
d fr
om w
ww
.wor
ldsc
ient
ific
.com
by 1
03.2
40.1
26.9
on
10/2
1/18
. Re-
use
and
dist
ribu
tion
is s
tric
tly n
ot p
erm
itted
, exc
ept f
or O
pen
Acc
ess
artic
les.
7. T. Hamaoka, K. K. McCully, \Muscle researchwork with britton chance from in vivo magneticresonance spectroscopy to near-infrared spectro-scopy," J. Innov. Opt. Health Sci. 4(03), 227�237(2011).
8. Y. Hoshi, \Functional near-infrared spectroscopy:Potential and limitations in neuroimaging studies,"Int. Rev. Neurobiol., 66, 237�266 (2005).
9. S. Suzuki, S. Takasaki, T. Ozaki, Y. Kobayashi, \Atissue oxygenation monitor using NIR spatiallyresolved spectroscopy," Proc. SPIE 3597, 582�592(1999).
10. T. Muehlemann, D. Haensse, M. Wolf, \Wirelessminiaturized in-vivo near infrared imaging," Opt.Express 16(14), 10323�10330 (2008).
11. B. R. Shadgan, \Wireless near-infrared spectroscopyof skeletal muscle oxygenation and hemodynamicsduring exercise and ischemia," Spectroscopy 23(5�6),233�241 (2009).
12. G. Yurtsever, A. Bozkurt, F. Kepics, K. Pourrezaei,A. Devaraj, \Pocket PC based wireless continuouswave near infrared spectroscopy system for func-tional imaging of human brain," Proc. 25th AnnualInt. Engineering in Medicine and Biology SocietyConf. of the IEEE, Vol. 4, pp. 3435�3437 (2003).
13. Y. Zhang, J. W. Sun, G. Wei, F. Scopesi, G. Serra,P. Rolfe, \Design of a portable near infra-red spec-troscopy system for tissue oxygenation mea-surement," Proc. 3rd Int. Conf. Bioinformatics andBiomedical Engineering ICBBE pp. 1�4 (2009).
14. A. V. Patil, J. Safaie, H. A. Moghaddam, F. Wallois,R. Grebe, \Experimental investigation of NIRSspatial sensitivity," Biomed. Opt. Express 2(6),1478�1493 (2011).
15. S. R. Arridge, \Photon-measurement density func-tions. Part I: Analytical forms," Appl. Opt. 34(31),7395�7409 (1995).
16. Y. Zhang, J. Sun, P. Rolfe, \Reduction of globalinterference in functional multidistance near-infrared spectroscopy using empirical mode de-composition and recursive least squares: A MonteCarlo study," J. Eur. Opt. Soc. — Rapid Publi-cations 6, 11033�11010 (2011).
17. C. J. Soraghan, T. E. Ward, F. Matthews,C. Markham, \Optical safety assessment of a near-infrared brain-computer interface," Proc. IET IrishSignals and SystemsConf. ISSC, pp. 174�179 (2008).
18. A. Bozkurt, B. Onaral, \Safety assessment of nearinfrared light emitting diodes for di®use opticalmeasurements," Biomed. Eng. Online 3(1), 9 (2004).
19. G. Strangman, M. A. Franceschini, D. A. Boas,\Factors a®ecting the accuracy of near-infraredspectroscopy concentration calculations for focal
changes in oxygenation parameters," Neuroimage18(4), 865�879 (2003).
20. K. Uludag, J. Steinbrink, A. Villringer, H. Obrig,\Separability and cross talk: Optimizing dualwavelength combinations for near-infrared spec-troscopy of the adult head," Neuroimage 22(2),583�589 (2004).
21. M. K. Wallin, S. Wajntraub, \Evaluation of Blue-tooth as a replacement for cables in intensive care andsurgery," Anesth. Analg. 98(3), 763�767 (2004).
22. A. Duncan, J. H. Meek, M. Clemence, C. E. Elwell,L. Tyszczuk, M. Cope et al., \Optical pathlengthmeasurements on adult head, calf and forearm andthe head of the newborn infant using phase resolvedoptical spectroscopy," Phys. Med. Biol. 40(2),295�304 (1995).
23. T. P. Andriacchi, G. B. Andersson, R. W. Fermier,D. Stern, J. O. Galante, \A study of lower-limbmechanics during stair-climbing," J. Bone JointSurg. Am. 62(5), 749�757 (1980).
24. A. Protopapadaki, W. I. Drechsler, M. C. Cramp, F.J. Coutts, O. M. Scott, \Hip, knee, ankle kinematicsand kinetics during stair ascent and descent inhealthy young individuals," Clin. Biomech. (Bristol,Avon) 22(2), 203�210 (2007).
25. S. Nadeau, B. J. McFadyen, F. Malouin, \Frontaland sagittal plane analyses of the stair climbing taskin healthy adults aged over 40 years: What are thechallenges compared to level walking? " Clin. Bio-mech. (Bristol, Avon) 18(10), 950�959 (2003).
26. B. J. MacIntosh, L. M. Klassen, R. S. Menon,\Transient hemodynamics during a breath holdchallenge in a two part functional imaging study withsimultaneous near-infrared spectroscopy in adulthumans," Neuroimage 20(2), 1246�1252 (2003).
27. J. K. Startzell, D. A. Owens, L. M. Mul¯nger, P. R.Cavanagh, \Stair negotiation in older people: Areview," J. Am.Geriatr. Soc. 48(5), 567�580 (2000).
28. A. C. Tiedemann, C. Sherrington, S. R. Lord,\Physical and psychological factors associated withstair negotiation performance in older people," J.Gerontol. A Biol. Sci. Med. Sci. 62(11), 1259�1265(2007).
29. A. A. Butler, J. C. Menant, A. C. Tiedemann, S. R.Lord, \Age and gender di®erences in seven tests offunctional mobility," J. Neuroeng. Rehabil. 6, 31(2009).
30. E. Szu°adowicz, R. Maniewski, E. Kozluk, A. Zbiec,A.Nosek, F.Walczak, \Near-infrared spectroscopy inevaluation of cerebral oxygenation during vasovagalsyncope," Physiol. Meas. 25(4), 823�836 (2004).
31. Y. Zhang, D. H. Brooks, M. A. Franceschini, D. A.Boas, \Eigenvector-based spatial ¯ltering for
J. Safaie et al.
1350019-14
J. I
nnov
. Opt
. Hea
lth S
ci. 2
013.
06. D
ownl
oade
d fr
om w
ww
.wor
ldsc
ient
ific
.com
by 1
03.2
40.1
26.9
on
10/2
1/18
. Re-
use
and
dist
ribu
tion
is s
tric
tly n
ot p
erm
itted
, exc
ept f
or O
pen
Acc
ess
artic
les.

reduction of physiological interference in di®useoptical imaging," J. Biomed. Opt. 10(1), 11014(2005).
32. S.G.Diamond,T. J.Huppert,V.Kolehmainen,M.A.Franceschini, J. P. Kaipio, S. R. Arridge, et al.\Physiological system identi¯cationwith theKalman¯lter in di®use optical tomography," Med. Image
Comput. Comput. Assist. Interv. 8(Pt 2), 649�656(2005).
33. K. E. Jang, S. Tak, J. Jung, J. Jang, Y. Jeong, J. C.Ye, \Wavelet minimum description length detrend-ing for near-infrared spectroscopy," J. Biomed. Opt.,14(3), 034004 (2009).
Wireless Distributed Acquisition System for NIRS
1350019-15
J. I
nnov
. Opt
. Hea
lth S
ci. 2
013.
06. D
ownl
oade
d fr
om w
ww
.wor
ldsc
ient
ific
.com
by 1
03.2
40.1
26.9
on
10/2
1/18
. Re-
use
and
dist
ribu
tion
is s
tric
tly n
ot p
erm
itted
, exc
ept f
or O
pen
Acc
ess
artic
les.
Copyright © 2022 FDOKUMEN