Biochar increases soil N 2 O emissions produced by nitrification-mediated pathways
10
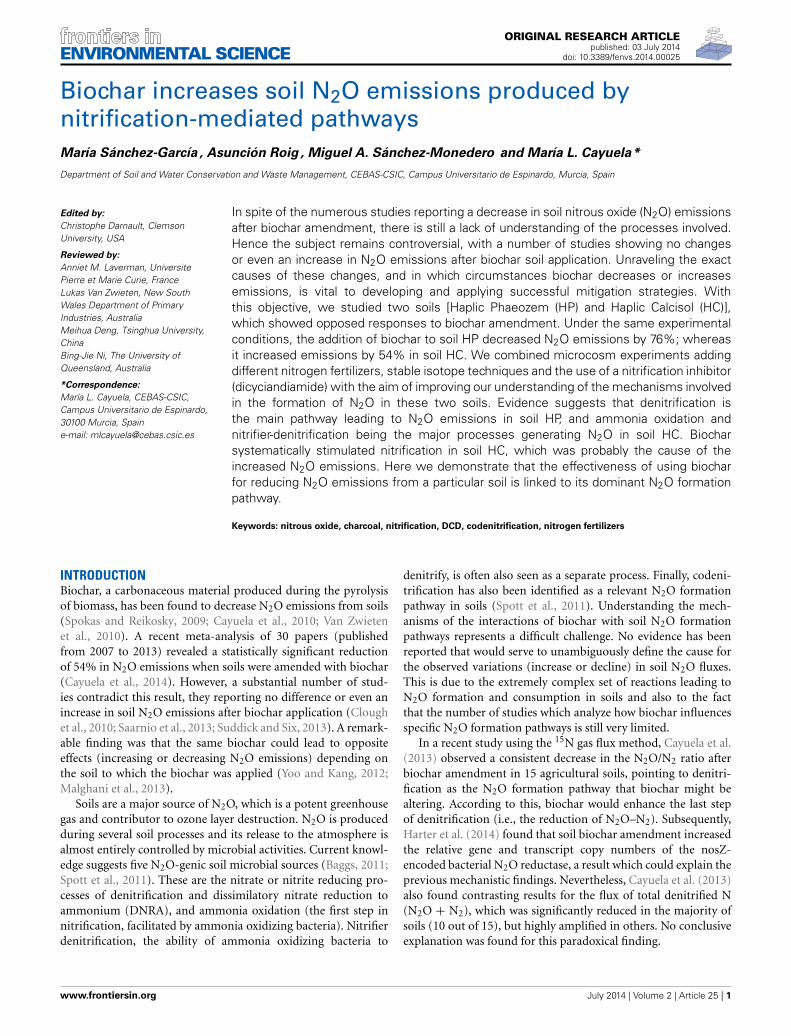
ORIGINAL RESEARCH ARTICLE published: 03 July 2014 doi: 10.3389/fenvs.2014.00025 Biochar increases soil N 2 O emissions produced by nitrification-mediated pathways María Sánchez-García , Asunción Roig , Miguel A. Sánchez-Monedero and María L. Cayuela* Department of Soil and Water Conservation and Waste Management, CEBAS-CSIC, Campus Universitario de Espinardo, Murcia, Spain Edited by: Christophe Darnault, Clemson University, USA Reviewed by: Anniet M. Laverman, Universite Pierre et Marie Curie, France Lukas Van Zwieten, New South Wales Department of Primary Industries, Australia Meihua Deng, Tsinghua University, China Bing-Jie Ni, The University of Queensland, Australia *Correspondence: María L. Cayuela, CEBAS-CSIC, Campus Universitario de Espinardo, 30100 Murcia, Spain e-mail: [email protected] In spite of the numerous studies reporting a decrease in soil nitrous oxide (N 2 O) emissions after biochar amendment, there is still a lack of understanding of the processes involved. Hence the subject remains controversial, with a number of studies showing no changes or even an increase in N 2 O emissions after biochar soil application. Unraveling the exact causes of these changes, and in which circumstances biochar decreases or increases emissions, is vital to developing and applying successful mitigation strategies. With this objective, we studied two soils [Haplic Phaeozem (HP) and Haplic Calcisol (HC)], which showed opposed responses to biochar amendment. Under the same experimental conditions, the addition of biochar to soil HP decreased N 2 O emissions by 76%; whereas it increased emissions by 54% in soil HC. We combined microcosm experiments adding different nitrogen fertilizers, stable isotope techniques and the use of a nitrification inhibitor (dicyciandiamide) with the aim of improving our understanding of the mechanisms involved in the formation of N 2 O in these two soils. Evidence suggests that denitrification is the main pathway leading to N 2 O emissions in soil HP, and ammonia oxidation and nitrifier-denitrification being the major processes generating N 2 O in soil HC. Biochar systematically stimulated nitrification in soil HC, which was probably the cause of the increased N 2 O emissions. Here we demonstrate that the effectiveness of using biochar for reducing N 2 O emissions from a particular soil is linked to its dominant N 2 O formation pathway. Keywords: nitrous oxide, charcoal, nitrification, DCD, codenitrification, nitrogen fertilizers INTRODUCTION Biochar, a carbonaceous material produced during the pyrolysis of biomass, has been found to decrease N 2 O emissions from soils (Spokas and Reikosky, 2009; Cayuela et al., 2010; Van Zwieten et al., 2010). A recent meta-analysis of 30 papers (published from 2007 to 2013) revealed a statistically significant reduction of 54% in N 2 O emissions when soils were amended with biochar (Cayuela et al., 2014). However, a substantial number of stud- ies contradict this result, they reporting no difference or even an increase in soil N 2 O emissions after biochar application (Clough et al., 2010; Saarnio et al., 2013; Suddick and Six, 2013). A remark- able finding was that the same biochar could lead to opposite effects (increasing or decreasing N 2 O emissions) depending on the soil to which the biochar was applied (Yoo and Kang, 2012; Malghani et al., 2013). Soils are a major source of N 2 O, which is a potent greenhouse gas and contributor to ozone layer destruction. N 2 O is produced during several soil processes and its release to the atmosphere is almost entirely controlled by microbial activities. Current knowl- edge suggests five N 2 O-genic soil microbial sources (Baggs, 2011; Spott et al., 2011). These are the nitrate or nitrite reducing pro- cesses of denitrification and dissimilatory nitrate reduction to ammonium (DNRA), and ammonia oxidation (the first step in nitrification, facilitated by ammonia oxidizing bacteria). Nitrifier denitrification, the ability of ammonia oxidizing bacteria to denitrify, is often also seen as a separate process. Finally, codeni- trification has also been identified as a relevant N 2 O formation pathway in soils (Spott et al., 2011). Understanding the mech- anisms of the interactions of biochar with soil N 2 O formation pathways represents a difficult challenge. No evidence has been reported that would serve to unambiguously define the cause for the observed variations (increase or decline) in soil N 2 O fluxes. This is due to the extremely complex set of reactions leading to N 2 O formation and consumption in soils and also to the fact that the number of studies which analyze how biochar influences specific N 2 O formation pathways is still very limited. In a recent study using the 15 N gas flux method, Cayuela et al. (2013) observed a consistent decrease in the N 2 O/N 2 ratio after biochar amendment in 15 agricultural soils, pointing to denitri- fication as the N 2 O formation pathway that biochar might be altering. According to this, biochar would enhance the last step of denitrification (i.e., the reduction of N 2 O–N 2 ). Subsequently, Harter et al. (2014) found that soil biochar amendment increased the relative gene and transcript copy numbers of the nosZ- encoded bacterial N 2 O reductase, a result which could explain the previous mechanistic findings. Nevertheless, Cayuela et al. (2013) also found contrasting results for the flux of total denitrified N (N 2 O + N 2 ), which was significantly reduced in the majority of soils (10 out of 15), but highly amplified in others. No conclusive explanation was found for this paradoxical finding. www.frontiersin.org July 2014 | Volume 2 | Article 25 | 1 ENVIRONMENTAL SCIENCE
-
Upload
independent -
Category
Documents
-
view
0 -
download
0
Transcript of Biochar increases soil N 2 O emissions produced by nitrification-mediated pathways
ORIGINAL RESEARCH ARTICLEpublished: 03 July 2014
doi: 10.3389/fenvs.2014.00025
Biochar increases soil N2O emissions produced bynitrification-mediated pathwaysMaría Sánchez-García , Asunción Roig , Miguel A. Sánchez-Monedero and María L. Cayuela*
Department of Soil and Water Conservation and Waste Management, CEBAS-CSIC, Campus Universitario de Espinardo, Murcia, Spain
Edited by:
Christophe Darnault, ClemsonUniversity, USA
Reviewed by:
Anniet M. Laverman, UniversitePierre et Marie Curie, FranceLukas Van Zwieten, New SouthWales Department of PrimaryIndustries, AustraliaMeihua Deng, Tsinghua University,ChinaBing-Jie Ni, The University ofQueensland, Australia
*Correspondence:
María L. Cayuela, CEBAS-CSIC,Campus Universitario de Espinardo,30100 Murcia, Spaine-mail: [email protected]
In spite of the numerous studies reporting a decrease in soil nitrous oxide (N2O) emissionsafter biochar amendment, there is still a lack of understanding of the processes involved.Hence the subject remains controversial, with a number of studies showing no changesor even an increase in N2O emissions after biochar soil application. Unraveling the exactcauses of these changes, and in which circumstances biochar decreases or increasesemissions, is vital to developing and applying successful mitigation strategies. Withthis objective, we studied two soils [Haplic Phaeozem (HP) and Haplic Calcisol (HC)],which showed opposed responses to biochar amendment. Under the same experimentalconditions, the addition of biochar to soil HP decreased N2O emissions by 76%; whereasit increased emissions by 54% in soil HC. We combined microcosm experiments addingdifferent nitrogen fertilizers, stable isotope techniques and the use of a nitrification inhibitor(dicyciandiamide) with the aim of improving our understanding of the mechanisms involvedin the formation of N2O in these two soils. Evidence suggests that denitrification isthe main pathway leading to N2O emissions in soil HP, and ammonia oxidation andnitrifier-denitrification being the major processes generating N2O in soil HC. Biocharsystematically stimulated nitrification in soil HC, which was probably the cause of theincreased N2O emissions. Here we demonstrate that the effectiveness of using biocharfor reducing N2O emissions from a particular soil is linked to its dominant N2O formationpathway.
Keywords: nitrous oxide, charcoal, nitrification, DCD, codenitrification, nitrogen fertilizers
INTRODUCTIONBiochar, a carbonaceous material produced during the pyrolysisof biomass, has been found to decrease N2O emissions from soils(Spokas and Reikosky, 2009; Cayuela et al., 2010; Van Zwietenet al., 2010). A recent meta-analysis of 30 papers (publishedfrom 2007 to 2013) revealed a statistically significant reductionof 54% in N2O emissions when soils were amended with biochar(Cayuela et al., 2014). However, a substantial number of stud-ies contradict this result, they reporting no difference or even anincrease in soil N2O emissions after biochar application (Cloughet al., 2010; Saarnio et al., 2013; Suddick and Six, 2013). A remark-able finding was that the same biochar could lead to oppositeeffects (increasing or decreasing N2O emissions) depending onthe soil to which the biochar was applied (Yoo and Kang, 2012;Malghani et al., 2013).
Soils are a major source of N2O, which is a potent greenhousegas and contributor to ozone layer destruction. N2O is producedduring several soil processes and its release to the atmosphere isalmost entirely controlled by microbial activities. Current knowl-edge suggests five N2O-genic soil microbial sources (Baggs, 2011;Spott et al., 2011). These are the nitrate or nitrite reducing pro-cesses of denitrification and dissimilatory nitrate reduction toammonium (DNRA), and ammonia oxidation (the first step innitrification, facilitated by ammonia oxidizing bacteria). Nitrifierdenitrification, the ability of ammonia oxidizing bacteria to
denitrify, is often also seen as a separate process. Finally, codeni-trification has also been identified as a relevant N2O formationpathway in soils (Spott et al., 2011). Understanding the mech-anisms of the interactions of biochar with soil N2O formationpathways represents a difficult challenge. No evidence has beenreported that would serve to unambiguously define the cause forthe observed variations (increase or decline) in soil N2O fluxes.This is due to the extremely complex set of reactions leading toN2O formation and consumption in soils and also to the factthat the number of studies which analyze how biochar influencesspecific N2O formation pathways is still very limited.
In a recent study using the 15N gas flux method, Cayuela et al.(2013) observed a consistent decrease in the N2O/N2 ratio afterbiochar amendment in 15 agricultural soils, pointing to denitri-fication as the N2O formation pathway that biochar might bealtering. According to this, biochar would enhance the last stepof denitrification (i.e., the reduction of N2O–N2). Subsequently,Harter et al. (2014) found that soil biochar amendment increasedthe relative gene and transcript copy numbers of the nosZ-encoded bacterial N2O reductase, a result which could explain theprevious mechanistic findings. Nevertheless, Cayuela et al. (2013)also found contrasting results for the flux of total denitrified N(N2O + N2), which was significantly reduced in the majority ofsoils (10 out of 15), but highly amplified in others. No conclusiveexplanation was found for this paradoxical finding.
www.frontiersin.org July 2014 | Volume 2 | Article 25 | 1
ENVIRONMENTAL SCIENCE

Sánchez-García et al. Biochar increases nitrification-mediated N2O
In this study we aimed to look more closely at the reasons forthese contrasting results. Our hypothesis was that, besides denitri-fication, other microbial processes (e.g., nitrifier-denitrification,dissimilatory nitrate reduction to ammonia, codenitrification)could have led to N2O and N2 formation in these soils, mecha-nisms that had not been addressed in previous studies. Hence, westudied two soils that, under identical experimental conditions,showed opposite responses to biochar amendment, i.e., whereasbiochar addition decreased N2O emissions in one soil, it increasedemissions in the other. The main objective was to investigate by15N gas measurements and the use of nitrification inhibitors, themain pathways leading to N2O formation in these two soils, withthe aim of understanding why biochar might be influencing N2Oemissions differently.
MATERIALS AND METHODSSOILS AND BIOCHAR SELECTED FOR THE EXPERIMENTSTwo agricultural soils were selected for the experiments (Table 1).Soil HP was used as a reference soil, since it had been previouslyused in numerous studies that proved that denitrification wasthe major process responsible for N2O emissions (Cuhel et al.,2010). Soil HC was selected from a series of agricultural soilsbecause it was the only one where (under identical optimal deni-trifying conditions) the addition of greenwaste biochar increasedN2O emissions. The soils were sampled from a depth of 0–0.25 m,air-dried and sieved (<2 mm).
We used a biochar produced by continuous slow pyrolysisof greenwaste at 550◦C provided by Pacific Pyrolysis Pty. Ltd.(Australia) (Table 1). Herbaceous and woody biochars have beenfound to be the most promising for mitigating N2O emissionsfrom soil (Cayuela et al., 2014). Therefore, this biochar wasselected for its mitigation potential and as a representative stan-dard biochar commonly used in other studies. The biochar wasground to a particle size <1 mm before soil application.
MICROCOSMS EXPERIMENTSThe incubation experiments were performed in 250 mlpolypropylene jars at optimum conditions for denitrifica-tion: 25◦C and moisture content of 90% water filled pore space(WFPS). The control treatments consisted of 100 g dry soil andthe biochar treatments of 98 g dry soil and 2 g biochar (2% w:w).The biochar was thoroughly mixed with the dry soil to obtaina completely homogeneous mixture. Subsequently deionizedwater (or a solution containing the appropriate concentration ofN fertilizer) was added to reach 90% WFPS (and the requiredN concentration in the fertilized treatments). The jars wereincubated aerobically, covered with a polyethylene sheet thatallows gas exchange but minimizes evaporation. Moisture wasgravimetrically adjusted every other day with the addition ofdeionised water for each individual jar. The experiments werelaid out as randomized block designs with four replicates pertreatment.
Experiment 1. Impact of biochar on soil N2O emissions and mineralN after the addition of different N fertilizersA set of 48 jars [2 soils (HP/HC) × 2 management treat-ments (biochar/control) × 3 fertilization treatments (no
Table 1 | Physical and chemical characteristics of soil and biochar
samples used in the experiments.
Soil HP Soil HC Biochar
Management Pasture Olive orchard –
(organic farm)
Location 48◦52′ N, 14◦13′ E 38◦23′ N 1◦22′ W –
Cassification(WRB)
Haplic phaeozem Haplic calcisol –
Texture Loamy sand Sandy loam –
Sand (%) 78 57 –
Clay (%) 6 16 –
Volatile matter (%) – – 26.8
Ash (%) – – 7.0
H:Corg – – 0.534
pH (in water, 1:20w:w 25◦C)
6.89 8.01 7.87
EC (µS cm−1) 140 518 166
Ca CO3 (%) – 30 –
TOC (g kg−1) 11.6 16.8 701.7
Total N (g kg−1) 2.0 2.4 2.7
DC (mg kg−1) 439.5 694.0 285.1
DOC (mg kg−1) 315.7 356.9 113.2
DN (mg kg−1) 34.7 74.0 8.6
DON (mg kg−1) 10.2 35.9 7.1
NH+4 - N (mg kg−1) 19.3 5.0 1.3
NO−2 -N (mg kg−1) <0.2 16.2 <0.2
NO−3 -N (mg kg−1) 5.3 16.9 <0.2
TOC, total organic carbon; DN, dissolved nitrogen; DON, dissolved organic
nitrogen; DC, dissolved carbon; DOC, dissolved organic carbon.
fertilizer/KNO3/CO(NH2)2) × 4 replicates] was set up for thefirst experiment. The fertilizers were homogeneously distributedin the soil at a rate of 200 kg N Ha−1 (corresponding to 55 mg Nkg−1 based on a plough layer of 25 cm). N2O samples were takentwice a day during the first 2 days decreasing subsequently to dailymeasurements, then every other day, then three times per week,etc. (see Figure 1). At the end of the incubation (14 days) mineralN (NH+
4 , NO−3 , and NO−
2 ) was extracted and determined in alljars.
Experiment 2. Isotopic composition of N2O and N2 emitted afterapplication of labeled 15N fertilizersThe following 15N-tracer experiments were performed:
(i) Soil HP + 15NO−3 , vs. soil HP + 15NO−
3 + biochar,(ii) Soil HC + 15NO−
3 vs. soil HC + 15NO−3 + biochar,
(iii) Soil HC + CO(15NH2)2 vs. Soil HC + CO(15NH2)2 +biochar
Moisture was adjusted to 90% WFPS in each jar by addingthe required volume of a solution containing K15NO3 orCO(15NH2)2 (>99% 15N enrichment) at the appropriate con-centration to obtain 90% WFPS and exactly 5.5 mg of 15N-perjar. Rewetting the soils in this way guaranteed a homogenous 15Npool. Gas samples for isotopic analysis were taken daily during the
Frontiers in Environmental Science | Soil Processes July 2014 | Volume 2 | Article 25 | 2

Sánchez-García et al. Biochar increases nitrification-mediated N2O
FIGURE 1 | Fluxes of N2O in soils HP and HC in control and
biochar treatments (mean ± SE ; n = 4). (A1–A3) correspond tosoil HP unfertilized, fertilized with KNO3 and fertilized withCO(NH2)2, respectively. (B1–B3) correspond to soil HC unfertilized,
fertilized with KNO3 and fertilized with CO(NH2)2, respectively.Cumulative N2O emissions (µg N-N2O kg−1 soil) and standarderrors by the end of the incubation are reported in the right-abovebox for each treatment.
first 3 days and on day 10. For each treatment, two gas sampleswere collected using a 12-ml syringe and needle: one immedi-ately after the screw cap was fitted to the jar (t = 0) and thesecond after 60 min (t = 60). The gas samples were transferredto 12-ml vials (Labco) previously purged with He and evacuated.Selected samples (a total of 192 samples) were analyzed for theisotope ratios of N2 [29/28 (29R) and 30/28 (30R)] and N2O[45/44 (45R) and 46/44 (46R)] by automated isotope ratio massspectroscopy [ThermoFinnigan GasBench and PreCon trace gasconcentration system interfaced to a ThermoScientific Delta VPlus isotope-ratio mass spectrometer (Bremen, Germany)].
Experiment 3. N2O emissions, mineral N, and N2O isotopiccomposition after addition of NO−
2in soil HC
Experiments 1 and 2 were reproduced in soil HC with a differ-ent source of nitrogen: NaNO2 was added to a set of 8 jars [4replicates × 2 management treatments (biochar/control)] andhomogeneously distributed in the soil at a rate of 200 kg N Ha−1.N2O and final concentrations of mineral N were determined asfor Experiment 1 (see Figure 5).
Subsequently, the following 15N tracer experiment was per-formed: Soil HC +Na15NO2 vs. Soil HC + Na15NO2 + biochar(as for Experiment 2).
Moisture was adjusted to 90% WFPS in each jar by addingthe required volume of a solution containing NaNO2 (>98%15N enrichment) at the appropriate concentration to obtain 90%WFPS and exactly 5.5 mg of 15N-per jar. Gas samples for isotopicanalysis were taken daily during the first 3 days and on the 10thday of incubation in the same way as in Experiment 2. A total of64 gas samples [2 management treatments (biochar/control) × 4replicates × 4 days (1/2/3/10) × 2 times per day (t = 0/t = 60)]were analyzed.
Experiment 4. N2O emissions and mineral N after addition ofdicyandiamide to soil HCThe nitrification inhibitor dicyandiamide (DCD) was applied incombination with N fertilizers in soil HC. DCD inhibits the firststage of nitrification, the oxidation of NH+
4 to NH2OH, by ren-dering the enzyme ammonia monooxygenase (AMO) ineffective.It is not a bactericide, and does not affect other heterotrophsresponsible of the soil biological activity (Zacherl and Amberger,1990).
A set of 24 jars [2 management treatments (biochar/control) ×3 fertilization treatments (no fertilizer/KNO3/CO(NH2)2) × 4replicates] was set up for the experiment. DCD was applied at arate of 30 mg kg−1 soil to ensure its persistence over the entire
www.frontiersin.org July 2014 | Volume 2 | Article 25 | 3
Sánchez-García et al. Biochar increases nitrification-mediated N2O
incubation period (Rajbanshi et al., 1992). The fertilizers werehomogeneously distributed in the soil at the same rate as in theprevious experiments (200 mg N Ha−1) in the solution includingthe DCD. N2O samples were taken following the same intervalsas in Experiment 1. Mineral N (NH+
4 , NO−3 , and NO−
2 ) was alsoextracted and determined in all jars at the end of the incubationperiod.
N2O SAMPLING AND MEASUREMENTSFor N2O sampling each unit was sealed with gas-tight polypropy-lene screw caps for an accumulation period of 60 min. Theheadspace gas was then sampled directly with a membrane airpump (Optimal 250, Schego, Offenbach am Main, Germany),attached to a gas chromatograph (VARIAN CP-4900 Micro-GC,Palo Alto, CA, USA) (Mondini et al., 2010).
N2O fluxes were calculated assuming a linear increase duringthe accumulation (closed) period, an approach which was verifiedprior to the experiments. Cumulative N2O was calculated assum-ing linear changes in fluxes between adjacent measurement points(Velthof et al., 2003).
CHEMICAL-PHYSICAL ANALYSES OF BIOCHAR AND SOILSBiocharProximate analysis was conducted using ASTM D1762-84Chemical Analysis of Wood Charcoal. Total N and C were ana-lyzed by automatic elemental analysis (FlashEA 1112 Series,Thermo scientific, Madrid, Spain). Water soluble C and N weredetermined in 1:10 (w/v) water extracts using a PhotometerNanocolor 500 D MACHEREY-NAGEL. Electrical conductivity(EC) and pH were determined in a 1:10 (w/v) water-solubleextract. NH+
4 was extracted with 2.0 M KCl at 1:10 (w/v) anddetermined by a colorimetric method based on Berthelot’s reac-tion. NO−
3 and NO−2 were extracted with water at 1:10 (w/v) and
determined by ion chromatography (HPLC, model 861, MetrohmAG, Herisau, Switzerland).
SoilSoil texture was determined using the pipette method accordingto Kettler et al. (2001). Soils were extracted by shaking four repli-cates of moist soil (1/10, w/v dry weight basis) with 2.0 M KCl(for NH+
4 ) or water (for NO−3 and NO−
2 ) for 2 h. Extracts werecentrifuged (2509 G) and filtered (0.45 µm) before analysis. NH+
4was determined by a colorimetric method based on Berthelot’sreaction. NO−
3 and NO−2 were determined by ion chromatogra-
phy (HPLC, model 861, Metrohm AG, Herisau, Switzerland).
15N CALCULATIONSThe 15N atomic fraction in N2O was calculated from the 45/44and 46/44 ratios of N2O. The 15N gas-flux method (Mulvaneyand Boast, 1986; Stevens et al., 1993; Stevens and Laughlin,2001) was used to quantify N2O and N2 emissions from den-itrification in soil HP. The molar fraction of 15N-NO−
3 (15XN )in the soil pool was calculated from �45R and �46R accord-ing to Stevens and Laughlin (2001). The flux of N2 and N2Owas then calculated by the equations given by Mulvaney andBoast (1986). The presence of hybrid nitrous oxide (45N2O)co-metabolically introduced into the reaction pathway of den-itrification was tested by the model developed by Spott and
Florian Stange (2011). This model considers two different Nsources, where each source generates non-hybrid N2O (46N2Oand 44N2O) and, simultaneously, both N sources can be com-bined to form hybrid N2O (45N2O). According to this model, thecontribution of each pathway to the total N2O formation can becalculated from the mass distribution of the released N2O andthe 15N mole fraction of the labeled N source (Spott and FlorianStange, 2011).
STATISTICAL ANALYSISUnivariate analysis of variance was used to investigate the signifi-cant differences in N2O emissions and mineral N concentrationsbetween biochar and control treatments with IBM SPSS Statistics21, Sommers, USA.
RESULTSEXPERIMENT 1. CUMULATIVE N2O EMISSIONS AND MINERAL N INSOILS A AND BSoil HP emitted N2O when NO−
3 was added but not in theabsence of fertilizer or after the addition of urea. In this soil,biochar significantly reduced N2O emissions, by an average of76% (Figures 1A1–A3).
Soil HC emitted N2O in all treatments: without N fertilization,after the addition of NO−
3 and urea. In this soil, biochar consis-tently increased total cumulative N2O emissions and the averageincrease was larger in the non-fertilized (95%) and urea (129%)treatments than in the NO−
3 treatment (54%), (Figures 1B1–B3).Comparing treatments without biochar, the addition of NO−
3increased total N2O emissions in soil HP (from 54 to 11580 µgN2O-N kg−1 soil), whereas it increased N2O emissions slightly insoil HC (from 3443 to 4546 µg N2O-N kg−1 soil). The additionof urea had no impact on soil HP, and increased emissions in soilHC (from 3443 to 5799 µg N2O-N kg−1 soil).
Figure 2 shows NH+4 -N concentration in soils HP and HC at
the end of the experiment. The original concentration of NH+4
in soil HP was 19.3 mg N kg−1 soil. After 14 days of incubation,soil HP underwent a significant increase in NH+
4 content for allfertilization treatments (74.5–110.4 mg N kg−1 soil). The high-est increase was observed when soil HP was fertilized with urea.Biochar addition did not have a significant impact on the finalNH+
4 concentration in this soil.Soil HC similarly increased its NH+
4 concentration throughoutthe incubation (initial concentration: 2.8 mg kg−1 soil), excludingthe KNO3 treatment. In this soil biochar significantly decreasedthe amount of NH+
4 by the end of the incubation for the non-fertilized soil. Biochar also decreased mean NH+
4 concentrationin the urea treatment, although not significantly due to the highvariability in the biochar samples.
Figure 3 shows (NO−3 + NO−
2 )-N concentrations in soils HPand HC. The concentrations of (NO−
3 + NO−2 )-N in soil HP
were very low (<2.0 mg kg−1) for all fertilization treatments andbiochar did not have a significant impact. However, NO−
2 wasdetected in biochar amended soils and not in the control. SoilHC had low (NO−
3 + NO−2 )-N concentrations when no fertil-
izer was added or after the addition of urea. In contrast, 33.3 mgof NO−
3 -N kg−1 were found in the KNO3 treatment irrespectiveof the biochar addition.
Frontiers in Environmental Science | Soil Processes July 2014 | Volume 2 | Article 25 | 4

Sánchez-García et al. Biochar increases nitrification-mediated N2O
FIGURE 2 | NH+4
-N concentrations in soils HP and HC after 14 days of
incubation (mean ± SE ; n = 4). (A1–A3) correspond to soil HPunfertilized, fertilized with KNO3 and fertilized with CO(NH2)2 respectively.(B1–B3) correspond to soil HC unfertilized, fertilized with KNO3 andfertilized with CO(NH2)2 respectively.
EXPERIMENT 2. ISOTOPIC COMPOSITION OF N2O EMITTED FROMSOILS A AND BFigure 4 shows the 15N atomic fraction in N2O emitted from soilsHP and HC in Experiment 2. When 15NO−
3 was added, the ini-tial 15N atomic fraction in N2O emitted from soil HP was 0.74,decreasing gradually to reach 0.04 at day 10 (Figure 4A). In con-trast, the 15N isotopic composition in soil HC followed totallydifferent dynamics: the initial 15N atomic fraction in N2O wasonly 0.18; it increased slightly to 0.33 by day three, and reacheda final value of 0.10 by day 10 (Figure 4B1). Biochar altered theisotopic composition of N2O emitted in both soils.
When urea was added, soil HP did not emit N2O (Figure 1A3).In soil HC (even when emissions were high) the initial 15N atomicfraction in N2O was zero (Figure 4B2), it successively increased,but always remained beneath 0.15. The biochar and controltreatments showed identical 15N-N2O concentration dynamics.
Table 2 shows the molar fraction of 15N-NO−3 and the
ratio N2O/(N2+N2O) calculated by the 15N gas flux method(Mulvaney and Boast, 1986) and the contribution of codenitri-fication to N2O formation according to Spott and Florian Stange(2011) in soil HP. The ratio N2O/(N2+N2O) was very high dur-ing the first 3 days, which demonstrates that most N was lost
FIGURE 3 | (NO−3
+ NO−2
)-N concentrations in soils HP and HC after 14
days of incubation (mean ± SE ; n = 4). (A1–A3) correspond to soil HPunfertilized, fertilized with KNO3 and fertilized with CO(NH2)2, respectively.(B1–B3) correspond to soil HC unfertilized, fertilized with KNO3 andfertilized with CO(NH2)2, respectively.
as N2O. Biochar decreased the N2O/N2 ratio, particularly at daythree (the peak of emissions in the control soil). The contributionof codenitrification was zero (see C in Table 2). This method ofcalculation could not be applied to soil HC, since other mech-anisms than denitrification were operating in this soil and wecould not calculate the enrichment of the source [15NO−
3 in soil(15XN )] (Mulvaney and Boast, 1986). Nonetheless, we found ahigh proportion of N2O with a hybrid bond (45N2O) in soil HC.
EXPERIMENT 3. N2O EMISSIONS, 15N ISOTOPIC COMPOSITION ANDMINERAL N AFTER FERTILIZATION OF SOIL HC WITH NO−
2
Addition of NO−2 to soil HC produced the highest N2O emissions
peak monitored in this soil (Figure 5B1); fourfold higher thanthat of the non-fertilized soil (Figure 1B1). Under these condi-tions, the biochar amendment did not modify cumulative N2Oemissions.
The 15N atomic fraction in N2O (Figure 5B2) followed a dif-ferent pattern than with 15NO−
3 (Experiment 2; Figure 4B1).The initial 15N atomic fraction in the N2O emitted was 0.30,
www.frontiersin.org July 2014 | Volume 2 | Article 25 | 5

Sánchez-García et al. Biochar increases nitrification-mediated N2O
FIGURE 4 | 15N atomic fraction in N2O emitted from soils HP and HC
in control and biochar treatments after 1, 2, 3, and 10 days of
incubation (mean ± SE, n = 4). (A) corresponds to soil HP fertilized
with K15NO3 (>99% enrichment). (B1) and (B2) correspond to soil HCamended with K15NO3 and CO(15NH2)2 respectively (both at >99%enrichment).
Table 2 | Means and standard deviations (n = 4) of 15XN , the ratio N2O/(N2+N2O) and the three fractions (A, B, C) of hybrid and non-hybrid
N2O (Spott and Florian Stange, 2011) in soil HP.
Parameter Treatment
Time (days)
1 2 3 10
15XN Control 0.98 (0.00) 0.99 (0.00) 0.99 (0.00) 0.84 (0.01)
(molar fraction of 15N-NO−3 in soil, calculated by the 15N gas flux method) Biochar 0.99 (0.00) 0.99 (0.00) 0.92 (0.06) 0.91 (0.09)
N2O/(N2+N2O) Control 1.01 (0.12) 0.99 (0.01) 0.99 (0.00) 0.14 (0.27)
(calculated by the 15N gas flux method) Biochar 0.93 (0.05) 0.89 (0.08) 0.04 (0.05) 0.05 (0.08)
A Control 0.19 (0.05) 0.02 (0.02) 0.00 (0.00) 0.95 (0.00)
(fraction of non-hybrid N2O from the unlabeled source) Biochar 0.03 (0.03) 0.01 (0.01) 0.48 (0.28) 0.75 (0.22)
B Control 0.81 (0.05) 0.98 (0.02) 1.00 (0.00) 0.05 (0.00)
(fraction of non-hybrid N2O from the labeled source) Biochar 0.99 (0.03) 1.00 (0.01) 0.49 (0.31) 0.24 (0.22)
C Control 0.00 (0.00) 0.00 (0.00) 0.00 (0.00) 0.00 (0.00)
(fraction of hybrid N2O formed by a 1:1 linkage of labeled and unlabeled sources) Biochar −0.02 (0.00) −0.02 (0.00) 0.04 (0.03) 0.01 (0.00)
FIGURE 5 | Fluxes of N2O (B1) 15N atomic fraction in N2O at days 1, 2, 3,
and 10 (B2) and NH+4
-N and NO−3
-N concentrations after 14 days of
incubation (B3) in soil HC (mean ± SE, n = 4). Soil HC had been fertilized
with Na15NO2 (>98% enrichment). Cumulative N2O emission (mg N-N2Okg−1 soil) and standard error by the end of the incubation is reported in theright-above box in B1.
decreasing gradually to reach 0.06 at day 10 (Figure 5B2). Biochardid not significantly modify this pattern.
The biochar amended soil had a significantly lower concen-tration of NH+
4 at the end of the incubation (Figure 5B3). Theconcentration of NO−
3 was low (below 5 mg kg−1 soil) and notaffected by biochar addition.
EXPERIMENT 4. IMPACT OF THE NITRIFICATION INHIBITORDICYCIANDIAMIDE (DCD) ON N2O EMISSIONS AND MINERAL NCONCENTRATION IN SOIL HCN2O emissions almost ceased when DCD was added to soil HC(Figure 6). The highest emissions were observed when the soilwas fertilized with NO−
3 (Figure 6B2), but still represented less
Frontiers in Environmental Science | Soil Processes July 2014 | Volume 2 | Article 25 | 6

Sánchez-García et al. Biochar increases nitrification-mediated N2O
FIGURE 6 | Fluxes of N2O (above) and NH+4
-N and NO−3
-N
concentrations during 14 days of incubation (below) in soil HC
containing DCD (30 mg kg−1 soil) in control and biochar
treatments (mean ± SE, n = 4). (B1–B3) correspond to unfertilized
soil, fertilized with KNO3 and fertilized with CO(NH2)2 respectively.Cumulative N2O emissions (µg N-N2O kg−1 soil) and standarderrors by the end of the incubation are reported in the right-abovebox for each treatment.
than 0.4% of the added N (compared to 12.7% without DCD(Figure 1B2).
The highest NH+4 concentrations were found in the soil
amended with urea, followed by the non-fertilized soil and thesoil amended with KNO3. Biochar (compared to the control)systematically decreased the concentration of NH+
4 by the endof the incubation for all treatments (non-fertilized soil, KNO3,and urea). NO−
3 concentration was lower than the original in soil(16.9 mg NO−
3 -N kg−1 soil).
DISCUSSIONPRE-DOMINANT N2O FORMATION PATHWAYS IN SOIL HP AND HCNitrous oxide emissions patterns and their response to the addi-tion of different N fertilizers were different in soils HP and HC,which clearly reflected the different N2O production pathwaysinvolved.
Figure 7 illustrates the main pathways for N2O formation insoil. Ammonia oxidation takes place in two steps: first NH3 is oxi-dized to NH2OH, which is then oxidized to NO−
2 . N2O may bedirectly released as a by-product of ammonia oxidation (nitrifier-nitrification) (Hooper and Terry, 1979) or it can be produced
through a denitrification pathway where NO−2 is reduced to N2O
(nitrifier-denitrification) (Kool et al., 2011). The ability to den-itrify is a widespread, if not ubiquitous, attribute in ammoniaoxidizers (Shaw et al., 2006). Classically, denitrification (fromNO−
3 ) has been considered the main N2O formation pathwayin soils. However, other pathways that have been systematicallyoverlooked in soil studies could play a more important role thanoriginally estimated (Baggs, 2011; Spott et al., 2011). This is thecase for codenitrification, which is potentially a widespread path-way of microbial N transformation in terrestrial environments(Spott et al., 2011) and dissimilatory nitrate reduction to ammo-nia (DNRA) (Giles et al., 2012). Although our knowledge ofmicrobial N transformation in soil has evolved significantly overthe last decades, recent findings show that, even today, our under-standing of N2O formation and consumption in soil is still verylimited (Sanford et al., 2012; Long et al., 2013).
In the nearly water-saturated soil conditions used in ourexperiments (90% WFPS), N2O production is expected to bedominated by denitrification of NO−
3 . This was the case in soilHP, where emissions were clearly controlled by the conventionaldenitrification pathway. This can be deduced from the following
www.frontiersin.org July 2014 | Volume 2 | Article 25 | 7

Sánchez-García et al. Biochar increases nitrification-mediated N2O
FIGURE 7 | Microbial sources of N2O during transformations of mineral
nitrogen in soil. Nu−: nuclophile (e.g., R-NH2, NH+4 , amino acids or other
organic N compounds). During codenitrification, nitrous acid reacts with anucleophile in soil through nitrosation reactions forming a hybrid N-N bond(Spott et al., 2011); DNRA, dissimilatory nitrate reduction to ammonium.
facts: (i) This soil only emitted N2O after the addition of NO−3
(Figure 1A2); (ii) the 15N atomic fraction of the N2O emittedat day one was 0.74 (Figure 4A), which shows that N2O wasprimarily produced from the added 15NO−
3 . The 15N atomic frac-tion decreased over time, showing the depletion of the labeledsource; (iii) given the limited nitrification activity detected in thissoil, addition of NO−
3 did not increase the final NH+4 concen-
tration (with respect to the non-fertilized soil), which suggeststhat DNRA was not a relevant pathway, and (iv) applying theequations developed by Spott and Florian Stange (2011), codeni-trification was found to be null (Table 2).
As previously found in other soils under analogous optimaldenitrifying conditions (Cayuela et al., 2013), biochar signifi-cantly decreased total N2O emissions in this soil.
In soil HC, the weak response of N2O emissions to NO−3
addition pointed out to a low contribution of denitrification orDNRA in this soil. Given that the original NO−
3 concentration inthe soil was 16.9 mg N kg−1 at a natural abundance of 0.364%15N, and that we added 55 mg N kg−1 of 15NO−
3 (>99% enrich-ment), the 15N-NO−
3 enrichment in the soil at the beginning ofthe incubation was 75.8%. Yet, the 15N atomic fraction in the N2Oemitted at day one (Figure 4B1) was only 0.18, which demon-strates that some N2O originated from denitrification, but alsothat NO−
3 was not the only source of N2O. Moreover, the lowC:N ratio of this soil and the NH+
4 concentration at the end ofthe incubation in the KNO3 treatment (Figure 2B2) indicatesthat DNRA was not a major N2O formation route in this soil(Giles et al., 2012). Instead, we hypothesize that N2O forma-tion in soil HC was mainly the result of nitrification-mediatedprocesses. The results supporting this hypothesis can be sum-marized: (i) The addition of extra NO−
3 did not increase N2Oemissions in this soil, whereas the addition of extra urea did; (ii)the 15N atomic fraction of the N2O emitted at day one was 17.7%(Figure 4B1), which shows that N2O was not pre-dominantlyformed from the added 15NO−
3 . (iii) The concentration of dis-solved organic N in this soil was very high (35.9 mg N kg−1soil),which can explain the low contribution of the labeled urea tothe emitted 15N2O (Figure 4B2). However, significant hybridN2O (45N2O) was produced (data not shown) and we cannot
discard the contribution of codenitrification to N2O formationin soil HC.
To better understand which processes (within nitrification-mediated pathways) biochar might be modifying we performedExperiments 3 and 4.
IMPACT OF BIOCHAR IN N2O BY NITRIFICATION-MEDIATEDPATHWAYSIn Experiment 3 the addition of NO−
2 to soil HC showed that,under high moisture conditions, this soil was able to rapidlyreduce NO−
2 to N2O, which was emitted in large quantities (38%of added NO−
2 -N). It is very unlikely that the N2O emittedwas just the product of the chemical decomposition of NO−
2(chemodenitrification), since this process, largely controlled bysoil pH, only occurs in neutral and acidic soils (Bremner, 1997).Instead, NO−
2 was most probably used as electron acceptor formicrobial respiration (nitrifier-denitrification). The high N2Oproduction in Experiment 3 (21.3 mg N kg−1compared to 3.4 mgN kg−1 in Experiment 1) may be related to enhanced nitrifier-denitrification for detoxifying NO−
2 (Jung et al., 2014).The subsequent tracer experiment with application of 15NO−
2 ,demonstrated that significant nitrite reduction to N2O occurs(the N2O originating from the added 15NO−
2 at day one was31.5%, see Figure 5B2), but also that it could not be the onlyprocess leading to N2O emissions. This experiment demon-strated that biochar was not increasing N2O emissions throughthe nitrifier-denitrification pathway, since N2O emissions in thebiochar and control treatments were not statistically different.
In our final experiment (Experiment 4), the high NH+4 and low
NO−3 concentrations by the end of the experiment demonstrate
the effectiveness of the DCD treatment to inhibit ammonia oxi-dation, which correlated with a large decrease in N2O emissionsfor all treatments. We assumed that DCD did not inhibit otherpossible N2O formation pathways. Although the impacts of DCDon other aspects of microbial N transformation in soil are largelyunknown, Bremner and Yeomans (1986) demonstrated that DCDdoes not inhibit N2O and N2 emissions by denitrification whenapplied at similar rates to those used in this study. More recently,Wakelin et al. (2013) also demonstrated in a field study that theapplication of DCD had a minor impact on denitrifying bacteriaactivity (nirS).
Addition of biochar significantly and consistently decreasedthe NH+
4 concentration in soil HC. These results reinforce ourconclusion that the production of N2O in soil HC must be theconsequence of nitrification processes (nitrifier-nitrification andassociated nitrifier-denitrification). It seems that biochar does notpromote the denitrification from NO−
2 (as was deduced fromExperiment 3), but it does promote the oxidation of ammo-nia and concomitantly the formation of N2O through nitrifier-nitrification. Clearly, if biochar raises the production of NO−
2in soil, it will intrinsically enhance its denitrification (nitrifier-denitrification) when the soil is under low oxygen conditions (asin our experiments).
Our results are in agreement with recent findings by Prommeret al. (2014), who showed that biochar promotes soil ammonia-oxidizer populations and accelerates gross nitrification rates ina calcareous arable soil. The importance of nitrifier-nitrification
Frontiers in Environmental Science | Soil Processes July 2014 | Volume 2 | Article 25 | 8

Sánchez-García et al. Biochar increases nitrification-mediated N2O
and nitrifier-denitrification for N2O production in calcareoussoils has been recently documented by Huang et al. (2014), whodemonstrated that these processes accounted for 35–53% and44–58% of total N2O emissions, respectively.
Here we present preliminary evidence that explains howbiochar might affect N2O emissions differently depending on theN2O formation pathway operating in the soil. When denitrifica-tion was the main N2O formation pathway (soil HP), biochar wasfound to decrease the N2O/(N2 + N2O) ratio (Table 2), which isin agreement with previous findings (Cayuela et al., 2013). Recentstudies have reported that biochar promotes an increase in theabundance of nitrous oxide reductase (nosZ) in soil (Harter et al.,2014), an enzyme that enhances the reduction of N2O to N2 (thelast step in denitrification). In contrast, when N2O was producedby nitrification (soil HC), biochar addition might have increasedemissions by promoting gross nitrification. To our knowledge,there are not published studies explicitly relating to biochar andnitrification-N2O production.
Another question that arises from this study is: why thesetwo soils under identical experimental conditions follow differentN2O formation pathways, which we hypothesize might be linkedto different soil microbial communities. In conclusion, predictingwhich N2O formation pathway pre-dominates in a certain kindof soil will be necessary for guaranteeing the success of biochar asa N2O mitigation strategy.
ACKNOWLEDGMENTSWe are very grateful to Prof. Miloslav Šimek (University of SouthBohemia, Czech Republic) for supplying soil HP and to PacificPyrolysis Pty. Ltd (Australia) for providing the biochar used inthe experiments. This work was possible thanks to a EuropeanCommunity Marie Curie Fellowship (FP7 PEOPLE-2010-MC-European Reintegration Grants (ERG) #277069). The EuropeanSocial Fund is acknowledged for co-financing María Luz Cayuela’sJAE-Doc contract at CSIC. The authors thank Dr. Sarah K.Wexler, expert in English editing and scientific writing, for herkind help revising this manuscript.
REFERENCESBaggs, E. M. (2011). Soil microbial sources of nitrous oxide: recent advances in
knowledge, emerging challenges and future direction. Curr. Opin. Environ. Sust.3, 321–327. doi: 10.1016/j.cosust.2011.08.011
Bremner, J. M. (1997). Sources of nitrous oxide in soils. Nutr. Cycl. Agroecosys. 49,7–16. doi: 10.1023/A:1009798022569
Bremner, J. M., and Yeomans, J. C. (1986). Effects of nitrification inhibitorson denitrification of nitrate in soil. Biol. Fert. Soils 2, 173–179. doi:10.1007/BF00260840
Cayuela, M. L., Oenema, O., Kuikman, P. J., Bakker, R. R., and Van Groenigen, J.W. (2010). Bioenergy by-products as soil amendments? Implications for carbonsequestration and greenhouse gas emissions. GCB Bioenergy 2, 201–213. doi:10.1111/j.1757-1707.2010.01055.x
Cayuela, M. L., Sánchez-Monedero, M. A., Roig, A., Hanley, K., Enders, A.,and Lehmann, J. (2013). Biochar and denitrification in soils: when, howmuch and why does biochar reduce N2O emissions? Sci. Rep. 3:1732. doi:10.1038/srep01732
Cayuela, M. L., Van Zwieten, L., Singh, B. P., Jeffery, S., Roig, A., and Sánchez-Monedero, M. A. (2014). Biochar’s role in mitigating soil nitrous oxideemissions: a review and meta-analysis. Agr. Ecosyst. Environ. 191, 5–16. doi:10.1016/j.agee.2013.10.009
Clough, T. J., Bertram, J. E., Ray, J. L., Condron, L. M., O’Callaghan, M., Sherlock,R. R., et al. (2010). Unweathered wood biochar impact on nitrous oxide
emissions from a bovine-urine-amended pasture soil. Soil Sci. Soc. Am. J. 74,852–860. doi: 10.2136/sssaj2009.0185
Cuhel, J., Šimek, M., Laughlin, R. J., Bru, D., Chèneby, D., Watson, C. J., et al.(2010). Insights into the effect of soil pH on N2O and N2 emissions and denitri-fier community size and activity. Appl. Environ. Microbiol. 76, 1870–1878. doi:10.1128/AEM.02484-09
Giles, M. E., Morley, N. J., Baggs, E. M., and Daniell, T. J. (2012). Soilnitrate reducing processes – drivers, mechanisms for spatial variation andsignificance for nitrous oxide production. Front. Microbiol. 3:407. doi:10.3389/fmicb.2012.00407
Harter, J., Krause, H.-M., Schuettler, S., Ruser, R., Fromme, M., Scholten, T., et al.(2014). Linking N2O emissions from biochar-amended soil to the structureand function of the N-cycling microbial community. ISME J. 8, 660–674. doi:10.1038/ismej.2013.160
Hooper, A. B., and Terry, K. R. (1979). Hydroxylamine oxidoreductase of nitro-somonas: production of nitric oxide from hydroxylamine. Biochim. Biophy. Acta571, 12–20. doi: 10.1016/0005-2744(79)90220-1
Huang, T., Gao, B., Hu, X.-K., Lu, X., Well, R., Christie, P., et al. (2014). Ammonia-oxidation as an engine to generate nitrous oxide in an intensively managedcalcareous Fluvo-aquic soil. Sci. Rep. 4:3950. doi: 10.1038/srep03950
Jung, M.-Y., Well, R., Min, D., Giesemann, A., Park, S.-J., Kim, J.-G., et al. (2014).Isotopic signatures of N2O produced by ammonia-oxidizing archaea from soils.ISME J. 8, 1115–1125. doi: 10.1038/ismej.2013.205
Kettler, T. A., Doran, J. W., and Gilbert, T. L. (2001). Simplified method for soilparticle-size determination to accompany soil-quality analyses. Soil Sci. Soc. Am.J. 65, 849–852. doi: 10.2136/sssaj2001.653849x
Kool, D. M., Dolfing, J., Wrage, N., and Van Groenigen, J. W. (2011). Nitrifier den-itrification as a distinct and significant source of nitrous oxide from soil. SoilBiol. Biochem. 43, 174–178. doi: 10.1016/j.soilbio.2010.09.030
Long, A., Heitman, J., Tobias, C., Philips, R., and Song, B. (2013). Co-occurringanammox, denitrification, and codenitrification in agricultural soils. Appl.Environ. Microb. 79, 168–176. doi: 10.1128/AEM.02520-12
Malghani, S., Gleixner, G., and Trumbore, S. E. (2013). Chars produced by slowpyrolysis and hydrothermal carbonization vary in carbon sequestration poten-tial and greenhouse gases emissions. Soil Biol. Biochem. 62, 137–146. doi:10.1016/j.soilbio.2013.03.013
Mondini, C., Sinicco, T., Cayuela, M. L., and Sanchez-Monedero, M. A. (2010). Asimple automated system for measuring soil respiration by gas chromatography.Talanta 81, 849–855. doi: 10.1016/j.talanta.2010.01.026
Mulvaney, R. L., and Boast, C. W. (1986). Equations for determination of nitrogen-15 labeled dinitrogen and nitrous oxide by mass spectrometry. Soil Sci. Soc. Am.J. 50, 360–363. doi: 10.2136/sssaj1986.03615995005000020021x
Prommer, J., Wanek, W., Hofhansl, F., Trojan, D., Offre, P., Urich, T., et al. (2014).Biochar decelerates soil organic nitrogen cycling but stimulates soil nitrifica-tion in a temperate arable field trial. PLoS ONE 9:e86388. doi: 10.1371/jour-nal.pone.0086388
Rajbanshi, S. S., Benckiser, G., and Ottow, J. C. G. (1992). Effects of concentration,incubation temperature, and repeated applications on degradation kinetics ofdicyandiamide (DCD) in model experiments with a silt loam soil. Biol. Fert.Soils 13, 61–64. doi: 10.1007/BF00337336
Saarnio, S., Heimonen, K., and Kettunen, R. (2013). Biochar addition indirectlyaffects N2O emissions via soil moisture and plant N uptake. Soil Biol. Biochem.58, 99–106. doi: 10.1016/j.soilbio.2012.10.035
Sanford, R. A., Wagner, D. D., Wu, Q., Chee-Sanford, J. C., Thomas, S. H., Cruz-García, C., et al. (2012). Unexpected nondenitrifier nitrous oxide reductase genediversity and abundance in soils. Proc. Natl. Acad. Sci. U.S.A. 109, 19709–19714.doi: 10.1073/pnas.1211238109
Shaw, L. J., Nicol, G. W., Smith, Z., Fear, J., Prosser, J. I., and Baggs, E. M.(2006). Nitrosospira spp. can produce nitrous oxide via a nitrifier denitrifica-tion pathway. Environ. Microbiol. 8, 214–222. doi: 10.1111/j.1462-2920.2005.00882.x
Spokas, K. A., and Reikosky, D. C. (2009). Impacts of sixteen different biochars onsoil greenhouse gas production. Ann. Environ. Sci. 3, 179–193. Available onlineat: http://hdl.handle.net/2047/d10019583
Spott, O., and Florian Stange, C. (2011). Formation of hybrid N2O in a suspendedsoil due to co-denitrification of NH2OH. J. Plant Nutr. Soil Sci. 174, 554–567.doi: 10.1002/jpln.201000200
Spott, O., Russow, R., and Stange, C. F. (2011). Formation of hybrid N2O andhybrid N2 due to codenitrification: First review of a barely considered process
www.frontiersin.org July 2014 | Volume 2 | Article 25 | 9
Sánchez-García et al. Biochar increases nitrification-mediated N2O
of microbially mediated N-nitrosation. Soil Biol. Biochem. 43, 1995–2011. doi:10.1016/j.soilbio.2011.06.014
Stevens, R. J., and Laughlin, R. J. (2001). Lowering the detection limit for dinitrogenusing the enrichment of nitrous oxide. Soil Biol. Biochem. 33, 1287–1289. doi:10.1016/S0038-0717(01)00036-0
Stevens, R. J., Laughlin, R. J., Atkins, G. J., and Prosser, S. J. (1993).Automated determination of nitrogen-15-labeled dinitrogen and nitrousoxide by mass spectrometry. Soil Sci. Soc. Am. J. 57, 981–988. doi:10.2136/sssaj1993.03615995005700040017x
Suddick, E. C., and Six, J. (2013). An estimation of annual nitrous oxide emis-sions and soil quality following the amendment of high temperature walnutshell biochar and compost to a small scale vegetable crop rotation. Sci. TotalEnviron. 465, 298–307. doi: 10.1016/j.scitotenv.2013.01.094
Van Zwieten, L., Kimber, S., Morris, S., Downie, A., Berger, E., Rust, J., et al. (2010).Influence of biochars on flux of N2O and CO2 from Ferrosol. Aust. J. Soil Res.48, 555–568. doi: 10.1071/SR10004
Velthof, G., Kuikman, P., and Oenema, O. (2003). Nitrous oxide emission fromanimal manures applied to soil under controlled conditions. Biol. Fert. Soils 37,221–230. doi: 10.1007/s00374-003-0589-2
Wakelin, S. A., Clough, T. J., Gerard, E. M., and O’Callaghan, M. (2013).Impact of short-interval, repeat application of dicyandiamide on soil Ntransformation in urine patches. Agric. Ecosyst. Environ. 167, 60–70. doi:10.1016/j.agee.2013.01.007
Yoo, G., and Kang, H. (2012). Effects of biochar addition on greenhouse gas emis-sions and microbial responses in a short-term laboratory experiment. J. Environ.Qual. 41, 1193–1202. doi: 10.2134/jeq2011.0157
Zacherl, B., and Amberger, A. (1990). Effect of the nitrification inhibitors dicyan-diamide, nitrapyrin and thiourea onNitrosomonas europaea. Fert. Res. 22,37–44. doi: 10.1007/BF01054805
Conflict of Interest Statement: The authors declare that the research was con-ducted in the absence of any commercial or financial relationships that could beconstrued as a potential conflict of interest.
Received: 28 February 2014; accepted: 09 June 2014; published online: 03 July 2014.Citation: Sánchez-García M, Roig A, Sánchez-Monedero MA and Cayuela ML (2014)Biochar increases soil N2O emissions produced by nitrification-mediated pathways.Front. Environ. Sci. 2:25. doi: 10.3389/fenvs.2014.00025This article was submitted to Soil Processes, a section of the journal Frontiers inEnvironmental Science.Copyright © 2014 Sánchez-García, Roig, Sánchez-Monedero and Cayuela. This is anopen-access article distributed under the terms of the Creative Commons AttributionLicense (CC BY). The use, distribution or reproduction in other forums is permitted,provided the original author(s) or licensor are credited and that the original publica-tion in this journal is cited, in accordance with accepted academic practice. No use,distribution or reproduction is permitted which does not comply with these terms.
Frontiers in Environmental Science | Soil Processes July 2014 | Volume 2 | Article 25 | 10