Can Biochar Come to the Rescue of Coastal Barren Species? A Controlled Study Reports on the Impact...
13
PEER-REVIEWED ARTICLE bioresources.com Licht et al. (2014). “Biochar & soil rescue,” BioResources 9(4), 6214-6226. 6214 Can Biochar Come to the Rescue of Coastal Barren Species? A Controlled Study Reports on the Impact of Biochar Amendment on Their Survival Jeff Licht, a, * Hugh McLaughlin, b Chris Burns, c and Frank Shields d Indigenous species in coastal barren communities are subject to anthropogenic and environmental pressures; some species are in decline, and there is uncertainty about their long-term survival. The authors added supplemental soil carbon in the form of red oak biochar to calcined clay (1:9) to determine the effect of this treatment on survival of legume (Lupinus perennis and Baptisia tinctoria) and non-legume (Vaccinium angustifolium and Quercus ilicifolia) species during a period spanning two and a half seasons of unirrigated pot tests. Red oak biochar used in the experiment was produced from pyrolysis, the thermochemical devolitization and carbonization of the starting biomass. Biochar significantly affected the survival rates of all species (P=<.03). Biochar- treated non-legumes had higher survival rates (P=<.10) than similarly treated legumes. Future investigations of biochars, particularly those evolved from recycled lignocellulosic wastes, associated with survival, should focus on reversal of habitat loss. Keywords: Species survival; Biochar amendment; Coastal barren communities; Legume; Bio-management Contact information: a: School for the Environment, University of Massachusetts, Boston, MA, 02110; b: AC Fox, Groton, MA, 01450; c: Department of Resource Economics, University of Massachusetts, Amherst, MA, 01003; d: Control Laboratories, Inc., Watsonville, CA,95076 * Corresponding author: [email protected] INTRODUCTION Plant survival in narrow-niche, coastal pine barren communities, imbued with infertile, sandy soils (Orwig et al. 2013), grows increasingly problematic (Howard et al. 2005) due to stressful anthropogenic (Bertness et al. 2002), phenologic (Primack and Miller-Rushing 2011), and climatic (Pennings et al. 2005) factors. This investigation sought to determine whether supplemental soil carbon in the form of biochar in a controlled study affects survival rates of several coastal barren species. Biochar, or terra preta (low-temperature black) soil, was first created thousands of years ago (German 2003; Lehmann et al. 2011) through a process of burning vegetation under large leaves at high heat under oxygen-depleted conditions. Nowadays, biochars are produced from a variety of devices including top-lit updraft (TLUD) and retort devices (McLaughlin et al. 2009). Biochars produced in this way offer advantages as soil additives over other non-pyrolytic organics, such as compost, including higher nutrient content (DeLuca et al. 2009; Angst and Sohi 2012), greater soil organic carbon content (Steinbeiss et al. 2009; Kimetu and Lehmann 2010; Landesman and Dighton 2010; Major et al. 2010), increased soil moisture (Nigussie et al. 2012), greater surface area (Zheng et al. 2010), and enhanced soil properties (Unger and Killorn 2011).
Transcript of Can Biochar Come to the Rescue of Coastal Barren Species? A Controlled Study Reports on the Impact...

PEER-REVIEWED ARTICLE bioresources.com
Licht et al. (2014). “Biochar & soil rescue,” BioResources 9(4), 6214-6226. 6214
Can Biochar Come to the Rescue of Coastal Barren Species? A Controlled Study Reports on the Impact of Biochar Amendment on Their Survival Jeff Licht,a,* Hugh McLaughlin,b Chris Burns,c and Frank Shields d
Indigenous species in coastal barren communities are subject to anthropogenic and environmental pressures; some species are in decline, and there is uncertainty about their long-term survival. The authors added supplemental soil carbon in the form of red oak biochar to calcined clay (1:9) to determine the effect of this treatment on survival of legume (Lupinus perennis and Baptisia tinctoria) and non-legume (Vaccinium angustifolium and Quercus ilicifolia) species during a period spanning two and a half seasons of unirrigated pot tests. Red oak biochar used in the experiment was produced from pyrolysis, the thermochemical devolitization and carbonization of the starting biomass. Biochar significantly affected the survival rates of all species (P=<.03). Biochar-treated non-legumes had higher survival rates (P=<.10) than similarly treated legumes. Future investigations of biochars, particularly those evolved from recycled lignocellulosic wastes, associated with survival, should focus on reversal of habitat loss.
Keywords: Species survival; Biochar amendment; Coastal barren communities; Legume; Bio-management
Contact information: a: School for the Environment, University of Massachusetts, Boston, MA, 02110;
b: AC Fox, Groton, MA, 01450; c: Department of Resource Economics, University of Massachusetts,
Amherst, MA, 01003; d: Control Laboratories, Inc., Watsonville, CA,95076
* Corresponding author: [email protected]
INTRODUCTION
Plant survival in narrow-niche, coastal pine barren communities, imbued with
infertile, sandy soils (Orwig et al. 2013), grows increasingly problematic (Howard et al.
2005) due to stressful anthropogenic (Bertness et al. 2002), phenologic (Primack and
Miller-Rushing 2011), and climatic (Pennings et al. 2005) factors. This investigation
sought to determine whether supplemental soil carbon in the form of biochar in a controlled
study affects survival rates of several coastal barren species.
Biochar, or terra preta (low-temperature black) soil, was first created thousands of
years ago (German 2003; Lehmann et al. 2011) through a process of burning vegetation
under large leaves at high heat under oxygen-depleted conditions. Nowadays, biochars are
produced from a variety of devices including top-lit updraft (TLUD) and retort devices
(McLaughlin et al. 2009). Biochars produced in this way offer advantages as soil additives
over other non-pyrolytic organics, such as compost, including higher nutrient content
(DeLuca et al. 2009; Angst and Sohi 2012), greater soil organic carbon content (Steinbeiss
et al. 2009; Kimetu and Lehmann 2010; Landesman and Dighton 2010; Major et al. 2010),
increased soil moisture (Nigussie et al. 2012), greater surface area (Zheng et al. 2010), and
enhanced soil properties (Unger and Killorn 2011).
PEER-REVIEWED ARTICLE bioresources.com
Licht et al. (2014). “Biochar & soil rescue,” BioResources 9(4), 6214-6226. 6215
There has been no research reporting the influence of biochar on coastal pine barren
species horticulture, reintroduction of these species, or survival. To examine the survival
aspect in a controlled study, we test three hypotheses: there is (1) no difference in survival
based on biochar soil amendment; (2) no difference in survival based on species type; and
(3) no difference in survival based on legume and non-legume typology.
EXPERIMENTAL
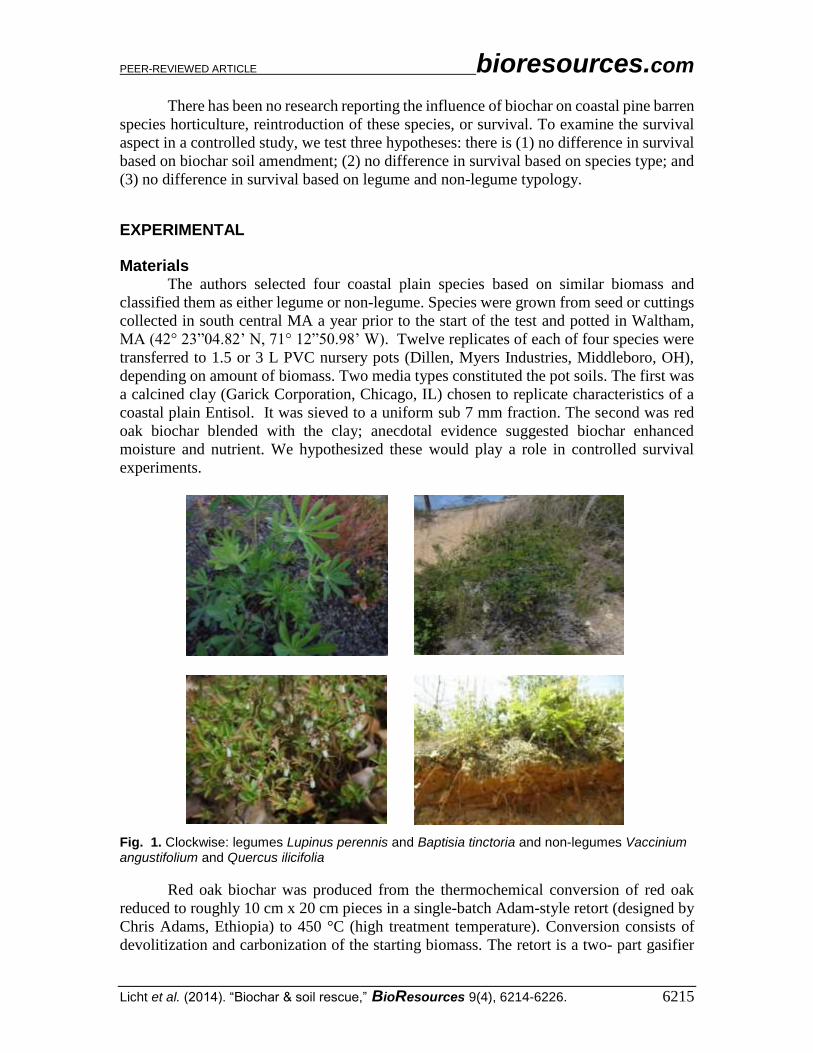
Materials The authors selected four coastal plain species based on similar biomass and
classified them as either legume or non-legume. Species were grown from seed or cuttings
collected in south central MA a year prior to the start of the test and potted in Waltham,
MA (42° 23”04.82’ N, 71° 12”50.98’ W). Twelve replicates of each of four species were
transferred to 1.5 or 3 L PVC nursery pots (Dillen, Myers Industries, Middleboro, OH),
depending on amount of biomass. Two media types constituted the pot soils. The first was
a calcined clay (Garick Corporation, Chicago, IL) chosen to replicate characteristics of a
coastal plain Entisol. It was sieved to a uniform sub 7 mm fraction. The second was red
oak biochar blended with the clay; anecdotal evidence suggested biochar enhanced
moisture and nutrient. We hypothesized these would play a role in controlled survival
experiments.
Fig. 1. Clockwise: legumes Lupinus perennis and Baptisia tinctoria and non-legumes Vaccinium angustifolium and Quercus ilicifolia
Red oak biochar was produced from the thermochemical conversion of red oak
reduced to roughly 10 cm x 20 cm pieces in a single-batch Adam-style retort (designed by
Chris Adams, Ethiopia) to 450 °C (high treatment temperature). Conversion consists of
devolitization and carbonization of the starting biomass. The retort is a two- part gasifier

PEER-REVIEWED ARTICLE bioresources.com
Licht et al. (2014). “Biochar & soil rescue,” BioResources 9(4), 6214-6226. 6216
that provides the heat indirectly to the pyrolyzing biomass, which is contained in a separate
chamber or retort where the biochar is created.
Fig. 2. Left: calcined clay; Right: calcined clay with red oak biochar added
Biochar Preparation Following pyrolysis, biochar was air-cooled for 24 h and mechanically pulverized
to sub-8-mm particles. Biochar amendment preparation fell into three stages: conditioning,
charging, and inoculation. To begin conditioning, raw biochar and dried, ground red oak
leaves were saturated. 15 L of biochar particles were placed in a 40 L plastic tub and
saturated with 13 L water. In this step, saturation drove off tars, sugars, ash, and lime from
the biochar. In a separate tub, an equal volume of leaves was saturated. As the wetted
biochar and leaves were solubilized, mycorrhizal activity was encouraged. After a week,
as part of a charging process materials were mixed into a single slurry 1:1 and poured into
two 40 L tubs. The charging process enabled equilibration of inorganic nutrient and trace
elements. In the third week, 75 mL Peters 5-10-5 fertilizer was mixed into each tub. The
fertilizer inoculation added additional nutrient to increase available nutrient, which was
converted to sugars fed on by microbes. It should be noted that as sugars were driven from
the biochar through microbial action, mobile matter became leachable carbon,
accompanied by an increase in water uptake. In the fourth week, the curing process
continued; each slurry mixture was removed from the tubs and shoveled onto a wire mesh
attached to a wooden frame with the screen suspended over two empty 20 L tubs.
Approximately 2 L of water were drained from the slurries, after which the remaining non-
liquified material was removed and air dried in a separate dry container. By week five,
sufficient drying had occurred for the biochar to be blended with the clay mineral. For
biochar amended clay media, the blend ratio was 1:9 red oak biochar to clay. Previous
findings have indicated optimum results for biochar addition should fall between 10-12%
volume (Yu et al. 2013). After potted materials were arranged randomly on an
experimental platform, they were watered to 100% field capacity, then left unirrigated
through the balance of the experiment which progressed over two and a half growing
seasons.
Analytic Methods Clay nutrients were analyzed using a Modified Morgan solution employing
inductively coupled plasma atomic emission spectrometry (ICP-AES) (Perkin Elmer Elan
5000; Waltham, MA) analysis. The Modified Morgan's (MM) solution, a 1.25 M

PEER-REVIEWED ARTICLE bioresources.com
Licht et al. (2014). “Biochar & soil rescue,” BioResources 9(4), 6214-6226. 6217
ammonium acetate buffer at pH 4.8, is a standard used by university soil laboratories in
the Northeast U.S.
The biochar sample was milled to a uniform 0.25 mm to 0.5 mm fraction and rinsed
with sterile water to remove fine ash, then prepared using a SPEX mill grinder and weighed
to ±5 mg on a Sartorius M2B analytical microbalance (DWS Inc.; Elkington, IL). Several
standard methods of soil analysis were modified to account for biochar properties such as
buoyancy and hydrophobicity, which make the centrifugation and wetting of biochar
challenging. Due to a high initial pH, the Modified Morgan's (MM) solution was used
to assess biochar CEC. Phosphorus concentrations in the extracts were determined using
the ascorbic acid method on a Lachat Quickchem 8500 flow injection (high sample
throughput and rapid method changeover) analyzer (Lachat Instruments; Loveland, CO).
Concentrations of available macro mineral elements (K, Ca, Mg, and Na) and micro
mineral nutrients (Zn, B, Cu, Fe, and Mn) in the soils were determined by extraction with
a MM solution followed by inductively coupled plasma atomic emission spectrometry
(ICP-AES) analysis (Perkin Elmer Elan 5000; Waltham, MA). Soil pH was assessed by
measuring the proton (H+) activity of a soil/water (1:1) slurry with a pH meter.
Other analyses were performed, following methods described by Amlinger et al.
(2004), Enders et al. (2012), and Rayment and Higginson (1992). A muffle furnace (SSFE,
Davis Instruments) was used to measure ash content using a crucible sample heated to 550
C until all combustible organic carbon was removed. C, H, N, and O were determined by
ultimate analysis (ASTM D-3176-09) using a Perkin Elmer 2400 CHNS/O continuous flow
isotope ratio mass spectrometer and elemental analyzer. A second sample, cardboard
biochar, was prepared using the same methods.
Adsorption was assessed using a gravimetric adsorption capacity scan (GACS)
method (McLaughlin et al. 2012). A sample wire basket containing a biochar sample was
heated to 300 °C under nitrogen purge, during which the sample was stabilized by the
removal of any adsorbed moisture and low boiling volatiles. At 300 °C, the heating supply
was turned off and the purge gas surrounding the sample changed to pure R134a (a
refrigerant used in air conditioning systems adapted to this method). Adsorption data was
calculated as the percent weight gain of R134a per minimum weight of the char sample
over the entire temperature history.
RESULTS AND DISCUSSION
In Table 1, results indicate that calcined clay yielded more than twice the K and Mg
fertility of clay treated with biochar. Ca values were abnormally high due to the influence
of carbonates. P availability was greater in the amended clay; this was an important clue as
to the presence of higher water holding capacity; a higher P value is known to correlate
with increased moisture retention (Uzoma et al. 2011). Trace element levels were
somewhat lower after biochar amendment; Beesley et al. (2011) reported reduced trace
metals in a field trial using biochar and greenwaste. Biochar CEC (76 cmol+/kg-1) was
found to have an effect on amended calcined clay CEC (15.2 cmol+/kg-1) when compared
with calcined clay only CEC (5.4 cmol+/kg-1). One year later, a retest of CEC found
amended clay had increased to 19.5 cmol+/kg-1. As a reliable indicator of soil health, soil
cation exchange capacity (CEC) measurement is preferred over biochar CEC measurement,
c d

PEER-REVIEWED ARTICLE bioresources.com
Licht et al. (2014). “Biochar & soil rescue,” BioResources 9(4), 6214-6226. 6218
which relies on internal ion exchange; soil CEC is dependent on soil surface (external) ion
exchange.
Table 1. Initial Fertility Characteristics using Modified Morgan’s Solution
In Table 2, one year follow-up results of Modified Morgan extract tests were
performed. Most macronutrient, OM, pH, and trace metal levels were lower; however, high
calcium carbonate was still very much in evidence. P cation availability decreased,
consistent with expectations of leaching effects.
Table 2. One Year Fertility using Modified Morgan’s Solution
Besides evaluating biochar effect on nutrient, we desired to gain some perspective
on elemental analysis of two converted, homogeneous feedstocks, red oak and cardboard.
C, H, N, and O properties were compared, as can be seen in Table 3. Previous findings
reported by Mukome et al. (2013), Basso et al. (2013) and Mitchell et al. (2013) shed light
Calcined clay Calcined clay/ red oak biochar
Red oak biochar
Dry weight 3.5 g/5cc 3.3 g/5cc 1.4 g/5cc
% OM 6.5 6.9 8.2
pH 6.1 6.6 7.6
expressed as ppm
P 13 111 492
K 76.5 194 626
Ca 651.6 2026 2535
Mg 67.9 138 391
B 1.3 1.1 4.8
Mn 6.8 6.1 11.4
Zn 7.3 3.6 3.9
Cu .2 .3 .2
Fe 6.3 2.5 3
S 30.4 412 72
Pb 29 27 27
Calcined clay Calcined clay/ red oak biochar
Red oak biochar
Dry weight 3.5 g/5cc 3.1 g/5cc 1.3 g/5cc
% OM 5.7 9.9 5.3
pH 5.9 6.9 7.4
ppm
P 10 53.2 89
K 55 268 866
Ca 420 3033 1863
Mg 81 308 198
B 1 1 2.1
Mn 7 6.1 11.4
Zn 9 7 4.8
Cu .01 .4 .3
Fe 5 3.6 1
S 30.2 15.8 31
Pb 22 5 16
PEER-REVIEWED ARTICLE bioresources.com
Licht et al. (2014). “Biochar & soil rescue,” BioResources 9(4), 6214-6226. 6219
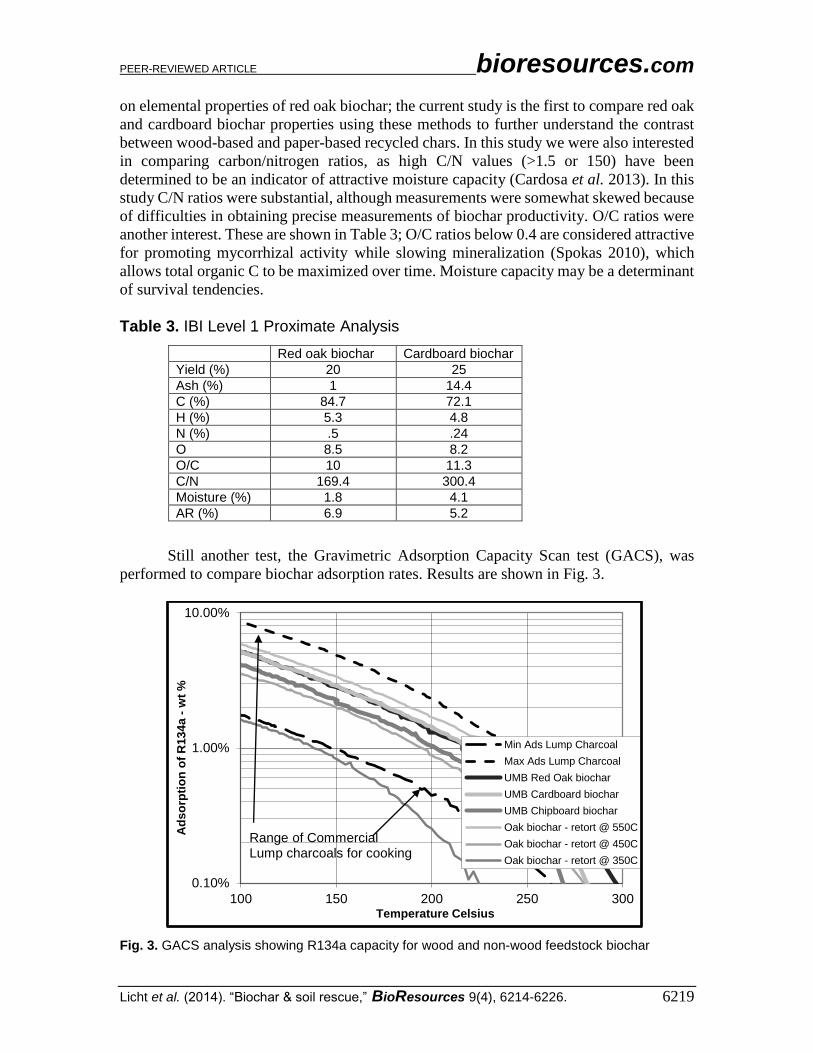
on elemental properties of red oak biochar; the current study is the first to compare red oak
and cardboard biochar properties using these methods to further understand the contrast
between wood-based and paper-based recycled chars. In this study we were also interested
in comparing carbon/nitrogen ratios, as high C/N values (>1.5 or 150) have been
determined to be an indicator of attractive moisture capacity (Cardosa et al. 2013). In this
study C/N ratios were substantial, although measurements were somewhat skewed because
of difficulties in obtaining precise measurements of biochar productivity. O/C ratios were
another interest. These are shown in Table 3; O/C ratios below 0.4 are considered attractive
for promoting mycorrhizal activity while slowing mineralization (Spokas 2010), which
allows total organic C to be maximized over time. Moisture capacity may be a determinant
of survival tendencies.
Table 3. IBI Level 1 Proximate Analysis
Still another test, the Gravimetric Adsorption Capacity Scan test (GACS), was
performed to compare biochar adsorption rates. Results are shown in Fig. 3.
Fig. 3. GACS analysis showing R134a capacity for wood and non-wood feedstock biochar
0.10%
1.00%
10.00%
100 150 200 250 300
Ad
so
rpti
on
of
R13
4a
-w
t %
Temperature Celsius
Min Ads Lump Charcoal
Max Ads Lump Charcoal
UMB Red Oak biochar
UMB Cardboard biochar
UMB Chipboard biochar
Oak biochar - retort @ 550C
Oak biochar - retort @ 450C
Oak biochar - retort @ 350C
Range of CommercialLump charcoals for cooking
Red oak biochar Cardboard biochar
Yield (%) 20 25
Ash (%) 1 14.4
C (%) 84.7 72.1
H (%) 5.3 4.8
N (%) .5 .24
O 8.5 8.2
O/C 10 11.3
C/N 169.4 300.4
Moisture (%) 1.8 4.1
AR (%) 6.9 5.2

PEER-REVIEWED ARTICLE bioresources.com
Licht et al. (2014). “Biochar & soil rescue,” BioResources 9(4), 6214-6226. 6220
The GACS test measures the difference in R134a adsorption capacity for the
experimental and other biochars. It is used to obtain a maximum global comparison of
adsorption data for red oak and cardboard biochars compared with other, benchmark chars.
Adsorption is measured by providing a “challenge gas”, in this case R134a, and measuring
the weight gain under a range of temperatures corresponding to a range of adsorption
energies. Insight gained from the R134a results can be used to make educated guesses about
potential increases in soil moisture and water vapor affinity due to the biochar addition.
Adsorption of the challenge gas correlates with the ability of the biochar to retain moisture
and soluble organics in soils. Our understanding of biochar water dynamics is based on
analogous behavior of activated C with respect to water vapor adsorption.
SURVIVAL ANALYSIS
A survival analysis was performed using Kaplan Meier (KM) curves in R, a test for
differences in group survival rates is an estimate using a non-parametric maximum
likelihood estimator known as the Kaplan-Meier estimator. Survival probability is
estimated by specifying a survival function for the data. In this experiment we modeled a
number of species as a function of time depending on treatment type (clay or biochar
modified clay). The model was then estimated using maximum likelihood, giving a fitted
probability of survival for each time period. The model was further enhanced by applying
the Kaplan-Meier estimate of the survival function. The plot of the KM estimate of the
survival function is a series of horizontal steps with declining magnitude.
SURVIVAL RESULTS
At the 5% level of significance (P=<.030), the authors rejected the first null
hypothesis and concluded red oak biochar and untreated calcined clay did not produce the
same survival rate. At each milestone of the 15-month test, which covered a period of two
and a half growing seasons, inoculated species outperformed their non-treated
counterparts, as shown in Fig. 4. Quercus ilicifolia was the only one of the four species
that showed only a modest survival benefit (15% compared with the other treatment) from
biochar. To compare the effect of calcined clay and red oak biochar blended with calcined
clay on survival rates, a survival plot was used to represent the difference in mean survival
found to be statistically significant at 5% level when plant subjects were treated to biochar-
added soil. Survival plots in Fig. 4 display 95% confidence bands (dotted lines) in the plots
overlap, suggesting no significant difference at a given time period. However, the log-rank
test asks whether the two survival curves are different across all time periods, which is
highly relevant to our analysis. The results show a statistically significant difference for
biochar vs. calcined clay (p= .030), and legume vs. non-legume (p=.10).
A simultaneous test was performed for mean survival across all time periods. In
Fig. 5, 95% confidence bands are shown for each individual time period. This explains why
the 95% confidence bands can overlap (suggesting no significant difference in survival
rate), but the joint test showed a significant difference. Bands (dotted lines) also

PEER-REVIEWED ARTICLE bioresources.com
Licht et al. (2014). “Biochar & soil rescue,” BioResources 9(4), 6214-6226. 6221
Fig. 4. Effect of biochar treatment on overall species survival. KM curves for untreated and red oak biochar treated calcined clay
Fig. 5. Times series plot shows overall species survival depending on treatment type
represent the sampling variability of the data. Because the sample data represent only a
subset of the whole population, the true population survival rate will be somewhat different,
and the confidence bands represent this uncertainty. Species-soil time series plots (Fig. 5)

PEER-REVIEWED ARTICLE bioresources.com
Licht et al. (2014). “Biochar & soil rescue,” BioResources 9(4), 6214-6226. 6222
portrayed a sizable difference in survival by the 15-month mark. However, the sample sizes
were too small to produce statistically significant differences regarding species-to-species
relationships. Thus, the null hypothesis was accepted.
As Fig. 6 illustrates, non-legumes had a significantly higher survival probability
(P=<.10) than their legume counterparts. Like results reported in Fig. 4, those in Fig. 6
show 95% confidence bands (dotted lines) in overlapped plots, suggesting that differences
in survival curves were evident across all time periods. Enhanced legume survival was an
important milestone in this study, given the difficulty of transplanting legumes to pots or
field placement (Smith 1997).
Fig. 6. Effect of biochar treatment on legume versus non-legume survival
CONCLUSIONS
Red oak biochar elevated survival rates of a number of coastal barren species under
controlled conditions; this in itself is a finding that suggests further investigation of biochar
supplement to augment survival of species in other biome types. Still, a number of pressing
questions remain. For example, will increasing specie sample sizes reveal more decisive
data regarding species-to-species comparisons of biochar-based survival benefits? If one
hypothesizes, as we did, that there is a connection between survival and moisture retention
following biochar amendment, is there evidence the biochar phenomenon extends past the
limits of our controlled study? With regards to this last question, there is a growing body
of evidence suggesting that biochar enhances soil moisture and nutrient holding for low
fertility Ultisols (Novak et al. 2009) from the Southeast U.S. and soil moisture retention,
shrinkage and plasticity for four different Entisols (Licht et al, in preparation) found in
Northeast U.S. coastal locations. Further investigation may determine a connection

PEER-REVIEWED ARTICLE bioresources.com
Licht et al. (2014). “Biochar & soil rescue,” BioResources 9(4), 6214-6226. 6223
between soil characterization (i.e., amended soils with elevated nutrient and water holding
capacity), characterization based on biochar blend type and plant physiological response
such as water use efficiency. Some preliminary data has been gathered to demonstrate
changes in water use efficiency as a result of increased carbon from red oak and cardboard
biochar soil amendment (Licht et al, in preparation). However there is much to learn about
the relation between carbon and water use efficiency of species in infertile soils and
whether or not biochar feedback is merely temporary.
Before biochar of any kind is tested in situ, more work is required to understand
current findings under the lens of feedstock selection, blending technique, and long-term
effects (Gurwick et al. 2013). As feedstock selection widens, for example, use of recycled
waste from paper products (Mitchell et al. 2013) may add to value already seen from wood
sources (e.g., red oak, spruce-pine-fir), dung (Guo et al. 2014), crop residues (Yuan and
Xu 2011), or wildlife-produced charcoal from forest fires (MacKenzie and Drozdowski
2013). We compared cardboard, an homogenous feedstock, to red oak, another
homogenous feedstock, to better understand the similarities or differences between these
converted waste biochars. Certainly one important research benefit from its use as a
research tool rests in the knowledge that cardboard feedstock, whether corrugated,
fiberboard or chipboard, is replicable worldwide.
Perhaps the issue that is most central to the potential value of biochar as an
ecological tool lies in determining whether biochar benefits will extend survival of other
species in other plant communities or, for example, in disturbed plant communities such as
those found on former military firing ranges (Moon et al. 2013; Uchimiya and Bannon,
2013) where mitigation is an additional concern. If biochar can be shown to improve soil
fertility and enhance plant physiological response even after anthropogenic disturbance,
perhaps it can play a rescue role in revitalization efforts to reverse habitat loss in the
Northeast U.S. (Foster and Motzkin 2003).
REFERENCES CITED
ASTM-D3176-09. “Standard practice for ultimate analysis of coal and coke,” American
Society for Testing and Materials, West Conshohocken, PA.
Amlinger, F., Favoino, E., and Pollack, M. (2004). “Heavy metals and organic
compounds from wastes used as organic fertilisers,” Working Group Final Report,
July 2004, Directorate-General for the Environment of the European Commission.
Angst, T. E., and Sohi, S. P. (2012). “Establishing release dynamics for plant nutrients
from biochar,” GCB Bioenergy, 5 (2), 221-226.
Basso, A. S., Miguez, F. E., Laird, D. A., Horton, R., and Westgate, M. (2013).
“Assessing potential of biochar for increasing water-holding capacity of sandy soils,”
Global Change Biology Bioenergy 5, 132-143.
Beesley, L., Moreno-Jiminez, E., Gomez-Eyles, J. L., Harris, E., Robinson, B., and
Sizmur, T. A. (2011). “A review of biochars’ potential role in the remediation,
revegetation and restoration of contaminated soils,” Environmental Pollution 159(12),
3269-3282.
Bertness, M. D., Ewanchuk, P. J., and Silliman, B. R. (2002). “Anthropogenic
modification of New England salt marsh landscapes,” PNAS 99 (3), 1395-1398.
PEER-REVIEWED ARTICLE bioresources.com
Licht et al. (2014). “Biochar & soil rescue,” BioResources 9(4), 6214-6226. 6224
Bureau de normalization du Quebec. Canadian Council of Ministers of the Environment
(CCME). (2006). “Soil quality guidelines for the protection of environmental and
human health”.
Cardosa, E. J. B. N., Vasconsellos, R. L. F, Miyauchi, M. Y. H., dos Santos, C., Alves, P.
R. L., dePaula, A., Nakatane, A., Periera, J., and Noguiera, M. (2013). “Soil health:
Looking for suitable indicators. What should be considered to assess the effects of
use and management on soil health,” Scientia Agricola 70, 4.
DeLuca, T., MacKenzie, M. D., and Gundale, M. J. (2009). “Biochar effects on soil
nutrient transformation,” in: Biochar for Environmental Management: Science and
Technology, Lehman, J., and Joseph, S. (eds.), Taylor and Francis Group, CRC, ISBN
9781844076581, Danvers, MA.
Enders, A., Hanley, K., Whitman, T., Joseph, S., and Lehmann, J. (2012).
“Characterization of biochars to evaluate recalcitrance and agronomic performance,”
Bioresource Technology 114, 644-653
Foster, D. R., and Motzkin, G. (2003). “Interpreting and conserving the open land
habitats of coastal New England: Insights from landscape history,” Forest Ecology
and Management 185, 127-150.
German, L. A. (2003). “Historical contingencies in the coevolution of environment and
livelihood: Contributions to the debate on Amazonian black earth,” Geoderma 111(3-
4), 307-331.
Guo, Y. J., Tang, H., Li, G. D., and Xie, D. T. (2014). “Effects of cow dung biochar
amendment on adsorption and leaching of nutrient from an acid yellow soil irrigated
with biogas slurry.” Water Air Soil Pollution 225, 1820-1833.
Gurwick, N. P., Moore, L. A., Kelly, C., and Elias, P. (2013). “A systematic review of
biochar research, with a focus on its stability in situ and its promise as a climate
mitigation strategy,” PLOS ONE 8(9), 1-9.
Howard, L. F., Litvaitis, J. A., Lee, T. D., and Ducey, M. J. (2005). “Reconciling the
effects of historic land use and disturbance on conservation of biodiversity in
managed forests in the northeastern United States: Part 1-Pine barrens,” National
Commission on Science for Sustainable Forestry. Washington, DC, USA.
Kimetu, J. M., and Lehmann, J. (2010). “Stability and stabilisation of biochar and green
manure in soil with different organic carbon contents,” Aust. J. Soil Res. 48, 577-585.
Landesman, W. J., and Dighton, J. (2010). “Response of soil microbial communities and
the production of plant-available nitrogen to a two-year rainfall manipulation in the
New Jersey Pinelands,” Soil Biology & Biochemistry 42, 1751-1758.
Lehmann, J., Rillig, M. C., Thies, J., Masiello, C. A., Hockaday, W. C. and Crowley, D.
(2011). “Biochar effects on soil biota - A review,” Soil Biology and Biochemistry 43,
1812-1836.
Licht, J., Shields, F., McLaughlin, H., and Burns, C. (2014a). “Biochar influence on
moisture retention, shrinkage and plasticity of coastal entisols determined by three
modified ASTM methods,” in preparation.
Licht, J., Shields, F., Burns, C., and McLaughlin, H. (2014b). “Biochar influences
stable isotope and stomatal conductance measures of water use efficiency for
four coastal barren species,” in preparation.
MacKenzie, M. D., and Drozdowski, B. (2013). “Possibilities for biochar in Alberta land
reclamation,” Conference of Alberta Biochar Initiative, Alberta, Canada.

PEER-REVIEWED ARTICLE bioresources.com
Licht et al. (2014). “Biochar & soil rescue,” BioResources 9(4), 6214-6226. 6225
Major, J., Lehmann, J., Rondon, M., and Goodale, C. (2010). “Fate of soil-applied black
carbon: Downward migration, leaching and soil respiration,” Global Change Biology
16, 1366-1379.
McLaughlin, H., Anderson, P. S., Shields, F. E., Reed, Thomas, B. (2009). “All biochars
are not created equal and how to tell them apart,” North American Biochar
Conference, Boulder, CO.
McLaughlin, H., Shields, F., Jagiello, J. and Thiele, G. (2012). “Analytical options for
biochar adsorption and surface area,” North American Biochar Conference, Sonoma,
CA.
Mitchell, P. J., Dalley, T. S. L., and Helleru, R. J. (2013). “Preliminary laboratory
production and characterization of biochars from lignocellulosic waste,” Journal of
Analytical and Applied Pyrolysis 99, 71-78.
Moon, D. H., Park, J. W., Chang, Y. Y., Ok, Y. S., Lee, S. S., Ahmad, M., Koutsospyros,
A., Park, J. H., and Baek, K. (2013). “Immobilization of lead in contaminated firing
range soil using biochar,” Environ. Sci. Pollut. Res. Int. Dec. 20 (12), 8464-71.
Mukome, F., Zhang, X., Silva, L., Six, J., and Parikh, S. (2013). “Use of chemical and
physical characteristics to investigate trends in biochar feedstocks,” Journal of
Agricultural and Food Chemistry 61, 2196-2204.
Novak, J. M., Busscher, W. J., Laird, D. L., Ahmedna, M., Watts, D. W. and Niandou, M.
A. S. (2009). “Impact of biochar amendment on fertility of a southeastern coastal
plain soil,” Soil Science, 174(2), 105-112.
Nigussie, A., Kissi, E., Misganaw, M., and Ambaw, G. (2012). “Effect of biochar
application on soil properties and nutrient uptake of lettuces grown in chromium
polluted soils,” American-Eurasian Journal of Agricultural and Environmental
Science 12(3), 369-376.
Orwig, D. A., Plotkin, A. A., Barker, E. D., A. Lux H., Savage, K. E., and Ellison, A. M.
(2013). “Foundation species loss affects vegetation structure more than ecosystem
function in a Northeast forest,” Peer J 1:e41.
Pennings, S. C., Clark, C. M., Cleland, E. E., Collins, S. L., Gough, L., Gross, K. L.,
Milchunas, D. G., and Suding, K. N. (2005). “Do individual plant species show
predictable responses to nitrogen addition across multiple experiments?” Oikos 110,
547-555.
Primack, R., and Miller-Rushing, A. (2011). “Broadening the study of phenology and
climate change,” New Phytologist 191(2), 397-391.
R Core Team (2012). “R: A language and environment for statistical computing,” R
Foundation for Statistical Computing, Vienna, Austria. (http://www.R-project.org/).
Smith, C. (1997). “Native legume transplant survivorship and subsequent seedling
recruitment on unamended coal mine soils in the Canadian Rocky Mountains,”
Mountain Research and Development 17(2), 145-147.
Spokas, K. (2010). “Review of the stability of biochars in soils: Predictability of O:C
molar ratios,” Carbon Management 1(2), 289-303.
Steinbeiss, S., Gleixner, G., and Antonietti, M. (2009). “Effect of biochar amendment on
soil carbon balance and soil microbial activity,” Soil Biology & Biochemistry 41,
1301-1310.

PEER-REVIEWED ARTICLE bioresources.com
Licht et al. (2014). “Biochar & soil rescue,” BioResources 9(4), 6214-6226. 6226
Uchimiya, M., and Bannon, D. (2013). “Solubility of lead and copper in biochar-
amended small arms range soils: Influence of soil organic carbon and pH,” Journal of
Agricultural and Food Chemistry 61(32), 7679-7688.
Unger, R., and Killorn, R. (2011). “Effect of three different qualities of biochar on
selected soil properties,” Communications in Soil Science & Plant Analysis 42, 2274-
2283.
Uzoma, K. C., Inoue, M., Andry, H., Zahoor, A., and Nishihara, E. (2011). “Influence of
biochar application on sandy hydraulic properties and nutrient retention,” Journal of
Food, Agriculture and Environment 9 (3-4), 1137-1143.
Yu, O.-Y., Raichle, B., and Sink, S. 2013. “Impact of biochar on the water holding
capacity of loamy sandy soil,” International Journal of Energy and Environmental
Engineering 4, 44-52.
Yuan, A.-H., and Xu, R.-K. (2011). “The amelioration effects of low temperature biochar
generated from nine crop residues on an acidic Ultisol,” Soil Use and Management
27, 110 pp., crop residues, 1-15.
Zheng, W., Sharma, G. K., and Rajagopalan, N. (2010). “Using biochar as a soil
amendment for sustainable agriculture,” Illinois Sustainable Technology Center,
University of Illinois at Urbana-Champaign, pp. 1-42.
Article resubmitted: March 31, 2014; Peer review completed: May 29, 2014; Revised
version received: August 20, 2014; Accepted: August 21, 2014; Published: August 27,
2014.