Biochar Tablets with and without Embedded Fertilizer ... - MDPI
15
sustainability Article Biochar Tablets with and without Embedded Fertilizer on the Soil Chemical Characteristics and Nutrient Use Efficiency of Zea mays Yit Leng Lee 1,2, *, Osumanu Haruna Ahmed 2,3,4 , Samsuri Abdul Wahid 5 and Zakry Fitri AB Aziz 2 Citation: Lee, Y.L.; Ahmed, O.H.; Wahid, S.A.; AB Aziz, Z.F. Biochar Tablets with and without Embedded Fertilizer on the Soil Chemical Characteristics and Nutrient Use Efficiency of Zea mays. Sustainability 2021, 13, 4878. https://doi.org/ 10.3390/su13094878 Academic Editor: António Dinis Ferreira Received: 4 March 2021 Accepted: 6 April 2021 Published: 27 April 2021 Publisher’s Note: MDPI stays neutral with regard to jurisdictional claims in published maps and institutional affil- iations. Copyright: © 2021 by the authors. Licensee MDPI, Basel, Switzerland. This article is an open access article distributed under the terms and conditions of the Creative Commons Attribution (CC BY) license (https:// creativecommons.org/licenses/by/ 4.0/). 1 Faculty of Mechanical Engineering Technology, Kampus Alam UniMAP Pauh Putra, Universiti Malaysia Perlis, Arau 02600, Perlis, Malaysia 2 Department of Crop Science, Faculty of Agriculture and Food Sciences, Universiti Putra Malaysia Bintulu Campus, Bintulu 97008, Sarawak, Malaysia; [email protected] (O.H.A.); zakryfi[email protected] (Z.F.A.A.) 3 Institut Ekosains Borneo, Universiti Putra Malaysia Bintulu Campus, Bintulu 97008, Sarawak, Malaysia 4 Institute of Tropical Agriculture and Food Security, Universiti Putra Malaysia, Serdang 43400, Selangor, Malaysia 5 Department of Land Management, Faculty of Agriculture, Universiti Putra Malaysia, Serdang 43400, Selangor, Malaysia; [email protected] * Correspondence: [email protected] Abstract: Densification of ashy biochar into tablet can enhance the handling and conveyance effi- ciencies of biochar. It was hypothesized that fertilizer-embedded biochar tablets can slowly release embedded nutrients in synchrony with optimum nutrient uptake by crops. The objectives of this research were to determine the effects of biochar tablets with and without embedded fertilizer on soil chemical properties and nutrient use efficiency of Zea mays (sweet corn). The biochar tablet (BT) was produced by blending a biochar mixture with starch followed by densification using a single punch tablet press whereas the fertilizer embedded biochar tablet (BF) was prepared using the same procedure except that NPK fertilizer was added during blending. A pot experiment with five fertilization treatments including control was carried out in an open field located in Perlis, Malaysia. Co-application of biochar and fertilizer increased soil total carbon, nitrogen, but it reduced soil electrical conductivity (EC). Additionally, the BF significantly increased leaf chlorophyll content, dry root weight, and total plant nutrient use efficiency of sweet corn. The findings suggest that BF can serve as a slow release fertilizer to improve crop nutrient use efficiency. Therefore, embedding fertilizer in biochar tablets is recommended for sweet corn production following a long term field study to confirm the findings of this pot study. Keywords: rice residues; densification; leaf chlorophyll content; ammonium; slow release nutrient 1. Introduction Mineral fertilizers are major farming inputs that are used to increase crop productivity worldwide. In Malaysia, approximately 3.72 million metric tons of fertilizer was produced in 2019 [1]. Although mineral fertilizers use promptly ameliorates nutrient deficiencies in soils or plants, extensive use of chemical fertilizers in particular adversely impact the environment and crop productivity negatively. An alternative approach such as co- application of fertilizer and organic material is considered as a sustainable method for soil nutrient improvement. Oladele et al. [2] reported improvement of plant growth following co-application of biochar and fertilizers although crop yield reduction with co-application of biochar and mineral fertilizer has been reported [3,4]. These contracting findings could be associated with the fact that the effects of biochar on plant growth and development depend on biochar type, biochar production process, and biochar application rate. Sustainability 2021, 13, 4878. https://doi.org/10.3390/su13094878 https://www.mdpi.com/journal/sustainability
-
Upload
khangminh22 -
Category
Documents
-
view
2 -
download
0
Transcript of Biochar Tablets with and without Embedded Fertilizer ... - MDPI

sustainability
Article
Biochar Tablets with and without Embedded Fertilizer on theSoil Chemical Characteristics and Nutrient Use Efficiency ofZea mays
Yit Leng Lee 1,2,*, Osumanu Haruna Ahmed 2,3,4, Samsuri Abdul Wahid 5 and Zakry Fitri AB Aziz 2
�����������������
Citation: Lee, Y.L.; Ahmed, O.H.;
Wahid, S.A.; AB Aziz, Z.F. Biochar
Tablets with and without Embedded
Fertilizer on the Soil Chemical
Characteristics and Nutrient Use
Efficiency of Zea mays. Sustainability
2021, 13, 4878. https://doi.org/
10.3390/su13094878
Academic Editor: António
Dinis Ferreira
Received: 4 March 2021
Accepted: 6 April 2021
Published: 27 April 2021
Publisher’s Note: MDPI stays neutral
with regard to jurisdictional claims in
published maps and institutional affil-
iations.
Copyright: © 2021 by the authors.
Licensee MDPI, Basel, Switzerland.
This article is an open access article
distributed under the terms and
conditions of the Creative Commons
Attribution (CC BY) license (https://
creativecommons.org/licenses/by/
4.0/).
1 Faculty of Mechanical Engineering Technology, Kampus Alam UniMAP Pauh Putra,Universiti Malaysia Perlis, Arau 02600, Perlis, Malaysia
2 Department of Crop Science, Faculty of Agriculture and Food Sciences, Universiti Putra Malaysia BintuluCampus, Bintulu 97008, Sarawak, Malaysia; [email protected] (O.H.A.);[email protected] (Z.F.A.A.)
3 Institut Ekosains Borneo, Universiti Putra Malaysia Bintulu Campus, Bintulu 97008, Sarawak, Malaysia4 Institute of Tropical Agriculture and Food Security, Universiti Putra Malaysia,
Serdang 43400, Selangor, Malaysia5 Department of Land Management, Faculty of Agriculture, Universiti Putra Malaysia,
Serdang 43400, Selangor, Malaysia; [email protected]* Correspondence: [email protected]
Abstract: Densification of ashy biochar into tablet can enhance the handling and conveyance effi-ciencies of biochar. It was hypothesized that fertilizer-embedded biochar tablets can slowly releaseembedded nutrients in synchrony with optimum nutrient uptake by crops. The objectives of thisresearch were to determine the effects of biochar tablets with and without embedded fertilizer onsoil chemical properties and nutrient use efficiency of Zea mays (sweet corn). The biochar tablet(BT) was produced by blending a biochar mixture with starch followed by densification using asingle punch tablet press whereas the fertilizer embedded biochar tablet (BF) was prepared using thesame procedure except that NPK fertilizer was added during blending. A pot experiment with fivefertilization treatments including control was carried out in an open field located in Perlis, Malaysia.Co-application of biochar and fertilizer increased soil total carbon, nitrogen, but it reduced soilelectrical conductivity (EC). Additionally, the BF significantly increased leaf chlorophyll content,dry root weight, and total plant nutrient use efficiency of sweet corn. The findings suggest that BFcan serve as a slow release fertilizer to improve crop nutrient use efficiency. Therefore, embeddingfertilizer in biochar tablets is recommended for sweet corn production following a long term fieldstudy to confirm the findings of this pot study.
Keywords: rice residues; densification; leaf chlorophyll content; ammonium; slow release nutrient
1. Introduction
Mineral fertilizers are major farming inputs that are used to increase crop productivityworldwide. In Malaysia, approximately 3.72 million metric tons of fertilizer was producedin 2019 [1]. Although mineral fertilizers use promptly ameliorates nutrient deficienciesin soils or plants, extensive use of chemical fertilizers in particular adversely impactthe environment and crop productivity negatively. An alternative approach such as co-application of fertilizer and organic material is considered as a sustainable method for soilnutrient improvement. Oladele et al. [2] reported improvement of plant growth followingco-application of biochar and fertilizers although crop yield reduction with co-applicationof biochar and mineral fertilizer has been reported [3,4]. These contracting findings couldbe associated with the fact that the effects of biochar on plant growth and developmentdepend on biochar type, biochar production process, and biochar application rate.
Sustainability 2021, 13, 4878. https://doi.org/10.3390/su13094878 https://www.mdpi.com/journal/sustainability

Sustainability 2021, 13, 4878 2 of 15
Biochar has gained attention because it is widely used as soil amendment, absorbent,and energy production [5]. The quality of biochar varies with pyrolysis temperature and thetype of raw materials used [6,7]. Biochar application to soils has been reported to increasenutrient retention which translates into improved the nutrient use efficiency [8]. Soilnitrogen (N) in the forms of ammonium (NH4
+) and nitrate (NO3−) are commonly leached
from soils into groundwater following intensive rainfall or irrigation. This process of losingN contaminates ground water and other water bodies to cause eutrophication. Sun et al. [9]reported that biochar application reduced N leaching by 23.1 to 32.4%. However, reportson the effects of biochar application on the leaching of soil inorganic N are inconsistent.Teutscherova et al. [10] reported that NH4
+ leaching was increased by higher biocharapplication rate without fertilization, but the loss of NH4
+ decreased by the lower biocharapplication rate with addition of fertilizer.
Although application of biochar could reduce nutrient leaching, the density of biocharis low and for example, approximately 30% of biochar are wind-blown during handlingand application to soil [11]. Biochar is an ashy material to work with, but densificationof biochar could reduce this undesirable property. Fertilizer-embedded biochar pelletscan hold nutrients for a long time because of their smaller pore sizes and reduced totalpore volume after densification [12]. A recent study demonstrated that adding fertilizerembedded biochar tablet to soil could increase the soil total nitrogen and cation exchangecapacity as well [13]. This indicates that the combination of biochar and fertilizer followingdensification is more efficient to minimize the losses of nutrients in soil and hence improvethe plant nutrient use efficiency. Nevertheless, there is lack of knowledge on the nutrientuse efficiency of plants which are cultivated on soils that are amended with fertilizerembedded biochar tablets. The objective of this study was to determine the effects ofbiochar tablets with and without embedded fertilizer on the soil chemical properties andnutrient use efficiency of sweet corn. Therefore, we hypothesized that adoption of biochartablet embedded with fertilizer in farming systems could simultaneously reduce nutrientloss and adverse effect of mineral salts concentration of the chemical fertilizers on plants toensure significant improvement in nutrient use efficiency and productivity of plants.
2. Materials and Methods2.1. Samples Collection and Preparation
The rice straw, rice husk, and rubber tree twigs used in this present study wereprocured from a paddy field (6.445558◦ N, 100.318728◦ E) and a rubber tree plantation(6.521817◦ N, 100.309526◦ E) in Perlis, northern Malaysia. The samples were sun-driedfor 3 days after which the rubber tree twigs were cut into 2 cm using a wood chipper(RC61605, SIMA, Shandong, China) whereas the rice straw was cut into 15 cm size. Therubber tree twigs, rice straw, and rice husks were charred separately before the productionof the biochar tablets with and without embedded fertilizer. Figure 1 shows a diagram ofthe study workflow.
2.2. Biochar Production and Preparation
Biochar was produced using a stainless steel kiln fabricated locally at the Facultyof Mechanical Engineering Technology, Universiti Malaysia Perlis, Perlis, Malaysia. Thetemperature was measured using an infrared thermometer (TM969, Lutron, Taipei, Taiwan)at 30 min interval (during the combustion). During charring, a maximum temperature of500 ◦C was attained after one hour of ignition. Throughout the charring process, the averagetemperature of the kiln was approximately 340 ◦C. The charring process was completed in2 h after which the charred product was collected and weighed to determine the percentageyield of the charring process. The percentage yield of the char was approximately 34%.The charred materials were ground and sieved to pass a 1 mm sieve before the biochartablets were produced.

Sustainability 2021, 13, 4878 3 of 15Sustainability 2021, 13, x FOR PEER REVIEW 3 of 15
Figure 1. Workflow diagram of the study.
2.2. Biochar Production and Preparation Biochar was produced using a stainless steel kiln fabricated locally at the Faculty of
Mechanical Engineering Technology, Universiti Malaysia Perlis, Perlis, Malaysia. The temperature was measured using an infrared thermometer (TM969, Lutron, Taipei, Tai-wan) at 30 min interval (during the combustion). During charring, a maximum tempera-ture of 500 °C was attained after one hour of ignition. Throughout the charring process, the average temperature of the kiln was approximately 340 °C. The charring process was completed in 2 h after which the charred product was collected and weighed to determine the percentage yield of the charring process. The percentage yield of the char was approx-imately 34%. The charred materials were ground and sieved to pass a 1 mm sieve before the biochar tablets were produced.
2.3. Biochar Tablet (BT) and Biochar Tablet Embedded with Fertilizer (BF) Production The biochar tablet (BT) was prepared by blending a mixture of charred rice husk,
charred rice straw, and charred rubber twigs at a ratio of 5:3:2, respectively with starch (20% by wt.), and water (30% by wt.) using a mixer. The ratio 5:3:2 used for blending a mixture of charred rice husk, charred rice straw, and charred rubber twigs into a tablet was based on the availability of the materials. Thereafter, the mixture was heated at 100 °C for 5 min using a water bath (MaXturdy™ 30, Daihan, Seoul, Korea) followed by a densification step using single press tablets (MTB3, Micro-Tec, East Sussex, England) with a punch weight of 0.4 tons. Tablets which were 6 mm in height and 10 mm in diameter were produced. The BT was oven dried at 60 °C for one hour after which it cooled and kept in an air-tight container. The same procedure was used to produce the biochar tablet embedded fertilizer (BF) except that NPK fertilizer (5:3:3) was added to the mixture after water bath heating at 100 °C for five minutes. The biochar to fertilizer ratio was 2:1. The pictures of BT, BF, and NPK were displayed in Figure 2.
Figure 1. Workflow diagram of the study.
2.3. Biochar Tablet (BT) and Biochar Tablet Embedded with Fertilizer (BF) Production
The biochar tablet (BT) was prepared by blending a mixture of charred rice husk,charred rice straw, and charred rubber twigs at a ratio of 5:3:2, respectively with starch (20%by wt.), and water (30% by wt.) using a mixer. The ratio 5:3:2 used for blending a mixtureof charred rice husk, charred rice straw, and charred rubber twigs into a tablet was basedon the availability of the materials. Thereafter, the mixture was heated at 100 ◦C for 5 minusing a water bath (MaXturdy™ 30, Daihan, Seoul, Korea) followed by a densification stepusing single press tablets (MTB3, Micro-Tec, East Sussex, England) with a punch weightof 0.4 tons. Tablets which were 6 mm in height and 10 mm in diameter were produced.The BT was oven dried at 60 ◦C for one hour after which it cooled and kept in an air-tightcontainer. The same procedure was used to produce the biochar tablet embedded fertilizer(BF) except that NPK fertilizer (5:3:3) was added to the mixture after water bath heating at100 ◦C for five minutes. The biochar to fertilizer ratio was 2:1. The pictures of BT, BF, andNPK were displayed in Figure 2.
Sustainability 2021, 13, x FOR PEER REVIEW 4 of 15
Figure 2. Images of biochar tablet (BT), biochar tablet embedded with fertilizer (BF), and NPK.
2.4. Chemical Characterization of Biochar Tablet (BT), Biochar Tablet Embedded with Fertilizer (BF), and NPK Fertilizer
The pH and electrical conductivity (EC) of BT, BF, and NPK were determined using a pH meter (PB10, Sartorius, Taguig, Philippines) and a conductivity meter (EC3000, STEP Systems GmbH, Nurnberg, Germany) respectively. Total carbon (TC) and total nitrogen (TN) of BT and BF were determined using a CNS analyzer (TruSpec, LECO Corporation, St. Joseph, USA) while the dry ashing method was adopted for the content determination of phosphorus (P), potassium (K) for BT and BF. The NPK fertilizer was sent for total nitrogen, phosphorus and potassium content determination based on the AOAC Official Method 955.04, 958.01, and 965.09. Data for selected chemical properties of BT, BF, and NPK fertilizer was presented in Table 1.
Table 1. Selected chemical properties of biochar tablets (BT), fertilizer embedded in biochar tablet (BF) and NPK fertilizer.
Chemical Properties BT BF NPK pH 9.34 ± 0.01 5.92 ± 0.02 3.35 ± 0.04
Electrical conductivity (mS cm−1) 3.78 ± 0.04 41.16 ± 0.76 90.9 ± 0.90 Total carbon (%) 48.49 ± 0.12 32.35 ± 0.42 n.a
Total nitrogen (%) 0.75 ± 0.01 4.96 ± 0.11 13.73 ± 0.27 Total phosphorus (%) 0.07 ± 0.01 0.36 ± 0.01 4.40 ± 0.10 Total potassium (%) 1.23 ± 0.09 2.45 ± 0.06 8.28 ± 0.23
Values are means of three replicates followed by ± standard error of means (n = 3).
2.5. Pot Experiment A pot study was conducted in an open field located at Arau, Perlis, Malaysia
(6.446950° N, 100.321475° E). Plastic pots measuring 32 cm (height) × 28 cm (diameter) were used and each pot was filled with 9.6 kg air-dried soil. The soil chemical properties were also determined before planting (Table 2). Rainfall data was collected using a rain gauge and the precipitation from April to May 2018 (53 days after planting) was approx-imately 469 mm.
Figure 2. Images of biochar tablet (BT), biochar tablet embedded with fertilizer (BF), and NPK.

Sustainability 2021, 13, 4878 4 of 15
2.4. Chemical Characterization of Biochar Tablet (BT), Biochar Tablet Embedded with Fertilizer(BF), and NPK Fertilizer
The pH and electrical conductivity (EC) of BT, BF, and NPK were determined using apH meter (PB10, Sartorius, Taguig, Philippines) and a conductivity meter (EC3000, STEPSystems GmbH, Nurnberg, Germany) respectively. Total carbon (TC) and total nitrogen(TN) of BT and BF were determined using a CNS analyzer (TruSpec, LECO Corporation, St.Joseph, MI, USA) while the dry ashing method was adopted for the content determinationof phosphorus (P), potassium (K) for BT and BF. The NPK fertilizer was sent for totalnitrogen, phosphorus and potassium content determination based on the AOAC OfficialMethod 955.04, 958.01, and 965.09. Data for selected chemical properties of BT, BF, andNPK fertilizer was presented in Table 1.
Table 1. Selected chemical properties of biochar tablets (BT), fertilizer embedded in biochar tablet(BF) and NPK fertilizer.
Chemical Properties BT BF NPK
pH 9.34 ± 0.01 5.92 ± 0.02 3.35 ± 0.04Electrical conductivity (mS cm−1) 3.78 ± 0.04 41.16 ± 0.76 90.9 ± 0.90
Total carbon (%) 48.49 ± 0.12 32.35 ± 0.42 n.aTotal nitrogen (%) 0.75 ± 0.01 4.96 ± 0.11 13.73 ± 0.27
Total phosphorus (%) 0.07 ± 0.01 0.36 ± 0.01 4.40 ± 0.10Total potassium (%) 1.23 ± 0.09 2.45 ± 0.06 8.28 ± 0.23
Values are means of three replicates followed by ± standard error of means (n = 3).
2.5. Pot Experiment
A pot study was conducted in an open field located at Arau, Perlis, Malaysia (6.446950◦ N,100.321475◦ E). Plastic pots measuring 32 cm (height) × 28 cm (diameter) were used andeach pot was filled with 9.6 kg air-dried soil. The soil chemical properties were also de-termined before planting (Table 2). Rainfall data was collected using a rain gauge and theprecipitation from April to May 2018 (53 days after planting) was approximately 469 mm.
Table 2. Selected chemical properties of soil before planting sweet corn.
Chemical Properties Soil
pH 5.66 ± 0.03Electrical conductivity (mS cm−1) 0.05 ± 0.01
Total carbon (g kg−1) 7.47 ± 0.33Total nitrogen (g kg−1) 1.00 ± 0.06Available P (mg kg−1) 0.25 ± 0.03
Exchangeable K (cmol(+) kg−1) 0.12 ± 0.02Exchangeable Ca (cmol(+) kg−1) 6.82 ± 0.40Exchangeable Mg (cmol(+) kg−1) 1.53 ± 0.45
CEC (cmol (+) kg−1) 10.52 ± 0.42Values are means of three replicates followed by ± standard error of means (n = 3).
There were 5 fertilization treatments including a control. The experiment was con-ducted using a completely randomized design with 5 replications. A mineral clay soil(Malacca series, Oxisol) was used in the experiment. The test crop used in this presentstudy was F1 hybrid sweet corn variety 516. The crops were irrigated with tap waterand the soil moisture was maintained at 60% field capacity. The amounts of ammoniumsulfate (AS), triple superphosphate (TSP), and muriate of potash (MOP) used were basedon the rates recommended by the Department of Agriculture, Malaysia. The rates used inthis study were a scale down of the standard fertilizer recommendation for the test crop.Treatment T3 was based on the standard recommendation of biochar and fertilizer for thetest crop. The application rates of fertilizer were reduced in T4 and the application ratefor T5 was a proportion of biochar to fertilizer in 2:1 ratio. The proportionate treatments

Sustainability 2021, 13, 4878 5 of 15
T3, T4, and T5 were varied to determine the best co-application rate for improving theplant nutrient use efficiency and soil quality. The amounts of AS, TSP, and MOP used were90 kg ha−1 N, 60 kg ha−1 P2O5, and 60 kg ha−1 K2O, respectively. The fertilizer applicationwas scaled down to per pot basis as follows:
i. T1: soil only (control);ii. T2: 36 g of mixture of NPK fertilizer;iii. T3: 67 g (36 g of mixture NPK fertilizer + 31 g biochar tablet);iv. T4: 67 g (29 g of mixture NPK fertilizer + 38 g biochar tablet);v. T5: 67 g of biochar tablet embedded fertilizer with 2:1 ratio (23 g of NPK embedded
44 g of biochar tablet).
The fertilizers were surface applied at 10 and 27 days after planting (DAP). The sweetcorn plants were grown for 53 days after planting (tasseling stage) because this growthstage is the maximum sweet corn plant growth stage before their reproductive stage.Before harvesting, the chlorophyll contents of the sweet corn plants were measured using aSPAD chlorophyll meter (SPAD-502, Konica Minolta, Osaka, Japan). At tasseling (53 daysafter planting), the sweet corn plants were harvested and partitioned into leaves, stems,roots, and flowers. Thereafter, they were cleaned, and oven-dried at 60 ◦C until constantweight was attained. Afterwards, the dry weight of the leaves, stems, roots, and flowersweight were determined using a digital weighing machine (UWA-C015, Accutec, Taipei,Taiwan). In addition, at 53 DAP, soil samples were taken from 0–15 cm depth of the pots(immediately after harvesting the sweet corn plants) and air-dried, ground and sievedless than 2 mm for chemical analysis. pH and electrical conductivity (EC) of the soil weredetermined using a pH meter (PB10, Sartorius, Taguig, Philippines) and a conductivitymeter (EC3000, STEP Systems GmbH, Nurnberg, Germany), respectively. The soil andwater ratio for the determination of pH and EC was 1:5 (v/v). Ammonium acetate (NH4OAc)shaking method [14] was used to determine the exchangeable potassium (K), calcium(Ca), magnesium (Mg), and cation exchange capacity (CEC) of the soil. The extractedammonium was determined for CEC using an auto-analyzer (QuikChem 8000 Series FIA+System, Lachat Instruments, Loveland, CO, USA) while the soil exchangeable cations weremeasured in the NH4OAc extract by atomic absorption spectrometry (AAS) (AAnalyst 400;PerkinElmer, Waltham, MA, USA). Bray P-II method was used to extract the soil availablephosphorus [15] and the P in the extract was determined using inductively couple plasmaoptical emission spectrometer (ICP-OES) (Optima 8300, PerkinElmer, Waltham, MA, USA).Total carbon (C) and N were determined using the dry combustion method. The analyticalmachine used for this analysis was a CNS analyzer (TruSpec, LECO Corporation, St. Joseph,MI, USA).
The total N in sweet corn plants’ tissues was determined using the dry combustionmethod and the analytical machine used for this analysis was a CNS analyzer (TruSpec,LECO Corporation, St. Joseph, MI, USA). Total P and K were extracted using the dry ashingmethod [16] after which the P and K contents in the extract were determined using AAS(AAnalyst 400, PerkinElmer, Waltham, MA, USA). The concentrations of N, P, and K in theplant parts multiplied by their dry weight gave the amount of N, P, and K taken up by theplant parts. The fertilizer nutrient use efficiency (NUE) was calculated using the formulaof Pomares-Gracia and Pratt [17]:
%NUE =TNF − TNU
RFA× 100, (1)
where,
TNF = total nutrient uptake of fertilized plants (g) (T2, T3, T4 and T5),TNU = total nutrient uptake of unfertilized plants (g) (T1), andRFA = rate of fertilizer applied (g).
Sustainability 2021, 13, 4878 6 of 15
2.6. Statistical Analysis
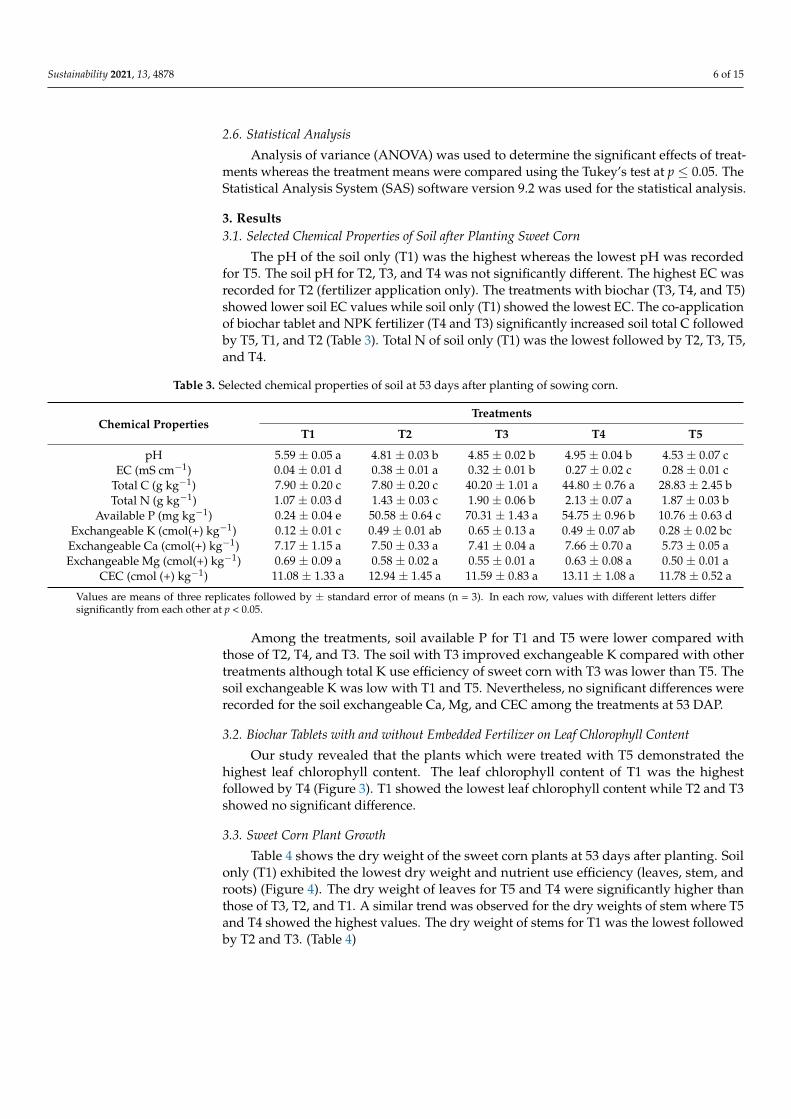
Analysis of variance (ANOVA) was used to determine the significant effects of treat-ments whereas the treatment means were compared using the Tukey’s test at p ≤ 0.05. TheStatistical Analysis System (SAS) software version 9.2 was used for the statistical analysis.
3. Results3.1. Selected Chemical Properties of Soil after Planting Sweet Corn
The pH of the soil only (T1) was the highest whereas the lowest pH was recordedfor T5. The soil pH for T2, T3, and T4 was not significantly different. The highest EC wasrecorded for T2 (fertilizer application only). The treatments with biochar (T3, T4, and T5)showed lower soil EC values while soil only (T1) showed the lowest EC. The co-applicationof biochar tablet and NPK fertilizer (T4 and T3) significantly increased soil total C followedby T5, T1, and T2 (Table 3). Total N of soil only (T1) was the lowest followed by T2, T3, T5,and T4.
Table 3. Selected chemical properties of soil at 53 days after planting of sowing corn.
Chemical PropertiesTreatments
T1 T2 T3 T4 T5
pH 5.59 ± 0.05 a 4.81 ± 0.03 b 4.85 ± 0.02 b 4.95 ± 0.04 b 4.53 ± 0.07 cEC (mS cm−1) 0.04 ± 0.01 d 0.38 ± 0.01 a 0.32 ± 0.01 b 0.27 ± 0.02 c 0.28 ± 0.01 c
Total C (g kg−1) 7.90 ± 0.20 c 7.80 ± 0.20 c 40.20 ± 1.01 a 44.80 ± 0.76 a 28.83 ± 2.45 bTotal N (g kg−1) 1.07 ± 0.03 d 1.43 ± 0.03 c 1.90 ± 0.06 b 2.13 ± 0.07 a 1.87 ± 0.03 b
Available P (mg kg−1) 0.24 ± 0.04 e 50.58 ± 0.64 c 70.31 ± 1.43 a 54.75 ± 0.96 b 10.76 ± 0.63 dExchangeable K (cmol(+) kg−1) 0.12 ± 0.01 c 0.49 ± 0.01 ab 0.65 ± 0.13 a 0.49 ± 0.07 ab 0.28 ± 0.02 bcExchangeable Ca (cmol(+) kg−1) 7.17 ± 1.15 a 7.50 ± 0.33 a 7.41 ± 0.04 a 7.66 ± 0.70 a 5.73 ± 0.05 aExchangeable Mg (cmol(+) kg−1) 0.69 ± 0.09 a 0.58 ± 0.02 a 0.55 ± 0.01 a 0.63 ± 0.08 a 0.50 ± 0.01 a
CEC (cmol (+) kg−1) 11.08 ± 1.33 a 12.94 ± 1.45 a 11.59 ± 0.83 a 13.11 ± 1.08 a 11.78 ± 0.52 a
Values are means of three replicates followed by ± standard error of means (n = 3). In each row, values with different letters differsignificantly from each other at p < 0.05.
Among the treatments, soil available P for T1 and T5 were lower compared withthose of T2, T4, and T3. The soil with T3 improved exchangeable K compared with othertreatments although total K use efficiency of sweet corn with T3 was lower than T5. Thesoil exchangeable K was low with T1 and T5. Nevertheless, no significant differences wererecorded for the soil exchangeable Ca, Mg, and CEC among the treatments at 53 DAP.
3.2. Biochar Tablets with and without Embedded Fertilizer on Leaf Chlorophyll Content
Our study revealed that the plants which were treated with T5 demonstrated thehighest leaf chlorophyll content. The leaf chlorophyll content of T1 was the highestfollowed by T4 (Figure 3). T1 showed the lowest leaf chlorophyll content while T2 and T3showed no significant difference.
3.3. Sweet Corn Plant Growth
Table 4 shows the dry weight of the sweet corn plants at 53 days after planting. Soilonly (T1) exhibited the lowest dry weight and nutrient use efficiency (leaves, stem, androots) (Figure 4). The dry weight of leaves for T5 and T4 were significantly higher thanthose of T3, T2, and T1. A similar trend was observed for the dry weights of stem where T5and T4 showed the highest values. The dry weight of stems for T1 was the lowest followedby T2 and T3. (Table 4)

Sustainability 2021, 13, 4878 7 of 15
Sustainability 2021, 13, x FOR PEER REVIEW 7 of 15
Values are means of three replicates followed by ± standard error of means (n = 3). In each row, values with different letters differ significantly from each other at p < 0.05.
Among the treatments, soil available P for T1 and T5 were lower compared with those of T2, T4, and T3. The soil with T3 improved exchangeable K compared with other treatments although total K use efficiency of sweet corn with T3 was lower than T5. The soil exchangeable K was low with T1 and T5. Nevertheless, no significant differences were recorded for the soil exchangeable Ca, Mg, and CEC among the treatments at 53 DAP.
3.2. Biochar Tablets with and without Embedded Fertilizer on Leaf Chlorophyll Content Our study revealed that the plants which were treated with T5 demonstrated the
highest leaf chlorophyll content. The leaf chlorophyll content of T1 was the highest fol-lowed by T4 (Figure 3). T1 showed the lowest leaf chlorophyll content while T2 and T3 showed no significant difference.
Figure 3. Effects of biochar tablets with and without embedded fertilizer on the leaves’ chlorophyll contents. Bars represents values of five replicates and contain standard error of means (n = 5). Bars with different letters differ significantly from each other at p < 0.05.
3.3. Sweet Corn Plant Growth Table 4 shows the dry weight of the sweet corn plants at 53 days after planting. Soil
only (T1) exhibited the lowest dry weight and nutrient use efficiency (leaves, stem, and roots) (Figure 4). The dry weight of leaves for T5 and T4 were significantly higher than those of T3, T2, and T1. A similar trend was observed for the dry weights of stem where T5 and T4 showed the highest values. The dry weight of stems for T1 was the lowest fol-lowed by T2 and T3. (Table 4)
Figure 3. Effects of biochar tablets with and without embedded fertilizer on the leaves’ chlorophyllcontents. Bars represents values of five replicates and contain standard error of means (n = 5). Barswith different letters differ significantly from each other at p < 0.05.
Table 4. Effects of treatments on dry weights of sweet corn plants at 53 days after planting.
TreatmentsLeaves Stems Roots Flowering
Tassels
g
T1 3.59 c ± 0.13 2.62 d ± 0.14 1.68 c ± 0.05 n.aT2 23.11 b ± 0.53 33.44 c ± 0.67 13.31 b ± 0.81 5.30 b ± 0.33T3 23.14 b ± 0.38 40.27 b ± 0.55 14.08 b ± 0.74 9.01 a ± 0.52T4 33.69 a ± 0.72 57.66 a ± 2.03 15.03 b ± 0.22 10.22 a ± 0.34T5 33.94 a ± 1.70 57.89 a ± 2.15 24.66 a ± 0.48 10.27 a ± 0.35
Values are means of three replicates followed by ± standard error of means (n = 3). In each column, values withdifferent letters differ significantly from each other at p < 0.05.
Sustainability 2021, 13, x FOR PEER REVIEW 8 of 15
Table 4. Effects of treatments on dry weights of sweet corn plants at 53 days after planting.
Treatments Leaves Stems Roots Flowering Tassels
g T1 3.59 c ± 0.13 2.62 d ± 0.14 1.68 c ± 0.05 n.a T2 23.11 b ± 0.53 33.44 c ± 0.67 13.31 b ± 0.81 5.30 b ± 0.33 T3 23.14 b ± 0.38 40.27 b ± 0.55 14.08 b ± 0.74 9.01 a ± 0.52 T4 33.69 a ± 0.72 57.66 a ± 2.03 15.03 b ± 0.22 10.22 a ± 0.34 T5 33.94 a ± 1.70 57.89 a ± 2.15 24.66 a ± 0.48 10.27 a ± 0.35
Values are means of three replicates followed by ± standard error of means (n = 3). In each column, values with different letters differ significantly from each other at p < 0.05.
Treatment T5 significantly increased the roots of the sweet corn compared with those for T4, T3, T2, and T1. The sweet corn plants without fertilizer (T1) did not tassel compared with those which were fertilized with NPK fertilizer (T2). Furthermore, the results demon-strated that the combination of biochar tablet and mineral fertilizer (T3, T4, and T5) sig-nificantly affected flowering tassels.
Figure 4. Sweet corn plant growth at 53 days after planting. T1: Soil only; T2: 36 g of mixture of NPK fertilizer; T3: 67 g (36 g of mixture NPK fertilizer + 31 g biochar tablet); T4: 67 g (29 g of mix-ture NPK fertilizer + 38 g biochar tablet); T5: 67 g of biochar tablet embedded fertilizer (23 g of NPK embedded 44 g of biochar tablet).
3.4. Nutrients Uptake in Leaves, Stems, Roots, and Flowering Tassels of Sweet Corn The highest N uptake occurred in the sweet corn plant leaves and stems for T4 fol-
lowed by T5, T3, T2, and T1. In comparison to other treatments, the lowest amount of fertilizer embedded in the biochar tablet (T5) increased N uptake by the sweet corn plant roots, whereas the N taken up by roots of the sweet corn plants with T1 was the lowest. Soil only could not significantly improve N uptake during flowering tassels because bio-char and fertilizer were not used compared with T5 < T4 < T3 < T2 which had biochar and NPK fertilizer.
Treatment 4 increased P uptake by the leaves of the sweet corn followed T2, T3, and T5. Treatment T1 had the lowest effect on P uptake by the stem of the sweet corn plants. The effects of T2, T3, T4, and T5 on P uptake by the stem of the sweet corn plants were similar (Table 5). The roots of T4 exhibited the lowest P uptake compared with T2, T3, and T5. At the tasseling stage of the sweet corn plants, the co-application of biochar and NPK fertilizer (T3, T4, and T5) significantly increased P uptake compared with NPK alone (T2).
Figure 4. Sweet corn plant growth at 53 days after planting. T1: Soil only; T2: 36 g of mixture of NPKfertilizer; T3: 67 g (36 g of mixture NPK fertilizer + 31 g biochar tablet); T4: 67 g (29 g of mixture NPKfertilizer + 38 g biochar tablet); T5: 67 g of biochar tablet embedded fertilizer (23 g of NPK embedded44 g of biochar tablet).

Sustainability 2021, 13, 4878 8 of 15
Treatment T5 significantly increased the roots of the sweet corn compared with thosefor T4, T3, T2, and T1. The sweet corn plants without fertilizer (T1) did not tassel com-pared with those which were fertilized with NPK fertilizer (T2). Furthermore, the resultsdemonstrated that the combination of biochar tablet and mineral fertilizer (T3, T4, and T5)significantly affected flowering tassels.
3.4. Nutrients Uptake in Leaves, Stems, Roots, and Flowering Tassels of Sweet Corn
The highest N uptake occurred in the sweet corn plant leaves and stems for T4followed by T5, T3, T2, and T1. In comparison to other treatments, the lowest amount offertilizer embedded in the biochar tablet (T5) increased N uptake by the sweet corn plantroots, whereas the N taken up by roots of the sweet corn plants with T1 was the lowest. Soilonly could not significantly improve N uptake during flowering tassels because biocharand fertilizer were not used compared with T5 < T4 < T3 < T2 which had biochar andNPK fertilizer.
Treatment 4 increased P uptake by the leaves of the sweet corn followed T2, T3, andT5. Treatment T1 had the lowest effect on P uptake by the stem of the sweet corn plants.The effects of T2, T3, T4, and T5 on P uptake by the stem of the sweet corn plants weresimilar (Table 5). The roots of T4 exhibited the lowest P uptake compared with T2, T3, andT5. At the tasseling stage of the sweet corn plants, the co-application of biochar and NPKfertilizer (T3, T4, and T5) significantly increased P uptake compared with NPK alone (T2).
Table 5. Nitrogen, phosphorus, and potassium uptake in leaves, stems, roots, and flowering tasselsof sweet corn.
TreatmentNutrients Uptake (mg/Plant)
N P K
LeavesT1 59.00 d 3.99 c 43.64 cT2 623.97 c 77.03 ab 363.75 bT3 624.78 c 67.03 b 353.43 bT4 898.40 a 86.13 a 502.09 aT5 763.65 b 68.56 b 499.60 a
StemsT1 31.27 e 4.23 b 30.43 dT2 727.88 d 76.35 a 543.96 cT3 883.26 c 100.68 a 642.98 bT4 1226.24 a 125.70 a 891.81 aT5 1040.09 b 81.43 a 858.70 a
RootsT1 12.54 d 0.94 c 3.59 dT2 160.61 bc 13.98 a 83.94 aT3 153.47 c 15.16 a 68.52 bT4 173.35 b 11.47 b 51.35 cT5 238.38 a 15.21 a 56.97 c
Flowering TasselsT1 n.a n.a n.aT2 188.68 d 23.00 b 46.87 bT3 395.99 c 32.80 a 67.22 aT4 461.43 b 34.37 a 72.90 aT5 496.04 a 37.04 a 76.92 a
Values are means of three replicates followed by ± standard error of means (n = 3). In each column, values withdifferent letters differ significantly from each other at p < 0.05.
The higher K uptake was observed in the leaves and stems caused by T4 and T5whereas T2 (NPK fertilizer only) caused the highest K uptake in the roots of the sweetcorn plants. The results revealed that T3, T4, and T5 significantly increased K uptake inflowering tassels in relative to T2 and T1. In comparison to treatments with biochar, higher

Sustainability 2021, 13, 4878 9 of 15
K uptake by the aboveground biomass was observed in T3, T4, and T5 during the initiationof flowering tassels of sweet corn (Table 5).
3.5. Effects of Treatments on Nutrients Use Efficiency in Leaves, Stems, Roots, and FloweringTassels of Sweet Corn
In this present study, the NPK fertilizer embedded with the biochar tablet (T5) sig-nificantly increased N, P, and K use efficiency in all of the parts of sweet corn plants(Tables 6 and 7). For T5 (biochar embedded with the lowest amount of NPK), the distribu-tion the N use efficiency was in the order of: leaves, stem, roots, and flowering tassels ofsweet corn. Additionally, the total N, P, and K uses efficiency of the sweet corn significantlyincreased with the biochar embedded with fertilizer (Table 7). On the contrary, the lowertotal N, P, and K uses efficiency were recorded for T2 that is, the treatment with fertilizeramendment only (Table 7). Overall, total N, P, K use efficiency of sweet corn caused bytreatments followed the order: T5 > T4 > T3 > T2.
Table 6. Nitrogen, phosphorus, and potassium use efficiency in leaves, stems, roots, and floweringtassels of sweet corn.
TreatmentsNutrients (%)
N P K
LeavesT2 2.35 c 1.04 b 6.40 cT3 2.37 c 0.90 b 6.19 cT4 4.35 b 1.44 a 11.40 bT5 4.79 a 1.49 a 14.91 a
StemT2 2.90 d 1.02 b 10.27 dT3 3.55 c 1.36 ab 12.25 cT4 6.19 b 2.18 a 21.38 bT5 6.86 a 1.83 ab 27.13 a
RootsT2 0.62 c 0.18 b 1.61 aT3 0.59 c 0.20 b 1.30 bT4 0.83 b 0.20 b 1.18 bT5 1.54 a 0.34 a 1.76 a
Flowering TasselsT2 0.78 d 0.33 d 0.94 dT3 1.65 c 0.47 c 1.35 cT4 2.36 b 0.61 b 1.81 bT5 3.37 a 0.87 a 2.51 a
Values are means of three replicates followed by ± standard error of means (n = 3). In each column, values withdifferent letters differ significantly from each other at p < 0.05.
Table 7. Total nitrogen, phosphorus, and potassium use efficiency of sweet corn.
TreatmentNutrients (%)
N P K
T2 6.66 d 2.58 b 19.22 dT3 8.16 c 2.93 b 21.09 cT4 13.74 b 4.42 a 35.76 bT5 16.56 a 4.53 a 46.32 a
Values are means of three replicates followed by ± standard error of means (n = 3). In each column, values withdifferent letters differ significantly from each other at p < 0.05.
4. Discussion
The constant input of chemical fertilizer in soil could adversely influence the soilquality. Biochar, a carbon rich solid organic material, has been suggested to improve

Sustainability 2021, 13, 4878 10 of 15
soil pH and soil fertility [18]. In the present study, this light density of biochar wasdensified into tablet to ease for the handling and transportation. A high pH in BT wasconsistent with the pH of biochar obtained by Leng et al. [19], who also studied biocharproduction by combustion at low temperature and long residence time. Mixing NPK withthe biochar decreased the pH of BF, which was likely due to generation of sulfuric acidsafter the binding reactions between the oxygenated functional groups of biochar surfacesand ammonium sulfate [20]. Mixing NPK fertilizers created a very low pH and high ECin fertilizer microsite which could retard the plant growth. High mineral salts in NPKcontributed to the high EC in BF. The EC value of BT fell in the range of biochar EC valuereported by Limvikran et al. [21]. The highest total nutrients found in NPK was correlatedwith the soluble fertilizer sources. Therefore, blending of fertilizer with the BF led to higherconcentration of total nitrogen, phosphorus, and potassium relative to BT. It is essential forthe BFs to contain ample amounts of essential plant nutrients, which could supplement thesole biochar application or conventional fertilizers.
The pH of soil used in this study falls in the range of Oxisol soil reported byNdzana et al. [22] and it is ideal for corn plant growth [23]. The results were in con-sensus with Shibata et al. [24] who also reported that Oxisol soil has low total C and N. Itappears that soil available P was very low to meet the plant demand [25]. Similarly, lowcontent of exchangeable K, Ca, Mg, and CEC were found in the soil before sweet cornplanting. The soil CEC of this study falls in the range of CEC compiled in Oxisol soil byXu et al. [26]. The data in Table 2 indicates the soil used in the pot experiment was infertileand additional nutrients were needed for a healthy plant growth.
Application of NPK fertilizer and biochar (T2, T3, T4, and T5) significantly decreasedthe soil pH and this finding is inconsistent with that of Oladele et al. [2] who reported anincrease in soil pH using biochar. The decrease in the soil pH is related to the ammoniumsulfate used in this present study because it might have released the hydrogen ions duringnitrification because this chemical reaction deceases soil pH [27]. The soil pH for T5suggests the role of fertilizer embedded in biochar tablet improved soil microbial activities,accelerated nitrification rates, and ammonium uptake by the sweet corn plants such thatthese processes led to soil acidification. High application rate of biochar favors nitrification.High application rate of biochar which specifically favors the nitrification activity ofmicrobes has also been reported by He et al. [28]. The higher EC for T2 (fertilizer applicationonly) is typical of NPK fertilizers because of their mineral salts content. The treatmentswith biochar (T3, T4, and T5) showed lower soil EC values because the adsorption sites ofthe biochar reacted with the soluble salts for a new equilibrium. Among the treatments,soil only (T1) showed the lowest EC because of lower salts.
The co-application of biochar tablet and NPK fertilizer (T4 and T3) significantlyincreased soil total C because of the inherent content of C in the biochar tablet (Table 1).Dong et al. [29] also reported increase in soil C with increasing biochar application. Onthe contrary, the biochar tablet embedded fertilizer application (T5) demonstrated lowersoil total C. This is because the oxidized compounds on the surface of the biochar tabletembedded with fertilizer (T5) which reacted with mineral fertilizer might have shiftedthe non-labile C compounds to more labile C compounds [30] followed by them beingdecomposed by the soil microorganisms. The highest soil total N in T4 was due to thehigher amount of the biochar in the biochar tablets (38 g). This observation agrees with thefindings of Thangarajan et al. [31] who also reported that high amount of biochar increasessorption of N on biochar surfaces in the soil compared N fertilizer only. Nitrogen usewithout amendments such as biochar does not prevent, for example, ammonium frombeing leached from soils particularly during rainfall.
The lower available P of T1 was due to no P fertilizer application whereas that forT5 was because the applied P was efficiently taken up (this treatment demonstrated thehighest P use efficiency) and utilized by the sweet corn plants for growth and development.Moreover, the fact that T5 had the highest effect on the dry weight of the sweet corn rootssuggests the viability of the roots of this crop played a significant role in the improved

Sustainability 2021, 13, 4878 11 of 15
productivity of the sweet corn plants. Although the highest soil available P was observedin T3, total P use efficiency of the sweet corn with this treatment was lower compared withthose with T4 and T5 due to the high EC associated with T3. High soil EC hinders nutrientuptake because it increases osmotic pressure of the soil nutrient solution [32].
The total K use efficiency of T3 was similar to the total P use efficiency, suggesting thatunbalanced use of fertilizers can increase stress of plants to a level that could limit themfrom taking nutrients efficiently. Nevertheless, no significant differences were recorded forthe soil exchangeable Ca, Mg, and CEC among the treatments at 53 DAP. These findingscontrasted those of Jien and Wang [33] and Wang et al. [34] who reported increase in soilCEC, exchangeable Ca, and K following application of biochar to the acidic alfisols soil.In this present study, densification of fine biochar particles which caused reduction in thesurface area and porous characteristics of the biochar explains why this amendment couldnot significantly increase soil CEC, exchangeable Ca, and Mg.
Allen Dray Jr et al. [35] reported a strong relationship between leaf chlorophyll contentand tissue N levels of plants. The plants which were treated with T5 demonstrated thehighest leaf chlorophyll content suggesting higher photosynthesis [36]. Additionally, itadds credence to the ability of the biochar tablet with embedded fertilizer to increaseN uptake by plant and concentration of photosynthetic pigments in leaves to the extentthat these effects translated into higher biomass production in T5. The leaves chlorophyllcontents for T1, T2, T3, and T4 were within the range reported by Yuan et al. [37]. Therewas no additional fertilizer and biochar explaining T1 had the lowest dry weight andnutrient use efficiency (leaves, stem, and roots). A lower dry weight of plants was observedin T2 which indicates the high mineral salts deposit to soil can impede crop growth anddevelopment through osmotic and specific ion stresses in addition reducing nutrientuptake [38]. Conversely, the amount of NPK fertilizer that was reduced in T4 and T5showed better dry weight of leaves and stems among the treatments. This was possiblydue to a higher biochar rate increasing the adsorption sites of the biochar reacted withthe soluble salts in soils towards a new equilibrium [39] and thereby reduced the effect offertilizer on the soil salinity. The ability of the biochar tablets to reduce salinity of the solublemineral salts released by the NPK fertilizer explains the lower values of the EC of the soilswith T4 and T5. In addition, treatment T5 significantly increased the roots of the sweetcorn. This observation is comparable to that of Cao et al. [40], who also reported highestroot activity when N fertilizer was applied at a lower levels in a biochar-amended soil. Itwas apparent that the sweet corn plants got stunted out of insufficient nutrient supply inT1. Furthermore, the combination of biochar tablet and mineral fertilizer (T3, T4, and T5)significantly affected flowering tasseling. This was possible because the biochar stimulatedmicrobial activity in addition to releasing the nutrients in the biochar tablets slowly fortimely uptake by the sweet corn plants [41]. Additionally, the high K of the biochar(ash produced during pyrolysis) accelerated flowering of the tassel inflorescences [42].Pandit et al. [43] also reported increased K upon biochar addition to soil increased maizegrain yield.
The nutrient uptake of the sweet corn plants without fertilization was poor becausenutrient deficiency stunted plants. The highest N uptake occurred in the sweet corn plantleaves and stems for T4 followed by T5, T3, T2, and T1. This indicates that optimum biochartablet application improved soil total N and this resulted in the improved N uptake inthe leaves and stems of plants [40]. High doses of biochar tablets significantly increasedthe soil total N in T4 (Table 3) and this increased the N uptake of leaves and stems. Thepossible reason is that high doses of biochar increased more surface functional groups toretain ammonium for soil N improvement [44].
In comparison to other treatments, the lowest amount of fertilizer embedded in thebiochar tablet (T5) increased N uptake by the sweet corn plant roots, suggesting thatbiochar densification with low amounts of fertilizer is an effective means of reducing theinhibition effect of high N on plant root viability. Soil only could not significantly improveN uptake during flowering tassels because biochar and fertilizer were not used. Treatment

Sustainability 2021, 13, 4878 12 of 15
T5 significantly increased N uptake during the tasseling stage, it enhanced rapid flowerinitiation because sufficient amount of N was used for the sweet corn plant reproductivestructure. The reduction in N uptake by leaves and stems of the sweet corn plant whichreceived T5 was due to allocation of a significant amount N for the reproductive structuresduring the reproductive period [45].
Treatment 4 increased P uptake by the leaves of the sweet corn followed T2, T3, andT5. The highest N uptake was also observed in the leaves of T4 (Table 5). These findingsare consistent with those of Razaq et al. [46] and Long et al. [47] who also reported that Npromotes P in plant uptake by increasing the aboveground biomass growth of plants. Theroots of T4 exhibited the lowest P uptake compared with T2, T3, and T5. High accumulationof P in the leaves might have slowed down the P uptake by the roots with T4 as energizedtransport of P from soil to plant is responsive to the P starvation in the plants [48]. At thetasseling stage of the sweet corn plants, the co-application of biochar and NPK fertilizer(T3, T4, and T5) significantly increased P uptake compared with NPK alone (T2) partlybecause the high K of the biochar might have accelerated tasseling [41]. The higher K in theleaves and stems caused by T4 and T5 indicates that co-application of optimum amountof biochar and NPK improves K uptake in the leaves and stems of the sweet corn plants.Although biochar tablets improve soil K availability [49], in this present study, T2 (NPKfertilizer only) caused the highest K uptake in the roots of the sweet corn plants. Potassiumuptake by roots mainly depends on the growth rate of plants. High allocation of K inthe roots of T2 could be ascribed to sustain the life cycle of the plant. In comparison totreatments with biochar, higher K uptake by the aboveground biomass was observed in T3,T4, and T5 during the initiation of flowering tassels of sweet corn (Table 5). Therefore, highK allocation in the roots of T2 indicates that a slow K translocation to the vegetative andreproductive parts would slow down the development of new tissues and ears. This resultexplains the lowest K uptake in flowering tassels of T2.
Low nutrient use efficiency (NUE) of inorganic fertilizers does not only cause lowcrop yield but it also increases production cost and environmental pollution. Therefore,improving the efficiency of fertilizer use is of utmost importance for developing sustainableagriculture. In this present study, the NPK fertilizer embedded with the biochar tablet (T5)significantly increased N, P, and K use efficiency in all of the parts of sweet corn plants(Tables 6 and 7). These findings suggest the potential of the biochar tablets embedded withfertilizer to increase sweet corn plants productivity. On the contrary, the lower total N, P,and K uses efficiency were recorded for T2 that is, the treatment with fertilizer amendmentonly and this could be attributed to the EC of T2 as earlier discussed that it impeded thegrowth and development of the roots of the sweet corn plants.
5. Conclusions
Co-application of biochar and fertilizer increases soil total carbon, nitrogen, butreduced soil EC. The BF significantly increased leaf chlorophyll content, dry root weight,and total plant nutrient use efficiency of sweet corn. Fertilizer only had the lowest effect onthe total nutrient uptake efficiency of sweet corn. The findings suggest that BF can serveas a slow release fertilizer not only to improve nutrient use efficiency that improves soiland crop productivity but it will also reduce leaching of nutrients into water bodies tocause for example, eutrophication. Therefore, embedding fertilizer in biochar tablets isrecommended for sweet corn production following a long term field study to confirm thefindings of this pot study.
Author Contributions: Conceptualization, Y.L.L. and O.H.A.; methodology, Y.L.L. and S.A.W.;investigation, Y.L.L.; resources, Y.L.L. and Z.F.A.A.; writing—original draft preparation, Y.L.L.;writing—review and editing, O.H.A. and S.A.W.; visualization, Z.F.A.A.; supervision, O.H.A., S.A.W.and Z.F.A.A.; project administration, Y.L.L.; funding acquisition, O.H.A. All authors have read andagreed to the published version of the manuscript.

Sustainability 2021, 13, 4878 13 of 15
Funding: This research was funded by Ministry of Higher Education, Malaysia with grant number[ERGS/1/11/STWN/UPM/02/65] and the APC was funded by Universiti Putra Malaysia.
Institutional Review Board Statement: Not applicable.
Informed Consent Statement: Not applicable.
Data Availability Statement: Data are available from the author.
Acknowledgments: The authors would like to acknowledge the Ministry of Higher Education,Malaysia for funding this research project through the Exploratory Research Grant Scheme (ERGS)grant code ERGS/1/11/STWN/UPM/02/65. Also, we acknowledge Universiti Putra Malaysia forthe collaborative research.
Conflicts of Interest: The authors declare no conflict of interest.
References1. Muller, J. Production of Fertilizer in Malaysia 2013–2019; Statista: Hamburg, Germany, 2020.2. Oladele, S.; Adeyemo, A.; Awodun, M.; Ajayi, A.; Fasina, A. Effects of biochar and nitrogen fertilizer on soil physicochemical
properties, nitrogen use efficiency and upland rice (Oryza sativa) yield grown on an Alfisol in Southwestern Nigeria. Int. J. Recycl.Org. Waste Agric. 2019, 8, 295–308. [CrossRef]
3. Lima, J.R.D.S.; Silva, W.D.M.; Medeiros, E.V.D.; Duda, G.P.; Corrêa, M.M.; Filho, A.P.M.; Clermont-Dauphin, C.; Antonino, A.C.;Hammecker, C. Effect of biochar on physicochemical properties of a sandy soil and maize growth in a greenhouse experiment.Geoderma 2018, 319, 14–23. [CrossRef]
4. Sadaf, J.; Shah, G.A.; Shahzad, K.; Ali, N.; Shahid, M.; Ali, S.; Hussain, R.A.; Ahmed, Z.I.; Traore, B.I.; Ismail, M.I.; et al.Improvements in wheat productivity and soil quality can accomplish by co-application of biochars and chemical fertilizers. Sci.Total Environ. 2017, 607, 715–724. [CrossRef]
5. Tang, L.; Yu, J.; Pang, Y.; Zeng, G.; Deng, Y.; Wang, J.; Ren, X.; Ye, S.; Peng, B.; Feng, H. Sustainable efficient adsorbent: Alkali-acidmodified magnetic biochar derived from sewage sludge for aqueous organic contaminant removal. Chem. Eng. J. 2018, 336,160–169. [CrossRef]
6. Guilhen, S.N.; Masek, O.; Ortiz, N.; Izidoro, J.C.; Fungaro, D.A. Pyrolytic temperature evaluation of macauba biochar for uraniumadsorption from aqueous solutions. Biomass Bioenerg. 2019, 122, 381–390. [CrossRef]
7. Angin, D.; Sensoz, S. Effect of Pyrolysis Temperature on Chemical and Surface Properties of Biochar of Rapeseed (Brassica napusL.). Int. J. Phytoremediat. 2014, 16, 684–693. [CrossRef]
8. Guerena, D.; Lehmann, J.; Hanley, K.; Enders, A.; Hyland, C.; Riha, S. Nitrogen dynamics following field application of biochar ina temperate North American maize-based production system. Plant Soil. 2013, 365, 239–254. [CrossRef]
9. Sun, H.; Min, J.; Zhang, H.; Feng, Y.; Lu, K.; Shi, W.; Yu, M.; Li, X. Biochar application mode influences nitrogen leaching andNH3 volatilization losses in a rice paddy soil irrigated with N-rich wastewater. Environ. Technol. 2018, 39, 2090–2096. [CrossRef]
10. Teutscherova, N.; Houska, J.; Navas, M.; Masaguer, A.; Benito, M.; Vazquez, E. Leaching of ammonium and nitrate from Acrisoland Calcisol amended with holm oak biochar: A column study. Geoderma 2018, 323, 136–145. [CrossRef]
11. Husk, B.; Major, J. Commercial Scale Agricultural Biochar Field Trial in Quebec, Canada, Over Two Years: Effects of Biochar on SoilFertility, Biology, Crop Productivity and Quality; Blue Leaf: Quebac, QC, Canada, 2008; pp. 1–38.
12. Kim, P.; Hensley, D.; Labbe, N. Nutrient release from switchgrass-derived biochar pellets embedded with fertilizers. Geoderma2014, 232–234, 341–351. [CrossRef]
13. Lee, Y.L.; Ahmed, O.H.; Wahid, S.A.; AB Aziz, Z.F. Effects of Mixture Biochar-Fertilizer with and without Tableting on the SoilChemical Characteristics. IOP Conf. Ser. Mater. Sci. Eng. 2020, 864, 012100. [CrossRef]
14. Muramoto, J.; Goto, I.; Ninaki, M. Application of inductively coupled atomic emission spectroscopy to soil analysis. Part. 6.Rapid analysis of exchangeable cations and cation exchange capacity by a shaking extraction method. Jpn. J. Soil Sci. Plant Nutr.1992, 63, 210–218.
15. Bray, R.H.; Kurtz, L. Determination of total, organic, and available forms of phosphorus in soils. Soil Sci. 1945, 59, 39–46.[CrossRef]
16. Cottenie, A. Soil testing and plant testing as a basis of fertilizer recommendation. FAO Soil Bull. 1980, 38, 3–70.17. Pomares-Gracia, F.; Pratt, P.F. Recovery of 15N-labelled fertilizer from manured and sludge-amended soils. Soil Sci. Soc. Am. J.
1987, 42, 717–720. [CrossRef]18. Yu, H.; Zou, W.; Chen, J.; Chen, H.; Yu, Z.; Huang, J.; Tang, H.; Wei, X.; Gao, B. Biochar amendment improves crop production in
problem soils: A review. J. Environ. Manag. 2019, 232, 8–21. [CrossRef]19. Leng, L.Y.; Husni, M.H.A.; Samsuri, A.W. Comparison of the carbon-sequestering abilities of pineapple leaf residue chars
produced by controlled combustion and by field burning. Bioresour. Technol. 2011, 102, 10759–10762. [CrossRef] [PubMed]20. Xue, B.; Huang, H.; Mao, M.; Liu, E. An investigation of the effect of ammonium sulfate addition on compound fertilizer
granulation. Particuology 2017, 31, 54–58. [CrossRef]

Sustainability 2021, 13, 4878 14 of 15
21. Limvikran, T.; Kheoruenromne, I.; Suddhiprakarn, A.; Prakongkep, N.; Gilkes, R.J. Dissolution of K, Ca, and P from biochargrains in tropical soils. Geoderma 2018, 312, 139–150. [CrossRef]
22. Ndzana, G.M.; Huang, L.; Zhang, Z.; Zhu, J.; Liu, F.; Bhattacharyya, R. The transformation of clay minerals in the particle sizefractions of two soils from different latitude in China. Catena 2019, 175, 317–328. [CrossRef]
23. Mallarino, A.P. Corn and soybean response to soil pH level and liming. In Integrated Crop Management Conference; Iowa StateUniversity: Ames, IA, USA, 2011; pp. 93–102. [CrossRef]
24. Shibata, M.; Sugihara, S.; Mvondo-Ze, A.D.; Araki, S.; Funakawa, S. Nitrogen flux patterns through Oxisols and Ultisols intropical forests of Cameroon, Central Africa. Soil Sci. Plant Nutr. 2017, 63, 306–317. [CrossRef]
25. El-Ramady, H.R.; Alshaal, T.A.; Amer, M.; Domokos-Szabolcsy, E.; Elhawat, N.; Prokisch, J.; Fari, M. Soil Quality and PlantNutrition. Sustain. Agric. Rev. 2014, 14, 345–447. [CrossRef]
26. Xu, R.; Zhao, A.; Yuan, J.; Jiang, J. pH buffering capacity of acid soils from tropical and subtropical regions of China as influencedby incorporation of crop straw biochars. J. Soil. Sediment. 2012, 12, 494–502. [CrossRef]
27. Fageria, N.K.; Santos, A.B.D.; Moraes, M.F. Influence of Urea and Ammonium Sulfate on Soil Acidity Indices in Lowland RiceProduction. Commun. Soil Sci. Plan. 2010, 41, 1565–1575. [CrossRef]
28. He, L.; Zhao, H.; Wang, S.; Xing, G. The effects of rice-straw biochar addition on nitrification activity and nitrous oxide emissionsin two Oxisols. Soil Till. Res. 2016, 164, 52–62. [CrossRef]
29. Dong, X.; Singh, B.P.; Li, G.; Lin, Q.M.; Zhao, X. Biochar increased field soil inorganic carbon content five years after application.Soil Till. Res. 2019, 186, 36–41. [CrossRef]
30. Lee, Y.L.; Ahmed, O.H.; Wahid, S.A.; AB Aziz, Z.F. Characterization of tablets made from mixture of charred agricultural residueswith and without embedded fertilizer. Acta Technol. Agric. 2019, 22, 70–74. [CrossRef]
31. Thangarajan, R.; Bolan, N.S.; Kunhikrishnan, A.; Wijesekara, H.; Xu, Y.; Tsang, D.C.; Song, H.; Ok, Y.S.; Hou, D. The potentialvalue of biochar in the mitigation of gaseous emission of nitrogen. Sci. Total Environ. 2018, 612, 257–268. [CrossRef]
32. Ding, X.; Jiang, Y.; Zhao, H.; Guo, D.; He, L.; Liu, F.; Zhou, Q.; Nandwani, D.; Hui, D.; Yu, J. Electrical conductivity of nutrientsolution influenced photosynthesis, quality, and antioxidant enzyme activity of pakchoi (Brassica campestris L. ssp. Chinensis) in ahydroponic system. PLoS ONE 2018, 13, e0202090. [CrossRef] [PubMed]
33. Jien, S.; Wang, C. Effects of biochar on soil properties and erosion potential in a highly weathered soil. Catena 2013, 110, 225–233.[CrossRef]
34. Wang, Y.; Yin, R.; Liu, R. Characterization of biochar from fast pyrolysis and its effect on chemical properties of the tea gardensoil. J. Anal. Appl. Pyrolysis 2014, 110, 375–381. [CrossRef]
35. Allen Dray, F., Jr.; Center, T.D.; Mattison, E.D. In situ estimates of waterhyacinth leaf tissue nitrogen using a SPAD-502 chlorophyllmeter. Aquat. Bot. 2012, 100, 72–75. [CrossRef]
36. Martin, A.; Belastegui-Macadam, X.; Quillere, I.; Floriot, M.; Valadier, M.H.; Pommel, B.; Andrieu, B.; Donnison, I.; Hirel,B. Nitrogen management and senescence in two maize hybrids differing in the persistence of leaf greenness: Agronomic,physiological and molecular aspects. New Phytol. 2005, 167, 483–492. [CrossRef] [PubMed]
37. Yuan, Z.; Ata-Ul-Karim, S.T.; Cao, Q.; Lu, Z.; Cao, W.; Zhu, Y.; Liu, X. Indicators for diagnosing nitrogen status of rice based onchlorophyll meter readings. Field Crops Res. 2016, 185, 12–20. [CrossRef]
38. Huang, L.; Liu, X.; Wang, Z.; Liang, Z.; Wang, M.; Liu, M.; Suarez, D.L. Interactive effects of pH, EC and nitrogen on yields andnutrient absorption of rice (Oryza sativa L.). Agric. Water Manag. 2017, 194, 48–57. [CrossRef]
39. De Vasconcelos, A.C.F. Biochar Effects on Amelioration of Adverse Salinity Effects in Soils. In Applications of Biochar forEnvironmental Safety; Abdelhafez, A.A., Abbas, M.H.H., Eds.; IntechOpen: London, UK, 2020. [CrossRef]
40. Cao, H.; Ning, L.; Xun, M.; Feng, F.; Li, P.; Yue, S.; Song, J.; Zhang, W.; Yang, H. Biochar can increase nitrogen use efficiency ofMalus hupehensis by modulating nitrate reduction of soil and root. Appl. Soil Ecol. 2019, 135, 25–32. [CrossRef]
41. Bass, A.M.; Bird, M.I.; Kay, G.; Muirhead, B. Soil properties, greenhouse gas emissions and crop yield under compost, biocharand co-composted biochar in two tropical agronomic systems. Sci. Total Environ. 2016, 550, 459–470. [CrossRef] [PubMed]
42. Zeb, N. Effect of Potassium and Maleic Hydrazide on Growth and Flower Quality of Chrysanthemum (Dendranthema grandiflo-rum). Sarhad J. Agric. 2015, 31, 210–216. [CrossRef]
43. Pandit, N.R.; Mulder, J.; Hale, S.E.; Martinsen, V.; Schmidt, H.P.; Cornelissen, G. Biochar improves maize growth by alleviation ofnutrient stress in a moderately acidic low-input Nepalese soil. Sci. Total Environ. 2018, 625, 1380–1389. [CrossRef]
44. Sohi, S.; Capel, E.L.; Krull, E.; Bol, R. Biochar, climate change and soil: A review to guide future research. In CSIRO Land WaterScience Report; Collingwood: Victoria, Australia, 2010; pp. 1–64.
45. Rentsch, D.; Schmidt, S.; Tegeder, M. Transporters for uptake and allocation of organic nitrogen compounds in plants. FEBS Lett.2007, 581, 2281–2289. [CrossRef]
46. Razaq, M.; Zhang, P.; Shen, H.; Salahuddin. Influence of nitrogen and phosphorous on the growth and root morphology of Acermono. PLoS ONE 2017, 12, e0171321. [CrossRef] [PubMed]
47. Long, M.; Wu, H.H.; Smith, M.D.; La Pierre, K.J.; Lu, X.; Zhang, H.; Han, X.; Yu, Q. Nitrogen deposition promotes phosphorusuptake of plants in a semi-arid temperate grassland. Plant Soil. 2016, 408, 475–484. [CrossRef]
48. Schachtman, D.P.; Reid, R.J.; Ayling, S.M. Phosphorus Uptake by Plants: From Soil to Cell. Plant Physiol. 1998, 116, 447–453.[CrossRef] [PubMed]

Sustainability 2021, 13, 4878 15 of 15
49. Wang, L.; Xue, C.; Nie, X.; Liu, Y.; Chen, F. Effects of biochar application on soil potassium dynamics and crop uptake. J. PlantNutr. Soil Sci. 2018, 181, 635–643. [CrossRef]