Characterization of mini-tablets - DiVA Portal
46
Master thesis, 30 hp Master of Science in Pharmacy, 300 hp Report approved: Spring term 2019 Supervisors: Sofia Mattsson and Patrik Appelblad, Examiner: David Andersson Characterization of mini-tablets Evaluation of disintegration and dissolution methods Annica Westberg
-
Upload
khangminh22 -
Category
Documents
-
view
0 -
download
0
Transcript of Characterization of mini-tablets - DiVA Portal

Master thesis, 30 hp
Master of Science in Pharmacy, 300 hp
Report approved: Spring term 2019
Supervisors: Sofia Mattsson and Patrik Appelblad, Examiner: David Andersson
Characterization of mini-tablets
Evaluation of disintegration and dissolution methods
Annica Westberg


Abstract Mini-tablets are a pharmaceutical dosage form with a diameter of typically ≤ 3 mm. This is a potential dosage form for pediatrics since the small size of mini-tablets can ease the swallowing of medicines. In recent years there has been an increasing demand for research and development concerning child-appropriate dosage forms. The goals are to improve the availability of approved medicines for children and increase the knowledge of medication use in the pediatric population. An important step in the manufacturing process is assessing the quality of the final product. Until know there has been an insufficient availability of standardized evaluation procedures concerning mini-tablets in the pharmacopoeias. The aim of the study was to evaluate whether the disintegration and dissolution methods used in this present study could be recommended for usage in future evaluation procedures on mini-tablets. An additional aim was to assess the impact of compaction pressure (50 or 150 MPa), compaction speed (20 or 50 strokes/min) and amount of model drug (1 or 10 % w/w) on the characteristics of the mini-tablets. Furthermore, the drug-binding tendency of three membrane filters; Polytetrafluoroethylene (PTFE), Polyvinylidene fluoride (PVDF) and Nylon was investigated to evaluate which filter/filters that could be recommended for usage in future dissolution tests. Mini-tablets were produced in a single-punch tablet press and sodium salicylate served as the model drug compound. The following tablet characterization tests were performed to assess the characteristics of the final products: uniformity of weight, uniformity of content, radial tensile strength, friability and disintegration and dissolution tests. Dissolution tests were performed on a mini paddle apparatus and compared with results retrieved from a conventional paddle apparatus. A petri dish filled with 40 mL phosphate saline buffer was used as the experimental set up in the disintegration tests. All six batches passed the disintegration test and the test for uniformity of weight. Radial tensile strength was only determined on tablet batches produced at 150 MPa, and these batches also passed the friability test. Four out of six batches displayed an insufficient homogeneity in the initial tests for content uniformity. In the dissolution tests, usage of the mini paddle and the standard paddle equipment resulted in similar dissolution profiles. When evaluating the membrane filters, the highest drug recoveries were obtained with the PTFE and PVDF filters. The PVDF and PTFE filters can be recommended for usage in future dissolution tests due to their low drug binding-tendencies. Saturation of the PTFE and PVDF filters had no significant effect (p>0.05) on the drug recovery. Only the two batches produced at 150 MPa were subjected to all characterization tests while the fragileness of the other four batches made them unsuitable as pharmaceutical dosage forms. The compaction pressure had the greatest impact on the characteristics of the mini-tablets. No correlations were detected when analyzing the impact of compaction speed or the impact of concentration of model drug on the tablet characteristics. The disintegration method used in this present study is a potential method for future characterization tests on mini-tablets. To further evaluate the suitability of this method, comparisons of different procedures must be made in future characterization studies on mini-tablets. The dissolution method used in this present study can be recommended for future characterization tests. The development of a dissolution procedure is dependent on the characteristics of the investigated drug compound. It is important to assess the physical and chemical characteristics of the mini-tablet when determining the different settings of the dissolution test. Keywords: Mini-tablets; Membrane filters; Disintegration tests; Dissolution tests.

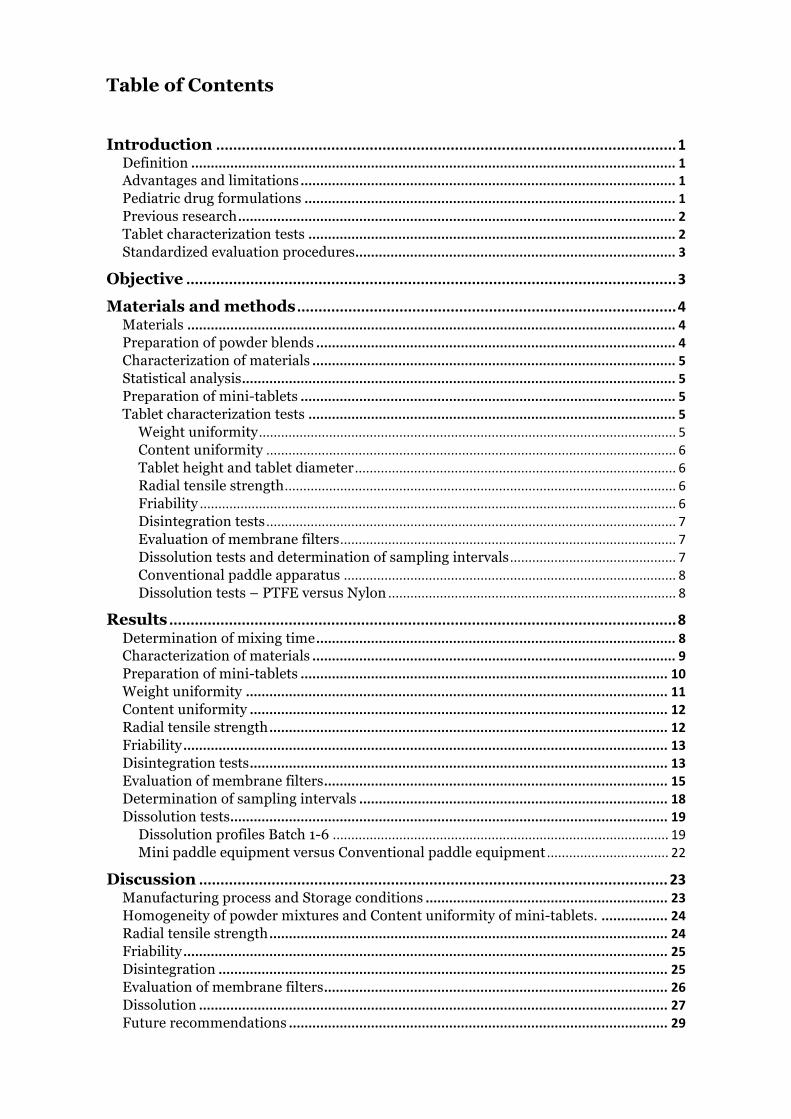
Table of Contents
Introduction............................................................................................................1Definition............................................................................................................................1Advantages and limitations................................................................................................1Pediatric drug formulations...............................................................................................1Previous research................................................................................................................2Tablet characterization tests..............................................................................................2Standardized evaluation procedures..................................................................................3
Objective...................................................................................................................3Materials and methods.........................................................................................4
Materials.............................................................................................................................4Preparation of powder blends............................................................................................4Characterization of materials.............................................................................................5Statistical analysis...............................................................................................................5Preparation of mini-tablets................................................................................................5Tablet characterization tests..............................................................................................5
Weight uniformity.................................................................................................................5Content uniformity...............................................................................................................6Tablet height and tablet diameter.......................................................................................6Radial tensile strength..........................................................................................................6Friability.................................................................................................................................6Disintegration tests...............................................................................................................7Evaluation of membrane filters...........................................................................................7Dissolution tests and determination of sampling intervals.............................................7Conventional paddle apparatus..........................................................................................8Dissolution tests – PTFE versus Nylon..............................................................................8
Results.......................................................................................................................8Determination of mixing time............................................................................................8Characterization of materials.............................................................................................9Preparation of mini-tablets..............................................................................................10Weight uniformity............................................................................................................11Content uniformity...........................................................................................................12Radial tensile strength......................................................................................................12Friability............................................................................................................................13Disintegration tests...........................................................................................................13Evaluation of membrane filters........................................................................................15Determination of sampling intervals...............................................................................18Dissolution tests................................................................................................................19
Dissolution profiles Batch 1-6...........................................................................................19Mini paddle equipment versus Conventional paddle equipment.................................22
Discussion..............................................................................................................23Manufacturing process and Storage conditions..............................................................23Homogeneity of powder mixtures and Content uniformity of mini-tablets..................24Radial tensile strength......................................................................................................24Friability............................................................................................................................25Disintegration...................................................................................................................25Evaluation of membrane filters........................................................................................26Dissolution........................................................................................................................27Future recommendations.................................................................................................29

Conclusion..............................................................................................................30Acknowledgements..............................................................................................30References..............................................................................................................31Appendices.............................................................................................................34
Appendix A: Scanning Electron Microscopy (SEM)- images..........................................34Appendix B: Uniformity of mass - weight of individual units........................................37Appendix C: Disintegration time of individual units......................................................37Appendix D: Standard curve of sodium salicylate filtrated by PVDF.............................38Appendix E: Standard curve of sodium salicylate filtrated by PTFE..............................38

Abbreviations AV – Acceptance value BET – Brunauer-Emmett-Teller CI – Confidence interval EMA – European Medicines Agency FDA – Food and Drug Administration HPLC – High-Performance Liquid Chromatography MODDE – MODeling and DEsign NMI – The National Microscopy Infrastructure ODMTs – Orally disintegrating mini-tablets ODT – Orally disintegrating tablet Ph.Eur. – European Pharmacopoeia PTFE – Polytetrafluoroethylene PVDF – Polyvinylidene fluoride RH – Relative humidity RPM – Rotations per minute RSD – Relative standard deviation RTS – Radial tensile strength SD – Standard deviation SEM – Scanning Electron Microscopy USP – United States Pharmacopeia UV-VIS – Ultraviolet-visible

1
Introduction Definition Mini-tablets or in some literature referred to as microtablets, are a pharmaceutical dosage form with a diameter of typically ≤ 3 mm [1,2]. This dosage form is smaller than conventional tablets and mini-tablets with a size of < 2.5 mm can sometimes be referred to as oral granules [2]. Mini-tablets can be manufactured in a conventional tablet machine using tools customized for small size tablet pressing. By varying the formulation composition, it is possible to produce different kinds of mini-tablets, like extended release formulations, formulations adapted for delivery in the gastrointestinal tract or orally disintegrating mini-tablets (ODMTs). After manufacturing, the mini-tablets can be further processed in to larger tablets containing several mini-tablets and other excipients. This type of formulation can for example be used for producing extended or sustained release products. Mini-tablets can also be filled in to capsules or sachets for multiparticulate dosing. An example of a formulation of mini-tablets available on the Swedish pharmaceutical market today (2019) is Orfiril long, an anti-epileptic drug available as capsules and sachets filled with mini-tablets of valproic acid [3].
Advantages and limitations Of the different pharmaceutical formulations available for the oral route, tablets are one of the most well accepted dosage forms by patients in general [1]. Both conventional tablets and mini-tablets are stable dosages forms with a high degree of dosage uniformity [4]. Except for these advantages, mini-tablets also provide some unique features compared to conventional tablets and other dosage forms. Mini-tablets can offer a high degree of dose flexibility and provide a more accurate dosing for pediatrics compared to splitting of tablets accommodated initially for adults. They also demonstrate superior stability characteristics compared with liquid formulations. Mini-tablets are a potential pharmaceutical dosage form to use in pediatric and geriatric populations. The small size can improve ease of tablet swallowing in these patient groups. Mini-tablets as a dosage form can also possess some limitations [2]. People suffering from motor impairments could experience difficulties with handling the small sized dosage form. These people may need assistance from a caregiver or a dosing device adapted for mini-tablets. Special care must also be taken when designing a manufacturing process for mini-tablets of highly potent substances. If the finished tablet batch contains units with varying amount of drug, the risk for intoxication of the user increases. Another disadvantage with this pharmaceutical dosage form is the potential risk of inadvertently losing a tablet due to its small size. An accidental drop of a mini-tablet could serve as a potential danger, especially if the mini-tablet contains a highly potent substance. Ingestion of the tablet by a child or companion animal could lead to serious adverse events. To prevent this situation from occurring, an appropriate packaging presentation of the mini-tablets is therefore necessary.
Pediatric drug formulations As previously discussed, mini-tablets are a potential dosage form for the pediatric population. In recent years there has been an increasing demand for research and development concerning dosage forms appropriate for usage by children [5]. To further improve the progress of pediatric dosage forms in Europe and the United States, a new legislation was introduced in these continents. Both the European Medicines Agency (EMA) in Europe and the Food and Drug Administration (FDA) in the Unites States have developed regulatory frameworks with specific guidelines and requirements concerning pediatric drug formulations. Several aims are associated with these regulations. The main objectives are to stimulate the research on pharmaceutical formulations for children, to improve the availability of approved medicines for the pediatric population and also increase the knowledge of medication use in children. The regulation has resulted in further obligations for the pharmaceutical industry. In return, the companies can be
2
provided with rewards and other compensations. An example of one such incentive is an extended patent for the pharmaceutical formulation [6]. According to an article by Martínez-Terán et al. [5] it is important to not consider children as small adults in terms of therapeutic approaches, since children have both anatomical, psychological and physiological differences compared to the adult population. The pediatric population is also very heterogeneous, as children possess differences in weight, age and physiological development. Several factors are therefore important to consider when evaluating appropriate pharmaceutical formulations for pediatrics.
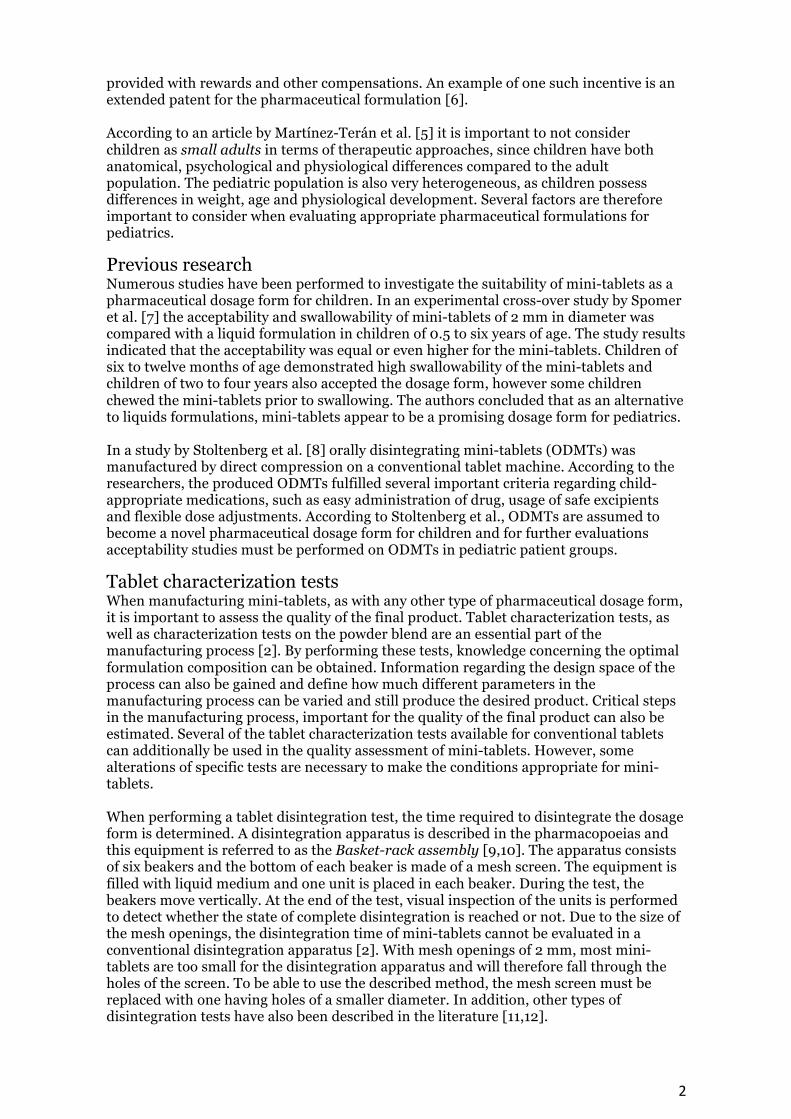
Previous research Numerous studies have been performed to investigate the suitability of mini-tablets as a pharmaceutical dosage form for children. In an experimental cross-over study by Spomer et al. [7] the acceptability and swallowability of mini-tablets of 2 mm in diameter was compared with a liquid formulation in children of 0.5 to six years of age. The study results indicated that the acceptability was equal or even higher for the mini-tablets. Children of six to twelve months of age demonstrated high swallowability of the mini-tablets and children of two to four years also accepted the dosage form, however some children chewed the mini-tablets prior to swallowing. The authors concluded that as an alternative to liquids formulations, mini-tablets appear to be a promising dosage form for pediatrics. In a study by Stoltenberg et al. [8] orally disintegrating mini-tablets (ODMTs) was manufactured by direct compression on a conventional tablet machine. According to the researchers, the produced ODMTs fulfilled several important criteria regarding child-appropriate medications, such as easy administration of drug, usage of safe excipients and flexible dose adjustments. According to Stoltenberg et al., ODMTs are assumed to become a novel pharmaceutical dosage form for children and for further evaluations acceptability studies must be performed on ODMTs in pediatric patient groups.
Tablet characterization tests When manufacturing mini-tablets, as with any other type of pharmaceutical dosage form, it is important to assess the quality of the final product. Tablet characterization tests, as well as characterization tests on the powder blend are an essential part of the manufacturing process [2]. By performing these tests, knowledge concerning the optimal formulation composition can be obtained. Information regarding the design space of the process can also be gained and define how much different parameters in the manufacturing process can be varied and still produce the desired product. Critical steps in the manufacturing process, important for the quality of the final product can also be estimated. Several of the tablet characterization tests available for conventional tablets can additionally be used in the quality assessment of mini-tablets. However, some alterations of specific tests are necessary to make the conditions appropriate for mini-tablets. When performing a tablet disintegration test, the time required to disintegrate the dosage form is determined. A disintegration apparatus is described in the pharmacopoeias and this equipment is referred to as the Basket-rack assembly [9,10]. The apparatus consists of six beakers and the bottom of each beaker is made of a mesh screen. The equipment is filled with liquid medium and one unit is placed in each beaker. During the test, the beakers move vertically. At the end of the test, visual inspection of the units is performed to detect whether the state of complete disintegration is reached or not. Due to the size of the mesh openings, the disintegration time of mini-tablets cannot be evaluated in a conventional disintegration apparatus [2]. With mesh openings of 2 mm, most mini-tablets are too small for the disintegration apparatus and will therefore fall through the holes of the screen. To be able to use the described method, the mesh screen must be replaced with one having holes of a smaller diameter. In addition, other types of disintegration tests have also been described in the literature [11,12].
3
For dissolution testing in general, several factors such as selection of dissolution medium, choice of dissolution apparatus and paddle speed are examples of considerations to be made regarding the dissolution method [2]. In terms of dissolution testing on mini-tablets, some specific considerations must be made. Selection of number of units to be included in the dissolution test is one example. Using the highest and lowest number of mini-tablets to be dosed in a clinical study or in an experimental animal is one suggestion. However, dissolution tests can also be performed on single units. When performing a dissolution test, analysis of the obtained sample is a key feature. Ultraviolet-visible (UV-VIS) spectrophotometry and high-performance liquid chromatography with UV detection (HPLC-UV) are two analytical methods commonly used for sample analyses in dissolution tests [13]. Prior to the sample analysis, a filtration step is required. A syringe filter is a commonly used filtration device. The membrane of the filter can consist of different materials and hydrophilic polytetrafluoroethylene (PTFE), hydrophilic polyvinylidene fluoride (PVDF) and Nylon are frequently used for this purpose. During the filtration step undissolved material is removed from the sample, providing a more representative sample as the obtained filtrate only contains the dissolved materials. In the literature, different versions of dissolution tests have been described for mini-tablets. Some researchers have performed the test according to the guidelines stated in the European pharmacopoeia (Ph.Eur.) monograph 2.9.3 [14]. The basket apparatus or the paddle apparatus has been used as the dissolution-testing device in different projects [14,15]. The volume of dissolution medium has also varied between different studies and 900, 500 and 100 mL of dissolution medium has for example been used in individual reports [14,15,16]. Moreover, different settings of the stirring speed, i.e. 100, 75 and 50 rotations per minute (rpm) have also been observed in the literature.
Standardized evaluation procedures As previously discussed, various disintegration and dissolution methods are described in the literature. In the article by Rumondor et al. [2] the authors point out that mini-tablets <2.5 mm sometimes may be referred to as oral granules, which then exclude dissolution testing as a part of the necessary regulatory specification. However, as stated by the authors, developing a suitable procedure regarding dissolution testing of mini-tablets can result in optimization and improve the formulation development of this dosage form. According to the study by Gaber et al. [17] there is an insufficient availability of evaluation procedures concerning mini-tablets in the pharmacopoeias. Thus there is a vital need for standardized evaluation procedures regarding this dosage form.
Objective The aim of this present study was to evaluate whether the disintegration and dissolution methods used in this study could be recommended for usage in future evaluation procedures on mini-tablets. An additional aim was to assess the impact of three different factors (compaction pressure, compaction speed and amount of model drug) on the characteristics of the final products. Varying these three parameters resulted in different batches of mini-tablets and the following tablet characterization tests were performed to access the characteristics of the final products: uniformity of mass, uniformity of content, radial tensile strength, friability, disintegration and dissolution tests. Finally, the impacts of three different membrane filters (PTFE, PVDF and Nylon) were investigated both prior to, and during the dissolution test. The aim of these evaluation procedures was to provide guidance in the selection of membrane filters for future dissolution tests on mini-tablets. The study address the following questions:

4
• Can the disintegration and dissolution methods used in this study be
recommended for usage in future evaluation procedures on mini-tablets?
• What impact will the compaction pressure, compaction speed and amount of model drug have on the characteristics of the produced mini-tablets?
• Which filter/filters can be recommended for usage in future dissolution tests on
mini-tablets and is saturation of the membrane a crucial step for the filtration procedure?
Materials and methods In this study mini-tablets of sodium salicylate were produced in a tablet machine. The dissolution tests were performed on a mini paddle apparatus and a petri dish filled with phosphate saline buffer was used as the experimental set-up for the disintegration tests. The results of these analyses were compared to the regulatory guidelines stated in the European pharmacopoeia monograph 2.9.1 (Disintegration of tablets and capsules) and the United States Pharmacopeia (USP) monograph (Sodium Salicylate Tablets).
Materials Sodium salicylate (Sodium 2-hydroxybenzoate) that meets USP testing specifications was purchased from Sigma-Aldrich (Merck KGaA, Darmstadt, Germany). Prosolv ODT G2 was kindly provided by JRS Pharma (JRS PHARMA GMBH & CO. KG, Germany). The membrane filters Nylon-Millex®-HN 0.45µm, PVDF- Millex®-HV 0.45µm and PTFE- Millex®-LH 0.45µm were purchased from Millipore (Merck KGaA, Darmstadt, Germany).
Preparation of powder blends The mini-tablets consisted of the following composition: sodium salicylate, Prosolv ODT and magnesium stearate. Sodium salicylate served as the model drug compound. Prosolv ODT is a ready-to-use tableting excipient, containing mannitol, crospovidone, microcrystalline cellulose, colloidal silicon dioxide and fructose. Prosolv ODT was used to produce orally disintegrating mini-tablets (ODMTs). Furthermore, magnesium stearate was used as lubricant in the powder blends. A DeltaRange (PB303, Mettler Toledo, Sweden) scale was used for weighing the different materials. By varying the amount of model drug compound, two different batches of powder blends were produced. The mixtures had a total weight of 50 g each and contained 1 % w/w and 10 % w/w of sodium salicylate respectively. Both batches contained 0.5 % w/w of magnesium stearate. Sodium salicylate and Prosolv ODT were initially mixed in a Turbula mixer (Turbula System Schatz Type T2F, Switzerland) during 24 hours at 72 rpm. Prior to the mixing step, a mortar and pestle were used for milling of the model drug. After addition of magnesium stearate, the mixing continued for one more minute at 72 rpm. To determine the optimal mixing time of sodium salicylate and Prosolv ODT, an evaluation of seven different mixing times was carried out. In this procedure, seven powder blends of 50 g each, containing Prosolv ODT and 1 % w/w of sodium salicylate was produced. Mixing of the blends occurred for 10, 30, 60, 480(8hrs), 960(16hrs), 1440(24hrs) and 2880(48hrs) minutes respectively. After each mixing-time, ten to thirty samples of approximately 6-17 mg were withdrawn with a powder thief. The theoretical amount of sodium salicylate in each sample was calculated. All samples were dissolved in a known amount of purified water (10 mL) and analyzed with a UV- spectrophotometer (CE 3041, Cecil Instruments, United Kingdom) at 295 nm. All measurements were performed in triplicates. The concentration and amount of sodium salicylate in each sample was determined. Finally, the relative standard deviation (RSD) of normalized values was determined. Normalized values were calculated according to the following equation [11]:
5
!"#$%&'()* !"#$% = !"#$%&"' !"#$%#$ (!!)!ℎ!"#!$%&'( !"#$%#$ (!")
Performing this experiment yields an estimation of the homogeneity of the mixtures, as samples with a high homogeneity will exhibit a low value of the RSD.
Characterization of materials The true densities of sodium salicylate and Prosolv ODT were determined by using a Helium Gas Pycnometer (AccuPyc II 1340, Micromeritics, USA). In addition, the Brunauer-Emmett-Teller (BET) surface area of these materials was determined by using a Surface Area and Porosity Analyzer (TriStar, Micromeritics, USA). The samples were degassed in a Programmable Degas System (SmartPrep, Micromeritics, USA) at 105 °C during three hours for removal of moisture and impurities. The morphologies of sodium salicylate, Prosolv ODT and the two powder mixtures were investigated by using two different types of Scanning Electron Microscopes (SEM)(Merlin, Carl Zeiss, Germany and EVO LS15, Carl Zeiss, Germany). The samples were initially dispersed onto a carbon tape attached on an aluminum stub and thereafter sputtered-coated with 5 nm of platinum by using a Turbomolecular-pumped coating system (Q150T ES, Quorum, United Kingdom).
Statistical analysis Mean values ± standard deviations (SD) and 95 % confidence intervals (CI) were calculated for all analyses subjected to three or more replicates. In addition, p-values were calculated by using student’s t-test (two-tailed) in Microsoft Excel (version 14.7.2). A p-value <0.05 was considered to be statistically significant. One of the aims with this study was to assess the impact of three different factors (compaction pressure, compaction speed and amount of model drug) on the characteristics of the produced mini-tablets. An experimental design was created using the analytical software MODeling and DEsign-MODDE (Sartorius stedim biotech, Sweden). In the beginning of the experimental procedure, three different powder blends containing 1% w/w, 5.5% w/w and 10% w/w of sodium salicylate were produced. All parameters consisted of three different values, which resulted in eleven batches (eight different batches, and three identical center points), and a full factorial 2 level-design was created. However, it was not possible to produce all the required batches in the manufacturing process, due to technical issues with the tablet press. The multivariate analysis in MODDE was therefore not possible to perform.
Preparation of mini-tablets A single-punch tablet press (Korsch XP1 Berlin, Germany) was used in the manufacturing process. The powder blends were manually filled into a hopper shoe, which was used for automatic filling of the dies during the process. Nine flat-faced mini-tablets with a diameter of 2 mm were produced during each compaction. After the manufacturing process, all batches were stored under ambient conditions for at least 24 hours prior to the tablet characterization tests. The compaction pressure varied slightly between each stroke. By recording the pressure during each compaction, it was possible to calculate the average compaction pressure for each batch. The highest and lowest pressures could also be detected using this technique.
Tablet characterization tests
Weight uniformity The uniformity of weight was determined according to the European pharmacopoeia (Ph.Eur.) monograph 2.9.5-uniformity of mass of single-dose preparations [18]. 20 mini-tablets were separately weighed and the individual mass was compared to the

6
average mass of the 20 units. According to the monograph, for units of 80 mg or less, not more than two individual masses are allowed deviate more than 10 % from the average mass. A further requirement for approval of the batch is that none of the individual masses are permitted to deviate more than 20 % from the average mass.
Content uniformity Determination of the content uniformity was performed in accordance with the guidelines stated in the Ph.Eur. monographs 2.9.6-uniformity of content of single-dose preparations [19] and 2.9.40-uniformity of dosage units [20]. In the procedure, ten units randomly selected were first separately weighed. The mini-tablets containing 1 % w/w of sodium salicylate were separately dissolved in 10 mL of purified water whereas the tablet batches containing 10 % w/w of model drug were dissolved in 100 mL of the same medium. A sample with a volume of about 3 mL was collected in a 10 mL plastic syringe (Luer-Lok Tip, BD, USA and Luer Lock Soft-Ject, Henke-Sass Wolf, Germany) and thereafter filtered through a PTFE membrane to remove un-dissolved material. A new unused filter was used for every sample. The amount of model drug was thereafter quantified by using a UV-spectrophotometer, measuring each sample in triplicates at 295 nm. According to the Ph.Eur. [19], the batch passes the test for single-dose preparations if all units have an individual content which not deviates more than 15% from the average content of the batch. In addition, the batch passes the test for uniformity of dosage units if it has an acceptance value (AV) of <15 [20].
Tablet height and tablet diameter A digital vernier caliper (Cocraft 0-150 mm, Sweden) was used to measure the tablet height (thickness) and tablet diameter of ten mini-tablets from each batch. Both height and diameter are needed to calculate the radial tensile strength of the mini-tablet.
Radial tensile strength The fracture force of ten individual mini-tablets per batch was determined using a diametral compression test (Pharmatest, Type PTB 311E, Germany). The radial tensile strength was thereafter determined by using the equation for flat-faced tablets according to Fell and Newton [21]. The following equation was used to calculate the radial tensile strength of the mini-tablets: !"#$"% !"#$%&" !"#$%&"ℎ = !×!
!×!×! Where F is the force required to fracture the unit, D is the diameter and H is the height of the mini-tablet. The unit of F is Newton (N) and the unit of the radial tensile strength is MPa.
Friability The friability test was performed on a tablet friability apparatus (PharmaTest, Type PTF 10E Germany) following the Ph. Eur. monograph 2.9.7-friability of uncoated tablets [22]. 20 mini-tablets were initially dedusted and thereafter weighed prior to insertion in to the friabilator drum. Additionally, about six grams of glass beads with a diameter of 2 mm were also inserted in to the apparatus together with the mini-tablets. The mini-tablets and the glass beads were subjected to 100 rotations in the friabilator drum, which resulted in duration of four minutes as the rotational speed was set to 25 rpm. Finally, the mini-tablets were dedusted for a second time and the percentage weight loss was determined according to the following equation: % !"#$%#&#'( = !"!#!$% !"#$!!!!"#$% !"#$!!
!"!#!$% !"#$!! ×100% The batch will pass the test if the percentage weight loss is ≤ 1 % [22]. Furthermore, in the presence of cracked or broken mini-tablets the batch also fails the test.

7
Disintegration tests The disintegration tests were performed according to the same method used in the study by Hagen et al. [11]. Ten mini-tablets per batch were placed in a petri dish filled with 40 mL of phosphate saline buffer (8.5 mg/mL of sodium chloride) with a pH of 6.8 and a temperature of 37 °C. The buffer solution was prepared according to the guidelines stated in the Ph.Eur. monograph 4.1.3-buffer solutions [23]. According to the Ph.Eur., orally disintegrating tablets should disintegrate within three minutes during the conventional disintegration test [24]. The mini-tablets were placed one by one in the buffer solution and the time required for all units to completely disintegrate was measured. All ten mini-tablets were placed in the same 40 mL buffer solution and gentle stirring of the medium was performed by hand to facilitate the visualization of the disintegrated state. Complete disintegration is defined as the state when the remainder of a dosage unit is a soft mass without rigid structure [9].
Evaluation of membrane filters Prior to the dissolution tests, an evaluation of the drug-binding tendencies of three different membrane filters (Nylon, PVDF and PTFE) was performed. The aim was to investigate the possible adsorption of model drug to the membrane filters and this was performed in a similar manner to the experimental procedure described in a study by Kiehm et al. [25]. Initially, two solutions with different concentration of sodium salicylate (0.005 mg/mL and 0.015 mg/mL) were prepared by dissolving the substance in purified water. By usage of a 10 mL plastic syringe, 3 mL and 5 mL of medium were collected from each solution. After collecting the 3 mL sample, the solution was immediately filtered by one of the three different membrane filters. The absorbance of the sample was thereafter measured by UV-spectrophotometry at 295 nm. For the 5 mL sample, the first 2 mL of filtrate was discarded prior to the UV-analysis. Flushing the membrane with 2 mL of sample was performed to saturate the surface of the membrane prior to the sample analysis. All membrane filters were subjected to the same procedure and all measurements were repeated three times. A new unused membrane filter was used during each filtration step. A membrane filter can possibly contain soluble residues as a by-product of the manufacturing process [25]. Such residues could affect the analytical results if the residue is detected at the same wavelength as the investigated substance. To examine the presence of soluble by-products, the UV-absorbance of filtered blank solution (purified water) was measured for each membrane filter at the same wavelength used for analysis of the model drug. The drug adsorption tendency of each filter was determined by calculating the drug recovery according to the following equation:
!"#$%"&' = !!"#$%&$' − !!"#$%!!"#"!"$%"
Where Afiltrate is the absorbance of filtered solution, Ablank represent the absorbance of filtered dissolution medium (purified water) and Areference is the absorbance of unfiltered solution. A membrane filter with a recovery of > 95 % was regarded as a suitable filtration device with a low degree of adsorption tendency. In addition, an absorbance of < 0.05 was selected as an acceptable value in the UV-analysis of the filtered blank solution.
Dissolution tests and determination of sampling intervals The dissolution tests were performed on the paddle apparatus, which is referred to as Apparatus 2 in the pharmacopoeias (PTWS 120 D, PharmaTest, Germany) [26,27]. Mini vessels containing 250 mL of purified water with a temperature of 37 °C was used as the dissolution medium. Mini paddles with a rotational speed of 100 rpm were used for stirring of the medium during the experiments. The dissolution profiles were determined and all analyses were performed in triplicates for each tablet batch. An amount of approximately 3 mg of model drug was included in each analysis. At six different time-points (0.5, 1, 1.5, 5, 10, and 20 minutes), 3 mL of dissolution medium was withdrawn from the dissolution vessels. Each sample was collected from the sampling zone using a 10 mL plastic syringe connected to a plastic hose placed in the

8
vessel. The sampling zone is defined as the position halfway between the surface of the dissolution medium and the highest position of the paddle blade [26]. In addition, the samples were withdrawn not less than 1 cm from the wall of the vessel. After collecting the sample, the liquid was immediately filtered through a PTFE membrane filter. A new unused filter was used for every sample. After the filtration step, the fraction of released model drug at each sampling point was determined by its UV-absorbance at 295 nm. All measurements were performed in triplicates. Prior to initiation of the dissolution tests, a pre-experiment investigating the appropriate sampling intervals was performed. The experimental set up and the sampling procedure were in accordance with the method described above. However, in this procedure the membrane filter PVDF was used in the filtration step. In addition, the sampling process was conducted in two different ways, performed in two separate vessels for all analyses. In vessel one (referred to as A in Figure 9, see Results), 3 mL of fresh dissolution medium was added after each sampling point whereas in vessel two (referred to as B in Figure 9, see Results), no dissolution medium was added after each sampling point. All tests were performed with 30 mini-tablets that were manufactured at a compaction pressure of approximately 100 MPa, a compaction speed of 20 strokes/min and contained 1 % w/w of model drug (referred to as Batch 7). The standard curve of sodium salicylate, prepared by filtration with the PVDF filter, was used for quantifying the amount of model drug in each sample (see Appendix D).
Conventional paddle apparatus In addition to performing the dissolution tests on the scaled down version, one batch was also subjected to dissolution tests on the conventional paddle equipment. The tests were performed on Batch 2, where the amount of mini-tablets was large. The experimental procedure was almost the same as for the mini-paddle apparatus, with a few exceptions. The volume of the dissolution medium was 900 mL, in accordance with the conventional test described in the USP [28]. In addition, approximately 4.7 mg of model drug was included in each analysis instead of 3 mg as for the scaled down version. Both the PVDF and PTFE filters were used, as neither of the membranes had shown negative impact in the earlier drug-binding studies. In each analysis, the first three samples (collected at 0.5, 1 and 1.5 minutes) were filtrated by the PTFE filter whilst the final three (collected at 5, 10 and 20 minutes) were filtrated by PVDF. A new unused filter was used for each sample.
Dissolution tests – PTFE versus Nylon Additional dissolution tests were performed to investigate whether usage of either the Nylon or PTFE filters could have an impact on the dissolution profile. The tests were performed on Batch 4, where the amount of mini-tablets also was large. The dissolution profile was determined by separately using the Nylon or PTFE filters. The tests were repeated three times for each filter and the mean ± SD of fraction released model drug (%) at each sampling point was determined. At each sampling point, 3 mL of dissolution medium was collected and immediately filtered without any discarded sample volume. UV-spectrophotometry was used for quantifying the amount of released sodium salicylate. The standard curve of sodium salicylate, prepared by filtration with the PTFE filter, was used for quantification purposes for both filter materials. The standard curve is presented in Appendix E (see Appendices).
Results Determination of mixing time When determining the optimal mixing time of sodium salicylate and Prosolv ODT, the tests were performed on powder mixtures containing 1 % w/w of the model drug. An overview of the results is presented in Table 1.
9
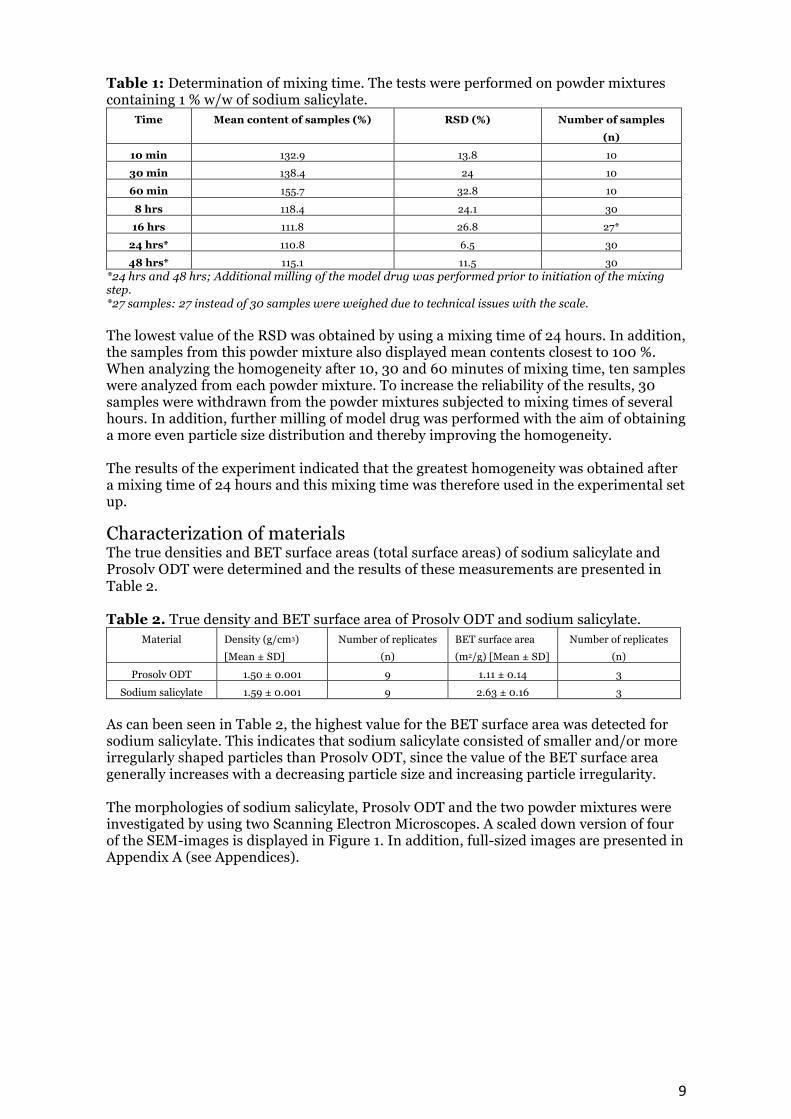
Table 1: Determination of mixing time. The tests were performed on powder mixtures containing 1 % w/w of sodium salicylate.
Time Mean content of samples (%) RSD (%) Number of samples (n)
10 min 132.9 13.8 10 30 min 138.4 24 10 60 min 155.7 32.8 10
8 hrs 118.4 24.1 30 16 hrs 111.8 26.8 27*
24 hrs* 110.8 6.5 30 48 hrs* 115.1 11.5 30
*24 hrs and 48 hrs; Additional milling of the model drug was performed prior to initiation of the mixing step. *27 samples: 27 instead of 30 samples were weighed due to technical issues with the scale. The lowest value of the RSD was obtained by using a mixing time of 24 hours. In addition, the samples from this powder mixture also displayed mean contents closest to 100 %. When analyzing the homogeneity after 10, 30 and 60 minutes of mixing time, ten samples were analyzed from each powder mixture. To increase the reliability of the results, 30 samples were withdrawn from the powder mixtures subjected to mixing times of several hours. In addition, further milling of model drug was performed with the aim of obtaining a more even particle size distribution and thereby improving the homogeneity. The results of the experiment indicated that the greatest homogeneity was obtained after a mixing time of 24 hours and this mixing time was therefore used in the experimental set up.
Characterization of materials The true densities and BET surface areas (total surface areas) of sodium salicylate and Prosolv ODT were determined and the results of these measurements are presented in Table 2. Table 2. True density and BET surface area of Prosolv ODT and sodium salicylate.
Material Density (g/cm3) [Mean ± SD]
Number of replicates (n)
BET surface area (m2/g) [Mean ± SD]
Number of replicates (n)
Prosolv ODT 1.50 ± 0.001 9 1.11 ± 0.14 3 Sodium salicylate 1.59 ± 0.001 9 2.63 ± 0.16 3
As can been seen in Table 2, the highest value for the BET surface area was detected for sodium salicylate. This indicates that sodium salicylate consisted of smaller and/or more irregularly shaped particles than Prosolv ODT, since the value of the BET surface area generally increases with a decreasing particle size and increasing particle irregularity. The morphologies of sodium salicylate, Prosolv ODT and the two powder mixtures were investigated by using two Scanning Electron Microscopes. A scaled down version of four of the SEM-images is displayed in Figure 1. In addition, full-sized images are presented in Appendix A (see Appendices).

10
Figure 1. SEM-images of sodium salicylate, Prosolv ODT and the two powder mixtures. Fig. 1A: Powder mixture of 1 % w/w sodium salicylate, taken at 150 x magnification. Fig. 1B: Powder mixture of 10 % w/w sodium salicylate, taken at 150 x magnification. Fig. 1C: Prosolv ODT, taken at 150 x magnification. Fig. 1D: Sodium salicylate, taken at 150 x magnification. As can be seen in the SEM-image of Prosolv ODT (Fig. 1C), the material is composed of several different excipients with varying particle sizes. It is difficult to distinguish between sodium salicylate and Prosolv ODT when viewing the SEM-images of the two powder mixtures (Fig. 1A and Fig. 1B). It is possible that the encircled area in Fig. 1B displays fragments of sodium salicylate in the powder mixture of 10 % w/w model drug. As can be seen in Fig. 1D, sodium salicylate consisted of flaky particles with varying sizes. Even in the presence of the large flakes the material consisted of many small particles that probably contributed to the larger BET surface area of sodium salicylate compared with Prosolv ODT (see Table 2). Despite additional milling of the model drug, the material consisted of a wide variety of particle sizes, which probably contributed to a relatively low homogeneity of the powder mixture and subsequently, the mini-tablets.
Preparation of mini-tablets In the manufacturing process, seven different batches of mini-tablets were produced. An overview of all batches is presented below in Table 3. In addition, one mini-tablet from Batch 1-6 is displayed in Figure 2.
11
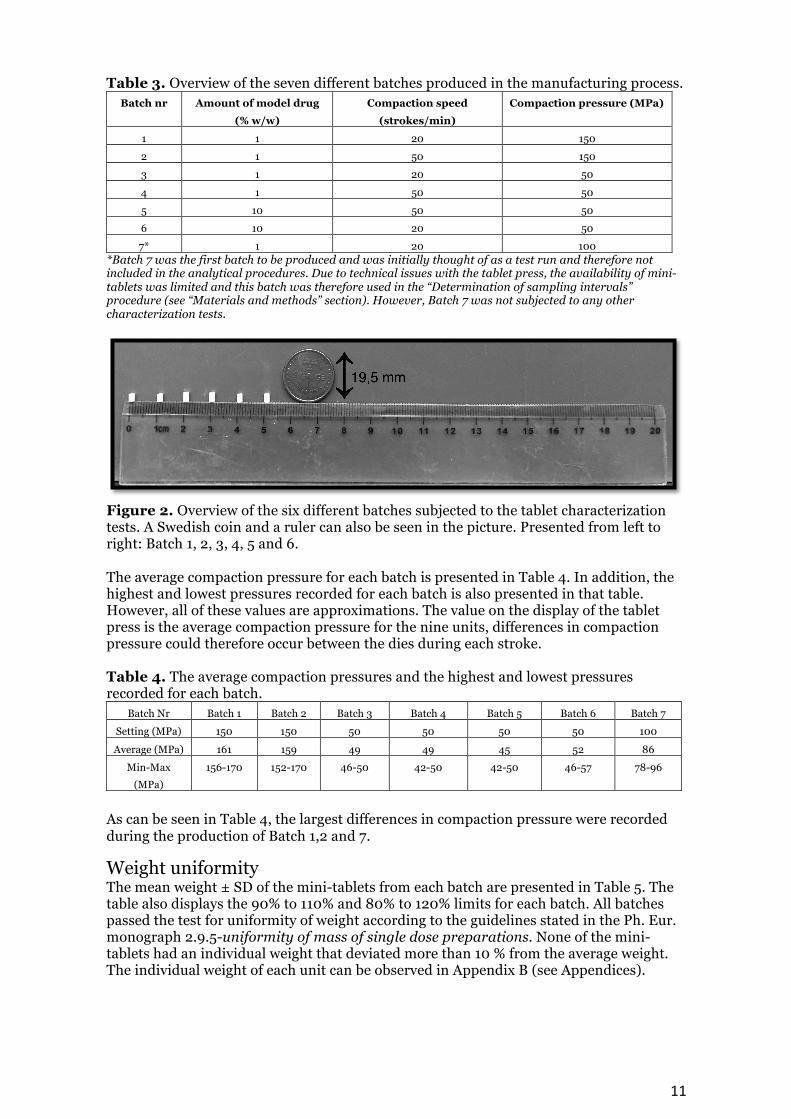
Table 3. Overview of the seven different batches produced in the manufacturing process. Batch nr Amount of model drug
(% w/w) Compaction speed
(strokes/min) Compaction pressure (MPa)
1 1 20 150 2 1 50 150 3 1 20 50
4 1 50 50 5 10 50 50 6 10 20 50 7* 1 20 100
*Batch 7 was the first batch to be produced and was initially thought of as a test run and therefore not included in the analytical procedures. Due to technical issues with the tablet press, the availability of mini-tablets was limited and this batch was therefore used in the “Determination of sampling intervals” procedure (see “Materials and methods” section). However, Batch 7 was not subjected to any other characterization tests.
Figure 2. Overview of the six different batches subjected to the tablet characterization tests. A Swedish coin and a ruler can also be seen in the picture. Presented from left to right: Batch 1, 2, 3, 4, 5 and 6. The average compaction pressure for each batch is presented in Table 4. In addition, the highest and lowest pressures recorded for each batch is also presented in that table. However, all of these values are approximations. The value on the display of the tablet press is the average compaction pressure for the nine units, differences in compaction pressure could therefore occur between the dies during each stroke. Table 4. The average compaction pressures and the highest and lowest pressures recorded for each batch.
Batch Nr Batch 1 Batch 2 Batch 3 Batch 4 Batch 5 Batch 6 Batch 7 Setting (MPa) 150 150 50 50 50 50 100
Average (MPa) 161 159 49 49 45 52 86 Min-Max
(MPa) 156-170 152-170 46-50 42-50 42-50 46-57 78-96
As can be seen in Table 4, the largest differences in compaction pressure were recorded during the production of Batch 1,2 and 7.
Weight uniformity The mean weight ± SD of the mini-tablets from each batch are presented in Table 5. The table also displays the 90% to 110% and 80% to 120% limits for each batch. All batches passed the test for uniformity of weight according to the guidelines stated in the Ph. Eur. monograph 2.9.5-uniformity of mass of single dose preparations. None of the mini-tablets had an individual weight that deviated more than 10 % from the average weight. The individual weight of each unit can be observed in Appendix B (see Appendices).

12
Table 5. The mean weight (mg) ± SD and the 90 % à 110 % and 80 % à 120 % limits associated with each batch, n=20.
Batch nr Batch 1 Batch 2 Batch 3 Batch 4 Batch 5 Batch 6
Mean weight (mg) ± SD
10.6 ± 0.2 10.4 ± 0.2 10.6 ± 0.3 10.4 ± 0.1 8.9 ± 0.2 9.3 ± 0.2
Limits in mg (90% & 110%, 10 %
deviation)
9.5 & 11.6 9.4 & 11.5 9.6 & 11.7 9.4 & 11.4 8.0 & 9.8 8.4 & 10.2
Limits in mg (80% & 120%, 20 %
deviation)
8.5 & 12.7 8.3 & 12.5 8.5 & 12.7 8.3 & 12.5 7.1 & 10.7 7.4 & 11.2
The automatic filling of the dies during the manufacturing process resulted in an even powder filling since all batches passed the test for uniformity of mass of single dose preparations. Using a compaction speed of 20 or 50 strokes/min had no negative impact on the process since all batches passed the test, independent of the setting of compaction speed. Furthermore, both powder blends displayed a sufficient flowability since this is a necessary feature for obtaining an even filling of the dies during the process.
Content uniformity The results of the evaluation of content uniformity are displayed in Table 6. For the batches containing 1 % w/w of model drug, three out of four batches presented one or two (Batch 3) mini-tablets that exhibited an individual content that deviated more than 15 % from the average content of the batch. Furthermore, all four batches exhibited an acceptance value >15. Due to these results, all four batches containing 1 % w/w of sodium salicylate (Batch 1-4) displayed insufficient results in the initial tests for content uniformity. Batch 5 and 6 both contained 10 % w/w of model drug and these batches passed the test for uniformity of content of single-dose preparations-2.9.6 and the test for uniformity of dosage units-2.9.40. These two batches displayed a sufficient homogeneity according to the guidelines stated in the Ph.Eur. [19,20]. Table 6. Results of content uniformity. Out-of-specification results are highlighted in black. N=10.
Batch Average drug content of the units within each batch (%) [Mean ± SD]
Uniformity of content (%) [Min-Max]
Uniformity of dosage units (AV)
Batch 1 95.8 ± 10.9 82.7 – 114.5 28.86 Batch 2 95.2 ± 6.0 85.3 – 104.3 17.7 Batch 3 94.6 ± 10.2 82.4* – 108.3 28.38 Batch 4 94.1 ± 7.5 82.6 – 106.4 22.4 Batch 5 98.3 ± 3.4 94.1 – 102.7 8.36 Batch 6 99.6 ± 3.3 94.3 – 105.2 7.92
*Batch 3; two units exhibited individual contents that deviated more than 15 % from the average content of the batch (82.4 % and 84.4 % respectively). The other batches (Batch 1 and 4) displayed one unit outside the above-mentioned limits).
Radial tensile strength The fracture force was measured on mini-tablets from Batch 1 and 2, which were manufactured at a compaction pressure of approximately 150 MPa. For all other batches, the mini-tablets were too soft and fragile and the fracture force was therefore too low to be measureable in the diametral compression test. Table 7 displays the mean values ± SD for the two batches. The values are also plotted in Figure 3 and as can be seen in the figure, the radial tensile strength (RTS) of Batch 1 was significantly higher (p=0.00006) than the RTS of Batch 2.

13
Table 7. The radial tensile strength (RTS) of Batch 1 and Batch 2, n=10. Batch nr Batch 1 Batch 2
RTS ± SD (N/mm2) 3.1 ± 0.2 2.3 ± 0.5
Figure 3. Radial tensile strength of Batch 1 and Batch 2, n=10. The error bars represents 95 % confidence intervals. Batch 2 was manufactured with the highest compaction speed of 50 strokes/min. Using a higher speed results in a shorter time-period for the punch to display its compression force on the powder mixture during the manufacturing process. This can affect the compactibility and mechanical strength of the final product. However, no major difference in RTS was detected between the two batches and this indicates that the compaction speeds used in this present study had a minor impact on the RTS. The mini-tablets from the other batches were very fragile which resulted in erroneous results. The fragileness of the units was probably due to the usage of a compaction pressure of 50 MPa, which was the common factor among these four batches (Batch 3-6).
Friability Batches 1 and 2 manufactured at a compaction pressure of approximately 150 MPa passed the friability test with a final weight loss of < 1 % (final weight loss of 0.51 % for Batch 1 and 0.52 % for Batch 2). The other batches (Batch 3-6) were produced at a compaction pressure of approximately 50 MPa, and were all very fragile and easily breakable, and thus not subjected to the friability tests. Batch 1 and 2 were manufactured at the highest compaction pressure, which resulted in a greater strength and resistance to attrition of these batches.
Disintegration tests Table 8 displays the mean ± SD values in seconds until complete disintegration for each batch. In addition, the disintegration time of each unit can be visualized in Appendix C (see Appendices). All six batches passed the disintegration test and each mini-tablet disintegrated within the specified time-period of three minutes. The longest disintegration times were recorded for Batch 1 and 2, which were manufactured at the highest compaction pressure of about 150 MPa. These results were significantly higher (p<0.05) than the disintegration time of mini-tablets compacted at 50 MPa, as can be seen in Figure 4. However, no significant difference (p=0.6) in disintegration time was
0
0,5
1
1,5
2
2,5
3
3,5
149 149,5 150 150,5 151
Radialtensilestrength(N/m
m2)
Compactionpressure(MPa)
Radialtensilestrength
Batch1
Batch2

14
detected between the two batches compacted at 150 MPa. The other batches, manufactured at a compaction pressure of about 50 MPa, exhibited a mean disintegration time of approximately 8 to 11 seconds. As can be seen in Figure 5, the mean values of Batch 3, 5 and 6 were approximately the same, and no statistically significant differences (p>0.05) in disintegration time were detected between these three batches. In addition, Batch 4 exhibited a mean disintegration time of approximately 8 seconds. The mean disintegration times of Batch 3, 5 and 6 were significantly higher (p<0.05) than the mean disintegration time of Batch 4. These results can be visualized in Figure 5. Table 8. Mean ± SD values of the disintegration time for each batch. The results are presented in seconds (s), n=10.
Batch nr Batch 1 Batch 2 Batch 3 Batch 4 Batch 5 Batch 6 Mean ± SD 79.6 ± 32.5 87.3 ± 22.1 10.3 ± 12.2 7.9 ± 0.6 10.5 ± 1.4 11 ± 1.4
Figure 4. Results of the disintegration tests. For approval of the batch, orodispersible tablets must disintegrate within three minutes (180 seconds). The error bars represents 95 % confidence intervals, n=10. The values presented above each staple are the mean values for the disintegration time in seconds (s).
79.6s 87.3s
10.3s 7.9s 10.5s 11s
0
20
40
60
80
100
120
Tim
e(seconds)
DisintegrationtestsBatch1-6
Batch1 Batch2 Batch3 Batch4 Batch5 Batch6

15
Figure 5. Enlarged figure displaying the results of the disintegration tests for Batch 3-6. For approval of the batch, orodispersible tablets must disintegrate within three minutes (180 seconds). The error bars represents 95 % confidence intervals, n=10. The values presented above each staple are the mean values for the disintegration time in seconds (s). As can be seen in Figure 4 and 5, the disintegration time only varied with a few seconds when comparing the results of Batch 1-2 and Batch 3-6, respectively. Therefore, no associations were made when analyzing the impact of concentration of model drug on the disintegration time. In addition, no correlations were seen when analyzing the impact of compaction speed either. The compaction pressure was the factor with the greatest impact on the disintegration time.
Evaluation of membrane filters Filtration of blank solution (purified water) resulted in a UV-absorbance below the acceptable limit of < 0.05 for all filter materials. The mean ± SD values are presented in Table 9. Table 9. UV-absorbance of filtered blank solution (purified water) at an analytical wavelength of 295 nm, n=3. The results are presented as mean ± SD.
Filter type Absorbance
Nylon 0.005 ± 0.001 PVDF 0.005 ± 0.001 PTFE 0.006 ± 0.002
The mean recovery (%) for each filter type is presented in Table 10. For the solution with the lowest concentration (0.005 mg/mL), measuring the absorbance without discarding the first 2 mL of sample volume (presented as 3 mL in Figure 6) resulted in a highest recovery for the PVDF and PTFE filters. Unlike the results for the PVDF and PTFE filters, the recovery of the Nylon filter was below the acceptable limit of > 95 % with no discarded sample volume. Discarding the first 2 mL of sample volume (presented as 5-2 mL in Figure 6) resulted in a mean recovery of > 95 % for all three filter materials. When measuring the absorbance without discarding the first 2 mL of sample volume for the solution with the highest concentration (0.015 mg/mL), the highest recovery was once again obtained for the PVDF and PTFE filters. The recovery of PVDF and PTFE were significantly higher (p<0.05) than the recovery of Nylon, as can be seen in Figure 7. Both PVDF and PTFE exhibited acceptable recoveries above the acceptance value, whereas the
10.3s
7.9s
10.5s 11s
0
2
4
6
8
10
12
14Tim
e(seconds)
DisintegrationtestsBatch3-6
Batch3 Batch4 Batch5 Batch6

16
recovery of Nylon was below the limit of > 95 %. The mean recovery of each filter type was, nonetheless above the acceptable limit after saturation of the membrane by discarding the first 2 mL of sample volume prior to the UV-analysis. When using the Nylon filter, discarding the first 2 mL of sample volume resulted in a significantly higher (p<0.05) recovery in comparison to the recovery obtained with no discarded sample volume. This association was observed in both concentrations and is displayed in Figure 6 and 7. For both the PVDF and PTFE filters, discarding the first 2 mL of sample volume resulted in no significant difference (p>0.05) in drug recovery, as can be seen for both concentrations. This can also be visualized in Figure 6 and 7. Table 10. Drug recovery of each membrane filter (%). The results are presented as mean ± SD. Values below the acceptable limit of > 95 % are highlighted in black, n=3.
0.005 mg/mL 0.015 mg/mL
Filter type No medium discarded (3mL)
2 mL of medium discarded (5-2 mL)
No medium discarded (3 mL)
2 mL of medium discarded (5-2 mL)
Nylon 86.0 ± 1.8 95.6 ± 1.8 92.1 ± 1.5 98.7 ± 0.3 PVDF 95.6 ± 2.5 95.9 ± 2.3 99.4 ± 1.2 99.5 ± 1.2
PTFE 96.8 ± 3.5 99.1 ± 1.3 100.3 ± 0.6 100.5 ± 0.7
Figure 6. Recovery of sodium salicylate at the lowest concentration (0.005 mg/mL). The error bars represents 95 % confidence intervals, n=3. 3 mL = 3 mL samples without no discarded sample volume. 5-2 mL = 5 mL samples were the first 2 mL of sample volume were discarded in the filtration procedure.
3mL 3mL 3mL 5-2mL 5-2mL 5-2mL70
75
80
85
90
95
100
105
110
Recovery(%)
Recovery:0.005mg/mL
NYLON PVDF PTFE

17
Figure 7. Recovery of sodium salicylate at the highest concentration (0.015 mg/mL). The error bars represents 95 % confidence intervals, n=3. 3 mL = 3 mL samples without no discarded sample volume. 5-2 mL = 5 mL samples were the first 2 mL of sample volume were discarded in the filtration procedure. As described in the Materials and methods section, an additional evaluation of the PTFE and Nylon filters were performed in several dissolution tests. Table 11 displays the mean ± SD of percentage released sodium salicylate at each sampling point for the Nylon and PTFE filters. In addition, the corresponding dissolution profiles for both filter materials are plotted in Figure 8. Table 11. Amount of released sodium salicylate (%) at each sampling point for the Nylon and PTFE filters. The tests were performed on Batch 4. Results are presented as mean ± SD, n=3.
Amount of released model drug (%) [Mean ± SD] Time (minutes) Nylon PTFE
0.5 77.4 ± 2.5 86.2 ± 1.3 1 88.7 ± 0.7 97.2 ± 0.5
1.5 88.7 ± 0.8 97.9 ± 0.7 5 90.9 ± 1.8 97.4± 0.9
10 90.7 ± 1.1 97.9 ± 0.6 20 91.7 ± 0.9 98.1 ± 0.2
As can be seen in Figure 8, both dissolution profiles levels off after about one minute of the dissolution test. Usage of the Nylon filter resulted in a maximum released amount of about 92 % whilst the usage of the PTFE filter resulted in a maximum amount of approximately 98 %. The percentage of released model drug was significantly higher (p<0.05) at all six sampling points for the PTFE filter in comparison to the Nylon filter.
3mL 3mL 3mL 5-2mL 5-2mL 5-2mL70
75
80
85
90
95
100
105
110Recovery(%)
Recovery:0.015mg/mL
NYLON PVDF PTFE

18
Figure 8. Dissolution profiles of Batch 4, obtained by usage of the Nylon and PTFE filters. The error bars represents 95 % confidence intervals, n=3. In conclusion, the highest drug recovery values were obtained by using the PTFE and PVDF filters and saturation of the membrane had no significant (p>0.05) effect on the recovery of these two filter types. To obtain recovery values > 95 % for the Nylon filter, saturation of the membrane surface must be performed. In addition, filtration of purified water resulted in an Ablank < 0.05 for all membrane filters, which ruled out the potential risk of soluble by-products affecting the analytical results.
Determination of sampling intervals Prior to initiation of the dissolution tests, an investigation of the appropriate sampling intervals was performed. Initially, the fraction of released sodium salicylate at the following ten time-points were investigated: 1, 2, 5, 7, 15, 20, 25, 35 and 45 minutes. The dissolution profiles indicated that almost all sodium salicylate had dissolved during the first minute of the dissolution test. In the second analysis, the fraction of released model drug was determined at the following six time-points: 0.5, 1, 1.5, 5, 10 and 20 minutes. The third and last analysis was a repetition of the second one. An overview of the results from all three analyses is plotted in Figure 9.
0
20
40
60
80
100
0 5 10 15 20Fractionofreleasedsodiumsalicylate(%)
Time(minutes)
Batch4-PTFEversusNYLON
PTFE
NYLON

19
Figure 9. Fraction of released sodium salicylate at all investigated time-points in the Determination of sampling intervals procedure. 1A = Analysis 1, 10 sampling points, addition of 3 mL of water after collecting a sample. 1B = Analysis 1, 10 sampling points, no addition of water. 2A = Analysis 2, 6 sampling points, addition of 3 mL of water after collecting a sample. 2B = Analysis 2, 6 sampling points, no addition of water. 3A = Analysis 3 (repetition of analysis 2), 6 sampling points, addition of 3 mL of water after collecting a sample. 3B = Analysis 3 (repetition of analysis 2), 6 sampling points, no addition of water. The results of the experiment indicated that a time-period of 20 minutes was an appropriate duration for the dissolution test since almost all model drug compound had dissolved within the first minutes of the tests. In addition, continuously adding 3 mL of fresh dissolution medium after each sampling point or not, didn’t seem to affect the dissolution profiles in any obvious ways. For convenience, no dissolution medium was therefore added to the vessels in the final dissolution tests.
Dissolution tests
Dissolution profiles Batch 1-6 Table 12 displays the fraction of released sodium salicylate at each sampling point for all batches. The dissolution profiles are also presented in Figure 10. As can be seen in the figure, the dissolution profiles levels off within the first minutes of the dissolution test for all batches. The similarity of the curves makes it difficult to visualize an individual dissolution profile in Figure 10. The dissolution profiles of Batch 1, 2, 3 and 6 were therefore plotted in two separate figures to increase the visibility of these four batches.
0
20
40
60
80
100
0 5 10 15 20 25 30 35 40 45
Fractionofreleasedsodiumsalicylate(%)
Time(minutes)
Analysis1A,1B,2A,2B,3Aand3B
1A 1B 2A 2B 3A 3B

20
Table 12. Fraction of released sodium salicylate (%) at each sampling point for all batches. Results are presented as mean ± SD, n=3.
Fraction of released sodium salicylate (%) [Mean ± SD]
Time (minutes)
Batch 1 Batch 2 Batch 3 Batch 4 Batch 5 Batch 6
0.5 43.9 ± 2.3 56.0 ± 3.9 87.5 ± 1.0 86.2 ± 1.3 86.3 ± 0.3 89.0 ± 2.6 1 74.8 ± 3.4 89.4 ± 4.2 98.1 ± 0.4 97.2 ± 0.5 96.1 ± 0.4 100.4 ± 2.6
1.5 93.9 ± 1.9 97.7 ± 3.7 98.9 ± 0.7 97.9 ± 0.7 97.0 ± 0.2 100.3 ± 2.7 5 99.6 ± 1.0 99.2 ± 4.0 99.0 ± 0.2 97.4 ± 0.9 96.6 ± 0.3 100.4 ± 2.3
10 101.0 ± 1.2 99.6 ± 3.5 99.0 ± 0.6 97.9 ± 0.6 97.0 ± 0.3 100.9 ± 2.5 20 100.2 ± 1.4 99.3 ± 3.8 98.9 ± 0.6 98.1 ± 0.2 96.7 ± 0.1 100.6 ± 2.4
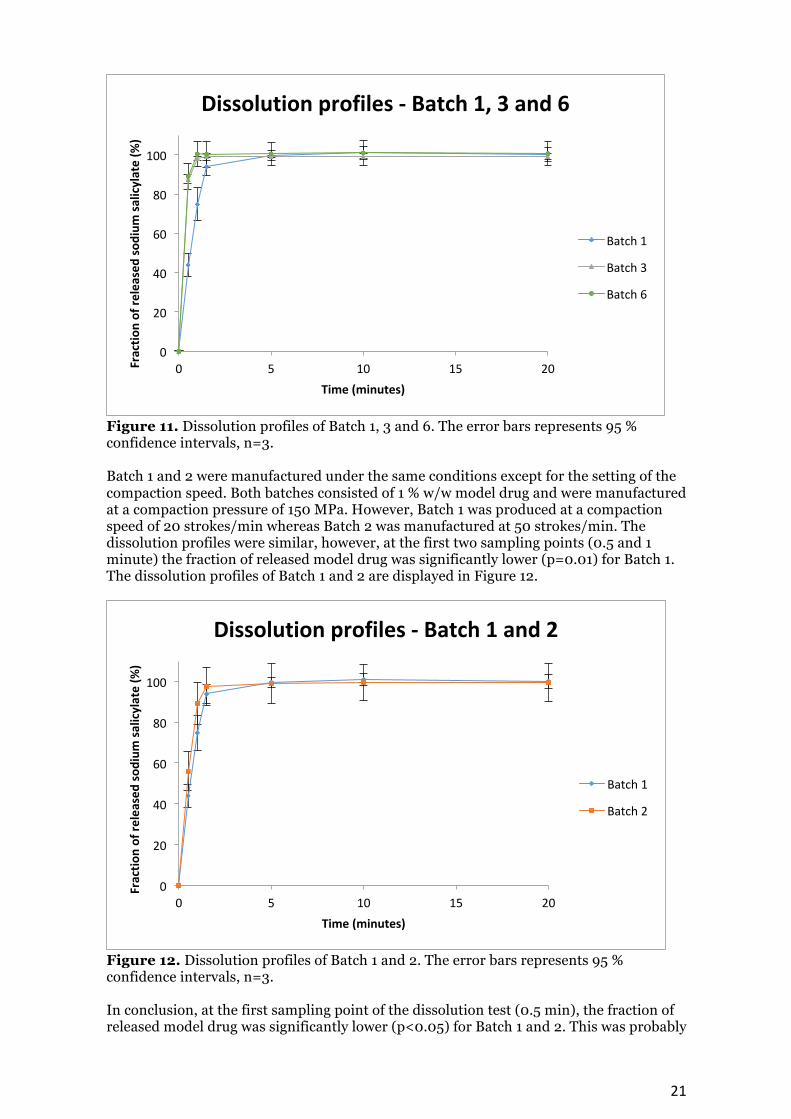
Figure 10. Dissolution profiles of all batches. The error bars represents 95 % confidence intervals, n=3. The dissolution profiles of Batch 1, 3 and 6 are displayed in Figure 11. Batch 1 and 3 consisted of 1 % w/w sodium salicylate, while Batch 6 consisted of the powder mixture with 10 % w/w of model drug. Batch 1 was manufactured at a compaction pressure of 150 MPa while 50 MPa was the pressure used in the production of Batch 3 and 6. All three batches were made with the same compaction speed of 20 strokes/min. At the first two sampling points (0.5 and 1 minute) the fraction of released model drug was significantly lower (p<0.05) for Batch 1 in comparison with Batch 3 and 6. In addition, no significant differences (p>0.05) were confirmed at any sampling points between Batch 3 and 6. These two batches were manufactured with the same pressure and speed, however they consisted of different amounts of model drug.
0
20
40
60
80
100
0 5 10 15 20Fractionofreleasedsodiumsalicylate(%)
Time(minutes)
Dissolutionprofiles-allbatches
Batch1
Batch2
Batch3
Batch4
Batch5
Batch6
21
Figure 11. Dissolution profiles of Batch 1, 3 and 6. The error bars represents 95 % confidence intervals, n=3. Batch 1 and 2 were manufactured under the same conditions except for the setting of the compaction speed. Both batches consisted of 1 % w/w model drug and were manufactured at a compaction pressure of 150 MPa. However, Batch 1 was produced at a compaction speed of 20 strokes/min whereas Batch 2 was manufactured at 50 strokes/min. The dissolution profiles were similar, however, at the first two sampling points (0.5 and 1 minute) the fraction of released model drug was significantly lower (p=0.01) for Batch 1. The dissolution profiles of Batch 1 and 2 are displayed in Figure 12.
Figure 12. Dissolution profiles of Batch 1 and 2. The error bars represents 95 % confidence intervals, n=3. In conclusion, at the first sampling point of the dissolution test (0.5 min), the fraction of released model drug was significantly lower (p<0.05) for Batch 1 and 2. This was probably
0
20
40
60
80
100
0 5 10 15 20Fractionofreleasedsodiumsalicylate(%)
Time(minutes)
Dissolutionprofiles-Batch1,3and6
Batch1
Batch3
Batch6
0
20
40
60
80
100
0 5 10 15 20
Fractionofreleasedsodiumsalicylate(%)
Time(minutes)
Dissolutionprofiles-Batch1and2
Batch1
Batch2

22
due to the compaction pressure, since no other batch was manufactured at the highest pressure of 150 MPa. In general the dissolution profiles of all batches were very similar and no correlations were therefore detected when analyzing the impact of amount of model drug on the dissolution behavior. Additionally, no general correlations were seen when analyzing the impact of compaction speed either. However, a potential reason for the varying results at the first two sampling points between Batch 1-2 could have been the setting of the compaction speed, since Batch 2 were compacted at a higher speed than Batch 1.
Mini paddle equipment versus Conventional paddle equipment The two dissolution profiles of Batch 2, obtained by usage of the mini paddle equipment and the conventional paddle equipment are displayed in Figure 13. In addition, the fraction of released model drug (%) at all sampling points is presented as mean ± SD in Table 13. In general the appearances of the curves were similar, which indicates that the type of equipment had no major impact on the final dissolution profiles. Table 13. Fraction of released sodium salicylate (%) at different sampling points using a mini paddle equipment (250 mL) and a conventional paddle equipment (900 mL). Results are presented as mean ± SD, n=3. Mini-tablets from Batch 2 were used in the tests.
Fraction of released sodium salicylate (%) [Mean ± SD] Time (minutes) Mini paddle equipment (250 mL) Conventional paddle equipment (900 mL)
0.5 56.0 ± 3.9 67.0 ± 3.6 1 89.4 ± 4.2 90.7 ± 1.5
1.5 97.7 ± 3.7 100.4 ± 2.7 5 99.2 ± 4.0 104.7 ± 1.9
10 99.6 ± 3.5 106.0 ± 0.9 20 99.3 ± 3.8 106.4 ± 1.6
Figure 13. Dissolution profiles of Batch 2, using both a mini paddle equipment (250 mL) and a conventional paddle equipment (900 mL). The error bars represents 95 % confidence intervals, n=3.
0
20
40
60
80
100
0 5 10 15 20
Fractionofreleasedsodiumslaicylate(%)
Times(minutes)
Dissolutionprofiles:Minipaddle(250mL)versusConventionalpaddleequipment(900mL)
250mL
900mL

23
Discussion Manufacturing process and Storage conditions The shape of the mini-tablets was cylindrical and this made the units look like pellets rather than conventional tablets. The batches were manufactured at 50 or 150 MPa, but higher settings have been used in other studies [12,29]. The reason for not choosing compaction pressures of several hundreds of MPa was the desire to produce orally disintegrating mini-tablets (ODMTs). Using a high pressure will theoretically not facilitate a rapid disintegrating which is a characteristic feature of ODMTs, since the mini-tablets then will be composed of a very compressed material. However, it is reasonable to assume that higher pressures could have been used in the manufacturing process of this present study, since all units compacted at 50 MPa became very fragile, which in general complicated the possibility of performing the tablet characterization tests. The compaction pressure varied slightly between each stroke and the units within each batch were submitted to different compaction pressures during the manufacturing process. The largest differences were detected for the batches produced at 150 MPa (see Table 4). By using a multi-tip tool, it is not possible to record the individual compaction pressure of each unit. With a single-tip tool this would be possible, however, that would decrease the yield of the manufacturing process and also increase the risk of punch overload. Maintaining an even compaction pressure throughout the manufacturing process is desirable, since inter-individual differences in tablet characteristics otherwise could occur between the units within the same batch. When working with the powder mixture that contained 10 % w/w of model drug, the tablet press reached its maximum ejection force, which resulted in discontinuation of the manufacturing process. Both disassembling and cleaning of the dies and the upper and lower punch led to no further improvement. The adhesion and friction properties as well as the flowability of the powder blend are important factors for the manufacturing process [30]. If the friction in the process is too high, it may have a negative impact on the quality of the final products, or even result in discontinuation of the process. When using a multi-tip tool, the total friction of the process is recorded during each stroke. This may complicate the tableting process since the tablet press can reach its maximum ejection force, even if the individual friction of each unit is below the highest limit. A lubricant is almost always included in tablet formulations to ensure a low friction between the powder blend and the tools of the tablet press [30]. Increasing the amount of lubricant in the powder blends could perhaps have improved the tableting operation in the present study. However, too much lubricant will reduce the strength of the tablet since the lubricant may interfere with the inter-particulate bonds of the tablet [30]. Due to the limited time-period of the present study, an optimization of the powder blends was not performed. In other studies on mini-tablets, the researchers have stored the units in a controlled environment regarding temperature and relative humidity (RH) [8,14]. In the present study, the mini-tablets were not stored in a controlled environment and the temperature and relative humidity varied between 20.4-21.4 °C and 10-34 % RH during the time of storage. In future studies, care should be taken considering the storage conditions since both the temperature and relative humidity can have an impact on the stability and the properties of the dosage form. As an example, high temperatures can affect the degradation rate of certain formulations [31]. In addition, the tensile strength can be reduced if the unit is stored at a moderately high relative humidity, since adsorbed water in gaseous phase then can condense in to liquid water in the pores of the tablet.

24
Homogeneity of powder mixtures and Content uniformity of mini-tablets. As can be seen in the SEM-images of Prosolv ODT and sodium salicylate, both materials consisted of a wide variety of particle sizes (see Figure 1 and Appendix A). For a powder blend consisting of a wide variety of particle sizes, demixing or segregation may occur in the mixing step due to variations in the properties of the particles [32]. For such formulations, the mixing time is crucial. A sufficient homogeneity may be obtained within certain duration of mixing time and after that, further mixing will result in segregation of the powder blend. When analyzing the initial results of content uniformity, the homogeneity of the tablet batches containing 1 % w/w of sodium salicylate was insufficient. Segregation is a possible explanation for these results. In a study by Hagen et al. [11], the researchers also produced mini-tablets containing 1 % w/w of sodium salicylate. However, in their study both the powder mixture and the mini-tablets displayed a high homogeneity. In the manufacturing process of their study, the materials were sieved prior to the mixing step. It is reasonable to assume that the sieving step contributed to an even particle size distribution and thereby a high homogeneity for both the mini-tablets and the powder mixture. Furthermore, the dies were manually filled with the powder prior to compaction, which may also have contributed to a higher homogeneity of the mini-tablets. For the tests of content uniformity, the Ph.Eur. specifies; If one unit displays an individual content which deviates more than 15 % from the average content of the batch, or if a batch displays an AV value > 15, further tests are performed on additional 20 units [19,20]. Compliance with the additional tests results in approval of the batch regarding uniformity of content of single-dose preparations (2.9.6) and uniformity of dosage units (2.9.40). Since the availability of the PTFE filter was limited it was not possible to perform the additional tests on the batches that displayed insufficient results in the initial ones. The additional tests must be performed in order to determine whether the batches actually failed or passed the tests for content uniformity. Furthermore, the two mini-tablet batches containing 10 % w/w of model drug displayed a sufficient homogeneity and passed both the test for uniformity of content of single dose preparations (2.9.6) and uniformity of dosage units (2.9.40). This was not unexpected, since it theoretically will be easier to obtain a sufficient homogeneity for a mini-tablet that contains a higher amount of model drug.
Radial tensile strength When determining the radial tensile strength (RTS), it was only measurable on mini-tablets from Batch 1 and 2, which were manufactured at the highest compaction pressure of 150 MPa. Similar results were obtained in a study by Tissen et al. [14], were an increasing compaction pressure resulted in an increasing RTS. During the manufacturing process, the compaction pressure causes volume reduction of the powder blend [33]. The particles are brought into closer proximity and inter-particulate bonds are formed. The strength of the tablet is dependent of the strength of the bonds. Generally, tensile strength increases initially with increasing compaction pressure. Depending on the characteristics of the tablet the tensile strength can continue to increase, level off or decrease at higher compaction pressures. The presence of defects in the tablet is usually the reason for a decreasing tensile strength seen at higher compaction pressures. Additionally, the tablet strength is also affected by the mechanical properties of the material. Mechanical properties such as low brittleness, low elasticity and high ductility are factors that generally favor the formation of tablets with high mechanical strength [34]. By knowing the mechanical properties of different materials, estimations of the relationship between compaction pressure and tablet strength can be made.

25
Several studies have measured the fracture force on a texture analyzer instead of the hardness tester used in this present study [8,11,14]. According to Stoltenberg et al. [8], the sensitivity of a texture analyzer is greater than the sensitivity of other types of hardness testers. This type of laboratory equipment was not available at the time of this present study. However, using a texture analyzer in future characterization tests could improve measurability and increase the sensitivity when determining the fracture force of mini-tablets.
Friability The friability test was only performed on Batch 1 and 2, which both passed the test with a final weight loss of < 1 %. The mini-tablets from the other batches were very fragile and it was therefore obvious that these batches wouldn’t pass the test. As previously discussed, Batch 1 and 2 were manufactured at a higher compaction pressure which resulted in a greater strength and resistance to attrition for these batches. According to the Ph.Eur., a sample size of 6.5 grams must be used in the friability test when the individual mass of one unit is ≤ 650 mg [22]. Due to the low weight of the mini-tablets (approximately 10 mg each), it was not possible to obtain that quantity of mini-tablets in the present study. However, the method used in the present study has been used before in a previous study on mini-tablets of prednisone [15]. In the present study, six grams of glass beads were inserted into the friabilator together with the mini-tablets. According to Rumondor et al. [2], the conventional friability test described in the pharmacopoeias can be used on mini-tablets. However, the authors state that the obtained results might be misleading. Due to the low weight of the mini-tablets, this dosage form is predisposed to static build up. The authors state that this may result in inaccurate tumbling in the friability apparatus, which can affect the reliability of the results. To solve this problem, a known amount of glass beads can therefore be introduced in to the drum and rotate together with the mini-tablets during the test. According to the authors, increasing the number of rotations is another possible solution to this problem [2].
Disintegration All batches passed the disintegration test and there was a significant difference (p<0.05) in disintegration time between the batches produced at 50 or 150 MPa (see Figure 4). The longest disintegration times were detected for the batches produced at 150 MPa. These observations were in accordance with the results of a study on conventional tablets by Riippi et al. [35]. In their study the researchers found an almost linear correlation between an increasing compaction pressure and an increase in disintegration time. According to Aulton et al. [36], the disintegration time is dependent on the tablet composition and the conditions of the manufacturing process. Therefore, an increasing compaction pressure can either increase or decrease the disintegration time of a certain formulation. Produced at the higher pressure of 150 MPa, it is reasonable to assume that the mini-tablets in the present study were more compressed which made it more difficult for the disintegration-liquid to penetrate the pores of the mini-tablet and thereby facilitate tablet disintegration. The disintegration method used in this present study is a potential method for future characterization tests on mini-tablets. By using the method from Hagen et al. [11] it was possible to determine the time until complete disintegration of each unit, which in turn made it possible to compare the disintegration times of different batches. Due to the large volume of liquid in the conventional test, it is reasonable to assume that it would be challenging to visually determine the time until complete disintegration for small sized mini-tablets, by using the conventional disintegration apparatus. When performed in vivo, the disintegration of ODMTs begins in the oral cavity. The normal pH value of saliva ranges from 6.2-7.6 and a buffer solution with a pH value of 6.8 was therefore used to mimic the physiological environment of the human mouth [37]. However, as stated by Hagen et al. [11], 40 mL of phosphate saline buffer is a

26
considerably larger volume of liquid than the amount of saliva present in the human mouth. In addition, the use of a petri dish will not simulate the environmental conditions and movements of the human mouth. However, as stated by Aulton et al. [38], creating correlations with in vivo behavior is usually not fundamental when establishing a disintegration test. Displaying a disintegration time within the specification is not a guarantee for desirable behavior in vivo, concerning the release and absorption profile. However, a batch that fails to meet the specification is assumed to exhibit an inefficient behavior in vivo as well.
Evaluation of membrane filters The drug binding-tendency was studied using three different filter types (PTFE, PVDF and Nylon), and the one´s included in this study together with seven others were also included in a study by Kiehm et al. [25]. In the latter study, acetylsalicylic acid and prednisolone were used as model drugs and stock solutions of each substance were prepared in different buffer solutions with varying pH-values. The results of this present study are similar to the results obtained in the study by Kiehm et al [25]. The lowest recoveries were obtained with the Nylon filters whereas both the PVDF and PTFE filters displayed high drug recovery values (> 95 %) in all investigated cases. Nylon is a polyamide membrane, and had the highest drug-binding tendency of the three filter materials included in the present study. Nylon can interact with both basic and acidic compounds by forming strong hydrogen bonds with the substance [13]. This is possible since Nylon consists of both a carboxylic acid group and an amino group. The material can also interact electrostatically with the analyte depending on the pH-value of the dissolution medium. As opposed to Nylon, the drug binding tendency of PTFE and PVDF are minor as neither of these materials interact with analytes according to the above-mentioned principles. According to Appelblad [13], one method to reduce the drug-binding tendency of a filter is flushing the membrane with the sample prior to the filtration step. By using 3-5 mL of the sample, the membrane becomes saturated and that may reduce the risk of inaccurate results. According to Kiehm et al. [25], saturation of the membrane resulted in a drug recovery of > 95 % for all filters, except for the Nylon filters from all suppliers when filtrating the prednisolone solutions. In the present study, discarding the first two mL of sample volume resulted in a drug recovery of > 95 % for the Nylon filter with both concentrations. These results were significantly higher (p<0.05) than the recoveries obtained with no discarded sample volume. However, saturation of the PTFE and PVDF filters had no significant effect (p>0.05) on the drug recovery and due to these results, no sample volume was therefore discarded in the dissolution tests. In addition, Kiehm et al. [25] obtained similar results in their study. For both solutions (0.005 and 0.015 mg/mL), the drug recoveries of PVDF and PTFE were significantly higher (p<0.05) than the recovery of Nylon when no sample volume was discarded. The drug binding-tendency of a material is more critical for samples containing a low amount of model drug. In such situations, a small fraction of bonded drug will have a greater impact on the results in comparison to if the sample contains a high amount of substance. All measurements were made in triplicates and the variance between the results affected the width of the resulting confidence intervals. Additional replicates could have been taken to further increase the reliability and accuracy of the obtained results. The higher drug-binding tendency of the Nylon filter was also confirmed when comparing the dissolution profiles obtained for both the PTFE and Nylon filters. The dissolution profile of Nylon was significantly lower (p<0.05) than the dissolution profile of PTFE at all six sampling points when no sample volume was discarded. To increase the drug recovery of the Nylon filter, a defined aliquot of initial sample volume should first be discarded. Therefore, other types of filtration devices (PTFE or PVDF) without the need of membrane saturation would be preferred in dissolution testing. Using a filtration device where saturation of the membrane is unnecessary will minimize the sample loss. This is
27
desirable in situations where the amount of sample and active substance is limited, for example at the early stages of formulation development. In addition, being able to omit the saturation step will simplify the dissolution procedure. This has also been declared in another study [39]. In conclusion, the PVDF and PTFE filters are appropriate filtration devices with low drug-binding tendencies. No saturation of these membranes is necessary to perform prior to the sample analysis. However as stated by Appelblad [13], it is important to take into consideration both the physical and chemical characteristics of the substance and also the characteristics of the membrane when performing the filtration step prior to sample analysis. In the dissolution procedure it is therefore important to always evaluate the filter material. Minimizing the risk of drug-adsorption will increase the likelihood of obtaining reliable and accurate results in the dissolution test.
Dissolution In the USP monograph for conventional tablets of sodium salicylate, the dissolution medium is 900 mL of water with a temperature of 37 °C [28]. In addition, the conventional test is performed on the basket apparatus (referred to as Apparatus 1) with a rotational speed of 100 rpm. The dissolution testing procedure in this present study was influenced by the guidelines stated in the USP monograph. However, modifications and alterations were made in attempt to adjust the procedure for mini-tablets and available laboratory equipment. The mini-tablets displayed a very rapid dissolution, probably due to the high water solubility of sodium salicylate and the use of Prosolv ODT, which facilitated a rapid disintegration of the units. The appearances of the curves were similar, even though three out of six batches displayed insufficient results in the initial tests for content uniformity and uniformity of dosage units. The reason for the similarities of the curves was probably due to the usage of multiple units in the dissolution tests. By usage of multiple units, the higher content of one unit will compensate for the lower content of another. Therefore, all batches reached a maximum amount of released model drug of approximately 100 %. However, in the conventional dissolution test, the maximum amount of released model drug was approximately 106 %. In this procedure about 45 units were included in each analysis (approximately 30 units in the other dissolution tests). Most likely, these units contained more than the theoretical amount of model drug, and the curve therefore reached a maximum released amount of > 100 %. The reason for including several units in each analysis was the desire to obtain detectable values at each sampling point throughout the dissolution test. Due to the low amount of model drug in each mini-tablet, it was not possible to perform the tests on single units. If each test was performed with one mini-tablet, all samples would have a very low concentration of model drug and it would therefore be impossible to quantify the amount of released sodium salicylate by UV-spectrophotometry. Furthermore, an extensive decrease in the amount of dissolution medium was also not possible to perform, since a sufficient amount of liquid is required in each vessel in order to ensure sufficient mixing of the dissolution medium. It was not necessary to replace the withdrawn liquid from the dissolution vessels with fresh dissolution medium. Instead, the gradual volume reduction was compensated for in the calculation procedure. The risk of not replacing withdrawn samples with fresh dissolution medium is the risk of not maintaining sink conditions throughout the entire dissolution test. To achieve sink conditions, the concentration of drug in the dissolution medium must never exceed 10 % of the solubility of the drug [40]. Obtaining and maintaining sink conditions during dissolution testing is crucial, since the results of the dissolution test then will become more reproducible and accurate. At a temperature of 20°C, the water solubility of sodium salicylate is 1000g/L, which is equal to 1 g/mL [41]. Sink conditions was therefore maintained during the entire dissolution test, even if the

28
volume of dissolution medium had decreased from 250 mL to 232 mL at the end of the test. In a study by Klein et al. [42] several dissolution tests were performed on eight different substances by usage of a standard paddle apparatus (DT 706 HH, Erweka, Heusenstamm Germany) and a mini paddle apparatus (modified DT 600 HH, Erweka, Heusenstamm Germany). The aim of the study was to evaluate whether the mini-paddle apparatus, a scaled down version of the standard paddle, could be used as a dissolution-testing device without losing the consistency and accuracy of the conventional equipment. The mini paddle apparatus used in the study was scaled down to 1/3 of the dimensions of the conventional paddle equipment described in the USP [26]. The tests were performed on various stirrings speeds and different volumes of dissolution medium. The results of the study indicated that there were similarities in hydrodynamic conditions between the two apparatuses and it is therefore possible to perform dissolution tests under scaled down conditions. The authors concluded that the mini paddle apparatus used in the study could serve as a useful dissolution-testing device under standardized test conditions. Additionally, the authors suggested that the equipment mainly should be used in dissolution tests on multi-particulate dosage forms, powders and for small sized tablets and capsules. Results from this present study showed that the type of dissolution apparatus did not affect the dissolution profile. Similar results were obtained with both the mini paddle and the conventional equipment. Hence, mini paddle apparatus can be recommended in future dissolution tests on mini-tablets. As stated by Klein et al. [42], performing a dissolution test with the standard apparatus can require a large sample size and a large volume of dissolution medium. This can result in a potential problem in situations where the amount of active ingredient is limited, which is often the case during early stage development, for instance. By using a scaled down version of the standard equipment, reduced amounts of both the sample size and dissolution medium may be required. However, using a reduced amount of dissolution medium may not always be suitable due to the desire to obtain sink conditions. Poorly soluble drugs can require large volumes of dissolution medium and in such situations, the standard paddle equipment could be preferred. However, using a large amount of liquid may result in a very diluted sample if the test is performed on a single unit. This could complicate the quantification process if the analysis is performed by UV-spectrophotometry. Under such circumstances, the usage of HPLC could provide a greater sensitivity to the analysis [43]. In addition to using a larger volume of dissolution medium, addition of surfactants can enhance the drug solubility in certain buffer solutions. Several aspects are considered when selecting the type of dissolution medium [40]. It should preferably be inexpensive and easily prepared. In addition, the medium must not affect the stability of the investigated drug. Most dissolution mediums are buffers. In the present study the dissolution medium was water, in accordance with the dissolution procedure for conventional tablets of sodium salicylate [28]. Water is usually not preferred due to its varying quality and inability to withstand pH-changes during the run [40,43]. However, as stated in the USP, use of water is justified when the dissolution behavior of the substance is independent of the pH of the dissolution medium [43]. The impact of various stirring speeds was investigated in the study by Klein et al. [42]. A stirring speed of 50 rpm resulted in coning (mounding) on both equipment and the researchers concluded that higher stirring speeds are required to obtain accurate dissolution profiles, especially for poorly soluble drugs. These results were in accordance with the guidelines stated by the USP; increasing the stirring speed from 50 to 75 rpm can reduce the coning tendency for dosage units that are subjected to coning at 50 rpm [43]. However the usage of stirring speeds outside the limits of 25-125 rpm are usually not recommended since stirring too slow or too fast can result in mixing incompatibilities.
29
In the study by Klein et al. [42], the similarity factor (f2) was calculated to evaluate the similarities of the dissolution profiles obtained by usage of the mini paddle or standard paddle equipment. An f2 value ≥ 50 (50 to 100) confirms the similarity of the curves and they are considered to be equivalent [44]. According to the USP [43], calculating the f2 value is not useful in situations where > 85 % of the dosage form has dissolved within 15 minutes of the dissolution test. The similarity factor was therefore not calculated in the present study since > 85 % of the model drug had dissolved after the first minutes of the dissolution tests. Additional studies are required to further evaluate the equivalence between dissolution profiles of the mini paddle and standard paddle apparatus. Future studies must be performed on mini-tablets with a slower dissolution, since the rapid dissolution seen in this present study excluded the possibility of calculating the similarity factor (f2).
Future recommendations Mini-tablets are a promising dosage form for pediatrics and the use and manufacturing of this dosage form are expected to increase in the coming years. Development of orally disintegrating mini-tablets (ODMTs) could serve as useful formulations in situations were a rapid onset of effect is desirable, for instance in the treatment of pain. When supplying pharmaceuticals to developing countries, solid dosage forms displays superior characteristics in comparison to liquid formulations [8]. For instance, the high temperatures in certain climate zones could have a negative impact on the stability of liquid formulations. In addition, high transportation and storage costs are also associated with this dosage form. In the present study the impact of compaction pressure, amount of model drug and compaction speed was investigated. Only the batches produced at 150 MPa were subjected to all characterization tests. The batches produced at 50 MPa were very fragile and even with an appropriate package presentation both handling and transportation of these units would be problematical. The fragileness of these batches therefore made them unsuitable as pharmaceutical dosage forms. In the analytical procedures, sodium salicylate was detected by UV-spectrophotometry. The mini-tablets contained different excipients and sodium salicylate was the only compound to be detected at 295 nm. However, this was only theoretically determined by using the available information in the USP. Background measurements could have been performed by using samples with all components except for the model drug, to investigate the potential risk of other components being detected at the same wavelength and thereby affecting the results. Performing background measurements must be performed in future studies to increase the reliability of the analytical results. Various types of disintegration methods have been used in different studies on mini-tablets. To further evaluate the appropriateness of the disintegration procedure used in the present study, a comparison of different methods can be conducted in future characterization studies of mini-tablets. This will allow possibilities to compare the results of different procedures and evaluate and compare the time, cost and reproducibility associated with each method. Furthermore, the same researcher performed all the disintegration tests in this present study. The method from Hagen et al. [11] is based on visual detection and to further evaluate the suitability of that method, additional tests must be performed by several individuals to rule out the potential risk of inter-individual differences in the determination of complete disintegration time. A mini paddle apparatus was used in this study for the dissolution tests, however this type of equipment is not described by the USP and a performance verification test is not available for this apparatus [42]. Up to today (2019) the availability of dissolution studies on mini-tablets are limited. In general, there is an insufficient availability of standardized evaluation procedures regarding this dosage form [17]. Additional studies are required in this research area for developing regulatory guidelines on dissolution testing of mini-tablets. As an example, an evaluation of the impact of various stirring speeds must be
30
made in future dissolution tests on mini-tablets to obtain the most accurate dissolution profile of the investigated drug. Importantly, it will not be possible to develop a universal dissolution method regarding mini-tablets as a dosage form. As for conventional tablets, selecting the volume and type of dissolution medium, stirring speed and type of filter material for the filtration step, are factors all dependent of the physical and chemical characteristics of the substance and the dosage form. However, assessing the quality of the product is a key feature of the manufacturing process and it is essential to ensure the safety and efficacy of the dosage form.
Conclusion The compaction pressure had the greatest impact on the characteristics of the mini-tablets. The batches produced at 150 MPa had a sufficient resistance to attrition and exhibited measurable values of the radial tensile strength. In addition, these batches displayed the longest disintegration times, however within the specification of three minutes. No correlations were detected when analyzing the impact of compaction speed or the impact of amount of model drug on the tablet characteristics. The type of filter material may have an impact on the results of the dissolution test. The PVDF and PTFE filter membranes are appropriate filtration devices with low drug-binding tendencies. Saturation of the PVDF and PTFE filters had no significant effect (p>0.05) on the drug recovery. On the contrary, the first two mL of sample volume must be discarded to obtain acceptable recovery values for the Nylon filter. The drug binding-tendency of a material is crucial when filtering a sample that contains a low concentration of model drug. A small fraction of bonded drug will then have a greater impact on the results in comparison to if the sample contains a high amount of the substance. The PVDF and PTFE used in this present study can be recommended for usage in future dissolution tests. However, the physical and chemical characteristics of the substance and the characteristics of the membrane must always be evaluated prior to the filtration procedure. The disintegration method used in the present study is a potential method for future characterization tests on mini-tablets. Comparing the time, cost and reproducibility of different methods must be made in future studies to further evaluate the suitability and accuracy of the disintegration method used in this present study. The mini paddle apparatus can be recommended for future characterization tests on mini-tablets. Usage of the mini paddle or standard paddle equipment had no impact on the dissolution profile. Due to the smaller volume of the mini vessels, the mini paddle apparatus should preferably be used for freely soluble drugs that require reduced volumes of dissolution medium for obtaining sink conditions. Development of a dissolution method is dependent on the characteristics of the investigated drug. It is important to assess the physical and chemical characteristics of the mini-tablet when determining the different settings of the dissolution test.
Acknowledgements The author gratefully acknowledges Sofia Mattsson and Patrik Appelblad for their valuable comments and opinions throughout this project. Additional thanks to The National Microscopy Infrastructure (NMI), Cheng Choo Lee and Chau Huynh at the Department of Chemistry, Umeå University, for help with SEM-images and BET-analysis. The author would also like to thank JRS Pharma for providing Prosolv ODT.

31
References 1. Aleksovski A, Dreu R, Gašperlin M, Planinšek O. Mini-tablets: a contemporary
system for oral drug delivery in targeted patient groups. Expert Opin Drug Deliv. 2015 Jan;12(1):65-84.
2. Rumondor A, Harris D, Flanagan F, Biyyala V, Johnson MA, Zhang D, et al. Minitablets: Manufacturing, Characterization Methods, and Future Opportunities. American Pharmaceutical Review. https://www.americanpharmaceuticalreview.com/Featured-Articles/190921-Minitablets-Manufacturing-Characterization-Methods-and-Future-Opportunities/, [published 2016-07-30, cited 2018-10-12].
3. Orfiril long. Fass.se Läkemedelsindustriföreningen, LIF.
https://www.fass.se/LIF/result?userType=0&nplId=19970919000027,19970919000034,20000225000018,20000225000025&query=Orfiril+long, [cited 2018-10-12]
4. Mitra B, Chang J, Wu SJ, Wolfe CN, Ternik RL, Gunter TZ, et al. Feasibility of
mini-tablets as flexible drug delivery tool. Int J Pharm. 2017 Jun 15;525(1):149-159.
5. Martínez-Terán ME, Hoang-Thi TH, Flament MP. Multi-Particulate Dosage
Forms for Pediatric Use. Pediar Ther. 2017;7(1).
6. The EU Paediatric Regulation in 5 minutes. EMA.europa.eu. https://www.ema.europa.eu/documents/presentation/presentation-european-union-paediatric-regulation-5-minutes-paolo-tomasi_en.pdf [published 2015-06-29, cited 2018-11-06].
7. Spomer N, Klingmann V, Stoltenberg I, Lerch C, Meissner T, Breitkreutz J.
Acceptance of uncoated mini-tablets in young children: results from a prospective exploratory cross-over study. Arch Dis Child. 2012 Mar;97(3):283-6.
8. Stoltenberg I, Breitkreutz J. Orally disintegrating mini-tablets (ODMTs)—a novel
solid oral dosage form for paediatric use. Eur J Pharm Biopharm. 2011 Aug;78(3):462-9.
9. Council of Europe, & European Pharmacopoeia Commission. 2.9.1. Disintegration
of tablets and capsules. In: PhEur 9th Edition 2018 (9.3).
10. The United States Pharmacopeial Convention. <701> Disintegration. In: USP-NF Online 2018.
11. Hagen E, Sandberg Loding F, Mattsson S, Tho I. Use of interactive mixtures to
obtain mini-tablets with high dose homogeneity for paediatric drug delivery. Journal of Drug Delivery Science and Technology. 2016;34:51-59.
12. Soulairol I, Chaheen M, Tarlier N, Aubert A, Bataille B, Sharkawi T. Evaluation of
disintegrants functionality for orodispersible mini tablets. Drug Dev Ind Pharm. 2017 Nov;43(11):1770-1779.
13. Appelblad P. Complete solutions for Dissolution Testing [Internet]. Merck
Millipore;2015 [cited 2018-10-18]. Available at: http://www.merckmillipore.com/SE/en.
14. Tissen C, Woertz K, Breitkreutz J, Kleinebudde P. Development of mini-tablets
with 1mm and 2mm diameter. Int J Pharm. 2011 Sep 15;416(1):164-170.

32
15. Lou H, Liu M, Wang L, Mishra SR, Qu W, Johnson J, et al. Development of a
mini-tablet of co-grinded prednisone-Neusilin complex for pediatric use. AAPS PharmSciTech. 2013 Sep;14(3):950-8.
16. Berthelsen R, Sjögren E, Jacobsen J, Kristensen J, Holm R, Abrahamsson B, et al.
Combining in vitro and in silico methods for better prediction of surfactant effects on the absorption of poorly water soluble drugs- a fenofibrate case example. Int J Pharm. 2014 Oct 1;473(1):356-65.
17. Gaber DM, Nafee N, Abdallah OY. Mini-tablets versus pellets as promising
multiparticulate modified release delivery systems for highly soluble drugs. Int J Pharm. 2015 Jul 5;488(1-2):86-94.
18. Council of Europe, & European Pharmacopoeia Commission. 2.9.5. Uniformity of
mass of single-dose preparations. In: PhEur 9th Edition 2018 (9.3).
19. Council of Europe, & European Pharmacopoeia Commission. 2.9.6. Uniformity of content of single-dose preparations. In: PhEur 9th Edition 2018 (9.3).
20. Council of Europe, & European Pharmacopoeia Commission. 2.9.40. Uniformity
of dosage units. In: PhEur 9th Edition 2018 (9.3).
21. Fell JT, Newton JM. Determination of tablet strength by the diametral-compression test. J Pharm Sci. 1970 May;59(5):688-91.
22. Council of Europe, & European Pharmacopoeia Commission. 2.9.7. Friability of
uncoated tablets. In: PhEur 9th Edition 2018 (9.3).
23. Council of Europe, & European Pharmacopoeia Commission. 4.1.3. Buffer solutions. In: PhEur 9th Edition 2018 (9.3).
24. Council of Europe, & European Pharmacopoeia Commission. Tablets. In: PhEur
9th Edition 2018 (9.3).
25. Kiehm K, Dressman JB. Evaluation of Drug Adsorption to Membrane Filters under Biowaiver Test Conditions. Dissolution Technologies. 2008 Nov; 15(4):13-17.
26. The United States Pharmacopeial Convention. <711> Dissolution. In: USP-NF
Online 2018.
27. Council of Europe, & European Pharmacopoeia Commission. 2.9.3. Dissolution test for solid dosage forms. In: PhEur 9th Edition 2018 (9.3).
28. The United States Pharmacopeial Convention. Sodium Salicylate Tablets. In: USP-
NF Online 2018.
29. Yeleken G, Kotlowska H, Sznitowska M, Golenia E, Ustenova G. Development of Direct Compressed Loratadine Minitablets. J. Pharm. Sci. & Res. 2017;9(4);401-406.
30. Aulton ME, Taylor K MG, editors. Aulton’s Pharmaceutics the design and
manufacture of medicines. 4th ed. Churchill Livingstone Elsevier; 2013. s. 510,517.
31. Aulton ME, Taylor K MG, editors. Aulton’s Pharmaceutics the design and manufacture of medicines. 4th ed. Churchill Livingstone Elsevier; 2013. s. 840,543.

33
32. Aulton ME, Taylor K MG, editors. Aulton’s Pharmaceutics the design and manufacture of medicines. 4th ed. Churchill Livingstone Elsevier; 2013. s. 178-179.
33. The United States Pharmacopeial Convention. <1062> Tablet Compression
Characterization. In: USP-NF Online 2018.
34. Kolakovic R, Peltonen L, Laaksonen T, Putkisto K, Laukkanen A, Hirvonen J. Spray-dried cellulose nanofibers as novel tablet excipient. AAPS PharmSciTech. 2011 Dec;12(4):1366-73.
35. Riippi M, Antikainen O, Niskanen T, Yliruusi J. The effect of compression force on
surface structure, crushing strength, friability and disintegration time of erythromycin acistrate tablets. Eur J Pharm Biopharm. 1998 Nov;46(3):339-45.
36. Aulton ME, Taylor K MG, editors. Aulton’s Pharmaceutics the design and
manufacture of medicines. 4th ed. Churchill Livingstone Elsevier; 2013. s. 520-521.
37. Baliga S, Muglikar S, Kale R. Salivary pH: A diagnostic biomarker. J Indian Soc Periodontol. 2013 Jul-Aug; 17(4):461-465.
38. Aulton ME, Taylor K MG, editors. Aulton’s Pharmaceutics the design and
manufacture of medicines. 4th ed. Churchill Livingstone Elsevier; 2013. s. 528-529.
39. Lindenberg M, Wiegand C, Dressman JB. Comparison of the Adsorption of
Several Drugs to Typical Filter Materials. Dissolution Technologies. 2005 Feb; 12(1):22-25.
40. Aulton ME, Taylor K MG, editors. Aulton’s Pharmaceutics the design and
manufacture of medicines. 4th ed. Churchill Livingstone Elsevier; 2013. s. 618.
41. Safety Data Sheet. Merckgroup.com. Merck Chemicals and Life Science AB. http://www.merckmillipore.com/INTERSHOP/web/WFS/Merck-BE-Site/fr_FR/-/EUR/ShowDocument-File?ProductSKU=MDA_CHEM-106601&DocumentType=MSD&DocumentId=106601_SDS_SE_SV.PDF&DocumentUID=366877&Language=SV&Country=SE&Origin=null&Display=inline [revised 2018-07-31, cited 2018-12-03].
42. Klein S, Shah VP. A standardized mini paddle apparatus as an alternative to the
standard paddle. AAPS PharmSciTech. 2008;9(4):1179-84.
43. The United States Pharmacopeial Convention. <1092> The Dissolution Procedure: Development and Validation. In: USP-NF Online 2018.
44. The United States Pharmacopeial Convention. <1090> Assessment of drug
product performance-bioavailability, bioequivalence, and dissolution. In: USP-NF Online 2018.

34
Appendices Appendix A: Scanning Electron Microscopy (SEM)- images.
Figure A1. SEM-image taken at 150 x magnification; powder mixture of 1 % w/w sodium salicylate.

35
Figure A2. SEM-image taken at 150 x magnification; powder mixture of 1o % w/w sodium salicylate.
Figure A3. SEM-image taken at 150 x magnification; Prosolv ODT.
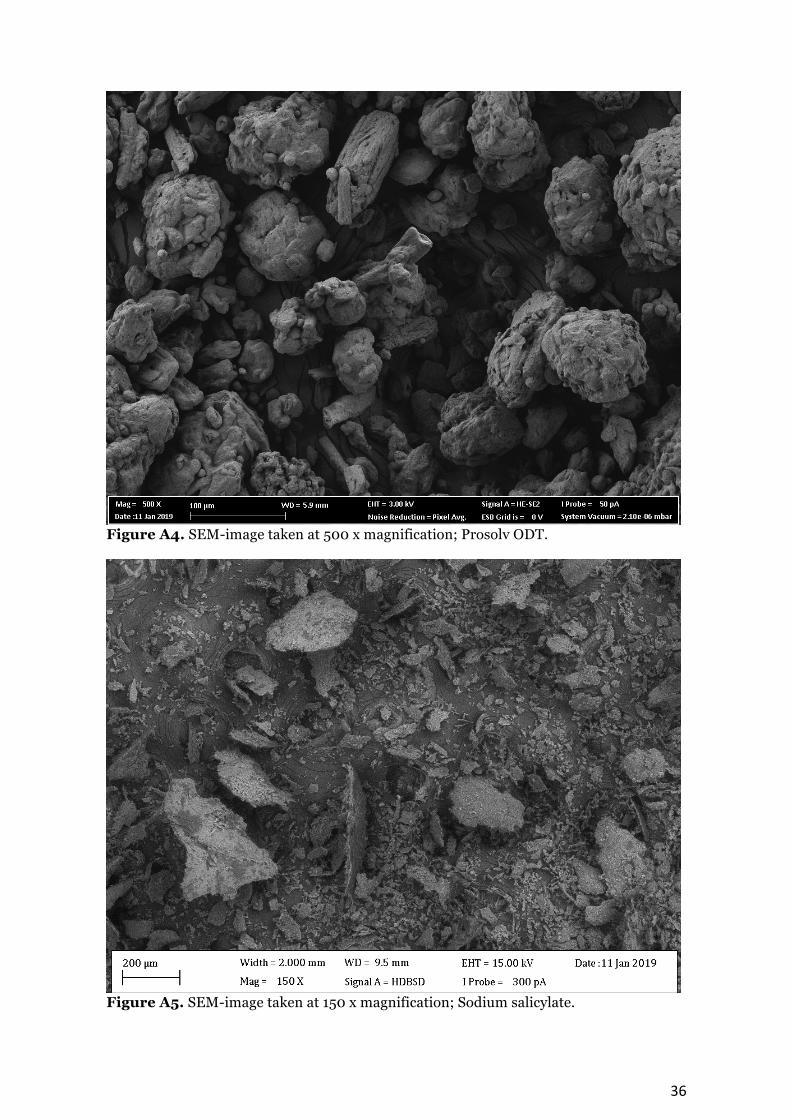
36
Figure A4. SEM-image taken at 500 x magnification; Prosolv ODT.
Figure A5. SEM-image taken at 150 x magnification; Sodium salicylate.

37
Appendix B: Uniformity of mass - weight of individual units.
Weight of individual units in milligram (mg)
Sample Batch 1 Batch 2 Batch 3 Batch 4 Batch 5 Batch 6
1. 10.4 10.5 10.7 10.4 8.9 9.6
2. 10.4 10.7 10.8 10.5 9.2 9.4
3. 10.8 10.5 10.5 10.4 8.7 9.1
4. 10.8 10.4 10.8 10.3 8.8 9.1
5. 10.5 10.8 10.7 10.7 8.8 9.1
6. 10.7 10.4 10.7 10.5 8.3 9.5
7. 10.7 10.5 10.6 10.3 9 9.5
8. 10.7 10.3 10.7 10.2 8.6 9.1
9. 10.6 9.9 10.6 10.2 9 9.2
10. 10.6 10.5 9.9 10.3 9 9.3
11. 10.4 10 10.8 10.4 9.1 9.3
12 10.6 10.5 10 10.4 9 9
13. 10.7 10.5 10.8 10.4 8.9 9.3
14. 10.6 10.4 10.7 10.4 9 9.3
15. 10.2 10 10.9 10.2 8.7 9.2
16. 10.2 10.6 10.6 10.5 9.3 9.7
17. 10.8 10.3 10.5 10.6 9 9.2
18. 10.6 10.7 10.5 10.3 8.9 9.2
19. 10.6 10.3 10.7 10.5 8.8 9.4
20. 10.4 10.5 10.8 10.3 8.8 9.6
Appendix C: Disintegration time of individual units.
Disintegration time in seconds (s)
Sample Batch 1 Batch 2 Batch 3 Batch 4 Batch 5 Batch 6
1. 57 102 10 9 8 13
2. 44 128 12 8 12 9
3. 110 71 11 8 10 12
4. 26 124 11 8 13 11
5. 110 50 8 8 10 12
6. 83 58 11 8 10 10
7. 120 71 9 8 11 9
8. 89 127 9 8 10 12
9. 53 55 11 7 10 12
10. 104 87 11 7 11 10

38
Appendix D: Standard curve of sodium salicylate filtrated by PVDF.
Appendix E: Standard curve of sodium salicylate filtrated by PTFE.
y=22x+0,0015R²=0,99998
00,050,10,150,20,250,30,350,40,450,5
0 0,005 0,01 0,015 0,02 0,025
Absorbanceat295nm
Concentration(mg/mL)
Standardcurveofsodiumsalicylate-filtratedbyPVDF
y=22,14x-0,0005R²=1
00,050,10,150,20,250,30,350,40,450,5
0 0,005 0,01 0,015 0,02 0,025
Absorbanceat295nm
Concentration(mg/mL)
Standardcurveofsodiumsalicylate-filtratedbyPTFE

Department of Pharmacology and Clinical Neuroscience Umeå University SE-901 87 Umeå, Sweden www.umu.se