Tablets in Enterprise - Dell
167
Tablets in Enterprise – The Big Opportunity An IDC Multi Client Study 2014 IDC Europe – Final report October 2014
-
Upload
khangminh22 -
Category
Documents
-
view
0 -
download
0
Transcript of Tablets in Enterprise - Dell

Tablets in Enterprise – The Big Opportunity
An IDC Multi Client Study 2014
IDC Europe – Final report
October 2014

Table of Contents
© IDC Visit us at IDC.com and follow us on Twitter: @IDC 2
INTRODUCTION
METHODOLOGY
DEMOGRAPHIC & PROFILE OF COMPANIES
EXECUTIVE SUMMARY
KEY FINDING ANALYSIS
TAKE AWAYS AND RECOMMENDATIONS
SURVEY FINDINGS
A. Current Client Device Equipment
B. Device Strategy – Decision Process and Tablet deployment
C. Purchase intentions, Product choice and Requirements
D. Supplier choice and Competitive benchmark
E. Security, Application and Mobile Device Management
KEY FINDINGS BY VERTICAL
MARKET OPPORTUNITY MAPPING AND FORECAST 2014-2017
CONTACT INFORMATION

Introduction
© IDC Visit us at IDC.com and follow us on Twitter: @IDC 3

© IDC Visit us at IDC.com and follow us on Twitter: @IDC 4
IDC’s Tablets in Enterprise multi-client study aims at assessing the opportunity of tablet deployment in the enterprise space across Europe and key geographies – France, Germany and the United Kingdom – as businesses embark on an accelerated adoption phase and transformation of their mobile computing infrastructure.
The study focuses on:
Evaluating the current deployment status of Tablets in enterprises and assessing its potential development over the next two years
Analysing the needs by vertical sector in terms of applications as well as product specs and usage requirements for Tablets
Understanding the key influencers and decision makers in the decision process regarding tablet purchasing and deployment
Developing a competitive benchmark of Tablet suppliers
Evaluate the integration of Tablets in the companies’ security and mobile device management strategy
Goals of the Study
© IDC Visit us at IDC.com and follow us on Twitter: @IDC 5
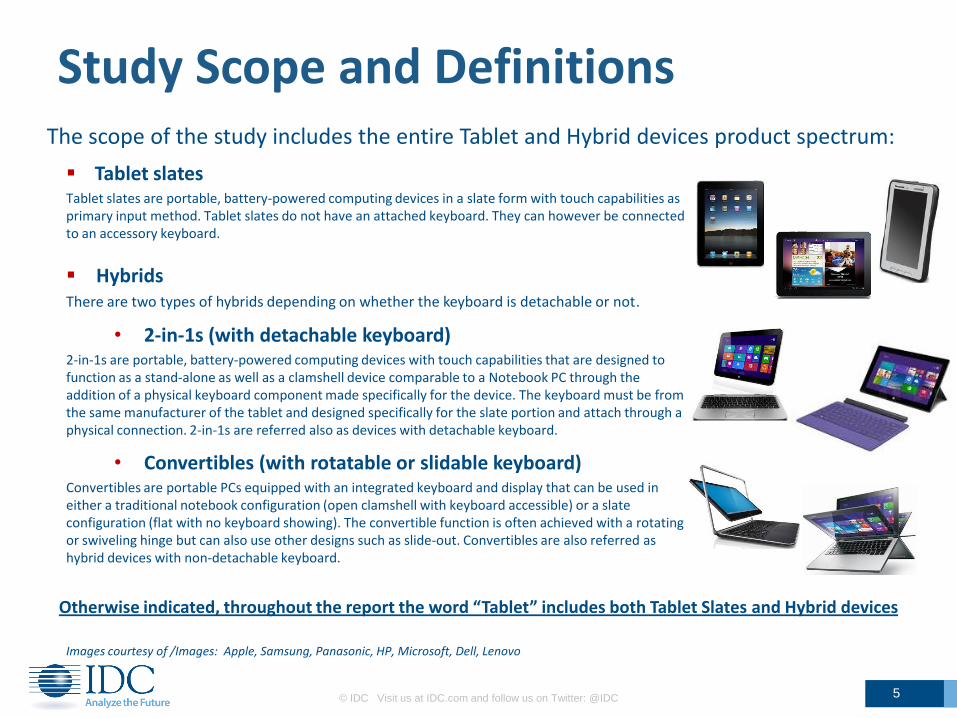
Tablet slates Tablet slates are portable, battery-powered computing devices in a slate form with touch capabilities as primary input method. Tablet slates do not have an attached keyboard. They can however be connected to an accessory keyboard.
Hybrids There are two types of hybrids depending on whether the keyboard is detachable or not.
• 2-in-1s (with detachable keyboard) 2-in-1s are portable, battery-powered computing devices with touch capabilities that are designed to function as a stand-alone as well as a clamshell device comparable to a Notebook PC through the addition of a physical keyboard component made specifically for the device. The keyboard must be from the same manufacturer of the tablet and designed specifically for the slate portion and attach through a physical connection. 2-in-1s are referred also as devices with detachable keyboard.
• Convertibles (with rotatable or slidable keyboard) Convertibles are portable PCs equipped with an integrated keyboard and display that can be used in either a traditional notebook configuration (open clamshell with keyboard accessible) or a slate configuration (flat with no keyboard showing). The convertible function is often achieved with a rotating or swiveling hinge but can also use other designs such as slide-out. Convertibles are also referred as hybrid devices with non-detachable keyboard.
The scope of the study includes the entire Tablet and Hybrid devices product spectrum:
Study Scope and Definitions
Otherwise indicated, throughout the report the word “Tablet” includes both Tablet Slates and Hybrid devices
Images courtesy of /Images: Apple, Samsung, Panasonic, HP, Microsoft, Dell, Lenovo
Methodology
© IDC Visit us at IDC.com and follow us on Twitter: @IDC 6
© IDC Visit us at IDC.com and follow us on Twitter: @IDC 7
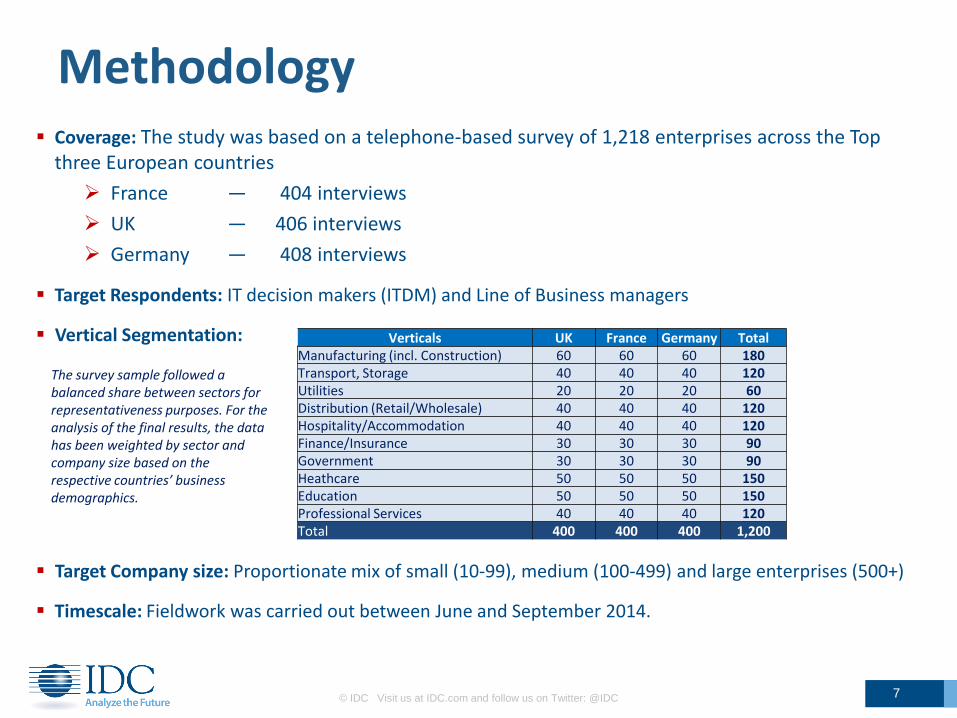
Coverage: The study was based on a telephone-based survey of 1,218 enterprises across the Top three European countries
France — 404 interviews
UK — 406 interviews
Germany — 408 interviews
Target Respondents: IT decision makers (ITDM) and Line of Business managers
Vertical Segmentation:
Target Company size: Proportionate mix of small (10-99), medium (100-499) and large enterprises (500+)
Timescale: Fieldwork was carried out between June and September 2014.
Methodology
Verticals UK France Germany Total Manufacturing (incl. Construction) 60 60 60 180 Transport, Storage 40 40 40 120 Utilities 20 20 20 60 Distribution (Retail/Wholesale) 40 40 40 120 Hospitality/Accommodation 40 40 40 120 Finance/Insurance 30 30 30 90 Government 30 30 30 90 Heathcare 50 50 50 150 Education 50 50 50 150 Professional Services 40 40 40 120 Total 400 400 400 1,200
The survey sample followed a balanced share between sectors for representativeness purposes. For the analysis of the final results, the data has been weighted by sector and company size based on the respective countries’ business demographics.
Demographic
& Profile of Companies
© IDC Visit us at IDC.com and follow us on Twitter: @IDC 8

© IDC Visit us at IDC.com and follow us on Twitter: @IDC 9
Countries and Verticals
N = 1218
France 33.2%
UK 33.3%
Germany 33.5%
Country breakdown
123
60
90
92
120
120
121
150
150
192
0 50 100 150 200
PROFESSIONAL SERVICES
UTILITIES
FINANCE/INSURANCE
GOVERNMENT
HOSPITALITY/ACCOMMODATION
DISTRIBUTION (Retail/Wholesale)
TRANSPORT AND STORAGE
HEALTHCARE
EDUCATION
MANUFACTURING/CONSTRUCTION
Vertical Breakdown
© IDC Visit us at IDC.com and follow us on Twitter: @IDC 10
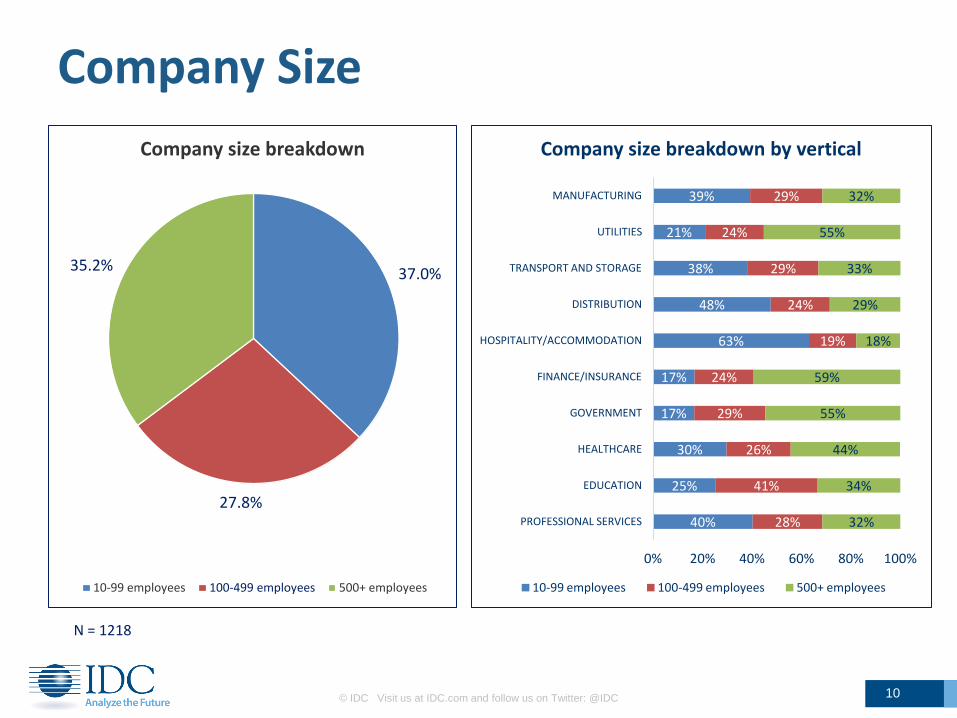
Company Size
N = 1218
37.0%
27.8%
35.2%
Company size breakdown
10-99 employees 100-499 employees 500+ employees
40%
25%
30%
17%
17%
63%
48%
38%
21%
39%
28%
41%
26%
29%
24%
19%
24%
29%
24%
29%
32%
34%
44%
55%
59%
18%
29%
33%
55%
32%
0% 20% 40% 60% 80% 100%
PROFESSIONAL SERVICES
EDUCATION
HEALTHCARE
GOVERNMENT
FINANCE/INSURANCE
HOSPITALITY/ACCOMMODATION
DISTRIBUTION
TRANSPORT AND STORAGE
UTILITIES
MANUFACTURING
Company size breakdown by vertical
10-99 employees 100-499 employees 500+ employees

© IDC Visit us at IDC.com and follow us on Twitter: @IDC 11
Profile of Respondents
79%
21%
IT vs Line of Business (LoB)
IT LOB
N = 1218
8.9%
2.4%
3.9%
8.9%
12.3%
63.7%
0% 10% 20% 30% 40% 50% 60% 70%
Other IT decision-maker
CFO/Finance Director or Manager
Managing Director / CEO / Owner
CIO/CTO/VP/Head of IT
IT Director
IT Manager
IT Job Titles
38.5%
1.6%
5.0%
12.6%
10.2%
11.9%
20.2%
0% 10% 20% 30% 40% 50%
Other LoB decision-maker
Logistics and Distribution Manager
Head of Customer Service
Production Manager
Operations Manager
Marketing Manager
Sales or Business Development …
LoB Job Titles

Executive Summary
© IDC Visit us at IDC.com and follow us on Twitter: @IDC 12
© IDC Visit us at IDC.com and follow us on Twitter: @IDC 13
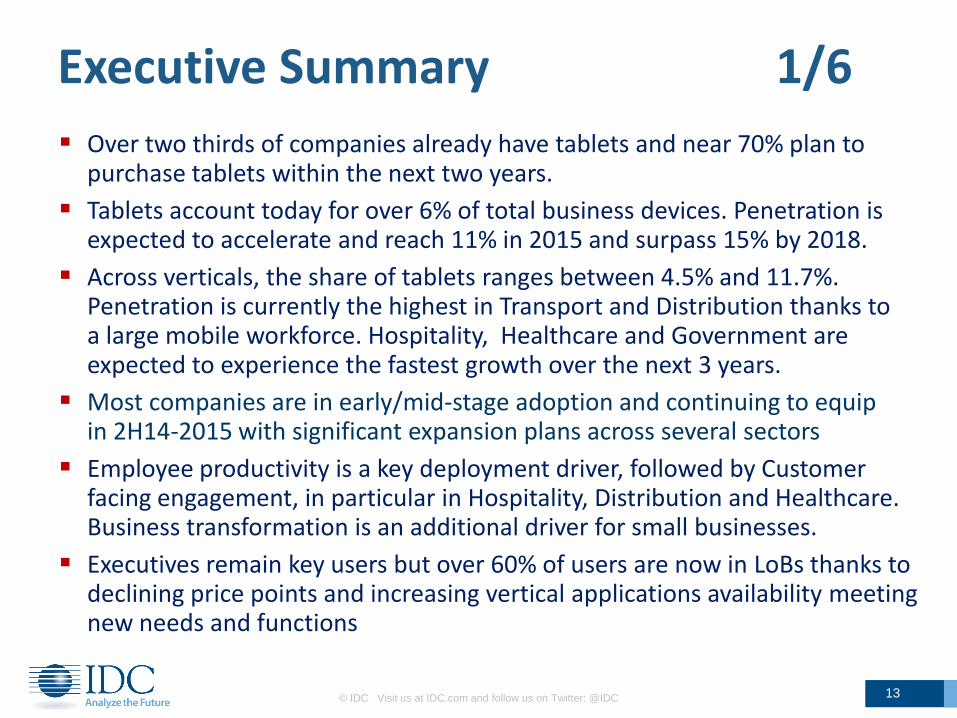
Executive Summary 1/6
Over two thirds of companies already have tablets and near 70% plan to purchase tablets within the next two years.
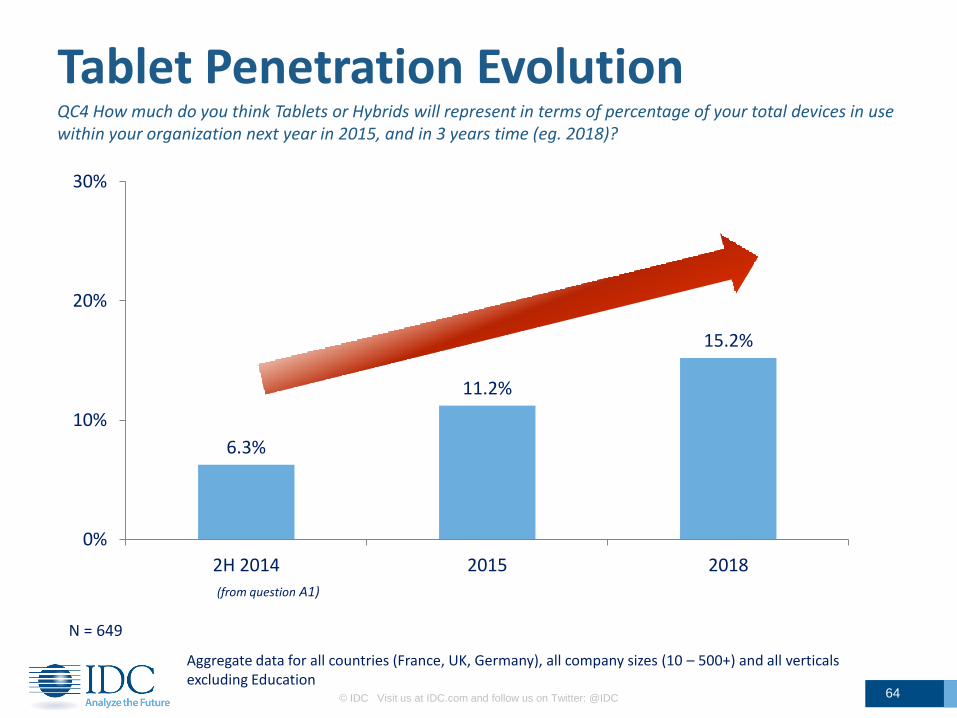
Tablets account today for over 6% of total business devices. Penetration is expected to accelerate and reach 11% in 2015 and surpass 15% by 2018.
Across verticals, the share of tablets ranges between 4.5% and 11.7%. Penetration is currently the highest in Transport and Distribution thanks to a large mobile workforce. Hospitality, Healthcare and Government are expected to experience the fastest growth over the next 3 years.
Most companies are in early/mid-stage adoption and continuing to equip in 2H14-2015 with significant expansion plans across several sectors
Employee productivity is a key deployment driver, followed by Customer facing engagement, in particular in Hospitality, Distribution and Healthcare. Business transformation is an additional driver for small businesses.
Executives remain key users but over 60% of users are now in LoBs thanks to declining price points and increasing vertical applications availability meeting new needs and functions
© IDC Visit us at IDC.com and follow us on Twitter: @IDC 14
Executive Summary 2/6
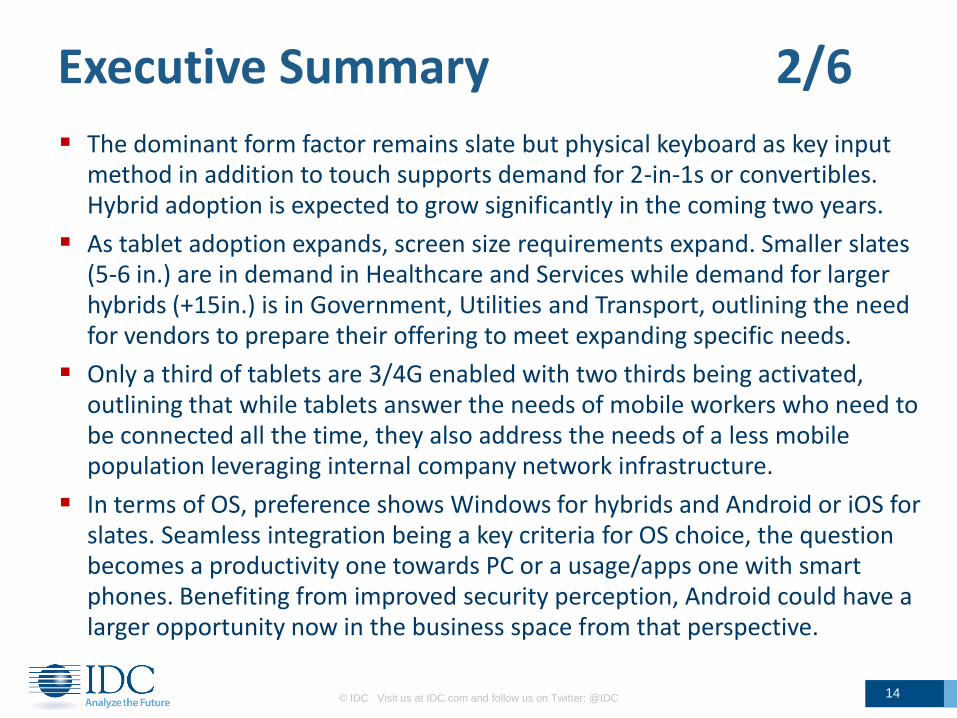
The dominant form factor remains slate but physical keyboard as key input method in addition to touch supports demand for 2-in-1s or convertibles. Hybrid adoption is expected to grow significantly in the coming two years.
As tablet adoption expands, screen size requirements expand. Smaller slates (5-6 in.) are in demand in Healthcare and Services while demand for larger hybrids (+15in.) is in Government, Utilities and Transport, outlining the need for vendors to prepare their offering to meet expanding specific needs.
Only a third of tablets are 3/4G enabled with two thirds being activated, outlining that while tablets answer the needs of mobile workers who need to be connected all the time, they also address the needs of a less mobile population leveraging internal company network infrastructure.
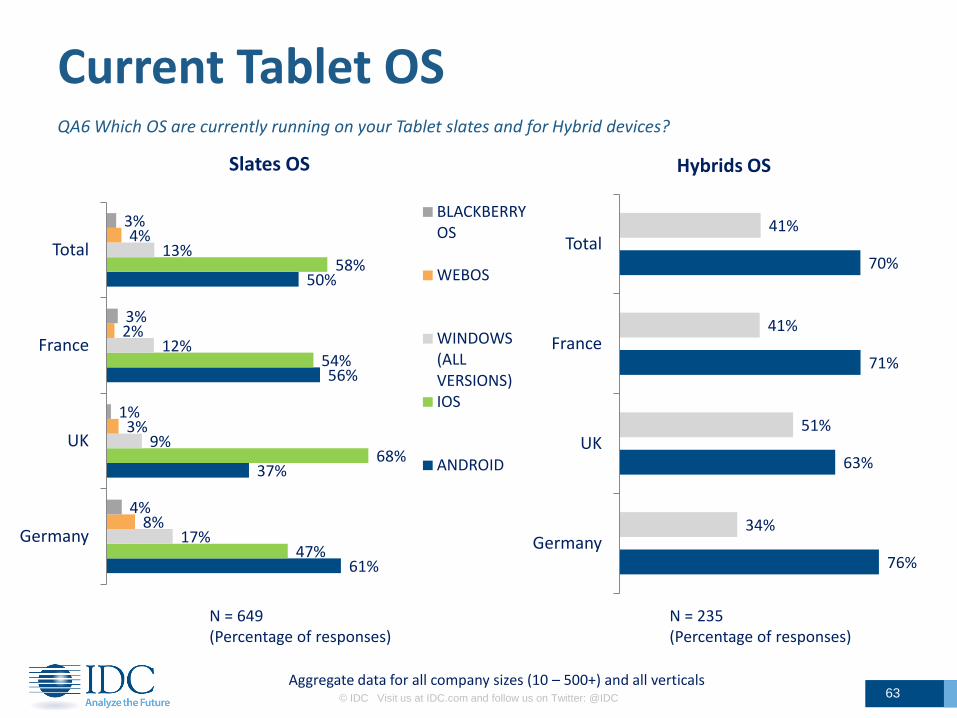
In terms of OS, preference shows Windows for hybrids and Android or iOS for slates. Seamless integration being a key criteria for OS choice, the question becomes a productivity one towards PC or a usage/apps one with smart phones. Benefiting from improved security perception, Android could have a larger opportunity now in the business space from that perspective.

© IDC Visit us at IDC.com and follow us on Twitter: @IDC 15
Executive Summary 3/6
Battery life is across all form factors and sectors a key product feature, followed by Voice capabilities and 3/4G for mobile usage and Security. As adoption expands, the need for additional features also expands, with for example demand for ruggedized devices seen in several sectors, or credit card or barcode scanners required in Hospitality, Distribution are also required now across other sectors such as Transport and Healthcare.
Tablet slates are used primarily as an additional device at 57% but are also used as only device in over 40% of the cases. Hybrids are used by the majority as only device (although 51% only), with 2-in-1s often used as additional device while Convertibles are the only device at over 70%.
Tablets address new user segments and in particular mobile workers whose activities do not take place in an office space but “on-the-road” (drivers, pilots, couriers…) or field agents, meter readers, operation personnel. A large opportunity is also on Customer facing roles and clients themselves thanks to the increasing importance for businesses of customer experience, omni-channel and related supporting apps.
© IDC Visit us at IDC.com and follow us on Twitter: @IDC 16
Executive Summary 4/6
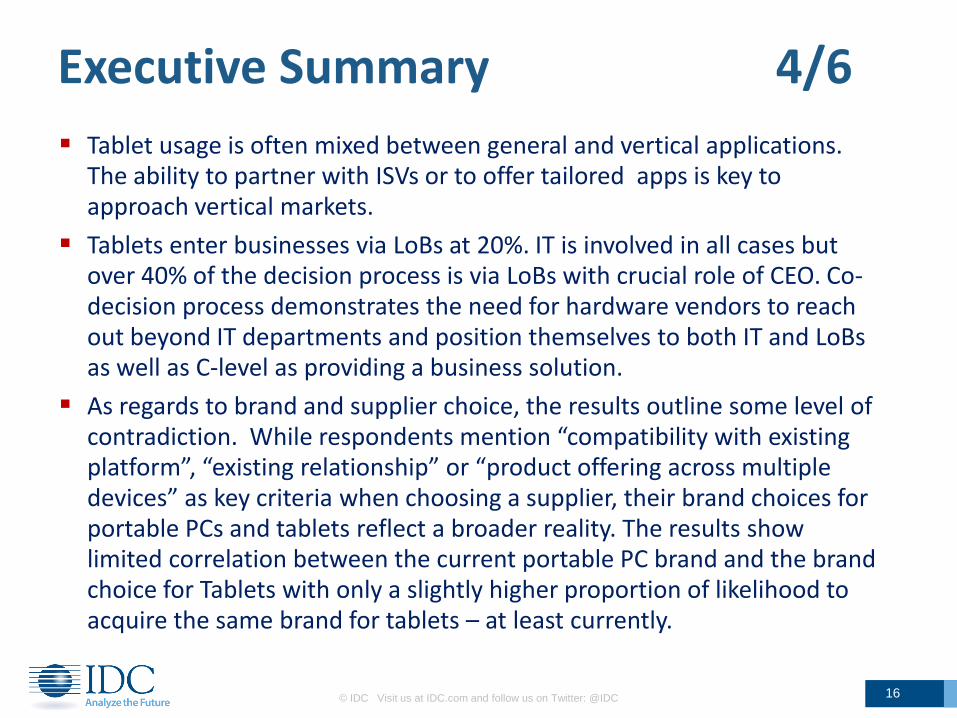
Tablet usage is often mixed between general and vertical applications. The ability to partner with ISVs or to offer tailored apps is key to approach vertical markets.
Tablets enter businesses via LoBs at 20%. IT is involved in all cases but over 40% of the decision process is via LoBs with crucial role of CEO. Co-decision process demonstrates the need for hardware vendors to reach out beyond IT departments and position themselves to both IT and LoBs as well as C-level as providing a business solution.
As regards to brand and supplier choice, the results outline some level of contradiction. While respondents mention “compatibility with existing platform”, “existing relationship” or “product offering across multiple devices” as key criteria when choosing a supplier, their brand choices for portable PCs and tablets reflect a broader reality. The results show limited correlation between the current portable PC brand and the brand choice for Tablets with only a slightly higher proportion of likelihood to acquire the same brand for tablets – at least currently.

© IDC Visit us at IDC.com and follow us on Twitter: @IDC 17
Executive Summary 5/6
For applications not included with the device, the preferred approach is in-house development or custom apps built by partners for specific business processes or needs
Apple and Android are perceived as more secure than Windows, Linux or BlackBerry platforms, with both Apple and Android felt to have appreciably improved the security of their offering in the last year
Most companies use the default device management tools from the vendor. There is a desire to move to specialized tools in future, but this budget will have to compete with other priorities
Routes-to-market show a rather fragmented picture. Compared to traditional PC channels, Resellers and SIs are less favoured with mobile phone operator or mobile retailers ranking high. As Tablets gain more traction in business and applications become more widely adopted, this will put pressure on the mobile phone channel to adopt PC solutions type capabilities, and increase the importance of the PC channels for Tablets.

Convertible
Large Smart Phone
Product/User Grid Mapping 6/6
© IDC Visit us at IDC.com and follow us on Twitter: @IDC 18
Connectivity and Input Method
Voice / 3/4G Touch Stylus Keyboard WiFi
Vers
atilit
y /
Usage
Mutli
Sin
gle
2-in-1 Exec/ Sales
Transport/ Delivery
Personnel Customer Facing
Data Entry/ Order Mgt
Creation / Production / Maintenance
White Collars / Office Functions

Take Aways and
Recommendations
© IDC Visit us at IDC.com and follow us on Twitter: @IDC 19
© IDC Visit us at IDC.com and follow us on Twitter: @IDC 20
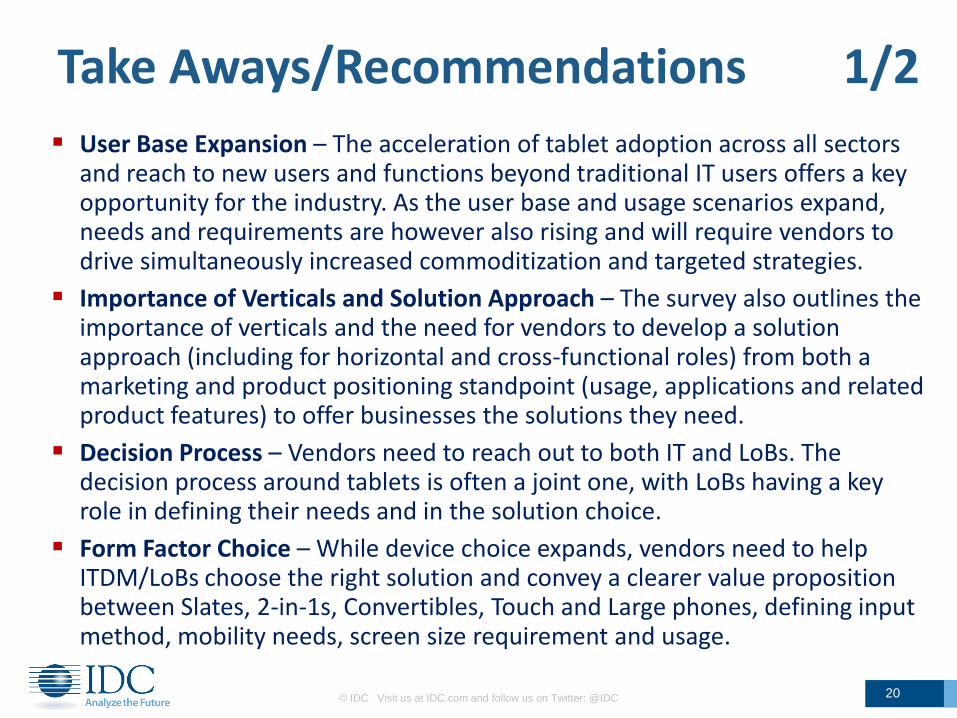
Take Aways/Recommendations 1/2
User Base Expansion – The acceleration of tablet adoption across all sectors and reach to new users and functions beyond traditional IT users offers a key opportunity for the industry. As the user base and usage scenarios expand, needs and requirements are however also rising and will require vendors to drive simultaneously increased commoditization and targeted strategies.
Importance of Verticals and Solution Approach – The survey also outlines the importance of verticals and the need for vendors to develop a solution approach (including for horizontal and cross-functional roles) from both a marketing and product positioning standpoint (usage, applications and related product features) to offer businesses the solutions they need.
Decision Process – Vendors need to reach out to both IT and LoBs. The decision process around tablets is often a joint one, with LoBs having a key role in defining their needs and in the solution choice.
Form Factor Choice – While device choice expands, vendors need to help ITDM/LoBs choose the right solution and convey a clearer value proposition between Slates, 2-in-1s, Convertibles, Touch and Large phones, defining input method, mobility needs, screen size requirement and usage.

© IDC Visit us at IDC.com and follow us on Twitter: @IDC 21
Take Aways/Recommendations 2/2
Application Development – To tap into the preference for custom applications and access via browsers to on-premises web servers or Cloud services, Tablet vendors should be forming wide ranging ISV programs to draw in in-house and contract/outsourcing developers that focus on the digitisation and integration of business processes and key applications.
Mobile Device Management – Vendors looking to grow their multi-device open MDM solutions have a market that understands the need for better device management and intend to invest in this area in an ideal world, but work is needed on the sales strategy and particularly the funding model in order to gain the expected traction due to competing investment priorities in IT.
Routes-to-Market – As Tablets mature and move from accessory devices to the main device, buying patterns will start to shift. PC centric vendors will need to better engage the mobile phone channel in order to reach customers through the preferred buying model, while mobile phone centric Tablet vendors will need to engage with the PC channel with end-to-end solutions and lifecycle capabilities.

Key Findings Analysis
© IDC Visit us at IDC.com and follow us on Twitter: @IDC 22

Early stage - still evaluating
21.6%
Medium stage - expect to expand
28.7%
Advanced stage - no further expansion planned
7.6%
We plan to purchase in the next 12 months
4.0%
We plan to purchase in the next 24 months
7.8%
We plan to purchase in more
than two year 5.3%
Currently evaluating
7.8%
Evaluated and decided not to
buy 17.2%
© IDC Visit us at IDC.com and follow us on Twitter: @IDC 23
Tablet Deployment Status QB5 What stage of Tablet adoption do you consider your organization to be at?
QB6 What are your company's plans with regards to deploying Tablets or Hybrid devices?
N = 1138 (Percentage of companies)
Total TAM = 83% and 70% short-term
purchase/expansion plans
Aggregate data for all countries (France, UK, Germany), all company sizes (10 – 500+) and all verticals
Two thirds of companies already have tablets and almost 70% plan or are likely to purchase tablets within the next two years.
Within the companies that already have tablets, the vast majority are in early/mid-stage adoption and expected to continue equipping in 2014/2015. Only 10-15% do not plan further expansion thus representing a likely replacement market.
Among companies that do not have tablets yet, approx 50% of are currently evaluating or planning to purchase tablets within two years while an additional 20% will buy in more than two years.
Across verticals (excl. Education), the percentage of companies that have decided not to buy does not exceeds 15% with Transport and Professional Services more likely to buy in the short-term.

© IDC Visit us at IDC.com and follow us on Twitter: @IDC 24
QA1 How many computing devices, purchased by your company, do you have in total in your company?
Tablet Penetration Today
N = 1218 (Percentage of total devices in the sample) Aggregate data for All countries (France, UK, Germany) and company sizes (10 – 500+)
7.1% 7.3% 11.7% 8.7% 5.3%
7.6% 4.6%
5.7%
4.6%
6.7%
0%
10%
20%
30%
40%
50%
60%
70%
80%
90%
100%
Desktop PC Portable PC Tablets*
Handheld SmartPhones POS
Tablets represent today over 6% of total client devices with France, UK and Germany sharing a similar picture on the sample.
Across verticals, penetration ranges between 4.5% and 11.7% with Transport and Distribution leading the way thanks to their more mobile workforce.
Penetration is still low in sectors where there are higher volumes of deskbound employees such as Government or where the use of computing client devices is typically low (ex. Hospitality).
6.3% 6.2% 6.3%
0%
20%
40%
60%
80%
100%
France UK Germany
6.3%
11.2%
15.2%
0%
10%
20%
30%
2H 2014 2015 2018
© IDC Visit us at IDC.com and follow us on Twitter: @IDC 25
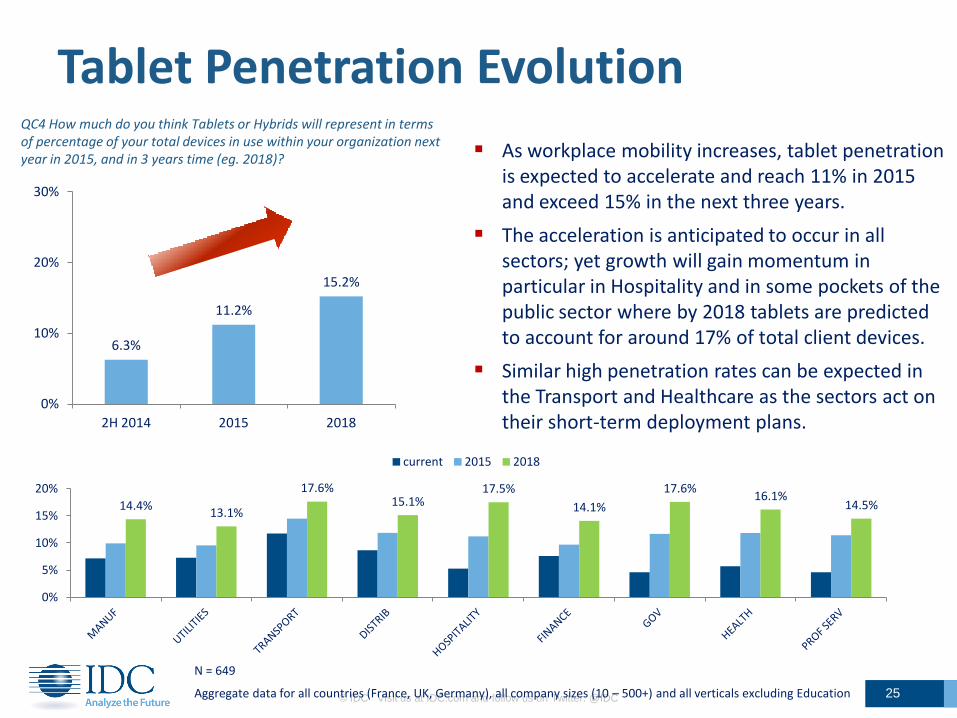
QC4 How much do you think Tablets or Hybrids will represent in terms of percentage of your total devices in use within your organization next year in 2015, and in 3 years time (eg. 2018)?
N = 649
Tablet Penetration Evolution
Aggregate data for all countries (France, UK, Germany), all company sizes (10 – 500+) and all verticals excluding Education
14.4% 13.1%
17.6% 15.1%
17.5%
14.1%
17.6% 16.1%
14.5%
0%
5%
10%
15%
20%
current 2015 2018
As workplace mobility increases, tablet penetration is expected to accelerate and reach 11% in 2015 and exceed 15% in the next three years.
The acceleration is anticipated to occur in all sectors; yet growth will gain momentum in particular in Hospitality and in some pockets of the public sector where by 2018 tablets are predicted to account for around 17% of total client devices.
Similar high penetration rates can be expected in the Transport and Healthcare as the sectors act on their short-term deployment plans.
© IDC Visit us at IDC.com and follow us on Twitter: @IDC 26
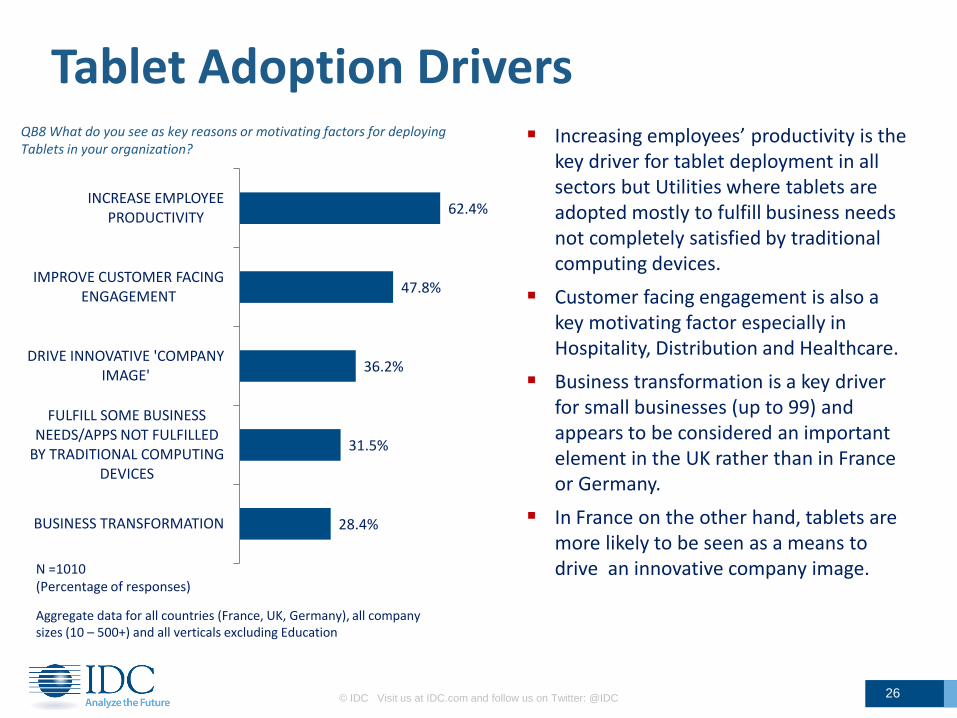
Tablet Adoption Drivers QB8 What do you see as key reasons or motivating factors for deploying Tablets in your organization?
N =1010 (Percentage of responses)
Aggregate data for all countries (France, UK, Germany), all company sizes (10 – 500+) and all verticals excluding Education
Increasing employees’ productivity is the key driver for tablet deployment in all sectors but Utilities where tablets are adopted mostly to fulfill business needs not completely satisfied by traditional computing devices.
Customer facing engagement is also a key motivating factor especially in Hospitality, Distribution and Healthcare.
Business transformation is a key driver for small businesses (up to 99) and appears to be considered an important element in the UK rather than in France or Germany.
In France on the other hand, tablets are more likely to be seen as a means to drive an innovative company image.
28.4%
31.5%
36.2%
47.8%
62.4%
BUSINESS TRANSFORMATION
FULFILL SOME BUSINESS NEEDS/APPS NOT FULFILLED
BY TRADITIONAL COMPUTING DEVICES
DRIVE INNOVATIVE 'COMPANY IMAGE'
IMPROVE CUSTOMER FACING ENGAGEMENT
INCREASE EMPLOYEE PRODUCTIVITY
© IDC Visit us at IDC.com and follow us on Twitter: @IDC 27
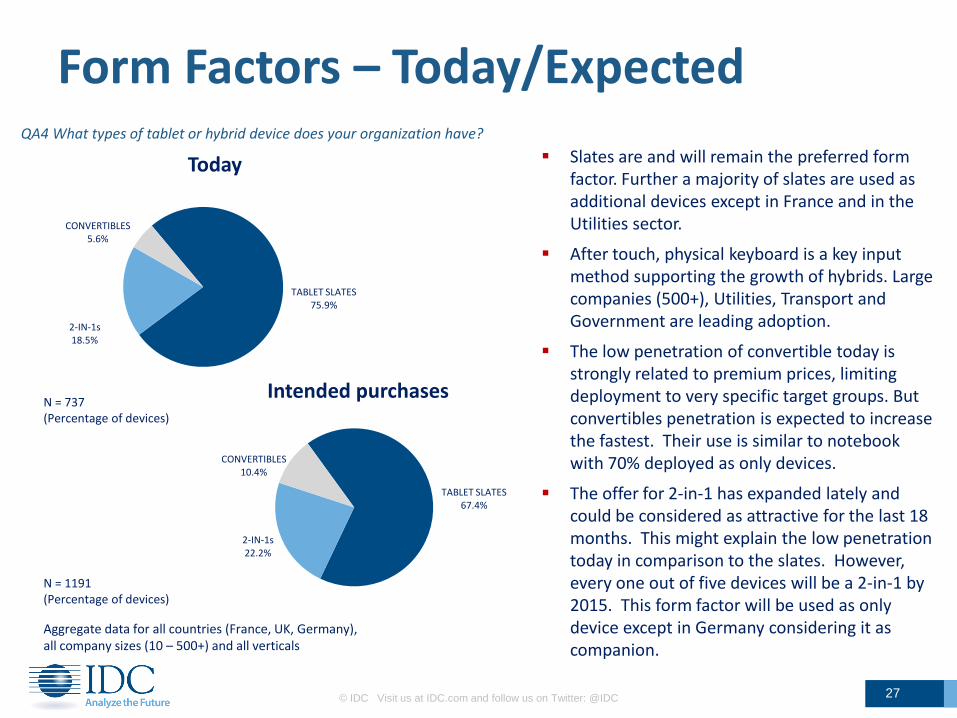
Form Factors – Today/Expected
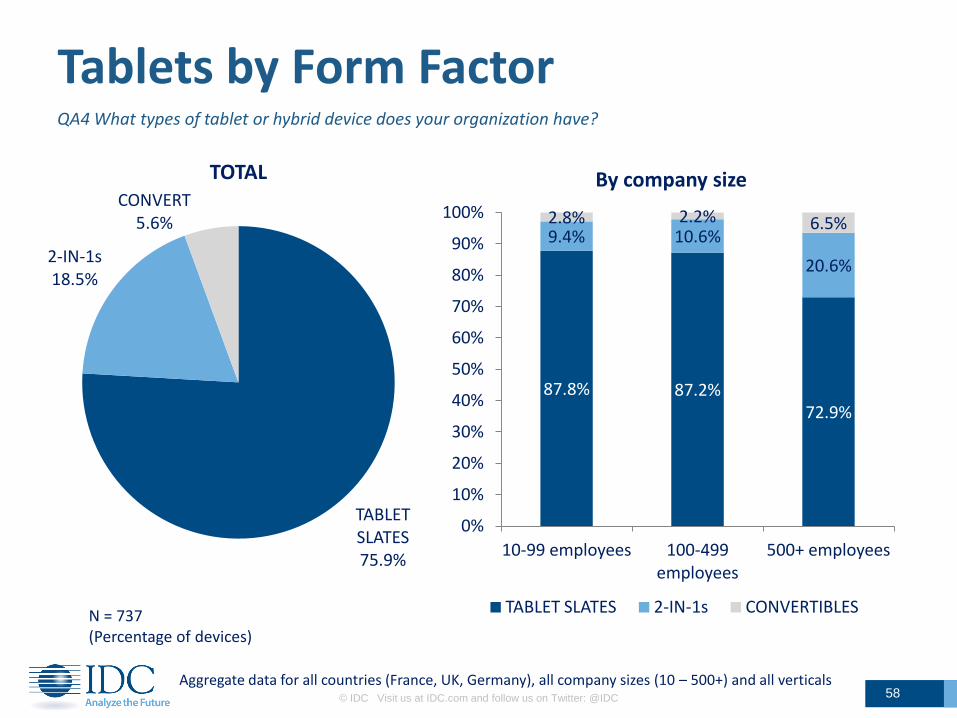
Slates are and will remain the preferred form factor. Further a majority of slates are used as additional devices except in France and in the Utilities sector.
After touch, physical keyboard is a key input method supporting the growth of hybrids. Large companies (500+), Utilities, Transport and Government are leading adoption.
The low penetration of convertible today is strongly related to premium prices, limiting deployment to very specific target groups. But convertibles penetration is expected to increase the fastest. Their use is similar to notebook with 70% deployed as only devices.
The offer for 2-in-1 has expanded lately and could be considered as attractive for the last 18 months. This might explain the low penetration today in comparison to the slates. However, every one out of five devices will be a 2-in-1 by 2015. This form factor will be used as only device except in Germany considering it as companion.
QA4 What types of tablet or hybrid device does your organization have?
N = 737 (Percentage of devices)
Aggregate data for all countries (France, UK, Germany), all company sizes (10 – 500+) and all verticals
TABLET SLATES 75.9%
2-IN-1s 18.5%
CONVERTIBLES 5.6%
Today
TABLET SLATES 67.4%
2-IN-1s 22.2%
CONVERTIBLES 10.4%
Intended purchases
N = 1191 (Percentage of devices)
© IDC Visit us at IDC.com and follow us on Twitter: @IDC 28
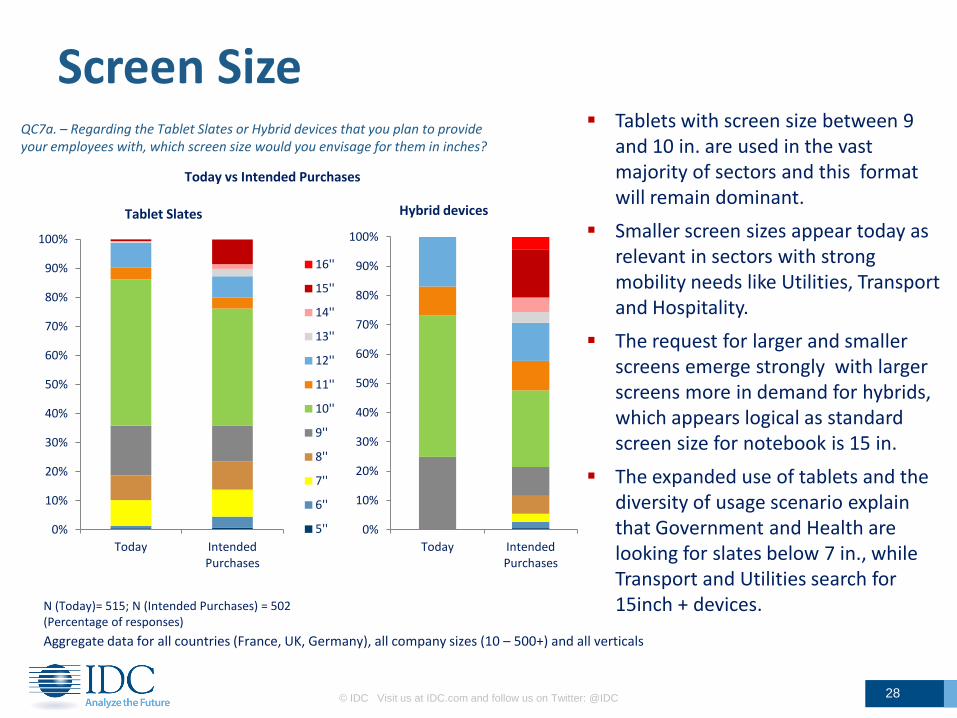
Screen Size
0%
10%
20%
30%
40%
50%
60%
70%
80%
90%
100%
Today Intended Purchases
Hybrid devices
16''
15''
14''
13''
12''
11''
10''
9''
8''
7''
6''
5''
N (Today)= 515; N (Intended Purchases) = 502 (Percentage of responses)
Aggregate data for all countries (France, UK, Germany), all company sizes (10 – 500+) and all verticals
QC7a. – Regarding the Tablet Slates or Hybrid devices that you plan to provide your employees with, which screen size would you envisage for them in inches?
0%
10%
20%
30%
40%
50%
60%
70%
80%
90%
100%
Today Intended Purchases
Tablet Slates
Today vs Intended Purchases
Tablets with screen size between 9 and 10 in. are used in the vast majority of sectors and this format will remain dominant.
Smaller screen sizes appear today as relevant in sectors with strong mobility needs like Utilities, Transport and Hospitality.
The request for larger and smaller screens emerge strongly with larger screens more in demand for hybrids, which appears logical as standard screen size for notebook is 15 in.
The expanded use of tablets and the diversity of usage scenario explain that Government and Health are looking for slates below 7 in., while Transport and Utilities search for 15inch + devices.
© IDC Visit us at IDC.com and follow us on Twitter: @IDC 29
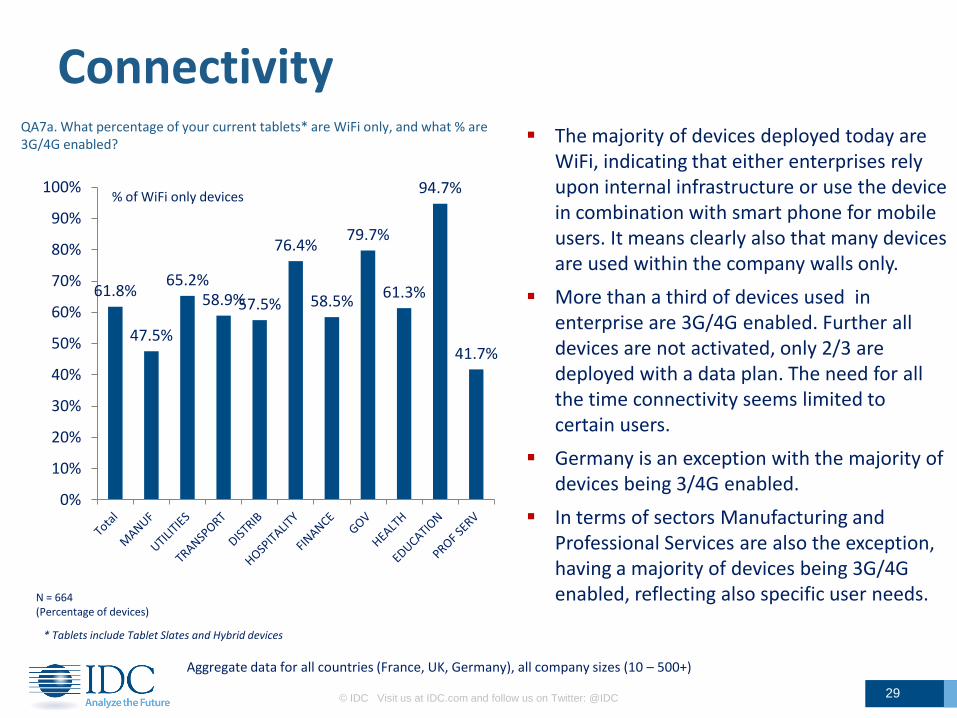
Connectivity QA7a. What percentage of your current tablets* are WiFi only, and what % are 3G/4G enabled?
* Tablets include Tablet Slates and Hybrid devices
Aggregate data for all countries (France, UK, Germany), all company sizes (10 – 500+)
N = 664 (Percentage of devices)
61.8%
47.5%
65.2% 58.9% 57.5%
76.4%
58.5%
79.7%
61.3%
94.7%
41.7%
0%
10%
20%
30%
40%
50%
60%
70%
80%
90%
100% % of WiFi only devices
The majority of devices deployed today are WiFi, indicating that either enterprises rely upon internal infrastructure or use the device in combination with smart phone for mobile users. It means clearly also that many devices are used within the company walls only.
More than a third of devices used in enterprise are 3G/4G enabled. Further all devices are not activated, only 2/3 are deployed with a data plan. The need for all the time connectivity seems limited to certain users.
Germany is an exception with the majority of devices being 3/4G enabled.
In terms of sectors Manufacturing and Professional Services are also the exception, having a majority of devices being 3G/4G enabled, reflecting also specific user needs.

© IDC Visit us at IDC.com and follow us on Twitter: @IDC 30
Product Requirements QD5 Using a scale of 1 to 5, where 1=not at all important and 5=extremely important, please indicate which of the following features are important for your tablet or hybrid devices
N = 830 (Sum of 4 and 5 rankings)
Aggregate data for all countries (France, UK, Germany), all company sizes (10 – 500+) and all verticals
52.0%
53.3%
53.9%
58.0%
60.0%
65.2%
75.6%
SERIAL/PARALLEL/USB/…
3G/4G ENABLED
DESIGN, …
OUTDOOR READABLE …
SECURITY FEATURES
VOICE CAPABILITIES
BATTERY LIFE
Very or Extremely Important Features
13.8%
16.3%
16.4%
16.9%
18.9%
19.4%
24.4%
29.9%
31.3%
37.0%
37.3%
37.9%
RFID - UHF
VEHICLE-MOUNTED HANDLING OPTIONS
CONFIGURATION, INTEGRATED PCI SLOT …
NOISE CANCELLATION
NFC (NEAR FIELD COMMUNICATION)
GLOVED TOUCH OPERATION
HIGH RESOLUTION FRONT AND BACK CAMS
FINGER PRINT READERS
CREDIT CARD READER
SMART CARD READER
BARCODE SCANNER
RUGGEDIZED: DROP, SHOCK, WATER …
Beyond screen size, OS and form factor, one key product feature is battery life. As mobile devices, tablets have to function long without recharging across all sectors.
Voice capabilities are the second feature on the list and if combined with 3G/4G enabled device requirement, it confirms tablets used as phone or collaboration devices.
Security is another key requirement (see Security slide)
QD7 Considering your business/organization's needs, which of the following ADDITIONAL FEATURES are important to have on your Tablet or Hybrid devices?
Additional product features answer differentiation needs for vertical usage and applications.
Ruggedized tablets are very much in demand in Utilities and Government.
Barcode scanner are key for tablet usage in Distribution, Transport and Health sectors.
Smart or credit card reader are very important for Hospitality but increasingly too for other sectors.

31
OS preference
Aggregate data for all countries (France, UK, Germany), all company sizes (10 – 500+) and all verticals
Managing multiple OSes is recognized as a challenge for half of the surveyed companies. Consequently the seamless integration with other OS and ability to scale appear as key criteria for decision making.
However the divide starts when integration with Windows environment is considered for the hybrids while integration with mobile smart phone OS is considered for slates.
The challenge becomes apps and usage. In a productivity and general apps environment (PC approach), Windows appears as the favourite. In a more apps specific including voice and more mobile cases (smartphone approach), iOS and Android seem to better allow integration.
Combined QD1a/b. Which OS would you likely choose/adopt for your tablet slates? And QD2 What would be the main reasons for choosing this OS?
15%
24%
27%
37%
55%
57%
57%
73%
14%
20%
16%
27%
41%
32%
48%
64%
20%
20%
25%
31%
47%
37%
54%
60%
Experience of using already the OS
Application developer (API) skill set availability
Existing relationship with current hardware vendor
Off-the-shelf business application availability
User interface / friendliness
Seamless integration with existing Windows
OS environment
Seamless integration with existing
mobile/smartphone OS …
Ability to scale current OS environment
iOS Android
Windows
Tablet Slates Hybrid devices
10%
18%
20%
38%
45%
47%
50%
54%
6%
13%
15%
24%
48%
32%
52%
32%
11%
11%
13%
21%
50%
31%
44%
30%
Experience of using already the OS
Existing relationship with current hardware vendor
Application developer (API) skill set availability
Off-the-shelf business application availability
Seamless integration with existing
mobile/smartphone OS …
User interface / friendliness
Ability to scale current OS environment
Seamless integration with existing Windows OS
environment
19% 18% 13% 24%
7% 6% 8%
7% 25% 27% 29%
20%
35% 42% 35% 28%
15% 8% 15% 20%
0%
10%
20%
30%
40%
50%
60%
70%
80%
90%
100%
TOTAL France UK Germany
Key concern/challenge
Moderate challenge
No real challenge, open to new/additional OS
Not planning to manage multiple OS
Don't know
QD3. - Do you see the management of multiple OSes within your organisation as a key concern, moderate challenge or not at all a challenge?
N = 764 (Percentage of responses)
N = 596 (Percentage of responses)

© IDC Visit us at IDC.com and follow us on Twitter: @IDC 32
Tablet User Expansion
• White Collars include analysts, consultants, doctors, legal, journalists etc. • Transport include drivers, delivery personnel, etc. • Customer Facing include shop floor staff, waiters, airport personnel etc.
Aggregate data for all countries (France, UK, Germany), all company sizes (10 – 500+) and all verticals
Executives are key users of tablets and are expected to remain as such in the future. However, thanks to declining price points and increasing device and apps verticalisation, over 60% of tablet users are in LoBs (excluding Sales).
LoBs also represent an important opportunity for Tablet deployment expansion as they provide new user types and functions.
New tablet users can be found among mobile workers whose activities do not take place in an office space but “on-the-road” (drivers, pilots, couriers…) or in the field (maintenance agents, meter readers, operation personnel…).
A large opportunity for the tablet market also comes also from Customer facing roles and clients themselves thanks to the increasing importance for businesses of customer experience, omni-channel and related supporting apps.
18.5%
13.8%
14.4%
9.7%
3.5%
9.0%
2.3%
4.6%
19.4%
1.5%
2.8%
0.4%
Executives
Sales
Marketing
Production, Maintenance
R&D
Operation
Transport, delivery
Customer facing
White collars
Teachers/Pupils
Clients, Vistors
Others
Current
Intended purchases
QA11 Who are Top 3 users of the Tablets purchased by your company? QC5. For which users do you consider purchasing tablets for?
N(A11) = 737 N(C5) = 800 (Percentage of responses)
Over 60% in LoBs outside
Sales
© IDC Visit us at IDC.com and follow us on Twitter: @IDC 33
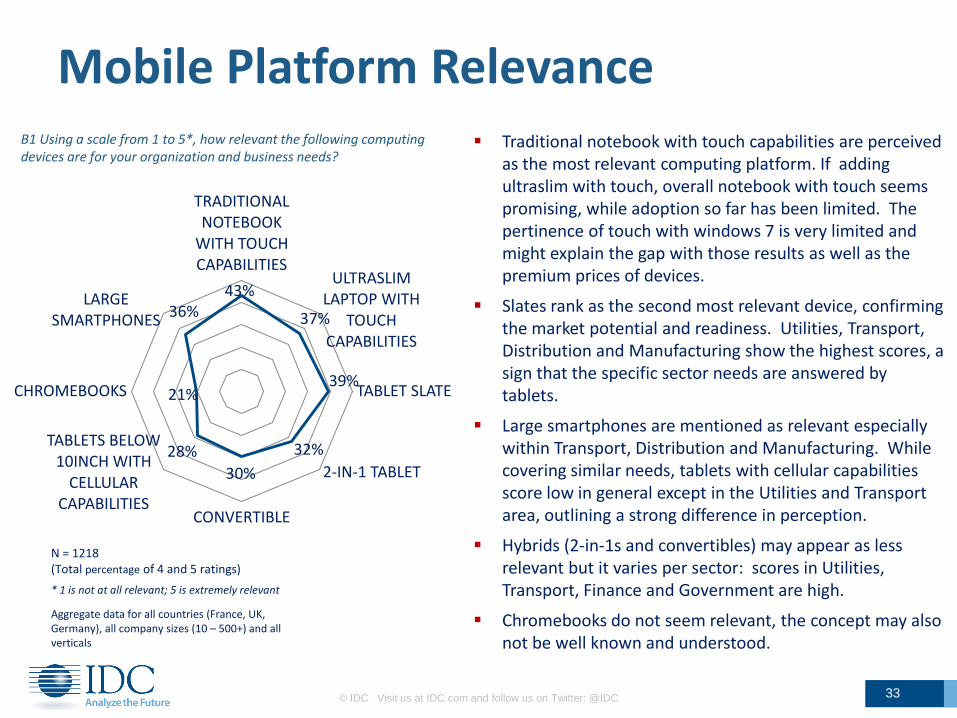
Mobile Platform Relevance Traditional notebook with touch capabilities are perceived
as the most relevant computing platform. If adding ultraslim with touch, overall notebook with touch seems promising, while adoption so far has been limited. The pertinence of touch with windows 7 is very limited and might explain the gap with those results as well as the premium prices of devices.
Slates rank as the second most relevant device, confirming the market potential and readiness. Utilities, Transport, Distribution and Manufacturing show the highest scores, a sign that the specific sector needs are answered by tablets.
Large smartphones are mentioned as relevant especially within Transport, Distribution and Manufacturing. While covering similar needs, tablets with cellular capabilities score low in general except in the Utilities and Transport area, outlining a strong difference in perception.
Hybrids (2-in-1s and convertibles) may appear as less relevant but it varies per sector: scores in Utilities, Transport, Finance and Government are high.
Chromebooks do not seem relevant, the concept may also not be well known and understood.
43%
37%
39%
32%
30%
28%
21%
36%
TRADITIONAL NOTEBOOK
WITH TOUCH CAPABILITIES
ULTRASLIM LAPTOP WITH
TOUCH CAPABILITIES
TABLET SLATE
2-IN-1 TABLET
CONVERTIBLE
TABLETS BELOW 10INCH WITH
CELLULAR CAPABILITIES
CHROMEBOOKS
LARGE SMARTPHONES
B1 Using a scale from 1 to 5*, how relevant the following computing devices are for your organization and business needs?
N = 1218 (Total percentage of 4 and 5 ratings)
Aggregate data for all countries (France, UK, Germany), all company sizes (10 – 500+) and all verticals
* 1 is not at all relevant; 5 is extremely relevant
© IDC Visit us at IDC.com and follow us on Twitter: @IDC 34
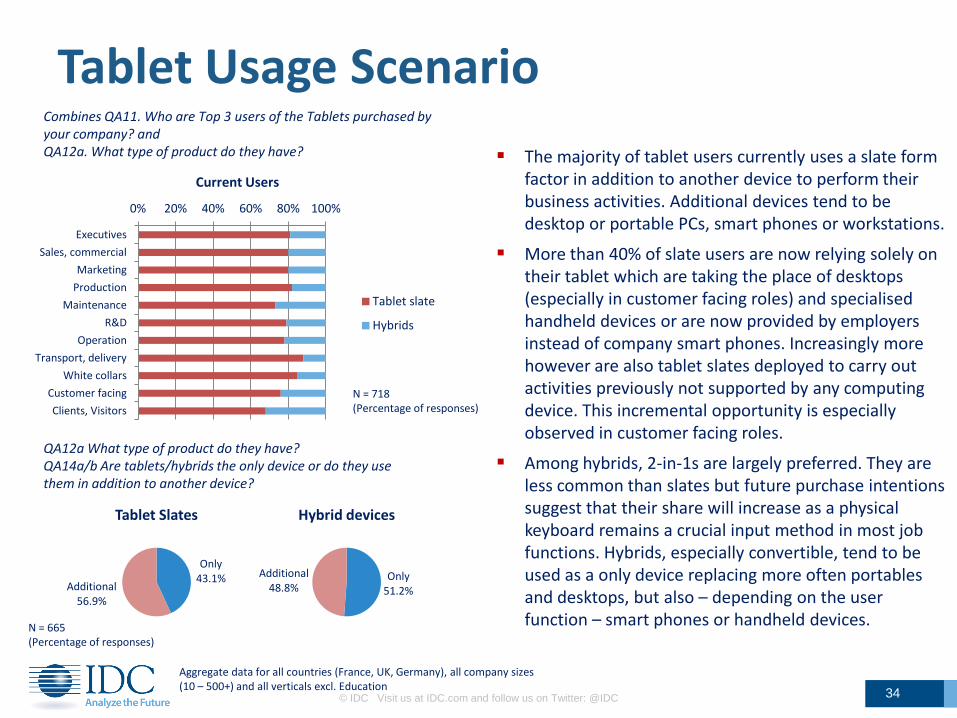
Tablet Usage Scenario Combines QA11. Who are Top 3 users of the Tablets purchased by your company? and QA12a. What type of product do they have?
Aggregate data for all countries (France, UK, Germany), all company sizes (10 – 500+) and all verticals excl. Education
N = 718 (Percentage of responses)
0% 20% 40% 60% 80% 100%
Executives
Sales, commercial
Marketing
Production
Maintenance
R&D
Operation
Transport, delivery
White collars
Customer facing
Clients, Visitors
Current Users
Tablet slate
Hybrids
QA12a What type of product do they have? QA14a/b Are tablets/hybrids the only device or do they use them in addition to another device?
N = 665 (Percentage of responses)
Only 43.1%
Additional 56.9%
Tablet Slates
Only 51.2%
Additional 48.8%
Hybrid devices
The majority of tablet users currently uses a slate form factor in addition to another device to perform their business activities. Additional devices tend to be desktop or portable PCs, smart phones or workstations.
More than 40% of slate users are now relying solely on their tablet which are taking the place of desktops (especially in customer facing roles) and specialised handheld devices or are now provided by employers instead of company smart phones. Increasingly more however are also tablet slates deployed to carry out activities previously not supported by any computing device. This incremental opportunity is especially observed in customer facing roles.
Among hybrids, 2-in-1s are largely preferred. They are less common than slates but future purchase intentions suggest that their share will increase as a physical keyboard remains a crucial input method in most job functions. Hybrids, especially convertible, tend to be used as a only device replacing more often portables and desktops, but also – depending on the user function – smart phones or handheld devices.
© IDC Visit us at IDC.com and follow us on Twitter: @IDC 35
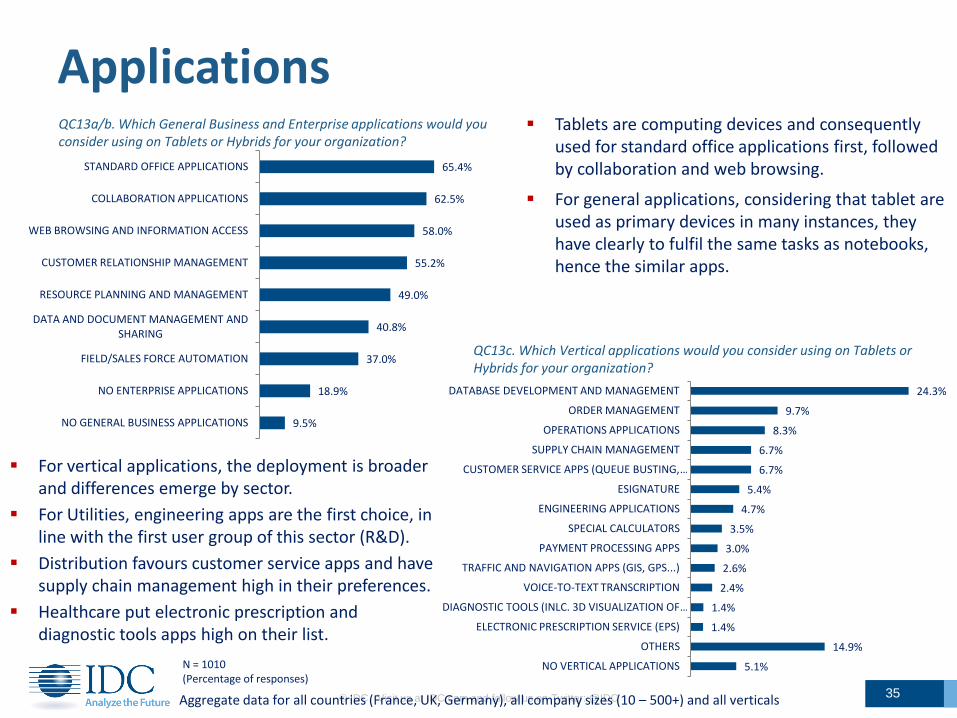
Applications Tablets are computing devices and consequently
used for standard office applications first, followed by collaboration and web browsing.
For general applications, considering that tablet are used as primary devices in many instances, they have clearly to fulfil the same tasks as notebooks, hence the similar apps.
QC13a/b. Which General Business and Enterprise applications would you consider using on Tablets or Hybrids for your organization?
9.5%
18.9%
37.0%
40.8%
49.0%
55.2%
58.0%
62.5%
65.4%
NO GENERAL BUSINESS APPLICATIONS
NO ENTERPRISE APPLICATIONS
FIELD/SALES FORCE AUTOMATION
DATA AND DOCUMENT MANAGEMENT AND SHARING
RESOURCE PLANNING AND MANAGEMENT
CUSTOMER RELATIONSHIP MANAGEMENT
WEB BROWSING AND INFORMATION ACCESS
COLLABORATION APPLICATIONS
STANDARD OFFICE APPLICATIONS
Aggregate data for all countries (France, UK, Germany), all company sizes (10 – 500+) and all verticals
N = 1010 (Percentage of responses)
5.1%
14.9%
1.4%
1.4%
2.4%
2.6%
3.0%
3.5%
4.7%
5.4%
6.7%
6.7%
8.3%
9.7%
24.3%
NO VERTICAL APPLICATIONS
OTHERS
ELECTRONIC PRESCRIPTION SERVICE (EPS)
DIAGNOSTIC TOOLS (INLC. 3D VISUALIZATION OF …
VOICE-TO-TEXT TRANSCRIPTION
TRAFFIC AND NAVIGATION APPS (GIS, GPS...)
PAYMENT PROCESSING APPS
SPECIAL CALCULATORS
ENGINEERING APPLICATIONS
ESIGNATURE
CUSTOMER SERVICE APPS (QUEUE BUSTING, …
SUPPLY CHAIN MANAGEMENT
OPERATIONS APPLICATIONS
ORDER MANAGEMENT
DATABASE DEVELOPMENT AND MANAGEMENT
QC13c. Which Vertical applications would you consider using on Tablets or Hybrids for your organization?
For vertical applications, the deployment is broader and differences emerge by sector.
For Utilities, engineering apps are the first choice, in line with the first user group of this sector (R&D).
Distribution favours customer service apps and have supply chain management high in their preferences.
Healthcare put electronic prescription and diagnostic tools apps high on their list.

© IDC Visit us at IDC.com and follow us on Twitter: @IDC 36
Decision Making Process
57%
59%
72%
69%
79%
36%
36%
32%
37%
33%
28%
23%
26%
19%
20%
Initiate request
Influence deployment
Influence product choice
Deployment decision
Product decision
ITDM
IT
C-level
LoBs
48%
54%
69%
62%
78%
34%
30%
30%
37%
32%
28%
25%
30%
18%
19%
Initiate request
Influence deployment
Influence product choice
Deployment decision
Product decision
LoB
N(ITDM) = 792 (Percentage of responses)
Aggregate data for all countries (France, UK, Germany), all company sizes (10 – 500+) and all verticals
N(LoB) = 217 (Percentage of responses)
QB7. Who in your organization is responsible for or involved in Initiating the request for Tablets? Influence the deployment decision, product choice? And Making the final decision as regards to deployment and product choice?
Tablet deployment is in most cases a joint decision between IT and LoBs.
LoBs have a critical role on the process initiation and on the product choice. As some devices have to answer specific users or sector needs, their role in the process and on product choice is essential.
IT departments are playing a key role in all phases of the process, for both budget ownership reasons and their central role on the implementation which gives them a stronger responsibility towards purchase, hence their weight on product choice and decision.
C-levels seem to be involved at all stages of the decision making process. This relating to the strategic choices made, the productivity gains or the company image to be obtained with the device adoption decision.

© IDC Visit us at IDC.com and follow us on Twitter: @IDC 37
Brand/Supplier Choice Brand and supplier choice criteria show some level
of contradiction.
While compatibility with existing platform, existing relationship or cross-device offering rank high in a supplier choice, the results show limited correlation and brand loyalty between portable PC and tablet brands, with the partial exception of Apple.
The strong share of Apple and Samsung in terms of brand likelihood have to be seen in light of their longer established tablet position and to the share of slates, while mainstream commercial tablets from traditional PC vendors were introduced later to the market, and at higher price points that standard notebook.
0%
10%
20%
30%
40%
50%
60%
70%
80%
90%
100%
Like
liho
od
to
bu
y ta
ble
t b
ran
d
Current Portable PC brand
TOSHIBA
SONY
SAMSUNG
PANASONIC
MICROSOFT
LENOVO
HP
FUJITSU
DELL
AMAZON
10.5%
23.8%
36.1%
40.5%
40.8%
49.4%
55.5%
CHANNEL PARTNER CHOICE/QUALITY
APPLICATION DEVELOPMENT …
SUPPORT/SERVICES CAPABILITIES
PRODUCT OFFERING COVERING …
EXISTING RELATIONSHIP
GLOBAL SOLUTION PROVIDER
COMPATIBILITY WITH EXISTING …
QD15 Excluding price, what would be your main criteria when selecting a Tablet or Hybrid device brand?
N = 830 (Percentage of responses)
Aggregate data for all countries (France, UK, Germany), all company sizes (10 – 500+) and all verticals
Combined QA2b. What Portable PC brands does your organization currently have? And D14. Among the following vendors how likely would you be, on a scale from 1 to 5 (1 not at all likely, 5 extremely likely) to purchase tablets from them and choose as your main Tablet or 2-in-1 device supplier?
N(D14) = 830 (Sum of 4 and 5 ratings = Very/Extremely Likely to purchase)
Compatibility with existing platform is clearly dominating the vendor selection process, which could favour all windows based portable PC vendors as well as Android phone vendors or iOS. This is reinforced by product offering for multiple platforms
The ability to provide global solution seems to be another aspect in identifying the right vendor.

0%
10%
20%
30%
40%
50%
60%
70%
TOTAL France UK Germany
A Bring Your Own Device (BYOD) policy
A Choose Your Own Device (CYOD) policy
No official policy but employees are allowed to bring and use their own device
We don't have any official policy and employees are not allowed to bring or use their own device
© IDC Visit us at IDC.com and follow us on Twitter: @IDC 38
B/C/UYOD QA20A Does your organization have a formal policy allowing employees to Bring, Choose or Use their own mobile device for work-related purposes?
N = 1068 (Percentage of responses)
Aggregate data for all company sizes (10 – 500+) and all verticals excluding Education
The majority of companies do not have a policy for employee bringing or using their own devices in all three countries.
When adopting a policy, CYOD is preferred over BYOD overall.
There are some strong differences between France, Germany and UK related to various cultural business approaches.
Germany seems to be the most advanced with a third of the companies declaring having a BYOD or CYOD policy, which may be attributed to a stronger compliance culture.
The UK appears as more flexible and tolerating the use of personal devices (UYOD), in line with a usually more flexible approach to mobility and remote working.
France has a significant proportion of companies without any policy and not authorizing devices, which might be either a sign of control or of denial.
© IDC Visit us at IDC.com and follow us on Twitter: @IDC 39
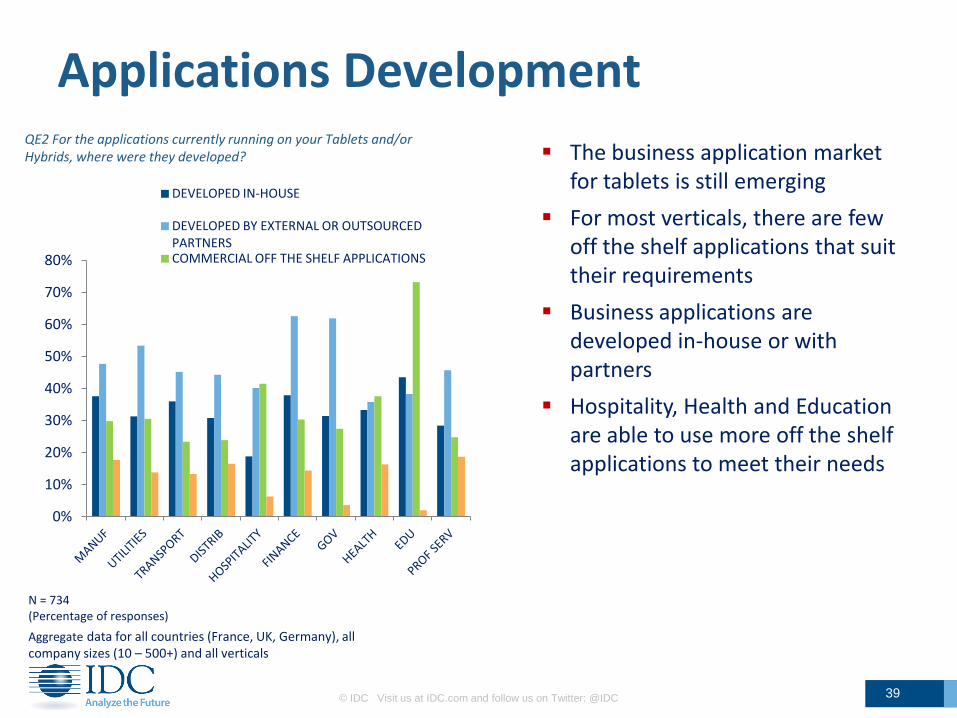
Applications Development QE2 For the applications currently running on your Tablets and/or Hybrids, where were they developed?
N = 734 (Percentage of responses)
Aggregate data for all countries (France, UK, Germany), all company sizes (10 – 500+) and all verticals
0%
10%
20%
30%
40%
50%
60%
70%
80%
DEVELOPED IN-HOUSE
DEVELOPED BY EXTERNAL OR OUTSOURCED PARTNERS COMMERCIAL OFF THE SHELF APPLICATIONS
The business application market for tablets is still emerging
For most verticals, there are few off the shelf applications that suit their requirements
Business applications are developed in-house or with partners
Hospitality, Health and Education are able to use more off the shelf applications to meet their needs

© IDC Visit us at IDC.com and follow us on Twitter: @IDC 40
Applications Management QE3 Where can employees download applications for Tablets and/or Hybrids from in your organization?
N = 565 (Percentage of responses) Aggregate data for all company sizes (10 – 500+) and all verticals
0%
10%
20%
30%
40%
50%
60%
70%
TOTAL France UK Germany
ENTERPRISE APP STORE
DEVICE VENDOR APP STORE
OPERATING SYSTEM VENDOR APP STORE
OTHERS
With many applications being custom developed, there is a strong preference for in-house managed enterprise App stores
With Apple devices and operating system being so closely linked, the device vendor App store is popular
Operating system vendor App stores are likely to gain in popularity as the Tablet market diversifies

© IDC Visit us at IDC.com and follow us on Twitter: @IDC 41
Applications Management - B/C/UYOD QE5. - How does your company manage the installation of applications on BYOD/CYOD/UYOD Tablets?
N = 107 (Percentage of responses) Aggregate data for all company sizes and verticals
28.6%
16.0%
40.0%
15.8%
49.1%
24.3%
48.8%
58.8%
22.4%
59.8%
11.2%
25.4%
0%
10%
20%
30%
40%
50%
60%
70%
80%
90%
100%
TOTAL France UK Germany
Employees may not install any applications
Employees may install most applications, but there are some exceptions
Employees may install any applications
46.1%
40.3%
30.6%
28.8%
13.4%
DEVICE VENDOR DEVICE MANAGEMENT SOFTWARE
SOFTWARE VENDOR DEVICE MANAGEMENT SOFTWARE
SPECIALIST INDEPENDENT DEVICE MANAGEMENT SOFTWARE
GENERAL IT MANAGEMENT SOFTWARE
NO DEVICE MANAGEMENT SOFTWARE DEPLOYED
Taken as a whole, there is a lot of freedom to install company Apps on devices that are not company owned.
UK is the most liberal, while France is the most guarded, when it comes to installing company Apps on personal devices
QE6. Which of the following types of dedicated device management software have been deployed to manage your devices?

© IDC Visit us at IDC.com and follow us on Twitter: @IDC 42
Mobile Device Management Approach QE7 When it comes to device management across Smartphones, Tablets and PCs, which statement best describes the situation you are in today, and where would you like it to be two years time?
N = 735 (Percentage of companies)
Aggregate data for all countries (France, UK, Germany), all company sizes (10 – 500+) and all verticals excluding Education
50.1%
25.0%
7.3%
17.6%
27.3%
21.7% 17.6%
33.3%
0%
10%
20%
30%
40%
50%
60%
Default tools that come with the
devices
Centralized management tool that covers most
devices and default tools for
remaining devices
Centralized management tool that covers most
devices and specialized tools
for remaining devices
Single management tool that manages all
devices
NOW IN TWO YEARS
Most companies do not invest in specialized tools for device or application management.
There is a universal appreciation of the needs for better and more integrated management, but getting the funding will be the challenge.
UK is appreciably ahead of France and Germany when it comes to centralized device management, which helps explain the freedom with which applications can be deployed to devices.

© IDC Visit us at IDC.com and follow us on Twitter: @IDC 43
Mobile Device Management Preference QE9. How would you prefer your Multi/Mobile Device Management solution to be?
Installed and run on-premises
49.9%
Installed on-premises and
managed from reseller/integrato
r's operations centre as a
service 21.9%
Installed and run from
reseller/integrator's operations
centre as a service 10.6%
Run from the Cloud 17.6%
N = 735 (Percentage of companies)
Aggregate data for all countries (France, UK, Germany), all company sizes (10 – 500+) and all verticals excluding Education
Most companies are reluctant to use a Cloud based approach for mobile device management.
If companies are going to outsource device management, it is to a trusted external party.
There is a noticeable variation in preference by industry verticals.
Utilities and Manufacturing are least likely to run on-premises and also most likely to use Cloud.
Finance, Healthcare, Distribution and Government are least likely to use Cloud.

© IDC Visit us at IDC.com and follow us on Twitter: @IDC 44
MDM – OS Perception QE10. Using a scale of 1 to 5, where 1 is Very poor and 5 is Excellent, please rate the following operating systems based on your perception or experience of their capabilities for governance, compliance and security
N = 735 (Percentage of companies)
Aggregate data for all countries (France, UK, Germany), all company sizes (10 – 500+) and all verticals excluding Education
Apple and Android standout as leaders in perceived security.
Much of this is due to a view that they have both improved their security posture significantly over the past year.
BlackBerry has suffered with a poor reputation for security on their new OS platform.
While UK, France and Germany generally feel the same about all platforms, UK has a noticeably high opinion of Android security.
0%
20%
40%
60%
80%
100%
(Significantly) Better
Stable
(Significantly) Worse
QE11. Using a scale of 1 to 5, where 1=Significantly worse, 3 Stayed the same, and 5=Significantly better, in your view, how have the security capabilities of each platform changed over the last 12 months?
11.1% 20.8%
26.9%
12.1%
28.2% 18.0%
30.8% 29.8%
18.8%
29.1%
70.8%
48.3% 43.3%
69.1%
42.6%
0%
10%
20%
30%
40%
50%
60%
70%
80%
90%
100%
APPLE MICROSOFT (ALL
VERSIONS)
BLACKBERRY ANDROID LINUX
Very poor or Poor Fair Good or Excellent

© IDC Visit us at IDC.com and follow us on Twitter: @IDC 45
MDM – Software QE8. Which device management software do you use?
11.6%
8.0%
3.5%
3.9%
4.3%
5.1%
6.1%
8.5%
16.5%
18.5%
22.8%
27.5%
39.6%
NONE
OTHERS
AIRWATCH
PANASONIC
MOBILEIRON
SYMANTEC
GOOD TECHNOLOGY
BLACKBERRY
HP
SAMSUNG
MICROSOFT
DELL
APPLE
N = 735 (Percentage of companies)
Aggregate data for all countries (France, UK, Germany), all company sizes (10 – 500+) and all verticals excluding Education
Given the preference for using the default software that comes with devices, it is no surprise to see software from device vendors dominates today.
Centralized tools vendors that cover all or most devices in use make up a small part of the market - but these should increase in importance in the coming years given the stated intention to invest more in this area.
© IDC Visit us at IDC.com and follow us on Twitter: @IDC 46
QE12. Which of the following is your preferred method to access Enterprise Applications on Tablets?
MDM – Application Access
N = 789 (Percentage of responses)
Aggregate data for all countries (France, UK, Germany), all company sizes (10 – 500+) and all verticals excluding Education
34.4% 29.2% 28.5%
17.9% 17.2%
11.0%
26.3% 39.0%
39.0%
21.4% 14.6%
21.2%
0%
20%
40%
60%
80%
100%
10-99 employees
100-499 employees
500+ employees
Browser-based
Cloud
Use and RDP or RCA to an external Windows environment device
Native application on tablet device
Given the move towards browser based interfaces for web or Cloud based applications in the PC world, it is clear that there is a preference for this approach for Enterprise Apps on Tablets too
Native Enterprise Apps for Tablets remains a sizeable minority preference, given the difficulties of cross-platform App development. This may change if a business standardises on one platform
A VDI/remote desktop approach to App access remains the least preferred approach

3.8%
3.1%
32.1%
39.5%
39.8%
41.4%
42.0%
50.4%
DON'T KNOW
NONE OF THE ABOVE
SECURITY SPECIFIC MODULES
SEPARATELY MANAGED PERSONAL AND CORPORATE DATA
ENCRYPTION CAPABILITIES
BIOMETRICS
EMAIL SESSION ENCRYPTION
CONTINUOUSLY REFRESHED SECURITY POLICIES
© IDC Visit us at IDC.com and follow us on Twitter: @IDC 47
Security Features
QD9 Which security features and policies will be implemented on your Tablets and/or Hybrids?
N = 596 (Percentage of responses) Aggregate data for all countries (France, UK, Germany), all company sizes
(10 – 500+) and all verticals
When it comes to security features, having up to date policies applied to the device is seen as the most important feature. Given the lack of investment in specialized tools, this is likely to be a big challenge to accomplish
Enhanced authentication is rising in importance, with Biometrics now seen as a way to accomplish this
Encryption is one of the top concerns. Given its importance for mitigating data loss notification requirements, it should have more focus

© IDC Visit us at IDC.com and follow us on Twitter: @IDC 48
Routes to Market QE1 Where do you typically purchase your PCs, Tablets and Smartphones?
Aggregate data for all countries (France, UK, Germany), all company sizes (10 – 500+) and all verticals
N(PCs) = 1005 N(Tablets) = 734 N(Smartphone) = 738 (Percentage of responses, not volumes)
PCs are bought almost entirely independently of the mobile phone operators or mobile phone retailers and resellers
Tablets are preferably bought in a similar manner to Smartphones currently – with a lot of influence from the mobile phone channels
As Tablets gain more traction in business and applications become more widely adopted, this will put pressure on the mobile phone channels to adopt PC solutions type capabilities, and increase the importance of the PC channels for Tablets
0%
10%
20%
30%
40%
50%
60%
70%
80%
90%
100%
PCs Tablets Smartphones
From an eTailer
From a retailer
From a Business consultancy as part of a solution
From a Systems Integrator (SI) or Independent Software Vendor (ISV) part of a solution
From a small/local IT reseller
From an IT corporate reseller
From a mobile phone retailer/reseller
From a mobile operator or affiliated stores
Directly from manufacturer

Survey Findings
© IDC Visit us at IDC.com and follow us on Twitter: @IDC 49

A. Current Client Device
Equipment
© IDC Visit us at IDC.com and follow us on Twitter: @IDC 50
© IDC Visit us at IDC.com and follow us on Twitter: @IDC 51
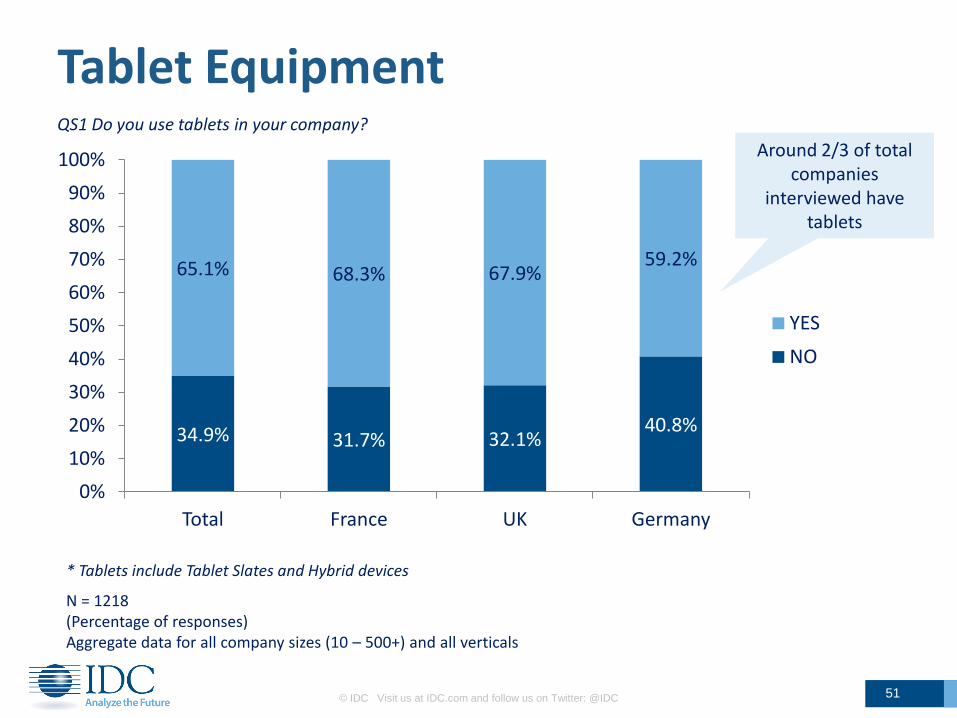
QS1 Do you use tablets in your company?
Tablet Equipment
* Tablets include Tablet Slates and Hybrid devices
N = 1218 (Percentage of responses) Aggregate data for all company sizes (10 – 500+) and all verticals
Around 2/3 of total companies
interviewed have tablets
34.9% 31.7% 32.1% 40.8%
65.1% 68.3% 67.9% 59.2%
0%
10%
20%
30%
40%
50%
60%
70%
80%
90%
100%
Total France UK Germany
YES
NO

© IDC Visit us at IDC.com and follow us on Twitter: @IDC 52
QA1 How many of the following computing devices, purchased by your company, do you have in total in your company?
Commercial Tablet Penetration
*Tablets include Tablet Slates and Hybrid devices ** POS for Distribution/Hospitality only *** Portable PCs include Netbooks
N = 1218 (Percentage of total devices in the sample – outliers adjusted, weighted) Aggregate data for all countries (France, UK, Germany), all company sizes (10 – 500+) and all verticals
Desktop PC 60.6%
Portable PC*** 18.0%
Tablets* 6.3%
Handheld 4.6%
SmartPhones 9.8%
POS** 0.7%
Total sample penetration
6.3% 6.2%
6.3%
0%
10%
20%
30%
40%
50%
60%
70%
80%
90%
100%
France UK Germany
By Country
POS**
SmartPhones
Handheld
Tablets*
Portable PC***
Desktop PC

7.1% 7.3% 11.7% 8.7% 5.3%
7.6% 4.6%
5.7%
4.6%
6.7%
0%
10%
20%
30%
40%
50%
60%
70%
80%
90%
100%
MANUF UTILITIES TRANSPORT DISTRIB HOSPITALITY FINANCE GOV HEALTH EDUCATION PROF SERV
Desktop PC Portable PC Tablets* Handheld SmartPhones POS
© IDC Visit us at IDC.com and follow us on Twitter: @IDC 53
QA1 How many computing devices, purchased by your company, do you have in total in your company?
Tablet Penetration by Vertical
* Tablets include Tablet Slates and Hybrid devices
N = 1218 (Percentage of total devices in the sample) Aggregate data for all countries (France, UK, Germany) and company sizes (10 – 500+)

© IDC Visit us at IDC.com and follow us on Twitter: @IDC 54
Stage of Adoption by country
65% of total companies interviewed have tablets
QB5 What stage of Tablet adoption do you consider your organization to be at?
N = 661 N(FR) = 238 N(UK) = 231 N(197) = 193 (Percentage of companies)
N = 1218
NO 35%
YES 65%
24%
45%
41%
37%
62%
44%
44%
49%
14%
11%
15%
13%
Germany
UK
France
TOTAL
Stage of Adoption
Early stage - still evaluating
Medium stage - expect to expand
Advanced stage - no further expansion planned
Aggregate data for all company sizes (10 – 500+) and all verticals

10.6%
9.3%
8.5%
9.5%
13.2%
17.3%
26.2%
18.4%
12.8%
14.7%
9.9%
12.5%
20.3%
23.8%
11.2%
18.6%
43.0%
34.9%
44.3%
40.9%
Germany
UK
France
TOTAL
Purchase Intentions
We plan to purchase in the next 12 months
We plan to purchase in the next 24 months
We plan to purchase in more than two year
We are currently evaluating the use of Tablets
We have evaluated and decided not to buy
© IDC Visit us at IDC.com and follow us on Twitter: @IDC 55
Tablet Deployment – Purchase Intentions
35% of total companies interviewed do not have
tablets
QB6 What are your company's plans with regards to deploying Tablets or Hybrid devices?
N = 481 N(FR) = 142 N(UK) = 150 N(GE) = 189 (Percentage of companies) Aggregate data for all company sizes (10 – 500+) and all verticals
NO 35%
YES 65%
N = 1218

© IDC Visit us at IDC.com and follow us on Twitter: @IDC 56
Tablet Deployment Overview Combined - QB5 What stage of Tablet adoption do you consider your organization to be at? and QB6 What are your company's plans with regards to deploying Tablets or Hybrid devices?
N = 1138
Total TAM = 83% and 70% short-term
purchase/expansion plans
(Percentage of companies)
Aggregate data for all countries (France, UK, Germany), all company sizes (10 – 500+) and all verticals
Early stage - still evaluating
21.6%
Medium stage - expect to expand
28.7%
Advanced stage - no further
expansion planned 7.6%
We plan to purchase in the next 12 months
4.0%
We plan to purchase in the next 24 months
7.8%
We plan to purchase in more
than two year 5.3%
We are currently evaluating the use
of Tablets 7.8%
We have evaluated and decided not to
buy 17.2%

© IDC Visit us at IDC.com and follow us on Twitter: @IDC 57
Tablet Deployment by Vertical Combined - QB5 What stage of Tablet adoption do you consider your organization to be at? and QB6 What are your company's plans with regards to deploying Tablets or Hybrid devices?
N = 1138 (Percentage of companies)
Aggregate data for all countries (France, UK, Germany), all company sizes (10 – 500+)
Total TAM 84.3% 88.1% 91.0% 86.2% 92.4% 93.3% 90.3% 85.8% 76.5% 89.4%
0%
10%
20%
30%
40%
50%
60%
70%
80%
90%
100%
MANUF UTILITIES TRANSPORT DISTRIB HOSPITALITY FINANCE GOV HEALTH EDU PROF SERV
Early stage - still evaluating Medium stage - expect to expand
Advanced stage - no further expansion planned We plan to purchase in the next 12 months
We plan to purchase in the next 24 months We plan to purchase in more than two year
We are currently evaluating the use of Tablets We have evaluated and decided not to buy
© IDC Visit us at IDC.com and follow us on Twitter: @IDC 58
QA4 What types of tablet or hybrid device does your organization have?
Tablets by Form Factor
N = 737 (Percentage of devices)
Aggregate data for all countries (France, UK, Germany), all company sizes (10 – 500+) and all verticals
TABLET SLATES 75.9%
2-IN-1s 18.5%
CONVERT 5.6%
TOTAL
87.8% 87.2% 72.9%
9.4% 10.6%
20.6%
2.8% 2.2% 6.5%
0%
10%
20%
30%
40%
50%
60%
70%
80%
90%
100%
10-99 employees 100-499 employees
500+ employees
By company size
TABLET SLATES 2-IN-1s CONVERTIBLES
© IDC Visit us at IDC.com and follow us on Twitter: @IDC 59
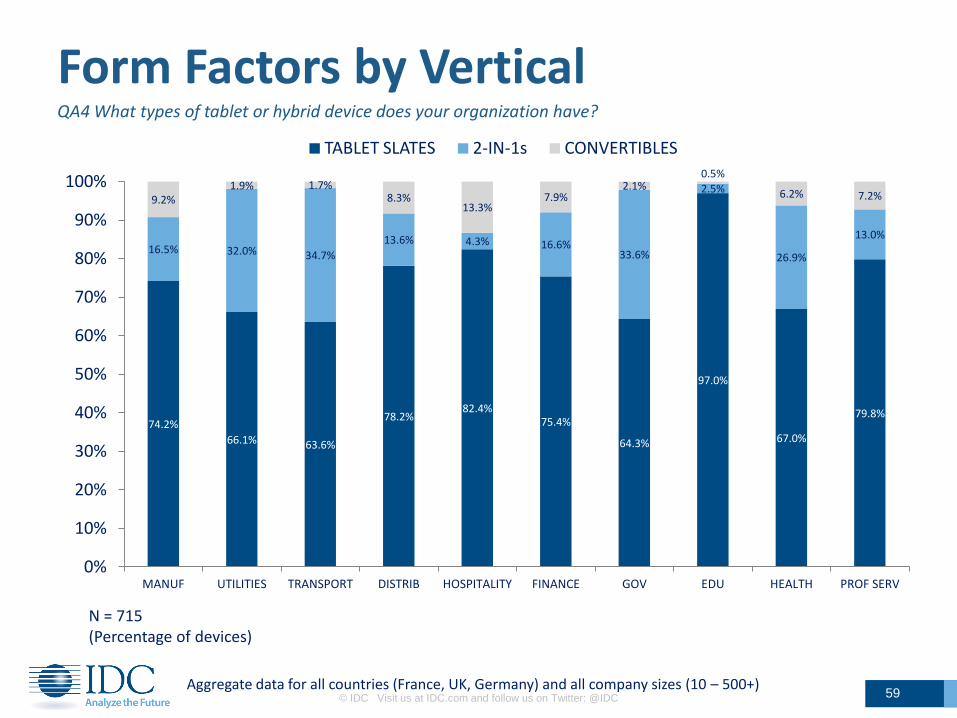
QA4 What types of tablet or hybrid device does your organization have?
Form Factors by Vertical
N = 715 (Percentage of devices)
Aggregate data for all countries (France, UK, Germany) and all company sizes (10 – 500+)
74.2%
66.1% 63.6%
78.2% 82.4%
75.4%
64.3%
97.0%
67.0%
79.8%
16.5% 32.0% 34.7%
13.6% 4.3% 16.6% 33.6%
2.5%
26.9%
13.0%
9.2% 1.9% 1.7%
8.3% 13.3%
7.9% 2.1%
0.5%
6.2% 7.2%
0%
10%
20%
30%
40%
50%
60%
70%
80%
90%
100%
MANUF UTILITIES TRANSPORT DISTRIB HOSPITALITY FINANCE GOV EDU HEALTH PROF SERV
TABLET SLATES 2-IN-1s CONVERTIBLES

© IDC Visit us at IDC.com and follow us on Twitter: @IDC 60
Tablet Screen size - Today QA13a. What is the screen size of your current Tablet Slates in inch?
N = 515 (Percentage of responses)
Aggregate data for all countries (France, UK, Germany), all company sizes (10 – 500+) and all verticals
8.9%
8.5%
17.2%
24.8%
50.4%
48.4%
4.0%
9.8%
8.6% 16.9%
0%
10%
20%
30%
40%
50%
60%
70%
80%
90%
100%
Tablet slate Hybrid device
15''
14''
13''
12''
11''
10''
9''
8''
7''
6''
5''

8% 16%
16% 7%
13% 11% 5% 16%
10% 10%
8% 2%
11% 7%
7% 5%
14% 10%
15% 22%
16% 17% 13% 18% 21%
22% 16%
18%
56% 47%
45% 46% 47% 46%
38%
50% 40%
58%
2% 3%
6% 4% 7%
13%
13%
4%
1% 10% 9% 12% 11% 20%
11% 15%
12%
3%
0%
10%
20%
30%
40%
50%
60%
70%
80%
90%
100%
MANUF UTILITIES TRANSPORT DISTRIB HOSPITALITY FINANCE GOV EDU HEALTH PROF SERV
5'' 6'' 7'' 8'' 9'' 10'' 11'' 12'' 13'' 14'' 15''
© IDC Visit us at IDC.com and follow us on Twitter: @IDC 61
Tablet Slates Screen size - Today QA13a. What is the screen size of your current Tablet Slates in inch?
N = 443 (Percentage of responses)
Aggregate data for all countries (France, UK, Germany), all company sizes (10 – 500+)

© IDC Visit us at IDC.com and follow us on Twitter: @IDC 62
Hybrid devices Screen size - Today QA13a. What is the screen size of your current Hybrid devices* in inch?
N = 72 (Percentage of responses)
Aggregate data for all countries (France, UK, Germany), all company sizes (10 – 500+)
* Hybrid devices include 2-in-1s and Convertibles
29%
17% 9%
24% 21%
35% 32%
41%
86% 46%
48% 75% 25%
47%
57%
100%
49%
15% 22%
25%
12%
11%
8%
8% 29%
14% 22% 22%
39%
21% 11%
0%
10%
20%
30%
40%
50%
60%
70%
80%
90%
100%
MANUF UTILITIES TRANSPORT DISTRIB HOSPITALITY FINANCE GOV HEALTH EDU PROF SERV
9'' 10'' 11'' 12'' 13'' 14'' 15''
61%
37%
56%
50%
47%
68%
54%
58%
17%
9%
12%
13%
8%
3%
2%
4%
4%
1%
3%
3%
Germany
UK
France
Total
Slates OS
BLACKBERRY OS
WEBOS
WINDOWS (ALL VERSIONS) IOS
ANDROID
© IDC Visit us at IDC.com and follow us on Twitter: @IDC 63
Current Tablet OS QA6 Which OS are currently running on your Tablet slates and for Hybrid devices?
N = 649 (Percentage of responses)
N = 235 (Percentage of responses)
Aggregate data for all company sizes (10 – 500+) and all verticals
76%
63%
71%
70%
34%
51%
41%
41%
Germany
UK
France
Total
Hybrids OS
© IDC Visit us at IDC.com and follow us on Twitter: @IDC 64
QC4 How much do you think Tablets or Hybrids will represent in terms of percentage of your total devices in use within your organization next year in 2015, and in 3 years time (eg. 2018)?
N = 649
Tablet Penetration Evolution
(from question A1)
Aggregate data for all countries (France, UK, Germany), all company sizes (10 – 500+) and all verticals excluding Education
6.3%
11.2%
15.2%
0%
10%
20%
30%
2H 2014 2015 2018

© IDC Visit us at IDC.com and follow us on Twitter: @IDC 65
QC4 How much do you think Tablets or Hybrids will represent in terms of percentage of your total devices in use within your organization next year in 2015, and in 3 years time (eg. 2018)?
N = 649
Tablet Penetration Evolution by Vertical
14.4%
13.1%
17.6%
15.1%
17.5%
14.1%
17.6%
16.1%
14.5%
41.8%
34.0%
22.6%
32.1%
82.2%
36.1%
95.5%
67.8%
77.1%
0%
20%
40%
60%
80%
100%
120%
0%
2%
4%
6%
8%
10%
12%
14%
16%
18%
20%
current 2015 2018 CAGR
Aggregate data for all countries (France, UK, Germany), all company sizes (10 – 500+) and all verticals excluding Education
© IDC Visit us at IDC.com and follow us on Twitter: @IDC 66
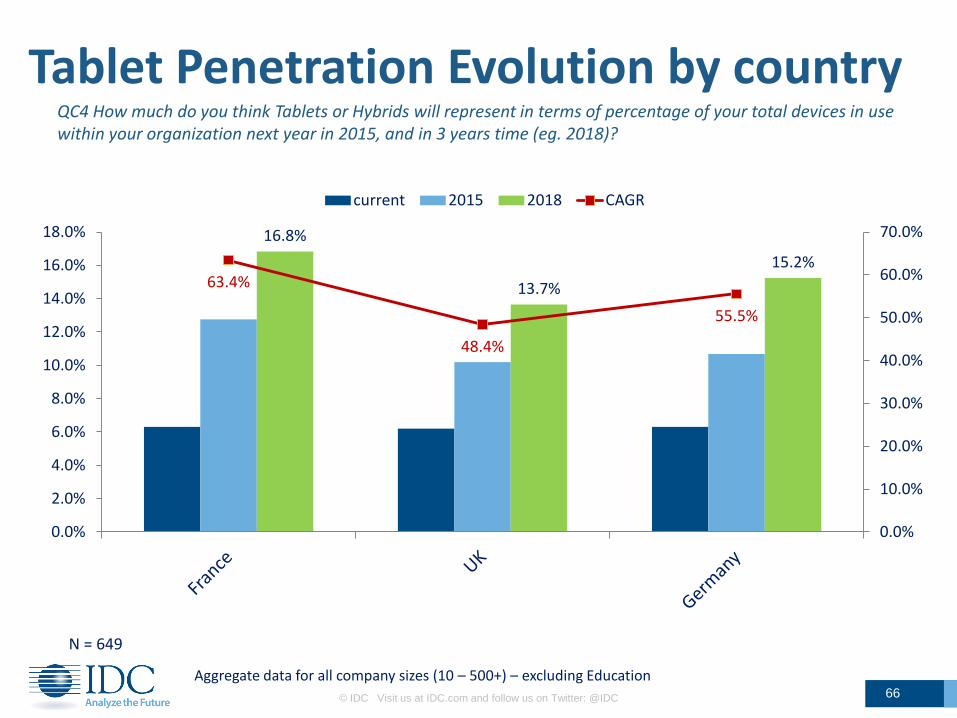
QC4 How much do you think Tablets or Hybrids will represent in terms of percentage of your total devices in use within your organization next year in 2015, and in 3 years time (eg. 2018)?
N = 649
Tablet Penetration Evolution by country
Aggregate data for all company sizes (10 – 500+) – excluding Education
16.8%
13.7%
15.2% 63.4%
48.4%
55.5%
0.0%
10.0%
20.0%
30.0%
40.0%
50.0%
60.0%
70.0%
0.0%
2.0%
4.0%
6.0%
8.0%
10.0%
12.0%
14.0%
16.0%
18.0%
current 2015 2018 CAGR

© IDC Visit us at IDC.com and follow us on Twitter: @IDC 67
Tablets Today – Only or Additional device QA12a What type of product do they have? QA14a/b Are tablets/hybrids the only device or do they use them in addition to another device?
YES
N = 665 (Percentage of responses)
Aggregate data for all countries (France, UK, Germany), all company sizes (10 – 500+) and all verticals excluding Education
52.5% 39.9% 35.1%
47.5% 60.1% 64.9%
France UK Germany
Additional
Only
Only 43.1%
Additional 56.9%
Tablet Slates
66.8% 49.7%
40.5%
33.2% 50.3%
59.5%
France UK Germany
Only 51.2%
Additional 48.8%
Hybrid devices
Hybrid devices include 2-in-1s and Convertibles
© IDC Visit us at IDC.com and follow us on Twitter: @IDC 68
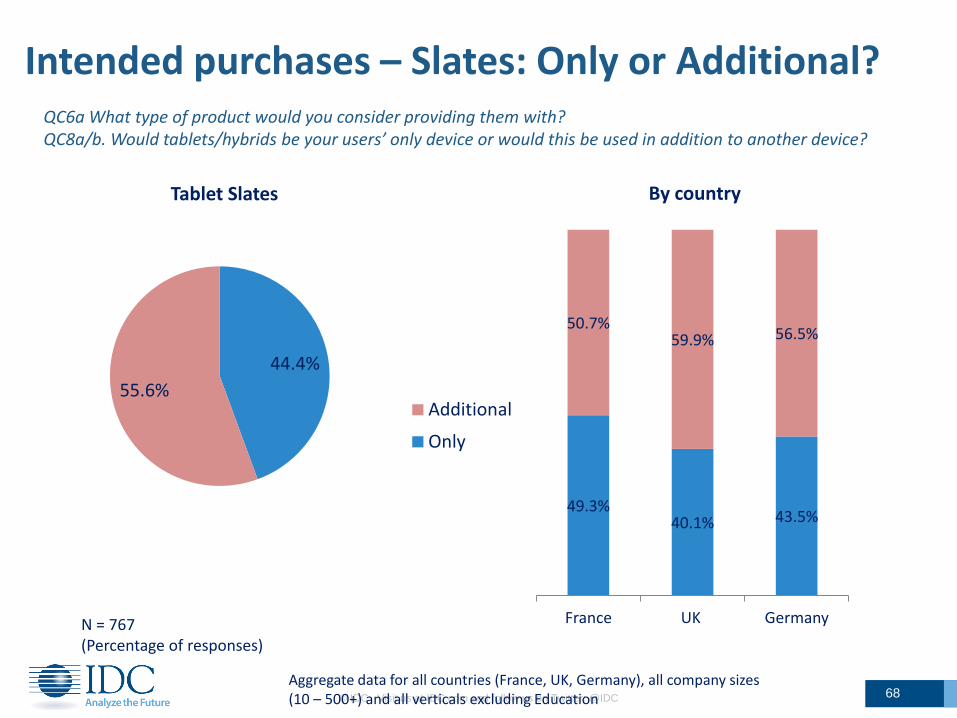
Intended purchases – Slates: Only or Additional?
YES
N = 767 (Percentage of responses)
Aggregate data for all countries (France, UK, Germany), all company sizes (10 – 500+) and all verticals excluding Education
QC6a What type of product would you consider providing them with? QC8a/b. Would tablets/hybrids be your users’ only device or would this be used in addition to another device?
49.3% 40.1% 43.5%
50.7% 59.9% 56.5%
France UK Germany
By country
Additional
Only
44.4%
55.6%
Tablet Slates

© IDC Visit us at IDC.com and follow us on Twitter: @IDC 69
N = 767 (Percentage of responses)
Aggregate data for all countries (France, UK, Germany), all company sizes (10 – 500+) and all verticals excluding Education
QC6a What type of product would you consider providing them with? QC8a/b. Would tablets/hybrids be your users’ only device or would this be used in addition to another device?
50.9% 49.1%
2-in-1s
Only
Additional 70.8%
29.2%
Convertible
56.9% 79.0% 61.3% 62.8% 39.3% 66.7%
43.1%
21.0%
38.7% 37.2%
60.7%
33.3%
2in1s Convertible 2in1s Convertible 2in1s Convertible
France UK Germany
Intended purchases – Hybrids: Only or Additional?

© IDC Visit us at IDC.com and follow us on Twitter: @IDC 70
Tablets as Only device by verticals
N = 665 (Percentage of responses)
QA14 Are tablets* the only device?
Aggregate data for all countries (France, UK, Germany), all company sizes (10 – 500+) and all verticals excluding Education
* Tablets include Tablet Slates and Hybrid devices
39.0%
63.3%
48.6% 48.5% 45.3% 39.9%
49.9% 50.6% 41.2%
61.0%
36.7%
51.4% 51.5% 54.7% 60.1%
50.1% 49.4% 58.8%
0%
10%
20%
30%
40%
50%
60%
70%
80%
90%
100%
MANUF UTILITIES TRANSPORT DISTRIB HOSPITALITY FINANCE GOV HEALTH PROF SERV
Only device Additional device

© IDC Visit us at IDC.com and follow us on Twitter: @IDC 71
Tablet User Groups - Current QA11 Who are Top 3 users of the Tablets purchased by your company?
N = 737 (Percentage of responses)
• White Collars include analysts, consultants, doctors, legal, journalists etc. • Transport include drivers, delivery personnel, etc. • Customer Facing include shop floor staff, waiters, airport personnel etc.
62.8% in LoBs outside Sales
Aggregate data for all countries (France, UK, Germany), all company sizes (10 – 500+) and all verticals
19.8%
13.7%
13.1%
9.2%
3.1%
8.5%
2.1%
4.1%
20.3%
2.5%
3.1%
0.5%
Executives
Sales
Marketing
Production, Maintenance
R&D
Operation
Transport, delivery
Customer facing
White collars
Teachers/Pupils
Clients, Vistors
Others
Clients, Visitors

18.5%
13.8%
14.4%
9.7%
3.5%
9.0%
2.3%
4.6%
19.4%
1.5%
2.8%
0.4%
Executives
Sales
Marketing
Production, Maintenance
R&D
Operation
Transport, delivery
Customer facing
White collars
Teachers/Pupils
Clients, Vistors
Others
Current
Intended purchases
© IDC Visit us at IDC.com and follow us on Twitter: @IDC 72
Tablet User – Current and Intended purchases QA11 Who are Top 3 users of the Tablets purchased by your company? QC5. For which users do you consider purchasing tablets for?
N(A11) = 737 N(C5) = 800 (Percentage of responses)
• White Collars include analysts, consultants, doctors, legal, journalists etc. • Transport include drivers, delivery personnel, etc. • Customer Facing include shop floor staff, waiters, airport personnel etc.
64.5% in LoBs outside Sales
Aggregate data for all countries (France, UK, Germany), all company sizes (10 – 500+) and all verticals
Clients, Visitors

© IDC Visit us at IDC.com and follow us on Twitter: @IDC 73
Tablet User Groups by country
• White Collars include analysts, consultants, doctors, legal, journalists etc. • Transport include drivers, delivery personnel, etc. • Customer Facing include shop floor staff, waiters, airport personnel etc.
Aggregate data for all countries (France, UK, Germany), all company sizes (10 – 500+) and all verticals excl. Education
0% 5% 10% 15% 20% 25%
Others
Clients, Vistors
Teachers/Pupils
White collars
Customer facing
Transport, delivery
Operation
R&D
Production, Maintenance
Marketing
Sales
Executives
UK
Germany
France
QA11 Who are Top 3 users of the Tablets purchased by your company? QC5. For which users do you consider purchasing tablets for?
N(A11) = 737 N(C5) = 800 (Percentage of responses)
Clients, Visitors

© IDC Visit us at IDC.com and follow us on Twitter: @IDC 74
Tablet User Groups – Current by vertical QA11 Who are Top 3 users of the Tablets purchased by your company?
N = 737 (Percentage of responses)
• White Collars include analysts, consultants, doctors, legal, journalists etc. • Transport include drivers, delivery personnel, etc. • Customer Facing include shop floor staff, waiters, airport personnel etc.
Aggregate data for all countries (France, UK, Germany), all company sizes (10 – 500+) and all verticals excl. Education
0%
10%
20%
30%
40%
50%
60%
70%
80%
90%
100%
MANUF UTILITIES TRANSPORT DISTRIB HOSPITALITY FINANCE GOV HEALTH EDU PROF SERV
Executives Sales Marketing Production, Maintenance
R&D Operation Transport, delivery Customer facing
White collars Teachers/Pupils Clients, Vistors Others Clients, Visitors

© IDC Visit us at IDC.com and follow us on Twitter: @IDC 75
Tablet User Groups – Intended by vertical
• White Collars include analysts, consultants, doctors, legal, journalists etc. • Transport include drivers, delivery personnel, etc. • Customer Facing include shop floor staff, waiters, airport personnel etc.
Aggregate data for all countries (France, UK, Germany), all company sizes (10 – 500+) and all verticals excl. Education
QC5. For which users do you consider purchasing tablets for?
N = 800 (Percentage of responses)
0%
10%
20%
30%
40%
50%
60%
70%
80%
90%
100%
MANUF UTILITIES TRANSPORT DISTRIB HOSPITALITY FINANCE GOV HEALTH EDU PROF SERV
Executives Sales Marketing Production, Maintenance
R&D Operation Transport, delivery Customer facing
White collars Teachers/Pupils Clients, Vistors Others Clients, Visitors
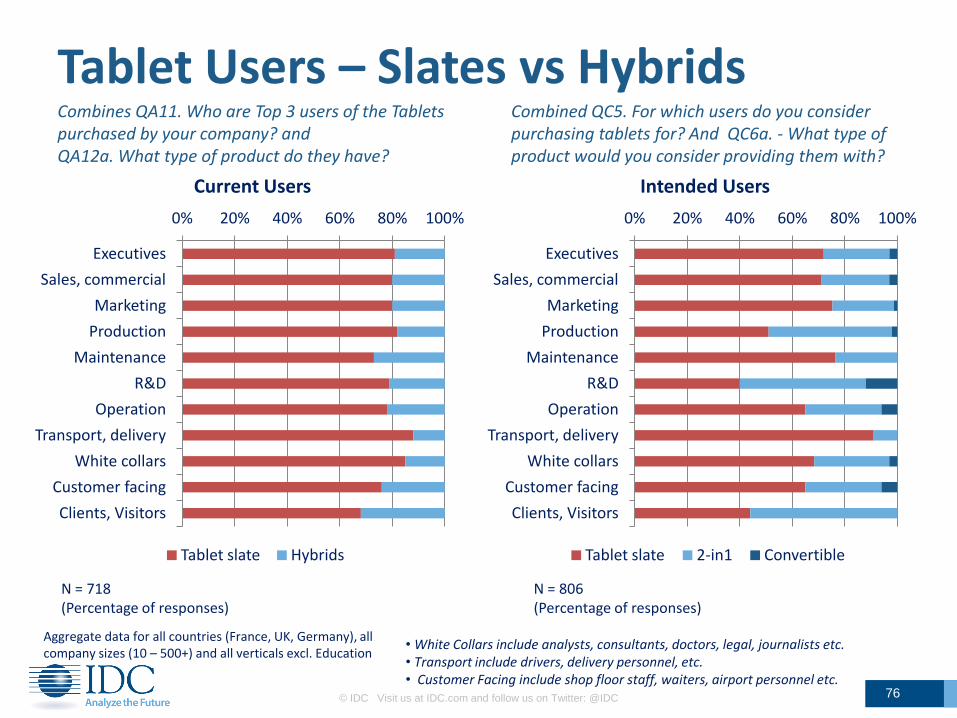
© IDC Visit us at IDC.com and follow us on Twitter: @IDC 76
Tablet Users – Slates vs Hybrids Combines QA11. Who are Top 3 users of the Tablets purchased by your company? and QA12a. What type of product do they have?
• White Collars include analysts, consultants, doctors, legal, journalists etc. • Transport include drivers, delivery personnel, etc. • Customer Facing include shop floor staff, waiters, airport personnel etc.
Aggregate data for all countries (France, UK, Germany), all company sizes (10 – 500+) and all verticals excl. Education
N = 718 (Percentage of responses)
0% 20% 40% 60% 80% 100%
Executives
Sales, commercial
Marketing
Production
Maintenance
R&D
Operation
Transport, delivery
White collars
Customer facing
Clients, Visitors
Intended Users
Tablet slate 2-in1 Convertible
0% 20% 40% 60% 80% 100%
Executives
Sales, commercial
Marketing
Production
Maintenance
R&D
Operation
Transport, delivery
White collars
Customer facing
Clients, Visitors
Current Users
Tablet slate Hybrids
Combined QC5. For which users do you consider purchasing tablets for? And QC6a. - What type of product would you consider providing them with?
N = 806 (Percentage of responses)

© IDC Visit us at IDC.com and follow us on Twitter: @IDC 77
Intended Tablet Users and Screen size choice Combined QC5. For which users do you consider purchasing tablets for? And QC7a. - What screen size would you envisage providing them with?
• White Collars include analysts, consultants, doctors, legal, journalists etc. • Transport include drivers, delivery personnel, etc. • Customer Facing include shop floor staff, waiters, airport personnel etc.
Aggregate data for all countries (France, UK, Germany), all company sizes (10 – 500+) and all verticals excl. Education
N = 502 (Percentage of responses)
0% 20% 40% 60% 80% 100%
Executives
Sales
Marketing
Customer facing
Production
Operation
R&D
Clients / Visitors
White collars
Hybrid devices
0% 20% 40% 60% 80% 100%
Executives
Sales
Marketing
Customer facing
Production
Operation
Maintenance
R&D
Transport
Clients / Visitors
White collars
Tablet Slates
5''
6''
7''
8''
9''
10''
11''
12''
13''
14''
15/16''

© IDC Visit us at IDC.com and follow us on Twitter: @IDC 78
User Profiles (1/4) MARKETING
Screen size
Only vs Additional
Replacing: • Desktop • Portable
Replacing • Smartphone • Nothing • Portable
In addition to • Desktop • Portable
SLATE HYBRIDS SLATE HYBRIDS
Replacing: • Desktop, • Portable
Replacing • Portable, • Desktop
% Shared device 10% 8% 14% 32%
EXECUTIVES
In addition to • Desktop, • Portable
In addition to • Desktop, • Portable
72% 25% 3%
Tablet slate
2-in1
Convertible
75% 23% 1%
38%
62%
Only
Additional 47% 53%
48% 52% 32%
68%
In addition to • Desktop • Portable
14% 10%
57%
33%
16%
28%
9%
28%
SLATES HYBRIDS
14''+
11''-13''
9''-10''
7''-8''
5''-6'' 6%
19% 44%
58% 22%
10% 11%
6%
22%
SLATES HYBRIDS

© IDC Visit us at IDC.com and follow us on Twitter: @IDC 79
User Profiles (2/4)
% Shared device 18% 33% 20% 20%
WHITE COLLARS OPERATIONS
Screen size
Only vs Additional
Replacing: • Desktop • Portable
Replacing • Desktop • Nothing
In addition to • Desktop • Portable
In addition to • Desktop • Portable • Smartphone
Replacing: • Desktop • Portable • Handheld • Workstation
Replacing • Smartphone • Desktop
In addition to • Desktop • Portable
SLATE HYBRIDS SLATE HYBRIDS
65% 29% 6% 68% 29% 3%
Tablet slate
2-in1
Convertible
44% 56%
Only
Additional 43%
57%
In addition to • Desktop/ Workstation • Portable/ Handheld
55%
45%
67%
33%
8% 17%
15%
62%
26%
5%
33%
9%
26%
SLATES HYBRIDS
14''+
11''-13''
9''-10''
7''-8''
5''-6''
14% 17%
59% 50%
23% 17%
5% 17%
SLATES HYBRIDS

40% 48% 12%
51% 47% 2%
Tablet slate
2-in1
Convertible
© IDC Visit us at IDC.com and follow us on Twitter: @IDC 80
User Profiles (3/4)
% Shared device 24% 8% 20% 20%
PRODUCTION R&D
Screen size
67%
33%
Only vs Additional
Replacing: • Desktop • Portable
Replacing • Desktop • Handheld • Nothing
In addition to • Desktop • Portable • Smartphone
In addition to • Smartphone • Desktop • Portable
Replacing: • Nothing • Smartphone
Replacing • Portable • Desktop • Handheld
64%
36%
Only
Additional
67%
33% 50% 50%
In addition to • Desktop • Portable
SLATE HYBRIDS SLATE HYBRIDS
17%
50%
40%
17% 40%
17% 20%
SLATES HYBRIDS
In addition to • Desktop • Portable
44% 21%
42% 22%
21% 22% 16% 11%
SLATES HYBRIDS
14''+
11''-13''
9''-10''
7''-8''
5''-6''
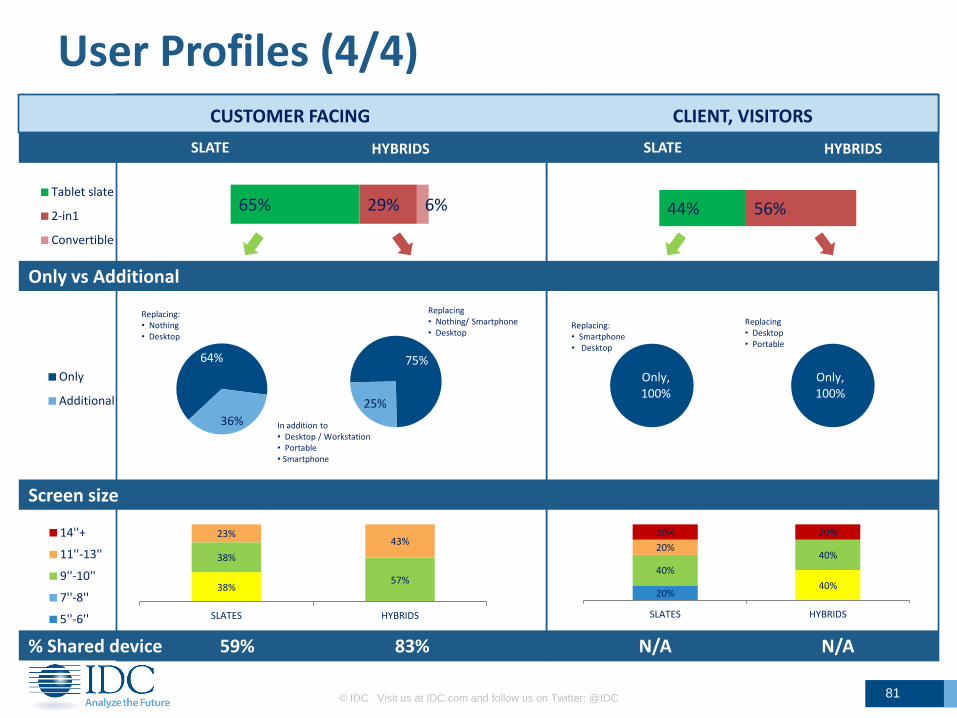
Only, 100%
© IDC Visit us at IDC.com and follow us on Twitter: @IDC 81
User Profiles (4/4)
Screen size
SLATE HYBRIDS SLATE HYBRIDS
Replacing: • Nothing • Desktop
Replacing • Nothing/ Smartphone • Desktop
% Shared device 59% 83% N/A N/A
CUSTOMER FACING
In addition to • Desktop / Workstation • Portable • Smartphone
CLIENT, VISITORS
Replacing: • Smartphone • Desktop
Replacing • Desktop • Portable
Only vs Additional
44% 56% 65% 29% 6% Tablet slate
2-in1
Convertible
Only, 100%
64%
36%
Only
Additional
75%
25%
20% 40%
40%
40% 20%
20% 20%
SLATES HYBRIDS
38%
38%
57%
23% 43%
SLATES HYBRIDS
14''+
11''-13''
9''-10''
7''-8''
5''-6''

© IDC Visit us at IDC.com and follow us on Twitter: @IDC 82
Use Cases: Business and Enterprise Applications
QC13a/b. Which General Business and Enterprise applications would you consider using on Tablets or Hybrids for your organization?
9.5%
18.9%
37.0%
40.8%
49.0%
55.2%
58.0%
62.5%
65.4%
NO GENERAL BUSINESS APPLICATIONS
NO ENTERPRISE APPLICATIONS
FIELD/SALES FORCE AUTOMATION
DATA AND DOCUMENT MANAGEMENT AND SHARING
RESOURCE PLANNING AND MANAGEMENT
CUSTOMER RELATIONSHIP MANAGEMENT
WEB BROWSING AND INFORMATION ACCESS
COLLABORATION APPLICATIONS
STANDARD OFFICE APPLICATIONS
Aggregate data for all countries (France, UK, Germany), all company sizes (10 – 500+) and all verticals
N = 1010 (Percentage of responses)

© IDC Visit us at IDC.com and follow us on Twitter: @IDC 83
Use Cases: Business and Enterprise Applications
QC13a/b. Which General Business and Enterprise applications would you consider using on Tablets or Hybrids for your organization?
Aggregate data for all countries (France, UK, Germany), all company sizes (10 – 500+)
N = 1010 (Percentage of responses)
0%
10%
20%
30%
40%
50%
60%
70%
80%
90%
100% NO ENTERPRISE APPLICATIONS
PERFORMANCE AND STRATEGY MANAGEMENT APPS
FINANCIAL ACCOUNTING APPS
FIELD/SALES FORCE AUTOMATION
RESOURCE PLANNING AND MANAGEMENT
CUSTOMER RELATIONSHIP MANAGEMENT
NO GENERAL BUSINESS APPLICATIONS
DATA AND DOCUMENT MANAGEMENT AND SHARING
WEB BROWSING AND INFORMATION ACCESS
COLLABORATION APPLICATIONS
STANDARD OFFICE APPLICATIONS

© IDC Visit us at IDC.com and follow us on Twitter: @IDC 84
Use Cases: Vertical Applications
Aggregate data for all countries (France, UK, Germany), all company sizes (10 – 500+) and all verticals
N = 1010 (Percentage of responses)
5.1%
14.9%
1.4%
1.4%
2.4%
2.6%
3.0%
3.5%
4.7%
5.4%
6.7%
6.7%
8.3%
9.7%
24.3%
NO VERTICAL APPLICATIONS
OTHERS
ELECTRONIC PRESCRIPTION SERVICE (EPS)
DIAGNOSTIC TOOLS (INLC. 3D VISUALIZATION OF …
VOICE-TO-TEXT TRANSCRIPTION
TRAFFIC AND NAVIGATION APPS (GIS, GPS...)
PAYMENT PROCESSING APPS
SPECIAL CALCULATORS
ENGINEERING APPLICATIONS
ESIGNATURE
CUSTOMER SERVICE APPS (QUEUE BUSTING, …
SUPPLY CHAIN MANAGEMENT
OPERATIONS APPLICATIONS
ORDER MANAGEMENT
DATABASE DEVELOPMENT AND MANAGEMENT
QC13c. Which Vertical applications would you consider using on Tablets or Hybrids for your organization?

© IDC Visit us at IDC.com and follow us on Twitter: @IDC 85
Use Cases: Selected Vertical Applications
Aggregate data for all countries (France, UK, Germany), all company sizes (10 – 500+)
N = 53 (Percentage of responses)
QC13c. Which Vertical applications would you consider using on Tablets or Hybrids for your organization?
12.9%
9.6%
11.4%
14.8%
16.5%
17.1%
18.6%
24.9%
25.3%
33.5%
37.7%
0% 20% 40%
NO VERTICAL APPLICATIONS
SECURITY/SURVEILLANCE APPS
SPECIAL CALCULATORS
TRAFFIC AND NAVIGATION APPS
RESOURCE MANAGEMENT APPS
CERTIFICATION CREATION/MANAGEMENT
ESIGNATURE
OPERATIONS APPLICATIONS
METER READING APP
DATA ENTRY/DATABASE MANAGEMENT
ENGINEERING APPS
Utilities
13.7%
6.6%
16.6%
16.9%
19.4%
25.7%
25.9%
35.8%
37.3%
0% 20% 40%
NO VERTICAL APPLICATIONS
WORKFORCE MANAGEMENT (STAFF SHIFTS/VACATION
SCHEDULE)
DIGITAL COMMERCE APPS
ESIGNATURE
PAYMENT PROCESSING APPS
ORDER MANAGEMENT
SUPPLY CHAIN MANAGEMENT
DATA ENTRY/DATABASE MANAGEMENT
CUSTOMER SERVICE APPS
Distribution
17.7%
11.8%
17.4%
20.6%
21.6%
28.2%
32.0%
32.1%
42.9%
0% 20% 40%
NO VERTICAL APPLICATIONS
VOICE-TO-TEXT TRANSCRIPTION
SPECIAL CALCULATORS
PATIENTS RECORDS MANAGEMENT
REFERRAL MANAGEMENT
OPERATIONS APPLICATIONS
DIAGNOSTIC TOOLS
ELECTRONIC PRESCRIPTION SERVICE (EPS)
DATA ENTRY/DATABASE MANAGEMENT
Healthcare
N = 100 (Percentage of responses)
N = 99 (Percentage of responses)

© IDC Visit us at IDC.com and follow us on Twitter: @IDC 86
Connectivity by country QA7a. What percentage of those tablets or hybrids are WiFi only, and what % are 3G/4G enabled?
Aggregate data for all company sizes (10 – 500+) and all verticals excluding Education
N= 664 (Percentage of devices)
61.7% 66.5%
52.4%
38.4% 33.5%
47.6%
0%
10%
20%
30%
40%
50%
60%
70%
80%
90%
100%
France UK Germany
By Country
3G/4G ENABLED
WiFi ONLY 61.4%
38.6%
Total

© IDC Visit us at IDC.com and follow us on Twitter: @IDC 87
Connectivity by vertical – WiFi only QA7a. What percentage of your current tablets* are WiFi only, and what % are 3G/4G enabled?
* Tablets include Tablet Slates and Hybrid devices
Aggregate data for all countries (France, UK, Germany), all company sizes (10 – 500+)
61.8%
47.5%
65.2%
58.9% 57.5%
76.4%
58.5%
79.7%
61.3%
94.7%
41.7%
0%
10%
20%
30%
40%
50%
60%
70%
80%
90%
100%
Total MANUF UTILITIES TRANSPORT DISTRIB HOSPITALITY FINANCE GOV HEALTH EDUCATION PROF SERV
WiFi only
N = 664 (Percentage of devices)
Two thirds of 3G/4G enabled Tablets in the sample are activated
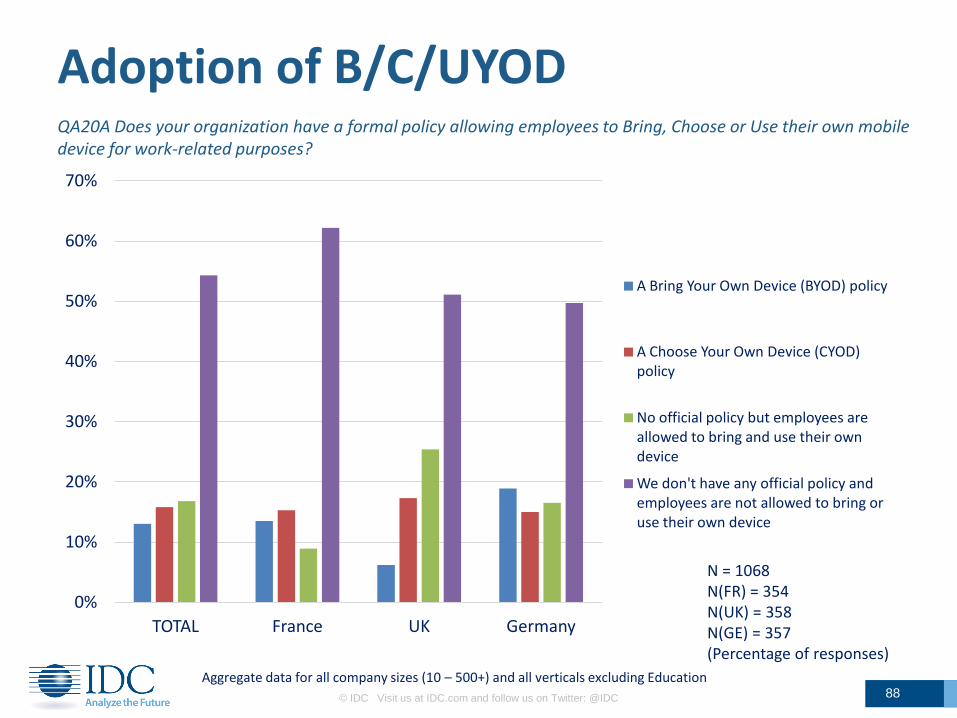
0%
10%
20%
30%
40%
50%
60%
70%
TOTAL France UK Germany
A Bring Your Own Device (BYOD) policy
A Choose Your Own Device (CYOD) policy
No official policy but employees are allowed to bring and use their own device
We don't have any official policy and employees are not allowed to bring or use their own device
© IDC Visit us at IDC.com and follow us on Twitter: @IDC 88
Adoption of B/C/UYOD QA20A Does your organization have a formal policy allowing employees to Bring, Choose or Use their own mobile device for work-related purposes?
N = 1068 N(FR) = 354 N(UK) = 358 N(GE) = 357 (Percentage of responses)
Aggregate data for all company sizes (10 – 500+) and all verticals excluding Education

© IDC Visit us at IDC.com and follow us on Twitter: @IDC 89
B/C/UYOD for Tablets by Country QA21a. How many tablets or hybrid devices are supported by BYOD/CYOD/UYOD in your company?
Aggregate data for all company sizes (10 – 500+) and all verticals excluding Education
N = 81 (respondents for Tablets for B/C/UYOD) (Percentage of devices in sample)
31.1%
2.4%
40.8%
67.8%
61.2%
22.8%
1.1%
36.4% 36.4%
0%
10%
20%
30%
40%
50%
60%
70%
80%
90%
100%
France UK Germany
UYOD
CYOD
BYOD
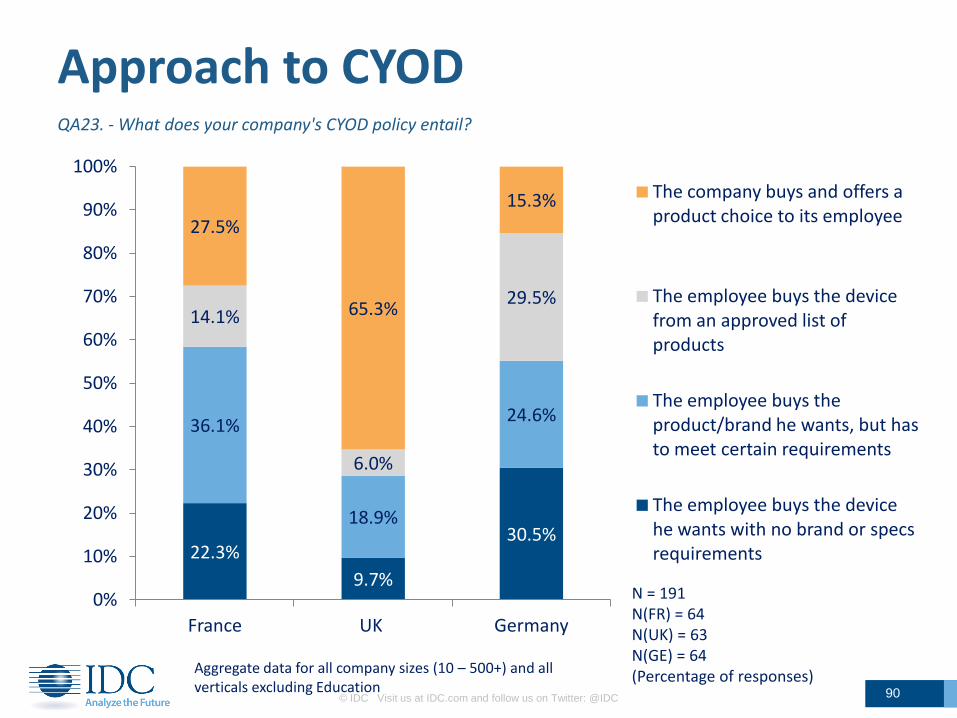
© IDC Visit us at IDC.com and follow us on Twitter: @IDC 90
Approach to CYOD QA23. - What does your company's CYOD policy entail?
N = 191 N(FR) = 64 N(UK) = 63 N(GE) = 64 (Percentage of responses)
22.3%
9.7%
30.5%
36.1%
18.9%
24.6%
14.1%
6.0%
29.5%
27.5%
65.3%
15.3%
0%
10%
20%
30%
40%
50%
60%
70%
80%
90%
100%
France UK Germany
The company buys and offers a product choice to its employee
The employee buys the device from an approved list of products
The employee buys the product/brand he wants, but has to meet certain requirements
The employee buys the device he wants with no brand or specs requirements
Aggregate data for all company sizes (10 – 500+) and all verticals excluding Education

© IDC Visit us at IDC.com and follow us on Twitter: @IDC 91
Future adoption of B/C/UYOD QA30. What are your organisation’s future plans with regard to BYOD/CYOD/UYOD?
N = 568 N(FR) = 203 N(UK) = 182 N(GE) = 183 (Percentage of responses)
11% 16%
3%
11%
16%
4%
4%
8%
1%
71% 42%
86%
2%
18%
6%
0%
10%
20%
30%
40%
50%
60%
70%
80%
90%
100%
France UK Germany
WE ARE UNLIKELY TO SUPPORT ANY OF THOSE POLICIES
WE HAVE NOT EVALUATED ANY OF THESE POLICIES
WE ARE EVALUATING UYOD
WE ARE EVALUATING A CYOD POLICY
WE ARE EVALUATING A BYOD POLICY

B. Device Strategy,
Decision Process and Tablet
Deployment
© IDC Visit us at IDC.com and follow us on Twitter: @IDC 92

43%
37%
39%
32%
30%
28%
21%
36%
TRADITIONAL NOTEBOOK WITH
TOUCH CAPABILITIES
ULTRASLIM LAPTOP WITH
TOUCH CAPABILITIES
TABLET SLATE
2-IN-1 TABLET
CONVERTIBLE
TABLETS BELOW 10INCH WITH
CELLULAR CAPABILITIES
CHROMEBOOKS
LARGE SMARTPHONES
© IDC Visit us at IDC.com and follow us on Twitter: @IDC 93
Mobile Platforms Relevance B1 Using a scale from 1 to 5*, how relevant the following computing devices are for your organization and business needs?
N = 1218 (Total percentage of 4 and 5 ratings)
Aggregate data for all countries (France, UK, Germany), all company sizes (10 – 500+) and all verticals
TABLET SLATE • Utilities • Transport • Distribution
2-in-1s: • Utilities • Transport • Finance
CHROMEBOOKS: • Distribution • Hospitality
* 1 is not at all relevant; 5 is extremely relevant
ULTRASLIM w/ TOUCH • Professional Services • Transport • Healthcare
CONVERTIBLES •Government •Utilities •Healthcare
TABLETS <10’’ w/CELLULAR
• Utilities • Transport • Finance
LARGE SMARTPHONES • Transport • Distribution • Manufacturing
NOTEBOOK w/ TOUCH • Hospitality • Education • Finance

© IDC Visit us at IDC.com and follow us on Twitter: @IDC 94
Mobile Platforms Relevance by Vertical B1 Using a scale from 1 to 5*, how relevant the following computing devices are for your organization and business needs?
N = 1218 (Total percentage of 4 and 5 ratings)
Aggregate data for all countries (France, UK, Germany), all company sizes (10 – 500+)
* 1 is not at all relevant; 5 is extremely relevant
Legend: NB w/Touch = Traditional Notebooks with Touch Ultraslim w/Touch = Ultraslim Notebooks with Touch Conv = Convertibles Large SP = Large Smartphones Tablets <10’’ w/Cell = Tablets below 10’’ with cellular capabilities
NB w/TOUCH
ULTRASLIM w/TOUCH
SLATE
2-IN-1s
CONV
TABLETS <10'' w/CELL
CHROMEB
LARGE SP
MANUFACTURING
NB w/TOUCH
ULTRASLIM w/TOUCH
SLATE
2-IN-1s
CONV
TABLETS <10''
w/CELL
CHROMEB
LARGE SP
UTILITIES
NB w/TOUCH
ULTRASLIM w/TOUCH
SLATE
2-IN-1s
CONV
TABLETS <10'' w/CELL
CHROMEB
LARGE SP
TRANSPORT
NB w/TOUCH
ULTRASLIM w/TOUCH
SLATE
2-IN-1s
CONV
TABLETS <10''
w/CELL
CHROMEB
LARGE SP
DISTRIBUTION
NB w/TOUCH
ULTRASLIM w/TOUCH
SLATE
2-IN-1s
CONV
TABLETS <10'' w/CELL
CHROMEB
LARGE SP
HOSPITALITY
NB w/TOUCH
ULTRASLIM w/TOUCH
SLATE
2-IN-1s
CONV
TABLETS <10'' w/CELL
CHROMEB
LARGE SP
FINANCE
NB w/TOUCH
ULTRASLIM w/TOUCH
SLATE
2-IN-1s
CONV
TABLETS <10'' w/CELL
CHROMEB
LARGE SP
HEALTH
NB w/TOUCH
ULTRASLIM w/TOUCH
SLATE
2-IN-1s
CONV
TABLETS <10'' w/CELL
CHROMEB
LARGE SP
PROF SERV
NB w/TOUCH
ULTRASLIM w/TOUCH
SLATE
2-IN-1s
CONV
TABLETS <10'' w/CELL
CHROMEB
LARGE SP
GOV
NB w/TOUCH
ULTRASLIM …
SLATE
2-IN-1s
CONV
TABLETS <10'' …
CHROMEB
LARGE SP
eREADER
NETBOOKS
EDU

© IDC Visit us at IDC.com and follow us on Twitter: @IDC 95
Decision Making Process Overview QB7. Who in your organization is responsible for or involved in Initiating the request for Tablets? Influence the deployment decision, product choice? And Making the final decision as regards to deployment and product choice?
N(ITDM) = 792 (Percentage of responses)
ITDM (Company wide) LoB (Business Unit level)
Aggregate data for all countries (France, UK, Germany), all company sizes (10 – 500+) and all verticals
IT dept. C-levels LoBs
Initiating request
Influencing deployment
Final deployment
Final product decision
Role of…
Influencing product choice
N(LoB) = 217 (Percentage of responses)
IT dept. C-levels LoBs
59%
72%
19%
69%
79%
54%
69%
62%
19%
78%
18%
20%
23% 25%
28% 28%
26%
30% 30%
30%
31%
32%
33%
34% 36%
36%
37% 37%
48% 57%

© IDC Visit us at IDC.com and follow us on Twitter: @IDC 96
Decision Making Process: Request Initiator QB7a Who in your organization is responsible for or involved in Initiating the request for Tablets?
N(IT) = 792 (Percentage of responses)
N(LoB) = 217 (Percentage of responses) Aggregate data for all countries (France, UK, Germany), all company sizes
(10 – 500+) and all verticals
27.2%
28.1%
28.1%
30.5%
40.6%
56.7%
0% 20% 40% 60%
MARKETING
SALES DEPARTMENT
CUSTOMER SERVICE DEPARTMENT
CFO
CEO
IT DEPARTMENT
ITDM
23.5%
29.2%
29.8%
31.6%
38.5%
47.8%
-20% 0% 20% 40% 60%
CUSTOMER SERVICE DEPARTMENT
CFO
SALES DEPARTMENT
MARKETING
CEO
IT DEPARTMENT
LOB

© IDC Visit us at IDC.com and follow us on Twitter: @IDC 97
Decision Making Process: Influencers QB7b/c Who in your organization is responsible for or involved in Influencing the deployment and product decision?
N(IT) = 792 N(LoB) = 217
Influencing the deployment decision
Influencing the product choice
Aggregate data for all countries (France, UK, Germany), all company sizes (10 – 500+) and all verticals
21.2%
22.6%
26.2%
33.4%
38.9%
58.5%
0% 15% 30% 45% 60% 75% 90%
MARKETING
CUSTOMER SERVICE DEPARTMENT
SALES DEPARTMENT
CFO
CEO
IT DEPARTMENT
ITDM
20.3%
23.3%
27.3%
32.6%
33.6%
53.5%
0% 15% 30% 45% 60% 75% 90%
CUSTOMER SERVICE DEPARTMENT
MARKETING
CEO
SALES DEPARTMENT
CFO
IT DEPARTMENT
LOB
25.2%
26.0%
27.6%
28.3%
35.3%
71.7%
0% 15% 30% 45% 60% 75% 90%
CUSTOMER SERVICE DEPARTMENT
MARKETING
SALES DEPARTMENT
CEO
CFO
IT DEPARTMENT
ITDM
24.9%
27.2%
28.9%
32.4%
35.0%
69.3%
0% 15% 30% 45% 60% 75% 90%
CEO
MARKETING
SALES DEPARTMENT
CUSTOMER SERVICE DEPARTMENT
CFO
IT DEPARTMENT
LOB

© IDC Visit us at IDC.com and follow us on Twitter: @IDC 98
Decision Making Process: Final Decision Makers QB7d/e Who in your organization is responsible for or involved in Making the final deployment and product decision?
Making the final deployment decision
Making the final product choice
14.4%
20.4%
21.7%
33.6%
39.4%
69.3%
0% 15% 30% 45% 60% 75% 90%
CUSTOMER SERVICE DEPARTMENT
MARKETING
SALES DEPARTMENT
CFO
CEO
IT DEPARTMENT
ITDM
14.1%
17.6%
22.8%
29.8%
43.5%
62.2%
0% 15% 30% 45% 60% 75% 90%
MARKETING
CUSTOMER SERVICE DEPARTMENT
SALES DEPARTMENT
CFO
CEO
IT DEPARTMENT
LOB
17.3%
19.4%
22.6%
31.2%
34.7%
79.2%
0% 15% 30% 45% 60% 75% 90%
CUSTOMER SERVICE DEPARTMENT
SALES DEPARTMENT
MARKETING
CFO
CEO
IT DEPARTMENT
ITDM
17.1%
18.7%
22.5%
26.5%
36.5%
77.6%
0% 15% 30% 45% 60% 75% 90%
CUSTOMER SERVICE DEPARTMENT
MARKETING
SALES DEPARTMENT
CFO
CEO
IT DEPARTMENT
LOB
N(IT) = 792 N(LoB) = 217
Aggregate data for all countries (France, UK, Germany), all company sizes (10 – 500+) and all verticals

© IDC Visit us at IDC.com and follow us on Twitter: @IDC 99
Tablet Adoption: Key Motivating Factors QB8 What do you see as key reasons or motivating factors for deploying Tablets in your organization?
N =943 (Percentage of responses)
28.4%
31.5%
36.2%
47.8%
62.4%
BUSINESS TRANSFORMATION
FULFILL SOME BUSINESS NEEDS/APPS NOT FULFILLED BY TRADITIONAL
COMPUTING DEVICES
DRIVE INNOVATIVE 'COMPANY IMAGE'
IMPROVE CUSTOMER FACING ENGAGEMENT
INCREASE EMPLOYEE PRODUCTIVITY
Aggregate data for all countries (France, UK, Germany), all company sizes (10 – 500+) and all verticals excluding Education

© IDC Visit us at IDC.com and follow us on Twitter: @IDC 100
Tablet Adoption: Key Motivating Factors QB8 What do you see as key reasons or motivating factors for deploying Tablets in your organization?
N =943 (Percentage of responses)
Aggregate data for all countries (France, UK, Germany), all company sizes (10 – 500+) and all verticals excluding Education
MANUF
UTILITIES
TRANSPORT
DISTRIBUTION
HOSPITALITY FINANCE
GOVERNMENT
HEALTHCARE
PROF SERVICES INCREASE EMPLOYEE PRODUCTIVITY
BUSINESS TRANSFORMATION
IMPROVE CUSTOMER FACING ENGAGEMENT
FULFILL SOME BUSINESS NEEDS/APPS NOT FULFILLED BY TRADITIONAL COMPUTING DEVICES
DRIVE INNOVATIVE 'COMPANY IMAGE'
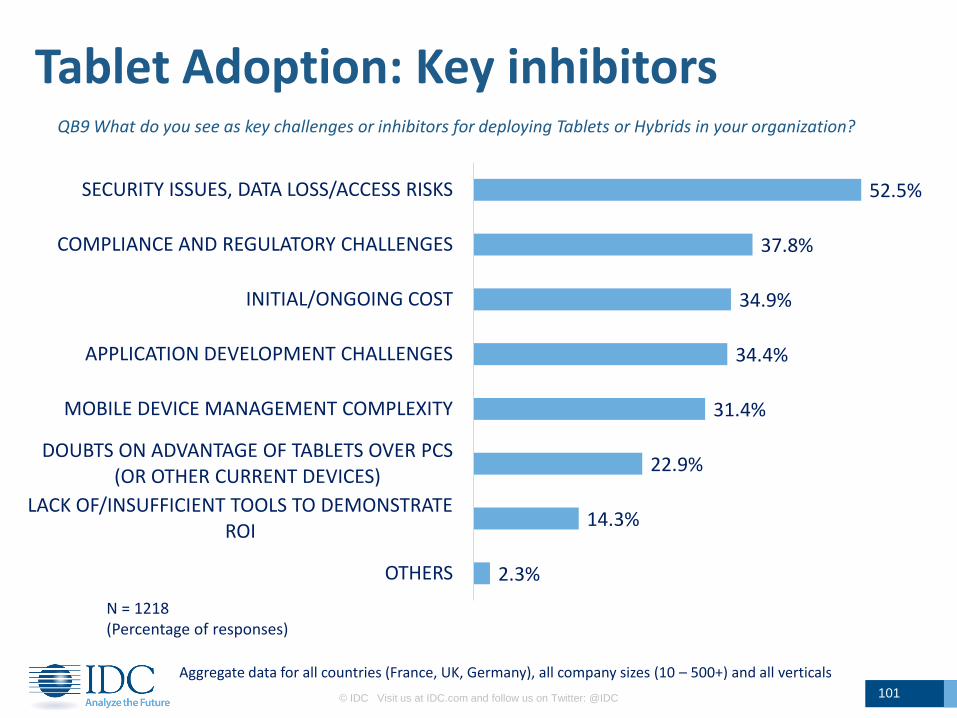
2.3%
14.3%
22.9%
31.4%
34.4%
34.9%
37.8%
52.5%
OTHERS
LACK OF/INSUFFICIENT TOOLS TO DEMONSTRATE ROI
DOUBTS ON ADVANTAGE OF TABLETS OVER PCS (OR OTHER CURRENT DEVICES)
MOBILE DEVICE MANAGEMENT COMPLEXITY
APPLICATION DEVELOPMENT CHALLENGES
INITIAL/ONGOING COST
COMPLIANCE AND REGULATORY CHALLENGES
SECURITY ISSUES, DATA LOSS/ACCESS RISKS
© IDC Visit us at IDC.com and follow us on Twitter: @IDC 101
Tablet Adoption: Key inhibitors
N = 1218 (Percentage of responses)
QB9 What do you see as key challenges or inhibitors for deploying Tablets or Hybrids in your organization?
Aggregate data for all countries (France, UK, Germany), all company sizes (10 – 500+) and all verticals

© IDC Visit us at IDC.com and follow us on Twitter: @IDC 102
Tablet Adoption: Key inhibitors
N = 1218 (Percentage of responses)
QB9 What do you see as key challenges or inhibitors for deploying Tablets or Hybrids in your organization?
Aggregate data for all countries (France, UK, Germany), all company sizes (10 – 500+) and all verticals
0%
10%
20%
30%
40%
50%
60%
France UK Germany
SECURITY ISSUES, DATA LOSS/ACCESS RISKS
COMPLIANCE AND REGULATORY CHALLENGES
MOBILE DEVICE MANAGEMENT COMPLEXITY
INITIAL/ONGOING COST
APPLICATION DEVELOPMENT CHALLENGES
DOUBTS ON ADVANTAGE OF TABLETS OVER PCS (OR OTHER CURRENT DEVICES)
LACK OF/INSUFFICIENT TOOLS TO DEMONSTRATE ROI
1st
1st 1st
2nd
2nd
2nd 3rd
3rd
3rd

C. Purchase intentions, Product
choice and Requirements
© IDC Visit us at IDC.com and follow us on Twitter: @IDC 103
Security, Application and Mobile Device Management

17.6% 14.6%
36.9% 26.8%
21.4% 14.0%
22.7% 18.8%
22.9%
28.6%
24.8%
28.1%
19.4%
20.5%
12.8% 16.7%
19.4% 21.0%
5.8% 9.9%
3.1% 5.9%
5.3% 6.2%
18.2% 19.9% 15.0% 14.5%
19.7% 21.2%
0%
10%
20%
30%
40%
50%
60%
70%
80%
90%
100%
2014 2015 2014 2015 2014 2015
FRANCE UK GERMANY
Don't know
2,500+
1,000 to 2,499
500 to 999
250 to 499
200 to 249
100 to 199
50 to 99
25 to 49
10 to 24
1 to 9
None
© IDC Visit us at IDC.com and follow us on Twitter: @IDC 104
QC2 How many Tablets or Hybrid devices do you plan/intend to purchase in 2014 and in 2015?
Purchase Intentions 2014 and 2015
N (2014) = 1010 N (2015) = 944 (excl. Education) Aggregate data for all company sizes (10 – 500+) and all verticals (excl. Education in 2015)
(Percentage of responses, not volumes)
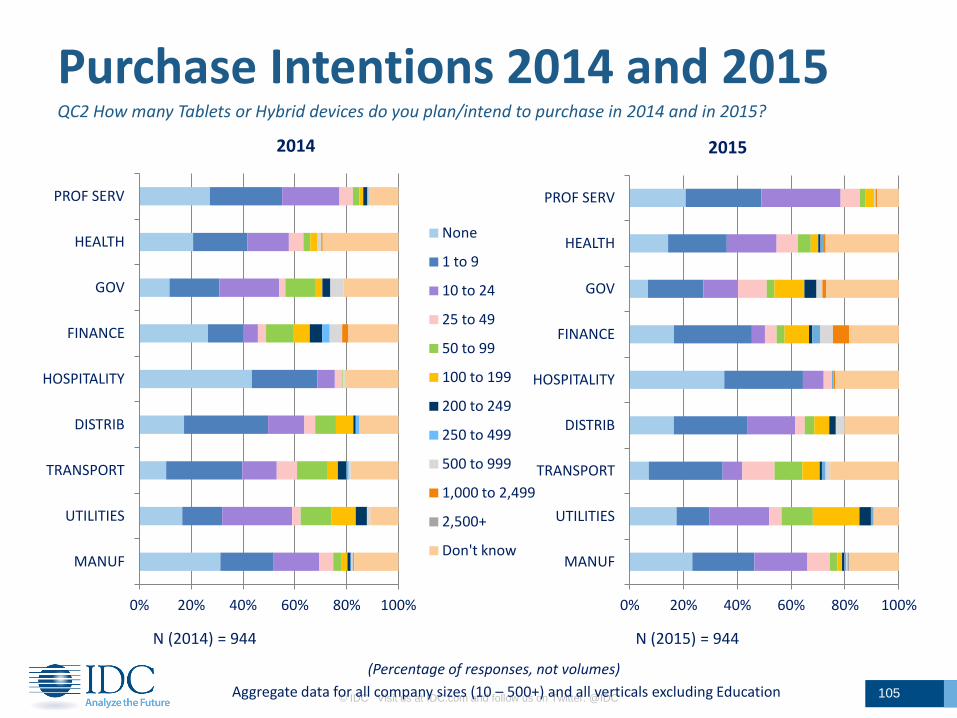
© IDC Visit us at IDC.com and follow us on Twitter: @IDC 105
QC2 How many Tablets or Hybrid devices do you plan/intend to purchase in 2014 and in 2015?
Purchase Intentions 2014 and 2015
N (2014) = 944 N (2015) = 944
Aggregate data for all company sizes (10 – 500+) and all verticals excluding Education
0% 20% 40% 60% 80% 100%
MANUF
UTILITIES
TRANSPORT
DISTRIB
HOSPITALITY
FINANCE
GOV
HEALTH
PROF SERV
2014
None
1 to 9
10 to 24
25 to 49
50 to 99
100 to 199
200 to 249
250 to 499
500 to 999
1,000 to 2,499
2,500+
Don't know
0% 20% 40% 60% 80% 100%
MANUF
UTILITIES
TRANSPORT
DISTRIB
HOSPITALITY
FINANCE
GOV
HEALTH
PROF SERV
2015
(Percentage of responses, not volumes)
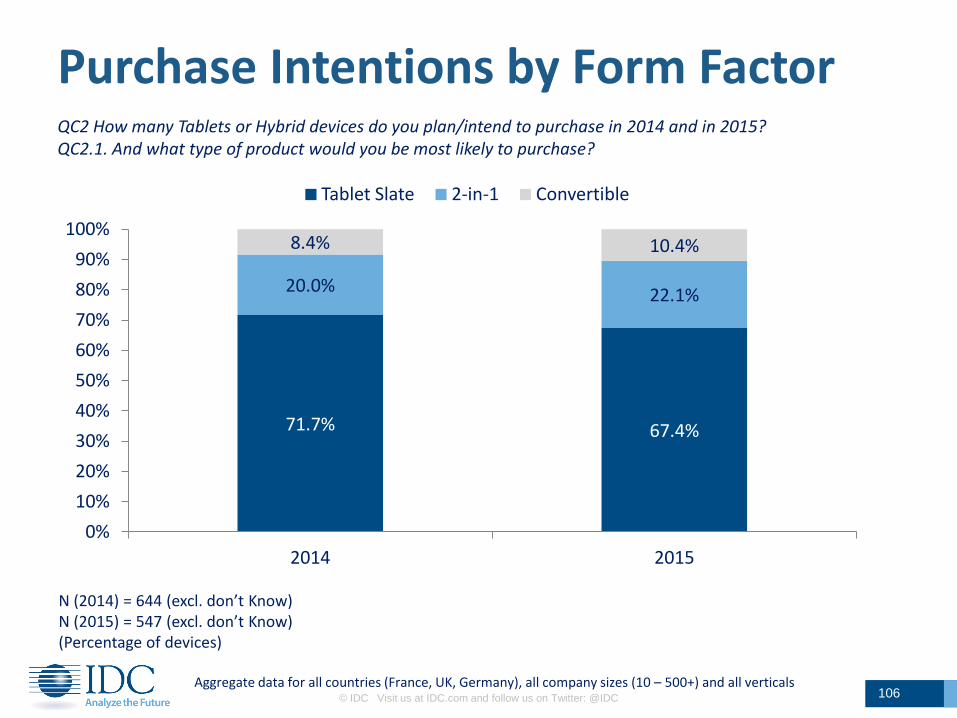
© IDC Visit us at IDC.com and follow us on Twitter: @IDC 106
Purchase Intentions by Form Factor QC2 How many Tablets or Hybrid devices do you plan/intend to purchase in 2014 and in 2015? QC2.1. And what type of product would you be most likely to purchase?
N (2014) = 644 (excl. don’t Know) N (2015) = 547 (excl. don’t Know) (Percentage of devices)
Aggregate data for all countries (France, UK, Germany), all company sizes (10 – 500+) and all verticals
71.7% 67.4%
20.0% 22.1%
8.4% 10.4%
0%
10%
20%
30%
40%
50%
60%
70%
80%
90%
100%
2014 2015
Tablet Slate 2-in-1 Convertible

© IDC Visit us at IDC.com and follow us on Twitter: @IDC 107
Purchase Intentions – Form Factor by Vertical QC2.1. And what type of product would you be most likely to purchase in 2014 and 2015?
Aggregate data for all countries (France, UK, Germany) and all company sizes (10 – 500+)
N (2014 + 2015) = 1193 (excl. don’t Know) (Percentage of devices)
0%
10%
20%
30%
40%
50%
60%
70%
80%
90%
100%
MANUF UTILITIES TRANSPORT DISTRIB HOSPITALITY FINANCE GOV HEALTH EDU PROF SERV
Tablet Slate 2-in-1 Convertible

57.7%
47.1%
10.7%
19.3%
18.0%
5.2%
Android
iOS
Windows 7
Windows 8.1 or RT
Windows embedded
Windows (don’t know yet which version)
Slates OS
43.0%
39.5%
13.5%
18.1%
21.7%
8.0%
0.4%
Android
iOS
Windows 7
Windows 8.1 or RT
Windows embedded
Windows (don’t know yet which version)
Other
Hybrid OS
© IDC Visit us at IDC.com and follow us on Twitter: @IDC 108
Future Purchases – OS Preference QD1a/b. Which OS would you likely choose/adopt for your tablet slates or Hybrids?
N = 764 (Percentage of responses)
N = 713 (Percentage of responses)
Windows all versions
53.2%
Aggregate data for all countries (France, UK, Germany), all company sizes (10 – 500+) and all verticals
Windows all versions
61.3%

© IDC Visit us at IDC.com and follow us on Twitter: @IDC 109
Future Purchases – OS by Country QD1a/b. Which OS would you likely choose/adopt for your tablet slates or Hybrids?
Aggregate data for all company sizes (10 – 500+) and all verticals
59.3%
51.7%
61.2%
41.8%
58.3%
42.7%
0%
10%
20%
30%
40%
50%
60%
70%
France UK Germany
Slates OS
Android
iOS
Windows 7
Windows 8.1 or RT
Windows embedded
Windows (don’t know yet which version)
42.2% 39.3%
46.9%
29.8%
48.7%
41.6%
0%
10%
20%
30%
40%
50%
60%
France UK Germany
Hybrid devices
N = 764 (Percentage of responses)
N = 713 (Percentage of responses)
52.1% 51.2%
56.0%
68.3%
53.6% 61.1%

39.7% 45.7% 40.1% 36.6% 37.4% 33.8% 43.2% 33.0% 22.6% 34.6%
26.2% 17.2% 29.3% 28.8% 35.3% 32.0% 21.7%
24.6% 46.6% 37.7%
34.0% 37.1% 30.6% 34.7% 27.4% 34.2% 35.0% 42.4% 30.8% 27.7%
0%
20%
40%
60%
80%
100%
MANUF UTILITIES TRANSPORT DISTRIB HOSPITALITY FINANCE GOV HEALTH EDU PROF SERV
Tablet Slates OS
Android iOS Windows (all versions)
© IDC Visit us at IDC.com and follow us on Twitter: @IDC 110
Future Purchases – OS by Vertical QD1a/b. Which OS would you likely choose/adopt for your tablet slates or Hybrids?
Aggregate data for all countries (France, UK, Germany) and all company sizes (10 – 500+)
N = 764 (Percentage of responses)
33.5% 30.4% 21.3%
30.8% 34.4% 31.4% 35.1% 26.8% 14.0%
28.6%
23.6% 16.9%
25.8%
31.8% 26.6% 28.2% 20.3% 25.5%
25.0%
33.9%
42.9% 52.7% 52.9%
37.4% 38.9% 40.4% 44.6% 47.8% 54.3%
37.5%
0%
20%
40%
60%
80%
100%
MANUF UTILITIES TRANSPORT DISTRIB HOSPITALITY FINANCE GOV HEALTH EDU PROF SERV
Hybrid devices
N = 713 (Percentage of responses)
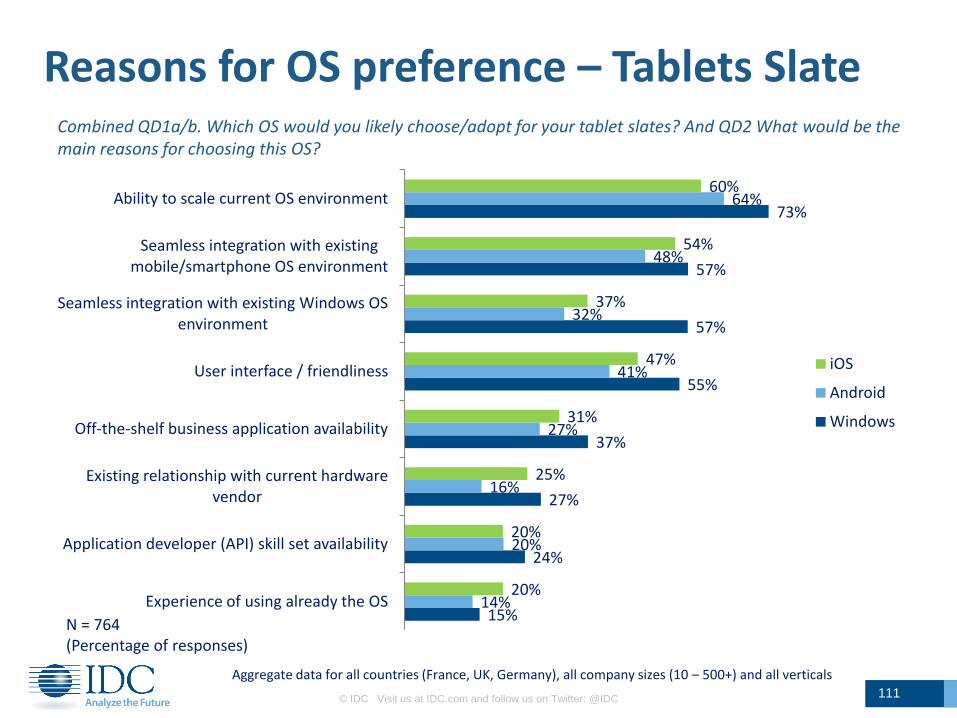
© IDC Visit us at IDC.com and follow us on Twitter: @IDC 111
Reasons for OS preference – Tablets Slate Combined QD1a/b. Which OS would you likely choose/adopt for your tablet slates? And QD2 What would be the main reasons for choosing this OS?
N = 764 (Percentage of responses)
Aggregate data for all countries (France, UK, Germany), all company sizes (10 – 500+) and all verticals
15%
24%
27%
37%
55%
57%
57%
73%
14%
20%
16%
27%
41%
32%
48%
64%
20%
20%
25%
31%
47%
37%
54%
60%
Experience of using already the OS
Application developer (API) skill set availability
Existing relationship with current hardware vendor
Off-the-shelf business application availability
User interface / friendliness
Seamless integration with existing Windows OS environment
Seamless integration with existing mobile/smartphone OS environment
Ability to scale current OS environment
iOS
Android
Windows
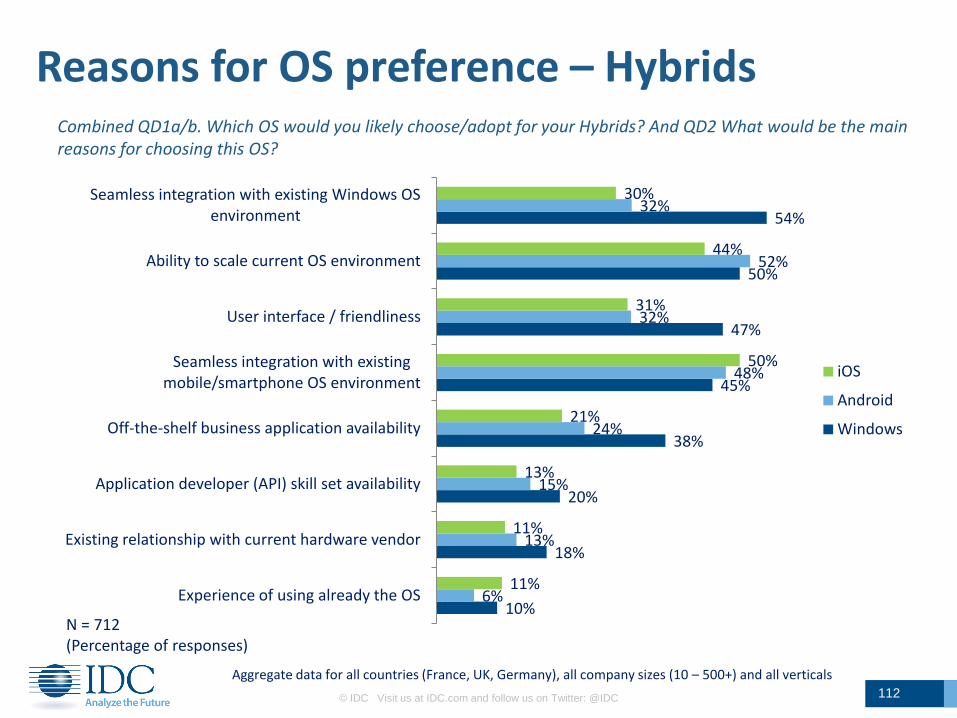
© IDC Visit us at IDC.com and follow us on Twitter: @IDC 112
Reasons for OS preference – Hybrids
N = 712 (Percentage of responses)
Combined QD1a/b. Which OS would you likely choose/adopt for your Hybrids? And QD2 What would be the main reasons for choosing this OS?
10%
18%
20%
38%
45%
47%
50%
54%
6%
13%
15%
24%
48%
32%
52%
32%
11%
11%
13%
21%
50%
31%
44%
30%
Experience of using already the OS
Existing relationship with current hardware vendor
Application developer (API) skill set availability
Off-the-shelf business application availability
Seamless integration with existing mobile/smartphone OS environment
User interface / friendliness
Ability to scale current OS environment
Seamless integration with existing Windows OS environment
iOS
Android
Windows
Aggregate data for all countries (France, UK, Germany), all company sizes (10 – 500+) and all verticals

© IDC Visit us at IDC.com and follow us on Twitter: @IDC 113
Multi OS Management
N = 596 (Percentage of responses)
QD3. - Do you see the management of multiple OSes within your organisation as a key concern, moderate challenge or not at all a challenge?
18.6% 17.6% 12.9% 24.4%
6.9% 5.6% 7.7%
7.3%
25.0% 26.5% 29.1%
20.0%
34.7% 42.0%
35.4% 27.9%
14.8% 8.2%
15.0% 20.4%
0%
10%
20%
30%
40%
50%
60%
70%
80%
90%
100%
TOTAL France UK Germany
Key concern/challenge
Moderate challenge
No real challenge, open to new/additional OS
Not planning to manage multiple OS
Don't know
Aggregate data for all countries (France, UK, Germany), all company sizes (10 – 500+) and all verticals

24.8% 9.9%
48.4%
26.1%
9.8%
10.1%
16.9%
13.0%
16.5%
0%
10%
20%
30%
40%
50%
60%
70%
80%
90%
100%
Today Intended Purchases
Hybrid devices
© IDC Visit us at IDC.com and follow us on Twitter: @IDC 114
Screen Size – Intended Purchases
N (Today)= 515 N (Intended Purchases) = 502 (Percentage of responses, not volumes)
Aggregate data for all countries (France, UK, Germany), all company sizes (10 – 500+) and all verticals
QC7a. – Regarding the Tablet Slates or Hybrid devices that you plan to provide your employees with, which screen size would you envisage for them in inches?
3.9%
17.2% 12.3%
50.4% 40.4%
8.3%
0%
10%
20%
30%
40%
50%
60%
70%
80%
90%
100%
Today Intended Purchases
Tablet Slates
16''
15''
14''
13''
12''
11''
10''
9''
8''
7''
6''
5''
10’’
9’’
6’’
15’ 13 to 16’
9’’ - 10’’
6’’ – 8’’

© IDC Visit us at IDC.com and follow us on Twitter: @IDC 115
Screen Size by Vertical – Slates vs Hybrids
N = 356 (Percentage of responses, not volumes)
Aggregate data for all countries (France, UK, Germany), all company sizes (10 – 500+)
QC7a. – Regarding the Tablet Slates or Hybrid devices that you plan to provide your employees with, which screen size would you envisage for them in inches?
0%
10%
20%
30%
40%
50%
60%
70%
80%
90%
100%
Hybrids devices
0%
10%
20%
30%
40%
50%
60%
70%
80%
90%
100%
Slates
16''
15''
14''
13''
12''
11''
10''
9''
8''
7''
6''
5''
N = 146 (Percentage of responses, not volumes)

© IDC Visit us at IDC.com and follow us on Twitter: @IDC 116
Input Method QD4 Considering your business/organization needs, what are the most important input methods?
N = 830 (Percentage of responses)
*Onboard or Network processed
Aggregate data for all countries (France, UK, Germany) and all company sizes (10 – 500+)
0%
20%
40%
60%
80%
100%
TOUCH INPUT PHYSICAL KEYBOARD STYLUS / PEN-BASED VOICE INPUT*
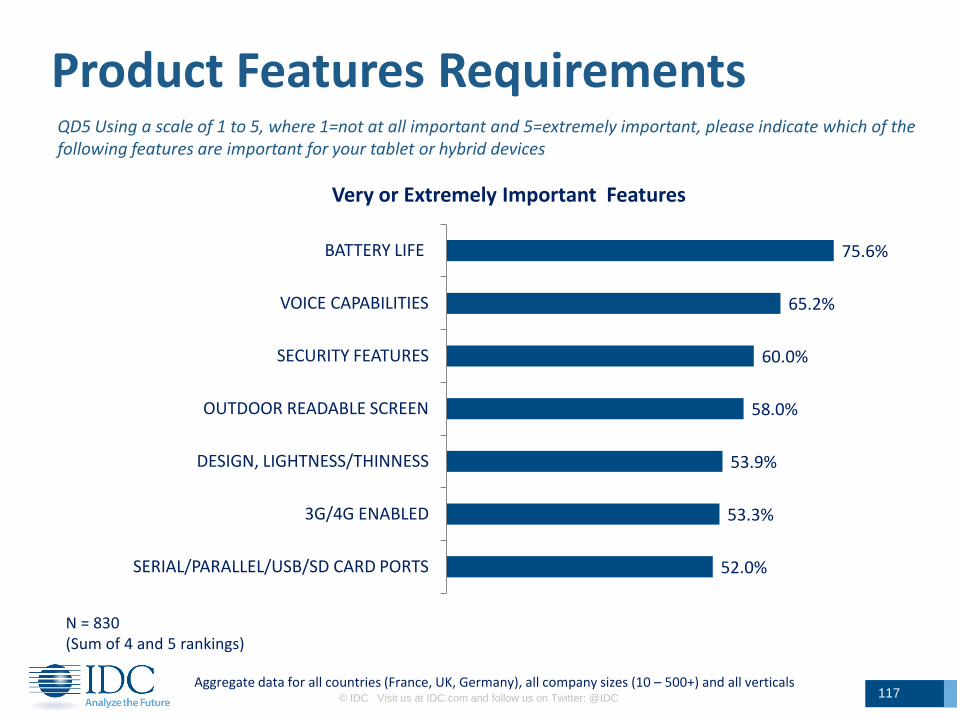
© IDC Visit us at IDC.com and follow us on Twitter: @IDC 117
Product Features Requirements QD5 Using a scale of 1 to 5, where 1=not at all important and 5=extremely important, please indicate which of the following features are important for your tablet or hybrid devices
N = 830 (Sum of 4 and 5 rankings)
Aggregate data for all countries (France, UK, Germany), all company sizes (10 – 500+) and all verticals
52.0%
53.3%
53.9%
58.0%
60.0%
65.2%
75.6%
SERIAL/PARALLEL/USB/SD CARD PORTS
3G/4G ENABLED
DESIGN, LIGHTNESS/THINNESS
OUTDOOR READABLE SCREEN
SECURITY FEATURES
VOICE CAPABILITIES
BATTERY LIFE
Very or Extremely Important Features

© IDC Visit us at IDC.com and follow us on Twitter: @IDC 118
Product Features by Vertical QD5 Using a scale of 1 to 5, where 1=not at all important and 5=extremely important, please indicate which of the following features are important for your tablet or hybrid devices
N = 830 (Sum of 4 and 5 rankings)
Aggregate data for all countries (France, UK, Germany), all company sizes (10 – 500+)
0% 20% 40% 60% 80% 100%
MANUF
UTILITIES
TRANSPORT
DISTRIB
HOSPITALITY
FINANCE
GOV
HEALTH
EDU
PROF SERV BATTERY LIFE
3G/4G ENABLED
VOICE CAPABILITIES
DESIGN, LIGHTNESS
OUTDOOR READABLE
SECURITY FEATURES
SERIAL/PARALLEL/USB/SD CARD PORTS TO CONNECT EXTERNAL DEVICES
EXTENDED WARRANTY, SUPPORT/SERVICE PLAN

© IDC Visit us at IDC.com and follow us on Twitter: @IDC 119
Additional Product Features QD7 Considering your business/organization's needs, which of the following ADDITIONAL FEATURES are important to have on your Tablet or Hybrid devices?
N = 674 (Percentage of responses)
Aggregate data for all countries (France, UK, Germany), all company sizes (10 – 500+) and all verticals excluding Education
13.8%
16.3%
16.4%
16.9%
18.9%
19.4%
24.4%
29.9%
31.3%
37.0%
37.3%
37.9%
RFID - UHF
VEHICLE-MOUNTED HANDLING OPTIONS
CONFIGURATION, INTEGRATED PCI SLOT …
NOISE CANCELLATION
NFC (NEAR FIELD COMMUNICATION)
GLOVED TOUCH OPERATION
HIGH RESOLUTION FRONT AND BACK CAMS
FINGER PRINT READERS
CREDIT CARD READER
SMART CARD READER
BARCODE SCANNER
RUGGEDIZED: DROP, SHOCK, WATER RESISTANT, …

© IDC Visit us at IDC.com and follow us on Twitter: @IDC 120
Additional Product Features by Vertical QD7 Considering your business/organization's needs, which of the following ADDITIONAL FEATURES are important to have on your Tablet or Hybrid devices?
N = 674 (Percentage of responses)
Aggregate data for all countries (France, UK, Germany), all company sizes (10 – 500+)
0% 10% 20% 30% 40% 50% 60% 70% 80% 90% 100%
MANUF
UTILITIES
TRANSPORT
DISTRIB
HOSPITALITY
FINANCE
GOV
HEALTH
PROF SERV BARCODE SCANNER
CREDIT CARD READER
SMART CARD READER
FINGER PRINT READERS
RUGGEDIZED
VEHICLE-MOUNTED HANDLING
NFC
RFID - UHF
NOISE CANCELLATION
HIGH RESOLUTION FRONT AND BACK CAMS
GLOVED TOUCH OPERATION
CONFIGURATION, INTEGRATED PCI SLOT CAPABILITY

3.8%
3.1%
32.1%
39.5%
39.8%
41.4%
42.0%
50.4%
0% 10% 20% 30% 40% 50% 60%
DON'T KNOW
NONE OF THE ABOVE
SECURITY SPECIFIC MODULES
SEPARATELY MANAGED PERSONAL AND CORPORATE DATA
ENCRYPTION CAPABILITIES
BIOMETRICS
EMAIL SESSION ENCRYPTION
CONTINUOUSLY REFRESHED SECURITY POLICIES
© IDC Visit us at IDC.com and follow us on Twitter: @IDC 121
Security Features QD9 Which security features and policies will be implemented on your Tablets and/or Hybrids?
N = 596 (Percentage of responses)
Aggregate data for all countries (France, UK, Germany), all company sizes (10 – 500+) and all verticals

© IDC Visit us at IDC.com and follow us on Twitter: @IDC 122
Security Features by Country QD9 Which security features and policies will be implemented on your Tablets and/or Hybrids?
N = 555 (Percentage of responses)
Aggregate data for all company sizes (10 – 500+) and all verticals
27.8%
46.0%
46.9%
48.3%
50.2%
51.4%
SECURITY SPECIFIC MODULES
BIOMETRICS
ENCRYPTION CAPABILITIES
EMAIL SESSION ENCRYPTION
CONTINUOUSLY REFRESHED SECURITY POLICIES
SEPARATELY MANAGED PERSONAL / CORPORATE
DATA
France
34.2%
35.9%
38.5%
48.5%
49.5%
59.1%
SECURITY SPECIFIC MODULES
SEPARATELY MANAGED PERSONAL / CORPORATE DATA
BIOMETRICS
ENCRYPTION CAPABILITIES
EMAIL SESSION ENCRYPTION
CONTINUOUSLY REFRESHED SECURITY POLICIES
UK
25.9%
29.9%
32.5%
34.0%
39.9%
43.1%
ENCRYPTION CAPABILITIES
EMAIL SESSION ENCRYPTION
SEPARATELY MANAGED PERSONAL / CORPORATE
DATA
SECURITY SPECIFIC MODULES
BIOMETRICS
CONTINUOUSLY REFRESHED SECURITY
POLICIES
Germany
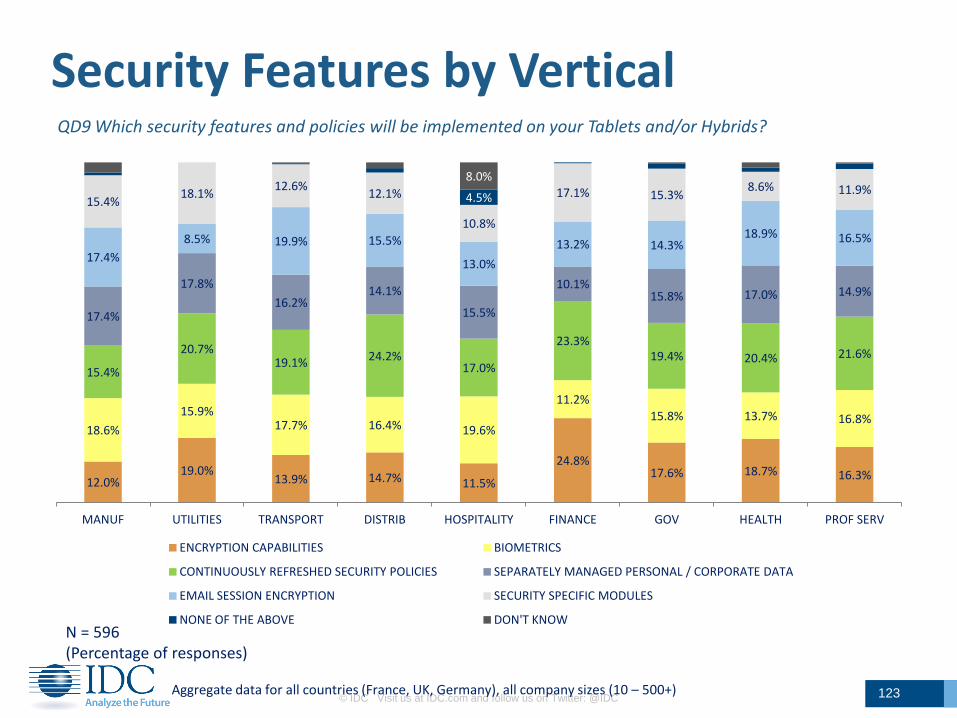
© IDC Visit us at IDC.com and follow us on Twitter: @IDC 123
Security Features by Vertical QD9 Which security features and policies will be implemented on your Tablets and/or Hybrids?
N = 596 (Percentage of responses)
Aggregate data for all countries (France, UK, Germany), all company sizes (10 – 500+)
12.0% 19.0%
13.9% 14.7% 11.5%
24.8% 17.6% 18.7% 16.3%
18.6%
15.9% 17.7% 16.4% 19.6%
11.2%
15.8% 13.7% 16.8%
15.4%
20.7% 19.1% 24.2%
17.0%
23.3% 19.4% 20.4% 21.6%
17.4%
17.8%
16.2% 14.1%
15.5%
10.1% 15.8% 17.0% 14.9%
17.4%
8.5% 19.9% 15.5%
13.0%
13.2% 14.3% 18.9% 16.5%
15.4% 18.1%
12.6% 12.1%
10.8%
17.1% 15.3% 8.6% 11.9%
4.5%
8.0%
MANUF UTILITIES TRANSPORT DISTRIB HOSPITALITY FINANCE GOV HEALTH PROF SERV
ENCRYPTION CAPABILITIES BIOMETRICS
CONTINUOUSLY REFRESHED SECURITY POLICIES SEPARATELY MANAGED PERSONAL / CORPORATE DATA
EMAIL SESSION ENCRYPTION SECURITY SPECIFIC MODULES
NONE OF THE ABOVE DON'T KNOW

24.9%
27.5%
31.3%
35.1%
36.1%
39.5%
42.3%
45.8%
46.8%
WIRELESS MOUSE
HEADSET
DISPLAY/VGA ADAPTOR OR OTHER ADAPTORS
ADDITIONAL BATTERY
CAR CHARGER
SCREEN PROTECTOR
STAND CASE
DOCKING STATION
JACKET SLEEVE/TABLET CASE
© IDC Visit us at IDC.com and follow us on Twitter: @IDC 124
Accessories D8. Considering your business’ needs, which of the accessories are important to have on your Tablet or hybrid devices?
N = 830 (Percentage of responses)
Aggregate data for all countries (France, UK, Germany), all company sizes (10 – 500+) and all verticals
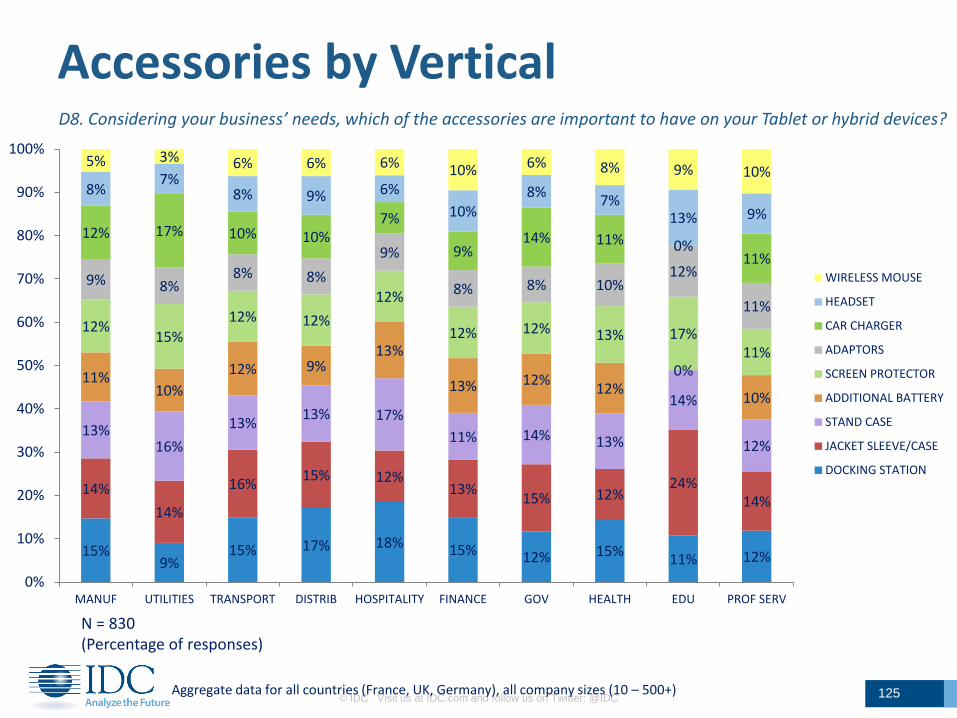
© IDC Visit us at IDC.com and follow us on Twitter: @IDC 125
Accessories by Vertical D8. Considering your business’ needs, which of the accessories are important to have on your Tablet or hybrid devices?
N = 830 (Percentage of responses)
Aggregate data for all countries (France, UK, Germany), all company sizes (10 – 500+)
15% 9%
15% 17% 18% 15% 12% 15% 11% 12%
14%
14%
16% 15% 12%
13% 15% 12%
24% 14%
13% 16%
13% 13% 17%
11% 14% 13%
14%
12%
11% 10%
12% 9% 13%
13% 12% 12%
0%
10%
12% 15%
12% 12%
12%
12% 12% 13% 17% 11%
9% 8% 8% 8%
9%
8% 8% 10% 12%
11%
12% 17% 10% 10% 7%
9% 14% 11% 0%
11%
8% 7%
8% 9% 6%
10% 8%
7% 13% 9%
5% 3% 6% 6% 6% 10% 6% 8% 9% 10%
0%
10%
20%
30%
40%
50%
60%
70%
80%
90%
100%
MANUF UTILITIES TRANSPORT DISTRIB HOSPITALITY FINANCE GOV HEALTH EDU PROF SERV
WIRELESS MOUSE
HEADSET
CAR CHARGER
ADAPTORS
SCREEN PROTECTOR
ADDITIONAL BATTERY
STAND CASE
JACKET SLEEVE/CASE
DOCKING STATION

0% 5% 10% 15% 20%
Less than Eur 100
Eur 100 - 199
Eur 200 - 299
Eur 300 - 399
Eur 400 - 499
Eur 500 - 599
Eur 600 - 799
Eur 800 - 999
Eur 1000 - 1199
Eur 1200 - 1399
Eur 1400 - 1599
Eur 1600 - 1799
1800 or more
Slates
© IDC Visit us at IDC.com and follow us on Twitter: @IDC 126
Pricing QD10. How much would you be prepared to pay for a Tablet Slate. And how much for a Hybrid device?
0% 2% 4% 6% 8% 10% 12% 14%
Less than Eur 100
Eur 100 - 199
Eur 200 - 299
Eur 300 - 399
Eur 400 - 499
Eur 500 - 599
Eur 600 - 799
Eur 800 - 999
Eur 1000 - 1199
Eur 1200 - 1399
Eur 1400 - 1599
Eur 1600 - 1799
1800 or more
Hybrids
N = 792 (Percentage of responses)
Aggregate data for all countries (France, UK, Germany), all company sizes (10 – 500+) and all verticals
N = 798 (Percentage of responses)

© IDC Visit us at IDC.com and follow us on Twitter: @IDC 127
Pricing by Company Size QD10. How much would you be prepared to pay for a Tablet Slate. And how much for a Hybrid device?
N = 792 (Percentage of responses)
Aggregate data for all countries (France, UK, Germany) and all verticals
N = 798 (Percentage of responses)
4% 5% 5% 5% 3% 3%
7% 6% 15%
9% 10%
7% 9% 10%
15%
17% 13%
18% 11%
11%
11% 12%
5%
7% 7%
5%
18% 16%
29%
0%
10%
20%
30%
40%
50%
60%
70%
80%
90%
100%
10-99 employees 100-499 employees
500+ employees
Slates
Don't know
Eur 2000 or more
Eur 1600 - 1799
Eur 1400 - 1599
Eur 1200 - 1399
Eur 1000 - 1199
Eur 800 - 999
Eur 600 - 799
Eur 500 - 599
Eur 400 - 499
Eur 300 - 399
Eur 200 - 299
Eur 100 - 199
Less than Eur 100 2%
4% 4% 6% 6% 5%
7% 9%
7% 4%
5% 8% 13%
10% 9%
13% 9% 13%
13% 10%
8%
7%
5% 6%
2%
5% 3%
31% 33% 31%
0%
10%
20%
30%
40%
50%
60%
70%
80%
90%
100%
10-99 employees 100-499 employees
500+ employees
Hybrids
D. Supplier Choice and
Competitive Benchmark
© IDC Visit us at IDC.com and follow us on Twitter: @IDC 128

10.5%
23.8%
36.1%
40.5%
40.8%
49.4%
55.5%
0% 10% 20% 30% 40% 50% 60%
CHANNEL PARTNER CHOICE/QUALITY
APPLICATION DEVELOPMENT CAPABILITIES
SUPPORT/SERVICES CAPABILITIES
PRODUCT OFFERING COVERING MULTIPLE MOBILE PLATFORMS (PORTABLE, TABLET, PHONE)
EXISTING RELATIONSHIP
GLOBAL SOLUTION PROVIDER
COMPATIBILITY WITH EXISTING PLATFORMS
© IDC Visit us at IDC.com and follow us on Twitter: @IDC 129
Supplier Choice Criteria QD15 Excluding price, what would be your main criteria when selecting a Tablet or Hybrid device brand?
N = 830 (Percentage of responses)
Aggregate data for all countries (France, UK, Germany), all company sizes (10 – 500+) and all verticals
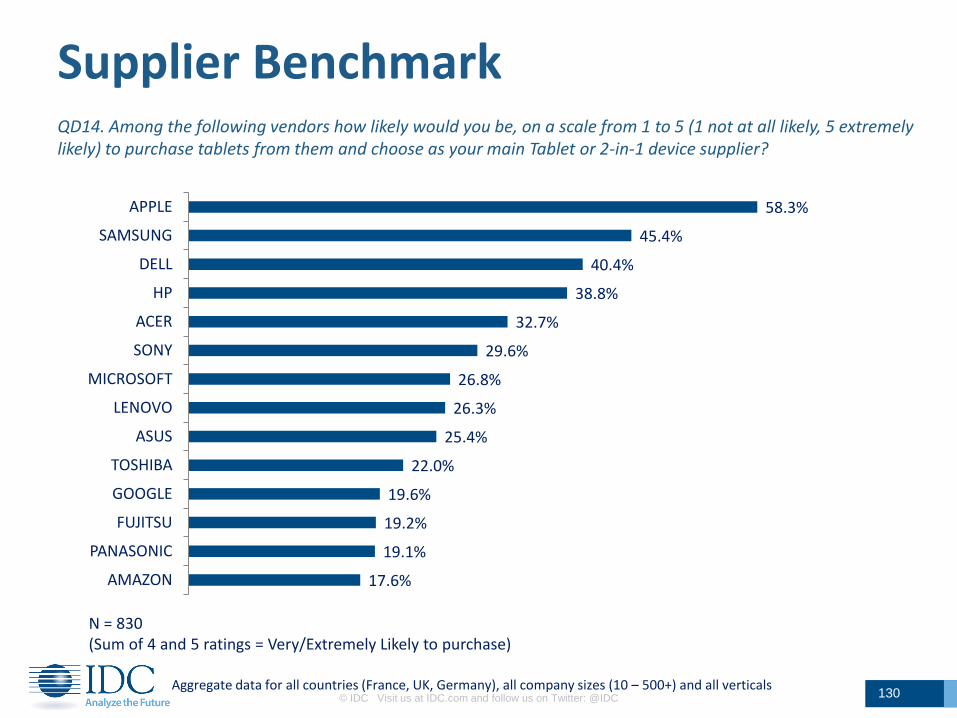
© IDC Visit us at IDC.com and follow us on Twitter: @IDC 130
Supplier Benchmark QD14. Among the following vendors how likely would you be, on a scale from 1 to 5 (1 not at all likely, 5 extremely likely) to purchase tablets from them and choose as your main Tablet or 2-in-1 device supplier?
17.6%
19.1%
19.2%
19.6%
22.0%
25.4%
26.3%
26.8%
29.6%
32.7%
38.8%
40.4%
45.4%
58.3%
AMAZON
PANASONIC
FUJITSU
TOSHIBA
ASUS
LENOVO
MICROSOFT
SONY
ACER
HP
DELL
SAMSUNG
APPLE
N = 830 (Sum of 4 and 5 ratings = Very/Extremely Likely to purchase)
Aggregate data for all countries (France, UK, Germany), all company sizes (10 – 500+) and all verticals

© IDC Visit us at IDC.com and follow us on Twitter: @IDC 131
Supplier Benchmark by Country QD14. Among the following vendors how likely would you be, on a scale from 1 to 5 (1 not at all likely, 5 extremely likely) to purchase tablets from them and choose as your main Tablet or 2-in-1 device supplier?
N = 830 (Sum of 4 and 5 ratings = Very/Extremely Likely to purchase)
Aggregate data for all company sizes (10 – 500+) and all verticals
15.2%
17.1%
18.2%
22.4%
24.4%
26.2%
30.1%
30.8%
32.1%
32.9%
39.2%
42.9%
53.9%
60.0%
FUJITSU
AMAZON
PANASONIC
TOSHIBA
ASUS
LENOVO
ACER
SONY
MICROSOFT
HP
DELL
SAMSUNG
APPLE
France
18.3%
18.8%
19.3%
19.4%
19.5%
20.5%
21.2%
22.2%
29.4%
31.8%
35.9%
36.0%
38.3%
59.0%
TOSHIBA
AMAZON
PANASONIC
FUJITSU
ASUS
LENOVO
MICROSOFT
SONY
ACER
HP
SAMSUNG
DELL
APPLE
UK
16.8%
17.0%
19.7%
22.8%
23.0%
24.8%
27.2%
27.3%
29.2%
35.6%
39.7%
40.9%
45.2%
55.9%
AMAZON
PANASONIC
TOSHIBA
FUJITSU
MICROSOFT
LENOVO
SONY
ASUS
ACER
DELL
HP
SAMSUNG
APPLE
Germany

© IDC Visit us at IDC.com and follow us on Twitter: @IDC 132
Supplier Choice vs. Portable Brand Combined QA2b. What Portable PC brands does your organization currently have? And D14. Among the following vendors how likely would you be, on a scale from 1 to 5 (1 not at all likely, 5 extremely likely) to purchase tablets from them and choose as your main Tablet or 2-in-1 device supplier?
N(D14) = 830 (Sum of 4 and 5 ratings = Very/Extremely Likely to purchase)
Aggregate data for all countries (France, UK, Germany), all company sizes (10 – 500+) and all verticals
11% 6%
11% 7% 4% 8% 5% 2% 7% 5% 5%
7% 5%
10% 5%
5% 5%
6%
3%
6% 3% 5%
13% 18%
10%
14% 14%
13% 14%
5%
14% 14% 12%
4% 4%
6%
5% 5%
4% 4%
5%
5% 7%
5%
11% 8%
8% 11%
8% 9% 8%
9%
9% 9%
8%
5%
5%
6% 5%
7% 4% 4%
7%
6% 6%
6%
5% 6%
5% 4%
4% 5% 4%
6%
6% 7%
4%
8% 9%
6% 9%
9% 12%
10%
9%
8% 9%
8%
4% 7% 6% 5%
7% 6%
8%
9%
6% 6%
8%
5% 7% 5% 7%
5% 6% 6%
6%
7% 7%
7%
4% 5% 5% 5% 7%
4% 5%
9%
5% 5%
6%
10% 11% 10% 11%
12% 12% 13% 12%
12% 9% 12%
8% 6% 6% 7% 9% 7% 6% 9%
6% 8% 7%
5% 4% 6% 5% 5% 6% 6% 9% 4% 5% 7%
ACER APPLE ASUS DELL FUJITSU HP LENOVO PANASONIC SAMSUNG SONY TOSHIBA
Like
liho
od
to
bu
y ta
ble
t b
ran
d
Current Portable PC brand
TOSHIBA
SONY
SAMSUNG
PANASONIC
MICROSOFT
LENOVO
HP
FUJITSU
DELL
AMAZON
APPLE
ASUS
ACER

E. Security, Application and
Mobile Device Management
© IDC Visit us at IDC.com and follow us on Twitter: @IDC 133
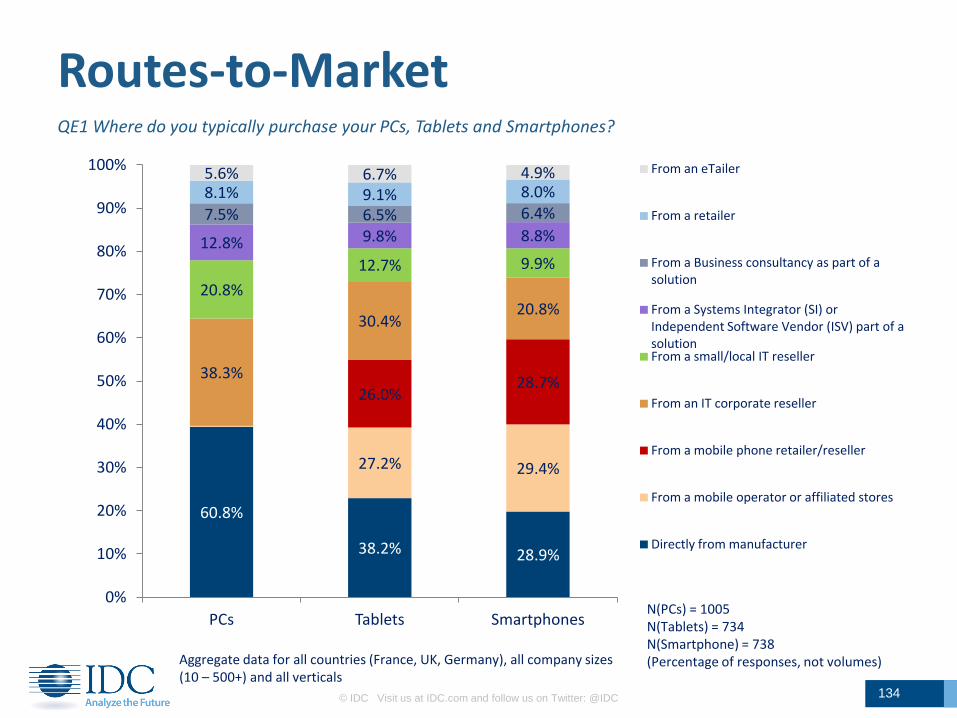
© IDC Visit us at IDC.com and follow us on Twitter: @IDC 134
Routes-to-Market QE1 Where do you typically purchase your PCs, Tablets and Smartphones?
Aggregate data for all countries (France, UK, Germany), all company sizes (10 – 500+) and all verticals
N(PCs) = 1005 N(Tablets) = 734 N(Smartphone) = 738 (Percentage of responses, not volumes)
60.8%
38.2% 28.9%
27.2% 29.4%
26.0% 28.7%
38.3%
30.4% 20.8%
20.8%
12.7% 9.9% 12.8% 9.8% 8.8% 7.5% 6.5% 6.4% 8.1% 9.1% 8.0% 5.6% 6.7% 4.9%
0%
10%
20%
30%
40%
50%
60%
70%
80%
90%
100%
PCs Tablets Smartphones
From an eTailer
From a retailer
From a Business consultancy as part of a solution
From a Systems Integrator (SI) or Independent Software Vendor (ISV) part of a solution From a small/local IT reseller
From an IT corporate reseller
From a mobile phone retailer/reseller
From a mobile operator or affiliated stores
Directly from manufacturer

© IDC Visit us at IDC.com and follow us on Twitter: @IDC 135
Applications Development by Country QE2 For the applications currently running on your Tablets and/or Hybrids, where were they developed?
N = 734 (Percentage of responses)
Aggregate data for all company sizes (10 – 500+) and all verticals
32.6%
38.0% 34.0%
24.8%
46.2%
52.4%
46.8%
38.5%
30.6% 28.1%
32.1% 31.6%
14.9%
10.4% 14.2%
20.8%
0%
10%
20%
30%
40%
50%
60%
TOTAL France UK Germany
DEVELOPED IN-HOUSE
DEVELOPED BY EXTERNAL OR OUTSOURCED PARTNERS
COMMERCIAL OFF THE SHELF APPLICATIONS
DON’T KNOW

© IDC Visit us at IDC.com and follow us on Twitter: @IDC 136
Applications Development by Vertical QE2 For the applications currently running on your Tablets and/or Hybrids, where were they developed?
N = 734 (Percentage of responses)
Aggregate data for all countries (France, UK, Germany), all company sizes (10 – 500+)
0%
10%
20%
30%
40%
50%
60%
70%
80%
MANUF UTILITIES TRANSPORT DISTRIB HOSPITALITY FINANCE GOV HEALTH EDU PROF SERV
DEVELOPED IN-HOUSE DEVELOPED BY EXTERNAL OR OUTSOURCED PARTNERS
COMMERCIAL OFF THE SHELF APPLICATIONS DON’T KNOW

© IDC Visit us at IDC.com and follow us on Twitter: @IDC 137
Applications Management by Country QE3 Where can employees download applications for Tablets and/or Hybrids from in your organization?
N = 565 (Percentage of responses)
Aggregate data for all company sizes (10 – 500+) and all verticals
43.9% 42.3% 44.1% 45.1%
56.1% 55.5% 52.8%
60.5%
33.0% 34.3%
45.6%
16.4%
3.7% 2.6% 5.3%
2.9%
0%
10%
20%
30%
40%
50%
60%
70%
TOTAL France UK Germany
ENTERPRISE APP STORE
DEVICE VENDOR APP STORE
OPERATING SYSTEM VENDOR APP STORE
OTHERS

© IDC Visit us at IDC.com and follow us on Twitter: @IDC 138
Applications Management by Vertical QE3 Where can employees download applications for Tablets and/or Hybrids from in your organization?
N = 565 (Percentage of responses) Aggregate data for all countries (France, UK, Germany), all company sizes (10 – 500+)
0%
10%
20%
30%
40%
50%
60%
70%
80%
MANUF UTILITIES TRANSPORT DISTRIB HOSPITALITY FINANCE GOV HEALTH EDU PROF SERV
ENTERPRISE APP STORE DEVICE VENDOR APP STORE OPERATING SYSTEM VENDOR APP STORE OTHERS

© IDC Visit us at IDC.com and follow us on Twitter: @IDC 139
Applications Management – B/C/UYOD QE5. - How does your company manage the installation of applications on BYOD/CYOD/UYOD Tablets?
N = 107 (Percentage of responses)
Aggregate data for all company sizes (10 – 500+) and all verticals excluding Education
28.6%
16.0%
40.0%
15.8%
49.1%
24.3%
48.8%
58.8%
22.4%
59.8%
11.2%
25.4%
0%
10%
20%
30%
40%
50%
60%
70%
80%
90%
100%
TOTAL France UK Germany
Employees may not install any applications
Employees may install most applications, but there are some exceptions
Employees may install any applications

© IDC Visit us at IDC.com and follow us on Twitter: @IDC 140
Applications Management – B/C/UYOD QE6. Which of the following types of dedicated device management software have been deployed to manage your devices?
N = 735 (Percentage of responses)
46.1%
40.3%
30.6%
28.8%
13.4%
DEVICE VENDOR DEVICE MANAGEMENT SOFTWARE
SOFTWARE VENDOR DEVICE MANAGEMENT SOFTWARE
SPECIALIST INDEPENDENT DEVICE MANAGEMENT SOFTWARE
GENERAL IT MANAGEMENT SOFTWARE
NO DEVICE MANAGEMENT SOFTWARE DEPLOYED
Aggregate data for all countries (France, UK, Germany), all company sizes (10 – 500+) and all verticals excluding Education
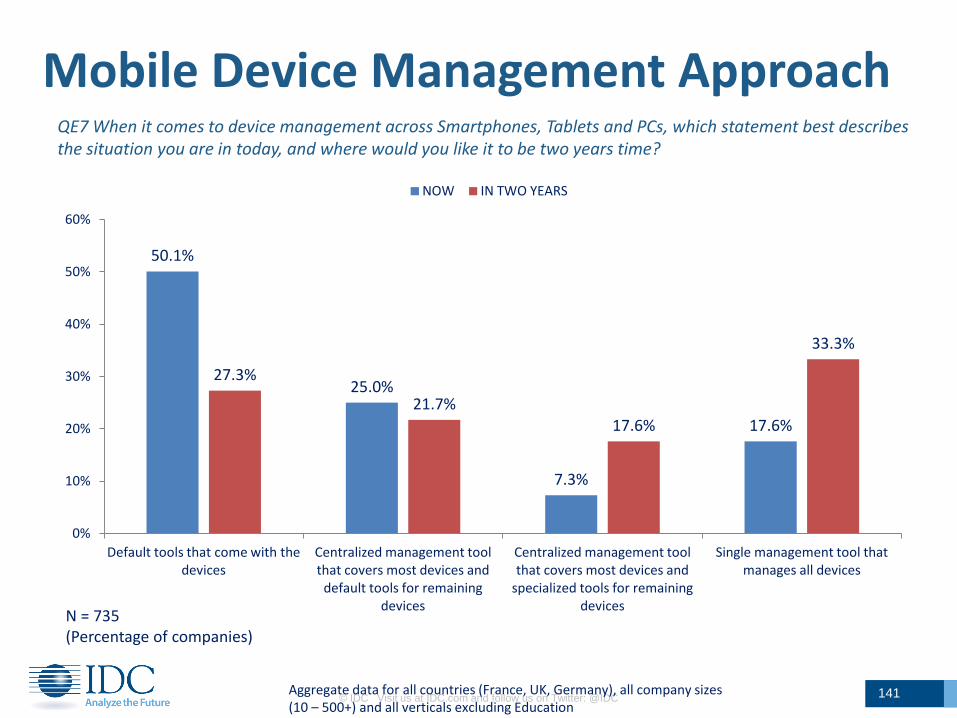
© IDC Visit us at IDC.com and follow us on Twitter: @IDC 141
Mobile Device Management Approach QE7 When it comes to device management across Smartphones, Tablets and PCs, which statement best describes the situation you are in today, and where would you like it to be two years time?
N = 735 (Percentage of companies)
Aggregate data for all countries (France, UK, Germany), all company sizes (10 – 500+) and all verticals excluding Education
50.1%
25.0%
7.3%
17.6%
27.3%
21.7% 17.6%
33.3%
0%
10%
20%
30%
40%
50%
60%
Default tools that come with the devices
Centralized management tool that covers most devices and
default tools for remaining devices
Centralized management tool that covers most devices and
specialized tools for remaining devices
Single management tool that manages all devices
NOW IN TWO YEARS

© IDC Visit us at IDC.com and follow us on Twitter: @IDC 142
Mobile Device Management Approach QE7 When it comes to device management across Smartphones, Tablets and PCs, which statement best describes the situation you are in today, and where would you like it to be two years time?
N = 735 (Percentage of companies)
Aggregate data for all company sizes (10 – 500+) and all verticals excluding Education
0%
10%
20%
30%
40%
50%
60%
France UK Germany
Now
Default tools that come with the devices
Centralized management tool that covers most devices and default tools for remaining devices
Centralized management tool that covers most devices and specialized tools for remaining devices
Single management tool that manages all devices
0%
10%
20%
30%
40%
50%
60%
70%
France UK Germany
In Two Years

© IDC Visit us at IDC.com and follow us on Twitter: @IDC 143
Mobile Device Management Approach QE7 When it comes to device management across Smartphones, Tablets and PCs, which statement best describes the situation you are in today, and where would you like it to be two years time?
N = 735 (Percentage of companies)
Aggregate data for all countries (France, UK, Germany) and all company sizes (10 – 500+)
0%
20%
40%
60%
MANUF UTILITIES TRANSPORT DISTRIB HOSPITALITY FINANCE GOV HEALTH PROF SERV
NOW
Default tools that come with the devices
Centralized management tool that covers most devices and default tools for remaining devices
Centralized management tool that covers most devices and specialized tools for remaining devices
Single management tool that manages all devices
-20%
0%
20%
40%
60%
MANUF UTILITIES TRANSPORT DISTRIB HOSPITALITY FINANCE GOV HEALTH PROF SERV
IN TWO YEARS

© IDC Visit us at IDC.com and follow us on Twitter: @IDC 144
Mobile Device Management Software QE8. Which device management software do you use?
11.6%
8.0%
3.5%
3.9%
4.3%
5.1%
6.1%
8.5%
16.5%
18.5%
22.8%
27.5%
39.6%
NONE
OTHERS
AIRWATCH
PANASONIC
MOBILEIRON
SYMANTEC
GOOD TECHNOLOGY
BLACKBERRY
HP
SAMSUNG
MICROSOFT
DELL
APPLE
N = 735 (Percentage of companies)
Aggregate data for all countries (France, UK, Germany), all company sizes (10 – 500+) and all verticals excluding Education
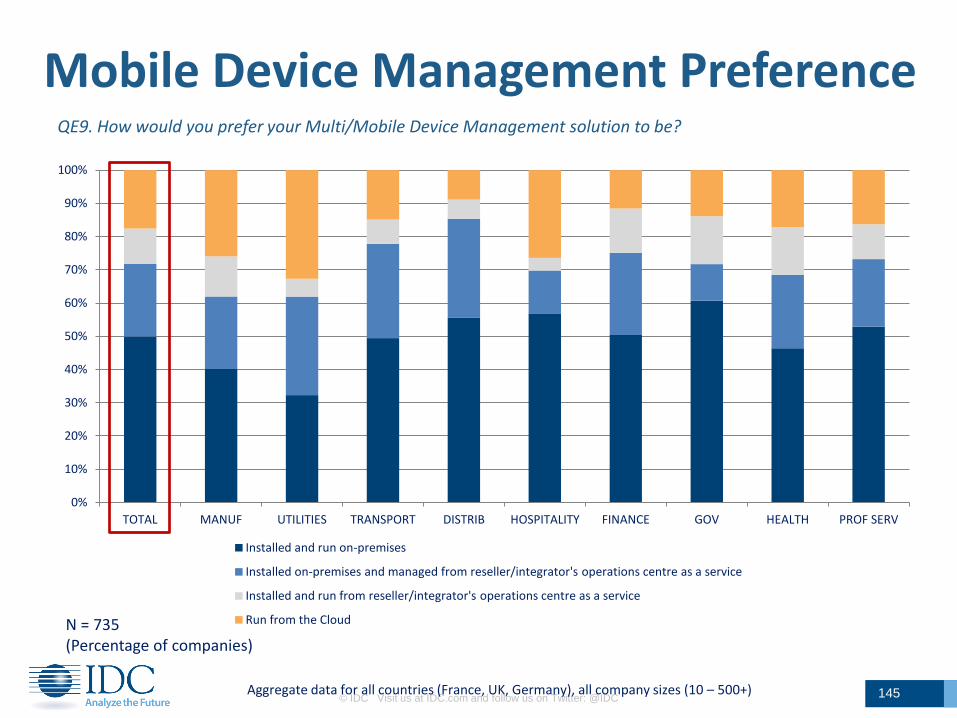
© IDC Visit us at IDC.com and follow us on Twitter: @IDC 145
Mobile Device Management Preference QE9. How would you prefer your Multi/Mobile Device Management solution to be?
N = 735 (Percentage of companies)
Aggregate data for all countries (France, UK, Germany), all company sizes (10 – 500+)
0%
10%
20%
30%
40%
50%
60%
70%
80%
90%
100%
TOTAL MANUF UTILITIES TRANSPORT DISTRIB HOSPITALITY FINANCE GOV HEALTH PROF SERV
Installed and run on-premises
Installed on-premises and managed from reseller/integrator's operations centre as a service
Installed and run from reseller/integrator's operations centre as a service
Run from the Cloud

© IDC Visit us at IDC.com and follow us on Twitter: @IDC 146
MDM – OS perception QE10. Using a scale of 1 to 5, where 1 is Very poor and 5 is Excellent*, please rate the following operating systems based on your perception or experience of their capabilities for governance, compliance and security
N = 735 (Percentage of companies)
Aggregate data for all countries (France, UK, Germany), all company sizes (10 – 500+) and all verticals excluding Education
*In the chart: Very poor or Poor = Sum of 1 and 2 ratings; Fair = 3; Good or Excellent = Sum or 4 and 5 ratings
11.1% 20.8% 26.9%
12.1%
28.2% 18.0%
30.8% 29.8%
18.8%
29.1%
70.8%
48.3% 43.3%
69.1%
42.6%
0%
10%
20%
30%
40%
50%
60%
70%
80%
90%
100%
APPLE MICROSOFT (ALL VERSIONS)
BLACKBERRY ANDROID LINUX
Very poor or Poor Fair Good or Excellent
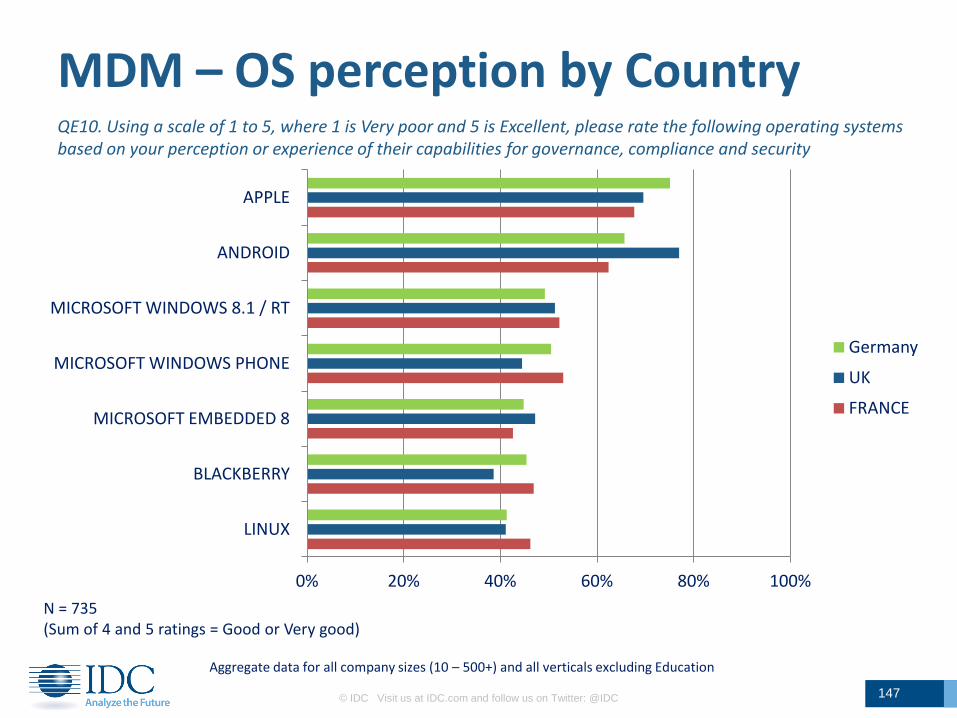
© IDC Visit us at IDC.com and follow us on Twitter: @IDC 147
MDM – OS perception by Country QE10. Using a scale of 1 to 5, where 1 is Very poor and 5 is Excellent, please rate the following operating systems based on your perception or experience of their capabilities for governance, compliance and security
N = 735 (Sum of 4 and 5 ratings = Good or Very good)
Aggregate data for all company sizes (10 – 500+) and all verticals excluding Education
0% 20% 40% 60% 80% 100%
LINUX
BLACKBERRY
MICROSOFT EMBEDDED 8
MICROSOFT WINDOWS PHONE
MICROSOFT WINDOWS 8.1 / RT
ANDROID
APPLE
Germany
UK
FRANCE

© IDC Visit us at IDC.com and follow us on Twitter: @IDC 148
Mobile Device Management – Security QE11. Using a scale of 1 to 5, where 1=Significantly worse, 3 Stayed the same, and 5=Significantly better, in your view, how have the security capabilities of each platform changed over the last 12 months?
N = 755 (Percentage of responses)
Aggregate data for all countries (France, UK, Germany), all company sizes (10 – 500+) and all verticals excluding Education
*In the chart: (Significantly) Worse = Sum of 1 and 2 ratings; Same = 3; (Significantly) Better = Sum or 4 and 5 ratings
11.0%
21.4%
16.1%
21.9%
24.6%
10.8%
24.4%
27.9%
34.2%
38.7%
36.1%
38.0%
32.2%
35.2%
61.1%
44.5%
45.2%
42.1%
37.4%
57.0%
40.4%
APPLE
MICROSOFT WINDOWS PHONE
MICROSOFT WINDOWS 8.1 / RT
MICROSOFT EMBEDDED 8
BLACKBERRY
ANDROID
LINUX
(Significantly) Worse
Stable
(Significantly) Better

© IDC Visit us at IDC.com and follow us on Twitter: @IDC 149
QE12. Which of the following is your preferred method to access Enterprise Applications on Tablets?
Mobile Device Management – Apps Access
Native application on tablet device
30.9%
Use and RDP or RCA to an external
Windows environment
device 15.2%
Cloud 34.2%
Browser-based 19.6%
N = 789 (Percentage of responses)
Aggregate data for all countries (France, UK, Germany), all company sizes (10 – 500+) and all verticals excluding Education
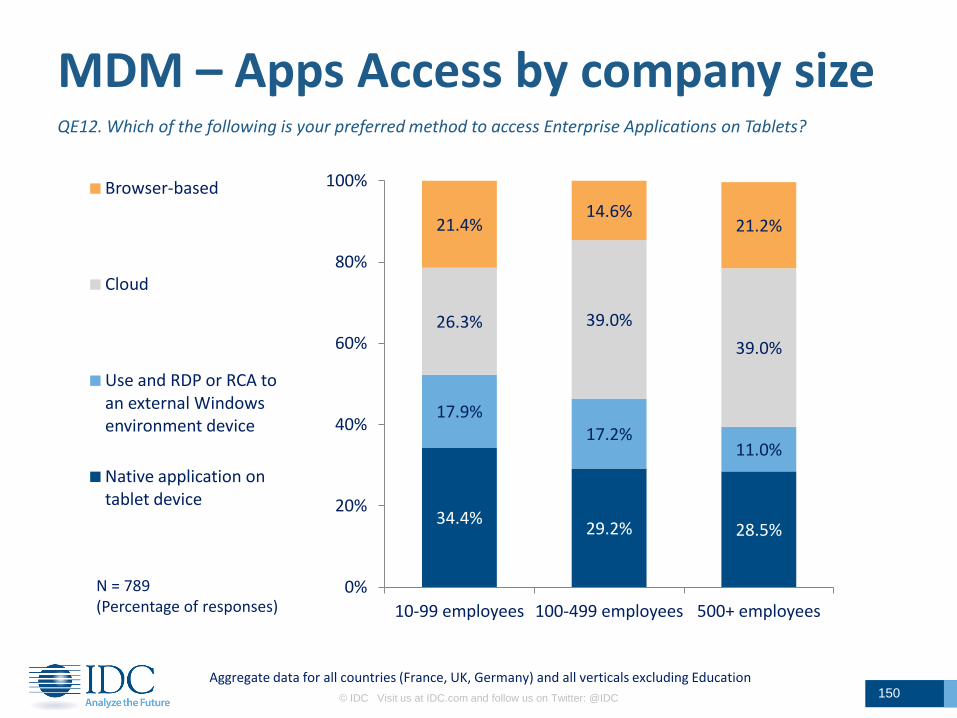
© IDC Visit us at IDC.com and follow us on Twitter: @IDC 150
QE12. Which of the following is your preferred method to access Enterprise Applications on Tablets?
MDM – Apps Access by company size
N = 789 (Percentage of responses)
Aggregate data for all countries (France, UK, Germany) and all verticals excluding Education
34.4% 29.2% 28.5%
17.9% 17.2%
11.0%
26.3% 39.0%
39.0%
21.4% 14.6%
21.2%
0%
20%
40%
60%
80%
100%
10-99 employees 100-499 employees 500+ employees
Browser-based
Cloud
Use and RDP or RCA to an external Windows environment device
Native application on tablet device

Key Findings by Vertical
© IDC Visit us at IDC.com and follow us on Twitter: @IDC 151

© IDC Visit us at IDC.com and follow us on Twitter: @IDC 152
Manufacturing (incl. Construction) The Manufacturing sector in Europe
presents a mixed picture in terms of tablet deployment with similar proportions of respondents being in early stage as in post evaluation and not buying.
Tablet penetration on average at 7% across the 3 countries, with a strong share of 2-in-1 and convertible in particular in Germany
Users are mainly in production and maintenance as well as operation
Tablet used as additional device. Manufacturing is one sector looking
for devices with 6 in. screen size for slates and hybrid and hybrids larger than 15 in.
Product feature requirements include Integrated PCI Slot and docking stations as accessory. Biometrics and containerization considered for security.
Tablet Deployment Status
N= 177 Sum of 4 and 5 ratings
Early stage - still evaluating, 17.1%
Medium stage - expect to expand, 29.0%
Advanced stage - no further expansion
planned, 3.2%
We plan to purchase in the next 12 months,
6.0%
We plan to purchase in the next 24 months,
10.1%
We plan to purchase in more than two year,
9.9%
We are currently evaluating the use of
Tablets , 8.9%
We have evaluated and decided not to buy ,
15.7%
TRADITIONAL NOTEBOOK WITH TOUCH
ULTRASLIM LAPTOP WITH TOUCH
TABLET SLATE
2-IN-1 TABLET
CONVERTIBLE
TABLETS <10INCH WITH CELLULAR CAPABILITIES
CHROMEBOOK
LARGE SMARTPHONES
Mobile Platform Relevance
N= 177
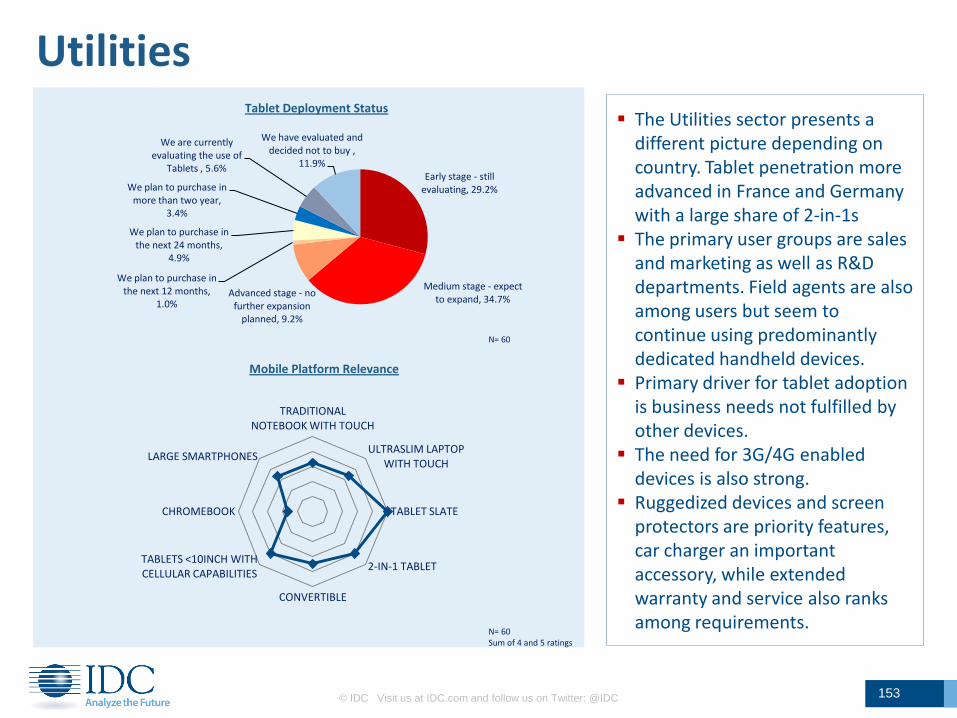
© IDC Visit us at IDC.com and follow us on Twitter: @IDC 153
Utilities The Utilities sector presents a
different picture depending on country. Tablet penetration more advanced in France and Germany with a large share of 2-in-1s
The primary user groups are sales and marketing as well as R&D departments. Field agents are also among users but seem to continue using predominantly dedicated handheld devices.
Primary driver for tablet adoption is business needs not fulfilled by other devices.
The need for 3G/4G enabled devices is also strong.
Ruggedized devices and screen protectors are priority features, car charger an important accessory, while extended warranty and service also ranks among requirements.
Tablet Deployment Status
Mobile Platform Relevance
N= 60 Sum of 4 and 5 ratings
Early stage - still evaluating, 29.2%
Medium stage - expect to expand, 34.7%
Advanced stage - no further expansion
planned, 9.2%
We plan to purchase in the next 12 months,
1.0%
We plan to purchase in the next 24 months,
4.9%
We plan to purchase in more than two year,
3.4%
We are currently evaluating the use of
Tablets , 5.6%
We have evaluated and decided not to buy ,
11.9%
TRADITIONAL NOTEBOOK WITH TOUCH
ULTRASLIM LAPTOP WITH TOUCH
TABLET SLATE
2-IN-1 TABLET
CONVERTIBLE
TABLETS <10INCH WITH CELLULAR CAPABILITIES
CHROMEBOOK
LARGE SMARTPHONES
N= 60

Early stage - still evaluating
21.7%
Medium stage - expect to expand
38.8%
Advanced stage - no further expansion
planned 12.7%
We plan to purchase in the next 12 months
4.0%
We plan to purchase in the next 24 months
5.2%
We plan to purchase in more than two year
4.1%
We are currently evaluating the use of
Tablets 4.4%
We have evaluated and decided not to buy
9.0%
© IDC Visit us at IDC.com and follow us on Twitter: @IDC 154
Transport & Storage Tablet penetration is and will remain
the highest in the Transport sector representing near 12% of devices – and higher in the UK – driven by the need for effective mobile platforms with continued deployments plans over the next 2 years.
The interest is strong for slates, 2-in-1s and large smart phones.
While Android is the dominant OS for slates, Windows leads for 2-in-1s, with an increasing demand for larger screen sizes on hybrids in the future.
Understandably, the need for 3G/4G connectivity is high. Ports to connect to external devices is also an important feature.
Barcode scanners are additional features considered as key.
In terms of security, E-mail encryption is a very clear sector need.
Tablet Deployment Status
N= 108 Sum of 4 and 5 ratings
TRADITIONAL NOTEBOOK WITH TOUCH
ULTRASLIM LAPTOP WITH TOUCH
TABLET SLATE
2-IN-1 TABLET
CONVERTIBLE
TABLETS <10INCH WITH CELLULAR CAPABILITIES
CHROMEBOOK
LARGE SMARTPHONES
Mobile Platform Relevance
N= 108

155
Distribution (Retail/Wholesale) Distribution is relatively advanced
in the adoption of tablets with several companies in mid-stage adoption and continuing over time as the sector transforms.
Current equipment includes a large share of Slates, identified as the most relevant platform along with large smart phones, but 2-in-1s have also a large share in Germany while Convertibles are used in France.
The variety of users from sales, logistic/warehouse functions to shop floor assistants explain the fragmented product mix.
Future intentions feature slates with larger screen size (+15 in.),
Barcode scanner is logically one of the most important feature. Ports to connect external devices and docking station also important.
Customer Service apps key
Tablet Deployment Status
N= 115 Sum of 4 and 5 ratings
Early stage - still evaluating, 15.6%
Medium stage - expect to expand, 36.4%
Advanced stage - no further expansion
planned, 4.7%
We plan to purchase in the next 12 months,
1.3%
We plan to purchase in the next 24 months,
9.9%
We plan to purchase in more than two year,
6.5%
We are currently evaluating the use of
Tablets , 11.8%
We have evaluated and decided not to buy ,
13.8%
TRADITIONAL NOTEBOOK WITH TOUCH
ULTRASLIM LAPTOP WITH TOUCH
TABLET SLATE
2-IN-1 TABLET
CONVERTIBLE
TABLETS <10INCH WITH CELLULAR CAPABILITIES
CHROMEBOOK
LARGE SMARTPHONES
Mobile Platform Relevance
N= 115
Note: For a more detailed analysis of the Distribution sector, please refer to the
Retail and Hospitality add-on Module if you subscribed to this option
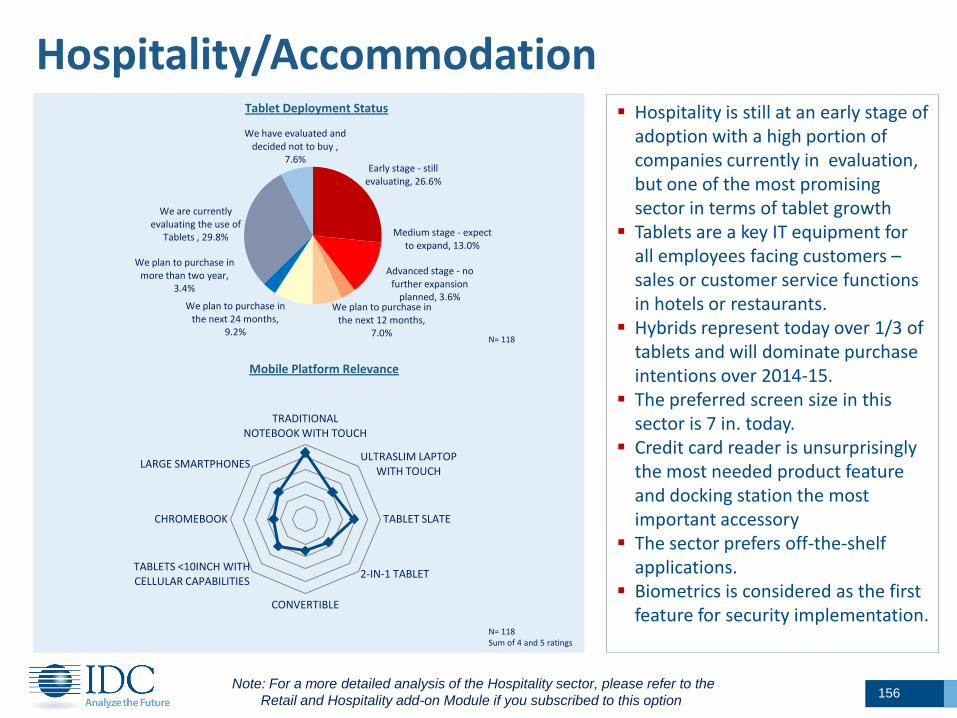
156
Hospitality/Accommodation Hospitality is still at an early stage of
adoption with a high portion of companies currently in evaluation, but one of the most promising sector in terms of tablet growth
Tablets are a key IT equipment for all employees facing customers – sales or customer service functions in hotels or restaurants.
Hybrids represent today over 1/3 of tablets and will dominate purchase intentions over 2014-15.
The preferred screen size in this sector is 7 in. today.
Credit card reader is unsurprisingly the most needed product feature and docking station the most important accessory
The sector prefers off-the-shelf applications.
Biometrics is considered as the first feature for security implementation.
Tablet Deployment Status
N= 118 Sum of 4 and 5 ratings
Early stage - still evaluating, 26.6%
Medium stage - expect to expand, 13.0%
Advanced stage - no further expansion
planned, 3.6% We plan to purchase in
the next 12 months, 7.0%
We plan to purchase in the next 24 months,
9.2%
We plan to purchase in more than two year,
3.4%
We are currently evaluating the use of
Tablets , 29.8%
We have evaluated and decided not to buy ,
7.6%
TRADITIONAL NOTEBOOK WITH TOUCH
ULTRASLIM LAPTOP WITH TOUCH
TABLET SLATE
2-IN-1 TABLET
CONVERTIBLE
TABLETS <10INCH WITH CELLULAR CAPABILITIES
CHROMEBOOK
LARGE SMARTPHONES
Mobile Platform Relevance
N= 118
Note: For a more detailed analysis of the Hospitality sector, please refer to the
Retail and Hospitality add-on Module if you subscribed to this option

© IDC Visit us at IDC.com and follow us on Twitter: @IDC 157
Finance/Insurance The finance /insurance sector is well
advanced on tablet adoption with many already equipped and others continuing to deploy
Business transformation key driver Purchase intentions include large
deployment plans of over 1,000 units – with 2-in-1s accounting for a 1/3 of planned purchases and overall share of Hybrid above 40%
Primary users are naturally white collars – advisors, analysts etc.
More than 40% of the devices are 3/4 G enabled.
This sector has unique security needs, the two most likely to be implemented being encryption and specific security modules.
NFC is a product feature important in this area.
Extended warranty/ service is high on the purchasing list too.
Tablet Deployment Status
N= 82 Sum of 4 and 5 ratings
Early stage - still evaluating, 15.6%
Medium stage - expect to expand, 35.8%
Advanced stage - no further expansion
planned, 8.3%
We plan to purchase in the next 12 months,
6.3%
We plan to purchase in the next 24 months,
8.4%
We plan to purchase in more than two year,
10.0%
We are currently evaluating the use of
Tablets , 9.0% We have evaluated and decided not to
buy , 6.7%
TRADITIONAL NOTEBOOK WITH TOUCH
ULTRASLIM LAPTOP WITH TOUCH
TABLET SLATE
2-IN-1 TABLET
CONVERTIBLE
TABLETS <10INCH WITH CELLULAR CAPABILITIES
CHROMEBOOK
LARGE SMARTPHONES
Mobile Platform Relevance
N= 82

© IDC Visit us at IDC.com and follow us on Twitter: @IDC 158
Government Government represents a large
opportunity across all countries . If current tablet penetration is low, the sector is expected to grow the fastest from a very low level.
Purchase plans for 2015 outlines the willingness of governments to invest in new technologies – for both slates and 2-in-1s
OS choices seem to go strongly for Windows on hybrid devices and Android on slates.
The largest user group is executives with the portion of white collars and administrative staff to increase in the near future.
Preferences in terms of screen size are clearly established: 11 inches for hybrid and 8 inch for slates.
WiFi is predominant Ruggedized devices also considered
by government. Warranty and service are also recognized features
Tablet Deployment Status
N= 87 Sum of 4 and 5 ratings
Early stage - still evaluating, 26.5%
Medium stage - expect to expand,
27.4%
Advanced stage - no further expansion
planned, 7.1%
We plan to purchase in the next 12 months,
2.4%
We plan to purchase in the next 24 months,
6.2%
We plan to purchase in more than two year,
4.8%
We are currently evaluating the use of Tablets , 15.9%
We have evaluated and decided not to
buy , 9.7%
Mobile Platform Relevance
N= 87
TRADITIONAL NOTEBOOK WITH TOUCH
ULTRASLIM LAPTOP WITH TOUCH
TABLET SLATE
2-IN-1 TABLET
CONVERTIBLE
TABLETS <10INCH WITH CELLULAR CAPABILITIES
CHROMEBOOK
LARGE SMARTPHONES
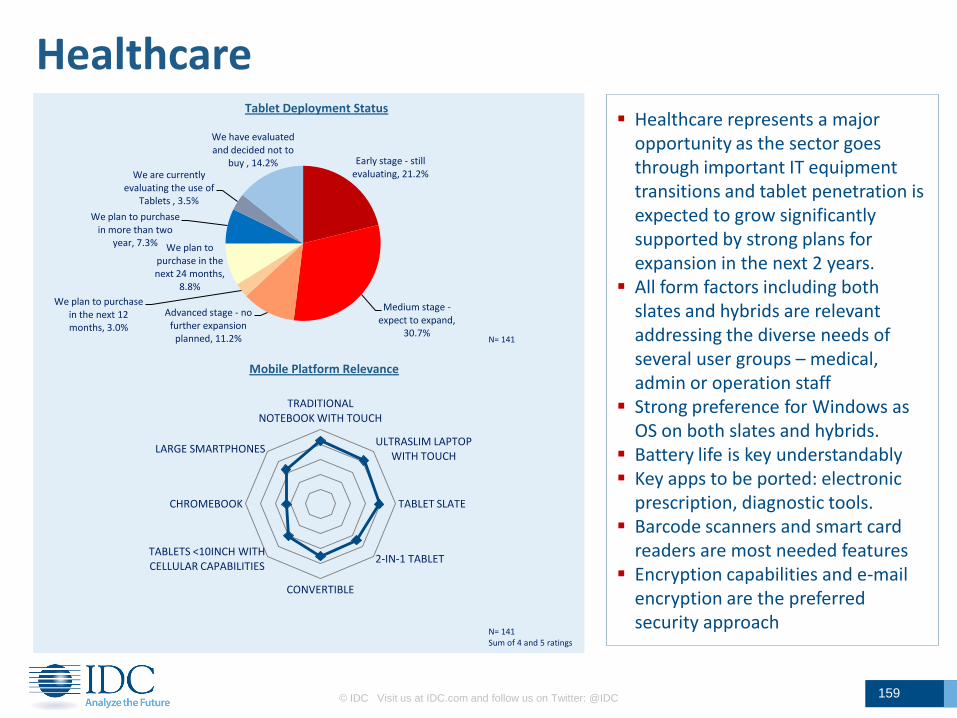
© IDC Visit us at IDC.com and follow us on Twitter: @IDC 159
Healthcare Healthcare represents a major
opportunity as the sector goes through important IT equipment transitions and tablet penetration is expected to grow significantly supported by strong plans for expansion in the next 2 years.
All form factors including both slates and hybrids are relevant addressing the diverse needs of several user groups – medical, admin or operation staff
Strong preference for Windows as OS on both slates and hybrids.
Battery life is key understandably Key apps to be ported: electronic
prescription, diagnostic tools. Barcode scanners and smart card
readers are most needed features Encryption capabilities and e-mail
encryption are the preferred security approach
Tablet Deployment Status
N= 141 Sum of 4 and 5 ratings
Early stage - still evaluating, 21.2%
Medium stage - expect to expand,
30.7%
Advanced stage - no further expansion
planned, 11.2%
We plan to purchase in the next 12 months, 3.0%
We plan to purchase in the next 24 months,
8.8%
We plan to purchase in more than two
year, 7.3%
We are currently evaluating the use of
Tablets , 3.5%
We have evaluated and decided not to
buy , 14.2%
TRADITIONAL NOTEBOOK WITH TOUCH
ULTRASLIM LAPTOP WITH TOUCH
TABLET SLATE
2-IN-1 TABLET
CONVERTIBLE
TABLETS <10INCH WITH CELLULAR CAPABILITIES
CHROMEBOOK
LARGE SMARTPHONES
Mobile Platform Relevance
N= 141

160
Education ICT equipment of the Education sector
is a priority for all Governments and tablets are part of the plans – but clearly different stages across Europe
The UK remains the most advanced with 2/3 schools already have Tablets. Earlier stage in France and Germany but catching up with stronger plans to acquire within the next 2 years
Platform wise, preference for Slates and importance of Touch in the UK – while importance of keyboard in France and Germany support hybrids. – Chromebook mostly considered as option in France
Teaching versatility and pupil/student engagement are key drivers – Content development and insufficient infrastructure remain largest inhibitors
Battery life and robustness among priorities – screen size between 8-12”
Deployments often part of larger ICT programs, but role of head of school
Tablet Deployment Status
N= 150 Sum of 4 and 5 ratings
Mobile Platform Relevance
Early stage - still evaluating, 12.2%
Medium stage - expect to expand, 26.4%
Advanced stage - no further expansion
planned, 3.2%
We plan to purchase in the next 12 months,
8.2%
We plan to purchase in the next 24 months,
17.0%
We plan to purchase in more than two year,
7.4%
We are currently evaluating the use of
Tablets , 2.1%
We have evaluated and decided not to buy ,
23.5%
TRADITIONAL NOTEBOOK WITH TOUCH
ULTRASLIM LAPTOP WITH TOUCH
TABLET SLATE
2-IN-1 TABLET
CONVERTIBLE
TABLETS <10INCH WITH CELLULAR CAPABILITIES
CHROMEBOOK
LARGE SMARTPHONES
EBOOK READER
NETBOOKS
Note: For a more detailed analysis of the Education sector, please refer to the
Education add-on Module if you subscribed to this option

© IDC Visit us at IDC.com and follow us on Twitter: @IDC 161
Professional Services Professional services represent a
key growth opportunity. Although the sector is very heterogeneous, a large number of businesses are already equipped and represent a key replacement market, other services are continuing to equip.
Slates and 2-in-1 after notebooks are the most relevant platforms, and mostly as companion devices.
Due to the mobile nature of several activities (legal, media, consultants etc.), 3/4G enabled are expected in larger proportion across the sector.
iOS is the preferred OS with an important legacy of Apple
The sector seems to have 5 in. screen size slate needs. NFC and high resolution camera are important product features
Continuous security refresh as preferred security policy.
Tablet Deployment Status
N= 109 Sum of 4 and 5 ratings
Early stage - still evaluating, 36.2%
Medium stage - expect to expand, 30.9% Advanced stage - no
further expansion planned, 14.5%
We plan to purchase in the next 12 months,
1.5%
We plan to purchase in the next 24 months,
3.4%
We plan to purchase in more than two year,
0.8%
We are currently evaluating the use of
Tablets , 2.0%
We have evaluated and decided not to buy ,
10.6%
TRADITIONAL NOTEBOOK WITH TOUCH
ULTRASLIM LAPTOP WITH TOUCH
TABLET SLATE
2-IN-1 TABLET
CONVERTIBLE
TABLETS <10INCH WITH CELLULAR CAPABILITIES
CHROMEBOOK
LARGE SMARTPHONES
Mobile Platform Relevance
N= 109

Market Opportunity Mapping
and Forecast 2014-2017
© IDC Visit us at IDC.com and follow us on Twitter: @IDC 162
Note:
Leveraging from the analysis of the survey results on Tablet penetration and Intended Purchases
for 2014-2015 of the 1,200 companies interviewed, and from additional information collected and
analysed by IDC part of its ongoing research into the Tablet market, this section presents a sizing
by Vertical sector of the Tablet and Hybrid market in the three largest countries in Europe – France,
Germany and the UK – The commercial segment analysed in this study includes all companies with
10+ employees and exclude businesses or institutions with less than 10 employees.
The data presented here is Confidential and for Strict Internal Use Only and will not be used in
full or partially in any external communication without express written confirmation from IDC and
the authors of this report.
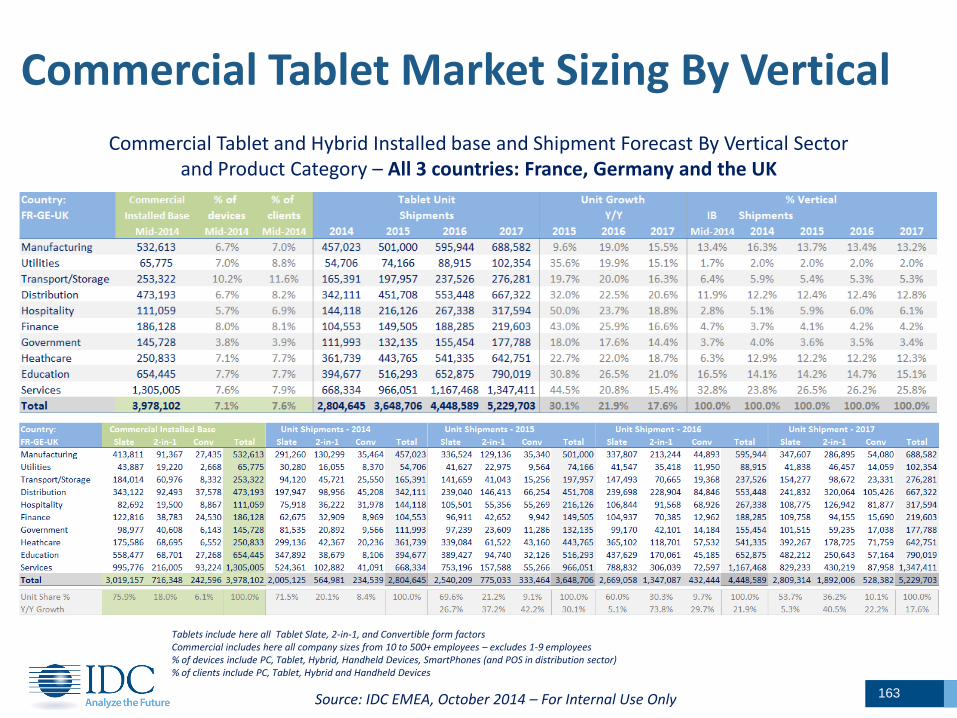
163
Commercial Tablet Market Sizing By Vertical
Commercial Tablet and Hybrid Installed base and Shipment Forecast By Vertical Sector and Product Category – All 3 countries: France, Germany and the UK
Source: IDC EMEA, October 2014 – For Internal Use Only
Tablets include here all Tablet Slate, 2-in-1, and Convertible form factors Commercial includes here all company sizes from 10 to 500+ employees – excludes 1-9 employees % of devices include PC, Tablet, Hybrid, Handheld Devices, SmartPhones (and POS in distribution sector) % of clients include PC, Tablet, Hybrid and Handheld Devices

164
Commercial Tablet Market Sizing By Vertical
Commercial Tablet and Hybrid Installed base and Shipment Forecast By Vertical Sector and Product Category – France
Source: IDC EMEA, October 2014 – For Internal Use Only
Tablets include here all Tablet Slate, 2-in-1, and Convertible form factors Commercial includes here all company sizes from 10 to 500+ employees – excludes 1-9 employees % of devices include PC, Tablet, Hybrid, Handheld Devices, SmartPhones (and POS in distribution sector) % of clients include PC, Tablet, Hybrid and Handheld Devices

165
Commercial Tablet Market Sizing By Vertical
Commercial Tablet and Hybrid Installed base and Shipment Forecast By Vertical Sector and Product Category – Germany
Source: IDC EMEA, October 2014 – For Internal Use Only
Tablets include here all Tablet Slate, 2-in-1, and Convertible form factors Commercial includes here all company sizes from 10 to 500+ employees – excludes 1-9 employees % of devices include PC, Tablet, Hybrid, Handheld Devices, SmartPhones (and POS in distribution sector) % of clients include PC, Tablet, Hybrid and Handheld Devices

166
Commercial Tablet Market Sizing By Vertical
Commercial Tablet and Hybrid Installed base and Shipment Forecast By Vertical Sector and Product Category – United Kingdom
Source: IDC EMEA, October 2014 – For Internal Use Only
Tablets include here all Tablet Slate, 2-in-1, and Convertible form factors Commercial includes here all company sizes from 10 to 500+ employees – excludes 1-9 employees % of devices include PC, Tablet, Hybrid, Handheld Devices, SmartPhones (and POS in distribution sector) % of clients include PC, Tablet, Hybrid and Handheld Devices
Karine Paoli Associate VP, IDC EMEA Systems Infrastructure Solutions [email protected] Chrystelle Labesque Research Manager, IDC EMEA Personal & Mobile Computing [email protected] Marta Fiorentini European Senior Analyst, IDC EMEA Personal Computing Group [email protected] Andrew Buss Consulting Manager, IDC Data Center Infrastructure & Client Devices [email protected]
167 © IDC Visit us at IDC.com and follow us on Twitter: @IDC
Contact information