Production and Characterization of Rice Husk Biochar and ...
Upload
khangminh22Category
view
2download
0
Energies 2015, 8, 621-644; doi:10.3390/en8010621
energies ISSN 1996-1073
www.mdpi.com/journal/energies
Article
Life Cycle Assessment of Biochar versus Metal Catalysts Used in
Syngas Cleaning
Robert S. Frazier *, Enze Jin and Ajay Kumar
Biosystems and Agricultural Engineering, Oklahoma State University, 212 Ag Hall, Stillwater,
OK 74074, USA; E-Mails: [email protected] (E.J.); [email protected] (A.K.)
* Author to whom correspondence should be addressed; E-Mail: [email protected];
Tel./Fax: +1-405-744-5289.
Academic Editor: Shusheng Pang
Received: 24 September 2014 / Accepted: 10 December 2014 / Published: 15 January 2015
Abstract: Biomass gasification has the potential to produce renewable fuels, chemicals and
power at large utility scale facilities. In these plants catalysts would likely be used to reform
and clean the generated biomass syngas. Traditional catalysts are made from transition metals,
while catalysts made from biochar are being studied. A life cycle assessment (LCA)
study was performed to analyze the sustainability, via impact assessments, of producing a
metal catalyst versus a dedicated biochar catalyst. The LCA results indicate that biochar
has a 93% reduction in greenhouse gas (GHG) emissions and requires 95.7% less energy
than the metal catalyst to produce. The study also estimated that biochar production would
also have fewer impacts on human health (e.g., carcinogens and respiratory impacts)
than the production of a metal catalyst. The possible disadvantage of biochar production in
the ecosystem quality is due mostly to its impacts on agricultural land occupation.
Sensitivity analysis was carried out to assess environmental impacts of variability in the
two production systems. In the metal catalyst manufacture, the extraction and
production of nickel (Ni) had significant negative effects on the environmental impacts.
For biochar production, low moisture content (MC, 9%) and high yield type (8 tons/acre)
switchgrass appeared more sustainable.
Keywords: biochar; syngas; catalyst; gasification; tar; life cycle assessment (LCA);
impacts; sustainability
OPEN ACCESS
Energies 2015, 8 622
1. Introduction
Biomass can be converted into solid, liquid and gaseous fuel products through either biological or
various thermochemical processes [1,2]. One of the technologies that utilize biomass is gasification,
a thermochemical process [3]. This process has gathered renewed interest because it is typically more
efficient than other thermochemical processes and has potential to be commercially feasible in
near-term for energy and fuels production [4]. This greater efficiency also translates into lower
emissions per mega joule of energy produced. Studies indicate an integrated biomass gasification
combined cycle (IGCC) electrical power production plant with CO2 removal could mitigate CO2
emissions by 76%–79% compared to a conventional coal IGCC power plant [5].
Life cycle assessment (LCA) can be used to the show impact differences between processes.
For example, a LCA study concluded that hydrogen production through biomass gasification for
electricity production for subsequent used in electrolysis system had 86% reduction in greenhouse gas
(GHG) emissions, although it also had greater acidification impacts than hydrogen production through
biomass gasification and subsequent steam reforming system [6]. This benefit and detriment identified
for each process are results of LCA studies. These results suggest that advantages in one impact area
(GHG) may be partially offset by damages (acidification) in other areas.
Biomass gasification produces syngas that must cleaned before it can utilized for fuels and
power production. The traditional methods of hot syngas cleaning include filtration, water scrubbing,
thermal cracking and catalytic cracking [7]. The current preferred methods for reducing syngas tars
is by using solvents (acetone and water) or catalysts (e.g., nickel-alumina catalyst) the later
converting the tars to more useful gases. The solvent processes avoid using higher temperatures
(>700 °C) and associated additional energy [8], however, they create a waste disposal issue.
Catalyst-based tar removal methods can crack and reform tar compounds to produce extra gases such
as carbon monoxide and hydrogen which are the main syngas components. Essentially, the catalysts
make the syngas production process more efficient. The typical catalysts used in cleaning syngas
process are nickel (Ni) catalysts with the most common being Ni/Al2O3 and Ni/CeO2/Al2O3 [9].
From an overall environmental standpoint, use of these transition metals as syngas catalysts could
negatively impact the overall sustainability of the final syngas biofuel due to extraction, processing and
disposal of the metals. Recent research has shown the potential for biochar to be used as a syngas
catalyst with possible environmental benefits [10].
The research involving LCA of biochar generated by gasification is limited and no study has been found
conducting a comparative LCA of biochar and metal catalyst used in the syngas tar removal process.
Because significant quantities of catalyst would likely be employed in utility-scale gasification plants,
knowledge of the two catalyst’s environmental impacts is important and the reason this comparative
LCA was undertaken.
1.1. Life Cycle Assessment of Biochar Production and Use
Besides its novel use as a syngas cleaning catalyst, biochar, usually a byproduct of biomass
gasification or pyrolysis, has many potential uses with one being use as a soil amendment, and it is
sometimes produced primarily for this task [11]. In this capacity, the material holds promise to help

Energies 2015, 8 623
mitigate climate change levels by sequestering and distributing carbon back into the soil [12].
The utilization of biochar as a substitute for fertilizer and as a source of heat, bio-oil and catalyst for
gases for farm and ranch use also holds promise for agricultural applications [13]. Selected LCA
studies on biochar are shown below.
There have been several LCA studies involving biochar that show both positive and negative
environmental effects of using the material. An LCA study on the energetic and climate change
performance of biochar produced by pyrolysis of switchgrass with two different land-use scenarios
showed that if energy crops such as switchgrass are planted on land converted from annual food crops,
the indirect land-use change impacts may lead to more GHG emissions than GHG sequestration.
The article concluded was that it may not be appropriate to replace food crops with fuel biomass crops
such as switchgrass on the same land [14].
In another study, a LCA of biochar co-firing with coal for electricity generation in Taiwan was
conducted [15]. When compared to a 100% coal-fired system, the biochar co-firing with co-firing ratios
of 10% and 20% (biochar to coal) had benefits in five environmental impact categories, including aquatic
eco toxicity, terrestrial eco toxicity, land occupation, global warming, and non-renewable energy [15].
For evaluating the environmental impact of biochar as a soil amendment, an LCA of biochar
implementation in agriculture in Zambia was conducted. The results confirmed that the use of biochar in
farming was beneficial for soil condition, climate change and fossil fuel consumption but on the negative
side, also had a possible increase in air borne (PM2.5, PM10—respiratory distress) particles [16].
1.2. Variability and Uncertainty in Life Cycle Assessment Studies
Uncertainty is defined as the error of the outcome caused by variability or deficient data in the
model input [17]. LCAs are very dependent on the data quality and sensitive to data variability
because the quality of an LCA is directly related to the inventory upon which it is based [18].
Although practitioners have been long aware of improving the data quality, the validity and uncertainty
of final LCA reports still exist and cannot be totally eliminated due to the inherent variations in the
inventory data [19]. Many articles note that the data uncertainty is caused by a general lack of accurate
data values and incorrect measurement techniques during the life cycle inventory (LCI) phase of
the study [20]. This situation is especially prevalent in natural or agricultural systems such as biomass
production where the amount of precipitation, crop yields and other critical inputs are essentially
random in nature.
The variability in LCA is typically addressed by applying sensitivity analysis. This ensures that the
LCA results are more useful by showing the effects of input variation, including more possible
scenarios, choosing more precise data collection, and explicitly demonstrating assumptions used [21].
The objective of this LCA was to assess the sustainability of biochar versus metal catalysts in the
production of syngas for utility-scale fuels and power. The study assumes that biochar (catalyst) and
syngas are the two major co-products of the gasification process (biochar is not considered a waste).
This assumption is conservative but could reflect large scale biochar production as a dedicated catalyst.
The LCA is performed considering the cycles of the production of raw material production to the final
catalyst for both metal and biochar. The analysis was conducted using the SimaPro 7.3.3® Software
(Pre’ North America Inc., Washington, DC, USA) to assess the environmental impacts. A sensitivity

Energies 2015, 8 624
analysis was carried out to identify the factors with the most expected environmental impacts in each
catalyst production system and how the results change by variations in identified catalyst production
input parameters.
2. Methodology
The main starting components of the LCA, which are the “functional unit” and system boundary are
discussed. The general model data sources (inventories) and output scoring are also examined below.
2.1. Functional Unit
The functional unit is a basic LCA standard component and one was determined for the comparison
of the two catalysts in question. The functional unit is often a “task” versus a material as is the
case here. The industrial amount of feedstock on a dry basis needed for utility-scale power plant
biochar production was assumed to be 2000 metric tons per day [22]. The syngas yield was 2 m3/kg of
dry biomass and the amount of tar to be removed was 4.28 g/m3 of syngas. The functional unit was
determined to be the amount of catalyst needed to condition the syngas based on an average gas production
of 4,000,000 m3/day. The amounts of catalysts used for cleaning the same quantity of syngas are
different due to the difference in tar removal efficiencies of two catalysts (metal versus biochar) [23].
At 800 °C syngas cleaning temperature, mean toluene (a model tar) removal efficiencies of biochar
and Ni catalysts were found to be 80.75% and 97.70%, respectively [23]. Amount of biochar used was
twice the amount of Ni catalyst. The efficiencies may change with change in reaction conditions but
this was the best efficiency reported and used in this study. Regeneration of the catalysts was not
examined in this study. Based on reported performance of the two catalysts, 396 kg/day of metal
catalysts or 952 kg/day of biochar catalyst were needed.
2.2. System Boundaries
Another fundamental component of the LCA study is the system boundary for each product or
process being compared. For the metal catalyst, the system boundary included all necessary production
processes up to the point of use in the gasifier. The processes of producing raw metals for the metal
catalyst included mining, crushing and transportation of ores. The raw materials such as nickel ore and
bauxite are the main inputs of industrial metal catalyst manufacture along with various mater ials
such as: air, water, chemicals and energy sources. The simplified process flow of the metal catalyst
production is given in Figure 1. As biochar is assumed to be one of the two main products of the
gasification for this study, the LCA scope only includes the fraction (10% based on biochar yield) of
energy and materials needed for syngas production. Biochar is collected typically in particle cyclones
from the syngas downstream of the gasifier. The simplified process flow of the biochar catalyst is given
in Figure 2 below.

Energies 2015, 8 625
Figure 1. Simplified system boundary for metal catalyst production.

Energies 2015, 8 626
Figure 2. Simplified system boundaries (inside dotted line) for biochar production.
2.3. Assumptions
Assumptions are another important aspect for an LCA study since they have a strong influence on
results, model manageability, and make the assessment as transparent as possible. Sensitivity analysis
was used to test the importance of some assumptions. Below is a list of assumptions used in this
comparative LCA. As previously mentioned, the boundary for the studied systems was for the
production of the catalysts only and a 0.5% cutoff was used in SimaPro® for the database inventory.

Energies 2015, 8 627
Biochar was considered for catalyst use only—no soil supplementation or other uses. Hifuel-110®
(Johnson Matthey, Catalysis and Chiral Technologies, West Deptford, NJ, USA) was used as an
analog for NiO/Al2O3 catalyst in the cleaning syngas experiment. The biochar yield of gasification was
10% of the switchgrass input [24]. The mass of materials used in the gasifier construction per volume
of syngas was a linear scale-up to a utility scale gasification power plant. No stochastic behavior for
the processes was modeled in this study. At the utility scale, we assumed an operation of 10 years and
220 day/year which is based on an operation efficiency of 60% [25]. The switchgrass land is used for
10 years with two harvests per year. The yield of switchgrass, a national (US) average, was obtained
from the National Renewable Energy Laboratory Department of Energy (NREL, Golden, CO, USA) [26].
The database of switchgrass production does not include use of pesticides. The disposal phases of both
catalysts’ life cycle were not considered. The mass ratio of nickel oxide (NiO) to aluminum oxide
(Al2O3) in the metal catalyst mixing process was 1 to 9.
2.4. Assessment Tool and Method
The SimaPro® LCA software was used to develop the model and compare production of the two
catalysts. Life cycle impact assessment (LCIA) is an output of LCA and is an evaluation of the
potential environmental impacts during a product’s life time. The impact assessment was performed
with the IMPACT 2002+ (within the SimaPro® Software) method which includes midpoint and
endpoint analysis in this study. A framework of the method is shown in Figure 3. A midpoint
(category) indicator is the characterization of the elementary flows and environmental interactions
and impacts [27]. Midpoints are considered to be links in the cause-effect chain (environmental
mechanism) of an impact category, prior to the endpoints (damage impact), at which characterization
factors or indicators can be calculated to indicate the relative importance of emissions or extractions in
a LCI [28].
Figure 3. Overall scheme of the IMPACT 2002+ framework [27]. LCI: life cycle inventory.
Energies 2015, 8 628
The LCIA methodology used classical impact assessment methods to group the similar LCA results
into midpoint categories such as climate change and eco-toxicity (Figure 2). A score of one midpoint
characterization factor was given in equivalents of a substance compared to a reference substance
(e.g., CO2 for GHG, C2H3Cl for toxicity, etc.). Then damage oriented methods modeled the cause-effect
chain out to the damage categories such as climate change or human health [27]. Within two different
product systems, a comparison of impacts was generated to determine which system is possibly
more sustainable.
2.5. Life Cycle Inventory
The full inventory database was obtained from the SimaPro® 7.3.3 Software and applicable to
most European and American processes. Most specific data for the gasification process were obtained
from Sharma et al. [29]. The remaining data were collected from published databases and academic
literature and cited accordingly.
2.6. Metal Catalyst Inventory
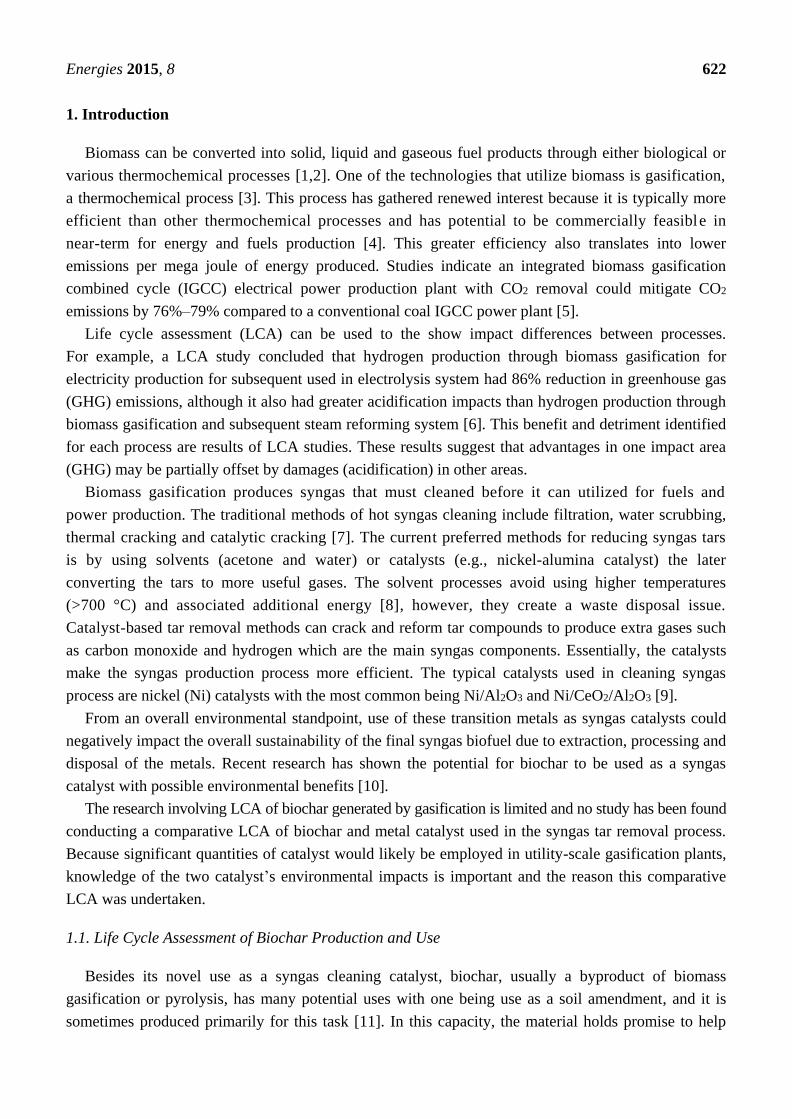
Data for the NiO material were obtained from the Nickel Institute LCI Report [30]. All inputs and
outputs of 1 kg Ni included in NiO (77 Ni wt%) are integrated in Table 1 and scaled up to the
functional unit when modeling the final catalyst. The inventory data for Al2O3, which is the base
support material, is obtained directly from the US-EI 2.2 Database [31] that is available in the
SimaPro® LCA Libraries.
The final metal catalyst consists of 10 wt% NiO and 90 wt% Al2O3. The nitrate solutions with
nickel and aluminum ions are filtered and heated at 105 °C in air to dry [32]. Subsequently the catalyst
samples are mixed by mechanical mixer into powders and heat treated at 700 °C. Using standard heat
transfer equations and a quantity of 1 kg of Ni/Al2O3, the energy for thermally drying and treating the
metal catalyst is calculated at approximately 0.5 MJ/kg.
Table 1. Inventory data for nickel oxide (NiO) production (1 kg of nickel (Ni) in NiO) [30].
Reprinted/Reproduced with permission from Nickel Institute, 2015.
Category Unit process Quantity
Resource (input)
Coal, in ground 3.1 kg
Iron (Fe, ore) 7.4 × 10⁻⁴ kg
Limestone (CaCO3) 0.4 kg
Natural gas, in ground 3.5 kg
Ni, in ground 2.5 kg
Oil, in ground 4.5 kg
Uranium (U, ore) 2.5 × 10⁻⁵ kg
Total water used 309 L
Technosphere (input) Total primary energy 455 MJ
Emission to air (output)
Carbon dioxide 26,337 g
Carbon monoxide 62 g
Nitrogen oxides, NO2 85 g
Nitrous oxide 2.0 g

Energies 2015, 8 629
Table 1. Cont.
Category Unit process Quantity
Emission to air (output)
Particulates 74 g
Sulfur oxides, SO2 2,205 g
Methane 47 g
Hydrocarbons 22 g
Ni 6.1 g
Chromium 3.3 × 10⁻³ g
Arsenic 1.0 g
Copper 1.2 g
Cobalt 5.6 × 10⁻² g
Zinc 0.19 g
Lead 0.53 g
Cadmium 3.7 × 10⁻³ g
Mercury 3.6 × 10⁻² g
Silver 1.1 g
Metals 0.23 g
Ammonia 4.7 g
Chloride 1.3 × 10⁻³ g
Dioxins 4.4 × 10⁻⁷ g
Volatile organic compounds 2.7 g
Hydrogen chloride 0.98 g
Hydrogen cyanide 3.9 × 10⁻⁵ g
Hydrogen fluoride 5.9 × 10⁻² g
Hydrogen sulfide 4.6 × 10⁻² g
Sulfuric acid 40 g
Emission to water (output)
Biochemical oxygen demand 1.1 g
Chemical oxygen demand 8.7 g
Sulfates 186 g
Nitrogenous matter, as N 269 g
Phosphates, as P 9.9 × 10⁻³ g
Total organic compounds 0.43 g
Arsenic 6.0 × 10⁻⁴ g
Ni 0.14 g
Copper 8.7 × 10⁻³ g
Zinc 1.3 × 10⁻³ g
Lead 4.1 × 10⁻² g
Mercury 4.0 × 10⁻⁵ g
Silver 1.8 × 10⁻⁴ g
Cadmium 4.2 × 10⁻⁵ g
Chromium 3.3 × 10⁻⁴ g
Acids 1.4 × 10⁻² g
Emission to soil (output)
Waste rock and backfill 175 kg
Tailing and other process residues 187 kg
Other solid materials 1.8 kg

Energies 2015, 8 630
2.7. Biochar Catalyst Inventory
The LCI data for the biomass feed material (switchgrass) was obtained from the NREL report [26]
that includes soil preparation, planting, harvesting, storage, transportation and pretreating. The land use
is based on an estimate of 10 years of life considering an average switchgrass yield of 14,800 kg/ha [26].
The detailed data of the switchgrass production is shown in Table 2. The metal used to construct
the gasifier included steel pipes and steel plates. Inputs of constructing the gasifier was based on
materials reported in a LCA of a gasification 407.1 MW power plant [33] with 42% efficiency [25].
Finally, the material masses of construction materials for a large gasifier for this case are 6099 tons
of steel, 6099 tons of cement and 36,660 tons of aggregates.
Table 2. Inventory data for 1 ton switchgrass feedstock production [26].
Reprinted/Reproduced with permission from National Renewable Energy Laboratory
(NREL), 2014.
Category Unit process Quantity
Resource (input)
Carbon dioxide 1.5 × 10³ kg
Energy, from biomass 1.5 × 10⁴ MJ
Occupation, pasture and meadow 0.68 ha
Transformation from permanent crop 2.25 × 10⁻² ha
Transformation from pasture and meadow 2.25 × 10⁻² ha
Transformation from arable 2.25 × 10⁻² ha
Technosphere * (input)
Tillage, rotary cultivator and rolling 6.8 × 10⁻³ ha
Fertilizer 0.068 ha
Planting 0.068 ha
Mowing, by rotary mower 9.33 × 10⁻² ha
Baling 9.33 × 10⁻² ha
Dried roughage store, non-ventilated 9.57 × 10⁻⁸ m3
Conveyor belt, at plant 3.47 × 10⁻⁵ m
Fodder loading, by self-loading trailer 2.2654 m3
Maize drying 50 kg
Grinding 0.97 tn.sh
Loading bales 1.43 p
Agricultural machinery 0.9 kg
Electricity, at grid 63.93 kW·h
Transport, tractor and trailer 7.42 tkm
Transport, combination truck 182.6 tkm
Transport, Train 200 tkm
Transport, Barge 11.3 tkm
Emission to air (output) Carbon dioxide, biogenic 295 kg
Water 333 kg
* Physical environment created or altered by humans.
2.8. Allocation Method
It is not uncommon for processes to produce more than one product, and the total environmental
impacts of that system should be allocated over the various outputs. It is recommended in the

Energies 2015, 8 631
International Standards Organization (ISO) Energy Management Standard ISO 14044 Standard that
allocation can be avoided by splitting a huge and complex process into separate processes or expanding
the system boundaries in order to cover the co-products [34]. If this is not possible, the ISO standards
advise that the allocation method should be used to identify the environmental load of co-products.
The biochar of gasification yield is approximately 10% of the feedstock mass and therefore 10%
allocation was used [24].
2.9. Sensitivity Analysis
Six input factors were varied in the sensitivity analysis and are discussed below. The ranges of the
factors were based on the author’s knowledge of the various systems and assumptions regarding which
parameters could experience variation in actual operations. One parameter at a time was changed and
the effects were compared with the reference case.
3. Results and Discussion
The LCA results show the calculated total environmental impacts of different substances in
midpoint categories. Results of the metal catalyst production system are shown in Table 3. The
midpoint categories are expressed in terms of a mass of a well-known reference substance which causes
damages (weighted impact). For example, 1 kg of emitted CH4 has the same GHG effect as 7 kg of
CO2 for the impact category “climate change”. The CO2 is the reference material multiplied by the
total GHG effect of all the various greenhouse gases. The same technique is used with carcinogenic
materials: there may be hundreds of carcinogens emitted by a process but all are combined into the
equivalent mass of C2H3Cl (vinyl chloride—a known carcinogen) for these overall reporting graphs.
Table 3. Characterization life cycle impact assessment (LCIA) results of metal catalyst
production. Functional unit = 396 kg/day. CFC: chlorofluorocarbon; and TEG:
triethylene glycol.
Impact category Unit Total NiO production
(%)
Alumina
production (%)
Mixing
process (%)
Carcinogens kg C2H3Cl(eq) 3.51 × 10³ 92.9 5.1 1.32
Non-carcinogens kg C2H3Cl(eq) 697 86.4 13.1 0.449
Respiratory inorganics kg PM2.5(eq) 11.7 93.1 6.27 0.647
Ionizing radiation Bq C-14(eq) 4.19 × 10³ 17 82.7 0.243
Ozone layer depletion kg CFC-11(eq) 7.15 × 10⁻⁵ 29.3 70.3 0.418
Respiratory organics kg C2H4(eq) 2.59 88.4 10.3 1.24
Aquatic ecotoxicity kg TEG water 1.37 × 10⁶ 88.7 10.2 1.11
Terrestrial ecotoxicity kg TEG soil 1.87 × 10⁵ 93.4 6.56 0.0143
Terrestrial acid/nutri kg SO2(eq) 167 91.7 7.67 0.598
Land occupation m2org.arable 2.16 15.4 84.4 0.22
Aquatic acidification kg SO2(eq) 144 95.3 4.08 0.665
Aquatic eutrophication
eutrophication kg PO4(P-lim) 0.14 62.8 36.4 0.835
Global warming kg CO2(eq) 2.95 × 10³ 82.3 16.9 0.776
Non-renewable energy MJ primary 1.73 × 10⁵ 90.9 7.91 1.19
Mineral extraction MJ surplus 2.34 × 10³ 78 22 0.00821

Energies 2015, 8 632
3.1. Life Cycle Assessment of Nickel Catalyst Production
NiO manufacturing processes are responsible for approximately 82% of the calculated global warming
impact of the metal catalyst. This contribution mainly results from the CO2 emissions of exploring,
mining, producing and transporting Ni. The combustion of natural gas, coal and oil lead to GHG
emissions and are used to supply the energy of manufacture and transportation. In this study, the
average CO2 emission rate was 47.2 kg CO2 eq/kg Ni, which is a little higher than the CO2 emission
(44.8 kg CO2 eq/kg Ni) in nickel laterite processing [35]. The difference may be due to different
technologies that are used for producing Ni. In addition, per unit mass, NiO production consumes more
energy such as natural gas and coal than Al2O3 production. The primary energy input of NiO in this
study was 350 MJ/kg which is close to 370 MJ/kg estimated by Eckelman [36] for global Ni industry.
The total non-renewable energy usage was 3970 MJ/kg NiO (calculated by IMPACT 2002+ Method),
which is 10 times more than the primary energy input. The difference could be attributed to the use of
natural gas (non-renewable) for most primary energy inputs used in the NiO database.
The impacts of carcinogens and non-carcinogens released from NiO production are four times as
much as the impacts of Al2O3 production. These results can be attributed to higher level of toxicity
and carcinogenicity in NiO than Al2O3 [37]. Respiratory inorganics are air pollutants in the form of
tiny particles (PM2.5) that can affect human lungs. These pollutants are released by heavy industries and
processes such as combustion, harvesting operations, and road traffic [38]. Al2O3 production indicates
more impacts on ionizing radiation, ozone layer depletion and land occupation than NiO production.
The ionizing radiation impact is caused by uranium tailings from uranium mining and subsequent
usage in utility electrical power nuclear reactors (U.S. National Electric Grid Average Blend) [39].
The ozone layer is damaged by various gases emitted from fossil fuels and chlorofluorocarbons
(CFCs). The mining extraction phase of aluminum and Ni is responsible for almost the entire LCA
impact portion of the metals on the remaining midpoint categories. Compared to the separate NiO and
Al2O3 production processes, the procedure of mixing the two materials into the final metal catalyst has
(relatively) small midpoint impacts.
3.2. Life Cycle Assessment of Biochar Catalyst Production
Table 4 shows the environmental impacts of biochar production. Most contributions to the global
warming impact are from switchgrass production. The fertilizer (N and P) used for cultivating switchgrass
results in increasing nitrous oxide emissions which are a major contributor of climate change [40].
Another reason for the high impact on climate change is the electricity and fuel oil used (leading to
GHG emissions) in planting and transportation. For biochar production, Roberts et al. [14] estimated
that the net climate change impact was 36 kg CO2 eq/t dry switchgrass. In this study, the net GHG
emission was 21.6 kg CO2 eq/t dry feedstock. Both were estimated based on cultivating switchgrass with
existing agricultural land (crop change) and with typical biochar production methods (slow pyrolysis
and gasification). The GHG emissions stemming from converting virgin natural land to agricultural
land may be much higher [41,42].
In the biochar production carcinogens impact category, gasification results in approximately 94% of
the total impact. The gasification process produces many volatile organic compounds that contribute to
respiratory organics impact. In addition, because production of an industrial scale gasifier is included

Energies 2015, 8 633
in the gasification process, non-renewable energy such as natural gas is consumed and more
carcinogens are generated. The impact on respiratory inorganics of gasification process is a little
higher than the same impact of switchgrass production for the same functional unit. The sources of
respiratory inorganics for the gasification processes are from natural gas and coal based electricity
generation. Fertilizer for switchgrass production also has an impact on respiratory inorganics. The land
use and transformation of pasture and meadow in planting switchgrass are responsible for impacts of
land occupation, aquatic and terrestrial ecotoxicity [43].
Table 4. Characterization LCIA results of biochar production. Functional unit = 952 kg/day.
Impact category Unit Total Switchgrass production (%) Gasification process (%)
Carcinogens kg C2H3Cl(eq) 130 6.25 93.8
Non-carcinogens kg C2H3Cl(eq) 12.4 33.1 66.9
Respiratory inorganics kg PM2.5(eq) 0.344 41.5 58.5
Ionizing radiation Bq C-14(eq) 283 73.5 26.5
Ozone layer depletion kg CFC-11(eq) 4.85 × 10⁻⁶ 80.7 19.3
Respiratory organics kg C2H4(eq) 5.6 1.14 98.9
Aquatic ecotoxicity kg TEG water 5.32 × 10⁴ 23.8 76.2
Terrestrial ecotoxicity kg TEG soil 4820 96.7 3.3
Terrestrial acid/nutri kg SO2(eq) 7.19 62.7 37.3
Land occupation m2org.arable 8,300 100 5.84 × 10⁻⁴
Aquatic acidification kg SO2(eq) 3.67 31 69
Aquatic eutrophication kg PO4(P-lim) 8.89 × 10⁻³ 59.3 40.7
Global warming kg CO2(eq) 206 69.3 30.7
Non-renewable energy MJ primary 7,550 27.6 72.4
Mineral extraction MJ surplus 2.7 70.8 29.2
The energy used for producing switchgrass in this study is 2.19 MJ/kg which is a little higher
than 1.67 MJ/kg estimated by Clarens et al. [44]. However, this result is consistent with other
published values that range from 1.67 MJ/kg to 2.31 MJ/kg [45]. The energy used in a biochar
production was approximately 888 MJ/t dry feedstock [14], which is a little higher than the energy used
(793 MJ/t dry feedstock) for biochar production in this study. The reason for this difference could be
disposal processes such as composting that were included in the reference study. The aquatic
eutrophication impact of switchgrass production is 5.53 × 10⁻⁶ kg PO4 eq/kg that is much lower as
compared to 3.5 × 10⁻⁴ kg PO4 eq/kg [44]. The yields of switchgrass in the reference article and this
study were 10 t/ha and 14.8 t/ha, respectively. The difference in yields of switchgrass may cause different
land occupation impacts which are related to aquatic eutrophication impact. The single point (“Pt”)
score as seen in Figure 4 indicates that land occupation, carcinogens, non-renewable and respiratory
inorganics are the most relevant of the potential environmental impacts for biochar production.
The “Pt” scoring method is a relative indicator based on the European Eco-Indicator methodology of
LCA impact scoring [28]. One point (1 Pt) is one thousandth of the yearly environmental load for a
European. While this study is for the United States the “Pt” eco indicator system will give relative
results that allow ranking of the impacts.

Energies 2015, 8 634
3.2%
100%
7.0% 4.3%
100%
19.0%
100% 100%
Human health Ecosystem quality Climate change Resources
Biochar Metal catalyst
Figure 4. Comparison of damage assessment.
3.3. Comparison Analysis
As can be seen in Table 5, only the respiratory organics and land occupation impacts of biochar
production are higher than the same impact areas of the metal catalyst production. The metal catalyst
production results in 30 times more carcinogens than the biochar production. The potential global
warming and non-renewable energy impacts of biochar production are 7% and 4.4% of the metal
catalyst production, respectively. Part of the lesser GHG emissions of biochar production is due to soil
organic carbon sequestration by switchgrass production [46]. The percentages in Figure 4 are the
proportions of lower value to higher value in different impact categories, and scaling up the higher
value to 100% for ease of side-by-side comparison.
Table 5. Characterized LCA comparison results (total value in each impact categories).
Impact category Unit Metal catalyst (396 kg) Biochar catalyst (953 kg)
Carcinogens kg C2H3Cl(eq) 3.51 × 10³ 130
Non-carcinogens kg C2H3Cl(eq) 697 12.4
Respiratory inorganics kg PM2.5(eq) 11.7 0.344
Ionizing radiation Bq C-14(eq) 4.19 × 10³ 283
Ozone layer depletion kg CFC-11(eq) 7.15 × 10⁻⁵ 4.85× 10⁻⁶
Respiratory organics kg C2H4(eq) 2.59 5.6
Aquatic ecotoxicity kg TEG water 1.37 × 10⁶ 5.32 × 10⁴
Terrestrial ecotoxicity kg TEG soil 1.87 × 10⁵ 4,820
Terrestrial acid/nutri kg SO2(eq) 167 7.19
Land occupation m2org.arable 2.16 8300
Aquatic acidification kg SO2(eq) 144 3.67
Aquatic eutrophication kg PO4(P-lim) 0.14 8.89 × 10⁻³
Global warming kg CO2(eq) 2.95 × 10³ 206
Non-renewable energy MJ primary 1.73 × 10⁵ 7,550
Mineral extraction MJ surplus 2.34 × 10³ 2.7
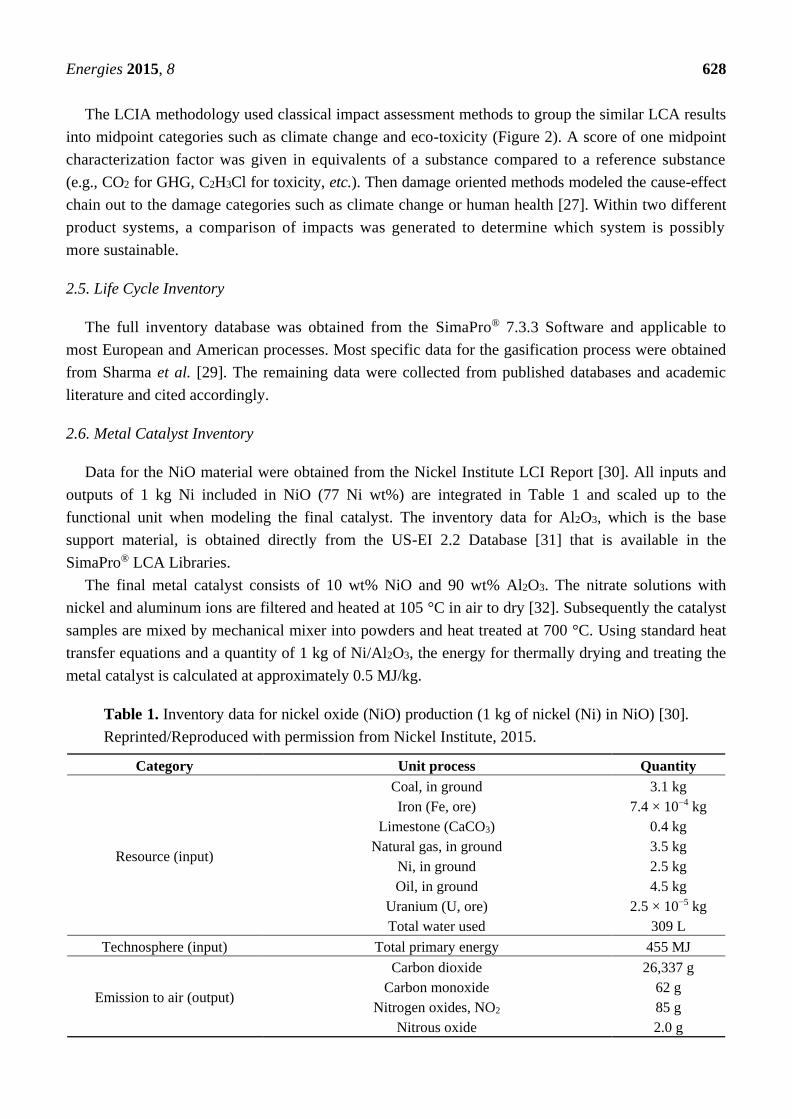
The environmental performance of the two catalysts is given in Figure 5. The single score (Pt) is
calculated by applying a weighting factor of each impact category to normalize score of damage
assessment [47]. The cumulative scores of biochar and metal catalyst production were 0.827 Pt and
4.4 Pt, respectively. The environmental damage of the metal catalyst is mainly caused by the impacts
Energies 2015, 8 635
on carcinogens (31.6%), non-renewable (26%), respiratory inorganics (26%), global warming (6.8%)
and non-carcinogens (6.3%) categories. The environmental damage of biochar is mostly due to the
impacts on land occupation (80%), carcinogens (6.2%), non-renewable (6.0%) and respiratory
inorganics (4.1%) categories. In both catalysts systems, the impacts on ionizing radiation, ozone layer
depletion, respiratory organics, aquatic ecotoxicity, terrestrial acidification/nutrition and mineral extraction
categories are relatively much lower than impacts on other categories. The normalization factors of
aquatic acidification and aquatic eutrophication are not well-developed in the IMPACT 2002+ method
so these do not have relative scores [27].
0
0.3
0.6
0.9
1.2
1.5
Biochar Metal catalyst
Figure 5. Comparison of LCA results expressed as single scores (Pt).
Table 5 indicates the impact categories of the two systems. The metal catalyst production had more
impacts on human health than biochar production because of its carcinogens and non-carcinogens
impacts. The energy used for biochar catalyst production is roughly 4.3% of energy used in metal catalyst.
The total GHG of biochar catalyst is 206 kg CO2 eq, which is 7% of the GHG of metal catalyst production.
Compared to LCA of biochar production through slow pyrolysis of switchgrass in another study,
which showed a net reduction in overall CO2 eq/kg [14], an emission rate of 0.21 kg CO2 eq/kg
observed in this biochar production study indicated that biochar production does not achieve a net
reduction in global warming impact. The reason is that the biochar, in this study, is used as a catalyst
instead of a soil amendment, which means carbon sequestration of biochar is not considered. Biochar can
contribute to a reduction in GHG emissions by 2.6–16 kg CO2 eq/kg when applied to soil [48]. The GHG
emission of biochar produced by slow pyrolysis using microalgae was 0.4–0.66 kg CO2 eq/kg [48]
that is higher than the emissions estimated in this study. This higher emission could be due to
additional energy used in microalgae cultivation.
Although the climate change and resource impacts of biochar production are lower than those of
metal catalyst, the biochar production indicates more (five times higher) impact on ecosystem quality.
Ecosystem quality is related to land occupation (transformation), aquatic ecotoxicity and terrestrial
ecotoxicity impacts. As more land is transformed from meadow and pasture to arable crop fields by human

Energies 2015, 8 636
managements such as tillage and pest control, these are reported as adverse impacts on the ecosystem.
Mining operations also occupy land areas, but need smaller area in comparison to the area needed for
agricultural crop operations to grow dedicated switchgrass. Switchgrass production reduces flora and
fauna diversity of the environment by changing to a monoculture system affecting the ecosystem quality
(LCA scoring) [49].
3.4. Sensitivity Analysis Results
LCA studies are highly dependent on the accuracy of the input parameters—some of which may be
educated assumptions. For this reason it is very important to test sensitivity of the model to some of
these input parameters and assumptions. Wide swings in LCA output results as a result of varying the
specific inputs indicate that these inputs should be scrutinized very closely. The input parameters (below)
for this sensitivity analysis were selected based on domain knowledge of the processes.
3.4.1. Vary Fraction of Nickel Oxide
NiO is widely used as a catalyst in steam reforming and syngas production processes. This study
uses a typical mix of 10 wt% NiO and 90 wt% Al2O3 as a basic mass fraction of the NiO catalyst.
For sensitivity analysis, the mass fraction of NiO in the metal catalyst was adjusted to 5 wt%, 10 wt%
and 20 wt% fraction of total mass for the sensitivity analysis.
As can be seen in Figure 6, by changing the weight fraction of NiO (5% to 20%) most impact
categories increased by 61%–92%.
−47%
−43%
−46%
−4%
−11%
−44%
−44%
−46%
−46%
−3%
−48%
−30%
−41%
−46%
−38%
87%
83%
90%
87%
31%
82%
83%
92%
88%
0.46%
92%
61%
78%
86%
76%
Carcinogens
Non-carcinogens
Respiratory inorganics
Ionizing radiation
Ozone layer depletion
Respiratory organics
Aquatic ecotoxicity
Terrestrial ecotoxicity
Terrestrial acid/nutri
Land occupation
Aquatic acidification
Aquatic eutrophication
Global warming
Non-renewable energy
Mineral extraction
5 wt% nickel oxide 20 wt% nickel oxide
Figure 6. Impacts of NiO fraction in the metal catalyst.
The ionizing radiation impact increased by 87% for the 20% increase in fraction of NiO, while it
decreased by 4% for the 5% increase in NiO. This large variation in output indicates that the
percentage of NiO has a large influence on ionizing radiation impacts reported. The ozone layer

Energies 2015, 8 637
depletion impact did not change as much as other impact categories. The land occupation impact
was not influenced to a large degree by the NiO fraction. Al2O3 had more adverse effects than NiO on
the ozone layer depletion and land occupation impacts. For process improvement, the LCA indicates
that the amount of NiO in the catalyst manufacturing process must be minimized to achieve high
production efficiency and low environmental impacts of the metal catalyst.
3.4.2. Vary Energy Used in Nickel Oxide Production
To further test the sensitivity of parameter inputs of the metal catalyst, the energy to produce the
NiO was varied. According to the various amounts of energy used in different industrial scale
manufacture of NiO with different technologies, the primary energy was varied to observe the effect
on the LCA outputs. A symmetrical sensitivity result is shown in the Figure 7. The 50% decrease and
increase in energy used in the NiO production resulted in the same variation in either direction of
all impact categories. The energy used in the NiO has more influence (positive or negative) on the
carcinogens, respiratory organics and non-renewable energy than other categories. The energy
adjustment minimally changes the impacts on terrestrial ecotoxicity and mineral extraction which are
directly affected by land use and mining process.
Figure 7. Energy used adjustment in NiO production.
3.4.3. Vary Land Use for Switchgrass Production
Figure 8 shows large changes in the various environmental impacts based on both land occupation
and terrestrial ecotoxicity. Increasing land use by 50% leads to increase in its environmental impact
because of potential damage to soil, flora and fauna, and microorganisms underground. The change in
land use also determines the amount of pesticide and fertilizer used which can contribute to the
impacts of terrestrial ecotoxicity. In contrast, the carcinogens and respiratory organics are relatively
insensitive to the change in the land use.

Energies 2015, 8 638
−0.08%
−3%
−1%
−4%
−5%
−0.09%
−1%
−13%
−1%
−20%
−1%
−4%
−1%
−1%
−4%
2%
14%
5%
18%
23%
0.20%
4%
63%
7%
100%
3%
19%
5%
3%
20%
Carcinogens
Non-carcinogens
Respiratory inorganics
Ionizing radiation
Ozone layer depletion
Respiratory organics
Aquatic ecotoxicity
Terrestrial ecotoxicity
Terrestrial acid/nutri
Land occupation
Aquatic acidification
Aquatic eutrophication
Global warming
Non-renewable energy
Mineral extraction
20% decrease 50% increase
Figure 8. Land use adjustment in switchgrass.
Generally the ecosystem quality impact category is one of the few potential weakness areas of
biochar production compared to the metal catalyst production, and land used should be considered
as an indicator when making a sustainability decision about biomass related processes including
planting switchgrass.
3.4.4. Vary Switchgrass Yield
Switchgrass crop yield varies with weather, soil quality and variety. The switchgrass database used
in this study shows a national average yield of 14,800 kg/ha and the specific switchgrass used can be
classified as a midrange type. The other two switchgrass types in the northern and southern range have
an average yield of 9867 kg/ha and 19,733 kg/ha, respectively (Figure 9).
100% 100% 100% 100%96.1%
66.7%
86.4%95.2%94.4%
50%
79.6%
93%
Human health Ecosystem quality Climate change Resources
Northern range Midrange Southern range
Figure 9. Damage assessment of producing syngas with various yields of switchgrass.
As the land occupation impact has a direct influence on the ecosystem quality, higher switchgrass
yield biomass requires lesser land area and hence has lower influence on ecosystem quality. The

Energies 2015, 8 639
variation on the human health and resources are relatively small, and these result from the energy used
in both production and gasification of switchgrass. The variation in the climate change category is
mainly due to the nitrogen fertilizer used in the switchgrass. Hence, the biomass with higher yield has
lesser impact on the GHG emissions.
3.4.5. Vary Gasification Equivalence Ratio
Many process conditions can be controlled to optimize the syngas production efficiency. In this study,
the variations in biomass moisture content (MC) and equivalence ratio (ER) were investigated to
evaluate the LCA results (as shown in Table 6). The ER (ratio of air supplied to the air required for
complete combustion) is an essential gasification parameter and usually modulated within a certain
range in order to achieve the optimum syngas production. The ER varied from 0.2 to 0.45 associated
with airflow and feedstock rate.
Table 6. Variations in inputs for producing 1 m3 syngas (adapted with modification from [29]).
ER: equivalence ratio.
Inputs ER
0.20 0.29 0.32 0.40 0.45
Air (kg) 0.96 0.95 0.956 1 1.08
Biomass energy (MJ) 15.7 11 9.45 8.56 7.53
Biomass mass (kg) 0.83 0.59 0.5 0.45 0.4
The results in Figure 10 show that the highest damage impact occurs at the lowest ER and the
variations in all damage categories are similar. The damage impact can vary from 48% to 71% of the
basic value at ER of 0.2. The variations are simply caused by the amount of biomass and energy used.
The biomass and energy used at an ER of 0.2 are two times than those at ER of 0.45 hence increasing
the damage impacts by a factor of 2.
100% 100% 100% 100%
72% 71% 71% 71%
59% 60% 60% 59%54% 54% 54% 54%
49% 48% 48% 48%
Human health Ecosystem quality Climate change Resources
ER=0.2 ER=0.29 ER=0.32 ER=0.4 ER=0.45
Figure 10. Damage assessment of producing syngas with various ERs.

Energies 2015, 8 640
3.4.6. Vary Biomass Moisture Content Fed to the Gasifier
The MC of the gasification feedstock was suspected to have a large effect on variability of the LCA
output due to the latent heat of vaporization (enthalpy) of water in the feedstock required and the
resulting effect on gasification operation efficiency. Typically the biomass MC is suggested at 10%–20%
on wet basis weight [49]. High MC will reduce the reaction temperature and may produce syngas gas
with lower yield and efficiency [49]. Based on the study data, three MC levels of 9%, 19% and 29%
were chosen (Table 7).
Table 7. Gasification products at various levels of switchgrass moisture content (MC)
(adapted with modification from [49]).
MC (% wet basis) Gasification products (% feed weight)
H2 CO CH4 CO2 H2O Tar Ash
9 0.90 37.91 5.74 55.92 17.71 2.81 8.94
19 0.59 34.54 4.62 51.07 20.26 2.14 8.47
29 0.43 29.42 3.41 50.01 21.06 1.62 8.28
As shown in Figure 11, the highest variation occurs in the climate change category with an increase
of 120%–240% with increase in MC from 9% to 29%. This difference in the climate change is due to
supplemental heat required to gasify additional MC in the switchgrass. For instance, the climate change
impact of 19% MC is 65% than that of 29% MC. The ecosystem quality does not change significantly
because of small variations in the MC. The human health and (energy) resources categories are also
affected by MC and high(er) heating value (HHV) of the syngas.
81.6%99%
29.2%
67.2%
91% 99.6%
65%
84%100% 100% 100% 100%
Human health Ecosystem quality Climate change Resources
9% MC 19% MC 29% MC
Figure 11. Damage assessment of producing syngas with various levels of switchgrass MC.
4. Conclusions
A comparative LCA was applied to model the environmental impact of producing metal versus
biochar as a catalyst used in the syngas cleaning system. The LCA results showed that production of
biochar requires 95.7% less energy than production of the metal catalyst which is a mixture of NiO
and Al2O3. Producing biochar as a catalyst has a potential in reducing 93% GHG emissions as
compared to producing a metal catalyst. Although biochar production system has more potential
impacts on ecosystem quality due to land use, it has lesser negative impacts on human health than

Energies 2015, 8 641
metal catalyst production. If biochar is examined as a waste of gasification, its ecological impacts will
be even less.
Most processes of the metal catalyst manufacture could be optimized to reduce the waste materials,
energy and correspondingly the environmental impacts to some degree. The impact of biochar
production can be improved by mitigating land occupation such as growing a higher yield switchgrass
in the southern range. Growing switchgrass on marginal lands with no fertilizer would also lower
impacts but would also probably lower harvest yields. The impacts of the gasification process in
general can be improved by optimizing reaction conditions and reactor design for use of low energy
and materials. In all, the sustainability of biochar catalysts appears promising when compared to
conventional transition metal catalysts using this preliminary LCA.
Future research should include the comparison of biochar catalyst to other non-metal catalyst
possibilities such as activated carbon. The use of syngas to generate electrical power and fuels at a
distributed location as well as recycling and disposal of the catalysts should also be examined.
Acknowledgments
Authors acknowledge the support of South Central Sun Grant Program and Oklahoma Agricultural
Experiment Station for this study.
Author Contributions
All three authors significantly contributed to the scientific study and writing. Robert S. Frazier
supervised Enze Jin to conduct life cycle analysis, interpretation of results and writing. Ajay Kumar
provided technical information on biochar and contributed to the interpretation of results.
Conflicts of Interest
The authors declare no conflict of interest.
References
1. Caputo, A.C.; Palumbo, M.; Pelagagge, P.M.; Scacchia, F. Economics of biomass energy
utilization in combustion and gasification plants: Effects of logistic variables. Biomass Bioenergy
2005, 28, 35–51.
2. Demirbas, A. Biofuels sources, biofuel policy, biofuel economy and global biofuel projections.
Energy Convers. Manag. 2008, 49, 2106–2116.
3. Alauddin, Z.A.B.Z.; Lahijani, P.; Mohammadi, M.; Mohamed, A.R. Gasification of lignocellulosic
biomass in fluidized beds for renewable energy development: A review. Renew. Sustain.
Energy Rev. 2010, 14, 2852–2862.
4. Pereira, E.G.; da Silva, J.N.; de Oliveira, J.L.; Machado, C.S. Sustainable energy: A review of
gasification technologies. Renew. Sustain. Energy Rev. 2012, 16, 4753–4762.
5. Corti, A.; Lombardi, L. Biomass integrated gasification combined cycle with reduced CO2
emissions: Performance analysis and life cycle assessment (LCA). Energy 2004, 29, 2109–2124.
Energies 2015, 8 642
6. Koroneos, C.; Dompros, A.; Roumbas, G. Hydrogen production via biomass gasification—A life
cycle assessment approach. Chem. Eng. Process. Process Intensif. 2008, 47, 1261–1268.
7. Gerber, M.A. Review of Novel Catalysts for Biomass Tar Cracking and Methane Reforming;
Pacific Northwest National Laboratory: Richland, WA, USA, 2007.
8. Mani, S.; Kastner, J. Catalytic cracking of tar using biochar as a catalyst. In Proceedings of the
2010 ASABE Annual International Meeting, Pittsburgh, PA, USA, 20–23 June 2010.
9. Kimura, T.; Miyazawa, T.; Nishikawa, J.; Kado, S.; Okumura, K.; Miyao, T.; Naito, S.; Kunimori, K.;
Tomishige, K. Development of Ni catalysts for tar removal by steam gasification of biomass.
Appl. Catal. B Environ. 2006, 68, 160–170.
10. Abu El-Rub, Z.; Bramer, E.A.; Brem, G. Experimental comparison of biomass chars with other
catalysts for tar reduction. Fuel 2008, 87, 2243–2252.
11. Sohi, S.; Krull, E.; Lopez-Capel, E.; Bol, R. A review of biochar and its use and function in soil.
Adv. Agron. 2010, 105, 47–82.
12. Woolf, D.; Amonette, J.E.; Street-Perrott, F.A.; Lehmann, J.; Joseph, S. Sustainable biochar to
mitigate global climate change. Nat. Commun. 2010, 1, doi:10.1038/ncomms1053.
13. Schahczenski, J. Biochar and Sustainable Agriculture; ATTRA—National Sustainable Agriculture
Information Service: Butte, MT, USA, 2010.
14. Roberts, K.G.; Gloy, B.A.; Joseph, S.; Scott, N.R.; Lehmann, J. Life cycle assessment of biochar
systems: Estimating the energetic, economic, and climate change potential. Environ. Sci. Technol.
2009, 44, 827–833.
15. Huang, Y.-F.; Syu, F.-S.; Chiueh, P.-T.; Lo, S.-L. Life cycle assessment of biochar cofiring
with coal. Bioresour. Technol. 2013, 131, 166–171.
16. Sparrevik, M.; Field, J.L.; Martinsen, V.; Breedveld, G.D.; Cornelissen, G. Life cycle assessment to
evaluate the environmental impact of biochar implementation in conservation agriculture in Zambia.
Environ. Sci. Technol. 2013, 47, 1206–1215.
17. Bojacá, C.R.; Schrevens, E. Parameter uncertainty in LCA: Stochastic sampling under correlation.
Int. J. Life Cycle Assess. 2010, 15, 238–246.
18. Vigon, B.W.; Jensen, A.A. Life cycle assessment: Data quality and databases practitioner survey.
J. Clean. Prod. 1995, 3, 135–141.
19. Huijbregts, M.A. Application of uncertainty and variability in LCA. Int. J. Life Cycle Assess.
1998, 3, 273–280.
20. Ardente, F.; Beccali, G.; Cellura, M.; Lo Brano, V. Life cycle assessment of a solar thermal
collector: Sensitivity analysis, energy and environmental balances. Renew. Energy 2005, 30,
109–130.
21. Baker, J.W.; Lepech, M.D. Treatment of uncertainties in life cycle assessment. In Proceedings of
the ICOSSAR 2009—10th International Conference on Structural Safety and Reliability, Osaka,
Japan, 13–17 September 2009.
22. Brown, T.R.; Zhang, Y.N.; Hu, G.P.; Brown, R.C. Techno-economic analysis of biobased
chemicals production via integrated catalytic processing. Biofuels Bioprod. Biorefining 2012, 6,
73–87.
23. Marin, L.S. Treatment of Biomass-Derived Synthesis Gas Using Commercial Steam Reforming
Catalysts and Biochar. Ph.D. Thesis, Oklahoma State University, Stillwater, OK, USA, 2011.

Energies 2015, 8 643
24. Brewer, C.E.; Schmidt-Rohr, K.; Satrio, J.A.; Brown, R.C. Characterization of biochar from fast
pyrolysis and gasification systems. Environ. Progress Sustain. Energy 2009, 28, 386–396.
25. Spath, P.L.; Mann, M.K.; Kerr, D.R. Life Cycle Assessment of Coal-Fired Power Production;
National Renewable Energy Laboratory: Golden, CO, USA, 1999.
26. National Renewable Energy Laboratory. U.S. Life Cycle Inventory Database, 2012.
Available online: https://www.lcacommons.gov/nrel/search 2012 (accessed on 19 November 2012).
27. Jolliet, O.; Margni, M.; Charles, R.; Humbert, S.; Payet, J.; Rebitzer, G.; Rosenbaum, R.
IMPACT 2002+: A new life cycle impact assessment methodology. Int. J. Life Cycle Assess.
2003, 8, 324–330.
28. Bare, J.C.; Hofstetter, P.; Pennington, D.W.; de Haes, H.A.U. Midpoints versus endpoints:
The sacrifices and benefits. Int. J. Life Cycle Assess. 2000, 5, 319–326.
29. Sharma, A.M.; Kumar, A.; Patil, K.N.; Huhnke, R.L. Performance evaluation of a lab-scale
fluidized bed gasifier using switchgrass as feedstock. Trans. ASABE 2011, 54, 2259–2266.
30. Life Cycle Assessment of Nickel Products; Ecobalance, Inc.: Bethesda, MD, USA, 2000; pp. 1–99.
31. US-EI SimaPro Database; EarthShift, LLC: Huntington, VT, USA, 2013.
32. Kiss, E.; Bošković, G.; Lazić, M.; Lomić, G.; Marinković-Nedučin, R. The morphology of the
NiO-Al2O3 catalyst. Scanning 2006, 28, 236–241.
33. Gorokhov, V.; Manfredo, L.; Ratafia-Brown, J.; Ramezan, M.; Stiegel, G. Life cycle assessment
of gasification-based power cycles. In Proceedings of the 2000 International Joint Power
Generation Conference, Miami Beach, FL, USA, 23–26 July 2000.
34. Goedkoop, M.; de Schryver, A.; Oele, M.; Durksz, S.; de Roest, D. Introduction to LCA with
SimaPro 7; PRé Consultants: Amersfoort, The Netherlands, 2008.
35. Norgate, T.; Jahanshahi, S. Assessing the energy and greenhouse gas footprints of nickel laterite
processing. Miner. Eng. 2011, 24, 698–707.
36. Eckelman, M.J. Facility-level energy and greenhouse gas life-cycle assessment of the global
nickel industry. Resour. Conserv. Recycl. 2010, 54, 256–266.
37. Coogan, T.P.; Latta, D.M.; Snow, E.T.; Costa, M.; Lawrence, A. Toxicity and carcinogenicity of
nickel compounds. CRC Crit. Rev. Toxicol. 1989, 19, 341–384.
38. Weisbrod, A.V.; van Hoof, G. LCA-measured environmental improvements in Pampers® diapers.
Int. J. Life Cycle Assess. 2012, 17, 145–153.
39. Frischknecht, R.; Braunschweig, A.; Hofstetter, P.; Suter, P. Human health damages due to ionising
radiation in life cycle impact assessment. Environ. Impact Assess. Rev. 2000, 20, 159–189.
40. Bai, Y.; Luo, L.; van der Voet, E. Life cycle assessment of switchgrass-derived ethanol as
transport fuel. Int. J. Life Cycle Assess. 2010, 15, 468–477.
41. Fargione, J.; Hill, J.; Tilman, D.; Polasky, S.; Hawthorne, P. Land clearing and the biofuel
carbon debt. Science 2008, 319, 1235–1238.
42. Searchinger, T.; Heimlich, R.; Houghton, R.A.; Dong, F.; Elobeid, A.; Fabiosa, J.; Tokgoz, S.;
Hayes, D.; Yu, T.H. Use of U.S. croplands for biofuels increases greenhouse gases through
emissions from land-use change. Science 2008, 319, 1238–1240.
43. Van der Voet, E. Land Use in LCA; CML-SSP Working Paper 02.002; Section Substances
and Products, Centre of Environmental Science, Leiden University (CML-SSP): Leiden,
The Netherlands, 2001.
Energies 2015, 8 644
44. Clarens, A.F.; Resurreccion, E.P.; White, M.A.; Colosi, L.M. Environmental life cycle
comparison of algae to other bioenergy feedstocks. Environ. Sci. Technol. 2010, 44, 1813–1819.
45. Kim, S.; Dale, B.E. Cumulative energy and global warming impact from the production of
biomass for biobased products. J. Ind. Ecol. 2003, 7, 147–162.
46. Liebig, M.A.; Schmer, M.R.; Vogel, K.P.; Mitchell, R.B. Soil carbon storage by switchgrass
grown for bioenergy. Bioenergy Res. 2008, 1, 215–222.
47. Humbert, S.; de Schryver, A.; Margni, M.; Jolliet, O. IMPACT 2002+: User Guide; Draft for
Version Q2.21; Industrial Ecology & Life Cycle Systems Group, GECOS, Swiss Federal Institute of
Technology Lausanne (EPFL): Lausanne, Switzerland, 2005.
48. Grierson, S.; Strezov, V.; Bengtsson, J. Life cycle assessment of a microalgae biomass cultivation,
bio-oil extraction and pyrolysis processing regime. Algal Res. 2013, 2, 299–311.
49. Worley, M.; Yale, J. Biomass Gasification Technology Assessment: Consolidated Report;
NREL/SR-5100-57085; National Renewable Energy Laboratory (NREL): Golden, CO, USA, 2012.
© 2015 by the authors; licensee MDPI, Basel, Switzerland. This article is an open access article
distributed under the terms and conditions of the Creative Commons Attribution license
(http://creativecommons.org/licenses/by/4.0/).
Copyright © 2022 FDOKUMEN