Biochar Type, Ratio, and Nutrient Levels in Growing Media ...
Upload
khangminh22Category
view
7download
0
Effect of charred digestate (biochar) and
digestate on soil organic carbon and
nutrients in temperate bioenergy
crop production systems
Dissertation zur Erlangung des Doktorgrades
an der Fakultät für Mathematik, Informatik und
Naturwissenschaften,
Fachbereich Geowissenschaften
der Universität Hamburg
vorgelegt von
Renuka Priyadarshani Suddapuli Hewage
aus
Weligama in Sri Lanka
Hamburg 2016

Tag der Disputation: 12.01.2016
Folgende Gutachter empfehlen die Annahme der Dissertation:
Prof. Dr. Eva-Maria Pfeiffer
Prof. Dr. Lars Kutzbach

Table of Contents
iii
Table of Contents
List of Figures ........................................................................................................................ vi
List of Tables .......................................................................................................................... ix
List of Abbreviations and Symbols .................................................................................... x
Summary ................................................................................................................................. xi
Zusammenfassung .............................................................................................................. xiii
Acknowledgements ............................................................................................................. xvi
1. Introduction ................................................................................................................... 1
1.1 Objectives ......................................................................................................... 3
2. State-of-the-art .............................................................................................................. 5
2.1 Renewable energy in Germany ........................................................................ 5
2.2 Development of biogas in the German renewable energy sector .................... 7
2.3 Agricultural anaerobic biogas digesters ........................................................... 9
2.4 Digestate from agricultural anaerobic biogas digesters ................................. 10
2.5 Application of digestate to agro-ecosystems: limitations and regulations .... 11
2.6 Effect of digestate on agro-ecosystems .......................................................... 12
2.7 Charred digestate (biochar) and its application ............................................. 13
2.7.1 What is biochar? ......................................................................................... 13
2.7.2 Characteristics of biochar ........................................................................... 16
2.7.3 Significance of applying biochar to soil in agro-ecosystems ..................... 17
3. Investigation Area ....................................................................................................... 23
3.1 Schleswig-Holstein ........................................................................................ 23
3.2 Regional geomorphology of SH .................................................................... 24
3.3 Soils around Drage and Stapelholm ............................................................... 25
3.4 Climate ........................................................................................................... 27
3.5 Land use and vegetation ................................................................................. 28
3.6 Experimental sites .......................................................................................... 30

Table of Contents
iv
4. Materials and Methods .............................................................................................. 33
4.1 Production of biochar ..................................................................................... 33
4.2 Field experiment: Soil treatments and crop management .............................. 34
4.3 Total biomass production ............................................................................... 38
4.4 In situ chamber measurements of greenhouse gases ...................................... 38
4.4.1 Soil respiration measurements.................................................................... 39
4.4.2 N2O and CH4 measurements ...................................................................... 40
4.5 Soil microbial biomass carbon (MBC) and nitrogen (MBN) ........................ 41
4.6 Potential carbon mineralization of digestate and biochar .............................. 42
4.6.1 Aerobic incubation experiment .................................................................. 42
4.6.2 δ13
C signatures of CO2 ............................................................................... 43
4.6.3 δ13
C signatures of soil organic matter, digestate and biochar .................... 43
4.7 Analysis of soil, digestate and biochar........................................................... 43
4.7.1 Soil profiles and soil sampling ................................................................... 43
4.7.2 Soil texture ................................................................................................. 44
4.7.3 Soil water retention .................................................................................... 45
4.7.4 Soil chemical properties ............................................................................. 45
4.7.5 Digestate and biochar ................................................................................. 47
4.8 Statistical analysis .......................................................................................... 48
5. Results ........................................................................................................................... 49
5.1 Environmental parameters and crop rotation ................................................. 49
5.2 Characteristics of biochar and biogas digestate ............................................. 51
5.3 Total biomass production ............................................................................... 53
5.4 Soil characteristics and classification ............................................................ 55
5.4.1 Effect of biochar on homogeneity of soil ................................................... 61
5.4.2 Mass losses of TOC during the biochar application ................................... 65
5.5 Effect of biochar and digestate on soil physico-chemical properties ............ 67
5.5.1 Soil moisture and matrix potential ............................................................. 67
5.5.2 Soil reaction (pH) and electrical conductivity (EC) ................................... 69
5.5.3 Soil organic carbon and nitrogen ................................................................ 70
5.5.4 CEC, BS and exchangeable cation concentration ...................................... 74

Table of Contents
v
5.6 Effect of biochar on soil microbial carbon and nitrogen ............................... 79
5.6.1 Soil microbial carbon ................................................................................. 79
5.6.2 Soil microbial nitrogen ............................................................................... 81
5.7 Effect of biochar and digestate on soil carbon turnover ................................ 83
5.7.1 Influence of biochar and digestate on soil carbon mineralization .............. 83
5.7.2 Influence of biochar on in situ soil respiration and trace gas production .. 88
5.8 Carbon balance in the topsoil ......................................................................... 97
6. Discussion ..................................................................................................................... 99
6.1 Characteristics of digestate and biochar......................................................... 99
6.2 Effect of biochar on above ground biomass production .............................. 100
6.3 Effects of biochar on soil physico-chemical properties ............................... 102
6.3.1 Soils in the two fields ............................................................................... 102
6.3.2 Initial changes of soil chemical properties ............................................... 103
6.3.3 Seasonal changes of soil chemical properties .......................................... 104
6.4 Effects of biochar on soil microbial biomass ............................................... 104
6.4.1 Review of the CHCl3 extraction procedure .............................................. 104
6.4.2 Effects of biochar on soil microbial carbon and nitrogen ........................ 105
6.5 Response of soil ecosystems to the application of biochar: soil carbon
turnover ................................................................................................................... 106
6.5.1 Influence of biochar and digestate on soil carbon mineralization: an
incubation experiment ............................................................................. 107
6.5.2 Influence of biochar and digestate on greenhouse gas emissions ............ 108
6.5.3 Influence of biochar and digestate on soil organic carbon balance .......... 110
6.6 Methodological limitations in the field experiment ..................................... 110
6.6.1 Treatment mixtures and biochar application rates ................................... 110
6.6.2 Carbon losses during the application ........................................................ 111
6.6.3 Chamber measurements ............................................................................ 111
7. Conclusion and outlook ........................................................................................... 113
References ............................................................................................................................ 117
Annex .................................................................................................................................... 137

List of Figures
vi
List of Figures
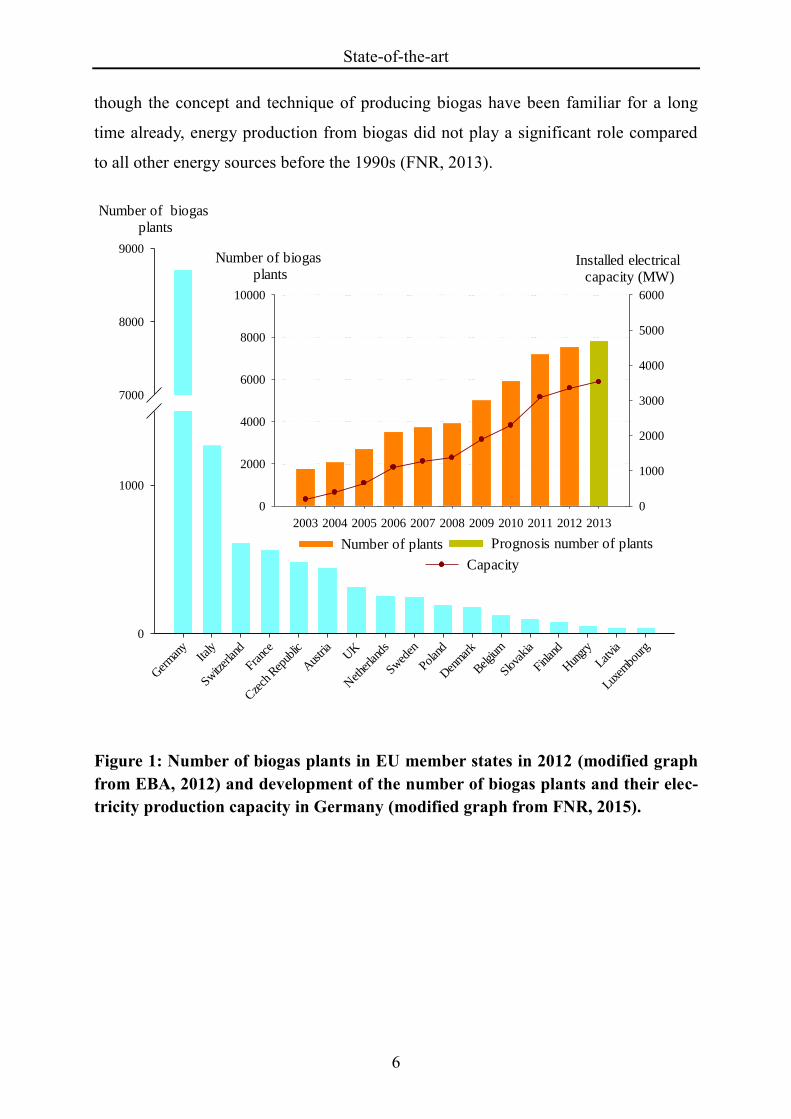
Figure 1: Number of biogas plants in EU member states in 2012 (modified graph
from EBA, 2012) and development of the number of biogas plants
and their electricity production capacity in Germany ................................. 6
Figure 2: Flow chart of inputs and outputs of agricultural biogas plants in
Germany’s bioenergy production system .................................................... 9
Figure 3: O/C spectrum of the products of thermo-chemical conversion of
biomass ..................................................................................................... 13
Figure 4: The location of Schleswig-Holstein with its borders and the natural
landscapes based on geomorphology ........................................................ 24
Figure 5: Map of mean annual precipitation (mm) in SH ........................................... 28
Figure 6: Aerial and ground views of the study sites in Drage. The arrows show
where the experimental plots were in the two sites................................... 31
Figure 7: Biochar production process at PYREG® ...................................................... 34
Figure 8: Crop rotation plan ......................................................................................... 35
Figure 9: Overview of the plots and the treatment distribution of the field
experiment ................................................................................................. 37
Figure 10: Setup for trace gas measurement and gas sample collection in the field ... 40
Figure 11: Smoothed monthly mean air temperature, and monthly precipitation,
together with changing of crops over the experimental period from
September 2012 to September 2014. Also shown are the monthly
mean values of maximum and minimum temperatures ............................ 50
Figure 12: Smoothed monthly precipitation (A) and smoothed mean daily air
temperatures (B) in the years 2012, 2013 and 2014, plotted in
comparison to the long term values .......................................................... 51
Figure 13: Physical appearance of biochar (left) prepared from dry biogas
digestate. .................................................................................................... 52
Figure 14: Total biomass production in winter and summer seasons for both
experimental sites ...................................................................................... 54
Figure 15: Vertical distribution of clay, silt, and sand fractions in Gleyic Podzol
and Gleyic Anthrosol ................................................................................. 56
Figure 16: Variation of TOC and TN of Gleyic Podzol in site 1 before and after
the application of biochar .......................................................................... 62

List of Figures
vii
Figure 17: Variation of TOC and TN in Gleyic Anthrosol in site 2 before and after
application of soil amendments ................................................................. 63
Figure 18: Available and lost TOC during the application of biochar, calculated
as % out of excepted TOC content after adding biochar........................... 66
Figure 19: The deposited sand particles around the soil collar show the effects of
wind and precipitation on the land when there were no or fewer crop
canopies and wind-breaks in site 2. ........................................................... 67
Figure 20: Soil moisture characteristic curves for each soil horizon of both site 1
and site 2 before applying soil amendments in October 2012. ................. 68
Figure 21: Soil moisture characteristic curves for Ap, E and GBv soil horizons of
Gleyic Anthrosol, two years after biochar application of D, BL and
BH treatments. ........................................................................................... 68
Figure 22: Seasonal variation of ammonium-nitrogen and nitrate-nitrogen
concentration in the topsoil (0 - 0.2 m) in site 1 and site 2 after
establishment of the experiment in October 2012..................................... 73
Figure 23: Seasonal variation of CEC and BS in the topsoil (0 - 0.2 m) of site 1
and site 2 after establishment of the experiment in October 2012 ............ 75
Figure 24: Seasonal variation of plant available K and P in the topsoil (0 - 0.2 m)
of site 1 and site 2 after establishment of the experiment in October
2012 ........................................................................................................... 78
Figure 25: Influence of biochar application on MBC in site 1 .................................... 80
Figure 26: Influence of biochar and digestate application on MBC in site 2 .............. 80
Figure 27: Influence of biochar application on MBN in site 1 .................................... 82
Figure 28: Influence of biochar and digestate application on MBN in site 2 .............. 82
Figure 29: Cumulative CO2 production during an aerobic soil incubation
experiment of Gleyic Podzol ..................................................................... 84
Figure 30: Carbon turnover rates during an aerobic soil incubation experiment of
Gleyic Podzol ............................................................................................ 85
Figure 31: Variation of δ13
C (‰ VPDB) values of produced CO2 from the
different treatments for the three different Gleyic Podzol topsoil
samples (0 - 0.2 m) on days 16, 52, 93 and 133 ........................................ 86
Figure 32: Cumulative amount of CO2 emitted from specific carbon pools on
days 16, 52, 93 and 133 of the aerobic incubation experiment of
Gleyic Podzol with treatments .................................................................. 87

List of Figures
viii
Figure 33: Daily average of in situ soil respiration (CO2 mg m-2
day-1
) of
different soil treatments from November 2012 to August 2014 ............... 89
Figure 34: Seasonal variation of in situ soil respiration in Gleyic Podzol for
control (C) and biochar (B) treatments after starting the experiment in
September 2012. ........................................................................................ 90
Figure 35: Seasonal variation of in situ soil respiration in Gleyic Anthrosol after
starting the experiment in September 2012 ............................................... 91
Figure 36: Seasonal variation of in situ CO2 emission rates from Gleyic Podzol ...... 92
Figure 37: Seasonal variation of in situ N2O emissions in Gleyic Podzol and
Gleyic Anthrosol ........................................................................................ 95
Figure 38: Seasonal variation of in situ CH4 emission in Gleyic Podzol and
Gleyic Anthroso ......................................................................................... 96

List of Tables
ix
List of Tables
Table 1: Available definitions for biochar .......................................................................... 15
Table 2: Treatment mixture and resp. soil type and added amount of carbon ............... 34
Table 3: Crop rotation ........................................................................................................... 36
Table 4: Selected chemical characteristics of digestate and fresh biochar. ................... 52
Table 5: Profile characteristics and soil classification of site 1 - Gleyic Podzol ........... 58
Table 6: Profile characteristics and soil classification of site 2 - Gleyic Anthrosol ...... 59
Table 7: Selected chemical properties of Gleyic Podzol and Gleyic Anthrosol
before applying biochar in October 2012. .......................................................... 60
Table 8: Seasonal variation of soil acidity in the topsoil (0 - 0.2 m) in site 1 and
site 2 after establishment of the experiment at both sites in October 2012 ... 69
Table 9: Seasonal variation of TOC, TN, and C/N in the topsoil (0 - 0.2 m) in site
1 and site 2 after establishment of the experiment in October 2012. .............. 71
Table 10: Seasonal variation of the exchangeable cation concentrations in the
topsoil (0 - 0.2 m) for selected cations in site 1 and 2 after establishment
of the experiment in October 2012. .................................................................... 76
Table 11: Means of TOC in Gleyic Podzol and Gleyic Anthrosol at the end of
main cropping harvests after biochar addition in October 2012 together
with the values before applying biochar (June 2012). ...................................... 98

Abbreviations and Symbols
x
List of Abbreviations and Symbols
a annum
B biochar only
BH digestate:biochar 1:5 treatment
BL digestate:biochar 1:1 treatment
BS base saturation
C control treatment
C/N carbon nitrogen ratio
CEC cation exchange capacity
d day
D digestate only treatment
DOC dissolved organic carbon
DON dissolved organic nitrogen
EC electrical conductivity
EEG German Renewable Energy Act (Erneuerbare Energien Gesetz)
EU European Union
GHG greenhouse gas
GWP global warming potential
MBC microbial biomass carbon
MBN microbial biomass nitrogen
n number of samples
n.a. not analyzed
p probability value
SH Schleswig-Holstein
SMB soil microbial biomass
TC total carbon
TN total nitrogen
TOC total organic carbon

Summary
xi
Summary
In recent years, the interest in bioenergy crop production as a renewable energy source
increased substantially because it may contribute to the reduction of greenhouse gas
emissions and the satisfaction of the ever increasing worldwide energy demands.
Combustion is not the only way of gaining energy from biomass, but also anaerobic
digestion or pyrolysis can be used. During the thermochemical decomposition (pyroly-
sis) of biomass in an oxygen free and high temperature environment, pyrolyzed bio-
mass or biochar is produced together with the two co-products energy and syn-gasses.
Biochar, being a carbonaceous material, is known to have the potential to improve soil
conditions, reduce greenhouse gas emissions and, most importantly, to improve the
long-term carbon storage in soil. However, there still are many unanswered questions
about biochar itself, its potential performance as a soil amendment, its influence on
terrestrial carbon sequestration, and its behavior in the ecosystems. For this reason, this
study was done with the overall objective to better understand the impact of biochar as
a soil amendment on terrestrial carbon sequestration, soil quality, crop productivity,
and greenhouse gas fluxes.
A field experiment was established at two sites in Drage, Schleswig-Holstein, Germa-
ny, with bioenergy crops (crop rotation of Zea mays L., Secale cereale L. and Triticum
aestivum L.). The sites represented two different sandy soils: Gleyic Podzol and Gleyic
Anthrosol, which were amended with a total of five different treatments in a random-
ized complete block design with three replicates. Gleyic Podzol was amended with
biochar (5 t biochar ha-1
), respectively not amended in the control plots. Gleyic Anthro-
sol had already been amended with digestate at 0.15 kg C m-2
, and was used unaltered
for the control plots. To other plots, biochar was added to establish 1:1 and 1:5 mix-
tures of the existing digestate and the added biochar (5 and 24 t biochar ha-1
resp.). The
biochar was produced from dry solid biogas digestate at 650 °C, and was mixed into
the topsoils (0 - 0.2 m). Data were collected in all seasons over a two year period. In
addition, an aerobic incubation experiment was conducted, investigating the interac-
tions between amended organic matter (digestates and biochar) and inherent soil or-
ganic matter, using samples from Gleyic Podzol with control, digestate only, biochar

Summary
xii
only, and 1:1 and 1:5 mixtures of digestate:biochar treatments. During the 133 day in-
cubation period, the CO2 production was determined, and on selected days samples of
the produced CO2 were analyzed for δ13
C.
The results of the field experiment showed that biochar had positive effects on the soil
physico-chemical properties in both soils. In the first season after the application, the
biochar amended plots had increased soil moisture content, soil reaction, TOC, TN,
C/N ratio, inorganic nitrogen, plant available-P and -K, CEC and exchangeable cations
(Ca, Mg, Na, K). The values of TOC, CEC, plant available-P and -K, and inorganic
nitrogen were significantly higher in biochar amended soils compared to the control
soils. Over the next seasons, the positive effects were diminishing, but the effects on
CEC and plant available-P and -K remained significant even after two years. In con-
trast to soil nutrients, a negative effect was detected on soil microbial carbon and ni-
trogen just after amending the soil with biochar, but in the next seasons the biochar
treated plots showed significantly higher microbial carbon, and nonsignificantly higher
microbial nitrogen contents. The plots amended with biochar only and with both mix-
tures of digestate and biochar had a significantly higher crop biomass production in
comparison to the control plots. The field experiment did not show a clear relationship
between greenhouse gas emissions and organic matter amendments. This may be due
to the low application rates of biochar. However, during the whole experimental period
the application of biochar to these sandy soils only nonsignificantly increased CO2
emissions. In the aerobic incubation experiment, all amendments accelerated carbon
mineralization during the first phase of the incubation. However, over the whole period
of 133 days, the biochar only treatment showed less loss of carbon, thus proving the
potential of biochar to increase carbon sequestration.
Overall, the results of this study lead to the conclusion that charred digestate (biochar)
is more stable than digestate, and can be used to enhance the sustainability of bioener-
gy crop production agro-ecosystems with sandy soils, increase their agricultural
productivity, and mitigate the impact on climate change.

Zusammenfassung
xiii
Zusammenfassung
In den letzten Jahren ist das Interesse an der Biomasseproduktion als Quelle erneuer-
barer Energie erheblich gestiegen, da diese zur Reduktion der Freisetzung von klima-
wirksamen Spurengasen und zur Sicherung des immer weiter ansteigenden globalen
Energiebedarfs beitragen kann. Verbrennung ist nicht die einzige Möglichkeit, aus
Biomasse Energie zu gewinnen, sondern dies kann auch durch anaerobe Gärung oder
durch Pyrolyse geschehen. Bei der thermo-chemischen Zersetzung (Pyrolyse) von
Biomasse in einer sauerstofffreien Hochtemperatur-Umgebung wird pyrolisierte Bio-
masse (Biokohle) erzeugt, sowie als Nebenprodukte Energie und Synthesegase. Es ist
bekannt, dass die kohlenstoffreiche Biokohle in der Lage ist, die Bodenqualität zu ver-
bessern, die Emission von Treibhausgasen zu verringern und vor allem auch die lang-
fristige Speicherung von Kohlenstoff im Boden zu verbessern. Dabei gibt es noch viele
offene Fragen im Hinblick auf die Biokohle an sich, ihre Wirksamkeit als Bodenver-
besserer, ihren Einfluss auf die Kohlenstoffbindung im Boden und ihr Verhalten in
Ökosystemen. Diese Arbeit wurde mit der Zielsetzung durchgeführt, den Einfluss von
Biokohle als Bodenverbesserer auf die Kohlenstoffbindung im Boden, die allgemeine
Bodenqualität, den Ernteertrag und die Freisetzung von klimawirksamen Spurengasen
besser zu verstehen.
Dazu wurde ein Feldversuch an zwei Standorten mit Bioenergiepflanzungen in Drage,
Schleswig-Holstein, Deutschland durchgeführt (Fruchtfolge mit Zea mays L., Secale
cereale L. und Triticum aestivum L.). Die sandigen Böden dieser Standorte (Gley Po-
dsol/Gleyic Podzol und Gley-Plaggenesch/Gleyic Anthrosol), erhielten insgesamt fünf
verschiedene Be-handlungen in einem vollständig randomisierten Block-Design mit 3
Replikaten. Der Gley Podsol wurde mit 5 t Biokohle ha-1 behandelt, bzw. blieb ohne
Zusatz in den Kontrollfeldern. Der Gley-Plaggenesch enthielt einen Zusatz von Gär-
rückstanden mit 0.15 kg C m-2 bzw. blieb ohne Behandlung in den Kontrollen. Andere
Plots erhielten Zusätze von Biokohle, so dass Mischungen der bereits vorhandenen
Gärreste mit der hinzugefügten Biokohle im Verhältnis von 1:1 und 1:5 erreicht wur-
den (5 bzw. 24 t Biokohle ha-1). Die verwendete Biokohle wurde aus trockenen, festen
Gärrückständen bei 650 °C hergestellt und in den Oberboden (0 – 0.2 m) eingearbeitet.
Daten wurden über einen Zeitraum von zwei Jahren zu jeder Jahreszeit ermittelt. Zu-

Zusammenfassung
xiv
sätzlich wurde ein Inkubations-Experiment mit Proben des Gleyic Podsol und den fünf
Zusätzen Kontrolle, nur Gärreste, nur Biokohle, und 1:1 und 1:5 Mischungen von Gär-
resten und Biokohle durchgeführt, um die Beziehung zwischen zugesetztem Kohlen-
stoff und Bodenkohlenstoff zu ermitteln. Die CO2 Emissionen wurden während der
gesamten Inkubationszeit von 133 Tagen ermittelt, und die δ13
C-Signaturen des emit-
tierten CO2 bestimmt.
Die Ergebnisse des Feldversuchs zeigten, dass Biokohle positive Auswirkungen auf
die physikalisch-chemischen Eigenschaften beider Böden hatte. In den ersten Monaten
nach der Anwendung hatten die Plots mit zugefügter Biokohle höhere Werte für Bo-
denwassergehalt, pH-Wert, Gesamtkohlenstoff, Gesamtstickstoff, C/N-Verhältnis, an-
organischen Stickstoff, pflanzenverfügbares Phosphor (P) und Kalium (K), Kationen-
austauschkapazität und austauschbare Kationen (Ca, Mg, Na, K). Dabei waren die
Werte für Gesamtkohlenstoff, Kationenaustauschkapazität, pflanzenverfügbares P und
K sowie anorganischen Stickstoff in den Böden mit zugefügter Biokohle signifikant
höher als in den Kontrollen. In der Folgezeit nahmen diese Effekte ab, aber die Aus-
wirkungen auf Kationenaustauschkapazität und pflanzenverfügbares P und K waren
auch nach zwei Jahren noch signifikant. Im Gegensatz zu den Nährstoffgehalten wurde
unmittelbar nach dem Zusatz von Biokohle eine negative Auswirkung auf den mikro-
biellen Bodenkohlenstoff und -stickstoff festgestellt. Danach hatten die Plots jedoch
signifikant höhere Werte für mikrobiellen Bodenkohlenstoff, und nicht-signifikant hö-
here mikrobielle Stickstoffgehalte. Die mit Biokohle bzw. einer Mischung aus Biokoh-
le und Gärresten behandelten Böden zeigten einen signifikant höheren Ernteertrag als
die Kontrollen. Aus dem Feldversuch ergab sich keine klare Beziehung zwischen dem
Ausstoß von Treibhausgasen und dem Zusatz von organischer Substanz. Dies kann an
den niedrigen Applikationsraten der Biokohle liegen. Während der gesamten Dauer
des Experiments erhöhte der Zusatz von Biokohle auf diesen sandigen Böden die CO2
Emissionen. Diese Erhöhung war jedoch nicht signifikant. In dem aeroben Inkuba-
tionsexperiment beschleunigten alle Bodenzusätze die Kohlenstoffmineralisation wäh-
rend der ersten Phase der Inkubation. Über die gesamte Dauer von 133 Tagen zeigte
der ausschließliche Zusatz von Biokohle geringere Kohlenstoffverluste als die anderen

Zusammenfassung
xv
Behandlungen. Somit konnte die Fähigkeit von Biokohle, die Kohlenstoffbindung im
Boden zu erhöhen, bestätigt werden.
Insgesamt führen die Ergebnisse dieser Studie zu dem Schluss, dass Biokohle im Bo-
den stabiler ist als Gärreste und verwendet werden kann, um die Nachhaltigkeit von
Agrar-Ökosystemen zur Erzeugung von Bioenergiepflanzen auf sandigen Böden zu
verbessern, die Anbauleistung zu erhöhen, und die Auswirkungen auf den Klimawan-
del zu vermindern.

Acknowledgements
xvi
Acknowledgements
First and foremost, I would like to express my sincere gratitude to my doctoral committee:
Prof. Dr. Eva-Maria Pfeiffer, Dr. Christian Knoblauch and Prof. Dr. Udo Schickhoff, for
keeping their doors always open for me, supporting my work and encouraging me. I am
thankful to Prof. Dr. Eva-Maria Pfeiffer, who gave me the opportunity to work on this
project and supported it with her expertise, understanding, and patience. I would like to
thank my co-supervisor Dr. Christian Knoblauch, for his fruitful discussions, encourage-
ment and support, from the field work to this writing as well as for initiating the way to
the Institut für Bodenkunde (IFB) together with Dr. Stephan M. Häfele who was the su-
pervisor of my master studies (2005 - 2008) at the International Rice Research Institute
(IRRI) in the Philippines. I am deeply thankful to Christian Vogt for his willingness to
read all of my drafts and give my English writing a finishing touch, and to both him and
Dr. Marion Vanselow-Algan for translating the summary into German (Zusammenfas-
sung).
I thank the Deutscher Akademischer Austauschdienst (DAAD) for awarding me a DAAD
scholarship, and the Cluster of Excellence Integrated Climate System Analyses and Pre-
diction (CliSAP) and the School of Integrated Climate System Sciences (SICSS) for their
support during those years at the University of Hamburg.
Thank you to Kai Spangenberg (the grower), Peter Hasche (Biogasvertrieb Nord GmbH
& Co.KG) and PYREG® GmbH for allowing me to use their resources and for their great
cooperation.
Thanks to Birgit Grabellus, Birgit Schwinge, Susanne Kopelke, Wilfried Glaeseker, and
Volker Kleinschmidt for their technical support at the field in Drage, and at the IFB in
Hamburg. They put immense efforts into producing the numbers out of “black-earth”.
Thank you to Birgit Grabellus, not only for sharing her immense expertise in “black-
earth”, but also for providing memorable experiences to my life in Hamburg. Many stu-
dents and student assistants supported me to see the inside of “black-earth”, without
whom the time would not have been as joyful and fruitful as it was: Jan-Hendryk Sjuts,
Ole van-Allen, Hedda Straehler-Pohl, Annika Ruffert, Christopher Breuer and Paulina
Meller. Also, Nicola Schröder, Sebastian Langheld, Lydia Neubauer, Magdalena von
Leliwa, Paulina Reimers who also successfully completed their bachelor, master and di-
ploma studies dealing with “black-earth”.
Thank you very much to all the fellow PhD students and post-docs who were in the Bo-
denbuddler team during my time at the IFB, and especially to Inken-M. Preuss, Pete
Schreiber, Sebastian Zubrzycki, and Josefine Walz, who shared the room with me during
those years.
I thank all the dozens of “Bodenbuddler” at the IFB, who have helped and taught me im-
mensely. Without you all, I could not have completed my digging into “black-earth”.
Thanks to Marion Vanselow-Algan and her family for being with me whenever I needed to
cry or to laugh, and for continuously encouraging me to see the end. Thank you very much
to Sigrid Maschke who welcomed me to her house in 2011 and has been a source of affec-
tion ever since.
Last but not least, my enormous gratitude is extended to all my family members for their
continuous support to keep up my moral and accepting me as who I am. I am an extremely
lucky person for always having them at my side.

Introduction
1
1. Introduction
Today, the balance between nature and human is at risk with many problems and chal-
lenges which are driven by each other: increasing human population, increasing global
food and energy demand, industrial and green revolutions, fossil fuel burning, increas-
ing concentrations of greenhouse gases in the atmosphere, global climate change, de-
mand for renewable energy sources, etc. The renewable energy concept is one of the
key issues in the diverse plans which are necessary to cope with those challenges. One
of the recent developments in the renewable energy concepts is the use of biomass,
which already contributes significantly to the energy supply in the European Union
(EU) as a whole, and in Germany in particular. The use of biomass, be it for combus-
tion, or for producing biogas, needs to be developed further with respect to efficient
and sustainable land use considering food security, securing soil fertility, and mitigat-
ing climate change by reducing greenhouse gas (GHG) emissions and sequestering
atmospheric carbon in terrestrial systems (Lal, 2004, 2007, 2010).
To overcome soil nutrient and carbon losses caused by intensive agriculture and to im-
prove soil quality, the addition of organic matter has been a common agricultural prac-
tice from the middle ages to the present. Sewage sludge, or digestate can supply soil
nutrients and improve soil quality, but traditional organic materials like manures or
composts have relatively short half-lives in soil (in compost up to 10 - 14 weeks:
Butler and Hooper, 2010, and in sewage sludge 39 - 330 days: Ajwa and Tabatabai,
1994). Terra-preta soils, also called Amazonian dark earth or Terra preta de índio, are
anthropogenic soils rich in organic carbon in the Amazonian basin. Contrary to other
highly weathered tropical soils, Terra-preta soils remain fertile for several centuries
(Lehmann et al., 2003b; Sombroek et al., 2003). After it became clear that the amend-
ment of charcoal and other organic residues from settlements caused the increased or-
ganic matter content and the high fertility of these soils, charcoal gained immense sci-
entific interest again, eventually leading to the development of pyrogenic carbon or
biochar (Lal, 2005, 2010; Lehmann and Joseph, 2009), and the re-evaluation of tradi-
tional organic amendments.

Introduction
2
The current study investigates the effect of organic soil amendments on the sustainabil-
ity of bio-energy crop production agro-ecosystems depending on the type of amend-
ment. Therefore, two different organic amendments were added to arable soils used for
bioenergy crop production. One amendment was the waste products from biogas pro-
duction plants, the digestate, which, under the current land use praxis, is applied to the
field in liquid form. The second amendment was thermally treated (pyrolyzed) diges-
tate that was converted to charred digestate or biochar. Rather than just burning the
biomass, pyrolysis is a process which produces energy in the form of heat, bio-
syngases and biochar.
Biochar is chemically similar to charcoal, but has its own distinguished features
(Woolf et al., 2010). Biochar is not only important because it contains carbon with a
relatively high residence time in soil, which plays a role in soil terrestrial carbon se-
questration (Hammes et al., 2009; Johannes and Joseph, 2009), but also because it can
have positive effects on soil structure (Jha et al., 2010), water retention (Glaser et al.,
2002), soil pH (Major et al., 2010b), availability and concentration of nutrients in soil
(Chan et al., 2008; Glaser et al., 2002; Steiner et al., 2009), nutrient retention (Chan et
al., 2008; Glaser et al., 2002; Steiner et al., 2009), and the soil micro-fauna (Lehmann
et al., 2011), and increases the retention time of soil pollutants and agrochemicals
(Graber et al., 2011; Jones et al., 2011a; Mesa and Spokas, 2011; Spokas et al., 2009).
Even though biochar has a long list of potential benefits and only few potential risks,
all those highly depend on many parameters of both the biochar itself, and of the soil
to which biochar is to be applied. Because of this, the results of previous researches
were inconsistent, and leave room for many discussions and future research. There still
are many knowledge gaps about how biochar is best used as a soil amendment in a
specific agro-ecosystem. Thus, the current study is important for better understanding
the impact of biochar on soils used for bio-energy crop production in Northern Germa-
ny, and for encouraging the use of biochar to meet global climate and carbon seques-
tration goals.

Introduction
3
1.1 Objectives
The general objective of this study is to evaluate how digestate and charred-digestate
(biochar) can be used as organic soil amendments to increase bioenergy crop produc-
tivity, soil quality, and terrestrial carbon sequestration in bioenergy crop production
systems in Northern Germany.
With this main objective, the study focused on evaluating the behavior of both biochar
and digestate in soil ecosystems with the following research questions:
1. Does biochar or the combination of biochar and digestate have a synergistic
effect on above ground biomass production that is greater than the effect of
digestate only?
2. Can biochar or the combination of biochar and digestate sustain soil nutrients
over multiple growing seasons?
3. How does biochar or the combination of biochar and digestate affect soil mi-
crobial biomass?
4. Do biochar or the combination of biochar and digestate affect soil organic
carbon turnover, terrestrial carbon sequestration and greenhouse gas emis-
sion?
To answer and evaluate research questions 1 and 2, the following two hypotheses were
formulated:
H1. Biochar application will significantly increase above ground biomass pro-
duction of bioenergy crops.
H2. Biochar application will significantly increase the availability of soil micro-
and macro-nutrients.
The following two hypotheses were formulated to evaluate research questions number
3 and 4:
H3. Soil amended with a mixture of digestate and biochar will have a signifi-
cantly higher soil microbial activity than soil amended with digestate only.
H4. The mineralization of soil inherent organic carbon and the greenhouse gas
fluxes will significantly increase with increasing amount of biochar.
To answer the research questions, the above mentioned hypotheses were tested by
conducting a field experiment and an aerobic incubation experiment.

Introduction
4
The field trial was conducted at two bioenergy crop production sites and used five dif-
ferent treatments containing digestate, biochar (charred digestate), and their mixtures.
The chemical parameters of topsoil (0 - 0.2 m) and the emission fluxes were measured
monthly, and at the end of each growing season, the above ground biomass was deter-
mined. The data was used to evaluate the effects of digestate and biochar on soil quali-
ty including the soil micro- and macro-nutrients content and availability, crop produc-
tivity, soil microbial biomass carbon and nitrogen, soil respiration and other trace gas
emissions.
The aerobic incubation experiment was done with the same treatments that were used
in the field trail, and CO2 production data and the isotope ratio (δ13
C) of the produced
CO2 were measured. The data were used to evaluate the effects of digestate and bio-
char and their mixtures on the potential mineralization of both soil organic matter and
amended organic matter.

State-of-the-art
5
2. State-of-the-art
2.1 Renewable energy in Germany
In the era of renewable energy, bio energy is considered one of the key options to miti-
gate climate change and reduce anthropogenic trace gas emissions. Consequently, both
the European Union as a whole, and the German government in particular started de-
veloping strategies and political agendas to make use of renewable energies for replac-
ing fossil fuels and reducing greenhouse gas emissions in both short- and medium-
term planning (Faaij, 2006; Bosch, Johnson, Clément, Mertens & Roubanis, 2009;
FNR, 2013). In 2010, the main sources of renewable energy in Germany were wind
power, which produced 36.5 billion kilo-watt hours (kWh), followed by hydropower
(19.7 billion kWh), biomass (33.5 billion kWh), photovoltaics (12.2 billion kWh), and
geothermal energy (< 0.1 billion kWh) (Böhme, et al., 2010).
The United Nations World Commission on Environment and Development (UN-
WCED) concept which was published as the Brundtland Report in 1987 (WCED,
1987) demands that the present generation satisfy its needs without endangering the
ability of future generations to meet theirs. Following this concept, the sustainable de-
velopment of the renewable energy sector, and the environmental, social and economic
sustainability of the industry became one of the main research areas of the German
Federal Ministry of Food, Agriculture and Consumer Protection (Bundesministerium
für Ernährung und Landwirtschaft, BMELV) with the goal to test new approaches in
research projects. The results shall be used to develop strategies to ensure the biodiver-
sity of energy crops and ecosystems, to breed new plant varieties, to establish new cul-
tural practices for bioenergy crops reducing the use of pesticide and fertilizer, to pro-
vide a year round vegetative cover to reduce soil erosion, to increase the efficiency of
energy conversion processes, to improve the cascading use of renewable resources
(first being used as a material and then being used as an energy source), and to re-use
residual materials as fertilizer (FNR, 2013). In the EU, anaerobic digestion plants or
biogas production plants commonly use three different input substrates: landfill waste,
sewage sludge, and agricultural residues. But Germany decided to encourage the plant-
ing of bioenergy crops to be used as substrate in digestion plants (FNR, 2014). Even
State-of-the-art
6
though the concept and technique of producing biogas have been familiar for a long
time already, energy production from biogas did not play a significant role compared
to all other energy sources before the 1990s (FNR, 2013).
Ger
man
yIta
ly
Switz
erlan
d
Franc
e
Cze
ch R
epub
lic
Aus
tria
UK
Nethe
rland
s
Swed
en
Polan
d
Den
mar
k
Belgium
Slova
kia
Finlan
d
Hun
gry
Latvia
Luxem
bour
g
Number of biogas plants
0
1000
7000
8000
9000
2003 2004 2005 2006 2007 2008 2009 2010 2011 2012 2013
Number of biogas plants
0
2000
4000
6000
8000
10000
Installed electrical capacity (MW)
0
1000
2000
3000
4000
5000
6000
Number of plants Prognosis number of plants
Capacity
Figure 1: Number of biogas plants in EU member states in 2012 (modified graph
from EBA, 2012) and development of the number of biogas plants and their elec-
tricity production capacity in Germany (modified graph from FNR, 2015).

State-of-the-art
7
2.2 Development of biogas in the German renewable energy sector
According to the German Agency for Renewable Resources (Fachagentur für na-
chwachsende Rohstoffe; FNR, 2014), the agricultural sector, including all bioenergy
crops, agricultural by-products, and animal waste, plays the dominant role in Germa-
ny’s biogas production. According to FNR (2013), over 7,515 biogas plants had the
capacity to generate approximately 3,352 megawatts (MW) of electricity (FNR, 2013).
The steady increase in agricultural anaerobic digesters in Germany can be directly at-
tributed to a supportive national legal framework coupled with the tariffs paid for re-
newable energy. The German Renewable Energy Act (Erneuerbare Energien Gesetz,
EEG) which was introduced in 2000 and its 2004, 2009, and 2012 amendments were
able to generate a massive boost in the development of biogas in Germany (FNR,
2014).
In 2012, biogas generated from biomass or agricultural waste and by-products contrib-
uted 15 % to the electricity generation, and 8 % to the supply of heat produced by us-
ing renewable energies (FNR, 2013). When adding biogas from bio-waste fermenta-
tion, landfills, and sewages, the total contribution of biogas was 20 % for electricity
and 15 % for heat (FNR, 2013). Biomass, including wood, bioenergy crops, straw and
animal excrement, will play a significant role in the future for a sustainable and envi-
ronmentally friendly energy supply nationwide.
Biogas produced from biomass is suitable for the simultaneous production of electrici-
ty and heat, and can be used as a substitute for fuel and natural gas (see Figure 2). The
main limitation of biogas to use as a stable energy source is the production fluctuation
which depends on the time of the year, time of the day, and weather. In comparison to
other renewable energy sources, biogas is flexible to use and easy to store (FNR,
2013). According to FNR (2013) and the Federal Ministry for the Environment, Nature
Conservation, Building and Nuclear Safety (Bundesministerium für Umwelt, Na-
turschutz, Bau und Reaktorsicherheit, BMUB), in Germany approximately 54 % of
biogas is produced by using bioenergy crops, and 50 % of the biogas produced in this
way is used for electricity production.

State-of-the-art
8
Biogas significantly reduces the burden on the environment. The greatest potential for
CO2 savings lies in the reduced energy expenditure for bioenergy crop production and
the installation of anaerobic digesters, compared to the energy gain from anaerobic
digestion of the bioenergy crop, slurry, manure and other biomass as input substrates.
A list of the environmental advantages of biogas should also include the utilization and
reduction of waste and the reduction of methane emissions from slurry and manure,
and the usage of digestate as a fertilizer after being processed properly (FNR, 2013).
The decentralized nature of energy production from biogas is not only improving the
income of rural farmers, but also entails follow-on investments that lead to the
strengthening of rural areas in economic terms. In 2012, the renewable energy sector in
Germany employed almost 380,000 people, and the biogas sector represented 13 % or
50,000 employees according to FNR (2013).
Biogas offers a diversity of options for use, including the decentralized production of
electricity and heat using CHP (Combined Heat and Power) production unit places in
the close proximity of the biogas production plant, the feeding into the national pow-
er grid using the benefits granted from the EEG, the feeding of upgraded biogas into
the natural gas grid, and its use as a substitute for natural gas for energy production, as
fuel, or in the chemical industry (Figure 2). However, the main objective is utilizing it
as an energy source in an efficient way.

State-of-the-art
9
Figure 2: Flow chart of inputs and outputs of agricultural biogas plants in Ger-
many’s bioenergy production system.
2.3 Agricultural anaerobic biogas digesters
Anaerobic digestion of organic matter takes place naturally in the absence of oxygen in
different habitats: at the bottom of lakes, in swamps, in the stomach of ruminants, in
landfills, volcanic hot springs, submerged rice fields, etc. Normally there are four steps
in anaerobic digestion: hydrolysis, acidification, acetic acid formation, and methane
formation, which all take place simultaneously. During complete anaerobic digestion,
different species of microorganisms are involved depending on the processing stage.
Those microorganisms produce different kind of gases. Generally, this mixture of gas
is known as biogas and includes methane (50 - 75 %), carbon dioxide (25 - 45 %), wa-
ter vapor (2 - 7 %), oxygen (< 2 %), nitrogen (< 2 %), ammonia (< 1 %), hydrogen
sulphide (< 1 %) and other trace gases (< 2 %) (FNR, 2013). Anaerobic digesters in
biogas production plants facilitate the anaerobic microbial decomposition of organic
matter in a moist environment and temporarily store the biogas. The total biogas yield

State-of-the-art
10
and the composition of the gas mixture highly depend on several parameters, e.g. the
composition of the input substrates (supply of nutrients), and the biological key figures
of the fermentation process including sensitivity of the microorganisms to the different
environmental conditions of the medium including temperature and pH (Al-Seadi and
Lukehurst, 2012).
A large number of organic substrates can be used to obtain biogas, but in an agricultur-
al installation the most commonly used substrates are animal excrements (e. g. slurry
from cattle and pigs), by-products from the food and timber processing industries (e.g.
vegetable waste from wholesale markets, food waste from restaurants, lawn cuttings,
material from landscape conservation, or organic waste from municipal disposals), and
bioenergy crops grown especially for this purpose. In 2012, bioenergy crop was the
most popular substrate (54 %) in Germany, followed by livestock excrement (41 %),
bio-waste (4 %) and industrial and harvest residues (1 %) according to the monitoring
report of EEG (FNR, 2013). Among the bioenergy crops, maize is very popular be-
cause of its high dry matter and energy yields, and because it provides the best techno-
logical suitability and cost structure, and only requires a small amount of fertilizer and
plant-protection products. Examples for other substrates are grain, grasses, and sugar
beet (FNR, 2013). However, there also are some negative consequences of the usage of
maize as a bioenergy crop, for example on soil fertility, biodiversity, and available land
for food supply. In Germany, there are numerous ongoing research projects focusing
on bioenergy crops for advancing the further development of existing bioenergy crops,
investigating the potentials of other bioenergy crop species, introducing new bioenergy
crops, and cultivating mixes of bioenergy crops and wild flowers (FNR, 2013).
2.4 Digestate from agricultural anaerobic biogas digesters
A mixture of partially digested or indigestible materials of the biodegradable substanc-
es, mineralized or live microbial cells, and mineralized inorganic molecules left after
anaerobic digestion is called digestate, which is a nutrient-rich liquid-solid suspension
(5 % to 10 % dry mass) (Domínguez, 2012; FNR, 2013; Madan and Mandan, 2015;
Makádi et al., 2012; Möller and Müller, 2012). Lignin, which cannot be biodegraded

State-of-the-art
11
by the microorganisms involved in the anaerobic digestion process, comprises a signif-
icant portion of this solid (Madan and Mandan, 2015). Digestate contains more than 90
% of the nutrients entered to the digester (OECD, 2010), but the final quality of the
digestate does not only depend on the nutrient value but also on other qualities of the
initial substrate including initial C/N ratio, dry matter content, as well as on the micro-
environment of the anaerobic digester, and the duration and intensity of the digestion
process (Domínguez, 2012; Smith et al., 2007). Due to the production of ammonium
substances, the average pH value of the digestate is higher than that of its initial sub-
strate (Brenner, 2008; Domínguez, 2012). Some of the phosphorus is converted into a
readily available form, but potassium and magnesium contents do not change signifi-
cantly during anaerobic digestion (FNR, 2013).
2.5 Application of digestate to agro-ecosystems: limitations and regulations
With the increasing number of large scale agricultural biogas plants, the way of han-
dling and the quality of digestate can have a significant impact on both the human
health, and the quality and sustainability of ecosystems especially in the agricultural
areas. The digestate produced by most of the agriculture based biogas digesters is di-
rectly used as a soil amendment acting as an organic fertilizer with or without pre-
application treatments, and bears a low risk of containing hazardous materials like
trace metals or harmful pathogens, contrary to the digestate coming out from industrial
and other kinds of anaerobic digesters (Evans, 2013; Lukehurst et al., 2010; Möller et
al., 2009). The quality of the digestate coming out from the digester solely depends on
the micro environment in the digester tank, the original nutrient value of the substrate,
and the pre-application handling (Möller et al., 2009). Taking all these facts into ac-
count, regulating and monitoring of digestate application to the soil are important. In
Germany, there are several regulations about monitoring the quality and disposal pro-
cess of digestate (BMJV, 2012; Dittrich, 2006; FNR, 2014; Lukehurst et al., 2010;
Schneider and Mastel, 2008b).
The use of digestate as an organic soil conditioner is mainly governed by § 3 No. 1 and
2 of the German Fertilizer Law 1977 (Düngemittelgesetz - 1977) which cover the im-

State-of-the-art
12
pacts on soil fertility, health of humans and domestic animals, food crops, and the sus-
tainability in the ecosystems (Dittrich, 2006). Application is forbidden when the soil is
frozen with more than 5 cm snow layer, or when it is flooded and saturated. The max-
imum application rate of organic fertilizer allowed in the EU is 170 kg N ha-1
yr-1
, but
in Germany there is a maximum permissible excess of 60 kg N ha-1
yr-1
with 20 kg
P2O5 ha-1
yr-1
as long as the soil has less than 20 mg P2O5 per 100 g of soil
(Domínguez, 2012; German Advisory Council on the Environment, 2013; Schneider
and Mastel, 2008b).
2.6 Effect of digestate on agro-ecosystems
In order to understand the effects of digestate on agricultural production, several stud-
ies were conducted in different locations in Germany. Most of the studies focused on
the effects of wet digestate from agricultural biogas plant as a liquid fertilizer on crops
(wheat, maize, rapeseed and rye), which were shown to be quite comparable to the
effects of mineral fertilizer (Schneider and Mastel, 2008a; Schneider-Götz, 2007;
Wenland et al., 2006). The significantly increased biomass productivity was docu-
mented by Stinner et al. (2005; for spring and winter wheat with wet digestate), and
Schneider-Götz (2007; winter wheat and maize with wet digestate). However,
Pacholski et al. (2011) and Kautz and Rauber (2007) showed in their studies that the
dry-matter yield of maize did not significantly increase by only using digestate from
agriculture based biogas plants as fertilizer. Besides its effects on biomass yield, diges-
tate from agricultural biogas production also has an effect on the soil quality which is a
fundamental component of agro-ecosystems.
Digestate, which is rich in labile organic matter, can create a favorable environment
for both macro and micro soil organisms. Several researches showed that the effect of
digestate from agricultural biogas production on the population of earthworms, which
is a well-known bio-indicator for the assessment of soil quality, is similar to the effect
of applying liquid manure (Elste et al., 2010; Hans-Jörg Brauckmann et al., 2009;
Sensel et al., 2009).

State-of-the-art
13
2.7 Charred digestate (biochar) and its application
2.7.1 What is biochar?
The black to dark brown soil in the Amazon River Basin was discovered in 1870. After
Wim Sombroek gave an explanation for that special soil in 1966, biochar gained its
first interest from the scientific community (Lehmann and Joseph, 2009; Lehmann,
2007; Lehmann et al., 2006; Schmidt, 2013; Sombroek et al., 2003; Woods and
Winklerprins, 2009; World Bank Carbon Finance Unit, 2011). The interest in biochar
was uplifted again when soil carbon sequestration was recognized as a potential con-
tribution to mitigating global climate problems. Biochar is a solid carbon rich com-
busted organic material produced by complete thermal decomposition of biomass by
heating it up to a high temperature in the absence of or with only a limited supply of
oxygen, in nature or with specialized pyrolysis technologies (Hammes et al., 2009).
Figure 3: O/C spectrum of the products of thermo-chemical conversion of bio-
mass (modified: Spokas, 2010).
Spokas (2010) summarized how biochar differed from other traditional carbon rich
combusted products like graphite, soot, charcoal, char and pure biomass after studying
their oxygen to carbon ratio (O/C ratio or black carbon continuum in Figure 3). He
further described the relationship between the O/C ratio and the stability of those
products in soils. Graphite, the product with the lowest ratio has the highest stability,
and the lowest stability is shown by pure biomass.

State-of-the-art
14
Several authors tried to give a definition for biochar including chemical and physical
characteristics, production conditions and usage (Table 1). The earlier definitions in-
clude only chemical and physical characteristics, but the later ones also give details
about the usability of biochar and even include specific production conditions for spe-
cific uses. Pyrogenic carbonaceous material (PCM), black carbon, and hydrochar are
more often discussed together with biochar in the literature, but Lehmann and Joseph
(2009) showed those materials are clearly different from each other. PCM is the com-
mon term for all materials which are produced by thermochemical conversion and con-
tain some organic carbon, like charcoal, biochar, char, black carbon, soot, or activated
carbon. Black carbon is a PCM which originating from wildfires or fossil fuel combus-
tion, and dispersed in the environment. Hydrochar is a solid product produced by hy-
drothermal carbonization (HTC) and differs from biochar both in the way it is pro-
duced and in its properties. Hydrochar has higher hydrogen to carbon (H/C) ratio than
biochar, and in contrast to biochar has little or no fused aromatic ring structures.

State-of-the-art
15
Table 1: Available definitions for biochar
Year Definition Author/Institute
2009 “biochar is the C-rich product obtained when biomass,
such as wood, manure or leaves, is heated in a closed
container with little or no available air”
Lehmann and
Joseph
2010 “charcoal (biomass that has been pyrolyzed in a zero or
low oxygen environment) for which, owing to its inher-
ent properties, scientific consensus exists that applica-
tion to soil at a specific site is expected to sustainably
sequester carbon and concurrently improve soil func-
tions (under current and future management), while
avoiding short- and long-term detrimental effects to the
wider environment as well as human and animal
health”
Verheijen et al. for
European Com-
mission
2010 “biochar is the porous carbonaceous solid produced by
thermo-chemical conversion of organic materials in an
oxygen-depleted atmosphere which has physicochemical
properties suitable for the safe and long-term storage of
C in the environment and, potentially, soil improvement”
Simon and Sohi
2012 “biochar is defined as char produced by pyrolysis for
use in agriculture (and other non-thermal applications)
in an environmentally sustainable manner”
EBC - European
Biochar Certificate
2012 “biochar is produced by biomass pyrolysis, a process
whereby organic substances are broken down at tem-
peratures ranging from 350 to 1000 °C in a low-oxygen
(<2 %) thermal process”
IBI - International
Biochar Initiative

State-of-the-art
16
2.7.2 Characteristics of biochar
Many authors documented characteristics of biochar in relation to feedstock, produc-
tion techniques and temperature, retention time, and post-production handling. Both
chemical and physical properties of biochar mainly depend on the feedstocks, with the
chemical properties having a higher dependency than the physical ones according to
available literature (Abdullah et al., 2010; Brewer et al., 2011; Bridgwater, 1999;
DeLuca et al., 2006; Liang et al., 2006; Mohan et al., 2006; Novak et al., 2014;
Raveendran et al., 1995; Warnock et al., 2007; Yang and Lua, 2003). The chemical
characteristics change with the feedstocks (Abdullah et al., 2010), the production tech-
nology and conditions (Novak and Busscher, 2013) including temperature and resi-
dence time (Bridgwater, 1999), and the cooling technique (Mohan et al., 2006; Yang
and Lua, 2003; Zhao et al., 2013).
Biochar produced from woody feedstock rich in lignin has a high carbon and a low ash
content compared to switchgrass and corn stove biochar (Brewer et al., 2011;
Raveendran et al., 1995). The chemical structure of the carbon in the feedstock decides
the final aromatic carbon groups in biochar depending on the production temperature
(Brewer et al., 2011; Kwapinski et al., 2010; Luo et al., 2011). The common structural
groups in biomass are hemicellulose, cellulose and lignins, which require different
temperature ranges in order to be completely pyrolyzed: 200 - 260 °C, 240 - 350 °C,
and 280 - 500 °C respectively (Mohan et al., 2006). The surface chemical characteris-
tics of biochar are determined by those aromatic carbon groups which give highly het-
erogeneous and not well defined surfaces which can have hydrophobic, acidic and
basic characteristics (Amonette and Joseph, 2009; Brennan et al., 2001; Hedges et al.,
2000; Preston and Schmidt, 2006; Schmidt and Noack, 2000; Spokas, 2010;
Trompowsky et al., 2005). Due to its high carbon and low nitrogen content, biochar
has highly variable C/N ratio with a maximum value of 400 (Chan and Xu, 2009).
Cheng et al. (2008) explained that the high cation exchange capacity (CEC) of biochar
is caused by the presence of negatively-charged functional groups. Novak et al. (2009)
discovered the relationship between pyrolysis temperature and CEC of biochar: an in-
crease in pyrolysis temperature decreases biochar CEC. This negatively-charged sur-
face of biochar not only adsorbs cations and increases CEC but also is able to adsorb

State-of-the-art
17
other organic and inorganic compounds (Abebe et al., 2012; Buss et al., 2015; Graber
et al., 2011; Kwon and Pignatello, 2005; Lucchini et al., 2014; Mesa and Spokas,
2011; Pignatello et al., 2006; Zhu and Pignatello, 2005). The porosity and surface area
of biochar correlates with a mass loss during the pyrolysis (Amonette and Joseph,
2009), and when the production temperature is less than 450 ºC, the porosity is low
due to the accumulation of volatile organic compounds inside the pores, and reduces
the adsorption capacity (Kwon and Pignatello, 2005; Pignatello et al., 2006).
2.7.3 Significance of applying biochar to soil in agro-ecosystems
The use of charcoal, biochar or biomass-derived black carbon in agriculture is not a
new technique, but this has been done by indigenous farmers in many parts of the
world including South America, South and South East Asia for a long time already.
Besides anthropogenic influences, naturally produced biomass-derived black carbon
(e.g. from wild fires) can be found in soil carbon pools (Grossman et al., 2010;
Sombroek et al., 2003; Swami et al., 2009; Woods and Winklerprins, 2009). With the
developing interest in biochar and all biomass-derived black carbon, those recently
started to be manufactured commercially with four main objectives: soil amelioration
to improve agricultural productivity, proper waste management, climate change miti-
gation, and energy production (Johannes and Joseph, 2009). According to Forbes et al.
(2006), the worldwide production of biochar was 0.05 - 0.27 Gt per year. Compared to
the terrestrial net primary productivity of 60 Gt/yr this was very small (IPCC, 2005,
2007), but all this black carbon makes up one third of soil organic carbon in the major-
ity of soils globally (Major et al., 2010a). Since more than a decade scientists have
been discussing the stability of biochar and other char products in soil, and their ability
to enhance the carbon sequestration. Those qualities are much higher when biochar is
produced at higher temperature (graphite stability: Shneour, 1966, biochar stability:
Baldock and Smernik, 2002; Bird et al., 1999; Brodowski et al., 2005; Glaser et al.,
2000; Hamer et al., 2004; Kawamoto et al., 2005; Lehmann et al., 2006; Pessenda et
al., 2001; Shindo, 1991). On the other hand, higher production temperature will give
nutrient losses and a small mass turnover (Bolan et al., 2012; Bruun et al., 2011;
Calvelo Pereira et al., 2011; Özçimen and Karaosmanoğlu, 2004).

State-of-the-art
18
2.7.3.1 Effects of biochar on soil physical properties
The effects of biochar on soil physical properties are based on its porosity, high surface
area, lower bulk density, and water repellency. Only a small number of researches have
been conducted on the effect of biochar on soil physical properties compared to re-
searches on biochar’s effects on soil chemical properties, but there were some interest-
ing findings. According to Lehmann et al. (2003a, 2003b), Liu et al. (2015) and Novak
et al. (2012) biochar increases the water holding capacity of soil because of its in-
creased particle surface area and the water storage within the porous structure, and in-
directly increases mycorrhizal fungi and microbial biomass. There was evidence from
the studies done by Verheijen et al. (2009) and Liu et al. (2015) that biochar applica-
tion significantly improves aggregate stability. Atkinson et al. (2010) and Hammes and
Schmidt (2009) investigated the influence of biochar on soil erodability. However,
there also are studies showing little effect on soil physical properties, and often even
conflicting evidences to the above positive effects. For example, Busscher et al.
(2010), Peng et al. (2011), and Eastman (2011) reported that biochar had no significant
effect on aggregate stability. Many studies and review articles showed the effects of
biochar on soil physical properties for specific soils which are of little relevance for
agricultural soils such as ancient anthropogenic soils (Atkinson et al., 2010; Ayodele
et al., 2009; Glaser et al., 2002; Mukherjee et al., 2014; Sohi et al., 2009, 2010;
Verheijen et al., 2010) or with non-agricultural soils (Belyaeva and Haynes, 2012;
Jones et al., 2011b; Uzoma et al., 2011). Other studies used disturbed soils, or did not
perform in situ soil experiments at the fields (Belyaeva and Haynes, 2012; Kameyama
et al., 2012; Liu et al., 2012; Pan et al., 2009; Streubel et al., 2011; Tryon, 1948;
Uzoma et al., 2011; Van-Zwieten et al., 2010).
2.7.3.2 Effects of biochar on soil chemical properties
Contrary to the soil physical properties, many studies have been done concerning the
effects of biochar on soil chemical properties (Busscher et al., 2010; Chan et al., 2007;
Deenik et al., 2010; Van-Zwieten et al., 2010). The promising results with highly
weathered tropical soils with poor chemical properties (Iswaran et al., 1980; Jeffery et

State-of-the-art
19
al., 2011; Liang et al., 2006) drew the attention of biochar research to tropical climate
(Glaser et al., 2002; Jeffery et al., 2011; Verheijen et al., 2010; Xie et al., 2015), but
recently the research interest has extended to subtropical areas with a growing interest
in the application of biochar to increase terrestrial carbon sequestration (Kimetu and
Lehmann, 2010; Tejada and Gonzalez, 2007; Trompowsky et al., 2005). As an attrac-
tive soil amendment, biochar significantly increases pH (EBC, 2012; Glaser et al.,
2002; IBI, 2012; Lehmann et al., 2003b; Major et al., 2009, 2010b; Yamato et al.,
2006), CEC (Alling et al., 2014; EBC, 2012; Glaser et al., 2002; Hale et al., 2013; IBI,
2012; Lehmann et al., 2003b; Major et al., 2009, 2010b; Yamato et al., 2006), overall
sorption capacity (Sohi et al., 2010), availability of major plant nutrients (Jeffery et al.,
2011, 2015; Verheijen et al., 2010), base saturation (BS) (Glaser et al., 2002; Lehmann
et al., 2003a, 2003b; Major et al., 2009, 2010b; Schulz and Glaser, 2012; Yamato et al.,
2006), and available P (Chidumayo, 1994; Yamato et al., 2006).
2.7.3.3 Effects of biochar on agricultural crop productivity
There was much research on the effects of biochar on agricultural soil and agronomic
performance. The results of those studies are varied and depend on feedstock, produc-
tion conditions, rates and procedure of biochar application, soil properties, crop prop-
erties, and cultural practices of production systems, but the majority of those studies
showed a positive plant response to biochar application (Jeffery et al., 2011; Jha et al.,
2010). The literature shows that the influence of biochar on plant biomass can be phys-
ical, chemical and biological, by increasing the water holding capacity (Glaser et al.,
2002; Laird et al., 2010), affecting the soil pH (Major et al., 2009, 2010b), directly in-
fluencing the supply of plant nutrients (Chan et al., 2008), indirectly influencing the
availability of plant nutrients (Chan et al., 2007; Pessenda et al., 2001), and affecting
the interactions with the soil micro-fauna (Hammes et al., 2009; Ruivo et al., 2009).

State-of-the-art
20
2.7.3.4 Effects of biochar on soil microbial biomass
Because the behavior of soil microbial biomass in biochar amended soils highly varied
in past studies (Grossman et al., 2010; Khodadad et al., 2011; O’Neill et al., 2009),
there are many controversies on how biochar effects soil biological processes, and this
still is not well understood (Lehmann et al., 2011). It is clear that biochar application
rates and soil type also affect the soil microbial biomass (Lehmann et al., 2011). Bruun
et al. (2011), Luo et al. (2011), Steinbeiss et al. (2009), and Zimmerman et al. (2011)
documented a higher amount of labile C fractions in biochar amended substrates than
in their non-charred feedstocks. Lehmann et al. (2011) explained the positive effect of
biochar on the soil microbial biomass (SMB) by its ability to increase the concentra-
tion of dissolved organic matter and soil nutrients (N, P, Ca and K), to remove toxic
compounds from soil solution by adsorption, and to change the quality of soil water
and its pH. Due to fresh biochar’s recalcitrance (Kuzyakov et al., 2009), water repel-
lence (Blackwell et al., 2009), and toxicity (Hale et al., 2011; Liu et al., 2008;
Zimmerman et al., 2011) some studies report no effect of biochar on soil microbial
biomass (Castaldi et al., 2011; Rutigliano et al., 2014; Zavalloni et al., 2011). Accord-
ing to Dempster et al. (2012) and Liu et al. (2008) the toxic effect of biochar due to its
polycyclic aromatic hydrocarbons (PAHs) and some highly volatile organic compound
substances caused soil microbial biomass to decrease. The ability of biochar to supply
a protective environment by avoiding grazers (Pietikainen et al., 2000), and its storage
capacity for labile carbon and nutrients (Saito and Marumoto, 2002; Warnock et al.,
2007) which is associated with the high internal porosity of biochar, may be the reason
for the positive effects of biochar on SMB.
2.7.3.5 Effects of biochar on greenhouse gas emissions and climate change
Applying different organic fertilizers, returning crop residues to the soil, decreased or
even zero tillage, and increasing the soil cover are the traditional ways of enhancing
the capability of soils in agricultural ecosystems to act as a carbon sink (Lal, 2004,
2007; Lorenz and Lal, 2014). The impacts of these methods on soil carbon storage

State-of-the-art
21
highly depend on the contribution of the organic amendments to the readily available
carbon and to soil nutrients which can boost carbon mineralization, soil respiration and
GHG emissions (Oelbermann and Voroney, 2007). Therefore, it is important to find
ways to reduce these contributions in order to increase the efficiency and effectiveness
of bioenergy production systems as a renewable energy source (Woolf et al., 2010).
Incorporating biochar into the soil in bioenergy crop production systems alters the bio-
chemical pathways of carbon and other elements, and increases the net withdrawal of
atmospheric carbon (Woolf et al., 2010). However, many controversial results were
reported by previous studies in both tropical and temperate regions: amending soil
with biochar may either increase (Deenik et al., 2010; Luo et al., 2011; Scheer et al.,
2011) or decrease (Bolan et al., 2012; Dempster et al., 2012; Knoblauch et al., 2011;
Liu et al., 2011; Malghani et al., 2013; Rondon et al., 2005; Zhang et al., 2010a,
2012b; Zimmerman, 2010) emission of CO2, N2O and CH4.
In 2011, an estimate was made by Matovic (2011) claiming that by converting 10 % of
the global net primary production to biochar and adding it to the terrestrial carbon se-
questration has the potential to reduce fossil fuel emissions by 4.8 Gt C/yr. The Global
Warming Potential (GWP) cannot only be reduced by reducing the CO2 emission, but
also by reducing N2O and CH4, which have an even higher GWP than CO2 (Bijay-
Singh et al., 2008; Singh and Cowie, 2014; Singh et al., 2010; Spokas et al., 2009). In
addition to the direct impacts on GHG emissions, more indirect ways to fix atmospher-
ic carbon into the soil by biochar were documented by researchers: by making soils
more resistant to microbial and physical degradation (Major et al., 2010a), by provid-
ing a habitat for soil microorganisms which leads to the fixation of carbon in under-
ground fungal networks (Warnock et al., 2007), by producing co-products like bio-oil
and bio-syngases which are energy sources and can replace fossil fuel (McCarl et al.,
2009). Kammann et al. (2012) and Zhang et al. (2012, 2011) reported no effect on
GHG gas emissions after soil was amended with biochar. The internal porosity of bio-
char together with its water repellence may change soil aeration and water status
(Karhu et al., 2011; Zhang et al., 2012a, 2011) and alter the soil microbial community
and activity (Feng et al., 2012; Lehmann et al., 2011), which may finally affect soil
CH4 emission.

22

Investigation Area
23
3. Investigation Area
3.1 Schleswig-Holstein
Schleswig-Holstein (SH) lies between the North Sea in the west and the Baltic Sea in
the east. The terrestrial borders of SH are with Denmark in the north, Mecklenburg-
Western Pomerania in the east, and Hamburg and Lower Saxony in the south (Figure
4). Looking at the geomorphological landscape, three regions can be identified in SH:
eastern, central, and western. The eastern region of SH has bays and fjords along the
coastline of the Baltic Sea. This part of SH is rich in natural landscape, including lakes
and hilly areas formed during the last European Ice Age (the Weichselian glaciation).
Geest, a slightly elevated land surrounded by plains and marshlands, is the common
landscape in the central area. The Geest acts as a bridge between the marshes and the
hills, and contains poor soils belonging to different ages and diverse origins like Saali-
an moraines, and fluvio-glacial deposits from the Weichselian period. Drage, where the
experimental sites are located, lies on the west side of the central region close to Sta-
pelholm (Figure 4). The area where young marine sediment was deposited during the
Holozene represents the marshlands in the western region. This western region has
heavy, fertile soils and is intensively used for livestock grazing. It was easily exposed
to the high tides and storm floods before those were controlled by manmade dikes (al-
so see land use and vegetation in 3.5). These natural events limit the full utilization of
the fertile soil for crop production and the development as an urban area (Becker &
Kaster, 2005; Behre, 2008; Schleswig-Holstein, 2014).

Investigation Area
24
Figure 4: The location of Schleswig-Holstein with its borders and the natural
landscapes based on geomorphology: the red circle shows the area of the experi-
mental sites. (Source: www.de.wikipedia.org/wiki/Schleswig-Holstein, accessed on
19.03.2014)
3.2 Regional geomorphology of SH
From a geological perspective, the surface landscape of SH was mainly shaped by the
most recent ice age. The greater part of SH, including Stapelholm and Drage where the
experimental sites are, has its origins in the ice ages of the Quaternary geological era
(2.6 Ma to 12 ka ago) and its interglacial periods (ICS, 2014). The Weichselian
(115,000 - 10,600 a ago) and Saalian (300,000 - 130,000 a ago) glacial periods also
had an influence on the landscape genesis of SH (Ehlers, 2011). But the development
of the SH landscape mainly occurred in the Holocene era (from 11,700 a ago until to-

Investigation Area
25
day; Ehlers, 2011; ICS, 2014; Langheld, 2013; Schmidtke, 1995). The Eemian inter-
glacial period and the Holocene, the two most recent warm periods of the geological
history, contributed to the conversion of former glacial valleys of SH into today’s
marshes and moors (Becker and Kaster, 2005). The development of marshes in the
western part of SH was associated with the rising sea levels after the ice age, the con-
tinuous influence of the tide and flooding by the North Sea, and the simultaneous rise
of the groundwater level. All those activities helped to deposit marine-clay-organic
sediments as marine and fluvial deposits in the lowland of west SH. But the Eider-
Treene depression (Eider-Treene-Sorge) and the mudflats of the North Sea are mainly
influenced by marine rather than by river sediments (Becker and Kaster, 2005).
3.3 Soils around Drage and Stapelholm
The parent materials of Stapelholm and Drage are sand and drifted sand formed during
the glacial era, which belongs to the Saale glacial period. (Langheld, 2013). Soils of
the Stapelholm area, Drage and their immediate neighborhood, are Podzols, Cambi-
sols, Gleysols, Anthrosols and marsh soils (Fluvisols) or combinations of two of those
soils, or of one of those soils with another soil type. In west Stapelholm, in the Eider-
Treene-Depression and directly next to the Geest border, there are Fluvisols, and in the
far north-eastern part of Stapelholm and Drage there are Stagnosols and Planosols
(Langheld, 2013).
Cambisols (WRB, 2006) can be identified by a cambic diagnostic horizon, but some-
times a mollic horizon also can be found. The low temperature limits the weathering of
medium- and fine-textured parent materials, and therefore the young soils still are in
the beginning stage of their horizon differentiation. Because of the slow weathering
process and the high precipitation throughout the year, the profile is not rich with illu-
viated clay and other ion compounds like aluminum and iron. Furthermore, the low
temperature regime and the reduced microbial activities lead to the accumulation of
lignin rich organic litter coming from acidophilic vegetation during the soil formation
process (Stahr et al., 2012; USDA, 2010; WRB, 2006). Podzol (WRB, 2006) has both

Investigation Area
26
eluvial and illuvial horizons as subsurface diagnostic horizons because of the podsoli-
zation process. The podsolization process is intensified by the acidic condition of the
soil, high precipitation, little evapotranspiration, low temperatures, acidic parent mate-
rials, and acidophillic vegetation including Ericaceae species, oaks and conifers. A
natural, non-cemented subsurface layer is common in between the eluvial and the illu-
vial horizons. Subsurface horizons enriched with the sesquioxides of iron and alumi-
num are common in Podzol (Scheffer & Schachtschabel, 2010; Stahr et al., 2012; Ad-
hoc-Arbeitsgruppe Boden, 2005; WRB, 2006).
The Eider-Treene depression is an area rich with Gleysols (WRB, 2006). Groundwater
governs most of the characteristics of the Gleysols profile. A year-round high ground-
water level generates an environment lacking oxygen, which leads to the development
of Gleysols with the typical diagnostic oxidized horizon and the lower adjacent re-
duced horizon. The oxygen lacking environment induces iron and manganese to stay in
their reduced state in which they are easily soluble in water and can therefore move
through the soil profile giving it the typical grey and pale grey color (USDA, 2010;
WRB, 2006; Scheffer & Schachtschabel, 2010; Stahr et al., 2012). The north-eastern
part of Stapelholm has Pseudogley (WRB, 2006). In contrast to Gleysols, Pseudogley
is not governed by the groundwater, but by the water added to the soil from above by
rainfall or thawing of snow. Pseudogley is characterized by redoximorphic features
with or without concretions, and a temporary but periodic water stagnation zone (Ad-
hoc-Arbeitsgruppe Boden, 2005; Scheffer and Schachtschabel, 2010; Stahr et al.,
2012).
In the area around Drage and Stapelholm, there also are young, organic soils associat-
ed with bog, fens, and peat lands (marsh soil). The organic matter content of those
soils exceeds 30 % by weight and the profile has features of horizon differentiation,
stratification, sometimes a distinct topsoil horizon, and the lower part of the profile can
have redoximorphic features. Several types of marshes can be distinguished, depend-
ing on their development from their original sediments (Ad-hoc-Arbeitsgruppe Boden,
2005; Scheffer and Schachtschabel, 2010; USDA, 2010; WRB, 2006). The decomposi-
tion of organic matter is slowed down due to anaerobic conditions in water saturated

Investigation Area
27
soils. Usually the marshes and fens around Stapelholm and Drage (the Eider-Treene
depression) are characterized by a low nutrients content which is caused by a rapid
flow of groundwater through the sandy materials. Some of those marshes also have an
influence from brackish water and the deposition of very fine-grained marine and flu-
vial sediments (Stahr et al., 2012).
Anthrosol (in German Plaggenesch; Ad-hoc-Arbeitsgruppe Boden, 2005; WRB, 2006)
can also be found in the vicinity of settlements in the study area. . The diagnostic hori-
zons of Anthrosol include an anthropogenic E-horizon and a thick A-horizon (Ad-hoc-
Arbeitsgruppe Boden, 2005; USDA, 2010; WRB, 2006). Anthrosol soils have been
transformed by anthropogenic activities, which added carbon and nutrients rich animal
manure or organic materials to the soil. Organic matter has been regularly added to the
topsoil and mixed with the subsurface horizons during the land preparation for crop
establishments. This procedure is common in SH where agriculture has a long history,
and was intensified after the increased availability of organic waste produced by bio-
energy plants (Langheld, 2013; LLUR, 2012).
3.4 Climate
Schleswig-Holstein has a wet humid climate which is affected by the maritime climatic
conditions of the Atlantic Ocean and the North Sea, limiting extreme temperature fluc-
tuations, and resulting in mild year-round temperatures. According to Strahler &
Strahler (2005), a main meteorological characteristic of SH is sufficient precipitation
in all months. The favorable temperature combined with the high precipitation and
humidity stimulates a strong development of vegetation (Schmidtke, 1995; Wagner,
1998). According to Wagner (1998), the weather in Stapelholm and Drage, including
the experimental sites, is mainly governed by the direction of the wind, the main air
flows, and the adjacent higher elevation lands. The main wind direction is from west to
east and has a great influence on SH weather. Two prominent air flows, the cold polar
air flow, and the tropical warm air flow caused by the Gulf Stream meet over SH
(Strahler and Strahler, 2005; Wagner, 1998). Stapelholm and Drage are subject to re-

Investigation Area
28
ceive orographic rainfall resulting from the adjacent high Geest area (Wagner, 1998).
For SH, the average monthly air temperature is 11.8 °C (- 4.0 °C to 27.7 °C), and the
monthly average precipitation is 74.1 mm (ranging from 1.3 mm to 275.4 mm) based
on long term historical climate data (from 1947 to 2014; DWD, 2014). The respective
values for the experimental sites, as gathered by the Erfde weather station which is
situated 14 km away from the field sites over a 50-year period (1965 - 2014), are a
monthly average air temperature of 8.7 °C, and an average monthly precipitation of 70
mm (DWD, 2014).
Figure 5: Map of mean annual precipitation (mm) in SH. The red circle indicates
the experimental site (source: www.schleswig-holstein.de, accessed on 10.11.2013)
3.5 Land use and vegetation
Except in the salt affected marshes in the south and west and in the fens, initially natu-
ral cold-loving arctic woody vegetation developed on the glacial deposits and perma-
frost soils. Later, with increasing temperatures, this cold-loving vegetation gradually
converted into heat-loving trees such as oak, alder, ash, hazel, lime and elm (Behre,
Investigation Area
29
2008). Vegetation changes were not only caused by the thawing of glacial ice and per-
mafrost soils, but also by the competition among vegetation and by human impact
from the Neolithic up to the agro-industrial age in the 20th
century. In most regions of
SH, the natural landscape and original vegetation has been transformed into a man-
made cultural landscape (Becker and Kaster, 2005). According to Behre (2008) and
Becker & Kaster (2005), Stapelholm and the adjacent high Geests were originally
dominated by nutrient-poor acidic soils. Before mid-19th
century, there were several
attempts to cultivate the marshes and bogs in SH, but the levees were not strong
enough to withstand the storm surges. After those unsuccessful attempts in the marshes
and bogs, people once again considered the hill Geests for use as arable land (Becker
and Kaster, 2005). The original forests in many parts of the high Geest areas in SH
were deforested to obtain timber and firewood and later were used as farm land for
agriculture. After several years, those lands were no longer productive and were ne-
glected as marginal land with highly degraded soil. Some of the present natural forest
areas of SH include the forests originating from re-growth of natural vegetation in
those neglected marginal lands (Becker and Kaster, 2005; Behre, 2008). Only small
primary forest areas remained untouched including hedges and hedgerows which were
originally planted to mark the borders of fields and pasture lands, to procure firewood,
and to be used as windbreaks (Becker and Kaster, 2005). Re-forestation activities were
started after a comprehensive agrarian reform in 1850, but despite intensive planting of
fast growing tree species such as pine and spruce primarily for use as timber, Schles-
wig-Holstein still is the state with the smallest area of primary forest (10 %) in Germa-
ny where the national average of forest land is 31 % (Behre, 2008; BMELV, 2011;
Liedtke and Marcinek, 2002; Statistikamt Nord, 2012). In 2011, the land use statistics
of SH showed that 70 % of the land in SH was used as agricultural land (BMELV,
2011; Statistikamt Nord, 2012), and 73 % in Stapelholm and Drage (Statistikamt Nord,
2012).
Agriculture was again intensified responding to the demand that was generated by in-
creasing population, which caused the agro-socio-economical soil degradation in
northern Germany. With the availability of powered pumping stations, it became easy
to drain the diked areas, thus reducing the flooding impacts, and continuous develop-

Investigation Area
30
ment of increasingly strong and efficient new levees stopped the devastating influence
of tides and storm surges on the marshes of Stapelholm during the 20th
century (Becker
& Kaster, 2005; Behre, 2008). This huge anthropogenic development is still visible in
some places in SH, the most prominent example being the development of the city
Heide.
3.6 Experimental sites
SH was chosen to carry out the field experiments because of its significant role in
Germany’s renewable energy production through biomass. According to the
Statistikamt Nord 2012-2, in 2011, 38.6 % of the electricity supplied by SH to the na-
tional electricity grid came from renewable energy sources. The highest portion of this
contribution is wind energy (25.3 %). Biogas was used to produce 7.7 % of the elec-
tricity in SH, while this contribution in all of Germany is only 6 %. SH utilized 19.8 %
of its biogas to generate electricity which was higher than the average in Germany: 5.4
% (Statistikamt Nord, 2013). In 2011, SH had 742 biogas plants producing electricity
out of biogas, and nearly 24 % of the arable land was used for energy crop production
(DBFZ, 2012; MELUR, 2012). The increased demand for biomass by biogas plants
converts many pasture lands into bio energy crop production land which is continuous-
ly altering the regional agricultural land use pattern.
The field experiments were established at two locations, which were 1.4 km apart from
each other in the bioenergy production area in Drage in SH (54° 35′ 41.18″ N, 9° 17′
27.16″ E and 54° 36′ 43.31″ N, 9°15′25.18″E) between the river Eider in the south and
the river Treene in the north and northwest (Figure 6). Site 1 is a flat land very close to
the bottom of a sloping land (< ≈ 2 % slope) with a depressed area between the bottom
of the slope and the experimental plot. Site 1 did not receive any additional organic
matter before, nor was it used for bio-energy crop production or any other agricultural
purposes recently. Site 2 is in a bio-energy crop production field, which had regularly
received biogas digestate (42 L m-2
) at the beginning of each cropping season as organ-
ic matter for many years already.

Investigation Area
31
Figure 6: Aerial and ground views of the study sites in Drage. The arrows show
where the experimental plots were in the two sites.

32

Materials and Methods
33
4. Materials and Methods
4.1 Production of biochar
The biochar we used in the field experiments was produced by the fast thermal com-
bustion of the dried solid portion of biogas digestate (average particle size < 20 mm)
by a bioenergy plant in northern Germany (Biogasvertrieb Nord GmbH & Co.KG in
Drage, Germany), which used a mixture of bioenergy crop and animal waste as a sub-
strate for the biogas production. This biogas plant used different crops as feedstock
depending on the seasons of the year, e.g. sweet corn, winter wheat and winter rye.
The pyrolysis process was done at PYREG® GmbH in Dörth, Germany, using the
PYREG® 500 multi-purpose dry, continuous flow pyrolysis unit at 650 °C temperature.
The pyrolysis unit contains a feeder to feed the feedstock to the reactor, a PYREG®
reactor where feedstock is pyrolyzed into biochar, and a FLOX® combustion chamber
which heats up to 1,250 °C to completely burn synthesis-gases generated during the
pyrolyzing process. Some portion of the heat generated in the FLOX®
combustion
chamber is used by the PYREG® reactor to carry out the pyrolyzing process, and some
other portion is used by the combi-dryer to dry the biomass before feeding it to the
reactor. The production flow chart of the PYREG® biochar production process is
shown in Figure 7.
The thermal decomposition zone operates as an oxygen free environment and under a
small to a negative pressure (1.5 mbar or less) to ensure safety by preventing the leak-
ing of flammable gases from the gasification zone. Two contra-rotating, interlocked
helical screws are placed inside the PYREG®
reactor and are driven by a motor. There-
fore, during the pyrolyzing process, both feedstock and biochar are subjected to being
physically broken down into smaller particles. The biochar production unit does not
have a specific cooling chamber or any air flow going through the warm and fresh bio-
char. The discharge pipe is equipped with a middle vertical screw leading to an upward
flow of the warm fresh biochar. The biochar is cooled down gradually inside this dis-
charge pipe while approaching the collecting container. After that, the biochar gradual-
ly is cooled down to room temperature inside the collecting container. The whole re-
tention time of the production process was 30 - 40 minutes.
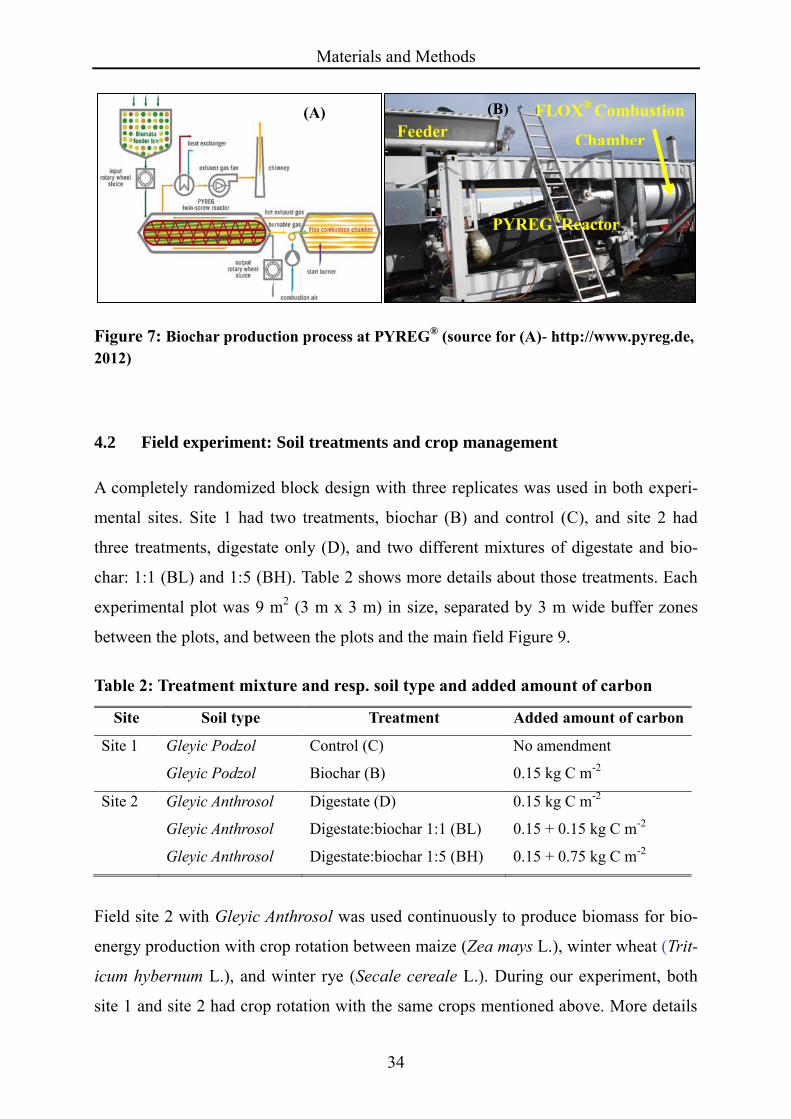
Materials and Methods
34
Figure 7: Biochar production process at PYREG® (source for (A)- http://www.pyreg.de,
2012)
4.2 Field experiment: Soil treatments and crop management
A completely randomized block design with three replicates was used in both experi-
mental sites. Site 1 had two treatments, biochar (B) and control (C), and site 2 had
three treatments, digestate only (D), and two different mixtures of digestate and bio-
char: 1:1 (BL) and 1:5 (BH). Table 2 shows more details about those treatments. Each
experimental plot was 9 m2 (3 m x 3 m) in size, separated by 3 m wide buffer zones
between the plots, and between the plots and the main field Figure 9.
Table 2: Treatment mixture and resp. soil type and added amount of carbon
Site Soil type Treatment Added amount of carbon
Site 1 Gleyic Podzol Control (C) No amendment
Gleyic Podzol Biochar (B) 0.15 kg C m-2
Site 2 Gleyic Anthrosol Digestate (D) 0.15 kg C m-2
Gleyic Anthrosol Digestate:biochar 1:1 (BL) 0.15 + 0.15 kg C m-2
Gleyic Anthrosol Digestate:biochar 1:5 (BH) 0.15 + 0.75 kg C m-2
Field site 2 with Gleyic Anthrosol was used continuously to produce biomass for bio-
energy production with crop rotation between maize (Zea mays L.), winter wheat (Trit-
icum hybernum L.), and winter rye (Secale cereale L.). During our experiment, both
site 1 and site 2 had crop rotation with the same crops mentioned above. More details
(A) (B)
Feeder
PYREG®Reactor
FLOX®
Combustion
Chamber

Materials and Methods
35
about crop management practices are shown in Figure 8 and Table 3. After harvesting
maize (Zea mays L.) as a summer crop in October 2012, the soil was chisel ploughed
down to 0.20 - 0.30 m depth before seeding winter wheat (Triticum hybernum L.) in
the 2012/13 winter season.
Figure 8: Crop rotation plan
Before seeding was done in the ploughed and pulverized soil, the biochar was incorpo-
rated into the soil as a fresh biogas digestate, up to a depth of 20 cm. The lowest appli-
cation rate used in the experiment (0.15 kg C m-2) represents the amount of carbon
applied as digestates by the farmer under normal agricultural praxis. To ensure the
equal distribution of biochar, we divided the experimental plot (9 m2) into 9 smaller
sub plots (1 m2), added the needed amount of biochar onto the soil surface of those
small sub plots manually, and distributed the biochar on the soil surface equally by
using wooden hand-rakes. Soon after, the biochar was mixed into the 0 - 0.2 m soil
layer using a rotary tiller fixed to a single-axle tractor (see Figure A 14 in the annex).
More details about the cropping seasons and crops are shown in Table 3.
2012/13 W 2013 S 2013/14 W 2014 S Winter Wheat Maize Winter Rye Maize

Materials and Methods
36
Table 3: Crop rotation
Crop* Season Date
Spacing**** Seeding Harvesting
Winter wheat (Triticum aes-
tivum L.)
Winter
2012/13
October 2012 June 2013 100 kg seeds ha-1
(10 g m-2
)
Maize (Zea mays L.) Summer 2013 June 2013** October 2013 250 kg seeds ha-1
(10 seeds m-2
)
Winter rye (Secale cereale L.) Winter
2013/14
November 2013 May 2014 100 kg seeds ha-1
(10 g m-2
)
Maize (Zea mays L.) Summer 2014 May 2014*** September
2014
250 kg seeds ha-1
(10 seeds m-2
)
* Variety information unavailable ** For site 2: Fertilizer application rate 25 g of Calcium
Ammonium Nitrate (CAN or Kalkammonsalpeter KALKAMON Dünger in German) m-2
***
25 g of CAN m-2
plus liquid digestate 42 L m-2
as a surface application ****Maize: row seed-
ing, wheat and rye: broadcasting
After seeding in each cropping season, two soil collars (Ø = 20 cm and height = 20
cm, LI-COR Biosciences) were randomly placed inside each experimental plot to use
for future gas emission measurements. The soil collars were inserted into the soil (ap-
proximately 15 cm to 18 cm deep), and stayed in the same place for the whole growing
season (see Figure 9 and Figure 10).

Materials and Methods
37
Figure 9: Overview of the plots and the treatment distribution of the field exper-
iment for field sites, site 1 with Gleyic Podzol and site 2 with Gleyic Anthrosol. The
number and the letters indicate the plot number and the treatment for a respec-
tive plot. The blue circles indicate the soil collars. Note: the diagram is not to
scale.

Materials and Methods
38
4.3 Total biomass production
At the end of every growing season, a randomly selected 1 m2 (1 m x 1 m) area was
used to collect a total biomass of the crop. The crop was harvested at a height of ≤ 10
cm above the soil surface. The collected samples were weighed, stored in polyethylene
bags, and sealed. The root was uprooted with the rest of the stem and the soil particles
were removed by shaking. Before obtaining the fresh weight of the root samples, all
soil particles were washed with tap water, and excess water was drained at room tem-
perature. Randomly selected, representative above and below ground biomass samples
(100 g) were oven dried at 70 ± 1 °C for ≥ 48 hours to determine the dry mass of bio-
mass. The same sample was used to determine the total carbon and nitrogen content as
described in subsection 4.7.4.
4.4 In situ chamber measurements of greenhouse gases
At each treatment plot, soil respiration, N2O and CH4 emissions on the soil surface
were determined by using the technique of closed chamber (CO2 by using Automated
Soil CO2 Flux System - LI-8100 survey chamber Ø = 20 cm, LI-COR Biosciences,
USA; and N2O and CH4 by using Acryl transparent chamber, Ø = 20 cm, University of
Hamburg, Germany: Figure 10). The closed chambers were placed on the soil collars
(Ø = 20 cm) which were installed at the beginning of each growing season. Both
chambers were equipped with a groove together with a rubber sealer to prevent gas
exchange with the surrounding environment. Gas flux measurements were carried out
over two years, including the crop rotation between winter and summer, from Novem-
ber 2012 to September 2014, except in December 2012 and January 2013 due to the
frozen soil collars. Inside the soil collars, the soil surface was cleaned by removing
litter material and vegetation at least 30 minutes before starting the monthly chamber
measurements to minimize the error caused by soil distraction.

Materials and Methods
39
4.4.1 Soil respiration measurements
The emission of CO2 from the soil surface was measured monthly using a LI-COR®
closed chamber. In each plot, measurements were taken at two different places which
remained fixed over the whole experimental period. Therefore, for each type of treat-
ment six measurements were taken on each measurement day. The times of the meas-
urements were spread over the day (10:00 to 15:00), but for each plot, the measure-
ments were always taken at the same time of the day.
Many authors discussed the pros and cons of closed chamber measurements. Kutzbach
et al. (2007) discussed various errors which are related to chamber measurements that
might cause differences to the natural emission fluxes. The placement of the chamber,
the pressure gradient between the inside chamber and the ambient atmosphere at the
closure time, and the volume of the chamber can alter the result of the chamber meas-
urements (LI-COR Biosciences, 2007; Xu et al., 2006; Conen and Smith 1998). The
LI-COR Biosciences Automated Soil CO2 Flux System was carefully designed to min-
imize those errors by using the following provisions: a top pressure vent to balance the
pressure during the measuring time, an automated slow closing of the chamber to pre-
vent pressure spikes at the chamber closing time and keep equal pressure inside and
outside the chamber during chamber closure, a volume of the chamber of 4843 cm3
which allows to measure small fluxes with higher accuracy, etc. (LI-COR Biosciences,
2007). To further minimize those errors, the automated calculation includes continuous
changes of temperature and pressure of the micro-environment inside the chamber dur-
ing the measurement (Biosciences, 2007).

Materials and Methods
40
Figure 10: Setup for trace gas measurement and gas sample collection in the field.
(A) Acryl transparent chamber and (B) LI-COR Biosciences chamber (Source for
(B): www.licor.com).
4.4.2 N2O and CH4 measurements
The fluxes of both N2O and CH4 were calculated using the gas concentrations meas-
ured with gas chromatographs (GC) of gas samples collected from the closed chamber
head space via the vent during the chamber closure. Five samples were taken using 60
ml plastic syringes (Omnifix 60 mL, BRAUN Melsungen AG, Melsungen, Germany)
equipped with three-way-stopcocks. The first sample was taken just after the chamber
closed, and the remaining four samples were taken at intervals of approximately ten
minutes. The collected gas samples were analyzed on the following day at the Institute
of Soil Science, Hamburg. Both N2O and CH4 fluxes were determined using the GC
fitted with both a flame ionization detector (FID) and an electron capture detector
(ECD) operating at 280 °C and 300 °C respectively (7890, Agilent Technologies,
Germany). To ensure the accuracy of the GC measurements, prior to measuring the
samples, standard gas samples (0.29, 1.05 and 1.55 ppm for N2O, and 1.7 and 200 ppm
for CH4) were measured following the same injection procedure. The N2O and CH4
A B

Materials and Methods
41
fluxes were calculated using the respective gas concentrations and time intervals, pres-
sures, and temperatures of chamber head space with a modified and updated version of
the MATLAB script developed by Kutzbach (Kutzbach, et al., 2007). A linear flux cal-
culation was used.
4.5 Soil microbial biomass carbon (MBC) and nitrogen (MBN)
Soil microbial carbon and nitrogen (MBC and MBN resp.) were measured using a
fresh soil sample collected from the experimental field in a monthly interval. After re-
moving organic litter materials from the fresh soil sample by hand, and sieving through
a 2 mm sieve, the chloroform-fumigation-extraction method (CFE) was performed
(Brookes et al, 1985, Vance and Brookes, 1987). For fumigation, 30 g of sieved fresh
soil was weighed into a 50 ml glass beaker and fumigated with chloroform for 24
hours at 25 °C under low pressure (- 600 mbar). The fumigated soil sample was shaken
for 30 min at 200 rpm with 20 ml of 0.05 M K2SO4 solution. The mixture was filtered
(Whatman 595 ½ filter papers) before quantifying the carbon and nitrogen content. For
another part of the same soil sample, total organic C and N content was determined in
the same way but without fumigation. Carbon and nitrogen in the soil microbial bio-
mass were calculated using the following equations (Joergensen, 1995, 1996; Wu et
al., 1990).
𝐌𝐁𝐂 =(𝐂𝐟𝐮𝐦−𝐂𝐧𝐨𝐧)
𝟎.𝟒𝟓 and 𝐌𝐁𝐍 =
(𝐍𝐟𝐮𝐦−𝐍𝐧𝐨𝐧)
𝟎.𝟓𝟒
where Cfum and Nfum are the organic carbon and organic nitrogen extracted from the
fumigated soil, and Cnon and Nnon stand for the respective values of non-fumigated soil,
all in µg g-1
. The extractable part of the soil microbial biomass is used as the denomi-
nator which is 0.45 for carbon and 0.54 for nitrogen (Brookes et al, 1985, Vance and
Brookes, 1987). The selected samples from May, August and November 2013, and
March, May and July 2014 were analyzed by Paulina Reimers, and the data was used
for her bachelor thesis.

Materials and Methods
42
4.6 Potential carbon mineralization of digestate and biochar
4.6.1 Aerobic incubation experiment
To study potential mineralization of digestate and biochar, an aerobic incubation ex-
periment was conducted using two different soils and five different treatments with
three replicates each as a part of the master thesis work of Magdalena von Leliwa (von
Leliwa, 2014). Three Gleyic Podzol topsoil (0 - 0.2 m) samples were collected from
three different places of the experimental field site 1 in Drage. Those soil samples
were collected along the transit which runs diagonally across the site.
For the laboratory incubation experiment, soil treatments similar to the ones used for
the field experiment were used (see Table 1 in 4.2.2). Homogenized and litter free soil
(25 g) was incubated using airtight glass jars (500 ml) with lids containing butyl rub-
ber stoppers. The soil was treated with the following amendment mixtures: control (C,
soil without amendments), biochar only (B), digestate only (D), digestate:biochar 1:1
mixture (D:B 1:1), and digestate:biochar 1:5 mixture (D:B 1:5). The water content of
the soil was adjusted to 40-60 % of its maximum water holding capacity by adding the
necessary amount of water. The incubation bottles were placed in a dark incubator at a
temperature of 22 ± 1 °C. Head space CO2 concentration was measured by collecting
an air sample through the butyl rubber stopper with gradually increasing measuring
intervals at the gas chromatograph (Agilent Technologies 7890 A GC system,
Böblingen, Germany). When the head space CO2 concentration exceeded 3 % of the
total volume, those samples were flushed with synthetic air to prevent disturbances
caused by excess CO2 in the head space on the new production of CO2 from the soil.
For this purpose, hypodermic needles connected to a vacuum pump were inserted
through the butyl rubber stopper in the bottle and the bottle was evacuated for 6
minutes. This was followed by the addition of synthetic air that flowed through the
incubation vessels. The synthetic air had a composition of 79.5 % nitrogen, and 20.5 %
oxygen. The CO2 content in the incubation bottles was determined again after one
hour.

Materials and Methods
43
4.6.2 δ13
C signatures of CO2
The δ13
C values of CO2 produced from the incubated soil samples were analyzed twice
using a gas chromatograph connected to an isotope ratio mass spectroscope (Ther-
moQuest Finnigan Delta Plus/GC Combustion III). With the previously measured CO2
concentration, the injection volume was calculated for each sample, and injected sam-
ple volumes varied from 0.01 - 0.3 ml. Values are expressed relative to VPDB using
the reference standards LSVEC (δ13
C VPDB -46.6 ‰) and IAEA B7 (δ13
C VPDB -3.0
‰). The standard deviations of duplicate measurements were less than 0.2 ‰.
4.6.3 δ13
C signatures of soil organic matter, digestate and biochar
The δ13
C signatures of digestate, biochar and soils were determined to quantify the
different sources of carbon in the CO2 produced from the incubated soil. The calculat-
ed amount of finely ground and dried samples was weighed into tin cups and measured
at a mass spectrometer (Flash 2000, Delta V Plus).
4.7 Analysis of soil, digestate and biochar
4.7.1 Soil profiles and soil sampling
For the soil survey, samples were taken from every diagnostic horizon from soil pits
which had been dug in both study sites till meeting the groundwater table. Soil classi-
fications were done with reference to the German soil classification (Ad-hoc-
Arbeitsgruppe Boden, 2005), and the World Reference Base for Soil Resources
(WRB, 2006). Soils were described according to the characteristics of the diagnostic
horizons including soil texture, organic matter content, moisture content, and ‘in situ‘
observations, with reference to the German Soil Classification System (Ad-hoc-
Arbeitsgruppe Boden, 2005). Collected soil samples were stored in polyethylene-
bags, and frozen at -5 °C to minimize biological activities prior to performing the la-
boratory physico-chemical analysis. Undisturbed soil core samples were collected
from each diagnostic horizon of the soil pit using a standard metal core (Ø = 5 cm, h =

Materials and Methods
44
5 cm) to determine soil water retention (pF). The top and bottom surface of the soil
core were trimmed and covered by polyethylene layer and a plastic cap to prevent wa-
ter losses by evaporation, and disturbances during transportation to the laboratory. The
soil core samples were stored at 4 °C temperature in the cool room until starting the
laboratory analysis. During the first year of the experiment, mixed soil samples from 0
- 20 cm depth were collected in a monthly interval. During the second year, mixed soil
samples were collected seasonally. After the summer crop was harvested in 2013, soil
samples were collected from different depths (0 - 0.2, 0.2 - 0.4, 0.4 - 0.6 m) using a
soil auger. In September 2014, at the end of the experiment, mixed soil samples and
undisturbed soil core samples were collected from all three different treatments in field
site 2. Those samples were collected from the uppermost three horizons (Ap, E, GBv)
of the soil profiles which were opened inside the treatment plots. All the mixed soil
samples were stored in polyethylene-bags under frozen condition until the beginning
of the analysis.
4.7.2 Soil texture
The grain size distribution of the collected soil samples was determined according to
DIN ISO 11277 (2002). Before the analysis started, the composite samples were dried
at room temperature, sieved using a 2 mm sieve, and treated with H2O2 when a sample
had high organic carbon (> 2%) content. None of the samples needed to be treated for
calcium carbonate. For the wet sieving, 30 g of each sample were mixed with 100 ml
of water and 25 ml of 0.4 M Na4P2O7 (sodium-pyrophosphate) and shaken for 18 hours
to disperse the clay minerals. The sand fraction of the pre-treated soil sample was sep-
arated from the clay and silt fraction by flushing through a 63 µm sieve and washing
with water until the washing water was clear. After drying the sand fraction at 105 °C
in the oven, a dry sieve set was used to separate fine, medium and coarse sand. The
fraction flushing through the 63 µm sieve was collected into a 1000 ml cylinder and
the volume was filled up to 1000 ml before fractioning clay and silt using the Köhn
pipette method according to DIN ISO 11277 (2002) using a SEDIMAT 4 - 12 analyzer
(UGT GmbH, Müncheberg, Germany).

Materials and Methods
45
4.7.3 Soil water retention
The soil water retention curves were determined for the soil horizons of both experi-
mental sites before starting the field experiment in September 2012. Five undisturbed
soil core samples were collected from each soil horizon using metal rings (see 4.7.1 on
page 43). After determination of the fresh weight, the soil cores were slowly saturated
and weighed again. Then, the saturated soil cores were transferred into a pressure plate
extractor, the soil water retention was determined gravimetrically at 20, 60, 300, and
1000 mbar pressure, and volumetric water content was calculated using those values
(Richards and Fireman, 1943).
4.7.4 Soil chemical properties
Prior to performing the soil chemical analysis, all litter materials, living plants and
plant roots, and animals were removed from the mixed samples. The fresh samples
were sieved to ≤ 2 mm before getting sub samples, subsequently dried at 105 ± 1 °C
for ≥ 24 hours, and milled to use for necessary analysis.
The gravimetric water contents were determined by using 10 g of fresh soil, after keep-
ing them in an oven at 105 ± 1 °C for ≥ 24 hours and then cooling them down to room
temperature in a humidity free environment. The amount of water loss due to the oven
drying process was used to calculate the gravimetric water content (VDLUFA, 1991).
For the determination of the soil pH and the electrical conductivity (EC), 10 g of fresh,
sieved soil samples were mixed with 50 ml distilled water (specific conductivity not
higher than 0.2 mS/m at 25 °C) and shaken using a horizontal shaker for 30 minutes.
The soil-water suspensions were kept for one hour, then agitated again for five minutes
before reading the value using a pH meter (CG 820, Schott, Germany) according to
DIN ISO 10390 (2005). The same soil-water suspensions were used to determine the
EC according to DIN ISO 11265 (1997), using a glass single-rod electrode conductivi-
ty meter (LF 90, WTW, Germany). Both, pH meter and conductivity meter, were cali-
brated with standard buffer solutions (pH 4 and pH 7 and 0.2 mS m-1
at 25 °C) before
taking measurements.

Materials and Methods
46
The total carbon (TOC) and total nitrogen (TN) content were determined according to
DIN ISO 10694 (1996) with an elemental analyzer (Vario MAX Elementar, Hanau,
Germany). The soil sample was finely ground using a vibration disk mill with tung-
sten-carbide-coated walls and oven-dried at 105 ± 1 °C for ≥ 24 hours before using for
analysis. The amount of sample that was used for the elemental analyzer depended on
the nature of the sample, e.g. 0.3 - 0.7 g for mineral soil samples, 0.245 - 0.280 g for
organic rich soil and plant samples. The samples were combusted at a temperature of
900 ºC, and released gases were passed through a copper oxide catalyst after having
been dried. During this passage, CO was oxidized to CO2 and mono-nitrogen oxides
(NOx) were reduced to N2, and both gases were separated using a CO2 adsorption tube.
The quantitative amount of CO2 and N2 were measured separately using a thermal
conductivity detector.
Following VDLUFA (1991), a double-lactate extraction was used to determine plant
available potassium and phosphorus. The samples were shaken with double-lactate
solution (0.04 N with respect to Calcium and 0.02 N with respect to HCl; Riehm,
1942) for 90 minutes, and the filtrates were analyzed for potassium in an atomic ab-
sorption spectrometer (ASS; type 1100B, Fa. Perkin-Elmer, USA). After adding fresh-
ly prepared color indicator solutions, the amount of phosphate molybdenum-complex
which was produced in the solution was used to determine the plant available phospho-
rus using a spectral photometer at 660 nm (DR 5000, Hach Lange).
Depletive extraction with ammonium chloride solution was used to determine the cati-
on exchange capacity (CEC), the amount of exchangeable basic cations, and the base
saturation (BS) (DIN ISO 11260, 2011, Blume et al. 2010 SL ). Air dried and finely
ground 5 g of soil materials were mixed with 25 ml of 1 M ammonium chloride solu-
tion. The mixture was shaken for 10 minutes, followed by 10 minutes of centrifugation
at 30,000 rpm. Afterwards, the supernatant was decanted into a 200 ml volumetric
flask. After repeating this step three times, 25 ml of 1.25 M NH4Cl2 solution was add-
ed to the sample and centrifuged and stored overnight. On the following day, the su-
pernatant was decanted into the same volumetric flask. The volume was adjusted of the
volumetric flask, the solution was filtered, and the filtrate was used to determine the
concentration of the exchangeable cations Na+, K
+, Mg
++ and Ca
++ using an atomic

Materials and Methods
47
absorption spectrometer (ASS; type 1100B, Fa. Perkin-Elmer, USA). The CEC was
calculated as the sum of the concentrations of the exchangeable cations. BS was given
as a percentage taken up by the sum of the concentrations of base cations (Na+, K
+,
Mg++
and Ca++
) in CEC.
Inorganic nitrogen compounds (nitrate/nitrite and ammonium), dissolved organic car-
bon (DOC) and dissolved organic nitrogen (DON) were determined using 0.0125 M
CaCl2 extraction. Sieved (2 mm), fresh 30 g of soil were weighed into 100 ml polyeth-
ylene bottles, 60 ml of 0.0125 M CaCl2 was added and shaken in a vertical rotating
shaker at 120 rpm for 30 minutes, and then filtered through ash free filter paper
(Whatman 595 ½, 12-25 μm filter papers). For nitrite and nitrate, 0.6 ml of the extract
was used and measured by high-performance liquid chromatography (HPLC, Agilent
1200, Hannover, Germany). In order to determine the amount of ammonium, the sam-
ple was analyzed with a spectro-photometer (Hach, Lange, type 5000). DOC and DON
in the filtrate were measured using a TOC Analyzer 5050 (Shimadzu TE 2009AH, Ja-
pan).
4.7.5 Digestate and biochar
Fresh biochar and dry digestate samples were analyzed to determine water content,
pH, EC, bulk density, TOC, TN, C/N ratio, exchangeable cations (K+, Ca
++, Mg
++,
Na+), CEC, and BS (TMECC, 2002). pH and EC were determined in an 1:10 (w/v)
water extract after shaking the mixture mechanically for one hour, using a pH meter
(CG 820, Schott, Germany) and a glass single-rod electrode conductivity meter (LF
90, WTW, Germany). For biochar, the bulk density was calculated by weighing 10 ml
of milled sample, and the ash content of biochar was determined by a muffle furnace at
550 °C (TMECC, 2002).

Materials and Methods
48
4.8 Statistical analysis
Sigmaplot 12.5®
(Systat Software, Inc., USA) was used for performing statistical anal-
ysis. The significance of the seasonal variations of gathered data from the field exper-
iments were tested separately for the two soils using one-way ANOVAs. The signifi-
cance of the differences between treatments were tested using either the Tukey or the
Holm-Sidak post-hoc test, depending on the nature of the data sets. Both Sigmaplot
12.5 and OriginPro 8.1G® (OriginLab Corporation, USA) software packages were
used to generate the graphs to present the experimental results.

Results
49
5. Results
5.1 Environmental parameters and crop rotation
The annual total precipitation in 2012, 2013 and the first nine months of 2014 was
967.3, 802.8 and 643.3 mm respectively, according to the weather data collected by
Erfde meteorological station (Deutscher Wetterdienst or DWD). The average annual
rainfall for a 30 year period (1981 - 2010) was 857 mm, hence the average monthly
rainfall was 71 mm, ranging from 40 mm (in April) to 95 mm (in October). In all
years, February, March and April were dry months compared to the rest of the months
of the year (Figure 11and Figure 12). In 2013 from May to June, during the time of the
maize crop establishment in the experimental plots, the seedling emergence, and the
very young seedling stage, precipitation was less compared to the previous and follow-
ing years, even though the total annual precipitation value was close to the long term
average (Figure 11 and Figure 12).
The long term data gathered from the Erfde weather station shows that the annual av-
erage air temperature was 8.7 °C, with monthly values ranging from 1.3 °C (in Janu-
ary) to 17.1 °C (in July). The average annual air temperature in 2013 was 8.7 °C. The
coldest month was March (- 0.3 °C), and the warmest month was August (17.5 °C). In
comparison to 2012 and 2013, the beginning of 2014 was warmer (Figure 11 and Fig-
ure 12).

Results
50
Sep
12
Oct
12
No
v 1
2
Dec
12
Jan 1
3
Feb
13
Mar
13
Ap
r 13
May
13
June
13
July
13
Aug 1
3
Sep
13
Oct
13
No
v 1
3
Dec
13
Jan 1
4
Feb
14
Mar
14
Ap
r 14
May
14
June
14
July
14
Aug 1
4
Sep
14
Temperature 0C
-20
0
10
20
30
40
50
Rainfall (mm)
0
20
40
60
80
100
120
140
160
180
200
Air Temperature(mean)
Air Temperature (minimum)
Air Temperature(maximum)
Rainfall
Figure 11: Smoothed monthly mean air temperature, and monthly precipitation, together with changing of crops over the exper-
imental period from September 2012 to September 2014. Also shown are the monthly mean values of maximum and minimum
temperatures. Note the different scales for the y-axis. Data source: Erfde meteorological station.

Results
51
Figure 12: Smoothed monthly precipitation (A) and smoothed mean daily air
temperatures (B) in the years 2012, 2013 and 2014, plotted in comparison to the
long term values. Data source: Erfde meteorological station.
5.2 Characteristics of biochar and biogas digestate
The biochar was produced by fast thermal combustion at 650 °C and had a finer and
more homogeneous texture compared to its original feedstock (Figure 13). The thermal
decomposition process resulted in an 87 % weight loss, while the density increased by
20 %. The elemental mass losses of carbon and nitrogen were 86 % and 92 % respec-
tively. The C/N ratio increased from 20 ± 0.2 to 37 ± 1.5 (Table 4). Biochar was more
alkaline compared to the original digestate. The elemental compositions of biochar and
digestate are shown in Table 4. The total and exchangeable concentrations of Ca++
,
Mg++
, K+ and Na
+ cations were noticeably higher in biochar, but the CEC of digestate
was higher compared to biochar.

Results
52
Table 4: Selected chemical characteristics of digestate and fresh biochar: the
mean values with standard deviations (n = 3) and without standard deviations
when the number of samples is two or less.
Characteristic Unit Digestate Biochar
pH 6.6 8.00
Bulk Density g cm-3
n.a. 0.49
Moisture (dry
wt.) % 21.46 ± 1.3 20.66 ± 5.3
TOC % 39.46 ± 0.3 43.89 ± 2.8
TN % 2.02 ± 0.04 1.19 ± 0.1
C/N 20 ± 0.4 37 ± 1.5
Total Na* g kg-1
1.16 ± 0.0 2.63 ± 0.1
Total K* g kg-1
19.14 ± 0.1 41.67 ± 3.3
Total Ca* g kg-1
12.48 ± 1.3 38.68 ± 100
Total Mg* g kg-1
11.14 ± 0.1 29.30 ± 1.6
CEC mmolc kg-1
387.73 282.4
BS % 52.12 100.0
Exch. Na g kg-1
7.61 9.21
Exch. K g kg-1
4.37 7.10
Exch. Ca g kg-1
1.85 2.07
Exch. Mg g kg-1
1.13 1.45
Ash % n.a. 0.45
n.a. = not analyzed, * HNO3 extraction and n=2
Figure 13: Physical appearance of biochar (left) prepared from dry biogas diges-
tate (right) used as a feedstock; pyrolyzed at 650 °C with a retention time of 30 -
40 minutes.

Results
53
5.3 Total biomass production
The total biomass productions of each treatment during two winters and two summers
are shown in Figure 14 for site1 and site 2 separately. In both site 1 and 2, adding bio-
char produced higher total above ground biomass. Site 1, which was not used before
for continuous agricultural crop production, just after biochar application showed sig-
nificantly higher total biomass (ANOVA, p < 0.001, n = 3) without any other addition-
al chemical or organic fertilizer application. The positive effect of biochar on biomass
production was most prominent in summer 2014. Site 1 with biochar treatment (B)
produced 40.6 % higher biomass which was significantly different from the perfor-
mance of control treatment (C) in summer 2014 (ANOVA, p = 0.009, n = 3). Even
though the biochar application rate was low, it already enhanced the total biomass pro-
duction in summer 2013 and winter 2013/14 (26.1 ± 2.4 t ha-1 and 0.74 ± 0.08 t ha
-1
respectively), but the increments were nonsignificant (ANOVA, summer 2013: p >
0.05, n = 3; winter 2013/14: p = 0.083, n = 3).
In site 2, which was intensively used for mono-cropping and continuously received
biogas digestate during past years, the application of biochar as a soil amendment had
a result similar to site 1 (Figure 14). In the BH treatment, the total above ground bio-
mass increased by approximately 18 % in winter 2012/13 (p = 0.005, n = 3) and 47 %
in winter 2013/14 (p = 0.037, n = 3) compared to the soil with digestate only. In the
summer growing seasons, the highest biomass yields were shown with the BH treat-
ment (19.1 ± 2 and 54.6 ± 1 t ha-1
for 2013 and 2014 respectively), and was signifi-
cantly higher compared to digestate only (ANOVA, 2013: p = 0.006, 2014: p < 0.001,
n = 3).

Results
54
C B
To
tal b
iom
ass
pro
ductio
n
(t h
a-1)
0
2
4
6
8
10
C B
0
10
20
30
40
50
a
b
c
d
D BL BH
To
tal b
iom
ass
pro
ductio
n
(t h
a-1)
0
2
4
6
8
10
12
14
16
18
20
D BL BH
0
10
20
30
40
50
60
a a
b
a
ab
b
c
dd
cc
d
Site 1 Site 1
Site 2 Site 2
Summer 2014
Summer 2013
Winter 2013/14
Winter 2012/13
Summer 2014
Summer 2013
Winter 2013/14
Winter 2012/13
Figure 14: Total biomass production in winter and summer seasons for both ex-
perimental sites. Vertical error bars represent ± one standard deviation of the
means (n = 3). The different letters near to the error bars indicate significant dif-
ferences of the mean values. Letters are not shown when differences between
means are not significant. C: control, B: biochar, D: digestate only, BL: diges-
tate:biochar 1:1, BH: digestate:biochar 1:5. Note the different scales on the y-axis.
Crop specification: winter wheat and winter rye in winter 2012/13 and 2013/14
respectively, maize for all summer seasons.

Results
55
5.4 Soil characteristics and classification
The soils in both sites developed from glacial sediments, and were later affected by
human activities. According to the German soil classification system, the soil in site 1
was classified and described as Gley-Podsol (Ad-hoc-Arbeitsgruppe Boden, 2005) and
is shown in Table 5. This Gley Podsol is named Gleyic Podzol according to the World
Reference Base soil classification (WRB, 2006). In site 1, the Gleyic Podzol did not
receive additional organic or inorganic amendments in the past several years and was
not used for agricultural crop production.
After modifying the centuries-old soils in order to increase the agricultural productivi-
ty, the soil in site 2 developed into a soil with thick Ap and E horizons (≈ 40 cm). The
soil in site 2 was classified as Gley-Plaggenesch (German classification; Ad-hoc-
Arbeitsgruppe Boden, 2005) or Gleyic Anthrosol (WRB, 2006) and is shown in Table
6. The soil profile had features of podsolization, providing enough evidence to say that
the Anthrosol emerged and developed from Podzol. According to the visual observa-
tion of profiles, both soils displayed old Podzol characteristics.
Gleyic Anthrosol had a sandy texture with 3.20 % clay, 3.23 % silt, and 92.59 % sand.
Gleyic Podzol had 1.96 % clay, 8.11 % silt, and 89.92 % sand, and hence belonged to
the same soil textural class as Gleyic Anthrosol in the Site 2. The clay fraction of Gley-
ic Podzol decreased with increasing profile depth, but the deepest horizon had an in-
creasing trend again (Figure 15). The clay fraction showed only a very slight increase
with increasing depth in the Gleyic Anthrosol profile, and the silt fraction of the third
horizon (GBv) was noticeably higher compared to the upper horizons (Figure 15). In
both sites, the sand fraction dominated in the whole profile. Small stones were ran-
domly distributed among the whole depth of the Gleyic Podzol profile.

Results
56
%
0 10 20 30 40 50 60
0 10 20 30 40 50 60
Dep
th f
rom
the
So
il S
urf
ace
(cm
)
0
5
10
15
20
25
30
35
40
45
50
55
60
65
70
%
0 10 20 30 40 50 60 70
0 10 20 30 40 50 60 70
Dep
th f
rom
the
soil
surf
ace
(cm
)
0
5
10
15
20
25
30
35
40
45
50
55
60
65
Clay Silt Fine sand Medium sand Coarse sand
Gleyic Anthrosol - Site 2Gleyic Podzol - Site 1
Figure 15: Vertical distribution of clay, silt, and sand fractions in Gleyic Podzol
and Gleyic Anthrosol
In Gleyic Podzol, the Ap horizon showed higher medium and fine sand content com-
pared to the lower horizons, and hence had higher soil water content (see Figure 20 in
4.5.1 on page 68). The Ap and E horizons in Gleyic Anthrosol had a similarly sandy
texture with the same particle density (2.5 g cm-3
). The E horizon of Gleyic Anthrosol
had a slightly lower matrix potential than Ap, which led to quicker drainage of water
from the E horizon (see Figure 20 in 4.5.1 on page 68). The last two horizons (GBv
and Gro) showed a higher fine sand fraction which resulted in more micro pores com-
pared to the horizons dominated by coarse sand particles.

Results
57
In their chemical properties, the soil profiles of the two sites were not very similar to
each other (Table 7). The upper horizons of the soil which were affected by the vegeta-
tion in both sites, in addition to the human activities in site 2, and the water in site 1,
differed from each other more in their chemical properties than in their physical ones.
In particular, the TOC of the surface Ap horizon of Gleyic Anthrosol was more than
twice as high compared to TOC in the same horizon in Gleyic Podzol. Table 5 and Ta-
ble 6 show the differences of the TOC, TN and C/N ratios of Gleyic Anthrosol and
Gleyic Podzol throughout the whole profile depth. The lower horizons of both soils
had fewer differences compared to the upper two horizons. Gleyic Anthrosol was
slightly acidic with higher EC compared to Gleyic Podzol. The differences between the
two soil profiles of the cation concentrations, CEC and BS were not as high as those of
the TOC, TN, DOC and DON values. However, the higher cation concentrations, CEC,
and BS values for Gleyic Anthrosol are giving evidence of the human activities. High
root density and surface litter were more prominent in the undisturbed Gleyic Podzol
compared to Gleyic Anthrosol which was used for a monocrop with a deep plough lay-
er during the last several years.

Results
58
Table 5: Profile characteristics and soil classification of site 1 - Gleyic Podzol
Profile details*
Location: Centre of the experimental site in Drage
Geographic coordinates: 54° 36′ 43.31″ N,
9°15′25.18″E
Date of profile acquisition: 25.05.2012
Remarks: Surface was covered slightly by grass and had signs
of recent disturbances in the surface.
Adjacent to the waterlogged area and the sloping
land small stones were scattered randomly among
the whole profile.
Depth
(cm)
Horizon
denotation**
Soil color TOC
(%)
TN
(%)
C/N Bulk density
(g cm-³)
pH Soil texture
0 - 20 Ap 10YR3/1 0.68 0.07 10 1.54 4.45 Sandy loam
20 - 55 Go-Bh 10YR5/8 0.67 0.01 67 1.67 5.00 Sand
55 - 65 II Bhs 5YR5/2 0.06 0.01 6 1.70 5.29 Sand
> 65 Cv 10YR6/4 0.04 0.01 4 1.74 6.21 Sand
German Classification (Ad-hoc-Arbeitsgruppe Boden, 2005): Gley-Podsol World Reference Base Classification (WRB, 2006): Gleyic Podzol
*See the profile description sheet (Aufnahmeformblatt) in Table A 1 in the Annex on page 141 **according to US Soil Taxonomy
Ap
Go-Bh
IIIBhs
Cv
20 cm
55 cm
65 cm

Results
59
Table 6: Profile characteristics and soil classification of site 2 - Gleyic Anthrosol
Profile details*
Location: Centre of the experimental site in
Stapelholm
Geographic coordinates: 54° 35′ 41.18″ N, 9° 17′
27.16″ E
Date of profile acquisition: 25.05.2012
Remarks: No surface ground cover vegetation found. Detri-
tus originated from clay bricks.
Well decomposed organic layer.
Much lower root density (3 to 4 fine roots dm-3
),
and water table at depth 75cm at the end of
spring 2012.
Depth
(cm)
Horizon
denotation** Soil color
TOC
(%)
TN
(%) C/N
Bulk density
(g cm-³)
pH Soil texture
0 - 20 Ap 10YR2/1 1.37 0.01 137 1.44 5.33 Sand
20 - 40 E 10YR3/1 1.37 0.11 12 1.42 5.78 Sand
40 - 70 GBv 5YR3/2 0.49 0.03 16 1.65 5.73 Sandy loam
> 70 Gro 7.5YR5/8 0.22 0.01 22 1.70 6.08 Sand
German Classification (Ad-hoc-Arbeitsgruppe Boden, 2005):
Gley-Plaggenesch
World Reference Base Classification (WRB, 2006):
Gleyic Anthrosol
*See the profile description sheet (Aufnahmeformblatt) in Table A 2 in the Annex on page 142 **according to US Soil Taxonomy
Ap
E
GBv
Gr
20 cm
40 cm
75 cm

Results
60
Table 7: Selected chemical properties of Gleyic Podzol and Gleyic Anthrosol before applying biochar in October 2012. The aver-
age values of the respective horizons are given in the table without standard deviations (n=2).
Soil and
site
Depth Horizon* EC DOC DON NO3
--N NH4
+-N Avail. K Avail.P Exchangeable Cations
Ca Mg K Na
CEC BS
(cm) (µS cm-1) (mg kg
-1) (µM) (mg kg
-1) (mg kg
-1) (mmolc kg
-1) (mmolc kg
-1) (%)
Gleyic
Podzol 0 - 20 Ap 37.7 14.0 5.6 86.1 n.a. 40.4 156.8 3.9 0.8 1.5 0.3 22.2 29
(Site 1) 20 - 55 Go-Bh 19.0 12.7 2.5 25.6 n.a. <15 46.7 1.8 0.3 0.4 0.2 6.3 44
55 - 65 II Bhs 18.2 8.5 0.7 6.3 n.a. 26.4 38.5 3.3 0.8 0.7 0.3 7.5 66
> 65 Cv 18.3 11.0 0.6 0.0 n.a. 38.4 14.1 5.5 1.1 0.9 0.2 6.8 100
Gleyic
Anthrosol 0 - 20 Ap 76.3 25.5 33.1 481.4 0.50 69.9 147.4 23.9 1.6 1.7 0.2 26.6 100
(Site 2) 20 - 40 E 158.6 27.2 36.7 532.4 0.56 192.9 186.5 32.9 4.6 4.5 0.6 33.8 100
40 - 70 GBv 58.2 26.7 7.4 113.2 0.19 51.9 49.9 11.3 2.3 1.4 0.2 15.3 99
> 70 Gro 32.8 25.9 1.3 10.5 0.21 51.9 < 10 4.6 1.0 1.3 0.1 8.3 83
n.a. = not analyzed; pH - 1:1 soil H2O suspension/slurry; *according to US Soil Taxonomy

Results
61
5.4.1 Effect of biochar on homogeneity of soil
Though the soils in both sites (Gleyic Podzol and Gleyic Anthrosol) showed similari-
ties in the soil texture, the huge differences of the chemical properties of the two soil
profiles and the different usage of the lands do not allow presenting and discussing the
experiment results together. Therefore, the results will be presented and discussed sep-
arately for site 1 and site 2.
For site 1, two treatments were applied: control (C) without any soil amendment, and
application of biochar at 0.15 kg C m-2
(B). Site 2 had three different treatments with
0.15 kg C m-2
as a minimum organic carbon input rate: digestate only (D), and two
different mixtures of digestate and biochar, 1:1 (BL) and 1:5 (BH). A control site
could not be established in site 2 since this site had received digestate regularly over a
longer period of time prior to the start of our field experiment. The distribution and
identification of the treatment plots in both sites were already shown in Figure 9 (on
page 37) in the chapter Materials and Methods.
Before applying biochar to site 1, TOC and TN were not significantly different be-
tween the rest of the experimental plots at p = 0.05 level, except for plot number 1
(ANOVA, p = 0.005, n= 3). Plot number 1 showed the lowest TOC level (0.06 ±
0.0008 %), and the rest of the plots had a TOC of 0.08 ± 0.006 % (n = 15). The added
amount of biochar (application rate was 0.15 kg C m-2
) to plots number 2, 4 and 6 was
enough to increase TOC significantly compared to the initial TOC in all the plots
(ANOVA, p < 0.001). After biochar was added, plot number 4 had the highest TOC
amount (1.2 ± 0.002 %), which significantly differed from plot number 6’s TOC (1.1 ±
0.02 %) at p = 0.03. The group of plots used for control (C) continued to exhibit the
same significant difference of TOC as in the initial measurements.
Before being amended with biochar, the TN content of Gleyic Podzol in site 1 had a
similar variation to that of TOC: only TN of plot number 1 significantly differed from
the rest of the plots (ANOVA, p < 0.05). After applying biochar, TN significantly
increased in plots 4 and 6 (4B and 6B in Figure 16) at p < 0.05 (ANOVA. n = 3).

Results
62
However, the increase of TN in plot number 2 was non-significant from the initial TN
of plot numbers 2, 3, 4 and 5 (ANOVA, p > 0.05).
Plot Numbers
1C 3C 5C 2 4 6 2B 4B 6B
TO
Cto
pso
il (k
g m
-3 )
0.0
0.5
1.0
1.5
2.0
TN
to
pso
il(kg m
-3)
0.0
0.1
0.2
0.3
0.4
0.5
A
aa,b
b
(A) (B)
TOC before adding biochar TOC after adding biochar
TN before adding biochar TN after adding biochar
B
a
b
c
Figure 16: Variation of TOC and TN of Gleyic Podzol in site 1 before and after the
application of biochar. (A) Variability before applying biochar and (B) variability
after applying biochar to plots number 2, 4 and 6. The vertical error bars repre-
sent ± one standard deviation of the mean (n = 3); the level of significance be-
tween the mean values is indicated by different letters: uppercase letters for be-
fore the application, and lowercase letters for after the application. B indicates
the biochar amended plots (0.15 kg C m-2
).
The TOC contents of the experimental plots in Gleyic Anthrosol in site 2 were 58.33 %
significantly different before applying biochar and digestate into the surface layer (0 -
0.2 m; ANOVA, Duncan's multiple comparison, p = 0.05). These initial significant
differences of TOC values were randomly distributed among the plots that were later
used for the treatments (symbols without filling color in Figure 17). Within the group
treated with digestate only (section A in the graph; plot numbers 7, 11 and 13), there
was a significant difference in TOC (ANOVA, p ≤ 0.001, n = 3).

Results
63
Plot Numbers
7D 11D 13D 8 12 14 8BL12BL
14BL 9 10 15 9BH10BH
15BH
TO
Cto
pso
il (k
g m
-3)
0
1
2
3
4
TN
top
soil
(kg m
-3)
0.0
0.2
0.4
0.6
0.8
1.0(A) (B) (C)
A
B
CA
A
B,CA,C
d
b
d
TOC before adding biochar TOC after adding biochar at 0.15 C kg m-2
TOC after adding biochar at 0.75 C kg m-2
TN before adding biochar TN after adding biochar at 0.15 C kg m-2
TN after adding biochar ar 0.75 C kg m -2
A
A
a
Figure 17: Variation of TOC and TN in Gleyic Anthrosol in site 2 before and after
application of soil amendments. The symbols without filling color in (A), (B) and
(C) show the variability before application, the symbols with filling color in (B)
and (C) show the variability after application of digestate:biochar (1:1 for BL, 1:5
for BH). The vertical error bars represent ± one standard deviation of the mean
(n = 3); Different letters indicate the level of significance between the mean values
- uppercase for before application and lowercase for after application. Letters are
not shown when the differences of means are not significant.
Among the plots which received biochar low amount (BL plots), number 12 initially
had a significantly higher TOC than the other two plots (8 and 14 plots; ANOVA, p ≤
0.001, n = 3) but after application the significant difference was gone. Among the plots
which received biochar high amount (BH plots), there initially were significant
differences between the TOC of all the plots (ANOVA, p = 0.015, n = 3). After
application, there was no significant difference between plots 9 and 15, but plot
number 10 had 19 % significantly higher TOC compared to both plots number 9 and
15 (ANOVA, p = 0.002, n = 3).

Results
64
Before application of biochar and digestate to the topsoil (0 - 0.2 m) in Gleyic Anthro-
sol, the TN content was not significantly different between plots except for number 9
and 7. Plot number 9 had significantly higher TN compared to all other plots
(ANOVA, p ≤ 0.01, n = 3), whereas the number 7 plot had significantly lower TN
compared to plot number 15 (ANOVA, P = 0.047, n = 3). After the soil was amended
with biochar and digestate, only the number 10 plot showed significantly lower TN
among the plots with high amount of biochar (ANOVA, p ≤ 0.05, n = 3).
The topsoil (0 - 0.2 m) of plot number 5 in site 1 had low DOC (1.45 g DOC per kg
soil per m3) but not significantly different from the rest of the plots (see Table A 4 on
page 144 in the Annex). The plots at the edge of the slope where water had accumu-
lated had higher concentration of DON in the surface horizon (0 - 0.2 m) than the ones
close to the road. Other chemical properties, including pH, EC, CEC, BS and ex-
changeable cation concentrations in the topsoil (0 - 0.2 m) of site 1 and 2 showed non-
significant variations between mean values of the plots (see Table A 4 on page 144 in
the Annex).
Biochar and digestate both are porous media, rich in elements (see Table 4 on page 52
in 5.2). Therefore, adding them to the soil can be expected to considerably alter the
chemical composition of soil solid and pore water. In fact, the experiment showed that
after adding biochar into the topsoil (0 - 0.2 m) of site 1 and 2, the concentration of
some selected soil elements changed (see Table A 5 on page 144 in the Annex). In site
1, all chemical properties increased after biochar was incorporated into the topsoil (0 -
0.2 m) except for DON and Na+. However, DOC, BS, Ca
++, Mg
++, and K
+ content did
not significantly change after the plots had been treated with biochar (ANOVA, p >
0.05, n = 3), but CEC significantly increased (ANOVA, p ≤ 0.05, n = 3). Also in site 2,
DON did not increase by adding biochar to the soil which already contained digestate
(see Table A 5 on page 144 in the Annex). After adding biochar in low concentration to
site 2 (BL plots), there were significant differences of Ca++
, K+, and Na
+ cation con-
centrations, and in the CEC and BS values between the treated plots (ANOVA, p ≤
0.05, n = 3). With the high biochar application rate (BH plots), only DON and Mg++
did not show any significant changes between the treated plots (ANOVA, p > 0.05, n
= 3), while all other parameters showed significant variation (ANOVA, p ≤ 0.05, n =

Results
65
3; see Table A 5 on page 144 in the Annex).
5.4.2 Mass losses of TOC during the biochar application
Because of the technique we used for biochar incorporation (see 4.2 on page 34 in Ma-
terials and Methods), there was a possibility of not having an equal distribution of the
added biochar throughout the topsoil (0 - 0.2 m) of the experimental plots. Therefore,
assuming that the added biochar was stored in the whole soil mass in the depth of the
topsoil (0 - 0.2 m), the application losses were calculated as mass losses of TOC (C kg)
to mass of soil (kg of soil in 1 m3) using the bulk density (Gleyic Anthrosol: 1.543 g cm
-3;
Gleyic Podzol: 1.438 g cm-3
) and the thickness of the soil layer (0 - 0.2 m).
Before applying digestate and biochar to site 1, except for plot one, TOC did not show
significant differences (see Figure 16 and Table A 1 on page 141 in the Annex; ANO-
VA, p = 0.45, n = 3), so it was to be expected that the TOC values would not differ
significantly after applying biochar either. However, after the application the measured
TOC values were significantly different among the various plots (ANOVA, p = 0.008,
n = 3). Plot number 4 had the highest TOC (1.85 ± 0.0 kg C per kg soil per m3), fol-
lowed by plot 6 and plot 2 (1.75 ± 0.05, and 1.70 ± 0.05 kg C per kg soil per m3 resp.).
Concerning the mass losses of TOC among the three plots with Gleyic Podzol in site 1,
there were no significant differences, and the average loss of TOC was 0.35 ± 0.1 kg C
kg soil-1 m
-3 (ANOVA, p = 0.5, n = 3).
The mean values of lost TOC in the BL plots in site 2 were not significantly different,
and the average loss of TOC was 0.60 ± 0.15 kg C per kg soil per m3 (ANOVA, p >
0.05). Plot number 12 had the highest loss of TOC, while number 14 showed the low-
est one. The BH plots showed a different behavior. The lost amounts of TOC between
the BH plots were significantly different, and the loss was higher than in the BL plots
(Figure 18). Hence, the application losses increased with increasing amount of biochar
applied, but there was no clear and significant correlation between losses and applied
amount of biochar.

Results
66
Figure 18: Available and lost TOC during the application of biochar, calculated as
% out of excepted TOC content after adding biochar. The olive green and black
colored parts of the bars represent available TOC in treated soils in site 1 and site
2 respectively, and the grey parts show the lost TOC.
Adding biochar into Gleyic Anthrosol in site 2 showed larger losses compared to Gley-
ic Podzol in site 1 where the experimental plot had a much closer (5.4 ± 0.37 m) thick
live fence along the road which acted as a wind-break (see Figure 9 on page 37 in Ma-
terials and Methods for the layout of the field and the experimental plots for both
sites). Site 2 had an open border along the road, where wind entered to the field with-
out any disturbances. Figure 19 shows how wind and precipitation acted on site 2 dur-
ing the crop establishment time and the young seedling stage.
0% 20% 40% 60% 80% 100%
222444666
888
121212141414
999
101010151515
Tre
atm
ent
gro
ups
wit
h r
espec
tive
soil
type
and p
lot
num
ber
s
Bio
char
D
iges
tate
:Bio
char
1:1
D
iges
tate
:Bio
char
1:5
Sit
e 1
S
ite
2
Sit
e 2
nm

Results
67
Figure 19: The deposited sand particles around the soil collar show the effects of
wind and precipitation on the land when there were no or fewer crop canopies
and wind-breaks in site 2.
5.5 Effect of biochar and digestate on soil physico-chemical properties
5.5.1 Soil moisture and matrix potential
Soil texture, organic matter content, precipitation rate, and evapotranspiration rate are
primary factors which can influence soil moisture, which in turn is a key factor for de-
termining agricultural productivity of a given soil. Hence, adding highly porous organ-
ic material like biochar and digestate to the soil may alter the soil water availability.
The application of biochar and digestate to Gleyic Podzol and Gleyic Anthrosol did not
significantly effect the seasonal variation in soil water content (ANOVA, p > 0.05, n =
3; see Table A 6). The BH treatment in site 2 resulted in a slightly, but nonsignificantly
higher soil moisture content throughout the experimental period except in summer
2013. The volumetric water content and matrix potential of both sites are shown in
Figure 20. Figure 21 shows the same parameters two years after biochar application to
the field in site 2.

Results
68
Site 1 - Gleyic Podzol
Matrixpotential (pF)0 1 2 3 4 5
Wat
er c
onte
nt
(V %
)
0
10
20
30
40 Ap
Go-Bh
II Bhs
Cv
Site 2 - Gleyic Anthrosol
Matrixpotential (pF)
0 1 2 3 4 5
0
10
20
30
40 Ap
E
GBv
Gro
Figure 20: Soil moisture characteristic curves for each soil horizon of both site 1
and site 2 before applying soil amendments in October 2012.
Gleyic Anthrosol - Ap
Matrixpotential (pF)
0.0 0.5 1.0 1.5 2.0 2.5
Wat
er c
onte
nt
(V %
)
0
10
20
30
40
50
D
BL
BH
Gleyic Anthrosol - GBv
Matrixpotential (pF)
0.0 0.5 1.0 1.5 2.0 2.5
D
BL
BH
Gleyic Anthrosol - E
Matrixpotential (pF)
0.0 0.5 1.0 1.5 2.0 2.5
D
BL
BH
Figure 21: Soil moisture characteristic curves for Ap, E and GBv soil horizons of
Gleyic Anthrosol, two years after biochar application of D, BL and BH treatments.

Results
69
5.5.2 Soil reaction (pH) and electrical conductivity (EC)
The effect of the application of digestate and biochar on soil pH and EC of the topsoil
(0 - 0.2 m) in both sites is shown in Table 8 and Table A 6 in the Annex on page 145.
In site 1, the mean values of soil reaction and EC in the topsoil (0 - 0.2 m) did not sig-
nificantly increase during the first season after amending the soil with biochar (winter
2012/13; ANOVA, for pH: p = 0.331, n = 6; for EC: p = 0.139, n = 6). The first five
seasons showed higher EC with biochar amended soil, but after that, EC values of the
biochar treated plots and the control plots were quite similar in site 1.
Table 8: Seasonal variation of soil acidity in the topsoil (0 - 0.2 m) in site 1 and site
2 after establishment of the experiment at both sites in October 2012. Shown are
mean values and the respective standard deviations (n = 3 to 9).
Soil amendments
pH * Site 1 Site 2
C B D BL BH
Winter 2012/13 4.4 ± 0.6 4.8 ± 0.8 5.2 ± 0.8 5.4 ± 0.8 5.9 ± 0.8
Spring 2013 4.0 ± 0.1 4.4 ± 0.1a 4.6 ± 0.1 4.7 ± 0.2 5.4 ± 0.6
a
Summer 2013 3.9 ± 0.2 4.2 ± 0.2a 4.5 ± 0.1 4.5 ± 0.3 5.2 ± 0.5
a
Autumn 2013 4.1 ± 0.1 4.2 ± 0.1a 4.4 ± 0.1 4.6 ± 0.3 5.2 ± 0.3
a
Winter 2013/14 4.2 ± 0.2 4.3 ± 0.2 4.3 ± 0.1 4.4 ± 0.2 5.0 ± 0.3
Spring 2014 4.1 ± 0.2 4.3 ± 0.1 4.3 ± 0.1 4.5 ± 0.2 4.9 ± 0.2a
Summer 2014 3.8 ± 0.0 3.9 ± 0.1a 4.1 ± 0.1 4.2 ± 0.2 4.7 ± 0.3
a
* H2O suspension. For each field site, values followed by the different letters are significant-
ly different at p ≤ 0.05. Letters are not shown when differences of means are nonsignificant.
C: control, B: biochar, D: digestate only, BL: digestate:biochar 1:1, BH: digestate:biochar
1:5
In site 2, the increase of the soil reaction in the BH treated plots was significant in all
seasons, except in both winter seasons (2012/13 and 2013/14). Even after seven sea-
sons since the experiment started in 2012, conditioning Gleyic Anthrosol in site 2 with
the slightly alkaline biochar in addition to digestate had a positive effect on soil reac-
tion compared to application of digestate only (Table 8). BH treatment also had signif-
icantly higher soil pH (ANOVA, p < 0.05, n = 3 to 6), except in the two winter sea-
sons. However, there were no significant differences between digestate only treatment
and BL treatment (ANOVA, p < 0.05, n = 6 to 9). In the seventh season after starting

Results
70
the experiment in 2012, the soil reaction finally had decreased by 20 % for all the
treatments in site 2.
5.5.3 Soil organic carbon and nitrogen
The effects of biochar as a soil amendment to Gleyic Podzol in site 1 and as a mixture
with digestate to Gleyic Anthrosol in site 2 on TOC, TN, C/N, DOC and DON concen-
tration in the topsoil (0 - 0.2 m) are shown in Table 9 and Table A 7 in the Annex on
page 145. TOC concentrations of both soils significantly increased after adding bio-
char (p < 0.05). In site 1, after mixing biochar at 0.15 kg C m-2
rate, TOC concentra-
tion in the topsoil (0 - 0.2 m) increased by 30 % (ANOVA, p < 0.024, n = 6). In site 2,
BH treatment increased TOC by 20.5 % (ANOVA, p < 0.030, n = 6), and BL treat-
ment increased it by 4.5 % (ANOVA, p = 0.790, n = 6) compared to the digestate only
treatment. At the end of the experiment, TOC in topsoil (0 - 0.2 m) had increased by
3.29 % resp. 1.3 % for BH resp. digestate only treatment, and decreased by 3.2 % for
BL treatment.
Site 1 showed only slightly higher TN concentration in the topsoil (0 - 0.2 m) of bio-
char treatment compared to the control treatment. For site 2, after the application of
biochar in October 2012, TN concentration did not clearly change in the first season
(winter 2012/13), and the same result showed at the end of the experiment in Septem-
ber 2014.
In site 1, adding 0.15 kg C m-2
to the topsoil (0 - 0.2 m) in the form of biochar (B) in
September 2012 significantly increased the C/N ratio by 12 % (ANOVA, p < 0.001, n
= 6). The following spring season did not show clear differences of C/N ratios be-
tween biochar treated and untreated plots. However, summer and autumn 2013 again
showed significant differences (ANOVA; summer: p = 0.003, n = 9; autumn: p =
0.016, n = 9). Two years after biochar application to Gleyic Podzol, the influences of
biochar on the C/N ratio nearly had vanished, and with 5 % there only was an insignif-
icantly higher value in the biochar plots (p > 0.05).

Results
71
Table 9: Seasonal variation of TOC, TN, and C/N in the topsoil (0 - 0.2 m) in site 1
and site 2 after establishment of the experiment in October 2012. Shown are mean
values and the respective standard deviations (n = 3 to 9).
Soil amendments
Site 1 Site 2
C B D BL BH
TOC (%)
Winter 2012/13 0.83 ± 0.1 1.08 ± 0.2a 1.51 ± 0.2
a 1.58 ± 0.1
ab 1.82 ± 0.3
b
Spring 2013 0.84 ± 0.1 1.01 ± 0.2a 1.45 ± 0.1 1.60 ± 0.2 1.89 ± 0.3
a
Summer 2013 0.86 ± 0.1 1.02 ± 0.2 1.56 ± 0.1 1.62 ± 0.1 1.86 ± 0.3a
Autumn 2013 0.73 ± 0.1 0.89 ± 0.1a 1.51 ± 0.1 1.57 ± 0.1 1.75 ± 0.3
a
Winter 2013/14 0.76 ± 0.0 0.94 ± 0.0a 1.46 ± 0.1 1.56 ± 0.1 1.86 ± 0.3
a
Spring 2014 0.83 ± 0.1 0.90 ± 0.1 1.50 ± 0.2 1.51 ± 0.1 1.74 ± 0.2
Summer 2014 0.82 ± 0.1 1.09 ± 0.1a 1.53 ± 0.1 1.53 ± 0.1 1.88 ± 0.2
a
TN (%)
Winter 2012/13 0.08 ± 0.01 0.10 ± 0.01 0.11 ± 0.01 0.11 ± 0.01 0.11 ± 0.01
Spring 2013 0.08 ± 0.01 0.09 ± 0.03 0.10 ± 0.04 0.11 ± 0.00 0.12 ± 0.01
Summer 2013 0.09 ± 0.01 0.09 ± 0.04 0.12 ± 0.00 0.12 ± 0.01 0.12 ± 0.01
Autumn 2013 0.08 ± 0.01 0.09 ± 0.01a 0.12 ± 0.00 0.12 ± 0.00 0.12 ± 0.01
Winter 2013/14 0.08 ± 0.01 0.09 ± 0.00a 0.11 ± 0.00 0.11 ± 0.00 0.12 ± 0.01
Spring 2014 0.09 ± 0.01 0.09 ± 0.01 0.12 ± 0.01 0.11 ± 0.01 0.12 ± 0.01
Summer 2014 0.09 ± 0.01 0.10 ± 0.01 0.12 ± 0.00 0.12 ± 0.00 0.12 ± 0.01
C/N
Winter 2012/13 10.05 ± 0.1 11.25 ± 0.6 a 13.5 ± 0.5 14.1 ± 0.5 15.9 ± 1.1
a
Spring 2013 10.16 ± 0.9 10.35 ± 1.9 13.3 ± 1.0
a 14.2 ± 1.8 15.7 ± 1.3
Summer 2013 9.43 ± 0.7 10.55 ± 0.7 a 13.1 ± 0.7 13.7 ± 0.8 15.3 ± 1.2
a
Autumn 2013 9.44 ± 0.5 9.96 ± 0.4 a 13.0 ± 0.8 13.5 ± 0.4 14.7 ± 1.1
a
Winter 2013/14 9.72 ± 0.4 10.04 ± 0.6 13.3 ± 0.7 14.0 ± 0.8 15.2 ± 1.0
Spring 2014 9.47 ± 0.4 9.80 ± 0.4 12.9 ± 1.0 13.6 ± 0.8 13.8 ± 1.1
Summer 2014 9.14 ± 0.9 9.60 ± 0.8 12.5 ± 0.6 15.2 ± 4.2 14.2 ± 1.4
For each field site, values followed by the different letters are significantly different at p ≤
0.05. Letters are not shown when differences of means are nonsignificant. C: control, B:
biochar, D: digestate only, BL: digestate:biochar 1:1, BH: digestate:biochar 1:5.
In site 2, amending Gleyic Anthrosol topsoil (0 - 0.2 m) with biochar and digestate in-
creased the C/N ratio by 17 % for the BH treatment (ANOVA, p = < 0.001, n = 9),
and 4 % for the BL treatment (ANOVA, p > 0.05, n = 9). In spring 2013, the D treat-
ment had a significantly lower C/N compared to the BL and BH treatments (ANOVA,
p = 0.009, n = 9). During the whole experimental time, the BH treatment showed a
higher C/N than the BL and the D treatments, but the differences were only significant

Results
72
in summer 2013 and autumn 2013 (ANOVA; summer: p = < 0.001, n = 9, autumn: p
= < 0.001, n = 9).
The influences of digestate and biochar on inorganic nitrogen in site 1 and 2 soils are
shown in Figure 22. The ammonium nitrogen content in the topsoil (0 - 0.2 m) was not
significantly influenced by any of the treatments in site 1 or 2 (ANOVA, p > 0.05, n =
3 to 9). However, site 1 showed higher ammonium nitrogen with the biochar treatment.
Both in site 1 and 2, the ammonium nitrogen data showed high standard deviations
caused by the highly varying data inside the treatment group.
Nitrate nitrogen content was significantly influenced by all soil amendments over the
whole experimental period (ANOVA, p < 0.009, n = 3 to 9). Except for the winter
2013/14 season, nitrate nitrogen in topsoil (0 - 0.2 m) of B treatment in site 1 was sig-
nificantly higher compared to the untreated soil (p < 0.05, n = 3 to 9). In the first win-
ter (2012/13) after application of biochar in October 2012, 57 % higher nitrate nitrogen
showed from the BH treatment (ANOVA; p < 0.05, n = 3 to 9), but only a 7 % nonsig-
nificant increase from the BL treatment (p > 0.05, n = 3 to 9), both compared to treat-
ment D. In the next spring season (2013), nitrate nitrogen content decreased drastically
by 69 %, 81 %, and 87 % for the BH, BL and D treatments respectively, and remained
like that without big fluctuations during the rest of the seasons (Figure 22). Through-
out the whole experimental time period, the BH treatment reported the significantly
highest nitrate nitrogen content compared to BL and D treatments (ANOVA; p < 0.05,
n = 3 to 9), but in summer 2013 the difference between BH and D was only small
(ANOVA; p > 0.05, n = 3 to 9).

Results
73
Wi.
12/1
3
Sp. 201
3
Su. 2
013
Au.
201
3
Wi.
13/1
4
Sp. 201
4
Su. 2
014
NH
+4
(mg k
g-1
)
0
2
4
6
8
10
D
BL
BH
Wi.
12/1
3
Sp. 201
3
Su. 2
013
Au.
201
3
Wi.
13/1
4
Sp. 201
4
Su. 2
014
NH
+4
(mg k
g-1
)
0
2
4
6
8
10
C
B
Wi.
12/1
3
Sp. 201
3
Su. 2
013
Au.
201
3
Wi.
13/1
4
Sp. 201
4
Su. 2
014
Nit
rate
(µ
M N
itra
te
100 g
of
dry
soil-1
)
0
200
400
600
800
1000
D
BL
BH
Wi.
12/1
3
Sp. 201
3
Su. 2
013
Au.
201
3
Wi.
13/1
4
Sp. 201
4
Su. 2
014
Nit
rate
(µ
M N
itra
te
10
0 g
of
dry
so
il-1
)
0
100
200
300
400
500
C
B a
a
aa a a a
a
a
aa a a a
a
bc
Site 2Site 1
Site 2Site 1
Figure 22: Seasonal variation of ammonium-nitrogen and nitrate-nitrogen con-
centration in the topsoil (0 - 0.2 m) in site 1 and site 2 after establishment of the
experiment in October 2012. Shown are mean values for each treatment. The ver-
tical error bars represent ± one standard deviation of the mean (n = 3 to 9); Dif-
ferent letters of the respective groups indicate the level of significance. Letters are
not shown when the differences of means are not significant. Note the different
scales in the Y-axis of the Nitrate graphs.

Results
74
5.5.4 CEC, BS and exchangeable cation concentration
In site 1, most of the seasons showed nonsignificant higher CEC with biochar treated
plots (B) (ANOVA, p > 0.05; Figure 23). The winter 2012/13 season, right after the
application, showed 65 % significant increment of CEC in the B treatment compared
to the control (ANOVA, p < 0.001, n = 3). During the following spring season, CEC in
both B and C treatments increased with different rates, but a significant difference was
not detected (ANOVA, p = 0.31, n = 3).
In site 2, which has a higher content of organic carbon than site 1, the result was dif-
ferent. Amending Gleyic Anthrosol in site 2 with biochar increased CEC significantly
(ANOVA, p ≤ 0.05; Figure 23). No significant differences were found between the BH
and BL treatments (p > 0.05, n = 6 and n = 3) except in autumn 2013 (p = 0.009, n =
6). Independent of the application rate, adding biochar to site 2 significantly increased
CEC by approximately 31 % (33.1 % for BH, and 29.5 % for BL; p <0.001, n = 3) in
winter 2012/13, and very similar values in the following spring 2013 season (p
<0.001, n = 3). After the first main growing season (summer 2013), CEC decreased in
the biochar treated plots (BH and BL), and remained the same with little fluctuation.
But, one year later, in winter 2013/14, BH treatment showed 36 % higher CEC com-
pared to the D treatment, but because of the high variation of measured values this dif-
ference was nonsignificant (ANOVA, p = 0.20, n = 3). Two years after the application
of mixture of digestate and biochar, CEC was still increased in site 2.
In site 1, BS ranged from 14.8 % to 51.4 % over all seasons and both treatments
(Figure 23). Treatment B showed nonsignificantly higher BS compared to C from
spring 2013 to autumn 2013 (p > 0.05, n = 3 to 6). In the rest of the seasons, BS val-
ues of C and B treatments in site 1 were significantly different (ANOVA, p < 0.05, n = 6).
Site 2 showed a similar pattern to site 1 (Figure 23), but the BS values had a higher
variability within the treatment. Therefore, no statistically significant differences (p >
0.05) were observed for BS in site 2 except in winter 2012/13 (ANOVA, p < 0.002, n
= 3) and spring and summer 2014 (spring: p < 0.001, n = 3; summer: p = 0.01, n = 3).
The spring 2013 season showed 92 % higher BS in the BH treatment than in the D

Results
75
treatment (p = 0.06, n = 3). At the end of the experiment in summer 2014, BS was still
33 % higher in the BH treatment (p = 0.01, n = 3).
a
Wi.
12/1
3
Sp. 201
3
Su. 2
013
Au.
201
3
Wi.
13/1
4
Sp. 201
4
Su. 2
014
BS
(%
)
0
20
40
60
80
100
120Site 2 - BSa
Wi.
12/1
3
Sp. 201
3
Su. 2
013
Au.
201
3
Wi.
13/1
4
Sp. 201
4
Su. 2
014
CE
C (
mm
ol c
kg-1
)
0
20
40
60
80
D
BL
BH
Site 2 - CEC
a a
bc a
a
a
aa
Wi.
12/1
3
Sp. 201
3
Su. 2
013
Au.
201
3
Wi.
13/1
4
Sp. 201
4
Su. 2
014
0
20
40
60
80
C
B
Site 1 - CEC
a
Wi.
12/1
3
Sp. 201
3
Su. 2
013
Au.
201
3
Wi.
13/1
4
Sp. 201
4
Su. 2
014
0
20
40
60
80
100
120
Site 1 - BS
a
a
a
a
Figure 23: Seasonal variation of CEC and BS in the topsoil (0 - 0.2 m) of site 1
and site 2 after establishment of the experiment in October 2012. Shown are mean
values for each treatment for each season (n varies from 3 to 6). Different letters
indicate significant differences between means. Letters are not shown when dif-
ferences of means are not significant.

Results
76
Table 10: Seasonal variation of the exchangeable cation concentrations in the top-
soil (0 - 0.2 m) for selected cations in site 1 and 2 after establishment of the exper-
iment in October 2012. Shown are mean values and the respective standard devi-
ations (n = 3 to 9) for each treatment.
Soil amendments
Site 1 Site 2
C B D BL BH
Ca++
Winter 2012/13 100.20 ± 4 81.87 ± 71 387.0 ± 30 466.9 ± 47 483.7 ± 72
Spring 2013 152.17 ± 22 155.36 ± 54 384.5 ± 8 514.5 ± 123 575.8 ± 149
Summer 2013 106.84 ± 11 156.39 ± 19b 405.0 ± 83 437.3 ± 128 501.8 ± 150
Autumn 2013 135.27 ± 35 125.80 ± 40 505.7 ± 107 432.1 ± 105 346.3 ± 68
Winter 2013/14 101.47 ± 25 121.58 ± 4 293.7 ± 44 423.6 ± 135 430.8 ± 119
Spring 2014 95.39 ± 17 147.03 ± 27 325.4 ± 23 367.0 ± 61 434.8 ± 124
Summer 2014 100.20 ± 11 120.91 ± 26 329.3 ± 38 332.6 ± 91 432.5 ± 134
Mg++
Winter 2012/13 15.47 ± 1 49.07 ± 42a 30.80 ± 8 58.67 ± 10 254.40 ± 97
a
Spring 2013 17.07 ± 4 43.33 ± 6a 20.00 ± 2 54.27 ± 12 170.27 ± 33
a
Summer 2013 12.07 ± 2 70.00 ± 9a 30.13 ± 12 48.07 ± 15 188.53 ± 56
a
Autumn 2013 23.20 ± 19 31.13 ± 19 86.93 ± 70 65.40 ± 63 84.87 ± 85
Winter 2013/14 14.26 ± 3 39.37 ± 4a 21.83 ± 7 35.72 ± 12 134.78 ± 63
a
Spring 2014 12.47 ± 4 43.34 ± 8a 10.27 ± 11 20.13 ± 22 69.64 ± 79
a
Summer 2014 12.03 ± 4 37.38 ± 8b 26.28 ± 7 34.38 ± 13 133.61 ± 4
a
K+
Winter 2012/13 70.57 ± 7 139.44 ± 20b 101.91 ± 65 105.11 ± 33 254.44 ± 24
a
Spring 2013 37.81 ± 10 62.81 ± 5b 43.30 ± 10 54.12 ± 5 114.45 ± 31
a
Summer 2013 46.87 ± 16 96.35 ± 28b 49.11 ± 16 41.92 ± 7 104.04 ± 26
a
Autumn 2013 68.73 ± 21 75.53 ± 14 99.07 ± 42 89.80 ± 34 112.19 ± 49
Winter 2013/14 50.18 ± 4 69.60 ± 33 40.40 ± 3 43.27 ± 6 93.58 ± 21a
Spring 2014 43.27 ± 19 72.47 ± 18 28.93 ± 2 28.54 ± 6 71.55 ± 31a
Summer 2014 40.14 ± 12 47.05 ± 12 61.13 ± 7a 42.23 ± 4 60.61 ± 7
Na+
Winter 2012/13 3.36 ± 1 2.95 ± 3 5.62 ± 3 6.34 ± 1 8.43 ± 0
Spring 2013 4.88 ± 2 6.34 ± 1 0.29 ± 0a 2.01 ± 1 4.42 ± 3
Summer 2013 17.18 ± 3 19.49 ± 3 18.18 ± 4 16.80 ± 3 21.65 ± 6
Autumn 2013 18.93 ± 2 19.80 ± 2 18.73 ± 5 22.47 ± 11 18.00 ± 1
Winter 2013/14 15.33 ± 2 18.39 ± 1 11.57 ± 0 11.95 ± 1 15.71 ± 3a
Spring 2014 10.27 ± 5 13.79 ± 4 6.21 ± 2 7.05 ± 1 9.73 ± 1a
Summer 2014 7.13 ± 1a 10.19 ± 0
b 9.58 ± 3 7.74 ± 1 8.43 ± 2
Values followed by the different letters are significantly different at P ≤ 0.05. Letters are not
shown when differences of means are not significant, C: control, B: biochar, D: digestate
only, BL: digestate:biochar 1:1, BH: digestate:biochar 1:5

Results
77
The seasonal variation of exchangeable cation concentrations in the topsoil (0 - 0.2 m)
is shown in Table 10. There was an initial increase of exchangeable Ca++
and ex-
changeable Na+ in site 2, which, however, was nonsignificant (p > 0.05, n = 3 to 6),
but no increase in site 1. For exchangeable Mg++
and exchangeable K+, there was a
clear increase in both soils. Exchangeable Mg++
and exchangeable K+ concentrations
were significantly higher in B treatment compared to C treatment in site 1, and in BH
treatment compared to D in site 2 (ANOVA, p < 0.05), except Mg++
in autumn 2013 (p
= 0.8 for site 1 and p = 0.4 for site 2). For site 2, exchangeable Mg++
and K+ concentra-
tions increased in the order of D < BL < BH (except for exchangeable K+ in spring
2014).

Results
78
Wi. 2
012/13
Sp. 2013
Su. 2013
Au. 2013
Wi. 2
013/14
Sp. 2014
Su. 2014
0
10
20
30
40
50
C
B
Wi. 2
012/13
Sp. 2013
Su. 2013
Au. 2013
Wi. 2
013/14
Sp. 2014
Su. 2014
0
20
40
60
80
100
C
B
a
a
aa
a
aa
aaa
Site 1
Site 1
Wi. 2
012/13
Sp. 2013
Su. 2013
Au. 2013
Wi. 2
013/14
Sp. 2014
Su. 2014
DL
- K
(m
g K
2O
/100g)
0
10
20
30
40
50
D
BL
BH
Wi. 2
012/13
Sp. 2013
Su. 2013
Au. 2013
Wi. 2
013/14
Sp. 2014
Su. 2014
DL
- P
(m
g P
2O
5/1
00g)
0
20
40
60
80
100D
BL
BH
a
a
a
a
a
a a
a a
a
a
b aa
aa,b
Site 2
Site 2
Figure 24: Seasonal variation of plant available K (DL - K in the top row) and P
(DL - P in the bottom row) in the topsoil (0 - 0.2 m) of site 1 and site 2 after estab-
lishment of the experiment in October 2012. Shown are mean values for each
treatment for each season (n varies from 3 to 6). Different letters indicate signifi-
cant differences between means. Letters are not shown when differences between
means are not significant.

Results
79
5.6 Effect of biochar on soil microbial carbon and nitrogen
Microbial carbon (MBC) and nitrogen (MBN) concentrations showed fluctuations
caused by the responses of microbial growth to temperature and crop management ac-
tivities for both sites. Generally, biochar had a positive effect on MBC and MBN dur-
ing the whole experimental period, but occasionally also showed a small negative one.
5.6.1 Soil microbial carbon
Except for the winter season 2012/13 just after amending Gleyic Podzol in site 1 with
biochar, MBC always increased compared to the plots without biochar (Figure 25). In
winter 2012/13, MBC was nonsignificantly lower (p = 0.201, n = 6). Application of
biochar stimulated MBC significantly in the subsequent winter season (winter
2013/14; ANOVA, p = 0.020, n = 6), and in spring 2013 (ANOVA, p = 0.003, n = 6),
autumn 2013 (ANOVA, p = 0.002, n = 6) and summer 2014 (ANOVA, p = 0.007, n =
6).
The seasonal variability of MBC in D treatment and with different rates of biochar ad-
dition to site 2 is shown in Figure 26. There were significant treatment effects on MBC
in all winter and summer seasons (winter 2012/13: p ≤ 0.001, n = 6; winter 2013/14: p
≤ 0.001, n = 6; summer 2013: p = 0.02, n = 6; summer 2014: p = 0.016, n = 6). Bio-
char with higher application rate enriched MBC content in site 2 in all seasons except
in autumn 2013 and spring 2014 before reapplication of digestate in summer 2014. In
autumn 2013, both D and BH treatments showed the same amount of MBC (62.4 ± 15
and 62.3 ± 11 mg kg-1
respectively). In spring 2014, for all treatments in site 2, MBC
ranged between 72.39 ± 17 and 79.78 ± 14 mg kg-1
. In winter seasons, MBC in the BH
treatment significantly increased by 47 % (2012/13: p < 0.001, n = 6) resp. 82 %
(2013/14: p < 0.001, n = 6), while in the BL plots MBC only showed a nonsignificant
increase by 13 % (2012/13: p = 0.280, n = 6) resp. 28 % (2013/14: p = 0.162, n = 6)
compared to the digestate only treatment.

Results
80
Winter 2012/13
C B
Mic
rob
ial C
arb
on (
mg C
kg
-1)
0
50
100
150
200Spring 2013
C B
0
50
100
150
200Summer 2013
C B
0
50
100
150
200Autumn 2013
C B
0
50
100
150
200
Winter 2013/14
C B
0
50
100
150
200Spring 2014
C B
0
50
100
150
200Summer 2014
C B
0
50
100
150
200
ab
ab
a b
a
b
Figure 25: Influence of biochar application on MBC in site 1. Vertical error bars
represent ± one standard deviation of the means (n varied between 6 and 12). The
different letters close to the error bars indicate significant differences of the mean
values. Letters are not shown when differences between means are not significant.
B: biochar treatment, C: Control.
Spring 2013
D BL BH
0
50
100
150
200
250
300 Autumn 2013
D BL BH
0
50
100
150
200
250
300
Spring 2014
D BL BH
0
50
100
150
200
250
300Winter 2013/14
D BL BH
Mic
rob
ial C
arb
on (
C m
g k
g-1
)
0
50
100
150
200
250
300
a ab
Summer 2013
D BL BH
0
50
100
150
200
250
300
a ab
Summer 2014
D BL BH
0
50
100
150
200
250
300
ab
a
Winter 2012/13
D BL BH
0
50
100
150
200
250
300
a ab
Figure 26: Influence of biochar and digestate application on MBC in site 2. Verti-
cal error bars represent ± one standard deviation of the means (n varied between
6 and 12). The different letters near to the error bars indicate significant differ-
ences of the mean values. Letters are not shown when differences between means
are not significant. D: digestate only, BL: digestate:biochar 1:1, BH: diges-
tate:biochar 1:5.

Results
81
5.6.2 Soil microbial nitrogen
The amendment of biochar increased MBN in site 1 (Figure 27). However, the first
significant increase of MBN only appeared in summer 2013 when MBN increased by
100 % (ANOVA, p < 0.001, n = 12), followed by 81 % in autumn 2013 (ANOVA, p <
0.001, n = 12), and 179 % in summer 2014 (ANOVA, p < 0.001, n = 6). In the rest of
the seasons during the total experimental period from October 2012 to September
2014, addition of biochar into site 1 increased MBN only non-significantly.
Higher contents of MBN in site 2 were found in the treatment with digestate only, ex-
cept in the two summer seasons (Figure 28). In summer 2014, the highest content of
MBN was found in the plots treated with BH (7.53 ± 1.8 mg kg-1
), while MBN in the
D treatment plots was 4.39 ± 1.5 mg kg-1
. This 72 % increase significantly differed
from the plots which were treated with D (ANOVA, p = 0.017, n = 6). In summer
2013, the highest MBN was found in the BH treatment (3.9 ± 1.1 mg kg-1
), followed
by the BL treatment (3.6 ± 0.8 mg kg-1
) and the D treatment (3.0 ± 1.1 mg kg-1
). In
winter 2012/13, the digestate only treated plots (D) contained 24 % and 34 % higher
amounts of MBN compared to the BH and BL treatments respectively, but the differ-
ences were not significant. In the next winter season (2013/14), there again was a sig-
nificantly higher MBN in the D treatment, with a 163 % resp. 177 % increase of MBN
compared to BH and BL (ANOVA, p = 0.003, n = 6 and p = 0.002, n = 6 respective-
ly). During autumn 2013, plots without biochar (D) showed the significantly highest
MBN (1.82 ± 1.0 mg kg-1
), a 57 % increase compared to the BL plots (ANOVA, p =
0.012, n = 12), and a nonsignificant 41 % increase compared to the BH plots (ANO-
VA, p > 0.05, n = 12).

Results
82
Winter 2012/13
C B
0
3
6
9
12
15Spring 2013
C B
Summer 2013
C B
Autumn 2013
C B
Winter 2013/14
C B
Mic
rob
ial N
itro
gen
(m
g N
kg
-1)
0
3
6
9
12
15Spring 2014
C B
Summer 2014
C B
a
b
ab
ab a
b
Figure 27: Influence of biochar application on MBN in site 1. Vertical error bars
represent ± one standard deviation of the means (n varied between 3 and 6). Bars
with different letters indicate significant differences of the means. Letters are not
shown when differences between means are not significant. C: control, B: biochar
application.
Winter 2012/13
D BL BH
Mic
rob
ial N
itro
gen
(m
g N
kg
-1)
0
2
4
6
8
10Spring 2013
D BL BH
Summer 2013
D BL BH
Spring 2014
D BL BH
Autumn 2013
D BL BH
ab a
Winter 2013/14
D BL BH
0
2
4
6
8
10
a b b
Summer 2014
D BL BH
a
bb
Figure 28: Influence of biochar and digestate application on MBN in site 2. Verti-
cal error bars represent ± one standard deviation of the means (n varied between
3 and 6). The different letters near to the error bars indicate significant differ-
ences of the mean values. Letters are not shown when differences between means
are not significant. D: digestate only, BL: digestate:biochar 1:1, and BH: diges-
tate:biochar 1:5.

Results
83
5.7 Effect of biochar and digestate on soil carbon turnover
5.7.1 Influence of biochar and digestate on soil carbon mineralization
An aerobic incubation experiment was conducted using the surface soil (0 - 0.2 m) of
Gleyic Podzol collected from site 1 in 2014. Before collecting the soil samples, a new
soil profile was opened for the soil description. The physical and chemical parameters
were slightly different from those of the profile opened in May 2012 (see Table 5 on
page 58 in 4.4 and Table A 11 on page 148 in the Annex). Non-treated surface soil
samples were collected from three different places which were distributed diagonally
within the site. These three different sub samples of Gleyic Podzol were labelled as
4394-GP, 4395-GP and 4627-GP. For the incubation experiment, the soil was treated
with the following amendment mixtures: control (C, soil without amendments), bio-
char only (B), digestate only (D), digestate:biochar 1:1 mixture (D:B 1:1), and diges-
tate:biochar 1:5 mixture (D:B 1:5). The incubation period was 133 days and δ13
CO2
values were measured on days 16, 52, 93 and 133.
5.7.1.1 Cumulative CO2 production
The aerobic cumulative CO2 productions of all three sub samples of the topsoil of
Gleyic Podzol increased over the whole incubation time (Figure 29). The aerobic cu-
mulative CO2 production from all treatments of Gleyic Podzol varied from 32.2 to
124.5 μmol CO2 gdw-1
. The biochar only treatment (B) produced the lowest cumula-
tive CO2 emission (54.8 ± 1, 80.7 ± 2 and 33.0 ± 1 µmol CO2 gdw-1
for the three sam-
ples 4394-GP, 4395-GP and 4627-GP resp.). The effects of the biochar only treatment
(B) on cumulative CO2 production within the three soil samples were significant
(ANOVA, p ≤ 0.016, n = 3). In addition to the treatment effect on cumulative CO2
productions, there were clear and significant sub soil sample effects and interaction
effects between soil and treatment (see Figure A 6 on page 150 in the Annex; two-way
ANOVA, p < 0.001, n = 44). Independent of the particular treatment, sub sample 4395-
GP always showed the significantly highest cumulative CO2 production, followed by
sub samples 4394-GP and 4627-GP (95.8 ± 13, 61.1 ± 6, and 38.6 ± 5 µmol CO2 gdw-1
resp.; ANOVA, p < 0.001, n = 15).

Results
84
4394-GB
0 20 40 60 80 100 120 140
µm
ol
CO
2 g
dw
-1
0
20
40
60
80
100
120
1404395-GB
Duration d
0 20 40 60 80 100 120 140
4627-GB
0 20 40 60 80 100 120 140
0
20
40
60
80
100
120
140
Duration d
Duration d
µm
ol
CO
2 g
dw
-1
C
D
B
D:B1:1
D:B1:5
C
D
B
D:B1:1
D:B1:5
C
D
B
D:B1:1
D:B1:5
Figure 29: Cumulative CO2 production during an aerobic soil incubation experi-
ment of Gleyic Podzol amended with biochar (B), digestate (D), digestate bio-
char1:1 (D:B 1:1) and 1:5 (D:B 1:5) mixtures and without any amendments (C).
The vertical error bars represent ± one standard deviation of the mean (n = 3).

Results
85
The carbon turnover rates of the different treatments decreased with incubation time
except for the control treatment in the 4395-GP sub sample which had a higher rate
after 60 days (Figure 30). The treatments with high organic carbon contents had higher
turnover rates than those with a low one and control (see Table A 11 on page 148 in the
Annex for TOC data). The effect of added organic carbon disappeared after 60 days,
and afterwards the turnover rates were similar for all the treatments except for the con-
trol treatment in the 4395-GP sub sample. The highest and the lowest turnover rates
were both shown by the D:B 1:5 treatment (2.6 ± 0.1 on day 2 for 4394-GP and 0.07 ±
0.1 on day 105 for 4627-GP).
4394-GP
0 20 40 60 80 100 120 140
µm
ol C
O2 g
dw
-1 d
-1
0.0
0.5
1.0
1.5
2.0
2.5
3.0
4395-GP
Duration d
0 20 40 60 80 100 120 140
4627-GP
0 20 40 60 80 100 120 140
C D B D:B1:1 D:B1:5
Figure 30: Carbon turnover rates during an aerobic soil incubation experiment of
Gleyic Podzol amended with biochar (B), digestate (D), digestate biochar 1:1 (D:B
1:1) and 1:5 (D:B 1:5) mixtures and without any amendments (C). The vertical
error bars represent ± one standard deviation of the mean (n = 3).
5.7.1.2 Isotopic ratio and fractionation of carbon in the emitted CO2
The stable carbon isotope values were measured not only for Gleyic Podzol but also
for pure digestate, pure biochar, and Gleyic Anthrosol. The δ13
C value of digestate was
-19.2 and was not significantly different from the value -19.5 for biochar (ANOVA, p
= 0.37, n = 4), but significantly different from the δ13
C value of Gleyic Podzol (ANO-
VA, p < 0.001, n = 6). The highest stable carbon isotope value was found in Gleyic
Anthrosol and the lowest in Gleyic Podzol (δ13
C values: -25.23 ± 0.3 and -27.56 ± 0.6
resp.; ANOVA, p < 0.001, n = 6).

Results
86
16 52 93 133
(C) 4627-GB
16 52 93 133
13C
-30
-29
-28
-27
-26
-25(A) 4394-GB
16 52 93 133
(B) 4395-GB
Measurment day d
C D B D:B1:1 D:B1:5
Figure 31: Variation of δ13
C (‰ VPDB) values of produced CO2 from the differ-
ent treatments for the three different Gleyic Podzol topsoil samples (0 - 0.2 m) on
days 16, 52, 93 and 133. The vertical error bars represent ± one standard devia-
tion of the mean (n = 3).
There were significant differences between the δ13
C values of the emitted CO2 be-
tween the control treatment (C) and the other treatments (B, D, D:B 1:1, D:B 1:5) dur-
ing the whole incubation experiment (see Table A 12 on page 149 in the Annex). The
δ13
C signature values of CO2 respired from the control treatment was the lowest with a
few exceptions (measurements on days 93 and 133 for the 4395-GP sub sample).

Results
87
4627-GP
Treatment
C D BD:B1:1
D:B1:5
µm
ol C
O2 g
dw
-1
0
10
20
30
40
50
Day 52
C D BD:B1:1
D:B1:5
Day 93
C D BD:B1:1
D:B1:5
Day 133
C D BD:B1:1
D:B1:5
Day 16
C D BD:B1.1
D:B1:5
µm
ol C
O2 g
dw
-1
0
20
40
60
80
100
120
Day 52
C D BD:B1.1
D:B1:5
Day 93
C D BD:B1.1
D:B1:5
Day 133
C D BD:B1.1
D:B1:5
Day 16
C D BD:B1.1
D:B1:5
µm
ol C
O2 g
dw
-1
0
20
40
60
Day 52
C D BD:B1.1
D:B1:5
Day 93
C D BD:B1.1
D:B1:5
Day 133
C D BD:B1.1
D:B1:5
4394-GP
4395-GP
Day 16
C amend in CO2 Corg in CO2
Figure 32: Cumulative amount of CO2 emitted from specific carbon pools on days
16, 52, 93 and 133 of the aerobic incubation experiment of Gleyic Podzol with
treatments: control (C), digestate only (D), biochar only (B), digestate:biochar 1:1
(D:B 1:1) and 1:5 (D:B 1:5). The different colors indicate the amount of CO2
emitted from specific soil carbon pools: grey for the soil inherent carbon (Corg),
and orange for the amendments’ carbon (Camend). Vertical error bars represent ±
one standard deviation of the mean (n = 3).
The proportions of soil organic carbon and amendment carbon in the emitted CO2 from
Gleyic Podzol during the incubation experiment are shown in Figure 32. The amount
of CO2 emitted from soil organic carbon was reduced by biochar only in soil samples
4395-GP, and 4394-GP, except on day 16 when the data also showed a lower amount
of CO2 derived from the soil organic carbon pool with the control treatment. At the end
of the incubation experiment, the CO2 produced by soil organic carbon in the diges-

Results
88
tate:biochar 1:5 treatment did not show a significant difference compared to the values
in the control treatment for all three soil samples. The biochar only treatment showed a
significantly lower release of amendment’s carbon as CO2 from both sub soil samples
4394-GP and 4627-GP, and a nonsignificantly lower amount in the 4395-GP sub soil
sample. The emitted CO2 from the amendment’s carbon in the BL and BH treatments
was not significantly different on all four measurement days and for all sub soil sam-
ples with the exception of sample 4627-GP on day 16.
5.7.2 Influence of biochar on in situ soil respiration and trace gas production
5.7.2.1 Average daily in situ soil respiration
During the experimental period from November 2012 to August 2014, the changes of
the daily soil respiration values for Gleyic Podzol and Gleyic Anthrosol followed the
changes of the temperature throughout the year (Figure 33). However, the soil temper-
ature had a higher influence on the daily in situ CO2 emission fluxes than the air tem-
perature. The highest emission was in summer, followed by autumn and spring sea-
sons.
For Gleyic Podzol, the CO2 emission from the soil surface ranged from -1.4 ± 1.5 g m-2
d-1
(March 2014, n = 4 ) to 22.9 ± 5.2 g m-2
d-1
(May 2013, n = 4 ) for the biochar
amended plots and -0.129 ± 0.5 g m-2
d-1
(February 2014, n = 4 ) to 16.0 ± 0.8 g m-2
d-1
(May 2013, n = 4 ) for the control plots (Figure 33). For Gleyic Anthrosol , the highest
amount of CO2 emitted from the BL plots in August 2014 (27.5 ± 12 g m-2
day-1
, n =
4), and the lowest emission was 54 mg m-2
day-1
occurring in both the digestate and the
BH plots in April 2014.

Results
89
Figure 33: Daily average of in situ soil respiration (CO2 mg m-2
day-1
) of different
soil treatments from November 2012 to August 2014. The vertical error bars rep-
resent ± one standard deviation of the mean (n = 12). Treatments are control (C),
Biochar (B), digestate (D), digestate:biochar 1:1 (BL) and digestate:biochar 1:5
(BH).

Results
90
5.7.2.2 Seasonal variation of in situ CO2 emission
For Gleyic Podzol, the seasonal variations of the measured daily values of CO2 result-
ing from the soil ecosystem respiration process during the experimental period were
not significantly influenced by biochar application (Figure 34; ANOVA, p > 0.05, n =
24 to 48). However, the addition of biochar produced more CO2 in the spring and
summer seasons of both 2013 and 2014. During winter and autumn 2013, both Gleyic
Podzol and Gleyic Anthrosol with and without biochar emitted approximately equal
amounts of CO2 (Figure 34 and Figure 35). In Gleyic Podzol, the amounts of CO2 pro-
duced over the whole experimental period in the biochar treated and the untreated plots
were nearly equal (121.8 ± 19 and 122.2 ± 15 g CO2 m-2
resp.). The emitted CO2 per
season was less in 2013 than in 2014, except in spring.
Winter 2012/13
C B
CO
2 F
lux (
g m
-2 d
ay-1
)
0
5
10
15
20
25
30Spring 2013
C B
Summer 2013
C B
Autumn 2013
C B
Winter 2013/14
C B
0
5
10
15
20
25
30Spring 2014
C B
Summer 2014
C B
* 37
* - 20
* - 36
Figure 34: Seasonal variation of in situ soil respiration in Gleyic Podzol for control
(C) and biochar (B) treatments after starting the experiment in September 2012.
In the boxplot diagrams, the central line shows the median, the lower/upper hori-
zontal bars are minimum and maximum, outliers (values between 1.5 and 3 times
the interquartile range from a quartile) are marked by circles within the plot, and
by asterisks together with values outside the plot area. Extreme data points were
removed before plotting the data, and n = 24 to 48.

Results
91
The seasonal soil respiration values for Gleyic Anthrosol were not significantly influ-
enced by biochar application (ANOVA, p > 0.05, n = 24 to 48; Figure 35), except in
winter 2012/13 and autumn 2013 (ANOVA, p = 0.023, n = 48 and p ≤ 0.001, n = 48
resp.; Figure 35). More CO2 was released from the BH treatment than from the diges-
tate only treatment, except in summer 2014, when after reapplication of digestate to all
treatment plots in site 2 the digestate only plots produced a higher amount of CO2
compared to both BL and BH (29 % and 5 %, respectively).
Winter 2012/13
D BL BH
CO
2 F
lux (
g m
-2 d
ay-1
)
0
10
20
30
40Spring 2013
D BL BH
Summer 2013
D BL BH
Autumn 2013
D BL BH
Spring 2014
D BL BH
Summer 2014
D BL BH
Winter 2013/14
D BL BH
0
10
20
30
40
a ab b
a ab
Figure 35: Seasonal variation of in situ soil respiration in Gleyic Anthrosol after
starting the experiment in September 2012 for digestate (D), digestate:biochar 1:1
(BL) and digestate:biochar 1:5 (BH) treatments. In the boxplot diagrams, the cen-
tral line shows the median, the lower/upper horizontal bars are minimum and
maximum, outliers (values between 1.5 and 3 times the interquartile range from a
quartile) are marked by circles. Extreme data points were removed before plot-
ting the data. Different letters indicate the level of significance, and n = 73 to 109.

Results
92
5.7.2.3 Seasonal variation of CO2 emission rates from the top soil
In summer, the maximum gas emission rates were observed, whereas the winter sea-
sons showed the lowest rates (Figure 36). For both soils, the seasonal mean values of
calculated emission rates between treatments did not show significant differences at p
= 0.05 level, due to high variability within the specific seasons, except in autumn 2013
for Gleyic Podzol (ANOVA, p < 0.002, n = 3). Addition of biochar to Gleyic Podzol
topsoil (0.2 m) reduced the CO2 emission rate during the whole experimental period.
The CO2 emission rates ranged from 0.08 to 8.5 mg CO2 g TOC-1
d-1
in Gleyic Podzol
(Figure 36). In summers 2013 and 2014, the control plots showed 10 % and 8 % higher
CO2 emission rates respectively, compared to the biochar amended ones.
Wi. 2
012/13
Sp. 2013
Su. 2013
Au. 2013
Wi. 2
013/14
Sp. 2014
Su. 2014C
O2 e
mis
sio
n r
ates
(m
g C
O2 g
TO
C-1
d-1
)
0
2
4
6
8
10
D
BL
BH
Wi. 2
012/13
Sp. 2013
Su. 2013
Au. 2013
Wi. 2
013/14
Sp. 2014
Su. 2014
0
2
4
6
8
10
C
B
a
Site 2 Site 1
Figure 36: Seasonal variation of in situ CO2 emission rates from Gleyic Podzol for
control (C) and biochar only (B), and from Gleyic Anthrosol for digestate only (D),
digestate:biochar 1:1 (BL) and digestate:biochar 1:5 (BH) applications after
starting the experiment in September 2012. The vertical error bars represent ±
one standard deviation of the mean, and the letter indicates the level of signifi-
cance of the means (n = 3 to 9).

Results
93
The positive effect of biochar on CO2 emission from Gleyic Anthrosol which contained
digestate was not as clear as the effect on Gleyic Podzol. Only in winters 2012/13 and
2013/14 and autumn 2013, BH had higher CO2 emission rates compared to the BL and
D treatments. Winter 2012/13 showed the lowest CO2 emission for all treatments in
Gleyic Anthrosol. However, in the following winter 2013/14, the emission rates in-
creased by 675 %, 434 % and 507 % compared to winter 2012/13 for digestate only,
BL and BH treatments respectively, and those were significant increases (ANOVA, p =
0.01, p = 0.049, p < 0.001 for digestate only, BL and BH resp., n = 3). In both spring
seasons (2013 and 2014), the BL treatment showed nonsignificantly higher CO2 emis-
sion rates compared to the two other treatments.
5.7.2.4 Seasonal variation of in situ methane (CH4) and nitrous oxide (N2O)
emissions
Over the whole two year period (September 2012 until August 2014), both N2O and
CH4 gas emissions from both experimental sites were measured and fluxes were calcu-
lated. Analysis of data revealed that the majority of N2O and CH4 flux curves was bet-
ter described by a linear regression than by an exponential model. Therefore, linear
fluxes were used for both N2O and CH4. Some of the measured data for N2O and CH4
emissions from the soil surfaces had a large standard deviation (Figure 37 and Figure
38). Mostly, CH4 fluxes varied around zero (Figure 38). In winter 2012/13 and in the
beginning of spring 2013 for both Gleyic Podzol and Gleyic Anthrosol, frozen soil, and
soil collars covered by an ice layer did not allow to take all monthly measurements.
Therefore, there were not enough samples (n ≤ 2) for statistically analyzing the differ-
ences between means. Hence, the seasonal variations of N2O fluxes are shown in Fig-
ure 37 only from spring 2013 to summer 2014.
In Gleyic Podzol, the biochar treated plots emitted less N2O from the soil surface com-
pared to the control plots (Figure 37). However, only spring 2013 showed significantly
lower N2O fluxes in the biochar treated plots (ANOVA, p = 0.031, n = 3). In all other
seasons, the difference of means of the two treatments was not significant at p = 0.05.
In summer 2014, there was a large difference between the means of emitted N2O for

Results
94
control and biochar (321.5 ± 182 and 15.7 ± 81 mg N2O m-2
d-1
resp.), but the variation
of the measured data values was very high (ANOVA, p = 0.057, n = 3).
Amending Gleyic Anthrosol with biochar did not show a significant effect on N2O
emission (ANOVA, p > 0.05, n = 3). However, there was a reduction of N2O emissions
from both BL and BH treatments compared to the D treatment. Both summers (2013
and 2014) showed a considerable increase of N2O from the digestate only plots com-
pared to both biochar treatments.

Results
95
Spring 2013
C B
-100
0
100
200
300
400Summer 2013
C B
Autumn 2013
C B
Winter 2013/14
C B
Spring 2014
C B
Summer 2014
C B
D BL BH D BL BH D BL BH D BL BH D BL BHD BL BH
Flu
x (m
g N
2O
m-2
day
-1)
-1000
100200300400500600
a b
*
Figure 37: Seasonal variation of in situ N2O emissions in Gleyic Podzol (top row) for control (C) and biochar (B), and of Gleyic
Anthrosol (bottom row) for digestate (D), digestate:biochar 1:1 (BL) and 1:5 (BH) after starting the experiment in September
2012. The vertical error bars represent ± one standard deviation of the mean (n = 6 to 12 measurements per treatment per sea-
son). The bars with a * sign indicate that the standard deviation is not shown because n < 3.

Results
96
Winter 2012/13
C B
-0.04
-0.02
0.00
0.02
0.04
0.06Spring 2013
C B
Summer 2013
C B
Autumn 2013
C B
Summer 2014
C B
Winter 2013/14
C B
Spring 2014
C B
D BL BH D BL BH D BL BH D BL BHD BL BHD BL BH
Flu
x (
µg C
H4
m-2
s-1
)
-0.04
-0.02
0.00
0.02
0.04
0.06
D BL BH
**
*
**
* *
* * *
* *
a
a a b c
a
ab
a b
Figure 38: Seasonal variation of in situ CH4 emission in Gleyic Podzol (top row) for control (C) and biochar (B), and of Gleyic An-
throsol (bottom row) for digestate (D), digestate:biochar 1:1 (BL) and 1:5 (BH) after starting the experiment in September 2012.
The vertical error bars represent ± one standard deviation of the mean (n = 6 to 12 measurements per treatment per season). The
bars with a * sign indicate that the standard deviation is not shown because n < 3.

Results
97
Methane showed both negative and positive fluxes for both Gleyic Podzol and Gleyic
Anthrosol during the experimental period (Figure 38). The lowest CH4 flux was - 0.03
± 0.0 µg CH4 m-2
s-1
in the control treatment in spring 2013. The highest value was
0.04 µg CH4 m-2
s-1
in the same treatment in winter 2012/13 (n = 2). When considering
all positive CH4 fluxes, added biochar nonsignificantly reduced the emission of CH4 in
Gleyic Podzol, except in autumn 2013 and summer 2014. In both autumn 2013 and
summer 2014, this reduction was significant (ANOVA, p = 0.003, n = 3 and p = 0.003,
n = 3 resp.). Adding biochar to Gleyic Anthrosol produced results similar to those in
Gleyic Podzol. Both positive and negative fluxes were produced, but the majority of
fluxes were negative. Most of the time, the BH treatment produced nonsignificantly
lower CH4 fluxes than both D and BL treatments, but differences between fluxes were
significant in summer 2013, autumn 2013 and spring 2014 (ANOVA, p < 0.001, p =
0.008, p < 0.001 resp., n = 3; Figure 38).
5.8 Carbon balance in the topsoil
During the whole experimental period, TOC in the different soil depths did neither
show a consistent accumulation nor a consistent depletion (Table 11). Two years after
adding the amendments to Gleyic Anthrosol, TOC in the surface layer (0 - 0.2 m) of
the digestate only plots had increased by 19 % compared to TOC in the same depth
before the start of the experiment (June 2012). The two treatments with biochar in ad-
dition to digestate showed higher TOC content in top soil (0 - 0.2 m) than the digestate
only treatment (20 % and 34 % for BL and BH resp.). Also the sub-surface soil layer
(0.2 - 0.4 m) had higher TOC compared to the value in June 2012. The highest accu-
mulation showed with the BL treatment. The accumulation of TOC in the lower soil
layers/depths did not show clear differences even after two years from the biochar ap-
plication. Considering Gleyic Podzol, TOC in the control treatment decreased by 13%
after one year of the experiment. The biochar treatment did not show changes of TOC
in the surface soil layer, but in the soil depths 0.2 - 0.4 m and 0.4 - 0.6 m where it sig-
nificantly increased the TOC (by 229 % and 2871 % resp.).

Results
98
Table 11: Means of TOC in Gleyic Podzol and Gleyic Anthrosol at the end of main
cropping harvests after biochar addition in October 2012 together with the values
before applying biochar (June 2012).
Soil Treatment Depth
(cm)
TOC (%)
2012
June*
2013
October
2014
May
2014
October*
Gleyic
Anthrosol
D 0-20 1.37 1.46 ± 0.1 1.42 ± 0.3 1.63
20-40 1.37 1.51 ± 0.2a 0.54 ± 0.1
b 1.50
40-60 0.49 0.62 ± 0.3 0.46 ± 0.3 0.61
BL 0-20 1.37 1.57 ± 0.1 1.46 ± 0.2 1.65
20-40 1.37 1.31 ± 0.2 1.04 ± 0.5 1.57
40-60 0.49 0.63 ± 0.3 0.92 ± 0.3 0.47
BH 0-20 1.37 1.75 ± 0.1 1.77 ± 0.5 1.83
20-40 1.37 1.61 ± 0.3 1.20 ± 0.5 1.40
40-60 0.49 0.82 ± 0.4 0.67 ± 0.2 0.18
Gleyic
Podzol
C 0-20 0.68 0.64 ± 0.1 0.59 ± 0.1 -
20-40 0.07 0.44 ± 0.2 0.25 ± 0.2 -
40-60 0.06 n.a. n.a. -
B 0-20 0.68 0.79 ± 0.0a 0.68 ± 0.1
b -
20-40 0.07 0.44 ± 0.3 0.23 ± 0.2 -
40-60 0.06 0.35 ± 0.3 2.08 ± 2.8 -
Different letters indicate significant differences between treatment means in the same depth
(n=3). Letters are not shown when differences are not significant. *Standard deviations are
not shown when n < 3. n.a.: not analyzed.

Discussion
99
6. Discussion
6.1 Characteristics of digestate and biochar
The solid digestate which was used as feedstock for our biochar was a byproduct of an
agricultural biogas plant which uses a mixture of cattle manure and bioenergy crop
biomass as feedstock. It had TOC, TN and C/N values of 39 %, 2 % and 20 resp., all of
which were close to the value ranges documented by Möller and Müller (2012) for
solid digestate originating from cattle manure and agricultural residue (39.6 - 40.0 %,
2.2 - 3.0 % and (11.2 - 19.3 resp.). The biochar had a fine and homogeneous texture,
caused by the texture of the fermented and chopped maize biomass feedstock, and due
to the way it was produced could easily be broken down into smaller pieces
The biochar produced for this study had a lower TOC content (39 %) and lower carbon
recovery (12 %) compared to biochar originating from wood or unfermented grass or
waste. Lehmann (2007) discussed the relationship between carbon recovery and
production temperature of biochar. According to their data, biochar produced from
corn cob at 400 - 800 °C showed 35 to 40 % carbon recovery. The C/N ratios of
charred materials can vary within a huge range from 7.3 to 700, depending on TOC in
the feedstock and production temperature (Krull et al., 2009; Liu et al., 2015). For our
biochar, the low TOC and a comparatively little higher TN content gave a low C/N
ratio (20 ± 0.4). This low C/N ratio is favorable for plant growth as was discussed by
Haefele et al (2011).
The nutrient content of biochar originating from maize stalk and cob was much lower
than in our biochar originating from an anaerobically fermented mix of the whole
biomass of maize with animal excretion (Amonette and Joseph, 2009). According to
unpublished work done by Schröder (2013), the heavy metals in our biochar did not
exceed the values allowed by German authorities in order to protect environmental and
human health. All those prove that our biochar and its feedstock were not exceptional,
but had normal and acceptable physico-chemical characteristics making them suitable
for being used as an organic soil amendment.

Discussion
100
6.2 Effect of biochar on above ground biomass production
The mean values of annual precipitation (822 mm) and daily temperature (8.6 °C)
within the experimental period were very close to the long term averages from 1981 to
2010 (857 mm and 8.7 °C resp.), so the experimental time represented average
climatic conditions for the region. However, the distribution of rainfall was different in
2013 (see Figure 12), which had an influence on the early growth rate and the later
development of the maize crop. When later more precipitation occurred, weed
flourished in the field. This abiotic stress influenced the total biomass production of
the maize in summer 2013 (see Figure 14). The maize in the grower’s field did not
have a water stress and subsequent weed problem because of an earlier crop
establishment and of chemical weeding. Nevertheless our study supported the working
hypothesis (H1) that the application of biochar positively influences the production of
biomass. All plots with biochar applications yielded higher biomass production in both
soils compared to the control plots in site 1 (Gleyic Podzol), respectively the digestate
only plots in site 2 (Gleyic Anthrosol).
The crop response to biochar amended soil is a synergistic effect of various factors:
chemical and physical properties of biochar, the rate and frequency of biochar
application, the way of application, soil conditions, climate conditions, crop type, and
management of the crop, as has been documented by several authors (Asai et al., 2009;
Gaskin et al., 2010; Haefele et al., 2011; Major et al., 2010b; Van-Zwieten et al., 2010;
Yamato et al., 2006). Although there have been no previous studies that discussed the
effect of biochar on the biomass of maize which was grown for bioenergy production
in the field trails, there have been many experiments which discussed the responses of
grain yield of cereal crops including maize (Grassini and Cassman, 2013; Liu et al.,
2015; Major et al., 2010b; Martinsen et al., 2014; Ndor et al., 2015; Zhang et al.,
2012b) .
Chan et al. (2007, 2008b) and Zhang et al. (2010a, 2010b, 2011) explained the
increased yield of maize after applying biochar derived from greenwaste and wheat
straw as a result of increased nutrient availability, decreased soil bulk density and
improvement of other soil physical properties. Pan et al. (2009) showed that high crop

Discussion
101
productivity and nitrogen efficiency result from the accumulation of high amounts of
soil organic carbon due to biochar addition. Zhang et al. (2012b) reported higher
nitrogen use efficiency, and maize yield increased by 16 resp. 7 % without N fertilizer,
and 9 resp. 12 % with N fertilizer when biochar was applied at 20 t biochar ha-1
resp.
40 t biochar ha-1
for a Calcareous loamy soil with poor soil organic carbon content in
the central plain in China. Few discussions exist on below-ground biomass yield, and a
meta-analysis was done by Biederman and Harpole (2012), showing that below ground
biomass in perennial crop plants did not significantly respond to biochar, but the
annual crop did show significant responses with or without fertilizer addition.
Lehmann et al. (2003b) found both positive and negative responses in their study, and
also there was no proportional relationship between biochar application rate and
increased yield. They also documented that higher rates of biochar application could
decrease the nitrogen availability. Similar findings were documented by Major et al.
(2010b), showing no change of maize yield in the first year, whereas the following
three years had significant yield increases after one time application of wood biochar
at 20 t ha-1
into an Oxisol in the Colombian savanna. However, with the degraded and
less productive Ultisol in Kenya, biochar increased the cumulative maize yield by 100
% after repeated application in a two year period at 7 t biochar ha-1
(Kimetu et al.,
2008).
Gleyic Podzol, which had relatively poor physico-chemical properties, showed similar
results to Gleyic Anthrosol, increasing biomass in the biochar amended plots by by 72
% and 47 % for the winter and summer seasons respectively during the first year of the
experiment (see Figure 14). Asai et al. (2009) reported the opposite to our results when
studying the effects of biochar on the yield of rice paddy: the yield of upland rice
(Oryza sativa L.) decreased after application of biochar with no nitrogen fertilization
in a nitrogen deficient soil. But Zhang et al. (2010a) reported a higher rice productivity
and an increased agronomic nitrogen use efficiency in an acidic organic carbon rich
paddy soil with biochar application at 10 t biochar ha-1
and 40 t biochar ha-1
. In our
study, the above ground total biomass of the bioenergy maize crop increased during
four consecutive cropping seasons after one time application of biochar at 5 t ha-1
with

Discussion
102
no additional NPK fertilizer to Gleyic Podzol with its poor physical properties and low
TOC content.
6.3 Effects of biochar on soil physico-chemical properties
Many biochar field trials were carried out all around the world in different climate and
agro-ecological zones, however the studies in the tropics were dominating among them
(Blackwell et al., 2009; Schulz and Glaser, 2012). Generally, those studies proved
positive effects of biochar on the concentration of nutrients, their retention and their
availability, which in turn increase soil fertility and thereby plant growth (Bélanger et
al., 2004; Glaser et al., 2002; Lehmann et al., 2003b; Major et al., 2010b; Novotny et
al., 2009; Rondon et al., 2007). Furthermore, increases in CEC (Glaser et al., 2002;
Mikan and Abrams, 1995; Topoliantz et al., 2002), water-holding capacity (Glaser et
al., 2002), soil microbial and mycorrhizal activity (Thies et al., 2009; Warnock et al.,
2007), soil acidity (Chan and Xu, 2009), and electric conductivity (Asai et al., 2009)
have been reported after biochar application to soils. There was one study with
negative effects on crop productivity and chemical properties (ryegrass with biochar
from biosolids), and some with no significant effect of biochar addition (Jeffery et al.,
2011).
The above mentioned studies mainly considered the effect on soil during the main
cropping season. This study incorporated the behavior of biochar in the soil
ecosystems during both active (summer crop) and inactive (winter crop) times in detail
for four consecutive cropping seasons. The second working hypothesis (H2), that the
application of biochar increases soil macro- and micro-nutrients, was confirmed by the
results of our study.
6.3.1 Soils in the two fields
As mentioned earlier, the soils in the two field experimental sites represent two
different soil ecosystems in SH, Germany. Site 1 represents the abandoned land which
has not been treated by biogas digestate before, and has not been used for an intensive
monoculture system. In contrast, the land utilization and management of site 2 were

Discussion
103
different: this site has been intensively used to produce biomass for agricultural biogas
plants during the past years, and received an amendment of digestate at a rate of 42
Lm-2
at the beginning of each cropping season. The chemical and physical properties
of Gleyic Anthrosol in site 2 have development and chemical characteristics closely
similar to those of the uppermost layer of Plaggic Anthrosol described by Meuser and
Blume (2001) for Osnabrück in Northwest Germany. The soil characteristics of the
experimental plots of site 2 were representative for the soils in the adjacent arable land
(Langheld, 2013; Rössler, 2013). There are no studies about the soils of the adjacent
fields in site 1, and hence there is no information available to compare in how far the
experimental plots represent the Gleyic Podzol soils of the surrounding area and fields.
6.3.2 Initial changes of soil chemical properties
Before applying biochar to both experimental sites, the experimental plots did not
show significant heterogeneity of TOC and TN. Our biochar application rates (5 and
24 t biochar ha-1
) were high enough to produce initial significant changes in the topsoil
(0 - 0.2 m) of Gleyic Podzol and Gleyic Anthrosol. The amendment of those sandy
soils with biochar derived from anaerobic biogas digestate significantly increased soil
pH, EC, TOC, TN, as well as other chemical properties including cations, CEC and
BS. As a porous substance with high surface area and many nutrients, biochar can alter
the soil nutrient status just after application as well as in the long run. Because our
biochar was alkaline compared to its feedstock material, it increased the alkality of the
soil. While adding biochar did not significantly influence TN, DON and ammonium, it
had significant influences on nitrate in both soils. We found high values of nitrate and
ammonium which shows that there is an indirect influence of biochar on the
mineralization of organic matter in the soil. All these initial changes of the
investigated ecosystems mainly depend on the quality of the biochar and much less on
the soil texture and agricultural use of the ecosystem. Our results clearly showed the
fertilizing effect of biochar on soils in bio energy crop production ecosystems.
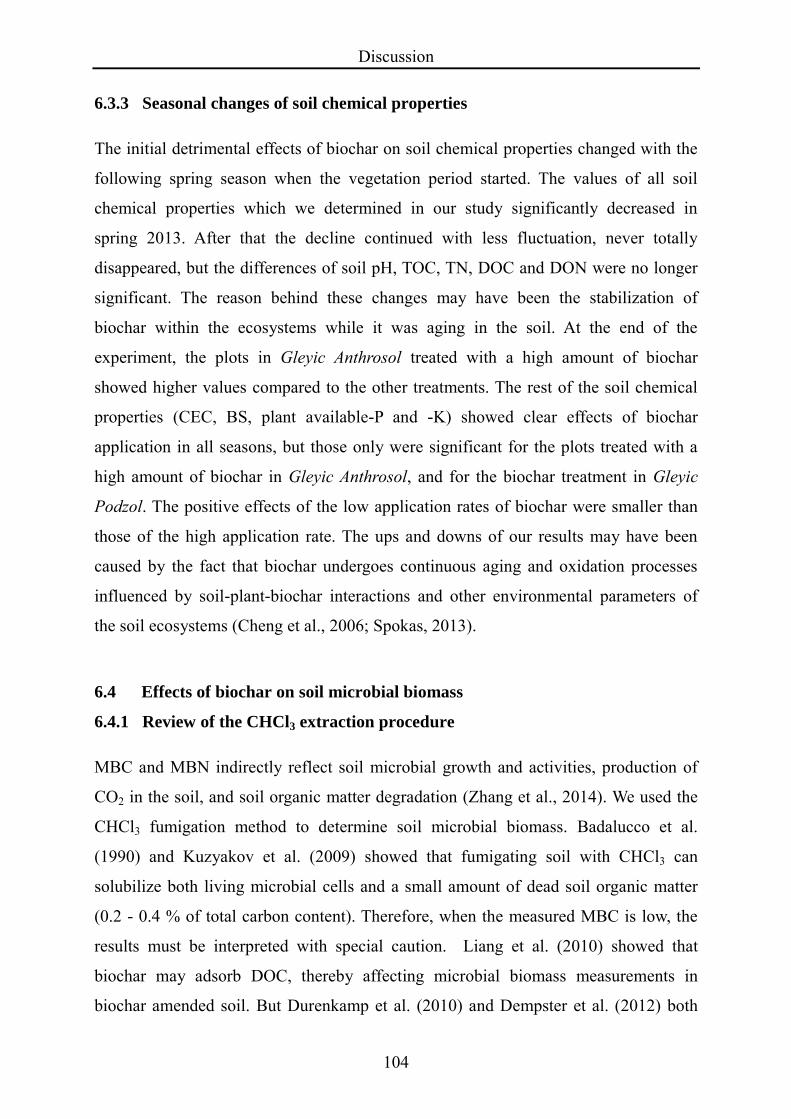
Discussion
104
6.3.3 Seasonal changes of soil chemical properties
The initial detrimental effects of biochar on soil chemical properties changed with the
following spring season when the vegetation period started. The values of all soil
chemical properties which we determined in our study significantly decreased in
spring 2013. After that the decline continued with less fluctuation, never totally
disappeared, but the differences of soil pH, TOC, TN, DOC and DON were no longer
significant. The reason behind these changes may have been the stabilization of
biochar within the ecosystems while it was aging in the soil. At the end of the
experiment, the plots in Gleyic Anthrosol treated with a high amount of biochar
showed higher values compared to the other treatments. The rest of the soil chemical
properties (CEC, BS, plant available-P and -K) showed clear effects of biochar
application in all seasons, but those only were significant for the plots treated with a
high amount of biochar in Gleyic Anthrosol, and for the biochar treatment in Gleyic
Podzol. The positive effects of the low application rates of biochar were smaller than
those of the high application rate. The ups and downs of our results may have been
caused by the fact that biochar undergoes continuous aging and oxidation processes
influenced by soil-plant-biochar interactions and other environmental parameters of
the soil ecosystems (Cheng et al., 2006; Spokas, 2013).
6.4 Effects of biochar on soil microbial biomass
6.4.1 Review of the CHCl3 extraction procedure
MBC and MBN indirectly reflect soil microbial growth and activities, production of
CO2 in the soil, and soil organic matter degradation (Zhang et al., 2014). We used the
CHCl3 fumigation method to determine soil microbial biomass. Badalucco et al.
(1990) and Kuzyakov et al. (2009) showed that fumigating soil with CHCl3 can
solubilize both living microbial cells and a small amount of dead soil organic matter
(0.2 - 0.4 % of total carbon content). Therefore, when the measured MBC is low, the
results must be interpreted with special caution. Liang et al. (2010) showed that
biochar may adsorb DOC, thereby affecting microbial biomass measurements in
biochar amended soil. But Durenkamp et al. (2010) and Dempster et al. (2012) both

Discussion
105
proved by using the recovery result of 14
C experiments that the adsorption of DOC to
biochar had no effects on the extraction efficiency of soluble carbon.
6.4.2 Effects of biochar on soil microbial carbon and nitrogen
Generally, our research proved that biochar addition influenced both MBC and MBN
in both tested soil ecosystems, showing that under the temperate climatic conditions in
Northern Germany, biochar accelerates microbial activities and growth thus confirm-
ing our working hypothesis H3. Previous studies showed that the effects of biochar on
soil microbial biomass were quite inconsistent: several studies found that soil microbi-
al biomass in biochar amended soils showed no differences from the control soil
(Bruun et al., 2011, 2012; Kuzyakov et al., 2009; Zavalloni et al., 2011), other studies
reported either an increased (Bruun et al., 2008; Kolb et al., 2009) or a decreased
(Dempster et al., 2012) soil microbial biomass after biochar application.
Several explanations for the positive response of soil microbial biomass in biochar
amended soils have been given. One explanation is that biochar causes increasing con-
centrations of labile organic carbon compounds, which derive from biochar (Bailey et
al., 2010; Bruun et al., 2011, 2012, 2008; Smith et al., 2010). Furthermore, biochar has
been shown to add nutrients directly to the soil nutrient pool, to increase the retention
of nutrients because of the larger surface area and highly porous structure of biochar
(Cheng et al., 2008; Masiello et al., 2013). Also, biochar applications may increase the
habitat for microbes by providing physical protection (Cheng et al., 2008; Pietikainen
et al., 2000), or by generating a chemically more favorable environment for the mi-
crobes due to the alkalinity of biochar (Lehmann et al. 2011). There also were reports
showing the ability of biochar to increase the decomposition of soil organic matter
which stimulates microbial activity (Wardle et al., 2008) and the sorption and retention
of organic carbon (Lehmann et al., 2011), which helps to increase microbial biomass.
However, also negative effects of biochar application on microbial abundance and ac-
tivity have been reported. Some studies showed that biochar was able to release some
harmful highly volatile organic compounds (VOCs) and polycyclic aromatic hydrocar-
bons (PAHs) which can inhibit microbial growth and activities (Buss et al., 2015;

Discussion
106
Deenik et al., 2010). Also, biochar trapped essential nutrients inside of its pores which
reduced the availability of nutrients in the soil solution temporarily or permanently
(Dempster et al., 2012), and this in turn reduced the activity of soil microbes, soil or-
ganic matter decomposition, and N mineralization.
Our research showed that biochar which was produced at high temperatures from nu-
tritionally rich feedstock reduced MBC by 9 % just after applying it to Gleyic Podzol.
This can be caused by initial fixation of nutrients inside the biochar, and VOCs and
PAHs in the biochar (Blackwell et al., 2009; Buss et al., 2015; Downie et al., 2012;
Zimmerman et al., 2011). However, MBN in Gleyic Podzol did not have an initial de-
pletion effect by applying biochar, but showed an increase in the first winter season.
The next three seasons showed both significant and nonsignificant increases of MBC
and MBN in the relatively unfertile and coarse-textured Gleyic Podzol. This result
even remained in the next winter, when Gleyic Podzol amended with biochar had a
larger active soil microbial community (Figure 25).
Those results suggest that biochar supplied a livable and protective habitat for micro-
organisms in soil. During the winter season, the growth of microorganisms can be
stimulated by biochar because of the albedo effects of biochar (Liang et al., 2014;
McCormack et al., 2013) which have a direct influence on the soil temperature. How-
ever, with our low application rate of biochar, the albedo effects were less important
than the effect on protective habitat.
6.5 Response of soil ecosystems to the application of biochar: soil carbon
turnover
In addition to studying the influences of biochar and digestate on soil nutrients, anoth-
er major goal of this research was to understand how charred (biochar) and non-
charred biogas digestate affect the soil carbon pool and soil carbon mineralization.
This goal represents the final hypothesis (H4) of our study. The results prove that the
CO2 production did not significantly increase after adding organic carbon as biochar to
the soil, but the effects on the other two gases that we measured were not clear from
our set of data.

Discussion
107
The results of our incubation experiment help to improve the understanding of how
biochar alters the potential carbon turnover in Gleyic Podzol, and the field gas flux
measurements of both Gleyic Podzol and Gleyic Anthrosol are used to improve the
understanding of the behavior of biochar, digestate and their mixture in the soil carbon
pool.
6.5.1 Influence of biochar and digestate on soil carbon mineralization: an
incubation experiment
In incubation experiments, the preparation of the samples has an effect on the results,
especially on the measurements taken on the initial days. During sample preparation,
removing plant roots, stones and macro organisms causes physical damages to the soil
matrix and soil aggregates, and alters the biological processes (Subke et al., 2010). In
addition to the treatment effects, those disturbances can result in initial mineralization
of soil carbon (Knoblauch et al., 2013; Subke et al., 2010). In our study, several of the
samples had high standard deviations between the replicates. This may be due to the
above mentioned disturbances, or to insufficient homogenization of the initial bulk
surface soil samples, or of the soil-amendment mixtures, even though we took great
care to homogenize the samples.
In an aerobic incubation experiment, CO2 concentration in the head space can inhibit
the activities of aerobic microorganisms. Knoblauch et al. (2013) showed the necessity
of flushing the head space with synthetic air when the CO2 concentration in the head-
space reaches ≥ 3 %. On the other hand, there is the possibility to get underestimated
cumulative CO2 and in turn carbon turnover due to the flushing. Also, the flushing can
affect the measurements of the post flushing mineralization rates which can occur due
to adjusting the equilibrium between partial pressure of CO2 in the head space and the
concentration of CO2 in the soil solution. However, our soil with sandy texture and
with a water holding capacity at 60 % of its field capacity (FC) was not affected as
heavily as clay soils with higher water holding capacities.
In the incubation experiment, the substantial differences between the δ13
C-signatures
of the organic amendments, whose source was a C4 plant like maize, and those of the

Discussion
108
soil organic matter were used to identify the contribution of the different carbon
sources (soil organic matter or organic amendment) to the overall released CO2. Our
amendments (digestate and biochar) had a significantly higher δ13
C value (-19.35 ‰)
compared to the soil (-27.56 ‰) used for the incubation experiment. At the beginning
of the incubation experiment, the δ13
C values of emitted CO2 from the amended soil
samples were significantly different from the control samples. But at the end of the
experiment these differences had disappeared. This gives evidence that a labile frac-
tion of the organic matter that was added to the soil as digestate and biochar was min-
eralized to CO2, in particular at the beginning of the experiment.
In all treatments, the CO2 emission went up just after adding the amendments, showing
that carbon mineralization was triggered. In this initial phase, the treatment with the
mixture of digestate and a high amount of biochar emitted significantly higher
amounts of CO2 than the digestate only and biochar only treatments.
After this initial phase, biochar had a negative effect on carbon mineralization in both
carbon pools, the carbon in the amendments and the carbon in the soil organic matter
pool. Some researchers found and discussed both positive and negative priming effects
of biochar on the soil organic carbon pool (Knicker et al., 2008; Kuzyakov et al., 2009;
Nguyen et al., 2008).
For each treatment, the measured values of produced CO2 were highly variable be-
tween the three soil sub samples; therefore it is difficult to draw a definite conclusion
based on those results. However, for each of the sub samples, the CO2 emissions of the
five different treatments basically showed the same behavior. Those three sub samples
had differences in their TOC, TN and CEC, but those were not statistically tested for
their significance because of lack of data points (Table A 11).
6.5.2 Influence of biochar and digestate on greenhouse gas emissions
Most studies leave the question of GHG emissions from biochar amended soils open,
in particular under field conditions, but a few field measurements of GHG emissions
from biochar amended soils have been performed (Castaldi et al., 2011; Karhu et al.,

Discussion
109
2011; Knoblauch et al., 2011; Scheer et al., 2011; Zhang et al., 2012a). In our experi-
ments, we studied the GHG emissions from the soil surface after amending the sandy
soil in a bio energy crop production system with biochar and digestate.
Our results showed that adding more carbon in the form of biochar to Gleyic Podzol
did not increase the CO2 emission from the soil surface compared to the control. In all
seasons, there were no significant differences between the biochar treated plots and the
control plots. The emission of CO2 from Gleyic Anthrosol topsoil (0 - 0.2 m) also did
not show significant differences, except just after adding biochar to the soil and in au-
tumn 2013. Similar to the incubation experiment, just after adding biochar and in au-
tumn 2013, the plots with a high amount of biochar emitted the significantly highest
amount of CO2, followed by the low amount of biochar plots and the digestate only
plots. We also calculated the carbon turnover rates based on CO2 emission and TOC in
the topsoil layer (mg of CO2 emitted per g of TOC per day). The results showed that
the plots with biochar high amount had lower turnover rates compared to the digestate
only and low biochar plots. In both soils CH4 and N2O emissions decreased after bio-
char application, but not significantly. Our results showed that it is necessary to study
the emission of these two gases from soils in bioenergy production agro-ecosystems
more intensively.
Earlier research mainly investigated the influence of biochar on GHG emissions and
soil organic matter in soil ecosystems associated with co-metabolic reactions (Cheng et
al., 2006; Hamer et al., 2004; Keith et al., 2011; Khodadad et al., 2011; Kuzyakov et
al., 2009), and the positive priming effect together with enhanced microbial activity
and labile fraction of C in biochar (Czimczik and Masiello, 2007; Wardle et al., 2008).
However, most of those works were not done in the field and did not identify the dif-
ferent origins of carbon in the emitted CO2 and (Lehmann and Sohi, 2008; Wardle et
al., 2008).

Discussion
110
6.5.3 Influence of biochar and digestate on soil organic carbon balance
After harvesting the 2013 and 2014 summer crops and the 2013 winter crop, we de-
termined TOC in the different soil layers, and later compared the values with those
obtained before starting the experiments. The TOC values of the uppermost layer var-
ied with the growing season, probably due to the mineralization of carbon and its
transport to lower soil horizons. In Gleyic Anthrosol, the lower horizons showed a
higher accumulation of TOC in all plots with low and high biochar than in the diges-
tate only plots. The TOC values of lower horizons nonsignificantly increased with
time, and with the amount of biochar applied, but we did not analyze the contribution
of biochar carbon to this TOC increase. Some authors who studied the stability of bio-
char in the soil showed that biochar in the subsurface soil layers was more stable than
in the topsoil (Major et al., 2010a; Masiello, 1998).
6.6 Methodological limitations in the field experiment
6.6.1 Treatment mixtures and biochar application rates
Site 2 had three different treatments but there was no control treatment without
amendment of digestate since the soil had already been enriched with digestate at a
rate of 0.15 kg C m-2
(roughly 42 L m-2
, personal communication with the grower Mr.
Kai Spangenberg). Therefore, for Gleyic Anthrosol in site 2 the digestate only
treatment (D) was used as a basic reference plot.
For our study, two biochar application rates were used: 0.15 and 0.75 kg C m-2
, which
means roughly 5 and 24 t biochar ha-1
respectively. Gleyic Anthrosol received both 5
and 24 t biochar ha-1
, whereas Gleyic Podzol received 5 t biochar ha
-1 only. As an
experiment which was conducted as part of a grower’s field, we determined the
application rates based on the organic carbon input rate from the grower’s application
of digestate which was 0.15 kg C m-2
. This is the limit allowed by authorities in SH
and Germany as regulated by DüMG 1977 (§1 and §2) (Dittrich, 2006; Domínguez,
2012; Schneider and Mastel, 2008b). Our application rates were low (5 and 24 t
biochar ha-1
corresponding to 1.5 and 7.5 t C ha-1
) compared to the application rates
used by previous studies (0.38 - 135 t C ha-1
for a pot experiment by Lehmann and

Discussion
111
Rondon in 2006; 8 - 30 t C ha-1
for a field experiment by Lehmann and Rondon in
2006 and Lehmann et al. in 2006).
According to Haefele et al. (2011) and Lehmann and Joseph (2009), low input rates of
biochar allow studying the effects on biomass production together with other effects on
the ecosystem. The effect of biochar on crop yield is one of the important aspects when
developing recommendations on how to improve the sustainability of agricultural
production ecosystems. On the other hand, the low application rates can aggravate the
evaluation of the effect of biochar on the terrestrial carbon sequestration of the soil
ecosystem (Haefele et al., 2011; Lehmann et al., 2006).
6.6.2 Carbon losses during the application
The biochar used for this study had a low bulk density of 0.49 gcm
-3 and contained a
considerable amount of dust particles. Therefore, the biochar could very easily be
blown away by the wind while it was lying on the soil surface before being
incorporated into the surface soil layer (0 - 0.2 m). There were significant and high
losses of TOC during the application, especially with the high biochar application rate
in site 2 where there is no wind barrier along the site. The efficiency and practicability
of the field application of biochar are a rarely investigated area in biochar experiments.
There were some experiments which studied the effectiveness of solo application,
mixed application with compost, animal manure or mineral fertilizer, but very few
discussed the effectiveness and practicability of different types of incorporation such
as deep vs. surface and banded vs. surface application, or the technical and economic
feasibility concerning losses during the application, or safety concerns (Blackwell et
al., 2009).
6.6.3 Chamber measurements
The closed chamber is the most commonly and frequently used method in gas
emission studies to determine the gas exchange between soil surface and atmosphere.
But chamber measurements are greatly influenced by many parameters and sometimes
underestimate fluxes. There were several improvements in the chambers which were

Discussion
112
used for our measurements and flux calculations to minimize the errors associated with
the chamber measurements (Davidson et al., 2002; LI-COR Biosciences, 2007;
Pihlatie et al., 2013; Xu et al., 2006). In our experiments, the measured concentrations
of N2O and CH4 were small. Those small concentrations may alter easily during the
time between air sample collection from the chamber head space and the laboratory
measurements. Those limitations could have some influence on the assessment of the
fluxes and the variability of different treatments.

Conclusion and Outlook
113
7. Conclusion and Outlook
This study has advanced the understanding of some basic aspects of the soil-plant-
biochar interactions after amending soil in bio energy plantation ecosystems in SH,
Germany with biochar produced from anaerobic biogas digestate. We used two field
sites with different soil types, Gleyic Podzol and Gleyic Anthrosol which have different
physico-chemical attributes and management conditions to investigate the potential
benefits of biochar amendment for bioenergy crop production, soil nutrient recycling,
climate change mitigation and reduction of greenhouse gas emissions from arable
soils.
The soil chemical properties pH, EC, TOC, TN, DOC, DON, inorganic nitrogen, cati-
on concentration, CEC, and plant available-P and -K increased after applying biochar.
The positive effects on TOC, inorganic nitrogen, CEC, and plant available-P and -K
were significant and remained so over four consecutive growing seasons. Also, biochar
significantly increased the microbial growth in the soils. The additional carbon which
was received from the biochar increased greenhouse gas emissions only slightly, but
this small increase was nonsignificant. The incubation experiment neither showed a
clear increasing nor a clear decreasing effect of biochar on the mineralization of the
soil organic carbon pool.
The results obtained from this study showed that a single application of biochar from
biogas digestate at low rates increased the crop biomass production in both Gleyic
Podzol (without inorganic fertilizer) and Gleyic Anthrosol (with minimal application of
inorganic fertilizer) during four consecutive growing seasons. This biomass increase
can be explained as a synergy of the effects of biochar on the nutrient concentrations
and availability in the soil, which are further increased by the high surface area and
porous nature of the biochar which give it the capacity to act as a nutrient holder and
medium for microorganisms.
The size of the plots and their position inside the grower’s field were chosen in the best
possible way, but there were some unexpected external disturbances which affected the
quality of the soil samples a few times and also affected plant growth of some plots.

Conclusion and Outlook
114
Those effects could only be noticed after the data were statistically analyzed long after
the plot establishment.
While already providing many insights into how biochar can reduce GHG fluxes from
arable fields and improve the sustainability of bio energy production agro-ecosystems,
our study also raises a set of questions to be answered in the future, and thus opens
new room for further research. Additional field and laboratory studies on both short-
and long-term basis are needed to answer those questions and further deepen the un-
derstanding before being able to gain those benefits at a commercial level and on a
large scale.
Outlook: Need for future research
There are a number of areas concerning the application of biochar or charred digestate
to soil in bio energy production agro-ecosystems which still require further investiga-
tion:
o Find out the contribution of different carbon pools to emitted CO2 under field con-
ditions which are more complex than in an incubation experiment, in order to gain
insight into soil-plant-biochar interactions in a more realistic situation.
o Deepen the knowledge about gas emissions. Our study showed interesting data
about the emission of N2O and CH4 under field conditions, but those need further
clarification to be able to draw valid conclusions. Therefore, future experiments
should collect a more representative and extensive set of data with more frequent
measurements under field conditions.
o Study the influence of the application of biochar on the energy value of biomass in
bioenergy crop production systems. This requires interdisciplinary studies and
needs to be done before using biochar in commercial agriculture on a large scale.
o Investigate the impact of biochar on the quality of DOC. This research is im-
portant to gain the understanding which is necessary for predicting the effects of
biochar on the ground water. Also, it is important to evaluate the potential risks
associated with the sorption capacity of biochar and certain organic compounds

Conclusion and Outlook
115
such as pesticides which are often used in bioenergy crop production agro-
ecosystems.
o Deepen the knowledge about soil microbial activities, focusing on diversity and
population changes, in particular the changes of ectomycorrhizal fungi.
o Design a more realistic field lysimeter experiment with undisturbed soil which
completely covers all the pathways in which biochar can get lost after adding it to
the ecosystem, with the goal of developing a model which can be used in future
studies.

116

References
117
References
Abdullah, H., Mediaswanti, K. A. and Wu, H.: Biochar as a fuel: 2. Significant differences in
fuel quality and ash properties of biochars from various biomass components of
Mallee trees, Energy & Fuels, 24(3), 1972–1979, 2010.
Abebe, N., Endalkachew, K., Mastawesha, M. and Gebermedihin, A.: Effect of biochar
application on soil properties and nutrient uptake of lettuces (Lactuca sativa) grown in
chromium polluted soils, Am. J. Agric. Environ. Sci., 12(3), 369–376, 2012.
Ad-hoc-Arbeitsgruppe Boden: Bodenkundliche Kartieranleitung (in German), 5th
ed.,
Hannover, Germany., 2005.
Ajwa, H. A. and Tabatabai, M. A.: Decomposition of different organic materials in soils, Biol.
Fertil. Soils, 18(3), 175–182, 1994.
Alling, V., Hale, S. E., Martinsen, V., Mulder, J., Smebye, A., Breedveld, G. D. and
Cornelissen, G.: The role of biochar in retaining nutrients in amended tropical soils, J.
Plant Nutr. Soil Sci., 177(5), 671–680, 2014.
Al-Seadi, T. and Lukehurst, C.: Quality management of digestate from biogas plants used as
fertiliser. [online] Available from: http://www.iea-biogas.net/ (Accessed 11 December
2014), 2012.
Amonette, J. E. and Joseph, S.: Characteristics of biochar: microchemical properties, in
Biochar for environmental management science and sechnology, edited by J. Lehmann
and S. Joseph, pp. 33–66, Earthscan, UK., 2009.
Asai, H., Samson, B. K., Stephan, H. M., Songyikhangsuthor, K., Homma, K., Kiyono, Y.,
Inoue, Y., Shiraiwa, T. and Horie, T.: Biochar amendment techniques for upland rice
production in Northern Laos, F. Crop. Res., 111(1-2), 81–84, 2009.
Atkinson, C. J., Fitzgerald, J. D. and Hipps, N. A.: Potential mechanisms for achieving
agricultural benefits from biochar application to temperate soils: a review, Plant Soil,
337(1-2), 1–18, 2010.
Ayodele, A., Oguntunde, P., Joseph, A., Dias Junior, M. de S., Abiodun, J. and Moacir Junior,
D. S. D.: Numerical analysis of the impact of charcoal production on soil hydrological
behavior, runoff response and erosion susceptibility, Rev. Bras. Ciência do Solo, 33(1),
137–146, 2009.
Badalucco, L., Nannipieri, P., Grego, S. and Ciardi, C.: Microbial biomass and anthrone-
reactive carbon in soils with different organic matter contents, Soil Biol. Biochem.,
22(7), 899–904, 1990.
Bailey, V. L., Fansler, S. J., Smith, J. L., Jr., H. B. and Bolton, H.: Reconciling apparent
variability in effects of biochar amendment on soil enzyme activities by assay
optimization, Soil Biol. Biochem., 43(2), 296–301, 2010.

References
118
Baldock, J. A. and Smernik, R. J.: Chemical composition and bioavailability of thermally
altered Pinus resinosa (Red pine) wood, Org. Geochem., 33(9), 1093–1109, 2002.
Becker, M. and Kaster, G.: Kulturlandschaft Eider-Treene-Sorge (in German), Wachholtz
Verlag. Neumünster., 2005.
Behre, K. E.: Landschaftsgeschichte Norddeutschlands: Umwelt und Siedlung von der
Steinzeit bis zur Gegenwart (in German), Wachholtz; Auflage., 2008.
Bélanger, N., Côte, B., Fyles, J. W., Courchesne, F. and Hendershot, W. H.: Forest regrowth as
the controlling factor of soil nutrient availability 75 years after fire in a deciduous
forest of Southern Quebec, Plant Soil, 262(1/2), 363–272, 2004.
Belyaeva, O. N. and Haynes, R. J.: Comparison of the effects of conventional organic
amendments and biochar on the chemical, physical and microbial properties of coal fly
ash as a plant growth medium, Environ. Earth Sci., 66(7), 1987–1997, 2012.
Biederman, L. A. and Harpole, W. S.: Biochar and its effects on plant productivity and
nutrient cycling: a meta-analysis, GCB Bioenergy, 5(2), 202–214, 2012.
Bijay-Singh, Shan, Y. H., Johnson-Beebout, S. E., Yadvinder-Singh and Buresh, R. J. J.:
Chapter 3- Crop residue management for lowland rice-based cropping systems in Asia,
Adv. Agron., 98(08), 117–199, 2008.
Biosciences, LI-COR.: LI-8100, Automated soil CO2 flux system & LI-8150 multiplexer.
instruction manual, 4th
ed., LI-COR Inc., Lincoln, Nebraska., 2007.
Bird, M. I., Moyo, C., Veenendaal, E. M., Lloyd, J. and Frost, P.: Stability of elemental carbon
in a savanna soil, Global Biogeochem. Cycles, 13(4), 923–932, 1999.
Blackwell, P., Riethmuller, G. and Collins, M.: Biochar application to soil, in Biochar for
environmental management science and sechnology, edited by J. Lehmann and S.
Joseph, pp. 207–226, Earthscan, UK., 2009.
BMELV: German forests Nature and economic factor, Bundesministerium für Ernährung,
Landwirtschaft und Verbraucherschutz (BMELV), Bonn, Germany., 2011.
BMJV: Verordnung zur Dürchführung des Tierische Nebenprodukte- Beseitigungsgesetzes.
(Tierische Nebenprodukte-Beseitigungsverordnung-TierNebV) : Artikel 2 der
Verordnung vom 23. April 2012 (BGBl. I S. 611) (in German), 21 [online] Available
from: http://www.gesetze-im-internet.de/ (Accessed 11 December 2014), 2012.
Böhme, D., Dürrschmidt, W. and Mark, M.: Renewable energy sources in figures: national
and international development., Federal Ministry for the Environment, Nature
Conservation and Nuclear Safety (BMU), Berlin. [online] Available from:
www.bmu.de/english (Accessed 11 December 2014), 2010.
Bolan, N. S., Kunhikrishnan, A., Choppala, G. K., Thangarajan, R. and Chung, J. W.:
Stabilization of carbon in composts and biochars in relation to carbon sequestration
and soil fertility, Sci. Total Environ., 424, 264–270, 2012.

References
119
Bosch, J., Johnson, F. X., Clément, E., Mertens, R. and Roubanis, N.: Panorama of energy.
Energy statistics to support EU policies and solutions, Office for Official Publications
of the European Communities, European Commission, Luxembourg. [online]
Available from: http://epp.eurostat.ec.europa.eu (Accessed 8 December 2014), 2009.
Brennan, J. K., Bandosz, T. J., Thomson, K. T. and Gubbins, K. E.: Water in porous carbons,
colloids surfaces a physicochem. Eng. Asp., 187-188, 539–568, 2001.
Brenner, von A.: PhD Thesis: Untersuchungen zur Düngewirkung von Gärrückständen unter
besonderer Berücksichtigung von NH3- und NO3- -Verlusten (in German), Rheinni-
schen Friedrich-Wilhelms-Universität zu Bonn, Bonn., 2008.
Brewer, C. E., Unger, R., Schmidt-Rohr, K. and Brown, R. C.: Criteria to select biochars for
field studies based on biochar chemical properties, BioEnergy Res., 4(4), 312–323,
2011.
Bridgwater, A. V.: Principles and practice of biomass fast pyrolysis processes for liquids, J.
Anal. Appl. Pyrolysis, 51(1-2), 3–22, 1999.
Brodowski, S., Amelung, W., Haumaier, L., Abetz, C. and Zech, W.: Morphological and
chemical properties of black carbon in physical soil fractions as revealed by scanning
electron microscopy and energy-dispersive X-ray spectroscopy, Geoderma, 128(1-2),
116–129, 2005.
Brookes, P., Kragt, J. F., Powlson, D. S. and Jenkinson, D. S.: Chloroform fumigation and the
release of soil nitrogen: The effects of fumigation time and temperature, Soil Biol.
Biochem., 17(6), 831–835, 1985.
Bruun, E. W., Ambus, P., Egsgaard, H. and Hauggaard-Nielsen, H.: Effects of slow and fast
pyrolysis biochar on soil C and N turnover dynamics, Soil Biol. Biochem., 46, 73–79,
2012.
Bruun, E. W., Hauggaard-Nielsen, H., Ibrahim, N., Egsgaard, H., Ambus, P., Jensen, P. A. and
Dam-Johansen, K.: Influence of fast pyrolysis temperature on biochar labile fraction
and short-term carbon loss in a loamy soil, Biomass and Bioenergy, 35(3), 1182–1189,
2011.
Bruun, S., Jensen, E. S. and Jensen, L. S.: Microbial mineralization and assimilation of black
carbon: Dependency on degree of thermal alteration, Org. Geochem., 39(7), 839–845,
2008.
Buss, W., Mašek, O., Graham, M. and Wüst, D.: Inherent organic compounds in biochar–
Their content, composition and potential toxic effects, J. Environ. Manage., 156, 150–
157, 2015.
Busscher, W. J., Novak, J. M., Evans, D. E., Watts, D. W., Niandou, M. A. S. and Ahmedna,
M.: Influence of pecan biochar on physical properties of a Norfolk loamy sand, Soil
Sci., 175(1), 10–14, 2010.
Butler, J. and Hooper, P.: Down to earth: An illustration of life cycle inventory good practice

References
120
with reference to the production of soil conditioning compost, Resour. Conserv.
Recycl., 55(2), 135–147, 2010.
Calvelo Pereira, R., Kaal, J., Camps Arbestain, M., Pardo Lorenzo, R., Aitkenhead, W.,
Hedley, M., Macías, F., Hindmarsh, J. and Maciá-Agulló, J. a.: Contribution to
characterisation of biochar to estimate the labile fraction of carbon, Org. Geochem.,
42(11), 1331–1342, 2011.
Castaldi, S., Riondino, M., Baronti, S., Esposito, F. R., Marzaioli, R., Rutigliano, F. A.,
Vaccari, F. P. and Miglietta, F.: Impact of biochar application to a Mediterranean wheat
crop on soil microbial activity and greenhouse gas fluxes, Chemosphere, 85(9), 1464–
1471, 2011.
Chan, K. Y. and Xu, Z.: Biochar: Nutrient Properties and Their Enhancement, in Biochar for
environmental management science and sechnology, edited by J. Lehmann and S.
Joseph, pp. 67–84, Earthscan, UK., 2009.
Chan, K. Y., Zwieten, L. Van, Meszaros, I., Downie, A. and Joseph, S.: Agronomic values of
greenwaste biochar as a soil amendment, Soil Res., 45(8), 629–634, 2007.
Chan, K. Y., Van Zwieten, L., Meszaros, I., Downie, A. and Joseph, S.: Using poultry litter
biochars as soil amendments, Aust. J. Soil Res., 46(5), 437, 2008.
Cheng, C.-H., Lehmann, J. and Engelhard, M. H.: Natural oxidation of black carbon in soils:
Changes in molecular form and surface charge along a climosequence, Geochim.
Cosmochim. Acta, 72(6), 1598–1610, 2008.
Cheng, C.-H., Lehmann, J., Thies, J. E., Burton, S. D. and Engelhard, M. H.: Oxidation of
black carbon by biotic and abiotic processes, Org. Geochem., 37(11), 1477–1488,
2006.
Chidumayo, E. N.: Effects of wood carbonization on soil and initial development of seedlings
in miombo woodland, Zambia, For. Ecol. Manage., 70(1-3), 353–357, 1994.
Czimczik, C. I. and Masiello, C. A.: Controls on black carbon storage in soils, Global
Biogeochem. Cycles, 21(3), 2007.
Davidson, E. A., Savage, K., Verchot, L. V. and Navarro, R.: Minimizing artifacts and biases
in chamber-based measurements of soil respiration, Agric. For. Meteorol., 113, 21–37,
2002.
DBFZ: Monitoring zur Wirkung des Erneuerbare -Energien-Gesetz (EEG) auf die
Entwicklung der Stromerzeugung aus Biomasse (in German), Leipzig., 2012.
Deenik, J. L., McClellan, T., Uehara, G., Antal, M.J., J. and Campbell, S.: Charcoal volatile
matter content influences plant growth and soil nitrogen transformations, Soil Sci. Soc.
Am. J., 354, 311–324, 2010.
DeLuca, T. H., MacKenzie, M. D., Gundale, M. J. and Holben, W. E.: Wildfire-produced
charcoal directly influences nitrogen cycling in Ponderosa pine forests, Soil Sci. Soc.

References
121
Am. J., 70(2), 448, 2006.
Dempster, D. N., Gleeson, D. B., Solaiman, Z. M., Jones, D. L. and Murphy, D. V.: Decreased
soil microbial biomass and nitrogen mineralisation with Eucalyptus biochar addition to
a coarse textured soil, Plant Soil, 354(1-2), 311–324, 2012.
DIN ISO 11260: Soil quality – Determination of effective cation exchange capacity,
Deutsches Institut fuer Normung e.V., 2011.
DIN ISO 10390: Soil quality - Determination of pH, Deutsches Institut fuer Normung e.V.,
2005.
DIN ISO 10694: Determination of organic and total carbon after dry combustion (elementary
analysis), Deutsches Institut fuer Normung e.V., 1996.
DIN ISO 11265: Soil quality - Determination of the specific electrical conductivity, Deutsches
Institut fuer Normung e.V., 1997.
Dittrich, B.: Düngemittelrechtliche und abfallrechtliche Vorgaben bei der landwirtschaftlichen
Verwertung von Gärrückständen (in German). [online] Available from:
http://www.landwirtschaft.sachsen.de/ (Accessed 23 January 2015), 2006.
Domínguez, G.: PhD Thesis: Agro-ecological aspects when applying the remaining products
from agricultural biogas processes as fertilizer in crop production. [online] Available
from: http://edoc.hu-berlin.de/ (Accessed 5 December 2014), 2012.
Downie, A., Munroe, P., Cowie, A., Van-Zwieten, L. and Lau, D. M. S.: Biochar as a
geoengineering climate solution: Hazard identification and risk management, Crit.
Rev. Environ. Sci. Technol., 42(3), 225–250, 2012.
Durenkamp, M., Luo, Y. and Brookes, P. C.: Impact of black carbon addition to soil on the
determination of soil microbial biomass by fumigation extraction, Soil Biol. Biochem.,
42(11), 2026–2029, 2010.
DWD: Klima + Umwelt: Klimadaten, Bundesministeriums für Verkehr und Digit.
Infrastruktur [online] Available from: http://www.dwd.de/ (Accessed 20 December
2014), 2014.
Eastman, C. M.: Soil Physical characteristics of an Aeric Ochraqualf amended with biochar,
Master Thesis, The Ohio State University., 2011.
EBA: European Biogas Association: Position papers & press peleases, [online] Available
from: http://european-biogas.eu/ (Accessed 16 December 2012), 2012.
EBC: European Biochar Certificate - Guidelines for a sustainable production of biochar
(Version 6.1), [online] Available from: http://www.european-biochar.org/en (Accessed
16 October 2012), 2012.
Ehlers, J.: Das Eiszeitalter (in German), Spektrum Akademischer Verlag., 2011.
Elste, B., Tischer, S. and Christen, O.: Einfluss von Biogasgärrückständen auf Abundanz und

References
122
Biomasse von Lumbriciden (in German), Ostnabrück., 2010.
Evans, G.: Biowaste and biological waste treatment. U.K., Earthscan Publications, London,
UK., 2013.
Faaij, A. P. C.: Bio-energy in Europe: changing technology choices, Energy Policy, 34(3),
322–342, 2006.
Feng, Y., Xu, Y., Yu, Y., Xie, Z. and Lin, X.: Mechanisms of biochar decreasing methane
emission from Chinese paddy soils, Soil Biol. Biochem., 46, 80–88, 2012.
FNR: Biogas an introduction. [online] Available from: https://mediathek.fnr.de/ (Accessed 6
May 2014), 2013.
FNR: Bioenergy in Germany: Facts and Figures. [online] Available from:
https://mediathek.fnr.de/ (Accessed 5 December 2014), 2014.
Forbes, M. S., Raison, R. J. and Skjemstad, J. O.: Formation, transformation and transport of
black carbon (charcoal) in terrestrial and aquatic ecosystems, Sci. Total Environ.,
370(1), 190–206, 2006.
Gaskin, J. W., Speir, R. A., Harris, K., Das, K. C., Lee, R. D., Morris, L. A. and Fisher, D. S.:
Effect of peanut hull and pine chip biochar on soil nutrients, corn nutrient status, and
yield, Agron. J., 102(2), 623, 2010.
German Advisory Council on the Environment: Opinion-amendment of the fertiliser
application ordinance (DüV): Limiting nutrient surpluses effectively, Berlin., 2013.
Glaser, B., Balashov, E., Haumaier, L., Guggenberger, G. and Zech, W.: Black carbon in
density fractions of anthropogenic soils of the Brazilian Amazon region, Org.
Geochem., 31(7-8), 669–678, 2000.
Glaser, B., Lehmann, J. and Zech, W.: Ameliorating physical and chemical properties of
highly weathered soils in the tropics with charcoal - a review, Biol. Fertil. Soils, 35(4),
219–230, 2002.
Graber, E. R., Tsechansky, L., Gerstl, Z., Lew, B. and Gerst, Z.: High surface area biochar
negatively impacts herbicide efficacy, Plant Soil, 353(1-2), 95–106, 2011.
Grassini, P. and Cassman, K. G.: High-yield maize and small global warming intensity
maximizing productivity per unit of arable land while reducing negative
environmental impact is goal., Fluid J., 21(81), 2013.
Grossman, J. M., O’Neill, B. E., Tsai, S. M., Liang, B., Neves, E., Lehmann, J. and Thies, J.
E.: Amazonian Anthrosols support similar microbial communities that differ distinctly
from those extant in adjacent, unmodified soils of the same mineralogy, Microb. Ecol.,
60(1), 192–205, 2010.
Haefele, S. M., Konboon, Y., Wongboon, W., Amarante, S., Maarifat, A. A., Pfeiffer, E. M.
and Knoblauch, C.: Effects and fate of biochar from rice residues in rice-based
systems, F. Crop. Res., 121(3), 430–440, 2011.

References
123
Hale, S. E., Alling, V., Martinsen, V., Mulder, J., Breedveld, G. D. and Cornelissen, G.: The
sorption and desorption of phosphate-P, ammonium-N and nitrate-N in cacao shell and
corn cob biochars., Chemosphere, 91(11), 1612–9, 2013.
Hale, S., Hanley, K., Lehmann, J., Zimmerman, A. and Cornelissen, G.: Effects of chemical,
biological, and physical aging as well as soil addition on the sorption of pyrene to
activated carbon and biochar, Environ. Sci. Technol., 45(24), 10445–10453, 2011.
Hamer, U., Marschner, B., Brodowski, S. and Amelung, W.: Interactive priming of black
carbon and glucose mineralisation, Org. Geochem., 35(7), 823–830, 2004.
Hammes, K., Schmidt, M. W. I., Johannes, L., Czimczik, C., Laird, D. and Sohi, S.: Stability
of biochar in soil, in Biochar for environmental management science and sechnology,
edited by J. Lehmann and S. Joseph, pp. 169–182, Earthscan, UK., 2009.
Hans-Jörg Brauckmann, Warnecke, S. and Broll, G.: Nährstoffstromanalyse einer Biogas -
anlage mit Gärrestaufbereitung (in German), in Gülzower Fachgespräche Band 30:
Gärrestaufbereitung für eine pflanzenbauliche Nutzung – Stand und F+E-Bedarf,
edited by F. N. R. e. V. (FNR), pp. 53–77., 2009.
Hedges, J., Eglinton, G., Hatcher, P., Kirchman, D., Arnosti, C., Derenne, S., Evershed, R.,
Kögel-Knabner, I., de Leeuw, J., Littke, R., Michaelis, W. and Rullkötter, J.: The
molecularly-uncharacterized component of nonliving organic matter in natural
environments, Org. Geochem., 31(10), 945–958, 2000.
IBI: The International Biochar Imitative - Standardized product definition and product testing
guidelines for biochar that is used in soil (Final Version of IBI-STD - 01: Revision
Date15 May 2012)., 2012.
ICS: International stratigraphy chart - Chart/Time Scale, [online] Available from:
http://www.stratigraphy.org/ (Accessed 19 February 2015), 2014.
IPCC: IPCC special report on carbon dioxide capture and storage. Prepared by working group
III of the Intergovernmental Panel on Climate Change [Metz, B., O. Davidson, H. C.
de Coninck, M. Loos, and L. A. Meyer (eds.)], Cambridge University Press,
Cambridge, United Kingdom and New York, NY, USA 2005.
IPCC: The physical science basis. Rep. 1., [Solomon, S., D. Qin, M. Manning, Z. Chen, M.
Marquis, K.B. Averyt, M. Tignor and H.L. Miller (eds.)]Cambridge University Press,
Cambridge, United Kingdom and New York, NY, USA, 2007.
Iswaran, V., Jauhri, K. S. and Sen, A.: Effect of charcoal, coal and peat on the yield of moong,
soybean and pea, Soil Biol. Biochem., 12(2), 191–192, 1980.
Jeffery, S., Meinders, M. B. J., Stoof, C. R., Bezemer, T. M., van de Voorde, T. F. J., Mommer,
L. and van Groenigen, J. W.: Biochar application does not improve the soil
hydrological function of a sandy soil, Geoderma, 251-252, 47–54, 2015.
Jeffery, S., Verheijen, F. G. A., van der Velde, M. and Bastos, A. C.: A quantitative review of
the effects of biochar application to soils on crop productivity using meta-analysis,

References
124
Agric. Ecosyst. Environ., 144(1), 175–187, 2011.
Jha, P., Biswas, A. K., Lakaria, B. L. and Subba Rao, A.: Biochar in agriculture - prospects
and related implications, Curr. Sci., 99(9), 1218–1225, 2010.
Joergensen, R.: The fumigation-extraction method to estimate soil microbial biomass:
extraction with 0.01 M CaCl2, Agrobiol. Res., 48, 319–324, 1995.
Joergensen, R.: The fumigation-extraction method to estimate soil microbial biomass:
Calibration of the kEC value, Soil Biol. Biochem., 28, 25–31, 1996.
Johannes, L. and Joseph, S.: Biochar system, in Biochar for environmental management
science and sechnology, edited by J. Lehmann and S. Joseph, pp. 147–168, Earthscan,
UK., 2009.
Jones, D. L., Edwards-Jones, G. and Murphy, D. V.: Biochar mediated alterations in herbicide
breakdown and leaching in soil, Soil Biol. Biochem., 43(4), 804–813, 2011a.
Jones, D. L. L., Murphy, D. V. V, Khalid, M., Ahmad, W., Edwards-Jones, G. and DeLuca, T.
H.: Short-term biochar-induced increase in soil CO2 release is both biotically and
abiotically mediated, edited by G. Edwards-Jones and T. H. DeLuca, Soil Biol.
Biochem., 43(8), 1723–1731, 2011b.
Kameyama, K., Miyamoto, T., Shiono, T. and Shinogi, Y.: Influence of sugarcane bagasse-
derived biochar application on nitrate leaching in calcaric dark red soil, J. Environ.
Qual., 41(4), 1131, 2012.
Kammann, C., Ratering, S., Eckhard, C. and Müller, C.: Biochar and hydrochar effects on
greenhouse gas (CO2, N2O, and CH4) fluxes from soils, J. Environ. Qual., 41(4), 1052,
2012.
Karhu, K., Mattila, T., Bergström, I. and Regina, K.: Biochar addition to agricultural soil
increased CH4 uptake and water holding capacity – Results from a short-term pilot
field study, Agric. Ecosyst. Environ., 140(1-2), 309–313, 2011.
Kautz, T. and Rauber, R.: Einfluss der Düngung mit Gärrückständen aus der Bio
gaserzeugung auf den Ertrag von Silomais und auf die bodenmikrobielle Aktivität (in
German), in Wissenschaftstagung Ökologischer Landbau., 2007.
Kawamoto, K., Ishimaru, K. and Imamura, Y.: Reactivity of wood charcoal with ozone, J.
Wood Sci., 51(1), 66–72, 2005.
Keith, A., Singh, B. B. P. and Singh, B. B. P.: Interactive priming of biochar and labile organic
matter mineralization in a Smectite-rich soil, Environ. Sci. Technol., 45(22), 9611–
9618, 2011.
Khodadad, C. L. M., Zimmerman, A. R., Green, S. J., Uthandi, S. and Foster, J. S.: Taxa-
specific changes in soil microbial community composition induced by pyrogenic
carbon amendments, Soil Biol. Biochem., 43(2), 385–392, 2011.
Kimetu, J. M. and Lehmann, J.: Stability and stabilisation of biochar and green manure in soil

References
125
with different organic carbon contents, Aust. J. Soil Res., 48(7), 577, 2010.
Kimetu, J. M., Lehmann, J., Ngoze, S. O., Mugendi, D. N., Kinyangi, J. M., Riha, S., Verchot,
L., Recha, J. W. and Pell, A. N.: Reversibility of soil productivity decline with organic
matter of differing quality along a degradation gradient, Ecosystems, 11(5), 726–739,
2008.
Knicker, H., Hilscher, A., González-Vila, F. J. and Almendros, G.: A new conceptual model
for the structural properties of char produced during vegetation fires, Org. Geochem.,
39(8), 935–939, 2008.
Knoblauch, C., Beer, C., Sosnin, A., Wagner, D. and Pfeiffer, E.-M.: Predicting long-term
carbon mineralization and trace gas production from thawing permafrost of Northeast
Siberia, Glob. Chang. Biol., 19(4), 1160–1172, 2013.
Knoblauch, C., Maarifat, A.-A., Pfeiffer, E.-M. and Haefele, S. M.: Degradability of black
carbon and its impact on trace gas fluxes and carbon turnover in paddy soils, Soil Biol.
Biochem., 43(9), 1768–1778, 2011.
Kolb, S. E., Fermanich, K. J. and Dornbush, M. E.: Effect of charcoal quantity on microbial
biomass and activity in temperate soils, Soil Sci. Soc. Am. J., 73(4), 1173, 2009.
Krull, E. S., Baldock, J. A., Skjemstad, J. O., Smernik, R. J., Amonette, J. E. and Joseph, S.:
Characteristics of biochar: Organo-chemical properties, in Biochar for environmental
management science and sechnology, edited by J. Lehmann and S. Joseph, pp. 33–52,
Earthscan, UK., 2009.
Kutzbach, L., Schneider, J., Sachs, T., Giebels, M., Nykänen, H., Shurpali, N. J., Martikainen,
P. J., Alm, J. and Wilmking, M.: CO2 flux determination by closed-chamber methods
can be seriously biased by inappropriate application of linear regression,
Biogeosciences Discuss., 4(4), 2279–2328, 2007.
Kuzyakov, Y., Subbotina, I., Chen, H., Bogomolova, I. and Xu, X.: Black carbon
decomposition and incorporation into soil microbial biomass estimated by 14
C
labeling, Soil Biol. Biochem., 41(2), 210–219, 2009.
Kwapinski, W., Byrne, C. M. P., Kryachko, E., Wolfram, P., Adley, C., Leahy, J. J., Novotny,
E. H. and Hayes, M. H. B.: Biochar from biomass and waste: waste and biomass
valorization, 1(2), 177–189, 2010.
Kwon, S. and Pignatello, J. J.: Effect of natural organic substances on the surface and
adsorptive properties of environmental black carbon (Char): Pseudo pore blockage by
model lipid components and its implications for N2-probed surface properties of
natural sorbents, Environ. Sci. Technol., 39(20), 7932–7939, 2005.
Laird, D. A., Fleming, P., Davis, D. D., Horton, R., Wang, B. and Karlen, D. L.: Impact of
biochar amendments on the quality of a typical Midwestern agricultural soil,
Geoderma, 158(3-4), 443–449, 2010.
Lal, R.: Soil Carbon Sequestration Impacts on Global Climate Change and Food Security,

References
126
Science (80-.)., 304(5677), 1623–1627, 2004.
Lal, R.: World crop residues production and implications of its use as a biofuel, Environ. Int.,
31(4), 575–584, 2005.
Lal, R.: Soil Science and the Carbon Civilization, Soil Sci. Soc. Am. J., 71(5), 1425, 2007.
Lal, R.: Managing soils for a warming earth in a food-insecure and energy-starved world, J.
Plant Nutr. Soil Sci., 173(1), 4–15, 2010.
Langheld, S.: Diplomarbeit: Auswirkungen von Gärresten aus Biogasanlagen auf die
Bodenphysik sandiger Böden auf Stapelholm in Schleswig-Holstein (In German),
University of Hamburg, Hamburg., 2013.
Lehmann, J.: Bio-energy in the black, Front. Ecol. Environ., preprint(2007), 1, 2007.
Lehmann, J., Gaunt, J. and Rondon, M.: Bio-char Sequestration in Terrestrial Ecosystems – A
Review, Mitig. Adapt. Strateg. Glob. Chang., 11(2), 395–419, 2006.
Lehmann, J. and Joseph, S.: Biochar for environmental eanagement: An introduction, in
Biochar for environmental management science and sechnology, edited by J. Lehmann
and S. Joseph, Earthscan, UK., 2009.
Lehmann, J., Kern, D., German, L., Mccann, J., Martins, G. C. and Moreira, A.: Soil fertility
and production potential, in Amazonian dark earths, edited by J. Lehmann, D. C. Kern,
B. Glaser, and W. I. Woods, pp. 105–124, Kluwer Academic Publishers, Dordrecht.,
2003a.
Lehmann, J., Pereira da Silva Jr., J., Steiner, C., Nehls, T., Zech, W. and Glaser, B.: Nutrient
availability and leaching in an archaeological Anthrosol and a Ferralsol of the Central
Amazon basin: fertilizer, manure and charcoal amendments, Plant Soil, 249(2), 343–
357, 2003b.
Lehmann, J., Rillig, M. C., Thies, J., Masiello, C. A., Hockaday, W. C. and Crowley, D.:
Biochar effects on soil biota – A review, Soil Biol. Biochem., 43(9), 1812–1836, 2011.
Lehmann, J. and Rondon, M.: Bio-char soil management on highly weathered soils in the
humid tropics, in Biological approaches to sustainable soil systems, edited by Norman
Uphoff, A. S. Ball, E. Fernandes, H. Herren, O. Husson, M. Laing, C. Palm, J. Pretty,
P. Sanchez, N. Sanginga, and J. Thies., 2006.
Lehmann, J. and Sohi, S.: Comment on Fire-derived charcoal causes loss of forest humus,
Science (80-.)., 321(5894), 1295–1295, 2008.
Liang, B., Lehmann, J., Sohi, S. P., Thies, J. E., O’Neill, B., Trujillo, L., Gaunt, J., Solomon,
D., Grossman, J., Neves, E. G. and Luizão, F. J.: Black carbon affects the cycling of
non-black carbon in soil, Org. Geochem., 41(2), 206–213, 2010.
Liang, B., Lehmann, J., Solomon, D., Kinyangi, J., Grossman, J., O’Neill, B., Skjemstad, J.
O., Thies, J., Luizão, F. J., Petersen, J. and Neves, E. G.: Black carbon increases cation
exchange capacity in soils, Soil Sci. Soc. Am. J., 70(5), 1719, 2006.

References
127
Liang, C., Zhu, X., Fu, S., Méndez, A., Gascó, G. and Paz-Ferreiro, J.: Biochar alters the
resistance and resilience to drought in a tropical soil, Environ. Res. Lett., 9(6), 064013,
2014.
Liedtke, H. and Marcinek, J.: Physische Geographie Deutschlands (in German), 3rd
ed., Justus
Perthes Verlag, Gotha., 2002.
Liu, C., Wang, H., Tang, X., Guan, Z., Reid, B. J., Rajapaksha, A. U., Ok, Y. S. and Sun, H.:
Biochar increased water holding capacity but accelerated organic carbon leaching
from a sloping farmland soil in China, Environ. Sci. Pollut. Res., 2015.
Liu, G., Niu, Z., Van Niekerk, D., Xue, J. and Zheng, L.: Polycyclic aromatic hydrocarbons
(PAHs) from coal combustion: Emissions, analysis, and toxicology, in Reviews of
environmental contamination and toxicology, edited by D. M. Whitacre, pp. 1–28,
Springer New York., 2008.
Liu, J., Schulz, H., Brandl, S., Miehtke, H., Huwe, B. and Glaser, B.: Short-term effect of
biochar and compost on soil fertility and water status of a Dystric Cambisol in NE
Germany under field conditions, J. Plant Nutr. Soil Sci., 175(5), 698–707, 2012.
Liu, Y., Yang, M., Wu, Y., Wang, H., Chen, Y. and Wu, W.: Reducing CH4 and CO2 emissions
from waterlogged paddy soil with biochar, J. Soils Sediments, 11(6), 930–939, 2011.
LLUR: Die Böden Schleswig-Holsteins (in German), Schriftenreihe LLUR SH – Geologie
und Boden; 11, Flintbek, Flintbe., 2012.
Lorenz, K. and Lal, R.: Biochar application to soil for climate change mitigation by soil
organic carbon sequestration, J. Plant Nutr. Soil Sci., 177(5), 651–670, 2014.
Lucchini, P., Quilliam, R. S., DeLuca, T. H., Vamerali, T. and Jones, D. L.: Does biochar
application alter heavy metal dynamics in agricultural soil?, Agric. Ecosyst. Environ.,
184, 149–157, 2014.
Lukehurst, C., Frost, P. and Seadi, T. Al: Utilisation of digestate from biogas plants as
biofertiliser, IEA Bioenergy [online] Available from:
http://www.biogas.org.nz/Publications (Accessed 11 December 2014), 2010.
Luo, Y., Durenkamp, M., De Nobili, M., Lin, Q. and Brookes, P. C.: Short term soil priming
effects and the mineralisation of biochar following its incorporation to soils of
different pH, Soil Biol. Biochem., 43(11), 2304–2314, 2011.
Madan, S. and Mandan, P.: Global encyclopaedia of environmental science, Technology and
Management, 2nd
ed., edited by S. Madan and P. Mandan, Global Vision Publishing
House, New Delhi., 2015.
Major, J., Lehmann, J., Rondon, M. and Goodale, C.: Fate of soil-applied black carbon:
downward migration, leaching and soil respiration, Glob. Chang. Biol., 16(4), 1366–
1379, 2010a.
Major, J., Rondon, M., Molina, D., Riha, S. J. and Lehmann, J.: Maize yield and nutrition

References
128
during 4 years after biochar application to a Colombian savanna oxisol, Plant Soil,
333(1-2), 117–128, 2010b.
Major, J., Steiner, C., Downie, A. and Lehmann, J.: Biochar effects on nutrient leaching, in
Biochar for environmental management science and sechnology, edited by J. Lehmann
and S. Joseph, pp. 271–288, UK., 2009.
Makádi, M., Tomócsik, A. and Orosz, V.: Digestate: a new nutrient source–review, Energy
[online] Available from: http://cdn.intechopen.com/pdfs-wm/31331.pdf (Accessed 5
December 2014), 2012.
Malghani, S., Gleixner, G. and Trumbore, S. E.: Chars produced by slow pyrolysis and
hydrothermal carbonization vary in carbon sequestration potential and greenhouse
gases emissions, Soil Biol. Biochem., 62, 137–146, 2013.
Martinsen, V., Mulder, J., Shitumbanuma, V., Sparrevik, M., Børresen, T. and Cornelissen, G.:
Farmer-led maize biochar trials: Effect on crop yield and soil nutrients under
conservation farming, J. Plant Nutr. Soil Sci., 177(5), 681–695, 2014.
Masiello, C. A.: Black carbon in deep-sea sediments, Science (80-.)., 280(5371), 1911–1913,
1998.
Masiello, C. A., Chen, Y., Gao, X., Liu, S., Cheng, H., Bennett, M. R., Rudgers, J. A., Wagner,
D. S., Zygourakis, K. and Silberg, J. J.: Biochar and microbial signaling: production
conditions determine effects on microbial communication, Environ. Sci. Technol.,
2013.
Matovic, D.: Biochar as a viable carbon sequestration option: Global and Canadian
perspective, Energy, 36(4), 2011–2016, 2011.
McCarl, B. A., Peacocke, C., Chrisman, R., Kung, C.-C. and Sands, R. D.: Economics of
biochar production, utilization and greenhouse gas offsets, in Biochar for
environmental management science and sechnology, edited by J. Lehmann and S.
Joseph, pp. 341–358, Earthscan, UK., 2009.
McCormack, S. A., Ostle, N., Bardgett, R. D., Hopkins, D. W. and Vanbergen, A. J.: Biochar
in bioenergy cropping systems: impacts on soil faunal communities and linked
ecosystem processes, GCB Bioenergy, 5(2), 81–95, 2013.
MELUR: Jährlicher Zwischenbericht 2011 über die Umsetzung des Entwicklungsprogramms
für den ländlichen Raum des Landes Schleswig-Holstein (in German), Kiel., 2012.
Mesa, A. C. and Spokas, K. A.: Impacts of biochar (Black Carbon) additions on the sorption
and efficacy of herbicides, in Herbicides and environment, edited by K. Andreas,
InTech., 2011.
Meuser, H. and Blume, H.-P.: Characteristics and classification of anthropogenic soils in the
Osnabrück area, Germany, J. Plant Nutr. Soil Sci., 164(4), 351, 2001.
Mikan, C. J. and Abrams, M. D.: Altered forest composition and soil properties of historic

References
129
charcoal hearths in southeastern Pennsylvania, Can. J. For. Res., 25(5), 687–696,
1995.
Mohan, D., Pittman, C. U. and Steele, P. H.: Pyrolysis of wood/biomass for bio-oil: A critical
review, Energy & Fuels, 20(3), 848–889, 2006.
Möller, K. and Müller, T.: Effects of anaerobic digestion on digestate nutrient availability and
crop growth: A review, Eng. Life Sci., 12(3), 242–257, 2012.
Möller, K., Schulz, R. and Müller, T.: Mit Gärresten richtig Düngen Aktuelle Informationen
für Berater (in German), Hohenheim., 2009.
Mukherjee, A., Zimmerman, A. R., Hamdan, R. and Cooper, W. T.: Physicochemical changes
in pyrogenic organic matter (biochar) after 15 months of field aging, Solid Earth, 5(2),
693–704, 2014.
Ndor, E., Dauda, S. and Azagaku, E.: Response of Maize Varieties (Zea mays) to Biochar
amended soil in Lafia, Nigeria, Am. J. Exp. Agric., 5(6), 525–531, 2015.
Nguyen, B. T., Lehmann, J., Kinyangi, J., Smernik, R., Riha, S. J. and Engelhard, M. H.:
Long-term black carbon dynamics in cultivated soil, Biogeochemistry, 89(3), 295–
308, 2008.
Novak, J. M. and Busscher, W. J.: Selection and use of designer biochars to improve
characteristics of southeastern USA Coastal Plain degraded soils, in Advanced
Biofuels and Bioproducts, pp. 69–96, Springer New York, New York, NY., 2013.
Novak, J. M., Busscher, W. J., Laird, D. L., Ahmedna, M., Watts, D. W. and Niandou, M. a.
S.: Impact of biochar amendment on fertility of a southeastern Coastal Plain Soil, Soil
Sci., 174(2), 105–112, 2009.
Novak, J. M., Busscher, W. J., Watts, D. W., Amonette, J. E., Ippolito, J. A., Lima, I. M.,
Gaskin, J., Das, K. C., Steiner, C., Ahmedna, M., Rehrah, D. and Schomberg, H.:
Biochars impact on soil-moisture storage in an Ultisol and two Aridisols, Soil Sci.,
177(5), 310–320, 2012.
Novak, J. M., Cantrell, K. B., Watts, D. W., Busscher, W. J. and Johnson, M. G.: Designing
relevant biochars as soil amendments using lignocellulosic-based and manure-based
feedstocks, J. Soils Sediments, 14(2), 330–343, 2014.
Novotny, E. H., Hayes, M. H. B., Madari, B. E., Bonagamba, T. J., Azevedo, E. R. de, Souza,
A. A. de, Song, G., Nogueira, C. M. and Mangrich, A. S.: Lessons from the Terra
Preta De Indios of the Amazon region for the utilisation of charcoal for soil
amendment, J. Braz. Chem. Soc., 20(6), 2009.
O’Neill, B., Grossman, J., Tsai, M. T., Gomes, J. E., Lehmann, J., Peterson, J., Neves, E.,
Thies, J. E., O’Neill, B., Grossman, J., Tsai, M. T., Gomes, J. E., Lehmann, J.,
Peterson, J., Neves, E. and Thies, J. E.: Bacterial community composition in brazilian
Anthrosols and adjacent soils characterized using culturing and molecular
identification, Microb. Ecol., 58(1), 23–35, 2009.

References
130
OECD: Bioheat, Biopower and biogas:Developments and implications for agriculture, OECD
Publishing. [online] Available from: http://www.oecd-ilibrary.org/agriculture-and-
food/ (Accessed 2 January 2015), 2010.
Oelbermann, M. and Voroney, R. P.: Carbon and nitrogen in a temperate agroforestry system:
Using stable isotopes as a tool to understand soil dynamics, Ecol. Eng., 29(4), 342–
349, 2007.
Özçimen, D. and Karaosmanoğlu, F.: Production and characterization of bio-oil and biochar
from rapeseed cake, Renew. Energy, 29(5), 779–787, 2004.
Pacholski, A., Techow, A., Quakernack, R., Herrmann, A., Taube, F. and Kage, H.: N-Umsatz,
Spurengasemissionen und Produktivität von Fruchtfolgen zur Biogasproduktion in
einer Kalkmarsch Schleswig-Holsteins (in German), Berlin., 2011.
Pan, G., Zhou, P., Li, Z., Smith, P., Li, L., Qiu, D., Zhang, X., Xu, X., Shen, S. and Chen, X.:
Combined inorganic/organic fertilization enhances N efficiency and increases rice
productivity through organic carbon accumulation in a rice paddy from the Tai Lake
region, China, Agric. Ecosyst. Environ., 131(3-4), 274–280, 2009.
Peng, X., Ye, L. L., Wang, C. H., Zhou, H. and Sun, B.: Temperature- and duration-dependent
rice straw-derived biochar: Characteristics and its effects on soil properties of an
Ultisol in southern China, Soil Tillage Res., 112(2), 159–166, 2011.
Pessenda, L. R., Gouveia, S. M. and Aravena, R.: Radiocarbon dating of total soil organic
matter and humin fraction and its comparison with (super 14) C ages of fossil
charcoal., Radiocarbon, 43, 595–601, 2001.
Pietikainen, J., Kiikkila, O. and Fritze, H.: Charcoal as a habitat for microbes and its effect on
the microbial community of the underlying humus, Oikos, 89(2), 231–242, 2000.
Pignatello, J. J., Kwon, S. and Lu, Y.: Effect of natural organic substances on the surface and
adsorptive properties of environmental black carbon (Char): Attenuation of surface
activity by humic and fulvic acids, Environ. Sci. Technol., 40(24), 7757–7763, 2006.
Pihlatie, M. K., Christiansen, J. R., Aaltonen, H., Korhonen, J. F. J., Nordbo, A., Rasilo, T.,
Benanti, G., Giebels, M., Helmy, M., Sheehy, J., Jones, S., Juszczak, R., Klefoth, R.,
Lobo-do-Vale, R., Rosa, A. P., Schreiber, P., Serça, D., Vicca, S., Wolf, B. and
Pumpanen, J.: Comparison of static chambers to measure CH4 emissions from soils,
Agric. For. Meteorol., 171-172, 124–136, 2013.
Preston, C. M. and Schmidt, M. W. I.: Black (pyrogenic) carbon: a synthesis of current
knowledge and uncertainties with special consideration of boreal regions,
Biogeosciences, 3(4), 397–420, 2006.
Raveendran, K., Ganesh, A. and Khilar, K. C.: Influence of mineral matter on biomass
pyrolysis characteristics, Fuel, 74(12), 1812–1822, 1995.
Richards, L. A. and Fireman, M.: Pressure-plate apparatus for measuring moisture sorption
and transmission by soils, Soil Sci., 56(6), 395–404, 1943.

References
131
Riehm, H.: Bestimmung der laktatlöschlichen Phosphorsäure in karbonathaltigen Boden.,
1942.
Rondon, M. A., Lehmann, J., Ramírez, J. and Hurtado, M.: Biological nitrogen fixation by
common beans (Phaseolus vulgaris L.) increases with biochar additions, Biol. Fertil.
Soils, 43(6), 699–708, 2007.
Rondon, M., Ramirez, J. A. and Lehmann, J.: Greenhouse gas emissions decrease with
charcoal additions to tropical soils, in 3rd
USDA Symposium on Greenhouse gases and
carbon sequestration in agriculture and forestry, p. 208, Baltimore, MD. 21–24 Mar,
University of Delaware, USA, USA., 2005.
Rössler, M. .: Verbreitung, Heterogenität und C-Pools von mit Gärresten gedüngten
Sandböden im Raum Stapelholm, Schleswig-Holstein (in German), University of
Hamburg, Hamburg., 2013.
Ruivo, M. de L., Amarante, C. do, Oliveira, M. de L., Muniz, I., Santos and Dos, D.:
Microbial population and biodiversity in Amazonian dark earth soils, in Amazonian
dark earths: Wim Sombroek’s vision, edited by W. I. Woods, W. G. Teixeira, J.
Lehmann, C. Steiner, A. M. G. A. WinklerPrins, and L. Rebellato, pp. 351–362,
Springer., 2009.
Rutigliano, F. A., Romano, M., Marzaioli, R., Baglivo, I., Baronti, S., Miglietta, F. and
Castaldi, S.: Effect of biochar addition on soil microbial community in a wheat crop,
Eur. J. Soil Biol., 60, 9–15, 2014.
Saito, M. and Marumoto, T.: Inoculation with arbuscular mycorrhizal fungi: the status quo in
Japan and the future prospects, Plant Soil, 244(1/2), 273–279, 2002.
Scheer, C., Grace, P. R., Rowlings, D. W., Kimber, S. and Van Zwieten, L.: Effect of biochar
amendment on the soil-atmosphere exchange of greenhouse gases from an intensive
subtropical pasture in northern New South Wales, Australia, Plant Soil, 345(1-2), 47–
58, 2011.
Scheffer, F. and Schachtschabel, P.: Lehrbuch der Bodenkunde (in German), 16th
ed.,
Spektrum Akademischer Verlag., 2010.
Schmidt, M.: Amazonian dark earths: pathways to sustainable development in tropical
rainforests?, Bol. Mus. Para. Emílio Goeldi. Cienc. Hum., Belém, 8(1), 11–38, 2013.
Schmidt, M. W. I. and Noack, A. G.: Black carbon in soils and sediments: Analysis,
distribution, implications, and current challenges, Global Biogeochem. Cycles, 14(3),
777–793, 2000.
Schmidtke, K. D.: Die Entstehung Schleswig-Holsteins (in German), 3rd
ed., Wachholtz.,
1995.
Schneider, N. and Mastel, K.: Merkblatt zur Düngerverordnung (in German), Rheinstetten.,
2008a.

References
132
Schneider, N. and Mastel, K.: Merkblatt zur Düngeverordnung (07.01.2008), [online]
Available from: http://www.ltz-bw.de/pb/,Lde/Startseite (Accessed 16 August 2014b),
2008.
Schneider-Götz, N.: Gärreste aus Biogasanlagen, Nähr- und Schadstoffe;
Einsatzmöglichkeiten im Ackerbau (in German), in Abstract zur Internationalen
Konferenz "Fortschritt beim Biogas", 19.-21.09.2007, edited by Landwirtschaftliches
Technologiezentrum and (LTZ), Universität Hohenheim, Augustenberg., 2007.
Schröder, N.: Einfluss von Biokohle aus Gärresten auf die Nährstoff- und
Schwermetallgehalte in ackerbaulich genutzten Böden (in German), University of
Hamburg., 2013.
Schulz, H. and Glaser, B.: Effects of biochar compared to organic and inorganic fertilizers on
soil quality and plant growth in a greenhouse experiment, J. Plant Nutr. Soil Sci.,
175(3), 410–422, 2012.
Sensel, K., Wragge, V. and Ellmer, F.: Pflanzenbauliche Nutzung von Gärprodukten (in
German), Nr. 30., Fachagentur Nachwachsende Rohstoffe e. V. (FNR), Gülzow., 2009.
Shindo, H.: Elementary composition, humus composition, and decomposition in soil of
charred grassland plants, Soil Sci. Plant Nutr., 37(4), 651–657, 1991.
Shneour, E. A.: Oxidation of graphitic carbon in certain soils, Science (80-.)., 151(3713), 991–
992, 1966.
Simon, S. and Sohi, S.: An assessment of the benefits and issues associated with the
application of biochar to soil, Edinburgh, UK., 2010.
Singh, B. P. and Cowie, A. L.: Long-term influence of biochar on native organic carbon
mineralisation in a low-carbon clayey soil, Sci. Rep., 4(i), 3687, 2014.
Singh, B. P., Hatton, B. J., Singh, B., Cowie, A. L. and Kathuria, A.: Influence of biochars on
nitrous oxide emission and nitrogen leaching from two contrasting soils, J. Environ.
Qual., 39(4), 1224, 2010.
Smith, J. L., Collins, H. P. and Bailey, V. L.: The effect of young biochar on soil respiration,
Soil Biol. Biochem., 42(12), 2345–2347, 2010.
Smith, K., Grylls, J., Metcalfe, P., Jeffrey, B. and Sinclair, A.: Nutrient value of digestate from
farm-based biogas plants in Scotland: Report for Scottish Executive Environment and
Rural Affairs Department - ADA/009/06, Wolverhampton and Edinburgh., 2007.
Sohi, S., Lopez-Capel, E., Krull, E. and Bol, R.: Biochar’s roles in soil and climate change: A
review of research needs, CSIRO Land and Water Science Report 05/09, 64, 2009.
Sohi, S. P., Krull, E., Lopez-Capel, E. and Bol, R.: A review of biochar and its use and
function in soil, Adv. Agron., 105, 47–82, 2010.
Sombroek, W., Ruivo, M. de L., Fearnside, P. M., Glaser, B. and Lehmann, J.: Amazonian
dark earths, edited by J. Lehmann, D. C. Kern, B. Glaser, and W. I. Wodos, Springer

References
133
Netherlands, Dordrecht., 2003.
Spokas, K. a: Review of the stability of biochar in soils: predictability of O:C molar ratios,
Carbon Manag., 1(2), 289–303, 2010.
Spokas, K. A. .: Impact of biochar field aging on laboratory greenhouse gas production
potentials, GCB Bioenergy, 5(2), 165–176, 2013.
Spokas, K. A., Koskinen, W. C., Baker, J. M. and Reicosky, D. C.: Impacts of woodchip
biochar additions on greenhouse gas production and sorption/degradation of two
herbicides in a Minnesota soil, Chemosphere, 77(4), 574–581, 2009.
Stahr, K., Kandeler, E., Herrmann, L. and Streck, T.: Bodenkunde und Standortlehre (in
German), 2nd ed., Verlag Eugen Ulmer., Stuttgart., 2012.
Statistikamt Nord: Statistische Berichte: Bodenflächen in Hamburg und Schleswig-Holstein
am 31.12.2011 nach Art der tatsächlichen Nutzung (in German), Hamburg., 2012.
Statistikamt Nord: Statistische Berichte: Erneuerbare Energien in Schleswig-Holstein :
Versorgungsbeitrag und Minderung von Treibhaus- gasemissionen in den Jahren 2006
- 2011 sowie Zielszenario für das Jahr 2020 (in German), Hamburg., 2013.
Steinbeiss, S., Gleixner, G. and Antonietti, M.: Effect of biochar amendment on soil carbon
balance and soil microbial activity, Soil Biol. Biochem., 41(6), 1301–1310, 2009.
Steiner, C., Garcia, M. and Zech, W.: Effects of charcoal as slow release nutrient carrier on N-
P-K dynamics and soil microbial population: Pot experiments with Ferralsol substrate,
in Amazonian Dark Earths:in Wim Sombroek’s vision, edited by W. I. Woods, W. G.
Teixeira, J. Lehmann, C. Steiner, A. M. G. A. WinklerPrins, and L. Rebellato, pp. 325–
338, Springer., 2009.
Stinner, W., Möller, K. and Leithold, G.: Biogaserzeugung im viehlosen Betrieb: Effekte auf
Stickstoffmanagement, Erträge und Qualität (in German), in Internationale
Konferenzen 2005: Wissenschaftstagung Ökologischer Landbau Deutschland, edited
by J. Heß and G. Rahmann, pp. 185–188, Wissenschaftstagung Ökologischer Landbau,
Universität Gießen, Gießen., 2005.
Strahler, A. H. and Strahler, A. N.: Physische Geographie (in German), Verlag Eugen Ulmer.
Stuttgart., 2005.
Streubel, J. D., Collins, H. P., Garcia-Perez, M., Tarara, J., Granatstein, D. and Kruger, C. E.:
Influence of contrasting biochar types onfive soils at increasing rates of application,
Soil Sci. Soc. Am. J., 75(4), 1402, 2011.
Subke, J.-A., Heinemeyer, A. and Reichstein, M.: Experimental design: scaling up in time and
space, and its statistical considerations, in soil carbon dynamics: An integrated
methodology, edited by W. L. Kutsch, M. Bahn, and A. Heinemeyer, pp. 34–48,
Cambridge University Press, UK., 2010.
Swami, S. N., Steiner, C., Teixeira, W. G. and Lehmann, J.: Charcoal making in the Brazilian

References
134
Amazon: Economic aspects of production and carbon conversion efficiencies of kilns,
in Amazonian Dark Earths: Wim Sombroek’s Vision, pp. 411–422., 2009.
Tejada, M. and Gonzalez, J. L.: Influence of organic amendments on soil structure and soil
loss under simulated rain, Soil Tillage Res., 93(1), 197–205, 2007.
Thies, J. E., Rillig, M. C., E.Thies, J., Rillig, M. C., Thies, J. E., Rillig, M. C., E.Thies, J. and
Rillig, M. C.: Characteristics of biochar: biological properties, in Biochar for
environmental management science and sechnology, edited by J. Lehmann and S.
Joseph, pp. 85–106, Earthscan, UK., 2009.
TMECC: Test methods for the examination of composting and compost, MD, USA, USA.
[online] Available from: http://compostingcouncil.org/tmecc/ (Accessed 1 December
2013), 2002.
Topoliantz, S., Ponge, J.-F., Arrouays, D., Ballof, S. and Lavelle, P.: Effect of organic manure
and the endogeic earthworm Pontoscolex corethrurus (Oligochaeta: Glossoscolecidae)
on soil fertility and bean production, Biol. Fertil. Soils, 36(4), 313–319, 2002.
Trompowsky, P. M., Benites, V. de M., Madari, B. E., Pimenta, A. S., Hockaday, W. C. and
Hatcher, P. G.: Characterization of humic like substances obtained by chemical
oxidation of eucalyptus charcoal, Org. Geochem., 36(11), 1480–1489, 2005.
Tryon, E. H.: Effect of charcoal on certain physical, chemical, and biological properties of
forest soils, Ecol. Monogr., 18(1), 81, 1948.
USDA: Keys to Soil Taxonomy, 10th
ed., United States Department of Agriculture Natural
Resources Conservation Service., 2010.
Uzoma, K. C., Inoue, M., Andry, H., Fujimaki, H., Zahoor, A. and Nishihara, E.: Effect of
cow manure biochar on maize productivity under sandy soil condition, Soil Use
Manag., 27(2), 205–212, 2011.
Vance ED, Brookes PC, J. D.: An extraction method for measuring soil microbial biomass C,
Soil Biol. Biochem., 19, 703–707, 1987.
Van-Zwieten, L., Kimber, S., Morris, S., Chan, K. Y., Downie, A., Rust, J., Joseph, S. and
Cowie, A.: Effects of biochar from slow pyrolysis of papermill waste on agronomic
performance and soil fertility, Plant Soil, 327(1-2), 235–246, 2010.
VDLUFA: Methoden. Die Untersuchung von Böden (in German), VDLUFA-Verlang,
Darmstadt., 1991.
Verheijen, F. G. A., Jeffery, S., Bastos, a C., van der Velde, M., Diafas, I., A.C., B., van der
Velde, M. and Diafas, I.: Biochar application to soils - A critical scientific review of
effects on soil properties, processes and functions, EUR 24099., European
Commission, Luxembourg., 2010.
von Leliwa, M: Masterarbeit: Kohlenstoff-Mineralisation von Gärresten und Biokohle aus
Biogas-Pflanzen auf sandigen Böden (In German), University of Hamburg, Hamburg.,

References
135
2014.
Wagner, M.: Das Schleswig-Holstein-Wetter (in German), Westholsteinische Verl.-Anst.
Boyens, Heide., 1998.
Wardle, D. A., Nilsson, M.-C. and Zackrisson, O.: Fire-derived charcoal causes loss of forest
humus, Science (80-.)., 320(5876), 629–629, 2008.
Warnock, D. D., Lehmann, J., Kuyper, T. W. and Rillig, M. C.: Mycorrhizal responses to
biochar in soil – concepts and mechanisms, Plant Soil, 300(1-2), 9–20, 2007.
WCED: Our Common Future., United Nations, Oxford University Press, 1987.
Wenland, M., Heigl, L. and Schmidt, M.: Pflanzenbauliche Wirkung verschiedener
organischer Düngemittel (in German), Freising, Germany. [online] Available from:
http://www.hortigate.de/ (Accessed 31 July 2015), 2006.
Woods, W. I. and Winklerprins, A. M. G. A.: Amazonian dark earths: Wim Sombroek’s vision,
edited by W. I. Woods, W. G. Teixeira, J. Lehmann, C. Steiner, A. WinklerPrins, and L.
Rebellato, Springer Netherlands, Dordrecht., 2009.
Woolf, D., Amonette, J. E., Street-Perrott, F. A., Lehmann, J. and Joseph, S.: Sustainable
biochar to mitigate global climate change, Nat. Commun., 1(5), 1–9, 2010.
World Bank Carbon Finance Unit: Bio-Carbon fund experience, The World Bank
,Washington, DC., 2011.
WRB: World reference base for soil resources 2006, Food and Agriculture Organization of the
United Nations, Rome., 2006.
Wu, J., Joergensen, R. G., Pommerening, B., Chaussod, R. and Brookes, P. C.: Measurement
of soil microbial biomass C by fumigation-extraction - an automated procedure, Soil
Biol. Biochem., 22, 1167–1169, 1990.
Xie, T., Sadasivam, B. Y., Reddy, K. R., Wang, C. and Spokas, K.: Review of the effects of
biochar amendment on soil properties and carbon sequestration, J. Hazardous, Toxic,
Radioact. Waste, 04015013, 2015.
Xu, L. ., Furtaw, M. D., Madsen, R. A., Garcia, R. L., Anderson, D. J., McDermitt, D. K. and
McDermitt., D. K.: On maintaining pressure equilibrium between a soil CO2 flux
chamber and the ambient air, J. Geophys. Res. Atmos., 111:D08S10, 2006.
Yamato, M., Okimori, Y., Wibowo, I. F., Anshori, S. and Ogawa, M.: Effects of the application
of charred bark of Acacia mangium on the yield of maize, cowpea and peanut, and soil
chemical properties in South Sumatra, Indonesia, Soil Sci. Plant Nutr., 52(4), 489–495,
2006.
Yang, T. and Lua, A. C.: Characteristics of activated carbons prepared from pistachio-nut
shells by physical activation., J. Colloid Interface Sci., 267(2), 408–17, 2003.
Zavalloni, C., Alberti, G., Biasiol, S., Vedove, G. D., Fornasier, F., Liu, J. and Peressotti, A.:

References
136
Microbial mineralization of biochar and wheat straw mixture in soil: A short-term
study, Appl. Soil Ecol., 50, 45–51, 2011.
Zhang, A., Bian, R., Pan, G., Cui, L., Hussain, Q., Li, L., Zheng, J. J., Zheng, J. J., Zhang, X.,
Han, X. and Yu, X.: Effects of biochar amendment on soil quality, crop yield and
greenhouse gas emission in a Chinese rice paddy: A field study of 2 consecutive rice
growing cycles, F. Crop. Res., 127, 153–160, 2012a.
Zhang, A., Cui, L., Pan, G., Li, L., Hussain, Q., Zhang, X., Zheng, J. and Crowley, D.: Effect
of biochar amendment on yield and methane and nitrous oxide emissions from a rice
paddy from Tai Lake plain, China, Agric. Ecosyst. Environ., 139(4), 469–475, 2010a.
Zhang, A., Liu, Y., Pan, G., Hussain, Q., Li, L., Zheng, J. and Zhang, X.: Effect of biochar
amendment on maize yield and greenhouse gas emissions from a soil organic carbon
poor calcareous loamy soil from Central China Plain, Plant Soil, 351(1-2), 263–275,
2012b.
Zhang, Q., Dijkstra, F. A., Liu, X., Wang, Y., Huang, J. and Lu, N.: Effects of biochar on soil
microbial biomass after four years of consecutive application in the North China Plain,
edited by A. C. Singer, PLoS One, 9(7), e102062, 2014.
Zhang, W., Niu, J., Morales, V. L., Chen, X., Hay, A. G., Lehmann, J. and Steenhuis, T. S.:
Transport and retention of biochar particles in porous media: effect of pH, ionic
strength, and particle size, Ecohydrology, 3(4), 497–508, 2010b.
Zhang, Y., Liu, J., Mu, Y., Pei, S., Lun, X. and Chai, F.: Emissions of nitrous oxide, nitrogen
oxides and ammonia from a maize field in the North China Plain, Atmos. Environ.,
45(17), 2956–2961, 2011.
Zhao, L., Cao, X., Wang, Q., Yang, F. and Xu, S.: Mineral constituents profile of biochar
derived from diversified waste biomasses: implications for agricultural applications, J.
Environ. Qual., 42(2), 545, 2013.
Zhu, D. and Pignatello, J. J.: Characterization of aromaticcompound sorptive interactions with
black carbon (Charcoal) assisted by graphite as a model, Environ. Sci. Technol., 39(7),
2033–2041, 2005.
Zimmerman, A. R.: Abiotic and microbial oxidation of laboratory-produced black carbon
(Biochar), Environ. Sci. Technol., 44(4), 1295–1301, 2010.
Zimmerman, A. R., Gao, B. and Ahn, M.-Y.: Positive and negative carbon mineralization
priming effects among a variety of biochar-amended soils, Soil Biol. Biochem., 43(6),
1169–1179, 2011.

Annex
137
Annex
List of Figures in Annex
Figure A 1: In October 2012: (A) mixing biochar with the soil using a single axle
tractor, (B) digestate only plot, (C) digestate:biochar 1:1 plot and (D)
digestate:biochar 1:5 plot ............................................................................... 139
Figure A 2: In October 2012 just after winter wheat establishment (A) Site 1 with
Gleyic Podzol and (B) Site 2 with Gleyic Anthrosol .................................. 139
Figure A 3: Vegetative stage of winter season crops: (A) winter rye in April 2014
and (B) winter wheat in April 2013 .............................................................. 139
Figure A 4: Vegetative stage of summer season crops: maize (A) in June 2013
and (B) in June 2014 ...................................................................................... 140
Figure A 5: At harvest time, winter and summer crops: (A) winter wheat in June
2013, (B) maize in October 2013, (C) winter rye in May 2014 and
(D) maize in August 2014 .............................................................................. 140
Figure A 6: Cumulative CO2 production during an aerobic soil incubation
experiment of Gleyic Podzol ......................................................................... 150
List of Tables in Annex
Table A 1: The profile description sheet (Aufnahmeformblatt) for Gleyic Podzol ..... 141
Table A 2: The profile description sheet (Aufnahmeformblatt) for Gleyic
Anthrosol .......................................................................................................... 142
Table A 3: Variation of TOC and TN content in the top soil (0 - 0.2 m) in Gleyic
Podzol and Gleyic Anthrosol before and after biochar application .......... 143
Table A 4: Selected soil chemical properties in the topsoil (0 - 0.2 m) for all the
treatment plots before applying biochar for both Gleyic Podzol and
Gleyic Anthrosol ............................................................................................. 144
Table A 5: Changes of selected soil chemical properties in the topsoil (0 - 0.2 m)
for all treated plots just after applying soil amendments ........................... 144
Table A 6: Seasonal variation of soil moisture and EC in the topsoil (0 - 0.2 m) in
site 1 and site 2 after establishment of the experiment in October
2012 .................................................................................................................. 145

Annex
138
Table A 7: Seasonal variation of DOC and DON in the topsoil (0 - 0.2 m) in site 1
and site 2 after establishment of the experiment in October 2012 ........... 145
Table A 8: Seasonal variation of ammonium nitrogen and nitrate nitrogen in the
topsoil (0 - 0.2 m) in Gleyic Podzol and Gleyic Anthrosol after
establishment of the experiment in October 2012 ...................................... 146
Table A 9: Seasonal variation of CEC and BS in the topsoil (0 - 0.2 m) in Gleyic
Podzol and Gleyic Anthrosol after establishment of the experiment in
October 2012 ................................................................................................... 146
Table A 10: Seasonal variation of plant available-P and -K in the topsoil (0 - 0.2
m) in Gleyic Podzol and Gleyic Anthrosol after establishment of the
experiment in October 2012. ......................................................................... 147
Table A 11: Selected physico-chemical characteristics of the topsoil (0 - 0.2 m) in
Gleyic Podzol .................................................................................................. 148
Table A 12: Isotope signature (‰ VPDB) of emitted CO2 from the different
treatments on different days for the aerobic incubation experiment ........ 149

Annex
139
Figure A 1: In October 2012: (A) mixing biochar with the soil using a single axle
tractor, (B) digestate only plot, (C) digestate:biochar 1:1 plot and (D) diges-
tate:biochar 1:5 plot
Figure A 2: In October 2012 just after winter wheat establishment (A) Site 1 with
Gleyic Podzol and (B) Site 2 with Gleyic Anthrosol
Figure A 3: Vegetative stage of winter season crops: (A) winter rye in April 2014
and (B) winter wheat in April 2013
A B C D
A
B
A B

Annex
140
Figure A 4: Vegetative stage of summer season crops: maize (A) in June 2013 and
(B) in June 2014
Figure A 5: At harvest time, winter and summer crops: (A) winter wheat in June
2013, (B) maize in October 2013, (C) winter rye in May 2014 and (D) maize in
August 2014
B A
A
A C
D E

Annex
141
Table A 1: The profile description sheet (Aufnahmeformblatt) for Gleyic Podzol
Aufnahmeformblatt für bodenkundliche Profilaufnahmen nach KA 5 (mit Seitenzahlenangabe)
Standort: Süderstapel Grünlandfläche von Bauer Spangenberg
Titeldaten TK-Nr.
55
Projekt,
55
Spez. Profil-Nr.,
55
Datum Bearbeiter, 55 Rechtswert,
55
Hochwert,
55
Höhe über NN Aufschl.Art
55,56
Bemerkungen, 55
1620 Dock. A rbeit ------- S1 15.05.2012 R. Suddapuli 3514181 6025227 7m GG ---------------
Aufnahme-
situation
Neigung
57,58
Exposition
59
Wölbung
59
Relieffor-
mtyp
63
Mikro-
relief
69
Lage-
im Relief
69
Bodenab-
/-auftrag
69
Nutzungsart
71
Vegetation
73
Witterung
74
anthropogene
Veränderungen
74
Bodenorganismen
76
Bemerkungen
79
N 1 NW-SE WS 2 H RE M ---- G GR WT 2 O Lu 2 -----------------
Horizontdaten
Lfd Nr.
Hori-zont/
Schicht
Ober-/ Unter
grenze
(cm)
79
Hori-zontsy
mbol
83
Pedogene und biogene Merkmale
Merkmale der Substratzusammensetzung
Boden-
art/
Torfart
141,148,
157
Boden-
farbe
108
Hu-
mus-
ge-halt
110
Hydro-
mor-
phie-merk-
male
112
Bo-
den-
feuchte
114
son-
stige
Merk-
male
114
Gefü-
ge-
form und
Größe
117,1
21
Hohl-
räume
(Risse, Poren
Röhren)
123
Lager-
ungs-
dichte Zer-
setz-
ungs-stufe
124
Durchw-
urzelun-
gsintens-ität
129
Substr-
atgenese
135
Grob-
boden-
frakt-ionen
und
Anteil-klassen
148
Summe
Skelett
(%)
150
Carbo-
nat-
gehalt
168
Boden-
aus-
gangs-gestein
172
Strati-
graphie
187
Bemer-
kungen
1 0 - 20 Ap Ss 10YR 3/1
h3 -------- feu 2 ----- ein gri4 f2 Ld2 Wf3 Wg1
pfl mGf4 5 - 10 % c0 Sp qh/qp -----
2 20 - 55 Go-Bhs Su2 10YR
5/8 h1 ed f3 feu 2 ----- ein gri2 f2 Ld1 Wf1 pky mGf3 5 %
c0 Sgf qp
-----
3 55 - 65 II Bhs Su4 5YR 5/2 h3 eh f2 feu 3 ----- ein-kit
gri2 f1 Ld1 W0 fg 0 0 % c0
Sgf qp -----
4 > 65 Cv Su3 10YR
6/4 h0 eh f1 feu 3 -----
ein-
sub gri2 f2 Ld1 W0 fg 0 0 %
c0 Sgf qp
-----
Bodensystematische Einheit 190 BB-PP
Substratsystematische Einheit 132,289,296 pfl/pky-(v)ls(Sp-qp)/fg-ss(Sgf-qp)
Bodenform
BB-PP: pfl/pky-(v)ls(Sp-qp)/fg-ss(Sgf-qp))
Kurzbeschreibung der wichtigsten Prozesse - Humusanreicherung, verbraunung und vergleyung
Humusform 298 (vmu)
Wasserstand u GOF, 310 Bemerkungen, 320

Annex
142
Table A 2: The profile description sheet (Aufnahmeformblatt) for Gleyic Anthrosol
Aufnahmeformblatt für bodenkundliche Profilaufnahmen nach KA 5 (mit Seitenzahlenangabe)
Standort: Süderstapel Grünlandfläche von Bauer Spangenberg
Titeldaten TK-Nr.
55
Projekt,
55
Spez. Profil-Nr.,
55
Datum Bearbeiter, 55 Rechtswert,
55
Hochwert,
55
Höhe über NN Aufschl.Art
55,56
Bemerkungen, 55
1621 Dock. arbeit ------- S2 15.05.2012 R. Suddapuli 3511303 6024891 7m GS ---------------
Aufnahme-
situation
Neigung
57,58
Exposition
59
Wölbung
59
Relieffor-mtyp
63
Mikro-relief
69
Lage- im
Relief
69
Bodenab-/-auftrag
69
Nutzungsart
71
Vegetation
73
Witterung
74
anthropogene Veränderungen
74
Bodenorganismen
76
Bemerkungen
79
N 1 N WS 1 KH RW K AY A HF WT 4 DG, O ----------------- Mais für Bio-
gasanlage
Horizontdaten
Lfd
Nr.
Hori-
zont/
Schicht Ober-/
Unter
grenze (cm)
79
Hori-
zontsy
mbol
83
Pedogene und biogene Merkmale
Merkmale der Substratzusammensetzung
Boden-
art/ Torfart
141,148,
157
Boden-
farbe
108
Hu-
mus-ge-
halt
110
Hydro-
mor-phie-
merk-
male
112
Bo-
den-feuc
hte
114
son-
stige Mer
k-
male
114
Gefü-
ge-form
und
Größe
117,1
21
Hohl-
räume (Risse,
Poren
Röhren)
123
Lager-
ungs-dichte
Zer-
setz-ungs-
stufe
124
Durchw-
urzelun-gsintens-
ität
129
Substr-
atgenese
135
Grob-
boden-frakt-
ionen
und Anteil-
klassen
148
Summe
Skelett (%)
150
Carbo-
nat- gehalt
168
Boden-
aus-gangs-
gestein
172
Strati-
graphie
187
Bemer-
kungen
1 0 - 20 Ap Ss
(mSfs)
10YR
2/1
(h4)
h2 -------- feu 2 -----
sub-
ein gri4 f3 Ld1 Wf3 om fGr1 < 2 % c0 Yj - Sp qh ----------
2 20 - 40 E Ss (mSfs)
10YR 3/1
(h3)h2
-------- feu 2 teils sgb
sub- ein
gri4 f2 Ld2 Wf2 om mG1 < 2 % c0
Yj - Sp qh ----------
3 40 - 70 GBv Su2 5YR 3/2 h1 -------- feu 3 ----- kit-ein gri2 f3 Ld3-
Ld2 Wf0 pfl
fO2
mG2 2 - 10 %
c0 Sp qp
----------
4 > 70 Gro Ss (fSms)
7.5YR 5/8
h0 eh / rb feu 5 ----- ein gri2 f2 Ld3 Wf0 fg -------- 0 % c0
Sgf qp ----------
Bodensystematische Einheit 190 GG-YE
Substratsystematische Einheit 132,289,296 om-(z1)ss(Yj-Sp-qh)/pfl-(k2/w2)ss(Sp-qp)//fg-ls(Sgf-qp)
Bodenform
GG-YE: om-(z1)ss(Yj-Sp-qh)/pfl-(k2/w2)ss(Sp-qp)//fg-ls(Sgf-qp)
Kurzbeschreibung der wichtigsten Prozesse - Plaggendüngung (om)
Humusform 298 (mu)
Wasserstand u GOF, 310 GWO ~75cm Bemerkungen, 320

Annex
143
Table A 3: Variation of TOC and TN content in the top soil (0 - 0.2 m) in Gleyic
Podzol and Gleyic Anthrosol before and after biochar application. Shown are
mean values and respective standard deviations (n = 3).
Soil type Plot TOC TN
kg m-3
Gleyic Podzol 1 1.08 ± 0.00 0.10 ± 0.001
3 1.44 ± 0.05 0.13 ± 0.001
5 1.36 ± 0.05 0.13 ± 0.002
2 1.39 ± 0.00 0.13 ± 0.002
4 1.37 ± 0.05 0.13 ± 0.006
6 1.27 ± 0.20 0.12 ± 0.019
2B 1.75 ± 0.05 0.14 ± 0.004
4B 1.85 ± 0.00 0.17 ± 0.002
6B 1.69 ± 0.05 0.27 ± 0.022
Gleyic Anthrosol 7 1.69 ± 0.05 0.133 ± 0.030
11 2.15 ± 0.10 0.149 ± 0.005
13 1.90 ± 0.05 0.143 ± 0.005
8 2.15 ± 0.05 0.155 ± 0.035
12 2.25 ± 0.10 0.150 ± 0.005
14 2.00 ± 0.10 0.152 ± 0.005
8BL 2.27 ± 0.10 0.166 ± 0.015
12BL 2.31 ± 0.15 0.150 ± 0.005
14BL 2.28 ± 0.15 0.155 ± 0.010
9 2.39 ± 0.00 0.216 ± 0.015
10 2.00 ± 0.20 0.161 ± 0.020
15 2.20 ± 0.15 0.171 ± 0.025
9BH 2.91 ± 0.25 0.201 ± 0.030
10BH 3.48 ± 0.00 0.156 ± 0.020
15BH 2.95 ± 0.20 0.174 ± 0.010
B: biochar, BL: digestate:biochar 1:1, BH: digestate:biochar 1:5.

Annex
144
Table A 4: Selected soil chemical properties in the topsoil (0 - 0.2 m) for all the
treatment plots before applying biochar for both Gleyic Podzol and Gleyic Anthro-
sol. Shown are mean values and respective standard deviations (n = 3).
Soil
type Plot DOC DON Ca++ Mg++ K+ Na+ CEC BS
g m-3
mmolc kg-1 %
GP 1 2.35 ± 0.5 0.45 ± 0.1 18.6 ± 1.5 1.85 ± 0.0 10.4 ± 0.5 0.60 ± 0.0 21.43 ± 1 42.7 ± 2
2 2.05 ± 0.5 0.50 ± 0.1 19.1 ± 2.5 1.75 ± 0.0 10.5 ± 1.2 1.00 ± 1.0 22.23 ± 0 41.6 ± 3
3 2.40 ± 0.5 0.60 ± 0.1 21.2 ± 3.0 1.90 ± 0.5 10.0 ± 2.0 0.30 ± 0.0 21.79 ± 1 45.6 ± 6
4 2.45 ± 0.5 0.45 ± 0.1 32.2 ± 23 2.10 ± 0.5 9.40 ± 0.0 0.30 ± 0.0 22.07 ± 0 60.9 ± 33
5 1.45 ± 0.0a 0.40 ± 0.1 15.9 ± 4.0 2.00 ± 0.5 9.60 ± 3.0 0.25 ± 0.0 21.58 ± 1 37.0 ± 7
6 1.95 ± 0.5 0.40 ± 0.0 16.9 ± 3.5 2.05 ± 0.5 9.70 ± 2.5 1.95 ± 2.5 22.18 ± 1 37.8 ± 6
GA 7 3.8 ± 0.5 1.10 ± 0.0 61.70 ± 5 3.25 ± 0.5 7.95 ± 1.0 0.60 ± 0.0 21.64 ± 1 114.6 ± 3
8 2.4 ± 0.5 1.35 ± 0.0 83.50 ± 5 3.95 ± 0.5 8.50 ± 0.5 1.00 ± 1.0 27.09 ± 1 121.9 ± 4
9 3.0 ± 0.5 0.95 ± 0.5 102.6 ± 5 5.70 ± 0.5 8.85 ± 1.0 0.30 ± 0.0 33.88 ± 2 119.4 ± 4
10 2.1 ± 0.0 1.05 ± 0.0 56.95 ± 10 2.65 ± 0.5 6.95 ± 0.5 0.30± 0.0 22.67 ± 1 99.2 ± 13
11 1.7 ± 0.0 a
0,95 ± 0.0 65.4 ± 10 3.40 ± 0.5 8.40 ± 1.0 0.25 ± 0.0 24.27 ± 3 107.6 ± 7
12 2.1 ± 0.5 0.85 ± 0.0 60.3 ± 10 2.85 ± 0.5 7.30 ± 2.0 1.95 ± 2.5 24.77 ± 2 98.4 ± 7
13 1.8 ± 0.0 b
1.05 ± 0.0 49.6 ± 10 2.85 ± 0.5 13.8 ± 0.5 0.20 ± 0.0 20.16 ± 1 105.6 ± 11
14 2.0 ± 0.0 0.85 ± 0.5 58.2 ± 5 3.30 ± 0.5 12.7 ± 1.0 0.55 ± 0.0 23.10 ± 1 105.1 ± 5
15 2.1 ± 0.0 0.95 ± 0.0 63.1 ± 10 2.80 ± 0.5 13.3 ± 1.0 0.65 ± 0.0 24.41 ± 1 106.4 ± 11
For a chemical property, values followed by the different letters are significantly different at P ≤ 0.05. Letters
are not shown when differences of means are nonsignificant. GP: Gleyic Podzol, GA: Gleyic Anthrosol.
Table A 5: Changes of selected soil chemical properties in the topsoil (0 - 0.2 m)
for all treated plots just after applying soil amendments (biochar, and mixtures of
digestate and biochar). Shown are mean values and respective standard devia-
tions (n = 3).
Soil
Type Plot DOC DON Ca Mg K Na CEC BS
g m-3
mmolc kg-1 %
GP 2B 2.80 ± 0.5 0.46 ± 0.1 32 ± 1.5 13.7 ± 2 34.4 ± 6 0.2 ± 0 26.26 ± 1a 92.3 ± 5
4B 3.55 ± 0.5 0.55 ± 0.1 26 ± 3.0 12.3 ± 6 30.7 ± 11 0.55 ± 0 24.69 ± 1b 83.5 ± 23
6B 3.40 ± 0.5 0.45 ± 5.1 26 ± 1.5 12.4 ± 2 31.3 ± 1 0.65 ± 0 25.05 ± 1ab
83.2 ± 5
GA 8BL 3.35 ± 1.5 0.55 ± 0.0 84 ± 10a 11.2 ± 3 23.2 ± 10
a 1.8 ± 0.1
a 32.26 ± 1 124.2 ± 18a
12BL 2.70 ± 0.5 0.60 ± 0.0 63 ± 5b 7.95 ± 2 102.1 ± 55 6.25 ± 0.6 47.36 ± 4
a 169.5 ± 32
14BL 3.50 ± 0.5 0.70 ± 0.0 71 ± 15ab
11.9 ± 3 106.8 ± 40 6.40 ± 0.4 35.18 ± 5 184.4 ± 31
9BH 5.45 ± 3.5b 0.65 ± 0.0 104 ± 5
a 43.5 ± 22 19.3 ± 3.5 1.90 ± 0.5 27.25 ± 2 111.5 ± 5
10BH 8.10 ± 0.5 0.80 ± 0.0 64 ± 10 39.9 ± 15 35.1 ± 7 1.70 ± 0.5 28.54 ± 3 132.9 ± 13
15BH 8.65 ± 1.0 0.90 ± 0.0 68 ± 5 38.4 ± 9 101 ± 25a 5.20 ± 1
a 40.26 ± 3
a 160.7 ± 16a
For a chemical property, values followed by the different letters are significantly different at P ≤ 0.05. Letters
are not shown when differences of means are nonsignificant. GP: Gleyic Podzol, B: biochar, GA: Gleyic An-
throsol, BL: digestate:biochar 1:1, BH: digestate:biochar 1:5.

Annex
145
Table A 6: Seasonal variation of soil moisture and EC in the topsoil (0 - 0.2 m) in
site 1 and site 2 after establishment of the experiment in October 2012. Shown are
mean values and the respective standard deviations (n = 3 to 9).
Soil amendments
Site 1 Site 2
C B D BL BH
Soil Moisture (%)
Winter 2012/13 18.8 ± 9 20.6 ± 8 19.3 ± 4 20.2 ± 6 20.9 ± 9
Spring 2013 16.9 ± 5 16.4 ± 8 13.1 ± 8 14.2 ± 4 14.9 ± 7
Summer 2013 8.2 ± 3 7.0 ± 2 8.6 ± 4 8.5 ± 3 8.3 ± 6
Autumn 2013 13.6 ± 3 16.3 ± 3 13.0 ± 3 12.5 ± 2 13.9 ± 1
Winter 2013/14 22.8 ± 2 23.6 ± 1 17.0 ± 1 17.8 ± 3 19.4 ± 1
Spring 2014 16.7 ± 4 18.4 ± 1 13.2 ± 3 12.2 ± 1 13.8 ± 1
Summer 2014 11.6 ± 1 10.6 ± 1 7.1 ± 1 8.9 ± 2 9.1 ± 5
EC* (µS cm-1
)
Winter 2012/13 29.3 ± 5 40.8 ± 17 43.2 ± 7 49.9 ± 23 60.8 ± 14
Spring 2013 18.3 ± 3 23.7 ± 4 33.3 ± 15 35.3 ± 5 73.3 ± 15a
Summer 2013 32.2 ± 19 41.9 ± 23 41.7 ± 8 44.9 ±1 6 59.9 ± 15a
Autumn 2013 16.6 ± 5 19.3 ± 5 34.5 ± 10 32.2 ± 7 44.7 ± 17
Winter 2013/14 16.1 ± 4 23.2 ± 7 24.5 ± 2 23.4 ± 1 31.5 ± 17
Spring 2014 9.6 ± 7 9.5 ± 6 10.8 ± 7 12.8 ± 8 13.2 ± 17
Summer 2014 60.0 ± 2 60.0 ± 13 80.3 ± 15 74.0 ± 3 78.3 ± 15
* H2O suspension. For each field site, values followed by the different letters are significantly dif-
ferent at p ≤ 0.05. Letters are not shown when differences of means are nonsignificant. C: control,
B: biochar, D: digestate only, BL: digestate:biochar 1:1, BH: digestate:biochar 1:5
Table A 7: Seasonal variation of DOC and DON in the topsoil (0 - 0.2 m) in site 1
and site 2 after establishment of the experiment in October 2012. Shown are mean
values and the respective standard deviations (n = 3 to 9).
Soil amendments
Site 1 Site 2
C B D BL BH
DOC (mg kg-1
)
Winter 2012/13 9.0 ± 6 9.2 ± 8 10.6 ± 10 8.2 ± 7 10.2 ± 10 Spring 2013 13.7 ± 5 13.3 ± 6 13.1 ± 8 12.8 ± 6 20.2 ± 10 Summer 2013 12.0 ± 9 11.8 ± 5 14.7 ± 6 11.9 ± 4 10.9 ± 8 Autumn 2013 7.5 ± 3 6.7 ± 2 9.2 ± 2 10.1 ± 2 9.9 ± 2 Winter 2013/14 8.8 ± 5 8.9 ± 2 7.8 ± 1 8.3 ± 1 7.9 ± 3 Spring 2014 9.6 ± 6 9.3 ± 6 11.9 ± 7 11.1 ± 8 11.8 ± 3 Summer 2014 15.2 ± 0 15.9 ± 1 17.6 ± 3 16.6 ± 2 16.1 ± 5 DON (mg kg
-1)
Winter 2012/13 0.7 ± 1 1.0 ± 1 1.3 ± 1 1.1 ± 1 1.4 ± 1 Spring 2013 2.6 ± 1 2.5 ± 1 3.7 ± 2 3.3 ± 1 3.5 ± 1 Summer 2013 1.4 ± 0 2.8 ± 2 2.2 ± 1 2.3 ± 1 2.5 ± 1 Autumn 2013 1.3 ± 1 1.4 ± 1 1.8 ± 0
a 2.5 ± 1
b 2.5 ± 0
b
Winter 2013/14 0.8 ± 1 1.0 ± 0 0.9 ± 0a 1.1 ± 0
ab 1.6 ± 1
b
Spring 2014 2.1 ± 1 2.1 ± 1 2.7 ± 1 2.4 ± 1 2.8 ± 1 Summer 2014 3.3 ± 1 3.4 ± 1 3.2 ± 1 2.8 ± 0 2.9 ± 0
For each field site, values followed by the different letters are significantly different at p ≤ 0.05. Letters are not
shown when differences of means are nonsignificant. C: control, B: biochar, D: digestate only, BL: diges-
tate:biochar 1:1, BH: digestate:biochar 1:5.

Annex
146
Table A 8: Seasonal variation of ammonium nitrogen and nitrate nitrogen in the
topsoil (0 - 0.2 m) in Gleyic Podzol and Gleyic Anthrosol after establishment of the
experiment in October 2012. Shown are mean values and the respective standard
deviations (n = 3 to 9).
Soil amendments
Site 1 Site 2
C B D BL BH
NO3 - N (µmol Nitrate 100 g of dry soil-1)
Winter 2012/13 45.48±13a 106.45±26
b 415.11±26a 444.26±52
a 651.31±262b
Spring 2013 28.45±10a 42.39±14
b 55.88±48a 85.61±25
a 205.03±66b
Summer 2013 27.62±7a 67.89±10
b 128.19±30a 93.81±38
b 146.30±33a
Autumn 2013 18.77±8a 51.28±13
b 150.44±76a 138.70±34a
b 194.98±39b
Winter 2013/14 19.38±3 27.83±0 41.00±4a 83.74±15
a 145.88±37b
Spring 2014 27.98±6a 48.65±13
b 68.68±37a 89.81±19
a 187.31±34b
Summer 2014 12.60±2a 47.47±10
b 119.38±10a 140.12±26
a 195.76±45b
NH4 - N (mg kg-1
)
Winter 2012/13 2.64±2.1 4.91±3.3 4.55±2.4 3.96±2.0 4.61±1.9 Spring 2013 1.88±0.5 2.68±2.0 2.27±2.6 1.97±0.9 2.05±0.9 Summer 2013 1.67±0.6
a 3.76±1.8b 1.98±1.0 2.75±2.1 2.59±1.5
Autumn 2013 1.03±0.4 1.12±0.5 1.87±0.6 1.50±0.2 1.79±0.3 Winter 2013/14 0.96±0.8 0.89±0.7 0.56±0.0 0.72±0.3 0.60±0.2 Spring 2014 1.95±0.6 2.62±1.0 2.26±0.7
a 1.94±1.1a 3.37±0.4
b Summer 2014 2.06±1.0 3.28±0.2 2.23±0.4 1.32±0.5 1.72±0.8
For each soil type, values followed by the different letters are significantly different at P ≤ 0.05. Letters are
not shown when differences of means are nonsignificant. C: control, B: biochar, D: digestate only, BL: diges-
tate:biochar 1:1, BH: digestate:biochar 1:5
Table A 9: Seasonal variation of CEC and BS in the topsoil (0 - 0.2 m) in Gleyic
Podzol and Gleyic Anthrosol after establishment of the experiment in October
2012. Shown are mean values and the respective standard deviations (n = 3 to 9).
Soil amendments
Site 1 Site 2
C B D BL BH
CEC (mmolc kg-1)
Winter 2012/13 31.5±1a 52.1±1
b 41.0±2a 53.1±2
b 54.6±3b
Spring 2013 51.7±3 58.8±10 35.6±1a 53.2±1
b 54.2±1b
Summer 2013 24.2±3 23.8±3 22.5±4a 32.9±4
b 34.6±1b
Autumn 2013 16.7±3 18.3±2 19.1±4a 25.5±7
b 33.8±3c
Winter 2013/14 21.5±2 23.8±2 22.3±5 24.0±2 30.3±8 Spring 2014 17.7±3 22.7±2 22.0±2
a 21.2±3a 31.1±6
b Summer 2014 20.9±2 21.7±3 23.2±1 22.8±3 29.2±5 BS (%)
Winter 2012/13 14.8±3a 25.7±1
b 43.6±8a 49.1±5
a 87.9±12b
Spring 2013 16.3±4 19.2±6 42.3±11 45.8±10 81.3±25 Summer 2013 32.0±10 38.4±11 78.7±13 68.4±17 73.8±17 Autumn 2013 27.7±4 31.6±6 67.3±25 60.8±24 55.8±15 Winter 2013/14 30.0±5
a 39.4±1b 64.7±9 83.6±15 91.7±6
Spring 2014 36.1±4a 51.4±6
b 75.7±5a 93.8±3
b 98.8±0b
Summer 2014 27.9±2a 39.4±3
b 70.8±2
a 72.5±11
a 94.2±5
b
For each soil type, values followed by the different letters are significantly different at P ≤ 0.05. Letters are
not shown when differences of means are nonsignificant. C: control, B: biochar, D: digestate only, BL: diges-
tate:biochar 1:1, BH: digestate:biocha r 1:5

Annex
147
Table A 10: Seasonal variation of plant available-P and -K in the topsoil (0 - 0.2
m) in Gleyic Podzol and Gleyic Anthrosol after establishment of the experiment in
October 2012. Shown are mean values and the respective standard deviations (n =
3 to 9) .
Soil amendments
Site 1 Site 2
C B D BL BH
DL-P (mg P2O5/100 g)
Winter 2012/13 37.5±4.1 47.6±1.8 32.0±2.5a 66.7±3.5
b 64.0±3.4b
Spring 2013 33.6±2.5a 43.2±3.4
b 30.2±2.5a 64.8±3.5
b 62.6±3.4b
Summer 2013 46.0±3.4a 50.0±3.9
b 37.8±5.1a 46.2±13.1
b 66.9±11.9b
Autumn 2013 39.9±0.6a 42.0±0.4
b 38.5±0.8a 42.8±1.2
b 57.3±1.3c
Winter 2013/14 30.2±2.8 32.6±2.6 20.8±1.7a 22.8±3.6
ab 36.0±9.6b
Spring 2014 24.3±2.3a 35.3±3.2
b 20.3±1.5a 22.7±5.4
a 38.2±10.1b
Summer 2014 28.5±2.0a 35.9±2.4
b 22.5±3.0a 28.3±6.3
a 40.1±2.3b
DL - K (mg K2O/100g)
Winter 2012/13 2.3±1.0a 14.6±0.7
b 6.9±9.1a 7.7±5.1
a 35.0±6.0b
Spring 2013 10.9±8.1 8.4±1.5 6.2±1.8a 8.4±2.6
a 25.9±2.2b
Summer 2013 8.7±1.2a 21.4±2.5
b 10.4±2.8a 10.5±4.3
a 27.9±8.1b
Autumn 2013 5.8±1.2a 12.9±0.8
b 10.6±2.3a 10.6±2.9
a 25.8±0.9b
Winter 2013/14 8.0±1.1a 14.3±2.5
b 8.2±0.8a 8.4±0.4
a 17.8±3.7b
Spring 2014 10.5±4.3 18.3±3.9 8.5±0.4a 8.2±1.4
a 15.7±2.9b
Summer 2014 8.0±1.2a 11.3±1.5
b 11.8±1.7
a 12.6±0.7
a 17.4±1.0
b
For each soil type, values followed by the different letters are significantly different at P ≤ 0.05. Letters are not
shown when differences of means are nonsignificant. C: control, B: biochar, D: digestate only, BL: diges-
tate:biochar 1:1, BH: digestate:biochar 1:5

Annex
148
Table A 11: Selected physico-chemical characteristics of the topsoil (0 - 0.2 m) in Gleyic Podzol.
Depth
(cm)
Horizon
denotation
Sand
(%)
Silt
(%)
Clay
(%) pH
EC
(µS cm-1
)
TC
(%)
TN
(%) C/N
CEC
(mmolc kg-1
)
BS
(%)
δ13
C
(‰)
0 - 10 Ah 81.1 11.6 7.4 5.1 47 0.91 0.10 9.19 26.7 55 n.a.
10 - 35 rAp 80.5 12.5 7.1 5.1 47 0.69 0.08 8.33 27.6 423 n.a.
35 - 50 Ap-Bv 69.6 21.3 9.1 5.4 40 n.a. n.a. n.a. 35.1 84 n.a.
50 - 85 Bv-Go 81.8 10.3 7.9 5.7 40 n.a. n.a. n.a. 38.7 81 n.a.
85 - 110 IIGo1 87.2 7.7 5.1 6.3 38 n.a. n.a. n.a. 31.0 97 n.a.
110 - 145 Go2 75.6 16 8.4 6.6 57 n.a. n.a. n.a. 40.7 99 n.a.
> 145 Gro 88.1 8.7 3.2 6.6 31 n.a. n.a. n.a. 26.8 101 n.a.
0 - 20 *4394 (P1) n.a. n.a. n.a. n.a. n.a. 1.35 0.13 10.10 26.6 71 -28.8
0 - 20 *4395 (P2) n.a. n.a. n.a. n.a. n.a. 1.64 0.16 10.10 34.1 313 -28.8
0 - 20 *4627 (P3) n.a. n.a. n.a. n.a. n.a. 0.85 0.09 9.47 24.3 61 -27.8
Source: Magdalina von Leliwa (von Leliwa, 2014)
*Sample notation, n.a: not analyzed

Annex
149
Table A 12: Isotope signature (‰ VPDB) of emitted CO2 from the different treat-
ments on different days for the aerobic incubation experiment (n = 3).
Sample Treatment
δ13
C (‰)
Time (d)
16 54 93 133
GP-4394 C -29.8 ± 0.2a -30.0 ± 0.3
a -30.0 ± 0.1
a -29.9 ± 0.1
ac
D -28.6 ± 0.3
b -29.0 ± 0.2
b -29.2 ± 0.2
b -29.1 ± 0.1
cb
B -29.5 ± 0.2
a -29.6 ± 0.1
ab -29.6 ± 0.1
ab -29.6 ± 0.1
c
D:B 1:1 -28.5 ± 0.6
b -28.8 ± 0.1
ab -28.9 ± 0.5
b -28.9 ± 0.4
b
D:B 1:5 -28.2 ± 0.1
b -28.9 ± 0.1
b -29.0 ± 0.1
b -29.0 ± 0.1
c
GP-4395 C -29.8 ± 0.2a -29.9 ± 0.1
a -29.2 ± 0.3 -29.1 ± 0.4
b
D -29.1 ± 0.2
b -29.3 ± 0.3
b -29.0 ± 0.1 -29.2 ± 0.2
B -29.7 ± 0.0
a -29.7 ± 0.1
ab -29.3 ± 0.1 -29.4 ± 0.1
D:B 1:1 -29.0 ± 0.2
b -29.2 ± 0.1
b -28.9 ± 0.1
a -29.2 ± 0.2
D:B 1:5 -28.9 ± 0.1
b -29.4 ± 0.1
b -29.1 ± 0.0 -29.3 ± 0.0
GP-4627 C -28.2 ± 0.0a -28.7 ± 0.0
a -28.5 ± 0.0
a -28.8 ± 0.2
a
D -26.6 ± 0.2b -27.2 ± 0.1
b -26.8 ± 0.2
b -27.0 ± 0.1
b
B -28.0 ± 0.1ac
-28.6 ± 0.1a -28.0 ± 0.1
c -28.4 ± 0.0
c
D:B 1:1 -26.2 ± 0.2bd
-27.0 ± 0.2b -26.8 ± 0.1
b -27.1 ± 0.1
b
D:B 1:5 -25.5 ± 0.3e -27.2 ± 0.3
b -27.2 ± 0.2
bd -27.3 ± 0.1
b
Values followed by the different letters are significantly different at P ≤ 0.05. Letters are not shown
when differences of means are nonsignificant. C: control, B: biochar; D: digestate only, D:B 1:1: diges-
tate:biochar 1:1, D:B 1:5: digestate:biochar 1:5

Annex
150
Figure A 6: Cumulative CO2 production during an aerobic soil incubation experiment of Gleyic Podzol amended with biochar,
digestate, biochar digestate 1:1 and 1:5 mixtures and without any amendments (Control). The vertical error bars represent ± one
standard deviation of the mean (n = 3). The letters close to the respective graphs show significant differences of the cumulative
CO2 production between the different soil sub samples (von Leliwa, 2014).
Copyright © 2022 FDOKUMEN