NITRIFICATION BY IMMOBILIZED CELLS - WUR eDepot
179
NITRIFICATION BY IMMOBILIZED CELLS 9 n r•-.:•• 1 u ->Util fop; René H. Wijffels CENTRALE L^NDBOUWCATALOGUS ''boÖ0 0574jÏ90Ï ù(C^/"5~/
-
Upload
khangminh22 -
Category
Documents
-
view
1 -
download
0
Transcript of NITRIFICATION BY IMMOBILIZED CELLS - WUR eDepot
NITRIFICATION BY IMMOBILIZED CELLS
9 n r•-.:•• 1 u ->Util f op ;
René H. Wijffels
CENTRALE L^NDBOUWCATALOGUS
''boÖ0 0574jÏ90Ï ù(C^/"5~/

Promotor: dr. ir. J. Tramper hoogleraar in de bioprocestechnologie

/*o?fc>», / t o o
René H. Wijffels
NITRIFICATION BY IMMOBILIZED CELLS
Proefschrift ter verkrijging van de graad van doctor in de landbouw- en milieuwetenschappen, op gezag van de rector magnificus, dr. C.M. Karssen, in het openbaar te verdedigen op maandag 20 juni 1994 des namiddags te vier uur in de aula van de Landbouwuniversiteit Wageningen
\5n lb(SDot>
blbUOlHfc-EM UgHßBOUWUNIVERSEIll»
KAGEN1NGEM
Cover:
Micro-colonies of Nitrosomonas europaea.
Nitrifying bacteria convert ammonia into nitrate. In this study bacteria were immobilized
'artificially' in a hydrophylic gel.
Growth and substrate consumption by these bacteria was studied. Growth appeared by
expansion of micro-colonies. Colonies near the surface of the gel bead were larger as a
consequence of diffusion limitation over the gel.
Ontwerp kaft:
met dank aan Hans Wijffels, Boudewijn van Veen en Ida Akkerman

rJüoi??o1, | & Köö
STELLINGEN
1. Indien de door Keen en Prosser gevonden kinetische parameters voor Nitrobacter juist zijn, zou dit organisme niet bestaan.
Keen G.A., Prosser J.l. (1987) Steady state and transient growth of autotrophic nitrifying
bacteria. Arch Microbiol 147: 73-79
2. Bij vergelijking van geïmmobiliseerde cellen met gesuspendeerde cellen wordt
ten onrechte diffusielimitatie als nadeel van immobilisatie genoemd.
Dit proefschrift
3. Bacteriën groeien tegen de verdrukking in.
Stewart P.S., Robertson CR. (1989) Microbial growth in a fixed volume: studies with entrapped
Escherichia coli. Appl Microb Biotechnol 30: 34-40
4. Polyvinylalcohol zal voor de meeste micro-organismen niet geschikt zijn als
dragermateriaal indien het met de boorzuurmethode geproduceerd wordt.
Hashimoto S., Furukawa K. (1987) Immobilization of activated sludge by PVA-boric acid
method. Biotechnol Bioeng 30: 52-59
5. Het door Kokufuta beschreven gecoïmmobiliseerde systeem van nitrificerende
en denitrificerende bacteriën, waarbij beide soorten over de gehele drager
verdeeld zijn werkt alleen in kortdurende experimenten.
Kokufuta E., Shimohashi M., Nakamura I. (1988) Simultaneously occurring nitrification and
denitrification under oxygen gradient by polyelectrolyte complex-coimmobilized Nitrosomonas
europaea and Paracoccus denitrificans cells. Biotechnol Bioeng 31: 382-384
6. Onderzoeksscholen zijn in het leven geroepen om minder geld op een andere manier te verdelen.

7. Het aantal terreinauto's neemt evenredig toe met het geasfalteerde oppervlak.
8. Het jarenlange overleg omtrent verandering van de openingstijden van winkels,
resulterend in een verlengde openingstijd van een half uur, kan worden
bestempeld als zonde van de tijd.
9. Als ook in restaurants de klant koning is, dan is veel van het bedienend
personeel republikeins.
10. Het toelaten dat mestquota omzeild worden door struisvogelfarms op te zetten is een vorm van struisvogelpolitiek.
11. Uit het feit dat een puddingbroodje gezonder is dan een broodje 'gezond', omdat het minder vet bevat, kan de conclusie getrokken worden dat het gezonder is helemaal geen broodje te eten.
Stellingen behorende bij het proefschrift 'Nitrification by Immobilized Cells'.
R.H. Wijffels
Wageningen, 20 juni 1994.

aan mijn ouders
voor Ida

VOORWOORD
In dit proefschrift worden fundamentele aspecten van geïmmobiliseerde cellen voor toepassing binnen de milieubiotechnologie behandeld. Meermalen is dit toepassingsaspect aan de orde geweest en ik ben de hele periode achtervolgd geweest met de vraag: "Denk je nou echt dat die bolletjes in afvalwater toegepast kunnen worden?" Nee, dat denk ik niet. Dit is een fundamentele studie geweest die het inzicht heeft vergroot en die duidelijk de mogelijkheden van geïmmobiliseerde cellen binnen de milieubiotechnologie en andere gebieden heeft laten zien. Het laat zien dat het de moeite waard is naar stabiele dragermaterialen te zoeken om dergelijke processen ook werkelijk toe te passen. Wij hebben bewust niet gekozen eerst een systeem toe te passen en vervolgens te begrijpen. Wij zijn andersom te werk gegaan.
Bij deze benadering heb ik veel steun gekregen van Hans Tramper, mijn promotor. Ik heb een grote vrijheid gekregen, en er was altijd ruimte voor overleg. Discussies waren altijd zeer verhelderend voor mij.
Kees de Gooijer is nauw betrokken geweest bij de ontwikkeling van de in dit onderzoek gebruikte modellen. Die modelontwikkeling heeft het tot dan toe soms erg kwalitatieve onderzoek met geïmmobiliseerde cellen op een hoger niveau gebracht naar mijn idee.
Experimenten werden uitgevoerd in air-lift loop reactoren. Samen met Ido Wolters en Rens Vreeburg zijn vele ontwerpen gemaakt voordat ze aan alle eisen voldeden.
Bij Proceskunde is een groepje ontstaan waarin gewerkt wordt aan nitrificatie en denitrificatie met geïmmobiliseerde cellen. Binnen dit groepje wordt goed samengewerkt en ik wil daarvoor de mensen die hier van deel uitmaken of maakten bedanken: Jan Hunik (de prettige treinreis naar Budapest zal ik niet snel vergeten), Vftor Santos, Imke Leenen, Ida Günther en José Obón. Ook mijn andere collega's wil ik graag bedanken voor de prettige werksfeer en alle activiteiten naast het werk.
Aan dit onderzoek hebben veel studenten meegewerkt, zonder wie dit nooit tot stand zou zijn gekomen. Zij hebben een essentiële bijdrage aan dit werk geleverd: Ingrid Gaemers, Gertjan Smolders, Sjon Kortekaas, Carlos Vilchez, Wim Dodde, Leonard Mallée, Meinard Eekhof, Marleen Verheul, Evelien Beuling, Serge Lochtmans, Ana Becerril Rojas, Hans van 't Noordende en Aldo Schepers.
Professor Willemse van de vakgroep Plantencytologie en -morfologie wil ik bedanken voor het beschikbaar stellen van de apparatuur om dunne coupes van

bolletjes te kunnen maken. We werden hierbij begeleid door Marieke Smit.
Metingen met micro-electrodes werden uitgevoerd aan de Universiteit van Amsterdam. Ik heb op prettige wijze samengewerkt met Dirk de Beer en Han van den Heuvel.
De medewerkers van de werkplaats, fotolocatie, tekenkamer, afdeling automsatisering, bibliotheek en magazijnen van de Centrale Dienst Biotechnion wil ik bedanken voor hun verrichtte diensten.
Bij Proceskunde ben ik veel sportiever geworden. Marcel Zwietering liet me lopen en naar de kroeg gaan als voorbereiding op de Veluweloop, Anja Janssen zorgde er altijd voor dat ik geen nee kon zeggen tegen het zwemkilometertje van tussen de middag, Rhea Rekker leerde me fierljeppen, Gerrit Heida liet een nieuwjaarsreceptie uitlopen in een schaatstochtje, Henk van Sonsbeek liet met 112.5 km in de Ardennen fietsen en Jan Hunik gaf me mijn eerste skiles door aan te wijzen dat ik naar beneden moest gaan (ik lig er soms nog wakker van).
Het woon-werk verkeer werd veraangenaamd door mijn medecarpoolers: Eveline Vaane, Gab van Winkel, Charles Crombach en Jos Frijns. Alle roddels aan de LU werden tijdens die ritjes behandeld.

CONTENTS
1. Nitrification by immobilized cells 7
2. Performance of growing Nitrosomonas europaea cells
immobilized in carrageenan 41
3. Growth and substrate consumption of Nitrobacter agilis cells
immobilized in carrageenan: part 1. dynamic modelling 55
4. Growth and substrate consumption of Nitrobacter agilis cells
immobilized in carrageenan: part 2. model evaluation 79
5. Pseudo-steady-state oxygen-concentration profiles
in an agar slab containing growing Nitrobacter agilis 105
6. Dynamic modelling of immobilized Nitrosomonas europaea:
implementation of diffusion limitation over expanding micro-colonies 119
7. Effect of initial biomass concentration on the growth of
immobilized Nitrosomonas europaea 147
8. Immobilized cells: model or practical system? 163
Summary 177
Samenvatting 181
Bibliography 185
Curriculum vitae 188

This chapter has been submitted for publication by the authors R.H. Wijffels and J. Tramper
CHAPTER 1
NITRIFICATION BY IMMOBILIZED CELLS
ABSTRACT
The capacity of reactors in which nitrification takes place can be improved by increasing the biomass-retention time independent from the liquid-retention time. This is done by immobilization of the bacterial cells. Natural immobilization of bacteria by spontaneous attachment to inert support materials is widely used in wastewater-treatment systems, in so-called biofilm processes. An alternative technique is artificial immobilization by entrapment in gel materials.
Immobilized-cell processes are complex because of the interaction of many factors. Understanding of the process can be improved by basic knowledge of the important factors involved, and by modelling the interactions of these factors. Biofilm models that have been developed can be divided in steady-state and dynamic models. A factor that limits further understanding of the process is uncontrolled biofilm loss because of, for instance, shear. This factor determines the thickness of the biofilm and as a result the capacity of the film. Dynamic models for artificially entrapped cells have been developed as well.

Chapter 1
Techniques have been developed with which components inside biofilms can be analyzed. With micro-electrodes profiles of substrates and/or products over the support can be measured, and by slicing the support in combination with staining techniques, specific biomass profiles can be determined. These techniques are important tools for evaluation of models that describe growth and substrate consumption of immobilized cells.
The various aspects mentioned above are reviewed in this paper.
INTRODUCTION
Industrial and agricultural developments lead to an increased prosperity in Europe after the Second World War. In the Netherlands this development was accompanied by an exponential growth of the human population. This period of prosperity and growth also showed its negative side-effects. It became clear that economic growth should be more controlled and that negative environmental effects had to be reduced strongly. This resulted in laws to regulate discharge of wastewater. Intensive treatment of wastewater started more than 30 years ago now. Initially it was focused on the removal of organic components that cause an increased oxygen demand in the receiving surface waters.
Although much progress has been made, many pollutants still cause problems. To these pollutants belong the eutrophication-causing nitrogen compounds. Traditional wastewater-treatment systems often do not offer effective solutions for nitrogen removal. Although it is possible to accomplish nitrification in the more conventional systems like activated-sludge plants and trickling filters, the nitrification capacities of these systems are poor.
The process of nitrification is known for a long time. Especially the fact that the produced nitrate was a source for gunpowder made the process economically attractive already in the 13th century. One of the methods to produce nitrate was by means of dung hills over which urine and water were percolated. This system can be considered as a precursor of the modern manure-treatment factories, which are currently in development in the Netherlands. In that time producers were not aware of the biological fundament of this process. At the end of the 19th century it became clear that the basis of nitrification was biological; nitrification was a two-step oxidation
Nitrification by immobilized cells
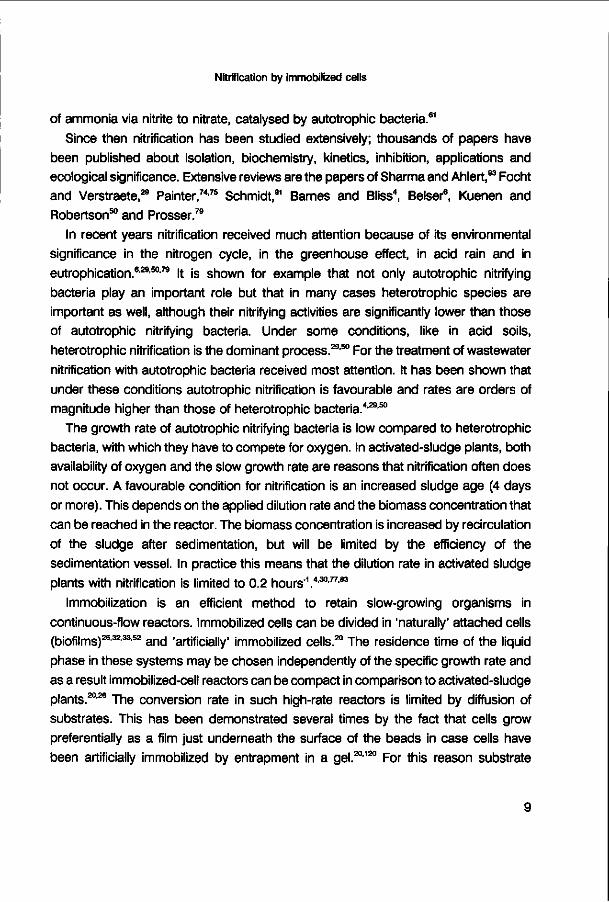
of ammonia via nitrite to nitrate, catalysed by autotrophic bacteria.61
Since then nitrification has been studied extensively; thousands of papers have been published about isolation, biochemistry, kinetics, inhibition, applications and ecological significance. Extensive reviews are the papers of Sharma and Ahlert,93 Focht and Verstraete,29 Painter,74,75 Schmidt,91 Barnes and Bliss4, Belser6, Kuenen and Robertson50 and Prosser.79
In recent years nitrification received much attention because of its environmental significance in the nitrogen cycle, in the greenhouse effect, in acid rain and in eutrophication.6,29,50,79 It is shown for example that not only autotrophic nitrifying bacteria play an important role but that in many cases heterotrophic species are important as well, although their nitrifying activities are significantly lower than those of autotrophic nitrifying bacteria. Under some conditions, like in acid soils, heterotrophic nitrification is the dominant process.29,50 For the treatment of wastewater nitrification with autotrophic bacteria received most attention. It has been shown that under these conditions autotrophic nitrification is favourable and rates are orders of magnitude higher than those of heterotrophic bacteria.4,29,50
The growth rate of autotrophic nitrifying bacteria is low compared to heterotrophic bacteria, with which they have to compete for oxygen. In activated-sludge plants, both availability of oxygen and the slow growth rate are reasons that nitrification often does not occur. A favourable condition for nitrification is an increased sludge age (4 days or more). This depends on the applied dilution rate and the biomass concentration that can be reached in the reactor. The biomass concentration is increased by recirculation of the sludge after sedimentation, but will be limited by the efficiency of the sedimentation vessel. In practice this means that the dilution rate in activated sludge plants with nitrification is limited to 0.2 hours"1.4,30,77,83
Immobilization is an efficient method to retain slow-growing organisms in continuous-flow reactors. Immobilized cells can be divided in 'naturally' attached cells (biofilms)26,32,33,52 and 'artificially' immobilized cells.20 The residence time of the liquid phase in these systems may be chosen independently of the specific growth rate and as a result immobilized-cell reactors can be compact in comparison to activated-sludge plants.20,26 The conversion rate in such high-rate reactors is limited by diffusion of substrates. This has been demonstrated several times by the fact that cells grow preferentially as a film just underneath the surface of the beads in case cells have been artificially immobilized by entrapment in a gel.20,120 For this reason substrate

Chapter 1
conversion rates tend to be proportional to the surface area and not to the total mass
of the organisms.2026323352121
IMMOBILIZED CELLS
Naturally attached cells (biofilms)
The trickling filter is the most widely applied immobilized-cell system. A trickling filter is a percolating filter consisting of a bed of a porous support on which a biofilm develops. In first instance the support materials used were lava and stone which have relatively limited external specific surface areas (100 m2, m"3). In the second generation of trickling filters plastic media were used with a specific surface area of 100-300 m2. m"3. Although the specific surface area of trickling filters is still small, the system is widely used because there is much practical experience with them. Knowledge of the process in wastewater treatment, however, is mainly empirical.
A system with a comparable specific surface area is the rotating biological contactor. In a rotating biological contactor the biofilm is attached to discs. A large number of these discs are closely arranged and mounted on a shaft which rotates in the reactor. The discs are partly submerged in the sewage. As the shaft rotates slowly, attached biomass is alternately exposed to air and sewage.
Both trickling filters and rotating biological contactors have a limited capacity because of the relatively low specific surface area of the support. High-rate biofilm reactors have a much higher specific surface area, usually accomplished by using small particles (e.g. sand). Examples of compact systems are the packed-bed and fluidized-bed reactors. The reactors contain small solid particles with an attached biofilm. The specific surface area is about 3000 m2, m"3. Aerated wastewater moves through the bed. The limitation of these systems is, that the transfer of oxygen from the gas phase to the liquid phase is low and therefore often oxygen depletion along the length of the reactor occurs. The capacity of these reactors is thus limited by oxygen supply. In case of fluidized-bed reactors increased oxygen transfer rates can be reached by sparging air in the column, creating a three-phase reactor.8'26'84,101,113
Similar capacities can be reached in fluidized-bed systems with a draft tube, air-lift loop reactors, which have a more defined liquid flow.34
10
Nitrification by immobilized cells
Artificial immobilized cells
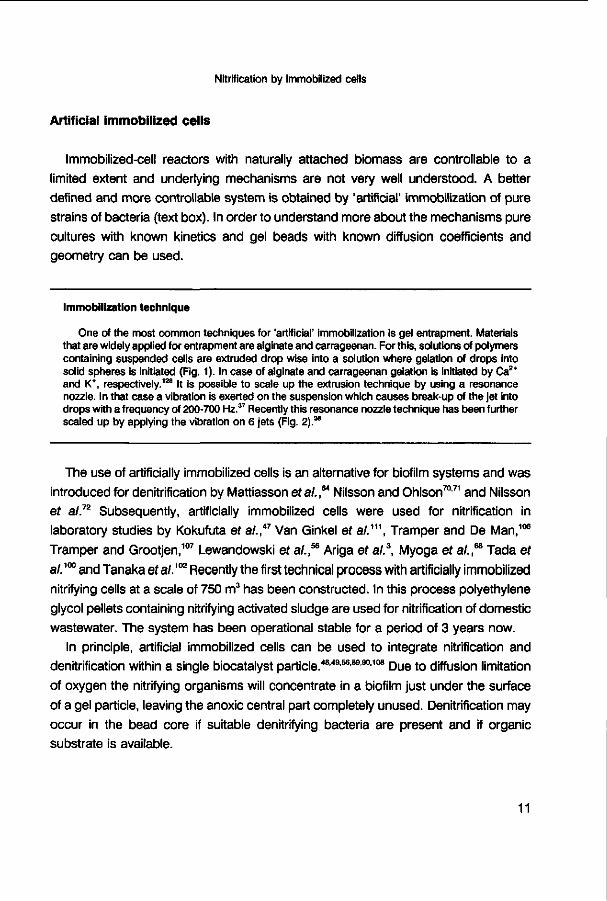
Immobilized-cell reactors with naturally attached biomass are controllable to a limited extent and underlying mechanisms are not very well understood. A better defined and more controllable system is obtained by 'artificial' immobilization of pure strains of bacteria (text box). In order to understand more about the mechanisms pure cultures with known kinetics and gel beads with known diffusion coefficients and geometry can be used.
Immobilization technique
One of the most common techniques for 'artificial' immobilization is gel entrapment. Materials that are widely applied for entrapment are alginate and carrageenan. For this, solutions of polymers containing suspended cells are extruded drop wise into a solution where gelation of drops into solid spheres is initiated (Fig. 1). In case of alginate and carrageenan gelation is initiated by Ca2+
and K*, respectively.128 It is possible to scale up the extrusion technique by using a resonance nozzle. In that case a vibration is exerted on the suspension which causes break-up of the jet into drops with a frequency of 200-700 Hz.37 Recently this resonance nozzle technique has been further scaled up by applying the vibration on 6 jets (Fig. 2).M
The use of artificially immobilized cells is an alternative for biofilm systems and was introduced for denitrification by Mattiasson ef al.,6* Nilsson and Ohlson70,71 and Nilsson ef a/.72 Subsequently, artificially immobilized cells were used for nitrification in laboratory studies by Kokufuta et al.*7 Van Ginkel et a/.111, Tramper and De Man,106
Tramper and Grootjen,107 Lewandowski ef a/.,56 Ariga ef a/.3, Myoga ef a/.,68 Tada ef a/.10C and Tanaka ef a/.102 Recently the first technical process with artificially immobilized nitrifying cells at a scale of 750 m3 has been constructed. In this process polyethylene glycol pellets containing nitrifying activated sludge are used for nitrification of domestic wastewater. The system has been operational stable for a period of 3 years now.
In principle, artificial immobilized cells can be used to integrate nitrification and denitrification within a single biocatalyst particle.48,4956,89,90,108 Due to diffusion limitation of oxygen the nitrifying organisms will concentrate in a biofilm just under the surface of a gel particle, leaving the anoxic central part completely unused. Denitrification may occur in the bead core if suitable denitrifying bacteria are present and if organic substrate is available.
11

Chapter 1
o 0 o o 0 o 8 0 0 O ,
air pressure
gel-biocatalyst suspension
airflow needle
CaCI2 or KCl solution
immobilized biocatalysts magnetic stirrer
Fig. 1: Schematic representation of drop wise extrusion of alginate or carrageenan in a CaCI2 or
KCl solution where gelation is initiated.37
I * V//////////SS/////////7*
vibration exciter
membrane
nozzle chamber
break-up of jet
Fig. 2: Schematic representation of the resonance-nozzle technique.9
12

Nitrification by immobilized cells
BASICS OF IMMOBILIZED-CELL PROCESSES
Naturally attached cells (biofilms)
Biofilm systems are complex (Fig. 3) due to a combination of factors like bacterial growth, substrate consumption, attachment, external/internal mass transfer of substrate and products, cell death, shear loss (biofilm loss because of erosion), sloughing (fragments disrupt from the film), structure of the support material, competition between bacterial species, effects of predators. All these factors play a significant role in the overall capacity of the biofilm process. Process conditions like the concentration of substrate, temperature, pH, turbulence, dilution rate will all influence these factors differently (Table 1). For example, increasing the turbulence influences most factors mentioned:
i) The stagnant-liquid layer at the film interface will be thinner and as a result of that the external mass-transfer resistance will be lower. ii) Lower external mass-transfer resistance results in an increased penetration depth in the biofilm and therefore both substrate consumption rate and growth rate will increase.
iii) Shear rates will increase. iv) Consequently, the rate of attachment of cells and the type of cells that attach will be influenced (biofilms grown at higher shear stresses are dense and less sensitive to high shear stress).11,83
v) In dense biofilms, diffusion coefficients and biomass concentration will be different than in less dense biofilms.
biofilm
support Ykl^£&\ T5Z&5Z&
time
Fig. 3: Schematic representation of the formation of a biofilm.
13
Chapter 1
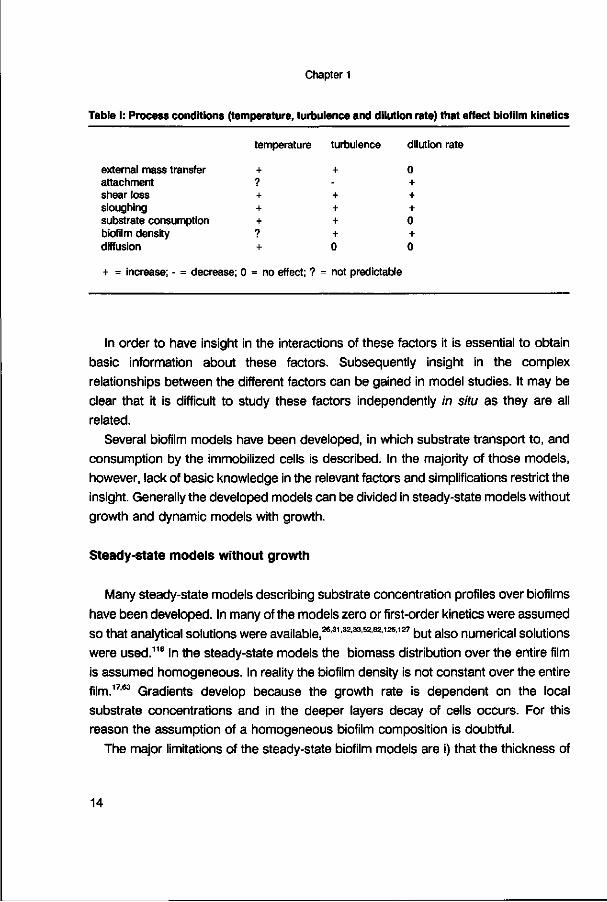
Table I: Process conditions (temperature, turbulence and dilution rate) that effect biofilm kinetics
temperature turbulence dilution rate
external mass transfer + + 0 attachment ? - + shear loss + + + sloughing + + + substrate consumption + + 0 biofilm density ? + + diffusion + 0 0
+ = increase; - = decrease; 0 = no effect; ? = not predictable
In order to have insight in the interactions of these factors it is essential to obtain basic information about these factors. Subsequently insight in the complex relationships between the different factors can be gained in model studies. It may be clear that it is difficult to study these factors independently in situ as they are all related.
Several biofilm models have been developed, in which substrate transport to, and consumption by the immobilized cells is described. In the majority of those models, however, lack of basic knowledge in the relevant factors and simplifications restrict the insight. Generally the developed models can be divided in steady-state models without growth and dynamic models with growth.
Steady-state models without growth
Many steady-state models describing substrate concentration profiles over biofilms have been developed. In many of the models zero or first-order kinetics were assumed so that analytical solutions were available,26,31'32,33K'82'126,127 but also numerical solutions were used.116 In the steady-state models the biomass distribution over the entire film is assumed homogeneous. In reality the biofilm density is not constant over the entire film.17,63 Gradients develop because the growth rate is dependent on the local substrate concentrations and in the deeper layers decay of cells occurs. For this reason the assumption of a homogeneous biofilm composition is doubtful.
The major limitations of the steady-state biofilm models are i) that the thickness of
14

Nitrification by immobilized cells
the steady-state biofilm must be known and that ii) obviously only the steady state is described which means that it does not give insight in the response of the process to changes.
Steady-state biofilm models increase insight in biofilm processes in the case of thick films, in which the penetration depth of substrate is smaller than the film thickness. In that case, accurate information about the total thickness of the film for determination of the capacity is not so important. In the case of thinner films, however, the thickness is a key parameter.
Dynamic models with growth
In dynamic biofilm models bacterial growth is taken into consideration. Substrate consumption and growth are treated separately. This is a valid approach as long as the time scale for growth is much larger than the time scale for substrate consumption. Substrate concentration profiles over biofilms are calculated by numerical solutions as a function of time.2,5,13,44,105,117 In case of growing biofilms this will result in steeper profiles later in time.
In dynamic biofilm models, the thickness or the density of the biofilm will increase or decrease as a function of time. Consideration of the varying amount of biomass in the film is essential to study the dynamics of the system. To illustrate this, two examples will be given: i) the effect of changing temperatures and ii) competition between different species of organisms.
i) The substrate-consumption rate is a function of temperature. At temperatures below the optimum, the consumption rate will be lower. In the case of immobilized cells this results in a larger substrate-penetration depth. If viable biomass is present in the deeper layers of the biofilm, the substrate will be consumed in the deeper layers and the decreased capacity of the biofilm will partly be counterbalanced. In case, however, cells in deeper shells are not viable, the capacity of immobilized cells is more sensitive to temperature changes than in deep biofilms.123
ii) Competition between different species in a biofilm will result in a heterogeneous distribution. Wanner and Gujer116,117 showed that such a biofilm is built up of layers with different types of micro-organisms. In case for example both nitrifying and denitrifying cells are present, the organisms will compete for oxygen. As a result, nitrifying cells will to some extent be overgrown by denitrifying cells which will have an effect on the
15
Chapter 1
performance of the system.
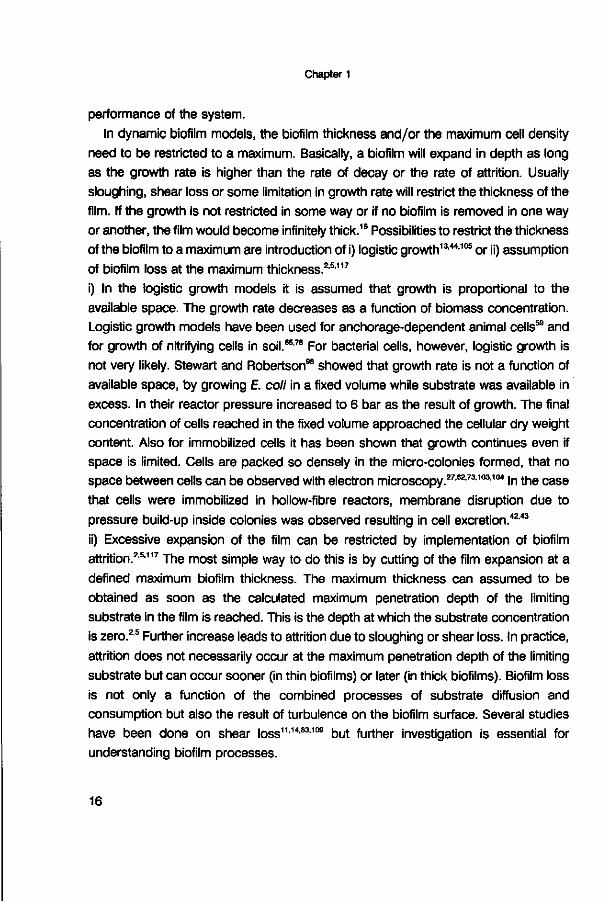
In dynamic biofilm models, the biofilm thickness and/or the maximum cell density need to be restricted to a maximum. Basically, a biofilm will expand in depth as long as the growth rate is higher than the rate of decay or the rate of attrition. Usually sloughing, shear loss or some limitation in growth rate will restrict the thickness of the film. If the growth is not restricted in some way or if no biofilm is removed in one way or another, the film would become infinitely thick.15 Possibilities to restrict the thickness of the biofilm to a maximum are introduction of i) logistic growth13,44,105 or ii) assumption of biofilm loss at the maximum thickness.2,5,117
i) In the logistic growth models it is assumed that growth is proportional to the available space. The growth rate decreases as a function of biomass concentration. Logistic growth models have been used for anchorage-dependent animal cells59 and for growth of nitrifying cells in soil.6578 For bacterial cells, however, logistic growth is not very likely. Stewart and Robertson98 showed that growth rate is not a function of available space, by growing £. coli in a fixed volume while substrate was available in excess. In their reactor pressure increased to 6 bar as the result of growth. The final concentration of cells reached in the fixed volume approached the cellular dry weight content. Also for immobilized cells it has been shown that growth continues even if space is limited. Cells are packed so densely in the micro-colonies formed, that no space between cells can be observed with electron microscopy.27,62,73,103,104 In the case that cells were immobilized in hollow-fibre reactors, membrane disruption due to pressure build-up inside colonies was observed resulting in cell excretion.42,43
ii) Excessive expansion of the film can be restricted by implementation of biofilm attrition.2,5,117 The most simple way to do this is by cutting of the film expansion at a defined maximum biofilm thickness. The maximum thickness can assumed to be obtained as soon as the calculated maximum penetration depth of the limiting substrate in the film is reached. This is the depth at which the substrate concentration is zero.2,5 Further increase leads to attrition due to sloughing or shear loss. In practice, attrition does not necessarily occur at the maximum penetration depth of the limiting substrate but can occur sooner (in thin biofilms) or later (in thick biofilms). Biofilm loss is not only a function of the combined processes of substrate diffusion and consumption but also the result of turbulence on the biofilm surface. Several studies have been done on shear loss11,14,83,109 but further investigation is essential for understanding biofilm processes.
16

Nitrification by immobilized cells
A different approach for studying dynamics of biofilm processes is formed by using more simplified systems in which less factors play a role and where basic knowledge of the important factors is available. In this respect immobilized-cell systems with entrapped cells form a much better defined and therefore a more adequate system for model evaluation.
Artificially Immobilized cells
In order to understand the interactions of mass transfer in films and the kinetics of immobilized cells, artificially immobilized cells form an excellent model system. In Fig. 4 the immobilized-cell process is schematically shown for an aerobic conversion with oxygen as the limiting substrate. Oxygen is supplied to the reactor system by means of air bubbles. The oxygen will be transferred from the gas phase to the liquid phase across a stagnant liquid layer surrounding the gas bubble. The liquid phase is assumed to be perfectly mixed. From there the oxygen will be transported through a stagnant layer surrounding the gel bead to the gel surface, through the gel bead, into
distance
Fig. 4: Transport of oxygen from the gas phase to immobilized cells where conversion occurs.
17

Chapter 1
Micro-colonies
Growth of immobilized cells appears as expanding micro-colonies. Colonies near the surface of the gel beads will be larger than the colonies in the centre as the result of diffusion limitation (Fig. 5). The colonies provide their own space in the gel.54 Due to expansion of the colonies, the cells will eventually reach the surface of the gel bead, the colony surface will confluence with the gel surface and cells are released into suspension.122 The process of cell release is schematically shown in Fig. 6. In steady state the cell-leakage rate will be equal to the net biomass production rate. Release of cells was confirmed in the experiments of Inloes ef a/.42,43 and Wijffels er a/.125
Inloes ef al. found membrane disruptions in hollow-fibre reactors containing growing cells.
micro-colonies (text box) and finally reaches the microorganisms where consumption will occur. As cells grow in micro-colonies, transport of substrate in these colonies is also taking place.
Similar to models for attached biofilms, growth needs to be restricted to a maximum in dynamic models of entrapped cells. If the biomass concentration is not restricted, an infinitely thin film of biomass with an infinitely high concentration would ultimately be obtained.
Fig. 5: Inner peripheral surface of a carrageenan bead showing various-size micro-colonies of
Nitrosomonas europaea, bar length 10 Jim.112
18

Nitrification by immobilized cells
Several dynamic models have been developed in which maximum biomass concentrations are defined.24,40,66,69 Values for maximum biomass concentrations were obtained experimentally by determination of the volumetric fraction of biomass near the surface of the beads by image analysis.40,66,122 There was, however, not a physical reason for limiting the concentration to this maximum as in none of the cases described the subsurface region was fully occupied by micro-colonies. In reality the biomass concentration in the subsurface region will be limited because colonies erupt from the gel bead and/or colonies become so large that the growth rate is limited by diffusion limitation over the colonies. Diffusion limitation over micro-colonies and cell eruption can be implemented in the models by considering growth as expansion of micro-colonies.25,86,122 Micro-colonies near the surface of the bead grow faster and as a result are larger than the colonies in deeper layers. Colony expansion near the surface may result in fusion of different colonies if they approach each other,66 grow out of the beads by an eruption like process,121 or are further limited in their growth by diffusional restrictions over the micro-colonies.122 By implementation of diffusion limitation over the colonies and by biomass release due to colony eruption as soon as colonies touch the gel surface, it was found there was no need to implement a maximum biomass concentration.122
single-cell release
X © o
Vo® colony eruption e o o
o o
time Fig. 6: Schematic representation of growth of artificially immobilized cells by colony expansion.
19

Chapter 1
PARAMETER ESTIMATIONS
The quality of model results is to a great extent dependent on the quality of the parameter estimation. Significant insight in the process can be obtained if parameters are obtained in independent experiments. Fitting of parameter values should therefore be avoided. For immobilized cells three types of parameters have to be considered, i.e., intrinsic kinetic parameters, physical parameters of the support containing the biomass and hydrodynamics-dependent physical parameters.
Intrinsic kinetic parameters
Intrinsic kinetic parameters that are important for growth of immobilized cells are the maximum specific growth rate, substrate affinity constants, biomass-yield coefficients and parameters that are related to maintenance and decay.
In literature the kinetics of nitrification have been described extensively. The reliability of the reported values of kinetic parameters is, however, often limited because experimental procedures showed serious deficiencies.53,96,97 Observed differences between intrinsic values and the values measured in bacterial floes or films are often the result of some kind of substrate limitation.85 Smith ef a/.95 showed for Mycobacterium sp. that the physiology of immobilized and suspended cells was not different in case there was no transport limitation. Only in a few models system-independent parameters have been used. Monbouquette ef a/.66 and De Gooijer era/.24
used kinetic parameters of the suspended cells and assumed that effects on these parameters are only determined by diffusion which is accounted for in the model. On the other hand, kinetic parameters seldomly have been determined under the extreme limiting conditions as existing in the deeper shells of immobilized cells. Wijffels era/.121
simulated starvation conditions in the deeper shells by estimation of the specific degradation rate, by growing the cells in a batch culture, depleting the medium from oxygen after some time and measuring the activity reduction as a function of time. This does, however, not indicate whether cells are indeed dead or in a dormant state.16,67,76
The viable fraction of immobilized cells may be critical in predicting long-term or steady-state reactor performance19 and for the estimation of the dynamics of the system.
20

Nitrification by immobilized cells
Physical parameters of the support
Within the support material substrate will be transferred by diffusion. The rate of diffusion depends on the diffusion coefficient of the substrate in the support and the effect of the presence of large amounts of biomass on this diffusion coefficient. Effective diffusion coefficients for oxygen and other compounds have been determined for most support materials.28,119,123 Indeed it has been shown that cells may have an effect on the diffusion coefficients. For instance, Sakaki etal.87 and Sun et a/.99 showed that with increasing cell densities diffusion coefficients decreased. For this reason biomass-concentration-dependent diffusion coefficients have been used.24,66 Another possibility is to assume two diffusion coefficients, one for the gel itself and one for the micro-colonies. Within closely packed aggregates of bacterial cells the effective diffusion coefficient is between 20 and 30% of the value in media.35,58,119 In case of the use of colony-expansion models86,124 both diffusion coefficients are introduced separately.
Hydrodynamic-dependent physical parameters
In processes with immobilized cells substrate is transferred from the liquid phase to the solid phase in which the reaction occurs. In many studies the diffusion of substrate through the solid phase was assumed to be the rate-limiting step in the process, because the thickness of the stagnant layer surrounding the solid particles was supposed to be much smaller than the radius of the gel bead used as a support for the immobilized cells. Furthermore, the diffusion coefficient in the support is usually smaller than in water. Usually, however, a relatively thin layer of biomass will be formed just beneath the support surface. If for example, oxygen is the limiting substrate, this active layer will be in the order of 100 ^m, which is the same order of magnitude as the thickness of the stagnant layer. Sensitivity analysis of the parameters showed that the value of the external mass transfer coefficient, /c,s, significantly influenced the overall consumption rate in such an immobilized-cell process.24 Relatively little is known, however, about external mass transfer in bioreactors as the relative velocity of the particles is generally not known. The relations used are based on empirical equations and need not only to be adapted for all types of bioreactors used, but also for all scales and procedures.
21

Chapter 1
Liquid/solid mass-transfer descriptions are often based on the film theory, in which the liquid-bulk phase is assumed to be perfectly mixed except for a thin, stagnant, layer surrounding the particles. It is assumed that mass transfer across this layer solely occurs by diffusion.
Mass transfer across the stagnant layer can thus be described by:
J. - % (C> -C.) (1)
As s is generally not known, a liquid/solid mass-transfer coefficient, kls, which can be
calculated with the dimensionless Sherwood number, is defined as:
D, ShD, k _ Zi _ i (2) à dp
Correlations for the Sherwood number are partly theoretical and partly empirical. For a sphere surrounded by an infinitely extended stagnant medium it can be derived that Sh equals 2. If the liquid starts to flow, the value of Sh increases. In that situation the stagnant region is limited to the near surroundings of the bead. The thickness of that stagnant layer, <s, decreases as the flow increases, while kls and Sh increase. The general form of the Sherwood equation is:
Sh- 2 + aScp Re1 (3)
The dependence of the Sherwood number of the Schmidt and Reynolds numbers is usually described by empirical correlations.
Wijffels era/.121 calculated the liquid/solid mass-transfer coefficient by assuming that the particles move with the rate of free fall. In this case the Reynolds number was calculated from the Galileo number.7 At lower Reynolds numbers (fle<30) the relation of Brian and Hales10 can be used. Whether this assumption is appropriate is not without doubt, because the experiments were executed in an air-lift loop reactor to which gas is supplied and where the volume fraction of beads was 15 %. This means that the particle movement is influenced by the turbulent flow in the reactor and is hindered because of the high particle concentration.
Another approach is Kolmogoroff's theory of local isotropical turbulence.60,88,118
22

Nitrification by immobilized cells
Turbulence in air-lift loop reactors is caused by the introduction of air. Air bubbles will expand as they rise. This isothermal expansion of the gas bubbles is the main source of power input in the reactor. The rising bubbles will generate large eddies, which in first instance cause large-scale mixing in the reactor. Fluid packages will be interchanged. Further mixing will occur because the initial large eddies scatter into smaller ones. Those larger eddies thus transfer their kinetic energy to the smaller ones which will scatter again and so on. This transfer of energy occurs in all directions and as eddy-generation proceeds the orientation of the eddies will be lost and turbulence becomes isotropic. Ultimately, the only information transferred from the large eddies to the very small ones is the energy which will finally be dissipated (by friction to heat) in the smallest eddies having a flow which is just laminar (Re = 1). On the basis of a dimension analysis the size of these smallest eddies can be derived and from that the Reynolds number of a spherical particle in an isotropic turbulent flow field can be defined:23468892'94
Re - c ed^1
v3 for dp > k (4)
The difference between the so defined Reynolds number and the Reynolds number
as used in the equations of Ranz and Marshall80 and Brian and Hales10 is that it is
dependent on the energy applied to the reactor and not on the density difference
between solid and liquid phase, and the solid/liquid mass-transfer coefficient is thus
a function of the superficial gas velocity. Sänger and Deckwer88 and Livingston and
Chase60 showed that the superficial gas velocity has indeed an effect on liquid/solid
mass transfer for suspended particles in bubble columns or air-lift reactors. To obtain
a relation for Sh they implemented the 'Kolmogoroff' Reynolds number (Eq. 4) in
equation 3 and fitted a, ß and -r to their experimental data. The relations obtained are,
however, not generally applicable as they are restricted to the flow regimes, density
differences between solid and liquid phase, particle radius and solid-hold up tested.
23

Chapter 1
EVALUATION OF MODELS
Models contribute significantly to the understanding of the process if simulations are evaluated experimentally. Biofilm or immobilized-cell models can be evaluated by comparing simulated and observed macroscopic substrate consumption rates (based on analyses in the bulk phase) and biomass and substrate concentration profiles (local measurements inside the film or support). In recent years much progress has been realized in local measurement techniques.
Micro-sensors
Micro-sensors are electrodes with a very small tip diameter (less than 10 /urn). It is possible to penetrate biofilms with such electrodes and measure local concentrations with a high spatial resolution. As such, micro-sensors form an efficient tool to measure substrate concentration profiles over a biofilm,110 the macroscopic consumption rate of a film from the slope at the surface of the support, the liquid/solid mass-transfer coefficient,36 diffusion coefficients110 and intermediate products. Micro-sensors have been developed for oxygen,21,36,81 pH, ammonia, nitrate22 and glucose.18
When immobilized-cell models are evaluated, micro-electrode techniques are an excellent tool to compare calculated profiles with measured profiles,124 although there are some limitations: i) Flow conditions.
If gel beads with immobilized cells are cultivated in a reactor where the support is kept in suspension the flow conditions in the reactor and in the flow chamber where measurements are done need to be the same, ii) Spatial resolution.
The position of the electrode tip is usually determined visually. The accuracy with which the location of the tip can be determined is often not sufficient as concentration profiles tend to be very steep. This problem may be solved by simultaneous measurement of the concentration profile and the optical density.57 The solid/liquid interface is then identified from the optical density profile.
Micro-electrode techniques have a surplus value in more complex systems where reactions occur in sequence. This is the case in most biofilms and in the coimmobilized systems that were used by Hunik ef a/.40 (Nitrosomonas europaea and
24

Nitrification by immobilized cells
Nitrobacter agilis) and Santos et a/.89'90 (the magic bead concept for integrated
nitrification and denitrification). Products are released which form the substrate of other
organisms. These intermediate products are often not detectable by analysis of the
bulk-liquid phase because they are only present in the subsurface shells of the
support. By means of micro-electrodes these intermediate products can be analyzed.
Biomass profiles
Total biomass concentrations in biofilms are relatively easy to determine by scraping of the biofilm and analyzing the obtained suspension.13 Local concentrations in biofilms can be determined by slicing or dissolving biofilm shells. Masuda et a/.63 used a microslicer to cut segments of a thickness of 10-50 urn. In the sliced films bacterial counts were executed. Shells can be dissolved from gel particles in which cell concentrations can be determined by cell counts or turbidity measurements.9,55,115 A drawback of this method is, that usually shells of a thickness larger than 50 ßm are obtained. As profiles tend to be very steep, a higher resolution than this is required.
More accurate methods have been developed for artificially immobilized cells. Ultra-thin sections out of the centre of the beads are sliced and within these sections the volumetric fraction of colonies can be determined.12,40,62,121,123 Profiles can be quantified by image analysis. The coordinates of the centres and the radii of the colonies are determined in relation to the centre or the surface of the bead.121 For this analysis, the slices have to be very thin to prevent that colonies overlap.
Samples for image analysis usually are stained: i) To increase contrast. General staining methods with e.g. toluidine blue are used.121,123
ii) To distinguish growing cells from non growing cells. Cell components or reactions which are related to cell growth are stained: -RNA66
- DNA synthesis51
- Addition of the yellow coloured dimethylthiazol salt which is transferred to MTT formazan which has a blue colour1
- 35S.45 Immobilized cells were stained with a /3-emitting isotope œS which was supplied in the form of sulphate and is incorporated in proteins during synthesis. Consequently,
25

Chapter 1
growth can be monitored as ̂ S activity. Biomass profiles were observed with a light microscope after exposure of the slices to an autoradiographic emulsion and development.
iii) To specify certain strains. Hunik ef a/.39 used a labelling technique with fluorescent antibodies to distinguish two species of immobilized cells. Two ultra-thin centre sections were labelled with antibodies. One with a rabbit antibody for Nitrosomonas and the other with a rabbit antibody for Nitrobacter. The rabbit antibodies were labelled with a goat antibody which was conjugated with fluorescein isothiocyanate (FITC). As a result fluorescent colonies were obtained.
Although the slicing methods used in combination with image analysis are more accurate than scraping or dissolving of shells, there are also some disadvantages. Samples have to be cut in thin slices (< 5 ßm) to prevent overlap of the colonies. To be able to make such thin sections with a microtome the samples have to be embedded in a resin and usually chemical fixation is necessary. Shrinkage of the samples has been observed during preparation112 and this may affect the results obtained. More direct methods would improve the quality of the results.
Recently such a direct technique has been presented by Worden and Berry.129 They mounted a thin slab of gel containing immobilized cells on a microscope slide. One side of the slab was in contact with nutrient medium and growth of cells could be observed through a microscope. Except for being a direct technique, the technique of Worden and Berry129 is non-invasive as well, which means that it is possible to study the dynamics of the process.
TOWARDS A RATIONAL REACTOR DESIGN
The models presented describe the performance of the immobilized-cell particles
or biofilms. Fig. 4 indicates that the immobilized-cell reactor is more than just the
immobilized cells. In the bioreactor, factors like fluid mixing and transfer of oxygen
from the gas to the liquid phase have to be considered as well. In order to form an
26

Nitrification by immobilized cells
reactor design transport/conversion
• .
• •
i l l—* (1
» ' ^f
rate limiting step
<C^F1 regime analysis
Fig. 7: Optimization of a process by determination of the rate-limiting step with regime analysis.41
efficient tool for bioreactor design, the immobilized-cell models have to be integrated in a reactor model. It may be clear that many factors potentially affect the overall process. It would be too time consuming to give a complete description of the process. An efficient tool to account for all steps in a process of any scale forms regime analysis. With regime analysis the rate-limiting step can be determined and if possible, this step can be optimized in the process design (Fig. 7). Hunik ef a/.41
performed this analysis for immobilized cells in air-lift loop reactors by determination of characteristic times of gas/liquid mass transfer, oxygen depletion in gas bubbles, liquid/solid mass transfer, mixing time and kinetics of the immobilized cells. For the latter, immobilized-cell models can be used. Hunik et al." showed that for three different conditions of the nitrification process (under optimal conditions and under two extreme conditions, i.e. low temperatures and high substrate concentrations) the capacity was controlled by mass transfer of oxygen or ammonia and to a lesser extent by the conversion rates (text box). The regime analysis proved to be a helpful tool for the understanding of the entire process and for establishing the rate-limiting step. Design rules for different conditions can be obtained from the results of this regime analysis.
27

Chapter 1
Rate-limiting step
Hunik ef a/.41 showed that nitrification by immobilized cells was mainly controlled by mass transfer of oxygen. This is an improvement in comparison to the activated-sludge process, which is controlled by the specific growth rate. As a result, for the design of such a bioreactor the capacity of the process can be increased by increasing the rate of oxygen transport. The transfer of oxygen is dependent on the gas/liquid and liquid/solid mass-transfer coefficients and on the specific surface area of the different phases. Optimization of single parameters, however, does not necessarily mean that the capacity as a whole will be increased as other factors may be influenced as well. For example, an increase of the solid-phase hold up decreases gas/liquid mass transfer.114
NOMENCLATURE
c = constant
dp = particle diameter
D, = diffusion coefficient in liquid phase
Jm = flux
k,s = liquid/solid mass-transfer coefficient
Re = Reynolds number
S„ = substrate concentration in bulk liquid phase
Ss = substrate concentration solid/liquid interphase
Sc = Schmidt number
Sh = Sherwood number
a = constant
ß = constant
i = constant
s = thickness of stagnant layer
e = specific energy dissipation per unit of mass
A = length scale of micro-scale eddy
v = kinematic viscosity
(m2
(mol. m"2.
(m
(mol.
(mol.
(m2
(m2
(-) (m)
s1) s-1)
s1)
(-) m"3)
m"3)
(-)
(-) (-)
(-) (-)
(m)
s3)
(m)
s1)
28

Nitrification by immobilized cells
REFERENCES
1. Al-Rubeai M., Spier R. (1989) Quantitative cytochemical analysis of immobilized hybridoma cells.
Appl Microbiol Biotechnol 31: 430-433
2. Annachatre A.P., Khanna P. (1987) Unsteady-state biofilm kinetics. J Env Eng 113: 429-433
3. Ariga O., Takagi H., Nishizawa H., Sa no Y. (1987) Immobilization of microorganisms with PVA
hardened by iterative freezing and thawing. J Ferment Technol 65 (6): 651-658
4. Barnes D., Bliss P.J. (1983) Biological control of nitrogen in wastewater treatment. E. & F. Spon
Ltd., London, 146 p
5. Benefield L., Molz F. (1985) Mathematical simulation of a biofilm process. Biotechnol Bioeng 27:
921-931
6. Belser L.W. (1979) Population ecology of nitrifying bacteria. Ann Rev Microbiol 33: 309-333
7. Bird R.B., Stewart W.E., Lightfoot E.N. (1960) Transport phenomena. Wiley International edition,
New York, 780 p
8. Black G.M. (1986) Characteristics and performance of Immobilised cell reactors. In: Process
engineering aspects of immobilised cell systems, eds. C. Webb, G.M. Black, B. Atkinson. The
institution of chemical engineers, Warwickshire, 75-86
9. Boross L., Papp P., Szajâni B. (1990) Determination of the growth of gel-entrapped microbial
cells at various depths of the alginate. In: Physiology of Immobilized Cells, Proceedings of an
International Symposium held at Wageningen, The Netherlands, 10-13 December 1989, J.A.M. de
Bont, J. Visser, B. Mattiasson, J. Tramper, Elsevier Science Publishers B.V., Amsterdam, 201-204
10. Brian P.L.T., Hales H.B. (1969) Effects of transpiration and changing diameter on heat and mass
transfer to spheres. AlChE Journal 14: 419-425
11. Bryers J.D. (1988) Modeling biofilm accumulation. In: Physiological models in microbiology, vol.
2. Eds. M.J. Bazin, J.I. Prasser. CRC Press Inc., Florida, 109-144
12. Burrill H.N., Bell L.E., Greenfield P.F., Do D.D. (1983) Analysis of distributed growth of
Saccharomyces cerevisiae cells immobilized in Polyacrylamide gel. Appl Environm Microbiol 46:
716-721
13. Capdeville B., Nguyen K.M., Rols J.L. (1992) Biofilm modelling: structural, reactional and
diffusional aspects. In: Biofilms-Science and Technology. Eds. L.F. Melo, T.R. Bott, M. Fletcher,
B. Capdeville. Kluwer Academic Publishers, the Netherlands, 251-276
14. Characklis W.G., Turakhia M.H., Zelver N. (1989) Transport and interfacial transfer phenomena.
In: Biofilms. Eds. W.G. Characklis, K.C. Marshall. John Wiley, New York, pp 265-340
15. Chen G.H., Ozaki H., Terashima Y. (1989) Modelling of the removal of organic substances and
nitrogen in a biofilm. Wat Sei Tech 21: 791-804
16. Chesbro W. (1988) The domains of slow bacterial growth. Can J Microbiol 34: 427-435
17. Christensen F.R., Kristensen G.H., Jansen J.L.C. (1991) Biofilm structure - an important and
neglected parameter in waste water treatment. Wat Sei Tech 21: 805-814
18. Cronenberg C , Van Broen B., De Beer D., Van Den Heuvel H. (1991) Oxygen-dependent
29

Chapter 1
glucose microsensor based on glucose oxidase. Analytica Chimica Acta 242: 275-278
19. Dale M.C., Chen C , Okos M.R. (1990) Cell growth and death rates as factors in the long-term
performance, modeling, and design of immobilized cell reactors. Biotechnol Bioeng 36: 983-992
20. Dalili M.t Chau P.C. (1987) Intraparticle diffusional effects in immobilized cell particles. Appl
Microbiol Biotechnol 26: 500-506
21. De Beer D., Van Den Heuvel J.C. (1988) Gradients in immobilized biological systems. Analytica
Chimica Acta 213: 259-265
22. De Beer D., Van Den Heuvel J.C., Ottengraf S.P.P. (1993) Microelectrode measurements of the
activity distribution in nitrifying bacterial aggregates. Appl Environm Microbiol 59: 573-579
23. Deckwer W.D. (1980) Physical transport phenomena in bubble column bioreactors-ll. liquid-solid
mass transfer, heating and heat transfer. In: eds: M. Moo-Young, C.W. Robinson, C. Vezina,
Advances in Biotechnology. Proc. 6th Int. Ferment. Symposium London, Pergamon Press,
Toronto 1: 471-476
24. De Gooijer CD., Wijffels R.H., Tramper J. (1991) Growth and substrate consumption of
Nitrobacter agilis cells immobilized in carrageenan: part 2. dynamic modeling. Biotechnol Bioeng
38: 224-231
25. De Gooijer CD., Wijffels R.H., Tramper J. (1992) Dynamic modeling the growth of immobilized
nitrifying bacteria: biofilm development. In: Biofilms-Science and Technology. Eds. L.F. Melo, T.R.
Bott, M. Fletcher, B. Capdeville. Kluwer Academic Publishers, the Netherlands, 291-296
26. Denac M., Uzman S., Tanaka H., Dunn I.J. (1983) Modeling of experiments on biofilm
penetration effects in a fluidized bed nitrification reactor. Biotechnol Bioeng 25: 1841-1861
27. Dhulster P., Barbotin J.N., Thomas D. (1984) Culture and bioconversion use of
plasmid-harbouring strain of immobilized E. coli. Appl Microbiol Biotechnol 20: 87-93
28. Estapé D., Godia F., Sola C. (1992) Determination of glucose and ethanol effective diffusion
coefficients in Ca-alginate gel. Enzyme Microbiol Technol 14: 396-401
29. Focht D.D., Verstraete W. (1977) Biochemical ecology of nitrification and denitrification. In:
Advances in Microbial Ecology, ed. M. Alexander 1 Plenum Press, New York, p 135-214
30. Grady C.P.L., Lim H.C. (1980) Biological wastewater treatment; theory and applications. Marcel
Dekker Inc., New York, p 787-831
31. Grady C.P.L. (1983) Modeling of biological fixed films-a state of the art review. In: Fixed film
biological processes for wastewater treatment, eds. Y.C. Wu, D. Smith, Noyes Data Corporation,
Park Ridge, New Jersey, p 75-133
32. Harremoës P. (1978) Biofilm kinetics. In: Water pollution microbiology 2, ed. R. Mitchell. John
Wiley & Sons, New York, p 71-109
33. Harremoës P. (1982) Criteria for nitrification in fixed film reactors. Wat Sei Tech 14: 167-187
34. Heijnen J.J., Mulder A., Weltevrede R., Hols J., Van Leeuwen H.L.J.M. (1991) Large scale
anaerobic-aerobic treatment of complex industrial waste water using biofilm reactors. Wat Sei Tech
23: 1427-1436
35. Ho CS. , Ju L-K. (1988) Effect of microorganisms on oxygen diffusion coefficients and solubilities
30

Nitrification by immobilized cells
in fermentation media. Biotechnol Bioeng 32: 313-325
36. Hooijmans CM. , Geraats S.G.M., Potters J.J.M., Luyben K.Ch.A.M. (1990) Experimental
determination of mass transfer boundary layer around a spherical biocatalyst particle. Chem Eng
J 44: B41-B46
37. Hulst A.C., Tramper J., Van 't Riet K., Westerbeek J.M.M. (1985) A new technique for the
production of immobilized biocatalyst in large quantities. Biotechnol Bioeng 27: 870-876
38. Hunik J.H., Tramper J. (1993) Large-scale production of /c-carrageenan droplets for gel beads
production: theoretical and practical limitations of size and production rate. Biotechn Progr 9:186-
192
39. Hunik J.H., Van Den Hoogen M.P., De Boer W., Smit M., Tramper J. (1993) Quantitative
determination of the spatial distribution of Nitrosomonas europaea and Nitrobacter agilis cells
immobilized in k-carrageenan gel beads by a fluorescent-antibody labelling technique. Appl
Environm Microbiol 9: 1951-1954
40. Hunik J.H., Bos CG., Van Den Hoogen P., De Gooijer CD., Tramper J. (1994) Co-immobilized
Nitrosomonas europaea and Nitrobacter agilis cells: validation of a dynamic model for
simultaneous substrate conversion and growth in k-carrageenan gel beads. Accepted for
publication in Biotechnol Bioeng
41. Hunik J.H., Tramper J., Wijffels R.H. (1994) A strategy to scale-up nitrification processes with
immobilized nitrifying cells. Accepted for publication in Biotechnol Progr
42. Inloes D.S., Taylor D.P., Cohen S.N., Michaels A.S., Robertson CR. (1983) Ethanol production
by Saccharomyces cerevisiae immobilized in hollow-fibre membrane bioreactors. Appl Env
Microbiol 46: 264-278
43. Inloes D., Smith W., Taylor D., Cohen S., Michaels A.S., Robertson CR. (1983) Hollow-fibre
membrane reactors using immobilized £ coli for protein synthesis. Biotechnol Bioeng 25:
2653-2681
44. Jones W.L., Dockery J.D., Vogel CR., Sturman P.J. (1993) Diffusion and reaction within porous
packing media: a phenomenological model. Biotechnol Bioeng 41: 947-956
45. Karel S.F., Robertson CR. (1989) Autoradiographic determination of mass-transfer limitations in
immobilized cell reactors. Biotechnol Bioeng 34: 320-336
46. Kawase Y., Moo-Young M. (1990) Mathematical models for design of bioreactors: application of
Kolmogoroff's theory of isotropic turbulence. Chem Eng J 43: B19-B41
47. Kokufuta E., Matsumoto W., Nakamura I. (1982) Immobilization of Nitrosomonas europaea cells
with polyelectrolyte complex. Biotechnol Bioeng 24: 1591-1603
48. Kokufuta E., Yukishige M., Nakamura I. (1987) Coimmobilization of Nitrosomonas europaea and
Paracoccus denitrificans cells using polyelectrolyte complex stabilized calcium alginate gel. J
Ferment Technol 65: 659-664
49. Kokufuta E., Shimohashi M., Nakamura I. (1988) Simultaneously occurring nitrification and
denitrification under oxygen gradient by polyelectrolyte complex-coimmobilized Nitrosomonas
europaea and Paracoccus denitrificans cells. Biotechn Bioeng 31: 382-384
31

Chapter 1
50. Kuenen J.G., Robertson L.A. (1988) Ecology of nitrification and denitrification. Symp. Soc. Gen.
Microbiol., 42nd nitrogen sulphur cycles, 161-218
51. Kuhn R.H., Peretti S.W., Ollis D.F. (1991) Micro fluorimetric analysis of spatial and temporal
patterns of immobilized cell growth. Biotechnol Bioeng 38: 340-352
52. LaMotta E.J. (1976) Internal diffusion and reaction in biological films. Environm Sei Techn 10:
765-769
53. LaMotta E.J., Shieh W.K. (1979) Diffusion and reaction in biological nitrification. J Environm Eng
Div 105 (EE4): 655-671
54. Larreta Garde V., Thomasset B., Barbotin J.N. (1981) Electron microscopic evidence of an
immobilized living cell system. Enzyme Microb Technol 3: 216-218
55. Lefebvre J., Vincent J.C. (1992) Dynamic simulations of cell-bearing membranes: modelling and
optimization of bioreactors. European Symposium on Computer Aided Process Engineering 2,5-7
October 1992, Toulouse, France, Supplement to Computers and Chemical Engineering 17,
Pergamon Press, S221-S226
56. Lewandowski Z., Bakke R., Characklis W.G. (1987) Nitrification and autotrophic denitrification
in calcium alginate beads. Wat Sei Tech 19: 175-182
57. Lewandowski Z., Walser G., Characklis G. (1991) Reaction kinetics in biofilms. Biotechnol
Bioeng 38: 877-882
58. Libicki S.B., Salmon P.M., Robertson CR. (1988) The effective diffusive permeability of a non-
reacting solute in microbial cell aggregates. Biotechnol Bioeng 32: 68-85
59. Lim J.H.F., Davies G.A. (1990) A stochastic model to simulate the growth of anchorage
dependent cells on flat surfaces. Biotechnol Bioeng 36: 547-562
60. Livingston A.G., Chase H.A. (1990) Liquid-solid mass transfer in a three phase draft tube fluidized
bed reactor. Chem Eng Comm 92: 225-244
61. Macdonald R.M. (1986) Nitrification in soil: an introductory history. In: Nitrification, ed.: J.I.
Prasser, IRL Press, Oxford, Washington DC. pp 1-16
62. Marin-lniesta F., Nasri M., Dhulster P., Barbotin J.N., Thomas D. (1988) Influence of oxygen
supply on the stability of recombinant plasmid pTG201 in immobilized E. coli cells. Appl Microbiol
Biotechnol 28: 455-462
63. Masuda S., Watanabe Y., Ishiguro M. (1991 ) Biofilm properties and simultaneous nitrification and
denitrification in aerobic biological contactors. Wat Sei Tech 23: 1355-1363
64. Mattiasson B., Ramstorp M., Nilsson I., Hahn-Hagerdal B. (1981) Comparison of the
performance of a hollow fibre microbe reactor with a reactor containing alginate entrapped cells,
denitrification of water using Pseudomonas denitrificans. Biotechnol Letters 3: 561-566
65. McLaren A.D. (1971) Kinetics of nitrification in soil: growth of the nitrifiers. Soil Sei Soc Amer Proc
35: 91-95
66. Monbouquette H.G., Sayles G.D., Ollis D.F. (1990) Immobilized cell biocatalyst activation and
pseudo-steady-state behavior: model and experiment. Biotechnol Bioeng 35: 609-629
67. Morita R.Y. (1988) Bioavailability of energy and its relationship to growth and starvation survival
32

Nitrification by immobilized cells
in nature. Can J Microbiol 34: 436-441
68. Myoga H., Asano H., Nomura Y., Yoshida H. (1991) Effects of immobilization conditions on the
nitrification treatability of entrapped cell reactors using PVA freezing method. Wat Sei Tech 23:
1117-1124
69. Nakasaki K., Murai T., Akiyama T. (1989) Dynamic modeling of immobilized cell reactor:
application to ethanol fermentation. Biotechnol Bioeng 33: 1317-1323
70. Nilsson I., Ohlson S. (1982) Columnar denitrification of water by immobilized Pseudomonas
denitrificans cells. Eur J Appl Biotechnol 14: 86-90
71. Nilsson I., Ohlson S. (1982) Immobilized cells in microbial nitrate reduction. Appl Biochem
Biotechnol 7: 39-41
72. Nilsson I., Ohlson S., Haggstrom L, Molin N., Mosbach K. (1980) Denitrification of water using
immobilized Pseudomonas denitrificans cells. Eur J Appl Microbiol Biotechnol 10: 261-274
73. Osuga J., Mori A., Kato J. (1984) Acetic acid production by immobilized Acetobacter aceti cells
entrapped in a /c-carrageenan gel. J Ferment Technol 62: 139-149
74. Painter H.A. (1986) Nitrification in the treatment of sewage and waste-waters. In: Nitrification, ed.:
J.I. Prosser, Society for general microbiology 20, p 185-211
75. Painter H.A. (1977) Microbial transformations of inorganic nitrogen. Prog Wat Tech 8 (4/5): 3-29
76. Pirt S.J. (1987) The energetics of microbes at slow growth rates: maintenance energies and
dormant organisms. J Ferment Technol 65: 173-177
77. Poduska R.A., Andrews J.F. (1975) Dynamics of nitrification in the activated sludge process.
JWPCF 47: 2599-2619
78. Prosser J.I. (1986) Experimental and theoretical models of nitrification. In: Nitrification, ed. J.I.
Prosser. Society for general Microbiology 20, 63-78
79. Prosser J.I. (1989) Autotrophic nitrification in bacteria. Advances in Microbial Physiology 30:125-
181
80. Ranz W.E., Marshall W.R. (1952) Evaporation from drops, part II. Chem Eng Progr 48:173-180
81. Revsbech N.P., Ward D.M. (1980) Oxygen microelectrode that is insensitive to medium chemical
composition: use in an acid microbial mat dominated by Cyanidium caldarium. Appl Environm
Microbiol 45: 755-759
82. Rittmann B.E., McCarty L. (1981) Substrate flux into biofilms of any thickness. J Environm Eng
107 (EE4): 831-849
83. Rittmann B.E. (1989) Detachment from biofilms. In: W.G. Characklis, P.A. Wilderer. Structure and
function of biofilms, Dahlem Conference. John Wiley & Sons, 49-58
84. Rittmann B.E. (1987) Aerobic biological treatment. Env Sei Technol 21: 128-136
85. Rouxhet P.G., Mozes N. (1990) The micro-environment of immobilized cells: critical assessment
of the influence of surfaces and local concentrations. Physiology of Immobilized Cells,
Proceedings of an International Symposium held at Wageningen, The Netherlands, 10-13
December 1989, J.A.M, de Bont, J. Visser, B. Mattiasson, J. Tramper, Elsevier Science Publishers
B.V., Amsterdam, 343-354
33

Chapter 1
86. Salmon P.M. (1989) Mass transport phenomena in reactors containing entrapped enzymes or
bacterial cells. PhD thesis Stanford University, USA
87. Sakaki K., Nozawa T., Furusaki S. (1988) Effect of intraparticle diffusion in ethanol fermentation
by immobilized Zymomonas mobilis. Biotechnol Bioeng 31: 603-606
88. Sänger P., Deckwer W.D. (1981) Liquid-solid mass transfer in aerated suspensions. Chem Eng
J 22: 179-186
89. Santos V.A., Tramper J., Wijffels R.H. (1992) Integrated nitrification and denitr'rfication with
immobilized microorganisms. In: Biofilms-Science and Technology. Eds. L.F. Melo, T.R. Bott, M.
Fletcher, B. Capdeville. Kluwer Academic Publishers, the Netherlands, p 449-453
90. Santos V.A., Tramper J., Wijffels R.H. (1993) Simultaneous nitrification and denitrification using
immobilized microorganisms. Biomat Art Cells & Immob Biotech 21 (3): 317-322
91. Schmidt E.L. (1982) Nitrification in soil. In: Nitrogen in Agricultural Soils, ed. R.C. Dinauer, K.E.
Gates, M. Stelly, F.J. Stevanson, Ü.M. Bremner, R.D. Hauck, D.R. Keeney Agronomy 22, Madison,
Wisconsin USA, p 253-288
92. Shah Y.T., Kelkar B.G., Godbole S.P., Deckwer W.D. (1982) Design parameters estimations for
bubble column reactors. AlChE Journal 28: 353-379
93. Sharma B., Ahlert R.C. (1977) Nitrification and nitrogen removal. Water Research 11: 897-925
94. Shinnar R., Church J.M. (1960) Statistical theories of turbulence in predicting particle size in
agitated dispersions. Ind Eng Chem 52: 253-256
95. Smith M.R., De Haan A., De Bont J.A.M. (1993) The effect of calcium alginate entrapment on
the physiology of Mycobacterium sp. strain E3. Appl Microbiol Biotechnol 38: 642-648
96. Stenstrom M.K., Poduska R.A. (1980) The effect of dissolved oxygen concentration on
nitrification. Water Research 14: 643-649
97. Stenstrom M.K., Song S.S. (1991) Effects of oxygen transport limitation on nitrification in the
activated sludge process. JWPCF 63: 208-219
98. Stewart P.S., Robertson CR. (1989) Microbial growth in a fixed volume: studies with entrapped
Escherichia coli. Appl Microbiol Biotechnol 30: 34-40
99. Sun Y., Furusaki S., Yamauchi A., Ichimura K. (1989) Drffusivity of oxygen into carriers
entrapping whole cells. Biotechnol Bioeng 34: 55-58
100. Tada M., Kimata T., Mori N., Emori H. (1990) Nitrogen removal systems using immobilized
microorganisms in synthetic resin. Hitachi Review 39 (6): 379-386
101. Tanaka H., Uzman S., Dunn I.J. (1981) Kinetics of nitrification using a fluidized sand bed reactor
with attached growth. Biotechnol Bioeng 23: 1683-1702
102. Tanaka K., Tada M., Kimata T., Harada S., Fujii Y., Mizuguchi T., Mori N., Emori H. (1991)
Development of new nitrogen removal system using nitrifying bacteria immobilized in synthetic
resin pellets. Wat Sei Tech 23: 681-690
103. Taxis du Poet P., Dhulster P., Barbotin J.N., Thomas D. (1986) Plasmid stability and biomass
production: comparison between free and immobilized cell cultures of Escherichia coli
BZ18(pTG201) without selection pressure. J Bacteriol 165: 871-877
34
Nitrification by immobilized cells
104. Taxis du Poet P., Arcand Y, Bernier R., Barbotin J.N., Thomas D. (1987) Plasmid stability in
immobilized and free recombinant Escherichia coli JM105(pKK223-200): importance of oxygen
diffusion, growth rate, and plasmid copy number. Appl Environm Microbiol 53: 1548-1555
105. Toda K., Sato K. (1985) Simulation study on oxygen uptake rate of immobilized growing
microorganisms. J Ferment Technol 63: 251-258
106. Tramper J., De Man A.W.A. (1986) Characterization of Nitrobacter agilis immobilized in calcium
alginate. Enzyme Microb Technol 8: 472-476
107. Tramper J., Grootjen D.R.J. (1986) Operating performance of Nitrobacter agilis immobilized in
carrageenan. Enzyme Microb Technol 8 477-480
108. Tramper J. (1987) Nitrification and denitrification by immobilized viable cells. In: Enzyme
Engineering 8, ed. A.I. Laskin, L. Mosbach, D. Thomas, LB. Wingard Annuals of the New York
Academy of Sciences 501: 362-366
109. Trulear M.G., Characklis W.G. (1982) Dynamics of biofilm processes. JWPCF 54: 1288-1301
110. Van Den Heuvel J.C., De Beer D., Cronenberg C.C.H. (1992) Microelectrodes: a versatile tool
in biofilm research. In: Biofilms-Science and Technology. Eds. LF. Melo, T.R. Bott, M. Fletcher,
B. Capdeville. Kl uwer Academie Publishers, the Netherlands, p 631-644
111. Van Ginkel CG., Tramper J., Luyben K.Ch.A.M., Klapwijk A. (1983) Characterization of
Nitrosomonas europaea immobilized in calcium alginate. Enzyme Microb Technol 5: 297-303
112. Van Neerven A.R.W., Wijffels R.H., Zehnder A.J.B. (1990) Scanning electron microscopy of
immobilized bacteria in gel beads: a comparative study of fixation methods. J Microbiol Methods
11: 157-168
113. Venkatasubramanian K., Karkare S.B., Vieth W.R. (1983) Chemical engineering analysis of
immobilized-cell systems. Appl Biochem Bioeng 4: 311-349
114. Verlaan P. (1987) Modelling and characterization of an air-lift loop bioreactor. PhD. thesis.
Wageningen Agricultural University, The Netherlands
115. Walsh P.K., Brady J.M., Malone D.M. (1993) Determination of the radial distribution of
Saccharomyces cerevisiae immobilised in calcium alginate gel beads. Biotechnol Techn 7 (6):
435-440
116. Wanner O., Gujer W. (1984) Competition in biofilms. Wat Sei Tech 17: 27-44
117. Wanner O., Gujer W. (1986) A multispecies biofilm model. Biotechnol Bioeng 28: 314-328
118. Wagner K., Hempel D.C. (1988) Biodegradation by immobilized bacteria in an airlift-loop reactor:
influence of biofilm diffusion limitation. Biotechnol Bioeng 31: 559-566
119. Westrin B.A., Axelsson A. (1991) Diffusion in gels containing immobilized cells: a critical review.
Biotechnol Bioeng 38: 439-446
120. Wijffels R.H., Tramper J. (1989) Performance of growing Nitrosomonas europaea cells
immobilized in /c-carrageenan. Appl Microbiol Biotechnol 32: 108-112
121. Wijffels R.H., De Gooijer CD., Kortekaas S., Tramper J. (1991) Growth and substrate
consumption of Nitrobacter agilis cells immobilized in carrageenan: part 2. model evaluation.
Biotechnol Bioeng 38: 232-240
35

Chapter 1
122. Wijffels R.H., De Gooijer CD., Schepers A.W., Beuling E.E., Mallée L.R., Tramper J. (1994)
Growth of immobilized Nitrosomonas europaea: implementation of diffusion limitation over
microcolonies. Submitted
123. Wijffels R.H., Englund G., Hunik J.H., Leenen E.J.T.M., Bakketun Â., Günther A., Obón de
Castro Ü.M., Tamper J. (1994) Effects of diffusion limitation on immobilized nitrifying
microorganisms. Submitted
124. Wijffels R.H., Eekhof M.R., De Beer D., Van Den Heuvel J.C., Tramper J. (1994) Pseudo-
steady-state oxygen concentration profiles in an agar slab containing growing Nitrobacter agilis.
Submitted
125. Wijffels R.H., Schepers A.W., Smit M., De Gooijer CD., Tremper J. (1994) Effect of initial
biomass concentration on the growth of immobilized Nitrosomonas europaea. Submitted
126. Williamson K., McCarty P.L. (1976) A model of substrate utilization by bacterial films. JWPCF 48:
9-24
127. Williamson K., McCarty P.L. (1976) Verification studies of the biofilm model for bacterial substrate
utilization. JWPCF 48: 281-296
128. Woodward J. (1988) Methods of immobilization of microbial cells. J Microbiol Methods 8: 91-102
129. Worden R.M., Berry L.G. (1992) The one-dimensional biocatalyst, a research tool for in situ
analysis of immobilized-cell biocatalysts. Appl Biochem Biotechnol 34/35: 487-498
36

INTERMEZZO
INTERMEZZO
Nitrification is the conversion of ammonia to nitrate. It is an important step in the removal of nitrogen compounds in wastewater treatment. In this thesis, nitrification by immobilized bacteria is studied. The bacteria are immobilized in solid beads which can be retained easily in a bioreactor. The advantage of using immobilized bacteria instead of suspended bacteria which are usually used for the treatment of wastewater is that the capacity is at least 20 times higher than in traditional systems. As a result compact treatment systems can be constructed which will become important in future generation treatment systems. The process of nitrification with immobilized cells is modelled and the results are compared with actual measurements. In this way we obtained information about growth and substrate conversion by immobilized bacteria. This is not only valuable for the development of efficient nitrification reactors but for other reactors which contain immobilized bacteria as well. Nitrosomonas europaea and Nitrobacter agilis are the nitrifying bacteria that were used in this study. Nitrosomonas converts ammonia into nitrite and Nitrobacter converts nitrite into nitrate. On the right page a scanning electron microscopic picture is shown of Nitrosomonas europaea cells. The bar length is 1 ^m.
The nitrifying bacteria are immobilized in carrageenan. Carrageenan is a gel obtained from seewead and is soluble in the absence of potassium ions. By suspending bacteria in the carrageenan solution, and extruding them dropwise through a hollow needle, drops are formed. The drops gelate into solid beads with a diameter of about 2 mm when collected in a solution containing potassium. On the right page such a solid bead is shown.

This chapter has been published in Applied Microbiology and Biotechnology 32 (1989) 108-112 by the authors R.H. Wijffels and J. Tramper
CHAPTER 2
PERFORMANCE OF GROWING NITROSOMONAS EUROPAEA CELLS IMMOBILIZED IN
CARRAGEENAN
ABSTRACT
Nitrosomonas europaea cells were immobilized in «-carrageenan. The performance of the immobilized cells was investigated in an air-lift loop reactor under wash-out conditions with respect to freely suspended cells. When fed with solutions of ammonia up to 16 mM, high substrate conversions were accomplished. Sudden increases in ammonium-ion concentration hardly influenced the conversion. Observations made by scanning electron microscopy showed that the immobilized cells were initially growing homogeneously across the beads, but as growth proceeded, a biomass density gradient developed, eventually resulting in a kind of biofilm.
41

Chapter 2
INTRODUCTION
Removal of nitrogen compounds from waste waters is essential and often accomplished by biological processes.10 The oxidation of ammonium to nitrite and nitrate ions, i.e. the nitrification step, in these biological processes is especially problematic because of the slow growth rate of the pertinent bacteria, which rapidly results in their wash-out from the treatment plant.
In earlier studies we have shown that the nitrifying cells can be retained in bioreactors by immobilization of these bacteria in a gel with maintenance of their nitrifying capacities.12'13,14'15'16,17 It has been demonstrated that in the case of immobilized Nitrosomonas europaea cells diffusion limitation increased as the amount of immobilized cells increased.17 It has also been demonstrated, for instance with Nitrobacter agilis™, that immobilized cells can grow in principle. Under substrate-limiting conditions, the growth rate of the cells is higher when the substrate concentration is higher. Therefore, if diffusion limitation is involved, i.e. a significant substrate-concentration gradient exists, cells in the outer layers of the beads will grow faster and thus the substrate-concentration gradient becomes steeper and steeper, resulting in a biomass gradient. Eventually, according to this theory, this should result in a very dense biofilm in the outer layers of the beads. For mathematical modelling it is important to know whether the cells are homogeneously distributed or whether a biofilm can be assumed to exist.
The phenomenon of heterogeneous growth of immobilized cells has already been shown by several authors, for example with cells of Pseudomonas putida and Aspergillus niger,7 Streptomyces aureofacfensfSaccharomyces carlsbergensis™ and Saccharomyces cerevisiae,1*7 all immobilized in alginate or carrageenan. So far, in immobilized biocatalyst models a homogeneous distribution of the cells across the bead or the outer shell was assumed.3,4,5,6,8,11
In this paper the situation for Nitrosomonas europaea cells immobilized in carrageenan beads is qualitatively described and presently used as the foundation for a model in which growth and substrate flux are quantified.
42

Growth of Nitrosomonas in carrageenan
MATERIALS AND METHODS
Cultivation of the free and immobilized cells and the immobilization procedure
were executed under aseptic conditions.
Organism and culture conditions
Cultivation of the Nitrosomonas europaea cells (ATCC 19718) was done in a chemostat culture, supplied (dilution rate (D) = 0.025 h"1) with a medium containing per dm3 of demineralized water: 25 mmol NH4CI; 2 mmol NaCI; 1 mmol MgS04; 1 mmol KCl; 1 mmol CaCI2; 2.5 mmol NaH2P04; 2.5 mmol Na,HPO„ and a general micro-nutrient solution. The fermenter (2 dm3) was operated at 30 °C, aerated, and the pH controlled at 7.5 with a 1 M NaHC03 solution.
Immobilization procedure
When cells were needed for immobilization, the overflow of the chemostat was collected in an ice-cooled vessel (to conserve activity) for 2 or 3 days (to have a sufficient amount of cells). The cell suspension was harvested by centrifugation in a Son/all RC2-B centrifuge (Wilmington, Del, USA) for 15 minutes, 16,300 g and 5 °C. The cells were washed with demineralized water.
A /c-carrageenan solution (Genugel X0828, A/S Kobenhavns Pektinfabrik, DK Lille Skensved) of about 4 % in demineralized water was sterilized during 20 minutes, 110 °C, 2 atm., and cooled to 35 °C. By adding the bacterial suspension the percentage of carrageenan was brought to 2.6 %. This mixture was extruded drop wise through a thin hollow needle into a 0.75 M KCl solution. The size of the drops was controlled by a water-saturated longitudinal air flow at an average diameter of 3.1 mm. The beads were kept in the KCI-solution during 2 hours. The immobilization set-up was temperature controlled at 30 °C.
43

Chapter 2
Immobilized cell cultivation
The immobilized cells were cultivated in an air-lift loop reactor of 1.3 dm3 with an external loop (Fig. 1). The medium used for these experiments contained per dm3 of sterilized water: a variable concentration of NH4CI; 1 mmol NaCI; 1 mmol MgSCy, 5.4 mmol KCl; 1 mmol CaCI2; 5 mmol Ne^HPOJ NaH2P04; 2.5 mmol H2S04; 5 mmol NaHC03 and 1 cm3 of the micro-nutrient solution.
The volume fraction of immobilized particles in the reactor varied between 6 and 10 % (v/v) in the various experiments.
A D of 0.13-0.15 h1 was applied, i.e. wash-out conditions for the free cells.
The air-lift loop reactor was operated at 30 °C and the pH was controlled at 7.4 with a 0.1 M KHC03 solution.
Fig. 1: Lab-scale air-lift loop reactor.
44

Growth of Nitrosomonas in carrageenan
Analytical methods
Ammonia and nitrite were determined colorimetrically with Neissler reagent (Dutch
Standard Methods: NEN 3235 6.1.11) and Griess Romijn and van Eck reagent (Dutch
Standard Methods: NEN 3235 6.3.), respectively.
Electron microscopic observation
For observation of the beads by scanning electron microscopy (SEM) a comparative study of different techniques was made.18 The most suitable technique proved to be fixation with 2 % glutaraldehyde in a buffer solution followed by a 1 % osmiumtetroxide solution in the same buffer. The buffer contained 0.025 M Na-cacodylate (pH 6.8) and 0.1 M KCl. The samples were dehydrated stepwise using ethanol. In the first steps KCl was added to preserve the rigidity of the gel. The beads were broken after freezing them above liquid nitrogen and critical point dried in a Balzers CPD 10. After coating with gold in a vacuum evaporator Balzers SCD 028 (127 V, 30 mA, 0.1 bar), the samples were observed in a Jeol JSM 35 C scanning microscope (15 kV).
RESULTS AND DISCUSSION
In 3 separate experiments and at various ammonia concentrations the conversion (based on influent and effluent ammonia concentrations) was determined and observations with SEM were made in the steady states. The experiments were terminated as soon as technical problems prevented further reliable measurements.
Daily results of experiments 2 and 3 are given in Fig. 2 and 3. The experiments were performed under sterile conditions to prevent infections with Nitrobacter cells. The results show that the only formed product was nitrite so Nitrobacter cells were excluded. The nitrite concentration of the effluent sometimes is higher than the ammonia concentration of the influent but always within the accuracy of the assay.
After start up of the first run the ammonium-ion conversion increased to 89 % on the tenth day. In this experiment the conversion in only one steady state was determined. In the second experiment, the ammonium-ion conversion quickly
45

Chapter 2
concentration (mM) conversion (%)
time (days)
Fig. 2: Influent and effluent ammonia (a, m respectively) and effluent nitrite ( • ) concentrations and
conversion (O) in a growth experiment with 8.85 % gel; dilution rate (D) = 0.14 h"1.
concentration (mM) conversion (%)
100
20 time (days)
Fig. 3: Influent and effluent ammonia (o, • respectively) and effluent nitrite ( • ) concentrations and
conversion (O) in a growth experiment with 9.08 % gel; dilution rate (D) = 0.15 h' .
46
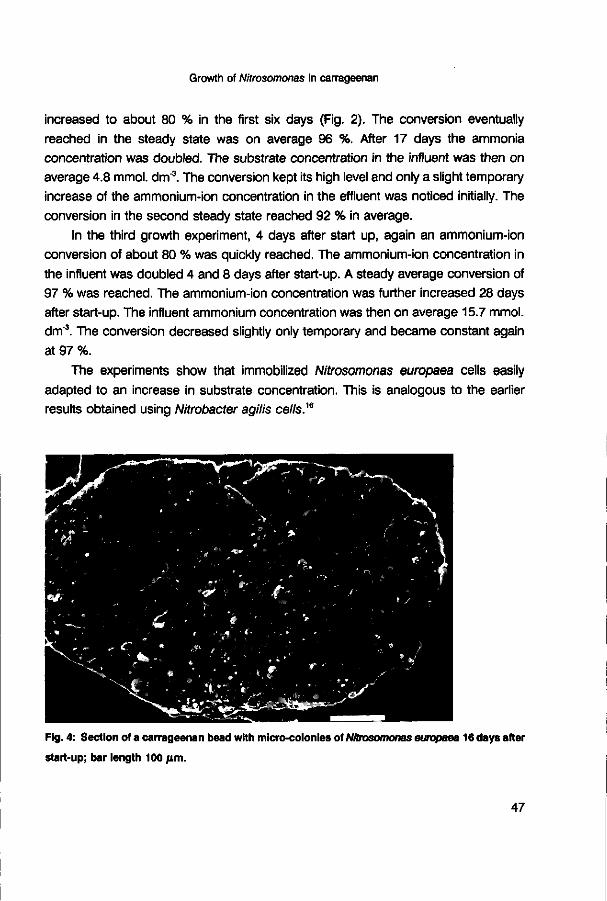
Growth of Nitrosomonas in carrageenan
increased to about 80 % in the first six days (Fig. 2). The conversion eventually reached in the steady state was on average 96 %. After 17 days the ammonia concentration was doubled. The substrate concentration in the influent was then on average 4.8 mmol, dm3. The conversion kept its high level and only a slight temporary increase of the ammonium-ion concentration in the effluent was noticed initially. The conversion in the second steady state reached 92 % in average.
In the third growth experiment, 4 days after start up, again an ammonium-ion conversion of about 80 % was quickly reached. The ammonium-ion concentration in the influent was doubled 4 and 8 days after start-up. A steady average conversion of 97 % was reached. The ammonium-ion concentration was further increased 28 days after start-up. The influent ammonium concentration was then on average 15.7 mmol. dm"3. The conversion decreased slightly only temporary and became constant again at 97 %.
The experiments show that immobilized Nitrosomonas europaea cells easily adapted to an increase in substrate concentration. This is analogous to the earlier results obtained using Nitrobacter agilis cells.™
Fig. 4: Section of a carrageenan bead with micro-colonies of Nitrosomonas europaea 16 days after
start-up; bar length 100 pm.
47

Chapter 2
In the second experiment, two samples were taken for observation by SEM, one at start-up and one on day 16 after the first steady state had been reached. The fresh immobilized cells appeared to be well distributed over the beads, all as single cells. After 16 days growth clearly had occurred (Fig. 4). The originally single cells had grown into micro-colonies that were homogeneously distributed over the gel bead. The biomass concentration was up to that time still relatively low, and thus the activity of the bead as a whole. Therefore, relatively little transport of substrate took place across the bead, needing only a small concentration gradient. This resulted in little radial differences in specific growth rate, explaining the still rather homogeneous distribution after 16 days.
In the third experiment samples were also taken for observation by SEM, in this case on days 6, 28 and 32. After 6 days the micro-colonies were not yet clearly visible. They were small and homogeneously distributed throughout the support. At day 28, after feeding with an ammonium-ion concentration of about 8 mmol, dm"3 for a prolonged period, a different distribution appeared. Fig. 5 shows that the cells were more concentrated at the periphery of the beads and that the micro-colonies in the
Fig. 5: Section of carrageenan bead with micro-colonies of Nitmsomonas europaea 28 days after
start-up; bar length 100 /xm.
48

Growth of Nitrosomonas in carrageenan
centre of the beads were small. That the micro-colonies are projected out of the surface was an artefact, because during preparation for SEM the carrageenan material shrank about 50 % more than the bacteria.18 In the third steady state (after 32 days) the same observations were made. Figure 5 shows that a gradient in biomass density had indeed developed. Due to a heterogeneous specific growth rate, varying radially, the gradient in biomass density, apparently became steeper and steeper. Two periods in immobilized cell growth could thus be observed. In the first homogeneous growth was observed because there were no diffusional restrictions. In the second period there were diffusional restrictions which resulted in heterogeneous growth.
The situation as given in the Fig. 2 and 3 only apparently is reaching so quickly a steady state. It appeared to be a steady state situation because the substrate concentration in the reactor was constant, but in reality the biomass gradient was slowly developing, due to net growth in the outer layers and net starvation in the core. In this pseudo-steady state it is not possible that the very rapid adaptation to a doubling in substrate concentration in the influent was caused by a doubling of cell mass, because the maximum specific growth rate of Nitrosomonas europaea is very low ( / ^ = 0.05 h1) and the substrate concentration in the reactor is far below the half saturation constant (K, = 0.7 mmol, dm"3).10
In the present experiments ammonia was clearly the rate-limiting substrate. It has to be, otherwise an increase of the ammonia concentration in the influent never could lead to such a rapid adaptation. Calculation of the Thiele moduli for ammonia and oxygen indicate that both substrates could give rise to some limitation. Normally oxygen is the only limiting substrate in aerobically grown cells, but in this case its Ks
value (0.02 mmol, dm'3) was much lower than the concentration in the reactor (0.10 mmol. dm3). The ammonia concentration in the reactor, on the other hand, was lower than the Ks value for Nitrosomonas europaea. As a consequence, an increase in feeding is merely adapted by an increase in specific growth rate, and thus substrate consumption rate, rather than by an increase in immobilized biomass concentration. As can be seen in Fig. 2 and 3 the level of the ammonia concentration in the effluent became higher (though still low) when the influent substrate concentration was increased. When the substrate concentration in the reactor is much higher than the Ks value, the specific growth rate would be equal to the maximum specific growth rate and an increase in substrate concentration of the influent could only lead to an adaptation of the system by growth of the immobilized biomass as we have seen with
49

Chapter 2
immobilized denitrifying cells.20 However, in the first order regime of the Monod curve the adaptation is possible by an increase in the specific growth rate and is for that reason fast. Eventually this must lead to an increase in the immobilized biomass concentration and to the heterogeneous distribution as observed.
We are presently studying the various phenomena in more detail and quantitatively in order to derive to a mathematical model, enabling prediction of transient phenomena, steady states and maximum capacities.
REFERENCES
1. Beronio P.B., Jansen N.B., Tsao G.T., Bracker C.B. (1986) Analysis of the distribution of
Saccharomyces cerevislae immobilized in K-carrageenan. American Chemical Society Meeting
7-12 Sept 1986, Anaheim, California, paper MBTD44
2. Chang H.N., Moo-Young M. (1988) Analysis of oxygen transport in immobilized whole cells.
In: Moo-Young M. (ed) Bioreactor immobilized enzymes and cells fundamentals and
applications. Elsevier, London, pp 33-51
3. Chang H.N., Moo-Young M. (1988) Estimation of oxygen penetration depth in immobilized
cells. Appl Microbiol Biotechnol 19: 107-112
4. Chibata I., Tosa T., Fujimura F. (1983) Immobilized living microbial cells. In: Tsao G.T. (ed)
Annual Reports on Fermentation Processes, vol. 6. Academic Press, London, pp 1-22
5. Dalili M., Chau P.C. (1987) Intraparticle diffusional effects in immobilized cell particles. Appl
Microbiol Biotechnol 26: 500-506
6. De Gooijer CD., Hens H.J.H., Tramper J. (1989) Optimum design for a series of continuous
stirred tank reactors containing immobilized biocatalyst beads obeying intrinsic Michaelis-Menten
kinetics. Bioprocess Eng 4: 153-158
7. Gosmann B., Rehm H.J. (1986) Oxygen uptake of microorganisms entrapped in Ca-alginate.
Appl Microbiol Biotechnol 23: 163-167
8. Khang Y.H., Shankar H., Senatore F. (1988) Modeling the effect of oxygen mass transfer on
ß-lactam antibiotic production by immobilized Cephalosporium acremonium. Biotechnol Lett 10:
861-866
9. Mahmoud W., Rehm H.J. (1986) Morphological examination of immobilized Streptomyces
aurofaciens during Chlortetracycline fermentation. Appl Microbiol Biotechnol 23: 305-310
10. Painter H.A. (1977) Microbial transformations of inorganic nitrogen. Prog Water Technol 8:3-29
11. Radovich J.M. (1985) Mass transfer effects in fermentations using immobilized whole cells.
Enzyme Microb Technol 7: 2-10
12. Tramper J. (1985) Nitrification and denitrification by immobilized bacteria. Third European
Congress on Biotechnology, vol. 4.10-14 September 1984, Dechema, VCH, Weinheim, pp 363-
50

Growth of Nitrosomonas in carrageenan
368
13. Tramper J. (1987) Nitrification and denitrification by immobilized viable cells. In: Laskin A.I.,
Mosbach K., Thomas D., Wingard L.B. (eds) Enzyme Engineering, vol. 8. Ann. N. Y. Acad. Sei.,
New York, pp 362
14. Tramper J., Suwinska-Borowiec G., Klapwijk A. (1985) Characterization of nitrifying bacteria
immobilized in calcium alginate. Enzyme Microb Technol 7:155-160
15. Tramper J., De Man A.W.A. (1986) Characterization of Nitrobacter agilis immobilized in calcium
alginate. Enzyme Microb Techn 8: 472-476
16. Tramper J., Grootjen D.R.J. (1986) Operating performance of Nitrobacter agilis immobilized
in carrageenan. Enzyme Microb Techn 8: 477-480
17. Van Ginkel CG., Tramper J., Luyben K.Ch.A.M., Klapwijk A. (1983) Characterization of
Nitrosomonas europaea immobilized in calcium alginate. Enzyme Microb Technol 5: 297-303
18. Van Neerven A.R.W., Wijffels R.H., Zehnder A.J.B. (1990) Scanning electron microscopy of
immobilized bacteria in gel beads: a comparative study of fixation methods. J Microbiol Meth
11: 157-168
19. Wada M., Kato J., Chibata I. (1980) Continuous production of ethanol using immobilized
growing yeast cells. Eur J Appl Microbiol Biotechn 10: 275-287
20. Wijffels R.H., Schukking G., Tramper J. (1989) Characterization of a denitrifying bacterium
immobilized in «-carrageenan. Appl Microbiol Biotechnol 34: 399-403
51
INTERMEZZO
Dropwise immobilization is a time-consuming technique. The capacity that can be reached with one needle is about 100 ml per hour. For large-scale experiments and for eventual practical significance this is not sufficient. To speed up the production the resonance nozzle technique has been developed. A jet of gel is formed and subjected to a vibration. The vibration breaks up the jet into small droplets. This method allows 200-700 beads to be formed per second, which means a capacity per jet of 10 liters per hour.

This chapter has been published in Biotechnology and Bioengineering 38 (1991 ) 224-231 by the authors CD. de Gooijer, R.H. Wijffels and J. Tramper
CHAPTER 3
GROWTH AND SUBSTRATE CONSUMPTION OF NITROBACTER AGILIS CELLS IMMOBILIZED IN
CARRAGEENAN: PART 1. DYNAMIC MODELLING
ABSTRACT
The modelling of the growth of Nitrobacter agilis cells immobilized in «-carrageenan is presented. A detailed description is given of the modelling of internal diffusion and growth of cells in the support matrix in addition to external mass transfer resistance. The model predicts the substrate and biomass profiles in the support as well as the macroscopic-oxygen consumption rate of the immobilized biocatalyst in time. The model is tested by experiments with continuously operated air-lift loop reactors, containing cells immobilized in «-carrageenan. The model describes experimental data very well. It is clearly shown that external mass transfer may not be neglected. Furthermore, a sensitivity analysis of the parameters at their values during the experiments revealed that apart from the radius of the spheres and the substrate bulk concentration, the external mass transfer resistance coefficient is the most sensitive parameter for our case.
55
Chapter 3
INTRODUCTION
The application of immobilized, growing cell systems has become of increasing interest in the past few years. Examples of applications are immobilized yeast cells for ethanol production,10,24,33 and producing acrylamide from acrylonitril with Corynebacterium8. Traditionally, biofilms are used in wastewater treatment,3,28,36,38 and in this field the use of entrapped nitrifying bacteria is gaining importance.42
Many researchers have reported the phenomenon of growth of cells near the surface of immobilized particles, whereas in the centre of these particles no growth, or even decay of cells occurred.16,18,30,40,42 As a result of this non-homogeneous growth, the characteristics of the solid phase will alter, thereby affecting, among other things, the effective diffusion coefficient.5,11,14,19,32
The main feature of immobilized growing systems is the high attainable concentration of active biocatalyst in the solid phase, which, combined with a high reactor load, can lead to small reactor volumes compared to cell suspensions. A major drawback of these systems can be considered to be the rather troublesome mathematics involved with the simultaneous diffusion of substrate and/or product(s) and the growth of the immobilized cells. Steady-state models for growing cells1,19,38 can be quite satisfactory for design purposes but may fail to describe the start-up phase and the response to changing conditions in the reactor system. In recent work, Nakasaki et al.2t and Sayles and Ollis31 presented a dynamic model describing the transient growth of immobilized cells. However, in both studies external mass transfer resistance was neglected, whereas Nakasaki ef ai also did not consider a biomass-dependent effective diffusion coefficient. Only recently, Monbouquetteefa/.21 presented a model that included both external mass transfer and a biomass-dependent diffusion coefficient.
In this article we describe the modelling of the growth of immobilized cells, accounting for external mass transfer resistance and simultaneous diffusion and consumption of substrate for respiration and growth, using a biomass concentration-dependent diffusion coefficient. The growth model used allows a negative net growth, and the biomass concentration is limited to a maximum value. The model has been tested by experiments in continuously operated air-lift loop reactors with Nitrobacter agilis cells immobilized in «-carrageenan.
56

Modelling immobilized growing cells
Cell
Fig. 1: Oxygen transfer in an air-lift loop reactor with immobilized cells.
THEORY
General consideration
In many aerobic systems oxygen is the limiting substrate, due to the rather low solubility. For our case, oxygen transfer can be divided into four different regions, as illustrated in Fig. 1. Oxygen has to be transferred (1) from the (ideally mixed, with a negligible stagnant gas layer) gas phase through a stagnant liquid layer to the (ideally mixed) bulk phase, (2) from the bulk phase through a stagnant layer adjacent to the solid phase, (3), in the solid phase to the cells, and (4) into the cells to the enzyme complex. In order to define the rate-limiting steps, we calculated the characteristic times for each step, as presented in Table I. Also, the possibility of exhaustion of oxygen from the gas bubble has to be considered. As for our case, the residence time of the air bubbles (1.2 s) is much lower than the characteristic time for exhaustion (33 s; Appendix) oxygen depletion is quite unlikely. With scale-up, however, the air bubble exhaustion might become considerable.25
57
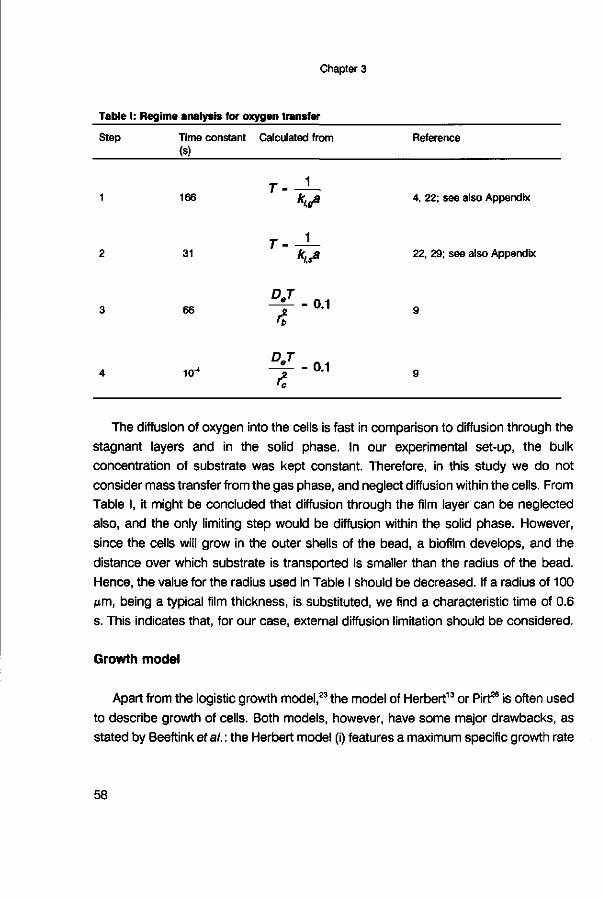
Chapter 3
Table I: Regime analysis for oxygen transfer
Step Time constant Calculated from Reference (s)
166 k,JBL 4, 22; see also Appendix
66
10-
T-
T-
DJ
1
V 1
- 01
31 k, .a 22, 29; see also Appendix
A
^T-o,
The diffusion of oxygen into the cells is fast in comparison to diffusion through the stagnant layers and in the solid phase. In our experimental set-up, the bulk concentration of substrate was kept constant. Therefore, in this study we do not consider mass transfer from the gas phase, and neglect diffusion within the cells. From Table I, it might be concluded that diffusion through the film layer can be neglected also, and the only limiting step would be diffusion within the solid phase. However, since the cells will grow in the outer shells of the bead, a biofilm develops, and the distance over which substrate is transported is smaller than the radius of the bead. Hence, the value for the radius used in Table I should be decreased. If a radius of 100 ßm, being a typical film thickness, is substituted, we find a characteristic time of 0.6 s. This indicates that, for our case, external diffusion limitation should be considered.
Growth model
Apart from the logistic growth model,23 the model of Herbert13 or Pirt26 is often used to describe growth of cells. Both models, however, have some major drawbacks, as stated by Beeftink etal.: the Herbert model (i) features a maximum specific growth rate
58

Modelling immobilized growing cells
that cannot be measured directly and (ii) directs that cells cover their maintenance requirements from biomass, even in the presence of excess substrate, whereas the Pirt model shows (i) a growth rate that is always positive or zero, and (ii) a non-zero substrate consumption even if no substrate is available.
In the case of growing immobilized cells, substrate depletion near the centre of the biocatalyst bead may occur, whereas a high substrate concentration will be available near the surface. Hence, a growth model is needed that is capable of describing both situations, allowing a negative net growth at low substrate concentrations and an observable maximum growth rate at high substrate concentrations. As Pirt's extended model27 would introduce an extra variable, we use the growth model suggested by Beeftink ef ai2:
y _ X + mxl—^— 1 (1) Vxs \ K.
rx-»X-mYxsX\ 1 - - j ^ j I (2)
This is a combination of the models of Pirt and Herbert. At low substrate concentrations, this model will perform as the Herbert model, while at high substrate concentrations it acts as the Pirt model.
The model is based on the consumption of one limiting substrate only. For our case, nitrification, both nitrite and oxygen are substrates. Andrews1 showed that the component with the lowest product of diffusion coefficient, yield factor and concentration in the liquid phase is rate limiting. For our case, oxygen is always rate limiting.43
Diffusion coefficient
As stated before, many researchers proved that the effective diffusion coefficient is affected by the concentration of biomass in the support material. The theoretically most correct way of describing this phenomenon by considering the tortuosity and the porosity of the gel matrix will introduce two, hardly determinable, variables. Therefore,
59
Chapter 3
more convenient relations were proposed by Scott et al. and Wakao and Smith41. These relations use the specific cell volume. Recent work of Stewart, Karei and Robertson suggests that cells can grow under considerable pressure, thereby decreasing their specific cell volume.16,37 As in the support matrix the available space for growth will be limited, the specific cell volume may be altered, and therefore its accurate determination is troublesome.
The determination of the effective diffusion coefficient at high biomass concentrations is also difficult: a homogeneous high biomass concentration can hardly be reached, and for a correct determination the cells must be intact, and therefore a non-consumable compound with the same physical properties as the substrate must be found, which is difficult. Alternatively, using oxygen as diffusing compound, the respiration of the cells must be stopped, and then the properties of the cells, and with that the effective diffusion coefficient, may be altered. Even if a suitable compound can be found, the relative error in the determination of the diffusion coefficient in biocatalyst beads is considerable.15
In order to account for the dependency of the effective diffusion coefficient on the biomass concentration, we have implemented a relationship that generates an effective diffusion coefficient that varies linearly with the biomass concentration between the diffusion coefficient in the gel and zero. The effective diffusion coefficient will become zero when all available space in the gel matrix is occupied by biomass, and if no biomass is present, the effective diffusion coefficient becomes equal to the diffusion coefficient in the gel. Mathematically this leads to:
D-D 1 -Y
p.max
(3)
Calculations
In order to facilitate a numerical solution, we treat the biomass growth and
substrate consumption process separately. This is a valid approach as long as the
time scale for growth is larger then the time scale for consumption.12,16 For our case,
the characteristic time for growth is 105 s (calculated from 1 / M J , and for substrate
60

Modelling immobilized growing cells
consumption 66 s (from Table I; characteristic time for diffusion). Hence, if i) time is discretisized, ii) a pseudo-steady-state substrate distribution inside the support matrix is assumed within one time step, and iii) the effective diffusion coefficient is assumed to be constant within one time step and within one step in the integrating algorithm, a differential mass balance over a biocatalyst bead in which simultaneous diffusion and consumption of substrate takes place combined with Equation (1) leads to
(4) d*S dr2
-$-X(t) + mX(t)\
D,
S
Ks+S) 2 dS r dr
Boundary conditions for Equation (4) are:
S- Ss at r- rb
-==• - 0 at r - 0 or r - r, dr
We have solved Equation (4) numerically using a second-order Runge-Kutta algorithm with Newton's method to satisfy the boundary conditions. Starting with a small value for r, and S, this results in a substrate concentration profile in the bead and a computed substrate concentration Ss and a dS/dr at r = rb.
In order to account for external mass transfer resistance, the latter can (optionally) be used for calculating a S's by means of the equation representing the film theory:
- / o D0 dS 5 "'%-*
(5)
While varying either r, or S„ Equations (4) and (5) are solved iteratively until the Ss and S's match, after which the new biomass distribution is calculated according to Equation (2). The calculation scheme, including the procedure used if the substrate concentration becomes essentially zero before the centre of the support matrix is reached, as presented earlier7 is illustrated in Fig. 2.
61

Chapter 3
Calculate Substrate profile (Eq. 1, 4, 5)
S
Ù r rf » fixed
S<» fixed
S(8>S« / \ , Ss <Ss
S
rf = fixed Sf * variable
- Itérât«
S
rf • variable S f= fixed
— Iterate
Calculate Blomass profile (Eq. 2, 6) Increase time
Fig. 2: Calculation of substrate and biomass concentration profiles in a biocatalyst bead.
The software program incorporating the model presented here is written in Pascal
on an HP vectra QS with 80387 mathematical coprocessor. An average run from time
0 to 1000 h requires about 4 minutes CPU time, which is more than thousand times
faster than the program presented by Monbouquette et a/.21 This is probably caused
by our much larger time steps, and the fact that we do not calculate biomass fluxes.
Maximum biomass concentration
A straightforward application of Equation (1) would lead to infinitively high biomass concentrations near the surface of the bead. As this is impossible, a restriction is added to this equation:
* * \ » x (6)
where X,^ is the observable maximum biomass concentration inside the support
62
Modelling immobilized growing cells
matrix (which is not the same as Xp mJ. This is, in a different notation, the same restriction as used by Toda and Sato40 and the same as used by Sayles and Ollis31
and Monbouquette ef a/.21 Nakasaki ef a/.24 did not explicitly consider this in their mathematical description, but mention the use of Xmax in their text. As the substrate consumption does not decrease when X has reached the value of X^ according to Equation (1), the substrate uptake by the cells may be used for a waste metabolism as suggested by McLaren17 or the cells may continue to grow and leak out of the support matrix as described by Sayles and Ollis,31 Monbouquette ef a/.,21
Monbouquette and Ollis,20 and Cheng and Huang.5 In the latter case, Shiraishi ef a/.36
stated that the substrate consumption of free cells may be neglected if the dilution rate in the reactor is much larger than the dilution rate at washout conditions, as in our case. This has been experimentally confirmed.43
RESULTS AND DISCUSSION
General Model
A typical result of the model is shown in Fig. 3. In the transient growth of immobilized cells, 4 phases can be recognized. In phase 1, there is hardly any diffusion limitation, and homogeneous growth occurs. Phase 2 shows inhomogeneous growth, as in the centre of the sphere substrate depletion aggravates. In phase 3, the substrate hardly reaches the core of the sphere, so biomass decays, whereas at the outer shell the biomass concentration reaches its maximum. In phase 4 this process of growth and decay continues and a distinct biomass film develops, whereas the substrate concentration in the centre of the sphere increases. At the end time of the simulation a distinct biomass film near the surface of the bead has developed, whereas the substrate concentration inside the bead corresponds to maintenance level of zero net growth, which is the same result as reported by Sayles and Ollis.31 By substituting r(x) = 0 in Equation (2), this value can be calculated from:
S - mYJ(' (7)
63
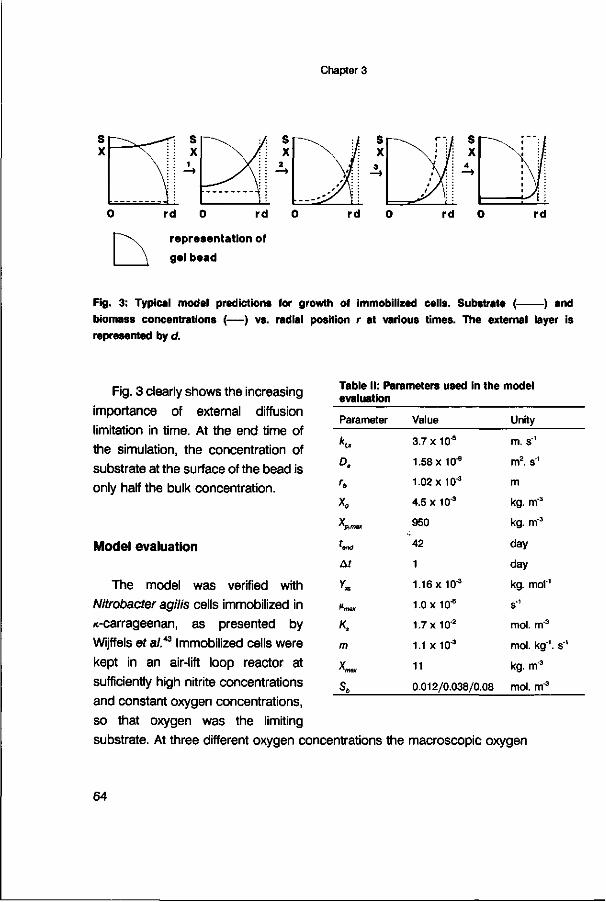
Chapter 3
representation of
gel bead
Fig. 3: Typical model predictions for growth of immobilized cells. Substrate ( ) and
biomass concentrations ( — ) vs. radial position r at various times. The external layer is
represented by d.
Fig. 3 clearly shows the increasing importance of external diffusion limitation in time. At the end time of the simulation, the concentration of substrate at the surface of the bead is only half the bulk concentration.
Model evaluation
The model was verified with Nitrobacter agilis cells immobilized in /c-carrageenan, as presented by Wijffels er al.*3 Immobilized cells were kept in an air-lift loop reactor at sufficiently high nitrite concentrations and constant oxygen concentrations, so that oxygen was the limiting substrate. At three different oxygen concentrations the macroscopic oxygen
Table II: Parameters used in the model evaluation
Parameter
*u
D.
rb
*o
Y p,max
'end
At
Ym
^tnax
Ks
m
Xmax
sb
Value
3.7 x10'5
1.58 x10'9
1.02 x If/3
4.5 x 10 3
950
42
1
1.16 X10"3
1.0 x10"5
1.7 x 10"2
1.1 x 10"3
11
0.012/0.038/0.08
Unity
m. s '
m2, s '
m
kg. m"3
kg. m'3
day
day
kg. mol"1
s1
mol. m"3
mol. kg"1, s"1
kg. m3
mol. m'3
64

Modelling Immobilized growing cells
macroscopic oxygen-consumption
rate (mol. nrr3.s"1)
0.006
0.004
0.002
20 30 40 50 time (days)
Fig. 4: Experimental evaluation of the model." Macroscopic consumption rates at three different
oxygen concentrations vs. time. Lines are model predictions, markers are experimental data.
Experiments were performed at oxygen concentrations of 0.012 mol. m 3 ( • ), 0.038 mol. m 3 (A,
—) and 0.08 mol. m"3 ( • , — ) .
consumption rates were determined in time by measuring the nitrite consumption rate,
and compared to model predictions. Parameters used in the model are given in Table
II, and results are shown in Fig. 4. As shown in Fig. 4, the curves predicted by the
model presented here match the experimental results very well.
Sensitivity analysis
To establish the sensitivity of the model for the different parameters, a sensitivity
analysis was made around the set point values used in the evaluation (Table II). Each
parameter was varied in the range 0.5-1.5 times the setpoint value, keeping all other
65

Chapter 3
oxygen consumption rate (-) A oxygen consumption rate (-) B
0.6 0.8 1 1.2 1.4
parameter value (-) 0.6 0.8 1 1.2 1.4
parameter value (-)
oxygen consumption rate (-) C oxygen consumption rate (-) D
0.6 0.8 1 1.2 1.4
parameter value (-) O.S 0.8 1.2 1.4
parameter value (-)
Fig. 5: Sensitivity analysis of the model. Oxygen bulk concentration is 3.8 x 10² mol. m*1 in (A) and
(B) and 1.2 x 10"2 and 8.0 x 10² mol. m 3 in (C) and (D), respectively. (A-D) Oxygen flux is plotted
vs. the dimensionless parameter value. In (A) solid line is the bulk concentration, dashed line is
the radius, and the shaded area represents all other parameters (B-D). I, mass transfer coefficient
in the film; II, maximum specific growth rate; III, diffusion coefficient; IV, maximum biomass
concentration in the gel; V, yield coefficient; VI, Monod constant.
66

Modelling immobilized growing cells
variables constant. The predicted macroscopic consumption rate (mol. m'3beaö. s"1) at
steady state was used to compare the predictions, realizing that other criteria can be used. Results are presented in Fig. 5. Fig. 5A clearly shows the high sensitivity of the model for the radius of the beads and the substrate bulk concentration. At other oxygen bulk concentrations the same model behaviour was found (results not shown). The model showed no response at changing the time step size over the same range, which indicates that the assumption that the substrate consumption process and growth may be treated separately, was valid. Varying the maximum attainable biomass concentration Xpmax, which only appears in Equation (3), did not result in a change in predicted substrate consumption rate, which can, for our case, be explained by the relatively low maximum biomass concentration Xmax.
At all oxygen bulk concentrations, the model showed no response to a change in initial biomass concentration, indicating that at these set points, the model is capable of finding the steady state rather well. Varying the end time of the simulation showed no response for the high bulk concentrations, whereas at the low oxygen concentration setpoint a 50 % smaller flux was predicted at the lowest end time, and from the set point to a higher end time no change occurred, indicating that at low bulk concentrations, it takes longer to reach the steady state, probably due to the low growth rate. Varying the maintenance coefficient at high bulk concentrations influenced the substrate flux less than 1 %, whereas at a low bulk concentration the predicted flux decreased by 10 % at a 50 % higher maintenance coefficient. This is a result of the use of Equation (1), where the second term will become more important compared with the first term at concentrations in the same magnitude as Ks, i.e., at the low oxygen bulk concentration.
The similarity between Figs. 5B and 5D indicates that at higher substrate bulk concentrations, the entire process becomes diffusion controlled, whereas at low substrate bulk (Fig. 5C) concentrations the kinetics gain importance. From Fig. 5 it is clear that apart from the radius and the bulk concentration, the most important parameter is the mass transfer coefficient in the stagnant layer, which indicates the importance of external mass transfer resistance.
The model was also tested without external diffusion limitation. Steady-state oxygen consumption rates are given in Table III where it is clearly shown that for our case, external mass transfer resistance is not negligible.
67

Chapter 3
Table III: Oxygen consumption rates with and without external diffusion limitation
Oxygen bulk concentration (mol. m'3)
Oxygen consumption rate with film theory (mol. m"3, s'1)
Oxygen consumption rate without film theory (mol. m"3, s"1)
Ratio (dimensionless)
1.2 x10"2
8.1 x 10"4
2.7 x 10'3
3.3
3.8 x 10 2
2.8 x 10³
7.0 x 10"3
2.5
8.0 x 10 2
5.6 x 10 3
1.2 x 10"2
2.1
CONCLUSIONS
The modelling of immobilized Nitrobacter agilis cells was successfully carried out. Measured macroscopic oxygen consumption rates matched well with model predictions at three different oxygen concentrations. The model shows, at the values of the parameters used in this case, the highest sensitivity for the substrate bulk concentration, the radius of the biocatalyst beads, and the external mass transfer resistance coefficient. More research is under way to verify the model prediction of the substrate concentration profile as proposed by de Beer et a/.6 and to extend the model to an overall reactor model.
APPENDIX: CALCULATION OF THE CHARACTERISTIC TIMES FOR AIR BUBBLE EXHAUSTION AND OXYGEN TRANSFER
As from our experiments the oxygen consumption rates are known at three different oxygen bulk concentrations, kß values for mass transfer from the gas bubbles can be calculated, since in steady state, the oxygen consumption rate must equal oxygen transfer:
rs - kltgag{ s;-Sb) (8)
with:
68

Modelling Immobilized growing cells
* „ - - (9,
Table IV: Characteristic times for oxygen transfer and exhaustion at three different bulk concentrations
s. '.
s\ exhaustion
' transfer
1.2 X 10"2
1.3 x 10"
1.3 x 1 0 2
1.5
7.6
3.8 x 10 "2
4.4 x KT1
1.2x10'
37
181
8.0 x 10²
8.8X10"
2.1 X 10'1
30
151
mol. m*3
mol. m'3, s"1
mol. m"3
s
s
The characteristic time for exhaustion of the gas bubble can be calculated from25,39
'exhaustion ~ . , 0 ^ ) Ki.gag
The characteristic time for oxygen transfer from the gas bubbles to the liquid phase can be calculated from25,39
^transfer " r, ( H ) Ki,gai
with:
e 1 - e
a, - ag T - ^ T (12)
Characteristic times calculated from our experiments, using H = 40 m3, m"3, e = 0.5
%, and db = 0.5 mm are given in Table IV. The considerable difference in the characteristic times at the low oxygen
concentration are probably caused by oxygen transfer through the head space of the reactor. This contribution will become negligible at higher oxygen bulk concentrations and, with that, higher consumption rates are reached in the steady state. Therefore,
69

Chapter 3
the calculated characteristic times at the low bulk concentration will not be considered.
As can be seen from Table IV, the characteristic time for exhaustion of the gas
bubbles can be estimated to be 33 s, and for oxygen transfer this is 166 s. These
values lie well within the range of values that can be found using correlations for kt
reported in literature.34
NOMENCLATURE
a specific surface area of a sphere (m1)
ag specific surface area of the gas phase (m1)
a, specific surface area of the liquid phase (m'1)
db diameter of air bubbles (m)
D effective diffusion coefficient (m2. s"1)
D effective diffusion coefficient in gel (m2. s"1)
H Henry coefficient (m3, m3)
klg substrate mass transfer resistance coefficient in the film
layer near the gas phase (m. s1)
k,s substrate mass transfer resistance coefficient in the film
layer near the solid phase
Ks Monod constant
m maintenance coefficient
r distance from the centre of the bead
rb radius of the bead
rc radius of the cell
r, distance from the centre of the bead where substrate
concentration is negligible
rs macroscopic consumption rate of substrate
rx biomass growth rate
S substrate concentration
Sb substrate concentration in the bulk
S'b saturation concentration (of oxygen) in the liquid
S, substrate concentration in the centre of the bead
70
(m
(mol.
(mol. kg"1
(mol. m"3
(kg. m 3
(mol.
(mol.
(mol.
(mol.
s1) m3)
•s 1 )
(m)
(m)
(m)
(m)
•s'1)
•s"1)
m"3)
m3) m3) m3)

Modelling Immobilized growing cells
Ss substrate concentration at the surface of the bead (mol. m3)
S\ substrate concentration at the surface of the bead, when external diffusion limitation is accounted for (mol. m"3)
f time (s) tert end time of the simulation (s) X biomass concentration (kg. m"3) X0 biomass concentration at t = 0 (kg. m"3)
X , ^ observable maximum biomass concentration (kg. m"3)
Xp,max maximum attainable biomass concentration (kg. m"3) V« yield coefficient (kg. mol"1)
e gas hold-up (-) ß specific growth rate (s"1)
Pnn maximum specific growth rate (s'1) T characteristic time (s) Af time step size for biomass growth (Equation 2) (s)
ACKNOWLEDGEMENTS
The authors wish to thank Dr. M. de Gee for his useful comments on the numerical solution of the differential equations, and W.A. Beverloo for the fruitful discussions on kß.
REFERENCES
1. Andrews G (1988) Effectiveness factors for bioparticles with Monod kinetics. Chem Eng J
37:b31-b37
2. Beeftink H.H., Van Der Heijden R.T.J.M., Heijnen J.J. (1990) Maintenance requirements: energy
supply from simultaneous endogenous respiration and substrate consumption. FEMS Microbiol
Ecol 73: 203-210
3. Canovas-Diaz M., Howell J.A. (1988) Stratified mixed-culture biofilm model for anaerobic
digestion. Biotechnol Bioeng 32: 348-355
4. Chang H.N., Moo-Young M. (1988) Analysis of oxygen transport in immobilized whole cells. In:
71

Chapter 3
Bioreactor Immobilized Enzymes & Cells, fundamentals and applications, Ed. M. Moo-Young,
Elsevier Applied Science, London
5. Chen K.C., Huang C.T. (1988) Effects of the growth of Trichosporon cutaneum in Ca-alginate
gel beads upon bead structure and oxygen transfer characteristics. Enzyme Microb Technol 10:
284-292
6. De Beer D., Van Den Heuvel J.C. (1988) Gradients in immobilized biological systems. Anal Chim
Acta 213: 259-265
7. De Gooijer CD., Hens H.J.H., Tramper J. (1989) Optimum design for a series of CSTR's
containing immobilized biocatalyst obeying intrinsic Michaelis-Menten kinetics. Bioprocess Eng
4: 153-158
8. Furusaki S. (1988) Engineering aspects of immobilized biocatalysts. J Chem Eng of Japan 21 (3) :
219-230
9. Furusaki S. (1989) Intradiffusion effect on reactivity of immobilized microorganisms. In:
Bioproducts & Bioprocesses, Eds: Fiechter, Okada, Tanner, Springer-Verlag, Berlin 71-85
10. Godia F., Casa C , Sola Ç. (1987) Mathematical moderation of a packed bed reactor
performance with immobilized yeast for ethanol fermentation. Biotechnol Bioeng 30: 836-843
11. Gosmann B., Rehm H.J. (1988) Influence of growth behaviour and physiology of
alginate-entrapped microorganisms on the oxygen consumption. Appl Microb Biotechnol 29:
554-559
12. Gujer W., Boller M. (1989) A mathematical model for rotating biological contactors. In:
Proceedings of the Technical Advances In Biofilm Reactors Conference, Nice, CFRP-AGHTM,
Paris, p. 69-89
13. Herbert D. (1959) Some principles of continuous culture. In: Recent progress in microbiology, Ed.
Tunevall G, Almqvist & Wiksell, Stockholm, p. 381-396
14. Hiemstra H., Dijkhuizen L., Harder W. (1983) Diffusion of oxygen in alginate gels related to the
kinetics of methanol oxidation by immobilized Hansenula polymorpha cells. Appl Microb
Biotechnol 18: 189-196
15. Itamunoala G.F. (1988) Limitations of methods of determining effective diffusion coefficients in
cell immobilization matrices. Biotechnol Bioeng 31: 714-717
16. Karel S.F., Robertson CR. (1989) Cell mass synthesis and degradation by immobilized
Escherichia coli. Biotechnol Bioeng 34: 337-356
17. McLaren A.D. (1970) Temporal and vectorial reactions of nitrogen in soil: a review. Can J Soil Sc
50: 97-109
18. Mahmoud W., Rehm H.J. (1986) Morphological examination of immobilized Streptomyces
aureofaciens during Chlortetracycline fermentation. Appl Microb Biotechnol 23: 305-310
19. Monbouquette H.G., Ollis D.F. (1986) A structured model for immobilized cell kinetics. Ann NY
Acad Sc 469: 230-244
20. Monbouquette H.G., Ollis D.F. (1988) Structured modeling of immobilized cell kinetics and RNA
content. In: Bioreactor Immobilized Enzymes & Cells, fundamentals and applications, Ed. M.
72

Modelling Immobilized growing cells
Moo-Young, Elsevier Applied Science, London
21. Monbouquette H.G., Sayles G.D., Ollis D.F. (1990) Immobilized cell biocatalyst activation and
pseudo-steady-state behavior: model and experiment. Biotechnol. Bioeng. 35: 609-629
22. Moser A. (1988) Bioprocess Technology: kinetics and reactors. Springer-Verlag, New York, USA
23. Mulchandani A., Luong J.H.T., Leduy A. (1988) Batch kinetics of microbial polysaccharide
biosynthesis. Biotechnol Bioeng 32: 639-646
24. Nakasaki K., Murai T., Akiyama T. (1989) Dynamic modeling of immobilized cell reactor:
application to ethanol fermentation. Biotechnol Bioeng 33: 1317-1323
25. Oosterhuis N.M.G. (1984) Scale-up of bioreactors: a scale-down approach. PhD. thesis, Technical
University, Delft, the Netherlands
26. Pitt S.J. (1965) The maintenance energy of bacteria in growing cultures. Proc Roy Soc London.
163B: 224-231
27. Pirt S.J. (1987) The energetics of microbes at slow growth rates: maintenance energies and
dormant organisms. J Ferment Technol 65 (2): 173-177
28. Saez P.B., Rittmann B.E. (1988) Improved pseudoanalytical solution for steady state biofilm
kinetics. Biotechnol Bioeng 32: 379-385
29. Sänger P., Deckwer W.D. (1981) Liquid-solid mass transfer in aerated suspensions. Chem Eng
J 22: 179-186
30. Sato K., Toda K. (1983) Oxygen uptake rate of immobilized growing Candida lipolytica. J
Ferment Technol 6 (3): 239-245
31. Sayles G.D., Ollis D.F. (1989) Periodic operation of immobilized cell systems: analysis. Biotechnol
Bioeng 34: 160-170
32. Scott CD., Woodward CA., Thompson J.E. (1989) Solute diffusion in biocatalyst gel beads
containing biocatalysis and other additives. Enzyme Microb Technol 11: 258-263
33. Seki M., Furukasi S. (1985) Effect of intraparticle diffusion on reaction by immobilized growing
yeast. J Chem Eng of Japan 18 (5): 461-463
34. Shah. Y.T., Kelkar B.G., Godbole S.P., Deckwer W.D. (1982) Design parameters estimations for
bubble column reactors. AlChE J 28: 353-379
35. Shiraishi F., Kawakami K., Kono S., Tamura A., Tsurata S., Kusunoki K. (1989)
Characterization of production of free gluconic acid by Gluconobacter suboxydans adsorbed on
ceramic honeycomb monolith. Biotechnol Bioeng 33: 1413-1418
36. Siegrist H., Gujer W. (1987) Demonstration of mass transfer and pH effects in a nitrifying biofilm.
Wat Res 21 (12): 1481-1487
37. Stewart P.S., Robertson CR. (1989) Microbial growth in a fixed volume: studies with entrapped
E. coli. Appl Microb Biotechnol 30: 34-40
38. Suidan M.T., Rittman B.E., Traegner U.K. (1987) Criteria establishing biofilm-kinetic types. Wat
Res 21 (4): 491-498
39. Sweere A.P.J., Luyben K.Ch.A.M., Kossen N.W.F. (1987) Regime analysis and scale down: tools
73

Chapter 3
to investigate the performance of bioreactors. Enzyme Microbiol Technol 9: 386-398
40. Toda K., Sato K. (1985) Simulation study on oxygen uptake rate of immobilized growing
microorganisms. J Ferment Technol 63 (3): 251-258
41. Wakao N., Smith J.M. (1962) Diffusion in catalyst pellets. Chem Eng Sei 17: 825-834
42. Wijffels R.H., Tramper J. (1989) Performance of growing Nitrosomonas europaea cells
immobilized in /c-carrageenan. Appl Microbiol Biotechnol 32: 6 108-112
43. Wijffels R.H., De Gooijer CD., Kortekaas S., Tramper J. (1991) Growth and substrate
consumption of Nitrobacter agilis cells immobilized in carrageenan: part 2. model evaluation.
Biotechnol. Bioeng. 38: 232-240
74

INTERMEZZO
INTERMEZZO
The beads with immobilized Nitrosomonas or Nitrobacter cells are brought in a reaction vessel. A medium containing ammonia (the waste stream) is supplied continuously to that bioreactor and the ammonia will be converted to nitrite or nitrate by the immobilized bacteria. As a consequence the effluent (cleaned waste stream) contains nitrite or nitrate. In case suspended bacteria are used, the bacteria would leave the reactor together with the effluent. By immobilizing cells in gel beads we can retain the bacteria in the bioreactor by simply putting a sieve in the effluent stream. As a bioreactor we use an air-lift loop reactor. It consists out of two connected vertical tubes. Air is sparged into the left tube. Air is needed for both the oxidation of ammonia or nitrite and for mixing.
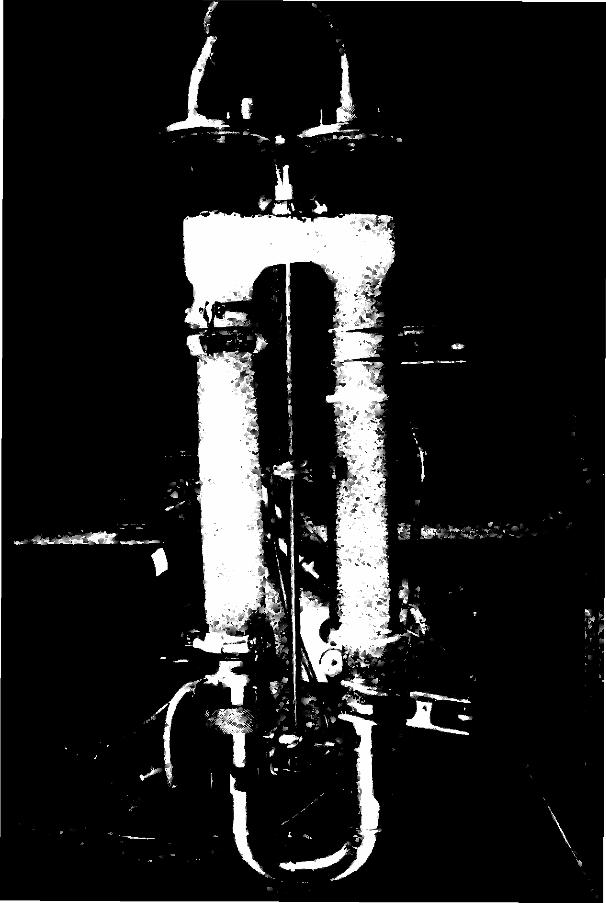

This chapter has been published in Biotechnology and Bioengineering 38 (1991) 232-240 by the authors R.H. Wijffels, CD. de Gooijer, S, Kortekaas and J. Tramper
CHAPTER 4
GROWTH AND SUBSTRATE CONSUMPTION OF NITROBACTER AGILIS CELLS IMMOBILIZED IN
CARRAGEENAN: PART 2. MODEL EVALUATION
ABSTRACT
A dynamic model, which predicts substrate and biomass concentration profiles across gel beads and from that the overall substrate consumption rate by the gel beads containing growing cells, was evaluated with immobilized Nitrobacter agilis cells in an air-lift loop reactor with oxygen as the limiting substrate. The model predictions agreed well with the observed oxygen consumption rates at three different liquid phase oxygen concentrations.
Image analysis showed that 90 % of the immobilized cells after 42 days of cultivation was situated in the outer shells in a film of 140 /xm, while the bead radius was about 1 mm. The maximum biomass concentration in the outmost film of 56 ßm was 11 kg. m"3 gel.
79

Chapter 4
INTRODUCTION
Nitrification is a problematic process within waste water treatment due to the slow growth rate of the nitrifying organisms. The main species within this group are Nitrosomonas and Nitrobacter, which successively oxidize ammonia to nitrite and nitrate.
In previous studies we have shown that nitrifying bacteria can be retained in continuous-flow bioreactors by immobilization in a gel with maintenance of their nitrifying capacities.47"51,54,60 It was demonstrated that diffusion limitation increased with increasing amounts of immobilized cells.49,54 It was also shown that both Nitrosomonas europaea60 and Nitrobacter agilis x can grow within the gel. For immobilized Nitrosomonas europaea, the effect of diffusion limitation on growth was described qualitatively.60 Initially, the cells were growing homogeneously across the beads, but as growth proceeded, a biomass density gradient developed, eventually resulting in a biofilm just below the surface of the gel beads. Accordingly, the reaction rate, which was originally limited by the kinetics of the cells, became diffusion limited.
For non-growing systems, substrate profiles across the beads and substrate fluxes into the beads were modelled and validated by De Gooijer et a/.13 A homogeneous distribution of enzyme across the beads was assumed. A differential mass balance with simultaneous diffusion and substrate consumption was made and integrated numerically across the biocatalyst bead. External mass transport was also incorporated by using the film theory. This model has been extended to growing systems by coupling substrate consumption to growth via a yield coefficient. A negative net growth was allowed at low substrate concentrations and the local biomass concentration was limited to a maximum.14 It predicts the overall substrate consumption rate in addition to biomass and substrate concentration profiles across the beads.
This article describes the experimental evaluation of the latter model with immobilized Nitrobacter agilis. Immobilized cells were cultivated in continuous-flow airlift loop reactors with oxygen as the limiting substrate. Andrews3 defined the limiting substrate as the component whose concentration reaches zero first; this is the component with the lowest value for the product of effective diffusion coefficient; yield factor and the pertinent component concentration. In our case this value was always lower for oxygen than for nitrite. For that, as the nitrification capacity of the system
80

Oxygen consumption rate of immobilized Nitrobacter
increased, the nitrite concentration of the influent was increased in such a way that nitrite in the reactor never was limiting. The oxygen concentration in the liquid phase was kept at a constant level. The oxygen consumption rates at various constant oxygen concentrations were determined and compared with model predictions. Biomass concentration profiles across the gel beads were determined by image analysis to estimate the local maximum immobilized biomass concentration.
MATERIALS AND METHODS
Organism and culture conditions
Nitrobacter agilis (ATCC 14123) was cultivated in a 5-dm3 batch culture. The composition of the medium was based on studies on nutrient requirements.2,6,10,34,43,53
The medium contained per m3 of demineralized water: 14.5 mol NaN02; 0.21 mol MgS04; 5 mol KH2P04; 5 mol Na2HP04; 1 mmol Na2Mo04; 0.015 mmol ZnS04; 0.016 mmol CuS04 and 5 mmol CaCI2. Per mole nitrite 0.02 mol of NaHC03 was added. The pH was adjusted to 7.8 with 2 N KOH. The medium was inoculated with about 10% (v/v) of cell culture. Every 3 days 72.5 mmol of NaN02 was added to obtain dense cultures. After 9 days the culture was harvested. Cultivation was executed at 30°C in the dark to prevent light inhibition.9,32,62
Immobilization procedure
The cell suspension was centrifuged during 10 minutes at 16,300 g and 5 °C. The cells were washed with 15.4 m/W NaCI solution.
A 3% «-carrageenan solution (Genugel X0828, A/S Kobenhavns Pektinfabrik, DK Lille Skensved) was mixed gently with the washed suspension such that a 2.6 % carrageenan solution was obtained. The carrageenan solution and the cell suspension were kept at 35 °C.
Immobilization was performed with a resonance nozzle 2S at 35 °C. Drops were collected in 0.75 M KCl at 5 CC. To obtain perfect spheres a decane layer was brought upon the KCl solution as proposed by Buitelaar et a/.11 The decane and the KCl solution were kept at 5 CC in order to initiate the gelation. Decane is non-toxic due to
81

Chapter 4
its high log P value.27
The average bead diameter was 2.04 mm (± 0.22 mm) and the initial biomass concentration in the beads was 4.5 x 10"3 kg. m"3.
Immobilized cell cultivation
Immobilized cells were cultivated in continuous-flow air-lift loop reactors (two of 3.40 dm3 and one of 2.35 dm3). The experimental set up is shown schematically in Fig. 1.
The reactors were coupled to a Programmable Logic Controller (PLC Melsec-G, Mitsubishi G62P). Communication with the PLC was accomplished via a personal computer. The oxygen concentration in each reactor was monitored (WTW Oxy 219/90R) and the signal sent to the PLC. Depending on the difference between the measured value and the set point, the PLC adjusted 2 mass flow controllers (Brooks instruments 5850 TR); one for air and one for nitrogen. The total gas flow into the reactors was thus kept constant (5.8 cm3, s"1 for the 3.4 dm3 reactors and 4.2 cm3, s"1
for the 2.35 dm3 reactor) in order to maintain constant mass transfer properties across the stagnant layer surrounding the beads.
©— medium in
medium out
probe
thermostat
PLC mass flow airlift controllers
Fig. 1: Experimental set up of the immobilized cell cultivation.
82

Oxygen consumption rate of immobilized Nitrobacter
In three experiments, the bulk oxygen concentration was kept at 0.012 (smallest reactor), 0.038 and 0.080 mol. m"3, respectively. The influent nitrite concentration was adjusted daily so as to keep the reactor concentration between 3 and 15 mol. m3. In this way oxygen is the limiting substrate and there are no toxicity problems of nitrite.
The medium contained per m3 of demineralized water: a variable amount of KN02; 0.21 mol MgS04; 5 mol KH2PO„; 5 mol KgHPO«; 1 mmol Na^oO«; 0.015 mmol ZnS04; 0.16 mmol CuS04; 5 mmol CaCI2 and 5 mol of KCl. Per mole nitrite 0.02 mol of KHC03
was added. The pH was adjusted to 7.8 with 2 N KOH. Cultivation was executed at 30°C in the dark to prevent effects of light inhibition.
In the reactor operated at 0.012 mol 02. m"3, the dilution rate was 4.6 x 10"5 s'1 and the reactor gel load 25 % (v/v). For the reactors operated at 0.038 and 0.080 mol 02. m'3, the dilution rate based on the liquid-phase volume was 4.0 x 10s s"1 and the reactor gel load was 15 % (v/v). In preliminary runs it appeared that the oxygen transfer rate from the gas phase to the liquid phase at a gel load of 25 % (v/v) was too low to keep the liquid phase oxygen concentration at 0.038 and 0.080 mol. m"3, respectively, during the entire experiment. Therefore the gel load was lowered to 15 % (v/v) for these two cases.
Oxygen consumption rate
Nitrite oxidation by Nitrobacter requires stoichiometric amounts of oxygen.1-29-30-44
Thus to estimate the oxygen consumption rate, the nitrite consumption rate per
amount of gel was determined regularly. Reactor nitrite concentrations were
determined at least 24 hours after increasing the influent nitrite concentration, such
that refreshment of the medium had occurred four times and a nitrogen balance
across the reactor could be made.
Nitrite and nitrate concentrations in influent and effluent were determined18 using
a continuous-flow analysis system (Technicon Auto Analyser 2). For nitrate analysis
the samples first passed through a copper-coated cadmium column in order to reduce
the nitrate to nitrite. By addition of a-naphtylamide in acid medium, the nitrite forms a
red diazo compound, that was measured at 550 nm.
83

Chapter 4
Biomass concentration
Overall viable biomass estimates were made by activity assays in a biological oxygen monitor as described before.54 In a reaction cuvette 50-200 beads and 4 cm3
potassium phosphate buffer (0.1 mol. dm"3, pH 7.8) were suspended and saturated with air. If the activity exceeded 0.002 mol. m"3gel. s"\ pure oxygen was used to prevent mass transfer limitations. Through a small opening a concentrated KN02
solution was injected to a final concentration of 20 mol. m3 and the decrease in oxygen concentration at 30 °C was recorded.
The activity per amount of gel was converted to a biomass dry weight concentration by dividing by the specific activity. The specific activity of Nitrobacter agilis is 7 x 10"3 mol. kg"1, s"1 at a nitrite concentration of 20 mol. m"3.10,50
Regularly the activity in the bulk liquid phase was measured. In that case the assay was executed in culture medium which was concentrated first by centrifugation.
Determination of biomass profile
After 42 days of cultivation at a liquid phase oxygen concentration of 0.080 mol. m"3, samples of the beads were used for image analysis. Image analysis was executed on sections through the centre of the beads by sectioning with an ultramicrotome.
In order to obtain thin sections the beads were dehydrated and embedded in a resin. Chemical fixation prior to dehydration appeared to be necessary. The procedure was based on the work of Van Neerven er a/.55 The beads were washed twice for 5 minutes in buffer (0.1 M Na-cacodylate, pH 7.5). To keep the carrageenan beads rigid, the Na-cacodylate buffer was supplemented with 0.1 mol. m3 KCl during all washing and fixation steps. A first fixation of 1.5 h was executed in the same buffer containing 2.5 % (w/v) glutaraldehyde. After washing the samples 3 times for 10 minutes in the Na-cacodylate buffer, they were placed for a second fixation of 1.5 h in this buffer containing 1.0 % Os04 (w/v). The beads were washed again in the buffer 3 times for 10 minutes prior to dehydration in a series of gradually increasing ethanol concentrations: 10, 30, 50, 70, 90 and twice 100 %. A decreasing KCl gradient from 0.09 to 0.03 mol. m"3 was used in the increasing ethanol series of 10, 30, 50 and 70 %. No KCl was added in the two ultimate dehydration steps. Each step was allowed to equilibrate for 10 minutes.
84

Oxygen consumption rate of immobilized Nitrobacter
The dehydrated beads were embedded in London Resin White (Bio-rad). Therefore, the beads were placed in ethanol-London Resin White solutions in the ratios 5:1, 3:1, 1:1 and 1:3, respectively, before treatment with pure London Resin White. Each step was allowed to equilibrate for 30 minutes. Treatment with pure London Resin White was executed in two steps. The first step for 60 min and the second for 24 h. Polymerization of the resin took place in a gelatine mould at 60CC during 24 h.
Sectioning was executed on a LKB 8800 Ultramicrotome III with a glass knife. Sections were stained with toluidine blue to improve the contrast between the gel and the colonies. The samples were observed at a magnitude of 40 on a light microscope and photographs were made with a Kodak Technical Pan film 2415 at 50 ASA. The prints (final magnification 150x) were used for image analysis with a Quantimet 970 (Cambridge Instruments). By image analysis the coordinates of the centres of the colonies were determined in relation to the centre of the bead. Also the radii of the colonies were determined. For determination of the volumetric fraction of colonies the beads were divided into fictive shells by test lines. In those shells the areal density was determined according to the principle of Rosiwal, which is that the areal density is equal to the fractional length of a test line that intersects the objects.58 In this case the test line is a circle with a fixed distance to the centre of the beads (Fig. 2). The fraction
= colony
Fig. 2: Procedure for determination of the volumetric fraction of biomass: r„, observed colony
radius; Rc, distance between centre of the colony and the centre of the bead; R, bead radius;
R,, radius test line.
85

Chapter 4
of the test line that sections the colonies can be calculated from the distance from the centre of the bead to the centre of the colony minus the distance from the centre of the bead to the drawn test line and the colony radius. In the core section of the beads the areal density was directly determined in three area classes, because the distribution of the colony fraction is relatively random there. In thin slices the areal density is equal to the volumetric density according to the principle of Delesse.58
As the observed areas are projections of the observed colonies situated in slices with a thickness L, it may be necessary to correct for over-estimations as more images are projected for thicker slices (the Holmes effect) and under-estimations as images can overlap.21525859
As the slices are thin compared to the colony radii, overlap may be neglected.59 For the Holmes effect, the observed radii can be corrected by a factor defined as59
(1) n + 2 —
As the observed colony radii are expectations of the colony radii, the colony radii can be obtained from
1 + £ rJL
E® - 2r„ -JL± <2> 1 + 2 ^
L
and the observed projections can be corrected individually.
Starvation under oxygen depletion
For determination of maintenance energy Nitrobacter agilis was cultivated batch wise in a stirred fermenter (at 450 rpm). Culture conditions were as described above. After one week of cultivation the oxygen supply was stopped and nitrogen gas was
86
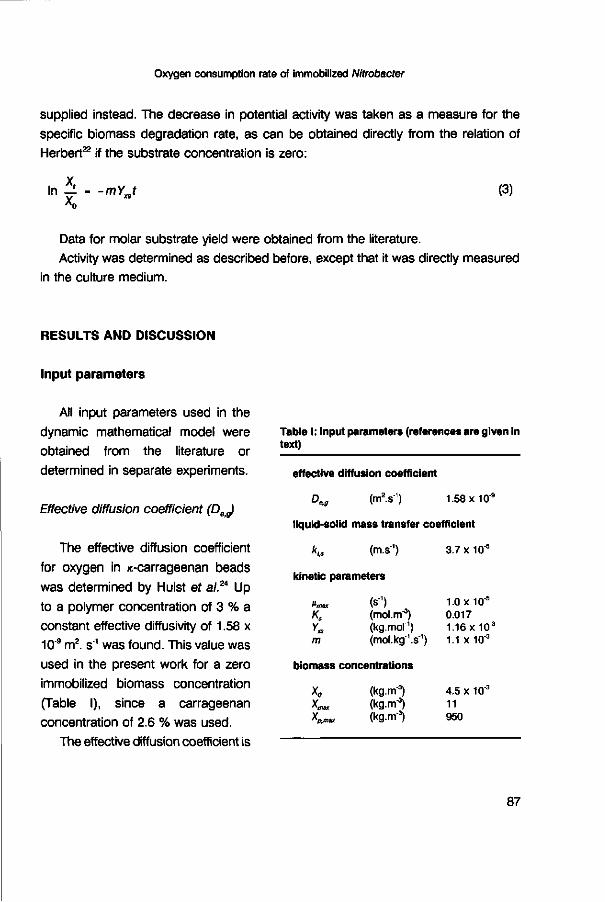
Oxygen consumption rate of immobilized Nitrobacter
supplied instead. The decrease in potential activity was taken as a measure for the specific biomass degradation rate, as can be obtained directly from the relation of Herbert22 if the substrate concentration is zero:
in 5 -mY„t (3)
Data for molar substrate yield were obtained from the literature. Activity was determined as described before, except that it was directly measured
in the culture medium.
RESULTS AND DISCUSSION
Input parameters
All input parameters used in the dynamic mathematical model were obtained from the literature or determined in separate experiments.
Effective diffusion coefficient (DeJ
The effective diffusion coefficient for oxygen in «-carrageenan beads was determined by Hulst et al.2* Up to a polymer concentration of 3 % a constant effective diffusivity of 1.58 x 10"9 m2, s1 was found. This value was used in the present work for a zero immobilized biomass concentration (Table I), since a carrageenan concentration of 2.6 % was used.
The effective diffusion coefficient is
Table I: Input parameters (references are given in text)
effective diffusion coefficient
Deg (m2.s'1) 1.58x10""
liquid-solid mass transfer coefficient
*t. (m.*1)
kinetic parameters
<w (s'1) K$ (mol.nT3) Ya (kg.mor1) m (mol.kg'.s'1)
biomass concentrations
X0 (kg.m3) Xma, (kg.m-3) X»™» (kg-m"3)
3.7 x10'5
1.0 x 10'5
0.017 1.16 x 10³
1.1 x10"3
4.5 x 10³
11 950
87
Chapter 4
affected by the concentration of biomass in the support material.12,16,23,31,42 As stated by De Gooijer ef a/.,14 the effective diffusion coefficient will be zero if all pores in the gel are completely filled by bacterial cells, with no intercellular space left. At the gel concentration used, the available pore volume will be at least 95 % of the total gel volume and the pores will be completely filled if the biomass concentration is about 950 kg. m"3. This value is defined as the maximum physically attainable biomass concentration Xpmax.
Liquid-solid mass transfer coefficient (k,J
From the Biot number it can be estimated whether external mass transfer has to be taken into consideration. If Bi approaches zero, all resistance is situated in the stagnant layer, and if it reaches infinite values the resistance across the stagnant layer may be neglected. The Biot number was estimated to be 25 in our case. The value will be much lower when only the active layer is considered. This means that external mass transfer certainly may not be neglected, such that kls is an important factor. For calculation of the liquid/solid mass transfer coefficient (kls) the relation of Ranz and Marshall37 was used:
1 i D. I 2+0 6 Sr DL (2+0.6 Sc 3 Re 2 ) ( 4 )
The Reynolds number was calculated from the Galileo number. Relations between Re and Ga can be derived easily for the Stokes, Newton and intermediate regimes.7 It was assumed that the particles move with the rate of free fall. Re thus calculated is 58, which means that Ranz and Marshall is applicable.37 Equation (4) gives with Re = 58 a mass-transfer coefficient of 3.7 x 10s m. s"1 (Table I), which gives good predictions of the overall oxygen consumption rates in all experiments as will be discussed.
In first instance the method of Kolmogoroff as used by Sänger and Deckwer41 for a bubble column and extended for an air-lift loop reactor by Wagner and Hempel57
seemed more appropriate to us. Kolmogoroff gave a relation between the energy dissipation and the Sherwood number. However, poor model predictions were
88

Oxygen consumption rate of immobilized Nitrobacter
obtained if those relations were used. This can be explained by differences in superficial gas velocities (ug), which were minimal double of what we used (0.0018 m. s"1). When the energy dissipations are compared, the differences are even much bigger. They found an energy dissipation (e) between 0.25 and 0.52 m2, s"3, while we calculated for our experiments 0.011 m2, s"3, which makes it inappropriate to apply their equations in our regime.
Maximum specific growth rate (ß„J
Literature data for maximum specific growth rates range from15,172026,38 0.98 x 10'5
to 2.3 x 10s s'1. In our experiments ßmax was taken to be 1.0 x 10"5 s"1, a value that was found by Tramper and Grootjen50, who used the same strain (Table I).
Monod constant (KJ
Most kinetic studies with nitrifying bacteria were executed with the nitrogenous compound as the limiting substrate. The few data known for oxygen as limiting substrate were obtained from activity assays instead of growth experiments.10,33,35,45,61
An overview of the effect of the dissolved oxygen concentration on nitrification has been given by Stenstrom and Poduska.45 The general range for Ks appears to be 0.009-0.026 mol. m"3.10,33,61 Sensitivity analysis demonstrated that within this range there was little effect on the predicted oxygen consumption rate.14 Therefore, an average Ks-value of 0.017 mol. m"3 was chosen (Table I).
Yield (YJ and maintenance (m) coefficients
In the present model maintenance energy plays an important role, because this factor determines the negative growth of cells that live under oxygen depletion. Almost no values are available for maintenance coefficients (m). Apart from that, in studies where maintenance was determined, nitrite was taken as the limiting substrate. The same holds for the yield coefficients (Yxs). Available data were recalculated to oxygen yields and maintenance coefficients according to the reaction stoichiometry. As general composition formula for biomass the relation as given by Roels39 (CH, 8O05N02) and the cell weight as given by Lees and Simpson x (10"1° mg/cell) were used.
89

Chapter 4
Keen and Prosser26 found yield coefficients of 19.6 x 10"3 and 3.92 x 10"3 kg. mol1
and maintenance coefficients of 5.6 x 10"4 and 11.0 x 10"4 mol. kg"1, s'1. The differences in their results were caused by the fact that two different calculation procedures were used for the same set of data. The first values were calculated by an iterative procedure and the latter by linear regression analysis of the double reciprocal plot. There is doubt about their results obtained by iteration, because the product of this growth yield (Y )̂ and maintenance coefficient (m), i.e., the specific biomass degradation rate as defined by Herbert,22 is higher than the maximum specific growth rate, or in other words, even at a maximum specific growth rate the biomass decay rate was higher than the growth rate.
Helder and de Vries20 and Belser6 found values for the yield coefficient of 0.98 x 10" 3 and 1.16 x 10"3 kg. mol"1, respectively. As Belser8 studied in our opinion yield most extensively, this value has been taken as input parameter (Table I).
From the work of Chiang (1969) as reported by Belser5 a maintenance of 2.78 x 10'3 mol. kg"1, s"1 can be estimated. When a yield factor of 1.16 x 10"3 kg. mol'1 is assumed and with the maintenance coefficient given by Belser5, the specific biomass degradation rate is 32 % of the maximum specific growth rate. When the regression results of Keen and Prosser26 apply, this ratio is 12.8 %. Laudelout ef a/.28 found a very broad range between 11 and 53 %. Because no more values were found in the literature, this parameter has been estimated in a separate experiment. Our model14
involves a combination of the models of Pirt36 and Herbert22, as proposed by Beeftink ef a/.4 Determination of maintenance energy was done with the bacteria under oxygen depletion. In that region the model of Herbert22 is applicable and the specific biomass degradation rate can directly be obtained from the observed decay rate (Equation 3).
The decrease in activity under oxygen depletion is shown in Fig. 3. The observed specific degradation rate was 12.8 % of the maximum specific growth rate, which means that the maintenance coefficient of 1.1 x 10"3 mol. kg"1, s"1 as given by Keen and Prosser26 is appropriate as input parameter (Table I).
With the chosen set of values model predictions were obtained which compared well to experimental results as will be shown. It was also shown that in the applied regimes the predicted oxygen consumption rates were relatively insensitive to changes in values of the yield and maintenance coefficients.14
90

Oxygen consumption rate of immobilized Nitrobacter
In (relative activity)
0 r
-3 0 5 10 15 20 25
time (days)
Fig. 3: Activity decrease of Nitrobacter agilis under oxygen depletion.
Performance immobilized cell reactor
Oxygen consumption rate
In three separate experiments the cells were cultivated in continuous-flow air-lift loop reactors. Daily results of the experiment with the highest oxygen concentration (0.080 mol. m"3) are given in Fig. 4. The influent nitrite concentration was 4 mol. nrï3 at start-up. After 4 days, the effluent nitrite concentration decreased, and the influent concentration was increased to 10 mol. m"3. Subsequently, it was adjusted every day to keep the effluent nitrite concentration above 3 mol. m3. As shown, in only a few days this concentration was lower. The influent nitrite concentration was raised almost linearly until 17 days after start-up. From that day on the influent nitrite concentration could be kept at 60 mol. m"3 as no further increase in substrate consumption was observed.
Two additional experiments were executed with bulk oxygen concentrations of 0.012 and 0.038 mol. m"3, and a similar reactor performance was observed. At these
91

Chapter 4
concentration (mol. m"3)
60
40
20 -
20 30
time (days)
50
Fig. 4: Influent nitrite (•) and effluent nitrite (•) and nitrate (*) concentrations in a continuous flow
experiment at a liquid phase oxygen concentration of 0.08 mol. m'3.
macroscopic oxygen-consumption rate (mol. nr3.s"1)
0.006
0.004
0.002
n i
•
. * ' T * - •
•/
/ /
k 0 10 20 30 40 50
time (days)
Fig. 5: Observed and predicted overall consumption rates in the biocataiyst beads at different
liquid phase oxygen concentrations: (• ) 0.012 mol. m3, (A, —) 0.038 mol. m'3 and (•, —)
0.08 mol. m3.
92

Oxygen consumption rate of immobilized Nitrobacter
oxygen concentrations the influent nitrite concentration could be kept constant after a while at levels of about 10 and 30 mol. m'3, respectively.
From the influent and effluent nitrite concentrations, the dilution rate and the amount of gel, the overall nitrite consumption rates of the beads were calculated. With that, the overall oxygen consumption rate of the beads was estimated. These rates are given for the three experiments in Fig. 5, which shows that the experimental results and the model predictions as described by De Gooijer ef al.u compare very well. It is also clearly shown that at higher oxygen concentrations the reactor capacity increased.
Biomass profiles and maximum biomass concentration (X^
The overall viable biomass concentrations were estimated by activity assays. The development of the potential activity for all experiments is shown in Fig. 6. Beads obtained at the end of the experiment with the highest liquid phase oxygen concentration (0.080 mol. m"3) were used to determine the biomass profile and the maximum biomass concentration. The overall average biomass concentration in these beads at that time was 3.7 kg. nrf3.
maximum oxygen-consumption rate (mol. m'3.s"1)
0.03
0.02
0.01
20 30
time (days) Fig. 6: Overall viable biomass concentration versus time in the air-lift loop reactors with bulk
oxygen concentrations of 0.012 ( • ) , 0.038 (A) and 0.080 (•) mol. m \ measured as potential
activity.
93
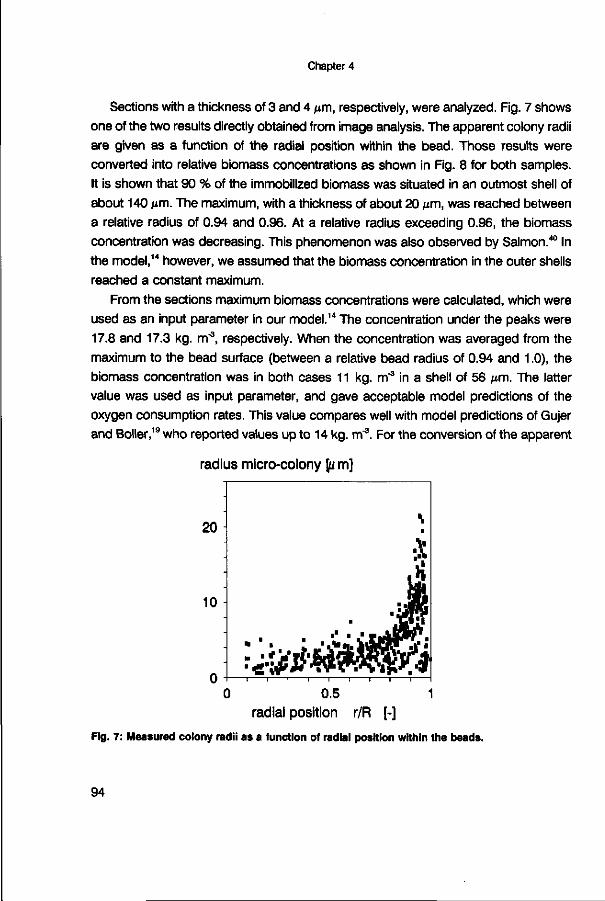
Chapter 4
Sections with a thickness of 3 and 4 mm, respectively, were analyzed. Fig. 7 shows one of the two results directly obtained from image analysis. The apparent colony radii are given as a function of the radial position within the bead. Those results were converted into relative biomass concentrations as shown in Fig. 8 for both samples. It is shown that 90 % of the immobilized biomass was situated in an outmost shell of about 140 mm. The maximum, with a thickness of about 20 jum, was reached between a relative radius of 0.94 and 0.96. At a relative radius exceeding 0.96, the biomass concentration was decreasing. This phenomenon was also observed by Salmon.40 In the model,1* however, we assumed that the biomass concentration in the outer shells reached a constant maximum.
From the sections maximum biomass concentrations were calculated, which were used as an input parameter in our model.14 The concentration under the peaks were 17.8 and 17.3 kg. m"3, respectively. When the concentration was averaged from the maximum to the bead surface (between a relative bead radius of 0.94 and 1.0), the biomass concentration was in both cases 11 kg. m"3 in a shell of 56 pm. The latter value was used as input parameter, and gave acceptable model predictions of the oxygen consumption rates. This value compares well with model predictions of Gujer and Boiler,19 who reported values up to 14 kg. m"3. For the conversion of the apparent
radius micro-colony [u m]
20
-
10
n
•
•
• •
in
.'•JH PJ6 SÖrï,: TO
0.5 1 radial position r/R [-]
Fig. 7: Measured colony radii as a function of radial position within the beads.
94
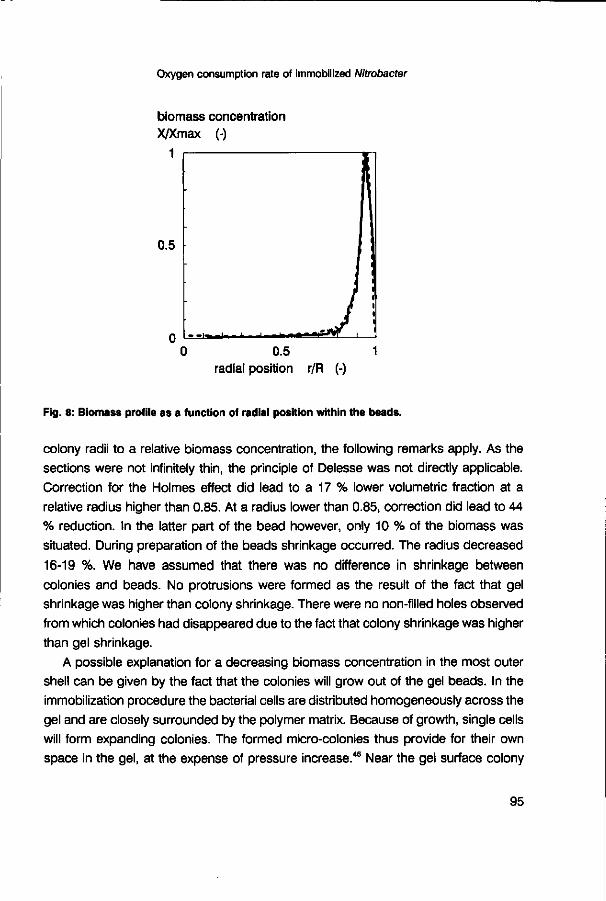
Oxygen consumption rate of immobilized Nitrobacter
biomass concentration X/Xmax (-)
1
0.5 radial position r/R (-)
Fig. 8: Biomass profile as a function of radial position within the beads.
colony radii to a relative biomass concentration, the following remarks apply. As the sections were not infinitely thin, the principle of Delesse was not directly applicable. Correction for the Holmes effect did lead to a 17 % lower volumetric fraction at a relative radius higher than 0.85. At a radius lower than 0.85, correction did lead to 44 % reduction. In the latter part of the bead however, only 10 % of the biomass was situated. During preparation of the beads shrinkage occurred. The radius decreased 16-19 %. We have assumed that there was no difference in shrinkage between colonies and beads. No protrusions were formed as the result of the fact that gel shrinkage was higher than colony shrinkage. There were no non-filled holes observed from which colonies had disappeared due to the fact that colony shrinkage was higher than gel shrinkage.
A possible explanation for a decreasing biomass concentration in the most outer shell can be given by the fact that the colonies will grow out of the gel beads. In the immobilization procedure the bacterial cells are distributed homogeneously across the gel and are closely surrounded by the polymer matrix. Because of growth, single cells will form expanding colonies. The formed micro-colonies thus provide for their own space in the gel, at the expense of pressure increase.46 Near the gel surface colony
95

Chapter 4
discharge due to this pressure build-up may have contributed to the decrease in peripheral biomass concentration. In future research, the present model will be extended and a biomass release term will be included.
Biomass release influences the reactor nitrite consumption. This effect has been considered for steady states.856 At high dilution rates, however, the contribution of suspended biomass is negligible. This was checked in our experiments. The discharged effluent did not show activity. At lower dilution rates this effect can be considerable. This effect will also be added to the model in order to come to an overall dynamic reactor model for all regimes.
APPENDIX: DIMENSIONLESS NUMBERS
Biot:
8.9
Galileo:
Ga - dB3g'
Reynolds:
Re P,udp
n
Schmidt:
Sc-^-D,
96
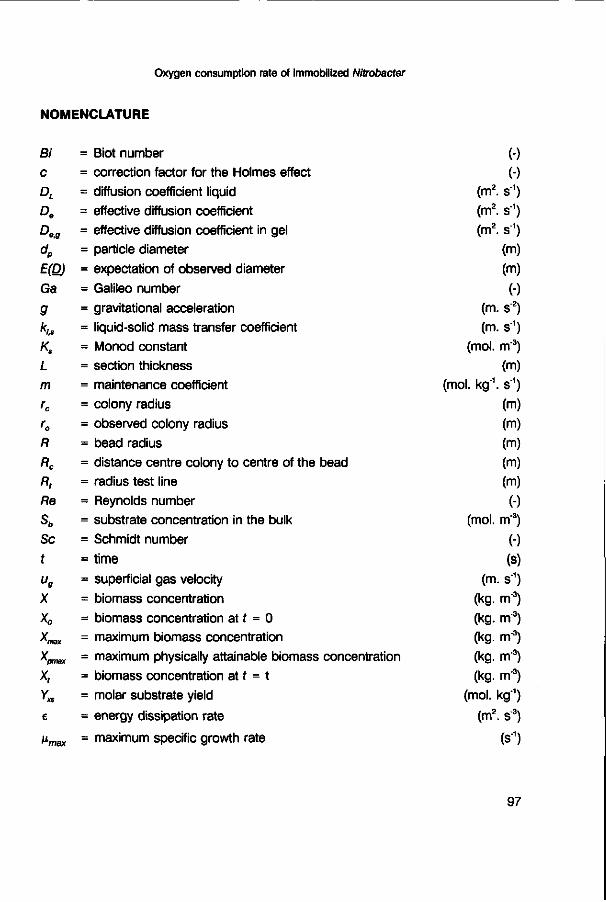
Oxygen consumption rate of immobilized Nitrobacter
N O M E N C L A T U R E
Bi = Biot number (-) c = correction factor for the Holmes effect (-)
DL = diffusion coefficient liquid (m2. s"1) De = effective diffusion coefficient (m2. s"1)
Deg = effective diffusion coefficient in gel (m2. s"1) dp = particle diameter (m)
E(D) = expectation of observed diameter (m)
Ga = Galileo number (-)
g = gravitational acceleration (m. s"2) kls = liquid-solid mass transfer coefficient (m. s"1) Ks = Monod constant (mol. m"3) L = section thickness (m)
m = maintenance coefficient (mol. kg"1, s"1) rc = colony radius (m)
r0 = observed colony radius (m)
R = bead radius (m)
Rc = distance centre colony to centre of the bead (m) R, = radius test line (m) Re = Reynolds number (-) Sb = substrate concentration in the bulk (mol. m"3)
Sc = Schmidt number (-)
f = time (s)
ug = superficial gas velocity (m. s"1)
X = biomass concentration (kg. m"3) X0 = biomass concentration at f = 0 (kg. m'3) Xmax = maximum biomass concentration (kg. m"3)
Xpmax - maximum physically attainable biomass concentration (kg. m"3) X, = biomass concentration at f = t (kg. m'3) V^ = molar substrate yield (mol. kg"1)
e = energy dissipation rate (m2. s"3)
ß m a x = maximum specific growth rate (s1)
97

Chapter 4
v = kinematic viscosity (m2. s"1)
r\ = dynamic viscosity (kg. m"\ s"1)
Pi = density liquid phase (kg. m'3)
pp = density particles (kg. m"3)
ACKNOWLEDGEMENTS
We wish to thank Mr. H. Heij for nitrite and nitrate analysis, Drs. M. Smit for assistance in sectioning of the beads, Mr. D. Schoonderbeek for assistance with the image-analysis equipment, Mr. H. Meijer for performing the experiment starvation of cells under oxygen depletion and Dr. M. van Montfort for discussions concerning the interpretations of the results from image analysis.
REFERENCES
1. Aleem M.I.H., Alexander M. (1958) Cell-free nitrification by Nitrobacter. J Bacteriol 76: 510-514
2. Aleem M.I.H., Alexander M. (1960) Nutrition and physiology of Nitrobacter agilis. Appl Microbiol
8:80-84
3. Andrews G. (1988) Effectiveness factors for bioparticles with Monod kinetics. Chem Eng J 37:
B31-B37
4. Beeftink H.H., Van Der Heijden R.T.J.M., Heijnen J.J. (1990) Maintenance requirements: energy
supply from simultaneous endogenous respiration and substrate consumption. FEMS Microb Ecol
73: 203-209
5. Belser L.W. (1979) Population ecology of nitrifying bacteria. Ann Rev Microb 33: 309-333
6. Belser LW. (1984) Bicarbonate uptake by nitrifiers: effects of growth rate, pH, substrate
concentration, and metabolic inhibitors. Appl Environ Microbiol 48: 1100-1104
7. Bird R.B., Stewart W.E., Lightfoot E.N. (1960) Transport phenomena. Wiley International edition,
New York, 780 p
8. Black G.M. (1986) Immobilized cell physiology. In: Process Engineering Aspects of Immobilized
Cell Systems. Eds: C. Webb, G.M. Black, B. Atkinson. The Institution of Chemical Engineers,
Warwickshire, pp 75-86
9. Bock E. (1965) Vergleichende Untersuchungen über die Wirkung sichtbaren Lichtes auf
Nitrosomonas europaea und Nitrobacter winogradskyi. Arch Microbiol 51: 18-41
10. Boon B., Laudelout H. (1962) Kinetics of nitrite oxidation by Nitrobacter winogradskyi. Biochem
98

Oxygen consumption rate of immobilized Nitrobacter
J 85: 440-447
11. Buitelaar R.M., Hulst A.C., Tramper J. (1989) Immobilization of biocatalysts in thermogels using
the resonance nozzle for rapid drop formation and an organic solvent for gelling. Biotechnol Techn
2: 109-114
12. Chen K.C., Huang C.T. (1988) Effects of the growth of Trichosporon cataneum in calcium
alginate gel beads, upon structure and oxygen transfer characteristics. Enzyme Microb Technol
10: 284-292
13. De Gooijer CD. , Hens H.J.H., Tramper J. (1989) Optimum design for a series of continuous
stirred tank reactors containing immobilized biocatalyst beads obeying intrinsic Michaelis-Menten
kinetics. Bioprocess Eng 4: 153-158
14. De Gooijer CD., Wijffels R.H., Tramper J. (1991) Growth and substrate consumption of
Nitrobacter agilis cells immobilized in carrageenan: part 1. dynamic modeling. Biotechnol Bioeng
38: 224-231
15. Gay G., Corman A. (1981 ) Comparative study of the growth of two strains of Nitrobacter in batch
and continuous culture Microb Ecol 10: 99-105
16. Gosmann B., Rehm H.J. (1988) Influence of growth behaviour and physiology of
alginate-entrapped microorganisms on the oxygen consumption. Appl Microb Biotechnol 29:554-
559
17. Gould G.W., Lees H. (1960) The isolation and culture of the nitrifying bacteria Part 1. Nitrobacter.
Can J Microbiol 6: 299-307
18. Greenberg A.E., Trussel R.R., Clesceri L.S. (1985) Standard methods for the examination of
water and wastewater. 16th ed American Public Health Association, Washington DC, 1268 p
19. Gujer W., Boller M. (1989) A mathematical model for rotating biological contactors. In: Proceedings
of the Technical Advances in Bioreactors conference, Nice, CFRP-AGHTM, Paris
20. Helder W., De Vries R.T.P. (1983) Estuarine nitrite maxima and nitrifying bacteria (Ems-Dollard
estuary). Netherlands J Sea Research 17 (1): 1-18
21. Hennig A. (1969) Fehler der Volumermittlung aus der Flächenrelation in dicken Schnitten (Holmes
Effekt). Mikroskopie 25: 25-44
22. Herbert D. (1959) Some principles of continuous culture. In: Recent Progress in Microbiology. Ed.
G. Tunevall, Almquist & Wicksell, Stockholm, p 381-396
23. Hiemstra H., Dijkhuizen L, Harder W. (1983) Diffusion of oxygen in alginate gels related to the
kinetics of methanol oxidation by immobilized Hansenula polymorpha cells. Appl Microb
Biotechnol 18: 189-196
24. Hulst A.C., Hens H.J.H., Buitelaar R.M., Tramper J. (1989) Determination of the effective
diffusion coefficient of oxygen in gel materials in relation to gel concentration. Biotechnol Techn
3: 199-204
25. Hulst A.C., Tramper J., Van 't Riet K., Westerbeek J.M.M. (1985) A new technique for the
production of immobilized biocatalyst in large quantities. Biotechnol Bioeng 27: 870-876
26. Keen G.A., Prosser J.I. (1987) Steady state and transient growth of autotrophic nitrifying bacteria.
99

Chapter 4
Arch Microbiol 147: 73-79
27. Laane C , Boeren S., Vos K., Veeger C. (1987) Rules for optimization of biocatalysis in organic
solvents. Biotechnol Bioeng 30: 81 -87
28. Laudelout H., Simonart P.C., Van Droogenbroeck R. (1968) Calorimetric measurement of free
energy utilization by Nltrosomonas and Nitrobacter. Arch Microb 63: 256-277
29. Laudelout H., Van Tichelen L. (1960) Kinetics of the nitrite oxidation by Nitrobacter winogradskyi
J Bacterid 79: 39-42
30. Lees H., Simpson J.R. (1957) The biochemistry of nitrifying organisms. Biochem J 65: 297-305
31. Monbouquette H.G., Ollis D.F. (1986) A structural model for immobilized cell kinetics. Ann NY
Acad Sc 469: 230-244
32. Müller-Neuglück M., Engel H. (1961) Photoinaktivierung von Nitrobacter winogradskyi Buch Arch
Microbiol 39: 130-138
33. O'Kelley J.C., Becker G.E., Nason A. (1970) Characterization of the particulate nitrite oxidase and
its component activities from the chemoautotroph Nitrobacter agilis. Biochim Biophys Acta 4:393-
425
34. Painter H.A. (1970) A review of literature on inorganic nitrogen metabolism in microorganisms.
Water Res 4: 393-450
35. Peeters T.L., Van Gooi A.P., Laudelout H. (1969) Kinetic study of oxygen-limited respiration in
nitrifying bacteria. Bacteriol Proc Am Soc Microb, Washington DC, p 141
36. Pirt S.J. (1966) The maintenance energy of bacteria in growing cultures. Proc Royal Soc London
163B: 224-231
37. Ranz W.E., Marshall W.R. (1952) Evaporation from drops, part 2. Chem Eng Progr 48: 173-180
38. Rennie R.J., Schmidt E.L. (1977) Autecological and kinetic analysis of competition between
strains of Nitrobacter in soils. Ecol Bull (Stockholm) 25: 431-441
39. Roels J.A. (1983) Energetics and kinetics in biotechnology. Elsevier Biomedical Press, Amsterdam,
330 p
40. Salmon P.M. (1989) Mass transport phenomena in reactors containing entrapped cells or bacterial
cells. Ph.D. Thesis, Stanford University, Stanford, USA, 348 p
41. Sänger P., Deckwer W.D. (1981) Liquid-solid mass transfer in aerated suspensions. Chem Eng
J 22: 179-186
42. Scott CD., Woodward CA., Thompson J.E. (1989) Solute diffusion in biocatalyst gel beads
containing biocatalysis and other additives. Enzyme Microb Technol 11: 258-263
43. Sharma B., Ahiert R.C (1977) Nitrification and nitrogen removal. Water Res 11: 897-925
44. Silver W.S. (1961) Studies on nitrite oxidizing microorganisms: I. nitrite oxidation by Nitrobacter.
Soil Sc Soc Proc 25: 197-199
45. Stenstrom M.K., Poduska R.A. (1980) The effect of dissolved oxygen concentration on
nitrification. Water Res 14: 643-649
46. Stewart P.S., Robertson CR. (1989) Microbial growth in a fixed volume: studies with entrapped
Escherichia coli. Appl Microb Biotechnol 30: 34-40
100

Oxygen consumption rate of immobilized Nitrobacter
47. Tramper J. (1985) Nitrification and denitrification by immobilized bacteria. Third Eur Congr
Biotechnol 4, VCH Weinheim, p 363-368
48. Tramper J. (1987) Nitrification and denitrification by immobilized viable cells. In: Enzyme
Engineering 8, Eds. A.I. Laskin, K. Mosbach, D. Thomas, LB. Wingard. Ann N Y Acad Sei 501,
New York, p 362-366
49. Tramper J., De Man A.W.A. (1986) Characterization of Nitrobacter agilis immobilized in calcium
alginate. Enzyme Microb Techn 8: 472-476
50. Tramper J., Grootjen D.R.J. (1986) Operating performance of Nitrobacter agilis immobilized in
carrageenan. Enzyme Microb Techn 8: 477-480
51. Tramper J., Suwinska-Borowiec G., Klapwijk A. (1985) Characterization of nitrifying bacteria
immobilized in calcium alginate. Enzyme Microb Technol 7: 155-160
52. Underwood E.E. (1972) The stereology of projected images. J Microscopy 95: 25-44
53. Van Droogenbroeck R., Laudelout H. (1967) Phosphate requirements of nitrifying bacteria.
Antonie van Leeuwenhoek 33: 287-296
54. Van Ginkel CG., Tramper J., Luyben K.Ch.A.M., Klapwijk A. (1983) Characterization of
Nitrosomonas europaea immobilized in calcium alginate. Enzyme Microb Technol 5: 297-303
55. Van Neerven R.W., Wijffels R.H., Zehnder J.B. (1990) Scanning electron microscopy of
immobilized bacteria in gel beads: a comparative study of fixation methods. J Microb Methods 11:
157-168
56. Venkatasubramanian K., Karkare S.B., Vieth W.R. (1983) Chemical engineering analysis of
immobilized-cell systems. Appl Biochem Bioeng 4: 311-349
57. Wagner K., Hempel D.C. (1988) Biodegradation by immobilized bacteria in an airlift-loop reactor:
influence of biofilm diffusion limitation: Biotechnol Bioeng 31: 559-566
58. Weibel E.R. (1979) Stereological methods 1, Academic Press, London, 415 p
59. Weibel E.R. (1980) Stereological methods 2, Academic Press, London, 340 p
60. Wijffels R.H., Tramper J. (1989) Performance of growing Nitrosomonas europaea cells
immobilized in K-carrageenan. Appl Microbiol Biotechnol 32: 108-112
61. Williamson K.J., McCarty P. (1975) Rapid measurement of Monod half-velocity coefficients for
bacterial kinetics. Biotechnol Bioeng 17: 915-924
62. Yoshioka T., Saijo Y. (1984) Photoinhibition and recovery of NH/-oxidizing bacteria and N02-
oxidizing bacteria. J Gen Appl Microbiol 30: 151-166
101

INTERMEZZO
After immobilization the bacteria are distributed homogeneously as single cells over the gel. Substrate is supplied to the bioreactor which diffuses to the immobilized cells. The bacteria will grow in the gel beads. Growth takes place by cell division and as a consequence clumps of cells are formed: micro-colonies. Micro-colonies were observed with scanning electron miscroscopy. In order to obtain a picture the object is coated with a very thin gold layer. This gold layer allows the relief of the surface to be observed. A beam of electrons is shooted at the object. Secondary electrons are generated out of the gold and these electrons are detected. The relief is being distinguished and the image is obtained, because the intensity of the electrons coming from deeper or higher regions of the surface is different.
Beads were split and micro-colonies on the obtained inside surface could be observed (bar length 10 ̂ m). Bacteria inside the micro-colonies can be distinguished.
The outside surface was also examined (bar length 10 ̂ m). Expansion of colonies resulted in the formation of protrusions. Further expansion of colonies results in eruption of entire colonies from the gel beads.

V Jr
.v^w», ..̂ ki
Iß •*'*

This chapter has been submitted for publication by the authors R.H. Wijffels, MR. Eekhof, D. de Beer, J.C. van den Heuvel and J. Tramper
CHAPTER 5
PSEUDO-STEADY-STATE OXYGEN-CONCENTRATION PROFILES IN AN AGAR SLAB
CONTAINING GROWING NITROBACTER AGIUS
ABSTRACT
A dynamic model for growth and substrate consumption of immobilized cells is evaluated by comparing experimental and calculated pseudo-steady-state oxygen-concentration profiles in the support material. For this, Nitrobacter agilis cells were immobilized and cultivated in agar slabs. The system was operated as a continuous submerged-bed reactor. At different growth stadia oxygen-concentration profiles were determined in the slabs with a microsensor. It was shown that simulated and measured profiles agreed very well, both in steady and in pseudo-steady states.
INTRODUCTION
Nitrogen reduction in waste streams can be accomplished by nitrification and denitrification in biological wastewater-treatment plants. Especially nitrification is a problematic process, because of the low growth rate of the microorganisms involved.
105
Chapter 5
The capacity of nitrification reactors can be increased by uncoupling the bacterial and the liquid-retention time, e.g. by immobilization of the bacterial cells. Immobilization of bacteria is widely used in wastewater-treatment systems, by taking advantage of the spontaneous attachment of cells. The resulting biofilm processes, however, are poorly understood because of their complexity: biofilms contain many microbial species, substrates are transferred to the organisms by diffusion and subsequently converted, and parts of the biofilm are lost due to erosion and sloughing. Because natural biofilms are not homogeneous, local variations, e.g. in substrate-concentration profiles, disturb observations. To improve the knowledge of bacterial kinetics in biofilms, research was executed with nitrifying pure cultures immobilized by gel entrapment.4,10 In this model system the performance of the immobilized cells is not obscured by uncontrolled processes like erosion or sloughing. Additionally, agar slabs are homogeneous, the surface is well defined and it is possible to distribute initially the biomass homogeneously in the gel. In previous studies a dynamic model for cell growth and substrate consumption was developed and experimentally evaluated. Both internal diffusion of substrate in the beads and external diffusion through the surrounding stagnant layer were incorporated.4 In a first evaluation the immobilized Nitrobacter agilis cells were cultivated in an air-lift loop reactor with oxygen as the limiting substrate. It was shown that the observed and predicted macroscopic oxygen-consumption rates agreed well for three different liquid-phase oxygen concentrations.10
As a further evaluation, pseudo-steady-state oxygen-concentration profiles have been determined with microelectrodes. Most microelectrode studies were done in flow cells.1,2,3,5,6 If gel beads with immobilized cells cultivated in air-lift loop reactors are transferred to a flow cell, however, the resulting oxygen profiles will only be comparable if the flow conditions in both devices are the same. As was shown by de Gooijer et al.4, the influence of external mass transfer is an important factor for growth of immobilized cells. Ideally, cultivation and measurement of substrate-concentration profiles should be performed in the same reactor under the same conditions. Therefore, cells were immobilized in a flat agar plate on the bottom of a stirred reactor, enabling a large number of profile measurements in time at a fixed radial distance from the stirrer without influencing the cultivation conditions.
106

Oxygen-concentration profiles in an agar slab
MATERIALS AND METHODS
Organism, culture conditions and immobilization procedure
Nitrobacter agilis was cultivated in a continuous culture at a dilution rate of 2.8 x
10"6 s'1. The growth medium has been described before.10 Effluent was collected for
2-3 days and cells were harvested by centrifugation during 20 min at 16,300 g. The
concentrated cell suspension was mixed with an agar solution at 39 °C in such a way
that the final agar concentration was 20 g. dm"3. The gel was poured into a cylindrical
vessel and after cooling a gel layer was formed on the bottom of the vessel.
Immobilized-cell reactor
The vessel with the agar plate was placed in a Faraday cage and used as a submerged-bed reactor as is shown in Fig. 1. The reactor was continuously fed at a high dilution rate (2 x 10"4 s"1) to ensure that during the entire experiment nutrients were available in excess and oxygen was the growth-limiting substrate. The liquid was mixed with a turbine stirrer (Applikon 1012) at a speed of 150 rpm situated 2.5 cm above the agar plate. The temperature was maintained at 30°C. Oxygen was supplied by a small air sparger; the liquid phase was air saturated during the entire experiment.
air influent _ .
\.J
IZMHZI
oxygen micro-sensor
agar
- ^ effluent
water bath 30C
Fig. 1: Experimental set up for determination of oxygen-concentration profiles in a submerged
agar-gel slab.
107

Chapter 5
The medium composition was as given before10, except that sodium salts were used instead of potassium salts.
Two experiments were executed; in a vessel with a diameter of 12.7 and 17.4 cm, respectively. The corresponding thickness of the agar layer was 2 and 1.5 cm, respectively.
The thickness of the stagnant layer will vary over the plate. For this reason, the variation of the thickness of the stagnant layer as a function of radial distance from the stirrer was determined, by measuring oxygen-concentration profiles as a function of distance from the turbine stirrer. For this experiment immobilized yeast cells were used, because it is possible to immobilized them at a high concentration. The medium consisted of an acetate buffer (0.02 mol. dm"3, pH 7).
Microelectrode
Oxygen-concentration profiles were measured with an oxygen microsensor. Electrodes with internal reference and a tip diameter of 10 ßtr\ were prepared as described before.3,9
Model
The model was described previously by De Gooijer ef a/.4
Pseudo-steady states with respect to the substrate-concentration profile over the beads were assumed. Within one time step a differential mass balance over the plate in which simultaneous diffusion and consumption occurs was solved. External mass transfer was calculated by the film theory. The macroscopic consumption rate of cells was calculated according to Monod kinetics in which maintenance
Table I: Model-input parameters
effective diffusion coefficient
D.g (m2.s1) 2.35 x 10*
liquid/solid mass-transfer coefficient
kliS (m.s1) 5.5 x 10'5
kinetic parameters
"max
m
(s'1) 1.0x10"5
(mol.rrï3) 0.017 (kg.moT) 1.16 x 10 3
(mol.kg\s1) 1.1 x 1 0 3
biomass concentrations
X0 (exp. 1) (kg.rrï3) X«, (exp. 2) (kg.m3) > U (kg.m-3)
7x10' 3
6 x 1 0 3
11
108

Oxygen-concentration profiles in an agar slab
requirements were taken into account. The set of equations was solved numerically using a second-order Runge-Kutta algorithm. The resulting substrate-concentration profile was used to calculate the biomass-concentration profile. The local biomass concentration was restricted to a maximum as a straightforward application of the differential equations would lead to infinitely high biomass concentrations near the surface of the bead.
Model input parameters (Table 1) were the same as in previous work10, except for the diffusion coefficient in the gel, the initial biomass concentration and the external mass-transfer coefficient. For the effective diffusion coefficient in agar the value found by Hulst er a/.7 was used. The initial biomass concentration was measured by means of colony counts of microscopic sections. It was assumed that each cell formed a separate colony as result of growth. After some time colonies could be observed and counted. Agar samples were taken after 13 and 21 days of cultivation in the first experiment and after 15 and 23 days in the second experiment. Agar cylinders were cut out of the plate and 3 ßvn sections were cut from the cylinder with an ultramicrotome as described before.10 The remaining hole was filled up with fresh agar. The numerical concentration obtained was converted to a mass density by a conversion factor of 10"10 mg/cell.8
RESULTS AND DISCUSSION
Variation in the thickness of the stagnant layer as a function of the radial distance from the stirrer was evaluated with immobilized yeast cells. Profiles were determined at the boarders of a strip of agar with a width of 1 cm, concentrically situated around the stirrer. It was shown that at 150 rpm at the two boarders exactly the same profiles were obtained (Fig. 2), which means that the hydrodynamic conditions above this strip are the same. For the experiment with immobilized Nitrobacter agilis cells, the same conditions were chosen and profiles were measured at the same location. As both growth and measurements of the profiles were done under these conditions the external mass-transfer coefficient can be assumed to be constant during the entire experiment.
109

Chapter 5
oxygen concentration (mM)
0.25
0.15
0.05
200 400 600 800 depth (f;m)
1000 1200 1400
Fig. 2: Oxygen-concentration profiles of immobilized yeast cells in an agar slab at the borders (•
inside, • outside) of a strip, concentrically situated around the stirrer.
From colony counts in agar samples it could be derived that the initial biomass concentration was 7 x 10"3 kg. m"3 and 6 x 10"3 kg. m"3 for the two experiments, respectively.
In the two separate experiments transient-state oxygen-concentration profiles of Nitrobacter agilis were measured. It appeared to be difficult to determine the exact position of the gel surface. In the case of particles this is done by rectangular observation of the point where the electrode penetrates the gel or biofilm.35 In the case of a gel plate, however, observation is done in a birds-eye perspective and depths are difficult to estimate. As is shown in Fig. 2, profiles tend to be very steep as within a depth of 20 jum the oxygen concentration decreases 0.1 mM. A spatial resolution of 20 jum in the determination of the location of the surface was impossible to obtain. For this reason other approaches were used. Based on the approximated position of the gel surface and the assumption that the thickness of the stagnant liquid film is constant, the position of the boundary of the liquid film can be determined according to Hooijmans et a/.6 They determined the thickness of the stagnant layer by means of linear regression, using five data points. In our case, the thickness obtained was dependent on the number of data points that were included in the regression
110

Oxygen-concentration profiles in an agar slab
oxygen concentration (mM)
0.25
0.10
experimental data fitted curve tangent concentration in liquid phase representation of stagnant layer agar plate
1000 distance (/im)
Fig. 3: Oxygen-concentration profile in the liquid phase.
analysis. This can be explained by the fact that the film theory, in which it is assumed that the concentration is linear with distance, used is a simplification of reality. In reality it is a non-linear function as is shown in Fig. 3. For this reason a non-linear function was fitted, the tangent was determined and the intersection of this tangent and the line representing the concentration of the bulk liquid phase determined the film thickness as is shown in Fig. 3. A disadvantage of this method was, that fluctuations in concentration in the liquid film occurred, resulting in variations in the thickness of the film layer found. We determined the location of the gel surface by fitting the mass-transfer coefficient with the simulation programme of De Gooijer ef a/.4 to the experimental data of the profile after 12 days of cultivation. The measured profile was matched with the calculated profile by translation of the origin. At a mass-transfer coefficient of 5.5 x 10s m. s"1 experimental and calculated profiles were in close agreement. For the other days, it was assumed that the mass-transfer coefficient was the same.
111
Chapter 5
Evaluation of the pseudo-steady-state profiles was done in a continuously operated submerged agar slab. The nitrite concentration in the influent was 15 mol. m"3. At the dilution rate applied the nitrite concentration in the effluent was never lower than 13 mol. m"3, which means that oxygen was the limiting substrate during the whole experiment.4,10 Experimentally obtained and simulated transient-state oxygen-concentration profiles after 5,6, 7,10,11,12,13,14,18 and 21 days of cultivation are shown in Fig. 4. The first days after immobilization the oxygen-concentration profile is flat, while the gradients increase as growth proceeds. After about 13 days a steady-state situation has been reached as judged from the concentration profiles. The profiles show clearly that the gradient over the stagnant liquid layer was considerable.
At day 13 and 18 the measured oxygen profile over the stagnant layer is somewhat lower than the calculated values. Additionally, these measurements show high scattering of the signal. Generally experimental profiles in the steady state situation are in closer agreement with the model predictions than in the start-up phase. On the whole, however, simulated and experimental results agree very well. In the second experiment similar results were obtained (results not shown).
CONCLUSIONS
It has been shown that microelectrode studies can be a valuable method to evaluate mathematical modelsthat describe pseudo-steady-state oxygen-concentration profiles over immobilized-cell slabs.
A drawback of the method used is the resolution in determination of the position of the microelectrode. As profiles tend to be very steep in a 'full-grown' slab, the accuracy of determination of the position is a limiting factor. Nevertheless, it was shown that model and experimental data were in excellent agreement for Nitrobacter agilis immobilized in an agar plate.
112

Oxygen-concentration profiles in an agar slab
liquid phase solid phase
oxygen concentration (mM)
0.2
0.1
* \*«»»«~l **•• •*•*""*-»«, day 5
-100 100 200
0.2
0.1
•
-
• •N*^5 day 7
100 200
0.1
7 •
•
• day 11
100 200
0.2
0.1 \
day 13
-100 100 200
0.1
- * *A •
day 18
V . -100 0 100 200
distance (fjm)
liquid phase solid phase
oxygen concentration (mM)
• • . • • 7 > i . day 6
-100 100 200
0.2
0.1
I ^ « î î ,
day 10
-100 100 200
0.2
0.1
•
-
-100
•
0 100
• \ • A
200
day 14
-100 100 200
0.2 day 21
-100 o
distance (fim) 100 200
Fig. 4: Experimental and simulated transient-state oxygen-concentration profiles in an agar slab
with immobilized Nitrobacter agilis after 5, 6, 7 ,10,11, 12,13, 14,18 and 21 days of cultivation.
113

Chapter 5
LITERATURE
1 De Beer D., Van Den Heuvel J.C. (1988) Gradients in immobilized biological systems. Analytica
Chimica Acta 213: 259-265
2 De Beer D., Van Den Heuvel J.C., Sweerts J.P.R.A. (1990) Microelectrode studies in
immobilized biological systems. In: Physiology of Immobilized Cells. Eds.: J.A.M. De Bont, J.
Visser, B. Mattiasson, J. Tramper. Elsevier Science Publishers B.V., Amsterdam, p 613-624
3 De Beer D. Van Den Heuvel J.C., Ottengraf S.P.P. (1993) Microelectrode measurements of the
activity distribution In nitrifying bacterial aggregates. Appl Environm Microbiol 59: 573-579
4 De Gooijer CD. , Wijffels R.H., Tramper J. (1991) Growth and substrate consumption of
Nltrobacter agllis cells Immobilized in carrageenan. Part I: dynamic modeling. Biotechnol Bioeng
38: 224-231
5 Hooijmans CM. , Ras C , Luyben K.Ch.A.M. (1990) Determination of oxygen profiles in
biocatalyst particles by means of a combined Polarographie oxygen microsensor. Enzyme Microb
Technol 12 178-183
6 Hooijmans CM. , Geraats S.G.M., Potters J.J.M., Luyben K.Ch.A.M. (1990) Experimental
determination of mass transfer boundary layer around a spherical biocatalyst particle. Chem Eng
J 44: B41-B46
7 Hulst A.C., Hens H.J.H., Buitelaar R.M., Tramper J. (1989) Determination of the effective
diffusion coefficient of oxygen in gel materials in relation to gel concentration. Biotechnol Techn
3: 199-204
8 Lees H., Simpson J.R. (1957) The biochemistry of nitrifying organisms 5. nitrite oxidation by
Nitrobacter. Biochem J 65: 297-305
9 Revsbech N.P., Ward D.M. (1980) Oxygen microelectrode that is insensitive to medium chemical
composition: use in an acid microbial mat dominated by Cyanidium caldarium. Appl Environm
Microbiol 45: 755-759
10 Wijffels R.H., De Gooijer CD., Kortekaas S., Tramper J. (1991) Growth and substrate
consumption of Nitrobacter agilis cells immobilized in carrageenan. Part II: model evaluation.
Biotechnol Bioeng 38: 232-240
114

INTERMEZZO
INTERMEZZO
In the nitrification process ammonia is converted with oxygen to nitrate. The rate with which the micro-organisms convert the ammonia to nitrate depends on the concentration of ammonia or oxygen. Generally this activity of the bacteria is higher when the concentration of one of these compounds is higher. In our experiments oxygen was always the rate-limiting substrate. Oxygen is supplied to the bacteria by bubbling air in the reactor. Schematically, the process can be represented as follows. Oxygen will be transferred from the air bubbles to the liquid phase. It is then transferred from the liquid phase to the gel beads, through the gel matrix and into the colonies. Finally a reaction will occur in the colonies. We developed equations for all of these steps and combined those equations to an overall model. With that model we were able to calculate the rate of the process. Experiments were used to verify if our model contained the correct components.

stagnant region
gas-liquid interface
liquid-solid interface
Icfocolony

This chapter has been submitted for publication by the authors R.H. Wijffels, CD. de Gooijer, A.W. Schepers, E.E. Beuling, L.F. Mallée and J. Tramper
CHAPTER 6
DYNAMIC MODELLING OF IMMOBILIZED NITROSOMONAS EUROPAEA: IMPLEMENTATION OF
DIFFUSION LIMITATION OVER EXPANDING MICRO-COLONIES
ABSTRACT
A dynamic model describing growth and substrate consumption of immobilized bacteria has been successfully evaluated for Nitrobacter agilis . Further evaluation of the model for immobilized Nitrosomonas europaea resulted in predictions of consumption rates, which were higher than the experimentally obtained rates. It was suspected that this overestimation was caused by effects of diffusion limitation over micro-colonies. For this reason diffusion limitation over micro-colonies has now been integrated in the model: the colony-expansion model. Growth is represented by expansion of colonies. Colonies breaking through the gel surface cause release of bacteria into the surrounding medium. Two options were considered for this release: either growth resulting in continuous leakage of single bacteria or eruption of entire colonies at once. In the latter case both macroscopic consumption rates and transient-state biomass-concentration profiles are described satisfactorily by the model. Results
119

Chapter 6
of the previous experiments with Nitrobacter agilis can also be described satisfactorily
by the model as well.
INTRODUCTION
Many papers are dedicated to modelling of simultaneous reaction and diffusion in immobilized-cell reactors. In the majority of these models, however, i) no growth is considered, ii) a homogeneous biomass distribution is assumed (over the entire bead or film), iii) only the steady state is treated, and iv) external mass transfer has not been included. Steady-state models for growing cells can be quite satisfactory for design purposes, but fail to describe the start-up phase and the response to changing conditions in the reactor.
Substrate gradients result in heterogeneous distributions of viable cells due to growth and death of cells.8,27,42 Only for very small particles, non-uniform cell growth can be prevented.6 For these reasons dynamic models have been developed describing simultaneous substrate consumption and growth.8,14,18,27
Evaluation of the model of De Gooijer et al.6 with immobilized Nitrobacter agilis showed that predicted oxygen-consumption rates agree well for three different bulk-phase oxygen concentrations.42 A discrepancy, however, was found in the biomass-concentration profiles.8 In the model, in the outer shells of the gel bead a constant maximum biomass concentration was defined, while experimentally a peak was observed. This was explained by the growth of biomass in micro-colonies.
Application of the model of De Gooijer et a/.8 to growth of Nitrosomonas europaea, did not only show differences in biomass concentration profiles, but in macroscopic consumption rates as well. Overestimations were suspected to be due to diffusion limitation over the micro-colonies. For this reason diffusion limitation over micro-colonies has now been included in the model. Consequently, model calculations and experimental results of macroscopic consumption rates and biomass-concentration profiles indeed agree better.
120

Diffusion limitation over expanding micro-colonies
GROWTH MODELS
Pseudo-homogeneous growth model
The pseudo-homogeneous growth model was described previously by De Gooijer ef a/.8 Growth of biomass and consumption of substrate were treated separately because the time scale for growth is several orders of magnitude larger than for substrate consumption. A pseudo-steady state with respect to the substrate-concentration profiles over the beads was assumed in one time step. Each time step a differential mass balance over a bead in which simultaneous diffusion and consumption is incorporated was solved. External mass transfer was calculated by the film theory. The macroscopic consumption rate of cells was calculated according to Monod kinetics in which maintenance requirements were taken into account.2 The set of equations was solved numerically using a second-order Runge-Kutta algorithm. The resulting substrate-concentration profile was used to calculate the biomass-concentration profile. The local biomass concentration was restricted to a maximum as a straightforward application of the differential equations would lead to infinitely high biomass concentrations near the surface of the bead.
Colony-expansion model
After inoculation, the concentration of cells is usually low and the cells are spatially uniformly distributed in the beads. Growth results in the formation of expanding micro-colonies. Due to transport limitation, colonies near the surface of the support material grow faster than the colonies near the centre. Expanding colonies near the surface of the gel beads will eventually touch the gel surface and biomass is released.33 In our case we assume that colonies need to build up pressure to break through the gel surface. It was arbitrarily assumed that release occurs as soon as 1/3 of the volume of the micro-colony protrudes. Furthermore, two mechanisms of biomass release are considered: either growth resulting in continuous leakage of single bacteria or eruption of entire colonies at once.
We did not incorporate a maximum biomass concentration in the colony-expansion model. Expanding colonies will grow until single-cell leakage or eruption occurs, or the growth rate will be restricted by diffusion limitation over the micro-colonies. The
121

Chapter 6
effectiveness factor of large micro-colonies will eventually be so low that the rate of expansion becomes negligible.
Substrate-concentration profiles over gel beads were calculated in a similar way as in the pseudo-homogeneous growth model, except for the fact that an effectiveness factor, r)(r)c, was inserted in order to account for diffusion limitation inside the micro-colonies:
with the boundary conditions:
S- Ss at
— - 0 at r - 0 or r - r, dr f
Calculation of the substrate-consumption rate and combination with external mass-transfer effects was the same as in the pseudo-homogeneous growth model. Equation 1 was solved by dividing the gel bead in 500 shells. In each shell the substrate concentration was calculated with a second-order Runge-Kutta algorithm. The colony effectiveness factor was calculated in all shells based on local substrate concentration and colony radius. In every shell the specific growth rate and the increase in colony radius was calculated.
For calculation of r\{r)c it was assumed, that the colonies remain spherical and that the biomass concentration inside the colonies (Xc) is constant, both in time and space. The substrate concentration over the colony/gel interface is not constant with position. For simplicity, however, we assumed the substrate concentration to be the same all over the surface. For this concentration, the concentration in the shell where the centre of the colony is situated was used.
The effectiveness factor is defined as:
n ( r ) c - 4 ( 2 )
122

Diffusion limitation over expanding micro-colonies
The actual substrate-consumption rate, rsac, was calculated by using differential mass
balances over the colonies where simultaneous diffusion and consumption occurs:
De.o ( $ • & $ ) • < •
with the boundary conditions:
S - St at p - p c
- 5 ^ - 0 at p - 0 or p - pf dp
The theoretical substrate-consumption rate, rsf, is calculated according to Beeftink ef a/.2:
'-BHMÄ) (4)
The dimensionless form of equation 3 was solved numerically by using the fourth-order Runge-Kutta method.
As indicated, growth is assumed to take place by expansion of colonies. Expansion of colonies is calculated by:
r r ( i K ^ - ^ - £ ^ ) H (5) Pe.HI) - P*«M) »V V \ ' II I
making the radii of the colonies dependent on the radial position of the colony in the gel sphere. From the radius distribution a local volume fraction can be calculated and from that and the colony density (j>x) a biomass concentration profile.9,30
The colony density f>J can be obtained by multiplication of X^ by the fraction of the testline that crossed the colonies. In case of Nitrosomonas the resulting density is 71 kg. m"3 and in the case of Nitrobacter 46 kg. m"3.
123

Chapter 6
MATERIALS AND METHODS
Organism and culture conditions
Nitrosomonas europaea (ATCC 19718) was cultivated in a 2.8 dm3 continuous culture at a dilution rate of 3.47 x 10"6 s'1. The composition of the medium was based on studies on nutrient requirements.3,1025'26,31,36,37,38 The medium contained per m3 of demineralized water: 19.0 mol (NH4)2S04; 0.21 mol MgS04; 5 mol NaH2P04; 5 mol Na;,HP04; 5 mmol CaCI2; 9 mmol FeS04 and 0.5 mmol CuS04. The pH was controlled to 7.4 with 7 M NaHC03.
Immobilization procedure
The effluent of the continuous culture was collected during 3 days in an ice-cooled vessel. The cell suspension was centrifuged during 10 minutes at 16,300 g and 5 °C and washed with demineralized water.
A 3 % «-carrageenan solution (Genugel X0828, A/S Kobenhavns Pektinfabrik, DK Lille Skensved) was mixed gently with the washed suspension such that a 2.6 % carrageenan solution was obtained. The carrageenan solution and the cell suspension were kept at 35 °C.
Immobilization was done with a resonance nozzle at 35 °C as described previously.42
The average bead diameter was 1.85 mm in the experiment with a liquid-phase oxygen concentration of 0.08 mol. m3 and 2.0 mm in the other experiments. The initial biomass concentration in the beads was 3.45 x 10³ kg. m"3.
Immobilized-cell cultivation
Immobilized cells were cultivated in continuous-flow air-lift loop reactors with a volume of 3.40 dm3. The reactors were coupled to a Programmable Logic Controller (PLC Melsec-G, Mitsubishi G62P) which controlled the oxygen concentration in the reactors at constant mass-flow rates by mixing nitrogen gas and air or air and pure oxygen as was described before.42 The superficial gas-flow rate was 1.76 x 10³ m. s"1. In three experiments, the bulk oxygen concentration was kept at 0.04, 0.08 and 0.12
124

Diffusion limitation over expanding micro-colonies
mol. m3, respectively. The influent ammonia concentration was adjusted daily to keep the reactor concentration higher than 10 mol. m"3. In this way oxygen was kept the limiting substrate.
The medium contained per m3 of demineralized water: a variable amount of NH4CI; 0.21 mol MgS04; 6.32 mol KH2P04; 6.02 mol KjHPC^; 5 mmol CaCI2; 9 mmol FeS04
and 0.5 mmol CuS04. The pH was controlled to 7.4 with 7 M KHC03. The dilution rate based on the liquid-phase volume was 3.8 x 10⁵ s"1 and the reactor gel load 15 % (v/v). Cultivation was carried out at 30 °C in the dark to prevent effects of light inhibition.5'1744
Oxygen-consumption rate
Ammonia oxidation by Nitrosomonas requires stoichiometric amounts of oxygen.1
Thus to estimate the oxygen-consumption rate, the nitrite-production rate per amount of gel was determined regularly.
Ammonia and nitrite concentrations in influent and effluent were determined using a continuous-flow analysis system (Skalar Auto Analyser).13 For nitrate analysis the samples first passed through a copper-coated cadmium column in order to reduce the nitrate to nitrite. By addition of a-naphtylamide in acid medium, the nitrite forms a red diazo compound, that was measured at 550 nm. Ammonia forms a green coloured complex with salicylate that was measured at 660 nm.
Biomass concentration
Overall viable-biomass estimates were made by activity assays in a biological oxygen monitor as described before.39 In a reaction cuvette 100 beads and 3.9 cm3
potassium phosphate buffer (75 mmol, dm"3, pH 7.4) were suspended and saturated with air. If the activity exceeded 0.002 mol. nrr'gel. s"1, pure oxygen was used to prevent mass-transfer limitations. Through a small opening 100 ß\ 4 M NH4CI was injected. The decrease in oxygen concentration at 30 °C was recorded.
The activity per amount of gel was converted to a biomass dry-weight concentration by dividing by the specific activity. The specific activity of Nitrosomonas europaea (0.01 mol. kg1, s"1) was calculated from the values of M™* and Yxs.
125

Chapter 6
Determination of biomass-concentration profiles
Transient-state biomass-concentration profiles were determined in the beads cultivated at a liquid phase oxygen concentration of 0.12 mol. m"3. Samples of the beads were used for image analysis as described before.42 Fixation prior to sectioning was done in a single step. In this fixation step a 2 % (w/v) solution of formaldehyde and 2.5 % (w/v) solution of glutaraldehyde in sodium-cacodylate buffer (pH 7.4, 0.1 M KCl) was used. Image analysis was executed on sections through the centre of the beads by sectioning with an ultramicrotome. Sectioning was executed on a LKB 8800 Ultramicrotome III with a glass knife. Sections with a thickness of 2 /urn were stained with toluidine blue to improve the contrast between the gel and the colonies. The samples were observed at a magnitude of 13.2 with a light microscope and photographs were made with a Kodak Technical Pan film 2415 at 50 ASA. The prints (final magnification 90x) were used for image analysis with a Quantimet 970 (Cambridge Instruments). The Quantimet 970 analyses a field of 800 x 625 pixels. Pixels were calibrated to absolute sizes. The width of one pixel was 1.250 or 1.471 um. By image analysis the coordinates of the centres of the colonies were determined in relation to the surface of the bead. Also the radii of the colonies were determined. For determination of the volumetric fraction of colonies the beads were divided into fictive shells by test lines. Results were corrected for overestimations as described before.42
Starvation under oxygen depletion
For determination of maintenance energy Nitrosomonas europaea was cultivated batch wise in a 1 dm3 stirred fermenter. The medium used was the same as in the continuous-flow experiments for immobilized cells. The initial ammonia concentration was 75 nriM. Due to aeration growth of cells occurred. As soon as the ammonia concentration was reduced to 25 mM, nitrogen gas was sparged instead of air. The decrease in activity was taken as a measure for the specific biomass-degradation rate, as can be obtained directly from the relation of Herbert15 when substrate concentration is zero:
126

Diffusion limitation over expanding micro-colonies
Data for molar substrate yield were obtained from the literature.
Activity was determined as described before, except that it was directly measured
in the culture medium.
pH profile
Nitrosomonas europaea was immobilized in carrageenan-gel beads of 3 mm in diameter. The cells were cultivated in a continuous-flow reactor in the same medium as used for the air-lift experiments at an oxygen concentration of 0.12 mol. m"3. After cultivation, beads were mounted on a needle in a continuous-flow chamber with air-saturated growth medium. Profiles were measured with a pH-microsensor with a tip diameter of 1 Mm as was described by De Beer ef a/.7
RESULTS AND DISCUSSION
Input parameters
All input parameters used in the dynamic mathematical model were obtained from the literature or determined in separate experiments. The liquid/solid mass-transfer coefficient (/c/s) was directly obtained from our previously reported experiments.42
Effective diffusion coefficient (Deg)
The effective diffusion coefficient for oxygen in «-carrageenan beads is 2.1 x 10"9
m2. s'1.43 The effective diffusion coefficient is affected by the concentration of biomass in the support material. For the use of the model of De Gooijer ef a/.8 a biomass-concentration-dependent diffusion coefficient was used. The effective diffusion coefficient will be zero if all pores in the gel are completely filled by bacterial cells, with no intercellular space left. At the gel concentration used, the available pore volume will be at least 95 % of the total gel volume and the pores will be completely filled if the biomass concentration is about 950 kg. m"3. This value was defined as the maximum physically attainable biomass concentration Xpmax.
In the case of the colony-expansion model two different effective diffusion
127
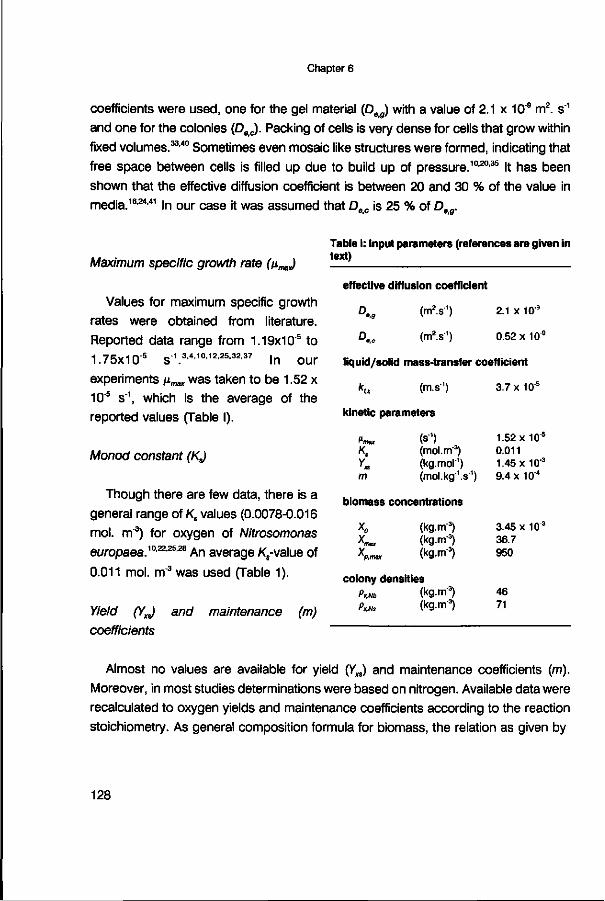
Chapter 6
coefficients were used, one for the gel material (Deg) with a value of 2.1 x 10⁹ m2. s"1
and one for the colonies (Dec). Packing of cells is very dense for cells that grow within fixed volumes.33,40 Sometimes even mosaic like structures were formed, indicating that free space between cells is filled up due to build up of pressure.10,20,35 It has been shown that the effective diffusion coefficient is between 20 and 30 % of the value in media.16,24,41 In our case it was assumed that Dgc is 25 % of Dgg.
Maximum specific growth rate (p^J
Values for maximum specific growth rates were obtained from literature. Reported data range from 1.19x10s to
1.75x10"! -1 3.4,10.12,25,32,37 In our experiments ßmax was taken to be 1.52 x 10"5 s1, which is the average of the reported values (Table I).
Monod constant (KJ
Though there are few data, there is a general range of Rvalues (0.0078-0.016 mol. m"3) for oxygen of Nitrosomonas
europaea. 1 An average Ks-value of
0.011 mol. m"3 was used (Table 1).
Y7e/d (YJ and maintenance (m) coefficients
Table I: Input parameters (references are given in text)
effective diffusion coefficient
D,g (rrr'.s"1) 2.1 x 10'9
D.c (m2.s1) 0.52 x 10⁹
liquid/solid mass-transfer coefficient
kliS (m.s1) 3.7 x 1 0 5
kinetic parameters
m
(s1) 1.52x10"5
(mol.rrï3) 0.011 (kg.mol'1) 1.45x10"3
(mol.kg-'.s-1) 9.4 xW4
biomass concentrations
X0 (kg.m-3) Km (kg.m-3) K,m„ (kg.m-3)
colony densities Pm, (kgm3) P*.NS (kg.m3)
3.45 x 10 3
36.7 950
46 71
Almost no values are available for yield (Vm) and maintenance coefficients (m). Moreover, in most studies determinations were based on nitrogen. Available data were recalculated to oxygen yields and maintenance coefficients according to the reaction stoichiometry. As general composition formula for biomass, the relation as given by
128
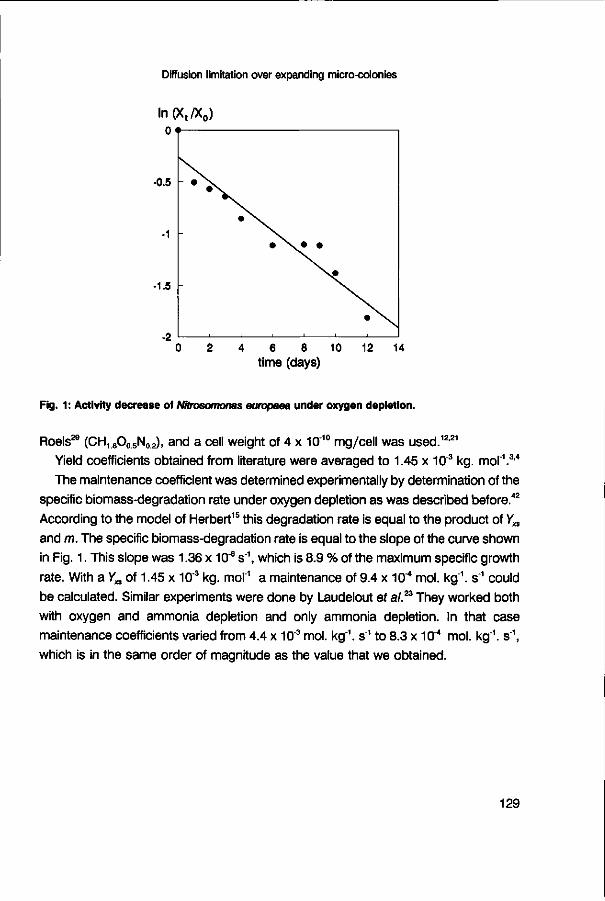
Diffusion limitation over expanding micro-colonies
ln(X t/X0) Of-
4 6 8 10 12 time (days)
14
Fig. 1 : Activity decrease of Nitrosomonas europaea under oxygen depletion.
Roels29 (CH, 8O05N02), and a cell weight of 4 x 10"10 mg/cell was used.12,21
Yield coefficients obtained from literature were averaged to 1.45 x 10³ kg. mol"1.3,4
The maintenance coefficient was determined experimentally by determination of the specific biomass-degradation rate under oxygen depletion as was described before.42
According to the model of Herbert15 this degradation rate is equal to the product of Y„ and m. The specific biomass-degradation rate is equal to the slope of the curve shown in Fig. 1. This slope was 1.36 x 1CT6 s"\ which is 8.9 % of the maximum specific growth rate. With a Yxs of 1.45 x 10"3 kg. mol"1 a maintenance of 9.4 x 10" mol. kg"1, s"1 could be calculated. Similar experiments were done by Laudelout ef a/.23 They worked both with oxygen and ammonia depletion and only ammonia depletion. In that case maintenance coefficients varied from 4.4 x 10'3 mol. kg"1, s"1 to 8.3 x 10"4 mol. kg'1, s"1, which is in the same order of magnitude as the value that we obtained.
129

Chapter 6
macroscopic oxygen-consumption rate (mol. rrr3. sr1)
0.012
0.008
0.004
n
f •
I t m
ƒ t
h /*A / À A * * * » A
/ , / . . • • • . . . . . • • • • •
10 20 30 time (days)
40
Fig. 2: Observed (markers) and predicted (lines) overall oxygen-consumption rates of immobilized
Nitrosomonas europaea at different liquid-phase oxygen concentrations: (• ) S„ = 0.04 mol. m3,
(», — ) S„ = 0.08 mol. m"3, ( • , — ) S„ = 0.12 mol. m3. Predictions were done by the pseudo-
homogeneous growth model.'
Validation pseudo-homogeneous growth model with Nitrosomonas europaea
Macroscopic oxygen-consumption rate
Macroscopic oxygen-consumption rates were determined in three separate experiments with continuous-flow air-lift loop reactors at three different liquid-phase oxygen concentrations (0.04, 0.08, 0.12 mol. m"3). Results are shown in Fig. 2. There are substantial differences between the experimentally obtained macroscopic oxygen-consumption rates and the calculated rates according to the pseudo-homogeneous growth model.8 In all cases simulated consumption rates were considerably higher than experimentally found.
130
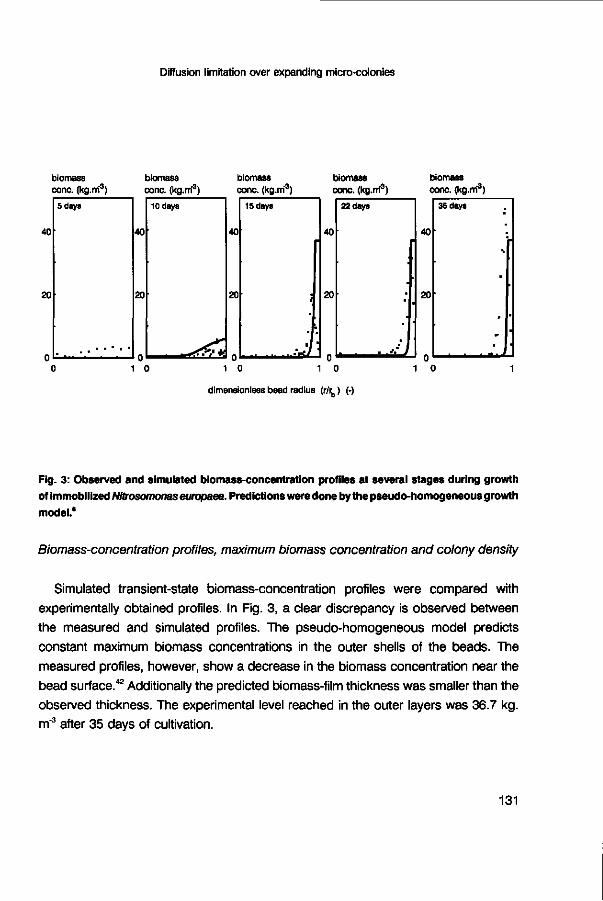
Diffusion limitation over expanding micro-colonies
biomass cone, (kg.rri3)
biomass biomass biomass oono. (kg.rri3)
biomass
dimensionless bead radius (r/rb ) (-)
Fig. 3: Observed and simulated biomass-concentration profiles at several stages during growth
of immobilized Nitrosomonas europaea. Predictions were done by the pseudo-homogeneous growth
model.'
Biomass-concentration profiles, maximum biomass concentration and colony density
Simulated transient-state biomass-concentration profiles were compared with experimentally obtained profiles. In Fig. 3, a clear discrepancy is observed between the measured and simulated profiles. The pseudo-homogeneous model predicts constant maximum biomass concentrations in the outer shells of the beads. The measured profiles, however, show a decrease in the biomass concentration near the bead surface.42 Additionally the predicted biomass-film thickness was smaller than the observed thickness. The experimental level reached in the outer layers was 36.7 kg. m"3 after 35 days of cultivation.
131
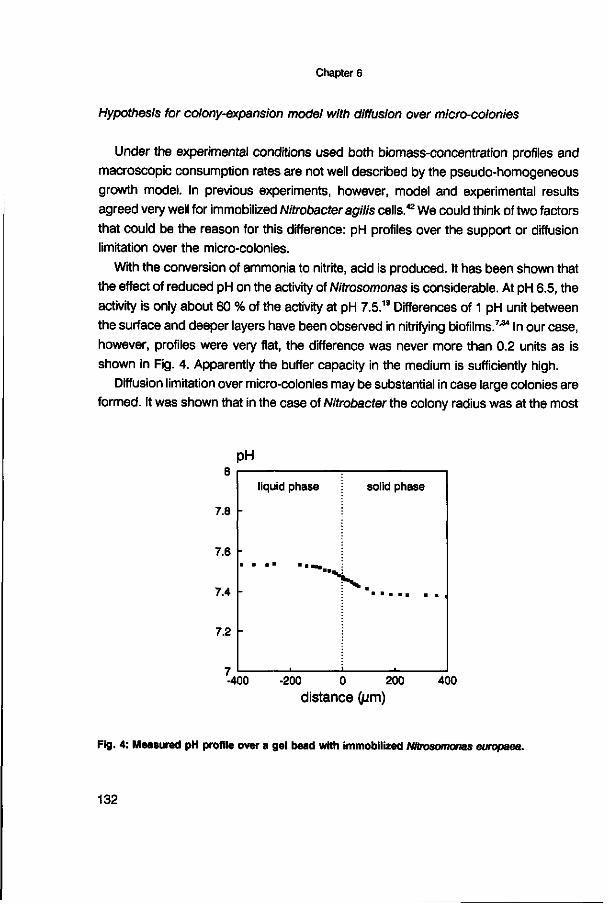
Chapter 6
Hypothesis for colony-expansion model with diffusion over micro-colonies
Under the experimental conditions used both biomass-concentration profiles and macroscopic consumption rates are not well described by the pseudo-homogeneous growth model. In previous experiments, however, model and experimental results agreed very well for immobilized Nitrobacter agilis cells.42 We could think of two factors that could be the reason for this difference: pH profiles over the support or diffusion limitation over the micro-colonies.
With the conversion of ammonia to nitrite, acid is produced. It has been shown that the effect of reduced pH on the activity of Nitrosomonas is considerable. At pH 6.5, the activity is only about 60 % of the activity at pH 7.5.19 Differences of 1 pH unit between the surface and deeper layers have been observed in nitrifying biofilms.734 In our case, however, profiles were very flat, the difference was never more than 0.2 units as is shown in Fig. 4. Apparently the buffer capacity in the medium is sufficiently high.
Diffusion limitation over micro-colonies may be substantial in case large colonies are formed. It was shown that in the case of Nitrobacter the colony radius was at the most
pH
7.8
7.6
7.4 -
7.2
liquid phase solid phase
"•vi
-400 -200 0 200
distance (jum) 400
Fig. 4: Measured pH profile over a gel bead with immobilized Nitrosomonas europaea.
132

Diffusion limitation over expanding micro-colonies
23 /um.42 In the present case, however, radii up to 57 /xm were observed as is shown in Fig. 5. Very likely diffusion limitation occurred over the larger micro-colonies resulting in less active or even dead biomass in the interior regions of the micro-colonies. Diffusion limitation over the micro-colonies thus results in a lower macroscopic consumption rate than expected on the basis of the pseudo-homogeneous growth model8 and could explain our results. To check this hypothesis, the observed surface of colonies per surface area of coupe was plotted as a function of maximum volumetric activity. The results are shown in Fig. 6. It is clear that the obtained plot is not linear. At higher relative colony surface areas, the ratio volumetric activity/colony surface area decreases, indicating that not all biomass in the colonies is active under the experimental conditions.
For this reason the model was adapted by describing immobilized-cell growth by expansion of bacterial colonies over which diffusion limitation occurs.
colony radius (jjm) colony radius (^m) 60
50
40
30
20
10
60
50
40
30
20
10
B
-
D ° D s ail D DD , D DD-WdoB
D
DC D p
D
D D
CP
D
DD
• D
D •
DDD a
CPDO
oa®DD
D£U=)
foal" D
o r °P D 0 0.2 0.4 0.6 0.8 1
dimensionless bead radius (-) 0 0.2 0.4 0.6 0.8 1
dimensionless bead radius (-)
Fig. 5: Measured colony radii as a function of radial position within a gel bead for Nitrobacteragilis
(A) and Nitrosomonas europaea (B).
133
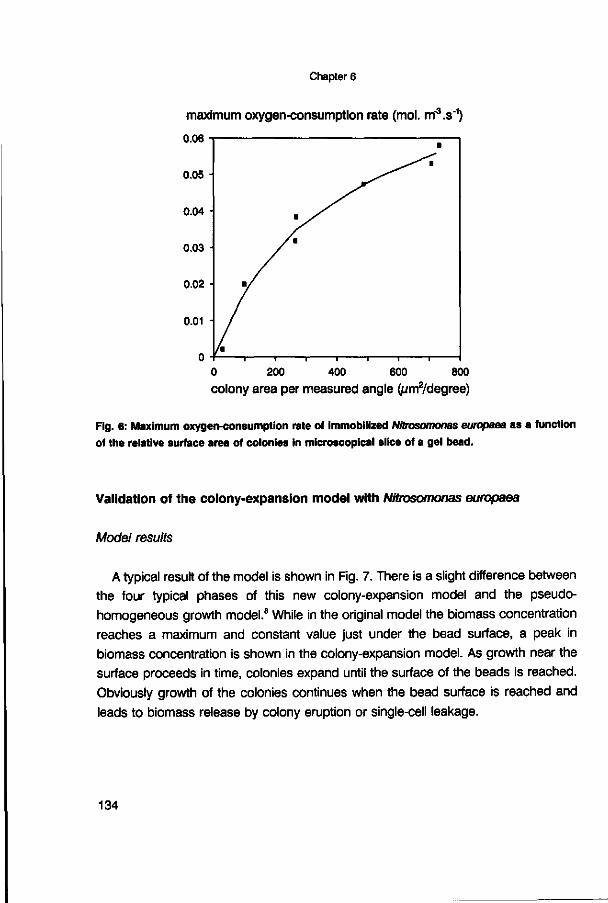
Chapter 6
maximum oxygen-consumption rate (mol. rrf'.s"1)
0.06
0 200 400 600 800 colony area per measured angle (/jm2/degree)
Fig. 6: Maximum oxygen-consumption rate of immobilized Nitrosomonas europaea as a function
of the relative surface area of colonies in microscopical slice of a gel bead.
Validation of the colony-expansion model with Nitrosomonas europaea
Model results
A typical result of the model is shown in Fig. 7. There is a slight difference between
the four typical phases of this new colony-expansion model and the pseudo-
homogeneous growth model.8 While in the original model the biomass concentration
reaches a maximum and constant value just under the bead surface, a peak in
biomass concentration is shown in the colony-expansion model. As growth near the
surface proceeds in time, colonies expand until the surface of the beads is reached.
Obviously growth of the colonies continues when the bead surface is reached and
leads to biomass release by colony eruption or single-cell leakage.
134

Diffusion limitation over expanding micro-colonies
rd
pX representation of gel bead
rd 0 rd 0
— substrate concentration, S
rd 0 rd
biomass concentration, X
Fig. 7: Typical results of the colony-expansion model for the growth of immobilized cells at various times; d represents the stagnant liquid layer surrounding the beads.
Macroscopic oxygen-consumption rate
The colony-expansion model with both biomass release mechanisms was evaluated by comparing simulations with the experimentally obtained macroscopic consumption rates of immobilized Nitrosomonas europaea. The model with single-cell release still resulted in overestimations as is shown in Fig. 8A, although less than with the pseudo-homogeneous growth model. The colony-expansion model with eruption matched best with experimentally determined macroscopic consumption rates (Fig. 8B). The sawtooth form of the curves with colony eruption is peculiar. This shape is not the result of instabilities in calculations but can be explained by eruption of the colonies. Colonies which are centred on the same shell in the gel bead expand until the surface is reached. These colonies will erupt simultaneously as the expansion is synchrone. The size of the saw teeth is decreased in case more shells are used in the calculation procedure. In average, however, the same macroscopic consumption rates are reached.
In Fig. 9A the effectiveness factor over the micro-colonies as a function of the radius of the beads is shown at different pseudo-steady states. It is shown that diffusion limitation over micro-colonies indeed is considerable in the region where the biomass concentration is highest (outer 100 /xm of the bead). After 35 days an effectiveness factor of about 0.2 at a depth of 50 ^m is reached. It is shown that as a function of
135

Chapter 6
macroscopic oxygen-consumption rate macroscopic oxygen-consumption rate (mol. m-3, s-1) (mol. m-3, s-1) 0.01
0.008
0.006
0.004
0.002
0.01
0.008
0.006
0.004
0.002
40 time (days) 40 0 10 20 30
time (days) Fig. 8: Observed (markers) and predicted (lines) overall oxygen-consumption rates of immobilized
Nitrosomonas europaea at different liquid phase oxygen concentrations: (a,....) Sb = 0.04 mol. m'3,
(±, —) Sb = 0.08 mol. m3, ( • , — ) S„ = 0.12 mol. m3. Predictions were done by the colony-
expansion model incorporating single-cell leakage (A) or with colony eruption (B).
effectiveness factor (-) effectiveness factor (-) 5 days
dimensionless radius (-) 0.9 1 dimensionless radius (-)
Fig. 9: Calculated effectiveness factors for micro-colonies as a function of the relative bead radius
after 5, 15, 22 and 35 days of cultivation of immobilized Nitrosomonas europaea (A) and
immobilized Nitrobacter agilis (B) cells.
136
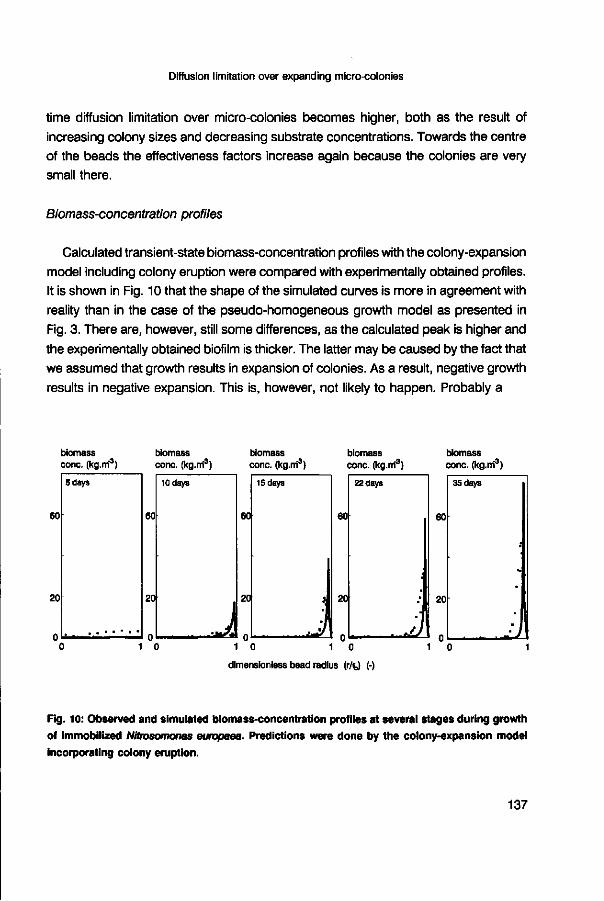
Diffusion limitation over expanding micro-colonies
time diffusion limitation over micro-colonies becomes higher, both as the result of increasing colony sizes and decreasing substrate concentrations. Towards the centre of the beads the effectiveness factors increase again because the colonies are very small there.
Biomass-concentration profiles
Calculated transient-state biomass-concentration profiles with the colony-expansion model including colony eruption were compared with experimentally obtained profiles. It is shown in Fig. 10 that the shape of the simulated curves is more in agreement with reality than in the case of the pseudo-homogeneous growth model as presented in Fig. 3. There are, however, still some differences, as the calculated peak is higher and the experimentally obtained biofilm is thicker. The latter may be caused by the fact that we assumed that growth results in expansion of colonies. As a result, negative growth results in negative expansion. This is, however, not likely to happen. Probably a
biomass cone, (kg.rri3)
biomass cone, (kg.rri3)
biomass cone, (kg.rri3)
biomass cone, (kg.rri3)
biomass cone, (kg.rri3)
1 0 1 0
dimensionless bead radius (r/rb) (-)
1 0
Fig. 10: Observed and simulated biomass-concentration profiles at several stages during growth
of immobilized NUrosomonas europaea. Predictions were done by the colony-expansion model
incorporating colony eruption.
137
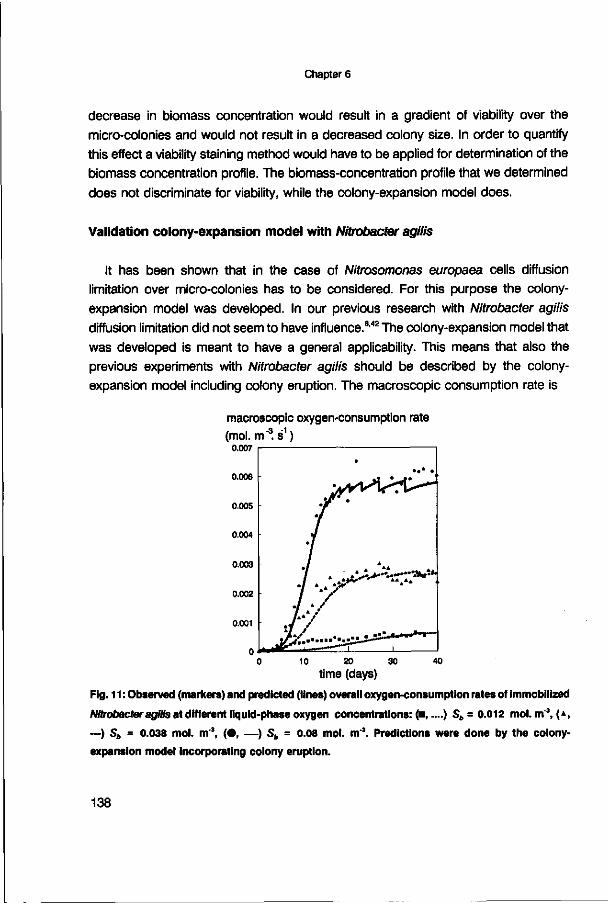
Chapter 6
decrease in biomass concentration would result in a gradient of viability over the micro-colonies and would not result in a decreased colony size. In order to quantify this effect a viability staining method would have to be applied for determination of the biomass concentration profile. The biomass-concentration profile that we determined does not discriminate for viability, while the colony-expansion model does.
Validation colony-expansion model with Nitrobacter agilis
It has been shown that in the case of Nitrosomonas europaea cells diffusion limitation over micro-colonies has to be considered. For this purpose the colony-expansion model was developed. In our previous research with Nitrobacter agilis diffusion limitation did not seem to have influence.8,42 The colony-expansion model that was developed is meant to have a general applicability. This means that also the previous experiments with Nitrobacter agilis should be described by the colony-expansion model including colony eruption. The macroscopic consumption rate is
macroscopic oxygen-consumption rate (mol. m "̂ s1 )
0.007
0.006
10 20 30
time (days)
Fig. 11 : Observed (markers) and predicted (lines) overall oxygen-consumption rates of immobilized
Nitrobacter agilis at different liquid-phase oxygen concentrations:^,....) S„ = 0.012 mol. m3, (*,
—) Sb = 0.038 mol. m', ( • , — ) S„ = 0.08 mol. m"3. Predictions were done by the colony-
expansion model incorporating colony eruption.
138

Diffusion limitation over expanding micro-colonies
described well by the model (Fig. 11). The reason that both the pseudo-homogeneous
growth model and the colony-expansion model can be applied for Nitrobacter agilis
is that diffusion limitation over micro-colonies is almost negligible (Fig. 9B).
CONCLUSIONS
A dynamic model has been developed for growth of nitrifying bacteria immobilized
in carrageenan gel beads. In this model growth occurs by expansion of micro-colonies
until cells erupt from the gel bead or are limited in their growth by diffusion limitation.
Diffusion limitation over micro-colonies has been considered as well.
Experiments with both immobilized Nitrosomonas europaea and Nitrobacter agilis
showed that steady and transient states are described satisfactorily with this colony-
expansion model incorporating colony eruption. This specific model is based on
general equations and on intrinsic kinetics of the immobilized cells and can thus be
used in a general way to predict capacities in reactors with any kind of immobilized
bacteria at defined conditions.
As diffusion limitation plays a significant role, the inoculum size will very likely affect
the capacity that can be reached in the process. At high initial biomass concentrations,
many small micro-colonies will be formed. At low initial biomass concentrations, less
but larger colonies will be formed, over which diffusion limitation plays a more
important role, probably resulting in lower capacities. In our future research we will pay
attention to this effects by comparing small and large inoculum sizes.
LIST OF SYMBOLS
Dgc = effective diffusion coefficient in micro-colonies (m2. s"1)
Dag = effective diffusion coefficient in gel (m2. s'1)
kls = liquid/solid mass-transfer coefficient (m. s'1)
Ks = Monod constant (mol. m3)
m = maintenance coefficient (mol. kg1 , s'1)
r = distance from the centre of the bead (m)
rb = radius of the bead (m)
139
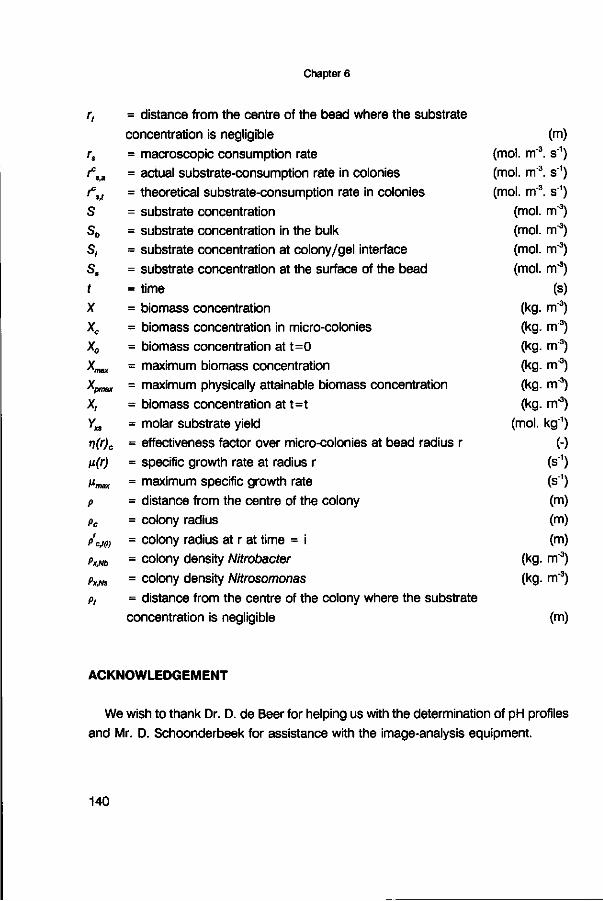
Chapter 6
r, = distance from the centre of the bead where the substrate
concentration is negligible
rs = macroscopic consumption rate fsa - actual substrate-consumption rate in colonies Ieu = theoretical substrate-consumption rate in colonies
S = substrate concentration S„ = substrate concentration in the bulk S, = substrate concentration at colony/gel interface Ss = substrate concentration at the surface of the bead
t = t ime X = biomass concentration Xc = b iomass concentration in micro-colonies X0 = b iomass concentration at t = 0
Xmax = maximum biomass concentration xpmax = maximum physically attainable biomass concentration X, = biomass concentration at t = t
Y^ = molar substrate yield r\(r)c = effectiveness factor over micro-colonies at bead radius r ß(r) = specific growth rate at radius r
»ma* = maximum specific growth rate P = distance f rom the centre of the colony pc = colony radius
p'em = colony radius at r at t ime = i f>x,Nb = colony density Nitrobacter px/is = colony density Nitrosomonas
p, = distance f rom the centre of the colony where the substrate concentration is negligible (m)
ACKNOWLEDGEMENT
We wish to thank Dr. D. de Beer for helping us with the determination of pH profiles
and Mr. D. Schoonderbeek for assistance with the image-analysis equipment.
(mol. m"3
(mol. m"3
(mol. m"3
(mol. (mol. (mol.
(mol.
(kg. (kg. (kg.
(kg. (kg.
(kg.
(m)
• s 1 )
• s 1 )
• s 1 ) m"3) m"3) m3)
rrr3)
(s) m"3) m"3) m3) m"3)
m"3) m3)
(mol. kg"1)
(kg.
(kg.
(-) (s1) (s1) (m) (m)
(m)
m3)
m3)
140

Diffusion limitation over expanding micro-colonies
LITERATURE
1. Barnes D., Bliss P.J. (1983) Biological control of nitrogen in wastewater treatment. E. & F.N.
Spon, London 146 p
2. Beeftink H.H., Van Der Heijden R.T.J.M., Heijnen J.J. (1990) Maintenance requirements: energy
supply from simultaneous endogenous respiration and substrate consumption. FEMS Microbiol
Ecol 73: 203-210
3. Belser L.W. (1984) Bicarbonate uptake by nitrrfiers: effect of growth rate, pH, substrate
concentration and metabolic inhibitors Appl Env Microbiol 48: 1100-1104
4. Belser L.W., Schmidt E.L. (1980) Growth and oxidation kinetics of three genera of ammonia
oxidizing nitrtfiers. FEMS Microbiol Letters, 7: 213-216 (1980)
5. Bock E. (1965) Vergleichende Untersuchungen über die Wirkung sichtbaren Lichtes auf
Nitrosomonas europaea und Nitrobacter winogradskyi. Arch Microbiol 51: 18-41
6. Dalili M., Chau P.C. (1987) Intraparticle diffusional effects in immobilized cell particles. Appl
Microbiol Biotechnol 26: 500-506
7. De Beer D., Van Den Heuvel J.C., Ottengraf S.P.P. (1993) Microelectrode measurements of the
activity distribution in nitrifying bacterial aggregates. Appl Environm Microbiol 59: 573-579
8. De Gooijer CD., Wijffels R.H., Tramper J. (1991) Growth and substrate consumption of
Nitrobacter agilis cells immobilized in carrageenan: part 1. dynamic modeling. Biotechnol Bioeng
38: 224-231
9. De Gooijer CD., Wijffels R.H., Tramper J. (1992) Dynamic modeling the growth of immobilized
nitrifying bacteria: biofilm development. In: Biofilms-Science and Technology. Eds. L.F. Melo, T.R.
Bott, M. Fletcher, B. Capdeville. Kluwer Academic Publishers, The Netherlands, p 291-296
10. Dhulster P., Barbotin J.N., Thomas D. (1984) Culture and bioconversion use of
plasmid-harboring strain of immobilized E. coli. Appl Microbiol Biotechnol 20: 87-93
11. Engel M.S., Alexander M. (1958) Culture of Nitrosomonas europaea in media free of insoluble
constituents. Nature 181:136
12. Engel M.S., Alexander M. (1958) Growth and autotrophic metabolism of Nitrosomonas
europaea. J Bacteriol 76: 217-222
13. Greenberg A.E., Trussel R.R., Clesceri L.S. (1985) Standard methods for the examination of
water and wastewater. 16th ed., American Public Health Association, Washington DC, 1268 p
14. Gujer W., Boller M. (1989) A mathematical model for rotating biological contactors. In:
Proceedings of technical advances in bioreactors conference, Nice, CFRP-AGHTM Paris, p 69-89
15. Herbert D. (1959) Some principles of continuous culture. In: Recent Progress in Microbiology.
Ed. G. Tunevall. Almquist & Wicksell, Stockholm, p 381-396
16. Ho CS. , Ju L-K. (1988) Effect of microorganisms on oxygen diffusion coefficients and solubilities
in fermentation media. Biotechnol Bioeng 32: 313-325
17. Hooper A.B., Terry K.R. (1974) Photo inactivation of ammonia oxidation in Nitrosomonas. J
Bacteriol 119: 899-906
141

Chapter 6
18. Hunik J.H., Bos CG., Van Den Hoogen M.P., De Gooijer CD., Tramper J. (1994) Co-
immobilized Nitrosomonas europaea and Nitrobacter agilis cells: validation of a dynamic model
for simultaneous substrate conversion and growth in k-carrageenan gel beads. Biotechnol Bioeng.
In press
19. Hunik J.H., Meijer H.J.G., Tramper J. (1992) Kinetics of Nitrosomonas europaea at extreme
substrate, product and salt concentrations. Appl Microbiol Biotechnol 37: 802-807
20. Inloes D., Smith W., Taylor D., Cohen S., Michaels A.S., Robertson CR (1983) Hollow-fiber
membrane reactors using immobilized E. coli for protein synthesis. Biotechnol Bioeng 25:
2653-2681
21. Keen G.A., Prosser J.I. (1987) Steady state and transient growth of autotrophic nitrifying
bacteria. Arch Microbiol 147: 73-79
22. Laudelout H., Lambert R., Pham M.L. (1976) Influence du pH et de la pression partielle
d'oxygène sur la nitrification. Ann Microbiol (Inst Pasteur) 127a: 367-382
23. Laudelout H., Simonart P.C., Van Droogenbroeck R. (1968) Calorimetric measurement of free
energy utilization by Nitrosomonas and Nitrobacter. Arch Microbiol 63: 256-277
24. Libicki S.B., Salmon P.M., Robertson CR. (1988) The effective diffusive permeability of a
nonreacting solute in microbial cell aggregates. Biotechnol Bioeng 32: 68-85
25. Loveless J.E., Painter H.A. (1968) The influence of metal ions and pH value on the growth of
Nitrosomonas strains isolated from activated sludge. J Gen Microbiol 52: 1-14
26. Meiklejohn J. (1953) Iron and the nitrifying bacteria. J Gen Microbiol 8: 58-65
27. Monbouquette H.G., Sayles G.D., Ollis D.F. (1990) Immobilized cell biocatalyst activation and
pseudo-steady-state behavior: model and experiment. Biotechnol Bioeng 35: 609-629
28. Peetere T.L., Van Gooi A.P., Laudelout H. (1969) Kinetic study of oxygen-limited respiration in
nitrifying bacteria. Am Soc Microbiol, Bact Proc. Washington DC, p 141
29. Roels J.A. (1983) Energetics and kinetics in biotechnology. Elsevier Biochemical Press,
Amsterdam
30. Salmon P.M. (1989) Mass transport phenomena in reactors containing entrapped enzymes or
bacterial cells. PhD thesis Stanford University, USA
31. Sato CS., Schnoor J.L., McDonald D.B., Huey J. (1985) Test medium for the growth of
Nitrosomonas europaea. Appl Env Microbiol 49: 1101-1107
32. Skinner F.A., Walker N. (1961) Growth of Nitrosomonas europaea in batch and continuous
culture. Arch Microbiol 38: 339-349
33. Stewart P.S., Robertson CR. (1989) Microbial growth in a fixed volume: studies with entrapped
Escherichia coli. Appl Microbiol Biotechnol 30: 34-40
34. Szwerinski H., Arvin E., Harremoes P. (1986) pH-decrease in nitrifying biofilms. Water Research
20: 971-976
35. Taxis du Poet P., Dhulster P., Barbotin J.N., Thomas D. (1986) Plasmid stability and biomass
production: comparison between free and immobilized cell cultures of Escherichia coli
BZ18(pTG201) without selection pressure. J Bacterid 165: 871-877
142
Diffusion limitation over expanding micro-colonies
36. Tomlinson T.G., Boon A.G., Trotman C.N.A. (1966) Inhibition of nitrification in the activated
sludge process of sewage disposal. J Appl Bact 29: 266-291
37. Underbill S.E., Prosser J.I. (1987) Inhibition and stimulation of nitrification by potassium ethyl
xanthate. J Gen Microbiol 133: 3237-3245
38. Van Droogenbroeck R., Laudelout H. (1967) Phosphate requirements of nitrifying bacteria. Ant
Leeuwenh 33: 287-296
39. Van Ginkel CG., Tramper J., Luyben K.Ch.A.M., Klapwijk A. (1983) Enzyme Microb Technol
5: 297-303
40. Van Neerven A.R.W., Wijffels R.H., Zehnder A.J.B. (1990) Scanning electron microscopy of
immobilized bacteria in gel beads: a comparative study of fixation methods. J Microbiol Meth 11 :
157-168
41. Westrin B.A., Axelsson A. (1991) Diffusion in gels containing immobilized cells: a critical review.
Biotechnol Bioeng 38: 439-446
42. Wijffels R.H., De Gooijer CD., Kortekaas S., Tramper J. (1991) Growth and substrate
consumption of Nitrobacter agilis cells immobilized in carrageenan: part 2. model evaluation.
Biotechnol Bioeng 38: 232-240
43. Wijffels R.H., Englund G., Hunik J.H., Leenen E.J.T.M., Bakketun Â., Günther A., Obón de
Castro J.M., Tramper J. (1994) Effects of diffusion limitation on immobilized nitrifying micro
organisms at low temperatures. Submitted for publication
44 Yoshioka T., Saijo Y. (1984) Photo inhibition and recovery of NH4+-oxidizing bacteria and N02-
oxidizing bacteria. J Gen Appl Microbiol 30: 151-166
143

INTERMEZZO
Substrate is transferred from the surface of the gel bead to the centre of the beads. The concentration of bacteria near the surface is so high that most of the oxygen is consumed in the outer shells of the bead: a gradient in oxygen concentration will develop. We calculated this profile and evaluated it experimentally with micro-electrodes. The concentration of oxygen can be measured by electrodes. At the University of Amsterdam, electrodes were developed with a very thin tip (less than 10 ßm). With such a micro-electrode it is possible to penetrate in a gel bead and measure the oxygen concentration at several depths.
Calculated and measured concentration profiles were compared at different stadia of the process. One of the results is shown: the calculated profile is given by the line and the experimental profile by the data points.

oxygen concentration
0.2
0.1
• • \
\ • • \
• \
liquid phase • ^
V solid phase \ ».
•\
•100 0 100
distance (jjm)
200

This chapter has been submitted for publication by the authors R.H. Wijffels A.W. Schepers, M. Smit, CD. de Gooijer and J. Tramper
CHAPTER 7
EFFECT OF INITIAL BIOMASS CONCENTRATION ON THE GROWTH OF IMMOBILIZED
NITROSOMONAS EUROPAEA
ABSTRACT
Nitrosomonas europaea was immobilized in carrageenan-gel beads with a low and a high biomass concentration (factor 100 difference). Under growth conditions in a continuous air-lift loop reactor, a low initial concentration yielded few large micro-colonies per bead, while a high initial biomass concentration resulted in many small micro-colonies per bead. The macroscopic-consumption rate of the latter was 3 times higher under the applied circumstances. This is also predicted by our colony-expansion model when diffusion limitation over the micro-colonies is incorporated. This model also predicts that diffusion limitation over the ultimate colonies is negligible when the initial biomass concentration exceeds 0.5 kg. m"3 carrageenan gel.
147

Chapter 7
INTRODUCTION
Growth of immobilized cells has been studied extensively in recent years. The main advantage of the use of immobilized cells is that the liquid-retention time in continuous bioreactors can be separated from the biomass-retention time. As a consequence, immobilization is especially advantageous in the case of slowly growing microorganisms in continuous bioreactors. In such bioreactors the biomass concentration is much higher than in reactors with suspended cells resulting in higher volumetric capacities.
One of the disadvantages of immobilized-cell processes is the occurrence of diffusion limitation over the support, resulting in an on average lower cell activity. Another capacity reducing effect is the occurrence of diffusion limitation over micro-colonies. This was shown in our previous research in which we studied growth of immobilized nitrifying bacteria in gel beads. Initially, only diffusion limitation over the gel bead was considered.2,7 Diffusion limitation over the micro-colonies, however, also appears to play a significant role under some conditions.8
Qualitatively the process can be described as follows. Growth in a gel bead results in the formation of micro-colonies. As growth proceeds, colonies expand until the surface of the beads is reached and further expansion leads to eruption of colonies from the beads into the surrounding liquid phase. The rate of expansion is limited both by diffusion limitation over the gel bead and micro-colonies, at least when the latter exceed a certain size.
In case diffusion limitation over micro-colonies is indeed important, this will also affect the overall capacity of the immobilized-cell reactor. Due to this colonial diffusion limitation the capacity that can ultimately be reached is influenced by the inoculum size. At high initial biomass concentrations, many small micro-colonies will be formed with little diffusion limitation. At low initial biomass concentrations, less but larger colonies will be formed, over which diffusion limitation plays an important role, resulting in lower capacities. In the study presented here, effects of inoculum size were studied. There was a difference of a factor 100 in the inoculum size. The capacity reached in both reactors was determined experimentally and compared with model calculations. Model calculations were done by the colony-expansion model with colony eruption as was described previously.8 Model input parameters were the same as used in that research and are summarized in Table I. Additionally, both processes were monitored
148
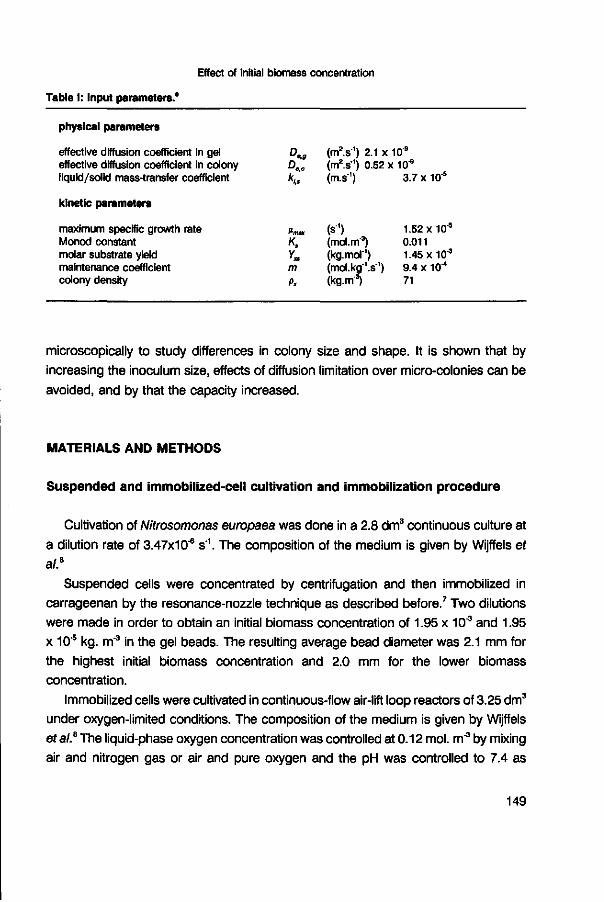
Effect of initial biomass concentration
Table I: Input parameters.'
physical parameters
effective diffusion coefficient in gel effective diffusion coefficient in colony liquid/solid mass-transfer coefficient
kinetic parameters
maximum specific growth rate Monod constant molar substrate yield maintenance coefficient colony density
°,9 D..C K*.s
cm„ K, Y» m Px
(mis1) 2.1 x (m2.s1) 0.52 (ras"1)
(s") (mol.m'3) (kg.mo|-1) (moi.kg1.s1) (kg.m-3)
10-9
K10-9
3.7 X10"5
1.52 X10"5
0.011 1.45 x10"3
9.4 x 10"* 71
microscopically to study differences in colony size and shape. It is shown that by
increasing the inoculum size, effects of diffusion limitation over micro-colonies can be
avoided, and by that the capacity increased.
MATERIALS AND METHODS
Suspended and immobilized-cell cultivation and immobilization procedure
Cultivation of Nitrosomonas europaea was done in a 2.8 dm3 continuous culture at a dilution rate of 3.47x10"6 s'1. The composition of the medium is given by Wijffels er a/.8
Suspended cells were concentrated by centrifugation and then immobilized in carrageenan by the resonance-nozzle technique as described before.7 Two dilutions were made in order to obtain an initial biomass concentration of 1.95 x 10"3 and 1.95 x 10"5 kg. m'3 in the gel beads. The resulting average bead diameter was 2.1 mm for the highest initial biomass concentration and 2.0 mm for the lower biomass concentration.
Immobilized cells were cultivated in continuous-flow air-lift loop reactors of 3.25 dm3
under oxygen-limited conditions. The composition of the medium is given by Wijffels et al.B The liquid-phase oxygen concentration was controlled at 0.12 mol. m"3 by mixing air and nitrogen gas or air and pure oxygen and the pH was controlled to 7.4 as
149

Chapter 7
described before.8 The superficial gas velocity was 0.2 cm. s"1, the solid-phase hold-up
0.15 and the applied dilution rate 8.85x10"5 s"1.
Oxygen-consumption rate and protein analysis
Macroscopic oxygen-consumption rates were estimated by determination of the nitrite production rate per amount of gel as for oxidation of ammonia by Nitrosomonas stoichiometric amounts of oxygen are needed.1 Ammonia and nitrite concentrations in influent and effluent were determined using a continuous-flow analysis system (Skalar Auto Analyzer) as described before.8
Overall viable-biomass estimates were made by activity assays in a biological oxygen monitor. The activity per amount of gel was converted to a biomass-dry weight concentration by dividing by the specific activity. The specific activity of Nitrosomonas europaea is 0.01 mol. kg1, s"1.8
For protein analysis, gel beads were solubilized as described by Smith et al.* A known amount of beads (approximately 1 g) was flash frozen in liquid nitrogen and freeze dried during 48 hours (-54 °C, 190 Pa). The sample was suspended in 10 ml of demineralized water. From this 0.9 ml was mixed with 0.1 ml 5 M NaOH and heated during 20 minutes in a boiling-water bath, cooled and assayed according to the method of Lowry3 with as standard BSA.
Microscopical analysis
From both reactors samples of beads were observed macroscopically and microscopically regularly.
For macroscopic analysis, photographs of the gel beads were made using a macro lens. On these macroscopic pictures development of micro-colonies could clearly be observed.
For microscopic analysis, beads were sectioned. Before sectioning, samples were fixed chemically in 4 % para-formaldehyde solution in a 0.1 mol. dm'3 phosphate buffer containing 0.1 mol. dm"3 KCl. After fixation, samples were washed with the buffer and dehydrated with ethanol as described before.6 Beads were then embedded by impregnation with a series of mixtures of pure ethanol and London Resin White (low grade, Bio-Rad) in ratios of 5:1, 3:1, 1:1 and 1:3 (30 minutes per step). Finally pure
150

Effect of initial biomass concentration
London Resin White was used and polymerization took place at 60 °C during 24 hours. Sections through the centre of the beads were cut with an LKB 8800 ultramicrotome with a glass knife. Sections with a thickness of 2 jum were collected in a drop of water on glass slides and dried on a hot plate and stained with 0.1% toluidine blue for 5 seconds to improve the contrast between the gel and the colonies. The sections were rinsed with demineralized water, dried and mounted in glycerine. Preparations were examined with a Nikon Optiphot FXA microscope and photographs were made with a Kodak Technical Pan film 2415 at 50 -ASA.
RESULTS AND DISCUSSION
Gel beads with different initial amounts of biomass were cultivated in air-lift loop reactors. Transient-state macroscopic consumption rates in both reactors were compared with simulations (Fig. 1) using the colony-expansion model with colony eruption.8 It can be observed that the capacity in the steady-state situation is much lower in case of a low initial biomass concentration. This is shown by both model
macroscopic oxygen-consumption rate (mol. m "? s"1)
0.012
0.008
0.004
20 30 40 50 time (days)
Fig. 1: Observed (markers) and predicted (lines) overall oxygen consumption rates of immobilized
Nitrosomonas europaea with different initial biomass concentrations: (a, —) X0 = 1.95 x 10⁵ kg. m3
and ( • , — ) Xo = 1.95 x 10"' kg. m1. Predictions were done by the colony-expansion model with
colony eruption.
151

Chapter 7
predictions and experimental results. Experimental and model results are comparable, although at the high initial biomass concentrations the volumetric capacity reached in steady state was considerably higher in the experimental analysis. The reason for this deviation probably is biofilm formation on the reactor walls, which was observed in this particular experiment. Model results show a saw-tooth appearance of the macroscopic consumption rate. The saw tooth is the result of the method of calculation. In the model the colonies are situated in shells in the gel bead. As the result of expansion, the colonies will at a certain time reach the surface, protrude and erupt as soon as 1 /3 of their volume is protruded (arbitrarily chosen). This eruption process is synchrone for all colonies that are centred in a certain shell, causing the saw tooth.8 The extent of protrusion before eruption will depend on the strength and elasticity of the gel and the pressure that the colony expresses on the gel matrix. Development of internal pressure in colonies was observed before by Stewart and Robertson.5 In case the force of pressure is higher than the strength of the gel, the gel will disrupt resulting in an excretion as is shown in Fig. 2.
50 pm
* \ : $
Fig. 2: Colony eruption from a gel bead
152
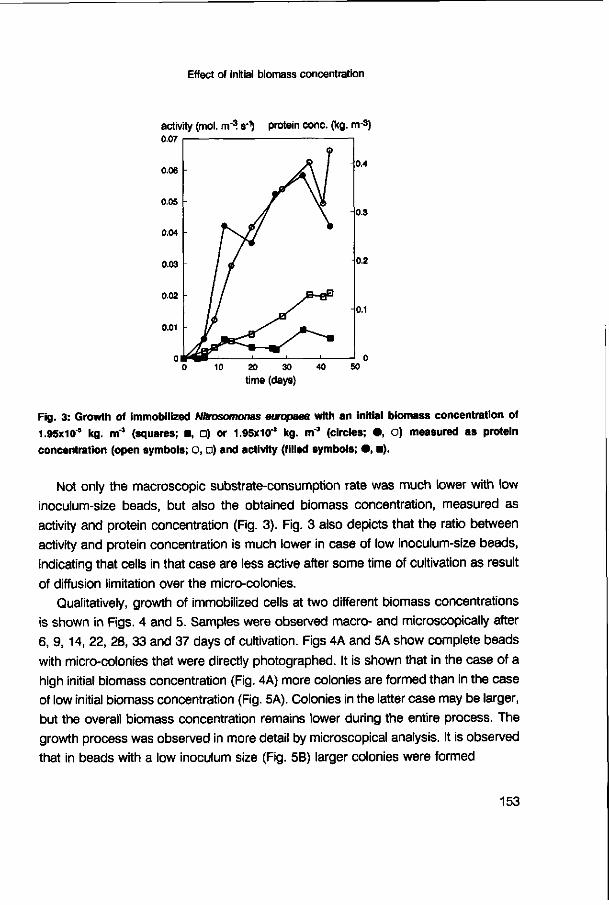
Effect of initial biomass concentration
activity (mol. nr? s"1) protein cone. (kg. m-3) 0.07
0.06
0.05
0.04
0.03
0.02
0.01
10 20 30 40 time (days)
Fig. 3: Growth of immobilized Nitrosomonas europaea with an initial biomass concentration of
1.95X10"5 kg. m"' (squares; • , o) or 1.95x10"' kg. nf* (circles; • , O) measured as protein
concentration (open symbols; o, a) and activity (filled symbols; • , • ) .
Not only the macroscopic substrate-consumption rate was much lower with low inoculum-size beads, but also the obtained biomass concentration, measured as activity and protein concentration (Fig. 3). Fig. 3 also depicts that the ratio between activity and protein concentration is much lower in case of low inoculum-size beads, indicating that ceils in that case are less active after some time of cultivation as result of diffusion limitation over the micro-colonies.
Qualitatively, growth of immobilized cells at two different biomass concentrations is shown in Figs. 4 and 5. Samples were observed macro- and microscopically after 6, 9, 14, 22, 28, 33 and 37 days of cultivation. Figs 4A and 5A show complete beads with micro-colonies that were directly photographed. It is shown that in the case of a high initial biomass concentration (Fig. 4A) more colonies are formed than in the case of low initial biomass concentration (Fig. 5A). Colonies in the latter case may be larger, but the overall biomass concentration remains lower during the entire process. The growth process was observed in more detail by microscopical analysis. It is observed that in beads with a low inoculum size (Fig. 5B) larger colonies were formed
153

Chapter 7
• . 1 «
*.. « ! — • • • • * • * • . ! «
. ' t *
-T
fe J » *
Fig. 4: Colony development
for a system with
immobilized cells with a
high initial biomass
concentration of 1.95 x 10³
kg. m 3 after 6, 9, 14,22,28,
33 and 37 days of
cultivation:
A) macroscopic observation
B) microscopic observation
154
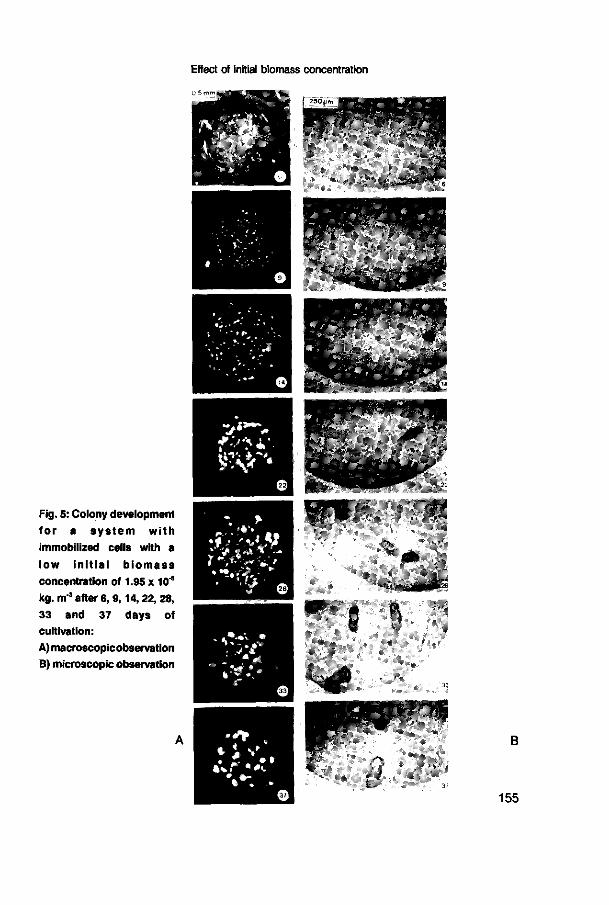
Effect of initial biomass concentration
•n
•&&&P*1*
tf*
Fig. 5: Colony development
for a system with
immobilized cells with a
low init ial b iomass
concentration of 1.95 x 10⁵
kg. m"3 after 6,9,14,22,28,
33 and 37 days of
cultivation:
A) macroscopicobservation
B) microscopic observation
/"'»
155

Chapter 7
than in the beads with a high inoculum size (Fig. 4B). Colonies from both type of beads expanded but did not remain spherical. The colonies in gel beads with a low inoculum size deviated from the spherical shape already after 9 days of cultivation (Fig. 5B) while in the high inoculum-size beads deviations were observed after 22 days of cultivation (Fig. 4B). It is shown that in case of the low inoculum size, more ellipsoid-shaped colonies were formed, which were not in all cases situated parallel with the gel surface. At the tips of those ellipsoid wing-like structures could be observed. In case of the high inoculum-size beads, deviations from the spherical shape were less pronounced. Colonies near the surface of the beads often looked like spheres with wings (Fig. 2). In the colony expansion model it is assumed that colonies remain spherical. Nevertheless, model predictions of macroscopic-consumption rates are quite satisfactory.
From the two experiments it can be concluded that the initial biomass concentration in gel beads influences the macroscopic substrate-consumption rate that can be reached. In case the initial biomass concentration is low, the immobilized-cell process will have less capacity than a system with a high initial biomass concentration. As a
macroscopic oxygen-consumption rate (mol. m"3, s'1) 0.012
10 10 10 10 10 10 10
initial biomass concentration (kg. m3)
Fig. 6: Calculated macroscopic substrate-consumption rates as a function of initial biomass concentration, with the colony-expansion model ( ) and the pseudo-homogenous growth model (—).
156

Effect of initial biomass concentration
consequence, the colony-expansion model can be used to calculate the minimum initial biomass concentration that is needed to prevent diffusion limitation over micro-colonies. In Fig. 6 the obtainable macroscopic consumption rate is given as a function of the initial biomass concentration. In order to account for the fluctuations due to of the saw-tooth curve as shown in Fig. 1, rates from day 30 to 40 were averaged. It is shown that under the given circumstances for Nitrosomonas europaea at initial biomass concentrations higher than about 0.5 kg. m"3 the capacity of immobilized-cell reactors approaches a maximum. In comparison, the model calculations were also made with the pseudo-homogeneous growth model of De Gooijer ef a/.2 which does not take diffusion limitation over micro-colonies into account. Clearly, it can be observed that capacities calculated with the colony-expansion model approach the values obtained by the pseudo-homogeneous growth model with increasing inoculum size of the gel beads at initial biomass concentrations higher than about 0.5 kg. m"3.
CONCLUSION
The capacity of immobilized-cell bioreactors is not only limited by diffusion over the carrier material, but can be limited by diffusion over micro-colonies as well. In case of Nitrosomonas europaea larger colonies were formed at low inoculum sizes than at high inoculum sizes. It was shown, both by model calculations and experimentally, that diffusion limitation over micro-colonies played a role in both systems, but that in the system with larger colonies the effect was more stringent. Calculations showed that at inoculum sizes larger than 0.5 kg. m"3 the effect of diffusion limitation over micro-colonies can be omitted.
ACKNOWLEDGEMENTS
We like to thank the Department of Plant Cytology and Morphology for giving us the opportunity to use the equipment for microscopical analysis.
157

Chapter 7
LITERATURE
1. Barnes D., Bliss P.J. (1983) Biological control of nitrogen in wastewater treatment. E. & F.N.
Spon, London, 146 p
2. De Gooijer CD., Wijffels R.H., Tramper J. (1991) Growth and substrate consumption of
Nitrobacter agilis cells immobilized in carrageenan: part 1. dynamic modeling. Biotechnol Bioeng
38: 224-231
3. Lowry O.H., Rosebrough N.J., Farm A.L., Randall R.J. (1951 ) Protein measurement with the folin
phenol reagent. J Biol Chem 193: 265-275
4. Smith M.R., De Haan A., Wijffels R.H., Beuling E.E., Vilchez C , De Bont J.A.M. (1991 ) Analysis
of growth and specific activities of immobilized microbial cells. Biotechnol Techn 5: 323-326
5. Stewart P.S., Robertson CR. (1989) Microbial growth in a fixed volume: studies with entrapped
Escherichia coli. Appl Microbiol Biotechnol 30: 34-40
6. Van Neerven A.R.W., Wijffels R.H., Zehnder A.J.B. (1990) Scanning electron microscopy of
immobilized bacteria in gel beads: a comparative study of fixation methods. J Microbiol Meth 11:
157-168
7. Wijffels R.H., De Gooijer CD., Kortekaas S., Tramper J . (1991) Growth and substrate
consumption of Nitrobacter agilis cells immobilized in carrageenan: part 2. model evaluation.
Biotechnol Bioeng 38: 232-240
8. Wijffels R.H., De Gooijer CD., Schepers A.W., Beuling E.E., Mallée L.F., Tramper J. (1994)
Dynamic modelling of diffusion limitation over expanding micro-colonies of immobilized
Nitrosomonas europaea. Submitted for publication
158

INTERMEZZO

INTERMEZZO
The growth rate of the bacteria is higher at higher oxygen concentrations. As a consequence of the oxygen concentration profile over the bead, colonies near the surface will be larger than in the centre. Not only an oxygen concentration profile will develop, but also a biomass concentration profile will develop over the gel bead. We calculated this profile and evaluated it experimentally by image analysis. We made thin slices of the beads and observed them with a microscope. The position of each colony and the size of that colony was measured by image analysis. Image analysis can be done automatically by scanning a picture of the bead.
The radii of the colonies were translated into a biomass concentration and plotted as a function of the distance from the centre of the bead. One of the results is shown: the calculated profile is given by the line and the experimental profile by the data points. The calculated and measured profiles show that the biomass concentration is highest near the surface of the bead.
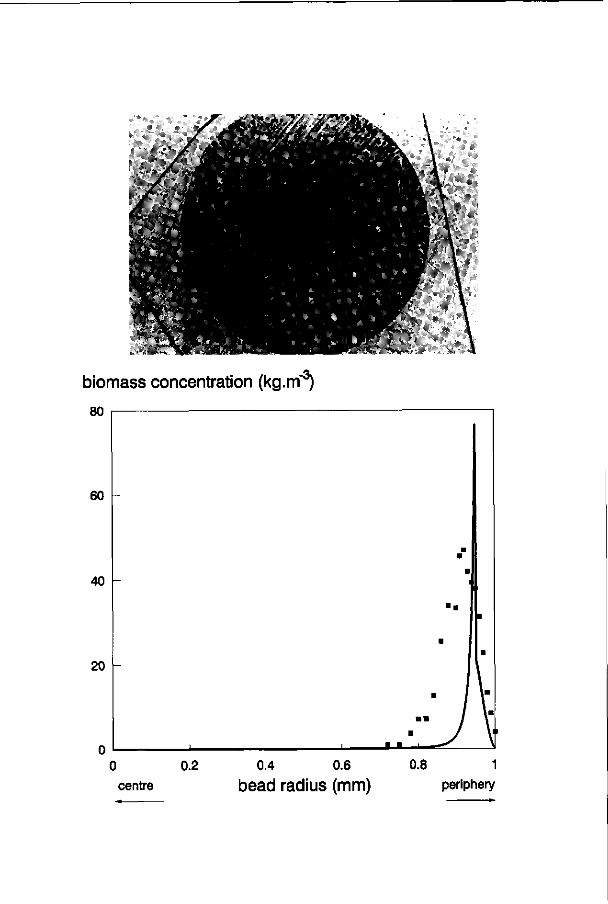
biomass concentration (kg.m"3)
80
0 0.2
centre
0.4 0.6
bead radius (mm) 0.8 1
periphery

This chapter has been submitted for publication by the authors R.H. Wijffels and J. Tramper
CHAPTER 8
IMMOBILIZED CELLS: MODEL OR PRACTICAL SYSTEM?
MODEL SYSTEMS
Studies with artificially immobilized nitrifying and denitrifying bacteria were started in our group more than a decade ago.27,29 At that time processes for removal of nutrients from wastewater received more and more attention as it was foreseen that in future generation wastewater-treatment plants, demands would become more and more stringent. Indeed, European laws demand a 75 % reduction in nitrogen inputs to the North Sea to be achieved in 1995 compared to the 1985 inputs.
For nitrogen removal biofilm processes are considered efficient processes. The 'natural' immobilized biomass, however, is only controllable to a limited extent and the underlying mechanisms are still not very well understood. For this reason we study a better defined and a more controllable system, consisting of 'artificially' immobilized pure strains of nitrifying and denitrifying bacteria. In order to learn more about these underlying mechanisms we use pure cultures with known kinetics, entrapped in gel beads with known diffusion coefficients and geometry.
We use nitrification as our key process to understand immobilized-gel processes in general, not only because of the environmental importance, but also because it is
163

Chapter 8
a perfect model, as the organisms are autotrophic, for which reason we do not have to work under aseptic conditions and as they have very slow growth rates for which reason there is sufficient time to study transient states. For comparison, with immobilized E. coli cells it would take less than a day to reach a maximum capacity, while with immobilized Nitrobacter agilis cells it takes about 15 days. The research, however, has been set up in such a way that basic information obtained from this system is also applicable to any other immobilized-cell process.
Initially the research was concentrated on characterization of activity and growth of immobilized cells and to describe the growth qualitatively. This period was concluded by describing, still qualitatively, growth in colonies, that are expanding with similar rates all over the beads just after start-up and, as time proceeds, mainly near the gel surface due to diffusion limitation as is shown in Fig. 1 .M Formation of such a biofilm has also been shown for many other processes.3,8,14,33
*X>K' Fig. 1: Pictures of coupes of carrageenan beads containing Nitrobacter
days of continuous cultivation.
71 d. after 10, 20 and 71
164

Model or practical system?
oxygen concentration (mM)
0.2
0.1
• « \
liquid phase i solid phase
-100 0 100
distance <pm)
200
Fig. 2: Experimental (markers) and simulated (line) oxygen concentration profiles in an agar slab
with immobilized Nitrobacter agilis after 21 days of cultivation.
In the subsequent period we tried to quantify the observations by model descriptions. Initially the most simple situation was studied,5,36,37 i.e., growth of Nitrobacter agilis, which does not produce acid, such that the occurrence of pH profiles across the gel matrix was excluded. The cell-growth model was developed5
and evaluated experimentally.36,37 The conclusion was that the model described our experiments well (Fig. 2). Because the model was built up from general equations and the parameters that were used in the cell-growth model were not fitted to the experimental results but directly obtained from literature or from separate experiments, it could be used in principle for any immobilized-cell system. A similar model was developed by Monbouquette et al. for immobilized £. coli.^5
To demonstrate the general applicability, evaluation was extended to immobilized Nitrosomonas europaea cells. It was in this case shown that model and experimental results did not match because of the influence of diffusion limitation over micro-
165

Chapter 8
colonies Fig. 3A.38 For this reason the growth model was extended by expressing growth as expansion of colonies,6,18,38 by implementation colony release when the colony surface and the bead surface merge and by considering diffusion limitation over these colonies. Predictions with this extended model did match with experimental results for Nitrosomonas europaea (Fig. 3B) and predicted those of Nitrobacter agilis (Fig. 3C) very well.38 It was shown that there is a relation between the inoculum size of the gel beads and the ultimate capacity reached.39 With the model it can be calculated what should be the minimum inoculum size to maximize the capacity of the immobilized-cell system. The simulations are in principle valid for any immobilized-cell system. With the knowledge built up now, it is possible to optimize the process and it thus forms a basic tool for efficient reactor design.
macroscopic consumption macroscopic consumption macroscopic consumption rate (mol. nr3. s"1) rate (mol. rrr3. s"1) rate (mol. m-3, s-1)
0.012
0.008
0.004
A
/
/ / . • / ' It • '. 1' Il ».• 1, ' *• « " . . . 1, .• » * « * I I*." • •
0.008
0.004
10 20 30 40
time (days)
10 20 30 40
time (days) time (days)
Fig. 3: Observed (markers) and predicted (lines) overall oxygen consumption rates of immobilized
Nitrosomonas europaea (A and B) and Nitrobacter agilis (C) after 21 days of cultivation. For
simulations of (A) diffusion limitation over the micro-colonies was not considered while for (B) and
(C) it was."
166

Model or practical system?
APPLICATION OF IMMOBILIZED CELLS
Nitrification and denitrification
Model predictions and experiments have shown that high capacities can be reached in reactors containing artificially immobilized nitrifying bacteria.36 This has been the reason to consider the possibility of using immobilized cells not only as a model, but as a practical system as well. Therefore, more applied projects have been initiated. For example the effect of low temperatures on performance are studied in an European research project of the Wageningen Agricultural University and the Norwegian Institute of Water Research. It has been shown that by immobilization the initially kinetic-limited process becomes diffusion limited. As diffusion is less temperature dependent than bacterial-growth rate, the process is less sensitive to temperature changes, such that even under winter conditions high capacities can be reached.3540
One of the elements that will receive much attention in our future research is the possibility of complete nitrification, denitrification and organic-carbon removal in a single-reactor system.
In conventional wastewater-treatment systems nitrification and denitrification are difficult to combine within a single reactor at high rates. Generally organic compounds are first oxidized before nitrification is executed. To integrate denitrification in such a process, an anaerobic stage can be introduced as a first or a last step. If it is introduced as a first step, part of the effluent of the nitrifying reactor has to be recycled. The result is, that part of the produced nitrate, depending on the recycle ratio, will not be converted. If it is introduced as a last step, a part of the influent has to be by-passed to the denitrification reactor in order to introduce organic compounds, needed for the denitrification. As a result some nitrogen is discharged as ammonia with the effluent. In none of these situations a complete nitrogen removal is thus achieved. One of the possibilities to integrate nitrification and denitrification in a single reactor is by co-immobilization of the bacteria involved.11,1920,27,28 Due to diffusion limitation of oxygen the nitrifying organisms will concentrate in a biofilm just under the surface of a gel particle, leaving the anoxic central part completely unused. Denitrification may occur in the bead core if suitable denitrifying bacteria are present and if organic substrate is available. This "magic bead" concept was presented by
167

Chapter 8
Tramper2728 and Santos ef a/.1920 and is shown in Fig. 4.
Fig. 4: The magic bead concept."
oxygen
ammonia
nitrite /
For application of artificially immobilized cells two further criteria have to be met: the production process of immobilized cells needs to be economically attractive and the produced gel particles need to be stable for a prolonged period. For this reason, studies were executed on the economical feasibility of the immobilized-cell system in addition to experiments on stability of the support material. It was shown that if gel beads remain stable for a period of more than 2 months, application of immobilized cells for nitrification is economically attractive.
Carrageenan and alginate are both polymeric materials that need to be stabilized by counter ions. If these ions are not present, the beads will dissolve, which make these polymers not suitable for all applications, such as treatment of domestic wastewater. Presently, research is being done with alternative materials, both within our group and in other research groups. Results of these studies look promising. Alternative materials that have been used for nitrification and show good perspectives in respect to stability are polyvinyl alcohol,1'17 polyethylene glycol,21,25 Polyacrylamide21,24
and polycarbamoylsulfonate.18,31 The process with the polyethylene-glycol resin has already been scaled up to a scale of 750 m3.25
168

Model or practical system?
From immobilized enzymes to immobilized whole cells
One of the first applications of immobilized biocatalysts is the immobilization of glucose isomerase for the production of high fructose corn syrup.30 Especially for glucose isomerase immobilization was an ideal solution because of the high price of the enzyme. The enzyme can be reused when it is immobilized. Immobilized enzymes have been used for the production of amino acids as well. A limitation of the use of immobilized isolated enzymes is their high cost of purification, often the need of cofactors, and loss of enzyme activity during immobilization and operation. An alternative approach is the use of immobilized cells. Several processes have been applied for the production of amino acids by immobilized cells. Initially non-growing cells were used.4 Industrially these systems have been used for the continuous production of e.g. L-alanine22 and L-malic acid23. Immobilized growing cells have also been used.10,2426,32 Other possible applications have been summarized by Tanaka and Nakajima24: organic acids, antibiotics, steroids, enzymes, vitamin B12 and alcohols. Also three processes with immobilized yeast cells have been applied for the production of carbon dioxide in sparkling wines and for the production of alcohol containing and alcohol-free beer (text box).
Immobilized yeast cells for beverage production
Traditional fermentations in food industry are seldom replaced by alternative processes as often producers are afraid that small changes in taste influence the fame of the product negatively, even if the fermentation time is reduced drastically. One of the exceptions is the production of beer with in alginate immobilized yeast cells by the Hwa-Kuang brewery in Shanghai/2 Also for the production of alcohol-free beers and the post fermentation of sparkling wines immobilized yeasts are used. In case of the introduction of new products, like alcohol-free beer, there is no risk that the product quality is influenced by new technologies and novelties can therefore be more easily implemented. For alcohol-free beer columns with immobilized yeast cells are used.9,13 For the production of sparkling wines, traditionally secondary fermentation is done in the bottle by adding some sugar and yeast cells. The only function of this fermentation is production of carbon-dioxide gas to make the wine sparkling. The yeast cells need to be removed after fermentation to obtain a clear product. For this reason yeast cells need to sediment in the neck of the bottle, which is a slow process for which much space and labour is needed. By immobilization of the cells, sedimentation is much faster.7
169
Chapter 8
The use of immobilized cells shows also possibilities for recombinant microbial cells (text box).
Recombinant microbial cells
Immobilization can be beneficial in the case of genetically improved microbial cells. At each cell division mutations occur in growing recombinant cells to much simpler forms. Mutant cells generally grow faster and the originally recombinant form would be overgrown in continuous culture if there is no antibiotic selection pressure applied.
In case cells are immobilized, the faster growing colonies at the periphery will erupt after a limited number of cell divisions. The remaining colonies contain a higher percentage of the recombinant form and will grow until they reach the surface and erupt. As a result the eruption provides wash out that affects the non-recombinant plasmid-containing cells to a much higher degree than the plasmid-containing cells. Therefore, immobilized cells form a more stable system than continuous-cultivated, suspended, genetically improved, microbial cells.2
PERSPECTIVES OF IMMOBILIZED CELLS IN ENVIRONMENTAL BIOTECHNOLOGY
As indicated, immobilized cells and the models developed for describing their
behaviour, can be used for much more processes than the nitrification process as
presented here. In principle it can be used for degradation of any compound or
accumulation of certain compounds as long as there is a suitable microorganism
available.
Especially in case of difficult-degradable compounds by specific slow-growing organisms, immobilization can lead to an efficient system. A combination of a collection of microorganisms which specifically degrade certain compounds, knowledge about their kinetics and the diffusional properties of the compounds and introduction into the model as presented, would result in specific solutions for the treatment of the pollutant-containing medium. Based on the amount of pollutants to be removed and the types of pollutants, process conditions can be designed for optimal degradation (Fig. 5).
Other systems that are potentially of interest are reactions in which accumulation
170

Model or practical system?
occurs, e.g. phosphate or heavy metals. The biomass concentration in the carriers is generally high. In case of accumulation of a compound in the immobilized bacteria, high concentrations of this compound are reached in the particles which are easy to separate from the pollutant containing medium. Such a system may be suitable for recovery of the waste as a raw material.
culture collection
H
pre-cultivation
immobilization
process
Fig. 5: Schematic representation of general approach for the development of a process with
immobilized cells.
L ITERATURE
1. Ariga O., Takagi H., Nishizawa H., Sano Y. (1987) Immobilization of microorganisms with PVA
hardened by iterative freezing and thawing. J Ferment Technol 65 (6): 651-658
171

Chapter 8
2. Barbotin J.N., Sayadi S., Nasri M., Thomas D. (1990) Improvement of plasmid stability by
immobilization of recombinant microorganisms. Ann NY Acad Sei 59: 41-53
3. Chibata I., Tosa T., Fujimara F. (1983) Immobilized living microbial cells. In: Annual reports on
fermentation processes, vol. 6. Ed.: Tsao G.T., Academic Press, London, p 1-22
4. Constantinides A., Bhatia D., Vieth W.R. (1981) Immobilization of Brevibacterium flavum cells
on collagen for the production of glutaminic acid in a recycle reactor. Biotechnol Bioeng 23: 899-
916
5. De Gooijer CD., Wijffels R.H., Tramper J. (1991) Growth and substrate consumption of
Nitrobacter agilis cells immobilized in carrageenan. Part 1: Dynamic modeling. Biotechnol Bioeng
38: 224-231
6. De Gooijer CD., Wijffels R.H., Tramper J. (1992) Dynamic modeling the growth of immobilized
nitrifying bacteria: biofilm development. In: Biofilms-Science and Technology. Eds. L.F. Melo, T.R.
Bott, M. Fletcher, B. Capdeville. Kluwer Academic Publishers, the Netherlands, p 291-296
7. Gôdia F., Casas C , Sola C. (1991) Application of immobilized yeast cells to sparkling wine
fermentation. Biotechnol Progr 7: 468-470
8. Gosmann B., Rehm H.J. (1986) Oxygen uptake of microorganisms entrapped in Ca-alginate.
Appl Microbiol Biotechnol 23: 163-167
9. Fieman F. (1992) Lageringstijd pils sterk verkort met geïmmobiliseerde gisten. Food Management
10 (3): 25-27
10. Fujimura M., Kato J., Tosa T., Chibata I. (1984) Continuous production of L-arginine using
immobilized growing Serratia marcescens cells: effectiveness of supply of oxygen gas. Appl
Microbiol Biotechnol 19: 79-84
11. Kokufuta E., Shimohashi M., Nakamura I. (1988) Simultaneously occurring nitrification and
denitrification under oxygen gradient by polyelectrolyte complex-coimmobilized Nitrosomonas
europaea and Paracoccus denitrificans cells. Biotechn Bioeng 31: 382-384
12. Linko P., Linko Y.Y. (1984) Industrial applications of immobilized cells. CRC Critical Reviews in
Biotechnology 1 (4): 289-337
13. Lommi H.O. (1990) Immobilized yeast for maturation and alcohol-free beer. Brewing & Distilling
International 21 (5): 22-23
14. Mahmoud W., Rehm H.J. (1986) Morphological examination of immobilized Streptomyces
aurofaciens during Chlortetracycline fermentation. Appl Microbiol Biotechnol 23: 305-3108
15. Monbouquette H.G., Sayles G.D., Ollis D.F. (1990) Immobilized cell biocatalyst activation and
pseudo-steady-state behavior: model and experiment. Biotechnol Bioeng 35: 609-629
16. Muscat A., Beyersdorf J., Vorlop K.D. (1993) Poly(carbamoylsulfonate), a material for
immobilization: synthesis, diffusion and mechanical properties. Biotechnol Techn 7 (8): 591-596
17. Myoga H., Asano H., Nomura Y., Yoshida H. (1991) Effects of immobilization conditions on the
nitrification treatability of entrapped cell reactors using PVA freezing method. Wat Sei Tech 23:
1117-1124
18. Salmon P.M. (1989) Mass transport phenomena in reactors containing entrapped enzymes or
172

Model or practical system?
bacterial cells. PhD thesis Stanford University, USA
19. Santos V.A., Tramper J., Wijffels R.H., Tramper J. (1992) Integrated nitrification and
denitrification with immobilized microorganisms. In: Biofilms-Science and Technology. Eds. L.F.
Melo et al. Kiuwer Academic Publishers, the Netherlands, p 449-453
20. Santos V.A., Tramper J., Wijffels R.H. (1993) Simultaneous nitrification and denitrification using
immobilized microorganisms. Biomat Art Cells & Immob Biotech 21 (3): 317-322
21. Tada M., Kimata T., Mori N., Emori H. (1990) Nitrogen removal systems using immobilized
microorganisms in synthetic resin. Hitachi Review 39 (6): 379-386
22. Takamatsu S., Yamamoto K., Tosa T., Chibata I. (1981) Stabilization of L-aspartate B-
decarboxylase activity of Pseudomonas dacunhae immobilized with carrageenan. J Ferment
Technol 59(6): 489-493
23. Takata I., Yamamoto K., Tosa T., Chibata I. (1980) Immobilization of Brevibacterium flavum with
carrageenan and its application for continuous production of L-malic acid. Enzyme Microbiol
Technol 2: 30-36
24. Tanaka A., Nakajima H. (1990) Application of immobilized growing cells. In: Advances in
Biochemical Engineering/Biotechnology, vol. 42. Ed.: Fiechter A. Springer-Verlag, Berlin
Heidelberg, p 97-131
25. Tanaka K., Tada M., Kimata T., Harada S., Fujii Y., Mizuguchi T., Mori N., Emori H. (1991)
Development of new nitrogen removal system using nitrifying bacteria immobilized in synthetic
resin pellets. Wat Sei Tech 23: 681-690
26. Tanaka T., Yamamoto K., Towprayoon S., Nakajima H., Sonomoto K., Yokozeki K., Kubota
K., Tanaka A. (1989) Continuous production of L-serine by immobilized growing Corynebacterium
glycinophilum cells. Appl Microbiol Biotechnol 30: 564-568
27. Tramper J . (1984). Nitrification and denitrification by immobilized bacteria. Third European
Congress on Biotechnology, München, 10-14 September 1984, p 363-368, VCH Weinheim
28. Tramper J. (1987) Nitrification and denitrification by immobilized viable cells. In: Enzyme
Engineering 8, ed. A.I. Laskin, L. Mosbach, D. Thomas, LB. Wingard Annuals of the New York
Academy of Sciences 501: 362-366
29. Van Ginkel CG., Tramper J., Luyben K.Ch.A.M., Klapwijk A. (1983) Enzyme Microb Technol
5: 297-303
30. Venkatasubramanian K., Harrow L.S. (1979) Design and operation of a commercial immobilized
glucose isomerase reactor system. Annals of the New York Academy of Sciences 326: 141-154
31. Vorlop K.D., Muscat A., Beyersdorf J. (1992) Entrapment of microbial cells within polyurethane
hydrogel beads with the advantage of low toxicity. Biotechnol Techn 62 (6): 483-488
32. Wada M., Uchida T., Kato J., Chibata I. (1980) Continuous production of L-isoleucine using
immobilized growing Serratia marcescens cells. Biotechnol Bioeng 22: 1175-1188
33. Wada M., Kato J., Chibata I. (1980) Continuous production of ethanol using immobilized growing
yeast cells. Appl Microbiol Biotechnol 10: 275-287
34. Wijffels R.H., Tramper J. (1989) Performance of growing Nitrosomonas europaea cells
173
Chapter 8
immobilized in /c-carrageenan. Appl Microbiol Biotechnol 32: 108-112
35. Wijffels R.H., Hunik J.H., de Gooijer CD., Tramper J. (1990) Nitrification with immobilized
bacteria in air-lift loop reactors: modelling and application. Proceedings 5th European Congress
on Biotechnology, Copenhagen July 8-13, 1990, vol. 1, C. Christiansen, L. Munck, J. Villadsen,
Munksgaard International Publisher, Copenhagen, p 392-395
36. Wijffels R.H., De Gooijer CD., Kortekaas S., Tramper J. (1991) Growth and substrate
consumption of Nitrobacter agilis cells immobilized in carrageenan. Part 2: Model evaluation.
Biotechnol. Bioeng. 38: 232-240
37. Wijffels R.H., Eekhof M.R., De Beer D., Van Den Heuvel J.C., Tramper J. (1994) Pseudo-
steady-state oxygen concentration profiles in an agar slab containing growing Nitrobacter agilis.
Submitted
38. Wijffels R.H., De Gooijer CD., Schepers A.W., Beuling E.E., Ma liée L.R., Tramper J. (1994)
Growth of immobilized Nitrosomonas europaea: implementation of diffusion limitation over
microcolonies. Submitted
39. Wijffels R.H., Schepers A.W., Smit M., De Gooijer CD., Tramper J. (1994) Effect of initial
biomass concentration on the growth of immobilized Nitrosomonas europaea. Submitted
40. Wijffels R.H., Englund G., Hunik J.H., Leenen E.J.T.M., Bakketun Â., Günther A., Obón de
Castro J.M., Tramper J. (1994) Effects of diffusion limitation on immobilized nitrifying micro
organisms at low temperatures. Submitted
174

SUMMARY
Nitrosomonas europaea and Nitrobacter agilis are nitrifying bacteria. Subsequently they oxidize ammonia to nitrite and nitrite to nitrate. Nitrification is a key process for the removal of nitrogen compounds from wastewater.
Ammonia is removed from wastewater by supply of oxygen to a reactor containing nitrifying bacteria. The hydraulic retention time in a reactor with suspended nitrifying bacteria needs to be sufficient to prevent wash-out of the bacteria. By immobilization, i.e., attach or entrap the organisms in a support material and retain the support material in the reactor, it is possible to run a reactor under wash-out conditions and consequently execute the nitrification process in compact systems. In practice, biofilm reactors are most commonly used for this.
In this research, artificial immobilized nitrifying bacteria are studied. The bacteria were suspended in a gel (carrageenan) and solid spheres were produced from this gel. The artificial immobilized cells were used as a model system for biofilm processes. By using the model system we were able to perform fundamental studies of growth within the support and substrate conversion by the immobilized cells.
Growth of immobilized cells has been described qualitatively in chapter 2. Immobilized cells form small colonies as the result of growth. Initially, such expanding micro-colonies were observed over the entire gel bead, but after some time growth just under the surface of the spheres was faster because of diffusion limitation over the support.
The qualitative observations have been quantified by modelling the significant transport processes (radial diffusion through the support and external mass transfer across the stagnant liquid layer surrounding the spheres), substrate consumption and growth (chapter 3). The model that we developed calculates substrate consumption and growth over time and shows for example that initially growth will take place all over the bead and after some time especially just under the surface of the beads. This is in agreement with our previous qualitative observations. The model has been validated experimentally by immobilized Nitrobacter agilis cells by determination of macroscopic substrate consumption rates, substrate profiles and biomass profiles (chapter 4 and
177

5). Experimental results were in close agreement with the model results.
The model consisted of general equations and the parameters were obtained from separate experiments or literature. For this reason the model should be general applicable. To demonstrate the general applicability the model was also used for Nitrosomonas europaea (chapter 6). The calculated macroscopic consumption rates, however, were much larger and the biomass concentration much lower than we found experimentally. We could show that in this experiment not only diffusion limitation over gel beads but also diffusion limitation over the micro-colonies was important. The size of micro-colonies of Nitrosomonas europaea was much larger than of Nitrobacter agilis in the previous experiment. This has been the reason to implement growth of biomass by expansion of colonies and taking diffusion limitation over those colonies into account in our model. Validation of this colony-expansion model showed that experimental and simulated results agreed much better. Application of the colony-expansion model to our previous experiment with Nitrobacter agilis also gave good results.
The size of the micro-colonies formed is dependent to a higher degree on the amount of organisms that is immobilized than on the type of organism. At low initial biomass concentrations, a few but large colonies will be formed. At high initial biomass concentrations much more and much smaller colonies will be formed. Those smaller colonies experience less diffusion limitation and consequently the substrate-utilization capacity of such beads will be higher. This effect could be demonstrated, both experimentally and by simulations with immobilized Nitrosomonas europaea (chapter 7).
The models that are presented in this thesis give insight in growth and substrate-
conversion capacity of immobilized cells. Our approach was general and as a
consequence the insight that is obtained is not only important for nitrification, but can
be used for other immobilized-cell processes as well.
178
SAMENVATTING
Nitrosomonas europaea en Nitrobacter agilis zijn nitrificerende bacteriën. Achtereenvolgens oxyderen zij ammonium tot nitriet en nitriet tot nitraat. Nitrificatie vormt een belangrijke stap in de verwijdering van stikstofverbindingen uit afvalwater.
In een reactor wordt afvalwater met daarin ammoniak met behulp van zuurstof door nitrificerende bacteriën verwijderd. Bij gebruik van gesuspendeerde nitrificerende bacteriën moet de verblijftijd van het afvalwater in de reactor groot genoeg zijn om de bacteriën niet uit te spoelen. Door de bacteriën te immobiliseren, dat wil zeggen ze vast te leggen op of in een dragermateriaal en dat dragermateriaal achter te houden in de reactor, is het mogelijk onder uitspoelcondities te werken en dientengevolge nitrificatieprocessen in compacte systemen uit te voeren. In de praktijk wordt dit meestal toegepast in biofilmreactoren.
In dit onderzoek zijn kunstmatig geïmmobiliseerde nitrificerende bacteriën bestudeerd. Bacteriën werden gesuspendeerd in een gel (carrageen) en van dit gel werden bolletjes gemaakt. Dit systeem vormde een modelsysteem voor biofilmprocessen. Aan de hand van dit modelsysteem is fundamenteel onderzoek gedaan naar groei en substraatomzetting van geïmmobiliseerde cellen.
In hoofdstuk 2 is de groei van geïmmobiliseerde cellen kwalitatief beschreven. Geïmmobiliseerde cellen blijken als gevolg van groei kleine kolonies in het gel te vormen. In eerste instantie worden dergelijke expanderende kolonies over de gehele bol waargenomen, maar in later stadium is groei aan het oppervlak sneller dan in het centrum van de bollen als gevolg van diffusielimitatie over het gelbolletje.
In hoofdstuk 3 zijn deze kwalitatieve waarnemingen gekwantificeerd door de belangrijkste stoftransportprocessen (diffusie over het gel in radiële richting en stoftransport over de stagnante vloeistoflaag om de bollen), substraatconsumptie en groei te modelleren. Het ontwikkelde model beschrijft substraatconsumptie en groei in de tijd en laat bijvoorbeeld zien, dat groei in eerste instantie over de gehele bol plaats vindt en later met name juist onder het oppervlak en komt dus overeen met onze kwalitatieve waarnemingen. Dit model is gevalideerd met behulp van geïmmobiliseerde Nitrobacter agilis cellen door gemeten macroscopische
181

substraatconsumptie, substraatprofielen en biomassaprofielen te vergelijken met de modelvoorspellingen (hoofdstuk 4 en 5). Het ontwikkelde model bleek onze experimenten goed te beschrijven.
Het ontwikkelde model was opgebouwd uit algemene vergelijkingen en de modelparameters waren verkregen uit andere experimenten en uit de literatuur. Het model is daarom in principe algemeen geldig. Om die algemene geldigheid aan te tonen werd het model ook getoetst met Nitrosomonas europaea (hoofdstuk 6). De voorspelde macroscopische consumptiesnelheid bleek echter veel hoger, en de biomassaconcentratie veel lager te zijn dan de experimenteel verkregen waarden. Aangetoond kon worden dat tijdens dit experiment niet alleen diffusielimitatie over de gelbollen maar ook diffusielimitatie over de gevormde microkolonies van belang was. De microkolonies van Nitrosomonas europaea bleken veel groter te zijn dan die van Nitrobacter agilis in het vorige experiment. Naar aanleiding van deze waarneming is de groei in het model opgenomen door discrete kolonies te laten expanderen en diffusielimitatie over die kolonies mee te nemen. Na toetsing bleek dit model veel beter de experimenten te beschrijven. Daarnaast bleek dit model ook het experiment dat we uitgevoerd hadden met Nitrobacter agilis goed te beschrijven.
De grootte van de gevormde microkolonies is niet zozeer afhankelijk van het type organisme dat geïmmobiliseerd wordt, maar veel meer van de hoeveelheid organismen die geïmmobiliseerd worden. Indien de initiële biomassaconcentratie laag is worden weinig, maar relatief grote kolonies gevormd. Bij een hoge initiële biomassaconcentratie worden veel meer, maar veel kleinere kolonies gevormd. Over die kleinere kolonies is er minder diffusielimitatie waardoor de omzettingscapaciteit van dergelijke bollen ook veel groter is. Dit werd zowel door onze modelvoorspellingen als in experimenten met Nitrosomonas europaea aangetoond (hoofdstuk 7).
De in dit proefschrift beschreven modellen geven inzicht in de groei en omzettingscapaciteit van geïmmobiliseerde cellen. De benadering van geïmmobiliseerde cellen was zo algemeen, dat verkregen kennis niet alleen voor nitrificatie van belang is, maar in principe voor alle geïmmobiliseerde bacteriën.
182

BIBLIOGRAPHY
Sayed S., Van Der Zanden J., Wijffels R., Lettinga G. (1988) Anaerobic digestion
of the various fractions of slaughterhouse wastewater. Biol Wastes 23: 117-142 Wijffels R.H., Tramper J. (1989) Performance of growing Nitrosomonas europaea
cells immobilized in «-carrageenan. Appl Microbiol Biotechnol 32: 108-112 Van Neerven A.R.W., Wijffels R.H., Zehnder A.J.B. (1990) Scanning electron
microscopy of immobilized bacteria in gel beads: a comparative study of fixation methods. J Microb Meth 11: 157-168
De Gooijer CD., Wijffels R.H., Tramper J. (1990) Modelling the growth of immobilized Nitrobacter agilis cells. Physiology of Immobilized Cells, Proceedings of
an International Symposium held at Wageningen, The Netherlands, 10-13 December 1989, J.A.M. de Bont, J. Visser, B. Mattiasson, J. Tramper, Elsevier Science Publishers
B.V., Amsterdam p 355-360
Wijffels R.H., De Gooijer CD., Kortekaas S, Tramper J. (1990) Nitrobacter agilis
immobilized in carrageenan: oxygen consumption and biomass density. Physiology of Immobilized Cells, Proceedings of an International Symposium held at Wageningen, The Netherlands, 10-13 December 1989, J.A.M, de Bont, J. Visser, B. Mattiasson, J.
Tramper, Elsevier Science Publishers B.V., Amsterdam p 475-480 Wijffels R.H., Schukking G.C., Tramper J. (1990) Characterization of a denitrifying
bacterium immobilized in «-carrageenan. Appl Microbiol Biotechnol 34: 399-403
Wijffels R.H., Hunik J.H., De Gooijer CD., Tramper J. (1990) Nitrification with immobilized bacteria in airlift loop reactors: modelling and application. Proceedings 5th
European Congress on Biotechnology, Copenhagen July 8-13, 1990, vol. 1, C. Christiansen, L Munck, J. Villadsen, Munksgaard International Publisher, Copenhagen, p 392-395 Wijffels R.H., Eekhof M.R., Tramper J., De Beer D., Van Den Heuvel J.C. (1991) Growth and substrate consumption by immobilized Nitrobacter agilis: validation of a
dynamic model. Int. Symp. Environmental Biotechnology, 22-25 April 1991, Ostend,
Belgium, pp 687-699
De Gooijer CD., Wijffels R.H., Tramper J. (1991 ) Growth and substrate consumption
185

of Nitrobacter agilis cells immobilized in carrageenan. Part 1: Dynamic modeling.
Biotechnol Bioeng 38: 224-231 Wijffels R.H., De Gooijer CD., Kortekaas S., Tramper J. (1991) Growth and substrate consumption of Nitrobacter agilis cells immobilized in carrageenan. Part 2:
Model evaluation. Biotechnol Bioeng 38: 232-240 Smith M.R., De Haan A., Wijffels R.H, Beuling E.E., Vilchez C , De Bont J.A.M. (1991) Analysis of growth and specific activities of immobilized microbial cells.
Biotechnol Techn 5: 323-326 Wijffels R.H., Hunik J.H., De Gooijer CD., Tramper J. (1992) Nitrification with
immobilized bacteria in airlift loop reactors. Congress Agriculture & Environment in Eastern Europe and the Netherlands, 5 & 6 sept. 1990. Wageningen Agricultural
University, p 169-175 De Gooijer CD., Wijffels R.H., Tramper J. (1992) Dynamic modeling the growth of
immobilized nitrifying bacteria: biofilm development. In: Biofilms-Science and
Technology. Eds. LF. Melo, T.R. Bott, M. Fletcher, B. Capdeville. Kluwer Academic
Publishers, the Netherlands, p 291-296 Santos V.A., Tramper J., Wijffels R.H. (1992) Integrated nitrification and denitrification with immobilized microorganisms. In: Biofilms-Science and Technology. Eds. LF. Melo, T.R. Bott, M. Fletcher, B. Capdeville. Kluwer Academic Publishers, the Netherlands, p 449-453
Wijffels R.H., Leenen E.J.T.M., Tramper J. (1993) Possibilities of nitrification with
immobilized cells in waste-water treatment: model or practical system? Wat Sei Tech 26: 233-240 Santos V.A., Tramper J., Wijffels R.H. (1993) Simultaneous nitrification and
denitrification using immobilized microorganisms. Biomat Art Cells & Immob Biotech
21 (3): 317-322
De Gooijer CD., Schepers A.W., Wijffels R.H., Tramper J. (1994) Dynamic
modelling of the growth of immobilized Nitrosomonas europaea cells. Proceedings 6th
European Congress on Biotechnology, Firenze Hunik J.H., Tramper J., Wijffels R.H. (1994) A strategy to scale-up nitrification
processes with immobilized nitrifying cells. Biotechnol Progr, Accepted Wijffels R.H., De Gooijer CD., Schepers A.W., Beuling E.E., Mallée LR., Tramper J. (1994) Growth of immobilized Nitrosomonas europaea: implementation of diffusion limitation over microcolonies. Submitted
Wijffels R.H., Schepers A.W., Smit M., De Gooijer CD., Tramper J. (1994) Effect
of initial biomass concentration on the growth of immobilized Nitrosomonas europaea.
186

Submitted Wijffels R.H., Englund G., Hunik J.H., Leenen E.J.T.M., Bakketun Â., Günther A., Obón de Castro Ü.M., Tamper J. (1994) Effects of diffusion limitation on immobilized
nitrifying microorganisms. Submitted Wijffels R.H., Eekhof M.R., De Beer D., Van Den Heuvel J.C., Tramper J. (1994) Pseudo-steady-state oxygen concentration profiles in an agar slab containing growing Nitrobacter agilis. Submitted Wijffels R.H., Tramper J. (1994) Nitrification by immobilized cells. Submitted
Wijffels R.H., Tramper J. (1994) Immobilized cells: model or practical system?
Submitted
187

Curriculum vitae
René Wijffels werd op 8 februari 1960 geboren in Uzendijke. In 1977 behaalde hij het diploma HAVO aan de scholengemeenschap St. Eloy in Oostburg. Hij vervolgde zijn opleiding aan de Hogere School voor Levensmiddelentechnologie in 's-Hertogenbosch en sloot deze af in 1982.
Vanaf 1982 studeerde hij aan de Landbouwuniversiteit Wageningen. In 1987 studeerde hij af in de studierichting Milieu-hygiëne met als afstudeervakken Proceskunde en Waterzuivering. Hij heeft o.a. stages gedaan bij de Technologische Dienst van de Zeeuwse Waterschappen te Terneuzen en Corporación Autonoma Regional del Cauca te Cali, Colombia.
Vanaf 1 October 1987 is hij werkzaam geweest bij de sectie Proceskunde van de Landbouwuniversiteit te Wageningen, eerst als assistent in opleiding en vanaf 1 januari 1991 als universitair docent.
188