
Phytoplankton photoacclimation and photoadaptation in response to environmental gradients in a shelf...
14
936 Limnol. Oceanogr., 51(2), 2006, 936–949 q 2006, by the American Society of Limnology and Oceanography, Inc. Phytoplankton photoacclimation and photoadaptation in response to environmental gradients in a shelf sea C. Mark Moore 1 National Oceanography Centre, European Way, Southampton SO14 3ZH, United Kingdom David J. Suggett Department of Biological Sciences, University of Essex, Colchester CO4 3SQ, United Kingdom Anna E. Hickman, Young-Nam Kim, and Jacqueline F. Tweddle National Oceanography Centre, European Way, Southampton SO14 3ZH, United Kingdom Jonathan Sharples Proudman Oceanographic Laboratory, Bidston Observatory, Birkenhead CH43 7RA, United Kingdom Richard J. Geider Department of Biological Sciences, University of Essex, Colchester CO4 3SQ, United Kingdom Patrick M. Holligan National Oceanography Centre, European Way, Southampton SO14 3ZH, United Kingdom Abstract Variability in the photosynthetic performance of natural phytoplankton communities, due to both taxonomic com- position and the physiological acclimation of these taxa to environmental conditions, was assessed at contrasting sites within a temperate shelf sea region. Physiological parameters relating to the structure of the photosystem II (PSII) antenna and processes downstream from PSII were evaluated using a combination of fast repetition rate fluorescence, oxygen flash yields, spectral fluorescence, and 14 C photosynthesis versus irradiance measurements. Parameters relating to PSII antenna structure, specifically the functional absorption cross-section (s PSII ) and the chlorophyll to PSII reaction center ratio, varied principally as a result of spatial (horizontal) taxonomic differences. Phenotypic plasticity in the size of the PSII light-harvesting antenna appeared to be limited. In contrast, parameters related to electron transport rates (ETRs) downstream of PSII, including the maximum ETR (1/t PSII ), the chlorophyll-specific maximum rate of carbon fixation (P ), and the light-saturation intensity (E k ), all decreased from the surface to the subsurface chlorophyll * max maximum (SCM) in stratified waters. The primary photoacclimation response to the vertical light gradient thus resulted in decreasing light-saturated carbon fixation per reaction center with increasing depth. Increases in the ratio of PSII reaction centers to carbon fixation capacity thus dominated the phenotypic response to decreased irradiance within the SCM. Perhaps counterintuitively, phytoplankton populations within fully mixed water columns, characterized by low mean irradiance, were acclimated or adapted to relatively high irradiance. Photoacclimation describes the phenotypic response of al- gae to changes in irradiance at the organism level (Falkowski and LaRoche 1991) and can be assessed by measuring dif- 1 Present address: University of Essex, Colchester C04 3SQ, Unit- ed Kingdom ([email protected]). Acknowledgments We thank E. Le Floch, G. Harris, M. Lucas, H. Thomas, and G. Tilstone for assistance with data collection at sea and M. Zubkov for assistance with the flow cytometry analysis. S. Laney kindly provided software and contributed to many useful discussions on the analysis of raw FRR fluorometer data. We also thank the officers and crew of the RRS James Clark Ross for their assistance during cruise JR98. Insightful comments from J. Cullen and an anonymous reviewer considerably improved an earlier version of this manu- script. This work was supported by the Natural Environment Research Council, UK (NER/A/S/2000/01237 to R.J.G.) and (NER/A/S/2001/ 00449 to P.M.H./J.S.). ferences in the photosynthetic physiology or biochemistry of a given taxon (genotype) in response to growth at a range of light intensities. Photoacclimation involves compensatory changes in a number of components of the photosynthetic apparatus (see reviews by Falkowski 1980; Falkowski and LaRoche 1991; MacIntyre et al. 2002). In particular, accli- mation to increased irradiance is typically accompanied by a decrease in cellular photosynthetic pigment content across all taxa (MacIntyre et al. 2002). In contrast, photoadaptation describes the genotypic re- sponse of algae to irradiance that has arisen during evolution (Falkowski and LaRoche 1991). Photoadaptation can be as- sessed by measuring differences in photosynthetic physiol- ogy or biochemistry of different taxa (different genotypes) when grown under identical environmental conditions. At the ecological level, species-specific traits influence the pho- tosynthetic performance of phytoplankton via interactions between the community of genotypes and the environment (Richardson et al. 1983; Cullen and MacIntyre 1998).
Transcript of Phytoplankton photoacclimation and photoadaptation in response to environmental gradients in a shelf...
936
Limnol. Oceanogr., 51(2), 2006, 936–949q 2006, by the American Society of Limnology and Oceanography, Inc.
Phytoplankton photoacclimation and photoadaptation in response to environmentalgradients in a shelf sea
C. Mark Moore1
National Oceanography Centre, European Way, Southampton SO14 3ZH, United Kingdom
David J. SuggettDepartment of Biological Sciences, University of Essex, Colchester CO4 3SQ, United Kingdom
Anna E. Hickman, Young-Nam Kim, and Jacqueline F. TweddleNational Oceanography Centre, European Way, Southampton SO14 3ZH, United Kingdom
Jonathan SharplesProudman Oceanographic Laboratory, Bidston Observatory, Birkenhead CH43 7RA, United Kingdom
Richard J. GeiderDepartment of Biological Sciences, University of Essex, Colchester CO4 3SQ, United Kingdom
Patrick M. HolliganNational Oceanography Centre, European Way, Southampton SO14 3ZH, United Kingdom
Abstract
Variability in the photosynthetic performance of natural phytoplankton communities, due to both taxonomic com-position and the physiological acclimation of these taxa to environmental conditions, was assessed at contrasting siteswithin a temperate shelf sea region. Physiological parameters relating to the structure of the photosystem II (PSII)antenna and processes downstream from PSII were evaluated using a combination of fast repetition rate fluorescence,oxygen flash yields, spectral fluorescence, and 14C photosynthesis versus irradiance measurements. Parameters relatingto PSII antenna structure, specifically the functional absorption cross-section (sPSII) and the chlorophyll to PSII reactioncenter ratio, varied principally as a result of spatial (horizontal) taxonomic differences. Phenotypic plasticity in thesize of the PSII light-harvesting antenna appeared to be limited. In contrast, parameters related to electron transportrates (ETRs) downstream of PSII, including the maximum ETR (1/tPSII), the chlorophyll-specific maximum rate ofcarbon fixation (P ), and the light-saturation intensity (Ek), all decreased from the surface to the subsurface chlorophyll*max
maximum (SCM) in stratified waters. The primary photoacclimation response to the vertical light gradient thus resultedin decreasing light-saturated carbon fixation per reaction center with increasing depth. Increases in the ratio of PSIIreaction centers to carbon fixation capacity thus dominated the phenotypic response to decreased irradiance within theSCM. Perhaps counterintuitively, phytoplankton populations within fully mixed water columns, characterized by lowmean irradiance, were acclimated or adapted to relatively high irradiance.
Photoacclimation describes the phenotypic response of al-gae to changes in irradiance at the organism level (Falkowskiand LaRoche 1991) and can be assessed by measuring dif-
1Present address: University of Essex, Colchester C04 3SQ, Unit-ed Kingdom ([email protected]).
AcknowledgmentsWe thank E. Le Floch, G. Harris, M. Lucas, H. Thomas, and G.
Tilstone for assistance with data collection at sea and M. Zubkovfor assistance with the flow cytometry analysis. S. Laney kindlyprovided software and contributed to many useful discussions onthe analysis of raw FRR fluorometer data. We also thank the officersand crew of the RRS James Clark Ross for their assistance duringcruise JR98. Insightful comments from J. Cullen and an anonymousreviewer considerably improved an earlier version of this manu-script.
This work was supported by the Natural Environment ResearchCouncil, UK (NER/A/S/2000/01237 to R.J.G.) and (NER/A/S/2001/00449 to P.M.H./J.S.).
ferences in the photosynthetic physiology or biochemistry ofa given taxon (genotype) in response to growth at a rangeof light intensities. Photoacclimation involves compensatorychanges in a number of components of the photosyntheticapparatus (see reviews by Falkowski 1980; Falkowski andLaRoche 1991; MacIntyre et al. 2002). In particular, accli-mation to increased irradiance is typically accompanied bya decrease in cellular photosynthetic pigment content acrossall taxa (MacIntyre et al. 2002).
In contrast, photoadaptation describes the genotypic re-sponse of algae to irradiance that has arisen during evolution(Falkowski and LaRoche 1991). Photoadaptation can be as-sessed by measuring differences in photosynthetic physiol-ogy or biochemistry of different taxa (different genotypes)when grown under identical environmental conditions. Atthe ecological level, species-specific traits influence the pho-tosynthetic performance of phytoplankton via interactionsbetween the community of genotypes and the environment(Richardson et al. 1983; Cullen and MacIntyre 1998).
937Photoacclimation in shelf seas
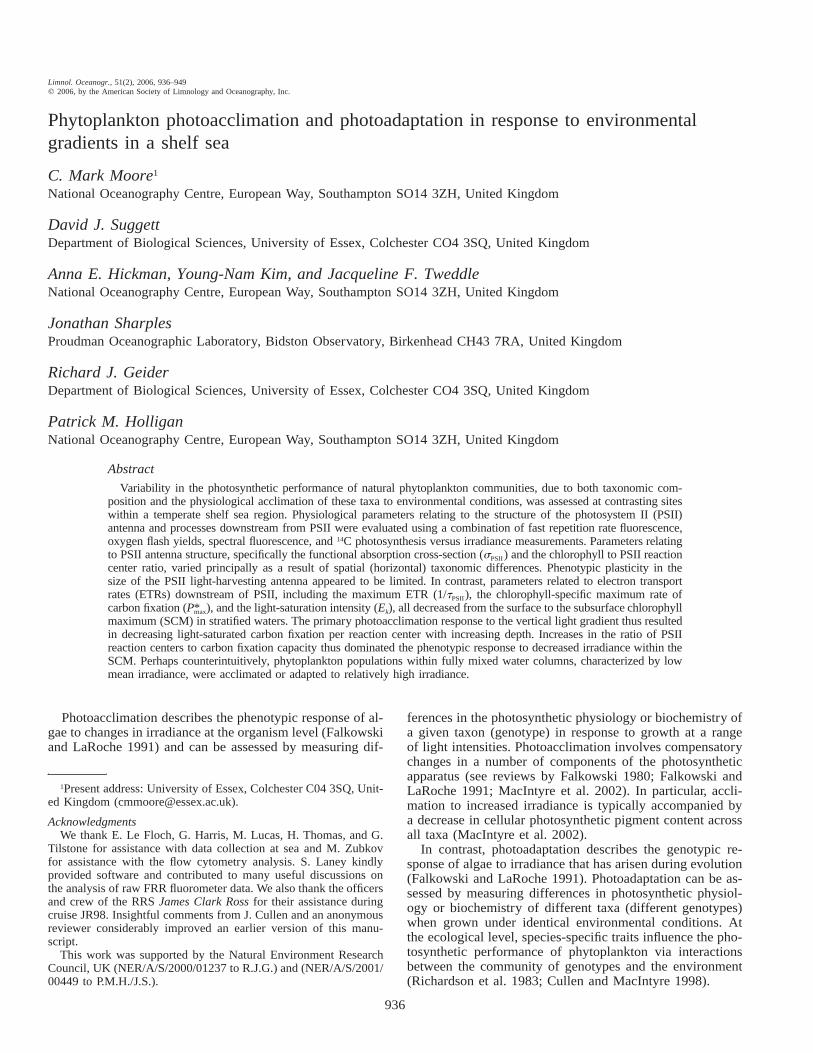
Fig. 1. Simplified schematics of photosynthetic apparatus as re-lated to two contrasting ‘‘strategies’’ of photoacclimation. (a) Ac-climation to lower irradiance occurs via increases in the ‘‘size’’ ofthe PSII antenna, increasing the functional absorption cross-sectionof PSII (sPSII ) at constant photosynthetic unit number per unit car-bon fixation capacity. The amount of PSII antenna pigment trans-ferring energy to active reaction centers largely governs sPSII. Hencetaxa with higher amounts of chlorophyll or accessory pigment perRCII will also tend to have an adaptively higher sPSII (Suggett etal. 2004). (b) Acclimation to decreased irradiance occurs by increas-ing the number of PSIIs of constant cross-section for a given carbonfixation capacity, leaving sPSII unchanged while decreasing the max-imum rate of whole-chain electron transport (1/tPSII ). For simplicityit is assumed that the ratio of PSII : PQ : PSI remains constant duringthe acclimation process as observed in Dunaliella tertiolecta (Su-kenik et al. 1987). The relation between 1/t and 1/tPSII willQ 2PQa
depend on the extent to which downstream processes limit the re-oxidation of Qa (Kolber and Falkowski 1993).
Distinguishing between photoacclimation and photoadap-tation is important for understanding the mechanisms thatregulate primary production in natural communities (Rich-ardson et al. 1983; Cullen and MacIntyre 1998). A betterknowledge of the environmental factors that influence thefunctional relationship between photosynthesis and irradi-ance (the P vs. E curve) in natural communities is also need-ed for improving estimates of oceanic productivity (Behren-feld et al. 2004). Specifically, ascribing changes in the Pversus E relation to physiological mechanisms or adaptivevariability underlies our ability to predict aquatic productionunder altered environmental forcing (Richardson et al. 1983;Cullen and MacIntyre 1998; MacIntyre et al. 2002).
The response of the molecular structure of the photosyn-thetic apparatus to changing irradiance varies between spe-cies (Fig. 1). Some taxa can acclimate to decreased irradi-ance by increasing the size of the light-harvesting antennaassociated with each reaction center (Fig. 1a). Conversely,other taxa acclimate by increasing the number of cellularreaction centers while the antenna size remains relativelyconstant (Fig. 1b) (Falkowski and Owens 1980; Perry et al.1981; Dubinsky et al. 1986). These acclimation responsesrepresent two different adaptive traits (Falkowski and Owens1980). The amount of accessory pigment within the antenna,the amount of chlorophyll per reaction center, and the max-imum capacity for carbon fixation can also vary betweentaxa (Falkowski and Raven 1997).
Shelf seas, with strong horizontal gradients in the degreeof water column mixing, are characterized by dynamic eco-systems (e.g., Moore et al. 2003). In stratified waters, thethermocline represents a barrier to transport between high-lightsurface waters and the low-light subsurface chlorophyll max-imum (SCM) (Sharples et al. 2001). Conversely, mixed wa-ter columns are characterized by rapid movement of phyto-plankton between high and low light (Moore et al. 2003).To understand the interactions of physical forcing and bio-logical response in these systems, observations of phyto-plankton physiology need to be made at high vertical, hor-izontal, and temporal resolution. This requirement has led tothe growing use of in situ active fluorescence techniquessuch as fast repetition rate (FRR) fluorometry for assessmentof physiological state and estimation of photosynthetic elec-tron transport rates (Kolber et al. 1990; Suggett et al. 2001;Moore et al. 2003). The FRR technique is capable of mea-suring a number of parameters that relate to photoacclima-tion and adaptation, including the functional absorptioncross-section of photosystem II (PSII) and the turnover timeof the primary PSII electron acceptor (Qa) (Kolber et al.1998).
The functional absorption cross-section (sPSII ) is the prod-uct of absorption by the suite of PSII antenna pigments andthe probability that an exciton within the antenna will causea photochemical reaction (Mauzerall and Greenbaum 1989).The amount of pigment associated with each PSII reactioncenter (RCII) will therefore govern much of the variabilityin sPSII (Kolber et al. 1988; Suggett et al. 2004). Taxon-dependent differences in antenna accessory pigment, or ac-climation responses that alter the ratio of pigment : RCII,thus result in variability of sPSII within natural populations(Fig. 1a).
The rate of Qa reoxidation (1/t ) should set an upper limitQa
on the rate of whole-chain electron transport (1/tPSII ). Irra-diance-dependent changes in the ratio of RCIIs to carbonfixation capacity (or per cell) appear to control 1/tPSII duringphotoacclimation (Sukenik et al. 1987) (Fig. 1b). A changein the number of reaction centers, rather than in the size ofthe antenna, can potentially alter 1/t . However, such a re-Qa
sponse will depend on the degree of downstream control ofQa reoxidation (Cleland 1998), the extent of cyclic electronflow (Prasil et al. 1996), and differing pathways of reductantuse (Behrenfeld et al. 2004). Parameters measured usingFRR fluorescence can thus potentially differentiate betweenthe two structural forms of photoacclimation, as well as otheradaptive traits.
At high irradiances, damage to RCII can occur, potentially

938 Moore et al.
leading to a reduction in photosynthetic rate (photoinhbition)(Prasil et al. 1992; Long et al. 1994). The probability of RCIIdamage can be modulated by both sPSII and the redox stateof Qa (Park et al. 1997; Baroli and Melis 1998). The lattereffect likely results from a decreased probability for stabi-lization of the primary charge separation when Qa is reduced(Park et al. 1997). The redox state of Qa will, in turn, begoverned by the rates of both light absorption and forwardelectron transport (Fig. 1).
Under excess irradiance a number of nonphotochemicalquenching (NPQ) processes act to dissipate excitation energyand hence protect RCII from damage (Krause and Weis1991; Horton et al. 1996). In particular, rapidly reversibleenergy-dependent quenching (qE), frequently associated withthe cycling of xanthophyll pigments in the PSII antenna, canreduce the functional absorption cross-section under ambientirradiance (s ) (Krause and Weis 1991; Olaizola 1994; Fal-9PSII
kowski and Raven 1997). Additionally, quenching associatedwith photoinhibition (qI), which relaxes over much longertimescales than qE, may be significant (Morrison 2003);however, the site and mechanism of qI remains equivocal(Krause and Weis 1991; Horton et al. 1996). Photoaccli-mation, photoprotection, and photodamage/inhibition arethus coupled processes requiring joint consideration (Beh-renfeld et al. 1998).
Recent models of photoacclimation suggest that the alter-ation of cellular pigment is a mechanism for balancing theenergy captured by light absorption with the energy demandfor growth (Geider et al. 1998). These models are concep-tually consistent with the redox state of the plastoquinone(PQ) pool providing the controlling signal for photoaccli-mation (Escoubas et al. 1995). However, there are limits onthe extent to which a given taxon can modulate pigmentcontent relative to carbon fixation capacity (MacIntyre et al.2002), and thus on its ability to compete in a given lightenvironment. Presumably, the taxonomic composition of thephytoplankton responds to different environments throughselection of genotypes that are better adapted to the prevail-ing light and nutrient environment (Richardson et al. 1983;Cullen and MacIntyre, 1998). Therefore, interpretation ofnatural variability in phytoplankton photosynthetic perfor-mance requires an understanding of the relative importanceof acclimation and adaptation in an ecological setting.
In the current study, we investigated photoacclimation andphotoadaptation of natural populations in a shelf sea regionduring summer. We provide the first demonstration that,within the natural system studied, marked vertical gradientsin acclimation state primarily result from changes in thenumber of PSII reaction centers per cell. In contrast, ob-served spatial (horizontal) variability in the PSII antenna sizewas primarily driven by changes in accessory pigmentationrelated to taxonomic gradients. These results are discussedin the context of current physiological models, the balanceof electron transport and carbon fixation, and the ecologicalsetting of the natural populations.
Methods
General—Data were collected in July–August 2003 dur-ing a cruise of the RRS James Clark Ross (JR98). Sites were
occupied in the stratified region of the Celtic Sea shelf andshelf break and at a mixed site within the Irish Sea (Fig. 2).Incident surface solar irradiance integrated from 400 to 700nm, hereafter referred to as photosynthetically available ra-diation (PAR), was recorded continuously. Hydrographicdata at each site were collected using a SeaBird 911 con-ductivity, temperature, depth (CTD) interfaced with a Chel-sea Instruments Aquatracka MKIII in situ chlorophyll fluo-rometer. Two Chelsea Instruments Fastracka FRRfluorometers, each interfaced with a 2p PAR sensor, werealso deployed in situ on the CTD frame. Optical depths (OD)were calculated from vertical PAR profiles. In situ irradianceat seven discrete wavelengths was also measured using aLicor Li-1800 UW spectroradiometer.
Water was sampled using 10-liter Niskin bottles. Four ofthe sites, CS1, CS2, CS3, and IS1 (Fig. 2), were occupiedfor 24-h periods on 31 July, 29 July, 05 August, and 02August respectively. This enabled the collection of multiplesamples of both surface and deeper phytoplankton popula-tions throughout the photoperiod. Additionally the CS1 andCS3 sites were resampled on 10 and 11 August respectively.Four additional sites were only sampled with a single CTDcast, typically at two depths (Fig. 2).
Phytoplankton community structure—Taxonomic variabil-ity was assessed using a combination of high-performanceliquid chromatography (HPLC) (see following), size-frac-tionated chlorophyll, flow cytometry, and microscopic iden-tification and enumeration of preserved samples. Flow cy-tometry data were used to estimate the contribution of smalleukaryotes and cyanobacteria (Synechococcus) to total au-totrophic community biovolume and the cellular fluores-cence to biovolume ratio (F : cell vol). Only relative changesin biovolume are reported.
FRR fluorometry measurements and analysis—To elimi-nate the influence of short-term kinetic responses, includingnonphotochemical quenching and state transitions, activefluorescence measurements were principally performed ondiscrete samples. Samples were left in the dark for .30 minin a temperature-controlled environment before measure-ment. This protocol allowed relaxation of qE (data notshown); however, some long-lived qI may have remained(Krause and Weis 1991; Horton et al. 1996). The FRR fluo-rometer was programmed to deliver sequences of 100 1.1-ms saturation flashes at 2.8-ms intervals followed by 20 1.1-ms relaxation flashes at 98.8-ms intervals. Nonlinearity ininstrument response was characterized using extracts ofchlorophyll a (Chl a) (Laney 2003). Blanks were run onfiltrates from each sample (Cullen and Davis 2003). Correc-tion for the contribution of the blank had no significant in-fluence on values of sPSII or 1/t , these parameters beingQa
dependent on rates of change of fluorescence and thus rel-atively insensitive to the baseline.
Induction curves were averaged over 160 individual se-quences to minimize error (Suggett et al. 2004). The fluo-rescence transient (f) at time t was then fitted to the follow-ing biophysical model (Kolber et al. 1998):
939Photoacclimation in shelf seas
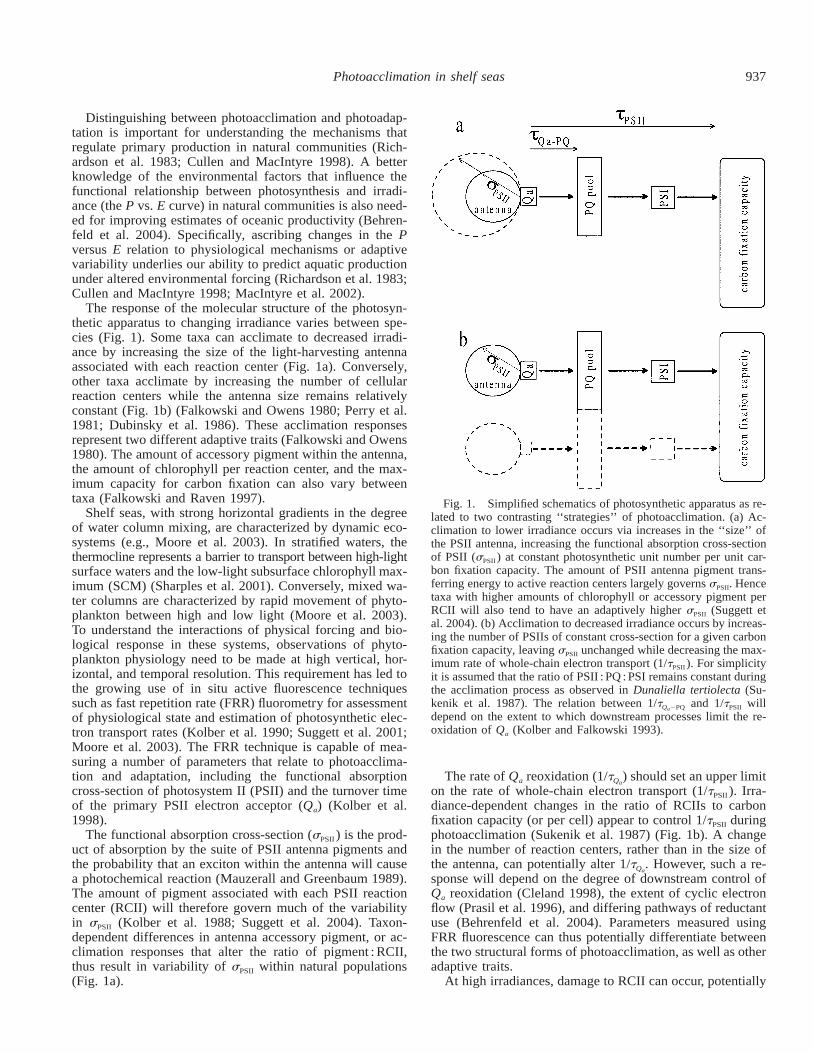
Fig. 2. (a) Map of study area and stations. Solid lines indicate200 m and 2,000 m depth contours. Open squares indicate positionsof the four principal sampling stations. (b) Temperature sectionthrough study region along a line from IS1-CS3-D2-CS1-N1-CS2-N9. Symbols indicate sampling depths and locations for physiolog-ical measurements. (c) Fluorescence section through study region.Fluorescence values are scaled to approximate the chlorophyll con-centration; however, the fluorescence yield varied both verticallyand horizontally throughout. (d) Water column mean sPSII,white versuscross-shelf distance from IS1. Error bars are 1 SE.
1 2 pf (t) 5 F 1 (F 2 F ) C(t) (1)0 m 0 [ ]1 2 C(t)p
where p is a connectivity parameter and F0 and Fm are theminimum and maximum fluorescence yields respectively.The fraction of closed (reduced) reaction centers (C(t)) wasdetermined iteratively using:
dC(t) 1 2 C(t) C(t)5 i(t)s 2 (2)PSIIdt 1 2 C(t)p tQa
where i(t) is the flash intensity (Kolber et al. 1998). Equa-tions 1 and 2 were used to define both saturation and relax-ation components of the fluorescence induction curve si-multaneously with revised software run in MATLABybased on original codes provided by S. Laney (Laney 2003).The revised software used the asymptotic value reached dur-ing the relaxation part of the curve, given by the steady-statesolution of Eq. 2 (see Kolber et al. 1998 their Eq. 15), toimprove estimation of t . Because of the constant delayQa
between relaxation flashes for the commercial instrumentused in this study, only one component of the rate of Qa
reoxidation could be measured (Kolber et al. 1998). The re-laxation protocol was 2 ms in duration, allowing an estimateof 1/t for the mean value of transport from Qa through theQa
PQ pool (Crofts et al. 1993; Falkowski and Raven 1997).Hereafter the term 1/t is used to represent the estimateQ →PQa
of electron transport rate directly obtained by FRR fluorom-etry.
Estimates of RCII abundance—To obtain a sample of suf-ficient density for measurements of RCII abundance, naturalphytoplankton populations were concentrated under a gentlevacuum onto 47-mm diameter, 0.2-mm pore size polycar-bonate filters. Material collected onto the filters was resus-pended in 4–5 mL of filtrate. The maximum PSII photo-chemical efficiency (Fv/Fm) was measured using the FRRfluorometer before and after concentration. Samples with asignificantly lower Fv/Fm following concentration were dis-carded. Oxygen flash yields were measured according toSuggett et al. (2004) using a Hansatech Instruments Clarke-type electrode housed within a DW1 liquid-phase oxygenelectrode chamber and a single turnover saturation flash sys-tem. The time-consuming concentration step provided fewmeasurable suspensions from low chlorophyll surface watersamples. Resolution of depth variability in RCII abundancewas therefore not possible. The ratio of Chl a to PSII reac-tion centers is reported throughout as the product of Chl a(O2)21 and 0.25 mol O2 (mol RCII)21 giving mol Chl : molRCII.
Spectral absorption, fluorescence, and pigments—Spec-tral absorption was routinely measured on board using sam-ples filtered through 25-mm Whatman GF/F filters followingthe method of Tassan and Ferrari (1995) on a Hitachi U-3000 spectrophotometer fitted with a f60 integrating sphere.Spectra were measured before and after depigmentation us-ing 1–2% NaClO. Concentrated suspensions were used toderive wavelength-dependent path-length amplification fac-tors (b) for each site. Absorption was normalized to Chl a
940 Moore et al.
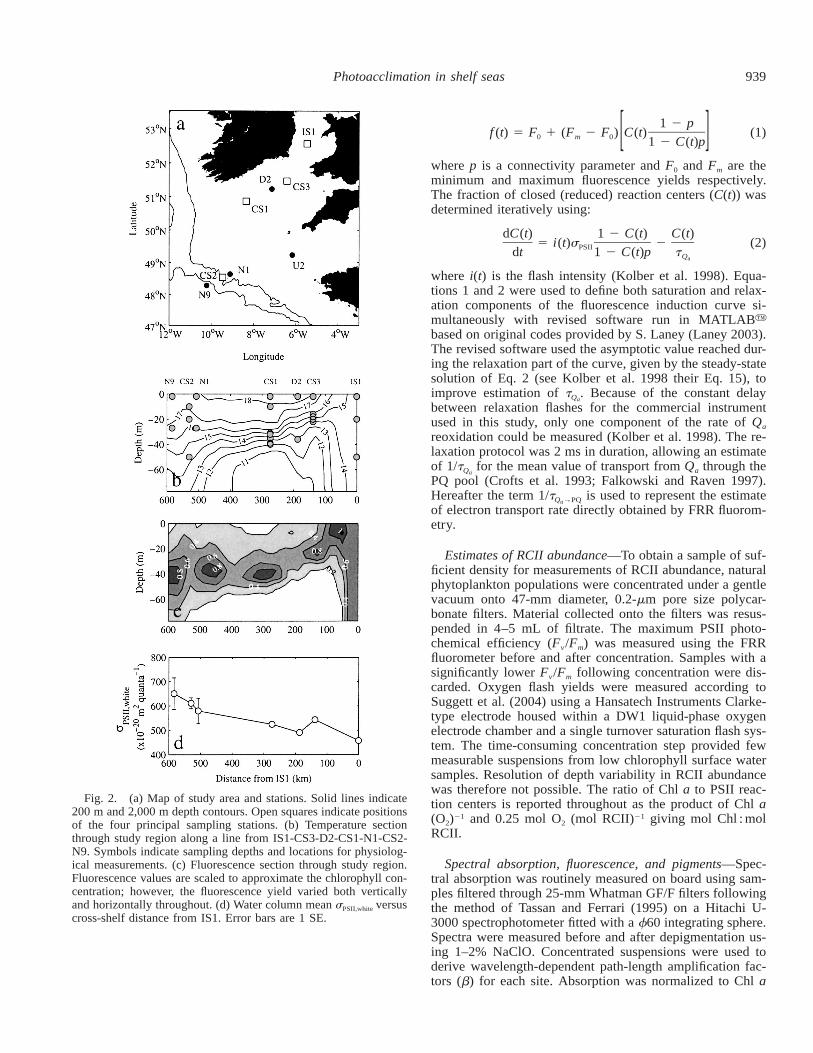
Fig. 3. (a–c) Spectral dependence of 730-nm fluorescence excitation, chlorophyll-specific opticalabsorption (a*) and a* corrected for absorption by nonphotosynthetic pigments (a ) from stations*ps
CS1 (a), CS3 (b), and IS1 (c). (d) Normalized FRR fluorometer and photosynthetron excitationspectra compared with in situ spectra at depths of 2 m and 35 m at CS1.
to derive the chlorophyll-specific absorption spectra (a*(l)).Fluorescence excitation spectra at 730 nm (F730) were alsomeasured using a Perkin Elmer LS50B on the same suspen-sion as that used for RCII abundance, using methods de-scribed previously (Suggett et al. 2004).
HPLC samples were filtered through 25-mm WhatmanGF/F filters and stored at 2808C. On return to the laboratory,pigments were extracted into 90% acetone using sonication.Extracts were analyzed according to the method of Barlowet al. (1993) on a Thermo Separation products HPLC. Pig-ments were identified by retention time and on-line diodearray spectroscopy. Absorption by total pigments (a (l))*pig
including chlorophylls a, b, and c; photosynthetic caroten-oids (PC); and nonphotosynthetic carotenoids (NPC) was re-constructed using the method of Bidigare et al. (1990) asdescribed in Suggett et al. (2004). Absorption by photosyn-thetic pigments (a (l)) was reconstructed in a similar man-*pspig
ner excluding the contribution of NPCs. Optical absorption(a*(l)) was weighted by the ratio of a (l)/a (l) to obtain* *pspig pig
a measure of the optical absorption by photosynthetic pig-ments (a (l)) (Fig. 3).*ps
The physiological or ecological relevance of spectrally de-pendent parameters (e.g., sPSII ) needs to be assessed withreference to the relevant excitation spectra (Suggett et al.2001, 2004). Thus, for example, assessment of variability insPSII by weighting to a spectrally flat (white) light sourcegives a less arbitrary measure of the absorption cross-sectionthan the instrument-specific value measured at any given
wavelength (Fig. 3d). Further, assessment of ecological rel-evance requires weighting to the spectral distribution of lightin situ. Hereafter, as necessary, we report all spectrally de-pendent parameters with a subscript denoting the relevantexcitation wavelength(s). Thus to derive a value of opticalabsorption directly comparable to the FRR fluorometry mea-surement of sPSII at 478 nm (sPSII,478), a (l) was weighted by*ps
the excitation spectrum of the FRR fluorometer to derivea (Fig. 3) (Suggett et al. 2004):*ps,478
a*(l)E (l)O ps FRR400–700 nma* 5 (3)ps,478 E (l)O FRR
400–700 nm
Similarly, values of sPSII weighted to a spectrally flat (white)light source (sPSII,white) and estimates of sPSII weighted to thespectral light distribution in situ sPSII,in situ were calculated us-ing:
a*(l) E (l)O O FRR400–700 nm 400–700 nms 5 s andPSII,white PSII,478 300 a*(l)E (l)O FRR
400–700 nm
a*(l)E (l) E (l)O Oin situ FRR400–700 nm 400–700 nms 5 sPSII,in situ PSII,478 a*(l)E (l) E (l)O OFRR in situ400–700 nm 400–700 nm
(4)
941Photoacclimation in shelf seas
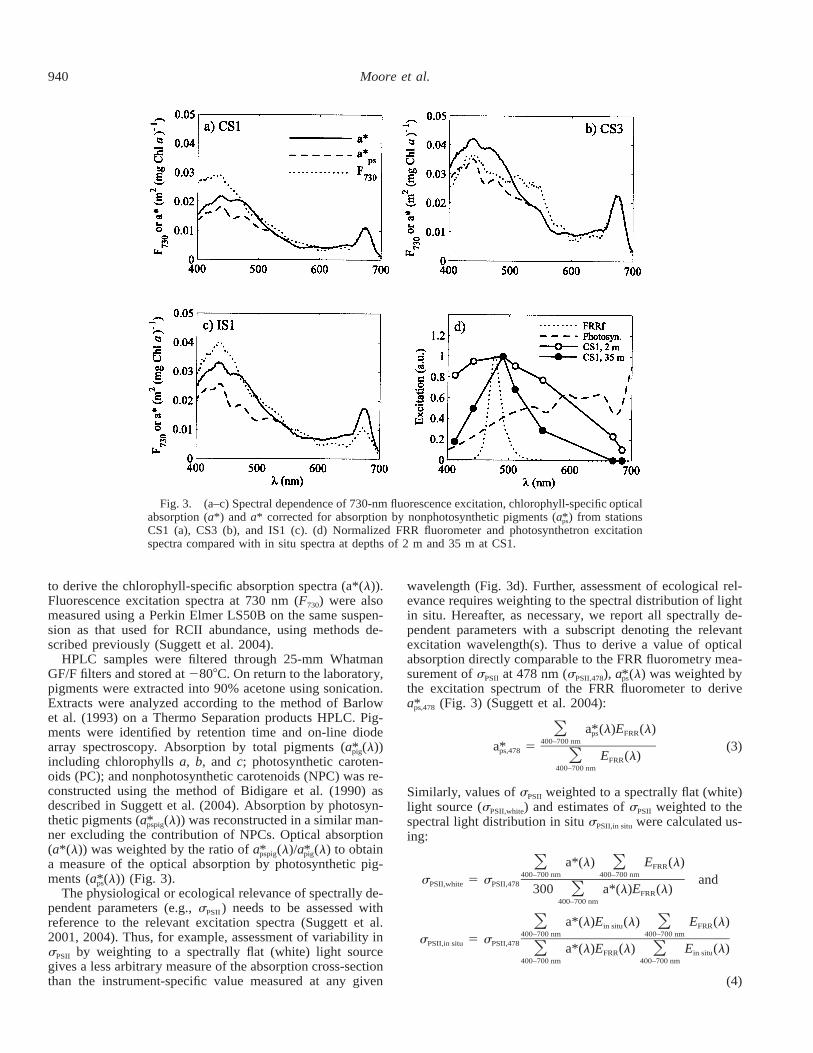
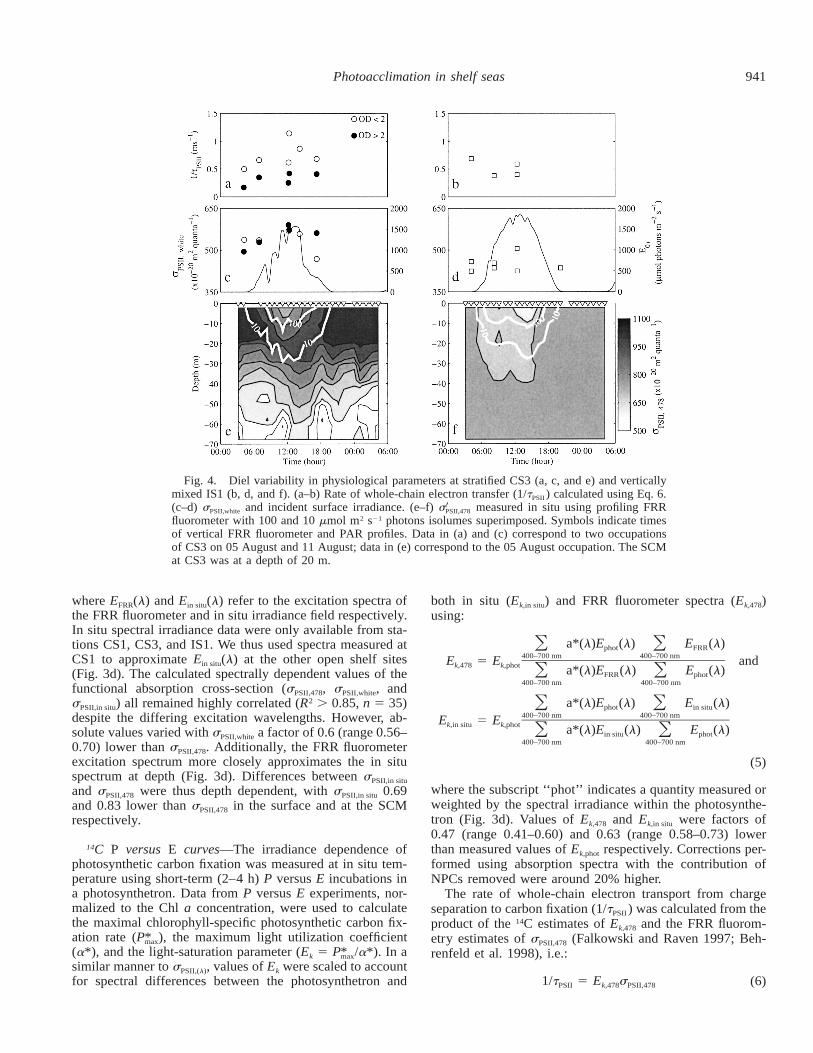
Fig. 4. Diel variability in physiological parameters at stratified CS3 (a, c, and e) and verticallymixed IS1 (b, d, and f). (a–b) Rate of whole-chain electron transfer (1/tPSII ) calculated using Eq. 6.(c–d) sPSII,white and incident surface irradiance. (e–f) s measured in situ using profiling FRR9PSII,478
fluorometer with 100 and 10 mmol m2 s21 photons isolumes superimposed. Symbols indicate timesof vertical FRR fluorometer and PAR profiles. Data in (a) and (c) correspond to two occupationsof CS3 on 05 August and 11 August; data in (e) correspond to the 05 August occupation. The SCMat CS3 was at a depth of 20 m.
where EFRR(l) and Ein situ(l) refer to the excitation spectra ofthe FRR fluorometer and in situ irradiance field respectively.In situ spectral irradiance data were only available from sta-tions CS1, CS3, and IS1. We thus used spectra measured atCS1 to approximate Ein situ(l) at the other open shelf sites(Fig. 3d). The calculated spectrally dependent values of thefunctional absorption cross-section (sPSII,478, sPSII,white, andsPSII,in situ) all remained highly correlated (R2 . 0.85, n 5 35)despite the differing excitation wavelengths. However, ab-solute values varied with sPSII,white a factor of 0.6 (range 0.56–0.70) lower than sPSII,478. Additionally, the FRR fluorometerexcitation spectrum more closely approximates the in situspectrum at depth (Fig. 3d). Differences between sPSII,in situ
and sPSII,478 were thus depth dependent, with sPSII,in situ 0.69and 0.83 lower than sPSII,478 in the surface and at the SCMrespectively.
14C P versus E curves—The irradiance dependence ofphotosynthetic carbon fixation was measured at in situ tem-perature using short-term (2–4 h) P versus E incubations ina photosynthetron. Data from P versus E experiments, nor-malized to the Chl a concentration, were used to calculatethe maximal chlorophyll-specific photosynthetic carbon fix-ation rate (P ), the maximum light utilization coefficient*max
(a*), and the light-saturation parameter (Ek 5 P /a*). In a*max
similar manner to sPSII,(l), values of Ek were scaled to accountfor spectral differences between the photosynthetron and
both in situ (Ek,in situ) and FRR fluorometer spectra (Ek,478)using:
a*(l)E (l) E (l)O Ophot FRR400–700 nm 400–700 nmE 5 E andk,478 k,phot a*(l)E (l) E (l)O OFRR phot400–700 nm 400–700 nm
a*(l)E (l) E (l)O Ophot in situ400–700 nm 400–700 nmE 5 Ek,in situ k,phot a*(l)E (l) E (l)O Oin situ phot400–700 nm 400–700 nm
(5)
where the subscript ‘‘phot’’ indicates a quantity measured orweighted by the spectral irradiance within the photosynthe-tron (Fig. 3d). Values of Ek,478 and Ek,in situ were factors of0.47 (range 0.41–0.60) and 0.63 (range 0.58–0.73) lowerthan measured values of Ek,phot respectively. Corrections per-formed using absorption spectra with the contribution ofNPCs removed were around 20% higher.
The rate of whole-chain electron transport from chargeseparation to carbon fixation (1/tPSII ) was calculated from theproduct of the 14C estimates of Ek,478 and the FRR fluorom-etry estimates of sPSII,478 (Falkowski and Raven 1997; Beh-renfeld et al. 1998), i.e.:
1/tPSII 5 Ek,478sPSII,478 (6)
942 Moore et al.
Results
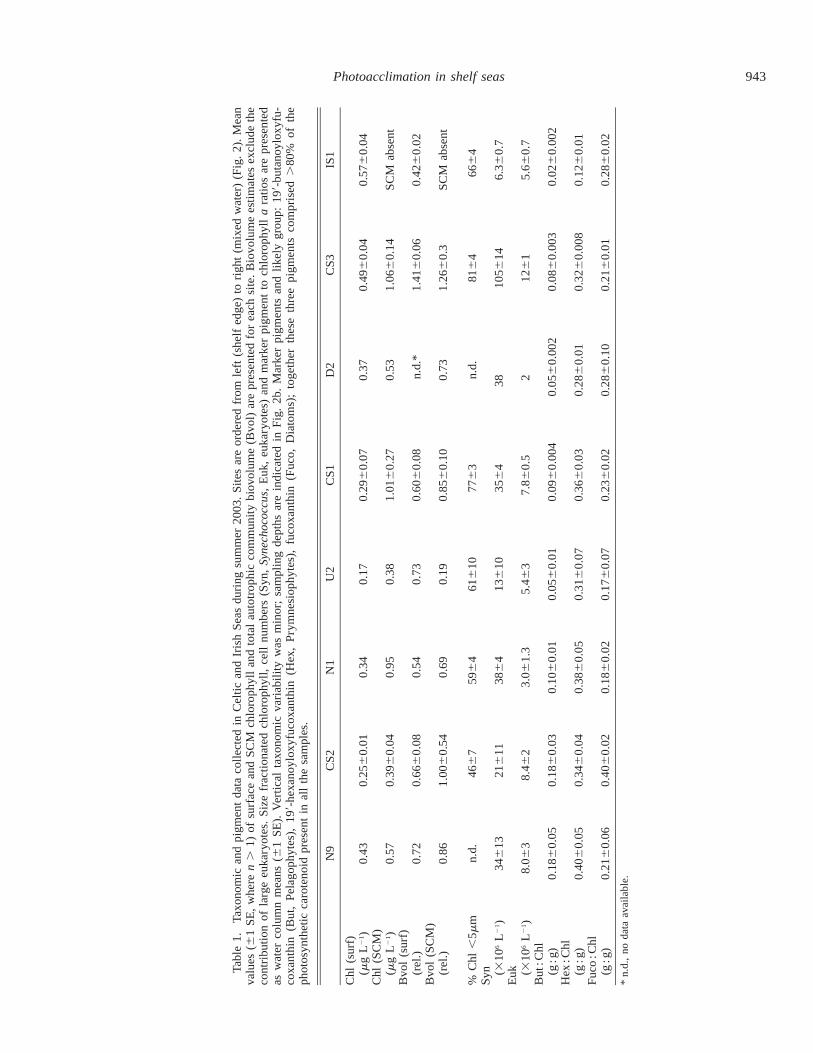
Hydrographic setting and taxonomy—Hydrographic con-ditions were typical of summer in the study region (Fig. 2b).Strong thermal stratification was observed throughout mostof the Celtic Sea, with weaker stratification at the shelf edgeand fully mixed conditions due to strong tides in the IrishSea. An SCM was observed at all the stratified sites (Fig.2c, Table 1). The peak of the SCM was typically situated ata depth corresponding to around 5% of surface irradiance.As previously observed (Sharples et al. 2001), considerablepatchiness in SCM chlorophyll concentration was apparent(Fig. 2c).
Phytoplankton cells ,5 mm in diameter dominatedthroughout most of the region (Table 1). Flow cytometrydata indicated that small eukaryotes dominated total com-munity biovolume at all stations apart from CS3 where Sy-nechococcus numbers reached .100 3 106 L21 in and abovethe SCM, contributing 50–80% of the total autotrophic bio-volume. The importance of the cyanobacteria was apparentin fluorescence and absorption spectra obtained at CS3 thatdisplayed peaks or shoulders from 500 to 550 nm due to thepresence of phycobiliproteins (Fig. 3b). Marker pigment ra-tios suggested that flagellates belonging to the prymnesio-phytes and pelagophytes comprised much of the eukaryoticpopulation, the latter group becoming more important to-ward the shelf edge (Table 1). Light microscopy indicatedthat the higher fucoxanthin : Chl a ratio observed at CS2 re-sulted from the presence of pennate diatoms. Estimates ofautotrophic biovolume from flow cytometry data (Table 1)excluded the (typically minor) contribution of such largereukaryotes. Acknowledging this limitation, ratios of totalcommunity biovolume to total chlorophyll were generallyhigher in the surface than within the SCM (Table 1).
PSII antenna characteristics—Physiological parametersrelating to the makeup of the PSII antenna for the four mainsites are presented in Table 2. Estimates of the Chl a : RCIIratio for natural populations were within the range reportedfor cultures (e.g., Dubinsky et al. 1986; Suggett et al. 2004).Values at eukaryote-dominated sites were around 630–720mol mol21 (Table 2). Prokaryotes typically have lower Chla : RCII ratios (Kolber and Falkowski 1993; Suggett et al.2004) and a significantly lower value of 530 mol mol21 wasobserved for the Synechococcus-dominated community atCS3 (Tables 1 and 2).
The PC : Chl a ratio varied markedly between stations,with a general decrease from the shelf edge through the strat-ified waters to the mixed station (Tables 1 and 2). Intersitedifferences in PC : Chl a were accompanied by variability inaccessory pigment composition and were thus ascribed totaxonomic differences (Table 1). Vertical differences in PC :Chl a were only significant at CS2. Both surface and deeperpopulations were collected from a deeper optical depth (low-er within the photic zone) at CS2. Deeper populations weresampled below the SCM and 1% light level at this station,complicating direct comparison of vertical physiological var-iability with the other stratified sites.
In contrast to the PC : Chl a ratios, NPC : Chl a varied littlebetween sites. A significant increase in NPC was observed
in the surface at strongly stratified sites as would be expectedgiven a photoprotectant role for these pigments (Table 2).Intersite variability in PC : Chl a and Chl a : RCII resulted ina decrease in PC : RCII from the shelf edge toward the mixedwater. The optical absorption cross-section (a ) did not vary*478
significantly between sites but increased toward the surfacein stratified waters.
Measured values of sPSII,478 were significantly higher at theshelf edge than on shelf, with lowest values at the mixedsite (Table 2). Calculated values of sPSII,white displayed a sim-ilar pattern (Fig. 2d). The functional absorption cross-sectionwas typically invariant with depth within and above theSCM (Table 2). Decreases in sPSII,478 frequently occurred be-low the SCM at stratified sites (Fig. 4e). Diel variability insPSII,478 or sPSII,white was limited. A minor (10%) increase insPSII,white was observed in the surface at midday at CS3 (Fig.4c,d). In contrast, decreases in s measured in situ in-9PSII,478
dicated the presence of significant antenna-based NPQ with-in surface populations, particularly at stratified stations (Fig.4e,f).
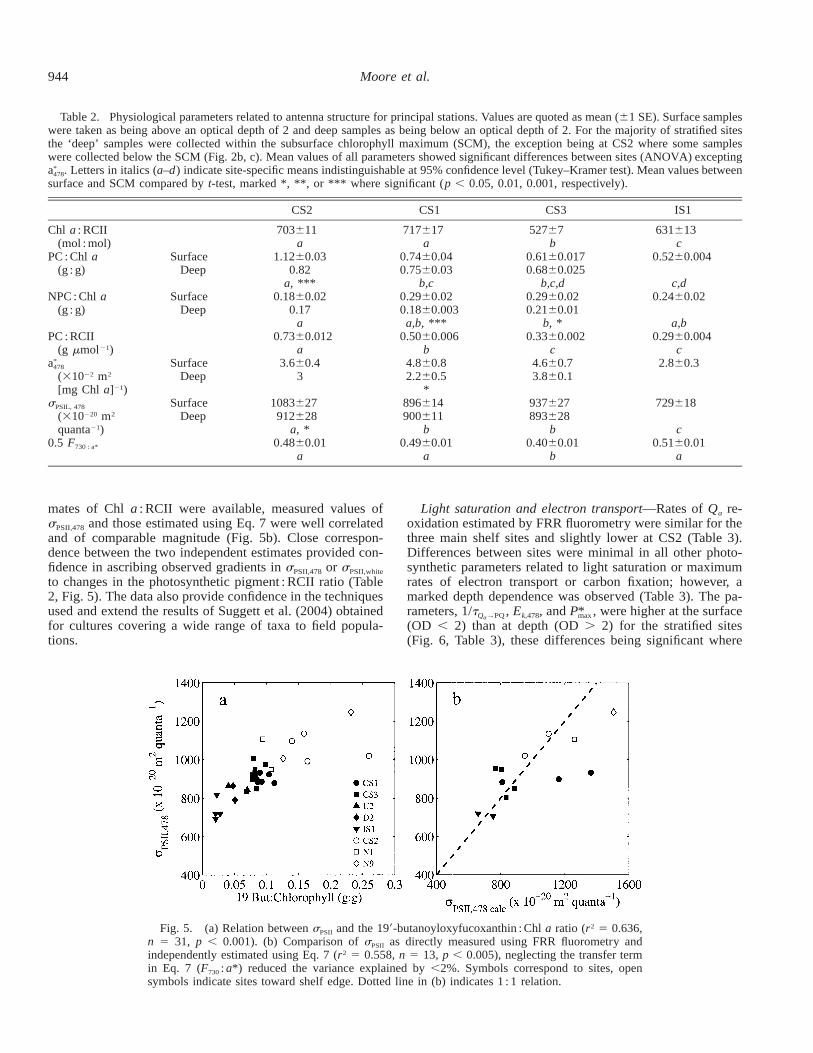
Much of the variability in the functional absorption cross-section throughout the study region could be explained bychanges in accessory pigmentation. In particular, the ratio of199-butanoyloxyfucoxanthin to Chl a was highly positivelycorrelated to sPSII,478 (Fig. 5a), as was the ratio of 199-hex-anoyloxyfucoxanthin to Chl a (r2 5 0.452, n 5 31, p ,0.001) (not shown). Similar relations were found for sPSII,white.Measured PSII cross-sections thus largely reflected the rel-ative dominance of different types of flagellate populations.The ratio PC : Chl a explained 45% of the variance in sPSII,478
and 50% of the variability in sPSII,white (p , 0.001). For areduced data set (n 5 13) where Chl a : RCII estimates wereavailable, the PC : RCII and PC : Chl a ratios could each ex-plain around 60% of the variance in sPSII,478 or sPSII,white (notshown). As previously noted (Moore et al. 2005), such co-variability is expected at 478 nm, i.e., overlapping the ab-sorption band of the photosynthetically active carotenoids.The similarity of the relations when considering sPSII,white
likely reflected the large proportion of the total cellular ab-sorption that could be attributed to the PCs for the sampledpopulations (Table 2).
Using the spectral fluorescence, absorption, and Chl a :RCII data, an independent estimate of sPSII,478 calc can be de-rived from (Suggett et al. 2004):
a* 0.5F : a*ps,478 730s 5 (7)PSII,478calc RCII : Chla
where 0.5 F730 : a* is assumed to indicate the proportion ofabsorbed light that is transferred to PSII, estimated by scal-ing the measured fluorescence excitation spectrum to the ab-sorption spectrum (see Suggett et al. 2004 and referencestherein).
The ratio F730 : a* dropped from around 1 at CS1, CS2,and IS1 to 0.8 at CS3. Hence half the absorbed energy at478 nm was transferred to PSII at the eukaryote-dominatedstations (Table 2), with significantly less (40%) transferredto PSII at the Synechococcus-dominated CS3 station, againconsistent with laboratory data (Suggett et al. 2004). Forpopulations (n 5 13) where spectral fluorescence and esti-
943Photoacclimation in shelf seas
Tabl
e1.
Taxo
nom
ican
dpi
gmen
tda
taco
llec
ted
inC
elti
can
dIr
ish
Sea
sdu
ring
sum
mer
2003
.S
ites
are
orde
red
from
left
(she
lfed
ge)
tori
ght
(mix
edw
ater
)(F
ig.
2).
Mea
nva
lues
( 61
SE
,w
here
n.
1)of
surf
ace
and
SC
Mch
loro
phyl
lan
dto
tal
auto
trop
hic
com
mun
ity
biov
olum
e(B
vol)
are
pres
ente
dfo
rea
chsi
te.
Bio
volu
me
esti
mat
esex
clud
eth
eco
ntri
buti
onof
larg
eeu
kary
otes
.S
ize
frac
tion
ated
chlo
roph
yll,
cell
num
bers
(Syn
,Sy
nech
ococ
cus,
Euk
,eu
kary
otes
)an
dm
arke
rpi
gmen
tto
chlo
roph
yll
ara
tios
are
pres
ente
das
wat
erco
lum
nm
eans
( 61
SE
).V
erti
cal
taxo
nom
icva
riab
ilit
yw
asm
inor
;sa
mpl
ing
dept
hsar
ein
dica
ted
inF
ig.
2b.
Mar
ker
pigm
ents
and
like
lygr
oup:
199-
buta
noyl
oxyf
u-co
xant
hin
(But
,P
elag
ophy
tes)
,19
9-he
xano
ylox
yfuc
oxan
thin
(Hex
,P
rym
nesi
ophy
tes)
,fu
coxa
nthi
n(F
uco,
Dia
tom
s);
toge
ther
thes
eth
ree
pigm
ents
com
pris
ed.
80%
ofth
eph
otos
ynth
etic
caro
teno
idpr
esen
tin
all
the
sam
ples
.
N9
CS
2N
1U
2C
S1
D2
CS
3IS
1
Chl
(sur
f)( m
gL
21 )
0.43
0.25
60.
010.
340.
170.
296
0.07
0.37
0.49
60.
040.
576
0.04
Chl
(SC
M)
( mg
L2
1 )0.
570.
396
0.04
0.95
0.38
1.01
60.
270.
531.
066
0.14
SC
Mab
sent
Bvo
l(s
urf)
(rel
.)0.
720.
666
0.08
0.54
0.73
0.60
60.
08n.
d.*
1.41
60.
060.
426
0.02
Bvo
l(S
CM
)(r
el.)
0.86
1.00
60.
540.
690.
190.
856
0.10
0.73
1.26
60.
3S
CM
abse
nt
%C
hl,
5mm
n.d.
466
759
64
616
1077
63
n.d.
816
466
64
Syn ( 3
106
L2
1 )34
613
216
1138
64
136
1035
64
3810
5614
6.36
0.7
Euk ( 3
106
L2
1 )8.
063
8.46
23.
061.
35.
463
7.86
0.5
212
61
5.66
0.7
But
:Chl
(g:g
)0.
186
0.05
0.18
60.
030.
106
0.01
0.05
60.
010.
096
0.00
40.
056
0.00
20.
086
0.00
30.
026
0.00
2H
ex:C
hl(g
:g)
0.40
60.
050.
346
0.04
0.38
60.
050.
316
0.07
0.36
60.
030.
286
0.01
0.32
60.
008
0.12
60.
01F
uco
:Chl
(g:g
)0.
216
0.06
0.40
60.
020.
186
0.02
0.17
60.
070.
236
0.02
0.28
60.
100.
216
0.01
0.28
60.
02
*n.
d.,
noda
taav
aila
ble.
944 Moore et al.
Table 2. Physiological parameters related to antenna structure for principal stations. Values are quoted as mean (61 SE). Surface sampleswere taken as being above an optical depth of 2 and deep samples as being below an optical depth of 2. For the majority of stratified sitesthe ‘deep’ samples were collected within the subsurface chlorophyll maximum (SCM), the exception being at CS2 where some sampleswere collected below the SCM (Fig. 2b, c). Mean values of all parameters showed significant differences between sites (ANOVA) excepting
. Letters in italics (a–d) indicate site-specific means indistinguishable at 95% confidence level (Tukey–Kramer test). Mean values between*a478
surface and SCM compared by t-test, marked *, **, or *** where significant (p , 0.05, 0.01, 0.001, respectively).
CS2 CS1 CS3 IS1
Chl a : RCII(mol : mol)
703611a
717617a
52767b
631613c
PC : Chl a(g : g)
SurfaceDeep
1.1260.030.82
a, ***
0.7460.040.7560.03
b,c
0.6160.0170.6860.025
b,c,d
0.5260.004
c,dNPC : Chl a
(g : g)Surface
Deep0.1860.02
0.17a
0.2960.020.1860.003a,b, ***
0.2960.020.2160.01
b, *
0.2460.02
a,bPC : RCII
(g mmol21)0.7360.012
a0.5060.006
b0.3360.002
c0.2960.004
c*a478
(31022 m2
[mg Chl a]21)
SurfaceDeep
3.660.43
4.860.82.260.5
*
4.660.73.860.1
2.860.3
sPSIL, 478
(310220 m2
quanta21)
SurfaceDeep
1083627912628
a, *
896614900611
b
937627893628
b
729618
c0.5 F730 : a* 0.4860.01
a0.4960.01
a0.4060.01
b0.5160.01
a
Fig. 5. (a) Relation between sPSII and the 199-butanoyloxyfucoxanthin : Chl a ratio (r2 5 0.636,n 5 31, p , 0.001). (b) Comparison of sPSII as directly measured using FRR fluorometry andindependently estimated using Eq. 7 (r2 5 0.558, n 5 13, p , 0.005), neglecting the transfer termin Eq. 7 (F730 : a*) reduced the variance explained by ,2%. Symbols correspond to sites, opensymbols indicate sites toward shelf edge. Dotted line in (b) indicates 1 : 1 relation.
mates of Chl a : RCII were available, measured values ofsPSII,478 and those estimated using Eq. 7 were well correlatedand of comparable magnitude (Fig. 5b). Close correspon-dence between the two independent estimates provided con-fidence in ascribing observed gradients in sPSII,478 or sPSII,white
to changes in the photosynthetic pigment : RCII ratio (Table2, Fig. 5). The data also provide confidence in the techniquesused and extend the results of Suggett et al. (2004) obtainedfor cultures covering a wide range of taxa to field popula-tions.
Light saturation and electron transport—Rates of Qa re-oxidation estimated by FRR fluorometry were similar for thethree main shelf sites and slightly lower at CS2 (Table 3).Differences between sites were minimal in all other photo-synthetic parameters related to light saturation or maximumrates of electron transport or carbon fixation; however, amarked depth dependence was observed (Table 3). The pa-rameters, 1/t , Ek,478, and P , were higher at the surface*Q →PQ maxa
(OD , 2) than at depth (OD . 2) for the stratified sites(Fig. 6, Table 3), these differences being significant where

945Photoacclimation in shelf seas
Table 3. Parameters related to light saturation and rates of photosynthetic electron transport for principal stations. Surface samples weretaken as being above an optical depth of 2 and deep samples as being below an optical depth of 2. There were no significant differencesat 95% confidence level between sites excepting lower 1/tQa at the shelf edge (ANOVA). The latter may have resulted from deeper opticaldepths being sampled at this station. Mean values between surface and SCM compared by t-test, marked *, **, or *** where significant(p , 0.05, 0.01, 0.001, respectively).
CS2 CS1 CS3 IS1
1/tQa→PQ
(ms21)Surface
Deep0.4060.060.3760.06
0.6660.020.4660.03
***
0.6960.040.5660.03
**
0.6660.03
Ek,478
(mmol photonsm22 s21)
SurfaceDeep
746537
101624564
***
1286135868
**
117614
*Pmax
(mol C[g Chl a]21 h21)
SurfaceDeep
0.3560.030.21
0.2860.030.1860.02
*
0.4460.050.2160.02
**
0.4560.08
Fig. 6. Relations of rate of whole-chain electron transport(1/tPSII ) as calculated using Eq. 6 to (a) 1/t measured by FRRQ →PQa
fluorometry (r2 5 0.425, n 5 35, p , 0.001) and (b) P measured*max
by 14C P versus E incubation (r2 5 0.624, n 5 35, p , 0.001).Squares indicate the mixed station (IS1); circles, stratified stations;open, OD , 2; filled, OD . 2. Dotted line in (a) indicates 1 : 1relation.
sufficient data were available to perform statistical tests (Ta-ble 3). Variability in P was dominated by changes of sim-*max
ilar magnitude in Ek,478 (r2 5 0.666, n 5 35, p , 0.001, notshown), with mean surface values being more than double
those of deep (SCM) samples. In contrast, no correlation wasobserved between P and a . Hence changes in P versus* *max phot
E parameters within the system studied were dominated by‘‘Ek-dependent’’ variability with minimal ‘‘Ek-independent’’variability (Behrenfeld et al. 2004).
Measured values of 1/t using FRR fluorometry wereQ →PQa
significantly correlated with independent estimates of 1/tPSII
calculated using Eq. 6 for the complete data set (Fig. 6a).Rearrangement of Eq. 6 and substitution of t for tPSIIQ →PQa
also allowed calculation of the light saturation intensity ofelectron transport (Ek ETR,478) purely from FRR fluorometry-derived parameters. A significant correlation betweenEk ETR,478 and the 14C-derived estimates of Ek,478 was alsofound (r2 5 0.416, n 5 35, p , 0.001, not shown). To ourknowledge, these data represent the first reported comparisonof 1/t measured using FRR fluorometry with other in-Q →PQa
dependently derived and related physiological parameters fornatural communities.
The maximum chlorophyll-specific rate of carbon fixationshould be related to the rate of whole-chain electron trans-port and the Chl a : RCII ratio according to (Falkowski andRaven 1997):
RCII : ChlaP* 5 (8)max tPSII
Vertical gradients in 1/tPSII accounted for .60% of the var-iance in P (Fig. 6b). Although this relation contained a*max
degree of circularity, as derivation of 1/tPSII depends on mea-surement of Ek and hence P (cf. Eqs. 6 and 8), it is con-*max
sistent with our observation of a low (1.5-fold) range ofvariation in Chl a : RCII (Table 2) and indicates that changesin maximal electron transport rates are the main cause of the.fourfold range in P . Similarly, vertical gradients in*max
1/t explained a significant proportion of the variance inQ →PQa
P (r2 5 0.296, n 5 35, p , 0.001).*max
Diel variability in photosynthetic parameters related tomaximum rates of electron transport or carbon fixation wasapparent from the limited time series data for surface pop-ulations at CS3 (Fig. 4a). In particular 1/tPSII was approxi-mately double the predawn value at midday on the 10th ofAugust.
946 Moore et al.
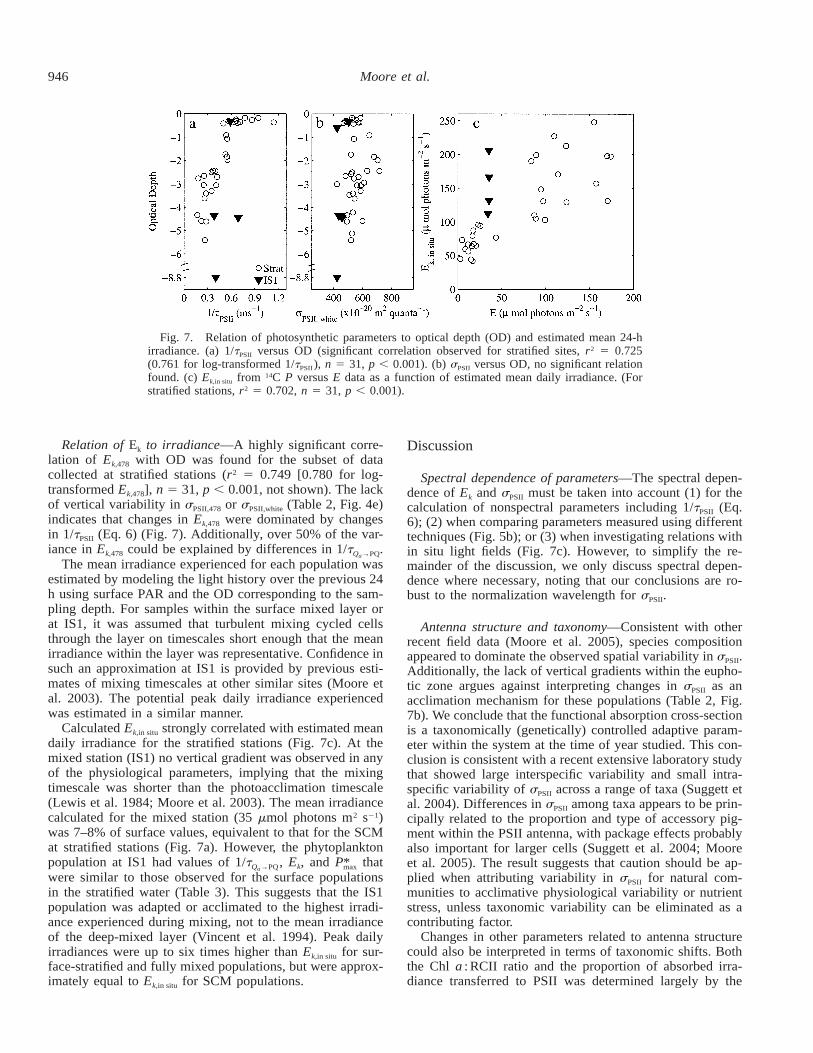
Fig. 7. Relation of photosynthetic parameters to optical depth (OD) and estimated mean 24-hirradiance. (a) 1/tPSII versus OD (significant correlation observed for stratified sites, r2 5 0.725(0.761 for log-transformed 1/tPSII ), n 5 31, p , 0.001). (b) sPSII versus OD, no significant relationfound. (c) Ek,in situ from 14C P versus E data as a function of estimated mean daily irradiance. (Forstratified stations, r2 5 0.702, n 5 31, p , 0.001).
Relation of Ek to irradiance—A highly significant corre-lation of Ek,478 with OD was found for the subset of datacollected at stratified stations (r2 5 0.749 [0.780 for log-transformed Ek,478], n 5 31, p , 0.001, not shown). The lackof vertical variability in sPSII,478 or sPSII,white (Table 2, Fig. 4e)indicates that changes in Ek,478 were dominated by changesin 1/tPSII (Eq. 6) (Fig. 7). Additionally, over 50% of the var-iance in Ek,478 could be explained by differences in 1/t .Q →PQa
The mean irradiance experienced for each population wasestimated by modeling the light history over the previous 24h using surface PAR and the OD corresponding to the sam-pling depth. For samples within the surface mixed layer orat IS1, it was assumed that turbulent mixing cycled cellsthrough the layer on timescales short enough that the meanirradiance within the layer was representative. Confidence insuch an approximation at IS1 is provided by previous esti-mates of mixing timescales at other similar sites (Moore etal. 2003). The potential peak daily irradiance experiencedwas estimated in a similar manner.
Calculated Ek,in situ strongly correlated with estimated meandaily irradiance for the stratified stations (Fig. 7c). At themixed station (IS1) no vertical gradient was observed in anyof the physiological parameters, implying that the mixingtimescale was shorter than the photoacclimation timescale(Lewis et al. 1984; Moore et al. 2003). The mean irradiancecalculated for the mixed station (35 mmol photons m2 s21)was 7–8% of surface values, equivalent to that for the SCMat stratified stations (Fig. 7a). However, the phytoplanktonpopulation at IS1 had values of 1/t , Ek, and P that*Q →PQ maxa
were similar to those observed for the surface populationsin the stratified water (Table 3). This suggests that the IS1population was adapted or acclimated to the highest irradi-ance experienced during mixing, not to the mean irradianceof the deep-mixed layer (Vincent et al. 1994). Peak dailyirradiances were up to six times higher than Ek,in situ for sur-face-stratified and fully mixed populations, but were approx-imately equal to Ek,in situ for SCM populations.
Discussion
Spectral dependence of parameters—The spectral depen-dence of Ek and sPSII must be taken into account (1) for thecalculation of nonspectral parameters including 1/tPSII (Eq.6); (2) when comparing parameters measured using differenttechniques (Fig. 5b); or (3) when investigating relations within situ light fields (Fig. 7c). However, to simplify the re-mainder of the discussion, we only discuss spectral depen-dence where necessary, noting that our conclusions are ro-bust to the normalization wavelength for sPSII.
Antenna structure and taxonomy—Consistent with otherrecent field data (Moore et al. 2005), species compositionappeared to dominate the observed spatial variability in sPSII.Additionally, the lack of vertical gradients within the eupho-tic zone argues against interpreting changes in sPSII as anacclimation mechanism for these populations (Table 2, Fig.7b). We conclude that the functional absorption cross-sectionis a taxonomically (genetically) controlled adaptive param-eter within the system at the time of year studied. This con-clusion is consistent with a recent extensive laboratory studythat showed large interspecific variability and small intra-specific variability of sPSII across a range of taxa (Suggett etal. 2004). Differences in sPSII among taxa appears to be prin-cipally related to the proportion and type of accessory pig-ment within the PSII antenna, with package effects probablyalso important for larger cells (Suggett et al. 2004; Mooreet al. 2005). The result suggests that caution should be ap-plied when attributing variability in sPSII for natural com-munities to acclimative physiological variability or nutrientstress, unless taxonomic variability can be eliminated as acontributing factor.
Changes in other parameters related to antenna structurecould also be interpreted in terms of taxonomic shifts. Boththe Chl a : RCII ratio and the proportion of absorbed irra-diance transferred to PSII was determined largely by the
947Photoacclimation in shelf seas
relative proportion of eukaryotes and prokaryotes within thecommunity.
It is not clear to what extent the taxonomic variabilityobserved in the current study is related to selective pressureon antenna structure. Although multiple factors will governspecies competition, given the diversity of marine autotrophs(Falkowski and Raven 1997), it is likely that the structureof the light-harvesting complex could play some role. Forany given total cellular light absorption, a species with alarger PC : Chl a ratio and hence higher sPSII (Table 2, Fig.5a) will require fewer RCIIs. Selective pressure between taxawith different sPSII may thus be related to the availability ofresources for the production of large antenna pigment–pro-tein complexes (principally requiring nitrogen) versus thegreater resources (including iron) required for synthesis ofreaction centers (Behrenfeld et al. 1998). Strzepek and Har-rison (2004) recently suggested that such a mechanism hasresulted in genotypic variability in the ratio of RCII to PSIreaction centers between coastal and oceanic diatoms. Forthe current study, higher values of sPSII for shelf break pop-ulations (Tables 1 and 2, Fig. 5) may thus have representedan adaptation to conditions of lower resource availability forreaction center synthesis.
Electron turnover and acclimation—Correlated declinesof Ek and P as a function of increased OD for stratified*max
stations were consistent with physiological acclimation tolow irradiance (MacIntyre et al. 2002). The common rela-tions between Ek (or P ) and OD between sites, despite*max
some taxonomic variability, suggest that these vertical gra-dients primarily result from acclimation. The acclimationmechanism was likely an increase of photosynthetic pigmentper cell in the SCM compared to the surface. The ratio ofred (chlorophyll) fluorescence to cell volume (F : Cell vol)was a factor of 2.1 6 0.3 and 3 6 0.8 larger for the SCMas opposed to the surface at stations CS1 and CS3 respec-tively (not shown). These differences were of comparablemagnitude to the changes in Ek (Table 3), consistent withadjustment of chlorophyll : cell and chlorophyll : C ratios be-ing the factor responsible for the acclimation response(MacIntyre et al. 2002).
Variability in 1/tPSII, rather than sPSII, dominated changesin Ek (and P ), strongly suggesting that acclimation to low*max
light involved an increase in the number of reaction centers,as opposed to an increase in antenna size (Figs. 6, 7). Weconclude that the increased numbers of reaction centers forthe SCM populations resulted in a higher ratio of RCII : cell(or RCII to carbon fixation capacity) and hence slower turn-over rates, as previously observed for Dunaliella tertiolecta(Sukenik et al. 1987).
It is reasonable to assume that the maximum achievable(i.e., intrinsic) rate of Qa through PQ electron transport, 1–1.6 ms21 (Crofts and Wraight 1983; Falkowski and Raven1997), would not be affected by an acclimation mechanisminvolving synthesis of RCIIs. The achieved rate of Qa re-oxidation (1/t , Fig. 6a) of 0.3 to 0.9 ms21 was belowQ →PQa
this maximum value for many of the populations studied,suggesting that there was an excess PSII capacity (Behren-feld et al. 1998; Kan̆a et al. 2002).
Similar magnitudes and significant correlations between
estimates of 1/tPSII and 1/t indicated a balance betweenQ →PQa
processes downstream and upstream of the PQ pool (Fig.6a). The achieved Qa reoxidation rate appeared to be gov-erned by downstream processes and ultimately constrainedby the capacity for carbon fixation to reoxidize the PQ pool,which then oxidizes Qa (Kolber and Falkowski 1993; Cle-land 1998; Kan̆a et al. 2002). Photoacclimation thus ap-peared to change both 1/t and 1/tPSII, which is consistentQ →PQa
with recent models (Geider et al. 1998), particularly if thesignal for this process resides within the redox state of thePQ pool (Escoubas et al. 1995).
A degree of balance between electron transport and carbonfixation supports the potential use of active fluorescence forproductivity estimation (Kolber and Falkowski 1993; Sug-gett et al. 2001). Electron transport appeared to be a reason-able indicator of carbon fixation in this system where pho-toacclimation was the dominant cause of variability in the Pversus E curve. This is the so-called ‘‘Ek-dependent’’ behav-ior identified by Behrenfeld et al. (2004). Electron transportand carbon fixation may be less tightly coupled in a systemwhere ‘‘Ek-independent’’ variability is large (Behrenfeld etal. 2004). Further work is clearly desirable to investigate thecovariation of 1/t and 1/tPSII under a variety of growthQ →PQa
conditions.
Photoacclimation and environmental forcing in stratifiedwater columns—The optimal light-harvesting strategy de-pends on balancing light absorption with carbon fixation,while minimizing the potential loss of photosynthetic per-formance due to photodamage. Photoacclimation reducedcellular pigment and increased 1/tPSII in the surface relativeto the SCM. This mechanism was effective in shifting thevalue of Ek,in situ (cf. Eq. 6) to partially track changes in am-bient irradiance (Fig. 7c). For SCM populations Ek,in situ wastypically fourfold higher than the estimated mean daily ir-radiance, while for surface populations these two valueswere more equal. Thus, peak irradiances significantly ex-ceeded Ek,in situ for surface populations, indicating a greaterpotential for RCII damage and hence photoinhibition.
In situ profiles using the submersible FRR fluorometerindicated significant antenna NPQ at stratified sites (Fig. 4e),as evidenced by midday decreases of around 30–40% insurface values of the functional absorption cross-section(s ) relative to the dark adapted value (sPSII ) (Olaizola et9PSII
al. 1994; Falkowski and Raven 1997). A greater capacity forantenna NPQ in surface populations was consistent with thehigher NPC : Chl a ratio (Table 2). Decreased s could thus9PSII
have increased the in situ value of Ek by 40–70% (Eq. 6);however, peak irradiances would still exceed Ek,in situ (Olai-zola et al. 1994). As outlined above, excess PSII capacity,which can raise 1/tPSII (Fig. 6) and thus Ek further (Eq. 6),could have maintained maximum carbon fixation rates evenif some of the RCIIs were photoinhibited (Behrenfeld et al.1998; Kan̆a et al. 2002).
Photoacclimation and environmental forcing in mixed wa-ter columns—The acclimation or adaptation to relativelyhigh light that we observed at the mixed station in the IrishSea (IS1) is consistent with the data of Vincent et al. (1994).In contrast, the field data of Behrenfeld et al. (1998) indicate
948 Moore et al.
acclimation to irradiances below the mean value in a shallow(i.e., optically thin) mixed layer where the depth of mixingwas likely less than the 1% light level. Although acclimationto lower irradiance can result in a lower initial 1/tPSII andhence a higher excess PSII capacity (Behrenfeld et al. 1998),such a strategy may also increase the probability of any in-dividual RCII being reduced in bright light and thus the po-tential for photodamage (Baroli and Melis 1998). In contrast,we can also speculate that a larger population of reducedRCIIs might increase NPQ, offsetting the potential for pho-todamage. Increased NPQ may result from quenching withina proportion of the closed RCIIs (Krause and Weis 1991).Additionally, when a large proportion of RCIIs are reduced,energy dissipation by quenchers within the antenna may beenhanced by the increased probability of the excitons pop-ulating the antenna (Horton et al. 1996). Resolution of suchissues awaits further clarification of the roles of differentNPQ mechanisms in situ.
Recent evidence suggests that qI may contribute signifi-cantly to decreases in the quantum yield of chlorophyll fluo-rescence in situ and hence the overall level of NPQ (Mor-rison 2003). Although we could not fully dismiss long-livedquenching at IS1, we observed no diel variability in the max-imum PSII quantum yield (F /F ) at depths .40 m, despite9 9v m
vigorous mixing throughout the water column, arguingagainst a major role for qI. Observed reversible antenna NPQwas minimal at IS1 with s ,10% lower than sPSII (Fig.9PSII
4f), despite relatively high levels of NPC (Table 2). Lowerantenna quenching in situ may result from mixing being fast-er than the timescale for complete NPQ induction or relax-ation (Moore et al. 2003). The lowest values of sPSII wereobserved at the IS1 station (Table 2, Fig. 5a), consistent withthe phytoplankton at this site being adapted to minimizeoverexcitation of PSII and potential photodamage (Park etal. 1997; Baroli and Melis 1998; Behrenfeld et al. 1998).Such adaptation would be particularly important if reversibleantenna NPQ is not an effective strategy in this vigorouslymixed environment (Moore et al. 2003). Additionally, a low-er sPSII allows for a lower 1/tPSII at any given Ek (Eq. 6),consistent with observations in the mixed and surface-strat-ified waters (Figs. 6a, 7c). Lower 1/tPSII, combined with anadaptively lower sPSII, could result in a larger excess PSIIcapacity, without a corresponding increase in the probabilityof RCII photodamage (Baroli and Melis 1998). Thus, thelower functional absorption cross-sections in phytoplanktonadapted to deep mixed coastal waters may reduce qI and thepotential for photodamage to adversely affect carbon fixation(Park et al. 1997; Baroli and Melis 1998; Behrenfeld et al.1998).
For the region studied, mixed waters are also character-ized by excess micro- and macronutrients. High nutrientavailability potentially negates any disadvantage, such as ahigher cellular iron quota, incurred by taxa with lower sPSII
having to synthesize greater numbers of RCIIs for a givenamount of total cellular absorption (Strzepek and Harrison2004).
The energetic cost of repairing damaged RCIIs may beless than that of not acclimating to low light under manyconditions (Raven 1994). However, given sufficiently vig-orous mixing, the rapid transport of photodamaged cells
from the surface to low irradiance at depth may increase thecost of photoinhibition to the point where acclimation oradaptation to high light becomes the optimal strategy (Beh-renfeld et al. 1998). Understanding photoacclimation and ad-aptation strategies in mixed layers is likely to require knowl-edge of the timescales and mechanisms for the differentcomponents of NPQ induction and relaxation and an under-standing of vertical cell movements by turbulent motion.Mechanistic understanding of interactions between NPQ,photoinhibition, and photoacclimation will also be required.These remain formidable research objectives.
Environmental forcing generates selective pressures on thegenotypes present within an ecosystem, resulting in changesin taxonomic composition. Environmental forcing can alsodrive physiological (phenotypic) responses that may amelio-rate or exacerbate these selective pressures. Such physiolog-ical acclimation can affect selection by modifying the en-ergetic and resource requirements for growth. Gradients inforcing can thus be accompanied by changes in both accli-mation state and community composition. This study pro-vides new insights into the functioning of the shelf sea eco-system in terms of both acclimation and adaptation.Photosynthetic parameters related to the makeup of the pig-ment antenna, specifically the PSII antenna, showed mostvariation in the horizontal, largely as a result of changes incommunity composition within the shelf sea region studied.Conversely, rates of maximum electron transport, carbon fix-ation, and light saturation intensity varied in the vertical asa result of photoacclimation to the light gradient in stratifiedwaters. This acclimation response was dominated by changesin RCII : cell rather than PSII antenna size.
References
BARLOW, R. G., R. MANTOURA, M. A. GOUGH, AND T. W. FILEMAN.1993. Pigment signatures of the phytoplankton composition inthe northeastern Atlantic during the 1990 spring bloom. Deep-Sea Res. II 40: 459–477.
BAROLI, I., AND A. MELIS. 1998. Photoinhibitory damage is mod-ulated by the rate of photosynthesis and by the photosystem IIlight-harvesting chlorophyll antenna size. Planta 205: 288–296.
BEHRENFELD, M. J., O. PRASIL, M. BABIN, AND F. BRUYANT. 2004.In search of a physiological basis for covariations in light-limited and light saturated photosynthesis. J. Phycol. 40: 4–25.
, , Z. S. KOLBER, M. BABIN, AND P.G. FALKOWSKI.1998. Compensatory changes in Photosystem II electron turn-over rates protect photosynthesis from photoinhibition. Pho-tosynth. Res. 58: 259–268.
BIDIGARE, R. R., M. E. ONDRUSEK, J. H. MORROW, AND D. A.KIEFER. 1990. In vivo absorption properties of algal pigments.SPIE 1302 (Ocean Optics X): 289–302.
CLELAND, R. E. 1998. Voltammetric measurement of the plastoqui-none redox state in isolated thylakoids. Photosynth. Res. 58:183–192.
CROFTS, A. R., I. BAROLI, D. KRAMER, AND S. TAOKA. 1993. Ki-netics of electron-transfer between Q(A) and Q(B) in wild-typeand herbicide-resistant mutants of Chlamydomonas reinhardtii.Z. Naturforsch. 48c: 259–266.
, AND C. A. WRAIGHT. 1983. The electrochemical domainof photosynthesis. Biochim. Biophys. Acta 726: 149–185.
CULLEN, J. J., AND R. F. DAVIS. 2003. The blank can make a big

949Photoacclimation in shelf seas
difference in oceanographic measurements. Limnol. Oceanogr.Bull. 12: 29–35.
CULLEN, J. J., AND J. G. MACINTYRE. 1998. Behaviour, physiologyand the niche of depth-regulating phytoplankton, p. 559–580.In D. M. Anderson, A. D. Cembella, and G. M. Hallegraeff[eds.], Physiological ecology of harmful algal blooms. Spring-er-Verlag.
DUBINSKY, Z., P. G. FALKOWSKI, AND K. WYMAN. 1986. Light har-vesting and utilisation by phytoplankton. Plant Cell Physiol.27: 1335–1349.
ESUCOUBAS, J., M. LOMAS, J. LAROCHE, AND P. G. FALKOWSKI.1995. Light intensity regulation of cab gene expression is sig-nalled by the redox state of the plastiquinone pool. Proc. Natl.Acad. Sci. USA 92: 10237–10241.
FALKOWSKI, P. G. 1980. Light-shade adaptation in marine phyto-plankton, p. 99–119. In P. G. Falkowski [ed.], Primary pro-ductivity in the sea. Plenum Press.
, AND J. LAROCHE. 1991. Acclimation to spectral irradiancein algae. J. Phycol. 27: 8–14.
, AND T. G. OWENS. 1980. Light shade adaptation: Two strat-egies in marine phytoplankton. Plant Physiol. 66: 632–635.
, AND J. A. RAVEN. 1997. Aquatic photosynthesis. Black-well.
GEIDER, R. J., H. L. MACINTYRE, AND T. M. KANA. 1998. A dy-namic regulatory model of phytoplankton acclimation to lightnutrients and temperature. Limnol. Oceanogr. 43: 679–694.
HORTON, P., A. V. RUBAN, AND R. G. WALTERS. 1996. Regulationof light harvesting in green plants. Annu. Rev. Plant Physiol.Plant Mol. Biol. 47: 655–684.
KAN̆A, R., D. LAZAR, O. PRASIL, AND J. NAUS. 2002. Experimentaland theoretical studies on the excess capacity of photosystemII. Photosynth. Res. 72: 271–284.
KOLBER, Z., AND P. G. FALKOWSKI. 1993. Use of active fluorescenceto estimate phytoplankton photosynthesis in situ. Limnol.Oceanogr. 38: 1646–1665.
, O. PRASIL, AND P. G. FALKOWSKI. 1998. Measurements ofvariable chlorophyll fluorescence using fast repetition rate tech-niques: Defining methodology and experimental protocols.Biochim Biophys Acta 1367: 88–106.
, K. D. WYMAN, AND P. G. FALKOWSKI. 1990. Natural var-iability in photosynthetic energy conversion efficiency: A fieldstudy in the Gulf of Maine. Limnol. Oceanogr. 35: 72–79.
, J. Zehr, and P. G. Falkowski. 1988. Effects of growth ir-radiance and nitrogen limitation on photosynthetic energy con-version in photosystem II. Plant Physiol. 88: 923–929.
KRAUSE, G. H., AND E. WEIS. 1991. Chlorophyll fluorescence andphotosynthesis: The basics. Annu. Rev. Plant Physiol. PlantMol. Biol. 42: 313–349.
LANEY, S. R. 2003. Assessing the error in photosynthetic propertiesdetermined by fast repetition rate fluorometry. Limnol. Ocean-ogr. 48: 2234–2242.
LEWIS, M. R., E. P. W. HORNE, J. J. CULLEN, N. S. OAKEY, AND T.PLATT. 1984. Turbulent motions may control phytoplanktonphotosynthesis in the upper ocean. Nature 311: 49–50.
LONG, S. P., S. HUMPHRIES, AND P. G. FALKOWSKI. 1994. Photo-inhibition of photosynthesis in nature. Annu. Rev. Plant Phy-siol. Plant Mol. Biol. 45: 633–662.
MACINTYRE, H. L., T. M. KANA, T. ANNING, AND R. J. GEIDER.2002. Photoacclimation of photosynthesis irradiance responsecurves and photosynthetic pigments in microalgae and cyano-bacteria. J. Phycol. 38: 17–38.
MAUZERALL, D., AND N. L. GREENBAUM. 1989. The absolute size ofa photosynthetic unit. Biochim. Biophys. Acta 974: 119–140.
MOORE, C. M., M. I. LUCAS, R. SANDERS, AND R. DAVIDSON. 2005.Basin-scale variability of phytoplankton bio-optical character-istics in relation to bloom state and community structure in theNortheast Atlantic. Deep Sea Res. I. 52: 401–419.
, AND OTHERS. 2003. Physical controls on phytoplanktonphysiology and production at a shelf sea front: A fast repeti-tion-rate fluorometer based field study. Mar. Ecol. Prog. Ser.259: 29–45.
MORRISON, R. J. 2003. In situ determination of the quantum yieldof phytoplankton chlorophyll a fluorescence: A simple algo-rithm, observations and a model. Limnol. Oceanogr. 48: 618–631.
OLAIZOLA, M., J. LAROCHE, Z. KOLBER, AND P. G. FALKOWSKI.1994. Non-photochemical quenching and the diadinoxanthincycle in a marine diatom. Photosynth. Res. 41: 357–370.
PARK, Y. I., W. S. CHOW, AND J. M. ANDERSON. 1997. Antennasize dependency of photoinactivation of photosystem II inlight-acclimated leaves. Plant Physiol. 115: 151–157.
PERRY, M. J., M. C. TALBOT, AND R. S. ALBERETE. 1981. Photoad-aptation in marine phytoplankton: Response of the photosyn-thetic unit. Mar. Biol. 62: 91–101.
PRASIL, O., N. ADIR, AND I. OHAD. 1992. Dynamics of photosystemII: Mechanism of photoinhibition and recovery process, p.295–348. In J. Barber [ed.], The photosystems: Structure, func-tion and molecular biology. Elsevier.
, Z. KOLBER, J. BERRY, AND P. G. FALKOWSKI. 1996. Cyclicelectron flow around PSII in vivo. Photosynth. Res. 48: 395–410.
RAVEN, J. 1994. The cost of photoinhibition to plant communities,p. 449–464. In N. R. Baker and J. R. Bowyer [eds.], Photo-inhibition of photosynthesis: From molecular mechanisms tothe field. BIOS Scientific Publishers.
RICHARDSON, K., BEARDALL, J., AND J. A. RAVEN. 1983. Adaptationof unicellular algae to irradiance: An analysis of strategies.New Phytol. 93: 157–191.
SHARPLES, J., C. M. MOORE, T. P. RIPPETH, P. M. HOLLIGAN, D. J.HYDES, N. R. FISHER, AND J. H. SIMPSON. 2001. Phytoplanktondistribution and survival in the thermocline. Limnol. Oceanogr.46: 486–496.
STRZEPEK, R. F., AND P. J. HARRISON. 2004. Photosynthetic archi-tecture differs in coastal and oceanic diatoms. Science 431:689–692.
SUGGETT, D., G. KRAAY, P. HOLLIGAN, M. DAVEY, J. AIKEN, AND
R. GEIDER. 2001. Assessment of photosynthesis in a springcyanobacterial bloom by use of a fast repetition rate fluorom-eter. Limnol. Oceanogr. 46: 802–810.
, H. L. MACINTYRE, AND R. J. GEIDER. 2004. Evaluation ofbiophysical and optical determinations of light absorption byphotosystem II in phytoplankton. Limnol. Oceanogr. Methods2: 316–332.
SUKENIK, A., J. BENNETT, AND P. G. FALKOWSKI. 1987. Light-sat-urated photosynthesis-limitation by electron transport or carbonfixation? Biochim. Biophys. Acta. 891: 205–215.
TASSAN, S., AND G. M. FERRARI. 1995. An alternative approach toabsorption measurements of aquatic particles retained on fil-ters. Limnol. Oceanogr. 40: 1358–1368.
VINCENT, W. F., N. BERTRAND, AND J. J. FRENETTE. 1994. Photoad-aptation to intermittent light across the St. Lawrence Estuaryfreshwater-saltwater transition zone. Mar. Ecol. Prog. Ser. 110:283–292.
Received: 10 March 2005Accepted: 13 September 2005
Amended: 17 October 2005