Optimal sensor placement for detecting organophosphate intrusions into water distribution systems
Intrusions of eastern North Atlantic central waters and
phytoplankton in the north and northwestern Iberian
shelf during spring
A. Bode*, M. Varela, B. Casas, N. Gonzalez
Instituto Espanol de Oceanografıa, Centro Oceanografico de A Coruna, Apdo. 130, E-15080 A Coruna, Spain
Received 16 October 2000; accepted 15 May 2002
Abstract
The influence of intrusions of eastern North Atlantic central water (ENACW) in the north and northwestern Iberian shelf on
phytoplankton composition and abundance and on particle-size distributions of seston was analyzed using data collected on
three extensive cruises during spring 1991 and 1992. Water with temperature and salinity values between 12.20 and 13.86 jCand between 35.66 and 35.98 psu, respectively, characteristics of the subtropical type of ENACW (ENACWt), was detected in
the upper 100 m of the water-column in all cruises, but particularly in the western coast in 1992. The highest salinity values of
this water were found near the surface (0–100-m depth) and in early spring 1992, while minimum salinity values, and also
minimum geographical extension, were found in late spring in both years. Phytoplankton blooms concentrated in frontal areas
between different water types, with maximum intensity and extension in early spring.
Using temperature and salinity characteristics, samples were classified in four groups corresponding to the major water types
found in the region: Bay of Biscay central water (BBCW), two segments of ENACW of different salinity and surface water
influenced by continental runoff. This classification was significantly confirmed by three independent discriminant analyses
using hydrographic and chemical (dissolved nutrients and chlorophyll) variables, phytoplankton species abundance variables
and particle-size concentration of seston variables. Phytoplankton blooms related to the presence of saline waters were
characterized by the dominance of either chain-forming diatoms or a mixture of diatoms and phytoflagellates and high
concentrations of seston. The diatom species dominating in saline waters were typical of upwelling-induced blooms occurring
generally during summer. Blooms occurring in waters influenced by runoff also contained diatoms but in lower numbers than
those of saline waters. Nutrients were not exhausted in the region, suggesting that phytoplankton populations were still in active
growth. These results are interpreted taking into account the known variability in water-mass formation and in the poleward
current driving ENACWt along the shelf, and indicate that saline intrusions are a major feature affecting the distribution and
composition of plankton in the spring in the southern Bay of Biscay, thus enlarging to a wider spatial scale their reported
influence on the pelagic ecosystem.
D 2002 Elsevier Science B.V. All rights reserved.
Keywords: Salinity; S Bay of Biscay; Phytoplankton; Nutrients; Eastern North Atlantic central waters
0924-7963/02/$ - see front matter D 2002 Elsevier Science B.V. All rights reserved.
PII: S0924 -7963 (02 )00187 -2
* Corresponding author. Tel.: +34-981-205362; fax: +34-981-229077.
E-mail address: [email protected] (A. Bode).
www.elsevier.com/locate/jmarsys
Journal of Marine Systems 36 (2002) 197–218

1. Introduction
The northwestern shelf of the Iberian Peninsula is a
region of great hydrologic and biogeochemical activ-
ity. The seasonal coastal upwelling, induced by east-
ern winds between March and October (Fraga, 1981;
Blanton et al., 1984), is the main recognized source of
phytoplankton production for most of the year (Tenore
et al., 1995). A review of published production data
(Bode et al., 1994, 1996) confirms that upwelling-
related blooms dominated in the western part of the
area (Galicia). In contrast, there are significant pro-
duction pulses during spring and autumn blooms in
the northern shelf (Mar Cantabrico) that are not
related to upwelling (Flos, 1982; Fernandez and Bode,
1991) because the influence of the upwelling in this
area is generally restricted to a narrow band near the
coast (Dickson and Hughes, 1981; Botas et al., 1990).
Mesoscale fronts produced by the separation of water
bodies with different temperature and, mainly, salinity
are the responsibilities of phytoplankton concentration
and increased production leading to spring blooms in
the Mar Cantabrico (Botas et al., 1988; Bode et al.,
1990; Fernandez et al., 1991, 1993).
Several water masses have been recognized in the
northwestern Iberian region, as summarized by Rios et
al. (1992). Waters above 500 m were dominated by
eastern North Atlantic central water (ENACW), of
which two subtypes were defined according to their
origin and temperature and salinity characteristics.
The subtropical subtype (ENACWt) range from 12.2
to 18.5 jC and from 35.66 to 36.75 psu (Fiuza and
Halpern, 1982; Fiuza, 1984; Rios et al., 1992), and its
origin was located in a front near the Azores (Fiuza,
1984). The subpolar subtype (ENACWp) is formed
46jN and corresponds to water between 4 and 12 jCand between 34.96 and 35.66 psu (Harvey, 1982).
These two subtypes are separated in summer by a
subsurface front at 42jN, near Cape Finisterre (Fragaet al., 1982). Below the salinity minimum near 500-m
depth, ENACW gradually mixes with intermediate
Mediterranean water, which reaches peak salinity
values at approximately 1000-m depth (Parrilla and
Moron, 1971; Rios et al., 1992; Diaz del Rio et al.,
1998). The upper bathymetric limit of ENACW
varies, according to the amount of continental water
in the surface, upwelling conditions and other phe-
nomena, but maximum salinity values over the shelf
were found generally between 0- and 100-m depth
(Lavın et al., 1992a,b; Cabanas et al., 1992; Perez et
al., 1993). A subtype of central waters with relatively
small variations in temperature and salinity (11.8–
12.2 jC; 35.53–35.58 psu) was also described in the
Bay of Biscay (Treguer et al., 1979; Fraga et al., 1982;
Botas et al., 1989) and named Biscay Bay central
water (BBCW). Interannual variability in the thermo-
haline properties of these water masses (notably
variations in salinity) was attributed to the intensity
of winter cooling in the formation areas (Pollard et al.,
1996) and related to regional-scale climatic fluctua-
tions (Perez et al., 1995, 2000).
While upwelling forces ENACW towards the coast
and the surface during most of spring and summer
(Fraga, 1981; Cabanas et al., 1992; Tenore et al.,
1995; Casas et al., 1997; Castro et al., 2000), downw-
elling and separation of shelf and oceanic waters
prevails during autumn and winter (Castro et al.,
1997). In addition, a strong poleward flow of
ENACWt has been described along the Iberian slope
during winter and early spring, reaching from south
Portugal (Ambar et al., 1984; Frouin et al., 1990;
Haynes and Barton, 1990) to the north of the Bay of
Biscay (Pingree and LeCann, 1990). This current was
detected over the shelf as an intrusion of saline water
that generated fronts affecting nutrient concentrations
(Botas et al., 1988), seston composition (Bode et al.,
1990) and plankton distribution, composition and
production (Fernandez et al., 1991, 1993). The occur-
rence and intensity of the poleward current, and
therefore the extension of ENACWt towards the north,
is known to vary between years (Garcıa-Soto et al.,
1991; Pingree and LeCann, 1990; Pingree, 1993,
1994; Lavın et al., 1998).
These hydrologic and hydrodynamic features affect
planktonic production on the northwestern Iberian
shelf and, in turn, may determine the success in the
recruitment of pelagic (Garcıa et al., 1992) and
demersal fish species (Pereiro and Fernandez, 1983)
that have recurrent spawning areas in this region.
Preliminary information on the food consumed by
the North Atlantic sardine in the area (Varela et al.,
1988, 1990) indicate that the availability of planktonic
cells and particles varies greatly during the spring, the
time of peak spawning of sardine (Sola et al., 1992).
The aim of this paper is to show the spatial
importance and temporal variability of intrusions of
A. Bode et al. / Journal of Marine Systems 36 (2002) 197–218198

ENACWalong the NW Iberian shelf during the spring
periods of 1991 and 1992, along with some of their
consequences for plankton distribution and composi-
tion. The effect of these intrusions will be compared to
those reported for 1987 in a small zone of the shelf
(Botas et al., 1988, 1989; Bode et al., 1990; Fernandez
and Bode, 1991; Fernandez et al., 1991, 1993). Using
a large number of samples and observations made
during three extensive cruises covering the whole
continental shelf and shelf-break areas, we demon-
strate a large degree of interannual variability in the
extent of saline intrusions and the existence of sig-
nificant differences in nutrients, phytoplankton bio-
mass and composition and particle-size distributions
between water bodies of different salinity. This paper
complements previous studies of plankton (Garcıa-
Soto et al., 1991), seston (Robins et al., 1991),
sardine-larvae (Lopez-Jamar et al., 1995) and
nutrients (Bode et al., 2001) focussed on part of the
study period.
2. Methods
Samples were collected during ECOSARP-0491
(April 1991), PROSARP-0392 and PROSARP-0492
cruises on R/V Cornide de Saavedra. On each cruise,
more than 80 stations were sampled along the NW
Iberian shelf and adjacent oceanic waters (Fig. 1).
Stations were arranged in coast to ocean transects and
most were visited in every cruise. Water-column
temperature and salinity were measured with a CTD
Seabird SBE-25 from the surface to 250-m depth in all
stations. CTD profiles were extended to 1000-m depth
at some stations. Water samples were collected at
three to five depths between the surface and 100-m
depth at all stations using 5-l Niskin bottles. Details of
sampling procedures and part of the raw data
employed in this paper can be found in Grupo SARP
(1993). In addition to ship-borne measurements, geo-
strophic wind conditions were summarized in the
form of an upwelling index, according to the values
provided in Lavın et al. (2000) for a location off the
Galician coast (43jN, 11jW). Positive values of the
upwelling index are indicative of winds blowing from
the north, while negative values indicate winds blow-
ing from the south.
Dissolved nutrients employed in this paper in-
cluded nitrate, nitrite and phosphate, and were deter-
mined in samples stored frozen on board by the
autoanalyzer methods described in Grasshoff et al.
(1983). Chlorophyll-a concentrations (Chl-a) were
Fig. 1. Map of sampling stations. Different symbols indicate stations sampled in each cruise.
A. Bode et al. / Journal of Marine Systems 36 (2002) 197–218 199

measured on 250-ml samples filtered on board
through Nucleopore membrane filters (0.8-Am pore
size) and stored frozen. Chlorophyll-a was extracted
in 90% acetone overnight and its fluorescence meas-
ured in a fluorometer (Parsons et al., 1984). Samples
for phytoplankton species determination were pre-
served with Lugol’s solution and observed with an
inverted microscope. Unidentified forms of dinofla-
gellates and flagellates were classified by size-
groups. Particle-size distributions (only available for
cruises in 1992) were measured on board by passing
7.5 ml of seawater through a tube of 140 Am of
aperture in a Coulter Counter TAII on board. The
particles counted were grouped in 16 size-classes of
doubling volume. To reduce the effect of electronic
noise on the counts of smaller particles and the
uncertainty in the counts of low numbers of large
particles, only results for size-classes 2–12 were
employed in this paper, representing a final range
of particle-sizes from 2.5 to 25.4 Am of mean
equivalent spherical diameter (ESD). Particle concen-
tration in each size-class was reported as particle
volume concentration in ml m� 3.
Samples (from 0- to 100-m depth only) were
classified according to their temperature and salinity
values in four groups, using the values of Table 1,
based on reported characteristics of the water types
described in the region, as reference limits for each
group. In practice, the position of each water sample
in a T/S diagram was computed and assigned to the
nearest group according to the reference limits of
Table 1. In general, all samples from the same station
were assigned to the same group, except with cases of
surface waters of salinity lower than 35.5 psu that
were classified in Group 4. Geographical location of
samples was also taken into account and, for instance,
samples assigned to Group 1 with thermohaline char-
acteristics close to BBCW were always located to the
north of 43jN. The validity of such classification was
tested independently by using discriminant analysis
on three sets of variables. One set of variables was
composed by temperature, salinity, dissolved nutrient
and chlorophyll concentrations. Phytoplankton spe-
cies abundance was used in the second set of varia-
bles, and particle concentration by size classes formed
the third set. Variables were logarithmically trans-
formed to normalize data before entering discriminant
analysis. Differences in mean values of the variables
between groups were tested using ANOVA and ‘a
posteriori’ Student–Neuman–Keuls tests (Sokal and
Rohlf, 1981).
3. Results
3.1. Distribution of saline intrusions and phytoplank-
ton
The poleward progression of surface waters at the
time of the study was restricted by the switch in the
average direction of geostrophic winds (Fig. 2). In all
cruises, the dominant conditions were of upwelling, as
indicated by positive values of the upwelling index
caused by winds blowing predominantly from the
north and northeast. However, converse conditions
were observed in the previous winter months, when
the upwelling index maintained negative values as a
consequence of winds blowing from the south, thus
favouring the poleward flow of surface water (Frouin
et al., 1990).
Vertical profiles of salinity revealed that maximum
salinity in the upper 500 m was always between the
Table 1
Reference temperature and salinity values for the grouping of samples from the study area
Group Temperature
(jC)Salinity (psu) Water type References
1 11.80–12.20 35.50–35.58 BBCW Treguer et al., 1979; Fraga et al., 1982;
Botas et al., 1989
2 12.20–12.50 35.66–35.79 ENACWt lower segment Fiuza, 1984; Rios et al., 1992;
3 12.50–18.50 35.80–36.75 ENACWt upper segment Fiuza and Halpern, 1982;
Rios et al., 1992; Pollard et al., 1996
4 variable < 35.50 surface water
BBCW: Biscay Bay central water. ENACWt: Subtropical eastern North Atlantic central water.
A. Bode et al. / Journal of Marine Systems 36 (2002) 197–218200
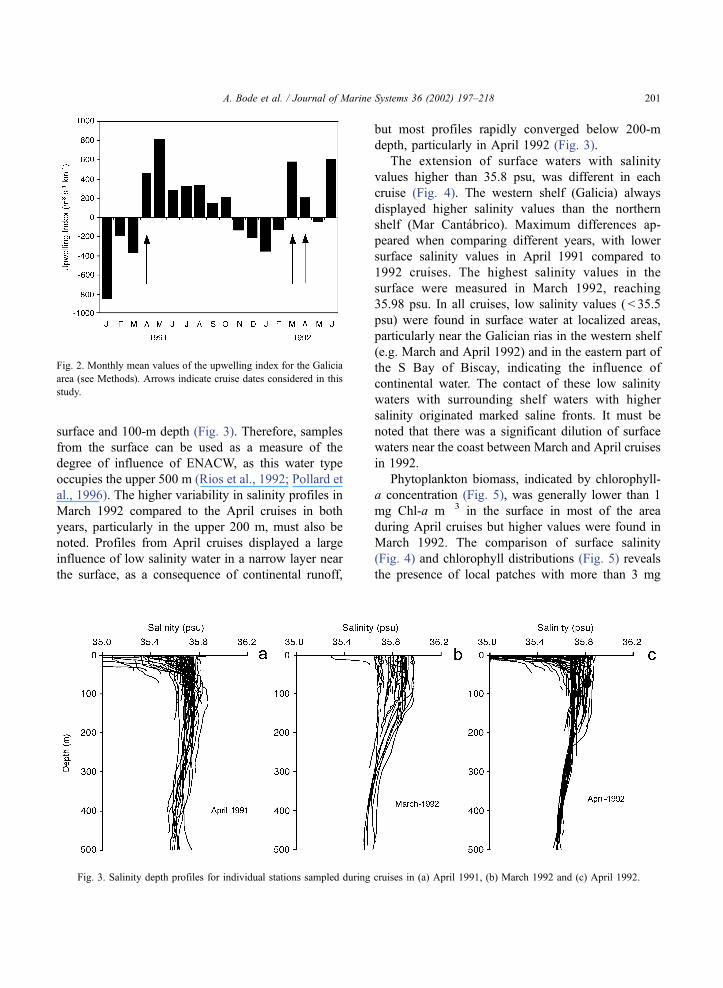
surface and 100-m depth (Fig. 3). Therefore, samples
from the surface can be used as a measure of the
degree of influence of ENACW, as this water type
occupies the upper 500 m (Rios et al., 1992; Pollard et
al., 1996). The higher variability in salinity profiles in
March 1992 compared to the April cruises in both
years, particularly in the upper 200 m, must also be
noted. Profiles from April cruises displayed a large
influence of low salinity water in a narrow layer near
the surface, as a consequence of continental runoff,
but most profiles rapidly converged below 200-m
depth, particularly in April 1992 (Fig. 3).
The extension of surface waters with salinity
values higher than 35.8 psu, was different in each
cruise (Fig. 4). The western shelf (Galicia) always
displayed higher salinity values than the northern
shelf (Mar Cantabrico). Maximum differences ap-
peared when comparing different years, with lower
surface salinity values in April 1991 compared to
1992 cruises. The highest salinity values in the
surface were measured in March 1992, reaching
35.98 psu. In all cruises, low salinity values ( < 35.5
psu) were found in surface water at localized areas,
particularly near the Galician rias in the western shelf
(e.g. March and April 1992) and in the eastern part of
the S Bay of Biscay, indicating the influence of
continental water. The contact of these low salinity
waters with surrounding shelf waters with higher
salinity originated marked saline fronts. It must be
noted that there was a significant dilution of surface
waters near the coast between March and April cruises
in 1992.
Phytoplankton biomass, indicated by chlorophyll-
a concentration (Fig. 5), was generally lower than 1
mg Chl-a m� 3 in the surface in most of the area
during April cruises but higher values were found in
March 1992. The comparison of surface salinity
(Fig. 4) and chlorophyll distributions (Fig. 5) reveals
the presence of local patches with more than 3 mg
Fig. 3. Salinity depth profiles for individual stations sampled during cruises in (a) April 1991, (b) March 1992 and (c) April 1992.
Fig. 2. Monthly mean values of the upwelling index for the Galicia
area (see Methods). Arrows indicate cruise dates considered in this
study.
A. Bode et al. / Journal of Marine Systems 36 (2002) 197–218 201
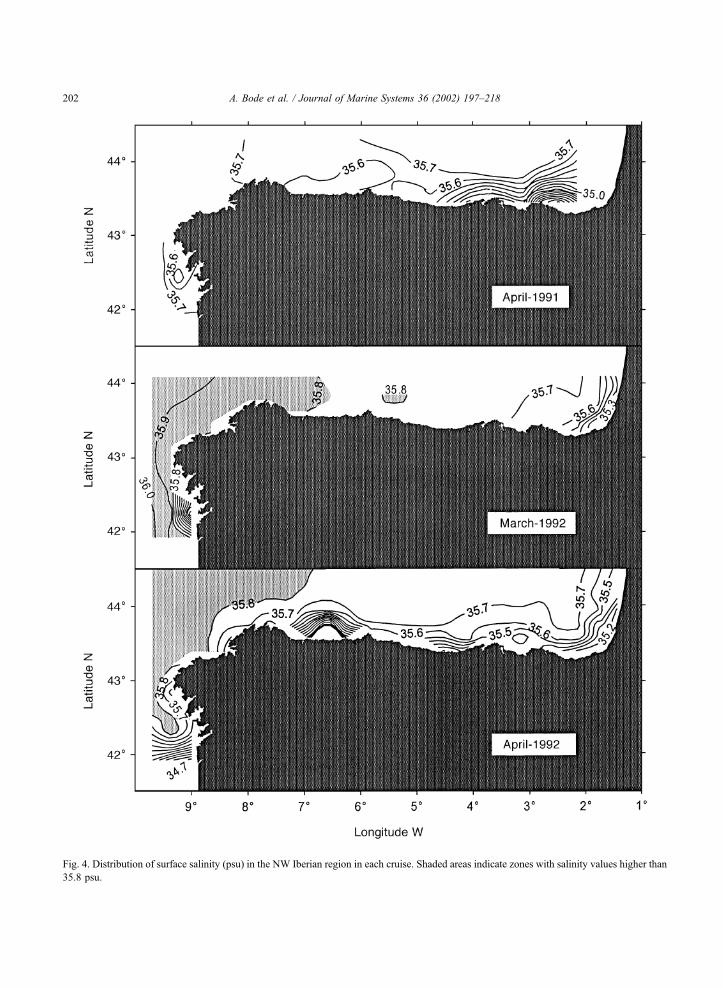
Fig. 4. Distribution of surface salinity (psu) in the NW Iberian region in each cruise. Shaded areas indicate zones with salinity values higher than
35.8 psu.
A. Bode et al. / Journal of Marine Systems 36 (2002) 197–218202
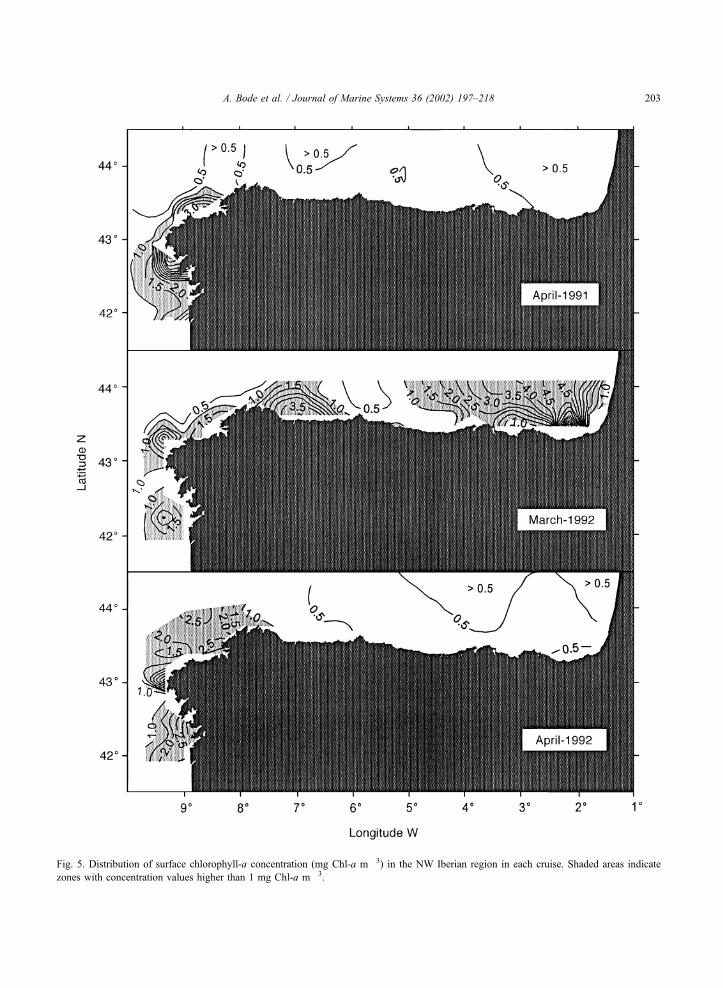
Fig. 5. Distribution of surface chlorophyll-a concentration (mg Chl-a m� 3) in the NW Iberian region in each cruise. Shaded areas indicate
zones with concentration values higher than 1 mg Chl-a m� 3.
A. Bode et al. / Journal of Marine Systems 36 (2002) 197–218 203
Chl-a m� 3, associated with salinity fronts near the
western coast (i.e. low salinity water in the mouth of
all Galician rias, 8jW) and, in March 1992, also in
the eastern part of the Mar Cantabrico (i.e. east of
4jW, with surface salinity lower than 35.7 psu).
However, there are also examples of areas in which
surface salinity is highly variable but there is no
apparent increase in chlorophyll (i.e. the Mar Can-
tabrico coastal zone in both April cruises).
3.2. Classification of samples according to temper-
ature and salinity characteristics
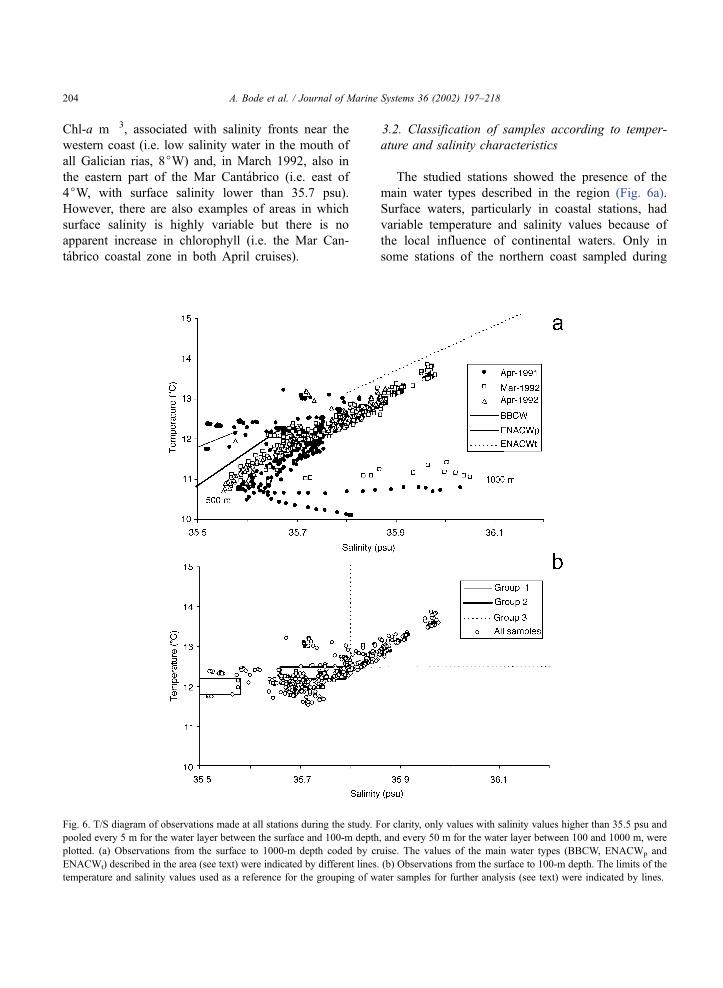
The studied stations showed the presence of the
main water types described in the region (Fig. 6a).
Surface waters, particularly in coastal stations, had
variable temperature and salinity values because of
the local influence of continental waters. Only in
some stations of the northern coast sampled during
Fig. 6. T/S diagram of observations made at all stations during the study. For clarity, only values with salinity values higher than 35.5 psu and
pooled every 5 m for the water layer between the surface and 100-m depth, and every 50 m for the water layer between 100 and 1000 m, were
plotted. (a) Observations from the surface to 1000-m depth coded by cruise. The values of the main water types (BBCW, ENACWp and
ENACWt) described in the area (see text) were indicated by different lines. (b) Observations from the surface to 100-m depth. The limits of the
temperature and salinity values used as a reference for the grouping of water samples for further analysis (see text) were indicated by lines.
A. Bode et al. / Journal of Marine Systems 36 (2002) 197–218204
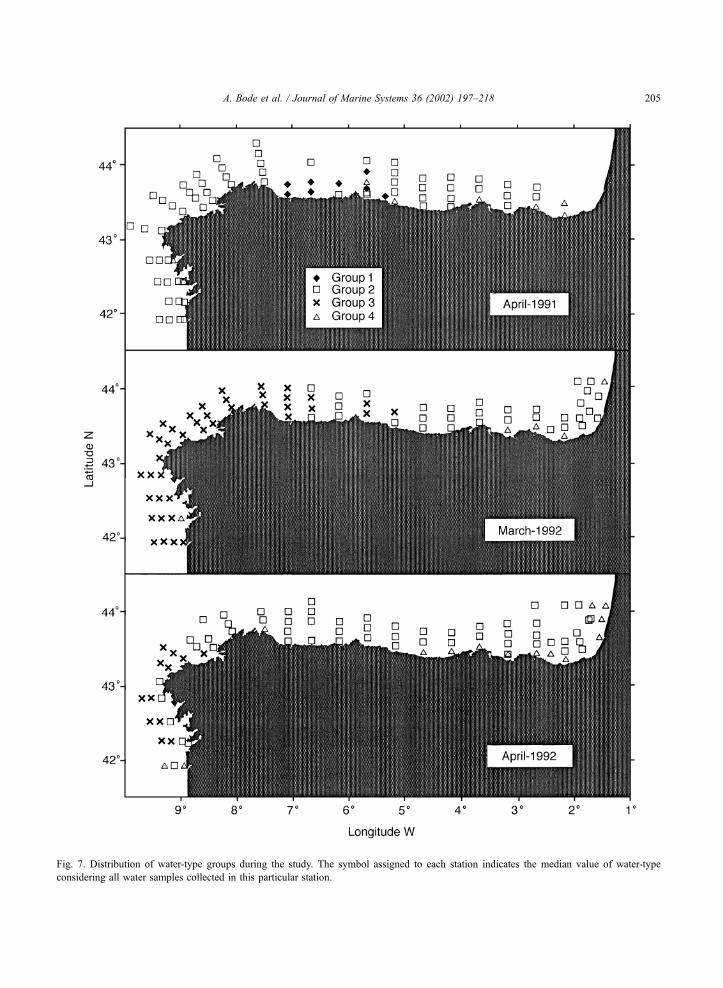
Fig. 7. Distribution of water-type groups during the study. The symbol assigned to each station indicates the median value of water-type
considering all water samples collected in this particular station.
A. Bode et al. / Journal of Marine Systems 36 (2002) 197–218 205
April cruises, water with characteristics close to
those described for BBCW was found. Water
between 20 and 500 m of most stations showed
temperature and salinity values corresponding to
variable amounts of the main types of ENACW, as
indicated by the linear trend of points in the T/S
diagram (Fig. 6a). A large number of observations
had thermohaline characteristics that fell in the
transition between typical subtropical and subpolar
subtypes of ENACW (Rios et al., 1992). These
observations showed a relatively large variability in
temperature values. However, waters with salinity
higher than 35.8 psu (that can be assimilated to
ENACWt) and located mostly between the surface
and 100-m depth resulted relatively homogeneous in
temperature, which reached the highest values in this
layer. It should be noted that all observations of
waters with temperature and salinity close to
ENACW were colder and saltier than the values of
ENACW reference lines. Finally, the layer between
500 and 1000 m, measured only at some stations,
had water with the characteristic transition between
ENACW and Mediterranean water, with a range of
temperature of 10.1–11.4 jC and a maximum sal-
inity of 36.05 psu.
Considering only waters in the surface to 100-m
depth layer, the observations can be arranged in four
groups corresponding to the main water types
described in the region (Fig. 6b), using temperature
and salinity reference values of Table 1. Group 1
waters had T/S characteristics similar to those of
BBCW, although we did not find any particular
sample that had T/S values comprised completely
between the published values for this water type.
Group 2 included waters with salinity higher than
35.66 psu, upper salinity limit for ENACWp, in the
transition zone described for ENACW in the region
(Rios et al., 1992). However, temperature and salinity
values of these waters did not reach values lying
completely within the published limits for ENACWt
and therefore can be considered the lower segment of
this water type. Group 3 waters had salinity values
higher than 35.8 psu that fit mostly in the line describe
for typical ENACWt. All surface samples with salinity
values below 35.5 psu were classified in Group 4.
None of the collected water samples had T/S charac-
teristics assimilable to ENACWp.
The distribution of these water types reveal that
Group 1 waters (BBCW) were restricted to a relative
small area in the western Mar Cantabrico during April
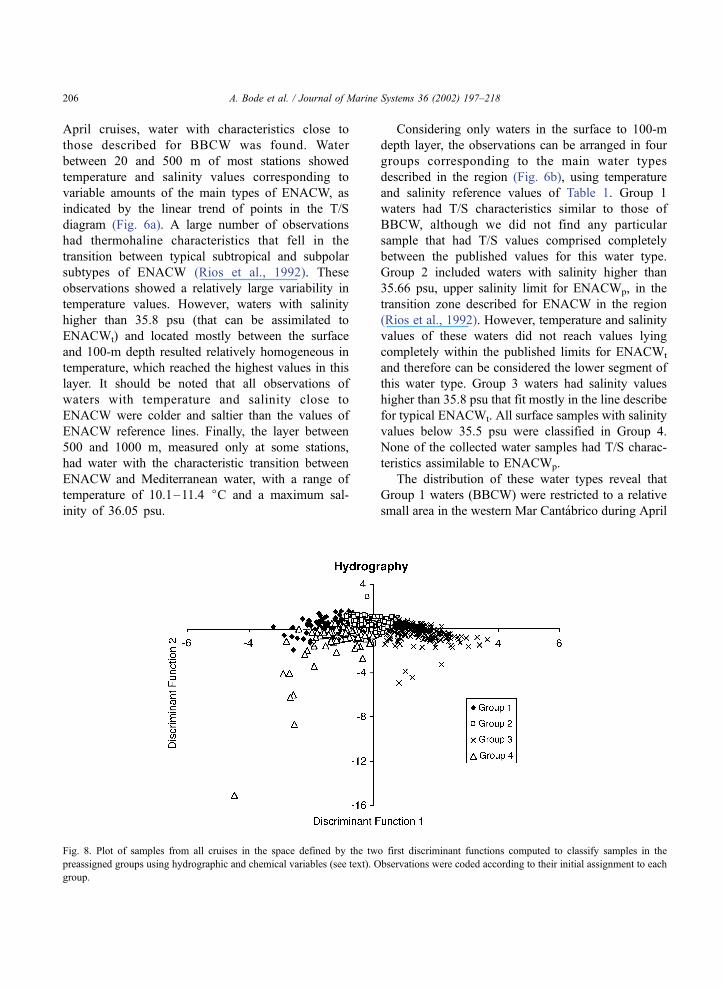
Fig. 8. Plot of samples from all cruises in the space defined by the two first discriminant functions computed to classify samples in the
preassigned groups using hydrographic and chemical variables (see text). Observations were coded according to their initial assignment to each
group.
A. Bode et al. / Journal of Marine Systems 36 (2002) 197–218206
1991 (Fig. 7). Similarly, waters with marked conti-
nental influence occurred in scattered locations in all
cruises but generally at the eastern limit of the Mar
Cantabrico and near the Galician rias. Most of the
study area was characterized by Group 2 waters,
present in all cruises, while high salinity waters
(Group 3) were restricted to Galicia (March and April)
and to the western Mar Cantabrico (March) in 1992
cruises, but were not found in April 1991.
3.3. Chemical and biological characteristics of water
bodies
The validity of the classification of water samples
according to the T/S characteristics was first tested
using hydrographic and chemical composition varia-
bles of 753 samples in a discriminant analysis that
correctly classified more than 80% of samples of
Groups 1 and 4, but only ca. 50% of samples
originally attributed to Groups 2 and 3 (Fig. 8). The
two first discriminant functions accounted for more
than 96% of the variance. Temperature, salinity and
chlorophyll had positive correlation values with the
first discriminant function, while nutrient concentra-
tions were negatively correlated with this function
(Table 2). The second discriminant function was
positively correlated with salinity, nitrate and phos-
phate and negatively with temperature, nitrite and
chlorophyll. Samples appeared arranged in the space
delimited by these functions from low salinity Group
4 and Group 1 samples (displaying mainly negative
values for the first discriminant function) to high
salinity samples of Group 3, with samples from Group
2 occupying an intermediate position near the zero
value of both discriminant functions. The second
discriminant function mostly separates samples from
the largely heterogeneous Group 4, with high chlor-
ophyll and temperature samples having low values of
the function. Even when the discriminant analysis
reconstructed the main characteristics of the ‘a priori’
classification taking into account temperature and
salinity, the inclusion of dissolved nutrients and chlor-
ophyll was insufficient to detect a clear separation
between samples of both segments of ENACWt
(Groups 2 and 3).
Mean values of temperature from Group 3 sam-
ples were significantly higher than those of other
groups (Table 3), while mean salinity of all groups
(except Groups 1 and 4) was significant (Student–
Neuman–Keuls test, p < 0.05). Mean nutrient con-
centrations also varied significantly between groups.
Nitrate values in Groups 1 and 2 were higher than
Table 2
Standardized canonical discriminant function coefficients and
pooled-within-groups correlations between discriminating variables
and canonical discriminant functions (DF1 and DF2) computed
using hydrographic and chemical variables
Variable Coefficient
DF1
Coefficient
DF2
Correlation
DF1
Correlation
DF2
Temperature 0.702 � 0.513 0.790 � 0.428
Salinity 0.315 0.833 0.396 0.769
Nitrate 0.500 0.265 � 0.129 0.347
Nitrite � 0.158 � 0.332 � 0.340 � 0.048
Phosphate � 0.601 � 0.059 � 0.509 0.154
Chlorophyll-a 0.104 � 0.138 0.243 � 0.299
Table 3
Mean and SD values of hydrographic and chemical variables used to classify samples in the preassigned groups by means of discriminant
analysis
Variable Group 1 Group 2 Group 3 Group 4
Mean SD Mean SD Mean SD Mean SD
Temperature (jC) 12.16* 0.24 12.32* 0.43 12.82+ 0.26 12.22* 0.37
Salinity (psu) 35.577* 0.097 35.725+ 0.096 35.794� 0.536 35.449* 0.442
Nitrate (mmol N m� 3) 4.40* 2.20 3.73* 1.63 3.17+ 1.48 3.42+ 2.79
Nitrite (mmol N m� 3) 0.30* 0.18 0.27* 0.16 0.18+ 0.11 0.31* 0.24
Phosphate (mmol P m� 3) 0.52* 0.11 0.38+ 0.14 0.28� 0.06 0.42o 0.21
Chlorophyll-a (mg m� 3) 0.27* 0.19 0.91+ 1.00 1.39� 1.36 0.97+ 1.29
n 28 401 173 151
n: Number of samples employed in each group. Symbols after the mean value indicate significance of values between groups. Values of a
variable in different groups with the same symbol were nonsignificantly different (Student–Neuman–Keuls test, p>0.05).
A. Bode et al. / Journal of Marine Systems 36 (2002) 197–218 207
values in Groups 3 and 4. Nitrite concentration was
significantly lower in Group 3 than in all other
groups, while phosphate concentrations were signifi-
cantly different in all groups, with maximum values
in samples from Group 1. Similarly, mean chloro-
phyll concentration was significantly different be-
tween most groups, except between Groups 2 and
4, and the maximum value occurred in Group 3. It
should be noted that there was a correspondence
between high nutrient concentrations (particularly
phosphate and nitrate) and low chlorophyll values
and vice versa.
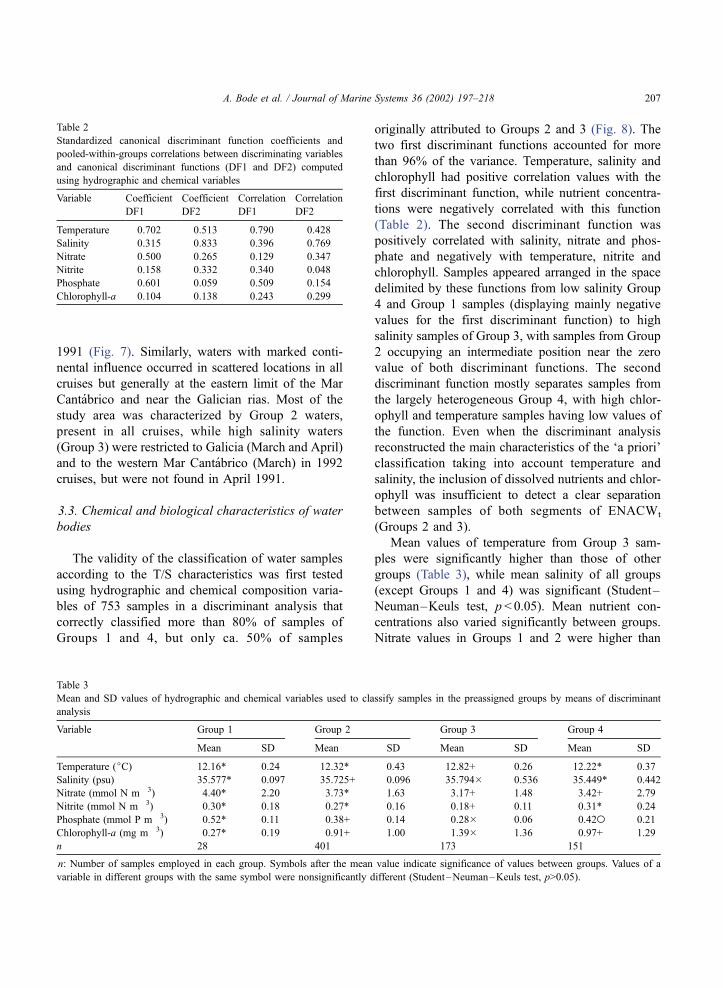
Fig. 9. Plot of samples from all cruises in the space defined by the two first discriminant functions computed to classify samples in the
preassigned groups using phytoplankton species abundances (see text). Observations were coded according to their initial assignment to each
group.
Table 4
Standardized canonical discriminant function coefficients and pooled-within-groups correlations between discriminating variables and canonical
discriminant functions (DF1 and DF2) computed using phytoplankton species or taxonomic group abundance values
Species or taxonomic group Coefficient DF1 Coefficient DF2 Correlation DF1 Correlation DF2
Cachonina hallii Freudentahl and Lee 0.107 0.188 0.191 � 0.029
Ceratium lineatum (Ehrenberg) Cleve � 0.125 0.265 0.149 0.299
Dinoflagellates < 30 Am 0.389 � 0.311 0.256 � 0.151
Prorocentrum balticum (Lohmann) Loeblich 0.280 0.304 0.215 0.341
Protoperidinium bipes (Paulsen) Balech 0.063 0.312 0.174 0.007
Scripsiella trochoidea (Stein) Lohmann 0.077 0.212 0.154 0.131
Chaetoceros curvisetus Brightwell � 0.152 � 0.042 � 0.198 0.005
Chaetoceros danicus Cleve 0.111 � 0.310 � 0.028 � 0.121
Ditylum brightwelli (West) Grunow 0.066 � 0.035 � 0.043 � 0.108
Leptocylindrus danicus Cleve 0.534 0.593 0.229 0.290
Pseudonitzschia delicatissima (Cleve) Heiden 0.077 0.011 � 0.162 0.043
Rhizosolenia fragilissima Bergon � 0.648 0.269 � 0.307 0.073
Rhizosolenia setigera Brightwell � 0.524 0.355 � 0.271 0.067
Rhizosolenia stolterfothii Peragallo � 0.172 0.056 � 0.230 0.000
Cryptophyceae 0.190 � 0.084 0.243 � 0.119
Only species having the highest absolute values of the coefficients were displayed.
A. Bode et al. / Journal of Marine Systems 36 (2002) 197–218208
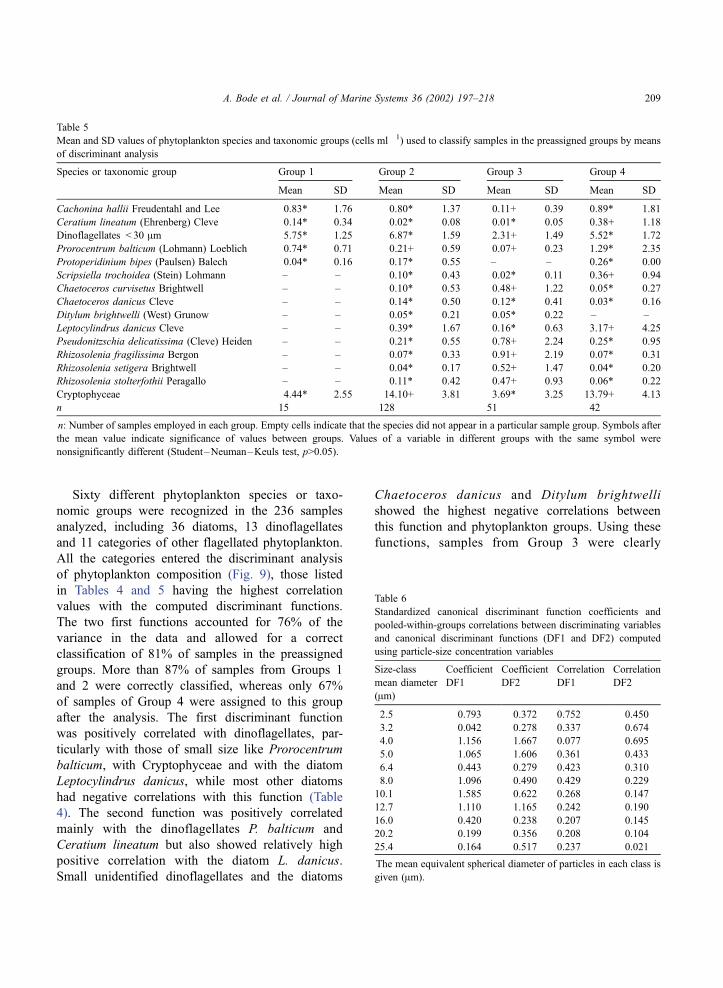
Sixty different phytoplankton species or taxo-
nomic groups were recognized in the 236 samples
analyzed, including 36 diatoms, 13 dinoflagellates
and 11 categories of other flagellated phytoplankton.
All the categories entered the discriminant analysis
of phytoplankton composition (Fig. 9), those listed
in Tables 4 and 5 having the highest correlation
values with the computed discriminant functions.
The two first functions accounted for 76% of the
variance in the data and allowed for a correct
classification of 81% of samples in the preassigned
groups. More than 87% of samples from Groups 1
and 2 were correctly classified, whereas only 67%
of samples of Group 4 were assigned to this group
after the analysis. The first discriminant function
was positively correlated with dinoflagellates, par-
ticularly with those of small size like Prorocentrum
balticum, with Cryptophyceae and with the diatom
Leptocylindrus danicus, while most other diatoms
had negative correlations with this function (Table
4). The second function was positively correlated
mainly with the dinoflagellates P. balticum and
Ceratium lineatum but also showed relatively high
positive correlation with the diatom L. danicus.
Small unidentified dinoflagellates and the diatoms
Chaetoceros danicus and Ditylum brightwelli
showed the highest negative correlations between
this function and phytoplankton groups. Using these
functions, samples from Group 3 were clearly
Table 5
Mean and SD values of phytoplankton species and taxonomic groups (cells ml� 1) used to classify samples in the preassigned groups by means
of discriminant analysis
Species or taxonomic group Group 1 Group 2 Group 3 Group 4
Mean SD Mean SD Mean SD Mean SD
Cachonina hallii Freudentahl and Lee 0.83* 1.76 0.80* 1.37 0.11+ 0.39 0.89* 1.81
Ceratium lineatum (Ehrenberg) Cleve 0.14* 0.34 0.02* 0.08 0.01* 0.05 0.38+ 1.18
Dinoflagellates < 30 Am 5.75* 1.25 6.87* 1.59 2.31+ 1.49 5.52* 1.72
Prorocentrum balticum (Lohmann) Loeblich 0.74* 0.71 0.21+ 0.59 0.07+ 0.23 1.29* 2.35
Protoperidinium bipes (Paulsen) Balech 0.04* 0.16 0.17* 0.55 – – 0.26* 0.00
Scripsiella trochoidea (Stein) Lohmann – – 0.10* 0.43 0.02* 0.11 0.36+ 0.94
Chaetoceros curvisetus Brightwell – – 0.10* 0.53 0.48+ 1.22 0.05* 0.27
Chaetoceros danicus Cleve – – 0.14* 0.50 0.12* 0.41 0.03* 0.16
Ditylum brightwelli (West) Grunow – – 0.05* 0.21 0.05* 0.22 – –
Leptocylindrus danicus Cleve – – 0.39* 1.67 0.16* 0.63 3.17+ 4.25
Pseudonitzschia delicatissima (Cleve) Heiden – – 0.21* 0.55 0.78+ 2.24 0.25* 0.95
Rhizosolenia fragilissima Bergon – – 0.07* 0.33 0.91+ 2.19 0.07* 0.31
Rhizosolenia setigera Brightwell – – 0.04* 0.17 0.52+ 1.47 0.04* 0.20
Rhizosolenia stolterfothii Peragallo – – 0.11* 0.42 0.47+ 0.93 0.06* 0.22
Cryptophyceae 4.44* 2.55 14.10+ 3.81 3.69* 3.25 13.79+ 4.13
n 15 128 51 42
n: Number of samples employed in each group. Empty cells indicate that the species did not appear in a particular sample group. Symbols after
the mean value indicate significance of values between groups. Values of a variable in different groups with the same symbol were
nonsignificantly different (Student–Neuman–Keuls test, p>0.05).
Table 6
Standardized canonical discriminant function coefficients and
pooled-within-groups correlations between discriminating variables
and canonical discriminant functions (DF1 and DF2) computed
using particle-size concentration variables
Size-class
mean diameter
(Am)
Coefficient
DF1
Coefficient
DF2
Correlation
DF1
Correlation
DF2
2.5 0.793 0.372 0.752 0.450
3.2 � 0.042 0.278 0.337 0.674
4.0 � 1.156 1.667 0.077 0.695
5.0 1.065 � 1.606 0.361 0.433
6.4 � 0.443 � 0.279 0.423 0.310
8.0 1.096 0.490 0.429 0.229
10.1 � 1.585 � 0.622 0.268 0.147
12.7 1.110 1.165 0.242 0.190
16.0 � 0.420 � 0.238 0.207 0.145
20.2 0.199 0.356 0.208 0.104
25.4 � 0.164 � 0.517 0.237 � 0.021
The mean equivalent spherical diameter of particles in each class is
given (Am).
A. Bode et al. / Journal of Marine Systems 36 (2002) 197–218 209
separated from those of Group 2, the latter having
most samples with positive values in the first
discriminant function and negative in the second
function (Fig. 9). Also, samples from Group 4
showed positive values in both functions and could
be clearly identified using these functions. Group 4
samples had generally high abundance values of
most phytoplankton species, mainly of small dino-
flagellates and L. danicus (Table 5). Differences
between Groups 2 and 3 were mostly due to
significantly higher abundances of Cryptophyceae
in the former and diatoms like Chaetoceros curvi-
setus, Pseudonitzschia delicatissima and various
species of Rhizosolenia in the latter. Group 1
samples displayed a phytoplankton composition
clearly different from the rest, lacking most diatoms
present in other groups.
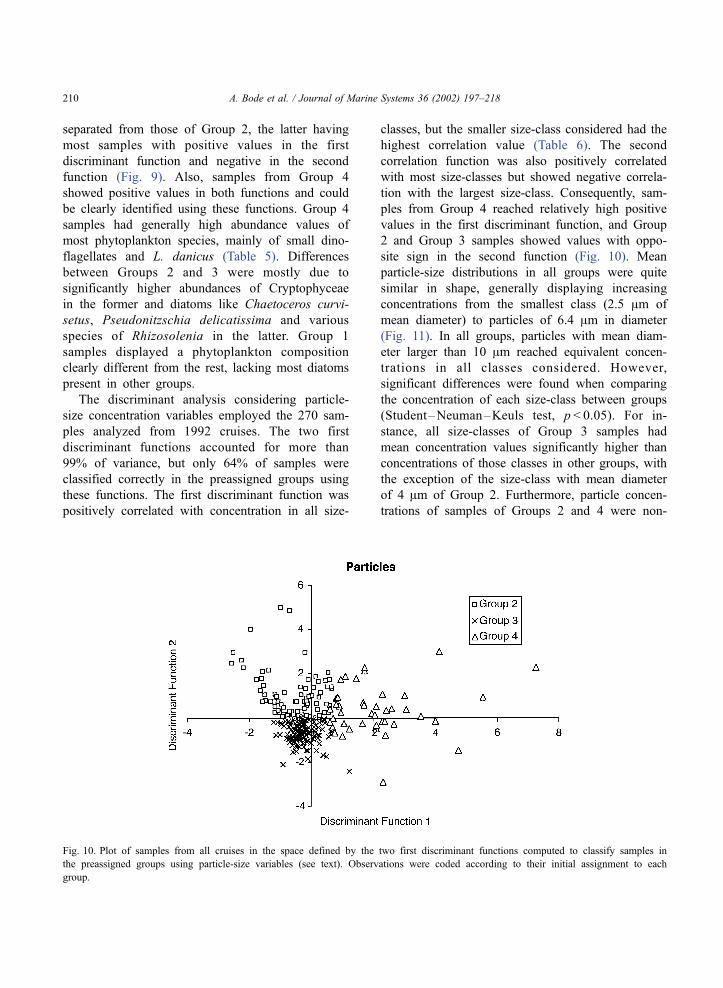
The discriminant analysis considering particle-
size concentration variables employed the 270 sam-
ples analyzed from 1992 cruises. The two first
discriminant functions accounted for more than
99% of variance, but only 64% of samples were
classified correctly in the preassigned groups using
these functions. The first discriminant function was
positively correlated with concentration in all size-
classes, but the smaller size-class considered had the
highest correlation value (Table 6). The second
correlation function was also positively correlated
with most size-classes but showed negative correla-
tion with the largest size-class. Consequently, sam-
ples from Group 4 reached relatively high positive
values in the first discriminant function, and Group
2 and Group 3 samples showed values with oppo-
site sign in the second function (Fig. 10). Mean
particle-size distributions in all groups were quite
similar in shape, generally displaying increasing
concentrations from the smallest class (2.5 Am of
mean diameter) to particles of 6.4 Am in diameter
(Fig. 11). In all groups, particles with mean diam-
eter larger than 10 Am reached equivalent concen-
trations in all classes considered. However,
significant differences were found when comparing
the concentration of each size-class between groups
(Student–Neuman–Keuls test, p < 0.05). For in-
stance, all size-classes of Group 3 samples had
mean concentration values significantly higher than
concentrations of those classes in other groups, with
the exception of the size-class with mean diameter
of 4 Am of Group 2. Furthermore, particle concen-
trations of samples of Groups 2 and 4 were non-
Fig. 10. Plot of samples from all cruises in the space defined by the two first discriminant functions computed to classify samples in
the preassigned groups using particle-size variables (see text). Observations were coded according to their initial assignment to each
group.
A. Bode et al. / Journal of Marine Systems 36 (2002) 197–218210
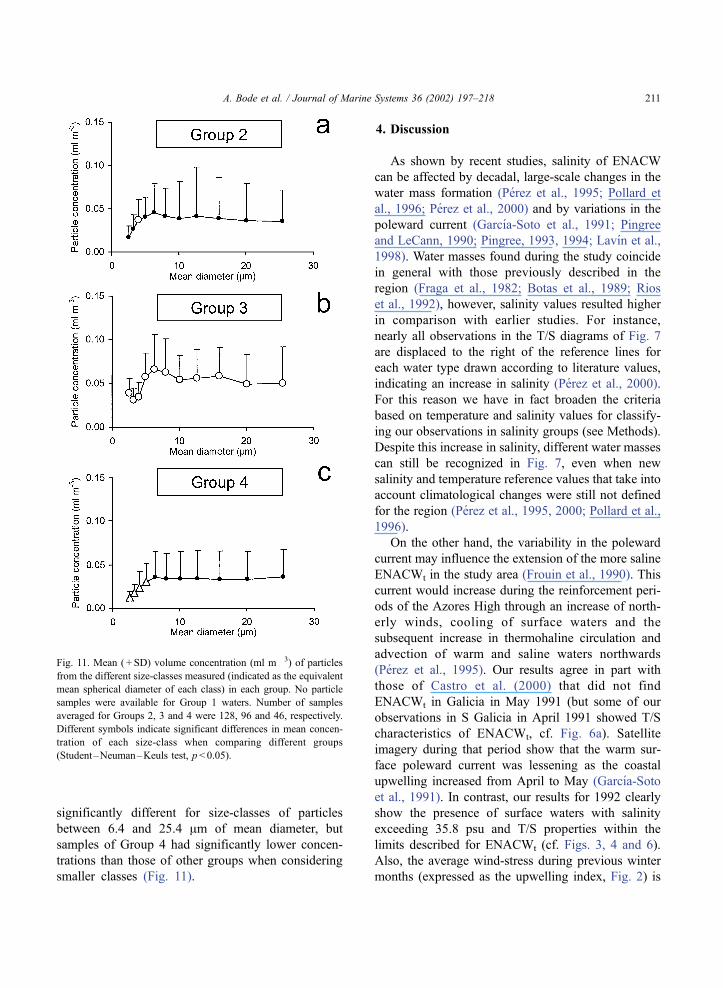
significantly different for size-classes of particles
between 6.4 and 25.4 Am of mean diameter, but
samples of Group 4 had significantly lower concen-
trations than those of other groups when considering
smaller classes (Fig. 11).
4. Discussion
As shown by recent studies, salinity of ENACW
can be affected by decadal, large-scale changes in the
water mass formation (Perez et al., 1995; Pollard et
al., 1996; Perez et al., 2000) and by variations in the
poleward current (Garcıa-Soto et al., 1991; Pingree
and LeCann, 1990; Pingree, 1993, 1994; Lavın et al.,
1998). Water masses found during the study coincide
in general with those previously described in the
region (Fraga et al., 1982; Botas et al., 1989; Rios
et al., 1992), however, salinity values resulted higher
in comparison with earlier studies. For instance,
nearly all observations in the T/S diagrams of Fig. 7
are displaced to the right of the reference lines for
each water type drawn according to literature values,
indicating an increase in salinity (Perez et al., 2000).
For this reason we have in fact broaden the criteria
based on temperature and salinity values for classify-
ing our observations in salinity groups (see Methods).
Despite this increase in salinity, different water masses
can still be recognized in Fig. 7, even when new
salinity and temperature reference values that take into
account climatological changes were still not defined
for the region (Perez et al., 1995, 2000; Pollard et al.,
1996).
On the other hand, the variability in the poleward
current may influence the extension of the more saline
ENACWt in the study area (Frouin et al., 1990). This
current would increase during the reinforcement peri-
ods of the Azores High through an increase of north-
erly winds, cooling of surface waters and the
subsequent increase in thermohaline circulation and
advection of warm and saline waters northwards
(Perez et al., 1995). Our results agree in part with
those of Castro et al. (2000) that did not find
ENACWt in Galicia in May 1991 (but some of our
observations in S Galicia in April 1991 showed T/S
characteristics of ENACWt, cf. Fig. 6a). Satellite
imagery during that period show that the warm sur-
face poleward current was lessening as the coastal
upwelling increased from April to May (Garcıa-Soto
et al., 1991). In contrast, our results for 1992 clearly
show the presence of surface waters with salinity
exceeding 35.8 psu and T/S properties within the
limits described for ENACWt (cf. Figs. 3, 4 and 6).
Also, the average wind-stress during previous winter
months (expressed as the upwelling index, Fig. 2) is
Fig. 11. Mean ( + SD) volume concentration (ml m� 3) of particles
from the different size-classes measured (indicated as the equivalent
mean spherical diameter of each class) in each group. No particle
samples were available for Group 1 waters. Number of samples
averaged for Groups 2, 3 and 4 were 128, 96 and 46, respectively.
Different symbols indicate significant differences in mean concen-
tration of each size-class when comparing different groups
(Student–Neuman–Keuls test, p< 0.05).
A. Bode et al. / Journal of Marine Systems 36 (2002) 197–218 211
indicative of northward transport of surface waters
(negative values of the upwelling index). Further-
more, the presence of the poleward current in winter
1992 was noted by Pingree and LeCan (1992) analyz-
ing satellite images until March–April 1992, and the
surface salinity and temperature distributions along
the NW Spanish coast in five cruises between March
and June 1992 showed by Lopez-Jamar et al. (1995)
illustrate the relaxation of the poleward flow and the
increasing importance of the southward, upwelling-
induced flow from spring to summer. Therefore, we
conclude that the high salinity of waters found in 1992
cruises were the consequence of both higher salinity
during water mass formation (Pollard et al., 1996) and
also of the poleward transport of southern ENACWt in
the previous winter.
One of the consequences of the increasing salinity
was the apparent reduction in the amount of BBCW in
the southern Bay of Biscay, as this water type was
well represented in the area prior to 1991 (Treguer et
al., 1979; Fraga et al., 1982; Botas et al., 1989) but
was barely detected in our study, and only during
1991 cruise. The increase in salinity of ENACWat the
time of water-mass formation (Pollard et al., 1996)
would also affect BBCW, which is a subtype of
ENACW influenced by the presence of continental
water in the Bay of Biscay (Treguer et al., 1979; Fraga
et al., 1982; Botas et al., 1989). Also, this water type
was displaced from the surface layer as a consequence
of advection of more saline ENACW types from the
west during spring (Botas et al., 1989). Both effects
would cause that most points in Fig. 6 close to BBCW
reference limits were displaced to the right in the T/S
diagram. At the same time, our results illustrate the
influence of local factors on the extension of ENAW
over the shelf. For instance, a period of heavy rain
between March and April 1992 cruises was the
responsibility of the dilution of saline waters near
the coast because of enhanced runoff of the Canta-
brian rivers and an increase in the formation of
salinity fronts and stratification in the upper 50 m
layer (Lopez-Jamar et al., 1995).
Another consequence of the presence of saline
waters was the separation of waters with different
nutrient, phytoplankton and particle concentrations.
Our classification of samples using thermohaline
characteristics was confirmed by each of the discrim-
inant analyses on chemical and biological variables,
although the differentiation of some water types was
more evident using certain combinations of variables.
Previous studies in the northern Iberian shelf during
spring, but on a much reduced spatial scale, also
found a differentiation of water bodies with charac-
teristic nutrient and plankton composition in close
relation with saline intrusions (Botas et al., 1988;
Bode et al., 1990; Fernandez et al., 1991; Lavın et
al., 1992a,b; Fernandez et al., 1993). In these studies,
high salinity waters showed in general higher nutrient
concentrations than coastal and, sometimes, oceanic
waters (e.g. nitrate). Botas et al. (1988) suggested
that high nitrite and low oxygen concentrations in
saline waters were indicative of a dominance of
remineralization processes in these waters, a hypoth-
esis also supported by studies of plankton composi-
tion (Bode et al., 1990; Fernandez et al., 1991, 1993).
In a more general context, Perez et al. (1993) showed
the importance of remineralization along the north-
ward progression of ENACWt, but particularly in
waters below 100-m depth. In contrast, we found
relatively low nutrient concentrations in saline waters
(i.e. Group 3, Table 3), but particularly those of
phosphate and nitrite. Our findings can be interpreted
as the result of a general bloom development in
saline waters, especially in those of highest salinity
(Group 3). Mean nitrate and phosphate concentra-
tions in ENACWt waters (Groups 2 and 3) were
lower than those reported by Perez et al. (1993) at the
salinity maximum (35.815 psu, 5.6 mmol N–NO3�
m� 3, 0.32 mmol P–PO43 + m� 3). Nitrate was more
depleted than phosphate in all waters, indicating that
in situ remineralization of nitrate was insufficient to
account for phytoplankton demand. This is further
supported by the low nitrite concentrations in saline
waters, as nitrite accumulation is known to occur
during nitrification (McCarthy et al., 1984). In addi-
tion, significantly higher chlorophyll concentrations
and the large diversity of diatom species in saline
waters compared with other water types are typical
characteristics of spring blooms in temperate regions
(e.g. Legendre, 1990).
The different phytoplankton assemblages found in
this study provide an additional proof of the occur-
rence of several blooms in temperate waters, instead
of a single bloom, typical of high latitudes (Legendre,
1990; Ducklow and Harris, 1993; Townsend et al.,
1994). Some of them displayed characteristics of other
A. Bode et al. / Journal of Marine Systems 36 (2002) 197–218212
spring-blooms reported in the area, either considering
chlorophyll concentrations (Flos, 1982; Fernandez
and Bode, 1991; Casas et al., 1997) and general
species composition (Estrada, 1982; Varela, 1992a,b;
Fernandez and Bode, 1994; Casas et al., 1999).
However, the dominance of particular species in
waters with high salinity in our study allows for a
differentiation of blooms occurring in these waters in
our study and those reported in earlier studies. Since
the cruises were made in different years and sampling
of the entire area was accomplished in 3 or 4 weeks
during each cruise, in this study no attempt was made
to establish a sequence between these blooms, but the
environmental and planktonic characteristics of the
recognized water bodies are interpreted in relation to
the available information on the NW Iberian shelf
instead. Phytoplankton species characteristic of Group
1 waters, found in the northern shelf in April 1991,
were typical of late-winter, having low cell abundan-
ces and being small dinoflagellates and flagellates the
only noticeable groups (Fernandez and Bode, 1994;
Casas et al., 1999). Low chlorophyll and relatively
high nutrient concentrations also indicate that the
bloom was not initiated in these waters, with a low
degree of vertical stratification (Lopez-Jamar et al.,
1995). In contrast, phytoplankton blooms were well
developed in all other groups recognized.
The two types of saline waters were characterized
by the presence of a larger number of species than
Group 1 waters. Both saline groups were separated
mainly by a dominance of Cryptophyceae in Group 2
(lower salinity segment of ENACWt), while both
shared most diatom species. Such dominance of
phytoflagellates is similar to the bloom described in
April 1987 by Fernandez et al. (1993) and was also
observed in other areas where large numbers of
microflagellates accompany or follow diatom blooms
(Nielsen and Richardson, 1989). The mixotrophic
nutrition of many marine flagellates (e.g. Riemann
et al., 1995), along with the favourable conditions
provided by stabilization of the water-column near
frontal zones between saline and coastal or oceanic
waters (Fernandez et al., 1991, 1993), may explain
this dominance. Moreover, time-series studies of phy-
toplankton composition noted an increase in micro-
flagellate abundances between 1989 and 1992 in the
coast of NW Spain (Casas et al., 1999), a general
trend attributed to increasing eutrophication near the
coast also found in other North Atlantic regions
(Hickel et al., 1993).
Dominance of several species of small-sized and
chain-forming diatoms was noticed for phytoplankton
blooms in the study area (Fernandez and Bode, 1994;
Casas et al., 1999). Chaetoceros socialis is always the
dominant diatom species in spring blooms in the
Galician shelf (Casas et al., 1999), while spring
blooms reported in the Mar Cantabrico included other
species such as L. danicus and P. delicatissima that
reach higher abundances than Chaetoceros spp. (Fer-
nandez and Bode, 1994). In this context, our results
show that the more saline waters (Group 3) contained
significantly higher abundances of species like L.
danicus, P. delicatissima and Rhizosolenia stolterfo-
thii than other groups. These species, of widespread
distribution in the Atlantic, are reported to increase
their abundances during blooms occurring in oceanic
and warm waters (e.g. Guillard and Kilham, 1977 and
references therein). This feature, along with the
reduced importance of C. socialis in our study
(although present in the results and entered the dis-
criminant analysis, this species was not one of the
main discriminant species, Table 4), allows us to
relate blooms occurring in these waters to blooms
produced later in the season as a consequence of the
upwelling (Casas et al., 1999). The codominance of
similar species, also found in other shelf regions
(Holligan, 1987; Legendre, 1990), was probably due
to the existence of zones with frequent mixing and
stabilization processes that create favourable condi-
tions for the simultaneous growth of several species,
while monospecific blooms often occur as a response
to a single major environmental change like fresh-
water runoff or coastal eutrophication (Holligan,
1987). Summer blooms caused by upwelling in the
northwestern Iberian shelf are also multispecific, and
several species of dinoflagellates increase their abun-
dances along with diatoms, particularly L. danicus
(Varela, 1992a; Casas et al., 1999). The upwelling-
favourable wind conditions during the cruises consid-
ered in this study would explain the production of
blooms in saline waters with a species composition
similar to those of summer, particularly in Galicia.
However, one of the main characteristics of the
studied spring blooms is the mixture of typical
bloom-forming diatoms along with flagellates and
small dinoflagellates, the latter being present all year
A. Bode et al. / Journal of Marine Systems 36 (2002) 197–218 213

round (Casas et al., 1999). This diversity of groups
originates large differences in sestonic particles,
which has important trophic implications.
On one hand, diatom chains and colonies form the
bulk of netphytoplankton (>12 Am, as in Bode et al.,
1994) and are a significant food source for pelagic fish
like sardine (Varela et al., 1988, 1990), with the
resulting shortening in the food chain and increase
in efficiency in energy transfer (Blaxter and Hunter,
1982). Fernandez et al. (1993) reported a differential
distribution of sardine larvae near the coast in the
northern Iberian shelf associated with diatom-domi-
nated phytoplankton populations. Our results extend
the importance of saline waters in the whole NW
Iberian shelf for the increasing availability of large
phytoplanktonic particles, as indicated by the abun-
dance of chain-forming diatoms, although the particle-
size data presented here did not show a specific shape
in the distributions of particles in these waters because
only sizes smaller than 25.4 Am ESD were considered.
However, Robins et al. (1991) found clear differences
in particle-size distributions of seston during April
1991 cruise. In their study, a large size range of
particles was employed (1–170 Am ESD) and the
signal of chain-forming diatoms was clearly seen in
waters of the western shelf (Galicia).
On the other hand, flagellate-dominated commun-
ities tend to be organized around microbial food
chains, with longer pathways and low efficiency of
energy transfer, although they are important for
nutrient remineralization (Glibert, 1993). Previous
studies of local blooms in the area also reported
flagellate dominance in fronts related to saline intru-
sions (Bode et al., 1990; Fernandez et al., 1991,
1993). In our case, the high abundance of Cryptophy-
ceae in Group 2 and Group 4 waters (low salinity
ENACWt and surface water, respectively) may be
explained by the existence of frontal zones caused
by the salinity gradient between ENACWt and surface
waters with low salinity since these areas would
provide enough stability to the water column for
flagellate growth and accumulation (Holligan, 1987).
Although we do not provide detailed depth distribu-
tions of variables in this study, other papers concern-
ing some of the cruises analyzed here reveal that high
chlorophyll areas occurred in zones near large hori-
zontal gradients of temperature and salinity (Garcıa-
Soto et al., 1991; Robins et al., 1991; Bode et al.,
2001). Phytoflagellates lower than 10 Am may be a
significant food source for planktonic copepods
known in the region (Cabal et al., 1990; Barquero et
al., 1998; Valdes and Moral, 1998), which in turn may
be consumed by the spawning sardine populations
(Varela et al., 1988, 1990; Varela, 1992b). Indirect
support for this hypothesis was provided by Barquero
et al. (1998) when reporting large abundances of
herbivorous copepods with daily grazing rates equiv-
alent to 12% of primary production for a coastal zone
dominated by phytoflagellates in the western Iberian
shelf during spring. In addition to phytoplankton, the
increased availability of all sestonic particles in saline
waters found in our study may be an important nutri-
tional resource for spawning adults and larvae of
pelagic fishes in the region. In this way, several
studies have related the distribution of sardine eggs
and larvae with suitable feeding areas (e.g. Robins et
al., 1991; Varela, 1992b). However, the survival of the
fish larvae would ultimately depend not only on the
availability of suitable food particles but also from
their retention in nursery areas by hydrographic pro-
cesses, like the currents associated with saline intru-
sions (Fernandez et al., 1993) and upwelling (Lopez-
Jamar et al., 1995).
This study confirms the importance of intrusions of
saline waters of subtropical origin along the northern
and northwestern shelf of the Iberian Peninsula during
spring, when these intrusions affect the development
of phytoplankton blooms mainly by the generation of
hydrodynamic discontinuities, such as fronts and jet
currents, which stabilize the water-column. The main
consequence for the pelagic ecosystem is the produc-
tion of a large degree of heterogeneity in plankton
composition, biomass and distribution that would
occur if these intrusions were not produced. On a
shelfwide scale, the occurrence of waters with differ-
ent salinity during the spring is critical for the devel-
opment and composition of phytoplankton blooms in
this region of NW Spain, as the large hydrodynamic
changes made by the seasonal switch in the dominant
surface currents affect the retention and transport of
planktonic organisms (Fernandez et al., 1993; Lopez-
Jamar et al., 1995). First, the accumulation of surface
water and plankton towards the coast is favoured by
predominantly northward flow, such as in winter and
early spring, generally associated to well-mixed
water-columns and low phytoplankton biomass and
A. Bode et al. / Journal of Marine Systems 36 (2002) 197–218214
production (e.g. Bode et al., 2001). Second, offshore
transport of surface low-salinity waters occurring near
the coast as a consequence of the increasing impor-
tance of upwelling during the spring season would
favour stabilization of the upper water-column and
phytoplankton development (e.g. Lopez-Jamar et al.,
1995).
The broad spatial and temporal coverage of this
study suggests that the effects caused by saline
intrusions on the composition, distribution and pro-
duction of plankton and pelagic fishes described in
previous studies at lower space and time scales (Bode
et al., 1990; Fernandez et al., 1991, 1993) may
determine biogeochemical fluxes and the success of
fish populations at annual or even larger time scales in
the southern Bay of Biscay. In contrast, earlier studies
of this region only considered the seasonal upwelling
in the northwestern part of the area as the major
source of nutrients and hydrodynamic forcing affect-
ing the pelagic shelf ecosystem even during spring
(Robins et al., 1991; Varela, 1992a,b; Tenore et al.,
1995). However, a large variability on the effects of
saline intrusions on plankton could be expected given
the evidences on the interannual variability of the
salinity of ENACW (Rios et al., 1992; Perez et al.,
1995; Pollard et al., 1996; Lavın et al., 1998; Perez et
al., 2000) and in the intensity of the poleward current
which can affect these intrusions (Pingree and
LeCann, 1992). For instance, salinity of ENACW in
the study area increased in late 1980s (Perez et al.,
1995; Pollard et al., 1996), reaching a maximum in
1992 and decreased until 1995 (Lavın et al., 1998;
Perez et al., 2000). At the same time, Valdes and
Moral (1998) detected a decrease in copepod species
diversity between 1991 and 1995 in a coastal station
in the northern Iberian shelf.
It must be noted that the situation described in our
study corresponds to a period when salinity in the
southern Bay of Biscay reached their maximum
intensity recorded in almost 20 years, and that the
composition and distribution of plankton may be very
different from those of years with low-intensity or
nonexistent intrusions. Therefore, the results provided
here can be used as a reference for comparison of
values obtained in other years. The main difference
between the results reported here and those described
for 1987 in the central Cantabrian Sea (Botas et al.,
1988, 1990; Bode et al., 1990; Fernandez and Bode,
1991; Fernandez et al., 1991, 1993) is the absence of a
jet-like structure of the intrusions in spring 1991 and
1992, when ENACW of higher salinity than those of
previous years washed large shelf areas, thus prevent-
ing the formation of BBCW and limiting the forma-
tion of salinity fronts when meeting runoff water. In
late 1990s, a decrease in the recruitment of sardine
populations has been noted in this region (ICES,
1999), but the possible links between these changes
and those in the water masses or in the pelagic
ecosystem were not known. Long-term fluctuations
in the characteristics of water masses and currents
found along the Iberian shelf are probably linked to
large-scale climatic processes since their formation is
affected by variations of atmospheric pressure and
winds (Frouin et al., 1990; Perez et al., 1995, 2000).
Further studies in this region would need to take into
account the large-scale variability in hydrology and
planktonic populations along with small-scale pro-
cesses in order to understand the implications of these
sources of natural variability for the sustainability of
the shelf ecosystem.
Acknowledgements
The authors thank the crew of the R/V Cornide de
Saavedra and all the participants in the cruises for
their help during sampling and data collection. A.
Garcıa and E. Lopez-Jamar, chief scientists of the
cruises, provided all the logistic facilities for this
study. CTD files were provided by J.M. Cabanas and
G. Dıaz del Rio. We are indebted to J. Lorenzo for
phytoplankton analysis, and to R. Carballo and M.
Canle for nutrient determinations. This work was
funded in part by projects SARP (MA 1.96, DGXIV)
and PELASSES (99/10, DGXIV) of the EU, and by
additional funds of the Instituto Espanol de Ocean-
ografıa. B.C. received an FPI fellowship from the
Ministerio de Educacion y Ciencia (Spain).
References
Ambar, I.J., Fiuza, A.F.G., Boyd, T., Frouin, R., 1984. Observations
of a warm oceanic current flowing northward along the coasts of
Portugal and Spain during November–December, 1983. EOS
Trans. Am. Geophys. Union 67 (44), 1054.
Barquero, S., Cabal, J.A., Anadon, R., Fernandez, E., Varela, M.,
A. Bode et al. / Journal of Marine Systems 36 (2002) 197–218 215

Bode, A., 1998. Ingestion rates of phytoplankton by copepod
size-fractions on a bloom associated with an off-shelf front off
NW Spain. J. Plankton Res. 20, 957–972.
Blanton, J.O., Atkinson, L.P., Fernandez de Castillejo, F., Lavin, A.,
1984. Coastal upwelling off the Rias Bajas, Galicia, northwest
Spain: I. Hydrographic studies. Rapp. P.-V. Reun.-Cons. Int.
Explor. Mer 183, 79–90.
Blaxter, J.H., Hunter, J.R., 1982. The biology of the clupeoid fishes.
Adv. Mar. Biol. 20, 1–223.
Bode, A., Fernandez, E., Botas, A., Anadon, R., 1990. Distribution
and composition of suspended particulate matter related to a
shelf-break saline intrusion in the Cantabrian Sea (Bay of Bis-
cay). Oceanol. Acta 3, 219–228.
Bode, A., Casas, B., Varela, M., 1994. Size-fractionated primary
productivity and biomass in the Galician shelf (NW Spain):
netplankton versus nanoplankton dominance. Sci. Mar. 58,
131–141.
Bode, A., Casas, B., Fernandez, E., Maranon, E., Serret, P., Varela,
M., 1996. Phytoplankton biomass and production in shelf waters
off NW Spain: spatial and seasonal variability in relation to
upwelling. Hydrobiologia 341, 225–234.
Bode, A., Varela, M., Canle, M., Gonzalez, N., 2001. Dissolved and
particulate organic nitrogen in shelf waters of northern Spain
during spring. Mar. Ecol. Prog. Ser. 214, 43–54.
Botas, J.A., Bode, A., Fernandez, E., Anadon, R., 1988. Descrip-
cion de una intrusion de agua de elevada salinidad en el Can-
tabrico Central: distribucion de los nutrientes inorganicos y su
relacion con el fitoplancton. Investig. Pesq. 52, 559–572.
Botas, J., Fernandez, E., Bode, A., Anadon, R., 1989. Water masses
off the central Cantabrian Coast. Sci. Mar. 53, 755–761.
Botas, J.A., Fernandez, E., Bode, A., Anadon, R., 1990. A persis-
tent upwelling off the central Cantabrian Coast (Bay of Biscay).
Estuar. Coast. Shelf Sci. 30, 185–199.
Cabal, J.A., Acuna, J.L., Menendez, P., Perez, C., Villegas, M.L.,
Alvarez-Marques, F., Anadon, E., 1990. Datos basicos de las
campanas ‘COCACE’: II- Zooplancton de la costa central del
Cantabrico (Asturias). Biobas. Rev. Biol. Univ. Oviedo 2, 1–63
Suppl.
Cabanas, J.M., Dıaz del Rio, G., Lavın, A., Nunes, T., 1992. Hydro-
graphic conditions off the Galician coast, NW of Spain, during
an upwelling event. Bol. Inst. Esp. Oceanogr. 8 (1), 27–40.
Casas, B., Varela, M., Canle, M., Gonzalez, N., Bode, A., 1997.
Seasonal variations of nutrients, seston and phytoplankton, and
upwelling intensity off La Coruna (NW Spain). Estuar. Coast.
Shelf Sci. 44, 767–778.
Casas, B., Varela, M., Bode, A., 1999. Seasonal succession of
phytoplankton species on the coast of A Coruna (Galicia, north-
west Spain). Bol. Inst. Esp. Oceanogr. 15 (1–4), 413–429.
Castro, C.G., Alvarez-Salgado, X.A., Figueiras, F.G., Perez, F.F.,
Fraga, F., 1997. Transient hydrographic and chemical conditions
affecting microplankton populations in the coastal transition
zone of the Iberian upwelling system (NW Spain) in September
1986. J. Mar. Res. 55, 321–352.
Castro, C.G., Perez, F.F., Alvarez-Salgado, X.A., Fraga, F., 2000.
Coupling between the thermohaline, chemical and biological
fields during two contrasting upwelling events off the NW Iber-
ian Peninsula. Cont. Shelf Res. 20, 189–210.
Diaz del Rio, G., Gonzalez, N., Marcote, D., 1998. The intermedi-
ate Mediterranean water inflow along the northern slope of the
Iberian Peninsula. Oceanol. Acta 21, 157–163.
Dickson, R.R., Hughes, D.G., 1981. Satellite evidences of meso-
scale eddy activity over the Biscay abyssal plain. Oceanol. Acta
4, 43–46.
Ducklow, H.W., Harris, R.P., 1993. Introduction to the JGOFS
North Atlantic bloom experiment. Deep-Sea Res. II 40, 1–8.
Estrada, M., 1982. Ciclo anual del fitoplancton frente a Punta En-
data (Golfo de Vizcaya). Investig. Pesq. 46, 469–491.
Fernandez, E., Bode, A., 1991. Seasonal patterns of primary pro-
duction in the central Cantabrian Sea (Bay of Biscay). Sci. Mar.
55, 629–636.
Fernandez, E., Bode, A., 1994. Succession of phytoplankton as-
semblages in relation to the hydrography in the southern Bay
of Biscay: a multivariate approach. Sci. Mar. 58, 191–205.
Fernandez, E., Bode, A., Botas, A., Anadon, R., 1991. Microplank-
ton assemblages associated with saline fronts during a spring
bloom in the central Cantabrian Sea: differences in trophic struc-
ture between water bodies. J. Plankton Res. 13, 1239–1256.
Fernandez, E., Cabal, J., Acuna, J.L., Bode, A., Botas, A., Garcıa-
Soto, C., 1993. Plankton distribution across a slope current-
induced front in the southern Bay of Biscay. J. Plankton Res.
15, 619–641.
Fiuza, A.F.G., 1984. Hidrologia e dinamica das augas costeiras
de Portugal. PhD Thesis, University of Lisbonne, Portugal,
294 pp.
Fiuza, A.F.G., Halpern, D., 1982. Hydrographic observations of the
Canary Current between 21jN and 25.5jN in March/April
1974. Rapp. P.-V. Reun.-Cons. Int. Explor. Mer 180, 58–64.
Flos, J., 1982. Produccion primaria, clorofila a y visibilidad del
disco de Secchi en el Golfo de Vizcaya. Investig. Pesq. 46,
215–230.
Fraga, F., 1981. Upwelling off the Galician coast, northwest Spain.
In: Richards, F.A. (Ed.), Coastal Upwelling. American Geo-
physical Union, Washington DC, pp. 176–182.
Fraga, F., Mourino, C., Manriquez, M., 1982. Las masas de agua en
la costa de Galicia: junio–octubre. Result. Exped. Cient. 10,
51–77.
Frouin, R., Fiuza, A.F.G., Ambar, I., Boyd, T.J., 1990. Observations
of a poleward surface current off the coast of Portugal and Spain
during winter. J. Geophys. Res. 95, 679–691.
Garcıa, A., Franco, C., Sola, A., 1992. Sardine, Sardina pilchardus
(Walb.), egg and larval distribution off the Spanish North At-
lantic coast (Galician and Cantabrian areas) in April 1987. Bol.
Inst. Esp. Oceanogr. 8 (1), 87–96.
Garcıa-Soto, C., Halliday, N.C.H., Groom, S.B., Lavın, A.,
Coombs, S.H., 1991. Satellite imagery, hydrography and plank-
ton distributions off the NW coast of Spain in April–May 1991.
ICES CM, C:17.
Glibert, P.M., 1993. The interdependence of uptake and release
of NH4+ and organic nitrogen. Mar. Microb. Food Webs 7,
53–67.
Grasshoff, K., Ehrhardt, M., Kremlin, K., 1983. Methods of Sea-
water Analysis, 2nd. ed. Verlag Chemie, Weinheim, 419 pp.
Grupo SARP, 1993. Resultados de la campana PROSARP-392:
datos basicos de hidrografıa, nutrientes disueltos y material par-
A. Bode et al. / Journal of Marine Systems 36 (2002) 197–218216
ticulado en aguas superficiales de la costa de Galicia y Mar
Cantabrico (N-NO de Espana). Inf. Tecnol. Inst. Esp. Oceanogr.
143, 1–56.
Guillard, R.T.L., Kilham, P., 1977. The ecology of marine plank-
tonic diatoms. In: Werner, D. (Ed.), The Biology of Diatoms.
Blackwell, Oxford, pp. 372–469.
Harvey, J., 1982. u–S relationship and water masses in the eastern
North Atlantic. Deep-Sea Res. 29, 1021–1033.
Haynes, R., Barton, E.D., 1990. A poleward flow along the Atlantic
coast of the Iberian Peninsula. J. Geophys. Res. 95, 11425–
11441.
Hickel, W., Mangelsdorf, P., Berg, J., 1993. The human impact in
the German bight: eutrophication during three decades (1962–
1991). Helgol. Meeresunters. 47, 243–263.
Holligan, P.M., 1987. The physical environment of exceptional
phytoplankton blooms in the northeast Atlantic. Rapp. P.-V.
Reun.-Cons. Int. Explor. Mer 187, 9–18.
ICES, 1999. Report of the Working Group on the Assessment of
mackerel, horse-mackerel, sardine and anchovy. ICES CM 1999
ACFM:6.
Lavın, A., Cabanas, J.M., Dıaz del Rıo, G., 1992a. Hydrography in
N–NW Spanish coastal waters. MPH-Saracus 0488 cruise. Bol.
Inst. Esp. Oceanogr. 8 (1), 41–55.
Lavın, A., Diaz del Rio, G., Cabanas, J.M., Carballo, R., 1992b.
SARP-area cruise. Hydrography and nutrients. Bol. Inst. Esp.
Oceanogr. 8 (1), 7–26.
Lavın, A., Valdes, L., Gil, J., Moral, M., 1998. Seasonal and inter-
annual variability in properties of surface water off Santander,
Bay of Biscay, 1991–1995. Oceanol. Acta 21, 179–190.
Lavın, A., Dıaz del Rıo, G., Casas, G., Cabanas, J.M., 2000. Aflor-
amiento en el nororeste de la Penınsula Iberica. Indices de aflor-
amiento para el punto 43jN, 11jO. Perıodo 1990–1999. Datos
Resum.-Inst. Esp. Oceanogr. 15, 1–25.
Legendre, L., 1990. The significance of microalgal blooms for fish-
eries and for the export of particulate organic carbon in oceans.
J. Plankton Res. 12, 681–699.
Lopez-Jamar, E., Coombs, S.H., Garcıa, A., Halliday, N., Knust, R.,
Nellen, W., 1995. The distribution of larvae of sardine Sardina
pilchardus (Walbaum 1972) off the north and northwestern At-
lantic coast of the Iberian Peninsula, in relation to environmental
conditions. Bol. Inst. Esp. Oceanogr. 11, 27–46.
McCarthy, J.J., Kaplan, W., Nevins, J.L., 1984. Chesapeake Bay
nutrient and plankton dynamics: 2. Sources and sinks of nitrite.
Limnol. Oceanogr. 28, 84–98.
Nielsen, T.G., Richardson, K., 1989. Food chain structure of the
North Sea plankton communities: seasonal variations of the role
of the microbial loop. Mar. Ecol. Prog. Ser. 56, 75–87.
Parrilla, G., Moron, J.M., 1971. Contribucion al estudio de la vena
de agua mediterranea en la costa occidental de la Penınsula
Iberica. Bol. Inst. Esp. Oceanogr. 145, 1–23.
Parsons, T.R., Maita, Y., Lalli, C.M., 1984. A Manual of Chemical
and Biological Methods for Seawater Analysis. Pergamon, Ox-
ford, 173 pp.
Pereiro, F.J., Fernandez, F., 1983. Relacion entre las edades y la
profundidad e ındice y areas de reclutamiento de la merluza en
Galicia y aguas adyacentes. Bol. Inst. Esp. Oceanogr. 1 (1),
45–55.
Perez, F.F., Mourino, C., Fraga, F., Rios, A.F., 1993. Displacement
of water masses and remineralization rates off the Iberian Pen-
insula by nutrient anomalies. J. Mar. Res. 51, 869–892.
Perez, F.F., Rıos, A.F., King, B.A., Pollard, R.T., 1995. Decadal
changes of the u–S relationship of the eastern North Atlantic
central water. Deep-Sea Res. 42, 1849–1864.
Perez, F.F., Pollard, R.T., Read, J.F., Valencia, V., Cabanas, J.M.,
Rıos, A.F., 2000. Climatological coupling of the thermohaline
decadal changes in central water of the eastern North Atlantic.
Sci. Mar. 64, 347–353.
Pingree, R.D., 1993. Flow of surface waters to the west of the
British Isles and in the Bay of Biscay. Deep-Sea Res. II 40,
369–388.
Pingree, R.D., 1994. Winter warming in the southern Bay of Biscay
and Lagrangian eddy kinematics from a deep-drogued Argos
Buoy. J. Mar. Biol. Assoc. U.K. 74, 107–128.
Pingree, R.D., LeCann, B., 1990. Structure, strength and season-
ality of the slope currents in the Bay of Biscay. J. Mar. Biol.
Assoc. U.K. 70, 857–885.
Pingree, R.D., LeCann, B., 1992. Three anticyclonic slope water
oceanic eddies (SWODDIES) in the southern Bay of Biscay in
1990. Deep-Sea Res. 39, 1147–1175.
Pollard, R.T., Griffiths, M.J., Cunningham, S.A., Read, J.F., Perez,
F.F., Rıos, A.F., 1996. Vivaldi 1991—a study of the formation,
circulation and ventilation of eastern North Atlantic central
water. Prog. Oceanogr. 37, 167–192.
Riemann, B., Havskum, H., Thingstadt, F., Bernard, C., 1995. The
role of mixotrophy in pelagic environments. In: Joint, I. (Ed.),
Molecular Ecology of Aquatic Microbes. Springer Verlag, Ber-
lin, pp. 87–114.
Rios, A.F., Perez, F.F., Fraga, F.F., 1992. Water masses in the upper
and middle North Atlantic Ocean east of the Azores. Deep-Sea
Res. 39, 645–658.
Robins, D.B., Varela, M., Casas, B., Halliday, N.C., 1991. Charac-
terisation of natural particulate assemblages around the northern
coast of Spain in relation to a SARP study of sardine (Sardina
pilchardus) spawning. ICES CM, L:81.
Sokal, R.R., Rohlf, F.J., 1981. Biometry, 2nd ed. Freeman, San
Francisco, 858 pp.
Sola, A., Franco, C., Lago de Lanzos, A., Motos, L., 1992. Tem-
poral evolution of Sardina pilchardus (Walb.) spawning on the
N–NW coast of the Iberian Peninsula. Bol. Inst. Esp. Oceanogr.
8, 97–114.
Tenore, K.R., Alonso-Noval, M., Alvarez-Ossorio, M., Atkinson,
L.P., Cabanas, J.M., Cal, R.M., Campos, H.J., Castillejo, F.,
Chesney, E.J., Gonzalez, N., Hanson, R.B., McClain, C.R.,
Miranda, A., Roman, M.R., Sanchez, J., Santiago, G., Valdes,
L., Varela, M., Yoder, J., 1995. Fisheries and oceanography off
Galicia, NW Spain: mesoscale spatial and temporal changes in
physical processes and resultant patterns of biological produc-
tivity. J. Geophys. Res. 100 (C6), 10943–10966.
Townsend, D.W., Cammen, L.M., Holligan, P.M., Campbell, D.E.,
Pettigrew, N.R., 1994. Causes and consequences of the varia-
bility in the timing of spring phytoplankton blooms. Deep-Sea
Res. 41, 747–765.
Treguer, P., Le Corre, P., Grall, J.R., 1979. The seasonal variations
of nutrients in the upper waters of the Bay of Biscay region and
A. Bode et al. / Journal of Marine Systems 36 (2002) 197–218 217
their relation to phytoplankton growth. Deep-Sea Res. 26,
1121–1152.
Valdes, L., Moral, M., 1998. Time-series analysis of copepod diver-
sity and species richness in the southern Bay of Biscay off
Santander, Spain, in relation to environmental conditions. ICES
J. Mar. Sci. 55, 783–792.
Varela, M., 1992a. Upwelling and phytoplankton ecology in Gali-
cian (NW Spain) rias and shelf waters. Bol. Inst. Esp. Oceanogr.
8 (1), 57–74.
Varela, M., 1992b. Distribution of phytoplankton size fractions
during the SARP area cruise (April 1987) off the Galician and
Cantabrian coasts (NW Spain). Bol. Inst. Esp. Oceanogr. 8 (1),
75–85.
Varela, M., Larranaga, A., Costas, E., Rodriguez, B., 1988. Conte-
nido estomacal de la sardina (Sardina pilchardus Walbaum) du-
rante la campana Saracus 871 en las plataformas Cantabrica y de
Galicia en febrero de 1971. Bol. Inst. Esp. Oceanogr. 5, 17–28.
Varela, M., Alvarez-Ossorio, M.T., Valdes, L., 1990. Metodo para
el estudio cuantitativo del contenido estomacal de la sardina.
Resultados preliminares. Bol. Inst. Esp. Oceanogr. 6, 117–126.
A. Bode et al. / Journal of Marine Systems 36 (2002) 197–218218
Copyright © 2022 FDOKUMEN