Nutrient Enrichment and Its Effects on the Phytoplankton ...
451
Nutrient Enrichment and Its Effects on the Phytoplankton Populations of the Standing Freshwaters of the Shetland Islands A thesis submitted for the degree of Doctor of Philosophy Faculty of Science Mary Margaret Hennessy Department of Botany and Department of Chemistry University of Glasgow, Glasgow, U.K. December 1995 ° Mary Margaret Hennessy 15195
-
Upload
khangminh22 -
Category
Documents
-
view
0 -
download
0
Transcript of Nutrient Enrichment and Its Effects on the Phytoplankton ...

Nutrient Enrichment and Its Effects on the Phytoplankton Populations of the
Standing Freshwaters of the Shetland Islands
A thesis submitted for the degree of Doctor of Philosophy Faculty of Science
Mary Margaret Hennessy
Department of Botany and Department of Chemistry University of Glasgow, Glasgow, U.K.
December 1995
° Mary Margaret Hennessy 15195

ProQuest Number: 13818418
All rights reserved
INFORMATION TO ALL USERS The quality of this reproduction is dependent upon the quality of the copy submitted.
In the unlikely event that the author did not send a com p le te manuscript and there are missing pages, these will be noted. Also, if material had to be removed,
a note will indicate the deletion.
uestProQuest 13818418
Published by ProQuest LLC(2018). Copyright of the Dissertation is held by the Author.
All rights reserved.This work is protected against unauthorized copying under Title 17, United States C ode
Microform Edition © ProQuest LLC.
ProQuest LLC.789 East Eisenhower Parkway
P.O. Box 1346 Ann Arbor, Ml 48106- 1346

l o wC
t )
GLASGOWUNIVERSITYlibr a ry

DEDICATION
This work is dedicated to my mother
Winifred Hennessy (McQueen)
(1926-1978)
and to my friend
Lorraine Wilson
(1967-1994)

ABSTRACT
During the period 1989-1990, phytoplankton blooms were observed in three lochs on
Mainland Shetland. Land improvement procedures were taking place in each of the
three drainage basins involved. The standing freshwaters of the Shetland Islands
constitute a limited resource, having amenity value in terms of brown trout fishing,
potable water supply and nature conservation. There was therefore concern that
deterioration in water quality might be occurring as a result of fertiliser usage within
loch catchment areas. In order to investigate this hypothesis, studies of current water
quality, phytoplankton and macrophyte community structure, soil and sediment
characteristics were undertaken.
Of the thirty one lochs examined, only six were oligotrophic in nature. This indicated
that twenty five lochs were at risk of developing excessive algal growth, as once total
phosphorus levels exceed 10 /tg P L'1, this becomes increasingly likely. In addition,
monitoring of loch inflow waters of five drainage basins indicated that in catchment
areas incorporating improved grassland, cattle/dairy farming and septic tanks, P
concentrations were higher than those of both the receiving waters and the inflows in
other watersheds with little anthropogenic influence.
Examination of data collected from thirty one lochs on phytoplankton taxa and
numbers, combined with information on environmental parameters measured,
indicated that certain phytoplankton were associated with particular water column
conditions. Green algae were advantaged where enriched waters were relatively high
in total phosphorus (TP) and total ammoniacal nitrogen (TAN). Of the blue green
algae, Anabaena was found to be successful at the highest concentrations of TP and
TAN, in association with low total oxidised nitrogen (TON) levels.
Macrophyte community structure was not found to be a useful means to characterise
water column trophic status in the sites investigated. Examination of the macrophyte
communities was not therefore used in assessing the susceptibility of waters to
development of high phytoplankton biomass. This lack of explanation was partly due
to the direct influence of sediment quality on macrophyte community structure. Many
sediments represent an accessible nutrient source, whilst other types of bottom deposit
i

may either retain low levels of available nutrients, or inhibit macrophyte colonisation.
The types of macrophyte which tend to grow in oligotrophic water bodies have little
effect on nutrient cycling, whereas those associated with nutrient rich waters may act
as nutrient "pumps" from sediment to water column.
P adsorption tests indicated that soils with an organic content of >80% were likely
to retain little of the P added to them. Low soil pH (pH <4.00) also had a
deleterious effect on P retention capacity. P adsorption tests with sediment from four
lochs indicated that P retention within the upper 5 cm was related to organic content
and magnitude of previous P additions. Soils and sediments rich in Ca, Mg or Fe and
low in organic content retain a higher proportion of the P applied to them, than those
poor in cations and high in organic matter. The more organic soils and sediments also
release P which has been added to them previously.
After considering the literature on ameliorative measures in enriched loch systems,
it was concluded that implementation of appropriate catchment management
procedures in order to prevent development of nutrient enrichment difficulties was a
more appropriate approach than attempting to improve water quality after enrichment
has occurred. Using an established model, existing P loadings from five drainage
basins were estimated. In the watershed with the highest proportion of the catchment
undergoing pasture improvement, P export coefficients were found to be greatest.
The combined data from inflow water quality, soil and sediment nutrient retention and
estimates of nutrient runoff indicate that the freshwaters of Shetland are clearly
susceptible to enrichment. The deleterious effects which result are those of excessive
phytoplankton growth. In order to prevent further deterioration of water quality,
caution must be exercised in the management of both point and non-point nutrient
discharges in the future.

TABLE OF CONTENTS
ABSTRACT................................................................................................................. i
TABLE OF CONTENTS..................................................................................... iii
LIST OF FIGURES . ........................................................................................ xix
LIST OF TABLES........................................................................................... xxiii
ACKNOWLEDGMENTS.............................. xxviii
CHAPTER Is GENERAL INTRODUCTION................................................. 1
1.1 IN TRO D U CTIO N ........................................................................ 1
1.1.1 Physical processes influencing in development of primaryproduction in freshwater lakes .................................. ................ 1
1.1.1.1 Formation of lakes ........................................................................ 1
1.1.1.2 Light in lak es ................................................................................... 2
1.1.1.3 Distribution of heat energy in lakes ............................................. 2
1.1.1.4 E f f e c t s o f p h y s i c a l f a c t o r s on p l a n tgrow th.............................................................................................. 3
1.1.2 Nutrients of major importance to aquatic plant grow th ............... 4
1.1.2.1 S ilicon.............................................................................................. 4
1.1.2.2 Carbon.............................................................................................. 5
1.1.2.3 Nitrogen........................................................................................... 6
1.1.2.4 Phosphorus...................................................................................... 7
1.1.3 P l a n t c o m m u n i t i e s i n t e m p e r a t e l a k esystems ........................................................................................... 7
1.1.3.1 Phytoplankton growth and succession in freshwater lakes . . . . 7
1.1.3.2 Macrophyte zonation in freshwater la k e s .................................... 8
1.1.4 N u t r i e n t e n r i c h m e n t i n s t a n d i n gfreshwaters ..................................................................................... 9

1.1.5 The freshwater resources of the Shetland I s la n d s ......................
1.1.5.1 Water quality problems in the Shetland Islands ................
1.1.5.2 Land use in S hetland .....................................................................
1.1.5.2.1 Reseeding procedures.....................................................................
1.1.6 Problems of algal blooms for water supply authorities...............
1.1.7 Control of water quality in Scottish standing ffeshwaters
1.1.8 Project aims ..................................................................................
1.1.8.1 Catchments chosen for study ......................................................
CHAPTER 2: LIMNOLOGY AND WATER QUALITY OF SHETLAND FRESHWATER LOCHS .......................................................................
2.1 INTRODUCTION ......................................... ........................
2.1.1 Chemical status of Shetland waters..............................................
2.1.2 A im s ................................................................................................
2.2 MATERIALS AND METHODS ..............................................
2.2.1 Field procedures............................................................................
2.2.2 Treatment and storage of samples ..............................................
2.2.3 Laboratory measurement of environmental param eters.............
2.2.3.1 A lkalinity ........................................................................................
2.2.3.2 Phosphorus.....................................................................................
2.2.3.3 Nitrogen...........................................................................................
2.2.3.4 Calcium and magnesium ....................................... .......................
2.2.3.5 Sodium and potassium ..................................................................
2.2.3.6 C o lou r..............................................................................................
2.2.3.7 Chlorophyll a ....................
2.2.3.8. Presentation of survey data

2.3 RESULTS ...............................................................................
2.3.1 Water chemistry and physical characteristics of Shetland lochsin 1991 ....................................................................................
2.3.1.1 Dissolved oxygen concentration and temperature ................
2.3.1.2 Light attenuation......................................................................
2.3.1.3 p H .............................................................................................
2.3.1.4 Conductivity ............................................................................
2.3.1.5.1 Total phosphorus ....................................................................
2.3.1.5.2 Total dissolved phosphorus ...................................................
2.3.1.5.3 Dissolved reactive phosphorus ...............................................
2.3.1.6.1 Total oxidised nitrogen............................................................
2.3.1.6.2 Total ammoniacal nitrogen ...................................................
2.3.1.7.1 C alcium .....................................................................................
2.3.1.7.2 M agnesium................................................................................
2.3.1.7.3 Sodium .....................................................................................
2.3.1.7.4 Potassium..................................................................................
2.3.1.8 C olour........................................................................................
2.3.1.9 Chlorophyll a . . . . ..................................................................
2.3.2 Water chemistry and physical characteristics of the fiveShetland lochs studied in 1992 and 1993 ..............................
2.3.2.1 Bathymetry of the five study lochs of 1992 and 1993 ............
2.3.2.2 Dissolved oxygen and temperature profiles in the five studylrt/'lic / I n r in n 1 QQO 1 QQ^lu v iu u u i in g l y C U I U
2.3.2.3 pH, conductivity and alkalinity of waters in 1992 ................. ..
2.3.2.4 Phosphorus and chlorophyll a concentrations of lochs and theirinflows in 1992 ......................................................................
2.3.2.4.1 Loch of Gonflrth.......................................................................
35
35
35
37
37
40
40
43
43
43
47
47
50
50
50
54
54
54
56
56
62
64
64
v

2.3.2.4.2 Loch of Gonfirth inflow w aters....................................... 64
2.3.2.4.3 Helliers W a te r ....................................................................... 70
2.3.2.4.4 Helliers Water inflow waters ....................................................... 73
2.3.2.4.5 Loch of Tingwall ...............................................................................73
2.3.2.4.6 Loch of Tingwall inflow waters.................................................... 73
2.3.2.4.7 Sandy L o c h .........................................................................................76
2.3.2.4.8 Sandy Loch inflow w a te rs ............................................................. 76
2.3.2.4.9 Turdale W a te r ................................................................................... 79
2.3.2.4.10 Turdale Water inflow waters ....................................................... 79
2.3.2.5 pH, conductivity and alkalinity in the five study lochs in1993 .............................................................................................. 82
2.3.2.6 Phosphorus and chlorophyll a concentrations of lochs and theirinflows in 1993 ............................................................................ 84
2.3.2.6.1 Loch of Gonfirth............................................................................ 84
2.3.2.6.2 Loch of Gonfirth inflow w aters.................................................... 84
2.3.2.6.3 Helliers W a te r ................................................................................... 90
2.3.2.6.4 Helliers Water inflow samples ..................................................... 93
2.3.2.6.5 Loch of Tingwall................................................................................93
2.3.2.6.6 Loch of Tingwall inflow waters.................................................... 93
2.3.2.6.7 Sandy L o c h .........................................................................................96
2.3.2.6.8 Sandy Loch inflow w a te rs ............................................................. 96
2.3.2.6.9 Turdale W a te r ................................................................................... 99
2.3.2.6.10 Turdale Water inflow waters ....................................................... 99
2.4 DISCUSSION................................................................................... 99
2.4.1 The suitability of the techniques used in water analysis ............ 99
2.4.1.1 Filtration of water samples............................................................. 99
vi
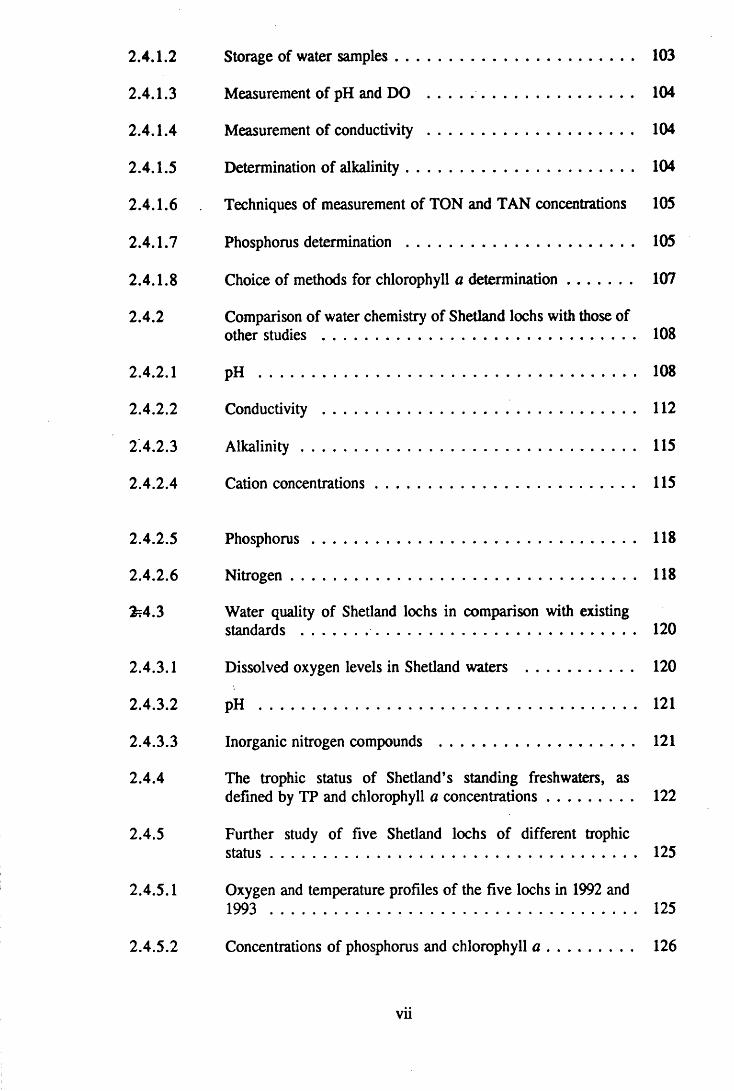
103
104
104
104
105
105
107
108
108
112
115
115
118
118
120
120
121
121
122
125
125
126
2.4.1.2
2.4.1.3
2.4.1.4
2.4.1.5
2.4.1.6
2.4.1.7
2.4.1.8
2.4.2
2.4.2.1
2.4.2.2
2.4.2.3
2.4.2.4
2.4.2.5
2.4.2.6
£4 .3
2.4.3.1
2.4.3.2
2.4.3.3
2.4.4
2.4.5
2.4.5.1
2.4.5.2
Storage of water samples.........................................................
Measurement of pH and DO ........... .......................................
Measurement of conductivity ...................................................
Determination of alkalinity......................................................
Techniques of measurement of TON and TAN concentrations
Phosphorus determination ......................................................
Choice of methods for chlorophyll a determination................
Comparison of water chemistry of Shetland lochs with those of other studies ...........................................................................
pH ...........................................................................................
Conductivity ...........................................................................
Alkalinity.................................................................................
Cation concentrations..............................................................
Phosphorus..............................................................................
Nitrogen...................................................................................
Water quality of Shetland lochs in comparison with existing standards ................ ................................................................
Dissolved oxygen levels in Shetland waters ..........................
PH ............................................................................................
Inorganic nitrogen compounds ..............................................
The trophic status of Shetland’s standing freshwalers, as defined by TP and chlorophyll a concentrations.....................
Further study of five Shetland lochs of different trophic sta tus.........................................................................................
Oxygen and temperature profiles of the five lochs in 1992 and 1993 .........................................................................................
Concentrations of phosphorus and chlorophyll a .....................
vii

2.5 CONCLUSIONS......................................................................... 129
CHAPTER 3: SHETLAND LOCH SEDIMENTS AS A STORE AND SOURCE OF PHOSPHORUS .......................................................................................... 131
3.1 INTRODUCTION ...................................................................... 131
3.1.1 Sediment as a nutrient sink and store ........................................ 131
3.1.1.1 Forms of P present in sediment................................................... 132
3.1.2 Release of nutrients within lake sediments ................................ 134
3.1.2.1 Redox potential (Eh) ................................................................... 134
3.1.2.2 pH effects...................................................................................... 135
3.1.3 Release of sediment P to the water column................................ 136
3.1.3.1 Factors influencing P release to an oxygenated water column . 136
3.1.3.1.1 Effect of nitrate on sediment DRP release ................................ 137
3.1.3.1.2 Effects of Fe:P ratio on P release ............................................. 138
3.1.3.1.3 Biological influences on sediment P dynamics.......................... 139
3.1.4 Availability of P released from lake sediments........................... 140
3.1.5 A im s.............................................................................................. 141
3.2 MATERIALS AND METHODS ............................................. 142
3.2.1 Determination of sediment characteristics................................... 142
3.2.1.1 Measurement of redox potential (Eh) ........................................ 142
3.2.1.2 Bulk density and organic conten t................................................ 143
3.2.1.3 Analysis of sediment %P, %N and %C content....................... 143
3.2.1.4 Data analysis................................................................................ 145
3.2.2 P adsorption capacity of sediments in study lo ch s..................... 145
3.3 RESULTS ................................................................................... 146
3.3.1 Characteristics of the sediments from the five study lochs . . . 146

3.3.1.1 Loch of Gonfirth........................................................................... 146
3.3.1.2 Helliers W a te r ............................................................................. 155
3.3.1.3 Loch of Tingwall North ............................................................. 156
3.3.1.4 Loch of Tingwall South ................... 157
3.3.1.5 Turdale W a te r ............................................................................. 158
3.3.1.6 Sandy L o c h ............................................................................. 160
3.3.2 Characteristics of loch sediment collected in 1993 .................. 160
3.3.2.1 Loch of Gonfirth........................................................................... 160
3.3.2.2 Helliers W a te r ............................................................................. 160
3.3.2.3 Loch of Tingwall ........................................................................ 161
3.3.2.4 Turdale W a te r ............................................................................. 162
3.4 DISCUSSION............................................................................. 162
3.4.1 Relevance of sedimentary P determination technique................ 162
3.4.2 Characteristics of sediments in the five water b od ies ............... 163
3.4.3 P adsorption tests with sediment sam ples.................................. 166
3.5 CONCLUSIONS .................................................................... . 168
CHAPTER 4: PHYTOPLANKTON IN SHETLAND LOCHS ................. 171
4.1 INTRODUCTION ..................................................................... 171
4.1.1 Phytoplankton blooms.................................................................. 171
4.1.2 Phytoplankton of freshwater lochs in Shetland.......................... 173
4.1.3 A im s.............................................................................................. 175
4.2. MATERIALS AND METHODS ...................... 175
4.2.1 Chlorophyll a ................................................................................ 175
4.2.2 Phytoplankton populations.......................................................... 175
4.2.3 Data analysis of 1991 phytoplankton num bers......................... 177
ix

4.3 RESULTS ................................................................................... 179
4.3.1 Chlorophyll a ................................................................................ 179
4.3.2 Phytoplankton distribution with respect to environmentalparameters .................................................................................. 179
4.3.2.1 Summary of CCA characteristics ............................... 179
4.3.2.2 Positioning of phytoplankton data along CCA environmentalgradients................................................. 190
4.3.2.2.1 Summary of information on TP, TAN and TON and differentalgal groups.................................................................................. 192
4.3.2.2.2 Inferred rankings of phytoplankton on pH, Ca and Mgconcentration gradients............................................................... 192
4.3.2.3 Positioning of lochs along CCA environmental gradients . . . 194
4.3.3 Changes in numbers of the main phytoplankton taxa in the fivewater bodies chosen for further s tu d y ...................................... 197
4.3.3.1 Loch of Gonfirth........................................................................... 197
4.3.3.1.1 1991 .............................................................................................. 197
4.3.3.1.1.1 Chrysophytes, cryptophytes and diatoms .................................. 197
4.3.3.1.1.2 Green and blue-green a lg a e ....................................................... 198
4.3.3.1.2 1992 .......................................................... 198
4.3.3.1.2.1 Chrysophytes, cryptophytes and diatoms .................................. 198
4.3.3.1.2.2 Green and blue-green a lg a e ........................................................ 201
4.3.3.1.3 1993 .............................................................................................. 201
4.3.3.1.3.1 Chrysophytes, cryptophytes and diatoms .................................. 201
4.3.3.1.3.2 Green and blue-green algae ....................................................... 203
4.3.3.2 Helliers W a te r .............................................................................. 203
4.3.3.2.1 1991 .............................................................................................. 203
4.3.3.2.1.1 Chrysophytes, cryptophytes and diatoms .................................. 203
4.3.3.2.1.2 Dinoflagellates.............................................................................. 204
x

4.3.3.2.1.3 Green and blue-green a lg a e ........................................................ 204
4.3.3.2.2 1992 .......................................................................................... . 204
4.3.3.2.2.1 Chrysophytes, cryptophytes and d ia to m s.................................. 207
4.3.3.2.2.2 Dinoflagellates.............................................................................. 207
4.3.3.2.2.3 Green and blue-green a lg a e ........................................................ 207
4.3.3.2.3 1993 ....................... 207
4.3.3.2.3.1 Chrysophytes, cryptophytes and d ia to m s.................................. 208
4.3.3.2.3.2 Dinoflagellates.............................................................................. 208
4.3.3.2.3.3 Green and blue-green a lg a e ........................................................ 208
4.3.3.3 Loch of Tingwall ........................................................................ 210
4.3.3.3.1 1991 ............................................................. 210
4.3.3.3.1.1 Chrysophytes, cryptophytes and diatoms .................................. 210
4.3.3.3.1.2 Green and blue-green a lg a e ........................................................ 210
4.3.3.3.2 North Basin, 1992 ........................................................................ 212
4.3.3.3.2.1 Chrysophytes, cryptophytes and d ia to m s.................................. 212
4.3.3.3.2.2 Green and blue-green a lg a e ........................................................ 212
4.3.3.3.3 North Basin, 1993 ........................................................................ 214
4.3.3.3.3.1 Chrysophytes, cryptophytes and d ia to m s.................................. 214
4.3.3.3.3.2 Green and blue-green a lg a e ........................................................ 214
4.3.3.3.4 South Basin, 1992 ........................................................................ 216
4.3.3.3.4.1 Chrysophytes, cryptophytes and diatoms .................................. 216
4.3.3.3.4.2 Dinoflagellates.............................................................................. 216
4.3.3.3.4.3 Green and blue-green a lg a e ........................................................ 216
4.3.3.3.5 South Basin, 1993 ........................................................................ 218
4.3.3.3.5.1 Chrysophytes, cryptophytes and diatoms .................................. 218
xi

4.3.3.3.5.2 Dinoflagellates............................................................................. 218
4.3.3.3.5.3 Green and blue-green a lg a e .................... 218
4.3.3.4 Sandy L o c h ................................................................................... 220
4.3.3.4.1 1991 .............................................................................................. 220
4.3.3.4.1.1 Chrysophytes, cryptophytes and diatoms . ............................. 220
4.3.3.4.1.2 Green and blue-green a lg a e ....................................................... 220
4.3.3.4.2 1992 .............................................................................................. 221
4.3.3.4.2.1 Chrysophytes, cryptophytes and d ia to m s.................................. 221
4.3.3.4.2.2 Green and blue-green a lg a e ....................................................... 221
4.3.3.4.3 1993 .............................................................................................. 224
4.3.3.4.3.1 Chrysophytes, cryptophytes and diatoms .................................. 224
4.3.3.4.3.2 Green and blue-green a lg a e ....................................................... 224
4.3.3.5 Turdale W a te r ............................................................................. 224
4.3.3.5.1 1991 .............................................................................................. 224
4.3.3.5.1.1 Chrysophytes, cryptophytes and diatoms .................................. 227
4.3.3.5.1.2 Green and blue-green a lg a e ....................................................... 227
4.3.3.5.2 1992 .............................................................................................. 227
4.3.3.5.2.1 Chrysophytes, cryptophytes and d ia to m s ..................... 227
4.3.3.5.2.2 Green and blue-green a lg a e ....................................................... 229
4.3.3.5.3 1993 .............................................................................................. 229
4.3.3.5.3.1 Chrysophytes, cryptophytes and diatoms .................................. 231
4.3.3.5.3.2 Dinoflagellates............................................................................. 231
4.3.3.5.3.3 Green and blue-green a lg a e ........................................................ 231
4.4 DISCUSSION............................................................................. 232
4.4.1 Disadvantages of algological techniques used in examination ofloch phytoplankton assemblages .............................................. 232
xii

4.4.2 Interpretation of the CCA results............................................... 233
4.4.3 Phytoplankton occurrence in relation to environmental factors 234
4.4.4 Physical, chemical and biological effects on phytoplanktonpopulations and b io m ass........................................................... 235
4.4.4.1 Specific growth requirements................................................... 235
4.4.4.1.1 Availability of phosphorus to phytoplankton........................... 236
4.4.4.1.2 Phytoplankton strategies for fulfilling nitrogen requirements . 239
4.4.4.1.3 Other chemical determinands of phytoplankton growth........... 241
4.4.4.2 Physical influences on phytoplankton dominance ................... 243
4.4.4.2.1 Light climate of the water co lum n........................................... 243
4.4.4.2.2 Water column turbulence........................................................... 244
4.4.4.2.3 Temperature of the water column ........................................... 246
4.4.5 Changes in phytoplankton community structure of the five study lochs over t im e ................................................................. 247
4.5 CONCLUSIONS...................................................................... 253
CHAPTER 5: AQUATIC MACROPHYTES OF SHETLAND LOCHS . 255
5.1 INTRODUCTION ................................................................... 255
5.1.1 A im s ............................................................................................ 261
5.2 MATERIALS AND METHODS ........................................... 261
5.2.1 Construction of macrophyte species lists ................................ 261
5.2.2 Estimation of macrophyte biom ass........................................... 262
< O 'l TWINSPAN analysis of macrophyte d a ta ................................ ZDZ
5.3 RESULTS ................................................................................. 263
5.3.1 Macrophyte species found in Shetland lo c h s ........................... 263
5.3.2 Estimates of macrophyte biomass in Shetland lochs................ 263
5.3.3 TWINSPAN classification of Shetland lo c h s ...........................
xiii
269

5.3.3.1 Comparisons of TWINSPAN G ro u p s ....................................... 269
5.4 DISCUSSION................................................. 274
5.4.1 Macrophyte species present in Shetland lochs compared withthose of other studies.................................................................. 274
5.4.2 Parameters affecting macrophyte growth in Shetland Lochs . . 275
5.4.2.1 pH, Carbon, Calcium and Magnesium....................................... 275
5.4.2.2 Light penetration.......................................................................... 278
5.4.2.3 Sources of nitrogen and phosphorus for plant growth............... 279
5.4.3 Factors influencing macrophyte or phytoplankton dominance oflake systems ............................................................................... 281
5.4.4 Classification of lochs incorporating macrophyte communities 286
5.4.5 Importance of macrophyte vegetation in freshwater lakes . . . 288
5.5 CONCLUSIONS....................................................................... 293
xiv
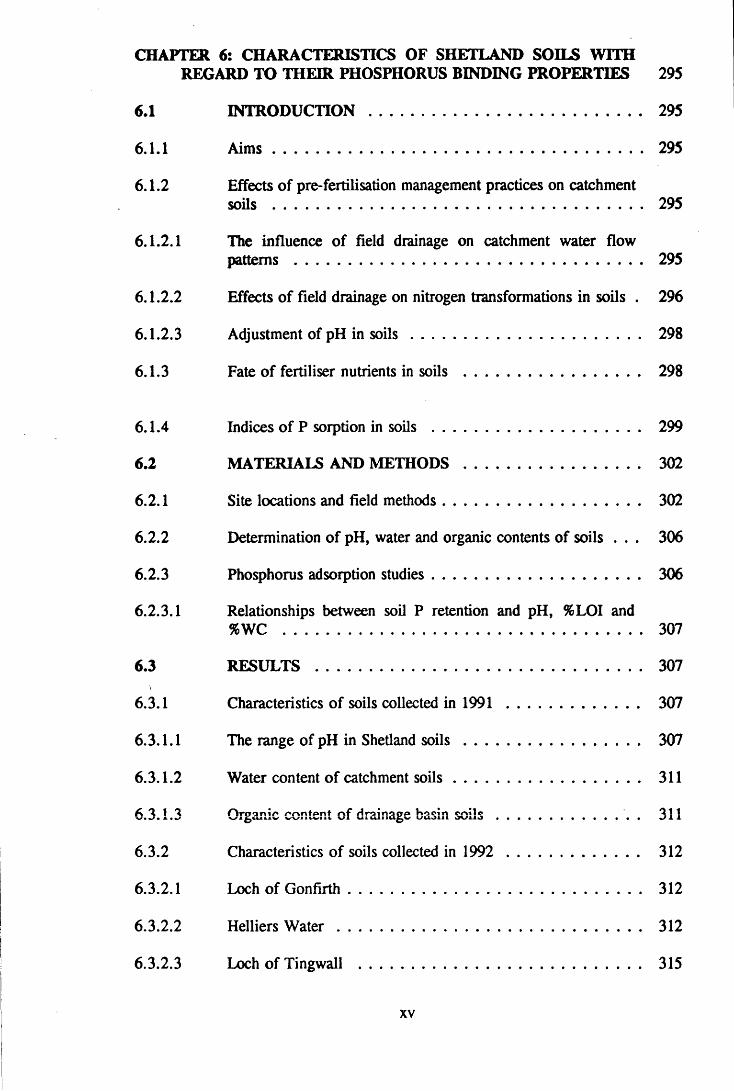
CHAPTER 6: CHARACTERISTICS OF SHETLAND SOILS WITHREGARD TO THEIR PHOSPHORUS BINDING PROPERTIES 295
6.1 INTROD UCTIO N ..................................................................... 295
6.1.1 A im s .............................................................................................. 295
6.1.2 Effects of pre-fertilisation management practices on catchmentsoils .............................................................................. 295
6.1.2.1 The influence of field drainage on catchment water flowpatterns ....................................................................................... 295
6.1.2.2 Effects of field drainage on nitrogen transformations in soils . 296
6.1.2.3 Adjustment of pH in s o i l s .......................................................... 298
6.1.3 Fate of fertiliser nutrients in soils ............................................. 298
6.1.4 Indices of P sorption in soils ..................................................... 299
6.2 MATERIALS AND METHODS ............................................. 302
6.2.1 Site locations and field methods.................................................. 302
6.2.2 Determination of pH, water and organic contents of soils . . . 306
6.2.3 Phosphorus adsorption studies..................................................... 306
6.2.3.1 Relationships between soil P retention and pH, %LOI and%WC .......................................................................................... 307
6.3 RESULTS .................................................................................. 307
6.3.1 Characteristics of soils collected in 1991 ................................ 307
6.3.1.1 The range of pH in Shetland s o i l s ...................................... 307
6.3.1.2 Water content of catchment so ils ............................................... 311
6.3.1.3 Organic content of drainage basin s o i l s ................................ . 311
6.3.2 Characteristics of soils collected in 1992 ................................ 312
6.3.2.1 Loch of Gonfirth.......................................................................... 312
6.3.2.2 Helliers W a te r ............................................................................. 312
6.3.2.3 Loch of Tingwall ....................................................................... 315
xv

6.3.2.4 Sandy Loch ....................................................................... 315
6.3.2.5 Turdale W a te r ................................................................. 315
6.3.3 Soil phosphorus adsorption isotherms of test samples from each of the five survey watersheds.................................................... 316
6.3.4 Phosphorus retention capacity of soils collected in 1992 318
6.3.4.1 Loch of Gonfirth.............................................................. 318
6.3.4.2 Helliers W a te r ................................................................. 318
6.3.4.3 Loch of Tingwall ............................................................ 318
6.3.4.4 Sandy Loch ....................................................................... 321
6.3.4.5 Turdale W a te r ................................................................. 321
6.3.5 Relationships of soil pH, %WC and %LOI with phosphorus adsorption capacity ......................................
soil321
6.4 DISCUSSION................................................................. 323
6.4.1 Relevance of field and laboratory procedures of characterisation.................................................................
soil323
6.4.1.1 Measurement of %WC, %LOI and p H ........................ 323
6.4.1.2 Applicability of a laboratory based approach to estimation of soil fertiliser nutrient lo sse s ...................................................... 324
6.4.1.3 Suitability of experimental P solution concentrations . . 325
6.4.2 Water soluble P in soils ................................................. 326
6.4.3 Factors influencing P sorption capacity of s o i l s ........... 326
6.4.3.1
« A 1 0
Effect of previous fertiliser applications on P adsorption . . . 326
0^0
6.4.3.3 Effects of magnitude of P addition on soil P uptake . .
J^O
329
6.4.3.4 Mechanisms of phosphorus binding in soils ................ 329
6.5 CONCLUSIONS............................................................ 336
xvi

CHAPTER 7: CONSIDERATION OF THE OPTIONS FORCATCHMENT MANAGEMENT IN SH ET L A N D ......................... 338
7.1 INTRODUCTION ...................................................................... 338
7.1.1 Methods of controlling blue-green algae ................................... 338
7.1.2 Prevention of nutrient enrichment through control of inputs . . 339
7.1.3 Modelling the effects of nutrient enrichment............................. 339
7.1.3.1 Dynamic m odels............................................. 339
7.1.3.2 Empirical models ......................................................................... 341
7.1.4 Control of nutrients within freshwater lake systems.................. 342
7.1.4.1 Removal of nutrients ................................................................... 342
7.1.4.2 Nutrient manipulation within the water column ........................ 344
7.1.5 Alleviation of the symptoms of nutrient enrichment.................. 345
7.1.6 Manipulation of physical aspects of standing waters ............... 345
7.1.7 Chemical destruction of phytoplankton ..................................... 346
7.1.8 Biological control of cyanophyte problem s................................ 346
7.1.8.1 The use of barley straw in reduction of algal b iom ass 348
7.2 MATERIALS AND METHODS ....................... 350
7.2.1 The use of the Dillon and Rigler (1974a) approach.................. 350
7.2.2 P-chlorophyll a relationships ...................................................... 353
7.3 RESULTS ................................................................................... 353
7.3.1 The use of a modelling approach for management of lochcatchment areas: estimation of loadings of P to the five watert v v l i o c olA I .WVU1VJ iivuuivu . . . . . . . . . . . . . . . . . . . . . . . . . . . . . J
COJ J J
7.3.2 TP-chlorophyll a relationships .................................................. 362
7.4 DISCUSSION............................................................................. 362
7.4.1 The modelling approach in catchment areas of Shetland lochs 362
7.4.1.1 Estimation of water loss through evaporation .......................... 362
xvii

7.4.1.2 Limitations associated with use of the m odels.................... 364
7.4.2 Implications of the results for catchment management of thefive sites....................................................................................... 369
7.4.3 Comparison of water management in the present study withother reported examples ............................................................ 373
7.4.4 Reduction of P losses to loch system s................................. 374
7.4.4.1 Good agricultural p rac tice ........................................................... 374
7.4.4.2 Soil assessment.............................................................................. 375
7.4.4.3 Future options for land and runoff management procedures . . 375
7.5 CONCLUSIONS ........................................................................ 377
CHAPTER 8: CONCLUSIONS....................................................................... 378
8.1 Thesis a im s ............................................................................... ... 378
8.2 Thesis conclusions ...................................................................... 379
BIBLIOGRAPHY ............................................................................................. 385
xviii

LIST OF FIGURES
CHAPTER Is GENERAL INTRODUCTION
Figure 1.1 Map of Shetland Islands and locationsof study lochs 1991-1993 ............................................................... 23
CHAPTER 2: LIMNOLOGY AND WATER QUALITY OF SHETLANDFRESHWATER LOCHS
Figure 2.1 Mean summer total phosphorus levels in the thirty one Shetlandlochs studied in 1991 ( n = 3 ) ......................................................... 42
Figure 2.2 Mean summer total dissolved phosphorus levels in the thirtyone Shetland lochs studied in 1991 (n=3) ................................... 44
Figure 2.3 Mean summer total ammonical nitrogen levels in the thirty oneShetland lochs studied in 1991 ( n = 3 ) ........................................... 48
Figure 2.4 Mean summer calcium levels in the thirty one Shetland lochsstudied in 1991 (n=3) ................................................................. 49
Figure 2.5 Mean summer magnesium levels in the thirty one Shetlandlochs studied in 1991 (n= 3 ) ......................................................... 51
Figure 2.6 Mean summer sodium levels in the thirty one Shetland lochsstudied in 1991 (n=3) ................................................................. 52
Figure 2.7 Mean summer potassium levels in the thirty one Shetland lochsstudied in 1991 (n=3) ................................................................. 53
Figure 2.8 Mean summer chlorophyll a levels in the thirty one Shetlandlochs studied in 1991 (n = 3 ) ............................................. 55
Figure 2.9 Bathymetric maps of Loch of Gonfirth, Helliers and TurdaleWater ................................................................................................57
Figure 2.10 Bathymetric maps of Loch of Tingwall and Sandy L o ch 58
Figure 2.11 Phosphorus levels in Loch of Gonfirth, 1992 sampling season(n = 15)................................................................................................65
Figure 2.12 Chlorophyll a levels in Loch of Gonfirth, 1992 sampling season(n = 15)................................................................................................66
Figure 2.13 Phosphorus levels in Helliers Water, 1992 sampling season(n=3) ................................................................................................71
xix

Figure 2.14 Chlorophyll a levels in Helliers Water, 1992 sampling season(n=3) ............................. 72
Figure 2.15 Phosphorus levels in Loch of Tingwall, 1992 sampling season(n=15) .............................................................................................74
Figure 2.16 Chlorophyll a levels in Loch of Tingwall, 1992 samplingseason ( n = 1 5 ) .................................................................................. 75
Figure 2.17 Phosphorus levels in Sandy Loch, 1992 sampling season(n=8) ............................................................................................... 77
Figure 2.18 Chlorophyll a levels in Sandy Loch, 1992 sampling season(n=8) ............................................................................................... 78
Figure 2.19 Phosphorus levels in Turdale Water, 1992 sampling season(n=3) ................................................................................................80
Figure 2.20 Chlorophyll a levels in Turdale Water, 1992 sampling season(n=3) ................................................................................................81
Figure 2.21 Phosphorus levels in Loch of Gonfirth, 1993 sampling season(n=6) ................................................................................................85
Figure 2.22 Chlorophyll a levels in Loch of Gonfirth, 1993 sampling season(n=6) ................................................................................................86
Figure 2.23 Phosphorus levels in Helliers Water, 1993 sampling season(n=3) ............................................................................................... 91
Figure 2.24 Chlorophyll a levels in Helliers Water, 1993 sampling season(n=3) ................................................................................. 92
Figure 2.25 Phosphorus levels in Loch of Tingwall, 1993 sampling season(n = 10)............................................ * ................................................94
Figure 2.26 Chlorophyll a levels in Loch of Tingwall, 1993 samplingseason (n = 1 0 ) .................................................................................. 95
Figure 2.27 Phosphorus levels in Sandy Loch, 1993 sampling season(n=3) ............................................................................................... 97
Figure 2.28 Chlorophyll a levels in Sandy Loch, 1993 sampling season(n=3) ............................................................................................... 98
Figure 2.29 Phosphorus levels in Turdale Water, 1993 sampling season(n=3) ......................................................................................... 100
Figure 2.30 Chlorophyll a levels in Turdale Water, 1993 sampling season(n=3) ......................................................................................... 101
xx

CHAPTER 3: SHETLAND LOCH SEDIMENTS AS A STORE AND SOURCE OF PHOSPHORUS
Figure 3.1 Locations of sediment sampling sites in the five study lochs . 144
Figure 3.2 Bulk density profiles of sediments from the five loch coringsites of 1992 .............................................................................. 147
Figure 3.3 Percentage, loss on ignition profiles of sediments from the fiveloch coring sites of 1992 ........................................................... 148
Figure 3.4 Percentage carbon content profiles of sediments from the fiveloch coring sites of 1992 ........................................................... 149
Figure 3.5 Percentage nitrogen content profiles of sediments from the fiveloch coring sites of 1992 ........................................................... 150
Figure 3.6 Percentage phosphorus content profiles of sediments from thefive loch coring sites of 1992 ................................................... 151
Figure 3.7 Redox potential profiles of sediments from the five loch coringsites of 1992 .............................................................................. 152
CHAPTER 4: PHYTOPLANKTON IN SHETLAND LOCHS
Figure 4.1a CCA biplot of phytoplankton distribution along environmentalgradients...................................................................................... 183
Figure 4.1b Detail of Figure 4 .1 a ................................................................. 184
Figure 4.2a CCA biplot of loch sites along environmental gradients . . . . 187
Figure 4.2b Detail of Figure 4 .2 a ........................................ 188
Figure 4.3 Changes in numbers of the main phytoplankton taxa in Loch ofGonfirth during summer, 1991 ................................................. 199
Figure 4.4 Changes in numbers of the main phytoplankton taxa in Loch ofGonfirth during the 1992 sampling season .............................. 200
Figure 4.5 Changes in numbers of the main phytoplankton taxa in Loch ofGonfirth during the 1993 sampling season .............................. 202
Figure 4.6 Changes in numbers of the main phytoplankton taxa in HelliersWater during summer, 1991 ...................................................... 205
Figure 4.7 Changes in numbers of the main phytoplankton taxa in HelliersWater during the 1992 sampling season................................... 206
xxi

Figure 4.8 Changes in numbers of the main phytoplankton taxa in HelliersWater during the 1993 sampling season................................... 209
Figure 4.9 Changes in numbers of the main phytoplankton taxa in Loch ofTingwall during summer, 1 9 9 1 ................................................. 211
Figure 4.10 Changes in numbers of the main phytoplankton taxa in Loch ofTingwall, North Basin, during the 1992 sampling season . . . 213
Figure 4.11 Changes in numbers of the main phytoplankton taxa in Loch ofTingwall, North Basin, during the 1993 sampling season . . . 215
Figure 4.12 Changes in numbers of the main phytoplankton taxa in Loch ofTingwall, South Basin, during the 1992 sampling season . . . 217
Figure 4.13 Changes in numbers of the main phytoplankton taxa in Loch ofTingwall, South Basin, during the 1993 sampling season . . . 219
Figure 4.14 Changes in numbers of the main phytoplankton taxa in SandyLoch during summer, 1991 ...................................................... 222
Figure 4.15 Changes in numbers of the main phytoplankton taxa in SandyLoch during the 1992 sampling season ................................... 223
Figure 4.16 Changes in numbers of the main phytoplankton taxa in SandyLoch during the 1993 sampling season ................................... 225
Figure 4.17 Changes in numbers of the main phytoplankton groups inTurdale Water during summer, 1991 ...................................... 226
Figure 4.18 Changes in numbers of the main phytoplankton taxa in TurdaleWater during the 1992 sampling season................................... 228
Figure 4.19 Changes in numbers of the main phytoplankton taxa in TurdaleWater during the 1993 sampling season................................... 230
CHAPTER 5: AQUATIC MACROPHYTES OF SHETLAND LOCHS
Figure 5.1 TWINSPAN division of lochs by macrophyte species present 270
CHAPTER 6: CHARACTERISTICS OF SHETLAND SOILS WITH REGARD TO THEIR PHOSPHORUS BINDING PROPERTIES
Figure 6.1 Three characteristic forms of adsorption test results ............... 301
Figure 6.2 Soil sampling sites in Shetland catchments, 1992 .................... 305
Figure 6.3 Adsorption isotherms derived for the soils of the five studycatchments, 1992 ...................................................................... 317

LIST OF TABLES
CHAPTER Is GENERAL INTRODUCTION
Table 1.1 General characteristics of dystrophic, oligotrophic andeutrophic lakes (Maitland, 1 9 9 0 )............................. 10
Table 1.2 General characteristics of lakes of different trophic states(Ratcliffe, 1977).................................................................... 11
Table 1.3 Phytoplankton associated with different lake types (Wetzel,1983)................................................................................................ 14
Table 1.4 Morphometric characteristics of large lakes of Shetland,Scotland, Europe and the W o r ld ................................ 15
Table 1.5 Algae associated with polluted water, filter clogging, taste andodour problems (APHA, 1989) and toxicity (NRA, 1990) . . . . 19
Table 1.6 Freshwater lochs in Shetland included in 1991 su rv e y ............... 22
CHAPTER 2: LIMNOLOGY AND WATER QUALITY OF SHETLANDFRESHWATER LOCHS
Table 2.1 Classification of Shetland Island lochs according to geology(Britton, 1974)............................................................................... 26
Table 2.2 Range of water quality parameters from 53 lochs in Shetland(Carter and Bailey-Watts, 1981) . . . ....................................... 27
Table 2.3 Sites and dates of water sampling 1991, 1992 and 1993 ............. 30
Table 2.4 Ranges of summer water column temperatures and dissolvedoxygen concentrations in the 31 lochs of the 1991 su rv e y ................................................................................................ 36
Table 2.5 Ranges of light attenuation coefficients and water colourdetermined in the surface waters of the 31 lochs of the 1991 su rv e y ................................................................................................ 38
Table 2.6 Summer water column pH and conductivity in the lochs of the1991 survey........................................................................................ 39
Table 2.7 Range of dissolved reactive phosphorus concentrations presentin the thirty one lochs studied in summer 1991 ( n = 3 ) .............. 45
Table 2.8 Range of total organic nitrogen concentrations present in thethirty one lochs studied in summer 1991 (n=3 ) ......................... 46
xxiii
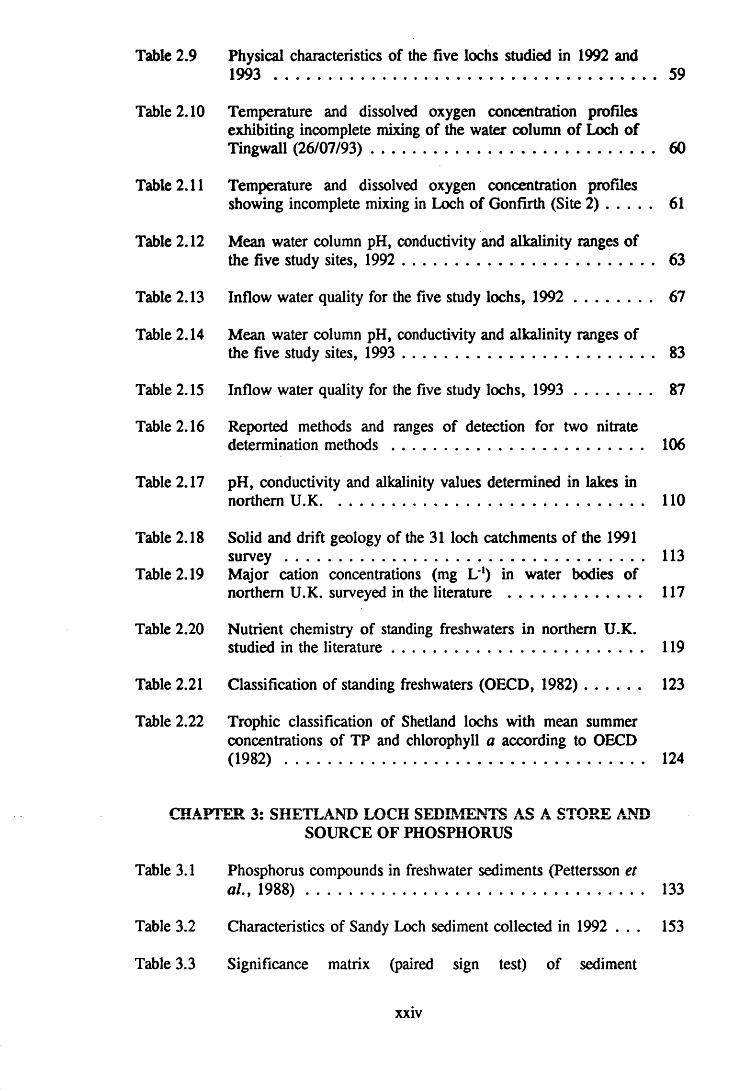
Table 2.9 Physical characteristics of the five lochs studied in 1992 and1993 ............................................................................................... 59
Table 2.10 Temperature and dissolved oxygen concentration profilesexhibiting incomplete mixing of the water column of Loch of Tingwall (26/07/93)....................................................................... 60
Table 2.11 Temperature and dissolved oxygen concentration profilesshowing incomplete mixing in Loch of Gonfirth (Site 2 ) ........... 61
Table 2.12 Mean water column pH, conductivity and alkalinity ranges ofthe five study sites, 1992 ........................................... 63
Table 2.13 Inflow water quality for the five study lochs, 1992 .................... 67
Table 2.14 Mean water column pH, conductivity and alkalinity ranges ofthe five study sites, 1993 ............................................................... 83
Table 2.15 Inflow water quality for the five study lochs, 1993 .................... 87
Table 2.16 Reported methods and ranges of detection for two nitratedetermination m ethods............................................................... 106
Table 2.17 pH, conductivity and alkalinity values determined in lakes innorthern U.K................................................................................. 110
Table 2.18 Solid and drift geology of the 31 loch catchments of the 1991su rv e y .......................................................................................... 113
Table 2.19 Major cation concentrations (mg L'1) in water bodies ofnorthern U.K. surveyed in the literature ................................. 117
Table 2.20 Nutrient chemistry of standing freshwaters in northern U.K.studied in the literature............................................................... 119
Table 2.21 Classification of standing freshwaters (OECD, 1982)............... 123
Table 2.22 Trophic classification of Shetland lochs with mean summerconcentrations of TP and chlorophyll a according to OECD (1 9 8 2 ) .......................................................................................... 124
CHAPTER 3: SHETLAND LOCH SEDIMENTS AS A STORE AND SOURCE OF PHOSPHORUS
Table 3.1 Phosphorus compounds in freshwater sediments (Pettersson etal„ 1 9 8 8 ).................................................................................... 133
Table 3.2 Characteristics of Sandy Loch sediment collected in 1992 . . . 153
Table 3.3 Significance matrix (paired sign test) of sediment
xxiv

characteristics 154
Table 3.4 Mean (±2 s.e.) bulk density and loss on ignition of sedimentsused for incubation experiments .............................................. 159
Table 3.5 Mean (±2 s.e.) phosphorus release from sediment incubationexperiments (n=5) .................................................................... 159
Table 3.6 The phosphorus content of sediments recorded in publishedliterature....................................................................................... 164
CHAPTER 4: PHYTOPLANKTON IN SHETLAND LOCHS
Table 4.1 Numbers of species found from different algal groups insamples from 53 Shetland lochs (Carter and Bailey-Watts,1981)............................................................................................. 174
Table 4.2 Summary data of CCA data analysis......................................... 180
Table 4.3 Intraset correlations of environmental variables with CCA Axes1 and 2 and significance of regression coefficient /-values . . . 189
Table 4.4 Ranking inferred by CCA of phytoplankton alongenvironmental gradients of TP, TAN and T O N ...................... 191
Table 4.5 Ranking inferred by CCA of phytoplankton alongenvironmental gradients of pH, Ca and Mg ........................... 193
Table 4.6 Ranking inferred by CCA of sites along environmentalgradients of TP, TAN and T O N .............................................. 195
CHAPTER 5: AQUATIC MACROPHYTES OF SHETLAND LOCHS
Table 5.1 Plants associated with different general water characteristics(Spence, 1967)............................................................................. 257
Table 5.2 Classification of standing waters (Palmer, 1989; Palmer et al.t1992)............................................................................................. 259
Table 5.3 Computer output of TWINS?AN analysis of macrophytespecies present in the 31 lochs of the 1991 su rv e y .................. 267
Table 5.4 Ranges of plant biomass estimates in areas of macrophytegrow th .......................................................................................... 268
Table 5.5 Median values of environmental parameters associated witheach TWINSPAN Group of water bodies................................. 271
xxv
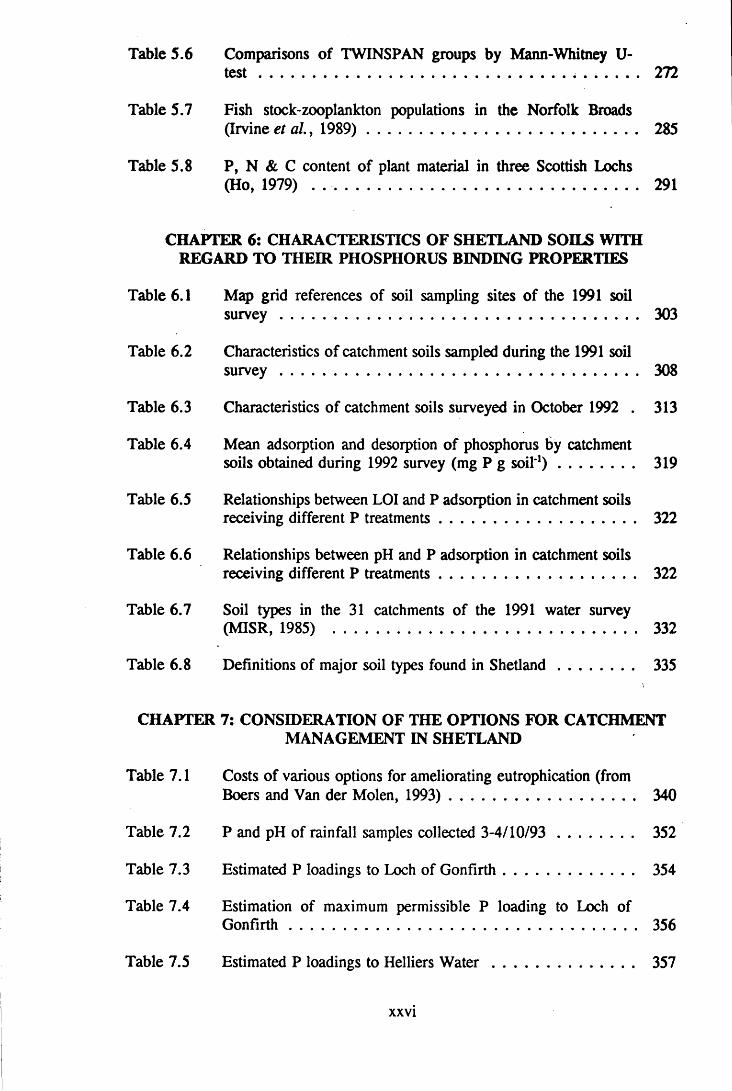
Table 5.6 Comparisons of TWINSPAN groups by Mann-Whitney U-t e s t .............................................................................. 272
Table 5.7 Fish stock-zooplankton populations in the Norfolk Broads(Irvine et al. , 1989).......................... 285
Table 5.8 P, N & C content of plant material in three Scottish Lochs(Ho, 1979) . ............................................................................ 291
CHAPTER 6: CHARACTERISTICS OF SHETLAND SOILS WITH REGARD TO THEIR PHOSPHORUS BINDING PROPERTIES
Table 6.1 Map grid references of soil sampling sites of the 1991 soilsu rv e y .......................................................................................... 303
Table 6.2 Characteristics of catchment soils sampled during the 1991 soilsu rv e y ......................................................................................... 308
Table 6.3 Characteristics of catchment soils surveyed in October 1992 . 313
Table 6.4 Mean adsorption and desorption of phosphorus by catchmentsoils obtained during 1992 survey (mg P g soil'1) ................... 319
Table 6.5 Relationships between LOI and P adsorption in catchment soilsreceiving different P treatments................................................. 322
Table 6.6 Relationships between pH and P adsorption in catchment soilsreceiving different P treatments................................................. 322
Table 6.7 Soil types in the 31 catchments of the 1991 water survey(MISR, 1985) ............................................................................ 332
Table 6.8 Definitions of major soil types found in Shetland................... 335
CHAPTER 7: CONSIDERATION OF THE OPTIONS FOR CATCHMENTMANAGEMENT IN SHETLAND
Table 7.1 Costs of various options for ameliorating eutrophication (fromBoers and Van der Molen, 1993)........................................ 340
Table 7.2 P and pH of rainfall samples collected 3-4/10/93 ................... 352
Table 7.3 Estimated P loadings to Loch of Gonfirth.................................. 354
Table 7.4 Estimation of maximum permissible P loading to Loch ofG onfirth ....................................................................................... 356
Table 7.5 Estimated P loadings to Helliers W a te r .................................... 357
xxvi

Table 7.6 Estimated P loadings to Loch of Tingwall ............................... 358
Table 7.7 Estimated P loadings to Sandy L o c h ......................................... 359
Table 7.8 Prediction of reduction of March water column TPconcentration of Sandy Loch assuming similar conditions ofrainfall and P areal loading as occurred in 1992 and 1993 . . 360
Table 7.9 Estimated P loadings to Turdale W ater..................................... 361
Table 7.10 Multiplicative models of P-chlorophyll a relationships inShetland lochs ............................................................................ 363
Table 7.11 P loss coefficients from various land use types... ....................... 372
xxvii

ACKNOWLEDGMENTS
I would like to thank the following people for their assistance in this research project:
Dr. Kevin Murphy (Department of Botany) and Dr. Ian Pulford (Department of Chemistry), without whom the project would not have existed;
Shetland Islands Council, in particular, David Okill for funding the project;
Aileen Adam and Michael Beglan for their helpfulness and Aileen’s readiness to buy chocolate and ice cream;
Jim Muckersie for making the water sampler and the sediment coring equipment;
George in the stores for his cheerful resourcefulness;
John Cooper at the University garage, without whose cooperation, the execution of the field work would have been impossible;
Bob, Jim and Jamie at Garscube for transporting "things";
GU field assistants Andrew Spink, Kevin Murphy, Mark Bannan, Anna Milligan, Stephen O’Neill, with special thanks to Fran O’Neill and Catherine Scott;
SIC field assistants Kevin Osborn, Martin, Ailish and Elena;
Alex Lyle (IFE), Willie Duncan and David Howell at (SNH) for time spent finding information;
Tony Bailey-Watts (IFE) for checking over the phytoplankton identification work and Kevin Murphy and Keith Watson (GU) for assistance with macrophyte identification;
Roger Tippett (GU) for recommending algal keys;
Tony Bailey-Watts (IFE), Mike Phillips and Billy Struthers (10A) for the training I received which made execution of this project possible;
Liam Kelly, Malcolm Beveridge, James Muir (IOA) and Andy Dowse (SNH) for allowing me to borrow equipment;
Steve Cuttle (IGER) for replying to my enquiries.
Particular thanks are due to Kevin Osborn for allowing us to abuse his home.
Without Karen Osborn I would probably have gone completely raving mad. She has been a very efficient and capable field assistant, but above all, a good friend.
Finally, thanks are due to Liam Kelly for his advice, criticisms, general helpfulness and a great deal of moral support.
xxviii

CHAPTER Is GENERAL INTRODUCTION
1.1 INTRODUCTION
1.1.1 Physical processes influencing in development of primary
production in freshwater lakes
1.1.1.1 Formation of lakes
Various mechanisms of lake formation are responsible for basin shape. Lake
morphometry influences development of primary production in standing freshwaters
as it determines the potential area of macrophyte colonisation and the volume of water
receiving sufficient light to support photosynthesis. Drift and solid geology of a lake
catchment area are important in determining lake sediment characteristics and water
chemistry. The three main classifications of lake basin are referred to as rock, barrier
and organic in origin (Maitland, 1990) and are created in essentially different ways.
Erosion of the Earth’s surface through glacial action can result in formation of rock
basins. Geomorphological indentations caused by ice scour and or alternate freezing
and thawing of water allow formation of lacustrine features when ice melts. A glacial
lake may also be formed if ice melts on erosional deposits associated with an ice
sheet. Examples of lakes formed by glacial action are the Great Lakes of North
America (Strahler and Strahler, 1973). Rock basins are also located in areas of
previous volcanic activity. Collapse of rock structures created by lava flows, or sites
of eruption, collect water from the surrounding watershed to form volcanic lakes, e.g.
Crater Lake, Oregon, USA and Lake Kivu, East Africa (Strahler and Strahler, 1973).
Movements of tectonic plates in the Earth’s crust may form depressions along fault
lines, at sites of folding processes or subsidence. In areas of upward movements of
the surface, where plates are colliding, changing hydrological patterns can result in
creation of new water bodies, in addition to those occurring due to stranding of
marine basins. Standing waters formed by such processes are termed tectonic lakes,
e.g. Lake Victoria and Lake Nyasa in East Africa (Strahler and Strahler, 1973). In
areas where geological strata consist largely of sodium chloride, calcium sulphate,
aluminium or ferric hydroxides and limestone, surface erosion and subsidence due to
disappearance of supporting structures may occur as a consequence of dissolution of
these minerals. The resulting lakes are known as solution lakes and include Deep
Lake, Florida (Butzer, 1976). Depressions in the Earth’s surface occurring as a result
of meteorite collision account for the final category of rock basins (Butzer, 1976).

Barrier basins are formed by natural damming processes such as the blockage of a
valley by lava flows or the erosional products of glaciers (moraine), flowing waters
(alluvium) or wind (loess). For example, Slide Lake, Madison River, Nebraska was
formed after a landslide (Strahler and Strahler, 1973).
Organic basins are those occurring because of the action of living organisms.
Damming may occur as a result of formation of dense vegetation growth, a coral
atoll, beaver activity, or reservoir creation by man (Wetzel, 1983).
1.1.1.2 Light in lakes
The amount of radiation energy falling as incident light upon an aquatic system
depends on time of year, time of day, latitude and altitude of the site, climatic,
atmospheric and local weather conditions. Only 1.5% of light which is vertical in
incidence is lost (Maitland, 1990), but quantity of light reflected obviously increases
with increasing angle of incidence, such as occurs during early morning or evening
and during winter in temperate regions. Under these conditions, the depth to which
light pervades the water column is shallow. Penetration of water by light not reflected
at the surface is further dissipated through absorbance by matter in solution or
suspension, as well as by water itself. Approximately 53% of light penetrating the
water surface is converted to thermal energy within the upper 1 m of water column
(Wetzel and Likens, 1990). Shorter wavelengths of light generally penetrate further,
but light intensity decreases logarithmically with depth (Maitland, 1990). Depth of the
water column is also important as shallow lakes are more likely to have significant
quantities of resuspended material present and more likely to exhibit light effects due
to sediment characteristics.
1.1.1.3 Distribution of heat energy in lakes
Lakes are often characterised by their mixis i.e. the process of physical circulation
of the water column, through temperature dependent water density changes. Whereas
pure ice has a low specific gravity and therefore floats, at a temperature of
approximately 4°C, water is at its maximum density. Consequently, water of this
temperature sinks (Wetzel, 1983). The nature of heat distribution and consequent
stratification in lakes falls into several categories. Amictic lakes are located at high
latitudes and altitudes only. There is no water circulation in these lakes, which remain
2

permanently ice covered and below 4°C on an annual basis. In cold monomictic
lakes, seasonal ice formation occurs, winter temperature remaining greater at depth.
Mixis is initiated in summer, temperature never exceeding 4°C during this season.
Warm monomictic lakes are found mostly in areas of tropical climate, thermal
stratification taking place in summer and circulation occurring the remainder of the
year when temperature is never below 4°C (and normally considerably higher).
Equatorial oligomictic lakes occur only in areas where incoming solar radiation
continually maintains water temperature significantly in excess of 4°C. Stratification
is disturbed infrequently by wind mixing only. Under conditions of strong chemical
stratification, inhibition of lake mixis may occur, despite uniform water temperature.
This type of lake is termed meromictic. In contrast, holomictic or polymictic lakes
are continually mixed.
In temperate regions, such as the UK, a dimictic regime dominates. In autumn, water
temperature is greater than 4°C and full mixing occurs. Inverse stratification is
present in winter and as in cold monomictic lakes, ice often forms at the surface. As
temperatures rise above 4°C in spring, overturn is initiated, wind mixing the entire
water column. Thermal stratification takes place in summer owing to greater heating
of surface waters. The warmest layer nearest the lake surface is the epilimnion and
is separated from the colder deeper water, or hypolimnion, by a zone of rapidly
changing temperature, the metalimnion. Circulation is then maintained in the
epilimnion by wind action. The hypolimnion circulates separately, induction of mixing
occurring through movement of the back current of the epilimnion or by internal
seiches (Macan and Worthington, 1990). In a shallow lake, mechanical mixing
through wind action makes it possible for the entire water column to be of constant
temperature, regardless of season. However, in deeper, narrower lake basins, the
restricted surface areaivolume ratio encourages formation of discrete masses of water
of different temperatures.
1.1.1.4 Effects of physical factors on plant growth
Hydrodynamic considerations, such as water column stratification, turbulence and
water exchange rate, together with light intensity and temperature, all influence
phytoplankton productivity. As photosynthetically active radiation (PAR) decreases
with depth, phytoplankton biomass will be proportionally higher in broad, shallow
3

lakes than in narrow, deep basins. Similarly, the whole water column may be heated
to constant temperature in a shallow lake, so stimulating greater algal growth when
considering it in relation to lake mass. In lakes where stratification occurs,
phytoplankton growth tends to be concentrated in the epilimnion. As growth proceeds,
nutrient levels become limiting and high phytoplankton biomass may lead to light
limitation. During periods of wind induced turbulence, additional nutrient supplies
from the hypolimnion are distributed throughout the water column. This may
stimulate algal growth, but limitation of biomass is imposed by continual removal of
phytoplankton from the photic zone. Volume of a lake basin in comparison to volume
of water supply from its catchment determines flushing rate of a body of water, which
in turn influences time available to phytoplankton for growth. This is because flushing
rate determines length of time available for water and sediment interactions, for
concentration of nutrients from the watershed, loss of nutrients from the catchment
through lake outflow and rate of loss of particulate matter (including phytoplankton)
to sediment and outflow.
1.1.2 Nutrients of major importance to aquatic plant growth
Water chemistry is influenced by sediment and catchment characteristics and is of
considerable importance to phytoplankton productivity and population dynamics. Four
other major elements are considered to be significant in determining productivity of
freshwater systems: Si, N, P and C.
1.1.2.1 Silicon
Silica (SiOJ is a requirement of all phytoplankton for protein and carbohydrate
synthesis (Reynolds, 1986), but is of major significance to diatoms and some species
of Chrysophyceae and Xanthophyceae (Round, 1973). In diatoms, a pair of siliceous
frustules are necessary for strengthening the cell wall and in chrysomonads, silica is
used to construct protective scales (Reynolds, 1986). Although fragile diatoms such
as Rhizosolenia may dissolve after death, silica cycling in lakes may be complicated
by the permanent loss of assimilated silica to sediments because of the insolubility of
phytoplankton structures. Such structures are soluble only in very acid (Wetzel, 1983)
or peaty conditions in the water and sediments (Round, 1973), where silica solubility
is increased by humic acids and formation of iron- and aluminium-silicate-humic
complexes (Wetzel, 1983).
4

At the time of maximum diatom growth (spring in temperate lakes), lake waters
exhibit a notable decrease in concentration of dissolved silica (Lund, 1950) Although
species succession may occur in response to this, it is generally unlikely that low
levels of silica inhibit diatom cell growth in freshwaters (Boney, 1989). Silicates are
abundant components of mineral structures of rocks, therefore silica is continually
supplied from catchment soils and geology. It is likely that other nutrients such as P
and N become limiting before silica decreases to concentrations which would restrict
phytoplankton growth.
1.1.2.2 Carbon
Carbon (C) cycling in lakes may be described as following the processes of
photosynthesis, grazing, detritus formation and subsequent release of dissolved
organic compounds from products of death and excretion of aquatic organisms (Moss,
1980). Bacterial transformations have a varying, but important role in C assimilation
in lakes. In terms of plant uptake for photosynthesis, there are species, especially
mosses, which can utilise C in its dissolved carbon dioxide (COJ form. Aquatic
angiosperms may recycle respiratory C 0 2 through their lacunar systems. However,
many species have the ability to incorporate H2 C0 3 into cellular processes, rather than
COj. This is important as inorganic C compounds exist in a series of equilibria as
follows:
C02 + H20 * H2 C 0 3 HC0 3 + H+ C 0 3 2 + H+
The relative quantities of C02, H2 C 03, bicarbonate (HC0 3 ) and carbonate (CCV )
influence pH changes in the water. A change in the proportion of one of these
compounds shifts the equilibrium, so that photosynthetic utilisation of C0 2 can lead
to increased pH, so allowing formation of CaC0 3 or MgC0 3 (Wetzel, 1983). When
pH is < 4, C 0 2 and H2 C0 3 are the inorganic C species present in the water column.
In contrast, at pH 10, C 032' formation is enhanced, little or no C0 2 or H2 C0 3 being
present (Moss, 1980). In temperate lakes, during times of peak photosynthesis in
summer, temporary shortages in C 0 2 can be compensated for by plant species capable
of assimilation of C from H2 C03, although a metabolic cost will obviously be
incurred. Increases in concentration of C 0 2 in hypolimnetic waters cannot occur until
water column overturn. Although there is a continual C source from the atmosphere,
temporary dissolved C 0 2 shortages due to photosynthesis or low levels in hard water
lakes (i.e. lakes which have high concentrations of Ca2+ and or Mg2+ ions) may
5

nevertheless lead to changes in plant community structure.
1.1.2.3 Nitrogen
Nitrogen (N) in freshwaters exists in the following forms (Forsberg, 1977):
(1) molecular N2 in solution
(2) dissolved inorganic ammoniacal compounds N H ^ and NH3 and
oxidised forms of nitrate (NO3 ) and nitrite (N02)
(3) dissolved N in complex organic compounds of biological origin such
as peptides, purines, amines, amino acids and urea
(4) N which is particulate in nature through assimilation into the structure
of organisms within the water column or catchment area
N may also be present as inorganic forms which have been adsorbed to organic
matter (Wetzel, 1983), although most inorganic N salts are not readily bound to clay
minerals or organic matter in the sediments (Riemer, 1984).
N is necessary to aquatic organisms for formation of amino acids and proteins.
Organic N compounds also function in plant nutrition through their ability to act as
chelators. Soluble chelator complexes supply algae with metal ions such as iron (Fe3+)
and molybdenum (Mo3+) (Moss, 1980). Owing to the lower energy cost of utilising
more complex forms of N, most primary producers have the ability to use dissolved
organic N. Preference then falls to NH,* followed by N 03' then N 02* (Forsberg,
1977). However, bacterial uptake accounts for much of the dissolved organic N,
particularly of smaller molecules e.g. amino acids, as they outcompete algae,
especially when organic N sources in the water column are at low concentrations
(Moss, 1980).
Relative amounts of different N sources in freshwaters are dependent upon the
processes of nitrification, denitrification, ammonification and N fixation. Ammonium
(N H /) is generated within lakes as a product of heterotrophic bacterial break down
of organic matter (Salisbury and Ross, 1978). Generally it exists as N H / and
undissociated NH4 OH, molecular breakdown being dependent upon pH and
temperature (Wetzel, 1983). Nitrification involves conversion of N in a reduced state
(N H /) through oxidation stages to N 03\ These steps involve bacteria, fungi and
autotrophic organisms. Through molybdenum dependent enzyme systems, the
6
converse of this process is carried out in aquatic plants. Denitrification also occurs
through biochemical reduction of oxidised N in bacterial oxidation of organic matter
(Wetzel, 1983).
Molecular N can be used only by prokaryotic microorganisms which can reduce N2
to NH4 + in the process termed N-fixation (Salisbury and Ross, 1978). In many
temperate lakes, this form of N is relatively unimportant. Greater concentrations are
likely to occur in P-enriched systems where N-fixing algae have become important
(Moss, 1980). Increased phytoplankton biomass stimulated by P addition to the
system can result in other sources of N being exhausted, so favouring development
of a large population of N-fixers.
1 .U .4 Phosphorus
Phosphorus (P) is the element which most commonly limits primary production in
freshwater ecosystems (Wetzel, 1983). Total P (TP) in the water column consists of
particulate P (PP) and dissolved P. PP may be further subdivided according to its
source. PP of a physicochemical nature comes from catchment rocks and soils and
may be present adsorbed to inorganic complexes such as clays, carbonates and ferric
hydroxides. P may also be found attached to organic matter. Organic P assimilated
in aquatic organisms commonly exists as nucleic acids, phosphoproteins, esters of
enzymes, vitamins and nucleotide phosphates (Wetzel, 1983). Organic P may also be
transported to a lake ecosystem from life forms within the drainage basin. Inorganic
water soluble P is present in the water column on organic or adsorptive colloids, in
polyphosphates and as phosphate ions (P043', H2 P04', HP042') (Moss, 1980).
1.13 Plant communities in temperate lake systems
1.13.1 Phytoplankton growth and succession in freshwater lakes
In temperate lakes, the relationships between physical and chemical parameters of
standing freshwater bodies result in an annual succession, with phytoplankton species
and abundance changing seasonally (Lund, 1950). During winter, lake water
conditions of lower thermal input, light intensity and availability, the phytoplankton
present are predominantly Bacillariophyceae and Chrysophyceae. These are usually
present in low numbers (NCC, 1990). Overwintering cells of species which become
abundant in spring (e.g. diatoms and desmids) comprise much of the plant life within
7

the water column at this time (Boney, 1989).
With increasing light and water temperature levels in spring, a bloom dominated by
diatom species occurs, with algae utilising nutrients released from the hypolimnion
to the whole water column during spring overturn. Depletion of this nutrient store,
through increased water temperature and formation of a thermocline in summer
results in catastrophic reduction ("crash") of the spring population (Jeffries and Mills,
1990). Lake phytoplankton communities may exhibit productivity peaks of green,
blue-green and dinoflagellate species throughout summer to autumn (NCC, 1990).
There may be great species diversity in the epilimnion, resulting from biological
pressures on the phytoplankton population. Cryptophyceae may be present in large
numbers, along with different forms of green algae, desmids, unicellular and colonial
flagellates and non-flagellates (Boney, 1989). In Scotland, there may be periods of
dominance by Chrysophyceae (Bailey-Watts and Duncan, 1981a).
When hypolimnedc water mixes with the epilimnion during autumn, a further
phytoplankton peak may be stimulated by higher nutrient concentrations, despite
reduced light intensity and water temperatures. Blue-green algae may flourish in
autumn before grazing, greater mixing and a less favourable light climate reduces
numbers to winter levels.
Biological processes within the water column exert a "top down" pressure on
phytoplankton communities. Examples of these are grazing by zooplankton or
predation by fish, destruction of algal cells by disease or parasites, and competition
between species for available resources.
1.1.3.2 Macrophyte zonation in freshwater lakes
Rooted aquatic plants occupying the area from lake shore to the littoral zone have
developed a number of anatomical and physiological adaptations to their environment.
The exposure of the rhizosphere to anaerobic conditions in the sediment and changes
in lake water level (the latter being especially important in summer in reservoir
waters), are important in defining aquatic plant community structure. Area of lake
sediment available for colonisation is dependent upon lake basin shape together with
depth of light penetration. Primary production of rooted plants in the littoral zone of
8

a deep lake with steeply sloping sides and large volume, will be relatively small in
comparison to that in a shallow lake.
Plants which grow in the land-water interface may be divided into three groups
depending upon situation within this gradient (Wetzel, 1990). These categories are (a)
emergent, (b) floating leaved and (c) submersed. Outwith this classification are free-
floating macrophytes, which do not root in sediment and include species of Lemna
and Utricularia. Emergent plants such as species of Scirpus, Phragmites and Typha
are found growing both above and below the water level. These plants are generally
perennials of a rhizomatous or cormous nature which are located in the region where
the water table range is approximately -0.5 m to +1.5 m (Wetzel, 1983). Floating
leaved macrophytes have leaves which reside on the water surface despite petiole
(e.g. Nuphar and Nymphaea species) or petiole plus stem attachment (e.g.
Potamogeton natans) to rhizomes in the sediment (Wetzel, 1983; Moss, 1980). These
plants are mainly angiosperms and may be present to a water depth of c. 3.0 m.
Submersed plants comprise a diverse group, which exhibit considerable variability in
leaf form both within and between species and include pteridophytes (e.g. lsoetes),
mosses (e.g. Fontinalis) and stoneworts (e.g. Chara) as well as flowering plants.
They occur between the water line and the depth at which light becomes limiting.
1.1.4 Nutrient enrichment in standing freshwaters
Nutrient enrichment, or eutrophication, may be defined as "natural or "man-made""
and "is the response in water to overenrichment by nutrients, particularly phosphorus
and nitrogen." (OECD, 1982).
Natural waters may receive increased nutrient loadings from anthropogenic sources
such as industrial developments, sewage systems, forestry and agriculture. Nutrients
from agricultural sources include those from fertiliser, silage and dairy waste. Such
artificial inputs of nutrients cause eutrophication to proceed at a higher rate than
would occur naturally. General characteristics of lakes of different nutrient status are
presented in Table 1.1 (Maitland, 1990) and Table 1.2 (Ratcliffe, 1977), where lakes
of low and high water nutrient concentrations are referred to as oligotrophic and
eutrophic respectively, the term mesotrophic indicating the intermediate state.
9

Table 1.1 General characteristics of dystrophic, oligotrophic and eutrophiclakes (Maitland, 1990)
Characteristic
Basin shape
Lake substrate
Lake shoreline
Water
Dystrophic
small, shallow
peaty silt
stony, peaty
low
Oligotrophic Eutrophic
narrow, deep broad, shallow
stony,inorganic silt fine, organic silt
stony
high
weedy
lowtransparency
Water colour
Dissolved solids
Suspended solids
Dissolvedoxygen
Phytoplankton
Macrophytes
Zooplankton
Zoobenthos
Fish
brown
lowpoor in Ca
low
high
few species low numbers
few species some abundant in shallow water
few species low numbers
few species low numbers
very few species often none
green or blue
lowpoor in N
low
high
many species low numbers Chlorophyceae typical
few species rarely abundant found in deep water
many species low numbers
many species low numbers
few species Salmonidae characteristic
yellow or green
highmuch N and Ca
high
high at surface low under ice or thermocline
few species high numbers C y a n o p h y c e a e typical
many species abundant in shallow water
few species high numbers
few species high numbers
many species especially Cyprinidae
10

Table 1.2 General characteristics of lakes of different trophic states(Ratcliffe, 1977)
Trophic Alkalinity Winter pH Water colourstate (meq L*1)
Dystrophic 0-0.04 <6.0 brownpeat stained
Oligotrophic 0-0.2 6.0-7.0 clear
Mesotrophic 0.2-0.6 c.7.0 slight greenalgal colouration
Eutrophic >0.6 >7.0 often discolouredby algae
Marl >2.0 >7.4 extremely clear(calcareous)
Brackish high ionic variable usually clear concentration
Productivity
extremely low limited by low nutrientconcentration and light penetration
low, limited by low nutrient concentrations
moderate to high possibly some hypolimnetic oxygen depletion during summer in deeper lakes
high, hypolimnetic oxygen depletion in deeper lakes
extremely low p h y t o p l a n k t o n production high m a c r o p h y t e production
variablephytoplankton, generally sparse
11

Dystrophic lakes are those which are yellow/brown in colour, owing to the influence
of organic soils in the catchment area.
Lakes formed in rock basins of glacial, volcanic or tectonic origin frequently exhibit
the characteristics of deep water, nutrient deficiency, poor sediment and stony shores
(although volcanic areas may also produce rich lakes). Often anthropogenic influence
is minimal, as areas where these types of lakes predominate are generally
inhospitable. Nutrient status therefore remains low. In contrast, lakes of low mean
depth occurring on sedimentary rocks or deposits of wind, alluvium or glacial drift,
have naturally enriched waters due to the supply of nutrients from catchment geology.
Suitability of surrounding land for agriculture increases the potential for artificially
enhanced inputs from such sources as fertiliser run-off and sewage from centres of
population, leading to enrichment of these water bodies (Granberg, 1986; Kauppi et
al., 1990). Although sedimentation is a natural process in lakes, it is accelerated in
catchments such as these. Accretion of littoral sediment and subsequent development
of macrophyte communities, may result in further sediment accumulation. Basin shape
is also important as it influences the effect of sediment characteristics on the
overlying water and vice versa. In shallow lakes a greater proportion of water mass
is in contact with the sediment. Similarly, mean depth: volume ratio is important in
considering effects of solar radiation on a lake, the latter being the energy source
responsible for driving production in aquatic systems.
Potential for P recycling is partly dependent upon the sediment area:water volume
ratio. Limited opportunities for P recycling occur in narrow, deep basins, compared
with shallow, broad basins. In oxygenated waters, it is possible for an aerobic surface
layer of sediment to act as a sink for P with formation of trivalent iron phosphate and
trivalent iron hydroxide. In nutrient enriched productive waters, there is the
possibility that oxygen depletion in the hypolimnion will result in an anoxic
sedimentary environment. Consequently, destruction of this barrier layer may occur
when oxygen is absent from hypolimnetic waters. Ferric iron may then be reduced
to more soluble ferrous iron, thereby leading to release of P from sediment to
hypolimnion. The released P may then become available to the entire water column
at overturn (Mortimer, 1941). As a consequence of depleted oxygen reserves, there
may also be elevated concentrations of ammoniacal N through reduction of oxidised
12

sources and metal ions e.g. Fe2* and Mn2+. Therefore, in addition to importation of
nutrients from the drainage basin, plant growth in enriched waters may also be
supported through internal lake sources of sediment nutrient release.
Increasing nutrient concentrations in lakes can cause significant augmentation of
biomass of macrophytes, periphyton and phytoplankton. Enhanced algal growth in
particular may result in deterioration of water quality through changes in pH,
transparency, dissolved oxygen concentrations and suspended solids within the water
column. Increased productivity and phytoplankton numbers occur in eutrophic water
bodies (Tables 1.1 and 1.2). Table 1.3 (Wetzel, 1983), synthesised from published
information (Hutchinson, 1967), illustrates general associations between water type
and phytoplankton groups present in the water column. In oligotrophic waters,
desmids, diatoms, dinoflagellates and chrysophytes tend to dominate phytoplankton
assemblages, whereas in nutrient enriched waters certain diatoms and blue-green algae
generally assume dominance. Species of cyanobacteria have been found to produce
poisons (NRA, 1990). Therefore, through eutrophication, water quality can also
deteriorate because of the development of populations of toxin producing
phytoplankton in the water column.
1.1.5 The freshwater resources of the Shetland Islands
Morphometric characteristics of Shetland water bodies are such that the smaller lochs
have high area:depth ratios whilst conversely, larger lochs possess lower area:depth
ratios, when compared with lochs on the Scottish mainland (George and Maitland,
1984). Of the freshwater lochs in the Shetland Islands, Loch of Cliff has the greatest
catchment area, Loch of Strom the largest surface area, but Loch of Girlsta contains
the greatest volume of water (Murray and Pullar, 1908). However, when
morphometric characteristics of the large Shetland lochs are examined in a global
context, or even in terms of Scottish water bodies, they are relatively small (Table
1.4). From a study of Ordnance Survey 1:63 360 scale maps, the total number of
standing freshwaters in Shetland is 1569 (Lyle and Britton, 1985).
13

Table 1.3 Phytoplankton associated with different lake types (Wetzel, 1983)
Trophicstatus
Characteristics Phytoplankton of water type Dominant Present
Oligotrophic slightly acid;very low salinity
Stauras trum, Staurodesmus
Sphaerocystis, Gloeocystis, Rhizosolenia, Tabellaria
Oligotrophic neutral to slightly alkaline; nutrient poor
Oligotrophic neutral to slightly alkaline; nutrient poor
Oligotrophic neutral to slightly alkaline;generally nutrient poor e.g. shallow Arctic lakes
diatoms especially Cyclotella and Tabellaria
Botryococcus or Oocystis
dinoflagellates especially Peridinium spp., Ceratium spp.
some Asterionella spp., some Melosira spp., Dinobryon
diatoms
small chrysophytes, cryptophytes and diatoms
Oligotrophic neutral to slightly alkaline; nutrient poor or seasonally nutrient poor
Mesotrophic neutral to slightly or Eutrophic alkaline;
annual dominants or seasonally under eutrophic conditions
Eutrophic
Eutrophic
usually alkaline lakes with nutrient enrichment
usually alkaline; nutrient enriched common in warmer periods in temperate lakes or perennially in tropical lakes
chrysophytes especially Dinobryon, some Mallomonas
dinoflagellates, some Peridinium spp. and Ceratium spp.
diatoms much of the year especially Asterionella spp., Fragilaria crotonensis, Stephanodiscus,
chrysophytese.g. Synura, Uroglena;Tabellaria
many phytoplanktonincludingGlenodinium
many phytoplankton especially greens and blue-greens during warm periods; desmids if dissolved organic matter
Melosira granulata relatively high
blue-green algae especially Microcystis, Aphanizomenon, Anabaena
other blue-green algae; euglenophytes if organically enriched or polluted
14

Table 1.4 Morphometric characteristics of large lakes of Shetland, Scotland, Europe and the World
Lake Location Volume Surface Mean Max(km3) area depth depti
(km2) (m) (m)
Caspian Sea Russia 79,319 436,400 182 946Baikal Siberia 23,000 31,500 730 1741Tanganyika Africa 18,940 34,000 557 1470Superior North 1 2 , 0 0 0 83,300 144 307
AmericaConstance Germany 49.3 540 91 252"Balaton Hungary 1 . 8 596 3.0 4.0Windermere England 0.35 14.8 24.0 67.0"Tjeukemeer Holland 0.03 2 0 . 0 1.5 3.0Lomond Scotland 2 . 6 71.1 37.0 189.9Awe Scotland 1 . 2 38.5 32.0 93.6Ness Scotland 7.5 56.4 132.0 229.8Morar Scotland 2.3 26.3 8 6 . 6 310.0Shiel Scotland 0 . 8 19.6 40.5 128.0Girlsta Shetland 0.009 0.91 9.6 2 2 . 6
Strom Shetland 0.003 1.34 2 . 1 4.0Cliff Shetland 0.003 1.04 3.3 6.4Spiggie Shetland 0.003 0.98 3.5 12.5
KEY:
approximate figures
1 Goldman and Home (1983)2 Smith et al. (1981)3 George and Maitland (1984)
15

The density of standing freshwater bodies in Shetland compared with mainland Britain
is therefore relatively high, accounting for as much as 30% of the land area in North
Roe (Britton, 1974) and at least 3% of the land area in the Shetland Island group as
a whole (Lyle and Smith, 1994). However, compared with the other regions of
Scotland, in terms of numbers, accumulated area and volume, the Shetland region is
relatively poor in freshwater resources (Lyle and Smith, 1994). The standing
freshwaters of Shetland are therefore important, as they represent a limited resource
in the Scottish context.
1.1.5.1 Water quality problems in the Shetland Islands
From 1989-1990, the Environmental Health Department of Shetland Islands Council
(SIC), in its capacity as River Purification Authority (RPA), received reports of
excessive algal growth in three lochs on Mainland Shetland. Of these, only one,
Strand Loch (NGR: HU 432 460), had given any previous indication of possible
problems, having for some years exhibited substantial growth of filamentous algae.
During 1989, Turdale Water (NGR: HU 307 529) was found to have a dense
population of algae. Although this was not investigated further, a bloom forming in
mid May 1990 was diagnosed as being mainly Anabaena which is potentially toxicto
fish and mammals. This was present for approximately two weeks before a period of
weather associated with a zone of high pressure ended and the nuisance algae
dispersed. A second bloom occurring in mid July, 1990, at Punds Water (NGR: HU
325 757), was also identified as being a dense colony of Anabaena. Finally, a late
season "pea soup" was found at Strand Loch on 28-29 September, 1990.
Although SIC information on land use indicated that a significant nutrient input to
Strand Loch from sewage and agricultural sources such as silage was likely, Turdale
Water had possibly only one septic tank discharge and Punds Water had none. The
lack of obvious point sources of nutrients at Turdale and Punds Water, together with
the knowledge that Strand Loch had not previously suffered phytoplankton blooms,
led to consideration of the possibility that fertilisation of land to improve sheep
grazing (reseeding) might stimulate dense phytoplankton populations, as all three
catchments had ongoing reseeding operations.
16
1.1.5.2 Land use in Shetland
According to statistics (SIC, 1991) for the period 1971 to 1990, the amount of land
used for grassland and crops in the Shetland Islands increased from 8,407 to 12,840
ha. Rough grazing also increased from 129,019 to 130,736 ha, although greater areas
were in use during the early/mid 1980s. It may be that the difference from early to
mid 1980s was a result of rough grazing being converted to grassland; from 1986-
1989 approximately the same area of land was lost from rough grazing as was gained
to grassland.
As part of SIC’s 10-year Agricultural Plan, the Council’s Charitable Trust operated
an agricultural loans scheme which began in 1982. Grants are also available from the
Scottish Office Agriculture and Fisheries Department (SOAFD); those not qualifying
for SOAFD grants may apply for a 50% grant from SIC. In practice, most aid comes
from SOAFD (G. Petrie, SOAFD, pen. comm., 1991). Reseeding development
projects in 1989 were approved for 3664.4 ha at a gross cost to the SIC loans scheme
of £1,238,152.
1.1.5.2.1 Reseeding procedures
A standard method of reseeding is implemented for those receiving SOAFD grants.
Most of the work is carried out by a contractor; therefore adjacent tracts of land
owned by different grant holders are often treated at approximately the same time.
As a consequence of this practice total fertiliser load to a particular catchment may
be increased substantially. SOAFD recommend procedures for land regeneration
which are also the qualifying criteria for grant aid and include heavy harrowing or
discing, application of lime, additions of fertiliser and finally, provision of grass
seeds. Application of at least 5 t of limestone per hectare is compulsory unless soil
is found to require less by the College of Agriculture. A balanced compound fertiliser
must then be used, providing at least 110 kg per hectare of nutrients as N, P2 0 5 and
potash, before a subsequent addition of 150 kg P2 0 5 as ground mineral phosphate or
basic slag per hectare. Fertiliser additions are made during May, June and July and
seeds are broadcast before 31st July. Proportions of Kent Wild White Clover,
Aberystwyth White Clover and Huia White Clover are stipulated and use of lower
grade seed prohibited. In the second year, balanced compound fertiliser must again
be applied, providing at least 110 kg nutrients as described above per hectare. Grant
17
aid is not provided in cases where nitrogenous fertiliser alone is applied in the second
year.
According to the Scottish Agricultural College, the time of surface seeding is usually
during early to mid July when increasing humidity and showers, together with warm,
moist soil promote efficient germination and growth of grass and clover. Provision
of lime and fertiliser plus any cultivation occurs prior to sowing while the weather
is dry. Initial nutrient addition therefore occurs coincidentally with early summer
phytoplankton growth in the lochs.
1.1.6 Problems of algal blooms for water supply authorities
Increased algal biomass can cause significant problems for potable water supply
authorities. Water treatment filters may become blocked and it is possible for algal
toxins to pass into the consumer supply. Wholesomeness of water received at the tap
can deteriorate badly with respect to taste and odour. Table 1.5 lists algae which have
been associated with polluted water, filter clogging, taste, odour (APHA, 1989) and
toxicity problems (NRA, 1990). Finally, when considering public health issues, the
production of trihalomethanes (THMs) can occur with chlorination of cyanophyte
infested waters.
Blue-green algae and humic substances which are present in peaty lochs produce
THMs as carcinogenic by-products of traditional disinfection methods. Present EC
legislation provides a low non-statutory guideline of 1 fig L' 1 rather than a standard
(Foster et al. , 1991). Water authorities in England have been investigating alternative
treatment processes to chlorination in order to alleviate THM problems. It is now
generally accepted that treatment with ozone and granular activated carbon deals with
THM precursors and removes taste and odour problems. Ozone is a powerful oxidant
which alters organic substances in raw supply water to produce aldehydes, ketones
and acids which are more biodegradable. This process increases available organic
carbon which can be removed in a subsequent biological treatment stage (Foster et
al., 1991).
18

Table 1.5 Algae associated with polluted water, filter clogging, taste and odour problems (APHA, 1989) and toxicity (NRA, 1990)
Polluted water Filter clogging
Phormidium SynedraCarteria AsterionellaLepocinclis TribonemaLyngbya OscillatoriaGomphonema TrachelomonasStigeoclonium RivulariaChlorella CyclotellaMicrocystis ChlorellaOscillatoria NaviculaTetraedron DinobryonNitzschia TabellariaAnabaena DiatomaEuglena SpirogyraSpirogyra FragilariaChlamydomonas PalmellaMerismopedia Closterium
MicrocystisAnabaenaCymbella
Taste and odour Toxicity
Tabellaria AnabaenaAnabaena MicrocystisUroglenopsis OscillatoriaSynedra NostocCeratium CylindrospermumGomphosphaeria AphanizomenonSynuraPandorinaVolvoxDinobryonAphanizomenonPeridiniumHydrodictyonMicrocystisNitellaMallomonasStaurastrumAsterionella
19

1.1.7 Control of water quality in Scottish standing fresh waters
The River Purification Authorities (RPAs) are the primary regulatory organisations
responsible for water quality in fresh and coastal waters in Scotland. These RPAs are
constituted of seven River Purification Boards and three island councils. RPA criteria
for maintaining freshwater resources in Scotland involve the setting of an
environmental quality objective (EQO). An EQO is decided depending upon the
present or predicted amenity value of the water body, based on water quality
parameters. Environmental Quality Standards (EQS) are then set in accordance with
the EQO and appropriate EC Directive on water quality criteria (e.g. if the objective
is to support freshwater fish life, Directive 78\659\EEC would be consulted). In the
absence of EC directives, standards such as those of the European Inland Fisheries
Advisory Commission (EIFAC) may be employed. However, where EC standards do
exist, these must be met regardless of other guidelines. Where a water body has more
than one usage, compliance must be with the most stringent user requirements. In the
case of interconnected water bodies (e.g. the catchments of Brow-Spiggie and
Tingwall-Asta), it is required that upstream water quality is of a standard sufficient
to meet all downstream EQS.
In cases of identifiable point or diffuse effluents to water bodies, the discharger must
apply to the RPA for Consent to Discharge under the Control of Pollution Act (1974),
Part 2, Section 34. Conditions for Consent to Discharge are set by RPAs with
reference to maintaining the appropriate EQS for that water body. Information
relating to the discharge is therefore required on such parameters as nutrient loading,
concentration of metals and biochemical oxygen demand (BOD) of the intended
discharge before Consents can be granted.
However, practices relating to the application of fertiliser on forest or agricultural
land do not require clearance from RPAs. In order to limit such activities, a request
to the Secretary of State would be required, stating application of fertiliser as a
prescribed activity under Section 31(4), Schedule 23 of the Water Act (1989). Forth
River Purification Board (FRPB) (pers. comm.) indicated that this situation was under
reconsideration by RPAs, both locally and nationally, but that the Secretary of State
would ultimately decide on applicability of regulations to these activities. Two RPAs
in Scotland (Clyde and North East) (pers. comm.) considered that data they possessed
20

indicated no cause for concern with regard to these inputs. Scottish Natural Heritage
(pers. comm.) foresee no change in current circumstances under present Government
policy.
However, in small loch systems such as those of Shetland, it is possible that any
addition of nutrients from fertilised land may have an impact on receiving water
bodies. In small drainage basins, it is conceivable that the fertilised area may make
up a considerable proportion of total catchment area. In shallow lakes, the sediments
already represent a potentially important internal nutrient source as a consequence of
low mean depth and wind mixing. Although little information exists concerning
integrated catchment studies of the fate of agricultural fertiliser, possible deleterious
effects of forestry practises are well documented (Bailey-Watts et al., 1987a).
1.1.8 Project aims
The potable water supplies of the Shetland Islands rely upon water treatment systems
which are largely unsuitable for dealing with waters affected by algal blooms. In
addition to this, there are at present no guidelines as to an acceptable level of algal
toxin present in a potable water supply. The water supply in Shetland is not on a grid
system, therefore no alternative water source exists for a community should
abstraction from a reservoir be interrupted because of increased algal biomass. A full
investigation was therefore undertaken to assess the following points:
(a) present status of water quality in Shetland Island lochs
(b) susceptibility of Shetland standing waters to excessive primary production
problems associated with nutrient enrichment
(c) the potential for fertiliser applications on land to cause nutrient enrichment of
standing freshwaters
(d) possible preventative or remedial measures to preserve water quality should
problems of elevated plant productivity occur.
1.1.8.1 Catchments chosen for study
The first year of the project consisted of a broad study to enable the classification of
lochs and soils and identification of five catchment areas for more detailed
investigation in the second and third years. Lochs from all over Shetland were chosen
for the baseline study; from Mainland, Unst, Yell, Fetlar, Whalsay, Bressay and Papa
21

Table 1.6 Freshwater lochs in Shetland included in 1991 surrey
Water body Map reference Amenity value
1 Arthurs Loch HU 270 565 WS (West Burrafirth)2 Bu Water HU 548 620 WS (Whalsay)3 Loch of Brindister HU 433 370 F WS (Gulberwick/Quarf)4 Loch of Brough HU 513 407 F WS (Bressay)5 Loch of Brough HP 530 029 F WS (Cullivoe)6 Loch of Brow HU 384 157 SSSI7 Loch of Cliff HP 600 120 F8 Eela Water HU 330 785 WS (Sullom Voe/Northmavine)9 Loch of Gonfirth HU 385 623 WS (Voe)10 Gorda Water HU 167 607 WS (Papa Stour)11 Gossa Water HU 303 457 F WS (Skeld)12 Helliers Water HP 610 047 F WS (Unst)13 Loch of Huesbreck HU 389 139 WS (Sumburgh)14 Loch of Huxter HU 556 622 F WS (Whalsay)15 Loch of Kettlester HU 513 806 WS (Burravoe/South Yell)16 Lunga Water HU 234 527 F WS (Walls)17 Mill Pond HU 386 334 WS (Burra Isle)18 Papil Water HU 604 904 F19 Punds Water HU 325 757 F20 Roer Water HU 336 863 F WS (Sullom Vod
Northmavine)21 Sand Water HU 416 545 F SSSI22 Sandy Loch HU 450 403 F WS (Lerwick/Scalloway)23 Skutes Water HU 623 920 F WS (Fetlar)24 Loch of Snarravoe HP 570 015 F25 Loch of Spiggie HU 371 170 F SSSI26 Strand Loch HU 432 460 F27 Loch of Tingwall HU 417 430 F SSSI28 Turdale Water HU 307 52929 Loch of Ustaness HU 399 434 F WS (Whiteness/Weisdale)30 Loch of Watlee HP 593 055 F WS (Unst)31 Whitelaw Loch HU 385 540 WS (Aith)
KEY:
Numbers 1-31 refer to Figure 1.1 SSSI Site of Special Scientific Interest WS potable water supply loch F trout angling (from Burrows and Hoseason, 1982)
22

Figure 1.1 Map of Shetland Islands and locations of study lochs 1991-1993(see Table 1.6 for code numbers)
Unst
Papa StourWhalsay
23

Stour (Table 1.6 and Figure 1.1). This was in order to reflect effects of different
catchment geologies (the geology of Shetland is complex and variable), soil types and
management practices in the results. All twenty one water supply lochs were visited,
whilst ten sites were chosen as they were of interest to SIC for the following reasons.
Papil Water on Fetlar, Lochs of Cliff and Snarravoe on Unst had all supported fish
farm operations; Lochs of Tingwall, Brow and Spiggie and Sand Water were Sites
of Special Scientific Interest, whilst Turdale Water, Strand Loch and Punds Water
were included as the three "problem" lochs mentioned previously. The five lochs
chosen for further study in 1992 and 1993 were Loch of Gonfirth, Helliers Water,
Loch of Tingwall, Sandy Loch and Turdale Water.
24

CHAPTER 2: LIMNOLOGY AND WATER QUALITY OF SHETLAND
FRESHWATER LOCHS
2.1 INTRODUCTION
2.1.1 Chemical status of Shetland waters
There has been much interest in small lakes in Scandinavia and North America,
especially those high in water colour (Jackson and Schindler, 1975; Jones, 1990;
1992a). In contrast, little work has been carried out on the standing waters of
Shetland and much of the data collected to date remains unpublished. The status of
fresh waters in the Islands has been estimated from information on geology of
catchment areas (Table 2.1). The majority of lochs are those which are highly
coloured (yellow/brown) by peaty substances, such as humic and fulvic acids. Britton
(1974) claims these water bodies are characterised by low nutrient concentrations, low
biological productivity and are generally small, for with increasing size it becomes
more likely that mineral soils will form part of the catchment. However, waters of
this lake type tend to exhibit higher total P concentrations than comparable clear
water lakes (Hutchinson, 1957; Wetzel, 1983), but phytoplankton production and
biomass development is frequently lower than expected from the P concentration.
This being the case, many Shetland lochs, although largely free from anthropogenic
influences, may be expected to exhibit relatively high nutrient concentrations.
It is possible that in highly humic lakes an appreciable proportion of phosphate P may
be present as part of a dissolved humic matter-Fe-P complex, rather than immediately
biologically available phosphate P (Jones et al., 1988). Free phosphate can be
progressively released from these complexes as ambient free phosphate P
concentration declines, thereby possibly providing a long term buffer against P
deficiency (Jones et al., 1990). In shallow and/or nutrient-rich lakes of this type,
phosphorus release from the peaty sediments is dependent upon mineralisation of
organic matter (Sinke et al., 1990). As a large reservoir of dissolved organic carbon
exists in humic waters, higher microbial activity may be sustained, so allowing
nutrient regeneration through the food chain (Jones et al., 1990).
25

Table 2.1 Classification of Shetland Island lochs according to geology (Britton, 1974)
Loch type Number of lochs % of total
Dystrophic 547 34.7Oligotrophic 661 41.9Mesotrophic 2 1 2 13.4Eutrophic 1 1 1 7.0Brackish 45 2 . 8
Marl 1 0 . 1
26

Table 2.2 Range of water quality parameters from 53 lochs in Shetland (Carter and Bailey-Watts, 1981)
Nutrient Concentration
N03-N trace - 100 ng N L* 1
NH3-N trace - 400 fig N L ' 1
PO4-P trace - 400 /xg P L' 1
Si02-Si trace - 2 mg Si L' 1
27
Carter and Bailey*Watts (1981) undertook a synoptic survey of Shetland lochs. In a
wide range of lochs, P concentration was found to be similar to, or in excess of, that
of inorganic N (Table 2.2). This situation may encourage algae which fix N (i.e.
certain species of cyanobacteria), although once enrichment occurs, dependent upon
relative quantities of N and P, this advantage may be lost. Subsequently, non N-fixing
cyanophytes may bloom and in cases of great hypemutrification, green phytoplankton
may dominate. As N levels are generally low in Shetland lochs, the addition of a
N + P+ K fertiliser, rather than P alone may be important, as it is possible that in
some circumstances primary production may be N-limited.
2.1.2 Alms
Before management decisions regarding land use in catchment areas of Shetland
freshwater lochs are possible, it is necessary to know the current limnological status
of the water bodies concerned. From the information on ranges of nutrient levels in
Shetland lochs of Carter and Bailey-Watts (1981), it is likely that a variety of water
types exist, water quality being influenced by different geology, soil type and land
use. When current status of a water body has been determined, it is possible to
recognise its amenity value and therefore attempt to comprehend the limitations to be
imposed on nutrient inputs. The aims of this section of work were therefore as
follows.
(a) Determine the status of the thirty one lochs in terms of a number of different
physical and chemical variables, i.e. conduct a synoptic survey of these water
bodies.
(b) Compare results of the synoptic survey with existing standards of water
quality required for drinking water and for the purpose of supporting
freshwater fish.
(c) Using existing standards, classify the water bodies surveyed in terms of
trophic status and likelihood of phytoplankton blooms.
(d) From the first year’s data, select five water bodies incorporating a range of
water types for further study. Examine variation in total P and chlorophyll a
concentrations, during the period of the year when phytoplankton growth is
expected to be elevated, i.e. from March to October.
(e) Ascertain whether inflow waters of selected water bodies are likely sources of
nutrient enrichment.
28

2.2 MATERIALS AND METHODS
2.2.1 Field procedures
During summer 1991, each of the thirty one lochs was visited on three occasions.
Three sites were chosen mid water in each water body. Water collection was
undertaken using a Van Dorn self closing sampler throughout the survey. Depending
on water depth, samples were taken at 0, 2 and 5 m (Table 2.3). These samples were
composited, except for subsamples taken for discrete measurements of pH and
conductivity (HMSO, 1980). Dissolved oxygen and temperature readings were
recorded in situ to water collection depth, whilst light readings were taken with a
PAR meter to 1 m depth only. The oxygen probe was of the Mackereth type and was
agitated continuously whilst readings were taken using a pHOX Model 62 oxygen
meter. The light attenuation coefficient (LAC) was calculated according to Moss
(1980):
(lnl,, - lnlj/z = v
where:
I,, PAR reading in surface water
lz PAR reading at depth
z depth of PAR reading
r\ negative extinction coefficient (light attenuation coefficient)
Variables of 1991 water samples measured in the laboratory were pH and
conductivity values, total phosphorus (TP), total dissolved phosphorus (TDP) and
dissolved reactive phosphorus (DRP) concentrations, total ammoniacal nitrogen
(TAN), total oxidised nitrogen (TON), calcium (Ca), magnesium (Mg), sodium (Na),
potassium (K) levels, colour and chlorophyll a (chi a).
Sampling in 1992 was more detailed and intensive; five visits were made from March
to October, to each of the five study lochs, the entire water column being studied at
the same three sites per water body as used in the 1991 survey (Table 2.3). Discrete
samples and readings of dissolved oxygen and temperature were taken at intervals
from surface to deep water. In 1993, lochs were visited on four occasions between
March and October, sampling continuing as in 1992, though at one site only (with the
exception of Loch of Tingwall where there was one site in each of the two
basins)(Table 2.3).
29

Table 2.3 Sites and dates of water sampling 1991,15192 and 15193 (all sampling carried out between 09:00 and 16:30)
1991
Site Depth (m) Date
Arthurs Loch 0 16/07/91 14/08/91 25/09/91Bu Water 0 15/07/91 18/08/91 28/09/91Loch of Brindister 0 , 2 12/07/91 17/08/91 18/09/91Loch of Brough (Bressay) 0 16/07/91 22/08/91 27/09/91Loch of Brough (Yell) 0 17/07/91 21/08/91 28/09/91Loch of Brow 0 13/07/91 22/08/91 20/09/91Loch of Cliff 0 , 2 18/07/91 20/08/91 22/09/91Eela Water 0 , 2 21/07/91 16/08/91 26/09/91Loch of Gonfirth 0, 2 ,5 20/07/91 16/08/91 26/09/91Gorda Water 0 22/07/91 27/08/91 01/10/91Gossa Water 0 16/07/91 14/08/91 20/09/91Helliers Water 0 18/07/91 20/08/91 22/09/91Loch of Huesbreck 0 , 2 14/07/91 17/08/91 18/09/91Loch of Huxter 0 , 2 15/07/91 18/08/91 28/09/91Loch of Kettlester 0 17/07/91 19/08/91 21/09/91Lunga Water 0 , 2 20/07/91 14/08/91 25/09/91Mill Pond 0 13/07/91 15/08/91 27/09/91Papil Water 0 , 2 19/07/91 25/08/91 23/09/91Punds Water 0 , 2 21/07/91 16/08/91 26/09/91Roer Water 0 25/07/91 28/08/91 29/09/91Sand Water 0 15/07/91 15/08/91 19/09/91Sandy Loch 0 12/07/91 15/08/91 18/09/91Skutes Water 0 19/07/91 23/08/91 23/09/91Loch of Snarravoe 0 , 2 17/07/91 21/08/91 22/09/91Loch of Spiggie 0 , 2 14/07/91 17/08/91 18/09/91Strand Loch 0 13/07/91 15/08/91 19/09/91Loch of Tingwall 0, 2 ,5 13/07/91 26/08/91 19/09/91Turdale Water 0 15/07/91 14/08/91 25/09/91Loch of Ustaness 0 24/07/91 28/08/91 29/09/91Lodi of Watlee 0 18/07/91 20/08/91 22/09/91Whitelaw Loch 0 23/07/91 29/08/91 30/09/91
1992 and 1993 water sampling locations
Water body Site Depth (m)Sampling dates for each site and depth
Loch of Gonfirth 0, 2, 5, 10 0, 2, 5, 10, 15, 20 0, 2, 5, 10, 15
23/03/9211/05/9223/06/9220/08/9207/10/92
30

Table 2.3 (cont.)
Water body Site
Loch of Gonfirth
Helliers Water 123
Loch of Tingwall 12
Sandy Loch
Turdale Water 123
Depth (m)
0, 2, 5, 10, 15, 20
0, 2, 5, 10 0, 2, 5, 10, 15, 20 0, 2, 5, 10, 15
0, 2, 5, 10 0, 2, 5, 10, 15, 20
0 , 2 0, 2 ,5 0, 2 ,5
0, 2 ,5
Sampling dates for each site and depth
22/03/9320/05/9325/07/9303/10/93
19/03/9212/05/9220/06/9223/03/9323/05/9328/07/9302/10/93
22/03/9213/05/9224/06/9222/08/9208/10/92
24/03/9321/05/9326/07/9304/10/93
21/03/9210/05/9220/06/9221/08/9210/10/92
21/03/9322/05/9327/07/9301/10/93
18/03/92n/fywcn18/06/9221/08/9209/10/9224/03/9322/05/9329/07/9305/10/93
31

Records of Secchi disc depth were taken instead of light readings in 1993. Variables
of 1992 and 1993 samples determined in the laboratory were pH, conductivity,
alkalinity, TP, TDP, DRP and chi a levels. Samples of loch inflow and outflow
waters were taken during each visit from May 1992 to October 1993 (Positions
marked in Figure 3.1). The same parameters were measured in these samples as in
the loch samples, with the exception of chi a concentration.
Bathymetric surveys of the five study lochs were carried out in May, 1992. This was
conducted using a Lowrance X16 echosounder and motorised boat. Depending upon
the surface area of the water body, between six and thirteen sounding tracks were
taken in each loch. A "flying start" (H&kanson, 1981) was practised for each transect.
From an identifiable point on the shoreline, direction was maintained using a compass
reading. Constant engine speed was sustained during all soundings. Echosoundings
were conducted parallel and at right angles to the shoreline. Depth contours were then
constructed using the echogram and the appropriate 1:25 000 OS map for each loch.
2.2.2 Treatment and storage of samples
All bottles involved in sample collection and storage were pre treated in 1.2 M HC1.
Polyethylene sampling bottles were rinsed in deionised water then thoroughly rinsed
in loch water prior to use. Water for TP analysis was decanted into iodised
polyethylene bottles rinsed with deionised, double distilled and sample water. Rinsing
procedure was the same for all other storage bottles. Subsamples for metals analysis
were decanted into polyethylene bottles. Water samples were filtered through
prewashed 0.45 /tm cellulose nitrate papers (1991) or 1.2 /xm GF/C papers (1992 and
1993) shortly after sampling and stored for measurement of dissolved parameters at
the laboratory. Filtrate was stored in polyethylene bottles. All filtered samples were
stored frozen in darkness until analysis.
2.2.3 Laboratory measurement of environmental parameters
All glassware utilised in the following techniques was pretreated with 1.2 M HC1 then
Decon 90 P-free detergent before rinsing in deionised and double distilled water.
2.23.1 Alkalinity
A 100 mL sample was decanted into a conical flask. A few drops of BDH 4.5
32

indicator were added to the sample and titration carried out using 0.01 M HC1 to the
pink pH 4.5 end point. The first sample of each loch water titrated to pH 4.5 was
retained for reference colour. Volume of acid titre was multiplied by a factor of 0.1
in order to express results in terms of meq L"1.
2.2.3.2 Phosphorus
Total phosphorus (TP), total dissolved phosphorus (TDP) and dissolved reactive
phosphorus (DRP) determinations were performed with 15 mL aliquots of sample, TP
analyses being carried out on unfiltered water, TDP and DRP on filtrate. After a
sulphuric acid/potassium persulphate digestion in an autoclave for 30 minutes at 15
p.s.i. (Phillips, 1985a), TP and TDP were measured spectrophotometrically as DRP
using a molybdenum blue complex technique with ascorbic acid as the reducing agent
(Phillips, 1985a). Absorbance was read at 690 nm, using a 4 cm cell. All DRP results
were colour corrected.
2.2.3.3 Nitrogen
Total ammoniacal nitrogen (TAN) was determined using an automated technique
based on Method F, HMSO (1982a). Hypochlorite was generated in situ, by alkaline
hydrolysis of sodium dichlorocyanurate. Ammonia and hypochlorite were reacted with
a phenolic compound i.e. the salicylate ion, to form a blue colour. Sodium
nitroprusside was used as the catalyst and trisodium citrate was utilised as a
complexing agent to prevent interference from metals such as Mg. Total oxidised
nitrogen (TON) was determined using an automated technique modified from Method
D, HMSO (1982b). Nitrate was reduced to nitrite by passing samples through a
copper coated cadmium coil, after addition of ammonium chloride. TON was
subsequently measured as nitrite using an NED/sulphanilamide procedure. TAN and
TON were determined simultaneously, using a Technicon n autoanalyser at 640 and
70 nm respectively.
2.2.3.4 Calcium and magnesium
Ca and Mg determinations were carried out by atomic absorption spectroscopy, using
a direct air acetylene flame technique after installation of appropriate lamp,
wavelength and slit width and optimisation of lamp alignment for each element. All
samples were diluted to within standard range. All solutions including distilled water
33

blanks were made up to have a final concentration of 1% strontium (Sr), using
SrCl2 (6H2 0) and of 1% ’Spectrosol’ grade nitric acid (HNOj). Standards were made
by dilution of Spectrosol stock 1000 mg Ca L' 1 and 1000 mg Mg L 1 to within the
ranges 1-5 mg Ca L* 1 and 0.1-0.5 mg Mg L' 1 respectively. Samples for Ca analysis
were diluted (sample volume: water volume) 1:1 to 1:19, those for Mg determinations
generally 1:9, though by as much as 1:49. All dilutions were carried out with distilled
water.
2.2.3.5 Sodium and potassium
Concentrations of Na and K in water were determined by flame emission
spectroscopy. Standards for Na determinations were made by dilution of Ciba
Coming 1000 mg Na L 1 stock to within the range 10-50 mg Na L 1, whilst those for
K measurement were in the range 1-5 mg K L'1, having been diluted from Ciba
Coming 1000 mg K L' 1 stock. For each element, the most concentrated standard was
aspirated and the machine set to give a reading of 100 units. Similarly a distilled
water blank was used to set the instrument to zero. Samples were diluted where
necessary to within standard range. All dilutions were carried out using distilled
water.
2.2.3.6 Colour
The colour in filtered water samples was measured spectrophotometrically at 400 nm
(HMSO, 1984), using 4 cm cells.
2.2.3.7 Chlorophyll a
Chi a was used as an estimate of phytoplankton biomass within the water column. Up
to 2 L of water was filtered through a 1.2 ^m GF/C filter paper. The filter paper was
then stored frozen in darkness until analysis. Chi a was extracted from each filter
paper using 14 mL 100% methanol neutralised with MgC03. Methanol was added to
centrifuge tubes containing the filter papers. These tubes were subsequently heated
in a water bath at 62 ±2°C for 5 minutes. Centrifuge tubes were then shaken and
placed in a centrifuge for 5 minutes at 3,000 rpm. Absorbance of each chi a extract
was measured spectrophotometrically at wavelengths 665 nm and 750 nm, using 4 cm
glass cuvettes. To correct for phaeophytin, 11 mL of extract was then decanted into
a test tube and 0.11 mL 3% HC1 added. After 5 minutes, this extract was neutralised
34

with 0.11 mL 0.3 M dimethylaniline (organic base in methanol). Each extract was
then reread at 665nm and 750nm to allow correction for phaeophytin. Chi a
concentration was then calculated using the equation of HMSO (1983), modified for
the particular conditions of the techniques used. The equation was as follows:
Chi a = (13.9 x (3.0 (Ah - A$) X v) / dV
where:
Ah absorbance of extract at 665 nm, minus extract absorbance at 750 nm
v initial volume of extract (mL)
d cell path length (cm)
V sample volume (mL)
13.9 constants associated with properties of
3.0 the solvent, methanol
Aj = ((v + 0 .2 2 ) x Aj) / v
where:
v volume of acidified extract (niL)
0.22 total volume of additions to the acidified extract (mL)
Aj absorbance of acidified extract at 665 nm minus
absorbance of acidified extract at 750 nm
2.2.3.8. Presentation of survey data
Data from each loch and each environmental variable were summarised using the
range or mean (± 2 standard errors) (n=3).
2.3 RESULTS
2.3.1 Water chemistry and physical characteristics of Shetland lochs in
1991
All ± values accompanying mean values given in the following text represent ± 2
standard errors (± 2 s.e.). Similarly, Figures 2.1-2.8 present the parameter mean
± 2 s.e..
2.3.1.1 Dissolved oxygen concentration and temperature (Table 2.4)
In 1991, daytime dissolved oxygen concentrations measured ranged from 6.5 mg L' 1
(63.7%) in Lunga Water during August, to 12.5 mg L* 1 (116.4%) in Loch of Brow
in September.
35

Table 2.4 Ranges of summer water column temperatures and dissolvedoxygen concentrations in the 31 lochs of the 1991 survey
Water body Temperature (°C) Dissolved oxygen(ms O, L ')
min max min max
Arthurs Loch 9.6 17.7 6.9 1 1 . 6
Bu Water 8.9. 16.1 9.1 11.4Loch of Brindister 1 2 . 2 15.0 9.3 10.9Loch of Brough (Bressay) 9.0 14.7 9.3 1 0 . 8
Loch of Brough (Yell) 8.3 15.9 9.1 1 1 . 2
Loch of Brow 1 2 . 1 15.2 10.4 12.5Loch of Cliff 1 1 . 6 16.7 8.7 10.7Bela Water 10.4 15.4 9.0 1 0 . 6
Loch of Gonfirth 1 0 . 8 15.2 9.3 10.4Gorda Water 8.3 15.7 9.0 11.4Gossa Water 1 2 . 1 16.6 6.7 11.3Helliers Water 1 1 . 0 16.3 9.8 10.9Loch of Huesbreck 1 2 . 0 16.1 10.4 12.3Loch of Huxter 9.7 16.0 8 . 8 1 1 . 2
Loch of Kettlester 1 1 . 6 17.7 9.3 1 0 . 8
Lunga Water 1 0 . 8 15.6 6.5 1 1 . 1
Mill Pond 9.1 15.2 9.5 10.9Papil Water 10.9 16.6 8.9 1 1 . 1
Punds Water 1 0 . 0 15.7 8.9 10.7Roer Water 8 . 8 14.2 9.4 10.7Sand Water 1 1 . 8 16.1 9.3 10.9Sandy Loch 1 1 . 8 15.4 9.0 1 1 . 0
Skutes Water 9.7 15.9 9.5 10.4Loch of Snarravoe 1 1 . 6 16.8 9.0 10.9Loch of Spiggie 12.5 15.8 8 . 8 1 1 . 2
Strand Loch 12.4 16.1 1 0 . 0 1 1 . 6
Loch of Tingwall 12.4 16.1 9.4 1 0 . 6
Turdale Water 9.9 16.8 7.1 1 1 . 2
Loch of Ustaness 1 0 . 6 14.9 9.2 1 0 . 6
Loch of Watlee 11.3 17.7 9.3 10.7Whitelaw Loch 7.4 14.2 1 0 . 0 11.3
36
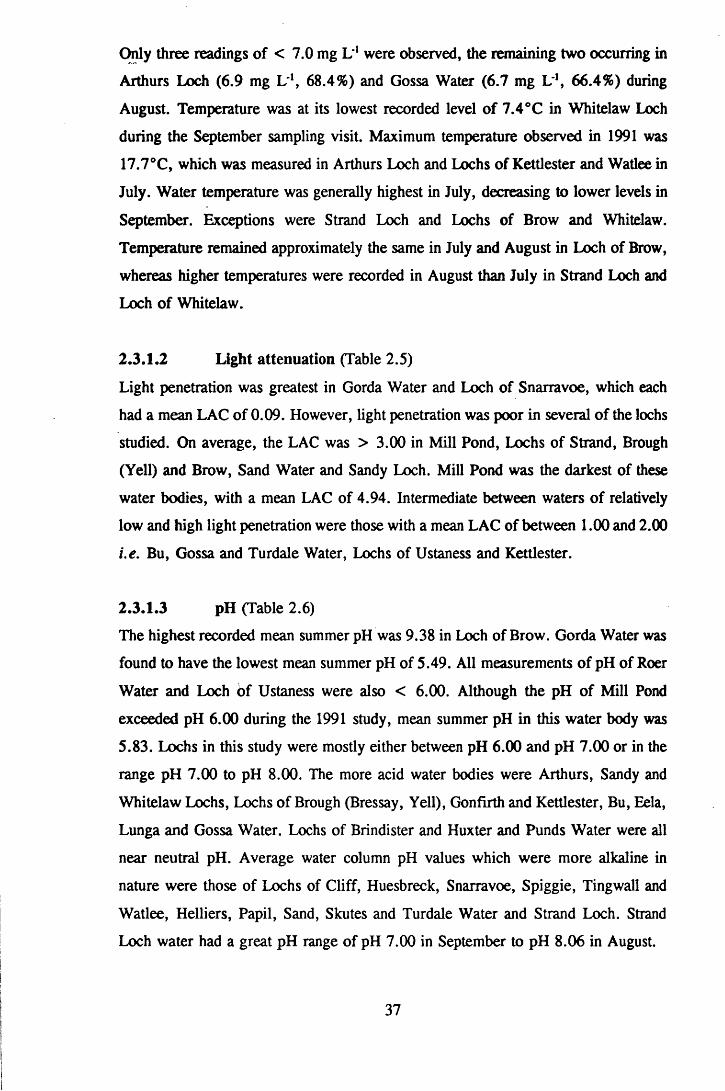
Only three readings of < 7.0 mg L* 1 were observed, the remaining two occurring in
Arthurs Loch (6.9 mg L*1, 68.4%) and Gossa Water (6.7 mg L~\ 66.4%) during
August. Temperature was at its lowest recorded level of 7.4°C in Whitelaw Loch
during the September sampling visit. Maximum temperature observed in 1991 was
17.7°C, which was measured in Arthurs Loch and Lochs of Kettlester and Watlee in
July. Water temperature was generally highest in July, decreasing to lower levels in
September. Exceptions were Strand Loch and Lochs of Brow and Whitelaw.
Temperature remained approximately the same in July and August in Loch of Brow,
whereas higher temperatures were recorded in August than July in Strand Loch and
Loch of Whitelaw.
2.3.1.2 Light attenuation (Table 2.5)
Light penetration was greatest in Gorda Water and Loch of Snarravoe, which each
had a mean LAC of 0.09. However, light penetration was poor in several of the lochs
studied. On average, the LAC was > 3.00 in Mill Pond, Lochs of Strand, Brough
(Yell) and Brow, Sand Water and Sandy Loch. Mill Pond was the darkest of these
water bodies, with a mean LAC of 4.94. Intermediate between waters of relatively
low and high light penetration were those with a mean LAC of between 1.00 and 2.00
i.e. Bu, Gossa and Turdale Water, Lochs of Ustaness and Kettlester.
2.3.1.3 pH (Table 2.6)
The highest recorded mean summer pH was 9.38 in Loch of Brow. Gorda Water was
found to have the lowest mean summer pH of 5.49. All measurements of pH of Roer
Water and Loch bf Ustaness were also < 6.00. Although the pH of Mill Pond
exceeded pH 6.00 during the 1991 study, mean summer pH in this water body was
5.83. Lochs in this study were mostly either between pH 6.00 and pH 7.00 or in the
range pH 7.00 to pH 8.00. The more acid water bodies were Arthurs, Sandy and
Whitelaw Lochs, Lochs of Brough (Bressay, Yell), Gonfirth and Kettlester, Bu, Eela,
Lunga and Gossa Water. Lochs of Brindister and Huxter and Punds Water were all
near neutral pH. Average water column pH values which were more alkaline in
nature were those of Lochs of Cliff, Huesbreck, Snarravoe, Spiggie, Tingwall and
Watlee, Helliers, Papil, Sand, Skutes and Turdale Water and Strand Loch. Strand
Loch water had a great pH range of pH 7.00 in September to pH 8.06 in August.
37

Table 2.5 Ranges of light attenuation coefficients and water colourdetermined in the surface waters of the 31 lochs of the 1991 survey
Water body
Arthurs Loch Bu Water Loch of Brindister Loch of Brough (Bressay)Loch of Brough (Yell)Loch of Brow Loch of Cliff Eela Water Loch of Gonfirth Gorda Water Gossa Water Helliers Water Loch of Huesbreck Loch of Huxter Loch of Kettlester Lunga Water Mill Pond Papil Water Punds Water Roer Water Sand Water Sandy Loch Skutes Water Loch of Snarravoe Loch of Spiggie Strand Loch Loch of Tingwall Turdale Water Loch of Ustaness Loch of Watlee Whitelaw Loch
KEY: * missing data
Light attenuation coefficientmin max mean
0.08 0.25 0.250.33 1.48 1.290.16 1.17 0.90
0.06 0.36 0.19
2.44 3.76 3.320.17 3.62 3.140.06 0.60 0.330.15 0.69 0.410 . 1 1 0.52 0.470.07 0.14 0.090.39 1.72 1.510.07 0.24 0.160.06 0.19 0 . 1 2
0.19 0.30 0.260.53 1.29 1.060.17 0.73 0.511.78 5.33 4.94
0 . 1 0 0.47 0.260 . 1 1 0.30 0.290 . 1 0 0.13 0 . 1 1
0.35 3.45 3.092.76 3.54 3.270.08 0.46 0.250.08 0.09 0.090 . 1 1 0.57 0.380.46 5.01 4.530.08 0.64 0.470.71 2.42 1.970 . 1 2 1.28 1 . 0 1
0 . 1 2 0.19 0.160.24 1.17 0.79
Water colour (absorbance at 400 nm)mm max mean
0.027 0.126 0.0690.340 0.401 0.3790.185 0.198 0.191
0.045 0.099 0.068
0.457 0.643 0.5270.079 0.125 0 . 1 0 0
0.106 0.186 0.1350.153 0.180 0.1640.114 0 . 1 2 2 0.1180.014 0.040 0.0270.275 0.323 0.2990.030 0.066 0.0460.141 0.166 0.1520.228 0.280 0.2460.272 0.417 0.3300.192 0.208 0 . 2 0 0
0.434 0.887 0.6100.044 0.079 0.056* * *0.048 0.118 0.0800.300 0.578 0.4590.490 0.530 0.5060.037 0.219 0 . 1 0 0
0.052 0.056 0.0540.057 0.064 0.0600.174 0.525 0.2980.063 0.068 0.0650 . 2 0 1 0.620 0.3550.105 0 . 1 1 0 0.1080.086 0.152 0.1080.142 0.305 0.229
38

Table 2.6 Summer water column pH and conductivity in the lochs of the 1991survey
Water body pHmin max
Arthurs Loch 6.54 6.90Bu Water 5.97 7.24Loch of Brindister 6.40 7.27Loch of Brough(Bressay) 6.39 6.62Loch of Brough(Yell) 5.96 6.83Loch of Brow 8.40 9.80Loch of Cliff 7.29 7.41Eela Water 6.13 6.56Loch of Gonfirth 6 . 2 0 6.52Gossa Water 6.35 6.71Gorda Water 5.09 5.82Helliers Water 6.78 7.44Loch of Huesbreck 7.70 7.88Loch of Huxter 6.30 7.48Loch of Kettlester 6.48 6.65Lunga Water 6 . 2 0 6.38Mill Pond 5.51 6 . 1 1
Papil Water 7.34 7.55Punds Water 6.56 7.06Roer Water 5.57 5.79Sand Water 6 . 8 8 7.23Sandy Loch 6.25 6.90Skutes Water 7.26 7.90Loch of Snarravoe 7.15 7.61Loch of Spiggie 7.44 7.94Strand Loch 7.00 8.06Loch of Tingwall 7.11 7.86Turdale Water 7.18 7.97Loch of Ustaness 5.64 5.67Loch of Watlee 7.53 7.64Whitelaw Loch 6 . 2 2 6.59
Conductivity (jiS cm"1)mean mm max mean
6.75 250 268 2616.84 317 340 3287.00 2 0 0 246 225
6.48 307 429 357
6.63 238 296 2739.38 441 463 4497.37 324 349 3346.41 194 206 1996.34 167 274 2056.51 259 266 2635.49 418 455 4387.30 269 319 2907.81 563 695 6337.07 298 331 3176.56 241 269 2596.27 2 2 1 228 2255.83 347 397 3667.35 342 369 3536.93 246 259 2515.69 164 181 1757.11 151 242 2056.77 241 255 2487.61 316 403 3687.48 364 396 3797.72 569 617 5947.80 256 17410 107957.72 328 380 3557.69 257 318 2955.65 227 252 2427.59 335 376 3526.38 176 195 188
39
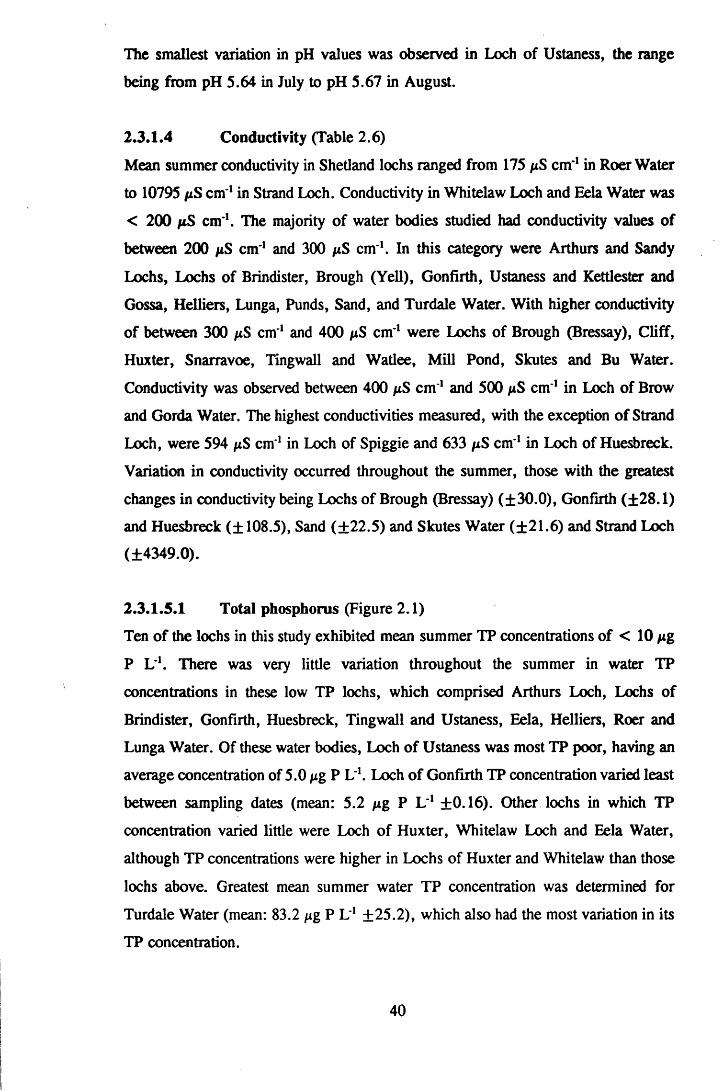
The smallest variation in pH values was observed in Loch of Ustaness, the range
being from pH 5.64 in July to pH 5.67 in August.
2.3.1.4 Conductivity (Table 2.6)
Mean summer conductivity in Shetland lochs ranged from 175 /xS cm' 1 in Roer Water
to 10795 fiS cm 1 in Strand Loch. Conductivity in Whitelaw Loch and Eela Water was
< 200 fiS cm'1. The majority of water bodies studied had conductivity values of
between 200 /xS cm' 1 and 300 /xS cm 1. In this category were Arthurs and Sandy
Lochs, Lochs of Brindister, Brough (Yell), Gonfirth, Ustaness and Kettlester and
Gossa, Helliers, Lunga, Punds, Sand, and Turdale Water. With higher conductivity
of between 300 /xS cm' 1 and 400 /xS cm 1 were Lochs of Brough (Bressay), Cliff,
Huxter, Snarravoe, Tingwall and Watlee, Mill Pond, Skutes and Bu Water.
Conductivity was observed between 400 /xS cm 1 and 500 /xS cm' 1 in Loch of Brow
and Gorda Water. The highest conductivities measured, with the exception of Strand
Loch, were 594 /xS cm' 1 in Loch of Spiggie and 633 /xS cm' 1 in Loch of Huesbreck.
Variation in conductivity occurred throughout the summer, those with the greatest
changes in conductivity being Lochs of Brough (Bressay) (±30.0), Gonfirth (±28.1)
and Huesbreck (±108.5), Sand (±22.5) and Skutes Water (±21.6) and Strand Loch
(±4349.0).
2.3.1.5.1 Total phosphorus (Figure 2.1)
Ten of the lochs in this study exhibited mean summer TP concentrations of < 10 /xg
P L'1. There was very little variation throughout the summer in water TP
concentrations in these low TP lochs, which comprised Arthurs Loch, Lochs of
Brindister, Gonfirth, Huesbreck, Tingwall and Ustaness, Eela, Helliers, Roer and
Lunga Water. Of these water bodies, Loch of Ustaness was most TP poor, having an
average concentration of 5.0 /xg P L'1. Loch of Gonfirth TP concentration varied least
between sampling dates (mean: 5.2 /xg P L ' 1 ±0.16). Other lochs in which TP
concentration varied little were Loch of Huxter, Whitelaw Loch and Eela Water,
although TP concentrations were higher in Lochs of Huxter and Whitelaw than those
lochs above. Greatest mean summer water TP concentration was determined for
Turdale Water (mean: 83.2 /xg P L' 1 ±25.2), which also had the most variation in its
TP concentration.
40

KEY TO FIGURES 2.1-2.8:
Loch name
Arthurs LochBu WaterEela WaterGorda WaterGossa WaterHelliers WaterLoch of HuxterLoch of BrowLoch of GonfirthLoch of SnarravoeLoch of SpiggieLoch of CliffLoch of Brough (Bressay)Loch of HuesbreckLoch of Brough (Yell)Loch of KettlesterLoch of WatleeLoch of BrindisterLoch of UstanessLoch of TingwallLunga WaterMiU PondPapil WaterPunds WaterRoer WaterSand WaterSandy LochSkutes WaterStrand LochTurdale WaterWhitelaw Loch
Loch Code
ABuEGorGosHelHuxBrGonSnSpCBBHueBYKWaBriUTiLMPaPuRSSySkStTuWh
41

Figure 2.1 Mean summer total phosphorus levels in the thirty one Shetland
lochs studied in 1991 (n=3)
Total phosphorus (jig P L'1)
o roo o 0 5O ooo oo
CD
CD
O
o
CD
£Z
CD
CO
\e\
CDcz
CDCD
CD
m
CDo
CD
~o05
ZD
CO
CO=3
CO
o/ t
"OZTOCO“Oz rocCO
cozrCD
05ZJp .
coCO
05
42

Sandy Loch, Mill Pond, Bu Water, Lochs of Brow and Brough (Yell), all exhibited
sufficient variation between sampling visits that the standard errors of the mean TP
concentrations coincided with those of Turdale Water, thus indicating the high TP
levels in these water bodies.
2.3.1.5.2 Total dissolved phosphorus (Figure 2.2)
Though present at lower concentrations, TDP levels followed a similar pattern to TP
concentrations. Generally, less variation of water TDP concentrations was evident
between sampling dates than had been in TP levels, although Turdale Water (mean:
59.2 fig P L 1 ±26.5), Strand Loch (mean: 11.8 fig P L' 1 ±3.0) and Mill Pond
(mean: 30.8 fig P L 1 ±3.5) exhibited high deviations from their mean values.
Average summer water TDP concentration was greatest in Turdale Water, followed
by Mill Pond and Sandy Loch (mean: 30.3 fig P L' 1 ±0.5), whilst Bu Water, Lochs
of Brough (Yell) and Brow also had elevated levels of TDP in comparison to the
remaining study sites. The lowest level of TDP was determined in Loch of Ustaness,
which had both the smallest summer average TDP concentration of 2.8 fig P L 1 and
the minimum individual TDP concentration for one sampling date of 1.5 fig P L'1.
Seven other lochs contained < 5 fig P L ' 1 on average, these water bodies being
Arthurs Loch, Lochs of Brindister, Gonfirth, Huesbreck and Watlee, Roer and
Helliers Water.
2.3.1.5.3 Dissolved reactive phosphorus (Table 2.7)
Generally, the concentration of DRP in the lochs studied was < 1 fig P L*1. There
were few exceptions. Li July, Eela and Gorda Water, Loch of Snarravoe and
Whitelaw Loch had DRP levels of 1.3 fig P V \ 2.9 fig P L*!, 4.1 fig P L* 1 and 2.4
fig P L 1 respectively. During September, DRP was again detected in Loch of
Snarravoe at 1.3 fig P L'1. In Turdale Water, DRP levels ranged from < 1 fig P L' 1
in July, to 90.8 fig P L' 1 in September.
2.3.1.6.1 Total oxidised nitrogen (Table 2.8)
The highest mean water column TON concentration in 1991 was 254 fig N L* 1 for
Loch of Gonfirth. Three other water bodies had mean TON of > 100 fig N L 1.
These were Roer Water, Sandy Loch and Loch of Ustaness which had average water
TON levels of 139 fig N L 1, 129 fig N L 1 and 144 fig N L* 1 respectively.
43

Figure 2.2 Meap summer total dissolved phosphorus levels in the thirty one
Shetland lochs studied in 1991 (n=3)
Total dissolved phosphorus (jxg P L'1}
i\j> cr> ooo o o o o
W -
WWCD-<
o - Q.-m co
COo
■ o cd — Q_
CP oCO
CO
m-a occoCOCD
-J O COCOCO
_C0
-CO3
-CO
-O-
44

Table 2.7 Range of dissolved reactive phosphorus concentrations present In the thirty one lochs studied in summer 1991 (n=3)
Site Range (in ng P L'1)
Arthurs Loch all < 1 . 0
Bu Water < 1 .0 -2 .9Loch of Brindister all < 1 . 0
Loch of Brough (Bressay) all < 1 . 0
Loch of Brough (Yell) all < 1 . 0
Loch of Brow all < 1 . 0
Loch of Cliff all < 1 . 0
Eela Water < 1 .0 - 1 .3Loch of Gonfirth all < 1 . 0
Gorda Water <1.0-2.9Gossa Water all < 1 . 0
Helliers Water all < 1 . 0
Loch of Huesbreck all < 1 . 0
Loch of Huxter all < 1 . 0
Loch of Kettlester all < 1 . 0
Lunga Water all < 1 . 0
Mill Pond all < 1 . 0
Papil Water all < 1 . 0
Punds Water all < 1 . 0
Roer Water all < 1 . 0
Sand Water all < 1 . 0
Sandy Loch all < 1 . 0
Skutes Water all < 1 . 0
Loch of Snarravoe < 1.0-4.1Loch of Spiggie all < 1 . 0
Strand Loch all < 1 . 0
Loch of Tingwall all < 1 . 0
Turdale Water <1.0-90.8Loch of Ustaness all < 1 . 0
Loch of Watlee all < 1 . 0
Whitelaw Loch <1.0-2.4
Note: limit of detection 1.0 fig P L'1)
45

Table 2.8 Range of total organic nitrogen concentrations present in the thirtyone lochs studied in summer 1991 (n=3)
Site Range (in jig N L'1)
Arthurs Loch <5-11Bu Water all < 5Loch of Brindister 80-85Loch of Brough (Bressay) all <5Loch of Brough (Yell) <5-51Loch of Brow all <5Loch of Cliff 7-13Eela Water 58-74Loch of Gonfirth 249-258Gorda Water all <5Gossa Water <5-17Helliers Water all <5Loch of Huesbreck <5-40Loch of Huxter <5-11Loch of Kettlester <5-82Lunga Water 82-116Mili Pond 13-161Papil Water <5-7Punds Water 18-20Roer Water 111-169Sand Water <5-18Sandy Loch 114-159Skutes Water all <5Loch of Snarravoe <15-10Loch of Spiggie all <5Strand Loch 40-87Loch of Tingwall <5-13Turdale Water <5-42Loch of Ustaness 134-154Loch of Watlee <5-13Whitelaw Loch <5-9
Note: limit of detection 5.0 /xg N L* 1
46

TON levels in Loch of Brindister, Eela and Lunga Water and Strand Loch were
greater than those of the remaining lochs with the exceptions of Turdale Water, Loch
of Kettlester and Mill Pond, each of which exhibited high variability in TON
concentration between sampling trips. The majority of water bodies in the 1991 study
were low in TON with twenty two lochs having an average TON concentration of <
20 fig N L'1. The lowest mean TON levels occurred in the following waters which
had mean summer TON concentrations of < 5 fig N L 1: Lochs of Brough (Bressay),
Brow, Snarravoe and Spiggie, Bu, Gorda, Helliers, Papil and Skutes Water.
2.3.1.6.2 Total ammoniacal nitrogen (Figure 2.3)
Generally, there was a high degree of variation in TAN concentrations in individual
lochs between sampling dates. Greatest mean summer TAN concentration was in Mill
Pond (Mean 103.0 ±55.7), followed by Turdale Water (Mean 101.0 ±32.7). Several
water bodies had mean TAN levels which were 20-40 fig N L* 1 i.e. were intermediate
in comparison with values for other lochs in the study. Loch of Brough (Yell) and
Punds Water exhibited average values of 63.0 fig N L' 1 ±0.9 and 55.7 fig N L' 1
±2.4, respectively, with little variation around the mean. Lochs of Brough (Bressay),
Brow, Huxter and Spiggie, Gorda, Gossa and Sand Water, Sandy and Strand Lochs
and Mill Pond also had intermediate mean TAN concentrations, but high variability
over the summer. Lowest mean summer TAN concentrations found for waters in the
study were for Arthurs Loch (16.0 fig N L 1 ±0.9), Loch of Ustaness (13.7 fig N L* 1
±2.0) and Roer Water (13.3 fig N L' 1 ±1.1), with little variation occurring through
the summer.
2.3.1.7.1 Calcium (Figure 2.4)
The highest mean Ca concentration (196.8 mg Ca L* 1 ±152.1) was calculated for
Strand Loch. The highest mean recorded for a water body which did not have a direct
sea water input was 68.5 mg Ca L 1 ±9.4 for Loch of Huesbreck. Lochs of Tingwall,
Brow and Spiggie and Turdale Water all had mean Ca concentrations which were
elevated compared to the remaining lochs, with the exception of Sand Water which
showed relatively high variability in its summer Ca concentration range. Twenty four
of the lochs studied had mean Ca concentrations of < 10 mg Ca L 1, lowest average
Ca levels being recorded in Loch of Ustaness and Whitelaw Loch, both of which had
mean Ca concentrations of 2.6 mg Ca L 1.
47

Figure 2.3 Mean summer total ammonical nitrogen levels in the thirty one
Shetland lochs studied in 1991 (n=3)
TAN (NHj+NHJ) (jig L)
O CDO f\J>o CDO
>CD
CDCDCDCD
-<CD
O
ooZD oOoco
CDdX
“D
cZD
CO
COZD
Id
C l
zr
C.t-f
OOZDOCDZJr -t03
o 'Z3CO
COz rCD♦*03ZJQ _
COCO
48

Figure 2.4 Mean summer calcium levels in the thirty one Shetland lochs
studied in 1991 (n=3)
Ca (mg L'1)
roo -F*.O CDO 00O OO
0 0
CDUD
0 0
CD
mo
CD
oco
X
CD
ZJ
COCDCO
CDCQ
OCD
CD
CD
O03OOZJoCD
4 • t
O13CO
CDzrCD
oTZJQ_
COCO
49

2.3.1.7.2 Magnesium (Figure 2.5)
The highest mean Mg concentration for summer 1991 was 177 mg Mg L' 1 ±252.1
for Strand Loch. There was much variation in Mg content of this water body between
July and September. Of the remaining lochs which had no direct sea water input,
Loch of Watlee had the highest mean water Mg concentration of 20.3 mg Mg L 1.
Lochs of Brow, Cliff, Huesbreck, Snarravoe and Spiggie, Helliers and Skutes Water,
all exhibited average water Mg levels of > 10 mg Mg L*1. Minimum average
summer water Mg concentration was 3.1 mg Mg L* 1 for Loch of Gonfirth, the
following lochs also having mean Mg levels of < 5.0 mg Mg L l: Arthurs and
Whitelaw Lochs, Lochs of Brindister and Ustaness, Eela, Roer and Sand Water.
2.3.1.7.3 Sodium (Figure 2.6)
Lochs of Brow, Huesbreck and Spiggie, Gorda Water and Mill Pond exhibited mean
summer Na concentrations which were > 40 mg Na L"1, although Na levels in Mill
Pond fell below this level in September. Maximum average Na concentration was
52.8 mg Na L' 1 for Loch of Spiggie. Five lochs were observed to have average Na
concentrations of < 30 mg Na L 1. These water bodies were Eela, Roer and Sand
Water, Whitelaw Loch and Loch of Gonfirth. Minimum calculated mean summer Na
concentration was 23.8 mg Na L ' 1 for Sand Water.
2.3.1.7.4 Potassium (Figure 2.7)
The following five lochs had mean summer K concentrations of > 2.0 mg K L"1: Bu,
Gorda and Turdale Water, Mill Pond and Loch of Spiggie. The latter exhibited the
maximum average water K level of 3.2 mg K L*1. Variation in K levels in Bu Water
and Mill Pond was such that the range of concentrations through the summer in these
lochs coincided with levels in water bodies with lower mean summer K concentrations
e.g. Lochs of Huesbreck, Huxter and Tingwall. Four lochs in the study had mean
summer K concentrations of < 1.0 mg K L'1. These water bodies comprised Loch
of Gonfirth (0.9 mg K L'1), Whitelaw Loch (1.0 mg K L*1), Roer (0.9 mg K L 1) and
Sand Water (1.0 mg K L'1).
50

Figure 2.5 Mean summer magnesium levels in the thirty one Shetland lochs
studied in 1991 (n=3)
Mg(mgL‘1)
O noocoo o cno
>
co
CD-<
o
ooZJ
Ooco
co
~D
CD
CO
CD"O
(E)
© •
CD
0
O
0
■
0
<D
0
©
©
i e i
a ■
®
ae
mean
=
'©
<D
e
b
0
©
i e i
a
3(Q
CQ
©
©
0a
0_l_____ a____ M. A t -A--- 1 1 1 1 1____ A---- * . 4_____1 . * 1
CDcz
CD□ 3
CD
m
oo
zrCD
IEcX
“D0 )
DO
CD
CD
CD
(QOO13OCDZJ
CDt to'ZJCOCDZ3"CD
65"ZJQ_COCO
CD
51

Bri BY
C Gon
Gos Hue
Figure 2.6 Mean summer sodium levels in the thirty one Shetland lochs
studied in 1991 (n=3)
Na (mg L'1)
ro go cji CDo o o o o
\Q\>CDd
CDCD
I-0H
o
CD
ax
CDCD
CD
CD
— I
c
zr
52
Na concentrations. Shetland
1991

Figure 2.7 Mean summer potassium levels in the thirty one Shetland lochs
studied in 1991 (n = 3)
K t rrq L ' 1)
o \>
>rJ0hen
330 0
o
oc
c
C r>
GO31
—i
53
oo
ncentialions,
Shetland
1991

23 .1 .8 Colour (Table 2.5)
Water colour at 400nm ranged from 0.014 in Gorda Water to 0.887 in Mill Pond.
Other lochs which exhibited at least one colour reading of <0.100 were Arthur’s
Loch, Helliers, Papil, Roer and Skutes Water, Lochs of Brough (Bressay), Snarravoe,
Spiggie, Tingwall and Watlee. Water colour of >0.400 was observed in several
water bodies: Lochs of Brough (Yell) and Kettlester, Bu, Turdale and Sand Water,
Strand and Sandy Lochs and Mill Pond.
23 .1 .9 Chlorophyll a (Figure 2.8)
Lochs with higher mean summer chi a levels tended to exhibit greater variability in
chi a concentrations through the summer than those which were observed to have low
levels. Although seven lochs had mean chi a concentrations of > 8 /xg chi d L'1, only
those of Lochs of Spiggie and Brow resulted from determinations of chi a which all
exceeded this level. Chi a concentration in the other water bodies of Lochs of Brough
(Yell), Huesbreck and Cliff, Turdale Water and Mill Pond was < 8 fig chi a L' 1
during at least one sampling trip. The highest mean water chi a concentration was
19.2 fig chi a L' 1 for Loch of Brow. Second to this was 16.8 fig chi a L* 1 for Turdale
Water. Lochs with intermediate average levels of chi a (2.5-8.0 fig chi a L 1), but
which were recorded as being variable in chi a concentration between July and
September were Strand and Sandy Lochs, Papil, Punds and Bu Water and Loch of
Tingwall. Minimum average chi a concentration was 1.2 fig chi a L"1, observed in
Roer Water. Arthurs Loch, Loch of Gonfirth and Helliers Water also had mean chi
a levels of < 2.0 fig chi a L 1.
23 .2 Water chemistry and physical characteristics of the five Shetland
lochs studied in 1992 and 1993
The following water bodies were selected for further study as they represented a
range of water column conditions: Loch of Gonfirth, Helliers Water. Loch of
Tingwall, Sandy Loch, Turdale Water.
54

Figure 2.8 Mean summer chlorophyll a levels in the thirty one Shetland
lochs studied in 1991 (n=3)
Chlorophyll-a (|ig L"1)
_ j . _ i . r o r o o cji o cji o c n
>CDc
0 3
CD03CD-<
CD
Om
OoZD oCDoco
CD
CD
X
hen~ucz
ZD
COCO
CO7TCO
COTD
CO
—Icz
cz
55
Chlorophylla Shetland
1991

2.3.2.1 Bathymetry of the five study lochs of 1992 and 1993
Figures 2.9 and 2.10 present maps of the bathymetry of the five study lochs of 1992
and 1993. Table 2.9 shows characteristics of the five study lochs. The shallowest
water body was Turdale Water, which was of relatively uniform depth, having a
mean depth of 0.9 m. This basin also had the lowest volume of water (58,951 m3).
Helliers Water had the smallest catchment and loch surface area, but had a maximum
depth of 2.3 m. The combined volume of the two basins of Loch of Tingwall
accounted for the highest volume of water of the five lochs (1,971,770 m3). Loch of
Gonfirth was the deepest water body, mean and maximum depths being 7.8 and 25.5
m respectively. Despite the depth of Loch of Gonfirth, the surface area of Sandy
Loch (41.4 ha) meant that the latter was of greater volume.
2.3.2.2 Dissolved oxygen and temperature profiles in the five study lochs
during 1992 and 1993
Generally, there was little or no difference in temperature and DO from surface to
deep water at the sites. No evidence for stratification was observed in Helliers Water,
Turdale Water or Sandy Loch. Profiles exhibiting greatest changes in DO
concentration and temperature with depth are presented in Tables 2.10 and 2.11.
Owing to instrument malfunction, no readings of DO are available for the August
1992 field visit to Loch of Tingwall. However, temperature remained constant
throughout the water column. Greatest changes in temperature and DO concentration
in the water column of Loch of Tingwall were noted in July 1993. At Site 1, DO and
temperature decreased by only 0.72 mg DO L* 1 and 0.4°C respectively. DO was
supersaturated at all depths. However, between surface and 20 m depth at Site 2, DO
was diminished by 4.05 mg DO V 1 and temperature decreased by 2.2°C. DO
saturation decreased from 115% at surface, to 715 in deep water. Greatest change in
temperature and dissolved oxygen occurred between 13 m and 15 m depth (Table
2.10). In Loch of Gonfirth during June 1992 and July 1993, a discontinuity was noted
in DO concentration between 13 m and 15 m depth. Temperature change from surface
to 20 m depth was 1°C in June 1992 and 1.4°C in July 1993. Diminution of DO
concentration from surface to 20 m depth was 2.03 mg DO L' 1 (21%) in June 1992
and 1.08 mg DO L 1 (13%) during July 1993 (Table 2.11).
56

Figure 2.9 Bathymetric maps of Loch of Gonfirth, Helliers and Turdale
Water (depths in metres)
eo
57
Loch
of
Gon
firt
h
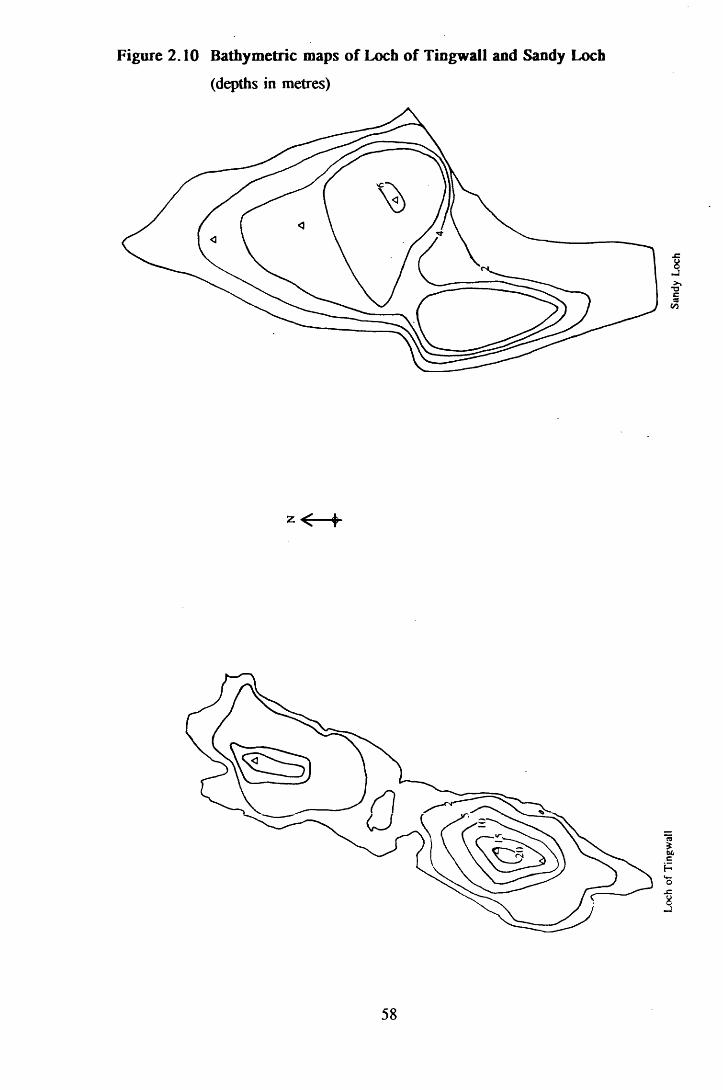
Figure 2.10 Bathymetric maps of Loch of Tingwall and Sandy Loch
(depths in metres)
58
Loch
of
Tin
gwal
l

Table 2.9 Physical characteristics of the five lochs studied in 1992 and 1993
Water body Catchment Loch Loch Max Meanarea (ha) surface volume depth depth
area (ha) (m3) (m) (m)
Helliers Water 40.8 4.4 61,092 2.3 1.4
Loch of Gonfirth 63.6 14.6 1,131,100 25.5 7.8
Loch of Tingwall 309.6 46.3 1,971,770 22.5 4.3
Sandy Loch 287.3 41.4 1,503,058 7.9 3.6
Turdale Water 92.7 6.4 58,951 1.5 0.9
59

Table 2.10 Temperature and dissolved oxygen concentration profiles exhibiting incomplete mixing of the water column of Loch of Tingwall (26/07/93)
Site
1 (North Basin)
2 (South Basin)
Depth Temperature Dissolved oxygen(m) (°Q (mg 0 2 L-1) ( % saturation)
0 14.2 11.38 111.11 14.3 11.42 111.72 14.4 11.49 112.63 14.2 11.42 111.54 14.0 11.32 110.05 14.0 11.12 108.17 13.9 11.04 107.19 13.8 10.87 105.1
10 13.8 10.66 103.1
0 14.8 11.59 114.61 14.6 11.67 115.02 14.4 11.50 112.73 14.1 11.42 111.24 14.0 11.35 110.35 13.9 11.38 110.47 13.8 11.18 108.19 13.7 11.02 106.4
11 13.5 10.86 104.413 13.2 10.01 95.615 12.8 9.11 86.217 12.6 8.46 79.719 12.5 7.71 72.520 12.6 7.54 71.0
60

Table 2.11 Temperature and dissolved oxygen concentration profiles showing incomplete mixing in Loch of Gonfirth (Site 2)
Date
23/06/92
25/07/93
Depth Temperature Dissolved oxygen(m) (°C) (mg 0 2 L*1) (% sati
0 12.3 10.85 101.51 12.3 10.83 101.32 12.3. 10.82 101.23 12.3 10.86 101.64 12.3 10.90 102.05 12.3 10.90 102.07 12.1 10.86 100.99 12.1 10.87 101.0
11 11.9 10.73 99.413 11.6 10.72 98.715 11.5 8.87 81.517 11.4 8.76 80.319 11.4 8.63 79.120 11.3 8.82 80.6
0 12.2 11.06 103.21 12.1 11.11 103.42 12.1 11.09 103.33 12.0 11.08 103.04 12.0 11.08 103.05 12.0 11.09 103.17 12.0 11.10 103.29 11.9 11.09 102.8
11 11.9 11.03 102.213 11.9 11.01 102.015 11.5 10.85 99.617 11.1 10.43 94.919 10.9 10.12 91.720 10.8 9.98 90.2
61
23.2.3 pH, conductivity and alkalinity of waters in 1992 (Table 2.12)
Mean water column pH in Loch of Gonfirth ranged from pH 6.04 in March to pH
6.30 in June. Average water alkalinity in this loch showed its minimum of 0.09 meq
L ' 1 in March, buffering capacity being greatest during August and October, when
alkalinity was 0.11 meq L'1. In contrast, the highest mean water column conductivity
of 222 fiS cm 1 was recorded in May, the lowest of 173 jtS cm' 1 in October.
In Helliers Water mean pH ranged from pH 6.42 in October to pH 6.87 during May.
Highest mean alkalinity was measured as 0.70 meq L ' 1 in August, lowest average
a l k a l i n i t y being 0.14 meq L 1 in March samples. The highest conductivity of 350 fiS
cm' 1 was also detected in August, whilst the minimum of 252 ftS cm' 1 was recorded
in May.
Average water column pH in Loch of Tingwall remained > pH 7.00 throughout the
sampling program, ranging from pH 7.52 in June to pH 8.00 in May. Compared with
the South Basin, variation in pH was more extreme in the North Basin, where mean
pH values extended from pH 7.25 in October, to pH 8.15 in May. Mean conductivity
measured for both basins was 362 jxS cm' 1 in March and 377 /*S cm' 1 in August.
Again, more extreme mean conductivity values of 352 fiS cm' 1 (March) and 377 /xS
cm' 1 (October) were recorded for the North Basin. Mean alkalinity for Loch of
Tingwall ranged from 1.06 meq L' 1 in May to 1.75 meq L ' 1 in August. Greater
variability was noted in the South Basin than the North Basin, maximum and
minimum values in the former being 1.76 meq L 1 (August) and 0.94 meq L* 1 (May)
respectively.
In Sandy Loch, mean water column pH was greatest in May (pH 7.09) and lowest in
June (pH 6.79). Minimum conductivity measured was 257 jxS cm' 1 in May, the
highest mean conductivity of 271 /xS cm 1 subsequently being observed in August.
Water buffering capacity was poorest in March, when average alkalinity was 0.26
meq L'1. During October, alkalinity was at its highest level (0.38 meq L 1).
62

Table 2.12 Mean water column pH, conductivity and alkalinity ranges of the five study sites, 1992
Site pH Conductivity Alkalinity(/zS cm'1) (meq L 1)
Loch of Gonfirth 6.04-6.30 173-222 0.09-0.11
Helliers Water 6.42-6.87 252-350 0.14-0.70
Loch of Tingwall 7.52-8.00 362-377 1.06-1.75(both basins)
Sandy Loch 6.79-7.09 257-271 0.26-0.38
Turdale Water 6.50-9.30 256-334 0.26-1.33
63

Great variation occurred in mean water column pH values for Turdale Water, ranging
from pH 6.50 during October to pH 9.30 in June. Mean conductivity readings varied
from 256 /xS cm' 1 in March to 334 /xS cm' 1 in August. Mean alkalinity was also
highly variable, ranging from 0.26 meq L 1 in March to 1.33 meq L ' 1 in August.
2.3.2.4 Phosphorus and chlorophyll a concentrations of lochs and their
inflows in 1992
Changes in TP, TDP, DRP and chi a concentrations over time are presented in
Figures 2.11-2.20. These figures represent the water column parameter mean ± 2
s.e. for each sampling date.
2.3.2.4.1 Loch of Gonfirth
Average water column TP concentration changed little from March to June sampling
dates. Maximum recorded TP level was 4.9 /xg P L' 1 in May. This decreased to a
minimum of 3.4 /xg P L' 1 determined in samples taken in October. Mean water
column TDP concentration was observed to decrease from 3.2 /xg P L' 1 during March
to 1.3 fig P L 1 in October, greatest change occurring between March and May, when
TDP was present in the water column at 2.3 /xg P L' 1 (Figure 2.11). Concentration
of DRP in water from Loch of Gonfirth was < 1 /xg P L' 1 in every sample analysed.
Mean water column chi a concentration increased from its minimum level of 0.5 /xg
chi a L* 1 in March to peak chi a content of 1.8 /xg chi a L' 1 in May (Figure 2.12).
From May to October average water column chi a concentration decreased to 1.3 /xg
chi a L*1. Chi a content therefore exhibited a similar pattern to TP concentration
during 1992.
2.3.2.4.2 Loch of Gonfirth inflow waters (Table 2.13)
Maximum recorded TP concentration of a Loch of Gonfirth inflow was 23.9 /xg P L'1,
determined for Inflow 3 during May. A relatively high TP concentration was also
found in Inflow 5 at this time (15.6 /xg P L'1). Least TP was present in Inflow 1 in
May (5.3 /xg P L 1). During June, only Inflow 6 had sufficient water flow to allow
sampling. TP was determined at 5.3 /xg P L' 1 in this inflow. In August TP
concentration ranged from 7.2 /xg P L 1 in Inflow 1 and Inflow 6 to 9.1 /xg P L 1 in
Inflow 3.
64
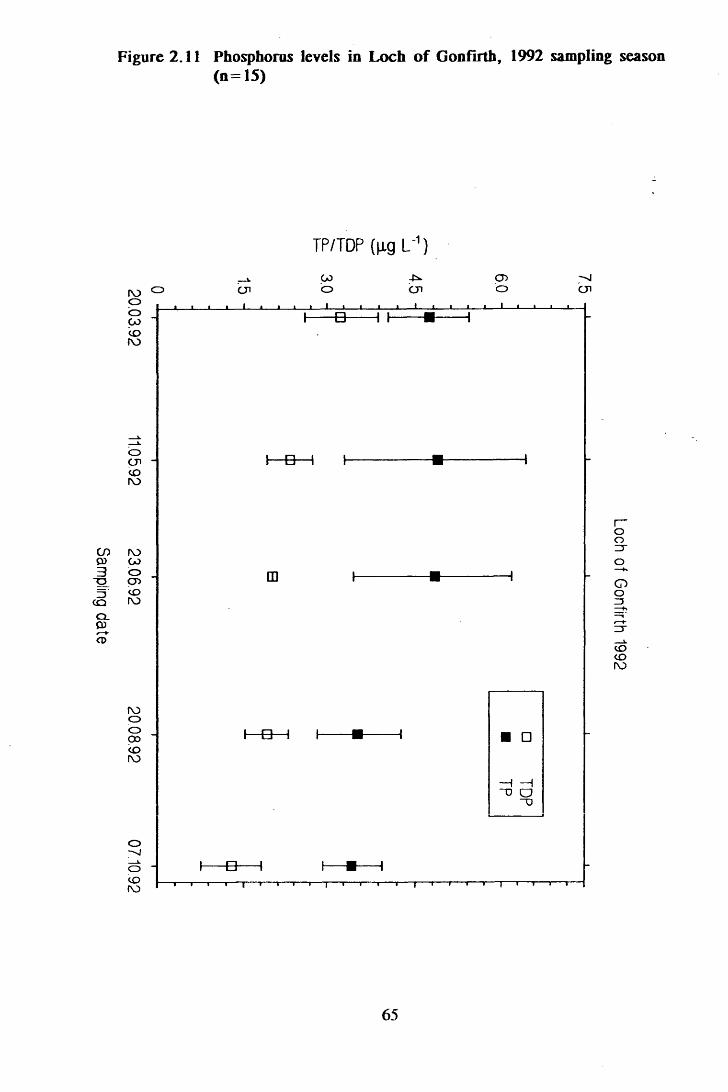
20.03.92 11.0592
23.06.92 20.08.92
071092
Sampling date
Figure 2.11 Phosphorus levels in Loch o f Gonfirth, 1992 sampling season(n=15)
TP/TDP (M-g L'1)
CJlGOO CJl
CDO-nICJl
65
Loch of
Gonfirth 1992

Sampling date
Figure 2.12 Chlorophyll a levels in Loch of Gonfirth, 1992 sampling season(n =15)
Chlorophyll a (jxg L'1)
O _ k T O JOw O CJl < o CJl o C J looCO<oro
\e\
C DCJlCOro
rocooCT>COro
roooODcoro
66
Loch of
Gonfirth 1992

Table 2.13 Inflow water quality for the five study lochs, 19512 (all data reported as /xg P L 1)
(site details given on Figure 3.1)
Loch of Gonfirth
Site I n i In 2 In3 In 4 In5 In 6Date20.03.92
TPTDP no samples takenDRP
11.05.92TP 5.3 8.5 23.9 7.8 15.6 n.s.TDP 3.3 4.6 11.0 6.5 8.4DRP
23.06.92n.d. n.d. n.d. n.d. n.d.
TP n.s. n.s. n.s. n.s. n.s. 5.3TDP 2.7DRP
20.08.92n.d.
TP 7.2 n.s. 9.1 n.s. n.s. 7.2TDP 4.0 6.5 6.5DRP
07.10.92n.d. n.d. n.d.
TP 5.9 n.s. n.s. 3.4 5.9 7.8TDP 5.9 1.5 4.7 4.7DRP n.d. n.d. n.d. n.d.
67

Table 2.13 (cont.)Helliers Water
Site I n i In 2 In 3Date19.03.92
TPTDP no samples takenDRP
12.05.92TP 7.8 16.8 n.s.TDP 3.3 2 . 0
DRP20.06.92
n.d. n.d.
TP n.s. n.s. 10.4TDP 5.9DRP
21.08.92n.d.
TP 4.0 3.4 n.s.TDP 1.4 1.4DRP
10.10.92n.d. n.d.
TP 2.7 2.7 n.s.TDP n.s. 1.5DRP n.d. n.d.
Sandy Loch
Site In 1 In 2 In 3Date21.03.92
TPTDPno samples taken DRP
10.05.92TPTDPno samples taken DRP
23.06.92TP 47.7 n.s. n.s.TDP 32.0TY D D
19.08.92n.d.
TP 48.0 32.1 n.s.TDP 35.9 16.1DRP
06.10.92n.d. n.d.
TP 64.3 35.7 19.2TDP 54.2 29.1 14.1DRP 1 2 . 0 n.d. n.d.
68

Table 2.13 (cont.)Loch of Tiiigwall
Site I n i In 2 In 3 In 4 In 5Date22.03.92
TPTDPno samples taken DRP
13.05.92TP 49.6 14.3 14.3 2 . 1 9.8TDP 39.0 9.7 6.5 n.s. n.s.DRP
19.06.92n.d. n.d. n.d. n.d. n.d.
TP 31.0 18.8 36.1 n.s. 13.6TDP 2 1 . 8 n.s. 1 2 . 2 1 1 . 6
DRP22.08.92
n.d. n.d. n.d. n.d.
TP 27.0 12.3 n.s. n.s. 11.7TDP 19.9 1 1 . 0 9.7DRP
08.10.92n.d. n.d. n.d.
TP 41.4 19.9 n.s. n.s. 9.7TDP 27.3 14.1 6 . 6
DRP 3.8 n.d. n.d.
Turdale Water
Site In 1 In 2 In 3 In 4 In :Date18.03.92
TPTDP no samples takenDRP
12.05.92TP 2223 172 904 1223 n.s.TDP 1464 150 892 1059DRP
18.06.92971 97 352 733
TP n.s. 1 2 0 . 0 n.s. n.s. 16.2TDP 97.7 9.7n n nl y i v t
21.08.92n.d. n.d.
TP n.s. 66.5 n.s. n.s. 18.0TDP 51.2 13.6DRP
09.10.92n.d. n.d.
TP 20.9 119.0 561.0 n.sl336.0TDP 12.9 1 1 1 . 0 n.s. n.s.DRP n.d. 69.9 503.4 n.s.
69

The depths of remaining inflows were too shallow for samples to be taken. During
October, Inflow 4A exhibited a concentration of 3.4 fig P L*1. This was the lowest
TP concentration determined in Loch of Gonfirth inflow waters. Maximum TP
concentration of waters collected at this time was 7.8 /zg P L' 1 in Inflow 6 . Greatest
TDP levels were found in the same samples as highest TP concentrations. During
May, Inflow 3 and Inflow 5 contained 11.0 fig TDP L* 1 and 8.4 fig TDP L* 1
respectively, whereas lowest TDP levels in May were observed in Inflow 1 (3.3 fig
P L*1). During June TDP concentration was 2.7 fig P L* 1 in Inflow 6 and a relatively
restricted range was noted in August, from 4.0 fig P L 1 (Inflow 1) to 6.5 fig P L' 1
(Inflow 3 and Inflow 6 ). As with TP, Inflow 4A during October accounted for the
lowest recorded concentration of TDP of 1.5 fig P L'1, whilst Inflow 5 and Inflow 6
were each observed to have 4.7 fig TDP L"1, the maximum TDP level for this
sampling visit.
2.3.2.43 Helliers Water
At 4.8 fig P L"1, mean water column TP concentration was low during March and
August. Two peaks were also observed in TP levels, the greater of 9.8 fig P L* 1
during May, the other of 7.0 fig P L* 1 in October (Figure 2.13). Average water
column TDP concentration did not follow the same pattern as exhibited by TP. Little
change in TDP levels occurred between sampling dates. Mean concentration increased
from 2.9 fig P L* 1 in March to the maximum level of 3.3 fig P L 1 during May and
June. Greatest change was observed from June to August, when TDP concentration
decreased to its lowest value of 2.1 fig P L"1. October levels were similar to those
found in March. No P was detected in the DRP form in any of the samples collected
(Figure 2.13). From 1.9 fig chi a L' 1 March, mean water column chi a concentration
decreased to 0.9 fig chi a L' 1 in May (Figure 2.14). In comparison, chi a levels were
elevated in June, average water concentration being 2.7 fig chi a L'1. Maximum levels
were detected in the October samples. From a concentration of 1.8 ug chi a L' 1 in
August, chi a levels rose to 3.9 fig chi a L'1.
70

Sampling date
Figure 2.13 Phosphorus levels in Helliers Water, 1992 sampling season (n=3)
TP/TDP (jxg L'1}
—1 .0 oo roc£>
roocjiCOro
roooCDCOro
HI
o0 0
COroH ■ □
oH i
71
Helliers W
ater 1992

190392 1205.92
20.0692 210892
10.10.92
Sampling date
Figure 2.14 Chlorophyll a levels in Helliers Water, 1992 sampling season(n=3)
Chlorophyll a [\ig L'1)
ro g o
72
Helliers W
ater 1992

2.3.2.4.4 Helliers Water inflow waters (Table 2.13)
Shortage of water during summer resulted in SIC pumping water from Loch of
Watlee to Helliers Water. Although transference of water occurred intermittently from
May to August, the inflow from Loch of Watlee was in operation during the June
survey only. TP and TDP concentrations in this inflow (Inflow 3) were determined
as 10.4 /xg P L* 1 and 5.9 fig P L 1 respectively. At this time, Inflow 1 and Inflow 2
had insufficient flow to allow collection of water samples. Concentration of TP in
these inflows decreased from March to October, when TP level in each was 2.7 fig
P L'1. Maximum concentrations of TP were 7.8 /xg P L' 1 and 16.8 fig P L* 1 in Inflow
1 and Inflow 2 respectively. TDP concentrations in Inflow 1 ranged from 1.4 /xg P
L 1 in August to 3.3 /xg P L' 1 during May. TDP level in Inflow 2 also ranged from
1.4 fig P L* 1 in August to 2.0 /xg P L* 1 in May. DRP concentration was < 1 /xg P L 1
in all inflow water samples analysed.
2.3.2.4.5 Loch of Tingwall
Mean water column TP concentration decreased in both North and South Basins from
March to October. In the North Basin, maximum and minimum average TP levels
were 20.6 /xg P L 1 and 10.5 /xg P L* 1 respectively. Mean water TP concentration
range in the South Basin was from 14.7 /xg P L*! down to 8.5 /xg P L" 1 (Figure 2.15).
Mean range for both basins combined was 16.4 /xg P L* 1 to 9.1 /xg P L'1. Mean water
column chi a concentration in Loch of Tingwall North Basin decreased from 8 . 8 /xg
chi a L' 1 in March to levels between 3.6 /xg chi a L* 1 and 4.2 /xg chi a L' 1 during the
other sampling visits. South Basin chi a concentrations decreased from 8.1 /xg chi a
L' 1 in March to 1.9 /xg chi a L 1 during May. From this minimum concentration, chi
a levels increased to 5.7 /xg chi a L ' 1 in June. During August and October, chi a
concentration remained at 4.0 /xg chi a L 1. Average chi a range for the entire loch
was from 8.3 /xg chi a L 1 in March to 2.5 /xg chi a L' 1 in May (Figure 2.16).
2.3.2.4.6 Loch of Tingwall inflow waters (Table 2.13)
The greatest concentration of TP determined for Loch of Tingwall inflow waters was
49.6 fig P L’ 1 in Inflow 1 during May. Inflow 4 exhibited a TP concentration of only
2.1 fig P L' 1 at this time, which was the minimum measured. In June, greatest TP
concentration of 36.1 /xg P L' 1 was found in Inflow 3A, Inflow 5 having the lowest
TP concentration at this time of 13.6 /xg P L 1.
73
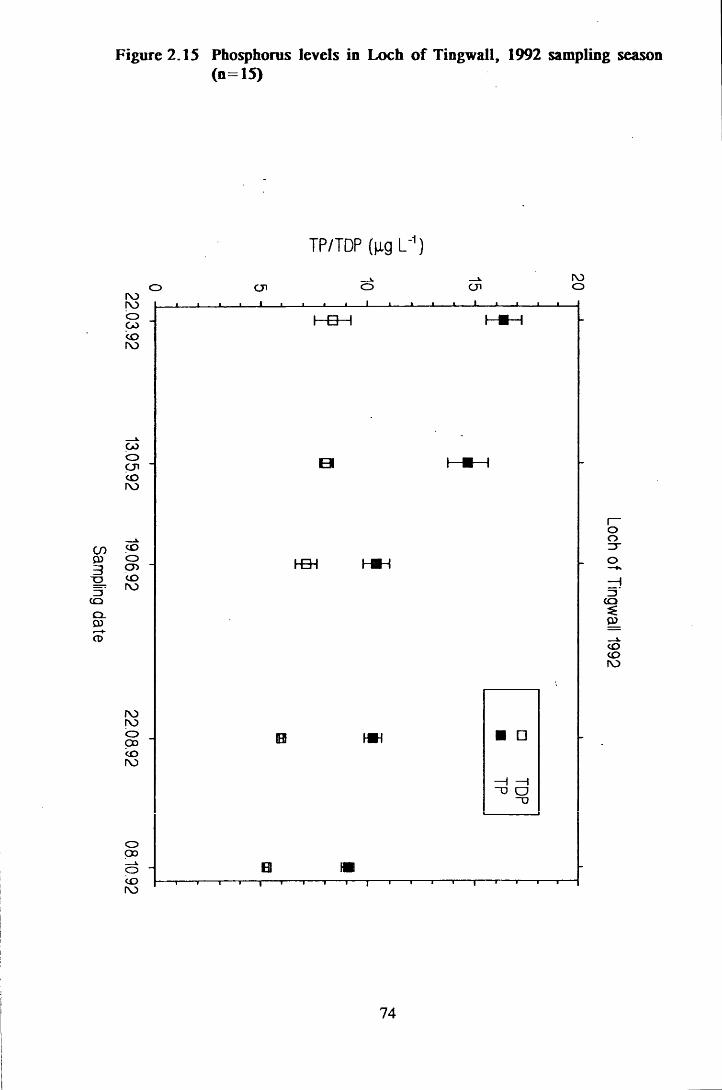
Sampling date
Figure 2 .IS Phosphorus levels in Loch o f Tingwall, 1992 sampling season(n=15)
TP/TDP (|ig L'1)
_x _s. roo cn o cji ororoCD
COCDCJICOro
Bl
roroCDCDCOro
■ □
CDCD
74
Loch of
Tingwall 1992

Sampling date
Figure 2.16 Chlorophyll a levels in Loch of Tingwall, 1992 sampling season(n=15)
Chlorophyll a (jig L'1)
o ro -fc- CD oo oro
COocnro
toocr>t oro
roroocot oro
1 0 1
oCo
\Q\
15
Loch of
Tingwall 1992

Of samples taken during August and October, TP content was highest in Inflow 1 and
lowest in Inflow 5. TP levels ranged from 11.7 fig P L 1 to 27 ^g P L* 1 in August and
9.7 fig P L' 1 to 41.4 fig P L* 1 in October. TDP levels detected in samples taken in
May were greatest in Inflow 1 (39.0 fig P L 1) and least in Inflow 4 (0.9 fig P L"1).
As with TP concentrations, samples from Inflows 1 and 4 demonstrated the extremes
of TDP levels for all the Loch of Tingwall inflow samples analysed. The following
ranges of TDP concentrations were observed in inflow water of the remaining
determinations: 11.6 fig P L* 1 to 31 fig P L 1 (June), 9.7 fig P L l to 27 fig P L' 1
(August), 6 . 6 fig P L* 1 to 41.4 fig P L* 1 (October). DRP was < 1 fig P L' 1 in all
inflow samples analysed in May, June, August and October, with the exception of
Inflow 1, which had a DRP concentration of 3.8 fig P L 1 during October.
2.3.2.4.7 Sandy Loch
Average water column TP concentration in Sandy Loch was 33.6 fig P L' 1 during
March, decreasing to 24.8 fig P L* 1 in June. From this level, mean water column TP
then increased to 32.3 fig P L' 1 in October (Figure 2.17). Average TDP levels
decreased from 24.3 fig P L* 1 in March to a minimum of 12.9 fig P L' 1 in May. Mean
TDP concentration then increased to the maximum of 25.2 fig P L* 1 in October.
During October, DRP was detected at levels of 2.7 fig P L' 1 and 1 fig P L' 1 in surface
samples from Site 1 and Site 2. Two peaks were noted in chi a concentrations in
Sandy Loch water samples (Figure 2.18). The first of 8.1 fig chi a L* 1 occurred in
May, the second of 11.6 fig chi a L 1 in August. Lowest mean chi a concentration of
2.7 fig chi a L 1 was detected in October.
2.3.2.4.8 Sandy Loch inflow waters (Table 2.13)
In samples taken from Inflow 1, TP concentration ranged from 47.7 fig P L 1 in June,
to 64.3 fig P L* 1 in October. TP concentrations determined in the two samples taken
of Inflow 2 waters were 32.1 fig P L' 1 and 35.7 fig P L* 1 for August and October,
respectively. The October sampling of Inflow 3 exhibited a TP level of 19.2 fig P L'1,
of which TDP constituted 14.1 fig P L'1. TDP concentration in Inflow 1 ranged from
32.0 fig P L' 1 in June to 54.2 fig P L 1 in October, whilst that in Inflow 2 was present
at 16.1 fig P L 1 and 29.1 fig P L' 1 in August and October respectively.
76

21.03.92 10.05.92
23.06.92 19.08.92
061092
Sampling date
Figure 2.17 Phosphorus levels in Sandy Loch, 1992 sampling season (n=8)
TP/TDP/DRP (jig L'1)
rooGOO 4O
O
—I —I O “O O 33 "D "O
77
Sandy Loch
1992

210392 10.05.92
230692 19.08.92
06.10.92
Sampling date
Figure 2.18 Chlorophyll a levels in Sandy Loch, 1992 sampling season (n=8)
Chlorophyll a (fig L'1)
CJI O CJI
78
Sandy Loch
1992

2.3.2.4.9 Turdale Water
Commencing at 159.0 /xg P L* 1 in March, mean water column TP concentration
increased to a maximum of 203.4 /xg P L 1 in May. TP levels were then depleted to
36.5 /xg P L 1 in August, before increasing once more to 127.4 /xg P L* 1 in October
(Figure 2.19). TDP concentrations followed a similar pattern to TP levels, exhibiting
maximum (134.2 /xg P L*1) and minimum (23.1 /xg P L*1) concentrations in May and
August respectively. Mean water column DRP concentration increased from 68.1 /xg
P L*1 in March to 115.4 /xg P L* 1 in May, but was below the limit of detection of 1.0
/xg P L 1 during June and August. However, DRP returned to a mean level of 46.7
M g PL * 1 in October (Figure 2.19). Mean chi a levels in Turdale Water increased from
12.1 Mg P L* 1 to 284.6 fig P L* 1 in June. Minimum chi a concentration of 5.2 fig chi
a L* 1 was observed in August, after which chi a increased to 9.7 fig chi a L* 1 in
October (Figure 2.20).
2.3.2.4.10 Turdale Water inflow waters (Table 2.13)
Maximum recorded TP concentration in Turdale inflow water was 2.22 mg P L* 1 in
Inflow 1 during May. Lowest TP concentration detected at this time was 172.3 fig P
L* 1 in Inflow 2. In June, Inflow 2 and Inflow 5 exhibited concentrations of 120.3 fig
P L* 1 and 16.2 fig P L* 1 respectively, the latter being the minimum TP level recorded
in a Turdale inflow in 1992. In August TP had decreased to 66.5 fig P L* 1 in Inflow
2, but increased to 18.0 fig P L* 1 in Inflow 5. TP content of samples collected in
October ranged from 20.9 fig P L* 1 in Inflow 1 to 1.34 mg P L* 1 in Inflow 5. TDP
concentration in May ranged from 149.9 fig P L* 1 in Inflow 2 to 1.46 mg P L* 1 in
Inflow 1. The latter TDP concentration was the highest recorded TDP level in
Turdale inflow waters during 1992. In samples of Inflow 2 and Inflow 5 collected in
June, TDP contents were found to be 97.7 fig P L* 1 and 9.7 fig P L ' 1 respectively,
whilst in August the corresponding values were 51.2 fig P L* 1 and 13.6 fig P L*1.
Greatest TDP concentration in October occurred in the Inflow 3 sample (545.2 fig P
L*1), the lowest in the Inflow 1 water (12.9 fig P L*1). In May, DRP content of inflow
waters collected ranged from 96.6 fig P L* 1 in Inflow 2 to 0.97 mg P L" 1 in Inflow
1. Concentration of DRP was < 1 Mg P L* 1 in Inflow 2 and Inflow 5 during June and
August. However, in October, DRP levels measured were between < 1 fig P L* 1 in
Inflow 1 and 503.4 fig P L* 1 in Inflow 3.
79
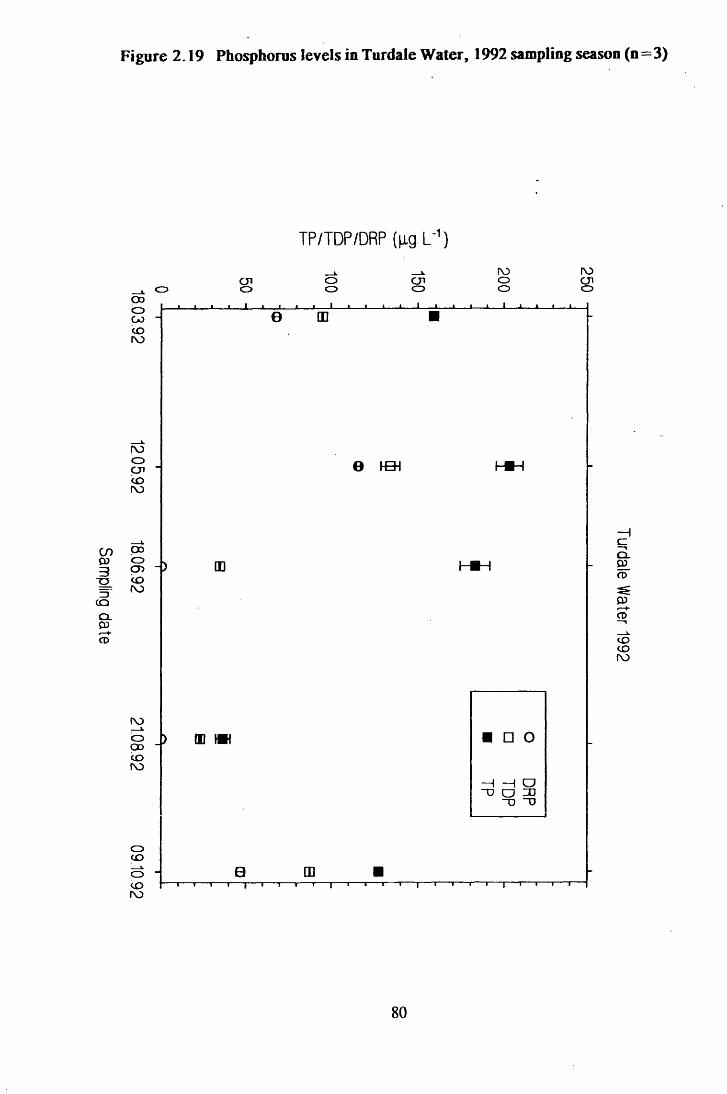
18.03.92 12.05.92
18.06.92 21.08.92
09.10.92
Sampling date
Figure 2.19 Phosphorus levels in Turdale Water, 1992 sampling season (n=3)
TP/TDP/DRP (p.g L~1)
_k ro rocn o cji o cjio o o <o o o
m >W
—I —I O“D □ ID “O “0
80
Turdale W
ater 1992

Sampling date
Figure 2.20 Chlorophyll a levels in Turdale Water, 1992 sampling season(n=3)
Chlorophyll a (|xg L'1)
k. ro coo o o, o o o o
oooCDCOro
o00<0ro
oco
81
Turdale W
ater 1992

23J2.5 pH, conductivity and alkalinity in the five study lochs in 1993
(Table 2.14)
In Loch of Gonfirth, mean water column pH ranged from 6.23 during March to 6.35
in August, pH values in May and October being 6.34 and 6.26 respectively. Average
water column conductivity was 185-189 pS cm 1, felling to 177 pS cm* 1 in August
only. Buffering capacity was lowest during August, when mean alkalinity was 0.09
meq L'1. Subsequently, average alkalinity increased to the maximum of 0.15 meq L* 1
during October.
Average water column pH values for Helliers Water increased from 6.80 during
March to 7.01 in August and October. Lowest average water column conductivity of
252 pS cm* 1 was recorded in May, whilst greatest mean conductivity of 324 pS cm' 1
occurred in October. An increase in buffering capacity was observed from the
minimum mean alkalinity in March of 0.18 meq L' 1 to 0.61 meq L' 1 in October.
Mean pH values in Loch of Tingwall increased from 7.50 in March to 7.95 in
August, before decreasing to 7.80 in October. In August, the high pH of the waters
of the North Basin resulted in the elevated mean water column pH for Loch of
Tingwall. The pH in the water column of the North Basin ranged from 8.02 to 8.22,
whereas pH 7.66 and pH 7.85 were the extremes noted in the South Basin.
Conductivity in the water column decreased from 371 pS cm' 1 during March to 323
/zS cm' 1 in May, rising to 385 /zS cm 1 in October. Maximum and minimum average
water alkalinity levels were recorded in March (1.43 meq L 1) and May (1.50 meq
L'1) respectively.
Average water column pH values in Sandy Loch ranged from 6.89 during August
down to 6.48 in October. Lowest average conductivity of 221 pS cm* 1 occurred in
May, greatest of 284 /zS cm 1 during October. Buffering capacity within the water
column increased from 0.29 meq L' 1 in March to 0.35 meq L' 1 in August,
subsequently decreasing to 0.34 meq L ' 1 in October. In Turdale Water a great change
in average water column pH was noted. The pH increased from 6.75 in March to
9.02 in May, exhibiting values of pH 7.60 and 7.50 in August and October
respectively. Conductivity decreased from 253 pS cm' 1 in March to 239 pS cm' 1 in
May, before rising to 375 pS cm' 1 in October.
82

Table 2.14 Mean water column pH, conductivity and alkalinity ranges of the five study sites, 1993
Site pH Conductivity Alkalinity(/xS cm*1) (meq L*1)
Loch of Gonfirth 6.23-6.35 177-189 0.09-0.15
Helliers Water 6.80-7.01 252-324 0.18-0.61
Loch of Tingwall 7.50-7.95 323-385 1.43-1.50(both basins)
Sandy Loch 6.48-6.89 221-284 0.29-0.35
Turdale Water 6.75-9.02 239-375 0.24-1.24
83

A large change also occurred in alkalinity, values of 0.24 meq L ' 1 and 1.24 meq L' 1
being noted in March and October, respectively.
2.3.2.6 Phosphorus and chlorophyll a concentrations of lochs and their
inflows in 1993
Changes in TP, TDP, DRP and chi a concentrations over time are presented in
Figures 2.21-2.30. These figures represent the water column parameter mean ± 2
s.e. for each sampling date.
2.3.2.6.1 Loch of Gonfirth
Maximum average TP concentration was recorded in March, that value being 4.4 /xg
P L 1. Minimum average TP concentration of 1.9 /xg P L' 1 was found in the May
sample. Mean TP concentration rose to 3.8 /xg P L' 1 during July, before decreasing
once more to 2.3 /xg P L' 1 in October (Figure 2.21). Concentrations of TDP
determined in Loch of Gonfirth water samples followed a similar pattern to those of
TP. Maximum average water column TDP concentration of 2.7 /xg P L* 1 was
recorded in March, levels dropping to 1 /xg P L' 1 in May, the minimum determined.
Water column average TDP concentration then increased to 1.7 /xg P L' 1 in July,
before decreasing to 1.4 /xg P L' 1 in October. Of the samples taken, in March, May,
July and October, none had detectable levels of DRP i.e. concentration was always
< 1 /xg P L* 1 (Figure 2.21). Chi a concentrations recorded from water samples from
Loch of Gonfirth indicated a minimum mean water column value of 0.6 /xg chi a L* 1
during March and the maximum level of 2.4 /xg chi a L* 1 in May (Figure 2.22). A
less pronounced peak of 1.4 /xg chi a L 1 was observed in October, mean chi a
concentration having risen from 0.9 /xg chi a L' 1 in July. Water column concentrations
of P and chi a exhibited peaks and troughs at different times i.e. when TP and TDP
concentrations were elevated, chi a concentration was at lower levels and vice versa
(Figures 2.21 and 2.22).
2.3.2.6.2 Loch of Gonfirth inflow waters (Table 2.15)
The range of TP concentrations found in Loch of Gonfirth inflow waters in March
was from 2.8 /xg P L' 1 in Inflow 1 to 5.9 /xg P L' 1 in Inflow 4A. In May, Inflow 1
was again observed to have the lowest TP concentration, whilst the highest TP level
of 9.3 /xg P L 1 was recorded in Inflow 3.
84

Sampling date
Figure 2.21 Phosphorus levels in Loch o f Gonfirth, 1993 sampling season(n=6)
TP/TDP (M-g P L'1)
ro co cjiroocococo
oco
85
Loch of
Gonfirth 1993

Sampling date
Figure 2.22 Chlorophyll a levels in Loch of Gonfirth, 1993 sampling season(n=6)
Chlorophyll-a (fig L'1)
pq o rv> g oiv>oGOCOGO
roooCJICOGO
oCOGO
86
Loch of
Gonfirth 1993

Table 2.15 Inflow water quality for the five study lochs, 1993(all data reported in /ig P L'1)
(site details given on Figure 3.1)
Loch of Gonfirth
SiteDate22.03.93
In 1 In 2 In 3 In 4A In 4B In 5 Inti
TP 2 . 8 4.0 3.4 5.9 4.0 4.0 5.3TDP n.s. 4.0 n.d. 4.7 n.d. 2 . 1 2 . 8
DRP20.05.93
n.d. n.d. n.d. n.d. n.d. n.d. n.d.
TP 2 . 8 3.4 9.3 4.1 4.1 4.1 8 . 0
TDP 0 . 8 0 . 8 3.4 2 . 8 2 . 8 4.1 6.7DRP
25.07.93n.d. n.d. n.d. n.d. n.d. n.d. n.d.
TPTDPDRP
03.10.93
n.s. n.s. n.s. n.s. n.s. 4.02 . 0
n.d.
6.54.6 n.d.
TP 4.8 5.4 23.8 8.7 8.7 1 2 . 0 1 0 . 0
TDP 3.4 4.8 14.6 6.7 7.4 11.3 1 0 . 0
DRP n.s. n.s. n.s. n.s. n.s. n.s. n.s.
Helliers Water
Site In 1 In 2 In 3Date23.03.93
TP 2 . 1 4.7 n.s.TDP 1.4 2 . 1
DRP23.05.93
n.d. n.d.
TP 2 . 1 1.4 n.s.TDP 1.4 0 . 8
DRP28.07.93
n.d. n.d.
TP 1.4 3.3 7.2TDP 1.4 2 . 0 4.6TYDpi / i \ l
02.10.93n.d. n.d. n.u.
TP 3.4 4.1 n.s.TDP 2 . 1 2 . 1
DRP n.d n.d.
87

Table 2.15 (cont.)
Sandy Loch
Site In 1 In 2 In 3 In 4 In 5 DrainDate21.03.93
TP 48.6 1 2 . 8 6.5 15.3 35.4 188.6TDP 31.6 8.4 6 . 0 1 2 . 2 17.8 181.0DRP 14.9 n.d. n.d. n.d. n.d. 147.6
22.05.93TP 45.8 n.s. 26.2 n.s. 16.5 98.7TDP 38.6 12.5 1 1 . 2 92.8DRP 23.4 5.0 n.d. 48.5
27.07.93TP 49.9 35.0 28.6 n.s. 29.2 13.0TDP 42.2 29.2 18.9 23.4 1 1 . 1
DRP 2 0 . 2 n.d. n.d. n.d. n.d.01.10.93
TP 90.8 25.1 19.2 n.s. 59.3 73.1TDP 31.7 9.4 9.4 8.7 38.3DRP n.d. n.d. n.d. n.d. n.d.
Loch of Tingwall
Site In 1 In 2 In 3A In 3B In 4 In 5 In 6 In 7Date24.03.93
TP 20.3 24.1 2 1 . 0 28.5 n.s. 36.0 26.0 36.7TDP 13.4 16.0 1 2 . 8 22.9 10.3 18.5 8.4DRP n.d. n.d. n.d. n.d. 1.9 n.d. n.d.
21.05.93TP 23.0 1 0 . 6 n.s. n.s. n.s. 16.5 111.7 n.s.TDP 19.7 7.3 11.9 74.5DRP n.d. n.d. n.d. 3.8
26.07.93TP n.s. 2 0 . 2 n.s. n.s. n.s. n.s. 7416 n.s.TDP 13.7 n.d.DRP n.d. 4544
04.10.93TDA A 64.5 29.7 1 2 . 6 n.s. n.s. AA 1zy.l A JAA n.s.TDP 25.8 17.2 1 0 . 0 19.2 2496DRP n.d. n.d. n.d. n.d. n.d.
88

Table 2.15 (coot.)
Turdale Water
Site I n i In 2 In 3 In 4 In 5Date24.03.93
TP 703.2 167.2 318.5 470.4 75.9TDP 700.1 146.5 305.3 413.3 67.4DRP n.s. 120.5 240.2 348.1 42.0
22.05.93TP n.s. 32.8 n.s. n.s. 21.0TDP 28.2 11.2DRP 10.0 n.d.
29.07.93TP n.s. 16.3 n.s. n.s. 13.0TDP 12.4 9.1DRP n.d. n.d.
05.10.93TP 1254 285 1169 719 167TDP 1166 259 1077 624 122DRP n.s. n.s. n.s. n.s. n.s.
89

In all inflows on the west side of the catchment (Inflows 4A, 4B and 5), TP
concentrations were 4.1 /xg P L*1. In July, only two inflows were of sufficient depth
to allow water samples to be taken. Inflow 5 had a concentration of 4 /xg P L'1, whilst
that of Inflow 6 was 6.5 /xg P L*1. Maximum recorded TP concentrations occurred in
the October samples. Concentration of TP determined in Inflow 3 water was
relatively high at 23.8 /xg P L !. As in March and May, lowest TP concentration of
4.8 /xg P L* 1 was measured in the sample of Inflow 1. As with TP, all inflows
exhibited maximum TDP concentrations in the October samples. TDP concentration
ranged from 3.4 /xg P L' 1 in Inflow 1 to 14.6 /xg P L' 1 in Inflow 3. In July, TDP
levels in the two inflows sampled were 2 /xg P L* 1 and 4.6 /xg P L' 1 for Inflow 5 and
Inflow 6 respectively. In samples taken during May, a range of 0.8 /xg P L* 1 (Inflows
1 and 2) to 6.7 /xg P L ' 1 (Inflow 6 ) was observed. The maximum TDP concentration
in March, which occurred in Inflow 4A, was 4.7 /xg P L*1, although TDP
concentrations in Inflows 4B and 1 were the lowest determined, at 2.0 /xg P L_1.
2.3.2.6.3 Helliers Water
Average water column TP concentration ranged from 4.9 /xg P L' 1 in the March
sample to 8 .1 /xg P L ' 1 in July. Mean values observed for TP in May and October
were similar, concentrations being 6.4 /xg P L* 1 and 6.9 /xg P L' 1 respectively (Figure
2.23). Water column TDP levels did not follow TP concentrations, minimum TDP
concentration occurring in May (1.2 /xg P L'1), maximum in October (3.4 /xg P L*1).
Concentrations in March and July were 2.0 /xg P L* 1 and 2.9 /xg P L ' 1 respectively.
In all samples collected, DRP concentration was < 1 /xg P L' 1 (Figure 2.23). In
March, lowest mean water column chi a concentration of 2.0 /xg chi a L' 1 was
detected. Subsequently chi a content rose to 3.2 /xg chi a L' 1 in May (Figure 2.24).
Greatest mean chi a concentration of 5.4 /xg chi a L' 1 was recorded in the October
sample, levels having risen since July, when water collected was found to contain,
on average, 2.6 /xg chi a L 1. Maximum mean concentrations of TP and chi a did not
coincide, although minimum values did, and maximum TDP concentration was
concurrent with that of chi a.
90

Sampling date
Figure 2.23 Phosphorus levels in Helliers Water, 1993 sampling season (n=3)
TP/TDP (w L'1)
r\jcooCOcoCO
rv> CD CD
rocoocjicoco
roCDo" v l
COCO
oroococo
mCD_
CDCO
03r +CD
COCOCO
91

Sampling date
Figure 2.24 CWorophyll a levels in Helliers Water, 1993 sampling season
Chlorophyll-a (p,g L"1)
fO GO CJI 0 3
roGOOCJICOGO
roGO"oCOGO
92
Hellers W
ater 1993

2.3.2.6.4 Helliers Water inflow samples (Table 2.15)
Maximum concentrations of both TP and TDP were found in water from Inflow 3 i.e.
from Loch of Watlee during July. Levels of P determined were 7.2 /xg TP L' 1 and 4.6
/xg TDP L'1. Lowest recorded TP concentration was 1.4 /xg P L* 1 in samples from
Inflow 1 and Inflow 2 in July and May respectively. Minimum TDP concentration ( <
1.0 /xg P L'1) was also detected in Inflow 2 in May. Peak TP and TDP levels were
determined for Inflows 1 and 2 in water collected in October. Analyses found DRP
to be < 1 /xg P L* 1 in all inflow water samples.
2.3.2.6.5 Loch of Tingwall
TP concentration in Loch of Tingwall was greatest during March, with a mean water
column concentration for both basins combined of 13.3 /xg P L*1. Average TP in the
South basin decreased from 12.3 /xg P L* 1 in March to 8 . 8 /xg P L' 1 in October, whilst
that of the North basin exhibited a maximum of 14.6 /xg P L' 1 in March and a
minimum of 9.6 /xg P L' 1 in May. Mean water column TP concentration then showed
a secondary peak in the North basin of 13.5 /xg P L' 1 in July, before falling to 10.5
/xg P L 1 in October (Figure 2.25). Average TDP concentration for both basins
combined was greatest in March at 6.9 /xg P L 1 and lowest in May at 4.4 /xg P L 1.
In the North basin, TDP maximum concentration (8.0 /xg P L*1) occurred in July,
having risen from the minimum (4.2 /xg P L'1) in May. In the South basin, TDP
ranged from 6.9 /xg P L' 1 in March down to 5.4 /xg P L’ 1 in May. All determinations
of water column DRP concentration were < 1 /xg P L' 1 (Figure 2.25). Mean chi a
concentration for both basins combined ranged from 11.2 /xg chi a Is1 in March down
to 2.6 /xg chi a L' 1 during October (Figure 2.26). Considering the basins separately,
average water column chi a concentration in the North basin decreased from 10.7 /xg
chi a L 1 in March to 3.6 /xg chi a L' 1 in October. That of the South basin decreased
from 11. 6 /xg chi a L ' 1 in March to 3.5 /xg chi a L* 1 in May. A small peak of 5.3 /xg
chi a L 1 occurred in July, before levels declined to the minimum of 2,0 /xg chi a L"1.
2.3.2.6 . 6 Loch of Tingwall inflow waters (Table 2.15)
Water collected from Inflow 6 had the highest concentration of TP, TDP and DRP
from May onwards. Maximum concentration of TP recorded for a sample of a Loch
of Tingwall inflow was 7.42 mg P L*1. This was determined in water collected from
Inflow 6 in July.
93

Sampling date
Figure 2.25 Phosphorus levels in Loch of Tingwall, 1993 sampling season(n=10)
TP/TDP (ng P L'1)
no o cji o cjiogocoGO
o
oCJICOGO
COGO
~0 O “0
o
94
Loch of
Tingwall 1993

Sampling date
Figure 2.26 Chlorophyll a levels in Loch of Tingwall, 1993 sampling season(n=10)
Chlorophyll-a (jig P L~1)
M O 4 . CD no
oCJICOCO
COCO
o
95
Loch of
Tingwall 1993
Greatest TDP and DRP concentrations were also measured in this sample, accounting
for 6.97 mg P L* 1 and 4.54 mg P L* 1 respectively. The lowest concentration of TP,
10.6 fig P L'!, was found in the Inflow 2 sample taken in May. Minimum TDP
concentration of 7.3 fig P L l was also found in this sample. DRP concentration was
found to range from < 1 fig P L 1 in all samples except those of Inflow 5 (24/03/93)
and Inflow 6 (21/05/93, 26/07/93, 04/10/93).
2.3.2.6.7 Sandy Loch
The range of mean water column TP concentrations determined in Sandy Loch was
from 33.7 fig P L’ 1 in March down to 21.0 fig P L' 1 in May. Average water column
TP levels then increased to 24.2 fig P L* 1 in July and 27.7 fig P L' 1 in October
(Figure 2.27). In contrast, greatest TDP concentrations were found in the samples
from July and October, levels reaching 20.6 fig P L 1 and 20.3 fig P L* 1 respectively.
From a mean water column TDP concentration of 17 fig P L* 1 in March, TDP
decreased to the minimum recorded level of 14.5 fig P L*1. DRP concentration in all
samples collected were < 1 fig P L 1 (Figure 2.27). Minimum average water column
chi a concentration was found in March, 4.9 fig chi a L' 1 being measurable in the
water analysed. Chi a levels then increased to 7.6 fig chi a L’ 1 in May. Highest
recorded mean chi a concentration was 8.7 fig chi a L' 1 during July, decreasing little
to 8.4 fig chi a L* 1 in October (Figure 2.28).
2.3.2.6.8 Sandy Loch inflow waters (Table 2.15)
During each sampling date, concentrations of TP, TDP and DRP were greatest in
water from Inflow 1, with the exception of DRP in October, as it was < 1 fig P L 1
in all inflows. DRP was detectable in Inflow 1 only, greatest recorded concentration
being 23.4 fig P L* 1 in May. Maximum TP concentration of 90.8 fig P L' 1 was
recorded in October, the lowest inflow concentration occurring in March, when 6.5
fig P L 1 was present in Inflow 3. In contrast, highest TDP concentration (42.2 fig P
L'1) was found in July in Inflow 1, though the lowest concentration (6.0 fig P L 1)
coincided with that of TP in Inflow 3. Water in a drain to Inflow 1 from the land in
the north east of the catchment area exhibited levels of TP ranging from 13.0 to
188.6 fig P L 1. A high proportion of the TP concentration was in the dissolved
fraction, the levels of which ranged from 11.1 to 181.0 figT* L'1.
96

2103.93 22.05.93
27.07.93 011093
Figure 2.27 Phosphorus levels in Sandy Loch, 1993 sampling season (n=3)
TP/TDP (ng P L'1)
_». ro coo o o o
O“ 0
97
Sandy Loch
1993
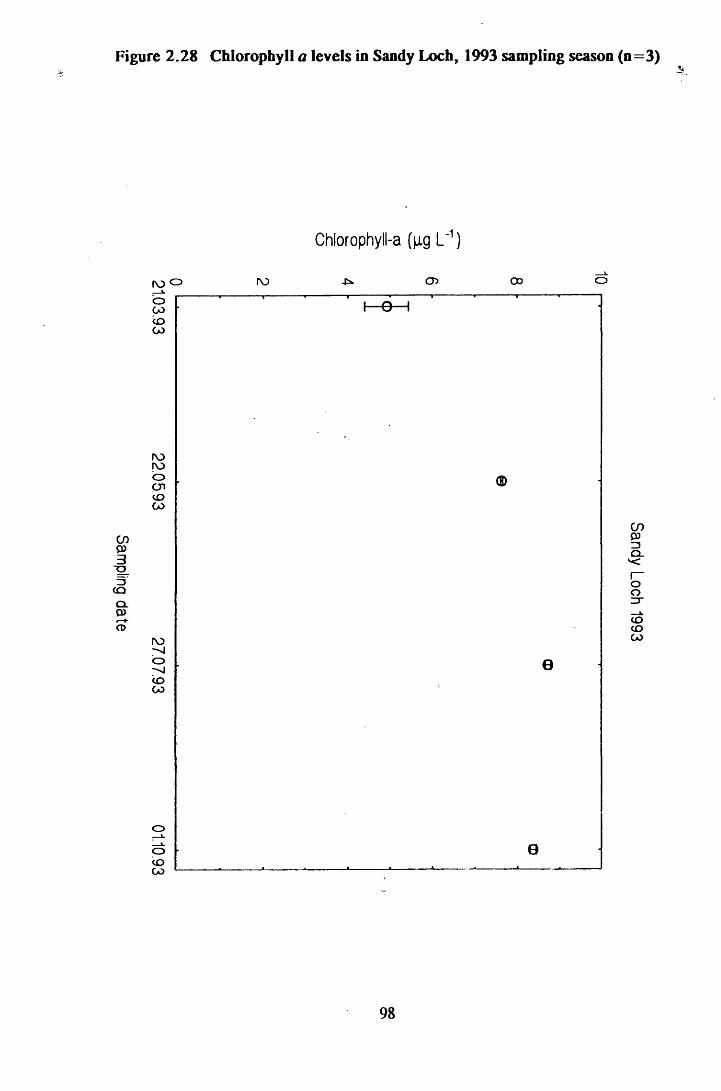
Sampling date
Figure 2.28 Chlorophyll a levels in Sandy Loch, 1993 sampling season (n=3)
Chlorophyll-a (jxg L‘1)
rxj o r\j CD cd o
ocoCD
ooCOCD
98
Sandy Loch
1993

2-3.2.6.9 Turdale Water
Mean water column TP concentration was at its maximum of 250.5 fig P L' 1 during
March. Thereafter it decreased to 124.1 fig J* L* 1 in May and 34.6 fig P L* 1 in July,
before rising to 43.7 fig P L 1 in October (Figure 2.29). TDP followed a similar
pattern to TP, maximum mean water column concentration of 8 8 . 8 fig P L* 1 occurring
in March, falling to 25.8 fig P L' 1 during May. TDP remained at similar
concentrations of 23.4 fig P L' 1 and 23.8 fig P L ' 1 in July and October respectively.
Like TP and TDP, greatest average DRP concentration was detected in the water
column in March. During May and October, DRP levels decreased to < 1 fig P L*!,
but a second peak occurred during July, when DRP was present at 4.5 fig P L* 1
(Figure 2.29). Mean water column chi a concentration in March samples was 24.4
fig chi a L'1. This increased to 100 fig chi a L' 1 in May, decreasing thereafter to 6.9
fig chi a L' 1 in July. Levels were slightly increased in the October samples, mean chi
a concentration accounting for 8.7 fig chi a L' 1 (Figure 2.30).
2.3.2.6.10 Turdale Water inflow waters (Table 2.15)
Greatest TP and TDP concentrations were determined as 1.25 mg P L* 1 and 1.17 mg
P L' 1 respectively in Inflow 1 during October. Minimum concentrations of TP (13 fig
P L 1) and TDP (9.1 fig P L 1) were measured in the sample taken from Inflow 5 in
July. DRP concentrations ranged from < 1 fig P L*! (Inflow 2, 29/07/93; Inflow 5,
22/05/93; Inflow 5, 29/07/93) to 669.4 fig P L 1 (Inflow 1, 24/03/93).
2.4 DISCUSSION
2.4.1 The suitability of the techniques used in water analysis
2.4.1.1 Filtration of water samples
A sample volume of up to 2 L was filtered to ensure that at least 1 fig chi a was
retained on the filter paper (Stirling, 1985), in order to achieve meaningful estimates
of phytoplankton biomass (Stockner et aL, 1990). Samples were filtered within 24
hours of collection in order to minimise degradation processes in suspended matter,
including phytoplankton, and consequent release of dissolved nutrients to the water
sample. Storage of algae overnight at < 5°C can result in significant release of
orthophosphate (Fitzgerald and Faust, 1967).
99

Sampling date
Figure 2.29 Phosphorus levels in Turdale Water, 1993 sampling season (n=3)
TP/TDP/DRP (jig P L‘1)
r\j o
cQ_9LCD
0 )CD
CDCDGO
100

Sampling date
Figure 2.30 Chlorophyll a levels in Turdale Water, 1993 sampling season(o=3) ^
Chlorophyll-a (jig L'1)
co cd co roro o o o o o
rocooCOGO
OcnocoCO
101
Turdale W
ater 1993

Choice of filter paper is extremely important as it defines what is measurable in the
filtrate. Of particular importance are the filter aperture size, the speed at which water
can pass through the filter and a lack of contamination effects. In the 1991 field
season, use of 0.45 pm cellulose nitrate filters was recommended (Pulford and
Flowers, University of Glasgow, pers. comm.). However, for a number of reasons
detailed below, GF/C 1.2 pm papers were used thereafter. Filter papers may ’leak',
as aperture size is rarely constant and may be larger than the pore size stated, in glass
fibre, cellulose nitrate and cellulose acetate varieties (Stockner et al., 1990). Initial
leakage from GF/C 1.2 pm papers is reduced as holes clog, whereas Altering with
0.45 pm filters is not practical for large volumes of water as pores block completely.
The 1.2 pm papers filter water at a faster rate and recover the same amount of chi
as 0.45 pm membrane filters from a variety of waters (Holm-Hansen and Riemann
1978). Vacuum pressure used during filtration is an important determinant of size of
particle retained on a filter paper. Low pressure filtration minimises "drag through"
or lysis of cells. Cell damage during filtration can cause elevated levels of dissolved
nutrients in the filtrate (Rigler, 1968). There is therefore an error involved in
employment of vacuum filtration apparatus, when using GF/C or 0.45 pm membrane
filters.
Cellulose nitrate filters have been shown to exhibit significant leaching of DRP and
to increase TDP concentration in filtrate, despite prewashing of the filters with 250
mL distilled water. Cellulose acetate papers are reported to generate almost no
leaching, whilst GF/C papers demonstrate only a small leaching effect within the
error range of the P analysis (Bloesch and Gavrielli, 1984). Cellulose nitrate papers
should not be used if determinations of dissolved nitrogen compounds are intended,
as they may cause contact contamination (HMSO, 1982b). In addition to these
problems, membrane filters dissolve in alcohol, producing turbidity in chi extracts
and consequent difficulties in determination.
It is recognised that filter pore sizes in normal use (> 0.4 pm) are inadequate in their
separation of particulate and dissolved fractions in natural waters, especially those of
high colloidal content such as bog, forest, or estuarine waters (Danielsson, 1982). It
was concluded that although both 0.45 pm and 1.2 pm filters are likely to undertrap
particulate matter, operational disadvantages associated with the membrane filters
102

made them unsuitable for this investigation. Ease of filtration with GF/C papers is
extremely important when time available for field work is restricted. The same filter
papers should obviously be used for chi a retention as for obtaining filtrate for
determination of dissolved parameters, so allowing direct comparison of the different
variables measured.
2.4.1.2 Storage of water samples
Deterioration of water samples stored frozen occurs as a result of two main processes
(a) exchanges of determinands to and from container walls and (b) transport of
elements from ice to the air cavity within each bottle. P and N are affected primarily
by these processes (APHA, 1989) respectively. No reliable method of preservation
of water samples for N analysis is known (HMSO, 1982b), therefore it is possible for
N compounds measured to be different to actual concentrations. However, freezing
should minimise processes of conversions between different N compounds such as
TAN and TON (denitrification and nitrification). Samples were retained in a freezer
separate from those containing sediment, soil, plant matter or animal remains in order
to minimise possibility of N uptake through the ice surface. Owing to the relatively
low levels of inorganic nitrogen compounds present in the samples and the rapidity
of freezing after filtration, any changes in concentrations of TON and TAN were
likely to have been small (Avanzino and Kennedy, 1993).
Ideally, glassware should be used for transport and storage of water samples for TP
analysis. However, cost and distance travelled made this option impractical during
field work. By treating the polyethylene bottles used for P samples with iodine, the
problem of phosphorus exchange with container walls was considerably reduced
(HMSO, 1981). Dissolved samples for DRP and TDP analyses were stored frozen in
polyethylene bottles. In waters low in P, significant changes in P concentration may
occur after only a few weeks (Phillips, 1985a). However, freezing has been shown
to be an effective short-term means of preserving samples for P analyses (Avanzino
and Kennedy, 1993) and samples were analysed promptly on return to the laboratory.
Interference with sample Na and K concentrations was minimised by storage in
polythene bottles. Small containers such as the 50 mL bottles used minimise the area
available for pick up of metals on container walls. It is also useful to retain water
103

samples for Na analysis in plastic bottles, as it is possible for contamination to occur
under alkaline or low Na conditions because of leaching from glassware. Shaking the
bottle promotes solution of Na and K attached to the container walls (APHA, 1985),
in addition to ensuring the sample is well mixed before analysis.
2.4.1.3 Measurement of pH and DO
Owing to the processes of plant respiration and photosynthesis, in productive waters,
both pH values and dissolved oxygen levels may change significantly within any
twenty four hour period. In darkness, pH and dissolved oxygen concentrations would
tend to be lower than during daylight. Therefore, the pH and dissolved oxygen results
recorded in the present study may not have been representative of the range of values
which occurred during each day of sampling. In contrast, in unproductive waters,
there is likely to have been relatively little variation in pH and dissolved oxygen
levels throughout the day.
2.4.1.4 Measurement of conductivity
Conductivity is related to the total ionic concentration of a water sample and is a
measure of the ability of a solution to conduct an electric current (Mackereth, 1963).
However, when making comparisons of conductivity between different water bodies,
it is important to consider that the relationship between conductivity and ionic content
is dependent on the types and relative amounts of the dominant ions present.
2.4.1.5 Determination of alkalinity
Alkalinity is a measure of the buffering capacity of the water i.e. its ability to
withstand pH changes. It represents the combined concentrations of anions of weak
acids, principally bicarbonate and carbonate in natural freshwaters. The 0.01 M HC1
used in titration contained 0.01 meq acid per mL as 0.01 M HC1 equals M100.
Therefore each mL of standard acid used in titration corresponds to 0.01 meq HCO3
per 100 mL sample. Alkalinity is therefore an important indicator of the free CO2
status of a water body, along with pH. However, extrapolation of free CO2 from
alkalinity and pH measurements is not precise in waters in which free mineral or
organic acids are present (Mackereth, 1963). A buffer solution of sodium acetate and
acetic acid for the purpose of colour standardisation (Mackereth, 1963) was not used
in the present study, as water from each loch had a different initial colour which
104

would affect the end point hue. Results were expressed in terms of HCQ* rather than
CaC0 3 as the latter "has no basis in reality" (Mackereth, 1963). Results were also
represented in chemical equivalents as asserting alkalinity in terms of molarity or
mass concentration is inappropriate owing to its variable molecular basis (Stirling,
1985).
2.4.1.6 Techniques of measurement of TON and TAN concentrations
"By far the best method for analysis of nitrate nitrogen in water is to reduce the
nitrate in alkaline-buffered solution to nitrite by passing the sample through a column
of copperized cadmium metal filings" (Wood et al., 1967, in: Wetzel and Likens,
1990). The cadmium-copper column method gives precise and quantitative results
(Phillips, 1985a) and the method is suitable for freshwater and waters of higher salt
content (Table 2.16). Two methods are generally used in the spectrophotometric
determination of TAN; one is based on phenol chemistry, the other on salicylate
reactions. When undertaking ammonia analyses using the phenol-hypochlorite method,
the hypochlorite stock solution may not be reliable throughout the period of analysis.
In contrast, the salicylate method used in the present study allows generation of
hypochlorite in situ. HMSO (1982a) define the salicylate method as the preferred
technique (except in the analysis of saline waters) owing to the greater reagent
stability and efficacy of analysis using less hazardous chemicals. When considering
safety regulations (COSHH), there is also an obligation to use the cadmium method
as risk assessment reveals hydrazine to be potentially more harmful, being more toxic
and carcinogenic.
2.4.1.7 Phosphorus determination
Methods involving formation of yellow vanadomolybdophosphoric acid are less
sensitive than those relying on reduction of molybdophosphoric acid to a molybdenum
blue complex (Allen et al.t 1974). In addition, it is advantageous to use ascorbic acid
as a reducing agent for P determination as the resultant blue colour is more stable
than that obtained using stannous chloride (Murphy and Riley, 1962) and precision
is improved using the former (Strickland and Parsons, 1972). The accuracy of the
technique is enhanced by using 4 cm cells rather than 1 cm cells owing to the
applicability of spectrophotometric principles of the Beer-Lambert Laws.
105

Table 2.16 Reported methods anddetermination methods
Hydrazine Cadmiummethod method
Concentration range (jig L'1)
10- 10,00050-260 1.3
14> 1.5 2-100
ranges of detection for two nitrate
Source
APHA (1985)HMSO (1981)Hilton and Rigg (1983) Nakashima et al. (1984) Gaugush and Heath (1984)
106

Throughout this study, absorbance was read at 690 nm, the secondary absorbance
peak of this method, as antimony in the colour development reagent may absorb light
at 882 nm (Murphy and Riley, 1962).
Over estimation of DRP may occur using the molybdenum blue complex technique
of determination, possibly because of acid breakdown of easily hydrolysable organic
P compounds (Rigler, 1968). The extent of this error will depend on the
characteristics of each water sample. DRP determination using this method is
therefore actually molybdate reactive P and should not be referred to as
orthophosphate (Broberg and Pettersson, 1988).
A method similar to that of this study (APHA, 1985) shows no interference up to 50
mg Fe?+ L 1, 10 mg SiC^L' 1 and 10 mg Cu L 1 over the analytical range 0.001-10 mg
P L 1. Avoidance of positive interference from silicate in P recovery occurs when the
acid:molybdate ratio is 4:1 (Murphy and Riley, 1962). Although good recoveries of
P are possible from some inorganic salts or sugar phosphate compounds using only
an acid digest, in order to estimate total P in a water sample, it is necessary to
incorporate persulphate as an oxidising agent (Broberg and Pettersson, 1988). The
quantity of persulphate added to each sample is optimized to ensure complete
oxidation of the sample, but a minimum residual (Gales et al., 1966).
2.4.1.8 Choice of methods for chlorophyll a determination
Absorption characteristics of chi a in methanol are not well known and chi a is less
stable in methanol than in acetone (HMSO, 1983). Chi a determinations made with
acetone are reproducible i.e. precision is good. However, methanol is the more
efficient solvent and therefore provides more accurate estimates of actual chi a
concentrations. Although grinding and maceration of sample is required when using
acetone, these procedures are unecessary if methanol is the solvent used (Marker,
1972). Extraction efficiency of methanol may be improved further by heating it to
near its boiling point of 64°C (HMSO, 1983). An efficient solvent is particularly
important when samples include members of the Chlorophyceae and Cyanophyceae,
which are especially resilient to extraction procedures (Bailey-Watts, 1978).
Acidification of chi a causes break down to phaeophytin, therefore magnesium
107

carbonate was added to the methanol, in order to neutralise it before use. Breakdown
products of chi a have visible absorption spectra similar to those of chi a and
therefore constitute a possible source of error (Moss, 1967). A correction for
phaeophytin interference was used in this work. In large lake systems, phaeophytin
levels in the water column are negligible (Bailey-Watts, 1978). However, the lochs
of Shetland are shallow and decay products could easily be resuspended from
sediments by wind mixing. Phaeophytin concentrations may also be elevated if an
algal bloom is in decline (Nusch, 1980). As phaeophytin absorbs light at 665 nm, the
sample is acidified to convert chi a to phaeophytin, so that by subtraction, the initial
concentration of phaeophytin can be calculated. However, neutralisation is necessary
to prevent further degradation to e.g. chlorophyllide and phaeophorbide (HMSO,
1983). Neutralisation of 100% methanol with MgC0 3 after acidification is
impractical. An organic base solution was used for the Shetland work because other
degradation products such as chlorophyllide and phaeophorbide become absorbed
when using MgC03 (HMSO, 1983).
Extraction with alcohol, followed by spectrophotometric determination of chi a
concentration, can only be an estimate of actual levels in the water column. When
chlorophyllase is present in decomposing cells, both chlorophyllide and phaeophorbide
will be present in addition to phaeophytin. It is probable that spectrophotometric
investigations cannot distinguish these products from each other (Marker, 1972).
Routinely used fluorometric and spectrophotometric techniques are unable to partition
chi a from its break down products (Jacobsen et al., 1988). Although fluorometric
analysis is more sensitive than spectrophotometric measurement, there are still
problems concerned with distinguishing between different pigments and detection
performance is related to excitation energy combined with the optics of each
particular instrument (Jacobsen et al., 1988). Limit of detection is determined by the
characteristics of the spectrophotometer used and commonly approximates to 1 /ig chi
a L 1 (Nusch, 1980).
2.4.2 Comparison of water chemistry of Shetland lochs with those of
other studies
2.4.2.1 pH
The range of pH values in Shetland lochs exhibits higher extremes than those in the
108

literature (Table 2.17). Lowest mean summer pH was pH 5.49 in Gorda Water, the
minimum individual reading of pH 5.09 occurring in this loch. In contrast, several
surveys of lochs in mainland Scotland have shown water bodies to have pH < 5.
Waters in Tayside (Maitland and Morris, 1981), Sutherland (Bell, 1991), the Inner
Hebrides (Maitland and Holden, 1983) and Scottish lochs generally (Phillips, 1985b;
Hardman and Pugh, 1994) all included such acid water bodies (Table 2.17). The
minimum pH value observed in 643 freshwater lochs in Scotland was 4.09 (Harriman
and Pugh, 1994). Lochs studied in the Outer Hebrides had a minimum pH of 5, this
being most similar to the lowest values in the Shetland study. Possibly this similarity
exists owing to the more exposed nature of the Outer Hebrides in comparison to other
sites studied in the literature. Exposure of the Shetland Islands probably results in
deposition of wind blown basic elements of marine origin in its water bodies,
resulting in higher pH readings than would otherwise be expected. Alternatively, the
higher minimum pH values could be due to an lack of small, highly coloured water
bodies located exclusively on acid bedrock and blanket peat in the present study,
rather than their absence from the Shetland landscape. During a previous study of
freshwaters in Shetland, lochs were noted as having a range from pH 4.00 to pH
1 0 .0 ; furthermore highly acidic waters were generally peaty pools, often of high
water colour (Carter and Bailey-Watts, 1981).
Maximum recorded mean summer pH value for a loch in the present study was pH
9.38, in Loch of Brow. The pH values in Shetland lochs therefore tend to be high
compared to those quoted in the literature for studies elsewhere in northern Britain,
the greatest recorded ift the literature reviewed being pH 9.19 in the survey of 643
Scottish freshwaters (Harriman and Pugh, 1994). However, mean summer pH in Loch
of Brow was found to be well in excess of pH in the other lochs studied. Loch of
Huesbreck ranked second with pH 7.81 in summer 1991. Fourteen lochs were
between pH 7.00 and pH 8.00, twelve between pH 6.00 and pH 7.00. The vast
majority of lochs in the present study therefore fell within the ranges of pH
determinations in the literature, with twelve being of comparable pH to the five
largest lochs of Scotland (Bailey-Watts and Duncan, 1981b), Loch Lurgainn and Loch
Bad o’ Ghaill (Spence and Allen, 1979) lochs in Northern Ireland (Rippey and
Gibson, 1984) and Ennerdale Water (Fryer, 1991) (Table 2.17).
109

Table 2.17 pH, conductivity and alkalinity values determined in lakes in northern U.K.
W ater body pH conductivity alkalinity Re(jiS cm*1) (meq L'1)
Loch Shiel 6.14 29 0.042 1
Loch Ness 6.70 30 0.09Loch Lomond 6.78 34 0.127Loch Morar 6.63 35 0.065Loch Awe 6.90 41 0.179Loch of the Lowes 7.90 64 0.46 2
Balgavies Loch 8.30 213 2 1 . 0
Forfar Loch 8.30 439 2.90Coldingham Loch 272-424 3Loch Borralie 8.50 363 2.28 4Loch Calladail 2.70Loch Croispol 2.89546 lochs in 4.20-9.00 27-390 0-3.4 5SutherlandScottish lochs 4.69-8.78 43-359 0 .0 0 1 -0 . 0 1 1 9(* = 8 )Inner Hebrides 6.3-8.4 0.112-2.48 1 0
(/i=17)Inner Hebrides 4.08-4.23 103-116 0
(*=4)Outer Hebrides(n=59) 5-7 < 0 . 2 1 1
Outer Hebrides 7.2-8.3 0.5-2.12(7! = 1 0 )Tayside lochs 4.3-8.5 24-5100 0.01-3.3 1 2
(*=74)Scottish lochs 4.09-9.19 11-1094 0.069-4.004 13(71=643) 0 *mhos)Loch Urigill 7.90 1 2 1 0.71 6
Loch Borallan 7.75 113 0.52Cam Loch 7.70 105 0.46Loch Lurgainn 6.60 70 0.04Loch Bad o’ Ghaill 6.75 79Loch Owskeich 7.00 81 0.195Loch Raa 7.15 142 0.09T Tintfn/'KonxAA/ii Duviuviioii 7.40 151Loch na Dalach 7.20 80 0.07Loch Buine Mhor 7.30 125Loch an Arbhair 7.50 162 0.29Loch na DoireDaraich 7.50 167Loch Maol a’ Choire 8 . 2 0 240 1.76
110

Table 2.17 (cont.)
Water body
30 lakes in N. Ireland Ennerdale Water Lake Windermere N Lake Windermere S Esthwaite Water Easedale Tam Urswick Tam
pH
6.60-8.206.57.07.17.15.6 8.0
conductivity alkalinity (jiS cm*1) (meq L'1)
70-240 0.04-1.760.0420.2040.2360.3860.0064.357
KEY:1 Bailey-Watts and Duncan (1981b)
2 Harper and Stewart (1987)3 Bailey-Watts et al (1987b)4 Spence et al (1984)5 Bell (1991)6 Spence and Allen (1979)7 Rippey and Gibson (1984)8 Fryer (1991)9 Phillips (1985b)1 0 Maitland and Holden (1983)1 1 Waterston et al (1979)1 2 Maitland and Morris (1981)13 Harriman and Pugh (1994)
Reference
78
111

In terms of pH, fourteen lochs were comparable with Loch of the Lowes (Harper and
Stewart, 1987), the majority of studied lochs of the Ullapool area (Spence and Allen,
1979), the range quoted for the thirty lakes examined in Northern Ireland (Rippey and
Gibson, 1984) and selected lakes of the English Lake District (Fryer, 1991) (Table
2.17). Many lochs in Shetland are probably slightly alkaline in nature owing to at
least some basic rather than acidic geology in catchment areas (Table 2.18). This is
also the case in several lochs of the Ullapool area e.g. Cam Loch and Loch Borrallan
which are in drainage areas which consist partly of limestone (Spence and Allen,
1979). In contrast, Loch Borralie which exhibited a value of pH 8.5 is located
entirely on limestone (Spence et al., 1984). More alkaline waters may also occur
owing to primary production within the water column. Forfar Loch and Balgavies
Loch are examples of eutrophic systems where plant biomass probably accounts at
least in part for high pH values of pH 8.30 in each water body. It is possible that this
process has not occurred to such an extent in Shetland, all mean summer pH values
being pH < 8.00, with the exception of Loch of Brow.
2.4.2.2 Conductivity
As with pH values, determinations of mean summer conductivity in Shetland lochs
exhibited values which were greater than those noted in the literature (Table 2.17).
The lowest conductivity results were 175 fiS cm'1, 188 nS cm' 1 and 199 /tS cm* 1
corresponding to Roer Water, Whitelaw Loch and Eela Water respectively. These are
high in comparison to minimum levels found in the literature, conductivity of
Shetland lochs contrasting with that of the deep, dilute waters of the five largest
Scottish lochs and the standing waters exhibiting low conductivities in the study of
Harriman and Pugh, 1994) (Table 2.17). This phenomenon was also noted by Carter
and Bailey-Watts (1981). Of the survey ranges examined, the most similar minimum
conductivity was found in the data for the Inner Hebrides (Table 2.17). It is likely
that conductivity in freshwater lochs of the Shetland Islands is higher than expected
owing to the wind blown salts in this exposed island group. This would explain the
similarity of results from the Hebridean Islands. Conductivity results for the Outer
Hebrides which might have been more analogous to those of the Shetland lochs were
not available for comparison. Excluding Strand Loch, which had a saline influence,
greatest mean summer conductivity of 594 /*S cm’ 1 was observed for Loch of Spiggie,
followed by 449 fiS cm' 1 for Loch of Brow and 438 ftS cm' 1 for Gorda Water.
112

Table 2.18 Solid and drift geology of the 31 loch catchments of the 1991 survey
Water body
Arthurs Loch
Bu Water
Loch of Brindister
Loch of Brough (Bressay)Loch of Brough (Yell)Loch of Brow
Loch of Cliff
Eela Water
Loch of Gonfirth
Gorda Water
Gossa Water Helliers Water
Loch of Huesbreck Loch of Huxter
Loch of Kettlester
Lunga WaterMui i y*w%A
a.MM JM
Papil Water
Funds Water
Drift geology
bedrock near surface
till and morainic drift, bedrock near surface peat, some boulder clay, bedrock near surface
peat, boulder clay bedrock near surface peat
boulder clay, alluvium, peatundifferentiated drift, peat, metamorphosed sedimentary and volcanic rocks, little alluvium
mostly peat, some undifferentiated drift till and morainic drift, peat, bedrock near surface undifferentiated glacial drift, boulder clay peatolder intrusive igneous, acid to ultrabasic blown sand till, morainic drift bedrock near surface boulder clay, peat
peat, bedrock near surface bedrock near surface
undifferentiated drift blown sand, alluvium
peat, some undifferentiated drift
Solid geology
felsite and unclassified acid rocks: mostly conglomerate (breccia) gneissose quartzite and schist
micaceous psammite, some calc- silicate and limestone: some sandstone, siltstone and basal brecciaflaggy sandstone and siltstone
mica-plagioclase-gneiss
sandstone, some siltstone
siliceous and quartzo-feldspathic flags with phyllite; schist, granitic material, serpentinite, granulite, mica schist, quartzo-feldspathic- granulitegranite, granophyre, diorite, gabbroquartzite, schist, granite, granophyre, diorite, hornblende rhyolite, ignimbrite, some basalt
granite, diorite, some limestone greenstone, metagabbro
sandstonegneissose quartzite, schist, granitic gneiss, micaceous schist and gneiss mica-plagioclase-gneiss, some granulitic-homblende-gneiss
micaceous psammite, some calc- silicate rock and limestone, gneissose rocksgreen beds, granulite, schist, wd quartzo-feldspathic-granulite, phyllitic, slaty rocks diorite, some granite and granophyre
113

Table 2.18 (cont.)
Water body
Roer Water
Sand Water
Sandy Loch Skutes Water
Loch of Spiggie
Strand Loch
Loch of Tingwall
Turdale Water Loch of Ustaness
Loch of Watlee
Whitelaw Loch
Drift geology Solid geology
peat,undifferentiated drift
moraines, peat
peatundifferentiated drift, some metamorphosed sedimentary and volcanic rocksboulder clay, peat, blown sand, bedrock near surface
till and morainic drift, alluvium, peat boulder clay, peat, undifferentiated drift bedrock near surface
peatpeat, bedrock near surface
peat, undifferentiated drift older intrusive igneous (acid to ultrabasic)
hill peat, serpentinite erratic
granite, granophyre, diorite, some gabbro
limestone, some homblende-schist, granulite with schist, homblende- schist and calcareous rocks conglomerate, sandstone antigoritite, phyllitic and slaty, some graphitic phyllite and schist, green beds and unclassified serpentiniteporphyritic adamellite, grandiorite, monzonite, some quartzite and schistose grit, sandstone limestone with homblende-schist
limestone, micaceous psammite, calcareous and siliceous rocks, phyllite with quartzite and schistose grit, some epidiorite, homblende-schist, granite limestonemigmatitic gneiss, psammitic rock, granitegranulite, schist, quartzo-drift, feldspathic granulite, mica schist, granulitic hornblende gneiss, phyllite with garnet kyanite, chloritoid andalusite h o m b len d e-b io tite -d io rite , gneissose, psammitic, granulite
114

Although the highest conductivity in the data of Harriman and Pugh (1994) was 1094
fiS cm*1, the mean of the 642 lochs was as low as 106 /xS cm 1. The greatest value
recorded in the remainder of the literature consulted was 439 /xS cm*1, in Forfar
Loch, a eutrophic system (Table 2.18). Again, the likely causes of elevated
conductivity in Shetland lochs are wind blown ions and geology of catchment, rather
than anthropogenic enrichment.
2.4.2.3 Alkalinity
It is possible only to compare alkalinity results from 1992 and 1993 in five lochs of
the present study with those found in the literature (Table 2.17). In a previous study
of Shetland waters (Carter and Bailey-Watts, 1981), minimum alkalinity of waters
was < 0 meq L* 1 i.e. positive acidity was observed. This was found to occur in
small, acid, peaty pools, none of which were included in the present study. Lowest
mean water column alkalinity determined was 0.086 meq L* 1 for Loch of Gonfirth,
whilst highest alkalinity was 1.757 meq L* 1 for Loch of Tingwall South Basin. The
buffering capacity in Loch of Gonfirth is therefore considerably lower than the mean
alkalinity value of 0.310 meq L* 1 in the survey of 643 Scottish freshwater lochs
(Harriman and Pugh, 1994). Alkalinity in Loch of Gonfirth is comparable with that
of Loch Ness and low alkalinity lochs of the Inner Hebrides, but relatively high
compared to water bodies at the lower extremities of alkalinity in the studies of
Bailey-Watts and Duncan (1981b), Phillips (1985b), Bell (1991), Rippey and Gibson
(1984), Fryer (1991) and Maitland and Morris (1981) (Table 2.17). Although Loch
of Tingwall has a high buffering capacity in comparison with the other four Shetland
lochs studied, it is not as high in alkalinity as Lochs Borralie, Croispol and Calladail,
Forfar Loch, Urswick Tam, nor the lochs of greatest buffering capacity in the studies
of the Inner and Outer Hebrides and the 643 Scottish water bodies (4.00 meq L*1)
(Harriman and Pugh, 1994). It is comparable with Loch Maol a* Choire and the
maximum alkalinity recorded in the survey of lakes in Northern Ireland (Table 2.17).
Like that of Loch Maol a’ Choire, the catchment of Loch of Tingwall is not situated
entirely on limestone (Table 2.18) and is also influenced by peaty soil within its
drainage area. Neither is it eutrophic as is Forfar Loch.
2.4.2.4 Cation concentrations
Minimum K concentrations were found in Loch of Gonfirth and Roer Water, mean
115

summer levels being 0.9 mg K L ' 1 in each water body. This is high compared to the
low K lakes in the studies of Bailey-Watts and Duncan (1981b), Bell (1991), Rippey
and Gibson (1984) and Fryer (1991). However, when comparing the maximum K
concentration of the Shetland study (3.2 mg K L* 1 in Loch of Spiggie) with the extent
of the surveys in Table 2.19, the value falls within the range of maximum K
concentrations. However, in comparison with the literature, Na levels in Shetland
waters were found to be high, varying from 23.8 mg Na L l in Sand Water to 52.8
mg Na L 1 in Loch of Spiggie. Lakes exhibiting Na concentrations of similar
magnitude were Forfar Loch (23 mg Na L*1) and Coldingham Loch (32 mg Na L’1)
(Table 2.19). Certainly, there is likely to be a marine influence on the latter, as it is
situated near the sea and is relatively exposed. Ca concentration was lowest in Roer
Water (1.3 mg Ca L'1), followed by Loch of Ustaness (2.6 mg Ca L*1) and Whitelaw
Loch (2.6 mg Ca L'1). Maximum Ca concentration of 196.8 mg Ca L * 1 in Strand
Loch was followed by 68.5 mg Ca L* 1 in Loch of Huesbreck and 33.7 mg Ca L ' 1 in
Loch of Tingwall. The concentration in Strand Loch is well in excess of any of the
published figures, though Ca levels in Loch of Huesbreck are comparable with those
of Urswick Tam (Fryer, 1991) and standing waters in Tayside (Maitland and Morris,
1981) (Table 2.19). A high Ca concentration would be expected in Loch of «Huesbreck owing to its location on sandstone (Table 2.18). The remaining Shetland
figures lie within the range of values in Table 2.19. Lowest water Mg concentrations
were 3.1 mg Mg L' 1 and 3.6 mg Mg L ' 1 in Loch of Gonfirth and Roer Water
respectively, whilst greatest values were 177.3 mg Mg L* 1 in Strand Loch and 20.3
mg Mg L* 1 in Loch of Watlee. Though Strand Loch exhibited greater Mg levels than
any quoted in Table 2.19, Loch of Watlee mean Mg concentration was within the
expected range. At the other extreme, Mg levels found for the Shetland lochs studied
were all greater than minimum values reported elsewhere. Loch of Watlee and other
water bodies of Unst and Fetlar were relatively high in Mg in the context of lochs in
the present study, reflecting the Mg rich nature of the geology of the Northern Isles
(Table 2.18).
116

Table 2.19 Major cation concentrations (mg L 1) in water bodies of northern U.K. surveyed in the literature
Location K Na Ca Mg Re
Loch Shiel 0.25 4.24 0.98 0.75 1
Loch Ness 0.27 3.84 1.99 0.81Loch Lomond 0.33 3.45 3.00 1 . 0 0
Loch Morar 0.34 3.34 1.23 0 . 8 8
Loch Awe 0.27 4.47 4.01 0.99Loch of the Lowes 0.78 5.06 1 0 . 0 2 2.4 2
Balgavies Loch 1.56 11.96 44.09 8 . 0
Forfar Loch 5.47 23.0 56.11 9.7Coldingham Loch 2 .2 -2 .4 12-32 26-29 15 3Loch Borralie 33.47 12.16 4Sutherland (/i=546) 0.23-31.0 0.39-43.0 0.4-90 5Loch Urigill 15.63 6
Loch Borallan 11.42Loch Lurgainn 3.21Loch Owskeich 7.41Loch Raa 6.41N. Ireland (ti=30) 0.5-4.3 7.0-19.6 1.8-39.1 1.1-11.3 7Ennerdale Water 0.39 4.30 2 . 0 0 0 . 8 8 8
Lake Windermere N 0.55 4.65 6.29 0.98Lake Windermere S 0 . 6 6 5.04 8.53 1 . 1 2
Esthwaite Water 0.98 5.73 12.65 1.50Easedale Tam 0.27 3.52 1.94 0.45Urswick Tam 2.54 12.31 76.7 13.34Inner Hebrides (n—17) 1.4-44.8 1.2-9.7 9Inner Hebrides (n= 4) 1 .0 - 1 . 1 1 .6 -2 . 1
Outer HebridesOuter Hebrides (/i= 59) 1-5 1-3 1 0
Outer Hebrides (n= 1 0 ) 8-42Tayside (n=74) 0.4-66.5 0.2-134 1 1
KEY:1 Bailey-Watts and Duncan (1981b)2 Harper and Stewart (1987)3 Bailey-Watts et al (1987b)4 Spence et al (1984)5 Bell (1991)6 Spence and Allen (1979)7 Rippey and Gibson (1984)8 Fryer (1991)9 Maitland and Holden (1983)10 Waterston et al (1979)11 Maitland and Morris (1981)
117

In summary, the tendency is that many of the Shetland lochs examined have higher
than expected pH, conductivity, alkalinity and cation concentrations. In water bodies
of infertile geology, predominantly wind blown salts probably account for elevated
levels of conductivity and cations, whereas in waters of rich geology, the effect may
not be as important as that of underlying bedrock. Although pH and alkalinity are also
affected by these factors, the absence of small, acid, peaty pools from this study must
also result in higher minimum pH and alkalinity results than might occur in a
completely random number of water bodies.
2.4.2.5 Phosphorus
Although there are lochs in the Shetland study which have low TP concentrations, the
lowest mean summer TP level recorded in 1991 was 5.0 /xg P L' 1 for Loch of
Ustaness. This is slightly higher than low values reported elsewhere, as TP has been
found to be < 5 fig P L 1 in e.g. several water bodies of the English Lake District
(Fryer, 1991) and in Sutherland (Bell, 1991) (Table 2.20). However, several ranges
of values in the literature exceed the mean summer TP concentration of 83.2 jig P L 1
for Turdale Water (the maximum for the present study), certain water bodies
exhibiting levels well in excess of this e.g. lochs in Sutherland (Bell, 1991), Tayside
(Maitland and Morris, 1981) and Coldingham Loch (Bailey-Watts et al.t 1987b)
(Table 2.20). Concentrations of DRP in the Shetland lochs studied were low, only
Turdale Water having significant levels. Generally DRP concentrations were < 1 /xg
P L'1. When compared to DRP concentrations in lakes in other areas of northern
Britain, levels in Shetland lochs are low, but it is likely that when DRP concentration
has been noted as < 10 /xg P L' 1 or < 5 /xg P L'1, this is the level of detection and
the actual concentration may be < 1 /xg P L*1, as in the present work. When
considering mean summer DRP concentration of 32.6 /xg P L* 1 in Turdale Water, this
loch is similar to Loch of the Lowes, though if maximum value of 90.8 /xg P L* 1 is
observed, Turdale Water is more analogous to the P enriched systems of the
Sutherland lochs examined. Turdale Water is within the range of values observed
previously in lakes in northern Britain (Table 2.20).
2.4.2.6 Nitrogen
The range of TON figures for Shetland lochs was within the extent of reported values
of TON in Table 2.20.
118

Table 2.20 Nutrient chemistry of standing freshwaters in northern U.K. studied in the literature
W ater body TP DRP TON TAN »
Loch Shiel < 1 0 <50-<150 < 1 0 0 * 1
Loch Ness < 1 0 >50- <150 < 1 0 0
Loch Lomond < 1 0 >150-<250 < 1 0 0
Loch Morar < 1 0 >50- <150 < 1 0 0
Loch Awe < 1 0 <50-<200 < 1 0 0 *ColdinghamLoch 55-300 5-225 50-1500 2
Loch Borralie 50 <5 8 0 3Sutherlandlochs (n=546) <5-310 <5-110 <10-190 < 1 0 - 1 1 0 0 4Scottish lochs 1-24 1-400* 5-135(71 = 8 ) l- 2 0 + 7Tayside lochs(n=74) 5-5500 8
sum of TAN+TONLoch of theLowes 32 194 5Balgavies Loch 77 2690Forfar Loch 2460 5870Wastwater <5 6
Ennerdale Water <5Buttermere <5Crummock Water <5Thirl mere <5Coniston Water <5Ullswater 5-10Derwentwater 5-10Loweswater 5-10Lake WindermereNorth 10-15Bassenthwaite 10-15Rydal Water 10-15Lake WindermereSouth 15-20Esthwaite Water 15-20Grasmere 20-25Blelham Tam OCLOS
KEY:one determination of > 100 /xg TAN L'1; * N0 3 -N; + N02-N
1 Bailey-Watts and Duncan (1981b) 42 Bailey-Watts et al (1987b) 53 Spence et al (1984) 6
7 Phillips (1985b) 8
Bell (1991)Harper and Stewart (1987) Fryer (1991)Maitland and Morris (1981)
119

With the exception of Loch of Gonfirth which had a mean summer concentration of
254 fig N L*1, all values were < 150 fig N L*1. Shetland values were therefore
similar to those of Sutherland (Bell, 1991) and the largest lochs of Scotland (Bailey-
Watts and Duncan, 1981b). Ranging from 16 fig N L* 1 to 103 fig N L 1, TAN
concentrations in Shetland lochs were also broadly comparable with available
information on other lakes in Scotland. Maximum concentration found in the
Sutherland survey was however much greater than the highest level found in Shetland
lochs (Table 2.20).
2.4.3 Water quality of Shetland lochs in comparison with existing
standards
2.4.3.1 Dissolved oxygen levels in Shetland waters
Three main physical factors affect the solubility of oxygen in water i.e. temperature,
salinity and atmospheric pressure. As temperature rises, water holds less oxygen.
Less oxygen is also present at higher salinities, or higher altitudes owing to the
decrease in atmospheric pressure. Shetland lochs are at low altitude, therefore
temperature is the most important of these parameters influencing DO. Owing to the
saline input to Strand Loch, expected DO saturation values will vary. However, DO
concentration never decreased below 10 mg O2 L'1. Generally, decreases in
concentration of DO in Shetland lochs were concurrent with increases in temperature,
therefore DO concentration tended to be lower during July and August. Other factors
which influence DO concentration in water are organic loadings (e.g. from septic tank
waste), phytoplankton blooms and aquatic vertebrates and invertebrates. Bacterial
oxidation of organic matter exerts an oxygen demand, as does respiration by
phytoplankton and other aquatic life. Death of phytoplankton blooms may result in
a decrease in DO in the same way as other organic substrates. Despite the oxygen
demands of respiration and decomposition and the increased water column
temperature during summer, DO concentrations in the Shetland lochs studied
remained at concentrations which would not be harmful to aquatic life. For example,
when considering standards recommended for waters supporting salmonid fish, which
tend to have limited tolerance ranges for many environmental parameters, at > 6 . 0
mg 0 2 L 1 these organisms grow and reproduce normally. Levels > 7.0 mg O2 L* 1
are recommended for efficient development of the eggs, owing to their high DO
requirement (Alabaster and Lloyd, 1980). However, though DO levels of between 6.0
120
and 7.0 O2 L* 1 were recorded, measurements were made from May to September, i.e.
before spawning was expected.
2.4.3.2 pH
Prescribed Concentration Values (PCVs) of pH from the Water Supply (Water
Quality)(Scotland) Regulations (1990) are pH 5.5 to pH 9.5. In terms of water
supply, Gorda Water in its untreated form, failed this standard in July and August,
pH 5.09 and pH 5.06 being recorded respectively. The pH value for Loch of Brow
during August (pH 9.80) was in excess of the PCV for drinking water. However,
Loch of Brow is not a potable supply reservoir. Values of pH > 9.0 and < 5.0
cause sublethal effects in fish. Between pH 5.0 and 6.0, fish productivity is poor.
Therefore the optimum pH range for most freshwater fish is pH 6.0 to pH 9.0. Loch
of Brow at pH 9.8 (August) may have resulted in stress to aquatic life. This was,
however, the only water body which became more alkaline than pH 9.0, although
Loch of Ustaness, Roer and Gorda Water were consistently at pH < 6.0.
2.4.3.3 Inorganic nitrogen compounds
The following equilibrium exists in water:
NH3 + H20 N IV + OH-
TAN measured in the present study is comprised of NH3 (unionised ammonia in the
gaseous form) and NH4 * (ionised ammonia i.e. the ammonium ion). The unionised
form is the more toxic. The PCV for ammonia from the water supply (Water
Quality)(Scotland) Regulations 1990, is 500 /*g NH4 L*1, presumably referring to total
ammonia, rather than NH3. Concentration of the latter in the water column is
dependent upon pH and temperature. As each of these parameters increases,
percentage of NH3 increases. For example, at pH 7.0 and 20°C, percentage NH3 is
0.4%; at pH 9.6 and 20°C, percentage NH3 is 61.3%. Temperatures recorded in the
present study did not exceed 19.1°C, whilst there was a tendency for TAN
concentrations to be low during times when temperatures were greatest.
Although pH was found to be as high as pH 9.80 in Loch of Brow during August,
TAN concentration was 33 fig N L 1 and temperature only 15.2°C. When considering
the amenity value of waters in terms of supporting freshwater fish, salmonids require
water containing < 20 \ig NH3 L 1. With respect to the pH, temperature and TAN
121

results and consequent proportion of NH3 recorded in all the water bodies studied, it
is evident that ammonia concentration at no time exceeded the limits specified above.
It was at no time at concentrations which could be harmful to aquatic life or with
respect to human consumption.
PCVs of nitrate and nitrite are 50 mg NO3 L' 1 and 100 ng NO2 L*1 respectively.
Nitrate is not toxic to fish except at concentrations > 400 mg NOj L*1. Therefore
both reservoir waters and those requiring an EQS for support of freshwater fish were
in compliance with required nitrate levels as maximum recorded TON concentration
was 258 /ig N L 1. Nitrite levels in Scottish freshwaters are generally very low, often
being < 3.0 /ig N L'1. It is unlikely that nitrite concentrations were in exceedence of
the standard, as high nitrite values are associated with low DO concentrations and
organic pollution.
2.4.4 Hie trophic status of Shetland’s standing freshwaters, as defined
by TP and chlorophyll a concentrations
The Organisation for Economic Cooperation and Development (OECD) produced
guidelines on monitoring assessment and control of freshwater lakes, covering a wide
range of geographical and limnological situations (OECD, 1982). Research was
carried out into a number of different water bodies, including Alpine waters, North
American lakes, reservoirs and shallow lakes. The data generated from this work
were used to produce a tentative classification of lochs by trophic status, based on
water column concentrations of P and chi a (Table 2.21). Although natural systems
form a continuum and other factors may be involved in limitation of primary
production, such as insufficient light, or grazing pressure, it is useful for water
management purposes to categorise freshwater bodies in such a manner, as a means
to form a risk assessment of likelihood of increasing primary production.
Comparing mean summer concentrations of TP and chi a in the lochs of the 1991
Shetland survey with those of the OECD (1982) categories resulted in the
classification of Shetland lochs as seen in Table 2.22. Only six could be categorised
as oligotrophic and therefore unlikely to have problems with excessive phytoplankton
growth, assuming that no increase in catchment nutrient input occurred.
122

Table 2.21 Classification of standing fresh waters (OECD, 1982)
Trophic state mean TP mean Chla max Chla
Ultraoligotrophic <4 £ 1 .0 £2 .5Oligotrophk £10 £2 .5 £ 8 .0Mesotrophic 10-35 2.5-8 8-25Eutrophic 35-100 8-25 25-75Hypertrophic ;>100 ^25 >75
mean TP mean summer TP concentrationmean Chla mean summer chlorophyll a concentrationmax Chla maximum summer chlorophyll a concentration
123
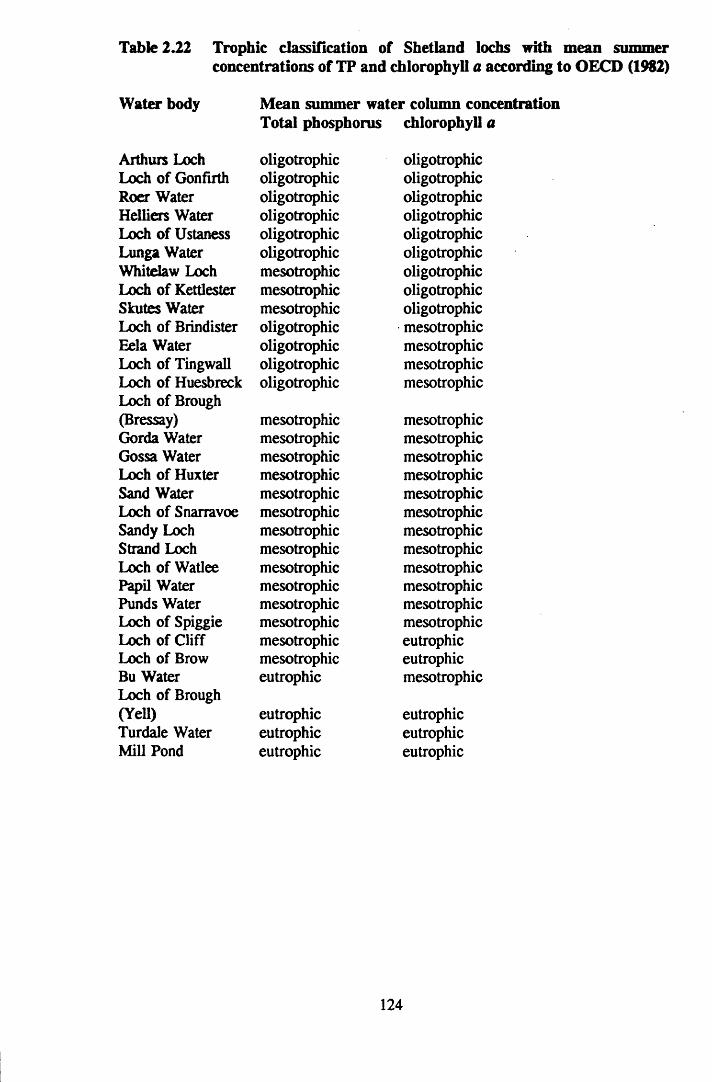
Table 2.22 Trophic classification of Shetland lochs with mean summer concentrations of TP and chlorophyll a according to OECD (1982)
Water body Mean summer water column concentrationTotal phosphorus chlorophyll a
Arthurs Loch oligotrophic oligotrophicLoch of Gonfirth oligotrophic oligotrophicRoer Water oligotrophic oligotrophicHelliers Water oligotrophic oligotrophicLoch of Ustaness oligotrophic oligotrophicLunga Water oligotrophic oligotrophicWhitelaw Loch mesotrophic oligotrophicLoch of Kettlester mesotrophic oligotrophicSkutes Water mesotrophic oligotrophicLoch of Brindister oligotrophic mesotrophicEela Water oligotrophic mesotrophicLoch of Tingwall oligotrophic mesotrophicLoch of Huesbreck oligotrophic mesotrophicLoch of Brough(Bressay) mesotrophic mesotrophicGorda Water mesotrophic mesotrophicGossa Water mesotrophic mesotrophicLoch of Huxter mesotrophic mesotrophicSand Water mesotrophic mesotrophicLoch of Snarravoe mesotrophic mesotrophicSandy Loch mesotrophic mesotrophicStrand Loch mesotrophic mesotrophicLoch of Watlee mesotrophic mesotrophicPapil Water mesotrophic mesotrophicPunds Water mesotrophic mesotrophicLoch of Spiggie mesotrophic mesotrophicLoch of Cliff mesotrophic eutrophicLoch of Brow mesotrophic eutrophicBu Water eutrophic mesotrophicLoch of Brough(Yell) eutrophic eutrophicTurdale Water eutrophic eutrophicMill Pond eutrophic eutrophic
124

Of twenty one water supply lochs, fifteen are at risk of having such problems, as
once mesotrophic levels of P are reached, it is possible for a bloom to occur. Seven
lochs were found to be borderline oligo/mesotrophic, with four possessing
oligotrophic P concentrations, but mesotrophic chi a levels, possibly indicating that
a maximum limit for TP of 10 fig P L 1 is in excess of that required to ensure low
algal productivity. The lowest mean TP concentration associated with mesotrophic
mean summer chi a concentrations (6.5 fig chi a L'1) was 7.1 fig P L* 1 for Loch of
Huesbreck. Bloom problems have been found to occur at P concentrations as low as
this in the literature. However, it was previously reported in sites deeper than those
in the 1991 study.
Twelve lochs in this study fell into the mesotrophic group, three into mesoeutrophic,
whilst only three were found to correspond to eutrophic conditions. Of the borderline
mesoeutrophic lochs, Bu Water was observed to have a mesotrophic mean chi a level,
but eutrophic TP concentration. The opposite was true of Loch of Cliff and Loch of
Brow. If trophic status of more humic lochs is considered, they range from
oligo/mesotrophic to eutrophic, the most eutrophic lochs in the study being highly
coloured. A classification of Shetland lochs by geology of catchment alone (Britton,
1974) showed the vast majority of waters to be either oligotrophic or dystrophic, with
the assumption that dystrophic was synonymous with nutrient poor, rather than a
brown water loch of variable nutrient concentrations. If water bodies involved in the
1991 study are representative of Shetland lochs, it is possible that a deterioration has
occurred in water quality of standing freshwaters in Shetland since only six of those
studied were oligotrophic. This situation may have arisen through catchment
management practices or natural eutrophication processes. Of the Shetland lochs with
higher water colour, i.e. Lochs of Brough (Yell) and Kettlester, Bu, Turdale and
Sand Water, Strand and Sandy Lochs and Mill Pond, all were of mesotrophic to
eutrophic status (four being the most enriched systems of the lochs studied). In
addition, the lochs which exhibited blooms or scums were all of high water colour
(although the water colour of Punds Water is not known).
2.4.5 Further study of five Shetland lochs of different trophic status
2.4.5.1 Oxygen and temperature profiles of the five lochs in 1992 and 1993
In the five lochs studied in detail during 1992 and 1993, stratification was either
125

absent or weak and intermittent, with DO levels never becoming low, e.g. at 20 m
depth, at Site 2, in Loch of Gonfirth, in June 1992, DO saturation was 80.6%; at 20
m depth, at Site 2, in Loch of Tingwall, in July 1993, DO saturation was 71.0%. In
Loch of Gonfirth and Loch of Tingwall, stratification occurred approximately at the
depth at which the depression within the loch basin (at Site 2 in each loch) became
deeper than the rest of the basin (at approximately 15 m depth), the loch
morphometry restricting mixing and water circulation. Stratification has been found
to be a feature of other lochs in Scotland, notably the largest lochs, Loch Shiel, Loch
Lomond, Loch Awe, Loch Morar and Loch Ness. These lochs are all well mixed
from late autumn to spring and stratification develops from May to autumn (Smith et
al., 1981). Stratification in smaller, shallower lochs in Scotland has been found to be
discontinuous over the summer period. Included in this category are Coldingham
Loch (Bailey-Watts et al., 1987b), Loch of the Lowes, Balgavies Loch, Forfar Loch
(Harper and Stewart, 1987) and Loch Borralie (Spence et al., 1984). The latter was
noted to be mixed entirely for most of the year and stratification to be only
intermittent. These water bodies, which do not form stable thermoclines or oxyclines,
are more comparable with Lochs of Tingwall and Gonfirth where interruption to the
mixing process is infrequent. In lakes which are particularly shallow, stratification is
unlikely. For example, Loch Leven (Kinross) has a mean depth of 4 m and is non
stratifying (Bailey-Watts, 1978). Turdale Water, Helliers Water and Sandy Loch did
not stratify as they are extremely shallow. High wind exposure conditions are
prevalent in Shetland, wind speeds being greater than those experienced on mainland
Scotland. For example, from May to August, 1990, maximum wind gust in Shetland
ranged from 33-45 knots (SIC, 1991). Under such conditions, a water body of similar
volume to Loch of Tingwall or Loch of Gonfirth, but with a more uniform basin
shape, probably would not stratify.
2.4.5.2 Concentrations of phosphorus and chlorophyll a
In Loch of Gonfirth TP concentrations were lower in 1992 and 1993 than in 1991,
possibly due in part to an increase in rainfall to the catchment, thereby causing a
dilution of the Loch water. With TP < 5 /xg P L'1, this water body became
ultraoligotrophic. Chi a concentrations confirmed that this Loch remained nutrient
poor in nature. Although there was little variation in TP concentration from March
to October, higher values tended to occur earlier in the year. Owing to a number of
126
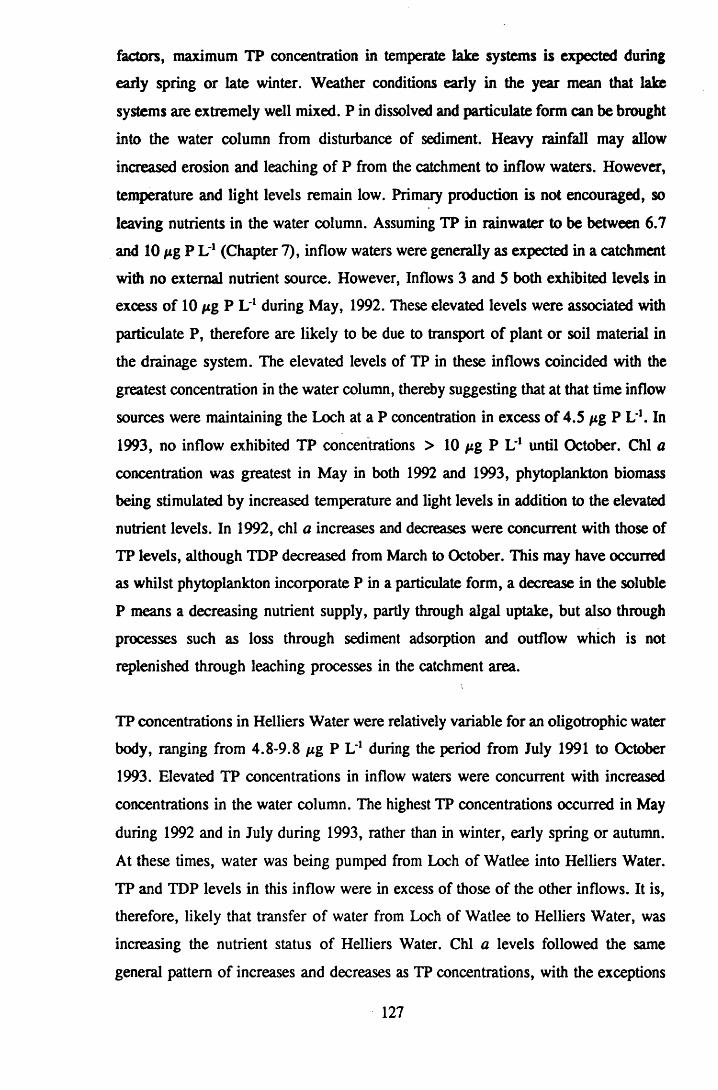
factors, maximum TP concentration in temperate lake systems is expected during
early spring or late winter. Weather conditions early in the year mean that lake
systems are extremely well mixed. P in dissolved and particulate form can be brought
into the water column from disturbance of sediment. Heavy rainfall may allow
increased erosion and leaching of P from the catchment to inflow waters. However,
temperature and light levels remain low. Primary production is not encouraged, so
leaving nutrients in the water column. Assuming TP in rainwater to be between 6.7
and 10 fig P L ' 1 (Chapter 7), inflow waters were generally as expected in a catchment
with no external nutrient source. However, Inflows 3 and 5 both exhibited levels in
excess of 10 fig P L 1 during May, 1992. These elevated levels were associated with
particulate P, therefore are likely to be due to transport of plant or soil material in
the drainage system. The elevated levels of TP in these inflows coincided with the
greatest concentration in the water column, thereby suggesting that at that time inflow
sources were maintaining the Loch at a P concentration in excess of 4.5 fig P L*1. In
1993, no inflow exhibited TP concentrations > 10 fig P L* 1 until October. Chi a
concentration was greatest in May in both 1992 and 1993, phytoplankton biomass
being stimulated by increased temperature and light levels in addition to the elevated
nutrient levels. In 1992, chi a increases and decreases were concurrent with those of
TP levels, although TDP decreased from March to October. This may have occurred
as whilst phytoplankton incorporate P in a particulate form, a decrease in the soluble
P means a decreasing nutrient supply, partly through algal uptake, but also through
processes such as loss through sediment adsorption and outflow which is not
replenished through leaching processes in the catchment area.
TP concentrations in Helliers Water were relatively variable for an oligotrophic water
body, ranging from 4.8-9 . 8 fig P L' 1 during the period from July 1991 to October
1993. Elevated TP concentrations in inflow waters were concurrent with increased
concentrations in the water column. The highest TP concentrations occurred in May
during 1992 and in July during 1993, rather than in winter, early spring or autumn.
At these times, water was being pumped from Loch of Watlee into Helliers Water.
TP and TDP levels in this inflow were in excess of those of the other inflows. It is,
therefore, likely that transfer of water from Loch of Watlee to Helliers Water, was
increasing the nutrient status of Helliers Water. Chi a levels followed the same
general pattern of increases and decreases as TP concentrations, with the exceptions
127

of the results for May 1992 and July 1993. During these times, chi a concentration
was lower than expected from the increase in TP levels. Nutrients from the Loch of
Watlee inflow were possibly not utilised immediately in increased phytoplankton
production, but elevated chi a concentrations were observed during the subsequent
monitoring visit in each case.
In Loch of Tingwall, during both 1992 and 1993, TP concentrations were highest in
March, as would be expected. However, fluctuations in chi a levels were not
particularly similar to those of the TP concentrations. Although this may have
occurred due to presence of varying amounts of inorganic particulate matter and
differences between algal types and cell condition, it is also likely that P from inflow
waters was affecting the TP-chl a relationship.
Within-loch TP concentrations ranged from 8.5-16.4 fig P L*!. Results of 1992 and
1993 surveys suggested that Loch of Tingwall was more mesotrophic than originally
surmised from 1991 data, stressing the importance of spring sampling. The trophic
status of this water body is as expected if it is considered that TP concentrations in
all inflows monitored were at least mesotrophic in nature. It is likely that elevated TP
levels in the inflow waters were as a result of human habitation and agricultural land
use within the catchment area.
As in Loch of Tingwall, the highest TP concentrations measured in 1992 and in 1993
in Sandy Loch both occurred in March, as would be expected in a temperate
freshwater lake. Over the three year study period, TP concentrations ranged from
21.0-38.2 fig P L'1. With the exception of the latter value, all results confirmed Sandy
Loch as being moderately productive. Inflow 1 consistently exhibited TP
concentrations considerably higher than those of either the Loch or the other inflow
waters. Although a covered, disused tip was partly within the catchment area for
Inflow 1, this Inflow also received drainage water from fertilised land areas; further
evidence that fertiliser treatment resulted in a loss of nutrients to the drainage system.
In addition, a high proportion of the TP was in the DRP fraction. Fluctuations in chi
a and TP concentrations in Sandy Loch did not correspond especially well. This may
have been related to high TP concentrations, but low phytoplankton numbers, in
inflow waters, causing immediate TP addition to the water column, but a delay
occurring before nutrients were utilised in increased phytoplankton productivity.
128

Instances of decreasing TDP and increasing chi a were observed, this perhaps
occurring because of uptake of the bioavailable fraction of TDP by the phytoplankton.
Turdale Water continued to be a highly productive water body throughout the study
period. Inflow waters of this loch had extremely high TP concentrations. As most
inflows consisted of drainage water from reseeded areas and no other land use, it is
suggested that the excessive TP concentrations occurred as a direct result of land
fertilisation. Similarly, it is probable that eutrophication of Turdale Water has arisen
because of high losses of P from fertilised land. The considerably lower TP
concentrations observed in the Turdale Water water column during summer may have
been a result of Inflows 1,3 and 4 drying up and TP levels in Inflows 2 and 5 being
much reduced. It is assumed that TP levels in inflows were higher in spring and
autumn because of increased rainfall resulting in greater nutrient leaching. In
addition, P uptake by plants decreases in autumn and vegetation dies back, so
releasing decay products such as P to the system. Although much of the TP input was
as particulate matter, concentrations of TDP and DRP were also high. It is likely that
TP concentrations in Turdale Water change rapidly. Consequently, an obvious
relationship between TP and chi a throughout the period of study would not
necessarly be expected. However, low chi a concentrations during summer in 1992
and 1993 were probably due to the decrease in input of readily available P at those
times.
2.5 CONCLUSIONS
(1) A variety of loch types, incorporating a range of physical and chemical
characteristics was observed within the thirty one water bodies surveyed.
Values for pH, alkalinity, conductivity and water cation concentrations were
slightly elevated in comparison with lochs elsewhere in Britain, but water
chemistry was as would be expected in shallow, lowland waters, with
influences from fertile geology and maritime salts.
(2) Water quality in Shetland waters was generally good, fulfilling the criteria
necessary for potable water supplies and for waters supporting freshwater fish
populations.
(3) A range of trophic states was observed, from oligotrophic to eutrophic. Only
six water bodies were classified as oligotrophic and therefore unlikely to
129

exhibit excessive phytoplankton production.
(4) A degree of variation in TP concentrations is to be expected in loch and
inflow waters and in chi a levels of these standing fresh waters, even in
situations where there is no anthropogenic nutrient input, other than in the
form of airborne substances.
(5) Data collected suggested that inflow waters were likely to be a source of loch
nutrient enrichment in catchment areas incorporating improved grassland,
cattle and septic tanks.
130

CHAPTER 3: SHETLAND LOCH SEDIMENTS AS A STORE AND SOURCE
OF PHOSPHORUS
3.1 INTRODUCTION
3.1.1 Sediment as a nutrient sink and store
P retention in lakes is dependent on availability and sedimentation characteristics of
possible P binding sites, organic or inorganic. P content of lake bottom deposits
therefore depends on a dynamic balance between the sediment P retention capacity
and the external P loading. The difference between quantity of naturally bound P and
potential immobilisation capacity may be small. However, if sediment P is loosely
bound, the internal P loading which this can exert may be significant in the overall
lake system (Rostrom, 1988). In the later stages of eutrophication, water column P
concentration may be expected to increase relatively rapidly in the lake waters,
although during the early stages of nutrient enrichment, P concentration may rise only
slowly (Golterman, 1982a). This is a result of P binding capacity in sediment of
oligotrophic lakes typically being high, so that effects of P enrichment through
increased external P loads on the P concentration in the water column may not be
immediately obvious. Lake sediments generally immobilise more P than is released
from them on an annual basis (Marsden, 1989). In more enriched lakes, P adsorption
sites in the sediment may already be occupied, so decreasing the capacity of the lake
to immobilise excess P. Effects on primary production within the water column may
therefore occur more rapidly.
Shallow lakes have a low water volume: sediment surface area ratio. The potential for
immobilisation of P from external sources may, therefore, be relatively large.
Consequently, shallow lakes can exhibit relatively high P concentrations before
changes occur in the biology of the lake (Berge, 1990). However, there is also the
possibility that resuspension and rerelease of P from the sediments could have a
considerable impact on the water column P concentration in shallow lochs. As
Shetland lochs tend to be shallower than most Scottish mainland lochs (Table 1.5;
George and Maitland, 1984) they are exposed to mechanical stirring of sediments via
wind-driven wave action. Through disturbance of the sediment, cycling of P from
sediments may assume importance in the loch nutrient cycle. Wind conditions in
Shetland ensure that lochs seldom stratify (Chapter 2). Contrary to classical temperate
large lake mechanics which involve temperature/chemical stratification in summer,
131

possibly resulting in an anoxic hypolimnion and consequent P release from sediments,
anoxia is not necessarily a prerequisite for P release from sediments, and an
oxygenated overlying water column does not always prevent it (Andersen, 1974;
1982). It is, therefore, possible that many Shetland lochs will exhibit higher P levels
than expected, due to internal, mechanical processes.
3.1.1.1 Forms of P present in sediment
Several inorganic P compounds have been defined in freshwater sediments (Table
3.1). However, P may also be stored in organic forms within the sediment. The
sediment-water interface is the major site of detrital decomposition within standing
freshwaters. Doremus and Clesceri (1982) found that in terms of microbial activity,
1 cm of surface sediment was approximately twice as productive as 18 m of water
column in soft water oligotrophic Lake George, New York. Dividing sediment into
humic and Fe/Ca-bound fractions of P, it was shown that four times more P was
incorporated into humic compounds than was combined with Fe/Ca complexes.
Inorganic P sorption by humic substances results in temporary P storage in an organic
form. Both microbial activity and presence of organic matter are therefore important
in P immobilisation, but separation of the effects of these parameters would be
difficult because of rapidity of turn over between living and dead components of the
biodetritus (Doremus and Clesceri, 1982).
Algal bioassay analyses (using Scenedesmus quadricauda) of sediment from four lakes
in the Netherlands, including clay, sand/peat and peat composition revealed that algal
extractable P was positively correlated with TP, total Fe and clay content, though
negatively correlated with organic matter (Klapwijk et al., 1982). Percentage
extractable P varies from lake to lake, depending upon sediment type. A significant
proportion of organic P in sediments has been found to incorporated in phytic acid
and similar compounds. Sequestration prevents chemical binding of ions without
removing them from solution. Phytic acid has been found to form complexes with
Ca2+, Mg2+, Mn2+, Fe?+ and Fe3+ (de Groot and Golterman, 1993). Golterman et al.
(1993) have found P adsorption efficiency to be related to pH but also to presence of
salts such as NaCl, MgCl2 and CaCl2, which may cause an effect through the electric
double layer of Fe(OOH). Conversely, S2' inactivates Fe(OOH) with regard to its P
binding capacity.
132

Table 3.1 Phosphorus compounds in freshwater sediments (Pettersson et al.t 1988)
Compound Chemical formula
ApatiteBrushiteoctoCalciumphosphateAnapaiteStrengiteVivianiteLipscombitePhosphoferriteLudlamiteVarisciteWavellite
* OH)CaHP04, 21^0 (Ca4 H(P04)3, 3 H2 0 > 2
Ca3 Fe(P0 4 )3 , 4H20 FeP04, 2H20 Fe3 (P04)2, 8H20 Fe3 (P0 4 )2 (0H ) 2
(Mn^e^CPO,),, 3H20 (Fe,Mn,Mg)3 (P0 4 )2 ,4H20 A1P04, 2H20 Al3 (OH)3 (P0 4 ) 2
133

3.1.2 Release of nutrients within lake sediments
The gradient in P concentrations between sediment interstitial water and water column
is an important mechanism of sediment P release to the overlying water. Under
anoxic conditions, sediment P release is linearly dependent upon the concentration
gradient across the sediment surface (Kamp-Nielsen, 1974). The magnitude of P
release within the sediments is therefore important in terms of its effect on the
likelihood of subsequent release of P to the water column. Mineralisation processes
affect the concentration gradient and diffusion to the water column is influenced by
the redox potential (Eh) and pH (Ryding, 1985).
3.1.2.1 Redox potential (Eh)
Oxidation is defined as a loss of electrons, whilst reduction is a gain of electrons,
these electron transfer reactions being reversible. "The Eh of a system is a
quantitative expression of its oxidising or reducing intensity. Redox potential may be
defined as the electron escaping tendency of a reversible oxidation-reduction system,
and is thus an intensity factor" (ZoBell, 1946b). The Eh in oxygenated water is
generally approximately +500 mV, but reducing conditions become dominant below
the sediment surface (Bostrom et al., 1982). Eh values of < +500 mV indicate that
conditions are no longer fully aerated (NCC, 1990). When dissolved oxygen
concentration in the water overlying the sediment is > 1-2 mg L*1, Eh at the oxidised
surface layer of sediment is generally in the region of +300 to +400 mV (Moss,
1980). In principle, this layer has a high P sorption capacity and limits release of P
from deeper sediment (Marsden, 1989).
The rapidity with which Eh decreases below sediment surface is dependent upon a
combination of processes within the sediment (Marsden, 1989). Sediment bacterial
action accounts for an oxygen demand resulting from utilisation of organic matter as
an energy source. Oxygen in surface sediment is replaced through diffusion from or
mixing with the water column. However, below the oxidised microlayer, oxygen
supply cannot meet demand. Anaerobic conditions are characterised by Eh values of
< +200 mV, which approximates to 0.01 mg DO L* 1 (NCC, 1990). Reduction of
the following chemicals takes place within the sediment as Eh decreases: NO *, Mn4+,
Fe3+, S0 4 2 and C02.
134
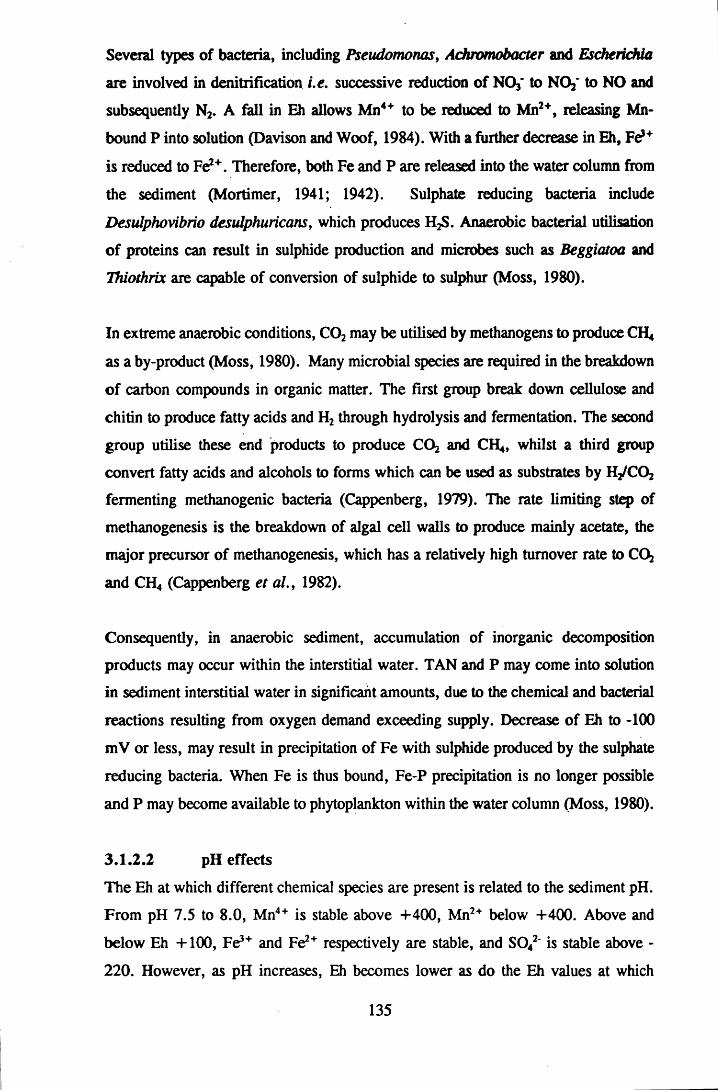
Several types of bacteria, including Pseudomonas, Achmmobacter and Escherichia
are involved in denitrification i.e. successive reduction of N(V to N(V to NO and
subsequently N2. A fall in Eh allows Mn4+ to be reduced to Mn2+, releasing Mn-
bound P into solution (Davison and Woof, 1984). With a further decrease in Eh, Fe?+
is reduced to Fe2+. Therefore, both Fe and P are released into the water column from
the sediment (Mortimer, 1941; 1942). Sulphate reducing bacteria include
Desulphovibrio desulphuricans, which produces HjS. Anaerobic bacterial utilisation
of proteins can result in sulphide production and microbes such as Beggiatoa and
Thiothrix are capable of conversion of sulphide to sulphur (Moss, 1980).
In extreme anaerobic conditions, C0 2 may be utilised by methanogens to produce CH
as a by-product (Moss, 1980). Many microbial species are required in the breakdown
of carbon compounds in organic matter. The first group break down cellulose and
chitin to produce fatty acids and H2 through hydrolysis and fermentation. The second
group utilise these end products to produce CO* and CH*, whilst a third group
convert fatty acids and alcohols to forms which can be used as substrates by H2 /C0 2
fermenting methanogenic bacteria (Cappenberg, 1979). The rate limiting step of
methanogenesis is the breakdown of algal cell walls to produce mainly acetate, the
major precursor of methanogenesis, which has a relatively high turnover rate to CO*
and CH4 (Cappenberg et al., 1982).
Consequently, in anaerobic sediment, accumulation of inorganic decomposition
products may occur within the interstitial water. TAN and P may come into solution
in sediment interstitial water in significant amounts, due to the chemical and bacterial
reactions resulting from oxygen demand exceeding supply. Decrease of Eh to -100
mV or less, may result in precipitation of Fe with sulphide produced by the sulphate
reducing bacteria. When Fe is thus bound, Fe-P precipitation is no longer possible
and P may become available to phytoplankton within the water column (Moss, 1980).
3.1.2.2 pH effects
The Eh at which different chemical species are present is related to the sediment pH.
From pH 7.5 to 8.0, Mn4+ is stable above +400, Mn2+ below +400. Above and
below Eh +100, Fe3+ and Fe2+ respectively are stable, and S042' is stable above -
220. However, as pH increases, Eh becomes lower as do the Eh values at which
135

chemical species are stable (Meadows and Campbell, 1988).
Breakdown of organic matter through bacterial fermentation in sediment results in
interstitial water becoming more acid (Marsden, 1989). Consequently, Si may be
released because of an increase in the dissolution rate from siliceous structures of
phytoplankton. Acidic breakdown of Ca- and Mg-bound P compounds may result in
release of these three elements to the sediment interstitial water.
3.1.3 Release of sediment P to the water column
Studies of P release from laboratory batch experiments with sediment from eight
different lakes were carried out by Bostrom and Pettersson (1982). Sediments could
be divided into three categories from behaviour of P in control, acetate (10 mg C L*1)
or N 03-N (mg N L'1) treatments:
(1) No P release. Mostly these were characterised by low adsorption, high
desorption, water extractable P, 1-2%, non-apatite inorganic P, 5% and
apatite P, 40% of TP. Sediment from one lake had 10% apatite P and 20%
non apatite inorganic P. These lakes were shallow and large areas of
agricultural cultivation in the catchment, little on low sewage input.
(2) High P release following acetate addition which stimulated bacterial oxygen
demand, but no release after addition of N03-N which stabilized Eh
conditions. Adsorption capacity was high, desorption low, water extractable
P 3-7% and non-apatite inorganic P constituted 10% of TP. Lower percentage
of cultivated land in drainage area and have periods of stratification.
(3) P release to a constant level regardless of acetate or NO3-N additions. These
lakes were shallow, had received substantial inputs of wastewater, had a high
organic P content and were apparently P saturated. Water extractable P was
10% of TP. Sediment produced P loading in summer despite oxygenated water
column.
This example illustrates that sediment P release is dependent upon several factors and
also that, in certain conditions, presence of N 0 3 may suppress sediment P release.
3.1.3.1 Factors influencing P release to an oxygenated water column
Most aerobic P release has been associated with eutrophic, shallow lakes which have
136

been receiving large nutrient inputs from industrial or domestic waste water (Bdstrom
and Pettersson, 1982). P released from Fe and Mn under reducing conditions in the
deeper sediments often does not become available in the water column, as the
released P encounters oxygenated surface sediment and is usually reprecipitaied.
However, it is still possible for P release to occur, as the oxidised surface zone of
sediment is shallow and may become saturated with respect to P. When this occurs,
release of P to the water column is feasible. Oxygen demand within the sediment
increases with increasing temperature, resulting in a thinner oxidised surface zone and
higher concentration of P within the interstitial water. P release may, therefore,
become independent of water column oxygen content when temperature rises above
17°C (Kamp-Nielsen, 1974).
If P binding capacity of surface sediment is low due to, for example, low Fe
concentrations, this may allow passage of P from sediments to the lake water column.
Since P adsorption capacity of peaty soil is poor, as a consequence of low Fe content,
it follows that effective P immobilisation may not occur in peaty sediments. In
addition, sorbed P may be released from aerobic organic sediment when surrounding
water is of a low P concentration, as occurs in soil chemistry, with P being released
from its adsorption sites (Chapter 6 ).
P release to an aerobic water column may also occur when high pH reduces ability
of Fe3+ to bind with P, so that in waters where primary production had raised pH,
rather than there being naturally occurring alkaline, hard water, P could become
available in the water column. In Ca rich waters there may be a relatively low Fe
pool, so that if acid conditions occur in the sediment, P could be mobilized. It is
likely that on reaching the overlying water this P would become Ca-bound.
A potential route of P release to aerobic conditions occurs when the major site of
decomposition is within an organic layer resulting from sedimentation of high algal
biomass i.e. at the sediment surface rather than deep in the mud. It is possible that
aerobic decomposition could mobilize P to the water column (Marsden, 1989).
3.1.3.1.1 Effect of nitrate on sediment DRP release
Jensen and Andersen (1990) examined impact of nitrate on P cycling. Experimental
137

tests were carried out with sediment cores from two shallow eutrophic lakes. At 5°C,
in January, sediment P release was greater at 0.1 mg NO3-N L ' 1 than at 2 mg NOj-N
L'1. However, in May, at a temperature of 15°C no significant difference was
observed in DRP release between the two NO3-N concentrations. During September,
at a temperature of 15°C, raised NO3-N concentrations had a positive influence on
DRP release from the sediment. Both lakes were found to have significant internal P
loading during summer. With few exceptions, the greatest net internal P loadings
occurred during increasing blue-green algae biomass and depletion of inorganic N
(IN) in the water column. Net P loading is a result of gross sediment DRP release
and sedimentation of PP. Because net internal P loading exceeded gross release of
DRP, it was concluded that increased PP occurred in the water column due to
buoyancy of Microcystis and Aphanizomenon, thereby increasing summer TP
concentrations in the lakes.
High N 03‘ concentration in the water column may result in decreased gross internal
P loading to a water body. In dimictic eutrophic lakes, P release from anoxic
sediments is suppressed because of the delay in Fe3+ reduction influencing P sorption
capacity of the sediment (Bostrdm and Pettersson, 1982). N 03* can postpone or
prevent release of Fe-P by maintaining Eh at a high level (Ryding, 1985), because
N 0 3 may act as an alternative electron acceptor to O2 and be reduced through
denitrification, so allowing increased mineralisation rates of organic matter (Ryding,
1985).
3.1.3.1.2 Effects of Fe:P ratio on P release
In the Norfolk Broads, high rates of P release occurred when the Fe:P ratio in
interstitial water was <1.8:1. In this situation external nutrient control measures
alone are unlikely to allow recovery of the water body (Phillips and Jackson, 1990).
Jensen et al. (1992) found in a study of 116 lakes, that water column TP decreased
as Fe:P ratio increased. In those with Fe:P ratios >15:1, there was a smaller
increase in lake water TP concentration from winter to summer than in the other
waterbodies studied. The greatest difference between winter and summer TP
concentrations in lake water occurred when Fe:P ratios were between 10:1 and 15:1.
In lakes with a Fe:P ratio of <10:1, no correlation was demonstrated between Fe:P
ratio and DRP release rate, although there were significant correlations with all
138

sediment P fractions, thus suggesting that perhaps organic P sources are controlling
sediment P loss in lakes where sediment Fe content is low. It is suggested that Fe:P
ratio shows an estimate of the available sites for orthophosphate sorption by Fe in
aerobic sediment
3 .13 .1 .3 Biological influences on sediment P dynamics
Nutrient requirements of bacterial decomposers on the sediment surface may be
satisfied either through diffusion of nutrients from deeper sediment or sedimentation
of material in the water column. Sediment microorganisms have the ability to uptake
and release DRP. The processes are dependent on Eh. Significant bacterial DRP
fixation has been found to occur after oxygenation of anoxic sediment, whilst
laboratory sterilization experiments have resulted in decreased DRP sorption in
aerobic sediment (Gachter et al., 1988). Since anoxic release of Fe and DRP have
been found to be partly uncoupled, bacterial fixation and release of DRP may be
controlled partly by redox-dependent changes in microbial physiology as well as
through production and decomposition of microbial biomass (Gachter et al., 1988).
In addition to effects caused by bacteria, algal cells also influence sediment P
dynamics. TP concentration may increase in the water column as a result of
recruitment of phytoplankton cells from the sediment. Similarly, TP content of the
surface sediment may increase as a consequence of death and sedimentation of the
water column algal population.
Refractory organic matter is unavailable to aquatic animals because they are unable
to digest it. However they have the ability to digest microbial cells. Death and
excretion products of animals may then be reutilised by bacteria (Moss, 1980).
Protozoan detritivores increase P turnover through excretion of inorganic P and
increase P retention time within the biodetritus (Barsdate et al., 1974). Invertebrates
feeding on biodetritus influence sediment-water P flux through excretion and
irrigation of the sediment by burrowing (Doremus and Clesceri, 1982). Vertical
burrowing increases sediment mixing (Ryding, 1985). Benthic invertebrate activity
within sediments might therefore be expected to have an effect on lake P cycling,
although it may be minor only (Kamp-Nielsen et al., 1982).
A significant relationship was found ip < 0.002) between P release rate and number
139

of fourth instar Chironomus plumosus larvae in the Norfolk Broads. However, no
relationship was observed between P release and numbers of any other small
chironomids or tubificid worms (Phillips and Jackson, 1990).
During previous studies of aerobic and anaerobic sediment and fourth instar
Chironomus plumosus larvae, silica release was increased 2-3 times after addition of
larvae to sediment cores. In aerobic core tubes TP release rate was at least doubled
after introduction of larvae. Fe and Mn release also increased in these tubes. Effects
on TON and NH4-N were variable. TP release from anaerobic cores was already
elevated compared with the aerobic sediment. Average TP release rate increased by
1.26-1.57 mg P m' 2 d' 1 in cores from two of the lakes studied and decreased by an
average of 0.12 mg P nr2 d' 1 in anaerobic cores from the third. NH^N release also
increased from these cores, but decreased from sediment in the other two. No change
was noted in TON release after addition of the animals to anaerobic cores, but both
Fe and Mn release decreased.
Changes associated with the oxygen status of the core tubes were much more
important in terms of release rates than those resulting from chironomid action. It is
postulated that effects of burrowing are physical only, greater exchange of water
column, interstitial water and high concentrations of inorganic nutrients becoming
possible (Gran61i, 1979). However some further oxygenation of deeper sediment
might occur in close proximity to the burrows. Downward movement of surface
deposits might result in increased P immobilisation, whereas upward transport of
material could cause increased release of P from the sediment (Kamp-Nielsen et al.,
1982). Effects of invertebrates are obviously complex, depending on the particular
conditions of individual sediments, size, species and numbers of animals. N release,
being closely linked to bacterial activity may be little affected by invertebrate activity.
3.1.4 Availability of P released from lake sediments
When sediment resuspension or P release to the water column occurs, the P does not
necessarily become available to the phytoplankton. Resuspended organic P may settle
again in particulate form, whilst DRP may become chemically bound within the water
column. Precipitation of P with metal ions is dependent upon the concentration of
metals available for binding and on the water column pH. In hard water lakes, for
140
example, Ca2+ is as important as Fe3* in regulation of P availability. When higher
pH occurs in interstitial water than in the water column, Fe controls P availability in
the lake. However, pH increases associated with algal growth in nutrient enriched
lakes can result in Ca2+ concentration controlling P solubility (Golterman, 1982a). It
has been suggested that the availability of Ca-bound and Fe-bound P compounds to
phytoplankton is different (Golterman, 1982b). P which has been recently combined
with calcite (CaC03) is in equilibrium with water DRP. Consequently desorption may
occur if water DRP concentrations decrease (Marsden, 1989).
In addition to chemical immobilisation, availability of P released from sediments may
also be limited by the distance travelled upward through the water column. Cycling
of nutrients in lake systems may be limited to the deepest water. For example, Mn
flux upward through soluble diffusion from sediment in Lac L6 man, Switzerland, has
been found to be approximately equal to downward flux through settlement of
Metallogenium, all within the deepest hypolimnetic waters (Jaquet et al., 1982).
3.1.5 Aims
P binding and release by lake sediments are dependent upon many factors, such as
sediment temperature, pH, Eh, oxygen, TON, Fe, Al and Ca content. From review
of published literature on sediment P dynamics, it is evident that lake sediments may
act either as a P sink, or as a source of P to the overlying water column. There was
no information available on P in loch sediments in Shetland, but clearly, sediment P
binding or release, could have a significant effect on water column P concentrations,
particularly as the water bodies are shallow and of low volume. The aims of the
present study were as follows.
(a) Determine background characteristics of bulk densities, redox potentials and
%C, %N and %LOI contents of sediment in the five study lochs.
(b) Measure the quantity of P assimilated by each sediment, i.e. the mass of P
stored, as a percentage of sediment mass.
(c) estimate the quantity of P which could be released as DRP from sediment in
each of the five study lochs, under current conditions.
(d) Depending upon present nutrient status of a water body, assess the sediment
P uptake capacity, should the trophic status of a water column be raised to
mesotrophic and or eutrophic conditions.
141

3.2 MATERIALS AND METHODS
32.1 Determination of sediment characteristics
Sediment sampling positions were determined from depth and area data, in
conjunction with a depth limit set by the SCUBA diver. Sediment cores were taken
by SCUBA diver from bottom deposits in Gonfirth (29/08/92), Helliers (21/08/92),
Tingwall (26/08/92) and Turdale (26/08/92). Plastic core tubes were of 7.5 cm
internal diameter and 0.3 cm wall thickness. At each sediment sampling site, six of
these were driven into bottom deposits. A rubber bung placed in the top of each
sediment core tube allowed extraction of the intact core from the loch bottom. A
second rubber bung was inserted at the bottom of each core to ensure it remained in
place. Sediment was transported in an upright position to the shore, where three cores
were extruded and sectioned and three were used to obtain redox readings. It proved
impossible to obtain cores from Sandy Loch owing to lack of light and the
impenetrable nature of the basin bottom, which is composed largely of peat deposits.
An Ekman grab was therefore used to collect three samples of surface sediment in
this instance (29/08/92). As a result of the sampling technique used at Sandy Loch,
no bulk density measurements were possible for this sediment. Locations of sediment
sampling sites are illustrated in Figure 3.1.
3.2.1.1 Measurement of redox potential (Eh)
Using a Jenway Model 3070 pH/temperature/millivolt (mV) meter, the
electrochemical potential developed by a platinum redox indicator electrode was
determined by comparison with the stable potential of the 4MKC1 silver-silver
chloride reference electrode. Prior to mV measurement in each core, a mV
determination in ZoBell’s solution (a standard redox system) was recorded to verify
the performance of the redox indicator system. This ensured that the indicator
electrode had not been damaged or poisoned. The mV readings (±1 mV) were then
taken from surface to 10 cm sediment depth. The redox indicator probe was lowered
at 1 cm intervals through each core. At each depth, 1 minute was allowed for
stabilisation of the mV reading. As redox potential is expressed as an Eh value
(ZoBell, 1946a&b; Riley and Chester, 1971; Andersen, 1982; Meadows and
Campbell, 1988), the potential of the reference electrode on the hydrogen scale
(+198) was then added to each mV reading recorded, in order to calculate the final
redox (Eh) potential. Eh is "the electromotive force of an oxidation-reduction system
142

referred to a standard hydrogen half-cell" (ZoBell, 1946b).
3.2.1.2 Bulk density and organic content
Each of the three cores was cut into slices of 7.5 cm (±0.1 cm) diameter and 1 cm
(±0.1 cm) thickness from 0-6 cm depth, then 2 x 1.5 cm (±0.1 cm) sections from
6-9 cm depth. Each fraction was then stored frozen in a polyethylene bag until
laboratory procedures could be carried out. Sediment was oven dried at 105 °C. All
sediment in each slice was weighed (±0.1 mg) for calculation of bulk density (BD)
as follows: dry weight of slice -r volume of slice. A subsample of dried sediment
from each core slice was weighed (±0.1 mg), ignited at 550°C for 6 hours, and
reweighed (±0.1 mg), in order to calculate percentage loss on ignition (%LOI) as an
estimate of sediment organic matter content.
3.2.1.3 Analysis of sediment %P, %N and %C content
For determination of the quantity of P present in each sediment depth section,
composite samples were created from the three cores. Approximately 40 mg of each
sample of oven dry sediment was weighed accurately (±0.1 mg) into a Pyrex flask
and digested with an acid mixture of nitric acid, 70% perchloric acid and sulphuric
acid, in the ratio 5:1:1. Flask contents were boiled almost dry. After cooling, distilled
water was added, followed by ammonium solution as described by Strickland and
Parsons (1972). Each of these solutions was boiled off before subsequent additions.
Acidified water (0.2% concentrated hydrochloric acid) was then introduced to each
flask to dissolve solids, before total volume was made up to 40 mL with distilled
water. This digest solution was filtered through Whatman Nfll papers before
spectrophotometric determination of molybdate reactive P, as described in Chapter
2, using a 1 cm path length. Standards and blanks were treated as samples and sample
digests were adjusted to the pH of standards and blanks prior to analysis. Analysis
of each sample was carried out in triplicate. %P was calculated by dividing results
in mg P g* 1 dry weight soil by 10.
The %C (±0.3%) and %N (±0.3%) contents in each individual core segment were
determined using 15-20 mg oven dried sediment in a Carlo Erba Model 1106 CHN
analyser.
143

Figure 3.1 Locations o f sediment sampling sites in the five study lochs (marked with an "s"; inflows marked by number (Chapter 2) and outflow by arrow)
CO
144
l.oel
i of
Ting
wal
l Tu
rilul
c W
itlcr
Su
mly
l.
och

3.2.1.4 Data analysis
Parameters of BD (g cm-3), %LOI, Eh, %C, %N and %P content were plotted
against depth of core. Statistical comparisons of each variable (with the exception of
Eh) were made between cores from the five different study sites, using the Sign
(paired) test (n = 16 or 14, two tailed probability of equalling or exceeding Z
percentage value)
3.2.2 P adsorption capacity of sediments in study lochs
Sediment sampling sites of the 1993 survey are illustrated in Figure 3.1. In August
1993, Perspex sediment tubes of 3.9 cm internal diameter were used to retrieve
intact, undisturbed sediment cores from Lochs of Gonfirth (31/07/93) and Tingwall
(04/08/93), Helliers (02/08/93) and Turdale Water (04/08/93). Coring was not
possible in Sandy Loch, owing to the impenetrable nature of the bottom of the Loch.
The first 5 cm of each core was sectioned into a glass conical flask on site. On return
to the laboratory, three treatments were administered to these mud samples in loch
water taken from depth. 50 mL water was added to each flask after spiking with 0,
10 or 50 fig P L 1, with P being present as KH2 P04. Five replicates of each treatment
were created.
Sediment from the four different loch sites did not receive the same treatments. Loch
water alone was added to sediment from all four water bodies, to assess the potential
DRP release in 24 hours, under present water column conditions. Loch water spiked
with 10 and 50 pg P L* 1 was added to Loch of Gonfirth and Helliers Water sediment,
in order to simulate conditions, should nutrient enrichment result in a mesotrophic or
eutrophic water column in these lochs. As Loch of Tingwall already has a
mesotrophic water column TP concentration in spring, cores from this loch were not
treated with loch water with 10 pg P L' 1 added, but did receive the 50 pg P L 1 spiked
water treatment. Similarly, as Turdale Water exhibits eutrophic water column TP
levels, cores from this loch were not treated with water which had been further
enriched.
Sediment-water mixtures were stirred with a glass rod, then stored in darkness at 16.5
±0.5 °C for 24 hours. A second stir was administered after 20 hours. Flasks were
arranged randomly in a 5 x 3 formation. After 24 hours water from each flask was
145

filtered through a Whatman Nfil filter paper previously washed in double distilled
water. Filtrates were stored frozen in polyethylene bottles until analysis. Analysis was
carried out as for DRP in routine water samples (Chapter 2). Colour correction for
each sediment filtrate was enabled by addition of DRP colour reagent without
reducing agent. Filter papers and sediment contained therein, were dried at 90°C for
48 hours, cooled and weighed for calculation of sediment bulk density. Organic
content of each sediment was then determined after ignition at 550°C for 6 hours.
3.3 RESULTS
3.3.1 Characteristics of the sediments from the five study lochs
BD, %LOI, Eh, %C, %N (means of three cores) and %P (composites of three cores)
for sediment from each loch except Sandy Loch are plotted in Figures 3.2-3.7.
Organic content, %C, %N and %P for Sandy Loch sediment are presented in Table
3.2. Outcomes of statistical comparisons of cores from different sites in terms of BD,
%LOI, %C, %N and %P content are presented in Table 3.3.
3.3.1.1 Loch of Gonfirth
BD was found to be in a range from 1.55 g cm' 3 at 3.0-4.0 cm to 3.2 g cm' 3 at 7.5-
9.0 cm depth (the latter being the highest recorded in this survey) in sediment from
Loch of Gonfirth. This sediment was found to be more compacted than bottom
deposits from each of the remaining sites (Figure 3.2). Gonfirth sediment was most
different from that of Helliers Water (p < 0.001), although also significantly
different from Tingwall North, Tingwall South and Turdale Water sediments (p <
0.01) (Table 3.3). In terms of %LOI, Loch of Gonfirth sediment was also
significantly different from the other samples (p < 0.001). Organic matter content
was found to account for a smaller proportion of Gonfirth sediment than any other,
the range of %LOI being 3.1% at 1.0-2.0 cm to 7% at 7.5-9.0 cm depth (Figure
3.3).
Plot of %C content was similar to that for %LOI (Figure 3.4). Loch of Gonfirth
sediment was significantly poorer in %C content than the other sediments (p <
0.001). Maximum %C content of 3.06% was recorded in sediment at 7.5-9 cm whilst
the lowest percentage was 0.94% at 4-5 cm. The proportion of C increased from this
depth to surface sediment.
146

Dry bulk
density (g
cm-3)
Figure 3.2 BuUcdensity profiles o f sediments from the five loch coring sites1992 (mean values, n=3)
Depth (cm)
o cp • i
ZD = ( 0 ( 0 0
^ W ^ ®
Z C/)
b
147

% loss
on ignition
Figure 3.3 Percentage loss on ignition profiles of sediments from the fiveloch coring sites of 1992 (mean values, n=3)
Depth (cm)
~ 'v l
cnCDo CJ1
0 0
O cn
Y ’
noo
,„-0- 0- 0 '
: I I i :I I I ’
6 A • ■CD H I — I — I — Io o_ j- ag , CD g -
^ 00 ^ CD
Z CD
. < ■
€>' O-.
---------- _______
J3 —■
" i
YE
GOOBr'
148
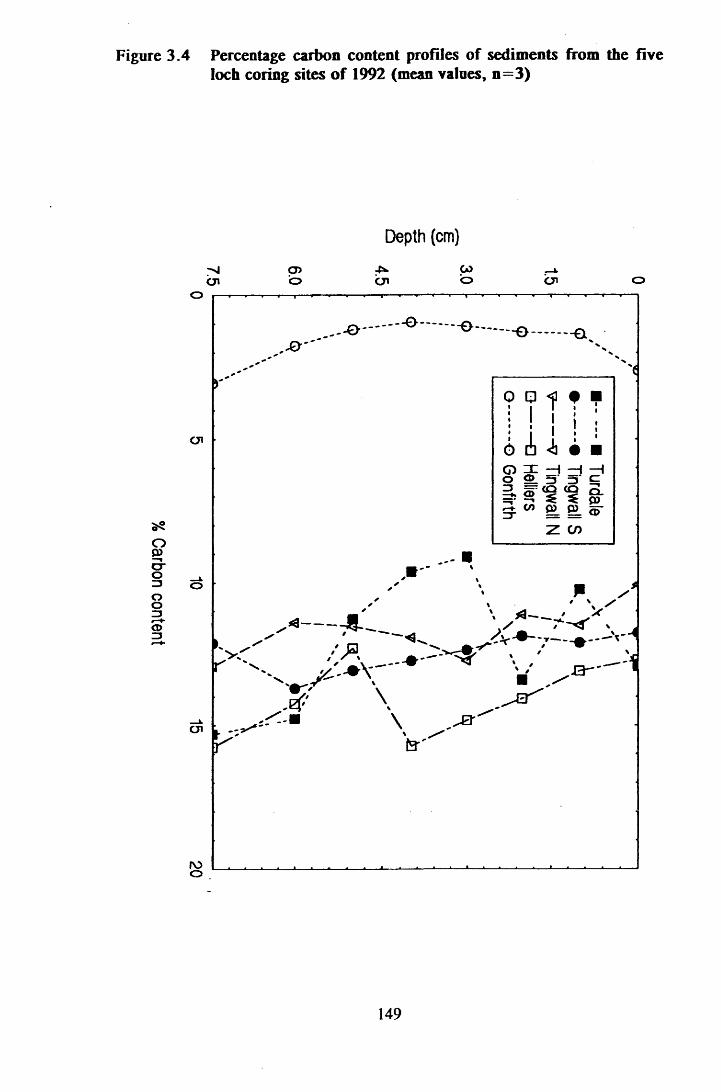
% Carbon
content
Figure 3.4 Percentage carbon content profiles of sediments from the fiveloch coring sites o f 1992 (mean values, n= 3)
Depth (cm)
OIo>o cn
GOo cn
Y‘
cn
..- -O ' - 0 .......... -0.........- 0 — >-0
9 * 1 : ! ! i :
o ^ . U .o n: ^ ^ —i o © □ □ c ^ o .^ ^ ^ OJ5 W I © O
Z CO
'€
Lv rr
* H -'m/ J3/ ' k A -
\
r\
A /
/
7*"^ sV -*
.3 "
roo
149

% Nitrogen
content
Figure 3.5 Percentage nitrogen content profiles of sediments from the fiveloch coring sites o f 1992 (mean values, n=3)
Depth (cm)
Cjlcr>o CJl
GOO
oCJI
3-----■Q-------
CP
\\
V^ \
\ X'J
CJI
noo
• I S(!) i i I• ■Q I H H —Io f f l i n e ^ CD ^ ^ g -
~ 0 0 o^ ro
rocn
150

% Phosphorus
content
Figure 3.6 Percentage phosphorus content profiles of sediments from the fiveloch coring sites of 1992 (composit values, n=3)
Depth (cm)
-Nlcn
o>o
-pvCJI
COo Cjl
h—7y'— <
oho
oGO
- - • 0 ^ * 1
-V
o
- e -
■ Tt
,o -* -
--C
(!)
0 qj < I i
r U
• ■
• ■
CQ (Q CP ^ ^cn
o . CD(S {S Q
co
o
151

Redox potential (m
V)
Figure 3.7 Redox potential profiles of sediments from the five loch coringsites o f 1992 (mean values, n=3)
Depth (cm)
cji o00 o> fV>
oo \
\
CJIo
tooo
oos
O B — B ------0 -------0 -------Q ___ _
Qii■1i
•iI Ti
■ii
i i 6 <
ii* A
ii*
o —I —1 m —1o ZJ zj' <0 £Z
CO (O CD' O .0)
z r CO v>_ C/5 oZ in
-B B -
O O- — -G O -----0 ——O — © ~ ~ © — © — <
CJiOo
152

Table 3.2 Characteristics of Sandy Loch sediment collected in 1992
Parameter % content
Loss on ignition 63.60
Carbon 36.70
Nitrogen 1.49
Phosphorus 0.06
153

Table 3.3 Significance matrix (paired sign test) of sediment characteristics
Bulk density (g cm*3)
Gonfirth Helliers Ting N TingS Turdale
Gonfirth < 0 . 0 0 1 < 0 . 0 1 < 0 . 0 1 < 0 . 0 1
Helliers < 0 . 0 0 1 n.s. n.s. < 0 . 0 1
%LOI Ting N < 0 . 0 0 1 < 0 . 0 1 n.s. n.s.
TingS < 0 . 0 0 1 < 0 . 0 1 < 0 . 0 1 n.s.
Turdale < 0 . 0 0 1 n.s. n.s. n.s.
% N content
Gonfirth Helliers Ting N TingS Turdale
Gonfirth ’ < 0 . 0 0 1 < 0 . 0 0 1 < 0 . 0 0 1 < 0 . 0 1
Helliers < 0 . 0 0 1 < 0 . 0 1 < 0 . 0 1 <0.05
%C Ting N < 0 . 0 0 1 < 0 . 0 1 n.s. < 0 . 0 1
TingS < 0 . 0 0 1 <0.05 n.s. < 0 . 0 1
Turdale < 0 . 0 0 1 n.s. n.s. n.s.
% P content
Gonfirth Helliers Ting N TingS Turdale
Gonfirth n.s. <0.05 n.s. n.s.
Helliers n.s. n.s. <0.05
Ting N <0.05 <0.05
TingS <0.05
Turdale
154

Compared to the sediment from the other sites, Gonfirth sediment also had a low
proportion of N in its structure. The %N present was within the range 0% at 4-5 cm
to 0.54% at 7.5-9 cm (Figure 3.5). The difference was highly significant between
Gonfirth sediment and that from Helliers Water and Loch of Tingwall (p < 0.001),
though the dissimilarity from Turdale Water sediment was of lower magnitude (p <
0.01) (Table 3.3).With respect to %P content, Loch of Gonfirth deposits were similar
to Helliers Water, Loch of Tingwall (South) and Turdale Water mud. Greatest %P
content of any of the samples was 0.34% recorded in sediment from 4-5 cm depth,
the minimum for this loch being 0.05% in sediment from 0-2 cm depth. A gradient
from the maximum %P content to surface mud was noted (Figure 3.7).
Proportionally, P present in Gonfirth sediment was slightly different from that found
in Loch of Tingwall (North), the latter incorporating less P (p < 0.05) (Table 3.3).
The Eh values in Loch of Gonfirth cores ranged from +336 to +458 mV. Eh values
were higher in the Loch of Gonfirth sediment than in the bottom deposits of the other
loch basins where cores were taken (Figure 3.4).
3.3.1.2 Helliers Water
The range of BD values down Helliers Water sediment cores was from 0.62 g cm' 3
at 3-4 cm to 1.13 g cm*3 at 7.5-9 cm depth (Figure 3.2). There was no significant
difference between BD in mud from Helliers Water and Loch of Tingwall, although
the former was found to be less dense than sediment from Turdale Water (p < 0.01).
Organic content in Helliers Water sediment was similar to that in Turdale Water
bottom deposits, though greater than that in Loch of Tingwall samples (p < 0.01).
%LOI determinations ranged from 26.2% of sediment at 1-2 cm to 35% at 7.5-9 cm
depth. The general depth-distribution pattern appears relatively similar in sediment
cores from Helliers Water and Turdale Water (Figure 3.3). Distribution of %LOI and
%C content in Helliers Water sediment appears relatively similar when plotted with
depth. Maximum recorded %C content of 15.77% at 7.5-9 cm was determined in
Helliers Water sediment, minimum for this loch being 12.3% at 5-6 cm depth. A
decrease in %C content in the sediment occurred between 4-5 cm (15.73% C) and
surface mud (Figure 3.5). As for %LOI, Helliers and Turdale sediments were
similar, whilst %C content was significantly smaller in Tingwall North (p < 0.01)
155

and Tingwall South (p < 0.05) (Table 3.3). The %N in Helliers Water sediment
cores was found to differ between 0.97% at 5-6 cm and 1.22% at 1-2 cm depth
(Figure 3.6). %N content was slightly greater in Helliers sediment than in Turdale
bottom deposits (p < 0.05), though significantly smaller than in Tingwall mud
(p<0.01) (Table 3.3).
The %P content in Helliers Water sediment was not significantly different from that
of Loch of Tingwall cores, though there was a small difference between Helliers and
Turdale, the latter containing more P (p< 0.05) (Table 3.3). A decrease in %P
content occurred from the maximum percentage of 0.09% at 3-4 cm to a proportion
of 0.06% in sediment taken from the surface. Minimum %P content of 0.04% was
located in the 6-7.5 cm core section (Figure 3.6).
Eh values in Helliers Water sediment ranged from +124 to +187 mV (Figure 3.7).
Of the sediments sampled, the conditions in Helliers Water bottom deposits were less
reducing than those observed in Loch of Tingwall and Turdale Water cores.
3.3.1.3 Loch of Tingwall North
Tingwall North was not significantly different from Tingwall South nor Turdale
Water in terms of sediment core BD (Table 3.3). The range was from 0.63 g cm' 3 in
sediment from 0-1 cm to 1.68 g cm*3 at 7.5-9 cm depth. Depth distribution of
sediment density for Tingwall North appears very similar to those of Tingwall South
and Helliers Water (Figure 3.2). There was little change in %LOI throughout the
depth sampled. It ranged from 22.5% (0-1 cm and 6-7.5 cm depth) to 24.2% (7.5-9
cm depth). The depth profiles of %LOI for Tingwall North and South appeared very
similar though Tingwall South had the significantly greater organic content of the two
sites (p < 0.01) (Figure 3.3 and Table 3.3). Conversely, although the depth-%LOI
profile of sediment from Tingwall North did not appear similar to that of Turdale
Water in terms of the fluctuations of %LOI with depth, these two sites were similar
when considering organic content of the entire core.
From below 2-3 cm depth, the increases and decreases in %C content with sediment
depth in Tingwall North contrasted with those of Tingwall South, but there was no
significant difference between these sites with respect to %C content. Neither was
156

there any difference between Tingwall North and Turdale Water cores (Figure 3.5
and Table 3.3). Proportion of sediment composed of C varied from 10.08% at the
surface to 24.2% in the deepest segment of the cores. From 3-4 cm depth, there was
a general gradation to lower %C content at the surface. A decrease in %N content
occurred from 3-4 cm depth to sediment surface in Tingwall North cores (Figure
3.5). Maximum %N was found in the 3-4 cm sediment, minimum in mud from 0-1
cm. These determinations were 1.42% and 1.12% respectively. Although Tingwall
North bottom deposits were similar to those of the southern basin, the proportion of
N in the former was significantly greater than that encountered in sediment from
Turdale Water. As with %C content, there was a tendency for variations in %N
content of Tingwall North sediment to be similar, but opposite to those of Tingwall
South.
The %P content of mud from Tingwall North was less than that of sediment from
both Tingwall South and Turdale Water (p < 0.05) and ranged from 0.07% at 4-5
cm to 0.03 at 5-6 cm depth. An increase in %P content was noted from surface
sediment (0.04% P) to 4-5 cm depth (0.07% P) (Figure 3.6).
Mean sediment Eh values observed in Tingwall North were similar to those of
Turdale Water bottom deposits (Figure 3.7). The range of Eh values in Tingwall
North sediments was from -123 to +42 mV and a discontinuity in mean Eh occurred
below 4-5 cm depth. From the surface of sediment cores to 5 cm depth, less reducing
conditions were observed in Tingwall North sediment, whereas in deeper sediment,
conditions were more reducing in Tingwall North than in Turdale Water cores.
3.3.1.4 Loch of Tingwall South
BD was lowest at 0.49 g cm*3 in surface deposits of Tingwall South. Maximum
density at this site (1.67 g cm'3) was determined in the deepest section of the cores
(7.5-9.0 cm) (Figure 3.2). Tingwall South was not significantly different from
Turdale Water with reference to BD or %LOI of sedimented material. %LOI varied
within the sediment between 23.7% and 25.3% in 1-2 cm and 5-6 cm segments
respectively (Figure 3.3). Tingwall South and Turdale Water were also similar in
terms of %C content, the range of this parameter in sediment from the southern basin
being 11.77% (0-1 cm) to 13.7% (6-7.5 cm)(Figure 3.4). In contrast, %N content of
157

Tingwall South mud was significantly greater than that incorporated in Turdale Water
bottom deposits. Its range was 1.13% in the deepest section to 1.46% at the surface
of the core.
The %P content was lowest at 0.06% in sediment from 3-4 cm depth, but rose to
0.08% in sections of 0-1 cm and 4-5 cm. Turdale Water sediment was found to
contain more P than sediment collected from Tingwall South (p < 0.05)(Figure 3.6).
Tingwall South sediment cores exhibited the most reducing conditions of the bottom
deposits examined. Eh values measured ranged from -241 to +90 mV (Figure 3.7).
Sediment from all five coring sites, except Loch of Gonfirth, had higher Eh values
at the surface of the sediment than deeper in the core. The most marked decrease in
Eh in the surface layers occurred in Tingwall South cores.
3 .3 .1 3 Turdale Water
The depth-distribution pattern for BD in Turdale Water deposits appeared similar to
that for Loch of Gonfirth (Figure 3.2). BD in Turdale sediment was highest at 1.63
g cm' 3 in sediment from 1-2 cm depth, lowest in the surface deposits (0.74 g cm'3).
%LOI varied from 18.4% at 1-2 cm depth to 31.5% in the 7.5-9 cm section. %C
content depth profile is similar to that of organic matter for Turdale Water sediment
(Figure 3.3). Proportion of C present in Turdale cores peaked at 15.31% in the
deepest sediment section. The lowest %C content was found to be 9.11 % in sediment
at 3-4 cm depth. Depth profile shapes of %C and %N content were found to be alike
and maximum and minimum %C and %N occurred at the same sediment depths
(Figures 3.4 and 3.5). These %N values were 1.16% and 0.48% respectively.
Percentage of Turdale sediment which was P ranged from 0.06% in the 1-2 cm
section to 0.24% at 3-4 cm depth. A gradient of decreasing %P therefore occurred
from 3-4 cm depth to near surface (Figure 3.6). Eh values measured in Turdale Water
cores ranged from -131 to +41 (Figure 3.7).
Turdale Water sediment has been compared in the above sections to bottom deposits
of the other loch sediment samples taken.
158

Table 3.4 Mean (±2 s.e.) bulk density and loss on ignition of sediments used for incubation experiments
Site
GonfirthHelliersTingwallTurdale
Date
31.07.9302.08.9304.08.9304.08.93
Bulk density (g cm'3)
0.20± 0.000.14±0.010.22± 0.010.20±0.04
Loss on ignition (%)
33.2±1.00 29.1 ±0.59 25.5±0.41 39.0±1.45
Table 3.5 Mean (±2 s.e.) phosphorus release from sediment incubation experiments (n—S)
Site Date
+ 0ng P L 1
Gonfirth Helliers Tingwall Turdale
+ 7 0 ng P L 1
Gonfirth Helliers
+50 ng P L 1
31.07.9302.08.9304.08.9304.08.93
31.07.9302.08.93
Mean release (jig P g'1)
+0.17+0.060.00± 0.00+0.34±0.04+0.52±0.11
-0.03 ±0.03 -0.11 ± 0.01
Gonfirth 31.07.93 -0.24±0.18Helliers 02.08.93 -0.54 ±0.02Tingwall 04.08.93 -0.44 ±0.02
KEY:+ refers to release of P
refers to uptake of P
159

3.3.1.6 Sandy Loch
%C and %N of Sandy Loch sediment were the highest of all sites surveyed at 36.7%
and 1.49% of sediment dry weight. There was a correspondingly high %LOI of
63.6%, which was also the greatest figure recorded. The %P was not high, a figure
of 0.06% being comparable with many of the results for the sediment of the other
lochs (Table 3.2).
3.3.2 Characteristics of loch sediment collected in 1993
Sediment BD and %LOI results are presented in Table 3.4 and those of the P
release/adsorption experiments in Table 3.5. All ± figures reported below represent
± 2 standard errors. A positive adsorption value represents a release of P from
sediments to the overlying water, whilst a negative value indicates P removal from
overlying water to the sediments.
3.3.2.1 Loch of Gonfirth
Cores take from Loch of Gonfirth in 1993 appeared different from those sampled
during 1992. Sediment from 0-5 cm was less dense and %LOI was greater in 1993
cores. In sediment taken in 1992, BD varied in the first 5 cm of core from 1.55 g cm*
3 to 3.2 g cm' 3 (Figure 3.2), but in 1993 density was only 0.19 g cm*3 to 0.21 g cm' 3
(Table 3.4). %LOI ranged from only 3.1% to 4.4% in the surface 5 cm of cores in
1992, compared to 30.3% to 37.4% in the 1993 0-5 cm bulk samples (Figure 3.3 and
Table 3.4). Sediment collected during 1992 appeared more minerogenic than that of
the 1993 survey, which on visual inspection, was peaty in nature.
A general pattern of increasing P adsorption with increasing water P concentration
was observed. When no addition of P was made to the sediment from Loch of
Gonfirth, DRP release ranged between +0.11 and +0.25 /xg P g 1 with a mean of
+0.17±0.06 (Table 3.5). Addition of P to raise loch water DRP concentration by 10
/xg P L* 1 resulted in average uptake of -0.03 +0.03 /xg P g'1. Assimilation increased
to -0.24 +0.18 /xg P g' 1 when loch water DRP concentration was elevated by 50 /xg
P L'1. Uptake ranged from -0.01 to -0.48 /xg P g' 1 at this treatment level (Table 3.5).
3.3.2.2 Helliers Water
BD of Helliers Water sediment was less than that of the other sediments examined.
160

It was found to range from 0.13-0.15 g cm'3. %LOI determinations were of the same
order of magnitude as in 1992, minimum organic content being 26.4%, maximum
31.2% (Table 3.4).
There was no detectable release of DRP from cores of Helliers Water sediment,
except in one core with an adsorption of +0.02 /xg P g' 1 (Table 3.5). As with Loch
of Gonfirth sediment, there appeared to be an increase in P uptake with increasing
DRP concentration in the water. In loch water+10 /xg P L* 1 treatment, mean
adsorption was -0.11 ±0.01 /xg P g*1, whilst in the +50 /xg P L* 1 treatment,
adsorption increased to -0.54 ±0.02 /xg P g 1. As indicated by the error values,
Helliers Water sediment cores were relatively uniform in their P sorption/desorption
characteristics. Mean uptake of P at both enrichment levels was greater for Helliers
Water sediment than that from Loch of Gonfirth. In none of the three experiments did
adsorption/release figures for Helliers Water and Loch of Gonfirth occur in the same
range, indicating that sediment from these two lochs was dissimilar in terms of P
sorption capacity (Table 3.5).
3.3.2.3 Loch of Tingwall
Loch of Tingwall sediment bulk density varied from 0.2-0.23 g cm*3 in the top 5 cm
of cores. %LOI was determined as being between 24.4% and 26.3% (Table 3.4).
Release of DRP from Loch of Tingwall bottom deposits appeared greater than that
from either Helliers Water or Loch of Gonfirth sediment as release figures for all five
cores were greater than those of either Helliers Water or Loch of Gonfirth. Mean
adsorption was +0.34 ±0.04 /xg P g* 1 (Table 3.5). In the loch water+50 /xg P L* 1
treatment, mean adsorption was determined as -0.44 ±0.02 /xg P g*1. This was greater
than mean DRP uptake in Gonfirth sediment, but less than the P adsorption capacity
of Helliers Water mud at this enrichment level. The range of adsorption values
associated with Loch of Tingwall sediments did not overlap those of Helliers Water,
indicating that Helliers Water sediments probably have a higher P sorption capacity
at this treatment level. Loch of Tingwall P uptake results do however all occur within
the range of Loch of Gonfirth P adsorption data. This is because of one Gonfirth data
point only, Loch of Tingwall taking up more P on a mean basis than Loch of
Gonfirth bottom deposits in +50 /xg P L* 1 loch water. There was relatively little
variation between each of the five cores in each treatment for Loch of Tingwall
161

(Table 3.5).
3.3.2.4 Turdale Water
BD of Turdale Water sediment ranged from 0.17 g cm' 3 to 0.27 g cm'3, with a mean
of 0.02 g cm 3. The corresponding organic content of these samples had a maximum
value of 41.0% and a minimum of 36.4%, resulting in mean %LOI of 39% (Table
3.4). Ranging from +0.37 to +0.65 /xg P g'1, DRP release from Turdale Water
sediment cores had a mean of +0.52 ±0.11 /xg P g' 1 (Table 3.5). Despite the
variability of these results, release figures for Turdale Water coincided with those of
neither Loch of Gonfirth nor Helliers Water. Turdale Water release rates are
therefore probably greater than those of either Loch of Gonfirth or Helliers Water.
P release rates from Loch of Tingwall sediment are similar to those at the lower end
of the range of P release rates of Turdale Water sediment, although on average, P
release from Turdale sediment was greater.
3.4 DISCUSSION
3.4.1 Relevance of sedimentary P determination technique
Sediment P characteristics have frequently been ascertained by utilising a sequential
extraction technique (Pettersson et al., 1988). Sequential extraction as developed by
Hieltjes and Lijklema (1980), allows determination of different fractions of
sedimentary P, efficiency of each extraction depending on the way in which P has
been assimilated. Successive solubilisation of P is undertaken using the following
compounds: NH^Cl, NaOH and HC1. These reagents release loosely and CaC03-
bound, Fe- and Al-bound and Ca-bound P respectively.
In peaty sediment, NaOH has been found to extract not only Al- and Fe-bound P, but
also much of the humic-bound fraction, thereby suggesting that this procedure is
inadequate under such conditions (Klapwijk et al. , 1982).
Attempts have also been made to chemically extract the bioavailable P fraction from
sediment. Nitrilotriacetic acid (NTA) extractable P has been shown to be an estimate
of phytoplankton available P in some sediments. However, available P may be over
estimated due to presence of organic or Ca-bound P (Golterman, 1977; 1982b). NTA
extractable P was found to be 4-90 times greater than that removed by Scenedesmus
162

quadricauda from clay, sand/peat and peat sediment. A correlation was found
between available P and NTA and NaOH extractable P, but a stronger relationship
was found between available P and TP (H2 S04-persulphate digest) (Klapwijk et al.,
1982).
None of the extraction techniques used in sediment chemistry determine definable P
compounds, but give an estimate of the amount of a group of P compounds
extractable by a particular method. In addition, the accuracy of results is highly
dependent upon sediment type (Pettersson et al., 1988). Difficulties associated with
measuring different P fractions, combined with the fact that the purpose of P
determination was to estimate the total quantity of P bound in the sediment, regardless
of the form in which it was present, meant that the nitric-perchloric-sulphuric acid
digestion of sediment samples was the most suitable for the present study. The hot
acid digestion results in destruction of all organic matter present, although there is
little breakdown of silicates. Procedures involved in this technique are relatively
simple and the methodology has been utilised repeatedly for determination of
quantities of P and N in previous studies of sediment nutrient content (Allen et al,
1974; Grimshaw, 1985).
3.4.2 Characteristics of sediments in the five water bodies
Shetland sediment analysed may have incorporated P in a number of forms, both
inorganic and organic. The range of values calculated, of %P in the sediments tested
(i.e. 0.03 to 0.34% P), was found to be comparable with information on sediment
%P content in published literature (Table 3.6). There did not appear to be a simple
relationship between organic content of the sediments and the quantity of P bound in
the sediment (Figure 3.3 and 3.6). This could be because, although P may be loosely
bound in organic matter, it may also be easily lost. In addition, there may be other
processes to consider, such as the availability of other types of binding site. For
example, if there was a considerable proportion of P immobilised by organic matter,
but the Fe content of the sediment was low, then the total P bound in the sediment
would not necessarily be particularly high.
163

Table 3.6 The phosphorus content of sediments recorded in published literature
Sediment P content (%)
0.15-0.25
0.06-0.16
0.03-0.48
0.14-0.18
0.11-0.37
0.09-0.20
0.10-0.65
0.08-0.19
0.12-0.32
0.04-0.49
0.21-0.39
0.05-0.10
0.03-0.39
0.07
Reference
Grandli (1978)
Bostrdm and Petersson (1982)
Klapwijk et al. (1982)
Bostrdm (1984)
Wisniewski and Planter (1985)
Bostrom (1988)
Bostrdm et al. (1988)
Gachter et al. (1988)
Jensen and Andersen (1990)
Jensen et al. (1992)
Eckerrot and Pettersson (1993)
Kleeberg and Schlungbaum (1993)
Lopez and Morgui (1993)
Waara et al. (1993)
164

As Loch of Gonfirth sediment Eh remained above +200 mV it is assumed that the
bottom deposits were aerated to some degree throughout the first 1 0 cm depth, i.e.
reducing conditions were not occurring (Figure 3.7). Conditions in Helliers Water
sediment were slightly reducing only. The relatively high organic content in Helliers
Water sediment may account for the lower Eh values in sediment from this water
body compared to those of Loch of Gonfirth. Much of the organic matter in the
Helliers Water bottom deposits is likely to have resulted from the presence of plant
material, as there is much macrophyte growth in this water body.Sediments from
Helliers Water and Loch of Gonfirth were the only two which exhibited positive Eh
values throughout core depth (Figure 3.7). The more favourable Eh values in Loch
of Gonfirth and Helliers Water are to be expected, owing to the low anthropogenic
inputs of organic matter to these loch systems. Under the Eh conditions observed, P
binding within the sediment is likely to be affected little in Loch of Gonfirth.
However, the type of sediment retrieved from this water body in 1993 may have
different characteristics to that sampled during 1992. In the slightly reducing
conditions observed in Helliers Water sediment, there may have been some
denitrification and reduction of Mn4+ occurring, depending upon sediment pH
(Schwoerbel, 1987; Meadows and Campbell, 1988).
There was no significant difference in BD, %LOI or %C between cores of Tingwall
North, Tingwall South and Turdale Water (Table 3.3). %LOI and %C are not
necessarly good indicators of organic enrichment in freshwater sediments, as both arc
influenced by the presence of peaty material. Although %N was greater in Tingwall
South than Turdale Water sediment, there was no significant difference between
bottom deposits from the two Tingwall basins in terms of %N. The difference in
redox conditions may be attributable to the characteristics of the external organic
inputs. The discharges to Tingwall South incorporate complex organic compounds
which cause a high oxygen demand, whereas a high proportion of anthropogenic
inputs to Turdale Water contribute to the inorganic nutrient loading of the waterbody.
It is possible that at the sediment Eh values observed, the processes of denitrification
and reduction of Mn4+ and Fe3+ were occurring within the sediment profiles of
Tingwall South, Tingwall North and Turdale Water, although stability of ion species
in sediments is also pH dependent (Schwoerbel, 1987; Meadows and Campbell,
1988). As Fe and Mn do not bind with P in their reduced forms, a proportion of the
165

total P within these bottom deposits was probably free within the sediments. There
are several mechanisms by which this P could be released to the oxygenated water
column, as decscribed in Section 3.1.3.1.
As observed with %P values, the %N (Gran61i, 1979; Bostrom and Pettersson, 1982;
Klapwijk et al., 1982; Bostrom, 1988) and %C (Bostrom and Pettersson, 1982;
Bostrom, 1988) contents of Shetland sediments were typical for freshwater lake
bottom deposits (Table 3.6). Similarities were observed in sediment profiles of %N,
%C and %LOI, such as in Turdale Water sediment cores. However, the distribution
of %P in the cores followed a distinctive pattern (Figure 3.6). Sediment from each
of the five lochs exhibited an elevated %P content toward the mid depth of the cores.
In addition, in Helliers and Turdale Water, Loch of Gonfirth and the North basin of
Loch of Tingwall, sediment %P content decreased from the mid depth of the core.
If interstitial P is related to total P, then this implies a concentration gradient from
depth to sediment surface, which may favour translocation of P to surface sediment.
It is possible that the upper layers of sediment incorporate less P because of periodic
resuspension of surface sediment in the water column.
It is likely that the low %P content of Helliers Water sediment was related to the low
P concentration in the water column of this water body (Chapter 2). The sediment
surface %P content in Loch of Gonfirth was also low, as would be expected from the
low P concentrations in the water column. Cores taken in 1992 from Loch of
Gonfirth were plastic and clay-like under the surface layers. The relatively high %P
content observed mid core may have been related to clay present at this depth. Clay
minerals are mainly hydrous silicates of Al, Mg and/or Fe and therefore have a high
potential P binding capacity. Turdale Water sediment %P content tended to be
relatively high in comparison with the other sediments examined (Figure 3.6). This
water body has been subject to high P concentrations in the water column, so partly
explaining elevated sediment %P content. Possible mechanisms of P binding in the
sediments of the five lochs will be discussed further with reference to the P
adsorption and release experiments of 1993.
3.4.3 P adsorption tests with sediment samples
P adsorption in Loch of Gonfirth sediment was not as efficient as that of Helliers
166

Water at either P enrichment treatment level (Table 3.5). Sediment from Loch of
Gonfirth 'idso assimilated less P than Loch of Tingwall sediment, when loch water
P concentration was elevated by 50 /xg P L 1. Of the five lochs examined, water from
Loch of Gonfirth was most acidic (mean pH: 6.36, 1991) and concentrations of water
Ca and Mg were also low (3.2 mg Ca L 1 and 3.1 mg Mg L ' 1 respectively, 1991).
Although more mineral sediment was found in 1992, sediment from Loch of Gonfirth
in 1993 was the most organic of the four examined. (There was no sediment sample
from Sandy Loch in 1993 upon which to comment).
The poor P adsorption capacity of this sediment was therefore perhaps due in part to
lack of Ca and Mg binding sites. At the pH levels of this loch Fe-P would be more
likely. However, effectiveness of Fe in immobilisation of P in peaty sediment may
be limited because Fe is rapidly reduced. Consequently little Fe-P binding occurs
(Keizer et al. , 1993). Release of P is greater from Loch of Gonfirth sediments than
from those from Helliers Water (Table 3.5). This suggests that, in Loch of Gonfirth,
P which is adsorped may be loosely bound in humic complexes. Loch of Gonfirth
sediment collected in 1992 was not organic and perhaps would have had relatively
good adsorption properties. However, owing to catchment soil types (Chapter 6 ), it
is likely that sediment of a more organic nature is dominant in the loch system.
Turdale Water sediment was found to release more P than the other sediments tested
(Table 3.5). This is most plausibly explained as the result of a combination of high
loading of P from the catchment area and the inability of the sediment to immobilise
P additions. Ca concentration in Turdale Water was found to be relatively high when
considering the five study lochs (mean: 13.7 mg Ca L 1, 1991). Turdale Water is
situated on limestone of the Walls Formation. This loch also has the second highest
Mg concentrations of the five lochs involved in the sediment study (mean: 8 . 8 mg Mg
L*1, 1991). Water pH values are also relatively high, indicating that P should
theoretically be binding with Ca2+ and Mg2+. However, the catchment area of Turdale
Water incorporates peaty soil and sediment from this loch was more organic than that
of the other lochs. In the peaty sediments of the Loosdrecht Lakes, The Netherlands,
formation of vivianite in interstitial water is insignificant, conditions in peaty sediment
precluding conversion of CaC0 3 to Ca-P compounds (Keizer et al.t 1993). It is
suggested that a significant proportion of P immobilised by Turdale Water sediment
167

is only temporarily or loosely bound, in humic complexes.
Sediment of Helliers Water was relatively efficient at P adsorption, greater uptake
occurring in this sediment than either of the other two tested (Table 3.5). Water of
this loch has high Mg concentrations (10.5 mg Mg L'1, 1991 mean), although Ca
concentration is relatively low at 4.0 mg Ca L* 1 (1991 mean). Situated on serpentine
bedrock, Helliers Water catchment area would be expected to have soils and
sediments high in Mg, Fe, Ni and Cr. A mean water pH of 7.23 in 1991 indicates
that at the low Ca concentrations present, it is likely that P is binding with Mg,
although some binding with Fe is possible, depending upon sediment conditions. Low
bulk density figures associated with Helliers Water sediment suggest the possibility
that penetration of dissolved oxygen may be relatively efficient, assisted also by
growth of rooted macrophytes. This would augment P retention in the field situation.
Organic content of Helliers Water sediment is likely to be influenced by the
macrophyte growth present, rather than by humic materials, as Helliers Water is a
clear water loch.
Loch of Tingwall sediment was not as efficient in its immobilisation of P as that of
Helliers Water, though it exhibited P uptake twice that of Loch of Gonfirth sediment
(Table 3.5). Loch of Tingwall sediment also had the second highest P release of 0.34
/xg P g 1 sediment. The latter may be as a consequence of there being a higher
external P loading on Loch of Tingwall, than on either Loch of Gonfirth or Helliers
Water. It is probable that Loch of Tingwall sediment P is binding with Ca, as loch
water is slightly alkaline (pH 7.72, 1991 mean) and Ca concentration is high (33.7
mg Ca L'1, 1991 mean). The west side of Loch of Tingwall is situated on limestone
bedrock, so that sediment Ca content is likely to be elevated.
The organic content of Sandy Loch sediment was greatly in excess of that in sediment
of the other four lochs (Table 3.2). Water in this loch is highly coloured. This
suggests that P adsorption capacity of Sandy Loch sediment is likely to be poor, P
binding loosely with humic substances rather than directly with metals.
3.5 CONCLUSIONS
%C, %N and %P contents of the sediments examined were all within the ranges of
168

values observed elsewhere. Eh conditions in the* sediments were generally insc?agreement with nutrient status information on the four basins i.e. Gonfirth sediment
remained slightly aerated, whilst sediment conditions became more reducing in the
following order: Helliers Water, Tingwall North, Turdale Water and Tingwall South.
This is the same order as increasing nutrient status, with the exception of Tingwall
South. As Eh values were smaller than expected from the trophic status of Loch of
Tingwall, this suggests that the water body is under considerable influence of organic
enrichment from anthropogenic sources within the catchment area.
It is apparent from the above results that, in Shetland lochs, the same sediment may
act as both a sink and a source of P. There was a tendency for P stored in sediment
to be present in highest quantities at approximately 3-5 cm sediment depth. A
proportion of the P present in the upper 5 cm of sediment was in a readily releasable
form, possibly loosely bound to humic substances, in sediment from Lochs of
Gonfirth, Tingwall and Turdale Water. Sediment P content is not necessarly a good
indicator of trophic status, since, as observed in the literature, %P can be highly
variable, within the same loch and between different waterbodies exhibiting similar
water column nutrient levels.
Turdale Water had the most elevated water column TP concentration, in addition to
having the most organic sediment and the highest P release. Loch of Tingwall
sediment had the lowest organic content, but the second highest water column TP
concentration and sediment P release. This illustrates the importance of external P
loading on sediment P dynamics. Sediment from Helliers Water did not release any
P, unlike Loch of Gonfirth sediments. Considering the similarity of water column TP
levels in these two water bodies, the inferior binding capacity of Loch of Gonfirth
sediment may have been related to the higher organic content of this sediment.
Of the three sediments tested for P uptake, Helliers Water sediment had the highest
adsorption capacity, followed by Lochs of Tingwall and Gonfirth. Therefore,
sediment in Helliers Water assists in maintaining water column P concentration at
levels lower than would be expected from P loading on the water body. In Loch of
Gonfirth, the sediment has a comparatively small capacity for retaining P and may
rerelease P to the water column. Sediment in Loch of Tingwall has a relatively good
P binding capacity, but again, P may be rereleased to the water column from the
169
sediment. Although Turdale Water sediment may release P, there is such a high
external P loading that this will not be of consequence, unless the external loading
decreases. The peaty nature of Sandy Loch sediment suggests that it would not have
a high P binding capacity. This would limit adsorptive capacity and lead to rapid
water column changes in P concentration with increased external P loading.
It is concluded that, if the external P loadings were removed from Loch of Tingwall,
Sandy Loch and Turdale Water, an internal P loading would remain. However, in
Helliers Water, it is likely that the P immobilised in the sediment would be retained.
Although Loch of Gonfirth sediment was found to release P, there has been no
artificial loading on this water body, so that the internal loading is not considerable.
170

CHAPTER 4: PHYTOPLANKTON IN SHETLAND LOCHS
4.1 INTRODUCTION
4.1.1 Phytoplankton blooms
As phytoplankton are primary producers i.e. organisms at the base of the aquatic food
chain, effects of shifting nutrient status due to anthropogenic influences within the
catchment are often detectable in the algal population before differences are evident
in communities of herbivorous or carnivorous organisms. As well as subtle changes
in size and species of phytoplankton present, nutrient enrichment may cause great
increases in algal numbers. Skulberg et al. (1984) suggest that moderate to high
nutrient levels, especially of nitrate and ammonia, water temperatures of 15-20°C and
pH 6-9 are ideal conditions for blooms to occur, whilst Boyd et al. (1978) stress the
importance of wind action in the distribution of blue-green algae in the water column,
as it prevents formation of localised areas of particularly high biomass. Dense
populations of phytoplankton occur in surface waters when weather conditions are
calm. Blue-green algae actively regulate their buoyancy (Fay, 1983; Fogg and
Walsby, 1971), so that they may remain in the photic zone of a water body;
therefore, if wind circulation stops, buoyancy is overcompensated, resulting in large
concentrations of phytoplankton in water surface layers. Incidences of algal bloom
problems in Scotland have not been restricted to recent years, occurring annually in
many small lochs such as Balgavies Loch (NGR: 533 508), Fingask Loch (NGR: 165
430), Lindores Loch (NGR: 265 165) Loch Marlee (NGR: 143 444), Monikie Island
pond (NGR: 505 380), Loch Rescobie (NGR: 515 515) and White Loch (NGR: 170
428) (Richard et a!., 1981).
Although any algal group may create blooms, increased biomass is often in the form
of blue-green species (Cyanophyceae, cyanophytes or cyanobacteria) such as
OsciUatoria, Anabaena, Aphanizomenon, or Microcystis (Gorham and Carmichael,
1980; Carmichael, 1982; NRA, 1990), other cyanophytes which have been known to
cause problems being Gomphosphaeria, Coelosphaerium, Nodularia, Nostoc and
Cylindrospermum (Lawton and Codd, 1991). Assessment of cyanophyte blooms from
nearly 300 British sites between 1981 and 1989 indicated that 45-75% were toxic
(Lawton and Codd, 1991), although of those blue-green blooms examined in 1989,
approximately 60-70% of cases were found to involve lethal substances. Cyanophyte
toxins may be divided into three groups: neurotoxins (some of which are alkaloids),
171

hepatotoxins (peptides) and lipopolysaccharides (fats and sugars). Neurotoxins are
produced by species of Anabaena, Aphanizomenon and Oscillatoria, hepatotoxins by
strains of species of Microcystis, Oscillatoria and Anabaena. The latter are also
known as microcystins and consist of a cyclic structure containing seven amino adds
and having a molecular weight of about 1000 (NRA, 1990). Lipopolysaccharides
differ from the other toxin types as they form as essential components of
cyanobacterial cells, rather than substances produced within those cells.
Animal poisoning incidents involving blue-green algal toxins have been reviewed
(Ingram and Prescott, 1954), deaths having occurred in livestock, birds and fish
(Gorham and Carmichael, 1980; Hunt, 1984). During investigations of toxitity of
Microcystis aeruginosa to rainbow trout (Oncorhynchus myldss), fish exposed to dense
populations of this algal species for ten days demonstrated no ill-effects, although
interperitoneal injection of Microcystis extract caused mortality (Phillips et al., 1985).
It is possible therefore, that chronic effects could occur in fish through exposure to
blue-green colonies. During 1992, brown trout (Salmo trutta) in Loch Leven (Fife,
Scotland) were found dead after senescence of a bloom of Anabaena flos-aquae.
Pathology of the gill epithelium revealed a change in mucus consistency and acute
irritation. Liver pathology was "consistent with the effects of potent hepatotoxin(s)"
and similar to that induced in rainbow trout through injection of Microcystis extract
by Phillips et al. (1985) (Rodger et al., 1994). Whereas liver damage was directly
attributable to a toxic effect, gill irritation may have occurred through elevated water
pH, concentration of blue-green algae, a direct toxic effect or an association of these
potential causes (Rodger et al., 1994). Although no human deaths have resulted from
contact with blooms, skin rashes, eye irritation, vomiting, diarrhoea, fever, liver
disorders, painful joints and muscles can occur in man (NRA, 1990). Obviously in
these cases blooming would severely limit the amenity value of the affected water
body.
Instances of any algal bloom can also significantly reduce dissolved oxygen
concentrations in the water column both overnight and when the bloom dies. The
increased BOD resulting from algal dieoff is perhaps a more likely cause of fish
mortality than toxin production, as avoidance strategies may be employed by these
organisms to deal with the latter. Fish, however may also encounter difficulties
172

through gill clogging during dense phytoplankton growth, thereby creating further
gaseous exchange problems. Large populations of phytoplankton can also result in
great changes in pH of standing water bodies. For example, Brook (1958), recorded
a change in waters of pH 6-7 to pH 8-10 during blooms of Cyanophyceae and
Chlorococcales. Further to these problems are the elevated levels of ammonia
associated with bloom death (Reynolds, 1984a), increased turbidity in the water
column and taste taint in fish flesh.
4.1.2 Phytoplankton of freshwater lochs in Shetland
In a study of Shetland freshwater algae from Bressay and Mainland (West and West,
1904) algal groups which were found, in order of decreasing numbers were
Chlorophyceae, Bacillariophyceae and Cyanophyceae. Of these, the green
phytoplankton were most diverse. The study included the sites of Loch Asta, Neugles
Water, Sandy Loch, Trebister Loch, Beosetter Loch and Brindister Loch and it was
concluded that plankton was not very rich, partly due to the wetness of the season
(West and West, 1904). There was, however, only one trip made (in August) so that
any successional effects cannot be identified.
In a second study of Shetland algae from standing freshwaters (Carter and Bailey-
Watts, 1981), over 400 species of phytoplankton in a total of 53 lochs were found,
each loch in detail being unique. In nearly every water, the two algal groups
represented by most species were those of Chrysophyceae and Chlorococcales.
Overall numbers of species found in each group are shown in Table 4.1.
In 80% of lochs, chrysophytes exceeded green algae in both numbers of species and
density of individuals. Phytoplankton of the Chrysophyceae do not tend to form major
blooms, although Dinobryon and Mallomonas may be associated with taste and odour
problems (APHA, 1989). Chrysophytes are believed to be unaffected by
considerations of loch volume, surface area, mixing depth and epilimnetic water
temperature, but other factors which have been associated with this algal type include
low to moderate productivity, low nutrient availability, low alkalinity, low
conductivity and neutral to slightly acid pH (Sandgren, 1988). Chrysophytes are often
associated with peaty waters, though possibly due to their wide tolerance of water
colour rather than their restricted range.
173

Table 4.1 Numbers of species found from different algal groups in samples from 53 Shetland lochs (Carter and Bailey-Watts, 1981)
Algal type Number of species
Chrysophyceae 82Chlorococcales 92Bacillariophyceae 47Volvocales 34Desmidaceae 32
174

However, though conditions in the Shetland lochs examined in the study were
favourable to chrysophyte growth, samples were taken in September only. As a
consequence of phytoplankton periodicity, dominance of the algal community by
Chrysophyceae could be transitory. No record of Cyanophyceae was made in the 53
lochs sampled in September, 1974 (Carter and Bailey-Watts, 1981), suggesting that
these algae were not important in a large proportion of lochs at that time. However,
this could also be a seasonal effect.
4.1.3 Alms
In the present study, the aims of examining the phytoplankton in Shetland lochs were
as follows.
(a) Identify and enumerate phytoplankton present in the thirty one lochs studied
during summer 1991.
(b) Using environmental data collected at the same time (Chapter 2), assess
whether the successful growth of different algae was associated with specific
conditions within the water column.
(c) Assess which environmental parameters are likely to be linked with excessive
production of cyanobacteria, in particular, Anabaena.
(d) Assess the possible effects of nutrient enrichment on the standing fresh waters
of Shetland.
(e) Examine the phytoplankton in five lochs of different water chemistry in terms
of succession and periodicity.
4.2. MATERIALS AND METHODS
4.2.1 Chlorophyll a
Chlorophyll a was determined by the method described in Chapter 2.
Correlations were examined between mean summer chi a concentration and
environmental data of mean summer pH, mean summer concentrations of TP, TDP,
TON, TAN, Ca, Mg, Na and K.
4.2.2 Phytoplankton populations
In 1991, samples for phytoplankton were taken and composited as described for water
chemistry (Chapter 2) although three phytoplankton samples were not examined,
175
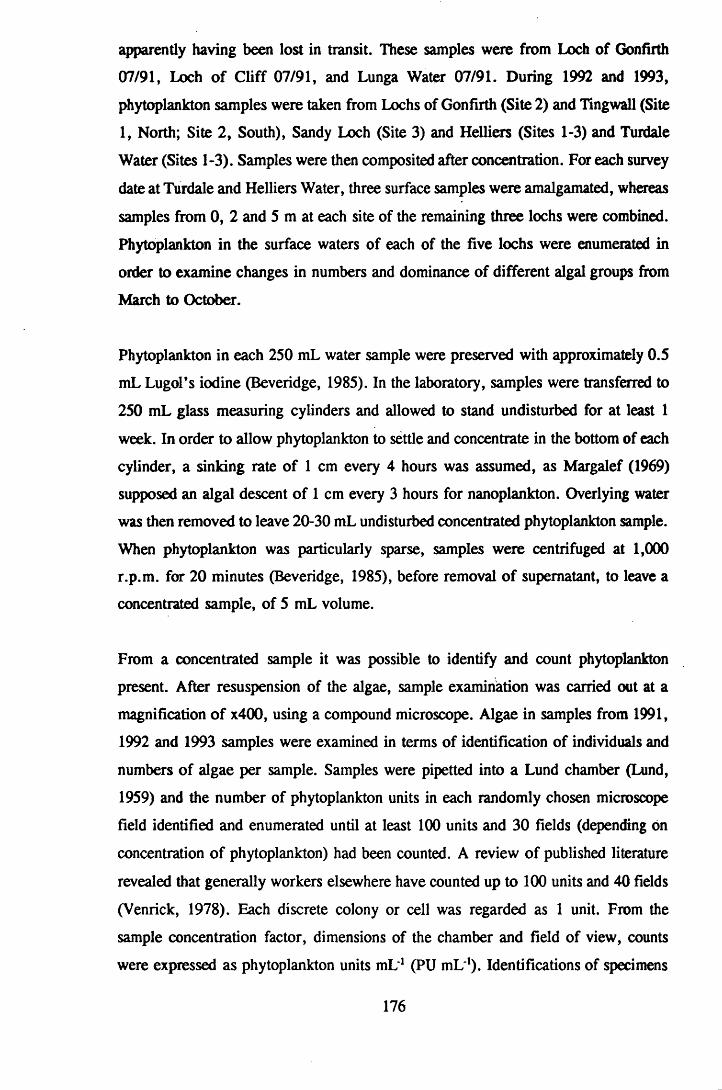
apparently having been lost in transit. These samples were from Loch of Gonfirth
07/91, Loch of Cliff 07/91, and Lunga Water 07/91. During 1992 and 1993,
phytoplankton samples were taken from Lochs of Gonfirth (Site 2) and Tingwall (Site
1, North; Site 2, South), Sandy Loch (Site 3) and Helliers (Sites 1-3) and Turdale
Water (Sites 1-3). Samples were then composited after concentration. For each survey
date at Turdale and Helliers Water, three surface samples were amalgamated, whereas
samples from 0, 2 and 5 m at each site of the remaining three lochs were combined.
Phytoplankton in the surface waters of each of the five lochs were enumerated in
order to examine changes in numbers and dominance of different algal groups from
March to October.
Phytoplankton in each 250 mL water sample were preserved with approximately 0.5
mL Lugol’s iodine (Beveridge, 1985). In the laboratory, samples were transferred to
250 mL glass measuring cylinders and allowed to stand undisturbed for at least 1
week. In order to allow phytoplankton to settle and concentrate in the bottom of each
cylinder, a sinking rate of 1 cm every 4 hours was assumed, as Margalef (1969)
supposed an algal descent of 1 cm every 3 hours for nanoplankton. Overlying water
was then removed to leave 20-30 mL undisturbed concentrated phytoplankton sample.
When phytoplankton was particularly sparse, samples were centrifuged at 1,000
r.p.m. for 20 minutes (Beveridge, 1985), before removal of supernatant, to leave a
concentrated sample, of 5 mL volume.
From a concentrated sample it was possible to identify and count phytoplankton
present. After resuspension of the algae, sample examination was carried out at a
magnification of x400, using a compound microscope. Algae in samples from 1991,
1992 and 1993 samples were examined in terms of identification of individuals and
numbers of algae per sample. Samples were pipetted into a Lund chamber (Lund,
1959) and the number of phytoplankton units in each randomly chosen microscope
field identified and enumerated until at least 100 units and 30 fields (depending on
concentration of phytoplankton) had been counted. A review of published literature
revealed that generally workers elsewhere have counted up to 100 units and 40 fields
(Venrick, 1978). Each discrete colony or cell was regarded as 1 unit. From the
sample concentration factor, dimensions of the chamber and field of view, counts
were expressed as phytoplankton units mL' 1 (PU mL'1). Identifications of specimens
176

were carried out using standard phytoplankton keys (Barber and Haworth, 1981;
Belcher and Swale, 1978; 1979; Bourrelly, 1966; 1968; 1970; Cleve-Euler, 1968;
Pentecost, 1984; Prescott, 1962; 1970; Lind and Brook, 1980; Smith, 1950).
At Brough (Yell) and Bu Water during 1991, localised areas of algal scum were noted
near to the shore. A sample of the scum was taken in each case. After preservation,
the phytoplankton present were identified as above.
4.2.3 Data analysis of 1991 phytoplankton numbers
CANOCO is a FORTRAN program designed to carry out canonical community
ordination using several methods, including Principal Components Analysis,
Correspondence Analysis, Detrended Correspondence Analysis and Canonical
Correspondence Analysis (CCA) (Ter Braak 1986; 1988; 1989). In the present study,
CCA was used to undertake canonical community ordination of the phytoplankton
data. Environmental data and phytoplankton numbers for each field visit in 1991 were
analysed. Environmental parameters which were found to have a variance inflation
factor (VIF) of > 19 were excluded from the data analysis. VIF is calculated as
follows:
VIF x (residual variance)/(n-^-l) = variance of the estimated regression
coefficient
where:
n = number of samples
q = number of environmental variables
VIF = 1/(1 -pmc)
where
pmc = (partial) multiple correlation between one environmental
variable and the other environmental variables in the
calculations
Therefore, as the VIF of a parameter increases it indicates a higher correlation with
other environmental variables. Environmenal parameters with high VIFs were
removed as they would not confer singular information to the analysis. Consequently,
177

conductivity, water colour and TOP were not included because of their relationships
with divalent cations, light attenuation and TP respectively. As the majority of lochs
exhibited concentrations of DRP < 1.0 pg P L \ this parameter was also rejected
from CCA. In addition, several samples were disregarded as their influence values
were > 15, i.e. these samples had a disproportionately large effect on the analysis.
These samples were: Loch of Brow (8/91), Mill Pond (7/91), Strand Loch (7/91 and
8/91) and Turdale Water (9/91).
From environmental information, CCA determined a number of ordination axes,
which accounted for most of the variability in the sample (site plus date) and
phytoplankton data. The greater the eigen value of an axis, the more variance in the
data was accounted for by that axis. Scores (eigenvectors) were calculated by the
program for both phytoplankton taxa and sites on each sampling date. These scores
were then plotted in relation to the first two CCA ordination axes (Axis 1 and Axis
2 accounted for most variability in the data) on two separate figures (Figures 4. la&b
and 4.2a&b). Figures 4. la&b represent phytoplankton groups along environmental
gradients, whilst Figures 4.2a&b represent the site positions along the same gradients.
Interset correlations from the CANOCO output were converted to intraset correlations
by division of the former with the species-environment correlations (Brown et al. ,
1993). The significance of the intraset correlations was then investigated by
comparing the f-values of the regression coefficients with the / distribution.
Examination of the regression coefficients and the intraset correlations facilitated
understanding of the ordination axes, through clarification of the most important
environmental variables in the Shetland phytoplankton community distribution.
Biplot scores of environmental variables were used to illustrate environmental
gradients on each biplot. Each environmental parameter included in the CCA analysis
was represented as an arrow, the bearing of which portrayed the direction of
maximum change within that parameter. Lengths of environmental gradient arrows
were linked to their importance in terms of their influence on phytoplankton and site
location in the biplots i.e. increased length was equated with greater correlation with
the ordination axes. A perpendicular line dropped from phytoplankton type to
environmental arrow indicated its location along that environmental gradient, relative
178

to other points on the biplot. Approximate rankings of phytoplankton taxa along the
most influential environmental gradients were therefore ascertained. Similarity of site
or phytoplankton points were assessed through the similarity of coordinates on the
biplot.
4.3 RESULTS
4.3.1 Chlorophyll a
From the results of the 1991 survey (n=93), correlation of chi a with each
environmental variable in turn revealed significant positive correlations between chi
a and TP (r = 0.49; p < 0.001), chi a and pH (r = 0.31; p < 0.01), chi a and Na
(r = 0.47; p < 0.001) and chi a and K (r = 0.47; p < 0.001). A strong positive
relationship between chi a and total algal counts was not observed (Figure 4. lb).
However, this was likely to have been an artifact which occurred as a result of the
method of algal enumeration used in the present study (Section 4.4.1).
4.3.2 Phytoplankton distribution with respect to environmental
parameters
4.3.2.1 Summary of CCA characteristics
Table 4.2 presents the summary of the CCA analysis. 38% of the species-environment
correlation was in the first two axes. The eigenvalues associated with Axis 1 and Axis
2 were 0.510 and 0.456 respectively and the decrease in eigenvalues from Axis 1 to
Axis 4 exhibited a low gradient. The ratio of the sum of unconstrained eigenvalues
(7.206) and the sum of canonical eigenvalues (2.543) was relatively high.
The intraset correlations of environmental variables with the Axes (Table 4.3)
indicated that TP, TAN and chi a were positively correlated with Axis 1, whilst TON
and total algal count were negatively correlated with the same Axis. TP, TAN and
TON were also positively correlated with Axis 2. Water pH values were negatively
correlated with this Axis. Significance of the f-values (assigned as if using a
conventional f-test) indicated importance in Axis 1 of TP, TON, TAN, K, chi a and
phytoplankton numbers, in addition to TP, TAN, TON, pH, Ca, Mg, chi a and
phytoplankton numbers in Axis 2. All other t-values were < 2.1 and therefore did
not explain an important proportion of the varition in the data (Ter Braak, 1988).
179

Table 4.2 Summary data of CCA data analysis
Axes 1 2 3 4 Total inertia
Eigenvalues 0.510 0.456 0.351 0.293 7.206Species environment correlations 0.929 0.911 0.895 0.782Cumulative % variance of:
species data 7.1 13.4 18.3 22.3species-environment relation 20.1 38.0 51.8 63.3
Sum of all unconstrained eigenvalues 7.206Sum of all canonical eigenvalues 2.543
180

01020304050607081011121314151617181920212324252627282930313233343536373839404142434445
KEY TO FIGURES 4.1a AND 4.1b
Phytoplankton taxa active in the CCA analysis
Phytoplankton Phytoplanktonactive in CCA class
Anabaena CyanophyceaeAphanothece CyanophyceaeAnkyra ChlorophyceaeAsterionella BacillariophyceaeAulomonas ChrysophyceaeBotryococcus ChlorophyceaeDiceras ChrysophyceaeTreubaria ChlorophyceaeCosmarium Chlorophyceae (Desmidiaceae)Closterium Chlorophyceae (Desmidiaceae)Chlamydomonas ChlorophyceaeCyclotella Bacillariophyceaecentric diatoms BacillariophyceaeCryptomonas CryptophyceaeCylindrospermum CyanophyceaeChroococcus CyanophyceaeCeratium DinophyceaeCoelosphaerium CyanophyceaeChrysolykos ChrysophyceaeChrysoflagellates ChrysophyceaeDictyosphaerium ChlorophyceaeDinobryon ChrysophyceaeEudorina ChlorophyceaeElakatothrix ChlorophyceaeEuastrum Chlorophyceae (Desmidiaceae)Eutetramorus ChlorophyceaeFragilaria BacillariophyceaeGomphosphaeria CyanophyceaeGymnodinium Dinophyceaeunicellular greens ChlorophyceaeKoliella (1) ChlorophyceaeKoliella (2) ChlorophyceaeKephyrion ChrysophyceaeLagerheimia ChrysophyceaeLyngbya CyanophyceaeMerismopedia CyanophyceaeMelosira BacillariophyceaeMonoraphidium (1) ChlorophyceaeMonoraphidium (2) ChlorophyceaeMougeotia ChlorophyceaeOocystis ChlorophyceaeOscillatoria CyanophyceaePediastrum Chlorophyceae
181

KEY TO FIGURES 4.1a AND 4.1b (cont.)
Phytoplankton taxa active in the CCA analysis
CCA Phytoplankton Phytoplanktonnumber active in CCA class
47 Peridinium Dinophyceae49 Rhodomonas Cryptophyceae50 Scenedesmus (2 cell) Chlorophyceae51 Synedra Bacillariophyceae53 Staurastrum Chlorophyceae (Desmidiaceae)55 Sphaerocystis Chlorophyceae57 Spirogyra Chlorophyceae58 Schroederia Chlorophyceae59 Tabettaria Bacillariophyceae60 Xanthidium Chlorophyceae (Desmidiaceae)62 filamentous A63 filamentous B64 Strand diatom Bacillariophyceae65 Selenastrum Chlorophyceae6 6 unknown A67 Euglena Euglenophyceae6 8 Crucigenia Chlorophyceae69 Brow filament A70 Brow filament B71 Scenedesmus (4 cell) Chlorophyceae74 Trachelomonas Euglenophyceae75 unknown E76 Tabellaria
IFragilariaBacillariophyceae
77 Kirchneriella Chlorophyceae
NOTE: Axis 1 is the horizontal axis (i.e. in the "x axis" position), Axis 2the vertical position (i.e. in the "y axis" position) on the biplot

Figure 4.1a CCA biplot of phytoplankton distribution along environmental gradients

Figure 4. lb Detail o f Figure 4. la
•25
30 •
5*
6 9 . * 7 • 43
• 74 • 53
16 •
60 •
Key to environmental gradients1 : LAC 2 : Dissolved oxygen 3: Temperature4: pH 5: TP 6 : TON7: TAN 8 : Calcium 9: Magnesium1 0 :13:
SodiumTotal algal count
1 1 : Potassium 1 2 : Chlorophyll a
184

KEY TO FIGURES 4.2a AND 4.2b
Shetland loch samples included in the CCA analysis
CCA no. Water body Sampling date
0 1 Arthurs Loch 07/910 2 08/9103 09/9104 Bu Water 07/9105 08/9106 09/9107 Loch of Brindister 07/9108 08/9109 09/911 0 Loch of Brough 07/911 1 (Bressay) 08/911 2 09/9113 Loch of Brough 07/9114 (Ydl) 08/9115 09/9116 Loch of Brow 07/9117 09/9118 Loch of Cliff 08/9119 09/91
2 0 Eela Water 07/912 1 08/912 2 09/9123 Loch of Gonfirth 08/9124 09/9125 Gorda Water 07/9126 08/9127 09/9128 Gossa Water 07/9129 \ 08/9130 09/9131 Helliers Water 07/9132 08/9133 09/9134 Loch of Huesbreck 07/9135 08/9136 09/9137 Loch of Huxter 07/9138 08/9139 09/9140 Loch of Kettlester 07/9141 08/9142 09/91
185

KEY TO FIGURES 4.2a AND 4.2b (cont.) Shetland loch samples included in the CCA analysis
CCA no. Water body Sampling date
43 Lunga Water 08/9144 09/9145 Mill Pond 08/9146 09/9147 Papil Water 07/9148 08/9149 09/9150 Punds Water 07/9151 08/9152 09/9153 Roer Water 07/9154 08/9155 09/9156 Sand Water 07/9157 09/9158 Sandy Loch 07/9159 08/9160 09/9161 Skutes Water 07/9162 08/9163 09/9164 Loch of Snarravoe 07/9165 08/916 6 09/9167 Loch of Spiggie 07/916 8 08/9169 09/9170 Strand Loch 09/9171 Loch of Tingwall 07/9172 08/9173 09/9174 Turdale Water 07/9175 08/9176 Loch of Ustaness 07/9177 08/9178 09/9179 Loch of Watlee 07/9180 08/9181 09/9182 Whitelaw Loch 07/9183 08/9184 09/9185 Sand Water 08/91NOTE: Axis 1 is the horizontal axis (i.e. in the "x axis" position), Axis 2 is
the vertical position (i.e. in the "y axis" position) on the biplot
186
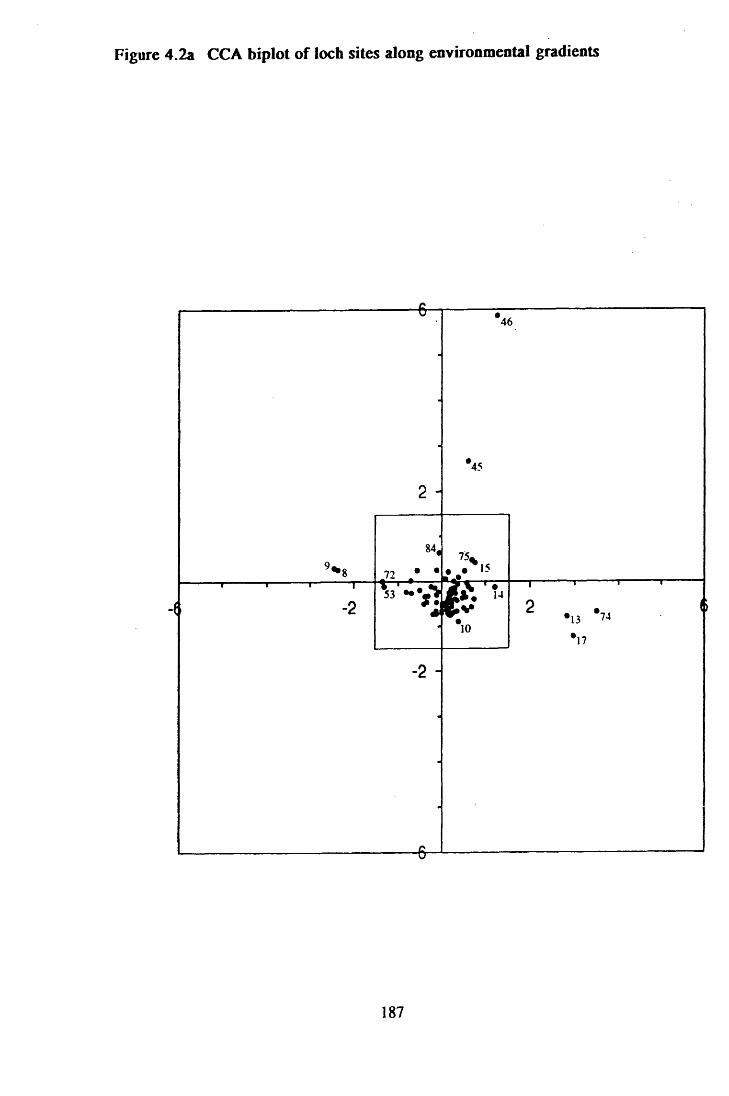
Figure 4.2a CCA biplot of loch sites along environmental gradients
2 -
' * 8
46
45
84,
72 * *
75%
15■ - •
1r*->
*104
-i r-2
13 74
'17
-2 -
187

Figure 4.2b Detail of Figure 4.2a
•19
12 *4
*20 •:
(4 V 79*2* 57
r •* *.21 22• • *85 49.
56-V 7..U4831».Vi35 12 34
23«
40* 26"
78* 77 76
Key to environmental gradients
1 : LAC 2 : Dissolved oxygen 3: Temperature4: pH 5: TP 6 : TON7: TAN 8 : Calcium 9: Magnesium1 0 : Sodium 1 1 : Potassium 1 2 : Chlorophyll a13: Total algal count
188

Table 4.3 Intraset correlations of environmental variables with CCA Axes 1 and 2 and significance of regression coefficient f-values
Variable Axis 1 Significance Axis 2 Significance
LAC 0.095 ns 0.203 nsTemperature-0.070 ns -0.294 nsDO -0.019 ns 0.166 nspH 0.013 ns -0.426 ***TP 0.571 *** 0.711 ***TON -0.347 ** 0.417 *TAN 0.589 ** 0.502 *Ca 0.123 ns -0.203 *»*Mg 0.291 ns -0.123 ***Na 0.317 ns 0.017 nsK 0.350 *** 0.025 nsChi a 0.527 *♦* -0.060 ***Algal count -0.509 *** 0.291 ***
*** p < 0 . 0 0 1
** p < 0 . 0 1
* p < 0.05
189

Axis 1 was therefore related to P and N enrichment, whilst Axis 2 was related to
water pH and hardness.
4.3.2.2 Positioning of phytoplankton data along CCA environmental
gradients
Approximate (several phytoplankton taxa might be located at similar coordinates on
the biplot) positions of phytoplankton taxa along important environmental gradients
are presented in Table 4.4. Phytoplankton which were associated with high TP levels
also tended to be associated with increased concentrations of TAN. Algal taxa for
which this was the case were (in order of decreasing TP levels) Scenedesmus (two
cell), Eudorina, Ankyra, Chlamydomonas, Closterium, Asterionella, small centric
diatoms and Anabaena. Similarly, the phytoplankton taxa which were associated with
low TP levels were also linked with low TAN concentrations. These algae included
Cylindrospermum, Xanthidium, Gomphosphaeria, Euastrwn, Coelosphaerium,
Crucigenia, Aulomonas, Botryococcus, Cosmarium and Merismopedia, (in order of
increasing TP concentration). However, although green algae, cyanobacteria and
chrysophytes were all represented when TP and TAN concentrations were low, none
of the diatom taxa observed in this study were associated with these water column
conditions. Certain genera of green algae and blue-green phytoplankton were also
linked with high concentrations of TP and TAN in the water column, as were
individual diatom taxa. In contrast, chrysophytes were not associated with high water
column TP and TAN levels.
The inferred ranking of phytoplankton on the TON gradient indicated that
Scenedesmus (two cell), Gomphosphaeria, Closterium, Aulomonas, Selenastrum,
Merismopedia, Eudorina, Cyclotella and Scenedesmus (four cell) were associated with
increased levels of TON in the water column. In contrast, small centric diatoms,
Anabaena, Staurastrum, Ankyra, Xanthidium, Dictyosphaerium, Trachelomonas,
Cylindrospermum and Treubaria were linked with low water TON concentrations.
Algae which were successful in waters with the combination of high TP, TAN and
TON concentrations were few. Only green phytoplankton were ranked highly on all
three gradients: Scenedesmus(two cell), Closterium, Eudorina and Selenastrum.
Certain phytoplankton which were observed at low TP and TAN concentrations were,
in contrast, ranked highly on the TON gradient.
190
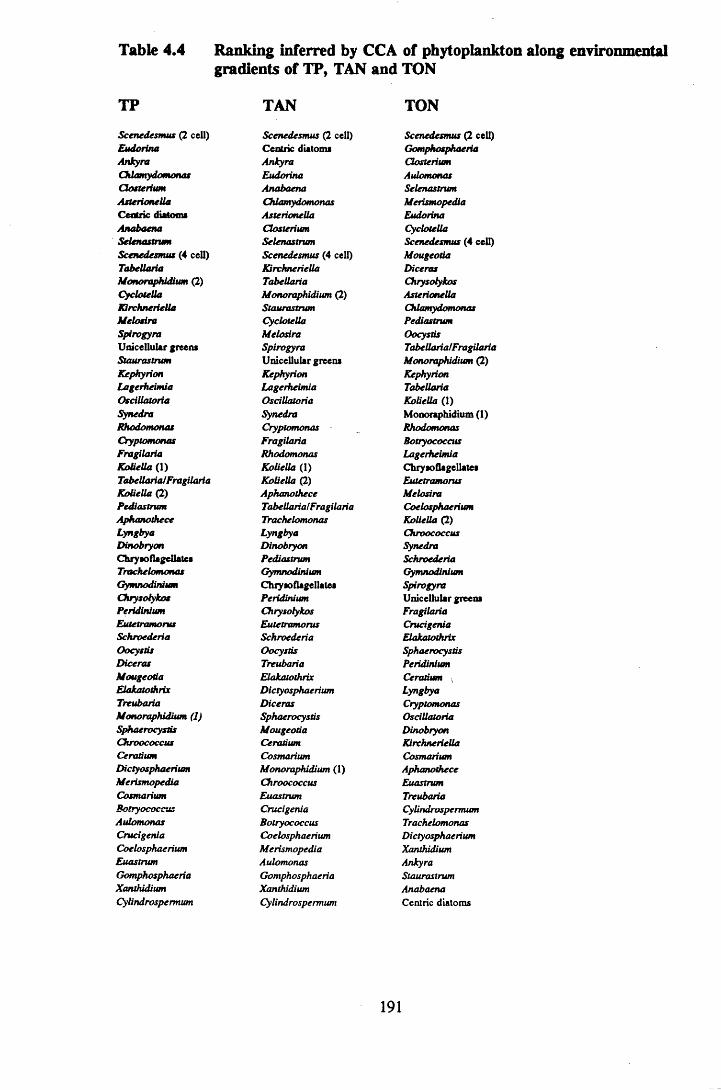
Table 4.4 Ranking inferred by CCA of phytoplankton along environmentalgradients of TP, TAN and TON
TP TAN TON
Scenedesmus (2 cell)EudorinaAnkyraChlamydomonasClosteriumAsterionellaCentric diatomsAnabaenaS e len a stru mScenedesmus (4 cell)TabellariaMonoraphidium (2)CyclotellaKirchneriellaM elosiraSpirogyraUnicellular greensStaurastrumKephyrionLagerheimiaOscillatoriaSynedraRhodomonasCryptomonasFragilariaKoliella (1)Tabellaria/FragilariaKoliella (2)PediastrumAphanotheceLyngbyaDinobryonChry so flagellatesTrachelomonasGymnodiniumChrysotykosPeridiniumEutetramorusSchroederiaOocystisD icerasM ougeotiaElakatothrixTreubariaMonoraphidium (1)SphaenocystisChroococcusCeratiumDictyosphaeriumMerismopediaCosmarium
AulomonasCrucigeniaCoelosphaeriumEuastrumGomphosphaeriaXanthidiumCylindrospermum
Scenedesmus (2 cell)Centric diatomsAnkyraEudorinaAnabaenaChlamydomonasAsterionellaClosteriumSelenastrumScenedesmus (4 cell)KirchneriellaTabellariaMonoraphidium (2)StaurastrumCyclotellaMelosiraSpirogyraUnicellular greensKephyrionLagerheimiaOscillatoriaSynedraCryptomonas -FragilariaRhodomonasKoliella (1)Koliella (2)AphanotheceTabellaria/FragilariaTrachelomonasLyngbyaDinobryonPediastrumGymnodiniumChrysoflagellalesPeridiniumChrysolykosEutetramorusSchroederiaOocystisTreubariaElakatothrixDictyosphaeriumDicerasSphaerocysdsMougeotiaCeratiumCosmariumMonoraphidium (1)ChroococcusEuastrumCrucigeniaBotryococcusCoelosphaeriumMerismopediaAulomonasGomphosphaeriaXanthidiumCylindrospermum
Scenedesmus (2 cell)GomphosphaeriaClosteriumAulomonasSelenastrumMerismopediaEudorinaCyclotellaScenedesmus (4 cell)MougeotiaDicerasChrysolykosAsterionellaChlamydomonasPediastrumOocystisTabellaria!FragilariaMonoraphidium (2)KephyrionTabellariaKoliella (1)Monoraphidium (1)RhodomonasBotryococcusLagerheimiaChryao flagellatesEutetramorusM elosiraCoelosphaeriumKoliella (2)ChroococcusSynedraSchroederiaGymnodiniumSpirogyraUnicellular greensFragilariaCrucigeniaElakatothrixSphaerocystisPeridiniumCeratium tLyngbyaCryptomonasOscillatoriaDinobryonKirchneriellaCosmariumAphanotheceEuastrumTreubariaCylindrospermumTrachelomonasDictyosphaeriumXanthidiumAnkyraStaurastrumAnabaenaCentric diatoms
191

These algae were Gomphosphaeria, Aulomonas, Merismopedia. The opposite was also
the case, as there were phytoplankton associated with high TP and TAN
concentrations, but which were ranked near to the bottom of the TON concentration
gradient. Such algae were small centric diatoms, Anabaena and Ankyra.
4.3.2.2.1 Summary of information on TP, TAN and TON and different algal
groups
Green algae were ubiquitous in their distribution, occurring in all conditions of TP,
TAN and TON described by the biplot (Figures 4. la&b). The most commonly
occurring and numerically important chrysophytes in the Shetland lochs studied, the
chrysoflagellates, occurred at low to intermediate levels on all three of the gradients
of water TP, TAN and TON concentrations. Dinobryon was located at a slightly more
elevated position in the TP and TAN rankings, but was lower on the TON scale.
Cyanophytes were not associated with the combination of high concentrations of TP,
TAN and TON together, but were included in all other varieties of conditions, such
as low TP and TAN and high TON. Dinoflagellates were associated with low to
intermediate concentrations of all three parameters. Peridinium and Gymnodinium
occupied similar positions on the TP and TAN gradients to the chrysoflagellates and
Dinobryon, although chrysoflagellates were located at a higher level on the TON
gradient than either of these dinoflagellates. Of the Bacillariophyceae, only small
centric diatoms were found at particularly low TON levels and no diatoms were
situated near the bottom of the TP and TAN gradients.
4.3.2.2.2 Inferred rankings of phytoplankton on pH, Ca and Mg
concentration gradients
When considering pH, Ca and Mg concentration gradients, which were important in
terms of the second CCA axis, inferred rankings of algae from the CCA analysis
indicated the following points (Table 4.5). Small centric diatoms, Anabaena, Ankyra,
Staurastrum and Trachelomas were associated with high levels of both Ca and Mg,
whilst Aulomonas, Gomphosphaeria, Merismopedia, Closterium and Selenastrum were
located at the bottom of these scales.
192

Table 4.5 Ranking inferred by CCA of phytoplankton along environmentalgradients of pH, Ca and Mg
pH Ca Mg
XanthidiumCentric diatomsCylindrospermumDictyosphaeriumEuastrumTreubariaCosmariumCeratiumCrucigeniaStaurastrumSphaerocysdsTrachelomonasElakatothrixAnabaenaCoelosphaeriumChroococcusAphanotheceBotryococcusPeridiniumSchroederiaDinobryonMonoraphidium (1)LyngbyaEutetramorusGymnodiniumCryptomonasChry so flagellate*OscillatoriaFragilariaKoUellaQ.)OocystisSynedraDicerasMougeotiaRhodomonasLagerheimiaKoliella (1)PediastrumChrysolykosTabellaria/FragilariaUnicellular greensKirchneriellaSpirogyraMerismopediaAulomonasMelosiraAnkyraKephyrionGomphosphaeriaTabellariaMonoraphidium (2)CyclotellaScenedesmus (4 cell)AsterionellaChlamydomonasSelenastrumEudorinaClosteriumScenedesmus (2 cell)
Centric diatomsAnabaenaStaurastrumXanthidiumDictyosphaeriumCylindrospermumTrachelomonasEuastrumTreubariaAnkyraAphanotheceCosmariumCeratiumSphaerocysdsDinobryonCrucigeniaElakatothrixPeridiniumLyngbyaCryptomonasOscillatoriaKirchneriellaSchroederiaFragilariaGymnodiniumChroococcusCoelosphaeriumUnicellular greensSynedraEutetramorusKoliella (2)SpirogyraBotryococcusChrysoflagellatesMonoraphidium (1)M elosiraLagerheimiaRhodomonasKoliella (1)OocystisTabellaria/FragilariaPediastrumKephyrionTabellariaDicerasMonoraphidium (2)MougeotiaChrysolykosChlamydomonasScenedesmus (4 cell)AsterionellaCyclotellaMerismopediaAulomonasEudorinaSelenastrumGomphosphaeriaClosteriumScenedesmus (2 cell)
Centric diatomsAnabaenaAnkyraStaurastrumKirchneriellaTrachelomonasUnicellular greensSpirogyraAphanotheceOscillatoriaCryptomonasM elosiraDictyosphaeriumChlamydomonasFragilariaXanthidiumTreubariaDinobryonLyngbyaSynedraAsterionellaTabellariaPeridiniumEuastrumLagerheimiaK oliella (2)Monoraphidium (2)GymnodiniumCosmariumRhodomonasElakatothrixCeratiumSphaerocysdsSchroederiaCyUndrospermtamChrysoflagellatesScenedesmus (4 cell)CrucigeniaKephyrionKoliella (1)EudorinaEutetramorusChroococcusCoelosphaeriumCyclotellaTabellaria/FragilariaMonoraphidium (1)BotryococcusPediastrumOocystisSelenastrumChrysolykosClosteriumDicerasMougeotiaSchroederiaMerismopediaAulomonasGomphosphaeria
193

According to the rankings, in the most alkaline waters, the following algae were
observed: Xanthidium, small centric diatoms, Cylindrospemuan, Dictyosphaerium,
Euastrum, Treubaria and Cosmarium, whereas Scenedesmus (two cell), Closterium,
Eudorina, Selenastrum, Chlamydomonas, Asterionella, Scenedesmus (four cell) and
Cyclotella occupied positions at the more acid end of the pH gradient
Chrysoflagellates were again associated with intermediate positions in these three
gradients, although Dinobryon appeared to have a preference for harder and more
alkaline waters than the chrysoflagellates. Dinoflagellates were successful at
intermediate to higher water pH and Ca levels and toward the middle of the ranking
on the water Mg concentration scale. Green and blue-green algae were represented
throughout the range of conditions of water pH and hardness. Although diatoms were
not situated at the extreme lower end of the Ca and Mg gradients (with the exception
of the diatom species which was found in Strand Loch only and was likely to be of
marine origin), they were present throughout the majority of conditions of water
hardness and the the pH gradient.
4.3.2.3 Positioning of lochs along CCA environmental gradients
Approximate positions of loch samples along the important environmental gradients
of TP, TAN and TON are presented in Table 4.6. Lochs which were associated with
high TP levels were Mill Pond, Loch of Brough (Yell), Loch of Brow, Turdale
Water, Loch of Cliff, Whitelaw Loch, Loch of Snarravoe, Sandy Loch, Bu, Punds
and Gossa Water. These lochs were also ranked highly on the CCA TAN scale.
Water bodies which were observed at the top of the TON gradient were as follows:
Mill Pond, Lochs of Brindister and Tingwall, Roer and Bu Water, Whitelaw Loch,
Skutes Water and Loch of Kettlester. Only Mill Pond, Bu Water and Whitelaw Loch
were ranked at relatively high positions on all three environmental gradients.
Loch of Brindister, Roer Water, Lochs of Tingwall and Ustaness. Skutes Water,
Lochs of Kettlester and Brow, Gorda Water and Whitelaw Loch were all linked with
low TP levels on the CCA biplot. These water bodies also occupied positions at the
lower end of the TAN scale. Loch of Brow, Turdale Water, Lochs of Brough (Yell
and Bressay), Spiggie, Huesbreck, Papil and Helliers Water, Arthurs and Sandy
Lochs, were all situated at a low level on the CCA TON ranking.
194

Table 4.6 Ranking inferred by CCA of sites along environmental gradientsof TP, TAN and TON
TP TAN TON
Mill 3 Mill 3 Mill 3Mill 2 Mill 2 Brindister 3Turdale 1 Turdale 1 Brindister 2Brough (Yell) 1 Brough (Yell) 1 Mill 2Brow 3 Brow 3 Tingwall 2Brough (Yell) 3 Brough (Yell) 3 Roer 1Turdale 2 Turdale 2 Bu 2Brough (Yell) 2 Brough (Yell) 2 Whitelaw 3Cliff 3 Cliff 3 Skutes 2Whitelaw 3 Snarravoe 3 Skutes 1Snarravoe 3 Sandy 2 Bu 3Cliff 2 Bu 1 Kettlester 3Sandy 2 Whitelaw 3 Whitelaw 3Bu 1 Cliff 2 Lunga 2Sandy 3 Punds 2 Sandy 3Punds 3 Sandy 3 Skutes 3Gossa 3 Punds 3 Brindister 1Punds 2 Huxter 3 Brow 1Huxter 3 Gossa 3 Strand 3Bu 3 Spiggie 3 Gonfirth 3Strand 3 Spiggie 1 Turdale 2Snarravoe 1 Snarravoe 1 Kettlester 2Spiggie 3 Punds 1 Roer 2Skutes 3 Sand 3 Lunga 3Punds 1 Strand 3 Gonfirth 2Sand 3 Watlee 3 Cliff 3Tingwall 3 Bu 3 Cliff 2Eela 1 Eela 1 Gossa 3Spiggie 1 Skutes 3 Brough (Yell) 3Snarravoe 2 Tingwall 3 Roer 3Huxter 2 Huesbreck 3 Tingwall 3Sandy 1 Snarravoe 2 Punds 3Eela 3 Papil 3 Watlee 3Gossa 1 Eela 3 Snarravoe 1Papil 3 Gossa 1 Huxter 2Huesbreck 3 Sandy 1 Punds 1Bu 2 U nv far 0ilUAlVl 4* Cnoffni ma jO n o iiav w
Tingwall 1 Tingwall 1 Sandy 1Watlee 1 Watlee 1 Tingwall 1Brindister 1 Eela 2 Snarravoe 3Gossa 2 Gossa 2 Arthurs 2Spiggie 2 Spiggie 2 Gossa 2Lunga 3 Huxter 1 Eela 1Eela 2 Papil 2 Watlee 2Huxter 1 Brough (Bressay) 2 Kettlester 1
195

Table 4.6 (cont.)
TP TANLunga 2 Huxter 1 Arthurs 3 Sand 2 Papil 2Brough (Bressay) 2 Gonfirth 2 Whitelaw 1 Huesbreck 2 Helliers 2 Gorda 3 Arthurs 2 Helliers 3 Arthurs 1 Watlee 2 Gorda 1 Sand 1 Papil 1 Roer 3 Skutes 2 Huesbreck 1 Gonfirth 3 Brough (Bressay) 1 Helliers 1 Brough (Bressay) 3 Whitelaw 2 Gorda 2 Brow 1 Ustaness 1 Roer 2 Kettlester 1 Ustaness 2 Kettlester 3 Kettlester 2 Skutes 1 Ustaness 3 Tingwall 2 Roer 1P r t n / l i r t a r O IIIUUIVI 4*
Brindister 3
TONSand 2 Arthurs 3 Lunga 3 Huesbreck 2 Brindister 1 Whitelaw 1 Gorda 3 Arthurs 1 Lunga 2 Helliers 2 Bu 2Helliers 3 Gonfirth 2 Brough (Bressay) 1 Arthurs 2 Papil 1 Watlee 2 Huesbreck 1 Sand 1 Gorda 1Brough (Bressay) 3 Helliers 1 Roer 3 Gorda 2 Gonfirth 3 Ustaness 1 Brow 1 Whitelaw 2 Kettlester 1 Skutes 2 Ustaness 2 Roer 2 Ustaness 3 Kettlester 2 Kettlester 3 Skutes 1 Tingwall 2 Roer 1 Brindister 2 Brindister 3
Ustaness 3 Whitelaw 1 Arthurs 3 Gorda 1 Spiggie 2 Watlee 1 Ustaness 2 Bu 1 Huxter 1 Helliers 2 Gossa 1 Helliers 3 Gorda 2 Huxter 3 Eela 2 Ustaness 1 Eela 3 Sand 1 Gorda 3 Sand 2 Sand 3 Sandy 2 Spiggie 3 Helliers 1 Papil 1Brough (Bressay) 3 Arthurs 1 Huesbreck 1 Huesbreck 2 Brough (Bressay) 2 Papil 2 Papil 3 Punds 2 Huesbreck 3 Spiggie 1 Brough (Yell) 2 Brough (Bressay) 1 Brough (Yell) 1 Turdale 1 Brow 3
NOTE:
1 sampling date, 07/912 sampling date, 08/913 sampling date, 09/91
196

Of these water bodies, Loch of Brow, Turdale Water, Loch of Brough (Yell), Punds
Water and Sandy Loch were also located at the top of the CCA TP and TAN
gradients.
The CCA analysis indicated that certain water bodies did not occupy the same
approximate position on the biplot on each sampling date. Nutrient levels changed
between sampling trips and differences were of sufficient magnitude to result in
movement of samples (sites on a sampling date) to a different general area of the
biplot It was therefore possible for a water body be located at various positions on
the same environmental gradient, during different sampling dates. For example,
Turdale, Punds, Gossa and Bu Water, Sandy Loch, Lochs of Brow and Brough (Yell)
were found to change position considerably on the TON gradient. Papil Water, Lochs
of Brow, Tingwall, Watlee and Brindister and Whitelaw Loch are examples of sites
which differed within the TAN ranking. In terms TP ranking, Lochs of Brow,
Tingwall and Brindister, Whitelaw Loch and Skutes Water are examples of water
bodies which changed position considerably through the period of observation.
4.3.3 Changes in numbers of the main phytoplankton taxa in the five
water bodies chosen for further study
4.3.3.1 Loch of Gonfirth
4.3.3.1.1 1991
During 1991, greatest number of phytoplankton was counted in the sample from
01/06/91 and totalled 808 PU mL'1. In August the phytoplankton density had
decreased to 6 6 8 PU mL'1. Changes in numbers of the main phytoplankton taxa in
Loch of Gonfirth are described below. In addition, variations in the abundance of the
most numerically important taxa observed in 1992 are included in Figure 4.3.
4.3.3.1.1.1 Chrysophytes, cryptophytes and diatoms
Chrysoflagellate numbers increased from 193 PU mL* 1 in June to 240 PU mL* 1 in
August and were least abundant at 164 PU mL' 1 in the September sample. Dinobryon
was countable in the June sample only, when it had a density of only 12 PU mL*1.
Although not abundant, presence of Aulomonas in the assemblage in all samples
should be noted. Diatom flora was mainly of Cyclotella. Peak abundance of this
genus was noted in June (64 PU mL'1), lowest density in September (35 PU mL'1).
197

Cryptomonas was absent from the June sample, though Rhodomonas abundance was
64 PU mL'1. Maximum count for the latter came to 94 PU mL ’.in the August
sample, dropping to 59 PU mL* 1 in September. Cryptomonas increased to 12 PU mL' 1
in August, greatest concentration of 29 PU mL" 1 occurring in September.
4.3.3.1.1.2 Green and blue-green algae
Cyanobacteria were present throughout the samples taken.
Anabaena, Gomphosphaeria, Merismopedia and Aphanothece were all represented,
though only the latter was present in sufficient numbers to be enumerated in all three
samples. In June Anabaena was at its greatest concentration of 6 PU mL'1, being
undetectable in the other samples. Maximum concentrations of Aphanothece and
Merismopedia occurred in August, numbers totalling 41 PU mL' 1 and 59 PU mL* 1
respectively. In September greatest blue-green numbers were accounted for by
Gomphosphaeria at 59 PU mL'1. Chlorophytes which were important in their
abundance in the samples were Monoraphidium (1), Koliella (1), Selenastrum and
Oocystis. Selenastrum and Oocystis both showed peak abundance of 76 PU mL* 1 in
the 01/06/91 sample, declining to minima in August of 29 PU mL* 1 and 18 PU mL* 1
respectively. Koliella showed a similar pattern, exhibiting a concentration of 23 PU
mL* 1 in June, but could not be located in the August sample. Greatest individual algal
count for this loch in 1991 was 152 PU mL' 1 for Monoraphidium in September.
Abundance of this alga in June was 105 PU mL*1, decreasing to 47 PU mL' 1 during
August.
4.3.3.1.2 1992
Total phytoplankton abundance in samples taken in 1992 ranged from 284 PU mL* 1
in August to 597 PU mL' 1 in May. Changes in numbers of the main phytoplankton
taxa in the Loch are described below. In addition, the counts of the algal taxa
observed to exhibit greatest numbers are presented in Figure 4.4.
4.3.3.1.2.1 Chrysophytes, cryptophytes and diatoms
In March, chrysoflagellates were present at 94 PU mL"1, but by May their density had
increased to 135 PU mL'1. Numbers then decreased to 19 PU mL* 1 in October.
Dinohryon remained in the plankton intermittently, whilst Aulomonas was present in
every sample.
198

Sampling date
Figure 4.3 Changes in numbers of the main phytoplankton taxa in Loch ofGonfirth during summer, 1991 (composite samples, n=9)
Algal count (PU ml:1)
CJio oo CJiofV>oo
roCJio
oCDCO
oCDoCOCO
roCD'oCOCO
□ <0 f ■ *> t
T i l .
□ < 4 rii n> +s c/) o o o 5o cp o z r ixZ> CD o Q_ o° =5 ^ W O S-^ p) W Q r+ O-S w §: 3w CO {D o
\Id tf
199
Loch of
Gonfirth, 1991

Sampling
date
Figure 4.4 Changes in numbers of the main phytoplankton taxa in Loch ofGonfirth during the 1992 sampling season (composite samples,n=3)
Algal count (PU mL1}
cno
> S CO O O 3"O o <2> zr=T 5 o v< o oo 05 0 5 o S' §o go ^ o_ 35 37 ^ » W §® o! S (D§ C 3 I MCD 3 05r-f-
<DGO
OCOro
d4 s ^
oo
Oo
CO(Oro
200

Production of neither genus achieved a high proportion of the phytoplankton
assemblage. Cyclotella continued to be the dominant diatom present in Loch of
Gonfirth, although small centric diatoms had increased in importance. Concentration
of Cyclotella remained similar in March and May, but peak numbers were present in
May (29 PU mL*1). The lowest count of 5 Cyclotella PU mL* 1 was observed in the
October sample. Small centric diatoms were absent in March and May, but present
during August (32 PU mL*1). Rhodomonas and Cryptomonas both exhibited maximum
numbers in May. These totalled 123 PU mL* 1 and 35 PU mL* 1 respectively.
Rhodomonas numbers were lowest in June (5 PU mL'1), whilst Cryptomonas
concentration was 4 PU mL* 1 in March, August and October.
4.3.3.1.2.2 Green and blue-green algae
Of blue-green algae present, Aphanothece exhibited greatest numbers. Its range of
abundance was 4 PU mL* 1 during March to 64 PU mL*1, during May. Merismopedia
was no longer numerically important, being absent from all but the August sample,
where its density was 2 PU mL*1. In addition, Gomphosphaeria and Anabaena were
absent from all samples in 1992. Monoraphidium, Selenastrum and Oocystis remained
the dominant green phytoplankton in Loch of Gonfirth. Maximum count for each
genus was observed in a different sample. Monoraphidium exhibited two peaks of 59
PU mL* 1 and 85 PU mL* 1 in March and August respectively, minimum count
occurring in October (12 PU mL*1). Selenastrum ranged from 2 PU mL* 1 in October,
to 75 PU mL* 1 during June. Peak abundance of Oocystis totalled 23 PU mL* 1 in May,
whereas only 2 PU mL* 1 were counted in the October sample.
4.3.3.1.3 1993
Total phytoplankton count in 1993 ranged from 309 PU mL* 1 in October to 521 PU
mL* 1 during May. Peak abundance was observed in May or early June in all three
years of the study. Variations in the numbers of the the main phytoplankton taxa
during 1993 are described below. In addition, the numbers of the algal taxa observed
to exhibit greatest abundances are presented in Figure 4.5.
4.3.3.1.3.1 Chrysophytes, cryptophytes and diatoms
Chrysoflagellate numbers in 1993 ranged from 55 PU mL* 1 in October to 193 PU mL*
1 in May.
201

Sampling date
Figure 4.5 Changes in numbers of the main phytoplankton taxa in Loch o fGonfirth during the 1993 sampling season (composite samples,n=3)
Algal count (PU mL'1}
rooooo CJioro 0 N> r
CO \ CO \
^ in o o oO CP Q I T * < Z3 CD O s P 0 _
Q l O CO' 5roooCJICOCO
CLO COcz
CO
fO
oCOCO
/ / // / '
oCO
oCO
202
Loch of
Gonfirth 1993

Aulomonas became more important, maximum of 57 PU mL' 1 decreasing to
uncountably low levels in July, before population recovery to a concentration of 19
PU mL'1. Small centric diatoms became relatively abundant in 1993, their count
increasing from 10 PU mL 1 in March, to 108 PU mL' 1 in July. In October, 19 PU
mL' 1 were enumerated. Cyclotella was a consistent member of the phytoplankton
assemblage, its numbers remaining constant throughout the survey. Maximum values
of 26 PU mL' 1 and 30 PU mL' 1 were observed in May and October respectively.
Cryptomonas was undetectable by the counting procedure in 1993. Rhodomonas
numbers fell to a minimum of 10 PU mL' 1 in May, after achieving a maximum count
of 6 8 PU mL' 1 in March. The density of Rhodomonas subsequently increased to 37
PU mL' 1 in October.
4.3.3.1.3.2 Green and blue-green algae
Gomphosphaeria was discovered once only in 1993, achieving an abundance of 5 PU
mL'1. Aphanothece increased from being undetectable in March to 19 PU mL* 1 during
July, decreasing to 14 PU mL' 1 in October. Merismopedia numbers remained low.
Greatest concentration of 2 PU mL* 1 was found in the October sample. Again,
Monoraphidium, Selenastrum and Oocystis were the most abundant forms of green
algae in Loch of Gonfirth. Oocystis increased from undetectable levels in March to
23 PU mL' 1 in August and October. Monoraphidium exhibited peaks of 73 PU mL* 1
and 136 PU mL' 1 in March and July respectively. Lowest recorded density of 9 PU
mL' 1 occurred in October. From below detection in March, Selenastrum increased to
16 PU mL* 1 in May, subsequently declining to 4 PU mL' 1 during October.
4.3.3.2 Helliers Water
4.3.3.2.1 1991
In 1991 total count of algae in Helliers Water rose from the minimum value in June
of 919 PU mL'1, to peak abundance in August of 1523 PU mL1. Variations in the
numbers of the the main phytoplankton taxa in Helliers Water are described below.
In addition, the numbers of the algal taxa observed to exhibit greatest abundances are
presented in Figure 4.6.
4.3.3.2.1.1 Chrysophytes, cryptophytes and diatoms
Members of the Chrysophyceae constituted a significant proportion of total
203

phytoplankton abundance. Greatest numbers were recorded for chrysoflagellates.
Counts ranged from 358 PU mL' 1 (18/07/91) to 789 PU mL' 1 (20/08/91). Dinobryon,
though undetectable in the sample taken on 04/06/91, totalled 72 PU mL*1, 62 PU
mL* 1 and 33 PU mL* 1 on the following three sampling dates respectively. The
abundance of the cryptophyte Rhodomonas increased from 23 PU mL* 1 during June
to 234 PU mL* 1 in August, before decreasing to 52 PU mL* 1 in September. Diatom
flora were dominated by Cyclotella, with the greatest count occurring in September
(59 PU mL*1), after numbers had decreased from 47 PU mL* 1 (04/06/91), to < 1 PU
mL* 1 during August.
4.3.3.2.1.2 Dinoflagellates
The Dinophyceae remained in the phytoplankton in sufficient numbers to be counted
throughout the sampling season. Maximum counts for Peridinium (234 PU mL*1) and
Gymnodinium (59 PU mL*1) were observed during July, minimum counts occurring
in August (16 PU mL*1) and June (12 PU mL*1) respectively.
4.3.3.2.1.3 Green and blue-green algae
Several desmid taxa were represented in this water body, though they did not
consistently constitute a large proportion of total sample abundance. These were
Cosmarium, Euastrum, Sphaerozosma, Spondylosium, Staurastrum, Staurodesmus and
Xamhidium. The appearance of Treubaria in the phytoplankton in July was followed
by its maximum numbers (16 PU mL*1) in August. The Cyanophyceae were also
represented, the following algae being present: Aphanothece, Chroococcus,
Gomphosphaeria, Merismopedia and Lyngbya. Again, this phytoplankton group did
not generally establish a critical fraction of total sample abundance. All were present
in numbers below the limit of detection, with the exceptions of Merismopedia and
Lyngbya (7 PU mL* 1 of each were observed during July) and Gomphosphaeria ( 8 PU
mL* 1 during August).
4.3.3.2.2 1992
Total phytoplankton count in 1992 ranged from a peak of 1405 PU mL' 1 in March
down to 783 PU mL* 1 in October. Variations in numbers of the main phytoplankton
taxa in Helliers Water samples during 1992 are described below. The numbers of the
phytoplankton taxa exhibiting greatest abundances are presented in Figure 4.7.
204

Sampling
date
Figure 4.6 Changes in numbers of the main phytoplankton taxa in HelliersWater during summer, 1991 (composite samples, n=3)
Algal count (PU mL1)
ooCDCO
rooo0 5Oo
a>oo
i1 1
V.i
V.\
COoCO
\
l\"\
/
\ /
\ /A
/
/ \
roooo oco
rorooCOCO
! /
V
\ ■' * * &
t
/
//
/
/
\\
□— 11
I1
I□
11
<
o OZ3O
co c rO * <
O03 13
COCD_
S -CDCO
i ft t>- p o o ® < < 3j . —i nCL
tiIi
+
—» o Q- c a ® 33 □ > §
§ 0 ) 3 co
\X
\
/ ■4
//
//
d '
205
Helliers W
ater. 1991

19.03.92 12.05.92
20.06.92 21.08.92
10.10.92
Sampling date
Figure 4.7 Changes in numbers of the main phytoplankton taxa in HelliersWater during the 1992 sampling season (composite samples, n=3)
Algal count (MU L"1}
COOO0 5OO
COOOrooo
O O o 7^ "O cno =r 3 c d 2> 'c
o ' S? ° ° § 055 OJ D D 33 ( Q
CD
CD0 0
206
Helliers W
ater 1992

4.3.3.2.2.1 Chrysophytes, cryptophytes and diatoms
As in 1991, the Chrysophyceae were again numerically important in Helliers Water.
Chrysoflagellate density peaked in March (1007 PU mL*1), declined to 78 PU mL* 1
in June and subsequently increased to 315 PU mL* 1 in October. A larger peak of
Dinobryon units was noted than in 1991, the 21/06/92 sample exhibiting 453 PU mL*
In 1992, Kephyrion and Chrysotykos both appeared in the plankton. Importance
of the cryptophyte Rhodomonas had decreased in 1992, being insignificant in May
and reaching a peak of only 40 PU mL* 1 in August. Numbers of Cyclotella observed
in Helliers Water samples were not as great as in the previous year, Synedra having
become the dominant diatom growth form. This genus reached maximum numbers
in May (62 PU mL*1), decreasing to 7 PU mL* 1 in August and October.
4.3.3.2.2.2 Dinoflagellates
Phytoplankton of the Dinophyceae constituted a proportion of the algal assemblages
sampled. Greatest number of Gymnodinium was detected in May (16 PU mL*1), but
this genus was not observed in August. The latter sample however, did exhibit 7 PU
mL* 1 Ceratium. Again, the dominant member of the Dinophyceae was Peridiniumy
maximum concentration of 148 PU mL* 1 occurring in June, the minimum in October,
when undetectable levels were present.
4.3.3.2.2.3 Green and blue-green algae
Cyanophytes were less important than in 1991; Gomphosphaeria and Merismopedia
were not observed, whilst Aphanothece, Chroococcus and Lyngbya were not present
in sufficient numbers to be counted. Of the desmids, however, Cosmarium had
become a greater component part of phytoplankton abundance. Though not observed
in March, numbers increased to 125 PU mL* 1 in the June sample before declining to
27 PU mL* 1 in August and October. Treubaria remained a feature of the 1992
assemblage.
4.3.3.2.3 1993
Timing of the maximum recorded phytoplankton count for Helliers Water was
different in each year of the three year study. Maximum and minimum total counts
in the three year study were observed in 1993, numbers being 1671 PU mL* 1 (05/93)
and 574 PU mL* 1 (03/93) respectively. Variations in the numbers of the the main
207

phytoplankton taxa during 1993 are described below. In addition, the numbers of the
algal taxa observed to exhibit greatest abundances are presented in Figure 4.8.
4.3.3.2.3.1 Chrysophytes, cryptophytes and diatoms
Greatest number of chrysoflagellates in Helliers Water samples was found in 1993.
From 305 PU mL 1 in March, chrysoflagellate count increased to 1054 PU mL' 1 in
May, before declining to minimum of 234 PU mL* 1 in October. Peak number of
Dinobryon units again occurred after that of the chrysoflagellate group. A maximum
concentration of 154 PU mL* 1 was observed in October, when chrysoflagellate
abundance was at its minimum. Chrysotykos continued to be present in the
assemblage, although Kephyrion was not apparent after March. The cryptomonad,
Rhodomonas, was present in numbers similar to those of 1992. The lowest count was
observed in May ( 8 PU mL*1), the highest in July (55 PU mL*1). In 1993, Synedra
continued to be the dominant member of the Bacillariophyceae, although Cyclotella
was also important. Maxima were 172 PU mL* 1 and 81 PU mL* 1 respectively, with
Synedra peaking in May and Cyclotella increasing from March to October. Minimum
counts of these diatoms occurred coincidentally in March.
4.3.3.2.3.2 Dinoflagellates
The dinoflagellate, Ceratium was not found in phytoplankton samples in 1993.
Gymnodinium concentration was < 1 PU mL* 1 in July and October samples, although
its maximum abundance of 47 PU mL* 1 (05/93) was greater than that found in 1992.
Peridinium density increased from 29 PU mL* 1 in March to 8 6 PU mL* 1 in May
before falling to 15 PU mL* 1 in October.
4.3.3.2.3.3 Green and blue-green algae
Blue-green algae once again reached detectable levels. In March, May, July and
October samples there were 6 PU mL* 1 Chroococcus, 8 PU mL' 1 and 16 PU mL* 1
Gomphosphaeria and 7 PU mL* 1 Aphanothece respectively. Cosmarium and
Staurodesmus were the most abundant desmids, on average, although the Euastrum
count reached 16 PU mL* 1 during July. Staurodesmus declined from 12 PU mL* 1 in
March to < 1 PU mL* 1 and 7 PU mL* 1 in July and October respectively. Cosmarium
showed its maximum abundance (23 PU mL*1) between May and October. Treubaria
abundance was low, with the exception of 78 PU mL* 1 observed in October.
208

Sampling date
Figure 4.8 Changes in numbers of the main phytoplankton taxa in HelliersWater during the 1993 sampling season (composite samples, n=3)
Algal count (PU mL'1)
go cr> co roo o o o
o o o o oGOoGOCOGO
roGOoCJ1
COGO
roCDOCOGO y o co joo
o =3 op r CD Q_ ^ 2 - 0 - 0
c © Q) 3</> g- o=* oCD Z3 (O CD
OCO
CDCO
OCOGO
209
Helliers W
ater 1993

4.3J.3 Loch of Tingwall
4.3.3.3.1 1991
During 1991, maximum total phytoplankton count observed occurred in July.
Numbers decreased from 3610 PU mL* 1 in July to 614 PU mL* 1 in September.
Variations in the numbers of the the main phytoplankton taxa during 1991 are
described below. In addition, the numbers of the algal taxa observed to exhibit
greatest abundances are presented in Figure 4.9.
4.3.3.3.1.1 Chrysophytes, cryptophytes and diatoms
The peak of chrysoflagellate numbers, in July, coincided with the highest
concentartion of Monoraphidium. A chrysoflagellate total of 2614 PU mL* 1 accounted
for the largest discrete count, of an individual algal type, found in Loch of Tingwall
in 1991. Numbers fell to 26 PU mL* 1 and 4 PU mL* 1 in August and September
samples respectively. Diatoms did not become numerically important until September,
Melosira, Synedra and Cyclotella increasing in number. Cyclotella was most abundant
at a concentration of 40 PU mL'1. Concurrent with maximum Gomphosphaeria count
in August was production of the greatest number of cryptophytes. Peak densities of
Cryptomonas and Rhodomonas came to 31 PU mL" 1 and 203 PU mL* 1 respectively.
These algae were also observed in May and July.
4.3.3.3.1.2 Green and blue-green algae
Cyanobacteria represented in the total counts were Gomphosphaeria and Aphanothece.
Though absent from the July sample, Aphanothece produced 106 PU mL* 1 in August
and 75 PU mL* 1 in September. Numbers of Gomphosphaeria were found to increase
from 7 PU mL* 1 in July to 534 PU mL* 1 in August. These were present as single or
double cells rather than colonies. During July, Monoraphidium (2) density was 622
PU mL*1. However, these algae decreased to undetectable levels in September.
Sphaerocystis colonies totalling 17 PU mL* 1 and Scenedesmus (4 cell) accounting for
18 PU mL* 1 appeared in the assemblage at this time.
210

Sampling date
Figure 4.9 Changes in numbers of the main phytoplankton taxa in Loch ofTingwall during summer, 1991 (composite samples, 9)
Algal count (PU mL"1)
rooCO I t
\ !
oooroooo
COooo
roCDocoCO
i\ i
V
'■ (! / \17 \
1 1 f •
r#• I
/ i r'
\\\,\\\
< 0
/
i /I /
COoCOCO
AE
! /1 /:/
■/
I
?
□ < i >> 0^:00"o o o *<j 5 3 J o^ -O O GO O
© -g §, £0 0 3- 05 Q3
CD q : CQg ® C S*0 CD 3 CO
+III
+JOzroC LO3oZJ0305
03 CD03
211
Loch of
Tingwall 1991

4.3 .33.2 North Basin, 1992
In 1992 numbers were maximal in May, with a total phytoplankton density of 13244
PU mL'1. Numbers fell to their lowest during August, the water column only
supporting 766 PU mL*1. By October algal concentration had risen to 1314 PU mL’1.
Changes in numbers of the main phytoplankton taxa in the North Basin of the Loch
during 1992 are described below. In addition, the counts of the algal taxa observed
to exhibit greatest numbers are presented in Figure 4.10.
4.3.3.3.2.1 Chrysophytes, cryptophytes and diatoms
Chrysoflagellate count in March was 767 PU mL*1. These phytoplankton increased
to 8059 PU mL' 1 during May, falling to a minimum of 127 PU mL' 1 in October.
Though absent from all but one other sample, Dinobryon produced 2311 PU mL* 1 in
May. Maximum number of cryptophytes coincided with Dinobryon and
chrysoflagellate peaks. Both Rhodomonas and Cryptomonas were persistent in the
phytoplankton throughout the sampling period. Greatest number of Rhodomonas was
1249 PU m L 1 and for Cryptomonas, 312 PU mL1. Minimum for each genus was 21
PU mL' 1 in June. Phytoplankton of the Bacillariophyceae was dominated by centric
diatoms, Asterionella, Synedra and Melosira, which numbered 596 PU mL'1, 469 PU
mL'1, 341 PU mL' 1 and 298 PU mL* 1 respectively. Centric diatoms and Melosira were
absent from subsequent samples. Synedra decreased to undetectably low levels in
May, but numbers increased again to 10 PU mL' 1 by August. Asterionella numbers
decreased to undetectable levels in August, reappearing at 71 PU mL' 1 in October.
4.3.3.3.2.2 Green and blue-green algae
Blue-green algae were represented by Aphanothece and Anabaena. The former was
present at 60 PU mL' 1 and 14 PU mL' 1 in August and October respectively. Anabaena
concentration in June accounted for 7 PU mL"1. Phytoplankton of the Chlorophyceae
were intermittently present in the plankton only. Unicellular greens, unicellular green
flagellates, Koliella (1) and Schroederia, all showed March peaks of 298 PU mL*1,
213 PU mL*1, 85 PU mL 1 and 256 PU mL' 1 respectively, before decreasing to levels
below detection in the remaining samples. Koliella (2) was not found in March, June
or October, but during May produced 187 PU mL'1. Monoraphidium (2) was located
in the October sample only, at a level of 64 PU mL*1.
212

22.03.92 13.05.92
19.06.92 22.08.92
08.10.92
Sampling date
Figure 4.10 Changes in numbers of the main phytoplankton taxa in Loch ofTingwall, North Basin, during the 1992 sampling season(composite sample, n=3)
Algal count (PU mL"1}
rooooooo
05ooo
CDooo
oooo
>3
JOo o 3" o
Q .05 O- O ^ o13CQ
CD 05
COCDCO
213
Loch of
TingwallN
orth 1992

4.3.3.3.3 North Basin, 1993
Total phytoplankton numbers in samples taken in 1993 were not as high as those
found in 1992 samples. From 5585 PU mL' 1 in March, numbers increased to 8902
PU mL' 1 in May, minimum levels of 742 PU mL' 1 occurring in the October sample.
Changes in numbers of the main phytoplankton taxa in Loch of Tingwall North Basin
are described below. In addition, variations in the abundance of the most numerically
important taxa observed in 1993 are included in Figure 4.11.
4.3.3.3.3.1 Chrysophytes, cryptophytes and diatoms
Chrysoflagellates were again the dominant phytoplankton in Loch of Tingwall, North
Basin in 1993. Numbers ranged from 6934 PU mL* 1 in the May sample, to 346 PU
mL* 1 in October. Dinobryon concentration was found to be below detection in March,
rising to 1249 PU mL' 1 in May, when the highest chrysoflagellate numbers were
recorded. Small centric diatoms were not numerically important in 1993, although
Cyclotella manifested itself in the community once more. It was present at 37 PU mL*
\ but during March only. Melosira numbers, after reaching 337 PU mL' 1 in March,
were reduced to undetectable levels during subsequent sampling trips. Synedra and
Asterionella decreased from 187 PU mL' 1 and 712 PU mL' 1 respectively in March,
to below detection during July, but reappeared in the phytoplankton assemblage in
October. This year, maximum cryptophyte numbers occurred in March instead of
May. Cryptomonas decreased from 75 PU mL* 1 to a density below level of detection,
whereas Rhodomonas concentration started at 562 PU m L 1 and fell to 120 PU mL*1.
Minimum cryptophyte density occurred in October.
4.3.3.3.3.2 Green and blue-green algae
Green and blue-green algae were again patchy in their distribution. Koliella (1) and
(2) were present in March only, at levels of 75 PU mL* 1 and 225 PU mL* 1
respectively. Monoraphidium abundance ranged from 94 PU mL* 1 in May down to
below detection in July and October. Desmids increased in number during 1992.
Cosmarium reached 62 PU mL* 1 in May, though was present thereafter only in
October (7 PU mL*1). Gomphosphaeria was present as single or double cells in May
only, reaching a density of 75 PU mL*1. Aphanothece then appeared in July (16 PU
mL*1) and October (14 PU mL*1).
214
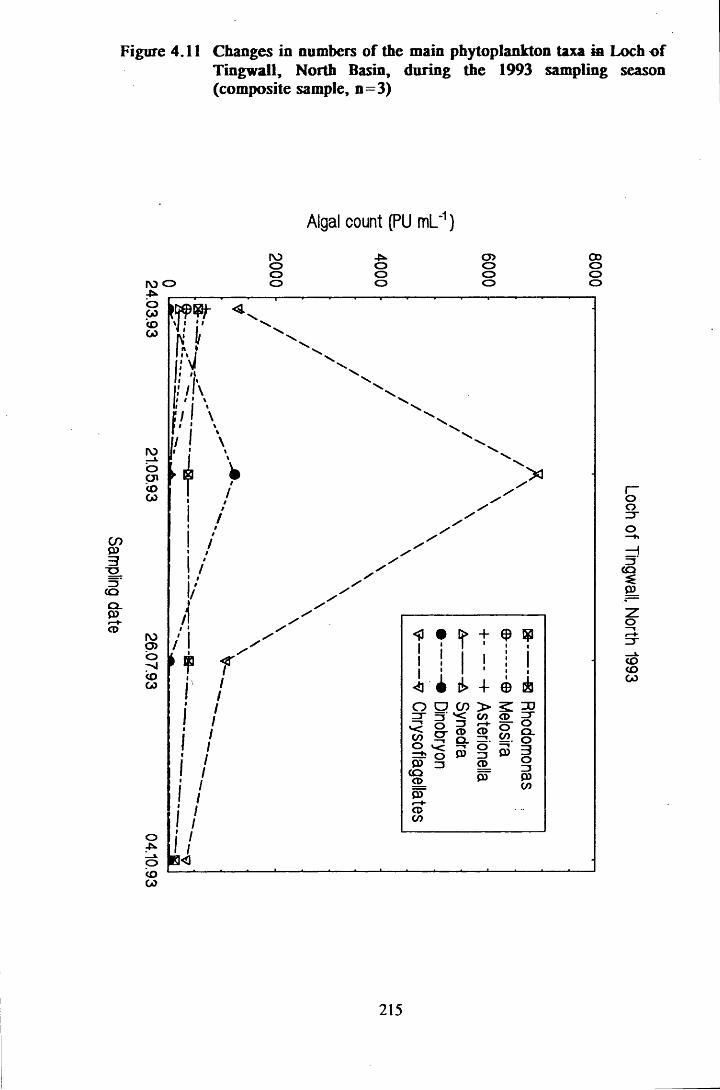
Sampling date
Figure 4.11 Changes in numbers of the main phytoplankton taxa in Loch o fTingwall, North Basin, during the 1993 sampling season(composite sample, n=3)
Algal count (PU mL‘1)
ro o
rooooooo
cr>ooo
CDooo
l> + (f) Ep
ODO) > 2 3 z f *< on o 3 -
M I" S. ® §.a>
o3oZJ03GO
215
Loch of
Tingwall. North 1993

4.3J.3 .4 South Basin, 1992
Total phytoplankton count in 1992 in Tingwall South Basin ranged from 4760 PU mL*
1 in June down to 777 PU mL' 1 in August. Variations in numbers of the main
phytoplankton taxa in Loch of Tingwall South Basin are described below. In addition,
variations in the numbers of the most abundant taxa observed in 1992 are included
in Figure 4.12.
4.33.3.4.1 Chrysophytes, cryptophytes and diatoms
As occurred in the North Basin, the dominant phytoplankton in the South Basin were
chrysoflagellates. A maximum number of 3973 PU mL* 1 was detected in June, the
minimum of 99 PU mL* 1 occurring in August. Dinobryon was present in the May
sample only, totalling 153 PU mL*1. Though generally sparse or absent, Diceras
totalled 17 PU mL* 1 during May, 1992. Melosira and Synedra were present in the
algal assemblage during March only, reaching concentrations of 281 PU mL* 1 and 62
PU mL* 1 respectively. Peak numbers of centric diatoms (187 PU mL*1) and
Asterionella (344 PU mL*1) also occurred at this time, though in contrast, these algae
reappeared in the October sample. The Cryptophyceae were persistent in the
phytoplankton community throughout the 1992 study period. Rhodomonas
concentration was greatest in August (403 PU mL*1), when phytoplankton numbers
were generally depressed, though cyanophyte numbers were elevated. It was lowest
in March (281 PU mL'1) when diatoms, dinoflagellates and green algae were at their
greatest density. Cryptomonas concentration ranged from 102 PU mL* 1 in May to 300
PU mL* 1 during June.
4.3.3.3.4.2 Dinoflagellates
The numbers of the Dinophyceae increased in Loch of Tingwall, South Basin, in
1992. Peak abundance was concurrent with that of the Bacillariophyceae in March.
Peridinium concentration was 156 PU mL*1, Gymnodinium 31 PU mL*1. Lowest
numbers occurred in October when neither genus was detectable.
4.3.3.3.4.3 Green and blue-green algae
Cyanophytes were mainly represented by Aphanothece, which ranged in abundance
from below detection from March to June, to 120 PU mL' 1 in August. Chroococcus
accounted for 7 PU mL* 1 in October.
216

22.03.92 13.05.92
19.06.92 22.08.92
08.10.92
Sampling date
Figure 4.12 Changes in numbers of the main phytoplankton taxa in Loch ofTingwall, South Basin, during the 1992 sampling season(composite sample, n=3)
Algal count (PU mL'1)
ooo
roooo
coooo
4*.ooo
OCD 3 * =3 O Qlo §Q . O
= T ;5 ' GO O
ZJCD<Q
CD
GOGO
217
Loch of
Tingwall. South 1992

Monoraphidium was not found in any of the samples from 1992, the dominant green
genus being Koliella. Koliella (2) achieved greatest density simultaneously with
diatoms during March (156 PU mL'1) and lowest numbers in June and August when
it was undetectable.
4»3.3.3.5 South Basin, 1993
In 1993 total phytoplankton abundance rose from 2041 PU mL' 1 in March to 7590 PU
mL' 1 in July, minimum number occurring in October at a density of 636 PU mL'1.
Variations in numbers of the main phytoplankton taxa in Loch of Tingwall South
Basin are described below. In addition, variations in the numbers of the most
abundant taxa observed in 1993 are included in Figure 4.13.
4.3.3.3.5.1 Chrysophytes, cryptophytes and diatoms
Chrysoflagellates once again accounted for a great proportion of this total, maximum
number of these algae occurring simultaneously with peak phytoplankton abundance.
Dinobryon was found in May only, at a concentration of 156 PU mL'1. Diceras was
again found in the May sample in 1993, numbers totalling 31 PU mL'1. As in 1992,
diatoms, green algae and dinoflagellates were at their most important in March.
Melosira, Asterionella, Cyclotella, centric diatoms, Synedra and Fragilaria were all
constituents of the phytoplankton community at this time. Asterionella was dominant
(521 PU mL1) followed by Synedra (187 PU mL'1) and Melosira (125 PU mL*1).
4.3.3.3.5.2 Dinoflagellates
Gymnodinium and Peridinium were both present at a concentration of 83 PU mL1,
although only Gymnodinium was located in any other sample. In July its density was
31 PU mL1. During 1993 Ceratium became sufficiently abundant to allow counting.
In October this dinoflagellate was present at 7 PU mL1.
4.3.3.3.5.3 Green and blue-green algae
In common with the 1992 algal assemblages, cyanobacteria were represented by
Aphanothece, which reached maximum count in October of 42 PU mL'1, although it
had been absent in the July sample.
218
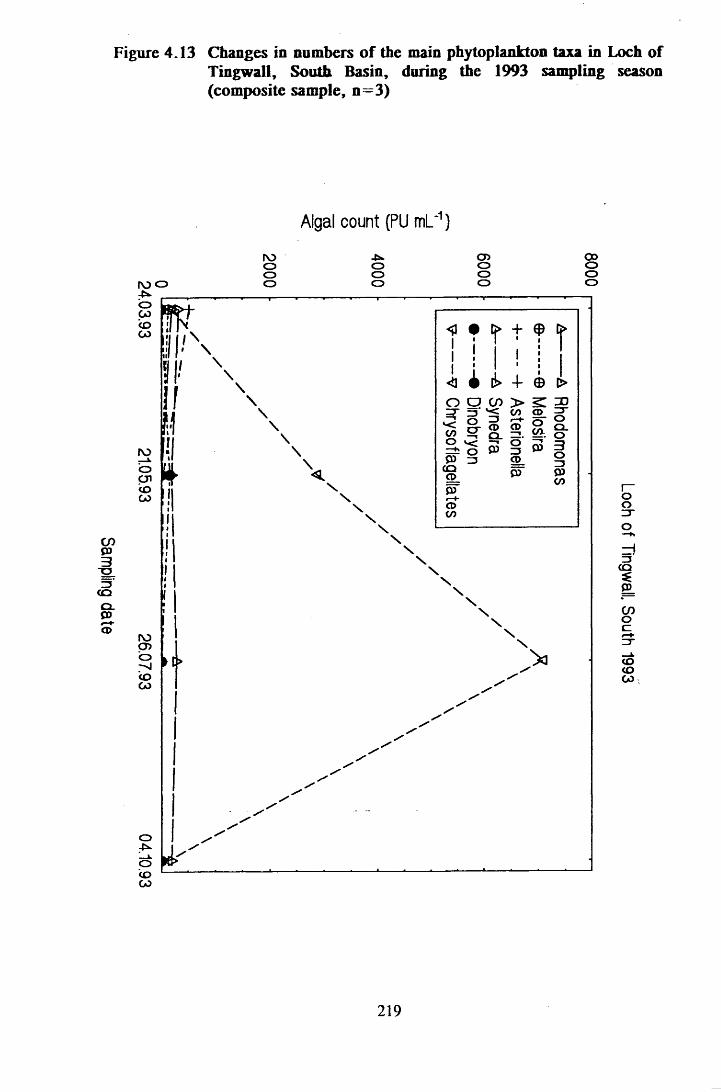
Sampling date
Figure 4.13 Changes in numbers of the main phytoplankton taxa in Loch ofTingwall, South Basin, during the 1993 sampling season(composite sample, n=3)
Algal count (PU mL’1}
roococoCO
rooooooo
o>ooo
c oooo
rooCJICDGO
roCT)OCDCO
o
OCD0 0
%
!
\
>[>
\\
\\
\\
\\
\\
\ \\
\
III
II
ooco>7 5 < w
!> + ( £ >
o w o-o *<Z ± o 03 Z3 CQ=03r+oC/5
CD CD
? f=03
CD
° Q . O03
03CO
\\ \
\\
\\
\\
\ \
219
Loch of
Tingwall South
1993

The green alga observed to be most abundant was Koliella. Koliella (2) was present
in March, May and October at densities of 42 PU mL*1, 62 PU mL' 1 and 7 PU mL' 1
respectively. Monoraphidium and Scenedesmus each numbered 21 PU mL' 1 in the
March phytoplankton sample, though only the latter was observeded subsequently,
exhibiting a concentration of 7 PU mL* 1 the following October.
4.3.3.4 Sandy Loch
4.3 .34.1 1991
In 1991, maximum number of phytoplankton units (PU) was found in a sample taken
on 25/05/91. The count recorded for this water sample was 3163 PU mL*1. The
minimum tally for a Sandy Loch sample in 1991 was 685 PU mL'1, noted for
12/07/91. Number of PU mL' 1 increased then in the following samples from 15/08/91
and 08/09/91. Changes in numbers of the main phytoplankton taxa in Sandy Loch are
described below. In addition, variations in the abundance of the most numerically
important taxa observed in 1991 are included in Figure 4.14.
4.3.3.4.1.1 Chrysophytes, cryptophytes and diatoms
Chrysoflagellate numbers were greatest in the 29/05/91 sample at 234 PU mL*1, but
decreased from May to the minimum recorded count in September of 8 6 PU mL*1.
Maximum numbers of Rhodomonas (246 PU mL'1) were noted in July when green
and chrysoflagellate numbers had decreased. A second peak of this alga occurred in
September (234 PU mL*1). Cryptomonas numbers followed the same pattern, but were
much less abundant. Diatoms were most abundant in the 08/09/91 sample. Melosira,
Asterionella and Cyclotella numbers were observed as 78 PU mL*1, 39 PU mL' 1 and
47 PU mL*1, respectively.
4.3.3.4.1.2 Green and blue-green algae
In May, the phytoplankton assemblage was dominated by green algae. Most numerous
was Monoraphidium (2) with 1335 PU mL*1. There were also 141 PU mL* 1 of
Koliella (2). This alga did not represent a large proportion of the total count in the
remaining samples in 1991. Monoraphidium (2) exhibited its lowest abundance in the
12/07/91 sample (53 PU mL*1). Numbers increased from 12/07/91 to 08/09/91, when
Monoraphidium (2) numbers reached 187 PU mL*1. Blue-green algae were most
abundant in the 08/09/91 sample, which incorporated 141 PU mL' 1 Gomphosphaeria
220
and 8 PU mL'1 Anabaena.
4.3.3.4.2 1992
In 1992, two peaks in total phytoplankton abundance were recorded, the first in May,
the second in August. The count of 5719 PU mL' 1 in the sample from 10/05/92 was
the greatest recorded for Sandy Loch during this study, the second peak in 1992
reaching only 2733 PU mL1. Variations in numbers of the main phytoplankton taxa
in Sandy Loch are described below. In addition, changes in the numbers of the most
abundant taxa observed in 1992 are included in Figure 4.15.
4.3.3.4.2.1 Chrysophytes, cryptophytes and diatoms
Greatest diatom numbers were found in a sample from 21/03/92, when Melosira was
present at 344 PU mL'1. Melosira became depleted and by 10/05/92, diatom
dominance had passed to Cyclotella (97 PU m L1) and Asterionella (32 PU mL'1).
Rhodomonas (1260 PU mL*1) also reached maximum abundance in the 10/05/92
sample, after Melosira numbers had been depleted. In contrast to Rhodomonas,
Cryptomonas did not show peak abundance (141 PU mL'1) in the samples until
23/06/92 and maximum chrysoflagellate abundance (364 PU mL*1) occurred in
August. Melosira and Cyclotella which had been undetectable in the 23/06/92 sample,
accounted for 156 PU mL' 1 and 78 PU mL' 1 respectively in the August sample. By
October, the majority of diatom biomass was to be found as Asterionella, numbers
accounting for 196 PU mL1. At this time chrysoflagellate and Rhodomonas numbers
were at their lowest and total phytoplankton count was the lowest of all Sandy Loch
samples in the study.
4.3.3.4.2.2 Green and blue-green algae
Monoraphidium (2) (3490 PU mL'1) and Koliella (2) (258 PU mL1) both reached
maximum abundance in the 10/05/92 sample, after Melosira numbers had been
depleted. Monoraphidium numbers were also elevated in August (937 PU mL'1), when
chrysoflagellates were abundant. Also concurrent with the peak chrysoflagellate
numbers was the Anabaena bloom (521 PU mL*1). Anabaena remained in the
phytoplankton after the bloom declined, abundance falling to 13 PU mL 1 in October.
221

Sampling date
Figure 4.14 Changes in numbers of the main phytoplankton taxa in SandyLoch during summer, 1991 (composite sample, n= 8)
Algal count (PU mL“1)
rooocnto
cjiooooo
CJIoo
T
\
11 fVIIIItlI/II II
I I I I II II I II I
/ //
/
/ / /
I I //
/
/
rooto
■
H T l t +
CJIoooto
\ / 1 I\ l \i s
I I: /\ \ i• / \ : 1: / \ j /■ / \:*
o00Ototo
\l/rA
- f t1
/\lt tl\: \ i
; VI I*w \
l\r
, i \i * * i *
T
o ^ o 0 0 2 " 3■o o 0 0
o -g a“ Td>
a < g0) c =
0 ^CD vP ^ O -O Q . C/5 r + /- j
1 i § §
05
CD05‘
05r +CDCO
CO CO
222
Sandy Loch
1991

Sampling date
Figure 4.15 Changes in numbers of the main phytoplankton taxa in SandyLoch during the 1992 sampling season (composite sample, n=3)
Algal count (PU mL'1)
ro
ooo
roooo
COoooooo
ocoCOro
oo
rocoCDCD<oro
> ^ 7 OZ3 o o03 =D =T
£ * 3 O ^^ no ^ 03
i t
a> oQ_o
COoOt>COIO
ZJCO
CDCO
223
Sandy Loch
1992

4.3.3.4.3 1993
In the three year study of Sandy Loch, maximum annual number of units was always
recorded in May. In 1993, phytoplankton numbers were consistent through the
sampling programme, ranging from 1218 PU mL* 1 in the October sample to 1874 PU
mL* 1 in the May sample. Variations in the numbers of the main phytoplankton taxa
in Sandy Loch are described below. In addition, changes in the numbers of the most
commonly observed taxa in 1993 are included in Figure 4.16.
4.3.3.4.3.1 Chrysophytes, cryptophytes and diatoms
Highest number of units recorded for a single alga was 776 PU mL* 1 for Melosira in
the sample from 03/93. Melosira concentration in the water column in May was not
sufficient for abundance to be estimated, though a peak occurred in July (172 PU mL*
!). Asterionella concentration rose continually from < 1 PU mL* 1 in March, to 187
PU mL' 1 in October. Chrysoflagellate numbers peaked in May (312 PU mL*1), with
a second, lesser peak occurring in October (117 PU mL'1). Rhodomonas numbers rose
from 27 PU mL* 1 in March to 750 PU mL' 1 during May, before declining to 398 PU
mL* 1 in October, whereas Cryptomonas peaked in July (187 PU mL*1).
4.3.3.4.3.2 Green and blue-green algae
Monoraphidium abundance remained consistently elevated, ranging from 203 PU mL* 1
(07/93) to 422 PU mL' 1 (05/93). Conversely, Koliella showed its greatest numbers
in March, declining thereafter. Anabaena was not observed in any of the
phytoplankton samples taken during 1993.
4.3.3.5 Turdale Water
4.3.3.5.1 1991
The greatest total count for phytoplankton samples in 1991 was 2628 PU mL*1, in a
sample taken in September. In the August sample, phytoplankton concentration was
at its lowest (1033 PU mL'1). Changes in the abundance of the main phytoplankton
taxa in Turdale Water during 1991 are described below. In addition, variations in the
numbers of the most commonly observed taxa are included in Figure 4.17.
224

Sampling date
Figure 4.16 Changes in numbers o f the main phytoplankton taxa in SandyLoch during the 1993 sampling season (composite sample, n=3)
Algal count (PU mL'1)
ro -P*- cd ooo o o o
|\3 O O O O O
rooCOco
CD ^
° Q_
OCOC L
COCOo > +COCO -----
225
Sandy Loch
1993

Sampling
date
Figure 4.17 Changes in numbers of the main phytoplankton groups in TurdaleWater during summer, 1991 (composite sample, n=3)
Algal count (PU m l/1)
GOOOCJICO
-p*.oo
CJIo"NlCO
oOOCO
'• V• X
> \" \1 ' \
l U *\ N . // \ / " "
/ X /1 / V* / '
''K ¥
/
\ '■ x
\ '
A
/
/
/
IV)CJIoCOCO
\ /V
/ \
\ ' V.\ / '
V
s V
/ \
/ \
00oo
T 1 1 t ■ T +
I I□ < 4 i > +> > I O H 3 3 3 O j ^05 7C Z3 J CT Oc r < o ^ ® 9 -03 0 0 ^ 0 0 05 O Q5 31303 03 & §
o;<g 3sn = CO3 £
CDCO
•+
rooo
226
Turdale W
ater 1991

4.3.3.5.1.1 Chrysophytes, cryptophytes and diatoms
ChrysoflageUates were found in only one sample (14/08/91), at a concentration of 196
PU mL'1. Dinobryon was observed in the 30/05/91 sample only (26 PU mL*1).
Diatom flora was comprised of Melosira, Asterionella, Synedra, Fragilaria, centric
diatoms and Tabellaria. Bacillariophyceae decreased in number from May (42 PU
mL'1) to August (9 PU mL'1), but peak count of 184 PU mL' 1 was observed in the
September sample. Tabellaria accounted for 69 PU mL' 1 of this total. Cryptophytes
were most numerous in the September sample. Cryptomonas decreased from 18 PU
mL' 1 to 3 PU mL' 1 in the samples from 30/05/91 to 14/08/91 respectively. Maximum
count was 69 PU mL'1. Rhodomonas was undetectable in the samples from May and
August, but increased to 79 PU mL' 1 in July and 1028 PU mL' 1 during September.
4.3.3.5.1.2 Green and blue-green algae
Anabaena was present in abundance in May (654 PU mL1), decreased in August (9
PU m L 1), before numbers rose again to 640 PU mL 1 in September. Green algae in
the algal assemblages were mostly dominated by Monoraphidium (2), which was
undetectable during July, but maximum count was 703 PU mL* 1 (14/08/91). This peak
was concurrent with that of the chrysoflagellates. Also present in the phytoplankton
were Ankyra, Shroederia and Scenedesmus. Generally, numbers of these algae were
undetectable with the exception of one or two peak counts. Shroederia abundance was
greatest (18 PU mL1) in May and August, Ankyra in July (233 PU mL*1) and
Scenedesmus (46 PU mL*1) in September.
4.3.3.5.2 1992
The maximum algal count in 1992 was 15602 PU mL 1 and was observed in May.
Lowest total phytoplankton count (1101 PU mL*1) occurred in March. Changes in the
abundance of the main phytoplankton taxa in Turdale Water during 1992 are
described below. In addition, variations in the numbers of the most commonly
observed taxa are included in Figure 4.18.
4.3.3.5.2.1 Chrysophytes, cryptophytes and diatoms
Only chrysoflagellates remained in the phytoplankton throughout 1992 sampling
period. Lowest recorded number was 47 PU m L1, concurrent with peak abundance
of Anabaena.
227

18.03.92 12.05.92
18.06.92 21.08.92
09.10.92
Sampling
date
Figure 4.18 Changes in numbers of the main phytoplankton taxa in TurdaleWater during the 1992 sampling season (composite sample, n=3)
Algal count (PU mL"1)
ooo
roooo
cooooooo
-IM P•l . K
o=3Q_
CDCOCDO
=3
CDCO
CO
O C JIOOOOOoo
Algal count (PU mL"1)
228
Turdale W
ater 1992
However, in June, the maximum chrysoflagellate concentration of 803 PU mL* 1
dominated the phytoplankton assemblage. Dinobryon was, however, absent from all
water samples. Diatoms were most abundant in June, Asterionella and Tabellaria
accounting for 201 PU mL' 1 and 134 PU mL' 1 respectively. However, no diatoms
were observed in May or August samples. Asterionella was also absent from the
October sample. Centric diatoms were present in March and October only.
Rhodomonas declined in numbers from 211 PU mL* 1 in March to undetectable levels
in June. Greatest abundance, totaling 3044 PU mL*1, occurred in August, with the
count remaining relatively high in October (683 PU mL*1). Cryptomonas numbers
increased from below detection in earlier samples to 33 PU mL* 1 and 59 PU mL' 1 in
August and October respectively.
4.3.3.5.2.2 Green and blue-green algae
Anabaena was most abundant in May (15133 PU mL*1), accounting for the majority
of the phytoplankton present when total algal count was at its highest. The number
of cyanobacteria then decreased to an undetectable level in September. Of the green
algae observed, Koliella (2) exhibited the greatest numbers. Although absent in
March, May and October, 669 PU mL* 1 were counted in the June sample. Maximum
Chlamydomonas concentration was also in this sample (134 PU mL'1). In other
samples this alga was not observed. However, unicellular green flagellates were
present at a concentration of 94 PU mL* 1 in the sample (12/05/92) containing
maximum density of Anabaena. Ankyra and Monoraphidium were absent or present
below detection levels in all samples except those of 18/03/92 and 09/10/92, where
they reached 23 PU mL* 1 and 98 PU mL*1. Scenedesmus was not observed in samples
from May or August, but occurred in the three other samples, with a maximum
density of 100 PU mL' 1 in June.
4.3.3.S.3 1993
In 1993, maximum phytoplankton density of 4490 PU mL* 1 was observed in a sample
taken in March. Algal numbers then decreased during the season to 751 PU mL' 1 in
the October sample. Changes in the numbers of the main phytoplankton taxa in
Turdale Water during 1993 are described below. In addition, variations in the
abundances of the most commonly observed taxa are included in Figure 4.19.
229

Figure 4.19 Changes in numbers of the main phytoplankton taxa in TurdaleWater during the 1993 sampling season (composite sample, n=3)
Algal count (PU mL'1}
COo)
CQCL039 tCD
roooo
COooo
>3
< 0 # D> + $ %
I4]) > C/3 O — I 5z j o o = r 03JD CD ~ O ' 5 o~ p ^ CD Q -8 a - ® I f §
I s !$= S)03r+CDCO
, o
c=CO
230
Turdale W
ater 1993

4.33.5.3.1 Chrysophytes, cryptophytes and diatoms
Chrysoflagellates accounted for the greatest number of phytoplankton units in the
March sample. However, from 508 PU mL* 1 in March, these algae decreased to
undetectable levels in May. Peak density was recorded as 1692 PU mL'1, during July.
In addition, Dinobryon, which was absent from the plankton in March, May and
October, comprised 52 PU mL* 1 in July. Highest diatom numbers occurred during
March, totalling 468 PU mL*1. Tabellaria was again the most abundant at a density
of 234 PU mL*1. Cryptophyceae were present in all samples in 1993. Maximum
density of Rhodomonas was 234 PU mL' 1 in March, but this alga was undetectable
in July. Cryptomonas minimum concentration was 39 PU mL'1, occurring
concurrently with the Rhodomonas peak in March. Maximum abundance of 104 PU
mL*1 was found in the July sample.
4.33.5.3.2 Dinoflagellates
In 1993, assemblages were different from 1991 and 1992 in that dinoflagellates
appeared in the plankton in March and July. Peridimum was present at 156 PU mL' 1
during March and 52 PU mL' 1 in July, whereas Gymnodinium concentration was 39
PU mL' 1 in March and 104 PU mL* 1 in July.
4.33.5.3.3 Green and blue-green algae
Anabaena concentration in March was 351 PU mL*1, but by May had risen to 2811
PU mL'1. Thereafter, Anabaena though present, was not found in the count. The most
commonly occurring Chlorophyceae in 1993 were Monoraphidium, Scenedesmus,
Koliella, Schroederia, unicellular green algae and Micractinium. Monoraphidium
numbers fell from 39 PU mL* 1 during March to undetectable levels in May. The total
then increased to 167 PU mL' 1 in October. Similarly, Scenedesmus count decreased
from 195 PU mL* 1 during March to a density of < 1 PU mL' 1 in May, before
increasing to 78 PU mL* 1 in July. The other green algae exhibited one or two peaks
over the four samples, but were otherwise absent from the phytoplankton. Greatest
abundance observed was 467 PU mL* 1 for Koliella during March.
231

4.4 DISCUSSION
4.4.1 Disadvantages of algological techniques used in examination of loch
phytoplankton assemblages
Although Lugol’s iodine stains, preserves and facilitates sedimentation of
phytoplankton, treatment of samples with this solution has disadvantages. Species
which have gas vacuoles may shrink because of the collapse of these structures and
fragmentation of large colonies such as those of Microcystis, or long filaments of, for
example, Anabaena may occur. As a consequence, overestimates of numbers of
colonies or filaments are possible, but also underestimates of sizes of aggregations
and of individual cells. In addition, misidentification could potentially occur due to
distortion of cells. For example, when considering the Bacillariophyceae, the form
of Asterionella may change (Bailey-Watts, pers. comm. 1988) and fragile green
phytoplankton (Beveridge, 1985) or Chrysophyceae, such as Uroglena (Margalef,
1969), may be damaged.
Owing to difficulties encountered, particularly because of the small size of many of
the phytoplankton, it was necessary in certain cases to assign individuals to a category
rather than to a genus e.g. small centric diatoms and unicellular green algae.
Members of the Chrysophyceae i.e. Ochromonas, Chromulina and occasionally
Chrysochromulina or Dinobryon cells outwith the lorica were all counted as
chrysoflagellates. Despite a magnification of x400, features such as presence of one
(Chromulina) or two flagellae (iOchromonas, Chrysochromulina), or a haptonema
(Chrysochromulina), remained indistinguishable. Chrysophytes have been noted
previously as being taxonomically "difficult’’ (Brook, 1994). Problems were also
encountered with algae of similar genera, such as Ankistrodesmus, Monoraphidium
and Selenastrum. Monoraphidium (1) resembled Ankistrodesmus whilst
Monoraphidium (2) may have been M. contortum. Selenastrum resembled species of
Ankistrodesmus and Monoraphidium. Koliella (2) denoted a more elongate cell than
Koliella (1), which may have been a younger form of Koliella (2), prior to
elongation.
Counting units rather than individual phytoplankton cells was necessary because of
the difficulties involved in enumeration of cells in colonies. However, this means that
filamentous algae, such as Anabaena, or colonial phytoplankton, such as
232

Aphanothece, are under-estimated relative to single celled units, such as Rhodomonas.
Inconsistencies may also occur where number of cells per unit varies, depending on
environmental conditions. For example, one colony or one or two cells of
Gomphosphaeria could be reported as one unit.
Although chi a and total algal counts were found to be related to the CCA Axes,
these parameters were not causative factors in phytoplankton community structure;
rather they occurred as a result of algal growth (Table 4.3). The gradients of these
two variables were in different directions, thus indicating that these parameters were
heterogeneous. It is suggested that this occurred because units were enumerated, not
cells. Therefore, in cases of high algal biomass, where colonial algae were dominant,
total count was not necessarly high. Conversely, when phytoplankton productivity was
low or moderate, single cell algae might account for much of the biomass and total
count could be high. Despite differences in chi a content between algal taxa and
depending on cell condition, it was concluded that chi a was a more effective estimate
of algal productivity. Had total number of cells been counted, greater similarity would
have been expected between count and chi a.
4.4.2 Interpretation of the CCA results
The ratio of the sum of unconstrained eigenvalues and the sum of canonical
eigenvalues was relatively high (Table 4.2). A high ratio such as this indicates that
a high proportion of variation between species was attributable to the environmental
variables used in the analysis. The remaining variation may be related to parameters
not included in the study, or random distribution of phytoplankton in a variety of
water conditions. Since changes in the eigenvalues between the four axes were of low
magnitude (Table 4.2), this indicated that variation in the data could not be attributed
to one or two parameters only, but a complex combination of factors. As points on
the biplots were the sum of positions on many environmental gradients, descriptions -
of positions of samples or phytoplankton scores on the biplots in terms of chemical
concentration gradients are only general trends, with some environmental parameters
having more impact than others. For example, as the variables TP and TAN were
closely linked to the Axes, points were often placed with reference to these
parameters foremost, although other factors such as TON and water hardness
remained important. CCA diagrams were used as an illustrative tool, as intraset
correlations of environmental variables with Axes were indicative of trends in
environmental data only (Figures 4.1a&b and 4.2a&b). The significance of the /-
values was presumptive, as intraset correlations and canonical coefficients have
greater variance than associated with normal correlations and therefore a Student /-test
is inadequate in assessing the importance of the environmental variables (Ter Braak,
1988). However, weight was also given to the /-values which were more than 2.1.
Values of < 2.1 are characteristic of variables which do not alone account for a
consequential effect on the plant community (Ter Braak, 1988).
4.4.3 Phytoplankton occurrence in relation to environmental factors
Lochs which had been reported to have blooms or algal scums, either prior to or
during the present study, had at least one sample which lay within the area of the
biplot described as having increased concentrations of TP, TAN and chi a , but low
TON concentrations (Figures 4.2a&b). These lochs were Turdale Water, Loch of
Brough (Yell), Bu Water, Punds Water and Sandy Loch. (Localised phytoplankton
scums observed near to the shore in Loch of Brough (Yell) and Bu Water during 1991
were constituted mainly of Anabaena.) Strand Loch did not appear to be of this
group, but this water body is susceptible to sudden changes depending on relative
contributions of freshwater and sea water to its volume. It is possible that the other
lochs which had samples located in this assemblage i.e. Gossa Water, Loch of
Snarravoe, Loch of Cliff and Loch of Brow did not develop algal blooms because a
higher proportion of the TP present in the water columns of these lochs was in a less
available form than in lochs which exhibited blooms or scums. In lochs with elevated
levels of Ca or Mg, a high proportion of P may be bound to these divalent cations.
Loch of Brow had elevated levels of Ca and Mg, Lochs of Snarravoe and Cliff each
had relatively high water column concentrations of Mg, whilst Gossa had slightly
higher levels of Mg in the water column than the waters of low cation concentrations
(Chapter 2). In addition, Turdale, Punds and Bu Water, Sandy Loch and Loch
Brough (Yell) were found to change position considerably on the TON gradient, but
not on the TP or TAN rankings. It is possible that this was an important infiiencing
factor in bloom formation. This did not occur with either Loch of Snarravoe or Loch
of Cliff, but was the case with Gossa Water and Loch of Brow. Gossa Water may
therefore be at risk of developing Anabaena blooms in future.
234

Lochs which remained located at low to intermediate levels in all three of the the TP,
TAN and TON rankings, such as Loch of Ustaness, Arthur’s Loch and Helliers
Water are unlikely to promote excessive phytoplankton biomass, assuming either all
three parameters remain low, so that P and N both limit growth, or TON increases
i.e. water chemistry becoming more like P limited lochs on the left of the biplot
(Figures 4.2a&b). However, should P increase in these waters, firstly Aphanothece
and Oscillatoria might be favoured and with further increasing P supply, growth of
Anabaena could become a problem.
The area of the biplot associated with low nutrient levels was also linked to elevated
Ca, Mg and chi a concentrations. Low P availability in a number of these lochs may
be linked to relatively high concentrations of divalent cations in the water and
probably also in the sediment, with P binding together with Ca and Mg. Since
elevated chi a levels were also linked, it is suggested that inorganic N compounds
were present in low concentrations as they were incorporated into the phytoplankton,
i.e. nutrients were assimilated as they became available. Blue-green algae in this
sector of the biplot may have been influenced by the increased pH and hence the
increased proportion of C present in the water column as bicarbonate.
Lochs which had samples positioned in the biplot area linked with high TON, low
TAN and low TP, such as Loch of Kettlester, Skutes and Roer Water, are unlikely
to promote high phytoplankton biomass in their present state (Figure 4.2a&b).
However, should P concentration increase within the water column, it is possible that
algae such as Gomphosphaeria may become a nuisance, it being associated with
higher TON concentrations. Further P enrichment might then shift water column
conditions to high TP and low TON concentrations, as TON would be utilised in
primary production once P was no longer limiting growth of the algal population.
4.4.4 Physical, chemical and biological effects on phytoplankton
populations and biomass
4.4.4 . 1 Specific growth requirements
Since the commencement of this work, Sandy Loch, the Lerwick water supply, has
exhibited excessive growth of cyanobacteria. A bloom was found in August, 1992
(although algal numbers appeared relatively low, owing to the enumeration of units
235

rather than cells) (Figure 4.15). Phytoplankton in the samples were mostly Anabaena.
Oscillatoria and Coelosphaerium were also present. By October, 1992, dominance
had shifted to Gomphosphaeria species, although Anabaena remained relatively
common (Figure 4.15). Prior to this bloom occurring, an area of catchment had been
fertilised for the purpose of growing fodder crops for sheep. Previous blooms in
Turdale Water and Punds Water were also identified as being mainly Anabaena. The
reasons for blue-green algae, and in particular, Anabaena dominance in certain
Shetland waters rather than cryptomonads or chrysophytes is probably related to the
specific physiological requirements of these algal groups. Increased competedve
ability for one environmental resource may be associated with less efficient harvesting
of another relative to the other phytoplankton groups present (Tilman et al., 1986).
In the present study, cyanobacteria were not successful when TP, TAN and TON
were all at elevated concentrations in combination, whereas certain genera of green
phytoplankton were linked with these conditions, perhaps as a consequence of TON
uptake rates superior to those of other genera.
4.4.4.1.1 Availability of phosphorus to phytoplankton
The growth strategies of green and blue-green algae have been reported to be more
suited to high P levels. At high P levels, cyanophytes are effective in sequestering,
storing and partitioning nutrients into growth, whereas although chrysophytes store
and utilise P for efficient growth, efficacy of uptake is inferior compared to that of
blue-green algae (Sandgren, 1988). Conversely, under P-limiting conditions,
chrysophytes often dominate, only diatoms such as Asterionella and small fast
growing green algae such as Scenedesmus and Chlamydomonas species being capable
of outcompeting them (Sandgren, 1988). However, intermittently higher P
concentrations do not favour diatoms as they cannot store nutrients, unlike e.g.
cyanophytes which have the faculty of luxury nutrient uptake, i.e. the capacity to take
up nutrients in excess of immediate growth requirements at times when external
nutrient supply is high. Dominance therefore passes from diatoms to other algal
groups under these circumstances.
In the present study, chrysoflagellates were most numerous at low to intermediate TP
levels. Asterionella, Chlamydomonas and Scenedesmus were all associated with higher
TP levels. However, of the blue-green algae observed, only Anabaena was found to
236

be particularly highly ranked on the CCA TP gradient, the other cyanobacteria
occupying low to intermediate positions on the TP scale (Table 4.4). This indicates
that a range of growth requirements exist within the cyanobacteria, in terms of P. The
positions of the blue-green algae on the TP gradient are also consistent with the work
of Jensen et al. (1994); in shallow Danish lakes, green algae were observed as fast
growing and capable of outcompeting other phytoplankton at high nutrient levels.
Green algae, rather than cyanobacteria, were associated with high TP concentrations
in the water column (Jensen et al., 1994).
Of the cyanobacteria observed, Oscillatoria was ranked second most highly on the
CCA TP gradient (Table 4.4). Oscillatoria redekei has been found to survive varying
P loadings to a water body due to its polyphosphate kinase activity. It has the ability
to take up polyphosphates during daylight for subsequent utilisation following
degradation in the dark or whilst external P supply is limiting (Hickel, 1988). This
may explain occurrences of high biomass of Oscillatoria in waters of low nutrient
status in the literature. The position of Oscillatoria in the biplot (Figure 4.1a&b), in
the same region as Synedra suggests that phytoplankton in this genus are efficient at
P uptake. From a literature review, Sommer (1988) concluded that of six diatom
species considered, Synedra was most competitive for P. Diatoms in the present study
were associated with intermediate to high TP concentrations in the water column.
Veldhuis et al. (1987) examined the availability of P to Phaeocystis pouchetii
(Haptophyceae) in the North Sea. Alkaline phosphatase activity (APA) was found to
be high in areas where DRP concentration was depleted below 0.02 /xmol.dm' 3 (0.6
fig P L 1). Though supply of P to the algae resulting from this occurred at a variable
rate, uptake rate was comparable to that associated with DRP. In areas where
nutrients were not at limiting levels, enzymatically hydrolysable P was not a
significant P source. This alga is therefore suited to growth conditions of intermittent
P enrichment, being able to capitalise on anthropogenic P inputs, but also to survive
when DRP is at limiting concentrations. Therefore, freshwater members of the Class
Haptophyceae, such as Chrysochromulina, or members of the Class Chrysophyceae
{e.g. of the Orders Ochromonadales and Chromulinales), may also operate this
strategy and dominate in such environments of variable DRP supply. The
Bacillariophyceae are also included in the Chrysophyta and may operate a similar
237
strategy, as experimentation with Cyclotella dominated communities revealed that
APA decreased when P was added to the ambient water (Stewart and Wetzel, 1982).
From a review of the available literature on chrysophyte nutrition, Sandgren (1988)
concludes that during P limitation in alkaline waters, stimulation of significant
alkaline phosphatase activity does not occur in this algal group. However, acid
phosphatases are produced by several species in response to low P concentrations in
acid waters, where they can utilise organophosphates e.g. glycerophosphate or
glucose phosphate (Lehman, 1976). Dominance by chrysophytes would therefore not
be expected in a l k a l i n e waters unless P supply was not limiting. In the present study
chrysoflagellates were the dominant phytoplankton group in a range of waters
including, for example, Loch of Tingwall, which is an alkaline and relatively hard
water body (Chapter 2). In a shallow hypertrophic lake, Hjarbaek Fjord in Denmark,
decline of the spring maximum of small centric diatoms could not be attributed to
nutrient depletion and predation by zooplankton was also an unlikely cause due to
relatively small numbers (Olrik and Nauwerck, 1993). However, cf. Ochromonas was
observed engulfing diatoms and its numbers increased concurrently with diatom
decline (Olrik and Nauwerck, 1993). Sandgren (1988) reported that of those
chrysophytes examined, the majority could actively ingest bacteria and algae.
Exceptions were Mallomonas and Synura. Nutrient requirements of chrysophytes are
therefore not restricted by the availability of simple chemical forms within the water
column, but can be met through phagotrophy. Mallomonas and Synura were noteably
rare or absent in the phytoplankton assemblages observed in the present study,
whereas other chrysoflagellates, including Ochromonas, were widespread in their
occurrence and often present in great numbers. Phagotrophy would explain their
presence in less acid waters of relatively low nutrient status, such as Loch of
Tingwall.
Common species of dinoflagellates form blooms during summer in temperate lakes.
During autumn, when stratification has ended, encystment occurs, with lipid used as
the long term energy source (Pollingher, 1988). Dinoflagellate cysts in sediment can
store P in their cells until resuspension under suitable growth conditions. Although
dinoflagellate nutrient affinities and specific growth rates are relatively low, long
generation time and the ability for luxury uptake of nutrients and motility within the
238
water column mean that these phytoplankton have an advantageous life-strategy in
waters subject to extreme nutrient shortage (Pollingher, 1988). Peridinium from Lake
Kinneret has been reported to grow in culture on ATP, G-6 -P and glycerophosphate
(Serruya and Berman, 1975). These factors explain dinoflagellate presence in waters
associated with low to intermediate TP, TON and TAN concentrations. In terms of
P dynamics within a waterbody, dominance of dinoflagellates allows slowing of P
cycling, as a consequence of the long generation times of these algae.
Cryptophytes sequester P using alkaline phosphatases. This allows them to obtain P
from dissolved humic complexes. However, enzyme activity does not stop when an
additional P source is provided (Stewart and Wetzel, 1982). Phytoplankton such as
Anabaena might therefore obtain a competitive advantage through superior uptake of
introduced P in circumstances where the natural phytoplankton population are adapted
to lower P availability and therefore do not compete for the same P source.
4.4.4.1.2 Phytoplankton strategies for fulfilling nitrogen requirements
Data collected during five years of studies at Lake St. George, Ontario indicated no
correlation between percentage of cyanobacteria and TN:TP ratio. However, at NOj
concentrations of > 100 fig N L*1, blue-green algae were never abundant.
Furthermore, it was found that when NOjrTP > 5:1, cyanophyte blooms were not
seen to occur (McQueen and Lean, 1987). Blue-green algae such as Anabaena and
Aphanizomenon have the ability to grow in low N:P ratio conditions through
heterocystous fixation of atmospheric N. Heterocysts are generally formed in response
to low supplies of combined forms of N such as TAN and TON, through
differentiation of normal vegetative cells (Fay, 1983). In the present study, Anabaena
was associated with high TAN concentrations (Table 4.4), which might indicate
superior uptake of TAN, but not TON. Anabaena is possibly unable to compete for
TON, being in some way inferior in its uptake or utilisation of this resource
compared to, for example, green algae, so making effective uptake of TAN or N
fixation necessary at low TON concentrations. In contrast, Gomphosphaeria,
Coelosphaerium, Merismopedia and Chroococcus were all associated with low TP and
TAN concentrations and increased TON levels (Table 4.4). These algae cannot fix
N. Aphanothece is similar to Microcystis and therefore probably does not fix N. It is
suggested that Aphanothece can grow efficiently at relatively low to intermediate
239

levels of nutrients, or is efficient at nutrient storage. It is possible that cyanobacteria
which are successful at higher TON and lower TAN concentrations may be efficient
in their uptake TON, but not TAN. Some species of Lyngbya and Oscillatoria fix N,
although this occurs within normal vegetative cell structure, rather than within
heterocysts. Both Lyngbya and Oscillatoria were associated with low TON
concentrations, but increasing TP and TAN concentrations.
In summary, as with P, a range of growth strategies exists within the cyanobacteria,
with respect to N uptake, thereby explaining the range of positions of blue-green
algae on the CCA TAN and TON gradients (Figures 4.1a&b).
Til man et al. (1986) state that it is likely that diatoms are inferior to blue-green algae
in terms of competition for N. However, although Anabaena was ranked highly on
the CCA TAN gradient, small centric diatoms were at the top of this scale.
Chrysophytes require a relatively high ratio of N:P, higher biomass occurring in lakes
with a TN:TP ratio between 30:1 and 60:1 (Sandgren, 1988). Nevertheless,
dominance by chrysophytes could occur in waters with low concentrations of TAN
and TON if available P concentration is extremely low, i.e. TON levels would be
high relative to P concentrtions. This would explain the occurrence of
chrysoflagellates in the present study at low to intermediate TP, TAN and TON
concentrations.
Chrysophytes can use either TAN or TON as their N source, though this may be
species dependent (Lehman, 1976). Ochromonas can utilise amino acids, urea and
secrete urease (Lui and Roels, 1970). Since chrysoflagellates can engulf other algae,
this ensures an N source, even under low water N concentrations. This explains
dominance by this phytoplankton group in many of the lochs in the present study
which exhibited low water concentrations of inorganic N. In contrast, Viera and
Klaveness (1986; in Klaveness, 1988) found cryptophyte Cryptomonas <f.
tetrapyrenoidosa to have poor versatility in use of organic N sources in comparison
to four other phytoplankton species examined. As a consequence this alga is
presumably reliant upon inorganic N sources and would not be numerous if these
were in short supply. Cryptophytes in the present study tended to exhibit peak
abundances at times which did not coincide with greatest total algal counts, thereby
240
suggesting their growth was possible when other phytoplankton peaks collapsed
because they could take advantage of the newly available nutrients.
Dinoflagellates in Shetland lochs were associated with lower concentrations of TP,
TAN and TON. Slow growth rate of larger dinoflagellates and their association with
nutrient-depleted waters is indicative of a K-selection strategy (Reynolds, 1984b).
According to Reynolds (1984a) the preferred source of water N for phytoplankton
uptake is TAN rather than TON. However, in monomictic Lake Kinneret in Israel,
it was found that when water NH4 + concentration was low (< 1 /xg-at N L'1) and
levels of N03' were high, phytoplankton sequestered N from NOj' (Berman et al.,
1984). This occurred during the annual dinoflagellate bloom (February to May),
perhaps indicating that dinoflagellates are more suited to conditions of low TAN than
other algal groups. Nitrate reductase activity was found between March and May in
Peridiniwn cinctum (Berman et al., 1984), indicating that other groups may be
outcompeted by dinoflagellates when TAN concentration is low. In culture, Ceratium
hirundinella has been found to prefer NaN03 and urea to TAN or TON (Pollingher,
1988). It is likely that assimilation of N from TON or organic N sources by
dinoflagellates will be followed by eventual availability of TAN in the water column
through excretion, death and decay processes. A different phytoplankton group might
then be expected to dominate. However, it is possible that a group such as the
dinoflagellates which use nitrate reductase activity could dominate in low N
environments, rather than nitrogen fixing cyanophytes, provided an adequate N
substrate was present.
4.4.4.1.3 Other chemical determinands of phytoplankton growth
When there are no chemical restraints, in terms of N and P availability, then the
ability of an alga to take up other elements may become important in determining
species dominance. Si is of particular importance to diatoms and certain chrysophytes.
Sommer (1988) considers that only Si limitation prevents diatoms from outcompeting
blue-green or green algae in P limiting situations. However, measurement of Si was
not undertaken in the present study.
Chrysophytes may be common in dystrophic lochs because the high organic content
of the water results in complexation of Fe, which is a particularly important limiting
241

trace element for chrysophytes. Chelation of Fe in the water results in its increased
availability to phytoplankton which cannot sequester it in ionic form. In contrast,
Anabaena can exist in water regardless of its chelated Fe status, as Anabaena has the
ability to use its own extracellular chelators. Low oxygen conditions are tolerated by
prokaryotic phytoplankton and perhaps preferred (Fay, 1983). Nitrogen fixation
requires oxygen exclusion from heterocysts and this is more easily attained should
extracellular conditions be low in oxygen. In contrast, because of the oxygen
consuming activities associated with cell division, dinoflagellates have a preference
for well-oxygenated conditions in the water column (Pollingher, 1988). As Shetland
waters were well-oxygenated low oxygen concentrations were not prerequisites for
excessive algal growth in the present study.
The most common bloom-forming armoured dinoflagellates, Ceratium, Peridinium,
and Peridiniopsis have a preference for hard water, with a high calcium concentration
(Pollingher, 1988). Dinoflagellates in Shetland lochs were found to be ranked at
intermediate to high pH, Ca and Mg concentrations on the CCA scales (Table 4.5).
Dinoflagellates exhibit a wide pH tolerance range, although growth decreases at pH
< 6 and species may be extremely particular in their specific requirements
(Pollingher, 1988). Highest numbers and growth rates have been recorded at pH >
8 (Lindstrom, 1984). This is consistent with dinoflagellates in the present study being
located at intermediate to high positions on the CCA pH gradient (Table 4.5).
Preference of higher pH values in cyanobacteria is well documented (Shapiro, 1990).
However, this may be related to the effects of pH on the form of dissolved inorganic
C present in the water column (Chapter 1), rather than as a direct result of H+
concentration. In harder, more alkaline waters, such as those towards the lower
section of the biplot, concentration of free C0 2 may be important in its effect on
cyanophyte positions within the biplot (Figures 4. la&b) According to Shapiro (1990),
blue-green algae have the ability to utilise HC03', so that in alkaline waters, free CO2
limitation favours these algae above diatoms and green algae. Occurrence of
Cylindrospermum, Anabaena, Coelosphaerium, Chroococcus and Aphanothece at
higher pH levels on the CCA pH gradient, may be explained by the pH/CC^
hypothesis. However, as green algae, diatoms and chrysophytes were also represented
in high positions on the pH ranking, this suggests that at least some of the
242

phytoplankton belonging to these groups may either scavenge particularly effectively
for CO* or utilise HC03* in alkaline conditions. In dinoflagellates, specific
photosynthetic carbon uptake is low in comparison with other algae (although low P:C
ratios are required by Peridinium) (Pollingher, 1988). Possibly this low requirement
means that low C0 2 concentrations in alkaline waters are adequate for growth,
without HC03* uptake.
4.4.4.2 Physical influences on phytoplankton dominance
Cyanobacteria may be unable to outcompete eukaryotic plankton, such as diatoms,
despite presence of high nutrient concentrations (Steinberg and Hartmann, 1988).
Nutrient status alone may not account for presence or absence of cyanophyte blooms.
Physical factors, such as the availability of PAR, temperature of the water column
and turbulence within the water column, may all have effects on development of algal
biomass and phytoplankton community structure.
4.4.4.2.1 Light climate of the water column
Availability of light to algal assemblages may effect phytoplankton nutrient uptake.
Phosphate additions to Cyclotella dominated algal assemblages have been found to
depress alkaline phosphatase activity under high or low light conditions (Stewart and
Wetzel, 1982). However, uptake rates for both NH4 ' and N 03' by phytoplankton
populations are affected by light intensity and therefore fluctuate diumally, partly in
response to changing light levels, but also in relation to biomass and the physiological
state of phytoplankton cells and ambient concentrations of N (Berman et al., 1984).
Phytoplankton tolerate a range of light conditions, with certain algal groups showing
adaptations to conditions of low PAR availability. Dinoflagellates prefer a plentiful
light supply and self shading is low in populations of armoured dinoflagellates
(Pollingher, 1988), presumably as a result of the large size of individuals within the
population. However, dinoflagellates may tolerate a range of conditions. For example,
Peridinium can survive in darkness for 7-9 days (Pollingher, 1988). Cryptomonads
are capable of growing in light regimes typical of those found in the dystrophic lochs
of Shetland. However, Anabaena also has this ability as cyanophytes can harvest light
using compounds other than chlorophyll, called phycobiliproteins (Fay, 1983), energy
then passing from these compounds to chlorophyll. Cyanophytes also have their
243

photosynthetic metabolism saturated at relatively low light intensities. Consequently,
although another algal type may grow better at higher light intensities, blue-green
phytoplankton can flourish in lower light and then shade other types.
In dystrophic lakes, water colour alone is possibly sufficient to favour growth of
cyanophytes. Suspension of particulates through turbulence will also limit available
light. Both high water colour and increased turbidity because of wind mixing exist in
the Shetland lochs studied. However, Mill Pond, despite its dark colour supported
Scenedesmus rather than blue-green populations, perhaps because this water body is
so shallow that development of cyanobacterial populations in a deeper, darker layer
is not possible and the green algae have adequate light for growth at the surface of
the water body only.
In situations where water column transparency is high, it remains possible for blue-
green algae to be more successful than other phytoplankton groups. For example,
Oscillatoria agardhii cannot outgrow Scenedesmus protruberans except at low P
concentrations and the maximum growth rate of occurs at lower light intensity than
that of S. protruberans (Mur et al. , 1978). In phytoplankton growth experiments
involving different light levels, O. agardhii dominated at low light intensity, but was
inhibited at high light intensity. However, although S. protruberans grew quickly to
steady state density under higher light levels, the increased S. protruberans population
caused shading within the water column, so allowing efficient growth of O. agardhii.
The volume of water available for growth of S. protruberans then became too small
to support the S. protruberans population (Mur et al.t 1978).
A potential for excessive blue-green growth therefore exists, not only in lochs of low
water clarity, but in water bodies where water column conditions allow sufficient
growth of green algae to inhibit light penetration to a level where cyanophyte
development is possible. This will depend on such factors as nutrient concentrations,
intensity of initial light source, particulate content and colour of the water.
4.4.4.2.2 Water column turbulence
During periods of water column stability, loss rates of dinoflagellates through sinking
processes are low because they can maintain themselves at their preferred depth
244

within the lake. Although turbulence is useful in minimising sinking loss in non-
motile phytoplankton such as diatoms, dinoflagellates find water mixing stressful as
it becomes difficult to maintain position at a particular depth (Pollingher, 1988).
Water column stability is of great importance to cyanophyte dominance. In calm
conditions blue-greens will have an advantage over non motile eukaryotic
phytoplankton e.g. diatoms. Non motile phytoplankton sink if the rate of mixing is
inferior to the rate of phytoplankton descent through the water column (Reynolds,
1973a), but buoyancy regulation occurs in cyanophytes. Gas vacuole formation
ensures that blue-green algae such as Anabaena can maintain themselves at the most
suitable depth in terms of light and nutrients.
Storm events may cause simultaneous mixing and outflow effects, i.e. phytoplankton
may be flushed from the lake system. If stratification has occurred and nutrient
concentration in deeper water is relatively high in comparison to the potentially
nutrient depleted epilimnion, then increased wind velocity can result in these nutrients
becoming available throughout the water column. Phytoplankton with strategies for
survival in low nutrient environments i.e. slow-growing K-selected species can then
be replaced by r-selected species, i.e. small, rapidly growing algal types. If there is
a simultaneous rainfall event accounting for a considerable inflow of water to the
lake, or if precipitation alone occurs, then the dominant algal population in the
epilimnion or surface waters may decrease significantly due to losses through the lake
outflow. Jacobsen and Simonsen (1993) believed losses from the epilimnion through
outflow was the likely cause of a decline in Aphanizomenon biomass following a
summer bloom in Lake Godstrup, Denmark. Although this storm event may not have
resulted in complete destruction of water column stratification and was therefore
followed by re-establishment of the Aphanizomenon population, storms in late August
allowed complete mixing, mechanical stress on the blue-green colonies, increased
nutrients, a nine-fold increase in diversity and dominance by cryptomonads. Lochs
in Shetland stratify weakly and infrequently, or not at all (Chapter 2). However,
disturbance events may prevent the development of the potential biomass of
phytoplankton, result in wash out of algal communities and in the development of
cryptophyte populations. The latter may occur after resuspension of nutrients from
sediment sources, or nutrient availability through decline of the previously developing
phytoplankton assemblage.
245

In sediments, algae with exposed chloroplasts can be viable for many years
(Cronberg, 1982). However, although e.g. Mallomonas eoa (Cronberg, 1982) and
Melosira have the ability to survive on sediment surfaces (Lund, 1954), Asterionella
and Fragilaria do not have such a survival mechanism (Reynolds, 1973a). Aldnete
formation through differentiation of normal vegetative cells in cyanophytes such as
Anabaena means that vegetative spores may lie dormant in sediment for years, even
in anoxic conditions until appropriate conditions prevail. Formation of aldnetes
therefore not only allows overwintering, but also long term survival (Reynolds,
1973a). In shallow lochs such as those in Shetland, akinetes would be frequently
resuspended through wind mixing, thereby allowing advantage to be taken should
increased nutrient loading from the catchment occur.
4.4.4.2.3 Temperature of the water column
Higher water temperatures may allow blue-green algae to become dominant through
either preference of eukaryotic phytoplankton for lower water temperatures or
suitability of greater water temperatures for growth of cyanophytes. Diatoms bloom
in spring, but are then outcompeted by prokaryotes as water temperature increases.
Although formation of a thermocline may maintain a diatom population in an
advantageous position in terms of wind-induced circulation (Reynolds, 1973a),
exponential increase of Microcystis aeruginosa has been associated with onset of
water column stratification and water temperatures over 15°C (Reynolds, 1973b).
Examination of data from Lake St. George, Ontario revealed that blue-green blooms
were never observed when water temperature was < 21 °C (McQueen and Lean,
1987). In the present study, CCA analysis indicated that cyanobacteria were
associated with increased temperatures, with the exception of Gomphosphaeria. This
suggests that mid winter blooms of most blue-greens are unlikely, but
Gomphosphaeria could grow excessively at any time of year. Although many of the
Shetland lochs were found to be low in inorganic N during the summer months of
1991, this may not necessarily be the case during winter. In moderately productive
loch systems, it is possible for TON levels to have a wide range from summer to
winter. During summer, phytoplankton growth and perhaps sediment oxygen demand
account for low TON concentrations in the water column, but after summer growth
has collapsed, TON is again released to the system. As Gomphosphaeria is associated
with lower temperatures and increased TON and TP, a bloom could result.
246

4.4.5 Changes in phytoplankton community structure of the five study
lochs over time
Phytoplankton community structure is influenced throughout the year by successional
changes in dominance along nutrient ratio gradients and as a result of periodicity,
which is caused by physical changes in the environment e.g. differences in light and
temperature (Reynolds, 1984a; 1993). The information on the Shetland study lochs is
not continuous, i.e. the record of succession or periodicity during summers from 1991
to 1993 is incomplete (Figures 4.3-4.19). However, it is useful to compare
information on fluctuations in phytoplankton numbers with that in published literature,
in order to attempt to ascertain whether phytoplankton in Shetland lochs behave
typically for temperate lake systems. The PEG Model of phytoplankton succession
(Sommer et al., 1986) is a standardised sequence of twenty four events in the annual
succession of plankton in standing freshwaters. It states that at the end of winter,
small fast-growing algae become successful. Cryptophytes and small centric diatoms
are likely to be observed at this time. In the five lochs of the present study,
cryptophytes did not reach peak abundance until slightly later in the year (or
succession,i.e. after the enhancement of diatom biomass) and although centric diatoms
were observed, much of the phytoplankton biomass in spring was in the form of
pennate diatoms or filaments of the centric diatom Melosira. However, Turdale and
Helliers Water, Lochs of Gonfirth and Tingwall and Sandy Loch all behaved as
expected from the literature in terms of development of spring diatom increases.
Chrysoflagellate numbers tended to be highest at or near to the same time as the
cryptomonads in the five Shetland lochs studied, with the exception of Turdale Water
which exhibited Anabaena blooms in early summer (May/June)(Figures 4.17-4.19).
In Turdale Water, diatoms and chrysoflagellates were much less important as a
proportion of the phytoplankton community than in other lochs, even in spring.
After the first stage of algal growth, the PEG Model assumes zooplankton
development results in losses of phytoplankton through predation. Consequently, a
decrease in algal biomass occurs, resulting in a "clear-water" period and nutrient
increase within the water column. As Shetland is situated at approximately 60°N,
spring growth occurs later than would be expected further south, so that this sequence
of events is initiated later in the year. It is possible that in the Shetland lochs
surveyed, chrysoflagellates engulf small algae, such as small diatoms and
247

cryptomonads. The chrysoflagellates therefore become abundant in spring or early
summer, so that zooplankton numbers peak later, through feeding on
chrysoflagellates, i.e. there may be an extra step in the food chain. At times when
cryptomonads and chrysoflagellates were abundant, grazing pressure by zooplankton
is not likely to have been great (Bailey-Watts and Duncan, 1981a).
After the initial zooplankton peak, the PEG Model assumes that zooplankton numbers
decrease due to lack of food and fish predation. A diverse phytoplankton assemblage
then develops. Dominance by edible cryptophytes and inedible colonial green algae
occurs first, so removing DRP from the water column. In the Shetland lochs studied,
colonial green algae were never particularly important. However, elongate unicellular
forms were significant in all five lochs. In Sandy Loch, Koliella and Monoraphidium
were most numerous in May, at which time cryptomonads were also numerous, rather
than in summer as suggested by the PEG Model. In Loch of Tingwall, elongate green
forms again were the most important of this group, but summer phytoplankton tended
to be dominated by cryptomonads and chrysoflagellates. The most important green
algae in Loch of Gonfirth (Selenastrum, Monoraphidium and Oocystis) collectively
exhibited highest numbers during August, thereby showing a similarity with the PEG
Model.
In the PEG Model, after dominance of cryptomonads and green algae, grazing
pressure and nutrient limitation then restrict primary production. P competition results
in dominance passing from green algae to diatoms. Summer increases in diatom
numbers were noted in Sandy Loch (Cyclotella, Fragilaria and small centric diatoms)
and Turdale Water (Tabellaria and centric diatoms). Subsequently, decreasing Si
levels allow dinoflagellates or blue-green algae to become dominant within the
phytoplankton assemblage. N-fixing, or effective TAN scavenging cyanobacteria then
become advantaged through decreasing availability of TON. However, in P-limited
lochs such as Gonfirth where there is a supply of inorganic N, it is obviously far less
likely that N-fixing cyanobacteria form a high proportion of the total phytoplankton
biomass. Blue-green algae which were numerically important in Loch of Gonfirth
were Merismopedia and Gomphosphaeria which do not fix N and Aphanothece which,
owing to its similarity to Microcystis is assumed not to be an N-fixer. In addition, the
CCA analysis showed that increased TP is more important than water TON and TAN
248

levels as blue-green algae as a group are suited to both high and low water TON and
TAN concentrations. Lochs low in TP are unlikely to be dominated by cyanobacteria,
although they may be present in the phytoplankton. In Helliers Water, which was low
in TP and inorganic nitrogen, blue-green algae were represented by Aphanothecey
Merismopedia, Gomphosphaeria, Chroococcus and Lyngbya, but none of these were
ever abundant, regardless of time of year (Figures 4.6-4.8 ). The loch in which
dinoflagellates were most important was Helliers Water. In this water body, peak
numbers of Peridimum were found in July 1991, June, 1992 and May, 1993. The
phytoplankton assemblages in this loch therefore were not consistent with the PEG
Model.
In the PEG Model, small zooplankton of lower mortality rates and greater
reproduction rates replace the larger species which are affected more adversely by
fish predation and presence of inedible algae. Diversity of phytoplankton increases
and zooplankton biomass undulates throughout the summer season. At the end of
summer, physical factors of increasing mixing depth and decreasing availability of
light results in decreased phytoplankton biomass, followed by an increased of algae
adapted to these conditions e.g. large unicellular or filamentous forms and diatoms.
These are relatively inedible, but there may also be concurrent development of a
community of more edible small algae. An autumn zooplankton bloom is thus
encouraged. Lack of light finally results in the minimum winter algal concentration
and zooplankton biomass crashes as a result of this in combination with low water
temperature. All five lochs exhibited increases in diatom numbers later in the
sampling seasons i.e. during September or October.
In Loch of Tingwall in 1992 and 1993, of Melosira, Synedra, Asterionetta and small
centric diatoms which were found in the March algal community, only Asterionella
appeared to remain in the phytoplankton assemblage until May. The exception was
in the North Basin in 1993 (Figure 4.11), when Synedra instead was observed in
May. During 1992, dominance amongst the diatoms present in Sandy Loch passed
from Melosira in March to Cyclotella in May (when Asterionella also peaked) to
centric diatoms in June. Melosira was again numerous in March, 1993, centric
diatoms also being present. Diatom dominance then passed to Synedra and
Asterionella concurrently in May. Sequences of dominance within the diatom
249

community were also noted in late summer/autumn. Seasonal succession occurs not
only between algal groups, but also between species of the same group. For example,
in the small eutrophic Crose Mere (15.2 ha, 9.2 m maximum depth) in England,
Reynolds (1973a) discovered an annual succession of four major diatom species,
although biomass of each species peak was different in each year. Asterionella
formosa and Fragilaria crotonensis achieved maxima between February and May and
between July and September. Melosira granulata also attained maximal production
during summer, whilst Stephanodiscus astraea characterised winter and spring
phytoplankton populations, coinciding with reduced spring growth of A. formosa and
F. crotonensis. During a study of Farmoor Reservoir (0.49 km2, maximum depth 11
m) from November, 1973 to March, 1974, the following diatom succession was found
(Youngman et al., 1976). A. formosa exhibited peak numbers in January, followed
by S. astraea in February and S. hantzschii in March. Greatest numbers were
recorded of A. formosa, least of S. astraea. Concurrent to the diatom succession, a
population increase of Closterium peracerosum during February and March accounted
for the largest numbers of any alga counted. Diatom succession may occur in
response to availability of silica as e.g. wall synthesis is impaired in A. formosa at
0.5 mg SiC> 2 dm* 1 (Boney, 1989). A species capable of growing at lower silica levels
would therefore replace A. formosa at this concentration of silica. Succession is also
driven by P limitation or the ratio of Si to P (Tilman et al., 1982). In Loch of
Gonfirth, no continuous succession was observed. Diatoms in Gonfirth were
dominated by Cyclotella and small centric diatoms, but both of these tended to remain
in the phytoplankton throughout the part of the year examined (Figures 4.3-4.5).
All five lochs studied had many relatively stable components of the phytoplankton,
but there were also taxa which were not particularly consistent in terms of the size
of the population or proportion of the algal community. The same seasonal succession
may not occur each year in a water body, as it is possible for long term changes in
species composition and biomass to occur. For example, during a 13 year study in
Plu/Ssee, North Germany, dominance passed from Oscillatoria redekei and
Aphanizomenon gracile to Ceratium species and Anabaena species, a different taxa
of Anabaena dominating during each of six different years (Hickel, 1988). In Loch
of Gonfirth, which would be expected to be the most stable algal community because
250

of its low nutrient status, Merismopedia was relatively important in 1991 samples and
Gomphosphaeria was comparatively prominent during September 1991. However,
during subsequent sampling seasons, thse taxa were low in numbers or absent from
the water column. In contrast, Chrysolykos and Aulomonas were observed to be more
significant in 1992 and 1993, than in 1991.
Assessment of the sizes of cells in phytoplankton assemblages may assist
understanding of species succession as size affects metabolic processes e.g. nutrient
uptake and reflects environmental controls of species success. Seasonal changes are
possible in sizes of phytoplankton present in the water column. The size range of
algae in the plankton can affect the way light penetrates the water. Predation of
phytoplankton by zooplankton has a relationship with size range of algae present e.g.
Cyclops may be associated with populations of predominantly small species, whereas
a Daphnia dominated community may be indicative of presence of larger
phytoplankton species. Phytoplankton sinking rate is related to cell, filament or
colony size. During quiescent water column conditions, smaller algae remain in the
photic zone for a longer period than larger ones when species are neither motile nor
buoyant. Studies of O. redekei reveal that mean filament length can differ
substantially from lake to lake, suggesting that filament length is partly genetically
controlled (Gibson, 1975). Seasonal polymorphism in O. redekei filaments in Lough
Neagh, Northern Ireland, results in minimum length during the period of lowest water
turbulence and viscosity, but highest temperatures. Vacuolate cells were found to take
6 6 days to leave the photic zone. Little advantage would be gained through
cyclomorphosis for the purpose of an extended period of suspension, since rate of
sinking is extremely slow. It was concluded that filament size might be related to
nutrient availability, inferior growth conditions resulting in shorter filaments (Gibson,
1975). A greater relative surface area is available for nutrient uptake when filament
or colony size is smaller. In four of the five lochs studied, chrysoflagellates were
dominant. These yellow-brown algae were small in addition to having motility,
suggesting their size was related to nutrient shortage. In contrast, green algae
Monoraphidium and Koliella often made up a significant proportion of the total
phytoplankton numbers in the five lochs studied, perhaps as a result of more turbulent
water columns and greater nutrient availability, since these taxa are not motile and
are elongate in form. Elongate forms of phytoplankton are also less easily engulfed
251

or eaten.
Although there was conformity with the literature in certain aspects of successional
and periodic changes in phytoplankton community structure within the five study
lochs, such as spring and autumn diatom increases, divergences from the PEG Model
were also noted. Phytoplankton communities in Loch of Gonfirth and Helliers Water
remained diverse throughout the study periods. Succession was less marked than in
the other three lochs. For example, diatoms were observed in the algal assemblage
during all sampling visits. Low nutrient status may therefore mean that water bodies
are less likely to conform to all the stages in the PEG Model, or exhibit changes
within the phytoplankton asssemblages which are less marked than would be expected
from the Model. Lack of conformity of Shetland water bodies to the PEG Model may
also be related to the high occurrence of water column mixing, even during the
summer months. If it is assumed that phytoplankton communities develop towards a
state of equilibrium, then interference with this process at intervals shorter than the
time required to reach equilibrium are disturbances (Reynolds, 1993). Disturbances
of intermediate frequency, i.e. approximately three to eight days, result in greater
phytoplankton diversity (Reynolds, 1993). The relative importance of intermediate
disturbances is greatest in spring and during summer and autumn equilibrium phases
(Padisbk, 1993).
In shallow water bodies, such as those in Shetland, not only is there the annual cycle
of great physical changes in light, temperature and extent of mixing, but also
intermediate changes in the water environment superimposed upon the former by such
processes as wind stress, cloud formation and precipitation (Eloranta, 1993). From
examination of the published literature on phytoplankton seasonal changes, in lakes
which stratify, the "clear water" stage is often associated with the onset of
stratification (Sommer et al., 1986). However, in non-stratifying water bodies, this
phenomenon either does not occur or is of extremely short duration. In shallow lakes,
phytoplankton are exposed to disturbances throughout the summer. Mixing of the
water column continues to occur in summer. In a comparison of two lakes of
eutrophic status in Latvia, Trifonova (1993) observed greater diversity throughout the
summer in the shallower system (Lake Lobardzu) than in the stratifying lake (Lake
Rudusku). Because of disturbances in the shallow lake, establishment of dominance
252

and low diversity associated periods of autogenic succession was interrupted by
periods when biomass decreased and diversity increased. In the stratifying system,
blue-greens and dinoflagellates became dominant for long periods, a consequent
decrease in diversity occurring as a result of competitive exclusion (Trifonova, 1993).
Sommer (1993) noted a comparable response in two lakes of similar nutrient status
in northern Germany. Phytoplankton was found to be N-limited (and diatoms Si-
limited) in both lakes. In the lake with the more stable water column (Plu£see),
maximum algal biomass was close to the carrying capacity of the water column
environment, whereas in the lake which had significant changes in mixing depth each
week (Behler See), disturbance resulted in suppression of possible maximum biomass.
In addition, under stable water column conditions, phytoplankton diversity decreased
after algal biomass had developed to > 5% of the carrying capacity of the water
body.
In Shetland lochs, great biomass of individual taxa may not develop as frequently as
would be expected under conditions of higher water column stability. Despite elevated
numbers of algae in spring in the lochs studied, phytoplankton numbers did not
exhibit such high values during summer. Exceptions to this trend were found in
samples from Turdale Water during September, 1991, Sandy Loch in August 1992
and Loch of Tingwall South Basin in June/July 1991, 1992 and 1993. Increased
availability of nutrients at these times perhaps allowed dominance of individual taxa
(cryptomonads, Anabaena and chrysoflagellates respectively), but that peak biomass
was supressed. Decline of Aphanizomenon blooms and increased diversity after
disturbance events have been documented in a shallow Danish lake (Jacobsen and
Simonsen, 1993). Biomass decreased after heavy rainfall and destruction of
stratification, K-selected Aphanizomenon (slow growing) was replaced by fast-growing
r-selected species of cryptomonads.
4.5 CONCLUSIONS
As noted by Brook (1994), presence of green algae and cyanobacteria in lakes was
not in itself an indicator of nutrient enrichment. Blue-green algae, such as
Gomphosphaeria and Merismopedia, were observed in water bodies of low trophic
status. Similarly, green algae, such as desmids, Monoraphidium/Ankistrodesmus and
Oocystis were present in low nutrient waters. Chrysoflagellates were widespread in
253

Shetland lochs. These algae often dominate in Scottish lochs (Brook, 1964; Bailey*
Watts and Duncan, 1981a). A range of phytoplankton assemblages were observed in
the lochs surveyed and CCA analysis revealed that the distribution of phytoplankton
was associated with many environmental factors.
Of these parameters, TP was found to be most important. Green algae were found to
be linked with high TP levels, but Anabaena was the only blue-green genus of
phytoplankton ranked highly on the TP gradient. Other cyanobacteria exhibited a
range of preferences. From published literature, it was evident that cyanobacteria
have a variety of adaptations which may give them a competetive advantage in certain
circumstances, such as the ability to use HC03* and grow in conditions of low light
intensity. The environmental variables measured which appeared to positively
influence growth of Anabaena were increased TP, increased TAN and low TON
concentrations in the loch water column.
Changes in phytoplankton community structure with time demonstrated similarities
with those expected in temperate lake systems, such as the occurrence of the spring
diatom increase. Deviations from the model may be partly attributable to the
individual status of each loch {e.g. in low and high nutrient waters, the spring diatom
increase was not as marked and in waters where TON remained elevated throughout
summer, N-fixing cyanobacteria did not develop a high biomass), disturbance effects
and the infrequent nature of the sampling programme.
254

CHAPTER 5: AQUATIC M ACROPHYTES O F SHETLAND LOCHS
5.1 INTRODUCTION
Aquatic macrophytes release oxygen necessary to maintain aerobic conditions within
the water column, provide shelter for fish and invertebrates, consolidate littoral
sediments and banks of running and standing waters. Macrophytes provide a food
source for vertebrates both directly and through organisms existing on them. Fish
may spawn on plant substrates and birds find nesting and feeding sites within plant
communities. These primary producers may also be regarded as aesthetically pleasing
(Seagrave, 1988). The aforementioned factors are extremely important in Shetland,
as aesthetic quality, fishing and ornithological pursuits are of importance to both the
local population and tourists who contribute to the economy of the area. However,
if macrophyte growth becomes excessive, problems such, as flooding, silting,
encroachment, and difficulties for boat access can occur. As with excessive
phytoplankton growth, pH and oxygen regimes may be dramatically altered, both
diumally, as a result of macrophyte respiration (DO uptake, CO* release) and
photosynthesis (C0 2 fixation, DO release through photolysis of water) and through
decay of dead plant matter. It is possible for the pH of a water body to increase by
3 units in one day due to the physiological processes of plants (Riemer, 1984), i.e.
net production of CO2 in darkness and CO2 uptake in daylight.
Macrophyte distribution both within and between water bodies is determined by many
factors. The influence of interspecific competition between naturally coexisting
species of submerged plants is typically insignificant in comparison with the effects
of spatial heterogeneity or differential utilisation of abiotic resources. The availability
of growth factors and the ability of different plants to take advantage of resources
promote species diversity in these communities (Chambers and Prepas, 1990). From
extensive field study and information from Murray and Pullar (1910), Spence (1967)
concluded that macrophyte cover of the littoral zone of large loch basins rarely
occupies more than 5% of the total water surface area, although brown mud
substrates in deeper water may locally support 80% plant cover.
Physical characteristics of water bodies, such as latitude, altitude and area of the loch,
are important influences on plant growth. The larger the area of a water body, the
255

more likely it is that there will be a richness of species, simply because in a smaller
area there is less probability that a diversity of habitats will present itself. For
example, local enrichment may occur in a predominantly oligotrophic loch, or
sheltered areas may present opportunities for plant growth protected from strong wave
action (Rcrslett, 1991). Altitude and latitude are factors which act upon plant growth
in a similar manner. Generally, as these increase, species diversity decreases due to
the effects of water temperature and duration of daylight. In Shetland, the high
latitude results in a limited growing season, which in turn leads to lower potential
plant diversity.
However, variety of macrophyte flora may occur in association with moderate stress
(such as organic enrichment), herbivory and disturbance levels (Grime, 1979). Lakes
with water levels which fluctuate by 1-3 m y r 1 have been found to support more
species of plants than those with fluctuations of a lesser or greater degree (Rarslett,
1991). This could be of particular importance in Shetland where low summer rainfall
and the shallowness of many lochs can combine to cause significant changes in depth.
In addition, twenty one standing waters are used for abstraction of drinking water,
so that at times of low rainfall, there can be a considerable decrease in water depth,
before further rainfall replaces the water removed for the potable supply.
Chemical characteristics of a water body are the overriding factor determining species
richness, abundance and biomass (Rorslett, 1991). Many submerged macrophytes may
be confined to waters of specific chemical composition, or be associated with
particular conditions (Table 5.1), although others may appear to have an almost
ubiquitous distribution. Chloride levels in lochs of the Shetland Islands are higher
than would be expected in standing fresh waters in Scotland, as a result of marine
influence (wind-borne sea spray), so reducing the likelihood of water conductivity
being correlated with plant distribution. In contrast, alkalinity in the same sites has
been recorded as being lower on average than other Scottish lochs (Spence, 1967).
Alkaline waters are not only cation rich, but also act as sinks for CO2 and HC03'
ions, the former being supplied mostly by either air or oxidising/reducing conditions
in loch sediments (Spence, 1967).
256

Table 5.1 Plants associated with different general water characteristics(Spence, 1967)
Rich waters
Metal ions, various Alkalinity ^1.2 meq HC03 L'1
Ceratophyllum demersum Chora papillosa Cinclidotus fontinaloides Myriophyllum spicatum Potamogeton lucens
Poor waters
Alkalinity < 0.4 meq HC03 L'1
Elatine hexandra EUogiton fluitans Isoetes lacustris Subularia aquatica Ranunculus flamrmda Juncus bulbosus Lobelia dortmanna Sphagnum subsecondum
Rich and moderately rich, often slightly saline waters
Alkalinity ^0.74 meq HC03 L*1
Potamogeton filiformis Potamogeton pectinatus
Alkalinity >0.4 meq HC03 L'1
Potamogeton praelongus
257

As some plants require presence of either C 0 2 or HC03' for photosynthesis (for
example, Fontinalis antipyretica can only use free CO2 and not HCO3 ) plentiful
supply of both CO2 and HC03' will mean growth limitation will probably not occur
due to lack of carbon. Certain plants are confined to calcareous lochs (Chara,
Potamogeton and Ceratophyllum species), or to non-calcareous lochs with high pH
(Myriophyllum species). A third group of plants are restricted to slightly saline waters
of low alkalinity and pH slightly above neutral. Potamogeton praelongust
Potamogeton pectinatus and Potamogeton filiformis grow in all three types of these
high electrolyte waters containing quantities of HC03* (Spence, 1967).
A more extensive macrophyte classification involving 1124 fresh and brackish water
sites in Britain was developed by Palmer (1989) and Palmer et al. (1992), conducting
a TWINSPAN analysis of the Nature Conservancy Council (NCC) plant survey
information, as used by Rod well in the National Vegetation Classification (NVC)
(1991). Several plant groupings were found (Table 5.2). However, plant groups were
related only to a limited number of environmental parameters i.e. water pH,
conductivity and alkalinity (Palmer, 1989; Palmer et al., 1992). Many other water
chemical variables could be important in limiting plant types to particular groups.
Where P concentrations were quoted in the classification of Palma- (1989) and Palmer
et al. (1992), the limit of detection was 20 pg P L \ so detailed information on this
parameter was absent for lower categories of trophic state (i.e. ultra oligotrophic,
oligotrophic and less nutrient rich mesotrophic lake types). Water conductivity may
be slightly misleading as a predictor, for elevated concentrations of ions occur in
Shetland lochs in wind blown areas proximate to the sea. A strong correlation
between conductivity and trophic state may not therefore exist in the classically
understood sense. Use of macrophytes as indicators of trophic status is dependent
upon a clear relationship existing between P and N concentrations in the water
column and the species of plants which grow under different conditions of P and N
availability in standing freshwaters.
258

Table 5.2 Classification of standing waters (Palmer, 1989; Palmer et al.9 1992)
Group Characteristic plants pH
Sphagnum Juncus bulbosus Potamogeton polygonifolius
3.5-5.5
Conductivity (fiS cm'1)
<200
Alkalinity (meq L'1)
<0.04
2 Juncus bulbosus 5.0-7.5 <200Potamogeton polygonifoliusLittoreUa uniflora Lobelia dortmarma Potamogeton natans
3 as Group 2 but also 5.0-7.5 <200Myriophyllum altemiflorumIsoetes lacustris Fontinalis antipyretica
4 Myriophyllum spicatum 7.0-9.0 >200Myriophyllum alteriflorumPotamogeton natans CharaPotamogeton praelongus Potamogeton filiformis
5A Littorella uniflora 6.0-8.0 *Myriophyllum altemiflorum NitellaElodea canadensis Potamogeton various
0-0.5
5B Potamogeton natans Nymphaea alba
6 . 0- 8.0
0-0.5
0.5-4.0
0 . 2- 1.0
0 . 2- 1.0
Potamogeton pectinatus 8.0-9.0RuppiaFucus
>5000
similar to Group 4, but 7.5-9.5lacksMyriophyllum altemiflorum Juncus bulbosus
259

Table 5.2 (cont.)
Group Characteristic plants
8 Lenina minorPolygonum amphibium Callitriche stagnalis
pH
7.0-8.5
Conductivity (jlS cm'1)
200-1000
9 Nuphar lutea Nymphaea alba
B
KEY:
Elodea canadensis
Chora
6.5-8.5
10 Myriophyllum spicatum 6.5-8.5 Potamogeton praelongus
200-1000
200-1000
conductivity greater than that for Groups 2 and 3
Alkalinity (meq I/1)
1.0-5.0
0.2-4.0
0.5-4.0
260

5.1.1 Aims
Macrophytes have been used as indicators of chemical limnology (Sneddon, 1972).
In shallow loch systems such as those in Shetland, it is possible for macrophytes to
have significant effects on ecosystem processes. Canfield et al. (1984) successfully
used the percentage of lake volume occupied by macrophytes to improve the efficacy
of a TN/TP model for predicting water column chi a concentrations. Rooted aquatic
vegetation may compete with phytoplankton populations for available resources. If
competition exists between macrophyte and phytoplankton communities, then
information on macrophyte assemblages might be of use in developing a loch water
quality indicator system. This would assist in determining susceptibility of standing
freshwaters to excessive phytoplankton growth i.e. eutrophication. It may also be
possible to manage macrophyte growth for the purpose of prevention of algal bloom
development. An investigation of the macrophyte communities of Shetland lochs was
therefore undertaken, the aims of which are outlined below.
(a) Identify the macrophyte species present in thirty one loch sites across the
Shetland Islands.
(b) Estimate biomass of macrophytes growing in each of the study waters.
(c) Investigate whether macrophyte species present in Shetland lochs could be
used as indicators of water quality, including phytoplankton biomass.
(d) Using published information, consider the likely magnitude of the effects of
the species present on nutrient cycling within the loch systems examined.
Although other primary producers (e.g. bacteria and algae attached to macrophytes,
sediments and stones) are important in lacustrine environments, in terms of
competition with phytoplankton for resources and in nutrient cycling, examination of
these biota was outwith the scope of the present study.
5.2 MATERIALS AND METHODS
5.2.1 Construction of macrophyte species lists
Presence of macrophyte species in each loch was determined by two methods. Firstly,
vegetation in shallow water was identified and recorded while wading at and around
261

the shoreline, or, in the case of larger water bodies, by identifying different habitat
types and listing plant species found there. Secondly, grapnel hauls were undertaken
in transects parallel to the shore to investigate which species were present in deeper
water. During the 1993 survey, it was also possible for a SCUBA diver to view and
retrieve macrophytes from the deeper waters of Lochs of Gonfirth and Tingwall,
Helliers and Turdale Water. Plant samples requiring further identification were
pressed and returned to the laboratory. Standard plant keys were then used to
recognise taxa present (Wigginton and Graham, 1981; Haslam, Sinker and Wolseley,
1982; Polunin, 1988; Seagrave, 1988). In addition, macrophyte species identifications
were confirmed by Dr. K.J. Murphy and Dr. K. Watson (Department of Botany,
University of Glasgow). Chora and Nitella were not identified to species level due to
difficulties in taxonomy associated with these macroalgae (Arts and Leuven, 1988).
5.2.2 Estimation of macrophyte biomass
Samples for biomass estimates were taken using the following equipment:
Lamboum sampler 25 cm x 19.5 cm (1991, 1993)
Lamboum sampler 30 cm x 30.5 cm (1992)
Quadrat 50.5 cm x 50.5 cm (1992)
Quadrat 50 cm x 50 cm (1993)
Ekman grab 15 cm x 15.5 cm (1992)
Plant samples for biomass estimates were washed thoroughly in tap water before spin
drying to remove excess moisture. Each sample was then weighed fresh before being
oven dried at 90°C for 24 hours. Dry weights were then determined and biomass
calculated for each sample.
5.2.3 TWINSPAN analysis of macrophyte data
From macrophyte lists constructed for the thirty one lochs in 1991, a two-way
indicator species analysis (TWINSPAN) was carried out (Hill, 1979). This is a
method of cluster analysis which operates on a divisive strategy i.e. all individuals
begin the analysis in one group, rather than each individual starting as one group, as
occurs in accumulative clustering methods. TWINSPAN carries out Correspondence
Analysis (CA) on the entire data set and uses Axis 1 scores to divide site information
262

into two groups. Species which are highly correlated with this Axis are used as
indicators; indicators for one group are positively correlated with the Axis, those for
the other exhibit negative correlations with the Axis. This type of data analysis is then
repeated for the new groups formed. The resulting groups of lochs were then
compared (using a two-tailed Mann-Whitney U test on the Statgraphics statistical
package) in terms of water mean summer pH, colour, light attenuation and
concentrations of chi a, TP, TDP, TAN, TON, Ca, Mg, Na and K, in addition to
mean macrophyte biomass and number of macrophyte species present in each loch.
5.3 RESULTS
5.3.1 Macrophyte species found in Shetland lochs (Table 5.3)
Isoedds were widespread in their distribution. Subularia aquatica was located in two
lochs, Isoetes lacustris in nine, Lobelia dortmama in eleven and Littorella uniflora
in twenty three water bodies. Several Potamogeton species were observed i.e. P.
berchtoldii, P. filiformis, P. gramineus, P. natans, P. perfoliatus, P. polygonifolius
and P. praelongus. The most widespread of these was P. perfoliatus, which was
observed in seventeen lochs (Table 5.3). Species of Chora and Nitella were also
frequent in occurrence, these algae being located in twelve and ten water bodies
respectively. Charophytes were not noted in fourteen of the thirty one lochs surveyed.
Juncus bulbosus was common in occurrence, being observed in sixteen of the
Shetland sites studied. The macrophyte which was seen in most lochs was
Myriophyllum altemiflorum. Species of Callitriche which were found in the lochs
were C. hamulata, C. hermaphroditica, C. platycarpa and C. stagnalis.
5.3.2 Estimates of macrophyte biomass in Shetland lochs (Table 5.4)
On a dry weight basis, biomass was found to be highly variable both within and
between sites in areas of colonisation (Table 5.4). Average plant biomass estimates
for each loch in 1991 ranged from 0 g nr2 (Loch of Brough, Yell) to 1044.9 g m*2
(Loch of Huesbreck). In lochs where biomass estimates were > 0 g m'2, results from
individual Lamboum samples ranged from 0.2 g m*2 for Callitriche stagnalis in Mill
Pond and J. bulbosus in Roer Water, to 1289 g m' 2 in Loch of Huesbreck for a
Lamboum sample of Chara and Nitella. Although Loch of Huesbreck was productive
in terms of macrophyte growth, it is suggested that biomass figures may be
overestimated due to mineral encrustation of these algae.
263

KEY FOR TABLE 5.3Macrophyte taxa present In the 31 lochs of the 1991 survey
Macrophyte TWINSPAN code
Bryum pseudotriquatrum 59 BRY PSECallitriche hamulata 05 CAL HAMCallitriche hermaphroditica 04 CAL HERCallitriche platycarpa 03 CAL PLACallitriche stagnalis 06 CAL STACarex lasiocarpa 07 CAR LASCaltha palustris 02 CTH PALChara species 08 CHA SPPEleocharis acicularis 11 ELE ACIEleocharis palustris 09 ELE PALEnteromorpha intestinalis 12 ENT INTEpilobium palustre 13 EPI PALEquisetum fluviatile 10 EQU FLUEurytrichium cfpraelongum 61 EUR PRAFontinalis antipyretica 14 FON ANTGalium palustre 16 GAL PALGlyceria declinata 15 GLY DECHydrocotyle vulgaris 17 HYD VULIris pseudocorus 18 IRI PSEIsoetes lacustris 19 ISO LACJuncus articulatus 22 JUN ARTJuncus bufonius 21 JUN BUFJuncus bulbosus 20 JUN BULLemna minor 26 LEM MINLittorella uniflora 25 LIT UNILobelia dortmanna 24 LOB DORMentha aquatica 30 MTH AQUMenyanthes trifoliata 29 MEN TRIMyriophyllum altemiflorum 27 MYR ALTMyriophyllum spicatum 28 MYR SPINitella species 33 NIT SPPNymphaea alba 31 NYM ALBPhalaris arundinacea 35 PHA ARUPolygonum amphibium 34 POL AMPPotamogeton berchtoldii 44 POT BERPotamogeton filiformis 43 POT FILPotamogeton gramineus 39 POT GRAPotamogeton natans 38 POT NATPotamogeton pectinatus 42 POT PECPotamogeton perfoliatus 45 POT PERPotamogeton polygonifolius 36 POT POL
264

KEY FOR TABLE 5,3 (cont.)Macrophyte taxa present in the 31 lochs of the 1991 survey
Macrophyte TWINSPAN code
Potamogeton praelongus 37 POT PRAPotamogeton pusillus 40 POT PUSRanunculus aquatilis 48 RAN AQURanunculus flammula 47 RAN FLARuppia maritima 46 RUP MARScapama species 49 SCA SPPSchoenoplectus lacustris 55 SCH LACScorpidium scorpioides 50 SCO SCOSpargamum angustifolium 52 SPA ANGSparganium emersion 53 SPAEMESpargamum erectum 54 SPA ERESubularia aquatica 51 SUB AQUUtricularia species 57 UTR SPPZarmichellia palustris 58 ZAN PAL
265
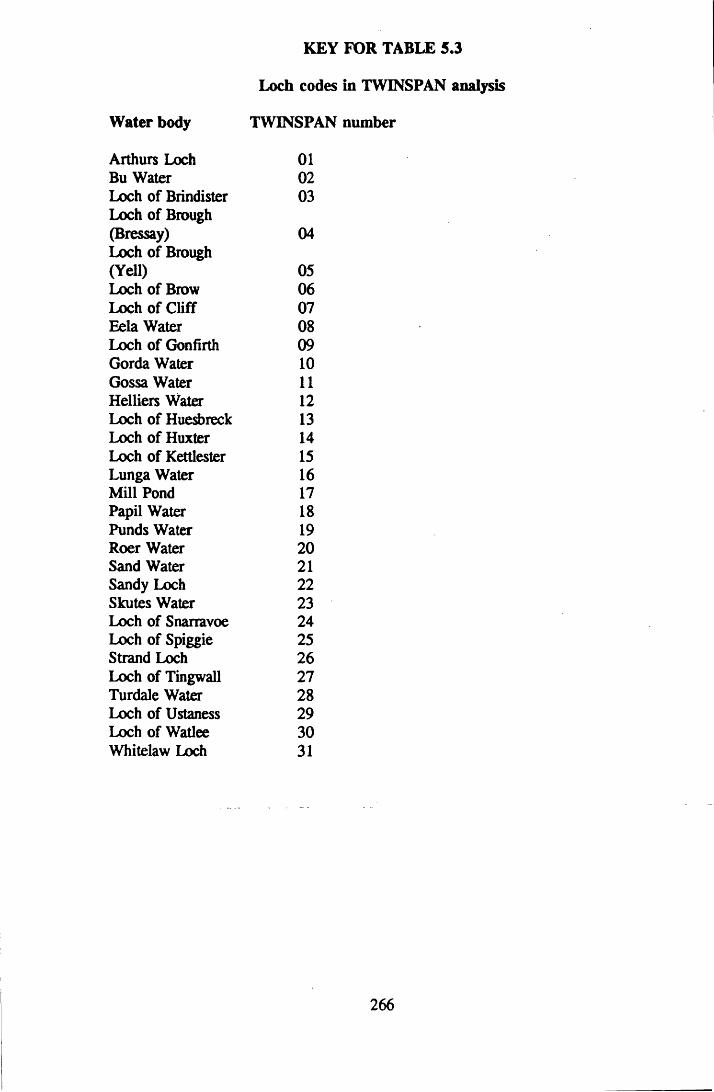
KEY FOR TABLE 5.3
Loch codes in TWINSPAN analysis
Water body TWINSPi
Arthurs Loch 0 1
Bu Water 0 2
Loch of Brindister 03Loch of Brough(Bressay) 04Loch of Brough(Yell) 05Loch of Brow 06Loch of Cliff 07Eela Water 08Loch of Gonfirth 09Gorda Water 1 0
Gossa Water 1 1
Helliers Water 1 2
Loch of Huesbreck 13Loch of Huxter 14Loch of Kettlester 15Lunga Water 16Mill Pond 17Papil Water 18Punds Water 19Roer Water 2 0
Sand Water 2 1
Sandy Loch 2 2
Skutes Water 23Loch of Snarravoe 24Loch of Spiggie 25Strand Loch 26Loch of Tingwall 27Turdale Water 28Loch of Ustaness 29Loch of Watlee 30Whitelaw Loch 31
266

Table 5.3 Computer output o f TWINSPAN analysis of macrophyte speciespresent in the 31 lochs o f the 1991 survey
Species Rel. True
Samples, relative numbers.
12 11 3111 22 12 2212 3 112222248094115790913686153770548326
60 POT28 MYR26 LEM16 GAL 15 GLY11 ELE13 EPI49 SCA 31 NYM24 LOB 22 JUN52 SPA47 RAN20 JUN3 CAL
54 SPA27 MYR25 LIT6 CAL
59 BRY 19 ISO 51 SUB45 POT33 NIT21 JUN61 EUR53 SPA38 POT14 FON 2 CTH
29 MEN17 HYD 9 ELE
44 POT39 POT 10 EQU8 CHA 5 CAL
37 POT 58 ZAN46 RUP40 POT12 ENT55 SCH48 RAN 43 POT 36 POT 35 PHA30 MTH18 IRI7 CAR4 CAL 57 UTR50 SCO34 POL
SPPSPIMINPALDECACIPALSPPALBDORARTANGFLABULPLAEREALTUNISTAPSELACAQUPERSPPBUFPRAE34ENATFNTPALTRIVULPALBERGRAFLUSPPHAMPRAPALMARPUSINTLACAQUFILPOLARUAQUPSELASHERSPPSCOAMP
1-11 1
- 1 - 1 1 1 1 1 — 1 - 1 1 -
11 —
1 - - - - - 1 1111 - 111 -
1 - 1 1 1 - 1 1 1 1 1 1- 1 - 1 — 1 1 - 1 1 1 1 1 1 -
1 1 -------------------
11 1 1 1 - 1 1 1 1 1 - 1 - 1- 1- 1 1 1 1 1 1 1 1 1 - 1 1 1 1 1
1 1 1 1 - 1 - 1 —
- 1 - 1 1 1 — 1 — 1 -----------------------------------
— 1
•1- 1 - 1 - 1 1 1 1 - 1 1 - 1 1 - 1 1 1 - 1 1 1
1 1 - 1 — 1 1 — 1 1 - 1 1 - 1 -
1 ■1- 1 ----------— 1 1 1 1 1 1 1 1 — 1 —
1 1 - -
- 1 1 — 1 1 1 1 1 - 1 1 1 1 - 1 — 1111- 1 1 — 1 1 — 1 1 1 - 1 1 1 -
1 1 1 - 1 — 1 1 — 1 ------------------------- -11 •1
• 1 1 — 1 1 1 1 -------------------------------
"1 — 1 — 1 1 1 1 1 —1 ------------------------
- 1 - 1 1 — 1 1 1 1 - 1 1 1 - 1 1 1 1 11 11-111-----
1 - 1 -1
---------- 1---------------
- 1 1-----------1 1 - 1 1 — 1 1 — 1 -
- 1 - 1 - 1 — 111
1 -
-1
1 1 1
- 1 ---------------- 1 - 1 1 1 — 1 1 1 1 1 - 1 -
1 1 1 1 1 1 1 - 11 -1 1 1 - 1 - 1 - 1 1 - 1 - 1 - 1 1 - 1 ----------------------
1 -------
•1 • 1 •1
1 1
• 1 — 1
1 1 1
111 1 1 1 1 1 1
1 1 1 111 111 1110 1110 1110 1110 1101 1101 1101 1101 1100 1011 1011 1011 1010 1010 100 100 100 100 011 0 1 1
011 010 010 0011 0011 0011 00101 00101 00101 00101 00101 00100 00011 00011 00011 00011 00010 00010 00010 00010 00010 00010 00010 00010 00010 0000 0000 0000
0000 00 00 00 000 00 0001111111111111 0000001111111111 110 00 00 00 00 00 01 01111100000111111 100 00 01 11 11 11
001 11 001110001111000110000001001111
267

Table 5.4 Ranges of plant biomass estimates in areas of macrophyte growth
Water body Macrophyte biomass (g dw m'2)Minimum Maximum
Arthurs Loch 14.6 123.9Bu Water 17.6 69.7Loch of Brindister 44.5 68.1Loch of Brough (Bressay) 2.9 207.8Loch of Brough (Yell) * *Loch of Brow 24.2 94.8Loch of Cliff 13.1 98.9Eela Water 0.6 158.2Loch of Gonfirth (1991) 17.2 207.8
(1992) 9.9 592.7(1993) 0.9 95.8
Gorda Water 6.8 25.6Gossa Water 8.6 300.7Helliers Water (1991) 35.5 130.9
(1992) 8.3 214.2(1993) 9.4 166.8
Loch of Huesbreck 701.7 1289.0Loch of Huxter 0.4 250.3Loch of Kettlester 2.3 30.6Lunga Water 44.9 64.6Mill Pond 0.2 6.2Papil Water 23.0 58.3Punds Water 1.6 74.1Roer Water 0.2 6.8Sand Water 0.4 44.3Sandy Loch * *Skutes Water 12.7 57.6Loch of Spiggie 9.0 188.5Strand Loch 26.5 126.6Loch of Tingwall (1991) 6 .8+ 255.0
(1992) 12.2 1154.0+(1993) 0.1 63.6+
Turdale Water (1991) 11.9 90.9(1992) 3.9 104.5(1993) 0.6 74.6+
Loch of Ustaness 28.7 37.9Loch of Watlee 10.7 1 AO f\
1 tJ.ULoch of Whitelaw 13.1 104.5
KEY:
extremely low biomass for entire loch includes filamentous algae
268

Locally dense stands of isoetids were found to result in biomass estimates up to 300
g m*2 for L. uniflora alone (Gossa Water, Lamboum sample, 1991), 345 g m*2 for a
stand of L. uniflora, L. dortmanna and 7. lacustris (Loch of Gonfirth, Ekman sample,
1992) and 592 g m' 2 for a colony of 7. lacustris (Loch of Gonfirth, Ekman sample,
1992). Minimum recorded biomass for single species samples of L. uniflora and 7.
lacustris were 2.3 g m' 2 (Loch of Kettlester, Lamboum sample, 1991) and 0.4 g m' 2
(Loch of Huxter, Lamboum sample, 1991) respectively.
5.3.3 TWINSPAN classification of Shetland lochs (Figure 5.1)
At the first level of TWINSPAN classification, one group of eighteen lochs was
categorised by presence of L. dortmanna. The other group of thirteen lochs was
associated with presence of Chara spp. and Equisetum fluviatile. At the second level
of classification, the first group was divided into a group of six lochs and one of
twelve lochs. These groups were characterised according to presence of 7. lacustris,
Gtyceria declinata and Nitella spp. in the former (Group 1) and Ranunculus
flammula, Sparganium angustifolium and J. bulbosus in the latter (Group 2). The
second group of the first classification level remained the same with the exclusion of
Strand Loch on the basis of presence of Enteromorpha intestinalis in that water body
(Group 3). Low Eigen values were associated with all these divisions made by
TWINSPAN, indicating that the Groups were not strongly heterogeneous.
5.3.3.1 Comparisons of TWINSPAN Groups (Tables 5.5 and 5.6)
Following statistical analysis, Group 3 (p < 0.001) and Group 1 (p < 0.1) were
found to have higher pH values than Group 2. Group 3 also had higher pH values
than Group 1 (p < 0.05). In addition to the weak difference in water pH between
Group 1 and Group 2, there also existed a significant difference in water Mg
concentrations, greater levels being associated with Group 1 (p < 0.05). Mg levels
in Group 2 were significantly lower than those in Group 3 (d < 0.01). In terms of
Mg concentrations, Group 1 and Group 3 were similar, although there may have been
a trend of slightly higher values in Group 3, since there was a less significant
difference between Groups 2 and 1 than Groups 3 and 2.
269
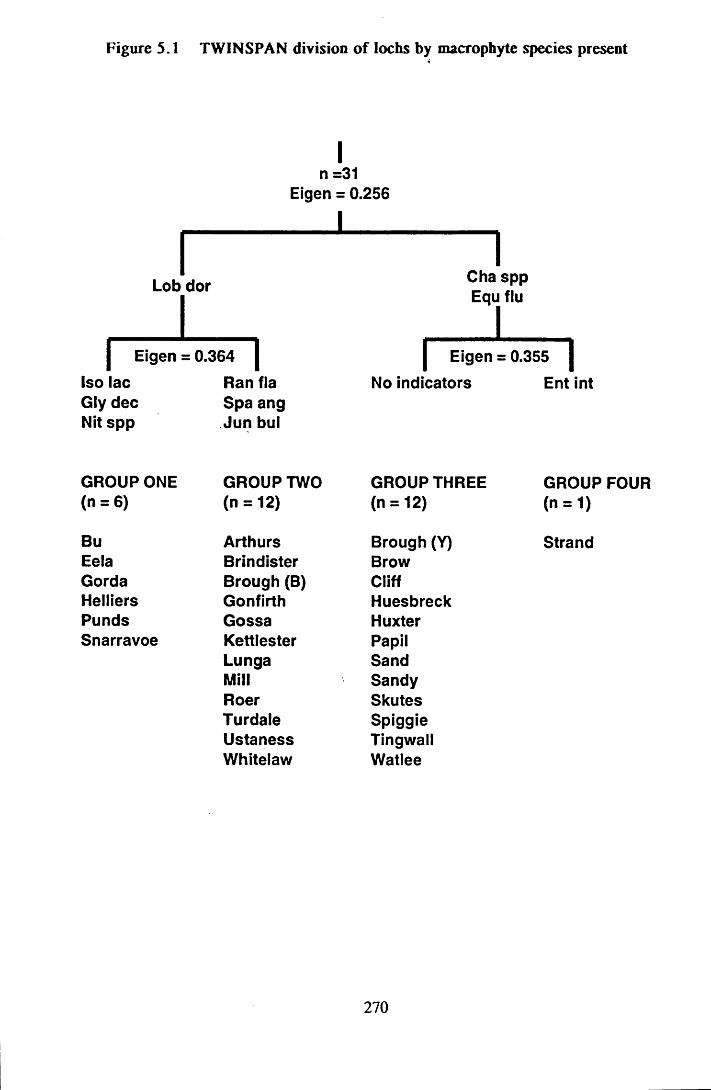
Figure 5.1 TWINSPAN division of lochs by macrophyte species present
In =31
Eigen = 0.256
Lob dor
| Eigen == 0.364 iIso lac Ran flaGly dec Spa angNit spp Ju n bul
GROUP ONE GROUP TWO(n = 6) (n = 12)
Bu ArthursEela BrindisterGorda Brough (B)Helliers GonfirthPunds G ossaSnarravoe Kettles ter
LungaMillRoerTurdaleU stanessWhitelaw
Cha spp Equ flu
| Eigen = 0.355 |
No indicators Ent int
GROUP THREE GROUP FOUR(n = 12) (n = 1)
Brough (Y) StrandBrowCliffHuesbreckHuxterPapilSandSandySkutesSpiggieTingwallWatlee
270

Table 5.5 Median values of environmental parameters associated with each TWINSPAN Group of water bodies
Environmentalparameter
Group 1 Group 2 Group
PH 6.89 6.36 7.48Conductivity (jiS cm'1) 276 251 353Light coefficient 0.350 0.649 0.354Colour (abs 400 nm) 0 . 1 0 2 0 . 2 0 0 0 . 1 2 2
TP (jig P L'1) 18.1 9.4 16.2TDP (jig P L 1) 6 . 6 5.3 6 . 8
TON (jig N L*1) 6.3 57.7 6.5TAN (ng N L 1) 37.7 27.5 40.5Ca (mg Ca L 1) 4.3 3.7 8 . 6
Mg (mg Mg L'1) 7.9 5.1 1 0 . 0
Na (mg Na L'1) 33.6 31.4 37.5K (mg K L*1) Chi a
1.7 1.4 1.7
(jig chlfl L 1) 4.1 2.4 5.8
271

Table 5.6 Comparisons of TWINSPAN groups by Mann-Whitney U-test
Group 1 vs Group 2 Group 1 vs Group 3 Group 3 vs Group 2Parameter
PH p < 0 A p<0.05 p< 0 . 0 0 1
Conductivity n.s. n.s. p<0.05LAC n.s. n.s. n.s.Water colour n.s. n.s. n.s.TP n.s. n.s. p < 0 . 1
TDP n.s. n.s n.s.TAN n.s. n.s. n.s.TON n.s. n.s. p < 0 . 1
Na n.s. n.s. n.s.K n.s. n.s. n.s.Ca n.s. p<0.05 p < 0 . 0 1
Mg p<0.05 n.s. p < 0 . 0 1
Ca + Mg n.s. p<0.05 pcO.OOlChin n.s. n.s. p<0.05NOS n.s. n.s. n.s.BM n.s. n.s. n.s.
KEY:
NOS number of macrophyte species observed BM macrophyte biomass estimates
272

Although Mg levels were different in Groups 1 and 2, a significant difference in Ca
concentrations could not be detected between these Groups. However, there may have
been a trend of higher Ca levels in Group 1, as a greater difference was detected
between Group 3 and Group 2 than between Group 3 and Group 1 when considering
this parameter.
When Ca and Mg concentrations were combined, the difference between Groups 3
and 2 became highly significant (p < 0.001), though the difference in Groups 1 and
3 remained similar to that for Ca concentration alone (p < 0.05). It is likely that the
significantly higher conductivity values in Group 3 compared to Group 2 were at least
partly attributable to the higher Ca and Mg concentrations in Group 3.
The concentrations of TP in Group 3 lochs were higher than those in Group 2 (p <
0.1); conversely TON concentrations were lower in Group 3 than in Group 2 (p <
0.1). Although these differences were not highly significant, chi a levels were also
higher in Group 3 than in Group 2 (p < 0.05). As in the CCA analysis of
phytoplankton data (Chapter 4) higher chi a values were associated with lochs with
increased water column TP levels, but low TON concentrations.
In summary, the most important differences between TWINSPAN Groups were in
pH, Ca and Mg concentrations. An increase in these parameters occurred from Group
2 to Group 1 to Group 3. As would be expected from the TWINSPAN divisions,
Group 3 was the least similar of the three Groups. No differences were found
between Groups on the basis of light attenuation, water colour (400 nm), number of
species or biomass of macrophytes, nor water concentrations of TAN, TDP, Na and
K. The median value for light attenuation in Group 2 was considerably greater than
that of Groups 1 and 3, but the degree to which ranges of values overlapped meant
that there was not a significant difference in this variable between Groups. Similarly,
although the median value of number of macrophyte species present was highest in
Group 3, there was considerable variability in the numbers found in each Group.
273

5.4 DISCUSSION
5.4.1 Macrophyte species present in Shetland lochs compared with those
of other studies
In Loch Urigill and other lochs of the Ullapool area, submerged vegetation was found
to consist of Lobelia, Littorella and J. bulbosus in shallow water, with I. lacustris,
P. praelongus and P. perfoliatus occurring in deeper water (Spence and Allen, 1979).
Many of the lochs in Rhum have been found to have L. uniflora, L. dortmanna and
J. bulbosus, with M. altemiflorum and I. lacustris sometimes growing in the same
lochs as these three species (Farmer, 1984). In general terms, the submerged
vegetation in Shetland lochs surveyed was similar to that observed in die above
studies. Also observed in Shetland were water bodies which contained species of
Chara, Nitella and Potamogeton, as did Loch Borralie (northern Scotland) when
surveyed by Spence et al. (1984). Plants growing in Shetland waters included
nationally scarce species as defined by Bell (1991), such as Callitriche
hermaphroditica, P. filiformis, P. praelongus and S. aquatica. Notably, S. aquatica
has also been described as "apparently very rare” in Shetland (Scott and Palmer,
1987). Certain species of macrophytes recorded in Shetland have been regarded as
infrequent in occurrence in the north of Scotland. P. praelongus and P. filiformis
were described as rare in Sutherland (Anthony, 1976). This is compared with
observations of these species in sixteen and ten percent respectively of the Shetland
waters surveyed. Occurrence of P. perfoliatus in Sutherland has been defined as
occasional (Anthony, 1976), whereas P. perfoliatus was noted in more than half the
Shetland lochs surveyed during 1991. Similarly, this species was described as
common in Shetland by Scott and Palmer (1987).
The catalogue of aquatic macrophyte species observed in the present study included
many of the list for Shetland of Spence (1979), although there were macrophytes
noted in the latter which were not observed in the 1991 survey. For example,
Potamogeton friesii and Phragmites australis were noted by Spence (1979), but were
not observed in the 1991 survey. This can be attributed to these species being scarce
in Shetland (Spence, 1979). Spence (1979) also recorded Sphagnum subsecundum in
small dark peaty pools. This species was not observed in the present study, but peaty
pools were not included in the survey.
274

Although previously recorded in Shetland (Maitland and Lyle, 1986; Scott and
Palmer, 1987), Potamogeton rutilus and P. pectinatus were not observed in the 1991
Shetland loch surveys. This is possibly due to the rapid nature of the survey of each
lochs, rather than the disappearance of these species. P. rutilus and P. pectinatus are
also described as being very rare (Scott and Palmer, 1987). In addition, P. rutilus is
similar to Potamogeton pusillus which was found in Shetland lochs in 1991, as was
P. filiformis, which resembles P. pectinatus. Therefore P. rutilus and P. pectinatus
may have been overlooked. Notably absent from all Shetland water bodies surveyed
was Elodea canadensis. This species has become a nuisance plant in many lakes,
where it forms extensive beds which may result in waters becoming impenetrable to
boats and a reduction in water quality. Introductions of Elodea have been widespread,
even occurring in Orkney (Robson, 1987). Another submerged macrophyte which was
not observed was Utricularia, which has been found in freshwater lochs of Sutherland
(Bell, 1991). Utricularia species have been associated particularly with West
Mainland (Scott and Palmer, 1987).
5.4.2 Parameters affecting macrophyte growth in Shetland Lochs
5.4.2.1 pH, Carbon, Calcium and Magnesium
Mean summer water pH, Ca and Mg concentrations were found to be the most
significant factors influencing species present in Shetland lochs. The pH of natural
waters broadly correlates with a number of other factors such as dissolved inorganic
carbon, conductivity and macronutrients. Rorslett (1991) indicated that none of these
other factors, either alone or in combination, produced such a good correlation with
macrophyte species richness as pH alone. In a study of 135 Finnish lakes, most
variance was accounted for by pH, though water colour also contributed significantly
to the variation between the sites (Heitto, 1990).
In a comparison of two circumneutral oligotrophic lakes and two acid oligotrophic
lakes in Maine, U.S.A. (Hunter et a l., 1986), fewer species were found in the acid
waters than in the circumneutral lakes. Rorslett (1991) also observed that acid waters
supported less species of macrophytes than alkaline waters. In the present study, no
significant differences were found between Groups on the basis of number of
macrophyte species present. However, there were no particularly acid waters included
in the present study. Hunter et al. (1986) also found biomass measurements showed
275

mass of macrophyte structures per unit area in acid waters to fall within the range of
biomass determinations of the macrophytes of circumneutral waters. It would
therefore be expected that no difference could be detected in macrophyte biomass
estimates between different loch Groups in the present study. Although species
composition was affected by pH, biomass and number of species adapted for growth
in the more acid conditions of Group 2 in the present study were not restricted.
Differences in species present in waters of different pH values may occur due to pH
alone, or because of differences occurring in the sources of C for photosynthesis
(Moss, 1980). Many plants are known to be able to utilise HCO3' as a C source (for
example, Ceratophyllum demersum, Lemna trisulca and Chora spp.) and are found
often in hard, HC03' rich waters (Moss, 1980). Aquatic mosses and plants such as
L. dortmanna and I. lacustris are generally associated with acid, soft water conditions
and like F. antipyretica, are apparently restricted to use of free COj (Moss, 1980).
Since L. dortmanna and Chara spp. were the indicator species at the first division of
the TWINSPAN classification in the present study, this suggested that the nature of
the inorganic C source might be affecting macrophyte distribution.
Rooted and non-rooted floating leaved plants and emergent species of macrophyte
carry out gaseous exchange with the atmosphere, thereby ensuring an unlimited
supply of CO2 . This C source is not directly available to plants which are entirely
under water. However, submerged plants have a variety of adaptations to the reduced
inorganic C:
(1 ) lower C0 2 compensation points
(2 ) seasonal variability of CO2 compensation points
(3) dark fixation of C 0 2 through Crassulacean Acid Metabolism (CAM)
(4) utilisation of the lacunar system to transport respiratory C Q to photosynthetic
C fixation sites
(5) employment of the lacunar system to transport CO2 from rhizosphere
interstitial water to photosynthetic C fixation sites
J. bulbosus, which was an indicator of the lochs in Group 2, can utilise bacterial CC
in the rhizosphere to assist with meeting its photosynthetic C requirement (Wetzel et
a l., 1985), but unlike isoetid species, it uses little of this C source. J. bulbosus is
276

particularly efficient at removal of CO2 from the water column: more efficient than
L. uniflora. Photosynthesis of the former is saturated at lower water free CO2
concentrations than the latter (Roelofs et a l., 1984). Presence of J. bulbosus in Group
2 lochs may be indicative of CO2 in the water column being the main C source, as
a consequence of low pH favouring C presence in this form. Plants in more acid
waters than in Group 3 (pH < 5) may become C 0 2 limited because of slow diffusion
from the atmosphere combined with little or no HCO3* being present for conversion
to CO2 . In addition, rates of decomposition of organic matter are slow (Wetzel et al. ,
1985). In acidified waters, J. bulbosus and or Sphagnum spp. may subdue growth of
isoetid plants (Roelofs et al., 1984; Heitto, 1990). However, other species which are
restricted to CO2 as their C source, such as P. natans and P. polygonifolius, may still
occur through growth of leaves at the water surface (Maberly and Spence, 1983). In
the present study, since isoetids were noted, but Sphagnum spp. were not observed
in lochs of Group 2, this confirmed that Group 2 lochs were only slightly acidic.
The primary nutrient source of Ca and Mg to submerged macrophytes is the water
column rather than bottom sediments (Barko et a l., 1991). However, these cations are
also involved with the availability of C within the water column, as at high pH they
combine with CO32* and C is therefore stored in this bound form. Contrastingly, at
lower pH values, a greater proportion of C present in the water is as free CO^ In
Group 1 waters, which had /. lacustris as an indicator species, Mg concentrations
were significantly greater than in Group 2 soft water, more acidic lochs, and there
may have been a trend of slightly higher Ca concentrations in Group 1 lochs.
However, Group 1 waters were relatively soft in absolute terms.
Isoetids have been associated previously with oligotrophic soft water lakes (Spence,
1964; Seddon, 1972). In addition, Isoetes species have been found to operate the
CAM system of C0 2 fixation, accumulating C overnight in malic acid and
decaiboxylating this during the light period for incorporation into the Calvin Cycle
(Keeley, 1982). This system is indicative of soft waters of low CO* concentration.
Other isoetids also occurred in Group 1 waters, further indicating low concentrations
of COj in overlying water column as e.g. L. dortmanna, L. uniflora and I. lacustris
can acquire C from sediment pore waters (Wium-Andersen, 1971; Sondergaard and
Sand Jensen, 1979). These plants are also suited to low C0 2 concentrations through
277

high root biomass and high oxygen release rate from roots (Roelofs et al. , 1984). It
is therefore suggested that CO2 limitation may be occurring in Group 1 lochs,
possibly as a result of near neutral pH. A greater proportion of available C would be
as HCO3' in circumneutral waters than in more acid conditions.
Under the conditions of higher pH values observed in Group 3 waters, there will be
proportionately less CO2 and more HC0 3 than in Group 1 or Group 2 lochs. This is
also suggested by the fact that as isoetids were not indicators for this Group, but P.
perfoliatus, which has the capability to use HCCV as a C source was present in many
of the lochs in Group 3. P. filiformis, which is similar in growth form to P.
pectinatus, was present in both Loch of Spiggie and Loch of Tingwall. P. pectinatus
can only obtain C from its shoots and in HC03* form (Van Wijk, 1989). Although
alkalinity was not measured in the first year of this study, it is suspected, because of
the harder, more alkaline waters in Group 3, that values would increase from Group
2 to Group 1 to Group 3 lochs.
5.4.2.2 Light penetration
Although light attenuation was not a significant influence on plant species present,
there may have been a tendency, as illustrated by the median values, for there to be
less light available in lochs of Group 2, than in either of the other Groups. Plant
species growth form is important in its influence on the ability of a plant to harvest
light for photosynthesis. In experiments involving sediment with different nutrient
concentrations and a range of light levels, maximum summer mean biomass of P.
praelongus, Vallisneria americana and Potamogeton robbinsii were found to be
affected by both sediment composition and light levels (Chambers and Kalff, 1987).
In shallow water, erect forms tend to be limited by sediment composition rather than
by light, whereas bottom-dwelling forms are light limited. Rosette forms such as
Vallisneria show an intermediate response (Chambers and Kalff, 1987). The /.
lacustris of Group 1 of the present study are rosette forms, which, like the Chora
spp. of Group 3, were generally found in deeper water, consequently requiring more
light than the emergent edge plant, R. flammula, which was an indicator of Group 2
lochs. Light limitation effects may be promoted by coloured water and loch basins of
higher depth:volume ratio, i.e. when the surface area of a water body is small in
relation its depth and consequent volume. Although Shetland lochs are not generally
278

of high depth:volume and no significant effect of water colour on plant species
present was detected, the median value for water colour in Group 2 was greater than
that for either of the remaining Groups.
5.4.2.3 Sources of nitrogen and phosphorus for plant growth
In the present study there was no significant difference between Groups in terms of
number of macrophyte species present, although highest numbers were observed in
lochs of Group 3, i.e. were associated with more alkaline pH and increased water
hardness. Differences between Groups were associated most with pH and water
hardness. However, Group 3 also had slightly higher TP and lower TON
concentrations than Group 2. Rorslett (1991) examined species richness data for 641
northern European lake systems and concluded that species richness was greater in
mesoeutrophic and eutrophic lakes than in those which were of dystrophic or
oligotrophic status, the latter two categories being relatively species poor.
Experimental work with Lagurosiphon major and Myriophyllum triphyllum involving
eutrophic and oligotrophic sediment in an oligotrophic lake resulted in those on
eutrophic sediments having twice the biomass of those grown on oligotrophic
sediments. In eutrophic lake water, no consistent difference was found between plants
on different sediments. This suggested that when substrate nutrient levels are low,
macrophyte nutrition is mainly from shoots, whereas under conditions of enriched
sediments, nutrient uptake occurs through the root system (Rattray, 1991).
Barko et al. (1991) state that the major source of plant N comes from benthic
sediments. However, there is evidence that both sediment and water act as nutrient
sources for aquatic macrophytes, though to varying degrees, depending upon plant
type, richness and chemical speciation of each N source. In oligotrophic lakes, water
is poorly buffered and relatively low in winter N levels compared to those of
eutrophic waters. The N present in oligotrophic waters is mostly as NO3 -N
(Schuurkes et al., 1986). Soft water macrophyte species show N03' dominated (63-
73%) N utilisation, with roots as the major uptake site (83%). These plants are
capable of surviving very low concentrations of N. This work was based on studies
of L. dortmanna, L. uniflora, Luronium natans and Echinodorus ranunculoides. This
situation may have occurred in the lochs of Group 1 in the present study, as Group
1 was characterised by isoetid plants.
279

Acidified systems are generally dominated by Juncus and Sphagnum communities.
From experimental work involving J. bulbosus, Sphagnum flexuosum and
Drepanocladus fluitans, it has been observed that in acid water communities, N
utilisation is ammonium dominated (85-90%) with leaves as the major uptake site (71-
82%). It is possible for soft water species to be rapidly saturated, not requiring N in
large quantities for survival and growth. In contrast, there is a strong increase in
biomass of J. bulbosus and Sphagnum with increase in N supply (Schuurkes et al. ,
1986).
From experiments adding P, N and K to sediment, Grace (1988) concluded that N
was the nutrient limiting Typha latifolia and Typha domingensis. When cultured
without an external DRP source, P. pectinatus survived for five weeks on P stored
in its tubers, whereas without either a source of TON or DIC, plants died quickly
(Van Wijk, 1989). In the present study, summer water TON concentrations were
relatively high in lochs of Group 2 in comparison with those of Group 3. In more
acid Group 2 waters, the major N source for macrophyte growth would be expected
to be TAN from the water column, thereby possibly explaining the TON pool
remaining relatively large. TON uptake in Group 3 would be greater from the
sediment than from the water column and water TON levels may have been low as
a result of low sediment TON concentrations.
During experimental work with Myriophyllum spicatum, no response was found to P
or K levels in enriched sediments, but a significant increase in biomass was observed
with increasing substrate N supply (Anderson and Kalff, 1986). In the present study,
although TON concentrations were significantly higher in Group 2 than Group 3, TP
concentrations were significantly lower in Group 2 than Group 3 (p < 0.1 in both
cases). It is therefore likely that both variables were having a relatively small effect
on plant species present. P is not generally a limiting factor for macrophytes owing
to their ability for P uptake from their roots. Carignan (1982) suggested a model for
P uptake by submersed macrophytes. It predicts that > 50% of the supply of P to
submersed aquatic macrophytes is from sediments when the water column
DRP:sediment interstitial water DRP ratio is > 1:4. As water DRP concentration is
often < 1.0 pg P L' 1 in the present study, it is likely that P for macrophyte growth
is mostly derived from the sediments.
280

The TP levels observed in Group 3 waters may have been important because of the
consequent enrichment of the sediment. Experimental studies on Egeria densa,
Hydrilla verticillata and M. spicatum demonstrated that these species are capable of
deriving their P nutrition exclusively from the substrate (Barko and Smart, 1980).
Furthermore, in oligotrophic Lake Hampen, Denmark, addition of P to sediment
resulted in increased leaf production rate of L. uniflora, so causing a depletion of N
in the sediment (Christiansen et al., 1985). If the sediment was providing a plentiful
P source, then it is possible that macrophytes of Group 3 lochs were N limited. P
availability in loch bottom deposites is infiienced by the P binding sites present within
the sediment (Chapter 3).In lochs of elevated water Ca and Mg concentrations, it is
likely that the sediment is Ca and Mg rich, thereby having enhanced P binding
capacity. Increased P content of the sediment would encourage macrophyte growth.
Although sediment P was not one of the parameters measured in relation to the
macrophyte studies, this variable may have an important effect on the macrophyte
community. The differences in water Ca and Mg levels between loch TWINSPAN
groups may have been related to sediment P binding efficiency.
5.4.3 Factors influencing macrophyte or phytoplankton dominance of
lake systems
Following enrichment of a body of standing water, it is difficult to predict whether
this will be expressed as macrophyte or phytoplankton dominance of primary
productivity. Development of a nutrient-rich water body of low mean depth has often
been associated with a loss of submerged plants and the occurrence of dense
phytoplankton populations, the common explanation of this result being loss of light
available to macrophytes (Balls et al., 1989). Isoetids decline in numbers and mass
with the onset of anthropogenic perturbation to a catchment, such as field drainage,
reservoir construction, acidification and eutrophication, the latter perhaps being most
important (Farmer and Spence, 1986). L. dortmanna and L. uniflora are more
resilient to disturbance and therefore are found in shallow water whereas Isoetes may
be found at greater water depth as it is a non-ruderal species. Eutrophication may lead
to loss of isoetids as they are outcompeted by faster growing macrophytes, or growth
is restricted due to epiphytic colonisation (Phillips et al., 1978). Isoetids in the
present study were indicators in Groups 1 and 2 rather than Group 3 which
incorporated lochs with elevated TP levels. S. aquatica, L. dortmanna and I. lacustris
281

are all generally restricted to waters of P concentration up to 10-20 fig P Lr1, whereas
L. uniflora may be found in waters of up to approximately 25 /xg P L'1. However, it
is actually alkalinity rather than P concentration which distinguishes the growth of
these four species as follows in order of increasing alkalinity of habitat: S. aquatica,
1. lacustris, L. dortmanna, L. uniflora (Farmer and Spence, 1986). Relatively high
alkalinity of the Shetland lochs examined in the present study (Chapter 2) could
account for the fact that S. aquatica was observed in two lochs only, rather than its
limited distribution occurring as a result of eutrophication.
A change from an aquatic system in which macrophytes are important to one in which
phytoplankton dominate does not necessarily occur with increasing nutrient
concentrations. In the present study, phytoplankton chi a concentration was found to
be slightly higher in Group 3 than Group 2 (p < 0.1), though there was no difference
between Group 1 and Group 3. It is probable that phytoplankton biomass was not
generally having a significant effect on macrophyte species present. Both
phytoplankton and macrophyte growth were dependent on water and sediment nutrient
dynamics, with increased phytoplankton chi a in Group 3 likely to be associated with
the higher TP levels in lochs of this Group. From the work of Chapter 3, it is
possible that a change from a macrophyte to phytoplankton dominated community
may be related to the P binding capacity of the loch sediment. Macrophyte
communities may be encouraged in lochs where P is adsorped by the sediments.
However, once binding sites become full, the sediment can no longer remove P from
the overlying water and may release P to the water column. The increased P in the
water column could then stimulate filamentous algae or phytoplankton growth.
Observational data on Turdale Water over the three year study period did, however,
suggest a decline of macrophytes with progressive intensification of eutrophication.
Macrophyte limitation in this instance was likely to be caused by a combination of
phytoplankton blooms and the observed growth of filamentous algae over submerged
vegetation. By 1993, the stand of P. perfoliatus noted in Turdale Water in 1991 had
almost completely disappeared. Those plants located by diver were weighed down
under filamentous algae, an observation in agreement with the work of Phillips et al.
(1978). Turdale Water sediment is likely to have had a low P binding efficiency
(Chapter 3). This combined with the high P concentrations within the water body and
282

its inflow waters (Chapter 2) resulted in augmentation of the algal assemblage
(Chapter 4).
However, explanations of either macrophyte or algal dominance may be complicated
and a holistic approach is necessary to understand the relevant processes which favour
one or other plant community (Moss, 1989). Strategies for maintenance of each
community type have been defined as follows (Balls et al., 1989):
Aquatic plant stabilisation:
(a) luxury nutrient uptake
(b) allelopathy
(c) shedding leaves with heavy epiphyte burdens
(d) provision of shelter for large grazing communities resulting in their protection
from fish and consequent consumption of phytoplankton
Phytoplankton stabilisation:
(a) early season growth allowing shading of plants
(b) easier acquisition of C0 2 especially when pH is high
(c) vulnerability of grazers to fish predation
(d) production of large inedible algae
Under conditions of low ambient water P concentrations phosphatase enzymes may
be utilised by bacteria and phytoplankton to acquire P. These proteins are located
bound to cells or released to the water column. Stands of littoral vegetation may
combat this process through release of dissolved humic compounds which form
complexes with these enzymes, thereby causing enzyme inhibition. Depending upon
enzyme reaction sites and type of organic compound involved, phosphatases may be
rereleased at some distance from their source, both spatially and temporally (Wetzel,
1990). However, in harder waters, divalent cations may complex with the organic
compounds so rendering them unable to bind with phosphatase enzymes. Therefore,
at low P concentrations planktonic algae may reach greater biomass than possible in
soft waters, this being assisted if alkalinity is also high, as phytoplankton are efficient
users of HC03' (Maberly and Spence, 1983). It is possible that Loch of Huesbreck
is such a water body, as it exhibited high macrophyte biomass, but also low water TP
concentration and chi a levels which were higher than expected for the water TP and
283

DRP values (Chapter 2).
Although water colour was not found to be significantly different between
TWINSPAN Groups, there were examples of coloured Shetland lochs where few
macrophytes were present and cyanophyte biomass became excessive. This occurred
in both Sandy Loch and Loch of Brough (Yell). Mill Pond also supported little
macrophyte growth, but dense communities of planktonic green algae were observed
in this water body. Many factors may cause growth difficulties to submerged plants
in humic lakes.
(1) Complexation of nutrient elements with organic matter may result in their non
availability (Sikora and Keeney, 1983).
(2) Anaerobic decomposition in highly organic sediments can result in production
of phytotoxins.
(3) Light limitation occurs as a consequence of high water colour, phytoplankton
dominance being likely as a result.
(4) Light limitation may also result from phytoplankton growth as algae can
remain in the surface waters to utilise available light.
(5) Slow release of phosphate from humus-iron complexes results in prevention
of acute P limitation of the phytoplankton in dystrophic lochs (Jones, 1992b).
In some highly coloured Shetland lochs, few macrophytes occurred and phytoplankton
were the successful primary producers. This situation was notable in both Sandy Loch
and Loch of Brough (Yell). It is therefore likely in these cases that initial ambient
conditions are not suitable for colonisation by rooted plants, but can support algal
growth in the water column, rather than macrophytes disappearing as a consequence
of phytoplankton growth.
The zooplankton grazing community affects phytoplankton numbers, size and
community structure. This in turn could influence macrophyte vegetation present.
During enrichment experiments on the Norfolk Broads, a complex relationship was
found between fish stock and dominant zooplankton (Irvine et al. , 1989, Table 5.7).
This example illustrates the importance of fish survival in determination of type of
predation system dominating in a water body because of its influence on the grazing
community present.
284

Table 5.7 Fish stock-zooplankton populations in the Norfolk Broads (Irvine et al,, 1989)
Stock (g m'2)
0.5-118.122.8-29.1
Dominant zooplankton type
DaphniaEudiaptomus gracilis Bosmina longirosrtis cyclopoid copepods
285

5.4.4 Classification of lochs incorporating macrophyte communities
Attempts to classify water bodies using plant communities must take fully into account
the influence of underlying physical, chemical and biological processes upon growth
of vegetation. The TWINSPAN classification of the present work failed to exhibit
many highly significant differences between Groups, owing to complex interactions
of these parameters, chance distribution of plant species and probability of different
conditions occurring within the same loch system. For example, Loch of Gonfirth was
an oligotrophic loch by water chemistry classification (Chapter 2), but had an area of
mineral sediment within it (Chapter 3).
The National Vegetation Classification (NVC) (Rodwell, 1991) acknowledges that
many different assemblages of aquatic plants may be present within a water body.
The NVC allows description of lakes with respect to macrophyte communities rather
than the individual species present. Information from NCC survey sites throughout
Britain, though with a bias toward Scotland (over 50% of NCC macrophyte data is
from Scottish sites), allowed characterisation of twenty four aquatic communities.
Many of these have sub-communities, making a total of thirty eight community types
from both lotic and lentic water environments. However, for water management
purposes, it would be more useful to have a system which classified entire water
bodies and a different approach is taken by other authors in attempts to categorise
lakes using plant species present.
From a study of twenty eight water bodies in The Netherlands, Arts and Leuwen
(1988) were able to divide macrophytes into five groups, each characteristic of a
different type of water body:
(a) J. bulbosus, Sphagnum spp., nymphaeids, species poor
(b) isoetids
(c) isoetids with a number of other species (soft waters)
(d) absence of a group of species such as Echinodorus repens, Eleocharis
acicularis, 7. lacustris and L. dortmanna which are mostly confined to groups
(c) and (e); F. antipyretica is almost restricted to (d)
(e) presence of Hydrocharis morsus-ranae and to a lesser degree, Riccia fluitans,
P. pusillus, Stratiotes aloides; group includes species frequently growing in
hard, circumneutral or alkaline waters.
286

Nitella and Chara were not included in this classification due to uncertainties of
taxonomic status and difficulties of identification.
The categories of TWINSPAN division produced by Palmer (1989) are shown in
Table 5.2. The second Group had characteristic plants of J. bulbosus and L.
dortmanna and therefore was similar to Group 2 of the present study. The third
category of categorisation was similar to the second, but had additional characteristic
species, including /. lacustris, suggesting a coincidence with Group 1 of this study.
Chara spp. were the indicators of Group 3 lochs of the present study. Water bodies
in this Group also incorporated Potamogeton species and M. altemiflorum.
Consequently, it is suggested that this division was similar to the fourth group of
Palmer (1989). As Strand Loch was under marine influence and was characterised by
Enteromorpha, this Loch may be likened to those of Group 6 of Palmer (1989).
It is suggested that both classification systems were restricted in their usefulness, as
a consequence of limited available data. The categorisation of Palmer (1989) was
confined by few environmental variables, whereas the present study was restricted to
a small number of sites and therefore fewer divisions were feasible. It is possible that
if more lochs had been involved in this study, TP and TON concentrations may have
been illustrated as being more important than they were using only thirty one water
bodies. However, the two studies were alike in suggesting a gradation in water pH
and ionic content between Groups.
From results of the present study, it is suggested that oligotrophic, dystrophic and
nutrient enriched lochs where phytoplankton population or epiphytic algae have
become dominant may possess similar macrophyte communities as expressions of low
diversity can result from different forms of limitation of primary production. A humic
loch, Mill Pond, was in the same TWINSPAN group as Roer Water and Loch of
Ustaness, which were waters of low P concentration. Turdale Water was found to be
in Group 2 of the TWINSPAN classification of the present study i.e. the same
category as oligotrophic and dystrophic lochs stated above. Chemical and chi a data
shows this water body to be highly eutrophic, therefore illustrating that the
TWINSPAN classification is not necessarily a good indicator of trophic status and
likelihood of excessive phytoplankton growth.
287

It appears that the indicator value of aquatic macrophytes for nutrient enrichment is
limited because both sediment and water characteristics affect macrophyte vegetation.
Nutrient dynamics in freshwater systems are complex. As a result, causal
relationships are difficult to establish without detailed study. Use of macrophytes as
indicators is further complicated by the variable response time which elapses between
a water enrichment event and eventual macrophyte response (Kelly and Whitton,
1994). Relationships between macrophytes, environmental variables and appropriate
procedures which would be common to all water bodies would therefore be difficult
to establish (Kelly and Whitton, 1994).
Results of the present study indicate a classification system based primarily on pH and
natural cation richness, associated with increased hardness, alkalinity, or Ca and Mg
concentrations and probably inorganic C sources, rather than P and N levels which
are involved with anthropogenic eutrophication and problems of phytoplankton
biomass. Water pH was significantly different between Groups 1 and 3, Groups 2 and
3 and Groups 1 and 2. This is consistent with the water Ca and Mg concentrations
of the different Groups, as waters are generally less acid when hardness is greater.
If pH increase had been due to increased phytoplankton growth through artificial
eutrophication, then a consistent relationship might be expected between chi a and
classification Group. Phytoplankton chi a was however, only slightly significantly
different between Groups 2 and 3.
5.4.5 Importance of macrophyte vegetation in freshwater lakes
Macrophyte stands in freshwater lakes may have important effects on water flow,
nutrient cycling and water temperature. In macrophyte stands where water circulation
is limited, temperature gradient from water surface to bottom may be greatly affected.
Retardation of water flow occurs in macrophyte stands (Carpenter and Lodge, 1986).
This in turn may have important effects on cycling of nutrients. It is possible that it
could result in much of the autumnal P losses from plants being retained within the
vegetation area until uptake in spring, the colonised area operating as a semi-closed
cell within the loch system. In the littoral Equisetum belt of oligotrophic Lake
Paajarvi (southern Finland), total primary production and respiration indicated high
internal C, N and P cycling during summer, with P requirements of Equisetum
288

growth being 2-4 times greater than that present in the surrounding water. The
amount of P available from decay and excretion products could not compensate for
this deficit. P content of the annual production of the Equisetum accounted for 2.3%
of the mean annual P loading of the lake and 5.3% of mean total P storage within the
water column (Sarvala et al. , 1982). The influence of submersed plants on lacustrine
nutrient cycling can be great, as the littoral zone is the most productive part of the
lake system (Sarvala et a l, 1982; Wetzel, 1990). As P nutritional requirements may
be met entirely from the sediment, this may allow substrate P to become available in
the water column through secretion or decay of plant material. P may be mobilised
mainly as DRP and N mostly as TAN (Kistritz, 1978). Since P is generally the
limiting nutrient for freshwater phytoplankton, this could result in increased algal
biomass. It is possible that macrophytes are actually competitively excluded from
aquatic systems having P concentrations high enough to allow significant uptake by
leaves (Barko and Smart, 1980).
In temperate eutrophic lakes, seasonal variation in nutrients contained within
macrophyte tissue may be great because of the life forms of plant species which tend
to colonise sediment under these conditions. Photosynthetic structures of species of
submerged elodeids die back in autumn, turions and rhizomes surviving to allow
redevelopment of the plant stand the following spring (Wetzel, 1964; in Sand-Jensen
and Sondergaard, 1979). However, in soft water lakes of low productivity, such as
water bodies included in TWINSPAN Groups 1 and 2 of this study, in which
macrophyte communities are dominated by isoetids, rooted plants may have a
relatively small seasonal effect on the water nutrient chemistry. For example, L.
uniflora in Lake Kalgaard (Denmark) has been found to vary little in its biomass
throughout the year, possibly as a result of its evergreen nature (Sand-Jensen and
Sondergaard, 1979). Christiansen et al. (1985) suggest that rather than P loss
occurring from L. uniflora leaves as they age, translocation to younger tissue takes
place. Consequently, lochs in the present study in which isoetids are the dominant
form of macrophyte, such as Loch of Gonfirth, will be affected relatively little by P
dynamics of the rooted vegetation. Generally Groups 1 and 2 had locally dense areas
of isoetid colonisation, but other plant growth forms such as Potamogetons were more
important in Group 3. Group 3 lochs would therefore be expected to experience a
greater effect on water nutrient chemistry from the macrophyte stands present.
289

In the present study, loch macrophyte biomass estimates were highly variable and no
difference could be detected between TWINSPAN Groups on this basis. It is possible,
even in nutrient poor acid conditions, for locally high biomass to occur. In acidified
systems (pH < 4.5), biomass of J. bulbosus and or Sphagnum spp. may be prolific,
associated with raised concentrations of N (with TAN as the major source) and
increased CO2 levels in sediment and water column (Roelofs et al., 1984). Biomass
of J. bulbosus in Group 2 lochs was not great and infrequently occurred in isolation,
often being found with L. uniflora. This is probably due to conditions not being acid
enough to promote greater J. bulbosus growth at the expense of other macrophyte
species. Mean midsummer biomass of L. uniflora and 7. lacustris in oligotrophic Lake
Kalgaard, Denmark were found to be 112 g organic dry weight m*2 and 6 6 g organic
dry weight m' 2 respectively, where organic dry weight represents loss on ignition
(Sand-Jensen and Sondergaard, 1979). The organic fraction of plant material
constitutes the great majority of the total dry weight. In the present study, single
species biomass samples ranged from 2.3 g dry weight m' 2 to 300 g dry weight m' 2
for L. uniflora and 0.4 g dry weight m' 2 to 592 g dry weight m' 2 for /. lacustris.
From analyses of plant material from the Scottish freshwaters of Forfar Loch
(polytrophic), Balgavies Loch (eutrophic) and Loch of the Lowes (mesotrophic), a
relationship was found to exist between enrichment of the environment of plant
growth and the nutrient content of the macrophyte biomass. This relationship was
stronger when considering P than N (Ho, 1979). Plants examined from these lochs
were Juncus effiisus, Iris pseudocorus, Carex rostrata, Gtyceria maxima, Nuphar
lutea, Polygonum amphibium and Schoenoplectus lacustris. From a variety of tissues
examined a range of P, N and C contents were found in plant material from each loch
(Table 5.8).
290

Table 5.8 P, N & C content of plant material in three Scottish Lochs (Ho, 1979)
Water body P (mg g*1) N (mg g’1) C (mg g'1)
Forfar Loch 3.12-5.90 6.91-34.24 450-502
Balgavies Loch 1.39-4.67 7.52-40.78 452-490
Loch of the Lowes 1.02-1.38 8.22-15.95 468-490
KEY:P and N reported as of dry weight, C content as ash-free dry weight
291

During sediment enrichment experiments, by Christiansen et al. (1985), tissue P
concentration in L. uniflora was found to increase with increasing P additions in leaf,
stem and root structures. Additions of TAN and TON, in a 1:3, TAN:TON ratio,
resulted in greater N content of leaves and shoots, but did not affect leaf production.
Average tissue concentrations of P and N in L. uniflora were 0.28% (estimated
critical tissue concentration) and 3.29% respectively. Critical tissue concentration of
P. pectinatus has been found to be only 0.15%, but this plant also takes up P in
excess to immediate requirements at high external DRP concentrations (Van Wijk,
1989).
Allenby (1981) found that there was no correlation between water DRP concentration
and P content of the following aquatic macrophytes: Lemna minor, Elodea
canadensis, Potamogeton crisp us, P. pectinatus, Ceratophyllum demersum, Scirpus
tabemaemontani. This may have been because macrophytes are generally dependent
upon sediment, rather than water, as a P source (although it is also possible for DRP
concentration to be influenced by plant uptake).
In water washed plants, P ranged from 0.68% per plant of S. tabemaemontani, to
2.56% per plant of E. canadensis. Total kjeldahl N (TKN) of water washed material
was determined in L. minor, L. gibba, P. crispus, P. pectinatus and C. demersum.
Mean TKN expressed on a per plant basis ranged from 2.4% in P. pectinatus to
4.3% of L. gibba (Allenby, 1980). Concentrations of P in plant tissues varies and
critical P concentrations for submerged macrophytes differ, depending upon species
(Christiansen et al., 1985) and generally, the more enriched a loch system, the
greater the concentration of nutrients in plant structures through luxury uptake. Plants
associated with enriched systems are more likely to lose nutrients to the water column
than those of nutrient poor situations. As a consequence, deterioration of water
quality through macrophyte growth is likely to be faster than in an oligotrophic
system. However, during studies of Typha latifolia and Typha domingensis, sediment
was affected by these species as follows: TAN was reduced by 90-95 %, K was
depleted by 35-55%, but P remained at the same concentration as uncolonised
sediment because of N limitation (Grace, 1988). Consequently, regardless of P
concentration available for macrophyte growth, if another factor is limiting, the
effects of macrophyte stands on P dynamics in the loch system are decreased. For
292

example, water depth effects prevent macrophytes utilising increased nutrient supply,
as a consequence of lower light availability in deeper water (Chambers and Kalff,
1985; Anderson and Kalff, 1986) and because the degree of aeration of the sediment
surrounding the macrophyte root system may be depth dependent in certain species
(Grace, 1988).
When oxygen leakage from vascular macrophytes occurs in reduced sediments, P
becomes bound to Fe, so decreasing concentrations of Fe and P in sediment
interstitial waters and resulting in arrest of P release from sediment sources to the
water column. Potential for aeration of roots and rhizosphere varies depending on
plant species. For example, sediment redox potential is increased by T. domingensis
at medium depths, but unaffected by T. latifolia, regardless of water depth (Grace,
1988). Oxidation of sediment in oligotrophic lakes by rosette forms decreases the rate
of P cycling (Jaynes and Carpenter, 1986). However, in eutrophic systems, rate of
oxygen release is slower owing to the different plant life forms present under these
conditions and sediment oxygen deficit is greater, so that the effect of macrophyte
growth is inadequate to improve sediment conditions (Sand-Jensen et al., 1982;
Carpenter et al.t 1983). Again, those lochs in the present study with a high
proportion of total macrophyte biomass as isoetid species, such as L. uniflora, are
likely to be less affected by P flux from the macrophyte colonisation zone. Generally
this applies to lochs of Group 1 and Group 2 where, though there may be other
growth forms, such as Potamogeton species, plants of rosette-like structure
nevertheless comprise much of the total biomass. Sediment of lochs of Group 3, such
as that in Lochs of Tingwall and Spiggie, is likely to be affected less by oxidation via
macrophytes, as much of total macrophyte biomass is present as non-rosette forms.
5.5 CONCLUSIONS
Macrophyte species present in Shetland Island lochs were typical of those observed
elsewhere in Scotland, in lowland areas under maritime influence, in water bodies
situated on fertile and non-fertile geology.
Between TWINSPAN Groups of lochs in this study, there was no significant
difference in macrophyte biomass estimates from areas of vegetation colonisation. As
total area and volume of macrophyte colonisation in each water body were not
293

determined, it is not possible to conclude whether these variables would have been
valuable as indicators of phytoplankton growth.
In terms of water quality, macrophyte species present in the Shetland lochs surveyed
were found to be influenced most by pH, Ca and Mg concentrations. The
classification system of Shetland lochs by TWINSPAN division was therefore
indicative of different water pH values, CCyHCCV levels, hardness and alkalinity.
Group 3 TP levels were elevated compared to those of Group 2 and TON
concentrations were low in the former. These conditions may be indicative of a
similar situation in the sediment. Therefore, particularly in lochs with higher TP
concentrations, macrophytes may be N rather than P limited.
Macrophytes may not be competing for the same nutrient sources as phytoplankton.
Phytoplankton can obtain nutrients from loch bottom deposits, either from the
sediment surface, or from the loch water when sediment nutrients have become
available to the water column. Macrophytes can assimilate nutrients directly from the
water column. However, phytoplankton nutrition is typically taken directly from the
water column, whilst sediments are the major source of P and N for macrophytes.
Phytoplankton growth in freshwater systems is normally P limited, although N levels
may influence species composition. Typically, aquatic macrophytes obtain their P
requirement from sediment sources and may become N limited.
Owing to within Group variation, there was no consistent relationship between chi a
concentrations and TWINSPAN Group. Chi a levels in Group 3 lochs were only
slightly elevated in comparison with Group 2 lochs. It was concluded that macrophyte
species present would not be an effective indicator of water column conditions likely
to support excessive phytoplankton growth.
In oligotrophic water bodies, macrophyte growth is likely to have relatively little
effect on nutrient cycling within the lake system. However, in enriched systems, it
is more probable that macrophyte vegetation accounts for an important proportion of
the total lake nutrient budget, through increased uptake with increased availability and
die-back of eutrophic growth forms.
294

CHAPTER 6 : CHARACTERISTICS OF SHETLAND SOILS WITH REGARD
TO THEIR PHOSPHORUS BINDING PROPERTIES
6.1 INTRODUCTION
6.1.1 Aims
The purpose of this section of the study was to investigate whether it was possible
that when land is treated with fertiliser, as occurs during reseeding operations,
fertiliser nutrients may be transported to the water drainage system and consequently
cause enrichment of standing fresh waters. Both N and P are important in primary
production in freshwaters. It is possible for N to restrict algal production and the
concentration of N in relation to P influences which genera of algae are likely to
dominate the phytoplankton community. However, P is generally the limiting nutrient
for phytoplankton in freshwater systems.
The aims of this section of work were therefore as follows.
(a) From published information consider briefly the effects of reseeding
procedures on soils in terms of drainage, N transformations and soil pH.
(b) Conduct a study of a range of soils from the catchment areas of the lochs
studied in 1991, in order to determine the basic soil characteristics of pH,
water and organic content.
(c) Collect soils from the study watersheds of the period 1992 to 1993 and
determine:
(i) soil characteristics as specified in (b) above
(ii) present water soluble molybdate-reactive P content, i.e. that which might
be lost to the drainage system through soil water flow
(iii) the capacity of soils for sorption of added P.
(d) relate water soluble P content and P uptake capacity to the simple soil
variables of pH, water and organic content determined in the soils from the
study drainage basins of the period 1992 to 1993.
(e) formulate a soil P loss risk assessment for Shetland soils, based on easily
measurable soil parameters of pH, water and organic content.
6.1.2 Effects of pre-fertilisation management practices on catchment soils
6 .1.2.1 The influence of field drainage on catchment water flow patterns
The greatest impact of drainage is on the route of water loss. During waterlogging,
infiltration of precipitation to the soil is slow and restricted to shallow depth. Water
295

leaves either by surface runoff or near surface flow, whereas introduction of drainage
enhances soil macroporosity and incident precipitation can then travel through the soil
and leave rapidly through the drainage system (Armstrong and Garwood, 1991). In
areas of clay loam soil, although drainage lowers the water table and reduces duration
of water logging, its effects in terms of total loss of water from a soil or on peak flow
are relatively small (Armstrong and Garwood, 1991).
In a study by Knight et al. (1972), water was traced through peat and found to move
in a distinct layer. A general flow of ground water was found which was independent
to that associated with flow to the drainage ditches. Different drainage conditions will
affect distribution of water movement. Water movement through peat is dependent on
hydraulic gradients which are generally related to hydraulic conductivity. However,
although it was possible to link downward movement to drainage conditions, lateral
movement is much more complex and may be inexplicable in terms of surface
topography or hydraulic gradient. Local configurations within peat may therefore
significantly affect water movement (Knight et al., 1972).
Ground water movement affects the distribution of vegetation. Benefits of water
movement may include removal of toxic waste products of breakdown of organic
matter, such as CO2 , sulphides and ethylene as well as transport of oxygen from the
soil surface (Knight et al. , 1972). Water movement can also transfer nutrients to plant
roots (Knight et al., 1972). It has been suggested that growth of Pinus contorta
(lodgepole pine) is improved through drainage on deep peat, due to the increase of
water movement within the soil, rather than from consequences of reduction of water
content (Boggie and Miller, 1976), although experimental work on blanket bog in
Scotland found that increased N availability to Pinus contorta following lowering of
the water table was a result of deeper rooting depth (Williams and Wheatley, 1988)
6.1.2.2 Effects of field drainage on nitrogen transformations in soils
Drainage results in aeration of the soil, thereby causing changes in the chemical form
in which nutrients are present. Decay processes are facilitated by oxygenation, with
a general increase in microbial biomass developing with improved aeration (Williams
and Wheatley, 1988). Because N mineralization in peat is slow, availability of N for
plant growth is limited despite the fact that peat may contain large amounts of organic
296

N (Dickson and Savill, 1974; in Williams and Wheatley, 1988). Biological activity
of microorganisms involved in N cycling may be affected considerably by increasing
soil aeration and plant growth (Williams and Wheatley, 1988). Increased
mineralization of organic matter may occur as a result of soil aeration. Numbers of
aerobic and anaerobic ammonifying bacteria in oligotrophic deep peat in Scotland
have been found to increase following lowering of the water table from 0 cm to 50
cm, 80-90 % of the ammonifiers occurring in the upper 20 cm of the soil profile
(Williams and Wheatley, 1988). Mineral N present mostly as ammonium decreased
rapidly with depth below 20 cm. NO3-N was present in trace amounts only, probably
due to low abundance of ammonium oxidising (nitrifying) bacteria in this soil.
Bacteria capable of transforming nitrate to nitrite, i.e. nitrate reducers were also
present mostly in the first 20-30 cm of profile, though in considerably smaller
numbers than the ammonifiers (Williams and Wheatley, 1988).
Effects of microorganisms on N cycling are likely to depend upon several factors.
High acidity, poor aeration and restricted ammonium supply are likely to limit growth
in oligotrophic peats, although other higher pH and more mineral rich peats may have
greater N availability. The nitrogen content of mineral soils generally falls within the
range 0.1-0.5 %, whilst that of organic soils is typically 0.5-1.5 % (Allen et al.,
1974).
During operation of a pump drainage scheme in England, lowering of the water table
through pumping resulted in discharge of nutrients from the peat in the watershed
(Heathwaite, 1991). In the water of the drainage ditch examined, solute peaks were
noted in the following order: S0 4 -S, NH4 -N, Ca+Mg + N 0 3 -N. It follows that
natural seasonal variations in the water table, such as the lowering of the water table
in summer, after the increased water level of winter and spring, could result in
nutrient releases. In addition, when soils are drained initially in preparation for
fertiliser treatment, a nutrient flux to a loch might occur. The nature of the nutrient
load would depend on soil type and there are differences between peats in terms of
their natural nutrient pools. Drainage increases bulk density and decreases hydraulic
conductivity in peat. The characteristics of the soil hydraulic conductivity affect the
volume of peat influenced by drainage. In base-rich, fen peats, removal of nutrients
from peat through drainage is high. The low hydraulic conductivities generally
297

present in amorphous peats result in relatively low nutrient removal when drainage
is implemented, whereas in fibrous peats, where hydraulic conductivity is greater, a
larger volume of peat contributes to nutrient loss (Burke, 1975).
6 .1 3 3 Adjustment of pH in soils
The soil pH which is required for agricultural purposes is approximately pH 6.5 (pH
6.0 for grass (I.D. Pulford, University of Glasgow, pers. comm., 1995)). In order
to improve land for pasture it is therefore generally necessary to increase the pH of
the soil. This may be achieved by the addition of lime (Ca(OH)i) or ground limestone
(CaC03). The lime requirement of a soil is dependent on the pH of the soil, but also
the total exchangeable hydrogen content. This means that when lime is first added to
the soil, neutralisation of the free H+ ions in the soil solution occurs, but ionization
of H+ from the unsaturated exchange complex continues. All exchangeable H+ must
be neutralised and replaced by metal cations before pH can be adjusted to pH 6.5.
(Etherington, 1982). Lime requirement will therefore depend on soil type. Sandy soil
needs relatively little lime because of its low CEC, whereas acid soils with a high
organic content would require more. CEC in clayey soils is extremely high, so an
acid soil with a significant clay content would be much more difficult to neutralise.
6.1.3 Fate of fertiliser nutrients in soils
Many factors influence what happens to fertiliser nutrients in soils: soil class, rainfall,
fertiliser type, together with method and time of application all have a variable effect
on fate. After fertilisation of soil, N is lost to drainage water or runoff. The inorganic
form in which N is mainly found when this occurs appears to vary. In temperate
regions, mineralization of N from soil reserves and plant remains through microbial
action accounts for more N loss than is possible through crop uptake during some
periods of the year. Loss of nitrate to drainage water is therefore inevitable. Though
losses from grassland are probably less substantial than from crop land, nitrate is
released from organic matter in spring through increased rate of mineralisation, and
much may be lost through leaching of decomposition products in winter, due to
increased precipitation and slow plant growth. After fertiliser applications of N (50
kg N ha'1), P (50 kg P ha*1) and K (100 kg K ha'1) to blanket bog, under drained and
undrained conditions (Burke, 1975), peak inorganic N concentrations in drain outflow
and surface runoff occurred immediately after soil treatment. Surface runoff exhibited
298

a nitrate concentration of > 3 mg N L' 1 and an TAN level of 20 mg N L 1. In
contrast, drainage outflow water had > 5 mg N L* 1 of both NOj* and TAN. The
increased level of P in fertilised soils has been associated with limited N
mineralisation rates. After treatment of free-draining peat with NPK additions
(Malcolm et al., 1977), TAN loss was observed to be three times greater from peat
treated with 200-400 kg P ha1, than from that with an addition of only 4.4 kg P ha1.
The fate of P additions to soils is influenced by soil pH, ash content, CEC (buffering
capacity), phosphate sorption index, iron (Fe) and aluminium (Al) content. All affect
P retention, CEC playing a crucial role (Cuttle, 1983) as it affects availability of
cations for binding with the anion PO 4 3". Both sorption and desorption of P in soils
are influenced positively by nutrient and electrolyte concentration, the period of
reaction and temperature (Barrow, 1983). Increasing temperature results in increased
sorption and conversely, desorption (Barrow, 1979). The amount of P adsorbed by
soil generally increases with concentration of P in solution, although this relationship
is complex and heavily dependent upon pH. Presence of a more concentrated
background electrolyte solution of other elements elevates sorption processes (Barrow
et al., 1980). Although P adsorption is dependent upon many parameters, through
formation of relatively insoluble complexes, it is not easily lost from soil once
sorbed. A longer period of uptake allows P to become more firmly bound and
therefore difficult to desorb, although if the rate of P soiption has been high,
desorption will occur more readily.
Local variations in soil structure may be significant influences on fates of fertiliser
nutrients through their influence on pore water flow rates (Heathwaite, 1991).
Occurrence and extent of preferential flow in larger water filled soil pores depends
on the hydraulic conductivity of all other pore sizes in the soil and on density of
rainfall. Degree of equilibration between soil zones of greater or lesser water mobility
varies with the relative volume of these zones and the rates at which solute
equilibrates with leaching water within a given area of low hydraulic conductivity
(Barraclough et al., 1983).
6.1.4 Indices of P sorption in soils
P in soil may be classified as P in solution, solid bound labile P, or solid bound non
299

labile P (Hartikainen, 1991). Since the fate of labile inorganic phosphate in soils is
dependent upon sorption and desorption mechanisms, characterisation of soils in terms
of these processes is useful for prediction of their behaviour during fertilisation. A
soil sorption index may also take into account Quantity (Q) and Intensity (I),
parameters which have been used in studies of plant P uptake (Bache and Williams,
1971). I is the P concentration in equilibrium solution and Q is the amount of labile
P available when solution concentration is changed, i.e. it is equated with P sorbed
plus P already sorbed in the field.
P uptake onto soil particles is dependent on quantity of adsorption sites and P affinity
of the sites. P in solution moves onto vacant adsorption sites until an equilibrium is
reached, between solution and solids. Conversely, when P is removed from soil
solution through leaching or plant growth, P moves from its binding sites into
solution to dynamic equilibrium. Intensity and quantity of labile P and the equilibrium
buffering capacity of a soil are related to the P adsorption capacity of the soil and
additions of P which have been made to the soil (Holford and Mattingly, 1976a).
Changes in Q and I occur between soils, depending on the slope of the sorption
isotherm which shows the buffering capacity of a soil in relation to P addition (Bache
and Williams, 1971; Holford and Mattingly, 1976a).
Adsorption isotherms show the amount of adsorbate as a function of the equilibrium
concentration of the added solution and are commonly used to quantitatively illustrate
solute adsorption by solids at constant temperature and pressure. The P buffering
capacity of a soil is the relationship between the concentration of P in soil solution
and the amount of adsorbed P. These parameters are known as intensive and
extensive respectively. The shape of the isotherm in adsorption studies is dependent
on the affinity of the soil for the adsorbate. There are three equations which are
generally used in describing data from adsorption tests: Langmuir, Freundlich and
Brunauer-Emmett-Teller (BET) equations (Figure 6 .1) (Bohn et al. , 1989). According
to Bohn et al. (1989), the shape of the Langmuir adsorption curve is well established
when considering P uptake by soil. The form of the curve is such that it can be
divided into two distinct straight lines.
300

Figure 6.1 Three characteristic forms o f adsorption test results
I
Monolayer
Langmuir
oC/5c01 •e 8 ■a
Monolayer
C9OS<
Freundlich
BET
>
Solution concentration
301

There may be two types of uptake sites of different binding strength and adsorption
maxima or two separate processes of uptake on similar sites (Bohn et al., 1989). It
is thought that high energy and low energy P adsorption surfaces exist (Bohn et al.,
1989; Holford and Mattingly, 1976b).
For most soils, sorption continues to increase slowly with increasing P concentration
and time, but an obvious end-point of maximum adsorption is difficult to ascertain.
The sorption maximum determined experimentally is generally greater than, though
may be proportional to, that calculated from tangents to Langmuir isotherms (Bache
and Williams, 1971). Maximum buffer capacity has been recommended as a P
sorption index by Holford and Mattingly (1976a). Isotherm slopes should be
compared at the same equilibrium concentration, since uptake varies with
concentration (Bache and Williams, 1971). Several P concentrations of addition are
required to produce data for an isotherm, but the simplest way of comparing soils is
through addition of a single P concentration. Isotherm slopes of different soils may
intersect, so that whilst sorption of P at a particular concentration may be the same
for various soils, P uptake rate is actually different. However, this is considered only
to occur at low equilibrium concentrations, due to differences in the initial amount
of exchangeable P present in different soils. At low concentrations, varying actual
concentration due to this differing residual may be taken into account by plotting mass
P sorped/eqilibrium concentration or log equilibrium concentration (Bache and
Williams, 1971).
Tangents to Langmuir isotherms, mass of adsorbate/log equilibrium P concentration,
mass of P sorped at a single equilibrium P concentration or a single P addition
concentration are all well correlated with isotherm slope. However, single addition
P concentration is the most convenient way of examining soil P uptake characteristics
when there are many soils to examine in a limited time period.
6.2 MATERIALS AND METHODS
6.2.1 Site locations and field methods
In October 1991, sites at which samples of soil were taken were chosen from
catchments of twelve of the thirty one lochs surveyed in order to encompass a range
of soil types (Table 6 .1). In October 1992 up to seven soil sampling pits were created
in each of the five chosen catchments.
302
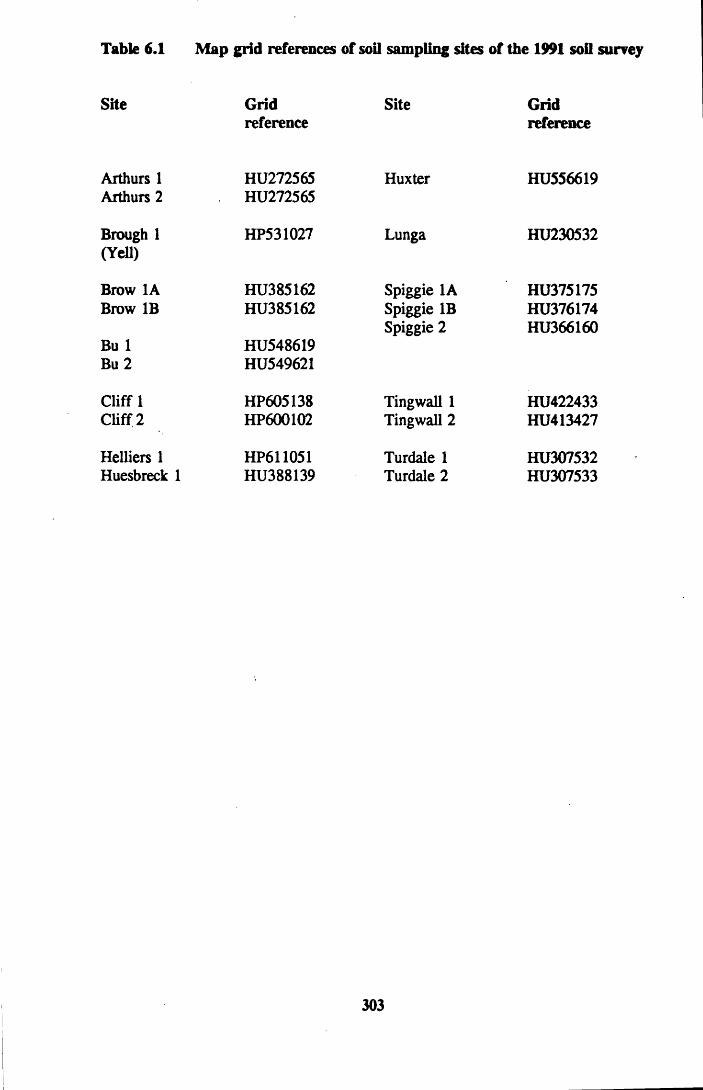
Table 6.1 Map grid references of soil sampling sites of the 1991 soil surrey
Site Grid Sitereference
Arthurs 1 Arthurs 2
Brough 1 (Yell)
Brow 1A Brow IB
Bu 1 Bu 2
Cliff 1 Cliff 2
Helliers 1 Huesbreck 1
HU272565HU272565
HP531027
HU385162HU385162
HU548619HU549621
HP605138HP600102
HP611051HU388139
Huxter
Lunga
Spiggie 1A Spiggie IB Spiggie 2
Tingwall 1 Tingwall 2
Turdale 1 Turdale 2
Gridreference
HU556619
HU230532
HU375175HU376174HU366160
HU422433HU413427
HU307532HU307533
303

KEY TO FIGURE 6.2 (overleaf)
Letter codes
Deep blanket peatPeaty gleys, peat; some peaty podzols and peaty rankers Peaty gleys, peaty podzols, peaty rankers Peat, peaty gleys, peaty podzols Magnesian gleys, some brown magensian soils Magnesian gleys, some magnesian soils Peaty gleys, peat, some peaty rankers and peaty podzols Alpine soils; some rankers, subalpine soils and peat Basin and valley peatBrown forest soils; some brown rankers and non calcareous gleys Peaty gleys, peaty podzols and peaty rankers Peaty gleys, peaty podzols and some peat Peaty podzols, peaty rankers Blanket peat; some peaty gleysPeat with some peaty gleys, peaty podzols and peaty rankers Peaty gleys, peat; some peaty podzols and peaty rankers Deep blanket peatPeaty gleys, non calcareous gleys; some peat, peaty podzols and rankers U
Number Codes
Numbers refer to sampling sites in text and tables
Shading/symbol
Sampling site ■
Loch surface
Other standing waters
Source: Data from MISR (1985)
304

Figure 6.2 Soil sampling sites in Shetland catchments, 1992
z < $■
CO
Q_
305
Sand
y Lc
xh
Turd
ale
Wat
er

Figure 6.2 illustrates the positions of soil sampling sites within each of the catchment
areas examined in 1992. At each site a pit was excavated in order that soil horizons
be identified, depth of each horizon measured and samples of soil obtained. Soil was
stored in polyethylene bags and remained refrigerated until further analysis on return
to the laboratory.
6.2.2 Determination of pH, water and organic contents of soils
In the laboratory, soils were spread out on plastic sheeting and air dried at
temperatures not exceeding 30°C. Lumps of soil were broken up to assist drying.
Sieving was undertaken after the soil was dry and removal of the majority of stones
and vegetation complete. A mortar and pestle were used to grind soil, taking care not
to break down stones, prior to passage through a 2 mm mesh. The sieved samples
were stored in glass jars.
Percentage water content (%WC) of each soil was determined by weighing 10 g air
dry soil on a (type) balance before and after oven drying overnight at 110°C.
Percentage loss on ignition (%LOI) of these samples was calculated after they had
been reweighed. Vitreous basins containing these subsamples of soil were placed in
a muffle furnace and heated at 500°C for 6 hours. After cooling in a desiccator,
samples were reweighed on the same balance. Both %WC and %LOI were calculated
as a percentage of oven dry soil weight. This method of calculating %WC can result
in values in excess of 100%. For example, when an air dry soil sample weighing 10.0
g contains 4.7 g soil and 5.3 g water, the %WC is calculated as 112.8%, rather than
53%.
pH measurement was carried out using air dry soil. 10 g of soil was weighed into a
beaker and 25 mL distilled water added. The mixture was stirred intermittently by
hand for 15 minutes using a glass rod. The resulting paste was then agitated and the
pH probe inserted. The pH was determined after 30 seconds to allow the Coming
Model 5 Meter reading to stabilise.
6.2.3 Phosphorus adsorption studies
Of the soils sampled in 1992, five were chosen on the basis of field description, pH,
water content and %LOI to give a range of soil types. 1 g of each soil was weighed
306

into a screw-capped glass bottle. Standard solutions of KH2 P0 4 were made up in 0.01
M CaCl2 solution. These eleven solutions contained standards at 10 mg P L* 1 intervals
within the range 0-100 mg P L*1. Each soil was treated with 25 mL of each solution.
The bottles were then shaken continuously on an end-over-end shaker for 18 hours,
before soil-solution mixtures were filtered through Whatman Nfil filter papers. Filtrate
was collected in polyethylene bottles and stored frozen until analysis. Procedure
blanks were obtained by passing 0.01 M CaCl2 through the above schedule. A t e
dilution to within the standard range, P was determined as molybdate reactive P,
using the techniques described in Chapter 2. Spectrophotometric determinations were
carried out using a 1 cm cell pathlength.
From results of the above investigation, P solution concentrations of 0, 20 and 100
mg P L' 1 were chosen as treatments for the remaining soil types. Soils which had
already received fertiliser additions in the field were given the control treatment of
0.01 M CaCl2 only, in order to estimate P losses, resulting from their previous
fertilisation in the field. Procedures were undertaken as described above.
6.2.3.1 Relationships between soil P retention and pH, %LOI and %WC
Linear regression analysis was carried out in order to ascertain whether significant
relationships existed between each of the parameters of pH, %WC and %LOI (as
independent variables) and each of water soluble P content and adsorption at the
different treatment levels (as dependent variables).
6.3 RESULTS
6.3.1 Characteristics of soils collected in 1991
Results of the determinations of pH, %WC and %LOI of soils sampled in 1991 are
presented in Table 6.2.
6.3.1.1 The range of pH in Shetland soils
Soils collected from twelve of the thirty one loch drainage basins showed a wide pH
range from acidic to slightly acidic conditions (of more than 3.00 pH units). Peat
from the catchment of Loch of Brough (Yell) had the lowest pH at pH 3.69. Soils in
the catchments of three other lochs had pH levels of < 4.00.
307

Table 6.2 Characteristics of catchment soils sampled during the 1991 soil survey
Site Horizon Depth (cm) pH %WC %LOI
Arthurs 24/10/911 O 0 - 8 4.57 14.0 32.4
2 O 0-15 5.09 2 . 1 8 . 0
Brough (Y) 25/10/911 P 0-29 3.69 29.5 91.2
Brow 27/10/911A O/A 0 - 6 4.96 n.d. n.d,
1A Bw 6-16 4.81 3.6 17.2
IB O 0 - 2 0 4.81 5.5 28.2
Bu 26/10/911 O 0-16 4.87 73.8 90.4
1 Bh/E 16-20 4.32 3.2 36.8
2 O 0-26 4.30 29.3 94.4
Cliff 25/10/911 O 0 - 2 0 4.25 4.4 25.1
1 E 20-23 5.02 1.7 5.3
1 E/Bs 23-34 4.97 2.3 6.5
1 Bsl 34-44 5.45 1 . 0 2 . 8
1 Bh 44-48 5.20 1.3 3.3
1 Bs2/C >48 5.51 2.9 5.8
2 A 0 - 1 1 5.10 13.1 67.9
2 Big 11-26 5.34 10.5 24.0
2 B2g 26-38 5.82 1 . 8 3.2
308

Table 6.2(cont.)
Site Horizon Depth (cm) pH %WC %LOI
Heiliers 25/10/91 1 A 0 - 8 4.35 1 2 . 2 32.5
1 B 8-16 4.67 4.0 20.5
Huesbreck 27/10/91 1 Ap 0-18 6.56 1 . 1 7.0
1 18-27 5.80 0.3 1.3
1 Bw2 >27 6.90 0 . 1 0.9
Huxter 26/10/91 1 P 0 - 2 0 3.99 34.3 96.8
Lunga 24/10/91 1 P 0-9 4.08 1 2 . 0 96.8
1 P 0 - 1 0 4.50 19.7 8 6 . 1
Spiggie 27/10/91 1A A 0-28 5.40 9.0 13.7
IB E 5-14 4.98 3.2 16.3
2 O 0 - 1 0 4.18 9.6 85.9
Tingwall 27/10/91 1 O 0-15 3.98 1 1 . 0 95.2
1 Bg >15 3.79 8.5 93.9
2 A 0 - 1 2 5.40 5.4 15.6
2 B J 12-39 5.59 6.7 9.5
2 Bw2 39-79 5.86 4.0 7.1
2 C >79 5.00 2.7 6.3
309

Table 6.2(cont.)
Site Horizon Depth (cm) pH %WC %LOI
Turdale 24/10/911 0 0-23 4.19 11.5 95.7
1 B >23 4.00 13.0 95.8
2 0 0-15 3.95 12.7 97.0
2 B2 15-40 4.00 11.9 97.0
310

These samples were taken from Loch of Huxter peat, Tingwall Site 1 (O and Bg
horizons), Turdale Site 1 (B horizon) and Turdale Site 2 (O and B2 horizons). Soils
from watersheds of Lochs of Cliff, Spiggie, Brow, Tingwall, Turdale Water, Helliers
Water, Lunga Water, Bu Water and Arthur’s Loch all fell into the range pH 4.08 to
pH 5.00, these values referring to Lunga Water surface peat and Loch of Tingwall
Site 2, C horizon respectively. Drainage basins of Lochs of Cliff, Spiggie, Tingwall
and Arthur’s Loch also incorporated soils within the range pH 5.02 (Cliff Site 1, E
horizon) to pH 5.86 (Tingwall Site 2, Bw2 horizon). Of the nine different horizons
sampled at Loch of Cliff, seven were in this category. Loch of Huesbreck soil from
the BW1 horizon with a pH of 5.80 also came within this range and the most alkaline
soils collected were obtained from this catchment. pH levels of 6.56 and pH 6.90
were recorded in soil of the Ap and B*2 horizons respectively.
6.3.1.2 Water content of catchment soils
Soil from Bu Water Site 1 had a %WC in the O horizon soil of 73.8%. This was in
excess of all other soil %WC observed, the next highest being Loch of Huxter peat
with a %WC of 34.3%. Also notably high were %WCs of 29.5% and 29.3% for
Brough (Yell) peat and Bu Water Site 2, O horizon respectively. Other soils which
were found to have %WC > 10% were collected from the following loch
catchments:- Arthur’s, Cliff, Helliers, Lunga and Tingwall. Soils with the lowest
%WCs were from the drainage basins of Lochs of Huesbreck, Spiggie, Brow,
Tingwall, Cliff, Helliers Water, Bu Water and Arthur’s Loch. These watersheds
incorporated soils with %WC < 10%. Least moisture was found in samples from
Loch of Huesbreck catchment, horizons BW1 and B*2 having water contents of 0.3%
and 0 . 1 % respectively.
6.3.1.3 Organic content of drainage basin soils
The maximum recorded %LOI of the samples taken was for Turdale Site 2. Organic
matter constituted 97% of both O and B2 horizons. Of thirty eight determinations,
thirteen soil samples were found to have %LOI of > 80%. Included in this category
were soils from the following catchments: Lochs of Huxter, Brough (Yell), Spiggie,
Tingwall, Lunga Water, Bu Water and Turdale Water. Those exhibiting >80 %
%LOI were mostly O horizons or peats; all peat samples contained > 80% organic
matter. Conversely, %LOI of seventeen samples was <20%. These less organic soil
311

samples were taken from the drainage basins of Lochs of Cliff, Spiggie, Brow,
Tingwall, Huesbreck and Arthur’s Loch. Least organic was the soil from Loch of
Huesbreck, the BW1 and B*2 horizons exhibiting 1.3% and 0.9% %LOI respectively.
Soil horizons taken from Bu Water and Helliers Water, Lochs of Brow and Cliff and
Arthur’s Loch were found to have %LOI figures intermediate between highly organic
and mineral soils. Loch of Cliff Site 2, A horizon showed the highest organic content
of these soils (67.9%), whereas Helliers Water Site 1, B horizon was only slightly
organic in comparison (20.5%).
The characteristics of %WC, %LOI and pH were found to vary both with depth in
individual soil profiles, diversity occurring between horizons and within catchment
areas. For example, although watersheds of Lochs of Cliff, Spiggie and Tingwall
incorporate a large proportion of mineral soils, relatively wet, organic, acid soils are
also present within these drainage basins.
6.3.2 Characteristics of soils collected in 1992
Results of pH, %WC and %LOI determinations in soil samples obtained from the 5
catchments of the 1992-1993 section of this study are presented in Table 6.3.
6.3.2.1 Loch of Gonfirth
The pH of soils collected in the Loch of Gonfirth catchment area ranged from pH
3.85 in soil taken from 24-52 cm depth at Site 6 , to pH 4.91 in soil from site 1, 0-20
cm. Generally, soils were characterised as being highly organic. With the exceptions
bf Sites 3 and 4, all %LOI determinations were >90%, greatest organic content of
97.5% being present in soil from Site 2, 20-50 cm. %LOI of soil from sites 3 (0-31
cm) and 4 (0-33 cm) was 65.5% and 54.1% respectively. %WC was greatest in soil
from Site 1 (20-50 cm), 8 6 .6 % being recorded, although only 11.6% of the soil
sample from Site 6 (24-52 cm) was found to be water.
6.3.2.2 Helliers Water
The pH of soil from Helliers Water catchment area was generally higher than pH of
soils from Loch of Gonfirth drainage basin. Maximum pH recorded was pH 5.81
(Site 5, 22-23 cm), minimum pH 4.48 (Site 3, 0-8.5 cm).
312

Table 6.3 Characteristics of catchment soils surveyed in October 1992
Loch of Gonfirth 12/10/92
Site Depth (cm) pH %WC %LOI
1 U 0 - 2 0 4.91 18.4 95.61L 20-50 4.00 8 6 . 8 94.7
2 U 0 - 2 0 4.65 50.1 97.22L 20-50 3.82 35.3 97.53 0-31 4.40 2 2 . 8 65.54 0-33 4.73 14.4 54.15U 0-25 4.72 13.6 96.65L 25-46 4.00 56.5 97.06 U 0-24 4.06 14.4 96.76 L 24-52 3.85 1 1 . 6 97.4
Helliers Water 10/10/92
Site Depth (cm) pH %WC %LOI
1 0-19 5.28 23.3 36.22 0 - 2 0 4.91 7.0 30.43U 0-8.5 4.48 42.5 94.53L 8.5-18.5 4.56 32.4 56.54U 0-7 4.85 16.5 80.54L 7-16 4.63 9.8 38.65U 0 - 2 2 5.35 24.2 37.35L 22-23 5.81 1 . 2 3.16 U 0-15 5.21 5.7 17.36 L 15-22 5.42 0 . 6 2.3
Sandy Loch 14/10/92
Site Depth (cm) pH %WC %LOI
1U 0 - 2 0 3.80 14.3 92.71L 20-50 4.17 2 1 . 2 96.72U 0 - 2 0 4.50 20.7 96.92L 20-50 4.25 20.5 97.63U 0 - 2 0 3.98 8 6 . 1 84.93L on cn
X V T JU 4.16 4A A*f9.j 8 6 . 0
4 0 - 1 0 6.15 7.8 43.45U 0 - 1 0 4.05 29.5 83.05L 10-26 3.80 189.4 97.36 U 0 - 2 1 4.25 6.4 49.56 L 21-30 4.56 3.2 26.57U 0 - 1 2 5.25 2 . 1 1 0 . 6
7L 12-29 5.03 2 . 8 1 2 . 2
313

Table 6.3(cont.)
Loch of Tingwall 14/10/92
Site Depth (cm) pH %WC %LOI
1U 0-14 4.02 19.2 91.91L 14-34 4.18 139.8 90.4
2 0-15 5.88 5.3 13.33 0 - 2 0 5.36 4.2 15.44U 0 - 8 4.90 3.8 26.24L 8 - 2 1 5.00 2 . 8 17.95 0-14 5.25 2.5 8.96 U 0 - 1 0 5.29 3.1 15.56 M 10*19 5.20 2.3 9.16 L 19-50 5.34 3.1 9.1
Turdale Water 12/10/92
Site Depth (cm) pH %WC %LOI
1U 0 - 1 0 4.56 19.7 93.91L 1 0 - 2 0 4.45 14.7 97.42U 0 - 1 0 4.58 16.8 93.92L 10-17 4.80 105.8 55.13U 0-9 4.02 15.7 96.43L 9-50 4.62 29.0 97.54U 0 - 1 0 4.14 44.6 97.74L 10-50 4.40 20.7 97.15U 0 - 1 0 4.35 16.0 97.35L 10-50 4.80 15.8 97.76 U 0 - 2 0 3.80 35.3 95.46 L 20-50 3.84 125.5 96.4
314

Organic content of Helliers Water soils was usually less than that of Gonfirth soils.
%LOI ranged from 2.3% at Site 6 , 15-22 cm, to 94.5% for soil from Site 3, 0-8.5
cm. A %LOI of 2.3% was the lowest value recorded in any soil tested in 1992.
%WC varied between 0.6% in soil from Site 6 (15-22 cm) to 42.5% in the wettest
soil from Site 3 (0-8.5 cm).
6.3.2.3 Loch of Tingwall
Results of pH determinations showed a range of pH 4.02-5.36 in soil from the east
side of Loch of Tingwall drainage basin and a gradation from pH 5.20-5.88 on the
west side. Lowest recorded pH was pH 4.02 in soil from site 1 (0-14 cm) and the
maximum of pH 5.88 was found in Site 2 (0-15 cm) soil. Least organic soil was
collected at Site 6 , where %LOI was 9.1% for soil samples between 10-19 cm and
19-50 cm depth. In contrast, soil from Site 1 (0-14 cm) contained 91.9% organic
matter. %LOI was greater in soil samples taken from the eastern part of the
catchment area. Relatively low moisture content was found in all Tingwall soils
examined, excluding soil from Site 1, 14-34 cm depth, of which 139.8% was water
with respect to oven dry weight. All other samples had %WCs of between 2.3% (Site
6 , 10-19 cm) and 19.2% (Site 1, 0-14 cm).
6.3.2.4 Sandy Loch
Soils collected at Sandy Loch showed a range of pH values from pH 3.80 in samples
from Site 1 (0-20 cm) and Site 5 (10-26 cm) to pH 6.15 in top-soil taken at Site 4.
Maximum pH recorded for an unimproved soil was pH 4.56 for soil from Site 6 (21-
30 cm). Organic content was > 80% in all samples of unimproved soil except that
from Site 6 . %LOI in the deeper soil of this site was 26.5%, rising to 49.5% in the
surface soil. Greatest %LOI found in the Sandy Loch watershed was 97.6% in Site
2 (20-50 cm) soil. %WC of soils from this catchment was found to range from 2.1%
in previously improved soil (Site 7, 0-12 cm) to 189.4% of soil oven dry weight in
soil from Site 5 (10-26 cm). The latter was the greatest recorded %WC of the 1992
survey.
6.3.2.5 Turdale Water
Soil taken from Site 6 (0-20 cm) was at pH 3.80, the most acidic in the 1992 survey.
315

Maximum pH 4.62 was determined for Site 3 (9-50 cm) soil. Turdale sods may be
compared to those of the Loch of Gonfirth drainage basin as pH was found to remain
below pH 5.00 in both cases. The range of pH values in Turdale Water catchment
soils was more acid than that of any of the other four loch catchment areas. %LOI
was consistently high, all samples except that of Site 2, 10-17 cm (55.1 %) containing
> 90% organic matter. Greatest %LOI was determined in soils from Sites 4 (0-10
cm) and 5 (10-50 cm). At 97.7% this was the maximum percentage of organic matter
found in soils examined in 1992. Maximum %WC of Turdale soils was 125.5% in
soil from Site 6 (20-50 cm). Moisture also accounted for 105.8% of Site 2 (10-17 cm)
soil on an oven dry basis. In the remaining soils %WC was within the range 14.7-
44.6% in soil from Sites 1 (10-20 cm) and 4 (0-10 cm) respectively.
6.3.3 Soil phosphorus adsorption isotherms of test samples from each of
the five survey watersheds
P adsorption isotherms for the five soils treated with solutions of 0 mg P L' 1 to 100
mg P L ' 1 are illustrated in Figure 6.3. Additions of P to soil from Helliers Water
catchment area (Site 2) resulted in increased adsorption of P with increased addition.
P uptake was more efficient in this soil than the other test soils. Soil from Loch of
Tingwall drainage area (Site 4L) also showed increasing uptake of P with increased
concentration of P in the experimental solution, although maximum P retention
occurred at a treatment level of 90 mg P L 1, rather than there being a continual
upward trend in P adsorption, as observed with soil from Helliers Water catchment
area. Uptake of P by this soil was nevertheless more efficient than that of any of the
remaining three soils. Soil samples from the watersheds of Sandy Loch (Site 5L),
Turdale Loch (Site 4L) and Loch of Gonfirth (Site 2U) exhibited little or no trend in
adsorptive capacity at the different treatment levels. At lower concentrations of P
addition (< 50 mg P L*1), retention of P by these three soils followed similar rates
of increase, but at subsequent higher treatment levels ( ^ 60 mg P L 1) P adsorption
failed to follow an upward relationship with increased additions of P. In summary,
the two more mineral soils were relatively efficient in their adsorption of P, whilst
the organic soils tested were comparatively inefficient.
316

Equilibrium P
concentration (mg P
r1)
Figure 6.3 Adsorption isotherms derived for the soils o f the five study catchments, 1992
Mass P adsorped (mg P g soil'1)
l ro ooo
o
o
J f V ) U !fO c '
o
317

Only two of these five test soils released water soluble P when the treatment P
concentration was 0 mg P L*1. Turdale Site 4L soil desorption was 0.01 mg P g soil* 1
and that of Gonfirth Site 2U was 0.02 mg P g soil'1.
6.3.4 Phosphorus retention capacity of soils collected in 1992
Means of adsorption and desorption of P by soils collected in 1992 are presented in
Table 6.4.
6.3.4.1 Loch of Gonfirth
In contrast to other Gonfirth soils tested, soil samples from Sites 1L and 3U did not
release any water soluble P. Retention of P increased as P concentration of the
treatment increased in soils from Sites 1U and 3U. However, adsorption of P was
poor in all soils tested, with the exception of that from Site 3U. In terms of P uptake,
the latter was comparable with soils from the Helliers Water catchment area.
6.3.4.2 Helliers Water
Water soluble P content was undetectable in all soils examined. Highest P
accumulation at both addition levels occurred in experiments involving the sample
from Site 2U. Least efficient in retention of P was soil from Site 3U, which was
comparable with soils from the Sandy Loch catchment area. All remaining soils were
relatively efficient at P uptake, although efficacy of P retention in the soils was
greater when the P addition was 20 mg P L*1, rather than at 100 mg P L*1.
6.3.4.3 Loch of Tingwall
Release of water soluble P was recorded for only one Tingwall soil sample of those
examined. This soil also showed poorest adsorption capacity in 20 mg P L* 1 and 100
mg P L* 1 treatments in comparison with the other three soils tested in these P
solutions. Generally, amount of P adsorped increased as P in the added solution
increased, though efficacy of uptake was greater in 20 mg P L' 1 than in 100 mg P L* 1
solution. Soils from Sites 3 and 4 were relatively efficient in retention of P, being
comparable with those of the Helliers Water catchment area in this respect.
318

pVO
P• f t
T3’OHesd0
£
1C8as
p< o
pN
PN
o ooo 8d i o
+o'+
COo 0 0O
« ooo*1o*+oi
8 CNd o
+ +s v oo Os
CNd i d
+d i
CNo CN CO
o’1 d+
98 o 3o*o
+o’+
CNo CN oCO
d i o+
d+
m
P
P
CO
N
PVO
ir> oo Tt OSO+00 ino’+ ot
o o o + +
o o +
8 5o d
+
r-CN8 -
o d d + + CN s oo o
o d d 1 + +
S
p* o
pco
p* o
pN
t }-CN CNo o + + mCOo o + +»—< Os CO CNo' o*+ + Os co^ r *o P+ +VO Os co so
Osco
o+
88O+ovr>O+
o+cooo’+
CN+
TfvoQ>
3C8
H
ca>E
j =u03
U
j =tccoO oo CN
as£0 DC o
O CN
E.22" 3E

Tabl
e 6.
4(co
nt.)
ooCu00Bin<N•o
pco
Pco
>>73C«
8
coo
88 O O
+o9
o o +
8 3d o*
+
o+oo oo+
CO CM VOO O -H9 ® 9co co ^ o o oo d d' + '
P o o o9 9 ®
8 2 2 g 3 3 8 o d d _ _ —
+ 'P
P
P
PCM
4£73b3H
9 ® 9’It 00o *—11
9 ® 9CO CM VO OO —9 ® 9
8 00 CM M- OOd d —
+ +CM CM 00 O CMo d d
' + +»n in o o
o d d
3 3 CMCMo o o
O O 0 < M - i
mdo~2•oc
IgooCOCMVOco•X3cn
8•oC/5CTj
PCUooa
oCM
oso•*->c
B§H
>-Hus
cu«i , cu O <«-,_ aG ~o c
\C O
r **2 oT 3 c/5cd o — *02 *-C (U+ ?
320

6 .3 .4.4 Sandy Loch
Soil samples from Sites 1U, 1L and 5U released 0.03 mg P g soil' 1 water soluble P
when treated with 0 mg P solution. All other soils studied (from Sites 3U, 3L, 4, 5L,
7U and 7L) retained their associated P within their structure when treated with P free
solution. Adsorption of P by soils from the Sandy Loch catchment area was
inefficient. Soils from Sites 3L and 4U exhibited increased retention of P with
increased concentration of P in the treatment solution. Nonetheless, the actual
percentage of P added to the soil which was retained was low (3.2-22.0%) and in
both soils, the proportion of treatment P retained was lower at the higher treatment
level.
6.3.4.5 Turdale Water
Generally, soils from the Turdale Water catchment area exhibited poor P uptake in
the treatments given. There were two soil samples which did not retain P in any of
the three treatment media. Samples from Site 1 released water soluble P regardless
of ambient P solution concentration. In contrast, soil from Site 2 adsorped more P as
P concentration of the treatment increased. In addition, unlike the other soils from
this drainage area, soil from Site 2L released no water soluble P in P free solution.
Results from this soil were comparable with the more efficient soils of the Helliers
Water watershed, discussed above.
6.3.5 Relationships of soil pH, %WC and %LOI with soil phosphorus
adsorption capacity
Linear regression analysis revealed that there was no relationship between %WC and
water soluble P release from the soils. Neither was %WC related to P adsorption at
either of the treatment P concentrations. Conversely, significant relationships were
found between %LOI and P adsorption/release by soils in the three treatment media
(Table 6.5).
All three relationships were significant at p < 0.001, but the regression of %LOI
with soil P adsorption in 20 mg P L' 1 solution was most significant. The correlation
coefficient of this linear equation was -0.77 and the standard error of the estimate
0.11 (Table 6.5).
321

Table 6.5 Relationships between LOI and P adsorption in catchment soils receiving different P treatments
Treatment (mg P L'1)
0
2 0
100
where:
Relationship
y = 0.0003x - 0.0054 y = -0.0041x + 0.47 y = -O.Olx + 1.1
P< se R2(%) F
0.001 0.60 0.014 36.3 22.20.001 -0.77 0.110 59.3 45.00.001 -0.56 0.510 31.6 14.3
x is the %LOI of the soily is expressed in mg P g soil' 1
p is the significance levelr is the correlation coefficientse is the standard error of the estimateR2 is the percentage variability in y explained by xF is the F value
Table 6.6 Relationships between pH and P adsorption in catchment soils receiving different P treatments
Treatment Relationship (mg P L'1)
P< se R2(%) F
0
20100
y = -0.013x + 0.07 y = 0.16x - 0.54 y = 0.39x - 1.45
0.01 -0.47 0.015 22.0 11.00.01 0.54 0.15 29.3 12.80.05 0.39 0.57 15.3 5.6
where:x is the soil sample pH
322

Correlation coefficient of the regression of %LOI vs water soluble P released was
0 .6 , whilst the standard error of the estimate was the lowest of the three linear
equations at 0.014 (Table 6.5). Least significant was the regression of %LOI vs P
adsorption in 100 mg P L 1 solution. This relationship had a correlation coefficient
of only -0.56 and had the greatest standard error of 0.51 associated with it (Table
6.5). It should be noted that despite the significance of these relationships, there is
a high degree of scatter around the regression slope, but also that P adsorption was
always low when %LOI > 80%.
Following linear regression analysis, significant equations were also observed between
pH and soil P release/adsorption in different treatments (Table 6 .6 ). These
relationships were found to be significant at p < 0.01, p < 0.01 and p < 0.05
respectively and are therefore not as significant as the regressions of %LOI and P
adsoiption/release rates (Table 6 .6 ).
Standard error of the estimate ranged from 0.015 for the pH vs P release equation to
0.57 for the relationship between pH and P adsorption in 100 mg P L' 1 solution. The
latter also had the lowest correlation coefficient of 0.39 compared to the highest for
these pH dependent equations of 0.54 associated with P adsorption in 20 mg P L' 1
solution (Table 6 .6 ). As with the %LOI vs P adsorption relationships, although
significant, the pH vs P adsorption regression slope had a high degree of scatter
around it. However, it is evident that soils with pH around pH 4.00 are poor in their
P uptake capacity.
6.4 DISCUSSION
6.4.1 Relevance of field and laboratory procedures of soil
characterisation
6.4.1.1 Measurement of %WC, %LOI and pH
Both %WC and %LOI were calculated as a percentage of soil oven dry weight, rather
than as a proportion of air dry soil weight. %LOI is relevant only when considered
in terms of the weight of the soil alone, as soil water is not a significant source of
organic matter. Calculating %WC as a percentage of oven dry soil weight allows it
to be expressed in a comparable way to %LOI, i.e. water and organic matter are
regarded as discrete from the mineral constituents of the soil matrix. Whereas the
323

mass of mineral components of a soil may be relatively constant, the amount of
organic matter and water present may vary considerably. Results of %WC and %LOI
are, therefore, expressed using the more consistent technique of the two discussed.
Direct measurement of soil pH in the field would give more accurate data on
conditions at a sampling site at the time of survey. However, use of air dried soil for
this purpose is more manageable and has become standard procedure (Jackson, 1958).
Different soilrwater ratios are used in pH determinations and CaCl2 or KC1 solutions
may be used instead of water, where relatively large variations in soil salt content
exist. Generally, the more dilute a soil sample, the higher soil pH becomes. The
increase in soil pH from ’sticky point’ to a 1:10 soil suspension is commonly in the
range 0.2-0.5 pH units, although it may be ^ 1 pH unit when dealing with neutral
or alkaline soils (Jackson, 1958). This means that pH values determined from soil
suspensions tend to be over-estimates of actual conditions. Using a low soil to water
ratio such as 1:2.5 utilised in the present study ensured relatively little change, whilst
providing enough water to saturate peaty samples. Although a 1:1 ratio may be used
(Jackson, 1958), this would not have fulfilled the latter requirement.
6.4.1.2 Applicability of a laboratory based approach to estimation of soil
fertiliser nutrient losses
Although laboratory experiments involving nutrient additions to air dry soil are
technically very different to field approaches to studying fertiliser losses, Romkens
and Nelson (1974) found good agreement between results obtained from both
approaches. Work with Russell sil soil suggested that DRP in runoff can be estimated
through ’overnight equilibration of 0.5 g of soil with a 25 ml aliquot of 0.1 NNaCT.
However applicability of this estimation technique to other soil types was not
investigated. Sharpley et al. (1977) found mean concentration of dissolved inorganic
P from surface runoff events from Tokomaru silt loam (fragiaqualf) under permanent
pasture to be correlated with inorganic P extracted using 0.1 M NaCl. Soil was
treated in four different ways in the field experiments: undrained, unfertilised;
drained, unfertilised; drained, fertilised; undrained, fertilised. Despite large variations
in observed runoff P concentrations, the linear relationships obtained for each of the
first three treatment pairings were similar. However, there was a considerable
difference in regression slope for the undrained, fertilised soil. The relationship
324

between extractable inorganic P and runoff concentration was more complex when
soil from different depths was studied. Considerable variation in soil adsorption
capacity may occur between sites, but also within sites. This variability is largely
because of differences in quantities of Fe oxides present in the soil (Holford and
Mattingly, 1976b).
A proportion of P adsorbed becomes non-labile and non-exchangeable, this occurring
more with time (Holford and Mattingly, 1976a). It is impossible to measure the exact
quantity of P in equilibrium with the soil solution due to slow continuous exchange
and effects of experimental variables such as soil:solution ratio, rate of shaking the
suspension (Bache and Williams, 1971). When examining effects of time on water-
extractable P content of mineral surface soils, Sharpley (1982) found it to be linearly
related to P addition, irrespective of time after application, although the slope of the
relationship decreased logarithmically with time (i.e. as time passes less P is water
extractable), thereby making prediction of extractable P impossible by a simple
exponential equation. However, percentage clay content and P sorption capacity of
the soil were found to be good predicters of extractable P during the first two weeks
after fertilisation.
Results of P enrichment experiments in the present study are therefore representative
of quantity of P potentially leachable directly after fertiliser addition at each treatment
level. Since no pH control was carried out in the experimental work, adsorption of
P occurred at a pH related to initial soil pH and pH of added solution. In previous
work of this nature, P sorbed/log equilibrium concentration at pH 6.5 in limed soil
differed by only 3% from that of the same soil unlimed at pH 4.3 (Bache and
Williams, 1971). The unbuffered approach was therefore chosen and was easily
applicable to both calcareous and acid soils, but in more acidic soils adsorption
figures may have been underestimated if pH were to be raised to recommended levels
in the field.
6.4.1.3 Suitability of experimental P solution concentrations
Langmuir isotherms have been efficient in description of P adsorption from solutions
of < Iff3 M P (Holford and Mattingly, 1976b). Bache and Williams (1971) found
that isotherm slopes for different soils at 10"4 M P were closely correlated with those
325

plotted using 10~3 M P and 10" 5 M P. These concentrations correspond to the lower
end of the range of solutions employed in the present study (10* M P corresponds to
31 mg P L'1). Use of considerably higher P concentrations than this in the present
work possibly accounts for isotherm shape not corresponding to the classical
Langmuir form when P solutions were added to soils from Tingwall Site 4L, Sandy
Site 5L, Helliers Site 2U and Gonfirth Site 2U (Figure 6.3). After soil P saturation
point is reached, the relationship between P adsorped and equilibrium P solution
concentration is no longer comparable with that at lower concentrations.
6.4.2 Water soluble P in soils
The quantities of TP in mineral and organic soils are generally within the ranges
0.02-0.2% and 0.01-0.2%, respectively (Allen et a l , 1974). In the present study,
there was a tendency for organic soils to release soluble molybdate reactive P (DRP).
As the plant matter in these soils is broken down, P mineralisation occurs. However,
there are few binding sites for this P within the soil, or in the soil solution, so a
portion of TP remains in soluble reactive form. The more mineral soils did not
release P in this water soluble molybdate reactive form. It is likely that this was due
to the superior adsorptive capacity of these soils, although the commonest forms of
inorganic P in soils all have low solubility, so that dissolved P is generally restricted
to concentrations up to 0.01-1.0 mg P L* 1 (Etherington, 1982). In more mineral soils,
fertiliser applications of water soluble phosphates may be precipitated in forms which
are only slightly water soluble. This results in soil water having a low P
concentration, therefore allowing little P to reach plant roots through movement of
water through the soil. Plant uptake of fertiliser P is consequently dependent on P
diffusion rate and proximity of root systems to P residues. The action of water
soluble phosphate alone is slow. The result is that in one growing season, only a
fraction of P added to the soil as fertiliser is actually taken up by plant roots.
6.4.3 Factors influencing P sorption capacity of soils
6.4.3.1 Effect of previous fertiliser applications on P adsorption
Investigations of P accumulation in 16 Finnish mineral soils have been carried out by
Hartikainen (1989). Crops were mostly cereals, but peas and grass were also grown.
Following seven years of cultivation, losses of NH4 F- extractable (Al bound) and
NaOH-extractable (Fe bound) P from clay soils which had not received fertiliser
326

applications ranged from 22-69 kg P ha' 1 (2-17 %). Losses of these P fractions from
coarser soils were within the range 8-140 kg P ha' 1 (2-17%).
H^C^-extractable (Ca bound) P from 16 - 34 kg P ha' 1 was lost from seven of the
soils. In soils where P as superphosphate had been added at a rate of 30 or 60 kg P
ha' 1 y r 1 (210 and 420 kg P ha* 1 total loadings respectively), Al-P and Fe-P increased
in twelve of the sixteen soils. In four soils, no significant difference was found before
and after P additions. The percentages of the total loadings of 210 kg P ha' 1 which
were found in these P fractions were within the range 11-83 %, whilst the
corresponding range for a total loading of 420 kg P ha' 1 was 11-88 %.
At higher fertiliser loadings, P was found proportionately more in NK^F-extractable
than in NaOH-extractable forms. However, Ca-P was found to increase in three soils
only. It is suggested that Ca compounds may have been broken down by NH4 F earlier
in the extraction procedure. This presumably might also account for the increase in
NILF-extractable P.
Results of the present study showed previously fertilised grassland in the catchment
of Loch of Tingwall to be retaining P as water soluble P was undetectable. The same
occurred with soil from Sandy Loch Sites 7U and 7L, which were in an old area of
reseeded land. All these soils followed the general pattern of low organic content and
pH > 5.00. However, soils collected from reseeded areas in Turdale Water
catchment area, i.e. Sites 1U, 1L and 2U, were found to release water soluble P.
Soils from these three sites were highly organic, whereas in soil from Site 2L, %LOI
was only 55.1 % and pH was slightly greater than that of the other three samples (all
were pH < 5.00) No release was recorded from soil at Site 2L.
P treatment of a soil reduces its P sorption capacity. When a soil has been previously
fertilised in the field, the mass of P adsorbed by the soil at any solution equilibrium
P concentration is less than it would be, had no earlier P addition occurred, i.e.
isotherm slope is lower (Barrow, 1974). However, when initial exchangeable P
present is taken into account, the pretreated soil exhibits the same isotherm
characteristics as the same soil which has received no earlier P addition (Bache and
Williams, 1971). The decrease in isotherm slope, as a result of earlier fertiliser
327

additions, indicates a reduction in the P buffering capacity of the soil (Barrow, 1974).
Field trials have confirmed that greater loss occurs if previous fertilisation has taken
place (Burke, 1975). However, reduction in P buffering capacity is not linearly
related to the size of previous P application, as low P addition concentrations result
in a proportionately greater effect than higher levels (Barrow, 1974). Presumably this
occurs due to the finite number of P binding sites.
It is thought that with time following a P addition, either (a) P leaves the original
adsorption sites to form crystals or to locate in less accessible places within the soil
matrix or (b) P becomes more tightly bound or occluded in some way. Because the
sorption curve has been found to change both position and slope this is indicative that
at least a proportion of the P which becomes non-isotopically exchangeable continues
to occupy adsoiption sites (Barrow, 1974). This means that in soils where water
soluble P was not detectable, assuming that it was not previously removed by water
flow, P is occupying binding sites and therefore potential for uptake of P in any
future fertiliser addition has been reduced. This indicates that not only is there a risk
of P leaching from highly organic and acid soil, when P is added, but also from more
mineral soils of higher pH which have previously received a fertiliser dressing.
6.4.3.2 The influence of soil type on P retention
In studies of the land use in the catchment area of the Loch of Harray in Orkney
(Sinclair et al., 1992), annual loss of P2 0 5 in water from fertilised grassland was
approximately 3% of that applied in fertiliser at the lowest treatment rate and < 1 %
at a treatment rate of > 40 kg P ha’1. However, agricultural land in this catchment
area incorporated mineral soils. In the present study, soils high in organic matter have
been found to be inferior to more mineral soils in terms of P uptake capacity. This
is in agreement with previous studies of P retention in peaty soils. In their natural,
undrained, unfertilised state, peat bogs are generally nutrient sinks, inputs exceeding
losses to drainage (Malcolm and Cuttle, 1983). However, Burke (1975) investigated
losses of NPK from blanket bog after fertiliser additions of N (50 kg N ha'1), P (50
kg P ha1) and K (100 kg K ha'1) under drained and undrained conditions. Losses of
fertiliser P occurred through drainage water and surface runoff, peak P loss occurring
in surface runoff immediately after fertilisation at the rates quoted above. Peak
concentrations of P in drain outflow and surface runoff were > 1 0 and > 25 mg P
328

L'1 respectively.
Therefore, although loss of P was not great when related to amount added and peak
discharge of nutrients was of short duration, a pulse of nutrients at the concentrations
given might be significant to a water body where nutrients are limiting. Shetland loch
water DRP, for example, is often found to be < 1 /xg P L 1 (Chapter 2). When
examining results from the present study, it is important to consider that even in
situations where increased P supply results in increased P uptake, adsorption does not
necessarily account for all P introduced. For example, soil from Tingwall Site 4L
adsoibed 0.45 mg P g soil*1 at the 20 mg P L*1 treatment level, but this leaves 50 jtg
P g soil'1 (10% of added P) free in solution. In a field situation, provision of P in
excess of P sorption capacity of the soil could result in the remainder leaching into
the drainage system, regardless of the P adsorption efficiency of that soil.
6.4*3.3 Effects of magnitude of P addition on soil P uptake
Larger applications of fertiliser result in increased losses from blanket peat bog
(Burke, 1975). This is in agreement with experimental results of the present study as
can be seen from Figure 6.3 and Table 6.4. P retention was shown to rise as P
addition concentration increased up to the 50 mg P L*1 treatment, after which, P
assimilation was poor. The results of the present study indicated that the greatest P
losses occurred from peaty soils which had been treated with high P additions. This
is consistent with the findings of Malcolm et al. (1977). In experimental work on
effects of fertilizer on Picea sitchensis (Sitka spruce), ground mineral phosphate was
mixed through free-draining Calluna-Sphagnum peat at a rate of 375 kg P ha'1
followed by surface addition of 232 kg P ha1; or 190 kg P ha*1 followed by a further
190 kg P ha'1. N was added as formalized casein (either 238 kg N ha*1 alone or plus
a subsequent equal addition) and K as K sulphate (total addition of 411-556 kg K ha*
!). Magnesian limestone was used to raise pH from 3.2 to 4.7 (1:2.5 v:v in CaClr).
The P was found to be highly mobile, leaching rapidly in the first few weeks after
fertilisation, whilst P found in leachate water was found to be 60% and 25% of the
original additions of 375 kg P ha*1 and 190 kg P ha'1, respectively. Greater P loss
occurred in more heavily fertilised peat and through high rainfall.
6.4.3.4 Mechanisms of phosphorus binding in soils
P in soil may be incorporated in Fe phosphate or occluded phosphate surrounded by
329

a coating of Fe oxide. Under anaerobic conditions such as occur during waterlogging,
Fe may become soluble as Fe2+, may form organoferrous compounds, or precipitate
as FeS, FeCOj or Fe(OH)2. This allows Fe bound P to become available in the soil
solution. Fe2* may also be produced in normal, neutral or alkaline soils if the redox
potential falls, though this is dependent upon soil type. Reducing conditions also
allow Fe2* to occupy cation exchange sites (Etherington, 1982). P availability in these
situations is therefore dependent upon redox conditions. However, in acid soils, Fe
will be more soluble, regardless of redox (Etherington, 1982). Fe?* in aerobic soils
is soluble below pH 3.0 (I.D. Pulford, University of Glasgow, pers. comm ., 1995).
Fe deficiency is therefore generally characteristic of well drained calcareous soils.
High accumulation of Al- and Fe-bound P has been found in very acid mineral soil
(pH 4.2 in CaClJ high in oxalate-soluble Fe treated with fertiliser (Hardkainen,
1989). Ionic interactions of P in soils are pH dependent. At low pH, Fe and Al
combine with orthophosphate ions, whereas at neutral to alkaline pH, bonding occurs
between Ca and P. In mineral soils, P can be sorped rapidly by soil components
(Sharpley, 1982).
However, acid organic soils may be low in Fe and Al content (Cuttle, 1983). As seen
from the results of the present study, poor P sorption capacity occurred in soils high
in organic matter in the P retention experiments. An inadequate supply of Fe and Al
binding sites would explain this result. The relationship found between P retention
and pH may be due to the higher solubility of Fe in acid soil conditions. This would
also explain the relationship between pH and low P retention capacity observed in the
present study and would have important implications in a field situation if soil pH was
not raised sufficiently to promote improved P uptake. Soil from Turdale Site 1 (1992)
was the only soil which released P regardless of P treatment applied. This may have
been partly because pH remained at approximately pH 4.5, rather than being at pH
6.5 as recommended for fertiliser operations. Turdale Water catchment area is
situated on limestone of the Walls Formation, but peat formation has invalidated the
potential advantage of such a Ca-rich drainage basin.
Elevated P adsorption capacity was exhibited by one soil of those examined in the
Turdale Water catchment area (Table 6.4). Soil 2L had a considerably lower organic
matter content than the other Turdale catchment soils. In addition it had the highest
330

pH value of the Turdale Water soils studied (Table 6.3). This soil was likely to
constitute a mineral horizon where soluble inorganic matter leached from the oragnic
soil above accumulated. Fe may have been present in an oxidised state and therefore
may have bound with P, thereby explaining the relatively efficient P adsorption
capacity of this soil.
Soil Sites 2, 5 and 6 in the west of Loch of Tingwall catchment area were efficient
at retaining P, water soluble P being undetectable. This is probably as a result of
pedogenesis from calcareous bedrock. It is likely that in these soils of pH > 5.0 and
low organic content, P is binding to Ca. To the east side of the catchment, P uptake
may be dependent upon Fe content.
In soil of the Leslie Association on Unst and Fetlar, pedogenesis is from serpentinite,
meaning that soil is rich in bases, especially Mg, but also in Fe, Ni and Cr. Although
soil maps do not indicate the presence of such soil within the Helliers Water
catchment area (Table 6.7), it is suggested that a proportion of the watershed
incorporates base rich soil, as loch water column Mg concentrations have been shown
to be high, though those of Ca have not. For example, it may be that the Alpine soils
in the Helliers Water drainage basin are Mg rich, as the term "Alpine* may refer to
mode of soil formation rather than describing the soil properties (Table 6.8).
Alternatively, the boundary of Leslie Association soils may extend further than
estimated (Figure 6.2), to include part of Helliers Water catchment area. It is
concluded that P adsorption is efficient in soil from the Helliers Water catchment area
because of P binding with Fe in soils of lower pH and Mg instead of Ca in soils of
higher pH. Examining Mg and Ca concentrations in the remaining lochs reveals that
Lochs of Cliff, Watlee, Snarravoe, Skutes Water and Papil Water also have high
water Mg levels. Soil maps show that all of these lochs have areas of Leslie
Association soil within their watersheds (Table 6.7). It is suggested that P in reseed
within areas of Leslie Association soil types would be assimilated by the soil
relatively efficiently i.e. in a comparable fashion to P uptake in soil from Helliers
Water drainage basin.
331

Table 6.7 Soil types in the 31 catchments of the 1991 water survey (MISR, 1985)
Water body Soil types
Arthurs Loch Bu Water
peaty rankers, peaty podzols, brown rankers peaty podzols, humus-iron podzols, peaty gleys, peaty rankers, peat
Loch of Brindister blanket peat, deep: peaty gleys, non-calcareous gleys:some saline gleyspeaty gleys, peaty podzols, peaty rankers, some peatLoch of Brough
(Bressay)Loch of Brough(Yell)Loch of Brow
peaty gleys, peat: some peaty podzols and peaty rankers: some blanket peatpeaty gleys, non-calcareous gleys: some peat and saline gleys: basin and valley peatspeaty gleys, peaty podzols, peaty rankers, non-calcareous gleys: some humic gleys and peat: magnesian gleys, some brown magnesian soilspeaty gleys, peat: some peaty podzols and peaty rankers: blanket peat, deep: some non-calcareous gleys, peaty gleys: some humic gleysblanket peat, deep: peaty gleys, peaty podzols and peaty rankers peaty podzols: some humus-iron podzols and gleys: blanket peat, deeppeaty gleys, non-calcareous gleys: some peat, peaty podzols and rankerspeaty gleys, peat: some peaty podzols and peaty rankers: some alpine soils, rankers, sub-alpine soils
Loch of Huesbreck calcareous regosols, brown calcareous soils, calcareous gleys peaty gleys, peat: some peaty podzols and peaty rankers
Loch of Kettlester peaty gleys, peat: some peaty podzols and peaty rankers: non-calcareous gleys: some humic gleys and peat blanket peat, deep: peaty gleys, peat, some peaty podzols and peaty rankerspeaty podzols, humus-iron podzols: some peaty gleys and rankerspeat, peaty gleys, peaty podzols: magnesian gleys, some brown magnesian soils: regosols, some gleys peaty gleys, peat: some peaty podzols and peaty rankers: blanket peat, deepblanket peat, deep: peaty gleys, peat: some peaty podzols and peaty rankersbasin and valley peats: blanket peat, deep: peaty podzols and peaty rankerspeaty podzols, peaty gleys, peaty rankers: blanket peat, deep magnesian gleys: some brown magnesian soils
Loch of Cliff
Eela Water
Loch of Gonfirth Gossa Water
Gorda Water
Helliers Water
Loch of Huesb Loch of Huxter Loch of Kettl
Lunga Water
Mill Pond
Papil Water
Funds Water
R ocr W ater
Sand Water
Sandy Loch Skutes Water
332

Table 6.7 (cont.)
W ater body
Loch of Snarravoe
Loch of Spiggie
S trand Loch
Lodi of Tingwall
Turdale W ater
Loch of U staness Loch of W atlee
W hitelaw Loch
Soil types
peaty gleys, peat: some peaty podzols and peaty rankers: magnesian gleys: some brown magnesian soils and gley rankers: non-calcareous gleys: some humic gleys: some peaty alluvial soilspeaty podzols, humus-iron podzols: some brown forest soils and gleys: calcareous regosols, brown calcareous soils, calcareous gleys: basin and valley peats: some peaty alluvial soils basin and valley peats: peaty gleys, peat: some peaty podzols and peaty rankerspeaty gleys, peat, peaty podzols and peaty rankers: brown forest soils: some brown rankers and non-calcareous gleys blanket peat, deep: peaty gleys, peat: some peaty podzols and peaty rankerspeaty gleys, peat: some peaty podzols and peaty rankers basin and valley peats: magnesian gleys: some brown magnesian soils: peaty gleys, peaty podzols: peat, peaty gleys, peaty podzolsblanket peat, deep
333

The low organic content, low water content and relatively high pH of soils collected
in the Loch of Cliff catchment area in 1991 indicate these soils are probably of the
Leslie Association rather the Arkaig Association to which other areas of the
watershed belong.
Unlike Loch of Tingwall which was high in Ca only and lochs which were high in
Mg only, the following had high water concentrations of both: Lochs of Spiggie,
Strand, Huesbreck and Brow. Strand Loch probably has elevated Mg levels due to sea
water inflow, but is situated on calcareous bedrock. However soils of the catchment
are mainly dystrophic peat (Table 6.7), the effect of which probably overrides that
of Ca rich bedrock as it does in the catchment area of Turdale Water. Soils collected
from drainage basins of the other three lochs all had relatively high pH and low
organic content (except Loch of Spiggie Site 2, O horizon), and therefore would
probably exhibit relatively efficient P assimilation. The entire catchment area of Loch
of Huesbreck incorporates shelly sand, brown calcareous soils and calcareous gleys
with regosols (Table 6.7), so probably has good P retention properties. Loch of
Spiggie catchment area also incorporates this soil class, but Sites 1A and IB were
within an area of humus Fe podzols, brown forest soils and gleys (Table 6.7).
Podzols are characterised by low pH and leaching of ions which would bind to P,
noteably Fe, whereas in brown earths, P may be bound with Ca (Table 6.8).
In 1991, soil from catchment areas of Brough (Yell), Huxter and Lunga were
sampled. These soils were peats, had low pH and high organic content (Table 6.2)
and are therefore likely to have poor P sorption capacity. The same may be said of
soil of Bu Water catchment, O horizons and Loch of Spiggie Site 2, O horizon.
Catchments incorporating soils such as these would be most at risk of elevated P
levels in drainage water if reseed operations were to be carried out.
In the Shetland Islands approximately 40% of all soils are classed as peat, most of
this being more than 1 m in depth. A great proportion of the remaining 60% of soils
have peaty surface horizons, occurrence of peaty gleys, peaty podzols and peaty
rankers being common. More fertile brown forest and non-calcareous gley soils are
limited in extent; cultivated land is relatively scarce (Dry and Robertson, 1982).
334

Table 6.8 Definitions of major soil types found In Shetland
Soil type
peat
brow n earth
podzol
gley
peaty gley podzol
peaty gley
ranker
regosol
arctic soil
Characteristics of soil type (E therington, 1982)
organic, variety of different types formed from remains of vegetation, nutrient poor, low pH
no eluviation of A horizon except in podzolic brown earths, mixing of soil (earth worm activity), nutrient (base) rich, not of low pH, little O horizon, formation typically on siliceous geology
high degree of horizon differentiation, free drainage, eluviation of surface horizons, movement of organic matter to lower levels, leaching of soluble inorganic matter (e.g. Mn, Ca, Mg, Al, Fe) from upper profile, desaturation of CEC, lowering of pH, accumulation of fibrous organic layer near surface, perhaps formation of Fe-pan causing some waterlogging in A horizon
profile partly waterlogged, reducing conditions, slow decay of organic matter, increased organic content of A horizon or some peat formation, conditions depend on degree of wetness and acidity
gley of lower pH, nutrient poor, Fe-pan in B horizon, aerated below Fe-pan, upper profile not free draining as in podzol
gley of lower pH, nutrient poor, formation of peat layer at surface, surface soil normally wet, thickening Fe-pan may exacerbate waterlogging
azonal (lithosol), little or no differentiation of profile, pedogenesis at early stage, found over nutrient deficient siliceous geology
azonal, little or no differentiation of profile, pedogenesis at early stage, formation from unconsolidated material (e.g. sand, loess, till)
formation through wind action, frost shattering and sorting, rocky, shallow
335

There are soils which have shelly sand incorporated in their structure, such as those
in the catchments of Loch of Spiggie (NGR: HU 371 170) and Gorda Water (NGR:
HU 167 607)(Dry and Robertson, 1982). Soils derived from limestone, such as those
in the catchment of Loch of Tingwall (NGR: HU 417 430) are uncommon in this
island group, although magnesian gleys have formed from the Leslie Association drift
derived from the ultrabasic rocks of, principally, Unst and Fetlar (Dry and Robertson,
1982). As a result of the prevalence of peat in the Shetland Islands (Table 6.7), it is
likely that a high proportion of Shetland soils have poor P retention characteristics.
6.5 CONCLUSIONS
Although there is a wide range of soil types in Shetland, prevalence of peat is
important when considering potential effects of reseeding on standing freshwater
resources. Compared to most mineral soils, peats tend to possess a high cation
exchange capacity (CEC), but poor phosphate sorption properties i.e. they have
inferior capacity for retention of P against leaching, as a result of the low aluminium
and iron content of these soils (Cuttle, 1983). Under such conditions processes of P
uptake by vegetation and rate at which fertiliser dissolves may be of greater
importance than soil characteristics in determining P losses from a catchment.
Not only is there a potential problem with soil type, but underlying geology of
Shetland is generally impermeable (Mykura, 1976). Impermeable bedrock suggests
a low water storage capacity thereby causing ’flashy’ stream flow i.e. rapid
fluctuations in surface water discharge in response to a given precipitation event. An
overlying layer of peat would obviously exacerbate this problem. Peat retains water,
even during dry conditions, and this allows surface saturation to occur rapidly during
a rainfall event, so resulting in a high runoff:rainfall ratio (Lyle and Britton, 1985).
This in turn could have detrimental effects on soil nutrient retention. P loss
immediately after peat fertilisation, is highest in surface runoff. With time, after P
application, the quantity of P being lost in drainage outflows becomes higher than that
in surface runoff (Burke, 1975).
When considering potential effects of P fertilisation on loch water quality, it would
be useful to assess the organic content of the soil involved, as a relationship exists
between %LOI and P adsorption capacity. Despite analysis showing this relationship
336

to be significant, P adsorption remains highly variable, so precluding accurate
prediction of fertiliser effects on P removal in surface runoff and drainage water.
However, if organic content of a soil is > 80%, it is highly likely that P sorption
will be poor. Measurement of pH may also be helpful in characterisation of soil type
for the purposes of predicting whether there may be problems of fertiliser P leaching
into drainage systems. As with organic content, although the relationship between pH
and soil P sorption capacity is significant, its usefulness as a predictive tool is limited
by the inherent variability of the model. However, it is highly likely that soils with
pH of around pH 4.0 or less will exhibit poor soil P sorption properties, especially
if organic content is > 80%. Compulsory pH adjustment to the recommended level
of pH 6.5 might assist in minimising potential pollution problems.
Because the capacity of peat to retain P and K is limited, emphasis must be on
supplying immediate requirements rather than build up of fertility, since successive
additions of fertiliser are likely to facilitate nutrient losses in a manner similar to that
which occurs if a large single application is made (Burke, 1975). Increased hydraulic
conductivity means that solutes spend less time in contact with soil. However, when
peat has been drained and there is no precipitation, loss of nutrients from normal
fertiliser applications is minimalised (Burke, 1975). Nutrient losses are more likely
to occur in drain flow or surface runoff immediately after fertiliser application
(Burke, 1975).
337

CHAPTER 7: CONSIDERATION O F T H E OPTIONS FOR CATCHMENT
M ANAGEMENT IN SHETLAND
7.1 INTRODUCTION
From the results of Chapter 2, it is evident that a range of nutrient concentrations
exists within the freshwater bodies of the Shetland Islands. Categorisation of the thirty
one lochs studied according to trophic status (OECD, 1982) indicated that only six
of these water bodies were oligotrophic. Monitoring of streams within the catchment
areas of the five lochs studied in more detail indicated that loch inflow waters had
higher nutrient concentrations in drainage basins incorporating septic tanks and
supporting agricultural activities, such as improvement of grassland, than those in
watersheds with little anthropogenic influence. Increases in water TP concentrations
in lochs as a consequence of higher catchment loadings may cause augmentation of
algal growth. In lochs with water column TP levels higher than 10 fig P L*1, there is
an increased risk of growth of dense algal populations within the water columns
(OECD, 1982). Phytoplankton blooms have been observed in several water bodies
studied (e.g. Turdale and Punds Water, Sandy Loch) in the present work, both before
and during the current research (Chapter 4). Excessive phytoplankton growth is
undesirable for a number of reasons (Chapter 4). Of particular concern are the
potential effects on human health of the occurrence of toxic algae in potable water
supply reservoirs. It is, therefore, good water management practice to prevent or
eliminate dense phytoplankton populations within loch systems.
7.1.1 M ethods of controlling blue-green algae
Many techniques have been put forward as being effective in control of the problem
of excessive blue-green algal growth in freshwater lakes. There are two distinct
approaches, the first being nutrient control, the second, alleviation of the effects of
nutrient enrichment. Nutrient control measures may also be categorised as either
preventative or reactive, the former being restriction of nutrient input to loch systems,
the latter, manipulation of nutrient levels within the loch system. In cases where
nutrient inputs have been high, and a management plan to reduce inputs is then
undertaken, it may also be necessary to implement a nutrient manipulation strategy,
the reduction of external nutrient loading alone being insufficient to improve water
quality (Marsden, 1989). Measures to eradicate algal blooms are useful only in the
short term. Prevention of nutrient enrichment is the most effective long-term measure
338

for restriction of phytoplankton growth. The different types of control strategies are
considered below. In addition, several options for control of nutrient enrichment
effects and the associated cost of each alternative are presented in Table 7.1 (Boers
and Van der Molen, 1993).
7.1.2 Prevention of nutrient enrichm ent through control of inputs
In lakes of low nutrient status, development of water quality problems can be avoided
by monitoring water quality and enforcing legislation. Estimates of the minimum TP
loading necessary to cause exceedence of the EQS for a water body may be made,
then limits to discharge set accordingly. Environmental modelling has been used for
such lake management purposes (Jorgensen, 1983).
7.1.3 M odelling the effects of nu trien t enrichm ent
Models of aquatic ecosystems have been developed to attempt to predict trophic status
from existing TP loadings to lake catchments, in order to avoid problems of excessive
phytoplankton growth. There are two types of model. Firstly there is the dynamic
model which typically involves many detailed parameters within the catchment system
incorporated into complex mathematical calculations. Secondly, empirical models
have been developed from lake survey statistics (Beveridge, 1984).
7.1.3.1 Dynamic models
Dynamic models have good predictive ability for the particular loch studied, firstly,
when the most influential subsystems of an ecosystem are studied, and secondly,
when near optimum numbers of variables are used in calculations, which are
calibrated and validated. However, the usefulness of dynamic models has also been
found to be limited (OECD, 1982), as there are several difficulties with this model
type, outlined by Jorgensen (1983):
(a) Many subsystems of the ecosystem must be accounted for, such as loch P, N,
C, Si cycles; phytoplankton, zooplankton and fish growth, sediment-water
interactions. It is therefore necessary to have an in depth knowledge of each
system and the rates at which processes occur within the subsystems.
(b) It is difficult to estimate the optimum number of subsystems to consider. The
more parts there are to the model, the more validation/calibration procedures
are necessary and the more error may be incorporated in the model.
339

Table 7.1 Costs of various options fo r am eliorating eutrophication (from Boers and Van der M olen, 1993)
M easure
P removal at treatment plants to 1 mg P L 1 in effluent
P removal at treatment plants to 0.2 mg P L'1 in effluent
P removal from inlet waters
Sedimentation basins to treat inlet waters
P removal using aluminium salts in deep lake
P removal using iron salts in shallow lake
Dredging
Biomanipulation
Hypolimnetic aeration
Artificial circulation
Costs (ECU/ha)
130 y r1
2,200 y r1
6.500-9,000 y r1
6.500-13,500
400
6,000
14,000-40,000
900
400
250
340

(c) As every loch system is different, complex models based on individual lochs
are not transferable to other loch systems.
(d) The data requirement is high and the sampling strategy intensive (a monitoring
programme of twice per month for a year is inadequate to fully describe loch
dynamics). In addition, an equally large independent data set is required to
validate the model. There has been a tendency to add to model complexity,
but not to obtain sufficient data to calibrate the model.
7.1.3.2 Empirical models
Correspondingly, the disadvantages of the empirical models are that they take account
of few variables in complex systems i.e. they are too simplistic. These are static
input-output models, rather than dynamic representations of the ecosystem. In
addition, transferrability of empirical models remains limited (Jorgensen, 1983).
The advantages of empirical models are that they are relatively simple and require
less detailed information on the lake. They are therefore easily and rapidly utilised.
In addition, the empirical models are more broadly applicable as they are less
complex.
Empirical mass balance models which estimate water column TP concentration from
TP loading, loch size, flushing rate and the proportion of TP in sedimentation include
those of Dillon and Rigler (1974a), Vollenweider (1975) and OECD (1982). The
Vollenweider model makes the following assumptions (Vollenweider, 1975):
(a) TP sedimentation rate is proportional to TP loading in the water column.
(b) The water body undergoes complete mixing, so that any variable entering the
water body is equally distributed throughout the water column immediately
upon arrival.
(c) Concentrations of TP in the lake outflow and in the water column are equal.
(d) TP loading rate does not vary seasonally.
Mass balance equations assume that the sum of all fluxes of TP in a lake system is
zero, i.e. the system is in a steady state (Vollenweider, 1975). Although steady state
conditions rarely exist in lakes, they may repeatedly exhibit similar characteristics
over several years, so varying around constant mean nutrient concentrations. This has
been referred to as repetitive steady state (OECD, 1982). The Dillon and Rigler
341

model is a modification of Vollenweider’s original model (Dillon and Rigler, 1974a)
and is based on dependence of water column TP concentration on TP loading to the
water body, lake area and mean depth (Z), water flushing rate and the proportion of
TP lost through sedimentation processes (Beveridge, 1984). Both water residence time
and Z are included as lakes with slow flushing rates are more sensitive to increasing
eutrophication than is expected from Z alone (Vollenweider, 1975). The model was
modified to incorporate a retention coefficient (R) owing to difficulties in measuring
the original sedimentation rate involved in the Vollenweider model (Dillon and
Rigler, 1974a).
Calculation of expected TP concentration within a lake allows its incorporation into
a second model linking TP concentration and chlorophyll a concentration in the water
column. A simple regression relates these two parameters (Dillon and Rigler, 1974b).
A variety of relationships have been determined in different regions of die world,
including the regression of Dillon and Rigler (1974b) for North American lakes and
that of Sakamoto (1966) for Japanese lakes. The equation of Dillon and Rigler
(1974b) for prediction of mean lake chlorophyll a concentration is outlined below
(correlation coefficient 0.95):
l°g10[Chl a] = 1.449 log10[TP] - 1.136
where: [Chi a] chlorophyll a concentration
[TP] TP concentration
This form of equation then allows estimates of chi a concentrations to be expected for
predicted (or observed) TP concentrations in the water columns of lakes, thereby
assisting in catchment management plans. Dillon and Rigler models (1974a and b) are
concerned with water column TP levels at spring overturn i.e. the maximum TP
concentration in the water column prior to summer phytoplankton growth.
7.1 .4 Control of nutrients within freshw ater lake systems
7.1.4.1 Removal of nutrients
Sediment may act both as an internal source of nutrients, and a nutrient sink. This
results from the specific conditions occurring between sediment and overlying water,
or perhaps due to previous external inputs (Chapter 3). Success of sediment removal
342
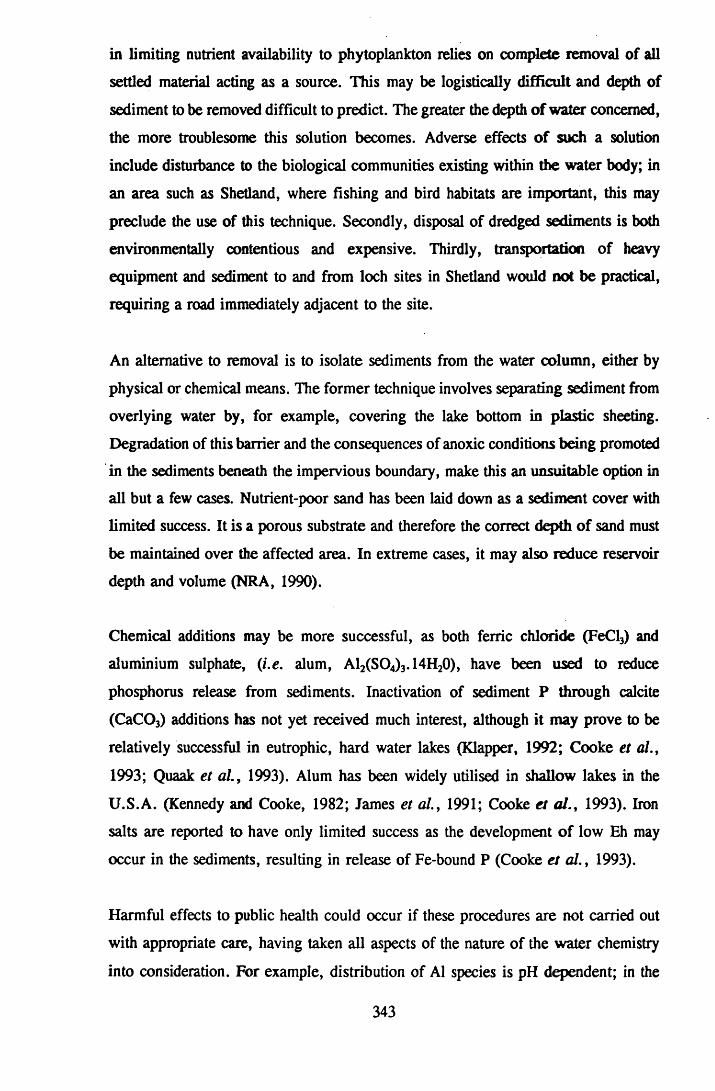
in limiting nutrient availability to phytoplankton relies on complete removal of all
settled material acting as a source. This may be logistically difficult and depth of
sediment to be removed difficult to predict. The greater the depth of water concerned,
the more troublesome this solution becomes. Adverse effects of such a solution
include disturbance to the biological communities existing within the water body; in
an area such as Shetland, where fishing and bird habitats are important, this may
preclude the use of this technique. Secondly, disposal of dredged sediments is both
environmentally contentious and expensive. Thirdly, transportation of heavy
equipment and sediment to and from loch sites in Shetland would not be practical,
requiring a road immediately adjacent to the site.
An alternative to removal is to isolate sediments from the water column, either by
physical or chemical means. The former technique involves separating sediment from
overlying water by, for example, covering the lake bottom in plastic sheeting.
Degradation of this barrier and the consequences of anoxic conditions being promoted
in the sediments beneath the impervious boundary, make this an unsuitable option in
all but a few cases. Nutrient-poor sand has been laid down as a sediment cover with
limited success. It is a porous substrate and therefore the correct depth of sand must
be maintained over the affected area. In extreme cases, it may also reduce reservoir
depth and volume (NRA, 1990).
Chemical additions may be more successful, as both ferric chloride (FeCl3) and
aluminium sulphate, (i.e. alum, Al2(SO4)3.14H20), have been used to reduce
phosphorus release from sediments. Inactivation of sediment P through calcite
(CaC03) additions has not yet received much interest, although it may prove to be
relatively successful in eutrophic, hard water lakes (Klapper, 1992; Cooke et al.,
1993; Quaak et al. , 1993). Alum has been widely utilised in shallow lakes in the
U.S.A. (Kennedy and Cooke, 1982; James et al. , 1991; Cooke et al., 1993). Iron
salts are reported to have only limited success as the development of low Eh may
occur in the sediments, resulting in release of Fe-bound P (Cooke et al. , 1993).
Harmful effects to public health could occur if these procedures are not carried out
with appropriate care, having taken all aspects of the nature of the water chemistry
into consideration. For example, distribution of Al species is pH dependent; in the
343

range pH 6-8, dissolved A1 concentrations are minimal. In addition, excessive inputs
of alum cause low pH and alkalinity, and high dissolved A1 levels (Kennedy and
Cooke, 1982). A possibility that anaerobic conditions could occur in the sediments,
as a result of the treatment also exists (NRA, 1990). These measures are best suited
to a plan of bloom prevention, rather than a means to control excessive algal growth,
once established (Reynolds, 1991). Inactivation of sediment P sources is ineffective
in limiting algal productivity when the external P loading has not been reduced (James
e ta l., 1991).
7.1.4.2 Nutrient manipulation within the water column
Typically, in temperate lake systems during late summer, higher water temperatures
and organic matter sedimentation rates at the sediment surface cause enhancement of
the processes of degradation of organic matter. This results in a lowering of the redox
potential and allows the potential for significant P release, as described by Mortimer
(1941). In the majority of cases, oxidised N may prevent P release from sediments
in lakes with anoxic hypolimnia, with nitrate acting as an electron acceptor,
maintaining redox potential and sustaining the P binding capacity of the sediments
(Tlrdn and Pettersson, 1985). Nitrate principally suppresses solution of Fe-bound P.
Andersen (1982) found that in lakes with > 0.1 g N m*3 and no oxygen in the
hypolimnion, P release from sediments was considerable, whereas at sites where there
were N concentrations of > 1 g N m'3, no release of P was experienced. In shallow
polymictic lakes, a less clear relationship was observed. Of twenty two such waters
studied, fifteen exhibited an internal P source at N levels of < 0.5 g N m*3, three had
no sediment P supply and three of the remaining four waters showed no P increase,
despite N being present at > 0.5 g N m'3 (Andersen, 1982).
During enrichment experiments in British Columbia (Stockner and Shortreed, 1988),
additions of N and P to oligotrophic Kennedy Lake resulted in the development of
late summer blooms of N-fixing cyanophytes. Subsequently, these were eradicated by
increasing the molar ratio of added N:P from 15:1 to 35:1. In following years,
hypolimnetic nitrate concentrations remained significantly higher than pre-
experimental levels (Stockner and Shortreed, 1988).
The above examples of nutrient manipulation illustrate that there exists a possibility
344

of such principles being usefully employed in lakes prone to excessive cyanobacterial
production. However, concentrations of N necessary to eradicate blue-green problems
may conflict with the reqiurements of other water resouce users in many waters. High
nitrate concentrations are particularly undesirable in waters supporting salmonid fish
or potable water supply reservoirs. There is also the risk of stimulating growth of
previously N-limited algae such as those cyanophytes which do not fix N, e.g.
Gomphosphaeria (Chapter 4).
7.1.5 Alleviation of the symptoms of nu trien t enrichm ent
As phytoplankton require light for photosynthesis, physical exclusion of light has been
suggested a means of combating cyanobacterial populations, as have removal of
surface scums and use of polystyrene floats on the water surface. However, the first
may result in death of non-target species, the second is difficult in rocky lochs and
may be regarded only as a temporary measure, whilst the third would be impractical
in unsheltered waters. Alternative algal control strategies, which are based on
physical, chemical and biological control methods and are intended to have more
enduring results, are outlined below.
7.1 .6 M anipulation of physical aspects of standing waters
Calm, stratified conditions in the upper water column favour over-production of
cyanobacteria. In lakes which stratify, methods of artificial destratification allow for
either continuous (Bailey-Watts et al., 1987) or intermittent (Steinberg and Gruhl,
1992) mixing of the whole water column to take place. This should encourage the
growth of diatom populations rather than many taxa of bloom-forming algae. When
net photosynthetic depth is exceeded by mixing depth of a water body, growth of
cyanobacteria may be discouraged. However, as some blue-green algae can survive
these conditions, so selective advantage would pass to other genera such as
Oscillatoria. Intermittent stratification favours diatoms and blue-greens alternately,
whilst maintaining artificially low biomass (NRA, 1990). Another alternate method
of algal control suggested is to use the pressures generated during pumping of water
between supply reservoirs (Walsby, 1992). Changes in pressure can rupture the gas
vacuoles of blue-green algae and prevent them from regulating buoyancy. The algal
cells then fall out of the photic zone, which in turn halts photosynthesis in deep lakes
and leads to scenecense of cells (Walsby, 1992).
345

However, in small shallow lochs, such as those in Shetland, wind action already
ensures complete water column mixing for the great majority of the year (Chapter 2),
whilst photosynthesis is possible in a large proportion of, if not the entire depth of
many lochs. This means that artificial mixing and hypolimnetic withdrawal of water
(another technique for amelioration of eutrophication effects in freshwater lakes) or
encouragement of gas vacuole collapse would not be appropriate in Shetland.
As rapidly flushing water bodies, or those which have periodically high flows, do not
generally support development of large phytoplankton populations, artificially
increasing flushing rate would work against increasing biomass of slow-growing
cyanophytes. However this solution is clearly unrealistic in many situations, and
would be in direct conflict with the purpose of reservoirs (Reynolds, 1991).
7.1.7 Chemical destruction of phytoplankton
Several inorganic (copper sulphate) and organic (diquat) compounds have been
employed in treating algal problems in standing water bodies. These do not have a
uniform effect on all algae and are potentially harmful to non-target organisms.
Profuse usage of such compounds is contrary to EC guidelines and employment of
these poisons is heavily regulated (Reynolds, 1991). Aside from lethal toxicity effects,
chronic toxic effects may go unnoticed. Exposure to elevated metals or organic
compound concentrations activates detoxification mechanisms in fish and mammals
which can result in production of more harmful, possibly carcinogenic compounds
forming within the body (Haux and Fdrlin, 1988; Paine, 1981; Parke, 1985).
Algicide usage results in death of dense populations of phytoplankton. However, these
then sink to the sediments and decay, so causing a depletion in oxygen, a release of
nutrients and clear water which could then stimulate another bloom. Copper sulphate
kills blue-green algae, but green phytoplankton are more tolerant of this algicide and
may replace the cyanobacteria as the bloom forming group (Moss, 1980).
7.1.8 Biological control of cyanophyte problems
Where it is impossible to limit nutrient input sufficiently to prevent bloom problems
arising, the most favourable supplementary course of action is often to attempt some
form of biological control (Moss, 1992). Whilst it is believed that this should cause
346

as little disruption to the existing ecosystem as possible, it is likely to be more
difficult to achieve than control of eutrophication through nutrient source limitation,
as it requires detailed understanding of the functioning of the ecosystem food web
(Benndorf, 1992).
Although juveniles of most fish species are planktivorous, only one species of
indigenous coregonid occurring in standing waters feeds on algae once mature. Powan
(Coregonus lavaretus), however, are associated with deep waters of low nutrient
status and feed mainly on zooplankton. Introductions of silver carp
(Hypophthalmichthys molitrix) or grass carp (Ctenopharyngodon idella) have been
used in Europe for algae control and if used in the UK would have the advantage of
being unable to breed. An obvious drawback of this proposal is the probable lack of
climatic suitability in northerly latitudes. These fish may also show preferences for
particular kinds of algae, so giving selective advantage to other species. In Britain,
introduction of non-indigenous fish would also require a licence and measures to
prevent escapes occurring into non-target waters (NRA, 1990).
An alternative to the introduction of fish is complete removal of the existing fish
population in order to encourage zooplankton growth and consequent phytoplankton
consumption. This would be unacceptable in waters with a high angling value (e.g.
Loch of Ustaness, Lunga, Gossa and Punds Water) or where the ecosystem is
protected, such as in an SSSI (e.g. Tingwall and Asta, Spiggie and Brow and Sand
Water). An obvious disadvantage of techniques which rely upon on consumption of
problem algae is that blue-green algae are generally unpalatable to potential grazers.
Avoidance of cyanophytes, in favour of other algal groups, would assist in the
development of blue-green communities.
Other potential solutions to blue-green algal problems include the use of viruses,
parasitic fungi and herbivorous ciliates. These microorganisms can significantly
reduce scum-forming populations (Reynolds, 1991). Harvesting and maintenance of
such organisms in culture has so far proved difficult (NRA, 1990). Certain bacteria
have been found to produce a group of enzymes which break down microcystin LR
(Anderson, 1995). More research is required on this topic, including environmental
impact assessment of the effects of inoculating ecosystems with such organisms.
347

7.1.8.1 The use of barley straw in reduction of algal biomass
The simple technique of introducing rotting barley straw to waters prone to algal
problems, appears to have been successful at locations in southern Britain (Barrett and
Gibson, 1989; Jones et al., 1989). Growth of Cladophora glomerata (Welch et al.,
1990; Gibson et al., 1990; Ridge and Barrett, 1992), Selenastrum capricomutum (a
standard laboratory bioassay test species) (Jones et al., 1989; Gibson et al., 1990),
Chlorella vulgaris, Klebsormidium rivulare, Oedogonium, Spirogyra, Stigeoclonium
terme, Ulothrix trentonense (Gibson et al., 1990) and Microcystis aeruginosa
(Newman and Barrett, 1993) have been limited in laboratory experiments. The
chemical in barley straw responsible for limitation of algal growth has not been
identified. It has been suggested that the presence of microorganisms within the straw
allows release of an organic algal growth retardant under aerobic conditions. There
is also the possibility that a complexing agent is produced, making nutrients less
available.
Results of utilisation of straw in the limitation of algal growth have shown the effect
to be algistatic as opposed to algicidal, with algae from test conditions recovering
after transfer to a control medium (Gibson et al., 1990; Newman and Barret, 1993).
Consequently, removal of straw from the test water results in recovery of algal
production (Ridge and Barrett, 1992). Optimum effects are reported to occur when
straw has been degrading for six months (Gibson et al., 1990; Jones et al., 1989) and
barley straw, rather than hay, is recommended as having the more efficient algistatic
effect (Gibson et al., 1990). This potential method of phytoplankton control is of
particular interest as straw is a cheap and plentiful material. Additionally, in reported
tests, water quality has not been unduly affected and habitats have been provided for
invertebrate fauna (Ridge and Barrett, 1992).
In aquatic systems where nutrient enrichment has occurred, the inherent variability
of phytoplankton productivity becomes greater than in nutrient poor systems (Chapter
2). At least one biomass peak occurs annually, but also at least one period where
processes such as low nutrient concentrations and zooplankton predation result in low
algal biomass (Sommer et al., 1986). Consequently, if growth inhibition effects occur
through the use of straw, the change induced must be greater than that expected in
the annual variation in order for this to be observed. Alternatively, biomass must be
348

suppressed for an extended period compared to that expected in a clear-water period.
Unless the decrease in phytoplankton productivity is great and or prolonged, the
following points are important:
(a) Differences in biomass and species present as a result of, for example,
variation of internal or external nutrient supplies will probably be greater than
those induced by introduction of straw.
(b) Frequent monitoring would be required in order to detect retardation of
phytoplankton growth. It is possible that the sampling frequency of the present
study was inadequate to detect an effect from the barley straw.
Newman and Barrett (1993) state that algal control was achieved in ponds, drainage
ditches, lakes, canals and reservoirs. In a survey of unreplicated field trials of use of
barley straw as an algal growth retardant (in Britain and Ireland), assessment of
success was based on a scoring system from one (no effect) to nine (no algal growth).
Assessments were made visually or on the basis of algal counts. However, visual
assessments are probably unreliable and it is not stated whether in cases where algal
counts were made if results were undoubtedly outwith variation caused by other
factors.
Experimental procedures are necessary to investigate viability of this control method
in a variety of water, algae and climatic types, as it is possible that it cannot be
efficient with, for example, cyanophytes in cold, humic or hard waters. There also
exists a lack of published information on controlled field trials. Identification of the
active agent is also highly desirable for two reasons. Firstly, it would allow an
investigation of the properties of that chemical. Ridge and Barrett (1992) stated that
it is possible that residues might accumulate in sediments (perhaps resulting in future
difficulties) presumably because sediments act as a sink for many substances including
metals and hydrocarbons. Although there is no evidence that the compound produces
an effect at the population level in organisms other than algae, there is a wealth of
literature on chronic effects of xenobiotics on aquatic animals at a sub-population
level (Sutcliffe, 1994). The stimulation of the mixed function oxidase reactions of
detoxication/toxication mechanisms is such an effect (Parke, 1985). It is also possible
that the substance produced is a phenolic compound. Secondly, should utilisation of
straw prove harmless, it would allow manufacture of the chemical, thereby possibly
enabling more efficient dosing.
349

7.1.9 Alms
The objectives of Chapter 7 are summarised below.
(1) As there is the possibility that unaffected water bodies may develop problems
of excessive phytoplankton growth, should nutrient enrichment occur (Chapter
4), the implications of a models approach to catchment management were to
be considered. The aim of this section of the study was to assess present
loadings of TP to the five study lochs, through use of water column TP
concentrations determined at the end of winter (March, 1992 and March,
1993) in the Dillon and Rigler (1974a) model.
(2) As establishment of TP - chlorophyll a relationships allows estimation of
concentrations of chlorophyll a from calculated or observed water column TP
levels, appraisal of the TP - chlorophyll a regression relationships in the
Shetland lochs studied was to be undertaken.
7.2 MATERIALS AND METHODS
7.2.1 The use of the Dillon and Rigler (1974a) approach to loch
catchment nutrient budgets
The Dillon and Rigler model used to estimate P loadings to the five study lochs was
as follows:
fDl _ T w x L x ( l - R )
where [PJ = predicted loch phosphorus concentration
Tw = water residence time
L — areal loading rate
R = sedimentation coefficient
Z = mean loch depth
The model was modified by substituting actual March loch P concentration for
predicted P concentration, in order to calculate estimated areal loading rate.
Sedimentation was calculated using the equation of OECD (1982) as follows:
350

R = 0.426 e(-°271 x *° + 0.574 e ('°00949 x **
where qa = hydraulic load = Z I Tw
Tw = net annual catchment water volume input / loch volume
Z = loch volume / loch area
Water residence time was calculated from the annual net volume of water entering the
catchment as rainfall, adjusted for evaporation and evapotranspiration, compared to
the loch volume, as calculated from bathymetric data. Evaporation from open water
was estimated as 550 mm each year, evapotranspiration from the surrounding land
as 450 mm on an annual basis. Rainfall figures were provided by the Meteorological
Office, Lerwick Observatory, though November and December, 1993 figures were
estimated as the mean of November and December, 1991 and 1992. No adjustment
was made to account for abstraction volumes as these were always less than the net
input of water to the catchment areas.
After estimation of the areal loading rate to each loch, i.e. the P loading rate per
surface area of the water body, this was converted to absolute P loading rate. The
absolute P loading rate was transformed to an estimate of the annual loading of P
from the land area surrounding each loch, after subtraction of the approximate annual
mass of P received directly by the loch through atmospheric deposition. It was not
possible to correct land input values for atmospheric deposition as the fate of the
latter was unknown. Rain water was collected simultaneously in three borosilicate
glass duran bottles from 3rd-4th October, 1993. The pH values and TP concentrations
in these samples were determined as described in Chapter 2. The mean TP
concentration of 8.0 /*g P L'1 (range: 6.7-10.0 /*g P L 1) (Table 7.2) was used to
calculate TP input to the water bodies directly from rainfall. In order to calculate
mass of P input in terms of land area surrounding Helliers Water, there was also a
correction to subtract the annual loading of P attributable to the pumping scheme from
Loch of Watlee. This was achieved using measured summer TP concentrations in the
water from Loch of Watlee (10.4 and 7.2 /*g P L'1 in 1992 and 1993 respectively) and
the volume of this water which was pumped into Helliers Water each year (487 m3
d'1 for 92 days).
351

Table 7.2 P and pH of rainfall samples collected 3-4/10/93
Sample pH TP (/eg P L*1)
1 4.18 10.0
2 4.14 7.4
3 4.13 6.7
352

In the case of Sandy Loch, estimated areal loading rate in 1992 and 1993 was added
to the conjectured additional areal loading expected from Loch of Brindister through
pumping operations due to begin in 1994. (SIC expected 4300 m3d'! to be pumped
from July to October i.e. approximately 92 days). This allowed estimation of total
expected P loading rate to the Loch after employment of the pumping scheme. This
was then used in the original model along with adjustments in water volume received
by the Loch to surmise the resulting P concentration in the water column. P
concentration in water from Loch of Brindister was estimated as the mean of summer
1991 values (8.5 fig P L'1).
Further calculations were also made for Loch of Gonfirth. A value of 10 fig P L'1 was
substituted into the original equation in order to estimate the maximum permissible
P loading rate to retain the oligotrophic status of the Loch. By subtraction of the
greater estimated present loading (inclusive of atmospheric deposition) from the
greatest feasible, an estimate of the mass of P which could possibly be tolerated by
the system in addition to that already received annually was made.
7.2.2 P-chlorophyll a relationships
Data from 1991 on summer P and chlorophyll a concentrations from three field visits
to the thirty one lochs were examined through simple regression analysis and through
use of a multiplicative model, using the Statgraphics computer package. All data from
each of the five study lochs from 1991 to 1993 were analysed in the same way, as
was the total data set from the five lochs combined.
7.3 RESULTS
7.3.1 The use of a modelling approach for management of loch
catchment areas: estimation of loadings of P to the five water
bodies studied
Estimated areal loading rates to Loch of Gonfirth in 1992 and 1993 were 0.59 and
0.56 kg P ha'1 y r1, corresponding to conjectured values of loading rates from the land
surrounding the Loch of 0.15 kg P ha*1 y r1 in 1992 and 0.13 kg P ha'1 y r1 in 1993
(Table 7.3). The areal loading rates were the lowest calculated for any of the five
lochs studied, though figures for land to loch loading rates were the second lowest
values.
353

Table 7.3 Estimated P loadings to Loch of Gonfirth
Loch mean depth (m)
Loch surface area (m2)
Area of catchment surrounding loch (m2)
Loch volume (m3)
Y ear
Water residence time (7\v) (yr)
Hydraulic load (qa)
March P concentration (mg P m'3)
Rainfall (m y r1)
Retention coefficient (R)
Areal loading (L) (mg P m'2 y r1)
Total areal loading - rainfall areal loading (mg P m*2 y r1)
Loch loading from surrounding land (mg P m'2 y r1)
KEY: n.d.
NOTE 1:NOTE 2:
7.77
145.625
490.625
1,131,100
1991 1992 1993
2.42 2.16 2.60
3.21 3.60 3.58
n.d. 4.7 4.4
1.207 1.297 1.292
0.735 0.715 0.716
n.d. 59.41 55.54
n.d. 49.03 45.20
n.d. 14.55 13.42
No data
mg P m*3 equals /*g P L'1Divide by 100 to convert mg P m'2 to kg P ha'1
354

The areal loading of this water body could theoretically be doubled and the March P
concentration in the water column remain below 10 /xg P L*1, assuming conditions
described previously. An additional areal loading rate of < 0.618 kg P ha*1 y r1
corresponds with a total mass addition of < 8.99 kg P yr1, or < 0.18 kg P ha1 y r1,
by catchment area (Table 7.4). Areal loading rates for Helliers Water were estimated
at 0.97 kg P ha’1 y r1 in 1992 and 0.99 kg P ha'1 y r1 in 1993, a total mass loading of
0.47 kg P y r1 and 0.32 kg P y r1 respectively being attributable to water pumped into
Helliers Water from Loch of Watlee (Table 7.5). The loading rate from the catchment
area was estimated as 0.11 kg P ha'1 y r1 in both 1992 and 1993. This was the lowest
loading rate from land calculated for any of the five loch catchments.
Estimated areal loading rate was greater for Loch of Tingwall, in both 1992 and 1993
(totalling 2.52 and 1.94 kg P ha1 y r1 respectively), than for either Loch of Gonfirth
or Helliers Water (Table 7.6). Catchment loadings in the Tingwall watershed were
computed as 0.43 and 0.34 kg P ha'1 yr'1 in 1992 and 1993, respectively. Estimated
areal loadings to Sandy Loch for 1992 and 1993 were similar (5.28 kg P ha'1 y r1)
(Table 7.7). When converted to TP loading rate from the catchment of Sandy Loch,
an export value of 0.87 kg P ha*1 yr'1 was derived. After estimation of an additional
areal loading of 0.08 kg P ha'1 yr'1 to Sandy Loch through pumping of water from
Loch of Brindister, the total potential areal loading, assuming 1992 and 1993
conditions of rainfall and TP input, increased slightly to 5.36 kg P ha'1 y r1. This
increase in TP loading to Sandy Loch in addition to the higher water volume supplied
to the Loch suggested a March TP concentration reduction in the water column of 2
fig P L 1 would be observed when the planned transfer of water from Brindister was
undertaken (Table 7.8).
TP loadings to Turdale Water estimated by the Dillon and Rigler (1974a) model were
in excess of those computed for any of the other four lochs studied (Table 7.9). Areal
loading rate was considerably greater in 1993 (64.62 kg P ha'1 y r1) than in 1992
(41.19 kg P ha*1 y r1). A large difference remained when results were expressed as
TP contributed to the water body from the surrounding catchment; in 1992 this was
estimated as 3.03 kg P ha'1 yr'1, whilst in 1993, an estimate of 4.77 kg P ha'1 yr'1 was
calculated.
355

Table 7.4 Estimation of maximum permissible P loading to Loch of Gonfirth
Lowest areal loading predicted to give water column P concentration of10 mg P m*3 (mg P m*2 y r1) 121.16 (1991 data)
Greater estimate of areal loading with present water column P concentration(mg P m*2 y r1) 59.41 (1992 data)
Increase in areal loading required toresult in water column P concentrationof 10 mg P m*3 (mg P m*2 yr'1) 61.75
Total increase in P mass to catchmentarea (mg P y r1) 8,992,343.8
Total increase in P loading from catchment surrounding loch(mg P m'2 y r1) 18.33
NOTE 1: Divide by 100 to convert mg P nr2 to kg P ha*1
NOTE 2: The above calculations are based on a maximum permissible spring TPconcentration in the water column of 10 /xg P L*1, therefore in order to maintain the TP concentration at less than 10 fig P L'1, the total allowable increase in P loading would have to be less than those quoted in the table.
356

Table 7.5 Estimated P loadings to Helliers Water
Loch mean depth (m) 1.38
Loch surface area (m2) 44,375
Area of catchment surrounding loch (m2) 363,125
Loch volume (m3) 61,092
Y ear 1991 1992 1993
Water residence time (7\v) (yr) 0.158 0.159
Hydraulic load (qa) 8.71 8.66
March P concentration (mg P nr3) n.d. 4.8 4.9
Rainfall (m y r1) 1.207 1.297 1.292
Retention coefficient (R) 0.569 0.569
Areal loading (L) (mg P nr2 y r1)* n.d. 96.98 98.57
Total areal loading - rainfall areal loading (mg P m 2 y r1) n.d. 86.61 88.24
Mass of P from Loch of Watlee (mg P y r1) n.d. 465,961.6 322,588.8
Loch loading from surrounding land (mg P m'2 yr*1) n.d. 10.59 11.16
K EY :
n.d. No dataDivide by 100 to convert to kg P ha'1 yr'1
357
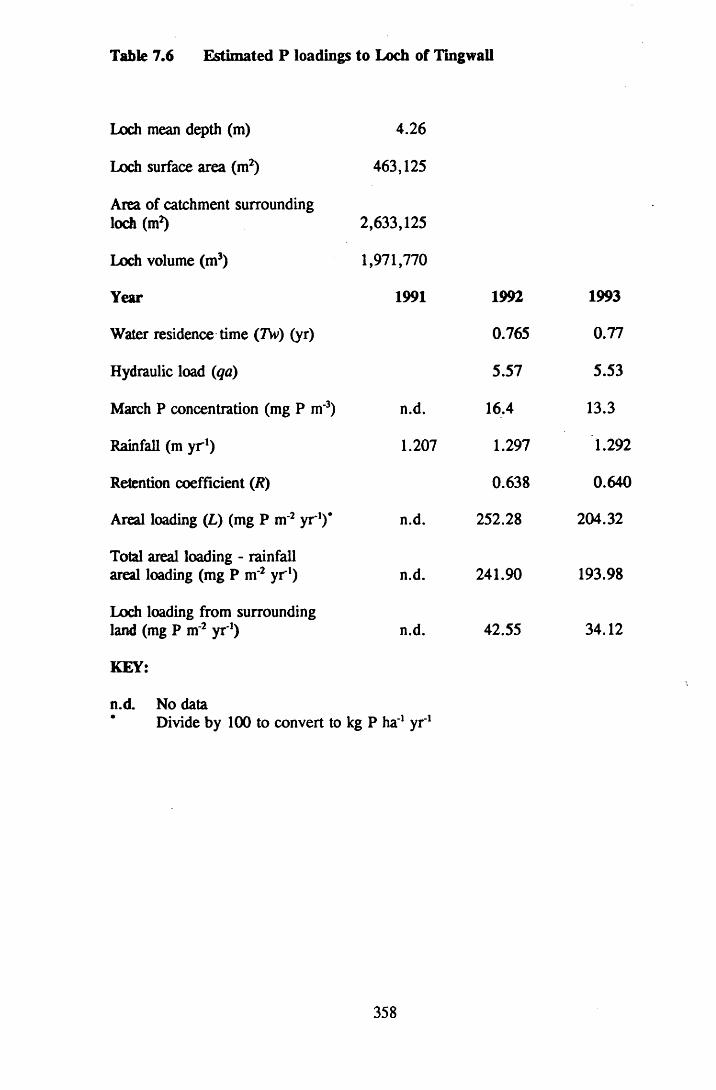
Table 7.6 Estimated P loadings to Loch of Tingwall
Loch mean depth (m) 4.26
Loch surface area (m2) 463,125
Area of catchment surroundingloch (m2) 2,633,125
Loch volume (m3) 1,971,770
Year 1991 1992 1993
Water residence time (7\v) (yr) 0.765 0.77
Hydraulic load (qa) 5.57 5.53
March P concentration (mg P m'3) n.d. 16.4 13.3
Rainfall (m y r1) 1.207 1.297 1.292
Retention coefficient (R) 0.638 0.640
Areal loading (L) (mg P m'2 yr*1)* n.d. 252.28 204.32
Total areal loading - rainfallareal loading (mg P m*2 y r1) n.d. 241.90 193.98
Loch loading from surroundingland (mg P m'2 yr*1) n.d. 42.55 34.12
KEY:
n.d. No dataDivide by 100 to convert to kg P ha'1 y r1
358

Table 7.7 Estimated P loadings to Sandy Loch
Loch mean depth (m)
Loch surface area (m2)
Area of catchment surrounding loch (m2)
Loch volume (m3)
Y ear
Water residence time (7\v) (yr)
Hydraulic load («qa)
March P concentration (mg P m'3)
Rainfall (m yr1)
Retention coefficient (R)
Areal loading (L) (mg P nr2 yr1)*
Total areal loading - rainfall areal loading (mg P nr2 yr1)
Loch loading from surrounding land (mg P nr2 yr1)
KEY:
3.63
414,375
2,458,125
1,503,058
1991
n.d.
1.207
n.d.
n.d.
n.d.
1992
0.63
5.78
33.6
1.297
0.632
528.05
517.67
87.27
1993
0.63
5.74
33.7
1.292
0.633
527.86
517.52
87.24
n.d. No dataDivide by 100 to convert to kg P ha'1 yr1
359

Table 7.8 Prediction of reduction of March water column TP concentration of Sandy Loch assuming similar conditions of rainfall and P areal loading as occurred in 1992 and 1993
Estimated P areal loading from Lochof Brindister (mg P m'2 yr1) 8.11
Rainfall and P areal loading data year 1992
Areal loading (L) (mg P m'2 yr'1) 528.05
Total estimated areal loading(mg P m'2 yr'1) 536.16
Residence time (7\v) adjusted forincreased volume of water input (yr) 0.539
Predicted hydraulic load (ga) 6.74
Predicted retention coefficient (R) 0.607
Predicted TP concentration(mg Pm'3) 31.3
Predicted reduction of water column TP concentration (mg P m'3) 2.0
1993
527.86
535.97
0.542
6.70
0.608
31.4
2.0
360

Table 7.9 Estimated P loadings to Turdale Water
Loch mean depth (m) 0.93
Loch surface area (m2) 63,750
Area of catchment surroundingloch (m2) 863,125
Loch volume (m3) 58,951
Year 1991 1992 1993
Water residence time (Tw) (yr) 0.076 0.076
Hydraulic load (qa) 12.29 12.20
March P concentration (mg P m'3) n.d. 159.0 250.5
Rainfall (m yr1) 1.207 1.297 1.292
Retention coefficient (R) 0.526 0.527
Areal loading (L) (mg P m*2 yr1)* n.d. 4118.94 6462.28
Total areal loading - rainfallareal loading (mg P m'2 yr1) n.d. 4108.56 6451.94
Loch loading from surroundingland (mg P m’2 yr1) n.d. 303.46 476.54
KEY:
n.d. No dataDivide by 100 to convert to kg P ha'1 yr1
361

7.3.2 TP-chlorophyll a relationships
The TP-chlorophyll a relationship of 1991 results for all thirty one lochs combined
was not described efficiently by a simple linear model, R2 value and correlation
coefficient being low. However, the log model of 1991 data gave a significant slope
estimate (p <0.001) and a correlation coefficient of 0.695, although the R2 value
remained low (R2 = 48.3%) (Table 7.10). Data from the five intensively studied
lochs were pooled, and the log model produced a significant TP-chlorophyll a relationship (p < 0.001). This relationship was similar to that for the 1991 data from
the synoptic survey of thirty one lochs, but had a greater R2 value (61.8%) and
correlation coefficient (0.79) (Table 7.10).
Separate investigations of the TP-chlorophyll a relationships for each of the five lochs
studied from 1991 to 1993, revealed that none of the five sets of results exhibited a
significant relationship between TP and chlorophyll a, using either the simple or
multiplicative analyses.
7.4 DISCUSSION
7.4.1 The modelling approach in catchment areas of Shetland lochs
7.4.1.1 Estimation of water loss through evaporation
From review of literature on annual evaporation rates in Britain, the range of
evapotranspiration figures from grassland was 370-438 mm and from heather covered
land, 454-478 mm (Petts and Foster, 1985). Shaw (1983) stated an annual loss of 669
mm from open water in England from review of published work. Strahler and
Strahler (1973) presented a contour map of the USA (after Mead) depicting rates of
water loss from open water. At 50°N (including coastal areas) evaporation was
approximately 510 mm. Bailey-Watts et al. (1987) estimated annual potential
evaporation and annual water surface evaporation at Coldingham Loch (Scotland) as
493 mm and 592 mm respectively. Whilst water loss is likely to be positively
influenced by the wind conditions in the Shetland Islands, it was also taken into
account that evaporation rates decrease with increased latitude.
362

Table 7.10 Multiplicative models of P-chlorophyll a relationships in Shetlandlochs
Model n p Correlation R2 Fcoefficient value ratio
(%) (%)
y = -0.66x°772 93* <0.001 0.70 48.3 84.9
y = -0.6Lc°74 60+ <0.001 0.79 61.8 93.9
logy = 0.7721ogr - 0.66
logy = 0.741og* - 0.61
KEY:
corresponds with three data points of thirty one lochs (1991)+ corresponds with twelve data points of five lochs (1991-1993)
363

7.4.1.2 Limitations associated with use of the models
Although empirical models have proven useful in oligotrophic and mesotrophic
systems, e.g. 4.1-15.3 /zg P L*1 (Dillon and Rigler, 1974b), over a wide range of
loadings and flushing rates, limitations in the usefulness of the models do exist.
Confidence limits for chi a concentrations predicted from TP levels are broad (Dillon
and Rigler, 1974b), and predicted water column TP levels are normally different from
measured concentrations. Dillon and Rigler (1974a) found that for the majority of
lakes examined, this difference was within the range ±20%, i.e. if the actual TP
concentration were 10.0 /zg P L'1, then the model would probably predict a value
between 8.0 and 12.0 /zg P L 1. The Ontario Trophic Status Model is similar to the
Dillon and Rigler (1974a) model (Hutchinson et al. , 1991). Differences in the
predicted and actual total phosphorus levels during the ice-free period were found to
be less than 20% in eleven of fifteen lakes examined in a validation study of this
model (Hutchinson et al., 1991).
If the initial conditions of the models are violated, estimated TP or chlorophyll a concentrations may be inaccurate. The following factors may all adversely influence
the applicability of the models: low loch mean depth, sediment P release, incomplete
water column mixing, differences in loch and outflow TP concentrations, seasonal TP
loading differences, failure to account for all TP inputs, limitation of production by
parameters other than P (such as N, light, water colour), biotic influences. These
factors are all discussed in more detail below.
(a) Lake Z (mean depth) may be important in influencing applicability of a model.
Dillon and Rigler (1974a) found predicted and actual lake water P concentrations to
be similar. However, the correlation was improved when two lakes with Z < 1 m
were removed from the data set. In the water residence time range 1.5-4.5 years, a
comparison of eight models revealed that all gave similar results of estimated P
loading. However, the Vollenweider (1976) model was found to overestimate P
loading at lower water exchange rates and underestimate below the above range,
whereas a model developed specifically from summer data of shallow lakes
(FOSRES), rather than one calibrated from annual averages from deep and shallow
lakes, could predict P loading more accurately under such conditions (Berge, 1990).
364

The FOSRES model was developed with the assumption that effects of P loading are
depth dependent, with shallow lakes having a greater tolerance to P loading than those
possessing a Z of approximately > 15 m. Although the limit for oligotrophic waters
remained at 10/xg P L'1, it was suggested from the literature that 7 /xg P L*1 would be
more appropriate for deep lakes (Berge, 1990). However, though it is possible for
shallow lochs to be more tolerant of increased P loading, these lakes are often
associated with nutrient enrichment. Although the shallow nature of Shetland lochs
may influence the accuracy of the estimates of the Dillon and Rigler calculation
(1974a), models developed specifically for lakes of low mean depth (OECD, 1982;
Berge, 1990) were not utilised in the present study; tolerance of higher TP loadings
has not been established for the shallow Shetland lochs, compared with deeper water
bodies. The response of a loch to nutrient enrichment is dependent upon rates of
flushing, sediment adsorption and release of nutrients, rather than water depth alone.
(b) The models may underestimate TP or chlorophyll a levels in enriched systems due
to sediment P release; they are not, therefore, applicable except when P loss to the
sediment ^ 0 (Vollenweider, 1975) i.e. there is not a net P input to the water column
from the sediment. Vollenweider-type models differ from Dillon and Rigler-type
models in that P sedimentation within the lake is dependent upon water column P
mass and loading P mass respectively. The two associated processes are referred to
as in-lake mass decay and loading decay (Prairie, 1988). An investigation into which
approach is generally more relevant to lake modelling revealed that loading decay
provided a more efficient predictive equation. However, incorporation of both
sedimentation parameters into a model resulted in a further improvement in
performance (Prairie, 1988). The latter approach was, however, beyond the scope of
the present project.
(c) It is a condition of the model that P concentration in the outflow is equal to that
of the water column. This may not be applicable if sediment resuspension occurs at
the outflow, or P is trapped by macrophyte stands (Berge, 1990). However, in the
present study of the five lochs, this condition was generally met, with the exception
of Turdale Water. The outflow TP concentration was greater than that of the water
column, during October 1993.
365

(d) It is a also a requirement of the model that the water body is completely mixed.
When lakes stratify they are not continuously and uniformly mixed. Inflows may run
to surface waters only (Prepas and Rigler, 1981). However, since no difference was
detectable either horizontally or vertically within the water column of four of the
Shetland lochs studied, this condition of the model was fulfilled. Turdale Water TP
and chlorophyll a concentrations were however, found to differ over the surface area
of the water body. TP and chlorophyll a levels varied within Turdale Water during
May 1993 and June 1992 (Chapter 2).
(e) With regard to seasonal differences in lake inputs and outputs, it has been
suggested that a seasonal model would be more appropriate for predictions under such
circumstances (Prepas and Rigler, 1981). Using three equations dealing with the
mixed layer only during the summer stratification period, Prepas and Rigler (1981)
found predicted and actual mean summer lake water TP concentrations were
comparable. This model may be generally applicable to medium-sized lakes, but it
is necessary that seasonal changes in lake water P are known.
Inaccuracies in the calculations of the present study are likely to have occurred
because P loading was not seasonally consistent. In all five catchment areas studied,
there were ephemeral inflows in which there was no flow for a considerable part of
the year (Chapter 2). In addition, sampling of loch inflows revealed that it was
possible for there to be a high degree of variability in nutrient concentrations present
within the same inflow at different times of sampling (Chapter 2). Both Helliers
Water and Sandy Loch are now influenced by input of water from separate water
bodies over the summer period only. Owing to episodic nature of agricultural P
loading in the catchments of Loch of Tingwall, Sandy Loch and Turdale Water, rate
of nutrient input is unlikely to have been consistent.
Annual variability of estimated P concentrations in inflow and outflow water may be
determined only when data have been compiled for several annual cycles (Prepas and
Rigler, 1981). The present study has data on spring P levels in the water column
during two years only, so that the estimated P loading rates have been calculated
using a limited data set.
366

(f) When using the Dillon and Rigler model to calculate expected P concentration in
the water column, account must be taken of all P sources in the catchment. During
studies of the applicability of the Dillon and Rigler (1974a) model in Scottish lochs
supporting cage fish farming operations, actual and predicted P concentrations were
similar when aquaculture was the only significant anthropogenic water user and there
had been ’relatively small perturbations to the nutrient cycle* (Kelly, 1995). However,
estimation of P loading from the drainage area and assumption of steady state become
difficult in multi user watersheds, particularly where forestry or improved grassland
provide irregular and diffuse P loadings (Kelly, 1995).
(g) If an environmental parameter other than P is limiting algal growth, predicted
chlorophyll a concentration will exceed the actual concentration in the lake water. In
the present study, for models relating TP and chlorophyll a concentrations, R2 values
were 48.3% and 61.8% for the 1991 (thirty one lochs) and 1991-1993 (five lochs)
data respectively. These values corresponded to the percentage of variability in
chlorophyll a concentrations accounted for by the TP concentrations. TP was the
variable measured which was most strongly related to phytoplankton taxa present and
to chlorophyll a concentrations (Chapter 4). However, other parameters influenced
phytoplankton growth. TAN and TON were noted as important in phytoplankton
growth patterns in the CCA analysis. It has been illustrated in the literature that
spring N:P ratio affects the accuracy of model results (Dillon and Rigler, 1974b;
OECD, 1982; Dillon et al., 1988).
Considering the TP-chlorophyll relationship of Sakamoto (1966), lake waters with
N:P ratio > 12:1 were found to deviate only slightly from the regression line,
whereas those with low N:P ratios were more divergent from the relationship (Dillon
and Rigler, 1974b). Lakes studied by Dillon and Rigler (1974b) had spring N:P ratios
> 12:1. TP enrichment of the water column increases the rate of N metabolism
within a water body, partly explaining the change from P to N limitation in eutrophic
systems (Vollenweider, 1975). Sakamoto (1966) illustrated that in lakes with a N:P
ratio of < 10:1, N and chlorophyll exhibited a better relationship than that found
between P and chlorophyll (Dillon et al., 1988). An important reason for variation
in results from P and chlorophyll predictive studies is that lakes with water column
N:P ratios < 10:1 have been incorporated in the work (Dillon et al., 1988). In
367

studies of North American lakes, around 80% of the variability in chlorophyll a concentration could be explained by P concentration, but the residual variance was
most highly correlated with N:P ratio (Dillon et al., 1988). Unfortunately,
measurement of TN was not possible in the present study, nor determination of TAN
and TON after 1991. Investigation of possible adjustments of the models with N
concentrations was therefore not feasible.
In enriched waters, light may become the dominant limiting factor for algal growth.
This is also an important consideration, particularly in dystrophic lakes. According
to Granberg and Haijula (1982) most of the developed nutrient-chlorophyll models
in their original state cannot be used for brown water lakes, as their predictive
capacity is based on data from clear water lakes. Consequently, models incorporating
a light coefficient have been tested and primary production may be estimated from
mean annual TP concentration and mean annual water colour (Granberg and Haijula,
1982). Granberg and Haijula (1982), however, obtained a relationship between
observed and predicted phytoplankton production with R2 = 0.62 only. This may
have been associated with the poor R2 = 0.52 of the relationship between mean
seasonal primary productivity and maximum primary production. Tolstoy et al. (1988) compared models with and without a light parameter incorporated in the
calculations and concluded that light was an important variable which the OECD
(1982) study excluded. Of three Swedish lakes studied, only predictions for brown-
water Lake Vanem fell outwith OECD model confidence limits. Using TP, water
colour and transparency improved the primary production predictive capacity and
uniformity of results compared to OECD models in Lake Vanem (Tolstoy et al.f1988). In the present study, the CCA did not show light to be one of the most
important factors accounting for differences in phytoplankton growth in different lochs
at different times (Chapter 4). It appears unlikely, therefore, that in the TP-
chlorophyll a models for Shetland lochs, inclusion of a light factor would have
improved their explanatory power substantially.
(h) Biotic factors may influence the efficacy of the model. Chlorophyll concentrations
vary between and within algal groups (Ahlgren et al., 1988). Differences in cell
chlorophyll content are known to occur between species and as a result of cell
condition and environmental factors. For example, from literature review, Reynolds
368

(1984a) presented chi a contents per algal cell as follows: Asterionella formosa 1.38-
2.21 pg; Closterium aciculare 89 pg; Ankyra judayi 0.45 pg; Anabaena cireinalis 0.6-
0.9 pg. Also, possible shifts in dominance of different phytoplankton are regarded as
typical of P enrichment in water bodies. This is not accounted for in the TP-chl a model and consequently could explain differences found between predicted and actual
effects of P on phytoplankton biomass, or between different predictive regressions
(Dillon et al., 1988). Mean seasonal chlorophyll a concentration and mean seasonal
phytoplankton productivity are highly positively correlated. A comparison of
chlorophyll a with phytoplankton biomass in estimation of trophic status revealed the
latter to have a more significant regression equation, particularly when diatom
biomass was discounted (Dillon et al., 1988). However, chlorophyll a is a rapidly and
easily measurable estimate of algal biomass. Zooplankton communities within the lake
also influence chlorophyll a concentration (Ahlgren et al., 1988), although in a study
of North American lakes, total crustacean and herbivorous crustacean variables were
included in the TP-chlorophyll a model and did not inprove the efficacy of the model
(Dillon et al., 1988).
7.4.2 Implications of the results for catchment management of the five
sites
Neither Loch of Gonfirth nor Helliers Water had any anthropogenic inputs of P from
the land within the drainage basin. Consequently the estimated TP loadings from these
catchment areas were the lowest calculated (Tables 7.3 and 7.5). That Helliers Water
catchment TP loadings were lower and more consistent from 1992 to 1993 is possibly
explained by the soil types present in each catchment. Soils present in the Helliers
Water catchment were found to be more efficient in adsorption and binding of P than
those in the Loch of Gonfirth watershed (Chapter 6). Consequently, in the Helliers
Water catchment area, P released from soil or vegetation would be rapidly
readsorbed. In addition, release of water soluble P from this soil is far less likely than
from soil of the Loch of Gonfirth drainage basin. In terms of rates of soil erosion,
it is also more likely for the loading of particulate P to the water body to be greater
in the Loch of Gonfirth watershed, as loss of P increases with slope (Goldman and
Home, 1983). The Helliers Water catchment area has lower slopes than those at Loch
of Gonfirth (OS 1:25000 Sheets HP 40/50/60 and HU 26/36 respectively).
369

However, despite the oligotrophic status of Helliers Water indicated by the March TP
concentrations in the water column and the capacity of the soil for P uptake, in
summer, the TP levels in this water body have been observed to be as high as 9.8 /xg
P L'1 (May, 1992). During summer, this reservoir is "topped up" with Loch of
Watlee water, which has a greater TP concentration than that of Helliers Water. As
the Helliers Water has a water residence time of approximately 0.16 yr i.e. it flushes
6.3 times per year, this action probably does not have a lasting effect. However,
increased loading in summer can increase phytoplankton productivity and result in
sediment P binding sites being occupied. Addition of P to a freshwater system is
likely to have the greatest impact in the summer, when conditions of light and
temperature are most favourable for algal growth. It is therefore not considered
advisable to have any additional P loading to this catchment area.
In contrast, Loch of Gonfirth drainage basin has been estimated as being able to
tolerate a further P loading rate from the surrounding land of < 0.18 kg P ha*1 yr1
(total mass addition of < 8.99 kg TP yr*1). Soil in this catchment area is, however,
unlikely to retain a large proportion of any applied fertiliser P, should reseeding be
undertaken. Of the three catchments studied which had experienced soil fertilisation,
none had a loading rate as low as 0.33 kg P ha*1 yr1 i.e. the maximum estimated
permissible loading rate from the land to Loch of Gonfirth.
Loch of Tingwall ranked third in terms of trophic status and in catchment TP loading
rates. The elevated P loading rates are accounted for by the nature of the land use in
the catchment, a greater proportion of the loading being attributable to the west side
of the watershed. Possible sources of P in this part of the drainage basin include:- ten
septic tanks, two slurry stores, one dairy, one beef unit, one golf course, substantial
areas of reseed and some arable land (Okill, J.D., SIC, pers. comm., 1994). Mean
TP concentration in the water column of Loch of Tingwall during summer was found
to range from 8.5-10.7/xg P L*1. However, during March and May, 1992 and March,
1993, mean water column TP levels of 16.4, 14.7 and 13.3 /xg P L*1 were recorded
respectively. In addition, mean chlorophyll a concentrations in Loch of Tingwall
exceeded OECD (1982) limits for oligotrophic waters on all sampling dates except
May, 1992, when mean water column concentration was at the OECD (1982) limit
of 2.5 /xg chla L*1. Of the five lochs studied, this water body had the greatest water
370
retention time (0.77 yr), corresponding to a flushing rate of 1.3 times annually. It is
therefore recommended that, despite relatively high soil P uptake potential, no further
land improvement is undertaken in this catchment area, nor are loading rates of P to
this water body increased through any other nutrient source.
Monitoring of the inflow waters of Loch of Tingwall revealed that existing point
sources of discharge may not be continually maintained to standards required for
protection of fteshwaters. Inflow 6, though ephemeral, was found to exhibit excessive
nutrient levels and growth of "sewage fungus", which is typical of heavily enriched
systems. It is suggested from a knowledge of land use that this was attributable to
either a dairy unit or silage storage, in which case it would probably also exhibit an
unacceptable biochemical oxygen demand. There exists the potential for improvement
of present discharges. As there is now a sewage scheme in the Tingwall area for
removal of waste from human habitation, and it is desirable that future developments
be incorporated into this scheme, with sewage being pumped to the sea, rather than
septic tanks discharging within the catchment area. Under EC legislation, emission
of sewage to the sea will be unlawful from 1998. However, inclusion of all waste
outputs in the existing scheme would provide the framework for sewage collection
and disposal in the future.
TP loading rates to Sandy Loch were greater than those to Loch of Tingwall (Tables
7.6 and 7.7). Whereas soil in Loch of Tingwall watershed has relatively high P
binding capacity, that in Sandy Loch drainage basin is highly organic and retains little
P against leaching. Therefore, the combination of a peaty catchment area and
additional nutrient loadings have resulted in relatively high TP loading rates. The TP
concentrations measured in inflow 1 and a drain from the north east of the catchment,
suggest that the cultivated land in this area of the drainage basin contributes a TP
loading to the Loch in excess of that which would be expected naturally. Two other
potential TP sources in the watershed are the disused tip to the north of the water
body, and the old area of reseed in the south west of the catchment area. It is likely
that much P is imported to the Loch in particulate or humic-bound form. Little
difference was apparent in Sandy Loch TP concentrations or loadings in 1992 and
1993, thereby suggesting that small additions in forms readily available to plants are
extremely important.
371
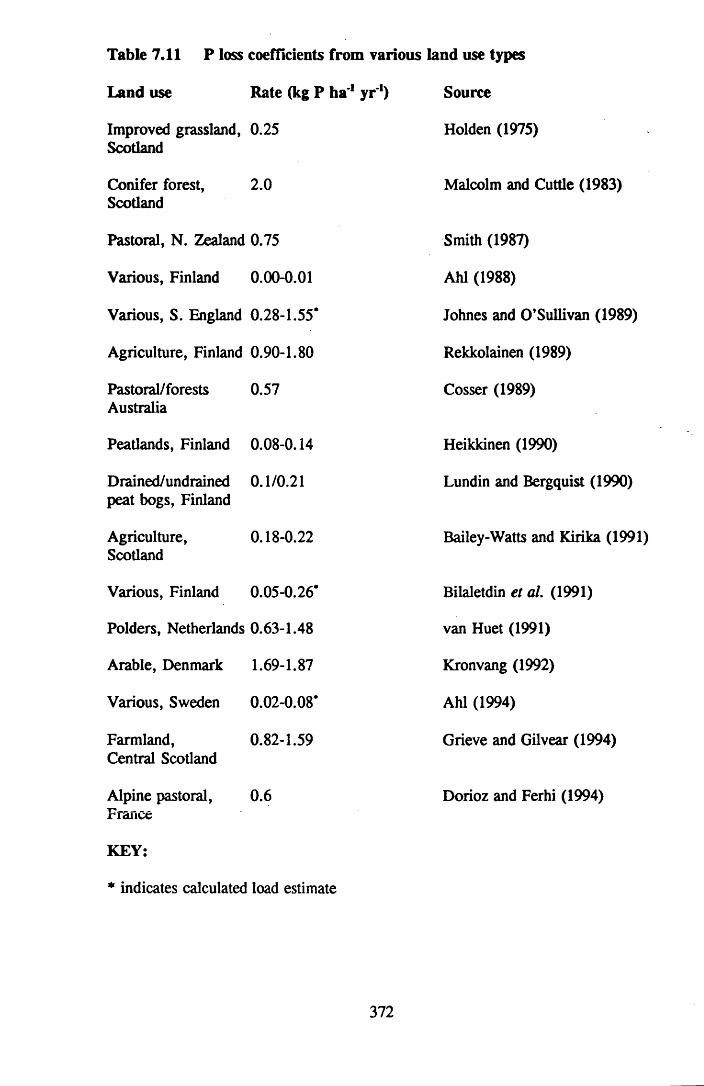
P loss coefficients from various land use types
Rate (kg P ha'1 yr'1) Source
Table 7.11
Land use
Improved grassland, 0.25 Scotland
Conifer forest, 2.0 Scotland
Pastoral, N. Zealand 0.75
Various, Finland 0.00-0.01
Various, S. England 0.28-1.55*
Agriculture, Finland 0.90-1.80
Pastoral/forests 0.57 Australia
Peatlands, Finland 0.08-0.14
Drained/undrained 0.1/0.21 peat bogs, Finland
Agriculture, 0.18-0.22Scotland
Various, Finland 0.05-0.26*
Polders, Netherlands 0.63-1.48
Arable, Denmark 1.69-1.87
Various, Sweden 0.02-0.08*
Farmland, 0.82-1.59Central Scotland
Alpine pastoral, 0.6 France
KEY:
* indicates calculated load estimate
Holden (1975)
Malcolm and Cuttle (1983)
Smith (1987)
Ahl (1988)
Johnes and O’Sullivan (1989)
Rekkolainen (1989)
Cosser (1989)
Heikkinen (1990)
Lundin and Bergquist (1990)
Bailey-Watts and Kirika (1991)
Bilaletdin et al. (1991)
van Huet (1991)
Kronvang (1992)
Ahl (1994)
Grieve and Gilvear (1994)
Dorioz and Ferhi (1994)
372
Estimated P loading rates to the different catchments were generally within the range
of values presented in the literature for P losses from various types of land use found
in these drainage basins (Table 7.11). The exception was Turdale Water, which had
estimated P loss values in excess of those in the literature. A high proportion of the
Turdale catchment area was reseeded. This in combination with the small volume of
the Loch, the low P retention characteristics of the highly organic soil (Chapter 6)
and the failure in adjusting soil pH to the less acid conditions required for soil
improvement (Chapter 6) account for the high TP loss rates from the land in the
Turdale Water catchment area and its subsequent upon Loch water quality.
7.4.3 Comparison of water management in the present study with other
reported examples
TP loadings can be estimated by continuous monitoring of TP concentrations and
discharge in all loch inflows, but this is an expensive an labour intensive approach.
Consequently, estimation of the TP loading to a loch through the use of loss
coefficients for different land uses observed in catchment studies elsewhere are
favoured (Table 7.12). Estimates of TP loadings are calculated from the proportions
of different land uses within the watershed. In the technique of hindcasting, loss
coefficients are also used to estimate the "original" TP concentration in the loch water
column.
Typically, there is no account taken of slope, soil P adsorption capacity, or extent of
vegetation cover in these types of calculation. However, slope of the land is
incorporated in PLUS (Marsden, 1995). Inclusion of this factor might improve TP
loss estimates in a relatively steep-sided drainage basin, such as that of Loch of
Tingwall. However, many of the Shetland watersheds are of relatively flat
topography, so slope may not be such an important influence on TP losses. The
results of the P retention in soil experiments in the present study suggest that TP
loadings calculations involving loss coefficients should be interpreted with extreme
care. Assuming the same loss coefficients for the same land use is inappropriate when
different soil types are present. Highly organic soils, especially those of low pH,
retain little of the P added to them, compared with more mineral soils of high pH
(Chapter 6). Not only is there P lost in the particulate form, as suggested in the
literature (Sinclair et al. , 1992; Reynolds, 1994), but also in the dissolved fraction
373
(Chapters 2 and 6).
A different approach to estimation of TP loadings to five study lochs was undertaken
in the present study. The Dillon and Rigler (1974a) model was rearranged to calculate
TP loading from loch water column TP concentrations. From these calculations it is
apparent that small changes in loading may have a significant effect on phytoplankton
productivity. Similarly, only small differences in loch water P concentrations (/xg P
L'1) are necessary to increase or decrease the probability of excessive phytoplankton
growth. Therefore, only a small error in the loadings estimated from loss coefficients
observed elsewhere could be significant.
It is doubtful whether a return to the original state of a water body can be achieved
following development in the catchment of more intensive agricultural or forestry land
use. Similarly, the majority of Scotland was originally forested naturally. The
hydrology and nutrient dynamics of a naturally forested catchment cannot be the same
as those of the cleared watershed. These objections raise serious doubts as to the
suitability of hindcasting as an effective management tool. It is suggested that
attempting to manage systems as they are is more practical than the hindcasting
approach.
Errors also exist in the use of a model such as that of Dillon and Rigler (1974a)
(Chapter 7). In addition, catchment TP loadings calculated with the rearranged
version of this model do not give loss coefficients for individual land uses, unless
there is one land use only within the drainage basin. However, use of the Dillon and
Rigler (1974a) model in estimation of export of TP from catchment to loch systems
requires only information on lake morphometry and the TP concentration in the water
column at the end of winter. Validation of this model has been undertaken in its
original form for calculation of water column TP concentrations from TP loadings to
the loch. In addition, the model in its original form may be utilised in assessing the
theoretical maximum tolerable additional TP loading to a loch system.
374

7.4.4 Reduction of P losses to loch systems
7.4.4.1 Good agricultural practice
Reductions in losses of nutrients to the catchment drainage system are possible
through appropriate farm management regimes which effectively limit surface runoff
quantity and quality. Measures for minimisation of enrichment of waters are outlined
by NRA (1992), the Control of Pollution (Silage Slurry and Agricultural Fuel
Oils)(Scotland) Regulations 1991 and the Code of Good Agricultural Practice
(SOAFD, 1991). Several major reduction strategies are suggested, including:
(a) soil analysis for determination of fertilisation requirements
(b) restoration of improved grassland to semi-improved or rough grazing
(c) use of unfertilised strips of land adjacent to drainage channels and standing
waters
(d) operation of a set aside policy
(e) replacement of silage with hay for winter livestock feed
(f) ploughing late in winter
(g) limitation of slurry spreading between October and March
(h) careful storage/containment of silage/slurry.
7.4.4.2 Soil assessment
With respect to point (a), Soil Survey maps indicate that few soils are present in the
thirty one catchment areas studied which would be efficient at P sorption (Table 6.7).
The majority of soil designations signify soils of peaty, wet and cation leached natures
(Table 6.7). Soil Survey information confirms that there are areas in certain drainage
basins which incorporate soils more likely to have a relatively good P sorption
capacity: Arthur’s, Cliff, Huesbreck, Papil, Skutes, Snarravoe, Spiggie, Tingwall and
Watlee. Also indicated in the maps and illustrated by %LOI and pH measurements
was the fact that poor soils were also present in the catchments with relatively
efficient P sorping soils, such as Tingwall and Spiggie. Consultation of soil maps is
therefore recommended as good practice for initial assessment of likely effects of
reseeding procedures. Measurements of soil pH and organic content are simple to
undertake and may assist in the estimation of the likely magnitude of TP loss
following fertilisation. As efficiency of P sorption is dependent upon soil type, and
previous additions of fertiliser affect the P sorption capacity of a soil (Chapter 6), it
375

is important to determine actual, rather than estimated fertiliser requirements.
7.4.4.3 Future options for land and runoff management procedures
With reference to points (e)-(h), ploughing late in winter minimises nutrient loss
through increased surface run-off resulting from waterlogging or freezing of the soil.
Minimal spreading of slurry between October and March is recommended for the
same reasons. Incidences of organic enrichment of water bodies from farm sources
have often been associated with inadequate containment of slurry/silage. Difficulties
have arisen as a consequence of storage receptacles having insufficient volume,
structural defects and cracks in the drainage system, in addition to poor management
practices (NRA, 1992).
Considering points (c) and (d), in drainage basins where land improvement has been
undertaken such as Loch of Tingwall, Sandy Loch and Turdale Water, the use of
buffer zones as recommended by NRA (1992) is suggested. Buffer zones have a
beneficial effect on water quality as the area of land receiving fertiliser is distanced
from the water body. Suspended soil particles and nutrients in drainage water from
the affected area are then trapped, broken down or assimilated into biological material
of the catchment soils and not discharged to the water course. NRA (1992) advocated
examination of the possibility of "set aside" being used for such a purpose.
The width of a vegetated buffer zone is recommended as 10-20 m, depending upon
slope, size of water body, soil nutrient retention capacity and vegetation type (Ahola,
1990). This will have implications for field size in small land holdings in Shetland.
Finally, a strategy which has not been considered in the present study is the
implementation of macrophyte based water treatment methods. The utilisation of
vegetated ditches and wetland systems to control run-off quality is not dissimilar to
the use of buffer zones. In vegetated ditches and wetland systems, the plants do not
account for a high percentage of the nutrient removal efficiency. Bacterial
transformations such as nitrification/denitrification and physicochemical processes,
such as sedimentation, adsorption and precipitation. However, the use of more than
one plant species is recommended for increased efficacy of nutrient removal
(Hammer, 1989). Species of Typha, Scirpus, Juncus and Phragmites have all been
376

used in constructed wetlands. Deep penetration of the substrate by Phragmites root
systems results in increased soil stabilisation, hydraulic conductivity and aerobic
microbial activity (Lawson, 1987). The main problem with wetland systems is the
area of land required for efficient nutrient removal. In sewage treatment, 1.34-4.44
ha ML*1 d'1 (or 1.78-2.22 ha ML*1 d*1 after primary treatment) is required (Hammer,
1989).
Vegetated drainage systems have been utilised in nature conservation areas in the
Netherlands (Meuleman and Beltman, 1993). Polluted river water has been routed
through drainage ditches or reed marshes and a zonation from eutrophic to
mesotrophic plant types has been observed along the vegetated ditch. Low N removal
efficiency has been observed, in contrast to high efficacy of P removal (90-95%), the
latter being associated particularly with an area of Fontinalis antipyretica (Meuleman
and Beltman, 1993). It is concluded that use of such treatment systems as vegetated
ditches and wetland systems in Shetland may be worth investigating in the future.
7.5 CONCLUSIONS
(1) Many algal and nutrient control methods have been considered (Section 7.1),
but there are few techniques which would be appropriate to the requirements
of Shetland.
(2) The predictive ability of the Dillon and Rigler (1974a) model has been
observed to be better than that of the other empirical models available
(Beveridge, 1984). However, there are limitations to the use of the Dillon and
Rigler (1974a) model for prediction of loch trophic state and therefore for
estimation of TP loadings from loch TP concentrations.
(3) Calculated loadings of TP to the five study lochs were within the range of
values observed elsewhere, with the exception of TP loadings in the Turdale
Water watershed. TP loadings in this drainage basin were higher than, those
in the published literature.
(4) The implications of the investigations into the TP budgets of the study
catchment areas are that further TP inputs to the lochs should be discouraged
and where possible, existing discharges should be improved.
377

CHAPTER 8: CONCLUSIONS
8.1 Thesis aims
As stated in the introductory chapter, section 1.18, the aims of the thesis were to
determine the following:
(a) present status of water quality in Shetland Island lochs
(b) susceptibility of Shetland standing waters to excessive primary production
problems associated with nutrient enrichment
(c) the potential for fertiliser applications on land to cause nutrient enrichment of
standing freshwaters
(d) possible preventative or remedial measures to preserve water quality should
problems of elevated plant productivity occur.
Aim (a) was acheived by undertaking three successive annual water sampling
programmes, with the initial survey in 1991 encompassing thirty one sites throughout
the Shetland Islands (Chapter 2). Samples taken were analysed for a wide range of
physico-chemical parameters, including P and N concentrations.
Aim (b) was completed by using the nutrient status information obtained in the 1991
survey and comparing this data to the OECD (1982) trophic status classification
scheme for freshwaters (Chapter 2). The potential for sediment to act as a source or
sink of nutrients was evaluated (Chapter 3). In addition, an examination of the
resident phytoplankton (Chapter 4) and macrophytes (Chapter 5) in freshwaters both
affected and unaffected by fertilisation was undertaken.
Aim (c) was acheived by three methods. Firstly, the analysis of inflow water nutrient
chemistry in fertilised catchment areas (Chapter 2). Secondly, calculation of P loss
coefficients from such areas (Chapter 7), and thirdly, through laboratory examination
of P adsorption and desorption from soils collected from five representative
catchments (Chapter 6).
Aim (d) was completed by consideration of available technologies for water quality
preservation in nutrient enriched areas, and their applicability in the Shetland Islands
freshwater environment (Chapter 7).
378

8.2 Thesis conclusions
(1) A variety of loch types, incorporating a range of physical and chemical
characteristics was observed within the thirty one water bodies surveyed.
Parameter
pH
Conductivity (jiS cm'1)
Water colour (at 400nm)
LAC
TP (/ig P L'1)
TOP (jig P L*1)
DRP (pg P L'1)
TAN (jig N L'1)
TON (jig N L'1)
Ca (mg L'1)
Mg (mg L'1)
Na (mg L'1)
K (mg L'1)
Chlorophyll a (jig L'1)
Range
5.09-9.80
151-695
0.027-0.887
0.06-5.33
4.1-154.3
2.8-59.2
<1.0-90.8
10-145
<5-58
1.3-80.0
2.8-20.9
24.3-52.8
0.8-3.3
1.0-32.8
(data excluding saline Strand Loch)
(2) Values for pH, alkalinity, conductivity and water cation concentrations were
slightly elevated in comparison with lochs elsewhere in Britain, but water
chemistry was as would be expected in shallow, lowland waters, with
influences from fertile geology and maritime salts.
(3) A range of trophic states was observed, from oligotrophic to eutrophic. Only
six water bodies were classified as oligotrophic and therefore unlikely to
exhibit excessive phytoplankton production. These were Arthur’s, Helliers,
Lunga and Roer Water and Lochs of Gonfirth and Ustaness.
(4) A degree of variation in TP concentrations is to be expected in loch and
inflow waters and in chlorophyll a levels of standing freshwaters, even in
situations where there is no anthropogenic nutrient input, other than in the
379

form of airborne substances.
(5) Data collected suggested that inflow waters were likely to be a source of loch
nutrient enrichment in catchment areas incorporating improved grassland,
cattle and septic tanks.
(6) Working in favour of good water quality in the standing waters of Shetland
are the prevailing meteorological conditions which ensure that stratification of
the water column is rare. This effect is augmented by the shallowness of the
loch basins. Stable water column conditions were noted only infrequently,
even in the deeper basins examined. Stratification when present was weak,
constituting a temperature change of approximately 2°C from surface to deep
water.
(7) %C, %N and %P contents of the sediments examined were all within the
ranges of values observed elsewhere:
Parameter Range
%C 0.94-36.7%
%P 0.03-0.34%
%N not detectable-l.49%
(8) Eh conditions in the sediments of the four basins were generally in agreement
with water column nutrient status information. Sediment Eh decreased in the
following order: Loch of Gonfirth, Helliers Water, Tingwall North, Turdale
Water, Tingwall South.
(9) In Shetland lochs, the same sediment may act as both a sink and a source of
P. There was a tendency for P stored in sediment to be present in highest
quantities at approximately 3-5 cm sediment depth.
(10) A proportion of the P present in the upper 5 cm of sediment was in a readily
releasable form, possibly loosely bound to humic substances, in sediment from
Lochs of Gonfirth, Tingwall and Turdale Water.
Range of sediment P release: 0.00-0.52 fig P g*1
380

(11) External P loading was an important influence on sediment P dynamics.
Turdale Water had the highest water column TP concentration, in addition to
having the most organic sediment and the highest P release. Loch of Tingwall
sediment had the lowest organic content, but the second highest water column
TP concentration and sediment P release.
(12) The P adsorption capacity of sediments studied decreased in the following
order: Helliers Water, Loch of Tingwall, Loch of Gonfirth. Sediment in
Helliers Water assists in maintaining water column P concentration at levels
lower than would be expected from P loading on the water body. Lochs in
catchment areas incorporating more mineral soils are likely to have sediments
which have relatively good P sorption properties. Conversely, lochs in
drainage basins of peaty soil types are likely to have sediments of poor P
sorption capacity.
Range of sediment P uptake: 0.03-0.54 fig P g'1
(13) It is concluded that, if the external P loadings were removed from Loch of
Tingwall, Sandy Loch and Turdale Water, an internal P loading would
remain. However, in Helliers Water, it is likely that the P immobilised in the
sediment would be retained. Although Loch of Gonfirth sediment was found
to release P, there has been no artificial loading on this water body, so that
the internal loading is not considerable.
(14) Presence of green algae and cyanobacteria in lakes was not in itself an
indicator of nutrient enrichment. Blue-green algae, such as Gomphosphaeria
and Merismopedia, were observed in water bodies of low trophic status.
Similarly, green algae, such as desmids, MonoraphidiumlAnkistrodesmus and
Oocystis were present in low nutrient waters.
(15) Chrysoflagellates were widespread in Shetland lochs. These algae often
dominate in Scottish lochs (Brook, 1964; Bailey-Watts and Duncan, 1981a).
(16) A range of phytoplankton assemblages was observed in the lochs surveyed.
CCA analysis indicated that distribution and abundance of phytoplankton
381

genera in the thirty one sites varied with the levels of TON and TAN found
in the water column. However, TP concentration remained the most important
parameter measured in this respect in the Shetland lochs.
(17) Changes in phytoplankton community structure with time demonstrated
similarities with those expected in temperate lake systems, such as the
occurrence of the spring diatom increase. Deviations from the model may be
partly attributable to the individual nutrient status of each loch.
(18) Anabaena was the only blue-green genus of phytoplankton ranked highly on
the TP gradient and in addition associated with increased TAN and low TON
concentrations. Other cyanobacteria exhibited a range of nutrient preferences.
(19) In 1991, on at least one water sampling date, lochs in which cyanobacterial
blooms had been observed were associated with increased TP, TAN, and chi
a levels, together with low TON concentrations. The sites were Turdale, Bu
and Punds Water, Sandy Loch and Loch of Brough (Yell).
(20) Other water bodies which experienced similar water column conditions on at
least one occasion were Gossa Water and Lochs of Brow, Snarravoe and Cliff.
It is postulated that Anabaena blooms did not develop in these water bodies
because P in the water column was bound to Ca or Mg, rather than being
present in more bioavailable forms.
(21) Macrophyte species present in Shetland Island lochs were typical of those
observed elsewhere in Scotland, in lowland areas under maritime influence,
in water bodies situated on fertile and non-fertile geology.
(22) In terms of water quality, macrophyte species present in the Shetland lochs
3surveyed were found to be influenced most by pH, Ca and Mg
concentrations. The classification system of Shetland lochs by TWINSPAN
division was therefore likely to be indicative of different water pH values,
C02/HC03' levels, hardness and alkalinity.
382
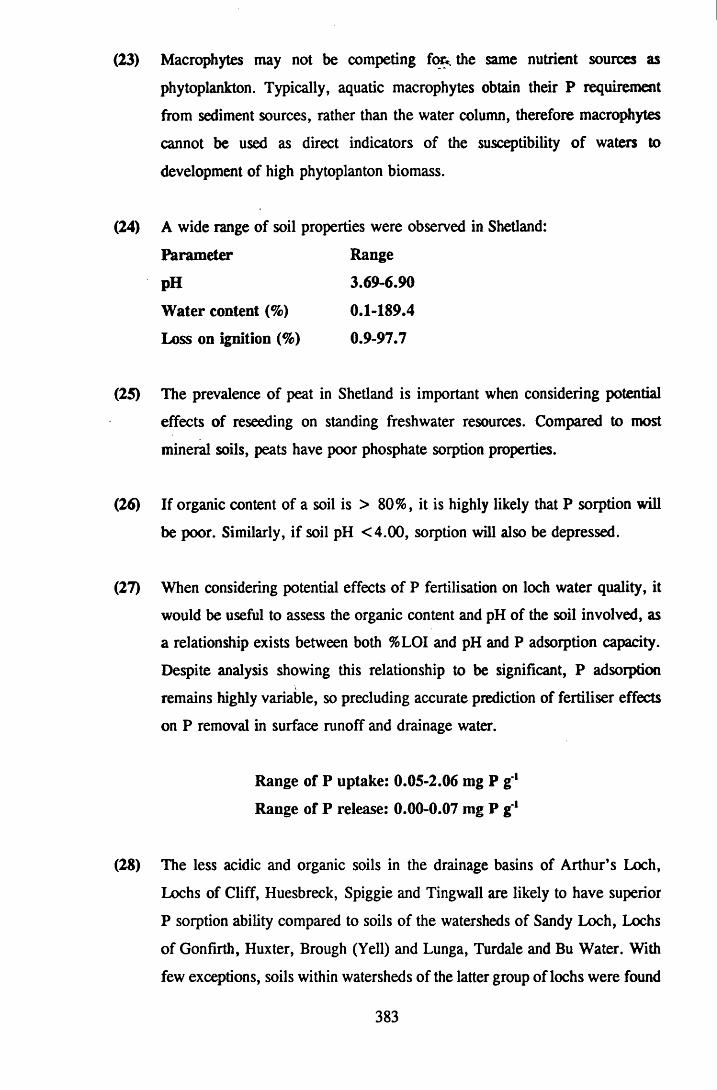
(23) Macrophytes may not be competing for*, the same nutrient sources as
phytoplankton. Typically, aquatic macrophytes obtain their P requirement
from sediment sources, rather than the water column, therefore macrophytes
cannot be used as direct indicators of the susceptibility of waters to
development of high phytoplanton biomass.
(24) A wide range of soil properties were observed in Shetland:
Parameter Range
(25) The prevalence of peat in Shetland is important when considering potential
effects of reseeding on standing freshwater resources. Compared to most
mineral soils, peats have poor phosphate sorption properties.
(26) If organic content of a soil is > 80%, it is highly likely that P sorption will
be poor. Similarly, if soil pH <4.00, sorption will also be depressed.
(27) When considering potential effects of P fertilisation on loch water quality, it
would be useful to assess the organic content and pH of the soil involved, as
a relationship exists between both %LOI and pH and P adsorption capacity.
Despite analysis showing this relationship to be significant, P adsorption
remains highly variable, so precluding accurate prediction of fertiliser effects
on P removal in surface runoff and drainage water.
(28) The less acidic and organic soils in the drainage basins of Arthur’s Loch,
Lochs of Cliff, Huesbreck, Spiggie and Tingwall are likely to have superior
P sorption ability compared to soils of the watersheds of Sandy Loch, Lochs
of Gonfirth, Huxter, Brough (Yell) and Lunga, Turdale and Bu Water. With
few exceptions, soils within watersheds of the latter group of lochs were found
pH
Water content (%) Loss on ignition (%)
3.69-6.90
0.1-189.4
0.9-97.7
Range of P uptake: 0.05-2.06 mg P g'1
Range of P release: 0.00-0.07 mg P g*1
383

to be of high organic content (83.0-97.6%) and low pH (pH 3.69-4.91) and
therefore unlikely to sorp P effectively
(29) Many algal and nutrient control methods have been considered but few
techniques which would be appropriate to the requirements of Shetland.
(30) There are limitations to the use of the Dillon and Rigler (1974a) model for
prediction of loch trophic state and therefore for estimation of TP loadings
from loch TP concentrations.
(31) Calculated loadings of TP to the five study lochs were within the range of
values observed elsewhere, with the exception of TP loadings in the Turdale
Water watershed. TP loadings in this drainage basin were higher than those
in the published literature.
(32) The implications of the investigations into the TP budgets of the study
catchment areas are that further TP inputs to the lochs should be discouraged
and where possible, existing discharges should be improved.
(33) Lochs which are likely to be most susceptible to development of
phytoplankton blooms when fertiliser is applied to the surrounding land are
those highly coloured waters within catchments incorporating peaty soils and
sediments, located on geology of low Fe, Mn, Al, Ca and Mg content.
(34) As reseeding within catchment areas has effects upon the receiving loch
systems, to prevent problems of deterioration of water quality, as a
consequence of augmentation of phytoplankton growth, watershed
management, rather than within loch restoration measures are necessary.
384

BIBLIOGRAPHY
Ahl T. (1988) Background yield of phosphorus from drainage area and atmosphere:
an empirical approach. Hydrobiologia 170: 35-44.
Ahl T. (1994) Regression statistics as a tool to evaluate excess (anthropogenic)
phosphorus, nitrogen, and organic matter in classification of Swedish fresh water
quality. Water, Air and Soil Poll. 74: 169-187.
Ahlgren I., Frisk T. and Kamp-Nielsen L. (1988) Empirical and theoretical models
of phosphorus loading, retention and concentration vs. lake trophic state.
Hydrobiologia 170: 285-303.
Ahola H. (1990) Vegetated buffer zone examinations on the Vantaa River basin. Aqua Fennica 20(l):65-69.
Alabaster J.S. and Lloyd R. (1980) Water Quality Criteria for Freshwater Fish. FAO
Copyright, Butterworth and Co. (Publishers) Ltd., pp.297.
Allen S.E., Grimshaw H.M., Parkinson J.A. and Quarmby C. (1974) In: Allen S.E.
(ed.) Chemical Analysis Of Ecological Materials, 1st edn. Blackwell Scientific
Publications, pp.368.
Allenby K.G. (1981) Some analysis of aquatic plants and their waters. Hydrobiologia 77: 177-189.
Andersen J.M. (1974) Nitrogen and phosphorus budgets and the role of sediments in
six shallow Danish lakes. Arch. Hydrobiol. 74(4): 528-550.
Andersen J.M. (1982) Effect of nitrate concentration in lake water on phosphate
release from the sediment. Wat. Res. 16: 1119-1126.
Anderson I. (1995) Hungry enzymes thrive on toxic slime. New Scientist 146(1980):
17.
385
Anderson M.R. and Kalff J. (1986) Nutrient limitation of MyriophyUum spicatum growth in situ. Freshw. Biol. 16: 735-743.
Anthony J. (1976) John Anthony’s Flora of Sutherland. In: Kenworthy J.B.(ed.)
Botanical Society of Edinburgh, pp.201.
APHA (1985) Standard Methods for the Examination of Waters and Waste Waters,
16th edn. American Public Health Association, Washington DC, pp. 1134.
Armstrong A.C. and Garwood E.A. (1991) Hydrological consequences of artificial
drainage of grassland. Hydrological Processes 5: 157-174.
Arts G.H.P. and Leuven R.S.E.W. (1988) Floristic changes in shallow soft waters
in relation to underlying environmental factors. Freshw. Biol. 20: 97-111.
Avanzino R.J. and Kennedy V.C. (1993) Long-term frozen storgae of stream water
samples for dissolved orthophosphate, nitrate plus nitrite, and ammonia analysis.
Water Res. Res. 29(10): 3357-3362.
Bache B.W. and Williams E.G. (1971) A phosphate sorption index for soils. J. Soil Sci. 22: 289-301.
Bailey-Watts A.E. (1978) A nine-year study of the phytoplankton of the eutrophic and
non-stratifying Loch Leven (Kinross, Scotland). J. Ecol. 66: 741-771.
Bailey-Watts A.E. and Duncan P. (1981a) Chemical Characterisation. A One-Year
Comparative Study. In: Maitland P.S. (ed.) The Ecology of Scotland’s Largest Lochs
Lomond, Awe, Ness, Morar and Shiel. Dr. W. Junk Publishers, p.67-89,
Bailey-Watts A.E. and Duncan P. (1981b) The Phytoplankton. In: Maitland P.S. (ed.)
The Ecology of Scotland’s Largest Lochs Lomond, Awe, Ness, Morar and Shiel. Dr.
W. Junk Publishers, p.91-118.
Bailey-Watts A.E. and Kirika A. (1991) Loch Eye, Easter Ross - a case study in
386

eutrophication. IFE/NCC project report T04050.
Bailey-Watts A.E., Kirika A. and Howell D.L. (1987) The potential effects of
phosphate runoff from fertilised forestry plantations on reservoir phytoplankton:
literature review and enrichment experiments. Final report to WRc and NERC
Contract no. 4139 pp.59.
Bailey-Watts A.E., Lyle A.A., Kirika A. and Wise E.J. (1987) Coldingham Loch,
S.E. Scotland: 1. physical and chemical features with special reference to the seasonal
patterns in nutrients. Freshw. Biol. 17: 405-418.
Balls H., Moss B. and Irvine K. (1989) The loss of submerged plants with
eutrophication. 1. Experimental design, water chemistry, aquatic plant and
phytoplankton biomass in experiments carried out in ponds in the Norfolk Broads.
Freshw. Biol. 22: 71-87.
Barber H. and Haworth E.Y. (1981) A Guide to the Morphology of the Diatom
Frustule. FBA Scientific Publication No.44, pp. 112.
Barko J.W. and Smart R.M. (1980) Mobilisation of sediment phosphorus by
submersed freshwater macrophytes. Freshw. Biol. 10: 229-238.
Barko J.W., Gunnison D. and Carpenter S.R. (1991) Sediment interactions with
submersed macrophyte growth and community dynamics. Aqua. Bot. 41: 41-65.
Barraclough D., Hyden M.J. and Davies G.P. (1983) Fate of fertiliser nitrogen
applied to grassland. 1. Field leaching results. J. Soil Sci. 34: 483-497.
Barrett P.R.F. and Gibson M.T. (1989) Aquatic Weeds Unit Research Report,
AWRU, Reading, pp. 19.
Barrow N.J. (1974) Effect of previous additions of phosphate on phosphate adsorption
by soils. Soil Sci. 118: 82-89.
387

Barrow N.J. (1979) Three effects of temperature on the reactions between inorganic
phosphate and soil. J. Soil Sci. 30: 271-279.
Barrow N.J. (1983) A mechanistic model for describing the sorption and desorption
of phosphate by soil. J. Soil Sci. 34: 733-750.
Barrow N.J., Bowden J.W., Posner A.M. and Quirk J.P. (1980) Describing the
effects of electrolyte on adsorption of phosphate by a variable-charged surface. Aust. J. Soil Research 18: 395-404.
Barsdate R.J., Prentki R.T. and Fenchel T. (1974) Phosphorus cycle of model
ecosystems: significance for decomposer food chains and effect of bacterial grazers.
Oikos 25: 239-251.
Belcher H. and Swale E. (1978) A Beginner’s Guide to Freshwater Algae. 3rd
impression. ITE-NERC, HMSO, pp.46.
Belcher H. and Swale E. (1979) An Illustrated Guide to River Phytoplankton. ITE-
NERC, HMSO, pp.63.
Bell S.L. (1991) Fresh-Water Macrophyte Survey of Selected Sutherland Lochs 1987
- 1988. Contract Surveys Report Number 34. NCC, pp. 162.
Benndorf J. (1992) The control of indirect effects of biomanipulation In: Sutcliffe
D.W. and Jones J.G. (eds.) Eutrophication: Research and Application to Water
Supply, FBA, p. 82-93.
Berge D. (1990) FOSRES - a phosphorus loading model for shallow lakes. Verh. Int. Verein. Limnol. 24: 218-223.
Berman T., Sherr B.F., Sherr E., Wynne D. and McCarthy J.J. (1984) The
characteristics of ammonium and nitrate uptake by phytoplankton in Lake Kinneret.
Limnol. Oceanogr. 29(2): 287-295.
388

Beveridge M.C.M. (1984) Cage and pen fish farming: carrying capacity models and
environmental impact. FAO Fish. Tech. Paper 225, FAO, Rome, pp. 131.
Beveridge M.C.M. (1985) Methods of Biological Analysis. In: Stirling H.P. (ed.)
Chemical and Biological Methods of Water Analysis for Aquaculturists, 1st edn.
Institute of Aquaculture, University of Stirling, p. 106-114.
Bilaletdin A., Koskinen K. and Frisk T. (1991) Statistical assessment of different
contributions to nutrient loading from a drainage basin. Aqua Fennica 21(2): 117-126.
Bloesch J. and Gavrieli J. (1984) The influence of filtration on particulate phosphorus
analysis. Verh. Int. Verein. Limnol. 22: 155-162.
Boggie R.B. and Miller H.G. (1976) Growth of Pinus contorta at different water-
table levels in deep blanket peat. Forestry 49: 123-131.
Boers P.C.M. and Van der Molen D.T. (1993) Control of eutrophication in lakes: the
state of the art in Europe. European Water Pollution Comrol 3(2): 19-25.
Bohn H., McNeal B. and O’Connor G. (1979) Soil Chemistry. John Wiley and Sons,
Inc., pp.329.
Boney A.D. (1989) Phytoplankton, 2nd Edition. New Studies in Biology Series,
Edward Arnold, pp. 118.
Bostrom B. (1984) Potential mobility of phosphorus in different types of lake
sediment. Int. Rev. Hydrobiol. 69: 457-474.
Bostrom B. (1988) Relations between chemistry, microbial biomass and activity in
sediments of a sewage-polluted vs a nonpolluted eutrophic lake. Verh. Int. Verein.
Limnol. 23 : 451-459.
Bostrom B., Andersen J.M., Fleischer S. and Jansson M. (1988) Exchange of
phosphorus across the sediment-water interface. Hydrobiologia 170: 229-244.
389

Bostrom B., Jansson M. and Forsberg C. (1982) Phosphorus release from lake
sediments. Arch. Hydrobiol. 18: 5-59.
Bostrom B. and Pettersson K. (1982) Different patterns of phosphorus release
ffomlake sediments in laboratory experiments. Hydrobiologia 92: 415-429.
Boyd C.E, Davis J.A. and Johnston E. (1978) Dieoffs of the blue greem alga,
Anabeana variabilis, in fish ponds. Hydrobiologia 61(2): 129-133.
Britton R.H. (1974) The Freshwater Ecology of Shetland. In: Goodier R. (ed.) The
Natural Environment of Shetland, NCC Edinburgh, p. 119-129.
Broberg O. and Pettersson K. (1988) Analytical determination of orthophosphate in
water. Hydrobiologia 170: 45-59.
Brook A.J. (1958) Changes in the phytoplankton of some Scottish hill lochs resulting
from their artificial enrichment. Verh. Int. Verein. Limnol. 13: 298-305.
Brook A.J. (1964) The Phytoplankton of the Scottish Freshwater Lochs. In: Burnett
J.H. (ed.) The Vegetation of Scotland, Oliver and Boyd, p.290-305.
Brook A.J. (1994) Algae. In: Maitland P.S., Boon P.J. and McLusky D.S. (eds.) The
Fresh Waters of Scotland, 1st edn. Wiley, Chichester, p. 131-146.
Bourrelly P. (1966) Les Algues D’Eau Douce. Initiation k la Syst6 matique. Tome i.
Les Algues Vertes. Boub6 e et Cie, Paris, pp.511.
Bourrelly P. (1968) Les Algues D’Eau Douce. Initiation & la Syst6 matique. Tome ii.
Les Algues Jaune et Brunes. Chrysophyc6 es, Ph6 ophyc6 es, Xanthophyc6 es et
Diatom6 es. Boub6 e et Cie, Paris, pp.438.
Bourrelly P. (1970) Les Algues D’Eau Douce. Initiation k la Syst6 matique. Tome iii.
Les Algues Bleues et Rouges. Les Eugteniens, P6 ridiniens at Cryptomonadines.
Boub6 e et Cie, Paris, pp.512.
390

Brown A., Birks H.J.B. and Thompson D.B.A. (1993) A new biogeographical
classification of the Scottish uplands. II. Vegetation - environment relationships. J.
Ecol. 81: 231-251.
Burke W. (1975) Fertiliser and other chemical losses in drainage water from blanket
bog. Ir. Journal o f Agricultural Research 14: 163-178.
Burrows D. and Hoseason M. (eds.) (1982) A Guide to Shetland Trout Angling.
Shetland Anglers' Association, pp.32.
Butzer K.W. (1976) Geomorphology from the Earth. Harper International, pp.463.
Canfield D.E., Shireman J. V., Colle D.E., Haller W.T., Watkins C.E. and Manceina
M.J. (1984) Prediction of chlorophyll a concentrations in Florida lakes: importance
of aquatic macrophytes. Can. J. Fish. Aquat. Sci. 41: 497-501.
Cappenberg Th.E. (1979) Kinetics of breakdown processes of organic matter in
freshwater sediments. Arch. Hydrobiol. 12: 91-94.
Cappenberg Th.E., Hordijk K.A., Jonkheer G.J. and Lauwen J.P.M. (1982) Carbon
flow across the sediment-water interface in Lake Vechten, The Netherlands.
Hydrobiologia 91: 161-168.
Carignan R. (1982) An empirical model to estimate the relative importance of roots
in phosphorus uptake by aquatic macrophytes. Can. J. Fish. Aquat. Sci. 39: 243-247.
Carmichael W.W. (1982) Chemical and toxicological studies of the toxic freshwater
cyanobacteria Microcystis aeruginosa, Anabaena flos-aquae and Aphanizomenon
flos-aquae. South African Journal o f Science 78: 367-372.
Carpenter S.R., Elser J.J. and Olson K.M. (1983) Effects of roots of Myriophyllum
verticillatum L. on sediment redox conditions. Aqua. Bot. 17: 243-249.
Carpenter S.R. and Lodge D.M. (1986) Effects of submersed macrophytes on
391

ecosystem processes. Aqua. Bot. 26: 341-370.
Carter J.R. and Bailey-Watts A.E. (1981) A taxonomic study of diatoms from
standing freshwaters in Shetland. Nova Hedwigia 33: 513-630.
Chambers P. A. and Kalff J. (1987) Light and nutrients in the control of aquatic plant
community structure. 1. In situ experiments. J. Ecol. 75: 611-619.
Chambers P.A. and Prepas E.E. (1990) Competition and coexistence in submerged
aquatic plant communities: the effects of species interactions versus abiotic factors.
Freshw. Biol. 23: 541-550.
Christiansen R., Friis N.J.S. and Sondergaard M. (1985) Leaf production and
nitrogen and phosphorus tissue content of Littorella uniflora (L.) Aschers in relation
to nitrogen and phosphorus enrichment of the sediment in oligotrophic Lake Hampen,
Denmark. Aqua. Bot. 23: 1-11.
Cleve-Euler A. (1968) Die Diatomeen von Schweden und Finnland. Band 2,1; 4,1;
4,5; 5,4; 3,3. Reprint original 1950s series. Wheldon and Wesley, Ltd., Stechert-
Hafner Service Agency, Inc., Codicote, Herts., New York, N.Y.
Cooke G.D., Welch E.B., Fulmer D.G. and Martin A. (1993) Phosphorus
inactivation with aluminium, calcium and iron salts. Hydrobiologia 253: 323-336.
Cosser P.R. (1989) Nutrient concentration-flow relationships and loads in the South
Pine River, South-Eastern Queensland. 1. Phosphorus loads. Aust. J. Mar. Freshw.
Res. 40: 613-630.
Cronberg G. j(1982) Changes in the phytoplankton of Lake Trummen induced by
restoration. Hydrobiologia 8 6 : 185-193.
Cuttle S.P. (1983) Chemical properties of upland peats influencing the retention of
phosphate and potassium ions. J. Soil Sci. 34: 75-82.
392
Danielsson L.G. (1982) On the use of filters for distinguishing between dissolved and
particulate fractions in natural waters. Wat. Res. 16: 179-182.
Davison W. and Woof C. (1984) A study of the cycling of manganese and other
elements in a seasonally anoxic lake, Rostheme Mere, U.K. Wat. Res. 18: 727-734.
Dickson D.A. and Savill P.S. (1974) Early growth of Picea sitchensis (Bong.) Carr,
on deep oligotrophic peat in Northern Ireland. Forestry 47: 57-88.
Dillon P.J., Nicholls K.H., Locke B.A., de Grosbois E. and Yan N.D. (1988)
Phosphorus-phytoplankton relationships in nutrient-poor, soft-water lakes in Canada.
Verh. Int. Verein. Limnol. 23: 258-264.
Dillon P.J. and Rigler F.H. (1974a) A test of a simple nutrient budget model
predicting the phosphorus concentration in lake water. J. Fish. Res. Bd. Canada 31:
1771-1778.
Dillon P.J. and Rigler F.H. (1974b) The phosphorus - chlorophyll relationship in
lakes. Limnol. Oceanogr. 19(5): 767-772.
Doremus C. and Clesceri L.S. (1982) Microbial metabolism in surface sediments and
its role in the immobilization of phosphorus in oligotrophic lake sediments.
Hydrobiologia 91: 261-268.
Dorioz J.M. and Ferhi A. (1994) Non-point pollution and management of agricultural
areas: phosphorus and nitrogen transfer in an agricultural watershed. Wat. Res. 28(2):
395-410. (English abstract, text in French).
Dry F.T. and. Robertson J.S. (1982) Soil and Land Capability for Agriculture: Orkney
and Shetland, Macaulay Institute, Aberdeen, pp.75.
Eckerrot A. and Pettersson K. (1993) Poer water phosphorus in sediments of the
western Danish Wedden Sea. Hydrobiologia 253: 165-178.
393

Eloranta P. (1993) Diversity and succession of the phytoplankton in a small lake over
a two-year period. Hydrobiologia 249: 25-32.
Etherington J.R. (1982) Environment and Plant Ecology. 2nd Edition. John Wiley and
Sons, pp.487.
Farmer A.M. (1984) Aquatic angiosperm communities from lochs on Rhum. Trans.
Bot. Soc. Edinburgh 44(3): 229-236.
Farmer A.M. and Spence D.H.N. (1986) The growth strategies and distribution of
isoetids in Scottish freshwater lochs. Aqua. Bot. 26: 247-258.
Fay P. (1983) The Blue-Greens (Cyanophyta-Cyanobacteria). In: Institute of
Biology’s Studies In Biology, Vol. 160, Edward Arnold, pp.84.
Fitzgerald G.P. and Faust S.L. (1967) Effect of water sampling preservation methods
on the release of phosphorus from algae. Limnol. Oceanogr. 12: 332-334.
Fogg G.E. and Walsby A.E. (1971) Buoyancy regulation and the growth of
planktonic blue-green algae. Mitt. Int. Verein. Limnol. 19: 182-188.
Forsberg C. (1977) Nitrogen as a growth factor in freshwater. Prog. Wat. Tech. 8:
275-290.
Foster D.M., Rachwal A.J. and White S.L. (1991) New treatment processes for
pesticides and chlorinated organics control in drinking water. J.l.W .E.M . 5(4):
466-477.
Fryer G. (1991) A Natural History Of The Lakes, Tams And Streams Of The English
Lake District, Freshwater Biological Association, pp.368.
Gachter R., Meyer J.S. and Mares A. (1988) Contribution of bacteria to release and
fixation of phosphorus in lake sediments. Limnol. Oceanogr. 33(6,2): 1542-1558.
394

Gales M.E., Julian E.C. and Kroner R.C. (1966) Method for quantitative
determination of total phosphorus in water. J.A.W.W.A. October: 1363-1368.
Gaugush R.F. and Heath R.T. (1984) A rapid manual method for nitrate
determination in small volumes by a modification of the cadmium reduction method.
Wat. Res. 18(4): 449-450.
George D.G. and Maitland P.S. (1984) The fresh waters of Shetland: physical and
morphometric characteristics of lochs. Freshw. Biol. 14: 95-107.
Gibson C.E. (1975) Cyclomorphosis in natural populations of Oscillatoria redekei
Van Goor. Freshw. Biol. 5: 279-286.
Gibson M.T., Welch I.M., Barrett P.R.F. and Ridge I. (1990) Barley straw as an
inhibitor of algal growth II: laboratory studies. J. Appl. Phycol. 2: 241-248.
Goldman C.R. and Home A.J. (1983) Limnology. McGraw Hill, New York, pp.464.
Golterman H.L. (1977) Sediments as source of phosphate for algal growth. In:
Golterman H.L. (ed.) Interactions between sediment and fresh water, Dr W. Junk,
The Hague, pp.286-293.
Golterman H.L. (1982a) Loading concentration models for phosphate in shallow
lakes. Hydrobiologia 91: 169-174.
Golterman H.L. (1982b) Differential extraction of sediment phosphates with NTA
solutions. Hydrobiologia 92: 683-687.
Golterman H.L., de Graaf I.M and de Groot C.J. (1993) Phosphate compounds in
sediments I: inorganic and biological aspects. Hydrobiologia 253: 99.
Gorham P.R. and Carmichael W.W. (1980) Toxic substances from freshwater algae.
Progr. Water Technol. 12: 189-198.
395
Grace J.B. (1988) The effects of nutrient additions on mixtures of Typha latifolia L.
and Typha domingensis Pers. along a water - depth gradient. Aqua. Bot. 31: 83-92.
Granberg K. (1986) The eutrophication of Lake Lestijarvi as a consequence of forest
bog ditching. Aqua Fennica 16(1): 57-61.
Granberg K. and Haijula H. (1982) Nutrient dependence of phytoplankton production
in brown-water lakes with special reference to Lake Paijanne. Hydrobiologia 86:129-
132.
Gran61i W. (1979) The influence of Chironomus plumosus larvae on the exchange of
dissolved substances between sediment and water. Hydrobiologia 66(2): 149-159.
Grieve I.C. and Gilvear D.J. (1994) Quantifying anthropogenic nutrient course and
loadings within a small catchment with conservation interests, Eastern Scotland.
Aquatic Conservation: Marine and Freshwater Ecosystems, 4: 273-287.
Grime J.P. (1979) Plant Strategies and Vegetation Processes. Wiley, Chichester,
pp.2 2 2 .
Grimshaw H.M. (1985) The Determination of Total Phosphorus in Soils by Acid
Digestion. In: Rowland A.P. (ed.) Chemical Analysis in Environmental Research,
1 TE Symposium No. 18, p.92-95.
de Groot C.J. and Golterman H.L. (1993) Phosphate compounds in sediments II
organic aspects. Hydrobiologia 253: 100.
H&kanson L. (1981) A Manual of Lake Morphometry. Springer Verlag, pp.78.
Hammer D.A. (1989) Constructed wetlands for wastewater treatment: an overview
of emerging technology. Tennessee Valley Authority Valley Resources Center, Waste
Management Symposium, March 14-16 1989, Colorado Springs, Colorado and
Multiobjective Management of River Corridors and their Restoration Symposium
March 21-23 1989, Knoxville, Tennessee.
396

Harper D.M. and Stewart W.D.P. (1987) The effects of land use upon water
chemistry, particularly nutrient enrichment, in shallow lowland lakes: comparative
studies of 3 lochs in Scotland. Hydrobiologia 148: 211-229.
Harriman R. and Pugh K.B. (1994) Water Chemistry. In: Maitland P.S., Boon P.J.
and McLusky D.S. (eds.) The Fresh Waters of Scotland, 1st edn. Wiley, Chichester,
p.89-112.
Hartikainen H. (1989) Effect of cumulative fertilizer dressings on the phosphorus
status of mineral soils. 1. Changes in inorganic phosphorus fractions. Journal o f
Agricultural Science in Finland 61: 55-59.
Hartikainen H. (1991) Potential mobility of accumulated phosphorus in soil as
estimated by the indices of Q/I plots and by extractant. Soil Sci. 152(3): 204-209.
Haslam S.M., Sinker C.A. and Wolseley P.A. (1982) British water plants. Field
Studies 4: 243-351.
Haux C. and Forlin L. (1988) Biochemical methods for detecting effects of
contaminants on fish. Ambio 17(6): 376-380.
Heathwaite A.L. (1991) Solute transfer from drained fen peat. Water, Air and Soil
Poll 55: 379-395.
Heikkinen K. (1990) Transport of organic and inorganic material in river, brook and
peat mining water in the draingae basin of the River Kiiminkijoki. Aqua Fennica
20(2): 143-155.
Heitto L. (1990) A macrophyte survey in Finnish forest lakes sensitive to
acidification. Verb. Int. Verein. Limnol 24: 667-670.
Hickel B. (1988) Unexpected disappearance of cyanophyte blooms in Plussee (North
Germany). Arch. Hydrobiol. Suppl. 80: 1-4.
397
Hieltes A.H.M. and Lijklema L. (1980) Fractionation of inorganic phosphates in
calcareous sediments. J. Env. Qual. 8 : 405-407.
Heikkinen K. (1990) Transport of organic and inorganic matter in river, brook and
peat mining water in the drainage basin of the River Kiiminkijoki. Aqua Fennica
20(2): 143-155.
Hill M.O. (1979) TWINSPAN - a FORTRAN Program for Arranging Multivariate
Data in an Ordered Two-way Table by Classification of the Individuals and
Attributes. Ecology and Systematics, Cornell University, Ithaca, New York.
Hilton J. and Rigg E. (1983) Determination of nitrate in lake water by the adaptation
of the hydrazine-copper reduction method for use on a discrete analyser: performance
statistics and an instrument-induced difference from segmented flow conditions.
Analyst 108: 1026-1028.
HMSO (1980) General Principles of Sampling and Accuracy of Results 1980. Crown
Copyright HMSO London, pp.58.
HMSO (1981) Phosphorus in Waters Effluents and Sewages 1980. Crown Copyright
HMSO London, pp.31.
HMSO (1982a) Ammonia in Waters 1981. Crown Copyright HMSO London, pp.47.
HMSO (1982b) Oxidised Nitrogen in Waters 1981. Crown Copyright HMSO London,
pp.61.
HMSO (1983) The Determination of Chlorophyll a in Aquatic Environments 1980=
Crown Copyright HMSO London, pp.24.
HMSO (1984) Colour and Turbidity of Waters 1981. Crown Copyright HMSO
London, pp.24.
Ho Y.B. (1979) Chemical composition studies on some aquatic macrophytes in three
398

Scottish lochs. 1. Chlorophyll, ash, carbon, nitrogen and phosphorus. Hydrobiologia
63(2): 161-166.
Holden A.V. (1975) The relative importance of agricultural fertilisers as a source of
nitrogen and phosphorus in Loch Leven. MAFF Technical Bulletin 32: 306-314.
Holford I.C.R. and Mattingly G.E.G. (1976a) A model for the behaviour of labile
phosphate in soil. Plant and Soil 44: 219-229.
Holford I.C.R. and Mattingly G.E.G. (1976b) Phosphate adsorption and plant
availability of phosphate. Plant and Soil 44: 377-389.
Holm-Hansen O. and Riemann B. (1978) Chlorophyll a determination: improvement
in methodology. Oikos 30: 438-447.
Hunt S.M. (1984) Algal Toxins - a Position Document. In: Algal Toxins - a Position
Document, Vol. 739-ML, WRc.
Hunter M.L., Jones J.J. and Witham J.W. (1986) Biomass and species richness of
aquatic macrophytes in four Maine (U.S.A.) lakes of different acidity. Aqua. Bot. 24:
91-95.
Hutchinson G.E. (1957) A Treatise on Limnology. 1. Geography, Physics and
Chemistry. John Wiley and Sons, New York, pp. 1015.
Hutchinson G.E. (1967) A Treatise on Limnology. 2. Introduction to lake biology and
the limnoplankton. John Wiley and Sons, New York, pp. 1115.
Hutchinson N.J., Neary B.P. and Dillon P.J. (1991) Validation and use of Ontario’s
trophic status model for establishing lake development guidelines. Lake and Reservoir
Management 7(1): 13-23.
Ingram W.M. and Prescott G.W. (1954) Toxic freshwater algae. The American
Midland Naturalist 52(1): 75-87.
399

Irvine K., Moss B. and Balls H. (1989) The loss of submerged plants with
eutrophication. II. Relationships between fish and zooplankton in a set of
experimental ponds, and conclusions. Freshw. Biol. 22: 89-107.
Jackson M.L. (1958) Soil Chemical Analysis. Constable, London, pp.498.
Jackson T.A. and Schindler D.W. (1975) The biogeochemistry of phosphorus in an
experimental lake environment: evidence for the formation of humic-metal-phosphate
complexes. Verh. Int. Verein. Limnol. 19: 211-221.
Jacobsen B.A. and Simonsen P. (1993) Disturbance events affecting phytoplankton
biomass, composition and species diversity in a shallow, eutrophic, temperate lake.
Hydrobiologia 249: 9-14.
Jacobsen T.R., Rai H. and Nusch E.A. (1988) The measurement of phytoplankton
pigments in freshwater: where do we go from here. Verh. Int. Verein. Limnol. 23:
952-956.
James W.F., Barko J.W. and Taylor W.D. (1991) Effects of alum treatment on
phosphorus dynamics in a north-temperate reservoir. Hydrobiologia 215: 231-241.
Jaquet J.-M., Nembrini G., Garcia J. and Vemet J.-P. (1982) The manganese cycle
in Lac L£man, Switzerland: The role of Metallogenium. Hydrobiologia 91: 323-340.
Jaynes M.L. and Carpenter S.R. (1986) Effects of vascular and nonvascular
macrophytes on sediment redox and solute dynamics. Ecology 67: 875-882.
Jeffries M. and Mills D. (1990) Freshwater Ecology. Principles and Applications.,
1st edn. Belhaven Press (Pinter Publications), pp.285.
Jensen H.S. and Andersen F.O. (1990) Impact of nitrate and blue-green algae
abundance on phosphorus cycling between sediment and water in two shallow,
eutrophic lakes. Verh. Int. Verein. Limnol. 24: 224-230.
400

Jensen H.S., Kristensen P., Jeppesen E. and Skytthe A. (1992) Iron:phosphorus ratio
in surface sediment as an indicator of phosphate release from aerobic sediments in
shallow lakes. Hydrobiologia 235/236: 731-743.
Jensen J.P., Jeppesen E., Olrik K. and Kristensen P. (1994) Impact of nutrients and
physical factors on the shift from cyanobacterial to chlorophyte dominance in shallow
Danish lakes. Can. J. Fish. Aquat. Sci. 51: 1692-1699.
Johnes P.J. and O’Sullivan P.E. (1989) The natural history of Slapton Ley Nature
Researve XVIII. Nitrogen and phosphorus losses from the catchment - an export
coefficient approach. Field Studies 7: 285-309.
Jones R.I. (1990) Phosphorus transformations in the epilimnion of humic lakes:
biological uptake of phosphate. Freshw. Biol. 23: 323-337.
Jones R.I. (1992a) Phosphorus transformations in the epilimnia of small humic forest
lakes. Hydrobiologia 243/244: 105-111.
Jones R.I. (1992b) The influence of humic substances on lacustrine planktonic food
webs. Hydrobiologia 229: 73-91.
Jones R.I., Salonen K. and De Haan H. (1988) Phosphorus transformations in the
epilimnion of humic lakes: abiotic interactions between dissolved humic materials and
phosphate. Freshw. Biol. 19: 357-369.
Jones R.I., Salonen K. and De Haan H. (1990) Abiotic transformations of iron and
phosphate in humic lake water revealed by double-isotope labelling and gel filtration.
Limnol. Oceanogr. 35(2): 491-497.
Jones V., Sedgwick R. and Leadbetter B. (1989) The use of straw for the control of
algae in freshwaters. University of Birmingham internal report, pp.20.
Jorgensen S.E. (1983) Eutrophication Models of Lakes. In: Jorgensen S.E. (ed.)
Application of Ecological Modelling in Environmental Management, Part A.
401

Developments in Environmental Modelling, 4A. Elsevier Scientific Publishing
Company, p.227-282.
Jorgensen S.E. (1992) Structural dynamic eutrophication models. In: Sutcliffe D.W.
and Jones J.G. (eds.) Eutrophication: Research and Application to Water Supply,
FBA, p.59-72.
Kamp-Nielsen L. (1974) Mud-water exchange of phosphate and other ions in
undisturbed sediment cores and factors affecting the exchange rates. Arch. Hydrobiol.
76(2): 218-237.
Kamp-Nielsen L., Mejer H. and Jorgensen S.E. (1982) Modelling the influence of
bioturbation on the vertical distribution of sedimentary phosphorus in L. Esrom.
Hydrobiologia 91: 197-206.
Kauppi L.H., Knuuttila S.T., Sandman K.O., Eskonen K., Luokkanen S. and Liehu
A. (1990) Role of landuse in the occurrence of blue-green algal blooms. Verh. Int.
Verein. Limnol. 24: 671-676.
Keeley J.E. (1982) Distribution of diurnal acid metabolism in the genus Isoetes.
Amer. J. Bot. 69: 254-257.
Keizer P., Galas J., Sinke A. and de Joode P. (1993) Phosphate immobilisation in
peaty sediment. Hydrobiologia 253: 374-375.
Kelly L.A. (1995) Predicting the effect of cages on nutrient status of Scottish
freshwater lochs using mass balance models. Aquaculture Research 26: 469-477.
Kelly M.G. and Whitton B.A. (1994) Plants for Monitoring Rivers. Report of
Workshop, University of Durham, September, 1994. R. and D. Note 366. National
Rivers Authority, pp.34.
Kennedy R.H. and Cooke G.D. (1982) Control of lake phosphorus with aluminium
sulfate dose determination and application techniques. Wat. Res. Bull. 18(3): 389-395.
402

Kistritz R.U. (1978) Recycling of nutrients in an enclosed aquatic community of
decomposing macrophytes (Myriophyllum spicatum). Oikos 30: 561-569.
Klapper H. (1992) Calcite covering of sediments as a possible way of curbing blue-
green algae. In: Sutcliffe D.W. and Jones J.G. (eds.) Eutrophication: Research and
Application to Water Supply, FBA, p. 107-111.
Klapwijk S.P. Kroon J.M.W. and Meijer M.-L. (1982) Available phosphorus in lake
sediments in The Netherlands. Hydrobiologia 92: 491-500.
Klaveness D. (1988) Ecology of the Cryptomonadida: A First Review. In: Sandgren
C.D. (ed.) Growth and Reproductive Strategies of Freshwater Phytoplankton.
Cambridge University Press, p. 105-133.
Kleeburg A. and Schlungbaum G. (1993) In situ phosphorus release experiments in
the Wamow River (Mecklenburg, northern Germany) Hydrobiologia 253: 263-274.
Knight A.H., Boggie R. and Shepherd H. (1972) The effect of ground water level on
water movement in peat: a study using tritiated water. J. Appl. Ecol. 9: 633-641.
Kronvang B. (1992) The export of particulate matter, particulate phosphorus and
dissolved phosphorus from two agricultural river basins: implications on estimating
the non-point phosphorus load. Wat. Res. 26(10): 1347-1358.
Lawson G.J. (1987) Cultivating reeds (Phragmites australis) for root zone treatment
of sewage. NERC/ITE Project No. 965. Contract report to WRc, ITE Grange-over-
Sands.
Lawton L. and Codd G. (1991) Cyanobacterial (blue-green algal) toxins and their
significance in U.K. and European waters. J.I.W.E.M. 5(4): 460-465.
Lehman J.T. (1976) Ecological and nutritional studies on Dinobryon Ehrenb.:
seasonal periodicity and the phosphate toxicity problem. Limnol. Oceanogr. 21: 646-
658.
403

Lind E.M. and Brook A.J. (1980) A Key to the Commoner Desmids of the English
Lake District. FBA Scientific Publication No.42, pp. 123.
Lindstrom K. (1984) Effect of temperature, light and pH on growth, photosynthesis
and respiration of the dinoflagellate Peridiniwn cinctum fa. westii in laboratory
cultures. J. Phycol. 20: 212-220.
Lopez P. and Morgui J.A. (1993) Factors influencing fractional phosphorus
composition in sediments of Spanish reservoirs. Hydrobiologia 253: 73-82.
Lui N.S.T. and Roels O. A. (1970). Nitrogen metabolism of aquatic organisms. I. The
assimilation and formation of urea by Ochromonas danica. Arch. Biochem. Biophys.
139: 269-277.
Lund J.W.G. (1950) Studies of Asterionella formosa Hass. II. Nutrient depletion and
the spring maximum. J. Ecol. 38: 1-35.
Lund J.W.G. (1954) The seasonal cycle of the planktonic diatom Melosira italica
(Ehr.) Kutz. subsp. sub arctica. O. Mull. J. Ecol. 42: 151-179.
Lund J.W.G. (1959) A simple counting chamber for nanoplankton. Limnol.
Oceanogr. 4: 57-65.
Lundin L. and Bergquist B. (1990) Effects on water chemistry after drainage of a bog
for forestry. Hydrobiologia 196: 167-181.
Lyle A. A. and Britton R.H. (1985) The fresh waters of Shetland: II. Resources and
distribution. Scottish Geographical Magazine 101: 157-164.
Lyle A.A. and Smith I.R. (1994) Standing Waters. In: Maitland P.S., Boon P.J. and
McLusky D.S. (eds.) The Fresh Waters of Scotland, 1st edn. Wiley, Chichester,
p.35-50.
Maberly S.C. and Spence D.H.N. (1983) Photosynthetic inorganic carbon use by
404

freshwater plants. J. Ecol. 71: 705-724.
Macan T.T. and Worthington, E.B. (1990) Life in Lakes and Rivers. 4th Edition.
Bloomsbury Books. Williams Collins Sons and Co. Ltd., pp.320.
Mackereth F.J.H. (1963) Some Methods of Water Analysis for Limnologists. FBA
Scientific Publication No. 21, Freshwater Biological Association, pp.70.
Maitland P.S. (1990) Biology of Fresh Waters. Tertiary Level Biology, Blaclde,
pp.276.
Maitland P.S. and Holden A.V. (1983) The inland waters of the Inner Hebrides.
Proc. Roy. Soc. Edinburgh 83(B): 229-244.
Maitland P.S. and Britton R.H. (1985) The fresh waters of Shetland: I. The strategy
of a synoptic resource analysis. Scottish Geographical Magazine 101: 150-156.
Maitland P.S. and Morris K.H. (1981) Water Chemistry. In: The Fresh Waters of
Tayside. NCC CST Report No.479., Nature Conservancy Council.
Maitland P.S. and Lyle A. A. (1986) The freshwaters of Shetland: a review of field
data, unpubl. report.
Malcolm D.C. and Cuttle S.P. (1983) The application of fertilisers to drained peat
1. nutrient losses in drainage. Forestry 56(2): 155-174.
Malcolm D.C., Bradbury I.K. and Freezaillah B.C.Y. (1977) The loss of nutrients
from fertilized peat in an artificial system in the field. Forestry Ecology and
Management 1: 109-118.
Margalef R. (1969) Sampling Techniques and Methods for Estimating Quantity and
Quality of Biomass. In: Vollenweider R.A. (ed.) Measuring Primary Productivity in
Aquatic Environments. IBP Handbook No. 12., Blackwell Scientific Publications,
p.7-14.
405

Marker A.F.H. (1972) The use of acetone and methanol in the estimation of
chlorophyll in the presence of phaeophytin. Freshw. Biol. 2: 361-385.
Marsden M.W. (1989) Lake restoration by reducing external phosphorus loading: the
influence of sediment phosphorus release, Freshw. Biol. 21: 139-162.
Meadows P.S. and Campbell J.I. (1988) An Introduction to Marine Science, 2nd
Edition. Blackie, pp.285.
Meuleman A.F.M. and Beltman B. (1993) The use of vegetated ditches for water
quality improvement {abstract). Hydrobiologia 253: 375.
McQueen D.J. and Lean D.R.S. (1987) Influence of water temperature and nitrogen
to phosphorus ratios on the dominance of blue-green algae in Lake St. George,
Ontario. Can. J. Fish. Aquat. Sci. 44: 598-604.
MISR (1985) Soil Survey of Scotland. Macaulay Instute for Soil Research, Aberdeen,
CRown Copyright, Sheets 1-4.
Mortimer C.H. (1941) The exchange of dissolved substances between mud and water
in lakes. I and II. J. Ecol. 29: 280-289.
Mortimer C.H. (1942) The exchange of dissolved substances between mud and water
in lakes, m and IV. J. Ecol. 30: 147-201.
Moss B. (1980) Ecology of Freshwaters. Blackwell Scientific Publications, Oxford,
pp.332.
Moss B. (1967) A spectrophotometric method for the estimation of percentage
degradation of chlorophylls to phaeo-pigments in extracts of algae. Limnol. Oceanogr.
12: 335 - 340.
Moss B. (1989) Water Pollution and the Management of Ecosystems: A Case Study
of Science and Scientist. In: Grubb P J . and Whittaker J.B. (eds.) Toward a More
406

Exact Ecology. 30th Symposium of the British Ecological Society. Blackwell
Scientific Publications, p.401-422.
Moss B. (1992) The scope for biomanipulation in improving water quality In:
Sutcliffe D.W. and Jones J.G. (eds.) Eutrophication: Research and Application to
Water Supply, FBA, p.73-81.
Mur L.R. Gons H.J. and Van Liere L. (1978) Competition of the green alga
Scenedesmus and the blue-green alga Oscillatoria. Mitt. Internal. Verein. Limnol. 21:
473-479.
Murphy J. and Riley J.P. (1962) A modified single solution method for the
determination of phosphate in natural waters. Anal. Chim. Acta 27: 31-36.
Murray J. and Pullar L. (1908) Bathymetrical Survey of Scottish Fresh Water Lochs.
Royal Geographical Society, Volume VI, London, Plates XCV-CVI.
Mykura W. (1974) Geological Basis of the Shetland Environment. In: Goodier R.
(ed.) The natural environment of Shetland, NCC Edinburgh, p. 1-12.
Nakashima S., Yagi M., Zenki M., Takahashi A. and Toei K. (1984) Determination
of nitrate in natural waters by flow-injection analysis. Fresenius Z. Anal. Chem. 319:
506-509.
NCC (1990) Fish Farming and the Scottish Freshwater Environment, NCC
Edinburgh, pp.285.
Newman J.R. and Barrett P.R.F. (1993) Control of Microcystis aemginosa by
decomposing barley straw. J. Aquatic Plant Management 31: 203-206.
NRA (1990) Toxic Blue Green Algae. NRA Report, National Rivers Authority,
London, pp. 128.
NRA (1992) The Influence of Agriculture on the Quality of Natural Waters in
407
England and Wales. NRA Water Quality Report No. 6 , National Rivers Authority,
pp. 156.
Nusch E.A. (1980) Comparison of different methods for chlorophyll a and
phaeopigment determination. Arch. Hydrobiol. 14: 14-36.
OECD (1982) Eutrophication of Waters, Assessment and Control. Organisation for
Economic Co-operation and Development, Paris, pp. 154.
Olrik K. and Nauwerck A. (1993) Stress and disturbance in the phytoplankton
community of a shallow hypertrophic lake. Hydrobiologia 249: 15-24.
Padisdk J. (1993) The influence of different disturbance properties on the species
richness, diversity and equitability of phytoplankton in shallow lakes. Hydrobiologia
249: 135-156.
Paine A.J. (1981) Hepatic Cytochrome P-450. In: Campbell P.N. and Marshall R.D.
(eds.) Essays in Biochemistry Volume 17, Academic Press, p.85-126.
Palmer M.A. (1989) A Botanical Classification of Standing Fresh Waters in Great
Britain. In: Research and Survey in Nature Conservation, Vol. 19, Nature
Conservancy Council, pp.20.
Palmer M.A., Bell S.L. and Butterfield I. (1992) A botanical classification of
standing waters in Britain: applications for conservation and monitoring. Aquatic
Conservation: Marine and Freshwater Ecosystems 2: 125-143.
Parke D.V. (1985) The role of cytochrome P-450 in the metabolism of pollutants.
Mar. Environ. Res. 17: 97-100.
Pentecost A. (1984) Introduction to Freshwater Algae. Richmond Publishing Co.
Ltd., Surrey, pp.247.
Pettersson K., Bostrom B. and Jacobsen O.S. (1988) Phosphorus in sediments -
408

speciation and analysis. Hydrobiologia 170: 91-101.
Petts G. and Foster I.D.L. (1985) Rivers and Landscape. Edward Arnold, pp.274.
Phillips G.L., Eminson D. and Moss B. (1978) A mechanism to account for
macrophyte decline in progressively eutrophicated freshwaters. Aqua. Bot. 4: 103-
126.
Phillips G. and Jackson R. (1990) The control of eutrophication in very shallow lakes
in the Norfolk Broads. Verh. Int. Verein. Limnol. 24: 573-575.
Phillips M.J. (1985a) Analysis of Nutrients. In: Stirling H.P. (ed.) Chemical and
Biological Methods of Water Analysis for Aquaculturists, 1st edn. Institute of
Aquaculture, University of Stirling, p.69-85.
Phillips M.J. (1985b) The Environmental Impact of Cage Culture on Scottish
Freshwater Lochs. Unpublished Report to the Highlands and Islands Development
Board. Institute of Aquaculture, University of Stirling, Stirling, Scotland, pp. 106.
Phillips M.J., Roberts R.J. and Stewart J.A. (1985) The toxicity of the
cyanobacterium Microcystis aeruginosa to rainbow trout, Salmo gairdneri Richardson.
J. Fish Diseases 8 : 339-344.
Pollingher U. (1988) Freshwater Armored Dinoflagellates: Growth, Reproduction
Strategies, and Population Dynamics. In: Sandgren C.D. (ed.) Growth and
Reproductive Strategies of Freshwater Phytoplankton. Cambridge University Press,
p. 134-174.
Polunin O. (1988) Collins Photoguide to Wild Flowers of Britain and Northern
Europe. William Collins Sons and Co. Ltd., pp.512.
Prairie Y.-T. (1988) A test of the sedimentation assumptions of phosphorus input-
output models. Arch. Hydrobiol. 111(3): 321-327.
409

Prepas E.E. and Rigler F.H. (1981) A test of a simple model to predict short term
changes in the phosphorus concentration in lake water. Verh. Int. Verein. Limnol. 21:
187-196.
Prescott G.W. (1962) Algae of the Western Great Lakes Area. Wm.C. Brown
Company Publishers, pp.977.
Prescott G.W. (1970) How to Know the Freshwater Algae. Picture Key Nature
Series. Wm.C. Brown Company Publishers, Dubuque, Iowa, pp.348.
Quaak M., van der Does J., Boers P. and van der Vlugt J. (1993) A new technique
to reduce internal phosphorus loading by in-lake fixation in shallow lakes.
Hydrobiologia 253: 337-344.
Ratcliffe D.A. (ed.) (1977) A Nature Conservation Review. Cambridge University
Press, Cambridge.
Rattray M.R., Howard-Williams C. and Brown J.M.A. (1991) Sediment and water
as sources of nitrogen and phosphorus for submerged rooted aquatic macrophytes.
Aqua. Bot. 40: 225-237.
Rekolainen S. (1989) Phosphorus and nitrogen load from forest and agricultural areas
in Finland. Aqua Fennica 19(2): 95-107.
Reynolds C.S. (1973a) The seasonal periodicity of planktonic diatoms in a shallow
eutrophic lake. Freshw. Biol. 3: 89-110.
Reynolds C.S. (1973b) Growth and buoyancy of Microcystis aeruginosa Kutz. emend.
Elenkin in a shallow eutrophic lake. Proceedings o f the Royal Society London B 184:
29-50.
Reynolds C.S. (1984a) The Ecology of Freshwater Phytoplankton. Cambridge
University Press Cambridge, pp.384.
410

Reynolds C.S. (1984b) Phytoplankton periodicity: the interactions of form, function
and environmental variability. Freshw. Biol. 14: 111-142.
Reynolds C.S. (1991) Toxic blue-green algae: the "problem" in perspective.
Freshwater Forum 1(1): 29-38.
Reynolds C.S. (1993) Scales of disturbance and their role in plankton ecology.
Hydrobiologia 249: 157-171.
Richard D.S., Beattie K.A. and Codd G. (1983) Toxicity of cyanobacterial blooms
from Scottish freshwaters. Environmental Toxicology 4: 377-382.
Ridge I. and Barrett P.R.F. (1992) Algal Control with Barley Straw. In: Aspects of
Applied Biology 29. Vegetation Management in Forestry, Amenity and Conservation
Areas, p.457-462.
Riemer D.N. (1984) Adaptions of Aquatic Plants. In: Introduction to Freshwater
Vegetation, AVI Publishing Company, Connecticut, USA, p.95.
Rigler F.H. (1968) Further observations inconsistent with the hypothesis that the
molybdenum blue method measures orthophosphate in lake water. Limnol. Oceanogr.
13: 7-13.
Riley J.P. and Chester R. (1971) Introduction to Marine Chemistry. Academic Press
Inc., London, pp.465.
Rippey B. and Gibson C.E. (1984) The variation of calcium, magnesium, sodium and
potassium concentration, pH and conductivity in lakes in Northern Ireland. Arch.
Hydrobiol. 101(3): 345-360.
Robson T.O. (1987) Loch of Harray, Orkney. Surveys of Aquatic Vegetation. NCC
CSD Report Number 859, pp.22.
Rodger H.D., Turnbull T., Edwards C. and Codd G.A. (1994) Cyanobacterial
(blue-green algal) bloom associated pathology in brown trout, Salmo trutta L., in
411

Loch Leven, Scotland. J. Fish Dis. 17: 177-181.
Rodwell, J.S. (1991) British Plant Communities. Cambridge University Press,
Cambridge.
Roelofs Schuurkes J.A.A.R. and Smits A.J.M. (1984) Impacts of
acidification and eutrophication on macrophyte communities in soft waters. 2 .
Experimental studies. Aqua. Bot. 18: 389-411.
Rdmkens M.J.M. and Nelson D.W. (1974) Phosphorus relationships in runoff from
fertilised soils. J. Environ. Qual. 3: 10-13.
Rorslett B. (1991) Principal determinants of aquatic macrophyte richness in northern
European lakes. Aqua. Bot. 39: 173-193.
Round F.E. (ed.)(1973) The Biology of the Algae, 2nd edn. Edward Arnold, pp.278.
Ryding S.-O. (1985) Chemical and microbiological processes as regulators of the
exchange of substances between sediments and water in shallow eutrophic lakes. Int.
Rev. Hydrobiol. 70(5): 657-702.
Sakamoto M. (1966) Primary production by the phytoplankton community in some
Japanese lakes and its dependence on depth. Arch. Hydrobiol. 62: 1-28.
Salisbury F.B. and Ross C.W. (1978) Plant Physiology. 2nd Edition. Wadsworth
Publishing Company, Inc., pp.422.
Sandgren, C.D. (1988) The Ecology of Chrysophyte Flagellates: Their Growth and
Perennation Studies as Freshwater Phytoplankton. In: Sandgren C.D. (ed.) Growth
and Reproductive Strategies of Freshwater Phytoplankton. Cambridge University
Press, pp.9-104.
Sand-Jensen K. and Sondergaard M. (1979) Distribution and quantitative development
of aquatic macrophytes in relation to sediment characteristics in oligotrophic Lake
412

Kalgaard, Denmark. Freshw. Biol. 9: 1-11.
Sand-Jensen K., Prahl C. and Stokholm H. (1982) Oxygen release from roots of
submerged aquatic macrophytes. Oikos 38: 349-354.
Sarvala J., Kairesalo T., Koskimies I., Lehtovaara A., Ruuhijarvi J. and
Vaha-Piikkio I. (1982) Carbon, phosphorus and nitrogen budgets of the littoral
Equisetum belt in an oligotrophic lake. Hydrobiologia 86: 41-53.
Schuurkes J.A.A.R., Kok C.J. and Den Hartog C. (1986) Ammonium and nitrate
uptake by aquatic plants from poorly buffered and acidified waters. Aqua. Bot. 24:
131-146.
Scott W. and Palmer R. (1987) The Flowering Plants and Ferns of the Shetland
Islands. The Shetland Times Ltd., Lerwick, pp.468.
Seagrave C. (1988) Aquatic Weed Control. Fishing News Books Ltd., pp. 154.
Serruya C. and Berman T. (1975) Phosphorus, nitrogen and the growth of algae in
Loch Kinneret. J. Phycol. 11: 155-162.
Shapiro J. (1990) Current beliefs regarding dominance by blue-greens: the case for
the importance of C 0 2 and pH. Verh. Int. Verein. Limnol. 24: 38-54.
Sharpley A.N. (1982) Prediction of water-extractable phosphorus content of soil
following a phosphorus addition. J. Environ. Qual. 11(2): 166-170.
Sharpley A.N., Tillman R.W. and Syers J.K. (1977) Use of laboratory extraction
data to predict losses of dissolved inorganic phosphate in surface runoff and tile
drainage. J. Environ. Qual. 6(1): 33-36.
Shaw E.M. (1983) Hydrology in Practice. Van Nostrand Reinhold (UK), pp.569.
Shetland Islands Council (1991) Shetland in Statistics, 19th edn. Shetland Island
413

Council pp.72.
Sikora L.J. and Keeney D.R. (1983) Further aspects of soil chemistry under
anaerobic conditions. In: Gore A.J.P. (ed.) Mires: Swamp, Bog, Fen and Moor.
General Studies, 4A: 247-256.
Sinclair A.H., Armstrong G., Young M., Ford M. and Raffaelli D. (1992) The
Impact of Agriculture on Water Quality in Loch of Harray Feeder Bums. Scottish
Agricultural College and the University of Aberdeen, pp. 113.
Sinke A.J.C., Comelese A.A., Keizer P., Van Tongeren O.F.R. and Cappenberg
Th.E. (1990) Mineralization, pore water chemistry and phosphorus release from peaty
sediments in the eutrophic Loosdrecht lakes, The Netherlands. Freshw. Biol. 23:
587-599.
Skulberg O.M., Codd G.A. and Carmichael W.W. (1984) Toxic blue green algal
blooms in Europe: a growing problem. Ambio 13(4): 244-247.
Smith C.M. (1987) Sediment, phosphorus, and nitrogen in channelised surface run-off
from a New Zealand pastoral catchment. N.Z. J. Marine and Freshw. Res. 21(4):
627-639.
Smith G.M. (1950) The Freshwater Algae of the United States. McGraw-Hill Book
Company, Inc., pp.719.
Smith I.R., Lyle A.A. and Rosie A.J. (1981) Comparative Physical limnology. In:
Maitland P.S. (ed.) The Ecology of Scotland’s Largest Lochs Lomond, Awe, Ness,
Morar and Shiel. Dr. W. Junk Publishers, p.29-65.
Sneddon B. (1972) Aquatic macrophytes as limnological indicators. Freshw. Biol. 2:
107-130.
SOAFD (1991) Prevention of environmental pollution from agricultural activity: Code
of good practice. Scottish Farm Waste Liaison Group, HMSO.
414

Sommer U. (1988) Does nutrient competition among phytoplankton occur in situ.
Verh. Int. Verein. Limnol. 23: 707-712.
Sommer U. (1993) Disturbance-diversity relationships in two lakes of similar nutrient
chemistry but contrasting disturbance regimes. Hydrobiologia 249: 59-65.
Sommer U., Gliwicz Z.M., Lampert W. and Duncan A. (1986) The PEG-model of
seasonal succession of phytoplankton events in freshwaters. Arch. Hydrobiol. 106:
433-471.
Sondergaard M. and Sand-Jensen K. (1979). Carbon uptake by leaves and roots of
Littorella uniflora (L.) Aschers. Aqua. Bot. 6 : 1-12.
Spence D. (1979) Shetland’s Living Landscape. A Study in Island Plant Ecology. The
Thule Press, Sandwick, pp. 152.
Spence D.H.N. (1964) The Macrophytic Vegetation of Freshwater Lochs, Swamps
and Associated Fens. In: Burnett J.H. (ed.) The Vegetation of Scotland. Oliver and
Boyd, p.306-425.
Spence D.H.N. (1967) Factors controlling the distribution of freshwater macrophytes
with special reference to the lochs of Scotland. J. Ecol. 55: 147-170.
Spence D.H.N. and Allen E.D. (1979) The macrophyte vegetation of Loch Urigill
and other lochs of the Ullapool area. Transactions o f the Botanical Society o f
Edinburgh 43(3): 131-144.
Spence D.H.N., Barclay A.M. and Allen E.D. (1984) Limnology and macrophyte
vegetation of a deep, clear, limestone lake, Loch Borralie. Transactions o f the
Botanical Society o f Edinburgh 44: 187-204.
Steinberg C.E.W. and Gruhl E. (1992) Physical measures to inhibit planktonic
cyanobacteria. In: Sutcliffe D.W. and Jones J.G. (eds.) Eutrophication: Research and
Application to Water Supply, FBA, p. 163-184.
415

Steinberg C.E.W. and Hartmann H.M. (1988) Planktonic bloom forming
cyanobacteria and the eutrophication of lakes and rivers. Freshw. Biol. 20: 279-287.
Stewart A.J. and Wetzel R.G. (1982) Influence of dissolved humic materials on
carbon assimilation and alkaline phosphatase activity in natural algal-bacterial
assemblages. Freshw. Biol. 12: 369-380.
Stirling H.P. (ed.) (1985) Chemical and Biological Methods of Water Analysis for
Aquaculturalists. Institute of Aquaculture, University of Stirling Stirling, pp. 119.
Stockner J.G. and Shortreed K.S. (1988) Response of Anabaena and Synechococcus
to manipulation of nitrogen:phosphorus ratios in a lake fertilisation experiment.
Limnol. Oceanogr. 33(6): 1348-1361.
Stockner J.G., Klut M.E. and Cochlan W.P. (1990) Leaky filters: a warning to
aquatic ecologists. Can. J. Fish. Aquat. Sci. 47: 16-23.
Strahler A.N. and Strahler A.H. (1973) Environmental Geoscience: Interaction
Between Natural Systems and Man. John Wiley and Sons, Inc., pp.509.
Strickland J.D.H. and Parsons T.R. (1972) A Practical Handbook of Seawater
Analysis. Fisheries Research Board of Canada, Ottowa, Bulletin 167, 2nd edition.
Sutcliffe D.W. (ed.) (1994) Water Quality and Stress Indicators in Marine and
Freshwater Systems: Linking Levels of Organisation (Individuals, Populations,
Communities). Freshwater Biological Association, pp. 182.
Ter Braak C.J.F. (1986) Canonical correspondence analysis: a new eigenvector
technique for multivariate direct gradient analysis. Ecology 67(5): 1167-1179.
Ter Braak C.J.F. (1988) CANOCO - a FORTRAN program for canonical community
ordination by (partial)(detrended)(canonical) correspondence analysis, principal
components analysis and redundancy analysis (version 2.1). Technical Report LWA-
88-02. Agricultural Mathematics Group, Wageningen, pp.95.
416

Ter Braak C.J.F. (1989) CANOCO - an extension of DECORANA to analyse
spedes-environment relationships. Hydrobiologia 184: 169-170.
Tilraan D., Kilham S.S. and Kilham P. (1982) Phytoplankton community ecology:
the role of limiting nutrients. Ann. Rev. Ecol. Syst. 13: 349-372.
Tilman D., Keisling R., Sterner R., Kilham S.S. and Johnson F.A. (1986) Green,
blue-green and diatom algae: taxonomic differences in competitive ability for
phosphorus, silicon and nitrogen. Arch. Hydrobiol. 106: 473-485.
Tirdn T. and Pettersson K. (1985) The influence of nitrate on the phosphorus flux to
and from oxygen depleted lake sediments. Hydrobiologia 120: 207-223.
Trifonova I. (1993) Seasonal succession of phytoplankton and its diversity in two
highly eutrophic lakes with different conditions of stratification. Hydrobiologia 249:
93-100.
Tolstoy A. (1988) Predicted and measured annual primary production of
phytoplankton - examples from some Swedish lakes. Arch. Hydrobiol. 113(5): 381-
404.
Van Huet H.J.W. (1991) Phosphorus loads from peaty polders in the SW Frisian
Lake district, The Netherlands. Water, Air and Soil Poll. 55(3-4): 321-335.
Van Wijk R.J. (1989) Ecological studies on P. pectinatus L. V. Nutritional ecology,
in vitro uptake of nutrients and growth limitation. Aqua. Bot. 35: 319-335.
Veldhuis M.J.W., Venekamp L.A.H. and Ietswaart T. (1987) Availability of
phosphorus sources for blooms of Phaeocystis pouchetii (Haptophyceae) in the North
Sea: impact of the River Rhine. Netherlands Journal o f Sea Research 21(3): 219-229.
Venrick E.L. (1978) How Many Cells to Count. In: Soumia, A. (ed.) Monographs
in Oceanographic Methodology. Phytoplankton Manual, UNESCO, p. 167-189.
417

Vieira A.A.H. and Klaveness D. (1986) The utilisation of organic nitrogen
compounds as sole nitrogen source by some freshwater phytoplankters. Nord. J. Bot.
63: 93-97.
Vollenweider R.A. (1975) Input-output models with special reference to the
phosphorus loading concept in limnology. Schweiz. Z. Hydrol. 37(1): 53-84.
Vollenweider R.A. (1976) Advances in defining critical loading levels for phosphorus
in lake eutrophication. Mem. Inst. Ital. Idrobiol. 33: 53-83.
Waara T., Jansson M. and Pettersson K. (1993) Phosphorus composition and release
in sediment bacteria of the genus Pseudomonas during aerobic and anaerobic
conditions. Hydrobiologia 253: 131-140.
Walsby A.E. (1992) The control of gas-vacuolate cyanobacteria In: Sutcliffe D.W.
and Jones J.G. (eds.) Eutrophication: Research and Application to Water Supply,
FBA, p. 150-162.
Waterston A.R., Holden A.V., Campbell R.N. and Maitland P.S. (1979) The inland
waters of the Outer Hebrides. Proc. Roy. Soc. Edinburgh 77(B): 329-351.
Welch I.M., Barrett P.R.F., Gibson M.T. and Ridge I. (1990) Barley straw as an
inhibitor of algal growth. I. Studies in the Chesterfield Canal. J. Appl. Phycol. 2:
231-239.
West W. and West T.G.S. (1904) Freshwater algae from the Orkneys and Shetlands.
Transactions and Proceedings o f the Botanical Society o f Edinburgh 23: 3-41.
Wetzel R.G. (1983) Limnology, 2nd Edition. W.B. Saunders Company, Philadelphia,
pp.743.
Wetzel R.G. (1990) Land-water interfaces: metabolic and limnological regulators.
Verh. Int. Verein. Limnol. 24: 6-24.
418

Wetzel R.G., Brammer E.S., Lindstrom K. and Forsberg C. (1985) Photosynthesis
of submersed macrophytes in acidified lakes. 2. Carbon limitation and utilisation of
benthic C 0 2 sources. Aqua. Bot. 22: 107-120.
Wetzel R.G. and Likens G.E. (1990) Limnological Analyses. 2nd Edition. Springer
Verlag, pp.391.
Wigginton M.J. and Graham G.G. (1981) Guide to the Identification of Some
Difficult Plant Groups. In: England Field Unit Occasional Paper, Vol. 1, Nature
Conservancy Council, pp. 145.
Williams B.L. and Wheatley R.E. (1988) Nitrogen mineralization and water-table
height in oligotrophic deep peat. Biology and Fertility o f Soils 6 : 141-147.
Wisniewski R.J. and Planter M. (1985) Exchange of phosphorus across sediment-
water interface (with special attention to the influence of biotic factors) in sseveral
lakes of different trophic status. Verh. Int. Verein. Umnol. 22: 3345-3349.
Wium-Andersen S. (1971) Photosynthetic uptake of free C0 2 by roots of Lobelia
dortmanna. Physiol. Plant. 25: 245-248.
Youngman R.E., Johnson D. and Farley M.R. (1976) Factors influencing
phytoplankton growth and succession in Farmoor Reservoir. Freshw. Biol. 6:
ZoBell C.E. (1946a) Marine Microbiology. A Monograph of Hydrobacteriology.
Chronica Botanica Company, Waltham, Mass. USA, pp.240.
ZoBell C.E. (1946b) Studies on redox potential of marine sediments. Bulletin o f the
American Asssociation o f Petroleum Geologists 30: 477-513.
253-263.
419' GLASGOWUNIVERSITYLIBRARY