Response of zooplankton to nutrient enrichment and fish in shallow lakes: a pan-European mesocosm...
14
Response of zooplankton to nutrient enrichment and fish in shallow lakes: a pan-European mesocosm experiment KIRSI VAKKILAINEN,* TIMO KAIRESALO,* JAANA HIETALA,* DAVID M. BALAYLA, † ELOY BE ´ CARES, ‡ WOUTER J. VAN DE BUND, § ELLEN VAN DONK, § MARGARITA FERNA ´ NDEZ- ALA ´ EZ, ‡ MIKAEL GYLLSTRO ¨ M, – LARS-ANDERS HANSSON, – MARIA R. MIRACLE, ** BRIAN MOSS, † SUSANA ROMO, ** JUAN RUEDA ** AND DEBORAH STEPHEN † *Department of Ecological and Environmental Sciences, University of Helsinki, Lahti, Finland † School of Biological Sciences, University of Liverpool, Liverpool, U.K. ‡ Faculty of Biology, Department of Ecology, University of Le ´on, Leon, Spain § Centre for Limnology, Netherlands Institute of Ecology, Nieuwersluis, The Netherlands – Department of Ecology/Limnology, University of Lund, Lund, Sweden ** Department of Microbiology and Ecology, University of Valencia, Burjassot, Valencia, Spain SUMMARY 1. Responses of zooplankton to nutrient enrichment and fish predation were studied in 1998 and 1999 by carrying out parallel mesocosm experiments in six lakes across Europe. 2. Zooplankton community structure, biomass and responses to nutrient and fish manipulation showed geographical and year-to-year differences. Fish had a greater influence than nutrients in regulating zooplankton biomass and especially the relative abundances of different functional groups of zooplankton. When fish reduced the biomass of large crustaceans, there was a complementary increase in the biomasses of smaller crustacean species and rotifers. 3. High abundance of submerged macrophytes provided refuge for zooplankton against fish predation but this refuge effect differed notably in magnitude among sites. 4. Large crustacean grazers (Daphnia, Diaphanosoma, Sida and Simocephalus) were crucial in controlling algal biomass, while smaller crustacean grazers and rotifers were of minor importance. Large grazers were able to control phytoplankton biomass even under hypereutrophic conditions (up to 1600 lg TP L )1 ) when grazer biomass was high (>80– 90 lg dry mass L )1 ) or accounted for >30% of the grazer community. 5. The littoral zooplankton community was less resistant to change following nutrient enrichment in southern Spain, at high temperatures (close to 30 °C), than at lower temperatures (17–23 °C) characterising the other sites. This lower resistance was because of a greater importance of nutrients than zooplankton in controlling algal biomass. 6. Apart from the reduced role of large crustacean grazers at the lowest latitude, no consistent geographical patterns were observed in the responses of zooplankton commu- nities to nutrient and fish manipulation. Keywords: eutrophication, fish predation, littoral zooplankton, mesocosm experiments, nutrient enrichment Introduction The outcomes of impacts like nutrient enrichment are reflected in community structure and interactions within the food web. The trophic structure of com- munities can be seen as the partitioning of biomass Correspondence: Timo Kairesalo, Department of Ecological and Environmental Sciences, University of Helsinki, Niemenkatu 73 C, FIN-15140 Lahti, Finland. E-mail: timo.kairesalo@helsinki.fi Freshwater Biology (2004) 49, 1619–1632 doi:10.1111/j.1365-2427.2004.01300.x Ó 2004 Blackwell Publishing Ltd 1619
Transcript of Response of zooplankton to nutrient enrichment and fish in shallow lakes: a pan-European mesocosm...
Response of zooplankton to nutrient enrichment and fishin shallow lakes: a pan-European mesocosm experiment
KIRSI VAKKILAINEN,* TIMO KAIRESALO,* JAANA HIETALA,* DAVID M. BALAYLA, †
ELOY BECARES,‡ WOUTER J. VAN DE BUND,§ ELLEN VAN DONK, § MARGARITA FERNANDEZ-
ALAEZ, ‡ MIKAEL GYLLSTROM,– LARS-ANDERS HANSSON,– MARIA R. MIRACLE, * *
BRIAN MOSS, † SUSANA ROMO, * * JUAN RUEDA * * AND DEBORAH STEPHEN †
*Department of Ecological and Environmental Sciences, University of Helsinki, Lahti, Finland†School of Biological Sciences, University of Liverpool, Liverpool, U.K.‡Faculty of Biology, Department of Ecology, University of Leon, Leon, Spain§Centre for Limnology, Netherlands Institute of Ecology, Nieuwersluis, The Netherlands–Department of Ecology/Limnology, University of Lund, Lund, Sweden**Department of Microbiology and Ecology, University of Valencia, Burjassot, Valencia, Spain
SUMMARY
1. Responses of zooplankton to nutrient enrichment and fish predation were studied in
1998 and 1999 by carrying out parallel mesocosm experiments in six lakes across Europe.
2. Zooplankton community structure, biomass and responses to nutrient and fish
manipulation showed geographical and year-to-year differences. Fish had a greater
influence than nutrients in regulating zooplankton biomass and especially the relative
abundances of different functional groups of zooplankton. When fish reduced the biomass
of large crustaceans, there was a complementary increase in the biomasses of smaller
crustacean species and rotifers.
3. High abundance of submerged macrophytes provided refuge for zooplankton against
fish predation but this refuge effect differed notably in magnitude among sites.
4. Large crustacean grazers (Daphnia, Diaphanosoma, Sida and Simocephalus) were crucial in
controlling algal biomass, while smaller crustacean grazers and rotifers were of minor
importance. Large grazers were able to control phytoplankton biomass even under
hypereutrophic conditions (up to 1600 lg TP L)1) when grazer biomass was high (>80–
90 lg dry mass L)1) or accounted for >30% of the grazer community.
5. The littoral zooplankton community was less resistant to change following nutrient
enrichment in southern Spain, at high temperatures (close to 30 �C), than at lower
temperatures (17–23 �C) characterising the other sites. This lower resistance was because
of a greater importance of nutrients than zooplankton in controlling algal biomass.
6. Apart from the reduced role of large crustacean grazers at the lowest latitude, no
consistent geographical patterns were observed in the responses of zooplankton commu-
nities to nutrient and fish manipulation.
Keywords: eutrophication, fish predation, littoral zooplankton, mesocosm experiments, nutrientenrichment
Introduction
The outcomes of impacts like nutrient enrichment are
reflected in community structure and interactions
within the food web. The trophic structure of com-
munities can be seen as the partitioning of biomass
Correspondence: Timo Kairesalo, Department of Ecological
and Environmental Sciences, University of Helsinki,
Niemenkatu 73 C, FIN-15140 Lahti, Finland.
E-mail: [email protected]
Freshwater Biology (2004) 49, 1619–1632 doi:10.1111/j.1365-2427.2004.01300.x
� 2004 Blackwell Publishing Ltd 1619

into different levels. It is basically determined by
available resources and primary productivity but is
also regulated by feedbacks from higher trophic
levels, which in turn affect resource availability
(Arditi & Ginzburg, 1989; Power, 1992; Leibold et al.,
1997; Polis, 1999; Persson et al., 2001). Theories of
food-web dynamics focus on the number of trophic
levels. They predict relatively discontinuous, alternat-
ing (high/low/high) changes in biomasses along the
food chain and an increasing number of trophic levels
with increasing productivity (Hairston, Smith &
Slobodkin, 1960; Fretwell, 1977; Oksanen et al., 1981;
Scheffer, 1991).
Such cascading effects between trophic levels have
successfully explained incongruous plant/herbivore
biomass variation in terms of resource availability.
Evidence for strong vertical structuring of aquatic
food webs has been gained through manipulations of
upper trophic levels (Carpenter, Kitchell & Hodgson,
1985; Carpenter et al., 1987; Horppila et al., 1998;
Jeppesen et al., 1998b; Kairesalo et al., 1999) and
nutrient availability (Hansson, 1992; Persson et al.,
1992; Sarnelle, 1992). However, nutrient manipula-
tions have shown a surprisingly high variability,
including positive correlations of two adjacent trophic
levels and responses unrelated to the number of
trophic levels in the food web (Hansson, 1992;
Mazumder, 1994; Brett & Goldman, 1997; Leibold
et al., 1997).
Variation in the responses of aquatic plankton
communities to nutrient enrichment has indicated
the importance of considering not only the number of
trophic levels but also the nature of the organisms
within them (Leibold et al., 1997; Persson et al., 2001)
and variation in the efficiency of consumers to exploit
their prey (Power, 1992). Compensatory community
responses may account for much of the observed
variation, and dampen trophic cascades when species
vulnerable to predation are replaced by less vulner-
able species. For instance, primary producer biomass
may increase with increasing nutrient availability
when species composition shifts to inedible species,
even in the presence of efficient grazers (Mazumder,
1994; Abrams & Walters, 1996; McCauley et al., 1999).
Such declines in the edibility of food with increasing
primary productivity may lead to ratio-dependent
interactions and proportional changes in biomass at
each trophic level (Arditi & Ginzburg, 1989; Power,
1992).
In shallow lakes and the littoral zones of larger
lakes, spatial heterogeneity produced by submerged
vegetation, coupled with movements of organisms
between open water, vegetated, and benthic environ-
ments may provide important compensatory mecha-
nisms. Through trophic interactions, this spatial
heterogeneity affects water quality and may also
buffer effects of nutrient enrichment (Scheffer et al.,
1993; Jeppesen et al., 1998c; Scheffer, 1999).
The resistance of aquatic ecosystems to perturba-
tions, such as nutrient enrichment, are controlled by
variable environmental factors that are often difficult
to predict. These include climate, and its manifesta-
tions in weather, an aspect that has received little
explicit consideration in field studies, which have
mainly been conducted in temperate ecosystems.
Most biological processes are temperature dependent
(McCauley & Murdoch, 1987; Lehman, 1988; Petchey
et al., 1999). Production of zooplankton has been
shown to increase with temperature, while biomass
accumulation is more dependent on resource availab-
ility (Shuter & Ing, 1997). Primary productivity at
higher temperatures may become more controlled by
nutrient turnover rate. Temperature may influence
demography (Arditi & Ginzburg, 1989). Thus, with
rising temperature, the inherently greater growth rate
of algae compared with that of zooplankton might
lead to reduced control of algal biomass by zooplank-
ton. In addition, the threshold food requirement of
zooplankton increases with water temperature and,
for metabolic reasons, with increasing animal size
(Lehman, 1988). This may mean a lower share of
large-bodied, typically more efficient grazers in the
zooplankton community at higher temperatures.
Thus, the resource base may have a major role in the
functioning of food webs as temperature increases,
such that the cascading top-down effect of fish via
zooplankton grazers on phytoplankton could become
less important.
In this study, the response of zooplankton commu-
nities to experimental manipulation of nutrients and
fish was studied in shallow-lake systems by compar-
ing nutrient and plankton dynamics at six field sites
across Europe.
We hypothesised (i) that algal biomass is controlled
by large crustacean grazers and (ii) that large grazers
increase in number or biomass with nutrient enrich-
ment, unless they are controlled by planktivorous fish
or submerged macrophytes provide refuges against
1620 K. Vakkilainen et al.
� 2004 Blackwell Publishing Ltd, Freshwater Biology, 49, 1619–1632

fish predation (Jeppesen et al., 1998a; Scheffer, 1999).
We aimed to find a threshold fish density below
which zooplankton escapes control by fish. Further-
more, we hypothesised (iii) that the loss of large
crustaceans is compensated by an increase in the
biomass of smaller zooplankton, which exert weaker
control of phytoplankton biomass. As we surmised
that the resistance of plankton community structure
and dynamics to nutrient enrichment is temperature
dependent, we hypothesised (iv) that at warmer
southern sites, control of phytoplankton by large
crustacean zooplankton and the cascading effects of
fish via zooplankton on phytoplankton are less
important than nutrient control, and vice versa at
colder northern sites.
Methods
Study sites and experimental design
Similar mesocosm experiments were carried out
simultaneously in 1998 and 1999 (Stephen et al.,
2004a). The study lakes were shallow (mean depth
about 1 m over the whole lake or over extensive lake
areas) and potentially rich in submerged macrophyte
vegetation. Experiments were run at 1-m depth at six
nearshore sites in Lake Vesijarvi (Finland), Lake
Krankesjon (Sweden), Little Mere (England), Lake
Naardermeer (The Netherlands), Lake Sentiz (Leon,
northern Spain) and Lake Xeresa (Valencia, southern
Spain). Hereafter, the study sites are referred to as
Finland, Sweden, England, Netherlands, Leon and
Valencia.
The mesocosms were 1-m diameter open cylinders
made of clear polyethylene suspended from wooden
or plastic frames at the surface and sealed into the
littoral sediment. The experiments had a fully factorial
block design with three levels of fish biomass (0, 4 and
20 g fresh mass m)2) in both years and four levels of
nutrient enrichment (0, 1, 5 and 10 mg N L)1 com-
bined with 0, 0.1, 0.5 and 1.0 mg P L)1) in 1998 and six
levels (0, 0.3, 0.6, 0.9, 1.5 and 3.0 mg N L)1 combined
with 0, 0.03, 0.06, 0.09, 0.15 and 0.3 mg P L)1) in 1999.
Hereafter, the fish treatments are referred to as fish-
free, low-fish and high-fish, and nutrient treatments
as N0, N1, N2, N3, N4 and N5. The fish were locally
the most appropriate planktivorous species of small
individual size (5–10 cm). The low-fish treatment had
at least two individuals. Each treatment had three
replicates in 1998 and two replicates in 1999, i.e.
altogether 36 mesocosms in each year per site. The
highest nutrient additions in 1998 resulted in unreal-
istically hypereutrophic conditions and mortality of
fish in one location (see below). We therefore nar-
rowed the nutrient range in 1999.
Samples for zooplankton were taken weekly for
6 weeks with a plastic tube (inner diameter 4 cm)
from the whole water column of the mesocosms.
Pretreatment samples for zooplankton were taken
just before the first nutrient addition and the intro-
duction of fish. Separate sub-samples were taken
randomly from different places in each mesocosm to
obtain 10 L of water. After mixing this pooled sample,
a 3-L sub-sample was filtered through a 25-lm mesh
net, and a 7-L sub-sample through a 50-lm mesh net
to obtain rotifer and crustacean zooplankton samples,
respectively. Zooplankton samples were preserved in
70% ethanol or 4% formaldehyde (final concentra-
tion). After counting and length measurement of
zooplankton, crustacean biomasses were calculated
from either length-dry weight (Bottrell et al., 1976) or
length-carbon regressions (Vasama & Kankaala, 1990;
Luokkanen, 1995; A. Lehtovaara, pers. comm.). Rotifer
carbon contents were obtained from Latja & Salonen
(1978) and Telesh, Rahkola & Viljanen (1998). Dry
weight of zooplankton was calculated assuming that
the carbon content is 40% of dry weight, the average
of values reported by Wiebe, Boyd & Cox (1975) and
Latja & Salonen (1978). More details of the study
lakes, mesocosm experiments, fish species used,
sampling protocol and analyses of the samples are
available in Stephen et al. (2004a,b), and in individual
papers describing the results of the experiments
(Fernandez-Alaez et al., 2004; Hansson et al., 2004;
Hietala, Vakkilainen & Kairesalo, 2004; Romo et al.,
2004; Stephen et al., 2004b; Van de Bund & Van Donk,
2004).
Data analysis
Zooplankton taxa were grouped into four functional
groups: (i) Rotifers; (ii) small crustacean grazers
(£0.5 mm), mainly Bosmina spp., Ceriodaphnia spp.,
chydorid cladocerans and copepod nauplii; (iii) large
crustacean grazers (>0.5 mm), mainly Daphnia spp.,
Diaphanosoma brachyurum Lieven, Sida crystallina O.F.
Muller, Simocephalus spp. and diaptomid calanoid
copepods; and (iv) raptorial feeders (Polyphemus
Zooplankton response to nutrients and fish 1621
� 2004 Blackwell Publishing Ltd, Freshwater Biology, 49, 1619–1632
pediculus L. and cyclopoid copepods). Time-weighted
averages (pretreatment data not included) for
zooplankton biomass, total phosphorus (TP) and
chlorophyll a concentrations (chl a) were used for
each replicate mesocosm. Macrophyte abundance was
classified as negligible, sparse and abundant. The
corresponding numeric values used are 0, 1 and 2.
The following data were excluded from analyses: (i)
results of fish treatments with the two highest nutrient
additions in 1998 in Finland, owing to the complete
mortality of fish in those mesocosms; (ii) results from
Sweden in 1998 because heavy storms destroyed the
mesocosms; (iii) the Netherlands rotifer data because
rotifers were counted only in week 6 in 1998; (iv) the
1999 fish treatments in Leon because of high fish
mortality and because dense growth of Myriophyllum
alterniflorum L. made it necessary to take water
samples from an artificially separated macrophyte-
free area in the centre of each mesocosm; and (v) the
England mesocosms in 1999, which accidentally
received a 10-fold higher phosphorus enrichment
than planned.
All statistical analyses were made using SPSS for
Windows (version 10.0). Treatment effects were tested
separately for the two study years with MANOVAMANOVA
followed by univariate ANOVAANOVA with type III sums of
squares and Tukey’s test. Time-weighted average
biomasses of the four zooplankton functional groups
were the response variables, study sites were treated
as block effects and nutrient and fish treatments were
the factorial variables. The homogeneity of variances
was tested with Levene’s test and the normality of the
data was tested with a Kolmogorov–Smirnov test and
on the basis of the residual plots. Log10-transforma-
tion was used to normalise the distribution of the data
before the statistical analyses. However, the criteria
for homoscedasticity were not met even after log-
transformation, thus increasing the risk for type I
error. Pillai’s trace was used in multiple comparisons
as this test of significance is the most robust to
violations of assumptions (Scheiner, 1993). Non-trans-
formed values are presented in the figures and tables.
In order to study the treatments between study
years and sites, the responses of similar nutrient
treatments in both study years were compared, i.e.
with 0.1 mg P L)1; 1.0 mg N L)1 in 1998 and 0.09 mg
P L)1; 0.9 mg N L)1 in 1999. Between-year compari-
sons were not possible for the whole enrichment
regime owing to the different enrichment levels. The
responses of time-weighted mean zooplankton bio-
masses (BIOM) to nutrient enrichment and fish
density were studied by calculating biomass res-
ponse factors as follows: log10 [(BIOMtreatment + 1)/
(BIOMcontrol + 1)]. The response factors were calcula-
ted for both fish and nutrient treatments. Using linear
regression, the zooplankton biomass response factors
were tested for the effects of mean water temperature
and macrophyte abundance as independent variables.
This approach allowed inclusion of the Netherlands
results, which could not be treated in the MANOVAMANOVA
owing to the lack of rotifer data. The use of response
factors harmonised the data and, thus enabled com-
parison of nutrient effects on zooplankton biomasses
under different water temperature and macrophyte
density (Table 1).
General trends in the relation of zooplankton func-
tional group biomass to chl a were studied at individ-
ual study sites. Results of both study years were
pooled and analysed after log10 transformation using
linear regression with chl a as the dependent variable
and zooplankton biomass as the independent variable.
Further analyses focused on the relationship between
chl a and TP at different biomasses of large crustacean
grazers. Before all regression analyses, normality of
the data was tested on the basis of the residual plots.
The overall potential of large crustacean grazers to
control phytoplankton was further analysed at differ-
ent productivity levels, measured as TP concentration,
by using the whole data set without separating it into
different study sites. Chl a was compared with the
large crustacean grazer biomass and their percentage
of the total grazer biomass. Further analyses aimed to
discover whether possible threshold biomasses and
shares of large grazers might provide a buffer mech-
anism and an efficient control of phytoplankton
biomass over the whole range of TP concentrations.
Results
Weather conditions in northern and central Europe
differed greatly between the study years: summer
1998 was cool and windy, whereas summer 1999 was
warm (Table 1). The southernmost study site, Valen-
cia, had the highest water temperature (29 �C) in both
years. The ranges of the time-weighted mean chl a
and TP concentrations in all experiments and treat-
ments were 3–870 and 15–3700 lg L)1, respect-
ively, thus covering a wide range of mesotrophic to
1622 K. Vakkilainen et al.
� 2004 Blackwell Publishing Ltd, Freshwater Biology, 49, 1619–1632

Tab
le1
Ch
arac
teri
stic
so
fm
eso
cosm
sat
six
shal
low
-lak
esi
tes
acro
ssE
uro
pe
du
rin
gex
per
imen
tsin
1998
and
1999
Sit
eY
ear
Tem
per
atu
re
(�C
)T
P(l
gL)
1)
Ch
la
(lg
L)
1)
To
tal
bio
mas
s
(lg
dry
mas
sL)
1)
Do
min
ant
zoo
pla
nk
ton
tax
a
Mac
rop
hy
te
abu
nd
ance
Do
min
ant
mac
rop
hy
teta
xa
Fin
lan
d19
9817
.3(1
5–21
)63
2(4
0–37
00)
70(7
–200
)15
00(3
00–4
500)
Ro
tife
rs,
Mes
ocyc
lops
,T
herm
ocyc
lops
,
Pol
yphe
mu
spe
dicu
lus
L.
Neg
lig
ible
Lem
na
tris
ulc
aL
.
Fin
lan
d19
9921
.3(1
7–23
)14
0(5
0–40
0)25
(8–6
5)67
0(3
30–1
280)
Cer
ioda
phn
ia,
Dia
phan
osom
a
brac
hyu
rum
Lie
ven
,D
aphn
ia
lon
gisp
ina
O.F
Mu
ller
,ch
yd
ori
d
clad
oce
ran
s,cy
clo
po
idco
pep
od
s
Ab
un
dan
tL
emn
atr
isu
lca
Sw
eden
1999
21.3
(19–
23)
70(2
5–28
0)50
(3–3
80)
1240
(430
–284
0)D
aphn
ia,
Bos
min
a,C
erio
daph
nia
,
Eu
diap
tom
us
Neg
lig
ible
Myr
ioph
yllu
m,
Cha
ra
En
gla
nd
1998
17.8
(17–
19)
500
(120
–125
0)50
(10–
240)
450
(200
–100
)D
aphn
iahy
alin
aL
eyd
ig,
Eu
diap
tom
us
grac
ilis
G.O
.S
ars,
Bos
min
a,
Cer
ioda
phn
ia,
cycl
op
oid
cop
epo
ds,
roti
fers
Sp
arse
Pot
amog
eton
,E
lode
a
can
aden
sis
Mic
hx
,
Cer
atop
hyll
um
dem
ersu
mL
.
Net
her
lan
ds
1998
18.5
(17–
22)
100
(15–
350)
20(3
–90)
40(1
–300
)*C
erio
daph
nia
,B
osm
ina,
Eu
diap
tom
us
Sp
arse
Cha
ra
Net
her
lan
ds
1999
22.4
100
(20–
360)
30(6
–85)
30(2
–220
)*C
erio
daph
nia
,D
aphn
iaga
leat
aS
ars,
Dia
phan
osom
abr
achy
uru
m
Ab
un
dan
tC
hara
Leo
n(n
ort
her
nS
pai
n)
1998
23.2
(20–
26)
430
(70–
1080
)45
(5–1
20)
3400
(127
0–84
00)
Cer
ioda
phn
ia,
chy
do
rid
clad
oce
ran
s,
Dap
hnia
lon
gisp
ina,
Eu
cycl
ops,
Mac
rocy
clop
s,M
egac
yclo
ps
Ab
un
dan
tM
yrio
phyl
lum
alte
rnifl
oru
mL
.
Leo
n(n
ort
her
nS
pai
n)
1999
19.7
(18–
21)
65(4
0–13
0)20
(10–
35)
760
(160
–245
0)C
erio
daph
nia
,ch
yd
ori
dcl
ado
cera
ns,
Eu
cycl
ops,
Mac
rocy
clop
s,M
egac
yclo
ps
Ab
un
dan
tM
yrio
phyl
lum
alte
rnifl
oru
m
Val
enci
a(s
ou
ther
nS
pai
n)
1998
28.7
(28–
29)
400
(20–
1150
)23
0(3
–870
)60
0(5
0–18
00)
Ro
tife
rs,
Cer
ioda
phn
ia,
Aca
nth
ocyc
lops
Ab
un
dan
tC
hara
Val
enci
a(s
ou
ther
nS
pai
n)
1999
28.7
(27–
30)
80(1
5–23
0)50
(6–1
80)
555
(65–
1260
)R
oti
fers
,C
erio
daph
nia
,A
can
thoc
yclo
ps,
The
rmoc
yclo
ps
Ab
un
dan
tC
hara
*Bio
mas
sav
aila
ble
on
lyfo
rto
tal
cru
stac
ean
zoo
pla
nk
ton
.
Mea
nv
alu
esw
ith
ran
ges
inp
aren
thes
esar
ep
rov
ided
for
tem
per
atu
re.T
ime-
wei
gh
ted
mea
nv
alu
esw
ith
ran
ges
inp
aren
thes
esar
eg
iven
for
tota
lp
ho
sph
oru
s(T
P)
and
chlo
rop
hy
ll
a(C
hl
a)co
nce
ntr
atio
ns
and
for
tota
lzo
op
lan
kto
nb
iom
asse
s.
Zooplankton response to nutrients and fish 1623
� 2004 Blackwell Publishing Ltd, Freshwater Biology, 49, 1619–1632

hypereutrophic conditions (Table 1). The species
composition and abundance of macrophyte and
zooplankton communities varied among sites and
years and there was no obvious geographical pattern
(Table 1). The cladoceran community was mostly
characterised by small genera such as Ceriodaphnia,
Bosmina and chydorid cladocerans, which often
occurred together with cyclopoid copepods. Daphnia
was found only in a few experiments, while Diap-
hanosoma was a quite common large-bodied cladocer-
an at many sites (Table 1). Total zooplankton
biomasses reached higher values in 1998, when
nutrient manipulations included greater enrichment
than in 1999 (Table 1, Fig. 1). They also showed an
increasing trend with nutrient enrichment in both
years and in 1998, when the greatest enrichment
exceeded that in 1999, the highest biomasses were
often measured at intermediate nutrient levels
(Fig. 1).
Nutrient enrichment had a marginally significant
multivariate effect on zooplankton only in 1998, when
it increased the biomass of small crustacean grazers
and, in all sites except Valencia, decreased that of
raptorials (Table 2; Fig. 2). The responses of large
crustacean grazers to nutrient enrichment were
mostly negligible in fish-free treatments, and negative
in fish treatments (Fig. 2). Thus, neither the main
effect of nutrients nor the joint effect of nutrients and
fish were significant on large grazers.
Fish had a highly significant multivariate effect on
zooplankton in both years (Table 2). In general, the
biomass of rotifers increased, and those of all other
functional groups decreased with increasing fish
density (Table 2; Fig. 2). Differences in the biomass
of almost all zooplankton groups were significant
between no-fish and high-fish treatments as well as
between no-fish and low-fish treatments (Tukey’s
test).
Table 2 M A N O V AM A N O V A and A N O V AA N O V A results of effects of treatments (nutrients and fish) and block (site) on time-weighted averages of
zooplankton biomass in mesocosm experiments carried out at four shallow-lake sites across Europe in 1998 and 1999
Year Source of effect
Pillai’s trace Anova Rotifers
Small crusta-
cean grazers
Large crusta-
cean grazers Raptorials
d.f. F P d.f. F P F P F P F P
1998 Nutrient 12 1.8 0.052 3 1.4 0.245 2.9 0.038 1.2 0.308 3.1 0.030
Fish 8 14.0 <0.001 2 33.1 <0.001 10.6 <0.001 44.0 <0.001 19.1 <0.001
Nutrient · fish 24 0.8 0.743 6 1.4 0.221 0.9 0.519 1.2 0.326 0.6 0.748
Site 12 41.8 <0.001 3 98.3 <0.001 52.0 <0.001 57.7 <0.001 28.4 <0.001
1999 Nutrient 20 0.9 0.594 5 0.7 0.652 1.2 0.322 1.4 0.242 1.3 0.271
Fish 8 9.1 <0.001 2 34.2 <0.001 14.2 <0.001 9.6 <0.001 12.5 <0.001
Nutrient · fish 40 0.7 0.903 10 0.4 0.922 0.2 0.992 1.9 0.057 0.3 0.985
Site 12 27.0 <0.001 3 52.2 <0.001 90.2 <0.001 398.5 <0.001 120.4 <0.001
Results are based on log10-transformed variables. The Netherlands’ results were excluded from this analysis.
Fig. 1 Time-weighted mean (±SE) of total zooplankton biomass in different nutrient and fish treatments of a series of mesocosm
experiments carried out at six shallow-lake sites across Europe in 1998 and 1999. Nutrient and fish treatments are given in sequential
order according to the levels detailed in the text.
1624 K. Vakkilainen et al.
� 2004 Blackwell Publishing Ltd, Freshwater Biology, 49, 1619–1632

Zooplankton biomass differed among study sites,
resulting in a highly significant multivariate main
effect (Table 2). Lowest total biomasses were found in
Valencia, the southernmost site, which differed
greatly from Leon, the other Spanish site, and also
from almost all other sites (Figs 1 & 2). Conversely, at
the two northernmost sites in Finland and Sweden,
the zooplankton communities resembled each other in
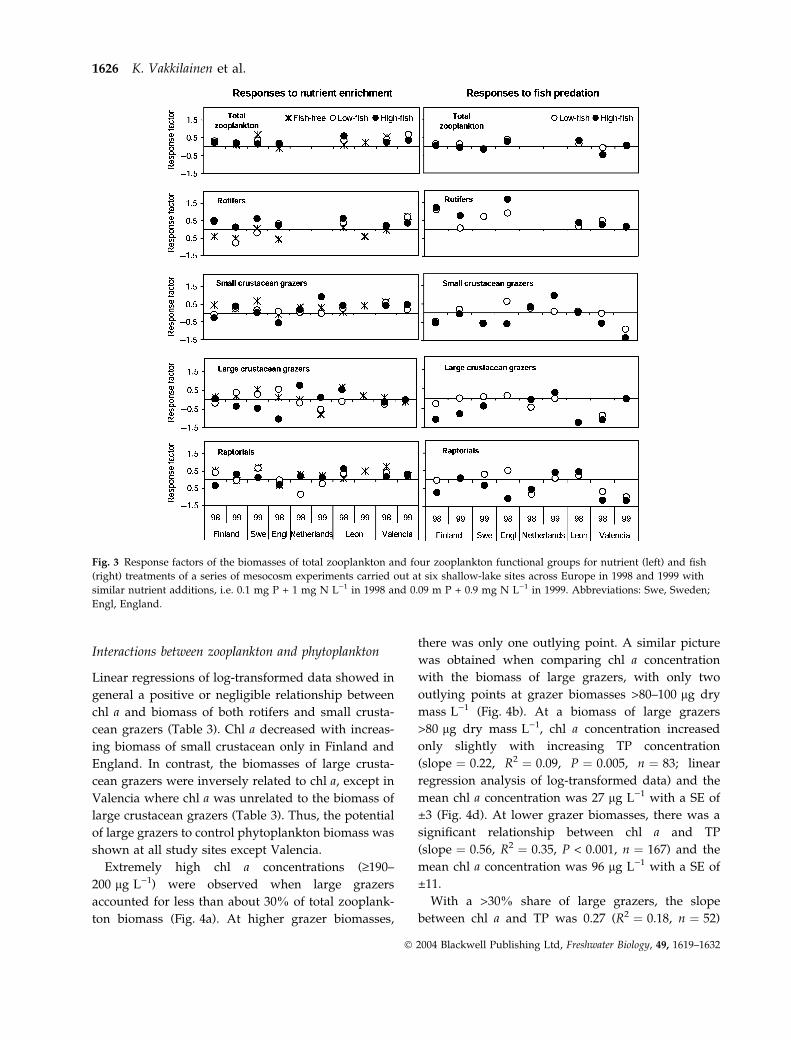
1999 (Fig. 2). The response factors of total zooplank-
ton biomass showed a consistently positive effect of
nutrients, whereas the effect of fish was variable
(Fig. 3). Similarly to MANOVAMANOVA and ANOVAANOVA, the
response factors of distinct functional groups showed
strong effects of fish and less clear effects of nutrients.
In the absence of fish, crustacean grazers and rapto-
rials responded positively to nutrient enrichment,
rotifers mostly negatively. In fish treatments,
however, the pattern was much more variable with
both positive and negative responses without clear
geographical trends. In Valencia, zooplankton bio-
masses increased with nutrients in all fish treatments,
with the exception of large crustacean grazers. The
Netherlands results were generally in line with those
of the other sites (Fig. 3). An exception was the
positive responses of large crustacean grazers in high-
fish treatments. The response factors of small crusta-
cean grazers to nutrients were significantly related to
mean water temperature (linear regression analysis;
R2 ¼ 0.26; F1,27 ¼ 9.08; P ¼ 0.006). High water tem-
peratures in 1999 (Table 1) apparently enhanced the
reproduction of small crustaceans in Finland, Sweden
and The Netherlands. At the high temperature in
Valencia, small crustaceans increased with nutrients
in both study years (Fig. 3).
Fig. 2 Time-weighted mean (±SE) biomasses of four zooplankton functional groups in different nutrient and fish treatments of a
series of mesocosm experiments carried out at six shallow-lake sites across Europe in 1998 and 1999. Nutrient and fish treatments
are given in sequential order according to the levels detailed in the text.
Zooplankton response to nutrients and fish 1625
� 2004 Blackwell Publishing Ltd, Freshwater Biology, 49, 1619–1632
Interactions between zooplankton and phytoplankton
Linear regressions of log-transformed data showed in
general a positive or negligible relationship between
chl a and biomass of both rotifers and small crusta-
cean grazers (Table 3). Chl a decreased with increas-
ing biomass of small crustacean only in Finland and
England. In contrast, the biomasses of large crusta-
cean grazers were inversely related to chl a, except in
Valencia where chl a was unrelated to the biomass of
large crustacean grazers (Table 3). Thus, the potential
of large grazers to control phytoplankton biomass was
shown at all study sites except Valencia.
Extremely high chl a concentrations (‡190–
200 lg L)1) were observed when large grazers
accounted for less than about 30% of total zooplank-
ton biomass (Fig. 4a). At higher grazer biomasses,
there was only one outlying point. A similar picture
was obtained when comparing chl a concentration
with the biomass of large grazers, with only two
outlying points at grazer biomasses >80–100 lg dry
mass L)1 (Fig. 4b). At a biomass of large grazers
>80 lg dry mass L)1, chl a concentration increased
only slightly with increasing TP concentration
(slope ¼ 0.22, R2 ¼ 0.09, P ¼ 0.005, n ¼ 83; linear
regression analysis of log-transformed data) and the
mean chl a concentration was 27 lg L)1 with a SE of
±3 (Fig. 4d). At lower grazer biomasses, there was a
significant relationship between chl a and TP
(slope ¼ 0.56, R2 ¼ 0.35, P < 0.001, n ¼ 167) and the
mean chl a concentration was 96 lg L)1 with a SE of
±11.
With a >30% share of large grazers, the slope
between chl a and TP was 0.27 (R2 ¼ 0.18, n ¼ 52)
Fig. 3 Response factors of the biomasses of total zooplankton and four zooplankton functional groups for nutrient (left) and fish
(right) treatments of a series of mesocosm experiments carried out at six shallow-lake sites across Europe in 1998 and 1999 with
similar nutrient additions, i.e. 0.1 mg P + 1 mg N L)1 in 1998 and 0.09 m P + 0.9 mg N L)1 in 1999. Abbreviations: Swe, Sweden;
Engl, England.
1626 K. Vakkilainen et al.
� 2004 Blackwell Publishing Ltd, Freshwater Biology, 49, 1619–1632

(Fig. 4c). Predictability of phytoplankton control was
not increased further by raising the threshold biomass
of large grazers from 80 to 100 lg DW L)1. Moreover,
the lower number of observations containing these
high biomasses likely augmented the possibility of
coincidence. In contrast, when the biomass thresholds
were lowered, the slope increased, e.g. to 0.26 (R2 ¼0.11) with a large grazer biomass of ‡60 lg DW L)1.
Similarly, when the 30% threshold of large grazers
was shifted to ‡20 and ‡40%, the slopes changed to
0.34 (R2 ¼ 0.21, n ¼ 71) and 0.26 (R2 ¼ 0.18, n ¼ 42),
respectively.
Changes in chl a over the TP concentration range
were explained better by the abundance of large
grazers than by the presence or absence of fish
(Fig. 4e). There was a significant relationship between
Table 3 Results of linear regressions des-
cribing relationships between zooplank-
ton biomass and chl a (log10-transformed)
determined in a series of mesocosm
experiments at six shallow-lake sites
across Europe
Dependent variable Site, years d.f. slope R2 F P
Rotifers Finland, 1998 & 1999 59 0.29 0.29 24.1 <0.001
Sweden, 1999 35 0.17 0.07 2.6 0.12
England, 1998 35 0.35 0.53 38.8 <0.001
Leon, 1998 & 1999 47 0.21 0.09 4.5 0.039
Valencia, 1998 & 1999 71 )0.13 0.01 0.6 0.43
Small crustacean
grazers
Finland, 1998 & 1999 59 )0.19 0.07 4.1 0.046
Sweden, 1999 35 0.26 0.03 0.9 0.36
England, 1998 35 )0.25 0.18 7.6 0.009
Netherlands, 1998 & 1999 71 0.12 0.03 1.9 0.18
Leon, 1998 & 1999 47 0.20 0.06 3.2 0.08
Valencia, 1998 & 1999 71 0.32 0.20 17.9 <0.001
Large crustacean
grazers
Finland, 1998 & 1999 59 )0.19 0.12 7.6 0.008
Sweden, 1999 35 )0.67 0.30 14.3 0.001
England, 1998 35 )0.33 0.50 34.4 <0.001
Netherlands, 1998 & 1999 71 )0.41 0.33 34.3 <0.001
Leon, 1998 & 1999 47 )0.35 0.37 27.3 <0.001
Valencia, 1998 & 1999 71 0.28 0.04 2.7 0.11
Fig. 4 Relationship between chlorophyll a concentration (chl a) and the (a) biomass share and (b) absolute biomass of large crustacean
grazers; chl a and the total phosphorus concentration (TP) in treatments with a biomass of large grazers below and above (c) 30% of
the total zooplankton biomass and (d) 80–90 lg dry mass L)1; and (e) chl a and TP at three fish densities. Data are from mesocosm
experiments carried out at six shallow-lake sites across Europe in 1998 and 1999. Note the logarithmic presentation of both axes in
Fig. 4c–e.
Zooplankton response to nutrients and fish 1627
� 2004 Blackwell Publishing Ltd, Freshwater Biology, 49, 1619–1632

chl a and TP even in fish-free treatments (slope ¼ 0.41,
R2 ¼ 0.21, P < 0.001, n ¼ 95). This relationship did
not markedly change in low-fish treatment (slope ¼0.37, R2 ¼ 0.13, P ¼ 0.001, n ¼ 77), but a stronger
response was observed in the high-fish treatment
(slope ¼ 0.78, R2 ¼ 0.78, P < 0.001, n ¼ 77).
Discussion
The results of this pan-European mesocosm experi-
ment emphasise the importance of consumer control
over resource control in determining zooplankton
biomass in shallow lake systems. Thus, our results are
in agreement with the general view that (large)
herbivores respond strongly to predator manipulations
in aquatic food webs (Brett & Goldman, 1997; Mehner
et al., 2002; Shurin et al., 2002). Rotifers increased with
nutrient enrichment in fish treatments, while small
crustacean grazers showed positive responses to nutri-
ent enrichment largely independently of the presence
or absence of fish. Small zooplankton species appar-
ently benefited from the mostly negative responses of
their larger competitors and raptorial predators to the
presence of fish. Thus, within zooplankton communi-
ties different functional groups responded inconsis-
tently to the treatments. Such compensation suggests a
ratio-dependent functional response and is consistent
with the view that nutrient enrichment leads to
proportional increases at all trophic levels (Arditi &
Ginzburg, 1989; Leibold et al., 1997).
The traditional equilibrium theory of food chain
dynamics and its modifications (Hairston et al., 1960;
Fretwell, 1977; Oksanen et al., 1981; Scheffer, 1991)
emphasises the control of lower trophic levels by
consumers, and predicts that effects of nutrient
enrichment are transferred into biomass at the top
trophic level and even-numbered levels below it.
Accordingly, zooplankton biomass increases with
enhanced primary productivity in two-level systems
(phytoplankton and herbivorous zooplankton) but
does not change in three-level systems (phytoplank-
ton, herbivorous zooplankton and planktivorous fish).
In contrast to this theory, the higher zooplankton
biomass we observed in fish treatments compared
with fish-free treatments, especially in 1998, shows
that total zooplankton biomass may increase with
nutrients independently of the number of trophic
links in the food chain. Several field and laboratory
studies of aquatic food chains have shown similar
increases with nutrient enrichment in both two- and
three-level systems (Mazumder, 1994; Leibold et al.,
1997; Persson et al., 2001). In our study, available food
resources appeared to determine total zooplankton
biomass, whereas fish regulated relative abundances
of different functional groups. This emphasises the
importance of compositional changes within trophic
levels and reveals the limitation of simple food-chain
and ratio-dependent models to capture such changes,
as pointed out by Leibold et al. (1997) and Hulot et al.
(2000). In addition, our result that algal biomass was
positively related with TP concentration even in the
presence of efficient grazers has often been observed
in previous studies (Hansson, 1992; Mazumder, 1994;
Brett & Goldman, 1997; Leibold et al., 1997; Shuter &
Ing, 1997; Persson et al., 2001). It reflects the positive
response of adjacent trophic levels and, therefore, is
not consistent with traditional food-chain theory.
The variability of responses to fish and nutrient
manipulations was also influenced by substantial
variation in community structure among sites. For
instance, in Leon, the biomass of large crustacean
grazers in 1998 increased with nutrients even when
fish density was high, most probably through the
refuge effect of the abundant growth of Myriophyllum
(Timms & Moss, 1984; Jeppesen et al., 1998a; Scheffer,
1999; Burks et al., 2002). In shallow lakes and littoral
zones, refuges provided to zooplankton by macro-
phytes work as an important buffering mechanism to
changes in fish predation pressure (Jeppesen et al.,
1998c). Chara beds have also been considered as good
refuges for zooplankton against fish predation (Diehl,
1988; Jeppesen et al., 1998a), but our results do not
support this view as Chara at the study sites in
Valencia and Netherlands did not prevent efficient
foraging of fish for large crustacean grazers.
There were substantial differences in zooplankton
community structure and biomass among study sites,
and even between study years at the same site.
Nonetheless, some consistent patterns were evident.
Valencia in southern Spain differed from the other
sites in that zooplankton had a minor influence on
phytoplankton dynamics. Nutrient enrichment appar-
ently increased algal growth rate more than that of
zooplankton and thus disrupted top-down control of
algae (cf. Arditi & Ginzburg, 1989; Power, 1992). In
addition, as Power (1992) pointed out, if grazers were
subject to predation, the grazer control of phytoplank-
ton would further weaken relative to resource control.
1628 K. Vakkilainen et al.
� 2004 Blackwell Publishing Ltd, Freshwater Biology, 49, 1619–1632
Our result supports this hypothesis because fish
efficiently reduced the biomasses of large grazers in
Valencia and the remaining small grazers were unable
to control algal biomass.
Daphnia has been suggested as a keystone species and
its abundance as a useful indicator to predict the
grazing impact of zooplankton on phytoplankton
(Hansson, 1992; Sarnelle, 1992; Mazumder, 1994; Pers-
son et al., 2001). Supporting evidence for food-chain
theory has been gained especially from open-water
systems with Daphnia as the key grazer (Carpenter
et al., 1985, 1987; Jeppesen et al., 1998b). In our experi-
ments, however, Daphnia was relatively sparse and
virtually absent in fish treatments. Its biomass was
therefore pooled with that of other large grazers. The
potential of large grazers to control phytoplankton
biomass was shown at all study sites except Valencia.
The share of large crustacean grazers of the whole
grazer biomass had a clear inverse relationship with chl
a concentration. A consistent result was obtained when
chl a concentration was related to the biomass of large
grazers. When abundant, these large grazers efficiently
controlled phytoplankton biomass even under hyper-
trophic conditions (up to 1600 lg TP L)1). Otherwise,
chl a concentration increased steeply with increasing
TP concentration. Sarnelle (1992), moreover, found
even stronger differences in the chl a/TP relationship in
systems with both high and negligible biomass of
Daphnia. Our empirically obtained threshold biomass
(80–90 lg dry mass L)1) is close to that (ca 100 lg dry
mass L)1) at which Hansson (1992) found an efficient
control of algal biomass by grazers.
Increase in the biomass of small crustaceans and
rotifers was generally associated with an increase in chl
a, indicating the low ability of small zooplankton to
control total phytoplankton biomass. In Finland and
England, however, even small grazers such as Ceriod-
aphnia were apparently able to restrain algal biomass. In
Finland, this control was probably enhanced by high
abundance of the free-floating macrophyte, Lemna
trisulca L. (Hietala et al., 2004). Rotifers are highly
specialised suspension-feeders and are not able to
control total algal biomass, at least in eutrophic
systems, because they feed mainly on nanoplankton
such as bacteria, flagellates, ciliates, and small algae
(Pourriot, 1977; Gilbert & Bogdan, 1984). In addition,
rotifers probably recycle nutrients more effectively
than larger crustaceans (Vanni, 2002) and therefore
further enhance the availability of nutrients to algae.
Nonetheless, the food-web role of rotifers is empha-
sised under turbid conditions. Through providing food
for young-of-the-year (YOY) fish, they may maintain a
high recruitment of zooplanktivorous fish. The pro-
liferation of small crustaceans and rotifers in our
experiment was probably related to their lower
susceptibility to fish predation. Additionally, their
shorter generation times compared with larger crusta-
ceans allowed the smaller zooplankton to respond
quickly to nutrient enrichment. On the contrary, it is
unlikely that life-history constraints affected the
nutrient enrichment responses of the larger zooplank-
ton during the 5-week experiments as with an average
growth rate of 0.3 day)1 populations turned over at
least 15 times. Suppression of large herbivores at higher
water temperature (Beisner, McCauley & Wrona, 1997)
and/or in enriched systems (McCauley et al., 1999) has
been explained by increases in inedible algae. How-
ever, no such consistent dominance of inedible algae
(i.e. forms having a Greatest Axial or Linear Dimension,
GALD, of ‡50 lm) was observed in our enriched or
high-temperature mesocosms (Van de Bund et al.,
2004).
A steep slope between chl a and TP concentration
suggests a cascading effect of fish through herbivor-
ous zooplankton on phytoplankton in systems with
three trophic levels (Hansson, 1992; Mazumder, 1994).
Our results from high-fish treatments agree with these
predictions, although the slope in low-fish treatments
was less steep and similar to that in fish-free
treatments. However, the abundance of large crusta-
cean grazers explained the relationship between chl a
and TP better than did the mere number of trophic
levels. This can be explained by the fact that our
experimental systems involved several hypereutroph-
ic fish-free systems with low biomass of large grazers,
as well as several low-fish systems with high biomass
of large grazers. In addition, small crustacean grazers
that were not heavily preyed upon by fish probably
had at least a complementary role in controlling
phytoplankton biomass. Thus, our results show that
high fish biomass (20 g dry mass m)2) leads to
generally low grazer biomass and consistently to high
algal biomass with increasing nutrient availability.
However, when fish biomass is low (4 g dry
mass m)2) grazer biomass can be high and control
algal biomass in shallow-lake systems.
In conclusion, fish had a greater role than nutrients
in regulating zooplankton biomass and especially
Zooplankton response to nutrients and fish 1629
� 2004 Blackwell Publishing Ltd, Freshwater Biology, 49, 1619–1632

relative abundances of zooplankton functional
groups. Large crustacean grazers were of crucial
importance in controlling algal biomass even under
hypereutrophic conditions provided that their bio-
mass proportion or absolute biomass was high. This
result supports our first hypothesis that algal bio-
mass is controlled by large crustacean grazers.
However, our second hypothesis that large crusta-
ceans increase in number or biomass with nutrient
enrichment either in the absence of fish or when
protected from fish predation by submerged macro-
phytes, was not supported. Although abundant
submerged macrophytes often provided refuges for
zooplankton against fish predation as expected,
differences in the magnitude of the refuge effect
occurred at different sites. These may be because of
differences in macrophyte species, fish species or
other factors that varied among sites. In agreement
with our third hypothesis, the biomass of large
crustaceans was reduced when fish were present and
smaller zooplankton species with minor or comple-
mentary importance in controlling phytoplankton
biomass became more abundant. Our fourth hypo-
thesis that at southern, warmer sites control of
primary producers by large crustacean zooplankton
and cascading effects of fish via zooplankton grazers
are less important than nutrients, and vice versa at
the northern cooler sites, was supported by the
Valencia results; the potential of zooplankton, espe-
cially that of large crustacean grazers, to control
phytoplankton biomass was evident at all other sites.
Apart from the reduced role of large crustacean
grazers in Valencia, no consistent geographical pat-
terns were observed in the responses of zooplankton
communities to nutrient and fish manipulation.
Acknowledgments
We are grateful to all technical staff, students and
other personnel who helped setting up the experi-
ments, taking and counting samples, and entering the
numerous numbers into computers. We are also
indebted to two anonymous reviewers for their
invaluable criticism, which markedly contributed to
the improvement of the manuscript. Brian Moss and
Mark Gessner provided valuable comments on earlier
versions of the manuscript. This study was financially
supported by the European Commission (SWALE,
contract ENV4-CT97-0420).
References
Abrams P.A. & Walters C.J. (1996) Invulnerable prey and
the paradox of enrichment. Ecology, 77, 1125–1133.
Arditi R. & Ginzburg L.R. (1989) Coupling in predator-
prey dynamics: ratio-dependence. Journal of Theoretical
Biology, 139, 69–75.
Beisner B.E., McCauley E. & Wrona F.J. (1997) The
influence of temperature and food chain length on
plankton predator-prey dynamics. Canadian Journal of
Fisheries and Aquatic Sciences, 54, 586–595.
Bottrell H.H, Duncan A., Gliwicz Z.M., Grygierek E.,
Herzig A., Hillbricht-Ilkowska A., Kurasawa H., Lars-
son P. & Wieglenska T. (1976) A review of some
problems in zooplankton production studies. Norwe-
gian Journal of Zoology, 24, 419–456.
Brett M.T. & Goldman C.R. (1997) Consumer versus
resource control in freshwater pelagic food webs.
Science, 275, 384–386.
Burks R.L., Lodge D.M., Jeppesen E. & Lauridsen L.L.
(2002) Diel horizontal migration of zooplankton: costs
and benefits of inhabiting the littoral. Freshwater
Biology, 47, 343–365.
Carpenter S.R., Kitchell J.F. & Hodgson J.R. (1985)
Cascading trophic interactions and lake productivity.
BioScience, 35, 634–639.
Carpenter S.R., Kitchell J.F., Hodgson J.R., Cochran P.A.,
Elser J.J., Elser M.M., Lodge D.M., Kretchmer D., He X.
& von Ende C.N. (1987) Regulation of lake primary
productivity by food web structure. Ecology, 68, 1863–
1876.
Diehl S. 1988. Foraging efficiency of three freshwater
fishes: effects of structural complexity and light. Oikos,
53, 207–214.
Fernandez-Alaez M., Fernandez-Alaez C., Becares E.,
Valentın M., Goma J. & Castrillo P. (2004) A 2-year
experimental study on nutrient and predator influ-
ences on food web constituents in a shallow lake of
north-west Spain. Freshwater Biology, 49, 1574–1592.
Fretwell S.D. (1977) The regulation of plant communities
by food chains exploiting them. Perspectives in Biology
and Medicine, 20, 169–185.
Gilbert J.J. & Bogdan K.G. (1984) Rotifer grazing: in situ
studies on selectivity and rates. In: Trophic Interactions
within Aquatic Ecosystems (Eds D.G. Meyers & J.R.
Strickler). AAAS Selected Symposium, 85, 97–133.
Hairston N.G., Smith F.E. & Slobodkin L.B. (1960)
Community structure, population control and compe-
tition. American Naturalist, 94, 421–425.
Hansson L.-A. (1992) The role of food chain composition
and nutrient availability in shaping algal biomass
development. Ecology, 73, 241–247.
1630 K. Vakkilainen et al.
� 2004 Blackwell Publishing Ltd, Freshwater Biology, 49, 1619–1632

Hansson L.-A., Gyllstrom M., Stahl-Delbanco A. &
Svensson M. (2004) Responses to fish predation and
nutrients by plankton at different levels of taxonomic
resolution. Freshwater Biology, 49, 1538–1550.
Hietala J., Vakkilainen K. & Kairesalo T. (2004) Commu-
nity resistance and change to nutrient enrichment and
fish manipulation in a vegetated lake littoral. Freshwa-
ter Biology, 49, 1525–1537.
Horppila J., Peltonen H., Malinen T., Luokkanen E. &
Kairesalo T. (1998) Top-down or bottom-up effects of
fish: issues of concern in biomanipulation of lakes.
Restoration Ecology, 6, 20–28.
Hulot F.D., Lacroix G., Lescher-Moutoue F. & Loreau M.
(2000) Functional diversity governs ecosystem
response to nutrient enrichment. Nature, 405, 340–344.
Jeppesen E., Lauridsen T.L., Kairesalo T. & Perrow M.R.
(1998a) Impact of submerged macrophytes on fish-
zooplankton interactions in lakes. In: The Structuring
Role of Submerged Macrophytes in Lakes (Eds E. Jeppesen,
Ma. Søndergaard, Mo. Søndergaard & K. Christoffer-
sen), pp. 397–406. Springer-Verlag, New York.
Jeppesen E., Søndergaard M., Jensen J.P., Mortensen E.,
Hansen A.-M. & Jørgensen T. (1998b) Cascading
trophic interactions from fish to bacteria and nutrients
after reduced sewage loading: An 18-year study of a
shallow hypertrophic lake. Ecosystems, 1, 250–267.
Jeppesen E., Søndergaard Ma., Søndergaard Mo. &
Christoffersen K. (1998c) The Structuring Role of Sub-
merged Macrophytes in Lakes. Springer-Verlag, New York.
Kairesalo T., Laine S., Luokkanen E., Malinen T. & Keto J.
(1999) Direct and indirect mechanisms behind success-
ful biomanipulation. Hydrobiologia, 395/396, 99–106.
Latja R. & Salonen K. (1978) Carbon analysis for the
determination of individual biomasses of planktonic
animals. Verhandlungen der Internationalen Vereinigung
fur Theoretische und Angewandte Limnologie, 20, 2556–
2560.
Lehman J.T. (1988) Ecological principles affecting com-
munity structure and secondary productivity by
zooplankton in marine and freshwater environments.
Limnology and Oceanography, 33, 931–945.
Leibold M.A., Chase J.M., Shurin J.B. & Downing A.L.
(1997) Species turnover and the regulation of trophic
structure. Annual Review of Ecology and Systematics, 28,
467–494.
Luokkanen E. (1995) The Species Composition, Biomass and
Production of the Pelagic Cladoceran Community in the
Enonselka Basin of Lake Vesijarvi. University of Helsinki,
Research and education center of Lahti, Report No. 25
(in Finnish with English summary).
Mazumder A. (1994) Patterns of algal biomass in dom-
inant odd- vs. even-link lake ecosystems. Ecology, 75,
1141–1149.
McCauley E. & Murdoch W.W. (1987) Cyclic and stable
populations: plankton as paradigm. American Natural-
ist, 129, 97–121.
McCauley E., Nisbet R.M., Murdoch W.W., Roos A.M. &
Gurney W.S.C. (1999) Large-amplitude cycles of
Daphnia and its algal prey in enriched environments.
Nature, 402, 653–656.
Mehner T., Benndorf J., Kasprzak P. & Koschel R. (2002)
Biomanipulation of lake ecosystems: successful appli-
cations and expanding complexity in the underlying
science. Freshwater Biology, 47, 2453–2465.
Oksanen L., Fretwell S.D., Arruda J. & Niemela P. (1981)
Exploitation ecosystems in gradients of primary
productivity. American Naturalist, 118, 240–261.
Persson L., Diehl S., Johansson L., Andersson G. &
Hamrin S.F. (1992) Trophic interactions in temperate
lake ecosystems: a test of food chain theory. American
Naturalist, 140, 59–84.
Persson A., Hansson L.-A., Bronmark C., Lundberg P.,
Pettersson L.B., Greenberg L., Nilsson P.A., Nystrom
P., Romare P. & Tranvik L. (2001) Effects of enrichment
on simple aquatic food webs. American Naturalist, 157,
654–669.
Petchey O.L., McPhearson T., Casey T.M. & Morin P.J.
(1999) Environmental warming alters food-web struc-
ture and ecosystem function. Nature, 402, 69–72.
Polis G.A. (1999) Why are parts of the world green?
Multiple factors control productivity and the distribu-
tion of biomass. Oikos, 86, 3–15.
Pourriot R. (1977) Food and feeding habits of Rotifera.
Archiv fur Hydrobiologie – Advances in Limnology, 8, 243–
260.
Power M.E. (1992) Top-down and bottom-up forces in
food webs: do plants have primacy? Ecology, 73, 733–
746.
Romo S., Miracle M.R., Villena M.-J., Rueda M., Ferriol C.
& Vicente E. (2004) Mesocosm experiments on nutrient
and fish effects on shallow lake food webs in a
Mediterranean climate. Freshwater Biology, 49, 1593–
1607.
Sarnelle O. (1992) Nutrient enrichment and grazer effects
on phytoplankton in lakes. Ecology, 73, 551–560.
Scheffer M. (1991) Fish and nutrients interplay deter-
mines algal biomass: a minimal model. Oikos, 62, 271–
282.
Scheffer M. (1999) The effect of aquatic vegetation on
turbidity: how important are the filter feeders? Hydro-
biologia, 408/409, 307–316.
Scheffer M., Hosper S.H., Meijer M-L., Moss B. &
Jeppesen E. (1993) Alternative equilibria in shallow
lakes. Trends in Ecology and Evolution, 8, 275–279.
Scheiner S.M. (1993) MAN OVAM ANOVA: Multiple response var-
iables and multispecies interactions. In: Design and
Zooplankton response to nutrients and fish 1631
� 2004 Blackwell Publishing Ltd, Freshwater Biology, 49, 1619–1632

Analysis of Ecological Experiments (Eds S.M. Scheiner &
J. Gurevitch). pp. 94–112, Chapman & Hall, New
York.
Shurin J.B, Borer E.T., Seabloom E.W., Anderson K.,
Blanchette C.A., Broitman B., Cooper S.D. & Halpern
B.S. (2002) A cross-ecosystem comparison of the
strength of trophic cascades. Ecology Letters, 5, 785–791.
Shuter B.J. & Ing K.K. (1997) Factors affecting the
production of zooplankton in lakes. Canadian Journal
of Fisheries and Aquatic Sciences, 54, 359–377.
Stephen D., Balayla D., Becares E. et al. (2004a) Contin-
ental-scale patterns of nutrient and fish effects on
shallow lakes: introduction to a pan-European meso-
cosm. Freshwater Biology, 49, 1517–1524.
Stephen D., Balayla D.M., Collings S.E. & Moss B. (2004b)
Two mesocosm experiments investigating the control
of summer phytoplankton growth in a small shallow
lake. Freshwater Biology, 49, 1551–1564.
Telesh I.V., Rahkola M. & Viljanen M. (1998) Carbon
content of some freshwater rotifers. Hydrobiologia, 387/
388, 355–360.
Timms R.M. & Moss B. (1984) Prevention of growth of
potentially dense phytoplankton populations by
zooplankton grazing in the presence of zooplanktivor-
ous fish, in a shallow wetland ecosystem. Limnology
and Oceanography, 29, 472–486.
Van de Bund W. & Van Donk E. (2004) Effects of fish and
nutrient additions on food-web stability in a charo-
phyte-dominated lake. Freshwater Biology, 49, 1565–
1573.
Van de Bund W.J., Romo S., Villena M.J. et al. (2004)
Responses of phytoplankton to fish predation and
nutrient loading in shallow lakes: a pan-European
mesocosm experiment. Freshwater Biology, 49, 1608–
1618.
Vanni M.J. (2002) Nutrient cycling by animals in fresh-
water ecosystems. Annual Review of Ecology and
Systematics, 33, 341–370.
Vasama A. & Kankaala P. (1990) Carbon-length regres-
sions of planktonic crustaceans in Lake Ala-Kitka (NE-
Finland). Aqua Fennica, 20, 95–102.
Wiebe P.H., Boyd S. & Cox J.L. (1975) Relationships
between zooplankton displacement volume, wet
weight, dry weight and carbon. Fishery Bulletin, 73,
777–786.
(Manuscript accepted 10 September 2004)
� 2004 Blackwell Publishing Ltd, Freshwater Biology, 49, 1619–1632
1632 K. Vakkilainen et al.