PAN AMERICAN WORLD HEALTH HEALTH ORGANIZATION ...
77
regional committee PAN AMERICAN WORLD HEALTH HEALTH ORGANIZATION ORGANIZATION XXX Meeting XXXVI Meeting Washington, D.C. INDEYCM September-October 1984 Provisional Agenda Item 24 CD30/16 (Eng.) 8 August 1984 ORIGINAL: SPANISH NATIONAL AND INTERNATIONAL FINANCIAL AND BUDGETING IMPLICATIONS OF THE REGIONAL STRATEGIES AND THE PLAN OF ACTION FOR HEALTH FOR ALL BY THE YEAR 2000 The Economic Crisis in Latin America and the Caribbean and its Repercus- sions in the Health Sector This report has been prepared in compliance with Resolution XX of the XXI Pan American Sanitary Conference of September 1982, which accepted the proposal made by the Executive Committee at its 88th Meeting in June of the same year. This report was presented by the Secretariat of PAHO to the April 1984 Meeting of the Subcommittee on Long-Term Planning and Programming of the Executive Committee of the Organization. Approved by the Subcommittee, it was submitted to the Executive Committee, which approved it during its 92nd Meeting in June 1984. The report contains overall socioeconomic information on Latin America and the Caribbean as a comprehensive frame of reference for under- standing the structural and transient causes and effects of the present economic crisis and its repercussions on most of the less-developed countries in the Region, and particularly for the local and international financing of social programs, particularly those for health. With this last purpose in view, it contains specific information on economic and financial aspects of the health systems and sectors of seven countries in which direct inquiries were made with the valuable collabo- ration of local professionals. The document offers a set of conclusions and recommendations for the Member Countries of PAHO, with emphasis on monitoring the financial aspects of the sector at the national level. Attached as Appendix IV is Resolution XIV, approved by the 92nd Meeting of the Executive Committee, which recommends to the XXX Meeting of the Directing Council that it consider and approve the proposed resolution. directing council
-
Upload
khangminh22 -
Category
Documents
-
view
2 -
download
0
Transcript of PAN AMERICAN WORLD HEALTH HEALTH ORGANIZATION ...
regional committee
PAN AMERICAN WORLDHEALTH HEALTHORGANIZATION ORGANIZATION
XXX Meeting XXXVI MeetingWashington, D.C. INDEYCM
September-October 1984
Provisional Agenda Item 24 CD30/16 (Eng.)8 August 1984ORIGINAL: SPANISH
NATIONAL AND INTERNATIONAL FINANCIAL AND BUDGETING IMPLICATIONS OF THEREGIONAL STRATEGIES AND THE PLAN OF ACTION FOR HEALTH FOR ALL BY THE YEAR2000
The Economic Crisis in Latin America and the Caribbean and its Repercus-sions in the Health Sector
This report has been prepared in compliance with Resolution XX of
the XXI Pan American Sanitary Conference of September 1982, which acceptedthe proposal made by the Executive Committee at its 88th Meeting in Juneof the same year.
This report was presented by the Secretariat of PAHO to the April1984 Meeting of the Subcommittee on Long-Term Planning and Programming of
the Executive Committee of the Organization. Approved by the Subcommittee,it was submitted to the Executive Committee, which approved it during its92nd Meeting in June 1984.
The report contains overall socioeconomic information on LatinAmerica and the Caribbean as a comprehensive frame of reference for under-standing the structural and transient causes and effects of the presenteconomic crisis and its repercussions on most of the less-developedcountries in the Region, and particularly for the local and internationalfinancing of social programs, particularly those for health.
With this last purpose in view, it contains specific information oneconomic and financial aspects of the health systems and sectors of sevencountries in which direct inquiries were made with the valuable collabo-ration of local professionals.
The document offers a set of conclusions and recommendations for
the Member Countries of PAHO, with emphasis on monitoring the financialaspects of the sector at the national level. Attached as Appendix IV isResolution XIV, approved by the 92nd Meeting of the Executive Committee,which recommends to the XXX Meeting of the Directing Council that itconsider and approve the proposed resolution.
directing council
TABLE OF CONTENTS
Page
INTRODUCTION ........................... ...... 1
A. BACKGROUND ................... ............ .. 1
CHAPTER I. CAUSES AND EFFECTS OF THE PRESENT SOCIOECONOMIC.CRISIS IN LATIN AMERICA AND THE CARIBBEAN .... 5
REPERCUSSIONS OF THE SOCIOECONOMIC CRISIS INLATIN AMERICA ...................... 7
INTERRELATIONSHIP OF CAUSES AND EFFECTS ....... 11
EXTERNAL AND INTERNAL STRUCTURAL AND SHORT TERMCAUSES AND EFFECTS .................. .. 21
EFFECTS OF THE SOCIOECONOMIC SITUATION ONHEALTH INDICATORS .................. .. 23
MULTILATERAL PUBLIC BANK FINANCING FOR HEALTH .... 24
CHAPTER II. SOCIOECONOMIC TRENDS IN SELECTED LATIN AMERICANAND CARIBBEAN NATIONS .................. 29
THE ECONOMIES AND PUBLIC SPENDING ........... 30
THE SOCIAL SECTOR ................... 36
HEALTH EXPENDITURES .................. 36
THE PRIVATE SECTOR ................ 45
CHAPTER III.' UPDATING SELECTED DATA IN THE BACKGROUND DOCUMENTON THE NATIONAL AND INTERNATIONAL FINANCIAL ANDBUDGETARY IMPLICATIONS OF THE REGIONAL STRATEGIESAND THE PLAN OF ACTION FOR HFA/2000 .......... 47
CHAPTER IV. CONCLUSIONS AND RECOMMENDATIONS ........... 58
A. Conclusions ........................ 58B. Recommendations ... ........... .. 64
-i -
TABLE OF CONTENTS (cont.)
APPENDICES
I
I. TENTATIVE INFORMATION THAT THE STUDY GROUPS SHOULDOBTAIN, IN THE SEVEN SELECTED COUNTRIES
II. OFFICIALS PARTICIPATING IN THE STUDY
III. OFFICIALS OF INTERNATIONAL ORGANIZATIONS INTERVIEWEDFOR THIS STUDY
IV. RESOLUTION CE92/R.14
- ii -
INTRODUCTION
A. BACKGROUND
1. During the 86th Meeting of the Executive Committee of the PanAmerican Health Organization in June 1981, emphasis was placed on theneed to continue studying financial conditions that could affectattainment of the goals of health for all by the year 2000 both in theindividual countries of Latin America and the Caribbean, and the Regionas a whole. It was also decided to review the related efforts of the PanAmerican Sanitary Bureau.
2. During the sixties and seventies, growth in the Regional economyand funding for social programs, including those for health, continued tobe steady. The Gross Domestic Product (GDP) grew an average of 7.2%annually from 1970 to 1974, 4.8% a year from 1975 to 1978, and 6.5% in1979.
3. Despite this growth, in the document on strategies of health forall by the year 2000 it was concluded that: "it is... apparent that anew type of economic development, different from and more dynamic thanthe present type, will be needed. For Latin American and the Caribbean,an economic growth rate of 7.5% a year has been targeted by the UnitedNations. This represents an intensification of growth and atechnological transformation of the Region's economy in comparison withtrend projections which would indicate a growth rate of 6.3% per year forthe area as a whole. Growth at 7.5% a year for the Region as a whole isnecessary in order for the rate of employment to increase at the growthrates predicted for the economically active population."l/
4. In 1980, the-Regional GNP grew at a slower rate than in the past,and in some countries the decline was sharply downward. Growth that yearwas 5.9% above the level of the previous year, but a mere 1.5% in 1981,after which it decreased to a negative 1.0% in 1982 and dived to a minus3.3% in 1983. According to figures of the Economic Commission for LatinAmerica (ECLA), the avarage annual growth of Latin America since 1981 hasbeen a negative 2.8%.
5. This situation gave ample grounds for the concern felt by the Exe-cutive Committee of the Pan American Health Organization, which wasreflected in its decisions at the June 1982 Meeting, and by the XXI Pan
-- 2 -
American Sanitary Conference the following September. Those decisions
were based on documents prepared by the Pan American Sanitary Bureau, andon the specific recommendations made by the Executive Committee's
Subcommittee on Long-Term Planning and Programming.
6. The XXI Pan American Sanitary Conference approved a proposal made
to it by the Executive Committee of the Directing Council in its 88th
Meeting of 29 June 1982, as follows:
THE EXECUTIVE COMMITTEE,
Having considered the preliminary background document prepared for
the Subcommittee on Long-Term Planning and Programming of the ExecutiveCommittee, which describes the financial and budgetary implications of
the Regional Strategies and Plan of Action;
Noting that the document was prepared with the cooperation and
participation of specialized personnel from other international agencies;
Bearing in mind that the document was prepared in keeping with the
concerns expressed at the 86th Meeting of the Executive Committee; and
Recognizing that the document contains important implications for
the capacity of the Member Governments and the Organization to achieve
the goals of Health for All by the Year 2000,
RESOLVES:
To recommend to the XXI Pan American Sanitary Conference, XXXIV
Meeting of the Regional Committee of the World Health Organization for
the Americas, that it adopt the following Resolution:
THE XXI PAN AMERICAN SANITARY CONFERENCE,
Having considered the document prepared for the Subcommittee
on Long-Term Planning and Programming of the Executive Committee,which describes the financial and budgetary implications of the
Regional Strategies and Plan of Action;
Bearing in mind Resolution XI of the XXVIII Meeting of the
Directing Council, which adopted the Regional Plan of Action for
Health for All by the Year 2000 and Resolution WHA35.23, in which
the World Health Assembly adopted the global Plan of Action for
implementing the global strategy for Health for All by the Year
2000; and
Noting the revisions and recommendations made by theSubcommittee on Long-Term Planning and Programming and by the 88thMeeting of the Executive Committee,
-3-
RESOLVES:
1. To express appreciation to the Director for the study onthe financial and budgetary implications of the RegionalStrategies and Plan of Action.
2. to urge Member Governments to examine the implications andrecommendations contained within the study and consider actions toenhance the likelihood that resources will be available and willbe used in the most efficient and effective manner to permit theattainment of Health for All by the Year 2000.
3. To request the Director:
a) To continue to examine the international economicenvironment and national and international resourceallocations to the health and related sectors and toinform the 92nd Meeting of the Executive Committee in1984 of any significant changes affecting the attainmentof Health for All by the Year 2000;
b) To advise those Member Governments which may request iton ways to implement the outcome of these studies.2/
7. Upon his election as Director of the Pan American Sanitary Bureauin September 1982, Dr. Carlyle Guerra de Macedo noted the effect that thecrisis could have on health financing in the Region, indicating that:
"In the economic sector, it is noteworthy that, despite thediversity of systems and stages of development, the national economieswill, in general, continue to experience strong pressures as a result oftheir entry into the world economy. In almost all the countries,internal development policies will be strongly conditioned by the need tobring the balance of payments into equilibrium. In the short and mid-term, it is probable that low economic growth rates will continue toprevail and that employment, income and the production structure willchange but little. A need for economic austerity measures can beforeseen and these will also affect the health sector."3/
8. The present Report on the results of the work done by the PanAmerican Sanitary Bureau is made in compliance with section 3 (a) ofResolution XX. Its preparation has been made easier by the spirit ofparticipation promoted by the present Direction, which has yieldedvaluable contributions from different staff members at PASB Headquartersand in the various countries, which have participated in preparing datafor the Report itself. Contributions have also been made by local staffmembers of the PAHO/WHO Country Offices.

- 4 -
Notes in the Introduction
I/Pan American Health Organization, Health for All by the Year 2000.Strategies, O.D. No. 173 (Washington, D.C.: PASB, 1980), p. 5.
2/XX Pan American Sanitary Conference, "Resolution XX," Final Report. XXIPan American Sanitary Conference, O.D. No. 185 (Washington, D.C.: PASB,1983), pp. 67-68.
3/Carlyle Guerra de Macedo, Declaration of Principles (Washington, D.C.:PASB, September 1982), p. 2.
-5-
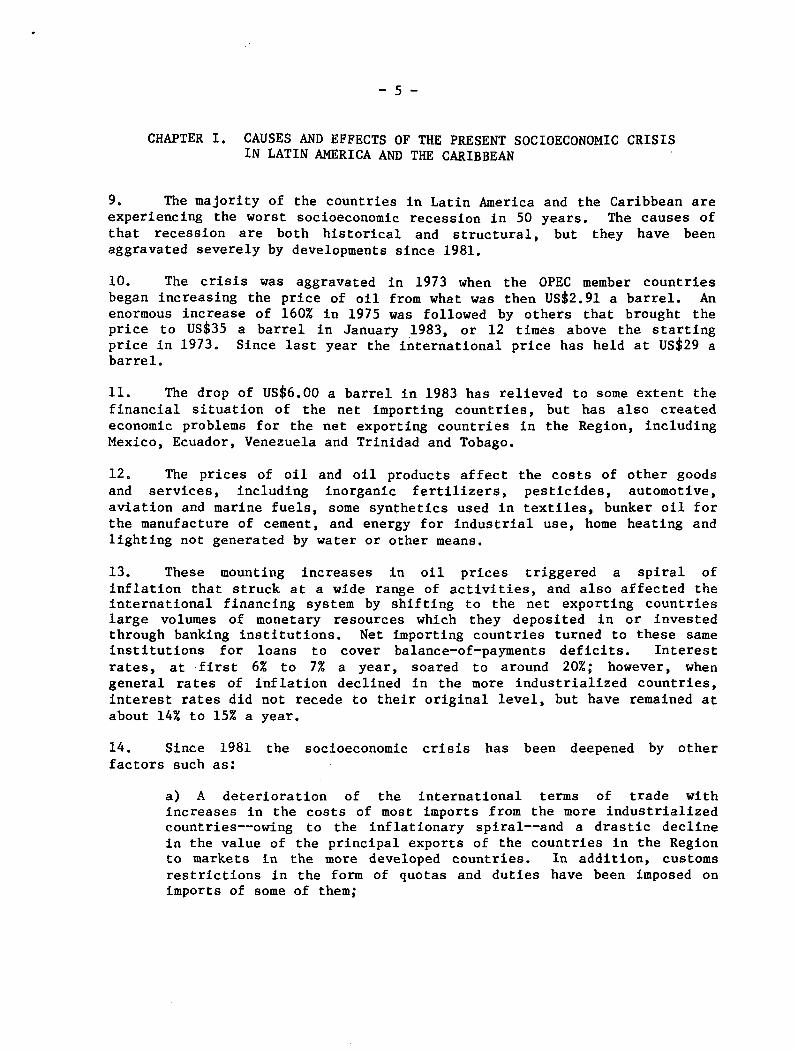
CHAPTER I. CAUSES AND EFFECTS OF THE PRESENT SOCIOECONOMIC CRISISIN LATIN AMERICA AND THE CARIBBEAN
9. The majority of the countries in Latin America and the Caribbean areexperiencing the worst socioeconomic recession in 50 years. The causes ofthat recession are both historical and structural, but they have beenaggravated severely by developments since 1981.
10. The crisis was aggravated in 1973 when the OPEC member countriesbegan increasing the price of oil from what was then US$2.91 a barrel. Anenormous increase of 160% in 1975 was followed by others that brought theprice to US$35 a barrel in January 1983, or 12 times above the startingprice in 1973. Since last year the international price has held at US$29 abarrel.
11. The drop of US$6.00 a barrel in 1983 has relieved to some extent thefinancial situation of the net importing countries, but has also createdeconomic problems for the net exporting countries in the Region, includingMexico, Ecuador, Venezuela and Trinidad and Tobago.
12. The prices of oil and oil products affect the costs of other goodsand services, including inorganic fertilizers, pesticides, automotive,aviation and marine fuels, some synthetics used in textiles, bunker oil forthe manufacture of cement, and energy for industrial use, home heating andlighting not generated by water or other means.
13. These mounting increases in oil prices triggered a spiral ofinflation that struck at a wide range of activities, and also affected theinternational financing system by shifting to the net exporting countrieslarge volumes of monetary resources which they deposited in or investedthrough banking institutions. Net importing countries turned to these sameinstitutions for loans to cover balance-of-payments deficits. Interestrates, at first 6% to 7% a year, soared to around 20%; however, whengeneral rates of inflation declined in the more industrialized countries,interest rates did not recede to their original level, but have remained atabout 14% to 15% a year.
14. Since 1981 the socioeconomic crisis has been deepened by otherfactors such as:
a) A deterioration of the international terms of trade withincreases in the costs of most imports from the more industrializedcountries--owing to the inflationary spiral--and a drastic declinein the value of the principal exports of the countries in the Regionto markets in the more developed countries. In addition, customsrestrictions in the form of quotas and duties have been imposed onimports of some of them;
-6-
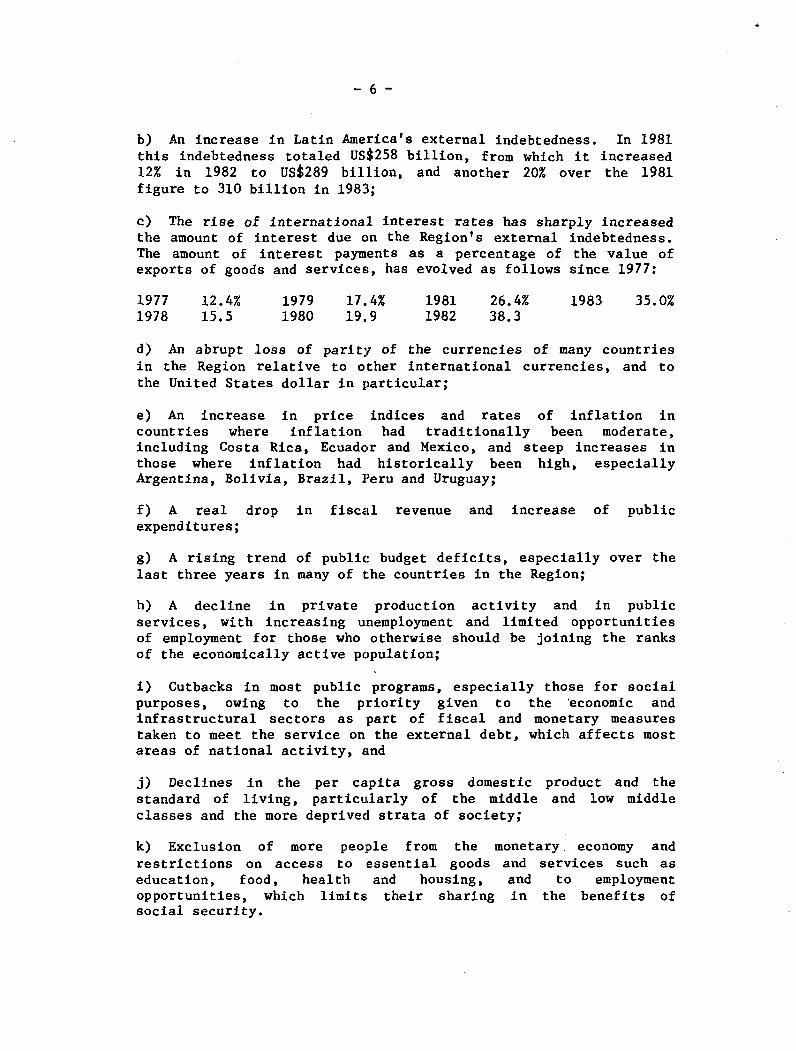
b) An increase in Latin America's external indebtedness. In 1981this indebtedness totaled US$258 billion, from which it increased12% in 1982 to US$289 billion, and another 20% over the 1981figure to 310 billion in 1983;
c) The rise of international interest rates has sharply increasedthe amount of interest due on the Region's external indebtedness.The amount of interest payments as a percentage of the value ofexports of goods and services, has evolved as follows since 1977:
1977 12.4% 1979 17.4% 1981 26.4% 1983 35.0%1978 15.5 1980 19.9 1982 38.3
d) An abrupt loss of parity of the currencies of many countriesin the Region relative to other international currencies, and tothe United States dollar in particular;
e) An increase in price indices and rates of inflation incountries where inflation had traditionally been moderate,including Costa Rica, Ecuador and Mexico, and steep increases inthose where inflation had historically been high, especiallyArgentina, Bolivia, Brazil, Peru and Uruguay;
f) A real drop in fiscal revenue and increase of publicexpenditures;
g) A rising trend of public: budget deficits, especially over thelast three years in many of the countries in the Region;
h) A decline in private production activity and in publicservices, with increasing unemployment and limited opportunitiesof employment for those who otherwise should be joining the ranksof the economically active population;
i) Cutbacks in most public programs, especially those for socialpurposes, owing to the priority given to the *economic andinfrastructural sectors as part of fiscal and monetary measurestaken to meet the service on the external debt, which affects mostareas of national activity, and
j) Declines in the per capita gross domestic product and thestandard of living, particularly of the middle and low middleclasses and the more deprived strata of society;
k) Exclusion of more people from the monetary. economy andrestrictions on access to essential goods and services such aseducation, food, health and housing, and to employmentopportunities, which limits their sharing in the benefits ofsocial security.
-7
15. There is a close interrelationship between many causes andeffects, and many effects are themselves the causes of fresh problems,which are exacerbated by inflexibilities and dependence on externalfactors. For example, the extremely unfavorable trend of the terms ofinternational trade caused by the imbalance between exports and importshas been compounded since 1981 by rising real international interestrates. In 1983, a massive recession of the net flow of foreign privatecapital into the Region also has occurred, and the combination has meantdifficulties in renegotiating both the public and the private externaldebt.
16. This whole situation has been referred to by the EconomicCommission for Latin America (ECLA) as one of "overadjustment" imposed bythe "financial depression," which in the last year has grown moreintense. It underscores even more the dependence of the less developedcountries on those that are wealthier and more advanced. This isaggravated by the uncertainty and internal conflicts that trouble some ofthe developing countries, the hegemony of the great world powers, whichpolarize East and West, and the varying extent to which all the countriesin the Region are dependent on the more industrialized nations for theirscience, technology and financing.
17. It is now clearer that medium and long-term solutions for theproblems of the Latin American and Caribbean countries will not be foundonly in internal adjustments of the moment, though some of these are alsonecessary. Those countries will have to undertake major political,social and economic structural changes, as has been suggested in widelydiffering international forums and documents, among them the SecondDevelopment Strategy of United Nations, the New International EconomicOrder, and the Strategies and Plan of Action of Health for All by theYear 2000.
REPERCUSSIONS OF THE SOCIOECONOMIC CRISIS IN LATIN AMERICA
18. The economic growth of a country is measured by a variety ofindicators, the one in widest international use being the gross domesticproduct (GDP), which is the value of the goods and services producedwithin a national or regional economy net of foreign transfers.
19. According to ECLA, the Latin American GDP declined 2.8% from 1981to 1983; over those three years the economic trend was downward, from agrowth of 1.5% in 1981 to a decline of 1.0% in 1982 and further declineof 3.3% in 1983.
20. A more representative and sensitive socioeconomic indicator of theeffects of the socioeconomic crisis of the last three years is the percapita GDP. From 1980 to 1983 this indicator dropped 9.5% at marketprices of 1970, according to the same ECLA source.
-8-
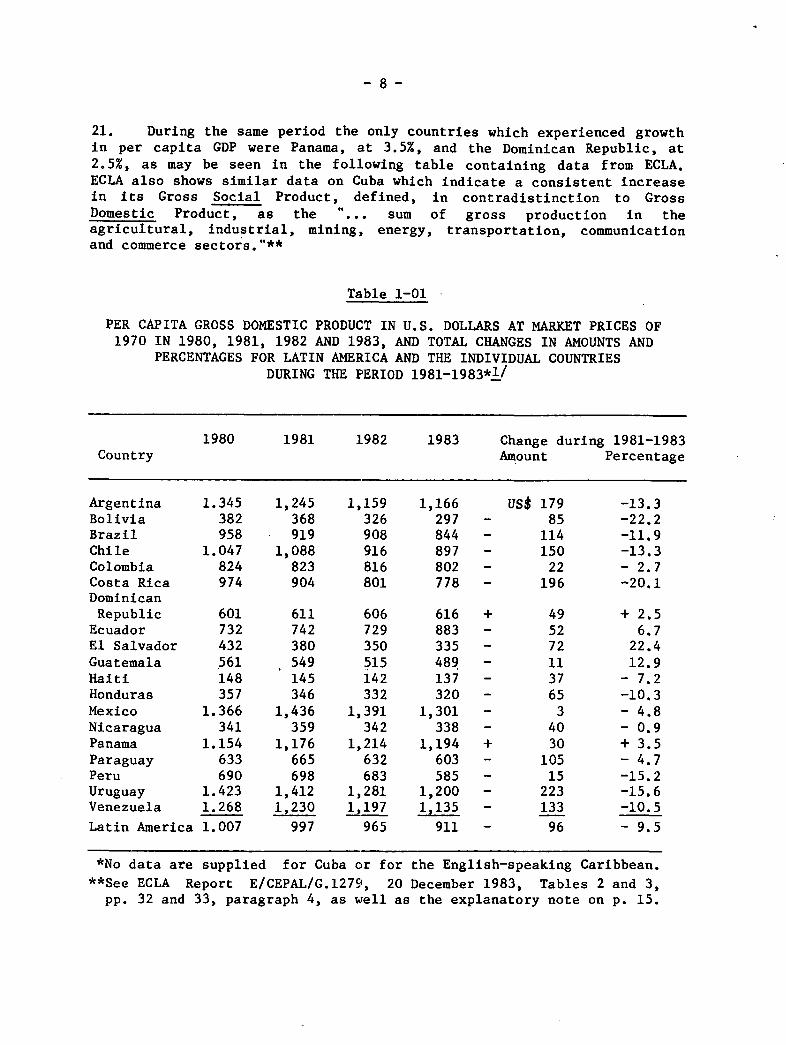
21. During the same period the only countries which experienced growthin per capita GDP were Panama, at 3.5%, and the Dominican Republic, at2.5%, as may be seen in the following table containing data from ECLA.ECLA also shows similar data on Cuba which indicate a consistent increasein its Gross Social Product, defined, in contradistinction to GrossDomestic Product, as the "... sum of gross production in theagricultural, industrial, mining, energy, transportation, communicationand commerce sectors."**
Table 1-01
PER CAPITA GROSS DOMESTIC PRODUCT IN U.S. DOLLARS AT MARKET PRICES OF1970 IN 1980, 1981, 1982 AND 1983, AND TOTAL CHANGES IN AMOUNTS AND
PERCENTAGES FOR LATIN AMERICA AND THE INDIVIDUAL COUNTRIESDURING THE PERIOD 1981-1983*1/
1980 1981 1982 1983 Change during 1981-1983Country Amount Percentage
Argentina 1.345 1,245 1,159 1,166 US$ 179 -13.3Bolivia 382 368 326 297 - 85 -22.2Brazil 958 919 908 844 - 114 -11.9Chile 1.047 1,088 916 897 - 150 -13.3Colombia 824 823 816 802 - 22 - 2.7Costa Rica 974 904 801 778 - 196 -20.1DominicanRepublic 601 611 606 616 + 49 + 2.5Ecuador 732 742 729 883 - 52 6.7El Salvador 432 380 350 335 - 72 22.4Guatemala 561 549 515 489 - 11 12.9Haiti 148 145 142 137 - 37 - 7.2Honduras 357 346 332 320 - 65 -10.3Mexico 1.366 1,436 1,391 1,301 - 3 - 4.8Nicaragua 341 359 342 338 - 40 - 0.9Panama 1.154 1,176 1,214 1,194 + 30 + 3.5Paraguay 633 665 632 603 - 105 - 4.7Peru 690 698 683 585 - 15 -15.2Uruguay 1.423 1,412 1,281 1,200 - 223 -15.6Venezuela 1.268 1,230 1,197 1,135 - 133 -10.5
Latin America 1.007 997 965 911 - 96 - 9.5
*No data are supplied for Cuba or for the English-speaking Caribbean.
**See ECLA Report E/CEPAL/G.1279, 20 December 1983, Tables 2 and 3,pp. 32 and 33, paragraph 4, as well as the explanatory note on p. 15.
-9-
22. Eleven countries posted loses of per capita GDP greater than theregional average of 9.5%, three of these indices declining by more than20%. These losses over those three years may be presumed to have reducedthe standard and general quality of life of the population, particularlyamong those strata less financially able to cope with prevalent criticalconditions.
23. Some evidence of this is supplied by two UNICEF studies, one donein Chile and the other in Sao Paulo state, Brazil. The one on Chileconcluded in translation, that:
"The sharp economic recession of 1975-1976 was accompanied by a
drastic curtailment of public expenditure in all the social sectors...thefirst recessive cycle saw a substantial drop in public expenditures inthe health sector for investments and outlays for the acquisition ofgoods needed for the operation of the system.
"Moreover, investment outlays made no recovery in any year afterthose considered in this study. To the contrary, they continue todecline until in 1979 they level off at 3% of the public expenditures forhealth. This figure, about 350 million pesos of 1978, comes to barely25% of the amount that had been invested in the early years of thedecade. Outlays for personnel also fell during the first year ofrecession, recovered and then fell again with fluctuations after 1980.The tendency of outlays for the procurement of goods is similar. In noyear of the period did they again reach the level of 1978.
"The paucity of investment in the sector and the decline inoutlays for the procurement of goods have in all probability resulted ina deterioration of the plant and equipment for health and, inconsequence, of the quality of care. This is borne out by frequentreports to this effect throughout the period by physicians and otherpersonnel of the sector...
"A reduction of investment in health on this scale made itpossible to maintain the levels of health care services in the short runat the expense of programs for the acquisition of equipment, maintenanceand expansion of installed capacity. Another contributing factor was thedrop in real remuneration to the staff employed in the sector. It may benoted that, in the health sector, about 40% of the total expenditure hadgone traditionally for personnel remunerations."2/
24. The study on Sao Paulo also reveals a downtrend of expendituresfor health, which by 1982 had dropped 18% since of 1978. The reportasserted that:
"The decline in real value of health expenditures is more evidence(for education). Separation of recurrent from capital costs does notchange the circumstances, in spite of the loss of capital expendituresfor the Ministry of Health which has been seen to be particularly severe.
- 10 -
"...Thus we have a general overview of a decline, or at least ofstagnation in health and education expenditures. However, it is notpossible to draw the conclusion that this has caused a reduction inservices in these areas, either on the part of the state or localgovernment. The major part of expenditures is for salaries, and theirstagnation or decline is a result mostly of "salary constriction," towhich most public sector employees have been submitted over the past fewyears. Sooner or later, of course', such a salary policy will affect thequality of services provided." 3/
25. It may be that the cases of Chile and Sao Paulo are notgeneralizable to other countries in the Region if their governments givepriority to the financing of health programs or have developed a greateroperating capacity. Either situation could check the decline in percapita GDP.
26. If this has happened, a proper answer is being given to thequestion posed by UNICEF: "...how can we sustain social progress withoutan increase in funding?"4/ For this international agency, the solutionor "...very probably...the watchword for this decade in favor of socialprogress should be to 'make the most of the available resources.'"5/
27. On the need to improve the management of national health servicesso that they will make more efficient use of the available human,financial and material resources and become more productive, whilemaintaining the effectiveness required for HFA/2000, a number of specificrecommendations will be presented in Chapter IV, below.
28. Economic development and the growth of a country's economy do notnecessarily imply immediate attainment of the goals of socialdevelopment; to the contrary, priority has to be given to programs forthat purpose and to financing for them. For example, Saudi Arabia hasone of the highest per capita GNPs in the world - estimated at US$12,600in 1981 - and yet had a very high infant mortality of 111 children underone year per 1,000 live births. According to UNICEF data, in Costa Ricaand Cuba, with lower per capita GNPs - US$1,430 and US$1,410,respectively, in 1981 - there were 27 and 19 deaths of infants under oneyear per 1,000 live births.6/
29. Infant mortality in the same age group was 12 per thousand in theUnited States of America, with a per capita GNP of US$12,820, and theUSSR, with a per capita GNP in the equivalent of US$4,550, had 27 perthousand, in both cases owing to policies and practices applied to thecountry's health programs.
30. The fact that social development is not an automatic or secondaryconsequence of economic development, but requires an explicitadministrative policy decision of government, was addressed in thedocument of the Ninth Session of the Committee of High-Level Experts(CEGAN) of ECLA, in which it is said, in translation, that:
- 11 -
...economic development per se does not guarantee socialdevelopment unless steps are taken that promote equity in thedistribution of wealth and access for the less privileged to the goodsand services of society.7/
INTERRELATIONSHIP OF CAUSES AND EFFECTS
31. In the web of causality in which the range of socioeconomicfactors is enmeshed, some of which are particularly exacerbating in timeof crisis, they are all so closely interwoven and interdependent that nodecision can be taken in isolation. For example, seeking to improvetheir balance of payments, many countries in the Region have givenpreference to production and exportation of nontraditional goods that arein greater demand and face less competition in the markets of the moredeveloped countries. This has also been necessary in some cases as arequirement of the domestic adjustment process to which governments havesubmitted under standby agreements entered into with the InternationalMonetary Fund. The purpose of such agreements is to enable a country toearn more foreign exchange with which to purchase the goods and servicesit needs for domestic production and service its foreign debt, and tomeet the population's demands for food, medicines and other products.
32. As a result of this unprecedented effort, in 1983 Latin Americanexports exceeded imports of goods and services by US$31,170 billion.According to ECLA data this performance is all the more impressive whenconsidering that it was accomplished on the strength of increases overprevious years in the volume of products exported, the prices of which,in most cases, reamined low on international markets. Eight countriesearned more from their exports than they spent on their imports, and soenjoyed trade surpluses, while the trade balances of eleven continued indeficit. In 1983 the value of total exports was US$87 billion againstimports of US$56 billion.
33. Another effect of that interdependence has been that some items inthe popular diet have become scarce as lands previously under cultivationfor sugarcane, cassava, tubers, vegetables, pastures, etc., have beendiverted exclusively to sugarcane for conversion into fuel alcohol orinto products for export alone.
35. Net payments of profits and interest abroad have increasedconsiderably as follows:
US$19 billion in 1980 US$37 billion in 1982US$29 billion in 1981 US$34 billion in 1983
The reason for the drop of US$3 billion in 1983 is thatamortizations were made on the principal of these debts, which hasobviously also lowered in the Region's international reserves.
- 12 -
35. According to figures of the Bank for International Settlements inBasel,8/ new loans by international private commercial banks to LatinAmerica, not counting those to Ecuador and Venezuela, have declinedconsiderably since 1981 as follows:
US$21 billion in the second half of 1981US$12 billion in the first half of 1982US$300 million in the second half of 1982US$3.7 billion in the first half of 1983
These loans in 1983 were obtained from international privatecommercial banks as a result of IMF intervention under standby agreementsin effect between the debtor governments and that international agency.
36. Between August 1982 and December 1983, reschedulings of theirforeign debts were requested by Argentina, Bolivia, Brazil, Chile, CostaRica, Cuba, the Dominican Republic, Ecuador, Guyana, Honduras, Jamaica,Mexico, Nicaragua, Peru, Uruguay, and Venezuela.
The number of countries that have had to resort to thesenegotiations is yet more evidence of the similarity of the situations inwhich they find themselves as a consequence of the crisis.
37. Another unfavorable development during 1983 was a dwindling flow
of capital to Latin America, which was about US$30 billion less than theoutward flow of payments of interest and principal on the Region'sforeign debt.
In this regard, ECLA says that:
"..as in 1982, [in 1983] Latin America, instead of receiving atransfer of real funds from abroad, made transfers of funds to the restof the world. This prolonged a situation which, given the relative stateof development of the Region, may be described as perverse.
"However, this transfer was very considerable: 20 billion dollarsin 1982 and almost 30 billion in 1983, or 19.0% and 27.0% of the value ofthe exports of goods and services and 2.5% and 4.0% of the gross domesticproduct, respectively, in those two years. Viewed from another
standpoint, this reversal of the flow of net financial payments between1981 and 1983 was equivalent to a drop of about one-third in the terms oftrade. "9/
38. Another effect of the influx of foreign capital has been a declinein its trend; the growth of this influx was 7% from 1982 to 1983 and 12%from 1981 to 1982, and so in both years was less than the average growthof 23% per annum during the period of 1977-1981. Even so, at the end of1983 the foreign debt of Latin America totaled about US$310 billion.
- 13 -
39. The net inflow of capital began dropping in 1981 from US$38billion to US$16.6 billion in 1982, and to US$4.5 billion in 1983. Thecausal effect of this was to reduce the surplus on current account fromabout US$40 billion in 1981 to US$36.4 billion in 1982, and to US$8.5billion in 1983, the lowest level since 1974.
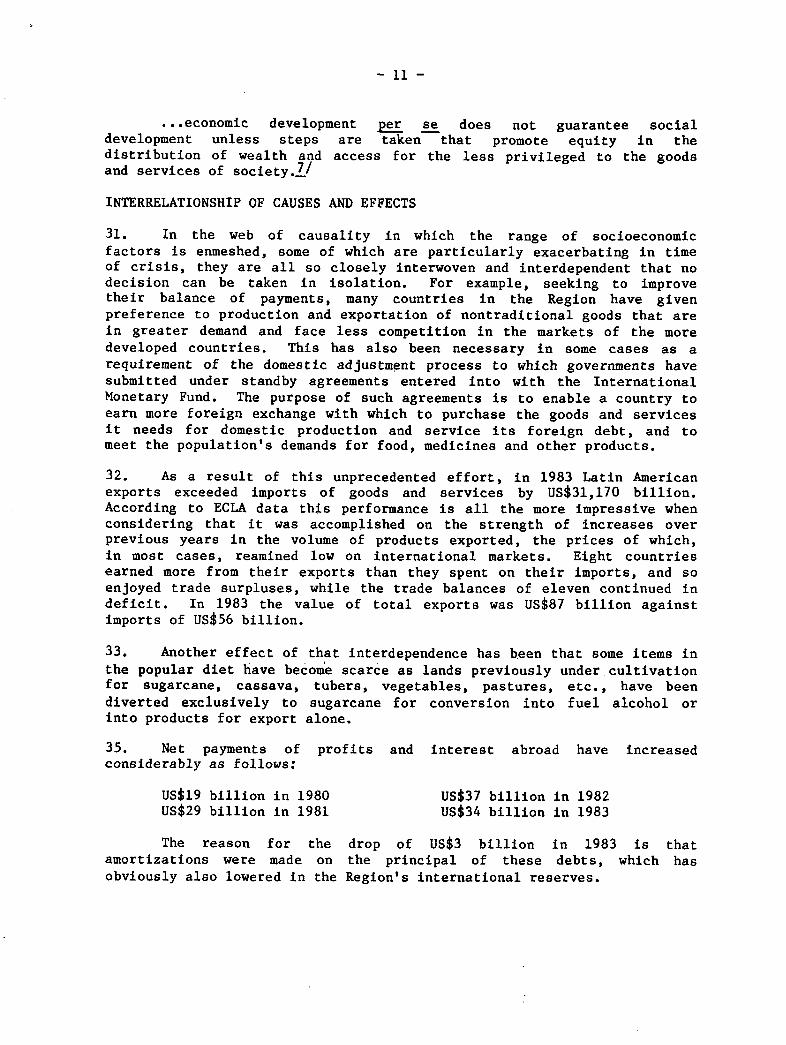
40. In a recent presentation Mr. Antonio Ortiz Mena, President of theInter-American Development Bank, illustrated his comments on the net flowof capital with the charts on the pages that follow.
Figure 1.01
External resources: the net flow turns negative
Latin America obtained an additional net external inflow ofcapital amounting to $20-$22 billion annually in the five yearsup to 1981. Then, debt service soared, and the region suddenlybegan to lose international reserves--over $10 billion in 1982.10/
Millions ofU.S. dollars
60O
70 -
Grossinflow
60
Debt60 service
40
20
10
O
10
1978 1878 1880 18811076 1977 162

- 14 -
Figure 1.02
The rising cost of borrowing
Latin America had to borrow heavily to pay its oil bills.region had good access to the private Eurocurrency market,maturities for loans grew increasingly shorter. 11/
Billions ofU.S. dollars Per
Thebut
cent
- 15 -
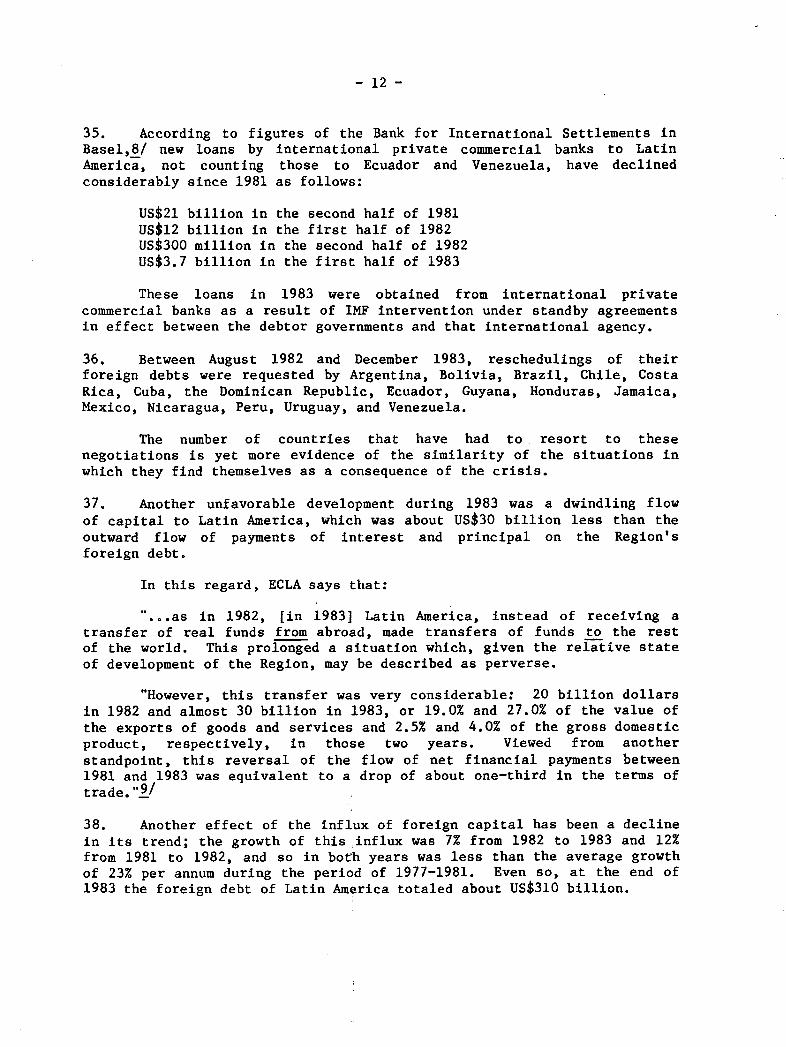
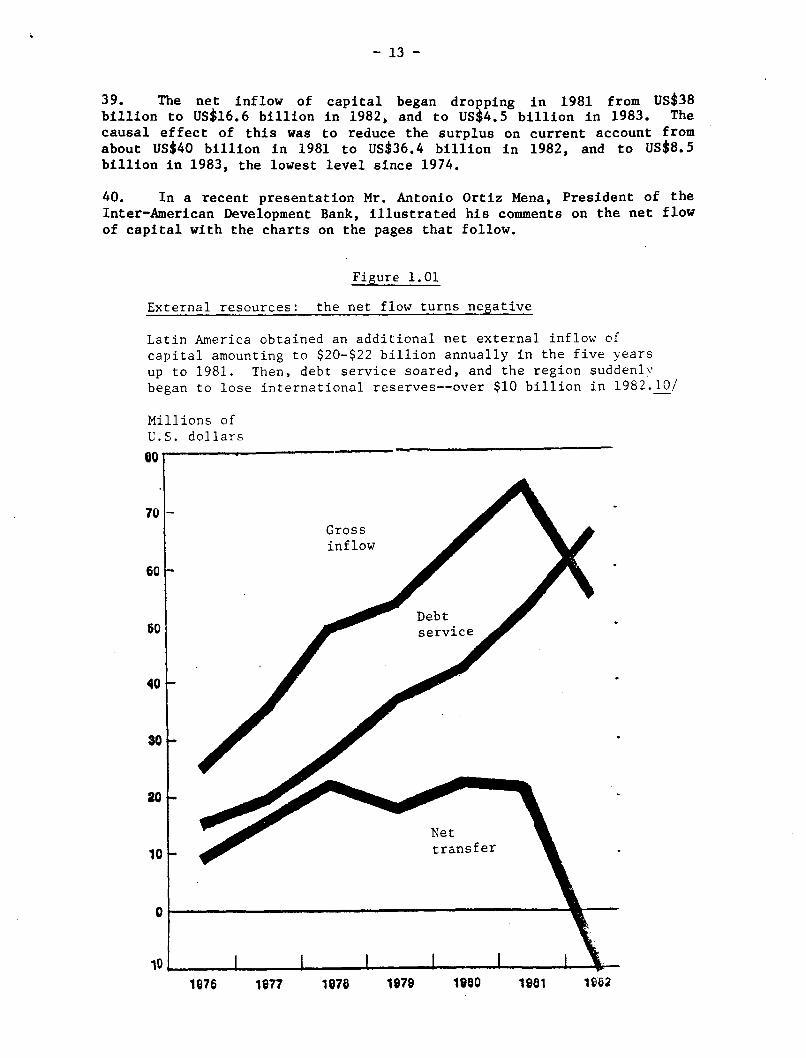
'Figure 1.03
Servicing
By makingfavorableare beingdebt. 12/
Per cent
tU
60 -
40F-
10
0
the debt: an increasing burden
extraordinary efforts, some countries have achieved
balances in their trade accounts. But the surpluses
wiped out by the increasing service on their external
I I .I I I I
Ratio of total debt service toexports of goods and services*
Ratio of interest toexports of goodsand services
Y
1677 1676 1978 1980 1981 198621676
- 16 -
41. Mr. Ortiz Mena indicated that the present crisis originated in1971, when the United States of America decided to change the BrettonWoods International Monetary System, according to the terms of whichUnited States dollars earned by other countries from their sales to theU.S. were convertible in to gold. When the flow of gold abroadincreased, the United States set the value of its currency through thefinancial market by a "floating" system, and surpluses were handledthrough the uncontrolled parallel system by central banks, thereby givingrise to the so-called "Eurodollars."
42. These surpluses were invested as loans in countries havingprojects that guaranteed satisfactory monetary returns at terms usuallyof 10 to 15 years and at reasonable interest rates.
43. As indicated in paragraph 2, the first sudden increase in oilprices took place in 1973, when they quadrupled, followed by a secondconsiderable increase in 1979. "Eurodollars" then became "petrodollars,"as international financial surpluses shifted to countries that were netoil producers and exporters.
44. As early as 1973, the financial conditions of internationallending also began to change with a hardening or worsening of the termsof loans, which contracted to five and seven years. There were alsochanges in interest rates for private corporations, which rose from 7.5%a year in 1972 to 8.1% in 1973, 9.5% in 1974, 9.6% in 1975, 7.9% in 1976,8.4% in 1977, 9.3% in 1978, 11.3% in 1979, 14.4% in 1980, 15.5% in 1981,12.2% in 1982, and 11.1% in 1983.13 /
45. Charges on international private commercial loans have always beenhigher than on those granted domestically on the basis of the prime rate,which in March 1984 is 11.5%. The former carry surcharges for othercosts of financial intermediaries, which at present run to about one andthree-quarters of the LIBOR (London Interbank Offered Rate), pluscommissions and financial insurance, which raise these costs to about 14%or 15% a year. Poorer nations in other regions of the world areauthorized loans at lower interest and longer grace and amortizationterms.
46. International interest rates went up when the rate of inflationrose in the wealthier and more industrialized countries, but did notfollow it back down, among other reasons because of the high fiscaldeficit of the United States of America; the government covers thisdeficit by borrowing on financial markets, which keeps the interest rateat about 11.75% a year.
47. When the financial situation hardened, net oil importing countrieshad to continue borrowing abroad, many of them to invest sizable amountsin hydroelectric works that in the long run would make them less dependenton oil energy. They also invested heavily in new, nontraditional energy
- 17 -
generation techniques, such as those using biomass and thermal energy,and the manufacture of fuel alcohol and diesel oil from agriculturalproducts.
48. Like liquids under the law of communicating vessels in physics,different macroeconomic factors operate interdependently. Thus, incountries whose tax systems are based largely on customs levies, fiscalrevenue diminishes appreciably when the imports that generate thoselevies decline. There is then a shift to other fiscal policies basedmore on direct taxes such as those on property, rent, appreciation,inheritances and consumption, among others.
49. Capital movements and foreign investment are used to solvebalance-of-payments problems (income outflow of foreign exchange). Toimprove the international trade balance, imports are cut back and greaterexports promoted, particularly those of nontraditional products that mayhave less competition in the markets to which they are shipped.
50. Increasing these nontraditional exports usually brings noadditional income into the treasury, because it is precisely by exemptingthem from taxation that they are encouraged to increase. Drasticreductions of imports have brought down fiscal revenue and productstocks, including medicines and foods not produced locally.
51. With lower public receipts and increased difficulties and costs ofreplacing them through accumulation of new external indebtedness, realoutlays at constant prices have been reduced. These constant prices areobtained by subtracting the inflationary component from current prices soas to obtain a time series of historically comparable figures in whichthe trend is apparent.
52. Another device has been printing money, that is, increasing thesupply of money without regard for real national output, whichaccelerates inflation and causes further losses of purchasing power ofthe currency.
53. In many countries this course has led to sudden and steepdevaluations of the national currency relative to stronger internationalcurrencies, which has been sought as another means of encouraging exports.
54. In some countries some of these factors have been indexed as ameans of averting their secondary effects and make their fiscal andmonetary policy decisions more flexible.
55. In some countries of the Region the public deficit has risensteeply relative to GDP and has worked against some of the correctivemeasures attempted in the internal adjustment process, particularly understandby agreements negotiated and signed between governments and the
- 18 -
IMF. These agreements establish targets for reduction of the fiscaldeficit relative to the GDP, which compels some countries to givepriority to programs that contribute more directly to economic recoveryin the short run. The result is an increase in the relative weight ofbudgetary allocations for typically economic activities.
56. In the overall development process, the economic and socialaspects are two sides of the same coin, and hence inseparable, as hasbeen said by the Director-General of the World Health Organization andthe Executive Director of the United Nations Children's Fund, in astatement on primary health care:
"Any distinction between economic and social development is nolonger tenable. Economic development is necessary to achieve most socialgoals and social development is necessary to achieve most economicgoals. Indeed, social factors are the real driving force behinddevelopment. The purpose of development is to permit people to liveeconomically productive and socially satisfying lives. Socialsatisfaction and economic productivity will be interpreted in widelydifferent ways according to the social and cultural values prevailing ineach society. Everywhere people themselves realize that their motivationin striving to increase their earnings is not greater wealth for its ownsake but the social improvement that increased purchasing power can bringto them and their children, such as better food and housing, bettereducation, better leisure opportunities, and, last but not least, betterhealth. Only when they have an acceptable level of health canindividuals, families and communities enjoy the other benefits of life.Health development is therefore essential for social and economicdevelopment, and the means for attaining them are intimately linked. Forthis reason, actions to improve the health and socioeconomic situationshould be regarded as mutually supportive rather than competative.Discussions on whether the promotion of health only consumes resources orwhether it is an economically productive factor contributing todevelopment, belong to the academic past." 1 4/
57. Hence, in addition to the purely economic effects of monetary andfiscal factors, others deriving from production and employment have to beconsidered; these other effects are both economic and sorcial in natureand have been affected by the downward trend of the GDP as reflected inthe following figures estimated by ECLA in constant United States dollarsof 1970:
350 billion in 1981347 billion in 1982335 billion in 1983
58. This decline is the outcome of widely diverse factors, includingsome of an economic nature stemming from the recession-cum-inflation,
- 19 -
(which did not occur during the Great Depression of the Thirties), whichhave adversely affected activity in many lines of production in both thepublic and private sector; that is, the decline of this activity has alsocurtailed opportunities for employment and worsened visible unemploymentand equivalent unemployment (visible plus invisible unemployment).
59. The figures for urban unemployment are as follows, in mean annualrates for 1983:15/
Argentina 4.9% Costa Rica 9.8%Bolivia 12.6 Mexico 12.5Brazil 6.8 Paraguay 9.4Chile 19.7 Peru 8.8Colombia 11.0 Uruguay 15.7
60. No country in Latin America or the Caribbean has unemploymentinsurance such as that available in the more developed countries, whichmakes the situation in the Region even worse. In recent decades, as theeconomic situation in the Region improved, governments in Latin Americaand the Caribbean undertook programs for construction of infrastructureworks, housing and social development as a means to generation of fullemployment. Some of these activities were supported by externalfinancing, and others added to the fiscal deficit and aggravated thecountries' monetary problems by being financed by printing money, whichwas regarded as the lesser evil.
61. In addition, bureaucratic job slots were created for thegeneration of employment, especially for unskilled labor. In theinternal adjustment process to which the countries have submitted intheir search for ways out of the economic crisis, these measures have hadto be curtailed. Even so, several governments have continued or evenexpanded programs of minimum employment, as in Chile, or of foodsubsidies or distribution, as in Brazil.
62. Other countries have been unable to do this, having to directthose internal adjustments called for in their standby agreements withthe IMF toward a drastic contraction of demand, for which they have hadto reduce the supply of money in circulation and public expenditures notonly of the central government, but of the decentralized agencies aswell, a course that in many countries has greatly increased thegovernment's consolidated public debt. This is what has happended inPeru, where, according to the Inter-American Development Bank,1 6/ thesix most important public enterprises accounted for 86% of the publicsector's operating deficit in 1982. According to the same source, inVenezuela 69% of public sector expenditures were generated by thedecentralized agencies.

-. 20 -
63. The adverse effects of the socioeconomic crisis in the labor areahave been severe, particularly for the young people entering the laborforce each year--estimated at 9 million--because 43.2% of the presentpopulation of Latin America and the Caribbean is between 15 and 44 yearsold. Most of this age group is economically active inasmuch as only asmall percentage of the segment between 15 and 24 years of age isenrolled in regular institutions of secondary, vocational and highereducation.
64. ECLA's Economic Projections Center is of the view that, as aresult of the prevailing situation, the demand and employmentopportunities for young people and women is lower than in past decades,and that preference for jobs is given to adult male heads of family. TheCenter also considers that earlier unemployment calculations are nowunrealistic and that the rates are higher than initially estimated. Italso suggests that purchasing power of wages will steadily decrease inthe next two years. This may also adversely affect future per capita GDPfigures and equitable distribution of national income in most of thecountries of the Region.
65. Other damage done by the socioeconomic crisis can be measured bythe changes that have taken place in prices to the average consumer andurban worker (very few countries have similar indexes for the ruralconsumer owing to measurement difficulties), and also by modifications ofwages and salaries. Changes in prices are measured by a predetermined"basic basket" of goods and services on which family income is spent,including such basic items as food, housing, education, health, andlesser expenditure items for apparel, recreation, etc.
66. According to ECLA figures,:L7/ between December 1982 and December1983 consumer prices rose throughout the region an average of 130.4%. Inthe countries of traditionally high inflation this average was 153.6%,and in those of traditionally moderate inflation it was 15.7%. The firstgroup comprises Argentina, Bolivia, Brazil, Chile, Colombia, Mexico, Peruand Uruguay, among which the figures in excess of the group average arethose of Argentina, Bolivia and Brazil, where retail prices rose 401.6%,249.0%, and 175.2%, respectively.
67. For the countries with moderate inflation, the group average of15.7% was exceeded by Ecuador with a rata of 65.9% and Trinidad andTobago with 16.7%. Costa Rica managed to drastically reduce the highinflation set off in 1981, during which year the index of prices to theaverage consumer and worker rose 65.1% above the 1980 level and 81% in1982, essentially because of a sudden change in the parity of thenational currency in 1981. The Costa Rican colon was devalued from 8.60to 60.0 in that year, from which it then depreciated in 1982 to 45colones to the United States dollar, and where it has, currentlystabilized. The devaluations of Mexico, Venezuela and Bolivia have also
- 21 -
abruptly changed the rate of exchange of their currencies with the UnitedStates dollar. The Mexican peso dropped from 12.5 to the United Statesdollar in 1976 to 154 in 1982; the bolivar from about 4.5 to the dollarto 11; and the Bolivian peso plummeted from 25 to one U.S. dollar in 1981to 2,200 to one on the parallel market today, although the official rateis 500 to the dollar.
68. The level of the exchange rate is the outcome of a variety offactors, including the monetary reserves held by a country, which in turnare determined by the components of its balance of payments. In turn,the exchange rate affects price changes just as these impact efforts byemployees to have their wages and salaries increased to offset losses inpurchasing power. In times of crisis, prices tend to change faster thanwages, so that when adjustments are made the gap is usually wider thanthe changes that have taken place in the market value of the goods.
69. Although short-run adjustment programs tend to keep inflation in
check by containing demand, when they fail to do this those who suffermost are people who depend on fixed incomes from wages, salaries,pensions and investments at fixed interest rates which have not beenindexed to national rates of inflation. Also hard hit are low andmoderate income people, who are less able to protect themselves fromsituations created by decisions made at levels and in spheres to whichthey have no access.
70. Loss of monetary parity and the deterioration of internationalreserves have made it difficult for some countries to buy medicine anddrugs, equipment, and replacement parts, for their health programs whenthose items are of foreign origin and the national monetary authoritiesrestrict the release of foreign exchange for these and others.
71. The above measures of the status of the Regional economy areexamples only and by no means constitute a comprehensive analysis of allcauses and effects of the present crisis made. Besides, there is noprecise dividing line between political and social indicators, such asthose described on Chapter 2, which discusses the situation in sevenselected countries in the Region.
EXTERNAL AND INTERNAL STRUCTURAL AND SHORT TERM CAUSES AND EFFECTS
72. The term structural is frequently used to describe and define thepermanent causes, factors and effects of overall development, whilecyclical describes the same aspects but for the short term only. Theformer are over the long term, while the latter transitory usuallylasting less than four years.
73. Those who have studied the origins of the current socioeconomiccrisis blame it essentially on structural causes, citing rises in oil
-. 22 -
prices as a trigger of the developments of the last decade. These causeshave been aggravated by domestic situations stemming from characteristicsunique to the countries in the Region themselves, which, nevertheless,have still much in common as subjects of external factors over which theyhave no control and are therefore spectators of the process rather thanactors in it. There is also a fairly widespread - if not actuallyunanimous - view that the structural crisis and current recession arelargely mutually reinforcing, the latter being exacerbated in manycountries by high rates of inflation.
74. The traditional devices used in the past by the governments of themore developed countries to regenerate their economies have now proved tohave been inadequate for the recovery begun, in some of them, in 1983 tobe regarded as solid or and to generate enough momentum to be of benefitto the less developed countries as well. For example, it has not beenpossible to restore the rate of capital accumulation to the level reachedbefore the onset of the latest decline; such instruments as credit andthe traditional fiscal, monetary and trade policies applied in the moredeveloped countries when aggregate demand and production decline are nowless effective.
75° The crisis in Latin America and the Caribbean can have adverseconsequences for the more developed countries themselves, as has beendemonstrated for the United States by the drastic US$21 billion reductionof that country's exports to the Region during 1981-1983 (12 billiondollars of the reduction attributable to Mexico alone). These figureswere disclosed by President Ronald Reagan in his report to the Congressin January 1984.
76. Again, according to President Reagan, "seven of the most heavilyindebted Latin American countries took in 13.9% of the exports of theUnited States in 1981... (and) these losses (of those exports), caused bythe economic adjustments that these heavily indebted countries had tomake, will not be greatly reversed in 1984".18/
77. The foreign trade deficit of the United States during 1983 reachedUS$60.6 billion, 66% greater than the gap between exports and imports in1982, which was US$36.4 billion; and 117% more than the trade deficit ofUS$27.9 billion in 1981.1 9 / According to the same source, thepreliminary estimates for 1984 are of a trade deficit of about US$100billion.
78. This situation has prompted groups of domestic producers to bringheavy pressure to bear on the Executive and Legislative branches forquotas and restrictions on the importation of some competing foreignproducts.
79. These figures also bear out the need for interaction between themore and the less developed countries and for efforts to attain recoveryobjectives in a spirit of solidarity and the international common good,along with fairness and equity in the distribution of welfare and wealth.
- 23 -
80. These efforts should also aim at assisting the less privilegedcountries and social strata, because "evidence exists to affirm that thegeneral quality of life has declined substantially in most of thecountries as a result of the many effects of the crisis in terms ofreduced real outlays for education, health and housing brought about bystabilization programs, and because of the weakening of the socialsecurity and welfare systems. This has meant less access for themajority of the population to such basic goods and services as food,housing, health and education".20/
EFFECTS OF THE SOCIOECONOMIC SITUATION ON HEALTH INDICATORS
81. As mentioned in the introduction to this document, the mainpurpose of Resolution XX of the XXI Pan American Sanitary Conference wasto determine the possible financial and budgetary implications, at boththe national and international level, of the present socioeconomic crisisfor carrying out the Plan of Action for implementation of the RegionalStrategies for Health for All by the Year 2000. The specific request tothe Director of the Pan American Sanitary Bureau was that he continue toexamine the international economic environment, and national andinternational resource allocations to health and related sectors,regarding any significant changes that could affect the attainment ofHealth for All by the Year 2000.
82. In compliance with that mandate, Chapter I has provided a body ofoverall macroeconomic and social data, and in some cases references tothe situation in the seven countries covered in more detail. Chapter IIwill examine more specific details of that situation, describe changesthat took place in the economy during the period 1978-1983 and tracetheir implications for the financing of social programs with emphasis onhealth.
83. Assessing the effects of the crisis on the "health situation,"that is, on coverage, on emergency services, and on the details of theallocation of financing of national health services, require data whicheither did not exist or was unavailable.
84. Distinction would also have to be made between inputs, such as theprovision of services, their distribution, percentages of coverage, andresults or effects. Such indexes as live birth weight, mortality amonginfants and children under five, morbidity from malaria, etc., arenegative indicators which, however, can indicate measurements of gains.However, these indicators of "health results" are affected not only byinputs for health such as personnel and equipment for immunization, butalso by improvements in development and social welfare. For example, anincrease of the food supply in a country plagued by production,distribution and financing shortfalls, can give rise to a significantreduction of infant mortality.
-. 24 -
85. Measurement by indicators of results is also hindered by otherfactors. There is a direct general correlation between the GDP and lifeexpectancy at birth. However, this correlation is not absolute, as hasbeen demonstrated in several countries, among them Sri Lanka, where highhealth levels have been attained with low per capita income levels thanksto the efficient application of very simple public health techniques.
86. While it is important to measure the results of the socioeconomicsituation over the long run, it is not always feasible to predict theeffect that the level of financing can have on health gains. Moreover,it is possible to predict that a reduction in financing for programs inthe social sectors will have negative effects on investments in thehealth sector and on the trend toward improvement of the healthsituation. But it could not be predicted that, because of reduction infinancing, infant mortality could be reduced or that the life expectancyof the population would be shortened.
MULTILATERAL PUBLIC BANK FINANCING FOR HEALTH
87. Until 1978 the Inter National Bank for Reconstruction andDevelopment (World Bank) did not directly finance health programs butonly certain components of health related activities such as water andsewerage. Since 1979, the Bank has begun to provide relatively smallamounts of its total loan portfolio for health projects. In 1981 and1982 such funds reached only 0.1 percent of total loans. In 1983, thisincreased by 0.5 percent.
88. During last year, the percent of loans of the total portfolioallocated to the social sector reeached 9.0 percent. Of this amount, 6.0percent was used for water and sewerage, 3 percent for education and theremainder for health, including population programs, nutrition as well ashealth itself.
89. Loans for water and sewerage increased to 4 percent in 1982 and 6percent in 1983. Funds for education, on the other hand, fell from 4percent in 1981 and 1982 to less than 3 percent in 1983.
90. Countries which receive credits for investment programs mustfinance 90 percent of programs with national resources derived fromordinary budget accounts based on tax revenues or charges to borrowers.Similar restrictions are applied to IMF standby agreements, since both
institutions operate according to similar policies and practices,although they have different goals. The World Bank is concerned withprograms of structural adjustment over the mid and long term, closelyassociated with economic development. Indeed, this is the reason that 42percent of its loan portfolio was allocated to productive sectors in1983. The IMF grants credit according to a special drawing fund forshort term adjustments or emergencies which require funds to improvebalance of payments and the capacity to service foreign debt.

- 25 -
91. The World Bank granted a credit to the Government of Peru in theamount of US$35 million for health programs. Depending on an evaluationof the Peruvian experience, the Bank may continue to authorize similarloans to other nations in the future. But it is necessary to bear inmind the objectives of the Bank as expressed in its 1983 WorldDevelopment Report which refer to:
- The type of administration which should be operational duringperiods of uncertainty, and which should be effective andefficient;
- the improvement of plans, budgets and evaluation of expenditures;
- improvement of information systems for management purposes;
- improvement in management of decentralized institutions;
- improvement in projects and programs; and
- national community participation.
92. With respect to the mandate of the Inter American Development Bank(IDB), its Special Operations Fund makes loans according to conditionswhich vary by type of country according to degree of development. In thefirst category are:
a) Bolivia, Ecuador, E1l Salvador, Haiti, Honduras, Guatemala,Guyana, Nicaragua, Paraguay and the Dominican Republic. Theyenjoy preferential, interest rates, usually from between 2 to 5percent lower than market rates, with 30 to 40 year terms, andgrace periods for amortization and interest payments. For theperiod of 1983-1986, US$100 million is available for these tencountries. This is still not enough to cover all needs, therebyforcing the countries to give priority, once again, to the
d producing sectors of the economy.
b) Barbados, Costa Rica, Jamaica, Panama, Suriname and Uruguayconstitute the second group of countries. They have access tocredits with an ordinary rate of interest, higher than that forthe first group, which is about 11 percent yearly, less fivepoints. Terms for liquidation of the entire debt range from 15 to25 years. The grace period for amortization and interest paymentsis less than that granted to the countries in the first group.For 1983-1986, the amount allocated to this second group is US800million.
93. The remaining countries in the Region have to use the otherresources of the IDB. These loans are not as soft as these nations areconsidered to have achived a higher level of economic development andhave their own financial resources.
- 26 -
94. During 1981-1983, IDB authorized loans in the amount of US$724millions for health programs and activities. Included in this figure arefunds for drinking water, sewerage and environmental improvements. Thedistribution oif these resources has been:
1981 US$208 million or 8.3 percent of total loans1982 US$245 million or 8.9 percent of total loans1983 US$271 million or 8.9 percent of total loans
95. There appears to be a view in the multilateral and bilateralfinancial and technical assistance organizations that the social sectors,including health, are plagued by poor management, or at least are open tosubstantial improvement in the administration of their resources toimprove impact. There is also the belief that health sector shouldgenerate savings and thereby capitalize more effectively on existingresources before seeking greater outside financial assistance.
96. It has been affirmed that attainment of HFA/2000 consitutes notonly a substantive medical and paramedical effort, but it should also beunderstood as a natural economic achievement:
"The concept of primary health care as a strategy to attainHFA/2000 must meet the requirments of impact, equity, social efficiency,social participation, intersectoral linkaging and cooperation amongcountries. Its essence is based on the recognition that in order toachieve 'Health for All,' meeting all those requirements constitutes aneconomic problem. Such is the relative scarcity of multiple useresources in a given society containing different groups of people withunequal opportunities to express and satisfy their specific needs andaspirations in a space and moment in time. 'Primary health' constitutesa strategy because it proposes to resolve the above problem in adetermined fashion by appropriating, recombining, reorganizing andreorienting all the resources (available and potential) from the entirehealth sector to satisfy the needs and aspirations (in the field ofhealth) for all the society exactly according to the requirements for thegoal and regional objectives already spelled out.
"From a strictly 'technical-administrative' perspective, thepotential of this strategy lies in the hypothesis, empirically confirmed,that it is possible to solve, efficiently, given sets of health problemswith combinations certain technological resources (functions ofproduction), of different complexities, and therefore with varying socialcosts. It is suggested that there exists a correlation between thecomplexity of health problems and the complexity (and social cost) ofproduction functions capable of solving them.
"On the other hand, empirical evidence also supports the contentionthat less complex health problems occur relatively more frequently than
- 27 -
those which are more complex. From this it may be deduced that there isa possibility to solve health problems for a given population byorganizing levels of care which minimize the social cost. In this way,primary care as a strategy implies organization of services according tolevels of care, but can be limited in some fashiion to a single levelconsidered to be minimal."21/
Notes in Chapter I
I/United Nations. Economic Commission for Latin America, PreliminaryOverview of the Latin American Economy During 1983, by Enrique V.Iglesias, Document E/CEPAL/G.1279, 1983, Table 3, "Latin America:Evolution of Per Capita Gross Domestic Product," p. 25. The data for 1983are estimates subject to revision and the changes in 1981-1983 correspondto those accumulated during the same period.
2/Corporaci6n de Investigaciones Econ6micas para la America Latina,
Grupos Vulnerables en Situaciones Recesivas: El Caso de los Nifios yJ6venes de Chile, by Alejandro Foxley and Dagmar Raczynski (Santiago deChile, CIEPLAN, 1983), pp. 31-32.
3/United Nations Children's Fund, The Economic Crisis and the Welfare ofBrazilian Children: A Case Study of the State of Sao Paulo, by RobertoMacedo (UNICEF, June 1983), pp. 43-44.
4/Fondo de las Naciones Unidas para la Infancia, Estado Mundial de laInfancia, 1984, by James P. Grant, (UNICEF, 1984), p. 6.
5/Ibid., p. 6.
6/Ibid., p. 12.
7/Comit6 de Expertos de Alto Nivel (CEGAN), Documento de Trabajo, Novenoperiodo de sesiones (Montevideo, 18-20 de enero de 1984).
8 /Iglesias, Preliminary Overview, E/CEPAL/G.1279, p. 22.
!/Ibid., p. 21.
10/Antonio Ortiz Mena, "The Economic Crisis: Looking Beyond EmergencyMeasures to Long-term Needs," Focus, January 1984, p. 5.
11/Ibid., p. 6.
12/Ibid., p. 7.
13/Lindley H. Clark Jr., "A Remembrance of Interest Rates--and an Editor--Past," The Wall Street Journal, 5 July 1983, p. 23.
- 28 -
14/World Health Organization, United Nations Children's Fund, PrimaryHealth Care. Alma-Ata, 1978 (Geneva, WHO, 1978), p. 44.
15/Iglesias, Preliminary Overview, E/CEPAL/G.1279, Table 4,America: Evolution of Urban Unemployment," p. 26.
"Latin
16/Inter-American Development BDepartment, External Debt and IBackground and Perspectives.Structure and Trends, by Luisa(Washington, D.C., January 1984),
ank, Economic and Social DevelopmentEconomic Development of Latin America,Special Study: Public Sector Size,
Carballo-Raines and Debora E. Rogersp,. 91.
17/Iglesias, Preliminary Overview, E/CEPAL/G.1279, Table 5,America: Evolution of Consumer Prices," p. 27.
"Latin
18/Inter-American Development Bank, Information received by teletype,2 February 1984, p. 1.
19/"Trade Deficit for 1983 Hits $606 Billion," The Washington Post,8 February 1984.
20/CEGAN, Documento de Trabajo.
21/Organizaci6n Mundial de la Salud, Manual sobre el Enfoque de Riesgo en
la Atenci6n de Salud, Capftulos I-IV, Medellin, Colombia, 1-10 de marzo de
1984, pp. 7-9.
- 29 -
CHAPTER II. SOCIOECONOMIC TRENDS IN SELECTED LATIN AMERICANAND CARIBBEAN NATIONS
97. The preceding Chapter has described in some detail the presenteconomic crisis throughout Latin America and the Caribbean. It has shownin broad outline the nature and extent of conditions, especially as theypertain to socioeconomic development, health in particular. In thisChapter the analysis narrows in focus on a review of seven countries.They are: Argentina, Brazil, Costa Rica, Jamaica, Mexico, Peru and SaintLucia. While these nations do not constitute a representative sample ofthe Region, they do contain virtually 60 per cent of the population inLatin America and the Caribbean. Thus while it is not possible withscientific accuracy to generalize to the Region the experiences of thegroup, neither is it possible to dismiss entirely strong suggestions thatwhat is happening in the seven countries may be occurring as well in theremaining nations of the Region. The seven countries included in thesample group were selected for a variety of reasons. Argentina, Braziland Mexico are the largest territories and represent a total of 52 percent of the regional population. Also, as large nations, they encounterhealth and finance problems of a distinct nature and scope than those oftheir smaller and less developed neighbors. Peru was chosen as an Andeannation, and one which is currently facing a series of severe developmentproblems which were believed necessary to be accounted for in the group.Costa Rica, a small and relatively developed nation, was selected fromthe Central American area where, to a certain extent, another set ofdistinct conditions exists. Jamaica is the most advanced country in theEnglish-speaking Caribbean, and Saint Lucia is among the smallest.
98. Before continuing, one important caveat needs to be explicated.In many instances data were not available or were so tentative to be ofmarginal value only. (A complete list of variables for which data wererequested may be found in the Appendix.) Hence it was impossible topresent uniformly comparable findings for all countries. What follows,then, is an elaboration of the major points of concern in examiningpublic and private financing of health care and health care systems inLatin America and the Caribbean between the years 1978 and 1982.Countries in the group will be analyzed individually and conclusionsregarding the group as whole are presented at the end of the report.
99. While budgeted funds are certainly a measure of health policyintent, as are national plans, they are not useful in evaluating realcommitment and outcome. That is an analytical function of expenditures.Consequently, the analysis will be directed almost exclusively at publicand, where possible, private outlays for health care and health relatedactivities. It should be noted, in addition, that some definitionalproblems were present, as might have been expected. Thus health sector,for example, was defined differently in the majority of the nations in
- 30 -
the group. While attempts were made to establish uniform definitions tofacilitate comparative analysis, this turned out not to be feasible.Consequently, comparisons between and among nations in the group aredifficult but not entirely impossible.
The Economies and Public Spending
100. The macroeconomic indicators in Table 2.1 show a somewhat mixedpattern among the seven countries in the group. Argentina, Jamaica,Peru, Argentina, Mexico and Costa Rica all register declines in GDP as ofthe last year measured. The two remaining nations experienced smallincreases. However, during the five year period of measurement, 1978 to1982, with the exception of Jamaica, the trend had been generally upwarduntil 1982, especially in the case of Costa Rica. That is, if 1978 iscompared against 1982 the net difference is positive. No doubt the worldand regional economic crises are reflected in these statistics,especially as of 1982, as severe recession and a crushing foreign debthave been taking their toll. Once again it is useful to look at CostaRica. That nation, which had been experiencing gradual growth since 1978(although the rate of increase had dropped off), suffered a dramaticplunge in its GDP from 0.8 percent in 1981 to minus 9.9 per cent in1982. Peru suffered a similarly spectacular decline.
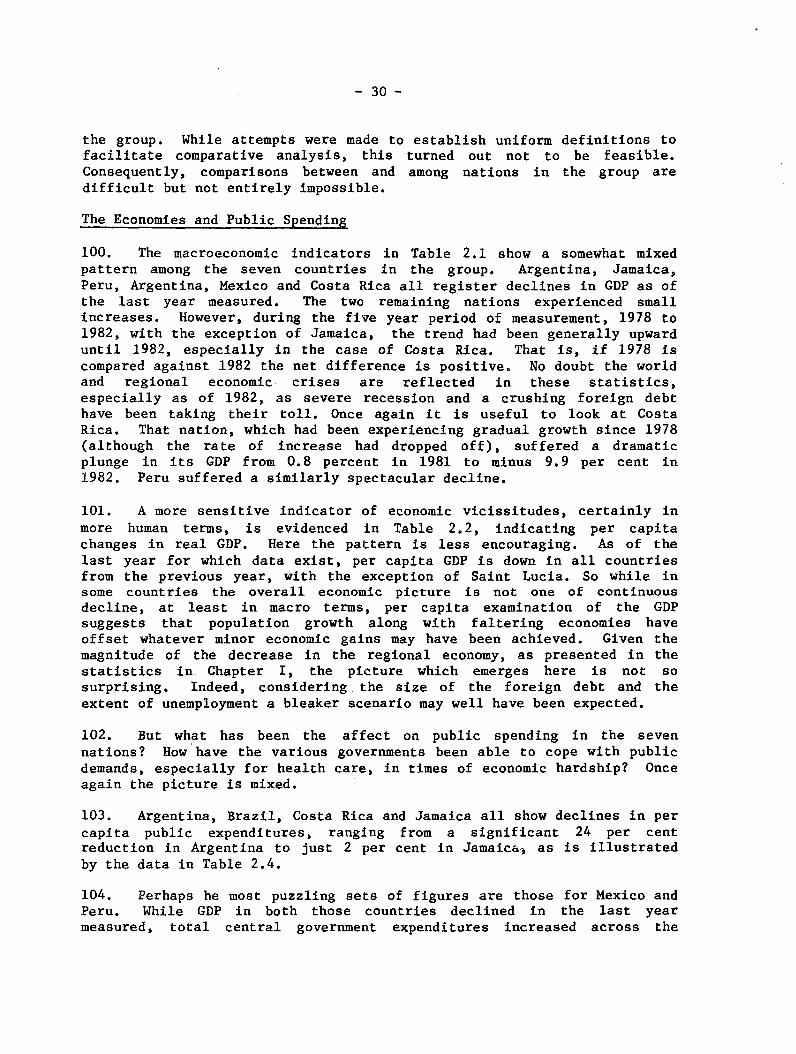
101. A more sensitive indicator of economic vicissitudes, certainly inmore human terms, is evidenced in Table 2.2, indicating per capitachanges in real GDP. Here the pattern is less encouraging. As of thelast year for which data exist, per capita GDP is down in all countriesfrom the previous year, with the exception of Saint Lucia. So while insome countries the overall economic picture is not one of continuousdecline, at least in macro terms, per capita examination of the GDPsuggests that population growth along with faltering economies haveoffset whatever minor economic gains may have been achieved. Given themagnitude of the decrease in the regional economy, as presented in thestatistics in Chapter I, the picture which emerges here is not sosurprising. Indeed, considering the size of the foreign debt and theextent of unemployment a bleaker scenario may well have been expected.
102. But what has been the affect on public spending in the sevennations? How have the various governments been able to cope with publicdemands, especially for health care, in times of economic hardship? Onceagain the picture is mixed.
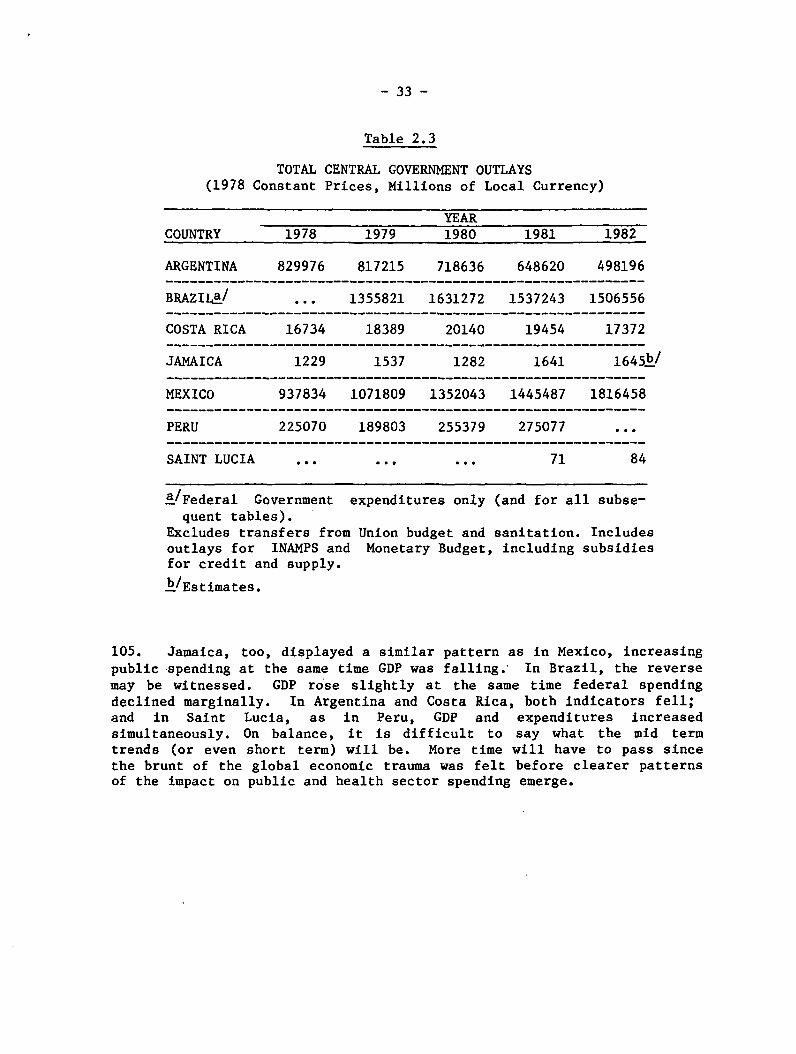
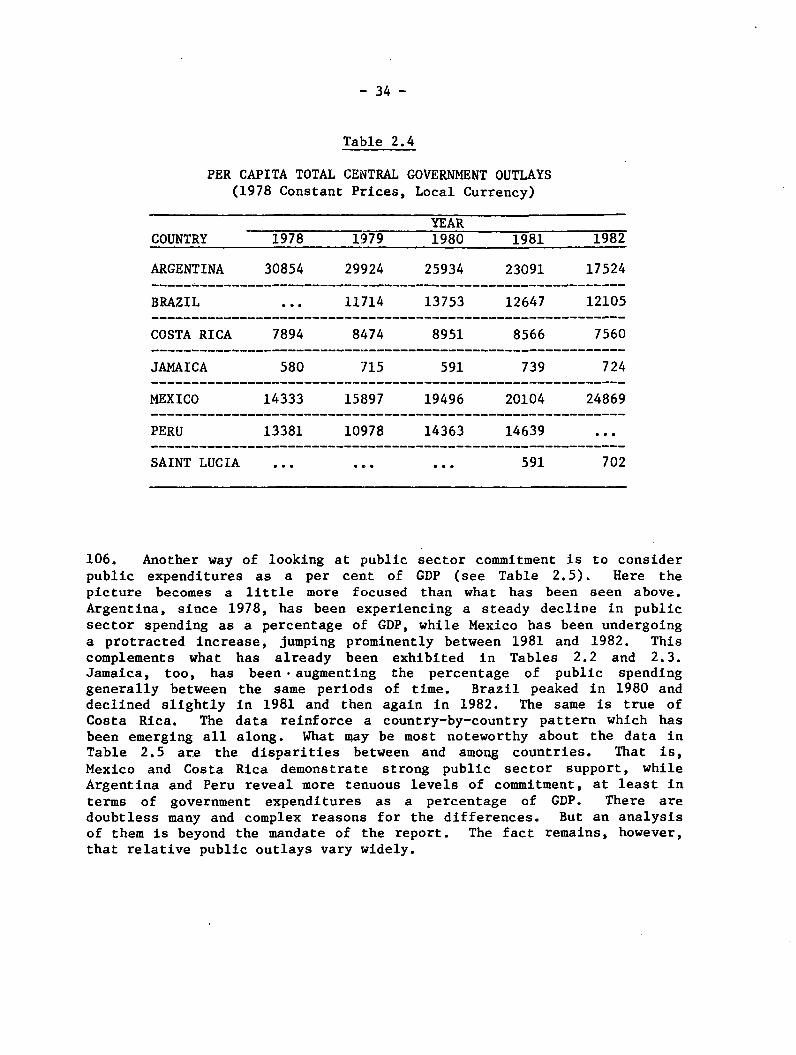
103. Argentina, Brazil, Costa Rica and Jamaica all show declines in percapita public expenditures, ranging from a significant 24 per centreduction in Argentina to just 2 per cent in Jamaica, as is illustratedby the data in Table 2.4.
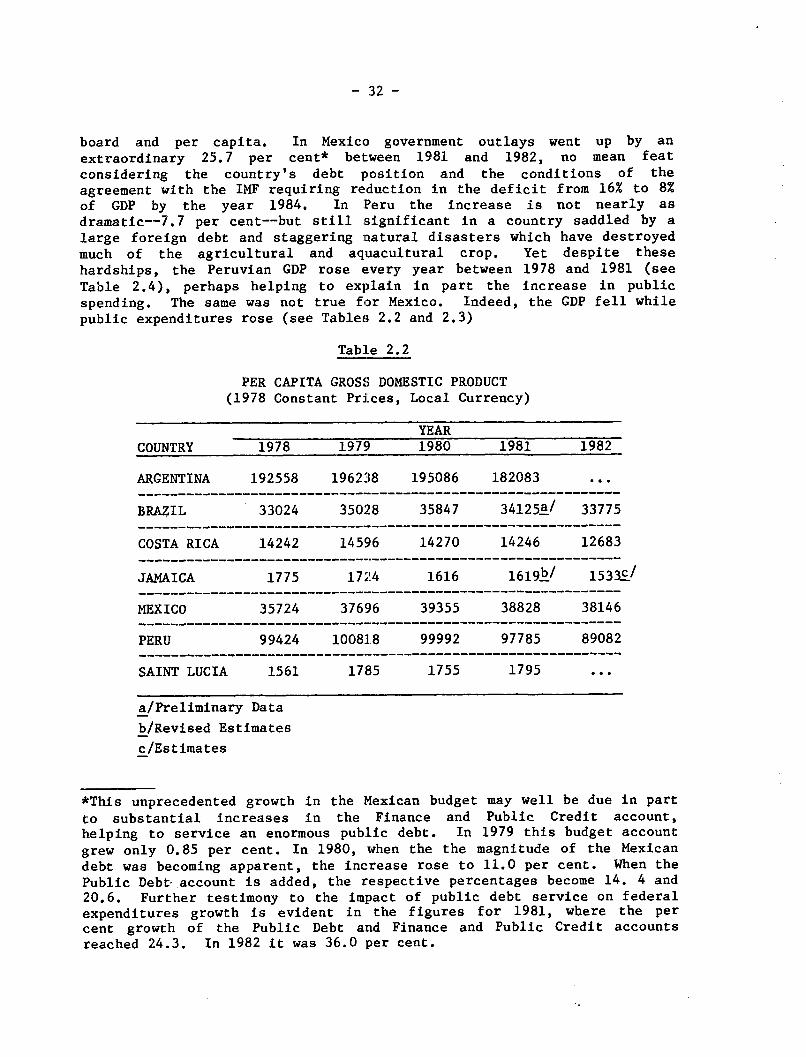
104. Perhaps he most puzzling sets of figures are those for Mexico andPeru. While GDP in both those countries declined in the last yearmeasured, total central government expenditures increased across the

Table 2.1
AMOUNT AND PERCENT CHANGE OF GROSS DOMESTIC PRODUCT(1978 Constant Prices, Millions of Local Currency)
YEAR
COUNTRY 1978 1979 1980 1981 1982
OUTLAY % OUTLAY % OUTLAY % OUTLAY % OUTLAY %
ARGENTINA 5179800 ... 5359253 3.5 5405823 0.9 5114706 -5.4 ...
BRAZIL 3729700 ... 4054191 8.7 4251849 4.9 4147921 -2.4 4203630 1.3
COSTA RICA 30193 ... 31674 4.9 32107 1.4 32353 0.8 29145 -9.9
JAMAICA 3763 ... 3708 -1.5 3506 -5.4 3593 2.5 3481 -3.1
MEXICO 2337398 ... 2541447 8.7 2729268 7.4 2791758 2.3 2786213 -0.2
PERU 1672307 ... 1743146 4.2 1777860 2.0 1837482 3.4 1720791 -6.4
SAINT LUCIA 187 ... 214 14.4 211 -1.7 215 2.3 ... ...
NOTE: Constant prices in all Chapter II tables calculated from Official Data.
- 32 -
board and per capita. In Mexico government outlays went up by an
extraordinary 25.7 per cent* between 1981 and 1982, no mean featconsidering the country's debt position and the conditions of theagreement with the IMF requiring reduction in the deficit from 16% to 8%of GDP by the year 1984. In Peru the increase is not nearly asdramatic--7.7 per cent--but still significant in a country saddled by a
large foreign debt and staggering natural disasters which have destroyedmuch of the agricultural and aquacultural crop. Yet despite these
hardships, the Peruvian GDP rose every year between 1978 and 1981 (see
Table 2.4), perhaps helping to explain in part the increase in public
spending. The same was not true for Mexico. Indeed, the GDP fell while
public expenditures rose (see Tables 2.2 and 2.3)
Table 2.2
PER CAPITA GROSS DOMESTIC PRODUCT(1978 Constant Prices, Local Currency)
YEARCOUNTRY 1978 1979 1980 1981 1982
ARGENTINA 192558 196238 195086 182083 ...
BRAZIL 33024 35028 35847 34125a/ 33775
COSTA RICA 14242 14596 14270 14246 12683
JAMAICA 1775 1724 1616 1619k/ 1533c/
MEXICO 35724 37696 39355 38828 38146
PERU 99424 100818 99992 97785 89082
SAINT LUCIA 1561 1785 1755 1795 ...
a/Preliminary Data
b/Revised Estimates
c/Estimates
*This unprecedented growth in the Mexican budget may well be due in part
to substantial increases in the Finance and Public Credit account,helping to service an enormous public debt. In 1979 this budget account
grew only 0.85 per cent. In 1980, when the the magnitude of the Mexican
debt was becoming apparent, the increase rose to 11.0 per cent. When the
Public Debt account is added, the respective percentages become 14. 4 and20.6. Further testimony to the impact of public debt service on federalexpenditures growth is evident in the figures for 1981, where the percent growth of the Public Debt and Finance and Public Credit accountsreached 24.3. In 1982 it was 36.0 per cent.
- 33 -
Table 2.3
TOTAL CENTRAL GOVERNMENT OUTLAYS(1978 Constant Prices, Millions of Local Currency)
YEARCOUNTRY 1978 1979 1980 1981 1982
ARGENTINA 829976 817215 718636 648620 498196
BRAZILa/ ... 1355821 1631272 1537243 1506556
COSTA RICA 16734 18389 20140 19454 17372____________________________________________________________
JAMAICA 1229 1537 1282 1641 1645Ž/
MEXICO 937834 1071809 1352043 1445487 1816458
PERU 225070 189803 255379 275077 ...
SAINT LUCIA ... ...... 71 84
a/Federal Governmentquent tables).
expenditures only (and for all subse-
Excludes transfers from Union budget and sanitation. Includesoutlays for INAMPS and Monetary Budget, including subsidiesfor credit and supply.
b/Estimates.
105. Jamaica, too, displayed a similar pattern as in Mexico, increasingpublic spending at the same time GDP was falling. In Brazil, the reversemay be witnessed. GDP rose slightly at the same time federal spendingdeclined marginally. In Argentina and Costa Rica, both indicators fell;and in Saint Lucia, as in Peru, GDP and expenditures increasedsimultaneously. On balance, it is difficult to say what the mid termtrends (or even short term) will be. More time will have to pass sincethe brunt of the global economic trauma was felt before clearer patternsof the impact on public and health sector spending emerge.
- 34 -
Table 2.4
PER CAPITA TOTAL CENTRAL GOVERNMENT OUTLAYS(1978 Constant Prices, Local Currency)
YEARCOUNTRY 1978 1979 1980 1981 1982
ARGENTINA 30854 29924 25934 23091 17524
BRAZIL ... 11714 13753 12647 12105
COSTA RICA 7894 8474 8951 8566 7560
JAMAICA 580 715 591 739 724
MEXICO 14333 15897 19496 20104 24869
PERU 13381 10978 14363 14639 ...
SAINT LUCIA ... ... ... 591 702
106. Another way of looking at public sector commitment is to considerpublic expenditures as a per cent of GDP (see Table 2.5). Here thepicture becomes a little more focused than what has been seen above.Argentina, since 1978, has been experiencing a steady decline in publicsector spending as a percentage of GDP, while Mexico has been undergoinga protracted increase, jumping prominently between 1981 and 1982. Thiscomplements what has already been exhibited in Tables 2.2 and 2.3.Jamaica, too, has been . augmenting the percentage of public spendinggenerally between the same periods of time. Brazil peaked in 1980 anddeclined slightly in 1981 and then again in 1982. The same is true ofCosta Rica. The data reinforce a country-by-country pattern which hasbeen emerging all along. What may be most noteworthy about the data inTable 2.5 are the disparities between and among countries. That is,Mexico and Costa Rica demonstrate strong public sector support, whileArgentina and Peru reveal more tenuous levels of commitment, at least interms of government expenditures as a percentage of GDP. There aredoubtless many and complex reasons for the differences. But an analysisof them is beyond the mandate of the report. The fact remains, however,that relative public outlays vary widely.
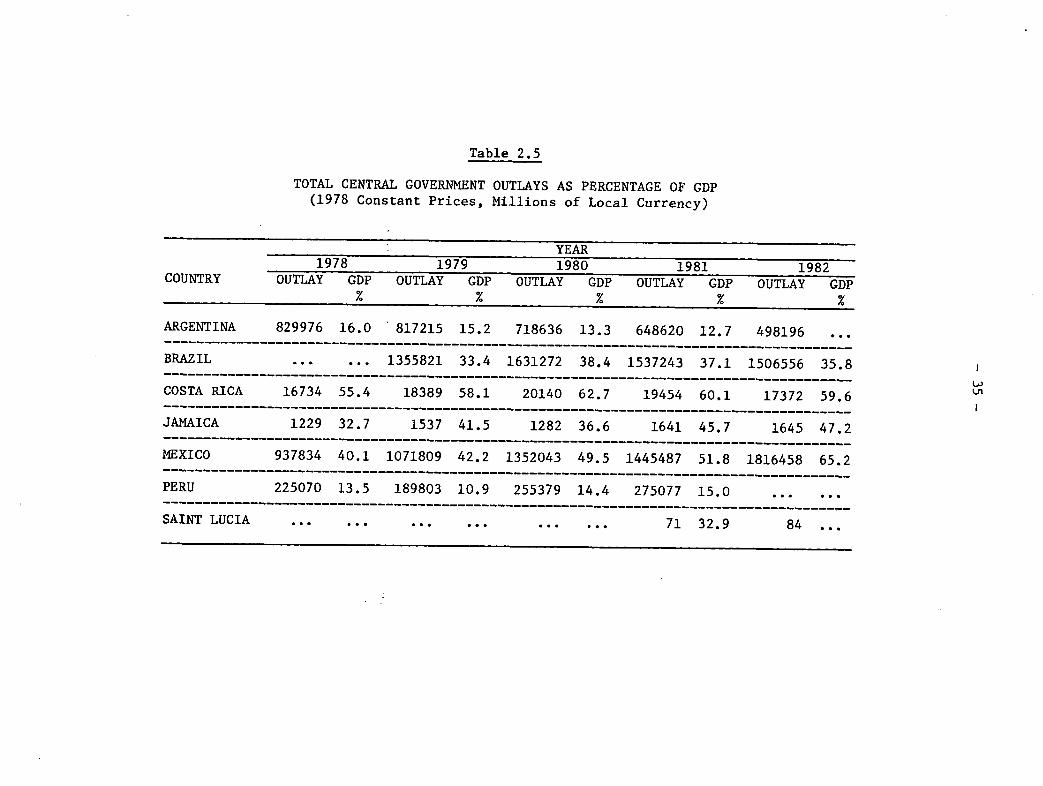
Table 2.5
TOTAL CENTRAL GOVERNMENT OUTLAYS AS PERCENTAGE OF GDP(1978 Constant Prices, Millions of Local Currency)
YEAR1978 1979 1980 1981 1982
COUNTRY OUTLAY GDP OUTLAY GDP OUTLAY GDP OUTLAY GDP OUTLAY GDP% % % % %
ARGENTINA 829976 16.0 817215 15.2 718636 13.3 648620 12.7 498196 ...
BRAZIL ... ... 1355821 33.4 1631272 38.4 1537243 37.1 1506556 35.8
COSTA RICA 16734 55.4 18389 58.1 20140 62.7 19454 60.1 17372 59.6 LJ
JAMAICA 1229 32.7 1537 41.5 1282 36.6 1641 45.7 1645 47.2
MEXICO 937834 40.1 1071809 42.2 1352043 49.5 1445487 51.8 1816458 65.2
PERU 225070 13.5 189803 10.9 255379 14.4 275077 15.0 ... ...
SAINT LUCIA ... . .. ... ... 71 32.9 84 ...
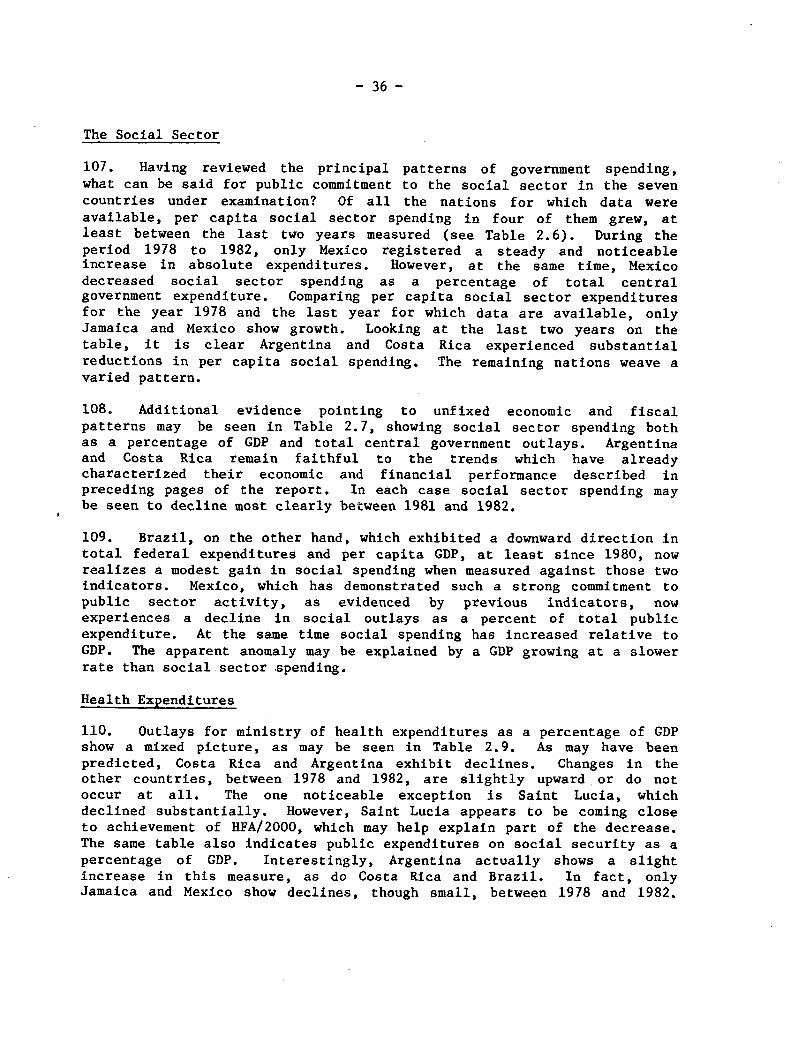
- 36 -
The Social Sector
107. Having reviewed the principal patterns of government spending,what can be said for public commitment to the social sector in the sevencountries under examination? Of all the nations for which data wereavailable, per capita social sector spending in four of them grew, atleast between the last two years measured (see Table 2.6). During theperiod 1978 to 1982, only Mexico registered a steady and noticeableincrease in absolute expenditures. However, at the same time, Mexicodecreased social sector spending as a percentage of total centralgovernment expenditure. Comparing per capita social sector expendituresfor the year 1978 and the last year for which data are available, onlyJamaica and Mexico show growth. Looking at the last two years on thetable, it is clear Argentina and Costa Rica experienced substantialreductions in per capita social spending. The remaining nations weave avaried pattern.
108. Additional evidence pointing to unfixed economic and fiscalpatterns may be seen in Table 2.7, showing social sector spending bothas a percentage of GDP and total central government outlays. Argentinaand Costa Rica remain faithful to the trends which have alreadycharacterized their economic and financial performance described inpreceding pages of the report. In each case social sector spending maybe seen to decline most clearly between 1981 and 1982.
109. Brazil, on the other hand, which exhibited a downward direction intotal federal expenditures and per capita GDP, at least since 1980, nowrealizes a modest gain in social spending when measured against those twoindicators. Mexico, which has demonstrated such a strong commitment topublic sector activity, as evidenced by previous indicators, nowexperiences a decline in social outlays as a percent of total publicexpenditure. At the same time social spending has increased relative toGDP. The apparent anomaly may be explained by a GDP growing at a slowerrate than social sector spending.
Health Expenditures
110. Outlays for ministry of health expenditures as a percentage of GDPshow a mixed picture, as may be seen in Table 2.9. As may have beenpredicted, Costa Rica and Argentina exhibit declines. Changes in theother countries, between 1978 and 1982, are slightly upward or do notoccur at all. The one noticeable exception is Saint Lucia, whichdeclined substantially. However, Saint Lucia appears to be coming closeto achievement of HFA/2000, which may help explain part of the decrease.The same table also indicates public expenditures on social security as apercentage of GDP. Interestingly, Argentina actually shows a slightincrease in this measure, as do Costa Rica and Brazil. In fact, onlyJamaica and Mexico show declines, though small, between 1978 and 1982.
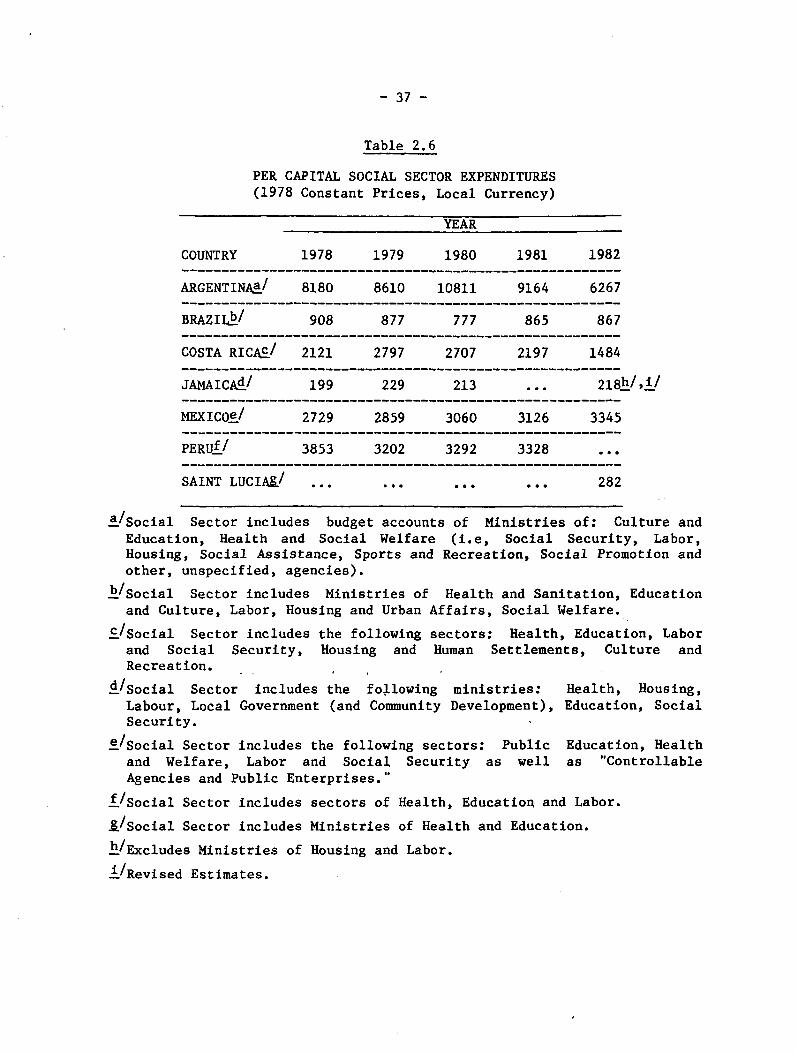
- 37 -
Table 2.6
PER CAPITAL SOCIAL SECTOR EXPENDITURES(1978 Constant Prices, Local Currency)
YEAR
COUNTRY 1978 1979 1980 1981 1982
ARGENTINAa/ 8180 8610 10811 9164 6267
BRAZIL/ 908 877 777 865 867
COSTA RICAc/ 2121 2797 2707 2197 1484_______________________________________________________
.TAMA TrAd/ 14Q 99Q 91
MEXICOe/ 2729 2859 3060 3126 3345
PERUf / 3853 3202 3292 3328 ...
SAINT LUCIA&/ ... ... ... ... 282
a/Social Sector includes budget accounts of Ministries of: Culture andEducation, Health and Social Welfare (i.e, Social Security, Labor,Housing, Social Assistance, Sports and Recreation, Social Promotion andother, unspecified, agencies).
b/Social Sector includes Ministries of Health and Sanitation, Educationand Culture, Labor, Housing and Urban Affairs, Social Welfare.
C/Social Sector includes the following sectors: Health, Education, Laborand Social Security, Housing and Human Settlements, Culture andRecreation.
d/Social Sector includes the following ministries: Health, Housing,Labour, Local Government (and Community Development), Education, SocialSecurity.
e/Social Sector includes the following sectors: Public Education, Healthand Welfare, Labor and Social Security as well as "ControllableAgencies and Public Enterprises."
f/Social Sector includes sectors of Health, Education and Labor.
8/Social Sector includes Ministries of Health and Education.
h/Excludes Ministries of Housing and Labor.
i/Revised Estimates.
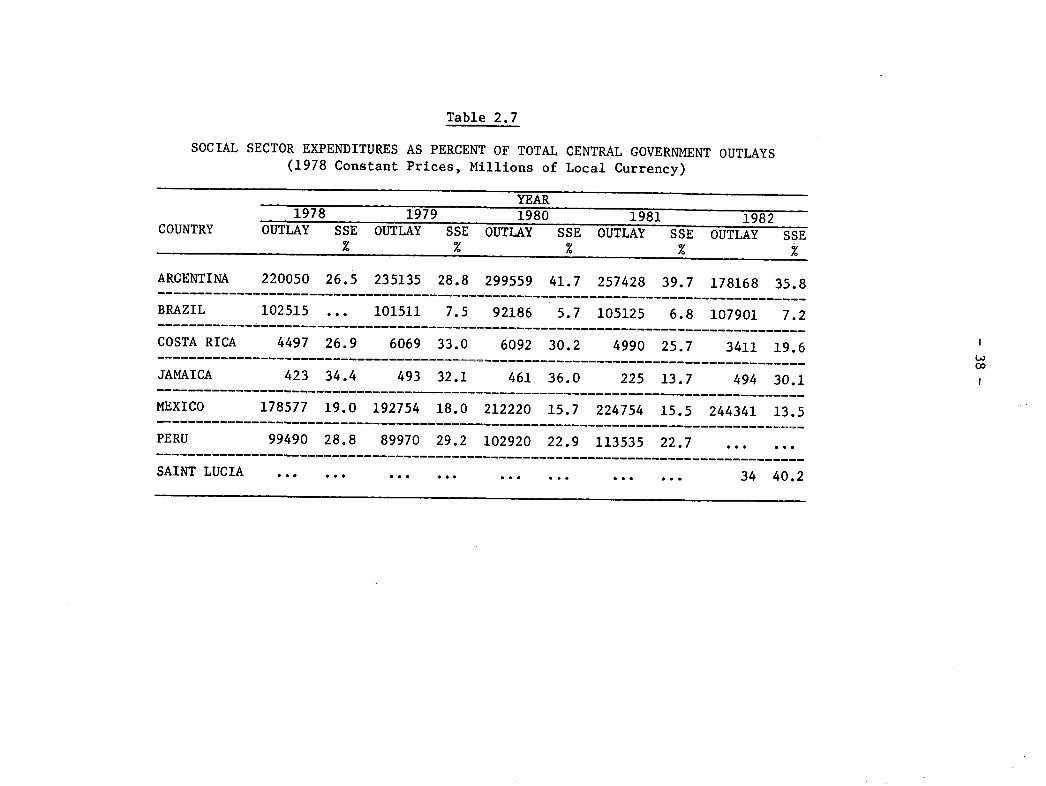
Table 2.7
SOCIAL SECTOR EXPENDITURES AS PERCENT OF TOTAL CENTRAL GOVERNMENT OUTLAYS(1978 Constant Prices, Millions of Local Currency)
YEAR1978 1979 1980 1981 1982
COUNTRY OUTLAY SSE OUTLAY SSE OUTLAY SSE OUTLAY SSE OUTLAY SSE% % % %
ARGENTINA 220050 26.5 235135 28.8 299559 41.7 257428 39.7 178168 35.8
BRAZIL 102515 ... 101511 7.5 92186 5.7 105125 6.8 107901 7.2
COSTA RICA 4497 26.9 6069 33.0 6092 30.2 4990 25.7 3411 19.6
JAMAICA 423 34.4 493 32.1 461 36.0 225 13.7 494 30.1
MEXICO 178577 19.0 192754 18.0 212220 15.7 224754 15.5 244341 13.5
PERU 99490 28.8 89970 29.2 102920 22.9 113535 22.7 ... ...
SAINT LUCIA .. ... ... ... ... ... ... ... 34 40.2
GO
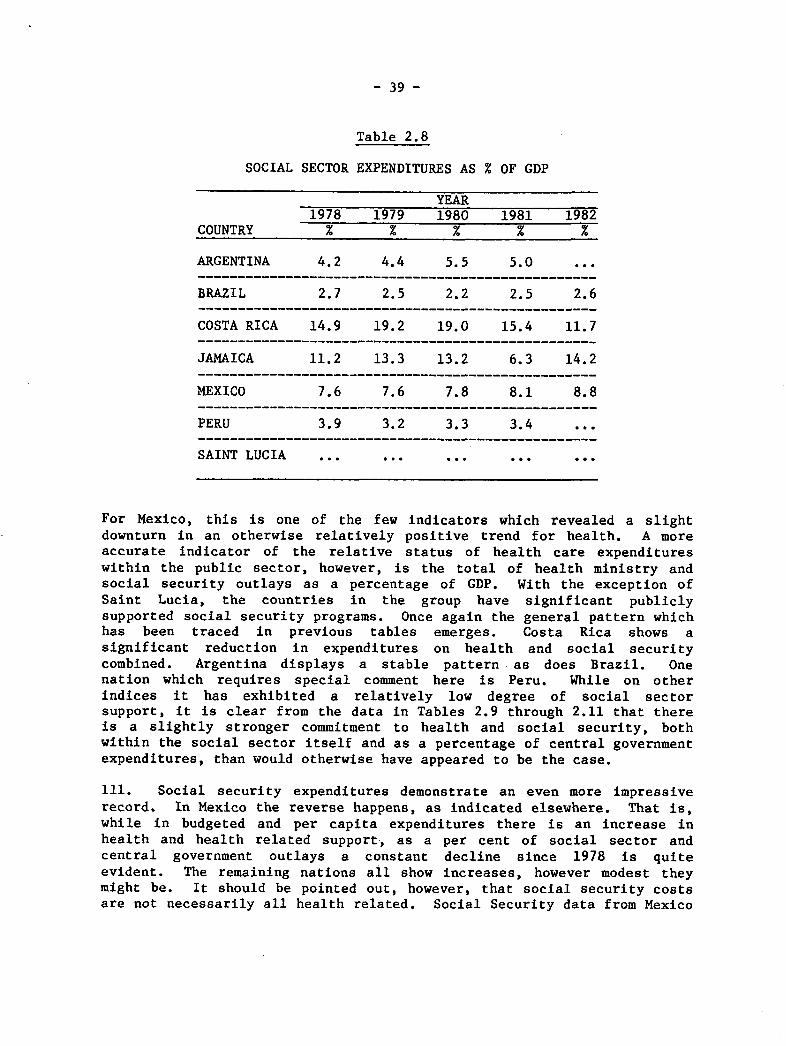
- 39 -
Table 2.8
SOCIAL SECTOR EXPENDITURES AS % OF GDP
YEAR1978 1979 1980 1981 1982
COUNTRY % x % % %
ARGENTINA 4.2 4.4 5.5 5.0 ...
BRAZIL 2.7 2.5 2.2 2.5 2.6
COSTA RICA 14.9 19.2 19.0 15.4 11.7
JAMAICA 11.2 13.3 13.2 6.3 14.2
MEXICO 7.6 7.6 7.8 8.1 8.8
PERU 3.9 3.2 3.3 3.4 ...
SAINT LUCIA ... ... ... ... ...
For Mexico, this is one of the few indicators which revealed a slightdownturn in an otherwise relatively positive trend for health. A moreaccurate indicator of the relative status of health care expenditureswithin the public sector, however, is the total of health ministry andsocial security outlays as a percentage of GDP. With the exception ofSaint Lucia, the countries in the group have significant publiclysupported social security programs. Once again the general pattern whichhas been traced in previous tables emerges. Costa Rica shows asignificant reduction in expenditures on health and social securitycombined. Argentina displays a stable pattern as does Brazil. Onenation which requires special comment here is Peru. While on otherindices it has exhibited a relatively low degree of social sectorsupport, it is clear from the data in Tables 2.9 through 2.11 that thereis a slightly stronger commitment to health and social security, bothwithin the social sector itself and as a percentage of central governmentexpenditures, than would otherwise have appeared to be the case.
111. Social security expenditures demonstrate an even more impressiverecord. In Mexico the reverse happens, as indicated elsewhere. That is,while in budgeted and per capita expenditures there is an increase inhealth and health related support, as a per cent of social sector andcentral government outlays a constant decline since 1978 is quiteevident. The remaining nations all show increases, however modest theymight be. It should be pointed out, however, that social security costsare not necessarily all health related. Social Security data from Mexico
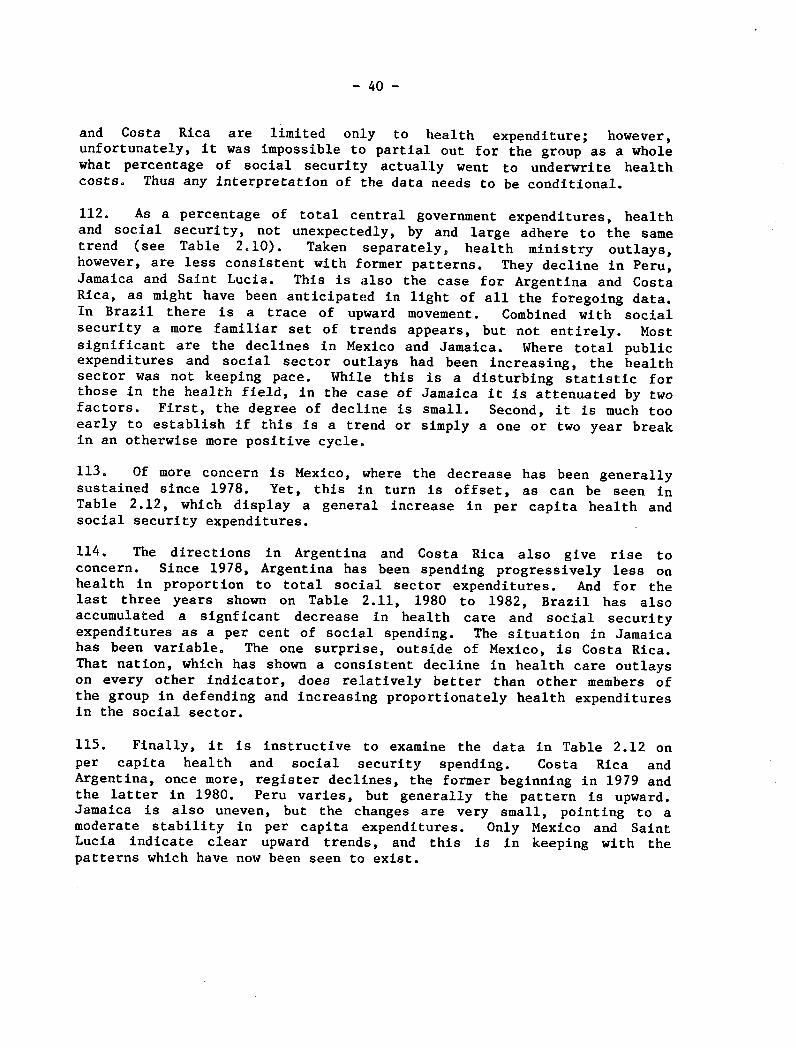
- 40 -
and Costa Rica are limited only to health expenditure; however,unfortunately, it was impossible to partial out for the group as a wholewhat percentage of social security actually went to underwrite healthcosts. Thus any interpretation of the data needs to be conditional.
112. As a percentage of total central government expenditures, healthand social security, not unexpectedly, by and large adhere to the sametrend (see Table 2.10). Taken separately, health ministry outlays,however, are less consistent with former patterns. They decline in Peru,Jamaica and Saint Lucia. This is also the case for Argentina and CostaRica, as might have been anticipated in light of all the foregoing data.In Brazil there is a trace of upward movement. Combined with socialsecurity a more familiar set of trends appears, but not entirely. Mostsignificant are the declines in Mexico and Jamaica. Where total publicexpenditures and social sector outlays had been increasing, the healthsector was not keeping pace. While this is a disturbing statistic forthose in the health field, in the case of Jamaica it is attenuated by twofactors. First, the degree of decline is small. Second, it is much tooearly to establish if this is a trend or simply a one or two year breakin an otherwise more positive cycle.
113. Of more concern is Mexico, where the decrease has been generallysustained since 1978. Yet, this in turn is offset, as can be seen inTable 2.12, which display a general increase in per capita health andsocial security expenditures.
114. The directions in Argentina and Costa Rica also give rise toconcern. Since 1978, Argentina has been spending progressively less onhealth in proportion to total social sector expenditures. And for thelast three years shown on Table 2.11, 1980 to 1982, Brazil has alsoaccumulated a signficant decrease in health care and social securityexpenditures as a per cent of social spending. The situation in Jamaicahas been variable. The one surprise, outside of Mexico, is Costa Rica.That nation, which has shown a consistent decline in health care outlayson every other indicator, does relatively better than other members ofthe group in defending and increasing proportionately health expendituresin the social sector.
115. Finally, it is instructive to examine the data in Table 2.12 onper capita health and social security spending. Costa Rica andArgentina, once more, register declines, the former beginning in 1979 andthe latter in 1980. Peru varies, but generally the pattern is upward.Jamaica is also uneven, but the changes are very small, pointing to amoderate stability in per capita expenditures. Only Mexico and SaintLucia indicate clear upward trends, and this is in keeping with thepatterns which have now been seen to exist.
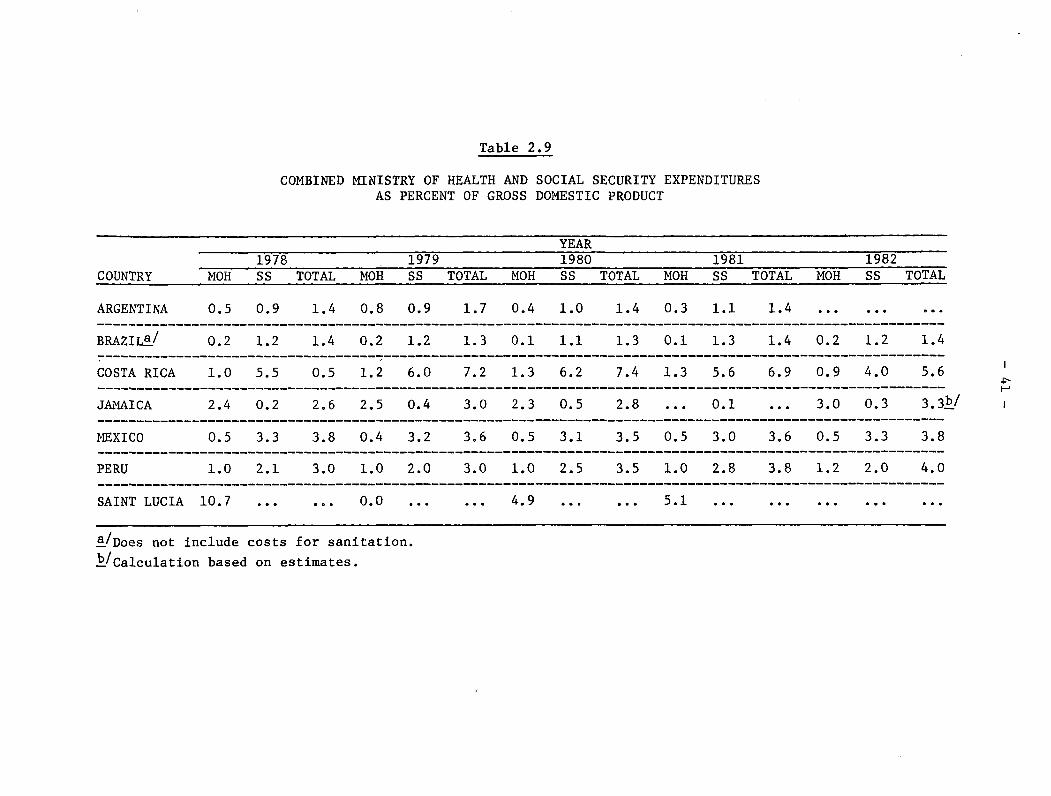
Table 2.9
COMBINED MINISTRY OF HEALTH AND SOCIAL SECURITY EXPENDITURESAS PERCENT OF GROSS DOMESTIC PRODUCT
1978 1COUNTRY MOH SS TOTAL MOH S
ARGENTINA 0.5 0.9 1.4 0.8 0
BRAZILa/ 0.2 1.2 1.4 0.2 1
COSTA RICA 1.0 5.5 0.5 1.2 6
JAMAICA 2.4 0.2 2.6 2.5 0
MEXICO 0.5 3.3 3.8 0.4 3
PERU 1.0 2.1 3.0 1.0 2
SAINT LUCIA 10.7 ... ... 0.0
a/Does not include costs for sanitation.
b/Calculation based on estimates.
979S
.9
.2
.0
.4
.2
.0
TOTAL
1.7
1.3
7.2
3.0
3.6
3.0______
MOH
0.4
0.1
1.3
2.3
0.5
1.0
4.9
YEAR1980SS TOTAL
1.0 1.4
1.1 1.3
6.2 7.4
0.5 2.8
3.1 3.5
2.5 3.5
1981SS
1.1
1.3
5.6
0.1
3.0
2.8
MOH
0.3
0.1
1.3
0.5
1.0
5.1
TOTAL
1.4
1.4
6.9
3.6
3.8
MOH
0.2
0.9
3.0
0.5
1.2
___ _,
1982SS
1.2
4.0
0.3
3.3
2.0
TOTAL
1.4
5.6
3.3b/
3.8
4.0
I
�r ::
.______
______.___--.
.___ _
______.___.___
.___
,___,___.___---
.____ _____,______.___
._____
___.___.___.___
.____ _____,___.___.___

Table 2.10
MINISTRY OF HEALTH AND SOCIAL SECURITY EXPENDITURES AS PERCENTOF CENTRAL GOVERNMENT OUTLAYS
YEAR
1978 1979 1980 1981 1982
COUNTRY MOH SS TOTAL MOH SS TOTAL MOH SS TOTAL MOH SS TOTAL MOH SS TOTAL
ARGENTINA 3.0 5.5 8.4 5.0. 6.0 11.0 2.9 7.6 10.5 2.5 8.3 10.8 2.2 6.8 9.0
BRAZIL ... 0.5 3.5 4.0 0.4 2.9 3.3 0.4 3.4 3.8 0.4 3.2 3.6
COSTA RICA 1.9 9.9 11.8 2.0 10.3 12.3 2.0 9.8 11.8 2.1 9.4 11.5 1.6 7.8 9.4
JAMAICA 7.3 0.7 8.0 6.1 1.0 7.1 6.4 1.3 7.7 ... 0.2 ... 6.3 0.7 7.0
MEXICO 1.2 8.2 9.4 1.0 7.6 8.6 0.9 6.2 7.1 1.0 5.9 6.9 0.8 5.1 5.9
PERU 7.2 15.4 22.6 8.9 18.2 27.1 6.9 17.4 24.3 6.6 18.5 25.1 ... ... ...
SAINT LUCIA ... ... .. … .... ... ... 15.6 ... ... 13.6 ... ...
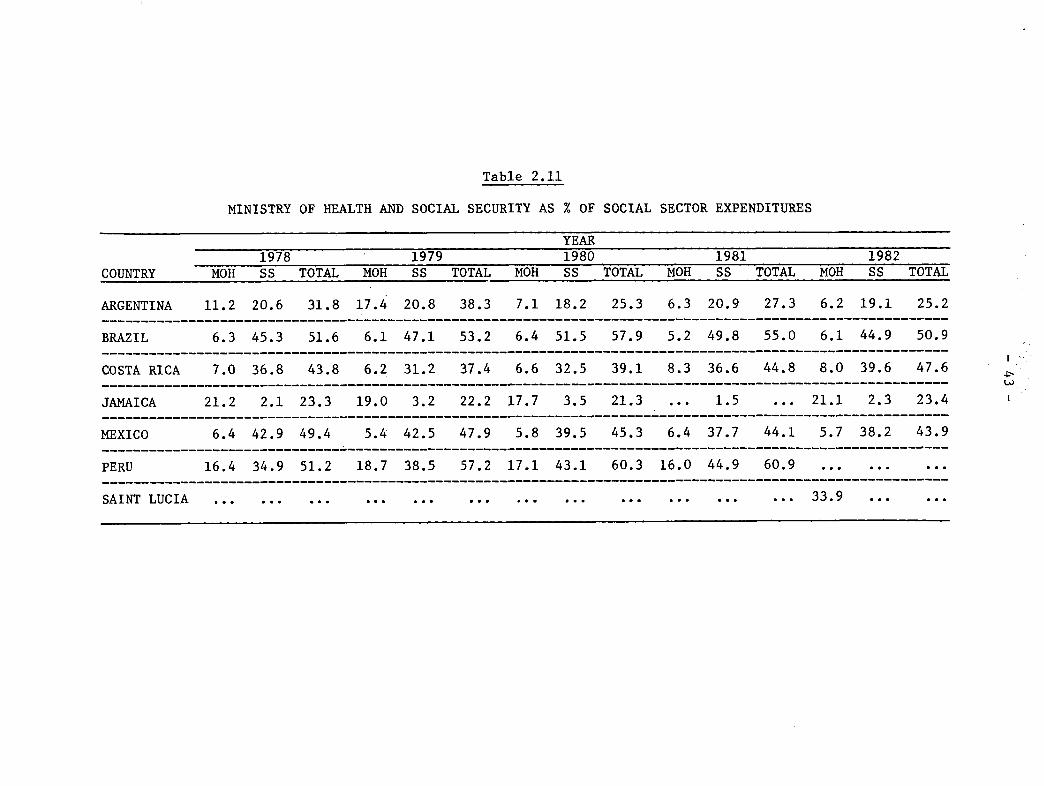
COUNTRY
ARGENTINA
BRAZIL
COSTA RICA
JAMAICA
MEXICO
PERU
Table 2.11
MINISTRY OF HEALTH AND SOCIAL SECURITY AS % OF
YEAR1978 1979 1980
MOH SS TOTAL MOH SS TOTAL MOH SS
11.2 20.6 31.8 17.4 20.8 38.3 7.1 18.2
6.3 45.3 51.6 6.1 47.1 53.2 6.4 51.5
7.0 36.8 43.8 6.2 31.2 37.4 6.6 32.5
21.2 2.1 23.3 19.0 3.2 22.2 17.7 3.5
6.4 42.9 49.4 5.4 42.5 47.9 5.8 39.5
16.4 34.9 51.2 18.7 38.5 57.2 17.1 43.1
SOCIAL SECTOR EXPENDITURES
1981
1981TOTAL MOH SS TOTAL
25.3 6.3 20.9 27.3
57.9 5.2 49.8 55.0
39.1 8.3 36.6 44.8
21.3 ... 1.5 ...
45.3 6.4 37.7 44.1
60.3 16.0 44.9 60.9
MOH
6.2
6.1
8.0
21.1
1982SS TOTAL
19.1 25.2
44.9 50.9
39.6 47.6
2.3 23.4------- ------ - --
5.7 38.2 43.9
... . . ....
I
P---I__
___I__
.__
SAINT LUCIA ......... ...... ......... ......... ... 33.9 ... ...--------------------------------SAINT LUCIA ... ... ... ... ... ... ... ... ... ... ... ... 33.9 . ..
__
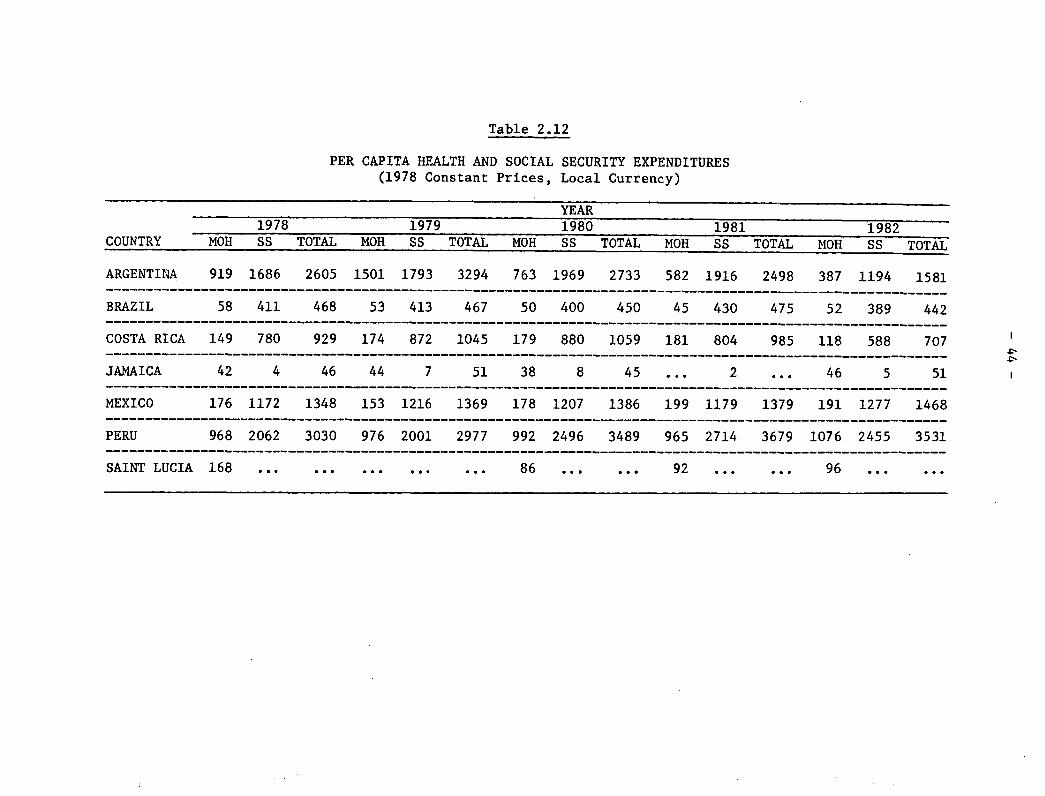
Table 2.12
PER CAPITA HEALTH AND SOCIAL SECURITY EXPENDITURES(1978 Constant Prices, Local Currency)
YEAR1978 1979 1980 1981 1982
COUNTRY MOH SS TOTAL MOH SS TOTAL MOH SS TOTAL MOH SS TOTAL MOH SS TOTAL
ARGENTINA 919 1686 2605 1501 1793 3294 763 1969 2733 582 1916 2498 387 1194 1581
BRAZIL 58 411 468 53 413 467 50 400 450 45 430 475 52 389 442----------------------------------------_________________________________________________________________
COSTA RICA 149 780 929 174 872 1045 179 880 1059 181 804 985 118 588 707
JAMAICA 42 4 46 44 7 51 38 8 45 ... 2 ... 46 5 51
MEXICO 176 1172 1348 153 1216 1369 178 1207 1386 199 1179 1379 191 1277 1468
PERU 968 2062 3030 976 2001 2977 992 2496 3489 965 2714 3679 1076 2455 3531
SAINT LUCIA 168 ... ... .. ... ... 86 ... 92 ... ... 96 ... ...
- 45 -
116. If, as has been illustrated, health care expenditures in thepublic sector are being reduced in a majority of the seven countriesunder examination, how then has this impacted distribution of financialresources within the sector? Have there been any significant changes inpatterns of expenditures, by type of outlay and, if so, to what degree?Once again, it needs to be explained at the outset that few data wereavailable. Even with that limitatiohn, it is important to present whatinformation exists.
117. The majority of disaggregated data dealt with salaries in thevarious ministries of health. While admittedly this is only a partialindication of types of expenditures within the ministries, it does pointto the fact that salaries are a major (and in some instances the major)component of outlays (see Table 2.13). In Jamaica they have remainedaround half of all costs. In Costa Rica, with the exception of 1981,they have accounted for over 50 per cent, peaking in 1982 at 63.5 percent. A similar if not identical, pattern emerges for Mexico. Indeed,as of 1982 salaries for the Mexican health sector climb close to 70 percent of total sector outlays. Only Argentina reveals a generallydeclining and relatively small percentage of ministerial expenses assalaries. This might have been explained by a significant predominanceof capital over recurrent costs. Yet this has not been the case.Recurrent costs ranged from a high of 94.4 per cent of all ministerialoutlays in 1978 to a low in 1982 of 73.3 per cent.
118. A few data were also available on public expenses for hospitalcare. While the information is scarce, it does support the patternswhich have been developed throughout this Chapter. In Costa Rica, forexample, there has been a drop in hospital outlays from a high of overone billion colones in 1980, during the five year period under study, toa low of 663 million in 1982, or a 34 per cent decline. Brazil showsmore stability, with outlay differences ranging only from a low of 57billion cruzeiros to a high of 62 million.
The Private'Sector
119. If, as a rule, public expenditures on health (and social security)as a proportion of social sector spending for the group have beenfalling, what if anything can be said about the ability of the privatesector to help shoulder some of the increased health care burden? Asdata were available for just three countries, and only for 1982 in one ofthem, the question is really unanswerable. It simply needs to be statedhere that the study did attempt to collect data on the private sector asa potentially important component of the entire health care system.

- 46 -
Table 2.13
SALARIES AS PERCENTAGE OF TOTAL HEALTH MINISTRY EXPENSES
COUNTRY
ARGENTINA
'D>A TT
1978 19791978 1979% F-
42.6 20.2
YEAR1980
37.0
19812
36.2
1982
31.3
13LAOA .. . ... ... ... . . .
COSTA RICA 55.0 58.7 59.2 51.1 63.0
JAMAICA ... 51. 1./ 48.8 ... 48.1-/
MEXICO,/ 48.3 53.5 54.0 62.5 67.0
PERU ... 47.5 44.2 48.6 63.5
SAINT LUCIA ... ... ...... ...
a/Calculations based on estimates.
b/Data are for entire Public Health Sector.
~~- - -
=--
-
- 47 -
CHAPTER III. UPDATING SELECTED DATA IN THE BACKGROUND DOCUMENT ONTHE NATIONAL AND INTERNATIONAL FINANCIAL AND BUDGETARY
IMPLICATIONS OF THE REGIONAL STRATEGIES AND THEPLAN OF ACTION FOR HFA/2000
120. In this chapter, selected statistical tables from the "BackgroundDocument on the National and International Financial and BudgetaryImplications of the Regional Strategies and the Plan of Action for HFA2000" will be updated and briefly examined. Because only two years haveelapsed since analysis of the data in the Background Document, it willnot be possible to establish subsequent trend lines documenting changes
since 1979. Nevertheless, useful and important tentative conclusions canand will be made. From the preceding pages, it has been made clear thatof health care financing in Latin America and the Caribbean is notgrowing and, indeed, in many cases is declining in real terms. Based onthe data in the Background Document, published in 1982, optimisticprojections for expanding public health care financing were made. Due to
the economic crisis which soon followed completion of the report, therewas strong concern that the impact on health care would be significant.In terms of the available data, then, has this been the case? Whatfollows is an attempt to answer this question. But once again it isnecessary to caution the reader that findings from the analysis aretentative. More time will have to pass before firm conclusions are ableto be established.
121. In Table 3.1 nine out of 11 countries, for which data were
available for 1981 show that health care expenditures, as a percentage oftotal central government outlays, were smaller in the last year
indicated than in the first year. This is not markedly different from the
data in the Backgound Document which showed that 18 out of 23 nationsreflected a similar pattern. Given the nature of the economic crisis amore accelerated decline may have been anticipated in 1982. However,that is no doubt attenuated by the fact that the crisis did not began tobe felt until during 1981 when most countries were spending funds alreadyappropriated.
122. A more significant and serious indicator, at least for the goalsof primary care and HFA 2000, is the jump in expenditures in the publicsector on hospitals between 1972 and 1979, noted in the BackgroundDocument. However, with the exception of the U.S., four countries in theHemisphere--the only ones for which data were available--registereddeclines in expenditures for hospitals and clinics as a percentage oftotal central government health care outlays as of 1981. Whether or notthis is a change in the previous trend has yet to be established. In themeantime, it is important to keep in mind that a "trend toward increasingproportions of total central government health expenditure to hospitalsand clinics has serious implications for the strategies of primary healthcare and HFA/2000."*
*Pan American Health Organization, XXI Pan American Sanitary Conference,Plan of Action for the Implementation of the Regional Strategies ofHealth for All by the Year 2000. Financial and Budgetary Implications,Document CSP21/21 (Washington, D.C., September 1982), p. 14.
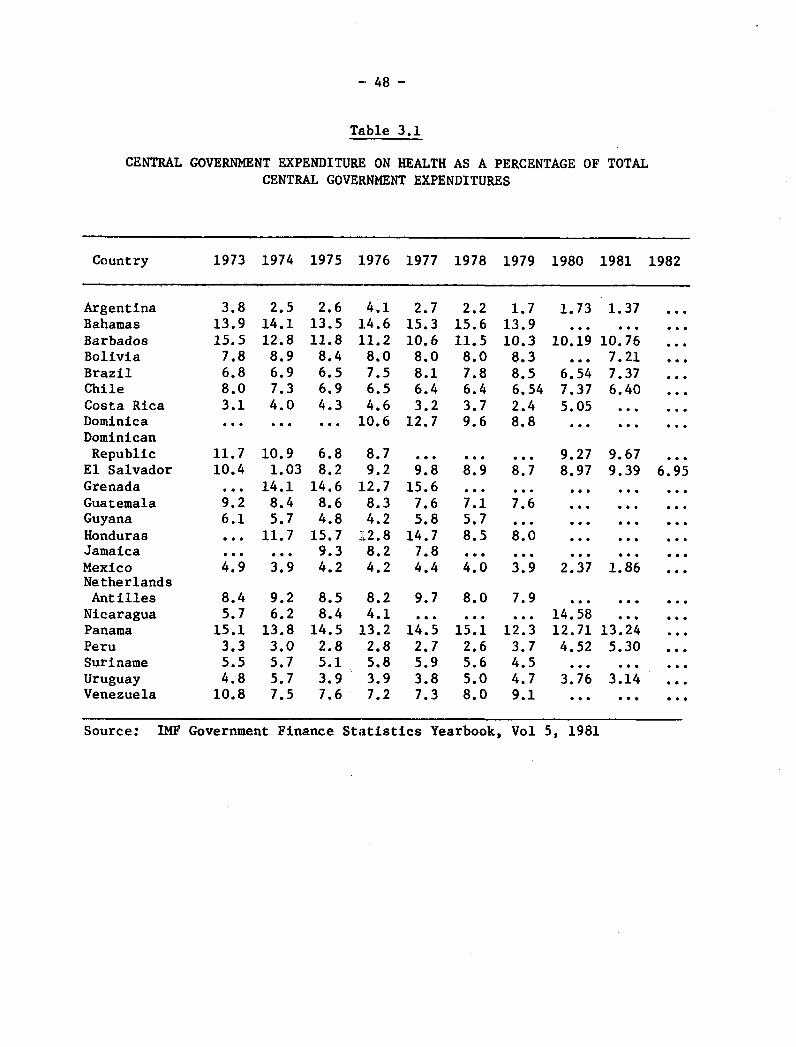
-- 48 -
Table 3.1
CENTRAL GOVERNMENT EXPENDITURE. ON HEALTH AS A PERCENTAGE OF TOTALCENTRAL GOVERNMENT EXPENDITURES
Country 1973 1974 1975 1.976 1977 1978 1979 1980 1981 1982
Argentina 3.8 2.5 2.6 4.1 2.7 2.2 1.7 1.73 1.37 ...Bahamas 13.9 14.1 13.5 14.6 15.3 15.6 13.9 ... ... ...Barbados 15.5 12.8 11.8 11.2 10.6 11.5 10.3 10.19 10.76 ...Bolivia 7.8 8.9 8.4 8.0 8.0 8.0 8.3 ... 7.21 ...Brazil 6.8 6.9 6.5 7.5 8.1 7.8 8.5 6.54 7.37 ...Chile 8.0 7.3 6.9 6.5 6.4 6.4 6.54 7.37 6.40 ...Costa Rica 3.1 4.0 4.3 4.6 3.2 3.7 2.4 5.05 ... ...Dominica ... ... ... 10.6 12.7 9.6 8.8 ...DominicanRepublic 11.7 10.9 6.8 8.7 ... ... ... 9.27 9.67 ...
El Salvador 10.4 1.03 8.2 9.2 9.8 8.9 8.7 8.97 9.39 6.95Grenada ... 14.1 14.6 12.7 15.6 ... ... ... ... ...Guatemala 9.2 8.4 8.6 8.3 7.6 7.1 7.6 ... ... ...Guyana 6.1 5.7 4.8 4.2 5.8 5.7 ... ... ... ...Honduras ... 11.7 15.7 12.8 14.7 8.5 8.0 ... ... ...Jamaica ... ... 9.3 8.2 7.8 ... ........Mexico 4.9 3.9 4.2 4.2 4.4 4.0 3.9 2.37 1.86NetherlandsAntilles 8.4 9.2 8.5 8.2 9.7 8.0 7.9 ... ... ...
Nicaragua 5.7 6.2 8.4 4.1 ... ... ... 14.58 ......Panama 15.1 13.8 14.5 13.2 14.5 15.1 12.3 12.71 13.24 ...Peru 3.3 3.0 2.8 2.8 2.7 2.6 3.7 4.52 5.30 ...Suriname 5.5 5.7 5.1 5.8 5.9 5.6 4.5 ... ... ...Uruguay 4.8 5.7 3.9 3.9 3.8 5.0 4.7 3.76 3.14 ...Venezuela 10.8 7.5 7.6 7.2 7.3 8.0 9.1 ... ... ...
Source: IMF Government Finance Statistics Yearbook, Vol 5, 1981
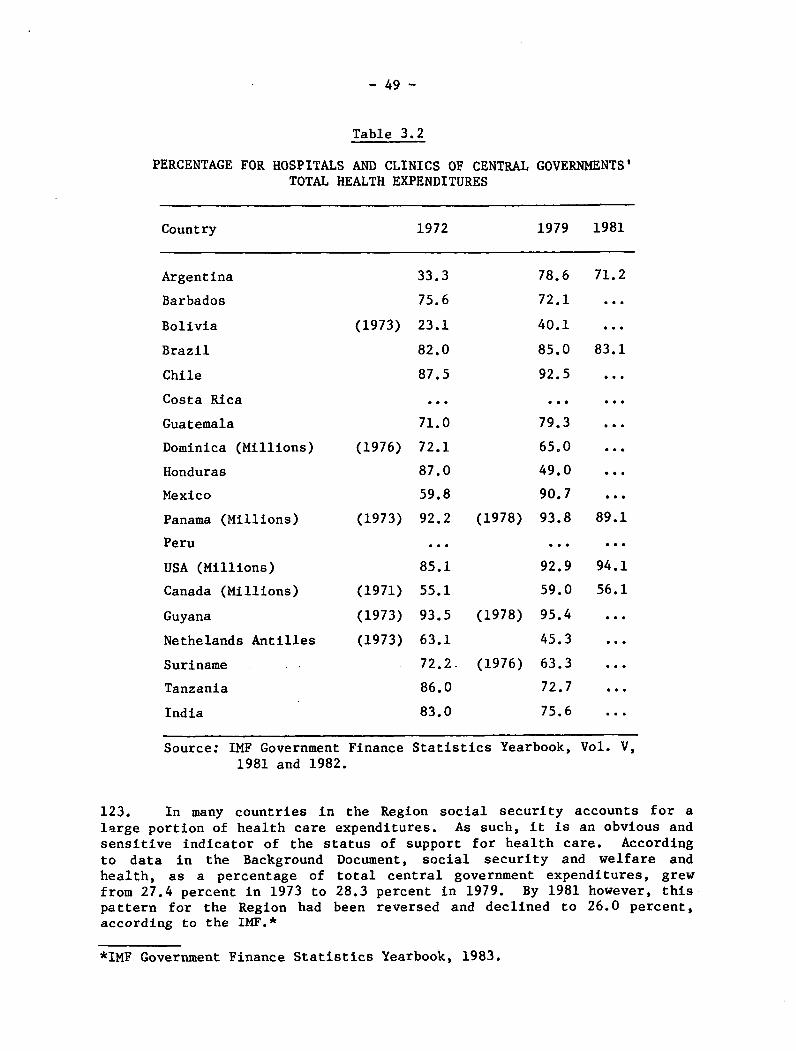
- 49 -
Table 3.2
PERCENTAGE FOR HOSPITALS AND CLINICS OF CENTRALTOTAL HEALTH EXPENDITURES
GOVERNMENTS'
Country 1972 1979 1981
33.3
75.6
(1973) 23.1
82.0
87.5
78.6 71.2
72.1
40.1 ...
85.0 83.1
92.5 ...
Costa Rica
Guatemala
Dominica (Millions)
Honduras
Mexico
Panama (Millions)
Peru
USA (Millions)
Canada (Millions)
71.0
(1976) 72.1
87.0
CA 0
l. .e ee
79.3 ..
65.0 ...
49.0 ...
An 7(1973) 92.2 (1978) 93.8 89.1
(1973) 92.2 (1978) 93.8 89.1
85.1
(1971) 55.1
... ...
92.9 94.1
59.0 56.1
Guyana
Nethelands Antilles
Suriname
Tanzania
India
Source: IMF Government Finance1981 and 1982.
(1973) 93.5 (1978) 95.4
(1973) 63.1 45.3
72.2 (1976) 63.3
86.0
83.0
72.7
75.6
Statistics Yearbook, Vol. V,
123. In many countries in the Region social security accounts for alarge portion of health care expenditures. As such, it is an obvious andsensitive indicator of the status of support for health care. Accordingto data in the Background Document, social security and welfare andhealth, as a percentage of total central government expenditures, grewfrom 27.4 percent in 1973 to 28.3 percent in 1979. By 1981 however, thispattern for the Region had been reversed and declined to 26.0 percent,according to the IMF.*
*IMF Government Finance Statistics Yearbook, 1983.
Argentina
Barbados
Bolivia
Brazil
Chile
...

- 50 -
124. Another set of statistics, however, does not exactly point to whatcould be called an emerging pattern of decreases in health care financingin the public sector, as may be seen in updated figures in Table 3.3.What appears here instead is a mixed picture, certainly in regard to theLatin American and Caribbean nations included in the table. Somecountries show declines in health care outlays. Others show increases.And one--Venezuela--reveals a seesaw effect. Of course, there are toofew data and too few Hemispheric countries to be able to come to any firmconclusion about the region as whole, save to observe that what had beena relatively stable and upward pattern over the past decade now may bechanging. More important is the need to interpet these data in light ofthe rest of the information presented in this Chapter.
125. While it may be expected that some of this decline would becompensated for by increases in private expeditures for health, this hasnot been the case, certainly not with respect to the four nations alreadycited--Honduras, Jamaica, Peru and Venezuela. The data in Table 3.4below show that private consumption expenditures as a percentage of GDP,between 1975 and the last year measured, declined in Jamaica, remainedthe same in Panama and increased only slightly in El Salvador, Hondurasand Venezuela. Nevertheless, given the lack of data on Latin America andthe Caribbean for the years 1980 through 1982, it is not possible to makeany definite statements regarding relevant patterns that are not alreadynoted in the Background Document. As is asserted "...there is still alot of room for the expansion of the public sector to capture a growingshare within the framework of a more effectively organized andefficiently managed public health care delivery system"* (see, forexample, Table 3.5).
126. The Background Document examined patterns of public and privateconsumption expenditure on health as a percentage of GDP. Usingidentical sources, it was impossible to update the information except infour countries, two of which are in Latin America, as may been seen inTable 3.6.
127. While clearly not enough time has lapsed in order to make anyconclusive statements as to current trends, nor are their enough data yetavailable, it is not surprising that the trend from the previous yearscontinues into 1980--except in India--the year before the start ofeconomic crisis. Still, as has been evidenced on preceding pages, theoverall picture is one of what appears to be the beginning of a generaldecline in health care expenditures.
*Financial and Budgetary Implications, Document CSP21/21, p. 26.
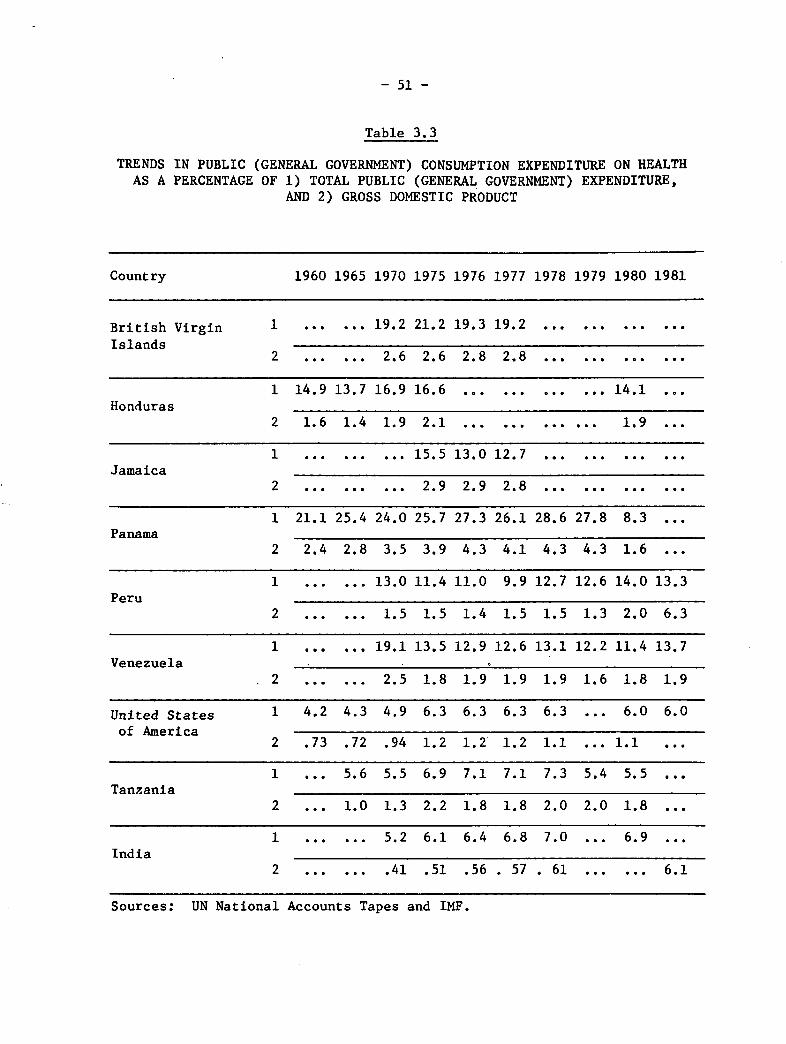
- 51 -
Table 3.3
TRENDS IN PUBLIC (GENERAL GOVERNMENT) CONSUMPTION EXPENDITURE ON HEALTHAS A PERCENTAGE OF 1) TOTAL PUBLIC (GENERAL GOVERNMENT) EXPENDITURE,
AND 2) GROSS DOMESTIC PRODUCT
Country 1960 1965 1970 1975 1976 1977 1978 1979 1980 1981
British Virgin 1 ...... 19.2 21.2 19.3 19.2 ............Islands
2 ...... 2.6 2.6 2.8 2.8 ............
1 14.9 13.7 16.9 16.6 ............ 14.1 ...Honduras
2 1.6 1.4 1.9 2.1 ............ 1.9 ...
1 ......... 15.5 13.0 12.7 ............Jamaica
2 ......... 2.9 2.9 2.8 ............
1 21.1 25.4 24.0 25.7 27.3 26.1 28.6 27.8 8.3 ...Panama
2 2.4 2.8 3.5 3.9 4.3 4.1 4.3 4.3 1.6 ...
1 ...... 13.0 11.4 11.0 9.9 12.7 12.6 14.0 13.3Peru
2 ...... 1.5 1.5 1.4 1.5 1.5 1.3 2.0 6.3
1 ...... 19.1 13.5 12.9 12.6 13.1 12.2 11.4 13.7Venezuela
2 ...... 2.5 1.8 1.9 1.9 1.9 1.6 1.8 1.9
United States 1 4.2 4.3 4.9 6.3 6.3 6.3 6.3 ... 6.0 6.0of America
2 .73 .72 .94 1.2 1.2 1.2 1.1 ... 1.1 ...
1 ... 5.6 5.5 6.9 7.1 7.1 7.3 5.4 5.5 ...Tanzania
2 ... 1.0 1.3 2.2 1.8 1.8 2.0 2.0 1.8 ...
1 ...... 5.2 6.1 6.4 6.8 7.0 ... 6.9 ...India
2 ...... .41 .51 .56 . 57 . 61 ...... 6.1
Sources: UN National Accounts Tapes and IMF.
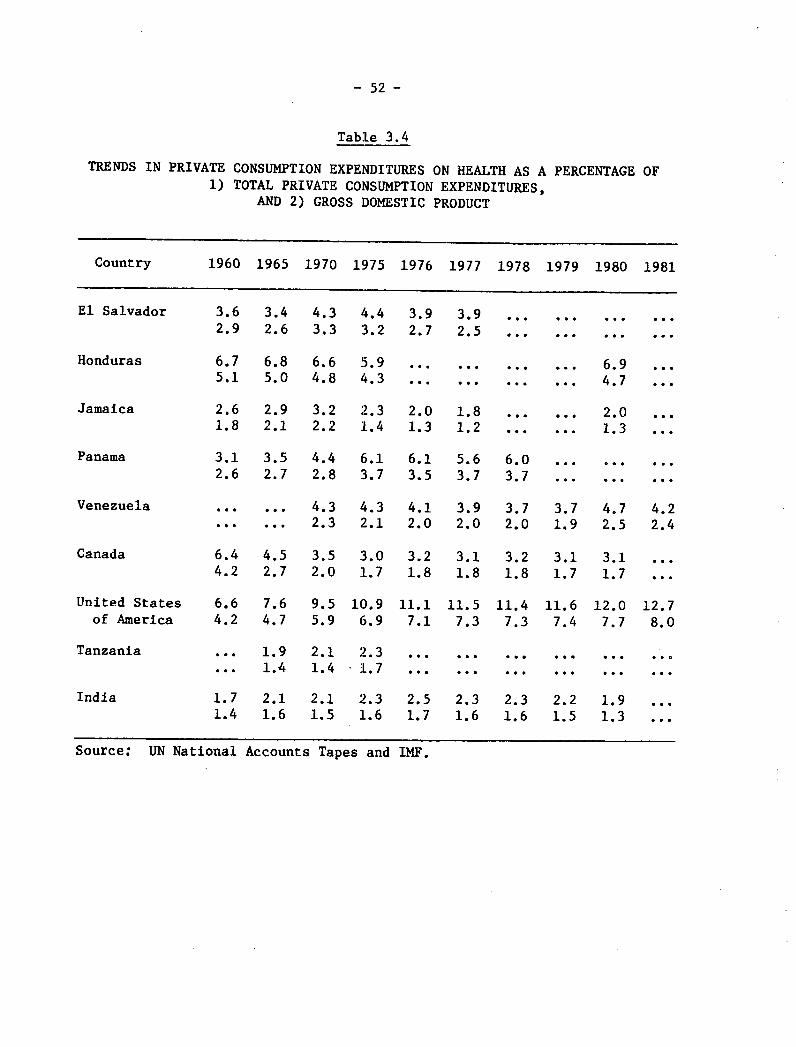
- 52 -
Table 3.4
TRENDS IN PRIVATE CONSUMPTION EXPENDITURES ON HEALTH AS A PERCENTAGE OF1) TOTAL PRIVATE CONSUMPTION EXPENDITURES,
AND 2) GROSS DOMESTIC PRODUCT
Country 1960 1965 1970 1975 1976 1977 1978 1979 1980 1981
El Salvador 3.6 3.4 4.3 4.4 3.9 3.9 ... ... ... ...2.9 2.6 3.3 3.2 2.7 2.5 ... ...
Honduras 6.7 6.8 6.6 5.9 ... ... ... ... 6.9 ...5.1 5.0 4.8 4.3 ... ... .. ... 4.7 ...
Jamaica 2.6 2.9 3.2 2.3 2.0 1.8 ... ... 2.0 ...1.8 2.1 2.2 1.4 1.3 1.2 ... ... 1.3 ...
Panama 3.1 3.5 4.4 6.1 6.1 5.6 6.0 ... ... ..2.6 2.7 2.8 3.7 3.5 3.7 3.7 ... ... ...
Venezuela ... ... 4.3 4.3 4.1 3.9 3.7 3.7 4.7 4.2... ... 2.3 2.1 2.0 2.0 2.0 1.9 2.5 2.4
Canada 6.4 4.5 3.5 3.0 3.2 3.1 3.2 3.1 3.1 ...4.2 2.7 2.0 1.7 1.8 1.8 1.8 1.7 1.7 ...
United States 6.6 7.6 9.5 10.9 11.1 11.5 11.4 11.6 12.0 12.7of America 4.2 4.7 5.9 6.9 7.1 7.3 7.3 7.4 7.7 8.0
Tanzania ... 1.9 2.1 2.3 ... ... ... ... ... ...... 1.4 1.4 1.7 ... ... ... ... ... ...
India 1.7 2.1 2.1 2.3 2.5 2.3 2.3 2.2 1.91.4 1.6 1.5 1.6 1.7 1.6 1.6 1.5 1.3
Source: UN National Accounts Tapes and IMF.

Table 3.5
TRENDS IN PRIVATE CONSUMPTION EXPENDITURE ON HEALTH AS A PERCENTAGE
OF TOTAL PUBLIC AND PRIVATE CONSUMPTION EXPENDITURES ON HEALTH
Country 1960 1965 1970 1971 1972 1973 1974 1975 1976 1977 1978 1979 1980 1981 1982
Honduras 76.1 78.5 71.4 74.5 71.6 73.5 68.7 67.4 ... ... ... ... 70.9 ... ...
Jamaica ... ... ...... . ... 43.4 33.0 32.2 30.0 ...... ... ...
Panama 52.2 49.0 45.2 48.2 49.6 48.9 48.3 48.8 45.3 47.5 46.0 ... ... ... ...
Venezuela ... 47.7 47.9 48.1 55.5 53.4 52.2 51.3 51.8 53.0 ... 63.0 ... ...
USA 85.3 86.8 86.4 85.8 85.6 85.4 85.2 85.3 85.9 86.4 86.5 ... 87.5 ... ...
Tanzania ... 56.9 53.0 51.0 53.2 48.9 44.7 43.0 ... ... ... ... ......
India ... ... 78.7 77.7 77.1 74.9 74.3 70.3 67.7 65.6 63.2 ... 68.7 ... ...
Spain ... ... 81.6 82.7 81.7 80.4 79.4 75.2 73.3 ... ... ... ...
UnitedKingdom 16.4 15.0 15.8 13.6 13.0 12.7 10.7 9.2 8.8 9.0 8.7 ... ... ... ...
Source: UN National Accounts Tapes and IMF.
en
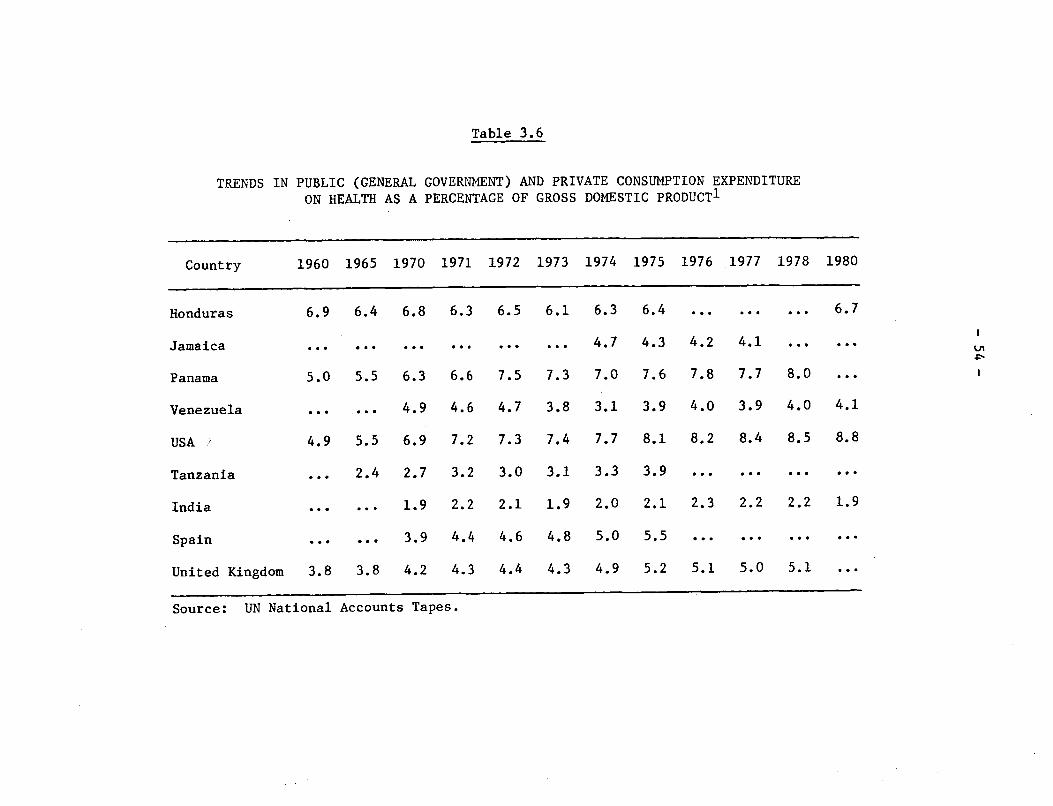
Table 3.6
TRENDS IN PUBLIC (GENERAL GOVERNMENT) AND PRIVATE CONSUMPTION EXPENDITURE
ON HEALTH AS A PERCENTAGE OF GROSS DOMESTIC PRODUCT1
Country 1960 1965 1970 1971 1972 1973 1974 1975 1976 1977 1978 1980
Honduras 6.9 6.4 6.8 6.3 6.5 6.1 6.3 6.4 ... ... ... 6.7
Jamaica ... ...... ... .... ... 4.7 4.3 4.2 4.1 .
Panama 5.0 5.5 6.3 6.6 7.5 7.3 7.0 7.6 7.8 7.7 8.0
Venezuela ... ... 4.9 4.6 4.7 3.8 3.1 3.9 4.0 3.9 4.0 4.1
USA : 4.9 5.5 6.9 7.2 7.3 7.4 7.7 8.1 8.2 8.4 8.5 8.8
Tanzania ... 2.4 2.7 3.2 3.0 3.1 3.3 3.9 ... ... ... ...
India ... ... 1.9 2.2 2.1 1.9 2.0 2.1 2.3 2.2 2.2 1.9
Spain ... ... 3.9 4.4 4.6 4.8 5.0 5.5 ... ... ... ...
United Kingdom 3.8 3.8 4.2 4.3 4.4 4.3 4.9 5.2 5.1 5.0 5.1 ...
Source: UN National Accounts Tapes.
en
- 55 -
128. Another set of indicators used in the Background Document whichhas been updated here is the series of trends in private consumptionexpenditures on selected consumer items as a percent of all privateconsumption outlays and as expressed in current prices. The BackgroundDocument states that "...there are no clear-cut trends in the share ofprivate consumption expenditures devoted to health,"* as revealed in thedata en Table 3o7. The updated information and conclusion are littlechanged from the 1982 report. The picture of societies spendingrelatively little on health, certainly in comparison to combinedexpenditures for such "anti-health" items as alcohol and tobacco,continues unabated from 1960. It is interesting to note, however, thatin the most developed nation, the U.S., relative private expenditure onhealth is much higher than in the rest of the countries. Yet in Hondurasa similar pattern emerges, while in Canada the proportion of privateexpenses on health is very small. Once again, the pattern is confusingand not open to facile analysis.
129. So far the examination has focused on health care expenditures asa measure of the status of health care financing in Latin America. Thereis a different type of measure which needs to be mentioned, the debtstructure. Little has changed, at least for the better, since theBackground Document was published. As may been seen in the table below,the largest change has been in the drop in the percentage of concessionalloans, as a component of the debt structure, along with a substantialincrease in grant elements. What was stated in the Background Documentin 1982 holds true more than ever today; that the changed terms of thedebt since 1971, exacerbated in 1982, "...highlight the Region'svulnerability and [make it] potentially the biggest detriment to theplacement of health sector loans."** Such a situation is obviously ofmajor importance to the affected countries. As revenues, especially inthe public sector, decline, as the result of crushing external debt andhigh inflation, there will be increasing pressure to reduce public sectorexpenditures. What the eventual impact will be on the health sector canonly be surmised at this point, other than to speculate that the presentsituation does not augur well for public sector programs based on theneed for high-cost investment.
*Financial and Budgetary Implications, CSP21/21, p. 29.**Ibid., p. 38.
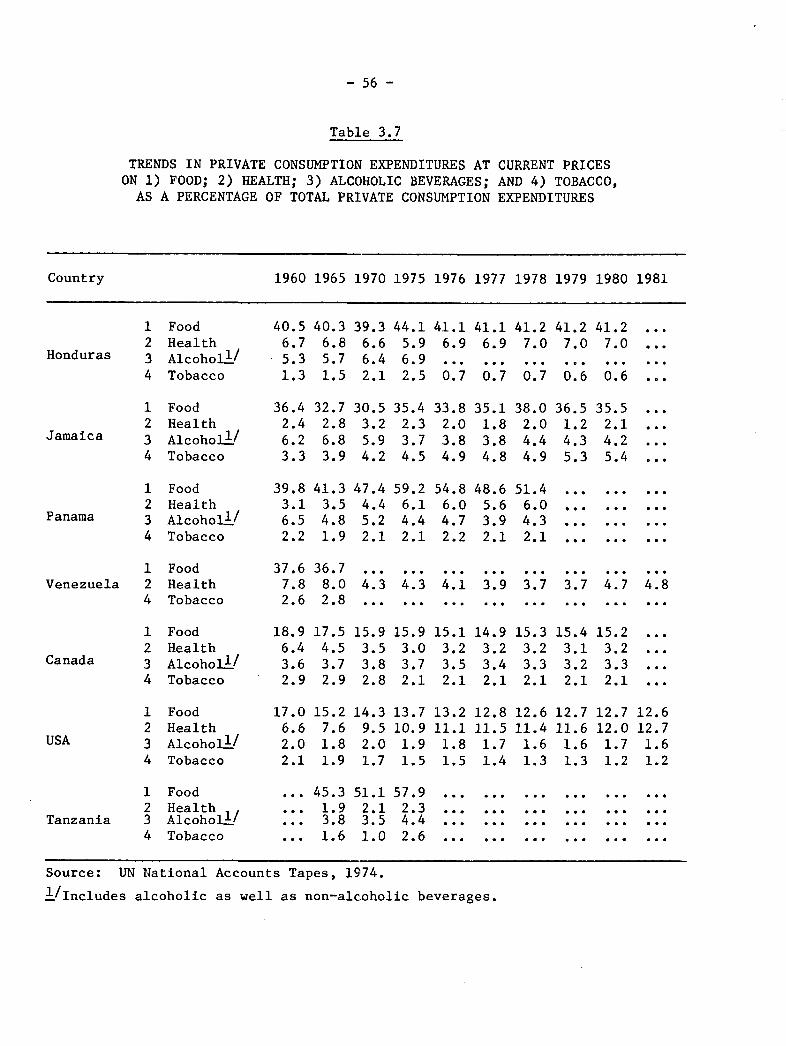
- 56 -
Table 3.7
TRENDS IN PRIVATE CONSUMPTION EXPENDITURES AT CURRENT PRICESON 1) FOOD; 2) HEALTH; 3) ALCOHOLIC BEVERAGES; AND 4) TOBACCO,AS A PERCENTAGE OF TOTAL PRIVATE CONSUMPTION EXPENDITURES
Country 1960 1965 1970 1975 1976 1977 1978 1979 1980 1981
12
Honduras 3
4
Jamaica
Panama
1234
1234
FoodHealthAlcoholS/Tobacco
FoodHealthAlcohol /Tobacco
FoodHealthAlcoholS/Tobacco
Venezuela
Canada
124
1234
FoodHealthTobacco
FoodHealthAlcohol /Tobacco
37.67.82.6
18.96.43.62.9
36.78.02.8
17.54.53.72.9
4.3
15.93.53.82.8
4.3 4.1 3.9 3.7 3.7 . .84.3 4.1 3.9 3.7 3.7 4.7 4.8... ... · .e ... ... e ...
15.93.03.72.1
15.13.23.52.1
14.93.23.42.1
15.33.23.32.1
15.43.13.22.1
15.23.23.32.1
USA
1234
12
Tanzania 34
FoodHealthAlcoholl/Tobacco
FoodHealthAlcoholl/Tobacco
40.56.75.31.3
36.42.46.23.3
39.83.16.52.2
40.36.85.71.5
32.72.86.83.9
41.33.54.81.9
39.36.66.42.1
30.53.25.94.2
47.44.45.22.1
41.27.0
0.7
38.02.04.44.9
44.15.96.92.5
35.42.33.74.5
59.26.14.42.1
41.27.0. . .
0.6
36.51.24.35.3
41.16.9
0.7
33.82.03.84.9
54.86.04.72.2
41.27.0. ..0.6
35.52.14.25.4
41.16.9
0.7
35.11.83.84.8
48.65.63.92.1
51.46.04.32.1
17.06.62.02.1
15.27.61.81.9
13.710.91.91.5
13.211.11.81.5
12.811.51.71.4
14.39.52.01.7
51.12.13.51.0
12.611.41.61.3
12.711.61.61.3
12.712.01.71.2
45.31.93.81.6
12.612.71.61.2
57.92.34.42.6
Source: UN National Accounts Tapes, 1974.
1/Includes alcoholic as well as non-alcoholic beverages.
. . .
. . .
. . .
. . .
. . .
.. .
.. .
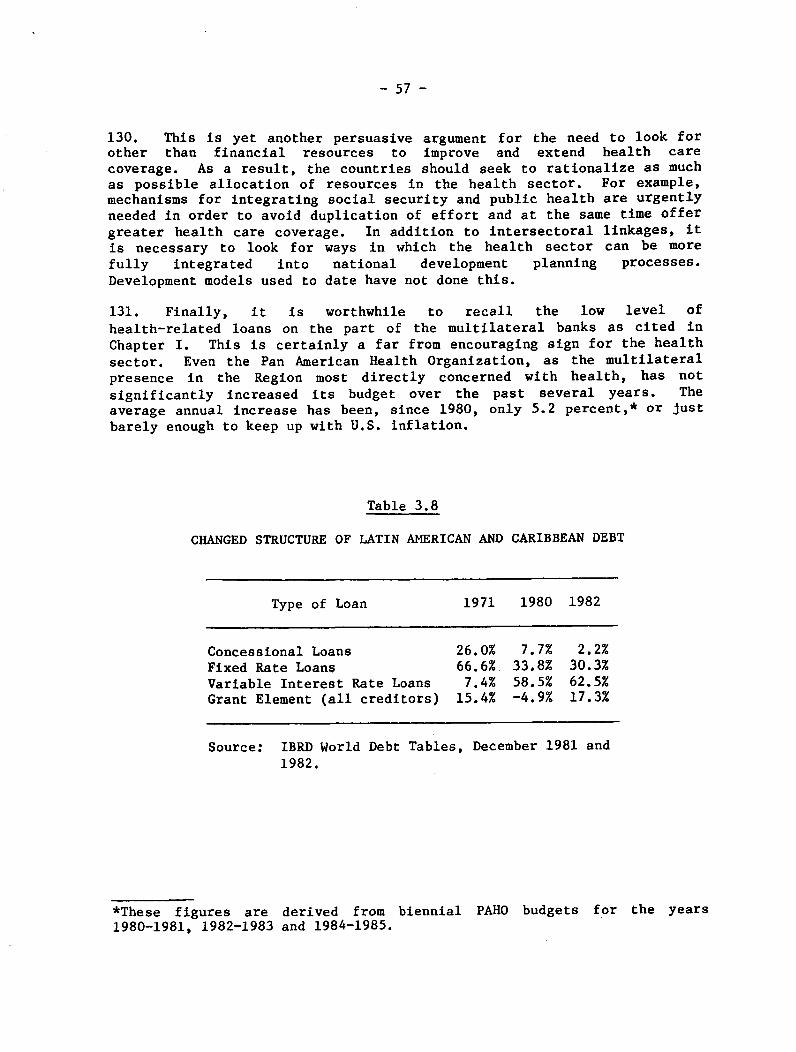
- 57 -
130. This is yet another persuasive argument for the need to look forother than financial resources to improve and extend health carecoverage. As a result, the countries should seek to rationalize as muchas possible allocation of resources in the health sector. For example,mechanisms for integrating social security and public health are urgently
needed in order to avoid duplication of effort and at the same time offer
greater health care coverage. In addition to intersectoral linkages, it
is necessary to look for ways in which the health sector can be more
fully integrated into national development planning processes.
Development models used to date have not done this.
131. Finally, it is worthwhile to recall the low level of
health-related loans on the part of the multilateral banks as cited in
Chapter I. This is certainly a far from encouraging sign for the health
sector. Even the Pan American Health Organization, as the multilateralpresence in the Region most directly concerned with health, has not
significantly increased its budget over the past several years. Theaverage annual increase has been, since 1980, only 5.2 percent,* or just
barely enough to keep up with U.S. inflation.
Table 3.8
CHANGED STRUCTURE OF LATIN AMERICAN AND CARIBBEAN DEBT
Type of Loan 1971 1980 1982
Concessional Loans 26.0% 7.7% 2.2%Fixed Rate Loans 66.6% 33.8% 30.3%Variable Interest Rate Loans 7.4% 58.5% 62.5%Grant Element (all creditors) 15.4% -4.9% 17.3%
Source: IBRD World Debt Tables, December 1981 and
1982.
*These figures are derived from biennial PAHO budgets for the years1980-1981, 1982-1983 and 1984-1985.

- 58 -
CHAPTER IV. CONCLUSIONS AND RECOMMENDATIONS
A. Conclusions
132. There is consensus that the current socioeconomic crisis in Latin
America and the Caribbean is the worst of the last 50 years, more severethan the one which gave rise to the Great World Depression of the
Thirties. There is also a widespread view that some countries havesuffered more than others because of their dependency on developednations and their own domestic policy adjustments.
133. In addition, most experts blame the crisis on essentiallystructural causes aggravated by short-term factors associated with
domestic adjustment policies and measures, as well as simultaneousrecession and inflation in some of the developed countries. In othercases, the crisis stems from noneconomic domestic problems, particularlyinternal and international warfare.
134. The macroeconomic characteristics briefly reviewed in Chapter I
indicate the range of contributing causal factors, showing how causes andeffects have been joined, even if they have been treated separately foranalytical purposes. Somewhat similar is the dichotomy sometimessuggested to exist among factors involved in the overall developmentprocess, some of which are social or economic, but all so closelyinterrelated that it has been necessary to pay special attention to the
former for purposes of this document, in order to lay a firm foundationand provide a clear frame of reference for determining their possiblesocial and even political repercussions.
135. It is anticipated that for the rest of the first half of thisdecade the socioeconomic crisis will continue, and there are factors thatcould make it even worse, some of them entirely beyond the power of theLatin American and Caribbean countries to control within their ownborders.
136. On the basis of the work of the ECLA Economic Projections Center,
this situation may be expected to worsen if the decline of per capita GDP
of the last three years persists in 1984. It is worth remembering that
the Regional average per capita GDP declined US$10, or 0.9%, in 1981;US$32, or 3.3%, in 1982; and USt54, or 5.6%, in 1983.
137. If conditions were to exist for a firm recovery of the LatinAmerican and Caribbean national economies by an increase in GDP of at
least 5-6% a year in the second half of the decade - which would dependon internal as well as external factors - ECLA considers that theRegional per capita GDP would rise in 1990, in the optimistic projection,
to the same level as in 1980, which means that 10 years of developmentwould have been lost.
- 59 -
138. The demographic predictions are based on a natural populationincrease of 2.5% a year for the rest of the decade, and of 2.0% a yearduring the Nineties. If GDP were to rise between 5% and 6% a year, theresult would be a net increase in per capita GDP of between 2.5% to 4.0%,respectively.
139. However, in order to provide employment opportunities not only forthose entering the labor market for the first time, but also for many ofthose already in the labor market who are unemployed or underemployed,faster growth of the economy is needed, which the ECLA EconomicProjections Center estimates at not less than 7.0% a year.
140. Impediments to the achievement of full employment of theeconomically active population have a negative impact on both the economyas a whole and on the financing of social security programs, which dependfor their income on contributions from workers, employers and thegovernment.
141. Many of the young people who today have no access to employment inthe formal sector enter the informal employment sector, and thereby donot contribute to support of social security institutions whose growthwould thus be slowed, along with that of some of their benefits,particularly for the aged. Having no formal employment, those working inthe informal sector are not covered by labor insurance, which providespreventive and curative health services to workers and their immediatefamilies.
142. Another damaging effect of the socioeconomic crisis, caused byinterntional reserve restrictions in many countries and by those imposedon the importation of goods and services, has been the curtailment of theacquisition of medicines and drugs abroad, reducing the stock of importedgoods in many countries and impeding maintenance of vehicles andequipment requiring foreign replacement parts.
143. Priority has been given to service on the external debt,regardless of whether or not that obligation is covered by the provisionsof the standby agreements which most of the countries in the Region haveentered into with the International Monetary Fund. This service on theforeign debt has consumed a high proportion of export earnings in manycountries. Moreover, in the last 18 months of 1982-1983 export earningshave become the main source of foreign exchange, now that the flow ofcapital into the countries of Latin America and the Caribbean has droppedso substantially.
144. Internal adjustments required under the standby agreements alsoinclude conventional monetary and fiscal measures to reduce aggregatedemand and expenditures from the treasury and decentralized publicagencies. Fiscal austerity programs usually reduce a large proportion of
-- 60 -
public investment and, to avert social problems, give priority tosalaries; as a result, a high percentage of budgets goes for fixedexpenditures for the payment of wages and salaries and for adjustmentsmade in response to the demands of trade unions to prevent major lossesof the purchasing power of real wages, particularly in countries withhigh and structured inflation.
145. Provisions are also favored which would make exports of the LatinAmerican and Caribbean countries more competitive on foreign markets. Tothis end, one internal adjustment measure promotes the devaluation ofnational currencies regarded as overvalued. Sooner or later, however,this has a ripple effect resulting in, among others things, changes inthe prices of imported goods.
146. As the currencies of many countries have steadily lost value -either abruptly or through frequent mini devaluations - their economieshave become "dollarized." Although local currency is still legal tender,it is only used in transactions of little importance and small amounts,while for others the prices are set and revised in terms of parity to theUnited States dollar. Examples include the purchase and sale of propertyand vehicles, setting of rental rates, and for production and servicecontracts.
147. Many internal adjustments, such as the increase of export volumes,have been neutralized by external adjustments which, as they are madeoutside their sphere of influence, are beyond the control or reach of theless developed countries. This continues to happen despite all theefforts they have made to gain a voice and vote in matters that seriouslyaffect them and to change international agreements governing thosematters.
148. In many other cases these internal adjustments have been guided bypolicies and measures established by such agencies as the IMF, the WorldBank, AID, etc., which giver priority to middle and long-term changesdesigned to reactivate production in agriculture, industry, mining,energy, etc., so as to increase exports or reduce imports and therebyredress or improve the balance of payments of countries and enable themto meet their foreign debt commitments.
149. The funds that the World Bank lends for programs in the socialsectors of countries do not even reach 10% of its total loans, and cometo a mere half of one percent for health, population and nutrition.Loans made by the IDB for health, drinking water and sewerage hardlyexceeded 8% of its total loans in 1981, and reached about 9% during 1982and 1983.
150. Other bilateral agencies, such as AID, beleive there were largeinvestments in the past. But with savings and better internalefficiency, the countries would meet the goal of HFA/2000. Despiteexternal aid, the countries have still had many financial andadministrative problems.
- 61 -
151. The view is fairly widespread in many international financing andtechnical-financial collaboration agencies that the health sector is notwell managed and needs substantive improvements to become effective,efficient to attain the goals of primary care by making rational use ofalready available resources, such as highly qualified professionals whorecevied their basic or specialized training abroad. Coordination amongthe operations of the various institutions comprising the health sector,including private sector, also needs to be achieved.
152. In some countries conventional medical practices still prevail or,in the best of cases, parallel efforts to make changes according to thespirit of the goals of HFA/2000. There are some who consider that if thehealth sector wants more external financing for its investments, it mustfirst generate savings and make better use of the resources alreadyallocated to it. External financial support has to be seen as acomplement and not a substitute for internal efforts to achieve greaterorganization.
153. In other cases, a gap has existed between high-quality medicineavailable to a minority of the population and a simplified medicine onwhich most of the population must rely, which runs counter to theStrategies of Health for All by the Year 2000.
154. Some resources are being used inefficiently; others are entirelywasted. Savings in some nonpriority programs and activities would resultin additional resources for primary health care.
155. In addition, less and less international and domestic financing isavailable for new investments in physical infrastructure and forprocurement and maintenance of equipment and vehicles for health for tworeasons: a) because it is felt that enough has been spent on such goodsin the past, indeed more than could be fully and efficiently and inrelation national development levels; b) because international agenciesfor multilateral and bilateral financing and collaboration now have lessresources with which they can work. In addition, they give higherpriority to financing of so-called "production" sectors of the economy onthe premise that these contribute to recovery faster in the short run.
156. The trend toward reduction of support for social expenditures as apercentage of total public budgets is not' restricted to the lessdeveloped countries alone, but is also true of some of the moreindustrialized countries.
157. Information from the study of seven Latin American and Caribbeancountries suggests as yet ill-defined trends. Nor is it possible to saywith precision what effects the social and economic crisis from 1981 to1983 has had on the national financing of social programs, those forhealth in particular.
- 62 -
158. Because there were relatively few social, political and economicchanges in the Region over the two year period updating the previousstudy, new trends have yet to be firmly established.
159. What can be concluded is that there is nothing in the short-termto justify any expectation of improvement in the negative developmentsalready identified. Hence, use of projections based on previous years,when in most countries sustained economic growth permitted relativelygenerous allocations to social sectors, could lead to erroneousinterpretations or false expectations of what could happen in the future.
160. A realistic view of the crisis by those in the social sectors,will make them better able to prepare for and deal with it. In thedecision-making process, real knowledge of problems improvespossibilities for solving them in a timely fashion. This is aresponsibility that falls essentially on the individual country, and newways should be found for overcoming the crisis in a spirit of regionaland international cooperation.
161. Efforts to acquire the economic and financial data in the sevencountries shows that, owing to the very specialized nature of thesubject, which has been the exclusive province of other agencies and notthose dealing with health sector, this sector is placed in a weakposition for compiling, processing and analyzing such data. However, itis on the basis of these data that plans and programs are formulated and
budgetary allocations and external financing decisions made. They alsoform the foundation for guiding formulation and evaluation of policies
based on monitoring and evaluation of actual activities.
162. Many health sectors have not participated effectively in thenational planning process, and their relations with the central planningagencies, the ministries of the treasury or finance, and central banksare, with few exeptions, tenuous. This hampers institutional relations.As a result, other agencies know few details of the work done in. thehealth sector. This impedes more effective intersectoral coordination.
163. Moreover, in many countries of the Region the different publicinstitutions that should be coordinated with the health sector continue
to function independently, making intersectoral realtions difficult.
164. From the information available on the seven countries it is
evident that the respective status of health care expenditures varieswidely, according to the several measures used.
165. Definite and consistent trends are apparent only in Argentina andCosta Rica, but they are, unfortunately, negative in both cases. For the
other countries, however, it may be concluded that the relationshipbetween health expenditures and GDP also varies as a result of decisionstaken at the national level. Because of this, the socioeconomic crisishas had different repercussions from one country to another, and atdifferent times during the years considered.
- 63 -
166. It is possible that countries which had previously made largerinvestments in health infrastructure had been able to deal moreeffectively with crisis and its repercussions.
167. It also seems, for other countries, that the period from 1978 to1982 was one of transition, and that the real effects of the crisis willprobably emerge more clearly in the years ahead, possibly in 1987 and1988.
168. The updating of data for all the Region demonstrates that, ingeneral, there has been no significative change for the countries as awhole regarding financing of health programs, even though in the majorityof them a decline in those expenses has occurred in relation to totalgovernment outlays. Further details on those figures are presented inChapter III which represents an updating of the information contained inthe document presented to the Subcommittee on Long-Term Planning, to theExecutive Committee and to the Pan American Sanitary Conference in 1982.
169. A reduction in financing of public health hospitals has occurredwhich could be positive for HFA/2000, if this means a change inorientation toward financing of primary health.
170. As to concessionary loans, there was a significative decrease, butdonations to countries for general activities increased.
171. It has not been possible to calculate projections nor to establishfuture trends for all the Region, as insufficient data were available forthe years 1983-1984. Within the list of information which was requestedfrom the seven countries (see Annex II), projections for the years1984-1987 had been included. Unfortunately, the data were unavailable.
172. Acquisition of the information for the "social sectors," referredto in Resolution XX, has also had its limitations; first, beacuse of thevariety of standards used to determine what constitutes a definition of"social." Some countries have included education, health, labor, socialsecurity, drinking water and sewerage, housing and social welfare. Inothers, the definition is narrower, and housing and drinking water andsewerage are included in either infrastructure or economic sectors,espeically housing which is frequently subsumed under economic sector.
173. Financing for housing has suffered a significant set back as aresult of the crisis, since the latter has sent interest rates soaringand made it difficult to obtain credits for programs whose finaicialrecuperation is a long term proposition, somehwere between 10 and 20years.
174. In the countries where the government or public institutions haveundertaken important low income housing programs, the difference betweenthe costs of real interest which they have to pay for foreign credits and

- 64 -
lower subsidized rates charged to borrowers, has been covered byresources and charged off as a social-financial cost. When standbyagreements have been neogotiated and sogned with the IMF, it has beennecessary to adjust interest rates to real levels, eliminating subsidiesand adding carrying and administrative costs. This has made it verydifficult for borrowers to service their debt. The lack of new softloans makes it difficult for important social programs to be continued,but does allow for generation of new employment and use of high gradenational raw materials
175. Another aspect which exacerbates financing of low income housingprograms is the high rate of inflation in so many of the countries in theRegion, which distorts the relationship between fixed wages and salaries,on the one hand, and interest rates and mortagage terms on the other Inmany cases such costs constitute the major family expense for low andmiddle income people, when it should never exceed more than 10 or 20percent of family income.
B. Recommendations
176. Analysis of available data in this study shows that futurefinancial resources for the health sector may not even reach 4 percent ofGDP, which, under different conditions, was felt to be a reasonablefigure in the 1982 document. This may be due to the presentsocioeconomic crisis and in the face of projections of what will happenthroughout the rest of the decade, as was indicated in the optimistichypothesis, i.e., that in 1990 the per capita GDP will be the same as in1980.
177. This evidently may have a negative impact on the proposals of thegovernments to achieve HFA/2000. For if resources available to thehealth sector are reduced, there is the clear and present danger of acorresponding reduction in health services. Hence, recommendations whichcan be made according to present judgments are framed according to a setof general principles, which provide a greater understanding of theavailability and optimal utilization of human, financial, and physicalresources.
It is recommended:
a) To conduct an analysis in each of the countries of availableresources in the health sector. These studies should be thedirect responsibility of the governments and their healthinstitutions.
b) To review different forms of financing of national healthservice systems in each country, including the public and privatesectors, in order to improve efficiencies, effectiveness andequity.
- 65 -
c) To analyze the utilization of resources in terms ofcost-effectiveness and productivity, by institution and nationalprogram. Productivity and cost analyses should include, amongother things, human capability and technology support.
d) It is necessary to promote intrasecotral improvements in orderto allow the different health institutions to coordinate moreeffectively their programs and activities, including those withprivate entities which belong to the national health system.Community pariticipation should also be encouraged in the effortto achieve HFA/2000.
e) Intersectoral coordination should be improved in order toobtain the most efficient use of national resources and satisfynational development goals, as well as to integrate moreeffectively activities of institutions working toward similarsocial goals. It is therefore recommended that the mechanisms befound to promote this kind of intersectoral coordination accordingto conditions in and characteristics of each country.
f) To improve the management of the different institutions whichcomprise the health sector, placing emphasis on information andfinancial management, with the purpose of improving nationalpolicies, plans and programs, especially on the basis ofinformation gained through evaluations and monitoring.
g) It is critical to promote, in addition, greater integration ofthe health sector within the national development planningprocess, providing fresh views in order to alter present theories,methods and practicing of planning.
APPENDIX I
TENTATIVE INFORMATION THAT THE STUDY GROUPS SHOULD OBTAIN,IN THE SEVEN SELECTED COUNTRIES
1. The actual plan for health, officially approved for 1983;
2. Short, medium and long term objectives of such plans as specifiedin detail in official documents, for example, in the National Plan ofDevelopment or in the health-sectoral plan;
3. Public budget assigned to the health sector for 1983, broken downby destination and origin for the ministry of health, and other publicinstitutions decentralized by regions/parishes and functions;
4. Public budget assigned to other social sectors, such as education,labor, housing, etc. for 1983, broken down by destination and origin forthe respective ministry other public institutions decentralized byregion/parish and functions for each of those sectors;
5. Resources of the private sector assigned to health in 1983,indicating destination and origin of the resources;
6. Chronological information, historic and prospective for the
1978-1987 period for: Gross domestic product in absolute figures and aspercentage of growth in relation to the base year (1978 = 100 percent);total expenditures for 1978-1982 and projected for 1983-1987 for the
miu4stry of health and broken down: in current and capital expenditures,in absolute numbers and as percentage of increase in relation to the baseyear (1978=100 percent); total expenditures for 1978-1982 and project for1983-1987 for the public agency for social security broken down in:recurrent and capital expenditures, in absolute figures and as percentageof increase in relation to the base year (1978=100 percent); retail priceindexes as percentage of increase in relation to the base year (1978=100percent) for 1979, 1980, 1981 and 1982 and a projection for 1983-1987;
7. Observed trends and projections for the sectoral distribution ofrecurrent expenditures of the public sector during the 1978-1987 period,in absolute figures in dollars and as percentage of distribution of thetotal of the respective year. Breakdown in three big groups of sectors,*social, economic, and infrastructure, and within each one of these groupsby the divisions that will take place in the respective country, forexample health, education, labor, housing, etc., for the social; farmingand animal husbandry, mining, industry, hunting and fising, forestry,etc., for the economic; and construction, transportation; energy, etc.,for the infrasture sector;
APPENDIX IPage 2
8. Trends (1979-1982) and projections (1983-1987) for the recurringspending distribution of the Health System during the period 1978-1987,in absolute terms and s a percentage of the total distribution for therespective year. Information should be divided by public and privateinstitutions,* indicating in the former case the institutions that formpart of the central government, and separately, the ones that areterritorially and functionally descentralized;
9. Observed trends and projections one for the distribution of thehealth system's expenditure during the 1978-1987 period in absolute termsand as percentage of the total distribution of the respective year.Breakdown the information by entities:* public and private, indicatingin the first group the one that are from the central government and inthe other group the ones the decentralized, entities, by function andterritory;
10. Trends and projections for the distribution of the health system'sexpenditures during the 1978-1987 period, in absolute terms and aspercentage of distribution of the total of the respective year.Breakdown that information in the same way as indicated in No. 9 above,starting with the*;
11. Financing sources of the entities of the national health system,in thousands of dollars during the 1978-1982 period and in the projectionfor 1983-1987, breaking down for each year the part coming from thegovernment budget, form social security quotas, from services providedand other income. Breakdown the information in two grupos*: publicsector and private sector, giving for the first one details for centralpublic entities: ministries of health and decentralized functionally andterritorial, with a breakdown of each;
12. Structure of the expenditures of the entities of the nationalsystem of health, as tendency of the evolution observed and one expectedfor 1978-1987, in the same way as it was requested for other pointsbefore, for the constituent of the hole health system, in thousands ofdollars. Breakdown the expenditure for personnel, construction,maintenance of equipment and buildings, medicines and drugs for eachyear. Also breakdown the information as indicated in No. 11 startingfrom the asterisk on page 1;
13. Tendency of the evolution of the expenditures of the entities ofthe national health system during the 1978-1982 period and the porjectionfor 1983-1987 for drugs and medicines, breaking down the informationdepending on the national or international origin and to the cost inthousand of dollars; breakdown that information by sectors, public andprivate and within the first one by entities that form it;

APPENDIX IPage 3
14. Tendency of the evolution of the expenditures of the entities ofthe national health system during 1978-1982 and the projections for1983-1987, for expenditures of investment as per space distribution:central, metropolitan, other urban and rural areas.
APPENDIX II
OFFICIALS PARTICIPATING IN THE STUDY
A. Nationals
Argentina Costa Rica
Olga NirembergAbraam Sonis
Brasil
Sol6n Magalhaes ViannaLucia Pontes de M. BaptistaSergio Francisco Piola
Humberto Aguilar ArroyoCarlos Luis Marin MoraRodrigo Meneses Castro
Mexico
Daniel Gutierrez PailletMargarita Ochoa de Mendoza
Peru
Antonio Aires SicherioMaria Esther Perez L6pezJuan Manuel SoteloFelix Vallena Sicherio
B. Pan American Health Organization
Mario BoyerPeter R. CarrFrancisco CastroLee M. HowardWilb4rg Jimenez-Castro*Robert S. LandmannFrancisco Cruz B. L6pez
Philip A. MusgroveLuis Jorge OsunaNestor Rodriguez CampoamorMark L. SchneiderJose Romero TeruelJuan Carlos Veronelli
*General Study Coordinator.

APPENDIX III
OFFICIALS OF INTERNATIONAL ORGANIZATIONS INTERVIEWED FOR THIS STUDY
Luis Olivos, Deputy Chief, Program Division and Chief of the LatinAmerican and Caribbean Branch, United Nations Fund of PopulationActivities.
Roberto Olivero, Public Administration Program, Department of TechnicalCooperation for Development, United Nations.
Joseph Oyugi, Officer in Charge, Public Administration Training SystemBranch, Public Administration Program, Department of TechnicalCooperation for Development, United Nations.
Juanita Bobbitt, Public Administration Program, Department of TechnicalCooperation for Development, United Nations.
Dragoljub Kauran, Public Administration Program, Department of TechnicalCooperation for Development, United Nations.
Dardo Sagredo, International Adviser, Development Advisory Services,Department of Technical Cooperation for Development, United Nations.
James R. Himes, Chief, Americas Section, Program Field Services Division,UNICEF.
Walter Franco, Technical Officer in charge of health Programs in theUnited Nations Development Program (UNDP).
Toshio SigematSu, Chief, Demographic Statistics Section, StatisticalOffice, Office for Development Research and Policy Analysis, Departmentof International Economic Affairs, United Nations.
Michael Platzer, Department of Technical Cooperation for Development,Unied Nations.
Alan Heston, National Accounts, Section, Statistical Office, Office forDevelopment Research and Policy Analysis, Department of InternationalEconomic Affairs, United Nations.
Julian Bertaux, WHO Liaison Officer, New York.
Vera Kalm, Director, WHO Liaison Office with the United Nations, New York.
APPENDIX IIIPage 2
Carlos Garcfa-Tudero, Interregional Adviser, Department of TechnicalCooperation for Development, United Nations.
Faquir Muhammad, Director Public Administration for Development,Department of Technical Cooperation for Development, United Nations.
Christian Ossa, Chief International Economic Branch, General Analysis andPolicies Division, Office for Development Research and Policy Analysis,Department of International Economic and Social Affairs, United Nations.
Julian G6mez, Secretary of the Committee for Development Planning andAssistant Director, Office for Development Research and Policy Analysis,Department of International Economic and Social Affairs, United Nations.
Alex Cornelissen, External Relations Officer from ECLA to the UnitedNations.
J. Baudot, Direction of Social Affairs. Department of TechnicalCooperation for Development, United Nations.
Gonzalo Martner, Director of the Center for Social Research of Vienna.United Nations.
John R. Moore, Assistant Provost for International Programs, Division ofAgricultural and Life Sciences, Maryland Universtiy.
Richard F. Davis, Professor and Associate to the Provost forInternational Programs, Division of Agricultural and Life Sciences,Maryland Universitiy.
Edward Rizzo, Consultant, Division of Agricultural and Life Sciences,Maryland University.
Jorge Ruiz Lara, Assistant Administrator, Department for Economic andSocial Development, Inter-American Development Bank.
Roberto Mayorga Cortes, Alternate Executive Director, member of theExecutive Board of the World Bank.
Carlos Quijano, Assistant to the Vice President Executive for LatinAmerica of the IBRD (World Bank).
Eduardo Weissner Duran, Director, Occidental Region for the InternationalMonetary Fund.
APPENDIX IIIPage 3
Ricardo Cibotti, Director of the Economic Development division of ECLA(Economic Commission for Latin America).
Andres Bianchi, Economic Development Division of ECLA.
German Rama, Social Development Division of ECLA.
Enzo Faletto, Social Development Division of ECLA.
John Durston, Social Development Division of ECLA.
Eligio Alves, Director of the Center for Economic Projections of ECLA.
Oscar Julian Bardeci, Director of the Latin American Demographic Center(CELADE).
Carmen Arretx, Chief of the Demographic Department of CELADE.
Guillermo Maccio, Officer of CELADE.
Alfredo Costa Filho, Director of the Latin American Center for Economic
and Social Planning (ILPES).
Jorge Israel, Officer of ILPES.
Abraham Horwitz, Consultant to the Pan American Health Organization.
Dwight Johnson, Director of Development Resources, Agency for Interna-tional Development, State Department, Washington, D.C.
Frederick W. Schieck, Agency for International Development, State Depart-ment, Washington, D.C.
Paula Feeney,. Public Health Advisor, Agency for International Development,
State Department, Washington, D.C.
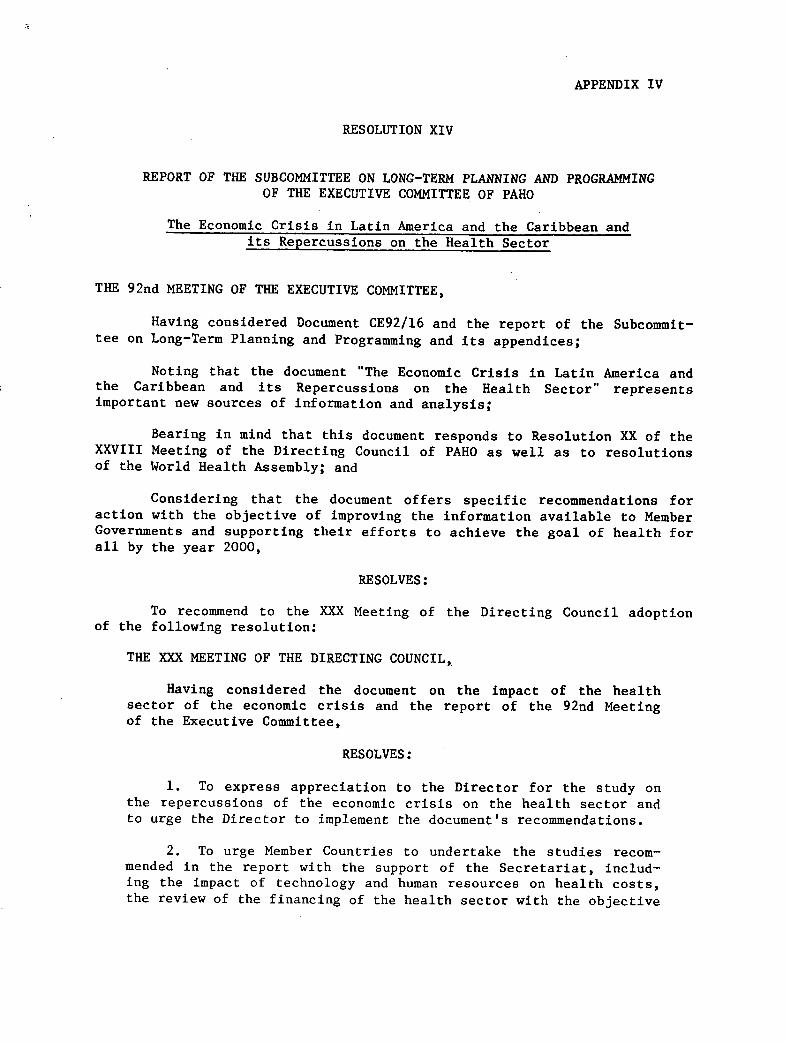
APPENDIX IV
RESOLUTION XIV
REPORT OF THE SUBCOMMITTEE ON LONG-TERM PLANNING AND PROGRAMMINGOF THE EXECUTIVE COMMITTEE OF PAHO
The Economic Crisis in Latin America and the Caribbean andits Repercussions on the Health Sector
THE 92nd MEETING OF THE EXECUTIVE COMMITTEE,
Having considered Document CE92/16 and the report of the Subcommit-tee on Long-Term Planning and Programming and its appendices;
Noting that the document "The Economic Crisis in Latin America andthe Caribbean and its Repercussions on the Health Sector" representsimportant new sources of information and analysis;
Bearing in mind that this document responds to Resolution XX of theXXVIII Meeting of the Directing Council of PAHO as well as to resolutionsof the World Health Assembly; and
Considering that the document offers specific recommendations foraction with the objective of improving the information available to MemberGovernments and supporting their efforts to achieve the goal of health forall by the year 2000,
RESOLVES:
To recommend to the XXX Meeting of the Directing Council adoptionof the following resolution:
THE XXX MEETING OF THE DIRECTING COUNCIL,
Having considered the document on the impact of the healthsector of the economic crisis and the report of the 92nd Meetingof the Executive Committee,
RESOLVES:
1. To express appreciation to the Director for the study onthe repercussions of the economic crisis on the health sector andto urge the Director to implement the document's recommendations.
2. To urge Member Countries to undertake the studies recom-mended in the report with the support of the Secretariat, includ-ing the impact of technology and human resources on health costs,the review of the financing of the health sector with the objective
APPENDIX IVPage 2
of moving toward the fulfillment of the principles of efficacy,efficiency and equity, and the examination of the impact of thecrisis on health sector resources, both public and private, and ontheir distribution and use.
3. To request the Director to continue to examine theinternational economic environment and the impact of changingdevelopments on the health sector, assisting the Member Countriesin their own analyses and reporting to the Governing Bodies anymajor changes in the situation, as appropriate.
(.Approved at the sixth plenary session,27 June 1984)