Download - WHO | World Health Organization
111
1
-
Upload
khangminh22 -
Category
Documents
-
view
4 -
download
0
Transcript of Download - WHO | World Health Organization
1

2
3
ÓWorldHealthOrganizationJuly2020Suggestedcitation:ThirteenthGeneralProgrammeofWork(GPW13):metadataforimpactmeasurementindicators.Geneva:WorldHealthOrganization;2020.
4
TableofContentsIntroduction..................................................................................................................................................................6
Section1:46OutcomeIndicators.................................................................................................................................7Table1.Overviewof46outcomeindicators............................................................................................................8SDG1.5.1Numberofpersonsaffectedbydisasters(per100000population).....................................................12SDG1.a.2Domesticgeneralgovernmenthealthexpenditure(GGHE-D)(%ofgeneralgovernmentexpenditure(GGE)).....................................................................................................................................................................13SDG2.2.1Prevalenceofstuntinginchildrenunder5(%)......................................................................................14SDG2.2.2Prevalenceofwastinginchildrenunder5(%).......................................................................................15SDG2.2.2Prevalenceofoverweightinchildrenunder5(%).................................................................................16SDG3.1.1Maternalmortalityratio(per100000livebirths).................................................................................17SDG3.1.2Proportionofbirthsattendedbyskilledhealthpersonnel(%)..............................................................18SDG3.2.1Under-fivemortalityrate(per1000livebirths).....................................................................................19SDG3.2.2Neonatalmortalityrate(per1000livebirths).......................................................................................21SDG3.3.1NewHIVinfections(per1000uninfectedpopulation)...........................................................................23SDG3.3.2Tuberculosisincidence(per100000population)..................................................................................24SDG3.3.3Malariaincidence(per1000populationatrisk)....................................................................................25SDG3.3.4HepatitisBincidence(measuredbysurfaceantigen(HBsAg)prevalenceamongchildrenunder5years)......................................................................................................................................................................27SDG3.3.5NumberofpeoplerequiringinterventionsagainstNTDs......................................................................28SDG3.4.1ProbabilityofdyingfromanyofCVD,cancer,diabetes,CRD(ages30-70)(%).....................................30SDG3.4.2Suicidemortalityrate(per100000population)....................................................................................31SDG3.5.1Coverageoftreatmentinterventionsforsubstance-usedisorders(%).................................................32SDG3.5.2Totalalcoholpercapitaconsumptioninadultsaged15+(litresofpurealcohol).................................33SDG3.6.1Roadtrafficmortalityrate(per100000population).............................................................................35SDG3.7.1Proportionofwomen(aged15-49)havingneedforfamilyplanningsatisfiedwithmodernmethods(%)...........................................................................................................................................................................36SDG3.8.1UHCServiceCoverageIndex..................................................................................................................37SDG3.8.2Populationwithhouseholdexpendituresonhealth>10%oftotalhouseholdexpenditureorincome(%)...........................................................................................................................................................................39SDG3.9.1Mortalityrateattributedtoairpollution(per100000population)......................................................42SDG3.9.2MortalityrateattributedtoexposuretounsafeWASHservices(per100000population)..................43SDG3.9.3Mortalityratefromunintentionalpoisoning(per100000population)................................................44SDG7.1.2Proportionofpopulationwithprimaryrelianceoncleanfuels(%).......................................................45SDG11.6.2Annualmeanconcentrationsoffineparticulatematter(PM2.5)inurbanareas(μg/m3)..................46SDG3.a.1Prevalenceoftobaccouseinadultsaged15+(%).................................................................................47SDG3.b.1Proportionofpopulationcoveredbyallvaccinesincludedinnationalprogrammes(DTP3,MCV2,PCV3)(%)................................................................................................................................................................49SDG3.b.3Proportionofhealthfacilitieswithessentialmedicinesavailableandaffordableonasustainablebasis(%)...........................................................................................................................................................................50SDG3.c.1Densityofhealthworkers(doctors;nurseandmidwives;pharmacists;dentistsper10000population)................................................................................................................................................................................51SDG3.d.1InternationalHealthRegulations(IHR)capacityandhealthemergencypreparedness........................53
5
SDG3.d.2Proportionofbloodstreaminfectionsduetoantimicrobialresistantorganisms(%)............................54SDG4.2.1Proportionofchildrenunder5developmentallyontrack(health,learningandpsychosocialwell-being)(%)................................................................................................................................................................55SDG5.2.1Proportionofwomen(15-49)subjectedtoviolencebycurrentorformerintimatepartner(%)..........56SDG5.6.1Proportionofwomen(15-49)whomaketheirowndecisionsregardingsexualrelations,contraceptiveuseandreproductivehealthcare(%).....................................................................................................................58SDG6.1.1Proportionofpopulationusingsafelymanageddrinking-waterservices(%)........................................59SDG6.2.1Proportionofpopulationusingsafelymanagedsanitationservicesandhand-washingfacility(%).....61SDG16.2.1Proportionofchildren(aged1-17)experiencingphysicalorpsychologicalaggression(%)................63HealthEmergenciesVaccinecoverageforepidemicpronediseases.....................................................................64HealthEmergenciesProportionofvulnerablepeopleinfragilesettingsprovidedwithessentialhealthservices(%)...........................................................................................................................................................................66WHA68.3Numberofcasesofpoliomyelitiscausedbywildpoliovirus(WPV)......................................................67WHA68.7Patternsofantibioticconsumptionatnationallevel............................................................................68WHA66.10Prevalenceofraisedbloodpressureinadultsaged18+.....................................................................70WHA66.10Effectivepolicy/regulationforindustriallyproducedtrans-fattyacids(TFA)(Y/N)............................71WHA66.10Prevalenceofobesity(%)....................................................................................................................72
Section2:UniversalHealthCoverage(UHC)Billion....................................................................................................73Table2.OverviewofUniversalHealthCoverage(UHC)BillionIndicators.............................................................74UHCBillion:FamilyPlanning...................................................................................................................................78UHCBillion:Pregnancyanddeliverycare...............................................................................................................79UHCBillion:Childtreatment(care-seekingforsymptomsofpneumonia).............................................................81UHCBillion:TuberculosisTreatment......................................................................................................................82UHCBillion:MalariaPrevention.............................................................................................................................84UHCBillion:WaterandSanitation..........................................................................................................................85UHCBillion:Preventionofcardiovasculardisease.................................................................................................86UHCBillion:Managementofdiabetes....................................................................................................................87UHCBillion:Tobacco...............................................................................................................................................88UHCBillion:Hospitalaccess....................................................................................................................................89UHCBillion:HealthExpenditure.............................................................................................................................92AverageServiceCoverage.......................................................................................................................................93
Section3:HealthEmergenciesBillion.........................................................................................................................95Table3.HealthEmergenciesBillionIndicators.......................................................................................................96HealthEmergenciesBillion:EmergencyPrepareIndicator(IHRCoreCapacity).....................................................97HealthEmergenciesBillion:EmergencyPreventIndicator.....................................................................................98HealthEmergenciesBillion:EmergencyDetectandRespondIndicator(Timeliness)............................................99
Section4:HealthierPopulationsBillion....................................................................................................................101Table4.HealthierPopulationsBillionIndicators..................................................................................................102
Section5:HealthyLifeExpectancy(HALE)................................................................................................................104Healthylifeexpectancy(HALE).............................................................................................................................105
Annex1:OutcomeIndicatorsandGPW132023Targets..........................................................................................107
6
IntroductionThe13thGeneralProgrammeofWork(GPW13)setsoutWHO’sstrategicdirection,outlineshowtheOrganizationwillproceedwithitsimplementationandprovidesaframeworktomeasureprogressinthiseffort.IthastakenaccountofthestrategicplansofWHOregionalofficesandhasbeendevelopedincollaborationwiththeRegionalDirectors.GPW13willcovertheperiod2019−2023andwillserveasthebasisforresourcemobilizationandfortheprogrammebudgetsforthebienniums2020−2021and2022−2023.
AttheheartofGPW13arethetriplebilliongoalswhicharetoensurethatby2023:
• Abillionmorepeoplehaveuniversalhealthcoverage• Abillionmorepeopleareprotectedfromhealthemergencies• Abillionmorepeoplearelivingwithbetterhealthandwellbeing
TheGPW13impactmeasurementsystemmakesmeasurablethetriplebilliontargetsofGPW13.TheaimsoftheGPW13aretomakeameasurableimpactonpeople’shealthatcountrylevel;increasethelikelihoodthatthetriplebilliontargetswillbemet;accelerateprogresstowardstheSustainableDevelopmentGoals(SDGs);transformhowWHOworksbyanchoringcommitmentsinmeasurableresults;provideameansoftrackingthejointeffortsoftheSecretariat,MemberStatesandpartners;andstrengthencountrydataandinformationsystemsforhealth.
Theimpactmeasurementsystemhasthreelayers:
1. The46outcomeindicatorscoverarangeofhealthissuesandprovideasetofmeasurementindicatorsthatwillbeusedtomeasureoutcomesintheprogrammebudget.
2. Eachofthetriplebilliontargetswillbemeasuredusingcompositeindicesincluding:a. Universalhealthcoverageindex;b. Healthemergenciesprotectionindex;c. Healthierpopulationsindex.
3. HALE,healthylifeexpectancy,quantifiesexpectedyearsoflifeingoodhealthataparticularageandcanbeconsideredasummarymeasureoftheoverallhealthofpopulations.ItisproposedtouseHALEwithinGPW13asanoverarchingandcomparablemeasureoftheimpactofthetriplebilliontargets.
Thereare40GPW132023targets(SeeAnnex1)linkedtothe46outcomeindicators.EachtargetistrackedbyaoneormoreindicatorsandarealignedtoSDGs.Thirty-nineofthe46outcomeindicatorsareSDGindicatorsand7arefromWorldHealthAssemblyresolutions.TheoutcomeindicatorsweredevelopedbyWHOtechnicalprogrammesinconsultationwithMemberStates.

7
Section1:46OutcomeIndicators
8
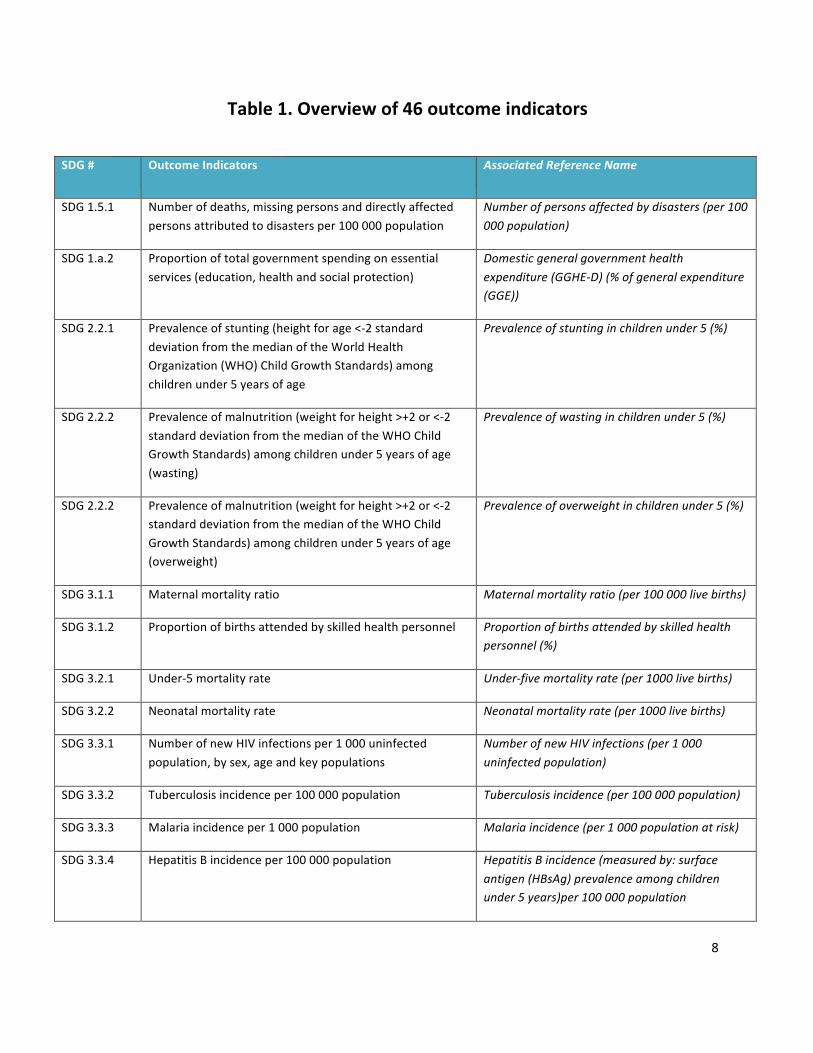
Table1.Overviewof46outcomeindicators
SDG# OutcomeIndicators AssociatedReferenceName
SDG1.5.1 Numberofdeaths,missingpersonsanddirectlyaffectedpersonsattributedtodisastersper100000population
Numberofpersonsaffectedbydisasters(per100000population)
SDG1.a.2 Proportionoftotalgovernmentspendingonessentialservices(education,healthandsocialprotection)
Domesticgeneralgovernmenthealthexpenditure(GGHE-D)(%ofgeneralexpenditure(GGE))
SDG2.2.1 Prevalenceofstunting(heightforage<-2standarddeviationfromthemedianoftheWorldHealthOrganization(WHO)ChildGrowthStandards)amongchildrenunder5yearsofage
Prevalenceofstuntinginchildrenunder5(%)
SDG2.2.2 Prevalenceofmalnutrition(weightforheight>+2or<-2standarddeviationfromthemedianoftheWHOChildGrowthStandards)amongchildrenunder5yearsofage(wasting)
Prevalenceofwastinginchildrenunder5(%)
SDG2.2.2 Prevalenceofmalnutrition(weightforheight>+2or<-2standarddeviationfromthemedianoftheWHOChildGrowthStandards)amongchildrenunder5yearsofage(overweight)
Prevalenceofoverweightinchildrenunder5(%)
SDG3.1.1 Maternalmortalityratio Maternalmortalityratio(per100000livebirths)
SDG3.1.2 Proportionofbirthsattendedbyskilledhealthpersonnel Proportionofbirthsattendedbyskilledhealthpersonnel(%)
SDG3.2.1 Under-5mortalityrate Under-fivemortalityrate(per1000livebirths)
SDG3.2.2 Neonatalmortalityrate Neonatalmortalityrate(per1000livebirths)
SDG3.3.1 NumberofnewHIVinfectionsper1000uninfectedpopulation,bysex,ageandkeypopulations
NumberofnewHIVinfections(per1000uninfectedpopulation)
SDG3.3.2 Tuberculosisincidenceper100000population Tuberculosisincidence(per100000population)
SDG3.3.3 Malariaincidenceper1000population Malariaincidence(per1000populationatrisk)
SDG3.3.4 HepatitisBincidenceper100000population HepatitisBincidence(measuredby:surfaceantigen(HBsAg)prevalenceamongchildrenunder5years)per100000population

9
SDG# OutcomeIndicators AssociatedReferenceName
SDG3.3.5 Numberofpeoplerequiringinterventionsagainstneglectedtropicaldiseases
Numberofpeoplerequiringinterventionsagainstneglectedtropicaldiseases(NTDs)
SDG3.4.1 Mortalityrateattributedtocardiovasculardisease,cancer,diabetesorchronicrespiratorydiseases
ProbabilityofdyingfromanyofCVD,cancer,diabetes,CRD(ages30–70)(%)
SDG3.4.2 Suicidemortalityrate Suicidemortalityrate(per100000population)
SDG3.5.1 Coverageoftreatmentinterventions(pharmacological,psychosocialandrehabilitationandaftercareservices)forsubstanceusedisorders
Coverageoftreatmentinterventionsforsubstanceusedisorders(%)
SDG3.5.2 Harmfuluseofalcohol,definedaccordingtothenationalcontextasalcoholpercapitaconsumption(aged15yearsandolder)withinacalendaryearinlitresofpurealcohol
Totalalcoholpercapitaconsumptioninadultsaged15+(litresofpurealcohol)
SDG3.6.1 Deathrateduetoroadtrafficinjuries Roadtrafficmortalityrate(per100000population)
SDG3.7.1 Proportionofwomenofreproductiveage(aged15–49years)whohavetheirneedforfamilyplanningsatisfiedwithmodernmethods
Proportionofwomen(aged15-49)havingneedforfamilyplanningsatisfiedwithmodernmethods(%)
SDG3.8.1 Coverageofessentialhealthservices(definedastheaveragecoverageofessentialservicesbasedontracerinterventionsthatincludereproductive,maternal,newbornandchildhealth,infectiousdiseases,noncommunicablediseasesandservicecapacityandaccess,amongthegeneralandthemostdisadvantagedpopulation)
UHCServiceCoverageIndex
SDG3.8.2 Proportionofpopulationwithlargehouseholdexpendituresonhealthasashareoftotalhouseholdexpendituresorincome
Proportionofpopulationwithlargehouseholdexpendituresonhealth>10%oftotalhouseholdexpenditureorincome(%)
SDG3.9.1 Mortalityrateattributedtohouseholdandambientairpollution
Mortalityrateattributedtoairpollution(per100000population)
SDG3.9.2 Mortalityrateattributedtounsafewater,unsafesanitationandlackofhygiene(exposuretounsafeWater,SanitationandHygieneforAll(WASH)services)
MortalityrateattributedtoexposuretounsafeWASHservices(per100000population)
SDG3.9.3 Mortalityrateattributedtounintentionalpoisoning Mortalityratefromunintentionalpoisoning(per100000population)

10
SDG# OutcomeIndicators AssociatedReferenceName
SDG7.1.2 Proportionofpopulationwithprimaryrelianceoncleanfuelsandtechnology
Proportionofpopulationwithprimaryrelianceoncleanfuels(%)
SDG11.6.2 Annualmeanlevelsoffineparticulatematter(e.g.PM2.5andPM10)incities(populationweighted)
Annualmeanconcentrationsoffineparticulatematter(PM2.5)inurbanareas(µg/m3)
SDG3.a.1 Age-standardizedprevalenceofcurrenttobaccouseamongpersonsaged15yearsandolder
Prevalenceoftobaccouseinadults15+(%)
SDG3.b.1 Proportionofthetargetpopulationcoveredbyallvaccinesincludedintheirnationalprogramme
Proportionofthetargetpopulationcoveredbyallvaccinesincludedinnationalprogrammes(DTP3,MCV2,PCV3,)(%)
SDG3.b.3 Proportionofhealthfacilitiesthathaveacoresetofrelevantessentialmedicinesavailableandaffordableonasustainablebasis
Proportionofhealthfacilitieswithessentialmedicinesavailableandaffordableonasustainablebasis(%)
SDG3.c.1 Healthworkerdensityanddistribution Densityofhealthworkers(doctors;nurseandmidwife;pharmacists;dentistsper10000population)
SDG3.d.1 InternationalHealthRegulations(IHR)capacityandhealthemergencypreparedness
InternationalHealthRegulations(IHR)capacityandhealthemergencypreparedness
SDG3.d.2 Percentageofbloodstreaminfectionsduetoantimicrobialresistantorganisms.
Percentageofbloodstreaminfectionsduetoantimicrobialresistantorganisms(%)
SDG4.2.1 Proportionofchildrenunder5yearsofagewhoaredevelopmentallyontrackinhealth,learningandpsychosocialwell-being,bysex
Proportionofchildrenunder5developmentallyontrack(health,learningandpsychosocialwell-being)(%)
SDG5.2.1 Proportionofever-partneredwomenandgirlsaged15yearsandoldersubjectedtophysical,sexualorpsychologicalviolencebyacurrentorformerintimatepartnerintheprevious12months,byformofviolenceandbyage
Proportionofwomen(15-49)subjectedtoviolencebycurrentorformerintimatepartner(%)
SDG5.6.1 Proportionofwomenaged15–49yearswhomaketheirowninformeddecisionsregardingsexualrelations,contraceptiveuseandreproductivehealthcare
Proportionofwomen(15-49)whomaketheirowndecisionsregardingsexualrelations,contraceptiveuseandreproductivehealthcare(%)

11
SDG# OutcomeIndicators AssociatedReferenceName
SDG6.1.1 Proportionofpopulationusingsafelymanageddrinkingwaterservices
Proportionofpopulationusingsafelymanageddrinkingwaterservices(%)
SDG6.2.1 Proportionofpopulationusing(a)safelymanagedsanitationservicesand(b)ahand-washingfacilitywithsoapandwater
Proportionofpopulationusingsafelymanagedsanitationservicesandhand-washingfacility(%)
SDG16.2.1 Proportionofchildrenaged1–17yearswhoexperiencedanyphysicalpunishmentand/orpsychologicalaggressionbycaregiversinthepastmonth
Proportionofchildren(aged1-17)experiencingphysicalorpsychologicalaggression(%)
HealthEmergencies
Vaccinecoverageofat-riskgroupsforepidemicorpandemicpronediseases
Vaccinecoverageforepidemicpronediseases
HealthEmergencies
Proportionofvulnerablepeopleinfragilesettingsprovidedwithessentialhealthservices
Proportionofvulnerablepeopleinfragilesettingsprovidedwithessentialhealthservices(%)
WHA68.3 Numberofcasesofpoliomyelitiscausedbywildpoliovirus(WPV)
Numberofcasesofpoliomyelitiscausedbywildpoliovirus(WPV)
WHA68.7 Patternsofantibioticconsumptionatnationallevel Patternsofantibioticconsumptionatnationallevel
WHA66.10 Age-standardizedprevalenceofraisedbloodpressureamongpersonsaged18+years(definedassystolicbloodpressureof>140mmHgand/ordiastolicbloodpressure>90mmHg)andmeansystolicbloodpressure
Prevalenceofraisedbloodpressureinadultsaged18+
WHA66.10 Protectionofthepopulationofacountrybyeffectivepolicy/regulationonindustryproducedtrans-fattyacids(TFA)
Effectivepolicy/regulationforindustriallyproducedtrans-fattyacids(TFA)(Y/N)
WHA66.10 Prevalenceofobesity Prevalenceofobesity
12
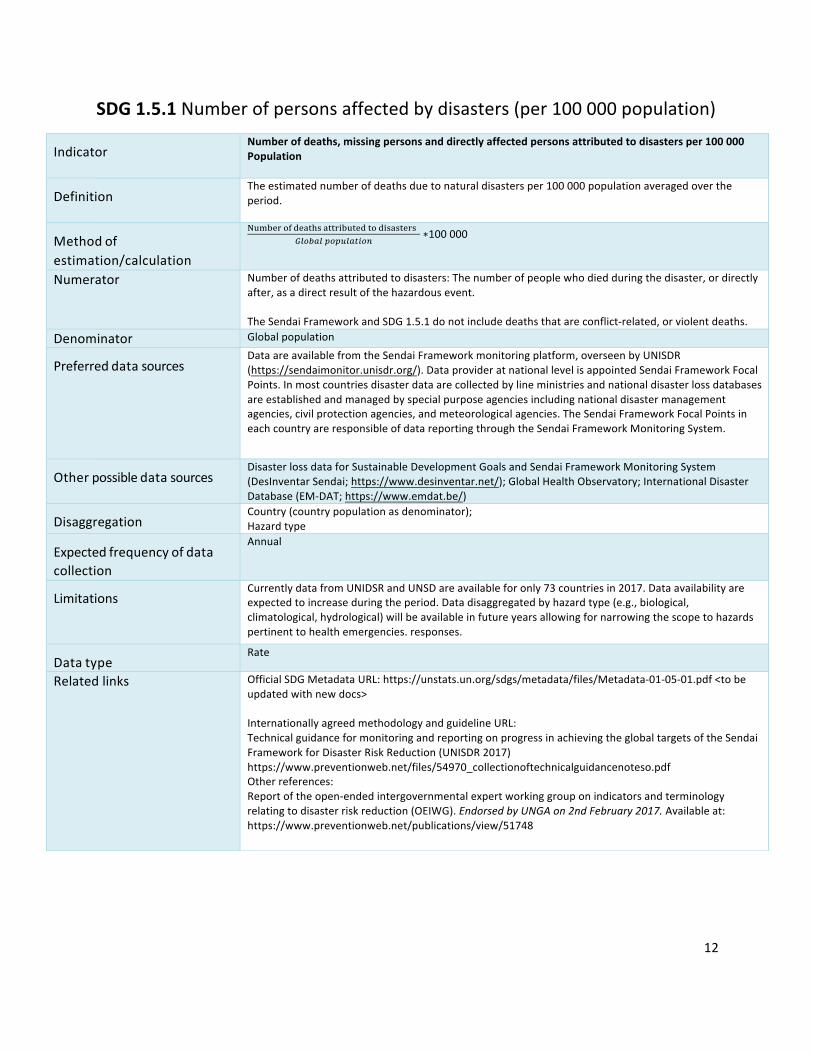
SDG1.5.1Numberofpersonsaffectedbydisasters(per100000population)
Indicator
Numberofdeaths,missingpersonsanddirectlyaffectedpersonsattributedtodisastersper100000Population
Definition
Theestimatednumberofdeathsduetonaturaldisastersper100000populationaveragedovertheperiod.
Methodofestimation/calculation
!"#$%&()*%+,-.+,,&/$",%*,(*/.+.,%&.0123415256147829
∗100000
Numerator Numberofdeathsattributedtodisasters:Thenumberofpeoplewhodiedduringthedisaster,ordirectlyafter,asadirectresultofthehazardousevent.TheSendaiFrameworkandSDG1.5.1donotincludedeathsthatareconflict-related,orviolentdeaths.
Denominator GlobalpopulationPreferreddatasources
DataareavailablefromtheSendaiFrameworkmonitoringplatform,overseenbyUNISDR(https://sendaimonitor.unisdr.org/).DataprovideratnationallevelisappointedSendaiFrameworkFocalPoints.Inmostcountriesdisasterdataarecollectedbylineministriesandnationaldisasterlossdatabasesareestablishedandmanagedbyspecialpurposeagenciesincludingnationaldisastermanagementagencies,civilprotectionagencies,andmeteorologicalagencies.TheSendaiFrameworkFocalPointsineachcountryareresponsibleofdatareportingthroughtheSendaiFrameworkMonitoringSystem.
Otherpossibledatasources
DisasterlossdataforSustainableDevelopmentGoalsandSendaiFrameworkMonitoringSystem(DesInventarSendai;https://www.desinventar.net/);GlobalHealthObservatory;InternationalDisasterDatabase(EM-DAT;https://www.emdat.be/)
Disaggregation
Country(countrypopulationasdenominator);Hazardtype
Expectedfrequencyofdatacollection
Annual
Limitations
CurrentlydatafromUNIDSRandUNSDareavailableforonly73countriesin2017.Dataavailabilityareexpectedtoincreaseduringtheperiod.Datadisaggregatedbyhazardtype(e.g.,biological,climatological,hydrological)willbeavailableinfutureyearsallowingfornarrowingthescopetohazardspertinenttohealthemergencies.responses.
Datatype
Rate
Relatedlinks
OfficialSDGMetadataURL:https://unstats.un.org/sdgs/metadata/files/Metadata-01-05-01.pdf<tobeupdatedwithnewdocs>InternationallyagreedmethodologyandguidelineURL:TechnicalguidanceformonitoringandreportingonprogressinachievingtheglobaltargetsoftheSendaiFrameworkforDisasterRiskReduction(UNISDR2017)https://www.preventionweb.net/files/54970_collectionoftechnicalguidancenoteso.pdfOtherreferences:Reportoftheopen-endedintergovernmentalexpertworkinggrouponindicatorsandterminologyrelatingtodisasterriskreduction(OEIWG).EndorsedbyUNGAon2ndFebruary2017.Availableat:https://www.preventionweb.net/publications/view/51748

13
SDG1.a.2Domesticgeneralgovernmenthealthexpenditure(GGHE-D)(%ofgeneralgovernmentexpenditure(GGE))*
*onlycovershealthaspectofindicator
Indicator
Proportionoftotalgovernmentspendingonessentialservices(education,healthandsocialprotection)
Definition
Shareofgovernmenthealthexpendituresfromdomesticsourcesingeneralgovernmentexpenditures
Methodofestimation/calculation
Theshareofdomesticgeneralgovernmenthealthexpendituresingeneralgovernmentexpenditureindicatesthepriorityofhealthingovernmentbudgetallocation.Itexpressesthisprioritybycomparingthesizeofcurrentgovernmenthealthexpendituresrelativetothetotalsizeofgovernmentexpenditure.Theindicatoriscalculatedas(GGHED%GGE_t+5-GGHED%GGE_t)/GGHED%GGE_t
Numerator DomesticGeneralGovernmentHealthExpenditure
Denominator GeneralGovernmentExpenditure
Preferreddatasources
GlobalHealthExpenditureDatabase(GHED)
Otherpossibledatasources
GlobalHealthObservatory(GHO)
Disaggregation
No
Expectedfrequencyofdatacollection
Annual
Limitations
AspermetadataforeachcountryinGHED
Datatype
Percentage
Relatedlinks http://www.who.int/health-accounts/

14
SDG2.2.1Prevalenceofstuntinginchildrenunder5(%)
Indicator
Prevalenceofstunting(heightforage<-2standarddeviationfromthemedianoftheWorldHealthOrganization(WHO)ChildGrowthStandards)amongchildrenunder5yearsofage
Definition
Percentageofstunting(length-orheight-for-agelessthan-2standarddeviationsoftheWHOChildGrowthStandardsmedian)amongchildrenaged0-4years.Children’slengthandheightaremeasuredusingstandardtechnology,trainingandstandardizationproceduresforanthropometryisessentialforaccuratemeasurements.Determinationoftheexactchild’sageisthefirstandmostimportantstepinthisanthropometricassessment.Recumbentlengthshouldbemeasuredforchildrenlessthan24monthsofageandstandingheightshouldbemeasuredforchildren24monthsandabove.
Methodofestimation/calculation
Prevalenceofstuntedchildrenaged<5years=𝑁𝑢𝑚𝑏𝑒𝑟𝑜𝑓𝑐ℎ𝑖𝑙𝑑𝑟𝑒𝑛𝑎𝑔𝑒𝑑0 − 4𝑦𝑒𝑎𝑟𝑠𝑡ℎ𝑎𝑡𝑓𝑎𝑙𝑙𝑏𝑒𝑙𝑜𝑤𝑚𝑖𝑛𝑢𝑠𝑡𝑤𝑜𝑠𝑡𝑎𝑛𝑑𝑎𝑟𝑑𝑑𝑒𝑣𝑖𝑎𝑡𝑖𝑜𝑛𝑠𝑓𝑟𝑜𝑚𝑡ℎ𝑒𝑚𝑒𝑑𝑖𝑎𝑛
𝑙𝑒𝑛𝑔𝑡ℎ − 𝑜𝑟ℎ𝑒𝑖𝑔ℎ𝑡 − 𝑓𝑜𝑟 − 𝑎𝑔𝑒𝑜𝑓𝑡ℎ𝑒𝑊𝐻𝑂𝐶ℎ𝑖𝑙𝑑𝐺𝑟𝑜𝑤𝑡ℎ𝑆𝑡𝑎𝑛𝑑𝑎𝑟𝑑𝑠𝑇𝑜𝑡𝑎𝑙𝑛𝑢𝑚𝑏𝑒𝑟𝑜𝑓𝑐ℎ𝑖𝑙𝑑𝑟𝑒𝑛𝑎𝑔𝑒𝑑0 − 4𝑦𝑒𝑎𝑟𝑠𝑡ℎ𝑎𝑡𝑤𝑒𝑟𝑒𝑚𝑒𝑎𝑠𝑢𝑟𝑒𝑑
×100%
Numerator Numberofchildrenaged0-4yearsthatfallbelowminustwostandarddeviationsfromthemedianlength-orheight-for-ageoftheWHOChildGrowthStandards.
Denominator Totalnumberofchildrenaged0–4yearswhoweremeasured.
Preferreddatasources
Nationalnutritionsurveys,anyothernationally-representativepopulation-basedsurveyswithnutritionmodules,andnationalsurveillancesystems.
Otherpossibledatasources
Disaggregation
Byage,sex,location(urban/rural,majorregions/provinces),andsocio-economiccharacteristics(e.g.mother’seducation,wealthquintile).
Expectedfrequencyofdatacollection
Annualorevery3-5yearsbasedonsurveyavailabilityincountries
Limitations
Surveyestimatescomewithlevelsofuncertaintyduetobothsamplingandnon-samplingerror(e.g.measurementtechnicalerror,recordingerroretc.
Datatype
Prevalence
Relatedlinks WHO:http://apps.who.int/gho/data/node.wrapper.imr?x-id=72;http://www.who.int/childgrowth/en/;http://www.who.int/nutgrowthdb/en/;http://apps.who.int/bookorders/anglais/detart1.jsp?sesslan=1&codlan=1&codcol=15&codcch=660.
15
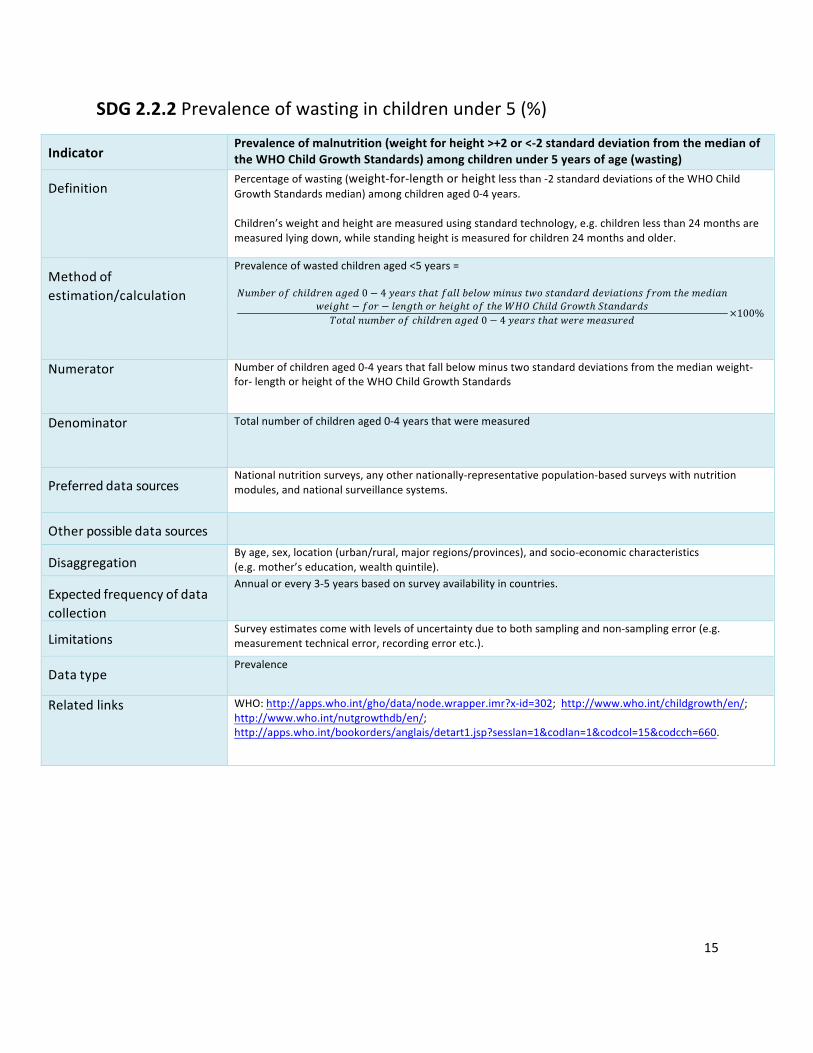
SDG2.2.2Prevalenceofwastinginchildrenunder5(%)
Indicator
Prevalenceofmalnutrition(weightforheight>+2or<-2standarddeviationfromthemedianoftheWHOChildGrowthStandards)amongchildrenunder5yearsofage(wasting)
Definition
Percentageofwasting(weight-for-lengthorheightlessthan-2standarddeviationsoftheWHOChildGrowthStandardsmedian)amongchildrenaged0-4years.Children’sweightandheightaremeasuredusingstandardtechnology,e.g.childrenlessthan24monthsaremeasuredlyingdown,whilestandingheightismeasuredforchildren24monthsandolder.
Methodofestimation/calculation
Prevalenceofwastedchildrenaged<5years=𝑁𝑢𝑚𝑏𝑒𝑟𝑜𝑓𝑐ℎ𝑖𝑙𝑑𝑟𝑒𝑛𝑎𝑔𝑒𝑑0 − 4𝑦𝑒𝑎𝑟𝑠𝑡ℎ𝑎𝑡𝑓𝑎𝑙𝑙𝑏𝑒𝑙𝑜𝑤𝑚𝑖𝑛𝑢𝑠𝑡𝑤𝑜𝑠𝑡𝑎𝑛𝑑𝑎𝑟𝑑𝑑𝑒𝑣𝑖𝑎𝑡𝑖𝑜𝑛𝑠𝑓𝑟𝑜𝑚𝑡ℎ𝑒𝑚𝑒𝑑𝑖𝑎𝑛
𝑤𝑒𝑖𝑔ℎ𝑡 − 𝑓𝑜𝑟 − 𝑙𝑒𝑛𝑔𝑡ℎ𝑜𝑟ℎ𝑒𝑖𝑔ℎ𝑡𝑜𝑓𝑡ℎ𝑒𝑊𝐻𝑂𝐶ℎ𝑖𝑙𝑑𝐺𝑟𝑜𝑤𝑡ℎ𝑆𝑡𝑎𝑛𝑑𝑎𝑟𝑑𝑠𝑇𝑜𝑡𝑎𝑙𝑛𝑢𝑚𝑏𝑒𝑟𝑜𝑓𝑐ℎ𝑖𝑙𝑑𝑟𝑒𝑛𝑎𝑔𝑒𝑑0 − 4𝑦𝑒𝑎𝑟𝑠𝑡ℎ𝑎𝑡𝑤𝑒𝑟𝑒𝑚𝑒𝑎𝑠𝑢𝑟𝑒𝑑
×100%
Numerator Numberofchildrenaged0-4yearsthatfallbelowminustwostandarddeviationsfromthemedianweight-for-lengthorheightoftheWHOChildGrowthStandards
Denominator Totalnumberofchildrenaged0-4yearsthatweremeasured
Preferreddatasources
Nationalnutritionsurveys,anyothernationally-representativepopulation-basedsurveyswithnutritionmodules,andnationalsurveillancesystems.
Otherpossibledatasources
Disaggregation
Byage,sex,location(urban/rural,majorregions/provinces),andsocio-economiccharacteristics(e.g.mother’seducation,wealthquintile).
Expectedfrequencyofdatacollection
Annualorevery3-5yearsbasedonsurveyavailabilityincountries.
Limitations
Surveyestimatescomewithlevelsofuncertaintyduetobothsamplingandnon-samplingerror(e.g.measurementtechnicalerror,recordingerroretc.).
Datatype
Prevalence
Relatedlinks WHO:http://apps.who.int/gho/data/node.wrapper.imr?x-id=302;http://www.who.int/childgrowth/en/;http://www.who.int/nutgrowthdb/en/;http://apps.who.int/bookorders/anglais/detart1.jsp?sesslan=1&codlan=1&codcol=15&codcch=660.
16
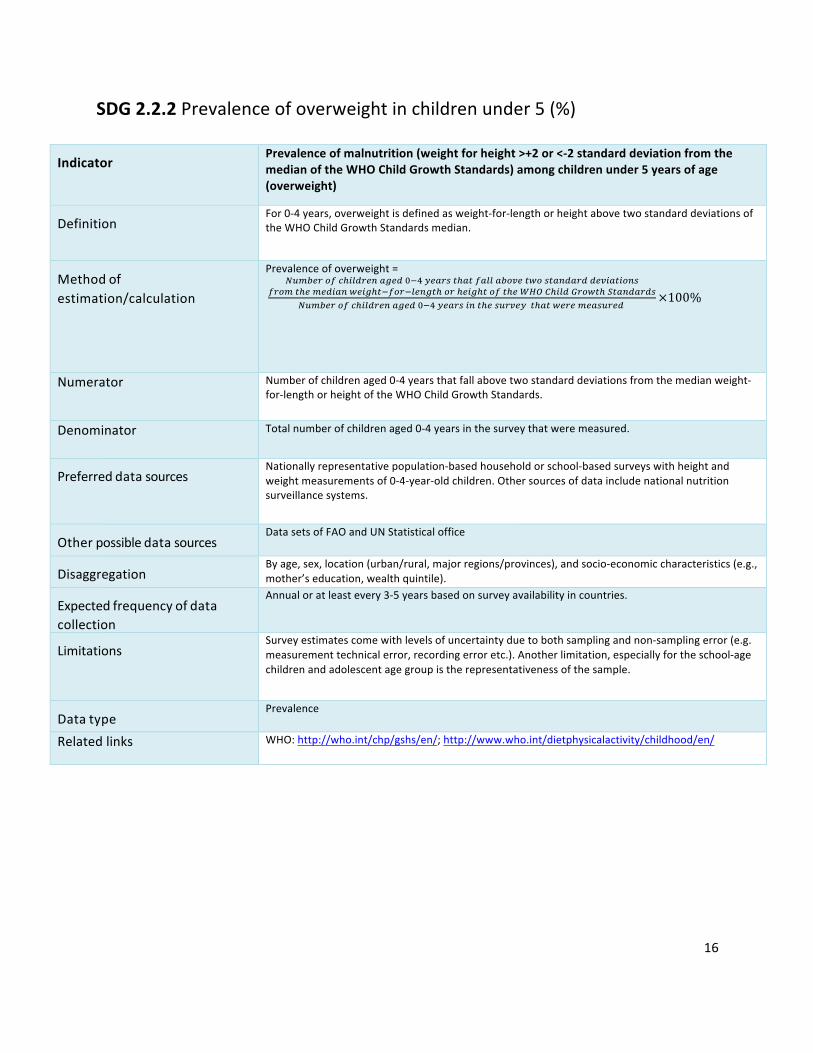
SDG2.2.2Prevalenceofoverweightinchildrenunder5(%)
Indicator
Prevalenceofmalnutrition(weightforheight>+2or<-2standarddeviationfromthemedianoftheWHOChildGrowthStandards)amongchildrenunder5yearsofage(overweight)
Definition
For0-4years,overweightisdefinedasweight-for-lengthorheightabovetwostandarddeviationsoftheWHOChildGrowthStandardsmedian.
Methodofestimation/calculation
Prevalenceofoverweight=
]6^3_`2abc81d`_94e_dfghi_4`j7c47a411432k_7l2j749d4`dd_k847829j
a`2^7c_^_d849l_8ec7ga2`g1_9e7c2`c_8ec72a7c_mnopc81d0`2l7cq749d4`dj]6^3_`2abc81d`_94e_dfghi_4`j897c_j6`k_i7c47l_`_^_4j6`_d
×100%
Numerator Numberofchildrenaged0-4yearsthatfallabovetwostandarddeviationsfromthemedianweight-for-lengthorheightoftheWHOChildGrowthStandards.
Denominator Totalnumberofchildrenaged0-4yearsinthesurveythatweremeasured.
Preferreddatasources
Nationallyrepresentativepopulation-basedhouseholdorschool-basedsurveyswithheightandweightmeasurementsof0-4-year-oldchildren.Othersourcesofdataincludenationalnutritionsurveillancesystems.
Otherpossibledatasources
DatasetsofFAOandUNStatisticaloffice
Disaggregation
Byage,sex,location(urban/rural,majorregions/provinces),andsocio-economiccharacteristics(e.g.,mother’seducation,wealthquintile).
Expectedfrequencyofdatacollection
Annualoratleastevery3-5yearsbasedonsurveyavailabilityincountries.
Limitations
Surveyestimatescomewithlevelsofuncertaintyduetobothsamplingandnon-samplingerror(e.g.measurementtechnicalerror,recordingerroretc.).Anotherlimitation,especiallyfortheschool-agechildrenandadolescentagegroupistherepresentativenessofthesample.
Datatype
Prevalence
Relatedlinks WHO:http://who.int/chp/gshs/en/;http://www.who.int/dietphysicalactivity/childhood/en/

17
SDG3.1.1Maternalmortalityratio(per100000livebirths)
Indicator
Maternalmortalityratio
Definition
Thematernalmortalityratio(MMR)isthenumberofmaternaldeathsduringagiventimeperiodper100,000livebirthsduringthesametime-period.Maternaldeathreferstothedeathofawomanwhilepregnantorwithin42daysofterminationofpregnancy,irrespectiveofthedurationandsiteofthepregnancy,fromanycauserelatedtooraggravatedbythepregnancyoritsmanagement(fromdirectorindirectobstetricdeath),butnotfromaccidentalorincidentalcauses.Pregnancy-relateddeathreferstothedeathofawomanwhilepregnantorwithin42daysofterminationofpregnancy,irrespectiveofthecauseofdeath.Livebirthreferstothecompleteexpulsionorextractionfromitsmotherofaproductofconception,irrespectiveofthedurationofthepregnancy,which,aftersuchseparation,breathesorshowsanyotherevidenceoflife-e.g.beatingoftheheart,pulsationoftheumbilicalcordordefinitemovementofvoluntarymuscles-whetherornottheumbilicalcordhasbeencutortheplacentaisattached.Eachproductofsuchabirthisconsideredliveborn.
Methodofestimation/calculation
MMR=r274196^3_`2a^47_`941d_47cjr274196^3_`2a18k_38`7cj
×100,000
Numerator Totalnumberofmaternaldeaths
Denominator Totalnumberoflivebirths
Preferreddatasources
Civilregistrationvitalstatistics(CRVS),healthservicerecords,householdsurveys,census.
Otherpossibledatasources
Sampleregistrationsystems;verbalautopsy.
Disaggregation
Byage,parity,location(urban/rural,majorregions/provinces),andsocio-economiccharacteristics(e.g.,educationlevel,wealthquintile).
Expectedfrequencyofdatacollection
Annual(forCRVSandhealthservicerecords).
Limitations
Maternaldeathis,fromanepidemiologicalperspective,arelativelyrareeventandmortalityisdifficulttomeasureaccurately.Manylow-incomecountrieshaveno,incompleteorunusabledeathregistrydata.Modellingmaybeusedtoobtainanationalestimate.
Datatype
Ratio
Relatedlinks WHO:http://www.who.int/healthinfo/statistics/indmaternalmortality/en/WHO:https://www.who.int/reproductivehealth/publications/monitoring/maternal-mortality-2015/en/.WHO:https://www.who.int/reproductivehealth/publications/monitoring/9789241548458/en/.UNSDG:https://unstats.un.org/sdgs/metadata/files/Metadata-03-01-01.pdf
18
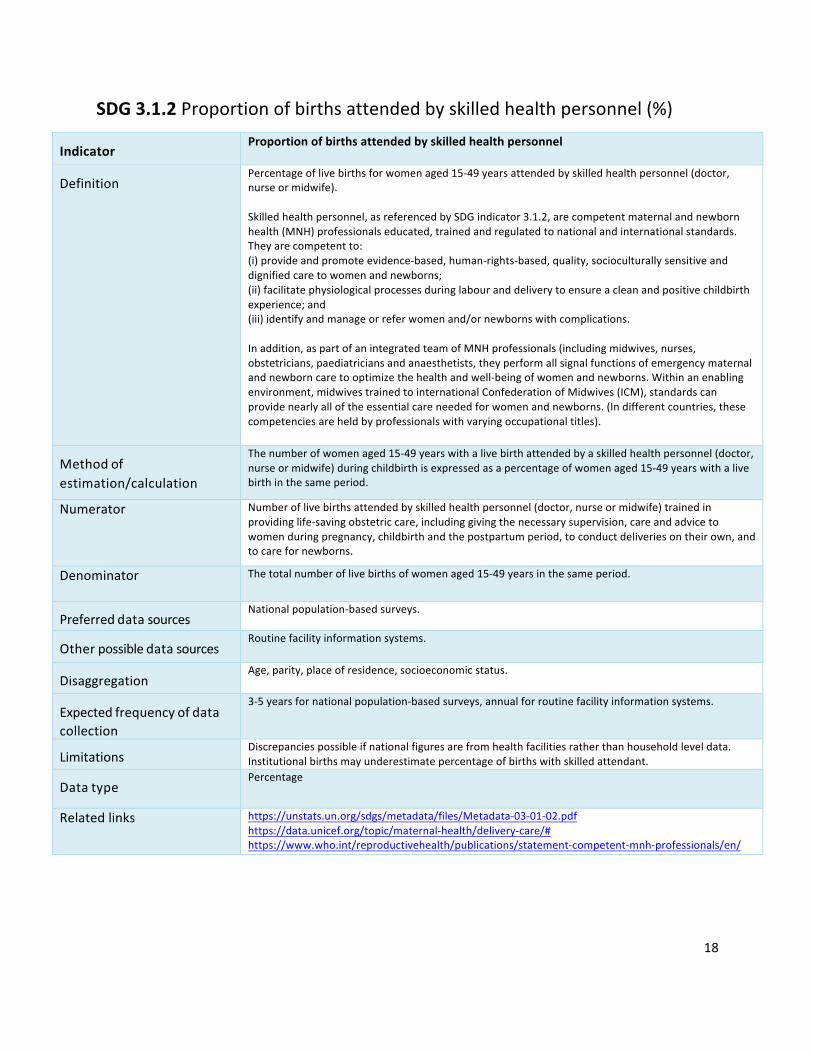
SDG3.1.2Proportionofbirthsattendedbyskilledhealthpersonnel(%)
Indicator
Proportionofbirthsattendedbyskilledhealthpersonnel
Definition
Percentageoflivebirthsforwomenaged15-49yearsattendedbyskilledhealthpersonnel(doctor,nurseormidwife).Skilledhealthpersonnel,asreferencedbySDGindicator3.1.2,arecompetentmaternalandnewbornhealth(MNH)professionalseducated,trainedandregulatedtonationalandinternationalstandards.Theyarecompetentto:(i)provideandpromoteevidence-based,human-rights-based,quality,socioculturallysensitiveanddignifiedcaretowomenandnewborns;(ii)facilitatephysiologicalprocessesduringlabouranddeliverytoensureacleanandpositivechildbirthexperience;and(iii)identifyandmanageorreferwomenand/ornewbornswithcomplications.Inaddition,aspartofanintegratedteamofMNHprofessionals(includingmidwives,nurses,obstetricians,paediatriciansandanaesthetists,theyperformallsignalfunctionsofemergencymaternalandnewborncaretooptimizethehealthandwell-beingofwomenandnewborns.Withinanenablingenvironment,midwivestrainedtointernationalConfederationofMidwives(ICM),standardscanprovidenearlyalloftheessentialcareneededforwomenandnewborns.(Indifferentcountries,thesecompetenciesareheldbyprofessionalswithvaryingoccupationaltitles).
Methodofestimation/calculation
Thenumberofwomenaged15-49yearswithalivebirthattendedbyaskilledhealthpersonnel(doctor,nurseormidwife)duringchildbirthisexpressedasapercentageofwomenaged15-49yearswithalivebirthinthesameperiod.
Numerator Numberoflivebirthsattendedbyskilledhealthpersonnel(doctor,nurseormidwife)trainedinprovidinglife-savingobstetriccare,includinggivingthenecessarysupervision,careandadvicetowomenduringpregnancy,childbirthandthepostpartumperiod,toconductdeliveriesontheirown,andtocarefornewborns.
Denominator Thetotalnumberoflivebirthsofwomenaged15-49yearsinthesameperiod.
Preferreddatasources
Nationalpopulation-basedsurveys.
Otherpossibledatasources
Routinefacilityinformationsystems.
Disaggregation
Age,parity,placeofresidence,socioeconomicstatus.
Expectedfrequencyofdatacollection
3-5yearsfornationalpopulation-basedsurveys,annualforroutinefacilityinformationsystems.
Limitations
Discrepanciespossibleifnationalfiguresarefromhealthfacilitiesratherthanhouseholdleveldata.Institutionalbirthsmayunderestimatepercentageofbirthswithskilledattendant.
Datatype
Percentage
Relatedlinks https://unstats.un.org/sdgs/metadata/files/Metadata-03-01-02.pdfhttps://data.unicef.org/topic/maternal-health/delivery-care/#https://www.who.int/reproductivehealth/publications/statement-competent-mnh-professionals/en/

19
SDG3.2.1Under-fivemortalityrate(per1000livebirths)
Indicator Under-fivemortalityrateDefinition
Theunder-5yearsmortalityrate(U5MR)istheprobabilityofachildborninaspecificyearorperioddyingbeforereachingtheageoffive,ifsubjecttotheage-specificmortalityratesofthatperiod,expressedper1000livebirths.Itis,strictlyspeaking,notarate(i.e.thenumberofdeathsdividedbythenumberofpopulationatriskduringacertainperiodoftime)butaprobabilityofdeathderivedfromalifetableandexpressedasrateper1000livebirths.Livebirthreferstothecompleteexpulsionorextractionfromitsmotherofaproductofconception,irrespectiveofthedurationofthepregnancy,which,aftersuchseparation,breathesorshowsanyotherevidenceoflife-e.g.beatingoftheheart,pulsationoftheumbilicalcordordefinitemovementofvoluntarymuscles-whetherornottheumbilicalcordhasbeencutortheplacentaisattached.Eachproductofsuchabirthisconsideredliveborn.
Methodofestimation/calculation
TheUNInter-agencyGroupforChildMortalityEstimation(UNIGME)estimatesarederivedfromnationaldatafromcensuses,surveysorvitalregistrationsystems.TheUNIGMEdoesnotuseanycovariatestoderiveitsestimates.Itonlyappliesacurvefittingmethodtogood-qualityempiricaldatatoderivetrendestimatesafterdataqualityassessment.Inmostcases,theUNIGMEestimatesareclosetotheunderlyingdata.TheUNIGMEaimstominimizetheerrorsforeachestimate,harmonizetrendsovertimeandproduceup-to-dateandproperlyassessedestimates.TheUNIGMEappliestheBayesianB-splinesbias-reductionmodeltoempiricaldatatoderivetrendestimatesofunder-fivemortalityforallcountries.Seereferencesfordetails.Fortheunderlyingdatamentionedabove,themostfrequentlyusedmethodsareasfollows:Civilregistration:Theunder-fivemortalityratecanbederivedfromastandardperiodabridgedlifetableusingtheage-specificdeathsandmid-yearpopulationcountsfromcivilregistrationdatatocalculatedeathrates,whicharethenconvertedintoage-specificprobabilitiesofdying.Censusandsurveys:Anindirectmethodisusedbasedonasummarybirthhistory,aseriesofquestionsaskedofeachwomanofreproductiveageastohowmanychildrenshehasevergivenbirthtoandhowmanyarestillalive.TheBrassmethodandmodellifetablesarethenusedtoobtainanestimateofunder-fiveandinfantmortalityrates.Censusesoftenincludequestionsonhouseholddeathsinthelast12months,whichcanbeusedtocalculatemortalityestimates.Surveys:Adirectmethodisusedbasedonafullbirthhistory,aseriesofdetailedquestionsoneachchildawomanhasgivenbirthtoduringherlifetime.Neonatal,post-neonatal,infant,childandunder-fivemortalityestimatescanbederivedfromfullbirthhistorymodule.
Numerator Totalnumberofdeathsamongchildrenaged0-4years(thetotalnumberisactuallytheprobabilityofdeathderivedfromalifetable)
Denominator TotalnumberoflivebirthsPreferreddatasources
Civilregistrationandvitalstatistics,
Otherpossibledatasources
censuses;andhouseholdsurveys.
Disaggregation
Bysex,placeofresidence,wealthquintileandmother’seducation
Expectedfrequencyofdatacollection
AnnualupdatesfromtheUN-IGMErevisions

20
Limitations
Thepreferredsourceofdataisacivilregistrationsystemthatrecordsbirthsanddeathsonacontinuousbasis.Ifregistrationiscompleteandthesystemfunctionsefficiently,theresultingestimateswillbeaccurateandtimely.However,manycountriesdonothavewell-functioningvitalregistrationsystems.Insuchcases,householdsurveys,suchastheUNICEF-supportedMultipleIndicatorClusterSurveys(MICS),theUSAID-supportedDemographicandHealthSurveys(DHS)andperiodicpopulationcensuseshavebecometheprimarysourcesofdataonunder-fivemortality.Thesesurveysaskwomenaboutthesurvivaloftheirchildren,anditisthesereportsthatprovidethebasisofchildmortalityestimatesforamajorityoflow-andmiddle-incomecountries.Thesedata,however,areoftensubjecttosamplingornon-samplingerrors(suchasmisreportingofageandsurvivorselectionbias;underreportingofchilddeathsisalsocommon)Theseunder-fivemortalityrateshavebeenestimatedbyapplyingmethodstotheavailabledatafromallMemberStatestoensurecomparabilityacrosscountriesandtime;hencetheyarenotnecessarilythesameastheofficialnationaldata.
Datatype
Mortalityestimate:probabilityofdeathderivedfromalifetableandexpressedasrateper1000livebirths.
Relatedlinks WHO:http://apps.who.int/gho/data/node.wrapper.imr?x-id=1;http://www.who.int/whosis/whostat2006InfantAndUnder5MortalityRate.pdf?ua=1;http://apps.who.int/gho/data/node.wrapper.imr?x-id=4717UNICEF:https://www.unicef.org/infobycountry/stats_popup1.html
21
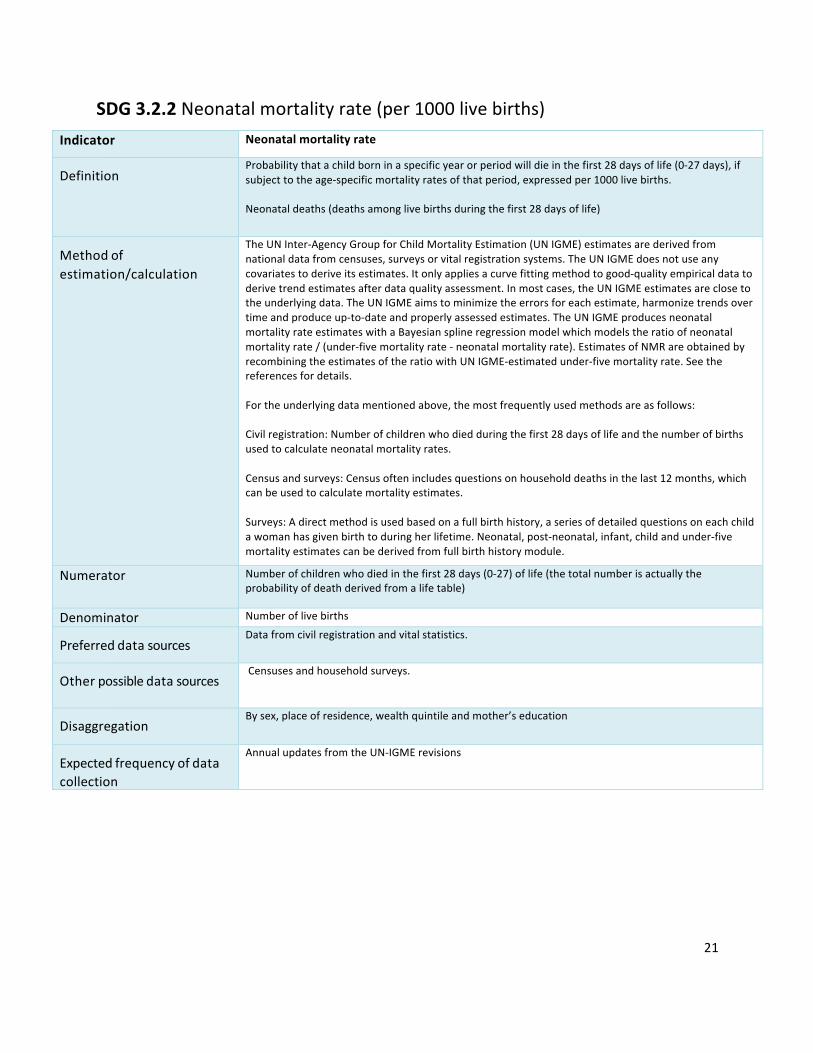
SDG3.2.2Neonatalmortalityrate(per1000livebirths)Indicator NeonatalmortalityrateDefinition
Probabilitythatachildborninaspecificyearorperiodwilldieinthefirst28daysoflife(0-27days),ifsubjecttotheage-specificmortalityratesofthatperiod,expressedper1000livebirths.Neonataldeaths(deathsamonglivebirthsduringthefirst28daysoflife)
Methodofestimation/calculation
TheUNInter-AgencyGroupforChildMortalityEstimation(UNIGME)estimatesarederivedfromnationaldatafromcensuses,surveysorvitalregistrationsystems.TheUNIGMEdoesnotuseanycovariatestoderiveitsestimates.Itonlyappliesacurvefittingmethodtogood-qualityempiricaldatatoderivetrendestimatesafterdataqualityassessment.Inmostcases,theUNIGMEestimatesareclosetotheunderlyingdata.TheUNIGMEaimstominimizetheerrorsforeachestimate,harmonizetrendsovertimeandproduceup-to-dateandproperlyassessedestimates.TheUNIGMEproducesneonatalmortalityrateestimateswithaBayesiansplineregressionmodelwhichmodelstheratioofneonatalmortalityrate/(under-fivemortalityrate-neonatalmortalityrate).EstimatesofNMRareobtainedbyrecombiningtheestimatesoftheratiowithUNIGME-estimatedunder-fivemortalityrate.Seethereferencesfordetails.Fortheunderlyingdatamentionedabove,themostfrequentlyusedmethodsareasfollows:Civilregistration:Numberofchildrenwhodiedduringthefirst28daysoflifeandthenumberofbirthsusedtocalculateneonatalmortalityrates.Censusandsurveys:Censusoftenincludesquestionsonhouseholddeathsinthelast12months,whichcanbeusedtocalculatemortalityestimates.Surveys:Adirectmethodisusedbasedonafullbirthhistory,aseriesofdetailedquestionsoneachchildawomanhasgivenbirthtoduringherlifetime.Neonatal,post-neonatal,infant,childandunder-fivemortalityestimatescanbederivedfromfullbirthhistorymodule.
Numerator Numberofchildrenwhodiedinthefirst28days(0-27)oflife(thetotalnumberisactuallytheprobabilityofdeathderivedfromalifetable)
Denominator NumberoflivebirthsPreferreddatasources
Datafromcivilregistrationandvitalstatistics.
Otherpossibledatasources
Censusesandhouseholdsurveys.
Disaggregation
Bysex,placeofresidence,wealthquintileandmother’seducation
Expectedfrequencyofdatacollection
AnnualupdatesfromtheUN-IGMErevisions

22
Limitations
Thepreferredsourceofdataisacivilregistrationsystemthatrecordsbirthsanddeathsonacontinuousbasis.Ifregistrationiscompleteandthesystemfunctionsefficiently,theresultingestimateswillbeaccurateandtimely.However,manycountriesdonothavewell-functioningvitalregistrationsystems.Insuchcases,householdsurveys,suchastheUNICEF-supportedMultipleIndicatorClusterSurveys(MICS),theUSAID-supportedDemographicandHealthSurveys(DHS)andperiodicpopulationcensuseshavebecometheprimarysourcesofdataonunder-fivemortality.Thesesurveysaskwomenaboutthesurvivaloftheirchildren,anditisthesereportsthatprovidethebasisofchildmortalityestimatesforamajorityoflow-andmiddle-incomecountries.Thesedata,however,areoftensubjecttosamplingornon-samplingerrors(suchasmisreportingofageandsurvivorselectionbias;underreportingofchilddeathsisalsocommon)Theseunder-fivemortalityrateshavebeenestimatedbyapplyingmethodstotheavailabledatafromallMemberStatestoensurecomparabilityacrosscountriesandtime;hencetheyarenotnecessarilythesameastheofficialnationaldata.
Datatype
Mortalityestimate:probabilityofdeathderivedfromalifetableandexpressedasrateper1000livebirths.
Relatedlinks WHO:http://apps.who.int/gho/data/node.wrapper.imr?x-id=1;http://www.who.int/whosis/whostat2006InfantAndUnder5MortalityRate.pdf?ua=1;http://apps.who.int/gho/data/node.wrapper.imr?x-id=4717UNICEF:https://www.unicef.org/infobycountry/stats_popup1.html

23
SDG3.3.1NewHIVinfections(per1000uninfectedpopulation)
Indicator
NumberofnewHIVinfectionsper1000uninfectedpopulation,bysex,ageandkeypopulations
Definition
ThenumberofnewHIVinfectionsper1000uninfectedpopulation,bysex,ageandkeypopulationsasdefinedasthenumberofnewHIVinfectionsper1000person-yearsamongtheuninfectedpopulation.
Methodofestimation/calculation
Longitudinaldataonindividualsarethebestsourceofdatabutarerarelyavailableforlargepopulations.SpecialdiagnostictestsinsurveysorfromhealthfacilitiescanbeusedtoobtaindataonHIVincidence.HIVincidenceisthusmodelledusingtheSpectrumsoftware.
Numerator NumberofnewHIVinfectionsbysex,ageandkeypopulations
Denominator Totaluninfectedpopulationbysex,ageandkeypopulations
Preferreddatasources
Spectrummodelling,householdorkeypopulationsurveyswithHIVincidence-testing
Otherpossibledatasources
Otherpossibledatasources:Regularsurveillancesystemamongkeypopulations.
DisaggregationGeneralpopulation,keypopulations(menwhohavesexwithmen,sexworkers,peoplewhoinjectdrugs,transgenderpeople,prisoners),agegroups(0-14,15-24,15-49,50+years),forkeypopulations(<25,25+years),modeoftransmission(includingmother-to-childtransmission),placeofresidence,sex
Expectedfrequencyofdatacollection
Datasourcesarecompiledallyearlong.ThespectrummodelsarecreatedinthefirstthreemonthsofeveryyearandfinalizedbyJune.
Limitations
Datatype
Rate
Relatedlinks https://www.unaids.org/en/dataanalysis/datatools/spectrum-eppUNAIDSGlobalAIDSMonitoring:Indicatorsformonitoringthe2016UnitedNationsPoliticalDeclarationonEndingAIDSPoliticalDeclarationonHIVandAIDS:OntheFastTracktoAcceleratingtheFightagainstHIVandtoEndingtheAIDSEpidemicby2030http://www.unaids.org/sites/default/files/media_asset/2017-Global-AIDS-Monitoring_en.pdf.UNAIDSwebsiteforrelevantdataandnationalSpectrumfileshttp://aidsinfo.unaids.org/ConsolidatedStrategicInformationGuidelinesforHIVintheHealthSector.Geneva:WorldHealthOrganization;https://www.who.int/hiv/pub/guidelines/en/Adescriptionofthemethodologyisavailableat:http://www.unaids.org/sites/default/files/media_asset/Estimates_methods_2018.pdf

24
SDG3.3.2Tuberculosisincidence(per100000population)
Indicator
Tuberculosisincidenceper100000population
Definition
TuberculosisincidenceisdefinedastheestimatednumberofnewandrelapseTBcases(allformsofTB,includingcasesinpeoplelivingwithHIV)arisinginagivenyear,expressedasarateper100000population.
Methodofestimation/calculation
Estimatesofincidenceforeachcountryarederivedusingoneormoreofthefollowingapproaches,dependingonavailabledata:(i)incidence=casenotifications/estimatedproportionofcasesdetected;(ii)capture-recapturemodelling;(iii)incidence=prevalence/durationofcondition.
Numerator EstimatednumberofnewandrelapseTBcases(allformsofTB,includingcasesinpeoplelivingwithHIV)arisinginagivenyear
Denominator Totalpopulation
Preferreddatasources
High-qualitysurveillancesystemsinwhichunderreportingisnegligible,andstronghealthsystemssothatunder-diagnosisisalsonegligible
Otherpossibledatasources
Annualcasenotifications,assessmentsofthequalityandcoverageofTBnotificationdata,nationalsurveysoftheprevalenceofTBdiseaseandinformationfromdeath(vital)registrationsystems
Disaggregation
Bycountry,sex,age(childrenvsadults).
Expectedfrequencyofdatacollection
Annual
Limitations
Uncertaintyinindicatorvalues
Datatype Rate
Relatedlinks https://unstats.un.org/sdgs/metadata/files/Metadata-03-03-02.pdf
25
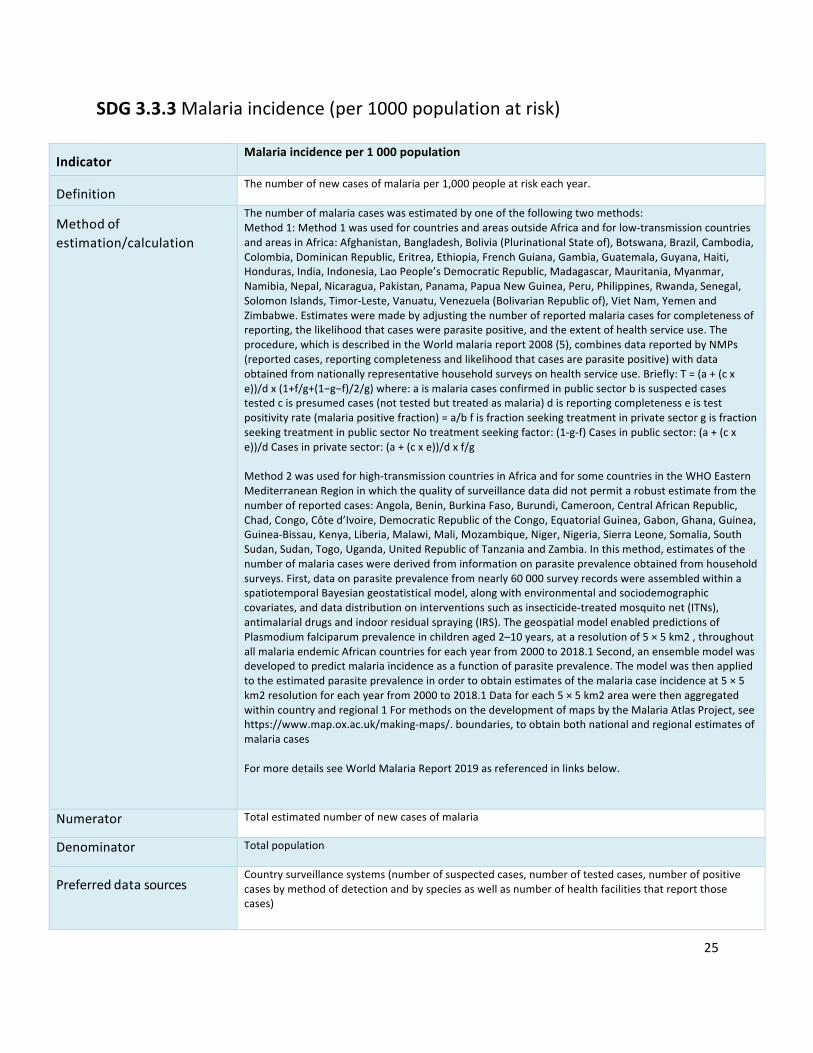
SDG3.3.3Malariaincidence(per1000populationatrisk)
Indicator
Malariaincidenceper1000population
Definition
Thenumberofnewcasesofmalariaper1,000peopleatriskeachyear.
Methodofestimation/calculation
Thenumberofmalariacaseswasestimatedbyoneofthefollowingtwomethods:Method1:Method1wasusedforcountriesandareasoutsideAfricaandforlow-transmissioncountriesandareasinAfrica:Afghanistan,Bangladesh,Bolivia(PlurinationalStateof),Botswana,Brazil,Cambodia,Colombia,DominicanRepublic,Eritrea,Ethiopia,FrenchGuiana,Gambia,Guatemala,Guyana,Haiti,Honduras,India,Indonesia,LaoPeople’sDemocraticRepublic,Madagascar,Mauritania,Myanmar,Namibia,Nepal,Nicaragua,Pakistan,Panama,PapuaNewGuinea,Peru,Philippines,Rwanda,Senegal,SolomonIslands,Timor-Leste,Vanuatu,Venezuela(BolivarianRepublicof),VietNam,YemenandZimbabwe.Estimatesweremadebyadjustingthenumberofreportedmalariacasesforcompletenessofreporting,thelikelihoodthatcaseswereparasitepositive,andtheextentofhealthserviceuse.Theprocedure,whichisdescribedintheWorldmalariareport2008(5),combinesdatareportedbyNMPs(reportedcases,reportingcompletenessandlikelihoodthatcasesareparasitepositive)withdataobtainedfromnationallyrepresentativehouseholdsurveysonhealthserviceuse.Briefly:T=(a+(cxe))/dx(1+f/g+(1−g−f)/2/g)where:aismalariacasesconfirmedinpublicsectorbissuspectedcasestestedcispresumedcases(nottestedbuttreatedasmalaria)disreportingcompletenesseistestpositivityrate(malariapositivefraction)=a/bfisfractionseekingtreatmentinprivatesectorgisfractionseekingtreatmentinpublicsectorNotreatmentseekingfactor:(1-g-f)Casesinpublicsector:(a+(cxe))/dCasesinprivatesector:(a+(cxe))/dxf/gMethod2wasusedforhigh-transmissioncountriesinAfricaandforsomecountriesintheWHOEasternMediterraneanRegioninwhichthequalityofsurveillancedatadidnotpermitarobustestimatefromthenumberofreportedcases:Angola,Benin,BurkinaFaso,Burundi,Cameroon,CentralAfricanRepublic,Chad,Congo,Côted’Ivoire,DemocraticRepublicoftheCongo,EquatorialGuinea,Gabon,Ghana,Guinea,Guinea-Bissau,Kenya,Liberia,Malawi,Mali,Mozambique,Niger,Nigeria,SierraLeone,Somalia,SouthSudan,Sudan,Togo,Uganda,UnitedRepublicofTanzaniaandZambia.Inthismethod,estimatesofthenumberofmalariacaseswerederivedfrominformationonparasiteprevalenceobtainedfromhouseholdsurveys.First,dataonparasiteprevalencefromnearly60000surveyrecordswereassembledwithinaspatiotemporalBayesiangeostatisticalmodel,alongwithenvironmentalandsociodemographiccovariates,anddatadistributiononinterventionssuchasinsecticide-treatedmosquitonet(ITNs),antimalarialdrugsandindoorresidualspraying(IRS).ThegeospatialmodelenabledpredictionsofPlasmodiumfalciparumprevalenceinchildrenaged2–10years,ataresolutionof5×5km2,throughoutallmalariaendemicAfricancountriesforeachyearfrom2000to2018.1Second,anensemblemodelwasdevelopedtopredictmalariaincidenceasafunctionofparasiteprevalence.Themodelwasthenappliedtotheestimatedparasiteprevalenceinordertoobtainestimatesofthemalariacaseincidenceat5×5km2resolutionforeachyearfrom2000to2018.1Dataforeach5×5km2areawerethenaggregatedwithincountryandregional1FormethodsonthedevelopmentofmapsbytheMalariaAtlasProject,seehttps://www.map.ox.ac.uk/making-maps/.boundaries,toobtainbothnationalandregionalestimatesofmalariacasesFormoredetailsseeWorldMalariaReport2019asreferencedinlinksbelow.
Numerator Totalestimatednumberofnewcasesofmalaria
Denominator Totalpopulation
Preferreddatasources
Countrysurveillancesystems(numberofsuspectedcases,numberoftestedcases,numberofpositivecasesbymethodofdetectionandbyspeciesaswellasnumberofhealthfacilitiesthatreportthosecases)
26
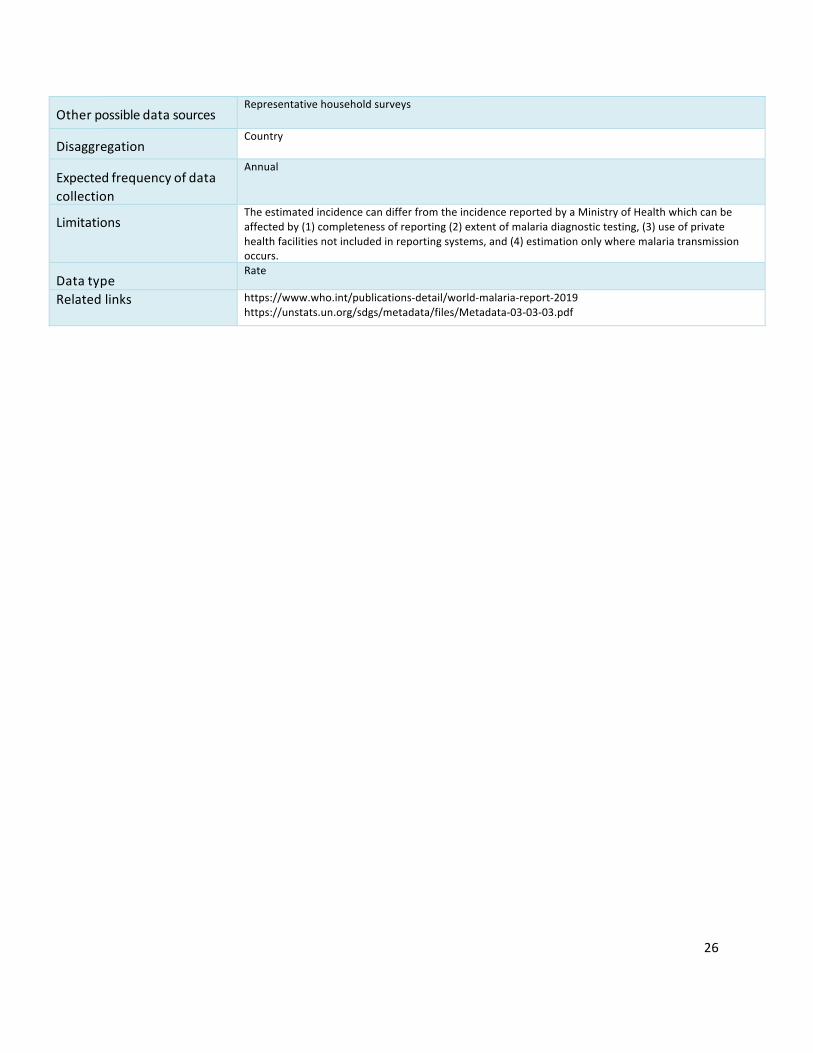
Otherpossibledatasources
Representativehouseholdsurveys
Disaggregation
Country
Expectedfrequencyofdatacollection
Annual
Limitations
TheestimatedincidencecandifferfromtheincidencereportedbyaMinistryofHealthwhichcanbeaffectedby(1)completenessofreporting(2)extentofmalariadiagnostictesting,(3)useofprivatehealthfacilitiesnotincludedinreportingsystems,and(4)estimationonlywheremalariatransmissionoccurs.
DatatypeRate
Relatedlinks https://www.who.int/publications-detail/world-malaria-report-2019https://unstats.un.org/sdgs/metadata/files/Metadata-03-03-03.pdf
27
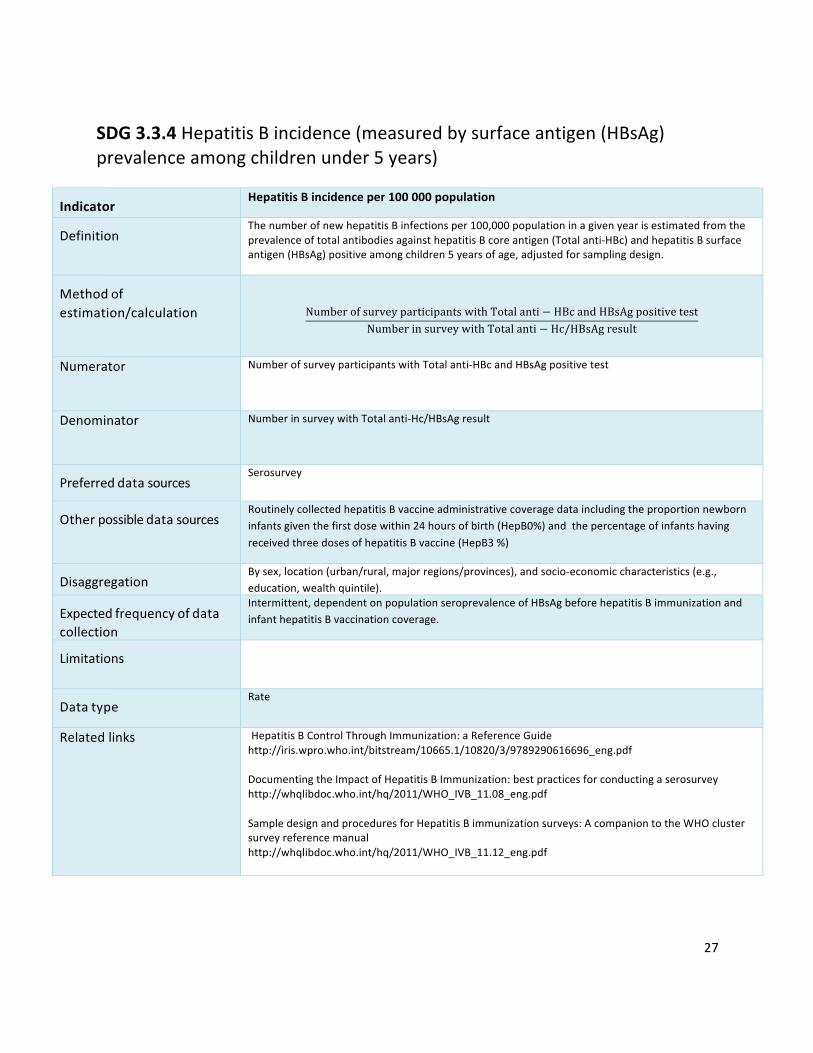
SDG3.3.4HepatitisBincidence(measuredbysurfaceantigen(HBsAg)prevalenceamongchildrenunder5years)
Indicator
HepatitisBincidenceper100000population
Definition
ThenumberofnewhepatitisBinfectionsper100,000populationinagivenyearisestimatedfromtheprevalenceoftotalantibodiesagainsthepatitisBcoreantigen(Totalanti-HBc)andhepatitisBsurfaceantigen(HBsAg)positiveamongchildren5yearsofage,adjustedforsamplingdesign.
Methodofestimation/calculation
NumberofsurveyparticipantswithTotalanti − HBcandHBsAgpositivetestNumberinsurveywithTotalanti − Hc/HBsAgresult
Numerator NumberofsurveyparticipantswithTotalanti-HBcandHBsAgpositivetest
Denominator NumberinsurveywithTotalanti-Hc/HBsAgresult
Preferreddatasources
Serosurvey
Otherpossibledatasources
RoutinelycollectedhepatitisBvaccineadministrativecoveragedataincludingtheproportionnewborninfantsgiventhefirstdosewithin24hoursofbirth(HepB0%)andthepercentageofinfantshavingreceivedthreedosesofhepatitisBvaccine(HepB3%)
Disaggregation
Bysex,location(urban/rural,majorregions/provinces),andsocio-economiccharacteristics(e.g.,education,wealthquintile).
Expectedfrequencyofdatacollection
Intermittent,dependentonpopulationseroprevalenceofHBsAgbeforehepatitisBimmunizationandinfanthepatitisBvaccinationcoverage.
Limitations
Datatype
Rate
Relatedlinks HepatitisBControlThroughImmunization:aReferenceGuidehttp://iris.wpro.who.int/bitstream/10665.1/10820/3/9789290616696_eng.pdfDocumentingtheImpactofHepatitisBImmunization:bestpracticesforconductingaserosurveyhttp://whqlibdoc.who.int/hq/2011/WHO_IVB_11.08_eng.pdfSampledesignandproceduresforHepatitisBimmunizationsurveys:AcompaniontotheWHOclustersurveyreferencemanualhttp://whqlibdoc.who.int/hq/2011/WHO_IVB_11.12_eng.pdf

28
SDG3.3.5NumberofpeoplerequiringinterventionsagainstNTDs
Indicator
Numberofpeoplerequiringinterventionsagainstneglectedtropicaldiseases
Definition
Numberofpeoplerequiringtreatmentandcareforanyoneoftheneglectedtropicaldiseases(NTDs)targetedbytheWHONTDRoadmap,WorldHealthAssemblyresolutionsandreportedtoWHO
Methodofestimation/calculation
Someestimationisrequiredtoaggregatedataacrossinterventionsanddiseases.Thereisanestablishedmethodologythathasbeentestedandanagreedinternationalstandard.[http://www.who.int/wer/2012/wer8702.pdf?ua=1]1)Averageannualnumberofpeoplerequiringmasstreatmentknownaspreventivecare(PC)foratleastonePC-NTD:PeoplemayrequirePCformorethanonePC-NTD.ThenumberofpeoplerequiringPCiscomparedacrossthePC-NTDs,byagegroupandimplementationunit(e.g.district).ThelargestnumberofpeoplerequiringPCisretainedforeachagegroupineachimplementationunit.ThetotalisconsideredtobeaconservativeestimateofthenumberofpeoplerequiringPCforatleastonePC-NTD.PrevalencesurveysdeterminewhenanNTDhasbeeneliminatedorcontrolledandPCcanbestoppedorreducedinfrequency,suchthattheaverageannualnumberofpeoplerequiringPCisreduced.2)NumberofnewcasesrequiringindividualtreatmentandcareforotherNTDs:Thenumberofnewcasesisbasedoncountryreports,wheneveravailable,ofnewandknowncasesofBuruliulcer,Chagasdisease,cysticercosis,dengue,guinea-wormdisease,echinococcosis,humanAfricantrypanosomiasis(HAT),leprosy,theleishmaniases,rabiesandyaws.WherethenumberofpeoplerequiringandrequestingsurgeryforPC-NTDs(e.g.trichiasisorhydrocelesurgery)isreported,itcanbeaddedhere.Similarly,newcasesrequiringandrequestingrehabilitation(e.g.leprosyorlymphoedema)canbeaddedwheneveravailable.Populationsreferredtounder1)and2)mayoverlap;thesumwouldoverestimatethetotalnumberofpeoplerequiringtreatmentandcare.Themaximumof1)or2)isthereforeretainedatthelowestcommonimplementationunitandsummedtogetconservativecountry,regionalandglobalaggregates.By2030,improvedco-endemicitydataandmodelswillvalidatethetrendsobtainedusingthissimplifiedapproach.Areductionof400millioniscalculatedbysubtractingcurrentyearnumeratorbybaselineyearnumerator(2017)
Numerator Numberofpeoplerequiringinterventionsagainstneglectedtropicaldiseases
Denominator NA
Preferreddatasources
ThenumberofpeoplerequiringtreatmentandcareforNTDsismeasuredbyexistingcountrysystems,andreportedthroughjointrequestandreportingformsfordonatedmedicines,theintegratedNTDdatabase,andotherreportstoWHO.
Otherpossibledatasources
DevelopastandardprotocolforsystematicdatacollectionforNTDsthroughWorldHealthSurveyPlus(WHS+).

29
Disaggregation
DisaggregationbyageisrequiredforPC:pre-school-agedchildren(1-4years),school-aged(5-14years)andadults(=15years).
Expectedfrequencyofdatacollection
Annual
Limitations
Countryreportsmaynotbeperfectlycomparableovertime.Improvedsurveillanceandcase-findingmayleadtoanapparentincreaseinthenumberofpeopleknowntorequiretreatmentandcare.Somefurtherestimationmayberequiredtoadjustforchangesinsurveillanceandcase-finding.Missingcountryreportsmayneedtobeimputedforsomediseasesinsomeyears.
Datatype
Absolutenumber
Relatedlinks https://unstats.un.org/sdgs/metadata/?Text=&Goal=3&Target=3.3http://www.who.int/neglected_diseases/mediacentre/resolutions/en/http://www.who.int/neglected_diseases/resources/NTD_Generic_Framework_2015.pdf
30
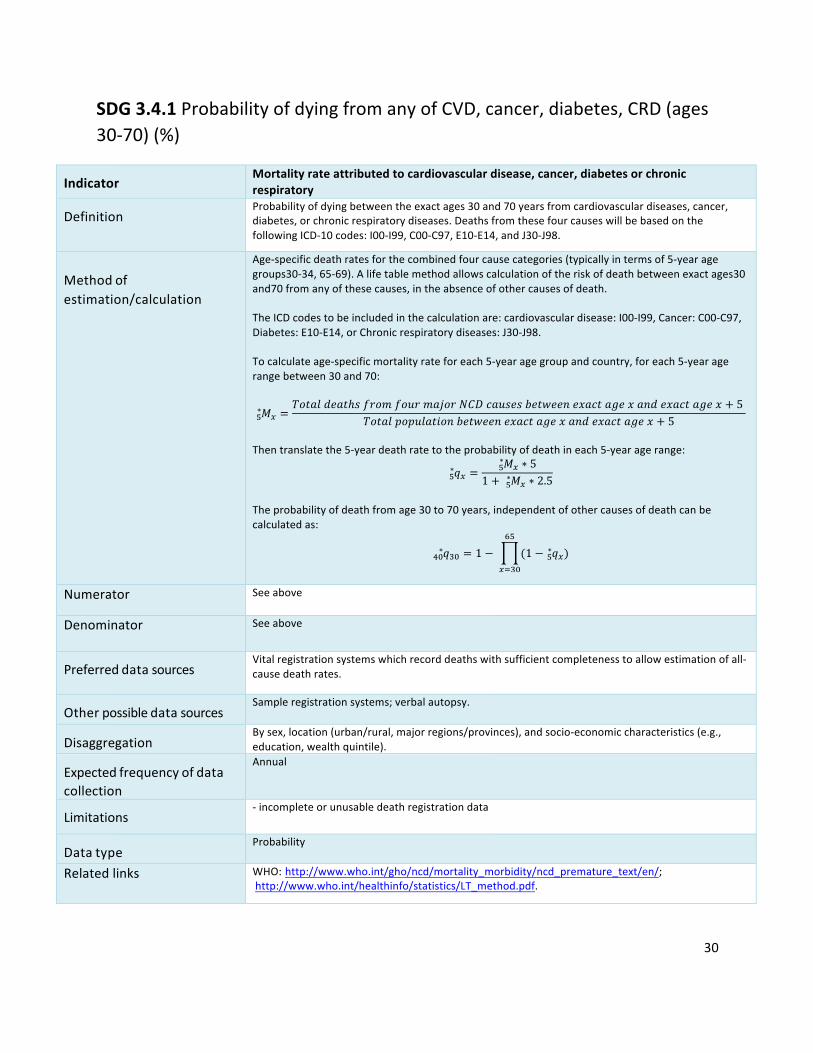
SDG3.4.1ProbabilityofdyingfromanyofCVD,cancer,diabetes,CRD(ages30-70)(%)
Indicator
Mortalityrateattributedtocardiovasculardisease,cancer,diabetesorchronicrespiratorydiseases
DefinitionProbabilityofdyingbetweentheexactages30and70yearsfromcardiovasculardiseases,cancer,diabetes,orchronicrespiratorydiseases.DeathsfromthesefourcauseswillbebasedonthefollowingICD-10codes:I00-I99,C00-C97,E10-E14,andJ30-J98.
Methodofestimation/calculation
Age-specificdeathratesforthecombinedfourcausecategories(typicallyintermsof5-yearagegroups30-34,65-69).Alifetablemethodallowscalculationoftheriskofdeathbetweenexactages30and70fromanyofthesecauses,intheabsenceofothercausesofdeath.TheICDcodestobeincludedinthecalculationare:cardiovasculardisease:I00-I99,Cancer:C00-C97,Diabetes:E10-E14,orChronicrespiratorydiseases:J30-J98.Tocalculateage-specificmortalityrateforeach5-yearagegroupandcountry,foreach5-yearagerangebetween30and70:
𝑀� =𝑇𝑜𝑡𝑎𝑙𝑑𝑒𝑎𝑡ℎ𝑠𝑓𝑟𝑜𝑚𝑓𝑜𝑢𝑟𝑚𝑎𝑗𝑜𝑟𝑁𝐶𝐷𝑐𝑎𝑢𝑠𝑒𝑠𝑏𝑒𝑡𝑤𝑒𝑒𝑛𝑒𝑥𝑎𝑐𝑡𝑎𝑔𝑒𝑥𝑎𝑛𝑑𝑒𝑥𝑎𝑐𝑡𝑎𝑔𝑒𝑥 + 5
𝑇𝑜𝑡𝑎𝑙𝑝𝑜𝑝𝑢𝑙𝑎𝑡𝑖𝑜𝑛𝑏𝑒𝑡𝑤𝑒𝑒𝑛𝑒𝑥𝑎𝑐𝑡𝑎𝑔𝑒𝑥𝑎𝑛𝑑𝑒𝑥𝑎𝑐𝑡𝑎𝑔𝑒𝑥 + 5�∗
Thentranslatethe5-yeardeathratetotheprobabilityofdeathineach5-yearagerange:
𝑞� =𝑀� ∗ 5�∗
1 + 𝑀� ∗ 2.5�∗�
∗
Theprobabilityofdeathfromage30to70years,independentofothercausesofdeathcanbecalculatedas:
𝑞�f = 1 − (1 − 𝑞��∗
��
���fhf∗ )
Numerator Seeabove
Denominator Seeabove
Preferreddatasources
Vitalregistrationsystemswhichrecorddeathswithsufficientcompletenesstoallowestimationofall-causedeathrates.
Otherpossibledatasources
Sampleregistrationsystems;verbalautopsy.
Disaggregation
Bysex,location(urban/rural,majorregions/provinces),andsocio-economiccharacteristics(e.g.,education,wealthquintile).
Expectedfrequencyofdatacollection
Annual
Limitations
-incompleteorunusabledeathregistrationdata
Datatype
Probability
Relatedlinks WHO:http://www.who.int/gho/ncd/mortality_morbidity/ncd_premature_text/en/;http://www.who.int/healthinfo/statistics/LT_method.pdf.
31
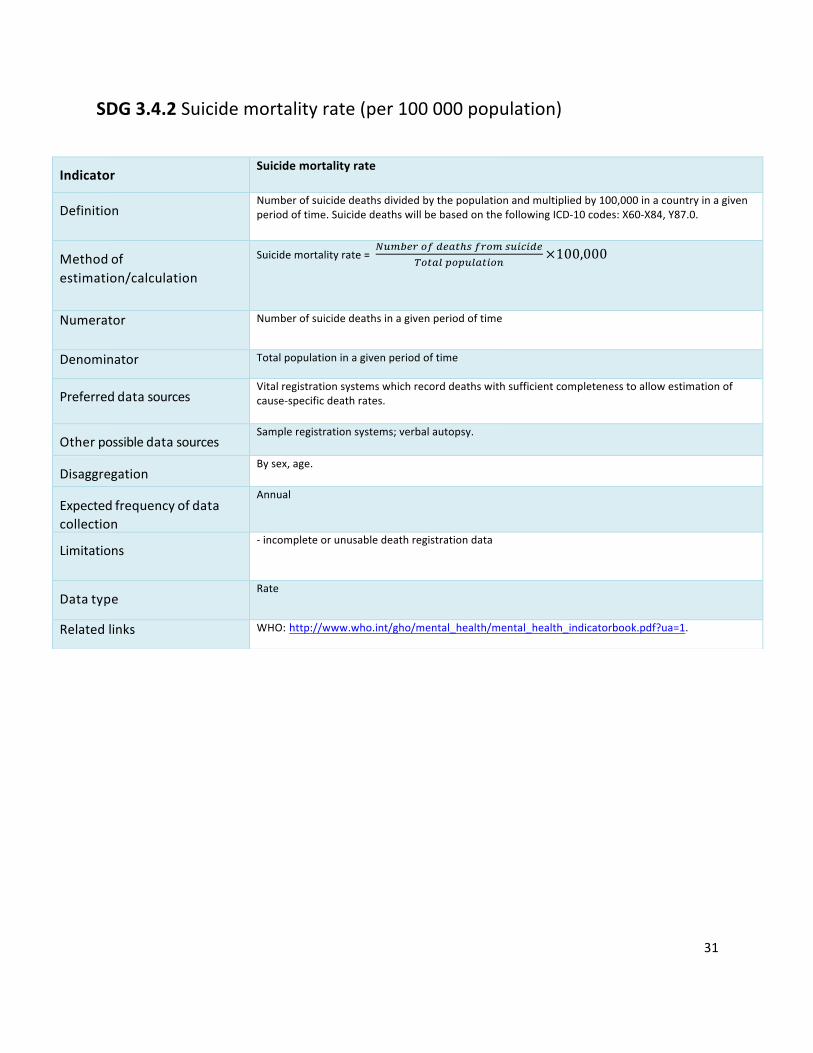
SDG3.4.2Suicidemortalityrate(per100000population)
Indicator
Suicidemortalityrate
Definition
Numberofsuicidedeathsdividedbythepopulationandmultipliedby100,000inacountryinagivenperiodoftime.SuicidedeathswillbebasedonthefollowingICD-10codes:X60-X84,Y87.0.
Methodofestimation/calculation
Suicidemortalityrate=]6^3_`2ad_47cja`2^j68b8d_
r27415256147829
×100,000
Numerator Numberofsuicidedeathsinagivenperiodoftime
Denominator Totalpopulationinagivenperiodoftime
Preferreddatasources
Vitalregistrationsystemswhichrecorddeathswithsufficientcompletenesstoallowestimationofcause-specificdeathrates.
Otherpossibledatasources
Sampleregistrationsystems;verbalautopsy.
Disaggregation
Bysex,age.
Expectedfrequencyofdatacollection
Annual
Limitations
-incompleteorunusabledeathregistrationdata
Datatype
Rate
Relatedlinks WHO:http://www.who.int/gho/mental_health/mental_health_indicatorbook.pdf?ua=1.

32
SDG3.5.1Coverageoftreatmentinterventionsforsubstance-usedisorders(%)
Indicator
Coverageoftreatmentinterventions(pharmacological,psychosocialandrehabilitationandaftercareservices)forsubstanceusedisorders
Definition
Substanceusedisordersincludesubstancedependenceandharmfulpatternofsubstanceuse.Severesubstanceusedisordersincludesubstancedependenceonly.
Methodofestimation/calculation
Therearetwoapproachescurrentlyunderdevelopmentandtestingtowardstheindicatorreport:1)Estimationbasedonactualserviceutilization:Treatmentcoverage= Treatmentdemands(Numberofpeopleincontactwithtreatmentservices)
Treatmentneeds(Numberofpeoplewithsubstanceusedisorders)×100%
2)Estimationbasedoncompositeindicatorofservicedevelopment:proxy-datareflectingmajorcomponentsoftreatmentsystemsforsubstanceusedisorders.
Numerator Numberofpeoplewithsubstanceusedisorders/substancedependenceincontactwithtreatmentservicesinagivenyear
Denominator Totalnumberofpeoplewithsubstanceusedisorders/substancedependenceinthepopulationinagivenyear
Preferreddatasources
WHOATLASonSubstanceUse(ATLAS-SU)andassociateddatacollectionactivities;WHOGlobalInformationSystemonAlcoholandHealth(GISAH)andassociateddatacollectionactivities;UNODCdatageneratedthroughAnnualReportQuestionnaire(ARQ)surveys;WHO-UNODCFacilitysurveys;datacollectedthroughNationalstatisticalsystemsandhealthsystemdata;population-basedhouseholdsurveys;GBDdataforsubstanceusedosoravailabilityandutilization.
Otherpossibledatasources
Othersourcesofinformationavailablefromdifferentinternationalorganizationsandmemberstates,suchasadministrative,projectdata,expertopinions,country-leveltargetedactivitiestogenerateandimputedata.Theunitisintheprocessofexploringfeasibilityandvalidityofthetwoapproachesforpickinguptrendsinthedevelopmentofpreventionandtreatmentsystemsforsubstanceusedisorders.Fundingwassecuredforadvancingtheworkonbothdirectionswithfieldtestingofthesecondapproachinatleast5countriesduring2019.
Disaggregation
Bytypeofsubstances,substanceusedisordersandtreatmentmodalities
Expectedfrequencyofdatacollection
Thefrequencyofdatacollectionwillremainthesame:-annualdatacollectionforillicitdrugscomponent;-annualoratleastbiennialforalcoholandothersubstanceusecomponent;-every3-5yearsforWHOATLASonSubstanceUsecollectsdata.
Limitations
Effectivecoverageestimationmaynotfeasibleorlimitedtofewpredominantlyhigh-incomecountries;Incaseofpoororunavailabledata,countryestimationsmaybelimitedtothelevelofavailabilitycoverage.
DatatypePercentage
Relatedlinks ATLAS-SU:http://www.who.int/gho/substance_abuse/en/GISAH:http://www.who.int/gho/alcohol/en/UNODCWorldDrugReport:https://www.unodc.org/wdr2018/http://www.who.int/mental_health/publications/action_plan/en/http://www.who.int/mental_health/evidence/atlas/mental_health_atlas_2017/en/
33
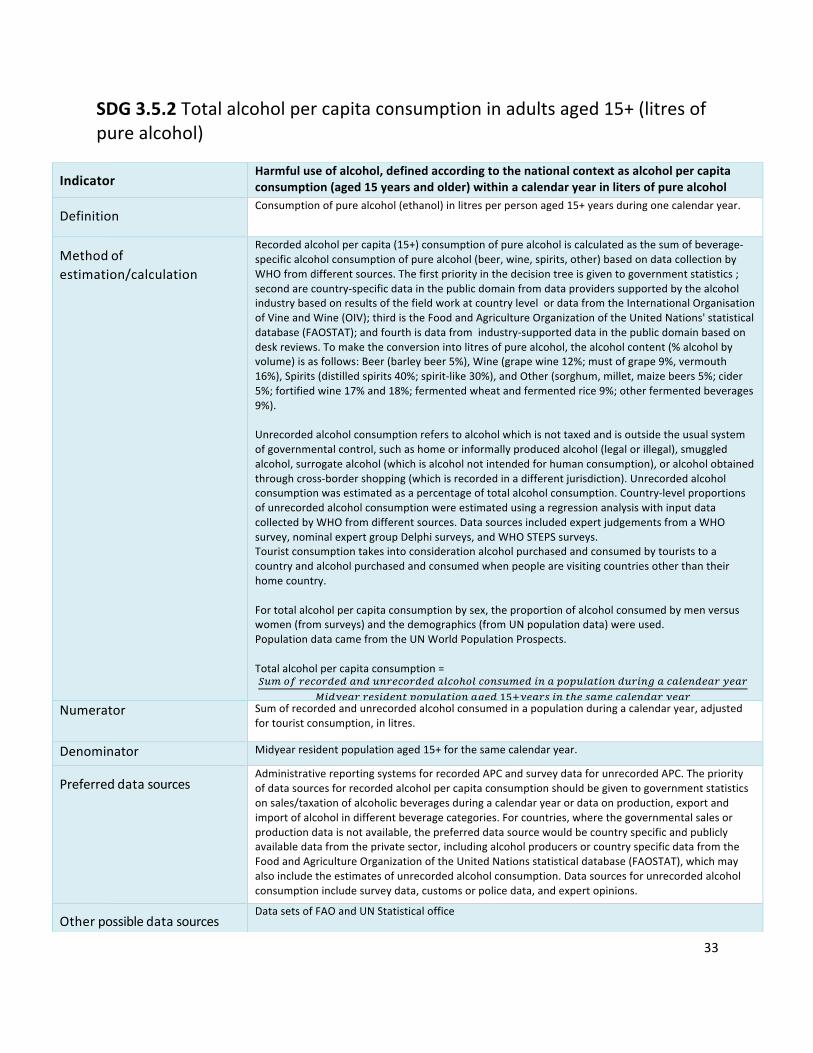
SDG3.5.2Totalalcoholpercapitaconsumptioninadultsaged15+(litresofpurealcohol)
Indicator
Harmfuluseofalcohol,definedaccordingtothenationalcontextasalcoholpercapitaconsumption(aged15yearsandolder)withinacalendaryearinlitersofpurealcohol
Definition
Consumptionofpurealcohol(ethanol)inlitresperpersonaged15+yearsduringonecalendaryear.
Methodofestimation/calculation
Recordedalcoholpercapita(15+)consumptionofpurealcoholiscalculatedasthesumofbeverage-specificalcoholconsumptionofpurealcohol(beer,wine,spirits,other)basedondatacollectionbyWHOfromdifferentsources.Thefirstpriorityinthedecisiontreeisgiventogovernmentstatistics;secondarecountry-specificdatainthepublicdomainfromdataproviderssupportedbythealcoholindustrybasedonresultsofthefieldworkatcountrylevelordatafromtheInternationalOrganisationofVineandWine(OIV);thirdistheFoodandAgricultureOrganizationoftheUnitedNations'statisticaldatabase(FAOSTAT);andfourthisdatafromindustry-supporteddatainthepublicdomainbasedondeskreviews.Tomaketheconversionintolitresofpurealcohol,thealcoholcontent(%alcoholbyvolume)isasfollows:Beer(barleybeer5%),Wine(grapewine12%;mustofgrape9%,vermouth16%),Spirits(distilledspirits40%;spirit-like30%),andOther(sorghum,millet,maizebeers5%;cider5%;fortifiedwine17%and18%;fermentedwheatandfermentedrice9%;otherfermentedbeverages9%).Unrecordedalcoholconsumptionreferstoalcoholwhichisnottaxedandisoutsidetheusualsystemofgovernmentalcontrol,suchashomeorinformallyproducedalcohol(legalorillegal),smuggledalcohol,surrogatealcohol(whichisalcoholnotintendedforhumanconsumption),oralcoholobtainedthroughcross-bordershopping(whichisrecordedinadifferentjurisdiction).Unrecordedalcoholconsumptionwasestimatedasapercentageoftotalalcoholconsumption.Country-levelproportionsofunrecordedalcoholconsumptionwereestimatedusingaregressionanalysiswithinputdatacollectedbyWHOfromdifferentsources.DatasourcesincludedexpertjudgementsfromaWHOsurvey,nominalexpertgroupDelphisurveys,andWHOSTEPSsurveys.Touristconsumptiontakesintoconsiderationalcoholpurchasedandconsumedbytouriststoacountryandalcoholpurchasedandconsumedwhenpeoplearevisitingcountriesotherthantheirhomecountry.Fortotalalcoholpercapitaconsumptionbysex,theproportionofalcoholconsumedbymenversuswomen(fromsurveys)andthedemographics(fromUNpopulationdata)wereused.PopulationdatacamefromtheUNWorldPopulationProspects.Totalalcoholpercapitaconsumption=
q6^2a`_b2`d_d49d69`_b2`d_d41b2c21b29j6^_d8945256147829d6`89e4b41_9d_4`i_4`¡8di_4``_j8d_9752561478294e_d¢�£i_4`j897c_j4^_b41_9d4`i_4`
Numerator Sumofrecordedandunrecordedalcoholconsumedinapopulationduringacalendaryear,adjustedfortouristconsumption,inlitres.
Denominator Midyearresidentpopulationaged15+forthesamecalendaryear.Preferreddatasources
AdministrativereportingsystemsforrecordedAPCandsurveydataforunrecordedAPC.Thepriorityofdatasourcesforrecordedalcoholpercapitaconsumptionshouldbegiventogovernmentstatisticsonsales/taxationofalcoholicbeveragesduringacalendaryearordataonproduction,exportandimportofalcoholindifferentbeveragecategories.Forcountries,wherethegovernmentalsalesorproductiondataisnotavailable,thepreferreddatasourcewouldbecountryspecificandpubliclyavailabledatafromtheprivatesector,includingalcoholproducersorcountryspecificdatafromtheFoodandAgricultureOrganizationoftheUnitedNationsstatisticaldatabase(FAOSTAT),whichmayalsoincludetheestimatesofunrecordedalcoholconsumption.Datasourcesforunrecordedalcoholconsumptionincludesurveydata,customsorpolicedata,andexpertopinions.
Otherpossibledatasources
DatasetsofFAOandUNStatisticaloffice
34
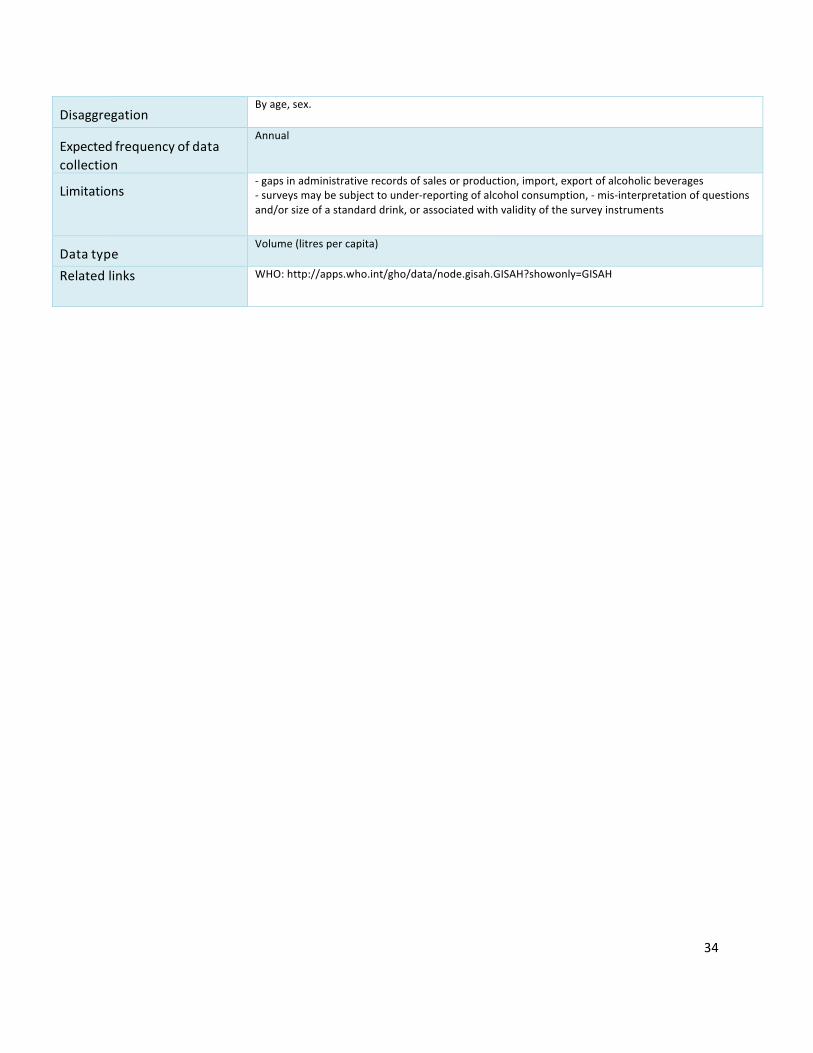
Disaggregation
Byage,sex.
Expectedfrequencyofdatacollection
Annual
Limitations
-gapsinadministrativerecordsofsalesorproduction,import,exportofalcoholicbeverages-surveysmaybesubjecttounder-reportingofalcoholconsumption,-mis-interpretationofquestionsand/orsizeofastandarddrink,orassociatedwithvalidityofthesurveyinstruments
Datatype
Volume(litrespercapita)
Relatedlinks WHO:http://apps.who.int/gho/data/node.gisah.GISAH?showonly=GISAH
35
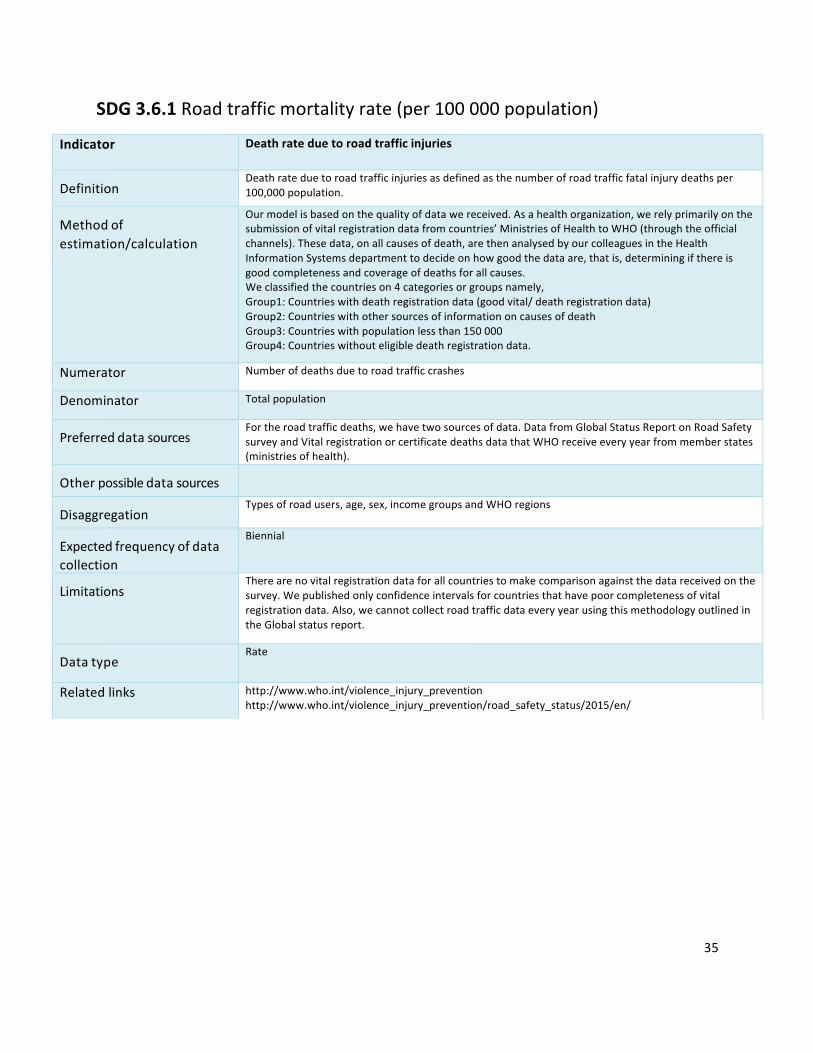
SDG3.6.1Roadtrafficmortalityrate(per100000population)
Indicator Deathrateduetoroadtrafficinjuries
Definition
Deathrateduetoroadtrafficinjuriesasdefinedasthenumberofroadtrafficfatalinjurydeathsper100,000population.
Methodofestimation/calculation
Ourmodelisbasedonthequalityofdatawereceived.Asahealthorganization,werelyprimarilyonthesubmissionofvitalregistrationdatafromcountries’MinistriesofHealthtoWHO(throughtheofficialchannels).Thesedata,onallcausesofdeath,arethenanalysedbyourcolleaguesintheHealthInformationSystemsdepartmenttodecideonhowgoodthedataare,thatis,determiningifthereisgoodcompletenessandcoverageofdeathsforallcauses.Weclassifiedthecountrieson4categoriesorgroupsnamely,Group1:Countrieswithdeathregistrationdata(goodvital/deathregistrationdata)Group2:CountrieswithothersourcesofinformationoncausesofdeathGroup3:Countrieswithpopulationlessthan150000Group4:Countrieswithouteligibledeathregistrationdata.
Numerator Numberofdeathsduetoroadtrafficcrashes
Denominator Totalpopulation
Preferreddatasources
Fortheroadtrafficdeaths,wehavetwosourcesofdata.DatafromGlobalStatusReportonRoadSafetysurveyandVitalregistrationorcertificatedeathsdatathatWHOreceiveeveryyearfrommemberstates(ministriesofhealth).
Otherpossibledatasources
Disaggregation
Typesofroadusers,age,sex,incomegroupsandWHOregions
Expectedfrequencyofdatacollection
Biennial
Limitations
Therearenovitalregistrationdataforallcountriestomakecomparisonagainstthedatareceivedonthesurvey.Wepublishedonlyconfidenceintervalsforcountriesthathavepoorcompletenessofvitalregistrationdata.Also,wecannotcollectroadtrafficdataeveryyearusingthismethodologyoutlinedintheGlobalstatusreport.
Datatype
Rate
Relatedlinks http://www.who.int/violence_injury_preventionhttp://www.who.int/violence_injury_prevention/road_safety_status/2015/en/
36
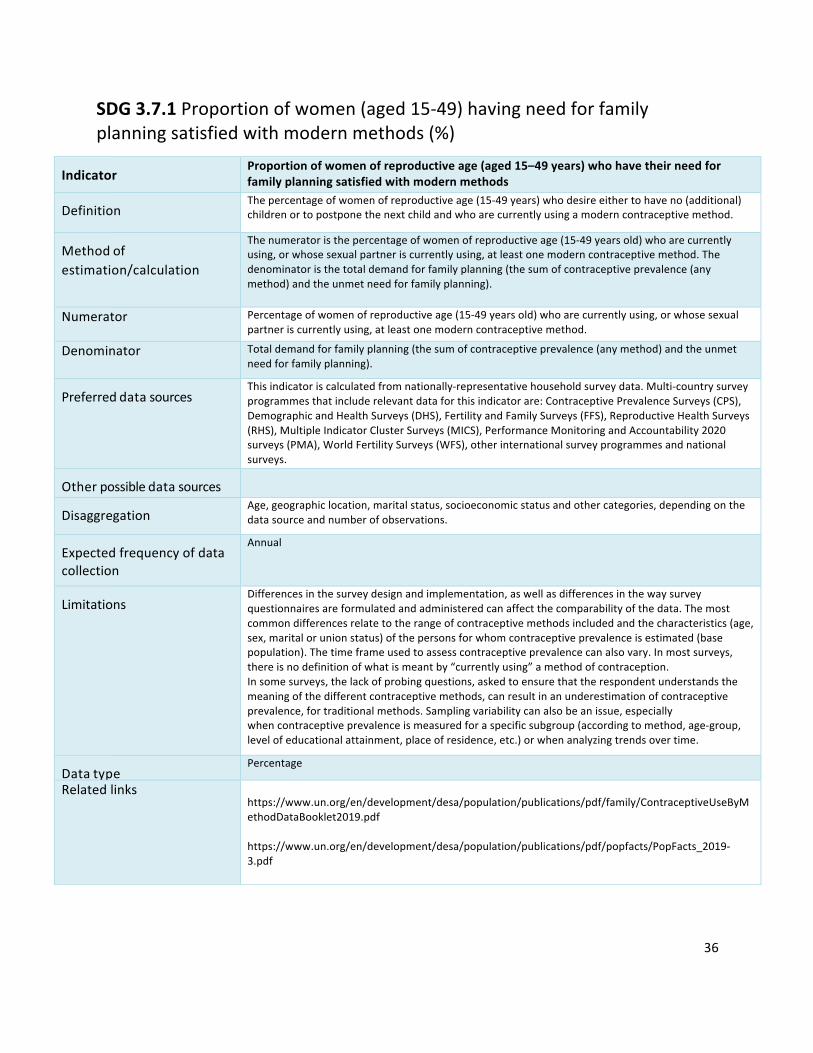
SDG3.7.1Proportionofwomen(aged15-49)havingneedforfamilyplanningsatisfiedwithmodernmethods(%)
Indicator
Proportionofwomenofreproductiveage(aged15–49years)whohavetheirneedforfamilyplanningsatisfiedwithmodernmethods
Definition
Thepercentageofwomenofreproductiveage(15-49years)whodesireeithertohaveno(additional)childrenortopostponethenextchildandwhoarecurrentlyusingamoderncontraceptivemethod.
Methodofestimation/calculation
Thenumeratoristhepercentageofwomenofreproductiveage(15-49yearsold)whoarecurrentlyusing,orwhosesexualpartneriscurrentlyusing,atleastonemoderncontraceptivemethod.Thedenominatoristhetotaldemandforfamilyplanning(thesumofcontraceptiveprevalence(anymethod)andtheunmetneedforfamilyplanning).
Numerator Percentageofwomenofreproductiveage(15-49yearsold)whoarecurrentlyusing,orwhosesexualpartneriscurrentlyusing,atleastonemoderncontraceptivemethod.
Denominator Totaldemandforfamilyplanning(thesumofcontraceptiveprevalence(anymethod)andtheunmetneedforfamilyplanning).
Preferreddatasources
Thisindicatoriscalculatedfromnationally-representativehouseholdsurveydata.Multi-countrysurveyprogrammesthatincluderelevantdataforthisindicatorare:ContraceptivePrevalenceSurveys(CPS),DemographicandHealthSurveys(DHS),FertilityandFamilySurveys(FFS),ReproductiveHealthSurveys(RHS),MultipleIndicatorClusterSurveys(MICS),PerformanceMonitoringandAccountability2020surveys(PMA),WorldFertilitySurveys(WFS),otherinternationalsurveyprogrammesandnationalsurveys.
Otherpossibledatasources
Disaggregation
Age,geographiclocation,maritalstatus,socioeconomicstatusandothercategories,dependingonthedatasourceandnumberofobservations.
Expectedfrequencyofdatacollection
Annual
Limitations
Differencesinthesurveydesignandimplementation,aswellasdifferencesinthewaysurveyquestionnairesareformulatedandadministeredcanaffectthecomparabilityofthedata.Themostcommondifferencesrelatetotherangeofcontraceptivemethodsincludedandthecharacteristics(age,sex,maritalorunionstatus)ofthepersonsforwhomcontraceptiveprevalenceisestimated(basepopulation).Thetimeframeusedtoassesscontraceptiveprevalencecanalsovary.Inmostsurveys,thereisnodefinitionofwhatismeantby“currentlyusing”amethodofcontraception.Insomesurveys,thelackofprobingquestions,askedtoensurethattherespondentunderstandsthemeaningofthedifferentcontraceptivemethods,canresultinanunderestimationofcontraceptiveprevalence,fortraditionalmethods.Samplingvariabilitycanalsobeanissue,especiallywhencontraceptiveprevalenceismeasuredforaspecificsubgroup(accordingtomethod,age-group,levelofeducationalattainment,placeofresidence,etc.)orwhenanalyzingtrendsovertime.
Datatype
Percentage
Relatedlinks https://www.un.org/en/development/desa/population/publications/pdf/family/ContraceptiveUseByMethodDataBooklet2019.pdfhttps://www.un.org/en/development/desa/population/publications/pdf/popfacts/PopFacts_2019-3.pdf
37
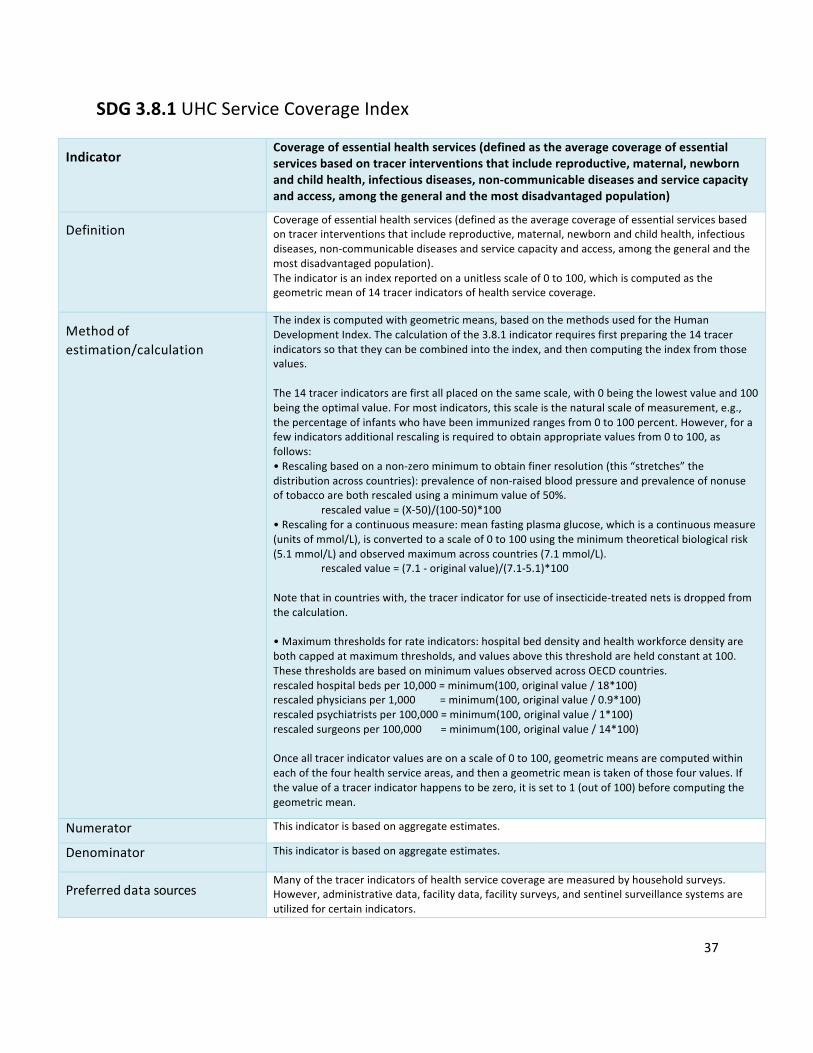
SDG3.8.1UHCServiceCoverageIndex
Indicator
Coverageofessentialhealthservices(definedastheaveragecoverageofessentialservicesbasedontracerinterventionsthatincludereproductive,maternal,newbornandchildhealth,infectiousdiseases,non-communicablediseasesandservicecapacityandaccess,amongthegeneralandthemostdisadvantagedpopulation)
DefinitionCoverageofessentialhealthservices(definedastheaveragecoverageofessentialservicesbasedontracerinterventionsthatincludereproductive,maternal,newbornandchildhealth,infectiousdiseases,non-communicablediseasesandservicecapacityandaccess,amongthegeneralandthemostdisadvantagedpopulation).Theindicatorisanindexreportedonaunitlessscaleof0to100,whichiscomputedasthegeometricmeanof14tracerindicatorsofhealthservicecoverage.
Methodofestimation/calculation
Theindexiscomputedwithgeometricmeans,basedonthemethodsusedfortheHumanDevelopmentIndex.Thecalculationofthe3.8.1indicatorrequiresfirstpreparingthe14tracerindicatorssothattheycanbecombinedintotheindex,andthencomputingtheindexfromthosevalues.The14tracerindicatorsarefirstallplacedonthesamescale,with0beingthelowestvalueand100beingtheoptimalvalue.Formostindicators,thisscaleisthenaturalscaleofmeasurement,e.g.,thepercentageofinfantswhohavebeenimmunizedrangesfrom0to100percent.However,forafewindicatorsadditionalrescalingisrequiredtoobtainappropriatevaluesfrom0to100,asfollows:•Rescalingbasedonanon-zerominimumtoobtainfinerresolution(this“stretches”thedistributionacrosscountries):prevalenceofnon-raisedbloodpressureandprevalenceofnonuseoftobaccoarebothrescaledusingaminimumvalueof50%.
rescaledvalue=(X-50)/(100-50)*100•Rescalingforacontinuousmeasure:meanfastingplasmaglucose,whichisacontinuousmeasure(unitsofmmol/L),isconvertedtoascaleof0to100usingtheminimumtheoreticalbiologicalrisk(5.1mmol/L)andobservedmaximumacrosscountries(7.1mmol/L).
rescaledvalue=(7.1-originalvalue)/(7.1-5.1)*100Notethatincountrieswith,thetracerindicatorforuseofinsecticide-treatednetsisdroppedfromthecalculation.•Maximumthresholdsforrateindicators:hospitalbeddensityandhealthworkforcedensityarebothcappedatmaximumthresholds,andvaluesabovethisthresholdareheldconstantat100.ThesethresholdsarebasedonminimumvaluesobservedacrossOECDcountries.rescaledhospitalbedsper10,000=minimum(100,originalvalue/18*100)rescaledphysiciansper1,000=minimum(100,originalvalue/0.9*100)rescaledpsychiatristsper100,000=minimum(100,originalvalue/1*100)rescaledsurgeonsper100,000=minimum(100,originalvalue/14*100)Oncealltracerindicatorvaluesareonascaleof0to100,geometricmeansarecomputedwithineachofthefourhealthserviceareas,andthenageometricmeanistakenofthosefourvalues.Ifthevalueofatracerindicatorhappenstobezero,itissetto1(outof100)beforecomputingthegeometricmean.
Numerator Thisindicatorisbasedonaggregateestimates.
Denominator Thisindicatorisbasedonaggregateestimates.
Preferreddatasources
Manyofthetracerindicatorsofhealthservicecoveragearemeasuredbyhouseholdsurveys.However,administrativedata,facilitydata,facilitysurveys,andsentinelsurveillancesystemsareutilizedforcertainindicators.

38
Otherpossibledatasources
Disaggregation
Geographiclocation,householdwealth.EquityiscentraltothedefinitionofUHC,andthereforetheUHCservicecoverageindexshouldbeusedtocommunicateinformationaboutinequalitiesinservicecoveragewithincountries.Thiscanbedonebypresentingtheindexseparatelyforthenationalpopulationvsdisadvantagedpopulationstohighlightdifferencesbetweenthem.
Expectedfrequencyofdatacollection
Datacollectionvariesfromevery1to5yearsacrosstracerindicators.Forexample,countrydataonimmunizationsandHIVtreatmentarereportedannually,whereashouseholdsurveystocollectinformationonchildtreatmentmayoccurevery3-5years,dependingonthecountry.
Limitations
Thetracerindicatorsaremeanttobeindicativeofservicecoverage,notacompleteorexhaustivelistofhealthservicesandinterventionsthatarerequiredforuniversalhealthcoverage.The14tracerindicatorswereselectedbecausetheyarewell-established,withavailabledatawidelyreportedbycountries(orexpectedtobecomewidelyavailablesoon).Therefore,theindexcanbecomputedwithexistingdatasourcesanddoesnotrequireinitiatingnewdatacollectioneffortssolelytoinformtheindex.
DatatypeIndex
Relatedlinks https://unstats.un.org/sdgs/metadata/files/Metadata-03-08-01.pdf.Individualtracerindicatorsareavailablehere:http://www.who.int/healthinfo/universal_health_coverage/UHC_Tracer_Indicators_Metadata.pdf

39
SDG3.8.2Populationwithhouseholdexpendituresonhealth>10%oftotalhouseholdexpenditureorincome(%)
Indicator
Proportionofpopulationwithlargehouseholdexpendituresonhealthasashareoftotalhouseholdexpendituresorincome
Definition
Proportionofthepopulationwithlargehouseholdexpenditureonhealthasashareoftotalhouseholdexpenditureorincome.Twothresholdsareusedtodefine“largehouseholdexpenditureonhealth”:greaterthan10%andgreaterthan25%oftotalhouseholdexpenditureorincome.
Methodofestimation/calculation
Populationweightedaveragenumberofpeoplewithlargehouseholdexpenditureonhealthasashareoftotalhouseholdexpenditureorincome
𝑚8𝜔81ℎ𝑒𝑎𝑙𝑡ℎ𝑒𝑥𝑝𝑒𝑛𝑑𝑖𝑡𝑢𝑟𝑒𝑜𝑓𝑡ℎ𝑒ℎ𝑜𝑢𝑠𝑒ℎ𝑜𝑙𝑑𝑖𝑡𝑜𝑡𝑎𝑙𝑒𝑥𝑝𝑒𝑛𝑑𝑖𝑡𝑢𝑟𝑒𝑜𝑓𝑡ℎ𝑒ℎ𝑜𝑢𝑠𝑒ℎ𝑜𝑙𝑑𝑖 > 𝜏8
𝑚88 𝜔8
whereidenotesahousehold,1()istheindicatorfunctionthattakesonthevalue1ifthebracketedexpressionistrue,and0otherwise,micorrespondstothehouseholdsize(numberofhouseholdmembersofi),ω/correspondstothesamplingweightofhouseholdi.Household’ssampleweightω/multipliedbythehouseholdsizemiisusedtoobtainrepresentativenumbersperperson.Ifthesampleisself-weightingtonlythehouseholdsizeisusedastheweight.τisathresholdidentifyinglargehouseholdexpenditureonhealthasashareoftotalhouseholdconsumptionorincome(i.e.10%and25%).
Numerator Totalnumberofpeoplewithlargehouseholdexpenditureonhealthasashareoftotalhouseholdexpenditureorincome(i.e.greaterthan10%and25%).Householdexpenditureonhealthisdefinedasanyexpenditureincurredatthetimeofserviceusetogetanytypeofcare(promotive,preventive,curative,rehabilitative,palliativeorlong-termcare)includingallmedicines,vaccinesandotherpharmaceuticalpreparationsaswellasallhealthproducts,fromanytypeofproviderandforallmembersofthehousehold.Thesehealthexpendituresarecharacterizedbyadirectpaymentthatarefinancedbyahousehold’sincome(includingremittances),savingsorloansbutdonotincludeanythird-partypayerreimbursement.TheyarelabelledOut-Of-Pocket(OOP)paymentsintheclassificationofhealthcarefinancingschemes(HF)oftheinternationalClassificationforHealthAccounts(ICHA).Thecomponentsofahouseholdexpenditureonhealthsodefinedshouldbeconsistentwithdivision06oftheUNClassificationofIndividualConsumptionAccordingtoPurpose(COICOP-2018)andincludeexpendituresonmedicinesandmedicalproducts(06.1),outpatientcareservices(06.2)and,inpatientcareservices(06.3)andotherhealthservices(06.4).Expenditureonhouseholdconsumptionandhouseholdincomearebothmonetarywelfaremeasures.Theformerisgenerallydefinedasthesumofthemonetaryvaluesofallitems(goodsandservices)consumedbythehouseholdduringareferenceperiod.Itincludestheimputedvaluesofgoodsandservicesthatarenotpurchasedbutprocuredotherwiseforconsumption.Themostrelevantmeasureofhouseholdincomeisdisposableincomeasitisclosetothemaximumavailabletothehouseholdforconsumptionexpenditureduringtheaccountingperiod.Disposableincomeisdefinedastotalincomelessdirecttaxes(netofrefunds),compulsoryfeesandfines.Totalincomeisgenerallycomposedofincomefromemployment,propertyincome,incomefromhouseholdproductionofservicesforownconsumption,transfersreceivedincashandgoods,transfersreceivedasservices.Expenditureonhouseholdconsumptionistherecommendedmonetarywelfaremeasure.
Denominator Totalnumberofpeople

40
Preferreddatasources
Keyrequirementsfortheselectionofadatasourceistheavailabilityofinformationonbothhouseholdexpendituresonhealthandhouseholdtotalexpenditureorincome,fromapopulationbasedsurveynationallyrepresentative;thethreemostcommondatasourcesarehouseholdbudgetsurveys(HBS),householdincomeandexpendituresurveys(HIES),socio-economicorlivingstandardssurveys.Thesesurveysaretypicallyimplementedbyorinclosecollaborationwithnationalstatisticalbureaus.
Otherpossibledatasources
Healthsurveyswithamodulecollectingexpendituredataonbothhouseholdtotalexpenditure(includingonfood,housingandutilities)andhouseholdexpenditureonhealth
Disaggregation
Subnationalvariablesavailableinsurveydata.Informationonhouseholdlocation(urbanvsrural);thegender,ageandeducationoftheheadofthehousehold;householdcharacteristics;andothersocio-economicvariablesareusefulforequityanalysis.
Expectedfrequencyofdatacollection
Every1–5yearsdependingonimplementationofpopulation-basedhouseholdexpendituresurveysledbynationalstatisticsoffices
Limitations
Thisindicatorattemptstoidentifyfinancialhardshipthatindividualsfacewhenusingtheirincome,savingsortakingloanstopayforhealthcare.However,mosthouseholdsurveysfailtoidentifythesourceoffundingusedbyahouseholdwhoisreportinghealthexpenditure.Incountrieswherethereisnoretrospectivereimbursementofhouseholdspendingonhealththisisnotaproblem.Butinthosecountrieswherethereisretrospectivereimbursement–forexample,viaacontributoryhealthinsurancescheme-theamountreportedbyahouseholdonhealthexpendituresmightbetotallyorpartiallyreimbursedatsomelaterpoint,perhapsoutsidetherecallperiodofthehouseholdsurvey.Thisindicatorreliesonasinglecut-offpointtoidentifywhatconstitutes‘largehealthexpenditureasashareoftotalhouseholdexpenditureorincome’.Peoplejustbeloworabovesuchthresholdsarenottakenintoaccount,whichisalwaystheproblemwithmeasuresbasedoncut-offs.Byplottingthecumulativedistributionfunctionofthehealthexpenditureratio,itispossibletoidentifytheproportionofthepopulationthatisdevotinganyshareofitshousehold’sbudgettohealthforanythreshold.Lowvaluesoftheseindicatorscanbedrivenbypeople’sinabilitytospendanythingatallonhealth.Forthisreasonfinancialhardshipneedstobemonitoredjointlywithindicatorsofservicecoverage.Thereareotherindicatorsusedtomonitorfinancialhardship.WithintheGPWmonitoringframeworkthedefinitionadoptedisconsistentwiththeSDGdefinitionofcatastrophichealthexpendituresbasedonabudgetsharemetric(indicator3.8.2).Catastrophichealthexpenditurescanbemeasuredindifferentwaystoenrichtheanalysisandprovidepolicyadvicetailoredtoindividualcountries.Foranoverviewofdifferentapproachestomonitorcatastrophichealthexpendituresusingdifferentversionsofcapacity-to-payapproaches(deductingformeetingbasicneeds)basedonrelevantglobalandregionalresolutionsseebox2.2inchapter2ofthe2017WHO/WBGlobalUHCMonitoringReportaswellasCylusetal2018andXuetal2003.FinancialhardshipcanalsobemonitoredbyestimatingtheproportionofthepopulationwithimpoverishinghealthexpendituretolinkSDGgoal3.8onUniversalhealthcoveragedirectlytothefirstSDGgoalonpovertyeradication.Differentpovertylinescanbeusedformonitoringatglobal,regionalandcountrylevel.Formoreinformationseechapter2ofthe2017WHO/WBGlobalUHC
Datatype
Percentage
41
Relatedlinks MetadataSDGindictor3.8.2metadataGlobalreferencelistof100coreindicatorlist-page136DataportalonfinancialprotectionUHCfinancialprotectiondataportalWHOwebpagesWHOfinancialprotectionWHO-EUROfinancialprotectionReports2018WHO-EUROcountryreviewsonfinancialprotection2017UHCglobalmonitoringreport2017regionalreportsonfinancialprotection2015PAHO/WBreportonUHCCOICOP-2018divisiononhealthUNStatisticsDivision.Division06oftheUNClassificationofIndividualConsumptionAccordingtoPurpose(COICOP-2018).NewYork.Internetsite:https://unstats.un.org/unsd/class/revisions/coicop_revision.asp
Scientificpapers(byyearofpublication)JonathanCylus,SarahThomson,TamásEvetovits,CatastrophichealthspendinginEurope:equityandpolicyimplicationsofdifferentcalculationmethods.WHObulletin2018.http://dx.doi.org/10.2471/BLT.18.209031HuiWang,LluisVinyalsTorres,PhyllidaTravis.FinancialprotectionanalysisineightcountriesintheWHOSouth-EastAsiaRegion.WHObulletin2018.http://dx.doi.org/10.2471/BLT.18.209858HsuJ,FloresG,EvansDetal.Measuringfinancialprotectionagainstcatastrophichealthexpenditures:methodologicalchallengesforglobalmonitoring.2017.InternationalJournalforEquityinHealth2018,17:69.https://doi.org/10.1186/s12939-018-0749-5WagstaffA,FloresG,HsuJetal.Progressoncatastrophichealthspending:resultsfor133countries.Aretrospectiveobservationalstudy.LancetGlobalHealth.2017.http://dx.doi.org/10.1016/S2214-109X(17)30429-1WagstaffA,FloresG,SmitzM-Fetal.Progressonimpoverishinghealthspending:resultsfor122countries.Aretrospectiveobservationalstudy.2017.http://dx.doi.org/10.1016/S2214-109X(17)30486-2SaksenaP,HsuJ,EvansDB.Financialriskprotectionanduniversalhealthcoverage:evidenceandmeasurementchallenges.PLoSMed.2014;11(9):e1001701.https://doi.org/10.1371/journal.pmed.1001701XuK,EvansDB,CarrinG,Aguilar-RiveraAM,MusgroveP,EvansT.Protectinghouseholdsfromcatastrophichealthspending.HealthAff(Millwood).2007;26(4):972-83.https://doi.org/10.1377/hlthaff.26.4.972XuK,EvansDB,KawabataKetal.Householdcatastrophichealthexpenditure:amulticountryanalysis.Lancet.2003;362(9378):111-7.https://doi.org/10.1016/S0140-6736(03)13861-5WagstaffA,vanDoorslaerE.Catastropheandimpoverishmentinpayingforhealthcare:withapplicationstoVietnam1993-1998.HealthEconomics.2003;12(11):921-34.https://doi.org/10.1002/hec.776

42
SDG3.9.1Mortalityrateattributedtoairpollution(per100000population)
Indicator
Mortalityrateattributedtohouseholdandambientairpollution
Definition
Evidencefromepidemiologicalstudieshaveshownthatexposuretoambientairpollutionislinked,amongothers,totheimportantdiseasestakenintoaccountinthisestimate:acuterespiratoryinfectionsinyoungchildren(estimatedunder5yearsofage);cerebrovasculardiseasesinadults(estimatedabove25years);ischemicheartdiseasesinadults(estimatedabove25years);chronicobstructivepulmonarydiseaseinadults(estimatedabove25years);andlungcancerinadults(estimatedabove25years).
Methodofestimation/calculation
Burdenofdiseaseattributedtoairpollutioniscalculatedbyfirstcombininginformationontheincreased(orrelative)riskofadiseaseresultingfromexposure,withinformationonhowwidespreadtheexposureisinthepopulation(inthiscase,theannualmeanconcentrationofparticulatemattertowhichthepopulationisexposed).Thisallowscalculationofthe'populationattributablefraction'(PAF),whichisthefractionofdiseaseseeninagivenpopulationthatcanbeattributedtotheexposure,inthiscasetheannualmeanconcentrationofparticulatematter.Applyingthisfractiontothetotalburdenofdisease(e.g.cardiopulmonarydiseaseexpressedasdeathsorDALYs),givesthetotalnumberofdeathsorDALYsthatresultsfromambientairpollution.
PopulationAttributedFraction(PAF)=©ª×««ªg ©ª
¬×««ªª®¯
ª®¯
©ªª®¯ ׫«ª
𝑃8=proportionofpopulationatexposureleveli,currentexposure𝑃8±=proportionofpopulationatexposureleveli,counterfactualorideallevelofexposureRR=therelativeriskatexposurelevelin=thelevelofexposurelevelsMortalityrateattributedtohouseholdandambientairpollution=
𝑇𝑜𝑡𝑎𝑙𝑛𝑢𝑚𝑏𝑒𝑟𝑜𝑓𝑑𝑒𝑎𝑡ℎ𝑠𝑎𝑡𝑡𝑟𝑖𝑏𝑢𝑡𝑒𝑑𝑡𝑜ℎ𝑜𝑢𝑠𝑒ℎ𝑜𝑙𝑑𝑎𝑛𝑑𝑎𝑚𝑏𝑖𝑒𝑛𝑡𝑎𝑖𝑟𝑝𝑜𝑙𝑙𝑢𝑡𝑖𝑜𝑛𝑇𝑜𝑡𝑎𝑙𝑝𝑜𝑝𝑢𝑙𝑎𝑡𝑖𝑜𝑛
×100,000
Numerator Totalnumberofdeathsattributedtohouseholdandambientairpollution
Denominator Totalpopulation
Preferreddatasources
Civilregistrationwithcompletecoverageandmedicalcertificationofcauseofdeath;Specialstudies
Otherpossibledatasources
SampleRegistrationSystemsandVerbalAutopsy
Disaggregation
Byage,sex,location(urban/rural,majorregions/provinces),andsocio-economiccharacteristics(e.g.,education,wealthquintile).
Expectedfrequencyofdatacollection
Annualorevery5years
Limitations
-incompleteorunusabledeathregistrationdata-measurementerrors
Datatype
Rate
Relatedlinks WHO:http://apps.who.int/gho/data/node.wrapper.imr?x-id=2259;http://www.who.int/healthinfo/global_burden_disease/metrics_paf/en/.
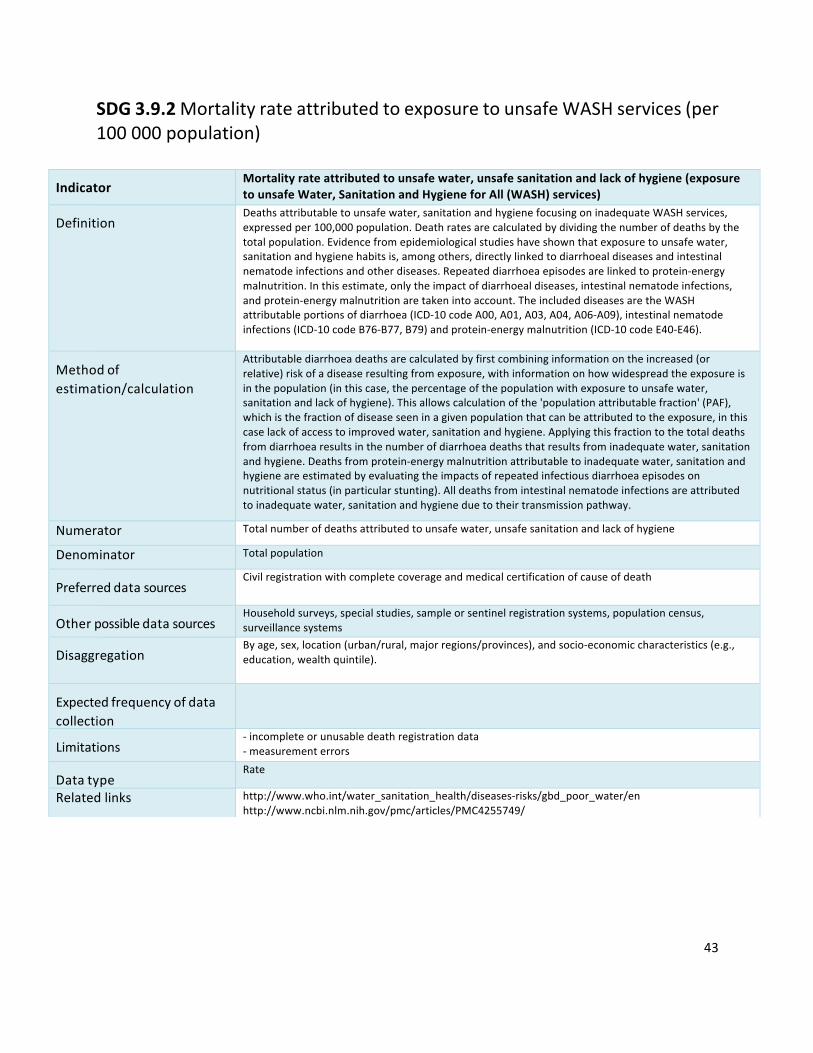
43
SDG3.9.2MortalityrateattributedtoexposuretounsafeWASHservices(per100000population)
Indicator
Mortalityrateattributedtounsafewater,unsafesanitationandlackofhygiene(exposuretounsafeWater,SanitationandHygieneforAll(WASH)services)
Definition
Deathsattributabletounsafewater,sanitationandhygienefocusingoninadequateWASHservices,expressedper100,000population.Deathratesarecalculatedbydividingthenumberofdeathsbythetotalpopulation.Evidencefromepidemiologicalstudieshaveshownthatexposuretounsafewater,sanitationandhygienehabitsis,amongothers,directlylinkedtodiarrhoealdiseasesandintestinalnematodeinfectionsandotherdiseases.Repeateddiarrhoeaepisodesarelinkedtoprotein-energymalnutrition.Inthisestimate,onlytheimpactofdiarrhoealdiseases,intestinalnematodeinfections,andprotein-energymalnutritionaretakenintoaccount.TheincludeddiseasesaretheWASHattributableportionsofdiarrhoea(ICD-10codeA00,A01,A03,A04,A06-A09),intestinalnematodeinfections(ICD-10codeB76-B77,B79)andprotein-energymalnutrition(ICD-10codeE40-E46).
Methodofestimation/calculation
Attributablediarrhoeadeathsarecalculatedbyfirstcombininginformationontheincreased(orrelative)riskofadiseaseresultingfromexposure,withinformationonhowwidespreadtheexposureisinthepopulation(inthiscase,thepercentageofthepopulationwithexposuretounsafewater,sanitationandlackofhygiene).Thisallowscalculationofthe'populationattributablefraction'(PAF),whichisthefractionofdiseaseseeninagivenpopulationthatcanbeattributedtotheexposure,inthiscaselackofaccesstoimprovedwater,sanitationandhygiene.Applyingthisfractiontothetotaldeathsfromdiarrhoearesultsinthenumberofdiarrhoeadeathsthatresultsfrominadequatewater,sanitationandhygiene.Deathsfromprotein-energymalnutritionattributabletoinadequatewater,sanitationandhygieneareestimatedbyevaluatingtheimpactsofrepeatedinfectiousdiarrhoeaepisodesonnutritionalstatus(inparticularstunting).Alldeathsfromintestinalnematodeinfectionsareattributedtoinadequatewater,sanitationandhygieneduetotheirtransmissionpathway.
Numerator Totalnumberofdeathsattributedtounsafewater,unsafesanitationandlackofhygiene
Denominator TotalpopulationPreferreddatasources
Civilregistrationwithcompletecoverageandmedicalcertificationofcauseofdeath
Otherpossibledatasources
Householdsurveys,specialstudies,sampleorsentinelregistrationsystems,populationcensus,surveillancesystems
Disaggregation
Byage,sex,location(urban/rural,majorregions/provinces),andsocio-economiccharacteristics(e.g.,education,wealthquintile).
Expectedfrequencyofdatacollection
Limitations
-incompleteorunusabledeathregistrationdata-measurementerrors
Datatype
Rate
Relatedlinks http://www.who.int/water_sanitation_health/diseases-risks/gbd_poor_water/enhttp://www.ncbi.nlm.nih.gov/pmc/articles/PMC4255749/
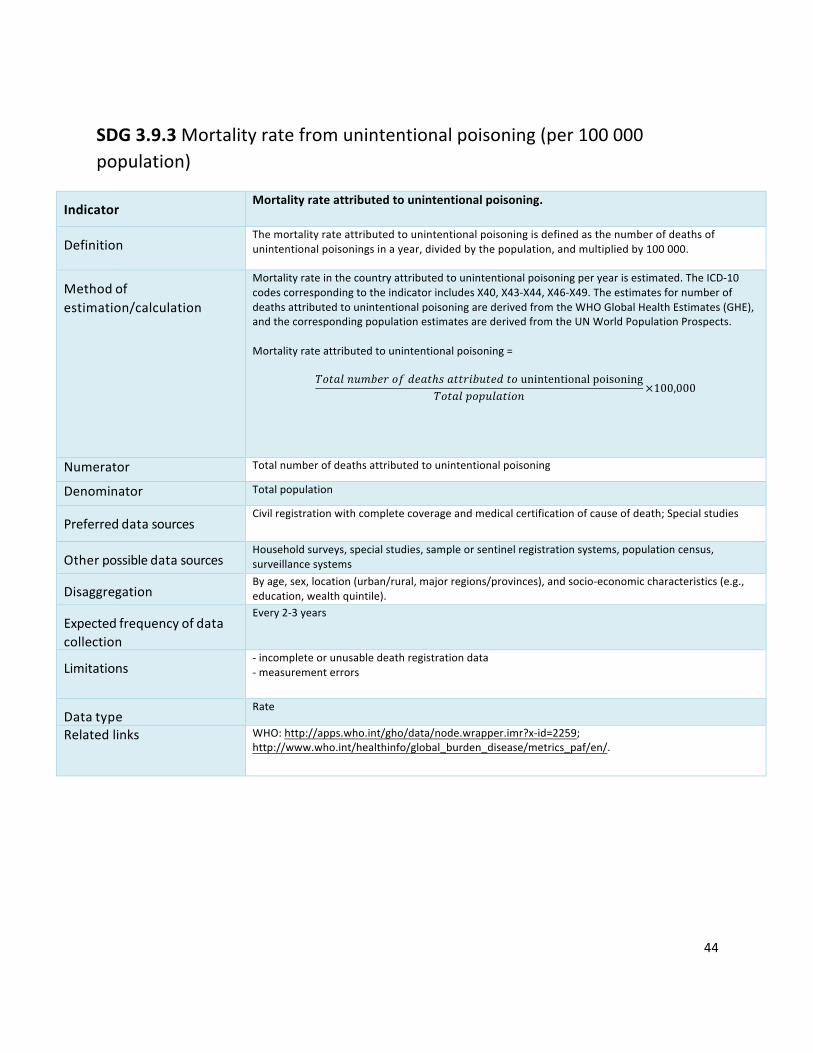
44
SDG3.9.3Mortalityratefromunintentionalpoisoning(per100000population)
Indicator
Mortalityrateattributedtounintentionalpoisoning.
Definition
Themortalityrateattributedtounintentionalpoisoningisdefinedasthenumberofdeathsofunintentionalpoisoningsinayear,dividedbythepopulation,andmultipliedby100000.
Methodofestimation/calculation
Mortalityrateinthecountryattributedtounintentionalpoisoningperyearisestimated.TheICD-10codescorrespondingtotheindicatorincludesX40,X43-X44,X46-X49.TheestimatesfornumberofdeathsattributedtounintentionalpoisoningarederivedfromtheWHOGlobalHealthEstimates(GHE),andthecorrespondingpopulationestimatesarederivedfromtheUNWorldPopulationProspects.Mortalityrateattributedtounintentionalpoisoning=
𝑇𝑜𝑡𝑎𝑙𝑛𝑢𝑚𝑏𝑒𝑟𝑜𝑓𝑑𝑒𝑎𝑡ℎ𝑠𝑎𝑡𝑡𝑟𝑖𝑏𝑢𝑡𝑒𝑑𝑡𝑜unintentionalpoisoning𝑇𝑜𝑡𝑎𝑙𝑝𝑜𝑝𝑢𝑙𝑎𝑡𝑖𝑜𝑛
×100,000
Numerator Totalnumberofdeathsattributedtounintentionalpoisoning
Denominator TotalpopulationPreferreddatasources
Civilregistrationwithcompletecoverageandmedicalcertificationofcauseofdeath;Specialstudies
Otherpossibledatasources
Householdsurveys,specialstudies,sampleorsentinelregistrationsystems,populationcensus,surveillancesystems
Disaggregation
Byage,sex,location(urban/rural,majorregions/provinces),andsocio-economiccharacteristics(e.g.,education,wealthquintile).
Expectedfrequencyofdatacollection
Every2-3years
Limitations
-incompleteorunusabledeathregistrationdata-measurementerrors
Datatype
Rate
Relatedlinks WHO:http://apps.who.int/gho/data/node.wrapper.imr?x-id=2259;http://www.who.int/healthinfo/global_burden_disease/metrics_paf/en/.

45
SDG7.1.2Proportionofpopulationwithprimaryrelianceoncleanfuels(%)
Indicator
Proportionofpopulationwithprimaryrelianceoncleanfuelsandtechnology
Definition
Thepercentageofthepopulationthatreliesoncleanfuelsandtechnologiesastheprimarysourceofdomesticenergyforcooking.“Clean”isdefinedbytheemissionratetargetsandspecificfuelrecommendations(i.e.againstunprocessedcoalandkerosene)includedinthenormativeguidanceWHOguidelinesforindoorairquality:householdfuelcombustion.
Methodofestimation/calculation
Theindicatoriscalculatedasthenumberofpeopleusingcleanfuelsandtechnologiesdividedbytotalpopulation,expressedaspercentage.Householdenergyusedataareroutinelycollectedatthenationalandsubnationallevelsinmostcountriesusingcensusesandsurveys.Householdsurveysusedinclude:UnitedStatesAgencyforInternationalDevelopment(USAID)-supportedDemographicandHealthSurveys(DHS);UnitedNationsChildren’sFund(UNICEF)-supportedMultipleIndicatorClusterSurveys(MICS);WHO-supportedWorldHealthSurveys(WHS);nationalpopulationandhousingcensusesandotherreliableandnationallyrepresentativecountrysurveys.
Numerator Thenumberofpeopleusingcleanfuelsandtechnologiesforcooking,heatingandlighting
Denominator TotalpopulationPreferreddatasources
Nationalsurvey,populationcensus,householdsurveys
Otherpossibledatasources
Disaggregation
Location(urban/rural)
Expectedfrequencyofdatacollection
Annual
Limitations
Theindicatorusescleanfuelsandtechnologiesuseasaproxyforindoorairpollution,asitisnotcurrentlypossibletoobtainnationallyrepresentativesamplesofindoorconcentrationsofcriteriapollutants,suchassmallparticlesandcarbonmonoxide.Theindicatorisbasedonthemaintypeoffuelusedforcookingascookingoccupiesthelargestshareofoverallhouseholdenergyneeds.However,manyhouseholdsusemorethanonetypeoffuelforcookingand,dependingonclimaticandgeographicalconditions,heatingwithsolidfuelscanalsobeacontributortoindoorairpollutionlevels.
Datatype
Percentage
Relatedlinks https://www.who.int/airpollution/data/HAP_exposure_results_final.pdf?ua=1https://www.who.int/indoorair/publications/burning-opportunities/en/
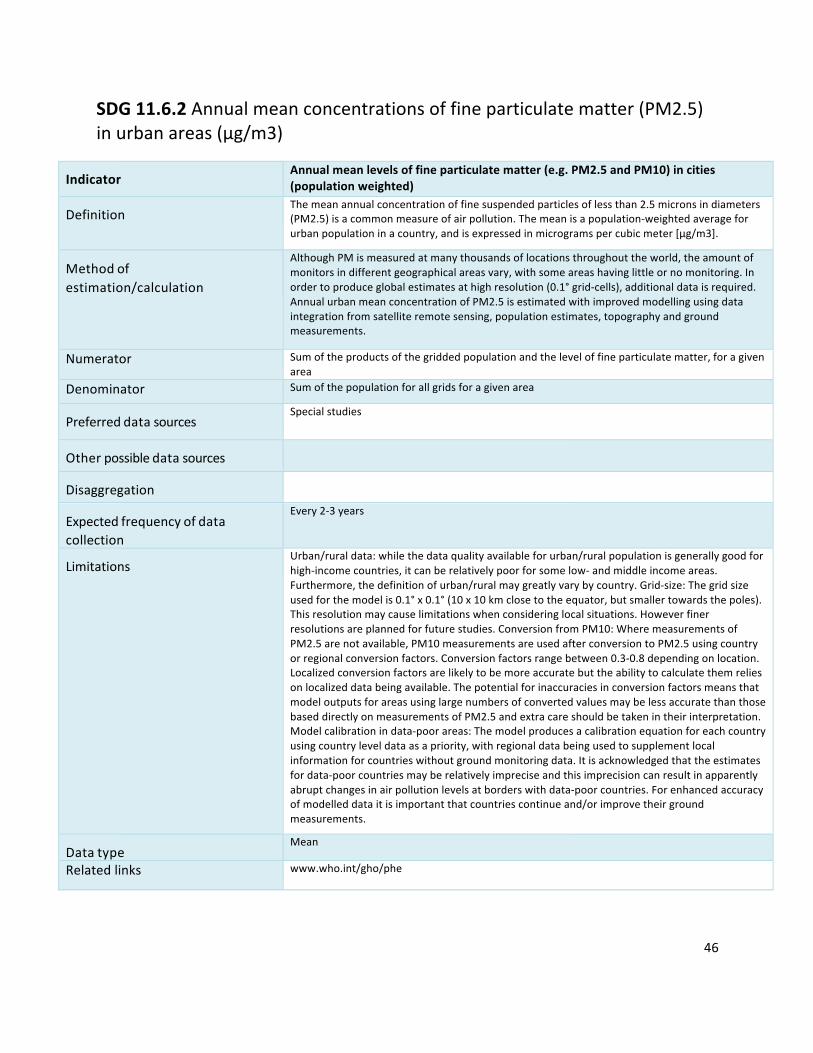
46
SDG11.6.2Annualmeanconcentrationsoffineparticulatematter(PM2.5)inurbanareas(μg/m3)
Indicator
Annualmeanlevelsoffineparticulatematter(e.g.PM2.5andPM10)incities(populationweighted)
Definition
Themeanannualconcentrationoffinesuspendedparticlesoflessthan2.5micronsindiameters(PM2.5)isacommonmeasureofairpollution.Themeanisapopulation-weightedaverageforurbanpopulationinacountry,andisexpressedinmicrogramspercubicmeter[μg/m3].
Methodofestimation/calculation
AlthoughPMismeasuredatmanythousandsoflocationsthroughouttheworld,theamountofmonitorsindifferentgeographicalareasvary,withsomeareashavinglittleornomonitoring.Inordertoproduceglobalestimatesathighresolution(0.1°grid-cells),additionaldataisrequired.AnnualurbanmeanconcentrationofPM2.5isestimatedwithimprovedmodellingusingdataintegrationfromsatelliteremotesensing,populationestimates,topographyandgroundmeasurements.
Numerator Sumoftheproductsofthegriddedpopulationandtheleveloffineparticulatematter,foragivenareaDenominator Sumofthepopulationforallgridsforagivenarea
Preferreddatasources
Specialstudies
Otherpossibledatasources
Disaggregation
Expectedfrequencyofdatacollection
Every2-3years
Limitations
Urban/ruraldata:whilethedataqualityavailableforurban/ruralpopulationisgenerallygoodforhigh-incomecountries,itcanberelativelypoorforsomelow-andmiddleincomeareas.Furthermore,thedefinitionofurban/ruralmaygreatlyvarybycountry.Grid-size:Thegridsizeusedforthemodelis0.1°x0.1°(10x10kmclosetotheequator,butsmallertowardsthepoles).Thisresolutionmaycauselimitationswhenconsideringlocalsituations.Howeverfinerresolutionsareplannedforfuturestudies.ConversionfromPM10:WheremeasurementsofPM2.5arenotavailable,PM10measurementsareusedafterconversiontoPM2.5usingcountryorregionalconversionfactors.Conversionfactorsrangebetween0.3-0.8dependingonlocation.Localizedconversionfactorsarelikelytobemoreaccuratebuttheabilitytocalculatethemreliesonlocalizeddatabeingavailable.ThepotentialforinaccuraciesinconversionfactorsmeansthatmodeloutputsforareasusinglargenumbersofconvertedvaluesmaybelessaccuratethanthosebaseddirectlyonmeasurementsofPM2.5andextracareshouldbetakenintheirinterpretation.Modelcalibrationindata-poorareas:Themodelproducesacalibrationequationforeachcountryusingcountryleveldataasapriority,withregionaldatabeingusedtosupplementlocalinformationforcountrieswithoutgroundmonitoringdata.Itisacknowledgedthattheestimatesfordata-poorcountriesmayberelativelyimpreciseandthisimprecisioncanresultinapparentlyabruptchangesinairpollutionlevelsatborderswithdata-poorcountries.Forenhancedaccuracyofmodelleddataitisimportantthatcountriescontinueand/orimprovetheirgroundmeasurements.
Datatype
Mean
Relatedlinks www.who.int/gho/phe
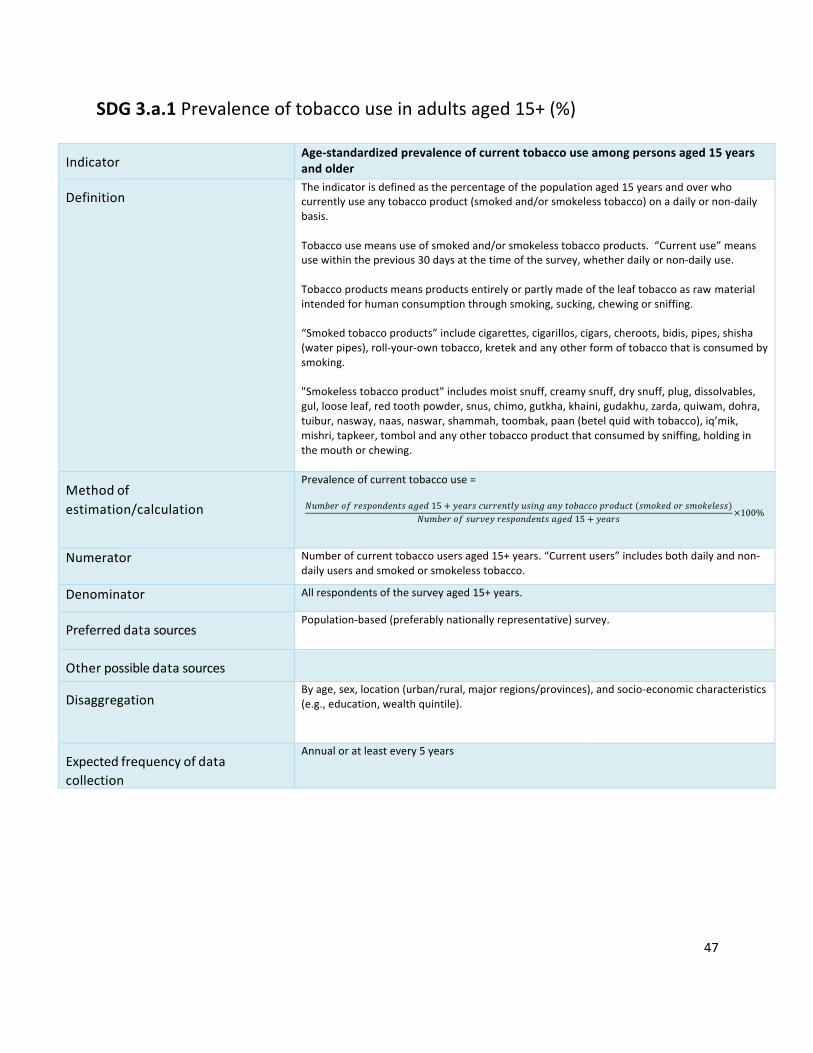
47
SDG3.a.1Prevalenceoftobaccouseinadultsaged15+(%)
Indicator
Age-standardizedprevalenceofcurrenttobaccouseamongpersonsaged15yearsandolder
Definition
Theindicatorisdefinedasthepercentageofthepopulationaged15yearsandoverwhocurrentlyuseanytobaccoproduct(smokedand/orsmokelesstobacco)onadailyornon-dailybasis.Tobaccousemeansuseofsmokedand/orsmokelesstobaccoproducts.“Currentuse”meansusewithintheprevious30daysatthetimeofthesurvey,whetherdailyornon-dailyuse.Tobaccoproductsmeansproductsentirelyorpartlymadeoftheleaftobaccoasrawmaterialintendedforhumanconsumptionthroughsmoking,sucking,chewingorsniffing.“Smokedtobaccoproducts”includecigarettes,cigarillos,cigars,cheroots,bidis,pipes,shisha(waterpipes),roll-your-owntobacco,kretekandanyotherformoftobaccothatisconsumedbysmoking."Smokelesstobaccoproduct"includesmoistsnuff,creamysnuff,drysnuff,plug,dissolvables,gul,looseleaf,redtoothpowder,snus,chimo,gutkha,khaini,gudakhu,zarda,quiwam,dohra,tuibur,nasway,naas,naswar,shammah,toombak,paan(betelquidwithtobacco),iq’mik,mishri,tapkeer,tombolandanyothertobaccoproductthatconsumedbysniffing,holdinginthemouthorchewing.
Methodofestimation/calculation
Prevalenceofcurrenttobaccouse=𝑁𝑢𝑚𝑏𝑒𝑟𝑜𝑓𝑟𝑒𝑠𝑝𝑜𝑛𝑑𝑒𝑛𝑡𝑠𝑎𝑔𝑒𝑑15 + 𝑦𝑒𝑎𝑟𝑠𝑐𝑢𝑟𝑟𝑒𝑛𝑡𝑙𝑦𝑢𝑠𝑖𝑛𝑔𝑎𝑛𝑦𝑡𝑜𝑏𝑎𝑐𝑐𝑜𝑝𝑟𝑜𝑑𝑢𝑐𝑡(𝑠𝑚𝑜𝑘𝑒𝑑𝑜𝑟𝑠𝑚𝑜𝑘𝑒𝑙𝑒𝑠𝑠)
𝑁𝑢𝑚𝑏𝑒𝑟𝑜𝑓𝑠𝑢𝑟𝑣𝑒𝑦𝑟𝑒𝑠𝑝𝑜𝑛𝑑𝑒𝑛𝑡𝑠𝑎𝑔𝑒𝑑15 + 𝑦𝑒𝑎𝑟𝑠 ×100%
Numerator Numberofcurrenttobaccousersaged15+years.“Currentusers”includesbothdailyandnon-dailyusersandsmokedorsmokelesstobacco.
Denominator Allrespondentsofthesurveyaged15+years.
Preferreddatasources
Population-based(preferablynationallyrepresentative)survey.
Otherpossibledatasources
Disaggregation
Byage,sex,location(urban/rural,majorregions/provinces),andsocio-economiccharacteristics(e.g.,education,wealthquintile).
Expectedfrequencyofdatacollection
Annualoratleastevery5years
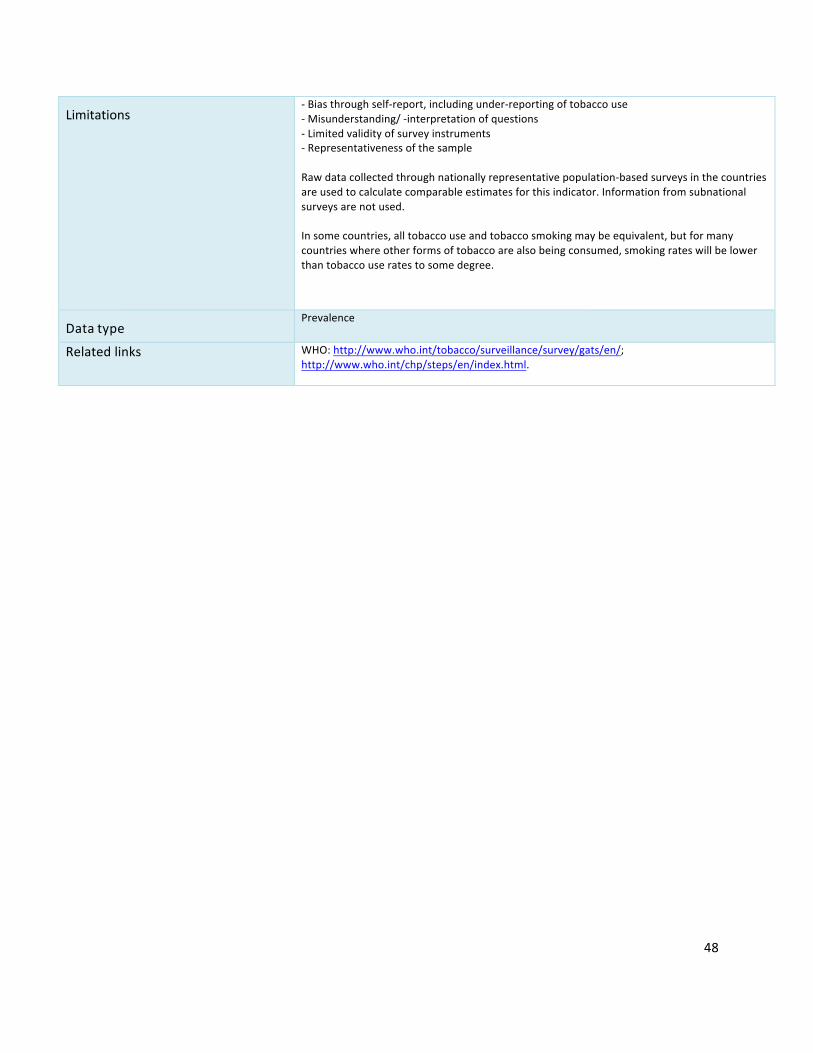
48
Limitations
-Biasthroughself-report,includingunder-reportingoftobaccouse-Misunderstanding/-interpretationofquestions-Limitedvalidityofsurveyinstruments-RepresentativenessofthesampleRawdatacollectedthroughnationallyrepresentativepopulation-basedsurveysinthecountriesareusedtocalculatecomparableestimatesforthisindicator.Informationfromsubnationalsurveysarenotused.Insomecountries,alltobaccouseandtobaccosmokingmaybeequivalent,butformanycountrieswhereotherformsoftobaccoarealsobeingconsumed,smokingrateswillbelowerthantobaccouseratestosomedegree.
Datatype
Prevalence
Relatedlinks WHO:http://www.who.int/tobacco/surveillance/survey/gats/en/;http://www.who.int/chp/steps/en/index.html.
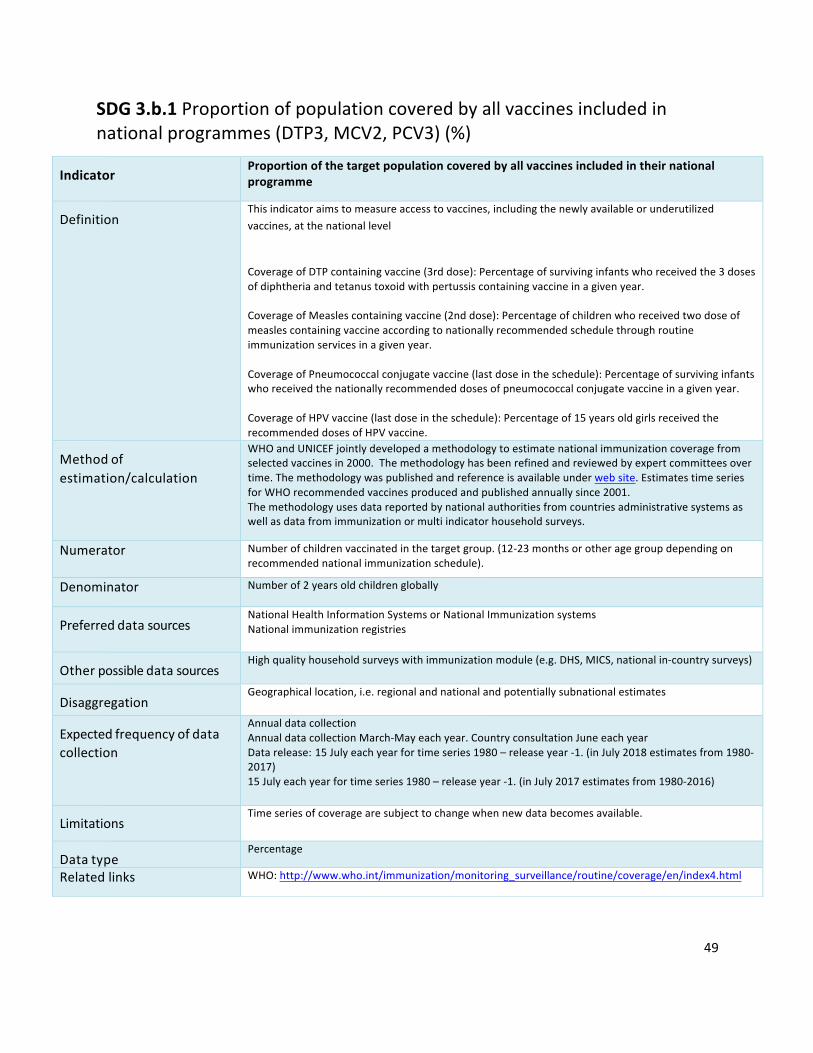
49
SDG3.b.1Proportionofpopulationcoveredbyallvaccinesincludedinnationalprogrammes(DTP3,MCV2,PCV3)(%)
Indicator
Proportionofthetargetpopulationcoveredbyallvaccinesincludedintheirnationalprogramme
Definition
Thisindicatoraimstomeasureaccesstovaccines,includingthenewlyavailableorunderutilizedvaccines,atthenationallevelCoverageofDTPcontainingvaccine(3rddose):Percentageofsurvivinginfantswhoreceivedthe3dosesofdiphtheriaandtetanustoxoidwithpertussiscontainingvaccineinagivenyear.CoverageofMeaslescontainingvaccine(2nddose):Percentageofchildrenwhoreceivedtwodoseofmeaslescontainingvaccineaccordingtonationallyrecommendedschedulethroughroutineimmunizationservicesinagivenyear.CoverageofPneumococcalconjugatevaccine(lastdoseintheschedule):Percentageofsurvivinginfantswhoreceivedthenationallyrecommendeddosesofpneumococcalconjugatevaccineinagivenyear.CoverageofHPVvaccine(lastdoseintheschedule):Percentageof15yearsoldgirlsreceivedtherecommendeddosesofHPVvaccine.
Methodofestimation/calculation
WHOandUNICEFjointlydevelopedamethodologytoestimatenationalimmunizationcoveragefromselectedvaccinesin2000.Themethodologyhasbeenrefinedandreviewedbyexpertcommitteesovertime.Themethodologywaspublishedandreferenceisavailableunderwebsite.EstimatestimeseriesforWHOrecommendedvaccinesproducedandpublishedannuallysince2001.Themethodologyusesdatareportedbynationalauthoritiesfromcountriesadministrativesystemsaswellasdatafromimmunizationormultiindicatorhouseholdsurveys.
Numerator Numberofchildrenvaccinatedinthetargetgroup.(12-23monthsorotheragegroupdependingonrecommendednationalimmunizationschedule).
Denominator Numberof2yearsoldchildrenglobally
Preferreddatasources
NationalHealthInformationSystemsorNationalImmunizationsystemsNationalimmunizationregistries
Otherpossibledatasources
Highqualityhouseholdsurveyswithimmunizationmodule(e.g.DHS,MICS,nationalin-countrysurveys)
Disaggregation
Geographicallocation,i.e.regionalandnationalandpotentiallysubnationalestimates
Expectedfrequencyofdatacollection
AnnualdatacollectionAnnualdatacollectionMarch-Mayeachyear.CountryconsultationJuneeachyearDatarelease:15Julyeachyearfortimeseries1980–releaseyear-1.(inJuly2018estimatesfrom1980-2017)15Julyeachyearfortimeseries1980–releaseyear-1.(inJuly2017estimatesfrom1980-2016)
Limitations
Timeseriesofcoveragearesubjecttochangewhennewdatabecomesavailable.
Datatype
Percentage
Relatedlinks WHO:http://www.who.int/immunization/monitoring_surveillance/routine/coverage/en/index4.html
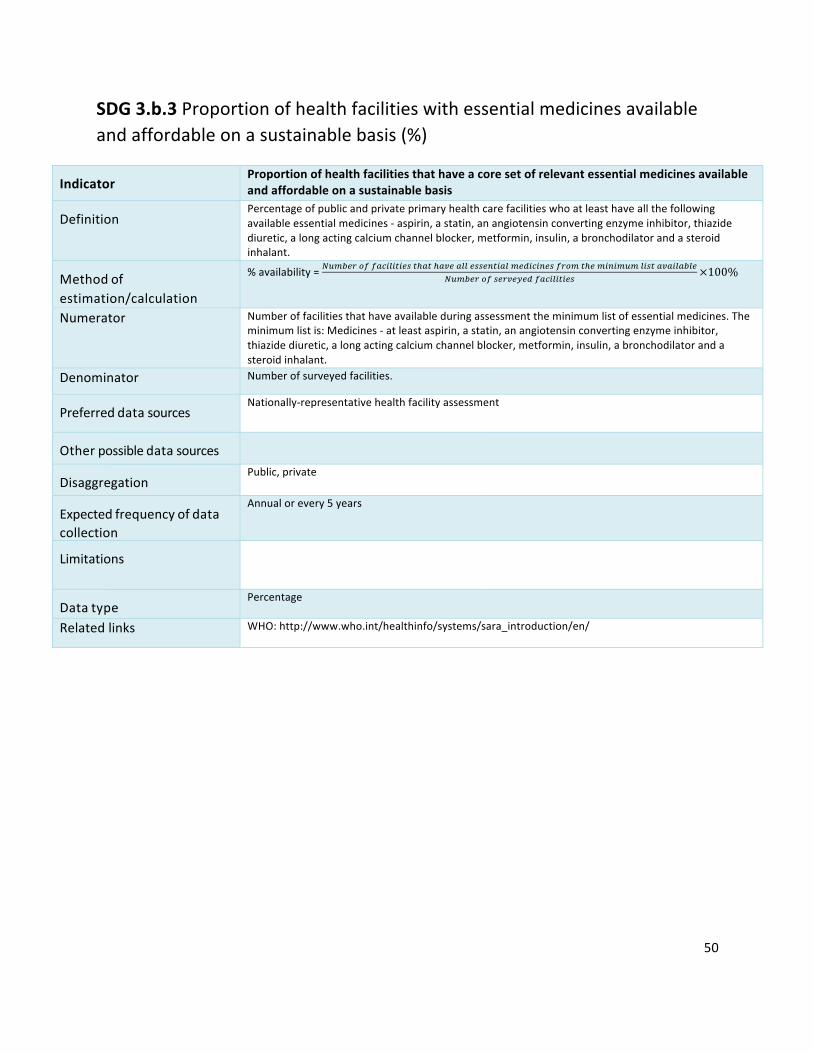
50
SDG3.b.3Proportionofhealthfacilitieswithessentialmedicinesavailableandaffordableonasustainablebasis(%)
Indicator
Proportionofhealthfacilitiesthathaveacoresetofrelevantessentialmedicinesavailableandaffordableonasustainablebasis
Definition
Percentageofpublicandprivateprimaryhealthcarefacilitieswhoatleasthaveallthefollowingavailableessentialmedicines-aspirin,astatin,anangiotensinconvertingenzymeinhibitor,thiazidediuretic,alongactingcalciumchannelblocker,metformin,insulin,abronchodilatorandasteroidinhalant.
Methodofestimation/calculation
%availability=]6^3_`2aa4b81878_j7c47c4k_411_jj_97841^_d8b89_ja`2^7c_^898^6^18j74k481431_]6^3_`2aj_`k_i_da4b81878_j
×100%
Numerator Numberoffacilitiesthathaveavailableduringassessmenttheminimumlistofessentialmedicines.Theminimumlistis:Medicines-atleastaspirin,astatin,anangiotensinconvertingenzymeinhibitor,thiazidediuretic,alongactingcalciumchannelblocker,metformin,insulin,abronchodilatorandasteroidinhalant.
Denominator Numberofsurveyedfacilities.
Preferreddatasources
Nationally-representativehealthfacilityassessment
Otherpossibledatasources
Disaggregation
Public,private
Expectedfrequencyofdatacollection
Annualorevery5years
Limitations
Datatype
Percentage
Relatedlinks WHO:http://www.who.int/healthinfo/systems/sara_introduction/en/
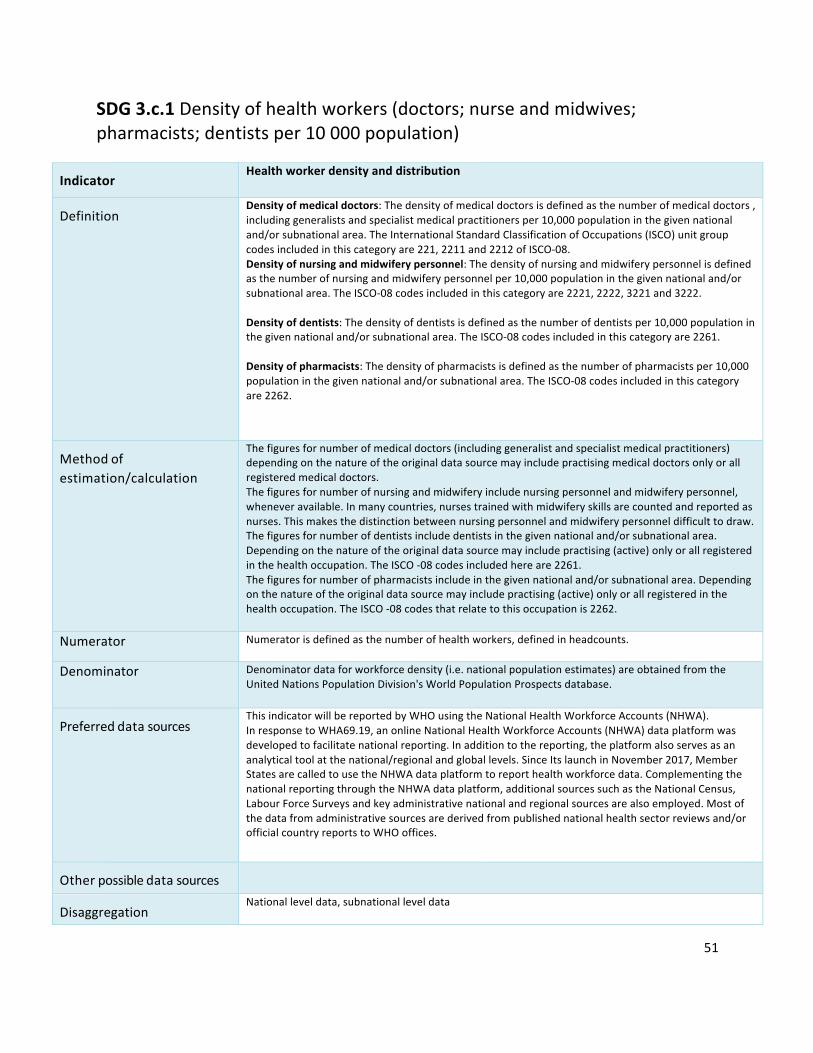
51
SDG3.c.1Densityofhealthworkers(doctors;nurseandmidwives;pharmacists;dentistsper10000population)
Indicator
Healthworkerdensityanddistribution
Definition
Densityofmedicaldoctors:Thedensityofmedicaldoctorsisdefinedasthenumberofmedicaldoctors,includinggeneralistsandspecialistmedicalpractitionersper10,000populationinthegivennationaland/orsubnationalarea.TheInternationalStandardClassificationofOccupations(ISCO)unitgroupcodesincludedinthiscategoryare221,2211and2212ofISCO-08.Densityofnursingandmidwiferypersonnel:Thedensityofnursingandmidwiferypersonnelisdefinedasthenumberofnursingandmidwiferypersonnelper10,000populationinthegivennationaland/orsubnationalarea.TheISCO-08codesincludedinthiscategoryare2221,2222,3221and3222.Densityofdentists:Thedensityofdentistsisdefinedasthenumberofdentistsper10,000populationinthegivennationaland/orsubnationalarea.TheISCO-08codesincludedinthiscategoryare2261.Densityofpharmacists:Thedensityofpharmacistsisdefinedasthenumberofpharmacistsper10,000populationinthegivennationaland/orsubnationalarea.TheISCO-08codesincludedinthiscategoryare2262.
Methodofestimation/calculation
Thefiguresfornumberofmedicaldoctors(includinggeneralistandspecialistmedicalpractitioners)dependingonthenatureoftheoriginaldatasourcemayincludepractisingmedicaldoctorsonlyorallregisteredmedicaldoctors.Thefiguresfornumberofnursingandmidwiferyincludenursingpersonnelandmidwiferypersonnel,wheneveravailable.Inmanycountries,nursestrainedwithmidwiferyskillsarecountedandreportedasnurses.Thismakesthedistinctionbetweennursingpersonnelandmidwiferypersonneldifficulttodraw.Thefiguresfornumberofdentistsincludedentistsinthegivennationaland/orsubnationalarea.Dependingonthenatureoftheoriginaldatasourcemayincludepractising(active)onlyorallregisteredinthehealthoccupation.TheISCO-08codesincludedhereare2261.Thefiguresfornumberofpharmacistsincludeinthegivennationaland/orsubnationalarea.Dependingonthenatureoftheoriginaldatasourcemayincludepractising(active)onlyorallregisteredinthehealthoccupation.TheISCO-08codesthatrelatetothisoccupationis2262.Numerator Numeratorisdefinedasthenumberofhealthworkers,definedinheadcounts.
Denominator Denominatordataforworkforcedensity(i.e.nationalpopulationestimates)areobtainedfromtheUnitedNationsPopulationDivision'sWorldPopulationProspectsdatabase.
Preferreddatasources
ThisindicatorwillbereportedbyWHOusingtheNationalHealthWorkforceAccounts(NHWA).InresponsetoWHA69.19,anonlineNationalHealthWorkforceAccounts(NHWA)dataplatformwasdevelopedtofacilitatenationalreporting.Inadditiontothereporting,theplatformalsoservesasananalyticaltoolatthenational/regionalandgloballevels.SinceItslaunchinNovember2017,MemberStatesarecalledtousetheNHWAdataplatformtoreporthealthworkforcedata.ComplementingthenationalreportingthroughtheNHWAdataplatform,additionalsourcessuchastheNationalCensus,LabourForceSurveysandkeyadministrativenationalandregionalsourcesarealsoemployed.Mostofthedatafromadministrativesourcesarederivedfrompublishednationalhealthsectorreviewsand/orofficialcountryreportstoWHOoffices.
Otherpossibledatasources
Disaggregation
Nationalleveldata,subnationalleveldata

52
Expectedfrequencyofdatacollection
Annual
Limitations
Dataonhealthworkerstendtobemorecompleteforthepublichealthsectorandmayunderestimatetheactiveworkforceintheprivate,military,nongovernmentalorganizationandfaith-basedhealthsectors.Inmanycases,informationmaintainedatthenationalregulatorybodiesandprofessionalcouncilsarenotupdated.Asdataisnotalwayspublishedannuallyforeachcountry,thelatestavailabledatahasbeenused.Duetothedifferencesindatasources,considerablevariabilityremainsacrosscountriesinthecoverage,periodicity,qualityandcompletenessoftheoriginaldata.DensitiesarecalculatedusingnationalpopulationestimatesfromtheUnitedNationsPopulationDivision'sWorldPopulationProspectsdatabaseandmayvaryfromdensitiesproducedbythecountry.
DatatypeRate
Relatedlinks https://www.who.int/hrh/statistics/en/

53
SDG3.d.1InternationalHealthRegulations(IHR)capacityandhealthemergencypreparedness
Indicator InternationalHealthRegulations(IHR)capacityandhealthemergencypreparedness
Definition
Percentageofattributesof13corecapacitiesthathavebeenattainedataspecificpointintime.The13corecapacitiesare:(1)Nationallegislation,policyandfinancing;(2)CoordinationandNationalFocalPointcommunications;(3)Surveillance;(4)Response;(5)Preparedness;(6)Riskcommunication;(7)Humanresources;(8)Laboratory;(9)Pointsofentry;(10)Zoonoticevents;(11)Foodsafety;(12)Chemicalevents;(13)Radionuclearemergencies.
Methodofestimation/calculation
IHR(2005)CapacityLevel(Annual)=q6^2aq_1ag«_52`7_d³n«p454b87i´k_`4e_j
¢�
Numerator StatePartyself-reportedaverageof13IHR(2005)capacities,asmeasuredbytheSPAR.
Denominator Totalnumberofreportedcapacities(i.e.,13).
Preferreddatasources
SPARreports(availableontheGlobalHealthObservatory);StrategicPartnershipforInternationalHealthRegulations(2005)andHealthSecurity(https://extranet.who.int/sph/)
Otherpossibledatasources
Jointexternalevaluation(JEE;availableathttps://extranet.who.int/sph/);CurrentHealthExpenditure(CHE;availableonGlobalHealthObservatory);previousyears’IHR(2005)self-assessmentannualreportingdata(availableonGlobalHealthObservatory).
Disaggregation
Country;capacity.
Expectedfrequencyofdatacollection
Annual
Limitations
Dataareself-reportedfromMemberStates;analysisofself-reportofcapacitiesusingtheSPAR(2018)identifiedthattherewasastrongcorrelationbetweenself-reportedcapacitiesandexternallyevaluatedcapacities.Althoughself-assessmentannualreportingismandatedunderIHR(2005),itispossiblethatnotallMemberStateswillsubmitareportintimeforcalculatingthebaseline.Inthisevent,whichisanticipatedtoberare,previousyears’annualreportingdata,validatedagainstotherexistingIHR(2005)monitoringandevaluationframeworkcomponents,willbeusedtoestimateabaselinevalue.
Datatype
Self-reportedassessmentdata,usingastandardizedtool.Averagevalue(0‒100)ofindicatorcapacitylevels,eachexpressedasanintegervaluefrom0‒5.
Relatedlinks GlobalHealthObservatory:http://www.who.int/gho/ihr/en/;SPH:https://extranet.who.int/sph/

54
SDG3.d.2Proportionofbloodstreaminfectionsduetoantimicrobialresistantorganisms(%)
Indicator
Percentageofbloodstreaminfectionsduetoantimicrobialresistantorganisms
Definition
Frequencyofbloodstreaminfectionamonghospitalpatients’duetomethicillin-resistantStaphylococcusaureus(MRSA)andEscherichiacoliresistantto3rd-generationcephalosporin(e.g.,ESBL-E.coli).RationalforselectingthesetwotypesofAMR:(i)E.coliandS.aureusareamongthemostcommonhumanfast-growingbacteriacausingacutehumaninfections;(ii)E.coliishighlyfrequentinbothhumans,animalsandenvironment,beinganexcellentindicatorformonitoringAMRacrossthesectorsinlinewiththeOneHealthapproach;(iii)bothMRSAandESBL-E.coliarelargelydisseminatedandfrequentlyinhighfrequencyinhospitalsettingsallovertheworld.InfectionswiththesetypesofAMRleadtoincreaseinuseofthelastresortdrugs(e.g.,vancomycinforMRSAinfections,andcarbapenemsforESBL-E.coli)againstwhichnewtypesofAMRareemerging.WHOhasdefinedglobalinfectionpreventionandcontrolstandardsandstrategies.EffectivecontrolofthesetwotypesofAMRwillultimatelypreservethecapacitytotreatinfectionswithavailableantimicrobialswhilenewpreventionandtreatmentsolutionscanbedeveloped.
Methodofestimation/calculation
TheWHOGlobalAMRSurveillanceSystem(GLASS)supportscountriestoimplementanAMRstandardizedsurveillancesystem.Atnationallevelcasesarefoundamongpatientsfromwhomroutineclinicalsampleshavebeencollectedforbloodcultureatsurveillancesitesaccordingtolocalclinicalpractices,andantimicrobialsusceptibilitytests(AST)areperformedfortheisolatedbloodpathogens.Themicrobiologicalresults(bacteriaidentificationandAST)arecombinedwiththepatientdataandrelatedtopopulationdatafromthesurveillancesites.GLASSdoescollectinformationontheoriginoftheinfectioneithercommunityorigin(lessthan2calendardaysinhospital)orhospitalorigin(patientshospitalizedformorethan2calendardays).DataarecollatedandvalidatedatnationallevelandreportedtoGLASSwhereepidemiologicalstatisticsandmetricsaregenerated.
Numerator NumberofpatientspresentingwithbloodstreaminfectionduetoMRSAandESBL-E.coliamongpatientsseekinghospitalcare
Denominator NumberofpatientsseekinghospitalcareandfromwhomthebloodspecimenwastakenduetosuspectedbloodstreaminfectionandfromwhombloodspecimenshavebeensubmittedforbloodcultureandAST.
Preferreddatasources
NationalAMRdatacollectedthroughthenationalAMRsurveillancesystemandreportedtoGLASS.
Otherpossibledatasources
Publishedandnon-publisheddatafromnationalcentersandresearch/academicinstitutionsandfromothersregionalsurveillancenetworks.
Disaggregation
Datawillbeaggregatedatthecountrylevel.Datawillbeanalyzedandreportedaccordingtowhetherspecimeniswithin2calendardaysofadmission(communityorigin)orafter2calendardaysofadmission(hospitalorigin).
Expectedfrequencyofdatacollection
Annual
Limitations
ConstraintsassociatedwithinnationalAMRsurveillancesystems(numberanddistributionofsurveillancesitesandrepresentativenessofsurveillancedata,samplingbias,poordiagnosticcapacity,measurementserrors,issueswithdatamanagement).
Datatype
Percentage
Relatedlinks http://www.who.int/glass/en/
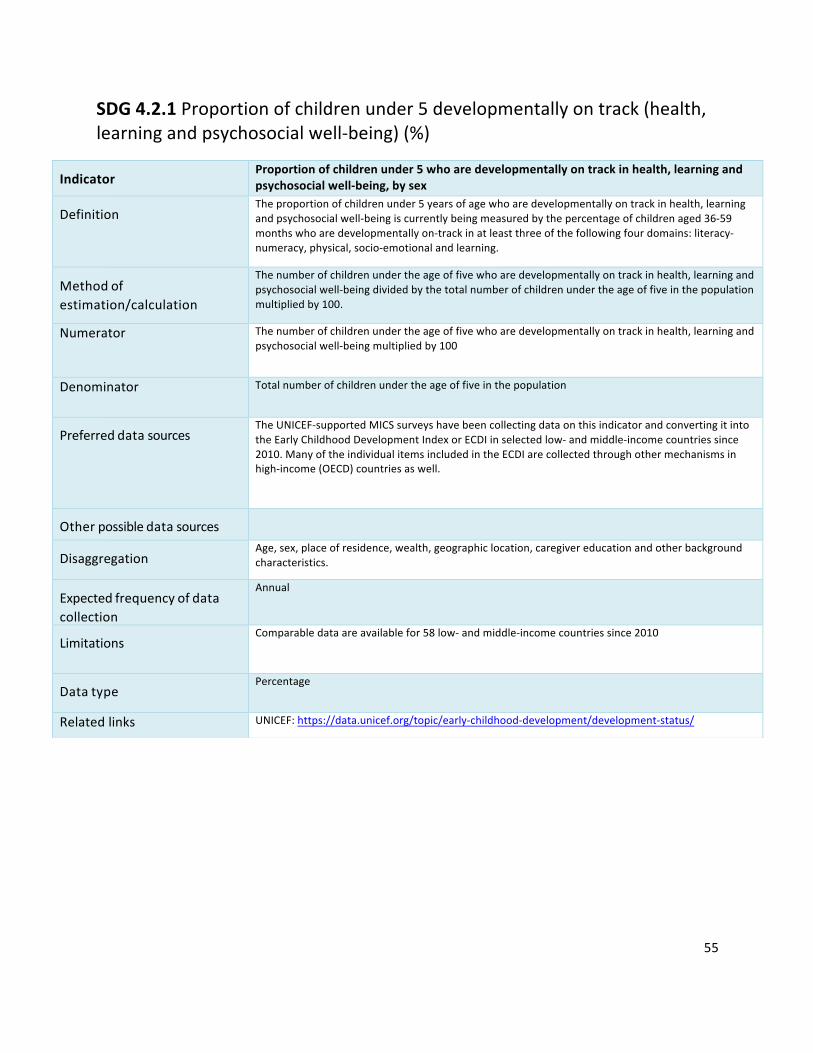
55
SDG4.2.1Proportionofchildrenunder5developmentallyontrack(health,learningandpsychosocialwell-being)(%)
Indicator
Proportionofchildrenunder5whoaredevelopmentallyontrackinhealth,learningandpsychosocialwell-being,bysex
Definition
Theproportionofchildrenunder5yearsofagewhoaredevelopmentallyontrackinhealth,learningandpsychosocialwell-beingiscurrentlybeingmeasuredbythepercentageofchildrenaged36-59monthswhoaredevelopmentallyon-trackinatleastthreeofthefollowingfourdomains:literacy-numeracy,physical,socio-emotionalandlearning.
Methodofestimation/calculation
Thenumberofchildrenundertheageoffivewhoaredevelopmentallyontrackinhealth,learningandpsychosocialwell-beingdividedbythetotalnumberofchildrenundertheageoffiveinthepopulationmultipliedby100.
Numerator Thenumberofchildrenundertheageoffivewhoaredevelopmentallyontrackinhealth,learningandpsychosocialwell-beingmultipliedby100
Denominator Totalnumberofchildrenundertheageoffiveinthepopulation
Preferreddatasources
TheUNICEF-supportedMICSsurveyshavebeencollectingdataonthisindicatorandconvertingitintotheEarlyChildhoodDevelopmentIndexorECDIinselectedlow-andmiddle-incomecountriessince2010.ManyoftheindividualitemsincludedintheECDIarecollectedthroughothermechanismsinhigh-income(OECD)countriesaswell.
Otherpossibledatasources
Disaggregation
Age,sex,placeofresidence,wealth,geographiclocation,caregivereducationandotherbackgroundcharacteristics.
Expectedfrequencyofdatacollection
Annual
Limitations
Comparabledataareavailablefor58low-andmiddle-incomecountriessince2010
Datatype
Percentage
Relatedlinks UNICEF:https://data.unicef.org/topic/early-childhood-development/development-status/

56
SDG5.2.1Proportionofwomen(15-49)subjectedtoviolencebycurrentorformerintimatepartner(%)
Indicator
Proportionofever-partneredwomenandgirlsaged15yearsandoldersubjectedtophysical,sexualorpsychologicalviolencebyacurrentorformerintimatepartnerintheprevious12months,byformofviolenceandbyage
Definition
Thisindicatormeasuresthepercentageofever-partneredwomenandgirlsaged15-49yearswhohaveexperiencedphysical,sexualorpsychologicalviolencebyacurrentorformerintimatepartner,intheprevious12months.Intimatepartnerviolenceisthemostcommonformofviolenceagainstwomenandgirlsglobally.Givenprevailingsocialnormsthatsanctionmaledominanceoverwomen,violencebetweenintimatepartnersisoftenperceivedasordinary,particularlyinthecontextofmarriage,cohabitationoranyformalorinformalunion.Violenceagainstwomenandgirlsisanextremeformofgenderinequality.
Methodofestimation/calculation
Thisindicatorcallsforbreakdownbyformofviolenceandbyagegroup.Countriesareencouragedtocomputeprevalencedataforeachformofviolence,disaggregatedbyageasdetailedbelowtoassistcomparabilityatregionalandgloballevels:1.Physicalviolence:Numberofever-partneredwomenandgirls(aged15-49yearswhoexperiencephysicalviolencebyacurrentorformerintimatepartnerintheprevious12monthsdividedbythenumberofever-partneredwomenandgirls(aged15yearsandabove)inthepopulationmultipliedby100.2.Sexualviolence:Numberofever-partneredwomenandgirls(aged15-49years)whoexperiencesexualviolencebyacurrentorformerintimatepartnerintheprevious12monthsdividedbythenumberofever-partneredwomenandgirls(aged15yearsandabove)inthepopulationmultipliedby100.3.Anyformofphysicaland/orsexualviolence:Numberofever-partneredwomenandgirls(aged15-49years)whoexperiencephysicaland/orsexualviolencebyacurrentorformerintimatepartnerintheprevious12monthsdividedbythenumberofever-partneredwomenandgirls(aged15-49years)multipliedby100.
Numerator Seemethodofestimation/calculation
Denominator Seemethodofestimation/calculation
Preferreddatasources
ThemainsourcesofintimatepartnerviolenceprevalencedataforSDGIndicator5.2.1comprisesdatafrominternationallycomparablepopulation-basedsurveysthatare(1)specializednationalsurveysdedicatedtomeasuringviolenceagainstwomenand(2)internationalhouseholdsurveysthatincludeamoduleonexperiencesofviolencebywomen,suchastheDHS.Whereavailable,otherdedicatedsurveysareincludedifthedataaredeemedcomparable.Since2015,around135countrieshadconductedviolenceagainstwomennationalprevalencesurveysorhaveincludedamoduleonviolenceagainstwomeninaDHSorothernationalhouseholdsurvey.
Otherpossibledatasources

57
Disaggregation
Inadditiontoformofviolenceandage,income/wealth,education,ethnicity(includingindigenousstatus),disabilitystatus,marital/partnershipstatus,relationshipwiththeperpetrator(i.e.current/formerpartner),geographiclocationandfrequencyofviolencearesuggestedasdesiredvariablesfordisaggregationforthisindicator.
Expectedfrequencyofdatacollection
Limitations
Comparability:Theavailabilityofcomparabledataremainsachallengeinthisareaasmanydatacollectioneffortshavereliedondifferentsurveymethodologies,useddifferentdefinitionsofpartnerorspousalviolenceandofthedifferentformsofviolenceanddifferentsurveyquestionformulations.Furthermore,diverseagegroupsareoftenutilized.Willingnesstodiscussexperiencesofviolenceandunderstandingofrelevantconceptsmayalsodifferaccordingtotheculturalcontextandthiscanaffectreportedprevalencelevels.Regularityofdataproduction:Since1995,onlysome40countrieshaveconductedmorethanonesurveyonviolenceagainstwomen.Obtainingdataonviolenceagainstwomenisacostlyandtime-consumingexercise,whethertheyareobtainedthroughstand-alonededicatedsurveysorthroughmodulesinothersurveys.Feasibility:Psychologicalpartnerviolence—whichmaybeconceptualiseddifferentlyacrossculturesandindifferentcontexts—isstillaTearIIIsub-indicator.Sinceitisnotyetfeasibletoreportonpsychologicalpartnerviolence,thisindicatorcurrentlyreportsonphysicaland/orsexualintimatepartnerviolenceonly.Effortsareunderway,ledbyWHO,todevelopaglobalstandardformeasuringandreportingonpsychologicalintimatepartnerviolence.Similarly,thisindicatorcallsforglobalreportingofviolenceexperiencedbyever-partneredwomenaged15yearsandabove.However,mostdatacomefromDHS,whichtypicallysampleonlywomenaged15-49,andthereisalackofconsistencyintheagerangeofsamplepopulationsacrossothercountrysurveys.Forthosesurveysthatinterviewasampleofwomenfromadifferentagegroup,theprevalenceforthe15-49agegroupisoftenpublishedorcanbecalculatedfromavailabledata.Theglobalindicatorthereforecurrentlyreportsviolenceexperiencedbyever-partneredwomenandgirls15-49yearsofage.Effortsareunderwaytoaddressthisissueandtobetterunderstandandmeasurepartnerviolenceagainstwomenaged50andabove.
Datatype
Percentage
Relatedlinks http://evaw-global-database.unwomen.org/endata.unicef.orghttp://unstats.un.org/unsd/gender/default.html

58
SDG5.6.1Proportionofwomen(15-49)whomaketheirowndecisionsregardingsexualrelations,contraceptiveuseandreproductivehealthcare(%)
Indicator
Proportionofwomenaged15-49yearswhomaketheirowninformeddecisionsregardingsexualrelations,contraceptiveuseandreproductivehealthcare
Definition
Proportionofwomenaged15-49years(marriedorinunion)whomaketheirowndecisiononallthreeselectedareasi.e.cansaynotosexualintercoursewiththeirhusbandorpartneriftheydonotwant;decideonuseofcontraception;anddecideontheirownhealthcare.Onlywomenwhoprovidea“yes”answertoallthreecomponentsareconsideredaswomenwhomakeherowndecisionsregardingsexualandreproductivehealth.Aunioninvolvesamanandawomanregularlycohabitinginamarriage-likerelationship
Methodofestimation/calculation
Proportion=NumeratorX100/Denominator[seenumeratoranddenominator]
Numerator Numberofmarriedorinunionwomenaged15-49yearsold:–whocansay“no”tosex;and–forwhomthedecisiononcontraceptionisnotmainlymadebythehusband/partner;and–forwhomdecisiononhealthcareforthemselvesisnotusuallymadebythehusband/partnerorsomeoneelseOnlywomenwhosatisfyallthreeempowermentcriteriaareincludedinthenumerator.
Denominator Totalnumberwomenaged15-49yearsold,whoaremarriedorinunion.
Preferreddatasources
Currentdataontheindicatorarederivedfromnationallyrepresentativedemographicandsurveys(DHS).PlansareunderwaytobroadenthedatasourcestoincludeMICsandothercountryspecificsurveys.
Otherpossibledatasources
Disaggregation
BasedonavailableDHSdata,disaggregationispossiblebyage,geographiclocation,placeofresidence,education,andwealthquintile.
Expectedfrequencyofdatacollection
CurrentlydatacomesfromtheDHSwhichhavethreetofive-yearcycles.
Limitations
Untilrecently,theindicatorcapturedresultsformarriedandin-unionwomenandadolescentgirlsofreproductiveage(15–49yearsold)whoareusinganytypeofcontraception.InthephaseofthenationalDemographicandHealthSurvey(DHS–7)andlaterrounds,thequestionnaireareextendedtorespondentswhethertheyareusingcontraceptionornot.Onelimitationofthedataisthatunmarriedwomenandgirlsarenotincluded.Asofearly2020,atotalof57countries,themajorityinsub-SaharanAfrica,haveatleastonesurveywithdataonallthreequestionsnecessaryforcalculatingIndicator5.6.1.Broaderdatasourcesareneededandeffortstoincreasedatacoverageareunderway.CurrentdataontheindicatoraremainlyderivedfromtheDHSandeffortsarebeingmadetoincludetheMultipleIndicatorClusterSurveys(MICS),theGenerationandGenderSurvey(GGS)andothercountry-specificsurveys.Inmanynationalcontexts,householdsurveys,whicharethemaindatasourceforthisindicator,excludethehomelessandarelikelytounder-enumeratelinguisticorreligiousminoritygroups. indicator,excludethehomelessandarelikelytounder-enumeratelinguisticorreligiousminoritygroups.
Datatype
Percentage
Relatedlinks

59
SDG6.1.1Proportionofpopulationusingsafelymanageddrinking-waterservices(%)
Indicator
Proportionofpopulationusingsafelymanageddrinkingwaterservices
Definition
Proportionofpopulationusingsafelymanageddrinkingwaterservicesiscurrentlybeingmeasuredbytheproportionofpopulationusinganimprovedbasicdrinkingwatersourcewhichislocatedonpremises,availablewhenneededandfreeoffaecal(andprioritychemical)contamination.‘Improved’drinkingwatersourcesinclude:pipedwaterintodwelling,yardorplot;publictapsorstandpipes;boreholesortubewells;protecteddugwells;protectedsprings;packagedwater;deliveredwaterandrainwater.
Methodofestimation/calculation
Householdsurveysandcensusescurrentlyprovideinformationontypesofbasicdrinkingwatersourceslistedabove,andalsoindicateifsourcesareonpremises.Thesedatasourcesoftenhaveinformationontheavailabilityofwaterandincreasinglyonthequalityofwateratthehouseholdlevel,throughdirecttestingofdrinkingwaterforfaecalorchemicalcontamination.Thesedatawillbecombinedwithdataonavailabilityandcompliancewithdrinkingwaterqualitystandards(faecalandchemical)fromadministrativereportingorregulatorybodies.TheWHO/UNICEFJointMonitoringProgrammeforWaterSupply,SanitationandHygiene(JMP)estimatesaccesstobasicservicesforeachcountry,separatelyinurbanandruralareas,byfittingaregressionlinetoaseriesofdatapointsfromhouseholdsurveysandcensuses.Thisapproachwasusedtoreportonuseof‘improvedwater’sourcesforMDGmonitoring.TheJMPisevaluatingtheuseofalternativestatisticalestimationmethodsasmoredatabecomeavailable.
Numerator Totalestimatednumberofpeopleusingsafelymanageddrinkingwaterservice
Denominator Totalpopulation
Preferreddatasources
Nationallyrepresentativehouseholdsurveys,censuses,andadministrativedata.CurrentlytheJMPdatabaseholdsover1,700censusesandsurveys.Inhigh-incomecountrieswherehouseholdsurveysorcensusesdonotalwayscollectinformationonbasicaccess,dataaredrawnfromadministrativerecords.
Otherpossibledatasources
Disaggregation
Disaggregationbyplaceofresidence(urban/rural)andsocioeconomicstatus(wealth,affordability)ispossibleforallcountries.Disaggregationbyotherstratifiersofinequality(subnational,gender,disadvantagedgroups,etc.)willbemadewheredatapermit.Drinkingwaterserviceswillbedisaggregatedbyservicelevel(includingnoservices,basic,andsafelymanagedservices)followingtheJMPdrinkingwaterladder
Expectedfrequencyofdatacollection
Biennial
Limitations
Datatype
Percentage

60
Relatedlinks JMPwebsite:www.washdata.org.JMP2017updateandSDGbaselineshttps://washdata.org/report/jmp-2017-report-finalSafelymanageddrinkingwaterthematicreporthttps://washdata.org/report/jmp-2017-tr-smdwWHOGuidelinesforDrinkingWaterQuality:http://www.who.int/water_sanitation_health/dwq/guidelines/en/

61
SDG6.2.1Proportionofpopulationusingsafelymanagedsanitationservicesandhand-washingfacility(%)
Indicator
Proportionofpopulationusingsafelymanagedsanitationservices,includingahand-washingfacilitywithsoapandwater
Definition
Theproportionofpopulationusingsafelymanagedsanitationservices,includingahand-washingfacilitywithsoapandwateriscurrentlybeingmeasuredbytheproportionofthepopulationusingabasicsanitationfacilitywhichisnotsharedwithotherhouseholdsandwhereexcretaissafelydisposedinsituortreatedoff-site.‘Improved’sanitationfacilitiesinclude:flushorpourflushtoiletstosewersystems,septictanksorpitlatrines,ventilatedimprovedpitlatrines,pitlatrineswithaslab,andcompostingtoilets.Populationwithabasichandwashingfacility:adevicetocontain,transportorregulatetheflowofwatertofacilitatehandwashingwithsoapandwaterinthehousehold.Concepts:Improvedsanitationfacilitiesincludethefollowing:flushorpourflushtoiletstosewersystems,septictanksorpitlatrines,ventilatedimprovedpitlatrines,pitlatrineswithaslab,andcompostingtoilets.Ahandwashingfacilitywithsoapandwater:ahandwashingfacilityisadevicetocontain,transportorregulatetheflowofwatertofacilitatehandwashing.Thisindicatorisaproxyofactualhandwashingpractice,whichhasbeenfoundtobemoreaccuratethanotherproxiessuchasself-reportsofhandwashingpractices.
Methodofestimation/calculation
Householdsurveysandcensusesprovidedataonuseoftypesofbasicsanitationfacilitieslistedabove,aswellasthepresenceofhandwashingmaterialsinthehome.Thepercentageofthepopulationusingsafelymanagedsanitationservicesiscalculatedbycombiningdataontheproportionofthepopulationusingdifferenttypesofbasicsanitationfacilitieswithestimatesoftheproportionoffaecalwastewhichissafelydisposedinsituortreatedoff-site.
Numerator Totalestimatednumberofpeopleusingsafelymanagedsanitationservices
Denominator Totalpopulation
Preferreddatasources
Nationallyrepresentativehouseholdsurveys,censuses,andadministrativedata.CurrentlytheJMPdatabaseholdsover1,700surveysandcensuses.Inhigh-incomecountrieswherehouseholdsurveysorcensusesdonotalwayscollectinformationonbasicaccess,dataaredrawnfromadministrativerecords.Estimatesofexcretamanagementwillbecollectedfromcountriesandusedtoadjustthedataonuseofbasicsanitationfacilitiesasneeded.Administrative,populationandenvironmentaldatacanalsobecombinedtoestimatesafedisposalortransportofexcreta,whennocountrydataareavailable.Dataondisposalortreatmentofexcretaarelimitedbutestimatesforsafemanagementoffaecalwastescanbecalculatedbasedonfaecalwasteflowsassociatedwiththeuseofdifferenttypesofbasicsanitationfacility.Sincethehandwashingwithsoapsurveyquestionswerestandardizedin2009,over70DHSandMICSsurveyshaveincludedthemodule.JMPpublishedhandwashingestimatesfor12countriesinits2014update,for54countriesinits2015update,andfor70countriesinits2017update.ThepopulationdatausedbyJMP,includingtheproportionofthepopulationlivinginurbanandruralareas,arethoseestablishedbytheUNPopulationDivision.
Otherpossibledatasources

62
Disaggregation
Disaggregationbyplaceofresidence(urban/rural)andsocioeconomicstatus(wealth,affordability)ispossibleforallcountries.Disaggregationbyotherstratifiesofinequality(subnational,gender,disadvantagedgroups,etc.)willbemadewheredatapermit.Sanitationserviceswillbedisaggregatedbyservicelevel(includingnoservices,basic,andsafelymanagedservices)followingtheJMPsanitationladder.
Expectedfrequencyofdatacollection
Biennial
Limitations
Aframeworkformeasuringfaecalwasteflowsandsafetyfactorshasbeendevelopedandpilotedin12countries(WorldBankWaterandSanitationProgram,2014),andisbeingadoptedandscaledupwithinthesanitationsectors.Thisframeworkhasservedasthebasisforindicators6.2.1and6.3.1.Dataonsafedisposalandtreatmentarenotavailableforallcountries.However,sufficientdatawereavailabletomakeglobalandregionalestimatesofsafelymanagedsanitationservicesin2017.Presenceofahandwashingstationwithsoapandwaterdoesnotguaranteethathouseholdmembersconsistentlywashhandsatkeytimes,buthasbeenacceptedasthemostsuitableproxy.Datawereavailablefor70countriesin2017.
Datatype
Percentage
Relatedlinks www.washdata.orgJMPwebsite:www.washdata.org.JMP2017updateandSDGbaselineshttps://washdata.org/report/jmp-2017-report-finalRam,P.,PracticalGuidanceforMeasuringHandwashingBehaviour:2013update,WorldBankWaterSupplyandSanitationProgramme,2013.http://www.wsp.org/sites/wsp.org/files/publications/WSP-Practical-Guidance-Measuring-HandwashingBehavior-2013-Update.pdf"

63
SDG16.2.1Proportionofchildren(aged1-17)experiencingphysicalorpsychologicalaggression(%)
Indicator
Proportionofchildrenaged1–17yearswhoexperiencedanyphysicalpunishmentand/orpsychologicalaggressionbycaregiversinthepastmonth
Definition
Proportionofchildrenaged1-17yearswhoexperiencedanyphysicalpunishmentand/orpsychologicalaggressionbycaregiversinthepastmonthiscurrentlybeingmeasuredbytheProportionofchildrenaged1-14yearswhoexperiencedanyphysicalpunishmentand/orpsychologicalaggressionbycaregiversinthepastmonth.
Methodofestimation/calculation
Numberofchildrenaged1-17yearswhoarereportedtohaveexperiencedanyphysicalpunishmentand/orpsychologicalaggressionbycaregiversinthepastmonthdividedbythetotalnumberofchildrenaged1-17inthepopulationmultipliedby100
Numerator Numberofchildrenaged1-17yearswhoarereportedtohaveexperiencedanyphysicalpunishmentand/orpsychologicalaggressionbycaregiversinthepastmonthmultipliedby100
Denominator Thetotalnumberofchildrenaged1-17inthepopulation
Preferreddatasources
HouseholdsurveyssuchasUNICEF-supportedMICSandDHSthathavebeencollectingdataonthisindicatorinlow-andmiddle-incomecountriessincearound2005.Insomecountries,suchdataarealsocollectedthroughothernationalhouseholdsurveys.
Otherpossibledatasources
Disaggregation
Sex,age,income,placeofresidence,geographiclocation
Expectedfrequencyofdatacollection
Limitations
Thereisanexisting,standardizedandvalidatedmeasurementtool(theParent-ChildversionoftheConflictTacticsScale,orCTSPC)thatiswidelyacceptedandhasbeenimplementedinalargenumberofcountries,includinghigh-incomecountries.DefinitionsofbothphysicalpunishmentandpsychologicalaggressionwillneedtobeveryclearlydefinedforcountriesbutthisshouldnotbeaproblemasthereisawealthofavailableliteratureandresearchontheviolentpunishmentofchildrenandGeneralCommentNo.13ontheConventionoftheRightsoftheChild(CRC)alsoprovidesadefinitionfor“corporal”or“physical”punishmentaswellas"mentalviolence".
Datatype
Percentage
Relatedlinks https://data.unicef.org/topic/child-protection/violence/violent-discipline/
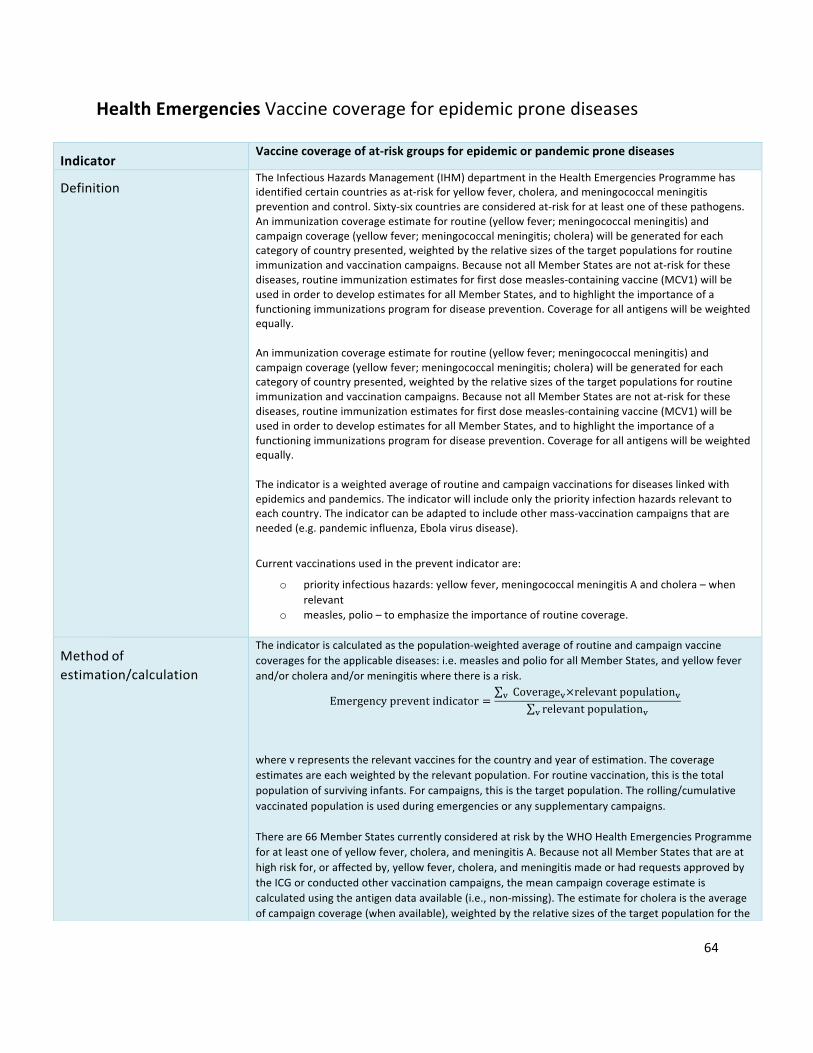
64
HealthEmergenciesVaccinecoverageforepidemicpronediseases
Indicator
Vaccinecoverageofat-riskgroupsforepidemicorpandemicpronediseasesDefinition
TheInfectiousHazardsManagement(IHM)departmentintheHealthEmergenciesProgrammehasidentifiedcertaincountriesasat-riskforyellowfever,cholera,andmeningococcalmeningitispreventionandcontrol.Sixty-sixcountriesareconsideredat-riskforatleastoneofthesepathogens.Animmunizationcoverageestimateforroutine(yellowfever;meningococcalmeningitis)andcampaigncoverage(yellowfever;meningococcalmeningitis;cholera)willbegeneratedforeachcategoryofcountrypresented,weightedbytherelativesizesofthetargetpopulationsforroutineimmunizationandvaccinationcampaigns.BecausenotallMemberStatesarenotat-riskforthesediseases,routineimmunizationestimatesforfirstdosemeasles-containingvaccine(MCV1)willbeusedinordertodevelopestimatesforallMemberStates,andtohighlighttheimportanceofafunctioningimmunizationsprogramfordiseaseprevention.Coverageforallantigenswillbeweightedequally.Animmunizationcoverageestimateforroutine(yellowfever;meningococcalmeningitis)andcampaigncoverage(yellowfever;meningococcalmeningitis;cholera)willbegeneratedforeachcategoryofcountrypresented,weightedbytherelativesizesofthetargetpopulationsforroutineimmunizationandvaccinationcampaigns.BecausenotallMemberStatesarenotat-riskforthesediseases,routineimmunizationestimatesforfirstdosemeasles-containingvaccine(MCV1)willbeusedinordertodevelopestimatesforallMemberStates,andtohighlighttheimportanceofafunctioningimmunizationsprogramfordiseaseprevention.Coverageforallantigenswillbeweightedequally.Theindicatorisaweightedaverageofroutineandcampaignvaccinationsfordiseaseslinkedwithepidemicsandpandemics.Theindicatorwillincludeonlythepriorityinfectionhazardsrelevanttoeachcountry.Theindicatorcanbeadaptedtoincludeothermass-vaccinationcampaignsthatareneeded(e.g.pandemicinfluenza,Ebolavirusdisease).
Currentvaccinationsusedinthepreventindicatorare:
o priorityinfectioushazards:yellowfever,meningococcalmeningitisAandcholera–whenrelevant
o measles,polio–toemphasizetheimportanceofroutinecoverage.
Methodofestimation/calculation
Theindicatoriscalculatedasthepopulation-weightedaverageofroutineandcampaignvaccinecoveragesfortheapplicablediseases:i.e.measlesandpolioforallMemberStates,andyellowfeverand/orcholeraand/ormeningitiswherethereisarisk.
Emergencypreventindicator =Coverage·×relevantpopulation··
relevantpopulation··
wherevrepresentstherelevantvaccinesforthecountryandyearofestimation.Thecoverageestimatesareeachweightedbytherelevantpopulation.Forroutinevaccination,thisisthetotalpopulationofsurvivinginfants.Forcampaigns,thisisthetargetpopulation.Therolling/cumulativevaccinatedpopulationisusedduringemergenciesoranysupplementarycampaigns.Thereare66MemberStatescurrentlyconsideredatriskbytheWHOHealthEmergenciesProgrammeforatleastoneofyellowfever,cholera,andmeningitisA.BecausenotallMemberStatesthatareathighriskfor,oraffectedby,yellowfever,cholera,andmeningitismadeorhadrequestsapprovedbytheICGorconductedothervaccinationcampaigns,themeancampaigncoverageestimateiscalculatedusingtheantigendataavailable(i.e.,non-missing).Theestimateforcholeraistheaverageofcampaigncoverage(whenavailable),weightedbytherelativesizesofthetargetpopulationforthe

65
specificcampaign(s).Thereisnocholeravaccinationcurrentlyrecommendedaspartoftheroutinevaccinationschedule.Wheretargetpopulationdataarenotavailableforaspecificcampaign,thenumberofdosesshippedbytheICGorGTFCCwillbeusedasaproxyfortargetpopulationsize.
Numerator Vaccinationcoverage(routineand/orcampaign)
Denominator TargetpopulationPreferreddatasources
Coverageestimatesforroutinevaccination(yellowfever,measles,polio)fromWHO/UNICEFestimateofimmunizationcoverage(WUENIC)forMCV1andYFroutineimmunizationestimates;WHO/UNICEFJointReportingForm(JRF)foradministrativecoverageestimatesofmeningococcalmeningitisroutineimmunizationcoverage;emergencyimmunizationcoverageforcholera,meningococcalmeningitisandyellowfeverusingtheInternationalCoordinatingGroup(ICG)onVaccineProvision;masspreventiveoralcholeravaccinationcampaigncoveragedatafromtheGlobalTaskForceonCholeraControl(GTFCC);polioimmunizationcampaigndatafromWHO/GlobalPolioEradication;additionalmeningitis,polioandyellowfeverimmunizationcampaigncoverageestimatesfromtheWHO/UNICEFJRF.
Otherpossibledatasources
GlobalHealthObservatory;pandemicinfluenzavaccinationcampaigndataintargetedcountries,whereapplicable
Disaggregation
Country;antigen
Expectedfrequencyofdatacollection
Annual(routineimmunizations);periodic(vaccinationcampaigns),updatedannually
Limitations
RoutineimmunizationdataformeningococcalmeningitisarenotavailablefromWUENICandareonlyavailable(self-reportedadministrativecoverage)fromtheJRF.Emergencyvaccinationcampaigncoverageestimatesmightrequiretheuseofadministrativeestimates,whichcouldbias(overestimate)campaigncoverageasmeasuredusingapopulation-basedsurvey.Becausecholeraisnotpartofroutineimmunizationprograms,relativelysmallcholeracampaignscanhaveadisproportionateinfluenceonthemeancoverageestimate.Theindicatorisanabsoluteestimate,meaningthatcountriescandemonstrateprogressbyincrementalimprovementindependentlyofothercountries’performance.Ultimately,allcountriesshouldhavecoverageestimatesof>90%.Theweightingschemeplacesahighweightonroutinevaccination,emphasizingthevalueofroutinecoverageformanydiseases.Apotentiallimitationofthisapproachisthatsmalltargetedcampaignswillhaveonlyasmallimpactontheindicator.Otherweightingschemeswerealsoconsidered(e.g.equalweightingforallantigens–inwhichsmallcampaigns(e.g.forcholera)hadanoversizedeffectonthemean).
Datatype
Percentage
Relatedlinks
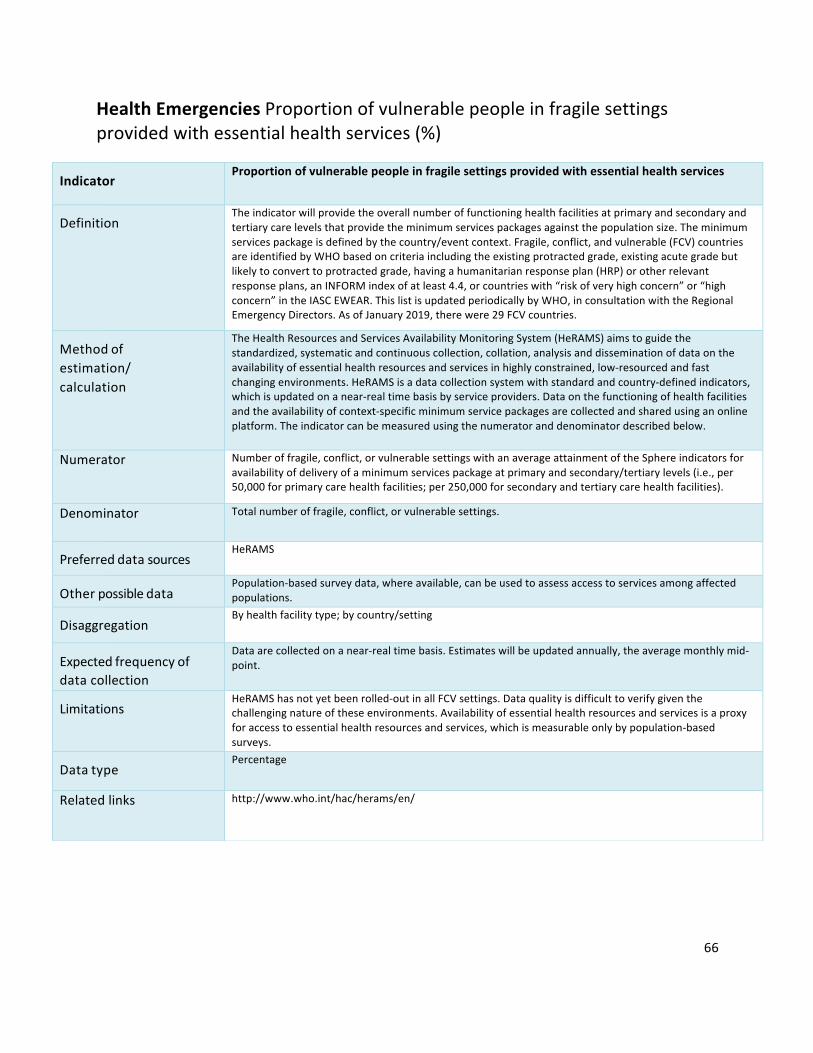
66
HealthEmergenciesProportionofvulnerablepeopleinfragilesettingsprovidedwithessentialhealthservices(%)
Indicator
Proportionofvulnerablepeopleinfragilesettingsprovidedwithessentialhealthservices
Definition
Theindicatorwillprovidetheoverallnumberoffunctioninghealthfacilitiesatprimaryandsecondaryandtertiarycarelevelsthatprovidetheminimumservicespackagesagainstthepopulationsize.Theminimumservicespackageisdefinedbythecountry/eventcontext.Fragile,conflict,andvulnerable(FCV)countriesareidentifiedbyWHObasedoncriteriaincludingtheexistingprotractedgrade,existingacutegradebutlikelytoconverttoprotractedgrade,havingahumanitarianresponseplan(HRP)orotherrelevantresponseplans,anINFORMindexofatleast4.4,orcountrieswith“riskofveryhighconcern”or“highconcern”intheIASCEWEAR.ThislistisupdatedperiodicallybyWHO,inconsultationwiththeRegionalEmergencyDirectors.AsofJanuary2019,therewere29FCVcountries.
Methodofestimation/calculation
TheHealthResourcesandServicesAvailabilityMonitoringSystem(HeRAMS)aimstoguidethestandardized,systematicandcontinuouscollection,collation,analysisanddisseminationofdataontheavailabilityofessentialhealthresourcesandservicesinhighlyconstrained,low-resourcedandfastchangingenvironments.HeRAMSisadatacollectionsystemwithstandardandcountry-definedindicators,whichisupdatedonanear-realtimebasisbyserviceproviders.Dataonthefunctioningofhealthfacilitiesandtheavailabilityofcontext-specificminimumservicepackagesarecollectedandsharedusinganonlineplatform.Theindicatorcanbemeasuredusingthenumeratoranddenominatordescribedbelow.
Numerator Numberoffragile,conflict,orvulnerablesettingswithanaverageattainmentoftheSphereindicatorsforavailabilityofdeliveryofaminimumservicespackageatprimaryandsecondary/tertiarylevels(i.e.,per50,000forprimarycarehealthfacilities;per250,000forsecondaryandtertiarycarehealthfacilities).
Denominator Totalnumberoffragile,conflict,orvulnerablesettings.
Preferreddatasources
HeRAMS
Otherpossibledatasources
Population-basedsurveydata,whereavailable,canbeusedtoassessaccesstoservicesamongaffectedpopulations.
Disaggregation
Byhealthfacilitytype;bycountry/setting
Expectedfrequencyofdatacollection
Dataarecollectedonanear-realtimebasis.Estimateswillbeupdatedannually,theaveragemonthlymid-point.
Limitations
HeRAMShasnotyetbeenrolled-outinallFCVsettings.Dataqualityisdifficulttoverifygiventhechallengingnatureoftheseenvironments.Availabilityofessentialhealthresourcesandservicesisaproxyforaccesstoessentialhealthresourcesandservices,whichismeasurableonlybypopulation-basedsurveys.
Datatype
Percentage
Relatedlinks http://www.who.int/hac/herams/en/
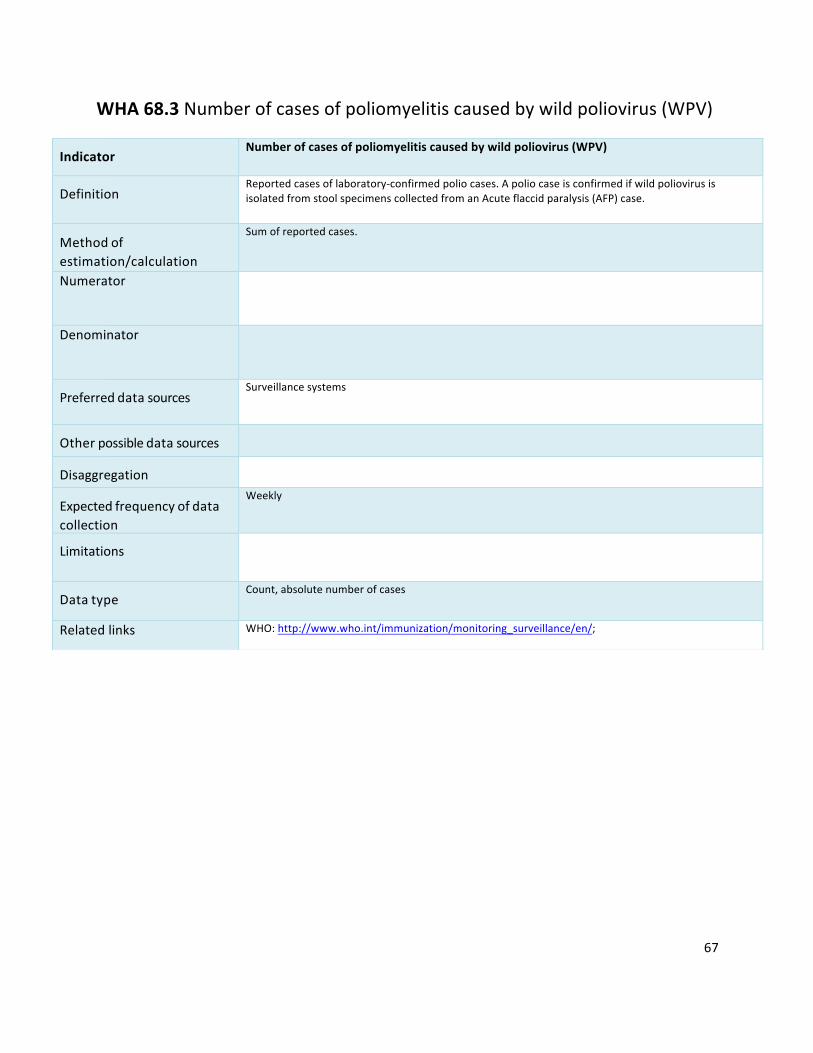
67
WHA68.3Numberofcasesofpoliomyelitiscausedbywildpoliovirus(WPV)
Indicator
Numberofcasesofpoliomyelitiscausedbywildpoliovirus(WPV)
Definition
Reportedcasesoflaboratory-confirmedpoliocases.ApoliocaseisconfirmedifwildpoliovirusisisolatedfromstoolspecimenscollectedfromanAcuteflaccidparalysis(AFP)case.
Methodofestimation/calculation
Sumofreportedcases.
Numerator
Denominator
Preferreddatasources
Surveillancesystems
Otherpossibledatasources
Disaggregation
Expectedfrequencyofdatacollection
Weekly
Limitations
Datatype
Count,absolutenumberofcases
Relatedlinks WHO:http://www.who.int/immunization/monitoring_surveillance/en/;

68
WHA68.7Patternsofantibioticconsumptionatnationallevel
Indicator
PatternsofantibioticconsumptionatnationallevelDefinition
ProportionofAccessgroupantibioticsaspercentageofoverallantibioticsales.Fromdataontotalconsumptionofantibiotics,theproportionofthetotal,byDDDthatarewithintheACCESSgroup(EML2017).Thetermconsumptionreferstoestimatesofaggregateddata,mainlyderivedfromimport,salesorreimbursementdatabases.IntherecentrevisionoftheWHOModelListofEssentialMedicines,antibioticsinthelisthavebeengroupedintothreeAWaRecategories:Access,WatchandReserve.TheAccesscategoryincludesfirstandsecondchoiceantibioticsfortheempiricaltreatmentofcommoninfectioussyndromesandtheyshouldbewidelyavailableinhealthcaresettings.AntibioticsintheWatchcategoryhaveahigherpotentialforresistancetodevelopandtheiruseasfirstandsecondchoicetreatmentshouldbelimited.Finally,theReservecategoryincludes“lastresort”antibioticswhoseuseshouldbereservedforspecializedsettingsandspecificcaseswherealternativetreatmentshavefailed.Rationale:Narrow-spectrumbeta-lactamsoftheAccessgroupsuchasamoxicillinarethepreferredtreatmentoptionformostRTIandarethoughttohavealowerecologicimpactregardingtheselectionandspreadofantibioticresistancethanbroader-spectrumagentssuchascephalosporins,macrolidesorfluoroquinolones.Accessgroupantibioticsshouldthereforeconstitutethemajorityofantibioticuseintheoutpatientsettingandoverall(asoutpatientuserepresentsthevastmajorityofABsales).Broader-spectrumagentsclassifiedintheWatchgroupshouldbemostlylimitedtotheirspecificrecommendedEMLuses.
Methodofestimation/calculation
DataonoverallconsumptionbyAWaRecategories:ACCESS,WATCH,RESERVE,OTHER,arecollectedandvalidatedatthenationallevelandreportedtoWHOwhereepidemiologicalstatisticsandmetricsaregenerated.Antibioticconsumptionispresentedusingthefollowingkeyindicators:
• QuantityofantibioticsasDDDper1000inhabitantsperdayfortotalconsumptionandbypharmacologicalsubgroup(ATC3)
• Quantityofantibioticsasweightintonnesfortotalconsumption• Relativeconsumptionofantibioticsasapercentageoftotalconsumptionbyrouteof
administration(oral,parenteral,rectalandinhaled)andAWaRecategories(Access,Watch,andReserve).
Tomeasuretheconsumptionofantimicrobials,themethodologyusesthenumberofdefineddailydoses(DDDs).TheDDDistheassumedaveragemaintenancedoseperdayofanantimicrobialsubstance(s)usedforitsmainindicationinadults,andisassignedtoactiveingredientswithanexistingATCcode.Asarule,theDDDsforantimicrobialsarebasedontreatmentforinfectionsofmoderateseverity.Toadjustforpopulationsize,theconsumptionisusuallypresentedasnumberofDDDsper1000inhabitantsperday.Thismetriccanberoughlyinterpretedasthenumberofindividualsper1000inhabitantsonantibiotictreatmentperday.Thevolumeofantibioticsconsumedcanbepresentedusingtwometrics:DDDandtheweightoftheantibioticsubstancesinmetrictonnes(t).Thesecondmetriccanbeusedforcomparisonwithantimicrobialconsumptionintheanimalsector.
Numerator AntibioticconsumptionofATCclassJ01antibioticsplusoralmetronidazole(P01AB01),oralvancomycin(A07AA09)andoralfidaxomicin(A07AA12)indefineddailydosesbelongingtotheACCCESgroup.ThenumberofDDDsconsumedforeachantibioticsubstancecanbecalculatedbydividingtheamountconsumedingramsofthesubstancebytheDDDvalueassignedtothatsubstance:NumberofDDDs=gramsofactivesubstance/substance-specificDDD.Thetotalamountingramsisobtainedbymultiplyingthestrengthofeachtabletorvialbythenumberofunitsperpackageandthenumberofpackagesconsumed.TheDDDvalueismostlyspecifiedingrams,butcanalsobedefinedasMU(millionunits)forcertainsubstances.Forcombinationsofantibiotics,theDDDvalueisspecifiedasUD(unitdose).OnetabletorvialofacombinationproductwithaspecificstrengthisdefinedasoneUD.

69
ToobtaintheDDDconsumedofaspecificcombinationproduct,thetotalnumberofUDsisdividedbytheassignedDDDvalue.ForcountriesthathavedataatthesubstancelevelandbyDDD,areversecalculationcanbedoneusingDDDvaluestoobtainthetotalnumberoftonnes.
Denominator Overallantibioticconsumption/salesofATCclasses:J01antibioticsplusoralmetronidazole
(P01AB01),oralvancomycin(A07AA09)andoralfidaxomicin(A07AA12)indefineddailydosesThepopulationsizeforeachcountrycanbeobtainedfromtheWorldBankpopulationdatabaseforallcountries,butforMemberStatesoftheESAC-Net,specificpopulationsindicatedbythedataprovider(EuropeanCentreforDiseasePreventionandControl)isused.
Preferreddatasources
National(orsamplingof)antibioticconsumptiondataavailableatnationallevelthroughdifferentsources(sales,prescribing,dispensing)ConsumptiondatawillbecollatedaccordingtotheWHOmethodologyforaglobalprogrammeonsurveillanceofantimicrobialconsumption.ConsumptiondatacollectedthroughastandardizedprotocolcomparablewiththeWHOmethodologywillalsobeutilized,includingdatacollectedthroughtheEuropeanSurveillanceofAntimicrobialConsumptionNetwork(ESAC-Net),theAntimicrobialMedicinesConsumptionNetworkmanagedbytheWHORegionalOfficeforEurope,andthesurveillanceprogrammesonantimicrobialconsumptioninCanada,Japan,NewZealandandtheRepublicofKorea.AccordingtotheWHOprotocol,dataarecollectedattheproductlevel(proprietaryandgeneric-products)andcompriseinformationontheactivesubstance(s)oftheproduct,routeofadministration,strengthperunit,numberofunitsperpackageandtotalnumberofpackagesconsumed.
Otherpossibledatasources
Salesshouldbethemainsourceofdata.Othersourcescouldinclude:
• Importrecords:forexamplefromcustomrecordsanddeclarationforms;• Productionrecordsfromdomesticmanufacturers;• Wholesalerrecords:bothprocurementdatabythewholesalerorsalesdatafromwholesaler
tohealthcarefacilitiesandpharmacies;• Publicsectorprocurement:fromcentralizedordecentralizedpurchasingofmedicinesforthe
publicsector,e.g.recordsfromcentralmedicalstores;
Disaggregation
Datawillbeaggregatedatthecountrylevel–allowdisaggregationatregional/districtlevel,byantibioticcategory(Access,WatchandReserve)
Expectedfrequencyofdatacollection
Yearly
Limitations
• Completeness/representativenessofsalesdata.Currently,dataarecollectedfromofficialchannelsandnodataexplicitlycapturingantimicrobialscirculatingontheinformalmarkethavebeenobtained.Consequently,forcountriesinwhichtheinformalmarketissignificant,onlyanincompletepictureofantibioticconsumptioncanbepresented.
• Datamaybeavailableonlyincertainmetrics(e.g.StandardUnitsinsteadofDDD)anditisunclearhowthiswillaffecttheindex.
• Measurementerrors• Antibiotic“Blackmarket”• DDDsarenotadequateforchildrenbutthiswillhavenoimpactinthisindicatorexpressedas
relativeproportionofDDDDatatype
Percentage
Relatedlinks http://www.who.int/antimicrobial-resistance/global-action-plan/optimise-use/surveillance/en/https://www.who.int/medicines/areas/rational_use/WHO_AMCsurveillance_1.0.pdf

70
WHA66.10Prevalenceofraisedbloodpressureinadultsaged18+
Indicator
Age-standardizedprevalenceofraisedbloodpressureamongpersonsaged18+years(definedassystolicbloodpressureof>140mmHgand/ordiastolicbloodpressure>90mmHg)andmeansystolicbloodpressure
Definition
Systolicbloodpressure≥140and/ordiastolicbloodpressure≥90amongpersonsaged18+years.
Methodofestimation/calculation
Prevalenceofraisedbloodpressure=
𝑁𝑢𝑚𝑏𝑒𝑟𝑜𝑓𝑟𝑒𝑠𝑝𝑜𝑛𝑑𝑒𝑛𝑡𝑠𝑎𝑔𝑒𝑑18 + 𝑦𝑒𝑎𝑟𝑠𝑤𝑖𝑡ℎ𝑠𝑦𝑠𝑡𝑜𝑙𝑖𝑐𝑏𝑙𝑜𝑜𝑑𝑝𝑟𝑒𝑠𝑠𝑢𝑟𝑒 ≥ 140𝑚𝑚𝐻𝑔𝑜𝑟𝑑𝑖𝑎𝑠𝑡𝑜𝑙𝑖𝑐𝑏𝑙𝑜𝑜𝑑𝑝𝑟𝑒𝑠𝑠𝑢𝑟𝑒 ≥ 90𝑚𝑚𝐻𝑔𝑁𝑢𝑚𝑏𝑒𝑟𝑜𝑓𝑠𝑢𝑟𝑣𝑒𝑦𝑟𝑒𝑠𝑝𝑜𝑛𝑑𝑒𝑛𝑡𝑠𝑎𝑔𝑒𝑑18 + 𝑦𝑒𝑎𝑟𝑠 ×100%
Numerator Numberofrespondentswithsystolicbloodpressure≥140mmHgordiastolicbloodpressure≥90mmHg.Ideallythreebloodpressuremeasurementsshouldbetakenandtheaveragesystolicanddiastolicreadingsofthesecondandthirdmeasuresshouldbeusedinthiscalculation.
Denominator Allrespondentsofthesurveyaged18+years.Preferreddatasources
Population-based(preferablynationallyrepresentative)surveyinwhichbloodpressurewasmeasured,notself-reported.
Otherpossibledatasources
Disaggregation
Byage,sex,location(urban/rural,majorregions/provinces),andsocio-economiccharacteristics(e.g.,education,wealthquintile).
Expectedfrequencyofdatacollection
Annualorevery5years
Limitations
-measurementerror-representativenessofthesample
Datatype
Prevalence
Relatedlinks WHO:http://www.who.int/chp/steps/en/;http://apps.who.int/gho/data/node.wrapper.imr?x-id=2386.

71
WHA66.10Effectivepolicy/regulationforindustriallyproducedtrans-fattyacids(TFA)(Y/N)
Indicator
Protectionofthepopulationofacountrybyeffectivepolicy/regulationonindustryproducedtrans-fattyacids(TFA)
Definition
PresenceofaWHObest-practiceTFApolicy/regulationwhichhascomeintoeffectinacountrytoeliminateindustriallyproducedtrans-fattyacids(TFA)inthefoodsupply.Thetwoalternativebest-practiceTFApoliciesare:1)mandatorynationallimitof2gramsofindustriallyproducedTFAper100gramsoftotaloilsandfatsinallfoods;and2)mandatorynationalbanontheproductionoruseofpartiallyhydrogenatedoils(PHO)asaningredientinallfoods.
Methodofestimation/calculation
Countrycanrespond"yes"tothequestion“Hasabest-practiceTFApolicy/regulationcomeintoeffectinyourcountrytoeliminateindustriallyproducedTFAinthefoodsupply?”TheindicatorwillstoretheY/Nforeachyear.
Numerator Yes/No.Yes:ifbest-practicepolicy/regulationisfullyimplemented;Missing:ifnodata
Denominator NotapplicablePreferreddatasources
WHOGlobaldatabaseontheImplementationofNutritionAction(GINA)(http://www.who.int/nutrition/gina/en/)
InformationfromWHORegionalOffices,CountryOffices,MinistriesofHealthandpartners
Otherpossibledatasources
Nationalnutritionandhealthsurvey,GlobalNutritionPolicyReview
Disaggregation
Notapplicable
Expectedfrequencyofdatacollection
Yearly
Limitations
Requirescarefulconfirmationtoascertaininformationonthepolicycontents,thestatusofpolicyadoption,andwhenpoliciescomeintoeffectincountries.
Datatype
Yearly
Relatedlinks WHO:https://www.who.int/nutrition/topics/replace-transfat/http://www.who.int/nutrition/gina/en/https://www.who.int/ncds/surveillance/ncd-capacity/en/http://www.who.int/nmh/publications/best_buys_summary.pdf.
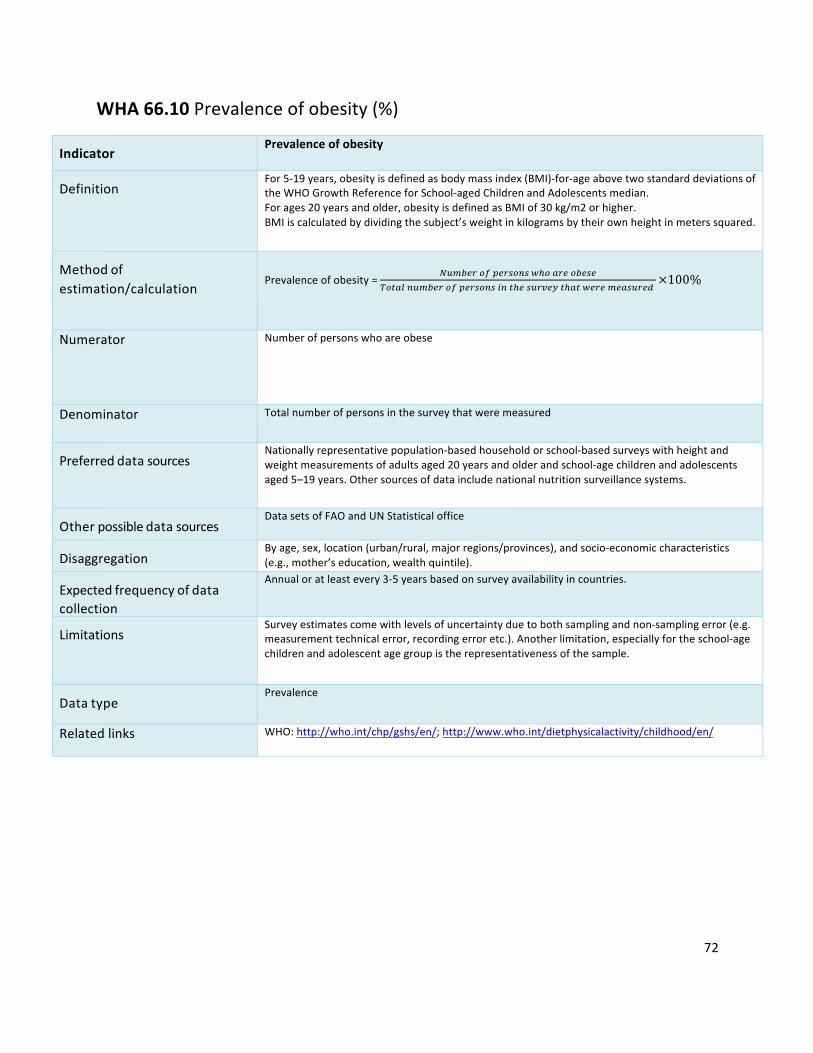
72
WHA66.10Prevalenceofobesity(%)
Indicator
Prevalenceofobesity
Definition
For5-19years,obesityisdefinedasbodymassindex(BMI)-for-ageabovetwostandarddeviationsoftheWHOGrowthReferenceforSchool-agedChildrenandAdolescentsmedian.Forages20yearsandolder,obesityisdefinedasBMIof30kg/m2orhigher.BMIiscalculatedbydividingthesubject’sweightinkilogramsbytheirownheightinmeterssquared.
Methodofestimation/calculation
Prevalenceofobesity=
]6^3_`2a5_`j29jlc24`_23_j_r274196^3_`2a5_`j29j897c_j6`k_i7c47l_`_^_4j6`_d
×100%
Numerator Numberofpersonswhoareobese
Denominator Totalnumberofpersonsinthesurveythatweremeasured
Preferreddatasources
Nationallyrepresentativepopulation-basedhouseholdorschool-basedsurveyswithheightandweightmeasurementsofadultsaged20yearsandolderandschool-agechildrenandadolescentsaged5–19years.Othersourcesofdataincludenationalnutritionsurveillancesystems.
Otherpossibledatasources
DatasetsofFAOandUNStatisticaloffice
Disaggregation
Byage,sex,location(urban/rural,majorregions/provinces),andsocio-economiccharacteristics(e.g.,mother’seducation,wealthquintile).
Expectedfrequencyofdatacollection
Annualoratleastevery3-5yearsbasedonsurveyavailabilityincountries.
Limitations
Surveyestimatescomewithlevelsofuncertaintyduetobothsamplingandnon-samplingerror(e.g.measurementtechnicalerror,recordingerroretc.).Anotherlimitation,especiallyfortheschool-agechildrenandadolescentagegroupistherepresentativenessofthesample.
Datatype
Prevalence
Relatedlinks WHO:http://who.int/chp/gshs/en/;http://www.who.int/dietphysicalactivity/childhood/en/

73
Section2:UniversalHealthCoverage(UHC)Billion
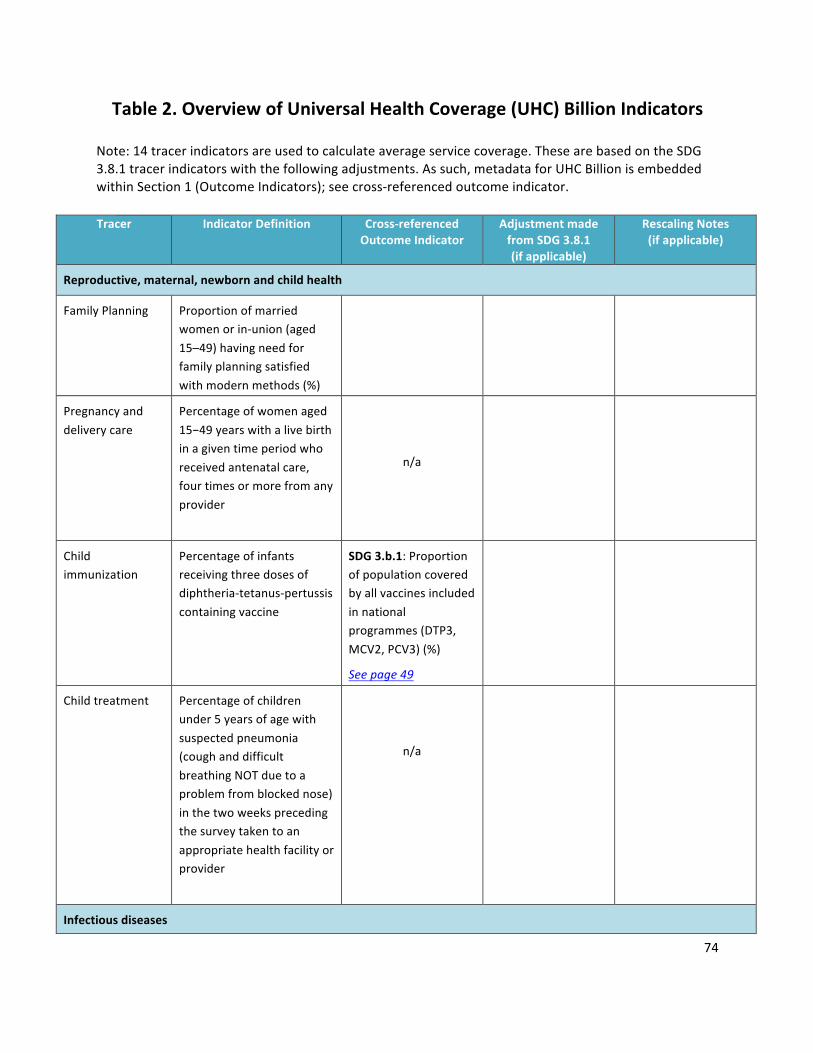
74
Table2.OverviewofUniversalHealthCoverage(UHC)BillionIndicatorsNote:14tracerindicatorsareusedtocalculateaverageservicecoverage.ThesearebasedontheSDG3.8.1tracerindicatorswiththefollowingadjustments.Assuch,metadataforUHCBillionisembeddedwithinSection1(OutcomeIndicators);seecross-referencedoutcomeindicator.
Tracer IndicatorDefinition Cross-referenced
OutcomeIndicatorAdjustmentmadefromSDG3.8.1(ifapplicable)
RescalingNotes(ifapplicable)
Reproductive,maternal,newbornandchildhealth
FamilyPlanning Proportionofmarriedwomenorin-union(aged15–49)havingneedforfamilyplanningsatisfiedwithmodernmethods(%)
Pregnancyanddeliverycare
Percentageofwomenaged15−49yearswithalivebirthinagiventimeperiodwhoreceivedantenatalcare,fourtimesormorefromanyprovider
n/a
Childimmunization
Percentageofinfantsreceivingthreedosesofdiphtheria-tetanus-pertussiscontainingvaccine
SDG3.b.1:Proportionofpopulationcoveredbyallvaccinesincludedinnationalprogrammes(DTP3,MCV2,PCV3)(%)
Seepage49
Childtreatment Percentageofchildrenunder5yearsofagewithsuspectedpneumonia(coughanddifficultbreathingNOTduetoaproblemfromblockednose)inthetwoweeksprecedingthesurveytakentoanappropriatehealthfacilityorprovider
n/a
Infectiousdiseases
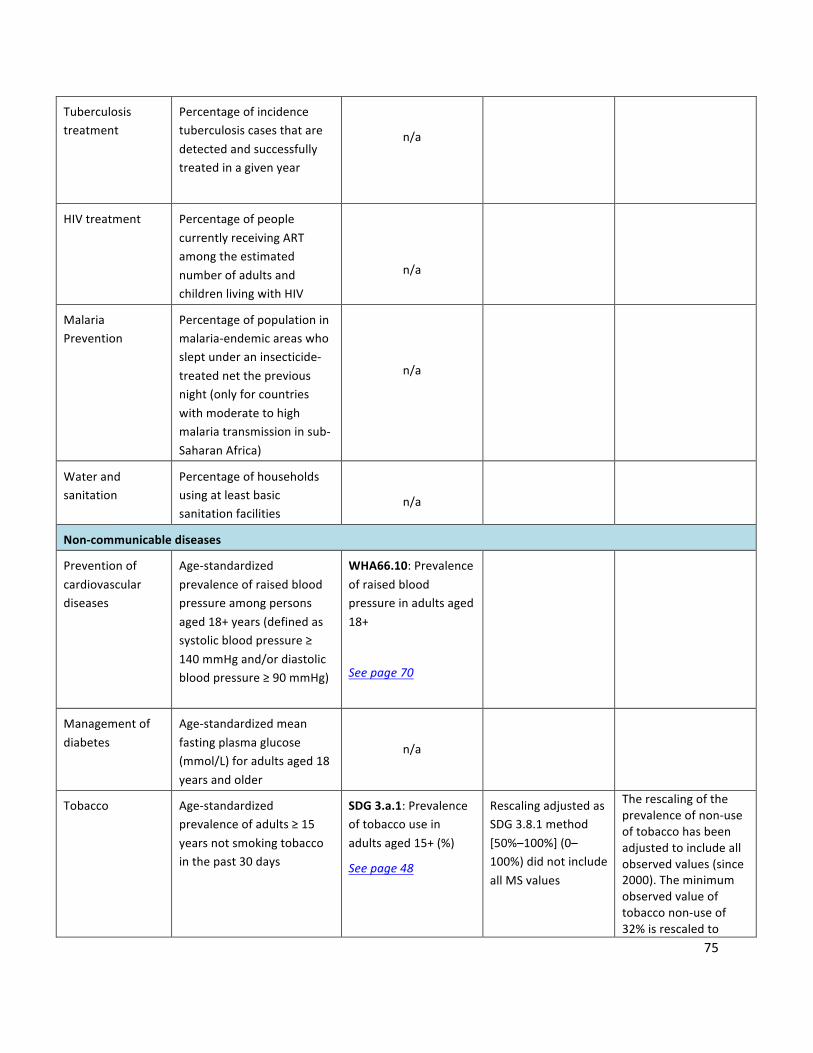
75
Tuberculosistreatment
Percentageofincidencetuberculosiscasesthataredetectedandsuccessfullytreatedinagivenyear
n/a
HIVtreatment PercentageofpeoplecurrentlyreceivingARTamongtheestimatednumberofadultsandchildrenlivingwithHIV
n/a
MalariaPrevention
Percentageofpopulationinmalaria-endemicareaswhosleptunderaninsecticide-treatednetthepreviousnight(onlyforcountrieswithmoderatetohighmalariatransmissioninsub-SaharanAfrica)
n/a
Waterandsanitation
Percentageofhouseholdsusingatleastbasicsanitationfacilities
n/a
Non-communicablediseases
Preventionofcardiovasculardiseases
Age-standardizedprevalenceofraisedbloodpressureamongpersonsaged18+years(definedassystolicbloodpressure≥140mmHgand/ordiastolicbloodpressure≥90mmHg)
WHA66.10:Prevalenceofraisedbloodpressureinadultsaged18+
Seepage70
Managementofdiabetes
Age-standardizedmeanfastingplasmaglucose(mmol/L)foradultsaged18yearsandolder
n/a
Tobacco Age-standardizedprevalenceofadults≥15yearsnotsmokingtobaccointhepast30days
SDG3.a.1:Prevalenceoftobaccouseinadultsaged15+(%)
Seepage48
RescalingadjustedasSDG3.8.1method[50%–100%](0–100%)didnotincludeallMSvalues
Therescalingoftheprevalenceofnon-useoftobaccohasbeenadjustedtoincludeallobservedvalues(since2000).Theminimumobservedvalueoftobacconon-useof32%isrescaledto

76
representzeroservicecoverage,and100%torepresent100%servicecoverage.
Servicecapacityandaccess
Hospitalaccess Numberofhospitalbedsper10000population
n/a
Healthworkerdensity
Numberofhealthprofessionals(physicians,nurses,andmidwives)per10000population
SDG3.c.1:Densityofhealthworkers(doctors;nurseandmidwives;pharmacists;dentistsper10000population)
Seepage51
Adjustedindicatorfromphysicians,psychiatristsandsurgeonstophysiciansandnurses/midwives
Rescaledusingamaximumdensityof155per10000population,whichisthe95thpercentileacrossallnationaldensitiesfrom2000to2017.Densitiesabovethatlevelareresetat100%.TheindicatorreplacestheSDG3.8.1tracerforphysicians,psychiatristsandsurgeonsforwhichdataavailabilityispoor,andwhichneglectsthelargeandimportantcategoryofnurses.
Healthsecurity InternationalHealthRegulations(IHR)corecapacityindex,whichistheaveragepercentageofattributesof13corecapacitiesthathavebeenattained
SDG3.d.1:InternationalHealthRegulations(IHR)capacityandhealthemergencypreparedness
Seepage53
FinancialHardship
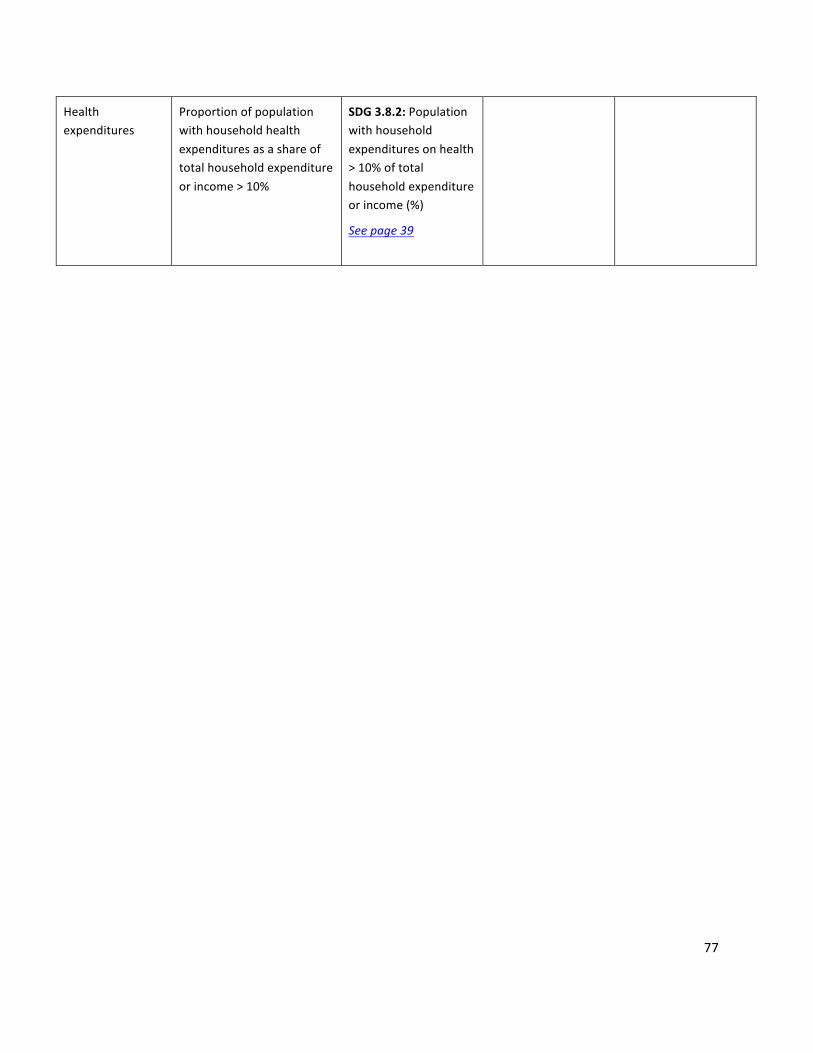
77
Healthexpenditures
Proportionofpopulationwithhouseholdhealthexpendituresasashareoftotalhouseholdexpenditureorincome>10%
SDG3.8.2:Populationwithhouseholdexpendituresonhealth>10%oftotalhouseholdexpenditureorincome(%)
Seepage39
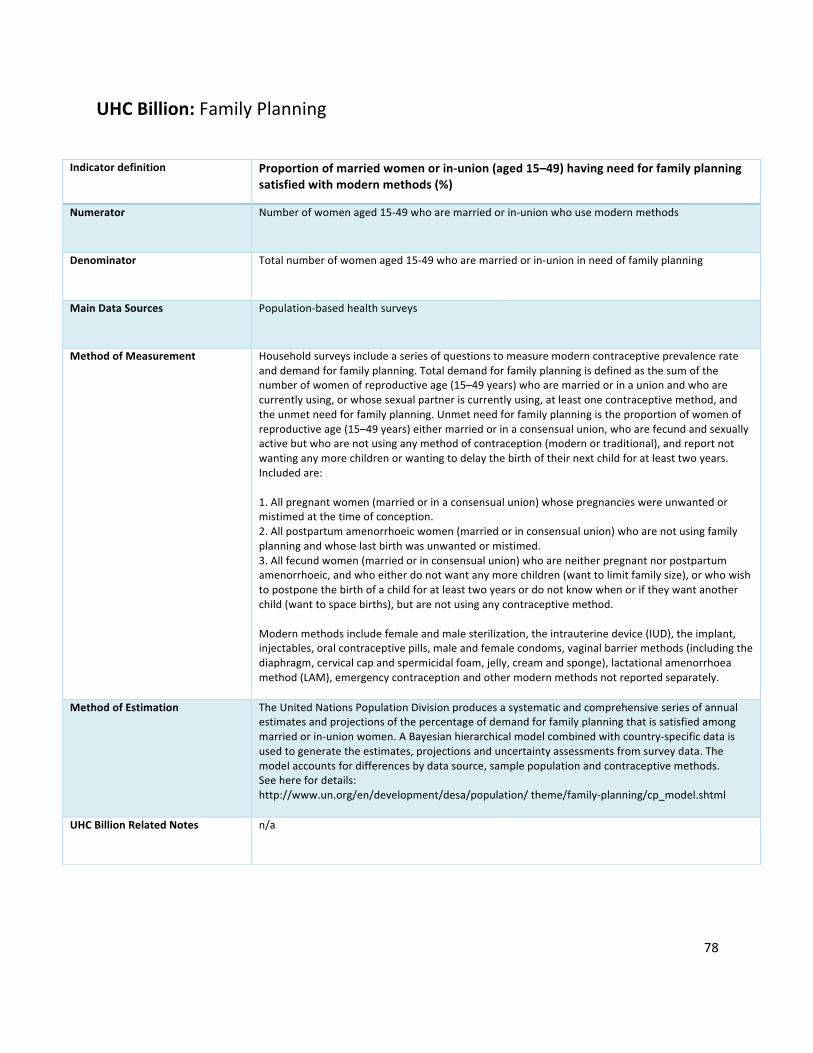
78
UHCBillion:FamilyPlanning
Indicatordefinition Proportionofmarriedwomenorin-union(aged15–49)havingneedforfamilyplanningsatisfiedwithmodernmethods(%)
Numerator Numberofwomenaged15-49whoaremarriedorin-unionwhousemodernmethods
Denominator Totalnumberofwomenaged15-49whoaremarriedorin-unioninneedoffamilyplanning
MainDataSources Population-basedhealthsurveys
MethodofMeasurement Householdsurveysincludeaseriesofquestionstomeasuremoderncontraceptiveprevalencerateanddemandforfamilyplanning.Totaldemandforfamilyplanningisdefinedasthesumofthenumberofwomenofreproductiveage(15–49years)whoaremarriedorinaunionandwhoarecurrentlyusing,orwhosesexualpartneriscurrentlyusing,atleastonecontraceptivemethod,andtheunmetneedforfamilyplanning.Unmetneedforfamilyplanningistheproportionofwomenofreproductiveage(15–49years)eithermarriedorinaconsensualunion,whoarefecundandsexuallyactivebutwhoarenotusinganymethodofcontraception(modernortraditional),andreportnotwantinganymorechildrenorwantingtodelaythebirthoftheirnextchildforatleasttwoyears.Includedare:1.Allpregnantwomen(marriedorinaconsensualunion)whosepregnancieswereunwantedormistimedatthetimeofconception.2.Allpostpartumamenorrhoeicwomen(marriedorinconsensualunion)whoarenotusingfamilyplanningandwhoselastbirthwasunwantedormistimed.3.Allfecundwomen(marriedorinconsensualunion)whoareneitherpregnantnorpostpartumamenorrhoeic,andwhoeitherdonotwantanymorechildren(wanttolimitfamilysize),orwhowishtopostponethebirthofachildforatleasttwoyearsordonotknowwhenoriftheywantanotherchild(wanttospacebirths),butarenotusinganycontraceptivemethod.Modernmethodsincludefemaleandmalesterilization,theintrauterinedevice(IUD),theimplant,injectables,oralcontraceptivepills,maleandfemalecondoms,vaginalbarriermethods(includingthediaphragm,cervicalcapandspermicidalfoam,jelly,creamandsponge),lactationalamenorrhoeamethod(LAM),emergencycontraceptionandothermodernmethodsnotreportedseparately.
MethodofEstimation TheUnitedNationsPopulationDivisionproducesasystematicandcomprehensiveseriesofannualestimatesandprojectionsofthepercentageofdemandforfamilyplanningthatissatisfiedamongmarriedorin-unionwomen.ABayesianhierarchicalmodelcombinedwithcountry-specificdataisusedtogeneratetheestimates,projectionsanduncertaintyassessmentsfromsurveydata.Themodelaccountsfordifferencesbydatasource,samplepopulationandcontraceptivemethods.Seeherefordetails:http://www.un.org/en/development/desa/population/theme/family-planning/cp_model.shtml
UHCBillionRelatedNotes n/a
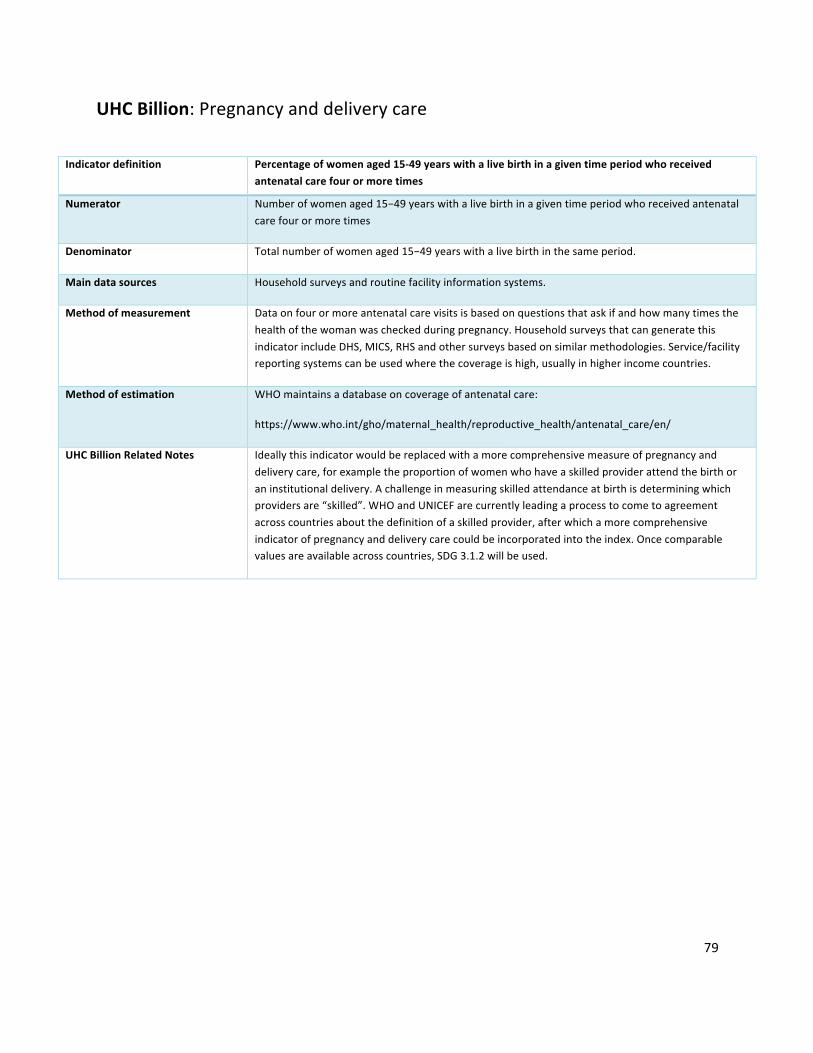
79
UHCBillion:Pregnancyanddeliverycare
Indicatordefinition Percentageofwomenaged15-49yearswithalivebirthinagiventimeperiodwhoreceivedantenatalcarefourormoretimes
Numerator Numberofwomenaged15−49yearswithalivebirthinagiventimeperiodwhoreceivedantenatalcarefourormoretimes
Denominator Totalnumberofwomenaged15−49yearswithalivebirthinthesameperiod.
Maindatasources Householdsurveysandroutinefacilityinformationsystems.
Methodofmeasurement Dataonfourormoreantenatalcarevisitsisbasedonquestionsthataskifandhowmanytimesthehealthofthewomanwascheckedduringpregnancy.HouseholdsurveysthatcangeneratethisindicatorincludeDHS,MICS,RHSandothersurveysbasedonsimilarmethodologies.Service/facilityreportingsystemscanbeusedwherethecoverageishigh,usuallyinhigherincomecountries.
Methodofestimation WHOmaintainsadatabaseoncoverageofantenatalcare:
https://www.who.int/gho/maternal_health/reproductive_health/antenatal_care/en/
UHCBillionRelatedNotes Ideallythisindicatorwouldbereplacedwithamorecomprehensivemeasureofpregnancyanddeliverycare,forexampletheproportionofwomenwhohaveaskilledproviderattendthebirthoraninstitutionaldelivery.Achallengeinmeasuringskilledattendanceatbirthisdeterminingwhichprovidersare“skilled”.WHOandUNICEFarecurrentlyleadingaprocesstocometoagreementacrosscountriesaboutthedefinitionofaskilledprovider,afterwhichamorecomprehensiveindicatorofpregnancyanddeliverycarecouldbeincorporatedintotheindex.Oncecomparablevaluesareavailableacrosscountries,SDG3.1.2willbeused.
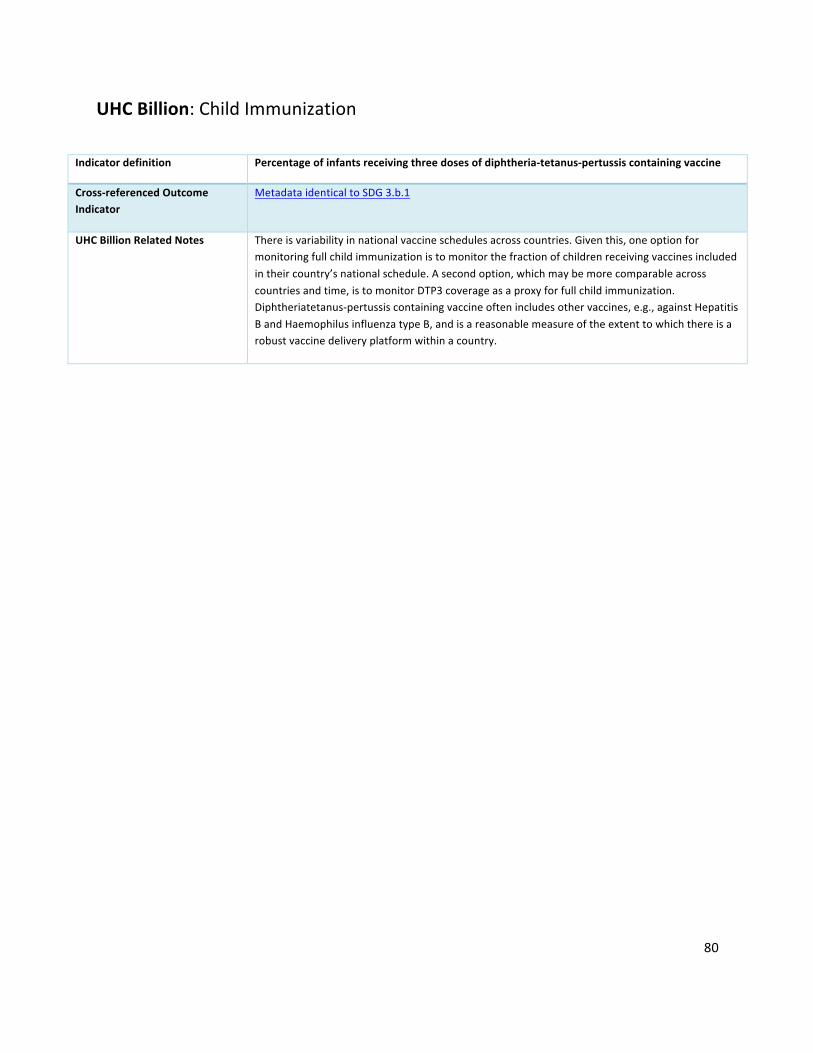
80
UHCBillion:ChildImmunization
Indicatordefinition Percentageofinfantsreceivingthreedosesofdiphtheria-tetanus-pertussiscontainingvaccine
Cross-referencedOutcomeIndicator
MetadataidenticaltoSDG3.b.1
UHCBillionRelatedNotes Thereisvariabilityinnationalvaccineschedulesacrosscountries.Giventhis,oneoptionformonitoringfullchildimmunizationistomonitorthefractionofchildrenreceivingvaccinesincludedintheircountry’snationalschedule.Asecondoption,whichmaybemorecomparableacrosscountriesandtime,istomonitorDTP3coverageasaproxyforfullchildimmunization.Diphtheriatetanus-pertussiscontainingvaccineoftenincludesothervaccines,e.g.,againstHepatitisBandHaemophilusinfluenzatypeB,andisareasonablemeasureoftheextenttowhichthereisarobustvaccinedeliveryplatformwithinacountry.
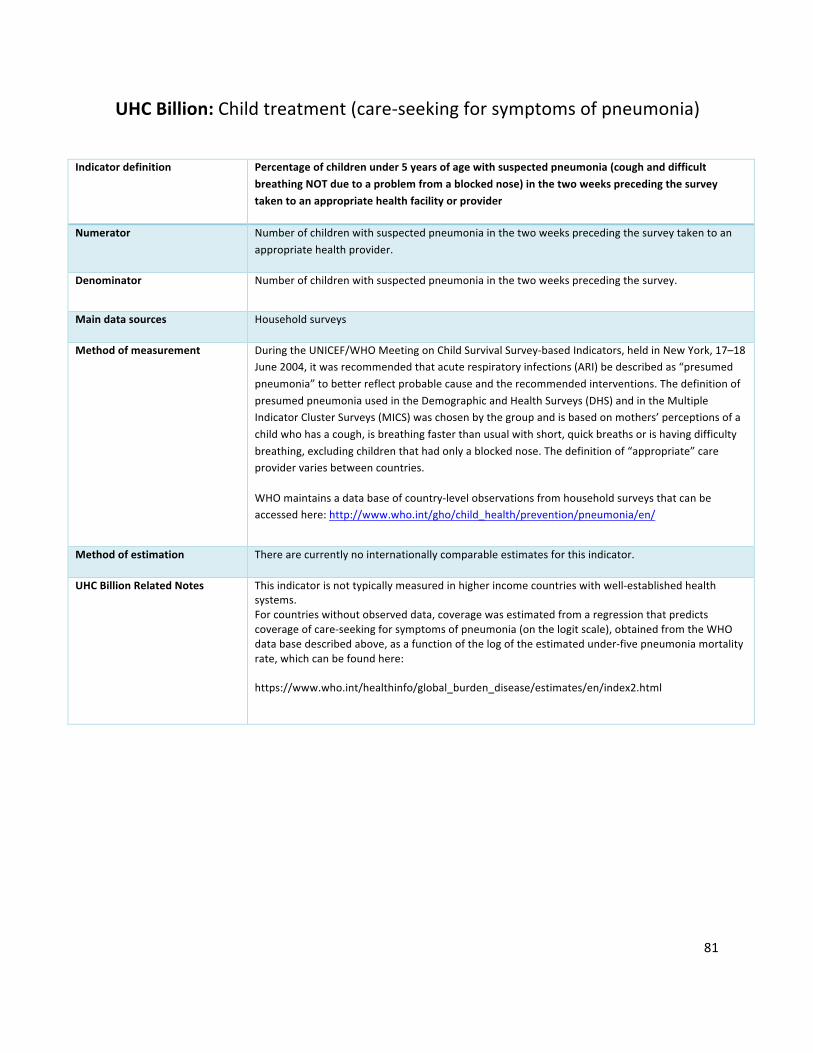
81
UHCBillion:Childtreatment(care-seekingforsymptomsofpneumonia)
Indicatordefinition Percentageofchildrenunder5yearsofagewithsuspectedpneumonia(coughanddifficult
breathingNOTduetoaproblemfromablockednose)inthetwoweeksprecedingthesurveytakentoanappropriatehealthfacilityorprovider
Numerator Numberofchildrenwithsuspectedpneumoniainthetwoweeksprecedingthesurveytakentoanappropriatehealthprovider.
Denominator Numberofchildrenwithsuspectedpneumoniainthetwoweeksprecedingthesurvey.
Maindatasources Householdsurveys
Methodofmeasurement DuringtheUNICEF/WHOMeetingonChildSurvivalSurvey-basedIndicators,heldinNewYork,17–18June2004,itwasrecommendedthatacuterespiratoryinfections(ARI)bedescribedas“presumedpneumonia”tobetterreflectprobablecauseandtherecommendedinterventions.ThedefinitionofpresumedpneumoniausedintheDemographicandHealthSurveys(DHS)andintheMultipleIndicatorClusterSurveys(MICS)waschosenbythegroupandisbasedonmothers’perceptionsofachildwhohasacough,isbreathingfasterthanusualwithshort,quickbreathsorishavingdifficultybreathing,excludingchildrenthathadonlyablockednose.Thedefinitionof“appropriate”careprovidervariesbetweencountries.
WHOmaintainsadatabaseofcountry-levelobservationsfromhouseholdsurveysthatcanbeaccessedhere:http://www.who.int/gho/child_health/prevention/pneumonia/en/
Methodofestimation Therearecurrentlynointernationallycomparableestimatesforthisindicator.
UHCBillionRelatedNotes Thisindicatorisnottypicallymeasuredinhigherincomecountrieswithwell-establishedhealthsystems.Forcountrieswithoutobserveddata,coveragewasestimatedfromaregressionthatpredictscoverageofcare-seekingforsymptomsofpneumonia(onthelogitscale),obtainedfromtheWHOdatabasedescribedabove,asafunctionofthelogoftheestimatedunder-fivepneumoniamortalityrate,whichcanbefoundhere:https://www.who.int/healthinfo/global_burden_disease/estimates/en/index2.html

82
UHCBillion:TuberculosisTreatment
Indicatordefinition PercentageofincidenceTBcasesthataredetectedandsuccessfullytreatedinagivenyear
Numerator Numberofnewandrelapsecasesdetectedinagivenyearandsuccessfullytreated
Denominator Numberofnewandrelapsecasesinthesameyear
Maindatasources Facilityinformationsystems,surveillancesystems,population-basedhealthsurveyswithTBdiagnostictesting,TBregisterandrelatedquarterlyreportingsystem(orelectronicTBregisters)
Methodofmeasurement Thisindicatorrequiresthreemaininputs:
(1)ThenumberofnewandrelapseTBcasesdiagnosedandtreatedinnationalTBcontrolprogrammesandnotifiedtoWHOinagivenyear.
(2)ThenumberofincidentTBcasesforthesameyear,typicallyestimatedbyWHO.
(3)PercentageofTBcasessuccessfullytreated(curedplustreatmentcompleted)amongTBcasesnotifiedtothenationalhealthauthorities.
Thefinalindicator==(1inyeart)/(2inyeart)x(3inyeart-1)
Methodofestimation EstimatesofTBincidenceareproducedthroughaconsultativeandanalyticalprocessledbyWHOandarepublishedannually.Theseestimatesarebasedonannualcasenotifications,assessmentsofthequalityandcoverageofTBnotificationdata,nationalsurveysoftheprevalenceofTBdiseaseandinformationfromdeath(vital)registrationsystems.Estimatesofincidenceforeachcountryarederived,usingoneormoreofthefollowingapproachesdependingonavailabledata:
1.incidence=casenotifications/estimatedproportionofcasesdetected;
2.incidence=prevalence/durationofcondition;
3.incidence=deaths/proportionofincidentcasesthatdie.
TheseestimatesofTBincidencearecombinedwithcountry-reporteddataonthenumberofcasesdetectedandtreated,andthepercentageofcasessuccessfullytreated,asdescribedabove.
UHCBillionRelatedNotes TocomputetheindicatorusingWHOestimates,onecanaccessnecessaryfileshere:http://www.who.int/tb/country/data/download/en/,andcomputetheindicatoras=c_cdrinyeartxc_new_tsrinyeart-1
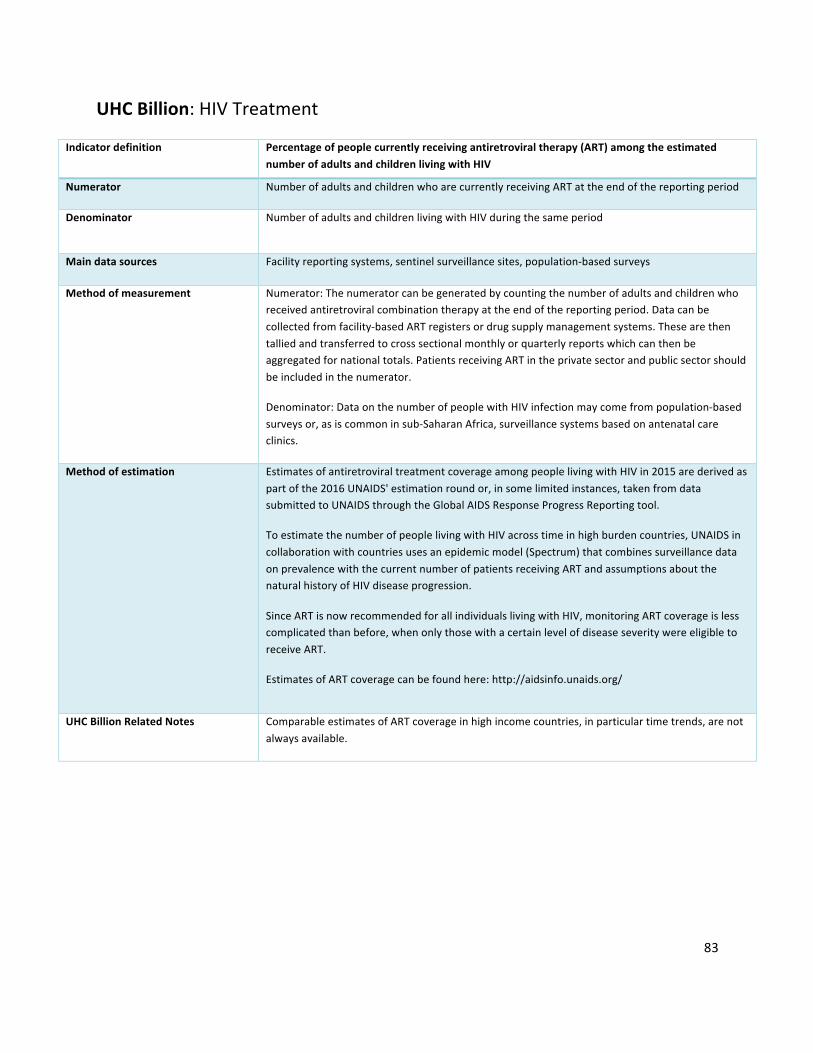
83
UHCBillion:HIVTreatment
Indicatordefinition Percentageofpeoplecurrentlyreceivingantiretroviraltherapy(ART)amongtheestimatednumberofadultsandchildrenlivingwithHIV
Numerator NumberofadultsandchildrenwhoarecurrentlyreceivingARTattheendofthereportingperiod
Denominator NumberofadultsandchildrenlivingwithHIVduringthesameperiod
Maindatasources Facilityreportingsystems,sentinelsurveillancesites,population-basedsurveys
Methodofmeasurement Numerator:Thenumeratorcanbegeneratedbycountingthenumberofadultsandchildrenwhoreceivedantiretroviralcombinationtherapyattheendofthereportingperiod.Datacanbecollectedfromfacility-basedARTregistersordrugsupplymanagementsystems.Thesearethentalliedandtransferredtocrosssectionalmonthlyorquarterlyreportswhichcanthenbeaggregatedfornationaltotals.PatientsreceivingARTintheprivatesectorandpublicsectorshouldbeincludedinthenumerator.
Denominator:DataonthenumberofpeoplewithHIVinfectionmaycomefrompopulation-basedsurveysor,asiscommoninsub-SaharanAfrica,surveillancesystemsbasedonantenatalcareclinics.
Methodofestimation EstimatesofantiretroviraltreatmentcoverageamongpeoplelivingwithHIVin2015arederivedaspartofthe2016UNAIDS'estimationroundor,insomelimitedinstances,takenfromdatasubmittedtoUNAIDSthroughtheGlobalAIDSResponseProgressReportingtool.
ToestimatethenumberofpeoplelivingwithHIVacrosstimeinhighburdencountries,UNAIDSincollaborationwithcountriesusesanepidemicmodel(Spectrum)thatcombinessurveillancedataonprevalencewiththecurrentnumberofpatientsreceivingARTandassumptionsaboutthenaturalhistoryofHIVdiseaseprogression.
SinceARTisnowrecommendedforallindividualslivingwithHIV,monitoringARTcoverageislesscomplicatedthanbefore,whenonlythosewithacertainlevelofdiseaseseveritywereeligibletoreceiveART.
EstimatesofARTcoveragecanbefoundhere:http://aidsinfo.unaids.org/
UHCBillionRelatedNotes ComparableestimatesofARTcoverageinhighincomecountries,inparticulartimetrends,arenotalwaysavailable.
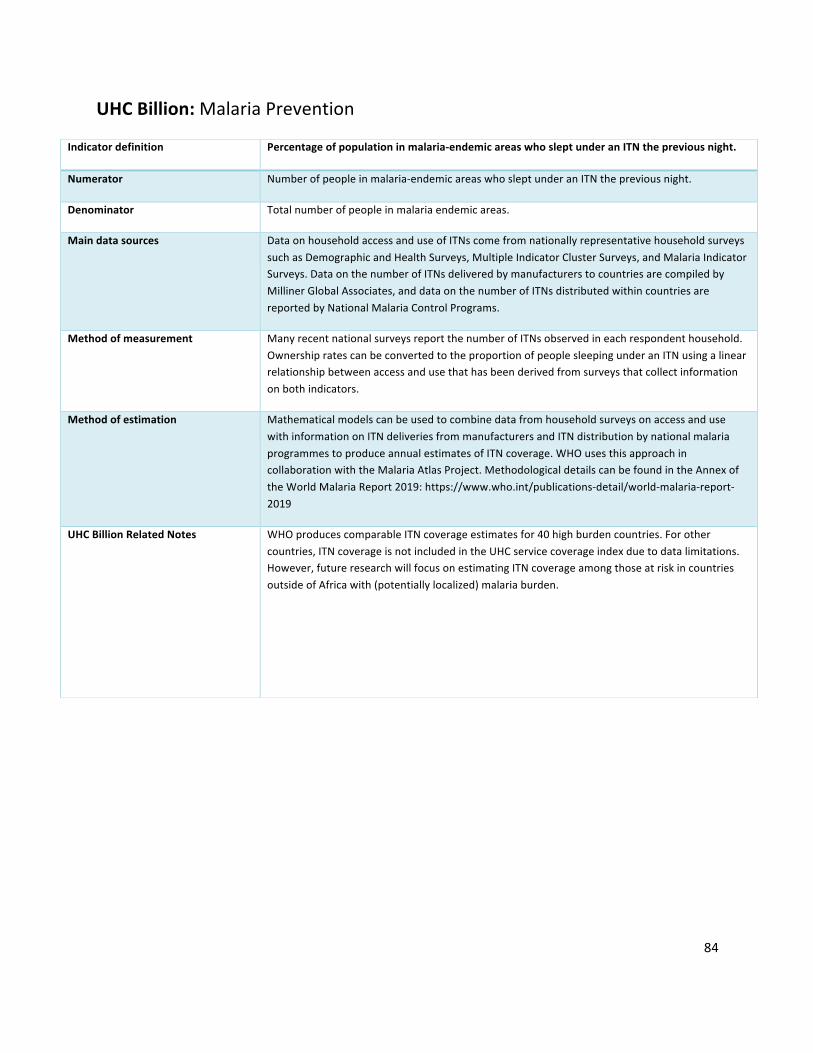
84
UHCBillion:MalariaPrevention
Indicatordefinition Percentageofpopulationinmalaria-endemicareaswhosleptunderanITNthepreviousnight.
Numerator Numberofpeopleinmalaria-endemicareaswhosleptunderanITNthepreviousnight.
Denominator Totalnumberofpeopleinmalariaendemicareas.
Maindatasources DataonhouseholdaccessanduseofITNscomefromnationallyrepresentativehouseholdsurveyssuchasDemographicandHealthSurveys,MultipleIndicatorClusterSurveys,andMalariaIndicatorSurveys.DataonthenumberofITNsdeliveredbymanufacturerstocountriesarecompiledbyMillinerGlobalAssociates,anddataonthenumberofITNsdistributedwithincountriesarereportedbyNationalMalariaControlPrograms.
Methodofmeasurement ManyrecentnationalsurveysreportthenumberofITNsobservedineachrespondenthousehold.OwnershipratescanbeconvertedtotheproportionofpeoplesleepingunderanITNusingalinearrelationshipbetweenaccessandusethathasbeenderivedfromsurveysthatcollectinformationonbothindicators.
Methodofestimation MathematicalmodelscanbeusedtocombinedatafromhouseholdsurveysonaccessandusewithinformationonITNdeliveriesfrommanufacturersandITNdistributionbynationalmalariaprogrammestoproduceannualestimatesofITNcoverage.WHOusesthisapproachincollaborationwiththeMalariaAtlasProject.MethodologicaldetailscanbefoundintheAnnexoftheWorldMalariaReport2019:https://www.who.int/publications-detail/world-malaria-report-2019
UHCBillionRelatedNotes WHOproducescomparableITNcoverageestimatesfor40highburdencountries.Forothercountries,ITNcoverageisnotincludedintheUHCservicecoverageindexduetodatalimitations.However,futureresearchwillfocusonestimatingITNcoverageamongthoseatriskincountriesoutsideofAfricawith(potentiallylocalized)malariaburden.

85
UHCBillion:WaterandSanitation
Indicatordefinition Percentageofhouseholdsusingatleastbasicsanitationfacilities
Numerator Populationlivinginahouseholdwith:flushorpour-flushtopipedsewersystem,septictankorpitlatrine;ventilatedimprovedpitlatrine;pitlatrinewithslab;orcompostingtoilet.
Denominator Totalpopulation
Maindatasources Population-basedhouseholdsurveysandcensuses
Methodofmeasurement Household-levelresponses,weightedbyhouseholdsize,areusedtocomputepopulationcoverage.
Methodofestimation TheWHO/UNICEFJointMonitoringProgrammehasproducedregularestimatesofcoverageofimprovedsanitationforMDGmonitoring.Aftercompilingadatabaseofavailabledatasources,foreachcountry,simplelinearregressionsarefittedtothecountry’sdataseriestoobtainanin-sampleestimate,aswellastoproducea2-yearextrapolationbeyondthelastavailabledatapoint,afterwhichcoverageisheldconstantfor4yearsandthenassumedmissing.Thisisdoneseparatelyforurbanandruralregions,andthencombinedtoobtainnationalcoverageestimates.Detailsofthemethodologyandmostrecentestimatescanbefoundhere:http://www.wssinfo.org/
UHCBillionRelatedNotes TheSDGindicatorforsanitation(SDG6.2.1)isanexpandedversionoftheMDGindicator,incorporatingthequalityofsanitationfacilities.Oncecountrydataandestimatesareavailableforthisnewindicator,itcouldbeusedforUHCmonitoringinlieuoftheMDGindicatordefinitiondescribedabove.Ajointindicatorthatidentifiestheproportionofhouseholdswithaccesstobothsafewaterandsanitationcouldalsobeconsidered.

86
UHCBillion:Preventionofcardiovasculardisease
Indicatordefinition Age-standardizedprevalenceofraisedbloodpressureamongpersonsaged18+years(definedassystolicbloodpressure≥140mmHgand/ordiastolicbloodpressure≥90mmHg)
Cross-referencedOutcomeIndicator
MetadataidenticaltoWHA66.10withnoteddifferencebelow
UHCBillionRelatedNotes Prevalenceestimatesareconvertedtotheprevalenceofnon-raisedbloodpressureforincorporationintotheUHCindexandAverageServiceCoverage,sothatavalueof100%istheoptimaltarget.Thisiscomputedas:non-raisedbloodpressureprevalence=100–raisedbloodpressureprevalence.Theaboveestimatesaredoneseparatelyformenandwomen;fortheUHCtracerindicatorasimpleaverageofvaluesformenandwomeniscomputed.Prevalenceofnon-raisedbloodpressureisthenrescaledusingaminimumvalueof50%whencalculatingtheUHCindexandAverageServicecoverage(rescaledvalue=(X-50)/(100-50)*100).Non-raisedbloodpressureisthesumofthepercentageofindividualswhodonothavehypertension,andthepercentageofindividualswhosehypertensioniscontrolledbymedication.Theabsenceofhypertensionisaresultofpreventioneffortsviapromotionofphysicalactivityandhealthydiets,aswellasotherfactors.Hypertensioncontrolledwithmedicationisaresultofeffectivetreatment.Thisindicatoristhusaproxyforbotheffectivehealthpromotionandeffectivemedicalservices.Asmoredatabecomeavailable,thisindicatorwilllikelybereplacedbythefractionofpopulationwithhypertensionreceivingtreatment.

87
UHCBillion:Managementofdiabetes
Indicatordefinition Age-standardizedmeanfastingplasmaglucoseforadultsaged18yearsandolder
Maindatasources Population-basedsurveysandsurveillancesystems
Methodofmeasurement Fastingplasmaglucose(FPG)levelsaredeterminedbytakingabloodsamplefromparticipantswhohavefastedforatleast8hours.Otherrelatedbiomarkers,suchashemoglobinA1c(HbA1c),wereusedtohelpcalculateestimates(seebelow).
Methodofestimation Forproducingcomparablenationalestimates,dataobservationsbasedonmeanFPG,oralglucosetolerancetest(OGTT),HbA1c,orcombinationstherein,areallconvertedtomeanFPG.ABayesianhierarchicalmodelisthenfittedtothesedatatocalculateage-sex-year-countryspecificprevalences,whichaccountsfornationalvs.subnationaldatasources,urbanvs.ruraldatasources,andallowsforvariationinprevalenceacrossageandsex.Age-standardizedestimatesarethenproducedbyapplyingthecrudeestimatestotheWHOStandardPopulation.Methodologicaldetailscanbefoundhere:https://www.thelancet.com/journals/lancet/article/PIIS0140-6736(16)00618-8/fulltext
UHCBillionRelatedNotes Meanfastingplasmaglucose,whichisacontinuousmeasure(unitsofmmol/L),isconvertedtoascaleof0to100usingtheminimumtheoreticalbiologicalrisk(5.1mmol/L)andobservedmaximumacrosscountries(7.1mmol/L)whencalculatingtheUHcindexorAverageServiceCoverage(rescaledvalue=(7.1-originalvalue)/(7.1-5.1)*100).Anindividual’sFPGmaybelowbecauseofeffectivetreatmentwithglucose-loweringmedication,orbecausetheindividualisnotdiabeticasaresultofhealthpromotionactivitiesorotherfactorssuchasgenetics.MeanFPGisthusaproxyforbotheffectivepromotionofhealthydietsandbehaviorsandeffectivetreatmentofdiabetes.Asmoredatabecomeavailable,thisindicatorwillbereplacedbythefractionofpopulationwithdiabetesundertreatment.Theaboveestimatearedoneseparatelyformenandwomen;fortheUHCtracerindicatorasimpleaverageofvaluesformenandwomeniscomputed.

88
UHCBillion:Tobacco
Indicatordefinition Age-standardizedprevalenceofadultsaged15yearsandoldernotsmokingtobaccoinlast30days
Cross-referencedOutcomeIndicator
MetadataidenticaltoSDG3.a.1withnoteddifferencebelow
UHCBillionRelatedNotes Prevalenceofnotsmokingtobaccoiscomputedas1minustheprevalenceoftobaccosmoking.Prevalenceofnon-useoftobaccoisrescaledusingaminimumvalueof32%whencalculatingaverageservicecoverage.
Rescaledvalue=(X-32)/(100-32)*100
.

89
UHCBillion:Hospitalaccess
Indicatordefinition Totalnumberofhospitalbedsper10000population
Numerator Numberofhospitalbeds(shouldexcludelaboranddeliverybeds)
Denominator Totalpopulation
Maindatasources Administrativesystems/Healthfacilityreportingsystem
Methodofmeasurement Countryadministrativesystemsareusedtototalthenumberofhospitalbeds,whicharedividedbythetotalestimatedpopulation,andmultipliedby10,000.
Methodofestimation n/a
UHCBillionRelatedNotes WhencalculatingtheUHCindexandAverageServicecoverage,theindicatoriscomputedrelativetoathresholdvalueof18hospitalbedsper10,000population.ThisthresholdisbelowtheobservedOECDhighincomecountryminimum(sinceyear2000to2015)of20per10,000andtendstocorrespondtoaninpatienthospitaladmissionrateofaround5per100peryear.Thisindicatorisdesignedtocapturelowlevelsofhospitalcapacity;themaximumthresholdisusedbecauseveryhighhospitalbeddensitiesarenotnecessaryanefficientuseofresources.Theindicatoriscomputedasfollows,usingcountrydataonhospitalbeddensity(x),whichresultsinvaluesrangingfrom0to100:
• Countrywithahospitalbeddensityx<18per10,000peryear,theindicator=x/18*100.• Countrywithahospitalbeddensityx>=18per10,000peryear,theindicator=100.
Analternativeindicatorcouldbehospitalin-patientadmissionrate,relativetoamaximumthreshold.However,thatindicatoriscurrentlynotreportedwidelyacrossregions,inparticulartheAfricanRegion.Incountrieswherebothhospitalbedspercapitaandin-patientadmissionratesareavailable,theyarehighlycorrelated.
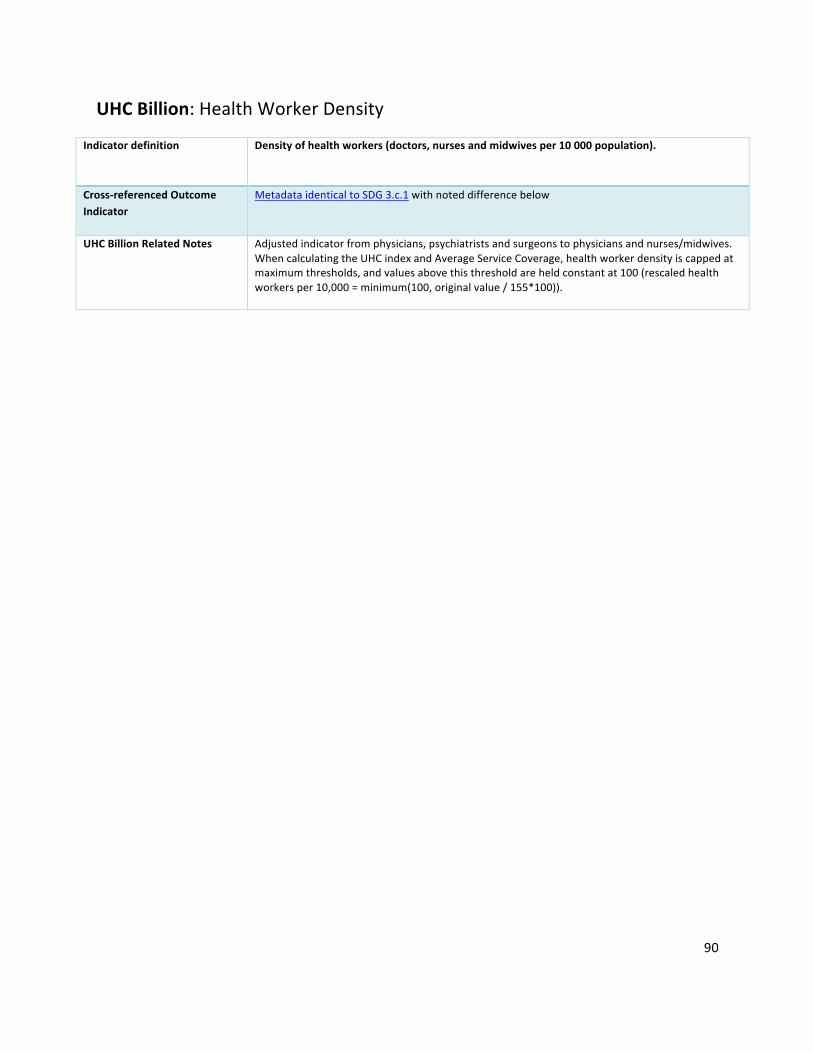
90
UHCBillion:HealthWorkerDensity
Indicatordefinition Densityofhealthworkers(doctors,nursesandmidwivesper10000population).
Cross-referencedOutcomeIndicator
MetadataidenticaltoSDG3.c.1withnoteddifferencebelow
UHCBillionRelatedNotes Adjustedindicatorfromphysicians,psychiatristsandsurgeonstophysiciansandnurses/midwives.WhencalculatingtheUHCindexandAverageServiceCoverage,healthworkerdensityiscappedatmaximumthresholds,andvaluesabovethisthresholdareheldconstantat100(rescaledhealthworkersper10,000=minimum(100,originalvalue/155*100)).
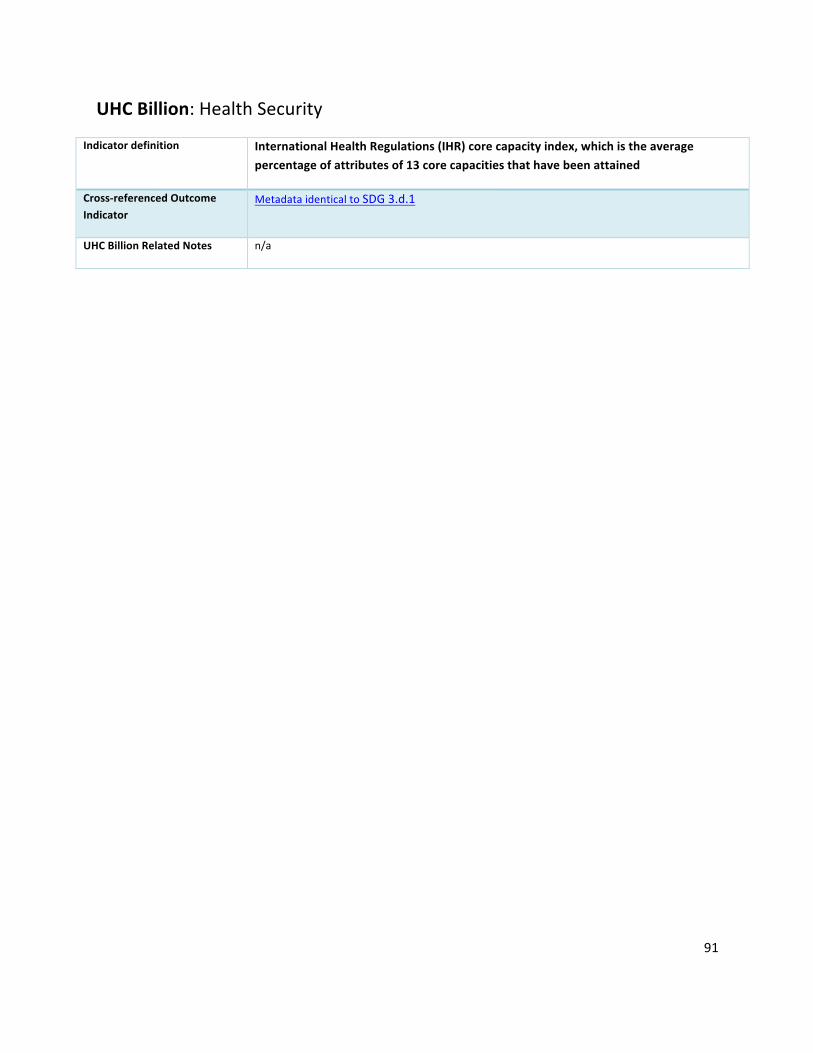
91
UHCBillion:HealthSecurity
Indicatordefinition InternationalHealthRegulations(IHR)corecapacityindex,whichistheaveragepercentageofattributesof13corecapacitiesthathavebeenattained
Cross-referencedOutcomeIndicator
MetadataidenticaltoSDG3.d.1
UHCBillionRelatedNotes n/a
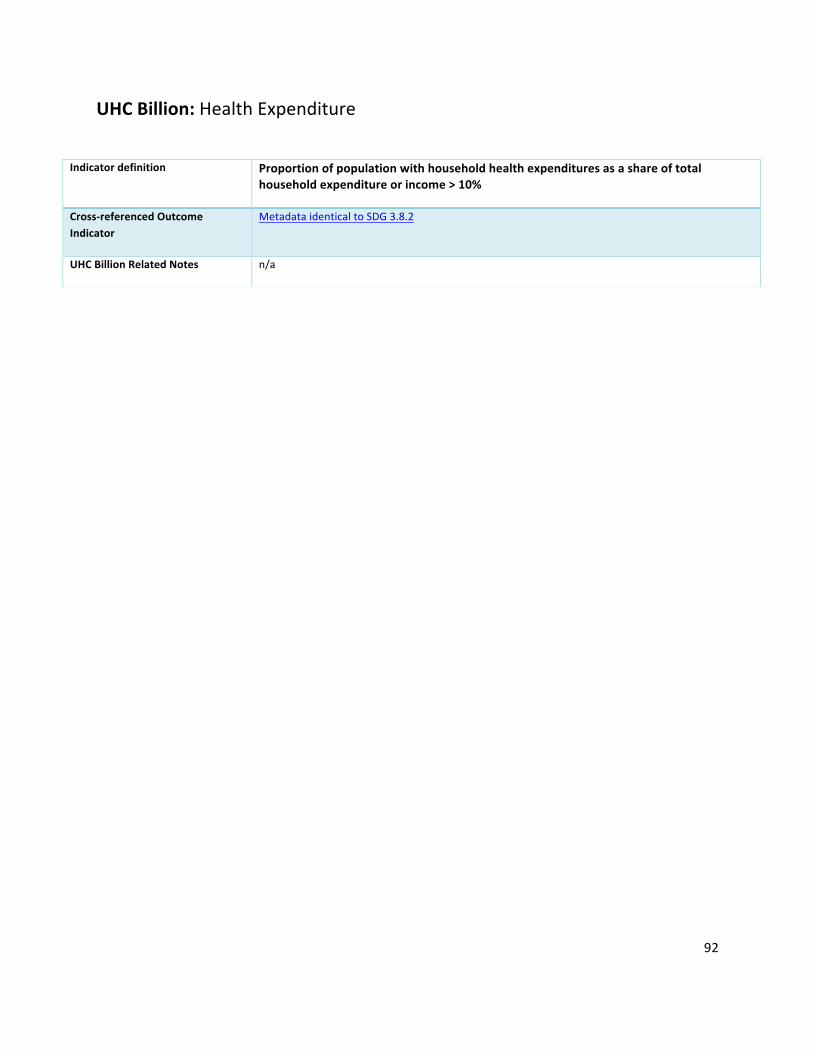
92
UHCBillion:HealthExpenditure
Indicatordefinition Proportionofpopulationwithhouseholdhealthexpendituresasashareoftotalhouseholdexpenditureorincome>10%
Cross-referencedOutcomeIndicator
MetadataidenticaltoSDG3.8.2
UHCBillionRelatedNotes n/a

93
AverageServiceCoverage
Indicator
Coverageofessentialhealthservices(definedastheaveragecoverageofessentialservicesbasedontracerinterventionsthatincludereproductive,maternal,newbornandchildhealth,infectiousdiseases,non-communicablediseasesandservicecapacityandaccess)
Definition
Coverageofessentialhealthservices(definedastheaveragecoverageofessentialservicesbasedontracerinterventionsthatincludereproductive,maternal,newbornandchildhealth,infectiousdiseases,non-communicablediseasesandservicecapacityandaccess).Theindicatorisanindexreportedonaunitlessscaleof0to100,whichiscomputedasthearithmeticmeanof14tracerindicatorsofhealthservicecoverage.
Methodofestimation/calculation
Thisindexindicatoriscomputedwitharithmeticmeansandrequiresfirstpreparingthe14tracerindicatorssothattheycanbecombinedintotheindex,andthencomputingtheindexfromthosevalues.The14tracerindicatorsarefirstallplacedonthesamescale,with0beingthelowestvalueand100beingtheoptimalvalue.Formostindicators,thisscaleisthenaturalscaleofmeasurement,e.g.,thepercentageofinfantswhohavebeenimmunizedrangesfrom0to100percent.However,forafewindicatorsadditionalrescalingisrequiredtoobtainappropriatevaluesfrom0to100,asfollows:Rescalingbasedonanon-zerominimumtoobtainfinerresolution(this“stretches”thedistributionacrosscountries):
- prevalenceofnon-raisedbloodpressureisrescaledusingaminimumvalueof50%.rescaledvalue=(X-50)/(100-50)*100;
- prevalenceofnon-useoftobaccoisrescaledusingaminimumvalueof32%.rescaledvalue=(X-32)/(100-32)*100
Rescalingforacontinuousmeasure:meanfastingplasmaglucose,whichisacontinuousmeasure(unitsofmmol/L),isconvertedtoascaleof0to100usingtheminimumtheoreticalbiologicalrisk(5.1mmol/L)andobservedmaximumacrosscountries(7.1mmol/L).rescaledvalue=(7.1-originalvalue)/(7.1-5.1)*100Maximumthresholdsfordensityindicators:hospitalbeddensityandhealthworkerdensityarebothcappedatmaximumthresholds,andvaluesabovethisthresholdareheldconstantat100.rescaledhospitalbedsper10,000=minimum(100,originalvalue/18*100)rescaledhealthworkersper10,000=minimum(100,originalvalue/155*100)Notethatincountrieswith,thetracerindicatorforuseofinsecticide-treatednetsisdroppedfromthecalculation.Oncealltracerindicatorvaluesareonascaleof0to100,arithmeticmeansarecomputedwithineachofthefourhealthserviceareas,andthenanarithmeticmeanistakenofthosefourvalues.
Numerator Thisindicatorisbasedonaggregateestimates.
Denominator Thisindicatorisbasedonaggregateestimates.
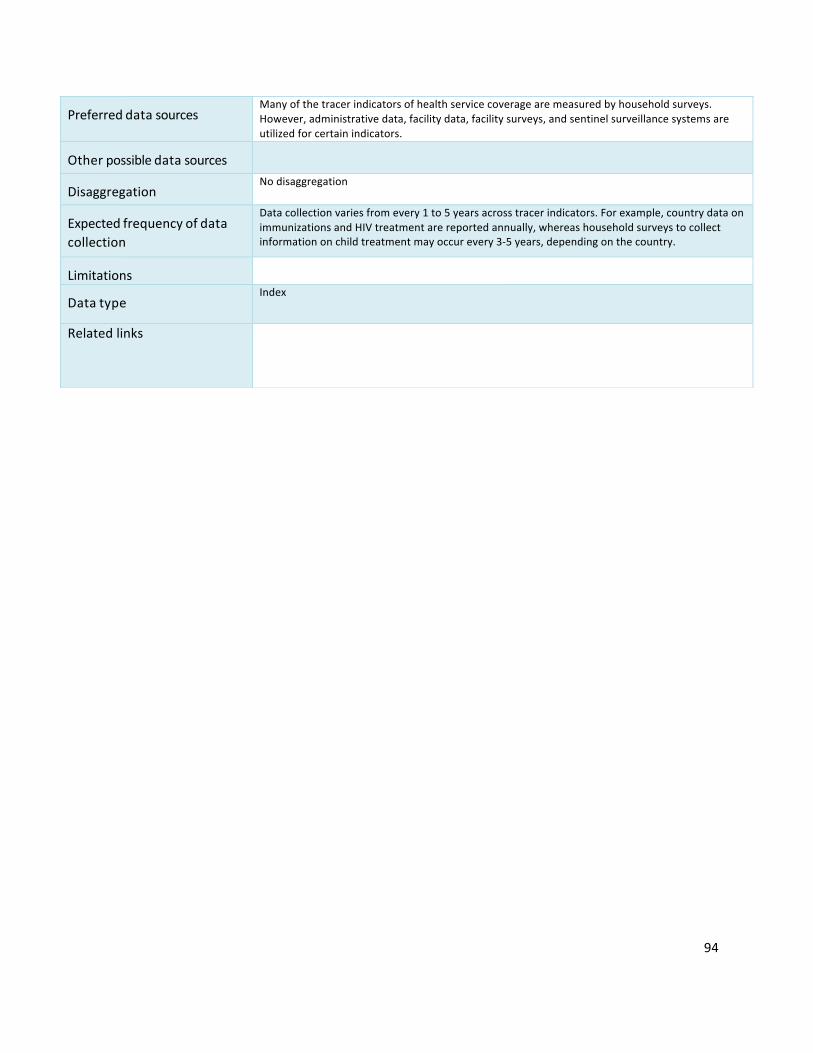
94
Preferreddatasources
Manyofthetracerindicatorsofhealthservicecoveragearemeasuredbyhouseholdsurveys.However,administrativedata,facilitydata,facilitysurveys,andsentinelsurveillancesystemsareutilizedforcertainindicators.
Otherpossibledatasources
Disaggregation
Nodisaggregation
Expectedfrequencyofdatacollection
Datacollectionvariesfromevery1to5yearsacrosstracerindicators.Forexample,countrydataonimmunizationsandHIVtreatmentarereportedannually,whereashouseholdsurveystocollectinformationonchildtreatmentmayoccurevery3-5years,dependingonthecountry.
Limitations
Datatype
Index
Relatedlinks
95
Section3:HealthEmergenciesBillion
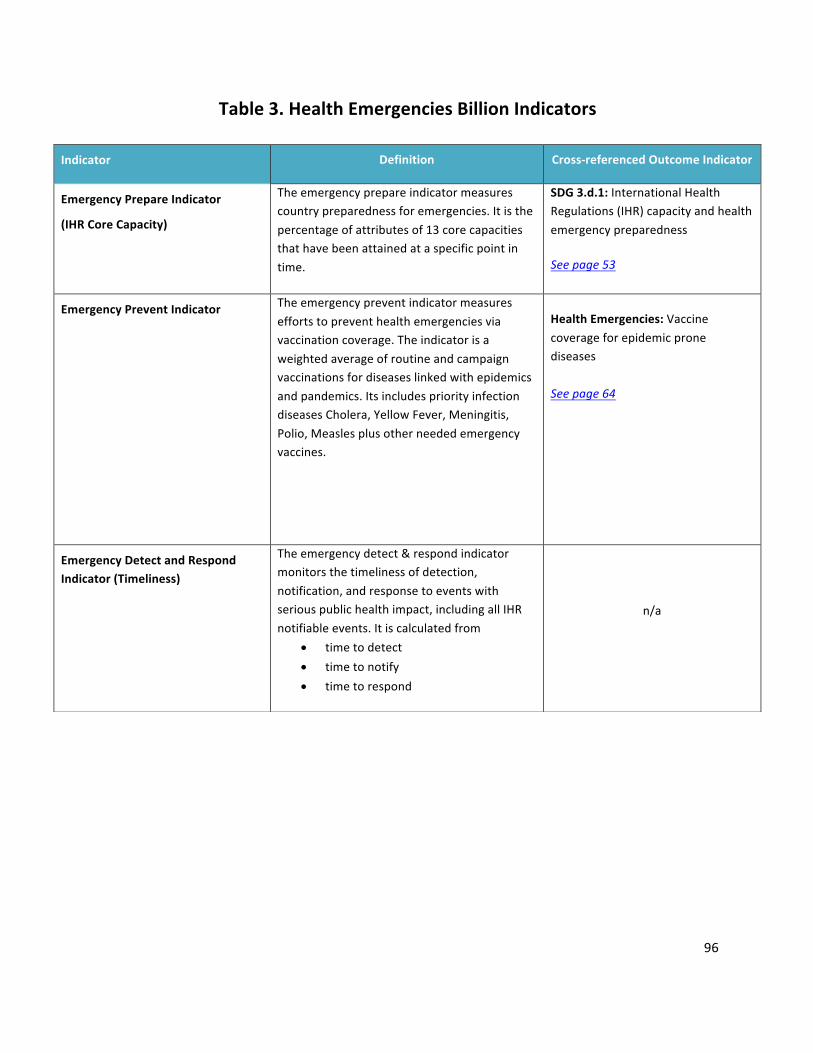
96
Table3.HealthEmergenciesBillionIndicators
Indicator Definition Cross-referencedOutcomeIndicator
EmergencyPrepareIndicator
(IHRCoreCapacity)
Theemergencyprepareindicatormeasurescountrypreparednessforemergencies.Itisthepercentageofattributesof13corecapacitiesthathavebeenattainedataspecificpointintime.
SDG3.d.1:InternationalHealthRegulations(IHR)capacityandhealthemergencypreparednessSeepage53
EmergencyPreventIndicator
Theemergencypreventindicatormeasureseffortstopreventhealthemergenciesviavaccinationcoverage.Theindicatorisaweightedaverageofroutineandcampaignvaccinationsfordiseaseslinkedwithepidemicsandpandemics.ItsincludespriorityinfectiondiseasesCholera,YellowFever,Meningitis,Polio,Measlesplusotherneededemergencyvaccines.
HealthEmergencies:VaccinecoverageforepidemicpronediseasesSeepage64
EmergencyDetectandRespondIndicator(Timeliness)
Theemergencydetect&respondindicatormonitorsthetimelinessofdetection,notification,andresponsetoeventswithseriouspublichealthimpact,includingallIHRnotifiableevents.Itiscalculatedfrom
• timetodetect• timetonotify• timetorespond
n/a
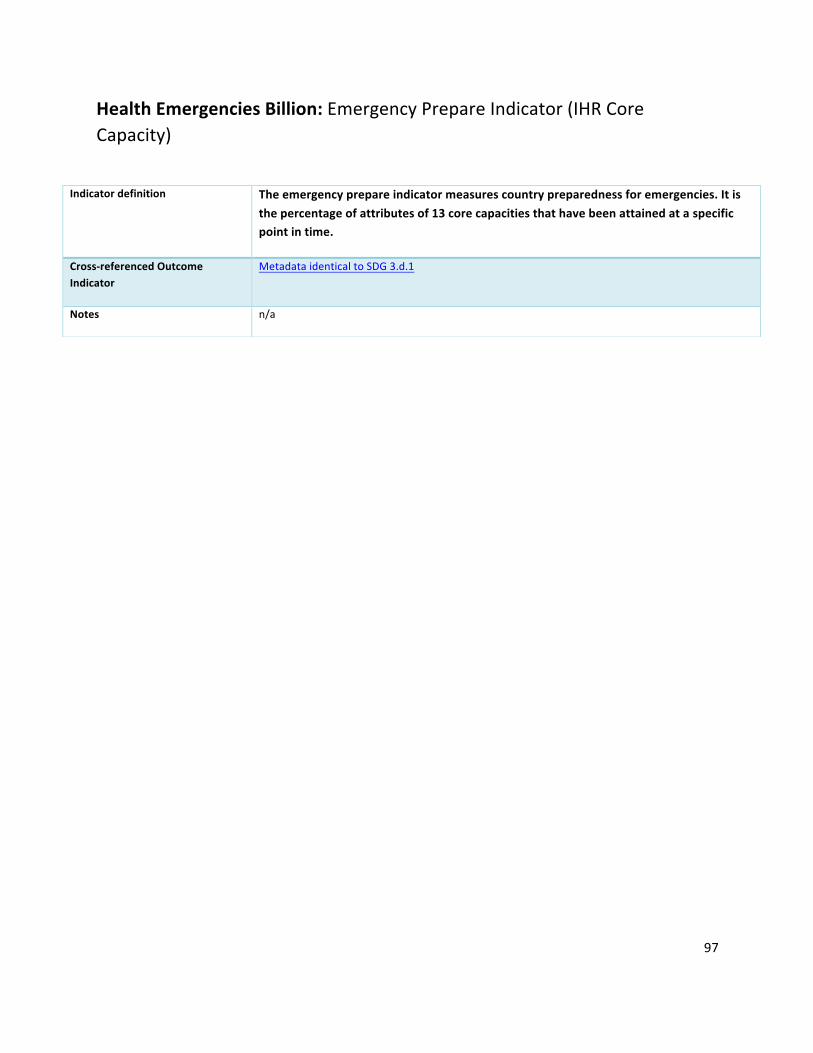
97
HealthEmergenciesBillion:EmergencyPrepareIndicator(IHRCoreCapacity)
Indicatordefinition Theemergencyprepareindicatormeasurescountrypreparednessforemergencies.Itisthepercentageofattributesof13corecapacitiesthathavebeenattainedataspecificpointintime.
Cross-referencedOutcomeIndicator
MetadataidenticaltoSDG3.d.1
Notes n/a

98
HealthEmergenciesBillion:EmergencyPreventIndicator
Indicatordefinition Theemergencypreventindicatormeasureseffortstopreventhealthemergenciesviavaccinationcoverage.Theindicatorisaweightedaverageofroutineandcampaignvaccinationsfordiseaseslinkedwithepidemicsandpandemics.ItsincludespriorityinfectiondiseasesCholera,YellowFever,Meningitis,Polio,Measlesplusotherneededemergencyvaccines.
Cross-referencedOutcomeIndicator
MetadataidenticaltoHealthEmergencies:Vaccinecoverageforepidemicpronediseases
Notes n/a
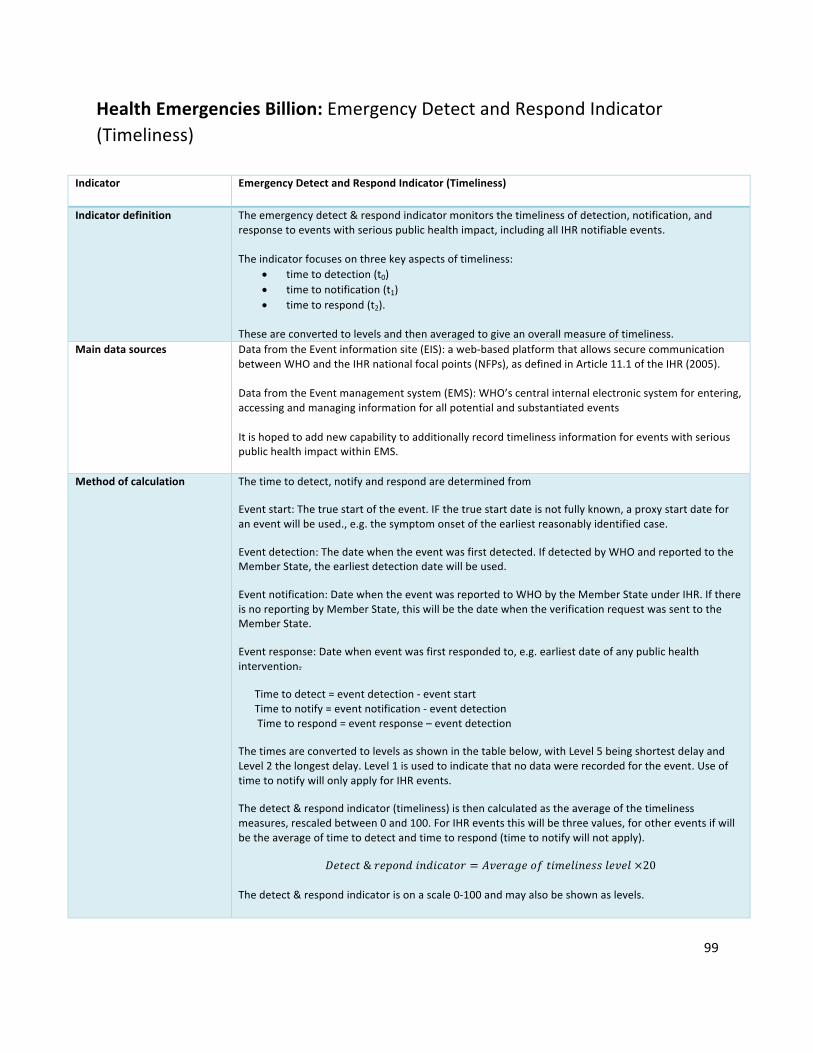
99
HealthEmergenciesBillion:EmergencyDetectandRespondIndicator(Timeliness)
Indicator EmergencyDetectandRespondIndicator(Timeliness)
Indicatordefinition Theemergencydetect&respondindicatormonitorsthetimelinessofdetection,notification,andresponsetoeventswithseriouspublichealthimpact,includingallIHRnotifiableevents.Theindicatorfocusesonthreekeyaspectsoftimeliness:
• timetodetection(t0)• timetonotification(t1)• timetorespond(t2).
Theseareconvertedtolevelsandthenaveragedtogiveanoverallmeasureoftimeliness.
Maindatasources DatafromtheEventinformationsite(EIS):aweb-basedplatformthatallowssecurecommunicationbetweenWHOandtheIHRnationalfocalpoints(NFPs),asdefinedinArticle11.1oftheIHR(2005).DatafromtheEventmanagementsystem(EMS):WHO’scentralinternalelectronicsystemforentering,accessingandmanaginginformationforallpotentialandsubstantiatedeventsItishopedtoaddnewcapabilitytoadditionallyrecordtimelinessinformationforeventswithseriouspublichealthimpactwithinEMS.
Methodofcalculation Thetimetodetect,notifyandrespondaredeterminedfrom
Eventstart:Thetruestartoftheevent.IFthetruestartdateisnotfullyknown,aproxystartdateforaneventwillbeused.,e.g.thesymptomonsetoftheearliestreasonablyidentifiedcase.
Eventdetection:Thedatewhentheeventwasfirstdetected.IfdetectedbyWHOandreportedtotheMemberState,theearliestdetectiondatewillbeused.
Eventnotification:DatewhentheeventwasreportedtoWHObytheMemberStateunderIHR.IfthereisnoreportingbyMemberState,thiswillbethedatewhentheverificationrequestwassenttotheMemberState.
Eventresponse:Datewheneventwasfirstrespondedto,e.g.earliestdateofanypublichealthintervention.
Timetodetect=eventdetection-eventstartTimetonotify=eventnotification-eventdetectionTimetorespond=eventresponse–eventdetection
Thetimesareconvertedtolevelsasshowninthetablebelow,withLevel5beingshortestdelayandLevel2thelongestdelay.Level1isusedtoindicatethatnodatawererecordedfortheevent.UseoftimetonotifywillonlyapplyforIHRevents.
Thedetect&respondindicator(timeliness)isthencalculatedastheaverageofthetimelinessmeasures,rescaledbetween0and100.ForIHReventsthiswillbethreevalues,forothereventsifwillbetheaverageoftimetodetectandtimetorespond(timetonotifywillnotapply).
𝐷𝑒𝑡𝑒𝑐𝑡&𝑟𝑒𝑝𝑜𝑛𝑑𝑖𝑛𝑑𝑖𝑐𝑎𝑡𝑜𝑟 = 𝐴𝑣𝑒𝑟𝑎𝑔𝑒𝑜𝑓𝑡𝑖𝑚𝑒𝑙𝑖𝑛𝑒𝑠𝑠𝑙𝑒𝑣𝑒𝑙×20
Thedetect&respondindicatorisonascale0-100andmayalsobeshownaslevels.

100
Level
Timeliness sub-indicators range (detection, notification,
and response)
(days)
Detect & respond indicator range
l Level 5 ≤1 indicator ≥ 90
l Level 4 1< t ≤7 70≤ indicator <90
l Level 3 7 < t ≤14 50≤ indicator <70
l Level 2 >14 30≤ indicator <50
l Level 1 no date reported Indicator <30
Limitations Detect&respondtimelinessisanewindicator.Thedefinitionandmeasurementoftimelinessischallenging.Keyeventmilestonesmaybeunknownandevenproxiescanbedifficulttodefine.Theproposedindicatorisexpectedtoevolve.Definitionsofsubindicatorsmayneedtobelinkedtothetypeofevent
ThenumberandnatureofeventsvariesenormouslybetweenMemberStates.Theveryvariablenatureofeventsmakesthisindicatorsensitivetoasingleevent.Thiswillbemitigatedbyincludingasmanyeventsaspossible(byincludingnationalhealthevents).
Thereisaneedtoextendthesourcesofdataused,inordertoincreasethenumberofeventsincludedintheDetectandRespondindicatorandtoimprovethequalityofeventtimelinessdata.

101
Section4:HealthierPopulationsBillion

102
Table4.HealthierPopulationsBillionIndicators*
*Note:SixteenGPW13outcomeindicatorsareusedtomeasuretheHealthierPopulations(HPOP)Billion. MetadataforHPOPindicatorsareembeddedwithinSection1(OutcomeIndicators).Forthehealthierpopulationcalculations,allindicatorsarerepresentedonascaleofhealthinessfrom0to100,with0%beingtheleasthealthyand100%beingthehealthiest.Forexample,forSDG3.a.1Prevalenceoftobaccouse,theindicator,x,willbetransformedto100–x.Avalueof0%,theleasthealthy,wouldmeaneveryoneusestobacco,andavalueof100%,thehealthiest,wouldmeannooneusestobacco.Thisinversionisrequiredfortobaccouse,stunting,wastingandoverweightinunder5s,obesity,intimatepartnerviolence,andviolenceagainstchildren.FiveoftheselectedindicatorsarenotmeasuresofprevalencebutareincludedintheHPOPBillionbecauseeachisakeycontributortoglobalhealthiness.Theseincludealcoholconsumption,roadsafety,meanparticulates(cleanair),transfats,suicidesmortality(mentalhealth).
GPW13Indicatorsselected(Indicatorshortname)
Definition TransformationtoBillion(ifapplicable)
Correspondingpagenumber
SDG2.2.1 Childhoodstunting<5
Prevalenceofstuntingamongchildrenunder5yearsofage
n/a
Seepage14
SDG2.2.2 Childhoodwasting<5
Prevalenceofwastingamongchildrenunder5yearsofage
n/a
Seepage15
SDG2.2.2 Childhoodoverweight<5
Prevalenceofoverweightamongchildrenunder5yearsofage
n/a
Seepage16
SDG3.4.2 Suicidesmortality Suicidemortalityrate Thenumberofadditionallyhealthierliveswillbecountedastheestimatednumberofpeopleavoidingsuicideorasuicideattempt.
Seepage31
SDG3.5.2 Alcoholconsumption
Alcoholpercapitaconsumption(15+years)withinacalendaryearinlitersofpurealcohol
Populationsaredeemedhealthier(intermsofalcoholconsumption)ifeitherheavyepisodicdrinkingisdecreasedorabstinenceisincreased–bothimplyingareducedalcoholconsumption.Thetransformationforalcoholwillthereforerelatechangesinmeanalcoholconsumptiontochangesinprevalenceofabstainersandofheavyepisodicdrinkers,usingthisasameasureoftheproportionofthepopulationthatcanbeconsideredhealthier.
Seepage33
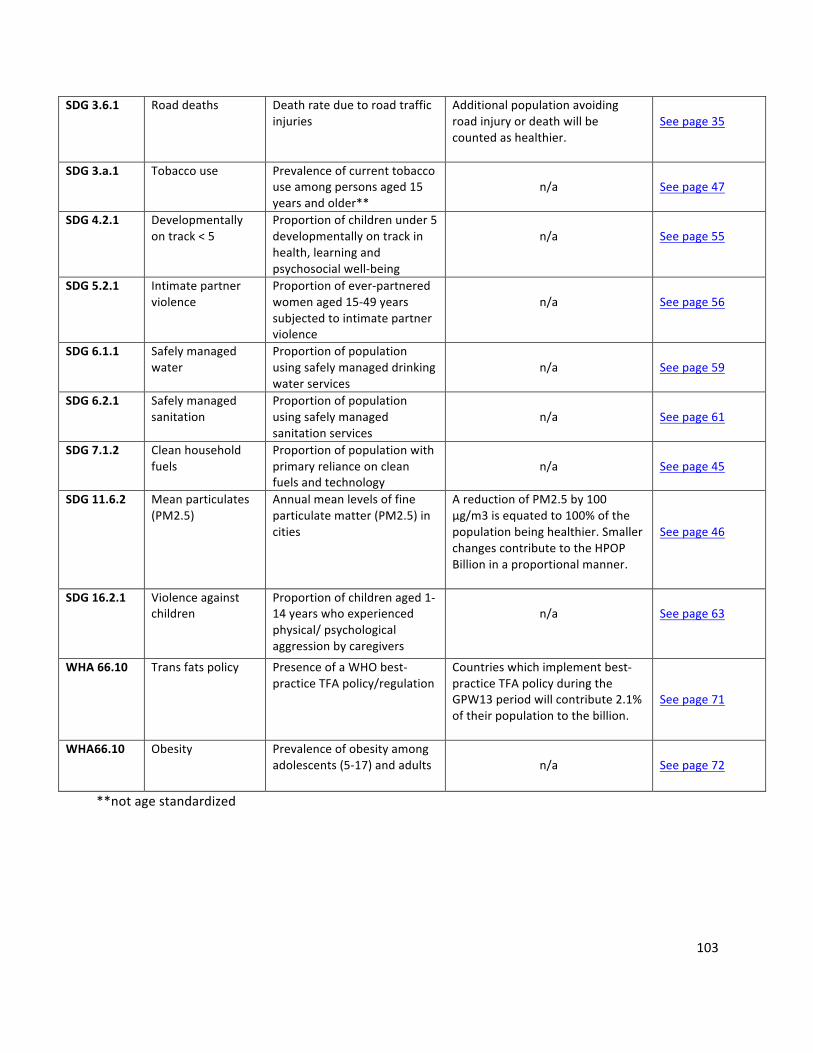
103
SDG3.6.1 Roaddeaths Deathrateduetoroadtrafficinjuries
Additionalpopulationavoidingroadinjuryordeathwillbecountedashealthier.
Seepage35
SDG3.a.1 Tobaccouse Prevalenceofcurrenttobaccouseamongpersonsaged15yearsandolder**
n/a
Seepage47
SDG4.2.1 Developmentallyontrack<5
Proportionofchildrenunder5developmentallyontrackinhealth,learningandpsychosocialwell-being
n/a
Seepage55
SDG5.2.1 Intimatepartnerviolence
Proportionofever-partneredwomenaged15-49yearssubjectedtointimatepartnerviolence
n/a
Seepage56
SDG6.1.1 Safelymanagedwater
Proportionofpopulationusingsafelymanageddrinkingwaterservices
n/a
Seepage59
SDG6.2.1 Safelymanagedsanitation
Proportionofpopulationusingsafelymanagedsanitationservices
n/a
Seepage61
SDG7.1.2 Cleanhouseholdfuels
Proportionofpopulationwithprimaryrelianceoncleanfuelsandtechnology
n/a
Seepage45
SDG11.6.2 Meanparticulates(PM2.5)
Annualmeanlevelsoffineparticulatematter(PM2.5)incities
AreductionofPM2.5by100µg/m3isequatedto100%ofthepopulationbeinghealthier.SmallerchangescontributetotheHPOPBillioninaproportionalmanner.
Seepage46
SDG16.2.1 Violenceagainstchildren
Proportionofchildrenaged1-14yearswhoexperiencedphysical/psychologicalaggressionbycaregivers
n/a
Seepage63
WHA66.10 Transfatspolicy PresenceofaWHObest-practiceTFApolicy/regulation
Countrieswhichimplementbest-practiceTFApolicyduringtheGPW13periodwillcontribute2.1%oftheirpopulationtothebillion.
Seepage71
WHA66.10 Obesity Prevalenceofobesityamongadolescents(5-17)andadults
n/a
Seepage72
**notagestandardized
104
Section5:HealthyLifeExpectancy(HALE)

105
Healthylifeexpectancy(HALE)
Nameabbreviated Healthylifeexpectancy(HALE)
Indicatorname Healthylifeexpectancyatagex(e.g,atbirth,atage60years,etc)
Definition Averageremainingnumberofyearsthatapersoncanexpecttolivein“fullhealth”atacertainagebytakingintoaccountyearslivedinlessthanfullhealthduetodiseaseand/orinjury.
Methodofestimation/calculation HALEisametricbasedonmethodsbySullivan(1971).Itprovidesasinglesummarymeasureofpopulationhealthacrossallcauses,combinedbyweightingyearslivedwithameasureoffunctionalhealthlossbeforedeath,andisthemostcomprehensiveamongcompetingexpectancymetrics.HALEatagexisthesumofYWDifromi=xtow(thelastopen-endedageintervalinthelifetable)dividedbylx(survivorsatagex):
𝐻𝐴𝐿𝐸� = 𝑌𝑊𝐷8
l
8��
/𝐼�
𝑌𝑊𝐷� = 𝐿�(1 − 𝐷�)–Yearslivedwithoutdisability,equivalentyearsofhealthylifelivedbetweenagesxandx+5.𝐼�–Survivorsatagex.𝐿�–Totalyearslivedbythelifetablepopulationbetweenagesxandx+5.𝐷�–Equivalentlosthealthyyearfractionbetweenagesxandx+5.
Numerator Seeabove
Denominator Seeabove
Preferreddatasources Vitalregistrationsystemsthatrecorddeathswithsufficientcompletenesstoallowestimationofall-causedeathrates.Nationalhealthexaminationsurveysontheprevalenceofdiseases,injuries,anddisabilities.
Otherpossibledatasources Sampleregistrationsystems;verbalautopsy.
Disaggregation Bysex,location(urban/rural,majorregions/provinces),andsocio-economiccharacteristics(e.g.,education,wealthquintile).
Expectedfrequencyofdatacollection
Limitations Lackofreliabledataonmortalityandmorbidity,especiallyfromlowincomecountries.Lackofcomparabilityofself-reporteddatafromhealthinterviewsandthemeasurementofhealth-statepreferencesforsuchself-reporting.
Datatype Numberofyears
Relatedlinks WHOMethodsandDataSourcesforLifeTables(MathersandHo,2018);SystemicAnalysisfortheGlobalBurdenofDiseaseStudy2016(Hayetal.,2017);HSMHAHealthReports(Sullivan,1971);SystemicAnalysisfortheGlobalBurdenofDiseaseStudy2015(Kassebaumetal.,2016)

106
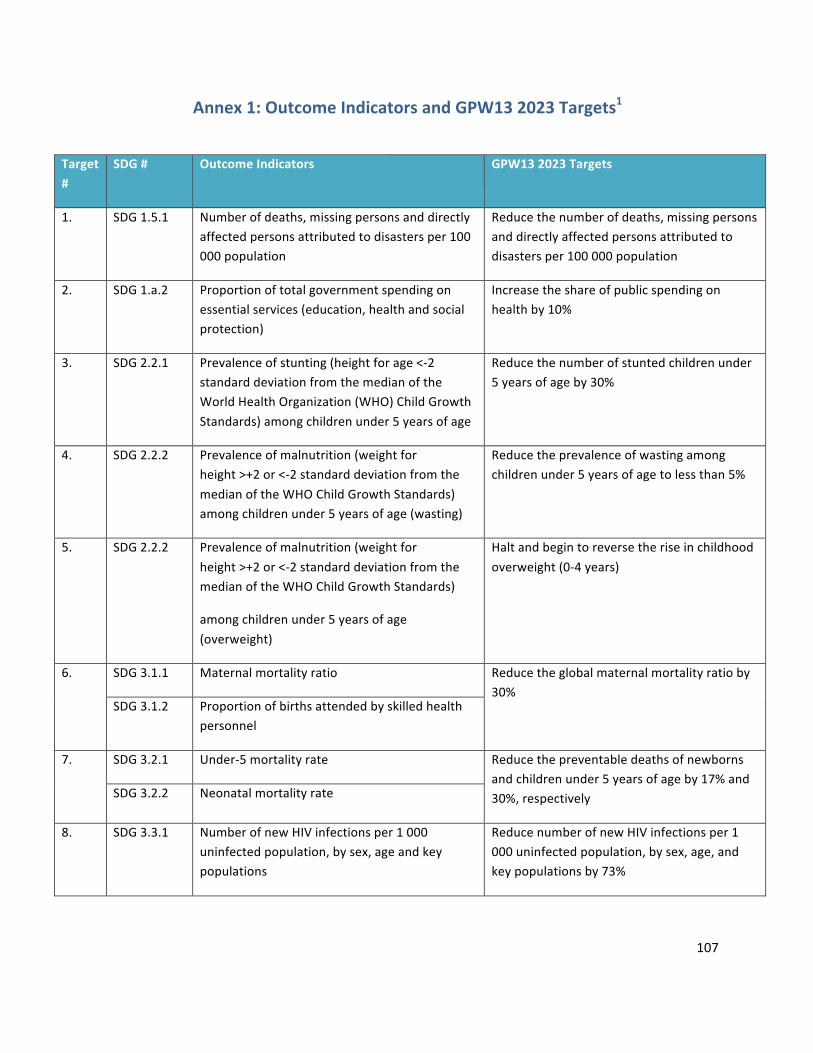
107
Annex1:OutcomeIndicatorsandGPW132023Targets1
Target#
SDG# OutcomeIndicators GPW132023Targets
1. SDG1.5.1 Numberofdeaths,missingpersonsanddirectlyaffectedpersonsattributedtodisastersper100000population
Reducethenumberofdeaths,missingpersonsanddirectlyaffectedpersonsattributedtodisastersper100000population
2. SDG1.a.2 Proportionoftotalgovernmentspendingonessentialservices(education,healthandsocialprotection)
Increasetheshareofpublicspendingonhealthby10%
3. SDG2.2.1 Prevalenceofstunting(heightforage<-2standarddeviationfromthemedianoftheWorldHealthOrganization(WHO)ChildGrowthStandards)amongchildrenunder5yearsofage
Reducethenumberofstuntedchildrenunder5yearsofageby30%
4. SDG2.2.2 Prevalenceofmalnutrition(weightforheight>+2or<-2standarddeviationfromthemedianoftheWHOChildGrowthStandards)amongchildrenunder5yearsofage(wasting)
Reducetheprevalenceofwastingamongchildrenunder5yearsofagetolessthan5%
5. SDG2.2.2 Prevalenceofmalnutrition(weightforheight>+2or<-2standarddeviationfromthemedianoftheWHOChildGrowthStandards)
amongchildrenunder5yearsofage(overweight)
Haltandbegintoreversetheriseinchildhoodoverweight(0-4years)
6. SDG3.1.1 Maternalmortalityratio Reducetheglobalmaternalmortalityratioby30%
SDG3.1.2 Proportionofbirthsattendedbyskilledhealthpersonnel
7. SDG3.2.1 Under-5mortalityrate Reducethepreventabledeathsofnewbornsandchildrenunder5yearsofageby17%and30%,respectivelySDG3.2.2 Neonatalmortalityrate
8. SDG3.3.1 NumberofnewHIVinfectionsper1000uninfectedpopulation,bysex,ageandkeypopulations
ReducenumberofnewHIVinfectionsper1000uninfectedpopulation,bysex,age,andkeypopulationsby73%

108
Target#
SDG# OutcomeIndicators GPW132023Targets
9. SDG3.3.2 Tuberculosisincidenceper100000population Reduceby27%thenumberofnewTBcasesper100000population
10. SDG3.3.3 Malariaincidenceper1000population Reducemalariacaseincidenceby50%
11. SDG3.3.4 HepatitisBincidenceper100000population ReduceHepatitisBincidenceto0.5%forchildrenunder5years
12. SDG3.3.5 Numberofpeoplerequiringinterventionsagainstneglectedtropicaldiseases
Reductionofpeoplerequiringinterventionsby400million
13. SDG3.4.1 Mortalityrateattributedtocardiovasculardisease,cancer,diabetesorchronicrespiratory
diseases
20%relativereductionintheprematuremortality(age30-70years)fromNCDs(cardiovascular,cancer,diabetes,orchronicrespiratorydiseases)throughpreventionandtreatment
14. SDG3.4.2 Suicidemortalityrate Reducesuicidemortalityrateby15%
15. SDG3.5.1 Coverageoftreatmentinterventions(pharmacological,psychosocialandrehabilitationandaftercareservices)forsubstanceusedisorders
Increaseservicecoverageoftreatmentinterventions(pharmacological,psychosocialandrehabilitationandaftercareservices)forsubstanceusedisorderstoxx%*
16. SDG3.5.2 Harmfuluseofalcohol,definedaccordingtothenationalcontextasalcoholpercapitaconsumption(aged15yearsandolder)withinacalendaryearinlitresofpurealcohol
ReductionwillbeinlinewithSDG2030target
17. SDG3.6.1 Deathrateduetoroadtrafficinjuries Reducethenumberofglobaldeathsandinjuriesfromroadtrafficaccidentsby20%
18. SDG3.7.1 Proportionofwomenofreproductiveage(aged15–49years)whohavetheirneedforfamilyplanningsatisfiedwithmodernmethods
Increasetheproportionofwomenofreproductiveage(15–49years)whohavetheirneedforfamilyplanningsatisfiedwithmodernmethodsto66%
19. SDG3.8.1 Coverageofessentialhealthservices(definedastheaveragecoverageofessentialservicesbasedontracerinterventionsthatincludereproductive,maternal,newbornandchildhealth,infectiousdiseases,noncommunicablediseasesandservicecapacityandaccess,among
Increasecoverageofessentialhealthservices

109
Target#
SDG# OutcomeIndicators GPW132023Targets
thegeneralandthemostdisadvantagedpopulation)
20. SDG3.8.2 Proportionofpopulationwithlargehouseholdexpendituresonhealthasashareoftotalhouseholdexpendituresorincome
Stoptheriseinpercentofpeoplesufferingfinancialhardship(definedasout-of-pocketspendingexceedingabilitytopay)inaccessinghealthservices
21. SDG3.9.1 Mortalityrateattributedtohouseholdandambientairpollution
Reducethenumberofdeathsandillnessesfromhazardouschemicalsandair,waterandsoilpollutionandcontamination
SDG3.9.2 Mortalityrateattributedtounsafewater,unsafesanitationandlackofhygiene(exposuretounsafeWater,SanitationandHygieneforAll(WASH)services)
SDG3.9.3 Mortalityrateattributedtounintentionalpoisoning
SDG7.1.2 Proportionofpopulationwithprimaryrelianceoncleanfuelsandtechnology
SDG11.6.2 Annualmeanlevelsoffineparticulatematter(e.g.PM2.5andPM10)incities(population
weighted)
22. SDG3.a.1 Age-standardizedprevalenceofcurrenttobaccouseamongpersonsaged15yearsandolder
ReductionwillbeinlinewithSDG2030target
23. SDG3.b.1 Proportionofthetargetpopulationcoveredbyallvaccinesincludedintheirnationalprogramme
Increasecoverageof2nddoseofmeaslescontainingvaccine(MCV2)to85%
24. SDG3.b.3 Proportionofhealthfacilitiesthathaveacoresetofrelevantessentialmedicinesavailableandaffordableonasustainablebasis
Increaseavailabilityofessentialmedicinesforprimaryhealthcare,includingtheonesfreeofchargeto80%
25. SDG3.c.1 Healthworkerdensityanddistribution Increasehealthworkforcedensitywithimproveddistribution
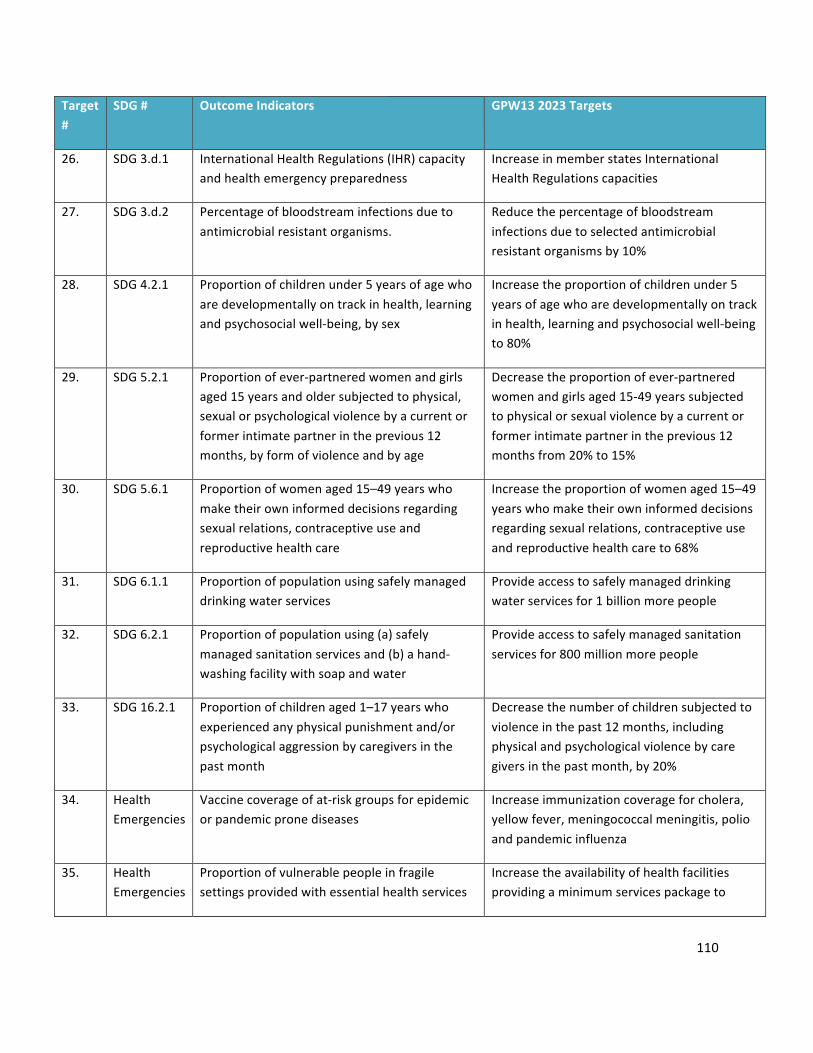
110
Target#
SDG# OutcomeIndicators GPW132023Targets
26. SDG3.d.1 InternationalHealthRegulations(IHR)capacityandhealthemergencypreparedness
IncreaseinmemberstatesInternationalHealthRegulationscapacities
27. SDG3.d.2 Percentageofbloodstreaminfectionsduetoantimicrobialresistantorganisms.
Reducethepercentageofbloodstreaminfectionsduetoselectedantimicrobialresistantorganismsby10%
28. SDG4.2.1 Proportionofchildrenunder5yearsofagewhoaredevelopmentallyontrackinhealth,learningandpsychosocialwell-being,bysex
Increasetheproportionofchildrenunder5yearsofagewhoaredevelopmentallyontrackinhealth,learningandpsychosocialwell-beingto80%
29. SDG5.2.1 Proportionofever-partneredwomenandgirlsaged15yearsandoldersubjectedtophysical,sexualorpsychologicalviolencebyacurrentorformerintimatepartnerintheprevious12months,byformofviolenceandbyage
Decreasetheproportionofever-partneredwomenandgirlsaged15-49yearssubjectedtophysicalorsexualviolencebyacurrentorformerintimatepartnerintheprevious12monthsfrom20%to15%
30. SDG5.6.1 Proportionofwomenaged15–49yearswhomaketheirowninformeddecisionsregardingsexualrelations,contraceptiveuseandreproductivehealthcare
Increasetheproportionofwomenaged15–49yearswhomaketheirowninformeddecisionsregardingsexualrelations,contraceptiveuseandreproductivehealthcareto68%
31. SDG6.1.1 Proportionofpopulationusingsafelymanageddrinkingwaterservices
Provideaccesstosafelymanageddrinkingwaterservicesfor1billionmorepeople
32. SDG6.2.1 Proportionofpopulationusing(a)safelymanagedsanitationservicesand(b)ahand-washingfacilitywithsoapandwater
Provideaccesstosafelymanagedsanitationservicesfor800millionmorepeople
33. SDG16.2.1 Proportionofchildrenaged1–17yearswhoexperiencedanyphysicalpunishmentand/orpsychologicalaggressionbycaregiversinthepastmonth
Decreasethenumberofchildrensubjectedtoviolenceinthepast12months,includingphysicalandpsychologicalviolencebycaregiversinthepastmonth,by20%
34. HealthEmergencies
Vaccinecoverageofat-riskgroupsforepidemicorpandemicpronediseases
Increaseimmunizationcoverageforcholera,yellowfever,meningococcalmeningitis,polioandpandemicinfluenza
35. HealthEmergencies
Proportionofvulnerablepeopleinfragilesettingsprovidedwithessentialhealthservices
Increasetheavailabilityofhealthfacilitiesprovidingaminimumservicespackageto

111
Target#
SDG# OutcomeIndicators GPW132023Targets
peopleinfragile,conflict,orvulnerablesettingstoatleast80%
36. WHA68.3 Numberofcasesofpoliomyelitiscausedbywildpoliovirus(WPV)
Eradicatepoliomyelitis:zerocasesofpoliomyelitiscausedbywildpoliovirusandestablishacleartimetablefortheglobalwithdrawaloforalpoliovaccinesinordertostopoutbreakscausedbyvaccine-derivedpoliovirus
37. WHA68.7 Patternsofantibioticconsumptionatnationallevel
ACCESSgroupantibioticsat≥60%ofoverallantibioticconsumption
38. WHA66.10 Age-standardizedprevalenceofraisedbloodpressureamongpersonsaged18+years(definedassystolicbloodpressureof>140mmHgand/ordiastolicbloodpressure>90mmHg)andmeansystolicbloodpressure
20%relativereductionintheprevalenceofraisedbloodpressure
39. WHA66.10 Protectionofthepopulationofacountrybyeffectivepolicy/regulationonindustryproducedtrans-fattyacids(TFA)
AllcountriesimplementWHObestpracticepolicy
40. WHA66.10 Prevalenceofobesity Haltandbegintoreversetheriseinobesity
1GPW132023Targetstobeupdated