Indonesia - WHO | World Health Organization
184
INTERACTIVE VISUALIZATION OF HEALTH DATA STATE OF HEALTH INEQUALITY Indonesia
-
Upload
khangminh22 -
Category
Documents
-
view
4 -
download
0
Transcript of Indonesia - WHO | World Health Organization

STATE OF H
EALTH
INEQ
UA
LITY: IND
ON
ESIA
I N T E R A C T I V E V I S U A L I Z AT I O N O F H E A LT H D ATA
STATE OF HEALTH INEQUALITY
Indonesia


STATE OF HEALTH INEQUALITY
Indonesia

State of health inequality: Indonesia
ISBN 978-92-4-151334-0
© World Health Organization 2017
Some rights reserved. This work is available under the Creative Commons Attribution-NonCommercial-ShareAlike 3.0 IGO licence (CC BY-NC-SA 3.0 IGO; https://creativecommons.org/licenses/by-nc-sa/3.0/igo).
Under the terms of this licence, you may copy, redistribute and adapt the work for non-commercial purposes, provided the work is appropriately cited, as indicated below. In any use of this work, there should be no suggestion that WHO endorses any specific organization, products or services. The use of the WHO logo is not permitted. If you adapt the work, then you must license your work under the same or equivalent Creative Commons licence. If you create a translation of this work, you should add the following disclaimer along with the suggested citation: “This translation was not created by the World Health Organization (WHO). WHO is not responsible for the content or accuracy of this translation. The original English edition shall be the binding and authentic edition”.
Any mediation relating to disputes arising under the licence shall be conducted in accordance with the mediation rules of the World Intellectual Property Organization.
Suggested citation. State of health inequality: Indonesia. Geneva: World Health Organization; 2017. Licence: CC BY-NC-SA 3.0 IGO.
Cataloguing-in-Publication (CIP) data. CIP data are available at http://apps.who.int/iris.
Sales, rights and licensing. To purchase WHO publications, see http://apps.who.int/bookorders. To submit requests for commercial use and queries on rights and licensing, see http://www.who.int/about/licensing.
Third-party materials. If you wish to reuse material from this work that is attributed to a third party, such as tables, figures or images, it is your responsibility to determine whether permission is needed for that reuse and to obtain permission from the copyright holder. The risk of claims resulting from infringement of any third-party-owned component in the work rests solely with the user.
General disclaimers. The designations employed and the presentation of the material in this publication do not imply the expression of any opinion whatsoever on the part of WHO concerning the legal status of any country, territory, city or area or of its authorities, or concerning the delimitation of its frontiers or boundaries. Dotted and dashed lines on maps represent approximate border lines for which there may not yet be full agreement.
The mention of specific companies or of certain manufacturers’ products does not imply that they are endorsed or recommended by WHO in preference to others of a similar nature that are not mentioned. Errors and omissions excepted, the names of proprietary products are distinguished by initial capital letters.
All reasonable precautions have been taken by WHO to verify the information contained in this publication. However, the published material is being distributed without warranty of any kind, either expressed or implied. The responsibility for the interpretation and use of the material lies with the reader. In no event shall WHO be liable for damages arising from its use.
The data presented in this publication are based on various sources containing information about health indicators and dimensions of inequality in the Indonesian population and are not necessarily the official statistics of WHO. Health indicators and dimensions of inequality may reflect definitions that are specific to the Indonesian context.
Design and layout by L’IV Com Sàrl, Villars-sous-Yens, Switzerland.Printed by the WHO Document Production Services, Geneva, Switzerland.

iii
Forewords . . . . . . . . . . . . . . . . . . . . . . . . . . . . . . . . . . . . . . . . . . . . . . . . . . . . . . . . . . . . . . . . . . viii
Acknowledgements . . . . . . . . . . . . . . . . . . . . . . . . . . . . . . . . . . . . . . . . . . . . . . . . . . . . . . . . . . . . xi
Abbreviations and acronyms . . . . . . . . . . . . . . . . . . . . . . . . . . . . . . . . . . . . . . . . . . . . . . . . . . . . xiii
Executive summary . . . . . . . . . . . . . . . . . . . . . . . . . . . . . . . . . . . . . . . . . . . . . . . . . . . . . . . . . . . xiv
Introduction . . . . . . . . . . . . . . . . . . . . . . . . . . . . . . . . . . . . . . . . . . . . . . . . . . . . . . . . . . . . . . . . . . 1
Chapter 1. Country context . . . . . . . . . . . . . . . . . . . . . . . . . . . . . . . . . . . . . . . . . . . . . . . . . . . . . . 4
Chapter 2. Methods . . . . . . . . . . . . . . . . . . . . . . . . . . . . . . . . . . . . . . . . . . . . . . . . . . . . . . . . . . . 13
Chapter 3. Public health development indices . . . . . . . . . . . . . . . . . . . . . . . . . . . . . . . . . . . . . . . 20
Chapter 4. Reproductive health . . . . . . . . . . . . . . . . . . . . . . . . . . . . . . . . . . . . . . . . . . . . . . . . . . 32
Chapter 5. Maternal, newborn and child health . . . . . . . . . . . . . . . . . . . . . . . . . . . . . . . . . . . . . . 42
Chapter 6. Childhood immunization . . . . . . . . . . . . . . . . . . . . . . . . . . . . . . . . . . . . . . . . . . . . . . 56
Chapter 7. Child malnutrition . . . . . . . . . . . . . . . . . . . . . . . . . . . . . . . . . . . . . . . . . . . . . . . . . . . . 66
Chapter 8. Child mortality . . . . . . . . . . . . . . . . . . . . . . . . . . . . . . . . . . . . . . . . . . . . . . . . . . . . . . 75
Chapter 9. Infectious diseases . . . . . . . . . . . . . . . . . . . . . . . . . . . . . . . . . . . . . . . . . . . . . . . . . . . 82
Chapter 10. Environmental health . . . . . . . . . . . . . . . . . . . . . . . . . . . . . . . . . . . . . . . . . . . . . . . . 89
Chapter 11. NCDs, mental health and behavioural risk factors . . . . . . . . . . . . . . . . . . . . . . . . . . . 95
Chapter 12. Disability and injury . . . . . . . . . . . . . . . . . . . . . . . . . . . . . . . . . . . . . . . . . . . . . . . . 108
Chapter 13. Health facility and personnel . . . . . . . . . . . . . . . . . . . . . . . . . . . . . . . . . . . . . . . . . . . 114
Chapter 14: State of inequality at a glance . . . . . . . . . . . . . . . . . . . . . . . . . . . . . . . . . . . . . . . . . 124
Chapter 15. Conclusions . . . . . . . . . . . . . . . . . . . . . . . . . . . . . . . . . . . . . . . . . . . . . . . . . . . . . . 130
Appendix tables . . . . . . . . . . . . . . . . . . . . . . . . . . . . . . . . . . . . . . . . . . . . . . . . . . . . . . . . . . . . . 134
Supplementary tables . . . . . . . . . . . . . . . . . . . . . . . . . . . . . . . . . . . . . . . . . . . . . . . . . . . . . . . . 140
Index . . . . . . . . . . . . . . . . . . . . . . . . . . . . . . . . . . . . . . . . . . . . . . . . . . . . . . . . . . . . . . . . . . . . . 154
Contents
STATE OF HEALTH INEQUALITY: INDONESIA
iv
FiguresFigure 1.1. Map of Indonesia . . . . . . . . . . . . . . . . . . . . . . . . . . . . . . . . . . . . . . . . . . . . . . . . . . . . 4Figure 1.2. Causes of premature death in Indonesia, 2015 . . . . . . . . . . . . . . . . . . . . . . . . . . . . . 6Figure 3.1. PHDI (overall), disaggregated by subnational region . . . . . . . . . . . . . . . . . . . . . . . . 24Figure 3.2. Reproductive and maternal health sub-index, disaggregated
by subnational region . . . . . . . . . . . . . . . . . . . . . . . . . . . . . . . . . . . . . . . . . . . . . . . 25Figure 3.3. Newborn and child health sub-index, disaggregated by subnational region . . . . . . 26Figure 3.4. Infectious diseases sub-index, disaggregated by subnational region . . . . . . . . . . . . . 27Figure 3.5. Environmental health sub-index, disaggregated by subnational region . . . . . . . . . . 28Figure 3.6. NCDs sub-index, disaggregated by subnational region . . . . . . . . . . . . . . . . . . . . . . 29Figure 3.7. Health risk behaviour sub-index, disaggregated by subnational region . . . . . . . . . . 30Figure 3.8. Health services provision sub-index, disaggregated by subnational region . . . . . . . . 31Figure 4.1. Contraceptive prevalence – modern methods, disaggregated by economic status,
education and place of residence . . . . . . . . . . . . . . . . . . . . . . . . . . . . . . . . . . . . . . . . 37Figure 4.2. Contraceptive prevalence – modern methods, disaggregated
by subnational region . . . . . . . . . . . . . . . . . . . . . . . . . . . . . . . . . . . . . . . . . . . . . . . . 37Figure 4.3. Demand for family planning satisfied, disaggregated by economic status,
education and place of residence . . . . . . . . . . . . . . . . . . . . . . . . . . . . . . . . . . . . . . . 38Figure 4.4. Demand for family planning satisfied, disaggregated by subnational region . . . . . . 38Figure 4.5. Adolescent fertility rate, disaggregated by economic status, education
and place of residence . . . . . . . . . . . . . . . . . . . . . . . . . . . . . . . . . . . . . . . . . . . . . . . 39Figure 4.6. Adolescent fertility rate, disaggregated by subnational region. . . . . . . . . . . . . . . . . 39Figure 4.7. Total fertility rate, disaggregated by economic status, education
and place of residence . . . . . . . . . . . . . . . . . . . . . . . . . . . . . . . . . . . . . . . . . . . . . . . 40Figure 4.8. Total fertility rate, disaggregated by subnational region . . . . . . . . . . . . . . . . . . . . . . 40Figure 4.9. Female genital mutilation, disaggregated by economic status
and place of residence . . . . . . . . . . . . . . . . . . . . . . . . . . . . . . . . . . . . . . . . . . . . . . . . 41Figure 4.10. Female genital mutilation, disaggregated by subnational region . . . . . . . . . . . . . . . . 41Figure 5.1. Antenatal care coverage – at least four visits, disaggregated by economic status,
education, occupation, age and place of residence . . . . . . . . . . . . . . . . . . . . . . . . . 48Figure 5.2. Antenatal care coverage – at least four visits, disaggregated
by subnational region . . . . . . . . . . . . . . . . . . . . . . . . . . . . . . . . . . . . . . . . . . . . . . . 48Figure 5.3. Births attended by skilled health personnel, disaggregated by economic status,
education, occupation, age and place of residence . . . . . . . . . . . . . . . . . . . . . . . . . 49Figure 5.4. Births attended by skilled health personnel, disaggregated by subnational region . . 49Figure 5.5. Postnatal care coverage for mothers, disaggregated by economic status,
education, occupation, age and place of residence . . . . . . . . . . . . . . . . . . . . . . . . . 50Figure 5.6. Postnatal care coverage for mothers, disaggregated by subnational region . . . . . . . 50Figure 5.7. Postnatal care coverage for newborns, disaggregated by economic status,
education, sex and place of residence . . . . . . . . . . . . . . . . . . . . . . . . . . . . . . . . . . . . 51Figure 5.8. Postnatal care coverage for newborns, disaggregated by subnational region. . . . . . . 51Figure 5.9. Early initiation of breastfeeding, disaggregated by economic status, education,
employment status, sex and place of residence . . . . . . . . . . . . . . . . . . . . . . . . . . . . 52Figure 5.10. Early initiation of breastfeeding, disaggregated by subnational region . . . . . . . . . . . 52Figure 5.11. Exclusive breastfeeding, disaggregated by economic status, education
and place of residence . . . . . . . . . . . . . . . . . . . . . . . . . . . . . . . . . . . . . . . . . . . . . . . 53
v
Figure 5.12. Exclusive breastfeeding, disaggregated by subnational region . . . . . . . . . . . . . . . . . 53Figure 5.13. Vitamin A supplementation coverage, disaggregated by economic status,
education, sex and place of residence . . . . . . . . . . . . . . . . . . . . . . . . . . . . . . . . . . . 54Figure 5.14. Vitamin A supplementation coverage, disaggregated by subnational region . . . . . . 54Figure 5.15. Low birth weight prevalence, disaggregated by economic status, education,
sex and place of residence . . . . . . . . . . . . . . . . . . . . . . . . . . . . . . . . . . . . . . . . . . . . 55Figure 5.16. Low birth weight prevalence, disaggregated by subnational region . . . . . . . . . . . . . 55Figure 6.1. BCG immunization coverage, disaggregated by economic status, education,
sex and place of residence . . . . . . . . . . . . . . . . . . . . . . . . . . . . . . . . . . . . . . . . . . . . . 61Figure 6.2. BCG immunization coverage, disaggregated by subnational region . . . . . . . . . . . . . . 61Figure 6.3. Measles immunization coverage, disaggregated by economic status, education,
sex and place of residence . . . . . . . . . . . . . . . . . . . . . . . . . . . . . . . . . . . . . . . . . . . . 62Figure 6.4. Measles immunization coverage, disaggregated by subnational region . . . . . . . . . . 62Figure 6.5. DPT-HB immunization coverage, disaggregated by economic status, education,
sex and place of residence . . . . . . . . . . . . . . . . . . . . . . . . . . . . . . . . . . . . . . . . . . . . 63Figure 6.6. DPT-HB immunization coverage, disaggregated by subnational region . . . . . . . . . . 63Figure 6.7. Polio immunization coverage, disaggregated by economic status, education,
sex and place of residence . . . . . . . . . . . . . . . . . . . . . . . . . . . . . . . . . . . . . . . . . . . . 64Figure 6.8. Polio immunization coverage, disaggregated by subnational region . . . . . . . . . . . . 64Figure 6.9. Complete basic immunization coverage, disaggregated by economic status,
education, sex and place of residence . . . . . . . . . . . . . . . . . . . . . . . . . . . . . . . . . . . 65Figure 6.10. Complete basic immunization coverage, disaggregated by subnational region . . . . 65Figure 7.1. Stunting prevalence, disaggregated by economic status, education,
employment status, age, sex and place of residence . . . . . . . . . . . . . . . . . . . . . . . . . 71Figure 7.2. Stunting prevalence, disaggregated by subnational region . . . . . . . . . . . . . . . . . . . . 71Figure 7.3. Underweight prevalence, disaggregated by economic status, education,
employment status, age, sex and place of residence . . . . . . . . . . . . . . . . . . . . . . . . . 72Figure 7.4. Underweight prevalence, disaggregated by subnational region . . . . . . . . . . . . . . . . . 72Figure 7.5. Wasting prevalence, disaggregated by economic status, education, employment
status, age, sex and place of residence . . . . . . . . . . . . . . . . . . . . . . . . . . . . . . . . . . . 73Figure 7.6. Wasting prevalence, disaggregated by subnational region . . . . . . . . . . . . . . . . . . . . 73Figure 7.7. Overweight prevalence, disaggregated by economic status, education,
employment status, age, sex and place of residence . . . . . . . . . . . . . . . . . . . . . . . . . 74Figure 7.8. Overweight prevalence, disaggregated by subnational region . . . . . . . . . . . . . . . . . . 74Figure 8.1. Neonatal mortality, disaggregated by economic status, education, sex
and place of residence . . . . . . . . . . . . . . . . . . . . . . . . . . . . . . . . . . . . . . . . . . . . . . . 79Figure 8.2. Neonatal mortality, disaggregated by subnational region . . . . . . . . . . . . . . . . . . . . 79Figure 8.3. Infant mortality, disaggregated by economic status, education, sex
and place of residence . . . . . . . . . . . . . . . . . . . . . . . . . . . . . . . . . . . . . . . . . . . . . . . 80Figure 8.4. Infant mortality, disaggregated by subnational region . . . . . . . . . . . . . . . . . . . . . . . 80Figure 8.5. Under-five mortality, disaggregated by economic status, education, sex
and place of residence . . . . . . . . . . . . . . . . . . . . . . . . . . . . . . . . . . . . . . . . . . . . . . . . 81Figure 8.6. Under-five mortality, disaggregated by subnational region . . . . . . . . . . . . . . . . . . . . 81Figure 9.1. Leprosy prevalence disaggregated by subnational region . . . . . . . . . . . . . . . . . . . . 86Figure 9.2. Malaria prevalence, disaggregated by economic status, education, occupation,
age, sex and place of residence . . . . . . . . . . . . . . . . . . . . . . . . . . . . . . . . . . . . . . . . 87
STATE OF HEALTH INEQUALITY: INDONESIA
vi
Figure 9.3. Malaria prevalence, disaggregated by subnational region . . . . . . . . . . . . . . . . . . . . 87Figure 9.4. Tuberculosis prevalence, disaggregated by age, sex and place of residence . . . . . . 88Figure 9.5. Tuberculosis prevalence, disaggregated by subnational region . . . . . . . . . . . . . . . . 88Figure 10.1. Access to improved sanitation, disaggregated by economic status, education
and place of residence . . . . . . . . . . . . . . . . . . . . . . . . . . . . . . . . . . . . . . . . . . . . . . . 93Figure 10.2. Access to improved sanitation, disaggregated by subnational region . . . . . . . . . . . 93Figure 10.3. Access to improved drinking-water, disaggregated by economic status,
education and place of residence . . . . . . . . . . . . . . . . . . . . . . . . . . . . . . . . . . . . . . . 94Figure 10.4. Access to improved drinking-water, disaggregated by subnational region . . . . . . . . 94Figure 11.1. Diabetes mellitus prevalence, disaggregated by economic status, education,
occupation, age, sex and place of residence . . . . . . . . . . . . . . . . . . . . . . . . . . . . . . 101Figure 11.2. Mental emotional disorders prevalence, disaggregated by economic status,
education, occupation, age, sex and place of residence . . . . . . . . . . . . . . . . . . . . . . 102Figure 11.3. Mental emotional disorders, disaggregated by subnational region . . . . . . . . . . . . . 102Figure 11.4. Hypertension prevalence, disaggregated by economic status, education,
occupation, age, sex and place of residence . . . . . . . . . . . . . . . . . . . . . . . . . . . . . . 103Figure 11.5. Hypertension prevalence, disaggregated by subnational region . . . . . . . . . . . . . . . 103Figure 11.6. Smoking prevalence (both sexes), disaggregated by economic status, education,
occupation, age, sex and place of residence . . . . . . . . . . . . . . . . . . . . . . . . . . . . . . 104Figure 11.7. Smoking prevalence (both sexes), disaggregated by subnational region . . . . . . . . . 104Figure 11.8. Smoking prevalence in females, disaggregated by economic status, education,
occupation, age and place of residence . . . . . . . . . . . . . . . . . . . . . . . . . . . . . . . . . . 105Figure 11.9. Smoking prevalence in females, disaggregated by subnational region . . . . . . . . . . . 105Figure 11.10. Smoking prevalence in males, disaggregated by economic status, education,
occupation, age and place of residence . . . . . . . . . . . . . . . . . . . . . . . . . . . . . . . . . . 106Figure 11.11. Smoking prevalence in males, disaggregated by subnational region . . . . . . . . . . . . 106Figure 11.12. Low fruit and vegetable consumption, disaggregated by economic status,
education, occupation, age, sex and place of residence . . . . . . . . . . . . . . . . . . . . . . 107Figure 11.13. Low fruit and vegetable consumption, disaggregated by subnational region . . . . . . 107Figure 12.1. Disability prevalence, disaggregated by economic status, education,
occupation, age, sex and place of residence . . . . . . . . . . . . . . . . . . . . . . . . . . . . . . 112Figure 12.2. Disability prevalence, disaggregated by subnational region . . . . . . . . . . . . . . . . . . . 112Figure 12.3. Injury prevalence, disaggregated by economic status, education, occupation,
age, sex and place of residence . . . . . . . . . . . . . . . . . . . . . . . . . . . . . . . . . . . . . . . . 113Figure 12.4. Injury prevalence, disaggregated by subnational region . . . . . . . . . . . . . . . . . . . . . . 113Figure 13.1. Subdistricts with a health centre, disaggregated by subnational region . . . . . . . . . . 118Figure 13.2. Basic amenities readiness in puskesmas, disaggregated by place of residence . . . . 119Figure 13.3. Basic amenities readiness in puskesmas, disaggregated by subnational region . . . . 119Figure 13.4. Health centres with sufficient number of dentists, disaggregated
by subnational region . . . . . . . . . . . . . . . . . . . . . . . . . . . . . . . . . . . . . . . . . . . . . . . 120Figure 13.5. Health centres with sufficient number of general practitioners, disaggregated
by subnational region . . . . . . . . . . . . . . . . . . . . . . . . . . . . . . . . . . . . . . . . . . . . . . . 121Figure 13.6. Health centres with sufficient number of midwives, disaggregated
by subnational region . . . . . . . . . . . . . . . . . . . . . . . . . . . . . . . . . . . . . . . . . . . . . . . 122Figure 13.7. Health centres with sufficient number of nurses, disaggregated
by subnational region . . . . . . . . . . . . . . . . . . . . . . . . . . . . . . . . . . . . . . . . . . . . . . . 123

vii
Figure 14.1. Subnational region inequality in public health development indices, calculated as mean difference from mean and index of disparity . . . . . . . . . . . . . . . 126
Figure 14.2. Wealth-related inequality in health service coverage indicators, calculated as slope index of inequality and relative index of inequality . . . . . . . . . . 127
Figure 14.3. Sex-related inequality in selected indicators, calculated as ratio . . . . . . . . . . . . . . . 129
TablesTable 1.1. Trends in select demographic and health indicators, 1990–2015 . . . . . . . . . . . . . . . . . 5Table 1.2. Strategic issues, major goals and policy directions for Indonesia, as identified in
RPJMN-III (2015–2019) . . . . . . . . . . . . . . . . . . . . . . . . . . . . . . . . . . . . . . . . . . . . . . . 9Table 2.1. Health topics and indicators . . . . . . . . . . . . . . . . . . . . . . . . . . . . . . . . . . . . . . . . . . . 13Table 2.2. Dimensions of inequality and subgroup categorization . . . . . . . . . . . . . . . . . . . . . . . 14Table 2.3. Data sources and corresponding health indicators and dimensions of inequality . . . 16Table 2.4. Overview of summary measures of inequality applied to calculate health
inequalities . . . . . . . . . . . . . . . . . . . . . . . . . . . . . . . . . . . . . . . . . . . . . . . . . . . . . . . . 17Table 3.1. Public health development indices indicators . . . . . . . . . . . . . . . . . . . . . . . . . . . . . . 21Table 4.1. Reproductive health indicators . . . . . . . . . . . . . . . . . . . . . . . . . . . . . . . . . . . . . . . . . 33Table 5.1. Maternal, newborn and child health indicators . . . . . . . . . . . . . . . . . . . . . . . . . . . . 43Table 6.1. Childhood immunization indicators . . . . . . . . . . . . . . . . . . . . . . . . . . . . . . . . . . . . . . 57Table 7.1. Child malnutrition indicators . . . . . . . . . . . . . . . . . . . . . . . . . . . . . . . . . . . . . . . . . . 67Table 8.1. Child mortality indicators . . . . . . . . . . . . . . . . . . . . . . . . . . . . . . . . . . . . . . . . . . . . . 75Table 9.1. Infectious diseases indicators . . . . . . . . . . . . . . . . . . . . . . . . . . . . . . . . . . . . . . . . . 83Table 10.1. Environmental health indicators . . . . . . . . . . . . . . . . . . . . . . . . . . . . . . . . . . . . . . . 90Table 11.1. NCDs, mental health and behavioural risk factors indicators . . . . . . . . . . . . . . . . . . 96Table 12.1. Disability and injury indicators . . . . . . . . . . . . . . . . . . . . . . . . . . . . . . . . . . . . . . . . . 109Table 13.1. Health facility and personnel indicator . . . . . . . . . . . . . . . . . . . . . . . . . . . . . . . . . . 115
Appendix tablesAppendix table 1. Overview of health indicators and corresponding data source
and dimensions of inequality . . . . . . . . . . . . . . . . . . . . . . . . . . . . . . . . . . . . . 134Appendix table 2. Health indicator characteristics used for the calculation of summary
measures . . . . . . . . . . . . . . . . . . . . . . . . . . . . . . . . . . . . . . . . . . . . . . . . . . . . 137Appendix table 3. Dimension of inequality characteristics used for the calculation of summary
measures . . . . . . . . . . . . . . . . . . . . . . . . . . . . . . . . . . . . . . . . . . . . . . . . . . . . 139
Supplementary tables Table S1. Difference calculations for health indicators, by dimensions of inequality . . . . . . . . 140Table S2. Ratio calculations for health indicators, by dimensions of inequality . . . . . . . . . . . . 144Table S3. Slope index of inequality and relative index of inequality calculations, by
economic status and education . . . . . . . . . . . . . . . . . . . . . . . . . . . . . . . . . . . . . . . . 148Table S4. Mean difference from mean and index of disparity calculations, by occupation
and subnational region . . . . . . . . . . . . . . . . . . . . . . . . . . . . . . . . . . . . . . . . . . . . . . 151
STATE OF HEALTH INEQUALITY: INDONESIA
viii
As the Director of the Department of Information, Evidence and Research at the World Health Organization (WHO), I am pleased to welcome the State of health inequality: Indonesia report.
At a time of unprecedented global momentum to improve health, the need to address inequalities in health is becoming increasingly apparent. Countries may report progress nationally in health services, outcomes or other aspects of the health sector; however, too often certain population subgroups are not part of the success story. These disadvantaged subgroups commonly include the people who are poor, uneducated or unemployed, those living in rural areas, children, adolescents and elderly. They may also be defined by the region where they live, the type of job that they hold, or their sex. Understanding the state of health inequalities in countries is a key step in determining how to advance health equitably, and move towards achieving the goals and targets of the United Nations 2030 Agenda for Sustainable Development. Data on health inequality should be an essential part of health programme design and execution.
The State of health inequality: Indonesia report demonstrates how the work of a committed group of stakeholders can advance efforts to understand and address health inequalities. As a key output of the group, this report reflects high-quality data and analysis techniques. It draws heavily on the expertise of a wide range of collaborators to present relevant applications of the findings, with an emphasis on priority setting and policy implications. Throughout, the report effectively visualizes data and provides concise summaries of findings.
Equally laudable as the findings presented here, is the process of capacity-building that led to the development of this report. Capacity-building for health inequality monitoring in Indonesia was facilitated by establishing a network of devoted stakeholders, whose continual efforts stand to further advance improvements in health inequality and strengthen health information systems that enable monitoring.
In my view, the State of health inequality: Indonesia report has the potential to benefit the country of Indonesia, and also serve as an example for other countries that are seeking to build national capacity for health inequality monitoring.
Foreword
Dr John Grove DirectorDepartment of Information, Evidence and ResearchWorld Health Organization
ix
Equity provides a platform for focusing on those who are being left behind. With the advent of the United Nations 2030 Agenda for Sustainable Development, we have a new global mandate before us. Equity is at the heart of the 2030 Agenda and its 17 Sustainable Development Goals (SDGs). In pledging to achieve the SDGs, countries have committed to leave no one behind. SDG 3 focuses on ensuring healthy lives for all at all ages, positioning equity as a central issue in health, while SDG 10 calls for a reduction in inequality within and between countries to promote the inclusion and empowerment of all.
Beginning in April 2016, the World Health Organization (WHO), in collaboration with the Indonesia Agency for Health Research and Development (IAHRD) and Badan Pusat Statistik (BPS, Statistics Indonesia), committed to strengthen Indonesia’s capacity for health inequality monitoring. This report places great emphasis on the state of health inequality in Indonesia across a wide selection of health topics and dimensions of inequality. It seeks to bring improvements to policies and activities to reduce health inequities. Carrying forward the momentum of the SDGs, we need to focus on improving indicators, data sources and communication tools to best measure equity and progress. WHO remains fully committed to work hand in hand with its country partners to realize the recommendations of this report.
I would like to thank the Government of Indonesia and all partners who have contributed to developing this report. We appreciate the hard work and efforts from WHO headquarters, the WHO Regional Office for South-East Asia and the WHO Country Office for Indonesia, as well as the inputs and suggestions received from the Ministry of Health, key health experts and our health development partners in the country. We will continue to work closely with them. A focus on equity is a powerful step towards better health, development, social justice and human rights.
Dr Vinod Bura Acting WHO RepresentativeWHO Country Office for Indonesia
Foreword
STATE OF HEALTH INEQUALITY: INDONESIA
x
The continual improvement and strengthening of public health is a crucial aspect of development. Indonesia, across its rich and varied social, economic and geographical landscapes, faces unique challenges and opportunities in addressing the many factors that underlie public health. While some population subgroups have easy access to health services, health promotion activities and disease prevention initiatives, others are at a disadvantage. Monitoring health inequality in Indonesia is a fundamental part of improving the health status of those who are disadvantaged, and ensuring that Indonesia fulfils its commitment of “no one left behind”.
Monitoring health inequality entails measuring performance across many different indicators of health and the health sector. It also requires consideration of different types of population subgroups, and comparing how subgroups perform for selected health indicators. This report, State of health inequality: Indonesia, contains the results of a collaborative effort to measure health inequalities in Indonesia. The analyses in this report were made possible, in large part, by World Health Organization (WHO) health inequality monitoring tools, some of which were developed in conjunction with the preparation of this report. The groundwork for this report began in 2016, with support from WHO (headquarters, the WHO Regional Office for South-East Asia and the WHO Country Office for Indonesia) in collaboration with the Indonesia Agency for Health Research and Development (IAHRD) and related programme units at the Ministry of Health, Badan Pusat Statistik (BPS, Statistics Indonesia), academic institutions, United Nations agencies and the United States Agency for International Development (USAID).
The State of health inequality: Indonesia report aims to support evidence-based policy development to ultimately improve health status and work towards closing the gaps that exist between social, economic and geographically defined subgroups. The report draws on existing national data from RISKESDAS (Basic Health Research), the Indonesia Demographic and Health Surveys (DHS) and SUSENAS (National Socioeconomic Survey) as well as report data from the Ministry of Health.
I would like to convey my sincere appreciation to the technical support given by WHO and to all of the contributors that have made this report possible. I confidently anticipate that this report will bring attention to issues of health inequality and lead to sustainable action to improve health performance in Indonesia.
Dr Siswanto HeadIndonesia Agency for Health Research and DevelopmentMinistry of Health Republic of Indonesia
Foreword

xi
The State of health inequality: Indonesia report is the product of a collaboration of stakeholders who are working to promote health inequality monitoring in Indonesia. The foundational material for this report was developed through an extensive process of national capacity-building for health inequality monitoring, which brought together a dedicated group of stakeholders across several institutions.
Capacity-building process
The Indonesia Agency for Health Research and Development (IAHRD), Ministry of Health, Indonesia, acted as the coordinating body for capacity-building training workshops and technical meetings. The following individuals attended and participated in capacity-building activities: Adhi Kurniawan, Mariet Tetty Nuryetty and Joko Widiarto (Badan Pusat Statistik/BPS, Statistics Indonesia); Istiqomah and Supriyono Pangribowo (Center for Data and Information, Ministry of Health, Indonesia); Mahlil Ruby (Centre for Health Economics and Policy Studies, Faculty of Public Health, Universitas Indonesia); Sabarinah and Fitra Yelda (Centre for Health Research, Universitas Indonesia); Mularsih Restianingrum (Family Health Directorate, Ministry of Health, Indonesia); Wisnu Trianggono (Family Health Directorate, Ministry of Health, Indonesia); Imran Pambudi (International Cooperation Bureau, Ministry of Health, Indonesia); Tin Afifah, Sri Poedji Hastuti, Lely Indrawati, Nunik Kusumawardani, Wahyu Pudji Nugraheni, Ria Yudha Permata Ratmanasuci, Suparmi, Tati Suryati and Ingan Tarigan (IAHRD, Ministry of Health, Indonesia); Feby Anggraini (Sustainable Development Goals Secretariat, Ministry of Health, Indonesia); Massee Bateman (United States Agency for International Development [USAID], Indonesia); Elvira Liyanto and Dedek Prayudi (United Nations Population Fund [UNFPA], Indonesia); Apolina Sidauruk (United Nations Children’s Fund [UNICEF], Indonesia); and Deni Harbianto (Center for Health Policy and Management, University of Gajah Mada, Indonesia).
The World Health Organization (WHO) provided technical and financial support for the capacity-building process, including WHO headquarters (Department of Information, Evidence, and Research; and Gender, Equity and Human Rights Team), the WHO Regional Office for South-East Asia, and the WHO Country Office for Indonesia. Contributions from individuals at WHO offices include:
WHO headquarters: Ahmad Reza Hosseinpoor (Lead, Health Equity Monitoring) led the capacity-building process and conducted the training workshops; Anne Schlotheuber (Technical Officer) facilitated the training workshops.
WHO Regional Office for South-East Asia: Benedicte Briot (Technical Officer until December 2016) facilitated the organization of the training workshops, and was a participant and observer.
WHO Country Office for Indonesia: Jihane Tawilah (WHO Representative until August 2016) provided overall managerial support; Rustini Floranita (National Professional Officer, Reproductive, Maternal, Newborn, Child and Adolescent Health [RMNCAH] and Gender, Equity and Human Rights [GER]) was the main technical support for the capacity-building process, including resource mobilization, and contributed
Acknowledgements
STATE OF HEALTH INEQUALITY: INDONESIA
xii
as an organizer, co-facilitator and participant; Theingi Myint (Technical Officer, RMNCAH) oversaw the technical support, and contributed as an organizer and participant; Siti Subiantari (Programme Assistant, RMNCAH and GER) provided administrative and logistical support; and Ari Handoko (Data Assistant, RMNCAH) provided logistical support.
Devaki Nambiar (Public Health Foundation of India, Delhi, India), Tamzyn Davey (University of Queensland, School of Public Health, Brisbane, Australia) and Nunik Kusumawardani facilitated training workshops.
The capacity-building process was funded in part by the Norwegian Agency for Development Cooperation (Norad).
Report development
Ahmad Reza Hosseinpoor led the overall development of the report. The conceptualization of the report was an iterative process with contributions from Nicole Bergen (University of Ottawa, Ottawa, Canada), Rustini Floranita, Ahmad Reza Hosseinpoor, Nunik Kusumawardani and Anne Schlotheuber. All data presented in this report, except data from Demographic and Health Survey (DHS), were prepared and analysed by Tin Afifah, Sri Poedji Hastuti, Wahyu Pudji Hugraheni, Lely Indrawati, Istiqomah, Adhi Kurniawan, Nunik Kusumawardani, Mariet Tetty Nuryetty, Supriyono Pangribowo, Ria Yudha Permata Ratmanasuci, Suparmi and Joko Widiarto. DHS data were drawn from the WHO Health Equity Monitor database and are the product of a reanalysis of survey micro-data by the WHO Collaborating Center for Health Equity Monitoring (International Center for Equity in Health, Federal University of Pelotas, Brazil). Anne Schlotheuber compiled and harmonized the data, and developed graphics for the report. Nicole Bergen compiled the report text, and provided technical editing. Tamzyn Davey provided technical editing support during the early stages of report development.
Chapters 3–13 were prepared in close consultation with subject matter experts across health topics, who led the data interpretation, contributed to content development, reviewed report drafts and approved the final chapter content. These individuals are: Suparmi (Chapters 3 and 6); Wisnu Trianggono (Chapter 4); Rustini Floranita (Chapters 5 and 6); Theingi Myint and Sabarinah Prasetyo (Chapter 7); Mariet Tetty Nuryetty (Chapters 8 and 10); Nunik Kusumawardani (Chapters 9, 11 and 12); Tin Afifah (Chapter 10); and Supriyono Pangribowo (Chapter 13). Other contributors include: Nunik Kusumawardani (Chapter 3); Lely Indrawati and Elvira Liyanto (Chapter 4); Tin Afifah, Massee Bateman, Mularsih Restianingrum and Suparmi (Chapter 5); Tin Afifah (Chapter 6); Sri Pudji Hastoety, Imran Pambudi and Fitra Yelda (Chapter 7); Feby Anggraini, Adhi Kurniawan and Ingan Tarigan (Chapter 8); Istiqomah and Tati Suryati (Chapter 9); Joko Widiarto (Chapter 10); Wahyu Nugraheni (Chapter 11); Wahyu Puji Nugraheni and Tati Suryati (Chapter 12); and Ria Yudha Permata Ratmanasuci (Chapter 13).
Rustini Floranita facilitated the coordination meetings among the chapter co-authors, and was the main liaison between contributors.
The report was reviewed by Ahmad Reza Hosseinpoor and Anne Schlotheuber.
Hernan Velasquez and Siti Subiantari provided administrative support.
AvisAnne Julien provided copy-editing and proofreading support, and Christine Boylan prepared the index.
xiii
ASEAN Association of Southeast Asian NationsBAPPENAS National Development Planning Agency (Badan Perencanaan Pembangunan Nasional) BCG Bacille Calmette-GuérinBKKBN National Population and Family Planning Board (Badan Kependudukan dan Keluarga Berencana Nasional)BPJS Kesehatan Social Security Management Agency (Badan Penyelenggara Jaminan Sosial Kesehatan)BPS Statistics Indonesia (Badan Pusat Statistik) DHS Demographic and Health SurveysDPT-HB diphtheria-pertussis-tetanus and hepatitis BDPT-HB-Hib diphtheria-pertussis-tetanus and hepatitis B and Haemophilus influenzae type B GDP gross domestic productHEAT Health Equity Assessment ToolkitIAHRD Indonesia Agency for Health Research and DevelopmentJKN single-payer national insurance programme (Jaminan Kesehatan Nasional)NCD noncommunicable diseasePHDI Public Health Development IndexPIS-DPK Healthy Indonesia Programme with Family Approach (Program Indonesia Sehat Dengan Pendekatan Keluarga)PODES Village Potential Survey (Potensi Desa) puskesmas primary health care centre (pusat kesehatan masyarakat)RIFASKES Health Facility Survey (Riset Fasilitas Kesehatan) RISKESDAS Basic Health Research (Riset Kesehatan Dasar) RPJMN National Medium-Term Development Plan (Rencana Pembangunan Jangka Menengah Nasional)STEPS WHO STEPwise Approach to SurveillanceSIRKESNAS National Health Indicator Survey (Survei Indikator Kesehatan Nasional)SUSENAS National Socioeconomic Survey (Survei Sosial Ekonomi Nasional)UNICEF United Nations Children’s FundWHO World Health Organization
Abbreviations and acronyms
STATE OF HEALTH INEQUALITY: INDONESIA
xiv
Between April 2016 and October 2017, a network of stakeholders in Indonesia committed to strengthen Indonesia’s capacity for health inequality monitoring. This report is a key product of that commitment, presenting the state of inequality in Indonesia across a wide selection of health topics and dimensions of inequality. The first of its kind in Indonesia, the aims of the report were: to quantify the magnitude of health inequalities across health topics and dimensions of inequality; based on this analysis, to identify priority areas for action and their policy implications; and to showcase the work of an emerging network of stakeholders that monitor health inequality in Indonesia.
The State of health inequality: Indonesia report covers 11 health topics, drawing data from about 53 health indicators, which were disaggregated by eight dimensions of inequality. Findings were derived from analysis of disaggregated data estimates and summary measures of health inequality. In consultation with subject matter experts, these findings were situated within the context of health in Indonesia, and presented alongside recommendations for how priorities and policies can be oriented for the reduction of health inequalities.
Summary of findings by health topicPublic Health Development Index (PHDI): The PHDI has been used as a health monitoring tool in Indonesia since 2008, and is primarily used to do high-level comparisons across subnational regions. The overall index is comprised of 30 indicators of community-based health services, outcomes and determinants, and topic-specific sub-indices are comprised of two to six indicators. Inequality between subnational regions was reported for
Executive summary
all indices, but was particularly high for the noncommunicable diseases (NCDs) sub-index in terms of both absolute and relative inequality. The level of relative inequality was elevated for the health services provision sub-index, and the environmental health sub-index demonstrated elevated absolute inequality. Interventions should aim to strengthen community-based health services in underperforming subnational regions, where financial and technical supports should be accompanied by socially and culturally relevant policy approaches.
Reproductive health: Indonesia has implemented strategies that address aspects of reproductive health such as contraceptive use, family planning and fertility. Despite progress in some areas, the country faces diverse supply- and demand-side challenges when promoting the uptake of reproductive health services; certain issues such as female genital mutilation remain understudied. Our findings suggested that female genital mutilation was a high priority nationally, with elevated levels in certain subnational regions. High inequality across subnational regions was also reported for adolescent fertility rates. Education-related inequality was high for adolescent and total fertility rates, and for contraceptive prevalence – modern methods. Policy approaches should aim to build local capacity in poor-performing subnational regions to move forward on efforts to reduce female genital mutilation, and promote access and use of reproductive health services among disadvantaged populations.
Maternal, newborn and child health: Over the past decades, Indonesia has made progress in improving maternal, newborn and child health, however, ensuring that services are of high quality and reliably accessible to all remains a challenge. Indonesia has committed to several global and

xv
national initiatives for maternal, newborn and child health, including the roll out of a national health insurance scheme. Socioeconomic inequalities were high in maternal, newborn and child health services, though national coverage values were mixed. Across the indicators included in this report (related to health service coverage, breastfeeding and other aspects of child and newborn health), the most pressing areas for action were: universal improvements in exclusive breastfeeding; and equity-oriented improvements in antenatal care coverage, births attended by skill health personnel, and postnatal care coverage for both mothers and newborns. All indicators had inequality by subnational region, pointing to the importance of concentrated efforts to build capacity in poor-performing subnational regions.
Childhood immunization: Childhood immunization is a key aspect of childhood disease prevention in Indonesia, and the Ministry of Health coordinates a number of programmes to increase coverage throughout the country. Complete basic immunization coverage was low nationally, and demonstrated large inequality, especially by subnational region and economic status. Coverage of immunizations delivered through multiple doses (DPT-HB and polio) tended to have lower coverage and higher levels of inequality than immunizations delivered as single doses (Bacille Calmette-Guérin/BCG and measles). Policies should aim to strengthen capacity in health systems of underperforming subnational regions, and promote return visits for subsequent vaccine doses until completion, with a focus on vulnerable population subgroups.
Child malnutrition: Although child malnutrition has garnered attention in Indonesia, progress remains insufficient to put the country on track for meeting global child malnutrition targets, and a double burden of malnutrition (overweight and undernutrition) is emerging. Undernutrition in children under 5 years demonstrated high national prevalence, and pronounced inequalities, especially by subnational region, economic status and
mother’s education level. Thus, immediate action is required to address undernutrition, including approaches that are large scale, multisectoral and sustainable; longer-term initiatives should address the underlying determinants of child undernutrition. Proactive measures should be in place to avert increases in overweight prevalence.
Child mortality: Due to substantial improvements during the 1990s, Indonesia achieved the United Nations Millennium Development Goal 4 to reduce child mortality; however, recent progress has been hindered by stagnation of neonatal mortality. Alongside high national child mortality rates, large inequalities in child mortality were reported by economic status, subnational region, mother’s education level, place of residence and sex. Child mortality policies should aim to reduce mortality rates universally, with accelerated gains in disadvantaged subgroups. Diverse approaches across health and non-health sectors are recommended, and should be supported by adequate resources.
Infectious diseases: While several infectious disease rates have declined in Indonesia, their absolute burden remains high. Certain infectious disease control initiatives are still supported by donors (in addition to government support) and disease specific, with high-level coordination by the Ministry of Health. In the three infectious diseases indicators featured in this report (leprosy prevalence, malaria prevalence and tuberculosis prevalence), inequalities across subnational regions were elevated. Other forms of inequalities were reported where data were available, including higher tuberculosis prevalence in the elderly and in males, and higher malaria prevalence in rural areas, the poor and farmers/fishermen/labourers (as compared to their counterparts). Infectious disease control could be advanced through policies that target poor-performing regions, and strengthen health information systems (to enable improved surveillance and monitoring).
STATE OF HEALTH INEQUALITY: INDONESIA
xvi
Environmental health: Indonesia currently has a number of environmental health programmes that are designed to promote better access to products, services and infrastructure, and/or provide education to encourage healthy hygiene and sanitation practices. Based on our findings, which considered household-level access to improved sanitation and improved drinking-water, environmental health was identified as a high priority health topic, with poor national performance and high levels of inequality. Socioeconomic and geographic inequalities were high, and vast differences were evident across subnational regions. Policies to improve environmental health should be coordinated across sectors, and expanded, with an emphasis on vulnerable population subgroups. Environmental health programmes should be supported by sufficient resources to ensure that they can be fully implemented and adequately monitored, including health inequality monitoring.
NCDs, mental health and behavioural risk factors: The Indonesian Ministry of Health has coordinated several initiatives to address the growing burden of NCDs and mental health issues in the country, including the National Policy and Strategy on NCDs, which emphasizes NCD surveillance, early detection and prevention. Our findings across indicators of morbidity, physiological risk factors and behavioural risk factors showed a highly unique and complex situation, as traditional forms of disadvantage were evident for some indicators (e.g. mental emotional disorders were higher in the poor and those with less education), but other indicators had mixed or opposite patterns (e.g. diabetes prevalence). The highest priority areas were: high rates of smoking among males; low fruit and vegetable consumption universally; high prevalence of hypertension in older adults; and large socioeconomic gaps in mental emotional disorder prevalence. Policies approaches should incorporate regular health inequality monitoring to ensure that improvements are realized in traditionally disadvantaged subgroups alongside the whole population.
Disability and injury: Indonesia has made a number of commitments to address disability and injury, with an emphasis on prevention-oriented programmes. Still, the country faces challenges, including stigmatization and discrimination of people living with disabilities or injuries. Inequalities in disability were reported, demonstrating a higher prevalence in the socioeconomically disadvantaged (the poor and less educated), the elderly, females and the unemployed. Injury prevalence was higher in children and adolescents, and in males. A two-pronged policy approach is warranted to strengthen prevention efforts (including road traffic safety) and to strengthen social protection policies (including inclusive education and employment opportunities for people with disabilities).
Health facility and personnel: The Government of Indonesia is currently undertaking a series of reforms to improve health facilities and personnel, as their supply and quality are fragmented across the country; that is, the legal standards and requirements for health facility and health personnel are not fully realized. Based on our findings, health facility indicators were a medium priority nationally, with moderate levels of geographic inequality. The health personnel indicators were a high priority: the national percentages of health centres with sufficient health personnel were low, and inequality across subnational regions was elevated, especially for dentists and midwives.
Understanding the state of health inequalityCross-cutting examinations of health inequalities involved looking at patterns across health topics, according to classes of indicators, dimensions of inequality and shapes of inequality. These analyses revealed additional insights into the strengths and weaknesses of the health sector, policy implications and opportunities for intervention.

xvii
Patterns were observed across classes of health indicators, including health service coverage indicators, health behaviour indicators, and health status and outcomes indicators. Overall, health service coverage indicators were generally considered to be low to medium priority nationally, while inequalities in these indicators were assigned medium to high priority. Policies to improve health service coverage are warranted, and should emphasize the reduction of inequalities, especially in maternal and newborn health services and environmental health services. The national prevalence of health behaviour indicators tended to be high priority, and inequalities in these indicators ranged from low to high priority. As a result, remedial action should be universally oriented; for certain behaviours, such as female genital mutilation and male smoking, targeted action may be needed to achieve gains in disadvantaged subgroups. Health status and outcomes indicators related to neonatal and chid health were mostly high priority, based on their national average; other indicators related to adolescents and adults showed variable national performance. For instance, disability and injury indicators were low nationally, while fertility indicators performed moderately. Infectious disease and NCD morbidity indicators tended to perform poorly. Inequalities in health status or outcomes indicators were generally medium to high priority, with indicators related to child malnutrition and mortality being mostly high priority. Policies should seek to accelerate progress among disadvantaged subgroups.
Health inequalities were observed, to varying extents, for the featured dimensions of inequality, which included economic status, education, occupation, employment status, age, sex, place of residence and subnational region. Data across subnational regions demonstrated persistent inequality by this dimension, which was evident across all health topics. The extent of inequality by subnational region was particularly pronounced in indicators related to health personnel and female genital mutilation. The low fruit and vegetable
consumption indicator has lower subnational region inequality due to elevated prevalence of the indicator across all regions. In general, the eastern part of Indonesia tended to be disadvantaged; the poorest performing subnational regions were often those on the islands of Kalimantan, Papua and Sulawesi and the archipelago of Nusa Tenggara. Inequalities by economic status were prevalent, with the majority of indicators reporting better performance in richer subgroups. Wealth-related inequality tended to be elevated for health service coverage indicators, and was variable across health behaviour and health status and outcomes indicators. Characteristic shapes of inequality across wealth quintiles could be identified. The queuing (gradient) pattern was most common (seen in the environmental health indicators, certain child malnutrition and NCD, mental health and behavioural risk factors indicators, and others), followed by marginal exclusion (seen in several childhood immunization and child mortality indicators) and mass deprivation (seen in the injury prevalence indicator). Sex-related relative inequality was especially elevated in indicators of smoking and tuberculosis, where males reported higher prevalence than females. Health indicators with a moderate level of sex-related inequality sometimes showed males at a disadvantage (e.g. malaria prevalence and injury prevalence), and sometimes showed females at a disadvantage (e.g. mental emotional disorders, diabetes mellitus, hypertension and disability prevalence). Sex-related relative inequality was low for indicators of newborn and child health, childhood immunization and child malnutrition.
Moving forward
The widespread inequalities reported across health topics in this report call for increased attention to the reduction of inequalities in health in Indonesia. Building capacity for health inequality monitoring is one key step in improving the state of health inequality. Measuring and monitoring inequalities

STATE OF HEALTH INEQUALITY: INDONESIA
xviii
across health topics and by different dimensions of inequality provide important inputs to identify priority areas for action, inform appropriate policy and programme approaches, and ultimately close the gap between subgroups. An important point of intervention is during the planning and review phases of health sector programmes, plans and practices – optimally, all health sector activities should be equity oriented. The findings of this report can serve as a platform to advance further engagement with decision-makers and implementers in both health and non-health sectors. For example, the report can be used to develop specific policy recommendations for each health topic.
The process of preparing data for this report revealed opportunities to strengthen health information systems in Indonesia, including: strengthening data collection systems; building capacity to perform analyses; instituting routine reporting of health inequality findings; and improving the application of health inequality findings into policies and programmes. The scope and quality of health inequality monitoring are linked to the state of national health information systems. Overall, health inequality monitoring should be institutionalized in
Indonesia’s national health information system to provide high-quality, reliable evidence about health inequalities, and promote equity-oriented action to improve health among all Indonesians, leaving no one behind.
As an extension of the findings of this report, additional health inequality analyses are warranted, including exploring trends in inequality over time, and performing benchmarking with other countries that share similar characteristics. Expanded double disaggregation of health data is also recommended, which may entail further disaggregation of geographical data (e.g. to explore the health of the urban poor) or consideration of sex-specific data by other relevant dimensions of inequality (e.g. to explore socioeconomic-based health inequalities in men and women). Further quantitative and qualitative research should be conducted to address emergent questions such as: What are the root causes of health inequalities? Why do health inequalities persist? How can health inequalities be alleviated? Importantly, the network of stakeholders that convened to produce this report should be expanded to extend the reach of this work across diverse sectors and through different channels of influence.
Introduction
1
Introduction
Health is clearly stated as an important objective in the Indonesian constitution, and achieving the highest possible level of health for all remains a major priority of national development plans and international commitments (1). Many groups of people in Indonesia, however, remain at a disadvantage when it comes to health. Throughout the country, there are inequalities in health service coverage, access to health care, and health-related behaviours, conditions and outcomes. These health inequalities are evident between provinces (2), and also across subgroups of people of different economic status, education levels, occupations, places of residence, age and sex (3). Addressing health inequalities is paramount, especially as Indonesia progresses towards implementing sustainable universal health coverage and meeting the targets of the United Nations Sustainable Development Goals.
A comprehensive understanding of the nature of health inequalities leads the way to their reduction and mitigation. Health inequality monitoring draws on available data to quantify the extent of inequality, which helps to determine priority areas for action and develop policy responses. The process of health inequality monitoring can be thought of as a 5-step cycle, which includes: determining the scope of monitoring; obtaining necessary data; analysing data; reporting results; and implementing changes. At each step of the cycle, a unique set of skills, resources and expertise is required to ensure high-quality monitoring and serve the ultimate goals of identifying situations of inequality within a population, and taking action to move towards a more equitable society (4). Thus, health inequality monitoring across diverse health topics is a useful practice to support national health system planning and policy development.
The State of health inequality: Indonesia report is the product of a collaboration between a diverse network of stakeholders that, in various capacities, work to support improvements to the state of health inequality in Indonesia. The first of its kind in Indonesia, this report was undertaken to raise awareness of health inequalities, increase political will and encourage action across sectors. The report is directed at policy-makers, practitioners, researchers, academics, development agencies and civil society
Aims
The overall aims of this report are:• to quantify the magnitude of health inequalities
across health topics and dimensions of inequality;• based on this analysis, to identify priority areas
for action and their policy implications; and • to showcase the work of an emerging network
of stakeholders that monitor health inequality in Indonesia.
Report outline and structure
The State of health inequality: Indonesia report covers 11 health topics and 53 health indicators, and considers inequalities across eight dimensions: economic status; education; occupation; employment status; age; sex; place of residence; and subnational region. Chapter 1 is an orientation to the general context of Indonesia, with brief descriptions of demographic and health trends, the political and development landscapes, and health sector organization, planning and key initiatives. Chapter 2 describes the methods used in the report, including indicator and dimension of
STATE OF HEALTH INEQUALITY: INDONESIA
2
inequality definitions, data sources, data analysis and approach to reporting. Chapters 3–13 present the state of health inequality in 11 health topics, including background information, key findings, priority areas and policy implications. Each of these chapters also contains health indicator profiles, which feature graphical illustrations of inequalities shown across subgroups. The chapters focus on the following health topics: Chapter 3 presents the Public Health Development Index (PHDI) and several sub-indices; Chapter 4 addresses reproductive health; Chapter 5 addresses maternal, newborn and child health; Chapter 6 addresses childhood immunization; Chapter 7 addresses child malnutrition; Chapter 8 addresses child mortality; Chapter 9 addresses infectious diseases; Chapter 10 addresses environmental health; Chapter 11 addresses noncommunicable diseases (NCDs), mental health and behavioural risk factors; Chapter 12 addresses disability and injury; and Chapter 13 addresses health facility and personnel. Chapter 14 outlines various approaches for cross-cutting analyses of health inequalities across all topics, and presents preliminary findings of inequalities by classes of indicators, select dimensions of inequality and characteristic shapes of inequality. Chapter 15 concludes the report by summarizing the key findings, their overarching implications and the way forward.
Building capacity for health inequality monitoring in IndonesiaStakeholders in Indonesia have committed to building national capacity for health inequality monitoring, with accelerated efforts beginning April 2016 (5). The impetus for this process stemmed from Indonesia’s participation in a health inequality monitoring workshop hosted by the World Health Organization (WHO) in Jaipur, India, in 2014, during which participants were introduced to concepts and processes of health inequality monitoring and gained exposure to working with national datasets.
Following this workshop, a number of stakeholders within Indonesia committed to partner with WHO and its trainer network to coordinate, expand and strengthen the country’s capacity for health inequality monitoring. This emerging collaboration includes stakeholders from: the Indonesia Agency for Health Research and Development (IAHRD) (the coordinating institution); other departments across the Ministry of Health (Center of Data and Information, Family Health Directorate, International Cooperation Bureau, and Sustainable Development Goals Secretariat); Statistics Indonesia (Badan Pusat Statistik/BPS); the Centre for Health Economics and Policy Studies, and the Center for Health Research, Universitas Indonesia; the Center for Health Policy and Management, University of Gajah Mada; the United Nations Population Fund (UNFPA); the United Nations Children’s Fund (UNICEF); and the United States Agency for International Development (USAID), Indonesia. Ongoing support and engagement was provided by the three levels of WHO (headquarters, the WHO Regional Office for South-East Asia and the WHO Country Office for Indonesia).
Key milestones and timeline
In April 2016, Indonesia’s health inequality monitoring capacity-building process was officially launched in Jakarta with a WHO training workshop. At this workshop, stakeholders reiterated their commitment to the process and identified key activities and outputs, which included plans to produce Indonesia’s first comprehensive report about the state of inequality.
In the months that followed, stakeholders undertook the tasks of selecting relevant health indicators and dimensions of inequality, in conjunction with completing a data source mapping exercise. From May to August 2016, two technical meetings were hosted by IAHRD, Ministry of Health. Data were compiled from multiple sources as an initial preparation step for eventual upload into the newly
Introduction
3
developed WHO Upload Database Edition of the Health Equity Assessment Toolkit (HEAT) software, known as HEAT Plus (6,7). From September to November 2016, IAHRD, with support from WHO, led the production of an extended database for analysis.
In November 2016, a WHO-led training workshop guided stakeholders through uploading and analysing data in HEAT Plus. As stakeholders gained proficiency with the new software, they offered feedback for its improvement. At this workshop, the outline for the State of health inequality: Indonesia report was refined; stakeholders identified other channels to disseminate results, including preparation of policy briefs as well as manuscripts for peer-reviewed publication in a special issue of Global Health Action. An interim technical meeting was held in February 2017 to chart progress on the report and the manuscripts, followed by a data clinic and paper write-up workshop in April 2017. A step-by-step manual for health inequality monitoring, an additional resource to support the practice of health inequality monitoring, was launched in July 2017.
References1. The 1945 Constitution of the Republic of
Indonesia (unofficial translation) [Internet]. Geneva: International Labour Organization; 2002 (http://www.ilo.org/wcmsp5/groups/public/---ed_protect/---protrav/---ilo_aids/documents/legaldocument/wcms_174556.pdf, accessed 18 August 2017).
2. Indonesian health profile 2015 [Internet]. Jakarta: Ministry of Health Republic of Indonesia; 2016 (http://www.depkes.go.id/resources/download/pusdatin/profi l-kesehatan-indonesia/indonesian%20health%20profile%202015.pdf, accessed 15 August 2017).
3. State of inequality: reproductive, maternal, newborn and child health. Geneva: World Health Organization; 2015.
4. Handbook on health inequality monitoring: with a special focus on low-and middle-income countries. Geneva: World Health Organization; 2013.
5. Hosseinpoor AR, Nambiar D, Tawilah J, Schlotheuber A, Briot B, Bateman M et al. Capacity building for health inequality monitoring in Indonesia: enhancing the equity-orientation of country health information systems. Glob Health Action. In press.
6. Hosseinpoor AR, Nambiar D, Schlotheuber A, Reidpath D, Ross Z. Health Equity Assessment Toolkit (HEAT): software for exploring and comparing health inequalities in countries. BMC Med Res Methodol. 2016 October 19;16(1471–2288 [Electronic]):141.
7. Health Equity Assessment Toolkit (HEAT) Plus, Upload Database Edition [Internet]. Geneva: World Health Organization; 2017 (http://www.who.int/gho/health_equity/assessment_toolkit/en/index2.html, accessed 18 August 2017).
STATE OF HEALTH INEQUALITY: INDONESIA
4
1. Country context
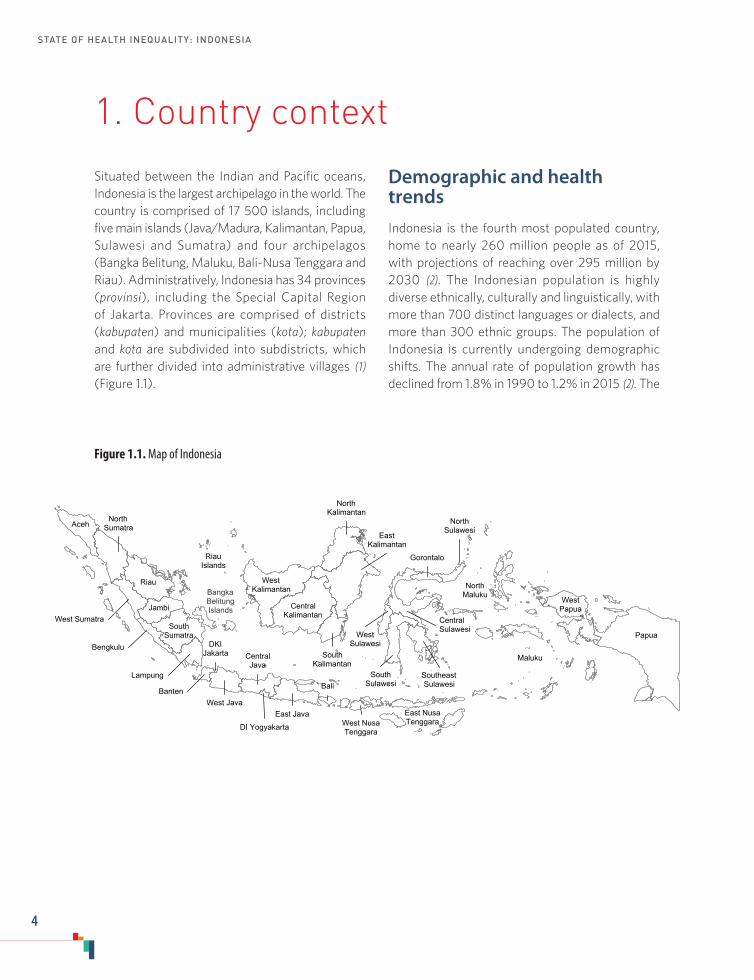
Situated between the Indian and Pacific oceans, Indonesia is the largest archipelago in the world. The country is comprised of 17 500 islands, including five main islands (Java/Madura, Kalimantan, Papua, Sulawesi and Sumatra) and four archipelagos (Bangka Belitung, Maluku, Bali-Nusa Tenggara and Riau). Administratively, Indonesia has 34 provinces (provinsi), including the Special Capital Region of Jakarta. Provinces are comprised of districts (kabupaten) and municipalities (kota); kabupaten and kota are subdivided into subdistricts, which are further divided into administrative villages (1) (Figure 1.1).
Demographic and health trendsIndonesia is the fourth most populated country, home to nearly 260 million people as of 2015, with projections of reaching over 295 million by 2030 (2). The Indonesian population is highly diverse ethnically, culturally and linguistically, with more than 700 distinct languages or dialects, and more than 300 ethnic groups. The population of Indonesia is currently undergoing demographic shifts. The annual rate of population growth has declined from 1.8% in 1990 to 1.2% in 2015 (2). The
Figure 1.1. Map of Indonesia
West Sumatra
WestPapua
West NusaTenggara
WestKalimantan
West Java
SouthSumatra
SouthKalimantan
RiauIslands
Riau
Papua
NorthSulawesi
NorthMaluku
Maluku
Lampung
Jambi
Gorontalo
East NusaTenggara
EastKalimantan
East Java
DKIJakarta
DI Yogyakarta
CentralKalimantan
CentralJava
Bengkulu
BantenBali
AcehNorth
Sumatra
NorthKalimantan
SouthSulawesi
SoutheastSulawesi
CentralSulawesi
WestSulawesi
BangkaBelitungIslands

1. Country context
5
proportion of the population in old age is increasing (5.1% of the population is aged 65 years or more) (2). Urbanization in Indonesia is among the fastest in Asia: between 2010 and 2015, the urban population grew by an average of 2.7% per year, with more than half of the population residing in cities in 2015 (3) (Table 1.1).
Indicators of overall health status in Indonesia have improved significantly, with life expectancy at birth increasing from 66.3 years in 2000 to 69.1 years in 2015 (4). There were great improvements in infant and child mortality, however, improvements in maternal mortality were slower and remain high (5,6). Currently, maternal, newborn and child health are among the top health priorities in Indonesia. To this end, Indonesia has made a host of national commitments, such as expanding universal coverage of maternal health services (7) and strengthening childhood immunization programmes (8), as well as global commitments,
Table 1.1. Trends in select demographic and health indicators, 1990–2015 (2–4)
Indicator name 1990 1995 2000 2005 2010 2015
Total population (million) 181.4 197.0 211.5 226.3 242.5 258.2
Population growth rate (annual %) 1.8 1.5 1.4 1.4 1.3 1.2
Population aged 65+ years (% of total) 3.8 4.2 4.7 4.8 4.8 5.1
Dependency ratio (population aged 0–14 and 65+ years per 100 population aged 15–64 years)
67.3 60.8 54.8 53.5 51.1 49.2
Population density (population per square kilometre) 100.2 108.7 116.8 125.1 133.9 142.5
Urban population (% of total) 30.6 36.1 42.0 45.9 49.9 53.7
Life expectancy at birth, both sexes (years) N/A N/A 66.3 67.2 68.1 69.1
Life expectancy at birth, female (years) N/A N/A 68.0 69.2 70.2 71.2
Life expectancy at birth, male (years) N/A N/A 64.6 65.3 66.1 67.1N/A = not available
such as the Sustainable Development Goals, which carry forward unfinished progress on maternal, newborn and child health from the United Nations Millennium Development Goals (9).
Patterns of disease epidemiology in Indonesia indicate an increasingly complex health situation (10). While communicable diseases remain a significant issue, NCDs are becoming more prevalent (11). In 2015, four of the top 10 leading causes of premature death were NCDs; five were communicable, maternal, neonatal and nutritional diseases, and one was injuries (12) (Figure 1.2). Neglected tropical diseases also constitute significant challenges within Indonesia, especially among the poor. The most widespread neglected tropical diseases in Indonesia include helminth infections such as soil-transmitted helminth infections and lymphatic filariasis, and neglected bacterial infections such as yaws and leptospirosis (13).

STATE OF HEALTH INEQUALITY: INDONESIA
6
Political landscape and developmentIndonesia has undergone sweeping changes to its political landscape since the late 1990s due to the formal process of decentralization. The country’s political transition away from authoritarianism through democratic and decentralized reforms began in 1999 with the passing of a law that relocated principal administrative powers from central to local governments (14). These changes have fundamentally impacted policy and decision-making processes internally, as well as internationally (15). Decentralization aimed to enhance responsiveness to local needs and promote a sustainable society; such outcomes have been realized to various extents across sectors. These aspirations, however, have been hindered by the varying levels of development, capacity and resources throughout the country, and the fragmentation of institutions and infrastructure (14,16).
Indonesia is emerging as a middle-income country and has experienced significant economic growth and an expanding middle class. For instance, the country’s human development index – a measure
of life expectancy, schooling and national income – increased steadily between 1990 and 2015, from 0.528 to 0.689 (17).
The national development process in Indonesia is guided by a long-term development plan (spanning 2005–2025) developed by the National Development Planning Agency (Badan Perencanaan Pembangunan Nasional/BAPPENAS). The main objectives of this plan include: establishing agriculture and mining as the primary products of the economy, with a globally competitive manufacturing sector and resilient service industry; increasing income per capita to US$ 6000 by 2025, with the proportion of poor people at 5% or less of the population; and reaching food self-sufficiency with nutritious food available for every household. Under this long-term plan, there is a series of four medium-term, 5-year plans (Rencana Pembangunan Jangka Menengah Nasional/RPJMN). Economic aspects of RPJMN-III (2015–2019) focus on infrastructure development and social assistance programmes targeting the poor, as well as pursuing economic growth alongside protecting natural resources and ecosystems.
Figure 1.2. Causes of premature death in Indonesia, 2015 (12)
0 400 800 1200 1600 2000 2400 2800 3200Years of life lost per 100 000 population
Stroke
Ischaemic heart disease
Tuberculosis
Lower respiratory infections
Diabetes mellitus
Preterm birth complications
Diarrhoeal diseases
Road injury
HIV/AIDS
Cirrhosis of the liver
Communicable, maternal, perinatal and nutritional conditionsNoncommunicable diseasesInjuries

1. Country context
7
Indonesia faces formidable challenges along its sustainable development path, particularly with regard to poverty and inequality. While poverty rates in Indonesia have fallen (the proportion of Indonesians living below the national poverty line decreased from 23.4% in 1999 to 11.3% in 2014), as of 2014, 29 million people lived below the national poverty line, with many millions more hovering just above (18). Interregional inequalities in Indonesia are growing, with considerable variation between districts and regions with regard to infrastructure, human resources, connectivity, etc. (19). The difficulties of addressing such inequalities are exacerbated by the uneven distribution of resources and services throughout the country, as well as the large and widespread nature of the Indonesian landmass and population.
Health sector overview
The current state of the health sector in Indonesia has been greatly shaped by the confluence of past and current political agendas and events, as well as transitions in governance structures (especially changes stemming from the decentralization process) (20). During the 1970s and 1980s, the Government of Indonesia prioritized the development of health-care infrastructure, with construction of thousands of health centres and hospitals. The national health system, Sistem Kesehatan Nasional (SKN), was initially instituted in 1982 (Ministry of Health Decree No. 99a/1982). SKN encompasses both private and public sectors, and provides guidance over the regulation of the health system, detailing health empowerment, financing and human resources management. SKN has been revised over the years to meet changing needs (20).
The Asian financial crisis of 1997 affected the Indonesian health sector, as public expenditures for health declined, driving up the prices of health services and resulting in worsened health status and increased levels of malnutrition in the population
(20). This event demonstrated the potential merits of a health insurance programme (21). After the process of decentralization, which began in the late 1990s, local governments were assigned increased control over managing health facilities and personnel, as well as how to implement health policies and programmes, and how to allocate their budgets to meet the health needs of the community (14,22). In 2004, the central government introduced Law 40/2004, making it mandatory for local governments to provide health insurance for all citizens, and especially the poor. In 2009, Health Law 36/2009 required that at least 5% of the total budget of the central government, and 10% of the total budget of the local government, be allocated to the health sector (14). In response to high out-of-pocket payments, the system was advanced to a national health insurance scheme under Law 24/2011 administered by the Healthcare Social Security Management Agency (Badan Penyelenggara Jaminan Sosial Kesehatan/BPJS Kesehatan), which is planned to roll out progressively, and achieve universal coverage by 2019 (14,21).
Health system organization
The health system in Indonesia centres around a primary health care model, which is provided through a continuum of care across administrative levels (11,23). At the village level, the provision of health-care services is community based, including integrated service posts (known as posyandu), village health posts (known as poskesdes), sub-health centres and mobile service units. These facilities offer the most basic primary health care services and provide referrals to other facilities.
Government health centres at the subdistrict level are known as puskesmas, which are particularly important at the community level as they serve as the gatekeeper for medical care as well as public health efforts. Puskesmas provide both curative and public health services, with a focus
STATE OF HEALTH INEQUALITY: INDONESIA
8
on essential service areas: health promotion; disease control and prevention; maternal and child health, and family planning; community nutrition; and environmental health (including water and sanitation) (11). Puskesmas provide inpatient and/or outpatient facilities. In each subdistrict, at least one puskesmas should be headed by a health professional, and a set of essential health workers should be stationed at the puskesmas (including one or more doctor, dentist, nurse, midwife, public health promoter, sanitarian, lab analyst, nutritionist and pharmacist) (24).
Hospitals, administered at district, provincial or central levels, play an important role in receiving the referral cases from more local levels of the health system, such as puskesmas. Hospitals are the main providers of curative care and employ a wider range of health professionals and specialists. The scope of services provided at hospitals ranges from teaching hospitals in major cities to district level hospitals that provide basic services and refer complicated cases.
In addition to the public system, there is a range of private health providers that operate across all levels of care. These include networks of hospitals and clinics managed by not-for-profit and charitable organizations and for-profit providers. There is a growing number of private hospitals in Indonesia: between 2011 and 2013, the number of for-profit private hospitals increased from 238 to 599 (20). Some doctors and midwives engage in dual practice – that is, they have a role in a private clinic as well as a public facility.
Health sector governance and planningHealth sector governance responsibilities span district, provincial and central governments (11). District governments are responsible for managing: district hospitals; the district public health network of puskesmas; and associated subdistrict facilities. Provincial governments are responsible for: managing provincial hospitals; providing technical oversight to provincial hospitals; providing technical and financing support to community-based health services and interventions; and monitoring and evaluation of district health services. They also coordinate cross-district health issues within the province. At the national level, tertiary (top-referral) hospitals provide the most advanced medical care. The central Ministry of Health is responsible for: managing certain tertiary and specialist hospitals; providing strategic direction for the health sector; setting health standards and regulations; and ensuring the availability of financial and human resources for health.
The health sector planning process in Indonesia combines top-down coordination with a strong tradition of bottom-up community participation (25,26). Thus, Indonesia has numerous, interrelated health sector plans, encompassing long-term, medium-term and annual plans, administered by central, provincial and district levels of governance. Notably, RPJMN-III – part of Indonesia’s national plan for development – specifies a number of medium-term health priorities for 2015–2019. These include 11 strategic issues, four major goals and 13 policy directions (Table 1.2). Over the course of the BAPPENAS long-term plan (2005–2025), the Ministry of Health aims to transition its services and programmes from curative/rehabilitative to promotive/preventive, as well as improve health service access and quality (27).

1. Country context
9
Table 1.2. Strategic issues, major goals and policy directions for Indonesia, as identified in RPJMN-III (2015–2019) (27,28)
Strategic issues Major goals Policy directions
1. To improve the health of mothers, children, adolescents and the ageing
2. To improve reproductive health and family planning
3. To improve the nutritional status of the community
4. To control diseases and improve environmental health
5. To fulfill the supplies of pharmaceutical, medical equipment and ensure the safety of food and drugs
6. To improve health promotion and increase community participation
7. To develop national health insurance8. To increase the access to primary health
care and quality referral services9. To ensure adequate human resources
for health10. To improve management, research and
development, and information11. To develop and increase the
effectiveness of health financing
1. Improved health status of the population
2. Improved community nutritional status3. Increased financial protection4. Increased equity in health services
1. Increase the access and quality of health services for mothers, children, adolescents and the ageing
2. Increase the access to and even coverage of quality family planning services
3. Increase the access to community nutrition services
4. Increase disease control and environmental health
5. Increase access to quality basic health services
6. Increase access to quality referral services
7. Increase the supply, distribution and quality of human resources for health
8. Increase the supply, coverage, equal distribution of quality pharmaceutical and medical equipment
9. Increase the control of drugs and food10. Increase health promotion and
community participation11. Strengthen management, research and
development and health information12. Develop and increase the effectiveness
of health financing13. Develop national health insurance
Health financing and social health insuranceNationally, health spending in Indonesia has been increasing rapidly in recent years: over the last eight years overall spending has increased by 222% (11). Between 2010 and 2014, the increase in health spending per capita (5.4%) was greater than the increase in gross domestic product (GDP) per capita (4.3%) (29). Despite this increase, health spending as a proportion of GDP remains below the average of low- and middle-income countries,
at 2.9% of GDP, and the private expenditure on health (62.2% of total expenditure on health) exceeds government expenditure (37.8% of total expenditure on health) (30). As of 2014, 46.9% of total expenditure on health was paid out of pocket (30).
The Government of Indonesia has administered a succession of social health insurance programmes to facilitate greater access to health services (11,21,31,32). In 1999, the Social Safety Net was established as a temporary measure in response
STATE OF HEALTH INEQUALITY: INDONESIA
10
to the 1997 financial crisis. The national programme Askeskin became operational in 2005, and was rebranded as Jamkesmas in 2008. These schemes provided coverage of basic health care in puskesmas and hospitals for people considered poor or near poor (with some exceptions for certain expensive diagnostic treatments). Alongside these programmes, locally administered health insurance programmes (called Jamkesda) operated in some areas, offering expanded coverage or benefits. In 2014, Jamkesmas and other social insurance programmes were merged under a single-payer national insurance programme, Jaminan Kesehatan Nasional (JKN), which is administered by BPJS Kesehatan. The legal statutes governing the programme imply that others, including informal workers, clients of providers and those covered by district/provincial health insurance, will eventually be covered by the new scheme. Coverage is planned to be incrementally expanded to reach universality by 2019, and provide a comprehensive benefit package with minimal user fees or co-payments. Increased spending on health through JKN is focused on curative care services and health infrastructure, with less emphasis on public health and prevention.
Health information systems
Indonesia has a national health information system, Sistem Informasi Kesehatan Nasional (SIKNAS), which is linked with provincial health information systems and district-level health information systems, Sistem Informasi Kesehatan Daerah (SIKDA) (11). SIKNAS was developed per the Ministry of Health Decree No. 511/Menkes/SK/V/2002, and consists of six subsystems: health services; health financing; health workforce; medicines and medical devices; community empowerment; and health management. SIKDA arose from the Ministry of Health Decree No. 932/2002; since decentralization, these systems have become fragmented such that hospitals, districts and municipalities often have multiple
systems that reflect various formats, software and datasets, and are of variable quality. The Centre for Data and Information (Pusat Data dan Informasi/PUSDATIN) in the Ministry of Health oversees the coordination of health information systems in Indonesia.
Vital registration in Indonesia is incomplete, though a variety of measures have been introduced to encourage improvements (11). A number of national health surveys, organized by IAHRD, supplement the incomplete vital registration system and collect a broader range of health information. These include: the National Health Indicator Survey (Survei Indikator Kesehatan Nasional /SIRKESNAS); Basic Health Research (Riset Kesehatan Dasar/RISKESDAS); and the Health Facility Survey (Riset Fasilitas Kesehatan/RIFASKES). Indonesia also uses the Sample Registration System for cause of death data. Additionally, Indonesia participates in the Demographic and Health Surveys programme (Survei Demografi dan Kesehatan Indonesia/SDKI) (33), which constitutes an important source of data for BPS.
References1. Kementerian Dalam Negeri Republik Indonesia.
Kode dan Data Wilayah Administrasi Pemerintahan (Permendagri No. 56–2015) [Internet]. 2017 (http://www.kemendagri.go.id/pages/data-wilayah, accessed 29 September 2017).
2. World population prospects: the 2017 revision [Internet]. New York: United Nations, Department of Economic and Social Affairs, Population Division; 2017 (https://esa.un.org/unpd/wpp/Download/Standard/Population/, accessed 10 November 2017).
3. World urbanization prospects: the 2014 revision [Internet]. New York: United Nations, Department of Economic and Social Affairs, Population Division; 2014 (https://esa.un.org/unpd/wup/CD-ROM , accessed 10 November 2017).
4. Global Health Observatory, Life Expectancy [Internet]. Geneva: World Health Organization; 2017 (http://apps.who.int/gho/data/node.main.688, accessed 10 November 2017).
1. Country context
11
5. Global Health Observatory, Mortality and Global Health Estimates [Internet]. Geneva: World Health Organization; 2017 (http://apps.who.int/gho/data/node.main.686?lang=en, accessed 10 November 2017).
6. Remarkable progress, new horizons and renewed commitment: ending preventable maternal, newborn and child deaths in the South-East Asia Region [Internet]. New Dehli: WHO Regional Office for South-East Asia, World Health Organization; 2016 (http://www.searo.who.int/entity/child_adolescent/topics/child_health/9789290225294.pdf?ua=1, accessed 14 August 2017).
7. World Bank Group. Universal maternal health coverage? Assessing the readiness of public health facilities to provide maternal health care in Indonesia. Jakarta: World Bank; 2014.
8. Comprehensive multi-year plan: National Immunization Program Indonesia, 2010–2014. Jakarta: Ministry of Health Republic of Indonesia; 2010.
9. United Nations General Assembly. Transforming our world: the 2030 agenda for sustainable development. New York, United Nations, 2015.
10. Dorkin D, Li R, Marzoeki P, Pambudi E, Tandon A, Yap WA. Health sector review: supply-side readiness. National Institute of Health Research (NIHRD) and World Bank; Jakarta and New York; 2014.
11. Asia Pacific Observatory on Health Systems and Policies. The Republic of Indonesia health system review. New Delhi: WHO Regional Office for South-East Asia, World Health Organization; 2017.
12. Global Health Estimates 2015: Disease Burden by Cause, Age, Sex, by Country and by Region, 2000-2015 [Internet]. Geneva, World Health Organization; 2016 (http://www.who.int/healthinfo/global_burden_disease/estimates/en/index2.html, accessed 10 November 2017).
13. Tan M, Kusriastuti R, Savioli L, Hotez PJ. Indonesia: an emerging market economy beset by neglected tropical diseases (NTDs). PLOS Negl Trop Dis. 2014 February 27;8(2):e2449.
14. Holzhacker RL, Wittek R, Woltjer J, editors. Decentralization and governance in Indonesia [Internet]. Cham: Springer International Publishing; 2016 (http://link.springer.com/10.1007/978-3-319-22434-3, accessed 2 July 2017).
15. Asian Development Bank Independent Evaluation Department. Special evaluation study on Asian Development Bank support for decentralization in Indonesia [Internet]. Manila: Asian Development Bank; 2010 (https://www.adb.org/sites/default/files/evaluation-document/35412/files/ses-ino-2010-15.pdf, accessed 5 July 2017).
16. Rokx C, Schieber G, Harimurti P, Tandon A, Somanathan A. Health financing in Indonesia: a roadmap for reform [Internet]. Washington (DC): World Bank; 2009 (http://elibrary.worldbank.org/doi/book/10.1596/978-0-8213-8006-2, accessed 7 July 2017).
17. United Nations Development Programme, editor. Human development report: human development for everyone. New York: United Nations; 2016.
18. Poverty & Equity Data: Indonesia [database] [Internet]. Washington (DC): World Bank (http://povertydata.worldbank.org/poverty/country/IDN, accessed 5 July 2017).
19. Structural policy country notes: Indonesia [Internet]. Paris: Organisation for Economic Co-operation and Development; 2013 (https://www.oecd.org/dev/asia-pacific/Indonesia.pdf, accessed 14 August 2017).
20. Pribadi K. The health care system in Indonesia. In: Aspaltar C, Pribadi K, Gauld R, editors. Health care systems in developing countries in Asia. Abingdon: Taylor & Francis; 2017:131–48.
21. Pisani E, Olivier Kok M, Nugroho K. Indonesia’s road to universal health coverage: a political journey. Health Policy Plan. 2016 September 6;czw120.
22. Heywood PF, Harahap NP. Human resources for health at the district level in Indonesia: the smoke and mirrors of decentralization. Hum Resour Health [Internet]. 2009 December 7(1) (http://human-resources-health.biomedcentral.com/articles/10.1186/1478-4491-7-6, accessed 1 August 2017).
23. Joint Committee on Reducing Maternal and Neonatal Mortality in Indonesia; Development, Security, and Cooperation, Policy and Global Affairs; National Research Council; Indonesian Academy of Sciences. Reducing maternal and neonatal mortality in Indonesia: saving lives, saving the future [Internet]. Washington (DC): National Academies Press; 2013 (http://www.nap.edu/catalog/18437, accessed 1 August 2017).
24. Ministry of Health Decree No. 75/2014. Jakarta: Ministry of Health Republic of Indonesia; 2014.
25. Sujarwoto S, Tampubolon G. Mother’s social capital and child health in Indonesia. Soc Sci Med. 2013 August;91:1–9.
26. Beard VA. Individual determinants of participation in community development in Indonesia. Environ Plan C Gov Policy. 2005 February;23(1):21–39.
27. WHO Country Cooperation Strategy 2014–2019: Indonesia [Internet]. New Delhi: WHO Regional Office for South-East Asia, World Health Organization; 2016 (http://apps.who.int/iris/bitstream/10665/250550/1/ccs_idn_2014_2019_en.pdf, accessed 7 July 2017).

STATE OF HEALTH INEQUALITY: INDONESIA
12
28. Rencana Strategis Kementerian Kesehatan Tahun 2015–2019 [Internet]. Jakarta: Kementerian Kesehatan Republik Indonesia; 2015 (http://www.depkes.go.id/resources/download/info-publik/Renstra-2015.pdf, accessed 23 October 2017).
29. Health at a glance: Asia/Pacific 2016. (OECD READ edition) [Internet]. OECD Library. Paris: Organisation for Economic Co-operation and Development; 2016 (http://www.keepeek.com/Digital-Asset-Management/oecd/social-issues-migration-health/health-at-a-glance-asia-pacific-2016_health_glance_ap-2016-en, accessed 18 August 2017).
30. Global Health Observatory, Health Financing [Internet]. Geneva: World Health Organization; 2017 (http://apps.who. int /gho/data/node.main.484?lang=en, accessed 10 November 2017).
31. Harimurti P, Pambudi E, Pigazzini A, Tandon A. The nuts and bolts of Jamkesmas, Indonesia’s government-financed health coverage program for the poor and near-poor. Washington (DC): World Bank; 2013 (https://openknowledge.worldbank.org/handle/10986/13304, accessed 2 July 2017).
32. Aspinall E. Health care and democratization in Indonesia. Democratization. 2014 July 29;21(5):803–23.
33. Indonesia Demographic and Health Survey 2012 [Internet]. Jakarta: Statistics Indonesia (BPS), National Population and Family Planning Board (BKKBN), Kementerian Kesehatan (KEMENKES), ICF International; 2013 (http://dhsprogram.com/PUBS/PDF/fr275/fr275.pdf, accessed 17 August 2017).

2. Methods
13
2. Methods
Health indicators
This report covers a total of 53 health indicators within 11 health topics (Table 2.1). Indicators were selected for inclusion in the report based on data availability, and relevance and importance to the health topic. Data about the health indicator were available nationally, and could be disaggregated by one or more dimensions of inequality. The relevance and importance of the indicator to the health topic was determined through consultations with Indonesian health experts in each topic. When selecting which indicators to include in the report, consideration was given to both the Indonesian context and global initiatives. For each health
topic, diverse indicators were chosen to represent different aspects of the topic.
Detailed information about each indicator, including its description, definition and data source, is available in the chapter about the corresponding health topic. Many of the indicators featured in the report reflect standardized definitions; for example, child malnutrition and child mortality indicators have common definitions that are widely applied globally (1,2). For some indicators, definitions have been adapted for suitability within the Indonesian context, such as several NCD, mental health and behavioural risk factors indicators and environmental health indicators. Other indicators,
Table 2.1. Health topics and indicators
Health topic Indicator
PHDI PHDI (overall); reproductive and maternal health sub-index; newborn and child health sub-index; infectious diseases sub-index; environmental health sub-index; NCDs sub-index; health risk behaviour sub-index; health services provision sub-index
Reproductive health contraceptive prevalence – modern methods; demand for family planning satisfied; adolescent fertility rate; total fertility rate; female genital mutilation
Maternal, newborn and child health
antenatal care coverage – at least four visits; births attended by skilled health personnel; postnatal care coverage for mothers; postnatal care coverage for newborns; early initiation of breastfeeding; exclusive breastfeeding; vitamin A supplementation coverage; low birth weight prevalence
Childhood immunization BCG immunization coverage; measles immunization coverage; DPT-HB immunization coverage; polio immunization coverage; complete basic immunization coverage
Child malnutrition stunting prevalence; underweight prevalence; wasting prevalence; overweight prevalence
Child mortality neonatal mortality; infant mortality; under-five mortality
Infectious diseases leprosy prevalence; malaria prevalence; tuberculosis prevalence
Environmental health access to improved sanitation; access to improved drinking-water
NCDs, mental health and behavioural risk factors
diabetes mellitus prevalence; mental emotional disorders prevalence; hypertension prevalence; smoking prevalence (both sexes); smoking prevalence in females; smoking prevalence in males; low fruit and vegetable consumption prevalence
Disability and injury disability prevalence; injury prevalence
Health facility and personnel subdistricts with a health centre; basic amenities readiness in puskesmas; health centres with sufficient number of dentists; health centres with sufficient number of general practitioners; health centres with sufficient number of midwives; health centres with sufficient number of nurses

STATE OF HEALTH INEQUALITY: INDONESIA
14
such as the PHDI and sub-indices, were developed specifically for application in Indonesia (3,4).
For a complete list of health topics and indicators, including the corresponding data sources and dimensions of inequality for each indicator, see Appendix table 1.
Dimensions of inequality
Health inequalities were explored according to several dimensions of inequality, as per data availability. Namely, health indicator data were disaggregated by economic status, education, occupation, employment status, place of
residence, age, sex and/or subnational region. The categorization of each dimension of inequality is provided in Table 2.2. Note that some dimensions have alternate categorization across indicators, which may result in different numbers of subgroups.
Economic status was determined at the household level using a wealth index calculated based on the ownership of assets and housing characteristics. For indicators related to newborn and child health, childhood immunization, child malnutrition and child mortality, education level reflects the highest level obtained by the child’s mother. An overview of the dimensions of inequality that were explored for each health indicator can be found in Appendix table 1.
Table 2.2. Dimensions of inequality and subgroup categorization
Dimension of inequality Subgroup categorization
Economic status five subgroups: quintile 1 (poorest); quintile 2; quintile 3; quintile 4; and quintile 5 (richest)
Education six subgroups (used for most indicators): no education; incomplete primary school; primary school; junior high school; high school; and diploma or higherthree subgroups (used for reproductive health and child mortality indicators): no education; primary school; and secondary school or higher
Occupation five subgroups: employee; entrepreneur; farmer/fisherman/labourer; not working; and other
Employment status two subgroups: not working and working
Place of residence two subgroups: rural and urban
Age three subgroups (all ages) (used for maternal, newborn and child health indicators): <20 years; 20–34 years; and 35+ yearssix subgroups (0–59 months) (used for child malnutrition indicators): 0–5 months; 6–11 months; 12–23 months; 24–35 months; 36–47 months; and 48–59 monthssix subgroups (15+ years) (used for diabetes and tuberculosis prevalence): 15–24 years; 25–34 years; 35–44 years; 45–54 years; 55–64 years; and 65+ yearsseven subgroups (10+ years) (used for low fruit and vegetable consumption and smoking prevalence): 10–14 years; 15–24 years; 25–34 years; 35–44 years; 45–54 years; 55–64 years; and 65+ yearsseven subgroups (15+ years) (used for hypertension, malaria and mental emotional disorders prevalence: 15–24 years; 25–34 years; 35–44 years; 45–54 years; 55–64 years; 65–74 years; and 75+ years10 subgroups (all ages) (used for injury prevalence): <1 year; 1–4 years; 5–14 years; 15–24 years; 25–34 years; 35–44 years; 45–54 years; 55–64 years; 65–74 years; and 75+ years11 subgroups (15+ years) (used for disability prevalence): 15–19 years; 20–24 years; 25–29 years; 30–34 years; 35–39 years; 40–44 years; 45–49 years; 50–54 years; 55–59 years; 60–64 years; and 65+ years
Sex two subgroups: female and male
Subnational region 33/34 subgroups (used for most indicators): Aceh; Bali; Bangka Belitung Islands; Banten; Bengkulu; Central Java; Central Kalimantan; Central Sulawesi; DI Yogyakarta; DKI Jakarta; East Java; East Kalimantan; East Nusa Tenggara; Gorontalo; Jambi; Lampung; Maluku; North Kalimantan*; North Maluku; North Sulawesi; North Sumatra; Papua; Riau; Riau Islands; South Kalimantan; South Sulawesi; South Sumatra; Southeast Sulawesi; West Java; West Kalimantan; West Nusa Tenggara; West Papua; West Sulawesi; and West Sumatrathree subgroups (used for tuberculosis prevalence): Java-Bali; Sumatra; and others
* The province North Kalimantan was created in 2012; thus, data for North Kalimantan are available from 2014.

2. Methods
15
Data sources
This report drew from various data sources that contain information about health indicators as well as dimensions of inequality in the Indonesian population (Table 2.3).
• The Demographic and Health Surveys (DHS) is a large-scale, nationally representative household survey, administered on a routine basis using face-to-face interviews (5,6). The 2012 Indonesia DHS used a stratified, two-stage cluster sampling design (7). Interviews were conducted with women aged 15–49 years to obtain information about reproductive health and child mortality indicators used in this report.
• The 2011 RIFASKES was the source of data about basic amenities readiness in puskesmas indicator. RIFASKES was conducted by IAHRD, covering all public facilities administered at central provincial and district levels. Data collection techniques included interviews, observation and secondary sources. Three public health faculties at the University of Indonesia, Airlangga University and Hasanuddin University provided independent validation of the data (8).
• The 2013 RISKESDAS was a major data source for many health indicators featured in this report. This survey, coordinated by IAHRD, covers 300 000 households and is nationally representative. Data are collected at the household and individual level, and cover multiple health topics across 18 modules (9).
• Routine reports from 2015 were the data source for the leprosy prevalence indicator, as well as several indicators related to health facility and
personnel. The routine reports used as data sources in this report are managed by the Ministry of Health Centre for Data and Information (data about leprosy prevalence and subdistricts with a health centre) and the National Board for Health Human Resources Development and Empowerment (data about health personnel sufficiency at health centres).
• The 2015 National Socioeconomic Survey (Survei Sosial Ekonomi Nasional/SUSENAS) was the data source for environmental health indicators, and provided data for the PHDI (overall) indicator. Conducted by BPS, SUSENAS is a multipurpose, nationally representative household survey that covers 300 000 households in all subdistricts of all provinces. Surveys consist of a core questionnaire about socioeconomic information, as well as modules that cover additional information, including health (10).
• Data about tuberculosis prevalence were derived from the 2014 Tuberculosis Prevalence Survey. The National Tuberculosis Prevalence Survey originated as a module of SUSENAS in 2004. In 2013–2014, the Tuberculosis Prevalence Survey was conducted in collaboration with the WHO Global Task Force on Tuberculosis Impact Measurement, and consists of questions plus chest x-ray, sputum culture and rapid molecular testing (9).
• The 2011 Village Potential Survey (Potensi Desa/PODES) provided data for part of the PHDI (overall) indicator. PODES obtains data at the village level about the potential and performance of health workforce and facilities. PODES includes data collected through interviews with leaders of villages and city block (11).
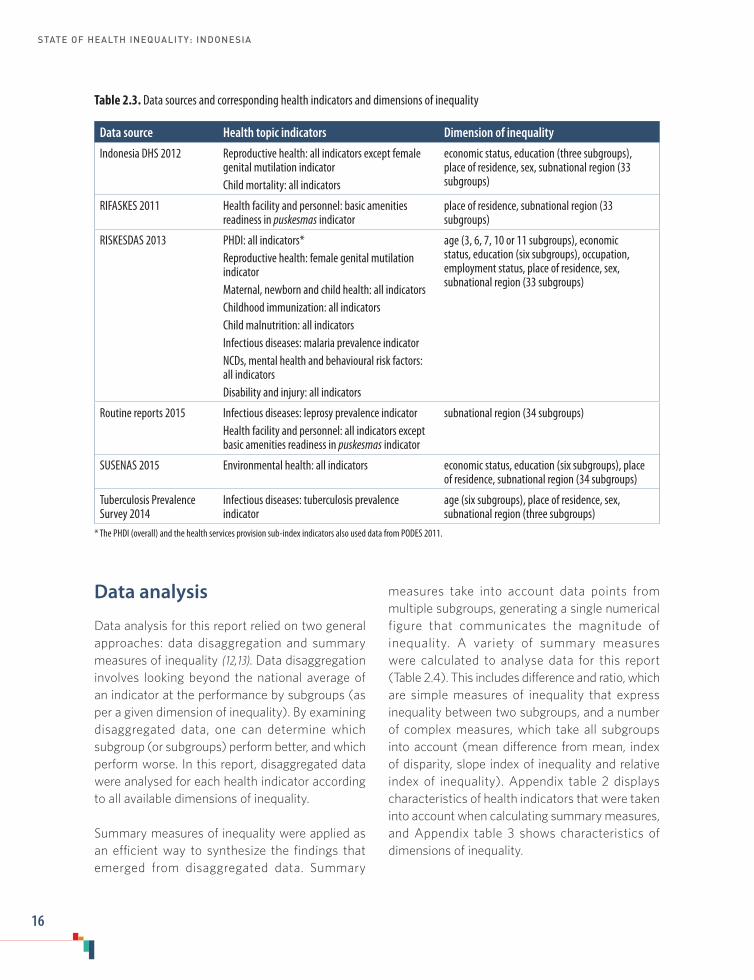
STATE OF HEALTH INEQUALITY: INDONESIA
16
Table 2.3. Data sources and corresponding health indicators and dimensions of inequality
Data source Health topic indicators Dimension of inequality
Indonesia DHS 2012 Reproductive health: all indicators except female genital mutilation indicatorChild mortality: all indicators
economic status, education (three subgroups), place of residence, sex, subnational region (33 subgroups)
RIFASKES 2011 Health facility and personnel: basic amenities readiness in puskesmas indicator
place of residence, subnational region (33 subgroups)
RISKESDAS 2013 PHDI: all indicators* Reproductive health: female genital mutilation indicatorMaternal, newborn and child health: all indicatorsChildhood immunization: all indicatorsChild malnutrition: all indicatorsInfectious diseases: malaria prevalence indicatorNCDs, mental health and behavioural risk factors: all indicatorsDisability and injury: all indicators
age (3, 6, 7, 10 or 11 subgroups), economic status, education (six subgroups), occupation, employment status, place of residence, sex, subnational region (33 subgroups)
Routine reports 2015 Infectious diseases: leprosy prevalence indicatorHealth facility and personnel: all indicators except basic amenities readiness in puskesmas indicator
subnational region (34 subgroups)
SUSENAS 2015 Environmental health: all indicators economic status, education (six subgroups), place of residence, subnational region (34 subgroups)
Tuberculosis Prevalence Survey 2014
Infectious diseases: tuberculosis prevalence indicator
age (six subgroups), place of residence, sex, subnational region (three subgroups)
* The PHDI (overall) and the health services provision sub-index indicators also used data from PODES 2011.
Data analysis
Data analysis for this report relied on two general approaches: data disaggregation and summary measures of inequality (12,13). Data disaggregation involves looking beyond the national average of an indicator at the performance by subgroups (as per a given dimension of inequality). By examining disaggregated data, one can determine which subgroup (or subgroups) perform better, and which perform worse. In this report, disaggregated data were analysed for each health indicator according to all available dimensions of inequality.
Summary measures of inequality were applied as an efficient way to synthesize the findings that emerged from disaggregated data. Summary
measures take into account data points from multiple subgroups, generating a single numerical figure that communicates the magnitude of inequality. A variety of summary measures were calculated to analyse data for this report (Table 2.4). This includes difference and ratio, which are simple measures of inequality that express inequality between two subgroups, and a number of complex measures, which take all subgroups into account (mean difference from mean, index of disparity, slope index of inequality and relative index of inequality). Appendix table 2 displays characteristics of health indicators that were taken into account when calculating summary measures, and Appendix table 3 shows characteristics of dimensions of inequality.

2. Methods
17
Table 2.4. Overview of summary measures of inequality applied to calculate health inequalities
Summary measure Description Application in report
Difference Shows the absolute inequality between two subgroups: the mean value of a health indicator in one subgroup is subtracted from the mean value of that health indicator in another subgroup
All dimensions except age
Ratio Shows the relative inequality between two subgroups: the mean value of a health indicator in one subgroup is divided by the mean value of that health indicator in another subgroup
All dimensions except age
Mean difference from mean
Shows the difference, on average, of each subgroup from the population mean
Non-ordered dimensions with more than two subgroups (occupation and subnational region)
Index of disparity Shows the mean difference from mean measure (above) expressed as a percentage of the overall mean
Non-ordered dimensions with more than two subgroups (occupation and subnational region)
Slope index of inequality Shows the absolute difference in predicted values of a health indicator between those that are the most advantaged (e.g. richest or most-educated subgroup) and those that are the most disadvantaged (e.g. the poorest or least-educated subgroup)
Ordered dimensions with more than two subgroups (economic status and education)
Relative index of inequality Shows the relative difference in predicted values of a health indicator between those that are the most advantaged (e.g. richest or most-educated subgroup) and those that are the most disadvantaged (e.g. the poorest or least-educated subgroup)
Ordered dimensions with more than two subgroups (economic status and education)
HEAT Plus served as the primary platform to calculate summary measures of inequality (14). This software, the upload database edition of HEAT (15), is publicly available, and facilitates within-country health inequality analysis, including exploration of disaggregated data and the calculation of summary measures of inequality. For this report, the data were prepared according to the specific template for HEAT Plus, which requires disaggregated data estimates, as well as a number of other mandatory variables (16). These datasets were uploaded directly into the HEAT Plus software, which was used to calculate summary measures of inequality for this report. The explore inequality component of the software was used to view the data in tabular and graphical formats, and assess inequalities.
Interpretation, assessing priorities and policy implicationsFollowing quantitative analyses, a complementary process was undertaken to understand the relevancy and application of the findings in the Indonesian context. A group of subject matter experts with expertise in various health topics and broad knowledge of the health system in Indonesia each assessed the importance of the findings within their area of expertise. Experts used a “traffic-light” system to assign priority levels to each indicator for the national average, difference value and ratio value. (A traffic light system assigns red in situations of high priority, yellow for medium priority and

STATE OF HEALTH INEQUALITY: INDONESIA
18
green for low priority.) In some cases, the subject matter experts developed criteria to guide this assessment. When applicable and available, priority assignments took into consideration benchmarking (comparisons) of results with other settings and health topics, national and global priorities, and trends over time. Policy implications of the findings were developed through literature reviews of academic literature, health reports and grey literature, and through consultation with subject matter experts. The suggested implications of the report were further corroborated through wider consultation with policy-makers in Indonesia.
Reporting
This report adopted an audience-conscious approach to reporting, aiming to present health inequality analyses in a manner that is concise, easy to comprehend and relevant. Additionally, the conclusions of the report are presented in a way that is supported by high-quality evidence. A guiding template for reporting was developed and applied for each of the 11 health topics, integrating text, tables and figures. First, background information was provided about the topic and corresponding indicators, followed by specific descriptions of each of the indicators. Then, key findings across each dimension of inequality were presented, referencing simple measures of inequality to highlight the magnitude of inequality. (Supplementary tables S1–S4 show relevant summary measures of inequality – simple and complex – for each health indicator.) Next, the findings were situated within the current context by identifying priority areas and policy implications. Detailed information about each health indicator was added to the indicator profiles appended to each topic: these profiles display figures showing disaggregated data by all applicable dimensions of inequality, and provide additional technical information such as the data source, indicator definition and national average. Electronic data visuals accompany the report, allowing the reader to access and explore disaggregated data in an interactive format.
References1. Nutrition Landscape Information System (NLIS)
country profile indicators: interpretation guide [Internet]. Geneva: World Health Organization; 2010 (http://www.who.int/nutrition/nlis_interpretation_guide.pdf, accessed 3 August 2017).
2. Global Health Observatory. Indicator Metadata Registry [Internet]. Geneva: World Health Organization; 2017 (http://apps.who.int/gho/data/node.wrapper.imr?x-id=1, accessed 16 August 2017).
3. Hidayangsih PS, Hapsari D, Ma’ruf NA. Formulation of the Indonesian Public Health Development Index. Bul Penelit Sist Kesehat [Internet]. 2011 April 2;14 (http://ejournal.litbang.kemkes.go.id/index.php/hsr/article/view/2316, accessed 5 August 2017).
4. National Institute of Health Research and Development. Public Health Development Index [Internet]. Jakarta: Ministry of Health Republic of Indonesia; 2014 (http://labmandat.litbang.depkes.go.id/images/download/publikasi/IPKM_2013_C3.pdf, accessed 5 August 2017).
5. Corsi DJ, Neuman M, Finlay JE, Subramanian SV. Demographic and health surveys: a profile. Int J Epidemiol. 2012 December;41(1464–3685 [Electronic]):1602–13.
6. Demographic and Health Surveys Program [Internet]. Washington (DC): United States Agency for International Development; 2017 (dhsprogram.com, accessed 17 August 2017).
7. Indonesia Demographic and Health Survey 2012 [Internet]. Jakarta: Statistics Indonesia (BPS), National Population and Family Planning Board (BKKBN), Kementerian Kesehatan (KEMENKES), ICF International; 2013 (http://dhsprogram.com/PUBS/PDF/fr275/fr275.pdf, accessed 17 August 2017).
8. World Bank Group. Universal maternal health coverage? Assessing the readiness of public health facilities to provide maternal health care in Indonesia. Jakarta: World Bank; 2014.
9. Asia Pacific Observatory on Health Systems and Policies. The Republic of Indonesia health system review. New Delhi: WHO Regional Office for South-East Asia, World Health Organization, 2017.
10. SUSENAS [Internet]. Jakarta: Government of Indonesia; 2017 (https://www.rand.org/labor/bps/susenas.html, accessed 17 August 2017).
11. Rokx C, Schieber G, Harimurti P, Tandon A, Somanathan A. Health financing in Indonesia: a roadmap for reform [Internet]. Washington (DC): World Bank; 2009 (http://elibrary.worldbank.org/doi/book/10.1596/978-0-8213-8006-2, accessed 7 July 2017).

2. Methods
19
12. Handbook on health inequality monitoring: with a special focus on low- and middle-income countries. Geneva: World Health Organization; 2013.
13. National health inequality monitoring: a step-by-step manual. Geneva: World Health Organization; 2017.
14. Health Equity Assessment Toolkit Plus (HEAT Plus): software for exploring and comparing health inequalities in countries. Upload Database Edition. Version 1.0 [Internet]. Geneva: World Health Organization; 2017 (http://www.who.int/gho/health_equity/assessment_toolkit/en/index2.html, accessed 7 July 2017).
15. Hosseinpoor AR, Nambiar D, Schlotheuber A, Reidpath D, Ross Z. Health Equity Assessment Toolkit (HEAT): software for exploring and comparing health inequalities in countries. BMC Med Res Methodol. 2016 October 19;16(1):141.
16. Health Equity Assessment Toolkit Plus (HEAT Plus) user manual [Internet]. Geneva: World Health Organization; 2017 (http://www.who.int/gho/health_equity/heat_plus_user_manual.pdf?ua=1, 22 August 2017).
STATE OF HEALTH INEQUALITY: INDONESIA
20
3. Public health development indices
The development of health indicator indices for high-level monitoring offers a concise way to summarize progress in community-based health services across one or more health topics. The PHDI has been used as one of the health monitoring tools in Indonesia since it was first initiated in 2008. In 2010, the Indonesian Ministry of Health released a decree establishing the PHDI to compare and monitor health across districts and provinces (1798/Menkes/SKI/XII/2010). The PHDI combines indicators of several community-based health services, outcomes and determinants in a single metric; indicators were selected based on their simplicity, ease of measurement, credibility and timeliness. Taken together, the indicators that comprise the PHDI collectively demonstrate the impact of health development, and serve as a reference for current and forthcoming health development programmes (1).
The index was designed to be used for ranking districts by their level of public health development progress, thereby serving as an advocacy and accountability tool for the Ministry of Health. For instance, a 2012 Ministry of Health Decree (027/Tahun/2012) called for mentoring for districts that reported low PHDI scores and high rates of poverty. As a result, a 2013 Ministry of Health Decree (220/Menkes/SK/VI/2013) delegated mentoring responsibilities across Ministry of Health units (echelon 1).
The PHDI was developed through a consultative process that involved experts within IAHRD, as well as other stakeholders across various programmes, sectors and professional organizations. Alternate
versions and iterations of the PHDI and related sub-indices have been developed, tested and improved over time (2). For example, the 2007 PHDI, calculated based on 24 indicators, was revised in 2013 to include 30 indicators, which were divided into seven sub-indices.
Public health development indices indicatorsThe index indicators featured in this chapter are composite indicators, composed of several health indicators related to a common topic. The overall PHDI is comprised of 30 indicators across multiple health topics, whereas each of the seven sub-indices is comprised of two to six indicators related to the specific topic. The higher the index number, the better the performance in that health topic. Note that the indices account for indicators where progress is measured in opposite directions, that is, rescaling was applied for disease prevalence (where a lower value is desirable) to have the same direction as service coverage (where a higher value is desirable).
A total of 30 individual indicators comprise the eight indices in this chapter (Table 3.1). Each of these 30 indicators was assigned a weight of 3, 4 or 5 based on their impact on health status, urgency, difficulty to overcome and population exposure. Weights were assigned based on experts’ consensus. The index values in this report, originally scaled from 0–1, were multiplied by 100 and expressed as percentage.
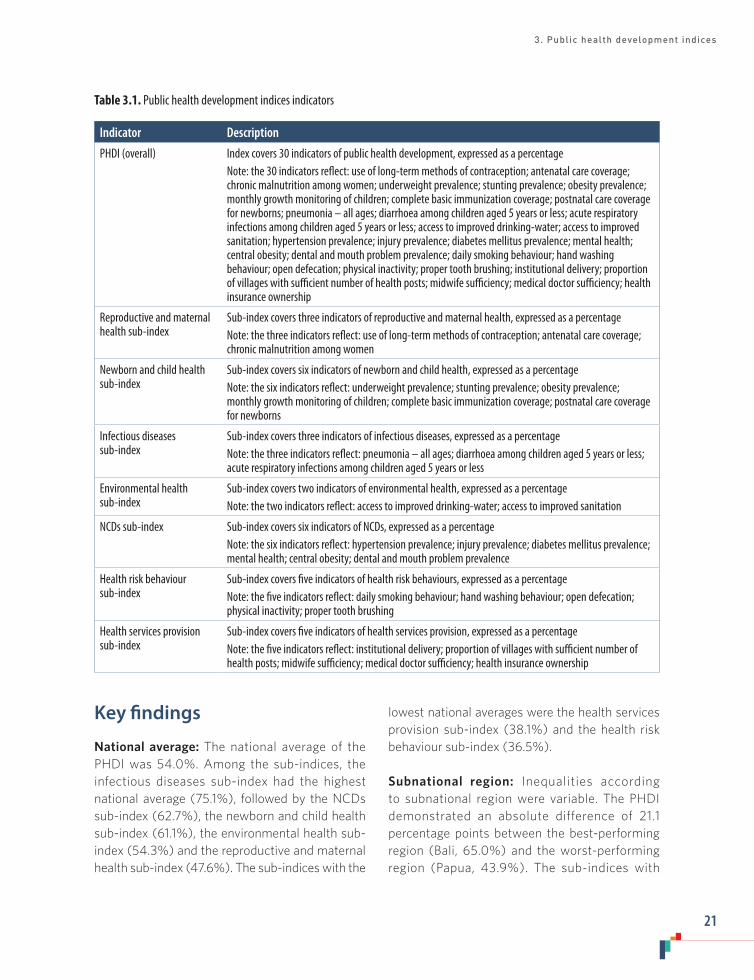
3. Public health development indices
21
Table 3.1. Public health development indices indicators
Indicator Description
PHDI (overall) Index covers 30 indicators of public health development, expressed as a percentageNote: the 30 indicators reflect: use of long-term methods of contraception; antenatal care coverage; chronic malnutrition among women; underweight prevalence; stunting prevalence; obesity prevalence; monthly growth monitoring of children; complete basic immunization coverage; postnatal care coverage for newborns; pneumonia – all ages; diarrhoea among children aged 5 years or less; acute respiratory infections among children aged 5 years or less; access to improved drinking-water; access to improved sanitation; hypertension prevalence; injury prevalence; diabetes mellitus prevalence; mental health; central obesity; dental and mouth problem prevalence; daily smoking behaviour; hand washing behaviour; open defecation; physical inactivity; proper tooth brushing; institutional delivery; proportion of villages with sufficient number of health posts; midwife sufficiency; medical doctor sufficiency; health insurance ownership
Reproductive and maternal health sub-index
Sub-index covers three indicators of reproductive and maternal health, expressed as a percentageNote: the three indicators reflect: use of long-term methods of contraception; antenatal care coverage; chronic malnutrition among women
Newborn and child health sub-index
Sub-index covers six indicators of newborn and child health, expressed as a percentageNote: the six indicators reflect: underweight prevalence; stunting prevalence; obesity prevalence; monthly growth monitoring of children; complete basic immunization coverage; postnatal care coverage for newborns
Infectious diseases sub-index
Sub-index covers three indicators of infectious diseases, expressed as a percentageNote: the three indicators reflect: pneumonia – all ages; diarrhoea among children aged 5 years or less; acute respiratory infections among children aged 5 years or less
Environmental health sub-index
Sub-index covers two indicators of environmental health, expressed as a percentageNote: the two indicators reflect: access to improved drinking-water; access to improved sanitation
NCDs sub-index Sub-index covers six indicators of NCDs, expressed as a percentageNote: the six indicators reflect: hypertension prevalence; injury prevalence; diabetes mellitus prevalence; mental health; central obesity; dental and mouth problem prevalence
Health risk behaviour sub-index
Sub-index covers five indicators of health risk behaviours, expressed as a percentageNote: the five indicators reflect: daily smoking behaviour; hand washing behaviour; open defecation; physical inactivity; proper tooth brushing
Health services provision sub-index
Sub-index covers five indicators of health services provision, expressed as a percentageNote: the five indicators reflect: institutional delivery; proportion of villages with sufficient number of health posts; midwife sufficiency; medical doctor sufficiency; health insurance ownership
Key findings
National average: The national average of the PHDI was 54.0%. Among the sub-indices, the infectious diseases sub-index had the highest national average (75.1%), followed by the NCDs sub-index (62.7%), the newborn and child health sub-index (61.1%), the environmental health sub-index (54.3%) and the reproductive and maternal health sub-index (47.6%). The sub-indices with the
lowest national averages were the health services provision sub-index (38.1%) and the health risk behaviour sub-index (36.5%).
Subnational region: Inequalities according to subnational region were variable. The PHDI demonstrated an absolute difference of 21.1 percentage points between the best-performing region (Bali, 65.0%) and the worst-performing region (Papua, 43.9%). The sub-indices with
STATE OF HEALTH INEQUALITY: INDONESIA
22
the highest absolute inequality were the NCDs sub-index (60.0 percentage points, ranging from 15.6% in South Sulawesi to 75.6% in Lampung) and the environmental health sub-index (58.3 percentage points, ranging from 25.0% in Papua to 83.3% in DKI Jakarta). The NCDs sub-index revealed six subnational regions that performed very poorly (under 30%). The infectious diseases sub-index and the health services provision sub-index had absolute inequality of 50.8 percentage points and 48.2 percentage points, respectively. In four subnational regions, the health services provision sub-index was less than 20%; the worst-performing region was South Kalimantan at 14.1%. Absolute inequality in the other three sub-indices were 38.9 percentage points for reproductive and maternal health, 29.6 percentage points for health risk behaviour and 15.2 percentage points for newborn and child health.
The subnational regions that tended to perform well (i.e. in the top five subnational regions for at least four of the seven sub-indices) included Bali, DI Yogyakarta and DKI Jakarta. Subnational regions that tended to perform poorly across the sub-indices were South Kalimantan (among the bottom five subnational regions for six of the seven indicators), as well as Central Kalimantan and Gorontalo (among the bottom five subnational regions for four of the seven indicators). Both West Kalimantan and West Sulawesi were among the top-performing subnational regions for the health risk behaviour sub-index, but were among the bottom-performing subnational regions for the newborn and child health sub-index. Subnational regions that had high scores on the infectious diseases sub-index often tended to score highly on the NCDs sub-index; conversely, subnational regions that scored poorly on the infectious diseases sub-index often also scored poorly on the NCDs sub-index. The same pattern was evident for the reproductive and maternal health sub-index and the health services provision sub-index.
Priority areas
Overall, the PHDI indicated that significant inequality existed between subnational regions; in general, subnational regions in the eastern part of the country tended to perform poorly. Across the seven sub-indices, the lowest national estimates were reported for health risk behaviours and health services provisions. Elevated inequality constituted high priority assignments for: NCDs; environmental health; infectious diseases; and health services provision. The remaining sub-indices were considered medium priority: reproductive and maternal health; health risk behaviour; and newborn and child health.
In a few cases, certain subnational regions reported estimates that were very low, suggesting that actions to seek improvements in those health topics in those regions should be pursued urgently. Health services provision strengthening should be prioritized in Central Kalimantan, Central Sulawesi, North Maluku and South Kalimantan. For NCDs, Central Sulawesi, East Kalimantan, Gorontalo, North Sulawesi, South Kalimantan and South Sulawesi represent the subnational regions with the most pressing need for improvement.
Policy implications
Interventions to strengthen community health should include a special focus on eastern parts of Indonesia, where subnational regions tended to perform poorly. Financial and technical supports should be accompanied by social and cultural approaches that promote behavioural change and leadership at the community level. Innovative health interventions should be explored, such as programme mentorship, and investing in infrastructure to improve access to transportation, communication systems, and high-quality education.

3. Public health development indices
23
NCDs and environmental health were the two sub-indices with the highest absolute subnational inequality, suggesting a need for behaviour changes to increase uptake of prevention-based health measures. Additionally, cross-sectoral collaborations and advocacy efforts should be strengthened to galvanize support for improvement from stakeholders in health and non-health sectors, and develop harmonized approaches across central to local levels of government.
The PHDI and sub-indices were developed to make use of sources of national data about health and serve as advocacy tools that promote the reduction of inequalities within the country. The overall strengthening of the health information system in Indonesia has the potential to benefit these indices by expanding the breadth and quality of community-level health data that are collected, and enhancing the technical capacity for data analyses and application through tools such as the PHDI.
Indicator profiles
In the following pages, Figures 3.1–3.8 illustrate disaggregated data by applicable and available dimensions of inequality. Supplementary tables S1–S4 contain relevant simple and complex summary measures.
Electronic visualization components accompany this report, enabling interactive data exploration. To access interactive visuals:
Interactive visuals
http://apps.who.int/gho/data/view.wrapper.HE-
VIZ20?lang=en&menu=hide
VISIT:SCAN HERE: or
References1. National Institute of Health Research and
Development. Public Health Development Index [Internet]. Jakarta: Ministry of Health Republic of Indonesia; 2014 (http://labmandat.litbang.depkes.go.id/images/download/publikasi/IPKM_2013_C3.pdf, accessed 5 August 2017).
2. Hidayangsih PS, Hapsari D, Ma’ruf NA. Formulation of the Indonesian Public Health Development Index. Bul Penelit Sist Kesehat [Internet]. 2011 April 2;14 (http://ejournal.litbang.kemkes.go.id/index.php/hsr/article/view/2316, accessed 5 August 2017).
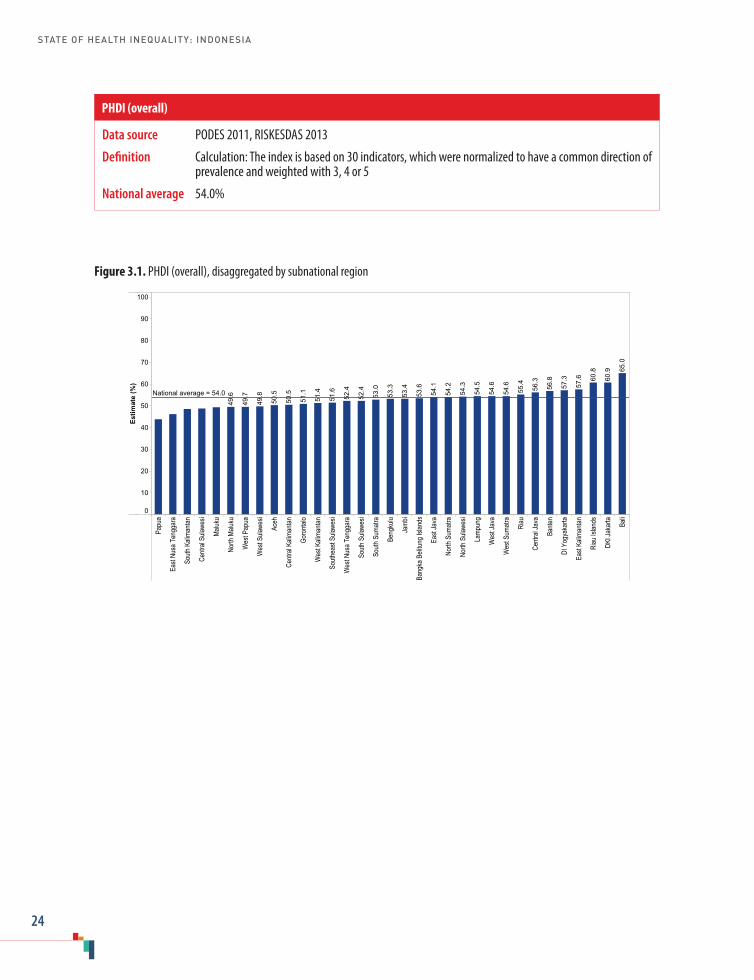
STATE OF HEALTH INEQUALITY: INDONESIA
24
Figure 3.1. PHDI (overall), disaggregated by subnational region
Papu
a
East
Nusa
Ten
ggar
a
South
Kali
manta
n
Centr
al Su
lawes
i
Maluk
u
North
Malu
ku
Wes
t Pap
ua
Wes
t Sula
wesi
Aceh
Centr
al Ka
liman
tan
Goro
ntalo
Wes
t Kali
manta
n
South
east
Sulaw
esi
Wes
t Nus
a Ten
ggar
a
South
Sula
wesi
South
Sum
atra
Beng
kulu
Jamb
i
Bang
ka B
elitun
g Isla
nds
East
Java
North
Sum
atra
North
Sula
wesi
Lamp
ung
Wes
t Jav
a
Wes
t Sum
atra
Riau
Centr
al Ja
va
Bante
n
DI Y
ogya
karta
East
Kalim
antan
Riau
Islan
ds
DKI J
akar
ta Bali
Estim
ate
(%)
0
10
20
30
40
50
60
70
80
90
100
65.0
60.9
60.8
57.6
57.3
56.8
56.3
55.4
54.6
54.6
54.5
54.3
54.2
54.1
53.6
53.4
53.3
53.0
52.4
52.4
51.6
51.4
51.1
50.5
50.5
49.8
49.7
49.6National average = 54.0
Data source PODES 2011, RISKESDAS 2013
Definition Calculation: The index is based on 30 indicators, which were normalized to have a common direction of prevalence and weighted with 3, 4 or 5
National average 54.0%
PHDI (overall)
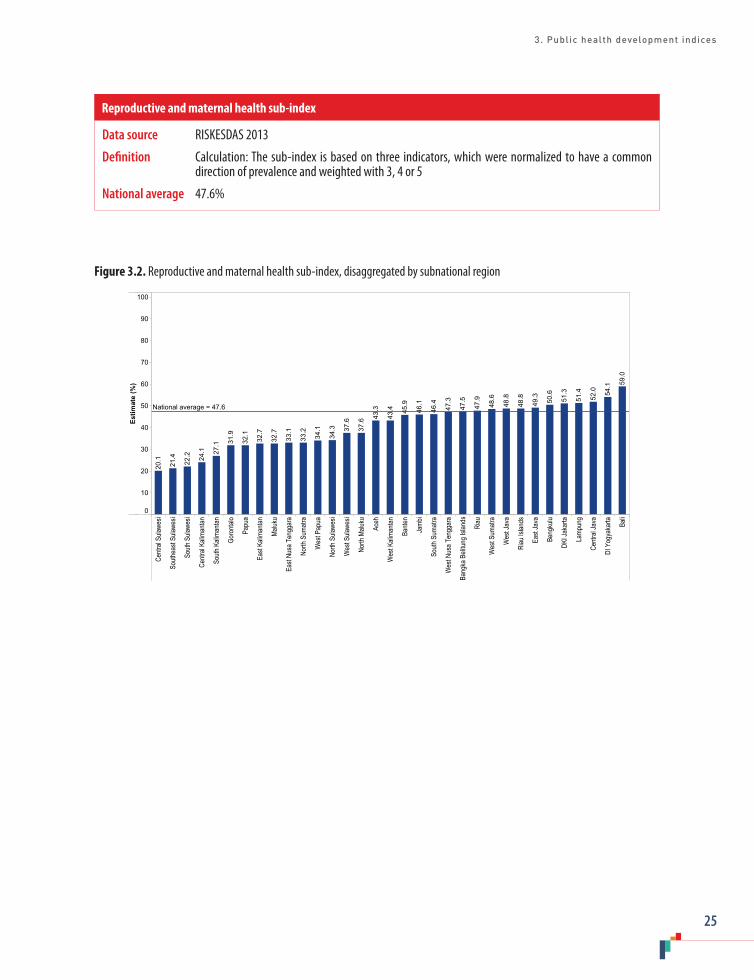
3. Public health development indices
25
Data source RISKESDAS 2013
Definition Calculation: The sub-index is based on three indicators, which were normalized to have a common direction of prevalence and weighted with 3, 4 or 5
National average 47.6%
Reproductive and maternal health sub-index
Figure 3.2. Reproductive and maternal health sub-index, disaggregated by subnational region
Centr
al Su
lawes
i
South
east
Sulaw
esi
South
Sula
wesi
Centr
al Ka
liman
tan
South
Kali
manta
n
Goro
ntalo
Papu
a
East
Kalim
antan
Maluk
u
East
Nusa
Ten
ggar
a
North
Sum
atra
Wes
t Pap
ua
North
Sula
wesi
Wes
t Sula
wesi
North
Malu
ku
Aceh
Wes
t Kali
manta
n
Bante
n
Jamb
i
South
Sum
atra
Wes
t Nus
a Ten
ggar
a
Bang
ka B
elitun
g Isla
nds
Riau
Wes
t Sum
atra
Wes
t Jav
a
Riau
Islan
ds
East
Java
Beng
kulu
DKI J
akar
ta
Lamp
ung
Centr
al Ja
va
DI Y
ogya
karta Ba
li
Estim
ate
(%)
0
10
20
30
40
50
60
70
80
90
100
59.0
54.1
52.0
51.4
51.3
50.6
49.3
48.8
48.8
48.6
47.9
47.5
47.3
46.4
46.1
45.9
43.4
43.3
37.6
37.6
34.3
34.1
33.2
33.1
32.7
32.7
32.1
31.9
27.1
24.1
22.2
21.4
20.1
National average = 47.6
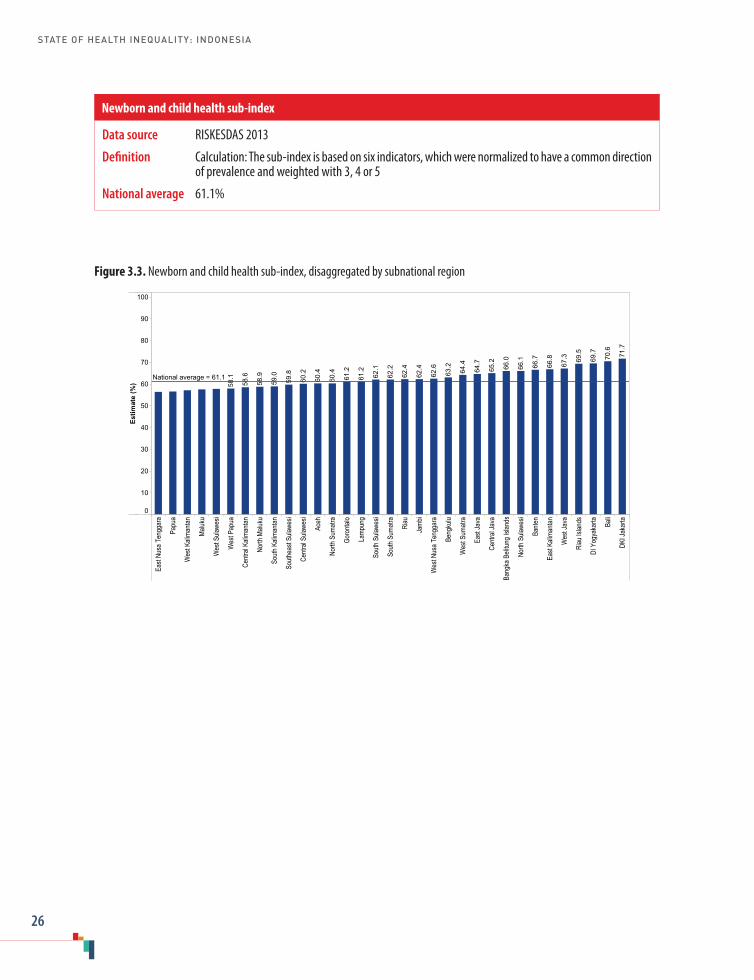
STATE OF HEALTH INEQUALITY: INDONESIA
26
Figure 3.3. Newborn and child health sub-index, disaggregated by subnational region
East
Nusa
Ten
ggar
a
Papu
a
Wes
t Kali
manta
n
Maluk
u
Wes
t Sula
wesi
Wes
t Pap
ua
Centr
al Ka
liman
tan
North
Malu
ku
South
Kali
manta
n
South
east
Sulaw
esi
Centr
al Su
lawes
i
Aceh
North
Sum
atra
Goro
ntalo
Lamp
ung
South
Sula
wesi
South
Sum
atra
Riau
Jamb
i
Wes
t Nus
a Ten
ggar
a
Beng
kulu
Wes
t Sum
atra
East
Java
Centr
al Ja
va
Bang
ka B
elitun
g Isla
nds
North
Sula
wesi
Bante
n
East
Kalim
antan
Wes
t Jav
a
Riau
Islan
ds
DI Y
ogya
karta Ba
li
DKI J
akar
ta
Estim
ate
(%)
0
10
20
30
40
50
60
70
80
90
100
71.7
70.6
69.7
69.5
67.3
66.8
66.7
66.1
66.0
65.2
64.7
64.4
63.2
62.6
62.4
62.4
62.2
62.1
61.2
61.2
60.4
60.4
60.2
59.8
59.0
58.9
58.6
58.1National average = 61.1
Data source RISKESDAS 2013
Definition Calculation: The sub-index is based on six indicators, which were normalized to have a common direction of prevalence and weighted with 3, 4 or 5
National average 61.1%
Newborn and child health sub-index

3. Public health development indices
27
Data source RISKESDAS 2013
Definition Calculation: The sub-index is based on three indicators, which were normalized to have a common direction of prevalence and weighted with 3, 4 or 5
National average 75.1%
Infectious diseases sub-index
Figure 3.4. Infectious diseases sub-index, disaggregated by subnational region
Centr
al Su
lawes
i
South
Sula
wesi
South
Kali
manta
n
Goro
ntalo
North
Sula
wesi
Centr
al Ka
liman
tan
South
east
Sulaw
esi
North
Sum
atra
East
Kalim
antan
East
Nusa
Ten
ggar
a
Papu
a
Aceh
DKI J
akar
ta
Wes
t Nus
a Ten
ggar
a
East
Java
Bante
n
Centr
al Ja
va
Wes
t Sula
wesi
Wes
t Jav
a
Maluk
u
Bang
ka B
elitun
g Isla
nds
DI Y
ogya
karta
Wes
t Sum
atra
Wes
t Pap
ua Bali
Beng
kulu
North
Malu
ku
Riau
Islan
ds
South
Sum
atra
Wes
t Kali
manta
n
Riau
Lamp
ung
Jamb
i
Estim
ate
(%)
0
10
20
30
40
50
60
70
80
90
100
83.1
83.0
82.6
82.3
80.7
80.3
80.0
79.5
78.6
77.9
77.8
76.7
76.0
75.8
74.4
73.9
73.8
73.7
72.9
72.6
71.1
69.7
66.0
61.8
61.2
55.0
47.5
47.4
46.1
44.5
41.0
34.6
32.3
National average = 75.1

STATE OF HEALTH INEQUALITY: INDONESIA
28
Figure 3.5. Environmental health sub-index, disaggregated by subnational region
Papu
a
East
Nusa
Ten
ggar
a
Goro
ntalo
Centr
al Ka
liman
tan
South
Kali
manta
n
Lamp
ung
Wes
t Kali
manta
n
Wes
t Nus
a Ten
ggar
a
South
Sula
wesi
Aceh
Centr
al Su
lawes
i
South
east
Sulaw
esi
Wes
t Sum
atra
South
Sum
atra
Jamb
i
Beng
kulu
Wes
t Pap
ua
Wes
t Sula
wesi
North
Malu
ku
North
Sula
wesi
DI Y
ogya
karta
Bang
ka B
elitun
g Isla
nds
North
Sum
atra
Riau
Maluk
u
Wes
t Jav
a
East
Java
Centr
al Ja
va
East
Kalim
antan
Riau
Islan
ds
Bante
n
Bali
DKI J
akar
ta
Estim
ate
(%)
0
10
20
30
40
50
60
70
80
90
100
83.3
72.7
69.7
68.5
59.8
55.9
54.3
54.1
53.3
50.9
49.1
49.0
48.0
46.4
46.3
44.9
44.7
44.4
43.9
43.7
43.6
42.6
42.3
42.0
42.0
41.6
41.3
38.9
34.7
32.6
30.9
30.8
25.0
National average = 54.3
Data source RISKESDAS 2013
Definition Calculation: The sub-index is based on two indicators, which were normalized to have a common direction of prevalence and weighted with 3, 4 or 5
National average 54.3%
Environmental health sub-index
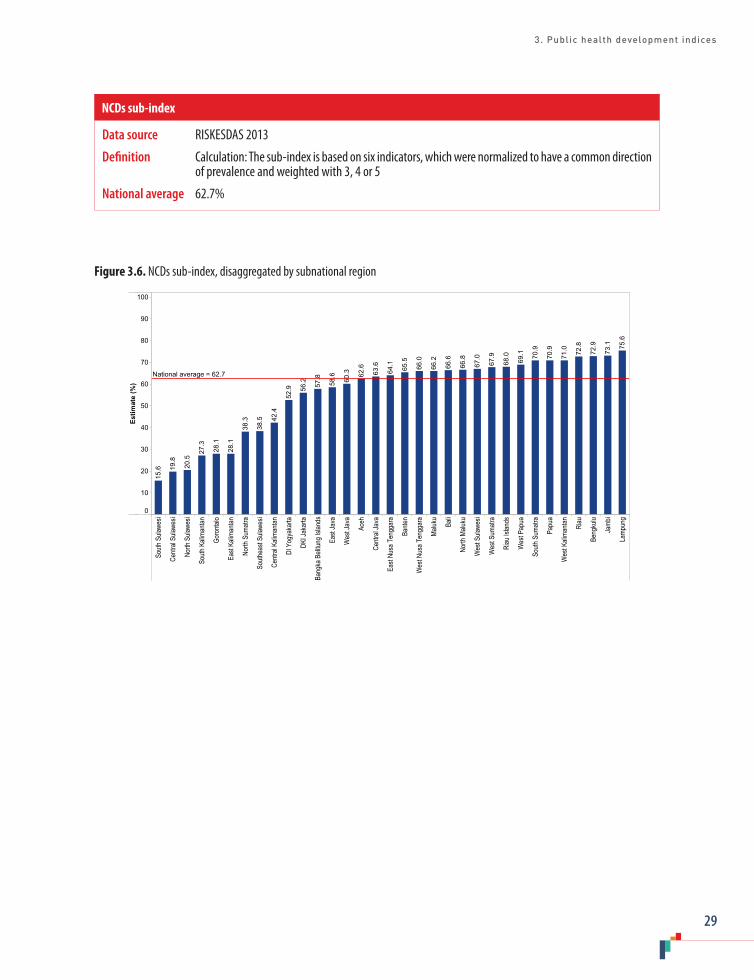
3. Public health development indices
29
Data source RISKESDAS 2013
Definition Calculation: The sub-index is based on six indicators, which were normalized to have a common direction of prevalence and weighted with 3, 4 or 5
National average 62.7%
NCDs sub-index
Figure 3.6. NCDs sub-index, disaggregated by subnational region
South
Sula
wesi
Centr
al Su
lawes
i
North
Sula
wesi
South
Kali
manta
n
Goro
ntalo
East
Kalim
antan
North
Sum
atra
South
east
Sulaw
esi
Centr
al Ka
liman
tan
DI Y
ogya
karta
DKI J
akar
ta
Bang
ka B
elitun
g Isla
nds
East
Java
Wes
t Jav
a
Aceh
Centr
al Ja
va
East
Nusa
Ten
ggar
a
Bante
n
Wes
t Nus
a Ten
ggar
a
Maluk
u
Bali
North
Malu
ku
Wes
t Sula
wesi
Wes
t Sum
atra
Riau
Islan
ds
Wes
t Pap
ua
South
Sum
atra
Papu
a
Wes
t Kali
manta
n
Riau
Beng
kulu
Jamb
i
Lamp
ung
Estim
ate
(%)
0
10
20
30
40
50
60
70
80
90
100
75.6
73.1
72.9
72.8
71.0
70.9
70.9
69.1
68.0
67.9
67.0
66.8
66.6
66.2
66.0
65.5
64.1
63.6
62.6
60.3
58.6
57.8
56.2
52.9
42.4
38.5
38.3
28.1
28.1
27.3
20.5
19.8
15.6
National average = 62.7
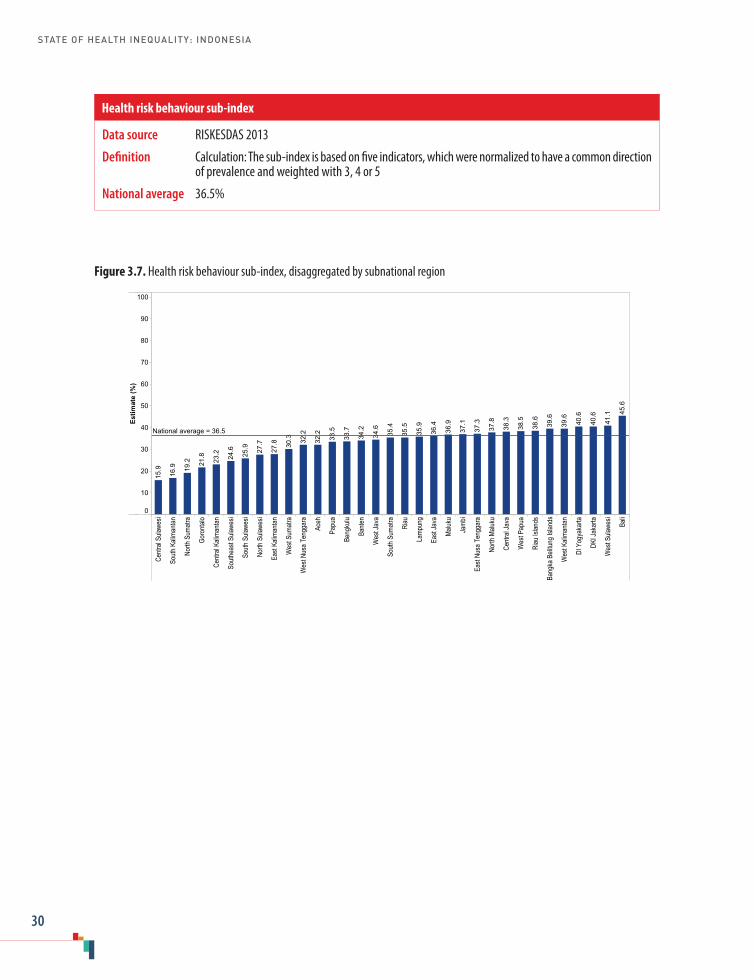
STATE OF HEALTH INEQUALITY: INDONESIA
30
Figure 3.7. Health risk behaviour sub-index, disaggregated by subnational region
Centr
al Su
lawes
i
South
Kali
manta
n
North
Sum
atra
Goro
ntalo
Centr
al Ka
liman
tan
South
east
Sulaw
esi
South
Sula
wesi
North
Sula
wesi
East
Kalim
antan
Wes
t Sum
atra
Wes
t Nus
a Ten
ggar
a
Aceh
Papu
a
Beng
kulu
Bante
n
Wes
t Jav
a
South
Sum
atra
Riau
Lamp
ung
East
Java
Maluk
u
Jamb
i
East
Nusa
Ten
ggar
a
North
Malu
ku
Centr
al Ja
va
Wes
t Pap
ua
Riau
Islan
ds
Bang
ka B
elitun
g Isla
nds
Wes
t Kali
manta
n
DI Y
ogya
karta
DKI J
akar
ta
Wes
t Sula
wesi
Bali
Estim
ate
(%)
0
10
20
30
40
50
60
70
80
90
100
45.6
41.1
40.6
40.6
39.6
39.6
38.6
38.5
38.3
37.8
37.3
37.1
36.9
36.4
35.9
35.5
35.4
34.6
34.2
33.7
33.5
32.2
32.2
30.3
27.8
27.7
25.9
24.6
23.2
21.8
19.2
16.9
15.9
National average = 36.5
Data source RISKESDAS 2013
Definition Calculation: The sub-index is based on five indicators, which were normalized to have a common direction of prevalence and weighted with 3, 4 or 5
National average 36.5%
Health risk behaviour sub-index

3. Public health development indices
31
Data source PODES 2011, RISKESDAS 2013
Definition Calculation: The sub-index is based on five indicators, which were normalized to have a common direction of prevalence and weighted with 3, 4 or 5
National average 38.1%
Health services provision sub-index
Figure 3.8. Health services provision sub-index, disaggregated by subnational region
South
Kali
manta
n
Centr
al Su
lawes
i
Centr
al Ka
liman
tan
South
east
Sulaw
esi
North
Malu
ku
Wes
t Kali
manta
n
North
Sum
atra
Maluk
u
Papu
a
Jamb
i
Beng
kulu
North
Sula
wesi
Goro
ntalo
Wes
t Sula
wesi
South
Sum
atra
Wes
t Pap
ua
Lamp
ung
Riau
East
Kalim
antan
Bang
ka B
elitun
g Isla
nds
East
Nusa
Ten
ggar
a
South
Sula
wesi
Bante
n
Wes
t Jav
a
East
Java
Aceh
Wes
t Nus
a Ten
ggar
a
Centr
al Ja
va
Wes
t Sum
atra
DKI J
akar
ta
Riau
Islan
ds
DI Y
ogya
karta Ba
li
Estim
ate
(%)
0
10
20
30
40
50
60
70
80
90
100
62.2
59.3
51.9
51.9
49.9
45.4
44.3
43.3
42.7
42.6
42.0
40.0
40.0
39.4
36.8
35.5
35.3
31.9
31.7
31.6
30.5
29.3
28.6
28.4
27.8
25.3
25.2
25.2
24.2
16.9
16.6
16.6
14.1
National average = 38.1

STATE OF HEALTH INEQUALITY: INDONESIA
32
4. Reproductive health
Since the late 1960s and the introduction of the National Population and Family Planning Board (Badan Kependudukan dan Keluarga Berencana Nasional/BKKBN), reproductive health initiatives in Indonesia have largely focused on increasing access to contraception and decreasing overall fertility. Over the 1970s to the early 2000s, the country experienced remarkable gains in contraceptive use and declining fertility rates, which have been attributed to diverse supply- and demand-side approaches to promote family planning (1).
At the London Summit on Family Planning in 2012, the Government of Indonesia expressed its renewed intention to reinvigorate family planning – including allocating financial resources, improving the quality of human resources and working to increase demand (2) – and committed to the global Family Planning 2020 initiative (3). The country has focused on decreasing its total fertility rate through initiatives to increase contraceptive prevalence rate, lower drop-out, increase long-term family planning contraceptive methods and lower unmet need of family planning (3). In 2014, the country expanded its family planning programme, providing free access to family planning services and contraception across all 33 provinces (4), in coordination with the introduction of JKN (5). In 2016, BKKBN introduced a campaign, Kampung KB, which is multisectoral by design and targeted to reach vulnerable populations, including: poor communities in isolated areas; densely populated urban areas; fishing villages; slums; and disadvantaged subnational regions (6). Despite progress, the country continues to face challenges related to: commodity supply systems of
contraceptives; staffing to delivery family planning; competency among midwives; community knowledge and understanding; and culture (7).
Although there has been growing awareness of the topic internationally, female genital mutilation in Indonesia remains understudied (8) despite the practice being common in certain communities (9). The medicalization of female genital mutilation in Indonesia is not uncommon (10). Through its adoption of the Association of Southeast Asian Nations (ASEAN) Regional Plan of Action on the Elimination of Violence against Women, the Government of Indonesia has committed to address female genital mutilation (11).
Reproductive health indicators
This report covers five reproductive health indicators (Table 4.1), which represent diverse aspects of reproductive health service coverage, impacts and risk factors/behaviours. The definitions adopted for these indicators concur with standardized global definitions. The two indicators that pertain to family planning services are considered to be favourable indicators, as higher coverage demonstrates success. The adolescent fertility rate is one subset of age-specific fertility rates, which are the basis for the calculation of total fertility rate. Regarding total fertility rate, BKKBN has set an official target of 2.1 births per woman by 2025 (12). For the female genital mutilation indicator, a lower percentage is desirable.
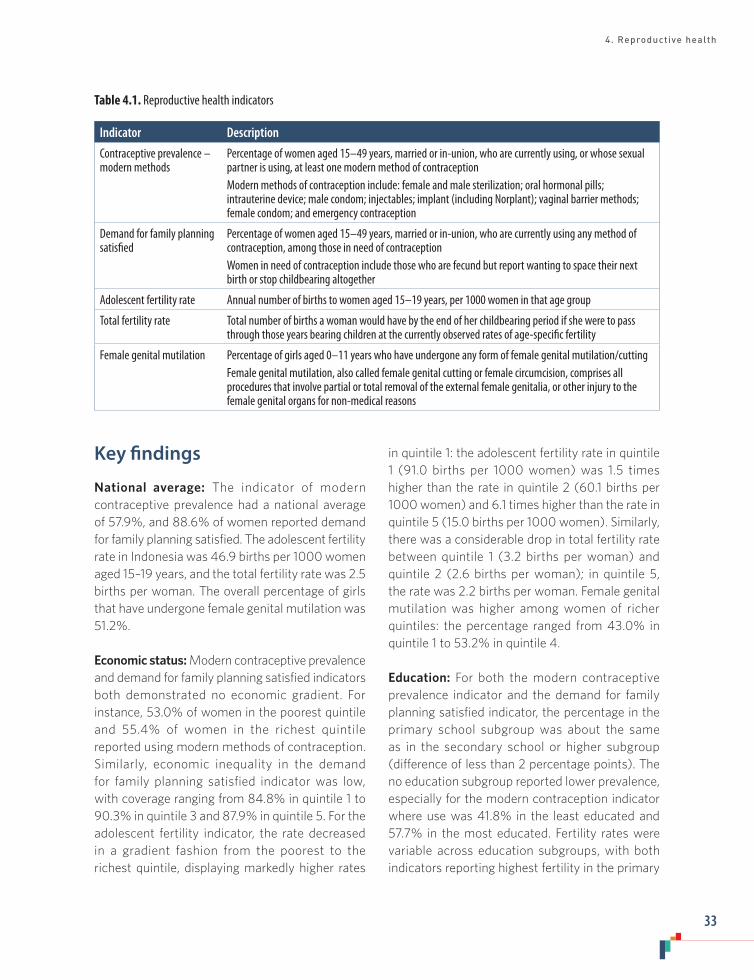
4. Reproductive health
33
Table 4.1. Reproductive health indicators
Indicator Description
Contraceptive prevalence – modern methods
Percentage of women aged 15–49 years, married or in-union, who are currently using, or whose sexual partner is using, at least one modern method of contraception Modern methods of contraception include: female and male sterilization; oral hormonal pills; intrauterine device; male condom; injectables; implant (including Norplant); vaginal barrier methods; female condom; and emergency contraception
Demand for family planning satisfied
Percentage of women aged 15–49 years, married or in-union, who are currently using any method of contraception, among those in need of contraceptionWomen in need of contraception include those who are fecund but report wanting to space their next birth or stop childbearing altogether
Adolescent fertility rate Annual number of births to women aged 15–19 years, per 1000 women in that age group
Total fertility rate Total number of births a woman would have by the end of her childbearing period if she were to pass through those years bearing children at the currently observed rates of age-specific fertility
Female genital mutilation Percentage of girls aged 0–11 years who have undergone any form of female genital mutilation/cutting Female genital mutilation, also called female genital cutting or female circumcision, comprises all procedures that involve partial or total removal of the external female genitalia, or other injury to the female genital organs for non-medical reasons
Key findings
National average: The indicator of modern contraceptive prevalence had a national average of 57.9%, and 88.6% of women reported demand for family planning satisfied. The adolescent fertility rate in Indonesia was 46.9 births per 1000 women aged 15–19 years, and the total fertility rate was 2.5 births per woman. The overall percentage of girls that have undergone female genital mutilation was 51.2%.
Economic status: Modern contraceptive prevalence and demand for family planning satisfied indicators both demonstrated no economic gradient. For instance, 53.0% of women in the poorest quintile and 55.4% of women in the richest quintile reported using modern methods of contraception. Similarly, economic inequality in the demand for family planning satisfied indicator was low, with coverage ranging from 84.8% in quintile 1 to 90.3% in quintile 3 and 87.9% in quintile 5. For the adolescent fertility indicator, the rate decreased in a gradient fashion from the poorest to the richest quintile, displaying markedly higher rates
in quintile 1: the adolescent fertility rate in quintile 1 (91.0 births per 1000 women) was 1.5 times higher than the rate in quintile 2 (60.1 births per 1000 women) and 6.1 times higher than the rate in quintile 5 (15.0 births per 1000 women). Similarly, there was a considerable drop in total fertility rate between quintile 1 (3.2 births per woman) and quintile 2 (2.6 births per woman); in quintile 5, the rate was 2.2 births per woman. Female genital mutilation was higher among women of richer quintiles: the percentage ranged from 43.0% in quintile 1 to 53.2% in quintile 4.
Education: For both the modern contraceptive prevalence indicator and the demand for family planning satisfied indicator, the percentage in the primary school subgroup was about the same as in the secondary school or higher subgroup (difference of less than 2 percentage points). The no education subgroup reported lower prevalence, especially for the modern contraception indicator where use was 41.8% in the least educated and 57.7% in the most educated. Fertility rates were variable across education subgroups, with both indicators reporting highest fertility in the primary
STATE OF HEALTH INEQUALITY: INDONESIA
34
school subgroup. Adolescent fertility rate was 113.4 births per 1000 women in the primary school subgroup, and 34.3 births per 1000 women in the secondary school or higher subgroup. Total fertility rate reached a maximum of 2.8 births per woman in the primary school subgroup. Data disaggregated by education were not available for female genital mutilation.
Place of residence: The modern contraceptive prevalence and demand for family satisfied indicators did not demonstrate place of residence inequality, reporting a difference of less than 2 percentage points between urban and rural areas. The two fertility indicators were both higher in rural than urban areas: the adolescent fertility rate was twice as high in rural than urban areas, while the total fertility rate was 2.7 births per woman in rural areas and 2.4 births per woman in urban areas. Female genital mutilation was higher in urban (53.5%) than rural (45.1%) areas.
Subnational region: All indicators showed inequality by subnational region. For both the modern contraception and demand for family planning satisfied indicators, Papua performed considerably worse than other regions, reporting prevalence that was more than 35 percentage points below the national average. Regions that performed poorly for modern contraceptive prevalence also tended to report high total fertility rates (namely, East Nusa Tenggara, Maluku, Papua and West Papua). These four regions, as well as West Sulawesi, reported total fertility rates of at least 3.5 births per woman. In 11 regions, the total fertility rate was 2.5 births per woman or less, including DKI Jakarta, where the rate reached the national target of 2.1 births per woman. The adolescent fertility rate spanned from 19.7 births per 1000 women in DKI Jakarta to 95.1 births per 1000 women in Central Kalimantan. Female genital mutilation ranged from 2.6% in East Nusa Tenggara to 83.2% in Gorontalo. Four regions reported female genital mutilation to be 10% or less, and six reported percentages in excess of 70%.
Priority areas
Overall, the results suggest that the highest priority reproductive health indicators were female genital mutilation (high priority) and modern contraceptive prevalence, adolescent fertility rate, and total fertility rate (medium priority). Due to its higher national average and lower levels of inequality, demand for family planning satisfied is generally considered a low priority indicator (although there was substantially poorer performance in the subnational region of Papua, for this and the modern contraception indicators). Ongoing monitoring is required to ensure that the demand for family planning satisfied indicator remains high, especially across vulnerable subgroups.
Strong subnational region inequality was reported for female genital mutilation and adolescent fertility rates. For each of these indicators, a number of regions performed very poorly, while other regions performed significantly better. Underperforming regions should be prioritized to improve these aspects of reproductive health.
Women with low levels of education constitute a reproductive health priority, especially with regard to the use of modern contraception and rates of adolescent fertility. Adolescent fertility rates were elevated in the no education and primary school subgroups, relative to the secondary school or higher subgroup; disadvantage among those in rural areas and those in the poorest quintile was also prevalent. The predominant form of inequality with regard to total fertility rates was economic based. Female genital mutilation did not appear to correspond with established socioeconomic patterns of vulnerability; expanded inequality analyses are warranted to explore additional dimensions of inequality, including religion and sociocultural values.
4. Reproductive health
35
Policy implications
The Government of Indonesia is following up on various commitments to enhance reproductive health, increasingly, with a focus on vulnerable populations. The findings of this report serve as an evidence basis to strengthen and refine proposed approaches, lending an understanding of how subgroups within the population experience different aspects of reproductive health and where regional inequalities exist. For instance, low prevalence of modern contraception and high total fertility in East Nusa Tenggara, Maluku, Papua and West Papua warrant targeted policy action that encourages local capacity-building.
To date, national policies in Indonesia have not fully addressed female genital mutilation, despite the short- and long-term implications of the practice on reproductive and sexual health (13). WHO and other United Nations agencies have urged countries to take measures to reduce female genital mutilation, including steps to halt the medicalization of female genital mutilation (14). In Indonesia, additional research is required to learn more about the specifics of the practice, including the role of sociocultural determinants (9). Elimination of the practice requires collaboration between government and leaders of communities, civil societies and faith-based organizations, as well as international organizations in advocating its eradication. National policies and strategies should be strengthened to bring about improvements, especially in regions where the practice is most prevalent.
The socioeconomic and subnational region inequalities in adolescent fertility rate call for approaches to enhance adolescent reproductive health among the disadvantaged. The reproductive health needs of Indonesian adolescents have changed rapidly over the past decades, and policies should be revamped accordingly (15). For instance, providing comprehensive reproductive health education as part of school curricula and
extracurricular activities (e.g. scouting), provision of adolescent-friendly health centres, and establishing reproductive health education and counselling for premarital couples are strategies that show promise for adoption throughout the country (16). Additionally, reproductive health programmes should be made accessible for hard-to-reach populations, including people with disabilities and people in prison.
Family planning policies and programmes in Indonesia should strive to ensure that underserved subgroups are reached through integrating reproductive health services at the community level, including close collaboration with community leaders and stakeholders (7). Extending the types and availability of reproductive health services covered under JKN should be considered as part of the progress towards universal health coverage.
Indicator profiles
In the following indicator profiles, Figures 4.1–4.10 illustrate disaggregated data by applicable and available dimensions of inequality. Supplementary tables S1–S4 contain relevant simple and complex summary measures.
Electronic visualization components accompany this report, enabling interactive data exploration. To access interactive visuals:
Interactive visuals
http://apps.who.int/gho/data/view.wrapper.HE-
VIZ20?lang=en&menu=hide
VISIT:SCAN HERE: or

STATE OF HEALTH INEQUALITY: INDONESIA
36
References1. Seiff A. Indonesia to revive national family planning
programme. Lancet. 2014;383(9918):683.
2. Family Planning 2020 commitment: Government of Indonesia [Internet]. Family Planning 2020; 2012 (http://ec2-54-210-230-186.compute-1.amazonaws.com/wp-content/uploads/2016/10/Govt.-of-Indonesia-FP2020-Commitment-2012.pdf, accessed 9 July 2017).
3. Family Planning 2016 commitment update: Government of Indonesia [Internet]. Family Planning 2020; 2016 (http://ec2-54-210-230-186.compute-1.amazonaws.com/wp-content/uploads/2016/09/FP2020_2016_Annual_Commitment_Update_Questionnaire-Indonesia_DLC.pdf, accessed 9 July 2017).
4. Presidential Regulation No. 12, chapter 21 [Internet]. 2013 (http://www.jkn.kemkes.go.id/attachment/unduhan/Perpres%20No.%2012%20Th%202013%20ttg%20Jaminan%20Kesehatan.pdf, accessed 14 August 2017).
5. Evans JS, Wickstead RM, Hanman K, Steeves S. Universal health coverage in countries across East and Southeast Asia – associations between health expenditure and service provision. Value Health. 2016;7(19):A820–A821.
6. Country action: opportunities, challenges, and priorities. Indonesia [Internet]. Family Planning 2020; 2016 (http://ec2-54-210-230-186.compute-1.amazonaws.com/wp-content/uploads/2016/11/Country_Action_Opportunities-Challenges-and-Priorities_INDONESIA_V2C.pdf, accessed 9 July 2017).
7. Byrne A, Morgan A, Soto E, Dettrick Z. Context-specific, evidence-based planning for scale-up of family planning services to increase progress to MDG 5: health systems research. Reprod Health. 2012;9(27):1–13.
8. Nnamuchi O. United Nation’s resolution on elimination of female genital ritual: a legitimate response to a human rights problem or what? Med Law. 2014;33(4):61–113.
9. Budiharsana M, Amaliah L, Utomo B, Erwinia. Female circumcision in Indonesia: extent, implications and possible interventions to uphold women’s health rights [Internet]. Jakarta: Population Council and United States Agency for International Development; 2003 (http://pdf.usaid.gov/pdf_docs/Pnacu138.pdf, accesssed 10 July 2017).
10. Serour GI. Medicalization of female genital mutilation/cutting. Afr J Urol. 2013 September;19(3):145–9.
11. ASEAN Secretariat. ASEAN Regional Plan of Action on the Elimination of Violence against Women [Internet]. Jakarta: Association of Southeast Asian Nations; 2016 (http://www.asean.org/wp-content/uploads/2012/05/Final-ASEAN-RPA-on-EVAW-IJP-11.02.2016-as-input-ASEC.pdf, accessed 10 July 2017).
12. McDonald P. A population projection for Indonesia, 2010–2035. Bull Indones Econ Stud. 2014 January 2;50(1):123–9.
13. Female genital mutilation [Internet]. Geneva: World Health Organization; 2017 (http://www.who.int/mediacentre/factsheets/fs241/en/, accessed 10 July 2017].
14. UNAIDS, UNDP, UNFPA, UNICEF, UNHCR, UNIFEM et al. Global strategy to stop health-care providers from performing female genital mutilation [Internet]. Geneva: World Health Organization; 2010 (http://apps.who.int/iris/bitstream/10665/70264/1/WHO_RHR_10.9_eng.pdf, accessed 11 July 2017).
15. Utomo ID, McDonald P. Adolescent reproductive health in Indonesia: contested values and policy inaction. Stud Fam Plann. 2009 June 1;40(2):133–46.
16. Situmorang A. Adolescent reproductive health in Indonesia [Internet]. Jakarta: STARH Program; 2003 (http://pdf.usaid.gov/pdf_docs/Pnacw743.pdf, accessed 11 July 2017).

4. Reproductive health
37
Figure 4.1. Contraceptive prevalence – modern methods, disaggregated by economic status, education and place of residence
Economic status Education Place of residence
Quint
ile 1
(poo
rest)
Quint
ile 2
Quint
ile 3
Quint
ile 4
Quint
ile 5
(rich
est)
No ed
ucati
on
Prim
ary s
choo
l
Seco
ndar
y sch
ool +
Rura
l
Urba
n
Estim
ate
(%)
0
10
20
30
40
50
60
70
55.458.760.261.4
53.0
57.759.6
41.8
57.058.7
Figure 4.2. Contraceptive prevalence – modern methods, disaggregated by subnational region
Papu
a
East
Nusa
Ten
ggar
a
Maluk
u
Wes
t Pap
ua
North
Sum
atra
Aceh
South
Sula
wesi
Riau
Islan
ds
Wes
t Sula
wesi
South
east
Sulaw
esi
Wes
t Sum
atra
North
Malu
ku
Centr
al Su
lawes
i
DKI J
akar
ta
Riau
East
Kalim
antan
Wes
t Nus
a Ten
ggar
a
DI Y
ogya
karta Ba
li
Wes
t Jav
a
Beng
kulu
Bante
n
Centr
al Ja
va
Goro
ntalo
Jamb
i
East
Java
North
Sula
wesi
Wes
t Kali
manta
n
South
Sum
atra
Centr
al Ka
liman
tan
Bang
ka B
elitun
g Isla
nds
Lamp
ung
South
Kali
manta
n
Estim
ate
(%)
0
10
20
30
40
50
60
7066
.4
66.3
65.3
64.8
64.4
63.9
63.7
62.4
62.0
61.5
61.5
61.3
61.2
60.3
59.6
59.6
55.1
54.1
54.0
53.4
52.5
51.1
50.2
48.4
48.0
48.0
47.5
44.4
42.8
41.0
40.4
38.3
19.1
National average = 57.9
Data source DHS 2012
Definition Numerator: Number of women aged 15–49 years, married or in-union, who are currently using, or whose sexual partner is using, at least one modern method of contraception
Denominator: Number of women aged 15–49 years who are currently married or in-union
National average 57.9%
Contraceptive prevalence – modern methods

STATE OF HEALTH INEQUALITY: INDONESIA
38
Figure 4.3. Demand for family planning satisfied, disaggregated by economic status, education and place of residence
Economic status Education Place of residence
Quint
ile 1
(poo
rest)
Quint
ile 2
Quint
ile 3
Quint
ile 4
Quint
ile 5
(rich
est)
No ed
ucati
on
Prim
ary s
choo
l
Seco
ndar
y sch
ool +
Rura
l
Urba
n
Estim
ate
(%)
0
10
20
30
40
50
60
70
80
90
100
87.989.790.389.484.8
89.088.383.4
88.289.0
Figure 4.4. Demand for family planning satisfied, disaggregated by subnational region
Papu
a
Wes
t Pap
ua
East
Nusa
Ten
ggar
a
Maluk
u
Wes
t Nus
a Ten
ggar
a
South
east
Sulaw
esi
Wes
t Sula
wesi
Aceh
Centr
al Su
lawes
i
Riau
Islan
ds
South
Sula
wesi
Wes
t Sum
atra
North
Sum
atra
North
Malu
ku
DKI J
akar
ta
Goro
ntalo
Riau
Wes
t Jav
a
East
Kalim
antan
Wes
t Kali
manta
n
Centr
al Ja
va
Beng
kulu
Bang
ka B
elitun
g Isla
nds
Bante
n
East
Java
North
Sula
wesi
DI Y
ogya
karta
Jamb
i
South
Sum
atra
South
Kali
manta
n
Bali
Lamp
ung
Centr
al Ka
liman
tan
Estim
ate
(%)
0
10
20
30
40
50
60
70
80
90
10093
.1
92.6
92.2
92.1
92.0
91.4
91.4
91.3
91.2
91.0
90.9
90.7
90.3
89.4
88.7
88.1
87.3
87.3
86.9
86.2
85.9
85.9
84.9
83.4
82.9
82.8
81.4
81.2
80.3
76.4
76.3
73.1
53.1
National average = 88.6
Data source DHS 2012
Definition Numerator: Number of women aged 15–49 who are fecund and are married or in-union and need contraception, who use any kind of contraceptive (modern or traditional)
Denominator: Number of women aged 15–49 who are fecund and are married or in-union and need contraception
National average 88.6%
Demand for family planning satisfied
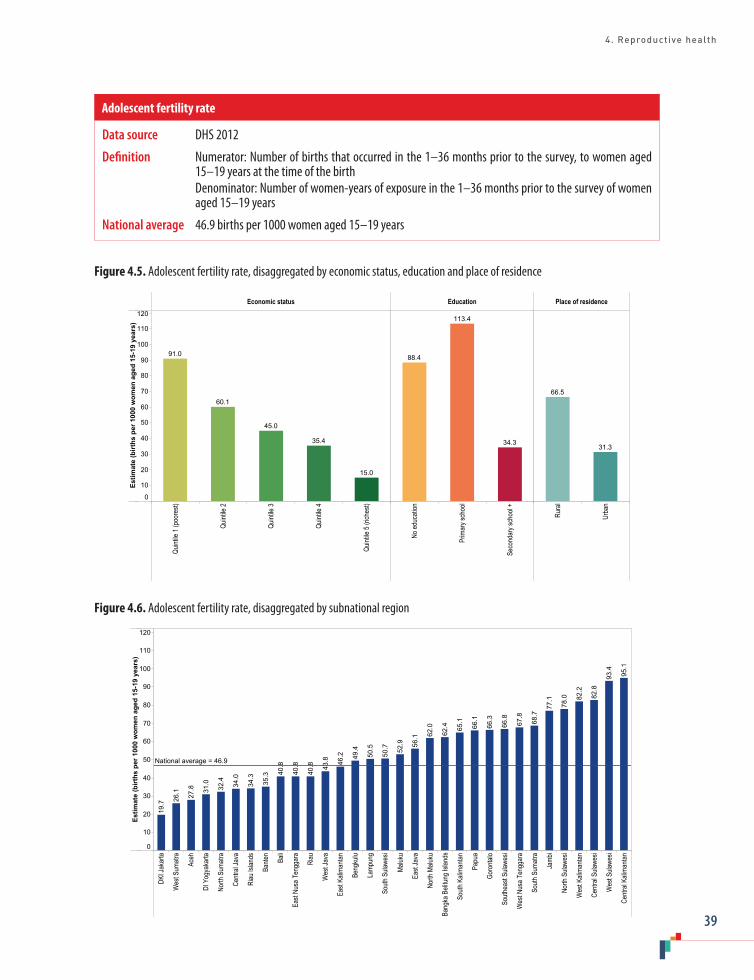
4. Reproductive health
39
Figure 4.5. Adolescent fertility rate, disaggregated by economic status, education and place of residence
Economic status Education Place of residence
Quint
ile 1
(poo
rest)
Quint
ile 2
Quint
ile 3
Quint
ile 4
Quint
ile 5
(rich
est)
No ed
ucati
on
Prim
ary s
choo
l
Seco
ndar
y sch
ool +
Rura
l
Urba
n
Estim
ate
(birt
hs p
er 1
000
wom
en a
ged
15-1
9 ye
ars)
0
10
20
30
40
50
60
70
80
90
100
110
120
15.0
35.4
45.0
60.1
91.0
34.3
113.4
88.4
31.3
66.5
Figure 4.6. Adolescent fertility rate, disaggregated by subnational region
DKI J
akar
ta
Wes
t Sum
atra
Aceh
DI Y
ogya
karta
North
Sum
atra
Centr
al Ja
va
Riau
Islan
ds
Bante
n
Bali
East
Nusa
Ten
ggar
a
Riau
Wes
t Jav
a
East
Kalim
antan
Beng
kulu
Lamp
ung
South
Sula
wesi
Maluk
u
East
Java
North
Malu
ku
Bang
ka B
elitun
g Isla
nds
South
Kali
manta
n
Papu
a
Goro
ntalo
South
east
Sulaw
esi
Wes
t Nus
a Ten
ggar
a
South
Sum
atra
Jamb
i
North
Sula
wesi
Wes
t Kali
manta
n
Centr
al Su
lawes
i
Wes
t Sula
wesi
Centr
al Ka
liman
tan
Estim
ate
(birt
hs p
er 1
000
wom
en a
ged
15-1
9 ye
ars)
0
10
20
30
40
50
60
70
80
90
100
110
12095
.1
93.4
82.8
82.2
78.0
77.1
68.7
67.8
66.8
66.3
66.1
65.1
62.4
62.0
56.1
52.9
50.7
50.5
49.4
46.2
43.8
40.8
40.8
40.8
35.3
34.3
34.0
32.4
31.0
27.8
26.1
19.7
National average = 46.9
Data source DHS 2012
Definition Numerator: Number of births that occurred in the 1–36 months prior to the survey, to women aged 15–19 years at the time of the birth
Denominator: Number of women-years of exposure in the 1–36 months prior to the survey of women aged 15–19 years
National average 46.9 births per 1000 women aged 15–19 years
Adolescent fertility rate
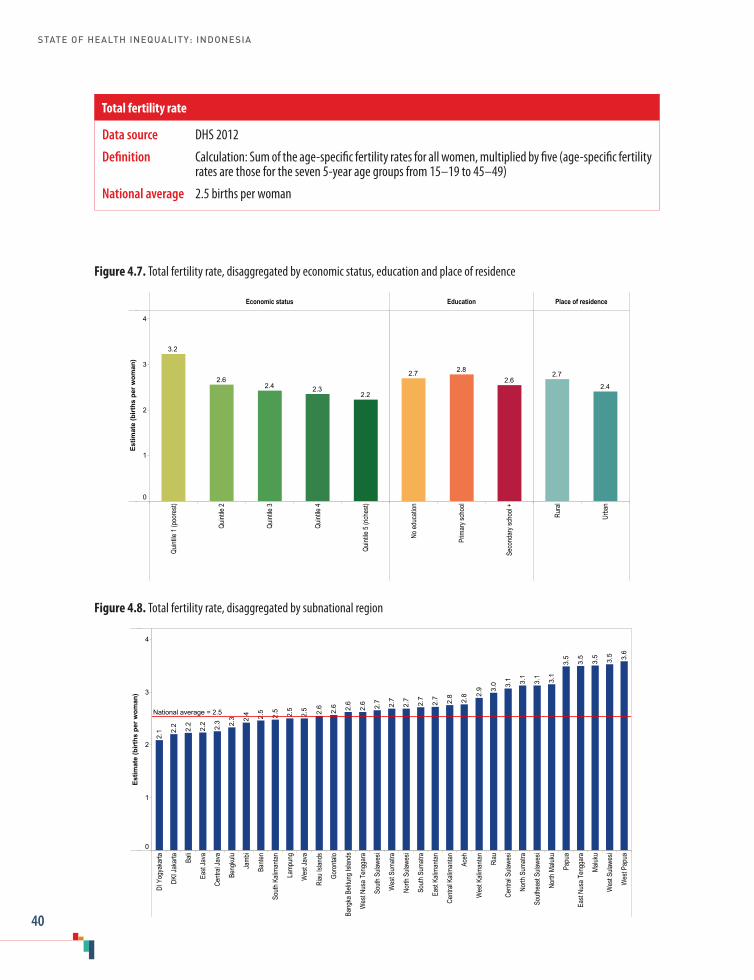
STATE OF HEALTH INEQUALITY: INDONESIA
40
Figure 4.7. Total fertility rate, disaggregated by economic status, education and place of residence
Economic status Education Place of residence
Quint
ile 1
(poo
rest)
Quint
ile 2
Quint
ile 3
Quint
ile 4
Quint
ile 5
(rich
est)
No ed
ucati
on
Prim
ary s
choo
l
Seco
ndar
y sch
ool +
Rura
l
Urba
n
Estim
ate
(birt
hs p
er w
oman
)
0
1
2
3
4
2.22.32.4
2.6
3.2
2.62.82.7
2.4
2.7
Figure 4.8. Total fertility rate, disaggregated by subnational region
DI Y
ogya
karta
DKI J
akar
ta Bali
East
Java
Centr
al Ja
va
Beng
kulu
Jamb
i
Bante
n
South
Kali
manta
n
Lamp
ung
Wes
t Jav
a
Riau
Islan
ds
Goro
ntalo
Bang
ka B
elitun
g Isla
nds
Wes
t Nus
a Ten
ggar
a
South
Sula
wesi
Wes
t Sum
atra
North
Sula
wesi
South
Sum
atra
East
Kalim
antan
Centr
al Ka
liman
tan
Aceh
Wes
t Kali
manta
n
Riau
Centr
al Su
lawes
i
North
Sum
atra
South
east
Sulaw
esi
North
Malu
ku
Papu
a
East
Nusa
Ten
ggar
a
Maluk
u
Wes
t Sula
wesi
Wes
t Pap
ua
Estim
ate
(birt
hs p
er w
oman
)
0
1
2
3
4
3.6
3.5
3.5
3.5
3.5
3.1
3.1
3.1
3.1
3.0
2.9
2.8
2.8
2.7
2.7
2.7
2.7
2.7
2.6
2.6
2.6
2.6
2.5
2.5
2.5
2.5
2.4
2.3
2.3
2.2
2.2
2.2
2.1
National average = 2.5
Data source DHS 2012
Definition Calculation: Sum of the age-specific fertility rates for all women, multiplied by five (age-specific fertility rates are those for the seven 5-year age groups from 15–19 to 45–49)
National average 2.5 births per woman
Total fertility rate

4. Reproductive health
41
Figure 4.9. Female genital mutilation, disaggregated by economic status and place of residence
Economic status Place of residence
Quint
ile 1
(poo
rest)
Quint
ile 2
Quint
ile 3
Quint
ile 4
Quint
ile 5
(rich
est)
Rura
l
Urba
n
Estim
ate
(%)
0
10
20
30
40
50
60
70
80
90
51.653.248.747.3
43.0
53.5
45.1
Figure 4.10. Female genital mutilation, disaggregated by subnational region
East
Nusa
Ten
ggar
a
Papu
a
Bali
DI Y
ogya
karta
Wes
t Pap
ua
North
Sula
wesi
Centr
al Ja
va
East
Java
South
east
Sulaw
esi
Maluk
u
Beng
kulu
South
Sula
wesi
Wes
t Kali
manta
n
Centr
al Ka
liman
tan
Lamp
ung
North
Sum
atra
East
Kalim
antan
Riau
Islan
ds
South
Sum
atra
Centr
al Su
lawes
i
DKI J
akar
ta
North
Malu
ku
Aceh
Jamb
i
Wes
t Nus
a Ten
ggar
a
Wes
t Sum
atra
Wes
t Jav
a
Wes
t Sula
wesi
Riau
Bante
n
South
Kali
manta
n
Bang
ka B
elitun
g Isla
nds
Goro
ntalo
Estim
ate
(%)
0
10
20
30
40
50
60
70
80
9083
.2
82.1
77.4
76.3
73.7
71.6
69.3
68.2
68.0
67.6
66.7
65.1
63.9
60.6
60.1
59.3
59.1
57.0
53.3
50.3
43.7
36.8
32.9
30.7
29.7
27.9
24.2
23.9
17.1
10.0
5.9
3.5
2.6
National average = 51.2
Data source RISKESDAS 2013
Definition Numerator: Number of girls aged 0–11 years who have undergone female genital mutilation/cutting Denominator: Number of girls and women aged 0–11 years
National average 51.2%
Female genital mutilation
STATE OF HEALTH INEQUALITY: INDONESIA
42
5. Maternal, newborn and child health
Globally, maternal, newborn and child health was a major focus of the Millennium Development Goals, and remains part of the Sustainable Development Goals. Global initiatives such as the Every Woman Every Child movement – which encompasses the WHO Global Strategy for Women’s, Children’s and Adolescents’ Health (2016–2030) (1) and the WHO Every Newborn Action Plan (2) – support government leadership and promote action by policy-makers and programme managers to improve maternal, newborn and child health.
While Indonesia made progress in improving child health (e.g. evidenced by reductions in the under-five mortality rate), the country still has room for advancement, particularly in the area of maternal and newborn health (3). To this end, the Indonesia Newborn Action Plan 2014–2025, endorsed by the Ministry of Health in October 2014, supports provincial and district health authorities in addressing newborn health within the broader context of maternal, perinatal and neonatal health. The Plan has been costed at the national level, and specifies targets for newborn mortality and stillborn reduction; subnational newborn health plans were also developed (2,4). The Government of Indonesia continues to roll out JKN, which aims to achieve universal coverage by 2019, including access to maternal, newborn and child health services (5).
In Indonesia, maternal, newborn and child health services are provided by primary health care facilities (private or public) (6). Since the 1980s, Indonesia has made strides in scaling up access to midwives – who are responsible for a large portion of maternal, newborn and child health services – with aims to have a skilled birth attendant in every village and enable greater access to facility
delivery. Rapid expansion of maternal, newborn and child health services, however, have resulted in low quality of health worker training, and some facilities lack the capacity to handle complications that arise during delivery (7). Many women lack access to obstetric emergency centres with basic or comprehensive emergency obstetric and newborn care. Since 2004, the Maternal and child health handbook has been used as a resource to promote service provision according to uniform practices and standards, and to enable recordkeeping.
Maternal, newborn and child health indicatorsThis chapter covers eight indicators of maternal, newborn and child health (Table 5.1). Four of these indicators capture the coverage of health services for women and/or newborns: antenatal care coverage (at least four visits); births attended by skilled health personnel; postnatal care coverage for mothers; and postnatal care coverage for newborns. Three indicators capture other aspects of newborn and child health, including: early initiation of breastfeeding; exclusive breastfeeding; and vitamin A supplementation coverage. One indicator – low birth weight prevalence – is an anthropometric measurement. All indicators are measured as percentages. With the exception of low birth weight prevalence – where lower prevalence is desirable – higher percentages of other indicators mark a desired situation of higher health service coverage or better newborn and child health.
The health services featured in this chapter demonstrate a continuum of care through the antenatal period, child birth and the postnatal
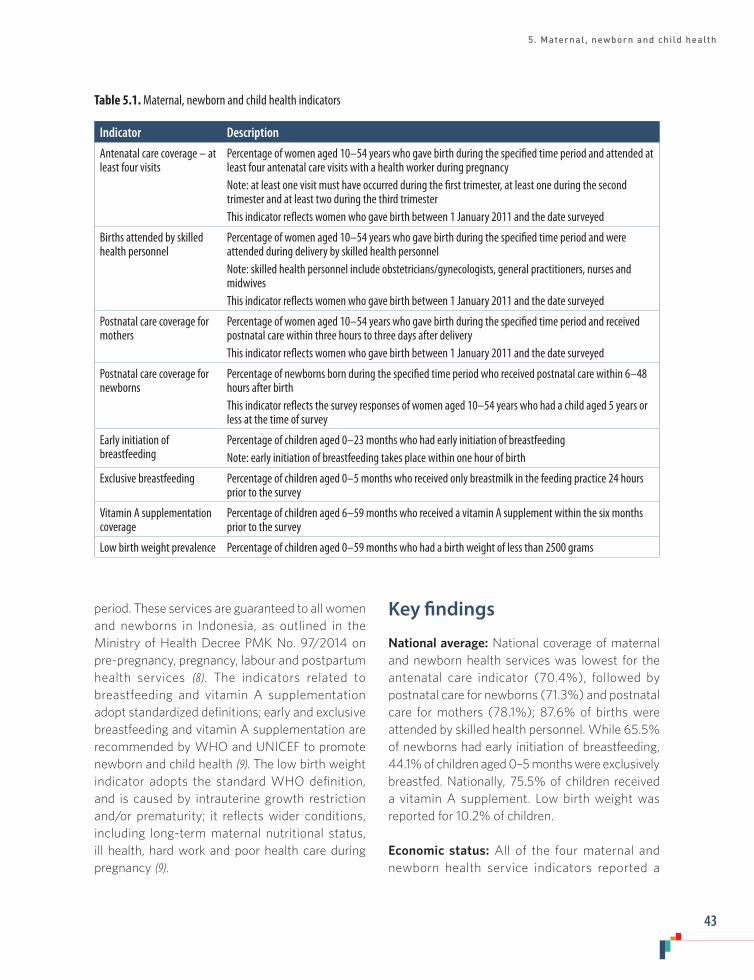
5. Maternal, newborn and child health
43
period. These services are guaranteed to all women and newborns in Indonesia, as outlined in the Ministry of Health Decree PMK No. 97/2014 on pre-pregnancy, pregnancy, labour and postpartum health services (8). The indicators related to breastfeeding and vitamin A supplementation adopt standardized definitions; early and exclusive breastfeeding and vitamin A supplementation are recommended by WHO and UNICEF to promote newborn and child health (9). The low birth weight indicator adopts the standard WHO definition, and is caused by intrauterine growth restriction and/or prematurity; it reflects wider conditions, including long-term maternal nutritional status, ill health, hard work and poor health care during pregnancy (9).
Key findings
National average: National coverage of maternal and newborn health services was lowest for the antenatal care indicator (70.4%), followed by postnatal care for newborns (71.3%) and postnatal care for mothers (78.1%); 87.6% of births were attended by skilled health personnel. While 65.5% of newborns had early initiation of breastfeeding, 44.1% of children aged 0–5 months were exclusively breastfed. Nationally, 75.5% of children received a vitamin A supplement. Low birth weight was reported for 10.2% of children.
Economic status: All of the four maternal and newborn health service indicators reported a
Table 5.1. Maternal, newborn and child health indicators
Indicator Description
Antenatal care coverage – at least four visits
Percentage of women aged 10–54 years who gave birth during the specified time period and attended at least four antenatal care visits with a health worker during pregnancy Note: at least one visit must have occurred during the first trimester, at least one during the second trimester and at least two during the third trimesterThis indicator reflects women who gave birth between 1 January 2011 and the date surveyed
Births attended by skilled health personnel
Percentage of women aged 10–54 years who gave birth during the specified time period and were attended during delivery by skilled health personnel Note: skilled health personnel include obstetricians/gynecologists, general practitioners, nurses and midwivesThis indicator reflects women who gave birth between 1 January 2011 and the date surveyed
Postnatal care coverage for mothers
Percentage of women aged 10–54 years who gave birth during the specified time period and received postnatal care within three hours to three days after deliveryThis indicator reflects women who gave birth between 1 January 2011 and the date surveyed
Postnatal care coverage for newborns
Percentage of newborns born during the specified time period who received postnatal care within 6–48 hours after birthThis indicator reflects the survey responses of women aged 10–54 years who had a child aged 5 years or less at the time of survey
Early initiation of breastfeeding
Percentage of children aged 0–23 months who had early initiation of breastfeeding Note: early initiation of breastfeeding takes place within one hour of birth
Exclusive breastfeeding Percentage of children aged 0–5 months who received only breastmilk in the feeding practice 24 hours prior to the survey
Vitamin A supplementation coverage
Percentage of children aged 6–59 months who received a vitamin A supplement within the six months prior to the survey
Low birth weight prevalence Percentage of children aged 0–59 months who had a birth weight of less than 2500 grams
STATE OF HEALTH INEQUALITY: INDONESIA
44
gradient pattern of increasing coverage across wealth quintiles. The difference between the richest and poorest was most pronounced for the skilled birth attendance indicator (34.4 percentage points). For all four indicators, the poorest quintile lagged substantially behind other quintiles. For instance, the poorest reported only 47.8% coverage of four antenatal care visits, and 49.9% coverage of postnatal care for newborns. The two breastfeeding indicators demonstrated mixed patterns across quintiles: while early initiation of breastfeeding was highest in the richest quintile (69.2%), the exclusive breastfeeding indicator was highest in the poorest quintile (51.4%). Vitamin A supplementation was lowest in the poorest quintile (65.2%). Low birth weight was most prevalent among the poorest (13.4%), and decreased in a step-wise fashion to a minimum of 8.2% in the richest.
Education: Data across six education subgroups demonstrated a gradient pattern for the four maternal and newborn health service indicators. The coverage of four antenatal care visits was 38.8 percentage points higher in the most-educated subgroup (85.1%) than the least-educated subgroup (46.3%); similarly, the difference between the most and least educated also exceeded 30 percentage points for the skilled birth attendance and postnatal care for newborns indicators. For postnatal care for newborns, the largest increase in coverage was between the primary school subgroup (65.2%) and the junior high school subgroup (73.9%). Early initiation of breastfeeding increased from a minimum of 57.4% in the no education subgroup over the next three subgroups, whereas exclusive breastfeeding was lowest in the most-educated subgroup (36.2%), with no clear pattern across other subgroups. Vitamin A supplementation increased from 66.8% in the least-educated subgroup by a margin of 11.7 percentage points to a maximum of 78.5% in the most-educated subgroup. The prevalence of low birth weight was 5.3 percentage points higher in the least-educated subgroup than the most-educated subgroup.
Occupation: Data disaggregated by occupation were available for three maternal, newborn and child health indicators. For the antenatal care, births attended by skilled health personnel, and postnatal care for mothers indicators, coverage was lowest in the farmer/fisherman/labourer subgroup and highest in the employee subgroup, followed by the entrepreneur subgroup. Antenatal care demonstrated the largest gap, with a difference of 25.7 percentage points between coverage in the farmer/fisherman/labourer subgroup (57.1%) and coverage in the employee subgroup (82.8%).
Employment status: Early initiation of breastfeeding was similar among the working subgroup (66.8%) and the not working subgroup (64.7%).
Age: The antenatal care, skilled birth attendance and postnatal care for mothers indicators were disaggregated by the age of the woman. Antenatal care coverage was higher in women aged 20–34 years (72.4%) than women less than 20 years (62.3%) or more than 35 years (64.9%). For births attended by skilled health personnel and postnatal care for mothers indicators, the subgroup aged less than 20 years reported lower coverage than the two older subgroups by a margin of about 5 percentage points.
Sex: Sex disaggregated data were reported for postnatal care coverage for newborns, early initiation of breastfeeding, vitamin A supplementation and low birth weight prevalence. Sex inequality was low: the female–male difference did not exceed 2 percentage points for any of these indicators.
Place of residence: The four maternal and newborn health service indicators demonstrated lower prevalence in rural than urban areas. The urban–rural difference was largest in the antenatal care indicator (14.3 percentage points) and the skilled birth attendance indicator (12.4 percentage points); this difference amounted to 9.9 percentage points for postnatal care for newborns,
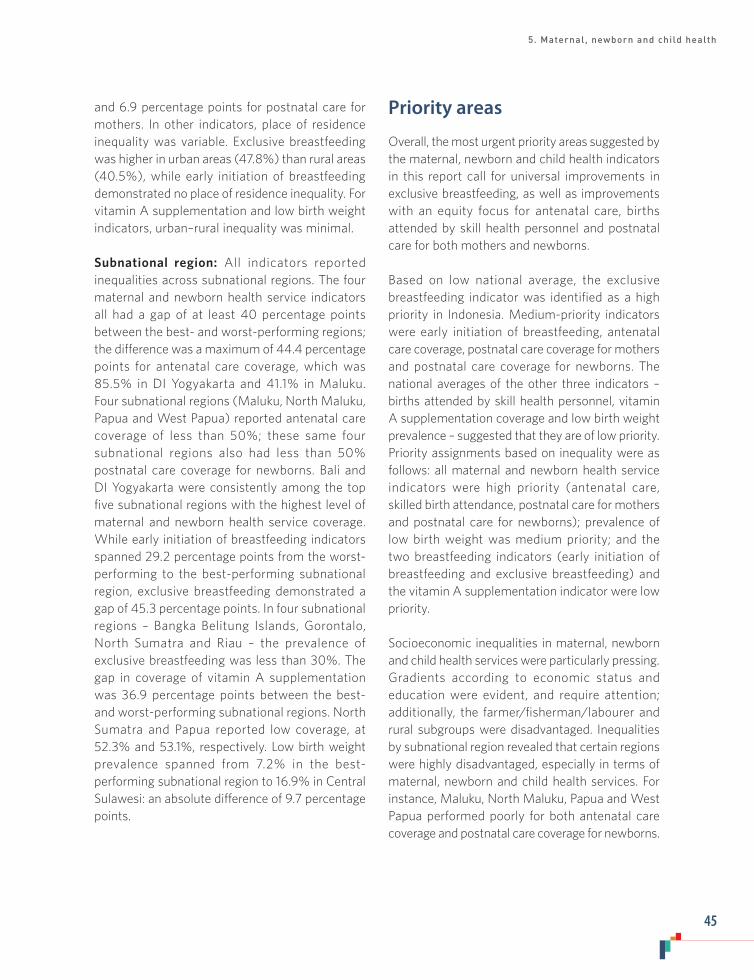
5. Maternal, newborn and child health
45
and 6.9 percentage points for postnatal care for mothers. In other indicators, place of residence inequality was variable. Exclusive breastfeeding was higher in urban areas (47.8%) than rural areas (40.5%), while early initiation of breastfeeding demonstrated no place of residence inequality. For vitamin A supplementation and low birth weight indicators, urban–rural inequality was minimal.
Subnational region: All indicators reported inequalities across subnational regions. The four maternal and newborn health service indicators all had a gap of at least 40 percentage points between the best- and worst-performing regions; the difference was a maximum of 44.4 percentage points for antenatal care coverage, which was 85.5% in DI Yogyakarta and 41.1% in Maluku. Four subnational regions (Maluku, North Maluku, Papua and West Papua) reported antenatal care coverage of less than 50%; these same four subnational regions also had less than 50% postnatal care coverage for newborns. Bali and DI Yogyakarta were consistently among the top five subnational regions with the highest level of maternal and newborn health service coverage. While early initiation of breastfeeding indicators spanned 29.2 percentage points from the worst-performing to the best-performing subnational region, exclusive breastfeeding demonstrated a gap of 45.3 percentage points. In four subnational regions – Bangka Belitung Islands, Gorontalo, North Sumatra and Riau – the prevalence of exclusive breastfeeding was less than 30%. The gap in coverage of vitamin A supplementation was 36.9 percentage points between the best- and worst-performing subnational regions. North Sumatra and Papua reported low coverage, at 52.3% and 53.1%, respectively. Low birth weight prevalence spanned from 7.2% in the best-performing subnational region to 16.9% in Central Sulawesi: an absolute difference of 9.7 percentage points.
Priority areas
Overall, the most urgent priority areas suggested by the maternal, newborn and child health indicators in this report call for universal improvements in exclusive breastfeeding, as well as improvements with an equity focus for antenatal care, births attended by skill health personnel and postnatal care for both mothers and newborns.
Based on low national average, the exclusive breastfeeding indicator was identified as a high priority in Indonesia. Medium-priority indicators were early initiation of breastfeeding, antenatal care coverage, postnatal care coverage for mothers and postnatal care coverage for newborns. The national averages of the other three indicators – births attended by skill health personnel, vitamin A supplementation coverage and low birth weight prevalence – suggested that they are of low priority. Priority assignments based on inequality were as follows: all maternal and newborn health service indicators were high priority (antenatal care, skilled birth attendance, postnatal care for mothers and postnatal care for newborns); prevalence of low birth weight was medium priority; and the two breastfeeding indicators (early initiation of breastfeeding and exclusive breastfeeding) and the vitamin A supplementation indicator were low priority.
Socioeconomic inequalities in maternal, newborn and child health services were particularly pressing. Gradients according to economic status and education were evident, and require attention; additionally, the farmer/fisherman/labourer and rural subgroups were disadvantaged. Inequalities by subnational region revealed that certain regions were highly disadvantaged, especially in terms of maternal, newborn and child health services. For instance, Maluku, North Maluku, Papua and West Papua performed poorly for both antenatal care coverage and postnatal care coverage for newborns.
STATE OF HEALTH INEQUALITY: INDONESIA
46
Policy implications
Ongoing efforts to advance maternal, newborn and child health can benefit from improving health service coverage among socioeconomically disadvantaged subgroups and disadvantaged subnational regions. This may require dedicated resources to alleviate financial and other barriers that prevent health service usage. Priority packages of maternal, newborn and child health interventions should be delivered and made available at the community level, where appropriate, with appropriate health worker skill assignments and adequate referral mechanisms.
Health system requirements for maternal, newborn and child health should be strengthened, including human resources, commodities and supplies, health infrastructure, information and accountability, and critical gaps should be addressed. Furthermore, quality control of programmes and services should be strengthened. For instance, shortcomings in the numbers and/or distribution of skilled health personnel should be reconciled through approaches that accelerate health worker production, retention and motivation. Task shifting should be considered, such as delegation of life-saving procedures to mid-level health providers, or training community health workers to provide postnatal care visits at home.
Additionally, efforts are warranted to enhance the quality of maternal, newborn and child health services, especially in disadvantaged subnational regions. For example, national standards and guidelines should be developed and enforced across all health facilities, ensuring that adequate resources are available to train, supervise and motivate staff. Accreditation and certification mechanisms need to be strengthened for training institutions and health workers, and reviewed periodically, since staffing and other factors at facilities can change over time. Midwifery curriculum used by various training schools should be standardized and a mechanism for ensuring consistency in the quality of training should be developed.
Indonesia has demonstrated the importance of exclusive breastfeeding, including Health Law 36/2009 article 128 that calls for every baby to be exclusively breastfed or given donor breastmilk for the first 6 months of life. This measure, however, has not had widespread success, due to the poor implementation of the law and the promotion of breastmilk substitutes by formula companies (10). Policy-makers may consider supplementary action, such as campaigns to increase the awareness of the importance of breastfeeding, and programmes oriented towards breastfeeding promotion and support; health worker training may be warranted, especially in poor-performing subnational regions.
Indicator profiles
In the following pages, Figures 5.1–5.16 illustrate disaggregated data by applicable and available dimensions of inequality. Supplementary tables S1–S4 contain relevant simple and complex summary measures.
Electronic visualization components accompany this report, enabling interactive data exploration. To access interactive visuals:
Interactive visuals
http://apps.who.int/gho/data/view.wrapper.HE-
VIZ20?lang=en&menu=hide
VISIT:SCAN HERE: or
References1. Progress in partnership: 2017 progress report on the
Every Woman Every Child global strategy for women’s, children’s and adolescents’ health [Internet]. Geneva: World Health Organization; 2017 (http://apps.who.int/iris/bitstream/10665/258504/1/WHO-FWC-NMC-17.3-eng.pdf, accessed August 2017).

5. Maternal, newborn and child health
47
2. Reaching the every newborn national 2020 milestones: country progress, plans and moving forward [Internet]. Geneva and New York; World Health Organization and United Nations Children’s Fund; 2017 (http://apps.who.int/iris/bitstream/10665/255719/1/9789241512619-eng.pdf, accessed 6 August 2017).
3. UNICEF Indonesia. Issue briefs: Maternal and child health. Jakarta: UNICEF; 2012.
4. Every Newborn Action Plan: country implementation tracking tool report. Geneva: World Health Organization; 2015.
5. World Bank Group. Universal maternal health coverage? Assessing the readiness of public health facilities to provide maternal health care in Indonesia. Jakarta: World Bank; 2014.
6. Asia Pacific Observatory on Health Systems and Policies. The Republic of Indonesia health system review. New Delhi: WHO Regional Office for South-East Asia, World Health Organization, 2017.
7. Joint Committee on Reducing Maternal and Neonatal Mortality in Indonesia; Development, Security, and Cooperation, Policy and Global Affairs; National Research Council; Indonesian Academy of Sciences. Reducing maternal and neonatal mortality in Indonesia: saving lives, saving the future [Internet]. Washington (DC): National Academies Press; 2013 (http://www.nap.edu/catalog/18437, accessed 1 August 2017).
8. PMK No. 97/2014 [Internet]. Jakarta: Ministry of Health Republic of Indonesia; 2014 (http://kesga.kemkes.go.id/images/pedoman/PMK%20No.%2097%20ttg%20Pelayanan%20Kesehatan%20Kehamilan.pdf, accessed 1 August 2017).
9. Nutrition Landscape Information System (NLIS) country profile indicators: interpretation guide [Internet]. Geneva: World Health Organization; 2010 (http://www.who.int/nutrition/nlis_interpretation_guide.pdf, accessed 3 August 2017).
10. Shetty P. Indonesia’s breastfeeding challenge is echoed the world over. Bull World Health Organ. 2014 April 1;92(4):234–5.
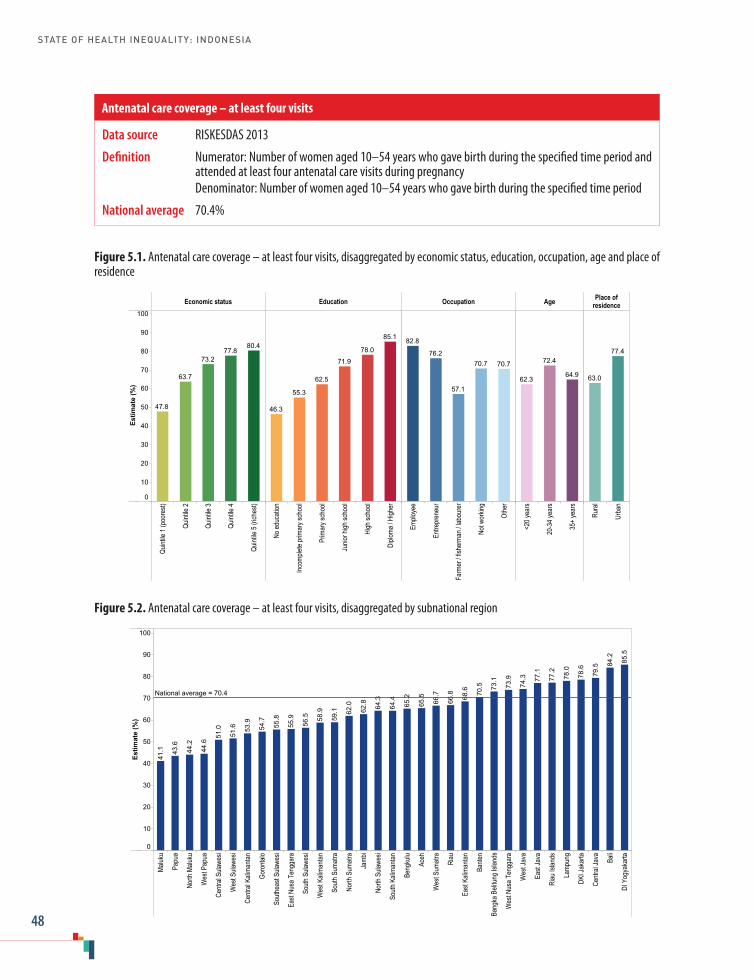
STATE OF HEALTH INEQUALITY: INDONESIA
48
Data source RISKESDAS 2013
Definition Numerator: Number of women aged 10–54 years who gave birth during the specified time period and attended at least four antenatal care visits during pregnancy
Denominator: Number of women aged 10–54 years who gave birth during the specified time period
National average 70.4%
Antenatal care coverage – at least four visits
Figure 5.2. Antenatal care coverage – at least four visits, disaggregated by subnational region
Maluk
u
Papu
a
North
Malu
ku
Wes
t Pap
ua
Centr
al Su
lawes
i
Wes
t Sula
wesi
Centr
al Ka
liman
tan
Goro
ntalo
South
east
Sulaw
esi
East
Nusa
Ten
ggar
a
South
Sula
wesi
Wes
t Kali
manta
n
South
Sum
atra
North
Sum
atra
Jamb
i
North
Sula
wesi
South
Kali
manta
n
Beng
kulu
Aceh
Wes
t Sum
atra
Riau
East
Kalim
antan
Bante
n
Bang
ka B
elitun
g Isla
nds
Wes
t Nus
a Ten
ggar
a
Wes
t Jav
a
East
Java
Riau
Islan
ds
Lamp
ung
DKI J
akar
ta
Centr
al Ja
va Bali
DI Y
ogya
karta
Estim
ate
(%)
0
10
20
30
40
50
60
70
80
90
10085
.5
84.2
79.5
78.6
78.0
77.2
77.1
74.3
73.9
73.1
70.5
68.6
66.8
66.7
65.5
65.2
64.4
64.3
62.8
62.0
59.1
58.9
56.5
55.9
55.8
54.7
53.9
51.6
51.0
44.6
44.2
43.6
41.1
National average = 70.4
Figure 5.1. Antenatal care coverage – at least four visits, disaggregated by economic status, education, occupation, age and place of residence
Economic status Education Occupation Age Place ofresidence
Quint
ile 1
(poo
rest)
Quint
ile 2
Quint
ile 3
Quint
ile 4
Quint
ile 5
(rich
est)
No ed
ucati
on
Incom
plete
prim
ary s
choo
l
Prim
ary s
choo
l
Junio
r high
scho
ol
High
scho
ol
Diplo
ma / H
igher
Emplo
yee
Entre
pren
eur
Farm
er / f
isher
man /
labo
urer
Not w
orkin
g
Othe
r
<20 y
ears
20-3
4 yea
rs
35+
year
s
Rura
l
Urba
n
Estim
ate
(%)
0
10
20
30
40
50
60
70
80
90
100
80.477.8
73.2
63.7
47.8
85.1
78.0
71.9
62.5
55.3
46.3
70.770.7
57.1
76.2
82.8
64.9
72.4
62.3
77.4
63.0

5. Maternal, newborn and child health
49
Data source RISKESDAS 2013
Definition Numerator: Number of women aged 10–54 years who gave birth during the specified time period and were attended during delivery by skilled health personnel
Denominator: Number of women aged 10–54 years who gave birth during the specified time period
National average 87.6%
Births attended by skilled health personnel
Figure 5.4. Births attended by skilled health personnel, disaggregated by subnational region
Papu
a
Maluk
u
North
Malu
ku
Wes
t Sula
wesi
East
Nusa
Ten
ggar
a
Wes
t Pap
ua
Centr
al Ka
liman
tan
Wes
t Kali
manta
n
Centr
al Su
lawes
i
South
east
Sulaw
esi
South
Sula
wesi
Wes
t Jav
a
North
Sula
wesi
South
Kali
manta
n
Bante
n
Riau
Jamb
i
Lamp
ung
South
Sum
atra
East
Kalim
antan
Bang
ka B
elitun
g Isla
nds
Aceh
Goro
ntalo
Wes
t Nus
a Ten
ggar
a
Wes
t Sum
atra
North
Sum
atra
East
Java
Beng
kulu
Riau
Islan
ds
Centr
al Ja
va
DKI J
akar
ta Bali
DI Y
ogya
karta
Estim
ate
(%)
0
10
20
30
40
50
60
70
80
90
100 99.9
98.8
98.3
96.1
95.7
94.8
94.2
92.6
92.3
91.7
91.1
90.9
90.1
89.6
89.3
88.6
88.4
87.4
84.5
84.5
82.3
81.9
81.7
78.7
76.1
74.4
74.0
71.2
67.2
62.1
61.2
60.4
59.1
National average = 87.6
Figure 5.3. Births attended by skilled health personnel, disaggregated by economic status, education, occupation, age and place of residence
Economic status Education Occupation Age Place ofresidence
Quint
ile 1
(poo
rest)
Quint
ile 2
Quint
ile 3
Quint
ile 4
Quint
ile 5
(rich
est)
No ed
ucati
on
Incom
plete
prim
ary s
choo
l
Prim
ary s
choo
l
Junio
r high
scho
ol
High
scho
ol
Diplo
ma / H
igher
Emplo
yee
Entre
pren
eur
Farm
er / f
isher
man /
labo
urer
Not w
orkin
g
Othe
r
<20 y
ears
20-3
4 yea
rs
35+
year
s
Rura
l
Urba
n
Estim
ate
(%)
0
10
20
30
40
50
60
70
80
90
100 97.694.8
91.6
81.2
63.2
98.396.190.8
78.9
71.2
61.9
88.988.0
75.3
94.796.6
87.288.182.6
93.6
81.2
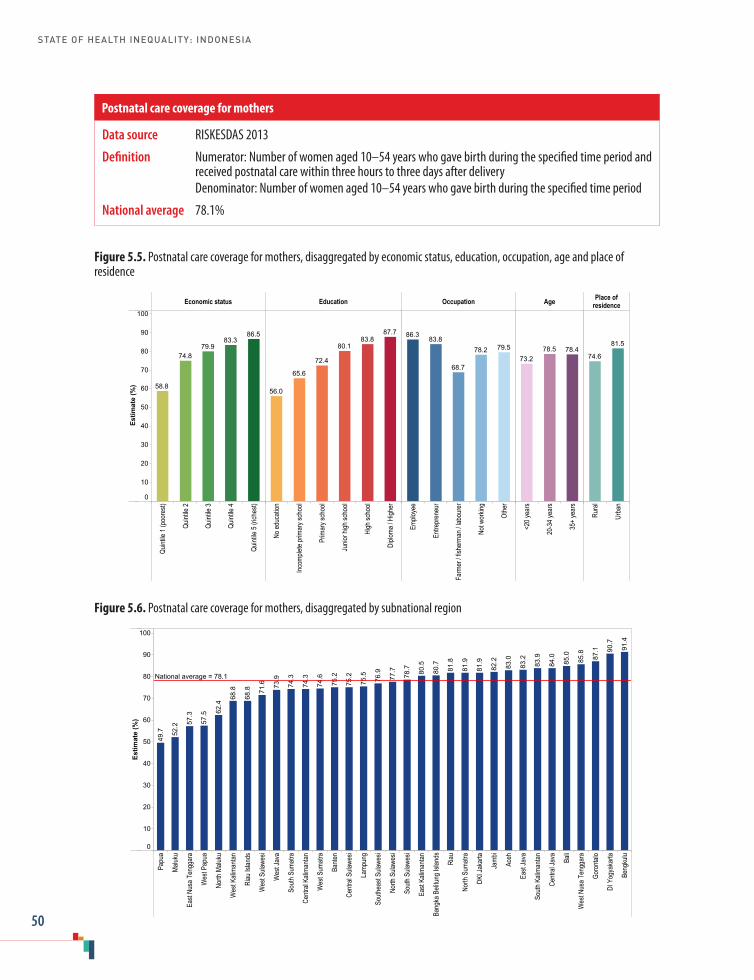
STATE OF HEALTH INEQUALITY: INDONESIA
50
Data source RISKESDAS 2013
Definition Numerator: Number of women aged 10–54 years who gave birth during the specified time period and received postnatal care within three hours to three days after delivery
Denominator: Number of women aged 10–54 years who gave birth during the specified time period
National average 78.1%
Postnatal care coverage for mothers
Figure 5.6. Postnatal care coverage for mothers, disaggregated by subnational region
Papu
a
Maluk
u
East
Nusa
Ten
ggar
a
Wes
t Pap
ua
North
Malu
ku
Wes
t Kali
manta
n
Riau
Islan
ds
Wes
t Sula
wesi
Wes
t Jav
a
South
Sum
atra
Centr
al Ka
liman
tan
Wes
t Sum
atra
Bante
n
Centr
al Su
lawes
i
Lamp
ung
South
east
Sulaw
esi
North
Sula
wesi
South
Sula
wesi
East
Kalim
antan
Bang
ka B
elitun
g Isla
nds
Riau
North
Sum
atra
DKI J
akar
ta
Jamb
i
Aceh
East
Java
South
Kali
manta
n
Centr
al Ja
va Bali
Wes
t Nus
a Ten
ggar
a
Goro
ntalo
DI Y
ogya
karta
Beng
kulu
Estim
ate
(%)
0
10
20
30
40
50
60
70
80
90
10091
.4
90.7
87.1
85.8
85.0
84.0
83.9
83.2
83.0
82.2
81.9
81.9
81.8
80.7
80.5
78.7
77.7
76.9
75.5
75.2
75.2
74.6
74.3
74.3
73.9
71.6
68.8
68.8
62.4
57.5
57.3
52.2
49.7
National average = 78.1
Figure 5.5. Postnatal care coverage for mothers, disaggregated by economic status, education, occupation, age and place of residence
Economic status Education Occupation Age Place ofresidence
Quint
ile 1
(poo
rest)
Quint
ile 2
Quint
ile 3
Quint
ile 4
Quint
ile 5
(rich
est)
No ed
ucati
on
Incom
plete
prim
ary s
choo
l
Prim
ary s
choo
l
Junio
r high
scho
ol
High
scho
ol
Diplo
ma / H
igher
Emplo
yee
Entre
pren
eur
Farm
er / f
isher
man /
labo
urer
Not w
orkin
g
Othe
r
<20 y
ears
20-3
4 yea
rs
35+
year
s
Rura
l
Urba
n
Estim
ate
(%)
0
10
20
30
40
50
60
70
80
90
100
86.583.3
79.974.8
58.8
87.783.8
80.1
72.4
65.6
56.0
79.578.2
68.7
83.886.3
78.478.573.2
81.5
74.6

5. Maternal, newborn and child health
51
Data source RISKESDAS 2013
Definition Numerator: Number of children aged 5 years or less at the time of survey who received postnatal care within 6–48 hours after birth
Denominator: Number of children aged 5 years or less at the time of survey
National average 71.3%
Postnatal care coverage for newborns
Figure 5.8. Postnatal care coverage for newborns, disaggregated by subnational region
Wes
t Pap
ua
Papu
a
Maluk
u
North
Malu
ku
East
Nusa
Ten
ggar
a
Riau
Islan
ds
Wes
t Kali
manta
n
South
Sum
atra
Centr
al Ka
liman
tan
Centr
al Su
lawes
i
Wes
t Sula
wesi
Bante
n
Wes
t Jav
a
Wes
t Sum
atra
South
east
Sulaw
esi
North
Sum
atra
Bang
ka B
elitun
g Isla
nds
Lamp
ung
East
Kalim
antan Riau
South
Sula
wesi
South
Kali
manta
n
Aceh
North
Sula
wesi
Goro
ntalo
Centr
al Ja
va
Jamb
i
Wes
t Nus
a Ten
ggar
a
East
Java
Beng
kulu
DI Y
ogya
karta Ba
li
DKI J
akar
ta
Estim
ate
(%)
0
10
20
30
40
50
60
70
80
90
10082
.8
82.2
80.5
79.9
78.8
78.4
78.0
76.8
74.8
74.6
74.5
73.7
72.2
72.0
71.5
71.4
71.1
70.9
69.7
67.9
67.5
67.0
66.7
65.4
64.2
62.7
62.0
60.2
51.3
49.7
43.3
42.8
42.1
National average = 71.3
Figure 5.7. Postnatal care coverage for newborns, disaggregated by economic status, education, sex and place of residence
Economic status Education Sex Place of residence
Quint
ile 1
(poo
rest)
Quint
ile 2
Quint
ile 3
Quint
ile 4
Quint
ile 5
(rich
est)
No ed
ucati
on
Incom
plete
prim
ary s
choo
l
Prim
ary s
choo
l
Junio
r high
scho
ol
High
scho
ol
Diplo
ma / H
igher
Fema
le
Male
Rura
l
Urba
n
Estim
ate
(%)
0
10
20
30
40
50
60
70
80
90
100
80.977.7
73.5
65.9
49.9
83.279.2
73.9
65.263.859.2
71.670.976.1
66.2
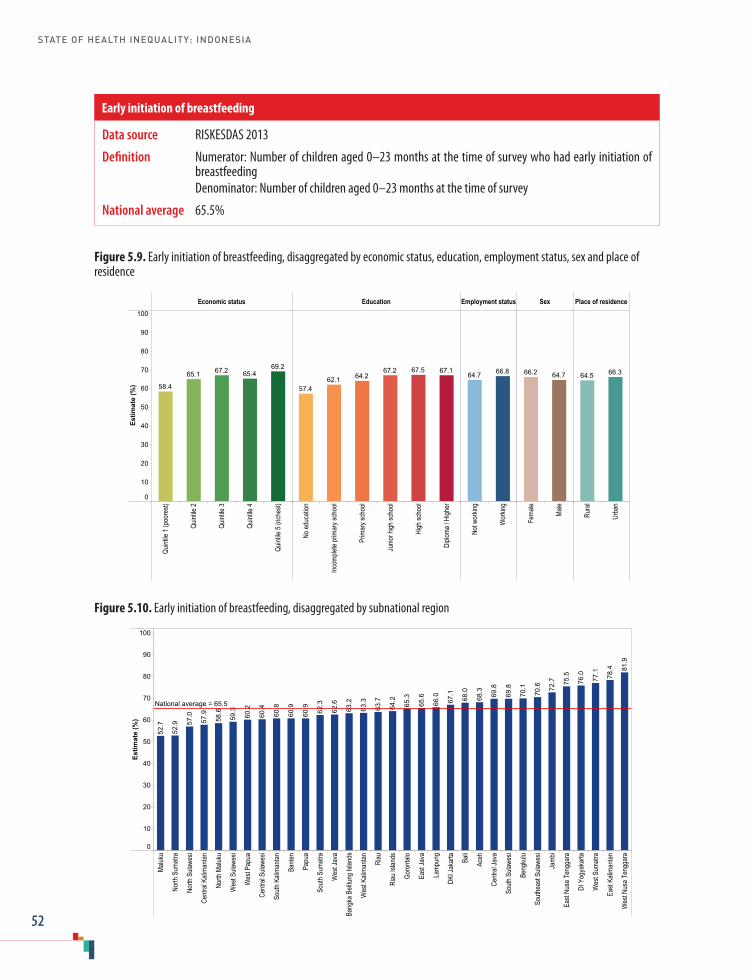
STATE OF HEALTH INEQUALITY: INDONESIA
52
Data source RISKESDAS 2013
Definition Numerator: Number of children aged 0–23 months at the time of survey who had early initiation of breastfeeding
Denominator: Number of children aged 0–23 months at the time of survey
National average 65.5%
Early initiation of breastfeeding
Figure 5.10. Early initiation of breastfeeding, disaggregated by subnational region
Maluk
u
North
Sum
atra
North
Sula
wesi
Centr
al Ka
liman
tan
North
Malu
ku
Wes
t Sula
wesi
Wes
t Pap
ua
Centr
al Su
lawes
i
South
Kali
manta
n
Bante
n
Papu
a
South
Sum
atra
Wes
t Jav
a
Bang
ka B
elitun
g Isla
nds
Wes
t Kali
manta
n
Riau
Riau
Islan
ds
Goro
ntalo
East
Java
Lamp
ung
DKI J
akar
ta Bali
Aceh
Centr
al Ja
va
South
Sula
wesi
Beng
kulu
South
east
Sulaw
esi
Jamb
i
East
Nusa
Ten
ggar
a
DI Y
ogya
karta
Wes
t Sum
atra
East
Kalim
antan
Wes
t Nus
a Ten
ggar
a
Estim
ate
(%)
0
10
20
30
40
50
60
70
80
90
10081
.9
78.4
77.1
76.0
75.5
72.7
70.6
70.1
69.8
69.8
68.3
68.0
67.1
66.0
65.6
65.3
64.2
63.7
63.3
63.2
62.6
62.3
60.9
60.9
60.8
60.4
60.2
59.3
58.6
57.9
57.0
52.9
52.7
National average = 65.5
Figure 5.9. Early initiation of breastfeeding, disaggregated by economic status, education, employment status, sex and place of residence
Economic status Education Employment status Sex Place of residence
Quint
ile 1
(poo
rest)
Quint
ile 2
Quint
ile 3
Quint
ile 4
Quint
ile 5
(rich
est)
No ed
ucati
on
Incom
plete
prim
ary s
choo
l
Prim
ary s
choo
l
Junio
r high
scho
ol
High
scho
ol
Diplo
ma / H
igher
Not w
orkin
g
Wor
king
Fema
le
Male
Rura
l
Urba
n
Estim
ate
(%)
0
10
20
30
40
50
60
70
80
90
100
69.265.467.265.1
58.4
67.167.567.264.262.1
57.4
66.864.7 64.766.2 66.364.5
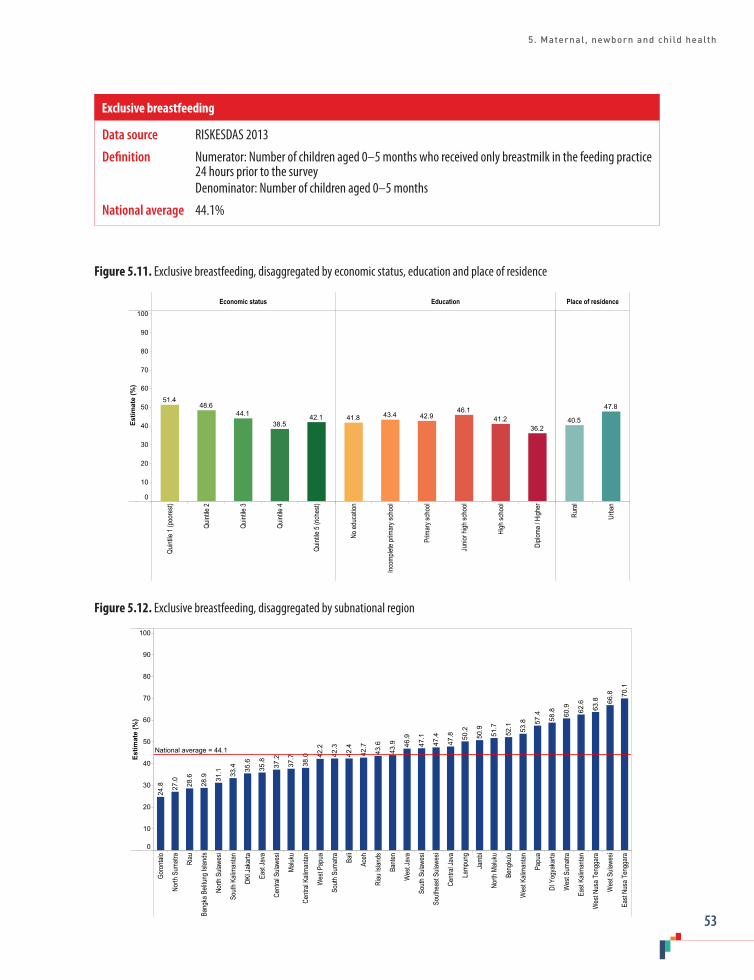
5. Maternal, newborn and child health
53
Data source RISKESDAS 2013
Definition Numerator: Number of children aged 0–5 months who received only breastmilk in the feeding practice 24 hours prior to the survey
Denominator: Number of children aged 0–5 months
National average 44.1%
Exclusive breastfeeding
Figure 5.12. Exclusive breastfeeding, disaggregated by subnational region
Goro
ntalo
North
Sum
atra
Riau
Bang
ka B
elitun
g Isla
nds
North
Sula
wesi
South
Kali
manta
n
DKI J
akar
ta
East
Java
Centr
al Su
lawes
i
Maluk
u
Centr
al Ka
liman
tan
Wes
t Pap
ua
South
Sum
atra
Bali
Aceh
Riau
Islan
ds
Bante
n
Wes
t Jav
a
South
Sula
wesi
South
east
Sulaw
esi
Centr
al Ja
va
Lamp
ung
Jamb
i
North
Malu
ku
Beng
kulu
Wes
t Kali
manta
n
Papu
a
DI Y
ogya
karta
Wes
t Sum
atra
East
Kalim
antan
Wes
t Nus
a Ten
ggar
a
Wes
t Sula
wesi
East
Nusa
Ten
ggar
a
Estim
ate
(%)
0
10
20
30
40
50
60
70
80
90
10070
.1
66.8
63.8
62.6
60.9
58.8
57.4
53.8
52.1
51.7
50.9
50.2
47.8
47.4
47.1
46.9
43.9
43.6
42.7
42.4
42.3
42.2
38.0
37.7
37.2
35.8
35.6
33.4
31.1
28.9
28.6
27.0
24.8
National average = 44.1
Figure 5.11. Exclusive breastfeeding, disaggregated by economic status, education and place of residence
Economic status Education Place of residence
Quint
ile 1
(poo
rest)
Quint
ile 2
Quint
ile 3
Quint
ile 4
Quint
ile 5
(rich
est)
No ed
ucati
on
Incom
plete
prim
ary s
choo
l
Prim
ary s
choo
l
Junio
r high
scho
ol
High
scho
ol
Diplo
ma / H
igher
Rura
l
Urba
n
Estim
ate
(%)
0
10
20
30
40
50
60
70
80
90
100
42.138.5
44.148.6
51.4
36.241.2
46.142.943.441.8
47.8
40.5

STATE OF HEALTH INEQUALITY: INDONESIA
54
Data source RISKESDAS 2013
Definition Numerator: Number of children aged 6–59 months who received a vitamin A supplement within the six months prior to the survey
Denominator: Number of children aged 6–59 months
National average 75.5%
Vitamin A supplementation coverage
Figure 5.14. Vitamin A supplementation coverage, disaggregated by subnational region
North
Sum
atra
Papu
a
Wes
t Sula
wesi
Riau
Wes
t Pap
ua
North
Malu
ku
Maluk
u
Centr
al Ka
liman
tan
South
Sum
atra
Wes
t Kali
manta
n
South
Sula
wesi
Riau
Islan
ds
Bang
ka B
elitun
g Isla
nds
Centr
al Su
lawes
i
Wes
t Sum
atra
East
Nusa
Ten
ggar
a
South
Kali
manta
n
South
east
Sulaw
esi
Lamp
ung
Aceh
Beng
kulu
Bante
n
DKI J
akar
ta
Jamb
i
Bali
East
Kalim
antan
North
Sula
wesi
Wes
t Jav
a
Goro
ntalo
East
Java
Centr
al Ja
va
DI Y
ogya
karta
Wes
t Nus
a Ten
ggar
a
Estim
ate
(%)
0
10
20
30
40
50
60
70
80
90
10089
.2
84.4
84.0
83.4
83.3
81.6
80.9
80.3
76.0
74.5
74.5
74.2
73.8
73.8
73.6
73.3
72.9
72.0
70.9
69.3
69.2
68.8
67.9
67.5
66.1
65.4
64.7
64.6
64.5
60.8
59.5
53.1
52.3
National average = 75.5
Figure 5.13. Vitamin A supplementation coverage, disaggregated by economic status, education, sex and place of residence
Economic status Education Sex Place of residence
Quint
ile 1
(poo
rest)
Quint
ile 2
Quint
ile 3
Quint
ile 4
Quint
ile 5
(rich
est)
No ed
ucati
on
Incom
plete
prim
ary s
choo
l
Prim
ary s
choo
l
Junio
r high
scho
ol
High
scho
ol
Diplo
ma / H
igher
Fema
le
Male
Rura
l
Urba
n
Estim
ate
(%)
0
10
20
30
40
50
60
70
80
90
100
76.278.978.5
74.8
65.2
78.578.078.274.8
71.066.8
75.475.5 77.073.9

5. Maternal, newborn and child health
55
Data source RISKESDAS 2013
Definition Numerator: Number of children aged 0–59 months who had a birth weight of less than 2500 grams Denominator: Number of children aged 0–59 months
National average 10.2%
Low birth weight prevalence
Figure 5.16. Low birth weight prevalence, disaggregated by subnational region
North
Sum
atra
Wes
t Sum
atra
North
Sula
wesi
Lamp
ung
Jamb
i
Aceh
Riau Ba
li
DKI J
akar
ta
Riau
Islan
ds
South
Sum
atra
Bang
ka B
elitun
g Isla
nds
DI Y
ogya
karta
South
east
Sulaw
esi
Bante
n
Centr
al Ja
va
Beng
kulu
South
Kali
manta
n
Wes
t Pap
ua
Wes
t Jav
a
East
Kalim
antan
East
Java
Maluk
u
North
Malu
ku
Wes
t Nus
a Ten
ggar
a
Wes
t Sula
wesi
South
Sula
wesi
Goro
ntalo
Centr
al Ka
liman
tan
Wes
t Kali
manta
n
East
Nusa
Ten
ggar
a
Papu
a
Centr
al Su
lawes
i
Estim
ate
(%)
0
2
4
6
8
10
12
14
16
18
16.9
15.5
15.4
14.5
13.7
13.3
12.4
12.2
12.2
11.4
11.3
11.2
10.9
10.8
10.6
10.1
9.8
9.7
9.7
9.5
9.4
9.4
9.3
9.3
9.2
8.8
8.6
8.6
8.3
8.0
7.9
7.3
7.2
National average = 10.2
Figure 5.15. Low birth weight prevalence, disaggregated by economic status, education, sex and place of residence
Economic status Education Sex Place of residence
Quint
ile 1
(poo
rest)
Quint
ile 2
Quint
ile 3
Quint
ile 4
Quint
ile 5
(rich
est)
No ed
ucati
on
Incom
plete
prim
ary s
choo
l
Prim
ary s
choo
l
Junio
r high
scho
ol
High
scho
ol
Diplo
ma / H
igher
Fema
le
Male
Rura
l
Urba
n
Estim
ate
(%)
0
2
4
6
8
10
12
14
16
18
8.29.1
11.0
12.2
13.4
8.18.8
10.0
11.311.9
13.4
9.2
11.2
9.4
11.2

STATE OF HEALTH INEQUALITY: INDONESIA
56
6. Childhood immunization
Indonesia adopted the Integrated Management of Childhood Illness strategy in 1997, demonstrating a strong commitment to child health through improving access and quality of key child health services (1,2). Over 1990–2015, the country made significant progress towards Millennium Development Goal 4 (to reduce child mortality), though improvements were not realized universally (3). One of the main strategies of Goal 4 was the rapid scale-up of key interventions, including the strengthening and expansion of childhood immunization programmes (4).
The WHO Expanded Programme on Immunization was launched in Indonesia in 1977, and the country currently has a comprehensive multiyear plan for immunization, covering 2015–2019 (5). Basic immunization for children is indicated as part of the minimum standard health services for districts and provinces, as specified in the 2016 Ministry of Health Decree No. 43. Furthermore, the complete basic immunization for children is included in the Healthy Indonesia Programme with Family Approach (Program Indonesia Sehat Dengan Pendekatan Keluarga/PIS-DPK), a recent programme to promote health through primary health centres. Beyond supporting the routine immunization programme, the Ministry of Health coordinates a number of programmes that aim to increase immunization coverage, including: Backlog Fighting; National Immunization Week; Catch up Campaigns; Sustained Outreach Strategy (SOS) for drop-out follow-up; and Outbreak Response Immunization (6,7).
District health offices are primarily responsible for the management and delivery of immunization programmes in Indonesia, which are typically delivered through primary health centres (puskesmas) and their networks (though the
programmes can also be accessed through private providers) (8). All districts have updated plans that include activities to increase immunization coverage (5). The Ministry of Health is responsible for vaccine procurement and supply and cold-chain management, and also provides technical assistance and oversight (8,9). The success of the programmes have been hampered by geographical disparities, limited resources of outreach activities and difficulties in cold-chain maintenance in vaccines; negative perceptions of immunization side-effects and suspicion of haram ingredients persist (8,10).
Childhood immunization indicatorsFive childhood immunization indicators were included in this report (Table 6.1). These indicators correspond with standard global indicators of immunization, and include vaccines that are part of Indonesia’s national immunization schedule. The Bacille Calmette-Guérin (BCG) and measles indicators capture receipt of a single dose, while the DPT-HB and polio indicators capture receipt of multiple doses; the complete basic immunization indicator covers multiple types of vaccines. According to Indonesia’s immunization schedule: BCG is administered at 1 month of age; hepatitis B is administered within 24 hours after birth; DPT-HB is administered at 2 months, 3 months, 4 months and 18 months; measles and rubella is administered at 9 months, 18 months and class 1; and polio is administered at 1 month, 2 months, 3 months and 4 months. Beyond their measure of immunization coverage, immunization indicators can serve as proxy indications of health service access, especially when vaccines are administered through routine systems.

6. Childhood immunization
57
Table 6.1. Childhood immunization indicators
Indicator Description
BCG immunization coverage Percentage of children aged 12–23 months who have received one dose of BCG vaccine
Measles immunization coverage
Percentage of children aged 12–23 months who have received one dose of measles vaccine
DPT-HB immunization coverage
Percentage of children aged 12–23 months who have received three doses of: DPT-HB vaccine; or DPT-HB-Hib vaccine
Polio immunization coverage
Percentage of children aged 12–23 months who have received four doses of oral polio vaccine
Complete basic immunization coverage
Percentage of children aged 12–23 months who have received: one dose of hepatitis B vaccine within seven days of birth (HB-0); one dose of BCG vaccine; three doses of DPT-HB or DPT-HB-Hib vaccine; one dose of measles vaccine; and four doses of oral polio vaccine
Key findings
National average: Of the five childhood immunization indicators, the complete basic immunization indicator had the lowest national average coverage (59.2%). The highest national average coverage was reported for the two indicators that capture a single vaccine dose (BCG at 87.6% and measles at 82.1%), followed by polio (77.0%) and DPT-HB (75.6%).
Economic status: All indicators reported a gradient across all quintiles, which was most pronounced in the case of the complete basic immunization indicator. A marginal exclusion pattern was observed in all indicators, whereby quintile 1 performed much worse than the other quintiles: coverage in quintile 1 was at least 10 percentage points lower than in quintile 2. For the complete basic immunization indicator, coverage was 39.5% in quintile 1, and reached a maximum of 67.8% coverage in quintile 5. For the DPT-HB indicator, quintiles 2-5 all reported coverage of at least 70% and for polio, quintiles 2–5 all reported coverage of over 75%. For the measles indicator, quintiles 2–5 all had coverage of at least 80% and for BCG, quintiles 2–5 had coverage of over 85%.
Education: Education subgroups are based on the highest level attained by the child’s mother.
For each indicator, the levels of coverage in the no education and incomplete primary school subgroups were about the same (less than 2 percentage points difference); apart from these two subgroups, a gradient was evident across all other education subgroups in all indicators. The BCG indicator had the smallest absolute gap between the most- and least-educated subgroups (15.6 percentage points), and the level of BCG coverage exceeded 90% in the three most-educated subgroups (junior high school, high school and diploma/higher). For the complete basic immunization indicator, coverage in all subgroups was below 75%; coverage was around 50% for the no education subgroup (52.2%) and incomplete primary school subgroup (51.6%).
Sex: In all five indicators, the level of coverage was about the same in females and males (less than 2 percentage points difference).
Place of residence: All indicators demonstrated place of residence inequality, with higher coverage in urban than rural areas. In absolute terms, the largest gap was reported for the complete basic immunization indicator (10.8 percentage points); the smallest gap was reported for the measles indicator (4.1 percentage points).

STATE OF HEALTH INEQUALITY: INDONESIA
58
Subnational region: Overall, the worst-performing regions across the five childhood immunization indicators – Aceh, Maluku and Papua – were consistently among the bottom five of the 33 subnational regions. Bali, Central Java, DI Yogyakarta and Gorontalo were consistently among the five best-performing regions.
The indicators with the largest gaps between the best- and worst-performing regions were DPT-HB (54.3 percentage points) and complete basic immunization (53.9 percentage points). The BCG indicator had the smallest gap between the best- and worst-performing regions, at 39.4 percentage points.
For BCG and measles, the indicators with the highest national coverage, 27 and 18 regions reported coverage of at least 80%, respectively, and 12 and eight regions reported coverage of at least 90%, respectively. For each DPT-HB and polio indicators, 12 regions reported coverage of at least 80%; three regions had DPT-HB coverage of over 90% and two regions had polio coverage of over 90%. For the complete basic immunization indicator, three regions had coverage exceeding 80% and none were over 90%; 15 regions had coverage of 50% or less, including two regions that had less than 30% coverage.
Priority areas
The most pressing priority areas for childhood immunization indicators include: improving overall coverage of complete basic immunization; addressing poor performance in certain subnational regions; and increasing coverage among the poorest 20%. Additionally, lower levels of immunization coverage were reported among subgroups with lower education levels and subgroups in rural areas.
Unsurprisingly, the worst-performing indicator was complete basic immunization, as it reflects performance across all other indicators combined.
Due to its low overall coverage, it is considered a high priority indicator. The multiple dose indicators (DPT-HB and polio) are considered medium priority; the single dose indicators (BCG and measles), which had national averages in excess of 80%, are considered low priority.
Inequality according to subnational regions indicated an urgent need for attention. In particular, in two regions (Maluku and Papua), fewer than one in three children had received complete basic immunization. Geographical inequalities in coverage of multiple dose indicators (DPT-HB and polio) are also considered a priority, given that coverage in the best-performing region was at least twice as high as in the poorest.
Analysis of data disaggregated by economic status suggests a general need to improve the situation in the poorest 20%, especially in terms of complete basic immunization coverage, but also the polio indicator.
Inequalities by education status demonstrated a gradient, however, the two least-educated subgroups were equally disadvantaged. Place of residence inequality was most pronounced in the complete basic immunization indicator.
Further inequality analyses are warranted within subnational regions to identify priority subgroups at local levels (i.e. through double disaggregation).
Policy implications
Policies at national and subnational levels should be oriented to address low levels of complete basic immunization, taking into account geographical inequalities between subnational regions and inequalities on the basis of economic status, education and place of residence. Subnational regions have variable levels of capacity to navigate the complexity of health systems, which affect budgetary management, programme monitoring
6. Childhood immunization
59
and evaluation, and overall facility efficiency (10,11). National reporting about immunization could be strengthened by integrating private sector Expanded Programme on Immunization (EPI) data.
Immunization coverage may be improved through efforts aimed to build local capacity in poor-performing regions, emphasizing strategies to strengthen immunization delivery. For instance, investing in village health posts, which provide promotive and preventive health services, have been shown to improve immunization coverage in Indonesia (10). The use of peer training of health workers by experienced health workers has also benefited immunization coverage in underperforming regions of Indonesia (12). Other strategies may build on efforts proven successful in other settings: bringing immunizations closer to communities; using information dissemination to increase vaccination demand; changing practices at fixed sites; and using innovative management practices (13). Additionally, high staff turnover at health posts should be minimized.
The lower coverage of multiple dose indicators relative to single dose indicators indicates that policies should aim to reduce the rate of immunization non-completion; that is, policies should promote return visits for subsequent vaccine doses until completion. Non-completion rates have been shown to vary across population subgroups and according to sociocultural contexts; health education efforts that are highly tailored to local contexts may help to increase coverage among vulnerable population subgroups (14). Efforts are warranted to foster community awareness on timely and full doses of vaccinations.
Indicator profiles
In the following pages, Figures 6.1–6.10 illustrate disaggregated data by applicable and available dimensions of inequality. Supplementary tables S1–S4 contain relevant simple and complex summary measures.
Electronic visualization components accompany this report, enabling interactive data exploration. To access interactive visuals:
Interactive visuals
http://apps.who.int/gho/data/view.wrapper.HE-
VIZ20?lang=en&menu=hide
VISIT:SCAN HERE: or
References1. Trisnantoro L, Soemantri S, Singgih B, Pritasari K,
Mulati E, Agung FH et al. Reducing child mortality in Indonesia. Bull World Health Organ. 2010;88(9):642.
2. Titaley CR, Jusril H, Ariawan I, Soeharno N, Setiawan T, Weber MW. Challenges to the implementation of the Integrated Management of Childhood Illness (IMCI) at community health centres in West Java province, Indonesia. WHO South East Asia J Public Health. 2014;3(2):161–70 (http://imsear.li.mahidol.ac.th/handle/123456789/154213, accessed 7 July 2017).
3. Schröders J, Wall S, Kusnanto H, Ng N. Millennium Development Goal 4 and child health inequities in Indonesia: a systematic review of the literature. In: Kokubo Y, editor. PLOS ONE. 2015 May 5;10(5):e0123629.
4. MDG 4: reduce child mortality [Internet]. Geneva: World Health Organization; 2015 (http://www.who.int/topics/millennium_development_goals/child_mortality/en/, accessed 7 July 2017).
5. EPI fact sheet: Indonesia [Internet]. Geneva: World Health Organization; 2016 (http://www.searo.who.int/entity/immunization/data/indonesia.pdf?ua=1, accessed 7 July 2017).
6. Ministry of Health Decree No. 42/2013. Jakarta: Ministry of Health Republic of Indonesia; 2013.
7. Permenkes Nomor 12 Tahun 2017 Tentang Penyelenggaraan Imunisasi [Internet]. Jakarta: Ministry of Health Republic of Indonesia; 2017 (http://hukor.kemkes.go.id/uploads/produk_hukum/PMK_No._12_ttg_Penyelenggaraan_Imunisasi_.pdf, 14 August 2017).

STATE OF HEALTH INEQUALITY: INDONESIA
60
8. Asia Pacific Observatory on Health Systems and Policies. The Republic of Indonesia health system review. New Delhi: WHO Regional Office for South-East Asia, World Health Organization; 2017.
9. Comprehensive multi-year plan: National Immunization Program Indonesia: 2010–2014. Jakarta: Ministry of Health Republic of Indonesia; 2010.
10. Maharani A, Tampubolon G. Has decentralisation affected child immunisation status in Indonesia? Glob Health Action [Internet]. 2014 August 25;7 (http://www.ncbi.nlm.nih.gov/pmc/articles/PMC4164015/, accessed 7 August 2017).
11. Rokx C, Schieber G, Harimurti P, Tandon A, Somanathan A. Health financing in Indonesia: a roadmap for reform [Internet]. Washington (DC): World Bank; 2009 (http://elibrary.worldbank.org/doi/book/10.1596/978-0-8213-8006-2, accessed 7 August 2017).
12. Robinson JS, Burkhalter BR, Rasmussen B, Sugiono R. Low-cost on-the-job peer training of nurses improved immunization coverage in Indonesia. Bull World Health Organ. 2001;79(2):150–8.
13. Ryman TK, Dietz V, Cairns KL. Too little but not too late: results of a literature review to improve routine immunization programs in developing countries. BMC Health Serv Res [Internet]. 2008 December;8(1). (http://bmchealthservres.biomedcentral.com/articles/10.1186/1472-6963-8-134, accessed 8 July 2017).
14. Cassell J. The social shaping of childhood vaccination practice in rural and urban Gambia. Health Policy Plan. 2006 July 28;21(5):373–91.

6. Childhood immunization
61
Data source RISKESDAS 2013
Definition Numerator: Number of children aged 12–23 months who have received one dose of Bacille Calmette-Guérin (BCG) vaccine
Denominator: Number of children aged 12–23 months
National average 87.6%
BCG immunization coverage
Figure 6.2. BCG immunization coverage, disaggregated by subnational region
Papu
a
Aceh
Maluk
u
Centr
al Ka
liman
tan
North
Sum
atra
Wes
t Sula
wesi
Wes
t Pap
ua
Wes
t Sum
atra
Wes
t Kali
manta
n
Riau
South
Kali
manta
n
Bante
n
North
Malu
ku
East
Nusa
Ten
ggar
a
Centr
al Su
lawes
i
South
Sula
wesi
South
east
Sulaw
esi
South
Sum
atra
Jamb
i
East
Kalim
antan
Wes
t Jav
a
Lamp
ung
DKI J
akar
ta
Riau
Islan
ds
Wes
t Nus
a Ten
ggar
a
Bang
ka B
elitun
g Isla
nds
Beng
kulu
East
Java
Centr
al Ja
va
Goro
ntalo
North
Sula
wesi
Bali
DI Y
ogya
karta
Estim
ate
(%)
0
10
20
30
40
50
60
70
80
90
100 98.9
97.6
97.3
97.2
94.8
93.3
93.0
92.8
92.2
92.0
90.9
90.0
87.8
87.3
85.5
84.9
84.8
84.8
84.3
84.2
83.6
83.6
83.2
81.4
81.2
81.0
80.4
79.3
78.1
77.0
73.6
72.9
59.5
National average = 87.6
Figure 6.1. BCG immunization coverage, disaggregated by economic status, education, sex and place of residence
Economic status Education Sex Place of residence
Quint
ile 1
(poo
rest)
Quint
ile 2
Quint
ile 3
Quint
ile 4
Quint
ile 5
(rich
est)
No ed
ucati
on
Incom
plete
prim
ary s
choo
l
Prim
ary s
choo
l
Junio
r high
scho
ol
High
scho
ol
Diplo
ma / H
igher
Fema
le
Male
Rura
l
Urba
n
Estim
ate
(%)
0
10
20
30
40
50
60
70
80
90
10093.391.7
88.885.6
73.2
94.593.190.4
86.180.278.9
87.987.291.0
83.9
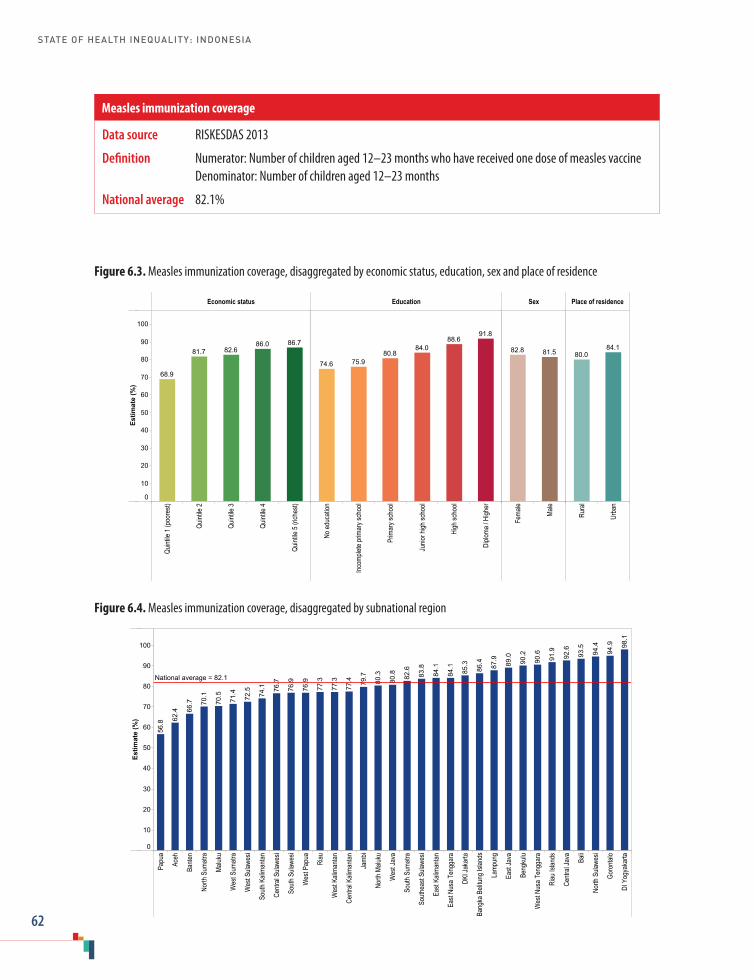
STATE OF HEALTH INEQUALITY: INDONESIA
62
Figure 6.3. Measles immunization coverage, disaggregated by economic status, education, sex and place of residence
Economic status Education Sex Place of residence
Quint
ile 1
(poo
rest)
Quint
ile 2
Quint
ile 3
Quint
ile 4
Quint
ile 5
(rich
est)
No ed
ucati
on
Incom
plete
prim
ary s
choo
l
Prim
ary s
choo
l
Junio
r high
scho
ol
High
scho
ol
Diplo
ma / H
igher
Fema
le
Male
Rura
l
Urba
n
Estim
ate
(%)
0
10
20
30
40
50
60
70
80
90
100
86.786.082.681.7
68.9
91.888.6
84.080.8
75.974.6
81.582.8 84.180.0
Figure 6.4. Measles immunization coverage, disaggregated by subnational region
Papu
a
Aceh
Bante
n
North
Sum
atra
Maluk
u
Wes
t Sum
atra
Wes
t Sula
wesi
South
Kali
manta
n
Centr
al Su
lawes
i
South
Sula
wesi
Wes
t Pap
ua
Riau
Wes
t Kali
manta
n
Centr
al Ka
liman
tan
Jamb
i
North
Malu
ku
Wes
t Jav
a
South
Sum
atra
South
east
Sulaw
esi
East
Kalim
antan
East
Nusa
Ten
ggar
a
DKI J
akar
ta
Bang
ka B
elitun
g Isla
nds
Lamp
ung
East
Java
Beng
kulu
Wes
t Nus
a Ten
ggar
a
Riau
Islan
ds
Centr
al Ja
va Bali
North
Sula
wesi
Goro
ntalo
DI Y
ogya
karta
Estim
ate
(%)
0
10
20
30
40
50
60
70
80
90
100 98.1
94.9
94.4
93.5
92.6
91.9
90.6
90.2
89.0
87.9
86.4
85.3
84.1
84.1
83.8
82.6
80.8
80.3
79.7
77.4
77.3
77.3
76.9
76.9
76.7
74.1
72.5
71.4
70.5
70.1
66.7
62.4
56.8
National average = 82.1
Data source RISKESDAS 2013
Definition Numerator: Number of children aged 12–23 months who have received one dose of measles vaccine Denominator: Number of children aged 12–23 months
National average 82.1%
Measles immunization coverage

6. Childhood immunization
63
Data source RISKESDAS 2013
Definition Numerator: Number of children aged 12–23 months who have received: three doses of DPT-HB vaccine; or DPT-HB-Hib vaccine
Denominator: Number of children aged 12–23 months
National average 75.6%
DPT-HB immunization coverage
Figure 6.5. DPT-HB immunization coverage, disaggregated by economic status, education, sex and place of residence
Economic status Education Sex Place of residence
Quint
ile 1
(poo
rest)
Quint
ile 2
Quint
ile 3
Quint
ile 4
Quint
ile 5
(rich
est)
No ed
ucati
on
Incom
plete
prim
ary s
choo
l
Prim
ary s
choo
l
Junio
r high
scho
ol
High
scho
ol
Diplo
ma / H
igher
Fema
le
Male
Rura
l
Urba
n
Estim
ate
(%)
0
10
20
30
40
50
60
70
80
90
100
83.980.5
76.973.4
56.6
87.383.3
78.172.7
69.067.5
75.675.779.9
71.1
Figure 6.6. DPT-HB immunization coverage, disaggregated by subnational region
Papu
a
Aceh
Maluk
u
Wes
t Pap
ua
Wes
t Sum
atra
North
Sum
atra
Bante
n
East
Nusa
Ten
ggar
a
Wes
t Sula
wesi
Centr
al Ka
liman
tan
North
Malu
ku
South
Sula
wesi
Riau
Wes
t Jav
a
Wes
t Kali
manta
n
South
Kali
manta
n
Centr
al Su
lawes
i
South
Sum
atra
South
east
Sulaw
esi
Jamb
i
DKI J
akar
ta
East
Kalim
antan
Lamp
ung
North
Sula
wesi
Bang
ka B
elitun
g Isla
nds
Wes
t Nus
a Ten
ggar
a
East
Java
Beng
kulu
Riau
Islan
ds
Centr
al Ja
va Bali
Goro
ntalo
DI Y
ogya
karta
Estim
ate
(%)
0
10
20
30
40
50
60
70
80
90
100
95.1
93.0
90.4
89.2
87.4
86.7
85.7
85.2
83.7
83.3
82.5
81.4
79.1
76.7
75.3
73.6
72.6
72.0
71.9
71.5
70.0
69.5
68.9
67.9
67.1
66.0
63.3
63.1
60.2
60.0
53.8
52.9
40.8
National average = 75.6

STATE OF HEALTH INEQUALITY: INDONESIA
64
Figure 6.7. Polio immunization coverage, disaggregated by economic status, education, sex and place of residence
Economic status Education Sex Place of residence
Quint
ile 1
(poo
rest)
Quint
ile 2
Quint
ile 3
Quint
ile 4
Quint
ile 5
(rich
est)
No ed
ucati
on
Incom
plete
prim
ary s
choo
l
Prim
ary s
choo
l
Junio
r high
scho
ol
High
scho
ol
Diplo
ma / H
igher
Fema
le
Male
Rura
l
Urba
n
Estim
ate
(%)
0
10
20
30
40
50
60
70
80
90
100
83.681.0
78.476.0
60.1
86.883.8
78.574.7
69.869.1
76.077.9 80.3
73.4
Figure 6.8. Polio immunization coverage, disaggregated by subnational region
Papu
a
Aceh
Maluk
u
Wes
t Pap
ua
Bante
n
Wes
t Sum
atra
North
Sum
atra
East
Nusa
Ten
ggar
a
Centr
al Ka
liman
tan
Wes
t Sula
wesi
Riau
South
Sula
wesi
North
Malu
ku
South
Kali
manta
n
Wes
t Jav
a
Centr
al Su
lawes
i
Wes
t Kali
manta
n
South
Sum
atra
DKI J
akar
ta
South
east
Sulaw
esi
Jamb
i
North
Sula
wesi
East
Kalim
antan
Lamp
ung
East
Java
Beng
kulu
Centr
al Ja
va
Wes
t Nus
a Ten
ggar
a
Riau
Islan
ds
Bang
ka B
elitun
g Isla
nds
DI Y
ogya
karta Ba
li
Goro
ntalo
Estim
ate
(%)
0
10
20
30
40
50
60
70
80
90
100
95.8
92.4
88.3
88.3
88.0
87.7
87.6
87.6
86.2
84.6
81.6
81.4
77.4
76.9
76.7
76.3
74.1
74.0
73.9
73.2
71.9
70.9
70.9
70.2
69.9
68.5
67.5
64.4
64.0
62.8
61.8
58.3
48.8
National average = 77.0
Data source RISKESDAS 2013
Definition Numerator: Number of children aged 12–23 months who have received four doses of oral polio vaccine Denominator: Number of children aged 12–23 months
National average 77.0%
Polio immunization coverage

6. Childhood immunization
65
Data source RISKESDAS 2013
Definition Numerator: Number of children aged 12–23 months who have received: one dose of hepatitis B vaccine within seven days of birth (HB-0); one dose of BCG vaccine; three doses of DPT-HB or DPT-HB-Hib vaccine; one dose of measles vaccine; and four doses of oral polio vaccine
Denominator: Number of children aged 12–23 months
National average 59.2%
Complete basic immunization coverage
Figure 6.9. Complete basic immunization coverage, disaggregated by economic status, education, sex and place of residence
Economic status Education Sex Place of residence
Quint
ile 1
(poo
rest)
Quint
ile 2
Quint
ile 3
Quint
ile 4
Quint
ile 5
(rich
est)
No ed
ucati
on
Incom
plete
prim
ary s
choo
l
Prim
ary s
choo
l
Junio
r high
scho
ol
High
scho
ol
Diplo
ma / H
igher
Fema
le
Male
Rura
l
Urba
n
Estim
ate
(%)
0
10
20
30
40
50
60
70
80
90
100
67.865.461.1
55.1
39.5
72.367.6
61.555.1
51.652.2
59.059.464.5
53.7
Figure 6.10. Complete basic immunization coverage, disaggregated by subnational region
Papu
a
Maluk
u
Wes
t Pap
ua
Aceh
North
Sum
atra
Wes
t Sum
atra
Centr
al Ka
liman
tan
North
Malu
ku
Bante
n
Centr
al Su
lawes
i
South
east
Sulaw
esi
Wes
t Kali
manta
n
South
Sum
atra
South
Sula
wesi
East
Nusa
Ten
ggar
a
South
Kali
manta
n
Riau
Wes
t Sula
wesi
Wes
t Jav
a
Jamb
i
North
Sula
wesi
Beng
kulu
Lamp
ung
DKI J
akar
ta
East
Kalim
antan
Bang
ka B
elitun
g Isla
nds
Riau
Islan
ds
East
Java
Wes
t Nus
a Ten
ggar
a
Centr
al Ja
va
Goro
ntalo
Bali
DI Y
ogya
karta
Estim
ate
(%)
0
10
20
30
40
50
60
70
80
90
100
83.1
80.8
80.6
76.9
75.4
74.5
71.6
67.7
65.9
64.5
62.4
62.1
60.9
60.3
56.6
52.4
52.2
52.0
50.3
49.5
48.3
47.4
47.3
47.1
45.8
42.6
42.0
39.7
39.1
38.3
35.6
29.7
29.2
National average = 59.2
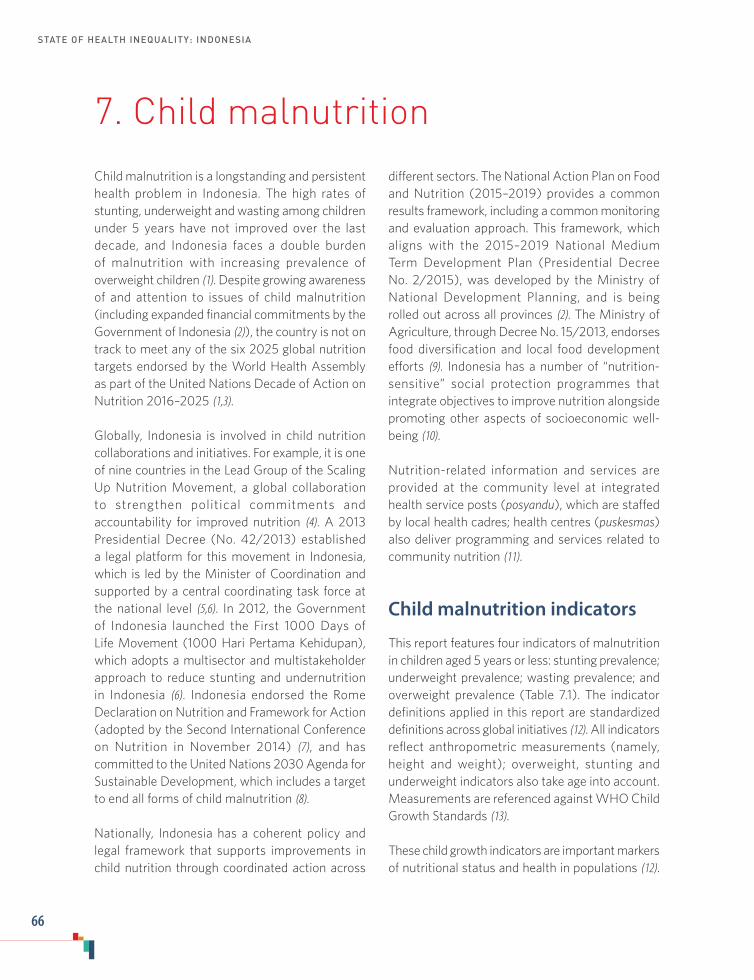
STATE OF HEALTH INEQUALITY: INDONESIA
66
7. Child malnutrition
Child malnutrition is a longstanding and persistent health problem in Indonesia. The high rates of stunting, underweight and wasting among children under 5 years have not improved over the last decade, and Indonesia faces a double burden of malnutrition with increasing prevalence of overweight children (1). Despite growing awareness of and attention to issues of child malnutrition (including expanded financial commitments by the Government of Indonesia (2)), the country is not on track to meet any of the six 2025 global nutrition targets endorsed by the World Health Assembly as part of the United Nations Decade of Action on Nutrition 2016–2025 (1,3).
Globally, Indonesia is involved in child nutrition collaborations and initiatives. For example, it is one of nine countries in the Lead Group of the Scaling Up Nutrition Movement, a global collaboration to strengthen political commitments and accountability for improved nutrition (4). A 2013 Presidential Decree (No. 42/2013) established a legal platform for this movement in Indonesia, which is led by the Minister of Coordination and supported by a central coordinating task force at the national level (5,6). In 2012, the Government of Indonesia launched the First 1000 Days of Life Movement (1000 Hari Pertama Kehidupan), which adopts a multisector and multistakeholder approach to reduce stunting and undernutrition in Indonesia (6). Indonesia endorsed the Rome Declaration on Nutrition and Framework for Action (adopted by the Second International Conference on Nutrition in November 2014) (7), and has committed to the United Nations 2030 Agenda for Sustainable Development, which includes a target to end all forms of child malnutrition (8).
Nationally, Indonesia has a coherent policy and legal framework that supports improvements in child nutrition through coordinated action across
different sectors. The National Action Plan on Food and Nutrition (2015–2019) provides a common results framework, including a common monitoring and evaluation approach. This framework, which aligns with the 2015–2019 National Medium Term Development Plan (Presidential Decree No. 2/2015), was developed by the Ministry of National Development Planning, and is being rolled out across all provinces (2). The Ministry of Agriculture, through Decree No. 15/2013, endorses food diversification and local food development efforts (9). Indonesia has a number of “nutrition-sensitive” social protection programmes that integrate objectives to improve nutrition alongside promoting other aspects of socioeconomic well-being (10).
Nutrition-related information and services are provided at the community level at integrated health service posts (posyandu), which are staffed by local health cadres; health centres (puskesmas) also deliver programming and services related to community nutrition (11).
Child malnutrition indicators
This report features four indicators of malnutrition in children aged 5 years or less: stunting prevalence; underweight prevalence; wasting prevalence; and overweight prevalence (Table 7.1). The indicator definitions applied in this report are standardized definitions across global initiatives (12). All indicators reflect anthropometric measurements (namely, height and weight); overweight, stunting and underweight indicators also take age into account. Measurements are referenced against WHO Child Growth Standards (13).
These child growth indicators are important markers of nutritional status and health in populations (12).

7. Child malnutrition
67
Stunting, underweight and wasting are considered indicators of undernutrition. Whereas stunting results from longer-term growth restriction and deprivations from the prenatal period and childhood, wasting is the result of recurrent acute deprivation of nutrition. Underweight prevalence can reflect wasting, acute weight loss and/or stunting. Nutritional imbalances during childhood have implications for long-term health. Being overweight as a child is associated with obesity in adolescence and adulthood, which increases the likelihood of experiencing various short-term and long-term diseases and risk factors. Children who are stunted are at greater risk for illness and death, and may have delayed mental development. Underweight also increases mortality risk, especially among those who are severely underweight. Wasting impairs the immune system, increasing susceptibility to infectious diseases as well as their severity.
Key findings
National average: Of the four child malnutrition indicators featured in this report, stunting had the highest national average (37.2%), followed by underweight (19.3%). Among children aged 5 years
Table 7.1. Child malnutrition indicators
Indicator Description
Stunting prevalence Percentage of children aged 5 years or less who are stuntedStunted was defined as more than two standard deviations below the median height-for-age of the WHO Child Growth Standards
Underweight prevalence Percentage of children aged 5 years or less who are underweight Underweight was defined as more than two standard deviations below the median weight-for-age of the WHO Child Growth Standards
Wasting prevalence Prevalence of children aged 5 years or less who are wastedWasted was defined as more than two standard deviations below the median weight-for-height of the WHO Child Growth Standards
Overweight prevalence Percentage of children aged 5 years or less who are overweight Overweight was defined as more than two standard deviations above the median weight-for-age of the WHO Child Growth Standards
or less, 12.1% met the criteria for wasting, and 4.5% were overweight.
Economic status: The stunting and underweight indicators demonstrated clear gradient patterns across quintiles, with step-wise declines in stunting/underweight percentages as economic status increased. For stunting, the absolute difference between the poorest (48.4%) and the richest (29.0%) was 19.4 percentage points. For underweight, the gap between the poorest (27.2%) and richest (13.7%) spanned 13.5 percentage points. Wasting prevalence differed by 3.5 percentage points across quintiles, and was highest in the poorest quintile (14.1%) and lowest in the richest quintile (10.6%). Overweight prevalence did not demonstrate a clear pattern according to economic status.
Education: Education subgroups are based on the highest level attained by the child’s mother. Disaggregated data across the six education subgroups revealed substantial inequality between the least-and most-educated subgroups in stunting (14.1 percentage points difference) and underweight prevalence (10.9 percentage points difference). Stunting was markedly lower in the most-educated subgroup (27.6%) than the three subgroups with

STATE OF HEALTH INEQUALITY: INDONESIA
68
primary school or lower (each had prevalence of more than 40%), whereas underweight prevalence showed a gradient pattern, from 24.0% in the no education subgroup, to 13.1% in the diploma/higher subgroup. Wasting prevalence was higher in the least-educated subgroup (13.5%) than the most-educated subgroup (10.8%) by a margin of 2.7 percentage points. Overweight prevalence was highest in the most-educated subgroup (7.0%).
Employment status: Inequality by employment status was not evident in any of the four malnutrition indicators.
Age: Age disaggregated data were available for six subgroups, and demonstrated different patterns for each indicator. Stunting prevalence peaked at age 24–35 months (41.9%) and was lowest at age 0–5 months (25.1%). Underweight prevalence increased incrementally from 0–5 months of age (10.7%), and levelled off at 24–35 months of age (22.0%). Wasting prevalence was highest at 6–11 months (14.1%) and then declined with age, reaching 10.7% at age 48–59 months. Overweight prevalence was highest during the first 5 months of life (6.0%), and lowest at age 24–35 months (3.7%).
Sex: In all indicators, sex-related inequality was minimal, with an absolute difference of less than 2 percentage points between males and females.
Place of residence: Rural areas had higher stunting and underweight prevalence than urban areas. The rural–urban difference amounted to 9.6 percentage points for the stunting indicator, and 5.6 percentage points for the underweight indicator. For both wasting and overweight indicators, the absolute difference between rural and urban areas was less than 2 percentage points.
Subnational region: Absolute inequality across subnational regions was most pronounced for the stunting indicator, where the prevalence in the best-performing region (Riau Islands, 26.3%) was 25.4 percentage points lower than the prevalence in
the worst-performing region (East Nusa Tenggara, 51.7%). Underweight prevalence had a gap of 19.3 percentage points between Bali (13.0%) and East Nusa Tenggara (32.3%). A larger percentage of children under 5 years in West Kalimantan were wasted (18.7%) than in any other subnational region; Bali reported wasting prevalence of 8.8%, which was 9.9 percentage points lower. West Papua was consistently among the five worst-performing subnational regions for stunting, underweight and wasting indicators. Overweight prevalence showed an absolute difference of 5.6 percentage points across subnational regions, with the highest prevalence in Bengkulu (8.1%).
Priority areas
Overall, high national rates of stunting, underweight and wasting in children under 5 years constitute an urgent and high priority. According to the WHO child malnutrition cut-off values for public health significance, national stunting has “high prevalence”, underweight has “medium prevalence” and wasting is “serious” (12). Even in the best-performing subgroups, the prevalence of these indicators did not reach an acceptable or low level. National overweight prevalence in children aged 5 years or less is considered a low priority, as are inequalities in this indicator. Ongoing monitoring is warranted to ensure that the national prevalence of overweight children remains low, especially among vulnerable subgroups and subnational regions.
Inequalities across stunting, underweight and wasting indicators are considered high priority, as disadvantaged subgroups across the selected dimensions of inequality tended to perform even worse than advantaged subgroups. Inequalities in the stunting and underweight indicators were particularly large for economic status and education level. In general, gradient patterns of inequality were reported. Stunting disaggregation by education subgroups, however, revealed consistently high prevalence across multiple subgroups with low

7. Child malnutrition
69
levels of education. Stunting and underweight prevalence were also high among children in rural areas.
All four indicators demonstrated inequality by subnational region. For each of the three indicators of undernutrition, several subnational regions reported prevalence that qualified as “very high prevalence” or “critical” (12). Along with other poor-performing subnational regions, priority should be given to West Papua, where stunting, underweight and wasting were considered very high or critical.
Policy implications
While Indonesia has demonstrated a commitment to reducing child malnutrition, gains have been largely unrealized and the situation remains urgent, especially regarding undernutrition. The findings of this chapter support the need for large-scale and sustained responses, recognizing that food security and malnutrition are multidimensional issues that require comprehensive, multisector and multidisciplinary approaches. In addition to tackling immediate needs, initiatives should address underlying determinants of nutrition, which may entail collaboration across sectors such as health, agriculture, social safety nets, early child development, education, water and sanitation, and others (14,15). Policies and programmes outside of the health sector have great potential to impact on nutritional outcomes through means such as improved targeting, integrating nutrition-specific goals and actions, and empowering women.
The patterns of inequality described in this chapter serve to indicate where concentrated efforts may be required to accelerate gains among the most disadvantaged. For instance, capacity-
building in poor-performing regions should aim to enhance the quality and administration of nutritional programmes. Nutrition initiatives that are administered centrally should account for local contexts, including geography, local governance, socioeco¬nomic status, demography and level of educational attainment (1). Socioeconomic inequalities in stunting and underweight prevalence call for increased attention to the economically and educationally disadvantaged through policies that combine universal and targeted approaches.
Regular evaluation and monitoring of child nutrition initiatives are warranted to indicate how resources can be efficiently and effectively used to promote accountability, and to ensure that improvements are achieved in an equitable manner. In particular, the evaluation of multisectoral programmes should be strengthened, including the integration of nutrition-related measurements.
Although the burden of undernutrition was found to be most pressing, policies should not neglect the emerging issue of children being overweight. The Strategic Action Plan to Reduce the Double Burden of Malnutrition in the South-East Asia Region 2016–2025 acknowledges that health systems of countries in the region have been designed to address persistent undernutrition, and calls for protective measures to mitigate trends of rising overweight and obesity (16). Moving forward, Indonesia should consider strengthening policies that: ensure nutrition policy-making is free from conflicts of interest; support enhanced accessibility of health foods; and foster healthy food environments in settings where children spend time, such as preschools and boarding schools.

STATE OF HEALTH INEQUALITY: INDONESIA
70
Indicator profiles
In the following pages, Figures 7.1–7.8 illustrate disaggregated data by applicable and available dimensions of inequality. Supplementary tables S1–S4 contain relevant simple and complex summary measures.
Electronic visualization components accompany this report, enabling interactive data exploration. To access interactive visuals:
Interactive visuals
http://apps.who.int/gho/data/view.wrapper.HE-
VIZ20?lang=en&menu=hide
VISIT:SCAN HERE: or
References1. Achadi E. 2014 global nutrition report: actions and
accountability to accelerate the world’s progress on nutrition. Washington (DC): International Food Policy Research Institute; 2014.
2. Scaling Up Nutrition Movement: annual progress report for Indonesia [Internet]. SUN: 2016 (http://docs.scalingupnutrition.org/wp-content/uploads/2016/11/Indonesia-SUN-Movement-Annual-Progress-Report-2016.pdf, accessed 2 August 2017).
3. Work Programme of the UN Decade of Action on Nutrition 2016–2025 [Internet]. New York: United Nations; 2017 (http://www.who.int/nutrition/decade-of-action/workprogramme-2016to2025/en/, accessed 2 August 2017).
4. Scaling Up Nutrition Movement [Internet]. SUN: 2017 (http://scalingupnutrition.org/, accessed 2 August 2017).
5. Planning and costing for the acceleration of actions for nutrition: experiences of countries in the Movement for Scaling Up Nutrition [Internet]. Secretariat SUN: 2014 (https://opendocs.ids.ac.uk/opendocs/handle/123456789/3889, accessed 2 August 2017).
6. Ministry of Health Decree No. 42/2013. Jakarta: Ministry of Health Republic Indonesia; 2013.
7. Rome declaration on nutrition (ICN2 2014/2) [Internet]. Rome and Geneva: Food and Agriculture Organization of the United Nations and World Health Organization; 2014 (http://www.fao.org/3/a-ml542e.pdf, accessed 2 August 2017).
8. United Nations General Assembly. Transforming our world: the 2030 agenda for sustainable development. New York: United Nations; 2015.
9. Ministry of Agriculture Decree No. 15/2015. Jakarta: Ministry of Agriculture Republic of Indonesia; 2015.
10. Spray A, editor. Leveraging social protection programs for improved nutrition: compendium of case studies. Prepared for the Global Forum on Nutrition-Sensitive Social Protection Programs, 2015 [Internet]. Washington (DC): World Bank Publications; 2016 (https://openknowledge.worldbank.org/handle/10986/25275, accessed 2 August 2017).
11. Asia Pacific Observatory on Health Systems and Policies. The Republic of Indonesia health system review. New Delhi: WHO Regional Office for South-East Asia, World Health Organization; 2017.
12. Nutrition Landscape Information System (NLIS) country profile indicators: interpretation guide [Internet]. Geneva: World Health Organization; 2010 (http://www.who.int/nutrition/nlis_interpretation_guide.pdf, accessed 3 August 2017).
13. WHO Child Growth Standards [Internet]. Geneva: World Health Organization; 2017 (http://www.who.int/childgrowth/standards/en/, accessed 2 August 2017).
14. World Bank Group. Improving nutrition through multisectoral approaches [Internet]. Washington (DC): World Bank; 2013 (http://documents.worldbank.org/curated/en/625661468329649726/pdf/75102-REVISED-PUBLIC-MultisectoralApproachestoNutrition.pdf, accessed 3 August 2017).
15. Ruel MT, Alderman H, and Maternal and Child Nutrition Study Group. Nutrition-sensitive interventions and programmes: How can they help to accelerate progress in improving maternal and child nutrition? Lancet. 2013;382(9891):536–51.
16. Strategic Action Plan to reduce the double burden of malnutrition in the South-East Asia Region, 2016–2025. New Dehli: WHO Regional Office for South-East Asia, World Health Organization; 2016.

7. Child malnutrition
71
Figure 7.1. Stunting prevalence, disaggregated by economic status, education, employment status, age, sex and place of residence
Economic status Education Employmentstatus Age Sex Place of
residence
Quint
ile 1
(poo
rest)
Quint
ile 2
Quint
ile 3
Quint
ile 4
Quint
ile 5
(rich
est)
No ed
ucati
on
Incom
plete
prim
ary s
choo
l
Prim
ary s
choo
l
Junio
r high
scho
ol
High
scho
ol
Diplo
ma / H
igher
Not w
orkin
g
Wor
king
0-5 m
onths
6-11
mon
ths
12-2
3 mon
ths
24-3
5 mon
ths
36-4
7 mon
ths
48-5
9 mon
ths
Fema
le
Male
Rura
l
Urba
n
Estim
ate
(%)
0
10
20
30
40
50
29.032.3
38.5
42.4
48.4
27.6
31.4
38.141.440.641.7
38.636.3
38.239.6
41.938.6
28.7
25.1
38.136.3
32.5
42.1
Figure 7.2. Stunting prevalence, disaggregated by subnational region
Riau
Islan
ds
DI Y
ogya
karta
DKI J
akar
ta
East
Kalim
antan
Bang
ka B
elitun
g Isla
nds
Bali
Bante
n
North
Sula
wesi
Wes
t Jav
a
East
Java
South
Sum
atra
Centr
al Ja
va
Riau
Jamb
i
Wes
t Kali
manta
n
Goro
ntalo
Wes
t Sum
atra
Beng
kulu
Papu
a
Maluk
u
South
Sula
wesi
North
Malu
ku
Centr
al Su
lawes
i
Centr
al Ka
liman
tan
Aceh
North
Sum
atra
Lamp
ung
South
east
Sulaw
esi
South
Kali
manta
n
Wes
t Pap
ua
Wes
t Nus
a Ten
ggar
a
Wes
t Sula
wesi
East
Nusa
Ten
ggar
a
Estim
ate
(%)
0
10
20
30
40
50
51.7
48.0
45.3
44.6
44.2
42.6
42.6
42.5
41.5
41.3
41.1
41.0
40.9
40.6
40.1
39.7
39.2
38.9
38.6
37.9
36.8
36.8
36.7
35.8
35.3
34.8
33.0
32.5
28.7
27.5
27.5
27.2
26.3
National average = 37.2
Data source RISKESDAS 2013
Definition Numerator: Number of children aged 5 years or less who are stunted Denominator: Number of children aged 5 years or less
National average 37.2%
Stunting prevalence coverage
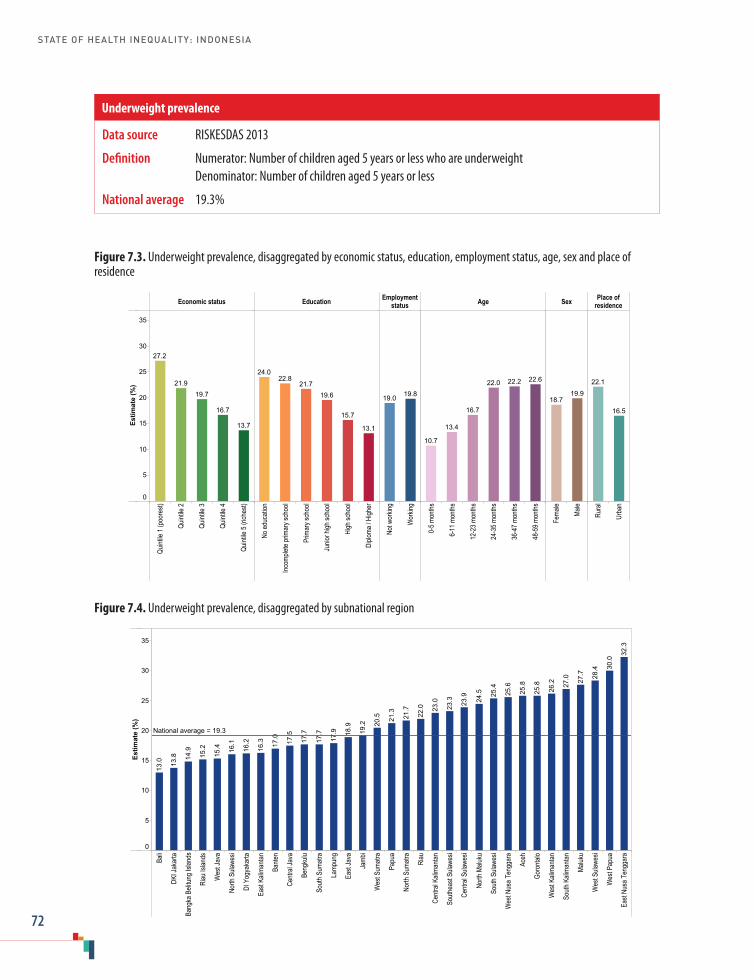
STATE OF HEALTH INEQUALITY: INDONESIA
72
Figure 7.3. Underweight prevalence, disaggregated by economic status, education, employment status, age, sex and place of residence
Economic status Education Employmentstatus Age Sex Place of
residence
Quint
ile 1
(poo
rest)
Quint
ile 2
Quint
ile 3
Quint
ile 4
Quint
ile 5
(rich
est)
No ed
ucati
on
Incom
plete
prim
ary s
choo
l
Prim
ary s
choo
l
Junio
r high
scho
ol
High
scho
ol
Diplo
ma / H
igher
Not w
orkin
g
Wor
king
0-5 m
onths
6-11
mon
ths
12-2
3 mon
ths
24-3
5 mon
ths
36-4
7 mon
ths
48-5
9 mon
ths
Fema
le
Male
Rura
l
Urba
n
Estim
ate
(%)
0
5
10
15
20
25
30
35
13.7
16.7
19.721.9
27.2
13.1
15.7
19.621.7
22.824.0
19.819.0
22.622.222.0
16.7
13.4
10.7
19.918.7
16.5
22.1
Figure 7.4. Underweight prevalence, disaggregated by subnational region
Bali
DKI J
akar
ta
Bang
ka B
elitun
g Isla
nds
Riau
Islan
ds
Wes
t Jav
a
North
Sula
wesi
DI Y
ogya
karta
East
Kalim
antan
Bante
n
Centr
al Ja
va
Beng
kulu
South
Sum
atra
Lamp
ung
East
Java
Jamb
i
Wes
t Sum
atra
Papu
a
North
Sum
atra
Riau
Centr
al Ka
liman
tan
South
east
Sulaw
esi
Centr
al Su
lawes
i
North
Malu
ku
South
Sula
wesi
Wes
t Nus
a Ten
ggar
a
Aceh
Goro
ntalo
Wes
t Kali
manta
n
South
Kali
manta
n
Maluk
u
Wes
t Sula
wesi
Wes
t Pap
ua
East
Nusa
Ten
ggar
a
Estim
ate
(%)
0
5
10
15
20
25
30
35
32.3
30.0
28.4
27.7
27.0
26.2
25.8
25.8
25.6
25.4
24.5
23.9
23.3
23.0
22.0
21.7
21.3
20.5
19.2
18.9
17.9
17.7
17.7
17.5
17.0
16.3
16.2
16.1
15.4
15.2
14.9
13.8
13.0
National average = 19.3
Data source RISKESDAS 2013
Definition Numerator: Number of children aged 5 years or less who are underweight Denominator: Number of children aged 5 years or less
National average 19.3%
Underweight prevalence
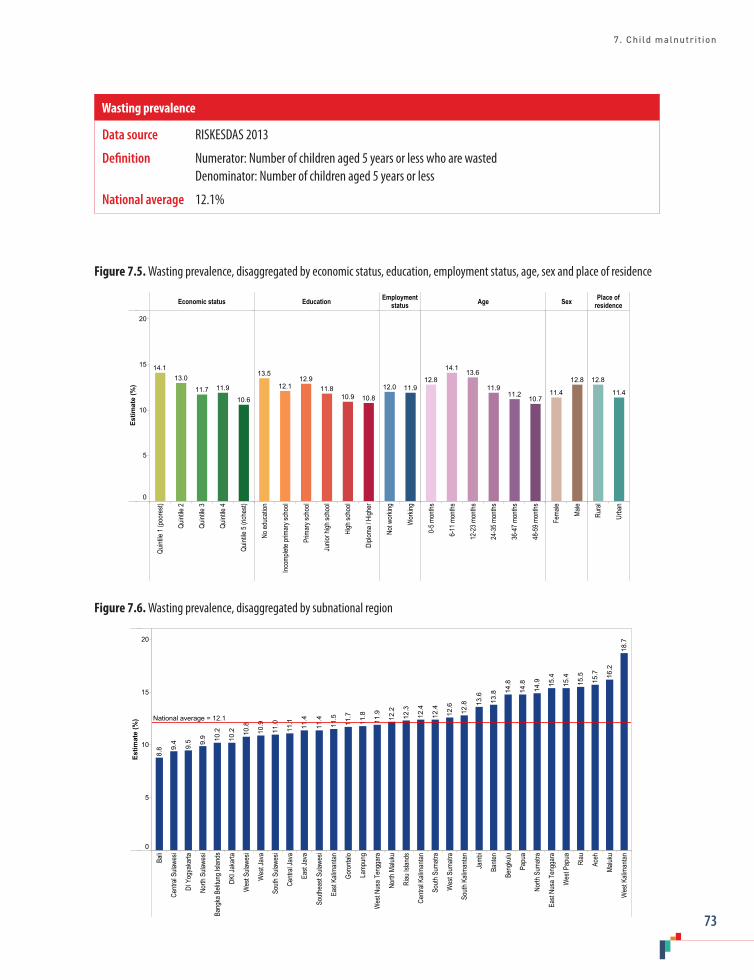
7. Child malnutrition
73
Figure 7.5. Wasting prevalence, disaggregated by economic status, education, employment status, age, sex and place of residence
Economic status Education Employmentstatus Age Sex Place of
residence
Quint
ile 1
(poo
rest)
Quint
ile 2
Quint
ile 3
Quint
ile 4
Quint
ile 5
(rich
est)
No ed
ucati
on
Incom
plete
prim
ary s
choo
l
Prim
ary s
choo
l
Junio
r high
scho
ol
High
scho
ol
Diplo
ma / H
igher
Not w
orkin
g
Wor
king
0-5 m
onths
6-11
mon
ths
12-2
3 mon
ths
24-3
5 mon
ths
36-4
7 mon
ths
48-5
9 mon
ths
Fema
le
Male
Rura
l
Urba
n
Estim
ate
(%)
0
5
10
15
20
10.6
11.911.7
13.014.1
10.810.911.8
12.912.1
13.5
11.912.0
10.711.2
11.9
13.614.1
12.8 12.8
11.4 11.4
12.8
Figure 7.6. Wasting prevalence, disaggregated by subnational region
Bali
Centr
al Su
lawes
i
DI Y
ogya
karta
North
Sula
wesi
Bang
ka B
elitun
g Isla
nds
DKI J
akar
ta
Wes
t Sula
wesi
Wes
t Jav
a
South
Sula
wesi
Centr
al Ja
va
East
Java
South
east
Sulaw
esi
East
Kalim
antan
Goro
ntalo
Lamp
ung
Wes
t Nus
a Ten
ggar
a
North
Malu
ku
Riau
Islan
ds
Centr
al Ka
liman
tan
South
Sum
atra
Wes
t Sum
atra
South
Kali
manta
n
Jamb
i
Bante
n
Beng
kulu
Papu
a
North
Sum
atra
East
Nusa
Ten
ggar
a
Wes
t Pap
ua
Riau
Aceh
Maluk
u
Wes
t Kali
manta
n
Estim
ate
(%)
0
5
10
15
20
18.7
16.2
15.7
15.5
15.4
15.4
14.9
14.8
14.8
13.8
13.6
12.8
12.6
12.4
12.4
12.3
12.2
11.9
11.8
11.7
11.5
11.4
11.4
11.1
11.0
10.9
10.8
10.2
10.2
9.9
9.5
9.4
8.8
National average = 12.1
Data source RISKESDAS 2013
Definition Numerator: Number of children aged 5 years or less who are wasted Denominator: Number of children aged 5 years or less
National average 12.1%
Wasting prevalence

STATE OF HEALTH INEQUALITY: INDONESIA
74
Figure 7.7. Overweight prevalence, disaggregated by economic status, education, employment status, age, sex and place of residence
Economic status Education Employmentstatus Age Sex Place of
residence
Quint
ile 1
(poo
rest)
Quint
ile 2
Quint
ile 3
Quint
ile 4
Quint
ile 5
(rich
est)
No ed
ucati
on
Incom
plete
prim
ary s
choo
l
Prim
ary s
choo
l
Junio
r high
scho
ol
High
scho
ol
Diplo
ma / H
igher
Not w
orkin
g
Wor
king
0-5 m
onths
6-11
mon
ths
12-2
3 mon
ths
24-3
5 mon
ths
36-4
7 mon
ths
48-5
9 mon
ths
Fema
le
Male
Rura
l
Urba
n
Estim
ate
(%)
0
1
2
3
4
5
6
7
8
6.4
4.44.4
3.2
3.9
7.0
5.5
4.03.63.43.3
4.74.2
4.74.3
3.7
4.3
5.0
6.0
4.34.7 4.9
4.1
Figure 7.8. Overweight prevalence, disaggregated by subnational region
Centr
al Su
lawes
i
East
Nusa
Ten
ggar
a
Riau
Islan
ds
Wes
t Nus
a Ten
ggar
a
South
Sula
wesi
Wes
t Sum
atra
Aceh
Goro
ntalo
Wes
t Pap
ua
North
Malu
ku
Centr
al Ja
va
DI Y
ogya
karta
South
Kali
manta
n
South
east
Sulaw
esi
Wes
t Sula
wesi
East
Java
Centr
al Ka
liman
tan
Wes
t Jav
a
Maluk
u
Bang
ka B
elitun
g Isla
nds
North
Sula
wesi
Bante
n
Jamb
i
North
Sum
atra
Wes
t Kali
manta
n
Bali
East
Kalim
antan
Papu
a
Riau
South
Sum
atra
DKI J
akar
ta
Lamp
ung
Beng
kulu
Estim
ate
(%)
0
1
2
3
4
5
6
7
8
8.1
7.6
7.5
7.3
6.7
6.3
5.8
5.5
5.0
4.8
4.8
4.7
4.6
4.6
4.5
4.4
4.4
4.1
4.0
4.0
3.5
3.5
3.5
3.4
3.0
3.0
3.0
2.9
2.9
2.8
2.6
2.6
2.5
National average = 4.5
Data source RISKESDAS 2013
Definition Numerator: Number of children aged 5 years or less who are overweight Denominator: Number of children aged 5 years or less
National average 4.5%
Overweight prevalence

8. Child mortality
75
8. Child mortality
Over the last 30 years, there has been a steep decline in child mortality in Indonesia, despite persistent and sometimes increasing inequality (1). Indonesia was one of 24 low- and lower-middle-income countries that achieved the target for Millennium Development Goal 4: to reduce the under-five mortality rate by at least two thirds between 1990 and 2015 (2). Substantial progress was made during the 1990s, due in part to cost-effective initiatives such as expanded immunization programmes, exclusive breastfeeding and quick diagnosis and treatment of common childhood illnesses (2). Since that time, however, reductions in child mortality have been slower due to stagnated progress on reducing neonatal deaths (1). As a result, neonatal mortality accounts for an increasing proportion of infant and under-five mortality (1,3).
In 2015, the leading causes of child mortality during the first month of life in Indonesia included: preterm birth complications; intrapartum-related events; congenital abnormalities; and sepsis/meningitis (4). The leading causes of child mortality in Indonesia during 1–59 months of age were pneumonia, other disorders (such as causes originating during the first month, cancer, severe malnutrition, etc.), injury and diarrhoea (4).
A number of government-supported initiatives within Indonesia have contributed to the reduction
of child mortality. For example, universal maternal health coverage (introduced in Indonesia in 2011–2013) had implications for neonatal care services (5). The national programme Jampersal, launched in 2011, provided maternity care to pregnant women who are not covered by other insurance schemes (the poor and near-poor). Jampersal emphasizes institutional delivery, though it also covers antenatal care, delivery care, postpartum care for mother and newborn, and family planning (6). The country has expanded the reach of basic and comprehensive emergency obstetric and neonatal care – for example, through Pelayanan Obstetri dan Neonatal Esensial Dasar (PONED) puskesmas and Pelayanan Obstetrik dan Neonatal Emergensi Komprehensif (PONEK) hospitals (5). The programme Nusantara Sehat supports capacity-building among rural health-care providers (7,8). In 2010, the joint regulation between the Ministry of Home Affairs and the Ministry of Health called for collaborative efforts to strengthen mortality and cause of death reporting (9).
Child mortality indicators
This report features three child mortality indicators, reflecting the probability of a child dying during the neonatal period, infancy and before age 5 (Table 8.1). The definitions used in this report are
Table 8.1. Child mortality indicators
Indicator Description
Neonatal mortality Probability that a child born in a specific year or period will die during the first 28 completed days of life if subject to age-specific mortality rates of that periodExpressed as deaths per 1000 live births
Infant mortality Probability that a child born in a specific year or period will die before reaching the age of 1 year, if subject to age-specific mortality rates of that periodExpressed as deaths per 1000 live births
Under-five mortality Probability that a child born in a specific year or period will die before reaching the age of 5 years, if subject to age-specific mortality rates of that periodExpressed as deaths per 1000 live births

STATE OF HEALTH INEQUALITY: INDONESIA
76
consistent with those applied by WHO (10). Child mortality indicators are commonly used to measure the health of a population, and are influenced by: presence/absence of a universal health-care system; economic status and level of education; fertility rates; level of health literacy; and other factors (3). Neonatal mortality is thought to be a good proxy indicator for the strength of health systems (1).
Key findings
National average: The national rate of neonatal mortality was 19.7 deaths per 1000 live births and infant mortality was 33.4 deaths per 1000 live births. Under-five mortality, which encompasses deaths during neonatal and infant periods, was 42.4 deaths per 1000 live births.
Economic status: The three indicators each demonstrated economic-related inequality, with lowest mortality in the richest quintile, and highest mortality in the poorest quintile. Mortality rates in the poorest quintile were about three times higher than mortality rates in the richest quintile (poorest to richest ratios were 3.0 for neonatal mortality, 3.1 for infant mortality and 3.2 for under-five mortality. In all indicators, the mortality rate declined substantially between quintiles 1 and 2; mortality rates were similar in quintiles 2 and 3. The mortality rate in the poorest quintile was 28.3 deaths per 1000 live births for neonatal mortality, 52.0 deaths per 1000 live births for infant mortality and 69.7 deaths per 1000 live births for under-five mortality.
Education: Education subgroups are based on the highest level attained by the child’s mother. Across the three education subgroups, mortality rate declined in a step-wise fashion as education level increased. The most pronounced relative inequality was reported in under-five mortality, where the rate in the no education subgroup (97.7 deaths per 1000
live births) was 3.3 times higher than the rate in the secondary school or higher subgroup (29.2 deaths per 1000 live births).
Sex: Sex disaggregated data demonstrated higher mortality rates in males than females. Neonatal mortality was 1.5 times higher in males (23.7 deaths per 1000 live births) than females (15.5 deaths per 1000 live births); infant mortality rates differed by a factor of 1.4, and under-five mortality rates differed by a factor of 1.3.
Place of residence: Mortality rates were consis-tently about 1.5 times higher in rural areas than urban areas: both neonatal and infant mortality indicators were 1.6 times higher in rural areas, and under-five mortality was 1.5 times higher in rural areas. Under-five mortality rates differed by 18.0 deaths per 1000 live births between rural (51.3 deaths per 1000 live births) and urban (33.2 deaths per 1000 live births) areas.
Subnational region: Disaggregated data were not reported for six subnational regions due to low sample size. Overall, the three mortality indicators demonstrated regional inequalities. For all indicators, East Kalimantan, DKI Jakarta and Riau were consistently among the five regions with the lowest mortality rates; Papua and West Nusa Tenggara were among the five regions with the highest mortality rates. Neonatal mortality ranged from 12.1 deaths per 1000 live births in East Kalimantan to 33.7 deaths per 1000 live births in West Nusa Tenggara. Infant mortality was 2.7 times higher in the worst-performing region (58.1 deaths per 1000 live births in Central Sulawesi) than the best-performing region (21.6 deaths per 1000 live births in East Kalimantan); three regions had mortality rates above 55 deaths per 1000 live births. Under-five mortality was particularly high in Papua (116.2 deaths per 1000 live births); the rate was 4.2 times higher than in the best-performing region of Riau (27.4 deaths per 1000 live births).
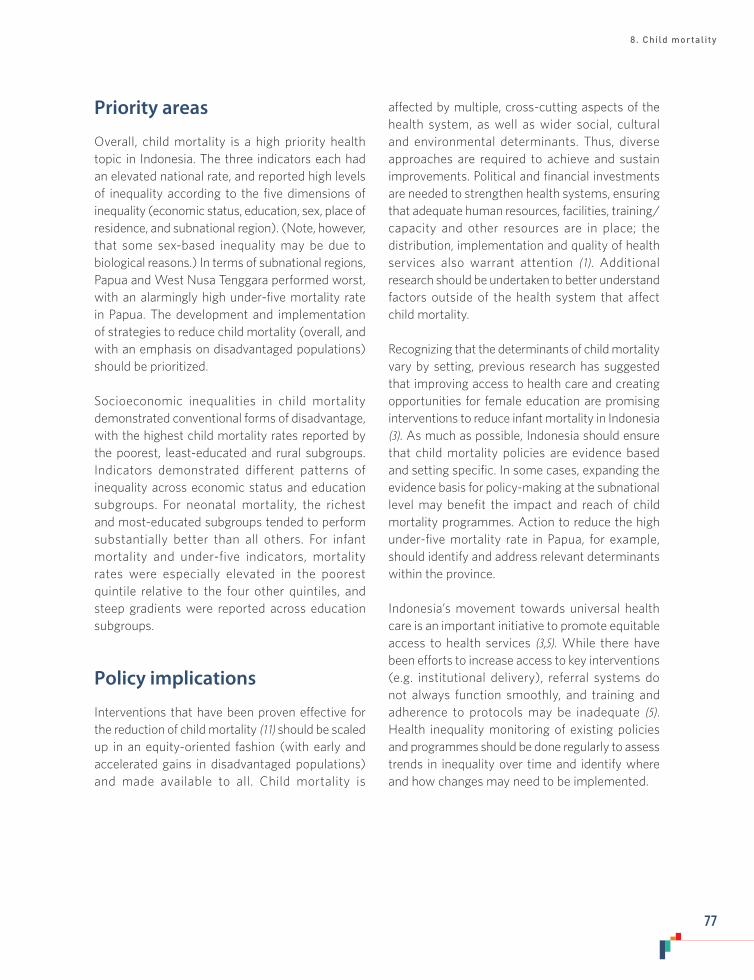
8. Child mortality
77
Priority areas
Overall, child mortality is a high priority health topic in Indonesia. The three indicators each had an elevated national rate, and reported high levels of inequality according to the five dimensions of inequality (economic status, education, sex, place of residence, and subnational region). (Note, however, that some sex-based inequality may be due to biological reasons.) In terms of subnational regions, Papua and West Nusa Tenggara performed worst, with an alarmingly high under-five mortality rate in Papua. The development and implementation of strategies to reduce child mortality (overall, and with an emphasis on disadvantaged populations) should be prioritized.
Socioeconomic inequalities in child mortality demonstrated conventional forms of disadvantage, with the highest child mortality rates reported by the poorest, least-educated and rural subgroups. Indicators demonstrated different patterns of inequality across economic status and education subgroups. For neonatal mortality, the richest and most-educated subgroups tended to perform substantially better than all others. For infant mortality and under-five indicators, mortality rates were especially elevated in the poorest quintile relative to the four other quintiles, and steep gradients were reported across education subgroups.
Policy implications
Interventions that have been proven effective for the reduction of child mortality (11) should be scaled up in an equity-oriented fashion (with early and accelerated gains in disadvantaged populations) and made available to all. Child mortality is
affected by multiple, cross-cutting aspects of the health system, as well as wider social, cultural and environmental determinants. Thus, diverse approaches are required to achieve and sustain improvements. Political and financial investments are needed to strengthen health systems, ensuring that adequate human resources, facilities, training/capacity and other resources are in place; the distribution, implementation and quality of health services also warrant attention (1). Additional research should be undertaken to better understand factors outside of the health system that affect child mortality.
Recognizing that the determinants of child mortality vary by setting, previous research has suggested that improving access to health care and creating opportunities for female education are promising interventions to reduce infant mortality in Indonesia (3). As much as possible, Indonesia should ensure that child mortality policies are evidence based and setting specific. In some cases, expanding the evidence basis for policy-making at the subnational level may benefit the impact and reach of child mortality programmes. Action to reduce the high under-five mortality rate in Papua, for example, should identify and address relevant determinants within the province.
Indonesia’s movement towards universal health care is an important initiative to promote equitable access to health services (3,5). While there have been efforts to increase access to key interventions (e.g. institutional delivery), referral systems do not always function smoothly, and training and adherence to protocols may be inadequate (5). Health inequality monitoring of existing policies and programmes should be done regularly to assess trends in inequality over time and identify where and how changes may need to be implemented.
STATE OF HEALTH INEQUALITY: INDONESIA
78
Indicator profiles
In the following pages, Figures 8.1–8.6 illustrate disaggregated data by applicable and available dimensions of inequality. Supplementary tables S1–S4 contain relevant simple and complex summary measures.
Electronic visualization components accompany this report, enabling interactive data exploration. To access interactive visuals:
Interactive visuals
http://apps.who.int/gho/data/view.wrapper.HE-
VIZ20?lang=en&menu=hide
VISIT:SCAN HERE: or
References1. Hodge A, Firth S, Marthias T, Jimenez-Soto E. Location
matters: trends in inequalities in child mortality in Indonesia. Evidence from Repeated Cross-Sectional Surveys. Pan C-W, editor. PLOS ONE. 2014 July 25;9(7):e103597.
2. Committing to child survival: a promise renewed. Progress report 2015 [Internet]. New York: United Nations Children’s Fund; 2015 (https://www.unicef.org/publications/files/APR_2015_9_Sep_15.pdf, accessed 30 July 2017).
3. Subramaniam T, Loganathan N, Yerushalmi E, Devadason ES, Majid M. Determinants of infant mortality in older ASEAN economies. Soc Indic Res [Internet]. 2016 December 17 (http://link.springer.com/10.1007/s11205-016-1526-8, accessed 30 July 2017).
4. Liu L, Oza S, Hogan D, Chu Y, Perin J, Zhu J et al. Global, regional, and national causes of under-5 mortality in 2000–15: an updated systematic analysis with implications for the Sustainable Development Goals. Lancet. 2016 December 17;388(10063):3027–35.
5. World Bank Group. Universal maternal health coverage? Assessing the readiness of public health facilities to provide maternal health care in Indonesia. Jakarta: World Bank; 2014.
6. Achadi E, Achadi A, Pambudi E, Marzoeki P. A study on the implementation of Jampersal policy in Indonesia. World Bank Group: Health, Nutrition and Population. Washington (DC): World Bank; 2014.
7. Kementerian Kesehatan Republik Indonesia. Permenkes Nomor 23 Tahun 2015 Tentang Penugasan Khusus Tenaga Kesehatan Berbasis Tim (Team Based) dalam Mendukung Program Nusantara Sehat. 2015.
8. Kementerian Kesehatan Republik Indonesia. Permenkes Nomor 16 Tahun 2017 Tentang Penugasan Khusus Tenaga Kesehatan dalam Mendukung Program Nusantara Sehat. 2017.
9. Kementerian Kesehatan Republik Indonesia, Kementerian Dalam Negeri Republik Indonesia. Peraturan Bersama Menteri Dalam Negeri dan Menteri Kesehatan Nomor 15 Tahun 2010; NOMOR 162/MENKES/PB/I/2010 Tentang Pelaporan Kematian dan Penyebab Kematian [Internet]. 2010(http://pdk3mi.org/file/download/PBM%20Menteri%20Dalam%20Negeri%20dan%20MENKES%20No.%20162%20ttg%20Pelaporan%20Kematian.pdf, accessed 30 July 2017).
10. Global Health Observatory. Indicator Metadata Registry [Internet]. Geneva: World Health Organization; 2017 (http://apps.who.int/gho/data/node.wrapper.imr?x-id=1, accessed 16 August 2017).
11. Bhutta ZA, Das JK, Bahl R, Lawn JE, Salam RA, Paul VK et al. Can available interventions end preventable deaths in mothers, newborn babies, and stillbirths, and at what cost? Lancet. 2014 July;384(9940):347–70.

8. Child mortality
79
Figure 8.1. Neonatal mortality, disaggregated by economic status, education, sex and place of residence
Economic status Education Sex Place of residence
Quint
ile 1
(poo
rest)
Quint
ile 2
Quint
ile 3
Quint
ile 4
Quint
ile 5
(rich
est)
No ed
ucati
on
Prim
ary s
choo
l
Seco
ndar
y sch
ool +
Fema
le
Male
Rura
l
Urba
n
Estim
ate
(dea
ths
per 1
000
live
birt
hs)
0
5
10
15
20
25
30
35
9.3
15.3
22.721.3
28.3
14.3
27.8
31.4
23.7
15.5 14.9
24.3
Figure 8.2. Neonatal mortality, disaggregated by subnational region
East
Kalim
antan
South
Sula
wesi
East
Java
Riau
DKI J
akar
ta
Jamb
i
Wes
t Jav
a
Wes
t Sum
atra
Wes
t Kali
manta
n
DI Y
ogya
karta Ba
li
Lamp
ung
South
Sum
atra
Centr
al Ja
va
Riau
Islan
ds
Bante
n
North
Sula
wesi
Centr
al Ka
liman
tan
Maluk
u
East
Nusa
Ten
ggar
a
South
east
Sulaw
esi
Centr
al Su
lawes
i
North
Sum
atra
Aceh
Papu
a
South
Kali
manta
n
Wes
t Nus
a Ten
ggar
a
Estim
ate
(dea
ths
per 1
000
live
birt
hs)
0
5
10
15
20
25
30
35 33.7
30.5
28.5
28.4
26.5
25.8
25.4
25.3
23.8
23.5
23.4
22.7
21.5
21.4
20.3
20.1
18.5
18.2
17.9
17.5
16.7
15.8
15.2
14.9
13.7
12.6
12.1
National average = 19.7
Data source DHS 2012
Definition Numerator: Deaths at age 0–28 days Denominator: Number of live births
National average 19.7 deaths per 1000 live births
Neonatal mortality
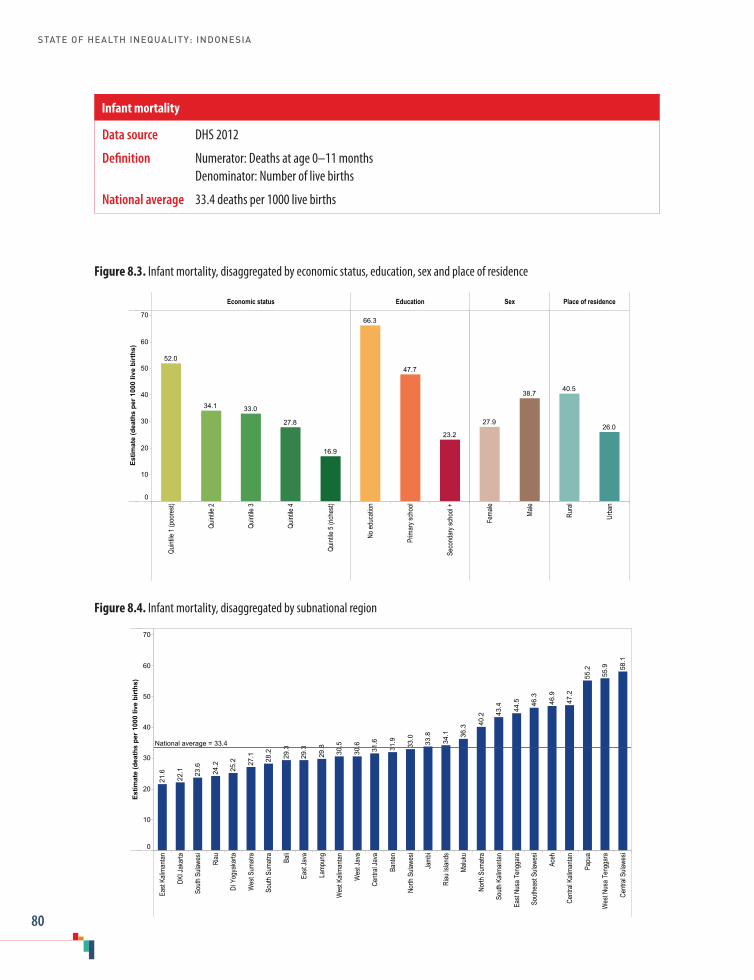
STATE OF HEALTH INEQUALITY: INDONESIA
80
Figure 8.3. Infant mortality, disaggregated by economic status, education, sex and place of residence
Economic status Education Sex Place of residence
Quint
ile 1
(poo
rest)
Quint
ile 2
Quint
ile 3
Quint
ile 4
Quint
ile 5
(rich
est)
No ed
ucati
on
Prim
ary s
choo
l
Seco
ndar
y sch
ool +
Fema
le
Male
Rura
l
Urba
n
Estim
ate
(dea
ths
per 1
000
live
birt
hs)
0
10
20
30
40
50
60
70
16.9
27.8
33.034.1
52.0
23.2
47.7
66.3
38.7
27.926.0
40.5
Figure 8.4. Infant mortality, disaggregated by subnational region
East
Kalim
antan
DKI J
akar
ta
South
Sula
wesi
Riau
DI Y
ogya
karta
Wes
t Sum
atra
South
Sum
atra
Bali
East
Java
Lamp
ung
Wes
t Kali
manta
n
Wes
t Jav
a
Centr
al Ja
va
Bante
n
North
Sula
wesi
Jamb
i
Riau
Islan
ds
Maluk
u
North
Sum
atra
South
Kali
manta
n
East
Nusa
Ten
ggar
a
South
east
Sulaw
esi
Aceh
Centr
al Ka
liman
tan
Papu
a
Wes
t Nus
a Ten
ggar
a
Centr
al Su
lawes
i
Estim
ate
(dea
ths
per 1
000
live
birt
hs)
0
10
20
30
40
50
60
70
58.1
55.9
55.2
47.2
46.9
46.3
44.5
43.4
40.2
36.3
34.1
33.8
33.0
31.9
31.6
30.6
30.5
29.8
29.3
29.3
28.2
27.1
25.2
24.2
23.6
22.1
21.6
National average = 33.4
Data source DHS 2012
Definition Numerator: Deaths at age 0–11 months Denominator: Number of live births
National average 33.4 deaths per 1000 live births
Infant mortality
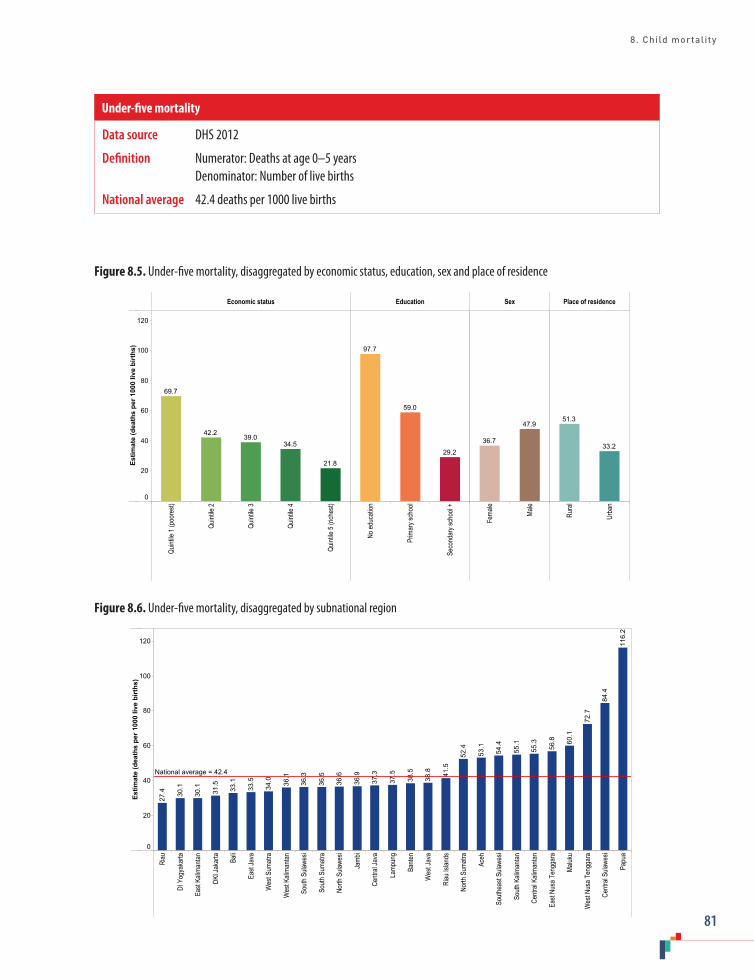
8. Child mortality
81
Figure 8.5. Under-five mortality, disaggregated by economic status, education, sex and place of residence
Economic status Education Sex Place of residence
Quint
ile 1
(poo
rest)
Quint
ile 2
Quint
ile 3
Quint
ile 4
Quint
ile 5
(rich
est)
No ed
ucati
on
Prim
ary s
choo
l
Seco
ndar
y sch
ool +
Fema
le
Male
Rura
l
Urba
n
Estim
ate
(dea
ths
per 1
000
live
birt
hs)
0
20
40
60
80
100
120
21.8
34.539.0
42.2
69.7
29.2
59.0
97.7
47.9
36.733.2
51.3
Figure 8.6. Under-five mortality, disaggregated by subnational region
Riau
DI Y
ogya
karta
East
Kalim
antan
DKI J
akar
ta Bali
East
Java
Wes
t Sum
atra
Wes
t Kali
manta
n
South
Sula
wesi
South
Sum
atra
North
Sula
wesi
Jamb
i
Centr
al Ja
va
Lamp
ung
Bante
n
Wes
t Jav
a
Riau
Islan
ds
North
Sum
atra
Aceh
South
east
Sulaw
esi
South
Kali
manta
n
Centr
al Ka
liman
tan
East
Nusa
Ten
ggar
a
Maluk
u
Wes
t Nus
a Ten
ggar
a
Centr
al Su
lawes
i
Papu
a
Estim
ate
(dea
ths
per 1
000
live
birt
hs)
0
20
40
60
80
100
120 116.
2
84.4
72.7
60.1
56.8
55.3
55.1
54.4
53.1
52.4
41.5
38.8
38.5
37.5
37.3
36.9
36.6
36.5
36.3
36.1
34.0
33.5
33.1
31.5
30.1
30.1
27.4
National average = 42.4
Data source DHS 2012
Definition Numerator: Deaths at age 0–5 years Denominator: Number of live births
National average 42.4 deaths per 1000 live births
Under-five mortality
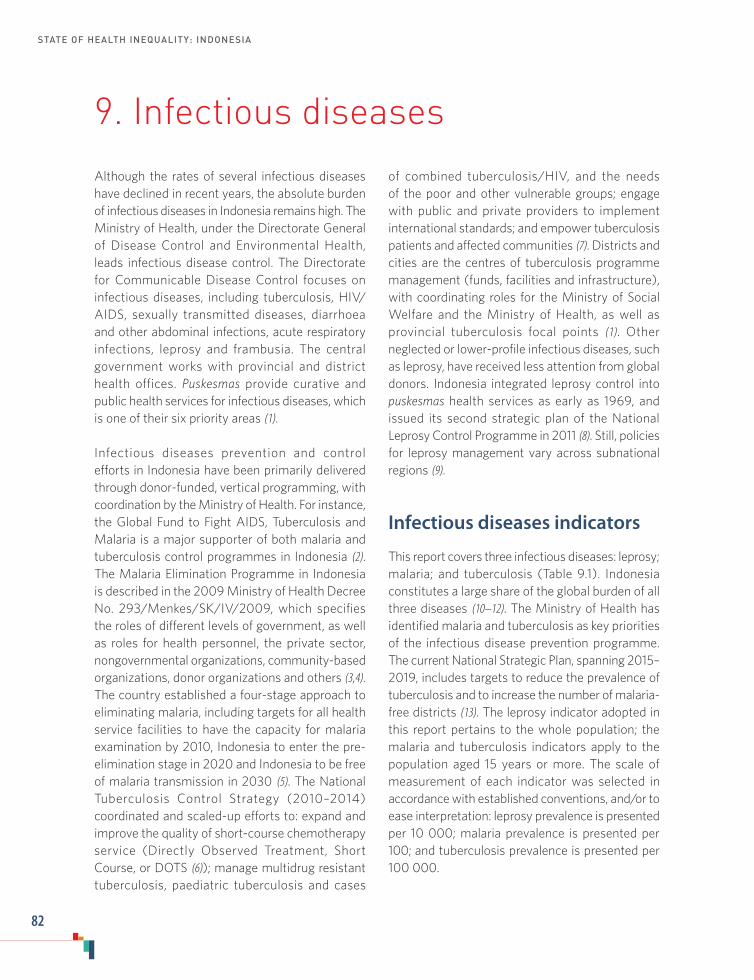
STATE OF HEALTH INEQUALITY: INDONESIA
82
9. Infectious diseases
Although the rates of several infectious diseases have declined in recent years, the absolute burden of infectious diseases in Indonesia remains high. The Ministry of Health, under the Directorate General of Disease Control and Environmental Health, leads infectious disease control. The Directorate for Communicable Disease Control focuses on infectious diseases, including tuberculosis, HIV/AIDS, sexually transmitted diseases, diarrhoea and other abdominal infections, acute respiratory infections, leprosy and frambusia. The central government works with provincial and district health offices. Puskesmas provide curative and public health services for infectious diseases, which is one of their six priority areas (1).
Infectious diseases prevention and control efforts in Indonesia have been primarily delivered through donor-funded, vertical programming, with coordination by the Ministry of Health. For instance, the Global Fund to Fight AIDS, Tuberculosis and Malaria is a major supporter of both malaria and tuberculosis control programmes in Indonesia (2). The Malaria Elimination Programme in Indonesia is described in the 2009 Ministry of Health Decree No. 293/Menkes/SK/IV/2009, which specifies the roles of different levels of government, as well as roles for health personnel, the private sector, nongovernmental organizations, community-based organizations, donor organizations and others (3,4). The country established a four-stage approach to eliminating malaria, including targets for all health service facilities to have the capacity for malaria examination by 2010, Indonesia to enter the pre-elimination stage in 2020 and Indonesia to be free of malaria transmission in 2030 (5). The National Tuberculosis Control Strategy (2010–2014) coordinated and scaled-up efforts to: expand and improve the quality of short-course chemotherapy service (Directly Observed Treatment, Short Course, or DOTS (6)); manage multidrug resistant tuberculosis, paediatric tuberculosis and cases
of combined tuberculosis/HIV, and the needs of the poor and other vulnerable groups; engage with public and private providers to implement international standards; and empower tuberculosis patients and affected communities (7). Districts and cities are the centres of tuberculosis programme management (funds, facilities and infrastructure), with coordinating roles for the Ministry of Social Welfare and the Ministry of Health, as well as provincial tuberculosis focal points (1). Other neglected or lower-profile infectious diseases, such as leprosy, have received less attention from global donors. Indonesia integrated leprosy control into puskesmas health services as early as 1969, and issued its second strategic plan of the National Leprosy Control Programme in 2011 (8). Still, policies for leprosy management vary across subnational regions (9).
Infectious diseases indicators
This report covers three infectious diseases: leprosy; malaria; and tuberculosis (Table 9.1). Indonesia constitutes a large share of the global burden of all three diseases (10–12). The Ministry of Health has identified malaria and tuberculosis as key priorities of the infectious disease prevention programme. The current National Strategic Plan, spanning 2015–2019, includes targets to reduce the prevalence of tuberculosis and to increase the number of malaria-free districts (13). The leprosy indicator adopted in this report pertains to the whole population; the malaria and tuberculosis indicators apply to the population aged 15 years or more. The scale of measurement of each indicator was selected in accordance with established conventions, and/or to ease interpretation: leprosy prevalence is presented per 10 000; malaria prevalence is presented per 100; and tuberculosis prevalence is presented per 100 000.
9. Infectious diseases
83
Key findings
National average: Leprosy prevalence in Indonesia is 0.8 per 10 000 people. Of those aged 15 years or more, malaria was reported by 1.1% and tuberculosis was diagnosed in 759.1 per 100 000 people.
Economic status: Data by economic status were available for the malaria indicator. Malaria prevalence in quintile 1 (2.1%) was 1.8 times as prevalent as in quintile 2 (1.2%) and 2.6 times as prevalent in quintiles 4 and 5 (0.8% in each).
Education: Malaria data were available across six education subgroups. Prevalence was 0.1 percentage points higher in the four subgroups with the least education (1.2% in each), relative to the group with high school (1.1%). The subgroup with the highest level of education reported prevalence of 0.9%.
Occupation: Malaria prevalence demonstrated some variation by occupation. The farmer/fisherman/labourer subgroup reported the highest malaria prevalence (1.6%) and the employee subgroup reported the lowest (0.9%).
Age: Age was grouped as seven subgroups for the malaria indicator, and six subgroups for the tuberculosis indicator. Malaria prevalence was highest in those aged 35–44 years (1.3%), and declined to 0.8% in those aged 75 years or more. Tuberculosis prevalence was much higher in those
Table 9.1. Infectious diseases indicators
Indicator Description
Leprosy prevalence Prevalence of leprosy (per 10 000)Leprosy diagnosis was based on health facility reports of old and new cases
Malaria prevalence Prevalence of malaria among people aged 15 years or more (per 100)Malaria diagnosis was based on self-report during an interview
Tuberculosis prevalence Prevalence of tuberculosis among people aged 15 years or more (per 100 000)Tuberculosis diagnosis was based on bacteriology confirmation
aged 65 years or more (1581.7 per 100 000) than those aged 15–24 years (360.8 per 100 000). The largest increases were reported between the subgroups aged 15–24 years and 25–34 years (by a factor or 2.1), and between the subgroups aged 55–64 years and 65 years or more (by a factor of 1.5).
Sex: For both malaria and tuberculosis, prevalence was higher in males than females. Malaria prevalence in males was 1.3% and 1.0% in females. Tuberculosis prevalence was 2.4 times higher in males (1082.7 per 100 000) than in females (460.6 per 100 000).
Place of residence: While malaria prevalence was 1.8 times higher in rural (1.4%) than urban (0.8%) areas, the tuberculosis indicator showed the opposite pattern, with 1.3 times higher prevalence in urban (845.8 per 100 000) than rural (674.2 per 100 000) areas.
Subnational region: The number of subnational regions subgroups applied to each indicator differed: leprosy prevalence is shown across 34 subgroups; malaria prevalence across 33 subgroups; and tuberculosis across three subgroups. All indicators demonstrated considerable variation across subnational regions. Leprosy prevalence differed by a factor of 110.0 between the subnational region with the highest prevalence (10.7 per 10 000 in West Papua) and the regions with the lowest prevalence (0.1 per 10 000 in Bengkulu, Lampung
STATE OF HEALTH INEQUALITY: INDONESIA
84
and West Kalimantan). Three subnational regions (North Maluku, Papua and West Papua) reported leprosy prevalence greater than 5 per 10 000. Malaria prevalence was highest in Papua (11.4%), and East Nusa Tenggara and West Papua (7.7% in each). Several subgroups reported very low malaria prevalence, including six subgroups with 0.4% or less. Tuberculosis prevalence was 1.5 times higher in Sumatra (913.1 per 100 000) than in Java-Bali (593.1 per 100 000); the subgroup of other regions reported an average of 842.1 cases per 100 000.
Priority areas
Tuberculosis and malaria were identified as high priority based on elevated national prevalence; leprosy constitutes a medium priority. All three indicators showed large inequalities across subnational regions, suggesting that efforts should be directed to realize improvements in infectious diseases in poor-performing regions. In particular, leprosy prevalence was elevated in West Papua, and malaria prevalence was elevated in East Nusa Tenggara, Papua and West Papua. Results across three subnational region subgroups suggested that tuberculosis prevalence was elevated in the Sumatra subgroup; more detailed studies at the level of subnational regions are warranted.
Tuberculosis and malaria initiatives should account for higher prevalence in vulnerable populations. Tuberculosis was higher in the elderly and males, whereas malaria was higher in rural areas and among the poor and farmers/fishermen/labourers. Efforts to enable exploration of leprosy and tuberculosis by socioeconomic dimensions of inequality should be prioritized.
Policy implications
Infectious disease policies in Indonesia should better target poor-performing regions. More specific case studies may need to be conducted
to better understand the diverse factors that underlie high infectious disease prevalence in certain regions (e.g. related to living conditions, environmental factors, health systems, governance capacity, etc.). In some areas, substantial capacity-building efforts may be required. (Prior to the late 1990s, infectious disease control was centralized; following the country’s decentralization process, however, variable capacity across regions may have exacerbated inequalities (1).
The high prevalence of tuberculosis and malaria calls for renewed prevention and control efforts, with a focus on enhancing sustainability, effectiveness and reach. To this end, adequate technical, financial and human investments should be secured, especially for disadvantaged regions and subgroups. Currently, tuberculosis programming in Indonesia faces a number of management and technical challenges. Policies should be revisited to address issues such as limited government resources, a lack of synergy among stakeholders, suboptimal early detection strategies, underreporting and challenges in adopting new diagnostic tools and treatments (14). Malaria prevention efforts may be strengthened by: improving malaria diagnostic accuracy; promoting better access to treatment centres in disadvantaged areas; advancing and adopting vector control strategies; and strengthening malaria surveillance to support early warning, outbreak management and post-outbreak management (5).
Health information systems should be strengthened to enable robust health inequality monitoring. For leprosy and tuberculosis indicators, limited data availability precluded monitoring of key dimensions of inequality, including economic status and education; additionally, sex and place of residence disaggregation was not possible for leprosy.
Indicator profiles
In the following pages, Figures 9.1–9.5 illustrate disaggregated data by applicable and available
9. Infectious diseases
85
dimensions of inequality. Supplementary tables S1–S4 contain relevant simple and complex summary measures.
Electronic visualization components accompany this report, enabling interactive data exploration. To access interactive visuals:
Interactive visuals
http://apps.who.int/gho/data/view.wrapper.HE-
VIZ20?lang=en&menu=hide
VISIT:SCAN HERE: or
References1. Asia Pacific Observatory on Health Systems and
Policies. The Republic of Indonesia health system review. New Delhi: WHO Regional Office for South-East Asia, World Health Organization; 2017.
2. The Global Fund: Indonesia [database] [Internet]. Geneva: Global Fund (https://www.theglobalfund.org/en/portfolio/country/?k=d0e17d32-68e3-481a-9ca5-bac4e685c119&loc=IDN, accessed 21 July 2017).
3. Country Office for Indonesia. Malaria [Internet]. New Delhi: WHO Regional Office for South-East Asia, World Health Organization; 2017 (http://www.searo.who.int/indonesia/topics/malaria/en/, accessed 21 July 2017).
4. Country Office for Indonesia. National malaria control programme review, Republic of Indonesia. New Delhi: WHO Regional Office for South-East Asia, World Health Organization; 2013.
5. Elyazar IRF, Hay SI, Baird JK. Malaria distribution, prevalence, drug resistance and control in Indonesia. Adv Parasitol. 2011;74:41–175.
6. What is DOTS (Directly Observed Treatment, Short Course) [Internet]. New Delhi: WHO Regional Office for South East Asia, World Health Organization; 2017 (http://www.searo.who.int/tb/topics/what_dots/en/, accessed 21 July 2017).
7. Breakthrough toward universal access: tuberculosis control national strategy in Indonesia: 2010–2014 [Internet]. Jakarta: Ministry of Health Republic of Indonesia; 2010 (http://www.nationalplanningcycles.org/sites/default/files/country_docs/Indonesia/indonesia_tb_2010-2014.pdf, accessed 21 July 2017).
8. Peters R, Lusli M, Zweekhorst M, Miranda-Galarza B, van Brakel W, Irwanto et al. Learning from a leprosy project in Indonesia: making mindsets explicit for stigma reduction. Dev Pract. 2015 November 17;25(8):1105–19.
9. Gillini L, Cooreman E, Wood T, Pemmaraju VR, Saunderson P. Global practices in regard to implementation of preventive measures for leprosy. PLOS Negl Trop Dis. 2017;11(5):e0005399.
10. Global tuberculosis report 2016. Geneva: World Health Organization; 2016.
11. Global Leprosy Strategy 2016–2020: accelerating towards a leprosy-free world [Internet]. New Delhi: WHO Regional Office for South-East Asia, World Health Organization; 2016 (http://apps.searo.who.int/PDS_DOCS/B5233.pdf?ua=1, accessed 21 July 2013).
12. World malaria report: 2016. Geneva: World Health Organization; 2016.
13. National Strategic Plan 2015–2019 (Rencana Strategis Kementrian Kesehatan). Jakarta: Ministry of Health Republic of Indonesia; 2015.
14. Bending the curve – ending TB 2030: annual report 2017. New Delhi: Regional Office for South-East Asia, World Health Organization; 2017.

STATE OF HEALTH INEQUALITY: INDONESIA
86
Figure 9.1. Leprosy prevalence disaggregated by subnational region
Beng
kulu
Wes
t Kali
manta
n
Lamp
ung
North
Sum
atra
Bali
Riau
Islan
ds
Wes
t Sum
atra
Riau
DI Y
ogya
karta
DKI J
akar
ta
Centr
al Ka
liman
tan
South
Sum
atra
Bang
ka B
elitun
g Isla
nds
South
Kali
manta
n
Wes
t Jav
a
East
Kalim
antan
Jamb
i
Centr
al Ja
va
Wes
t Nus
a Ten
ggar
a
Bante
n
North
Kali
manta
n
Aceh
East
Java
South
east
Sulaw
esi
South
Sula
wesi
East
Nusa
Ten
ggar
a
Centr
al Su
lawes
i
North
Sula
wesi
Goro
ntalo
Wes
t Sula
wesi
Maluk
u
Papu
a
North
Malu
ku
Wes
t Pap
ua
Estim
ate
(cas
es p
er 1
0 00
0 po
pula
tion)
0
1
2
3
4
5
6
7
8
9
10
11 10.7
5.6
5.3
3.2
2.4
2.3
1.7
1.6
1.5
1.4
1.3
1.0
1.0
1.0
0.9
0.6
0.6
0.6
0.6
0.5
0.5
0.5
0.4
0.4
0.4
0.3
0.3
0.2
0.2
0.2
0.2
0.1
0.1
0.1
National average = 0.8
Data source Routine reports 2015
Definition Numerator: Number of leprosy cases at all ages Denominator: Population (all ages)
National average 0.8 per 10 000
Leprosy prevalence
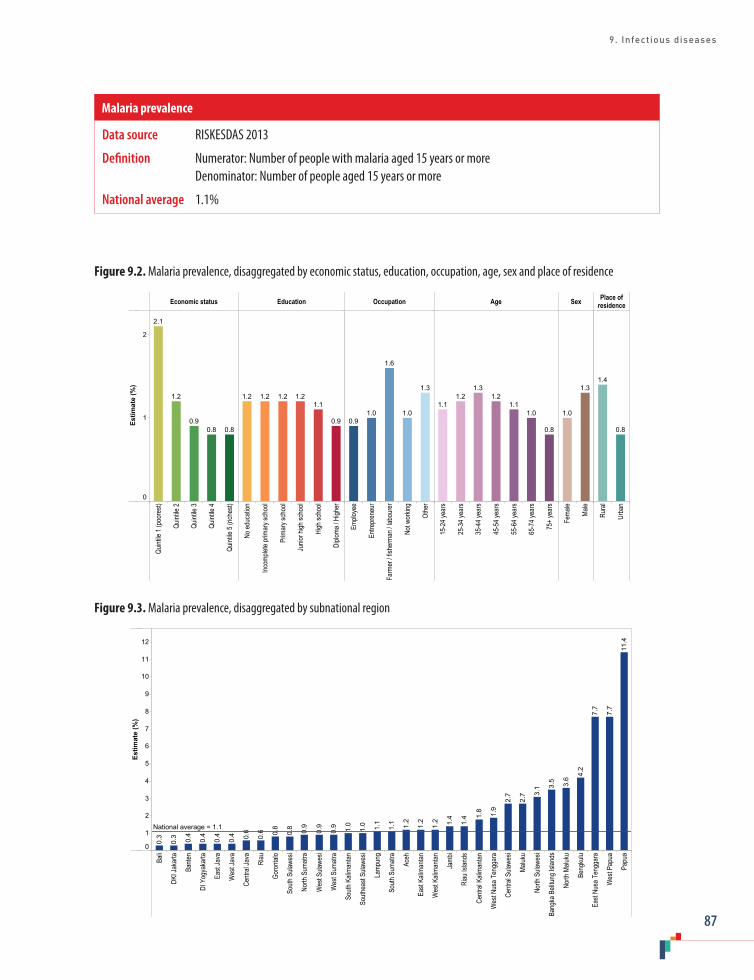
9. Infectious diseases
87
Figure 9.2. Malaria prevalence, disaggregated by economic status, education, occupation, age, sex and place of residence
Economic status Education Occupation Age Sex Place ofresidence
Quint
ile 1
(poo
rest)
Quint
ile 2
Quint
ile 3
Quint
ile 4
Quint
ile 5
(rich
est)
No ed
ucati
on
Incom
plete
prim
ary s
choo
l
Prim
ary s
choo
l
Junio
r high
scho
ol
High
scho
ol
Diplo
ma / H
igher
Emplo
yee
Entre
pren
eur
Farm
er / f
isher
man /
labo
urer
Not w
orkin
g
Othe
r
15-2
4 yea
rs
25-3
4 yea
rs
35-4
4 yea
rs
45-5
4 yea
rs
55-6
4 yea
rs
65-7
4 yea
rs
75+
year
s
Fema
le
Male
Rura
l
Urba
n
Estim
ate
(%)
0
1
2
0.80.80.9
1.2
2.1
0.9
1.11.21.21.21.2
1.3
1.0
1.6
1.00.9
0.8
1.01.1
1.21.3
1.21.1
1.3
1.0
0.8
1.4
Figure 9.3. Malaria prevalence, disaggregated by subnational region
Bali
DKI J
akar
ta
Bante
n
DI Y
ogya
karta
East
Java
Wes
t Jav
a
Centr
al Ja
va
Riau
Goro
ntalo
South
Sula
wesi
North
Sum
atra
Wes
t Sula
wesi
Wes
t Sum
atra
South
Kali
manta
n
South
east
Sulaw
esi
Lamp
ung
South
Sum
atra
Aceh
East
Kalim
antan
Wes
t Kali
manta
n
Jamb
i
Riau
Islan
ds
Centr
al Ka
liman
tan
Wes
t Nus
a Ten
ggar
a
Centr
al Su
lawes
i
Maluk
u
North
Sula
wesi
Bang
ka B
elitun
g Isla
nds
North
Malu
ku
Beng
kulu
East
Nusa
Ten
ggar
a
Wes
t Pap
ua
Papu
a
Estim
ate
(%)
0
1
2
3
4
5
6
7
8
9
10
11
12
11.4
7.7
7.7
4.2
3.6
3.5
3.1
2.7
2.7
1.9
1.8
1.4
1.4
1.2
1.2
1.2
1.1
1.1
1.0
1.0
0.9
0.9
0.9
0.8
0.8
0.6
0.6
0.4
0.4
0.4
0.4
0.3
0.3
National average = 1.1
Data source RISKESDAS 2013
Definition Numerator: Number of people with malaria aged 15 years or more Denominator: Number of people aged 15 years or more
National average 1.1%
Malaria prevalence
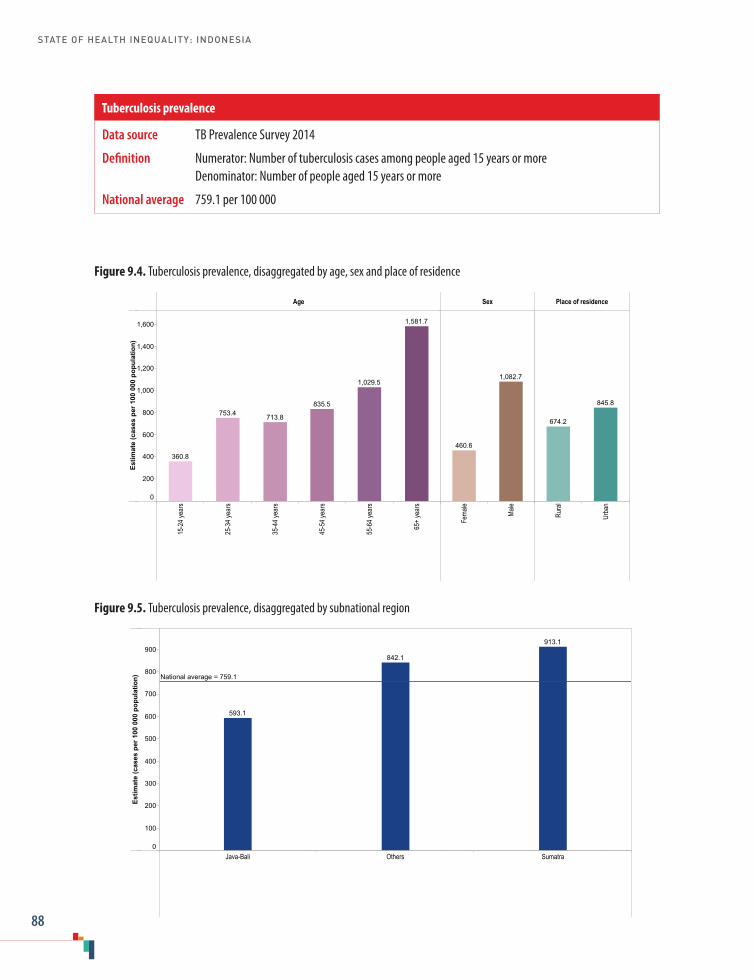
STATE OF HEALTH INEQUALITY: INDONESIA
88
Figure 9.4. Tuberculosis prevalence, disaggregated by age, sex and place of residence
Age Sex Place of residence
15-2
4 yea
rs
25-3
4 yea
rs
35-4
4 yea
rs
45-5
4 yea
rs
55-6
4 yea
rs
65+
year
s
Fema
le
Male
Rura
l
Urba
n
Estim
ate
(cas
es p
er 1
00 0
00 p
opul
atio
n)
0
200
400
600
800
1,000
1,200
1,400
1,600 1,581.7
1,029.5
835.5
713.8753.4
360.8
1,082.7
460.6
845.8
674.2
Figure 9.5. Tuberculosis prevalence, disaggregated by subnational region
Java-Bali Others Sumatra
Estim
ate
(cas
es p
er 1
00 0
00 p
opul
atio
n)
0
100
200
300
400
500
600
700
800
900913.1
842.1
593.1
National average = 759.1
Data source TB Prevalence Survey 2014
Definition Numerator: Number of tuberculosis cases among people aged 15 years or more Denominator: Number of people aged 15 years or more
National average 759.1 per 100 000
Tuberculosis prevalence
10. Environmental health
89
10. Environmental health
Environmental health priorities in Indonesia have shifted over the past decades (1). The 1970s focused on improved agricultural and irrigation practices, motivated by a need to address food shortages in light of an increasing population. In the 1980s, efforts to develop water supply infrastructure expanded, and community ownership, demand-responsive approaches were introduced. During the 1990s, the Dublin-Rio Principles brought international awareness to diverse issues associated with water use, including the importance of local-level decision-making (2). To this end, Indonesia currently demonstrates a strong commitment towards environmental health, including a host of community- and institution-based initiatives introduced during the 2000s to improve sanitation and access to safe water supplies (3,4).
Since the decentralization process in the 1990s, local governments have increasing responsibilities and authority over environmental health matters, with the central government primarily responsible for providing technical assistance (1). Environmental health roles and responsibilities cut across different sectors and levels of governance (5). At the national level, the Ministry of Public Works is responsible for ensuring a clean water supply and infrastructure, and the Ministry of Health oversees aspects of community knowledge and behaviours. Provincial governments coordinate actions across districts, while environmental health sections of district health offices are responsible for preparing, developing and implementing technical training. Nongovernmental organizations and the health sector also have roles in delivering environmental health programming.
Environmental health programmes and policies in Indonesia focus on developing supply side components (improving access to products, services and infrastructure) and/or demand creation (providing education about hygiene, discouraging open defecation practices and encouraging the use
of improved sanitation facilities) (4,6). Programmes such as the Water & Sanitation for Low Income Communities Project and the Community-Led Total Sanitation approach have contributed to increased access to clean source drinking-water and basic sanitation in the country (3).
The development aims of this sector also encompass improving general welfare through sustainable management of the water supply and environmental sanitation. For example, the Community-Led Total Sanitation approach aims to inspire and empower rural communities to stop open defecation and start using sanitary toilets, without offering external subsidies. The Ministry of Health has adopted this approach to change hygiene and sanitary behaviour as an aspect of environmental health programmes in all districts in Indonesia; this approach is part of the national strategy towards universal coverage of safe water and sanitation (7).
Environmental health indicatorsThis report focuses on water and sanitation aspects of environmental health, drawing on two indicators: access to improved sanitation; and access to improved drinking-water (Table 10.1) (8). Higher levels of coverage are indicative of success. Note that the indicator definitions adopted for this report have been altered from global definitions for greater relevance within the Indonesian context. The use of improved sanitation indicator applied in this report allows for shared toilet facilities. The access to improved drinking-water indicator includes an additional specification of protected spring being a distance of at least 10 metres from the septic tank absorption field. Note that data disaggregated by education reflect the highest level attained by the head of the household.

STATE OF HEALTH INEQUALITY: INDONESIA
90
Table 10.1. Environmental health indicators
Indicator Description
Access to improved sanitation
Percentage of households that have access to improved sanitationNote: households are considered to have access to improved sanitation if they use: private or shared toilet facilities with flush or pour flush to a piped sewer system, septic tank, or pit latrine; ventilated improved pit latrine; pit latrine with slab; or composting toilet
Access to improved drinking-water
Percentage of households that use any of the following types of drinking-water sources: piped water; tube well or borehole; protected well; protected spring with a distance of at least 10 metres from the septic tank absorption field; or rain water collection Note: households are considered to have access to improved drinking-water if they use unimproved drinking-water sources – including bottled water, refill water and protected spring with a distance of less than 10 metres from the septic tank absorption field – but use an improved water source for bathing and cooking
Key findings
National average: Overall, 62.1% of Indonesian households had access to improved sanitation, while 71.0% of households had access to improved drinking-water.
Economic status: Both indicators demonstrated a gradient across wealth quintiles; the gradient was steeper for the improved sanitation indicator. The percentage of households with access to improved sanitation was 40.2 percentage points higher in quintile 5 (83.5%) than quintile 1 (43.3%). Access to improved drinking-water also improved in a gradient pattern across quintiles, with a rich–poor gap of 25.9 percentage points. The most marked increase in access to improved drinking-water across quintiles was reported between quintile 4 (73.2%) and quintile 5 (84.9%).
Education: Inequality according to education demonstrated a gradient pattern, similar to that of economic status. Across the six education subgroups, access to improved sanitation reported a gap of 46.9 percentage points, with high coverage in the subgroup with the highest level of education (87.4%). Access to improved drinking-water ranged from 58.9% in the least educated to 89.3% in the most educated: a gap of 30.4 percentage points.
Place of residence: The two indicators each reported a worse situation in rural than urban areas. For the improved sanitation indicator, access of households in urban areas (76.4%) was 1.6 times greater than access of households in rural areas (47.8%). For the improved drinking-water indicator, household access in urban (81.3%) and rural areas (60.6%) differed by a factor of 1.3.
Subnational region: Certain subnational regions tended to perform better or worse in terms of environmental health. Bali, DI Yogyakarta and DKI Jakarta were among the five best-performing regions in both environmental health indicators, whereas Bengkulu and Papua were consistently among the bottom five regions. Access to improved sanitation was lowest in East Nusa Tenggara (23.9%), and exceeded 80% in four regions. In 24 of the 34 subnational regions, between 60% and 80% of households had access to improved drinking-water; access spanned from 41.1% in Bengkulu to 93.4% in DKI Jakarta.
Priority areas
The indicators reported here suggest that environmental health is a critical priority area in Indonesia, with overall poor national performance
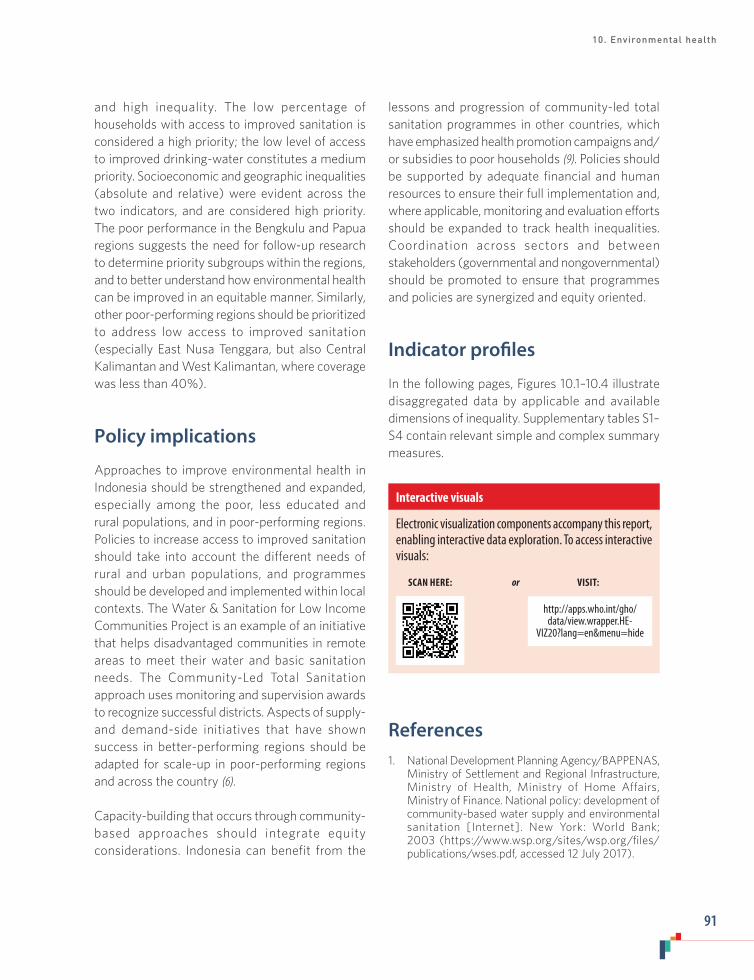
10. Environmental health
91
and high inequality. The low percentage of households with access to improved sanitation is considered a high priority; the low level of access to improved drinking-water constitutes a medium priority. Socioeconomic and geographic inequalities (absolute and relative) were evident across the two indicators, and are considered high priority. The poor performance in the Bengkulu and Papua regions suggests the need for follow-up research to determine priority subgroups within the regions, and to better understand how environmental health can be improved in an equitable manner. Similarly, other poor-performing regions should be prioritized to address low access to improved sanitation (especially East Nusa Tenggara, but also Central Kalimantan and West Kalimantan, where coverage was less than 40%).
Policy implications
Approaches to improve environmental health in Indonesia should be strengthened and expanded, especially among the poor, less educated and rural populations, and in poor-performing regions. Policies to increase access to improved sanitation should take into account the different needs of rural and urban populations, and programmes should be developed and implemented within local contexts. The Water & Sanitation for Low Income Communities Project is an example of an initiative that helps disadvantaged communities in remote areas to meet their water and basic sanitation needs. The Community-Led Total Sanitation approach uses monitoring and supervision awards to recognize successful districts. Aspects of supply- and demand-side initiatives that have shown success in better-performing regions should be adapted for scale-up in poor-performing regions and across the country (6).
Capacity-building that occurs through community-based approaches should integrate equity considerations. Indonesia can benefit from the
lessons and progression of community-led total sanitation programmes in other countries, which have emphasized health promotion campaigns and/or subsidies to poor households (9). Policies should be supported by adequate financial and human resources to ensure their full implementation and, where applicable, monitoring and evaluation efforts should be expanded to track health inequalities. Coordination across sectors and between stakeholders (governmental and nongovernmental) should be promoted to ensure that programmes and policies are synergized and equity oriented.
Indicator profiles
In the following pages, Figures 10.1–10.4 illustrate disaggregated data by applicable and available dimensions of inequality. Supplementary tables S1–S4 contain relevant simple and complex summary measures.
Electronic visualization components accompany this report, enabling interactive data exploration. To access interactive visuals:
Interactive visuals
http://apps.who.int/gho/data/view.wrapper.HE-
VIZ20?lang=en&menu=hide
VISIT:SCAN HERE: or
References1. National Development Planning Agency/BAPPENAS,
Ministry of Settlement and Regional Infrastructure, Ministry of Health, Ministry of Home Affairs, Ministry of Finance. National policy: development of community-based water supply and environmental sanitation [Internet]. New York: World Bank; 2003 (https://www.wsp.org/sites/wsp.org/files/publications/wses.pdf, accessed 12 July 2017).
STATE OF HEALTH INEQUALITY: INDONESIA
92
2. Dublin-Rio Principles [Internet]. Stockholm: Global water water partnership; 2000 ( h t t p : //w w w . g w p . o r g /c o n t e n t a s s e t s / 05190d0c938f47d1b254d6606ec6bb04/dublin-rio-principles.pdf, accessed 13 July 2017).
3. Robinson A. Indonesia National Program for Community Water Supply and Sanitation Services: improving hygiene and sanitation behavior and services. World Bank Group. Washington (DC): World Bank; 2005.
4. Community-Led Total Sanitation in East Asia and Pacific: progress, lessons and directions. Bangkok: East Asia and Pacific Regional Office, United Nations Children’s Fund; 2013.
5. Asia Pacific Observatory on Health Systems and Policies. The Republic of Indonesia health system review. New Delhi: Regional Office for South-East Asia, World Health Organization, 2017.
6. Cameron LA, Shah M. Scaling up sanitation: evidence from an RCT in Indonesia [Internet]. IZA Discussion Papers. Report No. 10619. 2017 (https://papers.ssrn.com/sol3/papers.cfm?abstract_id=2940609, accessed 13 July 2017).
7. Peraturan Menteri Kesehatan Nomor 3 Tahun 2014 Tentang SANITASI TOTAL BERBASIS MASYARAKAT [Internet]. Jakarta: Ministry of Health Republic of Indonesia; 2014 (http://www.hukumonline.com/pusatdata/detail/lt533e8cd67f522/nprt/lt50ed170e2a71c/peraturan-menteri-kesehatan-no-3-tahun-2014-sanitasi-total-berbasis-masyarakat, accessed 11 August 2017).
8. National Development Planning Agency/BAPPENAS. Metadata Indikator TPB/SDGs Indonesia [Internet]. Jakarta: Ministry of Health Republic of Indonesia; 2017 (http://www.sdgsindonesia.or.id/index.php/dokumen/item/274-metadata-indikator-tpb-sdgs-indonesia, accessed 13 July 2017).
9. Gertler P, Shah M, Alzua ML, Cameron L, Martinez S, Patil S. How does health promotion work? Evidence from the dirty business of eliminating open defecation [Internet]. Cambridge, MA: National Bureau of Economic Research; 2015 (http://www.nber.org/papers/w20997, accessed 13 July 2017).

10. Environmental health
93
Figure 10.1. Access to improved sanitation, disaggregated by economic status, education and place of residence
Economic status Education Place of residence
Quint
ile 1
(poo
rest)
Quint
ile 2
Quint
ile 3
Quint
ile 4
Quint
ile 5
(rich
est)
No ed
ucati
on
Incom
plete
prim
ary s
choo
l
Prim
ary s
choo
l
Junio
r high
scho
ol
High
scho
ol
Diplo
ma / H
igher
Rura
l
Urba
n
Estim
ate
(%)
0
10
20
30
40
50
60
70
80
90
100
83.5
70.6
60.9
52.3
43.3
87.4
78.3
65.4
54.2
47.2
40.5
76.4
47.8
Figure 10.2. Access to improved sanitation, disaggregated by subnational region
East
Nusa
Ten
ggar
a
Papu
a
Centr
al Ka
liman
tan
Beng
kulu
Wes
t Kali
manta
n
Lamp
ung
Wes
t Sum
atra
North
Kali
manta
n
Wes
t Sula
wesi
Riau
Aceh
Goro
ntalo
Centr
al Su
lawes
i
Jamb
i
North
Malu
ku
Wes
t Jav
a
Maluk
u
South
Kali
manta
n
South
Sum
atra
Wes
t Pap
ua
East
Java
South
east
Sulaw
esi
Wes
t Nus
a Ten
ggar
a
North
Sula
wesi
Bante
n
Centr
al Ja
va
North
Sum
atra
East
Kalim
antan
Riau
Islan
ds
South
Sula
wesi
Bang
ka B
elitun
g Isla
nds
Bali
DI Y
ogya
karta
DKI J
akar
ta
Estim
ate
(%)
0
10
20
30
40
50
60
70
80
90
10089
.3
86.3
85.5
80.8
72.4
72.0
68.8
67.9
67.2
67.0
66.8
63.7
63.6
63.5
62.8
61.3
60.1
60.0
59.4
59.2
58.2
55.4
55.0
54.7
51.3
51.2
48.4
45.0
44.8
39.8
39.2
35.9
28.0
23.9
National average = 62.1
Data source SUSENAS 2015
Definition Numerator: Number of households that have access to improved sanitation Denominator: Number of households
National average 62.1%
Access to improved sanitation
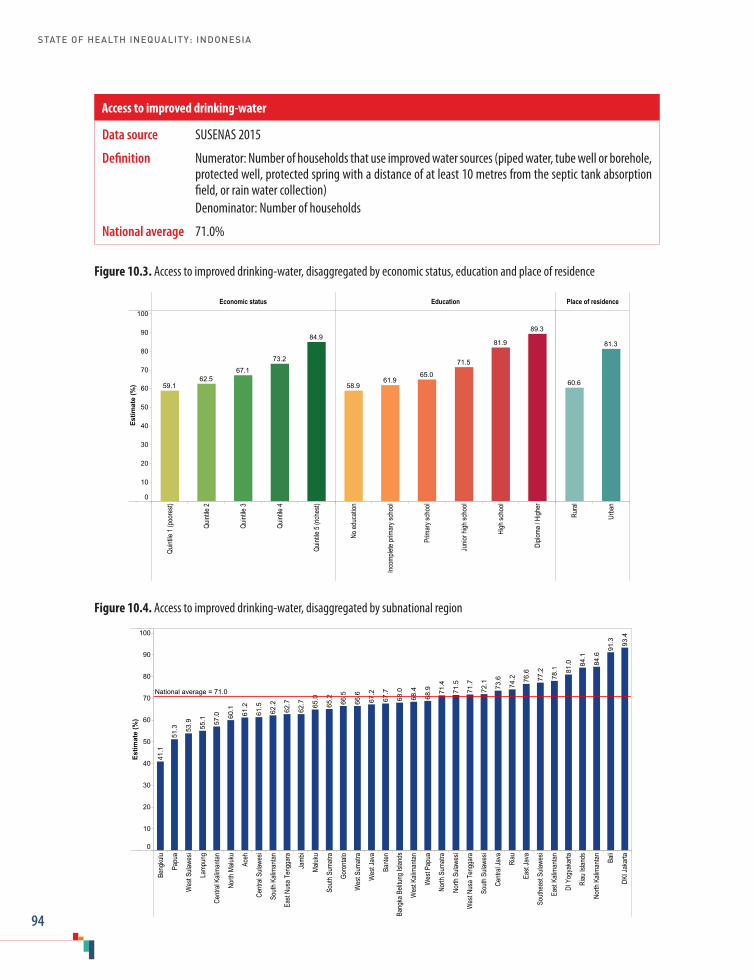
STATE OF HEALTH INEQUALITY: INDONESIA
94
Figure 10.3. Access to improved drinking-water, disaggregated by economic status, education and place of residence
Economic status Education Place of residence
Quint
ile 1
(poo
rest)
Quint
ile 2
Quint
ile 3
Quint
ile 4
Quint
ile 5
(rich
est)
No ed
ucati
on
Incom
plete
prim
ary s
choo
l
Prim
ary s
choo
l
Junio
r high
scho
ol
High
scho
ol
Diplo
ma / H
igher
Rura
l
Urba
n
Estim
ate
(%)
0
10
20
30
40
50
60
70
80
90
100
84.9
73.2
67.162.5
59.1
89.3
81.9
71.5
65.061.9
58.9
81.3
60.6
Figure 10.4. Access to improved drinking-water, disaggregated by subnational region
Beng
kulu
Papu
a
Wes
t Sula
wesi
Lamp
ung
Centr
al Ka
liman
tan
North
Malu
ku
Aceh
Centr
al Su
lawes
i
South
Kali
manta
n
East
Nusa
Ten
ggar
a
Jamb
i
Maluk
u
South
Sum
atra
Goro
ntalo
Wes
t Sum
atra
Wes
t Jav
a
Bante
n
Bang
ka B
elitun
g Isla
nds
Wes
t Kali
manta
n
Wes
t Pap
ua
North
Sum
atra
North
Sula
wesi
Wes
t Nus
a Ten
ggar
a
South
Sula
wesi
Centr
al Ja
va
Riau
East
Java
South
east
Sulaw
esi
East
Kalim
antan
DI Y
ogya
karta
Riau
Islan
ds
North
Kali
manta
n
Bali
DKI J
akar
ta
Estim
ate
(%)
0
10
20
30
40
50
60
70
80
90
10093
.4
91.3
84.6
84.1
81.0
78.1
77.2
76.6
74.2
73.6
72.1
71.7
71.5
71.4
68.9
68.4
68.0
67.7
67.2
66.6
66.5
65.2
65.0
62.7
62.7
62.2
61.5
61.2
60.1
57.0
55.1
53.9
51.3
41.1
National average = 71.0
Data source SUSENAS 2015
Definition Numerator: Number of households that use improved water sources (piped water, tube well or borehole, protected well, protected spring with a distance of at least 10 metres from the septic tank absorption field, or rain water collection)
Denominator: Number of households
National average 71.0%
Access to improved drinking-water

11. NCDs, mental health and behavioural risk factors
95
11. NCDs, mental health and behavioural risk factors
Since the late 1990s, there has been growing recognition by the Government of Indonesia about the importance of addressing NCDs, mental health and NCD risk factors. In particular, the Ministry of Health, responsible for health promotion activities, has played a prominent role in raising awareness and rolling out initiatives across the country, as well as coordinating and streamlining programmes across different sectors. For instance, following the introduction of the WHO STEPwise approach to Surveillance (STEPS) in 1998–1999 (1), IAHRD organized a pilot across workplace settings in Depok, West Java. In 2000–2001, IAHRD, together with WHO, expanded the initiative, integrating a community-based NCD risk factor component from 2001 to 2006 that was successful in improving behavioural NCD risk factors (2,3).
In 2003, a national policy and strategy on NCDs was established by the Centre for Health Promotion in collaboration with Medical Services, IAHRD, Sport Health, and the Centre for Disease Control and Environmental Health (2,4); as of 2006, it is under the auspices of the Directorate General of Disease Control and Environmental Health. The policy primarily focuses on five major NCDs: heart disease; stroke; diabetes mellitus; cancer; and chronic obstructive pulmonary disease (COPD). The NCD strategy adopts a community-based approach centred on risk factor reduction; it covers surveillance, early detection and prevention, health care and financing systems. A major component of the strategy is Posbindu, a community integrated programme that works across schools, workplaces and residences to address NCD risk factors (5).
The Ministry of Health has also made strides in quantifying and/or prompting action surrounding
mental health issues such as mental emotion disorders (e.g. depression and anxiety), severe mental health problems (e.g. psychosis), and suicide and self-harm. The Ministry of Health Strategic Plan for 2015–2019 has prioritized the strengthening of community-based programmes to prevent and improve mental health problems, with key roles for primary health care alongside community participatory approaches (6).
In recent years, the Ministry of Health has redoubled efforts to address NCD and behaviour risk factors, with a focus on diabetes mellitus and hypertension (to make progress towards targets for the Sustainable Development Goals and targets set out in the Ministry of Health Strategic Plan). In 2016, the Ministry of Health launched a National Action Plan on the Control and Prevention of NCDs, including GERMAS and PIS-DPK programmes. GERMAS (“community movement”) aims to increase physical activity, promote a healthy life style and strengthen disease prevention and early detection; PIS-DPK (“family approach for healthy Indonesia”) supports smoking reduction, mental health awareness and hypertension management. Indonesia has taken regulatory action to curb tobacco use, including: excise taxes on cigarettes; strict advertising and sponsorship regulations; packaging and labelling requirements; and smoke-free public places (5).
NCDs, mental health and behavioural risk factors indicatorsThis chapter covers seven indicators related to the topic of NCDs, mental health and behavioural
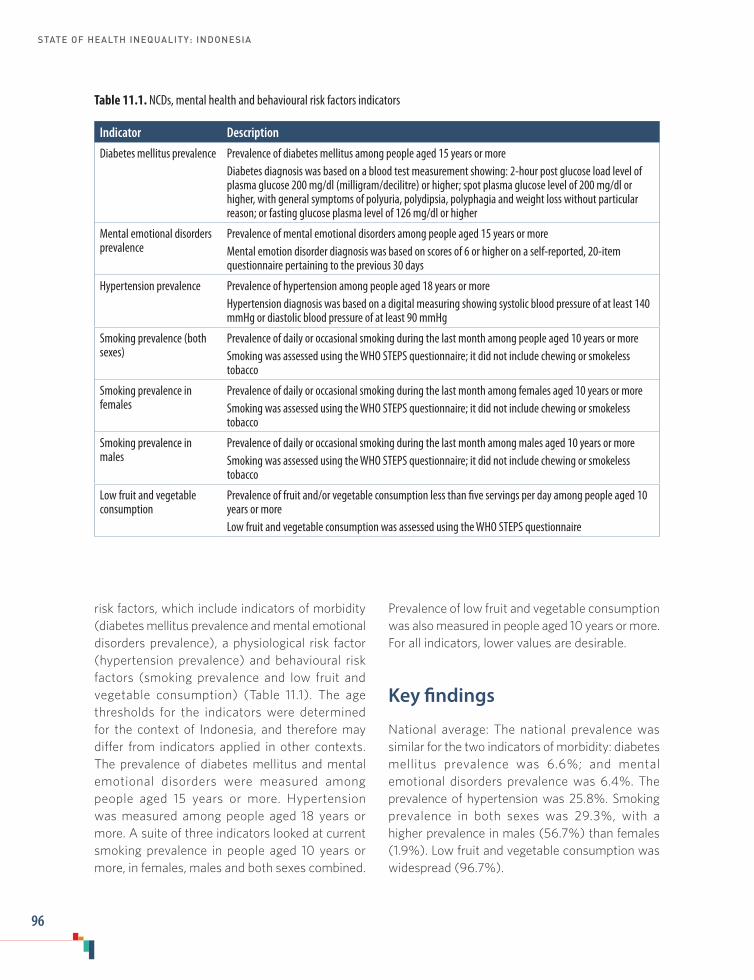
STATE OF HEALTH INEQUALITY: INDONESIA
96
risk factors, which include indicators of morbidity (diabetes mellitus prevalence and mental emotional disorders prevalence), a physiological risk factor (hypertension prevalence) and behavioural risk factors (smoking prevalence and low fruit and vegetable consumption) (Table 11.1). The age thresholds for the indicators were determined for the context of Indonesia, and therefore may differ from indicators applied in other contexts. The prevalence of diabetes mellitus and mental emotional disorders were measured among people aged 15 years or more. Hypertension was measured among people aged 18 years or more. A suite of three indicators looked at current smoking prevalence in people aged 10 years or more, in females, males and both sexes combined.
Table 11.1. NCDs, mental health and behavioural risk factors indicators
Indicator Description
Diabetes mellitus prevalence Prevalence of diabetes mellitus among people aged 15 years or moreDiabetes diagnosis was based on a blood test measurement showing: 2-hour post glucose load level of plasma glucose 200 mg/dl (milligram/decilitre) or higher; spot plasma glucose level of 200 mg/dl or higher, with general symptoms of polyuria, polydipsia, polyphagia and weight loss without particular reason; or fasting glucose plasma level of 126 mg/dl or higher
Mental emotional disorders prevalence
Prevalence of mental emotional disorders among people aged 15 years or moreMental emotion disorder diagnosis was based on scores of 6 or higher on a self-reported, 20-item questionnaire pertaining to the previous 30 days
Hypertension prevalence Prevalence of hypertension among people aged 18 years or moreHypertension diagnosis was based on a digital measuring showing systolic blood pressure of at least 140 mmHg or diastolic blood pressure of at least 90 mmHg
Smoking prevalence (both sexes)
Prevalence of daily or occasional smoking during the last month among people aged 10 years or moreSmoking was assessed using the WHO STEPS questionnaire; it did not include chewing or smokeless tobacco
Smoking prevalence in females
Prevalence of daily or occasional smoking during the last month among females aged 10 years or moreSmoking was assessed using the WHO STEPS questionnaire; it did not include chewing or smokeless tobacco
Smoking prevalence in males
Prevalence of daily or occasional smoking during the last month among males aged 10 years or moreSmoking was assessed using the WHO STEPS questionnaire; it did not include chewing or smokeless tobacco
Low fruit and vegetable consumption
Prevalence of fruit and/or vegetable consumption less than five servings per day among people aged 10 years or moreLow fruit and vegetable consumption was assessed using the WHO STEPS questionnaire
Prevalence of low fruit and vegetable consumption was also measured in people aged 10 years or more. For all indicators, lower values are desirable.
Key findings
National average: The national prevalence was similar for the two indicators of morbidity: diabetes mellitus prevalence was 6.6%; and mental emotional disorders prevalence was 6.4%. The prevalence of hypertension was 25.8%. Smoking prevalence in both sexes was 29.3%, with a higher prevalence in males (56.7%) than females (1.9%). Low fruit and vegetable consumption was widespread (96.7%).

11. NCDs, mental health and behavioural risk factors
97
Economic status: Across economic status subgroups, diabetes mellitus prevalence varied by 2.0 percentage points, with highest prevalence in quintile 5 (7.8%) and lowest prevalence in quintiles 1 and 2 (5.8%). The mental emotional disorders indicator showed an opposite pattern across subgroups, where the richer performed better than the poorer: coverage was lowest in the richest quintile (4.3%), and increased in a gradient pattern, reaching a maximum of 8.1% in the poorest quintile. For the hypertension indicator, there was no apparent pattern across subgroups; prevalence differed by 2.1 percentage points between the best-performing subgroup (25.1% in quintile 4) and the worst-performing subgroup (27.2% in quintile 2). The current smoking indicators all showed lowest prevalence in quintile 5 (e.g. 24.3% for both sexes), and highest prevalence in quintile 1 (e.g. 32.3% for both sexes). In females, current smoking was 2.4 times more prevalent in the poorest than the richest; in males, current smoking was 1.3 times higher in the poorest than the richest. The prevalence of low fruit and vegetable consumption was high across all subgroups, with a margin of 3.4 percentage points between the poorest (98.2%) and the richest (94.8%).
Education: The prevalence of diabetes mellitus showed no clear pattern across the six education subgroups; prevalence was highest in the no education subgroup (11.2%), and lowest among those with medium levels of education (4.7% in both junior high and high school subgroups). A gradient pattern of mental emotional disorders was evident: prevalence among the least educated (12.5%) was 4.5 times higher than prevalence among the most educated (2.8%). For hypertension prevalence, the no education subgroup reported prevalence of 42.0%, and prevalence declined with increasing levels of education until reaching a minimum of 18.6% in the best-performing subgroup (high school). The prevalence of smoking in both sexes did not demonstrate a clear pattern according to education level. In females, however, smoking prevalence was elevated in the no education
subgroup (4.2%), which was 1.9 times as high as the prevalence in the incomplete primary school subgroup (2.2%) and 4.2 times as high as in the diploma or higher subgroup (1.0%). In males, smoking prevalence was highest in subgroups with medium levels of education – primary school (59.3%), junior high (60.9%) and high school (62.0%). Low fruit and vegetable consumption was high across all education subgroups.
Occupation: Indicators demonstrated variation across occupation subgroups. For diabetes mellitus, mental emotional disorder and hypertension, the employee subgroup tended to perform best, while the worst performing were those classified as other (for diabetes mellitus) or not working (for mental emotional disorders and hypertension). Inequality was elevated for mental emotional disorders, as prevalence was 2.2 times higher in those not working (8.4%) than in employees (3.9%). Smoking prevalence was highest in those who worked as farmers/fishermen/labourers, in both females (2.8%) and males (75.5%). For the smoking indicator, including both sexes, the prevalence of smoking among farmers/fishermen/labourers (51.3%) was 41.5 percentage points higher than prevalence of smoking among those not working (9.9%). In males only, smoking prevalence was 26.6% among those not working.
Age: Diabetes mellitus prevalence increased from young to old age, with prevalence reaching a maximum of 14.3% in the subgroup aged 65 years or more. Mental emotional disorders remained between 5% and 8% in the subgroups spanning 15–64 years, and then increased markedly in the 65–74 years subgroup (11.2%) and the 75 years or more subgroup (17.6%). Hypertension prevalence increased with age: prevalence in the 15–24 years subgroup was 8.7%, whereas prevalence in the 75 years or more subgroup was 63.8%. Current smoking (both sexes) became much more prevalent after the age of 15 (higher than 25%) than at ages 10–14 years (1.4%). Between the ages of 25 and 64, smoking prevalence was 34%

STATE OF HEALTH INEQUALITY: INDONESIA
98
or higher. Current smoking in females increased with age, from 0.1% in the 10–14 years subgroup to 4.4% in the 65 years or more subgroup. The prevalence was similar across the 45–54 and 55–64 years subgroups, at 3.4% to 3.6%, respectively. In males, smoking prevalence was at a maximum in the 25–34 years subgroup (73.6%), and then decreased with increasing age. At age 65 years or more, smoking prevalence in males was 54.5%. Low fruit and vegetable consumption was prevalent at all ages, with prevalence of at least 96% in each of the seven subgroups.
Sex: Diabetes mellitus, mental emotional disorders and hypertension were more common in females than males. Smoking was more prevalent in males than females. Low fruit and vegetable consumption demonstrated no sex-based inequality, as it was equally high in females and males.
Place of residence: For most of the indicators (diabetes mellitus, mental emotional disorders, hypertension, low fruit and vegetable consumption, and current smoking in females), the level of absolute inequality between urban and rural subgroups was less than 2 percentage points. Current smoking in both sexes had a difference of 2.1 percentage points between rural (30.4%) and urban areas (28.3%), and current smoking in males had a difference of 4.1 percentage points (58.8% in rural areas and 54.6% in urban areas).
Subnational region: Inequalities between subnational regions were evident in mental emotional disorders. While Jambi and Lampung reported prevalence of less than 2%, prevalence in Central Sulawesi reached 11.9%. For the hypertension indicator, the worst-performing regions were Bangka Belitung Islands (30.9%) and South Kalimantan (30.8%), and the best-performing region was Papua (16.8%). For smoking (both sexes), the difference in prevalence between the best-performing region (Papua, 21.9%) and worst-performing region (West Java, 32.7%) was 10.8 percentage points. For smoking in females,
six regions reported prevalence of 1% or less, and one region reported prevalence of over 4% (Papua, 4.7%). In males, three regions had smoking prevalence of over 60%: Gorontalo; West Java; and West Nusa Tenggara.
Priority areas
Based on the indicators and dimensions of inequality included in this report, the highest priority areas in NCDs, mental health and behavioural risk factors include: lowering smoking prevalence among males (especially those in certain occupations); improving low fruit and vegetable consumption universally; addressing high prevalence of hypertension in older adults; and reducing socioeconomic gaps in mental emotional disorders prevalence. High priority indicators, based on national averages include: hypertension; low fruit and vegetable consumption; and smoking (generally, and among males); while diabetes mellitus and mental emotional disorders constitute medium priorities. In terms of inequality, mental emotional disorders is a high priority area, and hypertension and smoking are medium priorities.
A higher prevalence of smoking was reported among males than females, indicating that actions to curb smoking in males – and discourage further adoption by females – should be prioritized. The farmer/fisherman/labourer occupation subgroup was at an increased risk, and inequalities across male age groups revealed that prevalence initially increased during adolescence, and was high throughout adulthood.
Low fruit and vegetable consumption was reported across all subgroups for all inequality dimensions, indicating a need for wide-scale, universal improvement. More detailed studies should adopt sensitive measures to explore dietary patterns and their determinants in closer detail.
The findings regarding hypertension indicated that the condition is particularly problematic in

11. NCDs, mental health and behavioural risk factors
99
older adults, as well as those with lower levels of education, and in certain regions. Mental health inequalities showed elevated prevalence of mental health disorders in the poorest, the least educated, females, the elderly, and some subnational regions, including Central Sulawesi.
Policy implications
Indonesia faces a unique and complex situation with regard to NCDs, mental health conditions and behavioural risk factors. In some cases, indicators demonstrated traditional socioeconomic patterns of inequality, with disadvantage among the poorer and those with lower levels of education (e.g. mental emotional disorders); however, in other cases, inequality showed mixed or opposite patterns across subgroups (e.g. diabetes prevalence), or demonstrated equal prevalence across subgroups (e.g. low fruit and vegetable consumption). In general, and especially where a socioeconomic gradient was reported, policies should be equity oriented to promote sustained gains among disadvantaged subgroups.
As Indonesia continues to take action to improve upon NCDs, mental health and behavioural risk factors, regular inequality monitoring should be done to ensure that subgroups that are traditionally disadvantaged improve alongside the whole population. For instance, efforts to promote increased fruit and vegetable consumption across the whole population should be accompanied by monitoring to ensure that improvements are realized in an equitable manner, promoting early gains among disadvantaged subgroups. Initiatives for smoking cessation in males should also discourage smoking in females and among females that are poorer and less educated: though smoking prevalence was low among females, higher levels were reported in these subgroups. For hypertension, a physiological risk factor, there was no economic inequality, however, poorer
subgroups may be at higher risk of developing co-morbidities, having premature deaths or facing consequences of lower economic productivity (e.g. due to lower access to high quality health services). As a result, the government may face higher costs of medications through universal health coverage mechanisms.
Given that NCDs, mental health and behavioural risk factors may be greatly influenced by broader choices, conditions and environments outside of the health domain, policies across multiple sectors should be coordinated and aligned to promote the health of the population (7). In Indonesia, NCD policy and strategies have been directed towards greater harmonization with nongovernment entities at national and district levels, however, the implementation progress was varied in different districts depending on the district capacity and awareness. For example, the poor performance of some occupation types may indicate opportunities for a targeted intervention in collaboration with industry, workplace settings, community groups or professional bodies. In addition, policies that aim to prevent the adoption of behavioural risk factors by adolescents should be expanded and made more comprehensive, heeding lessons learned in other settings (8). Further research focused on adolescents is warranted to explore the factors and determinants surrounding the onset of NCDs, mental health problems and NCD risk factors.
Resources should be designated to ensure that policies and programmes can be fully implemented in all regions; resources should be of equal quality across socioeconomic and demographic subgroups, and aim to reach those with highest needs. Follow-up studies in poorly performing regions can help to identify where capacity-building is required. NCD screening and diagnostic capacities, for instance, have been found to be lower in some areas of the country that have higher NCD prevalence (5).

STATE OF HEALTH INEQUALITY: INDONESIA
100
Indicator profiles
In the following pages, Figures 11.1–11.13 illustrate disaggregated data by applicable and available dimensions of inequality. Supplementary tables S1–S4 contain relevant simple and complex summary measures.
Electronic visualization components accompany this report, enabling interactive data exploration. To access interactive visuals:
Interactive visuals
http://apps.who.int/gho/data/view.wrapper.HE-
VIZ20?lang=en&menu=hide
VISIT:SCAN HERE: or
References1. STEPwise approach to surveillance (STEPS)
[Internet]. Geneva: World Health Organization; 2017 (http://www.who.int/chp/steps/en/, accessed 15 July 2017).
2. National Institute of Health Research and Development, Ministry of Health, World Health Organization, Country Office for Indonesia. A report of situation analysis on NCD prevention and control program in Indonesia: a case study in four districts (Padang Panjang, Cilegon, Depok and Jakarta Barat). Jakarta: National Institute of Health Research and Development and World Health Organization; 2011.
3. Rahajeng E, Kusumawardani N. Framework on Community Based Intervention to Control NCD Risk Factors [Internet]. Report No. APEC#214-HT-03.1. Singapore: Asia-Pacific Economic Cooperation (APEC) Secretariate; 2014 (https://www.apec.org/Publications/2014/08/Framework-on-Community-Based-Intervention-to-Control-NCD-Risk-Factors, accessed 15 July 2017).
4. Directorate of NCD Prevention and Control Program. National Action Plan for NCD Prevention and Control. Jakarta: Ministry of Health Republic of Indonesia; 2015.
5. Asia Pacific Observatory on Health Systems and Policies. The Republic of Indonesia health system review. New Delhi: Regional Office for South-East Asia, World Health Organization; 2017.
6. Ministry of Health Strategic Plan 2015–2019 (Rencana Strategis Kementrian Kesehatan). Jakarta: Ministry of Health Republic of Indonesia; 2015.
7. Global status report on noncommunicable diseases 2014: attaining the nine global noncommunicable diseases targets, a shared responsibility. Geneva: World Health Organization; 2014.
8. Thakur J, Raina N, Karna P, Singh P, Jeet G, Jaswal N. Overview of national strategies on noncommunicable disease and adolescent health in South-East Asia Region countries. Int J Noncommunicable Dis. 2016 July 1;1(2):76–86.
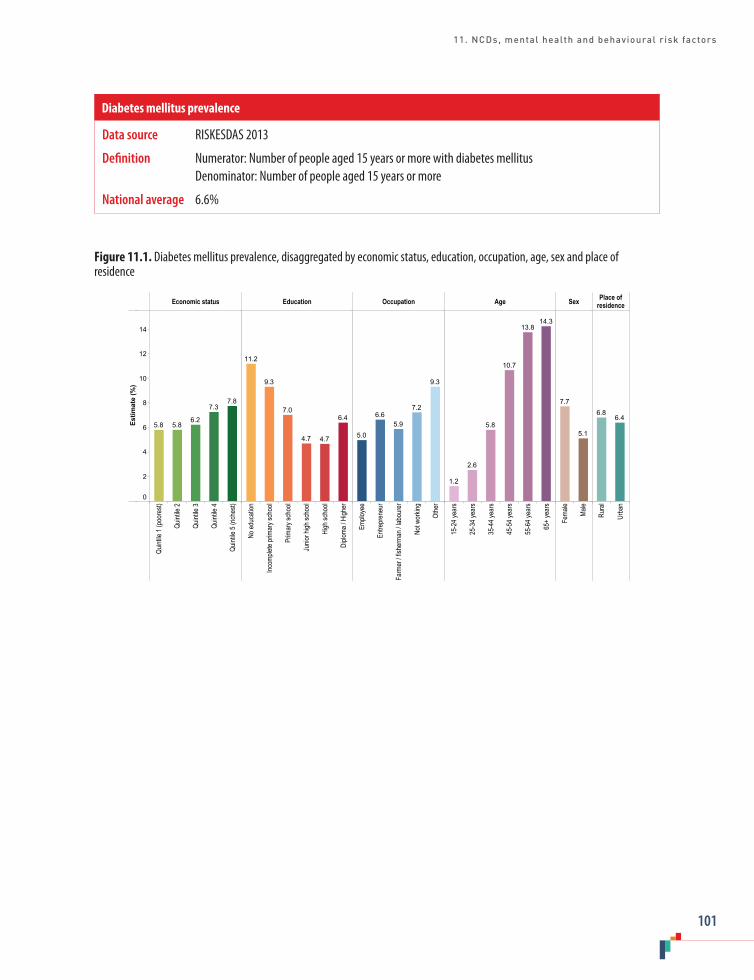
11. NCDs, mental health and behavioural risk factors
101
Figure 11.1. Diabetes mellitus prevalence, disaggregated by economic status, education, occupation, age, sex and place of residence
Economic status Education Occupation Age Sex Place ofresidence
Quint
ile 1
(poo
rest)
Quint
ile 2
Quint
ile 3
Quint
ile 4
Quint
ile 5
(rich
est)
No ed
ucati
on
Incom
plete
prim
ary s
choo
l
Prim
ary s
choo
l
Junio
r high
scho
ol
High
scho
ol
Diplo
ma / H
igher
Emplo
yee
Entre
pren
eur
Farm
er / f
isher
man /
labo
urer
Not w
orkin
g
Othe
r
15-2
4 yea
rs
25-3
4 yea
rs
35-4
4 yea
rs
45-5
4 yea
rs
55-6
4 yea
rs
65+
year
s
Fema
le
Male
Rura
l
Urba
n
Estim
ate
(%)
0
2
4
6
8
10
12
14
7.87.3
6.25.85.8
6.4
4.74.7
7.0
9.3
11.2
9.3
7.2
5.96.6
5.0
14.313.8
10.7
5.8
2.6
1.2
5.1
7.7
6.46.8
Data source RISKESDAS 2013
Definition Numerator: Number of people aged 15 years or more with diabetes mellitus Denominator: Number of people aged 15 years or more
National average 6.6%
Diabetes mellitus prevalence
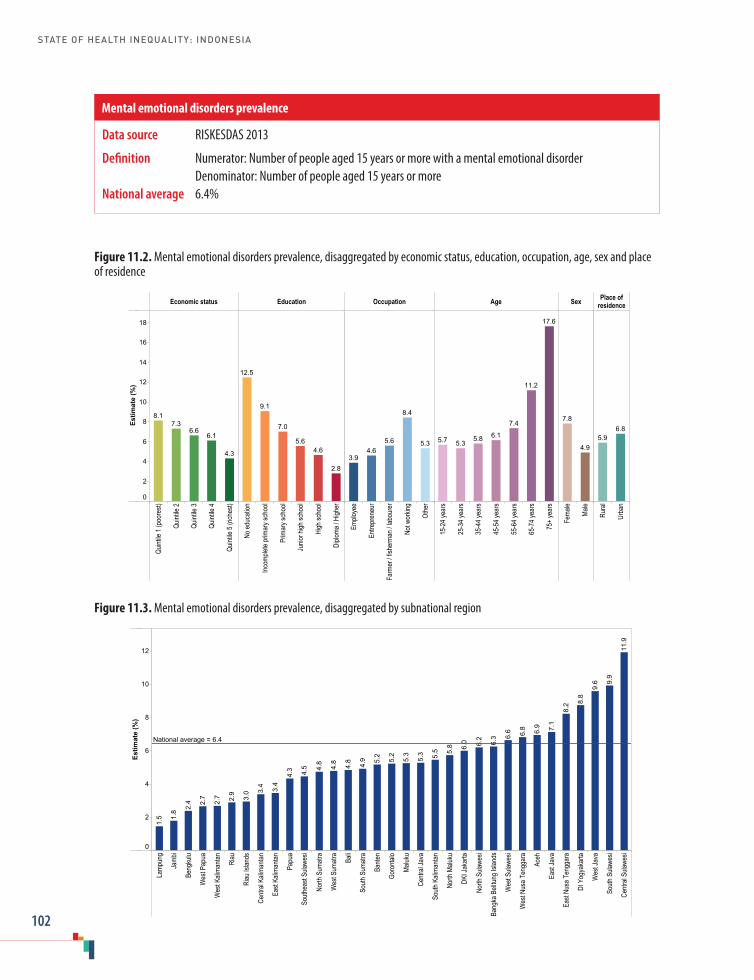
STATE OF HEALTH INEQUALITY: INDONESIA
102
Figure 11.2. Mental emotional disorders prevalence, disaggregated by economic status, education, occupation, age, sex and place of residence
Economic status Education Occupation Age Sex Place ofresidence
Quint
ile 1
(poo
rest)
Quint
ile 2
Quint
ile 3
Quint
ile 4
Quint
ile 5
(rich
est)
No ed
ucati
on
Incom
plete
prim
ary s
choo
l
Prim
ary s
choo
l
Junio
r high
scho
ol
High
scho
ol
Diplo
ma / H
igher
Emplo
yee
Entre
pren
eur
Farm
er / f
isher
man /
labo
urer
Not w
orkin
g
Othe
r
15-2
4 yea
rs
25-3
4 yea
rs
35-4
4 yea
rs
45-5
4 yea
rs
55-6
4 yea
rs
65-7
4 yea
rs
75+
year
s
Fema
le
Male
Rura
l
Urba
n
Estim
ate
(%)
0
2
4
6
8
10
12
14
16
18
4.3
6.16.6
7.38.1
2.8
4.65.6
7.0
9.1
12.5
5.3
8.4
5.64.6
3.9
17.6
11.2
7.4
6.15.85.35.7
4.9
7.86.8
5.9
Figure 11.3. Mental emotional disorders prevalence, disaggregated by subnational region
Lamp
ung
Jamb
i
Beng
kulu
Wes
t Pap
ua
Wes
t Kali
manta
n
Riau
Riau
Islan
ds
Centr
al Ka
liman
tan
East
Kalim
antan
Papu
a
South
east
Sulaw
esi
North
Sum
atra
Wes
t Sum
atra
Bali
South
Sum
atra
Bante
n
Goro
ntalo
Maluk
u
Centr
al Ja
va
South
Kali
manta
n
North
Malu
ku
DKI J
akar
ta
North
Sula
wesi
Bang
ka B
elitun
g Isla
nds
Wes
t Sula
wesi
Wes
t Nus
a Ten
ggar
a
Aceh
East
Java
East
Nusa
Ten
ggar
a
DI Y
ogya
karta
Wes
t Jav
a
South
Sula
wesi
Centr
al Su
lawes
i
Estim
ate
(%)
0
2
4
6
8
10
12 11.9
9.9
9.6
8.8
8.2
7.1
6.9
6.8
6.6
6.3
6.2
6.0
5.8
5.5
5.3
5.3
5.2
5.2
4.9
4.8
4.8
4.8
4.5
4.3
3.4
3.4
3.0
2.9
2.7
2.7
2.4
1.8
1.5
National average = 6.4
Data source RISKESDAS 2013
Definition Numerator: Number of people aged 15 years or more with a mental emotional disorder Denominator: Number of people aged 15 years or moreNational average 6.4%
Mental emotional disorders prevalence
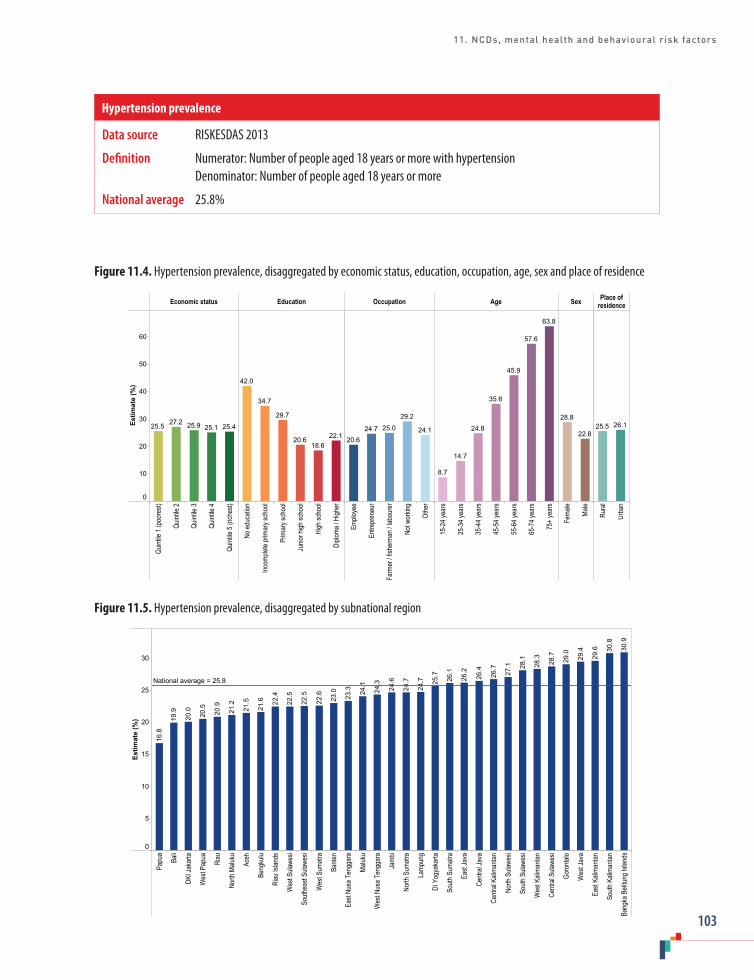
11. NCDs, mental health and behavioural risk factors
103
Figure 11.4. Hypertension prevalence, disaggregated by economic status, education, occupation, age, sex and place of residence
Economic status Education Occupation Age Sex Place ofresidence
Quint
ile 1
(poo
rest)
Quint
ile 2
Quint
ile 3
Quint
ile 4
Quint
ile 5
(rich
est)
No ed
ucati
on
Incom
plete
prim
ary s
choo
l
Prim
ary s
choo
l
Junio
r high
scho
ol
High
scho
ol
Diplo
ma / H
igher
Emplo
yee
Entre
pren
eur
Farm
er / f
isher
man /
labo
urer
Not w
orkin
g
Othe
r
15-2
4 yea
rs
25-3
4 yea
rs
35-4
4 yea
rs
45-5
4 yea
rs
55-6
4 yea
rs
65-7
4 yea
rs
75+
year
s
Fema
le
Male
Rura
l
Urba
n
Estim
ate
(%)
0
10
20
30
40
50
60
25.425.125.927.225.522.1
18.620.6
29.7
34.7
42.0
24.1
29.2
25.024.720.6
63.8
57.6
45.9
35.6
24.8
14.7
8.7
22.8
28.826.125.5
Figure 11.5. Hypertension prevalence, disaggregated by subnational region
Papu
a
Bali
DKI J
akar
ta
Wes
t Pap
ua
Riau
North
Malu
ku
Aceh
Beng
kulu
Riau
Islan
ds
Wes
t Sula
wesi
South
east
Sulaw
esi
Wes
t Sum
atra
Bante
n
East
Nusa
Ten
ggar
a
Maluk
u
Wes
t Nus
a Ten
ggar
a
Jamb
i
North
Sum
atra
Lamp
ung
DI Y
ogya
karta
South
Sum
atra
East
Java
Centr
al Ja
va
Centr
al Ka
liman
tan
North
Sula
wesi
South
Sula
wesi
Wes
t Kali
manta
n
Centr
al Su
lawes
i
Goro
ntalo
Wes
t Jav
a
East
Kalim
antan
South
Kali
manta
n
Bang
ka B
elitun
g Isla
nds
Estim
ate
(%)
0
5
10
15
20
25
30
30.9
30.8
29.6
29.4
29.0
28.7
28.3
28.1
27.1
26.7
26.4
26.2
26.1
25.7
24.7
24.7
24.6
24.3
24.1
23.3
23.0
22.6
22.5
22.5
22.4
21.6
21.5
21.2
20.9
20.5
20.0
19.9
16.8
National average = 25.8
Data source RISKESDAS 2013
Definition Numerator: Number of people aged 18 years or more with hypertension Denominator: Number of people aged 18 years or more
National average 25.8%
Hypertension prevalence
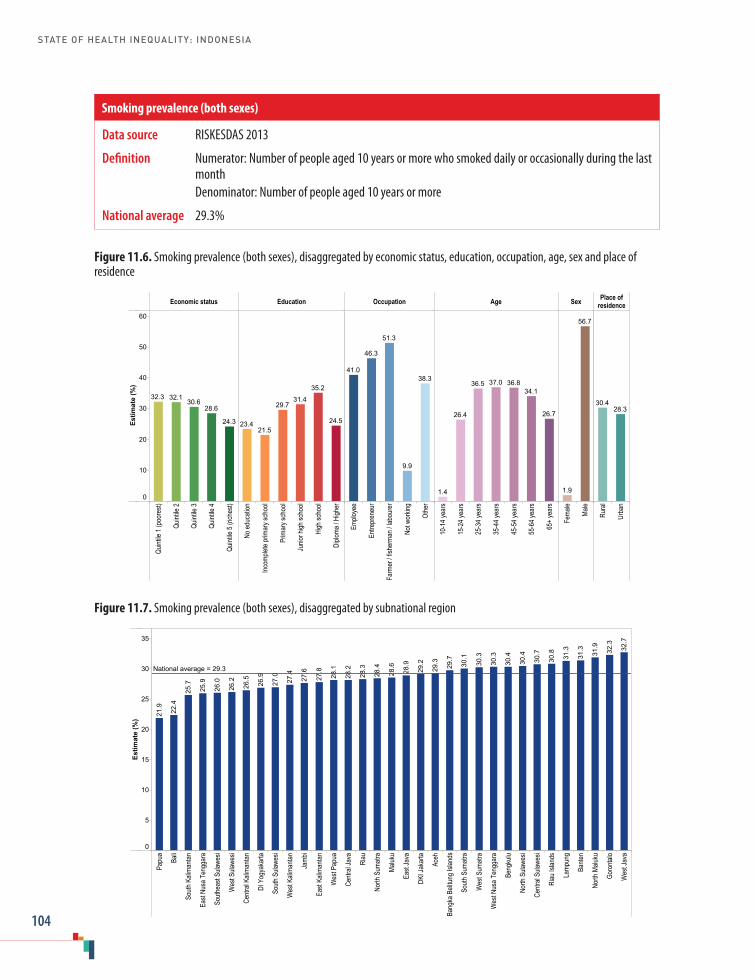
STATE OF HEALTH INEQUALITY: INDONESIA
104
Figure 11.6. Smoking prevalence (both sexes), disaggregated by economic status, education, occupation, age, sex and place of residence
Economic status Education Occupation Age Sex Place ofresidence
Quint
ile 1
(poo
rest)
Quint
ile 2
Quint
ile 3
Quint
ile 4
Quint
ile 5
(rich
est)
No ed
ucati
on
Incom
plete
prim
ary s
choo
l
Prim
ary s
choo
l
Junio
r high
scho
ol
High
scho
ol
Diplo
ma / H
igher
Emplo
yee
Entre
pren
eur
Farm
er / f
isher
man /
labo
urer
Not w
orkin
g
Othe
r
10-1
4 yea
rs
15-2
4 yea
rs
25-3
4 yea
rs
35-4
4 yea
rs
45-5
4 yea
rs
55-6
4 yea
rs
65+
year
s
Fema
le
Male
Rura
l
Urba
n
Estim
ate
(%)
0
10
20
30
40
50
60
24.3
28.630.6
32.132.3
24.5
35.2
31.429.7
21.523.4
38.3
9.9
51.3
46.3
41.0
26.7
34.136.837.036.5
26.4
1.4
56.7
1.9
28.330.4
Figure 11.7. Smoking prevalence (both sexes), disaggregated by subnational region
Papu
a
Bali
South
Kali
manta
n
East
Nusa
Ten
ggar
a
South
east
Sulaw
esi
Wes
t Sula
wesi
Centr
al Ka
liman
tan
DI Y
ogya
karta
South
Sula
wesi
Wes
t Kali
manta
n
Jamb
i
East
Kalim
antan
Wes
t Pap
ua
Centr
al Ja
va
Riau
North
Sum
atra
Maluk
u
East
Java
DKI J
akar
ta
Aceh
Bang
ka B
elitun
g Isla
nds
South
Sum
atra
Wes
t Sum
atra
Wes
t Nus
a Ten
ggar
a
Beng
kulu
North
Sula
wesi
Centr
al Su
lawes
i
Riau
Islan
ds
Lamp
ung
Bante
n
North
Malu
ku
Goro
ntalo
Wes
t Jav
a
Estim
ate
(%)
0
5
10
15
20
25
30
35
32.7
32.3
31.9
31.3
31.3
30.8
30.7
30.4
30.4
30.3
30.3
30.1
29.7
29.3
29.2
28.9
28.6
28.4
28.3
28.2
28.1
27.8
27.6
27.4
27.0
26.9
26.5
26.2
26.0
25.9
25.7
22.4
21.9
National average = 29.3
Data source RISKESDAS 2013
Definition Numerator: Number of people aged 10 years or more who smoked daily or occasionally during the last month
Denominator: Number of people aged 10 years or more
National average 29.3%
Smoking prevalence (both sexes)
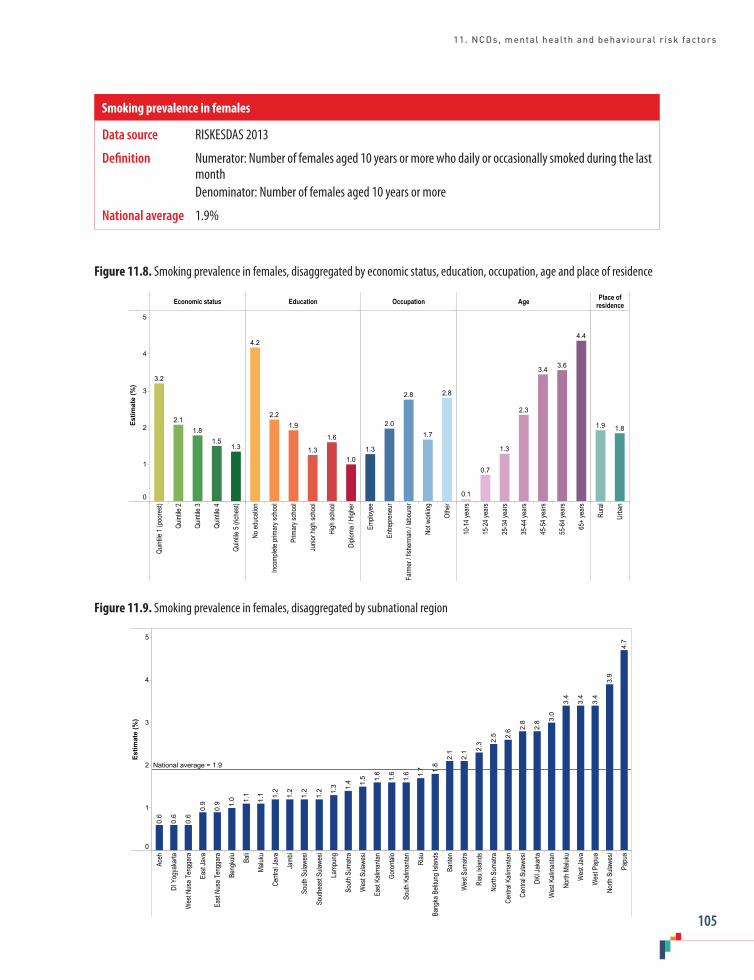
11. NCDs, mental health and behavioural risk factors
105
Figure 11.8. Smoking prevalence in females, disaggregated by economic status, education, occupation, age and place of residence
Economic status Education Occupation Age Place ofresidence
Quint
ile 1
(poo
rest)
Quint
ile 2
Quint
ile 3
Quint
ile 4
Quint
ile 5
(rich
est)
No ed
ucati
on
Incom
plete
prim
ary s
choo
l
Prim
ary s
choo
l
Junio
r high
scho
ol
High
scho
ol
Diplo
ma / H
igher
Emplo
yee
Entre
pren
eur
Farm
er / f
isher
man /
labo
urer
Not w
orkin
g
Othe
r
10-1
4 yea
rs
15-2
4 yea
rs
25-3
4 yea
rs
35-4
4 yea
rs
45-5
4 yea
rs
55-6
4 yea
rs
65+
year
s
Rura
l
Urba
n
Estim
ate
(%)
0
1
2
3
4
5
1.31.5
1.82.1
3.2
1.0
1.6
1.3
1.92.2
4.2
2.8
1.7
2.8
2.0
1.3
4.4
3.63.4
2.3
1.3
0.7
0.1
1.81.9
Figure 11.9. Smoking prevalence in females, disaggregated by subnational region
Aceh
DI Y
ogya
karta
Wes
t Nus
a Ten
ggar
a
East
Java
East
Nusa
Ten
ggar
a
Beng
kulu
Bali
Maluk
u
Centr
al Ja
va
Jamb
i
South
Sula
wesi
South
east
Sulaw
esi
Lamp
ung
South
Sum
atra
Wes
t Sula
wesi
East
Kalim
antan
Goro
ntalo
South
Kali
manta
n
Riau
Bang
ka B
elitun
g Isla
nds
Bante
n
Wes
t Sum
atra
Riau
Islan
ds
North
Sum
atra
Centr
al Ka
liman
tan
Centr
al Su
lawes
i
DKI J
akar
ta
Wes
t Kali
manta
n
North
Malu
ku
Wes
t Jav
a
Wes
t Pap
ua
North
Sula
wesi
Papu
a
Estim
ate
(%)
0
1
2
3
4
5
4.7
3.9
3.4
3.4
3.4
3.0
2.8
2.8
2.6
2.5
2.3
2.1
2.1
1.8
1.7
1.6
1.6
1.6
1.5
1.4
1.3
1.2
1.2
1.2
1.2
1.1
1.1
1.0
0.9
0.9
0.6
0.6
0.6
National average = 1.9
Data source RISKESDAS 2013
Definition Numerator: Number of females aged 10 years or more who daily or occasionally smoked during the last month
Denominator: Number of females aged 10 years or more
National average 1.9%
Smoking prevalence in females
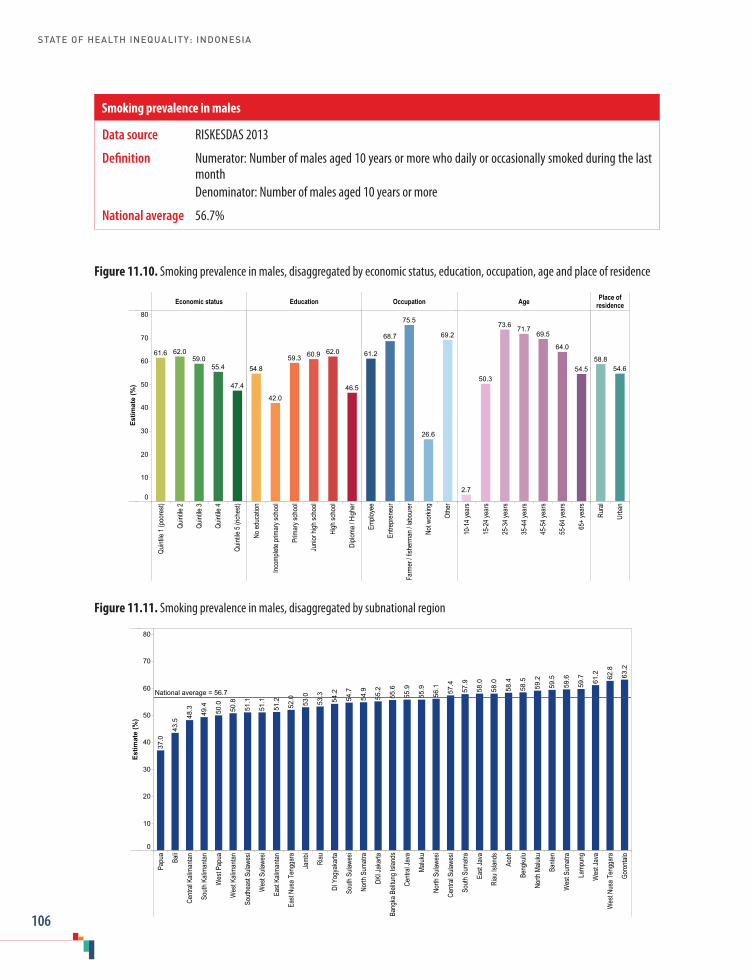
STATE OF HEALTH INEQUALITY: INDONESIA
106
Figure 11.10. Smoking prevalence in males, disaggregated by economic status, education, occupation, age and place of residence
Economic status Education Occupation Age Place ofresidence
Quint
ile 1
(poo
rest)
Quint
ile 2
Quint
ile 3
Quint
ile 4
Quint
ile 5
(rich
est)
No ed
ucati
on
Incom
plete
prim
ary s
choo
l
Prim
ary s
choo
l
Junio
r high
scho
ol
High
scho
ol
Diplo
ma / H
igher
Emplo
yee
Entre
pren
eur
Farm
er / f
isher
man /
labo
urer
Not w
orkin
g
Othe
r
10-1
4 yea
rs
15-2
4 yea
rs
25-3
4 yea
rs
35-4
4 yea
rs
45-5
4 yea
rs
55-6
4 yea
rs
65+
year
s
Rura
l
Urba
n
Estim
ate
(%)
0
10
20
30
40
50
60
70
80
47.4
55.459.0
62.061.6
46.5
62.060.959.3
42.0
54.8
69.2
26.6
75.5
68.7
61.2
54.5
64.0
69.571.773.6
50.3
2.7
54.658.8
Figure 11.11. Smoking prevalence in males, disaggregated by subnational region
Papu
a
Bali
Centr
al Ka
liman
tan
South
Kali
manta
n
Wes
t Pap
ua
Wes
t Kali
manta
n
South
east
Sulaw
esi
Wes
t Sula
wesi
East
Kalim
antan
East
Nusa
Ten
ggar
a
Jamb
i
Riau
DI Y
ogya
karta
South
Sula
wesi
North
Sum
atra
DKI J
akar
ta
Bang
ka B
elitun
g Isla
nds
Centr
al Ja
va
Maluk
u
North
Sula
wesi
Centr
al Su
lawes
i
South
Sum
atra
East
Java
Riau
Islan
ds
Aceh
Beng
kulu
North
Malu
ku
Bante
n
Wes
t Sum
atra
Lamp
ung
Wes
t Jav
a
Wes
t Nus
a Ten
ggar
a
Goro
ntalo
Estim
ate
(%)
0
10
20
30
40
50
60
70
8063
.2
62.8
61.2
59.7
59.6
59.5
59.2
58.5
58.4
58.0
58.0
57.9
57.4
56.1
55.9
55.9
55.6
55.2
54.9
54.7
54.2
53.3
53.0
52.0
51.2
51.1
51.1
50.8
50.0
49.4
48.3
43.5
37.0
National average = 56.7
Data source RISKESDAS 2013
Definition Numerator: Number of males aged 10 years or more who daily or occasionally smoked during the last month
Denominator: Number of males aged 10 years or more
National average 56.7%
Smoking prevalence in males

11. NCDs, mental health and behavioural risk factors
107
Figure 11.12. Low fruit and vegetable consumption, disaggregated by economic status, education, occupation, age, sex and place of residence
Economic status Education Occupation Age Sex Place ofresidence
Quint
ile 1
(poo
rest)
Quint
ile 2
Quint
ile 3
Quint
ile 4
Quint
ile 5
(rich
est)
No ed
ucati
on
Incom
plete
prim
ary s
choo
l
Prim
ary s
choo
l
Junio
r high
scho
ol
High
scho
ol
Diplo
ma / H
igher
Emplo
yee
Entre
pren
eur
Farm
er / f
isher
man /
labo
urer
Not w
orkin
g
Othe
r
10-1
4 yea
rs
15-2
4 yea
rs
25-3
4 yea
rs
35-4
4 yea
rs
45-5
4 yea
rs
55-6
4 yea
rs
65+
year
s
Fema
le
Male
Rura
l
Urba
n
Estim
ate
(%)
0
10
20
30
40
50
60
70
80
90
10094.896.597.297.798.2
94.296.397.397.597.897.5 96.496.997.695.895.4 96.996.496.096.396.897.197.5 96.996.5 96.197.3
Figure 11.13. Low fruit and vegetable consumption, disaggregated by subnational region
DI Y
ogya
karta
Maluk
u
North
Malu
ku
Papu
a
East
Java
Centr
al Ja
va
Goro
ntalo
DKI J
akar
ta
Wes
t Pap
ua
Centr
al Su
lawes
i
East
Kalim
antan
North
Sum
atra
North
Sula
wesi
Centr
al Ka
liman
tan
Lamp
ung
Aceh
Wes
t Jav
a
Bali
Bante
n
Riau
Islan
ds
Wes
t Nus
a Ten
ggar
a
South
east
Sulaw
esi
Bang
ka B
elitun
g Isla
nds
East
Nusa
Ten
ggar
a
Wes
t Kali
manta
n
South
Sula
wesi
South
Sum
atra
Jamb
i
Beng
kulu
Wes
t Sum
atra
Riau
South
Kali
manta
n
Wes
t Sula
wesi
Estim
ate
(%)
0
10
20
30
40
50
60
70
80
90
100 99.1
98.9
98.8
98.7
98.7
98.4
98.3
98.2
97.9
97.9
97.8
97.7
97.7
97.6
97.6
97.5
97.4
97.3
96.9
96.8
96.8
96.7
96.6
96.6
96.3
96.3
96.2
95.6
National average = 96.7
Data source RISKESDAS 2013
Definition Numerator: Number of people aged 10 years or more with fruit and/or vegetable consumption of less than five servings per day
Denominator: Number of people aged 10 years or more
National average 96.7%
Low fruit and vegetable consumption prevalence
STATE OF HEALTH INEQUALITY: INDONESIA
108
12. Disability and injury
The Government of Indonesia recognizes that disabilities and injuries have complex and wide-ranging impacts on the health and well-being of the population. Disability is increasingly viewed less as a medical condition and more as a human rights issue; it is linked to injuries, both as a risk factor for injury and a result of injury. Causes of injury in Indonesia are diverse, including fires, falls, violence, drowning, conflict, natural disasters and road traffic accidents. Road traffic injuries are a particular concern in Indonesia, with significant increases in recent years (1).
The government has introduced a number of laws, policies and programmes that address disability and injury. Since the 1970s, community-based rehabilitation programmes have aimed to expand community resources, and engage families and communities in the empowerment of people with disabilities (2). Legislation passed in 1997 (Law No. 4) guarantees equal rights and opportunities for people with disabilities, and obliges government and society to provide rehabilitation, social assistance and social welfare (3). In 2007, Indonesia ratified the United Nations Convention on the Rights of Persons with Disabilities (4) and, in 2011, Law No. 19 was enacted, which reaffirmed Indonesia’s commitment to the rights outlined in the Convention (5).
In 2004, five government ministries (namely, the Ministry of Health, the Ministry of Transportation, the Ministry of Police, the Ministry of Education and the Ministry of Settlement and Infrastructure) jointly issued a decree on measures to control traffic accidents (6). Subsequently, a number of prevention-oriented programmes have rolled out across the country (7). For example, the Global Road Safety is a multisector campaign that targets high school students, emphasizing the use of helmets and training the students in emergency first response (6). The Early Warning of Road Traffic
Injury programme includes increased surveillance measures during holidays. In 2010, representatives from provincial health offices, the Department of Transportation and regional police gathered in Yogyakarta for a national meeting on violence, injury and disability to strengthen networking and partnerships at national and subnational levels. Following the adoption of United Nations Resolution No. 64/255 on improving global road safety, Indonesia launched the Decade of Action for Road Safety (2011–2020) (8).
Despite strong commitments from the government, Indonesia faces challenges in disability and injury prevention and control. Organizational restructuring in the Ministry of Health in 2016 moved disability and injury prevention programmes into a smaller unit with fewer resources. Some laws and programmes have not been fully or consistently implemented (9). Furthermore, stigmatization and discrimination of people with disabilities or injuries may hamper efforts to create enabling environments.
Disability and injury indicators
Two indicators are featured in this chapter, covering disability prevalence and injury prevalence (Table 12.1). The disability indicator draws from an assessment instrument (the second edition of the WHO Disability Assessment Schedule) linked to the International Classification of Functioning, Disability and Health (10). It reflects an individual’s ability to function (self-evaluated on a scale from 1 to 5) across different domains. The injury indicator is linked to events that occurred within the last 12 months that affected ability to function. (Note that the severity of the injury was not specified.) For both indicators, lower prevalence is desirable.

12. Disability and injury
109
Table 12.1. Disability and injury indicators
Indicator Description
Disability prevalence Prevalence of disability among people aged 15 years or moreDisability was determined through an interview based on the 12-item WHO Disability Assessment Schedule 2.0, which covers the following domains: standing for 30 minutes; taking care of household responsibilities; learning new tasks; joining in community activities; degree of emotional effect of health problems; concentrating for 10 minutes; walking long distances (1 kilometre); washing one’s entire body; getting dressed; interacting with new people; maintaining friendships; and performing daily workDisability was defined as having a score of 3 or higher on a scale from 1 (no difficulty) to 5 (severe difficulty or inability to do the activity), for at least one domain
Injury prevalence Prevalence of injuries during the last 12 monthsInjury was determined through an interview, and was defined as an event that resulted in difficulty in performing daily activities
Key findings
National average: National disability prevalence was 11.0% among those aged 15 years or more, whereas national injury prevalence was 8.2% among the total population.
Economic status: Across wealth quintiles, the richest reported the lowest prevalence for both disability (8.3%) and injury (7.5%). Disability prevalence demonstrated a gradient pattern across quintiles, which had a maximum of 15.2% in the poorest; the rich–poor difference was 6.9 percentage points. Injury prevalence showed no apparent pattern across quintiles, with highest prevalence in quintile 4 (8.7%).
Education: Education-related inequality was demonstrated across six subgroups. Disability was 4.6 times higher in the least-educated subgroup (29.8%) than the most-educated subgroup (6.4%). The prevalence of disability decreased as education level increased. Likewise, injury prevalence was lowest in the most-educated subgroup (6.2%); prevalence in the no education subgroup (8.6%) was 1.4 times as high.
Occupation: Disability prevalence was variable across occupation subgroups, ranging from 6.0%
in employees to 14.4% in those not working: a gap of 8.4 percentage points. Injury prevalence did not demonstrate inequality by occupation, with less than 1 percentage point difference between subgroups.
Age: The lowest disability prevalence was reported in the 15–19 years subgroup (5.6%), with incremental increases across all other age groupings. The most marked increase occurred between the 60–64 years subgroup (22.0%) and the 65+ years subgroup (41.3%). The injury indicator, which captured all ages, showed highest prevalence at 15–24 years (11.7%), followed by 5–14 years (9.7%). Apart from the first year of life (where injury prevalence was 1.9%), the prevalence of injury was lowest in mid- to late adulthood (6.4%–6.9% in subgroups spanning age 35 to 74 years).
Sex: Disability was more prevalent in females (12.8%) than males (9.2%), whereas injuries were more prevalent in males (10.1%) than females (6.4%).
Place of residence: The two indicators each showed little difference in rural and urban areas (less than 1 percentage point difference).

STATE OF HEALTH INEQUALITY: INDONESIA
110
Subnational region: Across subnational regions, disability prevalence was 5.2 times higher in the worst-performing region (South Sulawesi, 23.8%) than the best-performing region (West Papua, 4.6%). Out of the 33 regions included in the analysis, five reported disability prevalence above 15%. Injury prevalence differed across subnational regions by a factor of 2.8. Prevalence was highest in South Sulawesi (12.8%), followed by DI Yogyakarta (12.4%) and East Nusa Tenggara (12.1%); the best-performing subnational regions were Jambi (4.5%) and Lampung and South Sumatra (4.6% in each).
Priority areas
Overall, national levels of disability and injury prevalence suggest that the topic is of low priority in Indonesia. Addressing inequalities in disability and injury prevalence is a medium priority. Findings from these data indicate that priority in this health topic should be assigned to: reducing high prevalence of disability among those with no education and among the elderly; and improving the situation in South Sulawesi (the worst-performing region for both indicators) and East Nusa Tenggara (among the bottom five regions for both indicators). In addition, elevated injury prevalence among children and adolescents warrants attention.
Inequality in disability reflected conventional forms of disadvantage: gradient patterns of inequality were reported with high prevalence among the poor, those with lower education, and the elderly. Females and the unemployed also demonstrated higher disability prevalence. Injuries were more common among males, and in age groups spanning 5–24 years.
Policy implications
Disability was more prevalent in socioeconomically disadvantaged people, and injury was more
prevalent in younger age groups and males. Further research, including longitudinal studies, is needed to better understand these associations and the context surrounding disability and injury prevention and management in Indonesia. Meanwhile, social protection policies should include efforts to make education and employment more inclusive for people with disabilities. This may entail: improving transportation options; leading disability-sensitive teacher training and curriculum development; raising awareness about disability-related misconceptions; introducing vocational training programmes; and promoting a rights-based approach to employment (9).
Many of the prevention-based policies surrounding disability and injuries in Indonesia have been developed in a multisectoral fashion, necessitating coordination and synergy across multiple stakeholders. While this is considered a strength, it also brings certain challenges, as programmes require strong high-level support across sectors and ministries. Policy-makers and planners should ensure that adequate human and financial resources are available, and that stakeholder roles are clearly articulated and formalized (11). Under the Ministry of Health, moving disability and injury prevention and control into NCD programmes is an avenue for effective action, as these health topics are closely related. To address regional inequalities, pilot projects and early programme implementation should consider targeting poor-performing regions such as East Nusa Tenggara and South Sulawesi.
Given that traffic accidents are a major cause of disability and injury in Indonesia, road safety policies and their implementation should be strengthened. This may include building capacities at the provincial levels, strengthening implementation of regulations (including use of child restraints, speed limits and seat belt usage) and increasing scientific and human capital to address current and emerging challenges (7).

12. Disability and injury
111
Indicator profiles
In the following pages, Figures 12.1–12.4 illustrate disaggregated data by applicable and available dimensions of inequality. Supplementary tables S1–S4 contain relevant simple and complex summary measures.
Electronic visualization components accompany this report, enabling interactive data exploration. To access interactive visuals:
Interactive visuals
http://apps.who.int/gho/data/view.wrapper.HE-
VIZ20?lang=en&menu=hide
VISIT:SCAN HERE: or
References1. Country Office for Indonesia. Injury prevention
[Internet]. Geneva: World Health Organization; 2017 (http://www.searo.who.int/indonesia/topics/injuryprevention/en/, accessed 25 July 2017).
2. Asia Pacific Observatory on Health Systems and Policies. The Republic of Indonesia health system review. New Delhi: Regional Office for South-East Asia, World Health Organization; 2017.
3. Government Regulation No. 4/1997: legislation on equal opportunities and full participation in development for disabled persons [Internet]. Jakarta: Government of the Republic of Indonesia; 1997 (http://www.refworld.org/pdfid/4da2d1b92.pdf, accessed 24 July 2017).
4. Convention on the Rights of Persons with Disabilities [Internet]. New York: United Nations; 2007. (https://www.un.org/development/desa/disabilities/convention-on-the-rights-of-persons-with-disabilities.html, accessed 24 July 2017).
5. Government Regulation No. 19/2011: law on the ratification of the Convention on the Rights of Persons with Disabilities. Jakarta: Government of the Republic of Indonesia; 2011.
6. National Institute of Health Research and Development, Ministry of Health, World Health Organization, Country Office for Indonesia. A report of situation analysis on NCD prevention and control program in Indonesia: a case study in four districts (Padang Panjang, Cilegon, Depok and Jakarta Barat). Jakarta: National Institute of Health Research and Development and World Health Organization; 2011.
7. ASEAN Secretariat. ASEAN Regional Road Safety Strategy. Jakarta: Association of Southeast Asian Nations; 2016.
8. United Nations Decade of Action for Road Safety [Internet]. KORLANTAS POLRI; 2013 (http://www.korlantas-irsms.info/united_nation, accessed 25 July 2017).
9. Adioetomo S, Mont D, Irwanto. Persons with disabilities in Indonesia: empirical facts and implications for social protection policies. Jakarta: Demographic Institute, Faculty of Economics, University of Indonesia; 2014.
10. Measuring health and disability: manual for WHO Disability Assessment Schedule 2.0 (WHODAS 2.0). Geneva: World Health Organization; 2010.
11. Preventing injuries and violence: a guide for ministries of health. Geneva: World Health Organization; 2007.

STATE OF HEALTH INEQUALITY: INDONESIA
112
Figure 12.1. Disability prevalence, disaggregated by economic status, education, occupation, age, sex and place of residence
Economic status Education Occupation Age Sex Place ofresidence
Quint
ile 1
(poo
rest)
Quint
ile 2
Quint
ile 3
Quint
ile 4
Quint
ile 5
(rich
est)
No ed
ucati
on
Incom
plete
prim
ary s
choo
l
Prim
ary s
choo
l
Junio
r high
scho
ol
High
scho
ol
Diplo
ma / H
igher
Emplo
yee
Entre
pren
eur
Farm
er / f
isher
man /
labo
urer
Not w
orkin
g
Othe
r
15-1
9 yea
rs
20-2
4 yea
rs
25-2
9 yea
rs
30-3
4 yea
rs
35-3
9 yea
rs
40-4
4 yea
rs
45-4
9 yea
rs
50-5
4 yea
rs
55-5
9 yea
rs
60-6
4 yea
rs
65+
year
s
Fema
le
Male
Rura
l
Urba
n
Estim
ate
(%)
0
10
20
30
40
8.39.6
10.812.8
15.2
6.47.07.6
11.7
18.0
29.8
9.2
14.4
10.28.0
6.0
41.3
22.0
16.0
12.19.8
8.47.47.17.06.85.6
9.2
12.810.811.2
Figure 12.2. Disability prevalence, disaggregated by subnational region
Wes
t Pap
ua
Lamp
ung
Bante
n
Jamb
i
Beng
kulu
Wes
t Kali
manta
n
Riau
Islan
ds
Papu
a
East
Kalim
antan
Centr
al Ka
liman
tan
DKI J
akar
ta
South
Sum
atra
Maluk
u
Riau
North
Sum
atra
North
Sula
wesi
Bang
ka B
elitun
g Isla
nds
Centr
al Ja
va Bali
North
Malu
ku
DI Y
ogya
karta
East
Java
Wes
t Jav
a
Aceh
South
east
Sulaw
esi
Wes
t Sum
atra
Wes
t Sula
wesi
South
Kali
manta
n
Wes
t Nus
a Ten
ggar
a
Goro
ntalo
East
Nusa
Ten
ggar
a
Centr
al Su
lawes
i
South
Sula
wesi
Estim
ate
(%)
0
10
20
23.8
19.6
19.2
17.6
15.9
14.4
13.4
13.1
12.9
12.7
12.7
11.6
11.5
11.3
10.6
10.3
10.1
10.0
9.3
8.5
8.4
8.1
8.0
7.7
7.5
7.0
6.7
6.4
6.0
5.8
5.1
5.0
4.6
National average = 11.0
Data source RISKESDAS 2013
Definition Numerator: Number of people aged 15 years or more who have a disability (scored 3 or higher on at least one domain)
Denominator: Number of people aged 15 years or more
National average 11.0%
Disability prevalence
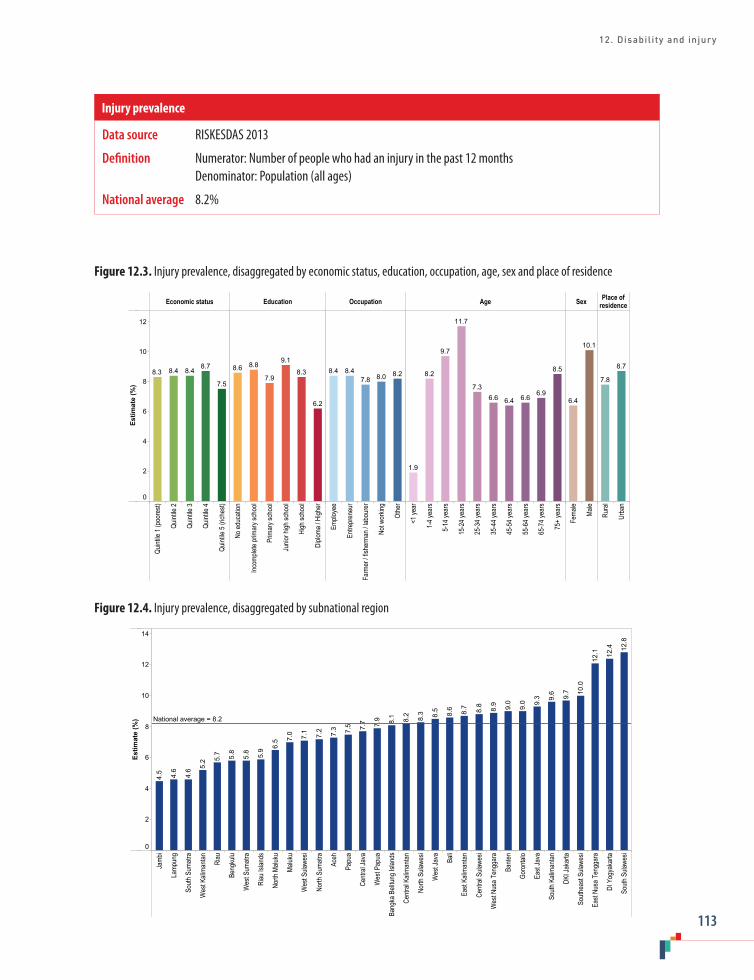
12. Disability and injury
113
Figure 12.3. Injury prevalence, disaggregated by economic status, education, occupation, age, sex and place of residence
Economic status Education Occupation Age Sex Place ofresidence
Quint
ile 1
(poo
rest)
Quint
ile 2
Quint
ile 3
Quint
ile 4
Quint
ile 5
(rich
est)
No ed
ucati
on
Incom
plete
prim
ary s
choo
l
Prim
ary s
choo
l
Junio
r high
scho
ol
High
scho
ol
Diplo
ma / H
igher
Emplo
yee
Entre
pren
eur
Farm
er / f
isher
man /
labo
urer
Not w
orkin
g
Othe
r
<1 ye
ar
1-4 y
ears
5-14
year
s
15-2
4 yea
rs
25-3
4 yea
rs
35-4
4 yea
rs
45-5
4 yea
rs
55-6
4 yea
rs
65-7
4 yea
rs
75+
year
s
Fema
le
Male
Rura
l
Urba
n
Estim
ate
(%)
0
2
4
6
8
10
12
7.5
8.78.48.48.3
6.2
8.3
9.1
7.9
8.88.68.28.07.8
8.48.4 8.5
6.96.66.46.6
7.3
11.7
9.7
8.2
1.9
10.1
6.4
8.7
7.8
Figure 12.4. Injury prevalence, disaggregated by subnational region
Jamb
i
Lamp
ung
South
Sum
atra
Wes
t Kali
manta
n
Riau
Beng
kulu
Wes
t Sum
atra
Riau
Islan
ds
North
Malu
ku
Maluk
u
Wes
t Sula
wesi
North
Sum
atra
Aceh
Papu
a
Centr
al Ja
va
Wes
t Pap
ua
Bang
ka B
elitun
g Isla
nds
Centr
al Ka
liman
tan
North
Sula
wesi
Wes
t Jav
a
Bali
East
Kalim
antan
Centr
al Su
lawes
i
Wes
t Nus
a Ten
ggar
a
Bante
n
Goro
ntalo
East
Java
South
Kali
manta
n
DKI J
akar
ta
South
east
Sulaw
esi
East
Nusa
Ten
ggar
a
DI Y
ogya
karta
South
Sula
wesi
Estim
ate
(%)
0
2
4
6
8
10
12
1412
.8
12.4
12.1
10.0
9.7
9.6
9.3
9.0
9.0
8.9
8.8
8.7
8.6
8.5
8.3
8.2
8.1
7.9
7.7
7.5
7.3
7.2
7.1
7.0
6.5
5.9
5.8
5.8
5.7
5.2
4.6
4.6
4.5
National average = 8.2
Data source RISKESDAS 2013
Definition Numerator: Number of people who had an injury in the past 12 months Denominator: Population (all ages)
National average 8.2%
Injury prevalence

STATE OF HEALTH INEQUALITY: INDONESIA
114
13. Health facility and personnel
The delivery of health care in Indonesia relies on a network of health facilities and personnel (1). Health facilities are defined as places or tools used to provide promotive, preventive, curative and rehabilitative health care, such as community health-care centres (puskesmas) and hospitals. According to the types of services available, health facilities are classified as primary, secondary or tertiary. Both central and local administrative bodies have responsibilities to ensure that health facilities are accessible, and that facilities are working to improve and/or maintain the status of public health, as specified in Law 36/2009 (2). Puskesmas, administered at the subdistrict level, are key providers of primary health care, with a focus on promotive and preventive efforts. Puskesmas across the country are variable in the services they provide and the health personnel they employ. They hold obligations to work alongside districts and municipalities to promote healthy subdistricts, as outlined in the Ministry of Health Decree No. 75/2014 (3).
The main types of health personnel in Indonesia include midwives, nurses, physicians and dentists, each of whom have a clearly defined scope of practice, and are registered by professional associations. (Doctors and dentists are registered by the Indonesian Medical Council, while other health professions are registered by the Indonesian Health Personnel Assembly (1). To ensure adequate health personnel in rural areas, certain professions require trainees to work for a few years in remote areas to obtain their professional licenses (4,5).
Indonesia faces a number of challenges related to health personnel, including: insufficient supply of health personnel; poor quality training and care; lack of oversight and licensing, especially in the private health sector; and difficulties planning, recruiting and retaining health personnel (5).
While Indonesia has realized increases in absolute numbers of health personnel, health worker ratios remain below WHO recommendations and geographical disparities exist (6). The central government is undertaking reforms to improve health facility and personnel. The Indonesia Human Resources for Health Development Plan (2011–2025) outlines a comprehensive direction and strategy for improvements across 13 categories of the health workforce (6). The Plan also aims to improve community access to health services by increasing the number of community health centres and further developing hospitals. In recent years, the government has moved to convert health personnel on central and local contracts into permanent civil servants (7). The Ministry of Health has increased the budget for health personnel, and encourages collaboration among different agencies and the public and private sectors.
Health facility and personnel indicatorsThis chapter features six health facility and personnel indicators (Table 13.1). Two indicators pertain to health facilities (basic amenities readiness in puskesmas and subdistricts with a health centre), while four indicators cover health personnel (dentists, general practitioners, midwives and nurses). The criteria for each indicator are based on the minimum requirements specified in the Ministry of Health Decree No. 75/2014 (3). For example, the Decree states that every subdistrict must have at least one health centre, and that puskesmas must have certain basic amenities; the Decree also sets out a minimum number of health personnel per health centre that is deemed sufficient to carry out health programmes as part of national and global commitments. For the six indicators featured here, the maximum, and optimal, value is 100%.

13. Health facility and personnel
115
Key findings
National average: Nationally, 91.6% of subdistricts had a health centre, and 74.0% of puskesmas met the criteria for basic amenities readiness. The percentage of health centres that had sufficient numbers of different types of health personnel varied: coverage of dentists was 53.3%; nurses was 57.8%; midwives was 62.5%; and general practitioners was 74.6%.
Place of residence: Data by place of residence were available for the basic amenities readiness in puskesmas indicator. The percentage of rural puskesmas with basic amenities readiness (72.0%) was 8.0 percentage points lower than the percentage of urban puskesmas with basic amenities readiness (80.0%).
Subnational region: Overall, Papua and West Papua performed poorly across all indicators (i.e. they were consistently among the five worst-performing regions). The percentage of subdistricts with a
Table 13.1. Health facility and personnel indicators
Indicator Description
Subdistricts with a health centre
Percentage of subdistricts with a health centre
Basic amenities readiness in puskesmas
Percentage of puskesmas that meet the criteria for basic amenities readinessNote: the criteria for basic amenities readiness refers to basic services required to provide medical care: electricity; water and sanitation; private room; toilet; communication; computer with internet; and transportation
Health centres with sufficient number of dentists
Percentage of health centres with sufficient number of dentistsNote: health centres (with or without inpatient care) must have a minimum of one dentist
Health centres with sufficient number of general practitioners
Percentage of health centres with sufficient number of general practitionersNote: health centres with inpatient care must have a minimum of two general practitioners and health centres without inpatient care must have a minimum of one general practitioner
Health centres with sufficient number of midwives
Percentage of health centres with sufficient number of midwivesNote: health centres with inpatient care must have a minimum of seven midwives and health centres without inpatient care must have a minimum of four midwives
Health centres with sufficient number of nurses
Percentage of health centres with sufficient number of nursesNote: health centres with inpatient care must have a minimum of eight nurses and health centres without inpatient care must have a minimum of five nurses
health centre ranged from a minimum of 63.9% in Papua to 100.0% in four subnational regions (Bali, DI Yogyakarta, DKI Jakarta and West Nusa Tenggara): an absolute difference of 36.1 percentage points. Basic amenities readiness varied by 35.0 percentage points, from a minimum of 53.0% of puskesmas in Papua to a maximum of 88.0% of puskesmas in DI Yogyakarta. Basic amenities readiness in health centres was under 60% in four regions, and over 80% in five regions.
The four indicators that looked at health centres with sufficient numbers of health personnel all demonstrated high levels of absolute inequality. The largest gap between the best- and worst-performing regions was reported for dentists. The percentage of health centres with sufficient number of dentists spanned 85.7 percentage points from Papua (12.7%) to DI Yogyakarta (98.3%). The indicator about midwives demonstrated absolute inequality of 81.9 percentage points between the best-performing region (93.9% of health centres in Banten) and the worst-performing region (12.0% of health centres in West Papua). Data about health
STATE OF HEALTH INEQUALITY: INDONESIA
116
centres with sufficient number of nurses showed a difference of 68.8 percentage points between DKI Jakarta (26.6%) and Riau Islands (95.4%). Notably, DKI Jakarta performed much more poorly than the second worst-performing region (Papua, where 39.0% of health centres had sufficient number of nurses). The regional percentage of health centres with sufficient number of general practitioners was highest in DI Yogyakarta (99.2%) and lowest in West Papua (34.4%). This represents an absolute gap of 64.9 percentage points between the best- and worst-performing regions.
Priority areas
Based on the national average values, the two health facility indicators are considered medium priority and the four health personnel indicators are considered high priority (given their low national averages). In particular, the low average of health centres with a sufficient number of midwives is of concern, given that midwives are considered important for efforts to reduce maternal and child mortality (which is one of Indonesia’s key national and global commitments). Substantial subnational regional inequalities were reported in all indicators, and especially in health personnel indicators. Thus, geographical inequality in health facility and personnel constitutes a high priority. Place of residence inequality in basic amenities readiness is a medium priority. Additional explorations of how other health facility and personnel indicators are experienced in rural versus urban areas are warranted; inequality analyses linked to area-level socioeconomic status should also be undertaken.
Poor performance in Papua and West Papua in the area of health facility and personnel necessitates urgent action. These two subnational regions demonstrated the lowest levels of health facility indicators, in addition to health personnel coverage that was well below the national average. Papua and West Papua reported particularly low percentages of health centres with dentists or midwives (less than 15% in all cases).
Policy implications
Indonesia has a number of ambitious policies and strategies for the improvement of health facilities and personnel, however, there is much progress to be made. Based on the findings in this chapter, efforts are required to increase the availability of health personnel (especially midwives) in eastern regions. Existing programmes should be strengthened, including Healthy Archipelago (Nusantara Sehat), a breakthrough programme to improve accessibility of primary health care by deploying health personnel to disadvantaged areas (8), and Midwives in Villages (Bidan Desa), a programme aiming to increase access to reproductive health care in rural areas (9). Efforts to improve accessibility to higher education institutions that produce health personnel are warranted, especially in eastern regions of the country. Currently, there is only one Ministry of Health educational institution for health sciences (poltekkes) in Papua, Maluku and North Maluku, and West Papua (located in Jayapura Sorong, Ternate and Ambon, respectively) (8).
Health facility and personnel reforms should ensure appropriate resource allocation, sustained political support and dedicated monitoring and evaluation. Nationally, centralized coordination is required to ensure that policies across different sectors and levels of governance are unified towards common goals and targets. Policies should be developed and implemented in an equity-oriented way to ensure that progress is realized equally (or faster) in disadvantaged regions. Additional explorations of the reasons for poor performance in regions such as Papua and West Papua are warranted.
As health facility and personnel reforms seek to address challenges that emerged after decentralization, efforts are needed to ensure that emerging issues are identified and mitigated. For instance, alongside other countries in South-East Asia, Indonesia faces issues of health worker migration and the so-called brain drain from the public to the private health sector (10). Centralized
13. Health facility and personnel
117
planning of health facility and personnel matters is hampered by the fragmented nature of the health information (7). New initiatives and approaches may be required to overcome current and emerging challenges, and existing ones can be strengthened. Indonesia can learn from strategies that have been successful in other settings, such as: adopting a multisectoral approach; doing comprehensive planning; building capacity for management of health personnel; revitalizing approaches to recruiting, training, testing and certifying health personnel; and revising health personnel training curricula (11).
Indicator profiles
In the following pages, Figures 13.1–13.7 illustrate disaggregated data by applicable and available dimensions of inequality. Supplementary tables S1–S4 contain relevant simple and complex summary measures.
Electronic visualization components accompany this report, enabling interactive data exploration. To access interactive visuals:
Interactive visuals
http://apps.who.int/gho/data/view.wrapper.HE-
VIZ20?lang=en&menu=hide
VISIT:SCAN HERE: or
References1. Asia Pacific Observatory on Health Systems and
Policies. The Republic of Indonesia health system review. New Delhi: Regional Office for South-East Asia, World Health Organization, 2017.
2. Ministry of Law and Human Rights Law No. 36/2009 on Health. Jakarta: Ministry of Law and Human Rights Republic of Indonesia; 2010.
3. Ministry of Health Decree 75/2014 on health centres. Jakarta: Ministry of Health Republic of Indonesia; 2014.
4. Global Health Workforce Alliance: Indonesia [Internet]. Geneva: World Health Organization; 2017 (http://www.who.int/workforcealliance/countries/idn/en/, accessed 1 August 2017).
5. Rokx C, Giles J, Satriawan E, Marzoeki P, Harimurti P. New insights into the supply and quality of health services in Indonesia [Internet]. Washington (DC): World Bank; 2010 (http://elibrary.worldbank.org/doi/book/10.1596/978-0-8213-8298-1, accessed 1 August 2017).
6. Global Health Workforce Alliance. Indonesia Human Resources for Health Development Plan 2011–2025 [Internet]. Geneva: World Health Organization; 2011 (http://www.who.int/workforcealliance/countries/indonesia_hrhplan_summary_en.pdf?ua=1, accessed 5 July 2017).
7. Heywood PF, Harahap NP. Human resources for health at the district level in Indonesia: the smoke and mirrors of decentralization. Hum Resour Health [Internet]. 2009 December;7(1) (http://human-resources-health.biomedcentral.com/articles/10.1186/1478-4491-7-6, accessed 1 August 2017).
8. Indonesian health profile 2015 [Internet]. Jakarta: Ministry of Health Republic of Indonesia; 2016 (http://www.depkes.go.id/resources/download/pusdatin/profi l-kesehatan-indonesia/indonesian%20health%20profile%202015.pdf, accessed 15 August 2017).
9. Joint Committee on Reducing Maternal and Neonatal Mortality in Indonesia, Development, Security, and Cooperation, Policy and Global Affairs; National Research Council; Indonesian Academy of Sciences. Reducing maternal and neonatal mortality in Indonesia: saving lives, saving the future [Internet]. Washington (DC): National Academies Press; 2013 (http://www.nap.edu/catalog/18437, accessed 1 August 2017).
10. Kanchanachitra C, Lindelow M, Johnston T, Hanvoravongchai P, Lorenzo FM, Huong NL et al. Human resources for health in Southeast Asia: shortages, distributional challenges, and international trade in health services. Lancet. 2011;377(9767):769–81.
11. Schiffbauer J, O’Brien JB, Timmons BK, Kiarie WN. The role of leadership in HRH development in challenging public health settings. Hum Resour Health [Internet]. 2008 December;6(1) (http://human-resources-health.biomedcentral.com/articles/10.1186/1478-4491-6-23, accessed 1 August 2017).

STATE OF HEALTH INEQUALITY: INDONESIA
118
Figure 13.1. Subdistricts with a health centre, disaggregated by subnational region
Papu
a
Wes
t Pap
ua
Maluk
u
North
Kali
manta
n
North
Sula
wesi
Goro
ntalo
Centr
al Su
lawes
i
Jamb
i
Riau
Islan
ds
South
Sum
atra
Wes
t Sum
atra
Bang
ka B
elitun
g Isla
nds
Beng
kulu
East
Nusa
Ten
ggar
a
Centr
al Ka
liman
tan
Bante
n
Wes
t Sula
wesi
East
Kalim
antan
Lamp
ung
South
Kali
manta
n
South
Sula
wesi
North
Malu
ku
Aceh
North
Sum
atra
Wes
t Jav
a
Riau
South
east
Sulaw
esi
East
Java
Centr
al Ja
va
Wes
t Kali
manta
n
Bali
DI Y
ogya
karta
DKI J
akar
ta
Wes
t Nus
a Ten
ggar
a
Estim
ate
(%)
0
10
20
30
40
50
60
70
80
90
100 100.
0
100.
0
100.
0
100.
0
99.4
99.3
99.2
97.1
96.9
96.8
96.6
96.5
96.5
96.4
96.1
96.0
95.1
94.2
94.2
94.1
92.8
92.1
91.5
89.9
89.6
89.4
87.7
85.6
81.8
81.4
76.0
74.6
65.5
63.9
National average = 91.6
Data source Routine report 2015
Definition Numerator: Number of subdistricts with a health centre Denominator: Number of subdistricts
National average 91.6%
Subdistricts with a health centre

13. Health facility and personnel
119
Figure 13.2. Basic amenities readiness in puskesmas, disaggregated by place of residence
Place of residence
Rural Urban
Estim
ate
(%)
0
10
20
30
40
50
60
70
80
90
100
80.0
72.0
Figure 13.3. Basic amenities readiness in puskesmas, disaggregated by subnational region
Papu
a
Wes
t Pap
ua
Wes
t Sula
wesi
North
Malu
ku
Maluk
u
East
Nusa
Ten
ggar
a
Beng
kulu
Centr
al Su
lawes
i
South
east
Sulaw
esi
Wes
t Kali
manta
n
North
Sum
atra
Riau
South
Sum
atra
Jamb
i
North
Sula
wesi
Aceh
Goro
ntalo
Lamp
ung
South
Sula
wesi
Centr
al Ka
liman
tan
Bante
n
East
Kalim
antan
Wes
t Jav
a
Wes
t Nus
a Ten
ggar
a
Bang
ka B
elitun
g Isla
nds
Riau
Islan
ds
South
Kali
manta
n
Wes
t Sum
atra
Bali
Centr
al Ja
va
East
Java
DKI J
akar
ta
DI Y
ogya
karta
Estim
ate
(%)
0
10
20
30
40
50
60
70
80
90
10088
.0
87.0
84.0
84.0
84.0
77.0
77.0
77.0
77.0
76.0
76.0
76.0
76.0
73.0
72.0
72.0
71.0
71.0
70.0
70.0
69.0
69.0
69.0
67.0
66.0
66.0
66.0
64.0
62.0
59.0
55.0
55.0
53.0
National average = 74.0
Data source RIFASKES 2011
Definition Numerator: Number of puskesmas satisfying the criteria for basic amenities readiness Denominator: Number of puskesmas
National average 74.0%
Basic amenities readiness in puskesmas

STATE OF HEALTH INEQUALITY: INDONESIA
120
Figure 13.4. Health centres with sufficient number of dentists, disaggregated by subnational region
Papu
a
Wes
t Pap
ua
North
Sula
wesi
North
Malu
ku
Maluk
u
South
east
Sulaw
esi
Goro
ntalo
Centr
al Ka
liman
tan
Beng
kulu
East
Nusa
Ten
ggar
a
Wes
t Kali
manta
n
South
Sum
atra
Centr
al Su
lawes
i
South
Kali
manta
n
Lamp
ung
Aceh
Wes
t Sula
wesi
Wes
t Nus
a Ten
ggar
a
Jamb
i
Bante
n
Wes
t Jav
a
South
Sula
wesi
North
Sum
atra
Bang
ka B
elitun
g Isla
nds
North
Kali
manta
n
Centr
al Ja
va
Riau
East
Java
East
Kalim
antan
Wes
t Sum
atra
DKI J
akar
ta Bali
Riau
Islan
ds
DI Y
ogya
karta
Estim
ate
(%)
0
10
20
30
40
50
60
70
80
90
100 98.3
87.7
81.4
78.9
76.7
73.8
71.6
68.6
67.6
67.6
65.5
65.2
64.3
58.6
57.4
55.2
50.0
47.3
43.5
43.0
41.4
33.7
33.2
31.2
29.7
29.6
27.9
27.0
23.5
23.1
23.0
14.7
13.0
12.7
National average = 53.3
Data source Routine report 2015
Definition Numerator: Number of health centres with sufficient number of dentists Denominator: Number of health centres
National average 53.3%
Health centres with sufficient number of dentists

13. Health facility and personnel
121
Figure 13.5. Health centres with sufficient number of general practitioners, disaggregated by subnational region
Wes
t Pap
ua
Maluk
u
Wes
t Sula
wesi
Papu
a
Wes
t Nus
a Ten
ggar
a
East
Nusa
Ten
ggar
a
South
east
Sulaw
esi
South
Sula
wesi
Bante
n
Beng
kulu
Centr
al Su
lawes
i
Wes
t Kali
manta
n
North
Malu
ku
South
Sum
atra
Goro
ntalo
East
Java
South
Kali
manta
n
Centr
al Ka
liman
tan
Jamb
i
East
Kalim
antan
Wes
t Sum
atra
Riau
DKI J
akar
ta
North
Sula
wesi
Bali
Lamp
ung
Bang
ka B
elitun
g Isla
nds
Aceh
Centr
al Ja
va
North
Sum
atra
Wes
t Jav
a
North
Kali
manta
n
Riau
Islan
ds
DI Y
ogya
karta
Estim
ate
(%)
0
10
20
30
40
50
60
70
80
90
100 99.2
98.5
94.6
91.6
91.2
90.0
87.4
86.2
85.3
84.1
83.5
81.6
79.4
79.1
79.1
75.9
73.2
73.0
71.0
70.8
69.0
67.2
66.7
66.3
64.8
62.6
59.2
55.1
50.5
48.7
44.0
43.0
39.9
34.3
National average = 74.6
Data source Routine report 2015
Definition Numerator: Number of health centres with sufficient number of general practitioners Denominator: Number of health centres
National average 74.6%
Health centres with sufficient number of general practitioners
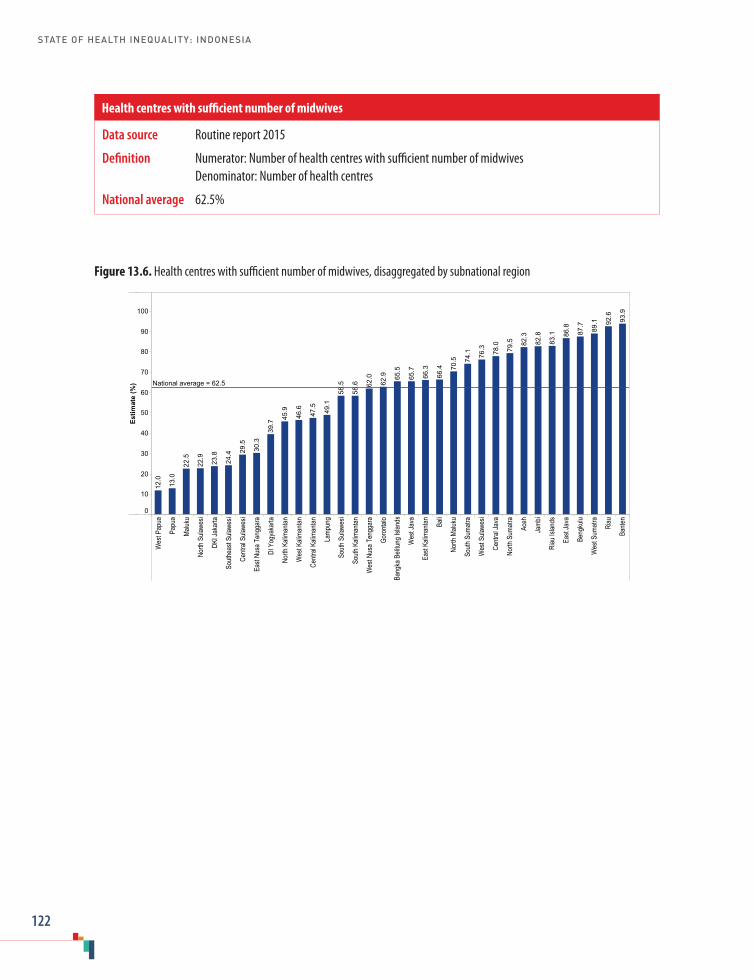
STATE OF HEALTH INEQUALITY: INDONESIA
122
Figure 13.6. Health centres with sufficient number of midwives, disaggregated by subnational region
Wes
t Pap
ua
Papu
a
Maluk
u
North
Sula
wesi
DKI J
akar
ta
South
east
Sulaw
esi
Centr
al Su
lawes
i
East
Nusa
Ten
ggar
a
DI Y
ogya
karta
North
Kali
manta
n
Wes
t Kali
manta
n
Centr
al Ka
liman
tan
Lamp
ung
South
Sula
wesi
South
Kali
manta
n
Wes
t Nus
a Ten
ggar
a
Goro
ntalo
Bang
ka B
elitun
g Isla
nds
Wes
t Jav
a
East
Kalim
antan Ba
li
North
Malu
ku
South
Sum
atra
Wes
t Sula
wesi
Centr
al Ja
va
North
Sum
atra
Aceh
Jamb
i
Riau
Islan
ds
East
Java
Beng
kulu
Wes
t Sum
atra
Riau
Bante
n
Estim
ate
(%)
0
10
20
30
40
50
60
70
80
90
100
93.9
92.6
89.1
87.7
86.8
83.1
82.8
82.3
79.5
78.0
76.3
74.1
70.5
66.4
66.3
65.7
65.5
62.9
62.0
58.6
58.5
49.1
47.5
46.6
45.9
39.7
30.3
29.5
24.4
23.8
22.9
22.5
13.0
12.0
National average = 62.5
Data source Routine report 2015
Definition Numerator: Number of health centres with sufficient number of midwives Denominator: Number of health centres
National average 62.5%
Health centres with sufficient number of midwives
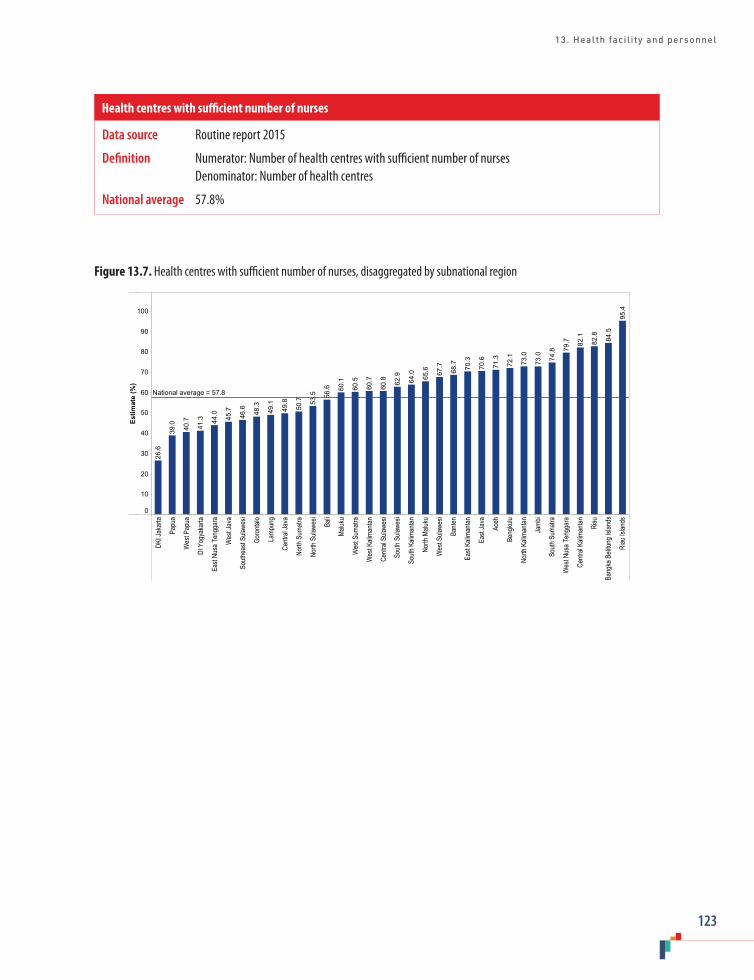
13. Health facility and personnel
123
Figure 13.7. Health centres with sufficient number of nurses, disaggregated by subnational region
DKI J
akar
ta
Papu
a
Wes
t Pap
ua
DI Y
ogya
karta
East
Nusa
Ten
ggar
a
Wes
t Jav
a
South
east
Sulaw
esi
Goro
ntalo
Lamp
ung
Centr
al Ja
va
North
Sum
atra
North
Sula
wesi
Bali
Maluk
u
Wes
t Sum
atra
Wes
t Kali
manta
n
Centr
al Su
lawes
i
South
Sula
wesi
South
Kali
manta
n
North
Malu
ku
Wes
t Sula
wesi
Bante
n
East
Kalim
antan
East
Java
Aceh
Beng
kulu
North
Kali
manta
n
Jamb
i
South
Sum
atra
Wes
t Nus
a Ten
ggar
a
Centr
al Ka
liman
tan Riau
Bang
ka B
elitun
g Isla
nds
Riau
Islan
ds
Estim
ate
(%)
0
10
20
30
40
50
60
70
80
90
100
95.4
84.5
82.8
82.1
79.7
74.8
73.0
73.0
72.1
71.3
70.6
70.3
68.7
67.7
65.6
64.0
62.9
60.8
60.7
60.5
60.1
56.6
53.5
50.7
49.8
49.1
48.3
46.6
45.7
44.0
41.3
40.7
39.0
26.6
National average = 57.8
Data source Routine report 2015
Definition Numerator: Number of health centres with sufficient number of nurses Denominator: Number of health centres
National average 57.8%
Health centres with sufficient number of nurses
STATE OF HEALTH INEQUALITY: INDONESIA
124
14. State of inequality at a glance
In previous chapters, inequalities in health indicators are presented for 11 health topics, which provide an overview of the state of inequality within each topic. Patterns of inequality, however, may also emerge when grouping indicators in other ways. For instance, one can look at a class of health indicators that cuts across health topics, or consider how inequalities according to a certain dimension of inequality compare across indicators. Additionally, shapes of inequality can be characterized across ordered subgroups such as wealth quintiles. These types of explorations offer a more cross-cutting perspective of health inequalities, revealing additional insights into the strengths and weaknesses throughout the health sector, possible policy implications and avenues for further analysis.
Inequality by classes of indicatorsDrawing from the findings and priority assignments of indicators featured in this report, this section explores the patterns of health inequalities across three classes of indicators: health service coverage indicators; health behaviour indicators; and health status or outcome indicators. (Two other classes of indicators, summary indicators and health facility indicators, are addressed in Chapters 3 and 13, respectively, and therefore not covered here.) Note that there are limitations when making direct comparisons between indicators in different topics, as the context of each health topic is unique. This preliminary exploration is intended to be an overview, and serve as a starting point for more detailed analyses. The following discussion reflects the priority assignments of the indicators (based on national average and an overall assessment of inequality across available dimensions of inequality), as presented in the preceding chapters.
Health service coverageThe health service coverage indicators included in this report were related to the topics of reproductive health (Chapter 4), maternal, newborn and child health (Chapter 5), childhood immunization (Chapter 6), and environmental health (Chapter 10). Based on the national average coverage, most of these indicators were assigned low to medium priority. Exceptions include the complete basic immunization coverage indicator and the access to improved sanitation indicator, which were considered high priority. Inequalities in health service coverage indicators were generally assigned medium to high priority, though two indicators were low priority (demand for family planning and vitamin A supplementation). The maternal and newborn health service indicators and environmental health indicators were high priority, and the childhood immunization indicators were medium priority.
Implication: Efforts to improve health service coverage are warranted, and the accompanying reduction of inequalities should be addressed urgently, especially in maternal and newborn health services and environmental health services.
Health behaviours A second class of indicators pertained to health behaviours, which encompasses the adoption (or non-adoption) of health interventions. These indicators were featured across several health topics, including reproductive health (Chapter 4), maternal, newborn and child health (Chapter 5) and NCDs, mental health and NCD risk factors (Chapter 11). Nationally, poor overall performance constituted a high priority assignment for the majority of these indicators, while a few indicators were of medium priority (e.g. early initiation of breastfeeding). With regard to inequality, priority assignments were mixed, with examples of low-
14. State of inequality at a glance
125
priority indicators (related to breastfeeding and the prevalence of low fruit and vegetable consumption), medium-priority indicators (related to smoking behaviours) and high-priority indicators (related to female genital mutilation).
Implication: Poor national performance in health behaviour indicators demonstrated a need for universal improvement; in some areas, such as female genital mutilation and smoking, targeted action may be needed.
Health status or outcomes A third general class of indicators related to measures of health status or outcomes, including a range of indicators from most health topics: reproductive health (Chapter 4); maternal, newborn and child health (Chapter 5); child malnutrition (Chapter 7); child mortality (Chapter 8); infectious diseases (Chapter 9); NCDs, mental health and behavioural risk factors (Chapter 11); and disability and injury (Chapter 12). In terms of national averages, all levels of priority were represented. Indicators related to neonatal and child health (especially child malnutrition and mortality) were mostly considered high priority, with the exception of the low birth weight indicator and the overweight prevalence indicator (both low priority, nationally). Other health status or outcomes indicators focusing on adolescents and adults showed distinct patterns by health topic: disability and injury indicators were considered low priority; fertility indicators were medium priority; infectious disease and NCD morbidity indicators were considered medium to high priority. Inequalities in health status or outcomes indicators were of medium to high priority (except for inequality in the overweight prevalence indicator, which was a low priority). The indicators related to child malnutrition and mortality were mostly high priority, while fertility indicators and disability and injury indicators were mostly medium priority.
Implication: Efforts should support universal improvements in health status and outcomes generally, but especially in child malnutrition and mortality, as well as infectious diseases; approaches should seek to accelerate gains among disadvantaged subgroups.
Inequality by dimensions of inequalityThis section contains a closer examination of patterns of inequality for three dimensions of inequality: subnational region; economic status; and sex. Across these three dimensions, selected health topics and/or indicators are highlighted to illustrate examples of high and low inequality. Appropriate summary measures were calculated, as per the characteristics of the dimension of inequality (Table 2.4 and Appendix table 3) (1,2). For subnational region, mean difference from the mean and the index of disparity were applied to measure absolute and relative inequality, respectively. For economic status, absolute inequality was shown using the slope index of inequality, and relative inequality was shown using the relative index of inequality. For sex, relative inequality was shown using ratio, calculated as the highest estimate divided by the lowest estimate. For absolute and relative summary measure calculations for all health indicators across all dimensions of inequality, see Supplementary tables S1–S4.
Subnational regionData according to the subnational region dimension of inequality were available for nearly all indicators (with the exception of diabetes mellitus prevalence), and inequality according to this dimension was prevalent. According to the PHDI and sub-indices (Chapter 3), regional inequalities were evident in all health topics (Figure 14.1). The mean difference from the mean was highest for the NCDs sub-index (10.5 percentage points) and the environmental health sub-index (9.5 percentage points), whereas the index of disparity was most elevated for the

STATE OF HEALTH INEQUALITY: INDONESIA
126
health services provision sub-index (26.3) and the NCDs sub-index (25.3). Of all the sub-indices, the newborn and child health sub-index had the lowest mean difference from the mean (3.4 percentage points) and index of disparity (6.4).
The magnitude of inequality across subnational regions was more pronounced in certain health indicators than others. For example, the indicators related to health personnel and female genital mutilation showed especially elevated subnational regional inequality according to absolute and relative measures. Subnational region inequality was less prominent in the low fruit and vegetable consumption indicator due to elevated prevalence across all regions. For a few indicators, such as smoking prevalence in females and leprosy prevalence, absolute levels of inequality were low whereas relative levels of inequality were high.
Overall, the eastern part of Indonesia generally tended to be at a disadvantage: subnational regions with the worst performance were often those located on the islands of Kalimantan, Papua and Sulawesi and the archipelago of Nusa Tenggara. Specifically, East Nusa Tenggara, Papua and West Papua reported levels of health indicators that were
Figure 14.1. Subnational region inequality in public health development indices, calculated as mean difference from mean and index of disparity
among the worst in the country, across several indicators. Papua was an outlier in many cases, reporting a high rate of under-five mortality and high malaria prevalence; Papua performed much more poorly than all other subnational regions in the following indicators: environmental health sub-index; contraceptive prevalence – modern methods; demand for family planning satisfied; BCG immunization coverage; DPT-HB immunization coverage; and polio immunization coverage. West Papua was also an outlier, with the highest prevalence of leprosy.
There were, however, some cases where subnational regions in the east performed well. For example, East Nusa Tenggara, Papua and West Papua were the three subnational regions that reported the lowest prevalence of female genital mutilation, and both Papua and West Papua were below the national average of disability and injury prevalence. Despite its elevated rates of child mortality, West Nusa Tenggara was one of four subnational regions to report that all subdistricts had a health centre.
Subnational regions located on the Java/Madura and Sumatra islands (especially Bali, DI Yogyakarta and DKI Jakarta) tended to be the top performers
0 2 4 6 8 10Mean difference from mean (percentage points)
0 5 10 15 20 25Index of disparity
Public health development index (overall)
Reproductive and maternal health sub-index
Newborn and child health sub-index
Infectious diseases sub-index
Environmental health sub-index
Noncommunicable diseases sub-index
Health risk behaviour sub-index
Health services provision sub-index
10.5
2.4
6.8
3.4
8.3
9.5
4.3
8.1
20.1
16.5
20.9
25.3
16.7
26.3
6.5
6.4

14. State of inequality at a glance
127
across health topics. DKI Jakarta, for example, was an outlier for two indicators, having an elevated environmental health sub-index and a lower adolescent fertility rate; the subnational region, however, reported high prevalence of injury.
Certain subnational regions reported mixed performance across health topics and indicators. For example, the subnational regions that tended to perform well in most topics (i.e. Bali, DI Yogyakarta and DKI Jakarta) had higher-than-average injury prevalence. Bengkulu performed poorly in terms of environmental health indicators, but reported one of the lowest prevalence values for leprosy. Gorontalo also had mixed results across health topics, with high coverage of childhood immunization, but also elevated female genital mutilation and high smoking prevalence.
Economic statusData disaggregated by economic status were available for most indicators that were measured at the household level, with the exception of the infectious disease indicators. (Note that the PHDI indicators and the health facility and personnel
indicators – Chapters 3 and 13 – were not analysed by household economic status.) For the majority of indicators, inequality was pro-rich, whereby richer subgroups tended to have better performance than poorer subgroups (i.e. a positive slope index of inequality value and a relative index of inequality value greater than 1). In four indicators, this was not the case: female genital mutilation; exclusive breastfeeding; overweight prevalence; and diabetes mellitus prevalence.
Overall, wealth-related inequality tended to be elevated for indicators of health service coverage (Figure 14.2). For example, the slope index of inequality was above 45 percentage points for one health service coverage indicator (access to improved sanitation, Chapter 10), and around 30 percentage points or higher for five additional indicators (births attended by skilled health personnel, antenatal care coverage – at least four visits, access to improved drinking-water, postnatal care coverage for newborns, and complete basic immunization coverage). For these indicators, the coverage among the richest was at least 1.6 times higher than in the poorest (the relative index of inequality was at least 1.6); access to improved
Figure 14.2. Wealth-related inequality in health service coverage indicators, calculated as slope index of inequality and relative index of inequality
0 10 20 30 40 50Slope index of inequality (percentage points)
0.0 0.5 1.0 1.5 2.0 2.5Relative index of inequality
Access to improved sanitation
Births attended by skilled health personnel
Antenatal care coverage – at least four visits
Access to improved drinking-water
Postnatal care coverage for newborns
Complete basic immunization coverage
Postnatal care coverage for mothers
Polio immunization coverage
BCG immunization coverage
Measles immunization coverage
DPT-HB immunization coverage
Vitamin A supplementation coverage
Demand for family planning satisfied
47.5
35.8
32.8
32.5
32.1
29.1
27.2
22.8
20.6
17.9
17.5
11.6
3.3
2.31
1.57
1.61
1.62
1.59
1.65
1.43
1.35
1.27
1.25
1.24
1.17
1.04

STATE OF HEALTH INEQUALITY: INDONESIA
128
sanitation was more than twice as high in the richest compared to the poorest (the relative index of inequality was 2.3). Health service coverage indicators with lower levels of wealth-related inequality included demand for family planning satisfied and vitamin A supplementation coverage.
Across other indicators (related to health behaviours, and health status and outcomes), wealth-related inequality was variable. Wealth-related inequality was low for hypertension prevalence (slope index of inequality was 1.3 percentage points and relative index of inequality was 1.1) and injury prevalence (slope index of inequality was 0.8 percentage points and relative index of inequality was 1.1). High levels of inequality by economic status were evident for certain child malnutrition indicators and all child mortality indicators, but especially under-five mortality (slope index of inequality was 57.1 deaths per 1000 live births and relative index of inequality was 3.8). Absolute and relative wealth-related inequalities in stunting prevalence and overweight prevalence were also elevated.
Some indicators displayed characteristic shapes of inequality across wealth quintiles, such as queuing (gradients), marginal exclusion and mass deprivation (1). A queuing pattern was common, whereby the health indicator improved in a step-wise fashion, moving from the poorest to the richest subgroups. This pattern was evident in several health topics, including environmental health, certain child malnutrition indicators (stunting and underweight), certain NCD, mental health and behavioural risk factors indicators (mental emotional disorders and disability prevalence) and others. Queuing patterns of inequality generally indicate the need for combined targeted and universal approaches to improve health. Marginal exclusion, which demonstrates poor performance in only the most disadvantaged subgroup, was reported for several of the childhood immunization indicators, and could also be seen in infant mortality and under-five mortality indicators. This shape of inequality
suggests the need for targeted approaches to accelerate progress among the most disadvantaged. Mass deprivation (poor performance in all but the most advantaged subgroup) was less common, though it could be seen to a small extent in the injury prevalence indicator. Policy approaches to address mass deprivation should be universal in scope.
SexSex-disaggregated data were reported for most indicators that were measured at an individual level, where sex was a relevant dimension of inequality. (Sex is not relevant for indicators that pertain specifically to women, such as maternal health services and the reproductive health indicators used in this report.) Due to data availability limitations, data about sex were not reported for exclusive breastfeeding and leprosy prevalence indicators.
Among health status and outcomes indicators, tuberculosis prevalence had the highest level of sex-related relative inequality, where prevalence among males was 2.4 times higher than prevalence among females (Figure 14.3). A number of indicators reported ratio values in the range of 1.3–1.6, including all indicators related to child mortality, the malaria prevalence indicator, certain NCD/mental health indicators, and all disability and injury indicators. Inequalities in child mortality indicators disadvantaged males, which may be attributed, in part, to biological reasons. While malaria was higher in males than females (by a ratio of 1.3), females reported higher prevalence of mental emotional disorders (ratio of 1.6), diabetes mellitus (ratio of 1.5) and hypertension (ratio of 1.3). Injury prevalence was higher in males (ratio of 1.6), whereas disability prevalence was higher in females (ratio of 1.4).
Health services and health behaviours indicators tended to demonstrate low sex-related relative inequality. With ratios of 1.0 or 1.1, sex-related relative inequality was low for indicators of childhood immunization and child malnutrition;
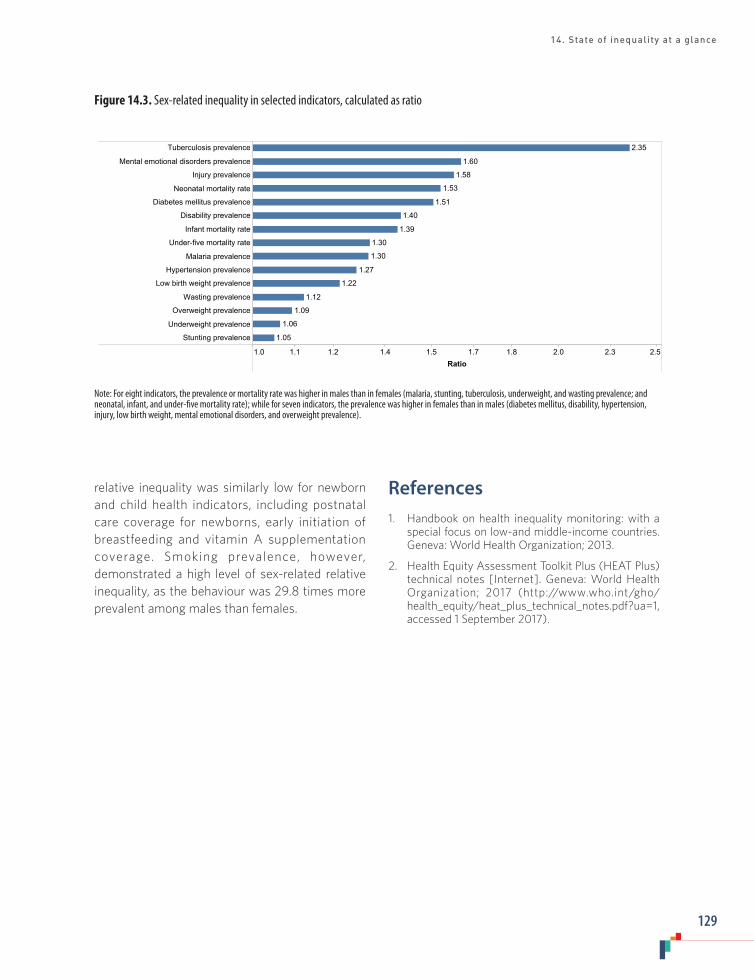
14. State of inequality at a glance
129
Figure 14.3. Sex-related inequality in selected indicators, calculated as ratio
relative inequality was similarly low for newborn and child health indicators, including postnatal care coverage for newborns, early initiation of breastfeeding and vitamin A supplementation coverage. Smoking prevalence, however, demonstrated a high level of sex-related relative inequality, as the behaviour was 29.8 times more prevalent among males than females.
References1. Handbook on health inequality monitoring: with a
special focus on low-and middle-income countries. Geneva: World Health Organization; 2013.
2. Health Equity Assessment Toolkit Plus (HEAT Plus) technical notes [Internet]. Geneva: World Health Organization; 2017 (http://www.who.int/gho/health_equity/heat_plus_technical_notes.pdf?ua=1, accessed 1 September 2017).
1.0 1.1 1.2 1.4 1.5 1.7 1.8 2.0 2.3 2.5Ratio
Tuberculosis prevalence
Mental emotional disorders prevalence
Injury prevalence
Neonatal mortality rate
Diabetes mellitus prevalence
Disability prevalence
Infant mortality rate
Under-five mortality rate
Malaria prevalence
Hypertension prevalence
Low birth weight prevalence
Wasting prevalence
Overweight prevalence
Underweight prevalence
Stunting prevalence
2.35
1.60
1.58
1.53
1.51
1.40
1.39
1.30
1.30
1.27
1.22
1.12
1.09
1.06
1.05
Note: For eight indicators, the prevalence or mortality rate was higher in males than in females (malaria, stunting, tuberculosis, underweight, and wasting prevalence; and neonatal, infant, and under-five mortality rate); while for seven indicators, the prevalence was higher in females than in males (diabetes mellitus, disability, hypertension, injury, low birth weight, mental emotional disorders, and overweight prevalence).
STATE OF HEALTH INEQUALITY: INDONESIA
130
Box 1. Illustrations of key findings
Health inequality is variable.
• For a given dimension of inequality, some health topics demonstrated more inequality than others. The public health development sub-indices in Chapter 3, for instance, suggested that inequalities by subnational region were most pressing for the NCDs sub-index (high absolute and relative inequality), the health services provision sub-index (high relative inequality) and the environmental health sub-index (high absolute inequality). Dimensions of inequality were more (or less) pertinent for different health topics. Inequalities in childhood immunization (Chapter 6) were reported by economic status, education, place of residence and subnational region, but not by sex. The disability and injury topic (Chapter 12) showed considerable inequality for the disability indicator by economic status, education, occupation, age, sex and subnational region, but did not demonstrate inequality by place of residence.
• Health indicators within a common topic sometimes revealed variable inequality. For instance, of the behavioural risk factor indicators reported in Chapter 11, smoking prevalence demonstrated inequality according to several dimensions of inequality (especially sex-based inequality), whereas low fruit and vegetable consumption prevalence was universally high. While breastfeeding indicators did not have large socioeconomic inequalities, other indicators of maternal, newborn and child health, such as service coverage, demonstrated high inequality according to economic status and education (Chapter 5).
Health inequality is a distinct measure from national average.
• Satisfactory national performance sometimes masked high levels of inequality. In general, the maternal, newborn and child health service indicators (Chapter 5) tended to have high levels of inequality, which were more pressing of a priority than the relatively good performance at the national level. For example, Indonesia reported a high national average of births attended by skilled health personnel (a low priority); however, the indicator was a high priority in terms of its elevated levels of inequality.
• For certain indicators, poor national performance was accompanied by low levels of inequality. This was the case for exclusive breastfeeding (Chapter 5) and low fruit and vegetable consumption (Chapter 11), where the entire population demonstrated poor performance.
• In some cases, national average and level of inequality were correlated. For example, certain indicators were assigned high priority (or low priority) for both national average and inequality. Child malnutrition indicators (Chapter 7) demonstrated this correlation: the stunting, underweight and wasting indicators were considered high priority based on high national levels and elevated inequality, whereas the overweight indicator was a low priority for both.
15. Conclusions
In this report, we provide an overview of the state of health inequality in Indonesia, covering diverse health topics and indicators, and incorporating multiple dimensions of inequality. Overall, inequalities were widespread across all 11 featured health topics. The data in this report demonstrate that the extent and nature of health inequality (i.e. their magnitude and type) varied across health topics and indicators. For example: for a given dimension of inequality, some health topics demonstrated more inequality than others; and
health indicators within a common topic sometimes revealed variable inequality. The findings also demonstrate that measuring health inequalities provided valuable information beyond the national average. In different cases throughout the report: satisfactory national performance sometimes masked high levels of inequality; poor national performance sometimes was accompanied by low levels of inequality; or good (or poor) national performance was reported alongside low (or high) levels of inequality (Box 1).

15. Conclusions
131
Overarching implicationsEquity-oriented policy-makingThe health sector can benefit from regular health inequality monitoring, which encompasses implementing equity-oriented changes to policies, programmes and practices (1). When considered alongside national averages, the magnitude of health inequalities across health indicators and dimensions of inequality can serve as a key input to identify priority areas for action (including further research) and topic-specific policy implications. Policy approaches for specific health topics are also strengthened by taking into account the historical and current context of the health topic. For instance, inequality by subnational region was a prominent form of health inequality in Indonesia, suggesting a need for technical and financial support to improve local leadership and build capacity in the health sector in poor-performing areas. Minimum service standards (standar pelayanan minimal/SPM) should be implemented in all districts, and accompanied by requisite monitoring to ensure compliance.
Equity-oriented policies aim to achieve accelerated improvement in disadvantaged populations, thereby reducing inequalities, while benefiting national averages. Optimally, health sector activities should be equity oriented, and an important entry point is during the planning and review phases of national and subnational health policies, strategies and plans (2,3). Data about health inequalities are useful during planning phases to help ensure that health sector objectives and targets capture relevant equity considerations; these data are also important inputs for regular and ongoing health programme reviews to promote accountability and transparency of progress towards equity-related goals. For example, in 2014–2015, the Indonesian Ministry of Health applied the WHO Innov8 Approach for Reviewing National Health Programmes to Leave No One Behind to strengthen the equity-orientation of national newborn and maternal health action plans (4).
Implications for health information systemsThe process of preparing the State of health inequality: Indonesia report revealed opportunities for health information system strengthening. For instance, in some topic areas, gaining access to raw datasets (to generate standard errors and confidence interval estimates) proved challenging, and introduced delays. The reality of multiple analysts across different organizations working on the data analysis introduced some inconsistencies and errors, highlighting the importance of coordination and frequent engagement.
The suitability of data sources for national health inequality monitoring in Indonesia can be enhanced by ensuring that data about relevant dimensions of inequality are routinely collected in surveys, civil registration, health facility data and other sources. Most of the data for this report were sourced from population health surveys (e.g. DHS and RISKESDAS), which are designed to cover specific health topics and dimensions of inequality. In some health topics, limited data availability for dimensions of inequality and/or health indicators narrowed the scope of health inequality monitoring. Where feasible, data sources should be expanded to collect more information (with oversampling of small population subgroups). Additionally, Indonesia should invest in strengthening its civil registration and vital statistics systems, which are fragmented across provinces and incomplete due to limited resources (5). When fully functional, these systems provide valuable information for health policy and programme decision-making, and contribute to better health outcomes in populations (6).
Expanded health inequality monitoring
The practice of health inequality monitoring in Indonesia can build on the findings of this report, including analysis of trends over time, expanded
STATE OF HEALTH INEQUALITY: INDONESIA
132
double disaggregation of health data, and benchmarking (7). Exploring trends over time (that is, using data from two or more time points) should be undertaken to assess whether inequalities in health have been improving, worsening or stagnant; alongside cross-section analyses of the current situation, trend analyses of health inequalities are an important form of evaluation to determine whether policies, programmes and practices are equity oriented. Double disaggregation, the process of simultaneously filtering data by more than one dimension of inequality, was done for the smoking prevalence indicator in this report. Our finding of widespread inequalities across subnational regions suggests a need for double disaggregation by this dimension of inequality to explore patterns of inequality at the local level. Additional analyses are warranted to explore areas such as health among the urban poor and socioeconomic-based health inequalities in males versus females. Benchmarking with other countries serves to provide additional context to the state of inequality, and is often done with countries that share similar characteristics (geographical region, country-income level, etc.) (8,9).
The way forward
The preparation of this report brought together subject matter experts, technical specialists and policy-makers across different sectors and organizations. In doing so, this report represents a major initial step in establishing regular health inequality monitoring in Indonesia. Through their collective efforts, the network of stakeholders has made inroads in sourcing data for health inequality monitoring, as well as strengthening capacity for data preparation, analysis and interpretation. Furthermore, the network has taken the important step of situating health inequality findings within the current context of health in Indonesia, and suggesting how priorities and policies can be oriented for the reduction of health inequalities. Forthcoming policy briefs will extend the findings of this report, detailing more contextualized, topic-specific recommendations for the reduction of
inequality.
This report, together with the other outputs of the collaboration, are key baseline assessments of the state of health inequality in Indonesia. The findings reported here serve as a basis for further investigations into why inequalities exist, and which factors are contributing to these inequalities. One important action point is to design and conduct both quantitative and qualitative research to explore the root causes and drivers of health inequalities in Indonesia, as well as strategies to address them. In addition, future reports should address the issues of trends in inequality over time and double disaggregation.
The work of this collaboration can be used as a launching point to advance health inequality monitoring, advocate for action to alleviate health inequalities and direct further analyses. This may necessitate efforts to reach out to an expanded group of stakeholders to pursue capacity-building through multiple channels. For example, the methods and protocols developed in the preparation of this report may be disseminated to Ministry of Health technical staff and integrated into university public health programme curricula.
Stakeholders in Indonesia should further efforts to institutionalize health inequality monitoring as a regular practice of the national health information system. This entails ensuring the regular collection of data pertaining to a range of diverse health topics, indicators and dimensions of inequality, and enhancing the capacity for data analysis and reporting. It also calls for including the results of health inequality monitoring in routine reporting across different levels of the health system – along with annual province and district health profiles – and promoting the use of health inequality monitoring to inform decision-making processes at national and subnational levels (10).
One of the overarching recommendations of the WHO Commission on Social Determinants of

15. Conclusions
133
Health called for the measurement and better understanding of health inequities, and the establishment of routine monitoring systems that could serve as a platform for action (11). Building on the foundational work showcased in this report, Indonesia is well positioned to further strengthen capacity in all aspects of health inequality monitoring, and move towards realizing this recommendation. The next steps in advancing this work should strive to harness the momentum of the stakeholder collaboration to garner a wider base of political support, and expand the reach of the collaboration across sectors and stakeholders.
References1. Hosseinpoor AR, Bergen N, Magar V. Monitoring
inequality: an emerging priority for health post-2015. Bull World Health Organ. 2015 September 1;93(1564–0604 [Electronic]):591–591A.
2. Innov8 approach for reviewing national health programmes to leave no one behind: technical handbook. Geneva: World Health Organization; 2016.
3. World Health Statistics: 2017. Geneva: World Health Organization; 2017.
4. Swift Koller T, Saint V, Floranita R, Sakti G, Pambudi I, Hermavan L et al. Applying the Innov8 approach for reviewing national health programmes to leave no one behind: lessons learnt from the Indonesia pilot in
the context of the Sustainable Development Agenda. Glob Health Action. In press.
5. Duff P, Kusumaningrum S, Stark L. Barriers to birth registration in Indonesia. Lancet Glob Health. 2016;4(4):e234–e235.
6. Phillips DE, AbouZahr C, Lopez AD, Mikkelsen L, de Savigny D, Lozano R et al. Are well functioning civil registration and vital statistics systems associated with better health outcomes? Lancet. 2015 October;386(10001):1386–94.
7. National health inequality monitoring: a step-by-step manual. Geneva: World Health Organization; 2017.
8. State of inequality: reproductive, maternal, newborn and child health. Geneva: World Health Organization; 2015.
9. Handbook on health inequality monitoring: with a special focus on low-and middle-income countries. Geneva: World Health Organization; 2013.
10. Hosseinpoor AR, Bergen N, Schlotheuber A, Boerma T. National health inequality monitoring: current opportunities and challenges. Glob Health Action Supplement. In press.
11. Commission on Social Determinants of Health. Closing the gap in a generation: health equity through action on the social determinants of health: final report of the commission on social determinants of health. Geneva: World Health Organization; 2008.
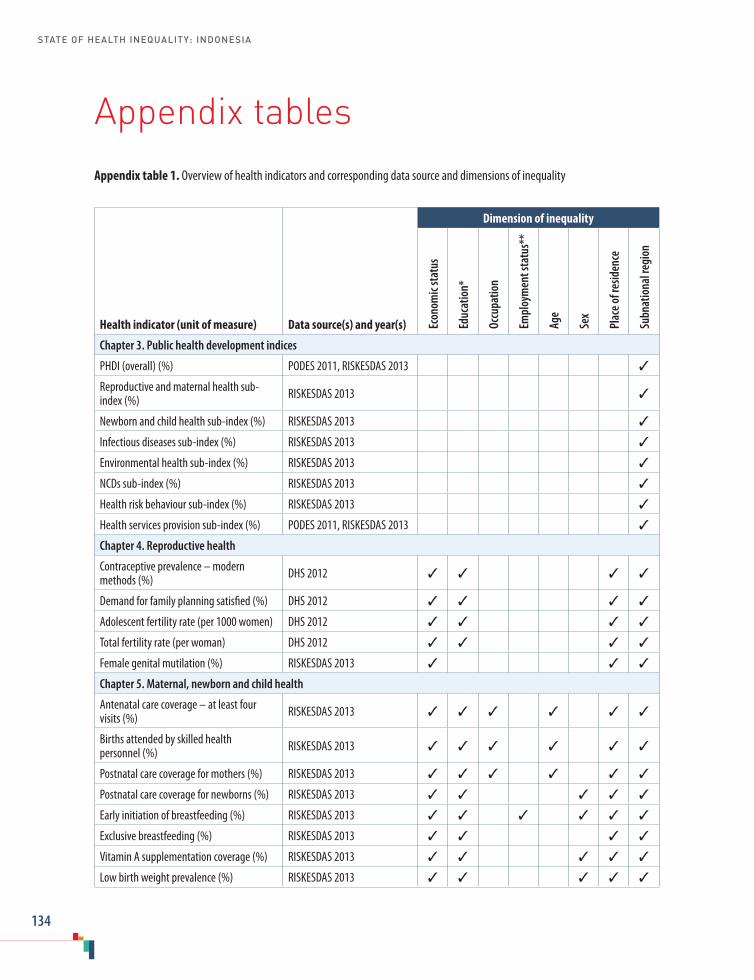
STATE OF HEALTH INEQUALITY: INDONESIA
134
Appendix tablesAppendix table 1. Overview of health indicators and corresponding data source and dimensions of inequality
Health indicator (unit of measure) Data source(s) and year(s)
Dimension of inequality
Econ
omic
stat
us
Educ
atio
n*
Occu
patio
n
Empl
oym
ent s
tatu
s**
Age
Sex
Plac
e of r
esid
ence
Subn
atio
nal r
egio
n
Chapter 3. Public health development indices
PHDI (overall) (%) PODES 2011, RISKESDAS 2013 ✓
Reproductive and maternal health sub-index (%) RISKESDAS 2013 ✓
Newborn and child health sub-index (%) RISKESDAS 2013 ✓
Infectious diseases sub-index (%) RISKESDAS 2013 ✓
Environmental health sub-index (%) RISKESDAS 2013 ✓
NCDs sub-index (%) RISKESDAS 2013 ✓
Health risk behaviour sub-index (%) RISKESDAS 2013 ✓
Health services provision sub-index (%) PODES 2011, RISKESDAS 2013 ✓
Chapter 4. Reproductive health
Contraceptive prevalence – modern methods (%) DHS 2012 ✓ ✓ ✓ ✓
Demand for family planning satisfied (%) DHS 2012 ✓ ✓ ✓ ✓
Adolescent fertility rate (per 1000 women) DHS 2012 ✓ ✓ ✓ ✓
Total fertility rate (per woman) DHS 2012 ✓ ✓ ✓ ✓
Female genital mutilation (%) RISKESDAS 2013 ✓ ✓ ✓
Chapter 5. Maternal, newborn and child health
Antenatal care coverage – at least four visits (%) RISKESDAS 2013 ✓ ✓ ✓ ✓ ✓ ✓
Births attended by skilled health personnel (%) RISKESDAS 2013 ✓ ✓ ✓ ✓ ✓ ✓
Postnatal care coverage for mothers (%) RISKESDAS 2013 ✓ ✓ ✓ ✓ ✓ ✓
Postnatal care coverage for newborns (%) RISKESDAS 2013 ✓ ✓ ✓ ✓ ✓
Early initiation of breastfeeding (%) RISKESDAS 2013 ✓ ✓ ✓ ✓ ✓ ✓
Exclusive breastfeeding (%) RISKESDAS 2013 ✓ ✓ ✓ ✓
Vitamin A supplementation coverage (%) RISKESDAS 2013 ✓ ✓ ✓ ✓ ✓
Low birth weight prevalence (%) RISKESDAS 2013 ✓ ✓ ✓ ✓ ✓

Appendix tables
135
Health indicator (unit of measure) Data source(s) and year(s)
Dimension of inequality
Econ
omic
stat
us
Educ
atio
n*
Occu
patio
n
Empl
oym
ent s
tatu
s**
Age
Sex
Plac
e of r
esid
ence
Subn
atio
nal r
egio
n
Chapter 6. Childhood immunization
BCG immunization coverage (%) RISKESDAS 2013 ✓ ✓ ✓ ✓ ✓
Measles immunization coverage (%) RISKESDAS 2013 ✓ ✓ ✓ ✓ ✓
DPT-HB immunization coverage (%) RISKESDAS 2013 ✓ ✓ ✓ ✓ ✓
Polio immunization coverage (%) RISKESDAS 2013 ✓ ✓ ✓ ✓ ✓
Complete basic immunization coverage (%) RISKESDAS 2013 ✓ ✓ ✓ ✓ ✓
Chapter 7. Child malnutrition
Stunting prevalence (%) RISKESDAS 2013 ✓ ✓ ✓ ✓ ✓ ✓ ✓
Underweight prevalence (%) RISKESDAS 2013 ✓ ✓ ✓ ✓ ✓ ✓ ✓
Wasting prevalence (%) RISKESDAS 2013 ✓ ✓ ✓ ✓ ✓ ✓ ✓
Overweight prevalence (%) RISKESDAS 2013 ✓ ✓ ✓ ✓ ✓ ✓ ✓
Chapter 8. Child mortality
Neonatal mortality rate (deaths per 1000 live births) DHS 2012 ✓ ✓ ✓ ✓ ✓
Infant mortality rate (deaths per 1000 live births) DHS 2012 ✓ ✓ ✓ ✓ ✓
Under-five mortality rate (deaths per 1000 live births) DHS 2012 ✓ ✓ ✓ ✓ ✓
Chapter 9. Infectious diseases
Leprosy prevalence (per 10 000 population) Routine report 2015 ✓
Malaria prevalence (%) RISKESDAS 2013 ✓ ✓ ✓ ✓ ✓ ✓ ✓
Tuberculosis prevalence (per 100 000 population) TB Prevalence Survey 2014 ✓ ✓ ✓ ✓
Chapter 10. Environmental health
Access to improved sanitation (%) SUSENAS 2015 ✓ ✓ ✓ ✓
Access to improved drinking-water (%) SUSENAS 2015 ✓ ✓ ✓ ✓
Chapter 11. NCDs, mental health and behavioural risk factors
Diabetes mellitus prevalence (%) RISKESDAS 2013 ✓ ✓ ✓ ✓ ✓ ✓
Mental emotional disorders prevalence (%) RISKESDAS 2013 ✓ ✓ ✓ ✓ ✓ ✓ ✓
Hypertension prevalence (%) RISKESDAS 2013 ✓ ✓ ✓ ✓ ✓ ✓ ✓
Smoking prevalence (both sexes) (%) RISKESDAS 2013 ✓ ✓ ✓ ✓ ✓ ✓ ✓
Smoking prevalence in females (%) RISKESDAS 2013 ✓ ✓ ✓ ✓ ✓ ✓
Smoking prevalence in males (%) RISKESDAS 2013 ✓ ✓ ✓ ✓ ✓ ✓
Low fruit and vegetable consumption prevalence (%) RISKESDAS 2013 ✓ ✓ ✓ ✓ ✓ ✓ ✓

STATE OF HEALTH INEQUALITY: INDONESIA
136
Health indicator (unit of measure) Data source(s) and year(s)
Dimension of inequality
Econ
omic
stat
us
Educ
atio
n*
Occu
patio
n
Empl
oym
ent s
tatu
s**
Age
Sex
Plac
e of r
esid
ence
Subn
atio
nal r
egio
n
Chapter 12. Disability and injury
Disability prevalence (%) RISKESDAS 2013 ✓ ✓ ✓ ✓ ✓ ✓ ✓
Injury prevalence (%) RISKESDAS 2013 ✓ ✓ ✓ ✓ ✓ ✓ ✓
Chapter 13. Health facility and personnel
Subdistricts with a health centre (%) Routine report 2015 ✓
Basic amenities readiness in puskesmas (%) RIFASKES 2011 ✓ ✓
Health centres with sufficient number of dentists (%) Routine report 2015 ✓
Health centres with sufficient number of general practitioners (%) Routine report 2015 ✓
Health centres with sufficient number of midwives (%) Routine report 2015 ✓
Health centres with sufficient number of nurses (%) Routine report 2015 ✓
BCG = Bacille Calmette-Guérin; DPT-HB = diphtheria-pertussis-tetanus and hepatitis B; NCD = noncommunicable disease; PHDI = Public Health Development Index* For reproductive and maternal health, infectious diseases, NCDs, mental health and behavioural risk factors, and disability and injury indicators, education refers to the individual’s education. For newborn and child health indicators, education refers to the mother’s education. For environmental health indicators, education refers to the education of the household head. ** For child health indicators, employment status refers to the employment status of the household head.
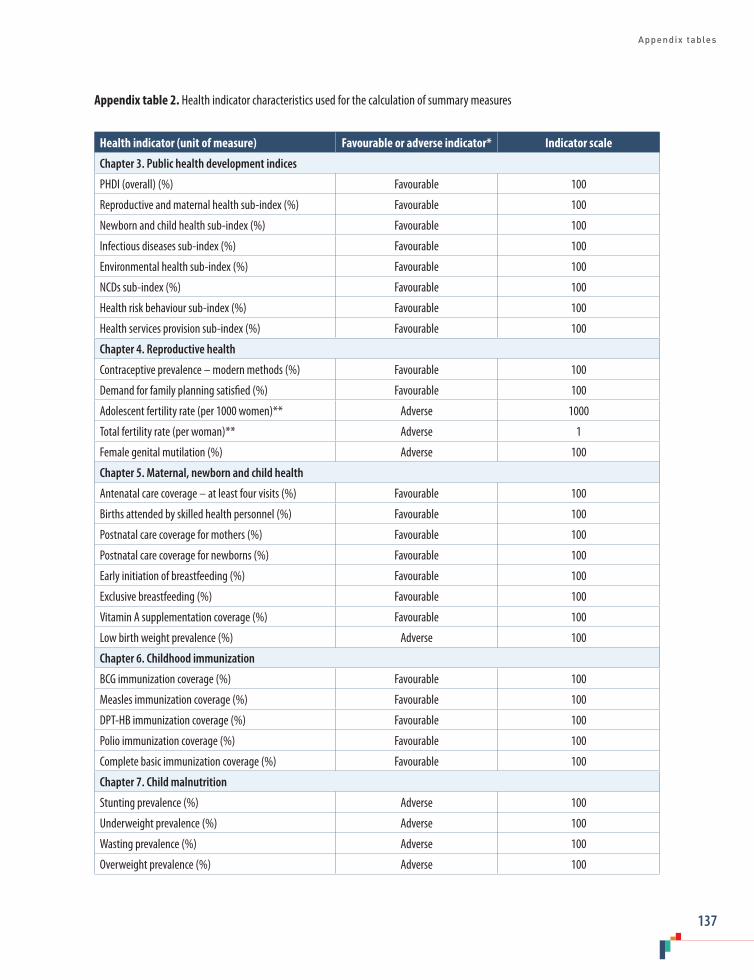
Appendix tables
137
Appendix table 2. Health indicator characteristics used for the calculation of summary measures
Health indicator (unit of measure) Favourable or adverse indicator* Indicator scale
Chapter 3. Public health development indices
PHDI (overall) (%) Favourable 100
Reproductive and maternal health sub-index (%) Favourable 100
Newborn and child health sub-index (%) Favourable 100
Infectious diseases sub-index (%) Favourable 100
Environmental health sub-index (%) Favourable 100
NCDs sub-index (%) Favourable 100
Health risk behaviour sub-index (%) Favourable 100
Health services provision sub-index (%) Favourable 100
Chapter 4. Reproductive health
Contraceptive prevalence – modern methods (%) Favourable 100
Demand for family planning satisfied (%) Favourable 100
Adolescent fertility rate (per 1000 women)** Adverse 1000
Total fertility rate (per woman)** Adverse 1
Female genital mutilation (%) Adverse 100
Chapter 5. Maternal, newborn and child health
Antenatal care coverage – at least four visits (%) Favourable 100
Births attended by skilled health personnel (%) Favourable 100
Postnatal care coverage for mothers (%) Favourable 100
Postnatal care coverage for newborns (%) Favourable 100
Early initiation of breastfeeding (%) Favourable 100
Exclusive breastfeeding (%) Favourable 100
Vitamin A supplementation coverage (%) Favourable 100
Low birth weight prevalence (%) Adverse 100
Chapter 6. Childhood immunization
BCG immunization coverage (%) Favourable 100
Measles immunization coverage (%) Favourable 100
DPT-HB immunization coverage (%) Favourable 100
Polio immunization coverage (%) Favourable 100
Complete basic immunization coverage (%) Favourable 100
Chapter 7. Child malnutrition
Stunting prevalence (%) Adverse 100
Underweight prevalence (%) Adverse 100
Wasting prevalence (%) Adverse 100
Overweight prevalence (%) Adverse 100
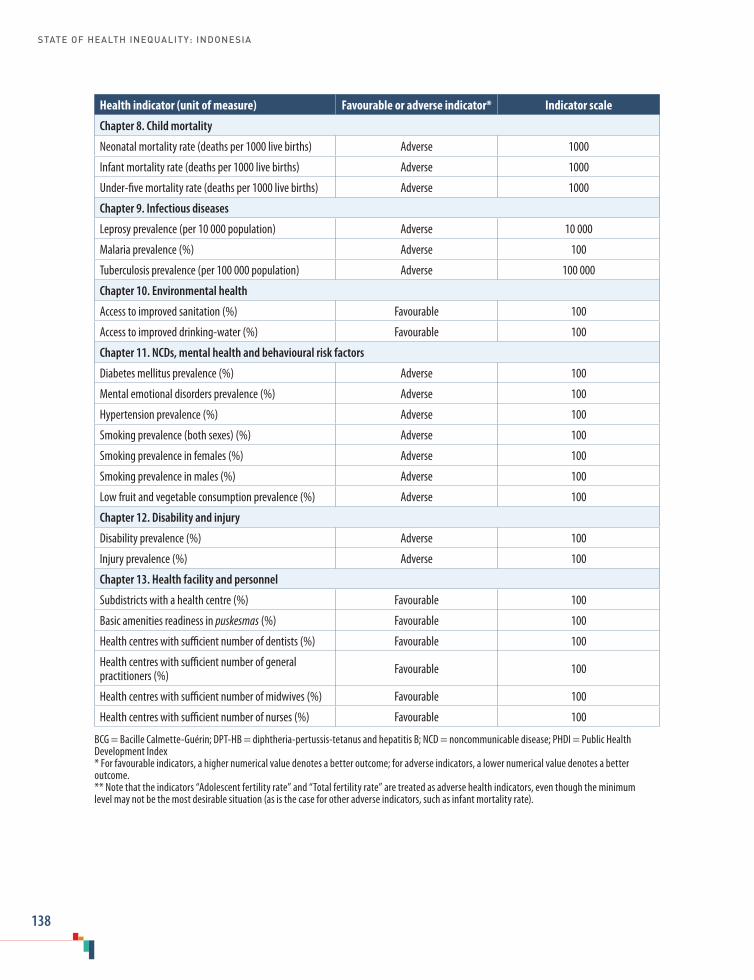
STATE OF HEALTH INEQUALITY: INDONESIA
138
Health indicator (unit of measure) Favourable or adverse indicator* Indicator scale
Chapter 8. Child mortality
Neonatal mortality rate (deaths per 1000 live births) Adverse 1000
Infant mortality rate (deaths per 1000 live births) Adverse 1000
Under-five mortality rate (deaths per 1000 live births) Adverse 1000
Chapter 9. Infectious diseases
Leprosy prevalence (per 10 000 population) Adverse 10 000
Malaria prevalence (%) Adverse 100
Tuberculosis prevalence (per 100 000 population) Adverse 100 000
Chapter 10. Environmental health
Access to improved sanitation (%) Favourable 100
Access to improved drinking-water (%) Favourable 100
Chapter 11. NCDs, mental health and behavioural risk factors
Diabetes mellitus prevalence (%) Adverse 100
Mental emotional disorders prevalence (%) Adverse 100
Hypertension prevalence (%) Adverse 100
Smoking prevalence (both sexes) (%) Adverse 100
Smoking prevalence in females (%) Adverse 100
Smoking prevalence in males (%) Adverse 100
Low fruit and vegetable consumption prevalence (%) Adverse 100
Chapter 12. Disability and injury
Disability prevalence (%) Adverse 100
Injury prevalence (%) Adverse 100
Chapter 13. Health facility and personnel
Subdistricts with a health centre (%) Favourable 100
Basic amenities readiness in puskesmas (%) Favourable 100
Health centres with sufficient number of dentists (%) Favourable 100
Health centres with sufficient number of general practitioners (%) Favourable 100
Health centres with sufficient number of midwives (%) Favourable 100
Health centres with sufficient number of nurses (%) Favourable 100
BCG = Bacille Calmette-Guérin; DPT-HB = diphtheria-pertussis-tetanus and hepatitis B; NCD = noncommunicable disease; PHDI = Public Health Development Index* For favourable indicators, a higher numerical value denotes a better outcome; for adverse indicators, a lower numerical value denotes a better outcome.** Note that the indicators “Adolescent fertility rate” and “Total fertility rate” are treated as adverse health indicators, even though the minimum level may not be the most desirable situation (as is the case for other adverse indicators, such as infant mortality rate).

Appendix tables
139
Appendix table 3. Dimension of inequality characteristics used for the calculation of summary measures
Dimension of inequality
Ordered or non-ordered*
Number of subgroups
Order of subgroups (for ordered dimensions)
Reference subgroup (for non-ordered dimensions)
Economic status Ordered 5 Poorest to richest
Education Ordered 3 or 6 Least educated to most educated
Occupation Non-ordered 5 None selected
Employment status Non-ordered 2 Working
Age Ordered 3, 6, 7, 10 or 11 Youngest to oldest
Sex Non-ordered 2 None selected
Place of residence Non-ordered 2 Urban
Subnational region Non-ordered 3, 33 or 34 None selected* Ordered subgroups have an inherent positioning that can be logically ranked; unordered subgroups are not based on criteria that can be logically ranked.
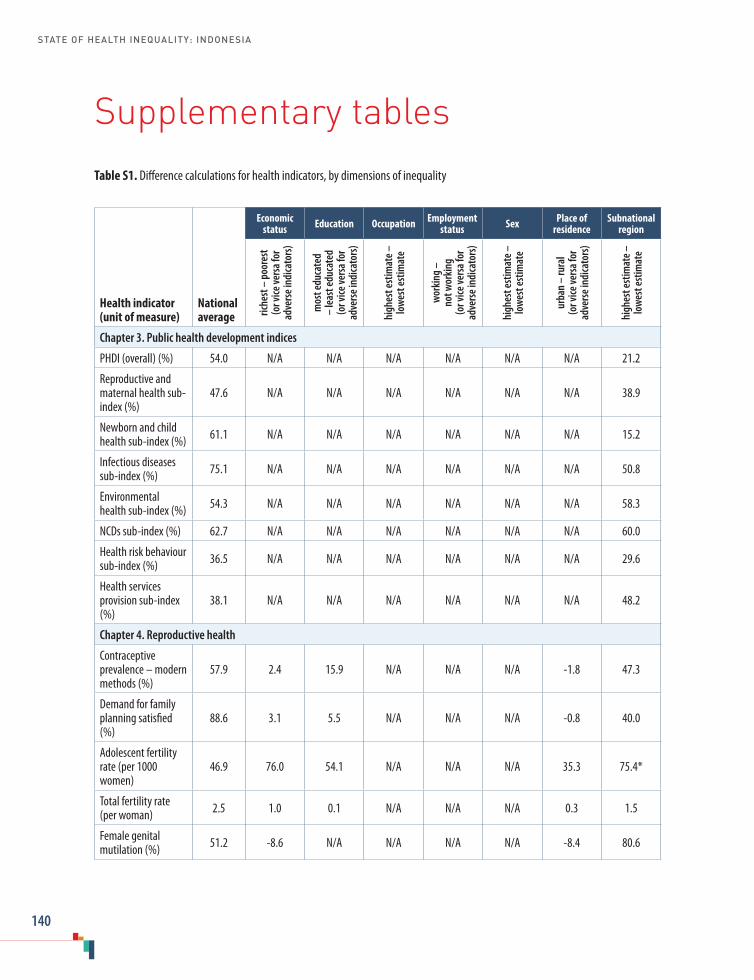
STATE OF HEALTH INEQUALITY: INDONESIA
140
Supplementary tablesTable S1. Difference calculations for health indicators, by dimensions of inequality
Health indicator (unit of measure)
National average
Economic status Education Occupation Employment
status Sex Place of residence
Subnational region
riche
st –
poo
rest
(o
r vice
vers
a for
ad
vers
e ind
icato
rs)
mos
t edu
cate
d –
leas
t edu
cate
d (o
r vice
vers
a for
ad
vers
e ind
icato
rs)
high
est e
stim
ate –
lo
wes
t est
imat
e
wor
king
–
not w
orki
ng
(or v
ice ve
rsa f
or
adve
rse i
ndica
tors
)
high
est e
stim
ate –
lo
wes
t est
imat
e
urba
n –
rura
l (o
r vice
vers
a for
ad
vers
e ind
icato
rs)
high
est e
stim
ate –
low
est e
stim
ate
Chapter 3. Public health development indices
PHDI (overall) (%) 54.0 N/A N/A N/A N/A N/A N/A 21.2
Reproductive and maternal health sub-index (%)
47.6 N/A N/A N/A N/A N/A N/A 38.9
Newborn and child health sub-index (%) 61.1 N/A N/A N/A N/A N/A N/A 15.2
Infectious diseases sub-index (%) 75.1 N/A N/A N/A N/A N/A N/A 50.8
Environmental health sub-index (%) 54.3 N/A N/A N/A N/A N/A N/A 58.3
NCDs sub-index (%) 62.7 N/A N/A N/A N/A N/A N/A 60.0
Health risk behaviour sub-index (%) 36.5 N/A N/A N/A N/A N/A N/A 29.6
Health services provision sub-index (%)
38.1 N/A N/A N/A N/A N/A N/A 48.2
Chapter 4. Reproductive health
Contraceptive prevalence – modern methods (%)
57.9 2.4 15.9 N/A N/A N/A -1.8 47.3
Demand for family planning satisfied (%)
88.6 3.1 5.5 N/A N/A N/A -0.8 40.0
Adolescent fertility rate (per 1000 women)
46.9 76.0 54.1 N/A N/A N/A 35.3 75.4*
Total fertility rate (per woman) 2.5 1.0 0.1 N/A N/A N/A 0.3 1.5
Female genital mutilation (%) 51.2 -8.6 N/A N/A N/A N/A -8.4 80.6

Supplementary tables
141
Health indicator (unit of measure)
National average
Economic status Education Occupation Employment
status Sex Place of residence
Subnational region
riche
st –
poo
rest
(o
r vice
vers
a for
ad
vers
e ind
icato
rs)
mos
t edu
cate
d –
leas
t edu
cate
d (o
r vice
vers
a for
ad
vers
e ind
icato
rs)
high
est e
stim
ate –
lo
wes
t est
imat
e
wor
king
–
not w
orki
ng
(or v
ice ve
rsa f
or
adve
rse i
ndica
tors
)
high
est e
stim
ate –
lo
wes
t est
imat
e
urba
n –
rura
l (o
r vice
vers
a for
ad
vers
e ind
icato
rs)
high
est e
stim
ate –
low
est e
stim
ate
Chapter 5. Maternal, newborn and child health
Antenatal care coverage – at least four visits (%)
70.4 32.6 38.8 25.8 N/A N/A 14.3 44.4
Births attended by skilled health personnel (%)
87.6 34.4 36.4 21.3 N/A N/A 12.4 40.8
Postnatal care coverage for mothers (%)
78.1 27.7 31.7 17.6 N/A N/A 6.9 41.7
Postnatal care coverage for newborns (%)
71.3 31.0 24.0 N/A N/A 0.7 9.9 40.7
Early initiation of breastfeeding (%) 65.5 10.8 9.7 N/A 2.1 1.5 1.8 29.2
Exclusive breastfeeding (%) 44.1 -9.3 -5.6 N/A N/A N/A 7.3 45.3
Vitamin A supplementation coverage (%)
75.5 11.0 11.7 N/A N/A 0.1 3.1 36.9
Low birth weight prevalence (%) 10.2 5.2 5.3 N/A N/A 2.0 1.8 9.7
Chapter 6. Childhood immunization
BCG immunization coverage (%) 87.6 20.1 15.6 N/A N/A 0.7 7.1 39.4
Measles immunization coverage (%)
82.1 17.8 17.2 N/A N/A 1.3 4.1 41.3
DPT-HB immunization coverage (%)
75.6 27.3 19.8 N/A N/A 0.1 8.8 54.3
Polio immunization coverage (%) 77.0 23.5 17.8 N/A N/A 1.9 6.9 47.0
Complete basic immunization coverage (%)
59.2 28.3 20.1 N/A N/A 0.4 10.8 53.9
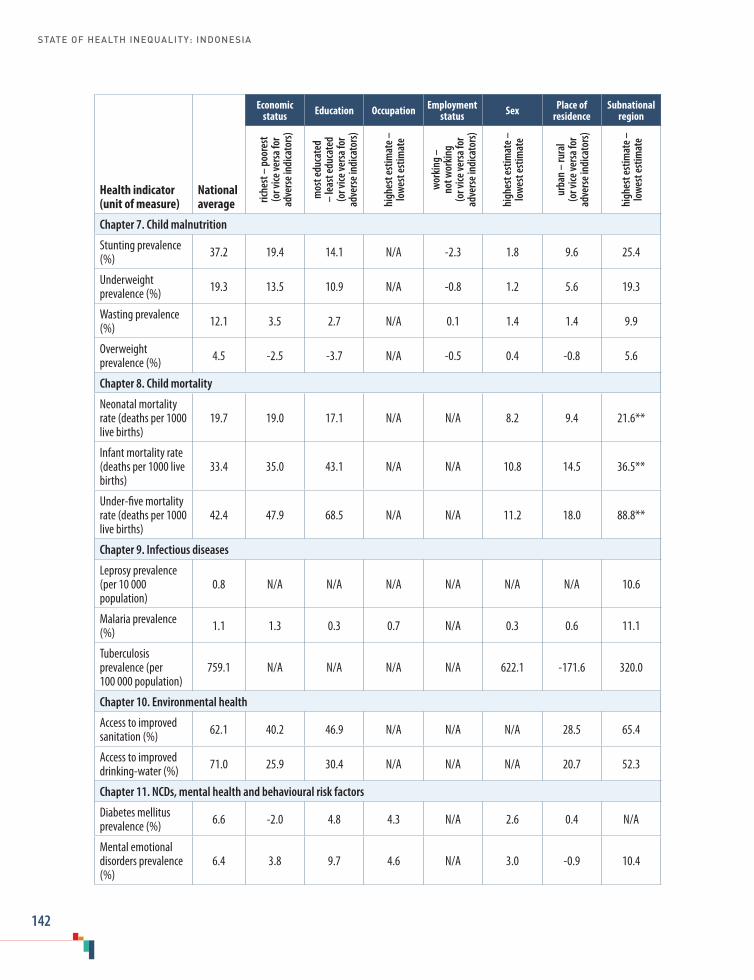
STATE OF HEALTH INEQUALITY: INDONESIA
142
Health indicator (unit of measure)
National average
Economic status Education Occupation Employment
status Sex Place of residence
Subnational region
riche
st –
poo
rest
(o
r vice
vers
a for
ad
vers
e ind
icato
rs)
mos
t edu
cate
d –
leas
t edu
cate
d (o
r vice
vers
a for
ad
vers
e ind
icato
rs)
high
est e
stim
ate –
lo
wes
t est
imat
e
wor
king
–
not w
orki
ng
(or v
ice ve
rsa f
or
adve
rse i
ndica
tors
)
high
est e
stim
ate –
lo
wes
t est
imat
e
urba
n –
rura
l (o
r vice
vers
a for
ad
vers
e ind
icato
rs)
high
est e
stim
ate –
low
est e
stim
ate
Chapter 7. Child malnutrition
Stunting prevalence (%) 37.2 19.4 14.1 N/A -2.3 1.8 9.6 25.4
Underweight prevalence (%) 19.3 13.5 10.9 N/A -0.8 1.2 5.6 19.3
Wasting prevalence (%) 12.1 3.5 2.7 N/A 0.1 1.4 1.4 9.9
Overweight prevalence (%) 4.5 -2.5 -3.7 N/A -0.5 0.4 -0.8 5.6
Chapter 8. Child mortality
Neonatal mortality rate (deaths per 1000 live births)
19.7 19.0 17.1 N/A N/A 8.2 9.4 21.6**
Infant mortality rate (deaths per 1000 live births)
33.4 35.0 43.1 N/A N/A 10.8 14.5 36.5**
Under-five mortality rate (deaths per 1000 live births)
42.4 47.9 68.5 N/A N/A 11.2 18.0 88.8**
Chapter 9. Infectious diseases
Leprosy prevalence (per 10 000 population)
0.8 N/A N/A N/A N/A N/A N/A 10.6
Malaria prevalence (%) 1.1 1.3 0.3 0.7 N/A 0.3 0.6 11.1
Tuberculosis prevalence (per 100 000 population)
759.1 N/A N/A N/A N/A 622.1 -171.6 320.0
Chapter 10. Environmental health
Access to improved sanitation (%) 62.1 40.2 46.9 N/A N/A N/A 28.5 65.4
Access to improved drinking-water (%) 71.0 25.9 30.4 N/A N/A N/A 20.7 52.3
Chapter 11. NCDs, mental health and behavioural risk factors
Diabetes mellitus prevalence (%) 6.6 -2.0 4.8 4.3 N/A 2.6 0.4 N/A
Mental emotional disorders prevalence (%)
6.4 3.8 9.7 4.6 N/A 3.0 -0.9 10.4
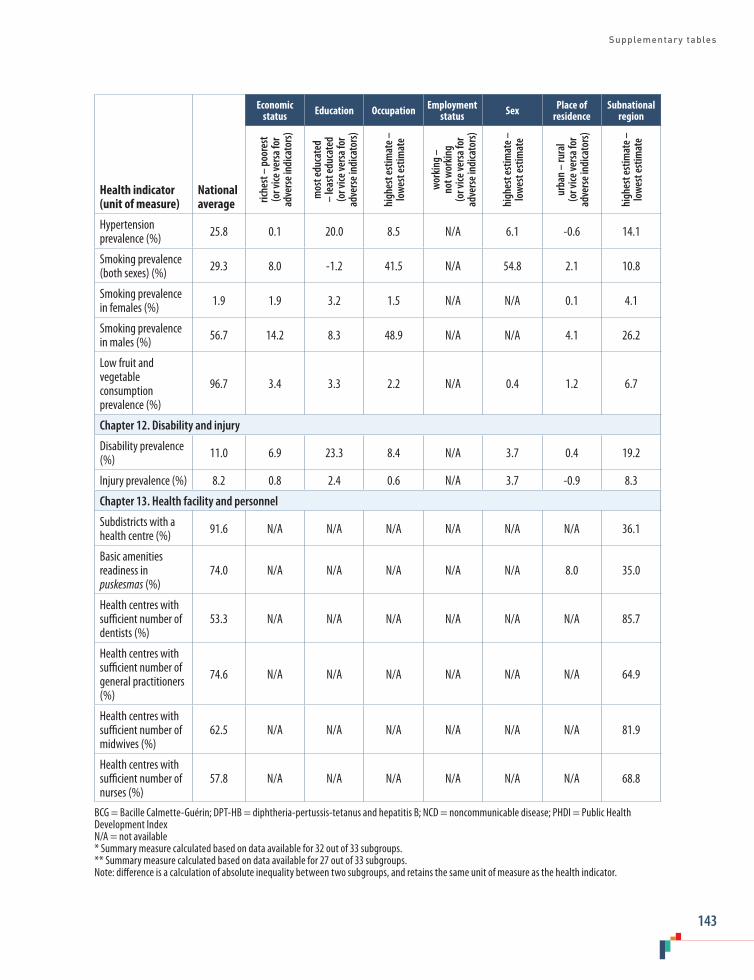
Supplementary tables
143
Health indicator (unit of measure)
National average
Economic status Education Occupation Employment
status Sex Place of residence
Subnational region
riche
st –
poo
rest
(o
r vice
vers
a for
ad
vers
e ind
icato
rs)
mos
t edu
cate
d –
leas
t edu
cate
d (o
r vice
vers
a for
ad
vers
e ind
icato
rs)
high
est e
stim
ate –
lo
wes
t est
imat
e
wor
king
–
not w
orki
ng
(or v
ice ve
rsa f
or
adve
rse i
ndica
tors
)
high
est e
stim
ate –
lo
wes
t est
imat
e
urba
n –
rura
l (o
r vice
vers
a for
ad
vers
e ind
icato
rs)
high
est e
stim
ate –
low
est e
stim
ate
Hypertension prevalence (%) 25.8 0.1 20.0 8.5 N/A 6.1 -0.6 14.1
Smoking prevalence (both sexes) (%) 29.3 8.0 -1.2 41.5 N/A 54.8 2.1 10.8
Smoking prevalence in females (%) 1.9 1.9 3.2 1.5 N/A N/A 0.1 4.1
Smoking prevalence in males (%) 56.7 14.2 8.3 48.9 N/A N/A 4.1 26.2
Low fruit and vegetable consumption prevalence (%)
96.7 3.4 3.3 2.2 N/A 0.4 1.2 6.7
Chapter 12. Disability and injury
Disability prevalence (%) 11.0 6.9 23.3 8.4 N/A 3.7 0.4 19.2
Injury prevalence (%) 8.2 0.8 2.4 0.6 N/A 3.7 -0.9 8.3
Chapter 13. Health facility and personnel
Subdistricts with a health centre (%) 91.6 N/A N/A N/A N/A N/A N/A 36.1
Basic amenities readiness in puskesmas (%)
74.0 N/A N/A N/A N/A N/A 8.0 35.0
Health centres with sufficient number of dentists (%)
53.3 N/A N/A N/A N/A N/A N/A 85.7
Health centres with sufficient number of general practitioners (%)
74.6 N/A N/A N/A N/A N/A N/A 64.9
Health centres with sufficient number of midwives (%)
62.5 N/A N/A N/A N/A N/A N/A 81.9
Health centres with sufficient number of nurses (%)
57.8 N/A N/A N/A N/A N/A N/A 68.8
BCG = Bacille Calmette-Guérin; DPT-HB = diphtheria-pertussis-tetanus and hepatitis B; NCD = noncommunicable disease; PHDI = Public Health Development IndexN/A = not available* Summary measure calculated based on data available for 32 out of 33 subgroups.** Summary measure calculated based on data available for 27 out of 33 subgroups.Note: difference is a calculation of absolute inequality between two subgroups, and retains the same unit of measure as the health indicator.

STATE OF HEALTH INEQUALITY: INDONESIA
144
Table S2. Ratio calculations for health indicators, by dimensions of inequality
Health indicator (unit of measure)
National average
Economic status Education Occupation Employment
status Sex Place of residence
Subnational region
riche
st –
poo
rest
(o
r vice
vers
a for
ad
vers
e ind
icato
rs)
mos
t edu
cate
d –
leas
t edu
cate
d (o
r vice
vers
a for
ad
vers
e ind
icato
rs)
high
est e
stim
ate –
lo
wes
t est
imat
e
wor
king
–
not w
orki
ng
(or v
ice ve
rsa f
or
adve
rse i
ndica
tors
)
high
est e
stim
ate –
lo
wes
t est
imat
e
urba
n –
rura
l (o
r vice
vers
a for
ad
vers
e ind
icato
rs)
high
est e
stim
ate –
low
est e
stim
ate
Chapter 3. Public health development indices
PHDI (overall) (%) 54.0 N/A N/A N/A N/A N/A N/A 1.5
Reproductive and maternal health sub-index (%)
47.6 N/A N/A N/A N/A N/A N/A 2.9
Newborn and child health sub-index (%) 61.1 N/A N/A N/A N/A N/A N/A 1.3
Infectious diseases sub-index (%) 75.1 N/A N/A N/A N/A N/A N/A 2.6
Environmental health sub-index (%) 54.3 N/A N/A N/A N/A N/A N/A 3.3
NCDs sub-index (%) 62.7 N/A N/A N/A N/A N/A N/A 4.8
Health risk behaviour sub-index (%) 36.5 N/A N/A N/A N/A N/A N/A 2.9
Health services provision sub-index (%)
38.1 N/A N/A N/A N/A N/A N/A 4.4
Chapter 4. Reproductive health
Contraceptive prevalence – modern methods (%)
57.9 1.0 1.4 N/A N/A N/A 1.0 3.5
Demand for family planning satisfied (%)
88.6 1.0 1.1 N/A N/A N/A 1.0 1.8
Adolescent fertility rate (per 1000 women)
46.9 6.1 2.6 N/A N/A N/A 2.1 4.8*
Total fertility rate (per woman) 2.5 1.4 1.1 N/A N/A N/A 1.1 1.7
Female genital mutilation (%) 51.2 0.8 N/A N/A N/A N/A 0.8 32.0
Chapter 5. Maternal, newborn and child health
Antenatal care coverage – at least four visits (%)
70.4 1.7 1.8 1.5 N/A N/A 1.2 2.1
Births attended by skilled health personnel (%)
87.6 1.5 1.6 1.3 N/A N/A 1.2 1.7

Supplementary tables
145
Health indicator (unit of measure)
National average
Economic status Education Occupation Employment
status Sex Place of residence
Subnational region
riche
st –
poo
rest
(o
r vice
vers
a for
ad
vers
e ind
icato
rs)
mos
t edu
cate
d –
leas
t edu
cate
d (o
r vice
vers
a for
ad
vers
e ind
icato
rs)
high
est e
stim
ate –
lo
wes
t est
imat
e
wor
king
–
not w
orki
ng
(or v
ice ve
rsa f
or
adve
rse i
ndica
tors
)
high
est e
stim
ate –
lo
wes
t est
imat
e
urba
n –
rura
l (o
r vice
vers
a for
ad
vers
e ind
icato
rs)
high
est e
stim
ate –
low
est e
stim
ate
Postnatal care coverage for mothers (%)
78.1 1.5 1.6 1.3 N/A N/A 1.1 1.8
Postnatal care coverage for newborns (%)
71.3 1.6 1.4 N/A N/A 1.0 1.1 2.0
Early initiation of breastfeeding (%) 65.5 1.2 1.2 N/A 1.0 1.0 1.0 1.6
Exclusive breastfeeding (%) 44.1 0.8 0.9 N/A N/A N/A 1.2 2.8
Vitamin A supplementation coverage (%)
75.5 1.2 1.2 N/A N/A 1.0 1.0 1.7
Low birth weight prevalence (%) 10.2 1.6 1.6 N/A N/A 1.2 1.2 2.3
Chapter 6. Childhood immunization
BCG immunization coverage (%) 87.6 1.3 1.2 N/A N/A 1.0 1.1 1.7
Measles immunization coverage (%)
82.1 1.3 1.2 N/A N/A 1.0 1.1 1.7
DPT-HB immunization coverage (%)
75.6 1.5 1.3 N/A N/A 1.0 1.1 2.3
Polio immunization coverage (%) 77.0 1.4 1.3 N/A N/A 1.0 1.1 2.0
Complete basic immunization coverage (%)
59.2 1.7 1.4 N/A N/A 1.0 1.2 2.8
Chapter 7. Child malnutrition
Stunting prevalence (%) 37.2 1.7 1.5 N/A 0.9 1.0 1.3 2.0
Underweight prevalence (%) 19.3 2.0 1.8 N/A 1.0 1.1 1.3 2.5
Wasting prevalence (%) 12.1 1.3 1.3 N/A 1.0 1.1 1.1 2.1
Overweight prevalence (%) 4.5 0.6 0.5 N/A 0.9 1.1 0.8 3.2
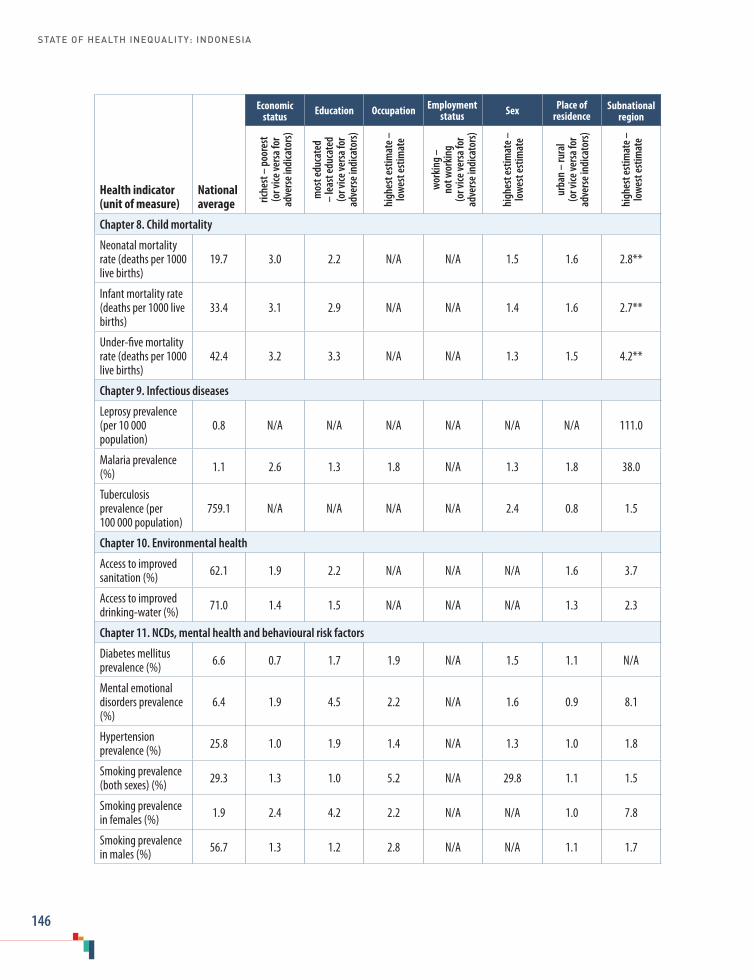
STATE OF HEALTH INEQUALITY: INDONESIA
146
Health indicator (unit of measure)
National average
Economic status Education Occupation Employment
status Sex Place of residence
Subnational region
riche
st –
poo
rest
(o
r vice
vers
a for
ad
vers
e ind
icato
rs)
mos
t edu
cate
d –
leas
t edu
cate
d (o
r vice
vers
a for
ad
vers
e ind
icato
rs)
high
est e
stim
ate –
lo
wes
t est
imat
e
wor
king
–
not w
orki
ng
(or v
ice ve
rsa f
or
adve
rse i
ndica
tors
)
high
est e
stim
ate –
lo
wes
t est
imat
e
urba
n –
rura
l (o
r vice
vers
a for
ad
vers
e ind
icato
rs)
high
est e
stim
ate –
low
est e
stim
ate
Chapter 8. Child mortality
Neonatal mortality rate (deaths per 1000 live births)
19.7 3.0 2.2 N/A N/A 1.5 1.6 2.8**
Infant mortality rate (deaths per 1000 live births)
33.4 3.1 2.9 N/A N/A 1.4 1.6 2.7**
Under-five mortality rate (deaths per 1000 live births)
42.4 3.2 3.3 N/A N/A 1.3 1.5 4.2**
Chapter 9. Infectious diseases
Leprosy prevalence (per 10 000 population)
0.8 N/A N/A N/A N/A N/A N/A 111.0
Malaria prevalence (%) 1.1 2.6 1.3 1.8 N/A 1.3 1.8 38.0
Tuberculosis prevalence (per 100 000 population)
759.1 N/A N/A N/A N/A 2.4 0.8 1.5
Chapter 10. Environmental health
Access to improved sanitation (%) 62.1 1.9 2.2 N/A N/A N/A 1.6 3.7
Access to improved drinking-water (%) 71.0 1.4 1.5 N/A N/A N/A 1.3 2.3
Chapter 11. NCDs, mental health and behavioural risk factors
Diabetes mellitus prevalence (%) 6.6 0.7 1.7 1.9 N/A 1.5 1.1 N/A
Mental emotional disorders prevalence (%)
6.4 1.9 4.5 2.2 N/A 1.6 0.9 8.1
Hypertension prevalence (%) 25.8 1.0 1.9 1.4 N/A 1.3 1.0 1.8
Smoking prevalence (both sexes) (%) 29.3 1.3 1.0 5.2 N/A 29.8 1.1 1.5
Smoking prevalence in females (%) 1.9 2.4 4.2 2.2 N/A N/A 1.0 7.8
Smoking prevalence in males (%) 56.7 1.3 1.2 2.8 N/A N/A 1.1 1.7

Supplementary tables
147
Health indicator (unit of measure)
National average
Economic status Education Occupation Employment
status Sex Place of residence
Subnational region
riche
st –
poo
rest
(o
r vice
vers
a for
ad
vers
e ind
icato
rs)
mos
t edu
cate
d –
leas
t edu
cate
d (o
r vice
vers
a for
ad
vers
e ind
icato
rs)
high
est e
stim
ate –
lo
wes
t est
imat
e
wor
king
–
not w
orki
ng
(or v
ice ve
rsa f
or
adve
rse i
ndica
tors
)
high
est e
stim
ate –
lo
wes
t est
imat
e
urba
n –
rura
l (o
r vice
vers
a for
ad
vers
e ind
icato
rs)
high
est e
stim
ate –
low
est e
stim
ate
Low fruit and vegetable consumption prevalence (%)
96.7 1.0 1.0 1.0 N/A 1.0 1.0 1.1
Chapter 12. Disability and injury
Disability prevalence (%) 11.0 1.8 4.6 2.4 N/A 1.4 1.0 5.2
Injury prevalence (%) 8.2 1.1 1.4 1.1 N/A 1.6 0.9 2.8
Chapter 13. Health facility and personnel
Subdistricts with a health centre (%) 91.6 N/A N/A N/A N/A N/A N/A 1.6
Basic amenities readiness in puskesmas (%)
74.0 N/A N/A N/A N/A N/A 1.1 1.7
Health centres with sufficient number of dentists (%)
53.3 N/A N/A N/A N/A N/A N/A 7.7
Health centres with sufficient number of general practitioners (%)
74.6 N/A N/A N/A N/A N/A N/A 2.9
Health centres with sufficient number of midwives (%)
62.5 N/A N/A N/A N/A N/A N/A 7.8
Health centres with sufficient number of nurses (%)
57.8 N/A N/A N/A N/A N/A N/A 3.6
BCG = Bacille Calmette-Guérin; DPT-HB = diphtheria-pertussis-tetanus and hepatitis B; NCD = noncommunicable disease; PHDI = Public Health Development Index N/A = not available* Summary measure calculated based on data available for 32 out of 33 subgroups.** Summary measure calculated based on data available for 27 out of 33 subgroups.Note: ratio is a calculation of relative inequality between two subgroups, and is unitless.
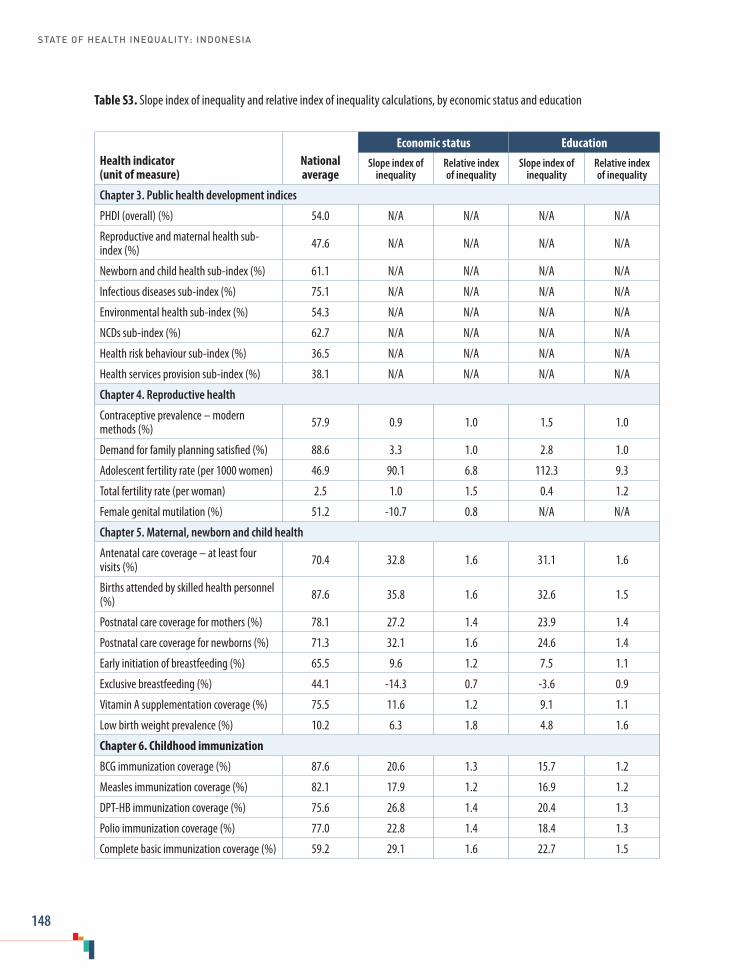
STATE OF HEALTH INEQUALITY: INDONESIA
148
Table S3. Slope index of inequality and relative index of inequality calculations, by economic status and education
Health indicator (unit of measure)
National average
Economic status EducationSlope index of
inequalityRelative index of inequality
Slope index of inequality
Relative index of inequality
Chapter 3. Public health development indices
PHDI (overall) (%) 54.0 N/A N/A N/A N/A
Reproductive and maternal health sub-index (%) 47.6 N/A N/A N/A N/A
Newborn and child health sub-index (%) 61.1 N/A N/A N/A N/A
Infectious diseases sub-index (%) 75.1 N/A N/A N/A N/A
Environmental health sub-index (%) 54.3 N/A N/A N/A N/A
NCDs sub-index (%) 62.7 N/A N/A N/A N/A
Health risk behaviour sub-index (%) 36.5 N/A N/A N/A N/A
Health services provision sub-index (%) 38.1 N/A N/A N/A N/A
Chapter 4. Reproductive health
Contraceptive prevalence – modern methods (%) 57.9 0.9 1.0 1.5 1.0
Demand for family planning satisfied (%) 88.6 3.3 1.0 2.8 1.0
Adolescent fertility rate (per 1000 women) 46.9 90.1 6.8 112.3 9.3
Total fertility rate (per woman) 2.5 1.0 1.5 0.4 1.2
Female genital mutilation (%) 51.2 -10.7 0.8 N/A N/A
Chapter 5. Maternal, newborn and child health
Antenatal care coverage – at least four visits (%) 70.4 32.8 1.6 31.1 1.6
Births attended by skilled health personnel (%) 87.6 35.8 1.6 32.6 1.5
Postnatal care coverage for mothers (%) 78.1 27.2 1.4 23.9 1.4
Postnatal care coverage for newborns (%) 71.3 32.1 1.6 24.6 1.4
Early initiation of breastfeeding (%) 65.5 9.6 1.2 7.5 1.1
Exclusive breastfeeding (%) 44.1 -14.3 0.7 -3.6 0.9
Vitamin A supplementation coverage (%) 75.5 11.6 1.2 9.1 1.1
Low birth weight prevalence (%) 10.2 6.3 1.8 4.8 1.6
Chapter 6. Childhood immunization
BCG immunization coverage (%) 87.6 20.6 1.3 15.7 1.2
Measles immunization coverage (%) 82.1 17.9 1.2 16.9 1.2
DPT-HB immunization coverage (%) 75.6 26.8 1.4 20.4 1.3
Polio immunization coverage (%) 77.0 22.8 1.4 18.4 1.3
Complete basic immunization coverage (%) 59.2 29.1 1.6 22.7 1.5

Supplementary tables
149
Health indicator (unit of measure)
National average
Economic status EducationSlope index of
inequalityRelative index of inequality
Slope index of inequality
Relative index of inequality
Chapter 7. Child malnutrition
Stunting prevalence (%) 37.2 23.4 1.9 14.9 1.5
Underweight prevalence (%) 19.3 15.7 2.2 10.9 1.7
Wasting prevalence (%) 12.1 3.9 1.4 2.6 1.2
Overweight prevalence (%) 4.5 -3.6 0.5 -3.8 0.4
Chapter 8. Child mortality
Neonatal mortality rate (deaths per 1000 live births) 19.7 23.2 3.4 26.2 3.7
Infant mortality rate (deaths per 1000 live births) 33.4 41.9 3.5 51.2 4.5
Under-five mortality rate (deaths per 1000 live births) 42.4 57.1 3.8 68.1 4.8
Chapter 9. Infectious diseases
Leprosy prevalence (per 10 000 population) 0.8 N/A N/A N/A N/A
Malaria prevalence (%) 1.1 * * * *
Tuberculosis prevalence (per 100 000 population) 759.1 N/A N/A N/A N/A
Chapter 10. Environmental health
Access to improved sanitation (%) 62.1 47.5 2.3 47.9 2.3
Access to improved drinking-water (%) 71.0 32.5 1.6 32.6 1.6
Chapter 11. NCDs, mental health and behavioural risk factors
Diabetes mellitus prevalence (%) 6.6 -2.6 0.7 7.2 2.7
Mental emotional disorders prevalence (%) 6.4 4.3 1.9 8.8 3.5
Hypertension prevalence (%) 25.8 1.3 1.1 25.1 2.6
Smoking prevalence (both sexes) (%) 29.3 9.2 1.4 -11.0 0.7
Smoking prevalence in females (%) 1.9 2.3 3.0 2.5 3.3
Smoking prevalence in males (%) 56.7 16.4 1.3 -11.2 0.8
Low fruit and vegetable consumption prev-alence (%) 96.7 4.0 1.0 1.0 1.0
Chapter 12. Disability and injury
Disability prevalence (%) 11.0 8.2 2.1 24.4 6.1
Injury prevalence (%) 8.2 0.8 1.1 0.7 1.1
Chapter 13. Health facility and personnel
Subdistricts with a health centre (%) 91.6 N/A N/A N/A N/A
Basic amenities readiness in puskesmas (%) 74.0 N/A N/A N/A N/A
Health centres with sufficient number of dentists (%) 53.3 N/A N/A N/A N/A

STATE OF HEALTH INEQUALITY: INDONESIA
150
Health indicator (unit of measure)
National average
Economic status EducationSlope index of
inequalityRelative index of inequality
Slope index of inequality
Relative index of inequality
Health centres with sufficient number of general practitioners (%) 74.6 N/A N/A N/A N/A
Health centres with sufficient number of midwives (%) 62.5 N/A N/A N/A N/A
Health centres with sufficient number of nurses (%) 57.8 N/A N/A N/A N/A
BCG = Bacille Calmette-Guérin; DPT-HB = diphtheria-pertussis-tetanus and hepatitis B; NCD = noncommunicable disease; PHDI = Public Health Development IndexN/A = not available* Cannot be calculated.Note: slope index of inequality is a calculation of absolute inequality and retains the same unit of measure as the health indicator; relative index of inequality is a calculation of relative inequality and is unitless.

Supplementary tables
151
Table S4. Mean difference from mean and index of disparity calculations, by occupation and subnational region
Health indicator (unit of measure)
National average
Occupation Subnational regionMean difference
from meanIndex of disparity
Mean difference from mean
Index of disparity
Chapter 3. Public health development indices
PHDI (overall) (%) 54.0 N/A N/A 2.4 6.5
Reproductive and maternal health sub-index (%) 47.6 N/A N/A 6.8 20.1
Newborn and child health sub-index (%) 61.1 N/A N/A 3.4 6.4
Infectious diseases sub-index (%) 75.1 N/A N/A 8.3 16.5
Environmental health sub-index (%) 54.3 N/A N/A 9.5 20.9
NCDs sub-index (%) 62.7 N/A N/A 10.5 25.3
Health risk behaviour sub-index (%) 36.5 N/A N/A 4.3 16.7
Health services provision sub-index (%) 38.1 N/A N/A 8.1 26.3
Chapter 4. Reproductive health
Contraceptive prevalence – modern methods (%) 57.9 N/A N/A 5.9 14.3
Demand for family planning satisfied (%) 88.6 N/A N/A 2.8 5.8
Adolescent fertility rate (per 1000 women) 46.9 N/A N/A 12.5 37.4*
Total fertility rate (per woman) 2.5 N/A N/A 0.3 14.0
Female genital mutilation (%) 51.2 N/A N/A 13.4 34.0
Chapter 5. Maternal, newborn and child health
Antenatal care coverage – at least four visits (%) 70.4 3.3 8.9 7.0 16.3
Births attended by skilled health personnel (%) 87.6 2.8 6.6 6.6 10.5
Postnatal care coverage for mothers (%) 78.1 2.5 6.2 5.2 9.8
Postnatal care coverage for newborns (%) 71.3 N/A N/A 5.7 11.5
Early initiation of breastfeeding (%) 65.5 N/A N/A 4.5 8.7
Exclusive breastfeeding (%) 44.1 N/A N/A 7.2 20.9
Vitamin A supplementation coverage (%) 75.5 N/A N/A 7.1 10.5
Low birth weight prevalence (%) 10.2 N/A N/A 1.4 18.4
Chapter 6. Childhood immunization
BCG immunization coverage (%) 87.6 N/A N/A 4.9 7.7
Measles immunization coverage (%) 82.1 N/A N/A 6.8 9.7
DPT-HB immunization coverage (%) 75.6 N/A N/A 8.9 13.6
Polio immunization coverage (%) 77.0 N/A N/A 7.7 11.6
Complete basic immunization coverage (%) 59.2 N/A N/A 11.6 22.4

STATE OF HEALTH INEQUALITY: INDONESIA
152
Health indicator (unit of measure)
National average
Occupation Subnational regionMean difference
from meanIndex of disparity
Mean difference from mean
Index of disparity
Chapter 7. Child malnutrition
Stunting prevalence (%) 37.2 N/A N/A 3.7 12.7
Underweight prevalence (%) 19.3 N/A N/A 3.9 22.0
Wasting prevalence (%) 12.1 N/A N/A 1.7 14.7
Overweight prevalence (%) 4.5 N/A N/A 1.2 28.0
Chapter 8. Child mortality
Neonatal mortality rate (deaths per 1000 live births) 19.7 N/A N/A 4.4 24.8**
Infant mortality rate (deaths per 1000 live births) 33.4 N/A N/A 5.8 25.1**
Under-five mortality rate (deaths per 1000 live births) 42.4 N/A N/A 9.2 31.7**
Chapter 9. Infectious diseases
Leprosy prevalence (per 10 000 population) 0.8 N/A N/A 0.5 139.3
Malaria prevalence (%) 1.1 0.3 20.0 3.4 70.4
Tuberculosis prevalence (per 100 000 population) 759.1 *** *** *** ***
Chapter 10. Environmental health
Access to improved sanitation (%) 62.1 N/A N/A 7.9 18.7
Access to improved drinking-water (%) 71.0 N/A N/A 6.2 12.2
Chapter 11. NCDs, mental health and behavioural risk factors
Diabetes mellitus prevalence (%) 6.6 0.8 17.1 N/A N/A
Mental emotional disorders prevalence (%) 6.4 1.7 27.9 1.9 35.5
Hypertension prevalence (%) 25.8 2.5 10.1 2.1 12.0
Smoking prevalence (both sexes) (%) 29.3 10.6 24.1 1.8 7.1
Smoking prevalence in females (%) 1.9 0.5 26.3 0.9 41.7
Smoking prevalence in males (%) 56.7 12.2 19.0 3.0 7.4
Low fruit and vegetable consumption prev-alence (%) 96.7 0.6 0.7 1.1 1.3
Chapter 12. Disability and injury
Disability prevalence (%) 11.0 2.7 28.0 2.9 32.2
Injury prevalence (%) 8.2 0.2 2.5 1.2 19.7
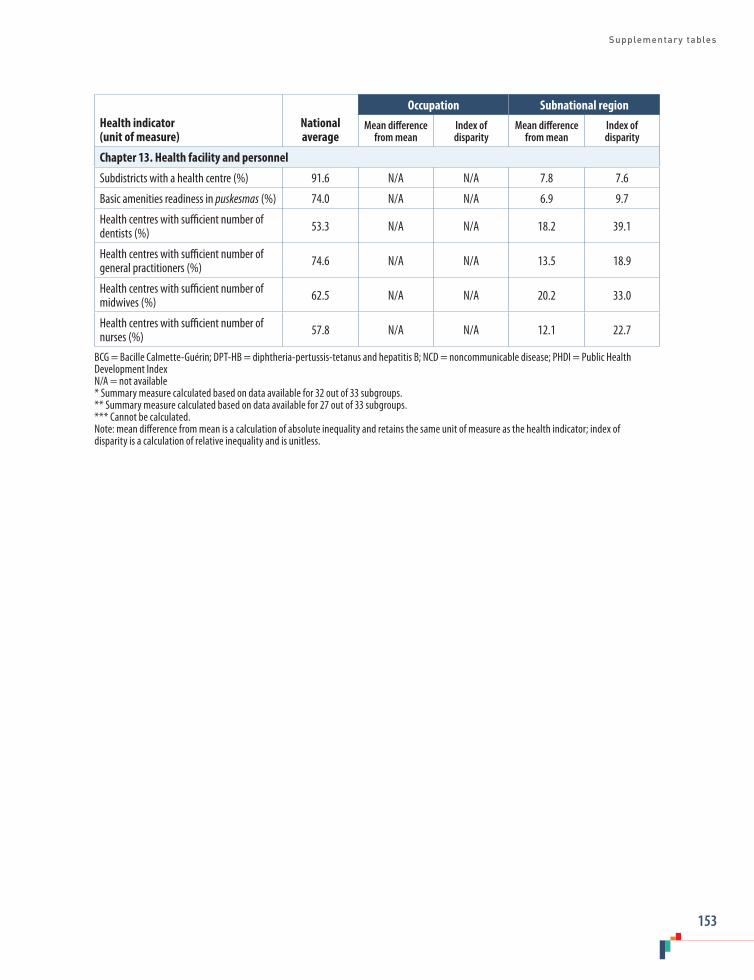
Supplementary tables
153
Health indicator (unit of measure)
National average
Occupation Subnational regionMean difference
from meanIndex of disparity
Mean difference from mean
Index of disparity
Chapter 13. Health facility and personnel
Subdistricts with a health centre (%) 91.6 N/A N/A 7.8 7.6
Basic amenities readiness in puskesmas (%) 74.0 N/A N/A 6.9 9.7
Health centres with sufficient number of dentists (%) 53.3 N/A N/A 18.2 39.1
Health centres with sufficient number of general practitioners (%) 74.6 N/A N/A 13.5 18.9
Health centres with sufficient number of midwives (%) 62.5 N/A N/A 20.2 33.0
Health centres with sufficient number of nurses (%) 57.8 N/A N/A 12.1 22.7
BCG = Bacille Calmette-Guérin; DPT-HB = diphtheria-pertussis-tetanus and hepatitis B; NCD = noncommunicable disease; PHDI = Public Health Development IndexN/A = not available* Summary measure calculated based on data available for 32 out of 33 subgroups.** Summary measure calculated based on data available for 27 out of 33 subgroups.*** Cannot be calculated.Note: mean difference from mean is a calculation of absolute inequality and retains the same unit of measure as the health indicator; index of disparity is a calculation of relative inequality and is unitless.
STATE OF HEALTH INEQUALITY: INDONESIA
154
1000 Hari Pertama Kehidupan 66
AAdolescent fertility rate 32, 33, 34, 35, 39Age 14 behavioural risk factors 97–98 child health 44 child malnutrition 68 disability 109 infectious diseases 83 injury 109 maternal health 44 mental health 97–98 newborn health 44 noncommunicable diseases 97–98 Antenatal care 42, 43, 44, 45, 48Askeskin 10Audience-conscious reporting 18
BBacille Calmette-Guérin (BCG) immunization 56, 57, 58, 61Backlog Fighting 56Badan Penyelenggara Jaminan Sosial Kesehatan (BPJS Kesehatan) 7Badan Perencanaan Pembangunan Nasional (BAPPENAS) 6, 8Basic Health Research (RISKESDAS) 10, 15BCG immunization 56, 57, 58, 61Behavioural risk factors xvi, 30, 95–107 age 97–98 economic status 97 education 97 indicator profiles 100, 101–107 indicators 95–96 national average 96 occupation 97 place of residence 98 policy implications 99 priority areas 98–99 sex 98 subnational region 98 Benchmarking 132Bidan Desa 116Births, skilled personnel attendance 42, 43, 44, 45, 49Brain drain 116Breastfeeding 42, 43, 44, 45, 46, 52, 53
CCapacity building child malnutrition 69 childhood immunization 59 disability and injury 110 environmental health 91 health inequality monitoring 2 health personnel 117 infectious diseases 84Catch up Campaigns 56Centre for Data and Information (PUSDATIN) 10Child health xiv–xv, 26, 42–55 age 44 economic status 43–44 education 44 employment status 44 indicator profiles 46, 48–55 indicators 42–43 national average 43 occupation 44 place of residence 44–45 policy implications 46 priority areas 45 sex 44 subnational region 45 Child malnutrition xv, 66–74 age 68 economic status 67 education 67–68 employment status 68 indicator profiles 70, 71–74 indicators 66–67 national average 67 place of residence 68 policy implications 69 priority areas 68–69 sex 68 subnational region 68 Child mortality xv, 75–81 economic status 76 education 76 indicator profiles 78, 79–81 indicators 75–76 infants 75, 76, 77, 80 national average 76
Index

Index
155
neonates 75, 76, 77, 79 place of residence 76 policy implications 77 priority areas 77 sex 76 subnational region 76 under-five 75, 76, 77, 81Childhood immunization xv, 56–74 BCG 56, 57, 58, 61 complete basic immunization 56, 57, 58, 65 DPT-HB 56, 57, 58, 63 economic status 57 education 57 indicator profiles 59, 61–65 indicators 56 measles 56, 57, 58, 62 national average 57 non-completion rates 59 place of residence 57 policy implications 58–59 polio 56, 57, 58, 64 priority areas 58 sex 57 subnational region 58 vaccine procurement and supply 56 Commission on Social Determinants of Health (WHO) 132–133Community-based healthcare services 7Community-Led Total Sanitation approach 89, 91Complete basic immunization 56, 57, 58, 65Contraceptive prevalence 32, 33, 34, 35, 37Country context 4–10
DData analysis 16–17 disaggregation 16, 132 sources 15, 131Decade of Action for Road Safety (2011–2020) 108Demographic and Health Surveys (DHS) 15Demographic and Health Surveys programme (SDKI) 10Demographic trends 4–5Dentists 114, 115, 116, 120Development plan 6Diabetes mellitus 95, 96, 97, 98, 99, 101Difference 16Disability xvi, 108–113 age 109 economic status 109 education 109 indicator profiles 111, 112–113
indicators 108 national average 109 occupation 109 place of residence 109 policy implications 110 priority areas 110 sex 109 subnational region 110 Donor-funded programmes 82Double disaggregation 132DPT-HB immunization 56, 57, 58, 63Drinking-water supply 89, 90, 91, 94 Dublin-Rio Principles 89
EEarly Warning of Road Traffic Injury programme 108Economic status 14 behavioural risk factors 97 child health 43–44 child malnutrition 67 child mortality 76 childhood immunization 57 disability 109 environmental health 90 health inequality 125, 127–128 infectious diseases 83 injury 109 maternal health 43–44 mental health 97 newborn health 43–44 noncommunicable diseases 97 reproductive health 33Education 14 behavioural risk factors 97 child health 44 child malnutrition 67–68 child mortality 76 childhood immunization 57 disability 109 environmental health 90 infectious diseases 83 injury 109 maternal health 44 mental health 97 newborn health 44 noncommunicable diseases 97 reproductive health 33–34Employment status 14 child health 44 child malnutrition 68

STATE OF HEALTH INEQUALITY: INDONESIA
156
maternal health 44 newborn health 44 Environmental health xvi, 28, 89–94 drinking-water supply 89, 90, 91, 94 economic status 90 education 90 indicator profiles 91, 93–94 indicators 89 national average 90 place of residence 90 policy implications 91 priority areas 90–91 sanitation 89, 90, 91, 93 subnational region 90 Epidemiological patterns 5Equal rights legislation 108Equity-oriented policy-making 131Every Newborn Action Plan (WHO) 42Every Women Every Child 42Expanded Programme on Immunization (WHO) 56
FFamily planning 32, 33, 34, 35, 38Female genital mutilation 32, 33, 34, 35, 41Fertility rate adolescent 32, 33, 34, 35, 39 total 32, 33, 34, 35, 40Finance Asian financial crisis (1997) 7 health finance 9First 1000 Days of Life Movement 66Fruit and vegetable consumption 96, 97, 98, 99, 107
GGeneral practitioners 114, 115, 116, 121GERMAS programme 95Global Fund to Fight AIDS, Tuberculosis and Malaria 82Global Road Safety 108
HHealth behaviours 124–125Health centres 114, 115, 118, see also PuskesmasHealth Equity Assessment Toolkit (HEAT) software 3, 17Health facility xvi, 114–123 indicator profiles 117, 118–123 indicators 114 national average 115 place of residence 115 policy implications 116–117 priority areas 116
subnational region 115–116Health Facility Survey (RIFASKES) 10, 15Health finance 9Health indicators 13–14Health inequality by classes of indicators 124–125 by dimensions of inequality 125–129 dimensions 14 monitoring xvii–xviii, 1, 2, 131–132, 133 understanding the state of xvi–xvii variability 130Health information systems xviii, 10, 84, 131Health insurance 7, 9–10Health outcomes 125Health personnel xvi, 114–123 dentists 114, 115, 116, 120 general practitioners 114, 115, 116, 121 indicator profiles 117, 118–123 indicators 114 midwives 42, 114, 115, 116, 122 national average 115 nurses 114, 115, 116, 123 place of residence 115 policy implications 116–117 priority areas 116 subnational region 115–116Health sciences education 116Health sector governance 8 overview 7 planning 8 Health service coverage 124 provision 31Health service posts (posyandu) 7, 66Health status 125Health systems maternal, newborn and child health 46 organization 7–8Health trends 4–5Health worker ratios 114Healthy Archipelago (Nusantara Sehat) 75, 116Healthy Indonesia Programme with Family Approach (PIS-DPK) 56, 95HEAT Plus 3, 17Higher education institutions 116Hospitals 8 Pelayanan Obstetrik dan Neonatal Emergensi Komprehensif (PONEK) 75Human development index 6Hypertension 95, 96, 97, 98–99, 103
Index
157
IImmunization, see Childhood immunization Index of disparity 16Indonesia Human Resources for Health Development Plan (2011–2025) 114Indonesia Newborn Action Plan (2014–2025) 42Infant mortality 75, 76, 77, 80Infectious diseases xv, 27, 82–88 age 83 economic status 83 education 83 indicator profiles 84–85, 86–88 indicators 82 leprosy 82, 83, 84, 86 malaria 82, 83, 84, 87 national average 83 occupation 83 place of residence 83 policy implications 84 priority areas 84 sex 83 subnational region 83–84 tuberculosis 82, 83, 84, 88Injury xvi, 108–113 age 109 economic status 109 education 109 indicator profiles 111, 112–113 indicators 108 national average 109 occupation 109 place of residence 109 policy implications 110 priority areas 110 sex 109 subnational region 110 Innov8 Approach for Reviewing National Health Programmes to Leave No One Behind (WHO) 131Integrated health service posts (posyandu) 7, 66Integrated Management of Childhood Illness strategy 56
JJaminan Kesehatan Nasional (JKN) 10Jamkesda 10Jamkesmas 10Jampersal 75
KKampung KB 32
LLeprosy 82, 83, 84, 86Life expectancy 5Low birth weight 42, 43, 44, 45, 55
MMalaria 82, 83, 84, 87Malaria Elimination Programme in Indonesia 82Marginal exclusion xvii, 128Mass deprivation xvii, 128Maternal and child health handbook 42Maternal health xiv–xv, 25, 42–55 age 44 economic status 43–44 education 44 employment status 44 indicator profiles 46, 48–55 indicators 42–43 national average 43 occupation 44 place of residence 44–45 policy implications 46 priority areas 45 sex 44 subnational region 45 Mean difference from mean 16Measles immunization 56, 57, 58, 62Mental emotional disorders 95, 96, 97, 98, 99, 102Mental health xvi, 95–107 age 97–98 economic status 97 education 97 indicator profiles 100, 101–107 indicators 95–96 national average 96 occupation 97 place of residence 98 policy implications 99 priority areas 98–99 sex 98 subnational region 98 Midwives 42, 114, 115, 116, 122Midwives in Villages 116Minimum service standards 131Ministry of Health Strategic Plan (2015–2019) 95Mobile service units 7
STATE OF HEALTH INEQUALITY: INDONESIA
158
NNational Action Plan on Food and Nutrition (2015–2019) 66National Action Plan on the Control and Prevention of NCDs 95National average behavioural risk factors 96 child health 43 child malnutrition 67 child mortality 76 childhood immunization 57 disability 109 environmental health 90 health facility 115 health personnel 115 infectious diseases 83 injury 109 maternal health 43 mental health 96 newborn health 43 noncommunicable diseases 96 Public Health Development Index (PHDI) 21 reproductive health 33National Development Planning Agency (BAPPENAS) 6, 8National Health Indicator Survey (SIRKESNAS) 10National health insurance scheme 7, 9–10National health surveys 10National health system (SKN) 7National Immunization Week 56National Leprosy Control Programme 82National Socioeconomic Survey (SUSENAS) 15National Strategic Plan (2015–2019) 82National Tuberculosis Control Strategy (2010–2014) 82Neonatal mortality 75, 76, 77, 79 Newborn health xiv–xv, 26, 42–55 age 44 economic status 43–44 education 44 employment status 44 indicator profiles 46, 48–55 indicators 42–43 national average 43 occupation 44 place of residence 44–45 policy implications 46 priority areas 45 sex 44 subnational region 45 Noncommunicable diseases (NCDs) xvi, 5, 29, 95–107 age 97–98 economic status 97 education 97
indicator profiles 100, 101–107 indicators 95–96 national average 96 occupation 97 place of residence 98 policy implications 99 priority areas 98–99 sex 98 subnational region 98 Nurses 114, 115, 116, 123Nusantara Sehat 75, 116
OObesity 67Obstetric emergencies 42Occupation 14 behavioural risk factors 97 child health 44 disability 109 infectious diseases 83 injury 109 maternal health 44 mental health 97 newborn health 44 noncommunicable diseases 97Outbreak Response Immunization 56Overweight 66, 67, 68, 69, 74
PPeer training 59Pelayanan Obstetri dan Neonatal Esensial Dasar (PONED) puskesmas 75 Pelayanan Obstetrik dan Neonatal Emergensi Komprehensif (PONEK) hospitals 75Physicians 114, see also General practitionersPlace of residence 14 behavioural risk factors 98 child health 44–45 child malnutrition 68 child mortality 76 childhood immunization 57 disability 109 environmental health 90 health facility 115 health personnel 115 infectious diseases 83 injury 109 maternal health 44–45 mental health 98 newborn health 44–45
Index
159
noncommunicable diseases 98 reproductive health 34Policy implications 18 behavioural risk factors 99 child health 46 child malnutrition 69 child mortality 77 childhood immunization 58–59 disability 110 environmental health 91 equity-oriented policy-making 131 health facility 116–117 health personnel 116–117 infectious diseases 84 injury 110 maternal health 46 mental health 99 newborn health 46 noncommunicable diseases 99 Public Health Development Index (PHDI) 22–23 reproductive health 35Polio immunization 56, 57, 58, 64 Political landscape 6–7Poltekkes 116Posbindu 95Poskesdes (village health posts) 7, 59Postnatal care 42, 43, 44–45, 50, 51Posyandu 7, 66Potensi Desa (PODES) 15Poverty rates 7Primary health care 7Priority areas assessment 17–18 behavioural risk factors 98–99 child health 45 child malnutrition 68–69 child mortality 77 childhood immunization 58 disability 110 environmental health 90–91 health facility 116 health personnel 116 infectious diseases 84 injury 110 maternal health 45 mental health 98–99 newborn health 45 noncommunicable diseases 98–99 Public Health Development Index (PHDI) 22 reproductive health 34
Private health care 8 Program Indonesia Sehat Dengan Pendekatan Keluarga (PIS-DPK) 56, 95Public Health Development Index (PHDI) xiv, 20–31 indicator profiles 23, 24–31 indicators 20 national average 21 policy implications 22–23 priority areas 22 subnational region 21–22Pusat Data dan Informasi (PUSDATIN) 10Puskesmas 7–8, 66, 82, 114, 115, 119 Pelayanan Obstetri dan Neonatal Esensial Dasar (PONED) 75
QQuality control 46Queuing pattern xvii, 128
RRatio 16Registration systems 10, 131Relative index of inequality 16Rencana Pembangunan Jangka Menengah Nasional (RPJMN) 6, 8Reporting approach 18Reproductive health xiv, 25, 32–41 economic status 33 education 33–34 indicator profiles 35, 37–41 indicators 32 national average 33 place of residence 34 policy implications 35 priority areas 34 subnational region 34 Riset Fasilitas Kesehatan (RIFASKES) 10, 15Riset Kesehatan Dasar (RISKESDAS) 10, 15Road safety 108, 110Rome Declaration on Nutrition and Framework for Action 66
SSample Registration System 10Sanitation 89, 90, 91, 93Scaling Up Nutrition Movement 66Sex 14 behavioural risk factors 98 child health 44 child malnutrition 68 child mortality 76 childhood immunization 57 disability 109

STATE OF HEALTH INEQUALITY: INDONESIA
160
health inequality 125, 128–129 infectious diseases 83 injury 109 maternal health 44 mental health 98 newborn health 44 noncommunicable diseases 98Sistem Informasi Kesehatan Daerah (SIKDA) 10Sistem Informasi Kesehatan Nasional (SIKNAS) 10Sistem Kesehatan Nasional (SKN) 7Slope index of inequality 16Smoking 95, 96, 97–98, 99, 104, 105, 106Social health insurance 7, 9–10Social protection 66, 110Social Safety Net 9–10Social Security Management Agency (BPJS Kesehatan) 7Standar pelayanan minimal (SPM) 131STEPwise approach to Surveillance (STEPS) 95Strategic Action Plan to Reduce the Double Burden of Malnutrition in the South-East Asia Region (2016–2025) 69Stunting 66, 67, 68–69, 71 Sub-health centres 7Subnational region 14 behavioural risk factors 98 child health 45 child malnutrition 68 child mortality 76 childhood immunization 58 disability 110 environmental health 90 health facility 115–116 health inequality 125–127 health personnel 115–116 infectious diseases 83–84 injury 110 maternal health 45 mental health 98 newborn health 45 noncommunicable diseases 98 Public Health Development Index (PHDI) 21–22 reproductive health 34Summary measures of inequality 16Survei Demografi dan Kesehatan Indonesia (SDKI) 10Survei Indikator Kesehatan Nasional (SIRKESNAS) 10Survei Sosial Ekonomi Nasional (SUSENAS) 15Sustainable Development Goals 5Sustained Outreach Strategy (SOS) 56
TTask shifting 46Time trends 132Tobacco, see SmokingTotal fertility rate 32, 33, 34, 35, 40Traffic accidents 108, 110Traffic-light system 17–18Training childhood immunization 59 health personnel 114 maternal, newborn and child health 46 peer 59 vocational 110 Tropical diseases 5Tuberculosis 82, 83, 84, 88Tuberculosis Prevalence Survey 15
UUnder-five mortality 75, 76, 77, 81Underweight 66, 67, 68, 69, 72United Nations 2030 Agenda for Sustainable Development 66 Convention on the Rights of Persons with Disabilities 108
VVaccine procurement and supply 56Vegetable and fruit consumption 96, 97, 98, 99, 107Village health posts (poskesdes) 7, 59Village Potential Survey (PODES) 15Vital registration 10, 131Vitamin A supplementation 42, 43, 44, 45, 54Vocational training 110
WWasting 66, 67, 68, 69, 73Water & Sanitation for Low Income Communities Project 89, 91Water supply 89, 90, 91, 94World Health Organization (WHO) Commission on Social Determinants of Health 132–133 Every Newborn Action Plan 42 Expanded Programme on Immunization 56 Innov8 Approach for Reviewing National Health Programmes to Leave No One Behind 131 STEPwise approach to Surveillance (STEPS) 95


h t t p : / / w w w . w h o . i n t / g h o / h e a l t h _ e q u i t y / r e p o r t _ 2 0 1 7 _ i n d o n e s i a / e n /

h t t p : / / w w w . w h o . i n t / g h o / h e a l t h _ e q u i t y / r e p o r t _ 2 0 1 7 _ i n d o n e s i a / e n /
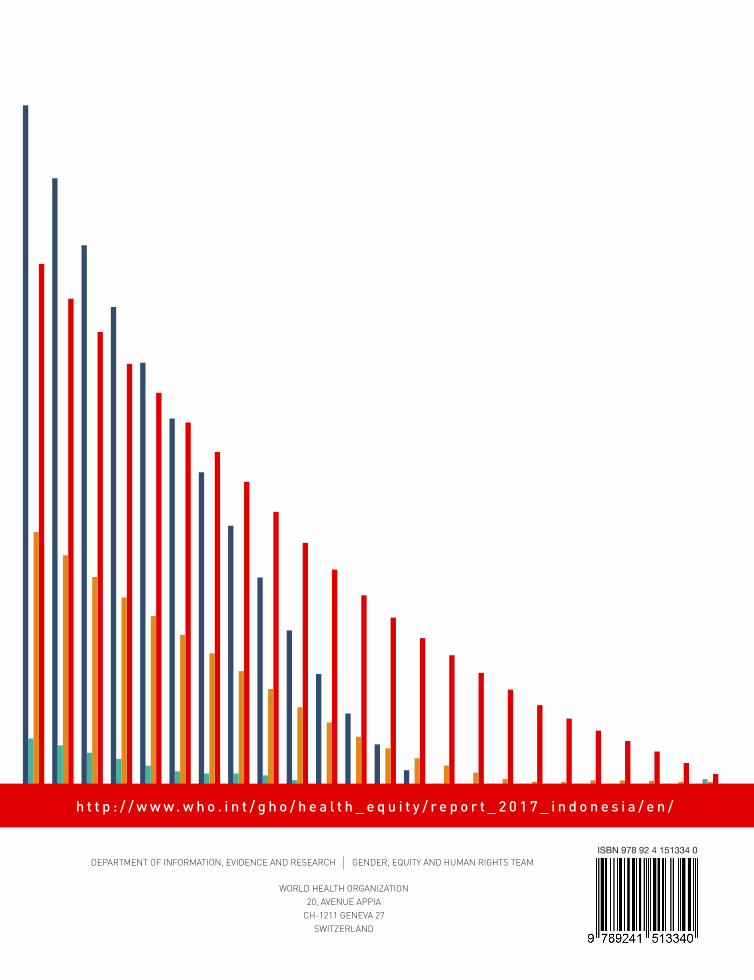
STATE OF H
EALTH
INEQ
UA
LITY: IND
ON
ESIA
h t t p : / / w w w . w h o . i n t / g h o / h e a l t h _ e q u i t y / r e p o r t _ 2 0 1 7 _ i n d o n e s i a / e n /
DEPARTMENT OF INFORMATION, EVIDENCE AND RESEARCH
WORLD HEALTH ORGANIZATION20, AVENUE APPIA
CH-1211 GENEVA 27SWITZERLAND
GENDER, EQUITY AND HUMAN RIGHTS TEAMISBN 978 92 4 151334 0