Growth-irradiance relationships in phytoplankton
11
Limnol. Oceanogr., 30(2), 1985, 311-321 0 1985, by the American Society of Limnology and Oceanography, Inc. Growth-irradiance re.lationships in phytoplankton’ Paul G. Falkowski Oceanographic Sciences Division, Brookhaven National Laboratory, Upton, New York 11973 Zvy Dubinsky Department of Life Sciences, Bar Ban University, Ramat Gan, Israel 52100 Kevin Wyman Oceanographic Sciences Division, Brookhaven National Laboratory Abstract The steady state growth rates of three species of marine phytoplankton, Thalassiosira weisflogii, Isochrysis galbana, and Prorocentrum micans, were followed in turbidostat culture. At each growth irradiance, photosynthesis and respiration were measured by following changes in oxygen. Together with measurements of optical absorption cross sections, cellular chlorophyll, carbon and nitrogen, and excretion rates as well as knowledge of the quantum flux, the quantum requirement for growth (l/&J and photosynthesis (l/&J were calculated. Our results suggest that variations in growth rate caused by changes in irradiance may be related to changes in respiration rates relative to growth as well as changes in optical absorption cross sections for a given species. Interspecific differences in growth rate at a given irradiance are not related to changes in respiration however, but are primarily attributable to differences in optical absorption cross sections normalized to chlorophyll a and differences in chlorophyll : carbon-ratios. A basic problem in phytoplankton phys- iological ecology has been that of defining relationships between irradiance, photosyn- thesis, and growth (e.g. Eppley 1972). Al- though the relationship between growth and photosynthesis is fixed for a given species under nutrient-saturated, steady state growth conditions (Laws and Bannister 1980), the relationships between irradiance and pho- tosynthesis and between photosynthesis and growth may vary between species. At least five hypotheses can be advanced to account for interspecific variations in the relation- ship between irradiance and growth: differ- ences in the light-harvesting properties of different species; variations in photosyn- thetic machinery which result in changes in the quantum requirement of photosynthe- sis; differences in photosynthesis : respira- tion ratios; varying proportions of photo- synthetically fixed carbon which is excreted or secreted; and the *chemical composition of different species influencing photosyn- thetic quotients. These hypotheses are not mutually exclu- sive, but some factors may be more impor- ’ This research was performed under the auspices the U.S. DOE Contract DE-AC02-76CHOOO 16. of tant in influencing the relationship between irradiance and growth than others. Here we use a simple model (Kiefer and Mitchell 1983) relating growth to irradiance in pho- toautotrophic organisms. The model ex- plicitly or implicitly includes each of the aforementioned factors. Our goal here is to investigate the relative importance of these variables on growth-irradiance relation- ships. We compared the photosynthetic perfor- mance and growth-irradiance relationships in three species of marine phytoplankton, the diatom Thalassiosira weisflogii, the chrysophyte Isochrysis galbana, and the dinoflagellate Prorocentrum micans. All species were grown in a turbidostat under identical growth conditions in continuous irradiance to avoid any variations in pho- tosynthetic activities and growth responses arising from nutrient limitation or photo- periodicity. We thank D. Kiefer and E. Laws for dis- cussions, comments, and suggestions on this manuscript. Materials and methods Culture conditions- Thalassiosira weis- flogii Bacillariophyceae (clone T. VIC, iso- 311
-
Upload
independent -
Category
Documents
-
view
0 -
download
0
Transcript of Growth-irradiance relationships in phytoplankton
Limnol. Oceanogr., 30(2), 1985, 311-321 0 1985, by the American Society of Limnology and Oceanography, Inc.
Growth-irradiance re.lationships in phytoplankton’
Paul G. Falkowski Oceanographic Sciences Division, Brookhaven National Laboratory, Upton, New York 11973
Zvy Dubinsky Department of Life Sciences, Bar Ban University, Ramat Gan, Israel 52100
Kevin Wyman Oceanographic Sciences Division, Brookhaven National Laboratory
Abstract
The steady state growth rates of three species of marine phytoplankton, Thalassiosira weisflogii, Isochrysis galbana, and Prorocentrum micans, were followed in turbidostat culture. At each growth irradiance, photosynthesis and respiration were measured by following changes in oxygen. Together with measurements of optical absorption cross sections, cellular chlorophyll, carbon and nitrogen, and excretion rates as well as knowledge of the quantum flux, the quantum requirement for growth (l/&J and photosynthesis (l/&J were calculated. Our results suggest that variations in growth rate caused by changes in irradiance may be related to changes in respiration rates relative to growth as well as changes in optical absorption cross sections for a given species. Interspecific differences in growth rate at a given irradiance are not related to changes in respiration however, but are primarily attributable to differences in optical absorption cross sections normalized to chlorophyll a and differences in chlorophyll : carbon-ratios.
A basic problem in phytoplankton phys- iological ecology has been that of defining relationships between irradiance, photosyn- thesis, and growth (e.g. Eppley 1972). Al- though the relationship between growth and photosynthesis is fixed for a given species under nutrient-saturated, steady state growth conditions (Laws and Bannister 1980), the relationships between irradiance and pho- tosynthesis and between photosynthesis and growth may vary between species. At least five hypotheses can be advanced to account for interspecific variations in the relation- ship between irradiance and growth: differ- ences in the light-harvesting properties of different species; variations in photosyn- thetic machinery which result in changes in the quantum requirement of photosynthe- sis; differences in photosynthesis : respira- tion ratios; varying proportions of photo- synthetically fixed carbon which is excreted or secreted; and the *chemical composition of different species influencing photosyn- thetic quotients.
These hypotheses are not mutually exclu- sive, but some factors may be more impor-
’ This research was performed under the auspices the U.S. DOE Contract DE-AC02-76CHOOO 16.
of
tant in influencing the relationship between irradiance and growth than others. Here we use a simple model (Kiefer and Mitchell 1983) relating growth to irradiance in pho- toautotrophic organisms. The model ex- plicitly or implicitly includes each of the aforementioned factors. Our goal here is to investigate the relative importance of these variables on growth-irradiance relation- ships.
We compared the photosynthetic perfor- mance and growth-irradiance relationships in three species of marine phytoplankton, the diatom Thalassiosira weisflogii, the chrysophyte Isochrysis galbana, and the dinoflagellate Prorocentrum micans. All species were grown in a turbidostat under identical growth conditions in continuous irradiance to avoid any variations in pho- tosynthetic activities and growth responses arising from nutrient limitation or photo- periodicity.
We thank D. Kiefer and E. Laws for dis- cussions, comments, and suggestions on this manuscript.
Materials and methods Culture conditions- Thalassiosira weis-
flogii Bacillariophyceae (clone T. VIC, iso- 311

312 Falkowski et al.
lated from Long Island Sound), I. galbana (clone ISO, provided by R. R. L. Guillard) and P. micans (clone PRO, isolated from Long Island Sound) were grown in natural seawater (29-3OYm) enriched with F/2 nu- trient levels (Guillard and Ryther 1962). Sil- icate was omitted from the P. micans and I. galbana cultures. The three species have similar temperature optima for growth (-20°C).
Cells were grown in steady state turbi- dostat cultures at 18” + 1°C in continuous light provided by banks of VHO fluorescent tubes at five irradiance levels: 30, 70, 150, 320, and 600 pmol quanta m-2 s-l. Irradi- ance was varied by changing either the num- ber of tubes used or their distance from the culture vessel. Diffuse scalar irradiance (400-700 nm) in the growth chamber was measured with a calibrated 47r quantum sensor (Biospherical Instruments QSL 100). The cultures were kept optically thin to minimize self-shading.
The culture vessel consisted of a 3.2-liter inner glass cylinder, 10 cm in diameter by 50 cm long, enclosed in a thermostatted water jacket. The vessel was stirred with a magnetic stirring bar and CO2 was provided by bubbling sterile air at 0.8 liter min-’ through a fine fritted glass tube near the bottom of the culture vessel. The culture was constantly recirculated by a Teflon dia- phragm pump through a 1 O-cm-long optical cuvette external to the culture vessel. A red light-emitting diode (X = 674 nm), flashing 1 s-l, and a matched photodiode served as the turbidity sensor. When the diode output voltage fell below a preselected threshold, a relay triggered a dual-head peristaltic pump that diluted the culture by simultaneously adding fresh media and removing old cul- ture. The flow rate of the pump was mea- sured and the number of seconds during each hour that the pump was on logged by a Hewlett-Packard HP85 computer, so that growth rates could be calculated hourly. Daily growth rates were calculated with the equation
P = v/V, x 24 (1) where V, is the culture volume (3,200 ml) and v is the rate of medium addition (ml h-l).
Photosynthesis-respiration measurements- Photosynthesis-irradiance profiles were ob- tained on at least three consecutive days for each steady state growth condition. Ap- proximately loo-ml samples were taken from the turbidostat; 30-ml subsamples were filtered on 25-mm Whatman GF/F glass- fiber filters for pigment analyses, and lo- and 20-ml samples were filtered on 13-mm precombusted Gelman AE glass-fiber filters for CHN analyses. A 5-lo-ml aliquot was taken for cell counts. Cells were counted both with a hemocytometer and a Coulter Counter (TA II). The remaining 30-35 ml of sample was gently bubbled with N2 through a Pasteur pipette to between 80 and 90% O2 saturation. A 7-ml sample was placed in a specially constructed tempera- ture-controlled PVC chamber with glass windows (Dubinsky and Falkowski in prep.). The chamber temperature was kept at 18.00” + 0.05”C with a water bath (Neslab RTE-5DD).
Light was provided by a tungsten source filtered through an infrared filter (Shott Glass RG-5) and a water-filled 500-ml roundbot- tom flask which also served as a lens. Light was attenuated with neutral density screens. The culture was continuously stirred and oxygen production or consumption mea- sured with a Clark-type electrode (Yellow Springs). The electrode was amplified with an operational amplifier (LF 356) with po- larizing and bucking circuits and the analog signal was recorded on a chart recorder. Light was simultaneously measured with a calibrated 2~ quantum sensor (LiCor LI- 190) mounted on the chamber behind the sample. Less than 2% of the incident irra- diance was attenuated through the full thickness of the sample chamber (1 .O cm).
Respiration was measured before illu- mination and measurements were recorded for at least 15 min. Gross photosynthesis- irradiance profiles were fit empirically for each experimental run. Photosynthesis-ir- radiance profiles were measured in triplicate on successive days for each species at each growth irradiance.
Chlorophylls were extracted by homog- enizing the filtered samples in 90% acetone in a glass mortar with a motor-driven Tef- lon pestle. The samples were clarified by

Growth-irradiance relationships 313
filtration and the corrected spectra were re- the general relationship between growth, II, corded on a spectrophotometer (Aminco and growth irradiance, Zp, within the con- DW-2a). Chlorophyll concentrations were text of a simple model. For a photosynthetic calculated with the equations of Jeffrey and organism growing in a steady state at a given Humphrey (1975). irradiance:
In vivo absorption spectra were measured in unconcentrated cell suspensions placed in l- x 1 -cm cuvettes close to the photo- multiplier tube of the spectrophotometer and recorded relative to distilled water. The spectra, corrected for baseline variations, were stored by a computer (HP 85) and used to calculate wavelength-specific cross sec- tions of optical absorption normalized to chlorophyll a (so-called kCA values: Dubin- sky et al. 1984, in press). The spectral dis- tribution of light was measured with a spec- troradiometer (Biospherical Instr. MER 1000). The spectrally averaged absorption cross section, normalized to chlorophyll a, & was calculated for the given light regime with the equation:
p = [EC x F x (1.04 X 10⁹)
X [l - (r + E)lPJ X M (3)
where p is the specific growth rate (d-l), & is the optical absorption cross section nor- malized to chlorophyll a (m2 mg-’ Chl a), Chl:C is the cellular chlorophyll to carbon ratio (mg mg-l), lfi is the incident growth irradiance, 400-700 nm (pm01 quanta me2 s-l), &, is the quantum yield for gross pho- tosynthesis at the given growth irradiance (mol O2 per mol quanta absorbed), Pg is the gross photosynthetic rate at Zfi (sometimes referred to as photosynthetic performance), r is the dark respiration rate, E is the ex- cretion rate of dissolved organic carbon at the given growth irradiance, and A4 is the assimilation quotient of CO,:O, (described in the text). The constant 1.04 x 10” is used to convert units from pm01 quanta m-2 s-l to mol quanta m-2 d-l and from mg C to mol C. Pg, r, and E may be expressed in either carbon or oxygen equivalents but the fractions r/Pg and E/P, must be dimension- less.
where AX is the wavelength interval of the spectral band and I, is the irradiance in spectral band A&,. Further details of the method and the mathematical derivations of I;, are given elsewhere (Dubinsky et al. 1984, in press; Bannister and Weidemann 1984).
Excretion of dissolved organic carbon was estimated relative to total carbon fixed. Ten- milliliter samples were withdrawn from the turbidostat and incubated with 5 &i NaHCO, for 24 h at the growth irradiance. The samples were filtered and the filtrate was acidified with 100 ~1 of coned HCl. Sub- samples of the acidified filtrate were left overnight in open scintillation vials. Radio- carbon in filters and filtrates was measured with a liquid scintillation counter (Beckman 3 150T) with Aquasol (New England Nucle- ar) as the scintillation cocktail, Particulate carbon and nitrogen were measured with an elemental analyzer (Perkin-Elmer 240B).
Results and discussion
The growth-irradiance model-Before we consider experimental data, let us consider
This model is similar to that of Kiefer and Mitchell (1983), with the following dif- ferences: the optical absorption cross sec- tion for chlorophyll a is calculated differ- ently (ref. Eq. 2); an excretion term is included here; and a correction is made for the assimilation quotient in the calculation of &,, which is expressed in O2 per quanta absorbed.
The ability of a cell to harvest light energy is directly proportional to the effective op- tical absorption cross section of the pho- tosynthetic pigments (Kiefer and Mitchell 1983; Dubinsky et al. in press). When the integrated cross section is normalized to Chl a within a specific light field, it is denoted by & (Bannister 1974). This absorption cross section has dimensions of m2 mg-l Chl a and is useful in calculating the probability

314 Falkowski et al.
I pL(pmol
100 quanta m-2s-1)
Fig, 1. Relationship between steady state growth OL) and growth irradiance (I,) for Thalassiosira weis- jlogii (0), Isochrysis galban; (A), and Prorocentrum micans (Cl) grown in turbidostat culture at 18°C.
of photons being absorbed by a cell if the photon flux density and Chl a concentration are known. Because cells do not absorb all wavelengths of light equally (i.e. they are not black) the probability of a photon being absorbed depends not only on the pigments in the cell but also on the wavelengths of the photon flux.
The product of EC and the Chl:C ratio at a given growth irradiance can be conceived of as an abstract representation of the ab- sorption cross section of cellular carbon (a3 (Kiefer and Mitchell 1983). Interspecific dif- ferences in gc reflect differences in light-har- vesting properties relative to cellular carbon content. The product of cc and Ip is pro- portional to the probability of photons being absorbed by the cellular carbon. It must be kept in mind that cellular carbon has no real optical absorption cross section; 6, is a mathematical construct, not a biological en- tity.
The efficiency of transduction of light en- ergy at Ip to chemical energy is represented by a quantum yield, $. If only light har- vesting and b are considered, 4 will be a quantum yield for growth, $r. If however, respiratory and excretory losses are known at Ip, then it is possible further to calculate a quantum yield for gross photosynthesis, &,. The values of &, and Ip do not necessarily correspond to the maximal quantum yield of photosynthesis but will be less as the probability of multiple hits of photosyn-
3 2 1.0 0 ,- 0.8 0 yO.6 5 $ 0.4 lx
---LdIILI--- I 100 1000
Ip(pmol quanta m-%-l)
Fig. 2. Normalized Chl:C ratios as a function of I, for the three species (symbols as in Fig. 1).
thetic reaction centers increases with in- creasing photon flux densities (Dubinsky et al. in press). Neither $r nor &, can be mea- sured directly, but both can be calculated in the steady state from the other (measurable) variables in Eq. 3. Interspecific variations in &, at the same growth irradiances reflect many variations in photosynthetic mecha- nisms, molecular design of the photosyn- thetic machinery, or both.
Growth rates- Specific growth rates ranged 24-fold, from 0.075 d-l in Proro- centrum grown at 75 pm01 quanta m-2 s-l to 1.80 d-l in Thalassiosira grown at 600 pmol quanta m-2 d-l. The relationship be- tween p and IW varied uniquely for each species (Fig. 1). The growth of P. micans at 30 hmol quanta mm2 s-l was so low as to be unreliable, and the dinoflagellate had the lowest specific growth rates at all growth irradiance levels. Isochrysis and Thalassio- sira had very similar growth responses at lower growth-irradiance levels, but growth of Isochrysis became light saturated at ca. 200 pmol quanta m-2 s-l, while in Thalas- siosira growth was just beginning to show effects of light saturation at 600 pmol quan- ta rnB2 s-l. Regression analyses of p vs. log I,, in the light-limited regions of the growth curves predicted compensation growth-ir- radiance levels (i.e. Ip at p = 0) of 17, 16, and 23 pmol quanta m-2 s-’ for Prorocen- trum, Isochrysis, and Thalassiosira. Al- though these compensation growth irradi- antes are similar, the fact that the slopes of the regressions were 0.12 for Prorocentrum,

Growth-irradiance relationships 315
Table 1. Growth (p, d-l), gross photosynthesis (P, pmol O2 cell-’ min-’ x lOlo), net growth efficiency (~3, respiration (r, pmol 0, cell-’ min-l x lOlo), chemical and calculated quantum requirements (I/@) for the three species of marine phytoplankton grown in steady state 18°C at each growth-irradiance level, 1, (pm01 quanta m-2 s-l). a
k Chl:C C:N UC w ‘4, 1 /tip
4 P ‘;$ ‘y ‘W)‘l
p, r (dry? P. (mol V C cell .I mg-’ C (quanta (quanta
mol-I) (pm’) (PP) x 104) c-0 02-‘)
Prorocentrum micans 70 0.075 0.0 11 6.21 133 0.083 0.47 4.3 4,340 1,068 0.68 66 21
150 0.108 0.012 4.74 165 2 0.115 0.49 4.8 5,096 1,096 0.57 82 27 320 0.164 0.013 2.89 230 125 0.195 0.46 4.8 5,122 1,117 0.40 81 25 600 0.178 0.021 2.42 280 150 0.205 0.46 4.6 5,350 1,178 0.51 179 57
Isochrysis galbana 30 0.30 0.0090 23.81 2.9 1.1 0.183 0.62 7.3 37 10.3 2.14 22 11 70 0.70 0.0104 17.24 5.9 1.3 0.198 0.79 6.4 50 12.4 1.79 19 11
150 1.10 03112 13.70 11.8 2.0 0.224 0.83 6.6 55 15.0 1.53 21 14 320 1.2 0.0131 8.77 15.0 2.2 0.206 0.85 6.0 52 16.5 1.15 33 20 600 1.2 0.0206 5.78 16.2 2.3 0.199 0.86 8.7 57 20.0 1.19 62 43
Thalassiosira weisflogii 30 0.25 0.0038 50.00 38 20 0.278 0.47 7.4 1,172 275 1.90 23 9 70 0.62 0.0044 42.74 130 47 0.351 0.64 7.7 1,460 277 1.88 22 11
150 1.15 0.0047 34.60 220 72 0.559 0.67 7.6 1,675 291 1.63 22 12 320 1.73 0.0058 21.10 360 75 0.455 0.79 9.7 1,364 328 1.22 23 14 600 1.80 0.0078 15.53 490 82 0.362 0.83 9.4 1,480 326 1.19 42 27
1.14 for Isochrysis, and 1.29 for Thalassio- sira suggests that per unit increase in PAR the flagellate and diatom had - 1 O-fold more growth than did the dinoflagellate.
Chl:cell and Chl:C ratios--n all species Chl:cell increased with decreasing growth- irradiance levels and Chl:C ratios, which ranged from 0.0024 to 0.05 (w/w), increased logarithmically with decreasing IP. When Chl:C ratios were normalized to the highest value for each species, the relative changes in these normalized ratios with log Iti (i.e. the slopes of normalized Chl:C vs. log Ifi) were not significantly different for the three species (Fig. 2).
Chlorophyll and carbon-specific absorp- tion cross sections- The integrated Chl-spe- cific absorption cross sections, It,, invari- ably decreased with decreased growth irradiance (Table 1). The variations in mea- sured I;, values with growth irradiance re- ported here suggest that the assumption of a constant & value, irrespective of growth irradiance, is incorrect (e.g. Laws and Ban- nister 1980). The variations in EC within a given species are strongly correlated with Chl:C ratios (Fig. 3). This effect is largely a consequence of variations in self-shading .
within the chloroplast membranes as cells adapt to the various irradiance levels. When cells become shade adapted there often is an increase in the chloroplast membrane surface area and thylakoid stacking. In- creases in thylakoid stacking increase the probability that a photon will be absorbed; however, pigment molecules in the center of a large stack may rarely have an oppor- tunity to absorb photons directly, as most of the quanta will have already been har- vested by pigment molecules in distal thy- lakoids, closer to the photon source. Thus, the same intracellular concentration of chlorophyll may absorb varying fractions of light, depending on the thickness of the thy- lakoid stack. Of course the absolute absorp- tion cross section of a Chl a molecule at a given wavelength is a constant; it is only the average cross section of all the molecules which changes in vivo. This phenomenon can be empirically corrected in in vivo spec- tra (Duysens 1956; Kirk 1975) to determine the actual intracellular chlorophyll concen- tration. It should be stressed however, that such corrections should not be made if one is interested in the in vivo absorption cross section of a cell in a given light field.

316 Falkowski et al.
1- Cl A
0 0
‘lo.olo q A
A A
o.o+ 0
o.oolL 0.00 0.01 0.02 0.03 0.04 0.05
Chl:C
Fig. 3. Relationship between optical absorption cross section normalized to Chl a (EJ and Chl:C ratio (symbols as in Fig. 1).
The values of I;, ranged from 0.0038 to 0.021 m2 mg-l Chl a. The decreases in 5 with decreased growth irradiance partially offset the increase in Chl:cell. Nevertheless, because C:cell also decreased with de- creased growth irradiance, the calculated absorption cross sections, normalized to cell carbon, (T,, generally were larger at lower growth-irradiance levels. An exception to this trend was observed in Prorocentrum grown at 600 pmol quanta mm2 s-l, where, because of an increased Ec due to higher carotenoid : Chl ratios, cc increased more markedly than predicted from the data of cells grown at lower irradiance levels. Ab- solute values of cc ranged from 4.0 x 10e5 m2 mg-’ C in Prorocentrum to 2.1 X 10e4 in Isochrysis (Table 1). Isochrysis and Tha- lassiosira had similar cc values at the same growth-irradiance levels, about 2.1 -fold higher than those calculated for Prorocen- trum.
Excretion- Excretion of DOC, measured by release of acid-stable 14C products after 24-h incubations at IW, accounted for <5% of the 14C fixed in all species and no sys- tematic variation in excretion with either p or Ip was observed (data not shown). We acknowledge that excretion of DOC may be > 5% of gross photosynthesis if cells are not uniformly labeled before measurement of 14C excretion, or are nutrient limited (Sharp 1977). Nevertheless, our results suggest that in the data presented here, excretion was so low as to be insignificant and we did not
Fig. 4. Gross photosynthesis (P,) at each growth irradiance for the three species (symbols as in Fig. 1).
correct for excretion in our estimates of &. However, excretion can be very significant in some systems such as zooxanthellae in vivo (Muscatine et al. 1984) or in severely nutrient limited phytoplankton communi- ties.
Photosynthesis and respiration- Both gross photosynthetic performance (Pg) (Fig. 4) and dark respiration (r) increased with increased growth irradiance. Specific res- piration (rp in d-l) was calculated from the relationship:
(4)
Specific respiration was low in Prorocen- turn, ranging from 0.083 to 0.205 d-l. In the other two species rP ranged from 0.183 to 0.559 d-l (Table 1). The ratio of specific respiration to total growth and respiration was calculated as
Pe cl- -L ( > ’ P + rr* (5)
This fraction represents the efficiency by which cells retain fixed carbon for growth (i.e. it is the ratio of net to gross photosyn- thesis, sometimes called net growth effi- ciency) .
Values of pe are remarkably constant for Prorocentrum, averaging 0.48. Simply put, at all growth irradiance levels studied Pro-

Growth-irradiance relationships 317
rocentrum respired - 52% of the carbon it to increase at the highest growth-irradiance fixed and retained -48% for growth. Sim- levels. ilar calculations for Isochrysis and Thalas- For cells in balanced, steady state growth, siosira reveal that net growth efficiencies are w the photosynthetic assimilation of carbon is generally higher in these species, ranging from 0.47 to 0.83 in Thalassiosira and from 0.62 to 0.86 in Isochrysis. These calcula- tions show that although a’bsolute values of specific respiration may be low (e.g. in Pro- rocentrum), the net growth efficiency of the organism may also be low. Our results sug- gest that specific respiration per se contains no information about growth efficiency, and that rfi should be considered along with p in the context of Eq. 5.
Quantum yields-The quantum yields for growth (mol C per mol quanta absorbed) calculated from the equation
. Ecx$ ( > x IM x (1.04 X 10⁹)
= 6, x P, x M (6)
ranged from 0.0056 to 0.0526. tifi was rel- atively constant at Ip < 320 pmol quanta m-2 s-l but decreased by as much as a factor of 2 when Z,, was increased to 600 pmol quanta rnM2 s-l. Prorocentrum had the lowest values of & at all growth irradiance levels, while Isochrysis and Thalassiosira had similar Cp, below 600 pmol quanta m-2 s-l.
Values of &, ranged from 0.111 to 0.0 175. & values were lower for Prorocentrum at all growth-irradiance levels (Table 1). When Isochrysis growth became light saturated, &, increased markedly.
Cell carbon, nitrogen, and volume- Cell carbon and volume (Table 1) ranged over two orders of magnitude in the three species; Zsochrysis was the smallest and Prorocen- trum was the largest. Both carbon and vol- ume tended to increase with increasing growth irradiance. This trend was most pro- nounced in Zsochrysis, where cell carbon doubled from 10.3 to 20.0 pg cell-’ between 30 and 600 pmol quanta m-2 s-l.
C:N ratios were relatively low in Proro- centrum, averaging 4.6 (mol mol-l), and re- mained unaffected by growth irradiance. In both Isochrysis and Thalassiosira C:N ra- tios were higher on the average and tended
stoichiometrically related to oxygen evo- lution. However the ratio of carbon incor- porated to oxygen evolved depends on the nitrogen source and the chemical compo- sition of the cell. Cellular N is reduced and may be considered to be NH3. Cellular C has a wide range of reduction levels, but may be approximated as carbohydrate (CH20), (Myers 1980). The source of nitro- gen in our study was N03-. For each or- ganism a set of balanced growth equations can be written:
nC0, + (n + 1)H20 + HN03 + (CH20),NH3 + (n + 2)02.
When C and N ratios for the algae are cal- culated in moles (=n) the ratio of CO,:O, will be n/n + 2. The calculated CO,:O, ra- tios averaged 0.70 in Prorocentrum, 0.77 in Isochrysis, and 0.80 in Thalassiosira. These calculations suggest that the efficiency of in- corporation of C into new cells per unit O2 evolved is - 15% higher in Thalassiosira than in Prorocentrum. Put in another way, even if the minimum quantum requirement for O2 evolution were identical for the two species, the minimum quantum require- ment for carbon assimilation would average - 15% more in Prorocentrum than in Tha- lassiosira.
Eficiency of light utilization-Let us con- sider the question of changes in the effi- ciency of light utilization with growth ir- radiance. For each species, at each growth irradiance, the number of pigment mole- cules associated with a photosynthetic re- action center varies. Consider now only those pigments associated with photosys- tern 2 (PS2). The pigments serve as anten- nae for a reaction center and have optical absorption cross sections which vary with the spectral distribution of the light field and the number of pigment molecules associ- ated with PS2. The absorption cross section describes the probability of a photon being absorbed within the defined light regime. Once absorbed the photon can either drive an electron from a PS2 reaction center to an acceptor (photochemistry), be re-emitted
318 Falkowski et al.
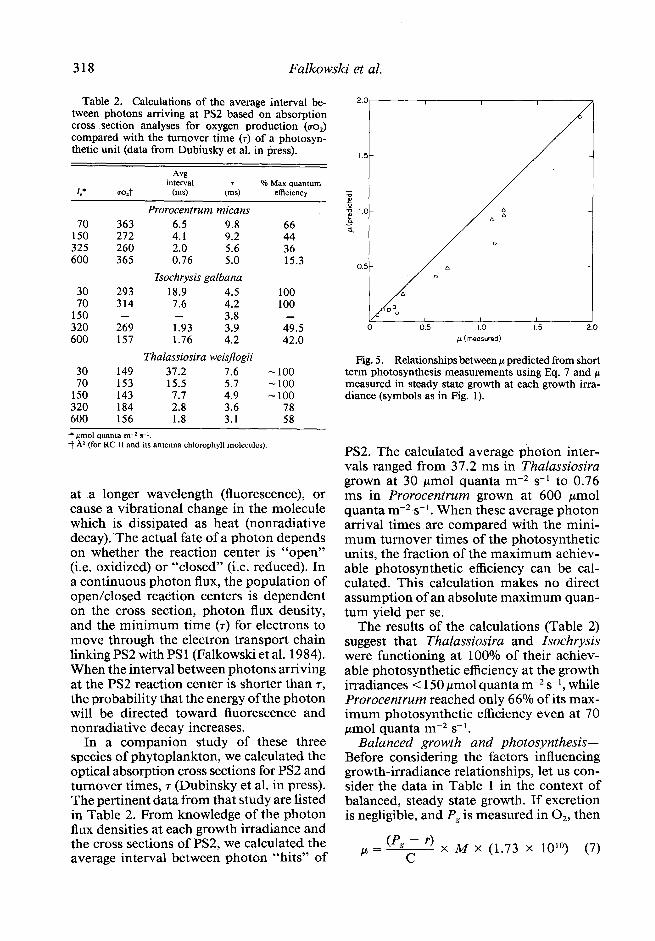
Table 2. Calculations of the average interval be- tween photons arriving at PS2 based on absorption cross section analyses for oxygen production (a~,) compared with the turnover time (T) of a photosyn- thetic unit (data from Dubinsky et al. in press).
Avg interval 7 % Max quantum
A* mt (ms) (ms) efficiency
Prorocentrum micans 70 363 6.5 9.8 66
150 272 4.1 9.2 44 325 260 2.0 5.6 36 600 365 0.76 5.0 15.3
Isochrysis galbana 30 293 18.9 4.5 100 70 314 7.6 4.2 100
150 - 3.8 - 320 269 1.93 3.9 49.5 600 157 1.76 4.2 42.0
Thalassiosira weisflogii 30 149 37.2 7.6 -100 70 153 15.5 5.7 -100
150 143 7.7 4.9 -100 320 184 2.8 3.6 78 600 156 1.8 3.1 58 * pm01 quanla m-z s-l. t A2 (for RC 11 and its antenna chlorophyll molecules).
at a longer wavelength (fluorescence), or cause a vibrational change in the molecule which is dissipated as heat (nonradiative decay). The actual fate of a photon depends on whether the reaction center is “open” (i.e. oxidized) or “closed” (i.e. reduced). In a continuous photon flux, the population of open/closed reaction centers is dependent on the cross section, photon flux density, and the minimum time (7) for electrons to move through the electron transport chain linking PS2 with PS 1 (Falkowski et al. 1984). When the interval between photons arriving at the PS2 reaction center is shorter than T, the probability that the energy of the photon will be directed toward fluorescence and nonradiative decay increases.
In a companion study of these three species of phytoplankton, we calculated the optical absorption cross sections for PS2 and turnover times, 7 (Dubinsky et al. in press). The pertinent data from that study are listed in Table 2. From knowledge of the photon flux densities at each growth irradiance and the cross sections of PS2, we calculated the average interval between photon “hits” of
p (measured 1
Fig. 5. Relationships between CL predicted from short term photosynthesis measurements using Eq. 7 and p measured in steady state growth at each growth irra- diance (symbols as in Fig. 1).
PS2. The calculated average photon inter- vals ranged from 37.2 ms in Thalassiosira grown at 30 pmol quanta m-2 s-l to 0.76 ms in Prorocentrum grown at 600 pm01 quanta m-2 s-l. When these average photon arrival times are compared with the mini- mum turnover times of the photosynthetic units, the fraction of the maximum achiev- able photosynthetic efficiency can be cal- culated. This calculation makes no direct assumption of an absolute maximum quan- tum yield per se.
The results of the calculations (Table 2) suggest that Thalassiosira and Isochrysis were functioning at 100% of their achiev- able photosynthetic efficiency at the growth irradiances < 150 pmol quanta m-2 s-l, while Prorocentrum reached only 66% of its max- imum photosynthetic efficiency even at 70 pm01 quanta m-2 s-l.
Balanced growth and photosynthesis- Before considering the factors influencing growth-irradiance relationships, let us con- sider the data in Table 1 in the context of balanced, steady state growth. If excretion is negligible, and Pg is measured in 02, then
P = !%$ x M x (1.73 X 10”) (7)

Growth-irradiance relationships 319
Table 3. Correlation matrices calculated individually for the three species of marine phytoplankton at all growth-irradiance levels.
;;” ehl:C
0.771 Prorocentrum micans
-0.998 -0.616 -0.757 -0.515
0.563
0.68 1 Isochrysis galbana
-0.953 0.959 -0.848 0.634
-0.962
0.875 Thalassiosira weisfogii
-0.990 0.965 -0.933 0.88 1
-0.966
-0.862 0.600 0.155
0.464 -0.647 -0.166 -0.786
-0.976 0.056 0.690
-0.238 -0.913 0.011
-0.117
-0.976 0.860 0.773
-0.900 , -0.876 0.805 -0.922
where p is in d-l, Pg and r are in pmol O2 cell-l min-‘, C is cell carbon in pg, and the constant 1.73 x 10 lo is used to convert (Pg - r)M to units of pg C per day.
Using the data in Table 1 we calculated p from Eq. 7 and compared the values with p measured in the turbidostat cultures (Fig. 5). The values of p predicted by Eq. 7 were consistently lower than the actual values of h. A linear regression yielded the relation- ship:
I-L (predicted) = 0.86 h (actual) - 0.03 (r2 = 0.91, n = 14).
At least three sources of error could con- tribute to the apparent inconsistency be- tween the predicted and measured growth rates. First, we assumed that respiration measured in the dark within the first 30 min after removal from the turbidostat was the same as the dark respiration in the turbi- dostat. If dark respiration in the light is low- er than that measured as oxygen consump- tion in the dark (i.e. if there is a “Kok” effect) Eq. 7 would consistently underesti- mate h. Second, photosynthetic perfor- mance was measured in a separate chamber than the turbidostat culture. We extrapo- lated Pg from the photosynthesis-irradiance profile back to the turbidostat. Small dif-
ferences in the light field could make large differences in Pg measurements, especially if Pg is measured at subsaturating irradiance levels (most cases). Third, the time scale of measurement for Pg and r from the oxygen electrode data is of the order of minutes, while growth in the turbidostat is recorded hourly and averaged over days. Although we ran each P vs. I curve in (at least) trip- licate, small errors in short term measure- ments of oxygen can appear to be large when extrapolated to daily rates.
It is technically difficult to resolve these inconsistencies experimentally. Accurate measurements of growth from short term measurements of photosynthesis are very difficult to achieve at subsaturating irradi- ance levels and, while experimentally easier to accomplish at saturating irradiance, not often made (Myers pers. comm.). We sug- gest, therefore, that our calculations of l/$, are probably somewhat low, since on av- erage the short term data of Pg and r account for only 86% of the observed growth and these data were used to calculate &, (Eq. 3).
Factor analyses-Let us return to our hy- potheses and analyze the data from the viewpoint of accounting for interspecific dif- ferences in p. Correlation matrices were computed from the data presented in Table

320 Falkowski et al.
Table 4. Correlation matrix for the three species combined.
r;, Chl:C /& UC M
!t -0.184 &l:C
-0.806 0.07 1 0.000 0.868 0.226 0.770 -0.443 -0.033
0.549 Pe 0.378 0.673 gc 0.653
1 for each species individually (Table 3). Irradiance was not included in the corre- lation matrices as it is a parameter selected in the experimental design. Furthermore &, and & were not included as they were cal- culated from the other (dependent) vari- ables. The correlation matrices suggest that for all specks p is highly positively corre- lated with kc and highly negatively corre- lated with Chl:C ratios and gc. In addition kc and Chl:C were highly negatively corre- lated with each other. In Thalassiosira and Isochrysis p was highly positively correlated with pe.
To account for interspecific differences in growth we look for the factors in our model which are highly correlated for individual species but weakly correlated for pooled data. When the data for the three species are pooled (Table 4), a different relationship emerged than for individual species: p was strongly positively correlated with I.C, and C:N ratios as reflected by Mand very weak- ly with Chl:C, I;,, or (T,. From these corre- lation matrices we conclude that differences in growth within a species are generally cor- related with net growth efficiencies as well as with chlorophyll- and carbon-normalized absorption cross sections (i.e. I;, and a& but that interspecific variations in p are strongly related to Chl:C ratios and to a lesser extent to & These results support the conclusion of Kiefer and Mitchell (1983) that growth is strongly influenced by absorption cross sections.
Our results suggest that the relationship of specific respiratory losses to the specific growth rates is an important parameter in- fluencing interspecific differences in p at a given growth irradiance. The influence of loss processes on growth is related to the difference Ml@, - I/&,. The differences be- tween the two quantum requirements is
another way of looking at net growth effi- ciencies. The data in Table 1 imply that this difference is largest for Prorocentrum at all growth-irradiance levels, and smallest for Thalassiosira.
It is interesting that in Thalassiosira l/&, approached the minimum quantum re- quirement of - 8 quanta per O2 at growth- irradiance levels of 30 and 70 pmol quanta mm2 s-l. Furthermore, Prorocentrum should have approached 100% of maximal quan- tum efficiency at -45 pm01 quanta m-2 s-l on the basis of its average absorption cross section and turnover time (Table 2). At that quantum flux density, however, its growth rate would approach zero because its respi- ratory losses are so large.
Respiratory activity provides the means by which cells convert the primary products of photosynthesis (carbohydrates) to new cell material (i.e. protein). Unfortunately respi- ratory losses are difficult to measure and probably are better predicted from growth measurements than vice versa. Measuring the loss of inorganic l 4C from isotopically labeled phytoplankton is not satisfactory because the potential for dark refixation of respired carbon can lead to severe under- estimates of true dark respiration (Cosper 1982). Unless cells are uniformly labeled, losses of 14C may not reflect true losses of inorganic carbon. At present a better, but more time-consuming, method for measur- ing respiratory losses is to follow changes in oxygen. Still, this method is not altogether satisfactory, and more measurements of “dark” respiration in the light (e.g. Brown 1953) are highly desirable. It should be pointed out that respiratory losses are only relevant to growth rates at the given growth irradiance.
Other results suggest that the light-har- vesting capability of phytoplankton, as re-

Growth-irradiance relationships 321
2.00-v 0
0
1.50
-$ -1 1.00
AA
A
0
1
A
A -0 Ql
0.00 40 ( , , , , , ( , 0 I 2 3 4 5
Chl : C (~10~)
Fig. 6. Relationship between Chl:C three species (symbols as in Fig. 1).
and p for the
fleeted by Chl:C ratios and absorption cross sections, accounts for most of the differ- ences in growth rates between species (Fig. 6). In the three species studied kc varied by about a factor of five, while Chl:C ratios varied by about 20. While Chl:C ratios are usually considered a simple representation of the chemical composition of phytoplank- ton, the ratios have biological meaning. The size and number of chloroplasts within a given cell is highly variable between species. Some organisms, such as many dinoflagel- lates, have very few chloroplasts in rela- tively large cell volumes (Amphidinium car- terae is an exception). Other organisms, especially many diatoms and chlorophytes, have relatively large numbers of chloro- plasts, or, when the number is genetically fixed (e.g. Skeletonema costatum has two), the chloroplasts occupy large areas of the cell volume.
References BANNISTER, T. T. 1974. Production equations in terms
of chlorophyll concentration, quantum yield, and upper limit to production. Limnol. Oceanogr. 19: 1-12.
-, AND A. D. WEIDEMANN. 1984. The maximum quantum yield of phytoplankton photosynthesis in situ. J. Plankton Res. 6: 275-294.
BROWN, A. H. 1953. The effects oflight on respiration using isotopically enriched oxygen, Am. J. Bot. 40: 7 19-729.
COSPER, E. 1982. Effects of variations in light inten- sity on the efficiency of growth of Skeletonema costatum (Bacillariophycea) in a cyclostat. J. Phy- col. 18: 360-368.
DUBINSKY, Z., T. BERMAN, AND F. SCHANZ. 1984. Field experiments for in situ measurement of photosyn- thetic efficiency and quantum yield. J. Plankton Res. 6: 339-349.
-, P. G. FALKOWSKI, AND K. WYMAN. In press. Light harvesting and utilization by phytoplankton. J. Phycol.
DUYSENS, L. N. 1956. The flattening of the absorption spectrum of suspensions, as compared to that of solutions. Biochim. Biophys. Acta 19: 1-12.
EPPLEY, R. W. 1972. Temperature and phytoplank- ton growth in the sea. Fish. Bull. 70: 1063-1085.
FALKOWSKI, P. C., K. WYMAN, AND D. MAUZERALL. 1984. Effects of continuous background irradi- ance on xenon-flash-induced fluorescence yields in marine phytoplankton, p. 163-166. In Ad- vances in photosynthesis research. Proc. 6th Int. Photosyn. Congr. (Brussels) 1.2.
GUILLARD, R. L., AND J. H. RYTHER. 1962. Studies of marine planktonic diatoms. 1. Cyclotellu nana Hustedt, and Detonulu confervuceu (Cleve) Gran. Can. J. Microbial. 8: 229-239.
JEFFREY, S. W., AND G. F. HUMPHREY, 1975. New spectrophotometric equations for determining chlorophylls a, b, c, and c, in higher plants, algae and natural phytoplankton. Biochem. Physiol. Pflanz. (BPP) 167: 191-194.
KIEFER, D. A., AND B. G. MITCHELL. 1983. A simple, steady state description of phytoplankton growth rates based on absorption cross section and quan- tum efficiency. Limnol. Oceanogr. 28: 770-776.
KIRK, J. T. 1975. A theoretical analysis of the con- tribution of algal cells to the attenuation of light within natural waters. 1. General treatment of pig- mented cells. New Phytol. 75: 1 l-20.
LAWS, E. A., AND T. T. BANNISTER. 1980. Nutrient- and light-limited growth of Thalassiosira fluvia- tilis in continuous culture, with implications for phytoplankton growth in the ocean. Limnol. Oceanogr. 25: 457-473.
MUSCATINE, L., P. FALKOWSKI, J. PORTER, AND Z. DUBINSKY. 1984. Fate of photosynthetically-fixed carbon in light and shade-adapted colonies of the symbiotic coral Stylophora pistillata. Proc. R. Sot. Lond. Ser. B. 222: 18 l-202.
MYERS, J. 1980. On the algae: Thoughts about phys- iology and measurements of efficiency. Brookha- ven Symp. Biol. 31: 1-16. Plenum.
SHARP, J. H. 1977. Excretion of organic matter by marine phytoplankton: Do healthy cells do it? Limnol. Oceanogr. 22: 38 l-399.
Submitted: 29 November I983 Accepted: 4 September I984