Ciliate and phytoplankton species composition in the sea ...
56
1 Ciliate and phytoplankton species composition in the sea-surface microlayer in the outer Oslofjord Roya Dindar-Safa Master thesis in Ecotoxicology Department of Biology UNIVERSITY OF OSLO January 2011
-
Upload
khangminh22 -
Category
Documents
-
view
0 -
download
0
Transcript of Ciliate and phytoplankton species composition in the sea ...

1
Ciliate and phytoplankton species composition in the sea-surface
microlayer in the outer Oslofjord
Roya Dindar-Safa
Master thesis in Ecotoxicology
Department of Biology
UNIVERSITY OF OSLO
January 2011
2
Acknowledgements The work for this Master thesis was carried out at the Department of Biology at the University
of Oslo during March – June 2010. This Master project is part the research project
”Interactions between eutrophication, oil and contaminants in marine ecosystems
(INTERACT)”.
I am grateful to my supervisor Professor Ketil Hylland at the University of Oslo for allowing
me to be a part of the project and for his help and comments on the statistics and my writing. I
also want to thank my co-supervisor Hege Vestheim at the University of Oslo for her help
during the sample collection and her advice and comments on my writing.
I want to thank Wenche Eikrem and Professor Bente Edvardson for their advice on my lab
work and Sissel Irene Brubak for teaching me the Quantitative Protargol Stain method and
Micah Dunthorn at the University of Kaiserslautern in Germany for helping me identify
ciliate species.
I am grateful to Lars Qviller and Therese Fosholt Moe for teaching me the statistics,
Vladyslava Hostyeva and Shuhei Ota for teaching me the inverted-microscope method and for
the conversations and their support.
I want to thank Tor Fredrik Holth and Lars Qviller for your proofreading, Mazyar Yazdani for
helping me improve my computer skills and for the conversations, discussions and his support
and comments during my writing and Sanaz Amirabedin for helping me improve my
computer skills and for her support.
Lastly, I want to thank my husband, his family, my parents and my sister for their
encouragement and support.

3
Abstract The sea-surface microlayer is the boundary layer between the water of the oceans and the
atmosphere occupying approximately “1000 micrometer” uppermost part of the sea-surface
microlayer (SML) (Liss and Duce, 1997). Nutrients and pollutants are known to be
concentrated in the SML compared to the water column. The unique physical and chemical
features of the SML may provide a habitat for a large number and diverse groups of neuston
(microorganisms living in the SML) such as ciliates and phytoplankton. However, these
microorganisms in the SML may be exposed to the higher concentrations of nutrients and
pollutants, compared to the water column, probably affecting their diversities and species
composition. The diversity and species composition of the ciliates and phytoplankton were
assessed in the sea-surface microlayer (SML) and sub-surface layer during an experiment at
three locations in the outer Oslofjord during July 2009. Verdens Ende was expected to have
low amounts of nutrients and oil pollution. Ferjeodden (a harbor) and Bustangen (close to a
farm) were expected to have elevated concentrations of oil and nutrients, respectively. The
results showed that there were variations in the number of individuals of ciliates and
phytoplankton between replicates collected from each habitat and location. Measures of
diversity indicated that there were not any differences in ciliate and phytoplankton between
the SML and the sub-surface layer and between the SML samples at the three locations. The
ciliate and phytoplankton species compositions in the two layers were not significantly
different but separations were observed between the two layers. Significant differences were
found in ciliate and phytoplankton species compositions in the SML samples from the three
locations. Oligotrich ciliates and diatoms were identified as the most responsible taxonomic
groups contributing to separations between neuston and plankton and between the neuston at
the three locations. Adaptation to eutrophication, oil pollution, and ultraviolet radiation
(UVR), predator pressure reduction and food availability could be possible explanations for
this observation. Finally, species composition could not be related to the environmental
factors (temperature and salinity) because the environmental factors did not vary substantially
at the three locations.

4
Content Acknowledgements .............................................................................................. 2
Abstract ................................................................................................................ 3
Contents ................................................................................................................ 4
Abbreviations ....................................................................................................... 5
1. Introduction ............................................................................................... 6 2. Materials and methods ........................................................................... 12 2.1.Locations ...................................................................................................................... 12 2.2.Sample collection ......................................................................................................... 13 2.3.Sample treatment and counts ........................................................................................ 15 2.4.Statistical analysis ........................................................................................................ 17 3. Results ...................................................................................................... 19 3.1.Environmental conditions ............................................................................................ 19 3.2.Species abundance ........................................................................................................ 20 3.3.Diversity ....................................................................................................................... 22
3.3.1. Neuston and plankton ............................................................................................... 22
3.3.2 Neuston at the three locations ................................................................................... 23
3.4. Species composition .................................................................................................... 23
3.4.1. Neuston and plankton ............................................................................................... 23
3.4.1.1. Ciliates ................................................................................................................... 23
3.4.1.2. Phytoneuston and phytoplankton .......................................................................... 28
3.4.2. Neuston at the three locations .................................................................................. 33
3.4.2.1. Ciliate communities ............................................................................................... 33
3.4.2.2. Phytoneuston communities ................................................................................... 36
4. Discussion .................................................................................................. 39 4.1. Environmental conditions ........................................................................................... 39
4.2. Diversity ...................................................................................................................... 39
4.3. Species composition .................................................................................................... 40
4.4. Links between diversity and environmental variables ................................................ 45
Conclusions ................................................................................................... 46
References ..................................................................................................... 47
5. Appendix ................................................................................................... 53 Table 5.1. ciliate and phytoplankton abundance ................................................................ 53

5
Abbreviations SML The sea-surface microlayer
UVR Ultraviolet radiation
PAHs Polyaromatic hydrocarbons
NMDS Non-metric multidimensional scaling
VES Verdens Ende sea-surface layer samples
FjS Ferjeodden sea-surface layer samples
BtS Bustangen sea-surface layer samples

6
1. Introduction The sea-surface microlayer is the boundary layer between the water of the oceans and the
atmosphere. It occupies approximately “1000 micrometer” uppermost part of the sea-surface
microlayer (SML) (Liss and Duce, 1997). The SML contains organic matters, primarily lipids
(Carlson and Mayer, 1980), as well as inorganic compounds such as inorganic phosphorus
(Williams, 1967) and nitrogen (Hardy, 1982; Gladyshev, 1986; Kuznetsova et al., 2004). A
recent study has shown the enrichment of transparent exopolymer particles (TEP) being
enriched in the SML in higher concentrations than in sub-surface layers (Wurl and Holmes,
2008). They are ubiquitous gels in the oceans, produced in surface waters from the
coagulation of phytoplankton-derived dissolved polysaccharides (Alldredge et al., 1993;
Verdugo et al., 2004). Because of their “sticky” features, TEP facilitate the aggregation of
microorganisms (Alldredge et al., 1993; Verdugo et al., 2004) in the SML. The physical and
chemical features of the SML including its high concentration of organic matters or nutrients,
provides a habitat for a large number and diverse groups of neuston (organisms living in the
sea-surface microlayer) such as bacterioneuston, phytoneuston (such as diatoms and
dinoflagellates), ciliates (such as oligotrichs and tintinnids) and zooneuston accumulating in
the SML (Hardy, 1982). Such organisms will commonly be found in a higher abundance in
the SML compared to sub-surface layers (Liss and Duce, 1997). Environmental conditions are
different between the SML and the sub-surface layers. For example, light intensity,
temperature, salinity and the concentration of organic and inorganic substances are known to
be higher in the SML than in the sub-surface layers. Neuston lives and thrives in the SML
because they have adapted to this unique habitat (Zaitsev, 1971; Zaitsev and Liss, 1997). The
neuston feeds, grows, and reproduces in the SML (Liss and Duce, 1997). This interface can
also serve as both a sink and a source of anthropogenic compounds, including chlorinated
hydrocarbons, organotin compounds, petroleum hydrocarbons and heavy metals due to its
unique chemical composition, in particular its high content of lipids and protein (Southwood
et al., 1999). The neuston community can be at greater risk of being exposed to higher
concentrations of environmental contaminants in the SML compared to the sub-surface layer
(Liss and Duce, 1997) for two reasons. First, because of the increasing amounts and types of
anthropogenic substances deposited into the atmosphere, thus, into the sea surface (Liss and
Duce, 1997); second, because both chemical contaminants and organisms tend to accumulate
in the same phase (Hardy, 1997). Therefore, assessing neuston community relative to
7
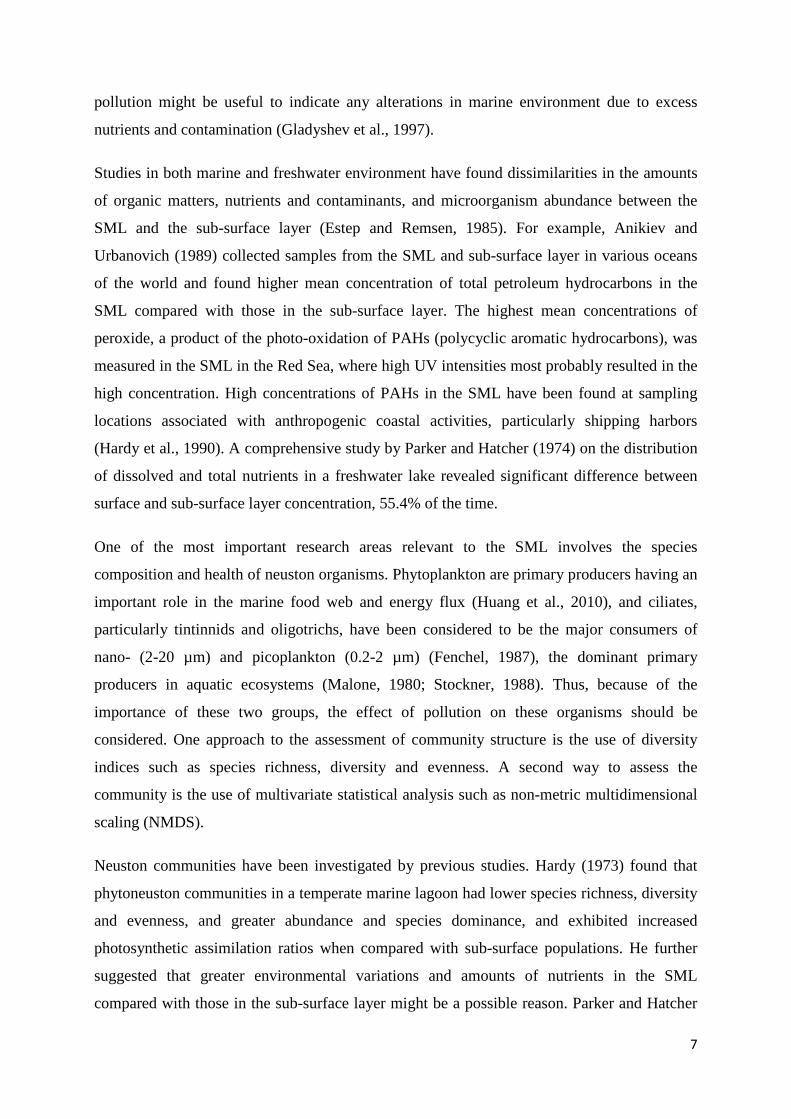
pollution might be useful to indicate any alterations in marine environment due to excess
nutrients and contamination (Gladyshev et al., 1997).
Studies in both marine and freshwater environment have found dissimilarities in the amounts
of organic matters, nutrients and contaminants, and microorganism abundance between the
SML and the sub-surface layer (Estep and Remsen, 1985). For example, Anikiev and
Urbanovich (1989) collected samples from the SML and sub-surface layer in various oceans
of the world and found higher mean concentration of total petroleum hydrocarbons in the
SML compared with those in the sub-surface layer. The highest mean concentrations of
peroxide, a product of the photo-oxidation of PAHs (polycyclic aromatic hydrocarbons), was
measured in the SML in the Red Sea, where high UV intensities most probably resulted in the
high concentration. High concentrations of PAHs in the SML have been found at sampling
locations associated with anthropogenic coastal activities, particularly shipping harbors
(Hardy et al., 1990). A comprehensive study by Parker and Hatcher (1974) on the distribution
of dissolved and total nutrients in a freshwater lake revealed significant difference between
surface and sub-surface layer concentration, 55.4% of the time.
One of the most important research areas relevant to the SML involves the species
composition and health of neuston organisms. Phytoplankton are primary producers having an
important role in the marine food web and energy flux (Huang et al., 2010), and ciliates,
particularly tintinnids and oligotrichs, have been considered to be the major consumers of
nano- (2-20 µm) and picoplankton (0.2-2 µm) (Fenchel, 1987), the dominant primary
producers in aquatic ecosystems (Malone, 1980; Stockner, 1988). Thus, because of the
importance of these two groups, the effect of pollution on these organisms should be
considered. One approach to the assessment of community structure is the use of diversity
indices such as species richness, diversity and evenness. A second way to assess the
community is the use of multivariate statistical analysis such as non-metric multidimensional
scaling (NMDS).
Neuston communities have been investigated by previous studies. Hardy (1973) found that
phytoneuston communities in a temperate marine lagoon had lower species richness, diversity
and evenness, and greater abundance and species dominance, and exhibited increased
photosynthetic assimilation ratios when compared with sub-surface populations. He further
suggested that greater environmental variations and amounts of nutrients in the SML
compared with those in the sub-surface layer might be a possible reason. Parker and Hatcher

8
(1974) observed differences in algal community structures between the SML and sub-surface
layer at freshwater ponds. They further found that availability of different organic and
inorganic chemicals for the neuston and plankton have probably resulted in possessing
different metabolic rates, microbial growth rates and community sizes in phytoneuston
compared with those in phytoplankton communities. In an estuary, higher abundance in
phytoneuston communities was observed that could be a result of accumulating and
concentrating of rising bubbles which move materials from sub-surface layers to the SML. In
addition, some algal species were missing in the SML leading to lower species diversity of
phytoneuston compared with the phytoplankton communities that were probably caused by
vertical mixing and total phytoplankton cell densities (Manzi et al., 1977). However, Estep
and Remsen (1985) found that even though nutrient abundance was higher in the SML
compared with those in the sub-surface layer, phytoplankton abundance was not consistently
higher in the SML than in the sub-surface layers suggesting that the SML could be an area for
microalgal accumulation. It is also a phase with high cell damage caused by ultraviolet
radiation or algal consumption by protists. In addition, species richness, diversity and
evenness of phytoneuston community were higher than those of phytoplankton community
suggesting that the increased diversity was because of increased diversity of diatom group
having a high affinity for the SML (Estep and Remsen, 1985). Using multivariate statistical
analysis, significant differences were found in combined algal and cyanobacterial community
structures between SML and sub-surface layer at two ponds suggesting that dominante algal
species might be a possible reason for the difference between the two communities. However
because of few number of studies on neuston communities, there was no clear conclusion of a
possible explanation for the result (Butler et al., 2007). Only one molecular biological method
determines that ciliate community in the surface microlayer is more abundant than the
underlying layers (Cunliffe and Murrell, 2009).
There have been few studies on how pollutants and excess nutrients may affect neuston
communities. However, there have been studies on the effects of pollutants and excess
nutrients on plankton communities. Pollutants such as pesticides, heavy metals, or oil may
affect few or all organisms. PAHs (polycyclic aromatic hydrocarbons) and petroleum
hydrocarbons belong to persistent organic pollutants (POPs) group in the SML (Wurl and
Obbard, 2004). In general, high concentrations of PAHs in the SML have been found at
sampling locations associated with anthropogenic coastal activities, particularly shipping

9
harbors (Hardy et al., 1990). Petroleum hydrocarbon concentrations have been found in higher
concentrations in the SML than in the sub-surface layer (Anikiev and Urbanovich, 1989).
Marine eutrophication is a process in which nutrient levels increase resulting in the production
of particulate organic matter (POM)/ dissolved organic matter (DOM) production; this is
mainly a result of an increase in the abundance and production of phytoplankton (Horrigan et
al., 2002), bacteria and zooplankton in the water column (Chapman and Craigie, 1977).
Finally, eutrophication leads to organic matter degradation resulting in decreased oxygen
concentrations in the water column (Gray et al., 2002). Nixon and Pilsom (1983) suggested
that agricultural fertilizers input and domestic sewege, via rivers, could be the major external
sources of DOM/POM to coastal waters. Organic nutrients have been known to have higher
concentrations in the SML than in the sub-surface layers (Estep and Remsen, 1985).
How oil pollution affects plankton ciliates and phytoplankton communities, have been studied
extensively both in the laboratory and in the field. Oil slicks on the surface will limit gas
exchange through the air sea interface and reduce light penetration into the water column
affecting phytoplankton photosynthesis (González et al., 2009). Ciliates have been thought to
ingest small globules of crude oil because these organisms have been seen to gather around
the globules of crude oil (Spooner, 1968). Bloom of flagellates associated with oil particles
has been observed (Smith, 1968). Phytoplankton abundance and species diversity increased in
response to oil contamination in a microcosm experiment (Vargo et al., 1982). In an
experiment of crude oil effects on plankton communities in an enclosed system, however,
diatom and copepod abundance decreased and bacterial and tintinnid abundance increased
(Dahl et al., 1983). Increased growth of marine ciliates and large droplets of oil in ciliate food
vacuoles in an oil-contaminated seawater have also been observed (Andrews and Floodgate,
1974; Skjoldal et al., 1982). Studies of crude oil in enclosed ecosystems showed an initial
toxic effect on marine protozoans and a decrease of heterotrophic ciliate abundance and a
complete removal of these organisms below an oil slick within the enclosed system. However,
the toxic effect decreased by adding nutrients to the experimental system (Dale, 1988).
Blooms of tintinnids (loricated ciliates) (Dale, 1988) and flagellates (Dahl et al., 1983) were
detected at later stages of these experiments. Oil-tolerant heterotrophic nanoflagellates have
been identified to be important grazers of bacterial population in the marine oil
biodegradation process (Dalby et al., 2008). It has been suggested that environmental factors
such as ultraviolet radiation might influence the oil toxicity (Sargian et al., 2005; Belzile et
al., 2006; Sargian et al., 2007).
10
Eutrophication or an increase in nutrient and dissolved organic matter (DOM) concentrations
over natural levels (Smith, 1984) may involve an increase in phytoplankton (Hodgkiss and
Lu, 2004; Liu, 2008) and ciliate abundance (Beaver and Crisman, 1982; Revelante et al.,
1985; Beaver and Crisman, 1989; Pfister et al., 2002; Xu et al., 2005). One reason why
eutrophication may lead to changes in phytoplankton and ciliate abundance may be their
relationships in the microbial loop. The microbial loop describes a trophic pathway in the
microbial food web where dissolved organic carbon (DOC) is returned to higher trophic
levels: the organic carbon is consumed by bacteria which can be grazed by phytoplankton and
microzooplankton (such as ciliates); these organisms can be ingested by mesozooplankton
such as copepods (Fenchel, 2008). Increased phytoplankton may be a result of decreased
predator pressure followed by decreased zooplankton abundance (Pfister et al., 2002). It is
well known that certain phytoplankton and ciliate species are more common in nutrient-rich
(eutrophic) than in oligotrophic waters (Revelante et al., 1985). For example, a community
change toward the smaller size classes of phytoplankton (Gilmartin and Revelante, 1980) and
plankton ciliates (Beaver and Crisman, 1982; Barría de Cao et al., 2003; Selifonova, 2009)
were observed following eutrophication. In 1998, a diatom Skeletonema costatum bloom was
observed in Jiaozhou Bay, China, after a large nutrient input from two days of heavy rain.
During the bloom, species diversity and evenness decreased (Liu et al., 2005). Xu et al.
(2005). found that eutrophication can cause a decrease in number of protozoan species (such
as flagellates and ciliates) in lakes, and Tas et al. (2009) observed an increase in the species
richness and a major change in phytoplankton community structure followed by decreased
eutrophication. Other studies reported that the number of individuals and community diversity
(number of species and Shannon-Weiner index) of ciliates increased with increasing
eutrophication (Beaver and Crisman, 1989; Pfister et al., 2002). According to a study of
phytoplankton community structure in two lakes differing in their trophic states, diatoms
dominated the lake with high nutrients concentrations and dinoflagellates dominated the lake
with low nutrient concentrations(Liu, 2008). Therefore, ciliates and phytoplankton could be
used as indicators of eutrophication (Arndt et al., 1990; Devlin et al., 2007).
The outer Oslofjord is a large area that includes open seas, fjords and Norway’s largest
estuary (Hvaler). It is a very dynamic and open fjord system. The degree of nutrient input
from the rivers into the outer Oslofjord can be influenced by the amount of precipitation.
Agriculture is the main source of anthropogenic input of nutrients, Nitrogen (N) and
Phosphorus (P), to the outer Oslofjord. A high nutrient concentration in late spring and

11
summer will be due to input from outside source or by runoff from land (Walday et al., 2009).
Because the Oslofjord has had a history of coastal eutrophication (De Jong, 2006; Berge,
1990), eutrophication was expected to occur along some of the coasts of the Oslofjord,
specially the coastal areas close to river mouths agricultural fields. In addition, because some
of the coastal areas in the Oslofjord are used as harbors, oil pollution was expected to occur
along the coasts of harbors in the Oslofjord.
Three inshore locations in the outer Oslofjord were chosen as sampling sites expecting to be
different in their amounts and types of pollutants. Verdens Ende, located at the southernmost
tip of the island of Tjøme in Vestfold, outer Oslofjord, was considered as a reference site
probably having low amounts of pollution. Ferjeodden (Røeds), located in northernmost tip of
the island Tjøme in Vestfold, is a small harbor probably having considerable amounts of oil
pollution. Bustangen (Kråkere) is located in the north of the island Tjøme. It is close to a farm
assuming that high amounts of organic pollution from the farm may find their way into the
shallow sampling area.
Due to its unique properties, the sea-surface micro-layer might be an important habitat for
growth and production of a large number of ciliates and phytoplankton communities. On the
other hand, contaminants such as organic materials and anthropogenic chemicals tend to be
enriched to higher concentrations in the SML than in sub-surface layer. Moreover, amounts of
contaminants entering to the atmosphere and ocean tend to increase and could further add to
their amounts in the SML. Therefore, neuston community (organisms living in the SML)
might be exposed to higher amounts of nutrients and pollution compared to plankton
community (organisms living in the sub-surface layers) affecting their species diversity and
community structure.
There are three main objectives in this thesis:
Are there differences in phytoplankton and ciliates diversity between the SML and sub-
surface water at different coastal locations?
Will hydrocarbon pollution affect the diversity of ciliates and phytoplankton?
Will eutrophication affect the diversity of ciliates and phytoplankton?

12
2. Materials and Methods
2.1. Locations In July 2009, sea-surface microlayer (SML) and sub-surface water samples were collected
from coastal areas of three different locations in the outer Oslofjord in the southeast part of
Norway; Verdens ende, Ferjeodden (Røeds), and Bustangen (Kråkere) (Figure 2.1).
Verdens ende is located at the southernmost tip of the island of Tjøme in Vestfold, Norway.
As a shallow and rocky bay, mostly used as an outdoor recreation area (The Climate and
Pollution Agency, 2010), this location was expected to have low amounts of nutrients and
water pollution. Hence, reference samples were taken from this location.
Ferjeodden (Røeds), located in northernmost tip of the island Tjøme in Vestfold, Norway, is a
small harbor where ships and boats, and barges commute probably leading to oil
contamination in the location. So, this location were expected to be influenced by
hydrocarbon pollutants.
Bustangen (Kråkere) is located also in the north of the island Tjøme. This sampling site is
located close to a farm; so, nutrients such as nitrogen and phosphorus might find their way
into the coastal areas close to the sampling location probably leading to eutrophication.

13
Figure 2.1. Map of the three sampling sites in the southeast of Norway: Ferjeodden, Bustangen and Verdens ende ( http://maps.google.no/maps).
2.2. Sample collection The SML and sub-surface water samples were taken at three different occasions from each
location in the period July 17-26 in 2009 (see Table 3.1 for details).
Samples from the SML were taken by a remotely operated boat equipped with a Teflon-
coated rotating drum (RD) (Figure 2.2) (Harvey, 1966; Hardy et al., 1988). The boat and the
rotation of the drum were operated by a storage battery. The drum was rotated while the boat
was driven forward pushing the drum ahead and a wiper attached on the drum collected the
SML sample directing it into a 4L-glass bottle (collection jar) (Figure 2.3). At each time of

14
sample collection, 0.5 to 1 liter of SML sample was taken. To avoid contamination and
vertical mixing, calm days without recent precipitation were chosen for sample collection.
The drum and all the components of the collecting system were cleaned with 10% bleach
solution and distilled fresh water before each use.
Figure 2.2. A picture of the SML sampler. Image credit: Hege Vestheim.

15
Figure 2.3. Schematic diagram of the SML sampler.
Sub-surface water samples were collected by submerging clean 300-ml dark bottles with
closed lids into the water and opening the lids when the mouth of the bottles reached 15 cm
below the surface.
Environmental factors including pH, salinity and temperature (°C) (Table 3.1) were measured
at each sampling occasion. Salinity and temperature were measured by a S-C-T (salinity-
conductivity-temperature) meter, YSL model 33, with a manual temperature compensation
(accuracy: +/-0.7 ppt).
2.3. Sample treatment and counts To preserve the samples, 250 ml of water samples were fixed with 1.5 ml pseudo-Lugol’s
solution. For pseudo-Lugol’s solution (Thomas D., unpublished results), equal volume of
solution A (30 g KI and 19.5 g I2 dissolved in 500 ml of deionized water) and solution B
(combine 135 ml of deionized water + 315 ml of absolute alcohol + 35 ml of 25%
glutaraldehyde + 15 ml of glacial acetic acid ) were mixed. Preserved samples were then
stored in 4°C in the dark until they were analyzed in the laboratory by the inverted-
microscope method (Hasle, 1978).
For ciliate and microalgae enumeration, the inverted-microscope method, or Utermohl
method, was used (Hasle, 1978). After gentle shaking of the water samples for 120 times (for
about 2 minutes), subsamples with different volumes (2, 2.5, 5, 10 or 50 ml), depending on

16
the cell density of the samples, were measured. Next, the subsamples were settled in
combined plate chambers with different sizes of top cylinders (10 and 50 ml) according to the
volume of the subsamples (Figure 2.4). Since the top cylinders with volumes lower than 10 ml
were not available, 24-well micro plate (maximum volume of each well: 3 ml) was used to
concentrate the subsamples with 2 and 2.5 ml volume. A settling time of 24 hours was used
for all the subsamples. Where possible, cells were identified to genus and species levels
according to Throndsen and Eikrem (2001), Strüder-Kypke et al (2003), Mathias (2006), and
Throndsen et al. (2007). The number of individuals counted in relative volumes was
calculated to the number of cells per ml. A Nikon Eclipse TE300 inverted microscope
equipped with a Nikon D50 Digital Camera was used to observe and count ciliates and
microalgae in the water samples.
Figure 2.4. Sedimentation table with combined plate chamber set for sedimentation (Tangen, 1976).

17
2.4. Statistical analysis Data were analyzed using the PAST (palaeontological statistics) software package (Hammer
and Harper, 2001).
Four diversity measures were chosen; total number of species, Margalef’s species richness
(d), Shannon-Weiner index (H’), and Pielou’s evenness (J’), in order to determine the
diversity of different ciliate and phytoplankton communities in the SML and sub-surface
layers at the three stations (Hammer and Harper, 2001).
Margalef’s species richness takes S (the number of species) and N (the total number of
individuals of all the species) into account in the following equation:
DMg = (S-1)/ln(n) (Clifford and Stephenson, 1975).
Shannon-Weiner index takes the number of individuals and number of taxa into account. It
assumes that individuals are randomly sampled (Pielou, 1975) and all the species are present
in the sample. It is calculated from the equation:
H`=-sum ((ni/n)ln(ni/n))
Where H` is Shannon index, ni is number of individuals of taxon i and n is number of
individuals in all taxa. It varies from 0 for communities with one single species to high values
for communities with many species having few individuals (Shannon, 1949).
Equitability (evenness) is another diversity measurement which belongs to the information
theory indices. It measures how evenly species are distributed in a community. It is calculated
from the equation:
E= H`/Hmax= H` /ln S
Where H`is Shannon index, Hmax is the maximum diversity which could possibly occur (which
could be found in a situation where all species were equally abundant) and S is number of taxa
(Pielou, 1969).
Two-tailed Mann-Whitney U test (Press et al., 2007) was applied to the diversity
measurements of the communities to test if there were significant differences (P<0.05) in the
species diversities between the SML and sub-surface layer at each location. In addition,

18
Kruskal-Wallis test, a non-parametric ANOVA (Zar, 1996), was performed to test if there
were significant differences in the diversities between the SML and sub-surface layers at the
three locations.
Multivariate community analyses were used to measure and display differences in the species
composition of ciliates and phytoplankton communities between the three SML samples as
well as between the SML and sub-surface layer samples at the three locations. Before further
data analysis, log (x+1) transformation was done in order to down weight the effect of
dominating species. Log (x+1) was preferred because the zero values produce log (0) = -∞.
Furthermore, in order to test for significant dissimilarities (P<0.05) in the ciliate and
phytoplankton community structures between the SML and sub-surface layers as well as
between the SML at the three locations, 1-way ANOSIM (analysis of similarities) (Clarke,
1993), a non-parametric test, based on Bray-Curtis similarity was performed. Bray-Curtis
similarity is often a suitable coefficient for biological data on community structure (Clarke
and Warwick, 2001). In order to display differences in the community structures of ciliates
and phytoplanktons between the SML and sub-surface layer as well as between the SML at
the three locations, NMDS (non-metric multidimensional scaling) was performed (Hill and
Gauch, 1980). Experience with ecological data suggested that two-dimensional diagram might
be more useful and accessible summary despite having a higher stress level compared to a
three-dimensional diagram (Clarke and Warwick, 2001). Moreover, the species responsible
for differences in the neuston (organisms living in the SML) and plankton (organisms living
in the sub-surface layer) communities between the three locations were identified using
SIMPER (the similarity percentage) (Hammer and Harper, 2001). The introduction of the
original data (the number of individuals of phytoplankton and ciliate species) to SIMPER
resulted mostly in identification of phytoplankton species contributing most to differences
between the groups (this was because there was greater number of individuals of
phytoplankton species than ciliate species in the samples). To avoid this problem,
phytoplankton and ciliate groups were separated before introducing them to ANOSIM,
NMDS, and SIMPER. Normally, SIMPER calculates the mean number of individuals of each
group (when all the replicates are chosen as one group) before comparing the groups. Because
there were only three replicates in each group, taking the mean should be avoided; therefore,
before introducing the groups to SIMPER, the sum of the number of individuals of species
were calculated out of the three replicates of each group.

19
3. Results
3.1. Environmental conditions Environmental variables are shown in table.3.1. Samples were collected different times of the
day. Temperature and salinity were not significantly different between the three locations
using Kruskal-Wallis test. Temperature was always between 19̊ C to 22˚C and salinity varied
between 20 to 23 and increasing to 26 in 17th of July at Verdens Ende (Table 3.1).
Table 3.1. Environmental conditions (depth: cm, date: July, time: hour, temperature: ˚C) measured in the study period.
Location Depth Date Replicate Time Temperature(˚C) Salinity
Verdens Ende
Surface July 17 1 22:00 20 26,5
Surface July 24 2 10:00 20 22
Surface July 26 3 10:00 19 21,2
Sub-surface July 17 1 22:00 20,08 26,5
Sub-surface July 24 2 10:00 20 22
Sub-surface July 26 3 10:00 19,5 21,2
Ferjeodden
Surface July 19 1 22:00 19,7 21
Surface July 20 2 22:30 19,9 23
Surface July 22 3 08:25 21 22
Sub-surface July 19 1 22:00 19,7 21
Sub-surface July 20 2 22:30 19,9 23
Sub-surface July 22 3 08:25 21 22
Bustangen
Surface July 19 1 20:30 20,3 20
Surface July 20 2 21:30 20,4 22,8
Surface July 22 3 10:30 22 22,2
Sub-surface July 19 1 20:30 20,3 20
Sub-surface July 20 2 21:30 20,4 22,8
Sub-surface July 22 3 10:30 22 22,2

20
3.2. Species abundance The numbers of individuals of ciliate and phytoplankton groups, taken from the SML and sub-
surface layer at the three stations, were presented in table 5.1. In addition, the total numbers of
individuals of main ciliate and phytoplankton groups were shown in table 3.2. No statistical
test was performed on the number of individuals of ciliates and phytoplankton.

21
Table 3.2. The number of individuals (cells/ml) of important ciliate and phytoplankton groups.
Replicate Oligotrichs Tintinnids other_ciliates Ciliates Dinoflagellates Diatoms Total
Phytoplankton
Verdens Ende
Surface 1 0,40 44,00 4,40 92,40 85,60 360,80 446,40 2 0,06 2,38 0,56 5,32 21,76 9,66 31,42 3 4,58 0,00 2,40 2,40 166,50 224,40 390,90
Sub-surface 1 1,50 8,10 5,40 21,60 7,30 16,30 23,60 2 0,00 0,06 19,08 19,20 0,92 4,70 5,62 3 0,00 1,60 0,40 3,60 12,40 24,00 36,40
Ferjeodden
Surface 1 4,00 38,80 6,80 84,40 406,00 61,20 467,20 2 0,80 7,20 9,60 24,00 435,60 66,40 502,00 3 10,00 0,40 9,20 10,00 122,40 39,20 161,60
Sub-surface 1 2,50 3,40 5,50 12,30 51,60 5,30 56,90 2 0,00 1,84 0,18 3,86 11,38 47,48 58,86 3 1,02 2,98 1,68 7,64 37,34 5,12 42,46
Bustangen
Surface 1 1,00 2,25 1,50 6,00 16,50 119,50 136,00 2 0,00 4,00 16,00 24,00 166,00 188,00 354,00 3 0,40 5,20 1,60 12,00 43,60 690,00 733,60
Sub-surface 1 0,40 7,00 0,00 14,00 1,00 24,10 25,10 2 1,00 2,70 1,90 7,30 91,10 10,00 101,10 3 0,04 1,66 0,02 3,34 0,50 24,84 25,34

22
3.3. Diversity
3.3.1. Neuston and plankton
The diversities of neuston and plankton communities (Table 3.3) were not significantly
different at the three locations according to the Mann-Whitney U test (p> 0.05).
Table 3.3. Measurements of diversity indices of neuston and plankton communities: the number of species (no. of species), Shannon-Weiner (H´), Margalef’s species richness, and Equitability (J´).
Replicates Number. of species
Shannon_Weiner (H´) Margalef Equitability (J´)
Verdens Ende
Surface 1 7 1,14 0,56 0,58 2 5 1,32 0,49 0,82 3 4 0,77 0,34 0,55
Sub-surface
1 10 1,62 0,9 0,7 2 5 0,05 0,41 0,03 3 2 0,5 0,13 0,72
Ferjeodden
Surface 1 7 1,15 0,56 0,59 2 6 1,48 0,51 0,83 3 7 1,37 0,6 0,7
Sub-surface
1 13 1,82 1,26 0,71 2 8 1,17 0,92 0,56 3 12 1,81 1,25 0,73
Bustangen
Surface 1 8 1,94 0,81 0,93 2 7 1,22 0,61 0,63 3 7 1,44 0,67 0,74
Sub-surface
1 6 0,82 0,56 0,46 2 9 1,57 0,91 0,71 3 6 1,22 0,64 0,68

23
3.3.2. Neuston at the three locations
The diversities of the neuston communities were compared at the three locations (Table 3.3)
and no significant difference were found between the diversities according to the Kruskal-
Wallis test (p> 0.05).
3.4. Species composition
3.4.1. Neuston and plankton
The neuston refers to organisms living in the SML and the plankton refers to organisms living in the sub-surface layer.
3.4.1.1. Ciliates
There were no significant differences in species composition between the SML and sub-
surface water layer at the three locations (Table 3.4).
Table 3.4. Differences in species composition between the SML and sub-surface layer (1-way ANOSIM analysis).
Verdens Ende Ferjeodden Bustangen R p R p R p
Ciliates -0.05 0.6 0.14 0.4 0.20 0.3
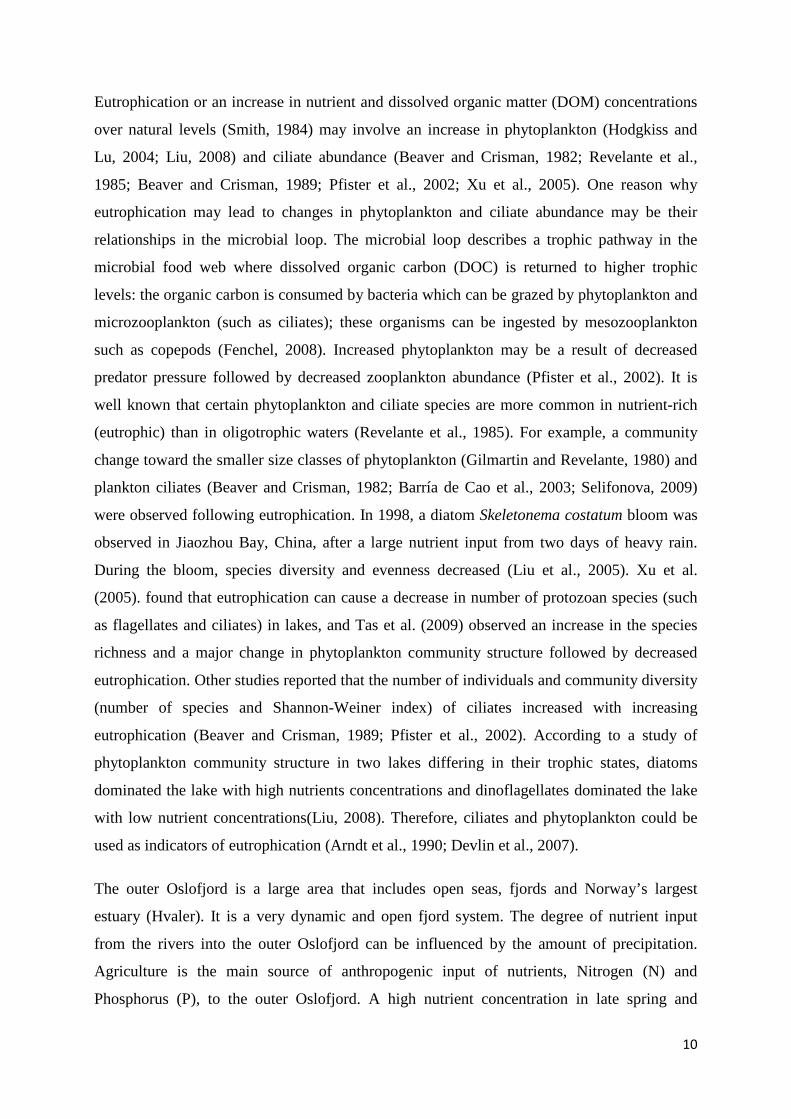
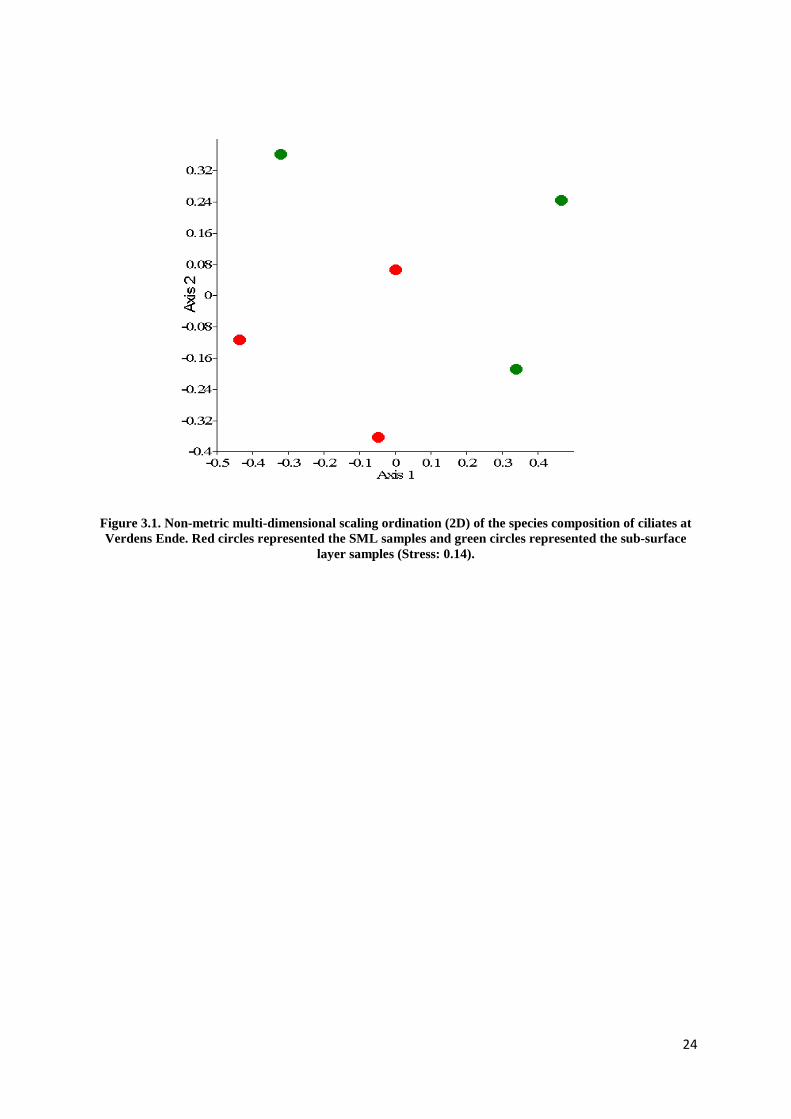
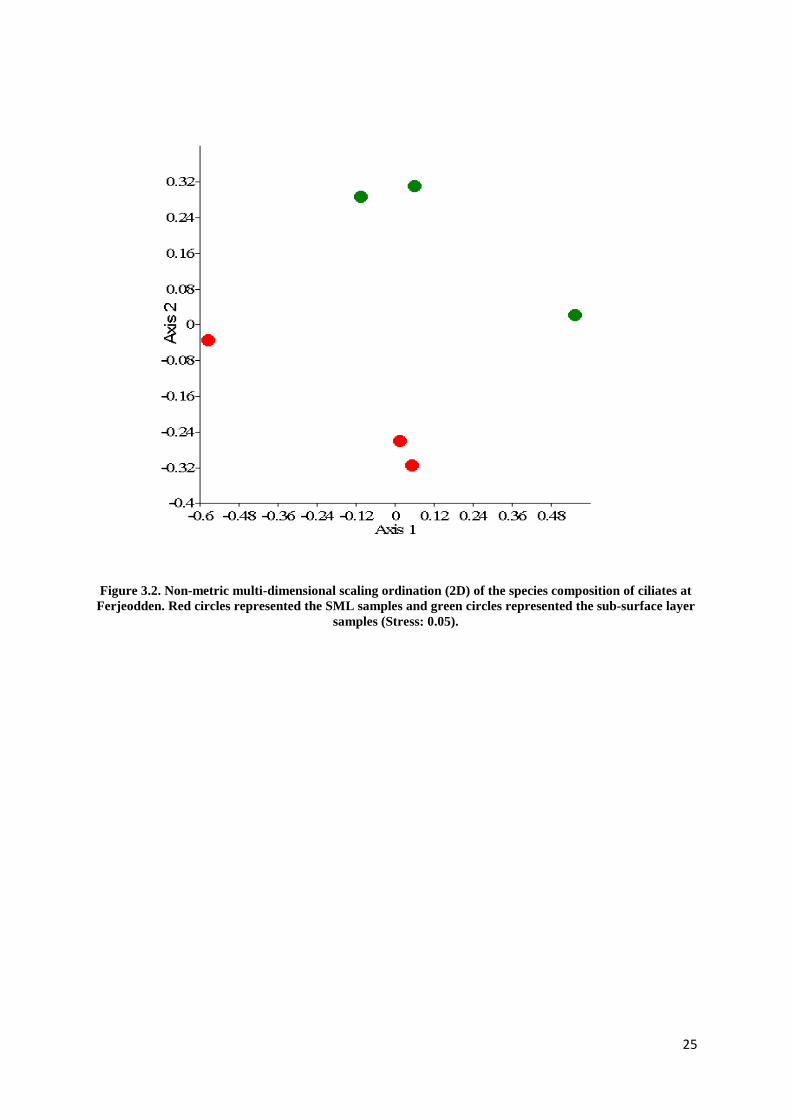
In addition, the neuston and plankton communities appeared to be separated at two locations
using NMDS method (Figure 3.2 and 3.3) except Verdens Ende (Figure 3.1). The distance
between the groups showed how much the groups were separated.
24
Figure 3.1. Non-metric multi-dimensional scaling ordination (2D) of the species composition of ciliates at Verdens Ende. Red circles represented the SML samples and green circles represented the sub-surface
layer samples (Stress: 0.14).
25
Figure 3.2. Non-metric multi-dimensional scaling ordination (2D) of the species composition of ciliates at Ferjeodden. Red circles represented the SML samples and green circles represented the sub-surface layer
samples (Stress: 0.05).
26
Figure 3.3. Non-metric multi-dimensional scaling ordination (2D) of the species composition of ciliates at Bustangen. Red circles represented the SML samples and green circles represented the sub-surface layer
water samples (Stress: 0).
Moreover, the most responsible species for separations between the SML and sub-surface
layer at the three locations were identified. At Verdens Ende, an oligotrich ciliate
(Strombidium spp.2) was only found in the SML and tintinnids (although in different species)
were found in both layers (Table 3.5). At Ferjeodden, in the SML, only two oligotrichs
(Tontonia spp. and Strombilidid spp.) were present and tintinnids and other ciliate groups
were only present in the sub-surface layer (Table 3.6). At Bustangen, tintinnids and
oligotrichs (Strombidium spp.2) were only present in the SML (Table 3.7).

27
Table 3.5. SIMPER analysis of combined samples from Verdens Ende.
Taxon The number of individuals of neuston
The number of individuals of plankton.
Helicostomella spp. 0,40 0,00 Eutintinnus spp.1 0,10 0,00 Strombidium spp.2 0,04 0,00 Favella spp. 0,00 0,02 Tintinnina spp.1 0,00 0,02
Table 3.6. SIMPER analysis of combined samples from Ferjeodden.
Taxon The number of individuals of
neuston
The number of individuals of
plankton Tintininna spp.3 0,00 0,10 Tintininna spp.1 0,00 0,04 Tiarina fusus 0,00 0,10 Hypotrichia spp.1 0,00 0,04 Strombidium spp.1 0,00 0,42 Tontonia spp. 0,40 0,00 Strombilidid spp. 0,80 0,00
Table 3.7. SIMPER analysis of combined samples from Bustangen.
Taxon The number of
individuals of neuston.
The number of individuals of
plankton Strombidium spp.2 0,70 0,00 Tintinnina spp.3. 0,50 0,00 Eutintinnus spp.2. 0,40 0,00 Salpingella spp. 0,40 0,00

28
3.4.1.2. Phytoneuston and phytoplankton
There were no significant differences in species composition between SML and sub-surface
water layer at the three locations (Table 3.8).
Table 3.8. Differences in species composition between the SML and sub-surface layer (1-way ANOSIM analysis).
Verdens Ende Ferjeodden Bustangen R p R p R p phytoplankton community
-0.03 0.6 0.5 0.1 0.7 0.09
Neuston and plankton communities were separated at Ferjeodden and Bustangen (Figure
3.5and 3.6). However, at Verdens Ende, the two communities were not well separated and
separations could be seen within the groups (between the replicates of each group) especially
within the phytonplankton in the sub-surface layer (green circles) (Figure 3.4).

29
Figure 3.4. Non-metric multi-dimensional scaling ordination (2D) of the phytoneuston and phytoplankton at Verdens Ende. Red circles represented the SML samples and green circles represented the sub-surface
samples (Stress: 0.12).

30
Figure 3.5. Non-metric multi-dimensional scaling ordination (2D) of the phytoneuston and phytoplankton at Ferjeodden . Red circles represented the SML samples and green circles represented the sub-surface
samples (Stress: 0).

31
Figure 3.6. Non-metric multi-dimensional scaling ordination (2D) of the phytoneuston and phytoplankton at Bustangen. Red circles represented the SML samples and green circles represented the sub-surface
samples (Stress: 0.05).
Species contributing most to separations between the SML and the sub-surface layer at the
three locations were identified. At Verdens Ende, three dinoflagellates and a diatom Paralia
spp. were only present in the SML and the diatoms Melosira spp. and another three
dinoflagellates were present only in the sub-surface layer (Table 3.9). At Ferjeodden, the
diatom Leptocylindrus danicus and three dinoflagellates were observed only in the sub-
surface layer and the diatom Chaetoceros spp. and three dinoflagellate species were present
only in the SML (Table 3.10). At Bustangen, the diatoms Skeletonema spp. and
Leptocylindrus danicus and two dinoflagellates were seen only in the SML while the diatom
Pseudo-nitzshia spp. and another four dinoflagellates were present in the sub-surface layer
(Table 3.11).

32
Table 3.9. SIMPER analysis of combined samples from Verdens Ende.
Taxon
The number of individuals of neuston
The number of individuals of plankton
Heterocapsa spp. 0,40 0,00 Dinophysis spp.3 0,08 0,00 Paralia spp. 0,06 0,00 Ceratium longipes 10,02 0,00 Protoceratium spp. 0,00 0,10 Scrippsiella spp. 0,00 0,20 Melosira spp. 0,00 0,10 Gonyualax spp. 0,00 0,40
Table 3.10. SIMPER analysis of combined samples from Ferjeodden.
Taxon The number of individuals of neuston
The number of individuals of plankton
Protoperidinium spp. 0,00 0,02 Leptocylindrus danicus 0,00 0,02 Lessardia spp. 0,00 0,16 Chaetoceros spp. 2,00 0,00 Ceratium macroceros 0,50 0,00 Scrippsiella spp. 1,20 0,00 Dinophysis acuminata 1,20 0,00
Table 3.11. SIMPER analysis of combined samples from Bustangen.
Taxon
The number of individuals of neuston
The number of Individuals of plankton
Ceratium spp. 0,50 0,00 Lessardia spp. 0,00 8,00 Skeletonema spp. 6,00 0,00 Dinophyceae spp.1 0,00 83,20 Ceratium macroceros 0,00 0,12 Leptocylindrus danicus 0,90 0,00 Dinophysis acuta 1,20 0,00 Pseudo-nitzshia spp. 0,00 0,04 Dinophysis norvegica 0,00 0,02
33
3.4.2. Neuston at the three locations
3.4.2.1 Ciliate communities
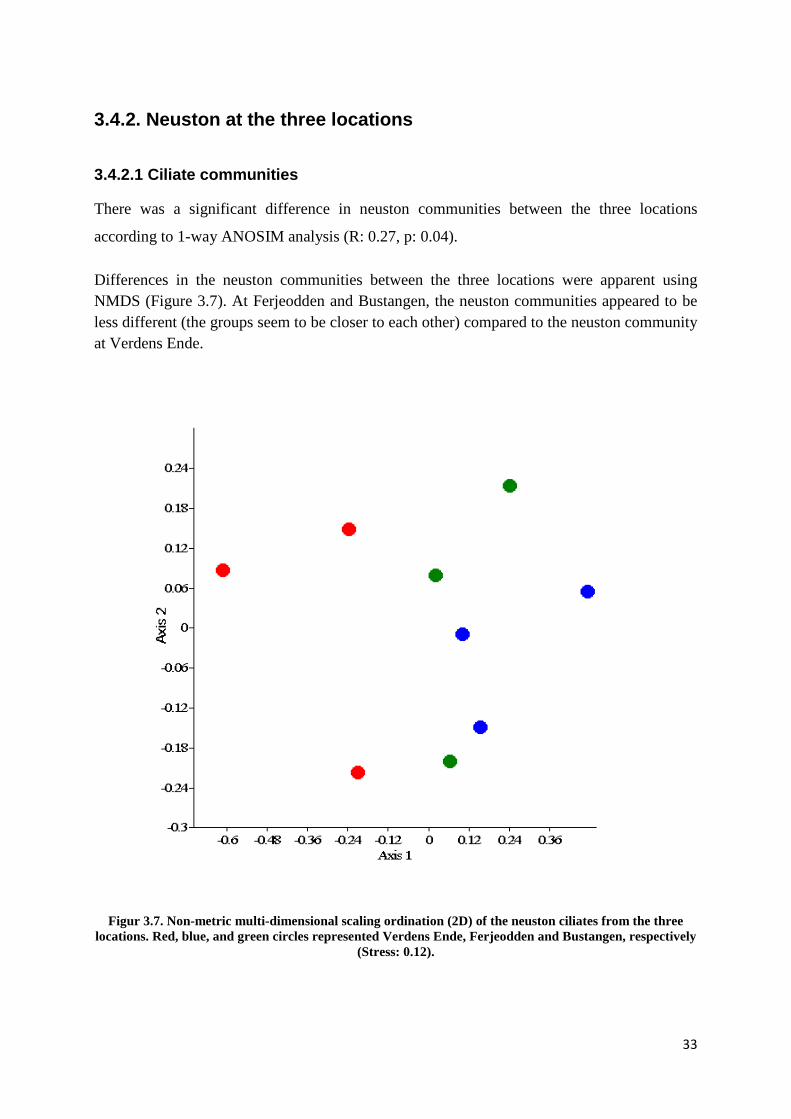
There was a significant difference in neuston communities between the three locations
according to 1-way ANOSIM analysis (R: 0.27, p: 0.04).
Differences in the neuston communities between the three locations were apparent using NMDS (Figure 3.7). At Ferjeodden and Bustangen, the neuston communities appeared to be less different (the groups seem to be closer to each other) compared to the neuston community at Verdens Ende.
Figur 3.7. Non-metric multi-dimensional scaling ordination (2D) of the neuston ciliates from the three locations. Red, blue, and green circles represented Verdens Ende, Ferjeodden and Bustangen, respectively
(Stress: 0.12).

34
Lohmanniella spp.1 and Strombidium spp.5 were identified as the most responsible species
for the overall difference in the neuston communities between the three locations (Table
3.12).
Table 3.12. SIMPER analysis of combined neuston ciliate samples from the three locations.
Taxon The Number of individuals in Verdens Ende
The number of individuals in Ferjeodden
The number of individuals in Bustangen
Lohmanniella spp.1 0,00 16,00 4,10 Strombidium spp.5 0,00 12,40 0,50 Helicostomella spp. 0,40 0,00 0,00 Strobilidiids spp. 0,00 0,80 0,00 Tontonia spp. 0,00 0,40 0,00 Tintinnina spp.2 0,00 0,40 0,00 Salpigella spp. 0,00 0,00 0,40 Strombidium spp.2 0,04 0,00 0,70
The numbers of individuals of Lohmanniella spp.1 and Strombidium spp.5 at the three
locations were shown in figure 3.8 and 3.9, respectively. There was a significant difference in
the number of individuals of Lohmanniella spp.1 between the three locations using Kruskal-
Wallis test (H: 6.82, p: 0.03, n: 3). However, no significant difference was found in the
number of individuals of Strombidium spp.5 between the three locations (H: 4.62, p: 0.09, n:
3).

35
Figure 3.8. The number of individuals of Lohmanniella spp. in the SML at the three locations. VES: Verdens Ende, FjS: Ferjeodden, BtS: Bustangen.
Figure 3.9. The number of individuals of Strombidium spp.5. in the SML at the three locations. VES: Verdens Ende, FjS: Ferjeodden, BtS: Bustangen.

36
3.4.2.2. Phytoneuston communities
A Significant difference was found in neuston communities between the three locations using
1-way ANOSIM (R: 0.48, p: 0.003).
The neuston communities at the three locations did not seem to be well separated using NMDS diagram. However, there seem to be a distance between the groups (Figure 3.10).
Figure 3.10. Non-metric multi-dimensional scaling ordination (2D) of the phytoneuston communities from the three locations. Red, blue, and green circles represented Verdens Ende, Ferjeodden and Bustangen, respectively (Stress: 0.09).
The species responsible for the difference in the neuston communities between the three
locations were identified. Among these species, centric diatoms and dinoflagellates were the
most important phytoplankton groups for the overall difference between the groups
(Table.3.13).
.

37
Table 3.13. SIMPER analysis of combined neuston ciliate from the three locations.
Taxon
The number of
individuals at Verdens Ende
The number of individuals at Ferjeodden
The number of individuals at
Bustangen
Centrales spp. 0,00 0,40 2,20 Melosira spp. 0,00 0,40 5,00 Ceratium lineatum 0,00 0,40 1,00 Ceratium spp. 0,00 1,20 0,50 Dinophysis acuta 0,00 0,04 1,20 Ceratium longipes 0,02 0,00 0,00 Dinophyceae spp.1 187,58 0,00 0,00 Heterocapsa spp. 0,40 0,00 0,00
The number of individuals of centric diatoms and dinoflagellates at the three locations were
shown in figure 3.11 and 3.12, respectively. There was a significant difference in the number
of individuals of centric diatoms between the three locations using the Kruskal-Wallis test (H:
6.2, p: 0.04, n: 3). However, there was not any significant difference in the number of
individuals of dinoflagellates between the three locations (H: 2.6, p: 0.3, n: 3).
Figure 3.11. Box plots of the number of individuals of centric diatoms. at the three locations. VES: Verdens Ende, FjS: Ferjeodden, BtS: Bustangen.

38
Figure 3.12. Box plots of the number of individuals of dinoflagellates at the three locations. VES: Verdens Ende, FjS: Ferjeodden, BtS: Bustangen.
39
4. Discussion
4.1. Environmental conditions The environmental conditions (temperature and salinity) (Table 3.1) did not vary substantially
at the three locations and in the different dates. Salinity was stable but there was an increase
in 17th of July at Verdens Ende.
4.2. Diversity No significant differences were determined in the ciliate and phytoplankton diversities
between the SML and the sub-surface layer and between the SML samples at the three
locations (sections 3.3.1. and 3.3.2.) applying statistical tests (Mann-Whitney U test and
Kruskal-Wallis test) to the diversity indices (Table 3.3). One possible reason could be that the
diversities of ciliates and phytoplankton groups were not influenced by expected
eutrophication and oil pollution at Bustangen and Ferjeodden, respectively. This result was
different from results obtained in previous studies that indicated differences between the
diversity of neuston and plankton communities (Hardy, 1973; Parker and Hatcher, 1974;
Manzi et al., 1977; Estep and Remsen, 1985). The differences between the result of the
present study and previous studies could be because of the number of replicates (three) which
might not be enough for any statistical test to detect possible “true” differences between the
groups (Zar, 1996). Also, the diversity indices might not be suitable to correctly represent the
species diversity of a community despite their popularity in the aquatic systems (Washington,
1984). Furthermore, there could be natural variations in the number of individuals of each
species as well as the number of species in a microbial community (Cairns Jr et al., 1971;
Cairns Jr et al., 1972). These natural variations within a community might be higher than
possible differences between the compared communities. In order to find differences between
the communities in locations differing in their amounts of nutrients and pollution, differences
between the communities should be significantly higher than the natural differences within
the communities (Cairns Jr et al., 1972).

40
4.3. Species composition In the present study, no significant difference in species composition was found between
neuston and plankton (Table 3.4 and 3.8). An explanation for this could be that the expected
higher concentrations of nutrients (Hardy, 1982) and contaminants (Liss and Duce, 1997) in
the SML than in the sub-surface layer did not affect the species composition of the neuston
relative to the plankton. Another explanation could be that the 1-way ANOSIM test did not
have enough power to determine differences or similarities between the groups. The number
of individuals of species within the groups varied; this was evident from the test results where
R= - 0.05 (for ciliates) (Table 3.4) and R= - 0.03 (for phytoplankton) (Table 3.8). In ANOSIM
test, R< 0 indicates that dissimilarity between the groups are lower than the dissimilarity
within the groups (Clarke, 1993), and ANOSIM test is sensitive to differences in dispersion
(within-group variation) among groups. In addition, because there were only three replicates
for each water layer and location in the present study, 1-way ANOSIM, like any other
statistical tests, might have insufficient power to detect differences or similarities between the
chosen groups (Clarke et al., 2006). In order to reliably detect small shifts in community
composition, larger sample sizes (higher number of replicates) would be needed. Significant
differences have been found between phytoneuston and phytoplankton communities by other
studies (Hardy and Valett, 1981; Hardy et al., 1988) that was in contrast to the results
obtained in the present study. One possible explanation of the difference between our result
and the results of other studies could be using different statistical tests, with different amounts
of power, by the other studies. Another explanation might be that in the previous studies,
differences in the amounts of nutrients and pollutants between the SML and the sub-surface
layer could have been greater than those in the present study. Therefore, the possible small
differences in nutrient and pollution levels between the two water layers in the present study
might have resulted in high similarity between neuston and plankton communities.
However, separations have been observed in ciliate communities in the SML and the sub-
surface layer at Ferjeodden and Bustangen (Figure 3.2 and 3.3) and ciliate species responsible
for the separations were identified (Table 3.5, 3.6 and 3.7). One of the most interesting
outcomes, seen in species responsible for separations between neuston and plankton ciliates,
was that only oligotrichs were found in the SML at Ferjeodden (Table 3.6). The existence of
only oligotrichs in the SML at Ferjeodden, could be a result of their adaptation to oil-pollution
or ultraviolet-B (UVB) radiation. According to Anikiev and Urbanovich (Anikiev and

41
Urbanovich, 1989), mean concentrations of total petroleum hydrocarbons in the SML in
various oceans of the world, was higher compared with those in the sub-surface layers.
Therefore, at Ferjeodden, a harbor, hydrocarbon pollutants would be expected to accumulate
to higher concentrations in the SML than in the sub-surface layer. The effects of oil pollution
on plankton ciliates was investigated in an experiment in an enclosed water column and it was
revealed that the abundance of oligotrichs was higher in bags containing oil than those in
control bags (Skjoldal et al., 1982). Also, UVB reaching the SML has higher intensity than
those in the sub-surface layer (Liss and Duce, 1997); tolerating and adapting to high UV
radiation is species-specific among ciliates (Marangoni et al., 2006) and there is little known
about adaptations of specific ciliate groups to UV radiation. However, neuston community
might be highly adaptive to environmental stressors (Zaitsev, 1971). Another possible
explanation of the presence of only oligotrich ciliates in the SML at Ferjeodden might be
decreased pressure from their predators, such as some copepod species, which might be
sensitive to oil-pollution (Raffaelli and Mason, 1981) and UV radiation (Browman et al.,
2000). Plankton ciliates particularly the oligotrichs that generally dominate in plankton
systems are often strongly grazed by various copepod species (Browman et al., 2000; Calbet
and Saiz, 2005). Consequently, if copepod abundance in the SML decrease as a result of
sensitivity to oil pollution or UV radiation, predation pressure (Zöllner et al., 2009) on
oligotrich ciliates may decrease resulting in increasing the ciliate abundance (Sakka Hlaili et
al., 2008) in the SML. The presence of oligotrichs at Ferjeodden could be a result of an
increased number of their prey, bacteria (Paranjape and Gold, 1982; Fenchel and Jonsson,
1988), being known to be highly abundant in oil-polluted areas (Dahl et al., 1983).
At Bustangen, where eutrophication was expected to occur, oligotrich and tintinnid ciliates
contributed most to the separation between neuston and plankton communities. These ciliate
groups were only present in the SML (Table 3.7). This result suggested that these ciliate
groups might tolerate the expected higher amounts of nutrients in the SML than in the sub-
surface layer. This result was similar to results obtained from other studies on pelagic
systems. In eutrophic waters with high concentration of particulate organic matter and
nutrients, oligotrichs such as Strombidium spp. were abundant (Beaver and Crisman, 1982;
Barría de Cao et al., 2003; Kim et al., 2007; Selifonova, 2009) suggesting that this ciliate
group might be tolerant to eutrophication (Barría de Cao et al., 2003; Selifonova, 2009).
These ciliate groups might be present in eutophic waters because of availability of their
favored prey, bacteria (Paranjape and Gold, 1982; Fenchel and Jonsson, 1988) and

42
nanoflagellates, found in high abundance in eutrophic waters (Beaver and Crisman, 1982;
Azam et al., 1983; Gast, 1985; Pierce, 1989; Kim et al., 2007). Bacteria are known to be
abundant in the most productive lakes (Fenchel, 1980) specially attached to surface film at the
SML (Cunliffe and Murrell, 2009); also, nanoflagellates are known to be an important group
of the microbial food web in the SML (Joux et al., 2006). In addition to oligotrichs, tintinnids
were found to be abundant at eutrophic lakes (Beaver and Crisman, 1982); however, studies
on tintinnids relative to eutrophication are rare (Barría de Cao et al., 2003) probably because
tintinnids are known to be highly sensitive to eutrophication (Curds, 1982). In another study
in eutrophic waters, the abundance of tintinnid ciliates was low (Selifonova, 2009). However,
the presence of tintinnids only in the SML at Bustangen might be because of availability of
their food, bacteria (Hollibaugh et al., 1980) that are known to be abundant in eutrophic areas
(Fenchel, 1980) and particularly in the SML (Cunliffe and Murrell, 2009). It has been
reported that bacteriovorous (such as tintinnids) ciliates might have the highest abundance of
ciliates in some eutrophic estuaries and may be able to consume one third of annual bacterial
production (Arndt et al., 1990).
Separations between phytoneuston and phytoplankton were also observed at Ferjeodden and
Bustangen (Figure 3.4, 3.5 and 3.6) and species responsible for the separations were identified
(Table 3.9, 3.10 and 3.11). An important finding was that genus Chaetoceros and three
dinoflagellate species, being present only in the SML, were among the most responsible
species for the separation between phytoneuston and phytoplankton at Ferjeodden with
expected oil-pollution (Table 3.10). This finding suggested that genus Chaetoceros and the
three dinoflagellate species might be tolerant to oil pollution at Ferjeodden. Vargo (1982) also
found that the centric diatom Chaetoceros, dominated the phytoplankton community in oil
tanks compared to controlled tanks; however, Vargo et al. (1982) did not explain clearly why
he obtained such a result. In contrast, other studies reported diatoms as more sensitive to
elevated oil concentrations than flagellates (Pulich et al., 1974; Hsiao et al., 1978). Davenport
et al. (1982) reported that low hydrocarbon concentration may increase microflagellate
abundance and decrease diatom abundance. Vargo et al. (1982) suggested that the difference
between the results of the above reports may be due to the source, kind of oil and specific
components of the oil. He added that the reason for Chaetoceros dominance could be the
reduction of predator pressure because of changed feeding behavior or non-lethal oil
concentrations in the water column. Decreased predation pressure could be as a result of a

43
remarkable negative effect that oil pollution have on some copepod species and other
microalgal predators (Davenport et al., 1982).
The species responsible for the separation between the phytoneuston and phytoplankton at
Bustangen, with expected eutrophication were identified (Table 3.11). The diatoms
Skeletonema and Leptocylindrus and three dinoflagellates were only seen in the SML
suggesting that these species might be tolerant to expected higher concentrations of organic
nutrients in the SML than in the sub-surface layer. This finding was in agreement with
Selifonova’s (2009) findings which indicated that Skeletonema, Leptocylindrus and
dinoflagellates could be tolerant to eutrophication. Another study also reported
Leptocylindrus, a tolerant genus to industrial effluents and sewage discharges (Verlecar et al.,
2006). There were two Ceratium species (dinoflagellates) among the responsible species for
the differences between phytoneuston and phytoplankton at Bustangen (Table 3.11)
suggesting that this genus (Ceratium) could be tolerant to eutrophication. This finding was
similar to another study’s finding in which Ceratium genus was assossiated with eutrophic
coastal areas (Drira et al., 2010).
The neuston at the three locations, may also be influenced by or tolerate ultraviolet radiation.
(UVR). We know UVR may affect growth and reproduction of plankton leading to changes in
species composition of the community (Villafane et al., 1995). Intense radiation precludes
microalgal species from the surface layers (Albright, 1980). For temperate areas, important
shifts in marine plankton species composition were found after exposing the community to
UVR (Santas et al., 1997; Helbling et al., 2005) leading to dominance of some species. A few
studies suggest that phytoflagellates compared to diatoms (especially pennate diatoms), have
more sensitivity towards UVR (Helbling et al., 1994; Villafane et al., 1995; Hernando and
San Román, 1999). However, we found both diatoms and dinoflagellates in the SML that
could be because the two groups were tolerant to UVR.
It is difficult to explain why significant differences were found in the species composition of
neuston ciliates (p: 0.04, section 3.4.2.1.) and microalga (p: 0.003, section 3.4.2.2.) between
the three locations because to our knowledge, there is no previous research on this subject.
However, differences have been found in zooneuston (zooplankton living in the SML)
(Holdway and Maddock, 1983) as well as in plankton (Vargo et al., 1982; Gillbricht, 1988;
Liu et al., 2005; Devlin et al., 2007; Liu, 2008; Tas et al., 2009) between locations differing in
their degrees of eutrophication and pollution. Zooneuston and plankton might have a close
44
relationship, with the neuston found in the present study, in the microbial food web and
changes in their communities might lead to changes in predator (copepods) pressure and
amounts of food (bacteria) availability. These changes might lead to changes in ciliate and
phytoplankton communities (as mentioned above).
Separations between the neuston ciliates at the three locations were observed (Figure 3.7) and
Lohmanniella spp. and Strombidium spp.5 were identified as the ciliate species contributing
most to the separations in neuston between the three locations (Table 3.12). Because the two
species were found only in the locations with expected eutrophication (Bustangen) and oil
pollution (Ferjeodden), these two species could be tolerant to eutrophication and pollution.
These two species are known to resist oil pollution (Skjoldal et al., 1982) and eutrophication
(Barría de Cao et al., 2003; Selifonova, 2009). Another explanation regarding the presence of
oligotrichs (Strombidium spp.5. and Lohmanniella spp.) in the SML at the two polluted
locations could be that they are known to feed on bacteria (Paranjape and Gold, 1982; Fenchel
and Jonsson, 1988), having a high number of individuals in eutrophic (Beaver and Crisman,
1982; Azam et al., 1983; Gast, 1985; Pierce, 1989; Kim et al., 2007) and oil polluted areas
(Dahl et al., 1983). A possible reason why there was a significant difference in the number of
individuals of Lohmanniella spp. between the three locations but not in the number of
individuals of Strombidium spp.5. (section 3.4.2.1.), could be the statistical test used. The
results of Kruskal-Wallis test like any other statistical test are less accurate with groups
having less than 5 replicates (Zar, 1996).
Separations in phytoneuston community structures between the three locations (Figure 3.10)
were explained by centric diatoms and dinoflagellates as the most responsible phytoneuston
groups for the separations (section 3.4.2.2. and Table 3.13). Finding a significant difference
only in the number of individuals of centric diatoms but not dinoflagellates may be explained
by the statistical test, Kruskal-Wallis, that could be less accurate with groups having less than
5 replicates (Zar, 1996); however, centric diatoms are known to tolerate oil pollution (Vargo
et al., 1982), eutrophication (Ruping, 1991; Ramaiah and Nair, 1998; Verlecar et al., 2006).
Therefore, centric diatoms could be identified as indicators of high organic nutrients (Harrison
et al., 1991; De et al., 1994) and oil pollution.

45
4.4. Links between diversity and environmental variables
There were small variations in the environmental variables between the three locations and
sampling times, and any differences in neuston communities between the three locations
could not be related to the environmental variables. In fact, neuston communities are known
to adapt with their unique habitat (Zaitsev, 1971; Zaitsev and Liss, 1997), a stressful
environment for microorganisms. Coastal and estuarine phytoplankton species seem to
tolerate salinity changes in their environments. Estuarine phytoplankton species have a very
wide range of salinity-tolerance being able to reproduce even in a salinity of 5-4 (Brand,
1984). Plankton ciliates can tolerate a salinity of 20-30 (Montagnes, 2001). Diatoms are able
to grow within a temperature range of 5-25˚C with optimum growth at 15˚C (Ryther, 1954).
Some dinoflagellates can grow within a temperature range of 10-25˚C or 10-30˚C (Pearce and
Hallegraeff, 2004). Plankton ciliates may tolerate a temperature range of 7-22˚C (Montagnes,
2001). It was difficult and speculative to relate variation in communities to variation in
recorded environmental factors that only represents small intervals well within the tolerance
limits of the studied organisms.

46
Conclusions There was no significant difference in the diversity of ciliates and phytoplankton between the
SML and water column and between the SML samples at the three locations as opposed to
other studies discussed in the previous chapter (Hardy, 1973; Parker and Hatcher, 1974;
Manzi et al., 1977; Estep and Remsen, 1985). This result does not rule out possible “true” but
unidentified differences because the representation of communities with diversity indices
could be unsatisfactory. Also, insufficient number of replicates (n=3) contribute to much
variation and large standard errors.
Ciliate and phytoplankton species compositions in the SML were compared with those in the
sub-surface layer at the three locations and no significant differences were found between
them. However, separations were observed in ciliate and phytoplankton between the two
water layers at the three locations. Significant differences were found in ciliate and
phytoplankton species compositions in the SML samples from the three locations. Oligotrich
ciliates and diatoms were identified as the taxonomic groups contributing most to separations
between neuston and plankton and between the neuston at the three locations. Adaptation to
eutrophication, oil pollution, and UVR (ultraviolet radiation), predator pressure reduction and
food availability could be possible reasons for this result.
The results obtained in the present study could not be related to the environmental factors
(temperature and salinity) because the environmental factors did not vary substantially at the
three locations.
47
References Albright, L. (1980). "Photosynthetic activities of phytoneuston and phytoplankton." Canadian
journal of microbiology 26(3): 389. Alldredge, A., U. Passow and B. Logan (1993). "The abundance and significance of a class of large,
transparent organic particles in the ocean." Deep Sea Research Part I: Oceanographic Research Papers 40(6): 1131-1140.
Andrews, A. and G. Floodgate (1974). "Some observations on the interactions of marine protozoa and crude oil residues." Marine Biology 25(1): 7-12.
Anikiev, V. and M. Urbanovich (1989). "Distribution of organic pollutants in the sea surface microlayer system in some areas of the World Ocean.)." Geokhimiya. Moscow(5): 738-744.
Arndt, H., G. Jost and N. Wasmund (1990). "Dynamics of pelagic ciliates in eutrophic estuarine waters: importance of functional groups among ciliates and responses to bacterial and phytoplankton production." Arch. Hydrobiol. Beih. Ergebn. Limnol., Stuttgart 34: 239-245.
Azam, F., T. Fenchel, J. Field, J. Gray, L. Meyer-Reil and F. Thingstad (1983). "The ecological role of water-column microbes in the sea." Marine ecology progress series. Oldendorf 10(3): 257-263.
Barría de Cao, M. S., R. Pettigrosso, E. Parodi and R. Freije (2003). "Abundance and species composition of planktonic Ciliophora from the wastewater discharge zone in the Bahía Blanca Estuary, Argentina." Iheringia. Série Zoologia 93: 229-236.
Beaver, J. and T. Crisman (1982). "The trophic response of ciliated protozoans in freshwater lakes." Limnology and oceanography 27(2): 246-253.
Beaver, J. and T. Crisman (1989). "Analysis of the community structure of planktonic ciliated protozoa relative to trophic state in Florida lakes." Hydrobiologia 174(3): 177-184.
Belzile, C., S. Demers, G. Ferreyra, I. Schloss, C. Nozais, K. Lacoste, B. Mostajir, S. Roy, M. Gosselin and E. Pelletier (2006). "UV effects on marine planktonic food webs: a synthesis of results from mesocosm studies." Photochemistry and photobiology 82(4): 850-856.
Berge, J. (1990). "Macrofauna recolonization of subtidal sediments. Experimental studies on defaunated sediment contaminated with crude oil in two Norwegian fjords with unequal eutrophication status. I. Community responses." Marine ecology progress series. Oldendorf 66(1): 103-115.
Brand, L. E. (1984). "The salinity tolerance of forty-six marine phytoplankton isolates." Estuarine, Coastal and Shelf Science 18(5): 543-556.
Browman, H., C. Rodriguez, F. Béland, J. Cullen, R. Davis, J. Kouwenberg, P. Kuhn, B. McArthur, J. Runge and J. St-Pierre (2000). "Impact of ultraviolet radiation on marine crustacean zooplankton and ichthyoplankton: a synthesis of results from the estuary and Gulf of St. Lawrence, Canada." Marine Ecology Progress Series 199: 293-311.
Butler, J., R. Croome and G. Rees (2007). "The composition and importance of the phytoneuston in two floodplain lakes in south-eastern Australia." Hydrobiologia 579(1): 135-145.
Cairns Jr, J., K. Dickson and W. Yongue Jr (1971). "The consequences of nonselective periodic removal of portions of fresh-water protozoan communities." Transactions of the American Microscopical Society 90(1): 71-80.
Cairns Jr, J., G. Lanza and B. Parker (1972). "Pollution related structural and functional changes in aquatic communities with emphasis on freshwater algae and protozoa." Proceedings of the Academy of Natural Sciences of Philadelphia: 79-127.
Calbet, A. and E. Saiz (2005). "The ciliate-copepod link in marine ecosystems." Aquatic Microbial Ecology 38(2): 157-167.
Carlson, D. and L. Mayer (1980). "Enrichment of dissolved phenolic material in the surface microlayer of coastal waters."

48
Chapman, A. and J. Craigie (1977). "Seasonal growth in Laminaria longicruris: relations with dissolved inorganic nutrients and internal reserves of nitrogen." Marine Biology 40(3): 197-205.
Clarke, K. (1993). "Non parametric multivariate analyses of changes in community structure." Australian Journal of Ecology 18(1): 117-143.
Clarke, K., M. Chapman, P. Somerfield and H. Needham (2006). "Dispersion-based weighting of species counts in assemblage analyses." Marine Ecology Progress Series 320: 11-27.
Clarke, K. and R. Warwick (2001). "Change in Marine Communities: an Approach to Statistical Analysis and Interpretation." Plymouth, UK: PRIMER-E 172.
Clifford, H. and W. Stephenson (1975). An introduction to numerical classification, 229 pp, New York: Academic Press.
Cunliffe, M. and J. Murrell (2009). "Eukarya 18S rRNA gene diversity in the sea surface microlayer: implications for the structure of the neustonic microbial loop." The ISME Journal 4(3): 455-458.
Curds, C. (1982). "Pelagic protists and pollution: a review of the past decade." Ann. Inst. Oceanogr 58: 117-136.
Dahl, E., M. Laake, K. Tjessem, K. Eberlein and B. Bohle (1983). "Effects of Ekofisk crude oil on an enclosed planktonic ecosystem." Marine ecology progress series. Oldendorf 14(1): 81-91.
Dalby, A., K. Kormas, U. Christaki and H. Karayanni (2008). "Cosmopolitan heterotrophic microeukaryotes are active bacterial grazers in experimental oil-polluted systems." Environmental Microbiology 10(1): 47-56.
Dale, T. (1988). "Oil pollution and plankton dynamics. 6. Controlled ecosystem experiments in Lindaaspollene, Norway, June 1981: Effects on planktonic ciliates following nutrient addition to natural and oil-polluted enclosed water columns." Sarsia 73(3): 179-191.
Davenport, J., M. Angel, J. Gray, D. Crisp and J. Davies (1982). "Oil and Planktonic Ecosystems [and Discussion]." Philosophical Transactions of the Royal Society of London. B, Biological Sciences 297(1087): 369.
De Jong, F. (2006). Marine eutrophication in perspective: on the relevance of ecology for environmental policy, Springer Verlag.
De, T., A. Choudhury and T. Jana (1994). "Phytoplankton community organization and species diversity in the Hugli estuary, north east coast of India." Indian journal of marine sciences 23(3): 152-156.
Devlin, M., M. Best, D. Coates, E. Bresnan, S. O'Boyle, R. Park, J. Silke, C. Cusack and J. Skeats (2007). "Establishing boundary classes for the classification of UK marine waters using phytoplankton communities." Marine pollution bulletin 55(1-6): 91-103.
Drira, Z., A. Hamza, M. Bel Hassen, H. Ayadi, A. Bouain and L. Aleya (2010). "Coupling of phytoplankton community structure to nutrients, ciliates and copepods in the Gulf of Gabès (south Ionian Sea, Tunisia)." Journal of the Marine Biological Association of the UK 90(06): 1203-1215.
Estep, K. and C. Remsen (1985). "Influence of the surface microlayer on nutrients, chlorophyll and algal diversity of a small eutrophic bog pond." Hydrobiologia 121(3): 203-213.
Fenchel, T. (1980). "Suspension feeding in ciliated protozoa: functional response and particle size selection." Microbial Ecology 6(1): 1-11.
Fenchel, T. (1987). Ecology of protozoa: the biology of free-living phagotrophic protists, Science Tech Publishers (Madison, Wis.).
Fenchel, T. (2008). "The microbial loop-25 years later." Journal of Experimental Marine Biology and Ecology 366(1-2): 99-103.
Fenchel, T. and P. Jonsson (1988). "The functional biology of Strombidium sulcatum, a marine oligotrich ciliate(Ciliophora, Oligotrichina)." Marine ecology progress series. Oldendorf 48(1): 1-15.
49
Gast, V. (1985). "Bacteria as a food source for microzooplankton in the Schlei Fjord and Baltic Sea with special reference to ciliates." Marine ecology progress series. Oldendorf 22(2): 107-120.
Gillbricht, M. (1988). "Phytoplankton and nutrients in the Helgoland region." Helgoland Marine Research 42(3): 435-467.
Gilmartin, M. and N. Revelante (1980). "Nutrient input and the summer nanoplankton bloom in the northern Adriatic Sea." Marine Ecology 1(2): 169-180.
Gladyshev, M. (1986). "Neuston of inland waters (a review)." Hydrobiol. J 22(5): 1-7. Gladyshev, M., G. Harding, J. Shenker, P. Tratnyek and Y. Zaitsev (1997). "Report Group 2-Biological
effects of chemical and radiative change in the sea surface." The sea surface and global change: 35-70.
González, J., F. Figueiras, M. Aranguren-Gassis, B. Crespo, E. Fernández, X. Morán and M. Nieto-Cid (2009). "Effect of a simulated oil spill on natural assemblages of marine phytoplankton enclosed in microcosms." Estuarine, Coastal and Shelf Science 83(3): 265-276.
Gray, J., R. Wu and Y. Or (2002). "Effects of hypoxia and organic enrichment on the coastal marine environment." Marine Ecology Progress Series 238: 249-279.
Hammer, Ø. and D. A. T. R. Harper, P.D. (2001). "PAST: Paleontological Statistics Software Package for Education and Data Analysis." Palaeontologia Electronica 4(1): 9.
Hardy, J. (1973). "Phytoneuston ecology of a temperate marine lagoon." Limnology and oceanography 18(4): 525-533.
Hardy, J. (1997). "Biological effects of chemicals in the sea-surface microlayer." The sea surface and global change: 339-370.
Hardy, J., J. Coley, L. Antrim and S. Kiesser (1988). "A hydrophobic large-volume sampler for collecting aquatic surface microlayers: Characterization and comparison with the glass plate method." Canadian Journal of Fisheries and Aquatic Sciences 45(5): 822-826.
Hardy, J., E. Crecelius, L. Antrim, S. Kiesser, D. Broadhurst Paul and L. Virginia (1990). "Aquatic surface microlayer contamination in Chesapeake Bay." Marine chemistry 28(4): 333-351.
Hardy, J. T. (1982). "The sea surface microlayer: Biology, chemistry and anthropogenic enrichment." Progress in Oceanography [PROG. OCEANOGR.] 11(4).
Hardy, J. T. and M. Valett (1981). "Natural and microcosm phytoneuston communities of Sequim Bay, Washington." Estuarine, Coastal and Shelf Science 12(1): 3-12.
Harrison, P., P. Clifford, W. Cochlan, K. Yin, M. JOHN, P. Thompson, M. Sibbald and L. Albright (1991). "Nutrient and plankton dynamics in the Fraser River plume, Strait of Georgia, British Columbia." Mar. Ecol. Prog. Ser 70: 291-304.
Harvey, G. (1966). "Microlayer collection from the sea surface: a new method and initial results." Limnology and oceanography 11(4): 608-613.
Hasle, G. (1978). "Settling: the inverted-microscope method." Monographs on oceanographic methodology 6: 88–96.
Helbling, E., E. Barbieri, M. Marcoval, R. Gonçalves and V. Villafañe (2005). "Impact of Solar Ultraviolet Radiation on Marine Phytoplankton of Patagonia, Argentina¶." Photochemistry and photobiology 81(4): 807-818.
Helbling, E., V. Villafañe and O. Holm-Hansen (1994). "Effects of ultraviolet radiation on Antarctic marine phytoplankton photosynthesis with particular attention to the influence of mixing." Antarct. Res. Ser 62: 207-227.
Hernando, M. and N. San Román (1999). "Preliminary data on chronic effects of ultraviolet radiation on the growth of some phytoplankton species of the Beagle Channel, Argentina." Scientia Marina 63(S1).
Hill, M. and H. Gauch (1980). "Detrended correspondence analysis: an improved ordination technique." Plant Ecology 42(1): 47-58.
Hodgkiss, I. and S. Lu (2004). "The effects of nutrients and their ratios on phytoplankton abundance in Junk Bay, Hong Kong." Hydrobiologia 512(1): 215-229.

50
Holdway, P. and L. Maddock (1983). "A comparative survey of neuston: geographical and temporal distribution patterns." Marine Biology 76(3): 263-270.
Hollibaugh, J., J. Fuhrman and F. Azam (1980). "Radioactively labeling of natural assemblages of bacterioplankton for use in trophic studies." Limnology and oceanography: 172-181.
Horrigan, L., R. Lawrence and P. Walker (2002). "How sustainable agriculture can address the environmental and human health harms of industrial agriculture." Environmental health perspectives 110(5): 445.
Hsiao, S., D. Kittle and M. Foy (1978). "Effects of crude oils and the oil dispersant Corexit on primary production of arctic marine phytoplankton and seaweed." Environmental Pollution (1970) 15(3): 209-221.
Huang, Y.-J., Z.-B. Jiang, J.-N. Zeng, Q.-Z. Chen, Y.-q. Zhao, Y.-b. Liao, L. Shou and X.-q. Xu (2010). "The chronic effects of oil pollution on marine phytoplankton in a subtropical bay, China." Environmental Monitoring and Assessment: 1-14.
Joux, F., H. Agogué, I. Obernosterer, C. Dupuy, T. Reinthaler, G. Herndl and P. Lebaron (2006). "Microbial community structure in the sea surface microlayer at two contrasting coastal sites in the northwestern Mediterranean Sea." Aquatic Microbial Ecology 42(1): 91-104.
Kim, Y., J. Chae, J. Hong and P. Jang (2007). "Comparing the distribution of ciliate plankton in inner and outer areas of a harbor divided by an artificial breakwater." Marine Environmental Research 64(1): 38-53.
Kuznetsova, M., C. Lee, J. Aller and N. Frew (2004). "Enrichment of amino acids in the sea surface microlayer at coastal and open ocean sites in the North Atlantic Ocean." Limnology and oceanography 49(5): 1605-1619.
Liss, P. and R. Duce (1997). The sea surface and global change, Cambridge Univ Pr. Liu, D. (2008). "Phytoplankton diversity and ecology in estuaries of southeastern NSW, Australia."
University of Wollongong Thesis Collection: 827. Liu, D., J. Sun, J. Zou and J. Zhang (2005). "Phytoplankton succession during a red tide of
Skeletonema costatum in Jiaozhou Bay of China." Marine pollution bulletin 50(1): 91-94. Malone, T. (1980). "Size-fractionated primary productivity of marine phytoplankton." Primary
productivity in the sea 301: 319. Manzi, J. J., P. E. Stofan and J. L. Dupuy (1977). "Spatial heterogeneity of phytoplankton
populations in estuarine surface microlayers." Marine Biology 41(1): 29-38. Marangoni, R., F. Marroni, F. Ghetti, D. Gioffré and G. Colomebtti (2006). Effect of UV-B Radiation
on Ciliated Protozoa. Environmental UV Radiation: Impact on Ecosystems and Human Health and Predictive Models. F. Ghetti, G. Checcucci and J. F. Bornman, Springer Netherlands. 57: 231-248.
Mathias, E. (2006). "Buchbesprechung: Coastal Plankton. Photo Guide for European Seas. Von Otto Larink und Wilfried Westheide." Biologie in unserer Zeit 36(4): 265.
Montagnes, D. (2001). "Guide to UK coastal Planktonic Ciliates." Retrieved 15.12.2010, from http://www.liv.ac.uk/ciliate/.
Nixon, S. and M. Pilson (1983). "Nitrogen in estuarine and coastal marine ecosystems." Nitrogen in the marine environment: 565–648.
Paranjape, M. and K. Gold (1982). Cultivation of marine pelagic protozoa. Parker, B. and R. Hatcher (1974). "Enrichment of Surface Freshwater Microlayers with Algae 1."
Journal of Phycology 10(2): 185-189. Pearce, I. and G. M. Hallegraeff (2004). "Genetic affinities, ecophysiology and toxicity of
Prorocentrum playfairii and P. foveolata (Dinophyceae) from Tasmanian freshwaters." Phycologia 43(3): 271-281.
Pfister, G., B. Auer and H. Arndt (2002). "Pelagic ciliates (Protozoa, Ciliophora) of different brackish and freshwater lakes--a community analysis at the species level*." Limnologica-Ecology and Management of Inland Waters 32(2): 147-168.
Pielou, E. (1969). "An introduction to mathematical ecology." New York: 286. Pielou, E. (1975). Ecological diversity, Wiley New York.

51
Pierce, R. (1989). "A SEASONAL STUDY CIF PLANKTON, LARVAL FISH, AND WATER QUALITY IN BUZZARDS BAY, MASSACHUSETTS INTERIM DATA REPORT OCTOBER, 1987 THROUGH SEPTEMBER, 1988."
Press, W., B. Flannery, S. Teukolsky and W. Vetterling (2007). Numerical recipes, Cambridge university press Cambridge.
Pulich, W., K. Winters and C. Baalen (1974). "The effects of a No. 2 fuel oil and two crude oils on the growth and photosynthesis of microalgae." Marine Biology 28(2): 87-94.
Raffaelli, D. G. and C. F. Mason (1981). "Pollution monitoring with meiofauna, using the ratio of nematodes to copepods." Marine pollution bulletin 12(5): 158-163.
Ramaiah, N. and V. Nair (1998). "Phytoplankton characteristics in a polluted Bombay harbour-Thana-Bassein creek estuarine complex." Indian journal of marine sciences 27: 281-285p.
Revelante, N., M. Gilmartin and N. Smodlaka (1985). "The effects of Po River induced eutrophication on the distribution and conimunity structure of ciliated protozoan and micrometazoan populations in the northern Adriatic Sea." Journal of Plankton Research 7(4): 461.
Ruping, W. (1991). "Studies on the plankton and sediment diatoms in Xuanwu Lake, Nanjing, China." Chinese Journal of Oceanology and Limnology 9(3): 277-289.
Ryther, J. H. (1954). "The Ecology of Phytoplankton Blooms in Moriches Bay and Great South Bay, Long Island, New York." Biological Bulletin 106(2): 198-209.
Sakka Hlaili, A., B. Grami, N. Niquil, M. Gosselin, D. Hamel, M. Troussellier and H. Hadj Mabrouk (2008). "The planktonic food web of the Bizerte lagoon (south-western Mediterranean) during summer: I. Spatial distribution under different anthropogenic pressures." Estuarine, Coastal and Shelf Science 78(1): 61-77.
Santas, R., C. Lianou and D. Danielidis (1997). "UVB radiation and depth interaction during primary succession of marine diatom assemblages of Greece." Limnology and oceanography 42(5): 986-991.
Sargian, P., S. Mas, E. Pelletier and S. Demers (2007). "Multiple stressors on an Antarctic microplankton assemblage: water soluble crude oil and enhanced UVBR level at Ushuaia (Argentina)." Polar Biology 30(7): 829-841.
Sargian, P., B. Mostajir, K. Chatila, G. Ferreyra, É. Pelletier and S. Demers (2005). "Non-synergistic effects of water-soluble crude oil and enhanced ultraviolet-B radiation on a natural plankton assemblage." Marine Ecology Progress Series 294: 63-77.
Selifonova, J. (2009). "The ecosystem of the Black Sea port of Novorossiysk under conditions of heavy anthropogenic pollution." Russian Journal of Ecology 40(7): 510-515.
Shannon, C. (1949). "The mathematical theory of communication." Urbana: University of Illinois Press.
Skjoldal, H. R., T. Dale, H. Haldorsen, B. Pengerud, T. F. Thingstad, K. Tjessem and A. Aaberg (1982). "Oil pollution and plankton dynamics 1. Controlled ecosystem experiments during the 1980 spring bloom in lindåspollene, Norway." Netherlands Journal of Sea Research 16: 511-523.
Smith, J. (1968). " Torrey Canyon" Pollution and Marine Life, University Press. Smith, S. (1984). "Phosphorus versus nitrogen limitation in the marine environment." Limnology
and oceanography 29(6): 1149-1160. Southwood, J., D. Muir and D. Mackay (1999). "Modelling agrochemical dissipation in surface
microlayers following aerial deposition." Chemosphere 38(1): 121-141. Spooner, M. (1968). Comments during discussion. In: Scientific aspects of pollution of the sea by
oil, Institute of Petroleum. Stockner, J. (1988). "Phototrophic picoplankton: an overview from marine and freshwater
ecosystems." Limnology and oceanography 33(4): 765-775. Strüder-Kypke, M., E. Kypke, S. Agatha, J. Warwick and D. Montagnes. (2003, 28. june 2006). "The
Planktonic Ciliate Project on the Internet." Retrieved 23. august 2010, from http://www.liv.ac.uk/ciliate/intro.htm.
Tangen, K. (1976). A device for safe sedimentation using the Utermohl technique. 36: 282.

52
Tas, S., I. Yilmaz and E. Okus (2009). "Phytoplankton as an Indicator of Improving Water Quality in the Golden Horn Estuary." Estuaries and Coasts 32(6): 1205-1224.
The Climate and Pollution Agency, S. (2010). "State of the Environment in Norway." Climate and Pollution Agency Retrieved 23 August, 2010, from http://www.environment.no/default.aspx.
Throndsen, J. and W. Eikrem (2001). Marine mikroalger i farger, Almater. Throndsen, J., G. Hasle and K. Tangen (2007). Phytoplankton of Norwegian coastal waters, Almater
Forlag AS. Vargo, G. A., M. Hutchins and G. Almquist (1982). "The effect of low, chronic levels of no. 2 fuel oil
on natural phytoplankton assemblages in microcosms: 1. Species composition and seasonal succession." Marine Environmental Research 6(4): 245-264.
Verdugo, P., A. Alldredge, F. Azam, D. Kirchman, U. Passow and P. Santschi (2004). "The oceanic gel phase: a bridge in the DOM-POM continuum." Marine chemistry 92(1-4): 67-85.
Verlecar, X. N., S. R. Desai, A. Sarkar and S. G. Dalal (2006). "Biological indicators in relation to coastal pollution along Karnataka coast, India." Water Research 40(17): 3304-3312.
Villafane, V., E. Helbling, O. Holm-Hansen and B. Chalker (1995). "Acclimatization of Antarctic natural phytoplankton assemblages when exposed to solar ultraviolet radiation." Journal of Plankton Research 17(12): 2295.
Walday, M., J. Gitmark, L. Naustvoll, K. Norling, J. Selvik and K. Sørensen (2009). Overvåking av Ytre Oslofjord 2009 (unpublished work).
Washington (1984). "Diversity, biotic and similarity indices: A review with special relevance to aquatic ecosystems." Water Research 18(6): 653-694.
Wurl, O. and M. Holmes (2008). "The gelatinous nature of the sea-surface microlayer." Marine chemistry 110(1-2): 89-97.
Wurl, O. and J. Obbard (2004). "A review of pollutants in the sea-surface microlayer (SML): a unique habitat for marine organisms." Marine pollution bulletin 48(11-12): 1016-1030.
Xu, M., H. Cao, P. Xie, D. Deng, W. Feng and J. Xu (2005). "The temporal and spatial distribution, composition and abundance of Protozoa in Chaohu Lake, China: Relationship with eutrophication." European Journal of Protistology 41(3): 183-192.
Zaitsev, Y. (1971). "Marine Neustonology (translated from Russian)." National Marine Fisheries Service, NOAA, and NSF. National Technical Information Service, Springfield, Virginia: 207 pp.
Zaitsev, Y. and P. Liss (1997). "Neuston of seas and oceans." The sea surface and global change: 371-382.
Zar, J. (1996). "Biostatistical analysis 3rd ed Prentice Hall." Upper Saddle River, NJ. Zöllner, E., H. Hoppe, U. Sommer and K. Jürgens (2009). "Effect of zooplankton-mediated trophic
cascades on marine microbial food web components (bacteria, nanoflagellates, ciliates)." Limnology and oceanography 54: 262-275.

53
5. Appendix
Table 5.1: The number of individuals (cells/ml) of ciliate (oligotrichs, tintinnids, and other ciliates) and phytoplankton (dinoflagellates and diatoms) species in Verdens Ende, Ferjeodden, and Bustangen. (untronsformed data)
Verdens Ende Ferjeodden Bustangen Surface Sub-surface Surface Sub-surface Surface Sub-surface Replicate 1 2 3 1 2 3 1 2 3 1 2 3 1 2 3 1 2 3 Oligotrichs Strombidium spp.1 0,40 0,00 0,14 0,40 0,00 0,00 0,00 0,00 0,00 0,40 0,00 0,02 0,50 0,00 0,00 0,10 0,10 0,00 Strombidium spp.2 0,00 0,00 0,04 0,00 0,00 0,00 0,00 0,00 0,00 0,80 0,00 0,10 0,00 0,70 0,00 0,00 0,00 0,00 Strombidium spp.3 0,00 0,06 4,4 0,80 0,00 0,00 0,00 0,40 0,00 0,90 0,00 0,82 0,00 0,00 0,40 0,10 0,10 0,04 Strombidium spp.4 0,00 0,00 0,00 0,30 0,00 0,00 0,00 0,00 0,00 0,00 0,00 0,00 0,00 0,00 0,00 0,00 0,00 0,00 Strombidium spp.5 0,00 0,00 0,00 0,00 0,00 0,00 3,20 0,40 8,80 0,40 0,00 0,08 0,50 0,00 0,00 0,20 0,10 0,00 Strobilidiina spp.1 0,00 0,00 0,00 0,00 0,00 0,00 0,80 0,00 0,00 0,00 0,00 0,00 0,00 0,00 0,00 0,00 0,00 0,00 Lohmanniella spp.1 0,00 0,00 0,00 4,50 0,00 0,40 3,20 5,60 7,20 5,10 0,02 0,00 0,50 3,20 0,40 0,00 1,80 0,00 Tontonia spp. 0,00 0,00 0,00 0,00 0,00 0,00 0,00 0,00 0,40 0,00 0,00 0,00 0,00 0,00 0,00 0,00 0,00 0,00 Total number of Oligotrichs 0,40 0,06 4,58 1,50 0,00 0,00 4,00 0,80 10,00 2,50 0,00 1,02 1,00 0,00 0,40 0,40 1,00 0,04 Tintinnids Tintinnopsis spp. 23,20 1,04 0,00 1,00 0,02 0,00 1,20 2,00 0,00 0,20 0,38 0,82 1,75 1,20 0,40 1,50 0,10 0,98 Tintinnidium spp. 19,20 1,34 0,00 7,00 0,00 1,60 34,0 5,20 0,00 3,00 1,34 2,08 0,00 2,00 4,40 5,50 2,60 0,66 Tintinnina spp.1 0,00 0,00 0,00 0,00 0,02 0,00 0,00 0,00 0,00 0,00 0,02 0,02 0,00 0,00 0,40 0,00 0,00 0,02 Tintinnina spp.2 0,00 0,00 0,00 0,00 0,00 0,00 0,00 0,00 0,40 0,10 0,00 0,02 0,00 0,00 0,00 0,00 0,00 0,00 Tintinnina spp.3 0,00 0,00 0,00 0,00 0,00 0,00 0,00 0,00 0,00 0,10 0,00 0,00 0,50 0,00 0,00 0,00 0,00 0,00 Favella spp. 0,00 0,00 0,00 0,00 0,02 0,00 0,00 0,00 0,00 0,00 0,00 0,00 0,00 0,00 0,00 0,00 0,00 0,00 Helicostomella spp. 0,40 0,00 0,00 0,00 0,00 0,00 0,00 0,00 0,00 0,00 0,00 0,00 0,00 0,00 0,00 0,00 0,00 0,00 Eutintinnus spp.1 0,10 0,00 0,00 0,00 0,00 0,00 0,00 0,00 0,00 0,00 0,00 0,00 0,00 0,00 0,00 0,00 0,00 0,00

54
Eutintinnus spp.2 1,20 0,00 0,00 0,00 0,00 0,00 3,60 0,00 0,00 0,00 0,10 0,04 0,00 0,40 0,00 0,00 0,00 0,00 Salpingella spp. 0,00 0,00 0,00 0,00 0,00 0,00 0,00 0,00 0,00 0,00 0,00 0,00 0,00 0,40 0,00 0,00 0,00 0,00 Total number of tintinnids 44,00 2,38 0,00 8,10 0,06 1,60 38,8 7,20 0,40 3,40 1,84 2,98 2,25 4,00 5,20 7,00 2,70 1,66 Other ciliates Hypotrichia spp.1 0,00 0,00 0,00 0,00 0,00 0,00 0,00 0,00 0,00 0,00 0,04 0,00 0,00 0,00 0,00 0,00 0,00 0,00 Steenstrupiella spp. 0,40 0,00 0,00 0,20 0,00 0,00 3,60 4,00 2,00 0,10 0,12 0,22 0,50 12,40 1,20 0,00 0,10 0,02 Tiarina spp. 0,00 0,00 0,00 0,00 0,00 0,00 0,00 0,00 0,00 0,10 0,00 0,00 0,00 0,00 0,00 0,00 0,00 0,00 Paramecium spp. 0,00 0,00 0,00 0,00 0,00 0,00 0,00 0,00 0,00 0,00 0,00 0,00 0,50 0,00 0,00 0,00 0,00 0,00 Total number of other ciliates 4,40 0,56 2,40 5,40 19,1 0,40 6,80 9,60 9,20 5,50 0,18 1,68 1,50 16,00 1,60 0,00 1,90 0,02 Total number of ciliates 92,40 5,32 2,4 21,60 19,2 3,60 84,4 24,00 10,00 12,30 3,86 7,64 6,00 24,00 12,00 14,00 7,30 3,34 Dinoflagellates Ceratium fusus 0,00 0,00 0,00 0,00 0,00 0,00 0,80 0,00 0,00 0,00 0,02 0,02 0,50 0,40 0,00 0,00 0,10 0,00 Ceratium longipes 0,00 0,00 0,02 0,00 0,00 0,00 0,00 0,00 0,00 0,00 0,00 0,00 0,00 0,00 0,00 0,00 0,00 0,00 Ceratium lineatum 0,00 0,00 0,00 0,00 0,00 0,00 0,40 0,00 0,00 0,00 0,00 0,00 1,00 0,00 0,00 0,00 0,00 0,02 Ceratium macroceros 0,00 0,00 0,00 0,00 0,00 0,00 0,00 0,04 0,46 0,00 0,00 0,00 0,00 0,00 0,00 0,00 0,10 0,02 Ceratium spp. 0,00 0,00 0,00 0,00 0,00 0,00 0,80 0,00 0,40 0,00 0,00 0,02 0,50 0,00 0,00 0,00 0,00 0,00 Dinophysis acuta 0,00 0,00 0,00 0,00 0,00 0,00 0,00 0,04 0,00 0,00 0,00 0,00 0,00 1,20 0,00 0,00 0,00 0,00 Dinophysis acuminata 0,00 0,00 0,00 0,00 0,00 0,00 0,00 1,20 0,00 0,00 0,00 0,00 0,00 0,00 0,00 0,00 0,00 0,00 Dinophysis norvegica 0,00 0,00 0,00 0,00 0,00 0,00 0,00 0,00 0,00 0,00 0,00 0,00 0,00 0,00 0,00 0,00 0,20 0,00 Dinophysis spp.4 0,00 0,08 0,08 0,30 0,02 0,00 11,6 0,00 0,80 0,00 0,04 0,04 0,00 4,80 0,40 0,00 0,00 0,00 Gymnodinium spp. 34,80 0,00 0,00 3,10 0,8 0,00 137, 15,60 81,20 0,00 0,94 0,00 0,00 0,00 14,00 0,00 0,00 0,28 Protocentrum micans 18,40 0,06 0,00 0,50 0,00 0,00 70,4 19,20 7,60 0,20 0,06 0,40 3,75 77,60 0,40 0,00 0,20 0,02 Protoperidinium spp. 0,40 0,00 0,00 0,10 0,00 0,00 0,00 0,00 0,00 0,00 0,00 0,02 0,50 0,00 0,00 0,00 0,00 0,00 Scrippsiella spp. 0,00 0,00 0,00 0,20 0,00 0,00 0,00 1,20 0,00 0,00 0,00 0,00 0,00 0,00 0,00 0,00 0,00 0,00 Diplopsalis spp. 1,20 0,04 0,00 1,30 0,00 0,00 6,80 0,40 7,60 1,00 0,16 0,86 1,00 6,40 0,40 0,10 0,20 0,00 Dinophyceae spp.1 0,00 21,58 166, 0,00 0,00 12,0 0,00 0,00 0,00 50,40 0,00 35,3 0,00 0,00 0,00 0,90 82,3 0,00 Dinophyceae spp.2 30,40 0,00 0,00 1,70 0,10 0,00 177, 399,2 24,80 0,00 10,1 0,00 9,25 75,60 28,40 0,00 0,00 0,16 Lessardia spp. 0,00 0,00 0,00 0,00 0,00 0,00 0,00 0,00 0,00 0,00 0,00 0,16 0,00 0,00 0,00 0,00 8,00 0,00

55
Heterocapsa spp. 0,40 0,00 0,00 0,00 0,00 0,00 0,00 0,00 0,00 0,00 0,00 0,00 0,00 0,00 0,00 0,00 0,00 0,00 Protoceratium spp. 0,00 0,00 0,00 0,10 0,00 0,00 0,00 0,00 0,00 0,00 0,00 0,00 0,00 0,00 0,00 0,00 0,00 0,00 Gonyaulax spp. 0,00 0,00 0,00 0,00 0,00 0,40 0,00 0,00 0,00 0,00 0,00 0,00 0,00 0,00 0,00 0,00 0,00 0,00 Total number of dinoflagellates 85,60 21,76 166, 7,30 0,92 12,4 406, 435,6 122,4 51,60 11,3 37,3 16,50 166,0 43,60 1,00 91,1 0,50 Diatoms Pennales spp.1 69,20 5,82 46,4 0,40 1,96 18,4 40,4 25,60 18,00 1,00 34,8 1,24 81,50 90,80 517,6 16,40 4,90 13,62 Centrales spp.1 0,00 0,00 0,00 0,00 0 0,00 0,00 0,00 0,40 0,00 0,06 0,00 1,00 0,80 0,40 0,30 0,00 0,00 Diatom spp.1 172,0 2,3 136, 2,50 2,12 3,60 1,60 1,20 0,00 0,00 1,18 0,10 1,00 0,00 0,40 0,10 0,00 0,02 Skeletonema spp. 0,00 0,00 0,00 0,00 0,00 0,00 0,00 0,00 0,00 0,00 0,00 0,00 6,00 0,00 0,00 0,00 0,00 0,00 Striatella spp. 0,00 0,00 0,00 0,00 0,00 0,00 0,00 0,00 0,80 0,00 0,00 0,00 0,00 0,00 0,00 0,00 0,00 0,00 Leptocylindrus danicus 0,00 0,00 0,00 0,00 0,00 0,00 0,00 0,00 0,00 0,00 0,02 0,00 0,50 0,40 0,00 0,00 0,00 0,00 Thalasiosira spp. 0,00 0,00 0,00 0,00 0,00 0,00 0,80 0,80 3,20 0,20 0,16 0,08 0,00 0,00 0,00 0,00 0,00 0,00 Paralia spp. 0,00 0,06 0,00 0,00 0,00 0,00 0,00 0,80 0,00 0,00 0,04 0,00 1,00 0,80 1,60 1,80 0,80 0,36 Dactyliosolen spp. 6,80 0,04 8,4 0,90 0,36 0,40 2,80 2,40 0,00 0,20 1,24 0,96 1,00 4,00 0,00 0,40 0,00 0,16 Pleurosigma normanii 0,40 0,02 0,8 0,00 0,06 0,40 1,60 1,60 0,00 0,00 0,24 0,06 3,75 4,40 4,40 2,90 0,40 1,76 Pseudo-nitzshia spp. 0,00 0,04 0,00 0,00 0,02 0,00 0,00 0,00 1,60 0,00 0,42 0,68 0,00 0,00 0,00 0,00 0,00 0,04 Cylindrotheca closterium 18,00 1,22 32 0,00 0,18 0,80 10,4 16,40 15,20 0,40 5,52 0,58 21,25 67,60 149,2 1,30 0,60 8,48 Proboscia spp. 93,60 0,16 0,4 12,40 0,00 0,00 3,60 15,20 0,00 3,50 3,70 1,42 1,50 18,40 13,20 0,80 3,20 0,14 Melosira spp. 0,00 0,00 0,00 0,10 0,00 0,00 0,00 0,40 0,00 0,00 0,04 0,00 1,00 0,80 3,20 0,10 0,10 0,26 Chaetoceros spp. 0,80 0,00 0,00 0,00 0,00 0,40 0,00 2,00 0,00 0,00 0,00 0,00 0,00 0,00 0,00 0,00 0,00 0,00 Total number of diatoms 360, 9,66 224, 16,30 4,7 24,00 61,2 66,40 39,20 5,30 47,4 5,12 119,5 188, 690,0 24,10 10,0 24,84 Prasinophyceae 0,00 0,00 0,00 0,00 0,00 0,00 0,00 0,00 0,00 0,00 0,00 0,00 0,00 0,00 0,00 0,00 0,00 0,00 Pterosperma spp. 0,40 0,00 0,00 0,00 0,00 0,40 0,80 1,20 0,00 0,00 0,00 0,00 0,00 0,00 1,20 0,00 0,00 0,00 Euglenophyceae 0,00 0,00 0,00 0,00 0,00 0,00 0,00 0,00 0,00 0,00 0,00 0,00 0,00 0,00 0,00 0,00 0,00 0,00 Euglenophyceae spp. 20,80 0,64 8,40 0,40 0,30 1,20 34,00 10,00 17,60 0,00 1,12 0,22 1,50 9,60 8,80 0,20 0,10 0,08 Total number of Phytoplankton 446,40 31,42 390,90 23,60 5,62 36,40 467,20 502,00 161,60 56,90 58,86 42,46 136,00 354,00 733,60 25,10 101,10 25,34

56