Southern elephant seal trajectories, fronts and eddies in the Brazil/Malvinas Confluence
Upload
independentCategory
view
0download
0
Polar Biol (1994) 14:77-90 �9 Springer-Verlag 1994
Irene Schloss" Marta Estrada
Phytoplankton composition in the Weddell-Scotia Confluence area during austral spring in relation to hydrography
Received: 2 July 1992/Accepted: 8 April 1993
Abstract During the EPOS leg 2 cruise of the RV "Polarstern", carried out in late austral spring of 1988-1989, the composition of phytoplankton in rela- tion to the distribution of hydrographic parameters was studied in four successive transects carried out along 49~ and 47~ across the Weddell-Scotia Con- fluence (WSC) and the marginal ice zone (which over- lapped in part). In all transects, a maximum of phyto- plankton biomass was found in the WSC, in surface waters stabilized by ice melting. Different phytoplank- ton assemblages could be distinguished. North of the Scotia Front (the northern limit of the WSC) diatoms with Chaetoceros neglectus, Nitzschia spp. and Thalas- siosira 9ravida) dominated the phytoplankton com- munity. This assemblage appeared to have seeded a biomass maximum which occupied, during the first transect, an area of the WSC, south of the Scotia Front. The southernmost stations of the first transect and all the stations to the south of the Scotia Front in the other transects were populated by a flagellate assemblage (with a cryptomonad, Pyramimonas spp. and Phaeocys- tis sp.) and an assemblage of diatoms (Corethron criophilum and Tropidoneis vanheurkii among others) associated to the presence of ice. During the last three transects, the flagellate assemblage formed a bloom in the low salinity surface layers of the WSC zone. The bulk of the biomass maximum was formed by the
Data presented here were collected during the European PoIarstern Study (EPOS) sponsored by the European Science Foundation
I. Schloss ( lZ) Instituto Antfirtico Argentino, Cerrito 1248 (1010), Buenos Aires, Argentina and CONICET, Argentina
M, Estrada Institut de Ciencies del Mar, Paseo Nacional s/n, 08039, Barcelona, Spain
cryptomonad which reached concentrations up to 4 x 10⁶ cells 1-1 towards the end of the cruise. Multi- variate analysis is used to summarize phytoplankton composition variation. The relationships between the distribution of the different assemblages and the hydro- graphic conditions indicate that the change of dominance from diatoms to flagellates in the WSC zone was related to the presence of water masses from different origin.
Introduction
Phytoplankton growth is directly affected by the physico-chemical variables and by biological interac- tions with other organisms. External energy, expressed as advection and turbulence, acts as a major factor in controlling the environmental conditions to which cells are exposed (Margalef 1978). Adequate light and nutri- ent supply for phytoplankton development tends to occur at particular times of the year, as for example, in the spring bloom (Gran and Braarud 1935) or in zones of external energy gradients (Legendre and Demers, 1985) such as marine fronts and ice-water interfaces (Lutjeharms et al. 1985; Demers et al. 1986; Smith and Nelson 1986). As a result, phytoplankton distribution is typically patchy at a number of spatial and temporal scales. One of the most interesting marine areas in relationship with these concepts is the Southern Ocean. Although high chlorophyll-a values have been found in neritic areas of the Antarctic Peninsula (EI-Sayed 1971) phytoplankton biomass in offshore waters is generally low (Holm-Hansen et al. 1977; Jacques 1989) and the mean primary production in the Southern Ocean has been calculated to be only around 20 g C m - 2 year - 1 (Nemoto and Harrison 1981), in spite of the presence of non-limiting macronutrients (Sakshaugh and Holm- Hansen 1984). This facts, together with the uncertainties

78
about micronutrient limitation (Jacques et al. 1984; Hayes et al. 1984; de Baar et al. 1990; Martin et al. 1990) has fueled discussion about the regulation of phytoplankton biomass and primary production in Antarctic waters. Proposed limiting factors include physical variables such as low stability of the water column (Hasle 1969; E1 Sayed and Taguchi 1981; Sakshaugh and Holm Hansen 1984); lack of iron (Martin et al. 1990) and the grazing pressure of micro- heterotrophs (N6thig 1988) or larger herbivores such as the Antarctic krill (Meyer and E1-Sayed 1983; Antezana and Ray 1984).
In addition to biomass, the qualitative composition of phytoplankton in Antarctic waters presents many interesting problems. The older studies tended to em- phasize the abundance of microplanktonic diatoms (Hart 1942), in part due to the sampling in neritic areas and the use of non-quantitative devices such as plank- ton nets. Later it was realized that pigmented flagellates and other organisms in the size range of nanoplankton ( < 20 #m) were important components of the plank- tonic community in many areas, including frontal zones (Hasle 1969; Jacques et al. 1969, Br6kel 1981; Kopczynska et al. 1986; Estrada and Delgado 1990; N6thig et al. 1991). The general abundance of macro- nutrients in the Southern Ocean makes particularly interesting the question of which factors may lead to dominance of nanoflagellates or diatoms in a particular zone. According to Margalef (1978), diatoms would dominate in relatively turbulent conditions. Hasle (1969) and N6thig et al. (1991) observed that the flagel- late dominated phytoplankton assemblages tended to be late summer assemblages in the surface waters. Other authors have suggested that grazing by large herbivores, including krill, may favor the dominance of small cells (Martin 1970; Quetin and Ross 1985; Meyer and E1 Sayed 1983). Kopczynska (1992) concluded that Antarctic nanoflagellates dominated over diatoms in unstable water columns, thus apparently contradicting Margalef's opinion. The question of nanoflagellate versus diatom dominance is not only of theoretical interest, because the composition of phytoplankton and its associated size structure may have important implications concerning sedimentation of blooms and carbon fluxes through the water column (von Bodun- gen 1986; Gonzfilez et al. 1991; Jacques and Panousse 1991).
The aim of this paper is to relate the qualitative and quantitative changes of the phytoplankton composi- tion in the Weddell-Scotia Confluence (WSC) zone, between November 1988 and January 1989 to the en- vironmental conditions in the area. The data were collected during the second leg of the European "Polar- stern" Study (EPOS leg 2) cruise (Hempel et al. 1989), in which repeated transects were carried out across the WSC and the marginal ice zone (MIZ) in the Weddell
Sea. In particular, we attempted to distinguish spatial from successional and temporal variations in the phytoplankton assemblages.
Materials and methods
The second leg of the European "Polarstern'" Study (R.V. "Polar- stern" Expedition, Antarktis VII/3), was carried out from November 1988 to January 1989 in the Antarctic sector of the Southern Ocean, west of the South Orkney Islands, along 49~ and 47~ from 57~ to 62~ Figure 1 shows the area and the location of the stations. Three of the four transects conducted were placed on the 49~ and one on the 47~ meridian. One of the 49~ transects, transect 3, was devoted to an intensive survey of the MIZ (Table 1).
A CTD-Rosette with Niskin and Go-Flo bottles was used to obtain water from selected depths. Hydrographic variables -temper- ature, salinity and conductivity - nutrients -ammonia, nitrate, phos- phate and silicate and chlorophyll-a concentrations were measured simultaneously. Methods of sampling and analysis techniques are described in EPOS-LEG 2 Data Report (1989). Ice cover values were taken from van Franeker (1989).
5 8 ~ .
6 0 ~ .
6 5 ~ 70" W
L I I 4 7 ~ 4 & I 5 6 ~
S
50"
143 - 182 ~) 160
144 - 183 ~) ' 161
145 - 186 ~ ) 162 5 8 0
146 - 187 ~ ) 163
1 4 7 - 1 7 2 - 1 8 8 ) 164
148 - 173 - 189 165
149 - 174 - 190 ) 166 - 6 0 ~
S o u t h O r k l l e y Is, 150 - 175 - 191 ) 167
192 ~ 168 151 - 176
D 169
152 . 177 . 1 7 8 . 1 9 3
62 ~ -153 - 6 2 ~
T R A N S E C T 1 T R A N S E C T 2 T R A N S E C T 3 T R A N S E C T 4
i 5 3 ~ 5 0 ~ 4L7 o W 4 4 ~
Fig. 1 Map showing the area studied and the position of the different transects

Table 1 Date and position of the transects performed during EPOS-Leg 2
Transect 1 26-30 Nov. St. 143-153 57~176 49~ Transect 2 13-19 Nov. St. 160-169 57~176 47~ Transect 3 20-24 Dic. St. 172-178 59~176 49~ Transect 4 27 31 Dic. St. 182-193 57~176 49~
Subsamples for phytoplankton counts were taken from 10, 20, 40, 60, 80, 100, 120, 150 and 200 m depth for the first 49~ transect; in the following transects only depths above 100 m were counted. The integration of the cell number down to 200 m for the first 49~ transect showed that cell numbers integrated to 100 m ranged from 83.7% in station 143 to 99.8% in station 148 (X = 92.5%) of those integrated to 200 m. For this reason, no quantitative analysis was carried out for the samples from below 100 m of the rest of the transects. All the 49~ phytoplankton samples were fixed with formalin with a final concentration of 4%; some of them were additionally fixed with lugol solution, which was also used (without cetic acid) for the 47~ samples. Phytoplankton quantification was carried out by the inverted microscope method (Uterm6hl 1958). The organisms were counted in two stages; 50 or 100 ml of water from the samples were settled in composite chambers; in order to obtain an acceptable error 100 individuals for the most frequent species (Edler 1979) or 400 cells per sample were counted. Low magnifications were used to enumerate abundant forms. The whole chamber bottom was scanned to count large and less frequent forms. The organisms were identified to the species level when possible but, specially for the flagellates that could not be adequately classified, artificial categories had to be used. Empty cells were distinguished and not included in the results, and their number was never signif- icant. It should be noted that the inverted microscope methodology does not allow the quantification of picoplankton abundance. In addition, many cells, specially small naked flagellates and coccolithophorids tend to deteriorate in the fixed samples (Booth et al. 1982). This was evidenced with some coccolithophorids which were identified on board (Buma et al. 1989) but were not found in the fixed samples. Spores or resting stages were also differentiated. For a more accurate determination of diatom species from some selected stations, permanent glass slides were prepared oxidizing the organic matter according to Simonsen (1974) and mounted with Hyrax.
Principal component analysis (PCA) was used to summarize the trends of variability of the phytoplankton abundance data along 49~ and to facilitate the interpretation of the relationships between phytoplankton assemblages and hydrographic features (Estrada and Blasco 1979; Blasco et al. 1981, Theriot and Fryxell 1985; Estrada and Delgado 1990). Analyses were performed on the correlation matrices among the logarithm-transformed abundance data for each station and each depth analyzed. The 36 most frequent taxa were selected in order to diminish the problems caused by multiple zeros (Gauch 1982). The programs used were implemented from Lleonart (1980) and IBM (1969). In order to classify the stations according to the main features of the vertical distribution of phytoplankton, a cluster analysis following the UPGMA algorithm (Sneath and Soka11973) was performed, consid- ering as variables the total cell numbers at each depth, for all the 49~ stations used in the calculation of the correlation matrix. The average phytoplankton depths were calculated after the formula (Pearre 1973):
m
D = ~ nidi/•ni i - - 1
where ni is the cell number at depth di, and m is the number of depths considered.
79
Results
Transect 1
Hydrography. The m a i n hyd rog raph i ca l feature found in this (Fig. 2a) and the fol lowing t ransects was the Weddel l -Scot ia Conf luence (WSC), a wide f rontal zone co r r e spond ing to the b o u n d a r y between the eas tward C i r c u m p o l a r Cur ren t and the n o r t h e r n b r a n c h of the Weddel l G y r e (Ceder l6f fe t al. 1989). The n o r t h e r n limit of the W S C , the Scotia F ron t , located between 57 ~ 30' and 58~ was m a r k e d by a sharp silicate (data no t shown) and t empera tu re f ront with t empera tu res ex- ceeding 0~ co r r e spond ing to the Scotia Sea. The W S C over lapped in par t with the M I Z defined here as the area in which ice cover ranges f rom 35% to 50%. The s o u t h e r n m o s t par t of the transect , with ice cover ex- ceeding 50%, co r r e sponded to Weddel l Sea water, with tempera tures below - 1.5~ A sharp pycnoc l ine was found at depths rang ing f rom 100-200 m at s ta t ions 143 and 144, to 2 0 - 6 0 m at s ta t ions 146 to 149, in which there was a surface lens of low salinity water, or ig inated by ice melting. The nut r ien t d is t r ibut ion has been descr ibed in van B e n n e k o m et al. (1989). The lowest concen t r a t i on of ni t rate and phospha te , exceed- ing respectively 20 # M and 1/~M were found at 58 ~ 30 'W (stat ion 146) in associa t ion with a ch lo rophy l l m a x i m u m . A subsurface a m m o n i a m a x i m u m was found fur ther south, at 59 ~ 30 'W (stat ion 148).
Phytoplankton composition
The phytoplankton composition showed marked dif- ferences in the zones north and south of the WSC. In the WSC itself, the pattern was complicated by what appeared to be an intrusion of Weddell Sea waters (see below).
Northern zone (stations 143-144)
N o r t h of the Scot ia F ron t , the mos t a b u n d a n t species were Nitzschia lineola-barkleyii (no dis t inct ion was m a d e between these two species), which reached p o p u - la t ion densities of 1.5 x 10 . 4 cells 1-1 in s ta t ion 143, N. kerguelensis and Chaetoceros neglectus. Small flagel- lates, with a h igh p r o p o r t i o n of the flagellate stage of Phaeocystis pouchetii were also present. The relative a b u n d a n c e of the different g roups is shown in Fig. 3a.
WSC (stations 145 149)
At s ta t ion 145, the p h y t o p l a n k t o n c o m m u n i t y was ma in ly c o m p o s e d of an unidentif ied c r y p t o m o n a d

80
(Buma et al. 1989), with a few other flagellates in lower abundances and Corethron criophilum as the only well represented diatom species. Although their maximum value was found in the 10 m sample, a relatively high number of both cryptomonads and Corethron crio- philum was still present at 80 m.
Between stations 146 and 149, a diatom bloom dominated the phytoplankton community; the highest chlorophyll-a concentrations (4.45 #g1-1) and cell numbers (4.5 x l0 s cells 1-1) were found in station 146, at 20 m (Fig. 2a). Again, phytoplankton biomass was relatively high (3 x 10⁵ cells 1-1) down to 100 m depth. The species composition was similar to that of the northern zone, but the bulk of the population was contributed by Thalassiosira gravida, forming huge col- onies, some centimeters in length, embedded in a gelati- nous matrix, as described by Theriot and Fryxell (1985). This species, together with Chaetoceros tortis- simus accounted for the vertical biomass distribution in the first group of the cluster analysis (Fig. 6). Other important taxa were Chaetoceros neglectus, C. bulbosus, Eucampia antarctica, Nitzschia kergueIensis, N. lineola- barkleyii, N. prolongatoides and N. curta (these two last species with a peak between 40 and 60 m depth), Pyra- mimonas spp. and some choanoflagellates.
Southern zone (stations 150-153)
At the stations to the south of the bloom, with ice covers exceeding 50%, the phytoplankton concentration was lower than in the northern zone (Fig. 2a). Among the diatoms, Corethron criophilum was well represented but, as a rule, the samples were dominated by flagellates. Cryptomonads were the most abundant among the autotrophic ones (Fig. 4a); another common form was a droplet-shaped heterotrophic flagellate (Buma et al. 1989). The colonial stage of the prymnesiophyte Phaeocystis pouchetii, was common along this first tran- sect. Its concentration was still relatively high in the southernmost stations, where population densities of 800 cells 1-1 were found under 75% ice cover.
transect; nitrate and phosphate concentrations re- mained high, except in the frontal zone, where all nutri- ents showed reduced values. Again, high ammonia con- centrations were found in subsurface layers.
Phytoplankton composition
As in Transect 1, there were important changes in the phytoplankton composition in the northern and south- ern zones of the studied area.
Northern zone A diatom dominated assemblage was present at the two northernmost stations of Transect 4 (Fig. 4b), where high numbers of Dactyliosolen tenuijunctus, Nitzschia cylindrus, N. pseudonana, N. lineola-barkleyii and N. kerguelensis were found (Fig. 3b). Although the species composition was similar to that of the northern sta- tions of Transect 1, there were some quantitative differ- ences, such as the increased contribution of Nitzschia pseudonana and N. cylindrus. In Transect 2, the domi- nant diatoms were also Nitzschia spp.
WSC As in the first transect, phytoplankton numbers and chlorophyll concentrations (Fig. 2b), peaked in the upper 20 m of this zone, within a lens of low salinity water influenced by ice melting. In this case, however, the maxi- ma were weaker and were contributed mainly by crypto- monads and other nanoflagellates (such as Pyramimonas spp. and Phaeocystis pouchetii) instead of diatoms.
Southern zone In this zone, closer to the ice, the phytoplankton com- munity was comparable to that found in Transect 1, with cryptomonads, Pyramimonas spp. and diatoms such as Nitzschia cylindrus, Corethron criophilum, Tropidoneis vanheurckii and T. belgicae (Fig. 3b).
Transects 2, 3 (MIZ-transect) and 4
Transects 2 (along 47~ 3 and 4 (Fig. 2b), presented a hydrographical situation roughly similar to that of the first transect, but there were some important changes; the frontal zone and the relatively warm waters from the northern part were displaced southward, as oc- curred with the MIZ, and the ice cover was very weak north of 61~ The density structure showed strong surface gradients in all stations, specially in those located between the front and the ice-edge, where the influence of melt water was stronger. Nutrient levels did not change significantly in comparison to the first
Statistical analysis of the 49~ data
Principal component analysis. All the dominant species in the stations to the north of the WSC, together with those present in the bloom zone of Transect 1 (Thalas- siosira gravida, Nitzschia kerguelensis, N. lineoIa-bar- kleyii) formed a group characterized by high correla- tions with principal component 1 (PC1) and negative or non-significant correlations with PC2 (Table 2). On the other hand, the PC2 (Fig. 5 and Table 2) showed the highest positive correlations with the nanoflagellate taxa (cryptomonads, Pyramimonas spp., Phaeocystis sp., and small flagellates) and the diatoms (Nitzschia

WSF MIZ
V - -V = . I
a
57 58 59 60 61 62
. - , -40 ?~ ?
-200
81
2
57 58 5g , 60 61 62
:
-200
3
57
-40 I
E -80
_-120
~23
-160
-200
58 59 60 61 6 2 I I
-40
-80 E
4 ~-~2o gO
('-3
-160
57
-200
58 59 60
l\~o~" Z i 6 1 6 2
I I
Fig. 2a, b Ice-cover, temperature (1), salinity (2), chlorophyll-a (3) and total cell number (4) distribution along the transects studied. a Transect 1, b Transect 4

82
b 57
WSF MIZ
V Y
58 59 50 61 62
-~ ~ ~ :J///ll~f \ ~ ~ f ~ ~ ,
57 ,58 59 60 61 62
2 ~-oo >,.~~ "P'~ O. 3A. O0
-100
57 .58 I
- 2 0
- 4 0
E
3 ~- E) s
- 8 0
- 1 0 0
I
59 60 51
0
57
- 2 0
- 4 0
E
4 ~ -5~ C3
- 8 0
58 59 60 61 62
t , ,"~ '~ \ \ V ' / ~\~---WJo--'~,.~J / ' ..~'~ooooo-
Fig. 2b - 1 0 0

83
70-
60-
50- r "
-(~ 40- c-
30" -Q
20- o~
10-
143 144 145 146 147 148 149 150 15"f 153
Stations
[ 1 N. ke rgue lens is ~ N. cur ta ~ C. c r i oph i l um
T, g r a v i d a r - - - t C r y p t o m o n a d s
70-
60- O~ C3 50- C
"0 4O-
_~ ao-
O~ 20-
113-
222 - - iiiii~ii!i
182 183 ~86 187 188 189 190 191 192 193 194
Stations
~ N. kerguelensis ~ N. cyfindrus ~ C. criophilum ] Pyramimonas sp. [ ~ Cryptornonads J
Fig. 3a, b Relative abundance (in %) of the dominating phyto- plankton taxa in a Transect 1 and b Transect 4
cylindrus, Corethron criophilum, Tropidoneis vanheur- kii) of the southern zone.
The distribution of the PC1 scores for Transect 1 (Fig. 5a) and 4 showed maxima coinciding with those of chlorophyll-a and total cell number (Fig. 2a). In Transect 1, negative scores were found at station 145 and south of station 149; PC1 scores were close to zero or negative in Transect 3, whose northernmost stations were located at 59~ and in Transect 4 south of 58~
The PC2 scores in the surface layers of Transect 1 (Fig. 5) presented a distribution contrasting again the stations to the north of the Scotia Front (negative scores) with those of stations 145 and 150-153 (positive scores). Practically all PC2 scores were positive in the upper levels of transect 3 and 4 (Fig. 5b).
The loadings and distributions of PC3 (Table 2) re- flected a temporal variation in species composition, as evidenced by the high positive loadings of taxa which appeared only in the last transect, such as Dactyliosolen tenuijunctus. However, the variability of PC3 in Tran- sect 4 presented also a geographical pattern, with posi- tive scores in the northern stations and negative scores in the southernmost ones. This distribution reflected the presence of a group of typical ice-related diatoms such as Corethron criophilum, Tropidoneis vanheurkii, Amphiprora spp. and Nitzschia closterium), character- ized by negative loadings on PC3 which occupied the
zones of denser ice cover, with low temperature and relatively high salinity.
Cluster analysis Two groups were clearly identified in the cluster ana- lysis performed on the cell numbers of all the 49~ stations (Fig. 6a): Group A, which included nine sta- tions, seven of them from the first transect, and group B, with sixteen stations, only two belonging to the first transect. Figure 6b presents the average vertical profile for each group. Group A shows a cell number in- crement from 20 to 40 m depth, while group B stations have a maximum at the upper layers, between 10 and 20 m. The average population depths for the total cell numbers were 43 m for group A and 28 m for group B. In group B, the peak at 20 m depth was produced by cryptomonads. Other species had biomass maxima at different depths, but their contribution to total cell numbers were relatively less important.
Discussion
Distribution of phytoplankton biomass
The conspicuous qualitative and quantitative vari- ations of the phytoplankton composition found along the studied transects can be related to the presence of different water masses separated by the WSC, and to the effect of local environmental conditions on phyto- plankton growth. During all transects, a maximum of phytoplankton biomass, as measured by cell number and chlorophyll-a concentrations, was present in the WSC area. A similar finding was reported from the previous leg (leg 1) of the EPOS cruise (Bianchi et al. 1991). The highest biomass in the bloom zone was associated with the lowest surface salinities and with a sharp and shallow pycnocline, suggesting the impor- tance of the stabilization of the upper water layers. Both, the WSC and the ice margin, coincided geo- graphically in the study zone at this. time of the year and might have acted together in the establishment of adequate conditions for the development of phyto- plankton. It is difficult, however, to determine the rela- tive contribution of each feature. The high biological activity in the MIZ has been attributed to the effects of ice melting and reduced wind stress, which favor stabil- ization of the surface layers and the retention of phytoplankton in the euphotic zone (E1-Sayed 1971; Smith and Nelson 1985). Another stabilization mech- anism, within the WSC, could have been provided by the presence of "balloons" of relatively warm water, originated from deeper layers of the Scotia Sea and ascending to shallower depths at the southern side of the Scotia Front (Cederl6ff et al. 1989).

# l~su~Ji q 'I laastI~JZ ~ moJj suo.q~ls
.IOJ SaILIoJd (Z) sp~uomoldLJ~ pu~ (I) uJol~!(I q '"1~ "~!J
Z9
~ 000009 ~%
,/~ ,/ / ,'R ,/11 t 9 og 6~
I
g~
O0 k -
Og-
C~
og- ~-
3 0~'-
OZ-
L~
Z
OOL-
Z9
I I l I I I
L9 Og 6~
t g~
Og-
3 0~'-
OZ-
q
00~-
Zg I I r t I
~g 09
~,o~
g~
Og L -
C?
og- ~J
O~-
L~
Z
i i ;
19 O9 L E
Ogt-
OZL- ~- =r
Og- ~
I L~
e
i,8

57
a
-+0
58 59 50
E -80
r" "+~ --120 (D
--160
-200
\ ' / ' 1 t t t J I ' ~ ~ - ' / \ \ \ \ 7.% o o ~>
O.OO ~ ~ ~~176 ~
61 62
, --~.~ ~ o.%,"
~0.50
85
2
57
7
E - 8 0
v
" ~ - 1 2 0
58 59 60 81 82
" ~ ' \ ~ J "k~,~ " - - - - ~ , ~ '~-z--j U-J ' ' '
z ~ "7 \~ -~ ~ ~ ' 3 ~ , + ~ " ~~ + + - + ~ 1 7 6 ' - - J
57 58 6O l I
b_2ok / ' ~,)
- 1 0 0
5 g I i
61 62
I
2
E v
r'~
-I!0
-100
57 58 59 60 61 62
__I - . . ._ ~ _o/ ~-~ \ '~ \ o ~ t f ~ ' o . , o / " <~~ ~ \ \ ~ / ' Fig. 5a, b Stations-scores distribution for PCA in a Transect 1 and b Transect 4 for components 1 and 2 respectively, derived from the analysis performed on the 36 more frequent species

86
Table 2 Loadings of the 36 more frequent taxa on the first four
components, resulting from P C A of the 4 9 ~ transect.
Component N ~ 1 2 3
% Variance explained 35.23 13.06 6.63
Accumulated variance 35.23 48.29 54.92
T A X A L I S T
Amphiprora spp. 0.3722 0.1211 - 0.5463
Asteromphalus spp. 0.4942 - 0.2241 0.1094
Chaetoceros bulbosus 0.7516 0.0948 0.2463
Chaetoceros neglectus 0.6322 0.0595 0.1858
Chaetoceros neogracile 0.4502 0.1048 0.0872
Chaetoceros tortissimus 0.6765 - 0.2694 - 0.1161
Corethron criophilum 0.4096 0.4783 - 0.3587
Dactyliosolen tenuijunetus 0.0601 0.1202 0.5633
Eucampia balaustium 0.8785 - 0.1854 - 0.0628
LeptocyIindrus spp. 0.5046 - 0.1656 - 0.1155
Navicula spp. 0.8077 - 0.2882 - 0.1644
Nitzschia closterium 0.6638 - 0.0092 - 0.4888
Nitzschia curta 0.5214 - 0.0902 - 0.495
Nitzschia cylindrus 0.4643 0.6833 0.2144
Nitzschia kerguelensis 0.8318 - 0.1771 0.1583
Nitzschia lineola 0.8787 - 0.0887 0.2482
Nitzschia prolongatoides 0.6126 0.3306 0.2927
Nitzschia spp. 0.2139 - 0.1777 - 0.1765
Odontella weissflogii 0.8542 - 0.0626 0.1086
Rhizosolenia alata 0.6163 - 0.0764 0.0611
Rhizosolenia chunii 0.6203 - 0.2784 - 0.043
Rhizosolenia hebetata 0.7574 - 0.1622 0.0886
Thalassiosira gravida 0.8649 - 0.137 - 0.0839
Thalassiosira spp. 0.3635 0.0743 0.2011
Thalassiosira tumida 0.8317 - 0.2006 0.0942
Thalassiotrix spp. 0.6563 0.0073 - 0.1053
Tropidoneis belgicae 0.7647 - 0.1377 - 0.2241
Tropidoneis vanheurkii 0.3773 0.4125 - 0.4631
Ciliates 0.032 0.5816 0.125
Choanoflayellates 0.3099 0.5628 0.2752
Cryptomonads - 0.0785 0.7763 - 0.3062
Distephanus speculum 0.7382 - 0.0419 0.3177
Flagellates (large) 0.6107 0.4142 - 0.0173
Flagellates (small) 0.135 0.8639 0.0594
Phaeocystis pouchetii 0.4103 0.559 0.1849
Pyramimonas spp. 0.0794 0.8011 0.236
Phytoplankton composition
In all transects, the WSC-MIZ frontal systems zones represented a boundary separating different phyto- plankton assemblages. The Scotia Sea assemblage was characterized by a series of diatoms (Chaetoceros negleaus, Thalassiosira gravida, Nitzschia lineola- barkleyii, N. kerguelensis, and other Nitzschia species of the Fragilariopsis section) with high loadings on PC1. This diatom composition was similar to that found during EPOS leg 1 (Bianchi et al. 1991) in the zone. Similar assemblages were observed in the WSC region by Garrison et al. (1987) and Fryxell and Kendrick (1988). Some of the species specially from the Fragilariopsis section, could have seeded from ice (Gar- rison and Buck 1989) but this seems unlikely for
a Correlation Index 0.2 0.4 0,6 0.8 1
Transect
i EI: -]
151 150 A 152
I i - I s 3 1 178
146 147 172
173
174 191 B
~ 188 189
- - 176 183 187 177 192 186
143 NI 1 144 NI 1
1 1 1 1 1 1 1 MIZ 3 1 1 MIZ MIZ 3 M 3 MIZ 3 3 3 MIZ 3 3 MIZ 3 3
b 10 - -
20 - - I 40
60
80 - -
100 - -
120 - -
150 - -
2 ~ - -
~ 0 0 ~
Fig. 6 a Dendrogram obtained from the cluster analysis performed on the 49 ~ data. N.I: stations not included in any of the groups. A, B:
stations belonging to group A and B respectively (see explanations in the text), b Average vertical profile for stations included in groups A a n d B after the cluster analysis
Thalassiosira gravida, given its known distribution (Hasle 1969; Fryxell and Kendrick 1988). Assemblages with large centric diatoms have also been reported as dominant in the Bransfield Strait area (Hart 1942; von Bodungen et al. 1986, 1987). Hasle (1969), in her study of phytoplankton of the Southern Pacific, found that Chaetoceros neglectus was abundant just north of the Antarctic Convergence, in December, and in the middle of the Antarctic zone, later in the season.
South of the WSC, two phytoplankton assemblages could be distinguished: one mainly formed by nano- planktonic flagellates (with high loadings on PC2), and another including ice-related diatoms (with high load- ings on PC3); their distributions showed some common patterns, but appeared to respond to different sources of variability. The flagellate assemblage, which reached the highest biomass in the WSC during the last tran- sect, included basically cryptomonads, Phaeocystis
87
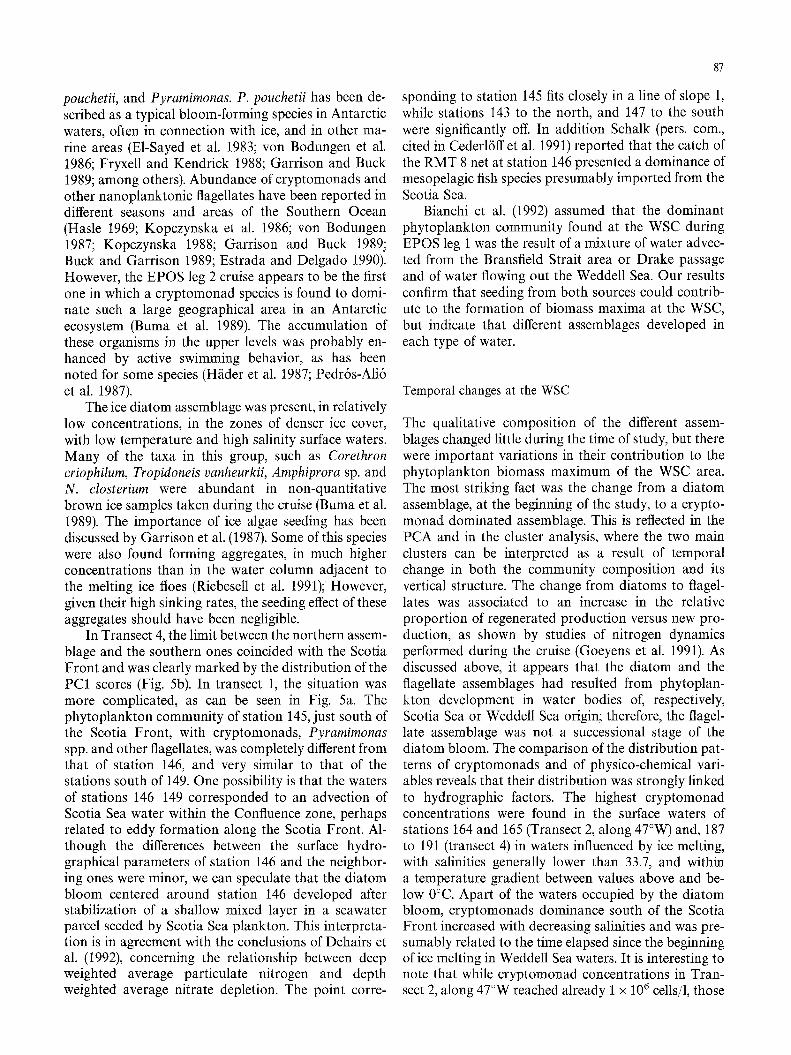
pouchetii, and Pyramimonas. P. pouchetii has been de- scribed as a typical bloom-forming species in Antarctic waters, often in connection with ice, and in other ma- rine areas (El-Sayed et al. 1983; von Bodungen et al. 1986; Fryxell and Kendrick 1988; Garrison and Buck 1989; among others). Abundance of cryptomonads and other nanoplanktonic flagellates have been reported in different seasons and areas of the Southern Ocean (Hasle 1969; Kopczynska et al. 1986; yon Bodungen 1987; Kopczynska 1988; Garrison and Buck 1989~ Buck and Garrison 1989; Estrada and Delgado 1990). However, the EPOS leg 2 cruise appears to be the first one in which a cryptomonad species is found to domi- nate such a large geographical area in an Antarctic ecosystem (Buma et al. 1989). The accumulation of these organisms in the upper levels was probably en- hanced by active swimming behavior, as has been noted for some species (H/ider et al. 1987; Pedrds-Ali6 et al. 1987).
The ice diatom assemblage was present, in relatively low concentrations, in the zones of denser ice cover, with low temperature and high salinity surface waters. Many of the taxa in this group, such as Corethron criophilum, Tropidoneis vanheurkii, Amphiprora sp. and N. closterium were abundant in non-quantitative brown ice samples taken during the cruise (Buma et al. 1989). The importance of ice algae seeding has been discussed by Garrison et al. (1987). Some of this species were also found forming aggregates, in much higher concentrations than in the water column adjacent to the melting ice floes (Riebesell et al. 1991); However, given their high sinking rates, the seeding effect of these aggregates should have been negligible.
In Transect 4, the limit between the northern assem- blage and the southern ones coincided with the Scotia Front and was clearly marked by the distribution of the PC1 scores (Fig. 5b). In transect 1, the situation was more complicated, as can be seen in Fig. 5a. The phytoplankton community of station 145, just south of the Scotia Front, with cryptomonads, Pyramimonas spp. and other flagellates, was completely different from that of station 146, and very similar to that of the stations south of 149. One possibility is that the waters of stations 146-149 corresponded to an advection of Scotia Sea water within the Confluence zone, perhaps related to eddy formation along the Scotia Front. Al- though the differences between the surface hydro- graphical parameters of station 146 and the neighbor- ing ones were minor, we can speculate that the diatom bloom centered around station 146 developed after stabilization of a shallow mixed layer in a seawater parcel seeded by Scotia Sea plankton. This interpreta- tion is in agreement with the conclusions of Dehairs et al. (1992), concerning the relationship between deep weighted average particulate nitrogen and depth weighted average nitrate depletion. The point corre-
sponding to station 145 fits closely in a line of slope 1, while stations 143 to the north, and 147 to the south were significantly off. In addition Schalk (pers. com., cited in Cederl6ff et al. 1991) reported that the catch of the RMT 8 net at station 146 presented a dominance of mesopelagic fish species presumably imported from the Scotia Sea.
Bianchi et al. (1992) assumed that the dominant phytoplankton community found at the WSC during EPOS leg 1 was the result of a mixture of water advec- ted from the Bransfield Strait area or Drake passage and of water flowing out the Weddell Sea. Our results confirm that seeding from both sources could contrib- ute to the formation of biomass maxima at the WSC, but indicate that different assemblages developed in each type of water.
Temporal changes at the WSC
The qualitative composition of the different assem- blages changed little during the time of study, but there were important variations in their contribution to the phytoplankton biomass maximum of the WSC area. The most striking fact was the change from a diatom assemblage, at the beginning of the study, to a crypto- monad dominated assemblage. This is reflected in the PCA and in the cluster analysis, where the two main clusters can be interpreted as a result of temporal change in both the community composition and its vertical structure. The change from diatoms to flagel- lates was associated to an increase in the relative proportion of regenerated production versus new pro- duction, as shown by studies of nitrogen dynamics performed during the cruise (Goeyens et al. 1991). As discussed above, it appears that the diatom and the flagellate assemblages had resulted from phytoplan- kton development in water bodies of, respectively, Scotia Sea or Weddell Sea origin; therefore, the flagel- late assemblage was not a successional stage of the diatom bloom. The comparison of the distribution pat- terns of cryptomonads and of physico-chemical vari- ables reveals that their distribution was strongly linked to hydrographic factors. The highest cryptomonad concentrations were found in the surface waters of stations 164 and 165 (Transect 2, along 47~ and, 187 to 191 (transect 4) in waters influenced by ice melting, with salinities generally lower than 33.7, and within a temperature gradient between values above and be- low 0~ Apart of the waters occupied by the diatom bloom, cryptomonads dominance south of the Scotia Front increased with decreasing salinities and was pre- sumably related to the time elapsed since the beginning of ice melting in Weddell Sea waters. It is interesting to note that while cryptomonad concentrations in Tran- sect 2, along 47~ reached already 1 x 10⁶ cells/l, those

88
on the following transect 3 were still relatively low and did not exceed 7.4 x 10⁴ cells/1. Thus, dense crypto- monad populations were already established in the study zone at 47~ before they appeared at 49~ The patchiness of the cryptomonad distribution suggests that water body displacement in addition to in situ changes could have played a role in the appearance of the dense populations of transect 4. These findings do not exclude that grazing may have been an important factor in producing qualitative and quantitative changes in the different assemblages, as shown by ex- periments performed on board (Gran61i et al. 1991) and by observations at station 157 (not included in the transect analysis), of a fast decrease of the phytoplank- ton biomass coinciding with the appearance of a krill swarm (Jacques and Panouse 1991). Presumably, graz- ing and sinking played a leading role in the disappear- ance of the diatom bloom of transect 1.
Diatom versus flagellate dominance
The main features of the phytoplankton composition found during EPOS legs 1 and 2 support the scheme of Smetacek et al. (1990), who suggested that diatom blooms could be considered as occasional phenomena superimposed on a typical phytoplankton assemblage of Antarctic waters consisting of autotrophic flagel- lates. It should be noted, however, that terms like "flagellates" mask a tremendous diversity of organisms, and that generalizations involving such categories can only be made in a very general sense. In this study, as observed previously (Hart 1942; Hasle 1969; Bianchi et al. 1992), a spring bloom of large diatoms lasted only during a limited period of time. The conditions for the development of these blooms have been widely dis- cussed (see review in Holm-Hansen 1984) and appear to involve the interplay between light availability and the formation of an adequately stabilized layer in the surface waters. Much less clear are the conditions lead- ing to termination of the diatom blooms, since this often occurs while macronutrients are still in excess. Stability erosion and grazing are likely factors, but there might be other possibilities (Sakshaugh and Holm-Hansen 1984; Jacques 1989). As found in marine regions (Margalef 1978), flagellate contribution in- creases in later successional stages and tends to domin- ate the summer assemblages in Antarctic waters (Hasle 1969; yon Br6ckel 1981; N6thig et al. 1991). Presum- ably, our study did not last enough for this to occur in the northern stations of 49~ where diatoms were still abundant at the end of December. On the other side, in the Weddell Sea waters to the south of the Scotia Front, autotrophic flagellates were already dominant in the inner marginal ice zone and the closed pack zone in early spring, during EPOS leg 1 (Bianchi et al. 1992).
Although ice related diatoms were present in this zone, no diatom bloom was detected and, as the season advanced, the flagellate biomass increased markedly. Patchiness may be very high in ice edge zones (Nelson et al. 1987) and it is not clear whether this is a general pattern, but similar observations of flagellate domi- nance in the southernmost stations of her study area were made by Hasle (1969). Kopczynska (1992) sugges- ted that deep vertical mixing and krill grazing created conditions of flagellate dominance over diatoms. The role of krill is difficult to evaluate; although preference for diatoms has been reported (Meyer and E1-Sayed 1983), krill can also feed on other organisms (Miller and Hampton 1989). Kopczynska's finding of flagellate dominance in zones of deep mixed water column and low population sizes can be interpreted as the back- ground situation of the scheme of Smetacek et al. (1990), which may include a diversity of autotrophic and heterotrophic organisms. As shown in our study, flagellates may also be dominant in highly stable condi- tions, which could be more comparable to the summer situation of temperate seas. Both in Antarctica and in temperate areas, diatoms are typical components of a spring bloom which develops only after adequate stabilization and light conditions follow the deep mix- ing winter period (in which some types of "flagellates" are likely to be the most abundant phytoplankton components).
Our results point out that the interaction between a particular hydrographic history and the response of the organisms may lead to a selection of different spe- cies in a phytoplankton assemblage. However, there are many difficulties in the interpretation of the spacio- temporal variability of marine ecosystems. More field work is needed for a better understanding of the com- plex interplay between biological and physical factors in the dynamics of Antarctic phytoplankton commu- nities.
Acknowledgements We would like to thank Prof. Victor Smetacek for his unconditional assistance, as well as the captain and R.V. "Polarstern" crew for their important help on board. Financial support to M. E. was provided by a grant of the Consejo Superior de Investigaciones Cientificas of Spain. Drs. Demetrio Boltovskoy and Gustavo Ferreyra made important suggestions on early versions of the manuscript.
References
Antezana T, Ray K (1984) Feeding on Euphausia superba in a swarm north of Elephant Island. J Crust Biol 4 (Spec N1):142-155
Blasco D, Estrada M, Jones BH (1981) Short time variability of phytoplankton populations in upwelling regions - The example of northwest Africa. American Geophysical Union Coastal Up- welling-Coastal and estuarine sciences pp 339-347

89
Bianchi F, Boldrin A, Cioce F, Dieckmann G, Kuosa H, Larsson AM, N6thig EM, Sehlstedt PI, Socal G, Syversten EE (1992) Phytoplankton distribution in relation to sea ice, hydrography, and nutrients in early spring 1988 during EPOS. Polar Biol 12:225-235
Bodungen B yon, Fischer G, N6thig EM, Wefer G (1987) Sedi- mentation of krill faeces during spring development of phyto- plankton in Bransfield Strait, Antarctica. In: Degens E, Honjo S, Izdar S (eds) Particle flux in the ocean. SCOPE/UNEP IS] 62:243-257
Bodungen B von, Smetacek V, Tilzer MM, Zeitzschel B (1986) Primary production and sedimentation during spring in the Antarctic Peninsula region. Deep-sea Research V33, pp 177-194
Booth BC, Lewin J, Norris RE (1982) Nanoptankton species pre- dominant in the subarctic Pacific in May and June 1978. Deep- Sea Res Vol 29, N2A, pp 185-200
Buck KR, Garrison DL (1983) Protists from the ice-edge region of the Weddell Sea. Deep-sea Res V30, NI2A, pp 1261-1277
Buma A, Estrada M, Larsen J, Riebesell U, Schloss I, Thomsen H (1989) Unicellular organisms studied alive using photographic and video techniques. In: Hempel I, Schalk PH, Smetacek V (eds) The expedition Antarktis VII/3 (EPOS LEG 2) of RV "Polar- stern" in 1988/89, Ber Polarf 65
Buma A, de Baar H, Nolting R, Bennekom A van (1991) Metal enrichment experiments in the Weddell-Scotia seas: effects of iron and manganese on various plankton communities. Limnol Oceanogr 36(8):1865 1878
Cadee GC, Cuzin-Roudy J, Gonz/dez H, Gran~li E, Lindner L, Riebesell U, Schalk P, Schiel S, Schloss I (1989) A multi- parameter approach to krill ecology: an attempt to summarize. In: Hempel I, Schalk PH, Smetacek V (eds) The expedition Antarktis VII/3 (EPOS LEG 2) of RV "Polarstern" in 1988/89, Ber Polarf 65
Cederl6ff U, Ober S, Schmidt R, Svansson A, Veth C (1989) Hydro- graphy. In: Hempel I, Schalk PH, Smetacek V (eds) The expedi- tion Antarktis VII/3 (EPOS LEG 2) of RV "PoIarstern" in 1988/89, Ber Potarf 65
Cederl6ff U, Bennekom AJ van, Veth C (1991) On the exchange of water masses across the Weddell Scotia Confluence. EPOS Sym- posium, Bremerhaven 1991
Deacon GER (1937) The hydrology of the Southern Ocean. Dis- covery Reports 15:pp 25-109
Deacon GER, Foster TD (1977) The boundary region between the Weddell Sea and Drake Passage currents. Deep- Sea Res V 24 pp 505 510
Deacon GER, Moorey JA (1975) The boundary region between currents from the Weddell Sea and the Drake Passage. Deep-Sea Res V 22 pp 265-268
Demers S, Legendre L, Therriault JC, Ingrain RG (1986) Biological production at the ice-water ergocline. In: Nihoul JCJ (ed) Marine Interfaces Ecohydrodynamics. Elsevier Oceanography Series 42
Dugdale RC, Goering JJ (1967) Uptake of new and regenerated forms of nitrogen in primary productivity. Limnol Oceanogr 12:196 206
Edler L (ed) (1979) Recommendations on methods for marine bio- logical studies in the Baltic Sea. Baltic Marine Biol Publ 5:1-38
E1-Sayed SZ (1971) Observations on phytoplankton bloom in the Weddell Sea. In: Llano GAI, E Wallen (eds). In Biology of Antarctic Seas (Ant Res Ser IV). American Geophysical Union, Washington, 17:301 312
E1-Sayed SZ, Weber LH (1982) Spatial and temporal variations in phytoplankton biomass and primary productivity in the south- west Atlantic and the Scotia Sea. Polar Biol I:83 90
E1-Sayed SZ, Biggs DC, Holm-Hansen O (1983) Phytoplankton standing crop, primary productivity, and near surface nitro- genous nutrient fields in the Ross Sea, Antarctica. Deep-Sea Res, Vol 30 N8 A p 871 886
Estrada M, Blasco D (1979) Two phases of the phytoplankton community in Baja California upwelling. Limnol Oceanogr 24(6), 1065 1080
Estrada M, Delgado M (1990) Summer phytoplankton distributions in the Weddell Sea. Polar Biol, 10:441-449
EPOS-LEG 2 (1989) EPOS-LEG 2 Data report hydrography Part 1, NIOZ, Texel
Franeker JA van (1989) Sea ice conditions. In: Hempel I, Schalk PH and Smetacek V (eds) The expedition Antarktis VII/3 (EPOS LEG 2) of RV "Polarstern" in 1988/89, Ber Polarfor 65
Fryxell GA, Kendrick GA (1988) Austral spring microalgae across the Weddell Sea ice edge: spatial relationships found along a northward transect during AMERIEZ 83. Deep-Sea Research V35 N1, pp 1-20
Garrison DL, Buck KR (1989) The biota of Antarctic pack ice in the Weddell Sea and Antarctic Peninsula Regions. Polar Biol 10:211-219
Garrison DL, Buck KR (1986) Organism losses during ice melting: a serious bias in sea ice community studies. Polar Biol 6:237-239
Garrison DL, Buck KR, Fryxell GA (1987) Algal assemblages in Antarctic pack-ice and ice edge plankton. J Phycol 23, 564-572
Gauch HG Jr (1982) Multivariate analysis in community ecology. Cambridge University Press, Cambridge, pp 1-298
Goeyens L, S6rensson F, Tr~guer P, Morvan J, Panouse M, Dehairs F (1991) Spatiotemporal variability of inorganic nitrogen stocks and uptake fluxes in the Scotia-Weddell Confluence area during November and December 1988 Mar Ecol Prog Ser 77:7-19
Gonz~ilez H, Iriarte JL, Acevedo A, Llanos A, Marin S, Bernal P, Troncoso A (1991) Distribucidn de clorofila-a fraccionada por tamafio de particulas en el paso Drake yen estrecho de Bransfield (Antfirtica) durante febrero de 1990. Ser Cien INACH 41:33 46
Gran~li E, Rabbani M, Franz G, Gran~li W, Daughjerg N, Cuzin- Roudy J, Alder V (1991) The influence of copepod and krill grazing on the species composition of phytoplankton communi- ties in the Scotia-Weddell Sea- An experimental approach. EPOS Symposium, Bremerhaven 1991
H/ider DP, Rhiel E, Wehrmeyer W (1987) Phototaxis in the marine flagellate Cryptomonas maculata. J Photochem Photobiol 1:115-122
Hart TJ (1942) Phytoplankton periodicity in antarctic surface waters. Discovery Rep 21:261-356
Hasle GR (1969) An analysis of the phytoplankton of the Pacific Southern Ocean: abundance, composition and distribution dur- ing the "Bratteg" Expedition, 1947 1948. Hvalradets skrifter, 52, 1-168
Hasle GR (1976) The biogeography of some marine planktonic diatoms. Deep-Sea Res 23:319-338
Hempel I, Schalk PH, Smetacek V (1989) The expedition Antarktis VII/3 (EPOS LEG 2) of RV "Polarstern" in 1988/89, Ber Polarf 65:1 200
Hewes CD, Holm-Hansen O, Sakshaug E (1985) Alternate carbon pathways at lower trophic levels in the Antarctic food web. In: Sigfried WR, Condy PR, Laws RM (eds) Antarctic nutrient cycling and food webs. Springer, Berlin Heidelberg New York, pp 277-283
Holm-Hansen O, E1-Sayed S, Franceschini GA, Cuhel RL (1977) Primary production factors controlling phytoplankton growth in the southern ocean. In: Llano GA (ed) Adaptations within Antarctic Ecosystems pp 11-50
Holm-Hansen O, Mitchell BG, Hewes CD, Karl DM (1989) Phyto- plankton blooms in the vicinity of Palmer Station, Antarctica. Polar Biol 10:49-57
Jacques G (1989) Primary production in the open Antarctic ocean during the austral summer. A review. Vie Milieu 39(1):1-17
Jacques G, Panouse M (1991) Biomass and composition of size fractionated phytoplankton in the Weddell-Scotia Confluence area. Polar Biol 11:315-328
Kopczynska EE (1988) Spatial structure of phytoplankton in the Scotia Front west of Elephant Island (BIOMASS III, Octo- ber-November 1986). Polish Polar Res 9:231-242
Kopczynska EE, Weber LH, Sayed SZ (1986) Phytoplankton spe- cies composition and abundance in the Indian sector of the Antarctic ocean. Polar Biol 6:161-169
90
Legendre L, Demers S (1985) Auxiliary energy, ergoclines and aqua- tic biological production. Nat Can 112:5-14
Lutjeharms JRE, Allanson BR, Parker L (1986) Frontal zones, Chlorophyll and primary production patterns in the surface waters of the southern ocean south of Cape Town. In: Nihoul JCJ (ed) Marine interfaces ecohydrodynamics - Elsevier
Lutjeharms JRE, Walters NM, Allanson BR (1985) Oceanic frontal systems and biological enhancement. In: Siegfried WR, Condy PR, Laws RM (eds) Antarctic nutrient cycles and food webs. Springer Berlin Heidelberg New York pp 11 21
Margalef R (1978) Life-forms of phytoplankton as survival alterna- tives in an unstable environment. Oceanol Acta 1:193-197
Meyer MA, E1-Sayed S (1983) Grazing of Euphausia superba Dana on natural phytoplankton populations. Polar Biol 1:193 197
Miller DGM, Hampton I (1989) Biology and ecology of the Antarc- tic krill. Polar Biol 2:203 206
Nelson DM, Smith WO Jr, Gordon LI, Huber BA (1987) Spring distribution of density, nutrients and phytoplankton biomass in the ice edge zone of the Weddell-Scotia Sea. J Geophys Res 92C:7181-7190
Nemoto T, Harrison G (1981) High latitude ecosystems. In Analysis of marine ecosystems. In: Longhurst AR (ed) Academic Press, London, New York 95-107
N6thig EM (1988) On the ecology of the phytoplankton in the southeastern Weddell Sea (Antarctica) in January/February 1985. Ber Polarf 53
N6thig EM, Bodungen B von, Sui Q (1991) Phyto- and protozoo- plankton biomass during austral summer in surface waters of the Weddell Sea and vicinity. Polar Biol 11:293-304
Pedr6s-Ali6 C, Gaslo JM, Guerrero R (1987) On the ecology of Cryptomonas phaseolus population forming a metalimnetic bloom in Lake Cis6, Spain: Annual distribution and loss factors. Limnol Oceanogr 32(2):285-298
Riebesell U, Schloss I, Smetacek V (1991) Aggregation of algae released from melting sea ice: implications for seeding and sedi- mentation. Polar Biol 11:239-248
Sakshaug E, Holm-Hansen O (1984) Factors governing primary production in polar oceans. In: Holm-Hansen O, Bolis L, Gilles R (eds) Marine phytoplankton and productivity. Lecture notes on coastal and estnarine studies, Springer Berlin Heidelberg New York vol 8
Schalk P (1990) Biological activity in the antarctic zooplankton community. Polar Biol 10:405 411
Simonsen R (1974) The diatom plankton of the Indian ocean expedi- tion of the RV Meteor 1964-1965. Meteor Forsch Erg 19:1 66
Smetacek V, Scharek R, N6thig E-M (1990) Seasonal and regional variation in the pelagial and its relationship to life history cycle of Krill. In: Kerry KR, Hempel G (eds) Antarctic ecosystems. Eco- logical change and conservation. Springer Berlin Heidelberg New York pp 103-114
Smith WO, Nelson DM (1986) Importance of ice edge phytoplank- ton production in the Southern Ocean. Bio Science 36:251-257
Sneath PHA, Sokal RR (1973) Numerical Taxonomy. The principles and practice of numerical classifications. WH Freeman, San Francisco XV, pp 573
Theriot E, Fryxell G (1985) Multivariate analysis of net Diatom Species distributions in the southwestern Atlantic and Indian ocean. Polar Biol 5:23 30
Tilzer M, Bodungen B von, Smetacek V (1985) Light dependence of phytoplankton photosynthesis in the Antarctic ocean: implica- tions for regulating productivity. In: Siegfried WR, Condy PR, Laws RM (eds) Antarctic nutrient cycles and food webs Springer Berlin Heidelberg New York pp 60 69
Tilzer MM, Elbr/ichter M, Gieskes W, Beese B (1986) Light-temper- ature interactions in the control of photosynthesis in Antarctic phytoplankton. Polar Biol 5:105-111
Uterm6hl H (1958) Zur Vervollkommung der quantitativen Phyto- plankton- Methodik. Mitt Int Verein Theor Angew Limnol 9:1-38
Wilson DL, Smith WO, Nelson DM (1986) Phytoplankton bloom dynamics of the western Ross Sea ice edge-I. Primary productivity and species specific production Deep Sea Res 33(10): 1375-1387
Copyright © 2022 FDOKUMEN