Allelopathy in phytoplankton - biochemical, ecological and evolutionary aspects
Upload
independentCategory
view
1download
0
Peptide hydrolysis and the uptake of dipeptides by phytoplankton
Margaret R. Mulholland,a,* and Cindy Leeb
a Department of Ocean, Earth and Atmospheric Sciences, Old Dominion University, Norfolk, VirginiabMarine Sciences Research Center, Stony Brook University, Stony Brook, New York
Abstract
Rates of peptide hydrolysis (using the fluorescent substrate, lucifer yellow anhydride-labeled tetra-alanine) anddipeptide uptake (using dually labeled, 15N and 13C, dialanine) were measured in phytoplankton cultures and innatural populations during algal blooms dominated by one or two taxa. During most sampling events, bothpeptide hydrolysis and dipeptide uptake were greatest in the size fraction containing the dominant phytoplankter,suggesting that phytoplankton contribute substantially to or may even dominate observed extracellular peptidehydrolysis and dipeptide uptake in the environment. These are the first data suggesting that dipeptides may betaken up directly by phytoplankton and this may represent a previously unaccounted-for nitrogen source inaquatic systems. Like many other processes in phytoplankton, peptide hydrolysis appears sensitive to the diel lightcycle and the nutrient environment, with rates varying depending on the dominant N source, but with no clearpattern. Uptake of dialanine, the dominant product of the hydrolysis of the peptide tetra-alanine, also varieddepending on the dominant taxa and the nutrient regime. Most of the time, it appeared that low production ofdialanine by tetra-alanine hydrolysis limited the uptake of the dipeptide. Close coupling between peptidehydrolysis and dipeptide uptake may also help explain the absence of correlations between rates of peptidehydrolysis and the concentration and composition of the free amino acid pool.
In many marine and estuarine systems, nitrogen isthought to limit growth and production. Althoughinorganic nitrogen species can be quickly depleted duringprimary production, dissolved organic nitrogen (DON)compounds are rarely depleted and can dominate the Npool in a variety of aquatic systems, including estuaries. Atleast some DON appears to be available to residentmicrobes (Berman and Bronk 2003), and this availabilityappears to be related to the size of the compounds.Although most of the dissolved organic matter (DOM)pool in nature is found in the ,1000-Da size fraction, wenow know that the high-molecular-weight (HMW) DOMpool, isolated using ultrafiltration, is more biologicallyreactive than previously thought (Amon and Benner 1996;Guo and Santschi 1997; Benner 2002).
In living cells of marine microorganisms, proteinsaccount for a major fraction of the cellular and intracellularcarbon and most of the nitrogen (Nguyen and Harvey1994; Kirchman 2000). We therefore expect DON releasedfrom living organisms to contain protein; the predomi-nance of amide N in the HMW DOM pool seems toconfirm this, and in fact, dissolved proteins have beenidentified in seawater (Tanoue 1995; Tanoue et al. 1996;Yamada and Tanoue 2003). Nuclear magnetic resonancespectroscopy suggests that .90% of the N in HMW DOMis amide N and ,10% is as the free amine (McCarthy et al.1996, 1997; Aluwihare et al. 2005).
Although smaller peptides are believed to be importantintermediates in the degradation of protein, the presence ofpeptides has not been clearly documented in the marineenvironment (except as isolated natural products), and only7–11% of total DON and 1–7% of total dissolved organiccarbon can be recovered as total hydrolyzable amino acids
(THAA) (Yamashita and Tanoue 2003; Jones et al. 2004),the analytical window that would include peptides. In theHMW DOM, amide N represents a somewhat largerportion of the N (16–30%) (McCarthy et al. 1996;Aluwihare and Repeta 1999; Aluwihare et al. 2005). Theserelatively low contributions to the HMW N pool suggestthat (1) protein N is not the dominant form of HMWDON, (2) protein and peptide N are rapidly degraded andconsumed in the environment, and (3) analytical methodscurrently being used underestimate the contribution ofproteins to this fraction of the DOM pool.
Hydrolysis of biopolymers like proteins is thought to bea rate-limiting step in microbial uptake of DOM andparticulate organic matter (POM) in many aquaticenvironments (Meyer-Reil and Koster 1992; Hoppe et al.2002). The current model of protein degradation in aquaticenvironments assumes that hydrolysis of proteinaceouscompounds yields peptides (amino acid sequences withmolecular weights ,6000 Da) and free amino acids (Hoppe1991; Hoppe et al. 2002; Nunn et al. 2003). Although largerorganisms can consume protein and hydrolyze it internally,marine microbes can only take up smaller compounds, sothey must hydrolyze proteins and peptides to smallersubstrates outside the cell (Payne 1980). Molecules largerthan approximately 600 Da (about the size of a dipeptide)are thought to be too large to be transported acrossmicrobial cell membranes for nutrient acquisition (Nikaidoand Vaara 1985).
Extracellular hydrolysis occurs by ecto- or extracellularenzymes. These hydrolytic enzymes (and most other cellsurface enzymes) have not been characterized or sequencedin the ocean, although numerous studies have detectedproteolytic activity in both seawater and sediments(Pantoja and Lee 1999; Sala et al. 2001; Hoppe et al.2002). Although bacteria have long been thought to be the* Corresponding author: [email protected]
Limnol. Oceanogr., 54(3), 2009, 856–868
E 2009, by the American Society of Limnology and Oceanography, Inc.
856

primary producers of protein hydrolases, it is now clearthat phytoplankton and cyanobacterial proteases make asubstantial contribution to exo- and ectocellular proteolyticactivity (Mulholland et al. 2002; Stoecker and Gustafson2003; Stoecker et al. 2005). It is thought that this capabilitymight be beneficial to phytoplankton competing for scarcenitrogenous resources. Culture (Antia et al. 1991; Lewitus2006) and field studies (Berman and Bronk 2003; Mulhol-land et al. 2004) have shown that some phytoplankton canuse organic compounds directly. We hypothesize that onepossible reason that dipeptides, the primary product ofpeptide hydrolysis, are not hydrolyzed further is that theyare small enough to be taken up directly by cells. Here wetest the hypotheses that peptide hydrolysis by phytoplank-ton may be more widespread than previously thought, andthat dipeptides can be taken up by phytoplankton. Wedescribe below a series of experiments that were conductedmeasuring peptide hydrolysis and dipeptide uptake incultures and field populations of microbes (phytoplanktonand bacteria) during monospecific or multispecies phyto-plankton blooms.
Methods
To determine whether peptide hydrolysis and dipeptideuptake are widespread among groups of marine microbesor within particular microbial size fractions, a study wasundertaken over several years and across a range ofenvironments including those that experience blooms of avariety of algal taxa known to take up DON. In addition,because field studies suggested that phytoplankton-sizedmicrobes contributed to peptide hydrolysis in nature,cultured populations were examined to determine whetherparticular phytoplankton were capable of peptide hydro-lysis and dipeptide uptake during growth on standardmedia and on media altered with respect to the N sourceand its concentration.
Cultures—Phytoplankton cultures were grown usingstandard media (Tables 1, 2) at salinities and temperaturescharacteristic of the environments from which they wereisolated. The nitrogen source and its concentration werevaried during treatment incubations as shown. All cultureswere conditioned for at least four generations on thespecified growth medium, but in some cases, cultures wereconditioned on media with altered N concentrations. Nconcentration is specified in Table 1 if it was substantiallyaltered from the specified growth medium. All experimentswere conducted using exponentially growing batch cultureswith the exception of the Synechococcus sp. and Nitzschiasp. cultures, for which experiments were conducted insteady-state continuous cultures. Cultures were deemed atsteady state when biomass was constant for at least fourgenerations.
Natural populations—Sampling of opportunity wasundertaken to investigate peptide hydrolysis and the uptakeof dipeptides across a range of environmental conditionsthat included a variety of populations and bloom organ-isms. Because organic nutrients are thought to be
important causative factors in many coastal algal blooms,we concentrated these studies on coastal areas that areprone to blooms. In particular, samples were collected inthe Lafayette River, Virginia, as the dominant phytoplank-ton assemblages changed seasonally. Experiments wereconducted at this site during spring and summer dinoflag-ellate blooms during 2002 and 2003. In addition, blooms ofthe brown tide pelagophyte, Aureococcus anophagefferens,occur during the spring in mid-Atlantic coastal lagoonssuch as Chincoteague Bay, Virginia. Peptide hydrolysis anddipeptide uptake were examined during a 2002 brown tidebloom at this site (Mulholland et al. 2004; Table 3). In theGulf of Mexico, red tides plague coastal waters along theWest Florida Shelf. Because organic matter is thought to beimportant in maintaining red tide blooms, we measuredrates of peptide hydrolysis during a massive Karenia brevisbloom in 2001 (aboard the RV Suncoaster). For compar-ison, we measured peptide hydrolysis during mixed diatomblooms in Florida coastal waters (Gulf of Mexico) in 2003(aboard the RV Pelican), and during slicks of Trichodes-mium sp. in the Arafura Sea between Australia and NewGuinea in 1999 (aboard the RV Maurice Ewing). Inaddition, because K. brevis, Trichodesmium, and anothercommon dinoflagellate found along the north coast ofAustralia, Pyrocystis sp., are large, we amended filteredseawater with cells isolated from gently collected planktontows. Water samples were collected using either Niskinbottles mounted on a conductivity–temperature–depthrosette or in acid-cleaned buckets and carboys. Experi-ments were initiated within 1 h of sample collection.
Nutrient and amino acid analysis—Concentrations ofdissolved free amino acids (DFAA) were measured by high-performance liquid chromatography (HPLC) (Cowie andHedges 1992). THAA were measured after modified vapor-phase hydrolysis (Kuznetsova and Lee 2002). Dissolvedcombined amino acids (DCAA) were calculated as thedifference between THAA and DFAA and includepeptides, proteins, and amino acids that are free but arein or adsorbed to humic and fulvic acids or clays, and thatcan be released upon acid hydrolysis.
Inorganic nutrient concentrations (nitrate, nitrite, phos-phate) were measured on an Astoria Pacific autoanalyzerusing colorimetric methods (Parsons et al. 1984). Ammo-nium and urea concentrations were determined using themanual phenol hypochlorite method (Solorzano 1969) andthe monoxamine method (Price and Harrison 1987),respectively. Total dissolved N (TDN) was measured afterpersulfate oxidation (Valderrama 1981) and DON calcu-lated as the difference between TDN and the summedinorganic N. Chlorophyll a (Chl a) concentrations wereestimated by fluorometry after extraction of cells in acetone(Welschmeyer 1994).
Uptake rate measurements—Uptake of 15N-labeledcompounds (NH z
4 , NO {3 ) and dually labeled (13C and
15N) urea, DFAA (mixed amino acids, glutamate, oralanine), and a dipeptide (dialanine) (custom-synthesizedby Cambridge Isotope Laboratory) were measured afterincubating water samples in acid-clean polycarbonate
Peptide hydrolysis and dipeptide uptake 857

Table
1.
Su
mm
ary
of
cult
ure
con
dit
ion
su
sed
inth
isst
ud
y,
bio
ma
sses
tim
ate
s(a
sC
hl
a,
PN
,a
nd
PC
),m
easu
red
or
esti
ma
ted
DC
AA
con
cen
tra
tio
ns,
mea
sure
dra
teco
nst
an
tsfo
rp
epti
de
hy
dro
lysi
s,a
nd
rate
so
fd
ipep
tid
eu
pta
ke
inw
ho
lecu
ltu
resa
mp
les.
Sta
nd
ard
dev
iati
on
so
ftw
oo
rm
ore
rep
lica
tesa
mp
les
are
inp
are
nth
eses
.E
mp
tyfi
eld
sin
dic
ate
tha
tn
od
ata
are
av
ail
ab
le.
Sp
ecie
sG
row
thm
ediu
mN
sou
rce
Sa
lin
ity
Tem
p(u
C)
Ch
la
(mg
L2
1)
PN
(mm
ol
NL
21)
PC
(mm
ol
CL
21)
DC
AA
(mm
ol
L2
1)
Pep
tid
eh
yd
roly
sis
(h2
1)
Dip
epti
de
up
tak
e(m
mo
lN
L2
1h
21)
Cy
an
op
hy
te:
Sy
nec
ho
cocc
us
(CC
MP
13
34
)f/
20
1m
mo
lL
21
NO
{ 3
32
22
20
.4(2
.6)
47
.2(1
2.6
)3
20
.0(9
0.7
)0
.42
(0.1
7)
0.2
8(0
.02
)1
.68
(0.2
8)
Sy
nec
ho
cocc
us
(CC
MP
13
34
)f/
20
1m
mo
lL
21
NO
{ 3
32
22
16
.3(0
.3)
55
.7(1
1.5
)4
27
.8(1
40
.9)
0.7
1(0
.07
)0
.16
(0.0
1)
1.5
1(0
.21
)
Pel
ag
op
hy
te:
Au
reo
cocc
us
an
op
ha
gef
fere
ns
(CC
MP
17
85
)L
12
0m
mo
lL
21
NO
{ 3
28
18
10
.9(3
.3)
10
1.3
(3.4
)1
21
1.0
(14
4.8
)0
.47
0.0
3(0
.01
)0
.40
(0.1
7)
Au
reo
cocc
us
an
op
ha
gef
fere
ns
(CC
MP
17
85
)L
12
0m
mo
lL
21
NH
z 4
28
18
11
.4(1
.7)
80
.8(4
.5)
11
24
.8(7
0.9
)0
.44
0.2
8(0
.01
)0
.44
(0.1
7)
Au
reo
cocc
us
an
op
ha
gef
fere
ns
(CC
MP
17
85
)L
12
0m
mo
lL
21
ure
a2
81
81
7.9
(4.4
)8
6.3
(2.3
)1
45
3.0
(10
.2)
0.2
90
.25
(0.0
2)
0.2
2(0
.02
)
Din
ofl
ag
ella
tes:
Pro
roce
ntr
um
min
imu
m(D
-5)
iso
late
dfr
om
the
Ch
op
tan
kR
iver
,M
D
f/2
-Si
NO
{ 31
51
55
8.2
(3.5
)2
58
.0(3
9.9
)0
.5*
0.0
7(0
.01
)2
.38
(0.3
6)
Pro
roce
ntr
um
min
imu
m(C
CM
P6
99
)L
1,
f/2
-Si
20
mm
ol
L2
1
NO
{ 3
28
18
21
.6(4
.4)
17
3.9
(12
.8)
85
0.2
(50
.9)
0.5
50
.20
(0.0
1)
0.2
4(0
.11
)
Pro
roce
ntr
um
min
imu
m(C
CM
P6
99
)L
1,
f/2
-Si
20
mm
ol
L2
1
NH
z 4
28
18
15
.4(1
.5)
12
9.0
(2.7
)7
39
.5(3
1.3
)0
.36
0.2
30
.09
(0.0
7)
Pro
roce
ntr
um
min
imu
m(C
CM
P6
99
)L
1,
f/2
-Si
20
mm
ol
L2
1
ure
a2
81
81
2.6
(1.5
)8
3.0
(2.4
)6
30
.8(2
3.8
1.3
80
.18
1.1
6(0
.11
)
Scr
ipp
siel
latr
och
oid
ea(C
CM
P1
33
1)
f/2
-Si
20
mm
ol
L2
1
NO
{ 3
28
18
11
.9(2
.8)
56
.9(6
.4)
31
6.0
(34
.0)
0.7
60
.33
0.5
7(0
.02
)
Scr
ipp
siel
latr
och
oid
ea(C
CM
P1
33
1)
f/2
-Si
20
mm
ol
L2
1
NH
z 4
28
18
13
.5(1
.1)
49
.4(2
.6)
23
5.4
(13
.0)
0.2
70
.33
(0.0
08
)0
.27
(0.0
4)
Scr
ipp
siel
latr
och
oid
ea(C
CM
P1
33
1)
f/2
-Si
20
mm
ol
L2
1
ure
a2
81
81
.1(0
.7)
19
.2(0
.2)
55
.4(3
.9)
1.6
40
.31
(0.0
5)
0.4
8(0
.14
)
Ka
tod
iniu
mro
tun
da
tum
(CC
MP
15
42
)f/
2-S
i2
0m
mo
lL
21
NO
{ 3
15
18
4.8
(0.7
)1
9.1
(3.6
)1
58
.1(3
2.2
)0
.73
0.0
6(0
.04
)
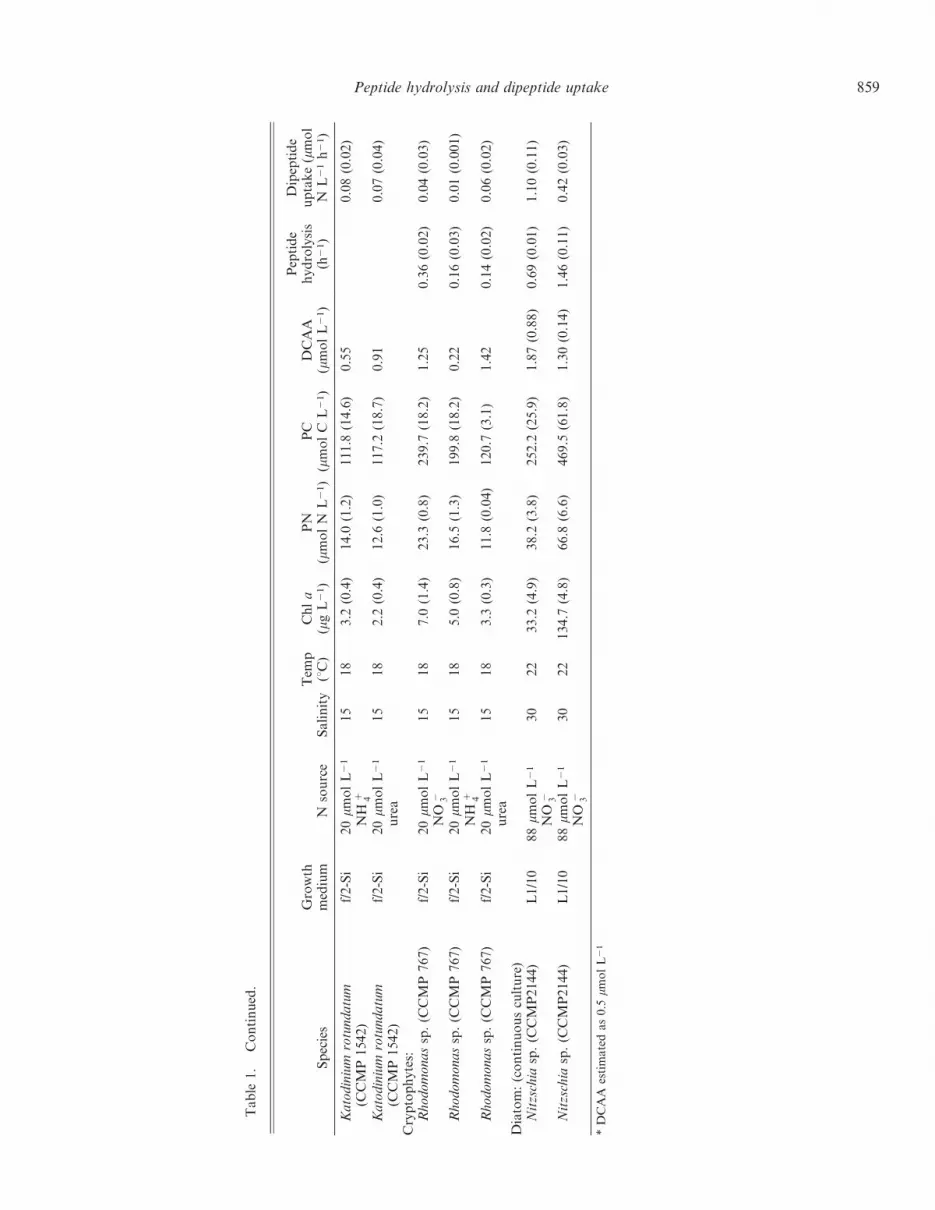
858 Mulholland and Lee
Table
1.
Co
nti
nu
ed.
Sp
ecie
sG
row
thm
ediu
mN
sou
rce
Sa
lin
ity
Tem
p(u
C)
Ch
la
(mg
L2
1)
PN
(mm
ol
NL
21)
PC
(mm
ol
CL
21)
DC
AA
(mm
ol
L2
1)
Pep
tid
eh
yd
roly
sis
(h2
1)
Dip
epti
de
up
tak
e(m
mo
lN
L2
1h
21)
Ka
tod
iniu
mro
tun
da
tum
(CC
MP
15
42
)f/
2-S
i2
0m
mo
lL
21
NH
z 4
15
18
3.2
(0.4
)1
4.0
(1.2
)1
11
.8(1
4.6
)0
.55
0.0
8(0
.02
)
Ka
tod
iniu
mro
tun
da
tum
(CC
MP
15
42
)f/
2-S
i2
0m
mo
lL
21
ure
a1
51
82
.2(0
.4)
12
.6(1
.0)
11
7.2
(18
.7)
0.9
10
.07
(0.0
4)
Cry
pto
ph
yte
s:R
ho
do
mo
na
ssp
.(C
CM
P7
67
)f/
2-S
i2
0m
mo
lL
21
NO
{ 3
15
18
7.0
(1.4
)2
3.3
(0.8
)2
39
.7(1
8.2
)1
.25
0.3
6(0
.02
)0
.04
(0.0
3)
Rh
od
om
on
as
sp.
(CC
MP
76
7)
f/2
-Si
20
mm
ol
L2
1
NH
z 4
15
18
5.0
(0.8
)1
6.5
(1.3
)1
99
.8(1
8.2
)0
.22
0.1
6(0
.03
)0
.01
(0.0
01
)
Rh
od
om
on
as
sp.
(CC
MP
76
7)
f/2
-Si
20
mm
ol
L2
1
ure
a1
51
83
.3(0
.3)
11
.8(0
.04
)1
20
.7(3
.1)
1.4
20
.14
(0.0
2)
0.0
6(0
.02
)
Dia
tom
:(c
on
tin
uo
us
cult
ure
)N
itzs
chia
sp.
(CC
MP
21
44
)L
1/1
08
8m
mo
lL
21
NO
{ 3
30
22
33
.2(4
.9)
38
.2(3
.8)
25
2.2
(25
.9)
1.8
7(0
.88
)0
.69
(0.0
1)
1.1
0(0
.11
)
Nit
zsch
iasp
.(C
CM
P2
14
4)
L1
/10
88
mm
ol
L2
1
NO
{ 3
30
22
13
4.7
(4.8
)6
6.8
(6.6
)4
69
.5(6
1.8
)1
.30
(0.1
4)
1.4
6(0
.11
)0
.42
(0.0
3)
*D
CA
Aes
tim
ate
da
s0
.5m
mo
lL
21
Peptide hydrolysis and dipeptide uptake 859

incubation bottles (Mulholland et al. 2002). Uptakeexperiments were initiated by adding tracer concentrations(most often 0.03 mmol L21; additions were always .1%,but usually #10% of the ambient concentration) of highlyenriched (96–99%) labeled substrates. After an incubationperiod (less than 1 h at in situ temperature and light levels),experiments were terminated by gentle filtration throughprecombusted (450uC for 2 h) GF/C (nominal pore size,1.2 mm) or GF/F (nominal pore size ,0.7 mm) filters.Filters were then frozen until analysis. Time-courseincubations were conducted periodically to determine thatappropriate incubation times were used (data not shown).
Particulate carbon and nitrogen masses and isotopicratios in samples were analyzed on a Europa Scientific 20-20 isotope ratio mass spectrometer equipped with anautomated nitrogen and carbon analyzer–SL prep unit.Uptake rates were calculated using the following equations(Mulholland et al. 2006):
15N uptake ~
atom % PNð Þfinal { atom % PNð Þinitial
atom % N source pool { atom % PNð Þinitial | time
| PN½ �
ð1Þ
13C uptake ~
atom % PCð Þfinal { atom % PCð Þinitial
atom % C source pool { atom % PCð Þinitial | time
| PC½ �
ð2Þ
where PN was the particulate nitrogen and PC was theparticulate carbon collected on the filter either before or atthe end of incubations. The source pool was the relevantdissolved pool that was enriched.
To calculate the atom percentage enrichment (both Cand N) of the DFAA and DCAA pools for the duallylabeled amino acids and dialanine (15N and 13C), the C : Nratio of the ambient DFAA pool was calculated on thebasis of the concentrations of individual amino acids fromHPLC runs (Mulholland et al. 2002). If all DCAA were
potentially dipeptides, the maximum dipeptide pool wouldbe the DCAA pool divided by two. Therefore, the initialdipeptide pool was estimated as half of the measuredDCAA pool. This is obviously an overestimate becausesome of the peptide linkages may be in other forms or maynot be easily hydrolyzed. Further, the DCAA pool innature may be a ‘‘residual’’ pool if dipeptide productionand uptake are tightly coupled and so labile forms don’taccumulate in nature.
Peptide hydrolysis rate measurements—Peptide hydroly-sis rates were measured using lucifer yellow anhydride(LYA)-labeled tetra-alanine (Pantoja et al. 1997; Mulhol-land et al. 2002). Rates of peptide hydrolysis were measuredin the ,1.2-mm size fraction (i.e., bacteria-sized), the ,10-or 20-mm size fraction (bacteria and small phytoplankton),and in whole water. During blooms, the dominantphytoplankton species was targeted for exclusion fromthe smaller size fractions. Differences among size fractionswere used to assess the contribution of specific groups oforganisms when possible. During previous studies, littleenzyme activity was observed in the ,0.2-mm size fractions(abiotic controls) (Mulholland et al. 2002, 2003), and sothis size fraction was often excluded in this study.
Rates of peptide hydrolysis were measured in triplicatesamples placed in acid-cleaned 25-mL polycarbonateincubation bottles. Assays were initiated by adding LYA-tetra-alanine (LYA-ala4) at a concentration of,100 nmol L21. We estimated this to be a ‘‘tracer’’addition (,10%) assuming that DCAA concentrationswere on the order of 1 mmol L21 in these environments,that all DCAA was peptide, and that turnover of thesubstrate would then reflect turnover times of the entiredipeptide pool. Subsamples were collected from incubationbottles at time zero and subsequently at intervals rangingfrom 30 min to 2 h. Samples were filtered (0.2 mm) and thefiltrate frozen until analysis by HPLC. LYA-ala4 and theproducts of its hydrolysis were separated and quantifiedusing a Shimadzu HPLC system (Pantoja et al. 1997;Mulholland et al. 2002, 2003). First-order rate constantsfor peptide hydrolysis were calculated on the basis ofquantification of parent compounds and products during
Table 2. Summary of culture conditions along with measured rate constants for peptide hydrolysis in cultures of unknown celldensity. These results suggest that other taxa may similarly hydrolyze peptides under nutrient-replete growth conditions. Standarddeviations of two or more replicate samples are in parentheses.
Species Growth medium N source SalinityTemp(uC)
Peptide hydrolysis(h21)
Cyanophyte:Trichodesmium IMS101 YBCII None 32 28 0.03 (0.004)
Dinoflagellates:Karenia brevis (Piney Pt Isolate B4) GP NO {
3 35 28 0.38 (0.004)Pfiesteria piscicida (NCSU113-3) SW None 15 20 1.90 (0.29)Pyrodinium bahamense (020501-1 B5 isolate) ESDK NO {
3 36 28 0.13 (0.03)Karlodinium micrum (CCMP 2283 – S Carolina) GP NO {
3 30 22 1.48 (0.31)Raphidophyte:
Heterosigma akashiwo (JW010423 – S Carolina) GP NO {3 25 22 0.85 (0.27)
Cryptophytes:Rhodomonas sp. (CCMP 768) SW + f/2 N 2 Si NO {
3 15 20 0.06 (0.003)
860 Mulholland and Lee

Table
3.
Ch
la,
PN
,a
nd
PC
bio
ma
ss,
ph
ysi
cal
pro
per
ties
,n
utr
ien
tco
nce
ntr
ati
on
s,ra
teco
nst
an
tsfo
rp
epti
de
hy
dro
lysi
s,a
nd
dip
epti
de
up
tak
ed
uri
ng
sam
pli
ng
per
iod
s.S
am
pli
ng
even
tsw
ere
du
rin
g‘‘
blo
om
s’’
or
per
iod
so
fel
eva
ted
Ch
la
wh
eno
ne
or
two
spec
ies
do
min
ate
dth
ep
op
ula
tio
n.
Fo
rd
ate
so
nw
hic
hth
ere
wer
em
ult
iple
sam
pli
ng
even
ts,
the
tim
eis
ind
ica
ted
nex
tto
the
do
min
an
tta
xa
.S
tan
da
rdd
evia
tio
ns
fro
mre
pli
cate
sam
ple
sa
rein
pa
ren
thes
es,
wh
ere
av
ail
ab
le.
BD
Lin
dic
ate
sth
at
the
an
aly
tew
as
bel
ow
the
lim
ito
fa
na
lyti
cal
det
ecti
on
.B
lan
kce
lls
ind
ica
teth
at
no
da
taa
rea
va
ila
ble
.
Da
teD
om
ina
nt
tax
aS
ali
nit
yT
emp
(uC
)C
hl
a(m
gL
21)
PN
(mm
ol
NL
21)
PC
(mm
ol
CL
21)
Dis
solv
edin
org
an
icN
(mm
ol
NL
21)
DO
N(m
mo
lN
L2
1)
DC
AA
(mm
ol
L2
1)
Pep
tid
eh
yd
roly
sis
(h2
1)
Dip
epti
de
up
tak
e(m
mo
lN
L2
1h
21)
Ch
op
tan
kR
iver
,M
D:
10
Ma
y0
2P
.m
inim
um
11
.52
3.0
49
.73
5.5
(1.1
)3
.30
.69
0.3
0(0
.01
)L
afa
yet
teR
iver
,V
A:
19
Ap
r0
2P
.m
inim
um
21
.21
9.8
21
.1(1
.6)
17
.3(2
.2)
98
.5(1
5.7
)7
.53
4.9
1.4
60
.03
(0.0
04
)0
.08
(0.0
02
)0
8M
ay
02
P.
min
imu
m2
0.7
21
.32
6.0
(0.6
)1
3.5
(1.9
)9
2.9
(12
.9)
11
.22
.36
*0
.03
(0.0
02
)0
.02
(0.0
03
)1
3M
ay
02
A.
san
gu
inea
20
.02
0.0
27
.09
5.8
(12
.0)
60
2.7
(61
.6)
1.1
2.3
60
.05
(0.0
1)
0.7
3(0
.04
)1
5M
ay
02
A.
san
gu
inea
20
.01
9.5
22
.4(7
.4)
67
.8(7
.8)
45
3.8
(35
.0)
5.4
3.9
60
.10
(0.0
3)
0.5
9(0
.07
)1
6M
ay
02
A.
san
gu
inea
an
dS
.co
sta
tum
20
.01
8.5
16
.13
7.9
(3.1
)3
01
.3(3
9.2
)7
.53
.96
*0
.16
(0.0
1)
0.3
8(0
.02
)
06
Au
g0
2A
.sa
ng
uin
ea2
2.0
28
.01
7.4
(1.1
)1
4.3
(1.0
)1
20
.2(9
.0)
8.9
24
.61
.40
0.0
9(0
.02
)0
.39
(0.0
2)
05
Feb
03
Het
ero
cap
sasp
.1
7.0
5.0
18
.0(0
.4)
40
.7(3
.7)
24
7.0
(17
.9)
3.6
42
.61
.0{
0.0
8(0
.00
4)
0.0
7(0
.00
2)
03
Ap
r0
3P
.m
inim
um
12
.01
4.4
17
.1(0
.2)
27
.7(1
.3)
19
8.6
(9.1
)2
.21
7.4
1.0{
0.0
3(0
.00
4)
0.0
4(0
.01
)1
1A
pr
03
P.
min
imu
m8
.01
0.0
13
.6(0
.7)
14
.7(1
.1)
12
6.3
(9.0
)7
.42
0.4
1.0{
0.0
5(0
.01
)0
.03
(0.0
01
)1
8A
pr
03
Het
ero
cap
sasp
.1
8.0
14
.89
.0(0
.2)
15
.5(2
.2)
10
7.9
(12
.2)
6.9
23
.41
.0{
0.0
5(0
.00
4)
0.0
5(0
.01
)2
8A
pr
03
P.
min
imu
m1
0.0
17
.82
3.2
(0.9
)1
6.0
(2.6
)9
7.0
(12
.6)
3.1
27
.51
.0{
0.0
3(0
.00
4)
0.0
6(0
.01
)3
0A
pr
03
P.
min
imu
m–
12
00
11
.01
9.0
23
.2(0
.6)
32
.9(2
.8)
30
2.1
(16
.8)
1.0
31
.50
.24
0.0
3(0
.00
)3
0A
pr
03
P.
min
imu
m–
16
00
10
.02
2.0
18
7.7
(30
.2)
37
1.7
(27
.6)
35
85
.0(2
18
.7)
1.0
32
.01
.22
1.2
7(0
.08
)3
0A
pr
03
P.
min
imu
m–
20
00
10
.02
0.0
10
.2(2
.9)
26
.2(2
.7)
31
9.9
(45
.7)
1.6
40
.90
.63
0.0
4(0
.01
)3
0A
pr
03
P.
min
imu
m–
24
00
10
.01
9.8
5.2
(1.3
)1
7.7
(3.8
)1
94
.7(2
1.5
)1
.02
3.4
0.5
80
.02
(0.0
1)
01
Ma
y0
3P
.m
inim
um
–0
40
01
0.0
19
.82
5.2
(0.6
)1
21
.8(7
.5)
40
9.6
(13
.3)
0.5
20
.30
.46
0.0
6(0
.00
)0
.24
(0.0
5)
01
Ma
y0
3P
.m
inim
um
–0
80
01
0.0
19
.01
7.3
(1.3
)2
8.7
(3.1
)2
05
.7(2
4.0
)0
.52
9.1
0.5
50
.07
06
Ma
y0
3P
.m
inim
um
–1
20
01
3.0
18
.09
.5(1
.5)
22
.7(2
.1)
23
4.2
(22
.4)
6.1
27
.70
.15
0.0
2(0
.00
)0
.02
(0.0
2)
06
Ma
y0
3P
.m
inim
um
–2
40
01
2.0
18
.03
.5(0
.2)
11
.3(1
.4)
89
.3(9
.8)
3.2
36
.00
.03
0.0
4(0
.00
)0
.00
1(0
.00
1)
08
Ma
y0
3P
.m
inim
um
–1
00
01
4.0
20
.61
2.8
47
.9(6
.0)
40
6.2
(48
.7)
3.9
42
.40
.12
0.0
4(0
.02
)0
.04
(0.0
3)
08
Ma
y0
3P
.m
inim
um
–2
20
01
3.0
20
.68
.8(1
.0)
27
.5(3
.8)
25
2.9
(26
.9)
6.7
46
.20
.50
0.0
5(0
.01
)0
.05
(0.0
4)
17
Jun
03
A.
san
gu
inea
–1
20
01
2.0
21
.81
59
.4(2
5.7
)2
34
.2(1
3.9
)1
14
9.4
(12
5.2
)1
.45
2.3
0.1
10
.13
(0.0
1)
17
Jun
03
A.
san
gu
inea
–2
20
01
2.0
21
.72
1.3
(7.5
)3
7.8
(9.4
)2
50
.9(5
2.3
)2
.84
2.9
0.3
50
.01
(0.0
1)
0.0
4(0
.00
)1
9Ju
n0
3A
.sa
ng
uin
ea–
10
00
9.0
22
.91
12
.0(1
.1)
33
9.8
(42
.8)
15
09
.3(1
85
.7)
4.4
22
.50
.10
0.0
5(0
.02
)0
.18
(0.0
01
)1
9Ju
n0
3A
.sa
ng
uin
ea–
22
00
10
.52
3.2
25
.5(0
.4)
35
.7(8
.2)
23
9.9
(52
.7)
3.2
27
.80
.11
0.0
5(0
.02
)B
DL
17
Jul
03
A.
san
gu
inea
13
.02
6.0
49
.6(1
.7)
95
.6(1
0.5
)4
95
.4(5
9.6
)2
.93
0.9
1.0
10
.11
(0.0
1)
0.7
9(0
.00
2)
22
Jul
03
A.
san
gu
inea
–1
00
01
4.0
25
.63
3.7
(0.1
)4
5.3
(9.6
)2
26
.3(4
3.8
)2
.92
1.9
1.5
4I
0.0
5(0
.01
)0
.45
(0.0
1)
22
Jul
03
A.
san
gu
inea
–2
20
01
6.0
25
.61
0.8
(0.2
)1
8.5
(2.9
)9
3.4
(16
.5)
3.0
33
.71
.54
I0
.81
(0.3
0)
0.2
1(0
.01
)2
6A
ug
03"
A.
san
gu
inea
an
dS
crip
psi
ella
sp.
17
.02
6.6
21
.7(2
.4)
14
.5(2
.6)
75
.7(1
1.7
)0
.42
8.1
1.5
80
.17
(0.0
7)
0.0
9(0
.01
)
30
Sep
03"
Co
chlo
din
ium
sp.
12
.02
1.4
24
.9(1
.3)
31
.3(4
.6)
14
4.4
(19
.4)
1.4
18
.41
.42
0.0
6(0
.03
)0
.12
(0.0
01
)M
id-A
tla
nti
cco
ast
al
lag
oo
n:
12
Jun
02
A.
an
op
ha
gef
fere
ns1
32
.62
4.8
19
.5(1
.5)
35
.6(1
.8)
49
5.1
(25
.5)
BD
L2
9.7
1.0{
0.0
5(0
.02
)0
.23
(0.0
4)
*U
sed
DC
AA
da
tafr
om
pre
vio
us
da
y.
{E
stim
ate
da
s1
.0m
mo
lL
21.
1M
ulh
oll
an
det
al.
20
04.
ID
CA
Aa
refr
om
asi
ng
lesa
mp
le.
"N
utr
ien
td
ata
are
fro
m2
8A
ug
an
d2
5S
ep2
00
3.
Peptide hydrolysis and dipeptide uptake 861
the time-course incubations (Pantoja et al. 1997). Rates ofpeptide hydrolysis were compared with estimates ofdipeptide uptake rates and the uptake of other N and Ccompounds.
Results
Turnover times for hydrolysis of our model peptidevaried from 0.03 to 1.48 h21 among taxa in culturedphytoplankton growing on N-replete culture media (Ta-
bles 1, 2), and from 0.01 to 0.81 h21 in field populationsdominated by different phytoplankton species (Table 3).Cultures of the diazotrophic cyanobacteria Trichodesmiumsp. had the longest turnover times for our model peptide,whereas the dinoflagellates Pfiesteria piscicida and Karlo-dinium micrum (veneficum), the raphidophyte Heterosigmaakashiwo, and the diatom Nitzschia sp. had the shortestturnover times (Tables 1, 2). For cultures (Table 1) andnatural whole water populations (Table 3) for which ratescould be biomass normalized, peptide hydrolysis rangedfrom 0.01 to 0.87 mmol PN21 h21 and 0.01 to 2.60 mmolPN21 h21, respectively.
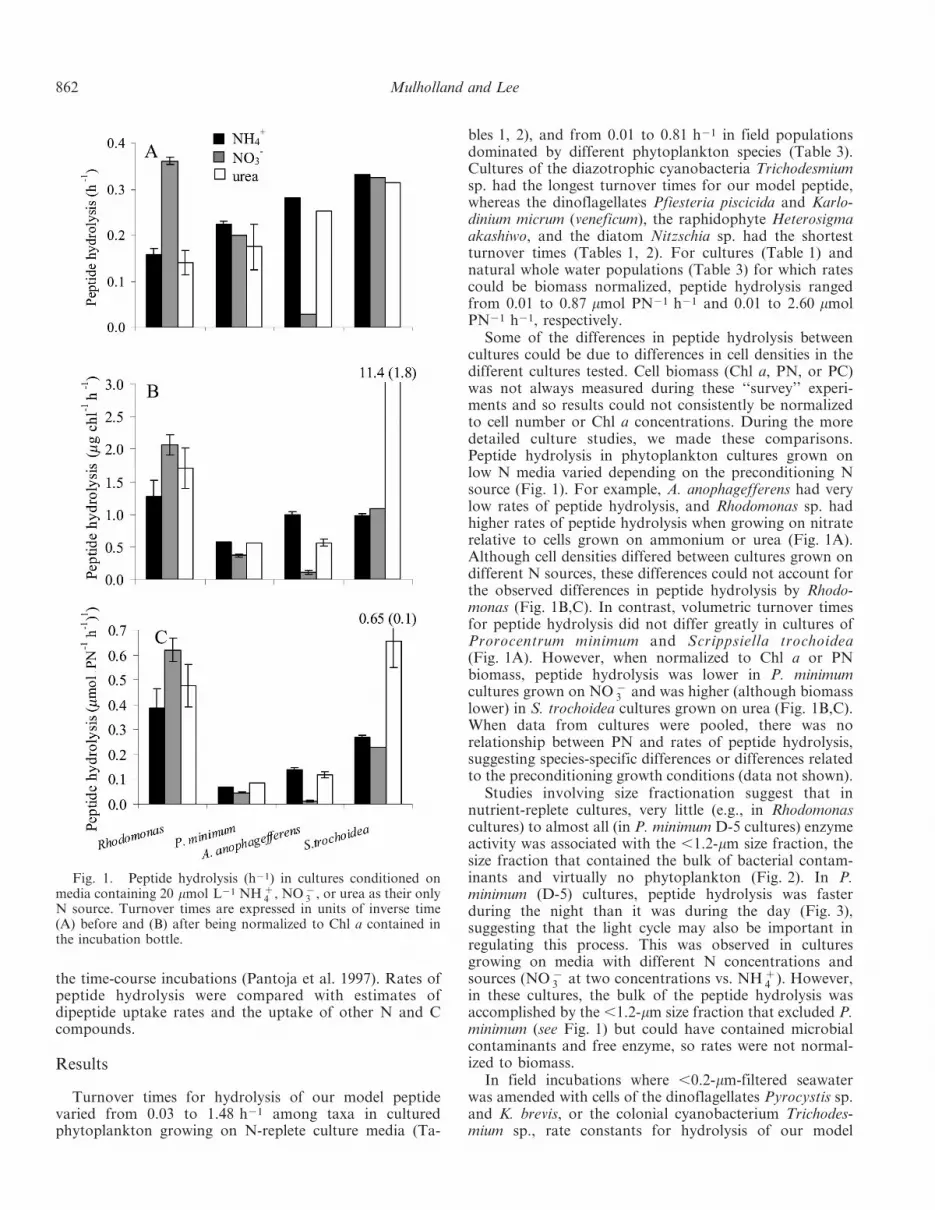
Some of the differences in peptide hydrolysis betweencultures could be due to differences in cell densities in thedifferent cultures tested. Cell biomass (Chl a, PN, or PC)was not always measured during these ‘‘survey’’ experi-ments and so results could not consistently be normalizedto cell number or Chl a concentrations. During the moredetailed culture studies, we made these comparisons.Peptide hydrolysis in phytoplankton cultures grown onlow N media varied depending on the preconditioning Nsource (Fig. 1). For example, A. anophagefferens had verylow rates of peptide hydrolysis, and Rhodomonas sp. hadhigher rates of peptide hydrolysis when growing on nitraterelative to cells grown on ammonium or urea (Fig. 1A).Although cell densities differed between cultures grown ondifferent N sources, these differences could not account forthe observed differences in peptide hydrolysis by Rhodo-monas (Fig. 1B,C). In contrast, volumetric turnover timesfor peptide hydrolysis did not differ greatly in cultures ofProrocentrum minimum and Scrippsiella trochoidea(Fig. 1A). However, when normalized to Chl a or PNbiomass, peptide hydrolysis was lower in P. minimumcultures grown on NO {
3 and was higher (although biomasslower) in S. trochoidea cultures grown on urea (Fig. 1B,C).When data from cultures were pooled, there was norelationship between PN and rates of peptide hydrolysis,suggesting species-specific differences or differences relatedto the preconditioning growth conditions (data not shown).
Studies involving size fractionation suggest that innutrient-replete cultures, very little (e.g., in Rhodomonascultures) to almost all (in P. minimum D-5 cultures) enzymeactivity was associated with the ,1.2-mm size fraction, thesize fraction that contained the bulk of bacterial contam-inants and virtually no phytoplankton (Fig. 2). In P.minimum (D-5) cultures, peptide hydrolysis was fasterduring the night than it was during the day (Fig. 3),suggesting that the light cycle may also be important inregulating this process. This was observed in culturesgrowing on media with different N concentrations andsources (NO {
3 at two concentrations vs. NH z4 ). However,
in these cultures, the bulk of the peptide hydrolysis wasaccomplished by the ,1.2-mm size fraction that excluded P.minimum (see Fig. 1) but could have contained microbialcontaminants and free enzyme, so rates were not normal-ized to biomass.
In field incubations where ,0.2-mm-filtered seawaterwas amended with cells of the dinoflagellates Pyrocystis sp.and K. brevis, or the colonial cyanobacterium Trichodes-mium sp., rate constants for hydrolysis of our model
Fig. 1. Peptide hydrolysis (h21) in cultures conditioned onmedia containing 20 mmol L21 NH z
4 , NO {3 , or urea as their only
N source. Turnover times are expressed in units of inverse time(A) before and (B) after being normalized to Chl a contained inthe incubation bottle.
862 Mulholland and Lee

peptide were 3–10 times higher than in unamended filteredseawater, suggesting that the presence of these organismscontributes to peptide hydrolysis (Fig. 4). During naturalsurface water ‘‘slicks’’ of Trichodesmium in the Arafura andCoral seas, whole water containing Trichodesmium usuallyhad the highest rates of peptide hydrolysis compared withsmaller size fractions that excluded Trichodesmium tri-chomes (Fig. 5). However, this is a case when we observedhigh peptide hydrolysis in the ,0.2-mm size fraction. Thismay be due to the presence of free enzyme, the presence ofsmall microbes, or the high temperature and requiresfurther examination. We are still exploring ways to identifywhich microbes are responsible for extracellullar peptidehydrolysis, whether activity is always confined to cells, andwhat controls these rates.
During monospecific or mixed blooms in subtributariesof the Chesapeake Bay, Chincoteague Bay (a mid-Atlanticcoastal bay), the Gulf of Mexico, and the north coast ofAustralia, cells greater than 1.2 mm in size contributed
substantially to peptide hydrolysis (Fig. 6). Further, in theElizabeth River, turnover of our model peptide was greaterwithin bloom patches than outside bloom patches (Fig. 7).In a visible patch of discolored water, Chl a concentrations
Fig. 2. Relative contribution to peptide hydrolysis (h21) ofcontaminating microbes and free enzymes (,1.2 mm; white bars)in whole cultures (black bars) of various phytoplankton species.
Fig. 3. Peptide hydrolysis (h21) in whole cultures of Pro-rocentrum minimum (D-5) growing on different culture mediaduring daytime (white bars) vs. at nighttime (black bars). Mosthydrolytic activity was due to microbes ,1.2 mm.
Fig. 4. Peptide hydrolysis (h21) in 0.2 mm seawater and in0.2 mm seawater amended with 100 Pyrocystis sp. cells (N coast ofAustralia), concentrated K. brevis (Gulf of Mexico), or 20Trichodesmium colonies (N coast of Australia). Water tempera-tures exceeded 30uC during all of these experiments.
Fig. 5. Peptide hydrolysis in size-fractionated surface waterfrom the north coast of Australia during a cruise in 1999 whenwater temperatures were nearly 30uC.
Fig. 6. Peptide hydrolysis in whole water (gray bars) and,1.2-mm filtered water (white bars) collected during algal bloomsin the Arafura Sea (Trichodesmium sp.), the Gulf of Mexico(Karenia brevis and mixed diatoms), a mid-Atlantic coastal bay(Aureococcus anophagefferens), and the Lafayette River, Virginia(all others). The dominant bloom-forming organism is indicated.
Peptide hydrolysis and dipeptide uptake 863

were 1.4 times higher than in surrounding water, butpeptide hydrolysis was 6.9 times higher. Both inside andoutside the patch, P. minimum was .90% of thephytoplankton community. Although peptide hydrolysiswas rapid when Chl a concentrations were high and whenthe population was dominated by a single or a few algalspecies (e.g., during blooms) (Table 3), they varied over thecourse of particular blooms such as P. minimum (Fig. 8A)and Akashiwo sanguinea (Fig. 8B) independently of bio-mass.
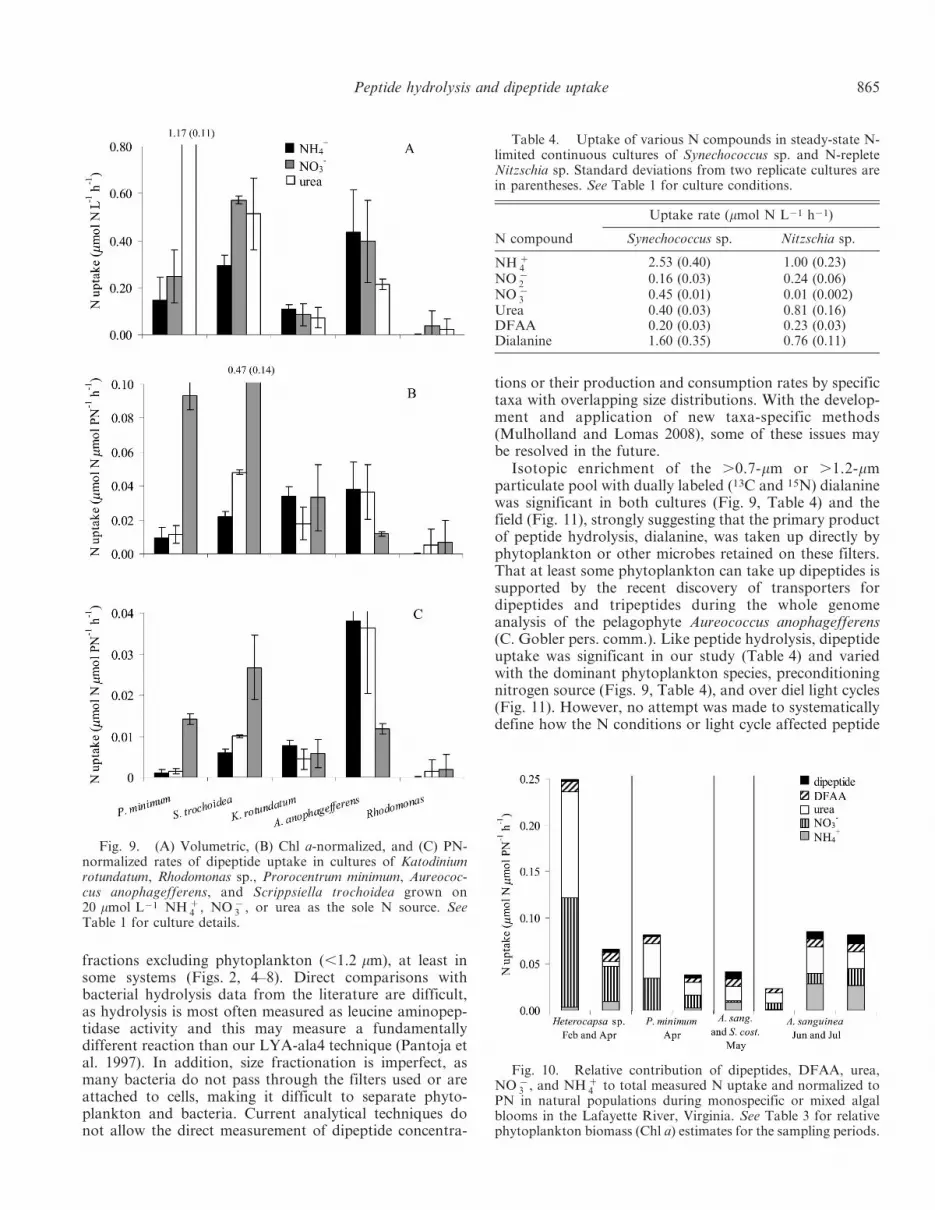
Rates of dialanine uptake were examined in conjunctionwith the hydrolysis of our model compound, LYA-ala4,and with respect to the uptake of a suite of nitrogenousnutrients in cultured and natural populations (Tables 1, 3).Nitrogen control of peptide hydrolysis and dipeptideuptake was evaluated in cultures preconditioned to20 mmol L21 ammonium, nitrate, or urea. Volumetric ratesof dipeptide uptake were highest in cultures of P. minimumgrown on urea (Fig. 9A); however, Chl a- (Fig. 9B) and PN(Fig. 9C)-normalized dipeptide uptake rates were highest incultures of S. trochoidea grown on urea. As was true forpeptide hydrolysis (see Fig. 1), normalizing for cell biomasschanged the relative outcomes from cultures that grewpreferentially on particular substrates; in particular, theculture of S. trochoidea did not grow well on urea so celldensities were low.
In continuous cultures of N-replete Nitzschia sp. and N-limited Synechococcus sp., rates of peptide hydrolysis werehigh and some of the highest rates of dipeptide uptake wereobserved. Although ammonium uptake was a higherproportion of the total, dipeptide uptake was 25.0% and29.9% of the total measured N uptake, 3.1 mmol N L21 h21
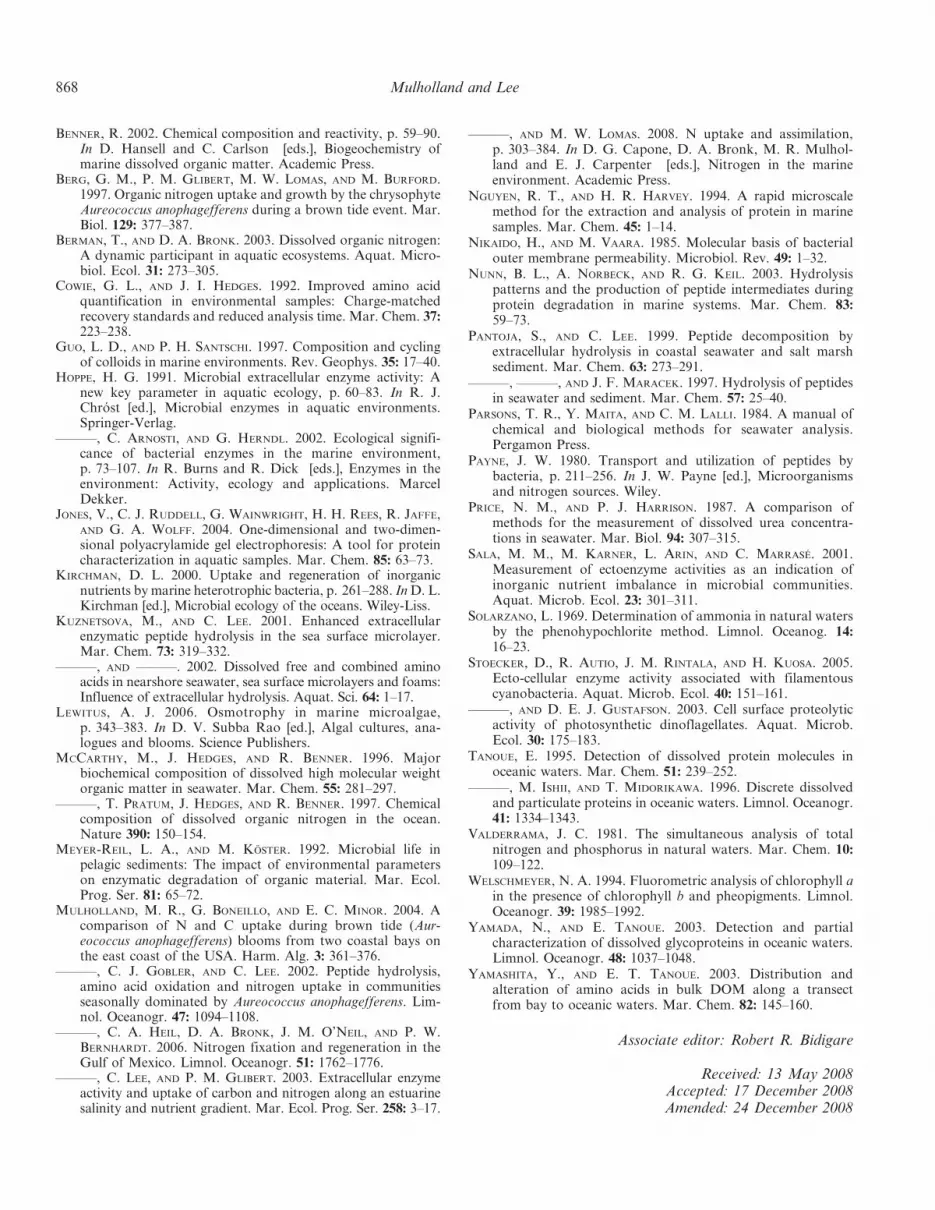
and 5.3 mmol N L21 h21, in the Nitzschia and Synecho-coccus cultures, respectively (Table 4). When dipeptideuptake was examined in natural microbial populationsduring monospecific algal blooms in the Lafayette River,the contribution of dipeptides to total N uptake measuredduring the day varied (Fig. 10), both with the dominantbloom species, over the course of a bloom, and duringdifferent blooms of the same species. Dipeptides contrib-uted between 0.7% and 18.1% to the total measured Nuptake. When compared on a diel basis, dipeptide uptake
occurred during the light and dark periods (Fig. 11A) andcontributed differentially to total N uptake during the day(Fig. 11B) vs. at night (Fig. 11C). For A. sanguinea,dipeptide uptake represented up to 25.6% of the totalmeasured N uptake at night.
Discussion
Hydrolysis and uptake of peptides by phytoplankton—Toestablish the capacity for phytoplankton to hydrolyzepeptides and take up dipeptides, we examined rates ofthese processes in culture systems dominated by a singlealgal or cyanobacterial species and in natural populationsdominated by a variety of bloom-forming algal taxa.Although the methods used cannot unequivocally distin-guish between phytoplankton and bacterial processes, ourresults show that rates of peptide hydrolysis vary amongcultured and natural populations dominated by differentphytoplankton species (Tables 1–3; Figs. 1, 2, 4, 6),preconditioned with different nitrogen sources (Figs. 1,3), and over diel cycles (Figs. 3, 11). Further, peptidehydrolysis in the size fraction that retained most phyto-plankton was often greater than that accomplished by size
Fig. 7. A comparison of peptide hydrolysis within andoutside an area affected by a bloom of P. minimum in theLafayette River, Virginia, on 08 May, 2002.
Fig. 8. (A) Peptide hydrolysis during monospecific bloomsof P. minimum in the Lafayette River, Virginia, during spring2003, and (B) during monospecific blooms of A. sanguinea in theLafayette River, Virginia, during summer 2003. Samples takenwhen the bloom algae were present in abundance are depicted ingray. The black bars indicate samples taken when there was no‘‘bloom’’ or single dominant algal taxa. On some dates,measurements were made at noon (12:00 h) and midnight (24:00h) to account for possible diel variability.
864 Mulholland and Lee
fractions excluding phytoplankton (,1.2 mm), at least insome systems (Figs. 2, 4–8). Direct comparisons withbacterial hydrolysis data from the literature are difficult,as hydrolysis is most often measured as leucine aminopep-tidase activity and this may measure a fundamentallydifferent reaction than our LYA-ala4 technique (Pantoja etal. 1997). In addition, size fractionation is imperfect, asmany bacteria do not pass through the filters used or areattached to cells, making it difficult to separate phyto-plankton and bacteria. Current analytical techniques donot allow the direct measurement of dipeptide concentra-
tions or their production and consumption rates by specifictaxa with overlapping size distributions. With the develop-ment and application of new taxa-specific methods(Mulholland and Lomas 2008), some of these issues maybe resolved in the future.
Isotopic enrichment of the .0.7-mm or .1.2-mmparticulate pool with dually labeled (13C and 15N) dialaninewas significant in both cultures (Fig. 9, Table 4) and thefield (Fig. 11), strongly suggesting that the primary productof peptide hydrolysis, dialanine, was taken up directly byphytoplankton or other microbes retained on these filters.That at least some phytoplankton can take up dipeptides issupported by the recent discovery of transporters fordipeptides and tripeptides during the whole genomeanalysis of the pelagophyte Aureococcus anophagefferens(C. Gobler pers. comm.). Like peptide hydrolysis, dipeptideuptake was significant in our study (Table 4) and variedwith the dominant phytoplankton species, preconditioningnitrogen source (Figs. 9, Table 4), and over diel light cycles(Fig. 11). However, no attempt was made to systematicallydefine how the N conditions or light cycle affected peptide
Fig. 9. (A) Volumetric, (B) Chl a-normalized, and (C) PN-normalized rates of dipeptide uptake in cultures of Katodiniumrotundatum, Rhodomonas sp., Prorocentrum minimum, Aureococ-cus anophagefferens, and Scrippsiella trochoidea grown on20 mmol L21 NH z
4 , NO {3 , or urea as the sole N source. See
Table 1 for culture details.
Table 4. Uptake of various N compounds in steady-state N-limited continuous cultures of Synechococcus sp. and N-repleteNitzschia sp. Standard deviations from two replicate cultures arein parentheses. See Table 1 for culture conditions.
N compound
Uptake rate (mmol N L21 h21)
Synechococcus sp. Nitzschia sp.
NH z4
2.53 (0.40) 1.00 (0.23)
NO {2 0.16 (0.03) 0.24 (0.06)
NO {3 0.45 (0.01) 0.01 (0.002)
Urea 0.40 (0.03) 0.81 (0.16)DFAA 0.20 (0.03) 0.23 (0.03)Dialanine 1.60 (0.35) 0.76 (0.11)
Fig. 10. Relative contribution of dipeptides, DFAA, urea,NO {
3 , and NH z4 to total measured N uptake and normalized to
PN in natural populations during monospecific or mixed algalblooms in the Lafayette River, Virginia. See Table 3 for relativephytoplankton biomass (Chl a) estimates for the sampling periods.
Peptide hydrolysis and dipeptide uptake 865

hydrolysis or dipeptide uptake or which taxa specificallywere performing these processes.
Comparison of peptide hydrolysis with dipeptide uptake—Whereas many studies of peptide hydrolysis have involvedartificial substrates that measure the hydrolysis of aterminal peptide linkage, the use of fluorescent derivativesof actual peptides as substrates (Pantoja et al. 1997;Pantoja and Lee 1999) allows for the direct measurementof specific hydrolysis products, and thus provides insightsinto enzymatic hydrolysis pathways and products. Previousstudies using these fluorescent peptide substrates have
demonstrated that extracellular hydrolysis of peptides isfaster than the rate of free amino acid production anduptake (Pantoja et al. 1997; Pantoja and Lee 1999). Indeed,Kuznetsova and Lee (2002) found little correlation betweenpeptide hydrolysis and changes in DFAA concentration.Pantoja and Lee (1999) also found that peptides containingmore than two amino acids were hydrolyzed 10–400 timesfaster than dipeptides or fluorescent dipeptide analogs.Further, fluorescent dipeptides are preferentially producedfrom the hydrolysis of larger substrates (Pantoja and Lee1999; Mulholland et al. 2002, 2003). Since dipeptides donot accumulate in seawater, and free amino acids are notbeing rapidly produced by hydrolysis of dipeptides,dipeptides must be rapidly removed by microorganisms(e.g., taken up) or removed from our analytical window insome other way (e.g., sorption, chemical reaction).
We have endeavored to compare estimates of dipeptideproduction and uptake by using stable isotopes to label themajor product of hydrolysis of our model peptidesubstrate. For example, DCAA concentrations in culturesof Synechococcus sp. were, on average, 0.57 mmol L21 andrates of peptide hydrolysis ranged from 0.16 to 0.28 h21.Assuming all DCAA were potentially available as dipeptideand that 1 mol DCAA equals 1 mol DCAA-N (e.g.,0.28 mmol N L21 dipeptide), then dipeptides were beingproduced at a rate of 0.045 to 0.078 mmol N L21 h21. Sincerates of dipeptide uptake were 1.5 to 1.7 mmol N L21 h21,dipeptides were being produced at lower rates than theywere being consumed by Synechococcus sp. Thus, theuptake of dipeptides by this species appears to exceed theirproduction by a factor of 20–30, suggesting that peptidehydrolysis might limit dipeptide uptake. Similar calcula-tions for all data presented in Tables 1 and 2 suggest thatdipeptide uptake rates exceed dipeptide production ratesvia peptide hydrolysis most of the time; exceptions were forcultures of Rhodomonas and during two bloom samplingdates, one dominated by P. minimum and the other byAkashiwo sanguinea. Peptide hydrolysis appeared to limitdipeptide uptake more often than not across a wide varietyof taxa, suggesting that production and uptake are tightlycoupled. This study demonstrates that quantifying standingstocks of dipeptides or DCAA may be insufficient fordetermining their importance as a nutrient source in marineand estuarine environments.
Ecological role of dipeptide production and uptake byphytoplankton vs. bacteria—Simple comparisons betweenthe amino acid composition of POM (e.g., bacteria andphytoplankton) and that of the HMW DOM and totalDOM pools in nature suggest that the amino acidcomposition of HMW DOM more closely reflects thatobserved in living organisms (POM), whereas the aminoacid composition of bulk DOM reflects the preservationand degradation processes acting on proteins in nature(Aluwihare and Meador 2008). These findings and those ofKuznetsova and Lee (2002) suggest that peptide hydrolysisis important in degrading peptides, but that other processesmay be more important in determining the composition ofthe residual amino acid pool. The assay used in this studyto assess peptide degradation was ideal for observing the
Fig. 11. (A) Diel variability in dipeptide uptake in naturalpopulations dominated by P. minimum or A. sanguinea ascompared with the diel variability in total N uptake by thesepopulations measured (B) during the day or (C) during the night.Dipeptides could represent up to 25.6% of total N uptake duringblooms of A. sanguinea.
866 Mulholland and Lee

primary products of peptide hydrolysis, including dipep-tides and free amino acids. In this study, the hydrolysis ofour model substrate beyond dialanine was insignificant,and dialanine was directly taken up by the microbialcommunity, including phytoplankton.
Rates of peptide hydrolysis varied seasonally, withmicrobial community composition, and with availabilityof labile N and C, as demonstrated here and previously(Mulholland et al. 2002, 2003, 2004), suggesting that thereare a variety of controls on peptide hydrolysis ranging fromphysiological capacity of particular organisms to thephysiological status of cells. The results presented heresuggest that the same is true for dipeptide uptake. Thesefindings and the observations that the production ofdipeptides is faster than amino acid production via otherenzymatic pathways may help explain the differencesbetween the compositions of the HMW DOM amino acidpool, wherein peptides are rapidly degraded, and the low-molecular-weight DOM or DFAA pool, which is producedand acted upon more slowly. Because it appears thatdipeptides can be consumed as rapidly as they areproduced, we propose that peptide hydrolysis limits theuptake of dipeptides.
Since dipeptides do not accumulate in seawater, anddipeptide hydrolysis is so slow as to limit the production offree amino acids, it is more likely that the most abundantterminal products of peptides are dipeptides rather than freeamino acids. We propose that dipeptides produced duringpeptide hydrolysis are taken up directly by microbes,including phytoplankton. Dipeptidases, on the other hand,are either uncommon in nature, or hydrolysis is carried outby nonspecific hydrolases with a low affinity for dipeptidesrelative to the dipeptide uptake systems of organisms.Uptake of dipeptides by microorganisms was seasonallyvariable, and rate constants of peptide hydrolysis weregenerally higher in spring and summer than in fall and winter,consistent with previous studies (Kuznetsova and Lee 2001).Further evidence that DFAA are not the terminal productsof peptide hydrolysis can be seen in experiments whereprotein added to seawater resulted in no change in DFAAconcentration or composition, even though protein concen-trations decreased (Kuznetsova and Lee 2002).
Because microorganisms are both consumers andproducers of dissolved N, their activity leads to complextemporal and spatial patterns of nutrient distribution andturnover. The ecological role of the marine DON reservoirand the factors that control its composition and size remainelusive. Previous studies have shown that some phyto-plankton can use organic compounds (Berg et al. 1997;Berman and Bronk 2003; Mulholland and Lomas 2008),and more recent studies have shown that phytoplanktonhave enzymes for degrading organic nitrogen compounds(Mulholland et al. 2002; Stoecker and Gustafson 2003;Stoecker et al. 2005). However, it has long been thoughtthey do not compete with bacteria in nature on theoreticalgrounds, although this conjecture has not been widelytested (Kirchman 2000). It has become increasingly clearthat this assumption must be re-evaluated as evidencemounts that bacteria and phytoplankton compete for thesame N sources in many aquatic systems (Mulholland and
Lomas 2008). Uptake of DON by phytoplankton anddissolved inorganic N by bacteria in the upper watercolumn are now widely recognized (reviewed in Mulhollandand Lomas 2008). Although bacteria have long beenthought to be the primary producers of protein hydrolases,it is clear from this study and others that phytoplanktonand cyanobacterial proteases make a substantial contribu-tion to exo- or ectocellular proteolytic activity and theuptake of products generated from this activity. However,little is known about hydrolysis at the molecular level.
To better understand the role of proteins in microbialnutrition in the environment, peptide hydrolysis anddipeptide uptake need to be examined systematically (inthe context of total N demand) over a time-dependentgradient of cellular physiological status (e.g., over diurnalcycles or as populations develop, and leading up to, during,and after blooms), and over seasonal cycles of variablenutrient availability, phytoplankton community composi-tion, and temperature. As uptake of organic N compoundsis examined more extensively, our view of N uptake and therelative importance of particular N compounds in theenvironment will continue to change, as will our under-standing of the functional roles of phytoplankton andbacteria.
AcknowledgmentsWe thank Peter Bernhardt, Michelle Watson, George Boneillo,
Andrea Rocha, and Ryan Morse for carrying out sampling andanalyses in conjunction with this project. We thank Doug Caponefor ship time and Cindy Heil for assisting in the isolation ofPyrocystis. Zhanfei Liu and Tiantian Tang assisted with totalhydrolyzable amino acid analyses.
This work was supported by a grant from the National ScienceFoundation to C.L., and grants from the National ScienceFoundation, the United States Ecology and Oceanography ofHarmful Algal Blooms (ECOHAB) Program, The VirginiaEnvironmental Endowment, and Virginia Water ResourcesResearch Center to M.R.M. The ECOHAB Program is sponsoredby the National Oceanographic and Atmospheric Administration,Environmental Protection Agency, National Science Foundation,National Aeronautics and Space Administration, and the Officeof Naval Research.
This is contribution 303 from the US ECOHAB Program and1378 from the Marine Sciences Research Center.
References
ALUWIHARE, L. I., AND T. MEADOR. 2008. Chemical compositionof marine dissolved organic nitrogen, p. 95–140. In D. G.Capone, D. A. Bronk, M. R. Mulholland and E. J. Carpenter[eds.], Nitrogen in the marine environment. Academic Press.
———, AND D. J. REPETA. 1999. A comparison of the chemicalcharacteristics of oceanic DOM and extracellular DOMproduced by marine algae. Mar. Ecol. Prog. Ser. 186: 105–117.
———, ———, S. PANTOJA, AND C. G. JOHNSON. 2005. Twochemically distinct pools of organic nitrogen accumulate inthe ocean. Science 308: 1007–1010.
AMON, R. M. W., AND R. BENNER. 1996. Bacterial utilization ofdifferent size classes of dissolved organic matter. Limnol.Oceanogr. 41: 41–51.
ANTIA, N. J., P. J. HARRISON, AND L. OLIVEIRA. 1991. The role ofdissolved organic nitrogen in phytoplankton nutrition, cellbiology and ecology. Phycologia 30: 1–89.
Peptide hydrolysis and dipeptide uptake 867
BENNER, R. 2002. Chemical composition and reactivity, p. 59–90.In D. Hansell and C. Carlson [eds.], Biogeochemistry ofmarine dissolved organic matter. Academic Press.
BERG, G. M., P. M. GLIBERT, M. W. LOMAS, AND M. BURFORD.1997. Organic nitrogen uptake and growth by the chrysophyteAureococcus anophagefferens during a brown tide event. Mar.Biol. 129: 377–387.
BERMAN, T., AND D. A. BRONK. 2003. Dissolved organic nitrogen:A dynamic participant in aquatic ecosystems. Aquat. Micro-biol. Ecol. 31: 273–305.
COWIE, G. L., AND J. I. HEDGES. 1992. Improved amino acidquantification in environmental samples: Charge-matchedrecovery standards and reduced analysis time. Mar. Chem. 37:223–238.
GUO, L. D., AND P. H. SANTSCHI. 1997. Composition and cyclingof colloids in marine environments. Rev. Geophys. 35: 17–40.
HOPPE, H. G. 1991. Microbial extracellular enzyme activity: Anew key parameter in aquatic ecology, p. 60–83. In R. J.Chrost [ed.], Microbial enzymes in aquatic environments.Springer-Verlag.
———, C. ARNOSTI, AND G. HERNDL. 2002. Ecological signifi-cance of bacterial enzymes in the marine environment,p. 73–107. In R. Burns and R. Dick [eds.], Enzymes in theenvironment: Activity, ecology and applications. MarcelDekker.
JONES, V., C. J. RUDDELL, G. WAINWRIGHT, H. H. REES, R. JAFFE,AND G. A. WOLFF. 2004. One-dimensional and two-dimen-sional polyacrylamide gel electrophoresis: A tool for proteincharacterization in aquatic samples. Mar. Chem. 85: 63–73.
KIRCHMAN, D. L. 2000. Uptake and regeneration of inorganicnutrients by marine heterotrophic bacteria, p. 261–288. In D. L.Kirchman [ed.], Microbial ecology of the oceans. Wiley-Liss.
KUZNETSOVA, M., AND C. LEE. 2001. Enhanced extracellularenzymatic peptide hydrolysis in the sea surface microlayer.Mar. Chem. 73: 319–332.
———, AND ———. 2002. Dissolved free and combined aminoacids in nearshore seawater, sea surface microlayers and foams:Influence of extracellular hydrolysis. Aquat. Sci. 64: 1–17.
LEWITUS, A. J. 2006. Osmotrophy in marine microalgae,p. 343–383. In D. V. Subba Rao [ed.], Algal cultures, ana-logues and blooms. Science Publishers.
MCCARTHY, M., J. HEDGES, AND R. BENNER. 1996. Majorbiochemical composition of dissolved high molecular weightorganic matter in seawater. Mar. Chem. 55: 281–297.
———, T. PRATUM, J. HEDGES, AND R. BENNER. 1997. Chemicalcomposition of dissolved organic nitrogen in the ocean.Nature 390: 150–154.
MEYER-REIL, L. A., AND M. KOSTER. 1992. Microbial life inpelagic sediments: The impact of environmental parameterson enzymatic degradation of organic material. Mar. Ecol.Prog. Ser. 81: 65–72.
MULHOLLAND, M. R., G. BONEILLO, AND E. C. MINOR. 2004. Acomparison of N and C uptake during brown tide (Aur-eococcus anophagefferens) blooms from two coastal bays onthe east coast of the USA. Harm. Alg. 3: 361–376.
———, C. J. GOBLER, AND C. LEE. 2002. Peptide hydrolysis,amino acid oxidation and nitrogen uptake in communitiesseasonally dominated by Aureococcus anophagefferens. Lim-nol. Oceanogr. 47: 1094–1108.
———, C. A. HEIL, D. A. BRONK, J. M. O’NEIL, AND P. W.BERNHARDT. 2006. Nitrogen fixation and regeneration in theGulf of Mexico. Limnol. Oceanogr. 51: 1762–1776.
———, C. LEE, AND P. M. GLIBERT. 2003. Extracellular enzymeactivity and uptake of carbon and nitrogen along an estuarinesalinity and nutrient gradient. Mar. Ecol. Prog. Ser. 258: 3–17.
———, AND M. W. LOMAS. 2008. N uptake and assimilation,p. 303–384. In D. G. Capone, D. A. Bronk, M. R. Mulhol-land and E. J. Carpenter [eds.], Nitrogen in the marineenvironment. Academic Press.
NGUYEN, R. T., AND H. R. HARVEY. 1994. A rapid microscalemethod for the extraction and analysis of protein in marinesamples. Mar. Chem. 45: 1–14.
NIKAIDO, H., AND M. VAARA. 1985. Molecular basis of bacterialouter membrane permeability. Microbiol. Rev. 49: 1–32.
NUNN, B. L., A. NORBECK, AND R. G. KEIL. 2003. Hydrolysispatterns and the production of peptide intermediates duringprotein degradation in marine systems. Mar. Chem. 83:59–73.
PANTOJA, S., AND C. LEE. 1999. Peptide decomposition byextracellular hydrolysis in coastal seawater and salt marshsediment. Mar. Chem. 63: 273–291.
———, ———, AND J. F. MARACEK. 1997. Hydrolysis of peptidesin seawater and sediment. Mar. Chem. 57: 25–40.
PARSONS, T. R., Y. MAITA, AND C. M. LALLI. 1984. A manual ofchemical and biological methods for seawater analysis.Pergamon Press.
PAYNE, J. W. 1980. Transport and utilization of peptides bybacteria, p. 211–256. In J. W. Payne [ed.], Microorganismsand nitrogen sources. Wiley.
PRICE, N. M., AND P. J. HARRISON. 1987. A comparison ofmethods for the measurement of dissolved urea concentra-tions in seawater. Mar. Biol. 94: 307–315.
SALA, M. M., M. KARNER, L. ARIN, AND C. MARRASE. 2001.Measurement of ectoenzyme activities as an indication ofinorganic nutrient imbalance in microbial communities.Aquat. Microb. Ecol. 23: 301–311.
SOLARZANO, L. 1969. Determination of ammonia in natural watersby the phenohypochlorite method. Limnol. Oceanog. 14:16–23.
STOECKER, D., R. AUTIO, J. M. RINTALA, AND H. KUOSA. 2005.Ecto-cellular enzyme activity associated with filamentouscyanobacteria. Aquat. Microb. Ecol. 40: 151–161.
———, AND D. E. J. GUSTAFSON. 2003. Cell surface proteolyticactivity of photosynthetic dinoflagellates. Aquat. Microb.Ecol. 30: 175–183.
TANOUE, E. 1995. Detection of dissolved protein molecules inoceanic waters. Mar. Chem. 51: 239–252.
———, M. ISHII, AND T. MIDORIKAWA. 1996. Discrete dissolvedand particulate proteins in oceanic waters. Limnol. Oceanogr.41: 1334–1343.
VALDERRAMA, J. C. 1981. The simultaneous analysis of totalnitrogen and phosphorus in natural waters. Mar. Chem. 10:109–122.
WELSCHMEYER, N. A. 1994. Fluorometric analysis of chlorophyll ain the presence of chlorophyll b and pheopigments. Limnol.Oceanogr. 39: 1985–1992.
YAMADA, N., AND E. TANOUE. 2003. Detection and partialcharacterization of dissolved glycoproteins in oceanic waters.Limnol. Oceanogr. 48: 1037–1048.
YAMASHITA, Y., AND E. T. TANOUE. 2003. Distribution andalteration of amino acids in bulk DOM along a transectfrom bay to oceanic waters. Mar. Chem. 82: 145–160.
Associate editor: Robert R. Bidigare
Received: 13 May 2008Accepted: 17 December 2008Amended: 24 December 2008
868 Mulholland and Lee
Copyright © 2022 FDOKUMEN