Lactobacillus reuteri 100-23 modulates urea hydrolysis in the murine stomach
Upload
khangminh22Category
view
6download
0
© 2009
MAYELA CRISTINA RAMIREZ-HUERTA
ALL RIGHTS RESERVED
STERIC AND ANCHIMERIC EFFECTS ON THE HYDROLYSIS OF OLIGOESTERS
AND THEIR INFLUENCE ON END-USE POLYURETHANE COATINGS
A Dissertation
Presented to
The Graduate Faculty of The University of Akron
In Partial Fulfillment
of the Requirements for the Degree
Doctor of Philosophy
Mayela Cristina Ramirez-Huerta
December, 2009

ii
STERIC AND ANCHIMERIC EFFECTS ON THE HYDROLYSIS OF OLIGOESTERS
AND THEIR INFLUENCE ON END-USE POLYURETHANE COATINGS
Mayela Cristina Ramirez-Huerta
Dissertation
Approved: Accepted:
_________________________________ _________________________________ Advisor Department Chair Dr. Mark D. Soucek Dr. Sadhan C. Jana _________________________________ _________________________________ Committee Member Dean of the College Dr. Kevin Cavicchi Dr. Stephen Z. D. Cheng _________________________________ _________________________________ Committee Member Dean of the Graduate School Dr. Avraam I. Isayev Dr. George R. Newkome _________________________________ _________________________________ Committee Member Date Dr. Bi-min Zhang Newby _________________________________ Committee Member Dr. Chrys Wesdemiotis
iii
ABSTRACT
Polyesters are used in a wide range of industries due to the ease of handling,
breadth of formulation, good balance of end properties, and cost. However, the
performance of polyesters is affected by the sensitivity of ester groups towards water.
Based on this setback, the objective of this dissertation was the study of the different
parameters affecting the hydrolysis of polyesters. Model oligoester compounds
synthesized with different diacids and diols were used to analyze the influence of the
chemical structure. The findings of this analysis were further applied to the hydrolysis of
polyester-urethane (PU) films. One of the main objectives was to prove that the
hydrolysis of the soft-segment of polyester-urethane films was reproduced by model
compounds. Additionally, in order to observe the reproducibility of the degradation
mechanism in an outdoor setting, weathering studies were also performed on different PU
films.
This research began with a hydrolysis study of model oligoester compounds. The
oligoesters were end-capped with phenyl isocyanate in order to eliminate end-group
effects and to mimic the chemical structure of the soft-segment of PU coatings. The
study focused on two key effects: the steric and the anchimeric. Different oligoesters
containing two (binary), three (ternary) and four (quaternary) different monomers were
used for this study. The monomers included a combination of diacids (adipic acid; 1,4-

iv
cyclohexanedicarboxylic acid; isophthalic acid;terephthalic acid; and phthalic acid) and
polyols (1,2-ethylene glycol; 1,3-propenediol; 1,4-butanediol; 1,5-pentanediol; 1,6-
hexanediol; neopentyl glycol; 1,4-cyclohexanedimethanol; 2-methyl-1,3-propanediol;
and trimethylolpropane). The binary systems were synthesized using one diacid and one
diol. These systems allowed the control of the chemical structure with different steric
and anchimeric effects. Hydrolysis rate constants were obtained from titration
measurements. It was observed that the hydrolysis of oligoesters based on 1,4-
cyclohexanedicarboxylic acid was influenced by steric effects. On the other hand, the
lack of steric hindrance and the flexibility of the chain were key factors triggering the
hydrolysis of adipic acid-based oligoesters.
Thermodynamic studies were performed in an attempt to verify the relationship
between steric and anchimeric effects in the initial stage of the hydrolysis of model
compounds. In the case of closely related reactions, plots of enthalpy (∆H‡) and entropy
of activation (∆S‡) can prove that the reactions undergo the same reaction mechanism.
This relationship is known as the compensation effect or the isokinetic relationship. This
study showed that the hydrolysis of adipic acid-based oligoesters was influenced by
anchimeric effects during the first stage of degradation. On the other hand, the beginning
of the hydrolysis of sterically hindered compounds containing neopentyl glycol was
influenced by steric effects.
After establishing the reaction mechanism of binary systems, the hydrolytic
stability of different copolyesters was evaluated. The oligoesters were prepared from
adipic acid (AA) and isophthalic acid (IPA), with different polyols. The experiments
included the investigation of phenyl isocyanate end-capped oligoesters and the resulting
v
polyurethane films. The presence of IPA had a direct impact on the hydrolytic stability
of the oligoesters due to the disruption of intra- and intermolecular catalysis. Ponderal
analysis demonstrated that the hydrolytic stability of oligoesters is a non-additive
property and revealed the importance of the ester block over the chain composition.
Accelerated weathering studies were performed on PU films in order to correlate
hydrolytic stability to the degradation of coating properties on outdoor conditions.
Coating properties were measured at different intervals during the accelerated weathering
test. Similarly to the hydrolysis of end-capped oligoesters, polyurethane films containing
AA-binary oligoesters showed poor weathering performance. On the other hand, binary
IPA-oligoester systems showed the best hydrolytic stability of all the oligoester systems.
Weathering of PU films caused not only the degradation of the ester groups (through
hydrolysis) but also the degradation of urethane groups, through photo-oxidation.
Overall, three different scenarios of degradation were proposed. The first
scenario of hydrolysis was a function of the steric hindrance. Build up of hydroxyl
functionalities gave rise to the second scenario of hydrolysis. Intramolecular catalysis
was the predominant mechanism of degradation. Subsequent degradation of the molecule
leaded to the hydrolysis of small molecules (3rd scenario). The hydrolysis of PU films
occurred through end-group scission, emphasizing the importance of the ester block over
the oligoester composition. The presence of flexible ester blocks with low steric
hindrance was the main cause of hydrolytic degradation. A good correlation between
hydrolysis of oligoesters and PU films confirmed the initial assumption that end-capped
oligoesters mimic the hydrolytic stability of the soft segment of polyester-urethanes.

vi
DEDICATION
To my parents, Guillermo and Maria Graciela, for always believing in me.

vii
ACKNOWLEDGEMENTS
I would like to thank my parents, Guillermo and Maria Graciela, for always
making me believe I can do things beyond my dreams. I would also like to extend my
sincere gratitude to my siblings, Geisy, Guille and Guillermo Manolo, for their love and
support all these years.
I would like to thank my advisor and committee members for their guidance and
suggestions along this academic journey: Dr. Mark D. Soucek, Dr. Kevin Cavicchi, Dr.
Avraam I. Isayev, Dr. Bi-min Zhang Newby, and Dr. Chrys Wesdemiotis. I would also
like to thank my groupmates and friends: Elif Alyamaç, Xiaojiang Wang, Dr. Ruby
Chakraborty, and Dr. Uma Chatterjee for their friendship, help and support.
I would like to thank OMNOVA Solutions, Inc. for their financial support. I
would like to specially thank Cathy Smith, Mina Garcia and Dr. Veronique Lachat for
their unconditional support. All you have been so special to me in each step of this
journey. Your support and advice helped me complete this high achievement. Thank
you very much.
Finally, I would like to thank Betty Protz, Vicky Martinez, Johanna Baena, and
Juan Manuel Adames for being my family here in Akron.

viii
TABLE OF CONTENTS
Page
LIST OF TABLES ........................................................................................................... xii
LIST OF FIGURES ........................................................................................................ xiv
CHAPTER
I. INTRODUCTION ...........................................................................................................1
II. BACKGROUND .............................................................................................................5
2.1 Introduction ......................................................................................................5
2.2 Background to Ester Synthesis ........................................................................5
2.3 Background to Urethane Chemistry.................................................................9
2.4 Hydrolysis of Polyesters ................................................................................12
2.5 Hydrolysis of Polyester-Urethanes ................................................................33
III. EXPERIMENTAL .......................................................................................................35
3.1 Materials .........................................................................................................35
3.2 Synthesis .........................................................................................................38
3.2.1 Synthesis of Oligoesters ....................................................................38
3.2.2 Synthesis of End-Capped Oligoesters ...............................................39
3.2.3 Sample Preparation and Acid Number Evaluation ...........................45
3.3 Characterization ..............................................................................................46
3.3.1 Acid Number Evaluation (Aac) ........................................................46

ix
3.3.2 Hydroxyl Number Evaluation ...........................................................47
3.3.3 Fourier Transform Infrared Spectroscopy (FT-IR) ...........................47 3.3.4 Gel Permeation Chromatography (GPC) ..........................................48
3.3.5 Differential Scanning Calorimetry (DSC) ........................................49
3.3.6 Dynamic Mechanical Thermal Analysis (DMTA) ...........................49
3.3.7 Tensile Testing ..................................................................................50
3.4 Coating Formulation and Film Preparation ......................................................51
3.5 Accelerated Weathering Test ............................................................................51
3.6 Film Characterization ........................................................................................55
3.6.1 Gouge and Scratch Hardness ............................................................55
3.6.2 Cross-Hatch Adhesion ......................................................................55
3.6.3 Pull-Off Adhesion .............................................................................56
3.6.4 Impact Resistance .............................................................................56
3.6.5 Gloss .................................................................................................56
IV. EFFECT OF STRUCTURAL PARAMETERS ON THE HYDROLYTIC STABILITY OF MODEL COMPOUNDS END-CAPPED WITH NON-POLAR GROUPS ............................................................................................................................58 4.1 Abstract ............................................................................................................58
4.2 Introduction ......................................................................................................59
4.3 Results ..............................................................................................................63
4.3.1 Linear Aliphatic- and Cycloaliphatic-Based Oligoesters ..................71
4.3.2 Aromatic-Based Oligoesters ..............................................................75
4.3.3 Base Catalyzed Hydrolysis of Model Compounds ............................78
4.4 Discussion ........................................................................................................79

x
4.4.1 Steric and Anchimeric Effects ...........................................................79
4.4.2 Hydrophobicity Effects ......................................................................87
4.4.3 Acid vs. Base Catalyzed Hydrolysis ..................................................93
4.4.4 Proposed Hydrolysis Model ...............................................................97
4.5 Conclusions ....................................................................................................100
V. THERMODYNAMIC STUDIES OF THE HYDROLYSIS OF END-CAPPED OLIGOESTERS: A LINEAR CORRELATION APPROACH TO COMPARE STERIC AND ANCHIMERIC PATHWAYS.................................................................101 5.1 Abstract ...........................................................................................................101
5.2 Introduction .....................................................................................................102
5.3 Results .............................................................................................................106
5.4 Discussion .......................................................................................................122
5.5 Conclusions .....................................................................................................128
VI. HYDROLYTIC STABILITY OF TERNARY AND QUATERNARY END-CAPPED OLIGOESTERS .....................................................................................129 6.1 Abstract ...........................................................................................................129
6.2 Introduction .....................................................................................................129
6.3 Results .............................................................................................................133
6.4 Discussion .......................................................................................................138
6.5 Conclusions .....................................................................................................143
VII. COATING PROPERTIES, HYDROLYSIS, AND WEATHERING PERFORMANCE OF HYDROLYTICALLY STABLE POLYESTER- URETHANE FILMS .......................................................................................................145 7.1 Abstract ...........................................................................................................145
7.2 Introduction .....................................................................................................146

xi
7.3 Results .............................................................................................................150
7.3.1 Mechanical and Coating Properties .................................................150
7.3.2. Hydrolysis of Polyurethane Films ..................................................156
7.3.3 Weathering of Polyurethane Films ..................................................159
7.4 Discussion .......................................................................................................176
7.5 Conclusions .....................................................................................................185
VIII. CONCLUSIONS .....................................................................................................186
REFERENCES ................................................................................................................189

xii
LIST OF TABLES
Table Page
2.1 Classification of the eight mechanisms for ester hydrolysis .....................................14
3.1 Quantities used in the synthesis of binary oligoester systems ..................................40 3.2 Reactant quantities used for the synthesis of oligoesters containing adipic acid and isophthalic acid as common dibasic acids .......................................41 3.3 Chemical properties of binary oligoester systems ....................................................42 3.4 Chemical properties of ternary and quaternary oligoester systems ..........................43 3.5 Physical properties of binary end-capped oligoesters at room temperature .............44 3.6 Physical properties of end-capped ternary and quaternary oligoester systems.........45 3.7 FT-IR band assignment61,70,71,72,73,74 .........................................................................48 3.8 Formulation of poly(ester-urethane) coatings ...........................................................53 3.9 Test program settings of SAE J1960 used on the accelerated weathering of polyurethane films ................................................................................................54 4.1 Relative hydrolysis rate constants of samples containing adipic acid (AA) and 1,4-cyclohexanedicarboxylic acid (1,4-CHDA) and different diols ..................73 4.2 Relative rates of aromatic-based end-capped oligoesters .........................................75 4.3 Comparison of hydrolysis rates of hydroxyl terminal7 and end-capped oligoesters .................................................................................................................84 4.4 Acid dissociation constant and water solubility of dibasic acids98,99,100 ...................89 5.1 Values of pre-exponential factors and activation energies of the hydrolysis of end-capped oligoester compounds ..........................................................................112

xiii
5.2 Thermodynamic parameters: enthalpy (∆H‡), entropy (∆S‡) and free energy (∆G‡) of activation of end-capped oligoesters at T = 313 K .......................120 6.1 Overall hydrolysis rates of ternary and quaternary end-capped oligoesters ...........136 6.2 Theoretical and experimental hydrolysis rate constants of ternary and quaternary oligoesters .............................................................................................138 7.1 Mechanical properties of polyester-urethane films.................................................152 7.2 Glass transition temperature and crosslink density of polyester-urethane films ....153 7.3 Coatings properties of polyester-urethane films containing binary oligoester systems ...................................................................................................154 7.4 Coatings properties of polyester-urethane films containing ternary and quaternary oligoester systems .................................................................................155 7.5 Hydrolysis rates (k) of polyurethane films .............................................................156 7.6 Gouge hardness values obtained during weathering ...............................................162 7.7 Scratch hardness values obtained during weathering .............................................163 7.8 Cross-hatch adhesion values otained during weathering ........................................164 7.9 Forward impact before and after weathering exposure...........................................165 7.10 Gouge hardness of stabilized samples during weathering ......................................167 7.11 Scratch hardness of stabilized samples during weathering .....................................168 7.12 Cross-hatch adhesion of stabilized samples during weathering .............................168 7.13 Rates of appearance of the (NH-OH) groups and (C=O) groups with respect to –CH- groups during weathering .........................................................................172

xiv
LIST OF FIGURES
Figure Page
2.1 Direct esterification of carboxylic acids with alcohols ............................................7
2.2 Synthesis of polyurethanes .......................................................................................9
2.3 Urethane groups form intermolecular (a) acyclic hydrogen bonds and (b) cyclic hydrogen bonds ...........................................................................................10 2.4 Hydrolysis of polyesters: a) acid catalysis and b) base catalysis ...........................13
2.5 Possible modes of rupture during hydrolysis of esters: a) acyl-oxygen fission and b) alkyl-oxygen fission ...................................................................................14 2.6 Bimolecular basic hydrolysis with acyl-oxygen fission: BAC2 mechanism ..........16 2.7 Unimolecular basic hydrolysis with alkyl-oxygen fission: BAL1 ..........................17 2.8 Bimolecular basic hydrolysis with alkyl-oxygen fission: BAL2 .............................18 2.9 Unimolecular acid hydrolysis with acyl-oxygen fission: AAC1 mechanism ........19 2.10 Bimolecular acid hydrolysis with acyl-oxygen fission: mechanism: AAC2 .........20 2.11 Unimolecular acid hydrolysis with alkyl-oxygen fission: AAL1 ............................21 2.12 Monoesters of (a) phthalic and (b) isophthalic acid...............................................24 2.13 Comparison of hydrolysis rate (k’) of different oligoesters comprised of 1,4-CHDA and a series of diols.43 .........................................................................26 2.14 Anchimeric effects through a) end-group effects (intra-molecular hydrogen bonding) and b) inter-molecular hydrogen bonding ..............................................26 2.15 Intramolecular catalysis of end-groups by hydrogen bonding (left) two carbon spacer diol and (right) two carbon spacer carboxylic acid ....................................28

xv
2.16 Representation of the influence of anchimeric effect on hydrolysis rates at different pH ............................................................................................................29 2.17 Schematic representation of the hydrolysis of vinyl acetate with varying initial water concentration ......................................................................................32 3.1 Chemical structures of the different dibasic acids used in the synthesis of oligoesters ..........................................................................................................36 3.2 Structure of the diols used in the synthesis of oligoesters ......................................37 3.3 Diagram of gloss measurement ...............................................................................57 4.1 Hydrolysis of polyester ...........................................................................................60 4.2 FT-IR spectra of oligoesters composed of adipic acid and 1,2-ethylene glycol and the end-capped resin .........................................................................................68 4.3 Increase in acid number (mgKOH/gresin) with time (days) of two end-capped oligoesters ...............................................................................................................71 4.4 Hydrolysis rates of end-capped oligoesters made with adipic acid (AA) and different diols ...................................................................................................74 4.5 Hydrolysis rates of end-capped oligoesters made with 1,4-cyclohexanedicarboxylic acid (1,4-CHDA) and different diols .......................74 4.6 Hydrolysis rates of phthalic anhydride (PA)-based oligoesters and different diols .........................................................................................................................76 4.7 Hydrolysis rates of IPA-based oligoesters synthesized with different diols...........77 4.8 Hydrolysis rates of terephthalic acid (TPA)-based end-capped oligoesters ...........77 4.9 Comparison of overall hydrolysis rates of acid- and base-catalyzed hydrolysis ....78 4.10 Intramolecular catalyzed hydrolysis of telechelic groups by hydrogen bonding: (a) two carbon spacer diol (b) four carbon spacer carboxylic acid .........................82 4.11 Intramolecular catalysis of 1,4-CHDA.12-EG oligoesters: a) ethylene glycol in one end (stable conformation) and b) in the other end the anchimeric effect of cis-14CHDA in boat position (unstable conformation). .....................................85 4.12 Phthalate esters (a) autocatalytic effect caused by nearby carboxylate ions; (b) sterically hindered phthalic anhydride-based oligoesters ..................................86

xvi
4.13 Proposed mechanisms104,105 of hydrolysis autocatalyzed by carboxylic acid (COOH) groups through a) pre-equilibrium protonation, b) pre-equilibrium protonation, electrophilic-nucleophilic by c) simultaneous attack and d) as a two step reaction; e) autocatalysis by carboxylate ion(COO-). ...............................92 4.14 Transition states developed during the hydrolysis of polyesters: a) acid- catalyzed and b) base-catalyzed .............................................................................93 4.15 Resonance structures of aromatic groups a) ortho-COOH substituents, b) meta-COOH substituents, and c) para-COOH substituents ...............................96 4.16 Proposed hydrolysis model .....................................................................................99 5.1 Hydrolysis of end-capped oligoesters at 25°C ......................................................108 5.2 Hydrolysis of end-capped oligoesters at 40°C ......................................................108 5.3 Hydrolysis of end-capped oligoesters at 50°C ......................................................109 5.4 Hydrolysis of end-capped oligoesters at 60°C ......................................................109 5.5 Arrhenius plots of the hydrolysis of oligoesters at 25, 40, 50, 60°C ....................111 5.6 Arrhenius plots of the hydrolysis of oligoesters at 25, 40, 50, 60°C ....................111 5.7 Arrhenius plots of the hydrolysis of oligoesters at 25, 40, 50, 60°C ....................112 5.8 Linear relationship between pre-exponential factor (A) and activation energy (Ea) obtained from the Arrhenius plots. The slope is equal to Tβ = 277 K.. ..........................................................................................................114 5.9 Extension of Arrhenius equation to a point of intersection that should converge at Tβ. ....................................................................................................114 5.10 Kinetic data influenced by a linear compensation effect, the Arrhenius plots displaying two distinctive sets of samples converging at one point equivalent to the compensation temperature (β).. ..................................................................116 5.11 Linear relationships: a) ∆H‡ and ∆S‡ of activation; b) from statistically independent values: ∆H‡ vs. ∆G‡. Line 1 () includes compounds: AA.13PD, AA.16HD, and AA.NPG. Line 2 () includes compounds: AA.NPG, SA.NPG, 14CHDA.NPG, HHPA.NPG, 14CHDA.13PD, and 14CHDA.16HD... ..................................................................................................121 6.1 End-capped hydroxyl-terminated oligoesters with phenyl isocyanate. ...............134

xvii
6.2 Acid number (Aac) increase with time ................................................................135 6.3 Hydrolysis of AA.IPA.NPG.DIOL2. a) Oligoester with chain-ends composed of MPD.AA, b) chain-ends of MPD.IPA, c) inter-molecular catalysis of low steric hindrance segment in AA.IPA.NPG.16HD, and d) intra-molecular catalysis of AA end-groups in low steric hindrance segments of AA.IPA.NPG.16HD ........................................................................141 6.4 End-group effect caused by hydroxyl terminated oligoesters composed of 2-butene-1,4-diol end-groups ...............................................................................142 7.1 Correlation between hydrolysis rates of end-capped oligoesters and polyurethane films ...............................................................................................157 7.2 FT-IR spectrum of polyurethane films before and after hydrolysis ....................159 7.3 Gloss retention (20°) of polyester urethane systems made with binary oligoester compounds after 1440 h of accelerated weathering ............................161 7.4 Gloss retention (20°) of polyester urethane made of ternary and quaternary
oligoesters after 1440 h of accelerated weathering ..............................................161 7.5 Gloss retention (20°) of stabilized and unstabilized polyester urethane films after 1440 h of weathering ...................................................................................166 7.6 Gloss retention (60°) of stabilized and unstabilized polyester urethane films after 1440 h of weathering ...................................................................................167 7.7 FT-IR spectra of an unstabilized polyester urethane coating (AA.IPA.1,5-PeD) inside a weathering chamber at 0, 480, 960, and 1440 h ......170 7.8 FT-IR spectra of a stabilized polyester urethane coating (AA.IPA.15PeD) inside a weathering chamber at 0, 480, 960, and 1440 h .....................................170 7.9 Percent increase of the ratio of (NH-OH) area (3600-3100 cm-1) to the –CH– area (3020-2780 cm-1) ...............................................................................171 7.10 Percent increase of the ratio of carbonyl (C=O) area (1830-1570 cm-1) to the –CH– area (3020-2780 cm-1) ...............................................................................171 7.11 Correlation between hydrolysis of end-capped oligoesters and 20° gloss retention (%). Excluded point () AA.IPA.BED...............................................173

xviii
7.12 Correlation between hydrolysis of polyurethane films and 20° gloss retention (%). Excluded points: () AA.IPA.BED and (▲) AA.IPA.BED.15PeD ....................................................................................174 7.13 Correlation between the hydrolysis of end-capped oligoesters and the rate of increase in the (NH,OH) area during weathering ...............................175 7.14 Correlation between the hydrolysis of PU films and the rate of increase in the (NH,OH) area during weathering. Excluded point: AA.IPA.MPD.TMP .............................................................................................175 7.15 Hydrolysis of polyurethane films through a) end-group scission or b) random scission ...............................................................................................178

1
CHAPTER I
INTRODUCTION
First produced in the late 1920s by W. H. Carothers, polyesters have become
important materials used in a wide variety of products. The synthesis of polyesters
involves the reaction of a diacid with a diol. The reaction is called a condensation
reaction because the initial monomers react to form a longer chain and produce water as
byproduct. Polyesters are characterized by high melting points as well as resistance to
abrasion, solvents and other chemicals.1 Also, polyesters have good mechanical
properties, such as high tensile strength, stiffness, and impact strength. Polyesters are
used in a wide variety of industries including textiles, automotive, coatings, film,
packaging, and medical devices. Polyesters used as thermoplastics have high molecular
weight and are crystalline.2
2
However, polyesters used in the coating industry have low
molecular weight (oligoesters), and are amorphous, branched, and usually crosslinked
with isocyanates melamine or epoxy groups. ,3
Polyesters used in this study represent chemical structures typically used as
coatings. In the coating industry, major commercial developments have been focused on
improving the overall performance of films and on reducing the solvent levels used in
coating preparations. The ever-changing Clean Air Legislation, regulating the emission
of volatile organic compounds (VOC) to the air, has had a big impact on the coatings

2
industry. Coatings are second only to gasoline as a source of VOC.2 Hence, much
research has been focused on the development of alternatives to reduce VOC emissions.
The industry is trying to transition to a more ecofriendly alternative like waterborne,
high-solids (>65% w/w), powder coating and 100% radiation curing systems.2
However, all of these systems have drawbacks. For example, high solids systems
have high viscosity; thus, lower molecular weight polyesters rather than compounds used
in solvent-borne systems are needed for processing. In the case of UV-curable systems, a
change in the processing equipment is required. Waterborne systems have the
disadvantages of limited stability, poor flow characteristics, and poor detergent and
solvent resistance.2 Additionally, waterborne systems have the drawback of triggering
the hydrolysis of ester groups. Polyesters react easily with water, causing an
autocatalytic reaction which leads to the molecular degradation of the resin and finally to
the failure of mechanical properties.
Esters are the functional group most prone to hydrolysis, followed by ureas,
urethanes, and ethers.2 Consequently, the use of polyesters has been limited not only in
waterborne systems but also in products used in exterior applications. For example,
polyester-based water-reducible systems exhibit poor package stability due to the slow
hydrolysis of ester linkages.4 As the final product, poly(ester-urethane) coatings for
exterior applications are exposed to environmental factors (such as humidity, high
temperatures, snow, salt, grit, grime, bird droppings, and tree sap) that can enhance the
hydrolytic degradation by altering the pH of the coating. In the automotive industry, the
degradation of coatings leads to a variety of undesired events such as loss of gloss,
chalking, rust, and eventually to mechanical failure (cracking, peeling, blisters).
3
In order to assess this problem, the objective of this dissertation focuses on the
analysis and understanding of the relationship between chemical structure and hydrolysis.
A systematic study of the chemical structure of polyester resins was done. Parameters
such as steric, anchimeric, and end-group effects were thoroughly studied. A careful
selection of monomers was made based on the steric and anchimeric contribution on the
final oligomeric product. Steric effects are related to the shielding provided by bulky
atoms near the ester group.5,6
6
On the other hand, the anchimeric effect is observed when
nucleophiles within the same molecule interact with nearby ester groups assisting the
attack by an external nucleophile on the carbonyl carbon, causing an increase in the
hydrolysis rates.
Previous studies analyzed the hydrolysis of hydroxyl-terminated oligoesters.7,8,9
2
In those studies, it was determined that anchimeric effects predominated in the first stage
of hydrolyis by end-group cleavage while steric effects controlled the main chain
scission. However, low molecular weight, hydroxyl-terminated polyesters are not used
by themselves as final products. Hydroxyl-terminated oligoesters are typically used in
the synthesis of polyurethanes. Polyurethanes constitute the toughest, most durable of
industrial coatings, with a wide range of uses from flooring to the automotive industry.10
2
The two-component (2K) polyurethanes are commonly used as primers and finishes in
ambient curing automotive markets. However, end-product performance is also affected
by the sensitivity of the ester groups towards water. In polyurethane resins, the
oligoesters form the soft segment of the resin; this segment is attached to other soft
segments by a hard segment, which is a polyisocyanate, and forms a 3-dimensional
structure.
4
Therefore, the hydrolytic mechanism of oligoester chains present in polyurethane
compounds is different than the one represented by telechelic (end-functional)
compounds. Based on this hypothesis, it was decided to end-cap the oligoesters with
phenyl isocyanate (monoisocyanate). By reacting the –OH groups and eliminating end-
group effects, the initial behavior of oligoester chains in contact with water can be
studied. In addition, using a phenyl isocyanate monomer to end-cap the oligomers
allowed us mimic the hydrolysis process affecting polyurethane resins. Samples
containing two, three and four monomers (diols and diacids) were studied. In order to
observe if the structural parameters of the model compounds (end-capped oligoesters)
played the same role as in the end-products, the hydrolysis of polyurethane films was also
studied. Polyurethanes were synthesized using the same oligoesters used as model
compounds on the first part of this research. In the last section, the mechanical and
coating properties of the polyurethane films were reported. Additionally, weathering
studies of polyurethane films were done. Weathering of a material refers to its
decomposition when exposed to outdoor conditions. Weathering studies of outdoor
material are a powerful tool to estimate product life.

5
CHAPTER II
BACKGROUND
2.1 Introduction
From our knowledge of the main structural factors governing hydrolytic
degradation, it is possible to obtain new industrial polyester resins with enhanced
hydrolytic resistance. A variety of monomers with functional groups suitable for the
preparation of polyesters are commercially available, making the number of polymer
structures which can be designed almost limitless.1 In industry the choice of raw
materials is determined by availability, cost, and the particular characteristics required by
the end-products.11
Macroscopic properties are strongly related to molecular structure;
therefore it is important to understand the relationship between chemical structure and
end-use properties. Ultimately, the chemical structure depends fundamentally on the
control of monomer reactivity and therefore of its functionality. Step polymerization is
carried out by the reaction between a diol and a diacid. The final chemical structure and
its properties can be designed using the proper choice of monomers: monofunctional,
multifunctional, linear, branches, tacticity, etc.
2.2 Background to Ester Synthesis
Step growth polymerization is a process in which monomers with two or more
functional groups react with each other and progressively increase molecular weight with
6
time. Step polymerization reactions are also known as condensation reactions due to the
low molecular weight by-products obtained during the reaction. Step polymerization
reactions are characterized by low equilibrium constant; therefore, the removal of low
molecular weight products is necessary to drive the reaction towards high molecular
weight polymers.10 The monomers used for step growth polymerization usually contain
at least two different types of functionalities (A and B) that react with each other but are
not able to react with themselves. Typically, the monomers used to prepare polyesters
contain diols, triols, dibasic acids or their anhydrides. Monomers can be bi-functional or
multifunctional according to the number of functional groups present on the monomer.
While polymerization of bi-functional monomers results in linear polymers, the
polymerization of poly-functional monomers leads to branched or crosslinked chemical
structures.
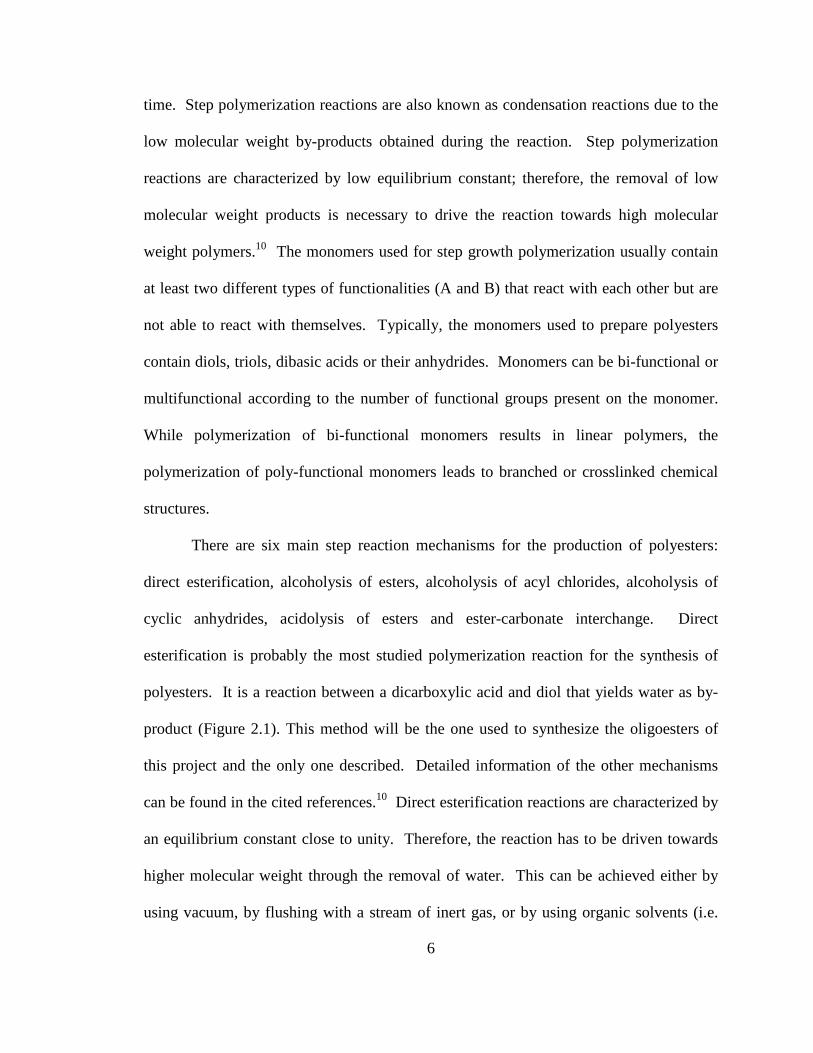
There are six main step reaction mechanisms for the production of polyesters:
direct esterification, alcoholysis of esters, alcoholysis of acyl chlorides, alcoholysis of
cyclic anhydrides, acidolysis of esters and ester-carbonate interchange. Direct
esterification is probably the most studied polymerization reaction for the synthesis of
polyesters. It is a reaction between a dicarboxylic acid and diol that yields water as by-
product (Figure 2.1). This method will be the one used to synthesize the oligoesters of
this project and the only one described. Detailed information of the other mechanisms
can be found in the cited references.10 Direct esterification reactions are characterized by
an equilibrium constant close to unity. Therefore, the reaction has to be driven towards
higher molecular weight through the removal of water. This can be achieved either by
using vacuum, by flushing with a stream of inert gas, or by using organic solvents (i.e.

7
benzene, toluene, xylene) which form azeotropes with water. An excess of diols is often
employed in order to increase the initial reaction rate and to compensate for possible diol
loss due to its high volatility compared to other components. Direct esterification
proceeds at high temperatures (> 180°C). Small amounts (0.1-0.5 %wt) of external
catalyst (i.e. strong protic acids, like p-toluenesulfonic acid, organometallic compound of
titanium, tin and zirconium) are usually added to increase the reaction rate during the last
stage of polymerization. Strong protic acids can be very effective as catalysts, but they
also catalyze side-reactions, leading to poor quality polyesters. Therefore, metal catalysts
are usually preferred. Commonly, in the absence of catalysts the kinetic equation is of
third order: first and second order in hydroxyl and carboxyl groups, respectively. When
strong protic acid is used as catalyst, experimental data fit an overall third order kinetic
equation; first order in COOH, OH and catalyst.12
+nn
+ (2n-1) H2O
HO R OH
O O
HOR'
OH HO R O
O O
R'OH
n Figure 2.1 Direct esterification of carboxylic acids with alcohols.
Due to the readiness of the ester group to react with water, the step
polymerization reaction is considered a reversible process in which the products react
with themselves decomposing into smaller molecules. Therefore, in order to avoid
reversibility of the reaction, by-products of the main and side reaction should be
removed. Common side reactions occurring during the synthesis of polyesters are the
consequence of temperature, ether moiety formation, cyclization reactions and

8
decarboxylation reactions, among other factors. These side reactions, as well as
impurities present during polymerization, limit the molecular weight of the final product,
affecting at the same time the final properties of the polymer. The molecular weight of
the polymer is determined by its application. High molecular weight polymers are strong
and have better mechanical properties than low molecular weight polymers. However,
high molecular weight leads to an increase of viscosity, crystallinity, and low solubility.
Generally, in the coating industry, oligomers with molecular weight ranging between
1000-5000 g⋅mol-1 are typically used. Oligomers are crosslinked with isocyanate,
melamine or epoxy resin in order to be used as a coating film.
A coating is a material (usually a liquid) that is applied to a substrate. Coatings
can be clear, pigmented, metallic, or glossy. They are used for one or more of three
reasons: decoration, protection, and/or some functional purpose. An organic coating is
generally composed of four chemical substances: binders, volatile components, pigments,
and additives. The binder is the material (polymer) that forms the continuous film that
adheres to the substrate and binds together the other substances in the coating. The
volatile components (VOC) are liquids that make the coating fluid enough for
application, and they evaporate during and after application. The volatile components
can be organic solvents, water, or a combination of both of them. Pigments are finely
divided insoluble solids that are dispersed in the vehicle and remained dispersed in the
film. Finally, additives are materials added in small quantities in order to modify a
specific property of the coating (i.e. flow modifiers, stabilizers).

9
2.3 Background to Urethane Chemistry
Polyurethane coatings are known for their durability and overall good balance of
mechanical properties. These include long-term weathering, flexibility, chemical
resistance, abrasion, scratching, chipping, and stress. The largest volume of urethane
coatings are two-package (2K) coatings. These coatings are typically used for wood,
plastic, automotive topcoats and aircraft topcoats.13
Polyurethanes are polymers
containing urethane or carbamate (-NH-CO-O-) linkage. They are usually derived from
the reaction between a hydroxyl-functionalized polymer or a polyol and an isocyanate,
C N R N CHO
R'OH
CO
R'O HOOn n NH
RNCO
O
+
Figure 2.2 Synthesis of polyurethanes.
Rates of urethane formation decrease in the following order: primary alcohols >
secondary alcohols > 2-alkoxyethanols > 1-alkoxy-2-propanols > tertiary alcohols.2
Hydroxyl-terminated polyesters with primary -OH react faster than secondary -OH, and -
COOH groups on the polyester hinder the NCO/OH reaction. In general, it is normal to
have high -NCO to -OH ratio, which produces harder more solvent resistant coatings.
Depending on the isocyanate used, different catalysts are required for the synthesis of
polyurethanes. Polyurethanes made from polyesters, and aromatic isocyanates are
catalyzed by amines, while polyesters reacted with aliphatic isocyanates are catalyzed
with tin or zinc compounds.2 Aromatic isocyanates react faster than aliphatic isocyanates
and are less expensive. Aliphatic isocyanates have better color retention and exterior
durability.

10
Polyurethane segments associate with each other through hydrogen bonding,
forming hard domains. Hydrogen bonds are formed between the carbonyl and N-H
groups of the urethane groups (Figure 2.3). This hydrogen bonding morphology gives
the distinctive elastomeric, thermal and mechanical properties to the polyurethane. The
polyester segment is called the soft segment because of its low glass transition
temperature—lower than room temperature—and flexible chain. Polyurethanes contain
many hydrogen bonded crosslinks, opposed to chemical cross-linking of a covalent bond;
they have the ability to reorganize upon mechanical deformation. Hence, energy can be
absorbed under applied stress by physical bond breakage. The hydrogen bond reforms
after releasing the stress and regains its deformation strength. Intermolecular hydrogen
bonding gives urethane coatings a limited ability to self-heal. This property allows the
design of polyurethanes that are abrasion-resistant while also being resistant to swelling
with solvents.
NC
O
O
HO
C N
N C O
OH
O
C N
H
H (a) (b)
Figure 2.3 Urethane groups form intermolecular (a) acyclic hydrogen bonds and (b) cyclic hydrogen bonds.
The major drawbacks of isocyanates are cost and toxicity.2 The isocyanate group
can easily react with functional groups, such as hydroxyl, amine, or carboxylic acid
groups, which are readily available in our bodies. Additionally, low molecular weight

11
isocyanates, especially aromatic ones, can cause sensitivity in some people, which can
cause asthma and hives.2 Aromatic diisocyanates can also hydrolyze and form amines,
which are known to be carcinogenic and tumor prone.14
The most common polyols used in polyurethane chemistry are hydroxyl-
terminated polyester and hydroxyl-functional acrylic resins.
In order to reduce the toxicity,
most isocyanates in coatings are used as oligomeric or polymeric derivatives, known as
adducts. When molecular weight increases, the toxic hazard decreases due to a reduction
in volatility, which reduces the chances of inhaling dangerous amounts of amine.
Additionally, the molecular weight increase decreases the permeability through body
membranes. Isocyanates react with each other to form dimers (uretdiones) and trimers
(isocyanurates). Uretdiones regenerate into isocyanates by applying heat and are used as
blocked isocyanates. Isocyanurates are stable and are used as multifunctional
isocyanates.
2 Polyester urethane coatings
are known for their chemical and solvent resistance, flexibility, superior adhesion, and
abrasion and corrosion resistance 2,15 This broad range of properties is the result of the
combination of soft (polyester) segments, which are responsible of the elasticity of the
coating, and the hard (polyurethane) segments, which supply the strength of the films.
Poly (ester-urethane) resins are used in automotive topcoats, aircraft finishes, marine
topcoats and primers, and building coatings. Despite their excellent balance of
mechanical properties compared to acrylics, polyester polyols have lower hydrolytic
stability compared to acrylics due to the reactivity of the ester groups with water.
Therefore, the hydrolytic stability of polyesters affects the ultimate performance of poly-
(ester urethane) coating under harsh environments.

12
2.4 Hydrolysis of Polyesters
The reduction of VOC emission, the need to replace toxic raw materials, and the
necessity to create coatings that can be used at faster production rates are some of the
objectives of the research and development in the coatings field. Coatings are second
only to gasoline-automobiles as a source of VOC.2 Therefore, the industry is trying to
move into more environment-friendly alternative products like waterborne, high-solids
(>65% w/w) solvent-based coatings, powder coating and 100% radiation curing systems.2
Although the use of waterborne systems complies with environmental rules by reducing
solvent emission (i.e. VOC), their use in polyester chemistry is not very popular.
Waterborne polyesters have poor package stability generally attributed to slow hydrolysis
of the ester linkages of the resin, poor flow characteristics due to the high surface tension
of water, and poor detergent and solvent resistance. Hydrolytic degradation causes a
change in molecular weight distribution, pH, and viscosity,16
4
which subsequently
deteriorates the mechanical, chemical, and physical properties of the coatings. ,17
2
Additionally, as end-products or during processing, polyester products are exposed to
sunlight, air, water, and high temperature, which cause the degradation of the material.
The degradation processes are classified according to the nature of the source as photo-
oxidative, hydrolytic, or thermal degradation. Degradation caused by outdoor exposure
results in changes in properties such as changes of modulus, loss of strength,
embrittlement, discoloration, loss of adhesion, chalking, loss of gloss, and environmental
etching.
Although hydrolysis is usually not desirable, degradation is sometimes a required
property. For example, in the biomedical field a facile rate of failure might be valuable
13
for drug release, sutures, scaffolds, vascular grafts, etc, leading to areas of interest in
degradation or longevity of the resins. There are several factors influencing the
hydrolytic stability of polyesters: steric hindrance from the surrounding groups, the
anchimeric effect or neighbor group effect, the pH, electronic effects, hydrophobicity and
end-group effects.10 Esters are the functional groups most prone to hydrolysis followed
by ureas, urethanes and ethers. The study of hydrolytic stability is important, especially
in the automotive industry and in places like Florida, where the warm, humid weather
combined with acid rain can deteriorate the exterior durability of the polyester-urethane
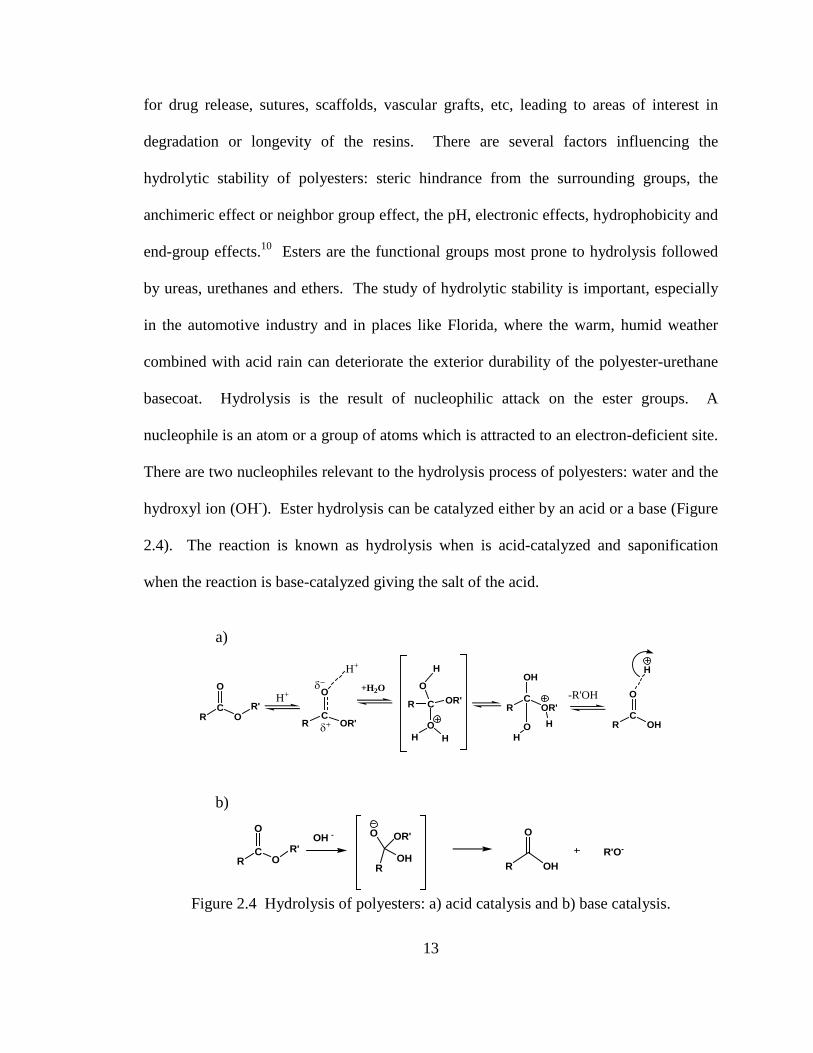
basecoat. Hydrolysis is the result of nucleophilic attack on the ester groups. A
nucleophile is an atom or a group of atoms which is attracted to an electron-deficient site.
There are two nucleophiles relevant to the hydrolysis process of polyesters: water and the
hydroxyl ion (OH-). Ester hydrolysis can be catalyzed either by an acid or a base (Figure
2.4). The reaction is known as hydrolysis when is acid-catalyzed and saponification
when the reaction is base-catalyzed giving the salt of the acid.
a)
RC
OR'
O +H2O
C
OOR'R
O
H
RC
OR'
OH
RC
OR'
O H+
δ+
δ−H+
O
-R'OH
RC
OH
O
H
H H HH
b)
RC
OR'
OOH - O OR'
ROH R'O-
R OH
O
Figure 2.4 Hydrolysis of polyesters: a) acid catalysis and b) base catalysis.

14
Ingold18
Table 2.1
proposed a classification of acid- and base-catalyzed hydrolysis based on
eight mechanisms ( ). This classification is based on the nature of reagent, type
of fission, and molecularity. Neutral and base-catalyzed hydrolysis are treated as equal
because they undergo reaction through the neutral ester molecule R’CO2R. On the other
hand, the acid-catalyzed hydrolysis reactions occur through the ionic conjugate acid
R’CO2HR+. Mechanisms requiring a base catalyst are assigned B, and A is used to
designate an acid catalyst.
Table 2.1 Classification of the eight mechanisms for ester hydrolysis
Acid catalysis Base catalysis Acyl cleavage: AAC1 Acyl cleavage: BAC1 AAC2 BAC2 Alkyl cleavage: AAL1 Alkyl cleavage: BAL1 AAL2 BAL2
In acyl-oxygen fission (Figure 2.5a) a bond rupture occurs between the ethereal
oxygen and the acyl carbon. Alkyl-oxygen fission (Figure 2.5b) takes place when bond
rupture occurs between the ethereal oxygen and the alkyl carbon. The subscripts AC and
AL are used to refer the acyl- and alkyl-oxygen fission, respectively. A number one is
assigned to unimolecular reactions, which occur when water does not participate
covalently in the rate-limiting step. On the other hand, bimolecular reactions are
represented with the number two and correspond to reactions in which water does
participate.
a)
R' C
O
OR
b)
R' C
O
O R
Figure 2.5 Possible modes of rupture during hydrolysis of esters: a) acyl-oxygen fission
and b) alkyl oxygen fission.

15
Although acid- and base-catalyzed hydrolysis are equilibrium reactions, only the
acid-catalyzed reactions are reversible and symmetrical. That means that the mechanisms
for ester formation follow the same mechanism as for hydrolysis.19
18
Base-catalyzed
hydrolysis is reversible only in theory but not in practice. Base-catalyzed systems form
an ionic complex which is stabilized by resonance. This complex does not react with
water as easily as the initial monomers. Therefore, once the ionic complex is formed, the
reaction cannot be reversed. Out of all of the mechanisms proposed, only six have been
observed; BAC1 and AAL2 have not been observed experimentally. The tetrahedral
mechanisms involving the acyl-oxygen cleavage are the most commonly observed for the
basic- (BAC2) and acid-catalysis (AAC2).19
The ester molecule has two carbon atoms that are susceptible to nucleophilic
attack: the carboxyl carbon and the α-carbon atom of the alkyl group. Since carboxyl
carbon is unsaturated, it represents a more powerful competitor for the reagent, which
results in acyl-oxygen fission. However, with hydroxide ion as a reagent, acyl as well as
alkyl attack may occur, though the former is faster and the only observable process.
Hydrolysis of esters by hydroxide ion in aqueous solution is widely known to occur as
bimolecular acyl-oxygen fission (BAC2). The reaction follows a second-order kinetic law.
Even though the process is reversible, the reaction is driven to the right by the final
proton transfer from the formed carboxylic acid to the alkali present in the solution
(Figure 2.6). Proof of the nature of the BAC2 mechanism was given by Polanyi and
Szabo,20 who employed water enriched in 18O and showed that for the saponification of
n-amyl acetate the oxygen from the medium did not appear in the formed alcohol, but it

16
appeared in the acid, thus proving the acyl-oxygen fission. Long and Friedman21
Assuming a certain rate of ionization of the ester R'⋅CO2R into R'⋅CO2- and R+, as
the nucleophilic reagent is weakened, first the rate of alkyl attack and then acyl attack fall
below the ionization rate. At this crossing of rates, there is change from bimolecular
acyl-oxygen fission (BAC2) to unimolecular alky-oxygen fission (BAL1); that is, from
mechanism BAC2 to BAL1. Thus, mechanism BAL1 will occur in hydrolysis in a neutral
solution (
gave a
similar demonstration for the alkaline hydrolysis of γ-butyrolactone.
Figure 2.7). The alkyl-fission can be proven with optically active esters with an
asymmetric α-carbon atom at R, hydrolyzed in a dilute alkali system, which gives a
racemized alcohol as product. Racemization is the process of an enantioenriched
substance becoming a mixture of enantiomeric forms. Enantiomers are stereoisomers
whose molecules are non-superimposable mirror images of each other. These chiral
molecules have two forms (at each point of asymmetry) which only differ in their optical
characteristics. Enantiomers, when presented in a symmetric environment, have
identical chemical and physical properties except for their ability to rotate plane-
polarized light by equal amounts but in opposite directions.
+C ORR'
O slow
fastC OR
R'
O -
HOslow
fastC OHR'
O
+ -ORHO-
Figure 2.6 Bimolecular basic hydrolysis with acyl-oxygen fission: BAC2 mechanism.

17
R' C
O
O R +H R' C
O
O+
H2O+ OH2
R' C
O
OH+
R++
R+ R
OH2R R' C
O
O+ OHR
Figure 2.7 Unimolecular basic hydrolysis with alkyl-oxygen fission: BAL1.
Kenyon et al22,23 observed BAC2 and BAL1 mechanisms during the preparation of
optically active alcohols by hydrolysis of hydrogen phthalates; the phthalates had an R
consisting of 1,3-disubstituted groups, which are known to have a considerable tendency
to pass into cationic forms, R+. They found that optically active 1,3-dimethylallyl
hydrogen phthalate and 1-methyl-3-phenylallyl hydrogen phthalate, on hydrolysis in
weakly alkaline aqueous solution, gave racemic alcohols. On the other hand, esters
hydrolyzed with concentrated alcoholic alkali yielded optically active alcohols. They
concluded that the reaction with concentrated alcoholic alkali involved bimolecular acyl
attack, BAC2, which could not racemize the alkyl group; however, in dilute aqueous
alkali, the rate of BAL1 was increased, and a cationic form, R+, of the alkyl group was
produced, leading to racemization. The racemization of BAL1 mechanism does not
exclusively depend on the concentration of the solution; it also depends on the alkyl
radical and the formation of stable carbonium ions R+. For example, optically active p-
methoxybenzyl hydryl hydrogen phthalate gives a racemic solution even with 10N
aqueous sodium hydroxide;24 on the other hand, p-phenoxybenzhydryl and 1-p-
anisylethyl hydrogen phthalates require a very dilute system.25,26

18
The bimolecular basic hydrolysis with alkyl-oxygen fission known as BAL2
mechanism is exemplified in Figure 2.8. Alkyl-oxygen fission is observed, as in previous
examples, when an asymmetric R group becomes inverted during hydrolysis. This type
of mechanism has been observed in β-lactone molecules in neutral hydrolysis.27
R' C
O
O R R' C
O
O+ H2O + OH2R
R' C
O
O + OH2R OHR R' C
O
OH+
Figure 2.8 Bimolecular basic hydrolysis with alkyl-oxygen fission: BAL2.
In the case of unimolecular acid hydrolysis of esters, there are also two possible
mechanisms: acyl-oxygen fission and alkyl-oxygen fission. The mechanism can be easily
detected by a configurational change of the R group, which should be asymmetric at its
point of union in the ester R'.CO2R. Holmberg28 showed that in the acid-catalyzed
hydrolysis of 18O-acetylmalic acid, CH3⋅CO2R, where R= CH(CO2H)⋅CH2⋅CO2H, the
asymmetric group retained its configuration, hence acyl-oxygen fission was proven.
Datta et al29 proved acyl-oxygen fission using 18O as a tracer in the acid hydrolysis of
methyl hydrogen succinate. Analysis of the sample showed that no traces of 18O could be
found on the solvent; hence acyl-oxygen fission was established. Once the acyl-oxygen
fission is determined, the molecularity of the mechanism is studied through the formation
of the oxonium ion. In the case of unimolecular mechanism, AAC1, the oxonium ion first
undergoes a rate-controlling heterolytic fission, which produces a carbonium ion,
specifically acylium ion (R'⋅CO+), that is attacked rapidly by a hydroxylic molecule. At

19
the end of the reaction, a proton, equivalent to that originally taken up, is split off. The
AAC1 mechanism is only found when R is very bulky, as bimolecular attack is sterically
hindered, and in ionizing solvents.
R' C
O
O R + +H R' C
O
ORfast
fast
fast
slowR' CO
++ HOR
R' CO+
+ H2Ofast
slowR' C
O
O
fast
fastR' C
O
O H + +H
H
R' C
O
OR
H
H
H
R' C
O
O
H
H Figure 2.9 Unimolecular acid hydrolysis with acyl-oxygen fission: AAC1 mechanism.
The bimolecular acid hydrolysis with acyl-oxygen fission mechanism, AAC2,
derives from the previously explained unimolecular mechanism (AAC1) but differs in the
life of the acylium ion, which is reduced to the order of a collision period. Thus, the
middle stage of the unimolecular mechanism representing the formation and destruction
of this ion is fused into a single bimolecular process. Studies30,31 using 18O as a tracer
have shown that oxygen exchange with the solvent and hydrolysis occurs at comparable
rates. Plots of log(kobs/[ester H+]) against log aH2O which have slopes close to 2 for ester
hydrolysis and for 18O exchanges were taken as evidence that two molecules of water are
involved in the transition state for each reaction.32 As water attacks the carbonyl group, a
second molecule is required to bind one proton from the nucleophile. Hence, a molecule

20
of water acts as a general base to assist the nucleophilic addition of the other molecule of
water to the protonated carbonyl group. AAC2 mechanism is more frequently observed
with respect to AAC1 if the acid catalyst is in dilute solution.
RC
O
OR' +H R C
O
O R'
+
H
R C
O
O R'
H
+ O
H
OH
R O
RO
R C
O
O H
H
+ HO R'
H
R C
O
O H
H
R OH
O+ H+
H
H
O
R O
O
H H
HR
O
R O
O
H H
HR
Figure 2.10 Bimolecular acid hydrolysis with acyl-oxygen fission: mechanism AAC2.
As is common with alkyl-oxygen fission, AAL1 mechanism undergoes
racemization when R+ is liberated. The rate of reaction shows strong polar effects; hence
under the influence of electron-releasing groups in R, a strong acceleration is observed.
Also, the rate of reaction is insensitive to steric effects. AAL1 mechanisms, as well as
BAL1, occur readily when R’ comes off as a stable carbocation, that is, when R’ is
tertiary, alkyl, allylic, benzylic, etc.

21
In general, it is observed that morphological changes are the major factors
regulating hydrolytic degradation. For example, alkyl substitution in the methylene
sequences of a glycol moiety leads to hydrolytically stable polyester.10 Highly hindered
diols like: 2,2,4,4-tetramethyl-1,3-cyclobutanediol or 2,2,4-trimethyl-1,3-pentanediol can
be used in order to avoid hydrolytic degradation.33
5
This effect, known as steric
hindrance, is characterized by the shielding provided by bulky molecules within a
molecule; it prevents chemical reactions that are rather observed in linear molecules.
Newman proposed an empirical equation known as the Rule of Six to quantify the
improvement of the hydrolytic stability based on steric grounds. Newman’s rule of six
states that a large number of substituents in the 6th position of the molecule, numbering
the carbonyl oxygen as one, gives a better hydrolytic stability to the molecule. Turpin6
observed that alkyl substitution on the α- and β-carbons on either side of the ester group
also improved the hydrolytic stability. He proposed a modification to the rule of six by
adding substituents in the 7th position (Equation 2.1).
R' C
O
O R
R+
+ H2O R OH2
+H+ R' C
O
OR
R' C
O
OH +
R+
ROH +H+
H
R' C
O
OR
H
R OH2 Figure 2.11 Unimolecular acid hydrolysis with alkyl-oxygen fission: AAL1.

22
According to Equation 2.1, NPG and TMP have a steric factor of 21; on the other
hand, diols like ethylene glycol and 1,6-hexanediol esters have steric factors of 13 and
15, respectively. Therefore, high steric factor values represent highly hindered
molecules, which are less prone to hydrolysis; low steric factors represent low structural
hindrance, which indicate molecules open to attack by water. Even though Turpin’s
factors represent a good prediction of the hydrolytic stability of linear and branches
compounds, cycloaliphatic and aromatic compounds do not necessarily comply with this
rule. Golob et al34
studied a series of polyesters containing cycloaliphatic diols, such as
cyclohexanedimethanol (CHDM), which prove to be more resistant to hydrolysis than
predicted by Turpin’s steric factor.
Steric Factor = 4(No. 6 position atoms) + (No. 7 position atoms) (2.1)
Although the rule of 6-7 states that a high degree of branching on both the polyol
and the diacid components of a polyester increase hydrolytic stability, it has been
observed that the steric hindrance provided by diols have a larger impact on hydrolysis
rates compared to the diacid side.6,35 A study conducted by Jones and Thomas35
6
on steric
effects showed that an increase on the number of α-methyl substitutions on the hydroxyl
functional monomers reduced the rate of hydrolysis to a greater extent than a
corresponding increment on acid-functional monomers. Additionally, it was observed
that aromatic acids gave more stable esters than the aliphatics, but this difference was
very small. Moreover, studies made with substituted benzene derivatives such as
isophthalic acid, phthalic acid and terephthalic acid, showed that the phenyl ring had little
23
impact on steric effect except when substituents were placed in the ortho-position, which
resulted in a preference for steric effects over inductive effects.36
Steric effects have the principal role in polyester hydrolysis when end-group
concentrations are limited. However, an increase of protic end-groups increases
anchimeric effects.
6,7 The anchimeric effect is produced when neighboring atoms or
groups within the same molecule catalyze the hydrolysis reaction. Adjacent hydroxyl
groups and carboxylate ions assist the external nucleophile attack, resulting in an
acceleration of the hydrolysis rate. The anchimeric group effect is a short-range effect;
thus, the hydrolysis rate decreases as the assisting group and the reaction site become
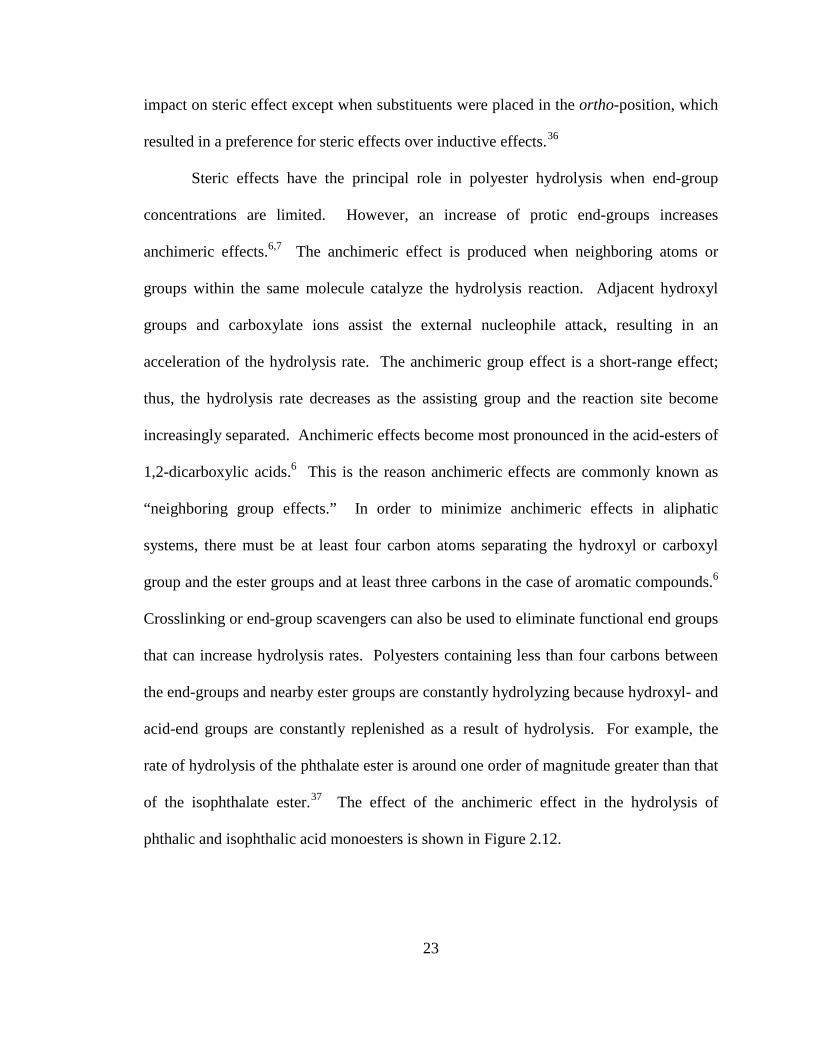
increasingly separated. Anchimeric effects become most pronounced in the acid-esters of
1,2-dicarboxylic acids.6 This is the reason anchimeric effects are commonly known as
“neighboring group effects.” In order to minimize anchimeric effects in aliphatic
systems, there must be at least four carbon atoms separating the hydroxyl or carboxyl
group and the ester groups and at least three carbons in the case of aromatic compounds.6
Crosslinking or end-group scavengers can also be used to eliminate functional end groups
that can increase hydrolysis rates. Polyesters containing less than four carbons between
the end-groups and nearby ester groups are constantly hydrolyzing because hydroxyl- and
acid-end groups are constantly replenished as a result of hydrolysis. For example, the
rate of hydrolysis of the phthalate ester is around one order of magnitude greater than that
of the isophthalate ester.37
Figure 2.12
The effect of the anchimeric effect in the hydrolysis of
phthalic and isophthalic acid monoesters is shown in .

24
OH
O
O
O
OH
OH
O
O OOH
(a) (b)
Figure 2.12 Monoesters of (a) phthalic and (b) isophthalic acid.
In contrast, the behavior of oligoesters showed different hydrolytic stabilities
compared to monoester hydrolysis. Studies made with oligoesters containing phthalic
anhydride38 and 1,2-cyclohexanedicarboxylic anhydride39
7
showed better hydrolytic
stabilities than samples made with terephthalic acid, isophthalic acid or 1,3- and 1,4-
disubstituent cyclohexanedicarboxylic acids. Studies made with oligoester comprised of
1,2-ethylene glycol/1,4-cyclohexane dicarboxylic acid showed that after an initial period
with high hydrolysis rates, hydrolysis occurred at lower rates than in diols with more
carbon spacers (Figure 2.13). In this specific case the author postulated that even though
anchimerically 1,2-diols were more prone to hydrolysis at the initial stage, once the
reaction took place, the steric effect dominated the hydrolysis mechanism. Formation of
hydrogen bonds between the hydroxyl proton of ethylene glycol (EG)-esters and the
carbonyl oxygen was readily observed due to the proximity between both functional
groups, making the ester group more susceptible to nucleophilic attack. On the other
hand, 1,3-propanediol (1,3-PD) did not form a hydrogen bond because the hydroxyl
hydrogen was seven atoms away and there was no overlap with the carbonyl oxygen.
However, lower hydrolysis rates were observed for EG-esters compared to 1,3-PD,
attributed to the steric stabilization by the cycloaliphatic diacid rather than anchimeric
effects.

25
Work done in the past40,41,42
Figure 2.14
with unsaturated polyesters (UP) showed that chain-
end concentration was associated with an increase in low-molecular-weight compounds
and in the random process of ester hydrolysis. In those studies, the UP molecular weight
was increased from 1071 to 1900 g⋅mol-1, which resulted in a reduction in the rate of
weight loss by 50% and a decrease in the rate of diffusion. It was observed that intra- or
inter-molecular ( ) hydrogen bonding of telechelic end-groups caused the
cleavage of lower molecular weight molecules due to an anchimeric effect.
Furthermore, it was observed that hydroxyl end-groups place a bigger stress on
end-group effects compared to carboxyl acid groups. Mortaigne40 observed that the
blocking of acidic end groups with carbodiimides did not have a big impact on the
hydrolytic stability, thus emphasizing the effects of hydroxyl groups. In addition, studies
made with 1,4-cyclohexanedicarboxylic acid and different diols showed that increasing
the initial hydroxyl concentration by adding a triol monomer in the structure increased
hydrolysis rates.9 A high initial concentration of hydroxyl functionalities on the chain
end increased the probability of intramolecular hydrogen bonding with the neighboring
carbonyl, assisting nucleophilic attack by water. Extraction of the end group left the
cycloaliphatic acid exposed, and a decrease in hydrolysis rates was observed depending
on the monomeric structure and its steric abilities.

26
0
0.05
0.1
0.15
0.2
0.25
1,4-CHDA.EG 1,4-CHDA.1,2-PD 1,4-CHDA.1,3-PD 1,4-CHDA.1,4-BD
1,4-CHDA.1,5PD
Rat
e k'
Initial Middle End
Figure 2.13 Comparison of hydrolysis rate (k’) of different oligoesters comprised of 1,4-
CHDA and a series of diols.43
a)
OH
O
O
O
OOHO
O O
O O
b)
O
OO
O
O
O
O
OO
O
HO
O
H
δ−
δ−
δ+
δ+
Figure 2.14 Anchimeric effects through a) end-group effects (intra-molecular hydrogen
bonding) and b) inter-molecular hydrogen bonding.

27
However, different studies performed by the same author7 showed that the overall
hydrolysis rates were affected more by a change on the chemical structure of the diacid.
Hydrolysis rates ranged between 1.8x10⁻³ to 773 x10-3 mgKOH/gresin-day for different
diacids; however, variation of the hydroxyl moiety gave rates between 35.4 x10⁻³ to 95.6
x10-3 mgKOH/gresin-day. The authors concluded that the ease of cyclic structure
formation at the chains ends with acidic groups was bigger than the hydrogen bonding
formed between hydroxyl and ester groups (Figure 2.15). Similarly, studies performed
with high molecular weight PET also showed that an increase in the initial –COOH
concentration caused an increase in hydrolysis rates.44
Cycloaliphatic monomers make a wise choice for the synthesis of esters with
good mechanical properties and hydrolytic stability. Studies showed that the addition of
>20 wt-% of 1,3-cyclohexanedicarboxylic acid (1,3-CHDA) monomer to a resin
composed of 1,4-CHDA and a glycol can reduce the viscosity of the ester.
45,46
8
Reduction
in viscosity brings a reduction on the amount of organic solvent needed for the coating
application. Besides viscosity, the unique chemical structure provides improved
hydrolytic stability to final products. Studies ,39,47
39
showed that the conformation of
cycloaliphatic molecules directly affected hydrolysis rates of ester compounds.
Cycloaliphatic monomers adopting an axial position (i.e. trans-1,3-CHDA and cis-1,4-
CHDA) were more hydrolytically stable compared to esters which favored equatorial
positions. Analogs of 1,3- and 1,-4-CHDA with equivalent axial to equatorial ratios
had similar hydrolysis rates. High hydrolysis rates were predicted in the case that cis-1,4-
CHDA monomers adopted a boat conformation; however, torsional strain and flagpole
interactions destabilize this conformer.48 The most stable conformation was achieved

28
with the trans-chair configuration that placed the ester groups in the equatorial position.
Comparison of 1,3- and 1,4-CHDA based esters showed that though 1,3-CHDA esters
had a higher percentage of trans-isomers than 1,4-CHDA esters, the former had higher
hydrolysis rates.8 Cis-1,3-CHDA in an axial position due to anomeric effect accounted
for the hydrolytic instability of esters comprised of this monomer.
OO
OO
OO
OH
O
OHO
OO
O
Figure 2.15 Intramolecular catalysis of end-groups by hydrogen bonding: (left) two carbon spacer diol and (right) two carbon spacer carboxylic acid.
Another factor affecting the hydrolytic stability of esters is the pH of the system.
Bender et al37 studied the pH effect on the hydrolysis of methyl hydrogen phthalates.
They observed that hydrolysis rates showed a minimum at approximately pH 2-3, instead
of at a neutral pH ~ 7. He explained that anchimeric effects prevailed in the pH range 4-
8, which made hydrolysis rates constant in this region. During acid hydrolysis when pH
approaches 1, COO- is replaced by a weaker nucleophile (COOH) and a minimum is
observed at pH~ 2.5. At pH greater than 8, there is a high concentration of COO, causing
an increase of anchimeric effect; however, attack by OH- from the base catalyst is the
dominant factor during hydrolysis, increasing again the hydrolysis rates.6 A schematic
representation of the effect of anchimeric effect on hydrolysis rates at different pH is
shown in Figure 2.16. For example, esters comprised of 1,4-cyclohexnedicarboxylic acid

29
(14CHDA) were more stable than isophthalic anhydride (IPA) esters at pH 8.9; however
14CHDA was less stable at pH 4.16
The electron-donating or withdrawing characteristics of substituents in a
carboxylic acid also affect hydrolysis rate. Electron-withdrawing groups increase the
partial positive charge on the carbonyl carbon, which makes the carbon more susceptible
to nucleophilic attack and prone to hydrolysis. Therefore, esters with hydrogen-bonding
capability undergo acid hydrolysis at moderately faster rates than their alkyl analogs. For
example, 3-oxabutyl acetate reacts twice as fast as butyl acetate at 37°C.49,50 The
tetrahedral intermediate formed is hydrophilic and interacts more strongly with the
surrounding aqueous medium compared to the hydrophobic alkyl analog. On the other
hand, a carbonyl with α,β-unsaturated substituents (i.e. aromatic ring) poses a resonance
that stabilizes the carbonyl against water attack.51
For example, esters of benzoic acid
have high hydrolytic stability even though the phenyl group provides little steric
hindrance.
Figure 2.16 Representation of the influence of anchimeric effect on hydrolysis rates at
different pH.
30
Hydrophobicity is another factor influencing the rate of hydrolysis in polyesters.
It is found that hydrophobic polyesters have a greater hydrolytic stability due to the lower
affinity between molecules and water. Studies made by Jones et al16 with adipic acid
(AA), 1,4-cyclohexane dicarboxylic acid (CHDA), isophthalic acid (IPA) and 2,2,4-
trimethyl-1,3-pentanediol showed that even though IPA (K1=24 x10-5,K2=2.5 x10⁻⁵) had
an acid dissociation constant an order higher than those for AA (K1=3.7x10⁻⁵,K2=0.39
x10-5), IPA had much better hydrolytic stability than those based on AA. It was also
found that IPA had a water solubility of 0.24g/100g water @ 100°C and AA had a water
solubility of 290 g/100g water at the same conditions. It was concluded that the water
solubility of both materials played an important role on hydrolysis reaction, even though
their dissociation constant favored an opposite behavior. Even more, polyesters
comprised of diacid with similar water solubility and hydrophobicity showed better
hydrolytic stability than the ones with lowest dissociation constants.16 The same criterion
applies to diol structure in regard to hydrolytic stability. Low water solubility and high
steric hindrance enhance hydrolytic stability.
However, some ester systems with low water solubility can phase separate in an
ester-rich phase and a water phase. These systems were observed on the neutral
hydrolysis of vinyl acetate.52 Hydrolysis reaction presented three stages depending on
which phase the reaction was taking place. In the first stage, the hydrolysis rate increased
with the increase in the initial vinyl acetate concentration. As the reaction proceeded, the
formation of carboxylic acid started to rise. However, the acid molecules dissociated
poorly on the ester-rich phase; hence, hydrolysis was stabilized. Autocatalysis was
expected in the water phase and was observed with an increase in acid concentration. A

31
schematic representation of the two main behavior observed in the hydrolysis of vinyl
acetate is shown in Figure 2.17.
Morphology of the resin is another aspect influencing the hydrolysis of polyesters.
Hydrolytic stability of semi-crystalline polymers presents two stages. During the first
stage, water diffuses through the amorphous regions and random chain scission of ester
links takes place. The second stage involves the hydrolytic attack of crystalline domains.
Generally, it is assumed that the water diffuses initially into the amorphous regions.
Increased solvency caused by swelling of cavitation causes a progressive increase in
main-chain scission.40 Studies on the enzymatic hydrolysis of polyesters suggested the
melting point of the ester as a correlating factor for degradation.53,54,55
55
It is known that in
semi-crystalline polymers, the amorphous phase is first attacked by hydrolytic enzymes.
However, after degradation of the more accessible first amorphous domains, crystalline
spherulites appear at the surface. The crystalline phase controls degradation by lowering
the rate of hydrolysis with a shield that protects the remaining amorphous domains.
Crystallinity limits the mobility of water. Therefore, the degradation process slows down
by accessibility of the ester bonds embedded in the crystallites. Additionally, hydrolysis
rates are also controlled by the difference between the melting temperature and the
temperature at which the degradation takes place (∆T). It was observed that the
degradation rate of semi-crystalline polyesters was controlled by the decrease of ∆T. It
was explained that performing the experiment at temperature close to the melting point
caused a decline of the attraction forces between polymer chains and the rise of chain
mobility, which ultimately caused an increased in hydrolysis rates. Other factors such as
chemical structure also contributed to controlling the degradation process.55

32
Figure 2.17 Schematic representation of the hydrolysis of vinyl acetate with varying
initial water concentration.
Independent of the hydrophobic or hydrophilic nature of the molecule, polyesters
are sensitive to warm humidity, which can produce hydrolytic cleavage. Complete
drying of the polyester is necessary before processing at high temperatures due to the
vulnerability of all polyesters to hydrolytic degradation and to the consequent loss of
mechanical properties. Equations enabling life-cycle prediction of loss of tensile strength
at any combination of temperature and humidity have been derived from Arrhenius plots
for PBT.56,57 PET is hydrolytically stable at normal application temperatures, but when it
is exposed for a long time to temperatures above 100°C, properties such as tensile
strength and elongation at break start to deteriorate.58 Studies with different particle size
PET59 suggested that the hydrolytic degradation of PET in water at 100°C is not
controlled by diffusion of water into the samples, but rather by the initial content of
carboxyl groups of PET. Compounds with higher concentration of –COOH groups

33
showed higher hydrolysis rates.59,60
41
Weight loss was observed due to the removal of
impurities and low-molecular-weight species created by chain scission near the chain
ends. It was concluded that carboxylic end-groups present or generated during
hydrolysis are the main catalyst of the polyester chain cleavage during hydrolytic
degradation. 9,42,60
In general, the hydrolytic stability of polyesters can be achieved by following
these requirements: 1) avoid anchimeric effect; 2) use sterically hindered polyols and
diacids; 3) use hydrophobic monomers; 4) control pH medium; and 5) avoid elevated
temperature and humidity.
2.5 Hydrolysis of Polyester-Urethanes
Previous studies used static and dynamic infrared linear dichroism to analyze the
aging of soft segments of poly(butylene adipate)-poly(4,4’diphenylmethane diisocyanate-
1,4-butanediol) resins and their impact on tensile properties.61
Murata et al.
The films were studied at
70°C and at 75% relative humidity. These conditions resulted in shorter soft segment
chains, which provided more mobility and lower alignment of the soft segment with
strain. Additionally, it was found that hydrolytic cleavage was responsible for altering
the hydrogen-bond interaction, which had an impact on stress-strain properties. The aged
samples showed little change in modulus, but demonstrated lower ultimate stress and
increased strain at break.
62,63 studied the hydrolytic stability of different polyurethane resins
synthesized with linear diols. It was observed that hydrolysis rates decreased by
increasing the total number of carbons in the polyester segment. It was also observed that

34
polyurethanes synthesized from diols with higher steric hindrance, based on Newman’s
Rule of six,5 had higher hydrolysis resistance. Therefore, in order to achieve higher
hydrolytic stability there should be an improvement of the polyester structure according
to the factors mentioned on the previous section. For example, poly (ester-urethanes)
synthesized from a linear diol with large number of methylene groups such as 1,6-
hexanediol showed excellent hydrolysis resistance.64 Highly branched polyesters also
produced polyurethanes with higher resistance to hydrolysis.65
In the medical field, polyurethanes are widely used in a diverse range of
implantable medical devices due to their unique combination of biocompatibility and
mechanical properties. However, it has been demonstrated that the good performance of
poly (ester-urethane) resins significantly degraded in vivo, via hydrolytic or oxidative
mechanisms.
66,67
Again, the ease of the ester group to react with water presents a
drawback in the long term performance of this material.

35
CHAPTER III
EXPERIMENTAL
3.1 Materials
Phthalic anhydride (PA) (ACS Reagent ≥ 99.0%), isophthalic acid (IPA) (purum
≥ 98.0%), terephthalic acid (98%), adipic acid (AA) (purum ≥ 99.0%), 1,4 -
cyclohexanedicarboxylic acid (14CHDA) (99%), hexahydrophthalic anhydride (HHPA)
(≥ 95%), sebacic acid (SA) (99%), 1,2-ethylene glycol (12EG) (Reagent Plus® ≥99%),
1,3-propanediol (13PD) ( ≥ 99.6%), 1,4 -butanediol (14BD) (purum ≥ 98.0%), 1,4 -
cyclohexanedimethanol (CHDM) (99%), 2-methyl-1,3-propanediol (MPD) (99%),
trimethylolpropane (TMP) (97%), 2-butene-1,4-diol (BED), reagent grade acetone
(99.5%), reagent grade ethanol (99.5%), reagent grade phenolphthalein, dibutyltin oxide
(DBTO) (98%), dibutyltin dilaurate (DBTDL) (95%), and potassium hydroxide (reagent
grade ≥ 90%) were purchased from Sigma Aldrich . 1,5-pentanediol (15PeD), 1,6-
hexanediol (16HD), and neopentyl glycol (NPG) were obtained from BASF.
Hexamethylene-1,6-diisocyanate, an aliphatic polyisocyanate, with the commercial name
Desmodur N 3300 was kindly provided by Bayer. All materials were used as received,
without further purification. Identification of oligoesters was done using acronyms which
start with the diacid followed by the diol. For example, AA.IPA.NPG.16HD is an
oligoester comprised of adipic acid (AA), isophthalic acid (IPA), NPG (neopentyl glycol)

36
and 1,6-hexanediol (16HD). Structures of all the dibasic acids and diols used on the
synthesis of oligoesters are shown in Figure 3.1 and Figure 3.2, respectively.
O
O
O
HEXAHYDROPHTHALIC ANHYDRIDE(HHPA)
TEREPHTHALIC ACID(TPA)
COOH
HOOC
O
O
O
PHTHALIC ANHYDRIDE(PA)
ISOPHTHALIC ACID(IPA)
COOH
COOH
COOH
HOOC
1,4-CYCLOHEXANEDICARBOXYLIC ACID(1,4-CHDA)
HOOCCOOH
ADIPIC ACID(AA)
HOOH
O
OSEBACIC ACID
(SA)
Figure 3.1 Chemical structures of the different dibasic acids used in the synthesis of oligoesters.

37
HOOH
1,2-ETHYLENE GLYCOL(1,2-EG)
HO OH
1,3-PROPANEDIOL(1,3-PD)
HOOH
1,4-BUTANEDIOL(1,4-BD)
HO OH
1,5-PENTANEDIOL(1,5-PeD)
HOOH
1,6-HEXANEDIOL(1,6-HD)
CH2OH
CH2OH
1,4-CYCLOHEXANDIMETHANOL(CHDM)
OHHO
NEOPENTYL GLYCOL(NPG)
2-BUTENE-1,4-DIOL(BED)
HOOH
HO OH
2-METHYL-1,3-PROPANEDIOL(MPD)
OH
OH
OH
TRIMETHYLOLPROPANE(TMP)
Figure 3.2 Structure of the diols used in the synthesis of oligoesters.

38
3.2 Synthesis
Hydroxyl terminated oligoesters which contain one dibasic acid and one diol were
synthesized with a molar excess of diol as indicated in Table 3.1. In the case of
oligoesters made with adipic acid, isophthalic acid and one or more diols the molar ratio
of dibasic acid 1 to dibasic acid 2 was 1:1 and diol to triol was 1.8:1.2 as indicated in
Table 3.2. Description of the procedure used during the synthesis of oligoesters and end-
capping of the oligoesters is explained in the following subsections.
3.2.1 Synthesis of Oligoesters
The hydroxyl functional oligoesters were prepared in a 500-mL three-neck
reaction flask equipped with a mechanical stirrer, a nitrogen purge, a Dean-Stark trap,
and a heating mantel. The nitrogen purge was used in order to avoid oxidative
degradation and moisture absorption of the materials before and during the reaction. It
also facilitated the removal of water and other volatile impurities as the resin molecular
weight built up. A transesterification catalyst, dibutyltin oxide (DBTO, 0.4 wt-%), was
used to reduce the reaction time. Xylene (3 wt-%) was added into the flask at the
beginning of the reaction. Additionally, the Dean-Stark trap was filled with xylene to the
reflux connection to azeotrope water away from the resin.
The reaction temperature was carefully controlled using a Love Controls Series
2600 auto-tuning PID temperature controller and a J-type thermocouple. The
temperature was set at 150°C for 30 min, at 160°C for 60 min, at 195°C for 120 min, and
at 210°C for 30 min. The final temperature, 210°C, was maintained until the resin
reached an ultimate acid number of less than or equal to 8 mgKOH/gresin. The oligoesters

39
were purified by drying at 110°C for 5 h under vacuum (1 mm Hg) to remove the residual
xylene and low molecular weight byproducts. The acid number and hydroxyl number of
all the oligoesters were measured according to the ASTM standards D 1639-90 and D
4274-99, respectively. Table 3.3 and 3.4 show the chemical properties of the hydroxyl
terminated oligoesters. Table 3.5 and 3.6 show the physical properties of the final end-
capped oligoesters. Identification of oligoesters was completed using acronyms which
start with the dibasic acid followed by the diol. For example, AA.12EG is an oligoester
comprised of adipic acid (AA) and 1,2-ethylene glycol (12EG). Refer to Table 3.1 and
Table 3.2 for the acronyms of each oligomer used.
3.2.2 Synthesis of End-Capped Oligoesters
Hydroxyl terminated polyesters were end-capped with phenyl isocyanate (PI).
Dibutyltin dilaurate (DBTDL, 0.1 wt-%) was used as catalyst to accelerate the reaction.
Excess isocyanate was used in order to assure the reaction of all hydroxyl groups. To
ensure that all hydroxyl groups were end-capped, an excess ratio of isocyanate to
hydroxyl groups was used (1.1:1). The reactants were mixed and heated to 100°C. The
reaction was monitored by FT-IR and considered complete by the disappearance of the
hydroxyl peak and the formation of the carbamate peak. FT-IR band assignments are
shown in Table 3.7.

40
Table 3.1 Quantities used in the synthesis of binary oligoester systems
mol g mol g
AA.1,2-EG adipic acid 1,2-ethylene glycol 1.50 219 2.25 140
AA.1,3-PD adipic acid 1,3-propane diol 1.50 219 2.00 152
AA.1,4-BD adipic acid 1,4-butane diol 0.75 110 1.00 90
AA.1,5-PeD adipic acid 1,5-pentane diol 0.80 117 1.07 111
AA.1,6-HD adipic acid 1,6-hexanediol 0.80 117 1.07 126
AA.CHDM adipic acid 1,4-cyclohexane dimethanol 1.00 146 1.33 192
AA.NPG adipic acid neopentyl glycol 0.68 99 0.91 94
1,4-CHDA.1,2-EG
1,4-cyclohexane dicarboxylic acid 1,2-ethylene glycol
1.70 258 2.55 116
1,4-CHDA.1,3-PD
1,4-cyclohexane dicarboxylic acid 1,3-propane diol
1.60 276 2.13 162
1,4-CHDA.1,4-BD
1,4-cyclohexane dicarboxylic acid 1,4-butane diol
1.50 258 2.00 180
1,4-CHDA.1,5-PeD
1,4-cyclohexane dicarboxylic acid 1,5-pentane diol
1.40 241 1.87 194
1,4-CHDA.1,6-HD
1,4-cyclohexane dicarboxylic acid 1,6-hexanediol
1.32 227 1.76 207
1,4-CHDA.CHDM
1,4-cyclohexane dicarboxylic acid
1,4-cyclohexane dimethanol 1.20 207 1.60 231
1,4-CHDA.NPG
1,4-cyclohexane dicarboxylic acid neopentyl glycol
1.20 207 1.60 167
IPA.1,4-BD isophthalic acid 1,4-butane diol 0.90 150 1.35 122
IPA.1,5-PeD isophthalic acid 1,5-pentane diol 0.39 65 0.58 60
IPA.1,6-HD isophthalic acid 1,6-hexanediol 0.34 56 0.51 60
IPA.MPD isophthalic acid 2-methyl-1,3-propanediol 0.74 123 1.11 100
IPA.NPG isophthalic acid neopentyl glycol 0.80 133 1.20 125
PA.1,4-BD phthalic anhydride 1,4-butane diol 1.01 150 1.52 137
PA.1,5-PeD phthalic anhydride 1,5-pentane diol 0.64 95 0.96 100
PA.1,6-HD phthalic anhydride 1,6-hexanediol 0.56 84 0.85 100
PA.MPDphthalic anhydride 2-methyl-1,3-
propanediol 0.74 110 1.11 100
PA.NPG phthalic anhydride neopentyl glycol 1.25 185 1.67 174
TPA.16HD terephthalic acid 1,6-hexanediol 0.85 141 1.28 115
TPA.NPG terephthalic acid neopentyl glycol 0.80 133 1.20 125
Sample
Dibasic Acid Diol
Dibasic Acid Diol

41
Table 3.2 Reactant quantities used for the synthesis of oligoesters containing adipic acid and isophthalic acid as common dibasic acids
mol g mol g mol g mol g
AA.IPA.14BD 0.51 75 0.51 85 1.54 139 - -
AA.IPA.15PeD 0.32 47 0.32 53 0.96 100 - -
AA.IPA.16HD 0.28 41 0.28 47 0.85 100 - -
AA.IPA.MPD 0.37 54 0.37 61 1.11 100 - -
AA.IPA.NPG 0.32 47 0.32 53 0.96 100 - -
AA.IPA.BED 0.31 45 0.30 50 0.91 80 - -
AA.IPA.NPG.MPD 0.37 54 0.37 61 0.55 48 0.56 50
AA.IPA.TMP.16HD 0.55 80 0.55 91 0.66 88 0.99 116
AA.IPA.TMP.MPD 0.55 80 0.55 91 0.66 88 0.99 89
AA.IPA.TMP.NPG 0.55 80 0.55 91 0.66 88 0.99 103
AA.IPA.HD.15PeD 0.18 26 0.18 30 0.25 30 0.29 30
AA.IPA.HD.MPD 0.37 54 0.37 61 0.55 65 0.56 50
AA.IPA.HD.NPG 0.24 35 0.24 40 0.34 40 0.38 40
AA.IPA.BED.BD 0.55 80 0.55 91 0.82 72 0.82 74
AA.IPA.BED.PeD 0.28 40 0.28 46 0.45 40 0.38 40
AA.IPA.BED.MPD 0.37 54 0.37 61 0.54 48 0.55 50* Diol 1 = diol following AA.IPA** Diol 2 = last diol indicated on sample acronym
Diol 2**Sample Adipic Acid
(AA)Isophthalic Acid
(IPA) Diol 1*

42
Table 3.3 Chemical properties of binary oligoester systems
Sample Reaction Time (h)
Acid Number (mgKOH/gresin)
Hydroxyl Number
(mgKOH/gresin)
AA.1,2-EG 7.00 5.60 140AA.1,3-PD 6.00 2.00 201AA.1,4-BD 4.43 3.54 72AA.1,5-PeD 4.33 1.64 128AA.1,6-HD 6.55 0.91 110AA.CHDM 5.00 1.32 114AA.NPG 4.50 0.98 1261,4-CHDA.1,2-EG 11.00 2.85 1551,4-CHDA.1,3-PD 6.00 8.13 1371,4-CHDA.1,4-BD 10.00 4.77 1341,4-CHDA.1,5-PeD 5.00 2.87 1341,4-CHDA.1,6-HD 4.00 2.35 1301,4-CHDA.CHDM 2.50 2.21 1111,4-CHDA.NPG 5.00 7.51 143IPA.1,4-BD 5.50 3.75 147IPA.1,5-PeD 5.25 5.34 219IPA.1,6-HD 4.00 2.24 128IPA.MPD 4.50 3.49 140IPA.NPG 8.00 3.00 57PA.1,4-BD 6.00 1.91 43PA.1,5-PeD 5.50 1.65 151PA.1,6-HD 5.70 2.95 70PA.MPD 6.75 4.17 199PA.NPG 6.60 7.00 129TPA.1,6-HD 7.00 1.28 99TPA.NPG 7.50 3.44 118

43
Table 3.4 Chemical properties of ternary and quaternary oligoester systems
Sample Reaction Time (h)
Acid Number (mgKOH/gresin)
Hydroxyl Number
(mgKOH/gresin)
AA.IPA.14BD 6.0 5.20 146AA.IPA.15PeD 6.2 3.30 198AA.IPA.16HD 4.2 6.30 177AA.IPA.MPD 5.0 6.93 189AA.IPA.NPG 6.0 3.60 218AA.IPA.BED 5.3 9.20 116AA.IPA.NPG.MPD 4.0 8.64 131AA.IPA.TMP.16HD 6.0 7.40 160AA.IPA.TMP.MPD 4.5 4.00 154AA.IPA.TMP.NPG 5.0 7.20 154AA.IPA.HD.15PeD 3.5 4.05 120AA.IPA.HD.MPD 3.5 9.52 144AA.IPA.HD.NPG 5.0 6.09 150AA.IPA.BED.BD 6.0 11.40 114AA.IPA.BED.PeD 6.5 7.22 213AA.IPA.BED.MPD 6.0 10.60 133

44
Table 3.5 Physical properties of binary end-capped oligoesters at room temperature
Sample
Number Average
Molecular Weight
Polydispersity Index
Physical State*
Steric Factor (diol)
Steric Factor
(diacid)
Glass Transition
Temperature (Tg)
AA.1,2-EG 1940 1.34 WS 13 15 -36
AA.1,3-PD 1750 1.07 TW 15 15 -32
AA.1,4-BD 2160 1.28 WS 15 15 -32
AA.1,5-PeD 1360 1.28 WS 15 15 -41
AA.1,6-HD 1740 1.28 WS 15 15 -50
AA.CHDM 1650 1.24 WS 18 15 -7
AA.NPG 1490 1.25 CV 21 15 -26
1,4-CHDA.1,2-EG 1880 1.24 CV 13 24 12
1,4-CHDA.1,3-PD 1760 1.23 CV 15 24 -2
1,4-CHDA.1,4-BD 1960 1.18 WS 15 24 -5
1,4-CHDA.1,5-PeD 1650 1.27 CV 15 24 -10
1,4-CHDA.1,6-HD 1850 1.29 TW 15 24 -11
1,4-CHDA.CHDM 1570 1.34 WS 18 24 27
1,4-CHDA.NPG 1870 1.28 WS 21 24 18
IPA.1,4-BD 1470 1.22 WS 15 17 17
IPA.1,5-PeD 1300 1.29 CV 15 17 6
IPA.1,6-HD 1470 1.23 WS 15 17 -9
IPA.MPD 1390 1.35 CW 18 17 0
IPA.NPG 1160 1.34 CW 21 17 -7
PA.1,4-BD 1520 1.28 CS 15 24 3
PA.1,5-PeD 1650 1.25 CV 15 24 -10
PA.1,6-HD 1150 1.26 CV 15 24 -30
PA.MPD 1320 1.33 CV 18 24 7.00
PA.NPG 1620 1.28 CW 21 24 41
TPA.16HD 1720 1.35 CW 15 15 5
TPA.NPG 1460 1.30 CW 21 15 -8*WS= white solid; CS= clear solid; CV=clear viscous; CW= clear wax; TW=turbid wax

45
Table 3.6 Physical properties of end-capped ternary and quaternary oligoester systems
Sample Number Average Molecular Weight
Polydispersity Index
Physical State*
Glass Transition Temperature (Tg)
AA.IPA.14BD 1390 1.39 WL -22AA.IPA.15PeD 1360 1.37 CV -14AA.IPA.16HD 1150 1.28 WL -14AA.IPA.MPD 1180 1.24 CV -6AA.IPA.NPG 1390 1.24 CV -12AA.IPA.BED 1190 1.40 CV -18AA.IPA.NPG.MPD 1640 1.31 CV -9AA.IPA.TMP.16HD 1920 1.20 CV -18AA.IPA.TMP.MPD 1910 1.15 CV -21AA.IPA.TMP.NPG 1900 1.26 CS -5AA.IPA.HD.15PeD 1020 1.29 CV -34AA.IPA.HD.MPD 1210 1.21 CV -24AA.IPA.HD.NPG 1620 1.08 CV -17AA.IPA.BED.BD 1510 1.19 CV -30AA.IPA.BED.PeD 1070 1.18 CV -14AA.IPA.BED.MPD 1590 1.08 CV -15*WS= white solid; CS= clear solid; CV=clear viscous; CW= clear wax; TW=turbid wax
3.2.3 Sample Preparation and Acid Number Evaluation
Equivalent amounts of polyester end-capped with isocyanate, acetone, and water
were used to maintain a large molar excess of water relative to the formation of
carboxylic acid of the partially hydrolyzed polyester. Equal amounts (30 g) of oligoester,
water and acetone were used. All of the samples were dissolved in acetone followed by
the addition of distilled water and vigorous agitation. In order to decrease reaction times,
the solutions were placed in sealed containers inside a constant temperature water bath.
Periodically, an aliquot of the oligoester solution was taken and dried in a convection
oven at 110°C for 3 h. After drying, 1g of the resin was dissolved in 50 g of an equal

46
mixture of acetone and ethanol; 1 mL of phenolphthalein indicator solution (0.5 wt-%
phenolphthalein in methanol) was added to the acetone/ethanol solution. The sample was
titrated with 0.1 N solution of potassium hydroxide in methanol to a phenolphthalein end
point. The reproducibility of the system was confirmed by measuring at least three
samples per point. Error bars were calculated from standard deviation values. The
kinetic data were obtained by measuring the acid number as a function of time. The
slope of acid number vs. time was used to calculate hydrolysis rates.
3.3 Characterization
Different methods were used to characeterize the initial resins before, after and
during the hydrolysis. The following subsections describe briefly each method used.
3.3.1 Acid Number Evaluation (Aac)
The acid number (Aac) is a measure of the amount of base needed to neutralize
one gram of carboxylic acid present in a solution. Acid number values were determined
according to ASTM standard D 1639-90.68 One gram of resin was measured and
dissolved in 50 g of an equal mixture of acetone and ethanol. A phenolphthalein
indicator solution was prepared was prepared at 0.5 wt-% in methanol. One milliliter of
the phenolphthalein indicator was added to the acetone/ethanol solution. The sample was
titrated with 0.1 N solution of potassium hydroxide in methanol until the solution
obtained a slight pink coloration. The potassium hydroxide solution was prepared by
measuring approximately 2.81 g of KOH and dissolved in ethanol in a 500 mL graduated
flask. At a given moment during the hydrolysis the acid number was calculated with the
following equation,

47
m
VNFWAac KOH ××
= (2.2)
where N and V represented the normality (mol/L) of the basic solution made from
potassium hydroxide (KOH), and the volume (mL) of KOH solution required to
neutralize the desired amount of oligoester, m, measured in grams. FWKOH represented
the formula weight of potassium hydroxide (56.1 g/mol).
3.3.2 Hydroxyl Number Evaluation
Hydroxyl Number values were determined according to ASTM D 4274-99.69
For
the –OH evaluation, the sample was acetylated with a solution of acetic anhydride in
pyridine in a pressure bottle at 98°C. After 2 h the bottles with the blank and the sample
were rinsed with water and crushed ice was added into both bottles. Phenolphthalein
indicator was added into the solution, which was immediately titrated with sodium
hydroxide solution (0.5 N) to the end point. The hydroxyl content was calculated from
the difference in titration of the bland and sample solutions.
W
NABvalueOH 1.56**)[( −=− (3.3)
where A and B are the NaOH quantities for the titration of the sample and the blank,
respectively, N is the normality of the NaOH solutions and W is the sample weight.
3.3.3 Fourier Transform Infrared Spectroscopy (FT-IR)
Fourier Transform Infrared Spectroscopy was obtained on a Nicolet 380 FTIR
instrument (Thermo Electron Corp.). Table 3.7 gives the band frequencies and

48
assignments used for the determination of polyester synthesis, end-capping with phenyl
isocyanate, and degradation due to accelerated weathering.
Table 3.7 FT-IR band assignment61,70,71,72,73,74
Group
ν (cm-1) frequency range
-OH groups related to RCOOH 3520 N-H group related to RCONHR' 3361 C-N groups 1244, 1321 C-O 1085, 1168, 1257 C=O free of H-bonding 1720 C=O stretching, H-bonded 1680 C-H groups 3000-2800 N-H bending mixed with some C-N stretching (amide II)
1548
- CH2 - 700, 1465 out of plane –N-H- wag 700
3.3.4 Gel Permeation Chromatography (GPC)
Gel Permeation Chromatography measurements were performed on a Waters
GPC instrument equipped with a series of six Styragel columns (HR 0.5, HR 1, HR 3, HR
4, HR 5 and HR 6) calibrated with narrow-MWD polystyrene standards. Tetrahydrofuran
was used as the mobile phase with a flow rate of 1.0 mL/min. A refractive index (RI)
detector (Optilab, Wyatt Technology), and a dual-ultraviolet absorbance detector (Waters
2487), and a laser light scattering detector (Minidawn, Wyatt Technology) were used to
obtain number average molecular weight )( nM , weight average molecular weight
)( wM and polydispersity index (PDI).

49
3.3.5 Differential Scanning Calorimetry (DSC)
Glass transition and melting temperatures for all samples were measured on a
Q1000 differential scanning calorimeter (DSC) from TA Instruments at a heating rate of
10°C/min. The experiments were run under nitrogen atmosphere.
3.3.6 Dynamic Mechanical Thermal Analysis (DMTA)
The viscoelastic properties were measured on a dynamic mechanical thermal
analyzer (DMTA V, Rheometrics Scientific, Piscataway, NJ). Stretching mode was used
at a frequency of 1 Hz and a heating rate of 3°C/min over a range of -50 to 120°C. The
testing conditions and methodology were based on ASTM D 4065-95.75
A minimum
preload force of 200 mN was applied by the instrument. The gap distance was arranged
at 4 mm for rectangular specimens with the following dimensions: 10 mm of length, 8-
10 mm of width, and 0.09 to 0.11 mm in thickness. When T >>> Tg, the loss modulus
(E’’) is very low and the modulus (E) can be considered approximately equal to the
storage modulus (E’). Thus, the crosslink density (υe) of the films was obtained through
the storage modulus in the rubbery plateau region. The relationship between rubbery
plateau modulus and crosslink density is given by the following equation:
RT
Ee 3
'min=υ (2.4)
where υe is the crosslink density of elastically effective network chains, '
minE is the
minimum value of the storage modulus (Pa) above Tg. The gas constant in J/(K mol) is
represented by R and T represents the absolute temperature in Kelvin (T >> Tg). The

50
glass transition temperature (Tg) of the crosslinked films was determined from the tan δ
vs. temperature plots.
3.3.7 Tensile Testing
The tensile properties of all crosslinked polyurethane films were measured
according to ASTM D 2370-98.76
The tests were performed on an Instron Universal
Tester model 1000 (Instron Corp., Grove City, PA). The specimens were rectangular
with the following dimensions: 0.09-0.11 mm in thickness, 6.5 mm wide and initial
length of 25 mm. A crosshead speed of 10 mm/min was used for all of the experiments
which were carried out at room temperature. The modulus, yield stress, yield strain,
fracture stress and elongation at break were obtained from the Instron software. The
stress and the strain were calculated using the following equations:
tw
FAF
×==σ (2.5)
oLL∆
=ε (2.6)
where σ represents the stress, ε is the strain, F is the load, w is the width, t is the
thickness, ΔL is the change in length of the gauge, and Lo is the initial gauge length.
The tensile tester was set at an initial gauge length and a specimen of uniform
thickness was placed between the grips of the machine. The specimen was elongated at
the specified crosshead speed until rupture. The elongation of the specimen was
determined by measuring the increase in gauge length from the initial point to the point
of rupture. The load and elongation data acquired during stretching were used to obtain
stress vs. strain plots. Since engineering stress and engineering strain values were used

51
for these plots, the calculations were based on the initial dimensions of the specimen.
Eight samples were tested for each film. The data were reported as the mean of the data
set, with an uncertainty based on the standard deviation.
3.4 Coating Formulation and Film Preparation
Polyesters were diluted in methyl ethyl ketone (30-50 wt-%) and then mixed with
hexane-1,6-diisocyanate (HDI isocyanurate). The mole ratio of isocyanate group to
hydroxyl group was kept constant at 1.1:1. A wetting additive, Tego wet 270, at 0.2 wt-
percent was added into the mixture to achieve even dispersion. All aluminum panels
(alloy 3003 H14, Q-panel lab products) were degreased with acetone. The films were
cast on the aluminum panels with a drawdown bar with thickness of 150 µm (6 mil). The
films were cured at 120 0C for 2 h. For mechanical and tensile properties, the films were
cast on a glass panel and a drawdown bar of 200 µm (8 mil) was used. The cured films
were stored for 3 days under ambient conditions in a dust-free cabinet before testing.
Actual composition of polyesters, solvent, and HDI isocyanurate for the formation for
polyurethane coating is given in Table 3.8. Hydrolysis of polyurethane films was
performed at 60°C in a solution of 5.5 N H2SO4.
3.5 Accelerated Weathering Test
The selection of weathering cycle was based on previous studies77,78,79 that
showed that SAE J1960 test with a combination of borosilicate inner and outer filter
instead of Quartz/Borosilicate gives a better correlation with solar radiation. Minimizing
the UV radiation below 290 nm is of utmost importance because it is part of the UVC
range, which is the most destructive to polymers and colorants. In natural weathering,

52
UV radiation below 295 nm is filtered out by the ozone layer. Since the UV light cutoff
for the xenon light with borosilicate inner/outer filter is around 290 nm and that for the
xenon with quartz/boro inner/outer filter is around 280 nm, this last filter combination
was selected for the experiments in this research.
Previous studies based on different accelerated weathering tests79 have shown that
accelerated weathering of acrylic coatings with xenon arc artificial light and either set of
filters, xenon boro/boro or xenon quartz/boro, correlated well with natural weathering.
However, natural weathering of polyester coatings only correlated properly using the
borosilicate inner/outer filter. Comparison of cycle also favors SAE J1960 over ASTM
G26 (latter known as ASTM G155). The cycle used on the SAE J1960 includes a dark
cycle with water spray at low temperatures that simulates a dew point occurring at night.
Thus, weathering of polyurethane films was completed on a Xenon Arc Weather-
Ometer from ATLAS Material Testing Technology LLC model Ci4000. The Weather-
Ometer uses a Xenon Arc lamp and has Type “S” Borosilicate inner and outer filters,
which is the most common combination for weathering tests.80 Four aluminum panels
coated with the polyurethane film were exposed for 60 days to the same weathering
conditions. Every 20 days a sample was removed from the chamber and the coating
properties were measured. The test program was SAE J 1960,81
Table 3.9
which consists of 4
segments: one dark and three light segments. SAE J1960 exposes samples to more light
in the 280-295 nm range than is screened out by the earth's ozone layer. The strength of
this cycle is that it includes a dark cycle with water spray at a lower temperature to
simulate nightly condensation and the subsequent drying concurrent with temperature
increase during the morning. shows the SAE J1960 test program.

53
Table 3.8 Formulation of poly(ester-urethane) coatings
Sample Sample weight
(g)
HDI isocyanurate
(g)
MEK (g)
Wetting Additive
(g) AA.14BD 7.57 4.62 5.05 0.025 AA.15PD 7.23 6.23 4.82 0.027 AA.16HD 7.86 7.62 7.86 0.030 AA.NPG 5.46 3.30 3.64 0.017 AA.BED 6.17 5.30 4.11 0.022 14CHDA.14BD 7.04 4.06 4.69 0.022 14CHDA.15PD 8.91 6.46 5.94 0.031 14CHDA.16HD 7.63 5.09 5.08 0.025 14CHDA.NPG 7.44 5.48 4.96 0.025 14CHDA.MPD 7.93 5.68 5.29 0.027 IPA.15PD 7.55 6.49 5.03 0.028 IPA.16HD 6.98 3.50 4.65 0.020 IPA.MPD 7.52 4.13 5.00 0.023 IPA.NPG 6.18 3.90 4.12 0.020 PA.14BD 7.81 1.65 6.2 0.019 PA.15PD 9.54 5.66 6.36 0.030 PA.16HD 7.44 2.04 7.44 0.002 PA.MPD 8.47 6.62 8.47 0.030 PA.NPG 7.86 4.94 7.86 0.025 AA.IPA.14BD 8.35 4.79 8.30 0.026 AA.IPA.15PD 8.09 4.65 5.39 0.025 AA.IPA.16HD 7.72 5.35 5.15 0.026 AA.IPA.MPD 9.17 6.80 9.17 0.030 AA.IPA.NPG 7.72 6.60 5.15 0.028 AA.IPA.BED 6.93 3.15 4.62 0.020 AA.IPA.MPD.BED 7.8 4.07 5.2 0.023 AA.IPA.14BD.BED 9.81 4.39 6.54 0.028 AA.IPA.15PD.BED 8.42 7.05 8.42 0.030 AA.IPA.MPD.16HD 8.35 4.73 8.30 0.026 AA.IPA.MPD.NPG 7.6 4.78 5.8 0.024 AA.IPA.MPD.TMP 8.04 4.86 5.36 0.025 AA.IPA.NPG.TMP 7.89 4.77 5.26 0.025 AA.IPA.16HD.TMP 8.86 5.58 5.90 0.028 AA.IPA.16HD.NPG 7.19 4.24 4.79 0.023 AA.IPA.16HD.15PD 5.36 2.5 3.57 0.015

54
Table 3.9 Test program settings of SAE J1960 used on the accelerated weathering of polyurethane films
Parameters SAE J1960
Total Number of Segments: 4 Duration Units (Time/Irrad.) Irradiance Controlling Black Sensor (BPT/BST) BPT – Black Panel Is Black Temperature Active? Yes Irradiance Filter 340 nm Chamber (DB) Temperature Active Yes Light Cycle Settings: Irradiance (340 nm Filter) 0.55 W/m2 Black Panel Temperature 70°C Chamber (DB) Temperature 47°C Relative Humidity 50% Dark Cycle Settings: Chamber (DB) Temperature 38°C Relative Humidity 95% Segment 1 Cycle Dark Duration (minutes/Joules) 60 minutes Specimen Spray (On/Off) On Rack Spray (On/Off) On Segment 2 Cycle Light Duration (minutes/Joules) 1320 Joules Specimen Spray (On/Off) Off Rack Spray (On/Off) Off Segment 2 Cycle Light Duration (minutes/Joules) 660 Joules Specimen Spray (On/Off) On Rack Spray (On/Off) Off Segment 2 Cycle Light Duration (minutes/Joules) 1980 Joules Specimen Spray (On/Off) Off Rack Spray (On/Off) Off

55
3.6 Film Characterization
Gouge and scratch hardness, cross-hatch adhesion, pull-off adhesion, gloss,
impact and reverse impact resistance were performed according to ASTM standards.
3.6.1 Gouge and Scratch Hardness
Pencil hardness (ASTM D 3363-00)82
measurement was used to determine the
hardness of coatings. The test consists of drawing a line on the surface of the coatings
with a pencil of known hardness. The process starts with the hardest pencil (6H) and
continues down the following scale:
6B – 5B – 4B – 3B – 2B – B – HB – F – H – 2H – 3H – 4H – 5H – 6H
Softer Harder
The process is repeated down the hardness scale until a pencil is found that does
not cut through the film to the substrate or would not leave a mark on the surface. The
pencil that does not cut through the coating is reported as the pencil or gouge hardness.
The pencil that does not leave a mark on the surface is reported as the scratch harndess.
3.6.2 Cross-Hatch Adhesion
The cross-hatch adhesion test (ASTM D 3359-02)83 is used to determine the
adhesion of coating films to metallic substrates. The method consists of applying and
removing pressure-sensitive tape over a lattice pattern consisting of six cuts in each
direction. The adhesion is evaluated by comparison with illustrations provided in ASTM
D 3359-02, which are classified in 6 levels. The following classification is given

56
according to the percent area removed after peeling with the pressure-sensitive tape: 5B
(0%), 4B (< 5%), 3B (5-15%), 2B (15-35%), 1B (35-65%), 0B (> 65%).
3.6.3 Pull-Off Adhesion
A pull-off adhesion test evaluates (ASTM D 4541-02)84
the pull-off strength of a
coating on rigid substrates. The test consists of securing a dolly perpendicular to the
panel with an adhesive (epoxy). After the epoxy is cured (1-2 days), testing equipment
with a center grip is attached to the dolly and force is gradually applied normal to the test
surface. The force is recorded when the dolly is detached from the panel.
3.6.4 Impact Resistance
The impact resistance test (ASTM D 2794-93)85
is used to determine deformation
by impacting a coating film and its substrate. The test consists of dropping a standard
weight from a specified height. The objective is to strike with an indenter (steel punch
with a hemispherical head) the front (forward impact) or the back (reverse impact) of the
substrate deforming the coating and the substrate. A cylindrical weight (3 lb) is used for
the free fall over a drop range of 2 to 4 ft. The drop tube is 5 ft long and contains a tub
with a lengthwise cut that act as a guide for the cylindrical weight. A scale is attached to
the guide tube for measuring the height of the drop. The height is gradually increased
until the film starts to crack (point of failure).
3.6.5 Gloss
Specular gloss (ASTM D 523)86 measures the capacity of a film to reflect light in
the specular direction (mirror direction) than in any other direction. Gloss values are

57
obtained from the ratio of the specular reflectance of the coatings to the specular
reflectance of a black glass standard surface. Typical incidence angles are 20°, 60°, and
85°. Incidence angle is equal to the angle between the incident beam and the
perpendicular to the specimen surface. The reflectance angle corresponds to the mirror
reflection of the axis of the incident beam.
Measurements were done with a NOVO-GLOSS instrument (Elcometer 401) at
20°/60° angle, including Novo-soft software used to analyze the gloss values. Ten
replicates of each coating were taken, and the average and standard deviation was
reported.
Figure 3.3 Diagram of gloss measurement.
θi θr
light source photodetector
incidence angle
reflectance angle

58
CHAPTER IV
EFFECT OF STRUCTURAL PARAMETERS ON THE HYDROLYTIC STABILITY
OF MODEL COMPOUNDS END-CAPPED WITH NON-POLAR GROUPS
4.1 Abstract
A series of hydroxyl-terminated oligoesters was synthesized for evaluation and
determination of the main effect triggering hydrolysis reactions. The study focused on
two key effects: the steric and the anchimeric effects. Model compounds consisting of
one diol and one dibasic acid were used because the simplicity of the chemical structure
allowed the analysis of individual effects. Once the main effect was established, more
complex structures were studied. Linear, cycloaliphatic and aromatic dibasic acids were
used. The diacids were reacted with a series of linear and bulky diols. All hydroxyl-
terminated oligoesters were end-capped with phenyl isocyanate to avoid end-group
effects. Three different stages were distinguished in the case of aliphatic oligoesters,
while more bulky structures (cycloaliphatic and aromatics) only presented one or two
stages. Hydrolysis rates showed a complex behavior in which steric and anchimeric
effects played a mutual role in initial hydrolysis rates. An excess of –COOH end groups
slowed down hydrolysis, forming a second stage. Eventually the formation of small
chains led to an increase in rates, forming a third stage. A slightly different scenario was
proposed for 1,4-CHDA-based samples due to the nature of the dibasic acid, which

59
hindered intramolecular catalysis. In contrast, aromatic-based oligoesters showed
hydrolysis rates influenced by steric hindrance, resonance effects and solubility.
4.2 Introduction
The necessity of manufacturing products that fit specific performance
qualifications increases the production of tailor-made polymers. The broad range of
monomers available in the market with different reactivity, functionality, rigidity and
cost, coupled with the various cross-linker options (melamine-formaldehyde, isocyanate,
2-hydroxyalkylamides, and epoxy resins) offer polyesters a wide spectrum of structural
features to cost-effectively meet most end-use needs.10 This versatility makes polyesters
an attractive choice for a wide variety of industries (fiber, films, packaging,
polyurethane-foams and coatings). In the coating industry, polyesters enjoy a good
reputation due to their excellent adhesion and flexibility, good impact, scratch, corrosion,
and stain resistance. Polyesters are widely used in coil, can, automotive, and industrial
coatings. They can be formulated as solvent-borne, high solids, waterborne, and powder
coatings.2
However, the performance of polyesters is affected by the sensitivity of ester
groups towards water.2 Under ambient conditions, esters are the functional groups most
prone to hydrolysis compared to ureas, urethanes and ethers.2 During hydrolysis, water
molecules attack ester groups at the carbonyl carbon, breaking the polymer into smaller
portions, one with a carboxyl-terminated structure and the other one with a terminal
hydroxyl group (Figure 4.1). Continuous attack of water eventually causes a failure of
the mechanical properties of the polyester product.

60
R O
O
R'+ H2O
R OH
O
+ HO R'
Figure 4.1 Hydrolysis of polyester.
Hydrolysis reactions are accelerated by acid environments and high
temperatures.19,87
4
Consequently, the use of polyesters has been limited for
environmentally friendly systems (waterborne) and products used for exterior
applications. For example, polyester-based water-reducible systems exhibit poor package
stability due to the slow hydrolysis of ester linkages. As the final product, poly (ester-
urethane) coatings for exterior applications are exposed to environmental factors such as
humidity, high temperatures, snow, salt, grit, grime, bird droppings, and tree sap that can
enhance the hydrolytic degradation by altering the pH of the coating. In addition,
airborne pollutants, such as sulfuric acid and carbon monoxide, interact with rainwater
producing acid rain,88
Early work by Newman
which can decrease the pH of the system, accelerating the
hydrolytic degradation of polyester products. The degradation of coatings leads to a
variety of undesired events such as loss of gloss, chalking, rust, and eventually to
mechanical failure (cracking, peeling, blisters).
5 on hydrolysis of polyester focused on steric effects.
Steric effects are related to the shielding provided by bulky atoms nearby the ester group.
Newman proposed an empirical equation that could measure the steric effect; the
equation is known as the Rule of Six.5 Newman’s Rule of Six (Equation 1) stated that if
one numbered the position of atoms, taking the carbonyl oxygen as one, higher
substitution on the six positions would provide a better hindrance on the ester group, thus
61
increasing the hydrolytic stability of the molecule. Later, this rule was modified by
Turpin,6 who observed that substitution on the alkyl α- and β- carbons on either side of
the ester group improved the hydrolytic stability of the molecule.
Steric Factor = 4*(atoms in the 6th position) + (atoms in the 7th position) (4.1)
Turpin6 also observed the influence of neighboring groups which were very
evident around neutral pH (4-8) and were known as the anchimeric effects. The
anchimeric effect is observed when nucleophiles within the same molecule interact with
nearby ester groups enhancing or assisting the attack by an external nucleophile on the
carbonyl carbon and accelerating the hydrolysis. The anchimeric effect is a short-range
effect; therefore, as the nucleophile and the ester group grow apart, the hydrolytic
stability of the molecule improves. Turpin6 suggested that in order to prevent the
hydrolytic degradation of aliphatic molecules, a minimum of four carbon spacers should
be placed between the reaction site and the assisting group and at least three carbons in
the case of aromatic systems.
Previous studies within the Soucek group7-9 compared the effect of steric and
anchimeric effects in hydroxyl-terminated oligoesters and showed that acid groups have a
larger impact on the anchimeric effects than the hydroxyl groups. Additionally,
hydrolysis rates comparing linear diols with an increasing number of carbons confirmed
that anchimeric effects are negligible for structures with four or more carbon spacers.7
Those studies concluded that anchimeric effects predominated in end-group cleavage
while steric effects controlled the main chain scission. In a second study, Soucek et al9
62
described the effect of the addition of trimethylolpropane monomer on systems
containing hexahydrophthalic anhydride, 1,3- and 1,4-cyclohexanedicarboxylic acid and
neopentyl glycol. This study confirmed the detrimental impact of additional hydroxyl
group on the hydrolytic stability of the compounds. However, after the initial stage
ended , the hydrolysis was controlled by the sterically hindered groups left as end-groups.
A third factor, the anomeric effect, was used to explain the hydrolysis of 1,2-, 1,3-
and 1,4-cycloaliphatic based-oligoesters.8 Hydrolysis of oligoesters prepared from 1,3-
cyclohexenedicarboxylic acid with either neopentyl glycol or cyclohexyldimethanol
showed higher rates of degradation compared to hexahydrophthalic anhydride. It was
postulated that in the axial position of the cis-1,3-cyclohexanedicarboxylic acid
configuration, the close proximity of the ester groups favored the hydrolysis of the 1,3
esters compared to 1,2- or 1,4-cyclohexane monomers, via anomeric effects similar to
carbohydrate chemistry.
In the coating industry, the study of hydroxyl and carboxyl acid terminated
oligoesters is important because the use of waterborne resin has been limited due to the
poor storage stability properties, caused mainly by autocatalysis of hydrolysis due to the
presence of telechelic groups. On the other hand, oligoesters are also used as thermosets
by crosslinking end-functional groups with isocyanate, melamine or epoxy groups.
However, the predicted performance can be quite different from model compounds
because most studies based their experiments on mono- or di-ester samples, as well as
hydroxyl- or carboxyl terminated resins. Yet, the expected performance of crosslinked
polyesters is quite different due to the elimination of end-group functionalities.
Therefore, the aim of the present work is to establish the intrinsic behavior of the

63
oligoesters in the presence of water and mimic the hydrolytic behavior of oligoesters used
in crosslinked compounds (i.e. polyurethanes). Hydroxyl-terminated oligoesters were
synthesized using a wide variety of diacids and diols. All hydroxyl-terminated
oligoesters were end-capped with phenyl isocyanate in order to eliminate initial end-
group effects. Thus, the auto catalysis effect of initial end-groups on the beginning of
hydrolysis was suppressed, allowing the proper evaluation of intrinsic behavior of
oligoesters in aqueous systems. Hydrolysis was monitored by titration of the formation
of carboxylic acid at different points in time.
4.3 Results
The properties of polyesters are more sensitive to changes in chemical structures
(relative weight, segmental mobility, etc) compared to those polymers where
intermolecular interactions play a significant role in the final properties (polyamides,
polyurethanes);10 thus the importance of studying structure-properties relationships. In
the case of polyesters, two major attributes are considered when formulating polyester
products to be used in exterior or harsh environments where water is a constant presence:
the steric and the anchimeric effects.7 Usually, one would like to have the shielding
provided by bulky molecules that impede the nucleophilic attack and at the same time,
provide good mechanical properties. Additionally, the use of small linear monomers that
can impart flexibility and low viscosity is also desired. However, the use of linear
monomers is limited due to the low steric hindrance and the ease of coiling and forming
hydrogen bonds. Formation of these hydrogen bonds can auto-catalyze the reaction with
water.

64
In order to analyze these two effects, linear and sterically bulky monomers were
selected to observe the respective impact on the hydrolysis rates. The oligomers prepared
consisted of one dibasic acid and one diol. In total, 23 hydroxyl-terminated oligoesters
were synthesized. Four dibasic acids were chosen to observe differences between linear,
cycloaliphatic and aromatic systems: adipic acid (AA), 1,4-cyclohexanedicarboxylic acid
(1,4-CHDA), phthalic anhydride (PA), and isophthalic acid (IPA). Linear, (1,2-ethylene
glycol (1,2-EG); 1,3-propanediol (1,3-PD); 1,4-butanediol (1,4-BD); 1,5-pentanediol
(1,5-PD); 1,6-hexanediol (1-,6-HD)), bulky (neopentyl glycol (NPG); 2-methyl-1,3-
propanediol (MPD)) and cycloaliphatic diols (1,4-cyclohexanedimethanol (CHDM))
were chosen to elucidate the difference between steric and anchimeric effects.
Cycloaliphatic acids, such as 1,4-cyclohexanedicarboxylic acid (1,4-CHDA) are
known for having better hydrolytic stability than the aliphatic acids such as adipic acid
(AA)3,7,16 because they prevent anchimeric interactions7 and provide high steric shielding.
The 1,4-cyclohexanedicarboxylic acid (1,4-CHDA) monomers are more hydrophobic
than adipic acid (AA).89
2
Adipic acid (AA) is the most widely used of the aliphatic
diacids and it is more soluble in water compared to 1,4-cyclohexanedicarboxylic acid
(1,4-CHDA) and isophthalic acid (IPA).89 Isophthalic acid (IPA) is the most
predominant aromatic acid used in the synthesis of polyesters due to its superior exterior
durability,2 excellent hardness, and resistance properties (stain, detergent and salt
spray).90
89
Isophthalic acid (IPA) has the highest dissociation constant, Ka (low pKa)
compared to AA and 1,4-CHDA, and it is more prone to the base-catalyzed hydrolysis.
Isophthalic acid (IPA) is the most hydrophobic of these three monomers (IPA, 1,4-
CHDA, and AA).89 Phthalic anhydride (PA) was selected due to its intrinsic lack of
65
steric hindrance7 and its low susceptibility to anchimeric effects.2 Terephthalic acid
(TPA) together with neopentyl glycol is the primary component for most polyester resins
for powder coatings.91
Linear glycols with 2 to 6 carbon spacers were chosen in order to observe the
‘back biting’ mechanism.
6 In addition, linear glycols allowed for the comparison
between less hindered and more bulky diols such as neopentyl glycol (NPG), 2-methyl-
1,3-propanediol (MPD) and 1,4-cyclohexanedimethanol (CHDM). Neopentyl glycol
(NPG) was selected due to its hydrolytic stability and common use.4-7 NPG is highly
reactive, providing fast processing and excellent stability during polyester synthesis and
imparting a combination of properties such as chemical resistance and improved
electrical and thermal properties.92
3
Cycloaliphatic diols such as 1,4-cyclohexane-
dimethanol (CHDM) are considered hydrolytically stable and impart a balance of
hardness and flexibility to the final product; the presence of primary, unhindered
hydroxyl groups provide a rapid curing time. ,93
Standardized experimental conditions were chosen in order to truly state the
intrinsic behavior of the molecule during hydrolysis and accurately compare the reaction
kinetics between each one of them. The first point to address was to fix the experimental
setup at a specific temperature, 40°C, for all the samples. The temperature (40°C) was
believed to represent typical paint storage temperature.
4,7 Measurements of hydrolysis
rates of systems composed of water and oligoesters are dependent on the difference
between the Tg of each resin and the temperature of the experiment (40°C). Structures
with Tg lower than 40°C are in a rubbery state which makes the molecules more mobile;

66
on the other hand, molecules with Tg higher than 40°C are in a glassy state and the
mobility of the molecules is limited.10
Samples in a glassy state are partially soluble or insoluble in water, limiting the
hydrolysis to the surface area and impeding the reaction in the bulk. Hence, in order to
avoid this kind of inadequacy all oligoesters were dissolved in acetone. By dissolving the
samples in acetone, the Tg is of no concern because solutions are not affected by
transition temperatures. Also, the water/acetone system provided an ideal environment
wherein large amounts of water surrounded each molecule in the system, providing a
constant water concentration throughout the experiment. Intermolecular catalysis
through end-group effects was not considered as part of this analysis since intermolecular
interactions in polyesters are relatively weak.10 Besides, diluted systems also minimize
the interaction between molecules. Concentrated systems have the disadvantage of being
time-dependant;94
A second point of importance was the presence of hydroxyl end-groups. The
impact of functional groups on hydrolysis rates has been previously described.
thus as the hydrolytic reaction takes place, the formation of carboxyl-
acid groups increases and has an impact not only in the molecule itself (intra-molecular
catalysis) but also in the surrounding molecules, favoring inter-molecular catalysis. In
addition, dissolving the oligomer in acetone helped the molecule to disentangle, allowing
the attack of water at different positions in the molecule.
7,9 Soucek
et al9 found that the presence of additional hydroxyl groups increased hydrolysis rates. In
those studies oligoesters comprised of 1,4-CHDA and diols, such as NPG and CHDM,
had an increase in hydrolysis rates when the same oligoesters were synthesized with
additional trimethylol propane, a triol. From those studies7-9 it was concluded that

67
hydrolysis of telechelic groups was controlled by anchimeric effects (‘back biting’
mechanism and hydrogen bond formation). After the removal of the monomers at the
chain-ends, scission at the main chain was controlled by steric effects. In general, it was
observed that the initial attack on ester groups occurred at the end of the molecule.
Molecules composed of monomers favoring anchimeric effects, such as 1,2-ethylene
glycol or maleic anhydride, showed the highest degradation rates compared to oligoesters
comprised of 16HD or NPG.
From these studies one could suggest that anchimeric effects controlled the
beginning of hydrolysis and the steric effect predominated in subsequent stages.
However, all previous studies have used model compounds with high initial hydroxyl
values, a parameter that sets favorable conditions for anchimeric effects, making it the
preferred factor for the beginning of hydrolysis. But, what would happen if the terminal
functional groups were eliminated? End-capping the hydroxyl groups with isocyanate
leaves a bulky component at each end of the linear molecule setting an environment free
of anchimeric effects. Therefore, the main effect triggering the hydrolysis could be
properly addressed.
For this study a mono-isocyanate was used to end-cap the hydroxyl-terminated
oligoesters. Isocyanate groups reacted with hydroxyl groups forming a urethane linkage.
Figure 4.2 shows FT-IR spectra of two oligoester resins comprised of adipic acid (AA)
and 1,2-ethylene glycol (12EG) and the end-capped version of the same resin. The
synthesis of hydroxyl-terminated oligoesters is confirmed by the presence of absorption
bands at 1740 and 1257 cm-1, which are related to the carbonyl and the -C-O- groups of
the ester, respectively. Terminal hydroxyl groups are observed at 3520 cm-1, this band

68
disappears after the reaction with phenyl isocyanate, and a new band is formed at 3361
cm-1, corresponding to the –NH- group of the urethane group (RCONHR’). The carbonyl
group of the urethane group is observed at 1600 cm-1.71 This band is overlapped with the
double bonds of the phenyl ring. The ester group (1721 cm-1) was not affected during the
reaction. The urethane end-capping is also confirmed by the absorption band at 1550 cm-
1, which represents the –N-H- bending (amide II) mixed with –C-N- stretching. The
absorption band at 2960 cm-1 and the small shoulder at 2910 cm-1 correspond to the
aliphatic C-H stretching.
Figure 4.2 FT-IR spectra of oligoesters composed of adipic acid and 1,2-ethylene glycol
and the end-capped resin.
The hydrolysis reaction is a second order rate equation, depending on the
concentration of water [H2O] and oligoester [RCOOR’] present at time, t,

69
[ ] βα ]'[])[( 2 RCOOROHTk
dtRCOOHd
= (4.2)
where d[RCOOH]/dt is the rate of formation of carboxylic groups; k(T) is the reaction
rate coefficient, which is mainly dependent on temperature; and α and β are the reaction
orders of water and oligoesters, respectively, and have a value equal to 1 (α = β = 1).
If water is present in excess, [H2O]>>> [RCOOR’], it can be considered that
water concentration remains constant throughout the experiment and can be included in
the rate constant, k’(T)=k(T)[H2O]. Substitution in Equation 4.2 results in a pseudo first
order rate equation,94
β]')[('][ RCOORTkdt
RCOOHd= (4.3)
As is observed in Equation 4.3, the rate equation becomes dependent only on the
concentration of oligoester present at time t. In order to find the pseudo first order
constant, k’, the derivative of the concentration of carboxyl-terminated oligoester and
time needs to be solved. By plotting the increase in concentration of carboxyl-terminated
oligoesters with time, one can solve the derivative shown in Equation 4.3. Monitoring
the concentration of carboxylic acid groups was done by measuring the acid number,
which increases with carboxyl group concentration. In the case of first order reactions
the rate equation yields a logarithmic function. However, Figure 4.3 shows a steady
increase of acid number with time. In the case of macromolecules, a linear rate
relationship has been previously reported, caused by a relatively low concentration of
carboxyl acid groups formed during hydrolysis.4,7,8,95 Therefore, the rate equation
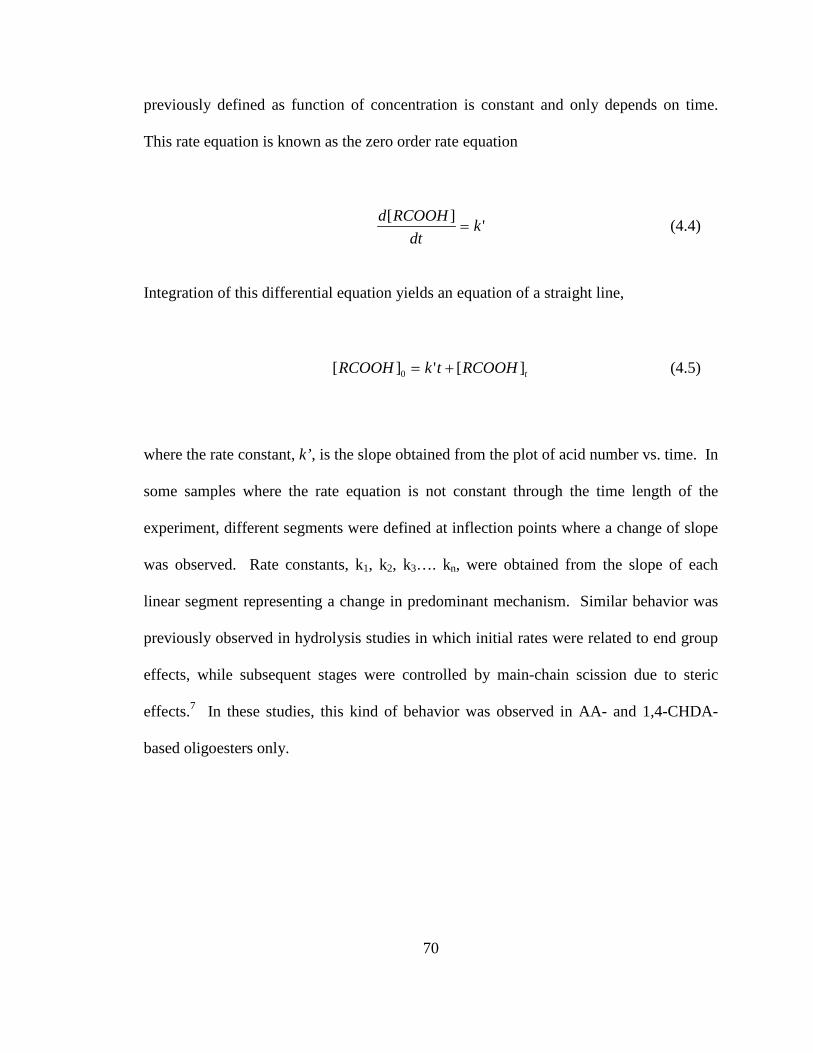
70
previously defined as function of concentration is constant and only depends on time.
This rate equation is known as the zero order rate equation
'][ kdt
RCOOHd= (4.4)
Integration of this differential equation yields an equation of a straight line,
tRCOOHtkRCOOH ]['][ 0 += (4.5)
where the rate constant, k’, is the slope obtained from the plot of acid number vs. time. In
some samples where the rate equation is not constant through the time length of the
experiment, different segments were defined at inflection points where a change of slope
was observed. Rate constants, k1, k2, k3…. kn, were obtained from the slope of each
linear segment representing a change in predominant mechanism. Similar behavior was
previously observed in hydrolysis studies in which initial rates were related to end group
effects, while subsequent stages were controlled by main-chain scission due to steric
effects.7 In these studies, this kind of behavior was observed in AA- and 1,4-CHDA-
based oligoesters only.

71
0
2
4
6
8
10
12
14
16
18
20
0 20 40 60 80 100
Time (days)
Aci
d N
umbe
r (m
g KO
H /g
resin
)
AA.1,3-PD1,4-CHDA.CHDM
i
Figure 4.3 Increase in acid number (mgKOH/gresin) with time (days) of two end-capped
oligoesters.
4.3.1 Linear Aliphatic- and Cycloaliphatic-Based Oligoesters
Relative hydrolysis values were obtained from the overall trend (average) in acid
number (Table 4.1). Linear aliphatic end-capped oligoesters (i.e. adipic acid-based) have
high overall hydrolysis rates. Oligoesters comprised of adipic acid and 1,2-ethylene
glycol showed the highest hydrolysis rates in these studies. AA.CHDM showed the
lowest degradation rates of the AA-based set, with overall rates values of 22 x 10-3
mgKOH/gresin-day. Adipic acid-based end-capped oligoesters have hydrolysis rates k’
(mgKOH/gresin-day x103) decreasing in the following order: 1,2-EG (338) >> 1,3-PD (164)
> 1,4-BD (113) > 1,5-PeD (100) > NPG > 1,6-HD (47) >> CHDM (21). Some of the
AA-based samples (AA.1,2-EG; AA.1,4-BD; AA.NPG) showed an inverse S-shaped
curve behavior (Figure 4.4) where high initial rates were followed by a slow second stage
rate and a high final stage rate, with rates similar to the initial stage. Initial hydrolysis

72
rates decrease when using diols with increasing number of carbons between functional
groups (1,2-EG > 1,3-PD > 1,4-BD > 1,5-PeD > 16HD). Surprisingly, AA.NPG (steric
factor, SF = 21) shows higher hydrolysis rates compared to AA.16HD (SF=15) due to the
crystallinity morphology of the AA.1,6-HD sample. Oligoesters of AA.CHDM showed
the lowest hydrolysis rates in this set.
Samples made with 1,4-CHDA have hydrolysis rates which are at least 40%
lower than AA-based end-capped oligoesters (Figure 4.5). This was attributed to the
more rigid and sterically hindered structure of the cycloaliphatic monomer (1,4-CHDA).
Just as in the case of AA-based samples, ethylene glycol (12EG) containing samples have
the highest initial hydrolysis rates among the same set of oligoesters, followed by 1,3-
PD- and 1,4-BD-based samples, which present a reduction of 70% in initial hydrolysis
rates compared to the 1,2-EG samples. These three oligoesters, composed of short chain
diols (2 to 4 carbon spacers), present a much lower second stage with a reduction of at
least 50% in its hydrolysis rates. Oligoesters of CHDA.NPG and CHDA.CHDM present
a steady increase in acid number and rate values very similar to each other; only one
stage could be determined. Samples containing 1,4-CHDA and linear diols such as 1,3-
PD; 1,4-BD; 1,5-PeD; and 1,6-HD, present a two stage hydrolysis mechanism with very
similar values. The first stage has a gradual increase in acid number and the second is
established by a reduction in the slope.

73
Table 4.1 Relative hydrolysis rate constants of samples containing adipic acid (AA) and 1,4-cyclohexanedicarboxylic acid (1,4-CHDA) and different diols
Sample K’ (mgKOH/gresin-day) x103 ± std. dev.
AA.1,2-EG 302.6 ± 1.60
AA.1,3-PD 164.8 ± 1.50
AA.1,4-BD 113.4 ± 2.50
AA.1,5-PeD 100.6 ± 1.61
AA.1,6-HD 47.4 ± 1.10
AA.NPG 82.2 ± 1.53
AA.CHDM 21.8 ± 2.10
1,4-CHDA.1,2-EG 66.0 ± 3.90
1,4-CHDA.1,3-PD 46.2 ± 0.10
1,4-CHDA.1,4-BD 23.5 ± 1.10
1,4-CHDA.1,5-PeD 32.6 ± 4.30
1,4-CHDA.1,6-HD 28.5 ± 3.00
1,4-CHDA.NPG 13.3 ± 0.55
1,4-CHDA.CHDM 13.6 ± 1.90

74
0
0.1
0.2
0.3
0.4
0.5
0.6
1,2-EG 1,3-PD 1,4-BD 1,5-PeD 1,6-HD NPG CHDM
Rat
e k'
(mgK
OH
/gre
sin-d
ay)
1st stage2nd stage
Figure 4.4 Hydrolysis rates of end-capped oligoesters made with adipic acid (AA) and
different diols.
0.00
0.05
0.10
0.15
0.20
1,2-EG 1,3-PD 1,4-BD 1,5-PeD 1,6-HD NPG CHDM
Rat
e k'
(mgK
OH
/gre
sin-d
ay)
1st stage2nd stage
Figure 4.5 Hydrolysis rates of end-capped oligoesters made with 1,4-
cyclohexanedicarboxylic acid (1,4-CHDA) and different diols.
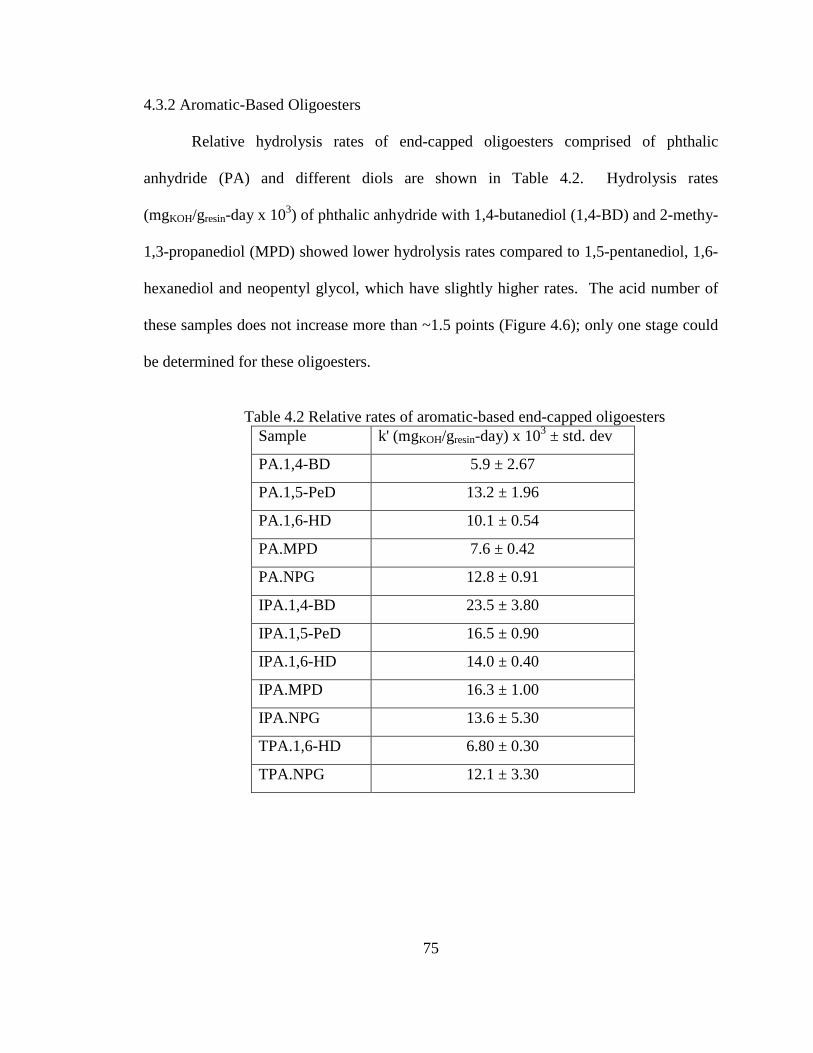
75
4.3.2 Aromatic-Based Oligoesters
Relative hydrolysis rates of end-capped oligoesters comprised of phthalic
anhydride (PA) and different diols are shown in Table 4.2. Hydrolysis rates
(mgKOH/gresin-day x 103) of phthalic anhydride with 1,4-butanediol (1,4-BD) and 2-methy-
1,3-propanediol (MPD) showed lower hydrolysis rates compared to 1,5-pentanediol, 1,6-
hexanediol and neopentyl glycol, which have slightly higher rates. The acid number of
these samples does not increase more than ~1.5 points (Figure 4.6); only one stage could
be determined for these oligoesters.
Table 4.2 Relative rates of aromatic-based end-capped oligoesters
Sample k' (mgKOH/gresin-day) x 103 ± std. dev
PA.1,4-BD 5.9 ± 2.67
PA.1,5-PeD 13.2 ± 1.96
PA.1,6-HD 10.1 ± 0.54
PA.MPD 7.6 ± 0.42
PA.NPG 12.8 ± 0.91
IPA.1,4-BD 23.5 ± 3.80
IPA.1,5-PeD 16.5 ± 0.90
IPA.1,6-HD 14.0 ± 0.40
IPA.MPD 16.3 ± 1.00
IPA.NPG 13.6 ± 5.30
TPA.1,6-HD 6.80 ± 0.30
TPA.NPG 12.1 ± 3.30

76
0.000.020.040.060.080.100.120.140.160.180.20
1,4-BD 1,5-PeD 1,6-HD MPD NPG
Rat
e k'
(mgK
OH
/gre
sin-d
ay)
Figure 4.6 Hydrolysis rates of phthalic anhydride (PA)-based oligoesters and different
diols.
Figure 4.7 shows the hydrolysis rates related to the different mechanisms involved
during the degradation of isophthalic acid (IPA). Samples with short diols, like 1,4-
butanediol and 1,5-pentanediol, showed a change in slope during the last 20 days of the
experiment. Relative hydrolysis rates of IPA-based end-capped oligoesters with different
diols have similar values within experimental error, although the sample made with 1,4-
butanediol is slightly higher than the others. Relative rates of terephthalic acid-end-
capped-based oligoesters are shown in Table 4.2. Both samples present a single stage
with change in acid number of less than 1 mgKOH/gresin (Figure 4.8). Terephthalic acid
(TPA)-based end-capped oligoesters show the lowest hydrolysis rates in the acid system
(pH ~6).

77
0.000.02
0.040.06
0.080.100.12
0.140.16
0.180.20
14BD 15PeD 16HD MPD NPG
Rat
e k'
(mgK
OH
/gre
sin-d
ay)
1st stage2nd stage
Figure 4.7 Hydrolysis rates of IPA-based oligoesters synthesized with different diols.
0.00
0.02
0.04
0.06
0.08
0.10
0.12
0.14
0.16
0.18
0.20
1,6-HD NPG
Rat
e k'
(mgK
OH
/ gr
esin
-day
)
Figure 4.8 Hydrolysis rates of terephthalic acid (TPA)-based end-capped oligoesters.

78
4.3.3 Base Catalyzed Hydrolysis of Model Compounds
Hydrolysis studies of end-capped model compounds were performed at a pH of
8.5-9. Comparison of overall hydrolysis rates between the acid- and base-catalyzed
systems is shown in Figure 4.9. Base-catalyzed systems showed higher hydrolysis rates
compared to the acid system. The only exception was AA.1,4-BD, which shows a slight
decrease in hydrolysis rates. The following samples showed an increase of more than
100%: IPA.1,6-HD (670%); PA.1,4-BD (540%); IPA.NPG (200%) AND TPA.1,6-HD
(110%), all aromatic based oligoesters. Similar to the acid-catalyzed system, adipic acid
(AA)-based oligoesters showed the highest rates. Opposite to what was observed in the
acid system where 1,4-CHDA based oligoesters were less stable than the aromatic-based
samples, in the basic system the rates of aromatic compounds performed more similarly
than 1,4-CHDA based samples. In some cases aromatic compounds were less stable than
1,4-CHDA, such as in the case of: PA.1,4-BD; IPA.1,4-BD; IPA.1,6-HD and IPA.NPG.
0.00
0.02
0.04
0.06
0.08
0.10
0.12
0.14
AA.14AA.16
AA.NPG
CHDA.14
CHDA.16
CHDA.NPG
PA.14BD
PA.16HD
PA.NPG
IPA.14BD
IPA.16HD
IPA.NPG
TPA.16HD
TPA.NPG
k' (m
g KO
H/g
resin
-day
)
AcidBase
Figure 4.9 Comparison of overall hydrolysis rates of acid- and base-catalyzed hydrolysis.
79
4.4 Discussion
Previous studies suggested that equilibrium reactions are governed by the
principles of steric effects in both directions.5,6,96
Table 3.3
Thus, according to the idea of “easy to
make, easy to break and hard to make, hard to break” no correlation is observed between
reaction time of oligoester synthesis and ease of hydrolytic degradation. As shown in
, end-capped oligoesters comprised of adipic acid (AA) and 1,4-BD (4.43h),
1,5-PeD (4.33h), neopentyl glycol (4.50h) and 1,4-CHDA.16 (4h) and 1,4-CHDA.NPG
(2.50h) were synthesized in a period of less than 5 hours, the lowest reaction time among
all the samples. These oligoesters were expected to perform poorly according to
aforementioned rule of thumb. However, those oligoesters show better hydrolytic
stability compared to oligoesters of AA.1,2-EG (trxn = 7h) or CHDA.1,2-EG (trxn = 11h)
which have the longest reaction times, but have poor hydrolytic stability. These trends
were previously observed by Johnson et al,7 who suggested that solvent effects should
also be considered since the media around the transition state during the polyester
synthesis are different from the polar acetone/water solution used for hydrolysis.
Additionally, the presence of a catalyst (DBTO) during the esterification reaction, which
was not present during hydrolysis, could also cause the difference in the reaction trends.
4.4.1 Steric and Anchimeric Effects
A comparison of oligoesters made from adipic acid and different diols (Figure
4.4) shows a decline in the initial hydrolysis rates even though oligoesters composed of
1,3-PD; 1,4-BD; 1,5-PeD; and 1,6-HD were expected to behave alike due to the
similarity of steric factors (SF= 15, Table 3.5). According to previous studies,4,6 linear

80
oligoesters with three or more carbon spacers inbetween ester groups have similar
anchimeric effects and should show hydrolysis rates independent of the number of
carbons between ester groups. It is presumed that initial hydrolysis rates are influenced
by the low steric hindrance provided by the linear monomers and, to a lesser extent, by
the autocatalysis effects caused by the small concentration of carboxyl acid end-group of
adipic acid. The low quantities of hydroxyl groups formed during the initial reactions
might trigger the autocatalysis by a back biting mechanism of terminal hydroxyl groups
with the carbonyl oxygen. Since the ease of the back biting mechanism formation of the
different hydroxyl terminal groups depends on the ease of cyclic formation, different
rates are observed for the different diols.
For example, AA.1,2-EG oligoesters create an oligoester that has a flexible linear
chain with a very low steric hindrance structure, prone to the attack of water. Initial
reactions create a low concentration of –COOH and –OH groups that set off an
autocatalytic reaction. Both adipic acid and 1,2-ethylene glycol have the ideal structure
for the formation of cyclic structures at the chain ends which can enhance autocatalysis
(Figure 4.10). The two carbon spacer diol located at the end of the chain can readily
twist and form a hexagonal cyclic structure that is stabilized by the formation of
hydrogen bonds (Figure 4.10a). Despite being a longer molecule compared to 1,2-EG,
adipic acid can also undergo a ‘back biting’ mechanism when the two electrons of the
carbonyl oxygen of the ester group located at the chain ends align with the carbonyl
carbon of the carboxyl-terminated group, compensating for the electron density
deficiency and forming a stable seven member cyclic structure (Figure 4.10b). The
formation of this cyclic structure locks the molecule in one position, allowing the

81
nucleophilic attack to the electron deficient carbonyl carbon located at the inner position.
Diols such as 1,4-BD, 1,5-PeD and 1,6-HD have longer chains that cannot readily form
hydrogen bonds, thus decreasing initial hydrolysis rates compared to oligoesters made
with 1,2-EG and 1,3-PD. In the case of 1,6-hexnediol, the molecule is not capable of
back biting. It is also important to mention that AA.1,4-BD and AA.1,6-HD oligoesters
presented a semi-crystalline structure with melting temperatures at 41°C and 43°C,
respectively, and were not completely soluble in water. However, hydrolysis is expected
to take place in the amorphous phase regardless of water diffusion.44 As it was observed
before, CHDM-based samples2 performed better than predicted by Turpin’s steric factor.
This stability towards water may come from the hydrophobicity of the cyclohexane
ring.8,9
The impact of hydroxyl and carboxyl end groups present in the system can have a
detrimental effect on the hydrolytic stability of the molecules. However, Mortaigne40
observed that the blocking of acidic end groups with carbodiimides did not have a large
impact on the hydrolytic stability, thus emphasizing the effects of hydroxyl groups. On
the other hand, recent studies7 have shown a higher hydrolysis rate impact with a change
of acid monomer than by a change in the hydroxyl moiety. Those studies concluded that
the ease of cyclic structure formation at the chain ends through hydrogen bonding with
acid groups was higher than the hydrogen bonding formed between hydroxyl and ester
groups. Additionally, studies of the effect of particle size on the hydrolysis of PET with
different initial concentrations of carboxyl end groups44 showed a clear correlation
between degradation rates and initial carboxyl groups caused by an autocatalytic
mechanism due to the hydrogen bond formation at the carboxyl terminated chains. These

82
studies also showed that hydrolysis occurred in amorphous regions and was not
controlled by diffusion of water into the sample.
a)
OO
OO
OO
OH
O
O
OH
H
b)
O
HO
O
O
O
O
O
O
O
O
OH
O
O
O
Figure 4.10 Intramolecular catalyzed hydrolysis of telechelic groups by hydrogen bonding: (a) two carbon spacer diol (b) four carbon spacer carboxylic acid.
Therefore, in the case of linear aliphatic oligoesters, initial hydrolysis is set off by
the low steric hindrance and the increase of free carboxyl and hydroxyl groups. Due to
the low steric hindrance and ease of intramolecular catalysis, oligoesters with hydroxyl
terminated diols with 2 and 3 carbons (1,2-EG and 1,3-PD) hydrolyze faster than their
carboxyl counterparts. Elimination of hydroxyl end-groups from the chain leaves an
excess of carboxyl terminated groups that slow down the reaction (2nd stage). As the

83
reaction progresses, the molecules become smaller and smaller, colliding more often and
keeping the degradation reaction moving forward at a faster pace for the formation of the
third stage.
A more controlled environment is observed in the hydrolysis of 1,4-CHDA-based
end-capped oligoesters, shown in Figure 4.5. Samples of 1,4-CHDA with linear diols
(1,3-PD; 1,4-BD; 1,5-PeD; 1,6HD) show similar reaction rates due to the same level of
steric hindrance (SF = 15) according to Turpin’s equation (Table 3.5). Additionally, the
anchimeric effects through end-groups are suppressed due to the large number of carbons
inbetween hydroxyl terminated functionalities and the nearest ester group. Comparison of
1,4CHDA-based end-capped oligoesters with hydroxyl-terminated 14CHDA-based
oligoesters used by Johnson et al7 (Table 4.3) shows the following percent reduction in
overall hydrolysis rates: 1,3-PD (51%), 1,4-BD (62%), 1,6-HD (53%), NPG (62%),
validating the absence of hydroxyl end groups of the oligoester used in these research. In
the case of 1,4-CHDA.1,2-EG, the first stage of hydrolysis (~220 x 10-3 mgKOH/gresin-day)
is around 2.7 times higher than the first stage of the end-capped 1,4-CHDA.12EG (~80 x
10-3 mgKOH/gresin-day), confirming again the detrimental effect of end group
functionalities capable of back biting on hydrolysis rates.
The 1,4-cyclohexanedicarboxylic acid (1,4-CHDA) based end-capped oligoesters
with 2 to 6 carbon diols show a lower hydrolysis rate compared to AA-based due to the
hindrance provided by the more bulky structure of the cycloaliphatic acid (1,4-CHDA).
Initial rates are controlled by the hindrance provided by the diol. Samples containing 1,2-
ethylene glycol have lower steric values (SF=13), a characteristic that makes the
molecule vulnerable to the attack of water and produces higher initial rates compared to

84
other compounds. Once the hydroxyl (-OH) and carboxyl acid (-COOH) functional
groups start to form, these samples can readily form cyclic structures which lock the
oligomers in one position, facilitating the attack of water (Figure 4.11). After the initial
removal of the terminal diols, oligoesters are left with an acid structure. Therefore,
hydrolysis rates are lowered due to the presence of 1,4-CDHA as terminal group, which
hinders the attack of water (2nd stage, Figure 4.5). Although there is a possibility for a
1,4-CHDA (-COOH) terminated oligoester to autocatalyze the hydrolysis reaction, when
this monomer assumes the boat conformation (Figure 4.11), the carbonyl oxygen of the
functional end-group attacks the carbonyl carbon at the other side of a cis-1,4-CHDA.
However, torsional strain and flagpole interactions can destabilize this conformer.48
Table 4.3 Comparison of hydrolysis rates of hydroxyl terminal7 and end-capped oligoesters
Sample k' (mgKOH/gresin-day) x 103
-OH terminated oligoesters
end-capped oligoesters
AA.NPG 183 ± 5.7 82.2 ± 1.53
1,4-CHDA.1,3-PD 95.6 ± 2.1 46.2 ± 0.13
1,4-CHDA.1,4-BD 61.3 ± 2.1 23.5 ± 1.11
1,4-CHDA.1,5-PeD 65.9 ± 2.5 32.6 ± 4.28
1,4-CHDA.NPG 35.4 ± 2.8 13.6 ± 1.89
1,4-CHDA.IPA.NPG 37.0 ± 2.3 -
IPA.NPG - 13.6 ± 5.34
PA.NPG 89.1 ± 9.2 12.8 ± 0.91

85
a)
O OO
OOH
O
O
b)
OO
OO
CC OOH
OO
OO CC O
HOO
O
Figure 4.11 Intramolecular catalysis of 1,4-CHDA.12-EG oligoesters: a) ethylene glycol in one end (stable conformation) and b) in the other end the anchimeric effect of cis-
14CHDA in boat position (unstable conformation).
In the case of aromatic based oligoesters, despite the fact that the phenyl groups
provide little steric hindrance, unless ortho-substitution is present,51 the electron donating
properties of the aromatic groups stabilize the electron deficiency of the carbonyl carbon
of ester groups and limit the nucleophilic attack. Thus, the bulky structure due to ortho-
substituents in phthalic anhydride-based oligoesters, combined with the rigidity provided
by the aromatic ring and resonance effects, makes almost impossible the attack of water
to the carbonyl carbon (Figure 4.12b). Hence, the low hydrolysis rates observed in these
experiments. Isophthalic acid-based oligoesters also showed low hydrolysis rates (Figure
4.7) caused by the limited solubility of IPA in water (explained in the following section)
and resonance effects. After the slow removal of terminal IPA groups, hydrolysis rates of
IPA.1,4-BD and IPA.1,5-PeD slightly increase due to the low hindrance provided by
linear diols on ester groups. Samples of IPA.NPG have the highest steric factor, thus
showing the lowest overall hydrolysis rate, as expected. Within experimental error,
initial stages of all the diols used in the IPA-based oligoesters (1,4-BD; 1,5-PeD; 1,6-HD

86
and MPD) are practically the same, supporting the fact that initial attack occurs on
carboxylic acid end groups.
O
O
O
O
OO
O O
(a) (b) Figure 4.12 Phthalate esters: (a) autocatalytic effect caused by nearby carboxylate ions;
(b) sterically hindered phthalic anhydride-based oligoesters.
Data in Table 4.3 clearly show the difference between hydroxyl terminated and
end-capped aromatic-based oligoesters. Hydroxyl terminated PA.NPG oligoesters have
poor hydrolytic stability, with a performance comparable to 1,4-CHDA.1,3-PD. It can be
inferred from samples of 14CHDA.NPG and 14CHDA.IPA.NPG that the hydrolysis rates
of -OH terminated IPA.NPG may also be around 35 to 37 x103 mgKOH/gresin-day.
Therefore, hydrolytic stability of –OH terminated samples increase in the following way:
PA.NPG < 1,4-CHDA.IPA.NPG ≤ 1,4 -CHDA.NPG. On the other hand, end-capped
oligoesters showed a completely different behavior. In the end-capped oligoesters,
PA.NPG compounds showed the best hydrolytic stability and IPA- and 1,4-CHDA-based
samples performed similarly just as in the case of hydroxyl terminated, but with lower
hydrolysis rates. This shift in hydrolytic stability is dependent on the fact that functional
end groups are close to ester groups in the phthalic acid samples, where anchimeric
effects can take place easily (Figure 4.12a). Actually, the acid dissociation constant
(Table 4.4) for phthalic acid (129) is higher than for IPA (29) or 1,4-CHDA (6.6), which
implies that phthalic acid can be found in ionized formed and can auto-catalyze the

87
reaction by anhydride formation (Figure 4.12a). Yet, the oligoesters that are end-capped
are structurally unable to coil and form hydrogen bonds that can catalyze the hydrolysis
reaction. (Figure 4.12b).
Similar behavior was previously observed in studies of methyl hydrogen phthalate
and isophthalate ester.10,37,97
Table 4.2
Hydrolysis rates were considerably higher (one order of
magnitude) for phthalates compared to the corresponding isophthalte ester. The
hydrolysis of phthalate half-esters was characterized by an autocatalytic effect caused by
the carboxylate ion in systems with a pH 4-7. Accordingly, results in show that
elimination of end-groups by end-capping increases the hydrolytic stability of ortho-
substituted dibasic acid (PA-based) compared to the corresponding IPA-based
oligoesters. In the present study, hydrolysis is restricted (rate-determining) by steric
hindrance and rotational strain. Figure 4.12 shows a schematic representation of
hydrolysis of PA-based oligoesters with functional end-groups (a) and the elimination of
anchimeric effects (b).
4.4.2 Hydrophobicity Effects
Adipic acid (AA)-based end-capped oligoesters present the highest difference (92
x10-3 mgKOH/gresin-day) between hydrolysis rates among samples made with 1,4-BD; 1,5-
PeD; 1,6-HD; NPG; and MPD, followed by 1,4-CHDA-based oligoesters with a
difference of 19 x10-3 mgKOH/gresin-day for samples made with the above mentioned diols.
IPA-based end-capped oligoester, as well as PA, showed a difference of 9.5 x10⁻³
mgKOH/gresin-day and 7.6 x10⁻³ mgKOH/gresin-day, respectively. Oligoesters containing
terephthalic acid (TPA) showed the lowest values among samples made with 1,6-

88
hexanediol (6.80 x10⁻³ mgKOH/gresin-day) and neopentyl glycol (12 x10-3 mgKOH/gresin-
day). Since the same diols are used for comparison, an explanation of the disparity in
hydrolysis rates based on the steric factors (SF) of the dibasic acids (SF: 1,4-CHDA = 24,
PA= 24, IPA = 17, AA=15, TPA=15) seems unlikely. According to steric values, PA-
and 1,4-CHDA-based samples would outperform any other sample. On the other hand,
according with steric factors, oligoesters made with AA-, and TPA-based oligoesters
should have similar hydrolysis rates and equally poor performance. However, TPA-
based oligoesters showed hydrolysis rates 85% lower than the AA-based counterparts,
which is opposite to that which is predicted by steric values.
The disparity between rates seems to be based on the hydrophobicity of the
dibasic acids rather than in the steric factors of the monomers. Jones and McCarthy16
observed that hydrophobic polyesters showed greater hydrolytic stability than hydrophilic
ones. When the molecule has a low affinity towards water, it coils (micelle formation)
into itself protecting the ester group from attack in an aqueous environment. Table 4.4
shows the acid dissociation constant and water solubility of dibasic acids. It can be
observed that although adipic acid (AA) is a weak acid (low dissociation constant), it has
the highest solubility in water (at least one order of magnitude). Relative rates of
oligoesters made with 1,4-BD; 1,5-PeD; 1,6-HD; NPG; and MPD are in fact much higher
(an order of magnitude) for AA-based oligoesters compared to other oligoesters (Table
4.1 and Table 4.2). Opposite to adipic acid (AA), phthalic acid (PA) is the strongest acid
(high Ka); however, its low water solubility and high steric value give high hydrolytic
stability to the oligoesters made with this monomer. Additionally, supporting the fact
that hydrophobicity plays a key role is the hydrolytic stability of the other two aromatic
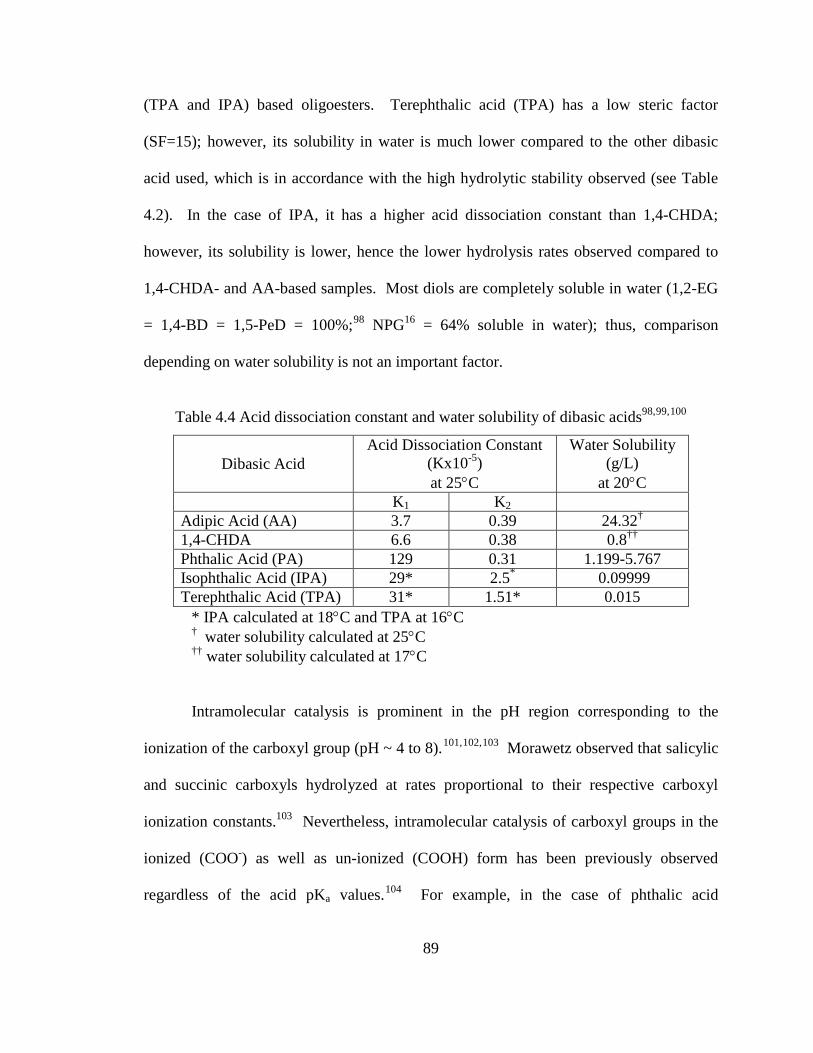
89
(TPA and IPA) based oligoesters. Terephthalic acid (TPA) has a low steric factor
(SF=15); however, its solubility in water is much lower compared to the other dibasic
acid used, which is in accordance with the high hydrolytic stability observed (see Table
4.2). In the case of IPA, it has a higher acid dissociation constant than 1,4-CHDA;
however, its solubility is lower, hence the lower hydrolysis rates observed compared to
1,4-CHDA- and AA-based samples. Most diols are completely soluble in water (1,2-EG
= 1,4-BD = 1,5-PeD = 100%;98 16 NPG = 64% soluble in water); thus, comparison
depending on water solubility is not an important factor.
Table 4.4 Acid dissociation constant and water solubility of dibasic acids98,99,100
Dibasic Acid
Acid Dissociation Constant (Kx10-5) at 25°C
Water Solubility (g/L)
at 20°C K1 K2 Adipic Acid (AA) 3.7 0.39 24.32† 1,4-CHDA 6.6 0.38 0.8††
Phthalic Acid (PA) 129 0.31 1.199-5.767 Isophthalic Acid (IPA) 29* 2.5* 0.09999 Terephthalic Acid (TPA) 31* 1.51* 0.015
* IPA calculated at 18°C and TPA at 16°C † water solubility calculated at 25°C †† water solubility calculated at 17°C
Intramolecular catalysis is prominent in the pH region corresponding to the
ionization of the carboxyl group (pH ~ 4 to 8).101,102,103
103
Morawetz observed that salicylic
and succinic carboxyls hydrolyzed at rates proportional to their respective carboxyl
ionization constants. Nevertheless, intramolecular catalysis of carboxyl groups in the
ionized (COO-) as well as un-ionized (COOH) form has been previously observed
regardless of the acid pKa values.104 For example, in the case of phthalic acid

90
monoesters, intramolecular catalysis by carboxyl anion occurs when good leaving groups
are present as in the case of trifluoroethyl hydrogen phthalate or phenyl hydrogen
phthalate. This reaction is a nucleophilic catalysis with intermediate anhydride
formation. On the other hand, phthalic acid monoesters derived from weak acid alcohols
(poor leaving groups) such as methyl hydrogen phthalate or chloroethyl hydrogen
phthalate are catalyzed by carboxylic acids end groups (un-ionized) through pre-
equilibrium protonation (see Figure 4.13 a-b).104 The switch in mechanism was caused
by the tendency of functional groups to leave more easily. Thus, phthalic acid
monoesters with leaving groups having high pKa values were catalyzed by COO-; in
contrast, leaving groups with low pKa values were catalyzed by COOH groups, the
crossover occurring at a pKa value of ca. 13.5 of the leaving group.104 At the crossover
point, hydrolysis of half esters of phthalic acid was catalyzed by both COOH and COO-
groups (Figure 4.13).
Similar observations were made by Bender et al105
105
who studied the hydrolysis of
phthalamic acid. Kinetic studies showed that intramolecular catalysis occurred through
undissociated carboxylic acid. Bender et al proposed two mechanisms for the
intramolecular process: one involving simultaneous electrophilic-nucleophilic
intramolecular process (Figure 4.13c) and the other having both reactions in two separate
steps (Figure 4.13d). The o-carboxylic acid performed as a bifunctional catalyst
attacking simultaneously the carbonyl atom of the amide (nucleophilic) and donating a
proton (electrophilic) to the departing ammonia with the formation of phthalic anhydride.
Subsequently, the phthalic anhydride was hydrolyzed to phthalic acid in a fast step. The
pKa values of the linear diols used in this study for the synthesis of aromatic compounds

91
(1,2-EG = 13.6 and 1,3-PD = 1,4-BD = 15.1)106
Figure 4.13
indicate that intramolecular catalysis (if
any) occurs through carboxyl groups in the un-ionized form. shows the
possible mechanism for intramolecular catalysis through COOH and COO- groups.

92
a)
OH
O
O
O
Keq O
HO
O
O
RH
OH
R
b)
KeqOH
O
O
O
R
O
HO
O
O
R
c)
O
O
O
O
H
R
δ−
δ+δ−
δ+
d)
O
C
O
OROH
OH
C
O
O
ORO
C
O
RO OH
O
C
O
O
H2O OH
O
O
OH
e)
OH
OR
O
O
Ka O
OR
O
O
k1
-RO-
O
O
O
H2O OH
O
O
OH
Figure 4.13 Proposed mechanisms104,105 of hydrolysis autocatalyzed by carboxylic acid (COOH) groups through a) pre-equilibrium protonation, b) pre-equilibrium protonation,
electrophilic-nucleophilic by c) simultaneous attack and d) as a two step reaction; e) autocatalysis by carboxylate ion(COO-).

93
4.4.3 Acid vs. Base Catalyzed Hydrolysis
Hydrolysis reactions catalyzed either by a base or an acid proceed through a
tetrahedral intermediate. However, in the base-catalyzed mechanism a neutral reactant
becomes negatively charged during the transition state (rate determining step), while in
acid-catalyzed hydrolysis the reactant becomes positively charged before going through
the transition state, maintaining its polarity through the formation of the activated
complex (Figure 4.14). Therefore, in acid catalyzed hydrolysis, polar effects are of no
consequence,30 but in the case of base catalyzed hydrolysis, polar interactions are
important.51 For example, it has been observed that ethyl propionate causes only a small
decrease in the rate of acid-catalyzed hydrolysis in aqueous acetone compared to ethyl
acetate. Similarly, ethyl chloroacetate only gives a slightly higher decrease in hydrolysis
rates.51
a)
RC
OR'
O+H2O
C
OOR'R
OH2
H
RC
OR'
OH
RC
OR'
O H+
δ+
δ−H+
OH2
-R'OH
RC
OH
O
H
b)
RC
OR'
OOH - O OR'
ROH R
OH
O R'O-
OR' R OH
O
Figure 4.14 Transition states developed during the hydrolysis of polyesters: a) acid-catalyzed and b) base-catalyzed.

94
In the case of aromatic-based oligoesters (PA, IPA, and TPA), base-catalyzed
hydrolysis rates are enhanced by the higher dissociation constants compared to pKa
values of 1,4-CHDA. Electron withdrawing groups, especially in the ortho- and para-
positions, increase the partial positive charge on the carbonyl carbon, making the carbon
more susceptible to nucleophilic attack. On the other hand, in acid-catalyzed hydrolysis,
where polar effects (pKa) do not influence the reaction, 1,4-CHDA-based oligoesters
show a lower hydrolytic stability compared to aromatic oligoesters due to higher water
solubility. In the case of aromatic-based samples, the electron donating properties (i.e. α-
β-unsaturation) of the phenyl ring stabilize the electron deficiency of the carbonyl carbon
in the ester groups by resonance, despite the fact that the ring provided little steric
hindrance unless ortho-substitution was present.16,51 For example, acid catalyzed
hydrolysis rates of substituted benzoate esters showed that para-nitro substituents
hydrolyzed more than twenty times as fast as the ester with the nitro group in the ortho
position, indicating a clear steric effect.30 Therefore, comparison between hydrolysis
rates in acid catalyzed systems is due to steric effects in the case of aliphatic monomers;
however, hydrolytic stability of aromatic diacids is based on resonance effects and
solubility.
Nucleophilic aromatic reactions can be divided in two general types: activated
and unactivated.51 These two types of reactions are characterized by the presence or
absence of an ortho or para electron donating substituent. These reactions proceed
through an almost tetrahedral intermediate with a planar reaction center and which
formation or decomposition controls the rate of the reaction.107,108,109 Substituents that
donate electrons by induction are activating and form stable structures when the reaction

95
center is at the ortho- or para- positions. However, carboxylic acid and ester substituents
are electron withdrawing groups, which are known for deactivating the aromatic ring
through resonance.110
These substituents destabilize the carbocations formed at all
positions in the ring. However, when deactivating substituents are at meta- positions,
they can be less destabilizing than if they were at the ortho- or para- positions (Figure
4.15). Therefore, in basic systems hydrolysis reactions of isophthalic acid (IPA)-based
oligoesters are favored compared to phthalic (PA) and terephthalic acid (TPA) (Figure
4.9), whose rates are comparable due to the similarities of resonance structures (Figure
4.15).

96
a)
C
C
O OH
O
OH C
C
O OH
O
OH C
C
O OH
O
OHC
C
O OH
O
OH
Strongly destabilizedcation
b)
C
C
O OH
O
OH
C
C
O OH
O
OH
CH
C
O OH
O
OH
C
C
O OH
O
OH
Less destabilizedcation
c)
C
C
O OH
O OH
C
C
O OH
O OH
CH
C
O OH
O OH
C
C
O OH
O OH
Strongly destabilizedcation
Figure 4.15 Resonance structures of aromatic groups a) ortho-COOH substituents, b) meta-COOH substituents, and c) para-COOH substituents.

97
4.4.4 Proposed Hydrolysis Model
A proposed model (Figure 4.16) based on end-capped oligoesters and hydroxyl-
terminated oligoesters was established as follows: the first stage of hydrolysis is
controlled by steric effects, hydrophobicity, the glass transition temperature (free
volume), and pre-established anchimeric effects. The chemical structure and the ability
of hindering water attack are initially controlled by the bulkiness or the number of nearby
atoms surrounding the reaction center (carbonyl group). The glass transition temperature
(although eliminated in the solution) also affects the initial stage because it affects the
amount of water that is in contact with the material. Additionally, the Tg also affects the
mobility of the molecule by limiting the free volume. Subsequent reactions occur by the
increase of hydroxyl groups, which enhance a back-bitting mechanism (intra-molecular
catalysis). Additionally, inter-molecular catalysis is also present. Finally, the hydrolysis
mechanism ends up in the reaction of small molecules (mono-, di-esters) colliding with
each other. Steric and anchimeric effects are both present; however, due to the diffusion
of polymer chains and the molecular weight, these effects are different for small chains.
Depending on the initial chemical structure of the oligoester, the degradation
mechanism starts in the first or second stage. In the case of adipic acid-based oligoesters,
initial hydrolysis rates showed a complex behavior where the lack of steric hindrance and
the ease of the molecules to back-bite play an important role. In the general model, the
AA-based oligoesters start at the second stage, where the end-group plays a predominant
role. The formation of –OH and -COOH end groups during this stage trigger
autocatalysis, which causes the high hydrolysis rates observed compared to other
oligoesters. Eventually the formation of small chains and the lower concentration of ester

98
groups compared to initial stages decrease the hydrolysis rates. In the case of 1,4-
CHDA-based samples, a more controlled scenario is present due to the nature of the
dibasic acid. The hydrolysis mechanism starts in the first stage of the model, where steric
hindrance dominates the initial hydrolysis rates. Aromatic-based oligoesters showed
hydrolysis rates influenced by the rigidity of the phenyl ring, resonance effects and
hydrophobicity, which position these oligoesters in the first stage of the proposed model.

99
Figu
re 4
.16
Pro
pose
d hy
drol
ysis
mod
el.

100
4.5 Conclusions
The end-capping of hydroxyl-end groups with phenyl isocyanate allowed the
study of hydrolytic stability of oligoesters used in crosslinked compounds. Drastic
reductions in hydrolysis rates were observed between hydroxyl-terminated oligoesters
and phenyl isocyanate end-capped samples. No correlation was observed between the
forward esterification reaction and the reverse hydrolysis reactions. Hydrolysis rates for
the different sets studied decrease as follows: AA > 1,4-CHDA > IPA > PA > TPA. A
three-stage mechanism was proposed based on the hydrolysis data obtained from end-
capped oligoesters. Depending on the chemical structure of the polymer, the hydrolysis
mechanism can start at the first or second stage. In the case of AA-based oligoesters,
initial hydrolysis rates showed a complex behavior in which the low steric hindrance and
the ease of hydrogen bond formation (back biting mechanism) play a mutual role. It was
suggested that oligoesters containing adipic acid start at the second stage of the proposed
hydrolysis mechanism. In the case of 1,4-CHDA based oligoesters, a more controlled
scenario is present due to the nature of the diacid. Steric hindrance plays an important
role in the initial hydrolysis stage; thus, the degradation mechanism starts at the first
stage of the proposed model. In the case of aromatic dibasic acids, solubility plays an
important role in the hydrolysis in acid media.
101
CHAPTER V
THERMODYNAMIC STUDIES OF THE HYDROLYSIS OF END-CAPPED
OLIGOESTERS: A LINEAR CORRELATION APPROACH TO COMPARE STERIC
AND ANCHIMERIC PATHWAYS
5.1 Abstract
Hydrolysis studies were performed on a series of end-capped oligoesters at four
different temperatures (25, 40, 50 and 60°C). The oligoesters were chosen in order to
observe steric and anchimeric effects and their linear correlation with thermodynamic
parameters. Comparison of different dibasic acids such as adipic acid, 1,4-
cyclohexanedicarboxylic acid, and hexahydrophthalic anhydride was performed by using
neopentyl glycol as the common diol. Linear diols such as 1,3-propanediol and 1,6-
hexanediol were also used. Linear dependence of hydrolysis rates with temperature was
observed. Initially, isokinetic relationship (IKR) as well as enthalpy (∆H‡)-entropy (∆S‡)
compensation pointed to a single mechanism of reaction for all compounds. However,
further treatment of the data was necessary due to the implication of using the same data
set in the calculation of IKR and enthalpy-entropy compensation, which can result in a
statistical misinterpretation rather than a true chemical condition. Results proved that
thermodynamic data can be successfully used to determine different reaction mechanisms
in the hydrolysis of polyesters.

102
5.2 Introduction
Correlation analysis has been widely used in organic chemistry to describe the
influence of certain parameters on reactions rates. Usually these empirical correlations
are linear relationships involving logarithms of rate (k) or equilibrium (K) constants.111
Some of the first studies on correlation analysis involving rate or equilibrium constants
were the ones of Hammett,112
51
who developed the Hammett equation, which described the
influence of meta- and para-substituents on the side-chain reactions of benzene
derivatives, which were almost entirely polar in nature. However, the identification of
linear correlation was not easy due mainly to the presence of steric effects in aliphatic
and ortho- substituted aromatic systems. In 1957, however, Taft moved forward in this
area by identifying the polar, steric, and resonance effects. Based on the work of
Hammett and Taft, a variety of substituent and reaction parameters have been proposed in
order to help understand the influence of molecular structure on chemical reactivity.111
The Arrhenius equation is another widely studied linear correlation in which the
reaction rate (k) is related to temperature. The Arrhenius rate law states that the rate of a
chemical reaction increases exponentially with the absolute temperature,113
RTEa
Aek−
= (5.1)
where Ea is known as the activation energy (J/mol), R is the universal gas constant
(J/(molK), T is the absolute temperature (K) and the parameter A is the pre-exponential
factor also known as the frequency factor. Thermodynamic parameters, such as enthalpy,
entropy, and free energy of activation, can also be derived from these data.

103
In the case of closely related reactions, plots of enthalpy of activation (∆H‡) and
entropy of activation (∆S‡) or pre-exponential factor (A) and activation energy (Ea)
indicate a relationship. These correlations are often found in a wide variety of process
and reaction equilibria including: solid state interdiffusion,114,115 heterogenous
catalysis,116 116 phase equilibria between hydrophobic and hydrophilic phases, and
different biological and pharmaceutical processes,117, 118 just to mention a few. Many of
these examples involve homogenous reactions and equilibria, either in gas phase119 or in
solution: hydrolysis, oxidation-reduction, micelle formation, ionization of weak
electrolytes, solvation of ions and non-electrolytes, among others. 120
120
Different names
have been used to describe these phenomena, for example, the compensation effect, ,121
116
the enthalpy-entropy relationship, the isokinetic or isoequilibrium relationship. ,117,119
Kinetic studies of the hydrolysis of fatty acid esters with different acyl and alkyl
chains in subcritical water are a clear example of this relationship.122 Activation energy
and frequency factors were evaluated according to the Arrhenius equation. It was
observed that methyl esters with longer acyl chains and laurates with longer alkyl chains
had higher values of activation energy and frequency factor. It was determined that the
steric hindrance of the acyl and alkyl chains increased the activation energy of the
hydrolysis. Plots of activation energy versus frequency factor lead to the conclusion that
enthalpy-entropy compensation held for the hydrolysis of all the tested materials,
indicating that the fatty acid esters used hydrolyzed through the same mechanism. In
another example, thermodynamic studies of micelle formation of three Na salts of alkyl
sulfates, dimethylalkylphosphine oxides, and dodecylpyridinium halides had also shown

104
that the enthalpy and entropy changes exhibited a linear correlation for a given chain
length, consistent with a compensation temperature of about 300 K.123
Several authors
119,124,125,126 concluded that the presence of the isokinetic
relationship indicated the presence of only one reaction mechanism. For example, the
partition coefficients of a series of 12 isomeric and homologous pyridylalkylamides in
octanol-water and di-n-butylether-water systems127
125
were divided into two groups
according to the isokinetic relationship. One group was able to form intramolecular
hydrogen bonds (N···H-N), while the other was unable to follow the same path due to the
steric configuration. In studies of the gas-phase dissociation of diatomic molecules in
argon, ,128
However, the linear relationship between the logarithm of the pre-exponential
factor, ln(A), and the activation energy, Ea, has often been questioned as a statistical
artifact arising from the means of evaluation of the kinetic data.
two mechanisms were also determined through the isokinetic relationship:
one group was composed of molecules which dissociated but did not react with argon;
only diatomic fluorine F2 molecules deviated from this group due to their reactivity with
argon.
119,129
129
This problem
arises from the underlying fact that both quantities are obtained from the same data set
making them statistically dependent upon each other. Naghibi et al studied the
discrepancies between van’t Hoff studies and calorimetry studies. These studies showed
that the usual assumption of a linear van’t Hoff plot in studies of the dependence of the
equilibrium constant on temperature variation for equilibria of the type A + B AB was
not always valid. They concluded that ΔHVH (van’t Hoff enthalpy) is temperature-

105
dependent and varies significantly from the true enthalpy, obtained from calorimetry
studies.
Nevertheless, several authors have pointed out that the real problems are in the
means of evaluation. In 1964, Exner130,131
123
proposed a sound statistical test based on the
intersection point (ln (kiso), 1/T iso), proving that both values were statistically
independent. In 1974, Kresheck and Hargraves studied the thermodynamic parameters
for micelle formation using calorimetry and temperature dependence of critical micelle
concentrations, CMC. They observed that the two approaches yielded different results.
Sugihara and Hisatomi121 later suggested that the inconsistency was based on the
equation used to calculate Gibbs energy, ∆G°m=2.303RT log (CMC), which did not take
into account the contribution of counterion binding to free energetical stabilization of
micelles. In the case of ionic surfactants, this equation assumed a state of completely
dissociated micelles, which did not give a true enthalpy value. Using the modified
equation of Gibbs free energy (∆G°m), the results showed that all the surfactants used had
the same slope in the entropy (∆S) vs enthalpy (∆H) plot. However, they all had different
intercepts at ∆H°m=0, which reflected the difference in hydrophobicity between
surfactants.
The objective of this chapter is to elucidate the mechanism of reactions that
involve steric and anchimeric effects by applying linear correlation functions such as the
Arrhenius equation and the enthalpy-entropy compensation. Hydroxyl-terminated
oligoesters were synthesized using a variety of monomers including: adipic acid, 1,4-
cyclohexandicarboxylic acid, sebacic acid, hexahydrophthalic anhydride, 1,3-
propanediol, and 1,6-hexanediol and neopentyl glycol. The hydroxyl-terminated

106
oligoesters were end-capped with phenyl isocyanate in order to eliminate end-group
effects. The oligoesters were dissolved in a water/acetone mixture and place in sealed
containers in a constant temperature water bath. Four different temperatures were used:
25, 40, 50 and 60°C. Hydrolysis rates were obtained from the formation of carboxylic
acid end groups with time (i.e. acid number measurements). Energy of activation and the
Arrhenius pre-exponential factor were obtained from plots of logarithm (k) vs. reciprocal
of temperature. Change in enthalpy, entropy, and free energy of activation were
evaluated from the Eyring equation based on the transition state theory.
5.3 Results
Steric and anchimeric effects are structure-related parameters that have a
profound effect on the hydrolysis rates of esters.9 Additionally, external parameters, such
as the temperature and the pH of the system, affect hydrolysis rates. Studies of these
external parameters on reaction rates can help in the correlation between reaction kinetics
and chemical structure.10,132
Hydrolysis rate constants (k) were evaluated in a water/acetone system. This
system provided an ideal environment in which a large amount of water surrounded each
In this chapter, attempts were made to prove the presence of
mechanisms involving steric and end-group effects through the use of thermodynamic
measurements (i.e. enthalpy and entropy of activation). The samples used in this study
can be divided in two main groups: linear and cyclic groups. The selection was based in
an attempt to observe the steric and ‘back-bite’ mechanisms. Adipic acid (AA) was
chosen in order to observe the back-biting mechanism and neopentyl glycol (NPG) was
used for the comparison of different sterically hindered dibasic acids.

107
molecule, providing a constant water concentration throughout the experiment and
simplifying the reaction rate equation. As in the previous chapter, hydroxyl end-groups
were eliminated by end-capping with phenyl isocyanate. A mono-isocyanate was used as
an end-capper in order to mimic the behavior of the soft segment of poly(ester-based
urethane) coatings. As was stated in previous chapters, the second order rate equation
used to describe the hydrolysis of polyesters can be converted to a zero order rate
equation when satisfying two requirements: 1) when water is present in excess and 2)
when a linear increase of acid number with time is observed during the experiment. Plots
of acid number vs. time were not entirely linear (Figure 5.1 to 5.4). However, the curves
can be sectioned at different points, distinguished by a change in slope, each section
representing different stages of the degradation process.7 These sections are linear and
rate constants, k1, k2, etc, can be defined at each inflection point. Reaction rate constants
were obtained for the eight samples at four different temperatures (25, 40, 50, and 60°C).

108
0
5
10
15
20
25
0 10 20 30 40 50 60 70
Time (days)
D A
ac (
mg K
OH
/ g
res
in)
)
AA.13PDAA.16HDAA.NPGSA.NPGHHPA.NPG14CHDA.NPG14CHDA.13PD14CHDA.16HDLinear (AA.13PD)Linear (AA.16HD)Linear (AA.NPG)Linear (14CHDA.13PD)Linear (14CHDA.16HD)Linear (14CHDA.NPG)Linear (SA.NPG)Linear (HHPA.NPG)
Figure 5.1 Hydrolysis of end-capped oligoesters at 25C.
0
5
10
15
20
25
30
35
40
45
50
0 10 20 30 40 50 60 70 80 90 100time (days)
D A
ac (
mg
KO
H / g
resi
n)
AA.13PDAA.16HDAA.NPGSA.NPGHHPA.NPG14CHDA.NPG14CHDA.13PD14CHDA.16HDAA.NPG2SA.NPG2CHDA.13-2CHDA.16-2AA.13-2Linear (AA.13PD)Linear (AA.16HD)Linear (AA.NPG)Linear (AA.NPG2)Linear (SA.NPG)Linear (SA.NPG2)Linear (HHPA.NPG)Linear (14CHDA.13PD)Linear (14CHDA.NPG)Linear (CHDA.13-2)Linear (14CHDA.16HD)Linear (CHDA.16-2)Linear (AA.13-2)
Figure 5.2 Hydrolysis of end-capped oligoesters at 40C.
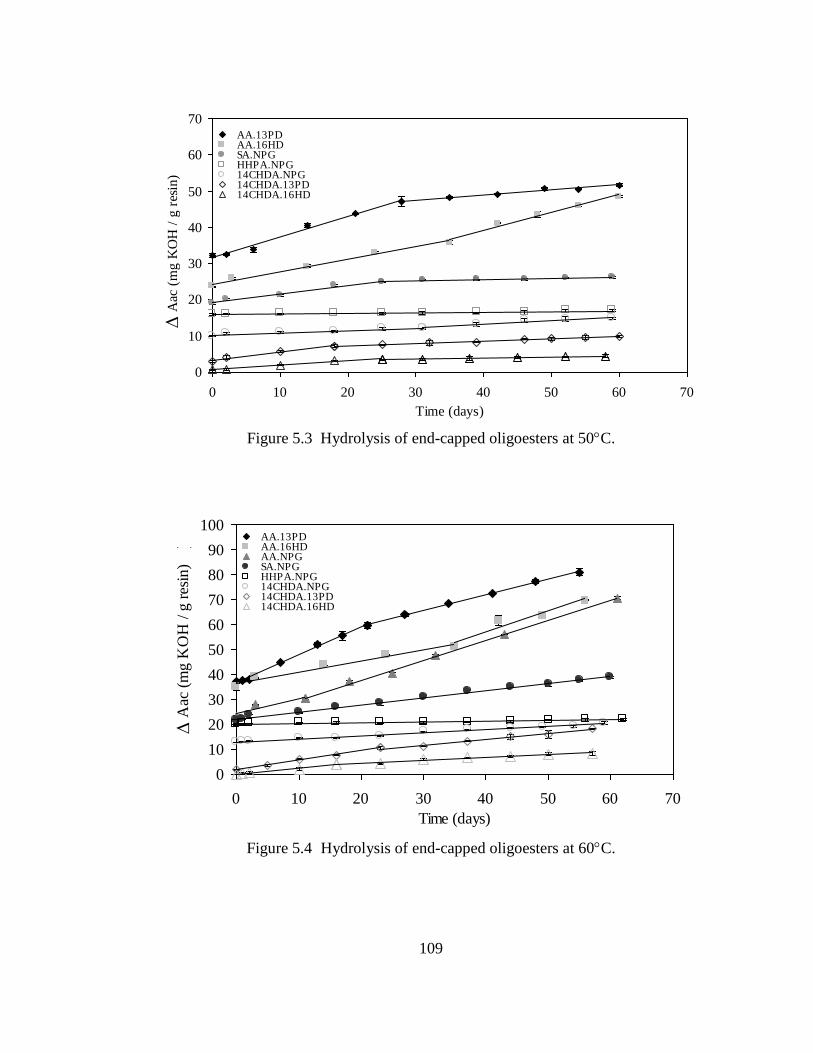
109
0
10
20
30
40
50
60
70
0 10 20 30 40 50 60 70
Time (days)
D A
ac (
mg K
OH
/ g
res
in)
AA.13PDAA.16HDSA.NPGHHPA.NPG14CHDA.NPG14CHDA.13PD14CHDA.16HDAA.NPG2AA.16-2SA.NPG-214CHDA.NPG214CHDA.13PD-214CHDA.16HD-2Linear (AA.13PD)Linear (AA.NPG2)Linear (AA.16HD)Linear (AA.16-2)Linear (SA.NPG-2)Linear (SA.NPG)Linear (HHPA.NPG)Linear (14CHDA.NPG2)Linear (14CHDA.13PD-2)Linear (14CHDA.13PD)Linear (14CHDA.16HD)Linear (14CHDA.16HD-2)Linear (14CHDA.NPG)
Figure 5.3 Hydrolysis of end-capped oligoesters at 50C.
0
10
20
30
40
50
60
70
80
90
100
0 10 20 30 40 50 60 70
Time (days)
D A
ac (
mg K
OH
/ g
res
in)
)
AA.13PDAA.16HDAA.NPGSA.NPGHHPA.NPG14CHDA.NPG14CHDA.13PD14CHDA.16HDAA.13PD2AA.16HD2AA.NPG214CHDA.13PD214CHDA.16HDLinear (AA.13PD2)Linear (AA.13PD)Linear (AA.16HD)Linear (AA.16HD2)Linear (AA.NPG2)Linear (AA.NPG)Linear (SA.NPG)Linear (HHPA.NPG)Linear (14CHDA.NPG)Linear (14CHDA.13PD)Linear (14CHDA.13PD2)Linear (14CHDA.16HD)Linear (14CHDA.16HD)
Figure 5.4 Hydrolysis of end-capped oligoesters at 60C.

110
Subsequently, pre-exponential factors and activation energies were obtained from
these data according to the Arrhenius equation. By taking the logarithm of both sides of
the Arrhenius equation (Equation 5.1), the following equation is obtained:
TREaAk 1lnln ⋅−= (5.2)
A plot of ln k against the reciprocal of the absolute temperature gives a linear plot
(Figure 5.5 – 5.7) where the slope is related to the activation energy (-Ea/R) and the
intercept is equal to ‘ln A’. The pre-exponential factor (A) and the activation energy
(Ea) for the first-stage and second-stage were obtained individually in an attempt to
correlate this data with the steric or anchimeric effects that could possibly be developing
during each stage. Table 5.1 shows the values of the activation energy and pre-
exponential factor for the first and second reaction rate constants of end-capped polyester
samples. All samples showed a correlation coefficient between 0.97 and 0.99 except for
AA.16HD (0.92) and 1,4-CHDA.13PD (0.91).
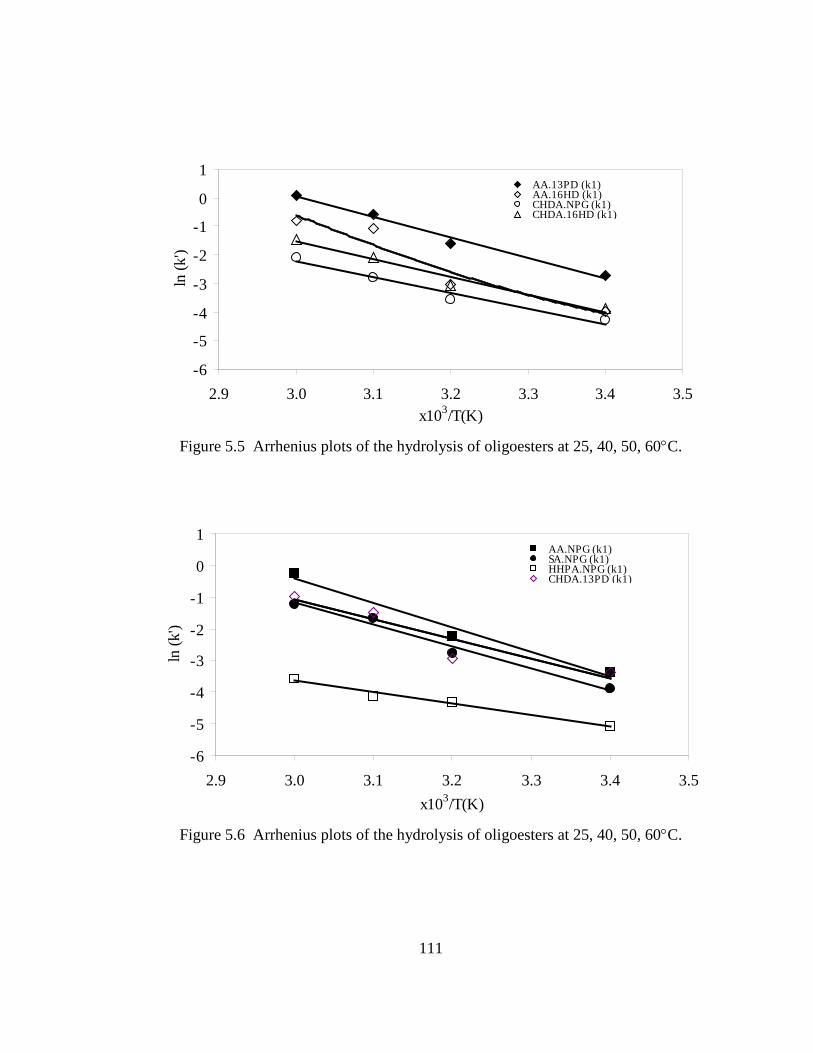
111
-6
-5
-4
-3
-2
-1
0
1
2.9 3.0 3.1 3.2 3.3 3.4 3.5x10³/T(K)
ln (k
')AA.13PD (k1)AA.16HD (k1)CHDA.NPG (k1)CHDA.16HD (k1)
Figure 5.5 Arrhenius plots of the hydrolysis of oligoesters at 25, 40, 50, 60°C.
-6
-5
-4
-3
-2
-1
0
1
2.9 3.0 3.1 3.2 3.3 3.4 3.5x10³/T(K)
ln (k
')
AA.NPG (k1)SA.NPG (k1)HHPA.NPG (k1)CHDA.13PD (k1)
Figure 5.6 Arrhenius plots of the hydrolysis of oligoesters at 25, 40, 50, 60°C.

112
-5
-4
-3
-2
-1
0
1
2
2.95 3.00 3.05 3.10 3.15 3.20 3.25
x103/T(K)
ln (k
')
CHDA.13PD (k2)CHDA.16HD (k2)AA.13PD (k2)
Figure 5.7 Arrhenius plots of the hydrolysis of oligoesters at 25, 40, 50, 60°C.
Table 5.1 Values of pre-exponential factors and activation energies of the hydrolysis of
end-capped oligoester compounds
Sample Name A Ea (KJ/mol)
AA.13PD 5.34E+10 68.13 ± 4.2
AA.13PD (k2) 3.39E+12 81.93 ± 7.0
AA.16HD 1.98E+12 80.16 ± 16.6
AA.NPG 2.36E+11 73.52 ± 9.5
14CHDA.13PD (k1) 9.41E+08 60.09 ± 3.4
14CHDA.13PD (k2) 2.27E+18 121.09 ± 4.0
14CHDA.16HD (k1) 2.81E+08 58.07 ± 5.5
14CHDA.16HD (k2) 1.10E+12 83.15 ± 2.0
14CHDA.NPG 1.71E+07 52.19 ± 5.1
SA.NPG 5.98E+09 65.51 ± 5.7
HHPA.NPG 5.50E+03 33.92 ± 4.2
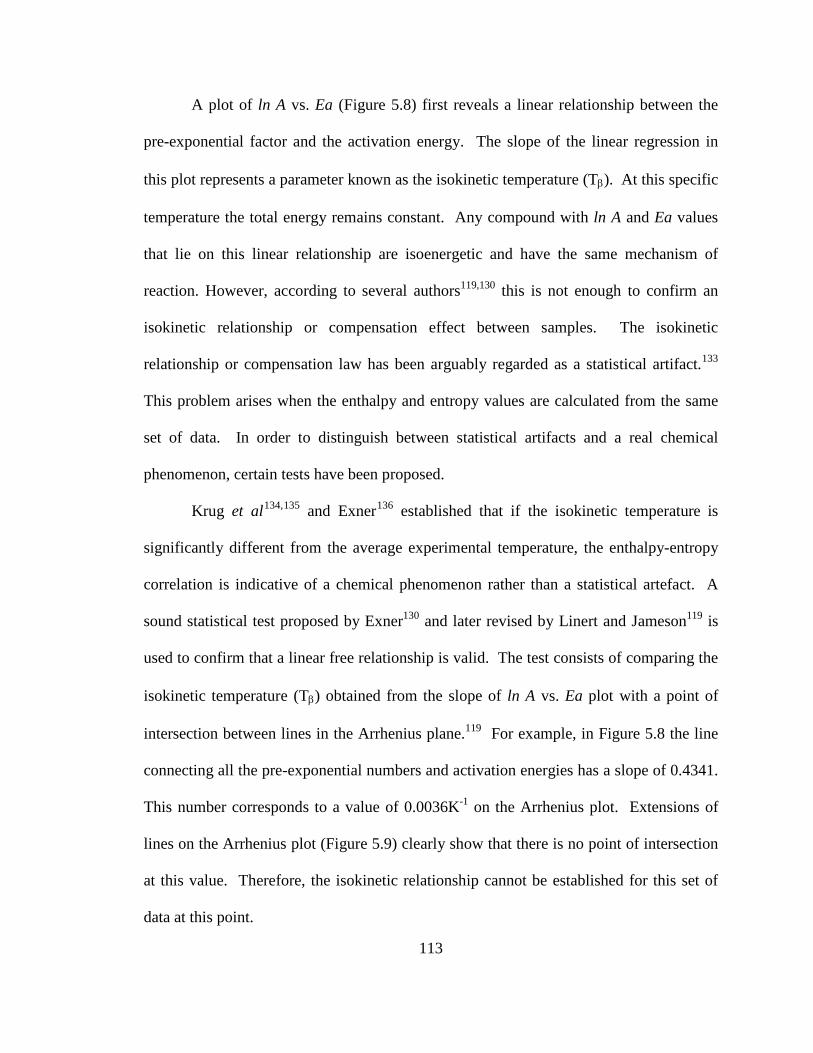
113
A plot of ln A vs. Ea (Figure 5.8) first reveals a linear relationship between the
pre-exponential factor and the activation energy. The slope of the linear regression in
this plot represents a parameter known as the isokinetic temperature (Tβ). At this specific
temperature the total energy remains constant. Any compound with ln A and Ea values
that lie on this linear relationship are isoenergetic and have the same mechanism of
reaction. However, according to several authors119,130 this is not enough to confirm an
isokinetic relationship or compensation effect between samples. The isokinetic
relationship or compensation law has been arguably regarded as a statistical artifact.133
Krug et al
This problem arises when the enthalpy and entropy values are calculated from the same
set of data. In order to distinguish between statistical artifacts and a real chemical
phenomenon, certain tests have been proposed.
134,135 and Exner136
130
established that if the isokinetic temperature is
significantly different from the average experimental temperature, the enthalpy-entropy
correlation is indicative of a chemical phenomenon rather than a statistical artefact. A
sound statistical test proposed by Exner and later revised by Linert and Jameson119 is
used to confirm that a linear free relationship is valid. The test consists of comparing the
isokinetic temperature (Tβ) obtained from the slope of ln A vs. Ea plot with a point of
intersection between lines in the Arrhenius plane.119 For example, in Figure 5.8 the line
connecting all the pre-exponential numbers and activation energies has a slope of 0.4341.
This number corresponds to a value of 0.0036K-1 on the Arrhenius plot. Extensions of
lines on the Arrhenius plot (Figure 5.9) clearly show that there is no point of intersection
at this value. Therefore, the isokinetic relationship cannot be established for this set of
data at this point.

114
y = 0.4341x - 5.8071
0
10
20
30
40
20 30 40 50 60 70 80 90 100Ea (KJ/mol)
ln A
HHPA.NPG
CHDA.NPG
AA.16
AA.NPGAA.13
SA.NPG
CHDA.13CHDA.16
Figure 5.8 Linear relationship between pre-exponential factor (A) and activation energy
(Ea) obtained from the Arrhenius plots. The slope is equal to Tβ = 277 K.
-10
-8
-6
-4
-2
0
2
4
6
0.0024 0.0026 0.0028 0.0030 0.0032 0.0034 0.0036 0.0038 0.00401/T(K)
ln (k
')
AA.13AA.16AA.NPGSA.NPGHHPA.NPGCHDA.NPGCHDA.13PDCHDA.16HD
Tβ
Figure 5.9 Extension of Arrhenius equation to a point of intersection that should converge
at Tβ.

115
However, points of intersection can be observed at two distinct positions
involving different samples (Figure 5.10). The first point is located at 2.50x10⁻³ K-1 (400
K) and includes linear samples containing adipic acid, and 1,3-propanediol (k1); 1,6-
hexanediol (k1); and neopentyl glycol (k1). The second point of intersection is at
3.68x10⁻³ K-1 (272 K) and includes samples of HHPA.NPG (k1), SA.NPG (k1), and
14CHDA.NPG (k1). In fact, AA.NPG (k1) and 14CHDA.16HD (k1) are slightly away
from the conjunction point and can be considered as part of this third group. As will be
shown later, this pattern will be confirmed in enthalpy-entropy plots. Plots of ln(A) vs.
Ea were made for these two sets of oligoesters to prove that this point corresponded to
the isokinetic temperature (inset Figure 5.10). Figure 5.10 shows that a relationship
between chemical structure and reactivity can be made based on the isokinetic
relationship.
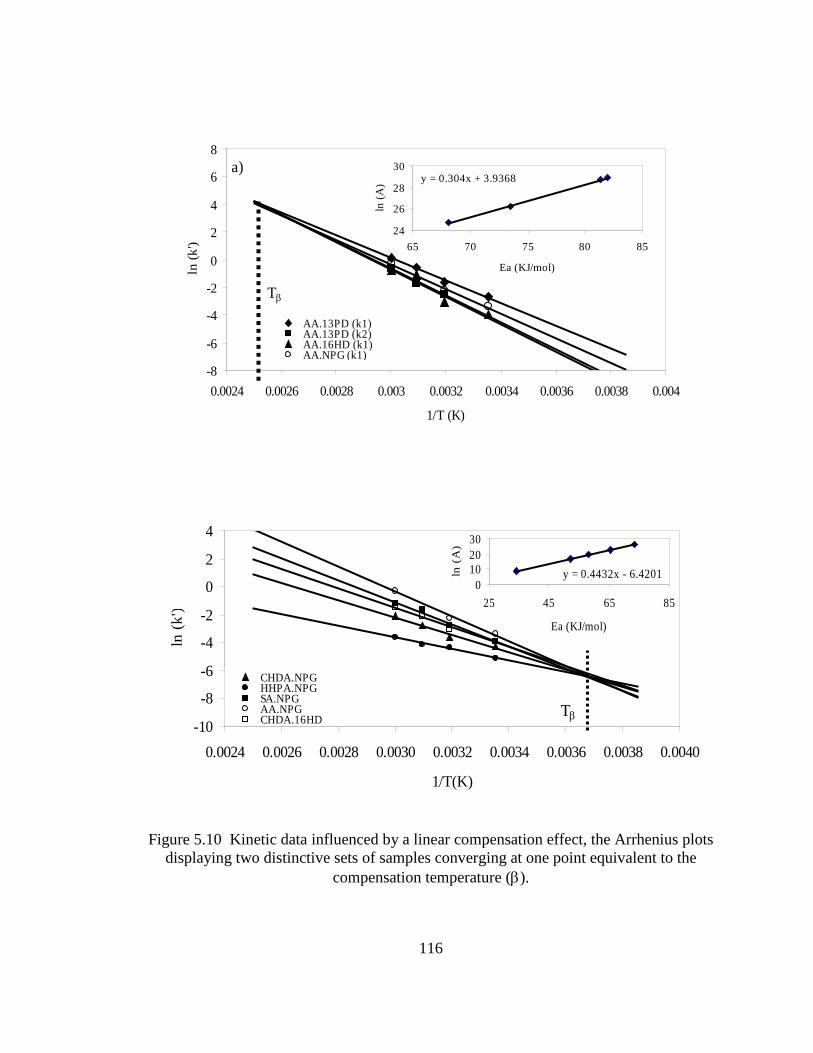
116
Figure 5.10 Kinetic data influenced by a linear compensation effect, the Arrhenius plots displaying two distinctive sets of samples converging at one point equivalent to the
compensation temperature (β).
-10
-8
-6
-4
-2
0
2
4
0.0024 0.0026 0.0028 0.0030 0.0032 0.0034 0.0036 0.0038 0.0040
1/T(K)
ln (k
')
CHDA.NPGHHPA.NPGSA.NPGAA.NPGCHDA.16HD
Tβ
y = 0.4432x - 6.42010
102030
25 45 65 85
Ea (KJ/mol)
ln (
A)
-8
-6
-4
-2
0
2
4
6
8
0.0024 0.0026 0.0028 0.003 0.0032 0.0034 0.0036 0.0038 0.004
1/T (K)
ln (k
')
AA.13PD (k1)AA.13PD (k2)AA.16HD (k1)AA.NPG (k1)
a)
Tβ
y = 0.304x + 3.9368
24
26
28
30
65 70 75 80 85
Ea (KJ/mol)
ln (A
)
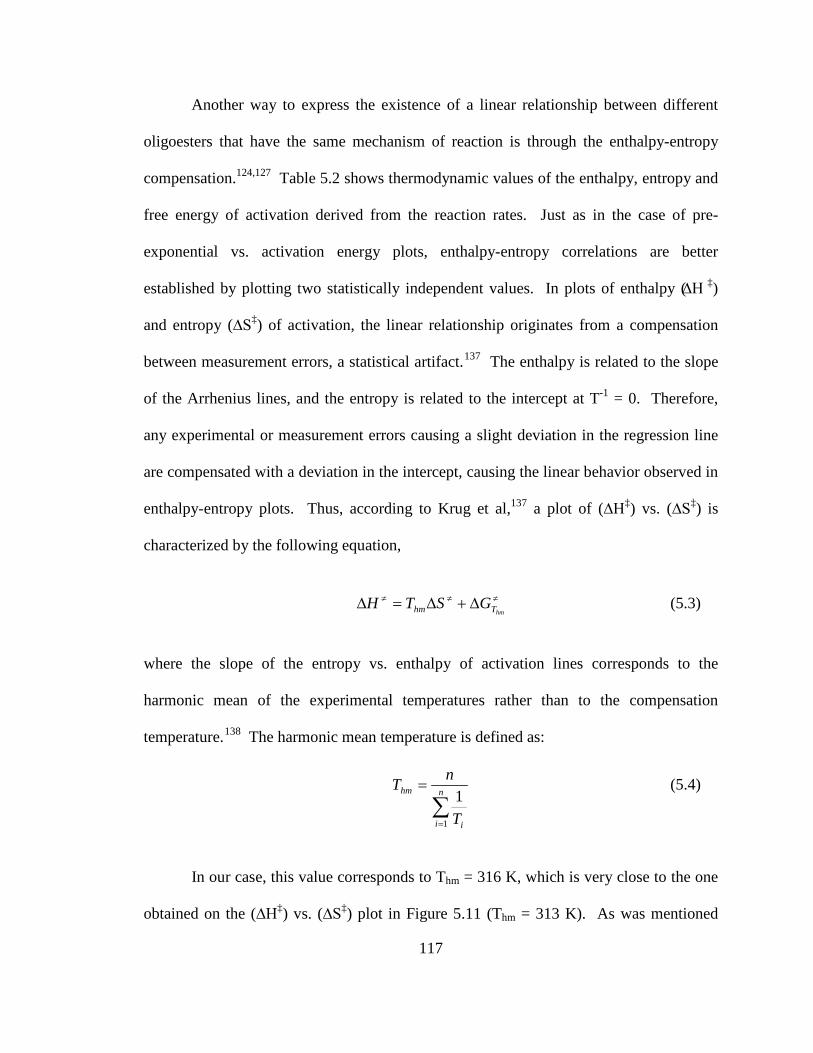
117
Another way to express the existence of a linear relationship between different
oligoesters that have the same mechanism of reaction is through the enthalpy-entropy
compensation.124,127 Table 5.2 shows thermodynamic values of the enthalpy, entropy and
free energy of activation derived from the reaction rates. Just as in the case of pre-
exponential vs. activation energy plots, enthalpy-entropy correlations are better
established by plotting two statistically independent values. In plots of enthalpy (∆H ‡)
and entropy (∆S‡) of activation, the linear relationship originates from a compensation
between measurement errors, a statistical artifact.137
137
The enthalpy is related to the slope
of the Arrhenius lines, and the entropy is related to the intercept at T-1 = 0. Therefore,
any experimental or measurement errors causing a slight deviation in the regression line
are compensated with a deviation in the intercept, causing the linear behavior observed in
enthalpy-entropy plots. Thus, according to Krug et al, a plot of (∆H‡) vs. (∆S‡) is
characterized by the following equation,
≠≠≠ ∆+∆=∆
hmThm GSTH (5.3)
where the slope of the entropy vs. enthalpy of activation lines corresponds to the
harmonic mean of the experimental temperatures rather than to the compensation
temperature.138
The harmonic mean temperature is defined as:
∑=
= n
i i
hm
T
nT
1
1 (5.4)
In our case, this value corresponds to Thm = 316 K, which is very close to the one
obtained on the (∆H‡) vs. (∆S‡) plot in Figure 5.11 (Thm = 313 K). As was mentioned

118
before, this value is not considered equal to the isokinetic temperature. A true
compensation mechanism can be defined when using two independent values. These
values are the free energy and the enthalpy of activation. The change in the free energy
of activation (∆G‡) can be obtained from acid number vs. time plots, and the change in
the enthalpy of activation (∆H‡) can be obtained from the Arrhenius plots. Therefore, the
change in the free energy of activation (∆G‡) is statistically independent of the change in
activation enthalpy (∆H‡).
)ln( ≠−=∆ eqKRTG (5.5)
RTEH a −=∆ ≠ (5.6)
RTk
AhRSB
−=∆ ≠ )ln( (5.7)
where TkhkK
Beq
'=≠ (5.8)
and k’ is the reaction rate, h is the Planck constant (6.62607095x10⁻³⁴ J-s), kB is the
Boltzmann constant (1.3807x10⁻²³ J/K), T is the temperature (Kelvin), and ≠eqK is the
equilibrium contant of activation. Therefore, the compensation effect can be measured
from the plots of ∆G‡ vs. ∆H‡ at the harmonic mean temperature (Thm).137,139
Thus,
chemically originated enthalpy-entropy compensation exists when the following
relationship is present,
αβ +∆=∆ ≠≠ SH (5.9)
βδδ
=≠
≠
SH
(5.10)

119
β represents the true isokinetic temperature and is different from the harmonic mean
temperature (β ≠ Thm),131 and α is a constant that represents the ∆G‡, which is similar for
all the oligoesters undergoing the same reaction mechanism.140
Substitution of ∆H‡ from
equation 5.9 into equation 5.3 results in:
αβ +∆−=∆ ≠≠ STG hm )( (5.11)
Taking the derivative with respect to ∆H‡ gives,
HST
HG
hm ∆∆
−=∆∆
≠
≠
δδβ
δδ )( (5.12)
Substitution of equation 5.10 in equation 5.12 gives,
β
βδδ T
HG −
=∆∆
≠
≠
(5.13)
Thus, the isokinetic temperature can be obtained from the slope of the ∆G‡ vs.
∆H‡ plots using equation 5.13. As observed in Figure 5.11b, points representing
thermodynamic parameters are scattered and do not follow a linear relationship.
However, two lines can be derived from different groups of compounds (previously
observed in the Arrhenius plot). Line 1 corresponds to the compensation effect of
compounds: AA.13PD (k1), AA.16HD (k1), and AA.NPG ((k1) and can be expressed as
follows:
233.922813.0 +∆=∆
hmTHG (5.14)

120
Line No.2 in Figure 5.11b includes compounds: AA.NPG (k1), SA.NPG (k1),
14CHDA.NPG (k1), HHPA.NPG (k1), 14CHDA.16HD (k1), 14CHDA.13PD (k1). The
free energy of activation of these compounds has the following equation:
14.1221377.0 +∆−=∆
hmTHG (5.15)
As observed in the aforementioned equations of the free energy of activation of
the two distinct groups, the lines are statistically different, all having different slopes and
intersects. Isokinetic temperatures (β) obtained from Equations 5.14 and 5.15 using
Equation 5.13 gives values of 275 K and 435 K, which are similar to the values obtained
with Exner’s method.
Table 5.2 Thermodynamic parameters: enthalpy (∆H‡), entropy (∆S‡) and free energy (∆G‡) of activation of end-capped oligoesters at T = 313 K
Sample Name ∆H‡
(KJ/mol)∆S‡
(KJ/mol K)∆G‡
(KJ/mol)
AA.13PD 65.52 ± 3.4 -0.143 110.62
AA.16HD 78.75 ± 9.6 -0.110 114.36
AA.NPG 70.92 ± 6 -0.130 112.24
CHDA.13PD 57.49 ± 3.5 -0.176 114.03CHDA.16HD 55.47 ± 4.0 -0.186 114.38
CHDA.NPG 49.5 ± 3.9 -0.210 115.72
SA.NPG 62.90 ± 3.4 -0.161 113.66HHPA.NPG 31.32 ± 3.4 -0.277 117.69

121
Figure 5.11 Linear relationships: a) ∆H‡ and ∆S
‡ of activation; b) from statistically
independent values: ∆H‡ vs. ∆G
‡. Line 1 () includes compounds: AA.13PD,
AA.16HD, and AA.NPG. Line 2 () includes compounds: AA.NPG, SA.NPG,
14CHDA.NPG, HHPA.NPG, 14CHDA.13PD, and 14CHDA.16HD.

122
5.4 Discussion
Eight end-capped oligoesters were selected based on the results obtained in
Chapter 4. These oligoesters included the following samples: AA.1,3-PD; AA.1,6-HD;
AA.NPG; 1,4-CHDA.1,3-PD; 1,4-CHDA.1,6-HD; 1,4-CHDA.NPG; SA.NPG; and
HHPA.NPG. These oligoesters contain chemical structures that allowed the study of the
different structural parameters controlling the hydrolysis reaction. Oligoesters containing
AA where chosen in order to elucidate if the anchimeric effect predominated in the initial
stage of hydrolysis. Linear polymers, especially those with molecular structure apt to
undergo a ‘back biting’141
5
mechanism (AA-based) tend to decompose faster than bulky
and more rigid structures. Hydrolysis is enhanced when this cyclic structure formed
through hydrogen bonds has 6- or 7-members, which are the most stable rings.
Formation of these rings allows unrestricted attack of water molecules on the carbonyl
carbon of the ester group. On the other hand, NPG-based oligoesters allowed the study
of compounds with more rigid and sterically hindered structure. The higher steric
hindrance of these oligoesters (NPG-based) disrupts the formation of hydrogen bonds of
nearby ester groups and prevents the nucleophilic attack.
The temperature dependence of hydrolysis rate constants was observed through
Arrhenius plots. Activation energies and pre-exponential factors were obtained
experimentally by measuring the rate constants at different temperatures. The linearity
observed in Arrhenius plots indicates that the rate-determining step of the hydrolysis
remains the same at every temperature.31 Activation energies (KJ/mol) related to the
hydrolysis rate constants of the first and second stage were in the range of 34-142
KJ/mol. Reported activation energies for the hydrolysis of other compounds ranged from

123
58 to 96 KJ/mol.142
94
However, reactions in solution usually have Ea values in the range of
42-125 KJ/mol. Oligoesters of AA.13PD, CHDA.13PD, CHDA.16HD, CHDA.NPG,
and SA.NPG are within these limits, which is an indication that the hydrolysis process
dominated the decomposition of these oligoesters in solution. The slight deviation from
the Arrhenius behavior of compounds made of adipic acid/1,6-hexanediol was due to the
low solubility at low temperatures caused by the crystallinity of the sample (Tm = 40°C).
Non-Arrhenius behavior (curvature) was previously observed in hydrolysis studies of
methyl trifuloroacetate and chloromethyl dicholoracetate in 2-butoxyethanol-water
solutions.143,144 In that case, the curvature was observed due to the formation of
aggregates at high temperatures.145
An increase was expected in activation energy (Ea) values (see
Table 5.1) of
compounds with a more sterically hindered structure.146
122
Steric hindrance causes a
destabilization of the transition state, thus increasing the activation energy and decreasing
reaction rates. This trend was previously observed in the hydrolysis of fatty acid
esters, where esters with longer alkyl or acyl chain had higher activation energies,
indicating a higher steric hindrance. However, an opposite effect was observed (Table
5.1), where a sterically hindered, rigid structure such as HHPA.NPG shows the lowest Ea-
values. The activation energy of CHDA-based oligoesters (14CHDA.13PD,
14CHDA.16HD, and 14CHDA.NPG) is independent of the diol used. This is probably
due to the more rigid structure of the cyclohexane ring compared to AA-oligoesters.
The AA-based oligesters show higher Ea-values for structures less prone to H-
bond through end-groups (AA.16HD) and with a higher steric factor (AA.NPG)
compared to AA.13PD, a structure prone to auto-catalysis through a back-biting
124
mechanism. A complex behavior has been previously observed in the case where cyclic
formation is present.5,147,148,149, 150 150 Decrease in activation energy values were observed
in ring closure of 3- to 5-membered rings of ω-bromoalkylamines, which was interpreted
as a decrease in strain involved in making the ends of the ring approach. In the same
studies, high pre-exponential factors were observed for the formation of 3-member rings
indicating that all the arrangements of the atoms were equally favorable for ring
formation.150 Similarities in the activation energy and pre-exponential factor of
AA.13PD and AA.NPG could have been caused by the presence of substituents.147-149
For example, ClCH(CH3)CH2NH2 forms cyclic compounds four times faster than
ClCH2CH2NH2.147 The presence of substituents may help relieve the compression at the
quaternary carbon, which help in the cyclic formation during the back-biting mechanism.
The disagreement between chemical structure and Ea-values (see Table 5.1) can
be explained by the pre-exponential constant values. Pre-exponential factors (A)
calculated from the intercept of the Arrhenius plots of the first-stage rate constant
increase in the following order: HHPA.NPG (5.5x10³) < 1,4-CHDA.NPG (1.7x10⁷) <
1,4-CHDA.13PD (9.4x10⁸) < 1,4-CHDA.16HD (2.8x10⁸) < SA.NPG (6x10⁹) < AA.13PD
(5.3x10¹⁰) < AA.NPG (2.4x10¹¹) < AA.16HD (2x10¹²). According to the collision theory
the pre-exponential factor (A) of gases for a second-order reaction31 has a normal value
of about 3 to 4x10¹¹ M-1 sec-1. Predicted ‘A’ values for solutions can be larger than that
for gases because bimolecular encounters within a solvent cage are more frequent.94
Additionally, the calculations in this dissertation were done assuming a zero-order
reaction rate equation, which could also contribute to the lower ‘A’values.

125
The pre-exponential factor is composed of two factors (A=PZ): Z, the collision
frequency, and P, the probability factor. In the simplest case, P represents a factor
describing the fraction of collisions between two reacting molecules which have the right
orientation to react.31 In the case of reaction in solution this parameter not only includes
steric factors but can include many different variables (anchimeric effect, molecular
weight, etc) and its value may even be larger than 1. That might also be the reason for
high and low pre-exponential values (see Table 5.1). Since high frequency factors (A)
are an indication of the tendency of compounds to exist in a coiled conformation,150 this
factor may describe the tendency to form cyclic structures more easily (back biting
mechanism). Thus, the high pre-exponential ‘A’ values of adipic acid (AA)-based
samples, which are more prone to back bitting. The low pre-exponential constant of end-
capped HHPA.NPG corresponds to the low possibility of finding it in a coiled position,
thus the low probabilities of forming hydrogen bonds (anchimeric effects). Therefore,
according to our data, the frequency of collision (Z) and the right orientation of the
racting particles (P) play a key role in the hydrolysis compared to activation energy (Ea).
Plots of ln A vs Ea showed a compensation effect with isokinetic temperature at
Tβ = 277K (see Figure 5.8). There is no physical meaning for the isokinetic temperature
other than being a constant characteristic for a group of reactions.136 Thus, focus should
be made on whether the isokinetic relationship holds or not. Arrhenius plots showed that
there are two main conjunction points (395 and 271 K), which should be equivalent to the
isokinetic temperature, Tβ.130,136 Surprisingly, each group showing a compensation effect
has something in common. The first group (T-1 = 0.0025 K-1) includes adipic acid (AA)-
based oligoesters: AA.13PD, AA.16HD, AA.NPG. On the other hand, the group with T-1

126
= 0.0037 K-1 involves compounds with a more sterically hindered structure. Most of
these structures have NPG in common (14CHDA.NPG; SA.NPG; HHPA.NPG;
AA.NPG; 14CHDA.16HD). The hydrolysis of these two groups is dominated by two
different mechanisms: anchimeric and steric effects.
The definition of intramolecular catalysis and steric effects dominating reaction
mechanisms using isokinetic relationship and compensation law has been studied in the
past.119,127,131 For example, in studies of the partitioning of pyridylalkanamides in n-
octanol(OCT)/water and di-n-butyl ether (DBE)/water,127 a compensation effect was
clearly observed in the DBE/water system. However, two different lines were observed
in the OCT/water system. Linert et al127 explained that in the case of DBE/water system,
intramolecular H-bonds were favored in the DBE solvent. On the other hand, in the
OCT/water system, 2-pyridylalkanamides and 3- and 4-pyridylpentanamide behaved
differently from the rest of the pyridylalkanamides. These solutes were the only ones in
the series sterically able to form intramolecular N…HN bonds. Similarly, in the results
shown in Figure 5.10, two different behaviors are observed. The AA-based oligoesters
are characterized by having low steric factors and a linear flexible backbone. These
oligoesters are prone to hydrolysis rates due to the ease of the chains to form H-bonds
through a back-bite mechanism (end-group effect). Additionally, due to low steric
hindrance of these oligoesters and to the low concentration of functional end-groups,
anchimeric effects through inter-molecular catalysis can also be present. On the other
hand, the second group is characterized by low hydrolysis rates due to the more bulky
and rigid structure, especially of those containing a cyclohexane ring. Additionally, these
structures have high steric hindrance and diols that cannot form H-bonding. An

127
exceptional case was the AA.NPG oligoesters, which were present in two different
groups. The combination of two mechanisms (steric and end-group effects) due to the
flexibility of AA and the hindrance provided by NPG allowed the AA.NPG a double
classification. Although a point of intersection was observed between the second stage of
14CHDA.13PD and 14CHDA.16HD, it was risky to establish any linear relationship
based on only two points.
A second method of proving reaction mechanisms was done through the enthalpy-
entropy compensation. The same two groups observed in the Arrhenius plots are clearly
observed in plots of ∆G‡-∆H‡. From Figure 5.11, two main behaviors are observed: one
with a negative slope in which in which Tβ < Texp and the other where a positive slope is
observed where Tβ > Texp. In the first case the selectivity increases with temperature and
entropic effects play an important role.5,136 That is, with decreasing temperatures the
reaction rates approach each other opposite to the usual chemical behavior.136 In the
second case, the selectivity decreases with temperature; hence with increasing
temperature the reaction rates approach each other, and the capacity of the molecule to
form H-bonds become more predominant. This idea coincides with the mechanism
previously proposed in which two groups where dominated by steric effects and the other
one by anchimeric effects.
The enthalpy-entropy compensation effect is not often used in hydrolysis studies
due to the the controversy of using thermodynamic parameters obtained from the same
kinetic data. However, it has been demonstrated that with the proper procedure, an
isokinetic relationship can be established. The use of thermodynamic parameters
(enthalpy, entropy, free energy of activation) proves to be a successful tool in

128
determining the structural parameters dominating different stages of the hydrolysis of
end-capped oligoesters. Thermodynamic data could be further used to observe the
dominating mechanism in the second stage (from the model proposed in Chapter 4) of
sterically hindered oligoesters.
5.5 Conclusions
Linear free energy relationships between thermodynamic parameters such as
enthalpy, entropy and free energy of activation provide very useful information for the
determination of the relationship between reactivity and chemical structure. Activation
energies and pre-exponential factors were obtained for all samples. Enthalpy-entropy
compensation was observed pointing at two distinctive groups: 1) end-group effects on
the initial hydrolysis rates of linear polymers containing adipic acid and 1,3-propanediol;
1,6-hexanediol; and neopentyl glycol; and 2) steric effects controlling initial hydrolysis
rates of polymers containing sterically hindered monomers such as hexahydrophthalic
anhydride, 1,4-cyclohexanedicarboxylic acid, sebacic acid and neopentyl glycol.

129
CHAPTER VI
HYDROLYTIC STABILITY OF TERNARY AND QUATERNARY END-CAPPED
OLIGOESTERS
6.1 Abstract
The hydrolytic stability of a series of copolyesters comprised of three and four
different monomers was evaluated. The oligoesters were prepared from adipic acid (AA)
and isophthalic acid (IPA), with six different diols and one triol, which included: 1,4-
butanediol, 1,5-pentanediol, 1,6-hexanediol, neopentyl glycol, 2-methyl-1,3-propanediol,
trimethylolpropane, and 2-butene-1,4-diol. Hydrolysis rate constants were obtained from
plots of acid number vs. time. It was observed that ternary oligoester systems had lower
hydrolysis rates than quaternary systems. The addition of IPA to a linear, flexible
systems containing AA caused a reduction in hydrolysis rates. Hydrolysis reaction was
triggered by the presence of end-groups containing adipic acid and a flexible diol.
6.2 Introduction
Polyesters are used in a wide range of industrial products due to ease of handling,
breadth of formulation, good balance of end properties and cost. Over 500 ester-based
products are marketed by different industries, covering a wide range of uses. Polyesters
can be used as plasticizers, coatings, flavors, pesticides, surface-active agents, as well as
chemical intermediates and monomers for resins and high molecular weight

130
polymers.151 Polyesters are produced by the reaction of a dibasic carboxylic acid and a
polyfunctional alcohol via step-growth polymerization. The wide range of end-products
comes from the variety of mixtures that can be made between dibasic acid (saturated and
unsaturated) and the polyol (diols, triols, etc).152
152
Furthermore, the existence in the
market of several crosslinking monomers that can be used for resin composition increases
the variety of possible arrays. Each combination of monomers presents a unique set of
properties. Low cost and short cycle-times are the two biggest advantages of the usage of
polyester resins. On the other hand, one of the major limitations of polyesters is shelf
life. Polyesters degrade easily in the presence of water and at high temperature.
In the coatings sector, the industrial coatings market is one of the most
competitive152 due to the large volume of industrial products involved, which includes:
automobile, equipment and machinery, aircraft, appliances, etc. Original equipment
manufacture (OEM) automotive coatings have the largest share of this division.2
Automotive coatings consist of four main layers: electrocoat, primer, basecoat and
clearcoat.153
10
Polyesters are mainly used as primers, in solid color and metallic single
layer top-coats, and in basecoats. Polyester resins used in primer formulations are
crosslinked with aromatic isocyanates and butylated or methylated melamines. Single
layer topcoats use melamine crosslinked-polyesters due to the lower cost and easier
application compared to acrylic resin. However, polyurethane coatings have a better
resistance to environmental etching compared to the melamine-formaldehyde cross-
linked coatings.154
Since the introduction of brighter metallic colors, single layer topcoats have been
replaced by basecoat-clearcoat systems. Metallic colors used in today’s automotive

131
coatings are composed of coarse aluminium flakes that without the proper orientation can
cause patchy appearance due to uneven light scattering. Additionally, random orientation
of metallic pigments can cause the flakes to protrude through the film, producing an
uneven surface. Hence, basecoats are formulated to maximize even orientation of
metallic flakes with minimum solvent content providing a rapid drying layer that helps
set in the pigment. Polyesters are typically used as basecoats due to the good pigment
wetting properties and ease of dispersion.
Additionally, complying with stringent environmental rules, more manufacturers
are switching to environmentally friendly coatings. Polyester-urethane dispersions have
already started to replace solvent-borne resins used as primers and basecoats. However,
more work needs to be done in this area. Polyesters are also used as modifiers in clear
coat formulation because they provide flexibility, help minimize the use of solvent, and
increase the solids content of the formulation. Polyesters are preferred as modifiers in
acrylic clearcoats due to their good compatibility with acrylics and the similarities
between reactions of free -OH groups in acrylic and polyesters with isocyantes.
However, due to the lower weathering performance of polyester compared to acrylics,
their use is limited and their concentration should not exceed 25 wt-% of acrylic.10 This
disadvantage is mainly attributed to the susceptibility of ester groups to hydrolysis.2
However, the benefits acquired in terms of flexibility and ease of application compensate
for this drawback.
As it is observed, coatings formulations may vary in order to meet different end-
use properties and processing requirements (i.e. drying conditions, VOC compliance). In
order to do so, one can use chemical structures with different reactivities to meet the
132
desired requirements. For example, the glass transition temperature, Tg, of the polyester
can be modified by changing the ratio of aromatic to aliphatic dibasic acids.2 In the case
of poly(ester-based urethane) the combination of soft (low Tg) and hard (high Tg)
segments allows the preparation of coatings with two opposing properties.2
Polyurethanes can be hard, but at the same time have good elasticity or be abrasion- and
solvent-resistant at the same time. The Tg of a system is one of the most important
properties of a polymer. It affects the synthesis of the product as well as end-use
properties. For example, if the Tg of a crosslinked system is considerably above curing
temperature, this property can slow down or stop the reaction before reaching
completion.155
2
Thus, during ambient curing conditions, one would need to synthesize
polyesters with Tg’s below room temperature. As it was mentioned above, this can be
achieved by a careful selection of polyester and polyisocyanate: for example, a
polyisocyanate with a flexible chain, such as an HDI derivative, and a high Tg polyester.
In general, coatings in the automotive industry serve two primary purposes:
appearance and corrosion protection. Polyester urethane systems are known for their
good pigment wetting properties and because they provide an excellent medium for
dispersion. However, these resins are outperformed in weathering performance by the
highly durable acrylic-based urethanes. Nevertheless, low quantities of polyesters are
used with acrylics in clearcoat formulations for reduction in cost and solvent usage and
ease of processing. Thus, the main reason holding back the use of polyesters is the
hydrolytic stability of its chains. Based on this understanding, the aim of this study is to
analyze different combinations of polyester coatings. The oligoesters were synthesized
using adipic acid and isophthalic acid and different diols. Adipic and isophthalic acids

133
are a very common combination of diacids used for the synthesis of water-borne
polyester coatings and in the automotive industry.2 The hydroxyl-terminated oligoesters
were end-capped with phenyl isocyanate in order to mimic the behavior that would be
encountered by the soft-segments of a polyurethane coating. The hydrolysis results of
oligoester compounds were compared to the hydrolytic degradation of polyurethane films
in order to find if the same structural mechanism observed in the model compound
explained the degradation of the end-product.
6.3 Results
In the present study, two common dibasic acid monomers, adipic acid and
isophthalic acid, common to the synthesis of water-reducible polyester coatings, were
chosen. Adipic acid (AA) is the most widely used aliphatic dibasic acid.2 Isophthalic
acid (IPA) is the most predominant aromatic acid used in the synthesis of polyesters due
to its superior exterior durability.2 Five diols, one unsaturated diol, and one triol were
used to compare different chemical structures in hydrolysis rates. Linear glycols with 4
to 6 carbon spacers were chosen for their anchimeric interactions (back-biting
mechanism).6 In addition, linear glycols allowed for the comparison between less
hindered and more bulky diols such as neopentyl glycol (NPG) or 2-methyl-1,3-
propanediol (MPD).2 Both the neopentyl glycol (NPG) and trimethylolpropane (TMP)
were selected based on the reported hydrolytic stability and common use.2,4-7 The 2-
butanediol-1,4-diol (BED) was used as an example of a short unsaturated diol.
Experimental conditions were chosen for comparison with Chapter 4. Hydroxyl-
terminal groups were eliminated by end-capping with phenyl isocyanate (Figure 6.1). As

134
was observed in previous chapters, end-capping the hydroxyl groups with isocyanates
removed the functionality and the possibility of intra- and inter-molecular catalysis.
Previous studies had shown the profound impact of the telechelic groups on hydrolysis
rates.7,9 Soucek et al9 concluded that high concentration of telechelic group initiated the
attack on ester groups, which classified these oligoesters into the second stage of the
hydrolysis mechanism proposed in Chapter 4. Relative hydrolysis values were obtained
from the overall trend (average) in acid number (Table 6.1).
HN CO
OOO
O
ONHC
OO O
OO
O
Figure 6.1 End-capped hydroxyl-terminated oligoesters with phenyl isocyanate.
Hydrolysis rates of two sets of end-capped oligoesters were studied. The first set
was a ternary system, which consisted of adipic acid (AA), isophthalic acid (IPA), and
one diol. The second set included a quaternary system comprised of AA and IPA with a
combination of two diols or a diol and a triol. The polyols included: 1,4-butanediol (1,4-
BD), 1,5-pentanediol (1,5-PeD), 1,6-hexanediol (1,6-HD), neopentyl glycol (NPG), 2-
methyl-1,3-propanediol (MPD), trimethylolpropane (TMP), and 2-butene-1,4-diol
(BED). In the case of ternary systems, oligoesters comprised of AA.IPA.BED showed
the highest overall hydrolysis rates. Oligoesters of AA.IPA.14BD, AA.IPA.15PeD, and
AA.IPA.NPG had very similar hydroysis rates (~36x10-3 mgKOH/gresin-day). Oligoesters
of AA.IPA.16HD were slightly higher than the above mentioned oligoesters (44x10-3
mgKOH/gresin-day). Oligoesters of AA.IPA.MPD and AA.IPA.BED had the highest
hydrolysis rates (63x10-3 and 113 x10-3 mgKOH/gresin-day) of the ternary oligoester set.

135
0
2
4
6
8
10
12
14
16
0 10 20 30 40 50 60 70 80 90Days
Aac
(mg K
OH
/gre
sin)
AA.IPA.15PeD
AA.IPA.MPD.NPG
Figure 6.2 Acid number (Aac) increase with time.
The second set of experiments included quaternary systems comprised of adipic
acid and isophthalic acid (AA.IPA), and the combination of two diols or a diol and a triol.
As in the case of the ternary systems, the oligoesters with lower hydrolytic stability were
the ones containing 2-butene-1,4-diol (BED). Oligoesters of AA.IPA.1,4-BD.BED were
the most hydrolytically unstable (72 x10-3 mgKOH/gresin-day). The AA.IPA.1,5-PeD.BED
and AA.IPA.MPD.BED showed also high hydrolysis rates (64 x10-3 mgKOH/gresin-day).
Additionally, oligoesters containing two linear diols with low steric hindrance,
AA.IPA.1,5-PeD.1,6-HD, showed a slightly higher hydrolysis rate compared to other
oligoesters containing 16HD and a more sterically hindered diol.
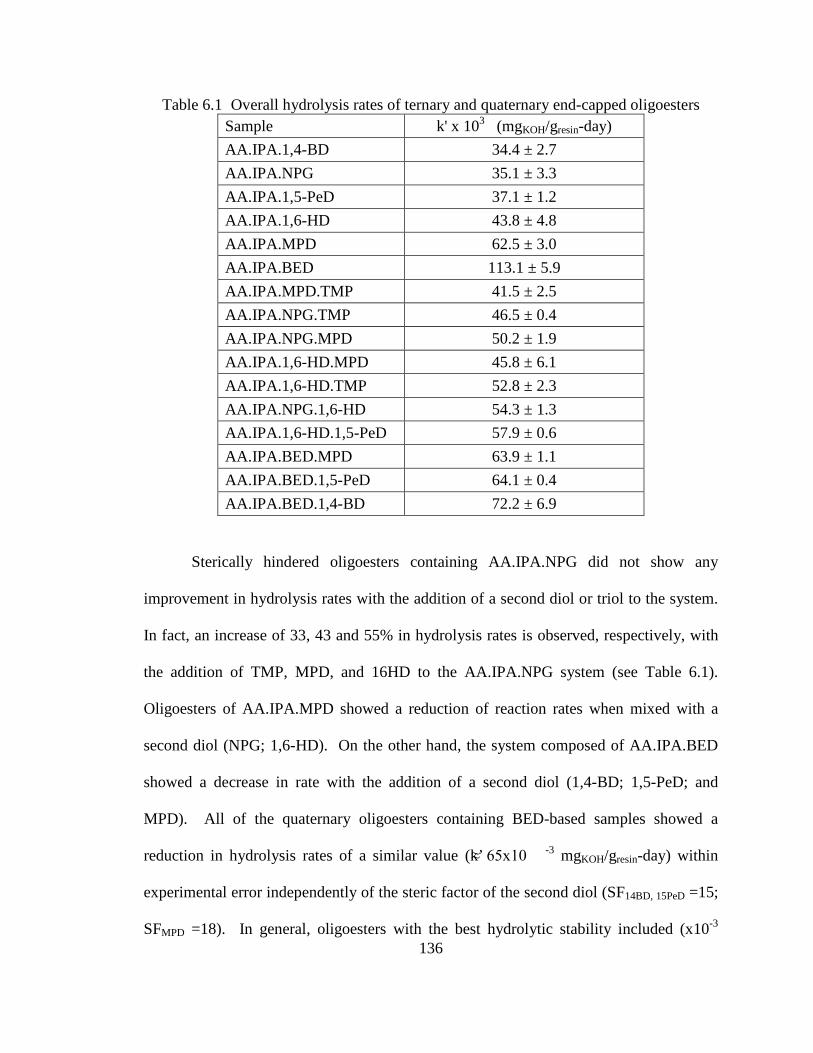
136
Table 6.1 Overall hydrolysis rates of ternary and quaternary end-capped oligoesters Sample k' x 103 (mgKOH/gresin-day) AA.IPA.1,4-BD 34.4 ± 2.7 AA.IPA.NPG 35.1 ± 3.3 AA.IPA.1,5-PeD 37.1 ± 1.2 AA.IPA.1,6-HD 43.8 ± 4.8 AA.IPA.MPD 62.5 ± 3.0 AA.IPA.BED 113.1 ± 5.9 AA.IPA.MPD.TMP 41.5 ± 2.5 AA.IPA.NPG.TMP 46.5 ± 0.4 AA.IPA.NPG.MPD 50.2 ± 1.9 AA.IPA.1,6-HD.MPD 45.8 ± 6.1 AA.IPA.1,6-HD.TMP 52.8 ± 2.3 AA.IPA.NPG.1,6-HD 54.3 ± 1.3 AA.IPA.1,6-HD.1,5-PeD 57.9 ± 0.6 AA.IPA.BED.MPD 63.9 ± 1.1 AA.IPA.BED.1,5-PeD 64.1 ± 0.4 AA.IPA.BED.1,4-BD 72.2 ± 6.9
Sterically hindered oligoesters containing AA.IPA.NPG did not show any
improvement in hydrolysis rates with the addition of a second diol or triol to the system.
In fact, an increase of 33, 43 and 55% in hydrolysis rates is observed, respectively, with
the addition of TMP, MPD, and 16HD to the AA.IPA.NPG system (see Table 6.1).
Oligoesters of AA.IPA.MPD showed a reduction of reaction rates when mixed with a
second diol (NPG; 1,6-HD). On the other hand, the system composed of AA.IPA.BED
showed a decrease in rate with the addition of a second diol (1,4-BD; 1,5-PeD; and
MPD). All of the quaternary oligoesters containing BED-based samples showed a
reduction in hydrolysis rates of a similar value (k’ ≈ 65x10 -3 mgKOH/gresin-day) within
experimental error independently of the steric factor of the second diol (SF14BD, 15PeD =15;
SFMPD =18). In general, oligoesters with the best hydrolytic stability included (x10-3
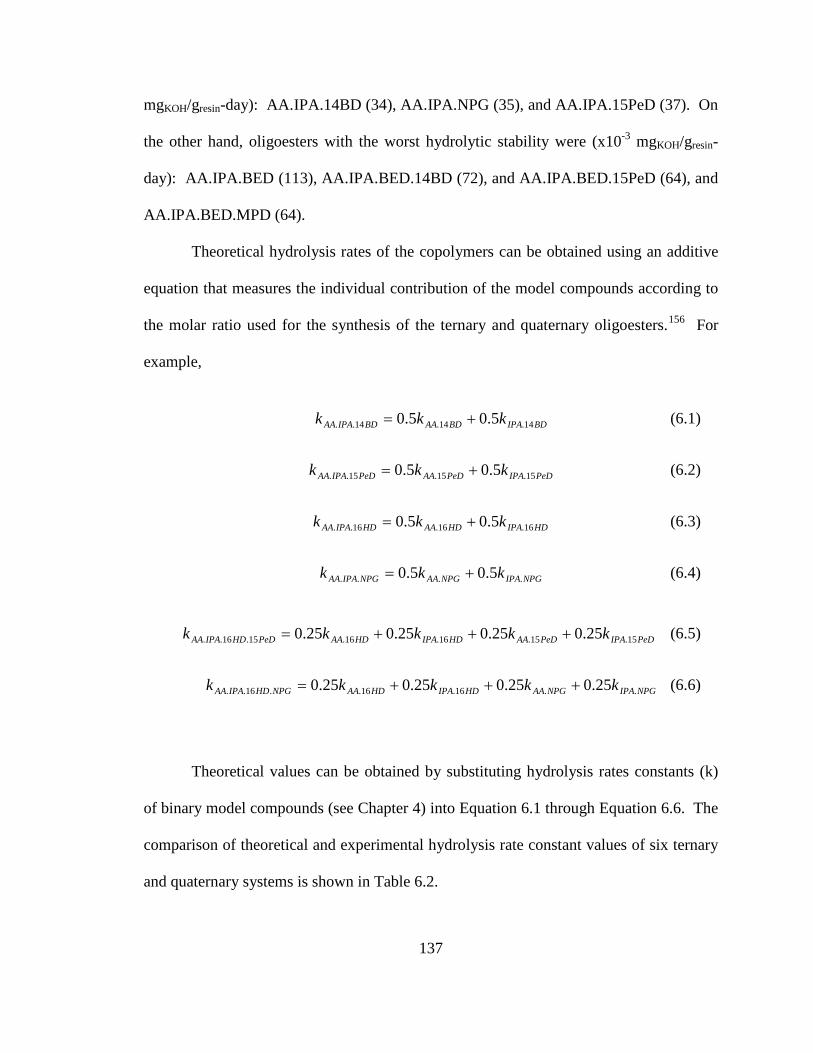
137
mgKOH/gresin-day): AA.IPA.14BD (34), AA.IPA.NPG (35), and AA.IPA.15PeD (37). On
the other hand, oligoesters with the worst hydrolytic stability were (x10-3 mgKOH/gresin-
day): AA.IPA.BED (113), AA.IPA.BED.14BD (72), and AA.IPA.BED.15PeD (64), and
AA.IPA.BED.MPD (64).
Theoretical hydrolysis rates of the copolymers can be obtained using an additive
equation that measures the individual contribution of the model compounds according to
the molar ratio used for the synthesis of the ternary and quaternary oligoesters.156
For
example,
BDIPABDAABDIPAAA kkk 14.14.14.. 5.05.0 += (6.1)
PeDIPAPeDAAPeDIPAAA kkk 15.15.15.. 5.05.0 += (6.2)
HDIPAHDAAHDIPAAA kkk 16.16.16.. 5.05.0 += (6.3)
NPGIPANPGAANPGIPAAA kkk .... 5.05.0 += (6.4)
PeDIPAPeDAAHDIPAHDAAPeDHDIPAAA kkkkk 15.15.16.16.15.16.. 25.025.025.025.0 +++= (6.5)
NPGIPANPGAAHDIPAHDAANPGHDIPAAA kkkkk ..16.16..16.. 25.025.025.025.0 +++= (6.6)
Theoretical values can be obtained by substituting hydrolysis rates constants (k)
of binary model compounds (see Chapter 4) into Equation 6.1 through Equation 6.6. The
comparison of theoretical and experimental hydrolysis rate constant values of six ternary
and quaternary systems is shown in Table 6.2.

138
Table 6.2 Theoretical and experimental hydrolysis rates constants of ternary and quaternary oligoesters
Sample kth x103
(mgKOH/gresin-day) kexp x103
(mgKOH/gresin-day) AA.IPA.1,4-BD 68.5 34.4
AA.IPA.1,5-PeD 58.6 37.1
AA.IPA.1,6-HD 30.7 43.8
AA.IPA.NPG 47.9 35.1
AA.IPA.1,6-HD.1,5-PeD 44.6 57.9
AA.IPA.1,6-HD.NPG 39.3 50.2
6.4 Discussion
Isophthalic acid and adipic acid are the most predominant aromatic and aliphatic
diacids used commercially due to the superior exterior durability of the former and the
flexibility imparted by the latter. In Chapter 4, both monomers were studied individually.
It was concluded that oligoesters containing aromatic monomers usually have a steady
increase in acid number. A single stage hydrolysis was observed, which was attributed to
the rigidity of the phenyl ring and its hydrophobicity. In the case of flexible monomers,
like adipic acid, hydrolysis reactions were triggered by the low steric hindrance of the
oligoester that enhanced anchimeric and end-group catalysis.
The selection of an aromatic monomer was based on its ability to increase the
glass transition temperature (Tg), hardness, and chemical resistance.2 However, the
photo-oxidative stability of the final polyesters is compromised due to the tendency of the
phenyl ring to absorb UV light.10 A aliphatic acyclic diacid, such as adipic acid, is used
to adjust Tg157 2 and viscosity. Thus, the combination of these two types of monomers
139
(aromatic and acyclic aliphatic) gives good film formation characteristics and high
hydrolytic stability.
Comparison of ternary and quaternary hydrolysis rates of end-capped oligoesters
(see Table 6.1) showed hydrolysis rates inbetween those achieved with the binary AA-
and IPA-based oligoesters (see Chapter 4). Hydrolysis rates of AA-based oligoesters
were at least two times higher than the AA.IPA-based counterpart: 1,4-BD (3.3X), 1,5-
PeD (2.7X), and NPG (2.3X). Two exceptions were the binary oligoesters of AA.BED
(101 x10-3 mgKOH/gresin-day) and AA.1,6-HD (47 x10-3 mgKOH/gresin-day), which had a
similar hydrolysis rate than the ternary systems: AA.IPA.BED (~ 106x10-3 mgKOH/gresin-
day), and AA.IPA.16HD (~ 45x10-3 mgKOH/gresin-day) within standard deviation. On the
other hand, IPA-binary systems were around 65% lower than the AA.IPA-based
oligoesters: 1,5-PeD (55%), 1,6-HD(68%), MPD (74%), NPG (61%). Thus, it can be
proposed that the addition of an aromatic diacid to an aliphatic acyclic system (AA-
based) caused a high increase in the hydrolytic stability of the ternary and quaternary
systems. The acyclic aliphatic diacids have a linear, flexible chain with low steric
hindrance, which is prone to anchimeric and end-group effects. The addition of a rigid,
bulkier structure with low solubility (IPA) caused a disruption of the ability to back bite
and of the ability of the molecule to interact with other molecules (inter-molecular
catalysis), explaining the large decrease in hydrolysis rates.
Another way of verifying the effect of adipic acid and isophthalic acid on the
hydrolysis rates of ternary and quaternary systems is by calculating theoretical values
through a ponderal analysis. Oligoesters containing 1,6-hexanediol have higher
experimental rate constants compared to the predicted theoretical value. This might be

140
due to the initial crystallinity observed in binary AA.16HD systems, which might have
affected their hydrolytic stability. Ternary samples of AA.IPA.14BD, AA.IPA.15PeD,
and AA.IPA.NPG show an opposite behavior where experimental hydrolysis rates were
lower than the predicted theoretical values. These results showed that hydrolysis rate
constants of ternary and quaternary systems are non-additive. Thus, it is proposed that
the hydrolytic stability of ternary and quaternary systems is a non-colligative property
because the hydrolysis rates depend on the different ester blocks present in the chain and
the interaction beyond the polymer cage. This interaction can be intra- and inter-
molecular. Thus, a synergy is observed between the individual elements that form the
copolymer systems. Additionally, the fact that experimental hydrolysis rates were lower
than the predicted theoretical values (ponderal analysis) indicates that the low hydrolysis
rate values are more influenced by the IPA-based system than the AA-based oligoesters.
It is interesting to note the influence of a second diol on quaternary systems. For
example, the hydrolysis rates of the different AA.IPA.NPG.DIOL2 are independent of
the steric effect of the NPG (see Table 6.1.). However, the hydrolytic stability appears to
be dependent of the steric value of the second diol/triol: 16HD (SF = 15), MPD (SF = 18)
and TMP (SF = 16). Monomers of 1,6-HD and MPD have lower steric values compared
to TMP (SF = 21), which explains the higher hydrolysis rates of AA.IPA.NPG.MPD and
AA.IPA.NPG.16HD compared to AA.IPA.NPG.TMP. The low concentration of end-
groups might also explain the higher hydrolysis rates of the oligoesters composed of
16HD and MPD compared to those of TMP. In the case of MPD, a six-member structure
can be formed through a hydrogen bond when a sequence of MPD.AA is left as a chain
end (Figure 6.3a). In the case of oligoesters of AA.IPA.NPG.16HD, end-groups

141
consisting of sequences of AA and 16HD form linear and flexible structures prone to
hydrolysis (Figure 6.3c & d). Since these end-group segments have low steric hindrance,
the polymer chains are able to undergo an inter- or intra-molecular catalysis that can
enhance the hydrolysis rates of AA.IPA.NPG.16 compared to AA.IPA.NPG.TMP.
Therefore, it appears to be that the presence of adipic acid at the chains ends triggers the
hydrolysis of ternary and quaternary systems.
a)
OO
OOO
O
OO
OH
H3C
b)
OO
OOO
O
O H
H3CO
O
H
H
H
H
c)
O
O
O
O
O
O
O
O
O
O
O
O
OOCO
OHO
O
HNC
O
d)
O
O
O
O
O
OO
OH
O
O
Figure 6.3 Hydrolysis of AA.IPA.NPG.DIOL2. a) Oligoester with chain-ends composed
of MPD.AA, b) chain-ends of MPD.IPA, c) inter-molecular catalysis of low steric hindrance segment in AA.IPA.NPG.16HD, and d) intra-molecular catalysis of AA end-
groups in low steric hindrance segments of AA.IPA.NPG.16HD.

142
The influence of adipic acid at the chain ends can also be observed in oligoesters
containing BED. According to Turpin’s rule,6 2-butene-1,4-diol (BED) represents the
monomer with the lowest steric factor (SF = 10). Additionally, linear, flexible end-
groups can be formed when segments of AA.BED are present in the chain. The low
steric hindrance and the flexibility of these groups increase the hydrolysis rates through
anchimeric effect (inter- and intra-molecular catalysis). Low concentration of BED at the
chain ends can also contribute to nucleophilic attack. The BED can undergo a back-
biting mechanism forming a cyclic structure that locks the oligomers in one position
(Figure 6.4), generating a carbonyl carbon more susceptible to nucleophilic attack.
Similar results were observed in the case of maleic anhydride based oligoesters.7,95
Reaction of maleic anhydride with a diol opens up the ring and creates an effect similar to
BED-based polyesters. Both monomers contributed an acyclic unsaturated four carbon
structure to the backbone chain of the polyester.
OO
OO
OO
O
OOH
O
O
HO
Figure 6.4 End-group effect caused by hydroxyl terminated oligoesters composed of 2-
butene-1,4-diol end-groups.
It is important to note the effect of end-cappers on systems containing a triol (i.e.
TMP). Systems containing TMP (AA.IPA.NPG.TMP and AA.IPA.MPD.TMP) showed
the lowest hydrolysis rates among quaternary systems. Soucek et al9 previously observed
143
that the addition of TMP to sterically stable systems increased the hydrolysis rates due to
the increase in end-group concentration. However, the use of phenyl isocyanate as an
end-capper eliminated end-group effects, which allowed the steric effects (SFTMP = 21) to
dominate the hydrolysis mechanism. By end-capping free hydroxyl groups, the
possibility of forming hydrogen bonds that could catalyze the hydrolysis reaction is
reduced. Additionally, the high steric hindrance is not only provided by the TMP
molecule, but also by the addition of the extra phenyl isocyanate and the aromatic diacid,
which limit the mobility of the chain and the interaction between oligoester chains.
The elucidation of the hydrolysis mechanism occurring in ternary and quaternary
systems is difficult to analyze. The copolymer system containing three and four
monomers can have different chain arrangements that can contribute in various ways to
the degradation of the oligoesters. However, the initial study of binary systems (Chapter
4) established the main parameters triggering hydrolysis according to different chemical
structures. This analysis helped to elucidate the elements triggering the hydrolysis of
ternary and quaternary systems. These results will be valuable assests in subsequent
analysis of the hydrolysis of oligoesters used in outdoor end-products.
6.5 Conclusions
One way of improving the hydrolytic stability of polyesters is by an optimization
of the monomers used (diols and dibasic acids). This optimization is based on the
reactivity of the polymer structure towards water. It was observed that ternary oligoester
systems showed better hydrolytic stability than quaternary systems. Comparison of
results with the binary systems showed that the hydrolytic stability is a non-colligative

144
property. The addition of rigid, bulky molecules (IPA) to the ternary and quaternary
systems had a sizeable effect on the hydrolysis rates of flexible systems (AA-based
oligoesters) due to the disruption of inter- and intra-molecular effects. However, it was
concluded that end-groups consisting of adipic acid and a low steric diol trigger the
hydrolysis of ternary and quaternary oligoesters.

145
CHAPTER VII
COATING PROPERTIES, HYDROLYSIS, AND WEATHERING PERFORMANCE
OF HYDROLYTICALLY STABLE POLYESTER-URETHANE FILMS
7.1 Abstract
The hydrolysis and weathering of polyurester-urethane films were studied. The
films were synthesized from hydroxyl-terminated oligoesters. These oligoesters
contained two, three or four different monomers (diacids and diols). The diacids used in
this study included: adipic acid, 1,4-cyclohexane-dicarboxylic acid, isophthalic acid, and
phthalic acid. The diols used included the following monomers: 1,4-butanediol; 1,5-
pentanediol; 1,6-hexanediol; neopentyl glycol; trimethylol propane; 2-methyl-1,3-
propanediol; and 2-butene-1,4-diol. The oligoesters were reacted with an aliphatic
polyisocyanate (1,6-hexanediisocyanate trimer) in order to form an elastomeric
polyurethane. The extent of hydrolysis of polyurethane films (ternary & quaternary
systems) was obtained by measureing the weight loss. All of the films (binary, ternary, &
quaternary systems) were exposed to accelerated weathering conditions. This test was
done in order to observe the degradation pattern of the coating under outdoor conditions.
Coating properties were measured at different intervals during the accelerated weathering
test. Gloss measurements as well as FT-IR prove to be a useful tool in analyzing the
physical and chemical degradation of polyester urethane films.
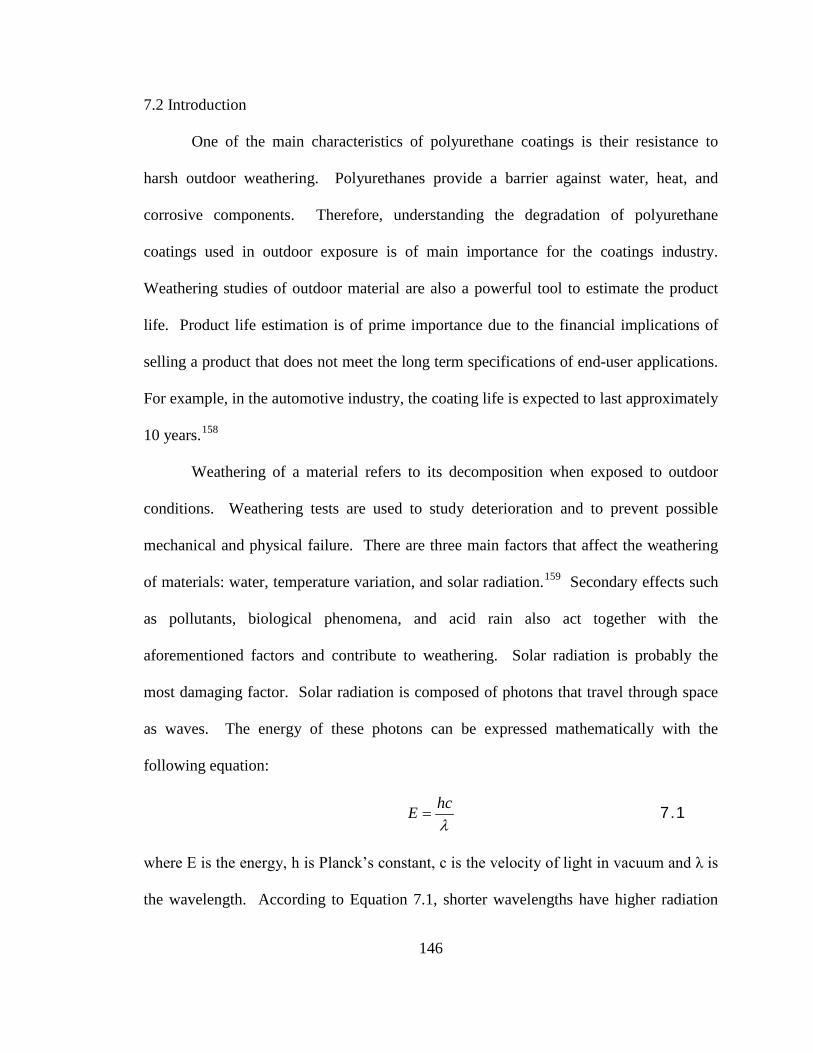
146
7.2 Introduction
One of the main characteristics of polyurethane coatings is their resistance to
harsh outdoor weathering. Polyurethanes provide a barrier against water, heat, and
corrosive components. Therefore, understanding the degradation of polyurethane
coatings used in outdoor exposure is of main importance for the coatings industry.
Weathering studies of outdoor material are also a powerful tool to estimate the product
life. Product life estimation is of prime importance due to the financial implications of
selling a product that does not meet the long term specifications of end-user applications.
For example, in the automotive industry, the coating life is expected to last approximately
10 years.158
Weathering of a material refers to its decomposition when exposed to outdoor
conditions. Weathering tests are used to study deterioration and to prevent possible
mechanical and physical failure. There are three main factors that affect the weathering
of materials: water, temperature variation, and solar radiation.
159
Secondary effects such
as pollutants, biological phenomena, and acid rain also act together with the
aforementioned factors and contribute to weathering. Solar radiation is probably the
most damaging factor. Solar radiation is composed of photons that travel through space
as waves. The energy of these photons can be expressed mathematically with the
following equation:
λhcE = 7.1
where E is the energy, h is Planck’s constant, c is the velocity of light in vacuum and λ is
the wavelength. According to Equation 7.1, shorter wavelengths have higher radiation

147
energy. Thus, the shorter the wavelength, the greater the damage it can cause to an
outdoor exposed material. Solar radiation consists of three regions: ultraviolet (UV),
visible (VIS), and infrared (IR). Ultraviolet light consists of wavelengths between 295
and 400nm and makes up about 4 to 7% of the total solar radiation. Visible light covers
the spectrum between 400 to 800 nm and makes up ~55% of solar radiation. Finally,
infrared light has a wavelength between 800 and 2450 nm and comprises about 38% of
solar radiation.159
Weathering of coatings can be performed outdoors or in chambers that produce
accelerated weathering. There are two main places for the outdoor weathering test: South
Florida, which has a subtropical climate, and central Arizona, which has a desert
environment.159 These two climates are considered the most severe climates encountered
in outdoor exposure. Florida is the most utilized outdoor test location due to the high UV
radiation, humidity and temperature provided all year around.158,170 Arizona is known for
having higher temperatures and lower humidity than Florida but receives almost 20%
more sunlight.160
160
Arizona also provides accelerated outdoor weathering facilities that use
mirrors to concentrate the amount of sunlight received. The results give good correlation
with Florida testing, in which 5 years of exposure equals 10-12 months in Arizona.
Natural outdoor weathering in any site requires long exposure time, which makes testing
of product time consuming and expensive.
Thus, in order to make degradation studies more cost efficient, the coating
industry relies on accelerated weathering. Accelerated weathering refers to the
degradation of material by artificial light sources that create accelerated degradation. The
main goal in using an accelerated weathering test is to learn well in advance the outdoor

148
performance of a material. The machines and tests used in accelerated weathering are
created to reproduce outdoor weather and to minimize the duration of outdoor evaluation.
Results can be obtained within months instead of waiting years in an outdoor natural
setting.
However, one of the main challenges of accelerated weathering is the exact
reproduction of solar radiation. Light sources generally used in accelerated weathering
can include: xenon arc, fluorescent, metal halide and carbon arc lamps. However, some
of these lamps are no longer recommended because of their poor match to natural
sunlight radiation. The use of the wrong lamp results in degradation patterns that are not
really observed in outdoor weathering. Having the incorrect degradation scheme for a
material causes the unnecessary investment of money in stabilizers or in the development
of more resistant (and more expensive) materials than one really needs.
The xenon long arc is considered the light source that most closely resembles UV
and visible solar radiation when properly filtered. Previous studies made with polyester
gel coats,161
79
comparing artificial accelerated weathering with outdoor exposure, showed
that xenon arc weathering had higher correlation coefficients with natural exposure than
methods employing carbon arc or a fluorescent light source. In a different study, Bauer
found that acrylic coatings could be tested with either quartz/borosilicate or
borosilicate/borosilicate filters using a xenon lamp. However, polyester coatings only
gave an accurate correlation between outdoor and accelerated weathering using the
borosilicate inner/outer filter combination. On the other hand, studies made by Gerlock
et. al162 with polyester/urethane clearcoats showed that only EMMAQUA-NTW, ozone

149
filtered xenon arc, and 3M Proprietary exposure had similar spectral power distribution to
sunlight.
In the automotive industry, coatings used on exterior applications serve two main
purposes: protective and aesthetic.163
163
Thus, in order to increase the lifetime of
automotive exterior coatings, stabilizing additives such as ultraviolet light absorbers
(UVAs) and/or hindered amine light stabilizers (HALS) are added to the coating’s
formulation. Previous experiments of accelerated weathering of solventborne and
waterborne clearcoats (2K acrylates polyurethanes) showed a drop of 13% in gloss
retention after 2500 h of exposure for stabilized samples. However, unstabilized samples
showed a drop of over 40% after 1500h. Studies made by Seubert et al72 also showed the
weathering of stabilized and unstabilized acrylic clearcoats (UV-cured and UV and
thermally cured). In those studies, they monitored the –CH area of the FT-IR as a
measure of the surface erosion during weathering. It was observed that fully stabilized
(UVA+HALS) and HALS stabilized UV-cured samples showed a very low decrease in
CH area after 4000h of weathering. However, UVA stabilized samples and samples with
no additives showed a remarkable decrease in –CH area after ~1500 h. It was suggested
that the loss of CH area represented the amount of film thickness loss during weathering
due to bond breaking between crosslinks.
In this chapter the mechanical and coating properties of polyester-urethane films
are reported. Some of the oligoesters previously used in this dissertation were selected in
order to establish a relationship between chemical structure and final properties.
Additionally, following the same line of study as previous chapters, the degradation
behavior of polyurethane coatings was studied under accelerated weathering through FT-

150
IR and gloss retention. Although one of the drawbacks of using accelerated weathering is
that natural sunlight radiation cannot be reproduced exactly, this technique provides a
controlled environment that can give reproducible results. Natural weathering has the
disadvantage of not being constant; thus, the results cannot be reproducible.
7.3 Results
The analysis of polyester-urethane (PU) films included coating properties,
hydrolysis, and weathering. The films were synthesized from the hydroxyl-terminated
oligoesters systems (binary, ternary, and quaternary) and 1,6-hexanediisocyante
isocyanurate (HDI-isocyanurate). The first part of this chapter includes the
characterization of the polyurethane film (PU) through mechanical and coating
properties. The second and third parts of this chapter include the hydrolysis and
weathering of polyurethane (PU) films containing ternary and quaternary systems. FT-IR
spectra were used to observe any chemical changes occurring during weathering (0, 480,
960, and 1440 h). Samples are identified with the acronym of the oligoester used for the
synthesis of the polyurethane film.
7.3.1 Mechanical and Coatings Properties
Mechanical properties of polyester-polyurethanes synthesized from different
hydroxyl terminated oligoesters are shown in Table 7.1. Not surprisingly, the
polyurethane synthesized from linear diacids (AA) binary oligoesters showed low
elongation at break and low modulus. Samples made with 1,4-cyclohexanedicarboxylic
acid (1,4-CHDA) had higher elongation at break than polyester urethanes made with
adipic acid (AA). In general, all the systems (binary, ternary and quaternary) containing

151
diols such as: 1,4-butanediol; 1,5-pentanediol; and 1,6-hexanediol, had higher elongation
at break values than more sterically hindered diols (NPG, TMP and MPD). PU films
synthesized from binary systems neopentyl glycol (NPG) and 2-methyl-1,3-propanediol
(MPD) showed modulus values close to or over 1000 MPa. Young’s modulus is higher
for polyurethane containing 1,4-CHDA compared to AA-oligoester films. As expected,
the films synthesized from the aromatic binary systems showed the highest modulus
(phthalic and isophthalic acid-based oligoesters). High modulus values were expected
in PU films synthesized with ternary and quaternary systems containing aromatic diacids
and bulky diols (i.e. AA.IPA.MPD.TMP and AA.IPA.TMP.NPG).
Table 7.2 shows the glass transition temperature and the crosslink density
obtained from DMA analysis for all the polyester-urethane (PU) films. Polyurethane
films containing AA-oligoesters show low Tg’s compared to other systems. Coating
properties of polyester urethanes films made with binary, ternary and quaternary
oligoester systems are shown in Table 7.3 and Table 7.4. Gloss (20° and 60°)
measurements showed very similar results for all of the systems, except for the film
composed of adipic acid/2-butene-1,4-diol (AA.BED). Adhesion tests showed that most
samples have adhesion force around 0.5-1.0 MPa. All PU films showed similar hardness
and impact forces of over 40 lb/in, except for aromatic polyesters made with neopentyl
glycol (NPG): PA.NPG and IPA.NPG.

152
Table 7.1 Mechanical properties of polyester-urethane films
SamplesYield Strain
(%)Yield Stress
(MPa)Elongation at
Break (%)Young's Modulus
(MPa)
AA.1,4-BD 26.6 ± 8.2 1.1 ± 0.3 25.6 ± 8.8 4.5 ± 0.5
AA.1,5-PeD 32.6 ± 4.3 2.2 ± 0.4 32.6 ± 4.3 8.0 ± 0.5
AA.1,6-HD 51.8 ± 9.5 3.4 ± 0.5 51.8 ± 9.5 8.4 ± 0.7
AA.NPG 119.5 ± 14.9 1.5 ± 0.3 119.9 ± 15.1 2.2 ± 0.2
AA.BED 53.1 ± 10.3 3.1 ± 0.3 53.1 ± 10.3 7.2 ± 1.1
1,4-CHDA.1,4-BD 154.3 ± 10.1 19.7 ± 3.8 154.5 ± 10.4 32.2 ± 8.8
1,4-CHDA.1,5-PeD 200.8 ± 7.5 22.1 ± 3.4 200.8 ± 7.5 28.9 ± 1.9
1,4-CHDA.1,6-HD 137.9 ± 16.9 17.3 ± 7.1 137.9 ± 16.9 25.4 ± 7.3
1,4-CHDA.NPG 3.0 ± 1.1 24.8 ± 3.9 3.2 ± 0.7 991.0 ± 61.4
1,4-CHDA.MPD 159.9 ± 8.0 26.6 ± 2.0 148.1 ± 19.0 706.8 ± 66.7
IPA.1,5-PeD 7.4 ± 2.4 24.6 ± 2.0 94.1 ± 12.6 828.4 ± 64.6
IPA.1,6-HD 220.9 ± 25.8 17.8 ± 2.2 221.5 ± 25.5 22.4 ± 8.8
IPA.NPG 3.8 ± 0.4 41.7 ± 8.2 3.8 ± 0.4 1713.0 ± 147.6
IPA.MPD 4.6 ± 0.6 48.6 ± 6.6 4.8 ± 0.4 1766.1 ± 125.8
PA.1,4-BD 171.5 ± 19.1 3.8 ± 0.5 175.2 ± 19.5 5.6 ± 1.0
PA.1,5-PeD 183.3 ± 17.2 9.6 ± 2.9 182.0 ± 13.5 11.0 ± 4.7
PA.1,6-HD 205.0 ± 11.3 2.6 ± 0.3 200.3 ± 7.1 1.7 ± 0.2
PA.NPG 3.7 ± 0.6 41.5 ± 4.9 3.8 ± 0.5 1579.9 ± 42.2
PA.MPD 3.8 ± 0.6 40.2 ± 4.0 4.1 ± 0.2 1434.6 ± 23.6
AA.IPA.1,5-PeD 132.4 ± 8.0 8.9 ± 1.7 133.0 ± 8.0 15.2 ± 4.8
AA.IPA.1,6-HD 116.0 ± 13.9 1.0 ± 0.2 154.3 ± 24.9 1.5 ± 0.1
AA.IPA.NPG 5.0 ± 0.3 37.1 ± 3.2 5.2 ± 0.3 1112.3 ± 41.0
AA.IPA.MPD 126.7 ± 14.8 21.5 ± 2.6 125.7 ± 14.0 130.4 ± 16.0
AA.IPA.BED 77.0 ± 10.2 2.4 ± 0.3 7.8 ± 9.6 4.3 ± 0.3
AA.IPA.1,6-HD.NPG 166.9 ± 23.5 5.9 ± 1.1 167.3 ± 23.5 6.2 ± 1.6
AA.IPA.MPD.NPG 158.5 ± 16.9 23.9 ± 1.9 159.6 ± 16.4 141.0 ± 22.3
AA.IPA.TMP.NPG 4.8 ± 0.7 45.6 ± 4.7 4.9 ± 0.4 1389.8 ± 54.8
AA.IPA.MPD.TMP 5.0 ± 0.7 46.5 ± 5.7 5.7 ± 0.6 1505.2 ± 85.5
AA.IPA.1,6-HD.1,5-PD 130.0 ± 8.1 9.0 ± 1.5 130.0 ± 8.1 14.2 ± 4.5
AA.IPA.MPD.1,6-HD 142.7 ± 7.3 16.3 ± 4.5 142.8 ± 7.2 34.2 ± 4.4
AA.IPA.1,6-HD.TMP 108.2 ± 16.9 23.1 ± 4.4 109.4 ± 18.7 188.6 ± 35.8
AA.IPA.1,5-PeD.BED 189.3 ± 15.6 12.4 ± 2.0 189.3 ± 15.6 17.4 ± 3.6
AA.IPA.MPD.BED 157.7 ± 8.8 6.7 ± 1.1 157.7 ± 8.7 7.3 ± 1.6

153
Table 7.2 Glass transition temperature and crosslink density of polyester-urethane films
SamplesTg ( °C ) from tanδ
Crosslink density (mol/m3)
AA.1,4-BD -9.5 100.9
AA.1,5-PeD 3.3 113.1
AA.1,6-HD 3.5 105.3
AA.NPG 5.7 103.6
AA.BED 8.7 316.7
1,4-CHDA.1,4-BD 37.5 93.5
1,4-CHDA.1,5-PeD 37.3 209.6
1,4-CHDA.1,6-HD 35.5 303.4
1,4-CHDA.NPG 67.8 143.3
CHDA.MPD 49.5 138.4
IPA.1,5-PeD 50.9 88.6
IPA.1,6-HD 32.2 99.0
IPA.NPG 76.8 89.1
IPA.MPD 77.6 216.9
PA.1,4-BD 36.9 142.8
PA.1,5-PeD 38.1 108.6
PA.1,6-HD 11.2 98.7
PA.NPG 83.6 68.0
PA.MPD 61.2 75.7
AA.IPA.1,5-PeD 30.5 251.5
AA.IPA.1,6-HD -0.4 109.3
AA.IPA.NPG 59.3 101.7
AA.IPA.MPD 43.7 170.7
AA.IPA.BED 19.8 131.1
AA.IPA.1,6-HD.NPG 41.1 90.9
AA.IPA.MPD.NPG 44.0 81.1
AA.IPA.TMP.NPG 69.9 51.6
AA.IPA.MPD.TMP 72.5 152.4
AA.IPA.1,6-HD.1,5-PD 27.6 166.2
AA.IPA.MPD.1,6-HD 32.0 564.8
AA.IPA.1,6-HD.TMP 45.3 257.1
AA.IPA.BED.1,5-PeD 12.7 102.8
AA.IPA.MPD.BED 44.0 392.9

154
Sam
ple
20° G
loss
60° G
loss
Pull-
Off
Adh
esio
n (M
Pa)
Gou
ge
Har
dnes
ssSc
ratc
h H
ardn
ess
Cros
s-H
atch
A
dhes
ion
Reve
rse
Impa
ct
(lb/in
)Fo
rwar
d Im
pact
(lb
/in)
AA
.13P
D16
3.7
± 7.
317
1.38
± 1
.71.
37 ±
0.2
66H
2H3B
>40
>40
AA
.15P
eD11
9.0
± 4.
012
8.0
± 3.
61.
00 ±
0.1
46H
5H5B
>40
>40
AA
.NPG
116.
1 ±
11.0
127.
9 ±
2.9
0.68
± 0
.10
2H-3
H5H
5B>4
0>4
0
AA
.BED
29.6
± 5
.856
.5 ±
8.4
0.87
± 0
.21
6H5H
5B>4
0>4
0
14CH
DA
.13P
D10
7.9
± 6.
211
9.4
± 2.
71.
09 ±
0.2
86H
5H5B
>40
>40
14CH
DA
.15P
eD79
.2 ±
16.
410
8.4
± 6.
91.
62 ±
0.3
66H
5H5B
>40
>40
14CH
DA
.16H
D12
3.9
± 3.
613
4.1
± 1.
80.
70 ±
0.2
16H
5H5B
39>4
0
14CH
DA
.NPG
114.
8 ±
11.1
129.
5 ±
3.0
0.83
± 0
.05
6H5H
5B39
>40
14CH
DA
.CH
DM
119.
0 ±
3.2
120.
7 ±
1.2
0.85
± 0
.20
6H5H
5B>4
0>4
0
14CH
DA
.MPD
102.
7 ±
5.4
123.
7 ±
1.4
0.80
± 0
.10
HB
5H5B
>40
>40
IPA
.15P
eD12
7.2
± 8.
513
2.8
± 4.
30.
95 ±
0.1
1H
B5H
5B>4
0>4
0
IPA
.16H
D10
5.0
± 7.
311
4.5
± 9.
40.
74 ±
0.2
36H
5H5B
>40
>40
IPA
.NPG
79.4
± 3
.810
3.0
± 2.
30.
40 ±
0.0
36H
5H5B
25
IPA
.MPD
120.
8 ±
6.1
134.
0 ±
1.0
0.63
± 0
.05
2H4H
5B>4
0>4
0
PA.N
PG12
9.6
± 3.
813
4.3
± 2.
30.
58 ±
0.2
06H
4H5B
05
Tabl
e 7.
3 C
oatin
gs p
rope
rties
of p
olye
ster
-ure
than
e fil
ms c
onta
inin
g bi
nary
olig
oest
er sy
stem
s

155
Sam
ple
20° G
loss
60° G
loss
Pull-
Off
Adh
esio
n (M
Pa)
Gou
ge
Har
dnes
ssSc
ratc
h H
ardn
ess
Cros
s-H
atch
A
dhes
ion
Reve
rse I
mpa
ct
(lb/in
)Fo
rwar
d Im
pact
(lb
/in)
AA
.IPA
.14B
D84
.4 ±
14.
510
7.0
± 8.
40.
60 ±
0.2
06H
5H5B
>40
39
AA
.IPA
.15P
eD10
2.1
± 11
.412
3.9
± 5.
20.
62 ±
0.0
76H
5H5B
>40
39
AA
.IPA
.NPG
60.9
± 3
.883
.2 ±
2.6
0.62
± 0
.11
4H4H
5B>4
0>4
0
AA
.IPA
.MPD
119.
9 ±
4.2
129.
5 ±
3.6
0.54
± 0
.12
6H5H
5B>4
0>4
0
AA
.IPA
.BED
125.
7 ±
8.9
130.
2 ±
8.0
0.46
± 0
.10
6H5H
5B>4
0>4
0
AA
.IPA
.NPG
.TM
P11
9.3
± 4.
012
8.2
± 2.
60.
52 ±
0.0
26H
4H5B
>40
>40
AA
.IPA
.16H
D.N
PG12
3.6
± 3.
513
1.2
± 2.
90.
88 ±
0.0
76H
5H5B
>40
>40
AA
.IPA
.MPD
.NPG
126.
1 ±
3.0
132.
4 ±
2.7
1.57
± 0
.32
6H5H
5B>4
0>4
0
AA
.IPA
.16H
D.T
MP
112.
9 ±
1.9
124.
4 ±
2.0
1.27
± 0
.15
6H5H
5B>4
0>4
0
AA
.IPA
.MPD
.TM
P96
.9 ±
12.
112
1.1
± 6.
60.
45 ±
0.0
86H
5H5B
>40
>40
AA
.IPA
.16H
D.1
5PeD
121.
4 ±
5.2
126.
4 ±
3.5
0.74
± 0
.05
6H3H
5B>4
0>4
0
AA
.IPA
.MPD
.16H
D12
6.1
± 5.
213
3.9
± 3.
10.
77 ±
0.0
96H
5H5B
>40
>40
AA
.IPA
.14B
D.B
ED12
9.3
± 3.
413
3.1
± 2.
30.
78 ±
0.1
56H
5H5B
>40
>40
AA
.IPA
.15P
eD.B
ED12
5.1
± 4.
813
1.9
± 2.
30.
85 ±
0.0
76H
5H5B
>40
>40
AA
.IPA
.MPD
.BED
128.
6 ±
4.0
134.
4 ±
3.1
0.58
± 0
.09
6H5H
5B>4
0>4
0
Tabl
e 7.
4 C
oatin
gs p
rope
rties
of p
olye
ster
-ure
than
e fil
ms c
onta
inin
g te
rnar
y an
d qu
ater
nary
olig
oest
er sy
stem
s
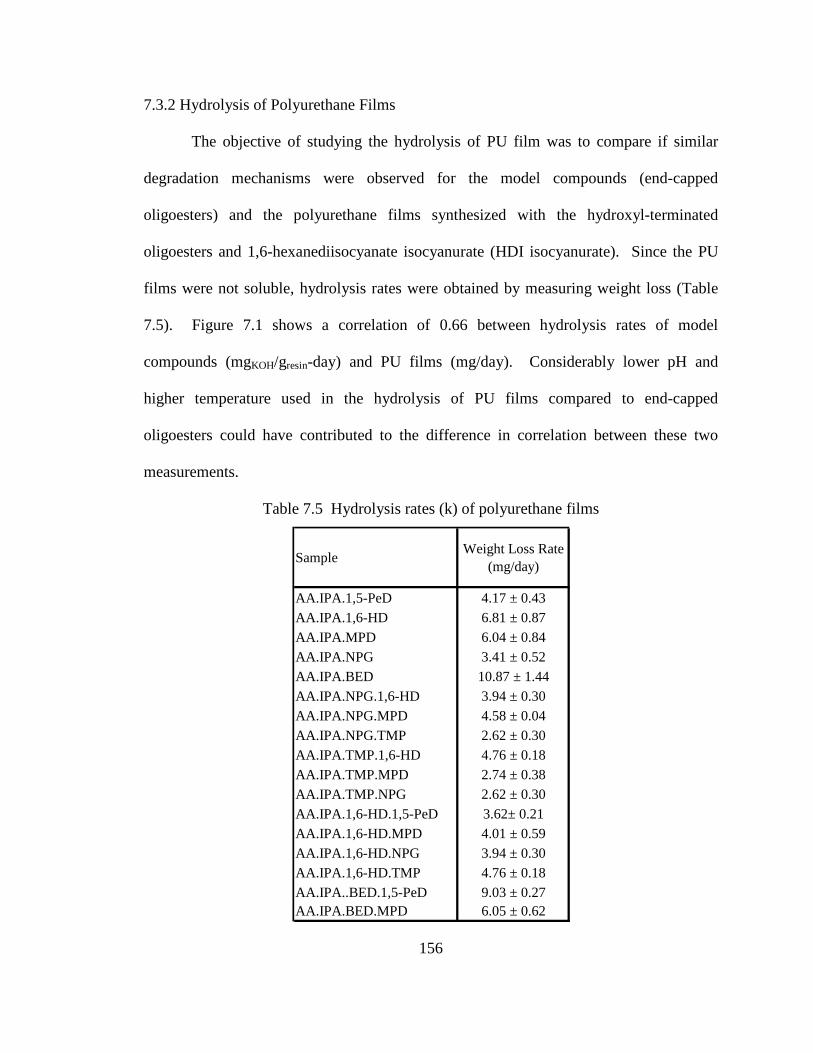
156
7.3.2 Hydrolysis of Polyurethane Films
The objective of studying the hydrolysis of PU film was to compare if similar
degradation mechanisms were observed for the model compounds (end-capped
oligoesters) and the polyurethane films synthesized with the hydroxyl-terminated
oligoesters and 1,6-hexanediisocyanate isocyanurate (HDI isocyanurate). Since the PU
films were not soluble, hydrolysis rates were obtained by measuring weight loss (Table
7.5). Figure 7.1 shows a correlation of 0.66 between hydrolysis rates of model
compounds (mgKOH/gresin-day) and PU films (mg/day). Considerably lower pH and
higher temperature used in the hydrolysis of PU films compared to end-capped
oligoesters could have contributed to the difference in correlation between these two
measurements.
Table 7.5 Hydrolysis rates (k) of polyurethane films
Sample Weight Loss Rate (mg/day)
AA.IPA.1,5-PeD 4.17 ± 0.43AA.IPA.1,6-HD 6.81 ± 0.87AA.IPA.MPD 6.04 ± 0.84AA.IPA.NPG 3.41 ± 0.52AA.IPA.BED 10.87 ± 1.44AA.IPA.NPG.1,6-HD 3.94 ± 0.30AA.IPA.NPG.MPD 4.58 ± 0.04AA.IPA.NPG.TMP 2.62 ± 0.30AA.IPA.TMP.1,6-HD 4.76 ± 0.18AA.IPA.TMP.MPD 2.74 ± 0.38AA.IPA.TMP.NPG 2.62 ± 0.30AA.IPA.1,6-HD.1,5-PeD 3.62± 0.21AA.IPA.1,6-HD.MPD 4.01 ± 0.59AA.IPA.1,6-HD.NPG 3.94 ± 0.30AA.IPA.1,6-HD.TMP 4.76 ± 0.18AA.IPA..BED.1,5-PeD 9.03 ± 0.27AA.IPA.BED.MPD 6.05 ± 0.62

157
y = 6.5318x + 21.006R2 = 0.6559
0
20
40
60
80
100
120
140
0 2 4 6 8 10 12 14rate k (mg/day)
polyurethane films
mod
el o
ligoe
sters
k' x
103 (m
gKO
H/g
resin
-day
)
Figure 7.1 Correlation between hydrolysis rates of end-capped oligoesters and
polyurethane films.
The hydrolysis rates of PU films containing ternary oligoester systems showed
similar trends compared to the end-capped oligoesters. Polyurethane films as well as
oligoester of AA.IPA.BED had the highest degradation rates, and the AA.IPA.NPG PU
films and oligoesters showed the lowest hydrolysis rates (Table 6.1 and Table 7.5).
Polyurethane films of AA.IPA.BED; AA.IPA.1,5-PeD; and AA.IPA.1,6-HD quickly
degraded and lost their shape, forming a sticky solid. Polyurethane films with the best
hydrolytic stability were (mg/day): AA.IPA.NPG.TMP (2.62) and AA.IPA.TMP.MPD
(2.74). These films showed different trends compared to the corresponding model
compounds. On the other hand, polyurethane films with the worst hydrolytic stability
(mg/day) were: AA.IPA.BED (10.9) > AA.IPA.BED.1,5-PeD (9.0) > AA.IPA.1,6-HD
(6.8) > AA.IPA.MPD ≈ AA.IPA.BE D.MPD (6.0). Except for AA.IPA.1,6-HD, all of
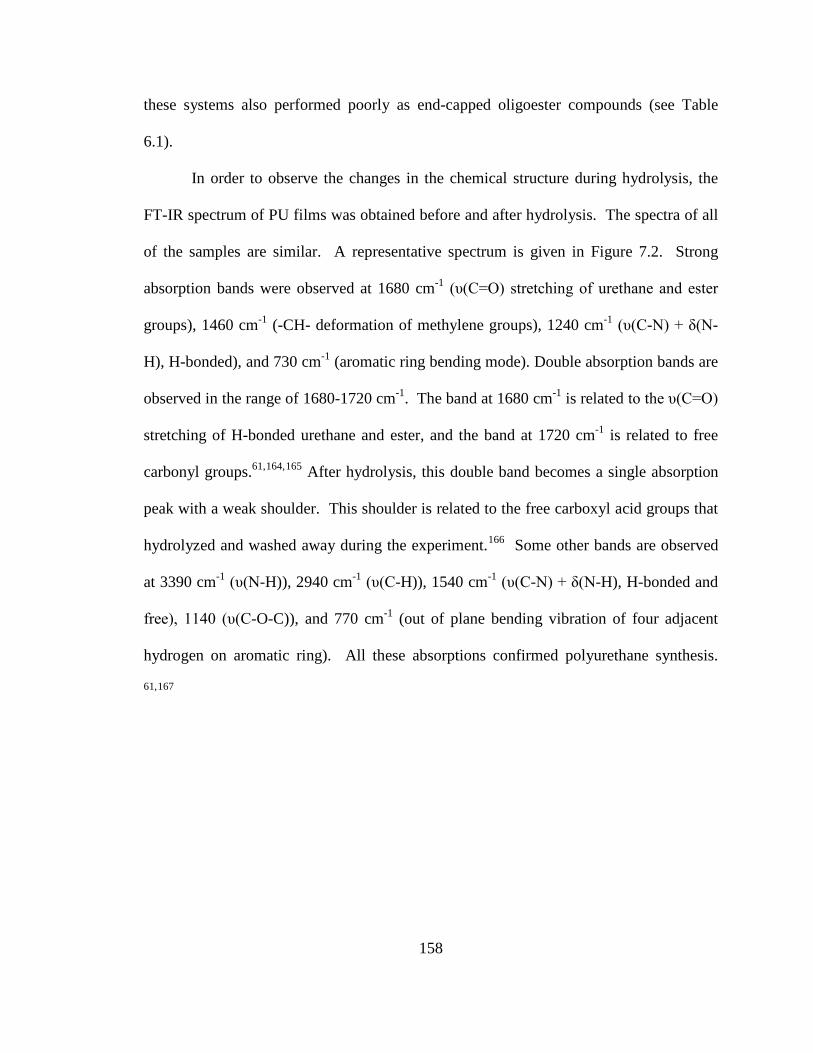
158
these systems also performed poorly as end-capped oligoester compounds (see Table
6.1).
In order to observe the changes in the chemical structure during hydrolysis, the
FT-IR spectrum of PU films was obtained before and after hydrolysis. The spectra of all
of the samples are similar. A representative spectrum is given in Figure 7.2. Strong
absorption bands were observed at 1680 cm-1 (υ(C=O) stretching of urethane and ester
groups), 1460 cm-1 (-CH- deformation of methylene groups), 1240 cm-1 (υ(C-N) + δ(N-
H), H-bonded), and 730 cm-1 (aromatic ring bending mode). Double absorption bands are
observed in the range of 1680-1720 cm-1. The band at 1680 cm-1 is related to the υ(C=O)
stretching of H-bonded urethane and ester, and the band at 1720 cm-1 is related to free
carbonyl groups.61,164,165 After hydrolysis, this double band becomes a single absorption
peak with a weak shoulder. This shoulder is related to the free carboxyl acid groups that
hydrolyzed and washed away during the experiment.166
61
Some other bands are observed
at 3390 cm-1 (υ(N-H)), 2940 cm-1 (υ(C-H)), 1540 cm-1 (υ(C-N) + δ(N-H), H-bonded and
free), 1140 (υ(C-O-C)), and 770 cm-1 (out of plane bending vibration of four adjacent
hydrogen on aromatic ring). All these absorptions confirmed polyurethane synthesis.
,167

159
Figure 7.2 FT-IR spectrum of polyurethane films before and after hydrolysis.
7.3.3 Weathering of Polyurethane Films
Accelerated weathering of polyester urethane coatings made with different
oligoester structures was monitored through gloss retention for a period of 1440 h. Gloss
is the physical property most commonly used to follow weathering.78 Additionally, in the
automotive coating industry, gloss loss caused by weathering is of more concern than
yellowing.158 Gloss retention percentage at the end of each experiment was plotted and
shown in Figure 7.3 and Figure 7.4. Figure 7.3 shows polyester urethane containing
binary prepolymers. It was observed that polyurethane containing isophthalic acid has
higher gloss retention than phthalic anhydride PU films. With the exception of PU films
containing CHDA.CHDM and AA.BED, all other CHDA- and AA-based PU films were
washed off from the panels during weathering exposure. These PU films included

160
AA.1,3-PD; AA.1,5-PeD; AA.NPG; 14CHDA.1,3-PD; 14CHDA.1,5-PeD; 14CHDA.1,6-
HD; and 14CHDA.NPG.
Figure 7.4 shows polyurethane coating films made with ternary and quaternary
oligoester systems. The results show low weathering performance for the following
samples: AA.IPA.1,6-HD.TMP (adipic acid/isophthalic acid/1,6-hexanediol/trimethylol-
propane) and AA.IPA.1,5-PeD.1,6-HD (adipic acid/isophthalic acid/1,5-pentanediol/1,6-
hexanediol). A noticeable increase in gloss was observed in oligoesters of AA.IPA.NPG
as well as in binary oligoesters of IPA.NPG. In general most of the samples retained at
least 60% of the gloss (20° gloss). The samples that had a better retention of gloss after
accelerated weathering were: AA.IPA.1,4-BD; AA.IPA.NPG; AA.IPA.NPG.TMP; and
AA.IPA.MPD.TMP. All aromatic binary systems outperformed the ternary and
quaternary systems.
Other coating properties such as gouge and scratch harndess, crosshatch adhesion,
and forward impact were also measured during weathering. The results are shown in
Table 7.6 to Table 7.9. The gouge hardness (Table 7.6) values show that all the films are
able to resist rupture after 1440 h of exposure. The scratch hardness test (Table 7.7)
shows that some of the samples loose hardness and become softer. These samples
include: AA.BED, IPA.NPG, IPA.MPD, AA.IPA.14BD, AA.IPA.15PeD, AA.IPA.NPG,
AA.IPA.MPD and AA.IPA.BED. Forward impact (Table 7.9) of all the unstabilized
samples after weathering showed poor performance with values of no more than 5 lb/in
after exposure. This means that the samples deformed easily after an impact due to
delamination from the substrate. The cross-hatch adhesion (Table 7.8) test did not show
any variation after weathering.

161
020406080
100120140160
AA.BED
14CHDA.C
HDM
IPA.15PeD
IPA.16HD
IPA.NPG
IPA.MPD
PA.NPG
% 2
0° g
loss
rete
ntio
n
Figure 7.3 Gloss retention (20°) of polyester urethane systems made with binary
oligoester compounds after 1440 h of accelerated weathering.
020406080
100120140160
AA.IPA.14
BD
AA.IPA.15
PeD
AA.IPA.M
PD
AA.IPA.N
PG
AA.IPA.B
ED
AA.IPA.N
PG.16HD
AA.IPA.N
PG.TMP
AA.IPA.M
PD.NPG
AA.IPA.16
HD.TMP
AA.IPA.M
PD.TMP
AA.IPA.16
HD.15PeD
AA.IPA.M
PD.16HD
AA.IPA.14
BD.BED
AA.IPA.15
PeD.B
ED
AA.IPA.M
PD.BED
% 2
0° g
loss
rete
ntio
n
Figure 7.4 Gloss retention (20°) of polyester urethane made of ternary and quaternary
oligoesters after 1440 h of accelerated weathering.

162
Table 7.6 Gouge hardness values obtained during weathering
t = 0 h t = 480 h t = 960 h t = 1440 h
AA.BED 6H 5H 5H 5H
CHDA.CHDM 6H 5H 5H 5H
IPA.15PeD 5H 5H 5H 5H
IPA.16HD 6H 5H 5H 5H
IPA.NPG 6H 5H 5H 5H
IPA.MPD 6H 5H 5H 5H
PA.NPG 6H 5H 6H 6H
AA.IPA.14BD 6H 5H 5H 5H
AA.IPA.15PeD 6H 4H 4H 5H
AA.IPA.NPG 4H 4H 4H 4H
AA.IPA.MPD 6H 5H 5H 5H
AA.IPA.BED 6H 5H 5H 5H
AA.IPA.NPG.TMP 6H 5H 5H 5H
AA.IPA.16HD.NPG 6H 4H 3H 6H
AA.IPA.MPD.NPG 6H 6H 6H 6H
AA.IPA.16HD.TMP 6H 6H 6H 6H
AA.IPA.MPD.TMP 6H 6H 6H 6H
AA.IPA.16HD.15PeD 6H 2H HB HB
AA.IPA.MPD.16HD 6H 5H 6H 6H
AA.IPA.14BD.BED 6H 6H 6H 5H
AA.IPA.15PeD.BED 6H 6H 6H 5H
AA.IPA.MPD.BED 6H 6H 6H 5H
PU FILMGouge Hardness

163
Table 7.7 Scratch hardness values obtained during weathering
t = 0 h t = 480 h t = 960 h t = 1440 h
AA.BED 5H HB HB HB
CHDA.CHDM 5H 5H 4H 4H
IPA.15PeD HB HB HB 4B
IPA.16HD 5H 2H HB 2B
IPA.NPG 5H 4H 2H F
IPA.MPD 4H 3H F F
PA.NPG 5H 5H 4H 4H
AA.IPA.14BD 5H 4B 6B HB
AA.IPA.15PeD 5H 4H 2H 2B
AA.IPA.NPG 4H B F F
AA.IPA.MPD 5H 6H 2H 2B
AA.IPA.BED 5H 3H 3H HB
AA.IPA.NPG.TMP 4H 4H 3H 2H
AA.IPA.16HD.NPG 5H 5H 4H 4H
AA.IPA.MPD.NPG 5H 5H 4H 3H
AA.IPA.16HD.TMP 5H 5H 5H 4H
AA.IPA.MPD.TMP 5H 5H 4H 3H
AA.IPA.16HD.15PeD 3H F 3B 3B
AA.IPA.MPD.16HD 5H 5H 4H 4H
AA.IPA.14BD.BED 6H 5H 5H 5H
AA.IPA.15PeD.BED 6H 5H 5H 4H
AA.IPA.MPD.BED 6H 5H 5H 4H
PU FILMScratch Hardness

164
Table 7.8 Cross-hatch adhesion values obtained during weathering
t = 0 h t = 480 h t = 960 h t = 1440 h
AA.BED 5B 5B 5B 5B
CHDA.CHDM 5B 3B 1B 2B
IPA.15PeD 5B 5B 5B 5B
IPA.16HD 5B 5B 5B 5B
IPA.NPG 5B 5B 5B 5B
IPA.MPD 5B 5B 5B 5B
PA.NPG 5B 5B 5B 4B
AA.IPA.14BD 5B 5B 5B 5B
AA.IPA.15PeD 5B 5B 5B 5B
AA.IPA.NPG 5B 5B 5B 5B
AA.IPA.MPD 5B 5B 5B 5B
AA.IPA.BED 5B 5B 5B 5B
AA.IPA.NPG.TMP 5B 5B 5B 5B
AA.IPA.16HD.NPG 5B 5B 5B 5B
AA.IPA.MPD.NPG 5B 5B 5B 4B
AA.IPA.16HD.TMP 5B 5B 5B 4B
AA.IPA.MPD.TMP 5B 5B 5B 4B
AA.IPA.16HD.15PeD 5B 5B 5B 5B
AA.IPA.MPD.16HD 5B 5B 5B 5B
AA.IPA.14BD.BED 5B 5B 5B 4B
AA.IPA.15PeD.BED 5B 5B 5B 4B
AA.IPA.MPD.BED 5B 5B 5B 5B
PU FILMCross-Hatch Adhesion

165
Table 7.9 Forward impact before and after weathering exposure
t = 0 h t = 1440 h
AA.BED >40 4
CHDA.CHDM >40 0
IPA.15PeD >40 5
IPA.16HD >40 5
IPA.NPG 5 0
IPA.MPD >40 1
PA.NPG 5 0
AA.IPA.14BD 39 3
AA.IPA.15PeD 39 2
AA.IPA.NPG >40 3
AA.IPA.MPD >40 1
AA.IPA.BED >40 1
AA.IPA.NPG.TMP >40 1
AA.IPA.16HD.NPG >40 1
AA.IPA.MPD.NPG >40 0
AA.IPA.16HD.TMP >40 1
AA.IPA.MPD.TMP >40 1
AA.IPA.16HD.15PeD >40 1
AA.IPA.MPD.16HD >40 1
AA.IPA.14BD.BED >40 1
AA.IPA.15PeD.BED >40 2
AA.IPA.MPD.BED >40 2
PU FILMForward Impact (lb/in)
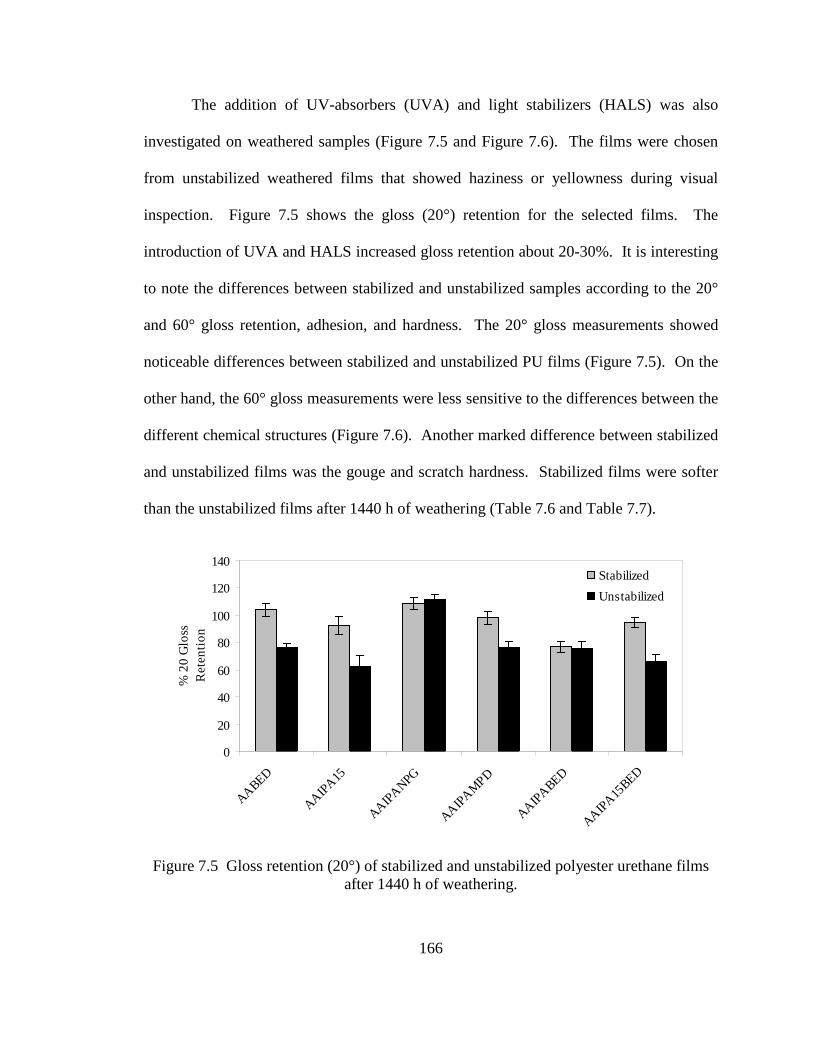
166
The addition of UV-absorbers (UVA) and light stabilizers (HALS) was also
investigated on weathered samples (Figure 7.5 and Figure 7.6). The films were chosen
from unstabilized weathered films that showed haziness or yellowness during visual
inspection. Figure 7.5 shows the gloss (20°) retention for the selected films. The
introduction of UVA and HALS increased gloss retention about 20-30%. It is interesting
to note the differences between stabilized and unstabilized samples according to the 20°
and 60° gloss retention, adhesion, and hardness. The 20° gloss measurements showed
noticeable differences between stabilized and unstabilized PU films (Figure 7.5). On the
other hand, the 60° gloss measurements were less sensitive to the differences between the
different chemical structures (Figure 7.6). Another marked difference between stabilized
and unstabilized films was the gouge and scratch hardness. Stabilized films were softer
than the unstabilized films after 1440 h of weathering (Table 7.6 and Table 7.7).
0
20
40
60
80
100
120
140
AABED
AAIPA15
AAIPANPG
AAIPAMPD
AAIPABED
AAIPA15BED
% 2
0 G
loss
R
eten
tion
StabilizedUnstabilized
Figure 7.5 Gloss retention (20°) of stabilized and unstabilized polyester urethane films after 1440 h of weathering.
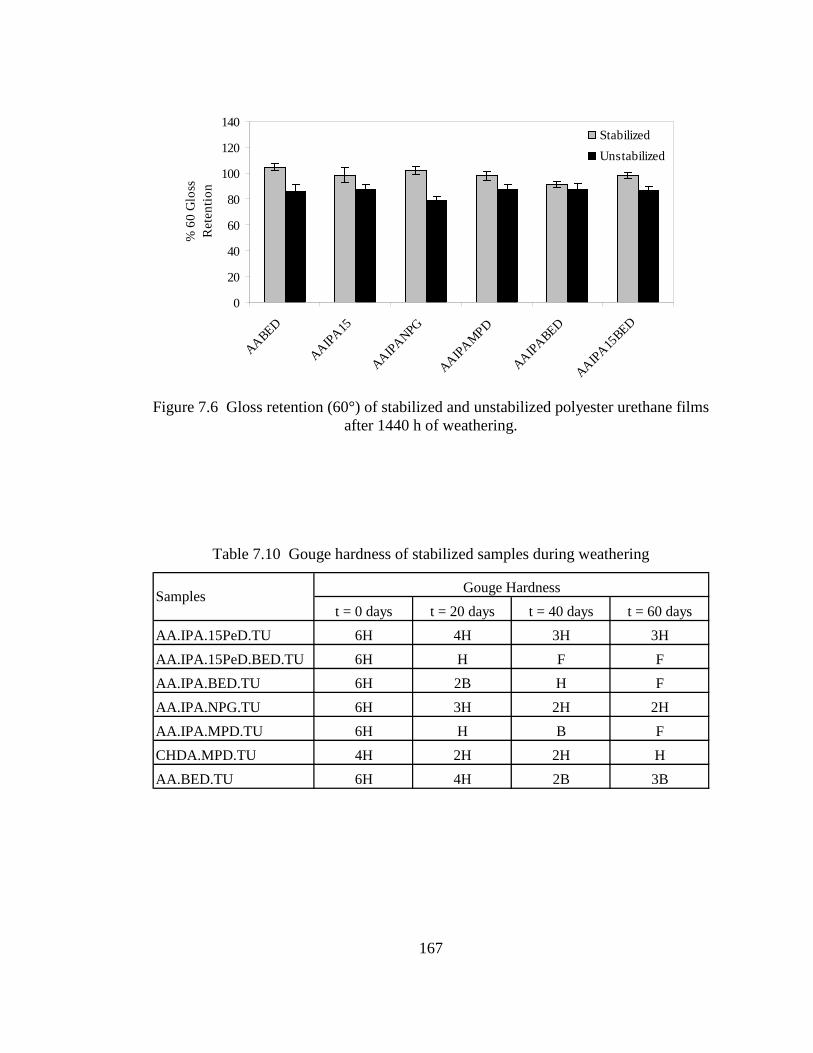
167
0
20
40
60
80
100
120
140
AABED
AAIPA15
AAIPANPG
AAIPAMPD
AAIPABED
AAIPA15BED
% 6
0 G
loss
R
eten
tion
StabilizedUnstabilized
Figure 7.6 Gloss retention (60°) of stabilized and unstabilized polyester urethane films
after 1440 h of weathering.
Table 7.10 Gouge hardness of stabilized samples during weathering
t = 0 days t = 20 days t = 40 days t = 60 daysAA.IPA.15PeD.TU 6H 4H 3H 3HAA.IPA.15PeD.BED.TU 6H H F FAA.IPA.BED.TU 6H 2B H FAA.IPA.NPG.TU 6H 3H 2H 2HAA.IPA.MPD.TU 6H H B FCHDA.MPD.TU 4H 2H 2H HAA.BED.TU 6H 4H 2B 3B
Samples Gouge Hardness

168
Table 7.11 Scratch hardness of stabilized samples during weathering
t = 0 days t = 20 days t = 40 days t = 60 daysAA.IPA.15PeD.TU 6H 4B 4B 4BAA.IPA.15PeD.BED.TU 6H 2B 2B 2BAA.IPA.BED.TU 5H 3H F 2BAA.IPA.NPG.TU F F F FAA.IPA.MPD.TU 6H 3B 2B FCHDA.MPD.TU F HB HB BAA.BED.TU 6H 2H 6B 6B
Samples Scratch Hardness
Table 7.12 Cross-hatch adhesion of stabilized samples during weathering
t = 0 days t = 20 days t = 40 days t = 60 daysAA.IPA.15PeD.TU 5B 5B 5B 5BAA.IPA.15PeD.BED.TU 5B 5B 5B 5BAA.IPA.BED.TU 5B 5B 5B 5BAA.IPA.NPG.TU 5B 5B 5B 5BAA.IPA.MPD.TU 5B 5B 5B 5BCHDA.MPD.TU 5B 5B 5B 5BAA.BED.TU 1B 3B 5B 5B
Samples Cross-Hatch Adhesion
Infrared spectroscopy is a common technique used to monitor chemical changes
occurring during weathering.78 All of the PU films show a similar pattern, a
representative spectrum of which is shown in Figure 7.7. Strong absorptions bands were
observed at 1680 and 1720 cm-1 (υ(C=O) stretching of H-bonded and free carbonyl
groups), 1460 cm-1 (-CH- deformation of methylene groups), 1240 cm-1 (υ(C-N) + δ(N-
H), H-bonded), 730 cm-1 (aromatic ring bending mode). Some other absorptions are
observed at 3390 cm-1 (υ(N-H)), 2940 cm-1 (υ(C-H)), 1540 cm-1 (υ(C-N) + δ(N-H), H-

169
bonded and free), 1140 (υ(C-O-C)), and 770 cm-1 (out of plane bending vibration of four
adjacent hydrogen on aromatic ring).61,167 Similar to the FT-IR of the hydrolysis of PU
films (see Figure 7.2), the disappearance of the 1720 cm-1 absorption band confirms the
hydrolysis of free carboxyl acid groups (end-groups). Additionally, the disappearance of
the urethane bands at 1240 and 1540 cm-1 and the increase in the –OH absorption region
confirm the degradation of the urethane crosslink and the ester groups during weathering.
Figure 7.8 shows the FT-IR spectra of stabilized PU films containing AA.IPA.15PeD at
0, 480, 960, and 1440 h during weathering. The most important thing to note in this
graph is the higher retention of the urethane bands at 3390 and 1540 cm-1.
The changes in the area under a specific band were used to measure the relative
concentration of a group with respect to another. The -CH- peak is usually preferred for
comparison because this peak can be related to the amount of material left or thickness of
the film.168,169 Figure 7.9 shows the relative concentration of -OH and –NH– groups on
the 3600-3100 cm-1 region with respect to the -CH- peak on the 3020-2780 cm-1 during
weathering exposure (h) for selected groups. Figure 7.10 shows the relative
concentration of carbonyl (C=O) groups on the 1830-1570 cm-1 region with respect to the
–CH– groups on the 3020-2780 cm-1 during weathering. The rates of peak appearance
(increase in concentration) of the OH-NH region and C=O region with respect to the
methylene groups left were obtained from the slopes of lines in Figure 7.9 & Figure 7.10.
The rates of appearance for all the samples are shown in Table 7.13.

170
0
20
40
60
80
100
120
40080012001600200024002800320036004000
wavenumber (cm-1)
% tr
ansm
issio
n )
0 h480 h960 h1440 h
OH & NH
C=Ofrom COOH
-CNH--CNH- -COC-
Figure 7.7 FT-IR spectra of an unstabilized polyester urethane coating (AA.IPA.15PeD)
inside a weathering chamber at 0, 480, 960, and 1440 h.
0
20
40
60
80
100
120
40080012001600200024002800320036004000wavenumber (cm-1)
% tr
ansm
issio
n (a
.u.))
0 h480 h960 h1440 h
OH & NH
-CNH--CNH-
-COOC-
Figure 7.8 FT-IR spectra of a stabilized polyester urethane coating (AA.IPA.15PeD)
inside a weathering chamber at 0, 480, 960, and 1440 h.
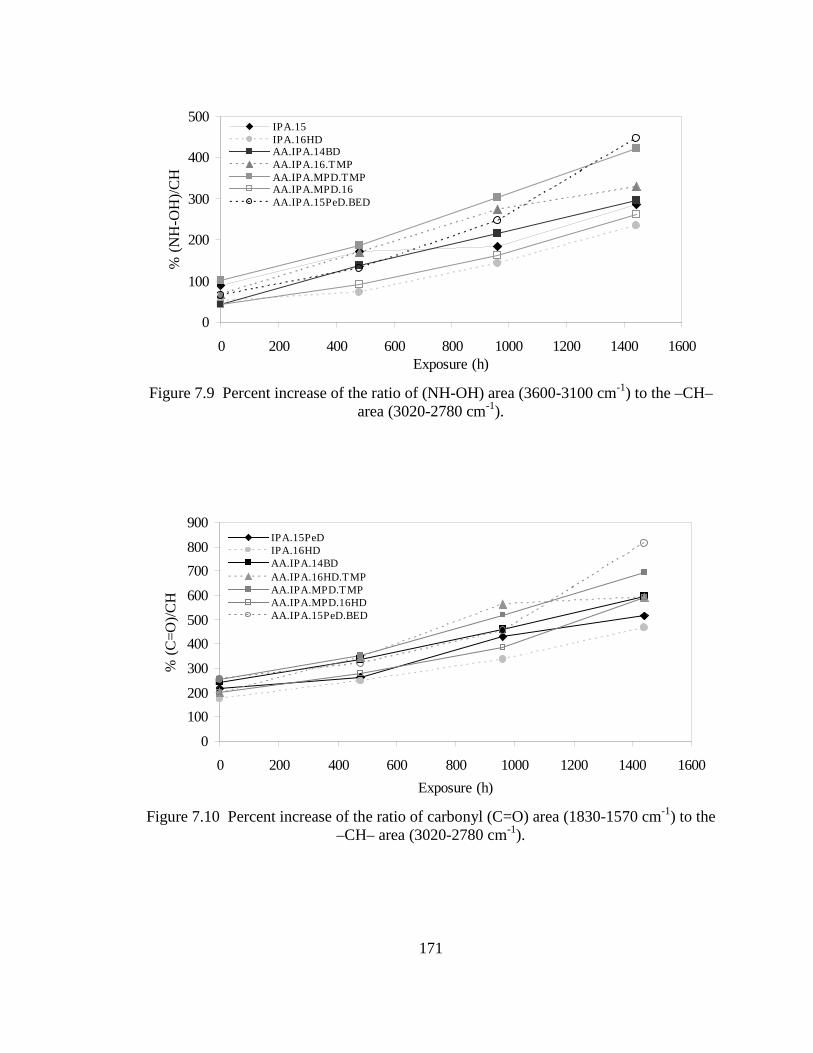
171
0
100
200
300
400
500
0 200 400 600 800 1000 1200 1400 1600Exposure (h)
% (N
H-O
H)/C
H
IPA.15IPA.16HDAA.IPA.14BDAA.IPA.16.TMPAA.IPA.MPD.TMPAA.IPA.MPD.16AA.IPA.15PeD.BED
Figure 7.9 Percent increase of the ratio of (NH-OH) area (3600-3100 cm-1) to the –CH–
area (3020-2780 cm-1).
0
100200
300
400500
600
700800
900
0 200 400 600 800 1000 1200 1400 1600Exposure (h)
% (C
=O)/C
H
IPA.15PeDIPA.16HDAA.IPA.14BDAA.IPA.16HD.TMPAA.IPA.MPD.TMPAA.IPA.MPD.16HDAA.IPA.15PeD.BED
Figure 7.10 Percent increase of the ratio of carbonyl (C=O) area (1830-1570 cm-1) to the
–CH– area (3020-2780 cm-1).

172
Table 7.13 Rates of appearance of the (NH-OH) groups and (C=O) groups with respect to –CH- groups during weathering
Samples Rate x103
%(NH-OH)/day (3600-3100 cm-1)
Rate x103 % (C=O)/day
(1830-1575 cm-1)
1,4-CHDA.CHDM 160 217 IPA.1,5-PeD 125 221 IPA.1,6-HD 131 201 IPA.NPG 144 238 IPA.MPD 145 132 PA.NPG 132 173 AA.IPA.14BD 173 246 AA.IPA.15PeD 145 190 AA.IPA.NPG 86 36 AA.IPA.MPD 131 180 AA.IPA.BED 369 169 AA.IPA.NPG.TMP 110 195 AA.IPA.16HD.NPG 120 203 AA.IPA.MPD.NPG 186 361 AA.IPA.16HD.TMP 185 292 AA.IPA.MPD.TMP 225 309 AA.IPA.16HD.15PeD 146 238 AA.IPA.MPD.16HD 151 268 AA.IPA.14BD.BED 269 460 AA.IPA.15PeD.BED 262 376 AA.IPA.MPD.BED 288 304
One of the crucial goals of this research was to find if the hydrolysis of outdoor
polyurethane coatings could be modeled by the hydrolysis of end-capped oligoesters in a
closed system. A correlation analysis was performed in order to observe if any
relationship existed between the different parameters measured in this study. A poor
correlation (0.53) was found between hydrolysis rates of end-capped oligoesters and the

173
weathered films (Figure 7.11). Photo-degradation during weathering could have
contributed to the differences between the correlation of the hydrolysis and weathering
results. A very low degree of correlation (0.15) was observed between the hydrolysis of
polyurethane films and the 20° gloss retention (Figure 7.12). The differences
(considerable low pH in the PU hydrolysis and the photo-degradation of weathered films)
between these two values might have caused the low correlation. PU films containing an
unsaturation in the backbone (AA.IPA.BED and AA.IPA.BED.15PeD) were
considerably away from the average. Unsaturation on the backbone due to the double
bond of the butene-diol (BED) caused a low photo-oxidative stability. Additionally,
BED-contaning oligoesters are prone to back-biting, causing high hydrolysis rates (see
Figure 6.4).
y = -0.6019x + 87.792R2 = 0.5327
0
20
40
60
80
100
120
140
0 20 40 60 80 100 120 140% 20° gloss retention
weathered polyurethane films
mod
el o
ligoe
sters
k' x
103 (m
gKO
H/g
resin
-day
)
Figure 7.11 Correlation between hydrolysis of end-capped oligoesters and 20° gloss retention (%). Excluded point () AA.IPA.BED.

174
y = -0.0238x + 5.8399R2 = 0.1543
0
2
4
6
8
10
12
14
0 20 40 60 80 100 120 140% 20° gloss retention
weathered polyurethane films
hydr
olys
is of
pol
yure
than
e fil
ms)
k (m
g/da
y)
Figure 7.12 Correlation between hydrolysis of polyurethane films and 20° gloss retention (%). Excluded points: () AA.IPA.BED and (▲) AA.IPA.BED.15PeD.
Weathering of PU films caused simultaneous hydrolysis and photo-oxidation
reactions. Gloss measurements quantified the overall degradation. However, FT-IR
allowed the change in absorption bands representing specific degradation products.
Correlation analysis (Figure 7.13) shows that there is a good correlation (0.51) between
the area increase in the 3600-3100 cm-1 region, corresponding to the –OH, -NH- groups
and the hydrolysis of end-capped oligoesters. Also, Figure 7.14 shows a strong
correlation (0.78) between this same FT-IR region and the hydrolysis of polyurethane
films. Thus, the -NH, -OH rate increase can be considered a good measure of the
hydrolysis of PU films during weathering.

175
y = 1.9558x + 87.003R2 = 0.5078
0
100
200
300
400
500
600
0 20 40 60 80 100 120 140rate of appearance (NH-OH)
weathered PU films
mod
el o
ligoe
sters
k' x
103 (m
gKO
H/g
resin
-day
)
Figure 7.13 Correlation between the hydrolysis of end-capped oligoesters and the rate of increase in the (NH,OH) area during weathering.
y = 0.0257x + 0.5896R2 = 0.7797
0
2
4
6
8
10
12
14
0 100 200 300 400 500rate of appearance (NH-OH)
weathered PU films
hydr
olys
is of
PU
film
s))ra
te (m
g/da
y)
Figure 7.14 Correlation between the hydrolysis of PU films and the rate of increase in the (NH,OH) area during weathering. Excluded point: AA.IPA.MPD.TMP.

176
7.4 Discussion
Comparison of binary with ternary and quaternary systems showed that modulus
values depended more on the diol than in the diacid. Polyurethane (PU) films containing
MPD, NPG or TMP monomer showed higher modulus than linear diols (1,4-BD; 1,5-
PeD; and 1,6-HD). The lower Tg values observed in AA-based samples translated into
lower modulus values (see Table 7.1 and Table 7.2). The PU films with high Tg (>70°C)
had modulus values of over 1000 MPa. Since the mechanical testing was performed at
room temperature before weathering, films with higher Tg were closer to the glassy state,
making the film stiff and less flexible. These glassy materials had very low elongation at
break (< 5 %). The high reverse and forward impact values observed in all PU films
indicated good adhesion. This can also be supported by the high numbers achieved in the
cross-hatch adhesion test.
In general, high Tg and crosslink density lowers the amount of water absorbed by
the polymer.170
Figure 6.3
Films with Tg higher than room temperature have limited free volume.
Thus, the amount of ester groups in contact with water decreases and hydrolysis is less
likely to strike. Polyurethane films with high Tg (see Table 7.2) had indeed higher gloss
retention values. The low Tg values observed in AA-based oligoesters are one of the
reasons for the low hydrolytic stability during weathering. The low Tg gives flexibility
to the chains and increases the free volume. Free volume in AA-based PU films gives
space to the molecule to move and change conformation. Thus, when AA is present as an
end-group, the chain can undergo a back-bite mechanism that increases hydrolysis rates
(see ). Additionally, the low steric hindrance of AA-binary systems places this

177
PU films in the second stage of the hydrolysis mechanism (see Table 7.2), which
eventually leads to full degradation.
Chain scisscion at different points along the polyurethane network has been
previously reported: random chain scission and end-group scission. 42,59,60 Several studies
have shown the presence of both scenearios, random chain scission and autocatalysis by
hydrogen (H+) or carboxyl (COO-) ions produced by the hydroxyl or carboxyl acid end-
groups. 42,60 When random chain scission is present, weight gain is expected.59 Random
hydrolysis processes lead to a weight increase of 18 g/mol per event (Figure 7.15) due to
the absorption of a water molecule at the breaking point.40 The release of a molecule
during random chain scission could only happen when two ester groups located in
between crosslink points are hydrolyzed. This event breaks the molecules at nearby
points and could potentially release a small molecule. However, it has been observed that
during random chain scission the polyester segment is broken in two relatively long
chains (not monomeric). The diffusion of these chains within the polymeric matrix is
very low.171
During end-group scission, weight loss is usually observed. This weight loss is
related to the release of small soluble monomeric units. Thus, the weight loss previously
observed during the hydrolysis of PU films (see Table 7.5) indicates the release of small
molecules (
Hence, the solubility in water is also low and extraction is not favored.
Figure 7.15). Just as in the case of oligoester model compounds (see Table
4.3), increasing the concentration of functional chain ends (-COOH and -OH) in the
polymeric matrix increases the weight loss rate during hydrolysis. 40,42 Previous studies
have shown that a high concentration of dangling chains and low levels of crosslinks
have a big impact on the erosion of accelerated weathered samples.74 Reduction of

178
thickness by about 50% had been previously observed in partially crosslinked polyester
urethane coatings, while fully crosslinked systems only lost about 20% of the original
thickness and had about the same level of oxidation as partially crosslinked systems.74
a)
b)
Figure 7.15 Hydrolysis of polyurethane films through a) end-group scission or b) random scission.
FT-IR is one tool that has been used in the past to track chemical changes
occurring during weathering. FT-IR spectra of PU films (see Figure 7.2 and Figure 7.7)
confirm that major extractable fragments are monomeric dibasic acids. FT-IR spectra
showed a decrease in the peak related to free –COOH groups. The loss of small
monomeric units is probably related to AA end-groups, which are more prone to
hydrolysis due to the low steric hindrance and the ability to undergo a back biting
C
O
O C
O
O C
O
O C
O
OC
O
OC
O
O C
O
O C
O
OC
O
O
C
O
O C
O
O C
O
O C
O
OC
O
OHC
O
O C
O
O C
O
OC
O
OHO
Polyurethane Film
HO
O
OH
O
HO OH

179
mechanism. Thus, the weight loss observed as well as the decrease in free carbonyl
groups show that the hydrolysis occurrs at the chain ends. Similar results were observed
in Chapter 6 (see Figure 6.3). Loss of molecular weight is also confirmed by the
brittleness observed in PU films at the end of the experiment.
The weathering of PU films causes a series of reactions (photo-oxidation, thermal
degradation, hydrolysis) that modifies the chemical composition of the coating (chain
scission and crosslinking). These reactions eventually lead to material loss, which in turn
affects the surface roughness and gloss retention.78 Results indicated that unstabilized
polyester urethane films were susceptible to the degradation effects (sunlight, moderate
temperature and water), causing extensive deterioration (see Figure 7.3 - Figure 7.4).
However, the addition of UVA and HALS stabilizers increased the gloss retention for all
the PU films studied (see Figure 7.5). The UVA additives absorb sunlight that can
initiate free radical formation, which leads to a photo-oxidative degradation.172
Figure 7.8
HALS
stabilizers were used to remove free radicals that lead to photooxidation. The addition of
UVA and HALS stabilizers (see ) inhibited the photo-oxidative attack of ester
and urethane groups compared to the unstabililzed samples (Figure 7.7), which had an
increase in hydroxyl groups (due to hydrolysis) and a decrease in urethane groups (due to
photo-oxidation).
The scratch hardness test of stabilized polyurethanes indicated that at the end of
the weathering test, the films became softer. Films that initially had a 6H (hard) value
obtained a 2B – 6B (soft) value after weathering (see Table 7.6 and Table 7.7). This
indicated that with the surface erosion of the film during weathering the concentration of
the stabilizers increased on the surface and plasticize the surface of the film. Previous

180
studies of the photodegradation of PET films173
173
have shown that carboxyl end-groups are
formed at the surface layer of the film after a short period of irradiation. Carboxyl end-
groups take longer to be formed in the bulk of the film due to the lower oxygen
concentration on inner layers compared to the surface layer. However, analysis of the
back surface of the film (unexposed to the light and attached to the substrate) showed a
higher concentration of carboxyl end-groups compared to the bulk, which led to the
conclusion that other chemical reactions besides photo-oxidation were also present.173
Hydrolysis of PU films showed a decrease in free carbonyl groups (see Figure
7.2). On the other hand, weathering of PU samples showed a degradation of the urethane
linkage (see Figure 7.7) as well as an increase in OH and C=O (H-bonded) groups (see
Figure 7.9). This was an indication of photo-oxidation and hydrolysis reactions acting
together. Recent studies showed that the combination of sunlight and humidity/moisture
have a large impact on outdoor polyester products. Studies comparing Florida vs.
Arizona for natural weathering158 showed that gloss retention measurements were more
affected in Florida due to the combination of the photo-degradation and the humidity
present than by the higher sun loads of Arizona. Further studies supporting the idea of a
humidity controlled weathering were done in Florida and the Netherlands.174
174
Florida was
considered to have the most aggressive environment based on global radiation per year
(6500 MJ/m2 vs 3800 MJ/m2) and temperature (23°C vs 10°C). Yet, the Netherlands had
higher humidity levels compared to Florida (87% vs 78%). Weathering of polyester and
highly durable non-polyester (PVDF/acrylics and polyurethane/polyamide) showed
that specimens at the Florida site had higher gloss retention values compared to the
Netherlands, emphasizing the susceptibility of ester groups to hydrolysis. The author

181
concluded that the degradation of polyester depended on humidity and time of wetness
and not so much on the intensity of solar radiation and temperature.174 Although
humidity played an important role in the weathering experiments, it is clear that the
photo-oxidation observed in PU films also contributed to the gloss loss.
It is difficult to confirm if the presence of UV light enhanced the hydrolysis rates.
However, hydrolysis data indicates that an increase in end-group functionalities leads to
an increase in hydrolysis rates. Since photo-oxidation creates carboxyl acid groups, an
increase in hydrolysis rates is expected due to the increase in functional end-groups.
Also, the tempearatures used during weathering could increase the photo-oxidation and
hydrolysis rates. According to Belder and Koldijk,170 outdoor temperature as well as the
one used in accelerated weathering is not high enough to initiate degradation reactions
(chemical cleavage) of polymers, but temperature increase does affect photo-oxidation
and hydrolysis rates.
Decrease in the intensity of the band at 1530 cm-1 with weathering (see Figure
7.7) represents scission of the urethane crosslink.162 The broadening of the 3400cm-1
peak suggests the increase of the –OH groups, pointing to the hydrolysis of ester groups.
An increase in the –OH,-NH peak area (see Figure 7.9) of the FTIR chromatograms is
usually found in weathered polyester-urethane coatings undergoing hydrolysis and photo-
oxidation.74 The increase in carbonyl concentration (see Figure 7.10) and the decrease in
the hydrocarbon region (3100-2800 cm-1) during weathering is an indication of a photo-
oxidative process with loss of the oxidized material.175,176
The photo-oxidative stability of the final polyurethane is also compromised by the
tendency of the phenyl ring to absorb UV light.
10 Photo-oxidation eventually leads to a

182
decrease in crosslink density and failure of mechanical properties. Therefore, the drastic
decrease in forward impact values at the end of weathering exposure (< 5 lb/in for all
samples) supported the idea of a decrease in crosslink density. This was an indication of
the polymer becoming more brittle with weathering exposure. Reduction in elongation as
well as an increase in elastic modulus is expected for all the samples.173,177
Photo-oxidation influenced gloss loss to a larger extent than hydrolysis.
175 A
marked decrease in the intensity of the -CH- peak is observed in the FT-IR spectra (see
Figure 7.7) of unstabilized PU films during weathering. This decrease in the –CH–
groups corresponds to a decrease in film thickness.72,162 However, FT-IR spectra taken
after 15 days of hydrolysis did not show a high decrease in –CH– groups (see Figure 7.2)
although gravimetric studies showed a decrease in the weight of PU films (see Table 7.5).
Therefore, the weight loss observed during hydrolysis was caused by the loss of other
groups than –CH– (i.e. -COOH end-groups).
Increase of 20° gloss values (see Figure 7.3 & Figure 7.4) during the initial
weathering exposure has been previously observed by several authors.170,174,178 Increase
in gloss values might be due to a different degradation reaction taking place, where chain
scission and reassociation reactions are taking place simultaneously.179 Yang et al.180
170
observed that the onset of chain scission and reassociation leads to different conformation
changes on the coating surface that resulted in an increase in gloss values. Belder and
Koldijk also observed during the weathering of carboxyl functional polyesters cured
with TGIC (triglycidyl isocyanate) that gloss retention values were initially constant and
then increased with exposure time, followed by a gradual gloss loss. Gloss retention data
showed that only samples containing IPA.16HD, IPA.NPG, AA.IPA.14BD, and

183
AA.IPA.NPG showed this particular behavior. These samples were characterized by
having low hydrolysis rates. Consequently, the high gloss retention may be associated
with the onset of the hydrolysis, which resulted in different conformation changes that
favor gloss retention.
Weathering results showed that the PU films synthesized from binary aromatic
systems studied (IPA and PA) have more than 90% gloss retention (Figure 7.3). On the
other hand, the AA-based PU films degraded to a higher percent and delaminated from
the substrate. Thus, the combination of both diacids (AA.IPA) in ternary and quaternary
systems resulted in degradation rates (photo-oxidation & hydrolysis) inbetween the
values of binary AA & IPA systems (see Figure 7.3 & Figure 7.4). In general, it was
observed that samples containing monomers with high steric hindrance, such as
AA.IPA.NPG, AA.IPA.NPG.TMP, and AA.IPA.TMPD.MPD have the lowest
degradation for either end-capped oligoesters or PU films (hydrolysis and weathering).
On the other hand, samples containing BED performed poorly due to the unstaturation
present in the backbone. Similar results were observed in Chapters 4 & 6, where the
hydrolysis rates of ternary and quaternary end-capped oligoesters were inbetween the
hydrolysis values of the AA & IPA binary oligoester systems. This was also confirmed
by the strong correlation data between hydrolysis rates and the increase in (NH,OH)
absorption area.
Previous studies have shown the impact of IPA on the chemical structure of
weathered samples. In those studies, polyester (AA/IPA/NPG/TMP) melamine
containing a higher concentration of isophthalic acid (IPA) had higher gloss retention and
color change than samples with lower IPA concentration.181 It was observed that the

184
concentration of IPA was related to oxygen consumption. Higher concentration of IPA
lowered the oxygen consumption and inhibited the photooxidation.181 Additionally,
Heidt and Jones181 observed that unstabilized films (acrylics) weathered in dark cycles at
high temperatures (70-80°C) had very low oxygen consumption compared to films that
were irradiated and heated. They concluded that while the temperature increased the rate
of oxygen consumption, the photochemical effect initiated the degradation reaction.
Therefore, the higher gloss retention values obtained in PU films containing binary-IPA
oligoesters were due to the higher concentration of IPA in binary systems, which limted
the oxygen consumption compared to ternary and quaternary systems.
Acceleration factors used to describe the ratio of failure time outdoors to failure
time in accelerated weathering are useful information to predict the outdoor service time
of a coating. These acceleration factors vary depending on the type of material studied,
the weathering cycle, and the place of outdoor exposure. Different acceleration factors
reported in the literature77,79,161,182,183
Correlation data between the hydrolysis of end-capped oligoesters and PU films
in acid solution showed that the original idea of eliminating end-groups to mimic the
degradation of the polyurethane soft segment holds to a good extent for all the chemical
structures used in this study. To the best of our knowledge, this is the first time a
correlation between hydrolysis of oligoesters and weathering of polyester-urethane film
has been done. The good correlation obtained between these two values (hydrolysis and
suggest that polyester-based coatings have an
acceleration factor of 14 – 15. Therefore, assuming an acceleration factor of 15, the gloss
retention measurements done in this study correspond to approximately 2.5 years of
outdoor weathering data.

185
weathering) is a strong indication of the potential of this type of experiments.
Weathering experiments are expensive and time consuming. Thus, a good approximation
of the weathering performance of outdoor coatings can be obtained by a simple and
inexpensive hydrolysis of model oligoester compounds (end-capped).
7.5 Conclusions
The mechanical and coating properties of a series of unstabilized polyester
urethane coatings were investigated. Stabilized samples showed low physical
degradation for the amount of time of the experiments. Therefore, unstabilized samples
were used in order to obtain a better picture of the degradation mechanism. FT-IR
measurements as well as 20° gloss retention proved to be useful tools when monitoring
physical and chemical degradation of polyester urethane coating films. Weathering of
polyester-urethane films occurs through a combination of photo-oxidation and hydrolysis.
In general, samples made with isophthalic acid (IPA) showed better weathering
performance than other samples containing adipic acid, 1,4-cyclohexanedicarboxylic acid
or a combination of AA.IPA diacids. It was confirmed that PU films with higher
concentration of IPA content increased the weatherability of the coating. Films
containing BED showed different trends to the rest of PU films due to the unsaturation
present in the backbone. The hydrolysis of end-capped oligoesters can be potentially
used to predict the weathering of PU films.

186
CHAPTER VIII
CONCLUSIONS
The end-capping of hydroxyl-terminated oligoesters resulted in a decrease of
hydrolysis rates. Three different scenarios for the hydrolysis of end-capped oligoesters
were proposed. The first scenario of the hydrolysis was a function of the steric
hindrance, the mobility of the chain (Tg) and the hydrophobicity. The second scenario of
the oligoester hydrolysis was dominated by anchimeric effects. Intramolecular catalysis
was the predominant mechanism in this stage. High concentration of hydroxyl and
carboxyl acid end-groups may or may not be present. Subsequent degradation of the
oligoester led to the third scenario, the hydrolysis of small molecules (di- and tri-esters),
in which the mechanism of reaction was different from those of the polymer due to the
difference in diffusion.
According to the proposed model and the individual characteristics of each
system, the beginning of the hydrolysis might start at the first or second scenario. For
example, binary AA-based oligoester systems were characterized by a flexible chain with
a low steric hindrance in which anchimeric effects and small concentrations of functional
end-groups were sufficient to trigger the hydrolysis. Therefore, the hydrolysis of AA-
based groups started through end-group reactions (2nd scenario), which eventually led to
the reaction of small molecules (3rd scenario). On the other hand, the high steric

187
hindrance and the rigidity of the chain controlled the hydrolysis of CHDA- and aromatic-
based oligoesters. Therefore, hydrolysis started at the first scenario of the propsed
degradation model.
Linear free energy relationships between thermodynamic parameters such as
enthalpy, entropy and free energy of activation were useful information for the
determination of the relationship between reactivity and chemical structure. Enthalpy-
entropy compensation was observed, pointing at two distinctive groups. The first group
contained AA-based oligoesters, which were characterized by low steric hindrance and
flexible chains prone to anchimeric and end-group effects. The second group was
characterized by binary oligoester systems containing NPG. These oligoesters contained
sterically hindered monomers such as hexahydrophthalic anhydride and 1,4-
cyclohexanedicarboxylic acid. These studies helped to corroborate the different
mechanisms triggering the hydrolysis of different chemical structures.
Hydrolysis studies of ternary and quaternary oligoesters and polyurethane films
showed that diacids have a larger impact on hydrolysis rates than diols. Hydrolysis
studies of ternary and quaternary oligoesters containing AA and IPA showed relatively
small variations on hydrolysis rates compared to binary systems. The concentration of
IPA had a direct impact on the hydrolytic stability of the oligoester due to the disruption
of intra- and inter-molecular catalysis. Ponderal analysis demonstrated that the
hydrolytic stability of oligoesters was a non-additive and revealed the importance of the
ester group over the chain composition. A good correlation between the hydrolysis of
oligoesters and PU films confirmed the initial assumption that end-capped oligoesters
mimic the hydrolytic stability of the soft segment of polyester-urethanes. It was
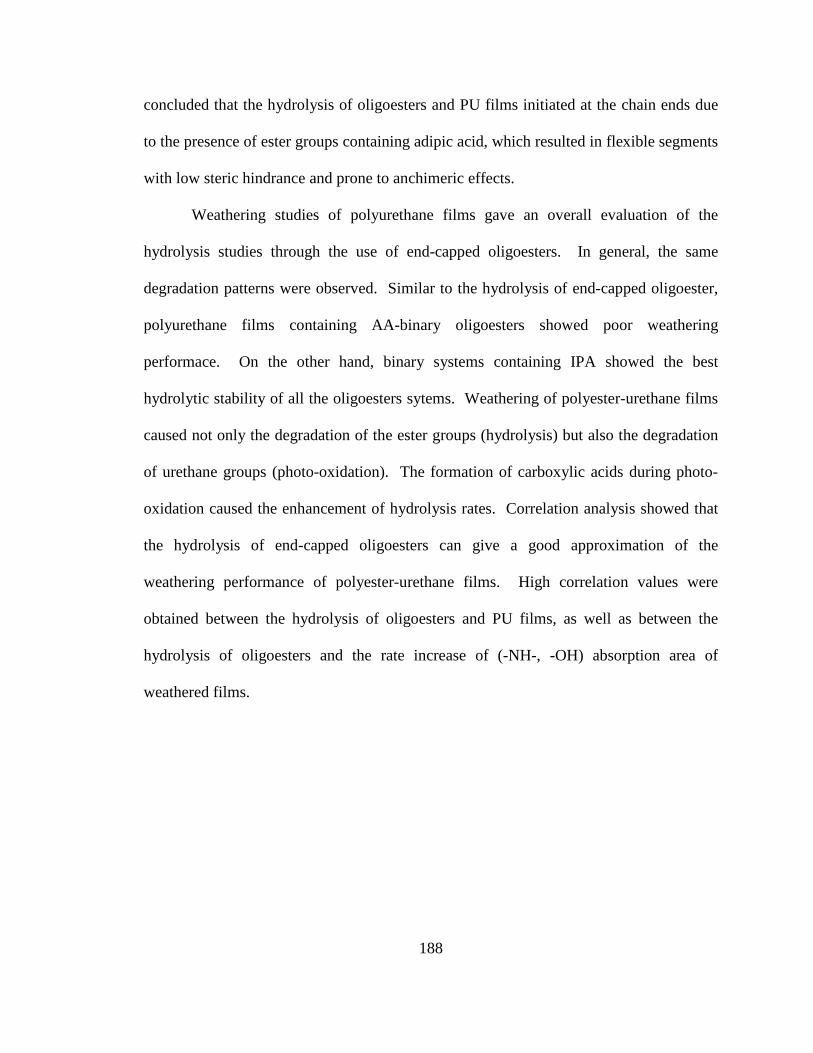
188
concluded that the hydrolysis of oligoesters and PU films initiated at the chain ends due
to the presence of ester groups containing adipic acid, which resulted in flexible segments
with low steric hindrance and prone to anchimeric effects.
Weathering studies of polyurethane films gave an overall evaluation of the
hydrolysis studies through the use of end-capped oligoesters. In general, the same
degradation patterns were observed. Similar to the hydrolysis of end-capped oligoester,
polyurethane films containing AA-binary oligoesters showed poor weathering
performace. On the other hand, binary systems containing IPA showed the best
hydrolytic stability of all the oligoesters sytems. Weathering of polyester-urethane films
caused not only the degradation of the ester groups (hydrolysis) but also the degradation
of urethane groups (photo-oxidation). The formation of carboxylic acids during photo-
oxidation caused the enhancement of hydrolysis rates. Correlation analysis showed that
the hydrolysis of end-capped oligoesters can give a good approximation of the
weathering performance of polyester-urethane films. High correlation values were
obtained between the hydrolysis of oligoesters and PU films, as well as between the
hydrolysis of oligoesters and the rate increase of (-NH-, -OH) absorption area of
weathered films.

189
REFERENCES
1 Korshak, V.V.; Vinogradova, S.V., Polyesters, Burdon, J., Ed.; Pergamon Press:
London, 1965, pp 548 2 Wicks, Z.W.; Jones, P.N.; Pappas, S.P., Organic Coatings: Science and Technology,
2nd edition, John Wiley & Sons, Inc.: New York, 1999, pp 630 3 Eastman Chemical Company, Appliance Coil Coatings Based on EASTMAN 1,4-
CHDA and CHDM, Publication N-330, 2003 4 Payne, K.; Jones, F.N.; Brandenburger, L.W.; J. Coat. Technol., 1985, 57 (723), 35-
42 5 Newman, M.S., Steric Effects in Organic Chemistry, John Wiley & Sons, Inc.: New
York, 1956; 710 6 Turpin, E.T., J. Paint Tech., 1975, 47(602), 40-46 7 Johnson, A.H.; Wegner, J.; Soucek, M.D., Eur. Poly. J., 2004, 40, 2773-2781 8 Soucek, M.D.; Johnson, A.H., JCT Research, 2004, 1(2), 111-116 9 Soucek, M.D.; Johnson, A.H.; Meemken, L.E., Macromol. Chem. Phys., 2004,
205(1), 35-41 10 Pilati, F.; Toselli, M.; Messori, M.; van Dijk, H.; Yeates, S.G.; Peterson, B.; Tuck, N.;
Storer, B.; Howell, D.; Rayner, G., Waterborne & Solvent Based Saturated Polyesters and their End User Applications, Sanders, D. Ed.; John Wiley & Sons: London, 1999, Vol. 4, pp 3-17, 400-440
11 Parkyn, B.; Lamb, F.; Clifton, B.V., Polyesters, Iliffe Books LTD: London, 1967,
Volume 2, pp 170 12 Fradet, A; Maréchal, Adv. Polym. Sci., 1982, 43, 51-142

190
13 Ni, H.; Daum, J.; Thiltgen, P.R.; Soucek, M.; Simonsick, W.Jr.; Zhong, W.; Skaja,
A.D., Prog. Org. Coat., 2002, 45, 49-58 14 Lamba, N.M.; Woodhouse, K.A.; Cooper, S.L.; Lelah, M.D., Polyurethane in
Biomedical Application, CRC Press: New York, 1998, pp 195 15 Hood, J.D.; Blount, W.W.; Sade, W.T., J. Coat. Technol., 1986, 58 (739), 49-52 16 Jones, T.E.; McCarthy, J.M., J. Coat. Technol., 1995, 67 (844), 57-65 17 Martin, C., FATIPEC Congress: New Results in the Field of Paints, Inks, and
Pigments, France, 1976; Vol. 13, pp 418 18 Ingold, C.K., Structure and Mechanism in Organic Chemistry, 2nd edition, Cornell
University Press: Ithaca, NY, 1969, pp 1129-1131 19 March, J., Advanced Organic Chemistry, 4th edition, Wiley: New York, 1992, pp
1495 20 Polanyi, M.; Szabo, A.L., Trans. Faraday Soc., 1934, 30, 508-512 21 Long, F.A.,; Friedman, L., J. Am. Chem. Soc., 1950, 72, 3692-3695 22 Kenyon, J.; Partridge, S.M.; Phillips, H., J. Chem. Soc., 1936, 85-88 23 Hills, W.J.; Kenyon, J.; Phillips, H., J. Chem. Soc., 1936, 576-583 24 Balfe, M.P.; Doughty, M.A.; Kenyon, J.; Poplett, R., J. Chem.Soc., 1942, 605-611 25 Balfe, M.P.; Evans, A.A.; Kenyon, J.; Nandi, K.N., J. Chem.Soc., 1946, 803-807 26 Balfe, M.P.; Kenyon, J.; Wicks, R., J. Chem.Soc., 1946, 807-811 27 Cowdrey, W.A.; Hughes, E.D.; Ingold, C.K.; Masterman, S.; Scott, A.D., J. Chem.
Soc, 1937, 1252-1271 28 Holmberg, B., Ber., 1912, 45, 997-1003 29 Dattta, S.C.; Day, J.N.E.; Ingold, C.K.; J. Chem. Soc., 1939, 838-840

191
30 Kirby, A.J., Hydrolysis and Formation of Esters of Organic Acids, Bamford, C.H.,
Tipper, C.F.H. Eds., Comprehensive Chemical Kinetics: Ester Formation and Hydrolysis and Related Reactions; Elsevier Publishing Company: New York, 1972; Vol. 10, 57-207
31 Jencks, W.P., Catalysis in Chemistry and Enzymology, McGraw-Hill: New York,
1987; 515-517, 605-606 32 Yates, K.; McClelland, R.A., J. Am. Chem. Soc., 1967, 89, 2686-2692 33 Morision, P.; Hutchings, J.E., Am. Chem. Soc., Div. Org. Coat. Plast., Chem.
Preprints, 1961, 21(1), 159-170 34 Golob, D.J.; Odom Jr., T.A.; Whitson, R.W.; Polym. Mater. Sci. Eng., 1990, 63, 826-
832 35 Jones, R.W.A.; Thomas, J.D.R., J. Chem. Soc., 1966, B, 661-664 36 Taft, R.W., Jr., J.Amer. Chem. Soc., 1952, 74, 3120-3128 37 Bender, H.S.; Chlupek, F.; Neveu, M.C., J. Am. Chem. Soc., 1958, 80, 5384-5387 38 O’Brien, M.E.; Faunce, J.A.; Hillshafer, D.K., The Journal of the Adhesive Sealant
Council: Ortho-Phthalic Esters for Non-Foam Polyurethanes, Spring Convention, Pittsburgh, PA, 1997; 89-130
39 Chapman, N.B.; Shorter, J.; Toyne, K.J., J. Chem. Soc., 1961, 2543-2553 40 Mortaigne, B.; Bellenger, V.; Verdu, J., Polym. Networks Blends, 1992, 2(4), 187-195 41 Belan, F.; Bellenger, V.; Mortaigne, B., Polym. Degrad Stab., 1997, 56(3), 93-102 42 Bellenger, V.; Ganem, M.; Mortaigue, B.; Verdu, J., Polym. Degrad. Stab., 1995,
49(1), 91-97 43 Johnson, A.H. Fundamental Concepts in Oligoester Hydrolysis and UV-Curable
Ceramers. Ph.D. Dissertation, North Dakota State University of Agriculture and Applied Science, 2003
44 Zimmermann, H., Degradation and Stabilization of Polyesters (Chapter 3,), Grassie,
N., Ed.; Developments in Polymer Degradation; Applied Science Publishers: Great Britain, 1984; volume 5, 79-119

192
45 Ni, H.; Daum, J.L.; Simonsick, W.J. Jr.; Soucek, M.D., J. Coat. Technol., 2002,
74(928), 49-56 46 Ni, H.; Daum, J.L.; Thiltgen, P.R.; Soucek, M.D.; Simonsick, W.J.Jr.; Zhong, W.;
Skaja, A.D., Prog. Org. Coat., 2002, 45, 49-58 47 Miškoviç-Stankoviç, V.; Nataša, Đ., J. Serb. Chem. Soc., 1998, 63, 53-62 48 Carey F.A.; Sundberg, R.J., Advanced Organic Chemistry, Part A: Structure and
Mechanisms, 3rd Edition, Plenum Press: New York, 1990; 726 49 Vega-Rios, A.; Villalobos, H.; Mata-Segreda, J.F., Int. J. Chem. Kinet., 1992, 24,
887-894 50 Mata-Segreda, J.F., Atual. Fis.-Quim. Org., 1991, 246-259 51 Taft, R.W. Jr., Separation of Polar, Steric, and Resonance Effects in Reactivity,
Newman, M.S., Ed.; Steric Effect in Organic Chemistry, John Wiley & Sons, Inc.: New York, 1956, 556-675
52 Karamyan, D.R.; Sergeeva, S.N.; Eritsyan, V.K.; Beileryan, N.M.; Voskanyan, P.S.;
Gevorkyan, L.A., Int. Polym. Sci. Technol., 2004, 31(1), 22-25 53 Tokiwa, Y.; Ando, T.; Suzuki, T.; Takeda, T., Polym. Mater. Sci. Eng., 1990, 62,
988-92 54 Witt, U.; Muller, R-J.; Deckwer, W-D., J. Environ. Polym. Degrad., 1995, 3, 215-223 55 Marten, E.; Muller, R.-J.; Deckwer, W.-D., Polym. Degrad. Stab., 2003, 80, 485-501 56 Gardner, R.J.; Martin. J.R., J. Appl. Polym. Sci., 1980, 25(10), 2353-2361 57 Borman, W.F.H., 11th NATAS Conference, New Orleans, October 1981; 177 58 Hinrichsen, G.; Iburg, A.; Eberhardt, A.; Springer, H.; Wolbring, P., Melliand
Textilber, 1980, 61(9), 807-810 59 Launay, A.; Thominette, F.; Verdu, J., Polym. Deg. Stab., 1994, 46, 319-324 60 Ravens, D.A.S.; Ward, I.M., Trans. Faraday Soc., 1961, 57, 150-159 61 Schoonover, J.R.; Thompson, D.G.; Osborn, J.C.; Orler, E.B.; Wrobleski, D.A.;
Marsh, A.L.; Wang, H.; Palmer, R.A.; Polym. Degrad. Stab., 2001, 74(2001), 87-96

193
62 Murata, S.; Nakajima, T.; Tsuzki, N.; Yasuda, M.; Kato, T., Polym. Degrad. Stab.,
1998, 61(3), 527-534 63 Furukawa, M.; Tetsuro, S.; Murata, S., Polymer, 1999, 40(7), 1791-1798 64 Schollenberger, C.S.; Stewart, F.D., Thermoplastic Polyurethane Hydrolysis Stability,
Frisch, K.C., Reegen, S.L., Eds.; Advances in Urethane Science and Technology; Technomic Publishing Co.: Westport, 1971; Volume 1, 65-93
65 Fukurawa, M.; Kawahara, T.; Yokoyama, T., Nippon Gomu Kyokaishi, 1991, 64,
192-200 66 Liu, C.; Gu, Y.; Qian, Z.; Fan, L.; Li, J.; Chao, G.; Tu, M.; Jia, W., J. Biomed. Mater.
Res., 2005, 75A, 465-471 67 Ochiai, B.; Amemiya, H.; Yamazaki, H.; Endo, T., J. Polym. Sci. Part A: Polym.
Chem., 2006, 44, 2802-2808 68 ASTM International, Annual Book of ASTM Standards, ASTM D 1639-90, Standard
Test Method for Acid Value of Organic Coating Materials, October 1996 69 ASTM International, Annual Book of ASTM Standards, ASTM D 4274-99, Standard
Test Methods for Testing Polyurethane Raw Materials: Determination of Hydroxyl Numbers of Polyols, February 2000
70 Gerlock, J.L.; Smith, C.A.; Cooper, V.A.; Dusbiber, T.G.; Weber, W.H., Polym.
Degrad. Stab., 1998, 62, 225-234 71 The Infrared Spectroscopy Committee of the Chicago Society for Coatings
Technology, An Infrared Spectroscopy Atlas for the Coatings Industry, Federation of Societies for Coatings Technology, Pennsylvania, 1980; 896
72 Seubert, C.M.; Nichols, M.E.; Cooper, V.A.; Gerlock, J.L., Polym. Degrad. Stab.,
2003, 81, 103-115 73 Huang, S.L.; Lai, J.Y., Eur. Polym. J., 1997, 33(10), 1563-1567 74 Skaja, A.; Fernando,D.; Croll, S., JCT Research, 2006, 3(1), 41-51 75 ASTM International, Annual Book of ASTM Standards, ASTM D 4065-95, Standard
Test for the measurement of Dynamic Mechanical Test, 1995
194
76 ASTM International, Annual Book of ASTM Standards, ASTM D 2370-98, Standard
Test for Tensile Properties of Organic Coatings, February 2002 77 Klemann, B.M., Material Testing Product and Technology News (ATLAS), 2005,
35(75), 1-9 78 Wernståhl, K.M.; Carlsson, B., J. Coat. Tech., 1997, 69 (865), 69-75 79 Bauer, D.R., Polym. Degr. Stab., 2000, 69, 307-316 80 ATLAS, Ci3000+/Ci4000/Ci5000 Xenon Arc Weather-Ometer Instruction Manual,
Doc. P/N 20320800, Rev. 4.1., January 2005 81 SAE International, Accelerated Exposure of Automotive Exterior Materials Using a
Controlled Irradiance Water-Cooled Xenon Arc Apparatus, SAE J1960 82 ASTM International, Annual Book of ASTM Standards, ASTM D 3363-00, Standard
Test Method for Film Hardness by Pencil Test, May 2000 83 ASTM International, Annual Book of ASTM Standards, ASTM D 3359-02, Standard
Test Methods for Measuring Adhesion by Tape Test, October 2002 84 ASTM International, Annual Book of ASTM Standards, ASTM D 4541-02, Standard
Test Method for Pull-Off Strength of Coatings Using Portable Adhesion Testers, April 2002
85 ASTM International, Annual Book of ASTM Standards, ASTM D 2794-93, Standard
Test Method for Resistance of Organic Coatings to the Effects of Rapid Deformation (Impact), November 1999
86 ASTM International, Annual Book of ASTM Standards, ASTM D 523-08, Standar
Test Method for Specular Gloss, June 2008 87 Bender, M.L., Chem. Rev., 1960, 60, 53-113 88 Lenntech Water- Luchtbehandeling Holding B.V. http://www.lenntech.com, (accessed
June 1, 2008) 89 Eastman Chemical Company, Improved Hydrolytic Stability of Waterborne Polyester
Resins with Eastman 1,4-CHDA and Eastman TMPD Glycol, Publication N-342A, 2003

195
90 Eastman Chemical Company, A Statistical Comparison of Eastman 1,4-CHDA,
Eastman PIA, AD, and HHPA in a High-Solids Resin System Based on Eastman TMPD Glycol, Publication N-335B, 2003
91 Eastman Chemical Company, Eastman Polyester Resin Intermediates for Powder
Coatings, Publication N-352, December 1998 92 Eastman Chemical Company, Eastman NPG Glycol and NPG 90 Glycol, Publication
N-154H, December 1997 93 Eastman Chemical Company, CHDM Glycol 1,4-Cyclohexanedimethanol for
Coatings and FRP Resins, Publication N-199K, September 2004 94 Connors, K., Chemical Kinetics: The Study of Reaction Rates in Solution, VCH
Publishers Inc: New York, 1990; 480 95 Belan, F; Bellenger, V.; Mortaigne, B.; Verdu, J., Polym. Deg. Stab., 1997, 56, 301-
309 96 Gould, E.S., Mechanism and Structure in Organic Chemistry, Holt Publishers: New
York, 1959; 790 97 Bender, M.L.; Neveu, M.C., J. Am. Chem. Soc., 1958, 80, 5388-5391 98 Yaws, C.L., Chemical Properties Handbook: Physical, Thermodynamic,
Environmental, Transport, Safety, and Health Related Properties for Organic and Inorganic Chemicals, McGraw Hill: New York, 1999; 372-383
99 Apelblat, A.; Manzurola, E.; Balal, N.A., J. Chem. Thermodyn., 2006, 38, 565-571 100 Martell, A.E.; Smith, R.M., Critical Stability Constants, Plenum Press: New York,
1976; volumes 1-4, 469 101 Koskikallio, J., Alcoholysis, acidolysis and redistribution of esters (Chapter 3), Patai,
S., Ed., The chemistry of carboxylic acids and esters; Interscience Publishers: New York 1969; 103-136
102 Garrett, E.R., J. Am. Chem. Soc., 1957, 79, 3401 -3408 103 Morawetz, H.; Ousker, I., J. Am. Chem.. Soc., 1958, 80, 2591-2592 104 Thanassi, J.W.; Bruice, T.C., J. Am. Chem. Soc., 1966, 88, 747-752

196
105 Bender, M.L.; Chow, Y.-L.; Chloupek, F., J. Am. Chem. Soc., 1958, 80, 5380-5384 106 Schrödinger, Chemical Solution Software- Jaguar, http://yfaat.ch.huji.acil/jaguar-
help/manTOC.html, (accessed June 1, 2009) 107 Berliner, E.; Quinn, M.J.; Edgerton, P.J., J. Am. Chem. Soc., 1950, 72, 5305-5308 108 Chapman, N.B.; Parker, R.E., J. Chem. Soc., 1951, 3301-3307 109 Bishop, R.R.; Cavell, E.A.S.; Chapman, N.B., J. Chem. Soc. 1952, 437-446 110 Vollhardt, K.P.C.; Schore, N.E., Organic Chemistry:Structure and Function, 4th
edition, W.H. Freeman & Co: New York, 2003; 682-694 111 Shorter, J., Correlation Analysis in Organic Chemistry: Introduction to LFER,
Oxford University Press: Oxford, 1973; volume 42, 119 112 Hammett, L.P., Physcial Organic chemistry, 2nd edition, McGraw-Hill: New York,
1970; 420 113 IUPAC Golden Book, http://goldbook.iupac.com, (accessed June 1, 2009) 114 Winchell, P., High Temp. Sci., 1969, 1, 200-215 115 Dosdale, T.; Brook, R.J., J. Am. Chem. Soc., 1983, 66, 392-395 116 Boots, H.M.J.; de Bokx, P.K., J. Phys. Chem., 1989, 93, 8240-8243 117 Dunitz, J.D., Chem. Biol., 1995, 2, 709-712 118 Tomlinson, E.; Davis, S.S., J. Colloid Interface Sci., 1980, 76, 563-572 119 Linert, W.; Jameson, R.F., Chem. Soc. Rev., 1989, 18, 477-505 120 Lumry, R.; Rajender, S., Biopolymers, 1970, 9, 1125-1227 121 Sugihara, G.; Hisatomi, M., J. Colloid and Interface Science, 1999, 219, 31-36 122 Khuwijitjaru, P.; Fujii, T.; Adachi, S.; Kimura, Y.; Matsuno, R. Chem. Eng. J., 2004,
99, 1-4 123 Kresheck, G.C.; Hargraves, W.A., J. Colloid Interface Sci., 1974, 48, 481-493

197
124 Leffler, J. E.; Grunwald, Rates and Equilibria of Organic Reactions, Wiley: New
York, 1963; 458 125 Brashears, H.C.; Setser, D.W.; Yu, Y.C., Phys. Chem., 1980, 84, 2495-2497 126 Sueishi, Y.; Nishimura, N., Bull. Chem. Soc. Jpn., 1983, 56, 2598-2604 127 Repond, C.; Mayer, J.M.; van de Waterbeemd, H.,; Testa, B.; Linert, W., Int. J.
Pharm., 1987, 38, 47-57 128 Kolts, J.H.; Setser, D.W., J. Phys. Chem., 1978, 82, 1766-1768 129 Naghibi, H.; Tamurea, A.; Sturtervant, J., Proc. Natl. Acad. Sci. U.S.A, 92, 1995,
5597-5599 130 Exner, O., Nature, 1964, 201, 488-490 131 Exner, O., Prog. Phys. Org. Chem., 1964, 29(3133), 1094 132 Bender, M., J. Am. Chem. Soc., 1951, 73, 1626-1629 133 Cornish-Bowden, A. J. Biosci., 2002, 27(2), 121-126 134 Krug, R.R.; Hunter, W.G.; Grieger, R.A. J. Phys. Chem., 1976, 80, 2335-2341 135 Krug, R.R.; Hunter, W.G.; Grieger, R.A. J. Phys. Chem., 1976, 80, 2341-2351 136 Exner, O, Prog. Phys. Org. Chem., 1973, 10, 411-482 137 Krug, R.R.; Hunter, W.G.; Grieger, R.A., Nature, 1976, 261, 566-567 138 Krug, R.R., Ind. Eng. Chem. Fundamen., 1980, 19(1), 50-59 139 Anderson, N.H.; Davis, S.S.; James, M.; Kojima, I, J. Pharm. Sci., 1983, 72, 443-448 140 Ranatunga, R.; Vitha, M.F.; Carr, P.W., J. of Chromatography A, 2002, 946, 47-49 141 Scheirs, J.; Long, T., Eds., Modern Polyesters: Chemistry and Technology of
Polyesters and Copolyesters, John Wiley & Sons: England, 2003; 53-133 142 Cannors, K.A.; Amidon, G.L.; Stella, V.J. Chemical Stability of Pharmaceuticals, 2nd
edition, John Wiley & Sons: New York, 1986; 847

198
143 Kanerva, L.T., J. Chem.. Soc. Perkin Trans. II, 1983, 467-470 144 Robertson, R.E., Prog. Phys. Org. Chem., 1967, 4, 213-280 145 Ito, N; Saito, K.; Kato, T.; Fujiyama, T., Bull. Chem.Soc. Jpn., 1981, 54, 991-997 146 Brown, H.C., Science, 1946, 103, 385-387 147 Freundlich, H.; Salomon, G., Z. Physik. Chem., 1933, 166, 161-178 148 Brown, R.F.van Gulick, NM., J. Am. Chem. Sc., 1955, 77, 1079-1089 149 Nilsson, H.; Smith, L., Z. Physik. Chem., 1933, 166A, 136-146 150 Freundlich, H., Krestornikov, A., Z. Physik. Chem., 1911, 76, 79 -104 151 McKetta, J.J.; Cunningham, W.A., Eds.; Energy, Costing Thermal Electric Power
Plants to Ethanol; Encyclopedia of Chemical Processing and Design; Marcel Dekker, Inc.: New York, 1983; volume 19, 382
152 Doyle, E.N., The development and use of polyester products, McGraw-Hill, Inc.: New
York, 1969; 370 153 Doyle, R., Paint & Coatings Industry, 2009, 25(5), 28-31 154 Nordstrom, J.D.; Dervan, A.H., Proc. Waterborne High-Solids Coat. Symp., New
Orleans, LA: 1993; 3 155 Fiori D.E.; Dexter, R.W., Proc. Waterborne Higher-Solids Coat. Symp., New
Orleans, LA: 1986, 186 156 Belan, F.; Bellenger, V.; Mortaigne, B.; Verdu, J.; Yang, Y.S., Compos. Sci. Technol.,
1996, 56, 733-737 157 Goodman, I.; Rhys, J.A., Polyesters: Saturated Polymers, American Elsevier
Publishing Company Inc.: New York, 1965; Volume 1, 106 158 Bauer, D.R., Polym. Degrad. Stab., 2000, 69, 297-306 159 McGreer, M., “Weathering Testing Guidebook”, ATLAS Material Testing Solutions,
USA, 2003 160 Q-Lab Corporation, http://www.q-lab.com, (accessed June 1, 2008)

199
161 Crump, L.S., Proc. of the 51st Annual Conference of the SPI Composites Institute,
1996, Session 22, 1-34 162 Gerlock, J.L.; Peters, C.A.; Kucherov, A.V.; Misovski, T.; Seubert, C.M.; Carter III,
R.O.; Nichols, M.E., J. Coat. Tech., 2003, 75 (936), 35-45 163 Bechtold, K., Material Testing Product and Technology News (ATLAS), 2006, 36(77),
1-11 164 Lee, H.S.; Wang, Y.K.; Hsu, S.L., Macromolecules, 1987, 20, 2089-2095 165 Huang,LaiEur. Polym. J., 1997, 1563-1567 166 Croll, S.G.; Skaja, A.D., J. Coat. Tech., 2003, 75(945), 85-94 167 Subramani, S.; Cheong, I.W.; Kim, J.H., Prog. Org. Coat., 2004, 51, 329-338 168 Decker, C.; Masson, F.; Schwalm, R., Polym. Degrad. Stab., 2004, 83, 309-320 169 Bauer, D.R., J. Coat. Tech., 1994, 66, 57-65 170 Belder, E.; Koldijk, F., Surf. Coat. Int., 1996, 10, 449-454 171 Ballara, A.; Verdu, J., Polymer Deg & stab., 1989, 26, 361-374 172 Gerlock, J.L.; Kucherov, A.V.; Smith, C.A., Met. Finish., 2001, 99(5), 8-14 173 Fechine, G.J.M.; Rabello, M.S.; Souto Maior, R.M.; Catalani, L.H., Polymer, 2004,
45, 2303-2308 174 Hoeflaak, M.; de Ruiter, B.; Maas, J.H., Material Testing Product and Technology
News (ATLAS), 2006, 36(78), 1-14 175 Bauer, D., Stabilization of Coatings, Ryntz, R., Ed.; Plastic & Coatings: Durability,
Stabilization, and Testing; Hanser Gardner Publications Inc.: Cincinnati, 2001; 99-113
176 Croll, S.G.; Skaja, A.D., J. Matrl. Sci., 2002, 37, 4889-4900 177 Wypych, G., Handbook of Material Weathering, 2nd Edition, ChemTec Publishing:
Canada, 1995; 25 178 Marsh, S.J., JCT Coatings Tech., 2005, 32-40

200
179 Narayan, R.; Chattopadhyay, D.K.; Sreedhar, B.; Raju, K.V.S.N.; Mallikarjuna, N.N.;
Aminabhavi, T.M., J. Appl. Polym. Sci., 2005, 97(3), 1069-1081 180 Yang, X.F.; Vang, C.; Tallman, D.E.; Bierwagen, G.P.; Croll, S.G.; Rohlik, S.,
Polym. Degrad. Stab., 2001, 74, 341 181 Heidt, P.; Jones, T., Proc. Int. Waterborne, High Solids, Powder, 27th edition, 2000,
295-307 182 Bauer, D.R.; Mielewski, D.F., Poly. Degrad. Stab., 1993, 40, 349-355 183 Bauer, D.R., Prog. Org. Coat., 1986, 14(3), 193-218
Copyright © 2022 FDOKUMEN