Hydrolysis of aspartic acid phosphoramidate nucleotides: a comparative quantum chemical study
Upload
candymangaCategory
view
2download
0
1
BIOTRANSFORMATION
•Enzymatic processes in liver and other tissues that modify the chemical structure of xenobiotics, render them more water-soluble, increase theirelimination, decrease their half-life
Biotransformed metabolites are chemically different from the parent molecule•Biotransformed metabolites are chemically different from the parent molecule
Xenobiotic Primary Secondaryproducts products
PHASE I PHASE IIExpose or Add Biosyntheticfunctional groups conjugation
OxidationReductionH d l iHydrolysis
Lipophilic Hydrophilic(Ionizable)
Excretion
e.g. barbital (water soluble) vs hexobarbital (highly liposoluble)t1/2= 55h (theoretical, real) vs t1/2 of months, real t1/2= 5hr
PHASE I
Add or exposefunctional groups:-OH, -SH, -NH2,
COOH-COOH, …(small increase inhydrophilicity)
Phase II
Conjugation with
Table 6.1 C&D
Conjugation with endogenous molecules:glucuronic acid, sulfate,glutathione, ...covalent bonds formed(large increase inhydrophilicity)

2
Major organ of biotransformationLIVER (hepatocytes)
Secondary organs of biotransformationkidneylungstestesskinintestines
Preparation of Phase I enzymes (e.g. liver) endoplasmic reticulum (microsomes) and cytosol
Liver homogenate
Centrifuge at 9 000g(separation of mitochondria lysosomes nuclei broken cells)(separation of mitochondria, lysosomes, nuclei, broken cells)
Supernatant at 105 000g
Precipitate(Phase I)
Supernatant(Phase II)
Biotransformation
PHASE IHydrolysis(chemical reaction of a compound with water, usually resulting in the formation(chemical reaction of a compound with water, usually resulting in the formation of one or more new compounds)• Carboxylesterases, cholinesterases, organophosphotases
• Peptidases
• Epoxide Hydrolase (EH)-detoxifying enzyme for epoxidesdetoxifying enzyme for epoxides
-formation of diols
-EH present in many tissues-epoxides: electrophilic,tend to bind to proteins,to nucleic acids Fig. 6.4 C&D, Hydrolyation of epoxides by EH

3
Role of EH in the biotransformation of benzo[a]pyrene B[a]P•Inactivation of benzo[a]pyrene 4,5-oxide •Conversion of B[a]P to tumorigenic diolepoxide
Fig. 6.6C&D
REDUCTIONe.g Azo- and Nitro-Reductions
Azo-reduction
N=N [4H] -NH2 -NH2Prontosil 1,2,4-triaminobenzene Sulfanilamide
Fig. 6.8 C&D
Azo- and Nitro-reductions can be catalyzed
•by enzymes of intestinal flora
• by cytochrome P450 (usually oxidizing enzyme), has the capacity to reduce xenobiotics under low oxygen or anaerobic conditions (substrate rather than oxygen, accept electrons and is reduced)
•interactions with reducing agents (reduced forms of glutathione, NADP,…)

4
REDUCTION – Role of intestinal microbial flora in biotransformation•
•Oxidation by cytochrome P450•Conjugation with glucuronicacid by UDP GTacid by UDP-GT
•Excretion of glucuronide in bile•Reduction by microbial floraunder anaerobic conditions•Reabsorption from intestine
•Hydroxylation of amine group•Conjugation with sulfate or acetate•Reactive metabolites•Tumorigenic
Fig. 6.9 C&D
OXIDATION•Monoamine oxidase (MAO), Multiple function oxidase (MFO)•Flavin Monooxygenases (nicotine, cocaine,…)•Alcohol dehydrogenase (liver ADH, gastric ADH)
oxidation of alcohols to aldehydeslow ADH links to high blood alcohol levelslow ADH links to high blood alcohol levelslower gastric ADH in women/menADH activity lower after fastingclinical alcoholics have lower gastric ADHracial differences in gastric ADH
•Aldehyde dehydrogenase (ALDH)oxidation of aldehydes to carboxylic acid
R-CH2OH R-C=O R-C=OH OH
ADH ALDH
NAD+ NADH + H+ NAD+ + H2O NADH + H+
Fig. 6.19C&D

5
Biotransformation of alcohol
Fig. 6.20C&D
CYTOCHROME P450• most versatile oxidative enzyme• heme-containing protein
ferric Fe3+ reduced to ferrous Fe2+• reduced cytP450 can bind oxygen
Tabl
e 6.
6 C
&D
6.35 C&D

6
Nomenclature of cytochrome P450 – use of recombinant DNACYP
Amino acid sequence known for many cytP450s<40% a.a. homology, assigned to different genes (CYP1 CYP2 CYP3 )(CYP1, CYP2, CYP3,..)
40-55% a.a. homology, different subfamily (CYP2A, CYP2B, CYP2C,…)
>55% a.a. homology, different members of same subfamily (CYP2A1, CYP2A2,…)
Use of Knockout Mice
Inhibition of cytochrome P450(aminobenzotriazole – inhibits synthesis of cytP450)detergents, CO, …
Fig. 6.35 C&D

7
Cytochrome P450-can oxidize a substrate (e.g. a xenobiotic)-can transport electrons-many isoforms of cytP450 isolated (in human, rat, others)-importance of NADPH-cytochrome P450 reductase (embedded in ER membrane with cytP450) -catalytic cyclecatalytic cycle-inducible by specific substrates (e.g. phenobarbital, benzo[a]pyrene, methylcholanthrene)
Simplified reaction:
Substrate (RH) + O2 + NADPH + H+
Product (ROH) + H2O + NADP+
How can we demonstrate a role for cytP450 in biotransformation of a XB?-cytP450 activity increases-enzymatic inhibitors of cytP450 (e.g. aminobenzotriazole)-absorption spectrum of cytP450-reaction can be reconstituted
Hydroxylation of substrates by cytochrome P450
Fig. 6.36 C&D Deactivation (detoxication)

8
Role of cytochrome P450 and peroxidase in activation of benzene in bone marrow
Fig. 6.29 C&D PHS – prostaglandin H synthase
Halothane hepatitis and activation by oxidation and reduction
Fig. 6.16 C&D
9
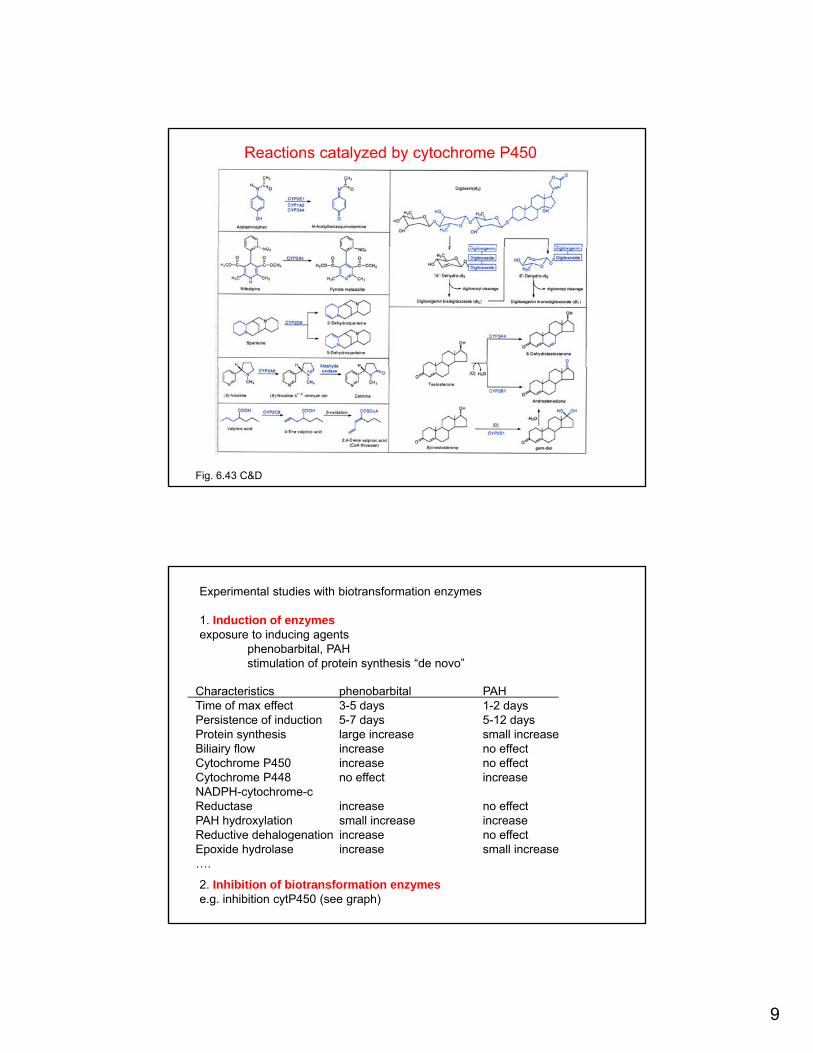
Reactions catalyzed by cytochrome P450
Fig. 6.43 C&D
Experimental studies with biotransformation enzymes
1. Induction of enzymesexposure to inducing agents
phenobarbital, PAHstimulation of protein synthesis “de novo”
Characteristics phenobarbital PAHTime of max effect 3-5 days 1-2 daysPersistence of induction 5-7 days 5-12 daysProtein synthesis large increase small increaseBiliairy flow increase no effectCytochrome P450 increase no effectCytochrome P448 no effect increaseNADPH-cytochrome-cReductase increase no effectReductase increase no effectPAH hydroxylation small increase increaseReductive dehalogenation increase no effectEpoxide hydrolase increase small increase….
2. Inhibition of biotransformation enzymese.g. inhibition cytP450 (see graph)

10
BIOTRANSFORMATION
•Enzymatic processes in liver and other tissues that modify the chemical structure of xenobiotics, render them more water-soluble, increase theirelimination, decrease their half-life
Biotransformed metabolites are chemically different from the parent molecule•Biotransformed metabolites are chemically different from the parent molecule
Xenobiotic Primary Secondaryproducts products
PHASE I PHASE IIExpose or Add Biosyntheticfunctional groups conjugation
OxidationReductionH d l iHydrolysis
Lipophilic Hydrophilic(Ionizable)
Excretion
PHASE II REACTIONS
•biosynthesis of polar,
Structure of cofactors for Phase II biotransformation
hydrophilic metaboliteseliminated in urine (small M.W.,250) or bile (M.W.>350)
•requires cofactors and endogenous substrates•ATP dependent
Fig. 6.45 C&D

11
Substrates that are glucuronidated
1. Glucuronidationmajor Phase II pathway in all mammals,except cats
• conjugation with glucuronic acidj g g• mediated by UDP-GT
Liver>>>>kidney, lung, brainlocalized in ER (other Phase II enzymes in cytosol)
• detoxication or bioactivation• large increase in hydrophilicity
Fig. 6.47 C&D
Bioactivation of xenobiotics by Phase II reactions (glucuronidation)
Fig. 6.49 C&D

12
bile
Fig. 6.9 C&D
2. SULFATION Bioactivation by sulfation
•cofactor:PAPS(3’-phosphoadenosine-5-Phosphosulfate)
enzyme•enzyme Sulfotransferase
•detoxication or bioactivation
3. Methylation
•cofactor: SAM
Fig. 6.50 C&D
(s-adenosyl methionine)•enzymemethyl transferase(minor, ~hydrophilicity)
4. Acetylation

13
Toxicity/Damage– alteration of the regulatory or maintenance function of the cell in target tissue
Fig. 3.10
5. GLUTATHIONE CONJUGATION
•cofactor: GSH (tripeptide glycine, glutamic acid, cysteine)•enzyme: glutathione-S-transferase (GST)
localized in cytoplasm>>>ERliver>kidney, testes, intestine, adrenal
GSTGSH + Substrate (XB) polar metabolites
•substrates for GST musthave affinity for GSHbe hydrophobiccontain electrophilic carbon
•glutathione conjugates are excreted in the bile (intact)excreted as mercapturic acid in urine

14
Biotransformation of acetaminophen – the good, the bad and the ugly
Fig.6.28 C&D
Biotransformation of acetaminophenPhase IPhase II:
At low dose of Acetaminophen:90% of dose excreted as sulfates(sulfotransferase has strong affinity, low capacity)no toxic intermediates, no toxicity
At high dose, Phase II enzymes capacity is surpassed43% of dose excreted as sulfatesglucuronides, glutahione cojugates (low affinity, strong capacity)
l i f i i di i iaccumulation of toxic intermediates, toxicity
•Protective effect of GSH supplementation, e.g. NAC•Fasting for 1 day decreases liver GSH levels by 50% in rats (increase in toxicity of acetaminophen) – effect of nutritional status•Liver pathologies will also influence its biotransformation capacity, as willage, sex, species differences

15
Biotransformation and difficulties of predicting effects of mixtures
Fig. 6.14

16
Toxicokinetics : study of modeling and mathematical description of the time course of xenobiotics in the whole organism
•Dilution and distribution of agent A
•Routes of excretion
•Theoretical graphs of bloodconcentrations of A againsttime (at time A, B and C)
Compare a mammal to fishto amphibian
Stocking DDT, PCB in adipose tissueStocking Pb, St in bone
Ecobichon, p.13
C = f(t) C = dependent variablet = independent variable
dC if > 0 → accumulation if < 0 → eliminationdt
Ecobichon

17
Classical approach to toxicokinetics: administer XB in a bolus mode (e.g. iv)take blood samplesmeasure XB in blood
•equilibrium reached rapidly between bloodand tissues•body behaves as a homogenous unit
C = Co x e –kel
x t
•more complex pattern of distribution•two (or more) compartments involved
C = A x e –α x t + B x e –ß x t
where A and B are proportionality constants of the change in Cα= constant of distributionß= constant of eliminationFig.7.1
One compartment modellog of plasma concentrations vs time straight line
C = Co x e –kel
x t (monoexponential model)
Log C = - (k /2 303) x t + log Co (logarithmic equation)Fig.7.2
Log C = - (kel/2.303) x t + log Co (logarithmic equation)
Kel = elimination constant (elimination includes biotransformation, excretion andexhalation)
C=plasma concentrationCo=concentration at t= 0 (y intercept )
How does the dose or the remaining concentration in the plasma influence elimination?
Copyright © 2022 FDOKUMEN