Arctic phytoplankton in unusually low sea ice cover
39
BGD 9, 2055–2093, 2012 Arctic phytoplankton in unusually low sea ice cover P. Coupel et al. Title Page Abstract Introduction Conclusions References Tables Figures Back Close Full Screen / Esc Printer-friendly Version Interactive Discussion Discussion Paper | Discussion Paper | Discussion Paper | Discussion Paper | Biogeosciences Discuss., 9, 2055–2093, 2012 www.biogeosciences-discuss.net/9/2055/2012/ doi:10.5194/bgd-9-2055-2012 © Author(s) 2012. CC Attribution 3.0 License. Biogeosciences Discussions This discussion paper is/has been under review for the journal Biogeosciences (BG). Please refer to the corresponding final paper in BG if available. Phytoplankton distribution in unusually low sea ice cover over the Pacific Arctic P. Coupel 1 , H. Y. Jin 2 , M. Joo 3 , R. Horner 4 , H. A. Bouvet 1 , V. Garc ¸on 5 , M.-A. Sicre 6 , J.-C. Gascard 1 , J. F. Chen 2 , and D. Ruiz-Pino 1 1 Laboratoire d’Oc ´ eanographie et du Climat, Exp ´ erimentation et Approches Num ´ eriques (LOCEAN), UPMC, CNRS/INSU, UMR7159, Paris, France 2 Laboratory of Marine Ecosystem and Biogeochemistry, Second Institute of Oceanography, SOA, PRC, Hangzhou 310012, China 3 Department of Oceanography, Pusan National University, 30, Jangjeon-dong, Busan 609-735, South Korea 4 School of Oceanography, University of Washington, 373 Marine Science Building, P.O. Box 357940, Seattle, WA, USA 5 LEGOS/UMR5566/CNRS/INSU, 18 Avenue Edouard Belin, 31401 Toulouse Cedex 4, France 6 Laboratoire des Sciences du Climat et de l’Environnement (LSCE), IPSL, CNRS/INSU/CEA/UVSQ, 91198 Gif-sur-Yvette, France Received: 19 January 2012 – Accepted: 24 January 2012 – Published: 22 February 2012 Correspondence to: P. Coupel ([email protected]) Published by Copernicus Publications on behalf of the European Geosciences Union. 2055
-
Upload
khangminh22 -
Category
Documents
-
view
0 -
download
0
Transcript of Arctic phytoplankton in unusually low sea ice cover
BGD9, 2055–2093, 2012
Arctic phytoplanktonin unusually low sea
ice cover
P. Coupel et al.
Title Page
Abstract Introduction
Conclusions References
Tables Figures
J I
J I
Back Close
Full Screen / Esc
Printer-friendly Version
Interactive Discussion
Discussion
Paper
|D
iscussionP
aper|
Discussion
Paper
|D
iscussionP
aper|
Biogeosciences Discuss., 9, 2055–2093, 2012www.biogeosciences-discuss.net/9/2055/2012/doi:10.5194/bgd-9-2055-2012© Author(s) 2012. CC Attribution 3.0 License.
BiogeosciencesDiscussions
This discussion paper is/has been under review for the journal Biogeosciences (BG).Please refer to the corresponding final paper in BG if available.
Phytoplankton distribution in unusuallylow sea ice cover over the Pacific ArcticP. Coupel1, H. Y. Jin2, M. Joo3, R. Horner4, H. A. Bouvet1, V. Garcon5,M.-A. Sicre6, J.-C. Gascard1, J. F. Chen2, and D. Ruiz-Pino1
1Laboratoire d’Oceanographie et du Climat, Experimentation et Approches Numeriques(LOCEAN), UPMC, CNRS/INSU, UMR7159, Paris, France2Laboratory of Marine Ecosystem and Biogeochemistry, Second Institute of Oceanography,SOA, PRC, Hangzhou 310012, China3Department of Oceanography, Pusan National University, 30, Jangjeon-dong, Busan609-735, South Korea4School of Oceanography, University of Washington, 373 Marine Science Building, P.O. Box357940, Seattle, WA, USA5LEGOS/UMR5566/CNRS/INSU, 18 Avenue Edouard Belin, 31401 Toulouse Cedex 4, France6Laboratoire des Sciences du Climat et de l’Environnement (LSCE), IPSL,CNRS/INSU/CEA/UVSQ, 91198 Gif-sur-Yvette, France
Received: 19 January 2012 – Accepted: 24 January 2012 – Published: 22 February 2012
Correspondence to: P. Coupel ([email protected])
Published by Copernicus Publications on behalf of the European Geosciences Union.
2055
BGD9, 2055–2093, 2012
Arctic phytoplanktonin unusually low sea
ice cover
P. Coupel et al.
Title Page
Abstract Introduction
Conclusions References
Tables Figures
J I
J I
Back Close
Full Screen / Esc
Printer-friendly Version
Interactive Discussion
Discussion
Paper
|D
iscussionP
aper|
Discussion
Paper
|D
iscussionP
aper|
Abstract
A large part of the Pacific Arctic basin experiences ice-free conditions in summer asa result of sea ice cover steadily decreasing over the last decades. To evaluate theimpact of ice retreat on the Arctic ecosystem, we investigated phytoplankton commu-nities from coastal sites (Chukchi shelf) to northern deep basins (up to 86◦ N), during5
year 2008 of high melting. Pigment and taxonomy in situ data were acquired underdifferent ice regime: the ice -free basins (IFB, 74◦–77◦ N), the marginal ice zone (MIZ,77◦–80◦ N) and the heavy ice covered basins (HIB, >80◦ N). Our results suggest that ex-tensive ice melting provided favorable conditions to chrysophytes and prymnesiophytesgrowth and more hinospitable to pico-sized prasinophytes and micro-sized dinoflagel-10
lates. Larger cell diatoms were less abundant in the IFB while dominant in the MIZ ofthe deep Canadian basin. Our data were compared to those obtained during more icyyears, 1994 and to a lesser extent, 2002. Freshening, stratification, light and nutrientavailability are discussed as possible causes for observed phytoplankton communitiesunder high and low sea ice cover.15
1 Introduction
Both sea ice extent (10 % per decade for 1979–2006, Comiso et al., 2008; Poliakovet al., 2010) and thickness (loss over 50 % of its ice volume, Kwok and Rothrock,2009) have shown significant decrease in the recent years, reaching lowest values in2007 and 2011 (Perovich, 2011). Concomitantly, river discharge increased (Peterson20
et al., 2006) leading to freshwater accumulation in the upper Arctic Ocean (Rabe et al.,2011), which is strongest in the Pacific sector of the Arctic Ocean also impacted by thePacific Water inflow (Proshutinsky et al., 2009; Woodgate et al., 2005). Environmen-tal parameters driving phytoplankton growth such as light, stratification, surface waterfreshening, temperature and nutrients availability have thus been modified and led to25
changes of Arctic primary producer distributions (Grebmeier, 2010; Wassmann et al.
2056

BGD9, 2055–2093, 2012
Arctic phytoplanktonin unusually low sea
ice cover
P. Coupel et al.
Title Page
Abstract Introduction
Conclusions References
Tables Figures
J I
J I
Back Close
Full Screen / Esc
Printer-friendly Version
Interactive Discussion
Discussion
Paper
|D
iscussionP
aper|
Discussion
Paper
|D
iscussionP
aper|
2010). Increased phytoplankton primary production (PP) and total biomass in marginalArctic seas are suggested by mathematical models (Zhang et al. 2010; Slagstad etal., 2011) and in situ data from the Beaufort Sea (Carmack and Chapman 2003; Leeand Whitledge, 2005), and the Barents and Greenland seas (Rysgaard et al., 1999).Satellite observations also concluded to increased PP in the Arctic basin (Arrigo et al.5
2008; Pabi et al., 2008).In Arctic shelf waters, higher PP would result from increased light due to smaller
ice cover and higher nutrient availability fed by wind-driven upwellings (Carmack etal., 2004; Yang et al., 2004), favoring the development of larger taxa such as diatoms(Babin et al., 2004). A longer phytoplankton growing season and the propagation of10
ice-edge blooms as the melt season lengthens would also contribute to enhance PP(Perette et al., 2011). However, the response of the Arctic phytoplankton is not uniformand shows differences in shallow seas and Arctic deep basin waters. Recent studiesin the deep Canada Abyssal Plain reported no PP increase in ice-free waters (Caiet al., 2010; Joo et al., 2012). Other works suggest a shift towards smaller sized15
phytoplankton (Li et al., 2009). A northward displacement of sub-Arctic species such ascoccolithophores in the Barents Sea (Hegseth and Sundfjord, 2008) or the occurrenceof Pacific diatom Neodenticulla seminae have also been observed (Reid et al., 2007).
Impact of ice melting on the Arctic phytoplankton differs among species, varyingwidely across the Arctic. High latitudes deep basins covered by ice throughout the year20
are often dominated by ice-associated algae (Gosselin et al., 1997) such as the centricdiatoms Melosira arctica (Gradinger, 1999; Melnikov et al., 2002) while picoplankton,mainly the prasinophyte Micromonas sp., dominates the water column phytoplaktoniccommunity (Lovejoy et al., 2006, 2007). Lower latitude shallow shelves free of ice insummer indicate high PP rates consisting of large-cell pelagic species dominated by25
pennate and centric diatoms, and dinoflagellates (Poulin et al., 2011). Highest produc-tion occurs in spring as “ice edge blooms” over the shelves (Sakshaug and Skodjal,1989), and is mainly due to centric colonial diatom genera Chaetoceros and Thalas-siosira and prymnesiophyte Phaeocystis pouchetii (Wassmann, 1999). In contrast,
2057

BGD9, 2055–2093, 2012
Arctic phytoplanktonin unusually low sea
ice cover
P. Coupel et al.
Title Page
Abstract Introduction
Conclusions References
Tables Figures
J I
J I
Back Close
Full Screen / Esc
Printer-friendly Version
Interactive Discussion
Discussion
Paper
|D
iscussionP
aper|
Discussion
Paper
|D
iscussionP
aper|
pre- and post-bloom periods are dominated by small cells, such as small prymne-siophytes, and picoplankton (Hodal and Kristiansen, 2008). Because phytoplanktoncommunities are differently affected by ice retreat, a comprehensive understanding ofthe Arctic ecosystem evolution requires knowledge at a local scale. Alteration of thephytoplankton population structure has consequences on the marine food web and nu-5
trient cycling (Tremblay et al., 1997; Laws et al., 2000; Beardall and Raven, 2004) andsubsequent Carbon fixation and export to the deep sea (Sigman and Boyle, 2000),which ultimately affect the CO2 Arctic sink (Bates et al., 2006; Anderson et al., 2010;Cai et al., 2010).
To address these issues, phytoplankton observations after ice melting need to be10
acquired together with environmental parameters. Phytoplanktonic pigments and tax-onomy enumerations are reported here for the first time in large areas of the deepbasins of the Pacific Arctic, free of ice in 2008, i.e. in the less documented while mostaffected area by ice melting (Grebmeier, 2010). Taxonomic data are compared withthose acquired in the same sector of the Arctic, along the Arctic Ocean Section (AOS)15
in summer 1994, when sea ice was much thicker above the entire basins (Booth andHorner, 1997; Sherr et al., 1997 and Gosselin et al., 1997). Pigment data over ice-freeshelf and slope are compared with those obtained in 2002, under partially ice-coveredconditions.
2 Methods20
2.1 Study area
The CHINARE 2008 oceanographic cruise was conducted onboard the Chinese ice-breaker R/V Xuelong, from 1 August to 8 September 2008, in the Pacific Arctic Oceanfrom 65◦ N to 86◦ N (Fig. 1a). The study area has been divided into two geographicalprovinces based on bathymetric features: the shallow Chukchi shelf (<100 m) and the25
deep basins (100 to 4000 m). The deep basins include the Canada Abyssal Plain, the
2058

BGD9, 2055–2093, 2012
Arctic phytoplanktonin unusually low sea
ice cover
P. Coupel et al.
Title Page
Abstract Introduction
Conclusions References
Tables Figures
J I
J I
Back Close
Full Screen / Esc
Printer-friendly Version
Interactive Discussion
Discussion
Paper
|D
iscussionP
aper|
Discussion
Paper
|D
iscussionP
aper|
Alpha Ridge, the Mendeleev Abyssal Plain (MAP) and the Chukchi Borderland. TheChukchi Borderland, considered as a mid-depth (∼1000 m) extension of the Chukchishelf, is composed of the deep Chukchi Abyssal Plain (CAP) and the Chukchi Cap(CC). The Canada Abyssal Plain ends in the South by an abrupt shelf-break, whilethe Northwind Ridge (NR) forms its western boundary and the Alpha Ridge (AR) its5
northern boundary.Waters of the Canada Arctic are characterized by an exceptionally wide range of
salinity, from 24 to 35, and temperatures varying from near-freezing point to 7 ◦C(Fig. 1b). The ubiquitous Arctic Polar Mixed Layer (PML; Codispoti et al., 2005) occu-pies the 5–25 m depth range and show highly variable temperature and salinity values.10
Below the PML down to 200 m depth, the water column exhibits a strong salinity gradi-ent, which characterizes the halocline layer (Aagaard et al., 1981). Below the halocline,down to 300 m, the thermocline layer is characterized by a pronounced temperatureand salinity grandients (34.0< S < 34.8, −0.7 < θ < 0 ◦C) marking the transition be-tween the halocline and the Atlantic Water (34.5<S < 34.9, θ > 0 ◦C), lying between15
300 and 1000 m. The Arctic Deep Waters (S ∼ 34.95, θ < 0 ◦C) occupy the water col-umn below 1000 m. The Pacific Water (PW, 31 < S < 33.5; Woodgate et al., 2005)penetrates into the Arctic Ocean through the Bering Strait. While, the PSW (PacificSummer Waters) become depleted in nutrients during its passage across the BeringSea, the PWW (Pacific Winter Waters) are enriched in nutrients (Aagaard and Roach,20
1990; Weingartner et al., 1998). The PW, lying between 20 and 60 m on the shelfand between 50 to 200 m in deep basins, represent a substantial reservoir of nutrients(NO3: 10–15 µM; Si: 20–40 µM) for the upper Arctic Ocean. The silicate signal of thePWW are observed at all stations up to 85◦ N, whereas the PSW are seen exclusivelyover the shelf and in the southern Canadian Abyssal Plain.25
Phytoplankton distributions in the water samples collected during the CHINARE 2008curise were determined from microscopic enumerations of individual species and pig-ments analyzed by high-performance liquid chromatography (HPLC) (Jeffrey et al.,1997). Species composition previously described by Joo et al. (2012) are combined
2059
BGD9, 2055–2093, 2012
Arctic phytoplanktonin unusually low sea
ice cover
P. Coupel et al.
Title Page
Abstract Introduction
Conclusions References
Tables Figures
J I
J I
Back Close
Full Screen / Esc
Printer-friendly Version
Interactive Discussion
Discussion
Paper
|D
iscussionP
aper|
Discussion
Paper
|D
iscussionP
aper|
to pigment data to more robustly characterize phytoplanktonic communities and becompared to earlier published data obtained under different summer sea ice coverconditions.
2.2 HPLC pigments
Samples for pigment analyses were collected at 65 stations (Fig. 1a) and 2 depths,5
i.e. in surface waters (3 m) and in the sub-surface chlorophyll maximum (SCM) lo-cated from in situ fluorescence profiles. About 2 l of seawater were filtered through25 mm Whatman GF/F filters (0.7 µm porosity), then stored in a freezer at −80 ◦C toavoid biological degradation. HPLC analyses were performed in SOA (Second In-stitute of Oceanography, Hangzhou, China) following the method developed by Van10
Heukelem and Thomas (2001). Pigments were extracted for 1 h at −20 ◦C in methanoland placed in an ultra-sonic bath to disrupt cells. An internal standard, the DL-α To-copherol acetate, was added to the solvent extracts to correct pigment concentrationsfrom recovery. Pigments were analyzed using a Waters 600E HPLC and an EclipseC8 column (150×4.6 mm, 3.5 µm) thermostated at 60 ◦C at a flow rate of 1 ml min−1.15
Every 30 samples, a standard mixture was analyzed under the same conditions as thesamples. Chlorophyll-a (chl-a) and chlorophyll-b (chl-b) standard concentrations weredetermined by spectrofluorometry using published extinction coefficients (Jeffrey andHumphrey, 1975). Chl-a and 17 accessory pigments were quantified based on theirretention time (see Supplementary Table 1). The proportion of each pigment relative20
to the total pigments was used to estimate the phytoplankton composition (Jeffrey andVesk, 1997).
The relative contribution of different phytoplankton classes to the total chl-a con-centration was obtained using the matrix factorization program CHEMTAX (CHEMi-
cal TAXonomy) running under MATLAB™ following Mackey et al. (1996). Twelve pig-25
ments were used to distinguish between eight phytoplankton classes and three sizeclasses: microphytoplankton (>20 µm), nanophytoplankton (2–20 µm) and picophyto-plankton (<2 µm) (see Supplementary Table 1).
2060

BGD9, 2055–2093, 2012
Arctic phytoplanktonin unusually low sea
ice cover
P. Coupel et al.
Title Page
Abstract Introduction
Conclusions References
Tables Figures
J I
J I
Back Close
Full Screen / Esc
Printer-friendly Version
Interactive Discussion
Discussion
Paper
|D
iscussionP
aper|
Discussion
Paper
|D
iscussionP
aper|
2.3 Light microscopy identification, counts and biomass of phytoplankton
26 stations were sampled for taxonomy enumerations at the same two depths as forpigment analyses (Fig. 1a). About 100 ml of water taken from Niskin bottles were usedfor microscopic identification and preserved with glutaraldehyde (final concentration1 %) before filtration through Gelman GN-6 Metricel filters (0.45 µm pore size, 25 mm5
diameter). The filters were mounted on microscope slides with water-soluble embed-ding media (2-hydroxypropyl methacrylate) onboard. In the laboratory, the slides wereused to identify and count phytoplankton species following the procedure of Lee etal. (2012). At least 300 cells were counted under the microscope (BX51, Olympus)with a combination of light and epifluorescence microscopy at 400× for microplankton10
and at 1000× for pico- and nanoplankton. The carbon biomass associated to eachphytoplanktonic group was estimated from species specific biovolumes according tothe equations of Menden-Dauer and Lessard (2000). Biovolume estimates of eachspecies were based on cell dimensions measured by light microscopy using appropri-ate geometric shapes according to Sun and Liu (2003).15
3 Results
3.1 Physical and biogeochemical parameters
Ice cover; temperature, salinity, euphotic depth, nitrate concentrations, nutricline depthand bathymetry are shown in Fig. 2.
Ice cover. Except for a tongue of ice (ice ∼ 50 %) between 72◦ and 74◦ N, the Chukchi20
shelf was free of ice (Fig. 2a). South of 77◦ N the ice cover was less than 20 %, a valuewhich characterizes the “ice-free basins” (IFB, ice <20 %). Ice concentration was highlyvariable (20–70 %) in the “marginal ice zone” (MIZ), over the Chukchi Borderland andthe Canada Abyssal Plain. In the latter called “heavy-ice basins” (HIB), the ice coverwas >70 %, reaching exceptionally 90 % or more, at three stations North of 84◦ N.25
2061
BGD9, 2055–2093, 2012
Arctic phytoplanktonin unusually low sea
ice cover
P. Coupel et al.
Title Page
Abstract Introduction
Conclusions References
Tables Figures
J I
J I
Back Close
Full Screen / Esc
Printer-friendly Version
Interactive Discussion
Discussion
Paper
|D
iscussionP
aper|
Discussion
Paper
|D
iscussionP
aper|
Temperature and Salinity. The surface temperature reached 6 ◦C South of theChukchi Plateau a region free of ice and thus exposed to light radiation for longerperiods (Fig. 2b). Over the deep basins, in the southern Canada Abyssal Plain, tem-peratures in the ice-free surface waters were 2 ◦C wamer than the near freezing valuesin ice-covered areas (−1.4±0.1 ◦C). Surface salinity was relatively low throughout the5
study area (28.1±2.2, Fig. 2b), reflecting freshwater inputs from sea ice melting andriver (Jones et al., 2008). The highest mean surface salinity was observed above theshelf (30.8±0.9) and the Mendeleev Abyssal Plain (29.7±1.3) with a maximum of31.7 at 80◦ N (St. P80). The lowest salinities were found in the Canada Abyssal Plain(26.4±1.5) and over the ice-free waters of the Chukchi Abyssal Plain (27.5±1.7).10
Euphotic depth. The euphotic zone was twice as deep in the deep basins (63±13 m)than over the shelf (33±11 m, Fig. 2c). While deep basins are oligotrophic and receiveless suspended matter from rivers, higher turbidity over the shelf is due to sedimentre-suspension and higher primary production (Emmerton et al., 2008). Euphotic depthdata are not available for the HIB because ice thickness prevented the deployment of in-15
struments and data acquisition from satellites. However, recently Sun Yun et al. (2011)reported that, in 90 % ice-covered areas of the Canada Abyssal Plain, the euphoticzone in summer was as deep as in the ice-free waters.
Nitrate concentration. The average nitrate concentrations in the euphotic zone arethe highest over the Chukchi shelf (5.5±3.4 µM) and decrease by a factor of 4 in the20
Canada Abyssal Plain. They are relatively high in the Chukchi Borderland averaging3.2±1.0 µM (Fig. 2d).
3.2 Spatial distribution of phytoplankton communities
3.2.1 Chl-a and pigment biomass
Accessory pigment concentrations in Arctic waters increase linearly with chlorophyll-25
a (r2 = 0.87, not shown). The chlorophyll-a represents on average 50 % of the totalaccessory pigments. The highest phytoplankton biomass was found in the SCM (red
2062
BGD9, 2055–2093, 2012
Arctic phytoplanktonin unusually low sea
ice cover
P. Coupel et al.
Title Page
Abstract Introduction
Conclusions References
Tables Figures
J I
J I
Back Close
Full Screen / Esc
Printer-friendly Version
Interactive Discussion
Discussion
Paper
|D
iscussionP
aper|
Discussion
Paper
|D
iscussionP
aper|
line, Fig. 2e and green line, Fig. 2f), at the depth of the nutricline (red line, Fig. 2f)coinciding with the base of the surface fresh layer (SFL) defined by the 31 isohaline(blue line, Fig. 2f). Shallow SCM above the shelf (20±9 m) deepens (37±11 m) overthe Chukchi Borderland and even more in the Canada Abyssal Plain (56±14 m). Algalbiomass in the deep basin surface waters is 10 times lower than in shelf surface waters.5
It is 5 times lower in the deep basin SCM than in shelf SCM.In the following sections, we discuss separately the shallow Chukchi shelf from the
oligotrophic Canada deep basin waters, and distinguish the SCM communities devel-opping in the nutricline apart from those from fresh and nutrient depleted well-lit surfacewaters.10
3.2.2 Accessory pigments
Shelf waters. The mean pigment concentration in shelf waters is three times higherin the SCM than at the surface. Values range from 0.20 to 5.60 mg m−3 at theSCM (2.59±2.28 mg m−3, Fig. 3b), and from 0.36 to 3.50 mg m−3 at the surface(0.99±0.64 mg m−3, Fig. 3a). The high pigment variability highlights the “patchiness”15
of the phytoplankton distribution. However, pigment distributions are quite similar insurface and subsurface waters. Shelf waters are characterized by high fucoxanthin(Fuco), produced mainly by diatoms, both in surface and SCM waters. Other pigmentssuch as prasinoxanthin (Prasino), chlorophyll-b (chl-b), diadinoxanthin (Diadino) andcarotenoids (Caro) account for 3 to 5 % of the total pigments. The peridinin (Peri)20
primarily synthesized by dinoflagellates represents less than 2 % of the accessory pig-ments.
Lowest pigment waters of the west coast of Alaska (Stations C31, R05, C23) are lowin Fuco (40 %) while pigments typical of small-size species, such as Pras (10 %), chl-b (10–30 %), neoxanthin (Neo∼5 %) and alloxanthin (Allo∼5 %) increase pie charts25
in Fig. 3a, b. Of note, the high SCM concentrations of 19’-hexanoyloxyfucoxanthine(19HF, 1.69 mg m−3) at station R17 (40 m) suggesting prymnesiophyte blooming overthe continental slope, North of Chukchi shelf.
2063

BGD9, 2055–2093, 2012
Arctic phytoplanktonin unusually low sea
ice cover
P. Coupel et al.
Title Page
Abstract Introduction
Conclusions References
Tables Figures
J I
J I
Back Close
Full Screen / Esc
Printer-friendly Version
Interactive Discussion
Discussion
Paper
|D
iscussionP
aper|
Discussion
Paper
|D
iscussionP
aper|
Deep basin waters. Pigment composition in deep basin waters is different from theshelf waters (Fig. 4). While over the Chukchi shelf pigment distributions are similarin surface and SCM waters, they show distinct communities with depth in deep basinwaters (pie charts in Fig. 4a and b). Surface waters of the Canada Abyssal Plain havea low pigment content (Fig. 4a) but Fuco dominates (62±20 %) in the ice covered and5
ice free areas, whereas Diadino prevails (44 %) in the MIZ followed by 19HF (5–25 %),the third major pigment. Highest concentrations are found near Barrow Canyon (S21,S22 and S14), at station P38 above the Northwind Ridge, and in the HIB and MIZ of theChukchi Borderland. These relatively “rich” surface waters, as compared to CanadaAbyssal Plain, have in most cases a similar pigment composition in the SCM. The most10
abundant pigments are Fuco (25–30 %), chl-b (23 %), Pras (11 %), 19HF (10 %) andNeo (4 %). Other pigments, zeaxanthin (Zea), 19’-butanoyloxyfucoxanthin (19BF) andviolaxanthin (Viola) are present in smaller proportions (<4 %). Surface water pigmentsin the ice-free Chukchi Abyssal Plain are as low as in the Canada Abyssal Plain.
In the SCM of the deep basins, the total pigment concentrations are up 6 times15
higher than in surface waters (Fig. 4a, b). The main accessory pigments are suces-sively Fuco, chl-b, Prasino and 19HF. They account for 80 % of the total accessorypigments and suggest that communities are dominated by prasinophytes (chl-b + Pras= 40 %), while diatoms (Fuco= 25 %) and prymnesiophytes (19HF = 15 %) account forthe remainder. Chl-b and Prasino are 30 % higher in the Chukchi Borderland than in20
the Canada Abyssal Plain, while Fuco is 30 % higher in the Canada Abyssal Plain thanin the Chukchi Borderland. 19HF locally reaches high values and dominates the totalpigments at two stations, B11 and N81. The 19BF, Neo and Diadino were detected atall stations but in concentrations 5 times lower than the four dominant pigments men-tioned above. Peri and divinyl chlorophyll-a (DVchla), produced by dinoflagellates and25
prochlorophytes, respectively, were absent from the deep basin waters.
2064
BGD9, 2055–2093, 2012
Arctic phytoplanktonin unusually low sea
ice cover
P. Coupel et al.
Title Page
Abstract Introduction
Conclusions References
Tables Figures
J I
J I
Back Close
Full Screen / Esc
Printer-friendly Version
Interactive Discussion
Discussion
Paper
|D
iscussionP
aper|
Discussion
Paper
|D
iscussionP
aper|
3.2.3 Taxonomy
Shelf waters. Above the Chukchi shelf, average phytoplankton abundance and biomasswere of the same order of magnitude in surface and SCM waters (Table 1 and Fig. 5),but phytoplanktonic communities differ. In surface waters, unidentified nanoplanktondominates the abundance (52 %) and biomass (60 %), except for the southern shelf5
where centric diatoms Chaetoceros spp. and Thalassiosira spp. and the prymnesio-phyte Phaeocystis pouchetii prevail (Fig. 5a, b, c). In the SCM, diatoms and nanoplank-ton are found in similar abundances (40 %) but the diatom biomass is 56 % whilenanoplankton accounts for 34 % (Fig. 5d, e). About 80 % of the nanoplankton wasunidentified, the remaining being represented by Phaeocystis pouchetii (15 %) and10
cryptomonads. (5 %). The most abundant diatoms in the SCM are centric Chaeto-ceros spp. and Thalassiosira spp. in the southern shelf waters, while the northernshelf waters are dominated by pennate species Fragilaria sp. and Fragilariopsis sp.and centric diatom Chaetoceros spp. (Fig. 5f). It should be noted that, in the centralshelf biomass is the lowest and is dominated by the dinoflagellate Gymnodinium sp.15
and the pennate diatom Cylindrotheca sp. Picoplankton (<2µm) accounts for <1 % ofthe total carbon biomass over the shelf and for 36 % and 16 % of total abundance inthe surface and SCM waters, respectively.
In the deep basins, the total phytoplankton abundances are slightly higher in theSCM (930±700 cells ml−1) than in the surface waters (640±510 cells ml−1) (Table 1,20
Fig. 6a, d), but biomasses are similar. They are both 4 times lower than over the shelf.Highest values are found at two stations of the Chukchi Borderland (M01 and N01,Fig. 6). Surface and SCM phytoplankton abundances are dominated by picoplankton(55 %) and nanoplankton (40 %), while diatoms represent only 5 %. Compared to theshelf waters, diatom abundances are lower by a factor of 10, while nanoplankton abun-25
dances are 5 times lower. Picoplankton is 2 times less abundant in surface watersbut increase at the SCM relative to the shelf. 95 % of the picoplankton could not beidentified with the techniques we used. The few species identified are the prasinophyte
2065
BGD9, 2055–2093, 2012
Arctic phytoplanktonin unusually low sea
ice cover
P. Coupel et al.
Title Page
Abstract Introduction
Conclusions References
Tables Figures
J I
J I
Back Close
Full Screen / Esc
Printer-friendly Version
Interactive Discussion
Discussion
Paper
|D
iscussionP
aper|
Discussion
Paper
|D
iscussionP
aper|
Micromonas sp. consistently with Lovejoy et al. (2007). Much of the nanoplankton isnot identified either (90 %), however relatively high concentrations of the cryptophyteCryptomonas sp. are found at station N01 and chrysophyte Dinobryon belgica over theAlpha Ridge.
The nanoplankton, abundant at all deep basin stations, accounts for 44 % and 60 %5
of the carbon biomass in surface and SCM waters, respectively. Nanoplankton largelydominates the low biomass waters (90 %, ∼5 mgC m−3) over the ice-free area of thebasin. Although picoplankton is the most abundant phytoplankton compartment (55 %)it accounts for only 5 % of the total carbon biomass of the deep basin waters. Con-versely, because of their large cell volume, the diatoms represent up to 70 % of the10
total carbon biomass in surface rich areas of the MIZ and dominate the biomass in theSCM at ice-covered stations, north of 83◦ N (52 %). The diatom species of the deepbasins are different from those found over the Chukchi shelf. Of note the dominance ofNitzschia spp. in surface waters of the northern Chukchi Abyssal Plain (290 cells ml−1,Fig. 6c, f). The remaining species consist of Fragilariopsis sp., Actinocyclus sp. in the15
Chukchi Borderland and Minidiscus sp. Navicula sp. and Chaetoceros sp., North of84◦ N. Dinoflagellates Gymnodinium sp. and Heterocapsa sp. represent 35 % of theSCM biomass in areas partially covered with ice over the MAP.
Our results show that while diatoms are present in minor abundances over the deepbasins as compared to nanoplankton and picoplankton, they account for a major frac-20
tion of the total biomass. Conversely, the picoplankton represents half of the total cellnumber but a small proportion of the total biomass.
4 Discussion4.1 Comparison between pigments and taxonomic counts
Shelf waters dominated by fucoxanthin. Both pigments and taxonomic data highlight25
the richness of the shelf waters in terms of cell abundance (∼3000 cells ml−1, Fig. 7a,b), carbon biomass (∼100 mgC m−3, Fig. 7c, d) and pigments (∼2.5 mg m−3, Fig. 7e,f). The phytoplankton abundance and biomass in shelf waters are on average 8 and
2066
BGD9, 2055–2093, 2012
Arctic phytoplanktonin unusually low sea
ice cover
P. Coupel et al.
Title Page
Abstract Introduction
Conclusions References
Tables Figures
J I
J I
Back Close
Full Screen / Esc
Printer-friendly Version
Interactive Discussion
Discussion
Paper
|D
iscussionP
aper|
Discussion
Paper
|D
iscussionP
aper|
4 times higher, respectively, than over the deep basins. Fuco suggests diatoms asdominant species of the phytoplankton population in surface and SCM waters of theChukchi Shelf and taxonomy indicate Chaetoceros sp. Cylindrotheca sp. Fragilariasp. and Fragilariopsis sp. Thalassiossira sp. as the main diatoms in SCM waters(Fig. 5f). These observations are consistent with previous taxonomic observations5
on the Chukchi shelf in 1994 (Booth et al., 1997) and 2003 (Seegreva et al., 2010).However, in surface waters our data reveal that 60 % of the carbon biomass over theshelf is nanoplankton (Fig. 7c) despite the large dominance of Fuco. Assignment ofFuco to diatoms by CHEMTAX may be responsible for this apparent discrepancy, asthis pigment can also be a major pigment in prymnesiophytes (Jeffrey et al., 1997).10
Picoplankton related pigments are very low over the shelf whereas this group rep-resents 35 % and 19 % of the total cell number in surface and SCM, respectively.Picoplankton produces 100 and 1000 times less carbon than nanoplankton and mi-croplankton, respectively, due to their low biovolume (Sun and Liu, 2003). As a result,pigment production is also much lower in picoplankton than larger cells. Pigments in15
shelf waters match biomass data better than abundance data.Poor deep basin waters with poorly identified dominant species. The deep basin
surface waters are oligotrophic and strongly dominated by diatoms (diadino + fuco) ac-cording to pigment data, while taxonomy determinations suggest dominant nanoplank-ton (Fig. 7a, c, e). However, under low total pigment concentrations, such as those20
of the surface of the Canada Abyssal Plain only pigments above the limit of detec-tion, estimated to be here 0.05 mg m−3, can be quantified. The detection of minorpigments by HPLC thus represents a limitation of the method that must be bare inmind. The taxonomic data of Segreeva et al. (2010) suggest a detection limit of phyto-plankton species dominance for abundances of less than 50 cells ml−1. In the southern25
and northern deep basins, microplankton cell concentrations are thus too low to in-fer dominant groups (<10 cells ml−1). Moreover, as for shelf waters we suspect that alarge fraction of the Fuco is associated to other species such as prymnesiophytes ordinoflagellates, rather than diatoms (Rodriguez et al., 2002).
2067
BGD9, 2055–2093, 2012
Arctic phytoplanktonin unusually low sea
ice cover
P. Coupel et al.
Title Page
Abstract Introduction
Conclusions References
Tables Figures
J I
J I
Back Close
Full Screen / Esc
Printer-friendly Version
Interactive Discussion
Discussion
Paper
|D
iscussionP
aper|
Discussion
Paper
|D
iscussionP
aper|
The SCM cell abundances and carbon biomass were comparable to surface valuesbut pigment biomasses are 5 times higher in the SCM. This finding likely reflects anincrease of the cell pigment content in response to adaptation to low light availabilityat the SCM (Henriksen et al., 2002). Picoplankton and nanoplankton accounting for55 % and 40 % of the cell abundances, respectively, and dominate in the SCM waters5
(Fig. 7b). Pigments indicate 53 % picoplankton and 35 % nanoplankton thus agreeingwith cell abundances (Fig. 7f). CHEMTAX identifies picoplankton as prasinophytes andnanoplankton as chrysophytes (75 %) and prymnesiophytes (25 %) (Fig. 7f). Althoughpigments are good indicators of the dominance in phytoplankton cell numbers, they donot match the phytoplankton dominance in terms of carbon biomass in the deep basins.10
For exemple, pigment data suggest the presence of diatoms and minor nanoplanktonat the SCM of the IFB, while the carbon biomass data indicate prevalent nano-sizephytoplankton. Also, in the northern basin, the SCM water biomass is dominated bydiatoms (56 %) while Fuco represents only 20 % and CHEMTAX results point to pico-and nano-plankton rather than diatoms.15
“Hots spots” occurred in oligotrophic surface waters of the deep basin. Taxonomyand pigment data both show a significant high surface biomass and cell abundancein the MIZ. However, pigments in the MIZ indicate dominant prasinophytes, chryso-phytes and diatoms while taxonomy suggests abundant unidentified picoplankton andnanoplankton and pennate diatoms (Fragilariopsis sp. Niztchia spp.); biomass data20
points to unidentified nanoplankton. Only, at some stations, they both indicate dom-inant nanoplankton possibly because of monospectific “blooms”, as for example thehigh 19HF from prymnesiophytes at station N81 (72 %, Fig. 4b), or high biomass(28 mgC m−3) due to high cryptophytes (Cryptomonas sp. at station N01), as revealedby taxonomy (79.5◦ N, Fig. 6e).25
Overall, pigments provide consistent information in the deep basin waters where cellabundances are dominated by small phytoplankton, largely unidentified (75 %). Pig-ments seem to reflect phytoplankton cell number in oligotrophic waters of the deepbasins (chl-a = 0.1–1 mg m−3) while they are better linked to phytoplankton biomass
2068
BGD9, 2055–2093, 2012
Arctic phytoplanktonin unusually low sea
ice cover
P. Coupel et al.
Title Page
Abstract Introduction
Conclusions References
Tables Figures
J I
J I
Back Close
Full Screen / Esc
Printer-friendly Version
Interactive Discussion
Discussion
Paper
|D
iscussionP
aper|
Discussion
Paper
|D
iscussionP
aper|
in the eutrophic areas such as the Chukchi Shelf waters (chl-a > 1 mg m−3). In theoligotrophic surface waters of the deep basins (<0.05 mg chl-am−3), CHEMTAX maybe misleading because of the low ratio of accessory pigments relative to chl-a. Wesuggest that in the deep basin and shelf waters much of the Fuco is produced bynanoplankton rather than to diatoms. Cross-comparison of pigments and taxonomic5
data thus provide a more accurate approach to more accurately diagnose phytoplank-ton populations. Improvement of our understanding of the relationship between taxo-nomic enumeration and pigment fingerprints would benefit from additionnal field data.
4.2 Comparison with previous expeditions in the Canadian Arctic
Phytoplankton distributions in the Pacific sector of the Arctic Ocean under reduced ice10
cover such as those encoutered in summer 2008 are limited. The only data avail-able for comparison to the CHINARE 2008 cruise area are those of the Arctic OceanSection (AOS) in summer 1994 and from the Shelf-Basin Interactions program (SBI),in summer 2002. We first compare our pigment data with those obtained in summer2002 from the Chukchi shelf and the southern Canada Abyssal Plain (Hill et al., 2005).15
We then compare our taxonomic data to those acquired in August 1994 in the ChukchiBorderland and the Mendeleev Abyssal Plain (Booth et al., 1997). The lower ice coverin summer 2008 as compared to summers 1994 and 2002 allows us to explore theeffect of ice retreat and freshwater input on the phytoplankton community (Fig. 9).
4.2.1 Comparison of the phytoplankton distributions in 2008 and 2002 over the20
Chukchi shelf and slope
The average chlorophyll-a concentrations North of Chukchi shelf in summer 2008(2.3±1.6 mg chl-am−3) are similar to those found in summer 2002 (2.0 mg chl-am−3,Hill and Cota, 2005). Nevertheless, Hill et al. (2005) reported the occurrence of phy-toplanktonic blooms at the shelf-break and thus locally high biomass (40 mg chl-am−3)25
and high production rate (8 mg C h−1). Such bloom conditions are not observed in 2008,
2069
BGD9, 2055–2093, 2012
Arctic phytoplanktonin unusually low sea
ice cover
P. Coupel et al.
Title Page
Abstract Introduction
Conclusions References
Tables Figures
J I
J I
Back Close
Full Screen / Esc
Printer-friendly Version
Interactive Discussion
Discussion
Paper
|D
iscussionP
aper|
Discussion
Paper
|D
iscussionP
aper|
where chlorophyll-a concentrations never exceed 1.4 mg m−3 (St. S24, Fig. 4b). Fucoover the Chukchi Shelf was 3 times larger in 2008 than 2002. We found more diatomsin 2008 than in 2002, when pigment distributions underline prevailing small phytoplank-ton like prasinophytes (chl-b, Pras). In the SCM, in both years, the phytoplankton com-munities are dominated by more than 80 % by large phytoplankton. However, in 20085
accessory pigments are 75 % Fuco, while in 2002 Fuco amounts 49 % and chlorophyllc1 and c2, 21 %, but the two latter are commonly found in large phytoplankton.
Over the slope and the deep Canada Abyssal Plain, chlorophyll-a concentrations in2008 indicate oligotrophic conditions in surface waters with values <0.1 mg chl-am−3
and around 0.2 mg chl-am−3 at the SCM, as also found in 2002 (<0.5 mg chl-am−3, Hill10
and Cota, 2005). In 2008, pigments from chrysophytes and prymnesiophytes (19HF,19BF) represent 25 % of total pigment at the SCM, while these two groups were minorin 2002. In contrast, Fuco was higher in 2002, suggesting that nanoplankton dominatedover diatoms in 2008. The relative proportions of picoplankton pigments, Pras andchl-b, are of the same order of magnitude. In surface deep basin waters, pigments15
associated to large phytoplankton is higher in 2008, those produced by small speciesdecrease drastically. Indeed, the chl-b and Pras are 3 and 5 times lower in 2008 thanin 2002; the 19HF are threefold higher in 2008, and Fuco rises from 16 % to 45 %.
Overall, pigment data highlight larger phytoplankton communities in shelf waters in2008 than 2002, and a larger proportion of nanoplankton in the deep basin waters in20
2008, at the expense of picoplankton in surface waters, and at the expense of diatomsin the SCM.
4.2.2 Comparison of the phytoplankton distributions over the deep basins athigh (1994) and low (2008) ice cover
The abundance and biomass of major phytoplankton groups measured during the25
CHINARE 2008 cruise are compared to those of the AOS transect (Gosselin et al.,1997) sampled in July–August 1994 in the same area. Both transects are similar over
2070
BGD9, 2055–2093, 2012
Arctic phytoplanktonin unusually low sea
ice cover
P. Coupel et al.
Title Page
Abstract Introduction
Conclusions References
Tables Figures
J I
J I
Back Close
Full Screen / Esc
Printer-friendly Version
Interactive Discussion
Discussion
Paper
|D
iscussionP
aper|
Discussion
Paper
|D
iscussionP
aper|
the Chukchi Borderland but differ North of 80◦ N. Sampling in 1994 was performedWest of Mendeleev Abyssal Plain (∼175◦ W longitude), while samples were taken Eastof the Mendeleev Abyssal Plain during CHINARE cruise.
Higher phytoplankton biomass in 2008 despite a drastic reduction in cell abun-dances. The most surprising observation is the lower abundance and biomass of5
picoplankton by a factor of 10 in 2008 (∼450 cells ml−1, Fig. 8a, b) as compared to1994 (Fig. 8i, j) (∼4500 cells ml−1, Fig. 8g, h) at all stations and depths. In 1994, pi-coplankton accounts for 96 % of the total abundance and 20 % of the total biomass, butonly 42 % of the abundance and 5 % of the total biomass, in 2008 (Fig. 8c, d). While,the total cell abundances is lower in 2008, the phytoplankton biomasses is higher by10
20 % in surface waters and by 100 % at the SCM, most probably because of increasedsize of phytoplankton under reduced ice conditions. In particular, in 2008 the abun-dance of nanoplankton increases by 50 % at the surface and by threefold at the SCM.The concentrations of diatoms are similar for the two years, however in 1994, diatomswere dominated by “sub-ice species” Melosira arctica, while in 2008 “pelagic species”15
Nitzschia sp., Fragilariopsis sp., Navicula sp. and Actinocyclus sp. predominated.The dinoflagellate Gymnodinium sp., quite abundant in 1994 (∼30 cell ml−1) is lowerby an order of magnitude in 2008 (Peri<1 %). The increase in total biomass in 2008is mainly due to increased abundance of nanoplankton identified as chrysophytes andprymnesiophytes by pigments analyses.20
However, phytoplankton biomass and composition are not uniform and show differ-ences in the MIZ (77–80◦ N), IFB (74–77◦ N) and HIB (80–86◦ N) in 2008 as comparedto the same area in1994 which was entirely ice covered, as discussed below.
Offshore “ice edge hot spots” and the proliferation of large phytoplankton in the MIZ.Biomass in the MIZ of the deep basins waters is higher in 2008 both in the surface25
(40.3 mgC m−3 in 2008 against 12.8 mgC m−3 in 1994) and SCM waters (29.1 mgC m−3
in 2008 against 9.0 mgC m−3 in 1994) as compared to the ice covered 1994. In sur-face waters, higher biomass is linked to diatoms Nitzschia sp. Fragilariopsis sp. andActinocyclus sp. and unidentified nanoplankton which are 10 and 5 times higher, in
2071
BGD9, 2055–2093, 2012
Arctic phytoplanktonin unusually low sea
ice cover
P. Coupel et al.
Title Page
Abstract Introduction
Conclusions References
Tables Figures
J I
J I
Back Close
Full Screen / Esc
Printer-friendly Version
Interactive Discussion
Discussion
Paper
|D
iscussionP
aper|
Discussion
Paper
|D
iscussionP
aper|
2008. The cryptophytes, rare in 1994 (<5 cells ml−1), are also much higher in 2008(79 cells ml−1).
Impoverishement of the ice-free basins (IFB) where nanoplankton dominate. In2008, lowest biomass (4.5 mgC m−3) is associated with 10 and 20 times lower abun-dances of diatoms and dinoflagellates, respectively. Both surface and SCM waters5
contain more than 90 % nanoflagellates. In 1994, the biomass is 2–3 times higher andphytoplankton mainly composed of diatoms (45 %), large flagellates >2 µm (30 %) andpicoplankton (25 %).
Ice-covered areas (HIB) depleted in surface microplankton and enriched in SCMnanoplankton. In 2008, the biomass in surface waters North of 83◦ N is reduced com-10
pared to 1994: the diatom biomass is low in 2008 (1.2 mgC m−3) and higher in 1994(5.5 mgC m−3), while the nanoflagellate biomass is similar. In the SCM, the nanoplank-ton biomass is 5 times higher in 2008 than in 1994.
4.3 Impact of ice melting on the phytoplankton distribution
The comparison between phytoplankton populations in 2008 and 1994 has shown that15
strong ice melting in 2008 promoted nanoplankton growth in Pacific sector of the Arc-tic Ocean, while the picoplankton and microplankton (dinoflagellates) declined. How-ever, the response to melting is contrasted with evidences of “hots spots” of diatomsin the MIZ while this biomass decreases in the IFB. In the HIB, higher abundanceand biomass are found at greater depth. Pigment data in 2002 and 2008 in southern20
Canada Abyssal Plain confirm these findings.Major physical changes linked with the ice melting. The reduction of the ice cover
and subsequent freshening of the upper water column are two key parameters for lightand nutrient availability affecting photosynthesis, production rates and phytoplanktoncomposition (Fig. 9). In 1994, all stations North of 75◦ N were sampled under thick25
ice cover (>90 %) (Fig. 9a). In 2008, the ice retreat above the deep basins led tothree areas, the IFB, the MIZ and the HIB North of 80◦ N, yet even in the HIB, iceconcentration always remains below the 1994 conditions (ice >90 %).
2072

BGD9, 2055–2093, 2012
Arctic phytoplanktonin unusually low sea
ice cover
P. Coupel et al.
Title Page
Abstract Introduction
Conclusions References
Tables Figures
J I
J I
Back Close
Full Screen / Esc
Printer-friendly Version
Interactive Discussion
Discussion
Paper
|D
iscussionP
aper|
Discussion
Paper
|D
iscussionP
aper|
The freshening depletes Arctic surface waters in nutrients and deepens the nutriclineand SCM. Surface salinity in 2008 is lower by 2 to 6 units in the IFB and HIB than inicy year 1994 (Fig. 9b). Salinity in the MIZ at 10 m is similar in 1994 and 2008. Fresh-ening of the deep basin reveals regional disparities due to variable influence of theriver discharge and ice melting on surface salinity (McCelland et al., 2006). One impor-5
tant consequence of freshening due to ice melting is the nutrient depletion of surfacewaters as a result of vertical stratification preventing supply of deep-water nutrientsto the surface. Another major consequence of freshening is the formation of a thickSFL which causes a deepening of the nutricline and therefore of the SCM (Fig. 9d)(McLaughlin et al., 2010). Our data show that the southern and northern deep basins10
are more strongly affected by freshening in 2008, with surface nutrient concentrations 5five times lower (0.40±0.25 µM) than in 1994 (1.97±0.63 µM) (Fig. 9e). The SCM is 3times deeper in 2008 (42±10 m) than in 1994 (14±8 m) (Fig. 9d). However, in the MIZwhere the freshening is less pronounced the SCM shallows (31±10 m) and the meannitrate concentration in upper 25 m is 3 times higher in 2008 (1.67±0.98 µM) than15
in 1994 (0.65±0.33 µM). Even though vertical stratification resulting from fresheningaffects surface nutrient concentrations, consumption by phytoplankton must be consid-ered. Notably, the high nitrate concentrations in the MIZ likely sustain early diatom andnanoplankton bloomings in the process of ice melting (Fig. 9g, h).
The effect of solar irradiance in the surface layer (∼100 m) in ice-free conditions is20
another important factor influencing the phytoplankton distribution. Data obtained insummer 2009 in the Canada Basin show that ice-covered areas (>90 %) have a eu-photic depth similar to the ice-free part of the basin (ice = 0 %) (Sun Yun et al., 2011).Over the recent summers, the thinning of ice and removing of snow over the ice indeep basins favored light penetration across the ice. Thus, rather than the direct ef-25
fect of light, freshening by deepening the nutricline would exert control on biomass,abundance and diversity of phytoplankton during summer. The SFL thickness wouldthus drive the nutricline and thus phytoplankton growth depth: deeper nutricline sus-tains deeper but less productive phytoplankton communities due to light attenuation.
2073

BGD9, 2055–2093, 2012
Arctic phytoplanktonin unusually low sea
ice cover
P. Coupel et al.
Title Page
Abstract Introduction
Conclusions References
Tables Figures
J I
J I
Back Close
Full Screen / Esc
Printer-friendly Version
Interactive Discussion
Discussion
Paper
|D
iscussionP
aper|
Discussion
Paper
|D
iscussionP
aper|
Conversely, photo-inhibition in near surface nutricline waters also affects phytoplank-ton (Finkel et al., 2010). Picoplankton sensitivity to high irradiance and UV exposuremay explain the low prasinophytes in surface waters under extended ice retreat in 2008as compared to 1994 (Key et al., 2010). In the HIB during 2008, higher freshening leda SFL at about 40 m, with a decrease of large phytoplankton in surface waters (diatoms5
and dinoflagellates) and maximum phytoplankton biomass and abundances at greaterdepth. In contrast, freshening in 1994 was reduced and phytoplankton mainly grew insurface waters.
An “offshore ice edge bloom” in the MIZ. Increase abundances of diatoms andnanoplankton in 2008 in the MIZ (77–80◦ N) led to the formation of “off-shore ice-edge10
blooms” as also found in marginal Arctic seas (Alexander and Niebauer, 1981; Luchettaet al., 2000; Hill et al., 2005; Tremblay et al., 2006; Sukhanova et al., 2009). The recentwithdrawal of ice in the MIZ, increase solar irradiance together with a shallow nutri-cline likely provide optimal conditions for large cell growth. The highest biomass in“offshore ice edge blooms” (M01, N01, Fig. 6b, e) is of the same order of magnitude15
as the mean biomass value over the shelf and 3 times lower than at the ice-edge ofthe Chukchi Shelf (R11, R13, Fig. 5e). Species in “offshore ice edge blooms” are alsodifferent from those living in ice edge over the shelf. The ice-edge over the shelf isdominated by diatoms like Chaetoceros spp. Fragilaria sp. and Fragilariopsis sp. andunidentified nanoplankton or Phaeocystis pouchetii while “offshore ice edge blooms”20
are composed of pennate diatoms Nitzschia sp. and Fragilariopsis sp., and nanoplank-ton like dictyochophytes or crysophytes. It is important to emphasize that in ice edgewaters over the Canada Abyssal Plain pigment biomass does not significantly increase,neither in surface nor at SCM waters, unlike in the MIZ of the Chukchi Borderland. Wecan speculate that nutrient replenishment from upwelled deep waters is favored under25
thin MIZ rather than thicker Canadian basin SFLs.The strong stratification due to intense freshening drives the ice-free zone (IFB) to
oligotrophy. In the IFB freshening induces nutrient depletion of surface waters and thedeepening of the SCM to about 40–50 m. As a result, microplankton and picoplankton
2074

BGD9, 2055–2093, 2012
Arctic phytoplanktonin unusually low sea
ice cover
P. Coupel et al.
Title Page
Abstract Introduction
Conclusions References
Tables Figures
J I
J I
Back Close
Full Screen / Esc
Printer-friendly Version
Interactive Discussion
Discussion
Paper
|D
iscussionP
aper|
Discussion
Paper
|D
iscussionP
aper|
declined in surface waters as compared to 1994 and remain low even in the SCM. Thenanoplankton does not show significant changes between 2008 and 1994, seeminglybecause of better adaptation to ice retreat.
5 Conclusions
During the IPY (2007–2008), a major effort was undertaken to acquire hydrological5
data in Polar regions, among which the Arctic Ocean, where phytoplankton and nutrientdata are scarce. Samples from the CHINARE 2008 cruise provide new pigment andtaxonomy data in a poorly documented area of the deep central basin of the Arctic,after the extreme ice melting conditions of summer 2007.
The phytoplankton composition in the Pacific Arctic Ocean reveals important10
changes as a result of recent ice shrinking over the deep basins. In 2008, we find dom-inant nano-sized chrysophytes in the deep basins and a decline of pico-sized prasino-phytes and micro-sized dinoflagellates. The diatoms are found in lower abundances inthe ice-free (ice<20 %) and heavy ice (ice>70 %) waters of the deep basins, but ele-vated values in the marginal ice zone (20 %< ice<70 %). High Fuco over the shelf and15
in the surface waters of the deep basins suggest that besides diatoms, nanoflagellateslikely produce this pigment.
The retreat of ice over the deep basins led to regional contrasts in phytoplankton sizeand abundances. At high latitudes, in partially ice covered deep basins (ice ∼70 %),the phytoplankton biomass is low in surface waters due to diminished abundances of20
large species, rising in the SCM. A shift from ice diatoms to deeper pelagic communitydominated by nano-sized phytoplankton accompanies the ice cover reduction. In themarginal ice zone of basins (77–80◦ N), localized “hot spots” with high abundances oflarge phytoplankton occur as already reported in Arctic shelf ice-edges.
Earlier studies suggested that increase light availability due to ice retreat would result25
in increased PP and biomass. We propose that freshening, by deepening the nutriclineand the SCM would reduce light available for phytoplankton growth. Likewise, stronger
2075
BGD9, 2055–2093, 2012
Arctic phytoplanktonin unusually low sea
ice cover
P. Coupel et al.
Title Page
Abstract Introduction
Conclusions References
Tables Figures
J I
J I
Back Close
Full Screen / Esc
Printer-friendly Version
Interactive Discussion
Discussion
Paper
|D
iscussionP
aper|
Discussion
Paper
|D
iscussionP
aper|
stratification would constrain nutrients availability for surface communities. Lower nu-trients and light availability would promote nanoflagellates (chrysophytes, prymnesio-phytes) growth in surface waters, while picoplankton, less adapted to higher and longerexposure to UV, declines in surface waters.
Our data evidence differences in the phytoplankton structure (cell size, species and5
abundances) in deep basin surface waters between heavily ice-covered (summer 1994)and ice-free or partially ice-covered years (summer 2008), yet phytoplankton biomassis similar. While we document impoverishment of ice-free basins, we see enrichmentat offshore ice edges. Nevertheless, with the northern extension of the ice-free areasand enhanced freshening subsequent to predicted increase of ice melting and river10
discharges, impoverishment of the ice-free basins would extend northward. The deepArctic basins would thus evolve towards decreasing phytoplankton biomass and pro-duction. We can thus anticipate that carbon production and export would decreasein the ice-free basins and increase in the marginal ice zone, as a consequence ofchanges in the phytoplankton adundance and size structure.15
Future CHINARE cruises planned every other year in the Arctic should provide ad-ditionnal biogeochemical data to improve our understanding of the response of phyto-plankton, from shelf to the deep basins, to on-going sea ice cover changes to ultimatelyproduce a more comprehensive picture of the Arctic ecosystem evolution.
Supplementary material related to this article is available online at:20
http://www.biogeosciences-discuss.net/9/2055/2012/bgd-9-2055-2012-supplement.pdf.
Acknowledgements. This research is a contribution to the Arctic Tipping Points (ATP) project(http://www.eu-atp.org) funded by FP7 of the European Union (contract #226248) and theEuropean programme DAMOCLES (Developing Arctic Modeling and Observing Capabilities25
for Long-term Environmental Studies, 2007–2010). We express our gratitude to the captainand the crew of the Chinese icebreaker Xuelong for the opportunity to take part in the field-work in the Arctic Ocean. We thank the Second Institute of Oceanography SOA/PRC (State
2076
BGD9, 2055–2093, 2012
Arctic phytoplanktonin unusually low sea
ice cover
P. Coupel et al.
Title Page
Abstract Introduction
Conclusions References
Tables Figures
J I
J I
Back Close
Full Screen / Esc
Printer-friendly Version
Interactive Discussion
Discussion
Paper
|D
iscussionP
aper|
Discussion
Paper
|D
iscussionP
aper|
Oceanic Administration, China, Hangzhou) and the National Natural Science Foundation ofChina (NSFC, No. 41076135) for the invitation to the French scientists from the LOCEAN labo-ratory (UPMC – University Pierre et Marie Curie) to participate in the CHINARE cruise and tosupport the stay of french scientists in China for the pigment analyses, but also for their warmwelcome and helpfulness. We are grateful to S. Q. Gao and Y. Lu (SOA, Hangzhou, China) for5
their help in the nutrient analysis and sample collection, as well as professor J. P. Zhao (OceanUniversity China, Qingdao, China) and the Chinese and Finnish physical teams (Finnish Me-teorological Institute, Helsinki) for the acquisition and transfer of the hydrological data (CTD).Support for Pr. Lee was provided by the Korea Research Foundation (KRF) grant funded by theKorea government (MEST) (No. 2011-0007761).10
The publication of this article is financed by CNRS-INSU.
References
Aagaard, K. and Roach, A. T.: Arctic Ocean-shelf exchange: measurements in Barrow Canyon,15
J. Geophys. Res., 95, 18163–18175, 1990.Aagaard, K., Coachman, L. K. and Carmack, E.: On the halocline of the Arctic Ocean, Deep
Sea Res. I, 28, 529–545, 1981.Alexander, V. and Niebauer, H. J.: Oceanography of the eastern Bering Sea ice-edge zone in
spring, Limnol. Oceanogr., 26, 1111–1125, 1981.20
Anderson, L. G., Tanhua, T., Bjork, G., Hjalmarsson, S., Jones, E. P., Jutterstrom, S., Rudels,B., Swift, J.H., and Wahlstrom, I.: Arctic ocean shelf-basin interaction: An active continentalshelf CO2 pump and its impact on the degree of calcium carbonate solubility, Deep-Sea Res.I, 57, 869–879, 2010.
2077
BGD9, 2055–2093, 2012
Arctic phytoplanktonin unusually low sea
ice cover
P. Coupel et al.
Title Page
Abstract Introduction
Conclusions References
Tables Figures
J I
J I
Back Close
Full Screen / Esc
Printer-friendly Version
Interactive Discussion
Discussion
Paper
|D
iscussionP
aper|
Discussion
Paper
|D
iscussionP
aper|
Arrigo, K. R., van Dijken G., and Pabi, S. Impact of a shrinking Arctic ice cover on marineprimary production, Geophys. Res. Lett., 35, L19603, doi:10.1029/2008GL035028, 2008.
Babin, S. M., Carton, J. A., Dickey, T. D., and Wiggert, J. D.: Satellite evidence of hurricane-induced phytoplankton blooms in an oceanic desert, J. Geophys. Res. Oceans, 109, C03043,doi:10.1029/2003JC001938, 2004.5
Bates, N. R., Moran, S. B., Hansell, D. A., and Mathis, J. T.: An increasing CO2 sink in the ArcticOcean dues to sea-ice loss, Geophys. Res. Lett., 23, L23609, doi:10.1029/2006GL027028,2006.
Beardall, J. and Raven, J. A.: The potential effects of global climate change on microalgalphotosynthesis, growth and ecology, Phycologia, 43, 26–40, 2004.10
Booth, B. C. and Horner, R. A.: Microalgae on the Arctic Ocean section, 1994: species abun-dance and biomass, Deep Sea Res. II, 44, 1607–1622, doi:10.1016/S0967-0645(97)00057-X, 1997.
Cai, W. J., Chen, L., Chen, B., Gao, Z., Lee, S. H., Chen, J., Pierrot, D., Sullivan, K., Wang,Y., Hu, X., Huang, W. J., Zhang, Y., Xu, S., Murata, A., Grebmeier, J. M., Jones, E. P., and15
Zhang, H.: Decrease in the CO2 uptake capacity in an ice-free Arctic Ocean basin, Science329, 556–559, doi:10.1126/science.1189338, 2010.
Carmack, E. C. and Chapman, D. C.: Wind-driven shelf/basin exchange on an Arctic shelf: Thejoint roles of ice cover extent and shelf-break bathymetry, Geophys. Res. Lett., 30, 1778,doi:10.1029/2003GL017526, 2003.20
Carmack, E. C., Macdonald, R. W., and Jasper, S.: Phytoplankton productivity on the CanadianShelf of the Beaufort Sea, Mar. Ecol. Prog. Ser., 277, 37–50, 2004.
Codispoti, L. A., Flagg, C., Kelly, V., and Swift, J. H.: Hydrographic conditions during the 2002SBI process experiments, Deep-Sea Res. II, 52, 3199–3226, 2005.
Comiso, J. C., Parkinson, C. L., Gersten, R., and Stock, L.: Accelerated decline in the Arctic25
sea ice cover, Geophys. Res. Lett., 35, L01703, doi:10.1029/2007GL031972, 2008.Emmerton, C. A., Lesack, L. F. W., and Vincent, W. F.: Mackenzie River nutrient delivery to
the Arctic Ocean and effects of the Mackenzie Delta during open water conditions, GlobalBiogeochem. Cy., 22, GB1024, doi:10.1029/2006GB002856, 2008.
Finkel, Z. V., Beardall J., Flynn K. J., Quiqq, A., Rees, T. A., and Raven, J. A.: Phytoplankton30
in a changing world: Cells size and elemental stoichiometry, J. Plankton Res., 32, 119–137,2010.
Gosselin, M., Levasseur, M., Wheeler, P. A., Horner, R. A., and Booth, B. C.: New measure-
2078

BGD9, 2055–2093, 2012
Arctic phytoplanktonin unusually low sea
ice cover
P. Coupel et al.
Title Page
Abstract Introduction
Conclusions References
Tables Figures
J I
J I
Back Close
Full Screen / Esc
Printer-friendly Version
Interactive Discussion
Discussion
Paper
|D
iscussionP
aper|
Discussion
Paper
|D
iscussionP
aper|
ments of phytoplankton and ice algal production in the Arctic Ocean, Deep-Sea Res. II, 44,1623–1644, 1997.
Gradinger, R.: Vertical fine structure of algal biomass and composition in Arctic pack ice, Mar.Biol., 133, 745–754, 1999.
Grebmeier, J. M., Moore, S. E., Overland, J. E., Frey, K. E., and Gradinger, R.: Biolog-5
ical response to recent Pacific Arctic sea ice retreats, Eos Trans. AGU, 91, 161–168,doi:10.1029/2010EO180001, 2010.
Hegseth, E. N. and Sundfjord, A.: Intrusion and blooming of Atlantic phytoplankton species inthe high Arctic, J. Mar. Syst., 54, 108–119, doi:10.1016/j.jmarsys.2007.11.011, 2008.
Henriksen, P., Riemann B., Kaas, H., Sørensen, H. M., and Sørensen, H. L.: Effects of nutrient-10
limitation and irradiance on marine phytoplankton pigments, J. Plankton Res., 24, 835–858,2002.
Hill, V. and Cota, G. F.: Spatial patterns of primary production on the shelf, slope and basin ofthe Western Arctic in 2002, Deep Sea Res. II, 52, 3344–3354, 2005.
Hill, V., Cota, G., and Stockwell, D.: Spring and summer phytoplankton communi-15
ties in the Chukchi and Eastern Beaufort Seas, Deep Sea Res. II, 52, 3369–3385,doi:10.1016/j.dsr2.2005.10.010, 2005.
Hodal, H. and Kristiansen, S.: The importance of small-celled phytoplankton in spring bloomsat the marginal ice zone in the northern Barents Sea, Deep-Sea Res. II, 55, 2176–2185,2008.20
Jeffrey, S. W. and Humphrey, G. F.: New spectrophotometric equations for determining chloro-phylls a, b, c1 and c2 in higher plants, algae and natural phytoplankton, Biochem. Physiol.Pflanz., 167, 191–194, 1975.
Jeffrey, S. W. and Vesk, M.: Introduction to marine phytoplankton and their pigmeJeffrey, S. W., Mantoura, R. F. C., and Wright, S. W.: Phytoplankton Pigments in Oceanography:25
Guidelines to Modern Methods. In UNESCO Publishing, Paris, France, 1997. nt signatures,in: Phytoplankton Pigments in Oceanography, edited by: Jeffrey, S. W., Mantoura, R. F. C.,and Wright, S. W., UNESCO, Paris, 37–84, 1997.
Jones, E. P., Anderson, L. G., Jutterstrom, S., Mintrop, L., and Swift, J. H.: Pacific freshwa-ter, river water and sea ice meltwater across Arctic Ocean basins: Results from the 200530
Beringia Expedition, J. Geophys. Res., 113, C08012, doi:10.1029/2007JC004124, 2008.Joo, H., Lee, S. H., Jung, S. W., Dahms, H. U., and Lee, J. H.: Latitudinal vari-
ation of phytoplankton communities in the western Arctic Ocean, Deep Sea Res. II,
2079
BGD9, 2055–2093, 2012
Arctic phytoplanktonin unusually low sea
ice cover
P. Coupel et al.
Title Page
Abstract Introduction
Conclusions References
Tables Figures
J I
J I
Back Close
Full Screen / Esc
Printer-friendly Version
Interactive Discussion
Discussion
Paper
|D
iscussionP
aper|
Discussion
Paper
|D
iscussionP
aper|
doi:10.1016/j.dsr2.2011.06.004, in press, 2012.Key, T., McCarthy, A., Campbell, D. A., Six, C., Roy, S., and Finkel, Z. V.: Cell size trade-
offs govern light exploitation strategies in marine phytoplankton, Env. Microbiol., 12, 95–104,2010.
Kwok, R. and Rothrock, D. A: Decline in Arctic sea ice thickness from submarine and ICESat5
records: 1958–2008, Geophys. Res. Lett., 36, L15501, doi:10.1029/2009GL039035, 2009.Laws, E. A., Falkowski, P. G., Smith, W. O. J., Ducklow, H., and McCarthy, J. J.: Temperature
effects on export production in the open ocean, Global Biogeochem. Cy., 14, 1231–1246,2000.
Lee, S. H. and Whitledge, T. E.: Primary production in the deep Canada Basin during summer10
2002, Polar Biol., 28, 190–197, 2005.Lee, S. H., Joo, H., Liu, Z., Chen, J. F., and He, J. F.: Phytoplankton productivity in newly opened
waters of the western Arctic Ocean, Deep-Sea Res. II, doi:10.1016/j.dsr2.2011.06.005, inpress, 2012.
Li, W. K., McLaughlin, F. A., Lovejoy, C., and Carmack, E. C.: Smallest algae thrive as the Arctic15
Ocean freshens, Science, 326, 539, doi:10.1126/science.1179798, 2009.Lovejoy, C., Massana, R., and Pedros-Alio, C.: Diversity and distribution of marine microbial
eukaryotes in the Arctic Ocean and adjacent seas, Appl. Environ. Microbiol., 2, 3085–3095,2006.
Lovejoy, C., Vincent, W. F., Bonilla, S., Roy, S., Martineau, M. J., Terrado, R., Potvin, M.,20
Massana, R., and Pedros-Alio, C.: Distribution, phylogeny, and growth of cold-adapted pico-prasinophytes in arctic seas, J. Phycol., 43, 78–89, 2007.
Luchetta, A., Lipizer, M., and Socal G.: Temporal evolution of primary production in the centralBarents Sea, J. Mar. Syst., 27, 177–193, 2000.
Mackey, M. D., Mackey, D. J., Higgins, H. W., and Wright, S. W.: CHEMTAX – a program for25
estimating class abundances from chemical markers: Application to HPLC measurementsof phytoplankton, Mar. Ecol. Prog. Ser., 144, 265–283, 1996.
McLaughlin, F. A. and Carmack, E. C.: Deepening of the nutricline and chlorophyll max-imum in the Canada Basin interior, 2003–2009, Geophys. Res. Lett., 37, L24602,doi:10.1029/2010GL045459, 2010.30
Melnikov, I. A., Kolosova, E. G., Welch, H. A., and Zhitina, L.: Sea ice biological communitiesand nutrient dynamics in the Canada Basin of the Arctic Ocean, Deep-Sea Res. I, 49, 1623–1649, 2002.
2080

BGD9, 2055–2093, 2012
Arctic phytoplanktonin unusually low sea
ice cover
P. Coupel et al.
Title Page
Abstract Introduction
Conclusions References
Tables Figures
J I
J I
Back Close
Full Screen / Esc
Printer-friendly Version
Interactive Discussion
Discussion
Paper
|D
iscussionP
aper|
Discussion
Paper
|D
iscussionP
aper|
Menden-Deuer, S. and Lessard, E. J.: Carbon to volume relationships for dinoflagellates, di-atoms, and other protist plankton, Limnol. Oceanogr., 45, 569–579, 2000.
Pabi, S, van Dijken, G. L., and Arrigo, K. R.: Primary production in the Arctic Ocean, 1998–2006, J. Geophys. Res., 113, C08005, doi:10.1029/2007JC004578, 2008.
Perovich, D. K.: The changing Arctic sea ice cover, Oceanography, 24, 162–173,5
doi:10.5670/oceanog.2011.68, 2011.Perrette, M., Yool, A., Quartly, G. D., and Popova, E. E.: Near-ubiquity of ice-edge blooms in
the Arctic, Biogeosciences, 8, 515–524, doi:10.5194/bg-8-515-2011, 2011.Peterson, B. J., McClelland, J., Curry, R., Holmes, R. M., Walsh, J. E., and Aagaard, K.: Trajec-
tory shifts in the Arctic and Subarctic freshwater cycle, Science, 313, 1061–1066, 2006.10
Polyakov, I. V., Timokhov, L. A., Alexeev, V. A., Bacon, S., Dmitrenko, I. A., Fortier, L.,Frolov, I. E., Gascard, J.-C., Hansen, E., Ivanov, V. V., Laxon, S., Mauritzen, C., Per-ovich, D., Shimada, K., Simmons, H. L., Sokolov, V. T., Steele, M., and Toole, J.: ArcticOcean warming contributes to reduced polar ice cap, J. Phys. Oceanogr., 40, 2743–2756,doi:10.1175/2010JPO4339.1, 2010.15
Poulin, M., Daugbjerg, N., Gradinger, R., Ilyash, L., Ratkova, T., and von Quillfeldt, C.: Thepan-Arctic biodiversity of marine pelagic and sea-ice unicellular eukaryotes: A first-attemptassessment, Marine Biodiversity, 41, 13–28, doi:10.1007/s12526-010-0058-8, 2011.
Proshutinsky, A., Krishfield, R., Timmermans, M. L., Toole, J., Carmack, E., McLaughlin,F., Williams, W. J., Zimmermann, S., Itoh, M., and Shimada, K.: Beaufort Gyre fresh-20
water reservoir: State and variability from observations, J. Geophys. Res. 114, C00A10,doi:10.1029/2008JC005104, 2009.
Rabe, B., Karcher, M., Schauer, U, Toole, J., Krishfield, R., Pisarev, S., Kauker, F., Gerdes, R.,and Kikuchi, T.: An assessment of pan-Arctic Ocean freshwater content changes from the1990s to the IPY period, Deep-Sea Res. I., 58, 173–185, 2011.25
Reid, P., Johns, D. G., Edwards, M., Starr, M., Poulin, M., and Snoeijs, P.: A biological con-sequence of reducing Arctic ice cover: arrival of the Pacific diatom Neodenticula seminaein the North Atlantic for the first time in 800000 years, Glob. Change Biol., 13, 1910–1921,2007.
Rodriguez, F., Varela, M., and Zapata, M.: Phytoplankton assemblages in the Gerlache and30
Bransfield Straits (Antarctic Peninsula) determined by light microscopy and CHEMTAX anal-ysis of HPLC pigment data, Deep-Sea Res. II, 42, 723–747, 2002.
Rysgarrd, S., Nielsen, T. G., and Hansen, B. W.: Seasonal variation in nutrients, pelagic primary
2081
BGD9, 2055–2093, 2012
Arctic phytoplanktonin unusually low sea
ice cover
P. Coupel et al.
Title Page
Abstract Introduction
Conclusions References
Tables Figures
J I
J I
Back Close
Full Screen / Esc
Printer-friendly Version
Interactive Discussion
Discussion
Paper
|D
iscussionP
aper|
Discussion
Paper
|D
iscussionP
aper|
production and grazing in a high-Arctic coastal marine ecosystem, Young Sound, NortheastGreenland, Mar. Ecol. Prog. Ser., 179, 13–25, 1999.
Sakshaug, E.: Primary and secondary production in Arctic Seas, in: The Organic Carbon Cyclein the Arctic Ocean, edited by: Stein, R. and Macdonald, R. W., Springer, Berlin, 57–81,2004.5
Sakshaug, E. and Skjoldal, H. R.: Life at the ice edge, Ambio, 8, 60–67, 1989.Sergeeva, V. M., Sukhanova, I. N., Flint, M. V., Pautova, L. A., Grebmeier, J. M., and Cooper, L.
W.: Phytoplankton Community in the Western Arctic in July–August 2003, Oceanology, 50,184–197, doi:10.1134/S0001437010020049, 2010.
Sherr, E. B., Sherr, B. F., and Fessenden, L.: Heterotrophic protists in the central Arctic Ocean,10
Deep-Sea Res. II, 48, 1665–1682, 1997.Sigman, D. and Boyle, E.: Glacial/interglacial variations in atmospheric carbon dioxide, Nature,
407, 859–869, 2000.Slagstad, D., Ellingsen, I. H., and Wassmann, P.: Evaluating primary and secondary production
in an Arctic Ocean void of summer sea ice: An experimental simulation approach, Prog.15
Oceanogr., 90, 117–131, doi:10.1016/j.pocean.2011.02.009, 2011.Sukhanova, I. N., Flint, M. V., Pautova, L. A., Stockwell, D. A., Grebmeier, J. M., and Sergeeva,
V. M.: Phytoplankton of the western arctic in the spring and summer of 2002: structureand seasonal changes, Deep-Sea Res. II, 56, 1223–1236, doi:10.1016/j.dsr2.2008.12.030,2009.20
Sun, J. and Liu, D.: Geometric models for calculating cell biovolume and surface area forphytoplankton, J. Plankton Res., 25, 1331–1346, 2003.
Sun Yun, M., Chung, K. O., Zimmermann, S., Zhao, J., Joo, H. M., and Lee, S. H.: Phyto-plankton productivity and its response to higher light levels in the Canada Basin, Polar Biol,doi:10.1007/s00300-011-1070-6, 2011.25
Tremblay, J. E., Klein B., Legendre, L., Rivkin, R. B., and Therriault, J. C.: Estimation of f ratiosin oceans based on phytoplankton size structure, Limnol. Oceanogr., 42, 595–601, 1997.
Tremblay, J. E., Michel, C., Hobson, K. A., Gosselin, M. G., and Price, N. M.: Bloom dynamicsin early-opening waters of the Arctic Ocean, Limnol. Oceanogr., 51, 900–912, 2006.
Van Heukelem, L. and Thomas, C. S.: Computer-assisted high -performance liquid chromatog-30
raphy method development with applications to the isolation and analysis of phytoplanktonpigments, J. Chromatogr. A, 910, 31–49, 2001.
Wassmann, P., Ratkova, T. N., Andreassen, I., Vernet, M., Pedersen, G., and Rey, F.: Spring
2082

BGD9, 2055–2093, 2012
Arctic phytoplanktonin unusually low sea
ice cover
P. Coupel et al.
Title Page
Abstract Introduction
Conclusions References
Tables Figures
J I
J I
Back Close
Full Screen / Esc
Printer-friendly Version
Interactive Discussion
Discussion
Paper
|D
iscussionP
aper|
Discussion
Paper
|D
iscussionP
aper|
bloom development in the marginal ice zone and the central Barents Sea, Mar. Ecol., 20,321–346, 1999.
Wassmann, P., Duarte, C. M., Agusti, S., and Sejr, M. K.: Footprints of climate changein the Arctic marine ecosystem, Glob. Change Biol., 17, 1235–1249, doi:10.1111/j.1365-2486.2010.02311.x, 2010.5
Weingartner, T. J., Cavalieri, D. J., Aagaard, K., and Sasaki, Y.: Circulation, dense water for-mation, and outflow on the northeast Chukchi shelf, J. Geophys. Res., 103, 7647–7662,1998.
Woodgate, R. A., Aagaard, K., and Weingartner, T. J.: Monthly temperature, salinity, andtransport variability of the Bering Strait throughflow, Geophys. Res. Lett., 32, L04601,10
doi:10.1029/2004GL021880, 2005.Yang, J., Comiso, J., Walsh, D., Krishfield, R., and Honjo, S.: Storm-driven mixing and potential
impact on the Arctic Ocean, J. Geophys. Res., 109, C04008, doi:10.1029/2001JC001248,2004.
Zhao, J. P., Weibo, W., and Cooper, L.: Calculation of photosynthetically available radiation15
using multispectral data in the Arctic Chinese, J. Polar Science, 21, 113–126, 2010.Zhang, I., Spitz, Y. H., Steele, M., Ashjian, C., Campbell, R., Berline, L., and Matrai, P.: Model-
ing the impact of declining sea ice on the Arctic marine planktonic ecosystem, J. Geophys.Res., 115, C10015, doi:10.1029/2009JC005387, 2010.
2083

BGD9, 2055–2093, 2012
Arctic phytoplanktonin unusually low sea
ice cover
P. Coupel et al.
Title Page
Abstract Introduction
Conclusions References
Tables Figures
J I
J I
Back Close
Full Screen / Esc
Printer-friendly Version
Interactive Discussion
Discussion
Paper
|D
iscussionP
aper|
Discussion
Paper
|D
iscussionP
aper|
Table 1. Average abundances, carbon biomass and relative contributions derived from CHEM-TAX for 4 phytoplankton groups in surface and SCM waters.
SURFACE Diatoms (20–200 µm) Dinoflagellates (10–100 µm) Nanoplankton (2–20 µm) Picoplankton (<2 µm) Total
Abundance (cell ml−1)
SHELF (68–74) 362.0 (12.2) 0.2 (0.0) 1542.8 (51.9) 1068.6 (35.9) 2973.6BASINS (68–86) 32.9 2.0 245.9 390.5 671.3IFB (75–77) 11.3 (4.1) 0.0 (0.0) 139.4 (50.0) 128.0 (45.9) 278.7MIZ (78–82) 92.2 (8.7) 4.6 (0.4) 396.8 (37.3) 569.1 (53.6) 1062.6HIB (83–86) 12.3 (2.9) 0.2 (0.0) 148.8 (35.0) 263.4 (62.0) 424.6
Carbon biomass (mgC m−3)
SHELF (68–74) 29.4 (37.8) 0.4 (0.5) 47.2 (60.7) 0.7 (0.8) 77.7BASINS (68–86) 5.6 1.8 7.7 1.3 16.4IFB (75–77) 0.4 (8.8) 0.0 (0.0) 4.0 (90.3) 0.0 (0.6) 4.4MIZ (78–82) 14.4 (45.0) 3.0 (9.3) 12.6 (39.5) 2.0 (6.3) 32.0HIB (83–86) 0.8 (13.9) 0.7 (11.5) 4.1 (66.8) 0.5 (7.6) 6.1
CHEMTAX (%) chl-a
SHELF (68–74) 92.6 0.0 4.6 2.8 1.19BASINS (68–86) 49.9 0.2 19.0 30.9 0.14IFB (75–77) 58.0 0.3 19.5 22.3 0.10MIZ (78–82) 17.2 0.1 27.8 54.9 0.21HIB (83–86) 99.4 0.2 0.2 0.3 0.04
SCM
Abundance (cell ml−1)
SHELF (68–74) 959.4 (40.6) 11.2 (0.5) 1009.6 (42.7) 385.5 (16.3) 2365.6BASINS (68–86) 31.6 3.6 377.2 561.5 974.0IFB (75–77) 0.4 (0.1) 0.0 (0.0) 160.4 (41.4) 226.8 (58.5) 387.6MIZ (78–82) 22.9 (2.1) 3.3 (0.3) 556.8 (52.2) 484.4 (45.4) 1067.4HIB (83–86) 72.7 (5.8) 6.7 (0.5) 240.1 (19.2) 929.1 (74.4) 1248.7
Carbon biomass (mgC m−3)
SHELF (68–74) 55.8 (55.6) 10.2 (10.2) 34.3 (34.2) 0.1 (0.1) 100.4BASINS (68–86) 4.5 2.7 13.3 0.6 21.1IFB (75–77) 0.1 (1.6) 0.0 (0.0) 4.7 (97.3) 0.0 (1.0) 4.9MIZ (78–82) 3.7 (14.0) 2.9 (11.1) 19.7 (74.5) 0.1 (0.4) 26.4HIB (83–86) 9.1 (38.5) 4.2 (17.6) 8.2 (34.5) 2.2 (9.3) 23.6
CHEMTAX (%) chl-a
SHELF (68–74) 88.1 0.2 4.9 6.8 2.16BASINS (68–86) 10.8 0.7 35.1 53.4 0.50IFB (75–77) 15.9 0.9 32.1 51.1 0.69MIZ (78–82) 9.3 0.8 43.2 46.7 0.40HIB (83–86) 2.5 0.0 23.4 74.1 0.28
The % abundance and carbon biomass are given in parenthesis. Stations where taxonomic data are available were
grouped according to bathymetry as Shelf and Basins. Basins are subdivided according to ice conditions: ice-free
basins (IFB), marginal ice zone (MIZ) and the heavy ice basins (HIB).
2084
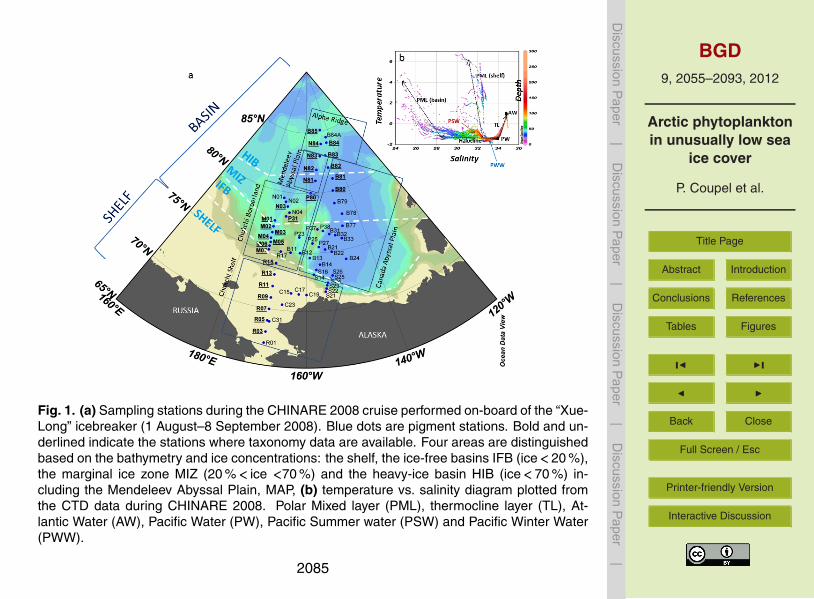
BGD9, 2055–2093, 2012
Arctic phytoplanktonin unusually low sea
ice cover
P. Coupel et al.
Title Page
Abstract Introduction
Conclusions References
Tables Figures
J I
J I
Back Close
Full Screen / Esc
Printer-friendly Version
Interactive Discussion
Discussion
Paper
|D
iscussionP
aper|
Discussion
Paper
|D
iscussionP
aper|
24
768
769 770
Figure 1. a) Sampling stations during the CHINARE 2008 cruise performed on-board of the 771
“XueLong” icebreaker (August 1 - September 8, 2008). Blue dots are pigment stations. Bold 772
and underlined indicate the stations where taxonomy data are available. Four areas are 773
distinguished based on the bathymetry and ice concentrations: the shelf, the ice-free basins 774
IFB (ice <20%), the marginal ice zone MIZ (20% < ice <70%) and the heavy-ice basin HIB 775
(ice <70%) including the Mendeleev Abyssal Plain, MAP, b) temperature vs salinity diagram 776
plotted from the CTD data during CHINARE 2008. Polar Mixed layer (PML), thermocline 777
layer (TL), Atlantic Water (AW), Pacific Water (PW), Pacific Summer water (PSW) and 778
Pacific Winter Water (PWW). 779
780
Fig. 1. (a) Sampling stations during the CHINARE 2008 cruise performed on-board of the “Xue-Long” icebreaker (1 August–8 September 2008). Blue dots are pigment stations. Bold and un-derlined indicate the stations where taxonomy data are available. Four areas are distinguishedbased on the bathymetry and ice concentrations: the shelf, the ice-free basins IFB (ice<20 %),the marginal ice zone MIZ (20 %< ice <70 %) and the heavy-ice basin HIB (ice<70 %) in-cluding the Mendeleev Abyssal Plain, MAP, (b) temperature vs. salinity diagram plotted fromthe CTD data during CHINARE 2008. Polar Mixed layer (PML), thermocline layer (TL), At-lantic Water (AW), Pacific Water (PW), Pacific Summer water (PSW) and Pacific Winter Water(PWW).
2085

BGD9, 2055–2093, 2012
Arctic phytoplanktonin unusually low sea
ice cover
P. Coupel et al.
Title Page
Abstract Introduction
Conclusions References
Tables Figures
J I
J I
Back Close
Full Screen / Esc
Printer-friendly Version
Interactive Discussion
Discussion
Paper
|D
iscussionP
aper|
Discussion
Paper
|D
iscussionP
aper|
25
780
781 782
Figure 2. Physical and environmental parameters over the Chukchi Shelf, the Canada Abyssal 783
Plain and the Chukchi Borderland. IFB, MIZ and HIB are defined in Figure 1 caption. a) Ice 784
concentration (in %) from in situ data (light blue line) and Special Sensor Microwave Imager 785
Fig. 2. Physical and environmental parameters over the Chukchi Shelf, the Canada Abyssal Plain and the Chukchi
Borderland. IFB, MIZ and HIB are defined in Fig. 1 caption. (a) Ice concentration (in %) from in situ data (light blue
line) and Special Sensor Microwave Imager (SSM/I) daily satellite data (level 2 products at 12.5 km spatial resolution)
(in dark blue line); (b) sea surface temperature and surface salinity from conductivity-temperature-depth (CTD) system
(Sea-Bird SBE 9); (c) euphotic depth (in m) calculated by MODIS satellite (yellow dots) and by two methods based on
in-situ CTD data (Zhao et al., 2010) (red dots) and based on 1 % light depth determined with a Secchi disk (orange
dots); (d) nitrate concentration averaged over the euphotic layer (in µM); (e) concentration of total pigments in surface
and Subsurface Chlorophyll Maximum (SCM); (f) depth of the nutricline (in m), depth of the SCM and depth of the
Surface Fresh Layer (SFL) determined by the position of the isohaline 31 (in m), (g) main topographic features: Barrow
Canyon (BC), Continental Slope (CS), Northwind Ridge (NR), Alpha Ridge (AR), Mendeleev Abyssal Plain (MAP),
Chukchi Cap (CC) and Chukchi Abyssal Plain (CAP). 2086
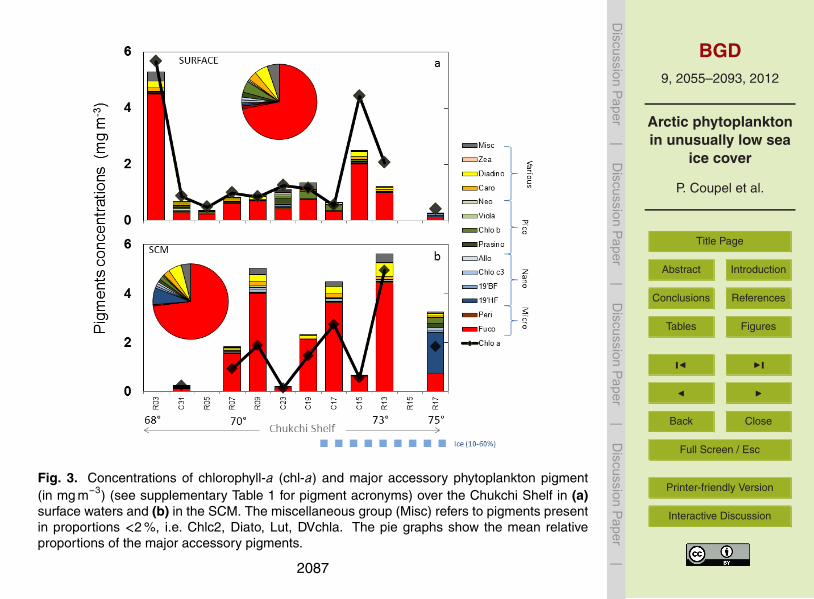
BGD9, 2055–2093, 2012
Arctic phytoplanktonin unusually low sea
ice cover
P. Coupel et al.
Title Page
Abstract Introduction
Conclusions References
Tables Figures
J I
J I
Back Close
Full Screen / Esc
Printer-friendly Version
Interactive Discussion
Discussion
Paper
|D
iscussionP
aper|
Discussion
Paper
|D
iscussionP
aper|
27
797
798 799
Figure 3. Concentrations of Chlorophyll-a (Chl-a) and major accessory phytoplankton 800
pigment (in mg m-3) (see supplementary Table 1 for pigment acronyms) over the Chukchi 801
Shelf in (a) surface waters and (b) in the SCM. The miscellaneous group (Misc) refers to 802
pigments present in proportions < 2%, i.e. Chlc2, Diato, Lut, DVchla. The pie graphs show 803
the mean relative proportions of the major accessory pigments. 804
805 806
Fig. 3. Concentrations of chlorophyll-a (chl-a) and major accessory phytoplankton pigment(in mg m−3) (see supplementary Table 1 for pigment acronyms) over the Chukchi Shelf in (a)surface waters and (b) in the SCM. The miscellaneous group (Misc) refers to pigments presentin proportions <2 %, i.e. Chlc2, Diato, Lut, DVchla. The pie graphs show the mean relativeproportions of the major accessory pigments.
2087

BGD9, 2055–2093, 2012
Arctic phytoplanktonin unusually low sea
ice cover
P. Coupel et al.
Title Page
Abstract Introduction
Conclusions References
Tables Figures
J I
J I
Back Close
Full Screen / Esc
Printer-friendly Version
Interactive Discussion
Discussion
Paper
|D
iscussionP
aper|
Discussion
Paper
|D
iscussionP
aper|
28
806 807
808 809
Figure 4. Concentrations of Chlorophyll-a (Chl-a) and major accessory phytoplankton 810
pigment concentrations (in mg m-3) (see supplementary Table 1 for pigment acronyms) over 811
the Chukchi Borderland and the Canada Abyssal Plain in (a) surface waters and in (b) the 812
SCM. The miscellaneous group (Misc) refers to pigments present in proportions < 2%, i.e. 813
Chlc2, Diato, Lut, DVchla. The pie graph shows the mean relative proportions of the major 814
accessory pigments. 815
816 817
Fig. 4. Concentrations of chlorophyll-a (chl-a) and major accessory phytoplankton pigment con-centrations (in mg m−3) (see supplementary Table 1 for pigment acronyms) over the ChukchiBorderland and the Canada Abyssal Plain in (a) surface waters and in (b) the SCM. The mis-cellaneous group (Misc) refers to pigments present in proportions <2 %, i.e. Chlc2, Diato, Lut,DVchla. The pie graph shows the mean relative proportions of the major accessory pigments.
2088

BGD9, 2055–2093, 2012
Arctic phytoplanktonin unusually low sea
ice cover
P. Coupel et al.
Title Page
Abstract Introduction
Conclusions References
Tables Figures
J I
J I
Back Close
Full Screen / Esc
Printer-friendly Version
Interactive Discussion
Discussion
Paper
|D
iscussionP
aper|
Discussion
Paper
|D
iscussionP
aper|
29
817
818 Figure 5. Phytoplankton abundance and carbon biomass derived from microscopic counts in 819
surface water (left panels) and in the SCM (right panels) over the Chukchi Shelf. The four 820
upper panels show the abundance (a-d) and carbon biomass (b-e) of the major taxa. Two 821
bottom panels (c-f) show the abundance of the 14 dominant species of centric and penate 822
diatoms. 823
824 825
Fig. 5. Phytoplankton abundance and carbon biomass derived from microscopic counts insurface water (left panels) and in the SCM (right panels) over the Chukchi Shelf. The fourupper panels show the abundance (a–d) and carbon biomass (b–e) of the major taxa. Twobottom panels (c–f) show the abundance of the 14 dominant species of centric and penatediatoms.
2089
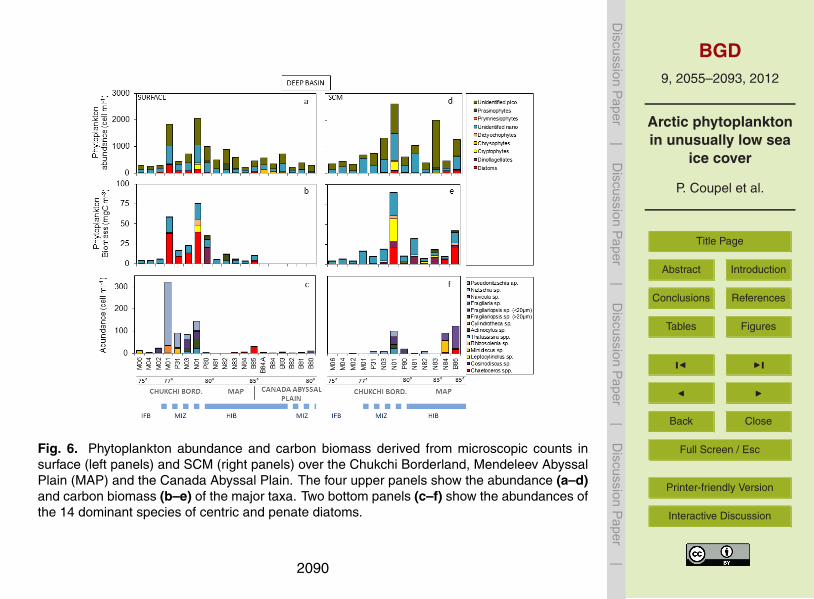
BGD9, 2055–2093, 2012
Arctic phytoplanktonin unusually low sea
ice cover
P. Coupel et al.
Title Page
Abstract Introduction
Conclusions References
Tables Figures
J I
J I
Back Close
Full Screen / Esc
Printer-friendly Version
Interactive Discussion
Discussion
Paper
|D
iscussionP
aper|
Discussion
Paper
|D
iscussionP
aper|
30
825
826 827
Figure 6. Phytoplankton abundance and carbon biomass derived from microscopic counts in 828
surface (left panels) and SCM (right panels) over the Chukchi Borderland, Mendeleev 829
Abyssal Plain (MAP) and the Canada Abyssal Plain. The four upper panels show the 830
abundance (a-d) and carbon biomass (b-e) of the major taxa. Two bottom panels (c-f) show 831
the abundances of the 14 dominant species of centric and penate diatoms. 832
833 834
Fig. 6. Phytoplankton abundance and carbon biomass derived from microscopic counts insurface (left panels) and SCM (right panels) over the Chukchi Borderland, Mendeleev AbyssalPlain (MAP) and the Canada Abyssal Plain. The four upper panels show the abundance (a–d)and carbon biomass (b–e) of the major taxa. Two bottom panels (c–f) show the abundances ofthe 14 dominant species of centric and penate diatoms.
2090
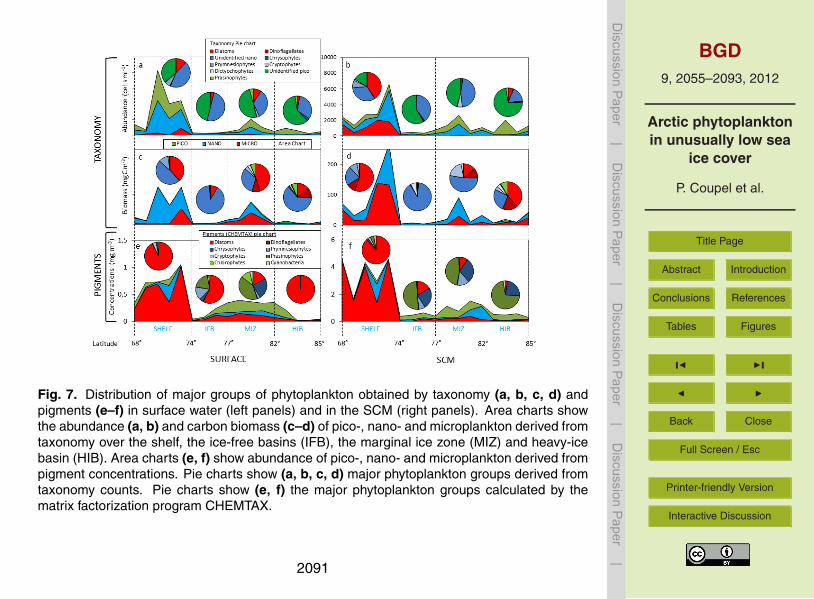
BGD9, 2055–2093, 2012
Arctic phytoplanktonin unusually low sea
ice cover
P. Coupel et al.
Title Page
Abstract Introduction
Conclusions References
Tables Figures
J I
J I
Back Close
Full Screen / Esc
Printer-friendly Version
Interactive Discussion
Discussion
Paper
|D
iscussionP
aper|
Discussion
Paper
|D
iscussionP
aper|
31
834
835 Figure 7. Distribution of major groups of phytoplankton obtained by taxonomy (a,b,c,d) and 836
pigments (e-f) in surface water (left panels) and in the SCM (right panels). Area charts show 837
the abundance (a,b) and carbon biomass (c-d) of pico-, nano- and microplankton derived from 838
taxonomy over the shelf, the ice-free basins (IFB), the marginal ice zone (MIZ) and heavy-ice 839
basin (HIB). Area charts (e,f) show abundance of pico-, nano- and microplankton derived 840
from pigment concentrations. 841
Pie charts show (a,b,c,d) major phytoplankton groups derived from taxonomy counts. Pie 842
charts show (e,f) the major phytoplankton groups calculated by the matrix factorization 843
program CHEMTAX. 844
845
Fig. 7. Distribution of major groups of phytoplankton obtained by taxonomy (a, b, c, d) andpigments (e–f) in surface water (left panels) and in the SCM (right panels). Area charts showthe abundance (a, b) and carbon biomass (c–d) of pico-, nano- and microplankton derived fromtaxonomy over the shelf, the ice-free basins (IFB), the marginal ice zone (MIZ) and heavy-icebasin (HIB). Area charts (e, f) show abundance of pico-, nano- and microplankton derived frompigment concentrations. Pie charts show (a, b, c, d) major phytoplankton groups derived fromtaxonomy counts. Pie charts show (e, f) the major phytoplankton groups calculated by thematrix factorization program CHEMTAX.
2091
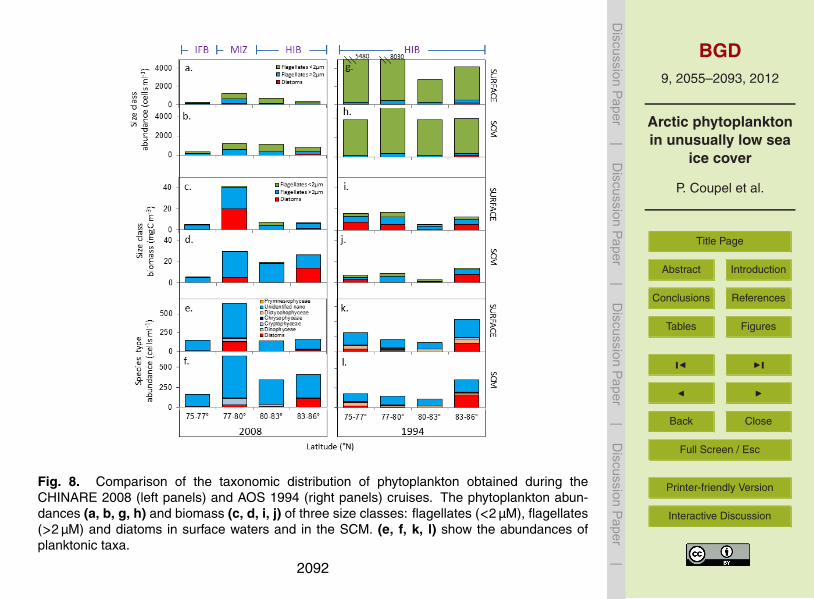
BGD9, 2055–2093, 2012
Arctic phytoplanktonin unusually low sea
ice cover
P. Coupel et al.
Title Page
Abstract Introduction
Conclusions References
Tables Figures
J I
J I
Back Close
Full Screen / Esc
Printer-friendly Version
Interactive Discussion
Discussion
Paper
|D
iscussionP
aper|
Discussion
Paper
|D
iscussionP
aper|
32
845
846 847
Figure 8. Comparison of the taxonomic distribution of phytoplankton obtained during the 848
CHINARE 2008 (left panels) and AOS 1994 (right panels) cruises. The phytoplankton 849
abundances (a,b,g,h) and biomass (c,d,i,j) of three size classes: flagellates (<2 µM), flagellates 850
(>2 µM) and diatoms in surface waters and in the SCM. (e,f,k,l) show the abundances of 851
planktonic taxa. 852
853 854
Fig. 8. Comparison of the taxonomic distribution of phytoplankton obtained during theCHINARE 2008 (left panels) and AOS 1994 (right panels) cruises. The phytoplankton abun-dances (a, b, g, h) and biomass (c, d, i, j) of three size classes: flagellates (<2 µM), flagellates(>2 µM) and diatoms in surface waters and in the SCM. (e, f, k, l) show the abundances ofplanktonic taxa.
2092

BGD9, 2055–2093, 2012
Arctic phytoplanktonin unusually low sea
ice cover
P. Coupel et al.
Title Page
Abstract Introduction
Conclusions References
Tables Figures
J I
J I
Back Close
Full Screen / Esc
Printer-friendly Version
Interactive Discussion
Discussion
Paper
|D
iscussionP
aper|
Discussion
Paper
|D
iscussionP
aper|
33
854
855 Figure 9. Environmental parameters (five top panels) and mean phytoplankton abundances in 856
surface waters and in the SCM during summer 1994 (blue bars) and 2008 (orange/brown bars) 857
in the deep basins. Ice conditions are indicated on the top of the panels: IFB (ice-free basin), 858
MIZ (marginal ice zone), HIB (heavy-ice basin). Ice cover (a), salinity at 10 m (b), SFL depth 859
Fig. 9. Environmental parameters (five top panels) and mean phytoplankton abundances insurface waters and in the SCM during summer 1994 (blue bars) and 2008 (orange/brown bars)in the deep basins. Ice conditions are indicated on the top of the panels: IFB (ice-free basin),MIZ (marginal ice zone), HIB (heavy-ice basin). Ice cover (a), salinity at 10 m (b), SFL depth(c), SCM depth (d) and averaged nitrate concentrations in the upper 25 meters are presentedfor 1994 (blue lines) and 2008 (orange line) (e). Lower panels indicate cell abundances ofdinoflagellates (f), diatoms (g), nanoplankton (h) and picoplankton (i) averaged for each zones.
2093