ARCTIC FISHERIES WORKING GROUP (AFWG) - ICES
589
ICES SCIENTIFIC REPORTS RAPPORTS SCIENTIFIQUES DU CIEM ICES INTERNATIONAL COUNCIL FOR THE EXPLORATION OF THE SEA CIEM COUNSEIL INTERNATIONAL POUR L’EXPLORATION DE LA MER ARCTIC FISHERIES WORKING GROUP (AFWG) VOLUME 2 | ISSUE 52
-
Upload
khangminh22 -
Category
Documents
-
view
0 -
download
0
Transcript of ARCTIC FISHERIES WORKING GROUP (AFWG) - ICES

ICES SCIENTIFIC REPORTS RAPPORTS SCIENTIFIQUES DU CIEM
ICES INTERNATIONAL COUNCIL FOR THE EXPLORATION OF THE SEA CIEM COUNSEIL INTERNATIONAL POUR L’EXPLORATION DE LA MER
ARCTIC FISHERIES WORKING GROUP (AFWG)
VOLUME 2 | ISSUE 52

International Council for the Exploration of the Sea Conseil International pour l’Exploration de la Mer
H.C. Andersens Boulevard 44-46 DK-1553 Copenhagen V Denmark Telephone (+45) 33 38 67 00 Telefax (+45) 33 93 42 15 www.ices.dk [email protected] The material in this report may be reused for non-commercial purposes using the recommended cita-tion. ICES may only grant usage rights of information, data, images, graphs, etc. of which it has owner-ship. For other third-party material cited in this report, you must contact the original copyright holder for permission. For citation of datasets or use of data to be included in other databases, please refer to the latest ICES data policy on ICES website. All extracts must be acknowledged. For other reproduction requests please contact the General Secretary. This document is the product of an expert group under the auspices of the International Council for the Exploration of the Sea and does not necessarily represent the view of the Council. ISSN number: 2618-1371 I © 2020 International Council for the Exploration of the Sea

ICES Scientific Reports
Volume 2 | Issue 52
ARCTIC FISHERIES WORKING GROUP (AFWG)
Recommended format for purpose of citation:
ICES. 2020. Arctic Fisheries Working Group (AFWG). ICES Scientific Reports. 2:52. 577 pp. http://doi.org/10.17895/ices.pub.6050
Editors
Daniel Howell
Authors
Caroline Aas Tranang • Asgeir Aglen • Matthias Bernreuther • Bjarte Bogstad • Anatolii Chetyrkin Elise Eidset • Johanna Fall • Anatolii Filin • Elvar Halldor Hallfredsson • Hannes Höffle • Daniel Howell Yuri Kovalev • Kjell Nedreaas • Anders Nielsen • Aleksei Russkikh • Arved Staby • Kristin Windsland Natalia Yaragina

ICES | AFWG 2020 | I
Contents
i Executive summary ...................................................................................................................... VI ii Expert group information ............................................................................................................. IX 1 Ecosystem information .................................................................................................................. 1
1.1 0-group abundance .......................................................................................................... 1 1.2 Consumption, natural mortality, and growth .................................................................. 1 1.3 Maturation, condition factor, and fisheries–induced evolution ...................................... 3 1.4 Recruitment prediction for northeast Arctic cod ............................................................. 3 1.4.1 Historic overview ............................................................................................................. 3 1.4.2 Models used in 2020 ........................................................................................................ 5 1.5 Biomass and exploitation levels of AFWG stocks............................................................. 6
2 Cod in subareas 1 and 2 (Norwegian coastal waters) ................................................................. 16 2.1 Stock status summary .................................................................................................... 16 2.2 Fisheries ......................................................................................................................... 17 2.2.1 2.2.1. Sampling fisheries and estimating catches (Tables 2.1–2.4, Figures 2.1–
2.5) ................................................................................................................................. 17 2.2.2 Regulations .................................................................................................................... 18 2.3 Survey data .................................................................................................................... 20 2.3.1 Indices of abundance and biomass (Tables 2.5-2.13, Figures 2.6-2.14) ........................ 20 2.3.2 Age reading and stock separation (Tables 2.4, 2.5, 2.8-2.12) ........................................ 20 2.3.3 Weights-at-age (Table 2.8, Figure 2.13a) ....................................................................... 20 2.3.4 Maturity-at-age (Table 2.10, Figure 2.13b) .................................................................... 21 2.4 Data available for the catch-at-age Assessment (XSA and SVPA) .................................. 21 2.4.1 Catch-at-age (Table 2.1a-e, and table 2.14) ................................................................... 21 2.4.2 Weights-at-age (Tables 2.8 and 2.13) ............................................................................ 21 2.4.3 Natural mortality ........................................................................................................... 21 2.4.4 Maturity-at-age (Tables 2.10, 2.15, Figure 2.13b) ......................................................... 22 2.5 Methods used for assessing trends in stock size and mortality (Table 2.13-2.18,
Figure 2.16-2.18) ............................................................................................................ 22 2.6 Results of the Assessment ............................................................................................. 22 2.6.1 Comparing trends with last year’s assessment (Table 2.6, 2.15—2.18, Figures
2.6, 2.13–2.14, 2.16–2.18) ............................................................................................. 22 2.6.2 Recruitment (Table 2.6, Figure 2.16) ............................................................................. 24 2.6.3 Catches in 2020 .............................................................................................................. 24 2.7 Comments to the Assessment ....................................................................................... 24 2.8 Reference points ............................................................................................................ 24 2.9 Management considerations ......................................................................................... 24 2.10 Rebuilding plan for coastal cod ...................................................................................... 25 2.11 Recent ICES advice ......................................................................................................... 26
3 Northeast Artic cod in subareas 1 and 2 ..................................................................................... 84 3.1 Status of the fisheries .................................................................................................... 84 3.1.1 Historical development of the fisheries (Table 3.1) ....................................................... 84 3.1.2 Reported catches prior to 2020 (Tables 3.1-3.4, Figure 3.1) ......................................... 84 3.1.3 Unreported catches of Northeast Arctic cod (Table 3.1) ............................................... 85 3.1.4 TACs and advised catches for 2019 and 2020 ................................................................ 85 3.2 Status of research .......................................................................................................... 85 3.2.1 Fishing effort and CPUE (Table A1) ................................................................................ 85 3.2.2 Survey results - abundance and size at age (Tables 3.5, A2-A14, Figure 3.7) ................ 86 3.2.3 Age reading .................................................................................................................... 88 3.3 Data used in the assessment ......................................................................................... 88 3.3.1 Catch-at-age (Table 3.6) ................................................................................................. 88

II | ICES SCIENTIFIC REPORTS 2: 52 | ICES
3.3.2 Weight-at-age (Tables 3.7-3.9, A2, A4, A6, A8, A12). .................................................... 89 3.3.3 Natural mortality including cannibalism (Table 3.12) .................................................... 90 3.3.4 Maturity-at-age (Tables 3.10-3.11) ................................................................................ 90 3.4 Changes of assessment model and data at the latest benchmark ................................ 91 3.5 Assessment using SAM (Tables 3.13, A13) ..................................................................... 91 3.5.1 Model adjustment and settings (Table 3.14, Figures 3.2a-3.2c) .................................... 92 3.5.2 Results (Tables 3.15-3.18, Figure 3.1) ............................................................................ 92 3.6 Results of the assessment .............................................................................................. 92 3.6.1 Fishing mortalities and stock biomass (Tables 3.18, 3.20) ............................................. 92 3.6.2 Recruitment (Table 1.7a) ............................................................................................... 92 3.7 Reference points and harvest control rules ................................................................... 92 3.7.1 Biomass reference points .............................................................................................. 93 3.7.2 Fishing mortality reference points ................................................................................. 93 3.7.3 Harvest control rule ....................................................................................................... 93 3.8 Prediction ....................................................................................................................... 93 3.8.1 Prediction input (Tables 3.16, 3.19, A1, Figures 3.3-3.6) ............................................... 93 3.8.2 Prediction results (Tables 3.20-3.21) ............................................................................. 94 3.9 Comparison with last year’s assessment and prediction ............................................... 95 3.9.1 Comparison to assessment (Figure 3.2b) ....................................................................... 95 3.9.2 Comparison to prediction .............................................................................................. 96 3.10 Concerns with the assessment ...................................................................................... 96 3.11 Additional predictions and assessment methods .......................................................... 97 3.11.1 Changing weight at age in catch in SAM predictions ..................................................... 97 3.11.2 XSA ................................................................................................................................. 97 3.11.3 TISVPA (Tables 3.22-3.24, Figure 3.8a-c) ....................................................................... 97 3.11.4 Model comparisons (Figures 3.2a, 3.8a, 3.9a) ............................................................... 98 3.11.5 SAM with settings chosen by AFWG-2019 (Figure 3.9b) ............................................... 98 3.12 New and revised data sources ....................................................................................... 98 3.12.1 Consistency between NEA cod and coastal cod catch data (Table 3.2) ......................... 98 3.12.2 Discard and bycatch data (Tables 3.25-3.26) ................................................................. 98
4 Northeast Arctic haddock (subareas 1 and 2) ........................................................................... 187 4.1 Introductory note......................................................................................................... 187 4.2 Status of the Fisheries .................................................................................................. 187 4.2.1 Historical development of the fisheries ....................................................................... 187 4.2.2 Landings prior to 2020 (Tables 4.1–4.3, Figure 4.1) ..................................................... 187 4.2.3 Unreported catches (Table 4.1) ................................................................................... 188 4.2.4 Catch advice and TAC for 2020 .................................................................................... 188 4.3 Status of Research ....................................................................................................... 188 4.3.1 Survey results ............................................................................................................... 188 4.4 Data Used in the Assessment ...................................................................................... 188 4.4.1 Catch-at-age (Table 4.4) ............................................................................................... 188 4.4.2 Catch-weight-at-age (Table 4.5) .................................................................................. 189 4.4.3 Stock-weight-at-age (Table 4.6) ................................................................................... 189 4.4.4 Maturity-at-age (Table 4.7) .......................................................................................... 189 4.4.5 Natural mortality (Table 4.8) ....................................................................................... 189 4.4.6 Data for tuning (Table 4.9) ........................................................................................... 190 4.4.7 Changes in data from last year (Tables 4.6-4.7, 4.9) .................................................... 190 4.5 Assessment models and settings ................................................................................. 190 4.5.1 SAM model settings (Table 4.10) ................................................................................. 191 4.6 Results of the Assessment (Tables 4.11–4.14 and Figures 4.1-4.3) ............................. 191 4.7 Comparison with last year’s assessment ..................................................................... 191 4.8 Additional assessment methods (Table 4.15, Figures 4.4-4.6) .................................... 191 4.8.1 XSA (Figure 4.4) ............................................................................................................ 191

ICES | AFWG 2020 | III
4.8.2 TISVPA (Figure 4.5) ....................................................................................................... 192 4.8.3 Model comparisons (Figure 4.6) .................................................................................. 192 4.9 Predictions, reference points and harvest control rules (Tables 4.16- 4.21) ............... 192 4.9.1 Recruitment (Tables 4.16, 4.17) ................................................................................... 192 4.9.2 Prediction data (Table 4.18) ......................................................................................... 193 4.9.3 Biomass reference points (Figure 4.1) ......................................................................... 193 4.9.4 Fishing mortality reference points (Figure 4.1)............................................................ 193 4.9.5 Harvest control rule ..................................................................................................... 194 4.9.6 Prediction results and catch options for 2021 (Tables 4.19 - 4.21) ............................. 194 4.9.7 Comments to the assessment and predictions (Figures 4.7, 4.8 and 4.9) ................... 195
5 Saithe in subareas 1 and 2 (Northeast Arctic) ........................................................................... 249 5.1 The Fishery (Tables 5.1-5.2, Figure 5.1) ....................................................................... 249 5.1.1 ICES advice applicable to 2019 and 2020 ..................................................................... 249 5.1.2 Management applicable in 2019 and 2020 ................................................................. 250 5.1.3 The fishery in 2019 and expected landings in 2020 ..................................................... 250 5.2 Commercial catch-effort data and research vessel surveys ........................................ 250 5.2.1 Catch-per-unit-effort ................................................................................................... 250 5.2.2 Survey results (Figure 5.2-5.3) ..................................................................................... 250 5.2.3 Recruitment indices ..................................................................................................... 251 5.3 Data used in the Assessment ....................................................................................... 251 5.3.1 Catch numbers-at-age (Table 5.3) ............................................................................... 251 5.3.2 Weight-at-age (Table 5.4) ............................................................................................ 251 5.3.3 Natural mortality ......................................................................................................... 251 5.3.4 Maturity-at-age (Table 5.5) .......................................................................................... 252 5.3.5 Tuning data (Table 5.6) ................................................................................................ 252 5.4 SAM runs and settings (Table 5.7) ............................................................................... 253 5.5 Final assessment run (Tables 5.8-5.11, Figures 5.4-5.7) .............................................. 253 5.5.1 SAM F, N, and SSB results (Tables 5.9-5.11, Figures 5.6-5.7) ....................................... 253 5.5.2 Recruitment (Table 5.10, Figure 5.1) ........................................................................... 254 5.6 Reference points (Figure 5.1) ....................................................................................... 254 5.6.1 Harvest control rule ..................................................................................................... 254 5.7 Predictions ................................................................................................................... 255 5.7.1 Input data (Table 5.12) ................................................................................................ 255 5.7.2 Catch options for 2021 (short-term predictions; Tables 5.13-14) ............................... 255 5.7.3 Comparison of the present and last year’s assessment .............................................. 255 5.8 Comments to the assessment and the forecast (Figure 5.7). ...................................... 256
6 Beaked redfish (Sebastes mentella) in subareas 1 and 2 .......................................................... 292 6.1 Status of the Fisheries .................................................................................................. 292 6.1.1 Development of the fishery ......................................................................................... 292 6.1.2 Bycatch in other fisheries............................................................................................. 292 6.1.3 Landings prior to 2020 (Tables 6.1—6.7, Figure 6.1) ................................................... 293 6.1.4 Expected landings in 2020 ........................................................................................... 293 6.2 Data used in the Assessment ....................................................................................... 294 6.2.1 Length- composition from the fishery (Figure 6.4) ...................................................... 294 6.2.2 Catch-at-age (Tables 6.8-6.11, Figure 6.5) ................................................................... 294 6.2.3 Weight-at-age (Tables 6.12, 6.13, Figures 6.6, 6.7) ..................................................... 295 6.2.4 Maturity-at-age (Table 6.14, Figure 6.8) ...................................................................... 295 6.2.5 Natural mortality ......................................................................................................... 295 6.2.6 Scientific surveys .......................................................................................................... 296 6.2.6.1 Surveys in the Barents Sea and Svalbard area (Tables 1.1, 1.2, 6.15-6.18, Figures
6.11–6.12) .................................................................................................................... 296 6.2.6.2 Pelagic survey in the Norwegian Sea (Table 6.19, Figures 6.13—6.14) ....................... 296 6.2.6.3 Additional surveys (Figures 6.15—6.17) ...................................................................... 297

IV | ICES SCIENTIFIC REPORTS 2: 52 | ICES
6.3 Assessment .................................................................................................................. 297 6.3.1 Results of the Assessment (Tables 6.20—6.21, Figures 6.18—6.24) ........................... 297 6.3.1.1 Stock trends ................................................................................................................. 297 6.3.1.2 Fishing mortality (Tables 6.20a,b – 6.21, Figure 6.19) ................................................. 297 6.3.1.3 Survey selectivity patterns (Figure 6.20)...................................................................... 298 6.3.1.4 Residual patterns (Figure 6.23) .................................................................................... 298 6.3.1.5 Retrospective patterns (Figure 6.24) ........................................................................... 298 6.3.1.6 Projections ................................................................................................................... 298 6.3.1.7 Additional considerations ............................................................................................ 298 6.3.1.8 Assessment summary (Table 6.21, Figure 6.21) .......................................................... 299 6.4 Comments to the assessment ...................................................................................... 299 6.5 Biological reference points .......................................................................................... 299 6.6 Management advice .................................................................................................... 299 6.7 Possible future development of the assessment ......................................................... 300
7 Golden redfish (Sebastes norvegicus) in subareas 1 and 2 ....................................................... 364 7.1 Status of the Fisheries .................................................................................................. 364 7.1.1 Recent regulations of the fishery ................................................................................. 364 7.1.2 Landings prior to 2020 (Tables 7.1–7.4 and Figures 7.1-7.2) ....................................... 364 7.1.3 Expected landings in 2020 ........................................................................................... 365 7.2 Data Used in the Assessment (Table 0.1 and Figure E1) .............................................. 365 7.2.1 Catch-at-length and age (Table 7.5 and Figure 7.4) ..................................................... 365 7.2.2 Catch weight-at-Age (Table 7.6) .................................................................................. 366 7.2.3 Maturity-at-age (Table E4, Figure 7.5a-b) .................................................................... 366 7.2.4 Survey results (Tables E1a,b-E2a,b-E3, Figures 7.6a,b–7.8)......................................... 366 7.3 Assessment with the GADGET model .......................................................................... 367 7.3.1 Description of the model ............................................................................................. 367 7.3.2 Data used for tuning .................................................................................................... 368 7.3.3 Assessment results using the Gadget model (Figures 7.9-7.13) .................................. 368 7.3.4 State of the stock ......................................................................................................... 369 7.3.5 Biological reference points .......................................................................................... 370 7.3.6 Management advice .................................................................................................... 370 7.3.7 Implementing the ICES FMSY framework ....................................................................... 370
8 Greenland halibut in subareas 1 and 2 ...................................................................................... 415 8.1 Status of the fisheries .................................................................................................. 415 8.1.1 Landings prior to 2020 (Tables 8.1–8.8) ...................................................................... 415 8.1.2 ICES advice applicable to 2020..................................................................................... 415 8.1.3 Management ................................................................................................................ 416 8.1.4 Expected landings in 2020 ........................................................................................... 416 8.2 Status of research ........................................................................................................ 416 8.2.1 Survey results (Tables 8.9-8.13, Figures 8.4-8.14) ....................................................... 416 8.2.2 Commercial catch-per-unit-effort (Table 8.6, Figure 8.15) .......................................... 418 8.2.3 Age readings ................................................................................................................ 418 8.3 Data used in the assessment ....................................................................................... 418 8.4 Methods used in the assessment ................................................................................ 419 8.4.1 Model settings ............................................................................................................. 419 8.5 Results of the Assessment ........................................................................................... 420 8.5.1 Biological reference points .......................................................................................... 421 8.5.2 NEA Greenland halibut surplus production models .................................................... 421 8.6 Comments to the assessment ...................................................................................... 422
9 Anglerfish in ICES subareas 1 and 2 ........................................................................................... 471 9.1 General......................................................................................................................... 471 9.1.1 Species composition .................................................................................................... 471 9.1.2 Stock description and management units ................................................................... 471

ICES | AFWG 2020 | V
9.1.3 Biology ......................................................................................................................... 472 9.1.4 Scientific surveys .......................................................................................................... 473 9.1.5 Fishery .......................................................................................................................... 473 9.2 Data .............................................................................................................................. 474 9.2.1 Landings data ............................................................................................................... 474 9.2.2 Discards ........................................................................................................................ 474 9.2.3 Length composition data ............................................................................................. 474 9.2.4 Catch per unit effort (CPUE) data ................................................................................ 475 9.3 Methods and results .................................................................................................... 475 9.3.1 The length-based-spawning-potential-ratio (LBSPR) approach ................................... 475 9.3.2 CPUE standardization ................................................................................................... 476 9.3.3 JABBA ........................................................................................................................... 478 9.4 Management considerations and future investigations .............................................. 478
10 Barents Sea capelin ................................................................................................................... 494 10.1 Regulation of the Barents Sea capelin fishery ............................................................. 494 10.2 TAC and catch statistics (Table 10.1) ........................................................................... 494 10.3 Sampling ...................................................................................................................... 494 10.4 Stock assessment ......................................................................................................... 494 10.4.1 Acoustic stock size estimates in 2019 (Table 10.2, Figure 10.1) .................................. 494 10.4.2 Recruitment estimation in 2019 (Table 10.3) .............................................................. 495 10.4.3 Forecast........................................................................................................................ 495 10.4.4 Recruitment ................................................................................................................. 495 10.4.5 Comments to the assessment ...................................................................................... 496 10.4.6 Further work on survey and assessment methodology ............................................... 496 10.5 Reference points .......................................................................................................... 498
11 References ................................................................................................................................. 514 Annex 1: List of participants.................................................................................................................... 526 Annex 2: Resolutions .............................................................................................................................. 527 Annex 3: Terms of reference (ToRs) ....................................................................................................... 533 Annex 4: Working documents ................................................................................................................. 546 Annex 5: Audit reports ............................................................................................................................ 567
VI | ICES SCIENTIFIC REPORTS 2:52 | ICES
i Executive summary
The Arctic Fisheries Working Group 2020 (AFWG) was chaired by Daniel Howell, Norway, and meetings were conducted online via Webex.
Assessments run at AFWG provide the scientific basis for the management of cod, haddock, saithe, redfish, Greenland halibut and capelin in subareas 1 and 2. Taking the catch values pro-vided by the Norwegian fisheries ministry for Norwegian catches1 and raising the total landed value to the total catches gives an approximate nominal first-hand landed value for the combined AFWG stocks of ca. 20 billion NOK or ca. 2 billion EUR (2018 estimates).
NEA cod and coastal cod are currently working towards a benchmark planned for 2021, before the next AFWG meeting. For NEA cod this involves refining the existing model, while for coastal cod we need to address the failure of the previous management plan. NEA haddock had a recent benchmark (WKDEM), which resulted in a reduction of the retrospective issue, and better fitting to the catch data in years with large catches. AFWG is currently working towards proposing a benchmark (and subsequent HCR evaluation) for Greenland halibut, ideally in 2022.
Due to COVID-19, the meeting this year was held via Webex. This posed several challenges, and working internationally was more challenging than usual. In general, due to extensive work conducted in advance, the meeting was a success, and the science required for the reduced ICES advice was all produced. However, there were some issues with working in this format: notably, the planned HRpa for Greenland halibut was postponed to next year, and an issue arising with predicting weight-at-age in NEA cod received less discussion than it should have, and so was also postponed to the benchmark. In general, where work progressed smoothly the Webex func-tioned (although work progressed more slowly than usual), but where more discussion was re-quired, the group found the web-based meetings suboptimal.
Stock by stock summaries COD IN SUBAREAS 1 AND 2 (NORWEGIAN COASTAL WATERS) • The cod in subareas 1 and 2, the Norwegian coastal waters, was assessed based on a
survey time-series 1995–2019, as well as catch-at-age data (including recreational and tourist fisheries). This is a category three stock. For the years 2012–2019, the advice has been based on the Norwegian rebuilding plan. Although the ADG has felt that this plan has not been successful, advice is currently given on this basis until a revised plan can be devised. The current advice for 2020 and 2021 is based on the recent trend in the survey.
• The stock has varied without a clear trend since 2002. The survey biomass in autumn 2019 is higher than the four previous years, but still low compared to the first years in the survey time-series. Fishing pressure (F) indicates a slowly declining trend since 1999.
COD IN SUBAREAS 1 AND 2 (NORTHEAST ARCTIC) • The cod in subareas 1 and 2, the Northeast Arctic, was assessed using the SAM model
following the outcome of the inter-benchmark meeting (IBP cod 2017). The biomass is declining slowly, but still at a high level, and SSB is well above Bpa, although it is consid-erably lower than the peak in 2013. Weight-at-age in the stock of the younger age groups has declined in recent years, and is now close to a historic low. Ecological effects on cod growth, and how to take these into account in stock projections, was discussed at length during the meeting.
1 https://fiskeridir.no/Yrkesfiske/Statistikk-yrkesfiske/Statistiske-publikasjoner/Noekkeltall-for-de-norske-fiskeriene

ICES | AFWG 2020 | VII
• The TAC advice for 2021 is 885 600 tonnes, corresponding to F=0.47. This is 20% up on the TAC in 2020 and 28% up on the advice for 2020. F is above Fpa, because in the harvest control rule adopted in 2016, fishing mortality is increased at high SSB values. The in-crease from last year’s advice is due to upwards adjustment of the abundance of inter-mediate age groups (5–10).
HADDOCK IN SUBAREAS 1 AND 2 (NORTHEAST ARCTIC) WAS ASSESSED USING SAM • The spawning-stock biomass (SSB) has been above MSY Btrigger since 1989. Due to the
strong recruitment-at-age three in 2008–2009 (2005–2006 year-classes) SSB reached an all-time high level in 2013 and afterwards started to decrease, but is currently well above MSY Btrigger. The 2016 year-class is strong and is entering the fishery.
• Fishing mortality (F) has increased since 2013 and was slightly above FMSY in 2018 – 2019. The higher F was partly due to overestimation of the stock at the start of the intermediate year for the short-term predictions, as seen from the retrospective bias in 2018 and 2019. After the benchmark in 2020, the retrospective bias is much lower.
• Catch predictions for three-year-olds are very uncertain because they depend on the in-dividual growth relative to the minimum fishing size limit. In 2019, a lower proportion of three-year-old haddock (outside the Fbar range), and a higher proportion of six-year-old haddock was fished than assumed in the forecast in 2019.
• The 2017 year-class now appear to be weaker than earlier assumed, and the 2016 year-class is currently age four in 2020. Therefore, we expect the uncertainty in the fishing pattern to be less of an issue in the coming years.
• The TAC advice for 2021 is 232 537 tonnes, corresponding to Fmsy=0.35.
SAITHE IN SUBAREAS 1 AND 2 (NORTHEAST ARCTIC) • The saithe in subareas 1 and 2, the Northeast Arctic, was assessed using SAM, following
the recommendations from the inter-benchmark meeting for this stock held in early 2014. • The spawning-stock biomass (SSB) has shown wide fluctuations and has been above Bpa
since 1996 and is currently increasing. The fishing pressure (F) has been close to or below the F management plan (FMP) since 1997. Recruitment (R) has fluctuated with no clear trend.
• Corresponding to the evaluated and implemented HCR, the catch in 2020 should be no more than 197 779 tonnes. This is a 15% increase compared to the TAC for 2019 and cor-responds to a fishing mortality of 0.28.
BEAKED REDFISH (SEBASTES MENTELLA) IN SUBAREAS 1 AND 2 (NORTHEAST ARCTIC). • Following the recommendations of the latest benchmark assessment and advice for this
stock, it was switched to a two-year cycle in 2018 and was therefore due for advice in 2020. Assessment was done using the same statistical catch-at-age model (SCAA) as in the last assessment, but with updated survey indices using the RstoX software. Adoption of a suggested management plan in 2018 was delayed by the joint Norwegian-Russian fisheries commission until the assessment could be updated with results of the deep pe-lagic ecosystem survey, which was conducted in August 2019 and served as one of the inputs for the current assessment. Both, total and spawning stock biomasses exhibit an increasing trend, affording an increased quota of 66 158 tonnes and 67 210 tonnes for 2021 and 2022, respectively. However, it must be noted that the, compared to earlier years, the substantially increased quota for 2019 was not fully caught. Per information from the fisheries, this was due to the migratory behaviour of the fish and pricing considerations in a mixed fishery. Partially, this information was confirmed by newly mature fish ob-served in the deep pelagic ecosystem survey outside the fishing grounds.
GOLDEN REDFISH (SEBASTES NORVEGICUS) IN SUBAREAS 1 AND 2 (NORTHEAST ARCTIC). • This stock is assessed with a GADGET model. The trends identified in recent years have
continued. There is a strong signal of incoming recruits, which have not yet entered the

VIII | ICES SCIENTIFIC REPORTS 2:52 | ICES
SSB. At the same time catches have continued to rise, resulting in an increased F on the mature fish. As a result, the SSB has continued to decline, while the immature biomass has increased. Provided the fishing can be brought under control, one can expect the immature fish to enter the SSB in the coming years, and this should stabilize the SSB.
GREENLAND HALIBUT IN SUBAREAS 1 AND 2 (NORTHEAST ARCTIC) • No advice on this stock this year. The stock is assessed on a two-year cycle, using
GADGET length-based model approved at WKBUT benchmark in 2015. There is as of yet no HCR. A plan to have an HRpa value in place for 2020 was postponed due to COVID-19, and a rollover advice is being provided for this stock.
ANGLERFISH IN SUBAREAS 1 AND 2 (NORTHEAST ARCTIC) • This stock is dependent on influx from ICES subareas 4 and 6. There are no survey data,
and only length data from the fishery, which is managed by technical regulations. Fol-lowing a benchmark in 2018, work has progressed on three different data-limited models that suggest the exploitation pattern seems to be sound (the stock is likely around Bmsy), but that the exploitation rate may well be too high and should be reduced. We recom-mend work towards defining reference points and an HCR, and that ICES subareas 1, 2, 3, 4 and 6 should be investigated together to get a more complete understanding of mi-grations and distributions.
BARENTS SEA CAPELIN • Following ToR b), the data on Barents Sea capelin were updated in this report. No as-
sessment is conducted during the AFWG itself, the assessment occurs in the autumn fol-lowing the ecosystem survey. There is an ongoing discussion about the possibility of conducting a benchmark over several different capelin stocks, including the Barents Sea stock.
ICES | AFWG 2020 | IX
ii Expert group information
Expert group name Arctic Fisheries Working Group (AFWG)
Expert group cycle Annual
Year cycle started 2019
Reporting year in cycle 1/1
Chair Daniel Howell, Norway
Meeting venue and dates 15-22 April 2020, online correspondence via Webex (18 participants)
ICES | AFWG 2020 | 1
1 Ecosystem information
The aim of this Section is to collect important ecosystem information influencing the assessment of fish stocks handled by AFWG. In general, such information is collected and updated by the ICES WGIBAR group (ICES CM 2019/SSGIEA:04), here we only provide information that is di-rectly relevant to the assessment of the AFWG stocks as well as information that is updated after the 2020 WGIBAR report was finished.
1.1 0-group abundance
The recruitment of the Barents Sea fish species measured as 0-group has shown a large year-to-year variability. The most important reasons for this variability are variations in the spawning biomass, hydrographic conditions, changes in circulation pattern, food availability and predator abundance, and distribution. In 2018, 0-group indices could not be calculated due to incomplete area coverage in the southeastern Barents Sea. Preliminary indices for 2019 are available in the survey report (Prozorkevitch and van der Meeren, 2020).
1.2 Consumption, natural mortality, and growth
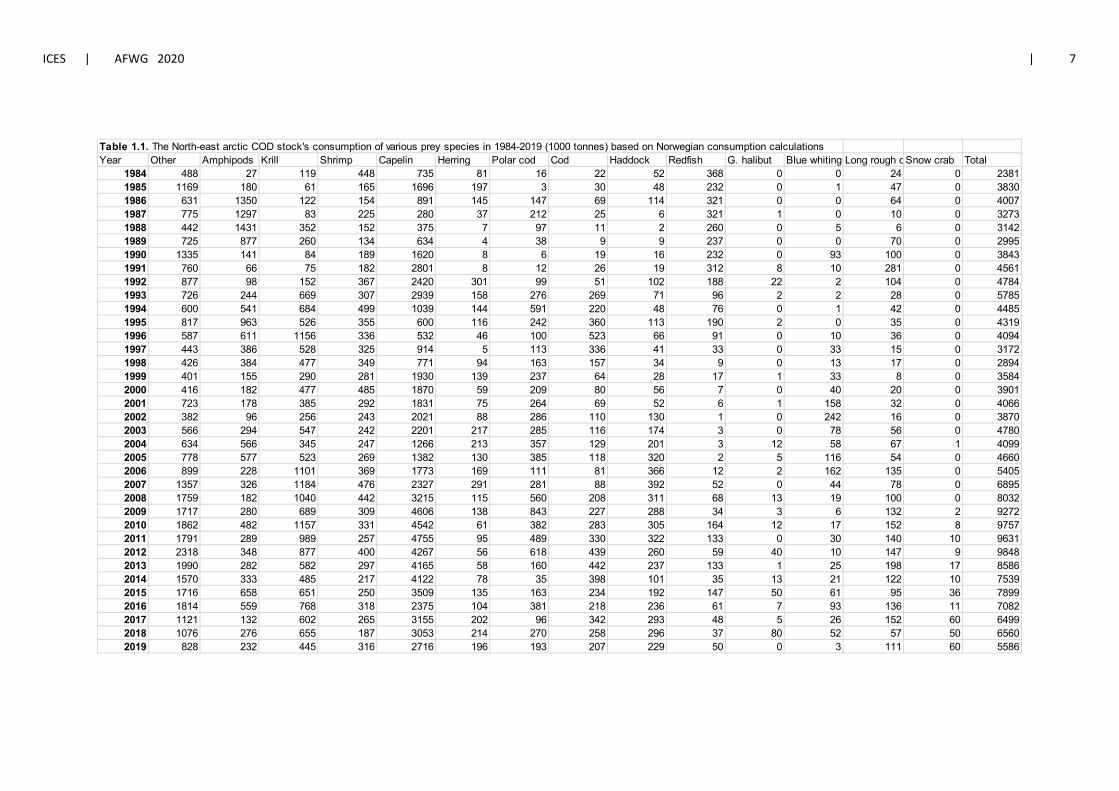
Cod is the most important predator among fish species in the Barents Sea. It feeds on a wide range of prey, including larger zooplankton, most available fish species, including own juveniles and shrimp (Tables 1.1–1.2). Cod prefer capelin as a prey, and fluctuations of the capelin stock may have a strong effect on growth, maturation and fecundity of cod, as well as on cod recruit-ment because of cannibalism. The role of euphausiids for cod feeding increases in the years when capelin stock is at a low level (Ponomarenko and Yaragina, 1990). Also, according to Ponoma-renko (1973; 1984), inter-annual changes in euphausiid abundance are important for the survival rate of cod during the first year of life.
The food consumption by NEA cod in 1984–2019, based on data from the Joint Russian-Norwe-gian stomach content database, is presented in Tables 1.1–1.2. The Norwegian calculations are based on the method described by Bogstad and Mehl (1997). The main prey items in 2019 were capelin, krill, shrimp, haddock, cod, polar cod, amphipods and herring. The consumption calcu-lations made by IMR show that the total consumption by age 1 and older cod in 2019 was 5.6 mil-lion tonnes, while PINRO estimates give a corresponding figure of 5.1 million tonnes. The con-sumption per cod-by-cod age groups is shown in Tables 1.1–1.2 (IMR and PINRO estimates), while the proportion of cod and haddock in the diet by cod age group (IMR and PINRO esti-mates) is given in Tables 1.3 and 1.4.
Growth of cod and consumption by cod has been relatively stable until 2019. However, some trends were observed in 2019-2020. In the winter survey 2020, weight at age was at or close to the lowest observed in the revised time series going back to 1994 for age groups 2-7. This was mainly due to reduced growth in length, see tables in Chapter 3. Similar trends were observed in the BESS survey 2019 for age groups 2 and 3 only, which is consistent with the reduction in size at age in the winter survey being strongest for age 3 and 4 cod. Other age groups in the BESS 2019 survey did not demonstrate any clear trend in size at age.
However, weight at age in the Lofoten survey was stable from 2019 to 2020, as was weight at age in catch from 2018-2019. The hepatosomatic index (liver weight/body weight ratio) pooled for all size groups shows a decreasing trend in the last couple of years both in the Lofoten survey and in Russian samples (surveys and commercial data combined). No data on hepatosomatic index

2 | ICES SCIENTIFIC REPORTS 2:52 | ICES
was available for Norwegian commercial fisheries. Consumption per cod declined somewhat from 2018 to 2019 (Table 1.3-1.4). Altogether this indicates that growth of younger age groups was negatively affected in late 2019 and early 2020 and that the trends were strongest and first seen for younger age groups (age 3-4 in 2020).
How does this then compare to trends in food abundance? This was discussed at the WGIBAR 2020 meeting. To summarize the food situation for young cod, taking also 2020 survey results into account: Abundance of pelagic fish stocks is low, and for the most important pelagic species, capelin, the abundance of immature capelin in 2019 was very low. The 2019-year class of capelin was strong as 0-group, but the relationship between age 0 and age 1 (and older) abundance for this stock is weak. Also, age 1 cod and haddock abundance in 2020 is low. On the positive side, shrimp abundance is high, while the abundance of other prey species is around average. Alto-gether, there seems to be reasonable consistency between growth, consumption and feeding data. In particular, it makes sense that low abundance of small capelin affects cod ages 2-4 the most, as those age groups have trouble feeding on the larger capelin. For plots of predator size-prey size relationships, see Holt et al. (2019). It is also reasonable that we observe a stronger effect in winter than in autumn data, as capelin has been a relatively more important prey in winter in recent years (Johannesen et al. 2016).
Looking beyond 2020-2021, it is known from previous capelin collapses in the 1980s, 1990s and 2000s, that capelin may recover quickly, but it should be noted that the cod stock was consider-ably lower during those collapses than it is at present, which may affect the rate of stock recovery.
One direct application for management of results from the trophic investigations in the Barents Sea is the inclusion of predator’s consumption into fish stock assessment. Predation on cod and haddock by cod has since 1995 been included in the assessment of these two species. These data, summarized in Tables 1.1, 1.3 and 1.5, are used for estimation of cod and haddock consumed by cod and further for estimation of their natural mortality within the SAM model (see sections 3.3.3 and 4.5.5). The average natural mortality for the last years is used as predicted M for the coming years for cod and haddock.
Cod consumption was used in capelin assessment for the first time in 1990, to account for natural mortality due to cod predation on mature capelin in the period January–March (Bogstad and Gjøsæter, 1994). This methodology has been developed further using the Bifrost and CapTool models (Gjøsæter et al., 2002; Tjelmeland, 2005; ICES CM 2009/ACOM:34). CapTool is a tool (in Excel with @RISK) for implementing results from Bifrost in the short-term (half-year) prognosis used for determining the quota.
In recent years, the abundance of large cod and haddock has been very high, and although it is now decreasing, it is still at a high level for both stocks. There are a limited number of predators on such large fish. As predation is likely to be a major source of natural mortality, it could thus be considered whether the natural mortality on older age groups should be reduced in such a situation. The assumption of reduced natural mortality on older cod was explored by IBPcod 2017, but no evidence of this was found based on available catch and survey data. To investigate this further, analyses on predator consumption and biomass flow at higher trophic levels like those done by Bogstad et al. (2000) should be updated, and such work is ongoing for marine mammals. For cod, in particular, the fishing mortality in recent years has been so much lower than before that the relative impact of the natural mortality on the survival of older fish has increased considerably.
The amount of commercially important prey consumed by other fish predators (haddock, Green-land halibut, long rough dab, and thorny skate), has also been calculated (Dolgov et al., 2007), but these consumption estimates have not been used in assessment for any prey stocks yet. Ma-

ICES | AFWG 2020 | 3
rine mammals are not included in the current fish stock assessments. However, it has been at-tempted to extend the stock assessment models of Barents Sea capelin (Bifrost) by including the predatory effects of minke whales, and harp seals (Tjelmeland and Lindstrøm, 2005).
1.3 Maturation, condition factor, and fisheries–induced evolution
Data on maturity-at-age are one of the basic components for spawning-stock biomass (SSB) esti-mates. There have been substantial changes observed in maturity-at-age of NEA cod over large historical period (since 1946) showing an acceleration in maturity rates, especially in the 1980s. They are thought to be connected both with compensatory density-dependence mechanisms and genetic changes in individuals (Heino et al., 2002; Jørgensen et al., 2008; Kovalev and Yaragina, 2009; Eikeset et al., 2013; Kuparinen et al., 2014) resulted from strong fishing pressure.
Studies on possible evolutionary effects for this stock should be updated with data for recent years to investigate the effects on population dynamics, including growth, maturation and evo-lutionary effects, of a prolonged period with low fishing mortality and high stock size.
Recent laboratory and fieldwork has shown that skipped spawning does occur in NEA cod stock (Skjæraasen et al., 2009; Yaragina, 2010). Experimental work on captive fish has demonstrated that skipped spawning is strongly influenced by individual energy reserves (Skjæraasen et al., 2009). This is supported by the field data, which suggest that gamete development could be in-terrupted by a poor liver condition especially. Fish, which will skip spawning, seem to remain in the Barents Sea and do not migrate to the spawning grounds. These fish need to be identified and excluded when estimating the stock-recruitment potential, as currently they are included in the estimate of SSB. However, more work needs to be undertaken to improve our knowledge of skipped spawning in cod (e.g. comparisons and inter-calibration of Norwegian and Russian da-tabases on maturity stages should be done) and other species to quantify its influence on the stock reproductive potential.
1.4 Recruitment prediction for northeast Arctic cod
Prediction of recruitment in fish stocks is essential to harvest prognosis. Traditionally, prediction methods have been based on spawning-stock biomass and survey indices of juvenile fish and have not included effects of ecosystem drivers. Multiple linear regression models can be used to incorporate both environmental and parental fish stock parameters. For such models to give pre-dictions there need to be a time-lag between the predictor and response variables.
1.4.1 Historic overview
Several statistical models, which use multiple linear regressions, have been developed for re-cruitment of northeast Arctic cod. All models try to predict recruitment-at-age 3 (at 1 January), as calculated from the assessment model, with cannibalism included. This quantity is denoted as R3. A collection of the most relevant models previously presented to AFWG is described be-low.
Stiansen et al. (2005) developed a model (JES1) with 2-year prediction possibility:
JES1: R3~ Temp(-3) + Age1(-2) + MatBio(-2)
JES2: R3~ Temp(-3) + Age2(-1) + MatBio(-2)
JES3: R3~ Temp(-3) + Age3(0) + MatBio(-2)

4 | ICES SCIENTIFIC REPORTS 2:52 | ICES
Temp is the Kola annual temperature (0–200 m, station 3–7), Age1 is the winter survey bottom-trawl index for cod age one, and MatBio the maturing biomass of capelin on 1 October. The number in parentheses is the time-lag in years. Two other similar models (JES2, JES3) can be made by substituting the winter index term Age1(-2) with Age2(-1) and Age3(0), giving 1 and 0-year predictions, respectively.
Svendsen et al. (2007) used a model (SV) based only data from the ROMS numerical hydrody-namical model, with 3-year prognosis possibility:
SV: R3~ Phyto(-3) + Inflow(-3)
Where Phyto is the modelled phytoplankton production in the whole Barents Sea and Inflow is the modelled inflow through the western entrance to the Barents Sea in autumn. The number in parentheses is the time-lag in years. The model has not been updated since 2007.
The recruitment model (TB) suggested by T. Bulgakova (AFWG 2005, WD14) is a modification of Ricker’s model for stock–recruitment defined by:
TB: R3~ m(-3) exp[-SSB(-3) + N(-3)]
Where R3 is the number of age 3 recruits for NEA cod, m is an index of population fecundity, SSB is the spawning-stock biomass and N is equal to the numbers of months with positive tem-perature anomalies (TA) on the Kola Section in the birth year for the year class. The number in parentheses is the time-lag in years. For the years before 1998 TA was calculated relative to the monthly average for the period 1951–2000. For intervals after 1998, the TA was calculated with relatively linear trend in the temperature for the period 1998–present. The model was run using two-time intervals (using cod year classes 1984–2000 and year classes 1984–2004) for estimating the model coefficients. The models have not been updated since 2009.
Titov (Titov, AFWG 2010, WD 22) and Titov et al. (AFWG 2005, WD 16) developed models with 1 to 4-year prediction possibility (TITOV0, TITOV1, TITOV2, TITOV3, TITOV4, respectively), based on the oxygen saturation at bottom layers of the Kola section stations 3–7 (OxSat), air tem-perature at the Murmansk station (Ta), water temperature: 3–7 stations of the Kola section (layer 0–200 m) (Tw), ice coverage in the Barents Sea (I), spawning-stock biomass (SSB), annual values of 0-group cod abundance index, corrected for capture efficiency (CodC0) and the bottom-trawl swept-area abundance of cod at the age 1 and 2, 3 derived from the joint winter Barents Sea acoustic survey (CodB1, CodB2, CodB3). At the 2010 AFWG assessment it was suggested (Dingsør et al., 2010, WD 19, and related discussions in the working group to try to simplify these models).
Hjermann et al., (2007) developed a model with a one-year prognosis, which have been modified by Dingsør et al. (AFWG 2010, WD19) to four models with 2-year projection possibility.
H1: log(R3)~ Temp(-3) + log(Age0)(-3) +BMcod3-6 /ABMcapelin(-2,-1)
H2: log(R3)~ Temp(-2) +I(surv)+ Age1(-2) + BMcod3-6 /ABMcapelin (-2,-1)
H3: log(R3)~ Temp(-1) + Age2(-1) + BMcod3-6 /ABMcapelin (-1)
H4: log(R3)~ Temp(-1) + Age3(0)
Temp is the Kola yearly temperature (0–200 m), Age0 is the 0-group index of cod, Age1, Age2 and Age3 are the winter survey bottom-trawl index for cod age 1, 2 and 3, respectively, BMcod3-6 is the biomass of cod between age 3 and 6, and ABM is the maturing biomass of capelin. The number in parentheses is the time-lag in years. The models were not updated this year.
At AFWG 2008, Subbey et al. presented a comparative study (AFWG 2008, WD27) on the ability of some of the above models in predicting stock-recruitment for NEA cod (Age 3). At the assess-ment in 2010, a WD by Dingsør et al. (AFWG 2010, WD19) was presented, which investigated the
ICES | AFWG 2020 | 5
performance of some of the mentioned recruitment models. It was strongly recommended by the working group that a Study Group should be appointed to look at criteria for choosing/rejecting recruitment models suitable for use in stock assessment.
The “Study Group on Recruitment Forecasting” (SGRF; ICES CM 2011/ACOM:31, ICES CM 2012/ACOM:24, ICES CM 2013/ACOM:24) have had three meetings (in October 2011 and 2012, and November 2013). Their mandate is to give a “best practice” (Standards and guidelines) for choosing recruitment models after their next meeting, which may be implemented at the next AFWG.
The SGRF 2012 report addressed the problem of combining several model predictions to obtain a recruitment estimate with minimum variance. The method (involving a weighted average of individual model predictions) was proposed as a replacement for the hybrid method of Subbey et al. (2008). One major issue not addressed in ICES SGRF (2012) was how to choose the initial ensemble of models, whose weighted average is sought. There are practical constraints (concern-ing time and personnel), which stipulates that not all plausible models can be included in the calculation of the hybrid recruitment value. A methodology for choosing models to include in the calculation of a hybrid, representative recruitment forecast was addressed in SGRF 2013. De-tails can be found in the SGRF 2013 ICES report.
1.4.2 Models used in 2020
The model approach taken in 2020 was the same as in 2018 and 2019. Some changes were made in 2018, they are described below.
In 2018 at the meeting of the AFWG, the correction and simplification of models was continued. Because in 2017–2018 there was a significant correction of the initial biological data, which caused significant changes in the results of the prognostic models, in 2018 a complete audit of both prognostic models and the hybrid model combining the results of their work was carried out. The main purpose of the model revision was to increase the stability of the models, that is, to reduce the possibility of potential correction of the models due to correction of the biological data included in the model. The solution of the problem was found by increasing the retrospec-tive database backwards in time, that is, from the beginning of the 1980s to the beginning of the 1960s. Accordingly, sets of predictor sets have been revised. The number of models was reduced from five to two and the names of the models were changed from Titov0(1,2,3,4) to TitovES (en-vironment, short prediction) and TitovEL (environment, long prediction).
This has been conducted and has improved the statistical performance (details are shown in Ti-tov, AFWG 2018, WD23):
TitovES: R32 ~ DOxSat2(t-13) + ITw(t-43) + expIce(t-40) + Ice(t-15)
TitovEL: R34 ~OxSat(t-39)+ ITw(t-43)
Where DOxSat(t-13)~ expOxSat(t-13) + OxSat(t-39), ITw(t-43) ~ I(t-43) +Tw(t−46). The number in parentheses is the time-lag in months, relative to April 2020.
At the 2018 AFWG assessment, a hybrid model (i.e. an average combination) of the best func-tioning statistical recruitment models were repeated. A statistical analysis of the accuracy of the model's work was carried out, which consisted of estimating the errors in the recovery of data on the number of NEA cod recruitment. Accuracy of the model's work was verified by calcula-tion of standard deviations of the NEA cod recruitment predicted values from the SAM values for the period 2005–2015 when the model was adjusted for data from 1983 to 2004, which con-sisted in estimating the errors in the recovery of data on the number of NEA cod recruitment.

6 | ICES SCIENTIFIC REPORTS 2:52 | ICES
Figure 1.1 shows the standard deviations of the NEA cod recruitment prediction. It can be seen that the addition of biological parameters (CodB1, CodB2, CodB3, CodC0, SSB) to environmental models (TitovES, TitovEL) substantially increases the error.
Based on these calculations, after comparing the results of constructing independent retrospec-tive forecasts using the methodology previously used in ICES SGRF (ICES CM 2013/ACOM:24), it was decided to abandon the use of biological predictors and to use only environmental data in the NEA cod recruitment forecasting models. It was also found that all models (TitovES, TitovEL, RCT3) satisfy the quality conditions concerning the forecast for the mean values accepted as the criterion for entering into the calculation of the hybrid model adopted earlier (ICES CM 2013/ACOM:24). It was decided that all biological data will be included in calculations based on the RCT3 model, and the remaining two models (TitovES, TitovEL) will be used only to account for the effect of environmental conditions on NEA cod recruitment.
In AFWG 2018, the procedure for estimating weights for various models (TitovES, TitovEL, RCT3) was repeated using the same method as was made on Study Group on Recruitment Fore-casting (SGRF) in 2013.
In summary, the SAM estimate for age three from the AFWG 2020 assessment was used as his-torical R3. The recruitment forecast for 2020–2023 are based on a hybrid model with weighting estimated at AFWG-2018. The weights and forecasts for the 2020 AFWG assessment can be found in Tables 1.7a–b.
1.5 Biomass and exploitation levels of AFWG stocks.
Figure 1.2 shows the biomass development for northeast Arctic cod, haddock, and saithe. The combined biomass of these three stocks peaked in 2013, but is still at a high level. These three stocks have in recent years been harvested below or at the target fishing mortalities in the man-agement plans (Figure 1.3), except for the fishing mortality on haddock in 2018–2019, which was above the target F
ICES | AFWG 2020 | 7
Table 1.1. The North-east arctic COD stock's consumption of various prey species in 1984-2019 (1000 tonnes) based on Norwegian consumption calculationsYear Other Amphipods Krill Shrimp Capelin Herring Polar cod Cod Haddock Redfish G. halibut Blue whiting Long rough dSnow crab Total
1984 488 27 119 448 735 81 16 22 52 368 0 0 24 0 23811985 1169 180 61 165 1696 197 3 30 48 232 0 1 47 0 38301986 631 1350 122 154 891 145 147 69 114 321 0 0 64 0 40071987 775 1297 83 225 280 37 212 25 6 321 1 0 10 0 32731988 442 1431 352 152 375 7 97 11 2 260 0 5 6 0 31421989 725 877 260 134 634 4 38 9 9 237 0 0 70 0 29951990 1335 141 84 189 1620 8 6 19 16 232 0 93 100 0 38431991 760 66 75 182 2801 8 12 26 19 312 8 10 281 0 45611992 877 98 152 367 2420 301 99 51 102 188 22 2 104 0 47841993 726 244 669 307 2939 158 276 269 71 96 2 2 28 0 57851994 600 541 684 499 1039 144 591 220 48 76 0 1 42 0 44851995 817 963 526 355 600 116 242 360 113 190 2 0 35 0 43191996 587 611 1156 336 532 46 100 523 66 91 0 10 36 0 40941997 443 386 528 325 914 5 113 336 41 33 0 33 15 0 31721998 426 384 477 349 771 94 163 157 34 9 0 13 17 0 28941999 401 155 290 281 1930 139 237 64 28 17 1 33 8 0 35842000 416 182 477 485 1870 59 209 80 56 7 0 40 20 0 39012001 723 178 385 292 1831 75 264 69 52 6 1 158 32 0 40662002 382 96 256 243 2021 88 286 110 130 1 0 242 16 0 38702003 566 294 547 242 2201 217 285 116 174 3 0 78 56 0 47802004 634 566 345 247 1266 213 357 129 201 3 12 58 67 1 40992005 778 577 523 269 1382 130 385 118 320 2 5 116 54 0 46602006 899 228 1101 369 1773 169 111 81 366 12 2 162 135 0 54052007 1357 326 1184 476 2327 291 281 88 392 52 0 44 78 0 68952008 1759 182 1040 442 3215 115 560 208 311 68 13 19 100 0 80322009 1717 280 689 309 4606 138 843 227 288 34 3 6 132 2 92722010 1862 482 1157 331 4542 61 382 283 305 164 12 17 152 8 97572011 1791 289 989 257 4755 95 489 330 322 133 0 30 140 10 96312012 2318 348 877 400 4267 56 618 439 260 59 40 10 147 9 98482013 1990 282 582 297 4165 58 160 442 237 133 1 25 198 17 85862014 1570 333 485 217 4122 78 35 398 101 35 13 21 122 10 75392015 1716 658 651 250 3509 135 163 234 192 147 50 61 95 36 78992016 1814 559 768 318 2375 104 381 218 236 61 7 93 136 11 70822017 1121 132 602 265 3155 202 96 342 293 48 5 26 152 60 64992018 1076 276 655 187 3053 214 270 258 296 37 80 52 57 50 65602019 828 232 445 316 2716 196 193 207 229 50 0 3 111 60 5586

8 | ICES SCIENTIFIC REPORTS 2:52 | ICES
Table 1.2. The North-east arctic COD stock's consumption of various prey species in 1984-2019 (1000 tonnes) based on Russian consumption calculations (Dolgov, WD 07)Year Other AmphipodsKrill Shrimp Capelin Herring Polar cod Cod Haddock Redfish G. halibut Blue whitin Long rough Snow crab Total
1984 560 31 94 353 593 34 18 14 50 197 0 5 52 20001985 767 441 31 211 1041 26 0 89 36 100 0 18 22 27791986 615 949 66 159 855 51 169 26 99 166 1 3 26 31861987 541 593 79 233 175 9 118 23 2 119 1 10 5 19081988 544 196 239 146 348 21 0 21 76 133 0 0 22 17451989 496 324 190 117 767 4 37 35 2 178 0 0 64 22131990 278 31 105 266 1264 65 8 24 15 237 0 39 79 24091991 289 81 55 277 3204 25 45 52 22 141 5 6 46 42481992 788 38 211 258 2021 335 196 82 37 117 1 0 42 41251993 563 174 184 220 2743 170 170 144 148 40 5 4 47 46111994 447 296 359 458 1276 102 486 383 72 55 0 1 40 39761995 502 455 396 533 670 192 191 541 130 110 3 0 52 37751996 674 346 957 195 469 74 74 451 57 67 0 9 45 34151997 463 134 510 257 511 52 111 383 35 29 2 17 17 25201998 311 220 645 286 916 73 134 131 23 15 0 24 20 27971999 179 81 458 268 1540 80 177 49 16 14 0 27 9 28982000 243 122 437 394 1800 53 167 59 32 4 0 28 21 33602001 384 75 411 322 1522 93 148 62 52 4 2 145 31 32502002 225 45 286 202 2400 55 302 100 80 4 0 110 17 38252003 400 171 547 227 1219 153 221 132 331 2 0 28 51 34812004 496 393 478 256 1097 129 369 86 144 7 16 48 62 35832005 620 163 688 244 1023 168 320 112 271 7 2 67 47 37312006 786 86 1547 274 1341 268 125 95 285 17 1 103 148 50762007 831 192 1340 420 1881 275 289 68 329 29 1 32 73 57602008 1021 51 1005 345 3278 122 664 156 331 60 13 17 121 71842009 1048 189 938 284 3360 229 828 142 347 28 0 8 285 76872010 973 330 1843 255 4120 143 512 181 246 163 1 16 136 89182011 1251 202 831 226 4473 85 422 259 359 143 2 57 170 84792012 1771 164 600 273 2986 97 439 291 415 41 7 33 133 72512013 1366 210 648 334 3676 45 146 447 272 178 2 40 216 75812014 1391 121 744 208 3340 56 98 390 170 20 7 27 154 67262015 1122 301 1160 442 2675 69 159 175 180 87 14 39 117 65392016 1542 654 775 216 2221 86 248 239 158 48 3 51 328 65682017 1042 85 681 316 2709 99 75 271 315 188 3 26 249 60602018 1153 146 1541 178 1624 271 117 352 479 41 41 41 121 61052019 751 97 498 189 2103 379 131 415 292 47 0 15 159 5075

ICES | AFWG 2020 | 9
Table 1.3 Consumption per cod by cod age group (kg/year), based on Norwegian consumption calculations.
Year/Age 1 2 3 4 5 6 7 8 9 10 11+1984 0.247 0.814 1.685 2.521 3.951 5.208 8.009 8.524 9.181 9.912 9.9381985 0.304 0.761 1.831 3.107 4.675 7.361 11.247 11.971 12.498 13.751 13.9051986 0.161 0.488 1.348 3.163 5.617 6.834 11.030 11.943 12.749 13.513 13.7781987 0.219 0.601 1.275 2.055 3.537 5.462 7.044 8.111 8.922 9.344 9.3331988 0.164 0.703 1.149 2.148 3.744 5.877 10.100 11.222 12.575 13.127 13.3661989 0.223 0.716 1.609 2.713 3.981 5.612 7.680 8.499 9.599 10.199 10.6101990 0.363 0.906 1.907 3.043 4.190 5.383 6.439 6.782 6.923 7.362 7.8301991 0.293 0.972 2.178 3.536 5.318 7.073 9.470 10.238 11.292 12.339 12.0051992 0.215 0.665 2.100 3.135 4.142 5.093 7.868 9.023 9.402 10.124 10.1581993 0.112 0.528 1.547 3.045 4.811 6.288 9.422 11.268 11.793 12.284 12.8901994 0.130 0.408 0.922 2.521 3.508 4.528 6.404 8.889 9.723 10.030 10.2151995 0.103 0.296 0.921 1.841 3.362 5.263 7.718 10.435 12.383 12.787 13.1771996 0.108 0.356 0.929 1.847 3.070 4.434 7.412 11.206 14.918 15.097 15.4121997 0.140 0.319 0.940 1.768 2.710 3.537 5.257 8.185 12.672 13.578 13.1741998 0.117 0.398 0.984 1.942 2.924 4.188 5.748 8.071 11.471 11.990 12.0541999 0.163 0.505 1.093 2.718 3.719 5.446 6.968 9.185 11.019 12.023 12.1242000 0.170 0.499 1.243 2.461 4.253 5.654 7.967 9.401 12.634 13.416 13.4752001 0.171 0.456 1.309 2.440 3.684 5.300 7.541 11.221 13.604 14.310 14.6412002 0.199 0.551 1.167 2.441 3.381 4.721 6.363 9.064 10.350 11.681 11.0762003 0.207 0.653 1.313 2.390 3.999 5.958 8.433 10.430 12.907 13.523 14.5712004 0.222 0.478 1.307 2.297 3.361 5.581 7.442 11.470 17.415 19.399 18.8732005 0.203 0.661 1.387 2.744 4.255 6.414 7.677 10.289 13.935 14.916 15.7252006 0.204 0.628 1.593 2.810 4.252 6.365 7.877 11.631 14.102 15.126 16.0562007 0.256 0.653 1.748 3.087 4.461 6.222 8.246 10.249 12.705 13.296 13.9562008 0.204 0.717 1.464 2.876 4.081 7.086 8.398 11.388 15.565 16.104 16.3262009 0.192 0.618 1.479 2.755 4.446 5.798 8.432 11.563 12.720 13.672 13.7182010 0.203 0.634 1.352 2.493 3.977 5.694 8.447 12.040 15.385 16.043 16.4692011 0.219 0.653 1.421 2.594 4.003 5.331 7.230 9.660 15.165 16.320 16.3422012 0.231 0.768 1.499 2.697 4.084 5.074 7.309 10.047 15.397 16.581 16.5682013 0.182 0.682 1.457 2.539 3.926 5.019 5.960 7.564 11.499 12.423 13.4422014 0.224 0.649 1.318 2.565 3.767 4.286 5.815 7.991 10.695 11.510 11.9972015 0.218 0.674 1.424 2.546 4.262 5.693 7.405 8.575 13.071 13.851 15.0572016 0.252 0.726 1.576 2.792 3.955 5.546 7.335 8.108 11.939 12.708 14.5432017 0.248 0.785 1.536 2.651 3.995 5.641 7.050 8.207 11.344 14.194 17.1212018 0.194 0.775 1.548 2.815 4.406 5.208 6.818 10.592 12.907 17.089 16.1432019 0.191 0.494 1.330 2.253 3.496 4.414 6.236 9.012 12.150 11.778 13.077
Average 0.202 0.616 1.414 2.593 3.981 5.517 7.661 9.779 12.295 13.205 13.587

10 | ICES SCIENTIFIC REPORTS 2:52 | ICES
Table 1.4 Consumption per cod by cod age group (kg/year), based on Russian consumption calculations.
Year/Age 1 2 3 4 5 6 7 8 9 10 11 12 13+1984 0.262 0.895 1.611 2.748 3.848 5.486 6.992 8.561 10.572 13.166 13.200 15.547 17.1531985 0.295 0.753 1.658 2.681 4.264 6.599 8.241 9.745 10.974 14.448 17.327 17.391 19.1861986 0.179 0.526 1.455 3.455 5.001 5.991 6.458 8.157 9.766 11.457 13.188 14.621 16.1341987 0.145 0.432 0.852 1.558 3.073 4.380 7.357 9.667 12.705 14.481 15.899 16.616 18.3181988 0.183 0.704 1.075 1.628 2.391 4.386 8.207 9.978 10.868 16.536 14.639 16.046 17.0001989 0.282 0.909 1.465 2.207 3.243 4.798 6.578 8.725 11.134 15.798 16.313 18.436 18.0411990 0.288 1.006 1.694 2.693 3.278 3.833 5.583 6.870 10.715 11.426 13.555 15.964 17.5951991 0.241 0.936 2.670 4.472 6.037 7.844 9.590 11.543 14.969 19.292 18.590 21.720 23.9601992 0.178 0.969 2.475 2.866 3.995 5.137 6.723 7.414 8.755 12.303 14.288 15.184 16.7451993 0.133 0.476 1.512 2.865 3.944 5.108 7.372 8.945 10.343 11.600 14.835 16.536 18.2491994 0.180 0.512 1.212 2.402 3.517 5.359 7.560 10.001 11.818 12.896 14.499 17.656 19.4691995 0.194 0.497 0.962 1.801 3.204 4.847 7.332 9.688 13.835 15.247 16.899 19.273 21.2541996 0.170 0.498 1.028 1.916 3.059 4.189 6.987 10.212 12.185 13.614 14.529 16.275 17.9451997 0.119 0.341 0.992 1.908 2.668 3.503 4.954 7.980 12.174 16.762 16.710 18.410 20.3081998 0.232 0.528 1.081 2.016 2.823 4.089 5.469 7.346 9.586 13.012 14.404 15.640 17.2431999 0.261 0.431 1.128 2.490 3.676 5.222 6.398 8.220 9.194 13.364 15.268 16.990 18.7272000 0.186 0.545 1.288 2.551 4.387 6.559 8.833 10.483 11.522 15.132 17.090 19.793 21.8222001 0.150 0.413 1.163 2.110 3.430 5.571 6.835 10.233 12.457 15.130 17.341 19.307 21.3452002 0.252 0.677 1.303 2.699 3.847 5.591 7.846 10.796 13.238 18.787 17.836 20.278 22.3592003 0.228 0.618 1.296 2.028 3.547 4.716 6.684 8.905 13.418 14.492 19.480 19.309 21.2922004 0.250 0.654 1.412 2.567 3.857 5.660 7.730 11.126 15.907 20.770 21.607 24.940 27.5032005 0.255 0.687 1.514 2.504 3.896 5.264 7.192 9.395 13.163 15.981 20.628 21.448 23.6392006 0.354 0.925 1.881 2.813 4.019 5.332 7.450 10.328 13.111 17.759 19.488 22.322 24.6092007 0.234 0.681 1.874 3.128 4.459 5.893 7.563 9.178 12.032 15.919 19.961 21.644 23.8632008 0.223 0.719 1.697 2.959 4.194 6.073 7.809 10.464 13.627 17.254 21.590 23.373 25.7792009 0.217 0.624 1.495 2.526 4.304 5.623 7.855 11.490 13.341 15.988 18.770 21.866 24.1112010 0.235 0.651 1.401 2.577 4.065 5.757 8.312 11.805 16.090 16.844 20.129 23.023 25.3872011 0.248 0.721 1.497 2.513 3.859 4.963 6.848 9.213 13.799 19.074 20.784 23.791 26.2412012 0.207 0.588 1.203 2.292 3.266 4.461 5.862 7.629 11.713 16.211 19.345 21.032 23.1902013 0.190 0.656 1.641 2.552 3.809 4.952 5.791 7.757 10.881 14.989 19.785 22.386 24.6912014 0.242 0.622 1.321 2.340 3.608 4.387 5.560 7.447 9.017 12.547 16.044 18.854 20.7812015 0.234 0.745 1.390 2.406 3.915 4.922 5.960 7.505 10.265 12.116 16.245 19.978 22.0232016 0.307 0.870 1.722 2.813 3.474 4.740 6.754 9.117 10.665 14.810 19.921 24.195 26.6832017 0.244 0.779 1.582 2.531 3.748 4.943 6.601 9.180 11.302 16.016 20.086 23.464 25.8702018 0.316 0.867 1.846 2.699 3.736 5.000 6.489 9.170 11.166 14.577 18.672 21.848 24.0912019 0.269 0.655 1.383 2.204 3.316 4.500 6.415 9.078 13.251 15.509 19.423 22.635 24.958
Average 0.226 0.670 1.468 2.523 3.755 5.177 7.022 9.265 11.894 15.137 17.398 19.576 21.503

ICES | AFWG 2020 | 11
Table 1.5 Proportion of cod in cod diet, based on Norwegian consumption calculations
Year/age 1 2 3 4 5 6 7 8 9 10 11+1984 0.0000 0.0000 0.0032 0.0000 0.0429 0.0264 0.0329 0.0358 0.0378 0.0392 0.03941985 0.0015 0.0009 0.0014 0.0017 0.0309 0.0073 0.0821 0.0827 0.0835 0.0837 0.08431986 0.0000 0.0022 0.0015 0.0004 0.0129 0.1730 0.1763 0.1761 0.1759 0.1748 0.17451987 0.0000 0.0000 0.0007 0.0051 0.0102 0.0248 0.0379 0.0389 0.0401 0.0409 0.04261988 0.0000 0.0000 0.0000 0.0002 0.0059 0.0013 0.0037 0.0037 0.0032 0.0036 0.00351989 0.0000 0.0006 0.0016 0.0019 0.0027 0.0039 0.0036 0.0036 0.0039 0.0039 0.00391990 0.0000 0.0000 0.0000 0.0007 0.0010 0.0010 0.0167 0.0173 0.0184 0.0181 0.01801991 0.0000 0.0005 0.0000 0.0003 0.0032 0.0020 0.0224 0.0229 0.0233 0.0234 0.02341992 0.0000 0.0021 0.0037 0.0129 0.0248 0.0475 0.0120 0.0161 0.0231 0.0231 0.02301993 0.0000 0.0409 0.0369 0.0515 0.0541 0.1141 0.0498 0.0795 0.0796 0.0798 0.08001994 0.0000 0.0037 0.0929 0.0349 0.0283 0.0774 0.1248 0.1331 0.2621 0.2644 0.26251995 0.0069 0.0813 0.0747 0.0804 0.0922 0.1115 0.1383 0.2523 0.2544 0.2543 0.25451996 0.0000 0.1502 0.2570 0.2051 0.1322 0.1262 0.1853 0.2082 0.2438 0.2436 0.24371997 0.0000 0.0690 0.0762 0.1138 0.1555 0.1550 0.2314 0.2287 0.2899 0.2878 0.28871998 0.0000 0.0135 0.0272 0.0417 0.1047 0.0989 0.1093 0.1494 0.2726 0.2736 0.27231999 0.0000 0.0000 0.0048 0.0136 0.0147 0.0340 0.0619 0.1115 0.1901 0.1908 0.18682000 0.0000 0.0000 0.0287 0.0148 0.0134 0.0266 0.0500 0.0568 0.2672 0.2675 0.25912001 0.0000 0.0159 0.0116 0.0082 0.0131 0.0242 0.0498 0.0375 0.3250 0.3246 0.32712002 0.0000 0.0385 0.0593 0.0143 0.0187 0.0284 0.0356 0.0620 0.1582 0.1562 0.15522003 0.0000 0.0190 0.0198 0.0199 0.0206 0.0188 0.0457 0.1037 0.2210 0.2229 0.22442004 0.0081 0.0235 0.0280 0.0269 0.0297 0.0319 0.0379 0.0658 0.1061 0.1064 0.10762005 0.0000 0.0266 0.0230 0.0265 0.0145 0.0278 0.0439 0.0789 0.1480 0.1468 0.14442006 0.0000 0.0103 0.0007 0.0128 0.0288 0.0158 0.0389 0.0368 0.0802 0.0805 0.08032007 0.0000 0.0000 0.0011 0.0117 0.0119 0.0305 0.0282 0.0900 0.1403 0.1395 0.13922008 0.0000 0.0558 0.0257 0.0101 0.0157 0.0098 0.0766 0.0873 0.0966 0.0960 0.09612009 0.0116 0.0225 0.0262 0.0251 0.0152 0.0140 0.0219 0.0946 0.1081 0.1081 0.10792010 0.0000 0.0327 0.0580 0.0270 0.0243 0.0243 0.0205 0.0385 0.1366 0.1367 0.13552011 0.0129 0.0152 0.0492 0.0170 0.0361 0.0300 0.0238 0.0572 0.1280 0.1280 0.12792012 0.0274 0.0608 0.0639 0.0617 0.0274 0.0431 0.0413 0.0373 0.0685 0.0689 0.06822013 0.0214 0.0303 0.0458 0.0388 0.0276 0.0226 0.0478 0.0539 0.1171 0.1176 0.13412014 0.0824 0.0363 0.0448 0.0341 0.0213 0.0458 0.0664 0.0790 0.0658 0.0659 0.07532015 0.0000 0.0088 0.0308 0.0283 0.0266 0.0193 0.0234 0.0283 0.0552 0.0554 0.05502016 0.0157 0.0192 0.0063 0.0394 0.0146 0.0172 0.0268 0.0138 0.0903 0.0914 0.09252017 0.0419 0.0353 0.0383 0.0469 0.0437 0.0402 0.0564 0.0921 0.0687 0.1014 0.14132018 0.0000 0.0186 0.0679 0.0480 0.0351 0.0378 0.0569 0.0309 0.0246 0.0076 0.02532019 0.0000 0.0000 0.0332 0.0296 0.0340 0.0228 0.0380 0.0752 0.0943 0.0251 0.0810
Average 0.0064 0.0232 0.0346 0.0307 0.0330 0.0427 0.0588 0.0772 0.1250 0.1237 0.1272

12 | ICES SCIENTIFIC REPORTS 2:52 | ICES
Table 1.6 Proportion of haddock in cod diet, based on Norwegian consumption calculations
Year/age 1 2 3 4 5 6 7 8 9 10 11+1984 0.0443 0.0175 0.0053 0.0225 0.0454 0.0212 0.0022 0.0020 0.0019 0.0018 0.00171985 0.0205 0.0227 0.0052 0.0076 0.0206 0.0108 0.0000 0.0000 0.0000 0.0000 0.00001986 0.0000 0.0188 0.0015 0.0864 0.0005 0.0524 0.0242 0.0247 0.0253 0.0291 0.02991987 0.0000 0.0052 0.0003 0.0025 0.0000 0.0000 0.0000 0.0000 0.0000 0.0000 0.00001988 0.0000 0.0000 0.0000 0.0000 0.0003 0.0034 0.0033 0.0034 0.0038 0.0035 0.00351989 0.0000 0.0000 0.0000 0.0000 0.0000 0.0002 0.0338 0.0339 0.0351 0.0350 0.03511990 0.0000 0.0000 0.0000 0.0024 0.0021 0.0007 0.0128 0.0123 0.0114 0.0117 0.01181991 0.0000 0.0000 0.0098 0.0079 0.0045 0.0051 0.0031 0.0029 0.0027 0.0027 0.00271992 0.0000 0.0000 0.0014 0.0684 0.0208 0.0272 0.0279 0.0318 0.0461 0.0460 0.04591993 0.0000 0.0000 0.0204 0.0073 0.0149 0.0144 0.0278 0.0261 0.0261 0.0262 0.02621994 0.0000 0.0000 0.0065 0.0131 0.0069 0.0142 0.0297 0.0495 0.0467 0.0460 0.04661995 0.0000 0.0355 0.0030 0.0428 0.0261 0.0243 0.0383 0.0950 0.1619 0.1618 0.16191996 0.0000 0.0000 0.0588 0.0155 0.0098 0.0170 0.0364 0.0480 0.0930 0.0978 0.09831997 0.0000 0.0000 0.0242 0.0189 0.0245 0.0159 0.0127 0.0174 0.0571 0.0556 0.05521998 0.0000 0.0000 0.0116 0.0119 0.0227 0.0193 0.0106 0.0323 0.0162 0.0164 0.01621999 0.0000 0.0000 0.0028 0.0078 0.0158 0.0123 0.0120 0.0139 0.0224 0.0225 0.02202000 0.0000 0.0000 0.0233 0.0102 0.0178 0.0116 0.0158 0.0522 0.0286 0.0286 0.02872001 0.0000 0.0081 0.0052 0.0163 0.0147 0.0170 0.0194 0.0198 0.0337 0.0336 0.03462002 0.0000 0.0000 0.0185 0.0339 0.0353 0.0470 0.0745 0.0762 0.1829 0.1796 0.17802003 0.0000 0.0000 0.0145 0.0311 0.0594 0.0436 0.0552 0.1215 0.1078 0.1078 0.10772004 0.0044 0.0419 0.0744 0.0389 0.0576 0.0502 0.0565 0.0999 0.0910 0.0913 0.09232005 0.0000 0.0853 0.1047 0.0596 0.0620 0.0643 0.1045 0.1090 0.1112 0.1105 0.10892006 0.0000 0.0409 0.0829 0.0871 0.0604 0.0898 0.0718 0.1065 0.0966 0.0964 0.09652007 0.0000 0.0035 0.0462 0.0417 0.0833 0.0983 0.1335 0.1153 0.1634 0.1639 0.16412008 0.0000 0.0045 0.0106 0.0156 0.0383 0.0752 0.1149 0.1328 0.2339 0.2346 0.23442009 0.0000 0.0218 0.0241 0.0182 0.0142 0.0363 0.1088 0.0596 0.1869 0.1870 0.18782010 0.0000 0.0031 0.0278 0.0181 0.0178 0.0217 0.0359 0.1424 0.1820 0.1806 0.18102011 0.0000 0.0049 0.0361 0.0284 0.0087 0.0205 0.0409 0.0919 0.1643 0.1642 0.16352012 0.0000 0.0000 0.0113 0.0282 0.0338 0.0273 0.0368 0.0334 0.0861 0.0852 0.08702013 0.0000 0.0074 0.0309 0.0112 0.0314 0.0234 0.0148 0.0363 0.0615 0.0615 0.09052014 0.0000 0.0090 0.0038 0.0255 0.0080 0.0046 0.0021 0.0338 0.0143 0.0143 0.01892015 0.0000 0.0175 0.0408 0.0253 0.0172 0.0166 0.0259 0.0197 0.0385 0.0384 0.03932016 0.0000 0.0051 0.0798 0.0772 0.0265 0.0258 0.0324 0.0420 0.0342 0.0343 0.03412017 0.0106 0.0430 0.0152 0.0449 0.0462 0.0568 0.0469 0.0529 0.0791 0.0678 0.08442018 0.0000 0.0000 0.0434 0.0365 0.0590 0.0661 0.0549 0.0589 0.0823 0.0304 0.11312019 0.0000 0.0000 0.0284 0.0563 0.0421 0.0487 0.0523 0.0407 0.0346 0.0654 0.2811
Average 0.0022 0.0110 0.0242 0.0283 0.0263 0.0301 0.0381 0.0511 0.0712 0.0703 0.0801

ICES | AFWG 2020 | 13
Table 1.7a. Overview of available prognoses of NEA cod recruitment (in million individuals of age 3) from different models (Section 1.4.2).
Model Prognostic years (counting this year’s assessment as first year
Updated 2020
Prognoses
2021
Prognoses
2022
Prognoses
2023
prognoses
TitovES 2 At assessment
528 585
TitovEL 4 At assessment
486 588 602 608
RCT3 3 At assessment
828 858 411
Hybrid model
At assessment
583 635 512 608
Table 1.7b. Related weights to the models used in the hybrid model.
Model Model weight 2020 Model weight 2021 Model weight 2022
TitovES 0.54 0.59
TitovEL 0.25 0.23 0.53
RCT3 0.22 0.18 0.47
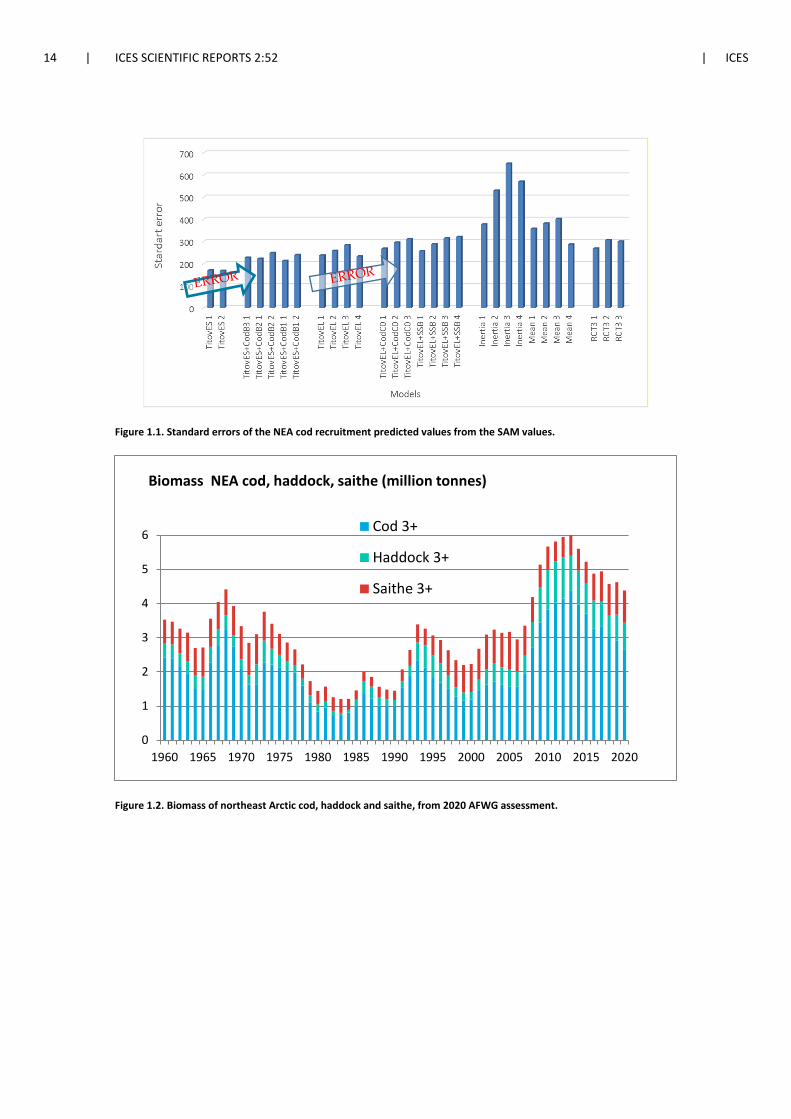
14 | ICES SCIENTIFIC REPORTS 2:52 | ICES
Figure 1.1. Standard errors of the NEA cod recruitment predicted values from the SAM values.
Figure 1.2. Biomass of northeast Arctic cod, haddock and saithe, from 2020 AFWG assessment.
0
1
2
3
4
5
6
1960 1965 1970 1975 1980 1985 1990 1995 2000 2005 2010 2015 2020
Biomass NEA cod, haddock, saithe (million tonnes)
Cod 3+
Haddock 3+
Saithe 3+

ICES | AFWG 2020 | 15
Figure 1.3. Annual fishing mortalities of the northeast Arctic cod, haddock and saithe stocks relative to FMP, i.e. the level used in the management plans for these stocks when SSB>Bpa. For cod FMP is not well-defined, as there is a two-step HCR. In this figure, the lower plateau (F=0.40) is used in calculating the ratio. Harvest control rules were introduced for cod and haddock in 2004 onwards and for saithe in 2007.
0.0
0.5
1.0
1.5
2.0
2.5
3.0
196019641968197219761980198419881992199620002004200820122016
F/FMP ratio
cod
haddock
saithe
1.0

16 | ICES SCIENTIFIC REPORTS 2:52 | ICES
2 Cod in subareas 1 and 2 (Norwegian coastal waters)
SPALY ASSESSMENT PROCEDURE, (NEW CATCH-AT-AGE TIME-SERIES AT AFWG 2019) NEED FOR BENCHMARK The stock was a part of the WKARCT benchmark meeting in January 2015 (ICES 2015/ACOM: 31). There is high uncertainty in the estimation of commercial catch, and useful information about recreational fishing and tourist fishing is largely lacking. A new time-series for commercial catch numbers-at-age with uncertainty estimates was presented to the benchmark by using the ECA-model (Hirst et al., 2012). The corresponding catches in tonnes are presented in Table 2.1a. The benchmark meeting accepted the new catch estimates but noticed that the differences com-pared to the old method should be further explored. Work after the benchmark has revealed some years with problematic sampling data in some areas (see: section 2.2.1). This has been partly resolved, and results with the new catch-at-age series were introduced at the 2019 AFWG and compared to the results from the old series for the years 1984–2018 (AFWG 2019, section 2.2.1, Figures 2.5b and 2.5.c.)
A new Benchmark is planned for autumn 2020/spring 2021 to deal with:
• Consider a split of the assessment area in two or three regions. There are genetic analysisindicating reasons for splitting the stock in two or more units (Dahle et al., 2018), andmore studies are ongoing. Both survey data and catch sampling data have better qualitynorth of 67 than south of 67. About 80% of the annual catches of coastal cod are takennorth of 67;
• A new fyke net/gillnet-survey series in shallow areas, during August, has been initiatedsouth of 67, alternating; one year between 67 and 65°N (2013, 2016, 2018, and planned for2020), and next year between 65 and 62°N (2015, 2017, 2019).
• Ongoing work aims at using the software StoX (Johnsen et al., 2016) for producing aswept-area time-series based on bottom-trawl hauls in the coastal survey (NOcoast-Aco-4Q), as well as re-estimating the acoustic time-series by use of StoX, and an improvedstrata system;
• Evaluate new information from the recreational fisheries.
• Choice of assessment model.
2.1 Stock status summary
Both the coastal acoustic survey in autumn (Figure 2.14) and the current assessment (Figure 2.17) show a considerable decline in SSB in the late 1990s. The current assessment indicates some in-creased SSB in the years 2001–2016 and a decline in 2017 and 2018, then some increase in 2019. The highest recruitments occurred in the two first years of the time-series (1984, 1985). Since then there seem to be a long-term declining trend in recruitment. Fishing mortality was very high at the beginning of the time-series (1984–1989) and rather high during 1997–1999. F shows a declin-ing trend over the period 1998–2013 and no clear trend for the latest years. Most recent F appears to be above the target in the rebuilding plan. The abundance indices from the coastal surveys in autumn 2013 and 2014 showed some increase compared to previous years. The surveys in 2015-2018 have showed rather low indices, while the 2019 survey showed some increase.

ICES | AFWG 2020 | 17
2.2 Fisheries
Coastal cod is fished throughout the year and within nearly all the distribution area in the Nor-wegian statistical areas 03, 04, 05, 00, 06, 07, Figures 2.1–2.3). Most of the coastal cod catches are taken as a bycatch during fisheries aimed at NEA cod during its spawning migration or feeding migration to coastal waters. The main fishery for coastal cod, therefore, takes place in the first half of the year. The main fishing areas are along the coast from Varangerfjord to Lofoten (areas 03, 04, 05, 00).
Except for the open fjords in eastern Finnmark, the quantities fished inside fjords are quite low. In the period 2011–2015 the average percentage share between gear types in the estimated coastal cod commercial landings was around 46% for gillnet, 26% for Danish seine, 26% for long-line/handline and 2% for bottom trawl. In 2017, there was some increase for Danish seine (35%) and longline (25%), and a decrease for gillnet (38%). Table 2.1b. shows catches in 2018 by gear groups for coastal cod plus NEA cod in statistical areas 00, 03, 04, 05, and 06+07, and table 2.1c show the ECA-estimated 2018 catches of coastal cod for gillnet, trawl and others. (Due to time constrains, these two tables were not updated with 2019-catches).
Recreational and tourist fisheries take an important fraction of the total catches in some local areas, especially near the coastal cities, and in some fjords where commercial fishing activity is low. However, there are a few reports trying to assess the amount in certain years. In 2010, these reports were used to construct a time-series (ICES CM 2010/ACOM:05) of recreational catches. These catch estimates are quite uncertain. No additional information has been included in later years, and the annual recreational catch since 2010 has been assumed equal to the one estimated for 2009 (12 700 t). For those years, the total catch numbers-at-age (Table 2.1c) have been upscaled from the estimated catch-at-age in the commercial landings, according to the added amount in tonnes. Historical there has been no reporting system for coastal cod (NCC) taken by recreational or tourist fishers in Norway. In 2019 the Norwegian Directorate for Fisheries established a web-portal for reporting recreational catch (both by the tourist industry and for private fishers). There are several ongoing research projects on recreational fishing. There is a need for synthesising the results from those.
2.2.1 2.2.1. Sampling fisheries and estimating catches (Tables 2.1–2.4, Figures 2.1–2.5)
Catch numbers-at-age are estimated by the ECA model. The commercial catches of Norwegian Coastal cod (NCC) have been calculated back to 1984 (Table 2.1a). For this period, the estimated annual landings have been between 27 kt and 65 kt. The commercial landings of NCC in 2019 were estimated to 40.1 kt t (Table 2.1a , Figure 2.3). Table 2.1b shows the estimated catch by gears, area and quarters in 2018. Figure 2.5b shows the ECA-estimates (1984-2019) and the results of the “traditional calculation method”(1984-2017).
Commercial catches of cod are separated to types of cod by the structure of the otoliths in com-mercial samples. Figure 2.4 illustrates the main difference between the two types: The figure and the following text is from (Berg et al., 2005): Coastal cod has a smaller and more circular first translu-cent zone than northeast Arctic cod, and the distance between the first and the second translucent zone is larger (Figure 2.4). The shape of the first translucent zone in northeast Arctic cod is similar to the outer edge of the broken otolith and to the subsequent established translucent zones. This pattern is established at an age of 2 years, and error in differentiating between the two major types does not increase with age since the established growth zones do not change with age. The precision and accuracy of the separa-tion method has been investigated by comparison of different otolith readers and results from genetic investigation of cod. The results indicate high accuracy using in the otolith method (Berg

18 | ICES SCIENTIFIC REPORTS 2:52 | ICES
et al., 2005). Nevertheless, in cases with a low percentage misclassification of large catches of pure NEA cod, the catches of coastal cod could be severely overestimated.
Sampling and landings The basis for estimating coastal cod catches is the total landings of cod in the Norwegian statis-tical areas 03, 04, 05, 00, 06, 07 (Figures 2.1a, and 2.1b), combined with the sampling of these fisheries. Since the catches are separated to type of cod by the structure of the otoliths, the num-bers of age samples are critical for the estimated catch of coastal cod. Table 2.2 shows the sam-pling of the cod fishery by quarters and areas in 2018, and similar for the years 2017 and 2016 in Tables 2.3. The sampling level in 2018 was somewhat improved compared to 2016 and 2017. Table 2.4 compares the numbers of fish sampled by quarters for the period 1985–2018. A total of 16 062 fish were aged in 2018. 5196 of these otoliths were classified as coastal cod. This represents 40% of all cod otoliths sampled within the coastal cod area. This percentage is similar to 2016, but well above the time-series average (Table 2.4). Similar tables are not produced for the sam-pling in 2019. The sampling program in 2019 was similar to previous years, and it is expected that the relative coverage by areas and quarters are similar to 2018.
The Norwegian sampling program was changed in 2010. This led to poor sampling in that year. The sampling in later years has gradually improved, and the number of samples (but not the number of otoliths) is now well above the level prior to 2010.
Tables 2.1b and 2.1.c show the total cod catch by area and quarters within the 12 n-mile and the estimated catches of coastal cod by statistical area and quarter for the years 2017 and 2016. The corresponding fractions of coastal cod in cod catches are also shown. The total cod catch within 12 n-mile was lower in 2017 than 2016, while the coastal cod catch (and fraction costal cod) was higher in 2017. (Due to time constrains, similar tables for 2019 are not produced).
The ECA-estimate of coastal cod in 2017 was close the traditional estimate. For the period 2003–2014 the ECA estimates were consistently above the traditional (Figure 2.5b).
2.2.2 Regulations
The Norwegian cod TAC is a combined TAC for both the NEAC stock and NCC stock. Landings of cod are counted against the overall cod TAC for Norway, where the expected catch of coastal cod is in the order of 10%. The coastal cod part of this combined quota was set 40 000 t in 2003 and earlier years. In 2004, it was set to 20 000 t, and in the following years to 21 000 t. There are no separate quotas given for the coastal cod for the different groups of the fishing fleet. Catches of coastal cod are thereby not effectively restricted by quotas.
Since the coastal cod is fished under a merged coastal cod/northeast Arctic cod quota, the main objective of these regulations is to move the traditional coastal fishery from areas with high frac-tions of coastal cod to areas where the proportion of NEA cod is higher.
Most regulation measures for northeast Arctic cod also applies to coastal cod; minimum catch size, minimum mesh size, maximum bycatch of undersized fish, closure of areas having high densities of juveniles, and some seasonal and area restrictions.
A number of regulations contribute to some protection of coastal cod: Trawl fishing for cod is not allowed inside the 6-nautical mile line (in the years 2006–2010 about 10 fresh fish trawlers had a dispensation to fish between the 4 and 6-mile line in a few areas in the period 15 April–15 September). Since the mid-1990s the fjords in Finnmark and northern Troms (areas 03 and 04) have been closed for fishing with Danish seine. Since 2000, the large longliners have been re-stricted to fish outside the 4 nautical mile line.

ICES | AFWG 2020 | 19
Regulations introduced 2004–2010 To achieve a reduction in landings of coastal cod additional technical regulations in coastal areas were introduced in May 2004 (after the main fishing season) and continued with small modifi-cations in 2005 and 2006. In those regulations “fjord-lines” were drawn along the coast to close the fjords for direct cod fishing with vessels larger than 15 metres. In 2005 also a box closed to all fishing gears except handline and fishing rod was defined in the Henningsvær-Svolvær area. This is an area where spawning concentrations of coastal cod are usually observed and where the catches of coastal cod have been high. Since the coastal cod is fished under a merged coastal cod/northeast Arctic cod quota, these regulations are aimed at moving parts of the traditional coastal fishery from the catching of coastal cod in the fjords to a cod fishery outside the fjords, where the proportion of northeast Arctic cod is higher.
The regulations for the closed spawning area near Henningsvær-Svolvær were during the 2012 spring fishery relaxed by allowing vessels less than 11 m to fish. This was continued in 2013–2017. The openings of this area were based on “real-time” genetic monitoring of catches, started in 2007 (Dahle et al., 2018). The area was closed in the seasons 2005–2010, and for the first time opened late in the 2011-season, based on the monitoring showing high percentage of NEA cod (>70%). In the spawning season in 2011–2016 large concentrations of NEA cod were observed in this area, and the fraction of coastal cod in the catches was low.
Further restrictions were introduced in 2007 by not allowing pelagic gillnet fishing for cod and by reducing the allowed bycatch of cod when fishing for other species inside fjord lines from 25–5%, and outside fjord lines from 25–20%. The regulations were maintained in 2008.
Since 2009 the most important coastal cod spawning area in the southern part of the stock distri-bution area (Borgundfjorden near Ålesund) has been closed to fishing (except for handline and fishing rod) during the spawning season. A similar real-time monitoring was set up for monitor-ing the fraction of NEA cod during the spring fishery (Johansen et al., 2017). No samples during the years 2009–2015 showed fractions of NEA cod above 70%, and the areas has been kept closed in all the yeas 2009–2018.
7000 t of the Norwegian cod quota has since 2010 been set aside to cover the catches taken in the recreational and tourist fisheries and catches taken by young fishers (to motivate young people to become fishers).
Additional regulations in 2011: No dispensations for fresh fish trawlers to fish inside 6 n-mile. In the recreational fishery, the maximum gillnet length per person was reduced from 210 m to 165 m, and the allowance for selling cod per person is reduced from 2000 kg to 1000 kg per year. Minimum landing size now also applies to recreational and tourist fishing. For cod this is set to 44 cm in the area north of 62°N. A reallocation of unfished quotas towards the end of 2011 lead to some increased fishing effort aimed at cod in coastal areas. This reallocation has contributed to the increase in coastal cod catch in 2011.
Additional regulations in 2012 and later: The rebuilding plan (Annex 3.4.2) was put into opera-tion in 2011. Since the spawning biomass index in the 2011 autumn survey was higher than the 2010 value, the rebuilding plan, implied that the 2011 regulation could be unchanged in 2012. A minimum mesh size (126 mm full mesh) for gillnets in recreational fisheries was activated from 1 January 2012. This had been announced more than a year in advance to allow people to prepare for the change.
The 2012 survey index for spawning biomass was lower than the previous, and the same was the case with the 2015 survey. According to the rebuilding plan additional measures for reducing catches of coastal cod should apply both for 2013 and 2016. For 2013–2016 no regulations in ad-dition to those in place in 2011 and 2012 have been communicated to ICES.
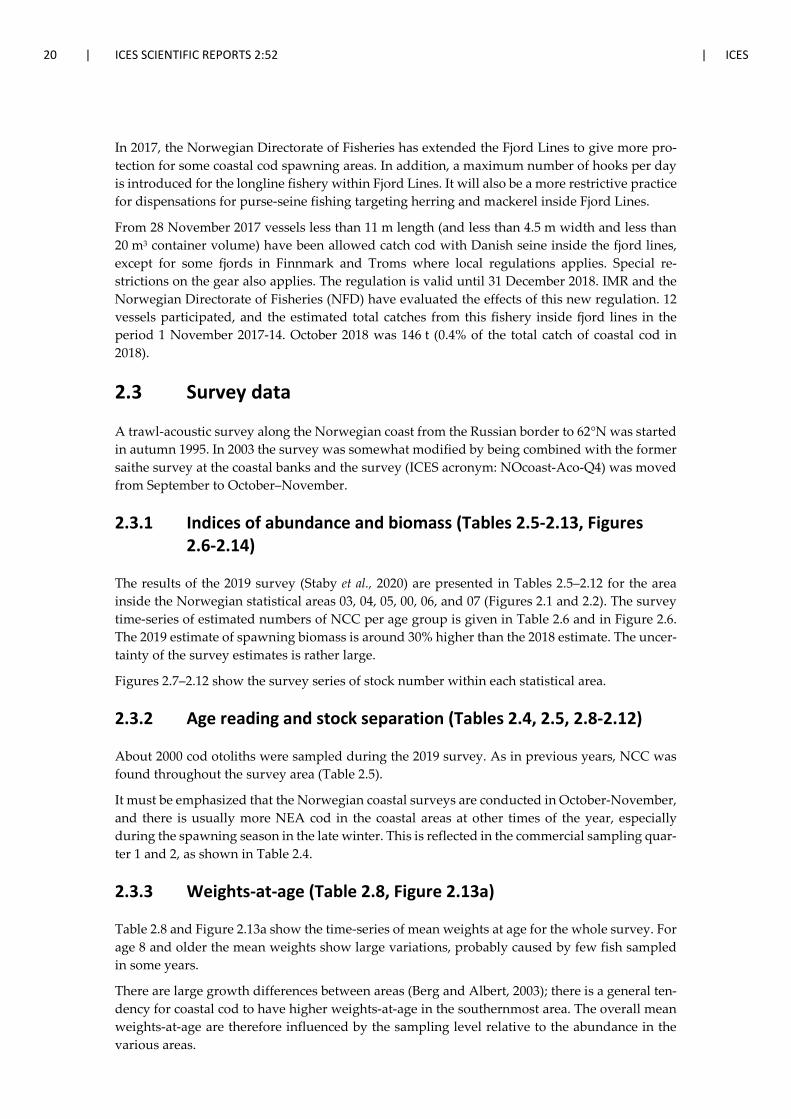
20 | ICES SCIENTIFIC REPORTS 2:52 | ICES
In 2017, the Norwegian Directorate of Fisheries has extended the Fjord Lines to give more pro-tection for some coastal cod spawning areas. In addition, a maximum number of hooks per day is introduced for the longline fishery within Fjord Lines. It will also be a more restrictive practice for dispensations for purse-seine fishing targeting herring and mackerel inside Fjord Lines.
From 28 November 2017 vessels less than 11 m length (and less than 4.5 m width and less than 20 m3 container volume) have been allowed catch cod with Danish seine inside the fjord lines, except for some fjords in Finnmark and Troms where local regulations applies. Special re-strictions on the gear also applies. The regulation is valid until 31 December 2018. IMR and the Norwegian Directorate of Fisheries (NFD) have evaluated the effects of this new regulation. 12 vessels participated, and the estimated total catches from this fishery inside fjord lines in the period 1 November 2017-14. October 2018 was 146 t (0.4% of the total catch of coastal cod in 2018).
2.3 Survey data
A trawl-acoustic survey along the Norwegian coast from the Russian border to 62°N was started in autumn 1995. In 2003 the survey was somewhat modified by being combined with the former saithe survey at the coastal banks and the survey (ICES acronym: NOcoast-Aco-Q4) was moved from September to October–November.
2.3.1 Indices of abundance and biomass (Tables 2.5-2.13, Figures 2.6-2.14)
The results of the 2019 survey (Staby et al., 2020) are presented in Tables 2.5–2.12 for the area inside the Norwegian statistical areas 03, 04, 05, 00, 06, and 07 (Figures 2.1 and 2.2). The survey time-series of estimated numbers of NCC per age group is given in Table 2.6 and in Figure 2.6. The 2019 estimate of spawning biomass is around 30% higher than the 2018 estimate. The uncer-tainty of the survey estimates is rather large.
Figures 2.7–2.12 show the survey series of stock number within each statistical area.
2.3.2 Age reading and stock separation (Tables 2.4, 2.5, 2.8-2.12)
About 2000 cod otoliths were sampled during the 2019 survey. As in previous years, NCC was found throughout the survey area (Table 2.5).
It must be emphasized that the Norwegian coastal surveys are conducted in October-November, and there is usually more NEA cod in the coastal areas at other times of the year, especially during the spawning season in the late winter. This is reflected in the commercial sampling quar-ter 1 and 2, as shown in Table 2.4.
2.3.3 Weights-at-age (Table 2.8, Figure 2.13a)
Table 2.8 and Figure 2.13a show the time-series of mean weights at age for the whole survey. For age 8 and older the mean weights show large variations, probably caused by few fish sampled in some years.
There are large growth differences between areas (Berg and Albert, 2003); there is a general ten-dency for coastal cod to have higher weights-at-age in the southernmost area. The overall mean weights-at-age are therefore influenced by the sampling level relative to the abundance in the various areas.

ICES | AFWG 2020 | 21
2.3.4 Maturity-at-age (Table 2.10, Figure 2.13b)
The fraction of mature fish in the autumn survey (Table 2.10) show rather large variation be-tween years. Parts of this variation could be caused by the difficulty of distinguishing mature and immature cod in autumn. Based on the records of spawning zones in the otoliths a back-calculation of proportion mature at age (Gulland, 1964) was considered at the 2010 AFWG. The analysis was based on samples from the spawning fisheries in March-April. The results are shown in Figure 2.13b. This does not confirm the amount of year-to-year variation seen in the survey observation, and thereby gives some support for rather using a fixed maturation as in-troduced by the 2010 WG. Since the age at maturation is higher in northern areas compared to southern areas (Berg and Albert, 2003), the back-calculation analysis should be refined by ensur-ing a reasonable balance in the amount of data from northern and southern areas.
2.4 Data available for the catch-at-age Assessment (XSA and SVPA)
2.4.1 Catch-at-age (Table 2.1a-e, and table 2.14)
The estimated commercial catch-at-age (2–10+) for the period 1984–2019 is given in Table 2.1a. Table 2.1c shows the total catch numbers-at-age when recreational and tourist fishing is in-cluded.
There have been conducted two investigations trying to estimate the level of discarding and mis-reporting from the coastal vessels in two periods (2000 and 2002–2003, WD 14 at 2002 WG). The amount of discard was calculated, and the report from the 2000-investigation concluded there was both discard and misreporting by species in 2000. In the gillnet fishery for cod this represents approximately 8–10% relative to reported catch. 1/3 of this is probably coastal cod. The last report concluded that misreporting in the Norwegian coastal gillnet fisheries have been reduced signif-icantly since 2000.
2.4.2 Weights-at-age (Tables 2.8 and 2.13)
Weight-at-age in catches is derived from the commercial sampling and is shown in Table 2.13. The same weight-at-age is assumed for the recreational and tourist catches.
The weight-at-age in the stock is obtained from the Norwegian coastal survey (Table 2.8). The survey is covering the distribution area of the stock. Weight-at-age from the survey is therefore assumed to be a relevant measure of the weight-at-age in the stock at survey time (October). These weights (Table 2.13) will, however, overestimate the stock biomass at the start of the year.
2.4.3 Natural mortality
A fixed natural mortality of 0.2 has been assumed in the assessment. However, in the Barents Sea cod cannibalism has been documented to be a significant source of mortality that varies in relation to alternative food and in relation to the abundance of large cod. This might also be the case for the coastal cod (Pedersen and Pope, 2003a and b). In the 2005 coastal cod survey 1125 cod stomachs were analysed (Mortensen, 2007). The observed average frequency of occurrence of cod in cod stomachs was around 4%. Other important predators on cod in coastal waters are cormorants, harbour porpoises and otters (Anfinsen, 2002; Pedersen et al., 2007; Mortensen, 2007). Young saithe (ages 2–4) has been observed to consume postlarvae and 0-group cod during summer/autumn (Aas, 2007).
22 | ICES SCIENTIFIC REPORTS 2:52 | ICES
2.4.4 Maturity-at-age (Tables 2.10, 2.15, Figure 2.13b)
The average maturity-at-age observed over the survey period 1995–2009 has been used in the assessment (Table 2.13), since there are uncertainties related to the annual variations seen in the survey observations of maturity (Figure 2.13b). The analyses based on back-calculation of spawning zones (Figure 2.13b) are relevant, but still preliminary.
2.5 Methods used for assessing trends in stock size and mortality (Table 2.13-2.18, Figure 2.16-2.18)
Earlier attempts to assess the stock using XSA analysis have shown retrospective problems. For several years the main basis for assessing the stock was the survey time-series (plotted in Figures 2.6–2.13), and SURBA was used for further analysing the survey trends.
In the 2010 WG mortality signals from the survey and from the catch-at-age data were analysed and an SVPA (“user-defined VPA” in the Lowestoft VPA95-menu) were run using the survey based estimate of F2009 (details described in Annex 10 in ICES CM 2010/ACOM:05) as terminal F. The same procedure was used this year: By using the survey indices for ages 2 to 8 (Table 2.6) a trial XSA (Tables 2.13–2.15) was run to obtain historic values of F(4–7). Calculated survey mortali-ties (Table 2.16 and Figure 2.15) were regressed with XSA Fs for the years 1996–2007 (Figure 2.15). This regression was used for converting the 2019 survey mortality to a VPA F(4–7) (Table 2.16). A selection pattern for 2019 was estimated as the average pattern over the years 2017–2019 in the trial XSA, and Fs on oldest true age was taken from the trial XSA. The SVPA, which is considered as the final assessment, was run by using the survey based F(4–7) for 2019 combined with the selection pattern and oldest true Fs described above. The same procedure was repeated for catch-at-age data including estimates of recreational catches, but the trial XSA for that dataset is not shown here.
The results are shown in Tables 2.17–2.18 and in Figures 2.16–2.18.
2.6 Results of the Assessment
2.6.1 Comparing trends with last year’s assessment (Table 2.6, 2.15—2.18, Figures 2.6, 2.13–2.14, 2.16–2.18)
The 2019 survey estimate of spawning biomass (34.3 kt) is well above the 2018 (Tables 2.9 and 2.11, Figure 2.17).
The survey-based estimate of the F2019 is 0.20 when relating to commercial catch and 0.29 when relating to total catch data. The text table below compares results for commercial catch with cor-responding values earlier years (see also Figure 2.16). The table also compares the SSB-results of SVPA-runs aimed at those Fs used as terminal Fs. The high catches in 2015–2017 (containing rea-sonable amounts of old fish) has in the current (and last year`s) assessment caused some upward stock revision for several years back in time. Corresponding downward revisions of F is ob-served. The “F on oldest true age” in the SVPA is derived from a trial XSA with a 20-year tuning window with time taper. The effect of the high survey estimates at the beginning of the time-series has thereby been reduced in the later assessments compared to the earlier. This has further contributed to upward revisions of SSB, and downward revisions of F seen in the text table below (also visible in Figure 2.17 for the years 2015–2017). Note that the results of the 2019 and 2020 assessment are based on a revised catch number-at-age series (AFWG 2019).

ICES | AFWG 2020 | 23
Ass Yr F 09 F 10 F 11 F 12 F 13 F 14 F 15 F 16 F 17 F 18 F19
2010 0.37
2011 0.38 0.38
2012 0.28 0.26 0.33
2013 0.29 0.23 0.33 0.37
2014 0.31 0.26 0.34 0.36 0.27
2015 0.31 0.27 0.36 0.37 0.29 0.27
2016 0.29 0.25 0.32 0.29 0.21 0.19 0.35
2017 0.28 0.24 0.30 0.26 0.18 0.15 0.25 0.30
2018 0.26 0.22 0.28 0.23 0.16 0.14 0.22 0.25 0.35
2019 0.22 0.30 0.27 0.19 0.15 0.16 0.17 0.26 0.31 0.27
2020 0.22 0.29 0.26 0.19 0.15 0.17 0.18 0,28 0.30 0.20 0.20
Ass Yr SSB 09 SSB 10 SSB 11 SSB 12 SSB 13 SSB 14 SSB 15 SSB 16 SSB 17 SSB 18 SSB 19
2010 46
2011 50 44
2012 59 58 70
2013 60 60 68 66
2014 59 58 64 59 51
2015 59 57 63 57 47 49
2016 63 62 69 67 61 70 75
2017 66 65 73 73 70 84 99 100
2018 75 74 83 82 78 95 114 114 109
2019 88 101 97 101 100 133 129 135 113 95
2020 89 103 99 102 101 132 126 130 115 100 114
The recruitment estimate for the final year is highly uncertain in all assessments (Figures 2.16). Figure 2.17 shows the SSB-series from VPA and survey, both scaled to their average over the years 1995–2017. Figure 2.18 compares the various time-series of F. The SVPA is fixed at the survey-derived F for the terminal year, but for most of the years 2001–2016 the SVPA give lower F than the one derived from the survey. For the SVPA based on commercial catch this happened in 13 of those 16 years, and for the SVPA based on total catch this was the case in 11 of the 16 years. This pattern seems to indicate some conflicts between the annual catch-at-age and the an-nual numbers-at-age in the survey.
24 | ICES SCIENTIFIC REPORTS 2:52 | ICES
2.6.2 Recruitment (Table 2.6, Figure 2.16)
The younger ages are poorly represented both in the survey and in the catch data. The VPA-estimates of recruits in latest data year, therefore, show large retrospective revisions (Figure 2.16). The survey estimate for age 2 is somewhat higher in the three recent years compared to the period 2002–2013. It is worth to notice that the recruitment started to decline a few years before the spawning stock, indicating that the recruitment failure is an important cause for the stock decline in the late 1990s.
2.6.3 Catches in 2020
No catch prediction for 2020 have been made.
2.7 Comments to the Assessment
Uncertain estimates of catch-at-age and limited information about the recreational fishery and the tourist fishery leads to high uncertainty in the catch-at-age based analysis. The series with recreational and tourist fisheries included may be said to scale the stock size to a more realistic level, but at the same time brings in additional uncertainty.
The acoustic survey has a rather large uncertainty. This is because cod contributes to a low frac-tion of the total observed acoustic values. The cod estimate is thus vulnerable to allocation error. The Norwegian coastal survey is the only survey covering the main distribution area of the stock. The survey is conducted in the period October/November. In this period, the maturity stage can be variable and difficult to define, and a survey index of SSB based on the long-term mean (cur-rently 1995–2009) maturity-at-age is considered to reduce some annual variation caused by stag-ing uncertainty.
2.8 Reference points
No biological reference points are established.
2.9 Management considerations
Estimated catches were rather stable in the period 2004–2014, while they were considerably higher in the years 2015–2017. For most years in the period 2004–2014 the regulations seem to have reduced the catches and fishing mortality compared to pre-2004 level, but have not been sufficient to cause persistent further reductions. Since 2013 the quotas for NEA cod has been very high. This has likely contributed to increased catches of coastal cod. In 2015, 2016 and 2017 catches of coastal cod were exceptionally high in January in southern Troms and northern Nord-land (Figure 1.16), where coastal cod where feeding on aggregations of herring. This fishery oc-curred before the NEA cod spawning migration reached those areas. Such concentrations of coastal cod were in 2015 rather unexpected, and illustrates a need for considering flexible regu-lations that on short notice may move fisheries from coastal cod to Northeast arctic cod.
The time-series of estimated recreational catch presumes rather stable catches, and they repre-sent thereby a higher fraction (about 35%) during the period 2004–2014 when the commercial catch was low.

ICES | AFWG 2020 | 25
The rebuilding plan (Annex 3.4.2) was put into operation in 2011. The plan specifies the following plan for reducing the fishing mortality in every year when the latest survey shows a reduced SSB-index:
Action year 1 2 3 4 5 6 7
Reduction relative to F2009 15% 30% 45% 60% 75% 90% 100%
The spawning biomass index in the 2010 survey was below the index in the 2009 survey. This means that the regulation in 2011 was aimed at a 15% reduction of F relative to 2009. The 2011 survey gave a higher spawning biomass index than in 2010. The 2012 survey index for spawning biomass was lower than the previous, and according to the rebuilding plan additional measures for reducing F by 30% (relative to 2009) should apply for 2013. For 2013 and later years no regu-lations in addition to those in place in 2011 and 2012 have been communicated to ICES. The survey showed an increase both in 2013 and 2014. Therefore, the 30% reduction of F still applied for 2015. The 2015 survey showed a decline, and the regulations in 2016 should aim for 45% reduced F. The 45% also applies for 2017, since the latest survey gave a higher SSB-estimate then the previous. Since the 2017 survey was lower than in 2016, the fourth step (60% reduction) should apply for 2018. Since both the 2018 survey and the 2019 survey showed increasing survey biomass, the 60% also applies for 2020 and 2021.
The VPA analysis presented indicate some reduction of F over the period 1999–2013, followed by increased F in 2014- 2017 and a reduced F (=0.2) in 2018 and 2019.
2.10 Rebuilding plan for coastal cod
The following rebuilding plan was suggested by Norway in 2010:
“The overarching aim is to rebuild the stock complex to full reproductive capacity, as well as to give sufficient protection to local stock components. Until a biologically founded rebuilding tar-get is defined, the stock complex will only be regarded as restored when the survey index of spawning stock in two successive years is observed to be above 60 000 tonnes1. Importantly, this rebuilding target will be redefined on the basis of relevant scientific information. Such infor-mation could, for instance, include a reliable stock assessment, as well as an estimate of the spawning stock corresponding to full reproductive capacity.
Given that the survey index for SSB does not increase, the regulations will aim to reduce F2 by at least 15 per cent annually compared to the F estimated for 2009. If, however, the latest survey index of SSB is higher than the preceding one - or if the estimated F for the latest catch year is less than 0.1 - the regulations will be unchanged.
Special regulatory measures for local stock components will be viewed in the context of scientific advice. A system with stricter regulations inside fjords than outside fjords is currently in opera-tion, and this particular system is likely to be continued in future.
The management regime employed is aiming for improved ecosystem monitoring in order to understand and possibly enhance the survival of coastal cod. Potential predators are - among others - cormorants, seals and saithe.
When the rebuilding target is reached, a thorough management plan is essential. In this regard, the aim will be to keep full reproductive capacity and high long-term yield.”
1The average survey index in the years 1995–1998.
2 Ages 4–7.

26 | ICES SCIENTIFIC REPORTS 2:52 | ICES
The Evaluation of this plan made at the 2010 WG (Annex 10 in ICES, 2010/ACOM:05) was not reviewed by the review group and advice drafting group dealing with the rest of the AFWG report. ICES selected some experts who during summer 2010 reviewed the evaluation, and an advice group wrote the response to Norwegian Authorities, issued on 1 October 2010. The con-clusions are:
Based on simulations, ICES conclude that the plan, if fully implemented, is expected to lead to significant rebuilding. Nonetheless, accounting for realistic uncertainties in the catches, surveys, and the assessment model, a rather long rebuilding period is required even if fishing mortality is markedly reduced within the next several years. Whereas not fully quantifiable, the needed reductions in fishing mortality will require accompanying reductions in the catches.
ICES consider the proposed rule to be provisionally consistent with the Precautionary Approach. The basis of this evaluation has been the precautionary approach, and not the new ICES MSY framework.
This rebuilding plan was in 2010 adopted by Norwegian authorities. Results from the coastal survey are available in early December, and management decisions for the following year will then be made according to the SSB index and the rebuilding plan.
Has the rebuilding plan worked?
According to the catch estimates, the commercial catch of coastal cod was quite high in the years 2015–2017, while the catches in 2018 and 2019 were somewhat lower. The high catches in 2015–2017 are mainly caused by targeting aggregations of cod during the first quarter in southern Troms and northern Nordland, prior to arrival of the spawning NEA cod.
The rebuilding plan has now been in operation for 10 years. The plan implies that the fishing mortality in 2019 should be at least 60% lower than the 2009 value. The 2019 data indicate a fishing mortality 17% below the F in 2009, while the estimated catch in 2019 is 24% above the catch in 2009. The regulations have therefore not been sufficient for constraining the coastal cod catches in the years 2015–2019.
The Norwegian Ministry of Fisheries is working on a new rebuilding plan. Fisheries scientists need to discuss with managers, how to facilitate a rebuilding of the stock, evaluate rebuilding targets and measures to avoid high fishing pressure in areas with high fractions of coastal cod.
Since coastal cod to a large extent is a bycatch in the fishery for Northeast Arctic cod, the regula-tions should aim for reducing catches in areas where the fraction of coastal cod is high. Stronger restrictions are required in all areas where coastal cod is distributed. These restriction require-ments include coastal cod taken as bycatch in northeast Arctic cod, haddock, and saithe fisheries.
2.11 Recent ICES advice
For the years 2004–2011 the advice was; No catch should be taken from this stock and a recovery plan should be developed and implemented.
For 2012, and later the advice has been to follow the rebuilding plan. The latest ICES advice strongly recommends a new rebuilding plan.
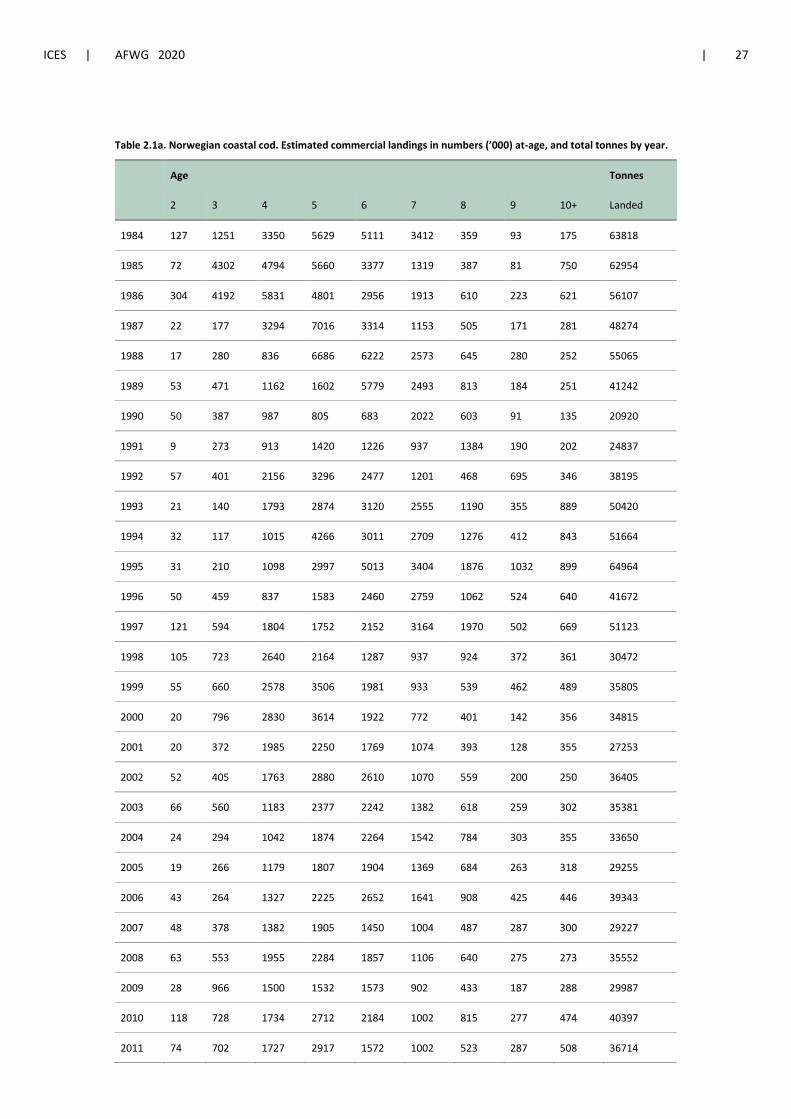
ICES | AFWG 2020 | 27
Table 2.1a. Norwegian coastal cod. Estimated commercial landings in numbers (’000) at-age, and total tonnes by year.
Age Tonnes
2 3 4 5 6 7 8 9 10+ Landed
1984 127 1251 3350 5629 5111 3412 359 93 175 63818
1985 72 4302 4794 5660 3377 1319 387 81 750 62954
1986 304 4192 5831 4801 2956 1913 610 223 621 56107
1987 22 177 3294 7016 3314 1153 505 171 281 48274
1988 17 280 836 6686 6222 2573 645 280 252 55065
1989 53 471 1162 1602 5779 2493 813 184 251 41242
1990 50 387 987 805 683 2022 603 91 135 20920
1991 9 273 913 1420 1226 937 1384 190 202 24837
1992 57 401 2156 3296 2477 1201 468 695 346 38195
1993 21 140 1793 2874 3120 2555 1190 355 889 50420
1994 32 117 1015 4266 3011 2709 1276 412 843 51664
1995 31 210 1098 2997 5013 3404 1876 1032 899 64964
1996 50 459 837 1583 2460 2759 1062 524 640 41672
1997 121 594 1804 1752 2152 3164 1970 502 669 51123
1998 105 723 2640 2164 1287 937 924 372 361 30472
1999 55 660 2578 3506 1981 933 539 462 489 35805
2000 20 796 2830 3614 1922 772 401 142 356 34815
2001 20 372 1985 2250 1769 1074 393 128 355 27253
2002 52 405 1763 2880 2610 1070 559 200 250 36405
2003 66 560 1183 2377 2242 1382 618 259 302 35381
2004 24 294 1042 1874 2264 1542 784 303 355 33650
2005 19 266 1179 1807 1904 1369 684 263 318 29255
2006 43 264 1327 2225 2652 1641 908 425 446 39343
2007 48 378 1382 1905 1450 1004 487 287 300 29227
2008 63 553 1955 2284 1857 1106 640 275 273 35552
2009 28 966 1500 1532 1573 902 433 187 288 29987
2010 118 728 1734 2712 2184 1002 815 277 474 40397
2011 74 702 1727 2917 1572 1002 523 287 508 36714

28 | ICES SCIENTIFIC REPORTS 2:52 | ICES
Age Tonnes
2 3 4 5 6 7 8 9 10+ Landed
2012 408 1159 1376 1928 1660 918 458 254 503 35540
2013 131 571 1544 1609 1154 886 627 290 474 30144
2014 110 510 1020 1730 1440 1110 840 300 490 33660
2015 140 680 1470 1290 1950 1010 650 450 820 35843
2016 110 1630 1970 2220 1750 2130 1150 670 1070 54767
2017 190 860 1890 1980 2490 1580 1220 690 850 51053
2018 150 830 1580 1730 1600 1310 800 530 500 36375
2019 70 1020 1600 1950 1870 1470 900 320 540 40107
Table 2.1b. Estimated commercial catch of coastal cod+NEA cod in 2018 by gear and area (t) within areas 00-07.
Year 2018 %
Area 03 04 00 05 06/07 Total by gear
Gillnet 8 808 18 268 27 142 35 958 3 549 93 726 36.4
L.line/Jig 17 346 12 447 7 373 11 256 1 216 49 638 19.3
Danish seine 17 965 19 189 11 028 30 462 317 78 961 30.7
Trawl 12 722 16 958 0 4 454 717 34 851 13.5
Others 37 119 0 8 76 240 0.1
Total 56 879 66 981 45 544 82 138 5 875 257 416
Table 2.1c. Estimated commercial catch of coastal cod in 2018 by gear and area (t) within areas 00-07.
Year 2018 %
Area 03 04;05;00 06;07 Total by gir
Gillnet 1 022 8 262 2 432 11 716 32.3
Trawl 881 2 364 519 3 764 10.4
Others 6 638 12 844 1 332 20 814 57.3
Total 8 541 23 470 4 283 36 294

ICES | AFWG 2020 | 29
Table 2.1d. Norwegian coastal cod. Total estimated catch number (’000) at age, including recreational and tourist catches.
AGE Tonnes
2 3 4 5 6 7 8 9 10+ landed
1984 1479 5209 9070 8945 7198 5561 2397 952 624 77118
1985 3558 10438 9733 10444 7732 3291 835 512 264 76354
1986 4722 7128 15330 10565 6889 4303 1521 481 407 69607
1987 278 2912 12244 14611 5076 3080 1236 351 149 61774
1988 744 3328 4910 8159 8714 5237 1590 591 333 68665
1989 459 1984 2917 4057 6610 3238 1057 270 86 54942
1990 408 1843 2485 2012 3838 3906 846 141 73 35420
1991 1308 3305 4448 4456 2681 1880 977 203 94 40137
1992 469 1946 5509 5913 3622 2459 1744 921 279 54295
1993 51 1645 2994 3156 3530 3768 2073 995 690 65220
1994 389 1274 3416 5017 3755 4008 1907 901 798 66364
1995 818 1228 3149 6639 7131 4050 1868 737 433 79664
1996 1214 2967 2989 5547 6144 5533 2543 1125 543 56172
1997 1377 4145 4173 3021 3225 5124 4000 1091 684 65623
1998 803 3956 7113 5339 2857 1956 2155 1230 343 45072
1999 301 1788 3791 6202 3693 1959 949 995 320 49705
2000 219 1525 4817 5322 3715 1448 453 241 152 48415
2001 44 848 2572 4020 2962 2282 740 321 119 40653
2002 248 1191 3161 3877 3681 2134 1250 490 377 50005
2003 166 1449 2758 3422 3076 1824 842 584 99 49281
2004 38 560 1407 2637 2919 2271 967 388 264 47050
2005 36 744 1957 2686 2289 1830 936 364 143 42455
2006 90 551 2672 2562 2678 1858 986 453 224 52343
2007 137 861 2155 2805 1858 1355 718 413 196 42227
2008 107 1065 2181 2473 1882 1262 701 349 170 48352
2009 3 322 1628 2007 2251 1665 825 262 276 42687
2010 21 1103 2512 2945 1616 1092 652 308 272 53097
2011 43 912 2754 2566 2203 1636 704 333 455 49414

30 | ICES SCIENTIFIC REPORTS 2:52 | ICES
AGE Tonnes
2 3 4 5 6 7 8 9 10+ landed
2012 30 622 1509 2066 2425 1771 821 472 638 48240
2013 140 843 2526 1928 1803 1054 788 384 340 42844
2014 36 1265 1908 2537 1556 1036 662 567 296 46360
2015 291 1240 2311 2438 2777 1892 997 638 895 48543
2016 384 2071 2283 2666 2311 2374 1198 682 906 67467
2017 338 2233 3090 3181 2938 2117 1572 832 962 63753
2018 202 1120 2132 2334 2159 1767 1079 715 675 49075
2019 92 1343 2107 2568 2462 1936 1185 421 711 52807
Table 2.1e. Norwegian coastal cod. Total estimated catch number (’000) at-age, in recreational and tourist catches.
AGE Tonnes
2 3 4 5 6 7 8 9 10+ landed
1984 650 1731 2116 1667 1194 597 236 133 13300
1985 3162 2590 2366 1745 647 225 130 79 0 13400
1986 627 3033 2668 1659 1139 435 251 139 0 13500
1987 108 1972 4008 2181 649 431 109 38 0 13500
1988 634 1407 1567 1708 2088 550 129 94 0 13600
1989 418 825 1483 1758 1413 518 108 34 0 13700
1990 401 1494 1252 682 2709 450 73 0 0 14500
1991 1183 2698 2996 1342 808 583 104 71 0 15300
1992 429 1281 2349 1491 630 514 846 84 0 16100
1993 47 1276 1288 813 846 696 202 368 0 14800
1994 57 701 1723 715 1288 671 393 124 0 14700
1995 8 332 804 1451 1585 780 413 180 0 14700
1996 21 591 509 617 1497 1373 461 227 0 14500
1997 51 707 1023 763 735 1189 688 132 0 14500
1998 249 1137 2327 1316 585 410 329 255 0 14600
1999 49 466 1445 1939 920 357 198 221 0 13900
2000 63 554 1153 1515 1044 344 127 109 0 13600

ICES | AFWG 2020 | 31
AGE Tonnes
2 3 4 5 6 7 8 9 10+ landed
2001 0 343 735 1046 964 873 198 134 0 13400
2002 56 298 830 1055 939 596 335 165 0 13600
2003 85 342 664 916 918 450 244 326 0 13900
2004 26 254 483 924 1099 827 358 162 0 13400
2005 21 270 658 858 853 715 423 176 0 13200
2006 19 236 1016 867 983 612 315 127 0 13000
2007 49 346 759 959 606 531 327 157 0 13000
2008 15 395 743 838 650 400 261 134 0 12800
2009 0 84 576 727 863 600 280 90 0 12700
2010 8 393 896 1050 576 389 232 110 97 12700
2011 13 281 847 789 678 503 216 102 140 12700
2012 9 177 430 588 690 504 234 134 182 12700
2013 51 305 912 696 651 380 284 139 123 12700
2014 13 448 676 898 551 367 234 201 105 12700
2015 71 302 563 594 676 461 243 155 218 12700
2016 85 459 506 591 512 526 265 151 201 12700
2017 66 432 598 616 569 410 304 161 186 12700
2018 52 290 552 604 559 457 279 185 175 12700
2019 22 323 507 617 592 465 285 101 171 12700

32 | ICES SCIENTIFIC REPORTS 2:52 | ICES
Table 2.2. Sampling from cod fisheries in 2018 in the statistical areas 00, 03, 04, 05, 06+07. Number of age samples of cod by quarter, and total number of cod otoliths.
Table 2.3. Sampling from cod fisheries in 2017and 2016 in the statistical areas 00, 03, 04, 05, 06+07. Number of age samples of cod by quarter, and total number of cod otoliths.
Samples 2017 Quarter 03 04 00 05 06+07 Tot
1 30 55 107 86 58 336
2 17 60 30 31 26 164
3 17 5 24 2 21 69
4 25 22 60 8 11 125
Total samples 89 142 221 127 116 694
Total otoliths 3271 4527 2716 3693 1860 16067
Coastal cod type otoliths 915 1133 982 755 1491 5196
Samples 2016 Quarter 03 04 00 05 06+07 Tot
1 46 42 107 99 40 330
2 38 30 26 10 27 131
3 8 7 4 5 8 32
4 18 23 7 15 19 82
Total samples 91 88 126 101 119 574
Total otoliths 3068 2703 2728 4058 2058 14615
Coastal cod type otoliths 845 906 687 1430 1787 5655
Samples 2018 Quarter 03 04 00 05 06+07 Tot
1 18 54 110 104 49 335
2 26 34 23 19 28 130
3 4 7 34 4 9 58
4 21 23 71 2 26 143
Total samples 69 118 238 129 112 666
Total otoliths 1696 2622 2787 3047 1768 11920
Coastal cod type otoliths 501 818 1147 671 1435 4572
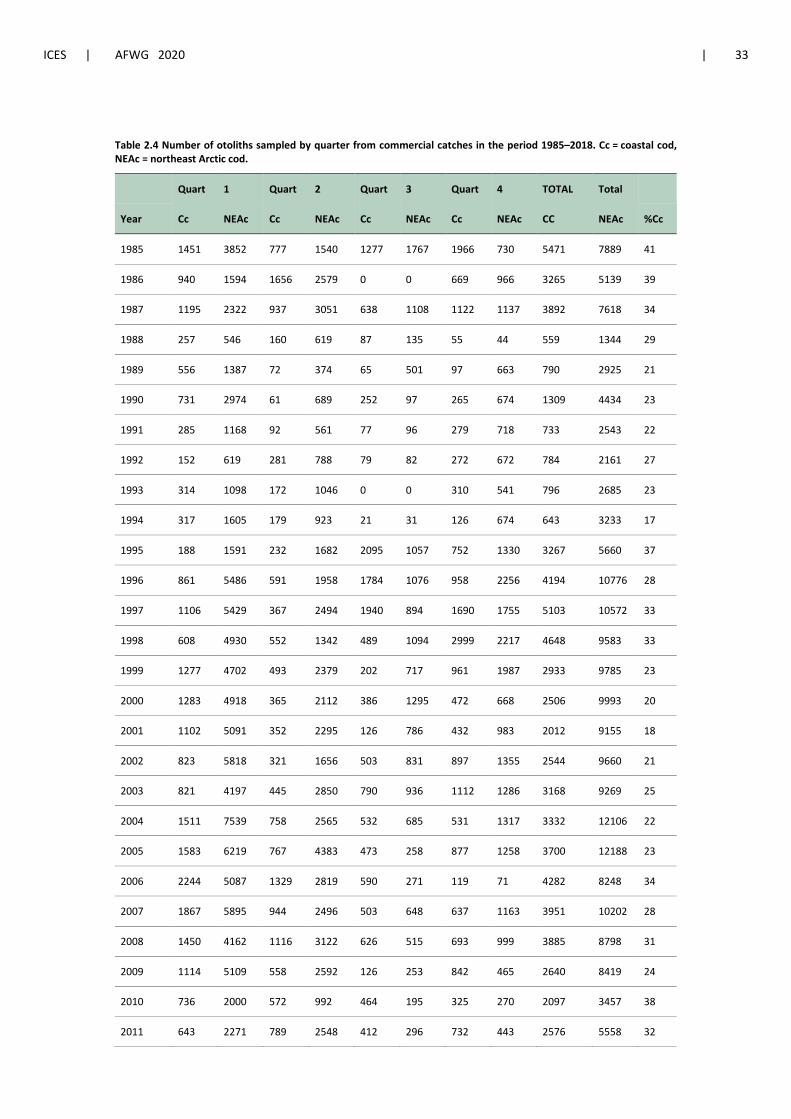
ICES | AFWG 2020 | 33
Table 2.4 Number of otoliths sampled by quarter from commercial catches in the period 1985–2018. Cc = coastal cod, NEAc = northeast Arctic cod.
Quart 1 Quart 2 Quart 3 Quart 4 TOTAL Total
Year Cc NEAc Cc NEAc Cc NEAc Cc NEAc CC NEAc %Cc
1985 1451 3852 777 1540 1277 1767 1966 730 5471 7889 41
1986 940 1594 1656 2579 0 0 669 966 3265 5139 39
1987 1195 2322 937 3051 638 1108 1122 1137 3892 7618 34
1988 257 546 160 619 87 135 55 44 559 1344 29
1989 556 1387 72 374 65 501 97 663 790 2925 21
1990 731 2974 61 689 252 97 265 674 1309 4434 23
1991 285 1168 92 561 77 96 279 718 733 2543 22
1992 152 619 281 788 79 82 272 672 784 2161 27
1993 314 1098 172 1046 0 0 310 541 796 2685 23
1994 317 1605 179 923 21 31 126 674 643 3233 17
1995 188 1591 232 1682 2095 1057 752 1330 3267 5660 37
1996 861 5486 591 1958 1784 1076 958 2256 4194 10776 28
1997 1106 5429 367 2494 1940 894 1690 1755 5103 10572 33
1998 608 4930 552 1342 489 1094 2999 2217 4648 9583 33
1999 1277 4702 493 2379 202 717 961 1987 2933 9785 23
2000 1283 4918 365 2112 386 1295 472 668 2506 9993 20
2001 1102 5091 352 2295 126 786 432 983 2012 9155 18
2002 823 5818 321 1656 503 831 897 1355 2544 9660 21
2003 821 4197 445 2850 790 936 1112 1286 3168 9269 25
2004 1511 7539 758 2565 532 685 531 1317 3332 12106 22
2005 1583 6219 767 4383 473 258 877 1258 3700 12188 23
2006 2244 5087 1329 2819 590 271 119 71 4282 8248 34
2007 1867 5895 944 2496 503 648 637 1163 3951 10202 28
2008 1450 4162 1116 3122 626 515 693 999 3885 8798 31
2009 1114 5109 558 2592 126 253 842 465 2640 8419 24
2010 736 2000 572 992 464 195 325 270 2097 3457 38
2011 643 2271 789 2548 412 296 732 443 2576 5558 32

34 | ICES SCIENTIFIC REPORTS 2:52 | ICES
Quart 1 Quart 2 Quart 3 Quart 4 TOTAL Total
Year Cc NEAc Cc NEAc Cc NEAc Cc NEAc CC NEAc %Cc
2012 1294 6283 749 1864 379 85 324 185 2746 8417 25
2013 966 5389 832 3155 216 88 1115 385 3129 9017 26
2014 1019 4470 869 3312 338 29 1060 524 3286 8335 28
2015 746 7770 618 3619 327 354 511 547 2202 12290 15
2016 2465 5581 1073 2445 616 207 1501 727 5655 8960 39
2017 2276 4568 879 2742 810 151 1231 475 5196 7936 40
2018 2007 4927 924 1882 498 104 1143 435 4572 7348 40
Av85-18 1064 4018 614 2102 521 489 796 880 2996 7521 28
Table 2.5. Coastal cod. Acoustic abundance indices by subareas and in total in 2019 (in thousands). Age 1 is not split between coastal cod and NEA cod.
Age (Year class)
Area 1
(18)
2
(17)
3
(16)
4
(15)
5
(14)
6
(13)
7
(12)
8
(11)
9
(10)
10+
(pre09) Sum
03
04
05
00
06
07
1726
2665
975
1025
858
303
1253
1065
308
348
497
0
1965
1425
282
617
1960
114
1303
712
522
401
1177
101
1120
1146
398
340
1193
245
828
523
421
125
251
372
548
227
171
243
487
363
244
90
82
255
139
64
112
179
191
110
170
39
109
172
30
110
130
46
9208
8204
3381
3573
6863
1607
Tot 7552 3470 6363 4216 4442 2520 2037 875 808 552 32836
Table 2.6. Coastal cod. Acoustic abundance indices by age 1995–2019 (in thousands). Age 1 is not split between coastal cod and NEA cod. Fjords in area 07 not covered in 2013.
Age
Year 1 2 3 4 5 6 7 8 9 10+ Sum
1995
1996
1997
1998
1999
2000
2001
2002
2003
28707
1756
30694
14455
6850
9587
8366
1329
2084
20191
17378
18827
13659
11309
11528
6729
2990
2145
13633
22815
28913
15003
12171
11612
7994
4103
3545
15636
12382
17334
13239
10123
8974
7578
4940
3880
16219
12514
12379
7415
7197
7984
4751
3617
2788
9550
6817
10612
3137
3052
5451
2567
2593
2389
3174
3180
3928
1578
850
1365
1493
1470
1144
1158
754
1515
315
242
488
487
408
589
781
242
26
169
112
85
189
29
364
579
5
663
128
54
97
116
128
80
109628
77843
124891
69099
51960
57171
40270
21607
19008
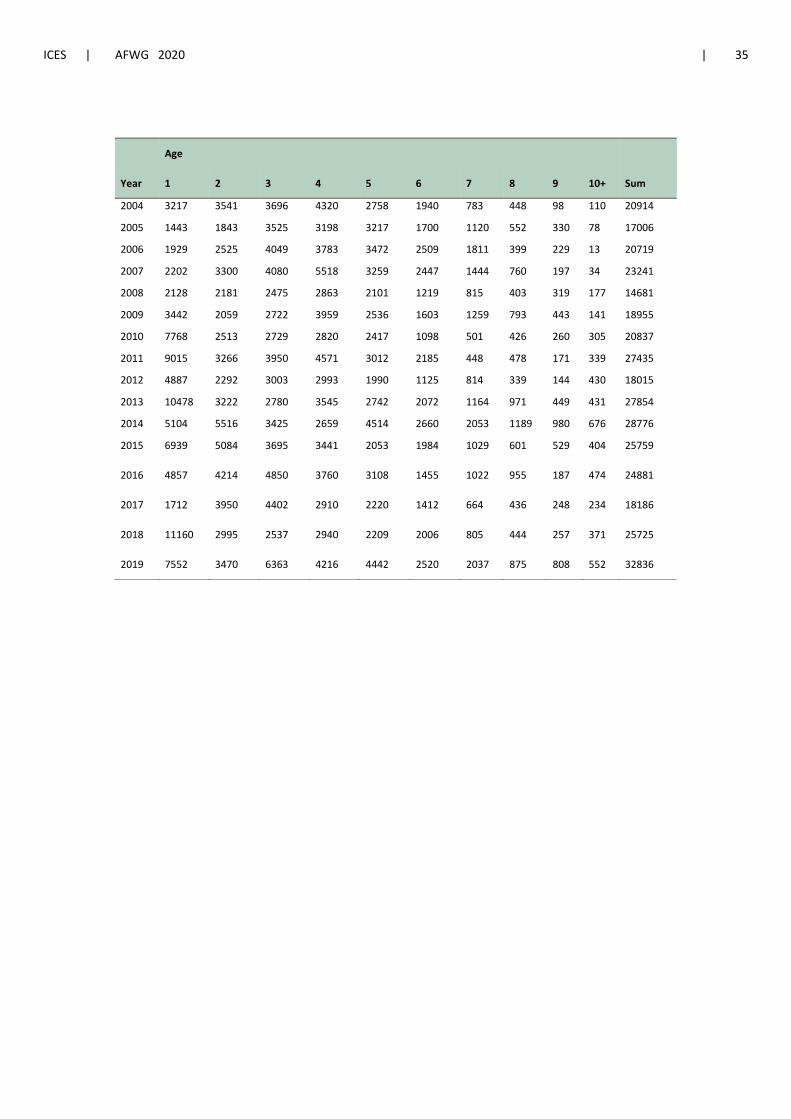
ICES | AFWG 2020 | 35
Age
Year 1 2 3 4 5 6 7 8 9 10+ Sum
2004
2005
2006
2007
2008
2009
2010
2011
2012
2013
2014
2015
3217
1443
1929
2202
2128
3442
7768
9015
4887
10478
5104
6939
3541
1843
2525
3300
2181
2059
2513
3266
2292
3222
5516
5084
3696
3525
4049
4080
2475
2722
2729
3950
3003
2780
3425
3695
4320
3198
3783
5518
2863
3959
2820
4571
2993
3545
2659
3441
2758
3217
3472
3259
2101
2536
2417
3012
1990
2742
4514
2053
1940
1700
2509
2447
1219
1603
1098
2185
1125
2072
2660
1984
783
1120
1811
1444
815
1259
501
448
814
1164
2053
1029
448
552
399
760
403
793
426
478
339
971
1189
601
98
330
229
197
319
443
260
171
144
449
980
529
110
78
13
34
177
141
305
339
430
431
676
404
20914
17006
20719
23241
14681
18955
20837
27435
18015
27854
28776
25759
2016 4857 4214 4850 3760 3108 1455 1022 955 187 474 24881
2017 1712 3950 4402 2910 2220 1412 664 436 248 234 18186
2018 11160 2995 2537 2940 2209 2006 805 444 257 371 25725
2019 7552 3470 6363 4216 4442 2520 2037 875 808 552 32836

36 | ICES SCIENTIFIC REPORTS 2:52 | ICES
Table 2.7. Coastal cod. Mean length (cm) at-age 1995–2019.
Age
Year 1 2 3 4 5 6 7 8 9 10+
1995
1996
1997
1998
1999
2000
2001
2002
2003
2004
2005
2006
2007
2008
2009
2010
2011
2012
2013
2014
2015
21.5
19.0
16.8
20.3
21.5
21.6
21.1
22.5
18.9
20.7
22.5
22.2
21.6
21.9
20.9
20.3
20.6
21.3
21.5
21.7
19.9
33.0
30.2
28.7
33.3
32.6
33.3
33.3
34.4
33.8
32.9
32.8
36.1
36.0
36.9
34.5
34.9
32.9
32.4
33.6
35.1
33.5
43.0
41.7
40.8
43.8
43.8
43.4
44.5
44.6
42.1
43.5
42.2
47.0
48.0
49.2
47.8
46.4
47.2
46.9
44.5
47.7
46.9
52.0
52.5
51.6
51.4
54.6
53.5
53.6
56.0
51.6
54.5
57.9
55.5
57.9
59.0
57.8
57.5
59.5
58.8
56.7
57.3
58.0
59.1
59.2
58.1
59.1
59.6
61.0
62.9
61.6
60.0
59.9
60.6
61.4
62.2
66.1
65.8
64.6
66.1
66.1
66.2
66.4
66.5
64.1
65.2
65.9
66.3
65.8
66.1
64.7
67.7
67.2
68.0
64.0
68.0
66.8
70.9
70.5
71.2
71.5
72.0
71.3
73.5
70.3
76.0
79.1
73.6
74.1
77.9
75.5
88.7
72.4
72.7
71.9
71.3
69.5
71.8
71.7
77.9
76.9
79.9
77.0
74.2
76.6
77.8
87.4
84.8
80.8
81.0
90.8
90.8
84.2
66.6
76.9
75.0
69.9
77.8
86.6
74.1
78.4
75.2
82.0
77.5
84.2
80.5
77.7
89.0
87.0
102.0
93.2
99.4
99.1
85.7
89.0
84.9
74.6
73.5
87.0
100.2
77.6
85.1
78.9
81.1
82.2
84.6
81.7
80.5
108.3
114.2
110.7
116.9
118.0
105.5
102.1
108.3
94.8
91.8
108.4
100.5
106.3
98.8
73.5
82.7
83.9
87.3
88.1
93.0
85.5
2016 20.5 32.9 47.8 58.7 67.8 72.2 75.1 83.0 89.7 86.9
2017 23.5 35.6 47.2 58.3 66.1 72.6 75.2 82.4 82.6 91.2
2018 19.4 35.4 47.7 58.8 68.1 71.3 79.8 80.3 85.5 84.4
2019 20.3 32.8 48.3 58.5 66.5 73.4 78.3 81.2 85.9 88.7

ICES | AFWG 2020 | 37
Table 2.8. Coastal cod. Mean weight (grams) at-age 1995–2019.
Age
Year 1 2 3 4 5 6 7 8 9 10+
1995
1996
1997
1998
1999
2000
2001
2002
2003
2004
2005
2006
2007
2008
2009
2010
2011
2012
2013
2014
2015
81
59
43
52
70
72
51
103
62
83
112
105
103
96
85
75
77
89
88
93
75
390
252
240
372
323
365
396
428
385
352
359
474
518
508
434
419
343
336
365
423
370
791
724
683
883
841
809
966
895
738
834
786
1080
1185
1208
1116
1026
1062
1038
851
1071
1045
1525
1433
1364
1456
1675
1554
1524
1741
1353
1690
2168
1746
2011
2095
2003
1996
2119
2006
1815
1845
1940
2222
2053
1893
2107
2192
2539
2314
2433
2145
2255
2265
2430
2500
2987
2894
2839
2882
2998
2856
2886
2910
2881
2748
2816
2950
2857
3049
3320
3133
3103
3312
2756
3336
3160
3671
3632
3665
3761
3727
3561
3905
3518
4665
4722
4426
4319
4540
4352
3695
4273
3981
4150
4174
3684
4241
3976
4875
4868
5505
4783
4122
4495
4927
6979
6685
6406
5625
6579
6203
6144
4397
4921
4594
3373
5125
6806
4387
5400
4895
6336
5071
6435
5249
4753
6759
6932
7805
8323
9454
8527
8768
7759
6923
4383
4502
7028
11051
5415
6125
5685
6309
5851
5974
5871
5868
9897
9723
1827
12468
12902
12066
12468
12992
9956
9733
15887
14650
14931
11588
4719
6504
6570
7446
7670
8762
7277
2016 77 344 1121 2033 3081 3734 4286 5895 7556 6980
2017 78 421 1026 1868 2687 3746 4419 6050 6887 7637
2018 69 392 1158 1948 3192 3705 5304 5354 6428 6038
2019 40 354 1222 1991 2806 3843 4975 5457 7415 7123

38 | ICES SCIENTIFIC REPORTS 2:52 | ICES
Table 2.9. Coastal cod. Acoustic biomass indices (tonnes) in 1995–2019. Age 1 is not split between coastal cod and NEA cod. Fjords in area 07 not covered in 2013 and partly covered in 2016.
Age
Year 1 2 3 4 5 6 7 8 9 10+ Sum
1995
1996
1997
1998
1999
2000
2001
2002
2003
2004
2005
2006
2007
2008
2009
2010
2011
2012
2013
2014
2015
2337
145
1319
752
477
688
425
137
125
329
109
202
227
206
294
583
695
295
519
456
424
7868
4386
4518
5078
3650
4321
2662
1279
876
1269
675
1197
1709
1212
893
1053
1120
767
1192
2218
1972
10786
16521
19748
13247
10233
9824
7724
3672
2569
3087
2947
4374
4835
3120
3037
2800
4195
2974
2767
3849
3872
23846
17739
23644
19274
16960
14464
11548
8600
5328
7394
6521
6605
11097
6085
7933
5629
9686
5914
6890
5026
6423
36039
25687
23435
15627
15774
20482
10993
8801
5788
6089
7167
8435
8148
6593
7335
6862
8681
5574
8067
13418
5646
27515
18731
29884
9255
8720
17067
8521
8124
6995
6901
4807
8367
7733
4203
5821
4024
8218
4143
7252
9994
6546
14445
15562
15060
6675
4723
5936
5517
6282
4201
3009
3648
6672
6124
3437
6137
2439
2466
3820
4756
9691
4587
8761
4376
8860
1646
2097
4359
3010
1794
2754
1779
1942
2045
5173
2014
4282
2085
3029
1673
5937
6367
2747
4933
3130
249
1329
1220
926
1705
225
2674
454
1315
1602
2177
1492
2707
1478
1079
775
2797
7308
3172
7779
46
8643
2083
567
1232
1917
1663
1136
1058
1205
190
508
2066
665
1984
2227
3265
3178
6608
2794
144309
106323
135360
74966
64421
79299
54022
40577
32446
31405
30336
39689
47731
30506
39107
28936
41396
29199
43355
64935
38183
2016 250 1364 5792 7746 10236 5409 4165 6091 1322 3657 46023
2017 133 1664 4517 5436 5965 5289 2934 2638 1708 1787 32070
2018 770 1173 2939 5726 7051 7433 4270 2377 1652 2240 35631
2019 291 1228 7773 8392 12466 9685 10135 4775 5991 3932 64669

ICES | AFWG 2020 | 39
Table 2.10. Coastal cod. Maturity-at-age as determined from maturity stages observed in the surveys over the period 1995 – 2019. Age 1 is not split between coastal cod and NEA cod.
Year AGE
1 2 3 4 5 6 7 8 9 10+
1995 0.00 0.00 0.01 0.21 0.48 0.71 0.87 0.87 1.00 1.00
1996 0.00 0.00 0.03 0.25 0.56 0.81 0.92 0.99 1.00 1.00
1997 0.00 0.00 0.06 0.29 0.45 0.76 0.97 1.00 1.00 1.00
1998 0.00 0.02 0.15 0.25 0.53 0.74 0.87 0.89 1.00 1.00
1999 0.00 0.02 0.03 0.21 0.43 0.66 0.74 1.00 1.00 1.00
2000 0.00 0.00 0.00 0.16 0.31 0.61 0.76 0.64 0.99 1.00
2001 0.00 0.00 0.00 0.04 0.37 0.78 0.98 0.99 0.97 1.00
2002 0.00 0.02 0.02 0.26 0.88 0.93 0.90 0.97 1.00 1.00
2003 0.00 0.00 0.00 0.05 0.29 0.49 0.90 0.98 0.96 1.00
2004 0.00 0.00 0.01 0.09 0.37 0.76 0.95 0.98 1.00 1.00
2005 0.00 0.00 0.00 0.07 0.40 0.56 0.89 0.98 1.00 1.00
2006
2007
2008
2009
2010
2011
2012
2013
2014
2015
0.00
0.00
0.00
0.00
0.00
0.00
0.00
0.00
0.00
0.00
0.00
0.00
0.00
0.00
0.00
0.01
0.00
0.00
0.00
0.00
0.00
0.00
0.03
0.02
0.00
0.00
0.01
0.00
0.00
0.00
0.14
0.14
0.12
0.06
0.08
0.06
0.05
0.01
0.06
0.07
0.52
0.54
0.48
0.26
0.38
0.42
0.38
0.32
0.24
0.23
0.75
0.76
0.72
0.35
0.66
0.73
0.66
0.65
0.66
0.57
0.91
0.96
0.89
0.59
0.83
0.81
0.90
0.86
0.81
0.75
0.87
0.83
0.94
0.74
0.88
0.53
0.92
0.94
0.94
0.88
0.96
1.00
0.96
0.60
0.95
0.92
0.97
0.99
1.00
0.89
1.00
1.00
1.00
0.92
0.97
0.85
0.99
0.96
0.97
0.94
2016 0.00 0.00 0.00 0.09 0.30 0.59 0.83 0.85 0.97 1.00
2017 0.00 0.00 0.00 0.07 0.30 0.65 0.88 0.94 0.97 0.97
2018 0.00 0.00 0.01 0.15 0.41 0.69 0.83 0.95 1.00 0.92
2019 0.00 0.00 0.00 0.13 0.39 0.62 0.81 0.95 1.00 0.92

40 | ICES SCIENTIFIC REPORTS 2:52 | ICES
Table 2.11. Coastal cod. Acoustic spawning biomass indices (tonnes) 1995–2019, corresponding to maturities in Table 2.10. Age 1 is not split between coastal cod and NEA cod.
Year Age
1 2 3 4 5 6 7 8 9 10+ Sum
1995
1996
1997
1998
1999
2000
2001
2002
2003
2004
2005
2006
2007
2008
2009
2010
2011
2012
2013
2014
2015
0
0
0
0
0
0
0
0
0
0
0
0
0
0
0
0
0
0
0
0
0
0
0
0
92
56
0
0
20
0
0
0
0
0
0
0
0
11
0
0
0
0
96
468
1185
2026
315
0
15
87
0
28
0
0
0
107
61
0
0
22
0
0
0
4925
4467
6857
4870
3544
2366
508
2240
269
679
447
925
1554
734
476
450
581
278
56
314
457
17424
14320
10546
8252
6778
6354
4102
7702
1670
2252
2844
4386
4400
3189
1907
2608
3646
2126
2580
3222
1301
19614
15130
22712
6804
5716
10426
6662
7551
3428
5253
2670
6275
5877
3012
2037
2656
5999
2748
4713
6593
3719
12573
14365
14608
5774
3478
4486
5398
5650
3778
2853
3247
6072
5879
3049
3621
2024
1997
3457
4112
7831
3436
7648
4311
8860
1461
2097
2798
2978
1747
2686
1736
1898
1779
4294
1902
3169
1835
1605
1539
5576
5958
2414
4933
3130
249
1329
1220
916
1650
225
2554
434
1315
1538
2177
1434
1624
1404
993
755
2773
7307
2811
7779
46
8643
2083
567
1232
1917
1663
1136
722
288
571
508
2066
612
1924
1893
3219
3046
6433
2627
74992
56237
73660
32691
23771
28579
23230
26885
15521
13959
12709
21546
24689
15493
13508
12901
16725
14143
22856
37659
16763
2016 0 0 0 725 3084 3196 3464 5190 1278 3657 20597
2017 0 0 0 734 1779 3464 2582 2489 1662 1729 14078
2018 0 0 29 859 2891 5129 3544 2258 1652 2061 18423
2019 0 0 0 1091 4862 6005 8209 4356 5991 3617 34311

Table 2.12. Proportion coastal cod among sampled cod during the coastal survey by age and statistical areas in the years 2005–2018. Age 1 is not split between coastal cod and NEA cod.
Year Area/Age 2 3 4 5 6 7 8 9 10+
2005 3 0.63 0.54 0.54 0.45 0.35 0.30 0.20 0.48 0.03
2005 4 0.96 0.91 0.76 0.74 0.71 0.60 0.76 0.81 0.50
2005 5 0.00 0.54 0.65 0.68 0.52 1.00 1.00 0.67
2005 0 0.11 0.39 0.70 0.61 0.70 0.85 0.50 1.00
2005 6 1.00 1.00 0.93 0.87 0.81 0.81 0.59 0.96
2005 7 1.00 1.00 1.00 1.00 1.00 0.86 0.67 0.00
2006 3 0.79 0.77 0.63 0.59 0.45 0.37 0.30 0.39 0.00
2006 4 1.00 0.88 0.84 0.79 0.68 0.63 0.82 0.40 0.42
2006 5 1.00 0.98 0.81 0.88 0.77 0.63 0.80 0.00 0.50
2006 0 0.99 0.99 0.95 0.87 0.86 0.89 0.85 0.33
2006 6 1.00 1.00 0.95 0.99 0.80 0.72 1.00 0.67
2006 7 1.00 0.97 0.95 0.98 0.89 1.00 0.50
2007 3 0.83 0.38 0.40 0.59 0.27 0.32 0.00 1.00
2007 4 0.91 0.92 0.92 0.80 0.80 0.90 0.71 0.67 1.00
2007 5 0.97 1.00 0.97 0.94 0.94 0.95 0.86 0.67 0.00
2007 0 1.00 0.88 1.00 1.00 1.00 0.00 1.00 1.00
2007 6 1.00 1.00 0.95 0.87 0.91 0.81
2007 7 1.00 1.00 1.00 0.89 0.86 0.86 1.00 1.00 1.00
2008 3 0.98 0.97 0.80 0.83 0.79 0.72 0.53 1.00 0.40
2008 4 1.00 0.99 0.80 0.88 0.84 0.78 0.88 0.88 0.86
2008 5 1.00 1.00 0.93 0.96 1.00 0.80 0.67 1.00 1.00
2008 0 1.00 1.00 1.00 1.00 1.00 1.00 1.00 1.00 0.00
2008 6 1.00 1.00 1.00 1.00 1.00 1.00 1.00 1.00 1.00
2008 7 1.00 1.00 1.00 1.00 1.00 1.00 1.00 1.00 1.00
2009 3 0.90 0.72 0.54 0.44 0.48 0.57 0.79 0.67 0.58
2009 4 0.95 0.89 0.78 0.62 0.69 0.92 0.72 0.78 0.79
2009 5 1.00 1.00 0.95 0.84 0.78 0.82 0.88 0.67 1.00
2009 0 1.00 1.00 1.00 1.00 1.00 1.00 0.50 1.00
41

Year Area/Age 2 3 4 5 6 7 8 9 10+
2009 6 1.00 1.00 1.00 1.00 0.82 1.00 1.00 1.00 0.50
2009 7 1.00 1.00 1.00 1.00 1.00 1.00 1.00 1.00
2010 3 0.86 0.78 0.56 0.47 0.36 0.37 0.81 0.89 0.95
2010 4 0.98 0.96 0.87 0.71 0.49 0.77 0.87 1.00 1.00
2010 5 1.00 0.98 1.00 1.00 0.84 0.88 1.00 0.73 1.00
2010 0 1.00 1.00 1.00 1.00 1.00 1.00 1.00 1.00 1.00
2010 6 1.00 1.00 1.00 1.00 1.00 1.00 1.00 1.00
2010 7 1.00 1.00 1.00 1.00 1.00 1.00 1.00 1.00
2011 3 0.83 0.83 0.78 0.67 0.44 0.28 0.70 0.73 0.67
2011 4 0.99 0.99 0.95 0.87 0.79 0.77 0.74 0.93 1.00
2011 5 0.97 1.00 1.00 0.93 0.75 0.71 0.75 0.83
2011 0 1.00 1.00 1.00 1.00 1.00 1.00
2011 6 1.00 1.00 1.00 1.00 1.00 1.00 1.00
2011 7 1.00 1.00 1.00 1.00 1.00 1.00 1.00 1.00 1.00
2012 3 0.50 0.83 0.65 0.67 0.51 0.51 0.49 0.78 0.64
2012 4 0.29 0.93 0.94 0.93 0.87 0.91 0.77 0.90 0.93
2012 5 0.84 0.91 0.92 0.89 0.72 0.83 0.75 0.80 0.89
2012 0 1.00 1.00 1.00 1.00 1.00 1.00 1.00 1.00
2012 6 1.00 1.00 1.00 1.00 1.00 1.00 1.00 1.00 1.00
2012 7 1.00 1.00 1.00 1.00 1.00 1.00 0.50
2013 3 0.87 0.79 0.58 0.54 0.73 0.59 057 0.58 1.00
2013 4 0.98 0.94 0.90 0.87 0.77 0.76 0.89 0.80 1.00
2013 5 1.00 1.00 1.00 1.00 0.95 1.00 0.94 1.00 1.00
2013 0 1.00 1.00 1.00 1.00 1.00 1.00 1.00 1.00 1.00
2013 6 1.00 1.00 1.00 1.00 1.00 1.00 1.00 1.00 1.00
2013 7 1.00 1.00 1.00 1.00 1.00 0.50
2014 3 0.99 0.98 0.92 0.84 0.76 0.85 0.68 0.73 0.70
2014 4 0.99 1.00 1.00 0.99 0.99 0.98 0.96 0.94 1.00
2014 5 1.00 1.00 1.00 1.00 1.00 1.00 1.00 0.95 1.00
42

Year Area/Age 2 3 4 5 6 7 8 9 10+
2014 0 1.00 1.00 1.00 1.00 1.00 1.00 1.00 1.00
2014 6 1.00 1.00 1.00 1.00 1.00 1.00 1.00
2014 7 1.00 1.00 1.00 1.00 1.00 1.00 1.00 1.00 1.00
2015 3 0.90 0.84 0.80 0.68 0.56 0.46 0.66 0.85 0.69
2015 4 0.93 0.89 0.89 0.77 0.81 0.68 0.68 0.71 0.86
2015 5 0.97 1.00 0.93 1.00 0.91 0.93 1.00 1.00 1.00
2015 0 1.00 1.00 1.00 1.00 1.00 0.92 0.75 1.00 1.00
2015 6 1.00 1.00 0.97 1.00 1.00 1.00 1.00 1.00
2015 7 1.00 1.00 1.00 1.00 1.00 1.00 1.00 1.00
2016 3 0.95 0.97 0.85 0.74 0.47 0.53 0.50 0.32 0.19
2016 4 0.99 0.98 0.89 0.84 0.71 0.72 0.64 0.59 0.16
2016 5 0.92 0.90 0.89 0.86 0.75 0.71 0.62 0.21 0.25
2016 0 1.00 1.00 1.00 1.00 1.00 1.00 1.00 1.00 0.00
2016 6 1.00 1.00 1.00 1.00 1.00 1.00 1.00 1.00 1.00
2016 7 1.00 1.00 1.00 1.00 1.00 1.00 1.00 1.00 1.00
2017 3 0.97 0.92 0.9 0.81 0.70 0.64 0.50 0.86 0.83
2017 4 0.98 0.97 0.94 0.82 0.64 0.76 0.87 0.75 0.88
2017 5 1.00 1.00 1.00 1.00 0.94 1.00 0.92 1.00 0.94
2017 0 1.00 1.00 1.00 1.00 1.00 0.00 0.00 1.00
2017 6 1.00 1.00 0.94 0.94 1.00 1.00 1.00 1.00
2017 7 1.00 1.00 1.00 1.00 1.00 1.00 1.00
2018 3 0.93 0.88 0.76 0.86 0.75 0.52 0.48 0.71 0.83
2018 4 0.99 0.95 0.93 0.87 0.81 0.71 0.85 1.00 0.83
2018 5 0.96 0.90 0.92 0.94 0.96 0.97 0.85 0.85 0.94
2018 0 0.97 1.00 1.00 1.00 1.00 1.00 1.00
2018 6 1.00 1.00 1.00 1.00 1.00 1.00 1.00
2018 7 0.93 0.88 0.76 0.86 0.75 0.52 0.48 0.71 0.83
43
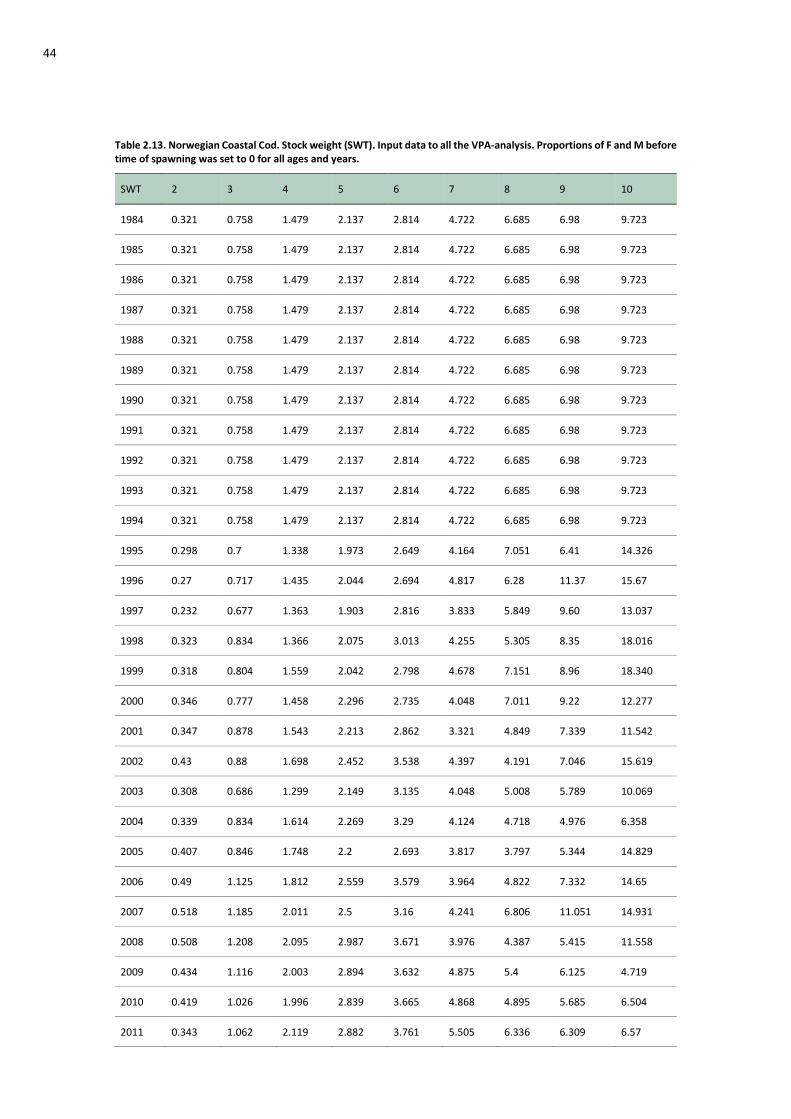
Table 2.13. Norwegian Coastal Cod. Stock weight (SWT). Input data to all the VPA-analysis. Proportions of F and M before time of spawning was set to 0 for all ages and years.
SWT 2 3 4 5 6 7 8 9 10
1984 0.321 0.758 1.479 2.137 2.814 4.722 6.685 6.98 9.723
1985 0.321 0.758 1.479 2.137 2.814 4.722 6.685 6.98 9.723
1986 0.321 0.758 1.479 2.137 2.814 4.722 6.685 6.98 9.723
1987 0.321 0.758 1.479 2.137 2.814 4.722 6.685 6.98 9.723
1988 0.321 0.758 1.479 2.137 2.814 4.722 6.685 6.98 9.723
1989 0.321 0.758 1.479 2.137 2.814 4.722 6.685 6.98 9.723
1990 0.321 0.758 1.479 2.137 2.814 4.722 6.685 6.98 9.723
1991 0.321 0.758 1.479 2.137 2.814 4.722 6.685 6.98 9.723
1992 0.321 0.758 1.479 2.137 2.814 4.722 6.685 6.98 9.723
1993 0.321 0.758 1.479 2.137 2.814 4.722 6.685 6.98 9.723
1994 0.321 0.758 1.479 2.137 2.814 4.722 6.685 6.98 9.723
1995 0.298 0.7 1.338 1.973 2.649 4.164 7.051 6.41 14.326
1996 0.27 0.717 1.435 2.044 2.694 4.817 6.28 11.37 15.67
1997 0.232 0.677 1.363 1.903 2.816 3.833 5.849 9.60 13.037
1998 0.323 0.834 1.366 2.075 3.013 4.255 5.305 8.35 18.016
1999 0.318 0.804 1.559 2.042 2.798 4.678 7.151 8.96 18.340
2000 0.346 0.777 1.458 2.296 2.735 4.048 7.011 9.22 12.277
2001 0.347 0.878 1.543 2.213 2.862 3.321 4.849 7.339 11.542
2002 0.43 0.88 1.698 2.452 3.538 4.397 4.191 7.046 15.619
2003 0.308 0.686 1.299 2.149 3.135 4.048 5.008 5.789 10.069
2004 0.339 0.834 1.614 2.269 3.29 4.124 4.718 4.976 6.358
2005 0.407 0.846 1.748 2.2 2.693 3.817 3.797 5.344 14.829
2006 0.49 1.125 1.812 2.559 3.579 3.964 4.822 7.332 14.65
2007 0.518 1.185 2.011 2.5 3.16 4.241 6.806 11.051 14.931
2008 0.508 1.208 2.095 2.987 3.671 3.976 4.387 5.415 11.558
2009 0.434 1.116 2.003 2.894 3.632 4.875 5.4 6.125 4.719
2010 0.419 1.026 1.996 2.839 3.665 4.868 4.895 5.685 6.504
2011 0.343 1.062 2.119 2.882 3.761 5.505 6.336 6.309 6.57
44

SWT 2 3 4 5 6 7 8 9 10
2012 0.336 1.038 2.006 2.998 3.727 4.783 5.071 5.851 7.446
2013 0.365 0.851 1.815 2.856 3.561 4.122 6.435 5.974 7.67
2014 0.423 1.071 1.845 2.886 3.905 4.495 5.249 5.871 8.762
2015 0.37 1.045 1.94 2.91 3.518 4.927 4.753 5.864 7.277
2016 0.344 1.121 2.033 3.081 3.734 4.286 5.895 7.556 6.984
2017 0.421 1.026 1.868 2.687 3.746 4.419 6.05 6.887 7.637
2018 0.392 1.158 1.948 3.192 3.705 5.305 5.354 6.428 6.038
2019 0.354 1.222 1.991 2.806 3.843 4.975 5.457 7.415 7.123
Table 2.14 Norwegian Coastal Cod. Catch weights (CWT). Input data to all the VPA-analysis.
CWT 2 3 4 5 6 7 8 9 10
1984 0.832 1.262 1.873 2.608 3.52 5.202 6.23 7.186 14.435
1985 0.893 1.288 1.929 2.63 3.819 5.023 6.432 8.053 14.074
1986 0.225 0.539 1.531 2.393 3.354 4.72 6.13 7.309 14.555
1987 0.423 0.842 1.386 2.266 3.602 4.861 6.287 8.098 19.751
1988 0.349 0.741 1.299 1.878 3.074 4.493 5.898 7.219 18.64
1989 0.647 1.127 1.429 2.136 2.958 4.164 5.155 5.897 11.31
1990 0.779 1.294 1.796 2.5 3.354 4.326 5.326 6.379 13.051
1991 1.069 1.602 2.17 2.811 3.52 4.302 5.043 5.736 9.886
1992 1.009 1.481 2.081 2.748 3.466 4.397 5.16 5.972 10.286
1993 1.028 1.64 2.2 2.903 3.616 4.344 5.204 5.764 8.154
1994 0.882 1.396 1.912 2.567 3.412 4.239 5.017 6.175 9.328
1995 0.732 1.239 1.744 2.302 3.137 4.299 5.424 6.273 9.847
1996 0.845 1.432 2.122 2.93 3.454 4.176 5.135 6.016 9.25
1997 1.053 1.694 2.126 2.959 3.529 4.313 5.427 6.424 8.668
1998 0.789 1.335 1.779 2.556 3.55 4.24 5.066 5.761 10.589
1999 1 1.603 2.045 2.607 3.492 4.317 4.956 5.742 8.169
2000 1.075 1.551 2.205 2.75 3.587 4.483 5.607 6.187 10.939
2001 0.913 1.496 2.055 2.631 3.381 4.143 5.065 5.719 9.9
2002 0.973 1.733 2.352 2.972 3.98 4.877 5.646 6.883 11.221
45
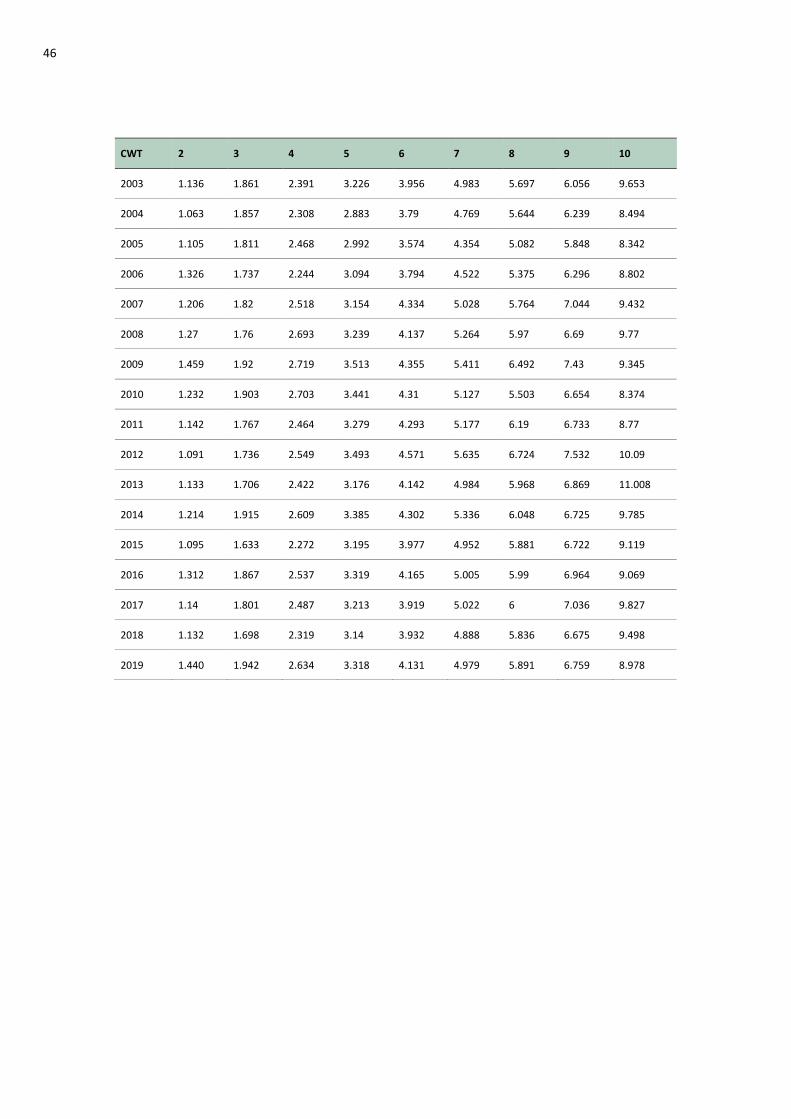
CWT 2 3 4 5 6 7 8 9 10
2003 1.136 1.861 2.391 3.226 3.956 4.983 5.697 6.056 9.653
2004 1.063 1.857 2.308 2.883 3.79 4.769 5.644 6.239 8.494
2005 1.105 1.811 2.468 2.992 3.574 4.354 5.082 5.848 8.342
2006 1.326 1.737 2.244 3.094 3.794 4.522 5.375 6.296 8.802
2007 1.206 1.82 2.518 3.154 4.334 5.028 5.764 7.044 9.432
2008 1.27 1.76 2.693 3.239 4.137 5.264 5.97 6.69 9.77
2009 1.459 1.92 2.719 3.513 4.355 5.411 6.492 7.43 9.345
2010 1.232 1.903 2.703 3.441 4.31 5.127 5.503 6.654 8.374
2011 1.142 1.767 2.464 3.279 4.293 5.177 6.19 6.733 8.77
2012 1.091 1.736 2.549 3.493 4.571 5.635 6.724 7.532 10.09
2013 1.133 1.706 2.422 3.176 4.142 4.984 5.968 6.869 11.008
2014 1.214 1.915 2.609 3.385 4.302 5.336 6.048 6.725 9.785
2015 1.095 1.633 2.272 3.195 3.977 4.952 5.881 6.722 9.119
2016 1.312 1.867 2.537 3.319 4.165 5.005 5.99 6.964 9.069
2017 1.14 1.801 2.487 3.213 3.919 5.022 6 7.036 9.827
2018 1.132 1.698 2.319 3.14 3.932 4.888 5.836 6.675 9.498
2019 1.440 1.942 2.634 3.318 4.131 4.979 5.891 6.759 8.978
46

Table 2.15 Norwegian Coastal Cod. Maturity proportions by age (MAT). Input data to all the VPA-analysis.
MAT 2 3 4 5 6 7 8 9 10
1984 0 0.02 0.16 0.46 0.69 0.87 0.91 0.96 1
1985 0 0.02 0.16 0.46 0.69 0.87 0.91 0.96 1
1986 0 0.02 0.16 0.46 0.69 0.87 0.91 0.96 1
1987 0 0.02 0.16 0.46 0.69 0.87 0.91 0.96 1
1988 0 0.02 0.16 0.46 0.69 0.87 0.91 0.96 1
1989 0 0.02 0.16 0.46 0.69 0.87 0.91 0.96 1
1990 0 0.02 0.16 0.46 0.69 0.87 0.91 0.96 1
1991 0 0.02 0.16 0.46 0.69 0.87 0.91 0.96 1
1992 0 0.02 0.16 0.46 0.69 0.87 0.91 0.96 1
1993 0 0.02 0.16 0.46 0.69 0.87 0.91 0.96 1
1994 0 0.02 0.16 0.46 0.69 0.87 0.91 0.96 1
1995 0 0.02 0.16 0.46 0.69 0.87 0.91 0.96 1
1996 0 0.02 0.16 0.46 0.69 0.87 0.91 0.96 1
1997 0 0.02 0.16 0.46 0.69 0.87 0.91 0.96 1
1998 0 0.02 0.16 0.46 0.69 0.87 0.91 0.96 1
1999 0 0.02 0.16 0.46 0.69 0.87 0.91 0.96 1
2000 0 0.02 0.16 0.46 0.69 0.87 0.91 0.96 1
2001 0 0.02 0.16 0.46 0.69 0.87 0.91 0.96 1
2002 0 0.02 0.16 0.46 0.69 0.87 0.91 0.96 1
2003 0 0.02 0.16 0.46 0.69 0.87 0.91 0.96 1
2004 0 0.02 0.16 0.46 0.69 0.87 0.91 0.96 1
2005 0 0.02 0.16 0.46 0.69 0.87 0.91 0.96 1
2006 0 0.02 0.16 0.46 0.69 0.87 0.91 0.96 1
2007 0 0.02 0.16 0.46 0.69 0.87 0.91 0.96 1
2008 0 0.02 0.16 0.46 0.69 0.87 0.91 0.96 1
2009 0 0.02 0.16 0.46 0.69 0.87 0.91 0.96 1
2010 0 0.02 0.16 0.46 0.69 0.87 0.91 0.96 1
2011 0 0.02 0.16 0.46 0.69 0.87 0.91 0.96 1
2012 0 0.02 0.16 0.46 0.69 0.87 0.91 0.96 1
47

MAT 2 3 4 5 6 7 8 9 10
2013 0 0.02 0.16 0.46 0.69 0.87 0.91 0.96 1
2014 0 0.02 0.16 0.46 0.69 0.87 0.91 0.96 1
2015 0 0.02 0.16 0.46 0.69 0.87 0.91 0.96 1
2016-20 0 0.02 0.16 0.46 0.69 0.87 0.91 0.96 1
Table 2.16. Norwegian Coastal Cod. Diagnostic output from XSA trial run based on commercial catch-at-age and survey index at age (ages 2–8 in Table 2.6). Proportions of F and M before time of spawning has been set to 0 for all years and ages.
Lowestoft VPA Version 3.1
18/04/2020 13:01
Extended Survivors Analysis
Norwegian Coastal Cod COMBSEX PLUSGROUP
CPUE data from file coast-9.txt
Catch data for 36 years. 1984 to 2019. Ages 2 to 10.
Fleet First Last First Last Alpha Beta
year year age age
Norw. Coast. survey 1995 2019 0 8 0.75 0.85
Time series weights :
Tapered time weighting applied
Power = 3 over 20 years
Catchability analysis :
Catchability dependent on stock size for ages < 4
Regression type = C
Minimum of 5 points used for regression
48
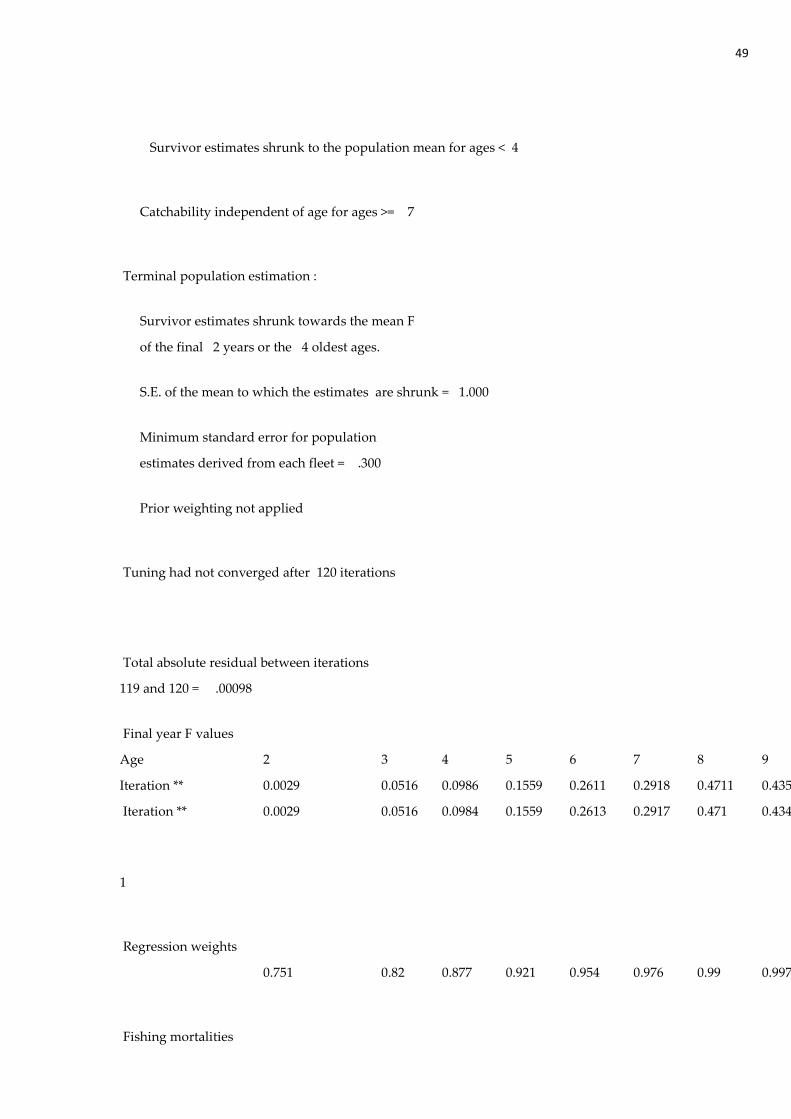
Survivor estimates shrunk to the population mean for ages < 4
Catchability independent of age for ages >= 7
Terminal population estimation :
Survivor estimates shrunk towards the mean F
of the final 2 years or the 4 oldest ages.
S.E. of the mean to which the estimates are shrunk = 1.000
Minimum standard error for population
estimates derived from each fleet = .300
Prior weighting not applied
Tuning had not converged after 120 iterations
Total absolute residual between iterations
119 and 120 = .00098
Final year F values
Age 2 3 4 5 6 7 8 9
Iteration ** 0.0029 0.0516 0.0986 0.1559 0.2611 0.2918 0.4711 0.435
Iteration ** 0.0029 0.0516 0.0984 0.1559 0.2613 0.2917 0.471 0.434
1
Regression weights
0.751 0.82 0.877 0.921 0.954 0.976 0.99 0.997
Fishing mortalities
49

Age 2010 2011 2012 2013 2014 2015 2016 2017
2 0.005 0.003 0.021 0.005 0.004 0.005 0.004 0.007
3 0.039 0.036 0.055 0.037 0.026 0.032 0.079 0.038
4 0.11 0.123 0.092 0.097 0.086 0.099 0.12 0.125
5 0.26 0.272 0.196 0.149 0.15 0.15 0.213 0.171
6 0.47 0.236 0.245 0.172 0.193 0.252 0.312 0.393
7 0.338 0.409 0.211 0.2 0.249 0.201 0.483 0.518
8 0.411 0.296 0.332 0.218 0.296 0.226 0.371 0.57
9 0.152 0.247 0.228 0.363 0.154 0.255 0.385 0.399
av4-7 0.2945 0.26 0.186 0.1545 0.1695 0.1755 0.282 0.301
1
XSA population numbers (Thousands)
AGE
YEAR 2 3 4 5 6 7 8 9
2010 2.68E+04 2.10E+04 1.84E+04 1.31E+04 6.44E+03 3.86E+03 2.67E+03 2.17E
2011 2.92E+04 2.18E+04 1.65E+04 1.35E+04 8.25E+03 3.30E+03 2.26E+03 1.45E
2012 2.16E+04 2.38E+04 1.72E+04 1.20E+04 8.44E+03 5.33E+03 1.79E+03 1.38E
2013 2.66E+04 1.73E+04 1.85E+04 1.29E+04 8.07E+03 5.41E+03 3.54E+03 1.05E
2014 2.97E+04 2.16E+04 1.36E+04 1.37E+04 9.07E+03 5.56E+03 3.63E+03 2.33E
2015 2.90E+04 2.42E+04 1.73E+04 1.02E+04 9.66E+03 6.12E+03 3.55E+03 2.21E
2016 3.11E+04 2.36E+04 1.92E+04 1.28E+04 7.21E+03 6.15E+03 4.10E+03 2.32E
2017 2.95E+04 2.54E+04 1.78E+04 1.39E+04 8.47E+03 4.32E+03 3.10E+03 2.32E
2018 2.75E+04 2.40E+04 2.00E+04 1.29E+04 9.61E+03 4.68E+03 2.11E+03 1.44E
2019 2.67E+04 2.24E+04 1.89E+04 1.49E+04 8.99E+03 6.42E+03 2.65E+03 1.00E
Estimated population abundance at 1st Jan 2020
0.00E+00 2.18E+04 1.74E+04 1.40E+04 1.05E+04 5.66E+03 3.93E+03 1.35E
Taper weighted geometric mean of the VPA populations:
2.71E+04 2.19E+04 1.72E+04 1.25E+04 8.22E+03 4.99E+03 2.85E+03 1.65E
50

Standard error of the weighted Log(VPA populations) :
0.1122 0.1216 0.1208 0.127 0.1288 0.1956 0.2447 0.321
1
Log catchability residuals.
Fleet : Norw. Coast. survey
Age 1995 1996 1997 1998 1999
2 99.99 99.99 99.99 99.99 99.99
3 99.99 99.99 99.99 99.99 99.99
4 99.99 99.99 99.99 99.99 99.99
5 99.99 99.99 99.99 99.99 99.99
6 99.99 99.99 99.99 99.99 99.99
7 99.99 99.99 99.99 99.99 99.99
8 99.99 99.99 99.99 99.99 99.99
Age 2000 2001 2002 2003 2004 2005 2006 2007
2 0.69 0.41 0.05 -0.11 0.22 -0.09 0.1 0
3 3.37 2.32 0.38 0.06 0.15 0.08 0.53 0.59
4 0.93 0.71 0.34 0.08 0.28 -0.02 0.23 0.66
5 1.21 0.53 0.24 0.01 -0.07 0.18 0.3 0.31
6 1.44 0.56 0.45 0.29 0.12 -0.17 0.46 0.32
7 1.04 0.8 0.58 0.29 -0.17 0.19 0.5 0.48
8 1 0.59 0.09 0.2 -0.01 0.03 -0.19 0.06
Age 2010 2011 2012 2013 2014 2015 2016 2017
2 -0.13 -0.08 0.04 0.01 0.19 0.17 0 0.02
3 -0.75 0.3 -0.55 -0.5 -0.14 -0.01 0.92 0.47
4 -0.27 0.33 -0.16 -0.05 -0.05 -0.02 -0.02 -0.19
5 -0.13 0.06 -0.29 -0.08 0.36 -0.14 0.1 -0.35
51

6 -0.1 0.15 -0.53 0.07 0.22 -0.09 -0.06 -0.19
7 -0.43 -0.33 -0.37 -0.04 0.54 -0.28 -0.07 -0.12
8 -0.17 0.02 -0.06 0.22 0.46 -0.25 0.18 -0.17
Mean log catchability and standard error of ages with catchability
independent of year class strength and constant w.r.t. time
Age 4 5 6 7 8
Mean Log q -1.3583 -1.1897 -1.1323 -1.1795 -1.1795
S.E(Log q) 0.2332 0.241 0.2425 0.3441 0.2131
Regression statistics :
Ages with q dependent on year class strength
Age Slope t-value Inter-cept RSquare No Pts Reg s.e Mean Log q
2 0.54 1.273 5.76 0.43 20 0.14 -1.95
3 2.94 -0.89 -14.59 0.02 20 0.88 -1.62
Ages with q independent of year class strength and constant w.r.t. time.
Age Slope t-value Inter-cept RSquare No Pts Reg s.e Mean Q
4 13.39 -1.734 ****** 0 20 2.87 -1.36
5 0.92 0.138 1.82 0.25 20 0.23 -1.19
6 1.03 -0.043 0.93 0.21 20 0.26 -1.13
7 0.66 0.995 3.71 0.45 20 0.23 -1.18
8 0.8 0.936 2.49 0.69 20 0.17 -1.15
1
52

Terminal year survivor and F summaries :
Age 2 Catchability dependent on age and year class strength
Year class = 2017
Fleet Esti-
mated Int Ext Var N Scaled Estimated
Survi-vors s.e s.e Ratio Weights F
Norw. Coast. survey 22815 0.3 0 0 1 0.139 0.003
P shrinkage mean 21938 0.12 0.849 0.003
F shrinkage mean 9559 1 0.013 0.007
Weighted prediction :
Survivors Int Ext N Var F
at end of year s.e s.e Ratio
21830 0.11 0.07 3 0.656 0.003
Age 3 Catchability dependent on age and year class strength
Year class = 2016
Fleet Esti-
mated Int Ext Var N Scaled Estimated
Survi-vors s.e s.e Ratio Weights F
Norw. Coast. survey 18654 0.289 0.464 1.61 2 0.14 0.048
P shrinkage mean 17150 0.12 0.848 0.052
F shrinkage mean 23387 1 0.012 0.039
Weighted prediction :
53

Survivors Int Ext N Var F
at end of year s.e s.e Ratio
17420 0.11 0.11 4 0.999 0.052
1
Age 4 Catchability constant w.r.t. time and dependent on age
Year class = 2015
Fleet Esti-
mated Int Ext Var N Scaled Estimated
Survi-vors s.e s.e Ratio Weights F
Norw. Coast. survey 14104 0.207 0.171 0.83 3 0.954 0.098
F shrinkage mean 12647 1 0.046 0.108
Weighted prediction :
Survivors Int Ext N Var F
at end of year s.e s.e Ratio
14033 0.2 0.14 4 0.675 0.098
Age 5 Catchability constant w.r.t. time and dependent on age
Year class = 2014
Fleet Esti-
mated Int Ext Var N Scaled Estimated
Survi-vors s.e s.e Ratio Weights F
Norw. Coast. survey 10483 0.171 0.147 0.86 4 0.965 0.156
F shrinkage mean 9745 1 0.035 0.166
Weighted prediction :
54

Survivors Int Ext N Var F
at end of year s.e s.e Ratio
10456 0.17 0.12 5 0.741 0.156
1
Age 6 Catchability constant w.r.t. time and dependent on age
Year class = 2013
Fleet Esti-
mated Int Ext Var N Scaled Estimated
Survi-vors s.e s.e Ratio Weights F
Norw. Coast. survey 5695 0.15 0.13 0.87 5 0.966 0.26
F shrinkage mean 4840 1 0.034 0.3
Weighted prediction :
Survivors Int Ext N Var F
at end of year s.e s.e Ratio
5664 0.15 0.12 6 0.774 0.261
Age 7 Catchability constant w.r.t. time and dependent on age
Year class = 2012
Fleet Esti-
mated Int Ext Var N Scaled Estimated
Survi-vors s.e s.e Ratio Weights F
Norw. Coast. survey 4001 0.14 0.118 0.84 6 0.966 0.287
F shrinkage mean 2360 1 0.034 0.447
Weighted prediction :
55

Survivors Int Ext N Var F
at end of year s.e s.e Ratio
3930 0.14 0.11 7 0.811 0.292
1
Age 8 Catchability constant w.r.t. time and age (fixed at the value for age) 7
Year class = 2011
Fleet Esti-
mated Int Ext Var N Scaled Estimated
Survi-vors s.e s.e Ratio Weights F
Norw. Coast. survey 1369 0.139 0.053 0.38 7 0.954 0.467
F shrinkage mean 1082 1 0.046 0.561
Weighted prediction :
Survivors Int Ext N Var F
at end of year s.e s.e Ratio
1354 0.14 0.05 8 0.366 0.471
Age 9 Catchability constant w.r.t. time and age (fixed at the value for age) 7
Year class = 2010
Fleet Esti-
mated Int Ext Var N Scaled Estimated
Survi-vors s.e s.e Ratio Weights F
Norw. Coast. survey 512 0.14 0.035 0.25 7 0.923 0.448
F shrinkage mean 838 1 0.077 0.297
Weighted prediction :
56

Survivors Int Ext N Var F
at end of year s.e s.e Ratio
532 0.15 0.06 8 0.4 0.435
57
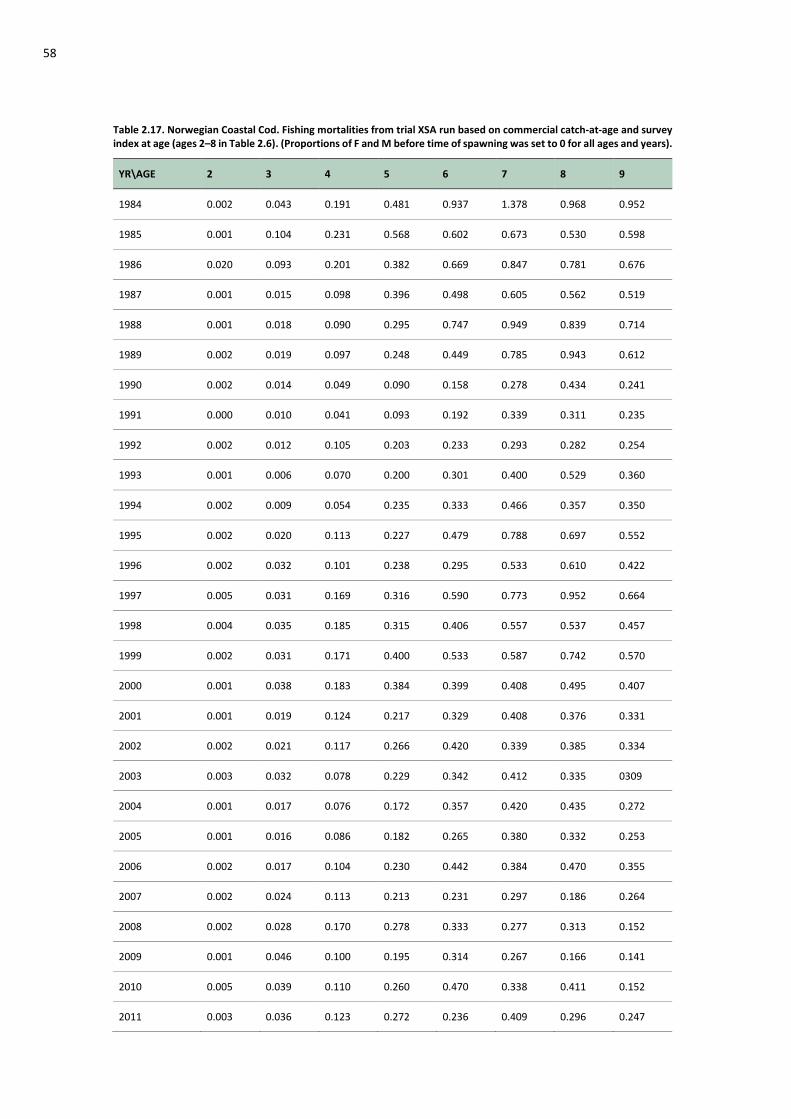
Table 2.17. Norwegian Coastal Cod. Fishing mortalities from trial XSA run based on commercial catch-at-age and survey index at age (ages 2–8 in Table 2.6). (Proportions of F and M before time of spawning was set to 0 for all ages and years).
YR\AGE 2 3 4 5 6 7 8 9
1984 0.002 0.043 0.191 0.481 0.937 1.378 0.968 0.952
1985 0.001 0.104 0.231 0.568 0.602 0.673 0.530 0.598
1986 0.020 0.093 0.201 0.382 0.669 0.847 0.781 0.676
1987 0.001 0.015 0.098 0.396 0.498 0.605 0.562 0.519
1988 0.001 0.018 0.090 0.295 0.747 0.949 0.839 0.714
1989 0.002 0.019 0.097 0.248 0.449 0.785 0.943 0.612
1990 0.002 0.014 0.049 0.090 0.158 0.278 0.434 0.241
1991 0.000 0.010 0.041 0.093 0.192 0.339 0.311 0.235
1992 0.002 0.012 0.105 0.203 0.233 0.293 0.282 0.254
1993 0.001 0.006 0.070 0.200 0.301 0.400 0.529 0.360
1994 0.002 0.009 0.054 0.235 0.333 0.466 0.357 0.350
1995 0.002 0.020 0.113 0.227 0.479 0.788 0.697 0.552
1996 0.002 0.032 0.101 0.238 0.295 0.533 0.610 0.422
1997 0.005 0.031 0.169 0.316 0.590 0.773 0.952 0.664
1998 0.004 0.035 0.185 0.315 0.406 0.557 0.537 0.457
1999 0.002 0.031 0.171 0.400 0.533 0.587 0.742 0.570
2000 0.001 0.038 0.183 0.384 0.399 0.408 0.495 0.407
2001 0.001 0.019 0.124 0.217 0.329 0.408 0.376 0.331
2002 0.002 0.021 0.117 0.266 0.420 0.339 0.385 0.334
2003 0.003 0.032 0.078 0.229 0.342 0.412 0.335 0309
2004 0.001 0.017 0.076 0.172 0.357 0.420 0.435 0.272
2005 0.001 0.016 0.086 0.182 0.265 0.380 0.332 0.253
2006 0.002 0.017 0.104 0.230 0.442 0.384 0.470 0.355
2007 0.002 0.024 0.113 0.213 0.231 0.297 0.186 0.264
2008 0.002 0.028 0.170 0.278 0.333 0.277 0.313 0.152
2009 0.001 0.046 0.100 0.195 0.314 0.267 0.166 0.141
2010 0.005 0.039 0.110 0.260 0.470 0.338 0.411 0.152
2011 0.003 0.036 0.123 0.272 0.236 0.409 0.296 0.247
58

ICES | AFWG 2020 | 59
YR\AGE 2 3 4 5 6 7 8 9
2012 0.021 0.055 0.092 0.196 0.245 0.211 0.332 0.228
2013 0.006 0.037 0.097 0.149 0.172 0.200 0.218 0.363
2014 0.004 0.026 0.086 0.150 0.193 0.249 0.296 0.154
2015 0.005 0.032 0.099 0.150 0.252 0.201 0.226 0.255
2016 0.004 0.080 0.120 0.213 0.312 0.483 0.371 0.385
2017 0.007 0.038 0.125 0.171 0.393 0.518 0.570 0.399
2018 0.006 0.039 0.092 0.161 0.203 0.370 0.543 0.523
2019 0.003 0.052 0.098 0.156 0.261 0.290 0.471 0.435
Table 2.17 cont. Summary output from trial XSA run based on commercial catch
Run title COMBSEX PLUSGROUP : Norwegian Coastal Cod
At 18/04/2020 13:14
Table 16 Summary (without SOP correction)
Year R_age2 TotBiom SSB Landings Y / SSB F(4-7)
1984 58760 168474 68331 63818 0.934 0.7467
1985 63890 189058 74607 62954 0.8438 0.5184
1986 16653 194538 78127 56107 0.7181 0.5249
1987 21181 184071 80787 48274 0.5975 0.3994
1988 34491 178503 92617 55065 0.5945 0.5202
1989 38244 163824 84462 41242 0.4883 0.3948
1990 35933 171550 85246 20920 0.2454 0.1438
1991 44488 205968 105416 24837 0.2356 0.1662
1992 31671 231646 125020 38195 0.3055 0.2084
1993 17063 245645 145008 50420 0.3477 0.2428
1994 14705 238121 152474 51664 0.3388 0.2722
1995 19778 208474 145233 64964 0.4473 0.4017
1996 26637 180981 125940 41672 0.3309 0.2915
1997 28169 143605 90414 51123 0.5654 0.4619

60 | ICES SCIENTIFIC REPORTS 2:52
1998 28927 135425 70695 30472 0.431 0.3657
1999 29242 147458 75691 35805 0.473 0.4227
2000 26784 136847 63303 34815 0.55 0.3436
2001 26441 143861 67687 27253 0.4026 0.2692
2002 24437 169382 84541 36405 0.4306 0.2855
2003 24190 147137 80446 35381 0.4398 0.2654
2004 22553 156398 82561 33650 0.4076 0.2558
2005 21630 161584 88738 29255 0.3297 0.228
2006 21203 188161 105473 39343 0.373 0.29
2007 27099 191481 105918 29227 0.2759 0.2136
2008 28893 196098 101686 35552 0.3496 0.2643
2009 25694 182638 89195 29987 0.3362 0.2185
2010 26775 198676 103920 40397 0.3887 0.2943
2011 29178 196626 99770 36714 0.368 0.26
2012 21554 196725 102618 35540 0.3463 0.1861
2013 26580 187805 101626 30144 0.2966 0.1544
2014 29666 226741 132494 33660 0.254 0.1697
2015 28956 222361 126172 35843 0.2841 0.1756
2016 31085 236144 130831 54767 0.4186 0.2821
2017 29487 216334 115593 51053 0.4417 0.3015
2018 27535 207699 99143 36375 0.3669 0.2063
2019 26734 216627 109687 40107 0.3656 0.2018

ICES | AFWG 2020 | 61
Table 2.18. Calculated survey mortalities (Z) and vpa- values of F(4–7) predicted from survey mortalities, both for the vpa using commercial catch and the vpa using all catch.
year av. survey Z com. Catch all catch
ages 4–9 Predict F(4–7) Predict F(4–7)
1996 0.881 0.3198 0.3404
1997 0.850 0.3166 0.3365
1998 1.604 0.3935 0.4301
1999 1.018 0.3337 0.3573
2000 0.538 0.2847 0.2977
2001 0.912 0.3229 0.3442
2002 1.084 0.3404 0.3655
2003 0.482 0.2790 0.2907
2004 0.725 0.2630 0.3210
2005 0.355 0.2693 0.2750
2006 0.324 0.2628 0.2711
2007 0.386 0.2684 0.2788
2008 0.925 0.3171 0.3457
2009 -0.030 0.2308 0.2272
2010 0.776 0.3037 0.3273
2011 0.229 0.2542 0.2594
2012 0.760 0.3022 0.3253
2013 -0.102 0.2243 0.2183
2014 -0.031 0.2307 0.2270
2015 0.677 0.2947 0.3150
2016 0.389 0.2687 0.2792
2017 0.802 0.3060 0.2903
2018 0.379 0.2678 0.2309
2019 -0.292 0.2002 0.2862

62 | ICES SCIENTIFIC REPORTS 2:52
Table 2.19. Norwegian Coastal Cod. Stock summary for SVPA based on commercial catch-at-age and survey derived F in terminal year (2019)
REC TOTALBI TOTSPBI LANDING YIELD/SS FBAR 4- 71984 79507 199527 79743 77118 0.9671 0.71391985 87853 221408 83710 76354 0.9121 0.50851986 42837 238127 90335 69607 0.7705 0.54591987 32962 229589 92757 61774 0.666 0.44041988 47702 229473 108933 68665 0.6303 0.55531989 56812 224070 107789 54942 0.5097 0.39941990 53470 219323 104704 35420 0.3383 0.21381991 64187 240506 119446 40137 0.336 0.19231992 49926 286678 150850 54295 0.3599 0.2391993 25560 312390 176713 65220 0.3691 0.2491994 22541 302831 184226 66364 0.3602 0.27711995 31325 265412 176593 79664 0.4511 0.38631996 46955 233634 155350 56172 0.3616 0.3031997 43020 192773 113257 65623 0.5794 0.43951998 42077 194554 95169 45072 0.4736 0.35621999 41295 206766 101885 49705 0.4879 0.37672000 39318 200874 93685 48415 0.5168 0.30442001 39004 211435 100349 40653 0.4051 0.26042002 35326 237243 117975 50005 0.4239 0.27762003 34517 210807 114983 49281 0.4286 0.2472004 32693 214913 112361 47050 0.4187 0.26552005 31751 219826 116925 42455 0.3631 0.23282006 30008 251764 136119 52343 0.3845 0.28022007 41115 263780 142577 42227 0.2962 0.22192008 38660 270592 135025 48352 0.3581 0.25212009 34312 249797 120454 42687 0.3544 0.23642010 34960 266679 138814 53097 0.3825 0.27052011 38841 265928 138018 49414 0.358 0.25462012 29454 265071 142458 48240 0.3386 0.18622013 35154 250838 137677 42844 0.3112 0.17542014 36413 290983 169950 46360 0.2728 0.18782015 39835 283956 160483 48543 0.3025 0.19172016 45555 298056 161638 67467 0.4174 0.27412017 42589 281831 145584 63753 0.4379 0.28372018 50960 290153 132360 49075 0.3708 0.20842019 22606 308411 149598 52807 0.353 0.2002
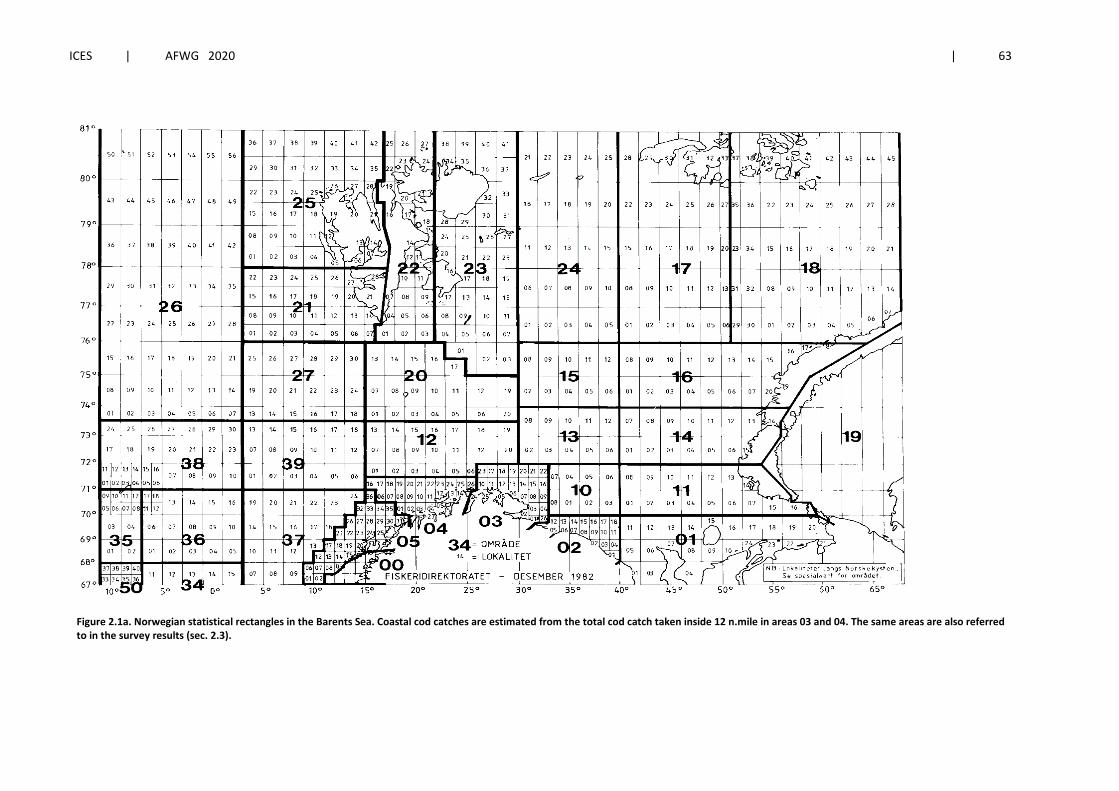
ICES | AFWG 2020 | 63
Figure 2.1a. Norwegian statistical rectangles in the Barents Sea. Coastal cod catches are estimated from the total cod catch taken inside 12 n.mile in areas 03 and 04. The same areas are also referred to in the survey results (sec. 2.3).

64 | ICES SCIENTIFIC REPORTS 2:52
Figure 2.1b. Norwegian statistical rectangles in the Norwegian Sea. Coastal cod catches are estimated from the total cod catch taken inside 12 n.mile in areas 05, 00, 06 and 07. The same areas are also referred to in the survey results (sec. 2.3).

ICES | AFWG 2020 | 65
Figure 2.2. An image of a coastal cod otolith (top) and a northeast Arctic cod otolith (bottom). The two first translucent zones are highlighted. (from Berg et al., 2005).

66 | ICES SCIENTIFIC REPORTS 2:52
Figure 2.3a. ECA-output for 2019 commercial catches by Norway in the coastal statistical areas (Figure 2.5c). Left panels NEA cod. Right panels coastal cod.

ICES | AFWG 2020 | 67
Figure 2.3b. ECA-output for 2019 commercial catches by Norway in the coastal statistical areas (Figure 2.5c). Left panels NEA cod. Right panels coastal cod.

68 | ICES SCIENTIFIC REPORTS 2:52
Figure 2.4. Norwegian statistical rectangles. The colors indicate area units used by the ECA-model for combining cod samples. Coastal cod are only estimated in coastal areas (0 and 300–701).
0 20 40 60
6570
7580
Longitude
Latit
ude
12
10 11
13 14
15 16
17 1824
301401
300400
12
30
34
36
37
38 39
20
21
22 23
25
26
27
0
501500
601
701
600
700
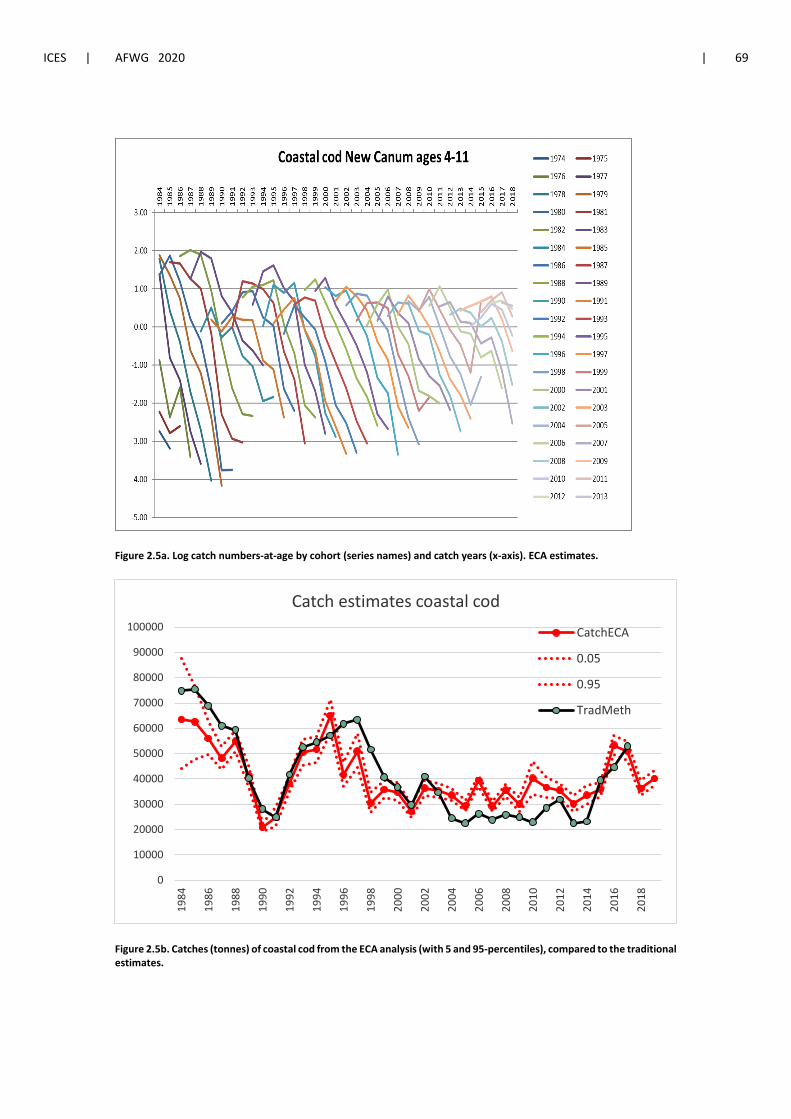
ICES | AFWG 2020 | 69
Figure 2.5a. Log catch numbers-at-age by cohort (series names) and catch years (x-axis). ECA estimates.
Figure 2.5b. Catches (tonnes) of coastal cod from the ECA analysis (with 5 and 95-percentiles), compared to the traditional estimates.
0
10000
20000
30000
40000
50000
60000
70000
80000
90000
100000
1984
1986
1988
1990
1992
1994
1996
1998
2000
2002
2004
2006
2008
2010
2012
2014
2016
2018
Catch estimates coastal cod
CatchECA
0.05
0.95
TradMeth

70 | ICES SCIENTIFIC REPORTS 2:52
Figure 2.5c. AFWG 2019-XSA run (1984-2017) with Traditional estimates of catch-at-age as input (old), as used in 2018 AFWG, and run with ECA-estimates of catch-at-age as input (new2019), both runs tuned by the coastal survey data 1995-2017, ages 2-10+ (NOcoast-Aco-4Q).
0
50000
100000
150000
20000019
8419
8619
8819
9019
9219
9419
9619
9820
0020
0220
0420
0620
0820
1020
1220
1420
16
SSB (tonnes) new old
00.10.20.30.40.50.60.70.8
1984
1986
1988
1990
1992
1994
1996
1998
2000
2002
2004
2006
2008
2010
2012
2014
2016
F(4-7) new old
01000020000300004000050000600007000080000
1984
1986
1988
1990
1992
1994
1996
1998
2000
2002
2004
2006
2008
2010
2012
2014
2016
Landings (tonnes)new old

ICES | AFWG 2020 | 71
Figure 2.6. Coastal cod survey. Abundance at age relative to time-series average in total survey. Upper: ages 2–5, Lower: ages 6–8.
0
0.5
1
1.5
2
2.5
3
3.519
9519
9619
9719
9819
9920
0020
0120
0220
0320
0420
0520
0620
0720
0820
0920
1020
1120
1220
1320
1420
1520
1620
1720
1820
19
Rel
ativ
e nu
mbe
rs b
y ag
eCoastal cod survey series TOTAL area
2345
0
0.5
1
1.5
2
2.5
3
3.5
1995
1996
1997
1998
1999
2000
2001
2002
2003
2004
2005
2006
2007
2008
2009
2010
2011
2012
2013
2014
2015
2016
2017
2018
2019
Rel
ativ
e um
bers
by
age
Coastal cod survey series TOTAL area
6
7
8
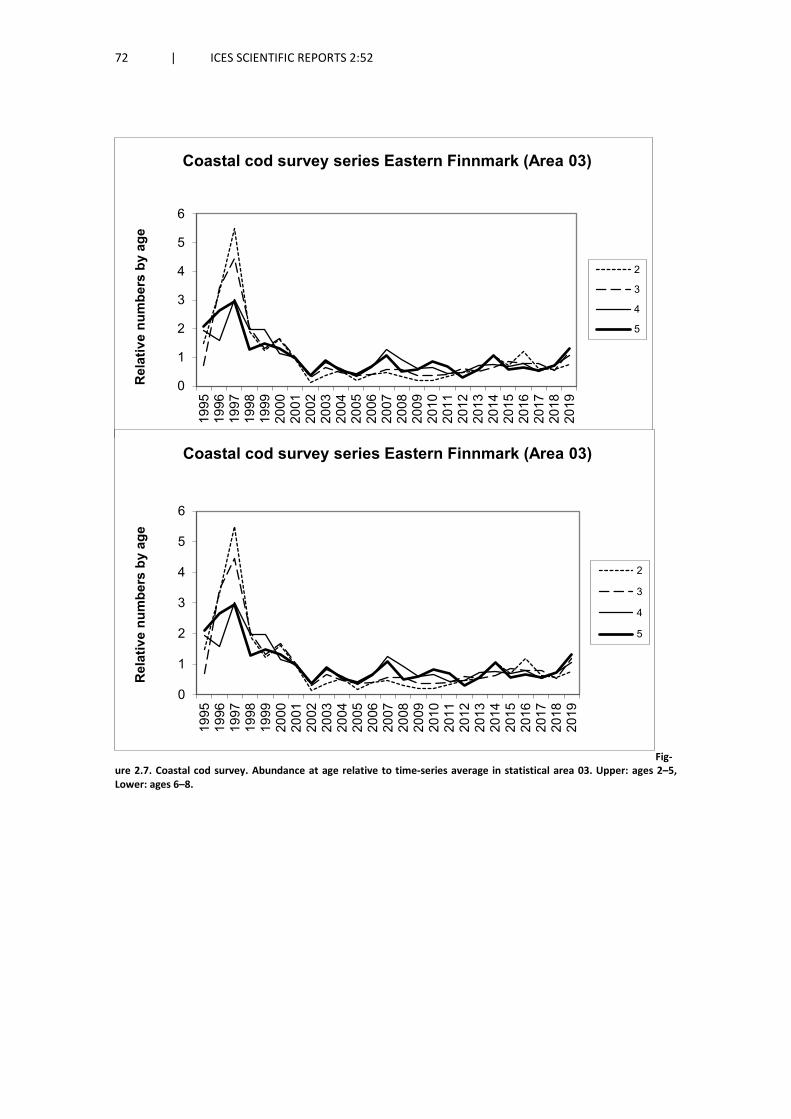
72 | ICES SCIENTIFIC REPORTS 2:52
Fig-ure 2.7. Coastal cod survey. Abundance at age relative to time-series average in statistical area 03. Upper: ages 2–5, Lower: ages 6–8.
0
1
2
3
4
5
619
9519
9619
9719
9819
9920
0020
0120
0220
0320
0420
0520
0620
0720
0820
0920
1020
1120
1220
1320
1420
1520
1620
1720
1820
19
Rel
ativ
e nu
mbe
rs b
y ag
eCoastal cod survey series Eastern Finnmark (Area 03)
2
3
4
5
0
1
2
3
4
5
6
1995
1996
1997
1998
1999
2000
2001
2002
2003
2004
2005
2006
2007
2008
2009
2010
2011
2012
2013
2014
2015
2016
2017
2018
2019
Rel
ativ
e nu
mbe
rs b
y ag
e
Coastal cod survey series Eastern Finnmark (Area 03)
2
3
4
5
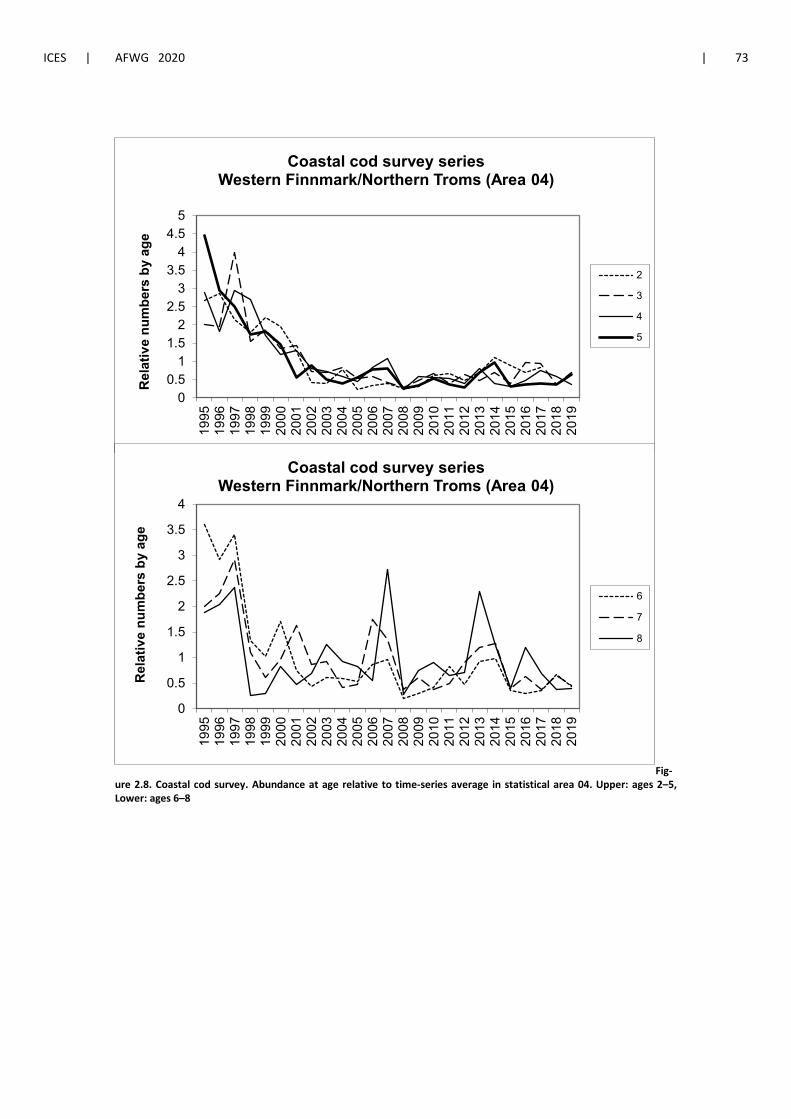
ICES | AFWG 2020 | 73
Fig-ure 2.8. Coastal cod survey. Abundance at age relative to time-series average in statistical area 04. Upper: ages 2–5, Lower: ages 6–8
00.5
11.5
22.5
33.5
44.5
519
9519
9619
9719
9819
9920
0020
0120
0220
0320
0420
0520
0620
0720
0820
0920
1020
1120
1220
1320
1420
1520
1620
1720
1820
19
Rel
ativ
e nu
mbe
rs b
y ag
eCoastal cod survey series
Western Finnmark/Northern Troms (Area 04)
2
3
4
5
0
0.5
1
1.5
2
2.5
3
3.5
4
1995
1996
1997
1998
1999
2000
2001
2002
2003
2004
2005
2006
2007
2008
2009
2010
2011
2012
2013
2014
2015
2016
2017
2018
2019
Rel
ativ
e nu
mbe
rs b
y ag
e
Coastal cod survey series Western Finnmark/Northern Troms (Area 04)
6
7
8

74 | ICES SCIENTIFIC REPORTS 2:52
Figure 2.9. Coastal cod survey. Abundance at age relative to time-series average in statistical area 05. Upper: ages 2–5, Lower: ages 6–8.
0
1
2
3
4
5
619
9519
9619
9719
9819
9920
0020
0120
0220
0320
0420
0520
0620
0720
0820
0920
1020
1120
1220
1320
1420
1520
1620
1720
1820
19
Rel
ativ
e nu
mbe
rs b
y ag
eCoastal cod survey series Vesterålen (Area 05)
2
3
4
5
00.5
11.5
22.5
33.5
44.5
5
1995
1996
1997
1998
1999
2000
2001
2002
2003
2004
2005
2006
2007
2008
2009
2010
2011
2012
2013
2014
2015
2016
2017
2018
2019
Rel
ativ
e nu
mbe
rs b
y ag
e
Coastal cod survey series Vesterålen (Area 05)
6
7
8

ICES | AFWG 2020 | 75
Figure 2.10. Coastal cod survey. Abundance at age relative to time-series average in statistical area 00. Upper: ages 2–5, Lower: ages 6–8.
00.5
11.5
22.5
33.5
44.5
519
9519
9619
9719
9819
9920
0020
0120
0220
0320
0420
0520
0620
0720
0820
0920
1020
1120
1220
1320
1420
1520
1620
1720
1820
19
Rel
ativ
e nu
mbe
rs b
y ag
eCoastal cod survey series Lofoten (Area 00)
2
3
4
5
00.5
11.5
22.5
33.5
44.5
1995
1996
1997
1998
1999
2000
2001
2002
2003
2004
2005
2006
2007
2008
2009
2010
2011
2012
2013
2014
2015
2016
2017
2018
2019
Rel
ativ
e nu
mbe
rs b
y ag
e
Coastal cod survey series Lofoten (Area 00)
6
7
8

76 | ICES SCIENTIFIC REPORTS 2:52
Figure 2.11 Coastal cod survey. Abundance at age relative to time-series average in statistical area 06. Upper: ages 2–5, Lower: ages 6–8.
0
1
2
3
4
5
6
7
819
9519
9619
9719
9819
9920
0020
0120
0220
0320
0420
0520
0620
0720
0820
0920
1020
1120
1220
1320
1420
1520
1620
1720
1820
19
Rel
ativ
e nu
mbe
rs b
y ag
eCoastal cod survey series Nordland (Area 06)
2
3
4
5
00.5
11.5
22.5
33.5
44.5
5
1995
1996
1997
1998
1999
2000
2001
2002
2003
2004
2005
2006
2007
2008
2009
2010
2011
2012
2013
2014
2015
2016
2017
2018
2019
Rel
ativ
e nu
mbe
rs b
y ag
e
Coastal cod survey series Nordland (Area 06)
6
7
8

ICES | AFWG 2020 | 77
Figure 2.12. Coastal cod survey. Abundance-at-age relative to time-series average in statistical area 07. Some important areas at Møre was not covered in 2013. Upper: ages 2–5, Lower: ages 6–8.
0
2
4
6
8
10
1219
9519
9619
9719
9819
9920
0020
0120
0220
0320
0420
0520
0620
0720
0820
0920
1020
1120
1220
1320
1420
1520
1620
1720
1820
19
Rel
ativ
e nu
mbe
rs b
y ag
eCoastal cod survey series Trøndelag/Møre (Area 07)
2
3
4
5
0
1
2
3
4
5
6
1995
1996
1997
1998
1999
2000
2001
2002
2003
2004
2005
2006
2007
2008
2009
2010
2011
2012
2013
2014
2015
2016
2017
2018
2019
Rel
ativ
e N
umbe
rs b
y ag
e
Coastal cod survey series Trøndelag/Møre (Area 07)
6
7
8

78 | ICES SCIENTIFIC REPORTS 2:52
Figure 2.13a. Mean weights at age in the coastal survey, not updated for 2018 and 2019

ICES | AFWG 2020 | 79
Figure 2.13b. Proportions mature-at-age as observed in the surveys. Ages 3, 5, 7 and 9 in blue, ages 4, 6, 8, and 10 in red. , not updated for 2018 and 2019
Figure 2.14. Survey SSB calculated by maturity observed in the surveys .
0
10000
20000
30000
40000
50000
60000
70000
80000
1995
1996
1997
1998
1999
2000
2001
2002
2003
2004
2005
2006
2007
2008
2009
2010
2011
2012
2013
2014
2015
2016
2017
2018
2019
SSB, coastal acoustic survey
Gytebiomasse

80 | ICES SCIENTIFIC REPORTS 2:52
Figure 2.15. Survey mortality Z (upper) and relation to VPA values of F(4–7) over the period 1996–2007 for a trial XSA based on commercial catch (middle) and a trial XSA based on all catch (bottom).
y = 0.102x + 0.2299R² = 0.2526
0.2
0.25
0.3
0.35
0.4
0.45
0.5
0.0 0.2 0.4 0.6 0.8 1.0 1.2 1.4 1.6 1.8
F(4-
7) tr
ial x
sa, c
om. c
atch
Survey Z(4-9)
1996-2007
y = 0.054x + 0.3019R² = 0.09030.2
0.25
0.3
0.35
0.4
0.45
0.5
0 0.2 0.4 0.6 0.8 1 1.2 1.4 1.6 1.8
F(4-
7) tr
ial x
sa, a
ll ca
tch
Survey Z(4-9)
1996-2007

ICES | AFWG 2020 | 81
Figure 2.16. Comparisons of SVPA outputs in current assessment (Ass20) with the assessments in the years 2010-2019, for analyses based on commercial catch (left) and total catch (right). In all assessments the recruit estimate for the final year is highly uncertain.
0
20000
40000
60000
80000
100000
1984
1986
1988
1990
1992
1994
1996
1998
2000
2002
2004
2006
2008
2010
2012
2014
2016
Recr age 2Ass10 CC
Ass11 CC
Ass12 CC
Ass13 CC
Ass14CC
Ass15CC
Ass16CC
Ass17CC
Ass18CC
Ass19CC
Ass20CC
0
50000
100000
150000
200000
250000
300000
350000
1984
1986
1988
1990
1992
1994
1996
1998
2000
2002
2004
2006
2008
2010
2012
2014
2016
TSBAss10 CC
Ass11 CC
Ass12 CC
Ass13 CC
Ass14CC
Ass15CC
Ass16CC
Ass17CC
Ass18CC
Ass19CC
Ass20CC
0
50000
100000
150000
200000
1984
1986
1988
1990
1992
1994
1996
1998
2000
2002
2004
2006
2008
2010
2012
2014
2016
SSBAss10 CC
Ass11 CC
Ass12 CC
Ass13 CC
Ass14CC
Ass15CC
Ass16CC
Ass17CC
Ass18CC
Ass19CC
Ass20CC
0
0.1
0.2
0.3
0.4
0.5
0.6
0.7
0.8
1984
1986
1988
1990
1992
1994
1996
1998
2000
2002
2004
2006
2008
2010
2012
2014
2016
2018
F (4-7)Ass10 CC
Ass11 CC
Ass12 CC
Ass13 CC
Ass14CC
Ass15CC
Ass16CC
Ass17CC
Ass18 CC
Ass19CC
Ass20CC0
0.1
0.2
0.3
0.4
0.5
0.6
0.7
0.8
1984
1986
1988
1990
1992
1994
1996
1998
2000
2002
2004
2006
2008
2010
2012
2014
2016
F (4-7)Ass10 TC
Ass11 TC
Ass12 TC
Ass13 TC
Ass14TC
Ass15TC
Ass16TC
Ass17TC
Ass18TC
Ass19TC
Ass20TC
0
50000
100000
150000
200000
250000
1984
1986
1988
1990
1992
1994
1996
1998
2000
2002
2004
2006
2008
2010
2012
2014
2016
SSBAss10 TC
Ass11 TC
Ass12 TC
Ass13 TC
Ass14TC
Ass15TC
Ass16TC
Ass17TC
Ass18TC
Ass19TC
Ass20TC
050000
100000150000200000250000300000350000400000450000
1984
1986
1988
1990
1992
1994
1996
1998
2000
2002
2004
2006
2008
2010
2012
2014
2016
TSBAss10 TC
Ass11 TC
Ass12 TC
Ass13 TC
Ass14TC
Ass15TC
Ass16TC
Ass17TC
Ass18TC
Ass19TC
Ass20TC
0
20000
40000
60000
80000
100000
120000
1984
1986
1988
1990
1992
1994
1996
1998
2000
2002
2004
2006
2008
2010
2012
2014
2016
Recr age 2Ass10 TC
Ass11 TC
Ass12 TC
Ass13 TC
Ass14TC
Ass15TC
Ass16TC
Ass17TC
Ass18TC
Ass19TC
Ass20TC

82 | ICES SCIENTIFIC REPORTS 2:52
Figure 2.17. Coastal cod. Trends in spawning biomass. Each series are shown relative to its 1995–2017 average. The red line is survey SSB calculated with the same maturity ogive as in the VPA.
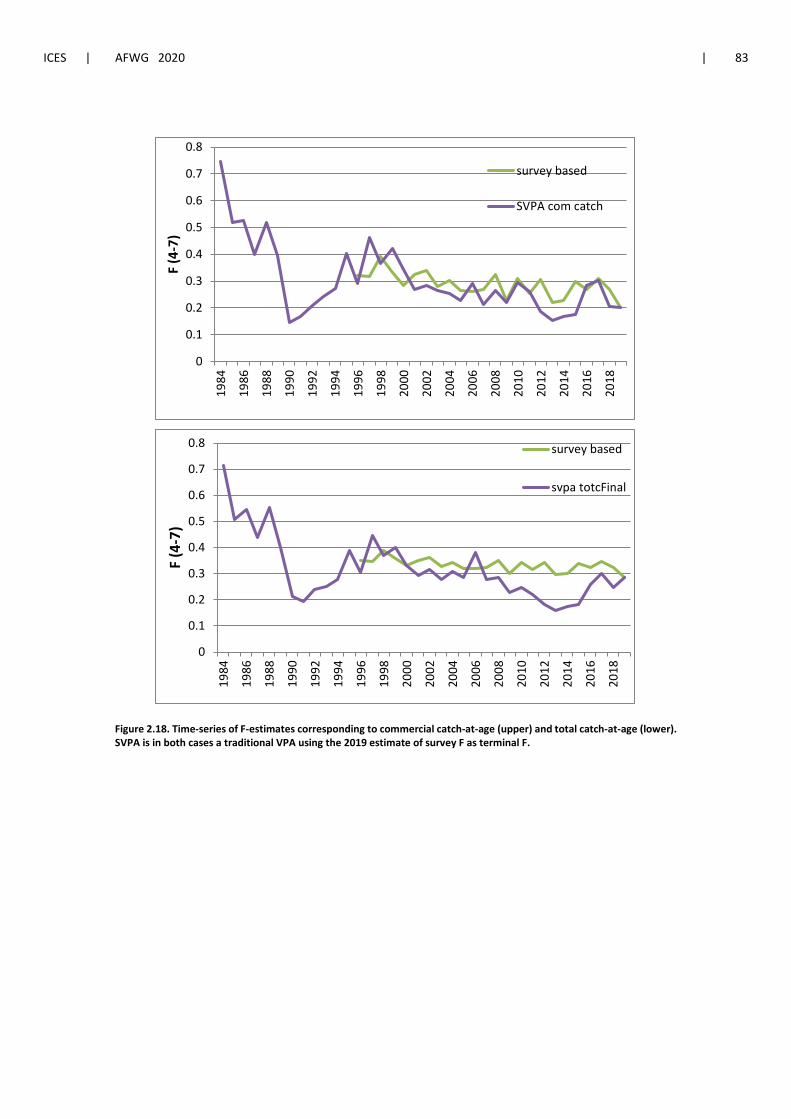
ICES | AFWG 2020 | 83
Figure 2.18. Time-series of F-estimates corresponding to commercial catch-at-age (upper) and total catch-at-age (lower). SVPA is in both cases a traditional VPA using the 2019 estimate of survey F as terminal F.
0
0.1
0.2
0.3
0.4
0.5
0.6
0.7
0.8
1984
1986
1988
1990
1992
1994
1996
1998
2000
2002
2004
2006
2008
2010
2012
2014
2016
2018
F (4
-7)
survey based
SVPA com catch
0
0.1
0.2
0.3
0.4
0.5
0.6
0.7
0.8
1984
1986
1988
1990
1992
1994
1996
1998
2000
2002
2004
2006
2008
2010
2012
2014
2016
2018
F (4
-7)
survey based
svpa totcFinal

84 | ICES SCIENTIFIC REPORTS 2:52 | ICES
3 Northeast Artic cod in subareas 1 and 2
3.1 Status of the fisheries
3.1.1 Historical development of the fisheries (Table 3.1)
From a level of about 900 000 t in the mid-1970s, total catch declined steadily to around 300 000 t in 1983—1985 (Table 3.1). Catches increased to above 500 000 t in 1987 before dropping to 212 000 t in 1990, the lowest level recorded in the post-war period. The catches increased rapidly from 1991 onwards, stabilized around 750 000 t in 1994—1997 but decreased to about 414 000 t in 2000. From 2000—2009, the reported catches were between 400 000 and 520 000 t, in addition there were unreported catches (see below). Catches have been above the long-term average since 2011 and have decreased from a peak of 986 449 tonnes in 2014 to 692 609 tonnes in 2019. The fishery is conducted both with an international trawler fleet and with coastal vessels using tra-ditional fishing gears. Quotas were introduced in 1978 for the trawler fleets and in 1989 for the coastal fleets. In addition to quotas, the fishery is regulated by a minimum catch size, a minimum mesh size in trawls and Danish seines, a maximum bycatch of undersized fish, closure of areas having high densities of juveniles and by seasonal and area restrictions.
3.1.2 Reported catches prior to 2020 (Tables 3.1-3.4, Figure 3.1)
Reported catch of cod in Subarea 1 and divisions 2.a and 2.b:
The provisional catch for 2019 reported to the working group is 692 609 t.
Reported catch figures used for the assessment of Northeast Arctic cod:
The historical practice (considering catches between 62°N and 67°N for the whole year and catches between 67°N and 69°N for the second half of the year to be Norwegian coastal cod) has been used for estimating the Norwegian landings of Northeast Arctic cod up to and including 2011 (Table 3.2). The catches of coastal cod calculated this way for the period 1960—2019 are given in Table 3.2 together with the coastal cod catches calculated based on otolith types (used in the coastal cod assessment as described in Section 2). For 2012–2019 the Norwegian catches have been analysed by an ECA-version designed for simultaneously providing estimates of catch numbers-at-age for each of the two stocks. By this procedure the amount of Norwegian catches calculated to be coastal cod in 2012, 2013, 2014, 2015, 2016, 2017, 2018 and 2019 is 35.2, 25.7, 33.6, 35.8, 54.9, 51.0, 36.3 and 40.1 thousand tonnes. Table 3.2 includes ECA estimates of coastal cod for the whole period 1984—2019. The plan at the 2015 benchmark was for both stocks to use the ECA estimates for this whole period. As described in the coastal cod section (section 2) these tabulated ECA-results are still considered preliminary, and there is a need for further work on this before the whole time-series is applied. The catch by area, are shown in Table 3.1, and further split into trawl and other gears in Table 3.3. The distribution of catches by areas and gears in 2019 was similar to 2018. The nominal landings by country are given in Table 3.4.
There is information on cod discards (see section 0.4) but it was not included in the assessment because this data are fragmented and different estimates are in contradiction with each other. Moreover the level of discards is relatively small in the recent period and inclusion of these esti-mates in the assessment should not change our perception on NEA cod stock size.
In summer/autumn 2018, a Norwegian vessel caught 450 t of cod in the Jan Mayen EEZ, which is a part of ICES area 2a, mostly by long-line. Cod is known to occasionally occur in this area, but

ICES | AFWG 2020 | 85
rarely in densities which are suitable for commercial fisheries. The cod caught in this area in 2018 was large (65–110 cm), and otolith readings and genetics both showed this cod to be a mix of Northeast Arctic and Icelandic cod. Norway did in 2019 carry out an experimental fishery dur-ing four different periods in order to investigate further the occurrence of cod in this area in space and time as well as stock identity. The size distribution and genetic composition of the cod caught in this area in 2019 was similar to that in 2018. Most of the cod caught in April-May 2019 was spawning or spent. Cod spawning in this area has not been observed previously. Total catches in 2019 amounted to 638 t. An experimental fishery will also be carried out in this area in 2020 in a similar way as in 2019, the quota set aside for this fishery in 2020 is 800 t. The 2018 catches in this area were counted against the Norwegian TAC for cod north of 62°N, while the 2019 and 2020 TAC for this area comes in addition to the Norwegian TAC for cod as agreed by JNRFC. These catches have not been included in the assessment.
3.1.3 Unreported catches of Northeast Arctic cod (Table 3.1)
In the years 2002–2008 certain quantities of unreported catches (IUU catches) have been added to the reported landings. More details on this issue are given in the Working group reports for that period.
There are no reliable data on level of IUU catches outside the periods 1990–1994 and 2002–2008, but it is believed that their level was not substantial enough to influence on historical stock as-sessment.
According to reports from the Norwegian-Russian analysis group on estimation of total catches the total catches of cod since 2009 were very close to officially reported landings.
3.1.4 TACs and advised catches for 2019 and 2020
The Joint Norwegian-Russian Fisheries Commission (JNRFC) agreed on a cod TAC of 725 000 t for 2019, and in addition 21 000 t Norwegian coastal cod. The total reported catch of 732 716 t in 2019 was 13 284 t below the agreed TAC. Since 2015 JNRFC has decided that Norway and Russia can transfer to next year or borrow from last year 10% of the cod country’s quota. That may lead to some deviation between agreed TAC and reported catch. Ignoring quota transfers, Norwegian catches in 2019 were about 6 000 t below the TAC, while third country catches were about 7 000 t below the TAC and Russian catches were very close to the TAC.
The advice for 2020 given by ACOM in 2019 was 689 672 t based on the agreed harvest control rule. The quota established by JNRFC for 2020 was equal to 738 000 tonnes. Thus, the TAC was not set according to the agreed HCR. In addition, the TAC for Norwegian Coastal Cod was set to the same value for 2020 as for 2019: 21 000 t.
3.2 Status of research
3.2.1 Fishing effort and CPUE (Table A1)
CPUE series of the Norwegian and Russian trawl fisheries are given in Table A1. The data reflect the total trawl effort, both for Norway and Russia. The Norwegian series is given as a total for all areas. Norwegian data for 2011–2019 are not necessarily compatible with data for 2007 and previous years. CPUE has been relatively stable since 2016. More details on Norwegian CPUE are given in WD 2.

86 | ICES SCIENTIFIC REPORTS 2:52 | ICES
3.2.2 Survey results - abundance and size at age (Tables 3.5, A2-A14, Figure 3.7)
Joint Barents Sea winter survey (bottom trawl and acoustics) Acronyms: BS-NoRu-Q1 (BTr) and BS-NoRu-Q1 (Aco)
The preliminary swept area estimates and acoustic estimates from the Joint winter survey on demersal fish in the Barents Sea in winter 2020 are given in Tables A2 and A3. More details on this survey are given in WD 10. The total area covered was smaller than in 2019 as the coverage was limited by ice particularly in the area east and north of Bear Island and by time and weather constraints in parts of the Russian zone.
Before 2000 this survey was made without participation from Russian vessels, while in 2001—2005, 2008—2016 and 2018-2020 Russian vessels have covered important parts of the Russian zone. In 2006—2007 the survey was carried out only by Norwegian vessels. In 2007 and 2016 the Norwegian vessels were not allowed to cover the Russian EEZ. The method for adjustment for incomplete area coverage in 2007 is described in the 2007 report. Table 3.5 shows areas covered in the time-series and the additional areas implied in the method used to adjust for missing cov-erage in the Russian Economic Zone. In 5 of the 6 adjusted years (including 2017) the adjustments were not based on area ratios, but the “index ratio by age” was used. This means that the index by age for the covered area was scaled by the observed ratio between total index and the index for the same area observed in the years prior to the survey. The adjustments for 2017 were based on average index rations by age for 2014–2016. Adjustments were also made in 2020 using the average index ratios by age for 2018-2019.
Regarding the older part of this time-series it should be noted that the survey prior to 1993 cov-ered a smaller area (Jakobsen et al. 1997), and the number of young cod (particularly 1- and 2-year old fish) was probably underestimated. Other changes in the survey methodology through time are described by Jakobsen et al. (1997), while the surveys for the years 2007—2012 and 2013—2018 are reported in Mehl et al. (2013, 2014, 2015, 2016, 2017a). Note that the change from 35 to 22 mm mesh size in the cod end in 1994 is not corrected for in the time-series. This mainly affects the age 1 indices.
The new method for calculating bottom trawl indices is described in Mehl et al. (2017b) and re-vised acoustic indices are given in Mehl et al. (2018a).
With the recent expansion of the cod distribution it is likely that in recent years the coverage in the February survey (BS-NoRu-Q1 (BTr) and BS-NoRu-Q1 (Aco)) has been incomplete, in partic-ular for the younger ages. This could cause a bias in the assessment, but the magnitude is un-known. The 2014–2020 surveys covered considerably larger areas than earlier winter surveys, and showed that most age groups of cod (particularly ages 1 and 2) were distributed far outside the standard survey area. The survey estimates within the standard area were used for the tuning data. If a wider coverage is continued in coming years, improved data for tuning and recruitment predictions might be obtained. Fig. 3.7 shows the proportion by age of the swept area index which was found in the new northern area (see also Section 0.4). In 2020 coverage of the northern area was only possible west of Spitsbergen, due to ice.
Lofoten acoustic survey on spawners Acronym: Lof-Aco-Q1
The estimated abundance indices from the Norwegian acoustic survey off Lofoten and Vesterå-len (the main spawning area for this stock) in March/April are given in Table A4. A description of the survey, sampling effort and details of the estimation procedure can be found in Korsbrekke (1997). The 2020 survey results in biomass terms was 556 thousand tonnes, this is 16% below the 2019 level. The survey was carried out from south to north, i.e. in the opposite direction to all previous years. This was due to covid-19 restrictions on where personnel could be exchanged.

ICES | AFWG 2020 | 87
This change of direction for the coverage was not considered to have any noticeable effect on the results.
Russian autumn survey Acronym: RU-BTr-Q4
Abundance estimates from the Russian autumn survey (November-December) are given in Ta-ble A9 (acoustic estimates) and Table A10 (bottom trawl estimates). The entire bottom trawl time-series was in 2007 revised backwards to 1982 (Golovanov et al., 2007, WD3), using the same method as in the revision presented in 2006, which went back to 1994. The new swept area indi-ces reflect Northeast Arctic cod stock dynamics more precisely compared to the previous one - catch per hour trawling. The Russian autumn survey in 2006 was carried out with reduced area coverage. Divisions 2a and 2b were adequately investigated in the survey in contrast to Subarea 1, where the survey covered approximately 40% of the long-term average area coverage. The Subarea 1 survey indices were calculated based on actual covered area (40 541 sq. miles). The 2007 AFWG decided to use the “final" year class indices without any correction because of satis-factory internal correspondence between year class abundances at age 2—9 years according to the 2006 survey and ones due to the previous surveys.
This survey was not conducted in 2016, but was carried out in 2017, when 79% of the standard survey area was covered (Sokolov et al 2018, WD 11). The index shows a reliable internal con-sistence and it was decided to use it in the assessment. This survey was not carried out in 2018-2019 and will likely be discontinued.
Joint Ecosystem survey Acronym: Eco-NoRu-Q3 (Btr)
Swept area bottom trawl estimates from the joint Norwegian-Russian ecosystem survey in Au-gust-September for the period 2004–2019 are given in Table A14. This survey normally covers the entire distribution area of cod at that time of the year.
In 2014 this survey had an essential problem with area coverage in the north-west region because of difficult ice conditions. In the area covered by ice in 2014 a substantial part of population was distributed during 2013 survey. So, based on those observations AFWG decided in 2015 to ex-clude 2014 year from that tuning series in current assessment. In 2016 there was incomplete cov-erage in the international waters and close to the Murman coast. An adjustment for this incom-plete coverage was made based on interpolation from adjacent areas (Kovalev et al 2017, WD 12). At this time of the year, usually a relatively small part of the cod stock is found in the area which was not covered in 2016. In 2017 and 2019 the coverage was close to complete, although the far northeastern part of the survey area (west of the north island of Novaya Zemlya) was not covered due to military restrictions. In 2018, a large area in the eastern part of the Barents Sea was not covered Thus it was decided not to include 2018 data from this survey in the assessment.
The survey indices have been revised using the StoX calculation method (WD 01), but the tuning series have not been updated as this was considered a benchmark issue.
Survey results - length and weight-at-age (Tables A5-A8, A11-A12)
Length-at-age is shown in Table A5 for the Norwegian survey in the Barents Sea in winter, in Table A7 for the Lofoten survey and in Table A11 for the Russian survey in October-December. Weight-at-age is shown in Table A6 for the Norwegian survey in the Barents Sea in winter, in Table A8 for the Lofoten survey and in Table A12 for the Russian survey in October-December.
The Joint winter survey in 2020 showed a noticeable decrease in size at age values for most ages (Table A6). For ages 2-6 and 8 the observed values were the lowest observed in the revised time series going back to 1994. For ages 2,3 and 8 the values were also below the minimum in the period prior to 1994. Most of the decrease is due to slower growth in length, changes in condition factor were minor. In the BESS 2019 survey decrease in size at age is not expressed as distinctly but low lengths and weights were observed for ages 2 and 3. Length and weight at age in the

88 | ICES SCIENTIFIC REPORTS 2:52 | ICES
Lofoten survey is stable. The decrease in size at age for younger age groups is discussed in an ecological context in section 1.2.
3.2.3 Age reading
The joint Norwegian-Russian work on cod otolith reading has continued, with regular exchanges of otoliths and age readers (see chapter 0.5). The results of fifteen years of annual comparative age readings are described in Yaragina et al. (2009). Zuykova et al. (2009) re-read old otoliths and found no significant difference in contemporary and historical age determination and subse-quent length at age. However, age at first maturation in the historical material as determined by contemporary readers is younger than that determined by historical readers. Taking this differ-ence into account would thus have effect on the spawning stock-recruitment relationship and thus on the biological reference points. The overall percentage agreement for the 2017–2018 ex-change was 87.7%(WD 8). The main reason for cod ageing discrepancies between Russian and Norwegian specialists remains the same, representing the latest summer growth zone, and dif-ferent interpretations of the false zones. The general trend is that the Russian readers assign slightly lower ages than the Norwegian readers compared to the modal age for all age groups. This is opposite of what we have seen in previous readings, where the Russian readers has tended to be slightly overestimating the age compared to the Norwegian readers. More details can be found in section 0.7.
The trend with bias in NEA cod age determination registered for some years of the period 1992–2018 between experts of both countries is a solid argument to continue comparative cod age reading between PINRO and IMR to monitor the situation. The German participant has ex-pressed an intention to join the age reading cooperation in future.
3.3 Data used in the assessment
3.3.1 Catch-at-age (Table 3.6)
For 2019, age compositions from all areas were available from Russia, Norway, Spain (all areas) and Germany and Poland (Division 2a only). Unsampled catches were distributed on age by using data from Russian trawl in Subarea 1 and Division 2a, and by using data from Norwegian trawl in Division 2b. The catch-at-age data was calculated using InterCatch (Table 3.6).
There is still a concern about the biological sampling from parts of the Norwegian fishery that may be too low. Also the split between NEA cod and coastal cod may be affected by the sampling coverage.
Length distributions from the Russian fishery were made by observers on board fishing vessels in reasonably sufficient quantity in all areas. Also, length samples of cod taken by Norwegian Coast Guard on board Russian fishing vessels in Norwegian economic zone (NEZ) in the second quarter and in Division 2.b in the fourth quarter of 2019 were used in calculations of length/age distributions. These data were combined with Russian observers’ data. An advantage of adding the Norwegian Coast Guard data is that they were taken regularly over the whole NEZ area and Division 2.b. However, biological sampling from the trawl fishery has been relatively low, espe-cially in Division 2a.
It should be noted that for ages 15+, the catch at age in 2019 is the highest since the early 1950s (Table 3.6).

ICES | AFWG 2020 | 89
3.3.2 Weight-at-age (Tables 3.7-3.9, A2, A4, A6, A8, A12).
Catch weights For 2019, the mean weight-at-age in the catch (Table 3.8) was obtained from InterCatch as a weighted average of the weight-at-age in the catch for Norway, Russia, Spain, Poland and Ger-many (Table 3.7). The weight-at-age in the catch for all countries is given in Table 3.9. From 2000 to 2016, AFWG working group applied 13 as plus group. The weight-at-age 13, 14 and 15 in the catch for 1946–1982, needed due to extended age range, was as last year taken from AFWG 2001 (ICES CM 2001/ACFM:19). For the 2020 assessment, it was decided to use the same, as in the last year, procedure for weight-at-age calculations for the recent period (1983-onwards): Observa-tions were used for ages up to 11. However, because of very noisy values observed for older fish, weight-at-age 12–15 was set to constant values in this period. Weight-at-age 12 was equal to the mean for 1983–2015; the mean increment for ages 12–13, 13–14 and 14–15+ groups in the 1983–2015 period were used to calculate weight-at-age 13, 14, and 15.
Stock weights For ages 1—11 stock weights-at-age at the start of year y (Wa,y) for 1983—2019 (Table 3.9) were calculated as follows:
))((5.0 ,,,,
1,1,, ,,
,,,,,,
yNyNWNyyWN
yarusya alofanbar
yalofyalofanbaranbarWW ++
−− +=
where
Wrus,a-1,y-1 : Weight-at-age a-1 in the Russian survey in year y-1 (Table A12)
Nnbar,a,y : Abundance-at-age a in the Norwegian Barents Sea acoustic survey in year y (Table A2)
Wnbar,a,y : Weight-at-age a in the Norwegian Barents Sea bottom trawl survey in year y (Table A6)
Nlof,a,y : Abundance-at-age a in the Lofoten survey in year y (Table A4)
Wlof,a,y : Weight-at-age a in the Lofoten survey in year y (Table A8)
Ecosystem survey data on length and weight-at-age are not used because of longer distance be-tween survey time and beginning of the year (assessment using numbers at 1 January).
This year, the same procedure was used for weight-at-age in stock calculations for retro period (1946—1982) assuming that weight-at-age in stock was equal to weight-at-age in catch. Weight-at-age 12—15 was fixed for recent period (1983-onwards). Average values of Fleet 15 (BS-NoRu-Q1 (BTr)) data available at the moment for older age groups (12—15) were used for calculations of average weight-at-age in stock in this period. The weight at age from the winter survey for 2019 used in the calculations has been revised.
Russian data for weight and maturity-at-age in autumn 2018 were not available as the survey was not conducted. In WD 15 to AFWG 2019, correction factors to allow for this when calculating the weight and maturity-at-age in 2019 were updated, based on historical differences between Norwegian and Russian data in the same way as in the 2017 (Yaragina and Bogstad, 2017, WD 10). These correction factors were then applied to the Norwegian data for 2019 and 2020.
At the moment, the weight-at-age data from the BESS survey are not used in assessment and prediction but during the next benchmark the possibility of including them should be investi-gated.

90 | ICES SCIENTIFIC REPORTS 2:52 | ICES
3.3.3 Natural mortality including cannibalism (Table 3.12)
A natural mortality (M) of 0.2 + cannibalism was used. Cannibalism is assumed to only affect natural mortality of ages 3-6. In addition, cannibalism was taken into account.
The method used for calculation of the prey consumption by cod described by Bogstad and Mehl (1997) is used to calculate the consumption of cod by cod (Table 3.12) for use in cod stock assess-ment. The consumption is calculated based on cod stomach content data taken from the joint PINRO-IMR stomach content database (methods described in Mehl and Yaragina 1992). On av-erage about 9000 cod stomachs from the Barents Sea have been analysed annually in the period 1984—2019.
These data are used to calculate the per capita consumption of cod by cod for each half-year (by prey age groups 0—6 and predator age groups 1–11+). It was assumed that the mature part of the cod stock is found outside the Barents Sea for three months during the first half of the year. Thus, consumption by cod in the spawning period was omitted from the calculations.
An iterative procedure was applied to include the per capita consumption data in the SAM run. It is described in detail in Stock Annex.
For the cod assessment data from annual sampling of cod stomachs has been used for estimating cannibalism, since the 1995 assessment. The argument has been raised that the uncertainty in such calculations are so large that they introduce too much noise in the assessment. A rather comprehensive analysis of the usefulness of this was presented in Appendix 1 in the 2004 AFWG report. The conclusion was that it improves the assessment.
The data on cod cannibalism for the historical period (1946—1983) was included in assessment during the benchmark to make the VPA time-series consistent (ICES 2015, WKARCT 2015). These estimates were based on hindcasted values of NEA cod natural mortality at ages 3—5 using PINRO data base on food composition from cod stomach for the historical period (Yar-agina et al. 2018).
3.3.4 Maturity-at-age (Tables 3.10-3.11)
Historical (pre–1982) Norwegian and Russian time-series on maturity ogives were reconstructed by the 2001 AFWG meeting (ICES CM 2001/ACFM:19). The Norwegian maturity ogives were constructed using the Gulland method for individual cohorts, based on information on age at first spawning from otoliths. For the time period 1946—1958 only the Norwegian data were available. The Russian proportions mature-at-age, based on visual examinations of gonads, were available from 1959.
Since 1982 Russian and Norwegian survey data have been used (Table 3.10). For the years 1985—2020, Norwegian maturity-at-age ogives have been obtained by combining the Barents Sea win-ter survey and the Lofoten survey. Russian maturity ogives from the autumn survey as well as from commercial fishery for November-February are available from 1984 until present. The Nor-wegian maturity ogives tend to give a higher percent mature-at-age compared to the Russian ogives, which is consistent with the generally higher growth rates observed in cod sampled by the Norwegian surveys. The approach used is consistent with the approach used to estimate the weight-at-age in the stock (described in Section 3.3.2). The percent mature-at-age for the Russian and Norwegian surveys have been arithmetically averaged for all years, except 1982—1983 when only Norwegian observations were used and 1984 when only Russian observations were used.
Russian data for the autumn survey 2018 and 2019 were not available as the survey was not conducted. In WD15, 2019, updated correction factors to allow for this when calculating the com-
ICES | AFWG 2020 | 91
bined maturity-at-age in 2019 were calculated, based on historical differences between Norwe-gian and Russian data. These correction factors were then applied to the Norwegian data for 2020.
Maturity-at-age for cod has been variable the last five years, particularly for ages 6–9. According to the combined data, maturation at age decreased in 2015–2016, then increased, but decreased again from 2019 to 2020.
The proportions of mature cod for age 13–15 was set to 1 for the period 1984–present, while for the period 1946–1983 data were taken from the AFWG 2001 report (ICES CM 2001/ACFM:19).
3.4 Changes of assessment model and data at the latest benchmark
The range of ages in the stock has been expanding and this has caused some problems with the age range used in the stock assessment. One of the basic goals of the Inter-Benchmark meeting in April 2017 (ICES 2017/ ACOM:29) was to investigate if and how information on stock dynam-ics at older ages (biological, survey, and fishery data) may be included into the analytical stock assessment.
At the inter-benchmark meeting it was decided to use SAM as the main assessment model for this stock and to use an extended age range in the tuning series.
3.5 Assessment using SAM (Tables 3.13, A13)
The following survey data series were used:
Fleet
code
Name Place Season Age Years
Fleet 15 Joint bottom trawl survey Barents Sea Feb-Mar 4–12 1981–2020
Fleet 16 Joint acoustic survey Barents Sea+Lofoten Feb-Mar 4–12 1985–2020
Fleet 18 Russian bottom trawl surv. Total area Oct-Dec 3–12 1982–2017
Fleet 007 Ecosystem surv. Total area Aug-Sep 3–12 2004–2019
Note that the surveys that are conducted during winter (FLT 15 and 16) are allocated to the time of the year when they are carried out, previously they were allocated the end of the previous year, as that was the only possibility for using them when running XSA.
The tuning fleet file is shown in Table 3.13. Note that the joint acoustic survey (sum of Barents Sea and Lofoten acoustic survey indices) is given in Table A13.
Survey indices for Fleet 15 have been multiplied by a factor 100, while survey indices for Fleets 007, 16 and 18 have been multiplied by a factor 10. This was done to keep the dynamics of the surveys even for very low indices, because some models (e.g. XSA) adds 1.0 to the indices before the logarithm is taken. The Fleet 16 index (Table A13), which is a sum of the index from the Lofoten survey and acoustic index from the winter survey, has not yet been updated for years before 2018 with new data from StoX estimates for the acoustic index from the winter survey (Mehl et al. 2018a). For 2018 onwards StoX estimates have been used in the calculations.

92 | ICES SCIENTIFIC REPORTS 2:52 | ICES
3.5.1 Model adjustment and settings (Table 3.14, Figures 3.2a-3.2c)
At AFWG 2019 an assessment was carried out using a different variance structure compared to that decided at the 2017 IBP, giving improved model diagnostics. This approach was rejected by ACOM, and the advice given in 2019 was based on the settings decided upon at the 2017 IBP. With a benchmark coming up in 2021, it was decided not to investigate alternative settings in this year’s assessment.
Residuals for the SAM run are shown in Fig 3.2a, while retrospective plots of F, SSB and recruit-ment are shown in Figure 3.2b. Figure 3.2c shows the catchability by survey and age group. Cur-rent SAM settings are shown in Table 3.14.
3.5.2 Results (Tables 3.15-3.18, Figure 3.1)
The fishing mortalities and population numbers are given in Tables 3.15 and 3.16. M values (M = 0.2+cannibalism mortality) are given in Table 3.17. For ages 3—5 the M matrix in 1946—1983 also includes M2 since the benchmark meeting in 2015 (WKARCT 2015).
Summaries of landings, fishing mortality, stock biomass, spawning stock biomass and recruit-ment since 1946 are given in Table 3.18 and Figure 3.1.
3.6 Results of the assessment
3.6.1 Fishing mortalities and stock biomass (Tables 3.18, 3.20)
The estimated F5-10 in 2019 is 0.34, which is below Fpa (Table 3.18). Fishing mortality has been stable in recent years. The spawning stock biomass in 2020 is estimated to be 1,368 kt (Table 3.20), which is high but lower than the peak in 2013 (2,639 kt). One should bear in mind that in the early part of the time-series the fraction at age of mature fish was considerably lower. It is noted that the highest fishing mortality at age (age 11) in 2019 is about 7 times higher than the 14+ fishing mortality, i. e. a very strong dome-shaped exploitation pattern.
Total stock biomass in 2020 is estimated to 2,652 kt which is somewhat above the long-term mean and well below the highest level observed (4,360 kt in 2013).
3.6.2 Recruitment (Table 1.7a)
At the 2008 AFWG meeting it was decided to use a hybrid model, which is a weighted arithmetic mean of different recruitment models (Section 1.4). It was agreed to use the same approach this year. The input data for those models are the following time-series; ice coverage, intensity of interaction between the arctic and boreal oceanic systems on the shelf of the Barents Sea, tem-perature and oxygen saturation at the Kola section. Prognosis from all the models, including the hybrid is presented in Table 1.9a. Since 2014 the hybrid model is based on objective weighting of different sub-models and includes the RCT3 model (see section 1.4 for details). The numbers-at-age 3 calculated by the hybrid method were: 583 million for the 2017 year class, 635 million for the 2018 year class, 512 million for the 2019 year class and 608 million for the 2020 year class.
3.7 Reference points and harvest control rules
The current reference points for Northeast Arctic cod were estimated by SGBRP (ICES CM 2003/ACFM:11) and adopted by ACFM at the May 2003 meeting.

ICES | AFWG 2020 | 93
At the 46th session of JRNFC a new version of the management rule was adopted (see section 3.7.3). The TAC advice for 2021 is based on the agreed harvest control rule.
3.7.1 Biomass reference points
The values adopted by ACFM in 2003 are Blim = 220 000 t, Bpa = 460 000 t. (ICES CM 2003/ACFM:11).
3.7.2 Fishing mortality reference points
The values adopted by ACFM in 2003 are Flim = 0.74 and Fpa = 0.40. (ICES CM 2003/ACFM:11).
3.7.3 Harvest control rule
The history of how the harvest control rule has developed is given in the 2017 AFWG report. JNRFC in 2015 asked ICES to explore the consequences of 10 different harvest control rules. This was done by WKNEAMP (ICES 2015, 2016). JNRFC in 2016 adopted one of the rules explored by WKNEAMP (Rule 6 in that report).
The current rule reads as follows:
The TAC is calculated as the average catch predicted for the coming 3 years using the target level of ex-ploitation (Ftr).
The target level of exploitation is calculated according to the spawning stock biomass (SSB) in the first year of the forecast as follows:
- if SSB < Bpa, then Ftr = SSB / Bpa × Fmsy;
- if Bpa ≤ SSB ≤ 2×Bpa, then Ftr = Fmsy;
- if 2×Bpa < SSB < 3×Bpa, then Ftr = Fmsy × (1 + 0.5 × (SSB - 2×Bpa) / Bpa);
- if SSB ≥ 3×Bpa, then Ftr = 1.5 × Fmsy;
where Fmsy=0.40 and Bpa=460 000 tonnes.
If the spawning stock biomass in the present year, the previous year and each of the three years of predic-tion is above Bpa, the TAC should not be changed by more than +/- 20% compared with the previous year’s TAC. In this case, Ftr should however not be below 0.30.
3.8 Prediction
3.8.1 Prediction input (Tables 3.16, 3.19, A1, Figures 3.3-3.6)
The input data to the short-term prediction with management option table (2020—2023) are given in Table 3.19. For 2020 stock weights and maturity were taken from surveys as described in Sections 3.3.2 and 3.3.4.
Catch weights in 2020 onwards and stock weights in 2021 and onwards for age 3–11 are predicted by the method described by Brander (2002), where the latest observation of weights by cohort are used together with average annual increments to predict the weight of the cohort the follow-ing year. The method is given by the equation
W(a+1,y+1)=W(a,y) + Incr(a), where Incr(a) is a “medium term” average of Incr(a,y)= W(a+1,y+1)-W(a,y)

94 | ICES SCIENTIFIC REPORTS 2:52 | ICES
For age 12 and older constant weights at age in the stock and the catch were used, based on 1983–2015 averages as described in Section 3.3.2.
This method was introduced in the cod prediction in the 2003 working group. Since 2005 work-ing group the 3 most recent values of annual increments have been used for predicting stock weights. For catch weights the last 10-year period for averaging the increments is used. Weight increment for ages older than 9 are fixed to the value calculated for age 9 because of low sampling and high variability observed for older ages. Figures 3.3 and 3.4 show how these predictions perform back in history.
The predictions for weight at age in stock indicate that the weights for the younger (mainly im-mature) age groups will stay approximately at the low level observed in 2020. Growth predic-tions in an ecological context is discussed in Section 1.2. It was noted that the present method for predicting stock and catch weight at age gave a ratio between catch and stock weights for ages 3-7 in the prediction years which was at or above the maximum ratio observed, and this could be considered as inconsistent. Thus, an alternative set of weights at age in catch was calculated, assuming the catch weight/stock weight at age ratio for all ages not to be higher than the 2010-2019 average. The results of such predictions are given in Section 3.11.1.
The maturity ogive for the years 2021—2023 was predicted by using the 2018-2020 average. The exploitation pattern in 2020 and later years was set equal to the previous 5 years according to the benchmark decision and described at Stock Annex (WKARCT 2015). It was observed that last AFWG the 3 -years average used by mistake. It should not have any noticeable effect because the fishing pattern is very stable in most recent years.
The method for prediction of weight-at-age in stock and catch and selection pattern for the oldest age groups (10+) should be reviewed at a benchmark, as we have more reliable data for those age groups in recent years and thus long time-series averages are not necessarily the most rele-vant to use.
The stock number-at-age in 2020 was taken from the “final” SAM run (Table 3.16) for ages 4 and older. The recruitment at age 3 in the years 2020—2023 was estimated as described in section 3.6.2. Figure 3.5 shows the development in natural mortality due to cannibalism for cod (prey) age groups 1-3 together with the abundance of capelin in the period 1984—2019. There was no clear trend in natural mortality, and the average M values for the last 3 years are used to predict natural mortality of age groups 3—6 for years 2020—2023 (based on benchmark decision, WKARCT 2015).
The assessment shows a stable F from 2015 to 2019. The fishing effort also increased, and CPUE decreased, but stabilised in 2016-2019 at a lower level than in previous years (Figure 3.6a,b, Table A1). In accordance with the benchmark decision (WKARCT 2015) and with support from AFWG-2019 WD 11 (Kovalev and Chetyrkin. 2019), the last year’s assessment F in terminal year 2019 (status quo) is used for F in the intermediate year (2020). Table 3.19 shows input data to the pre-dictions. The results of prediction show that the catch in 2020 predicted using Fsq is 9 % less than the agreed TAC. As the coastal cod catch in recent years has been almost 20 kt higher than the TAC, this means that the if the total Tac for Northeast arctic cod and Coastal cod will be taken, the difference between predicted catch using Fsq and the TAC will be less than 9%.
3.8.2 Prediction results (Tables 3.20-3.21)
The catches corresponding to Fsq in 2020 is 674.2 kt (Table 3.20). The resulting SSB in 2021 is 1,373 kt, which is close to SSB in 2020. Table 3.20 shows the short-term consequences over a range of F-values in 2021. The detailed outputs corresponding to Fsq in 2020 and the F corresponding

ICES | AFWG 2020 | 95
to the HCR and Fpa in 2021 is given in Table 3.21. Summarised results are shown in the text table below.
Since SSB in 2021 is between 2 × Bpa = 920 000 t and 3 × Bpa = 1 380 000 t, F = 0.597 is used in the 3-year prediction, giving catches of 1 059 716, 866 192 and 745 559 tonnes in 2021, 2022, and 2023, respectively. The average of this is 890 489 tonnes. According to HCR the maximum increase in TAC is limited by 20 % which corresponds to 885 600 tonnes.
Basis Total catch (2021)
Ftotal (2021)
SSB(2022) % SSB change **
% TAC change ***
% Advice change ****
ICES advice basis
Management plan*
885 600 0.47 1 171 141 -15 20 28
Other options
MSY approach: FMSY
774 860 0.40 1 257 564 -8 5 12
F = 0 0 0 1 898 191 38 -100 -100
F = F2019 673 954 0.3381 1 337 566 -3 -9 -2
Fpa 774 860 0.40 1 257 564 -8 5 12
Flim 1 236 791 0.74 907 720 -34 68 79
Weights in tonnes.
* 20 % increase from TAC 2020
** SSB 2022 relative to SSB 2021.
*** Catch 2021 relative to TAC 2020
**** Advice for 2021 relative to advice for 2020
This catch forecast covers all catches. It is then implied that all types of catches are to be counted against this TAC. It also means that if any overfishing is expected to take place, the above calcu-lated TAC should be reduced by the expected amount of overfishing.
3.9 Comparison with last year’s assessment and prediction
3.9.1 Comparison to assessment (Figure 3.2b)
As it was said at sec. 3.5.1 at AFWG 2019 two alternative SAM assessments were carried out. One called “SPALY run” with standard SAM settings were used by ACOM as a basis for advice. The text tables below compare this year’s estimates with last year’s estimates (from SPALY run) for the year 2019 of numbers at age (millions), total biomass, spawning biomass (thousand tonnes), as well as reference F for the year 2018.

96 | ICES SCIENTIFIC REPORTS 2:52 | ICES
*estimated by recruitment models **assuming Fsq
The number-at-ages 4-9 in 2019 from this year’s assessment is considerably (21-31%) above last year’s assessment, while the difference is less for other age groups. For ages 13 and older the number at age is lower than in last year’s assessment.
The retrospective pattern became worse than observed previously (Figure 3.2b). Adding the last year of data increased SSB and R and decreased F in the recent years. R was underestimated during most recent years (Mohn’s rho 30%), while rho’s for SSB and TSB are much smaller (3-4%).
3.9.2 Comparison to prediction
The changes in the advice are large compared to last year. The advice for 2021 is 885 600 t, while the advice for 2020 given by ICES was 689 672 tonnes and the value according to the AFWG assessment last year was 766 732 tonnes.
There has been an upwards revision of the assessed stock in 2020 in comparison with the assess-ment in 2019. The abundance of age groups 5-10 in particular was revised upwards, and these make up most of the catches in the prediction. The difference from last year’s assessment is higher in numbers than biomass, because the weight at age of younger age groups in 2020 is lower than predicted last year. Due to the use of a two-step hockey stick HCR, the upwards revision in biomass results in an increase in the target F to 0.597 (almost at the second plateau value of 0.6) in comparison with last year’s 0.533. The average catch predicted for the coming 3 years, using the mentioned target level of exploitation (Ftr) resulted in TAC advice equal to 885 600 t. The latter corresponds to the + 20 % limit stated in the HCR, and is slightly lower than the value without such a constraint (891 536 t).
3.10 Concerns with the assessment
SAM settings
When exploring SAM settings last year, the results for abundance and selection pattern for the oldest age groups, for which no tuning data were available, was discussed at length. The alter-native settings used at AFWG-2019 improved model diagnostics and increased the 13+ biomass in 2019 by 200 kt compared to the current (IBP 2017) settings. This difference was 2/3 of the total difference in 2019 biomass between the assessments. The total biomass and reference fishing mortality in this year’s assessment is closer to the biomass from the run with alternative settings last year than to the run made last year with the current settings. The difference between the runs made last year were mainly in abundance of age 4 and ages 11+. However, the current assessment gives a slight downward revision of the abundance of age 13+ compared to the assessment with the same settings last year. The abundance of age 12+ for the two surveys (BESS and acoustic winter+Lofoten) where age 12 is used in the assessment shows a stronger downwards trend from 2017 onwards than the assessment shows.
N2019
Assessment Year F(2018) age 3 age 4 age 5 age 6 age 7 age 8 age 9 age 10 age 11 age 12 age 13 age 14 age 15+
TSB 2019
SSB 2019 F 2019
2019 0.42 660* 293.3 346.7 123.58 78.84 95.026 44.249 22.628 9.836 4.259 6.093 7.348 7.504 2613 1496 0.421**2020 0.37 675 384.4 420.3 160.19 102.9 119.28 54.211 24.015 10.536 4.795 5.329 6.827 6.315 2925 1678 0.338
Ratio 2020/2019 0.89 1.02 1.31 1.21 1.30 1.31 1.26 1.23 1.06 1.07 1.13 0.87 0.93 0.84 1.12 1.12 0.80

ICES | AFWG 2020 | 97
Several additional features are now included in the SAM model (software), as described e.g. in the 2020 WKDEM report for NEA haddock. One feature of particular interest for the issue men-tioned above is the possibility of using a plus group in the tuning data which is not the same as the plus group in the assessment (i.e. the age 12 tuning series for this stock can be replaced by age 12+). It is hoped that this and other additional new SAM features, investigations of all SAM settings, together with revision of the input data, will improve the retrospective pattern for cod during the upcoming benchmark, as was the case for haddock benchmark at WKDEM this year.
The WG realizes that imprecise input data, in particular the catch-at-age matrix, and discontin-uation of some surveys as far as incomplete spatial coverage in other surveys could be a main obstacle to producing precise stock assessments, regardless of which model is used.
There are some conflicting signals from the different surveys and catch-at-age data. This in-creases the uncertainty of assessment.
3.11 Additional predictions and assessment methods
All models use the same tuning data, but FLT 15 and FLT 16 are shifted one year and one age group in XSA, but not in SAM and TISVPA. We also give here additional prediction from the SAM model assuming lower weight at age in the catch.
3.11.1 Changing weight at age in catch in SAM predictions
As described in section 3.8.1 alternative predictions with lower weight at age in the catch in 2020-2023 were run. The weights used are given in the text table below.
Using these values for weight at age in catch decreased the advised catch for 2021 according to the HCR from 885.6 to 801 kt if assuming status quo F in 2020. Status quo F in 2020 for this prediction corresponds to a catch of 631 kt in 2020.
3.11.2 XSA
The same settings as last year were used to run XSA this year. The model is run for ages 3–13+, while other models are runs for 3–15+.
3.11.3 TISVPA (Tables 3.22-3.24, Figure 3.8a-c)
This year the TISVPA model was applied to NEA cod with the same settings as last year and using the same data as SAM except that natural mortality values from cannibalism were taken from the SAM runs. During AFWG 2019 the results of exploratory runs using the TISVPA model were discussed (WD 12). The residuals of the model approximation of catch-at-age and “fleets” data are presented in Figure 3.8a. Likelihood profiles for different data source are presented in Figure 3.8b. Retrospective run results are shown in Figure 3.8c. The results (Tables 3.22-3.24) generally support the results of SAM model giving an estimate of SSB in 2020 of about 1.36 mil-lion tonnes.
Year/age 3 4 5 6 7 8 9 10 11 12 13 14 15+2020 0.375 0.951 1.468 2.011 2.904 4.453 5.809 7.232 8.387 11.420 12.800 14.180 15.5502021 0.584 0.843 1.409 2.022 2.830 4.128 5.697 7.106 8.523 11.420 12.800 14.180 15.5502022 0.609 0.977 1.329 1.973 2.840 4.057 5.388 6.922 8.408 11.420 12.800 14.180 15.5502023 0.609 0.977 1.329 1.973 2.840 4.057 5.388 6.922 8.408 11.420 12.800 14.180 15.550

98 | ICES SCIENTIFIC REPORTS 2:52 | ICES
3.11.4 Model comparisons (Figures 3.2a, 3.8a, 3.9a)
Figure 3.9a compares the results of SAM, XSA and TISVPA, showing F, SSB, TSB and recruit-ment. F and TSB is very similar for all models but deviate from each other for the most recent years. XSA tends to estimate TSB slightly higher in 2019 while TSB and SSB is very similar to SAM and TISVPA in most recent years. Recruitment in recent years is higher in XSA than in the other models. TISVPA and SAM demonstrate rather similar patterns in catch residuals (Figure 3.2a, 3.8a) while in previous assessments they were opposite.
3.11.5 SAM with settings chosen by AFWG-2019 (Figure 3.9b)
This approach that gave better diagnostics at AFWG 2019 (ICES, 2019) was rejected by ACOM on the basis of ADG stating that it was mostly an ad hoc solution and that it would not neces-sarily work in the future when the cohorts move on. At the AFWG 2020, it was observed that this approach gave predictions of total biomass and SSB in 2020 closer to the current assessment (Figure 3.9b) and SAM settings need to be explored deeper in the next benchmark.
An alternative assessment using this year data for this version of the model estimates F5-10 in 2019 as equal to 0.34; the spawning stock biomass in 2020 is estimated as 1,565 kt and total stock biomass in 2020 is estimated as 2,855 kt.
3.12 New and revised data sources
This section describes some data sources, which could be included in the assessment in the fu-ture.
3.12.1 Consistency between NEA cod and coastal cod catch data (Ta-ble 3.2)
Consistency between the catch data used for NEA cod and coastal cod should also be ensured. The catch figures used in the coastal cod assessment are not equal to the difference between the total cod catch and the catch used in the NEA cod assessment (Table 3.2). These discrepancies will be adjusted when the ECA-results for the period 1984—2019 are re-evaluated (Table 3.2, and section 2.2.1).
3.12.2 Discard and bycatch data (Tables 3.25-3.26)
Work on updating discard and bycatch data series (Table 3.25, 3.26) is ongoing, new data on age groups were not available in time for AFWG 2019. Revised bycatch estimates in numbers for the period 2005-2019 are described in Section 0.6. At WKARCT in 2015 it was, however, decided not to include those data in the catch-at-age matrix.
Table 3.26 (taken from Ajiad et al., WD2, 2008) presents bycatch in the Norwegian shrimp fishery by cod age (previously this has been given by cod length). The bycatch mainly consists of age 1 and 2 fish, but the bycatch is generally small compared to other reported sources of mortality: catches, discards and the number of cod eaten by cod. From 1992 onwards, bycatches of age 3 and older fish are negligible, because use of sorting grids was made mandatory. However, in 1985, bycatches of age 5 and 6 cod were about one third of the reported catches for those age groups. The year class for which the bycatches were highest, was the 1983 year class (total by-catch of age 2 and older fish of about 60 million, compared to a stock estimate of about 1000 million at age 3.

ICES | AFWG 2020 | 99
Table 3.1 Northeast Arctic COD. Total catch (t) by fishing areas and unreported catch.
Year Subarea 1 Division 2.a Division 2.b Unreported catches Total catch
1961 409 694 153 019 220 508
783 221
1962 548 621 139 848 220 797
909 266
1963 547 469 117 100 111 768
776 337
1964 206 883 104 698 126 114
437 695
1965 241 489 100 011 103 430
444 983
1966 292 253 134 805 56 653
483 711
1967 322 798 128 747 121 060
572 605
1968 642 452 162 472 269 254
1 074 084
1969 679 373 255 599 262 254
1 197 226
1970 603 855 243 835 85 556
933 246
1971 312 505 319 623 56 920
689 048
1972 197 015 335 257 32 982
565 254
1973 492 716 211 762 88 207
792 685
1974 723 489 124 214 254 730
1 102 433
1975 561 701 120 276 147 400
829 377
1976 526 685 237 245 103 533
867 463
1977 538 231 257 073 109 997
905 301
1978 418 265 263 157 17 293
698 715
1979 195 166 235 449 9 923
440 538
1980 168 671 199 313 12 450
380 434
1981 137 033 245 167 16 837
399 037
1982 96 576 236 125 31 029
363 730
1983 64 803 200 279 24 910
289 992
1984 54 317 197 573 25 761
277 651
1985 112 605 173 559 21 756
307 920
1986 157 631 202 688 69 794
430 113
1987 146 106 245 387 131 578
523 071
1988 166 649 209 930 58 360
434 939
1989 164 512 149 360 18 609
332 481

100 | ICES SCIENTIFIC REPORTS 2:52 | ICES
Year Subarea 1 Division 2.a Division 2.b Unreported catches Total catch
1990 62 272 99 465 25 263 25 000 212 000
1991 70 970 156 966 41 222 50 000 319 158
1992 124 219 172 532 86 483 130 000 513 234
1993 195 771 269 383 66 457 50 000 581 611
1994 353 425 306 417 86 244 25 000 771 086
1995 251 448 317 585 170 966
739 999
1996 278 364 297 237 156 627
732 228
1997 273 376 326 689 162 338
762 403
1998 250 815 257 398 84 411
592 624
1999 159 021 216 898 108 991
484 910
2000 137 197 204 167 73 506
414 870
2001 142 628 185 890 97 953
426 471
2002 184 789 189 013 71 242 90 000 535 045
2003 163 109 222 052 51 829 115 000 551 990
2004 177 888 219 261 92 296 117 000 606 445
2005 159 573 194 644 121 059 166 000 641 276
2006 159 851 204 603 104 743 67 100 537 642
2007 152 522 195 383 97 891 41 087 486 883
2008 144 905 203 244 101 022 15 000 464 171
2009 161 602 207 205 154 623
523 431
2010 183 988 271 337 154 657
609 983
2011 198 333 328 598 192 898
719 829
2012 247 938 331087 148 638
727 663
2013 360 673 421678 183 858
966 209
2014 320 347 468 934 197 168
986 449
2015 272 405 375 328 216 651
864 384
2016 321 347 351 468 176 607 849 422
2017 309 902 360 477 197 898 868 276
2018 249 397 321 548 207 681 778 627

ICES | AFWG 2020 | 101
Year Subarea 1 Division 2.a Division 2.b Unreported catches Total catch
20191 234 985 318 539 139 084 692 609
Data provided by Working Group members
1Provisional figure
Table 3.2. Landings of Norwegian Coastal Cod in subareas 1 and 2, 103 tonnes
Year Coastal cod catch used in NCC-assess
Coastal cod catch from ECA-model
Norwegian catches of cod in areas 06+07 whole yr plus q3&4 in areas 00+05
Norwegian catches of cod removed from the NEAC-assessment
v1960–70
38.6 38.6
1971–79
no data no data
1980
40 40
1981
49 49
1982
42 42
1983
38 38
1984 74.8 63.5 33 33
1985 75.5 62.5 28 28
1986 68.9 56.0 26 26
1987 61 48.2 31 31
1988 59.3 54.9 22 22
1989 40.3 41.2 17 17
1990 28.1 20.9 24 24
1991 24.8 24.8 25 25
1992 41.7 38.2 35 35
1993 52.6 50.4 44 44
1994 54.6 51.6 48 48
1995 57.2 65.0 39 39
1996 61.8 41.6 32 32
1997 63.3 51.0 36 36
1998 51.6 30.5 29 29
1999 40.7 35.8 23 23
2000 36.7 34.8 19 19
2001 29.7 27.2 14 14

102 | ICES SCIENTIFIC REPORTS 2:52 | ICES
Year Coastal cod catch used in NCC-assess
Coastal cod catch from ECA-model
Norwegian catches of cod in areas 06+07 whole yr plus q3&4 in areas 00+05
Norwegian catches of cod removed from the NEAC-assessment
2002 41 36.4 20 20
2003 34.6 35.4 19 19
2004 24.5 33.6 14 14
2005 22.4 29.3 13 13
2006 26.1 39.3 15 15
2007 23.8 29.2 13 13
2008 25.8 35.5 13 13
2009 24.8 30.0 15 15
2010 22.9 40.2 13.5 13.5
2011 28.6 36.6 18.8 18.8
2012 31.9 35.5 17.7 35.5
2013 22.5 30.1 16.8 30.1
2014 23.2 33.6 15.5 33.6
2015 39.4 35.8 13.2 35.8
2016 44.6 54.9 10.0 54.9
2017 52.9 51.0 7.6 51.0
2018 - 36.3 7.3 36.3
2019 - 40.1 6.4 40.1
Table 3.3 Northeast Arctic COD. Total nominal catch ('000 t) by trawl and other gear for each
Subarea 1
Division 2.a
Division 2.b
Year
Trawl Others Trawl Others Trawl Others
1967
238 84.8 38.7 90 121.1 -
1968
588.1 54.4 44.2 118.3 269.2 -
1969
633.5 45.9 119.7 135.9 262.3 -
1970
524.5 79.4 90.5 153.3 85.6 -
1971
253.1 59.4 74.5 245.1 56.9 -
1972
158.1 38.9 49.9 285.4 33 -
1973
459 33.7 39.4 172.4 88.2 -

ICES | AFWG 2020 | 103
Subarea 1
Division 2.a
Division 2.b
Year
Trawl Others Trawl Others Trawl Others
1974
677 46.5 41 83.2 254.7 -
1975
526.3 35.4 33.7 86.6 147.4 -
1976
466.5 60.2 112.3 124.9 103.5 -
1977
471.5 66.7 100.9 156.2 110 -
1978
360.4 57.9 117 146.2 17.3 -
1979
161.5 33.7 114.9 120.5 8.1 -
1980
133.3 35.4 83.7 115.6 12.5 -
1981
91.5 45.1 77.2 167.9 17.2 -
1982
44.8 51.8 65.1 171 21 -
1983
36.6 28.2 56.6 143.7 24.9 -
1984
24.5 29.8 46.9 150.7 25.6 -
1985
72.4 40.2 60.7 112.8 21.5 -
1986
109.5 48.1 116.3 86.4 69.8 -
1987
126.3 19.8 167.9 77.5 129.9 1.7
1988
149.1 17.6 122 88 58.2 0.2
1989
144.4 19.5 68.9 81.2 19.1 0.1
1990
51.4 10.9 47.4 52.1 24.5 0.8
1991
58.9 12.1 73 84 40 1.2
1992
103.7 20.5 79.7 92.8 85.6 0.9
1993
165.1 30.7 155.5 113.9 66.3 0.2
1994
312.1 41.3 165.8 140.6 84.3 1.9
1995
218.1 33.3 174.3 143.3 160.3 10.7
1996
248.9 32.7 137.1 159 147.7 6.8
1997
235.6 37.7 150.5 176.2 154.7 7.6
1998
219.8 31 127 130.4 82.7 1.7
1999
133.3 25.7 101.9 115 107.2 1.8
2000
111.7 25.5 105.4 98.8 72.2 1.3
2001
119.1 23.5 83.1 102.8 95.4 2.5

104 | ICES SCIENTIFIC REPORTS 2:52 | ICES
Subarea 1
Division 2.a
Division 2.b
Year
Trawl Others Trawl Others Trawl Others
2002
147.4 37.4 83.4 105.6 69.9 1.3
2003
146 17.1 107.8 114.2 50.1 1.8
2004
154.4 23.5 100.3 118.9 88.8 3.5
2005
132.4 27.2 87 107.7 115.4 5.6
2006
141.8 18.1 91.2 113.4 100.1 4.6
2007
129.6 22.9 84.8 110.6 91.6 6.3
2008
123.8 21.1 94.8 108.4 95.3 5.7
2009
130.1 31.5 102 105.2 142.1 11.4
2010
151.1 32.9 130 141.4 149.2 5.4
2011
158.1 38.4 163.5 167 181 11.9
2012
212.1 35.9 172.7 158.4 133.8 14.9
2013
308.5 52.2 216.9 204.7 159.7 24.1
2014
268.8 51.5 246.8 222.1 177.9 19.3
2015
224.3 48.1 192.2 183.2 197.7 19.0
2016 285.5 35.8 181.7 169.8 156.3 20.3
2017 265.4 44.5 189.5 171.0 180.0 17.9
2018 204.7 44.7 156.7 164.9 192.0 15.6
2019 1 199.4 35.6 177.8 140.7 128.9 10.1
Data provided by Working Group members 1 Provisional figures

ICES | AFWG 2020 | 105
Table 3.4 Northeast Arctic COD. Nominal catch(t) by countries. (Subarea 1 and divisions 2a and 2b combined, data pro-vided by Working group members
YearFaroe Islands
France German Dem.Rep.
Fed.Rep.Germany
Norway Poland United Kingdom
Russia2 Others Total all countries
1961 3 934 13 755 3 921 8 129 268 377 - 158 113 325 780 1 212 783 2211962 3 109 20 482 1 532 6 503 225 615 - 175 020 476 760 245 909 2661963 - 18 318 129 4 223 205 056 108 129 779 417 964 - 775 5771964 - 8 634 297 3 202 149 878 - 94 549 180 550 585 437 6951965 - 526 91 3 670 197 085 - 89 962 152 780 816 444 9301966 - 2 967 228 4 284 203 792 - 103 012 169 300 121 483 7041967 - 664 45 3 632 218 910 - 87 008 262 340 6 572 6051968 - - 225 1 073 255 611 - 140 387 676 758 - 1 074 0841969 29 374 - 5 907 5 543 305 241 7 856 231 066 612 215 133 1 197 2261970 26 265 44 245 12 413 9 451 377 606 5 153 181 481 276 632 - 933 2461971 5 877 34 772 4 998 9 726 407 044 1 512 80 102 144 802 215 689 0481972 1 393 8 915 1 300 3 405 394 181 892 58 382 96 653 166 565 2871973 1 916 17 028 4 684 16 751 285 184 843 78 808 387 196 276 792 6861974 5 717 46 028 4 860 78 507 287 276 9 898 90 894 540 801 38 453 1 102 4341975 11 309 28 734 9 981 30 037 277 099 7 435 101 843 343 580 19 368 829 3771976 11 511 20 941 8 946 24 369 344 502 6 986 89 061 343 057 18 090 867 4631977 9 167 15 414 3 463 12 763 388 982 1 084 86 781 369 876 17 771 905 3011978 9 092 9 394 3 029 5 434 363 088 566 35 449 267 138 5 525 698 7151979 6 320 3 046 547 2 513 294 821 15 17 991 105 846 9 439 440 5381980 9 981 1 705 233 1 921 232 242 3 10 366 115 194 8 789 380 434
Spain1981 12 825 3 106 298 2 228 277 818 14 500 5 262 83 000 - 399 0371982 11 998 761 302 1 717 287 525 14 515 6 601 40 311 - 363 7301983 11 106 126 473 1 243 234 000 14 229 5 840 22 975 - 289 9921984 10 674 11 686 1 010 230 743 8 608 3 663 22 256 - 277 6511985 13 418 23 1 019 4 395 211 065 7 846 3 335 62 489 4 330 307 9201986 18 667 591 1 543 10 092 232 096 5 497 7 581 150 541 3 505 430 1131987 15 036 1 986 7 035 268 004 16 223 10 957 202 314 2 515 523 0711988 15 329 2 551 605 2 803 223 412 10 905 8 107 169 365 1 862 434 9391989 15 625 3 231 326 3 291 158 684 7 802 7 056 134 593 1 273 332 4811990 9 584 592 169 1 437 88 737 7 950 3 412 74 609 510 187 0001991 8 981 975 Greenland 2 613 126 226 3 677 3 981 119 427 3 3 278 269 1581992 11 663 2 3 337 3 911 168 460 6 217 6 120 182 315 Iceland 1 209 383 2341993 17 435 3 572 5 389 5 887 221 051 8 800 11 336 244 860 9 374 3 907 531 6111994 22 826 1 962 6 882 8 283 318 395 14 929 15 579 291 925 36 737 28 568 746 0861995 22 262 4 912 7 462 7 428 319 987 15 505 16 329 296 158 34 214 15 742 739 9991996 17 758 5 352 6 529 8 326 319 158 15 871 16 061 305 317 23 005 14 851 732 2281997 20 076 5 353 6 426 6 680 357 825 17 130 18 066 313 344 4 200 13 303 762 4031998 14 290 1 197 6 388 3 841 284 647 14 212 14 294 244 115 1 423 8 217 592 6241999 13 700 2 137 4 093 3 019 223 390 8 994 11 315 210 379 1 985 5 898 484 9102000 13 350 2 621 5 787 3 513 192 860 8 695 9 165 166 202 7 562 5 115 414 8702001 12 500 2 681 5 727 4 524 188 431 9 196 8 698 183 572 5 917 5 225 426 4712002 15 693 2 934 6 419 4 517 202 559 8 414 8 977 184 072 5 975 5 484 445 0452003 19 427 2 921 7 026 4 732 191 977 7 924 8 711 182 160 5 963 6 149 436 9902004 19 226 3 621 8 196 6 187 212 117 11 285 14 004 201 525 7 201 6 082 489 4452005 16 273 3 491 8 135 5 848 207 825 9 349 10 744 200 077 5 874 7 660 475 2762006 16 327 4 376 8 164 3 837 201 987 9 219 10 594 203 782 5 972 6 271 470 5272007 14 788 3 190 5951 4619 199 809 9 496 9298 186 229 7316 5 101 445 7962008 15 812 3 149 5 617 4 955 196 598 9 658 8 287 190 225 7 535 7 336 449 1712009 16 905 3 908 4 977 8 585 224 298 12 013 8 632 229 291 7 380 7 442 523 4312010 15 977 4 499 6 584 8 442 264 701 12 657 9 091 267 547 11 299 9 185 609 9832011 13 429 1 173 7 155 4 621 331 535 13 291 8 210 310 326 12 734 17 354 4 719 8292012 5 17523 2841 8520 8 500 315 739 12814 11166 329 943 9536 11 081 727 6632013 13833 7858 7885 8 010 438 734 15042 12536 432 314 14734 15 263 966 2092014 33298 8149 10864 6 225 431 846 16378 14762 433 479 18205 13 243 986 4492015 26568 7480 7055 6 427 377 983 19905 11778 381 188 16120 9 880 864 3842016 24084 7946 8607 6 336 348 949 14640 13583 394 107 16031 15 139 849 4222017 28637 9554 13638 5 977 357 419 14414 16731 396 180 11925 13 802 868 2762018 26152 6605 12743 9 768 333 539 13143 11533 340 364 10708 14 071 778 6272019 1 22270 6371 7553 8 470 282 120 13939 11214 316 813 12294 11 565 692 609
1 Provisional figures.2 USSR prior to 1991.3 Includes Baltic countries.4 Includes unspecified EU catches.5 Revised figures.

106 | ICES SCIENTIFIC REPORTS 2:52 | ICES
Table 3.5. Barents Sea winter survey. Area covered (‘000 square nautical miles) and areas implied in the method used to adjust for missing coverage in Russian Economic Zone. In 4 of the 5 adjusted years the adjustments were not based on area ratios, but the “index ratio by age” was used. This means that the index by age (for the area outside REZ) was scaled by the observed ratio between total index and the index outside REZ observed in the years prior to the survey.
Year Area covered Additional area implied in adjustment Adjustment method
1981–92 88.1
1993 137.6
1994 143.8
1995 186.6
1996 165.3
1997 87.5 78.0 Index ratio by age
1998 99.2 78.0 Index ratio by age
1999 118.3
2000 162.4
2001 164.1
2002 156.7
2003 146.6
2004 164.6
2005 178.9
2006 169.1 18.1 Partly covered strata raised to full strata area
2007 122.2 56.7 Index ratio by age
2008 164.4
2009 170.9
2010 159.9
2011 173.1
2012 150.5 16.7 Index ratio by age
2013 202.1
2014 207.8
2015 195.7
2016 172.8
2017 146.9 37.5 Index ratio by age
2018 192.1

ICES | AFWG 2020 | 107
Year Area covered Additional area implied in adjustment Adjustment method
2019 207.1
2020 181.6 25.1 Index ratio by age
Table 3.6. Northeast Arctic cod. Catch numbers-at-age (Thous)
SAM. Sat Apr 18 11:47:15 2020
Year_age
3 4 5 6 7 8 9 10 11 12 13 14 +gp TOTAL-NUM
1946 4008 10387
18906
16596
13843
15370
59845
22618
10093
9573 5460
1927
750 189376
1947 710 13192
43890
52017
45501
13075
19718
47678
31392
9348 9330
4622
4103
294576
1948 140 3872 31054
55983
77375
21482
15237
9815 30041
7945 4491
3899
4205
265539
1949 991 6808 35214
100497
83283
29727
13207
5606 8617 13154
3657
1895
2167
304823
1950 1281 10954
29045
45233
62579
30037
19481
9172 6019 4133 6750
1662
1450
227796
1951 24687
77924
64013
46867
37535
33673
23510
10589
4221 1288 1002
3322
611 329242
1952 24099
120704
113203
73827
49389
20562
24367
15651
8327 3565 647 467 1044
455852
1953 47413
107659
112040
55500
22742
16863
10559
10553
5637 1752 468 173 156 391515
1954 11473
155171
146395
100751
40635
10713
11791
8557 6751 2370 896 268 123 495894
1955 3902 37652
201834
161336
84031
30451
13713
9481 4140 2406 867 355 128 550296
1956 10614
24172
129803
250472
86784
51091
14987
7465 3952 1655 1292
448 166 582901
1957 17321
33931
27182
70702
87033
39213
17747
6219 3232 1220 347 299 173 304619
1958 31219
133576
71051
40737
38380
35786
13338
10475
3289 1070 252 40 141 379354
1959 32308
77942
148285
53480
18498
17735
23118
9483 3748 997 254 161 98 386107
1960 37882
97865
64222
67425
23117
8429 7240 11675
4504 1843 354 102 226 324884
1961 45478
132655
123458
51167
38740
17376
5791 6778 5560 1682 910 280 108 429983
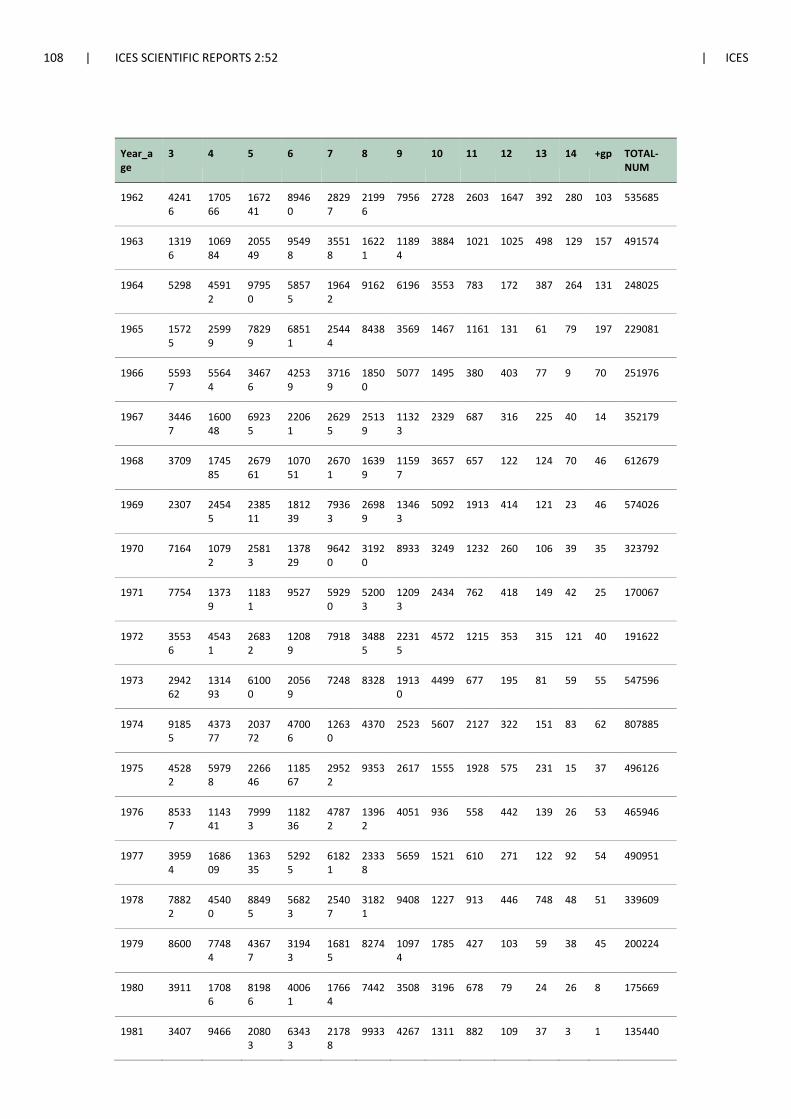
108 | ICES SCIENTIFIC REPORTS 2:52 | ICES
Year_age
3 4 5 6 7 8 9 10 11 12 13 14 +gp TOTAL-NUM
1962 42416
170566
167241
89460
28297
21996
7956 2728 2603 1647 392 280 103 535685
1963 13196
106984
205549
95498
35518
16221
11894
3884 1021 1025 498 129 157 491574
1964 5298 45912
97950
58575
19642
9162 6196 3553 783 172 387 264 131 248025
1965 15725
25999
78299
68511
25444
8438 3569 1467 1161 131 61 79 197 229081
1966 55937
55644
34676
42539
37169
18500
5077 1495 380 403 77 9 70 251976
1967 34467
160048
69235
22061
26295
25139
11323
2329 687 316 225 40 14 352179
1968 3709 174585
267961
107051
26701
16399
11597
3657 657 122 124 70 46 612679
1969 2307 24545
238511
181239
79363
26989
13463
5092 1913 414 121 23 46 574026
1970 7164 10792
25813
137829
96420
31920
8933 3249 1232 260 106 39 35 323792
1971 7754 13739
11831
9527 59290
52003
12093
2434 762 418 149 42 25 170067
1972 35536
45431
26832
12089
7918 34885
22315
4572 1215 353 315 121 40 191622
1973 294262
131493
61000
20569
7248 8328 19130
4499 677 195 81 59 55 547596
1974 91855
437377
203772
47006
12630
4370 2523 5607 2127 322 151 83 62 807885
1975 45282
59798
226646
118567
29522
9353 2617 1555 1928 575 231 15 37 496126
1976 85337
114341
79993
118236
47872
13962
4051 936 558 442 139 26 53 465946
1977 39594
168609
136335
52925
61821
23338
5659 1521 610 271 122 92 54 490951
1978 78822
45400
88495
56823
25407
31821
9408 1227 913 446 748 48 51 339609
1979 8600 77484
43677
31943
16815
8274 10974
1785 427 103 59 38 45 200224
1980 3911 17086
81986
40061
17664
7442 3508 3196 678 79 24 26 8 175669
1981 3407 9466 20803
63433
21788
9933 4267 1311 882 109 37 3 1 135440
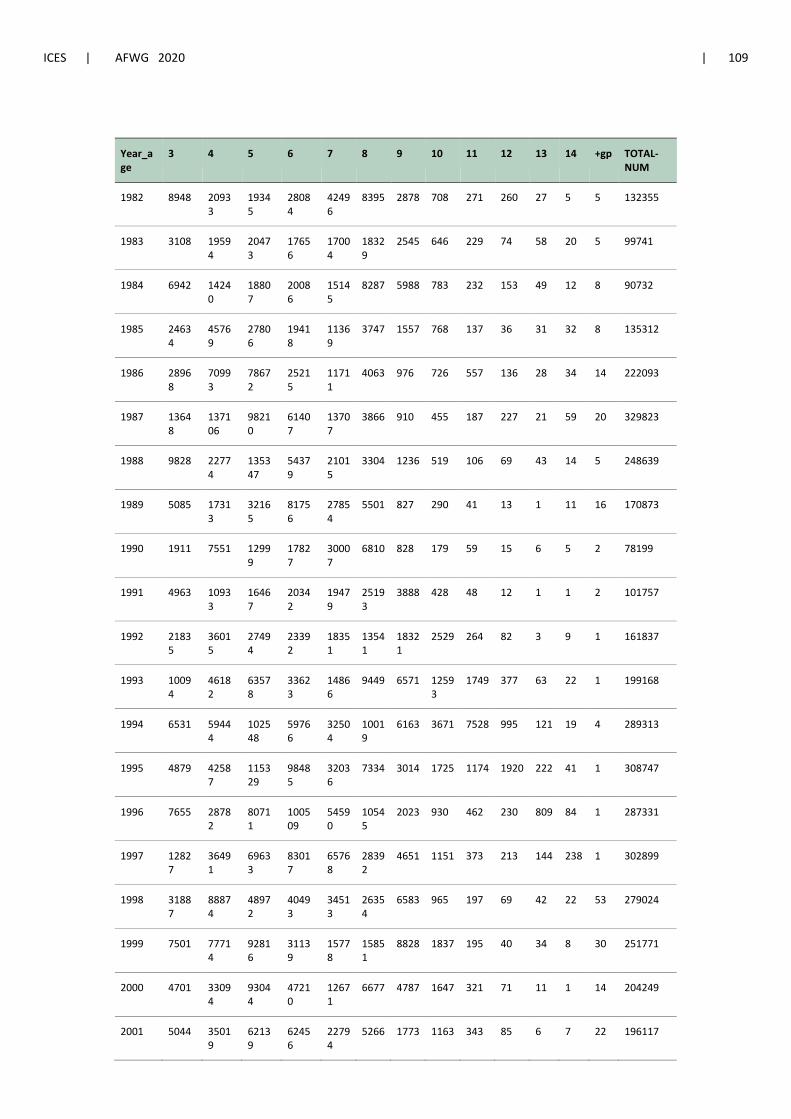
ICES | AFWG 2020 | 109
Year_age
3 4 5 6 7 8 9 10 11 12 13 14 +gp TOTAL-NUM
1982 8948 20933
19345
28084
42496
8395 2878 708 271 260 27 5 5 132355
1983 3108 19594
20473
17656
17004
18329
2545 646 229 74 58 20 5 99741
1984 6942 14240
18807
20086
15145
8287 5988 783 232 153 49 12 8 90732
1985 24634
45769
27806
19418
11369
3747 1557 768 137 36 31 32 8 135312
1986 28968
70993
78672
25215
11711
4063 976 726 557 136 28 34 14 222093
1987 13648
137106
98210
61407
13707
3866 910 455 187 227 21 59 20 329823
1988 9828 22774
135347
54379
21015
3304 1236 519 106 69 43 14 5 248639
1989 5085 17313
32165
81756
27854
5501 827 290 41 13 1 11 16 170873
1990 1911 7551 12999
17827
30007
6810 828 179 59 15 6 5 2 78199
1991 4963 10933
16467
20342
19479
25193
3888 428 48 12 1 1 2 101757
1992 21835
36015
27494
23392
18351
13541
18321
2529 264 82 3 9 1 161837
1993 10094
46182
63578
33623
14866
9449 6571 12593
1749 377 63 22 1 199168
1994 6531 59444
102548
59766
32504
10019
6163 3671 7528 995 121 19 4 289313
1995 4879 42587
115329
98485
32036
7334 3014 1725 1174 1920 222 41 1 308747
1996 7655 28782
80711
100509
54590
10545
2023 930 462 230 809 84 1 287331
1997 12827
36491
69633
83017
65768
28392
4651 1151 373 213 144 238 1 302899
1998 31887
88874
48972
40493
34513
26354
6583 965 197 69 42 22 53 279024
1999 7501 77714
92816
31139
15778
15851
8828 1837 195 40 34 8 30 251771
2000 4701 33094
93044
47210
12671
6677 4787 1647 321 71 11 1 14 204249
2001 5044 35019
62139
62456
22794
5266 1773 1163 343 85 6 7 22 196117

110 | ICES SCIENTIFIC REPORTS 2:52 | ICES
Year_age
3 4 5 6 7 8 9 10 11 12 13 14 +gp TOTAL-NUM
2002 2348 31033
76175
67656
42122
11527
1801 529 223 120 21 9 6 233570
2003 7263 20885
64447
71109
36706
14002
2887 492 142 97 21 43 1 218095
2004 2090 38226
50826
68350
50838
18118
6239 1746 295 127 39 16 8 236918
2005 5815 19768
113144
61665
44777
20553
6285 2348 562 100 21 24 7 275069
2006 8548 47207
33625
78150
31770
15667
7245 1788 737 210 26 45 155 225173
2007 25473
43817
62877
26303
34392
11240
4080 1381 505 285 44 13 35 210445
2008 8459 51704
40656
35072
14037
20676
5503 1794 715 229 42 26 13 178926
2009 4866 38711
83998
46639
20789
8417 8920 1957 872 987 76 21 20 216273
2010 1778 16193
53855
75853
36797
17062
4784 4325 3034 913 189 49 35 214867
2011 1418 8033 32472
70938
73875
21116
11708
5058 3237 600 434 12 0 228901
2012 2695 10462
16646
40372
70014
48315
12326
5214 1926 1124 317 70 24 209505
2013 2903 13659
22752
21020
54231
74451
47124
9143 2963 694 449 89 145 249623
2014 5234 19226
38407
36633
29901
56109
47540
22738
3717 1169 313 210 157 261354
2015 4315 31383
41181
51209
33745
22530
23609
24553
16071
2510 468 134 254 251962
2016 2076 11291
50231
43609
35265
23417
14592
20105
15862
4781 871 249 308 222657
2017 6535 13128
28365
66504
46136
28507
15307
10073
12169
6465 1927
399 285 235800
2018 6120 28569
27128
33816
54328
28323
16208
9722 7132 3740 2295
840 271 218492
2019 4389 21405
48422
29849
26548
39759
17395
8883 4606 2109 715 564 322 204966

ICES | AFWG 2020 | 111
Table 3.7. Northeast Arctic COD. Weights-at-age (kg) in landings from various countries
Norway
Year
Age
2 3 4 5 6 7 8 9 10 11 12 13 14 15+
1983 0.41 0.82 1.32 2.05 2.82 3.94 5.53 7.70 9.17 11.46 16.59 16.42 16.96 24.46
1984 1.16 1.47 1.97 2.53 3.13 3.82 4.81 5.95 7.19 7.86 8.46 7.99 9.78 10.64
1985 0.34 0.99 1.43 2.14 3.27 4.68 6.05 7.73 9.86 11.87 14.16 14.17 13.52 15.33
1986 0.30 0.67 1.34 2.04 3.14 4.60 5.78 6.70 7.52 9.74 10.68 12.86 9.59 16.31
1987 0.24 0.48 0.88 1.66 2.72 4.35 6.21 8.78 9.78 12.50 13.75 15.12 10.43 19.95
1988 0.36 0.56 0.83 1.31 2.34 3.84 6.50 8.76 9.97 11.06 14.43 19.02 12.89 10.16
1989 0.53 0.75 0.90 1.17 1.95 3.20 4.88 7.82 9.40 11.52 11.47
19.47 14.68
1990 0.40 0.81 1.22 1.59 2.14 3.29 4.99 7.83 10.54 14.21 17.63 7.97 14.64
1991 0.63 1.37 1.77 2.31 3.01 3.68 4.63 6.06 8.98 12.89 17.00
14.17 16.63
1992 0.41 1.10 1.79 2.45 3.22 4.33 5.27 6.21 8.10 10.51 11.59
15.81 6.52
1993 0.30 0.83 1.70 2.41 3.35 4.27 5.45 6.28 7.10 7.82 10.10 16.03 19.51 17.68
1994 0.30 0.82 1.37 2.23 3.35 4.27 5.56 6.86 7.45 7.98 9.53 12.16 11.45 19.79
1995 0.44 0.78 1.26 1.87 2.80 4.12 5.15 5.96 7.90 8.67 9.20 11.53 17.77 21.11
1996 0.29 0.90 1.15 1.67 2.58 4.08 6.04 6.62 7.96 9.36 10.55 11.41 9.51 24.24
1997 0.35 0.78 1.14 1.56 2.25 3.48 5.35 7.38 7.55 8.30 11.15 8.64 12.80
1998 0.38 0.68 1.03 1.64 2.23 3.24 4.85 6.88 9.18 9.84 15.78 14.37 13.77 15.58
1999 0.46 0.88 1.16 1.65 2.40 3.12 4.26 6.00 6.52 10.64 14.05 12.67 9.20 17.22
2000 0.31 0.65 1.23 1.80 2.54 3.58 4.49 5.71 7.54 7.86 12.71 14.71 15.40 20.26
2001 0.30 0.77 1.18 1.83 2.75 3.64 4.88 5.93 7.43 8.90 10.22 11.11 13.03 18.85
2002 0.31 0.90 1.40 1.90 2.60 3.55 4.60 5.80 7.40 9.56 8.71 12.92 8.42 17.61
2003 0.55 0.88 1.39 2.01 2.63 3.59 4.83 5.57 7.26 9.36 9.52 9.52 10.68 21.66
2004 0.54 1.08 1.41 1.95 2.69 3.46 4.77 6.72 7.90 8.66 12.21 14.02 16.50 11.37
2005 0.58 0.92 1.38 1.86 2.61 3.54 4.57 6.41 8.24 9.89 11.04 14.08 11.81 20.08
2006 0.51 0.97 1.45 2.06 2.71 3.56 4.57 5.53 6.61 7.53 8.55 8.44 9.82 12.31
2007 0.53 1.07 1.70 2.37 3.26 4.36 5.45 6.71 8.08 8.56 9.75 11.72 12.72 15.58
2008 0.65 1.12 1.70 2.44 3.32 4.41 5.61 6.84 8.25 9.31 10.54 12.45 13.59 21.15
2009 0.56 0.98 1.47 2.10 2.83 3.90 5.06 5.76 7.31 7.79 7.81 10.68 11.83 14.76

112 | ICES SCIENTIFIC REPORTS 2:52 | ICES
Norway
Year
Age
2 3 4 5 6 7 8 9 10 11 12 13 14 15+
2010 0.55 0.95 1.46 2.06 2.93 4.02 5.40 6.44 7.19 8.43 9.11 10.46 11.39 15.55
2011 0.53 1.09 1.50 2.06 2.85 3.70 5.01 6.26 7.33 8.34 9.87 13.23
2012
0.83 1.32 1.92 2.65 3.52 4.71 6.34 8.11 9.92 11.31 13.45 15.75
2013 0.43 0.95 1.40 2.00 2.64 3.44 4.51 5.67 7.29 8.80 10.33 11.38 12.56
2014 0.59 1.07 1.55 2.15 2.80 3.70 4.57 5.78 6.97 8.35 9.46 10.99 12.28 15.49
2015 0.64 0.96 1.42 1.96 2.57 3.30 4.13 5.49 6.46 7.18 8.63 10.37 12.24 14.60
2016 0.59 0.96 1.46 1.99 2.71 3.57 4.56 5.78 6.82 8.08 9.33 10.01 11.68 14.79
2017 0.55 0.99 1.53 2.06 2.69 3.64 4.72 5.91 6.91 7.88 9.41 10.93 11.78 15.07
2018 0.62 1.05 1.51 2.11 2.80 3.48 4.54 5.80 6.97 7.64 9.11 10.29 11.35 14.05
2019 0.51 0.96 1.43 2.02 2.72 3.60 4.51 5.80 6.91 7.94 8.89 10.94 11.55 14.49
Table 3.7. Northeast Arctic COD. Weights-at-age (kg) in landings from various countries (continued)
Russia (trawl only)
Year
Age
2 3 4 5 6 7 8 9 10 11 12 13 14 15+
1983
0.65 1.05 1.58 2.31 3.39 4.87 6.86 8.72 10.40 12.07 14.43
1984
0.53 0.88 1.45 2.22 3.21 4.73 6.05 8.43 10.34 12.61 14.95
1985
0.33 0.77 1.31 1.84 2.96 4.17 5.94 6.38 8.58 10.28
1986
0.29 0.61 1.14 1.75 2.45 4.17 6.18 8.04 9.48 11.33 12.35 14.13
1987
0.24 0.52 0.88 1.42 2.07 2.96 5.07 7.56 8.93 10.80 13.05 18.16
1988
0.27 0.49 0.88 1.32 2.06 3.02 4.40 6.91 9.15 11.65 12.53 14.68
1989
0.50 0.73 1.00 1.39 1.88 2.67 4.06 6.09 7.76 9.88
1990
0.45 0.83 1.21 1.70 2.27 3.16 4.35 6.25 8.73 10.85 13.52
1991
0.36 0.64 1.05 2.03 2.85 3.77 4.92 6.13 8.36 10.44 15.84 19.33
1992
0.55 1.20 1.44 2.07 3.04 4.24 5.14 5.97 7.25 9.28 11.36
1993
0.48 0.78 1.39 2.06 2.62 4.07 5.72 6.79 7.59 11.26 14.79 17.71
1994
0.41 0.81 1.24 1.80 2.55 2.88 4.96 6.91 8.12 10.28 12.42 16.93

ICES | AFWG 2020 | 113
Russia (trawl only)
Year
Age
2 3 4 5 6 7 8 9 10 11 12 13 14 15+
1995
0.37 0.77 1.21 1.74 2.37 3.40 4.71 6.73 8.47 9.58 12.03 16.99
1996
0.30 0.64 1.09 1.60 2.37 3.42 5.30 7.86 8.86 10.87 11.80
1997
0.30 0.57 1.00 1.52 2.18 3.30 4.94 7.15 10.08 11.87 13.54
1998
0.33 0.68 1.06 1.60 2.34 3.39 5.03 6.89 10.76 12.39 13.61 14.72
1999
0.24 0.58 0.98 1.41 2.17 3.26 4.42 5.70 7.27 10.24 14.12
2000
0.18 0.48 0.85 1.44 2.16 3.12 4.44 5.79 7.49 9.66 10.36
2001
0.12 0.31 0.62 1.00 1.53 2.30 3.31 4.57 6.55 8.11 9.52 11.99
2002
0.20 0.60 1.05 1.46 2.14 3.27 4.47 6.23 8.37 10.06 12.37
2003
0.23 0.63 1.06 1.78 2.40 3.41 4.86 6.28 7.55 11.10 13.41 12.12 14.51
2004
0.30 0.57 1.09 1.55 2.37 3.20 4.73 6.92 8.41 9.77 11.08
2005
0.33 0.65 0.98 1.50 2.10 3.08 4.31 5.81 8.42 10.37 13.56 14.13
2006
0.27 0.68 1.05 1.49 2.25 3.16 4.54 5.90 8.59 10.31 12.31
2007
0.23 0.67 1.12 1.66 2.25 3.31 4.57 6.27 8.20 10.02 12.36 12.42
2008
0.28 0.64 1.16 1.74 2.65 3.58 4.74 5.73 7.32 8.07 9.52 12.52
2009
0.31 0.64 1.09 1.58 2.11 3.19 4.80 6.58 7.97 9.84 11.51
2010
0.25 0.57 1.00 1.64 2.28 3.14 4.53 5.98 8.03 9.71 10.70 13.53
2011
0.25 0.62 1.05 1.56 2.18 2.95 4.33 6.21 8.04 10.13 12.25 15.18
2012
0.29 0.60 1.07 1.66 2.25 2.95 4.17 6.23 8.58 11.08 12.24 14.07 15.22 16.39
2013
0.33 0.63 1.05 1.54 2.26 3.09 4.08 5.47 7.37 9.59 12.57 15.54 17.05
2014
0.32 0.61 1.05 1.61 2.26 3.15 4.00 5.24 7.13 9.46 11.18 14.47
2015
0.30 0.60 0.97 1.49 2.11 3.13 4.64 5.78 7.13 9.53 12.12 16.71 17.37
2016
0.26 0.55 0.97 1.53 2.20 3.19 4.50 6.12 7.97 9.55 10.95 14.35 14.74 17.25
2017
0.33 0.63 1.03 1.56 2.24 3.24 4.67 6.34 7.74 9.40 11.12 14.43 16.67 11.91
2018 0.33 0.68 1.06 1.62 2.40 3.22 4.66 6.23 7.79 8.91 10.26 11.26 13.41 10.14
2019 0.29 0.62 1.10 1.60 2.33 3.22 4.44 6.45 8.10 9.60 11.02 13.83 10.65 10.65

114 | ICES SCIENTIFIC REPORTS 2:52 | ICES
Table 3.7. Northeast Arctic COD. Weights-at-age (kg) in landings from various countries (continued)
Germany (Division IIa and IIb)
Year
Age
2 3 4 5 6 7 8 9 10 11 12 13 14 15+
1994
0.68
1.04
2.24
3.49
4.51
5.79
6.93
8.16
8.46
8.74
9.48
15.25
1995
0.44
0.84
1.5 2.72
3.81
4.46
4.81
7.37
7.69
8.25
9.47
1996
0.84
1.15
1.64
2.53
3.58
4.13
3.9 4.68
6.98
6.43
11.32
1997
0.43
0.92
1.42
2.01
3.15
4.04
5.16
4.82
3.96
7.04
8.8
1998
0.23
0.73
1.17
1.89
2.72
3.25
4.13
5.63
6.5
8.57
8.42
11.45
8.79
1999 1
0.853
1.448
1.998
2.65
3.473
4.156
5.447
6.82
5.902
8.01
2000 2 0.26
0.73
1.36
2.04
2.87
3.67
4.88
5.78
7.05
8.45
8.67
9.33
6.88
2001
0.38
0.80
1.21
1.90
2.74
3.90
4.99
5.69
7.15
7.32
11.72
9.11
6.60
2002
0.35
1.00
1.31
1.80
2.53
3.64
4.38
5.07
6.82
9.21
7.59
13.18
19.17
19.20
2003
0.22
0.44
1.04
1.71
2.31
3.27
4.93
6.17
7.77
9.61
9.99
12.29
13.59
2004 2 0.22
0.73
1.01
1.75
2.58
3.33
4.73
6.32
7.20
8.45
9.20
11.99
10.14
13.11
2005 3 0.57
0.77
1.13
1.66
2.33
3.36
4.38
5.92
6.65
7.26
10.01
11.14
2006 2 0.71
0.91
1.39
1.88
2.56
3.77
5.33
6.68
9.14
10.89
11.51
16.83
18.77
2007 3 0.59
1.35
1.79
2.51
3.53
4.00
4.95
6.55
7.54
9.71
11.40
11.57
23.34
15.61
2008 3 0.23
0.51
1.14
1.76
2.57
3.15
4.40
5.43
7.18
8.39
10.15
10.03
10.99
14.26
2009 3 0.35
0.60
1.19
1.83
2.96
4.08
5.61
6.97
8.55
9.13
10.54
13.34
10.30
17.06
2010 3 0.36
0.67
0.93
1.71
2.46
3.21
4.93
6.75
7.80
8.70
8.53
10.17
12.36
14.11
2011 1
1.75
3.09
3.30
3.28
4.13
4.99
6.61
7.91
9.38
10.79
14.67
14.91

ICES | AFWG 2020 | 115
Germany (Division IIa and IIb)
Year
Age
2 3 4 5 6 7 8 9 10 11 12 13 14 15+
2013 3
1.03
1.37
1.87
2.65
3.45
4.49
7.26
11.42
12.86
13.07
2014 4
0.68
0.96
1.39
1.69
3.06
4.07
5.65
8.15
10.36
13.07
13.52
2015 4 0.82
1.05
1.67
2.33
3.56
4.50
5.41
6.20
6.39
2016 1
1.38
2.60
3.55
4.81
6.33
7.61
8.90
9.26
10.83
13.41
16.84
17.03
17.76
2017 1
1.58
2.79
3.93
3.93
4.77
6.35
8.16
9.09
10.39
11.24
12.48
14.39
13.04
2018 3 0.58
1.16
1.76
2.45
3.34
4.13
5.81
7.16
8.99
9.96
10.85
11.73
14.01
17.79
2019 1 0.82
1.37
1.80
2.26
3.49
4.45
5.44
7.08
9.25
9.39
13.30
12.24
15.25
1Division IIa onl
2IIa and IIb combined
3I,IIa and IIb combined
4Division IIb only
Table 3.7. Northeast Arctic COD. Weights at age (kg) in landings from various countries (continued)
Spain (Division IIb)
Year
Age
2 3 4 5 6 7 8 9 10 11 12 13 14 15+
1994
0.43 1.08 1.38 2.32 2.47 2.68 3.46 5.20 7.04 6.79 7.20 8.04 10.46 15.35
1995
0.42 0.51 0.98 1.99 3.41 4.95 5.52 8.62 9.21 11.42 9.78 8.08
1996
0.66 1.12 1.57 2.43 3.17 3.59 4.44 5.48 6.79 8.10
1997 1 0.51 0.65 1.22 1.68 2.60 3.39 4.27 6.67 7.88 11.34 13.33 10.03 8.69
1998
0.47 0.74 1.15 1.82 2.44 3.32 3.71 5.00 7.26
1999 1 0.21 0.69 1.06 1.69 2.50 3.32 4.72 5.76 6.77 7.24 7.63
2000 1 0.23 0.61 1.24 1.75 2.47 3.12 4.65 6.06 7.66 10.94 11.40 7.20
2001
0.23 0.64 1.25 1.95 2.86 3.55 4.95 6.46 8.50 11.07 13.09
2002
0.16 0.55 1.00 1.48 2.17 3.29 4.47 5.35 8.29 12.23 9.01 12.16 15.2

116 | ICES SCIENTIFIC REPORTS 2:52 | ICES
2003
0.58 1.05 1.70 2.33 3.33 4.92 6.24 9.98 13.07 14.74 14.17
2004 1 0.31 0.56 0.80 1.28 1.96 2.59 3.72 5.36 5.28 7.41
11.43
2005 1
0.63 1.14 1.85 2.48 3.43 4.25 5.38 8.41 11.19 15.04 16.93
2006
0.30 0.61 0.99 1.46 2.04 2.55 3.39 3.50 4.70 6.36
2007
0.42 0.60 1.20 1.76 2.40 3.18 3.96 5.19 6.61 9.48 7.65 12.65 15.74 19.66
2009 1 0.12 0.45 0.95 1.60 2.18 3.36 4.52 6.04 7.30 9.42 10.35 11.47 12.54
2010 2 0.18 0.56 1.11 1.73 2.36 3.36 5.14 6.88 8.64 9.65 6.83
2011 1
0.45 0.90 1.26 1.84 2.55 4.08 5.61 8.17 8.14 7.31 8.91
2012 2
0.40 0.84 1.29 1.96 2.78 3.71 4.99 7.42
7.19 9.32
2013
0.17 0.72 1.06 1.63 2.36 3.14 3.90 4.36 6.55
2014
0.24 0.43 0.74 1.27 1.85 2.60 3.56 4.51 5.52 7.18 9.42 9.26 13.16 15.05
2015 2
0.40 0.80 1.19 1.79 2.45 3.38 4.41 5.85 6.64 7.48 6.77
2016 3 0.11 0.38 0.76 1.20 1.72 2.50 3.39 4.96 7.11 8.56
2017 2 0.12 0.42 0.75 1.17 1.69 2.50 3.39 4.47 5.69 5.93 6.00 10.91 13.57 10.52
2018 2 0.19 0.45 0.83 1.30 1.86 2.57 3.55 4.92 5.51 7.84 7.08 7.28
2019 2 0.19 0.39 0.90 1.30 1.85 2.65 3.48 4.83 5.96 5.67 7.04 8.36
1 IIa and IIb combined
2 I,IIa and IIb combined
3 I and IIb combined
Iceland (Sub-area I)
1994
0.42 0.85 1.44 2.77 3.54 4.08 5.84 6.37 7.02 7.48 7.37
1995
1.17 0.91 1.60 2.28 3.61 4.73 6.27
6.26
1996
0.36 0.99 1.55 2.83 3.79 4.81 5.34 7.25 7.68 9.08 8.98 10.52
1997
0.42 0.43 0.76 1.60 2.40 3.45 4.40 5.74 6.15
8.28 10.52 9.89
UK (England & Wales)
1995 1
1.47 2.11 3.47 5.57 6.43 7.17 8.12 8.05 10.2 10.1
1996 2
1.55 1.81 2.42 3.61 6.3 6.47 7.83 7.91 8.93 9.38 10.9
1997 2
1.93 2.17 3.07 4.17 4.89 6.46
12.3 8.44
1 Division IIa and IIb
2 Division IIa

ICES | AFWG 2020 | 117
Poland (Division IIb)
2006
0.18 0.51 0.89 1.55 2.23 3.6 5.28 6.95 8.478 11 10.8 15.6 18.9
2008
0.49 0.90 1.45 2.24 2.79 3.82 4.68 5.015 6.45 7.02 7.22 5.99 6.91
2009
1.02 1.72 2.65 3.81 5.23 6.91 8.862 11.1 13.6 16.5
2010
1.39 1.66 2.29 2.98 3.92 5.18 6.313 6.66 8.72 9.05
2011
0.99 1.50 2.17 3.15 4.43 7.45 7.28
2016 1
0.84 1.59 2.29 2.81 3.91 4.78 5.61 6.709 7.89 8.54 11.6 13.7 16.09
2017 2
0.71 1.23 1.52 2.47 3.52 4.78 6.97 9.193 9.95 10.9 14.1
2018 3 0.74 1.15 1.66 2.45 3.55 4.48 6.06 6.31 7.59 7.91 8.28 8.52 9.40
2019 1 1.57 2.00 2.69 4.04 5.61 7.23 9.13 11.62 12.41 13.46 11.47
1 Division IIa
2 Division IIa and IIb
3 I and IIb combined
Table 3.8. Northeast Arctic COD. Catch weights at age (kg)
SAM Sat Apr 18 11:47:15 2020
Year_age 3 4 5 6 7 8 9 10 11 12 13 14 +gp
1946 0.35 0.59 1.11 1.69 2.37 3.17 3.98 5.05 5.92 7.2 8.15 8.13 9.25
1947 0.32 0.56 0.95 1.5 2.14 2.92 3.65 4.56 5.84 7.42 8.85 8.79 10
1948 0.34 0.53 1.26 1.93 2.46 3.36 4.22 5.31 5.92 7.09 8.43 8.18 9.43
1949 0.37 0.67 1.11 1.66 2.5 3.23 4.07 5.27 5.99 7.08 8.22 8.26 8.7
1950 0.39 0.64 1.29 1.7 2.36 3.48 4.52 5.62 6.4 7.96 8.89 9.07 10.27
1951 0.4 0.83 1.39 1.88 2.54 3.46 4.88 5.2 7.14 8.22 9.39 9.5 9.52
1952 0.44 0.8 1.33 1.92 2.64 3.71 5.06 6.05 7.42 8.43 10.19 10.13 10.56
1953 0.4 0.76 1.28 1.93 2.81 3.72 5.06 6.34 7.4 8.67 10.24 11.41 11.93
1954 0.44 0.77 1.26 1.97 3.03 4.33 5.4 6.75 7.79 10.67 9.68 9.56 11.11
1955 0.32 0.57 1.13 1.73 2.75 3.94 4.9 7.04 7.2 8.78 10.08 11.02 12.11
1956 0.33 0.58 1.07 1.83 2.89 4.25 5.55 7.28 8 8.35 9.94 10.25 11.56
1957 0.33 0.59 1.02 1.82 2.89 4.28 5.49 7.51 8.24 9.25 10.61 10.82 12.07
1958 0.34 0.52 0.95 1.92 2.94 4.21 5.61 7.35 8.67 9.58 11.63 11 13.83

118 | ICES SCIENTIFIC REPORTS 2:52 | ICES
Year_age 3 4 5 6 7 8 9 10 11 12 13 14 +gp
1959 0.35 0.72 1.47 2.68 3.59 4.32 5.45 6.44 7.17 8.63 11.62 11.95 13
1960 0.34 0.51 1.09 2.13 3.38 4.87 6.12 8.49 7.79 8.3 11.42 11.72 13.42
1961 0.31 0.55 1.05 2.2 3.23 5.11 6.15 8.15 8.68 9.6 11.95 13.18 13.42
1962 0.32 0.55 0.93 1.7 3.03 5.03 6.55 7.7 9.27 10.56 12.72 13.48 14.44
1963 0.32 0.61 0.96 1.73 3.04 4.96 6.44 7.91 9.62 11.31 12.74 13.19 14.29
1964 0.33 0.55 0.95 1.86 3.25 4.97 6.41 8.07 9.34 10.16 12.89 13.25 14
1965 0.38 0.68 1.03 1.49 2.41 3.52 5.73 7.54 8.47 11.17 13.72 13.46 14.12
1966 0.44 0.74 1.18 1.78 2.46 3.82 5.36 7.27 8.63 10.66 14.15 14 15
1967 0.29 0.81 1.35 2.04 2.81 3.48 4.89 7.11 9.03 10.59 13.83 14.15 16.76
1968 0.33 0.7 1.48 2.12 3.14 4.21 5.27 6.65 9.01 9.66 14.85 16.3 17
1969 0.44 0.79 1.23 2.03 2.9 3.81 5.02 6.43 8.33 10.71 14.21 15 17
1970 0.37 0.91 1.34 2 3 4.15 5.59 7.6 8.97 10.99 14.07 14.61 16
1971 0.45 0.88 1.38 2.16 3.07 4.22 5.81 7.13 8.62 10.83 12.95 14.25 15.97
1972 0.38 0.77 1.43 2.12 3.23 4.38 5.83 7.62 9.52 12.09 13.67 13.85 16
1973 0.38 0.91 1.54 2.26 3.29 4.61 6.57 8.37 10.54 11.62 13.9 14 15.84
1974 0.32 0.66 1.17 2.22 3.21 4.39 5.52 7.86 9.82 11.41 13.24 13.7 14.29
1975 0.41 0.64 1.11 1.9 2.95 4.37 5.74 8.77 9.92 11.81 13.11 14 14.29
1976 0.35 0.73 1.19 2.01 2.76 4.22 5.88 9.3 10.28 11.86 13.54 14.31 14.28
1977 0.49 0.9 1.43 2.05 3.3 4.56 6.46 8.63 9.93 10.9 13.67 14.26 14.91
1978 0.49 0.81 1.45 2.15 3.04 4.46 6.54 7.98 10.15 10.85 13.18 14 15
1979 0.35 0.7 1.24 2.14 3.15 4.29 6.58 8.61 9.22 10.89 14.34 14.5 15.31
1980 0.27 0.56 1.02 1.72 3.02 4.2 5.84 7.26 8.84 9.28 14.45 15 15.5
1981 0.49 0.98 1.44 2.09 2.98 4.85 6.57 9.16 10.82 10.77 13.93 15 16
1982 0.37 0.66 1.35 1.99 2.93 4.24 6.46 8.51 12.24 10.78 14.04 15 16
1983 0.84 1.37 2.09 2.86 3.99 5.58 7.77 9.29 11.55 11.42 12.8 14.18 15.55
1984 1.42 1.93 2.49 3.14 3.91 4.91 6.02 7.4 8.13 11.42 12.8 14.18 15.55
1985 0.94 1.37 2.02 3.22 4.63 6.04 7.66 9.81 11.8 11.42 12.8 14.18 15.55
1986 0.64 1.27 1.88 2.79 4.49 5.84 6.83 7.69 9.81 11.42 12.8 14.18 15.55
1987 0.49 0.88 1.55 2.33 3.44 5.92 8.6 9.6 12.17 11.42 12.8 14.18 15.55

ICES | AFWG 2020 | 119
Year_age 3 4 5 6 7 8 9 10 11 12 13 14 +gp
1988 0.54 0.85 1.32 2.24 3.52 5.35 8.06 9.51 11.36 11.42 12.8 14.18 15.55
1989 0.74 0.96 1.31 1.92 2.93 4.64 7.52 9.12 11.08 11.42 12.8 14.18 15.55
1990 0.81 1.22 1.64 2.22 3.24 4.68 7.3 9.84 13.25 11.42 12.8 14.18 15.55
1991 1.05 1.45 2.15 2.89 3.75 4.71 6.08 8.82 11.8 11.42 12.8 14.18 15.55
1992 1.16 1.57 2.21 3.1 4.27 5.19 6.14 7.77 10.12 11.42 12.8 14.18 15.55
1993 0.81 1.52 2.16 2.79 4.07 5.53 6.47 7.19 7.98 11.42 12.8 14.18 15.55
1994 0.82 1.3 2.06 2.89 3.21 5.2 6.8 7.57 8.01 11.42 12.8 14.18 15.55
1995 0.77 1.2 1.78 2.59 3.81 4.99 6.23 8.05 8.74 11.42 12.8 14.18 15.55
1996 0.79 1.11 1.61 2.46 3.82 5.72 6.74 8.04 9.28 11.42 12.8 14.18 15.55
1997 0.67 1.04 1.53 2.22 3.42 5.2 7.19 7.73 8.61 11.42 12.8 14.18 15.55
1998 0.68 1.05 1.62 2.3 3.3 4.86 6.87 9.3 10.3 11.42 12.8 14.18 15.55
1999 0.63 1.01 1.54 2.34 3.21 4.29 6 6.73 10.08 11.42 12.8 14.18 15.55
2000 0.57 1.04 1.61 2.34 3.34 4.48 5.72 7.52 8.02 11.42 12.8 14.18 15.55
2001 0.66 1.05 1.62 2.51 3.51 4.78 6.04 7.54 9 11.42 12.8 14.18 15.55
2002 0.72 1.13 1.56 2.31 3.52 4.78 6.2 7.66 9.14 11.42 12.8 14.18 15.55
2003 0.67 1.12 1.83 2.5 3.58 5.04 6.36 8.2 10.71 11.42 12.8 14.18 15.55
2004 0.72 1.13 1.61 2.43 3.27 4.72 6.71 7.98 9.19 11.42 12.8 14.18 15.55
2005 0.69 1.08 1.57 2.21 3.26 4.44 6.23 8.19 9.72 11.42 12.8 14.18 15.55
2006 0.72 1.16 1.6 2.39 3.32 4.54 5.47 6.78 7.7 11.42 12.8 14.18 15.55
2007 0.74 1.21 1.83 2.51 3.82 5.04 6.58 8.08 8.94 11.42 12.8 14.18 15.55
2008 0.77 1.27 1.87 2.82 3.79 5.12 6.22 7.75 8.4 11.42 12.8 14.18 15.55
2009 0.75 1.17 1.74 2.42 3.86 5.35 6.43 8.01 8.67 11.42 12.8 14.18 15.55
2010 0.78 1.2 1.74 2.44 3.4 5.04 6.25 7.32 8.53 11.42 12.8 14.18 15.55
2011 0.78 1.31 1.72 2.37 3.2 4.62 6.18 7.47 8.57 11.42 12.8 14.18 15.55
2012 0.67 1.14 1.73 2.34 3.12 4.4 6.28 8.24 10.35 11.42 12.8 14.18 15.55
2013 0.71 1.17 1.67 2.36 3.19 4.22 5.58 7.31 9.08 11.42 12.8 14.18 15.55
2014 0.79 1.2 1.73 2.34 3.28 4.21 5.49 6.98 8.67 11.42 12.8 14.18 15.55
2015 0.78 1.09 1.55 2.18 3.14 4.46 5.61 6.62 7.34 11.42 12.8 14.18 15.55
2016 0.78 1.14 1.66 2.26 3.25 4.5 5.98 7.31 8.54 11.42 12.8 14.18 15.55

120 | ICES SCIENTIFIC REPORTS 2:52 | ICES
Year_age 3 4 5 6 7 8 9 10 11 12 13 14 +gp
2017 0.71 1.15 1.66 2.32 3.32 4.67 6.13 7.15 8.14 11.42 12.8 14.18 15.55
2018 0.86 1.17 1.71 2.5 3.31 4.61 6.03 7.32 8.06 11.42 12.8 14.18 15.55
2019 0.68 1.15 1.66 2.39 3.33 4.45 6.11 7.29 8.41 11.42 12.8 14.18 15.55
Table 3.9. Northeast Arctic COD. Stock weights at age (kg)
SAM Sat Apr 18 11:47:15 2020
Year_age
3 4 5 6 7 8 9 10 11 12 13 14 +gp
1946 0.35 0.59 1.11 1.69 2.37 3.17 3.98 5.05 5.92 7.2 8.146 8.133 9.253
1947 0.32 0.56 0.95 1.5 2.14 2.92 3.65 4.56 5.84 7.42 8.848 8.789 9.998
1948 0.34 0.53 1.26 1.93 2.46 3.36 4.22 5.31 5.92 7.09 8.43 8.181 9.433
1949 0.37 0.67 1.11 1.66 2.5 3.23 4.07 5.27 5.99 7.08 8.218 8.259 8.701
1950 0.39 0.64 1.29 1.7 2.36 3.48 4.52 5.62 6.4 7.96 8.891 9.07 10.271
1951 0.4 0.83 1.39 1.88 2.54 3.46 4.88 5.2 7.14 8.22 9.389 9.502 9.517
1952 0.44 0.8 1.33 1.92 2.64 3.71 5.06 6.05 7.42 8.43 10.185
10.134
10.563
1953 0.4 0.76 1.28 1.93 2.81 3.72 5.06 6.34 7.4 8.67 10.238
11.409
11.926
1954 0.44 0.77 1.26 1.97 3.03 4.33 5.4 6.75 7.79 10.67 9.68 9.557 11.106
1955 0.32 0.57 1.13 1.73 2.75 3.94 4.9 7.04 7.2 8.78 10.077
11.023
12.105
1956 0.33 0.58 1.07 1.83 2.89 4.25 5.55 7.28 8 8.35 9.944 10.248
11.564
1957 0.33 0.59 1.02 1.82 2.89 4.28 5.49 7.51 8.24 9.25 10.605
10.825
12.075
1958 0.34 0.52 0.95 1.92 2.94 4.21 5.61 7.35 8.67 9.58 11.631
11 13.832
1959 0.35 0.72 1.47 2.68 3.59 4.32 5.45 6.44 7.17 8.63 11.621
11.95 13
1960 0.34 0.51 1.09 2.13 3.38 4.87 6.12 8.49 7.79 8.3 11.422
11.719
13.424
1961 0.31 0.55 1.05 2.2 3.23 5.11 6.15 8.15 8.68 9.6 11.952
13.181
13.422
1962 0.32 0.55 0.93 1.7 3.03 5.03 6.55 7.7 9.27 10.56 12.717
13.482
14.44

ICES | AFWG 2020 | 121
Year_age
3 4 5 6 7 8 9 10 11 12 13 14 +gp
1963 0.32 0.61 0.96 1.73 3.04 4.96 6.44 7.91 9.62 11.31 12.737
13.193
14.287
1964 0.33 0.55 0.95 1.86 3.25 4.97 6.41 8.07 9.34 10.16 12.886
13.251
14
1965 0.38 0.68 1.03 1.49 2.41 3.52 5.73 7.54 8.47 11.17 13.722
13.465
14.118
1966 0.44 0.74 1.18 1.78 2.46 3.82 5.36 7.27 8.63 10.66 14.148
14 15
1967 0.29 0.81 1.35 2.04 2.81 3.48 4.89 7.11 9.03 10.59 13.829
14.146
16.756
1968 0.33 0.7 1.48 2.12 3.14 4.21 5.27 6.65 9.01 9.66 14.848
16.3 17
1969 0.44 0.79 1.23 2.03 2.9 3.81 5.02 6.43 8.33 10.71 14.211
15 17
1970 0.37 0.91 1.34 2 3 4.15 5.59 7.6 8.97 10.99 14.074
14.611
16
1971 0.45 0.88 1.38 2.16 3.07 4.22 5.81 7.13 8.62 10.83 12.945
14.25 15.973
1972 0.38 0.77 1.43 2.12 3.23 4.38 5.83 7.62 9.52 12.09 13.673
13.852
16
1973 0.38 0.91 1.54 2.26 3.29 4.61 6.57 8.37 10.54 11.62 13.904
14 15.841
1974 0.32 0.66 1.17 2.22 3.21 4.39 5.52 7.86 9.82 11.41 13.242
13.704
14.291
1975 0.41 0.64 1.11 1.9 2.95 4.37 5.74 8.77 9.92 11.81 13.107
14 14.293
1976 0.35 0.73 1.19 2.01 2.76 4.22 5.88 9.3 10.28 11.86 13.544
14.311
14.284
1977 0.49 0.9 1.43 2.05 3.3 4.56 6.46 8.63 9.93 10.9 13.668
14.255
14.906
1978 0.49 0.81 1.45 2.15 3.04 4.46 6.54 7.98 10.15 10.85 13.177
14 15
1979 0.35 0.7 1.24 2.14 3.15 4.29 6.58 8.61 9.22 10.89 14.344
14.5 15.315
1980 0.27 0.56 1.02 1.72 3.02 4.2 5.84 7.26 8.84 9.28 14.448
15 15.5
1981 0.49 0.98 1.44 2.09 2.98 4.85 6.57 9.16 10.82 10.77 13.932
15 16
1982 0.37 0.66 1.35 1.99 2.93 4.24 6.46 8.51 12.24 10.78 14.041
15 16

122 | ICES SCIENTIFIC REPORTS 2:52 | ICES
Year_age
3 4 5 6 7 8 9 10 11 12 13 14 +gp
1983 0.37 0.92 1.6 2.44 3.82 4.76 6.17 7.7 9.25 12.621
14.544
16.466
18.388
1984 0.42 1.16 1.81 2.79 3.78 4.57 6.17 7.7 9.25 12.621
14.544
16.466
18.388
1985 0.413
0.875
1.603
2.81 4.059
5.833
7.685
10.117
14.29 12.621
14.544
16.466
18.388
1986 0.311
0.88 1.47 2.467
3.915
5.81 6.58 6.833 11.004
12.621
14.544
16.466
18.388
1987 0.211
0.498
1.254
2.047
3.431
5.137
6.523
9.3 13.15 12.621
14.544
16.466
18.388
1988 0.212
0.404
0.79 1.903
2.977
4.392
7.812
12.112
13.107
12.621
14.544
16.466
18.388
1989 0.299
0.52 0.868
1.477
2.686
4.628
7.048
9.98 9.25 12.621
14.544
16.466
18.388
1990 0.398
0.705
1.182
1.719
2.458
3.565
4.71 7.801 8.956 12.621
14.544
16.466
18.388
1991 0.518
1.136
1.743
2.428
3.214
4.538
6.88 10.719
9.445 12.621
14.544
16.466
18.388
1992 0.44 0.931
1.812
2.716
3.895
5.176
6.774
9.598 12.427
12.621
14.544
16.466
18.388
1993 0.344
1.172
1.82 2.823
4.031
5.497
6.765
8.571 10.847
12.621
14.544
16.466
18.388
1994 0.235
0.753
1.42 2.413
3.825
5.416
6.631
7.63 8.112 12.621
14.544
16.466
18.388
1995 0.201
0.485
1.14 2.118
3.47 4.938
7.16 9.119 10.101
12.621
14.544
16.466
18.388
1996 0.195
0.487
0.971
2.054
3.527
5.503
7.767
10.159
10.669
12.621
14.544
16.466
18.388
1997 0.202
0.521
1.079
1.878
3.369
5.263
8.927
12.154
11.204
12.621
14.544
16.466
18.388
1998 0.217
0.533
1.161
1.939
2.945
4.574
7.423
10.367
11.738
12.621
14.544
16.466
18.388
1999 0.203
0.52 1.174
2.031
3.034
4.464
6.482
10.269
10.882
12.621
14.544
16.466
18.388
2000 0.194
0.465
1.208
1.972
3.048
4.096
5.724
7.457 9.582 12.621
14.544
16.466
18.388
2001 0.285
0.522
1.196
2.239
3.313
5.118
6.376
9.241 11.322
12.621
14.544
16.466
18.388
2002 0.251
0.605
1.189
2.138
3.333
4.766
6.859
9.333 10.186
12.621
14.544
16.466
18.388

ICES | AFWG 2020 | 123
Year_age
3 4 5 6 7 8 9 10 11 12 13 14 +gp
2003 0.23 0.537
1.31 2.009
3.241
4.971
6.739
8.706 15.026
12.621
14.544
16.466
18.388
2004 0.25 0.546
1.087
2.035
2.921
4.384
6.254
8.543 9.735 12.621
14.544
16.466
18.388
2005 0.231
0.624
1.118
1.932
3.046
3.955
5.811
8.289 13.44 12.621
14.544
16.466
18.388
2006 0.256
0.602
1.201
2.009
3.114
4.427
6.03 8.037 9.928 12.621
14.544
16.466
18.388
2007 0.262
0.699
1.341
2.121
3.167
4.64 6.495
9.123 11.78 12.621
14.544
16.466
18.388
2008 0.286
0.734
1.37 2.367
3.29 4.82 6.548
8.483 8.902 12.621
14.544
16.466
18.388
2009 0.26 0.641
1.343
2.36 3.763
5.111
6.554
9.098 9.432 12.621
14.544
16.466
18.388
2010 0.257
0.589
1.183
2.052
3.181
4.8 6.759
7.859 10.008
12.621
14.544
16.466
18.388
2011 0.224
0.589
1.088
1.915
2.776
4.319
6.495
8.489 10.016
12.621
14.544
16.466
18.388
2012 0.21 0.561
1.108
1.76 2.775
4.056
6.117
8.718 11.676
12.621
14.544
16.466
18.388
2013 0.256
0.589
1.151
2.019
2.857
4.049
5.631
8.146 10.378
12.621
14.544
16.466
18.388
2014 0.22 0.588
1.146
1.827
2.835
3.828
5.142
6.953 9.015 12.621
14.544
16.466
18.388
2015 0.231
0.546
1.165
1.938
2.853
3.946
5.258
6.821 8.957 12.621
14.544
16.466
18.388
2016 0.229
0.53 1.037
1.805
2.712
3.964
5.537
7.073 8.648 12.621
14.544
16.466
18.388
2017 0.261
0.649
1.168
1.966
2.93 4.627
5.966
7.279 9.3 12.621
14.544
16.466
18.388
2018 0.277
0.631
1.21 1.943
2.742
4.041
5.701
7.485 9.406 12.621
14.544
16.466
18.388
2019 0.239
0.574
1.079
1.838
3.03 4.344
5.874
7.438 9.64 12.621
14.544
16.466
18.388
2020 0.12 0.475
0.99 1.633
2.56 4.135
5.773
7.548 9.511 12.621
14.544
16.466
18.388

124 | ICES SCIENTIFIC REPORTS 2:52 | ICES
Table 3.10. Northeast Arctic COD. Basis for maturity ogives (percent) used in the assessment. Norwegian and Russian data.
Norway Percentage mature
Age Year 3 4 5 6 7 8 9 10 1982 0 5 10 34 65 82 92 100 1983 5 8 10 30 73 88 97 100
Russia Percentage mature
Age Year 3 4 5 6 7 8 9 10 1984 0 5 18 31 56 90 99 100 1985 0 1 10 33 59 85 92 100 1986 0 2 9 19 56 76 89 100 1987 0 1 9 23 27 61 81 80 1988 0 1 3 25 53 79 100 100 1989 0 0 2 15 39 59 83 100 1990 0 2 6 20 47 62 81 95 1991 0 3 1 23 66 82 96 100 1992 0 1 8 31 73 92 95 100 1993 0 3 7 21 56 89 95 99 1994 0 1 8 30 55 84 95 98 1995 0 0 4 23 61 75 94 97 1996 0 0 1 22 56 82 95 100 1997 0 0 1 10 48 73 90 100 1998 0 0 2 15 47 87 97 96 1999 0 0.2 1.3 9.9 38.4 74.9 94 100 2000 0 0 6 19.2 51.4 84 95.5 100 2001 0.1 0.1 3.9 27.9 62.3 89.4 96.3 100 2002 0.1 1.9 10.9 34.4 68.1 82.8 97.6 100 2003 0.2 0 11 29.2 65.9 89.6 95.1 100 2004 0 0.7 8 33.8 63.3 83.4 96.4 96.4 2005 0 0.6 4.6 24.2 61.5 84.9 95.3 98.1 2006 0 0 6.1 29.6 59.6 89.5 96.4 100 2007 0 0.4 5.7 20.8 60.4 83.5 96 100 2008 0 0.5 4 24.6 48.3 84.4 94.7 98.7 2009 0 0 6 28 66 85 97 100 2010 0 0.2 1.5 22.8 47 77.4 90.2 95.5 2011 0 0 2.2 20.7 50.4 73.7 90.6 95.6 2012 0.2 0 1.5 10.8 43.9 76.1 90.8 96.4 2013 0 0 0.6 10.6 41.8 70.6 89.8 96.9 2014 0 0 1.9 14.1 45.9 76 92 97.5 2015 0 0.2 0.2 7.9 27 60.8 83.4 93.7 2016 0 0 0.2 5.2 22.4 44.1 74.8 92.5
2017* 0 0 0.8 6.3 20.8 51.6 80.4 98.6 2018 0 0.5 2.5 23.6 53.9 79.4 92.5 96.0
2019** 0 0 4.5 11.9 56.4 91.8 95.1 100 2020** 0 0.4 1.7 15.8 43.8 71.2 74.9 84.9
*Not used in inputs (instead ratios presented in WD 10, 2017 used for further calculations) **Not used in inputs (instead ratios presented in WD 15, 2019 used for further calculations) Norway

ICES | AFWG 2020 | 125
Percentage mature
Age Year 3 4 5 6 7 8 9 10
1985 0.31 1.36 8.94 38.33 51.27 85.13 100 79.2 1986 2.92 7 7.85 18.85 49.72 66.52 35.59 80.09 1987 0 0.07 4.49 12.42 16.28 31.23 19.32 1988 0 2.35 6.16 40.54 53.63 45.36 100 100 1989 1.52 0.67 3.88 30.65 70.36 82.02 100 100 1990 1.52 0.67 4.18 22 57.45 80.95 100 100 1991 0.1 3.4 13.93 38.03 75.52 90.12 95.39 100 1992 0.22 1.85 21.04 52.83 86.95 96.52 99.83 100 1993 0 2.6 10.37 52.6 84.8 97.25 99.3 99.73 1994 0.51 0.33 15.78 36.92 62.84 88.44 97.56 100 1995 0 0.62 8.19 51.48 63.75 81.11 98.01 99.34 1996 0.03 0 2.82 29.56 70.22 82.06 100 100 1997 0 0 1.48 17.91 73.31 93.01 99.12 100 1998 0.12 0.68 3.17 15.42 47.31 75.73 94.3 100 1999 0.42 0.16 1.6 27.46 70.48 94.57 98.99 100 2000 0 0.11 8.15 30.23 77.3 81.95 100 100 2001 0.49 0.51 9.03 43.81 62.52 74.36 94.13 100 2002 0.27 0.73 5.94 43.22 68.4 85.31 92.52 100 2003 0.02 0.18 6.5 35.97 68.56 87.97 96.3 100 2004 0.24 1.36 10.23 54.56 81.84 90.94 98.76 98.91 2005 0 0.27 9 55.16 81.77 93.51 98.03 100 2006 0 0.22 5.92 44.25 69.85 89.89 96.65 100 2007 0.12 0.33 8.7 47.88 84.29 91.68 99.11 100 2008 0 0.27 9.27 34.13 61.39 88.04 91.17 100 2009 0 0 9 46 85 86 98 99 2010 0 0.36 7.5 41.75 67.7 90.1 95.29 98.55 2011 0 0.2 5.2 48 77.7 89.7 97.3 97.2 2012 0 0 7.7 32.2 67.5 81 90.9 96.3 2013 0 0.3 1 20.2 55.3 80 91.8 99.3 2014 0 0.4 2 13.3 56.7 85 93.8 98.7 2015 0 0 1.9 10.9 29.2 79.1 93.1 99.6 2016 0.07 0.2 1.0 6.4 28.5 71.3 86.1 98.6 2017 0 0.2 0.5 18 54.8 81.4 95.9 100 2018 0 0.1 3.0 16.2 38.3 61.0 93.7 98.9 2019 0 0.4 4.0 24.0 68.6 93.2 96.7 99.8 2020 0 0.44 3.18 13.68 42.51 80.06 91.18 94.03

126 | ICES SCIENTIFIC REPORTS 2:52 | ICES
Table 3.11. Northeast Arctic cod. Proportion mature-at-age
SAM Sat Apr 18 11:47:15 2020
Year_age 3 4 5 6 7 8 9 10 11 12 13 14 +gp
1946 0 0 0.01 0.03 0.06 0.11 0.18 0.44 0.65 0.86 0.96 0.96 1
1947 0 0 0.01 0.03 0.06 0.13 0.16 0.42 0.75 0.91 0.95 1 1
1948 0 0 0.01 0.03 0.07 0.13 0.25 0.47 0.73 0.91 0.97 1 1
1949 0 0 0.01 0.03 0.09 0.17 0.29 0.54 0.79 0.88 0.97 1 1
1950 0 0 0.01 0.03 0.09 0.23 0.35 0.52 0.79 0.95 0.97 1 1
1951 0 0 0.01 0.03 0.1 0.24 0.4 0.58 0.72 0.85 0.96 1 1
1952 0 0 0.01 0.03 0.08 0.22 0.41 0.63 0.82 0.92 0.97 1 1
1953 0 0 0.01 0.03 0.07 0.19 0.4 0.64 0.84 0.94 0.97 1 1
1954 0 0 0.01 0.03 0.08 0.16 0.37 0.68 0.87 0.93 0.96 1 1
1955 0 0 0.01 0.03 0.07 0.13 0.26 0.53 0.83 0.92 0.97 1 1
1956 0 0 0.01 0.03 0.06 0.12 0.14 0.41 0.67 0.91 0.96 1 1
1957 0 0 0.01 0.03 0.06 0.09 0.12 0.22 0.6 0.82 0.97 1 1
1958 0 0 0.01 0.03 0.06 0.1 0.1 0.3 0.5 0.82 0.97 1 1
1959 0 0 0.01 0.04 0.12 0.34 0.49 0.67 0.84 0.87 1 1 1
1960 0 0.01 0.03 0.06 0.1 0.19 0.45 0.69 0.77 0.85 0.99 1 1
1961 0 0 0.01 0.06 0.12 0.31 0.65 0.91 0.98 0.98 1 0.96 1
1962 0 0 0.01 0.05 0.15 0.34 0.61 0.81 0.92 0.97 1 0.932 1
1963 0 0.01 0.01 0.03 0.07 0.28 0.42 0.81 0.98 0.98 1 0.966 1
1964 0 0 0 0.03 0.13 0.37 0.66 0.89 0.95 0.99 1 1 1
1965 0 0 0 0.01 0.06 0.2 0.55 0.73 0.99 0.98 1 1 1
1966 0 0 0.01 0.02 0.06 0.22 0.35 0.74 0.94 0.94 1 1 1
1967 0 0 0 0.03 0.07 0.14 0.38 0.64 0.89 0.9 1 1 1
1968 0 0 0.03 0.05 0.09 0.19 0.39 0.58 0.82 1 1 1 1
1969 0 0 0 0.02 0.04 0.12 0.34 0.55 0.74 0.95 1 1 1
1970 0 0.01 0 0.01 0.07 0.23 0.58 0.81 0.89 0.91 1 1 1
1971 0 0 0.01 0.05 0.11 0.3 0.59 0.79 0.86 0.88 1 1 1
1972 0.01 0.02 0.02 0.01 0.1 0.34 0.64 0.81 0.94 1 1 1 1
1973 0 0 0 0.02 0.16 0.53 0.81 0.92 0.95 0.98 1 1 1

ICES | AFWG 2020 | 127
Year_age 3 4 5 6 7 8 9 10 11 12 13 14 +gp
1974 0 0 0 0.01 0.03 0.21 0.5 0.96 1 0.96 1 1 1
1975 0 0 0.01 0.02 0.09 0.21 0.56 0.78 0.79 0.95 1 1 1
1976 0 0 0 0.05 0.12 0.29 0.45 0.84 0.83 1 0.9 1 1
1977 0 0 0.02 0.08 0.26 0.54 0.76 0.87 0.93 0.94 0.9 1 1
1978 0 0 0 0.02 0.13 0.44 0.71 0.77 0.81 0.89 0.8 1 1
1979 0 0 0 0.03 0.13 0.39 0.77 0.89 0.83 0.78 0.9 1 1
1980 0 0 0 0.02 0.13 0.35 0.65 0.82 1 0.9 0.9 1 1
1981 0 0 0.02 0.07 0.2 0.54 0.8 0.97 1 1 1 1 1
1982 0 0.05 0.1 0.34 0.65 0.82 0.92 1 1 1 1 1 1
1983 0.01 0.08 0.1 0.3 0.73 0.88 0.97 1 1 1 1 1 1
1984 0 0.05 0.18 0.31 0.56 0.9 0.99 1 1 1 1 1 1
1985 0 0.01 0.09 0.36 0.55 0.85 0.96 0.9 1 1 1 1 1
1986 0 0.05 0.08 0.19 0.53 0.71 0.62 0.9 1 1 1 1 1
1987 0 0.01 0.07 0.18 0.22 0.46 0.5 0.75 1 1 1 1 1
1988 0 0.02 0.05 0.33 0.53 0.62 1 1 1 1 1 1 1
1989 0.008 0.003 0.029 0.228 0.547 0.705 0.915 1 1 1 1 1 1
1990 0.008 0.013 0.051 0.21 0.522 0.715 0.905 0.975 1 1 1 1 1
1991 0.001 0.032 0.075 0.305 0.708 0.861 0.957 1 1 1 1 1 1
1992 0.001 0.014 0.145 0.419 0.8 0.943 0.974 1 1 1 1 1 1
1993 0 0.028 0.087 0.368 0.704 0.931 0.972 0.994 1 1 1 1 1
1994 0.003 0.007 0.119 0.335 0.589 0.862 0.963 0.99 1 1 1 1 1
1995 0 0.003 0.061 0.372 0.624 0.781 0.96 0.979 1 1 1 1 1
1996 0 0 0.019 0.258 0.631 0.82 0.975 1 1 1 1 1 1
1997 0 0 0.012 0.14 0.607 0.83 0.946 1 1 1 1 1 1
1998 0.001 0.003 0.026 0.152 0.472 0.814 0.957 0.98 1 1 1 1 1
1999 0.002 0.002 0.014 0.187 0.544 0.847 0.965 1 1 1 1 1 1
2000 0 0.001 0.071 0.247 0.643 0.83 0.978 1 1 1 1 1 1
2001 0.003 0.003 0.065 0.359 0.624 0.819 0.952 1 1 1 1 1 1
2002 0.002 0.013 0.084 0.388 0.683 0.841 0.951 1 1 1 1 1 1

128 | ICES SCIENTIFIC REPORTS 2:52 | ICES
Year_age 3 4 5 6 7 8 9 10 11 12 13 14 +gp
2003 0.001 0.001 0.088 0.326 0.672 0.888 0.957 1 1 1 1 1 1
2004 0.001 0.01 0.091 0.442 0.726 0.872 0.976 0.977 1 1 1 1 1
2005 0 0.004 0.068 0.397 0.716 0.892 0.967 0.991 1 1 1 1 1
2006 0 0.001 0.06 0.369 0.647 0.897 0.965 1 1 1 1 1 1
2007 0 0.004 0.072 0.343 0.723 0.876 0.976 1 1 1 1 1 1
2008 0 0.004 0.062 0.282 0.538 0.863 0.928 0.994 1 1 1 1 1
2009 0 0 0.076 0.372 0.755 0.857 0.977 0.997 0.981 1 1 1 1
2010 0 0.003 0.045 0.323 0.573 0.838 0.927 0.97 0.974 0.986 1 1 1
2011 0 0.001 0.037 0.343 0.64 0.817 0.94 0.964 0.991 0.989 1 1 1
2012 0.001 0 0.046 0.215 0.557 0.786 0.909 0.964 0.99 0.989 1 1 1
2013 0 0.002 0.008 0.154 0.486 0.753 0.908 0.981 0.989 1 1 1 1
2014 0 0.002 0.019 0.137 0.513 0.805 0.929 0.981 0.998 1 1 1 1
2015 0 0.001 0.011 0.094 0.281 0.7 0.883 0.967 0.988 0.994 1 1 1
2016 0 0.001 0.006 0.058 0.255 0.577 0.804 0.955 0.986 1 1 1 1
2017 0 0.002 0.004 0.148 0.493 0.781 0.94 0.99 1 0.996 1 1 1
2018 0 0.003 0.027 0.199 0.461 0.702 0.931 0.974 1 0.989 0.991 1 1
2019 0 0.003 0.033 0.199 0.624 0.894 0.947 0.988 0.997 1 1 1 1
2020 0 0.004 0.026 0.114 0.387 0.769 0.894 0.931 1 1 1 1 1
Table 3.12. The Northeast Arctic cod stock's consumption of cod in million individuals
Year/age 0 1 2 3 4 5 6
1984 0.000 430.697 21.334 0.188 0.000 0.000 0.000
1985 1602.184 354.850 68.317 0.189 0.000 0.000 0.000
1986 59.161 1041.218 318.545 81.642 0.000 0.000 0.000
1987 644.616 176.710 309.847 13.362 0.000 0.000 0.000
1988 32.542 503.062 27.578 1.828 0.000 0.000 0.000
1989 1013.198 157.889 0.000 0.000 0.000 0.000 0.000
1990 0.000 128.083 27.535 0.000 0.000 0.000 0.000
1991 127.457 159.522 216.192 1.845 0.000 0.000 0.000
1992 3502.487 975.416 160.309 4.532 0.000 0.000 0.000

ICES | AFWG 2020 | 129
Year/age 0 1 2 3 4 5 6
1993 3764.192 18803.842 509.990 54.112 1.380 0.434 0.000
1994 7820.202 6915.905 641.353 126.927 48.953 8.158 0.439
1995 7962.948 14781.906 748.177 205.060 65.166 3.552 0.216
1996 9943.654 21531.847 1469.280 133.743 51.579 17.896 1.038
1997 2979.493 16715.590 1837.155 164.019 15.438 1.169 0.206
1998 86.220 5309.872 555.817 204.236 23.530 1.485 0.476
1999 611.611 2033.647 294.157 49.208 3.976 0.004 0.000
2000 1786.894 2430.777 186.570 37.827 13.640 3.757 0.041
2001 94.894 2389.546 115.472 24.003 11.828 1.825 0.945
2002 7578.041 471.472 414.936 42.300 5.426 0.824 0.017
2003 5463.859 4336.099 113.459 25.654 0.000 0.000 0.000
2004 6533.068 2399.187 579.572 21.506 11.283 1.480 0.252
2005 2474.904 2998.989 133.624 82.615 4.727 5.780 0.537
2006 3632.277 2094.158 150.302 6.433 2.107 0.078 0.000
2007 2381.526 1147.731 190.796 74.527 3.382 0.124 0.000
2008 16584.374 812.326 90.968 100.918 33.117 4.359 0.000
2009 11213.946 8404.966 165.057 76.318 23.314 5.723 0.253
2010 5008.421 8464.908 345.533 61.930 31.976 19.324 2.562
2011 15058.553 5179.981 519.842 196.405 46.426 12.177 5.719
2012 24356.509 14081.218 1183.578 120.465 36.949 5.251 0.000
2013 30280.217 5596.784 1807.891 207.186 20.297 9.064 1.372
2014 36631.750 6458.317 844.305 228.391 62.500 6.130 0.075
2015 1676.025 10891.576 339.713 77.226 46.735 19.884 1.959
2016 12632.174 2722.775 535.776 14.264 22.197 32.131 7.579
2017 22070.330 1705.822 430.106 133.912 9.295 5.192 3.541
2018 7745.320 14463.885 296.922 40.939 2.572 0.315 0.000

130 | ICES SCIENTIFIC REPORTS 2:52 | ICES
Table 3.13. Northeast Arctic COD. Tuning data
North-East Arctic cod (Sub-areas I and II) (run name: XSAASA01)104
FLT15: NorBarTrSur 1981 2020
1 1 0.085 0.1894 121 2330 4000 3840 480 100 30 NA NA NA1 2770 2360 1550 1600 140 20 NA NA NA1 5234 4333 1696 582 321 97 NA NA NA1 2828 2144 1174 407 40 8 NA NA NA1 12598 1992 767 334 21 7 NA NA NA1 14393 6414 830 191 34 4 NA NA NA1 39115 5435 1570 200 45 3 NA NA NA1 8049 17331 2048 358 53 3 NA NA NA1 7586 3779 9019 982 94 10 NA NA NA1 3487 3459 2056 2723 161 38 NA NA NA1 3367 2565 2149 1215 1267 61 NA NA NA1 5771 1782 1283 767 429 272 NA NA NA1 14013 7248 1583 624 389 223 NA NA NA1 30760 15260 4680 813 259 132 55 52 111 24210 25230 7710 1790 233 113 55 59 191 11670 14070 11120 2480 279 37 16 8 81 6920 7500 6070 2680 495 63 68 46 01 16740 3170 2640 1750 826 79 52 65 01 18190 6130 1280 683 519 98 27 2 31 13000 11200 2700 473 182 123 36 10 31 19450 8160 3800 958 119 45 19 4 01 13770 10860 4650 1450 219 34 19 5 01 12540 9520 6660 1790 472 102 16 4 01 18610 5360 4320 3090 692 166 29 8 11 5480 10270 2240 1640 380 88 30 4 21 11400 2810 4330 1400 519 134 22 21 81 12730 6890 1370 2360 685 220 40 31 81 30000 11560 4080 1800 829 186 35 2 21 19610 21800 5820 1750 844 527 50 18 31 11490 15550 14450 3980 1120 370 164 57 51 5070 12990 13800 10310 1670 434 117 79 201 7030 3640 9390 13630 4960 938 233 87 601 11980 6400 4100 6500 7620 3360 221 283 411 8510 6790 4780 3260 4690 3170 936 101 971 17020 13570 9980 7120 2740 5280 1700 286 721 11230 15130 10900 6610 2660 1280 1500 643 961 3970 4870 5660 2780 1890 763 301 222 3491 14870 4610 5570 5340 2390 748 541 113 2241 13200 18860 6640 2700 2880 760 172 34 171 14013 10375 9643 4680 1887 1486 382 113 31
FLT16: NorBarLofAcSur 1985 2020
1 1 0.085 0.264 121 1416 204 151 157 33 13 10 5 NA1 1343 684 116 77 31 3 NA 4 NA1 2049 502 174 14 30 7 NA NA NA1 355 578 109 40 3 NA 1 NA NA1 344 214 670 166 32 5 2 NA NA1 206 262 269 668 73 6 3 NA NA1 346 293 339 367 500 37 2 2 NA1 658 215 184 284 254 824 43 17 NA1 1911 1131 354 255 252 277 442 49 NA1 4045 2175 895 225 119 94 39 180 NA1 1598 2166 1040 290 44 43 30 26 NA1 705 872 891 446 65 11 4 9 NA1 517 497 422 499 205 22 5 NA NA1 1826 424 338 340 247 49 7 2 NA1 964 454 122 112 187 92 10 2 NA1 1589 1457 493 129 69 52 12 6 NA1 1716 816 573 198 24 8 6 3 NA1 1122 1043 661 345 95 12 5 6 NA1 1144 1315 1445 643 212 38 5 1 NA1 928 327 451 468 222 88 22 2 NA1 337 661 299 432 172 75 18 1 NA1 591 157 381 169 155 88 24 3 NA1 371 318 130 427 138 75 33 8 NA1 3061 1410 754 246 329 58 28 17 NA1 1783 1405 495 401 133 260 37 17 NA1 1219 1759 1949 709 375 111 88 17 NA1 291 824 1587 2843 656 226 61 78 51 527 381 828 2244 1547 309 108 48 201 850 710 575 1194 2249 1756 209 126 491 1178 918 679 529 1354 1751 977 142 661 1542 1193 996 965 362 1112 663 300 681 583 969 646 587 339 341 481 292 1701 404 486 766 498 503 285 180 147 1721 1361 473 546 678 462 186 143 59 591 977 1248 563 480 677 264 212 65 291 1039 695 852 496 494 455 197 82 25
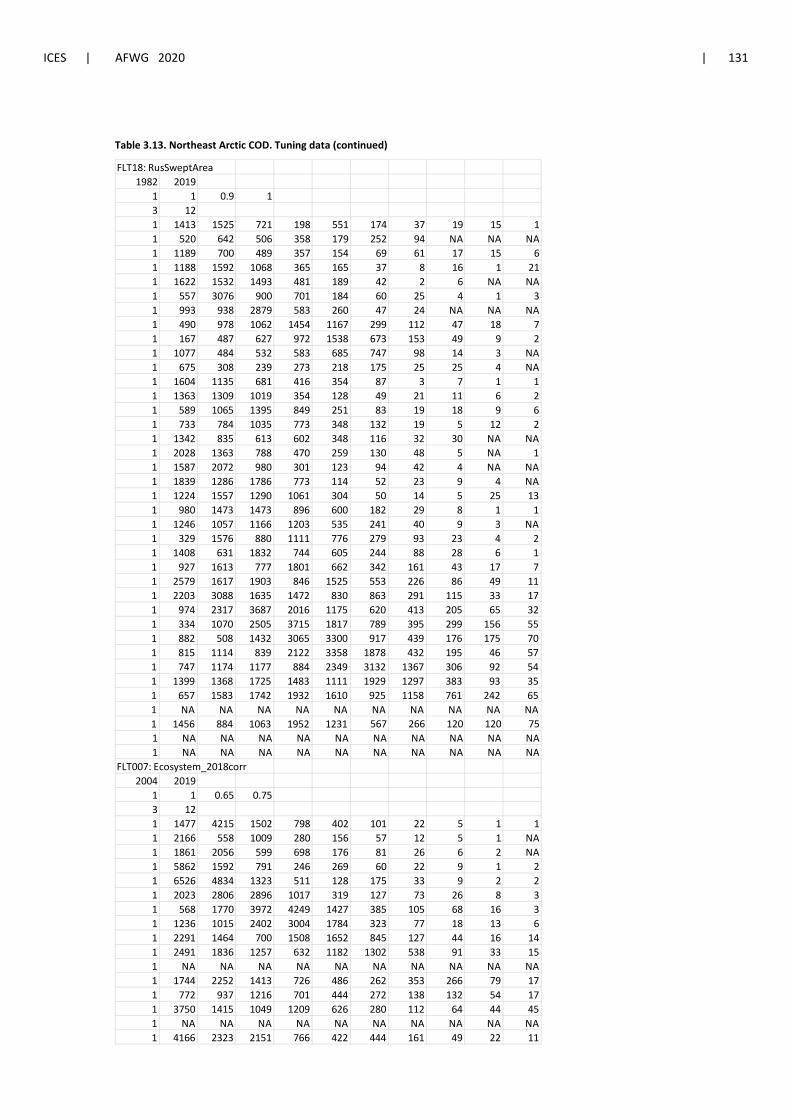
ICES | AFWG 2020 | 131
Table 3.13. Northeast Arctic COD. Tuning data (continued)
FLT18: RusSweptArea 1982 2019
1 1 0.9 13 121 1413 1525 721 198 551 174 37 19 15 11 520 642 506 358 179 252 94 NA NA NA1 1189 700 489 357 154 69 61 17 15 61 1188 1592 1068 365 165 37 8 16 1 211 1622 1532 1493 481 189 42 2 6 NA NA1 557 3076 900 701 184 60 25 4 1 31 993 938 2879 583 260 47 24 NA NA NA1 490 978 1062 1454 1167 299 112 47 18 71 167 487 627 972 1538 673 153 49 9 21 1077 484 532 583 685 747 98 14 3 NA1 675 308 239 273 218 175 25 25 4 NA1 1604 1135 681 416 354 87 3 7 1 11 1363 1309 1019 354 128 49 21 11 6 21 589 1065 1395 849 251 83 19 18 9 61 733 784 1035 773 348 132 19 5 12 21 1342 835 613 602 348 116 32 30 NA NA1 2028 1363 788 470 259 130 48 5 NA 11 1587 2072 980 301 123 94 42 4 NA NA1 1839 1286 1786 773 114 52 23 9 4 NA1 1224 1557 1290 1061 304 50 14 5 25 131 980 1473 1473 896 600 182 29 8 1 11 1246 1057 1166 1203 535 241 40 9 3 NA1 329 1576 880 1111 776 279 93 23 4 21 1408 631 1832 744 605 244 88 28 6 11 927 1613 777 1801 662 342 161 43 17 71 2579 1617 1903 846 1525 553 226 86 49 111 2203 3088 1635 1472 830 863 291 115 33 171 974 2317 3687 2016 1175 620 413 205 65 321 334 1070 2505 3715 1817 789 395 299 156 551 882 508 1432 3065 3300 917 439 176 175 701 815 1114 839 2122 3358 1878 432 195 46 571 747 1174 1177 884 2349 3132 1367 306 92 541 1399 1368 1725 1483 1111 1929 1297 383 93 351 657 1583 1742 1932 1610 925 1158 761 242 651 NA NA NA NA NA NA NA NA NA NA1 1456 884 1063 1952 1231 567 266 120 120 751 NA NA NA NA NA NA NA NA NA NA1 NA NA NA NA NA NA NA NA NA NA
FLT007: Ecosystem_2018corr2004 2019
1 1 0.65 0.753 121 1477 4215 1502 798 402 101 22 5 1 11 2166 558 1009 280 156 57 12 5 1 NA1 1861 2056 599 698 176 81 26 6 2 NA1 5862 1592 791 246 269 60 22 9 1 21 6526 4834 1323 511 128 175 33 9 2 21 2023 2806 2896 1017 319 127 73 26 8 31 568 1770 3972 4249 1427 385 105 68 16 31 1236 1015 2402 3004 1784 323 77 18 13 61 2291 1464 700 1508 1652 845 127 44 16 141 2491 1836 1257 632 1182 1302 538 91 33 151 NA NA NA NA NA NA NA NA NA NA1 1744 2252 1413 726 486 262 353 266 79 171 772 937 1216 701 444 272 138 132 54 171 3750 1415 1049 1209 626 280 112 64 44 451 NA NA NA NA NA NA NA NA NA NA1 4166 2323 2151 766 422 444 161 49 22 11

132 | ICES SCIENTIFIC REPORTS 2:52 | ICES
Table 3.14 –SAM parameter settings used in SAM run
# Min Age (should not be modified unless data are modified accordingly)
3
# Max Age (should not be modified unless data are modified accordingly)
15
# Max Age considered a plus group (0=No, 1=Yes)
1
# Coupling of the fishing mortality states (normally only first row is used).
0 1 2 3 4 5 6 7 8 9 10 11 11
-1 -1 -1 -1 -1 -1 -1 -1 -1 -1 -1 -1 -1
-1 -1 -1 -1 -1 -1 -1 -1 -1 -1 -1 -1 -1
-1 -1 -1 -1 -1 -1 -1 -1 -1 -1 -1 -1 -1
-1 -1 -1 -1 -1 -1 -1 -1 -1 -1 -1 -1 -1
# Correlation of fishing mortality across ages (0 independent, 1 compound symmetry, or 2 AR(1)
2
# Coupling of the survey catchability parameters (nomally first row is not used, as that is covered by fishing mortality).
1 -1 -1 -1 -1 -1 -1 -1 -1 -1 -1 -1 -1
-1 0 1 2 3 4 5 6 7 7 -1 -1 -1
-1 8 9 10 11 12 13 14 15 15 -1 -1 -1
16 17 18 19 20 21 22 23 24 24 -1 -1 -1
25 26 27 28 29 30 31 32 33 33 -1 -1 -1
# Density dependent catchability power parameters (if any).
-1 -1 -1 -1 -1 -1 -1 -1 -1 -1 -1 -1 -1
-1 -1 -1 -1 -1 -1 -1 -1 -1 -1 -1 -1 -1
-1 -1 -1 -1 -1 -1 -1 -1 -1 -1 -1 -1 -1
-1 -1 -1 -1 -1 -1 -1 -1 -1 -1 -1 -1 -1
-1 -1 -1 -1 -1 -1 -1 -1 -1 -1 -1 -1 -1
# Coupling of process variance parameters for log(F)-process (nomally only first row is used)
0 0 0 0 0 0 0 0 0 0 0 0 0
-1 -1 -1 -1 -1 -1 -1 -1 -1 -1 -1 -1 -1
-1 -1 -1 -1 -1 -1 -1 -1 -1 -1 -1 -1 -1
-1 -1 -1 -1 -1 -1 -1 -1 -1 -1 -1 -1 -1
-1 -1 -1 -1 -1 -1 -1 -1 -1 -1 -1 -1 -1
# Coupling of process variance parameters for log(N)-process
0 1 1 1 1 1 1 1 1 1 1 1 1
# Coupling of the variance parameters for the observations.

ICES | AFWG 2020 | 133
0 0 0 0 0 0 0 0 0 0 0 0 0
-1 1 1 1 1 1 1 1 1 1 -1 -1 -1
-1 2 2 2 2 2 2 2 2 2 -1 -1 -1
3 3 3 3 3 3 3 3 3 3 -1 -1 -1
4 4 4 4 4 4 4 4 4 4 -1 -1 -1
# Covariance structure for each fleet ("ID" independent, "AR" AR(1), or "US" for unstructured). | Possible values are: "ID" "AR" "US"
"ID" "AR" "AR" "AR" "AR"
# Coupling of correlation parameters can only be specified if the AR(1) structure is chosen above.
# NA's indicate where correlation parameters can be specified (-1 where they cannot).
#3-4 4-5 5-6 6-7 7-8 8-9 9-10 10-11 11-12 12-13 13-14 14-15
NA NA NA NA NA NA NA NA NA NA NA NA
-1 0 1 2 3 4 4 4 4 -1 -1 -1
-1 5 6 7 8 9 10 10 10 -1 -1 -1
11 12 13 14 14 14 14 14 14 -1 -1 -1
15 16 17 18 19 20 20 20 20 -1 -1 -1
# Stock recruitment model code (0=RW, 1=Ricker, 2=BH)
0
# Years in which catch data are to be scaled by an estimated parameter
0
# lowest and higest age included in Fbar
5 10
# Option for observational likelihood | Possible values are: "LN" "ALN"
"LN" "LN" "LN" "LN" "LN"

134 | ICES SCIENTIFIC REPORTS 2:52 | ICES
Table 3.15. Northeast Arctic cod. Fishing mortality
SAM, Sat Apr 18 11:47:16 2020
Year_age
3 4 5 6 7 8 9 10 11 12 13 14 +gp FBAR5-10
1946 0.0018
0.0182
0.0682
0.1391
0.2436
0.2156
0.2996
0.3108
0.4386
0.4046
0.4068
0.4414
0.4414
0.2128
1947 0.0017
0.0196
0.0857
0.1952
0.3598
0.3202
0.4478
0.4783
0.7192
0.6797
0.7023
0.7874
0.7874
0.3145
1948 0.0013
0.0163
0.0771
0.1902
0.361
0.3277
0.4484
0.4749
0.7156
0.7208
0.7804
0.9506
0.9506
0.3132
1949 0.0023
0.0284
0.1223
0.2675
0.4362
0.3723
0.474
0.5067
0.7557
0.7601
0.8186
1.0381
1.0381
0.3632
1950 0.0033
0.0388
0.1445
0.2796
0.4148
0.3679
0.4849
0.5599
0.8512
0.8942
0.934
1.2303
1.2303
0.3753
1951 0.0086
0.0859
0.248
0.3809
0.4721
0.4 0.4969
0.5629
0.7892
0.8423
0.8915
1.1951
1.1951
0.4268
1952 0.0136
0.1227
0.3246
0.4749
0.5396
0.4702
0.5923
0.7184
0.9985
1.0622
1.0761
1.4044
1.4044
0.52
1953 0.0147
0.1139
0.2697
0.3735
0.4015
0.354
0.4379
0.5392
0.7141
0.7259
0.7151
0.8953
0.8953
0.396
1954 0.015
0.1119
0.2699
0.3866
0.4137
0.3739
0.4606
0.5956
0.7719
0.7753
0.744
0.8685
0.8685
0.4167
1955 0.0152
0.1116
0.2923
0.463
0.5096
0.4851
0.56 0.6996
0.8897
0.8712
0.7912
0.8503
0.8503
0.5016
1956 0.0195
0.1393
0.3623
0.5808
0.6331
0.6111
0.6677
0.8217
1.0402
1.096
0.9584
0.9217
0.9217
0.6128
1957 0.0198
0.1311
0.3114
0.4844
0.5307
0.5326
0.5748
0.7164
0.9026
0.9312
0.8254
0.7495
0.7495
0.525
1958 0.0292
0.1841
0.3916
0.5337
0.5299
0.5103
0.5388
0.6579
0.7673
0.7399
0.5954
0.5255
0.5255
0.527
1959 0.0324
0.2015
0.4206
0.5349
0.5173
0.5077
0.5443
0.6652
0.7407
0.7012
0.5982
0.5488
0.5488
0.5316
1960 0.0321
0.1971
0.4051
0.4966
0.4741
0.488
0.5351
0.6796
0.7877
0.7403
0.6614
0.6446
0.6446
0.5131
1961 0.0367
0.2341
0.5085
0.6193
0.5823
0.6187
0.703
0.8502
0.958
0.9068
0.8278
0.7794
0.7794
0.647
1962 0.0383
0.2564
0.6082
0.7648
0.6998
0.7169
0.8112
0.9456
0.9675
0.8464
0.7888
0.7139
0.7139
0.7577
1963 0.0319
0.2242
0.5948
0.8233
0.8224
0.8751
0.991
1.1275
1.1556
0.9365
0.8711
0.7514
0.7514
0.8724

ICES | AFWG 2020 | 135
Year_age
3 4 5 6 7 8 9 10 11 12 13 14 +gp FBAR5-10
1964 0.0224
0.1483
0.3837
0.5408
0.594
0.7116
0.8718
0.9501
1.0017
0.9019
0.981
0.843
0.843
0.6753
1965 0.0225
0.1331
0.3194
0.4281
0.4741
0.5883
0.7385
0.7838
0.7773
0.7108
0.9015
0.8188
0.8188
0.5554
1966 0.0246
0.1306
0.2831
0.3697
0.4295
0.5531
0.6945
0.7063
0.6557
0.5724
0.6888
0.6086
0.6086
0.506
1967 0.0259
0.1347
0.2772
0.3509
0.429
0.5907
0.7762
0.7954
0.7498
0.6264
0.7219
0.5748
0.5748
0.5366
1968 0.0294
0.1589
0.3399
0.4213
0.4822
0.6327
0.8052
0.7923
0.727
0.5936
0.7386
0.6075
0.6075
0.5789
1969 0.0347
0.1834
0.4148
0.542
0.6507
0.8594
1.069
1.017
0.9108
0.6882
0.7791
0.6185
0.6185
0.7588
1970 0.0362
0.1659
0.3633
0.4844
0.6004
0.8245
0.9948
0.912
0.7778
0.5664
0.6505
0.5486
0.5486
0.6966
1971 0.0324
0.1288
0.2617
0.3432
0.4558
0.7025
0.9073
0.8407
0.7334
0.5331
0.5902
0.4929
0.4929
0.5852
1972 0.051
0.176
0.321
0.3904
0.4784
0.7712
1.092
1.0898
1.0126
0.7476
0.8225
0.649
0.649
0.6905
1973 0.0875
0.2541
0.4042
0.4367
0.4632
0.6423
0.8553
0.8451
0.8087
0.6156
0.6744
0.5294
0.5294
0.6078
1974 0.1185
0.3351
0.5159
0.5364
0.522
0.629
0.7624
0.8484
0.9567
0.7912
0.9288
0.6758
0.6758
0.6357
1975 0.1057
0.3017
0.5089
0.5813
0.5898
0.6779
0.7341
0.7206
0.8816
0.7659
0.868
0.5953
0.5953
0.6354
1976 0.118
0.3363
0.5539
0.6336
0.6477
0.7364
0.7559
0.6255
0.6882
0.6398
0.7559
0.5996
0.5996
0.6588
1977 0.1238
0.3805
0.6539
0.7519
0.7707
0.8906
0.9726
0.795
0.8314
0.729
0.9353
0.8347
0.8347
0.8058
1978 0.0996
0.3205
0.6245
0.8131
0.8734
1.0516
1.2777
1.1892
1.4322
1.2958
1.5975
1.4409
1.4409
0.9716
1979 0.0558
0.1953
0.4138
0.6182
0.7112
0.8412
1.0586
1.053
1.2823
1.2358
1.5176
1.7277
1.7277
0.7827
1980 0.0394
0.1487
0.3484
0.5976
0.7474
0.8696
1.0325
1.0692
1.2543
1.1798
1.3832
1.6699
1.6699
0.7775
1981 0.0319
0.1279
0.3116
0.5859
0.7955
0.9363
1.0234
0.9372
1.0114
0.9038
0.8532
0.8829
0.8829
0.765
1982 0.0372
0.1561
0.3679
0.7026
0.9433
1.0205
1.0052
0.844
0.8272
0.8356
0.7366
0.8628
0.8628
0.8139
1983 0.0298
0.1372
0.3318
0.6224
0.9269
1.0392
0.9592
0.783
0.6997
0.6923
0.6502
0.8839
0.8839
0.7771

136 | ICES SCIENTIFIC REPORTS 2:52 | ICES
Year_age
3 4 5 6 7 8 9 10 11 12 13 14 +gp FBAR5-10
1984 0.0291
0.141
0.3642
0.6908
1.0922
1.2091
1.0641
0.8984
0.7543
0.69 0.5657
0.8565
0.8565
0.8864
1985 0.0344
0.1609
0.4025
0.7132
0.9842
1.0761
0.8528
0.7122
0.6172
0.5366
0.4099
0.7355
0.7355
0.7902
1986 0.0376
0.1838
0.4835
0.8148
1.0149
1.162
0.9891
0.974
0.9189
0.8512
0.5323
1.0001
1.0001
0.9064
1987 0.0414
0.1987
0.5391
0.9144
1.1058
1.2179
1.1059
1.2471
1.3166
1.3295
0.7461
1.4647
1.4647
1.0217
1988 0.0325
0.1502
0.3906
0.7132
0.9885
1.1122
1.1146
1.3999
1.4301
1.5323
0.7712
1.389
1.389
0.9532
1989 0.0236
0.1076
0.2634
0.4806
0.673
0.8008
0.7629
0.9144
0.9195
0.9769
0.5456
1.337
1.337
0.6492
1990 0.0145
0.0669
0.156
0.2681
0.3655
0.4404
0.4534
0.532
0.6052
0.7358
0.4804
1.2289
1.2289
0.3692
1991 0.0153
0.0773
0.1793
0.2895
0.3551
0.3757
0.3574
0.3439
0.3383
0.394
0.2694
0.8293
0.8293
0.3168
1992 0.0197
0.1099
0.267
0.4288
0.5082
0.5183
0.5034
0.4601
0.4481
0.5187
0.3773
1.1786
1.1786
0.4476
1993 0.016
0.1039
0.2917
0.5047
0.6266
0.6605
0.703
0.6741
0.7211
0.8469
0.7072
1.8156
1.8156
0.5768
1994 0.0154
0.1117
0.3475
0.6612
0.8823
0.9417
0.9942
0.9581
1.0521
1.2555
1.2261
3.1321
3.1321
0.7975
1995 0.0154
0.1138
0.3478
0.6369
0.8545
0.9234
0.9759
0.9553
1.0073
1.1502
1.2939
3.3215
3.3215
0.7823
1996 0.0184
0.1349
0.386
0.6443
0.801
0.9156
0.9128
0.9447
0.9673
1.115
1.1733
2.7804
2.7804
0.7674
1997 0.0235
0.184
0.5088
0.7763
0.9168
1.1258
1.1817
1.173
1.1355
1.1868
0.9519
1.3347
1.3347
0.9471
1998 0.0253
0.2058
0.5497
0.8056
0.8857
1.0925
1.1781
1.2565
1.1122
1.1737
0.8685
0.93 0.93 0.9613
1999 0.0182
0.1634
0.4936
0.7605
0.8951
1.1037
1.233
1.281
1.076
1.1554
0.8605
0.8119
0.8119
0.9612
2000 0.0118
0.1104
0.361
0.6125
0.7907
0.9783
1.0822
1.1183
0.8442
0.8813
0.5722
0.5928
0.5928
0.8238
2001 0.0099
0.0897
0.2925
0.5299
0.7223
0.8612
0.8963
0.9479
0.7097
0.7276
0.5146
0.7382
0.7382
0.7084
2002 0.0092
0.0836
0.2725
0.5056
0.7229
0.8359
0.8042
0.7987
0.6015
0.6218
0.4241
0.6854
0.6854
0.6566
2003 0.0097
0.0835
0.2584
0.4562
0.66 0.7394
0.6944
0.6617
0.4743
0.4398
0.2749
0.4078
0.4078
0.5783

ICES | AFWG 2020 | 137
Year_age
3 4 5 6 7 8 9 10 11 12 13 14 +gp FBAR5-10
2004 0.0109
0.0928
0.2856
0.5132
0.794
0.9333
0.9119
0.8994
0.6543
0.5403
0.2876
0.3637
0.3637
0.7229
2005 0.0131
0.1085
0.3121
0.5179
0.777
0.9274
0.9204
0.8799
0.6661
0.5557
0.2785
0.3148
0.3148
0.7224
2006 0.0149
0.1133
0.2969
0.4648
0.6651
0.8136
0.8645
0.8697
0.7623
0.7357
0.4438
0.5332
0.5332
0.6624
2007 0.0137
0.0962
0.2372
0.3415
0.4619
0.5374
0.5673
0.5869
0.5717
0.5833
0.3644
0.3894
0.3894
0.4553
2008 0.0089
0.0608
0.1505
0.2317
0.3263
0.3837
0.4082
0.4236
0.4509
0.4633
0.2949
0.2682
0.2682
0.3207
2009 0.0073
0.048
0.1164
0.1828
0.2698
0.3267
0.3623
0.3844
0.4496
0.4939
0.3198
0.2369
0.2369
0.2737
2010 0.0061
0.0396
0.0963
0.1572
0.2495
0.3373
0.3866
0.4466
0.5364
0.5368
0.3836
0.2432
0.2432
0.2789
2011 0.0053
0.0355
0.0877
0.1428
0.2294
0.3291
0.3875
0.4428
0.4768
0.4031
0.2762
0.1518
0.1518
0.2699
2012 0.0055
0.036
0.0883
0.1379
0.2059
0.2894
0.3451
0.3958
0.4119
0.3296
0.2243
0.1256
0.1256
0.2437
2013 0.0062
0.0404
0.1005
0.16 0.2288
0.3161
0.3787
0.4451
0.4495
0.3412
0.2287
0.1381
0.1381
0.2715
2014 0.0079
0.0508
0.1258
0.1989
0.2653
0.3403
0.3879
0.474
0.4821
0.3576
0.2266
0.1383
0.1383
0.2987
2015 0.0093
0.0582
0.1423
0.2277
0.2874
0.3489
0.3841
0.5015
0.5609
0.4055
0.2382
0.141
0.141
0.3153
2016 0.0085
0.0526
0.1323
0.2189
0.2861
0.3596
0.3953
0.534
0.6095
0.4439
0.2534
0.147
0.147
0.321
2017 0.0096
0.0591
0.1468
0.2437
0.3198
0.4169
0.4518
0.6061
0.7027
0.4915
0.2606
0.1428
0.1428
0.3642
2018 0.0102
0.0622
0.1508
0.2469
0.3248
0.4216
0.4634
0.6354
0.7432
0.5081
0.2453
0.125
0.125
0.3738
2019 0.0091
0.0573
0.1386
0.2225
0.2975
0.3868
0.4174
0.5658
0.6584
0.4398
0.1935
0.0931
0.0931
0.3381
FBAR 0.0113
0.064
0.1707
0.2853
0.3656
0.4218
0.4126
0.482
0.5641
0.2997
0.1609
0.0943

138 | ICES SCIENTIFIC REPORTS 2:52 | ICES
Table 3.16. Northeast Arctic COD Stock number-at-age (Thous)
SAM, Sat Apr 18 11:47:16 2020
Year_age
3 4 5 6 7 8 9 10 11 12 13 14 +gp TOTAL
1946 1423343
681703
383964
180553
85029
89654
241747
85628
36528
32420
18290
8018
2534
3269411
1947 617235
823387
495310
292291
132449
55792
59366
145848
50889
19653
17769
9995
5824
2725807
1948 404564
358163
554464
353970
198821
75928
34159
31135
74119
19473
8259
7125
6003
2126185
1949 576298
273124
267977
396856
234906
110068
44393
17759
16064
30222
7566
3105
4095
1982433
1950 875549
374545
221035
190707
236313
120554
60595
22814
8855
6188
11947
2685
2085
2133873
1951 2469380
675460
290941
169549
117500
123702
67177
30115
10728
3036
2026
3964
1119
3964697
1952 2328260
1155885
417309
178912
104277
60235
66496
32988
14028
4127
1076
672 1259
4365524
1953 2588386
1109590
666524
232910
90013
53351
30952
29873
12966
4217
1158
302 376 4820621
1954 850213
1459176
704441
400426
132371
49759
32286
16326
14279
5163
1691
468 228 3666826
1955 388395
557107
965442
426431
224530
72329
29217
17398
7148
5436
1951
658 239 2696282
1956 743782
250861
386572
564170
213608
110997
36023
13946
7239
2314
1916
736 313 2332478
1957 1416452
405599
154914
211203
248813
90858
49025
15070
5100
2165
599 606 344 2600749
1958 1032979
701969
246044
91836
106348
116374
42067
22719
6096
1691
721 200 371 2369414
1959 1326289
542517
423461
135453
44853
51414
56682
19777
9640
2318
639 342 280 2613666
1960 1481044
627029
286550
216231
66427
21981
25575
26499
8124
3860
950 279 309 2764858
1961 1528761
701496
346684
147581
108908
34581
10985
12808
10852
2917
1547
413 248 2907781
1962 1250787
797519
383752
163202
65701
51107
15265
4361 4678
3405
924 559 245 2741506
1963 839041
707565
443363
161964
60892
27207
21176
5545 1341
1524
1206
336 324 2271485
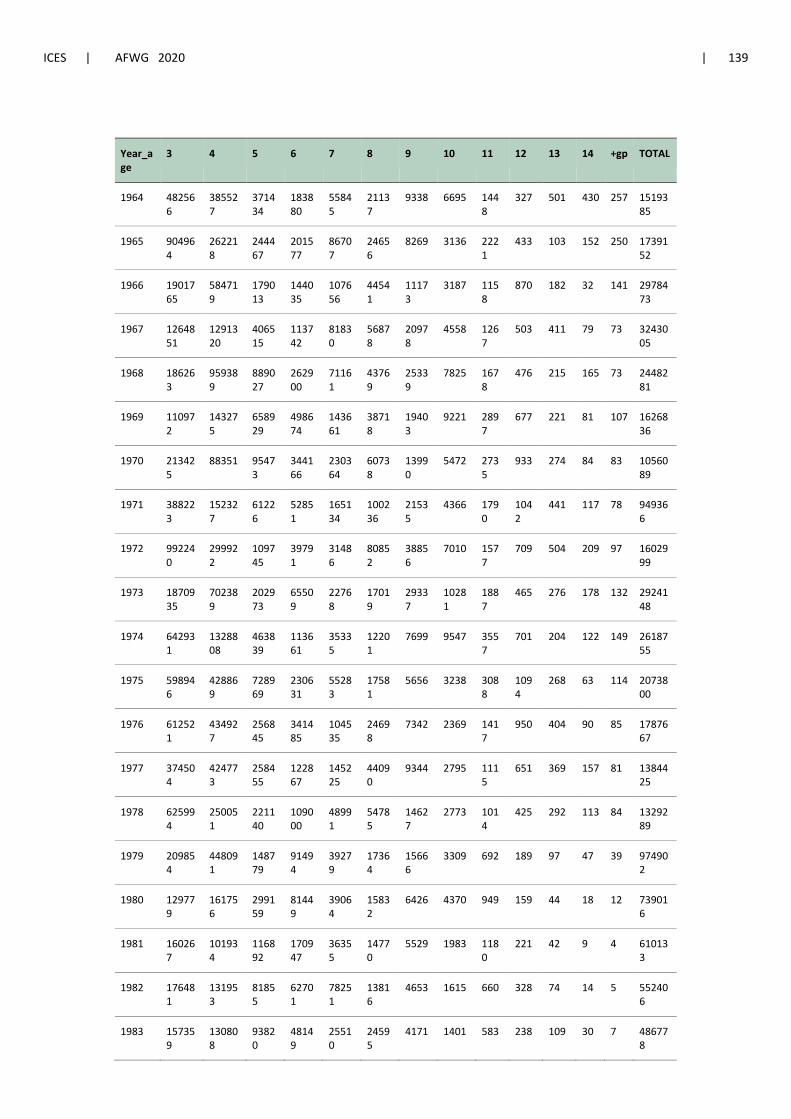
ICES | AFWG 2020 | 139
Year_age
3 4 5 6 7 8 9 10 11 12 13 14 +gp TOTAL
1964 482566
385527
371434
183880
55845
21137
9338 6695 1448
327 501 430 257 1519385
1965 904964
262218
244467
201577
86707
24656
8269 3136 2221
433 103 152 250 1739152
1966 1901765
584719
179013
144035
107656
44541
11173
3187 1158
870 182 32 141 2978473
1967 1264851
1291320
406515
113742
81830
56878
20978
4558 1267
503 411 79 73 3243005
1968 186263
959389
889027
262900
71161
43769
25339
7825 1678
476 215 165 73 2448281
1969 110972
143275
658929
498674
143661
38718
19403
9221 2897
677 221 81 107 1626836
1970 213425
88351 95473
344166
230364
60738
13990
5472 2735
933 274 84 83 1056089
1971 388223
152327
61226
52851
165134
100236
21535
4366 1790
1042
441 117 78 949366
1972 992240
299922
109745
39791
31486
80852
38856
7010 1577
709 504 209 97 1602999
1973 1870935
702389
202973
65509
22768
17019
29337
10281
1887
465 276 178 132 2924148
1974 642931
1328808
463839
113661
35335
12201
7699 9547 3557
701 204 122 149 2618755
1975 598946
428869
728969
230631
55283
17581
5656 3238 3088
1094
268 63 114 2073800
1976 612521
434927
256845
341485
104535
24698
7342 2369 1417
950 404 90 85 1787667
1977 374504
424773
258455
122867
145225
44090
9344 2795 1115
651 369 157 81 1384425
1978 625994
250051
221140
109000
48991
54785
14627
2773 1014
425 292 113 84 1329289
1979 209854
448091
148779
91494
39279
17364
15666
3309 692 189 97 47 39 974902
1980 129779
161756
299159
81449
39064
15832
6426 4370 949 159 44 18 12 739016
1981 160267
101934
116892
170947
36355
14770
5529 1983 1180
221 42 9 4 610133
1982 176481
131953
81855
62701
78251
13816
4653 1615 660 328 74 14 5 552406
1983 157359
130808
93820
48149
25510
24595
4171 1401 583 238 109 30 7 486778

140 | ICES SCIENTIFIC REPORTS 2:52 | ICES
Year_age
3 4 5 6 7 8 9 10 11 12 13 14 +gp TOTAL
1984 415597
123941
85766
55401
21532
8546 7138 1247 531 247 103 43 13 720104
1985 564693
366624
83297
45752
23990
5395 2194 2057 393 206 102 49 19 1094771
1986 1123445
440771
248674
43379
18882
7053 1444 812 851 180 99 56 26 1885671
1987 330792
976620
267098
104829
14852
6060 1704 486 244 283 63 49 25 1703105
1988 300608
243934
628926
115653
29803
4366 1478 462 121 54 59 25 13 1325503
1989 190122
223986
154580
343365
49497
8501 1302 398 90 25 9 21 9 971905
1990 156070
147999
144471
105617
165651
20659
2928 533 125 29 8 5 6 744100
1991 398889
134665
109008
98478
66981
94546
11110
1516 266 53 11 3 3 915529
1992 744428
318674
107282
75567
57510
37898
53028
6494 950 163 29 7 2 1402033
1993 935483
537960
252984
70885
38101
28074
17579
27492
3340
526 80 18 2 1912524
1994 738692
725615
400480
146912
35422
16713
11824
7114 11714
1341
182 31 3 2096041
1995 503553
503064
528977
223046
57350
12074
5335 3530 2276
3513
303 43 1 1843066
1996 416490
299474
333475
292153
97901
18884
4153 1573 1105
650 1035
65 1 1466962
1997 679661
228365
203859
176849
121537
37139
5831 1508 508 333 181 291 3 1456065
1998 969301
443973
130993
95113
69673
41312
9902 1420 395 126 80 57 69 1762414
1999 550901
587185
255263
59719
32775
25538
11454
2570 320 105 30 27 44 1525932
2000 678770
402402
379004
116250
23023
11121
7046 2608 622 89 27 9 28 1621001
2001 557105
532248
296071
184184
50788
8750 3453 1892 688 228 28 13 18 1635465
2002 413451
423622
377086
188583
82043
19945
3115 1186 612 267 94 13 12 1510028
2003 698613
307019
298227
246737
86925
32316
6919 1165 440 299 111 55 9 1678834
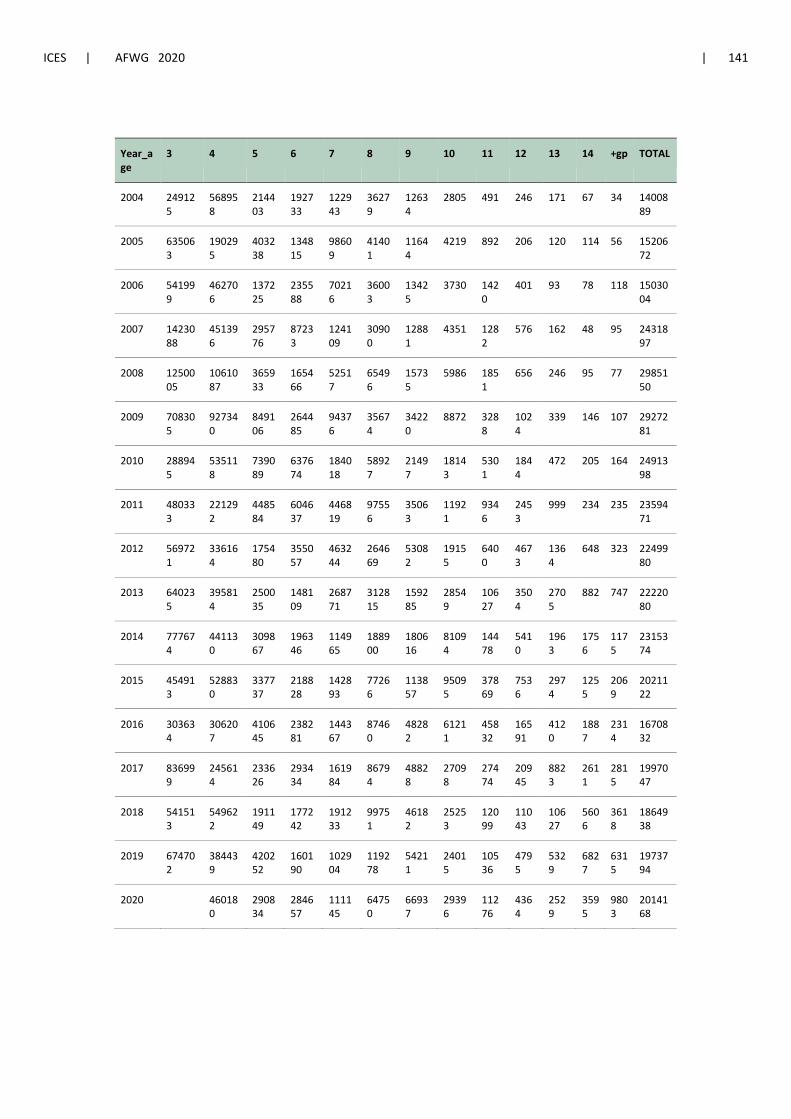
ICES | AFWG 2020 | 141
Year_age
3 4 5 6 7 8 9 10 11 12 13 14 +gp TOTAL
2004 249125
568958
214403
192733
122943
36279
12634
2805 491 246 171 67 34 1400889
2005 635063
190295
403238
134815
98609
41401
11644
4219 892 206 120 114 56 1520672
2006 541999
462706
137225
235588
70216
36003
13425
3730 1420
401 93 78 118 1503004
2007 1423088
451396
295776
87233
124109
30900
12881
4351 1282
576 162 48 95 2431897
2008 1250005
1061087
365933
165466
52517
65496
15735
5986 1851
656 246 95 77 2985150
2009 708305
927340
849106
264485
94376
35674
34220
8872 3288
1024
339 146 107 2927281
2010 288945
535118
739089
637674
184018
58927
21497
18143
5301
1844
472 205 164 2491398
2011 480333
221292
448584
604637
446819
97556
35063
11921
9346
2453
999 234 235 2359471
2012 569721
336164
175480
355057
463244
264669
53082
19155
6400
4673
1364
648 323 2249980
2013 640235
395814
250035
148109
268771
312815
159285
28549
10627
3504
2705
882 747 2222080
2014 777674
441130
309867
196346
114965
188900
180616
81094
14478
5410
1963
1756
1175
2315374
2015 454913
528830
337737
218828
142893
77266
113857
95095
37869
7536
2974
1255
2069
2021122
2016 303634
306207
410645
238281
144367
87460
48282
61211
45832
16591
4120
1887
2314
1670832
2017 836999
245614
233626
293434
161984
86794
48828
27098
27474
20945
8823
2611
2815
1997047
2018 541513
549622
191149
177242
191233
99751
46182
25253
12099
11043
10627
5606
3618
1864938
2019 674702
384439
420252
160190
102904
119278
54211
24015
10536
4795
5329
6827
6315
1973794
2020 460180
290834
284657
111145
64750
66937
29396
11276
4364
2529
3595
9803
2014168
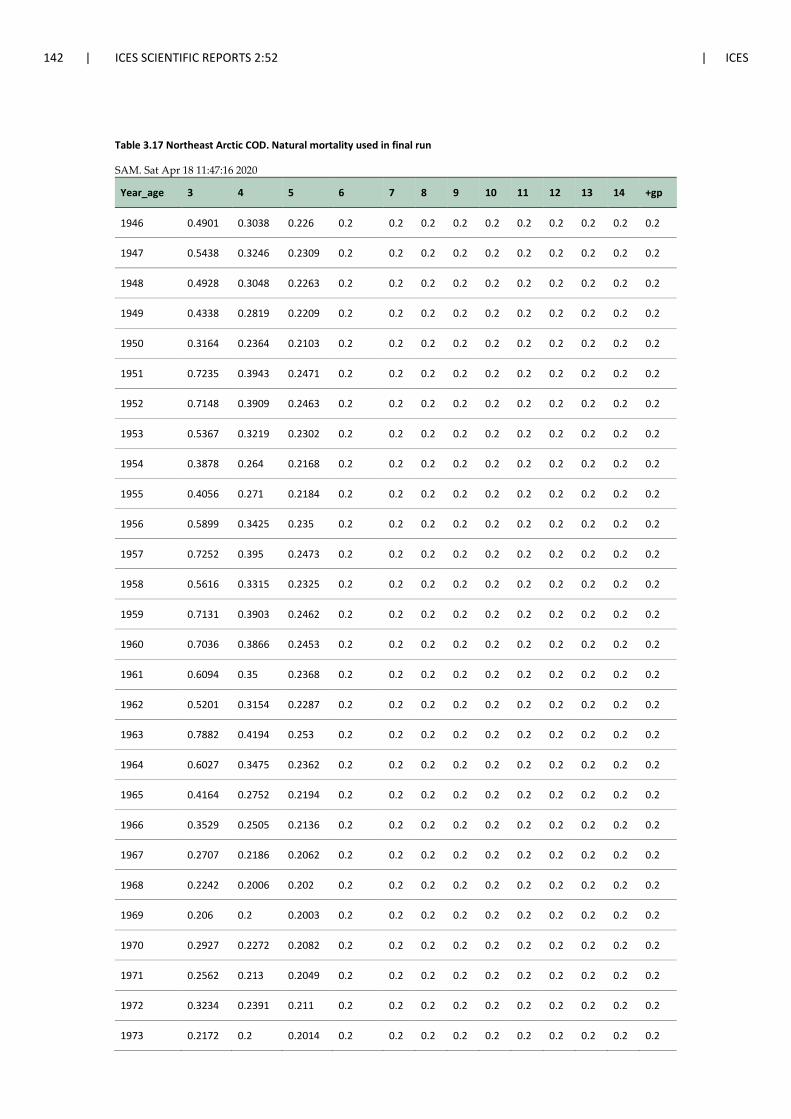
142 | ICES SCIENTIFIC REPORTS 2:52 | ICES
Table 3.17 Northeast Arctic COD. Natural mortality used in final run
SAM. Sat Apr 18 11:47:16 2020
Year_age 3 4 5 6 7 8 9 10 11 12 13 14 +gp
1946 0.4901 0.3038 0.226 0.2 0.2 0.2 0.2 0.2 0.2 0.2 0.2 0.2 0.2
1947 0.5438 0.3246 0.2309 0.2 0.2 0.2 0.2 0.2 0.2 0.2 0.2 0.2 0.2
1948 0.4928 0.3048 0.2263 0.2 0.2 0.2 0.2 0.2 0.2 0.2 0.2 0.2 0.2
1949 0.4338 0.2819 0.2209 0.2 0.2 0.2 0.2 0.2 0.2 0.2 0.2 0.2 0.2
1950 0.3164 0.2364 0.2103 0.2 0.2 0.2 0.2 0.2 0.2 0.2 0.2 0.2 0.2
1951 0.7235 0.3943 0.2471 0.2 0.2 0.2 0.2 0.2 0.2 0.2 0.2 0.2 0.2
1952 0.7148 0.3909 0.2463 0.2 0.2 0.2 0.2 0.2 0.2 0.2 0.2 0.2 0.2
1953 0.5367 0.3219 0.2302 0.2 0.2 0.2 0.2 0.2 0.2 0.2 0.2 0.2 0.2
1954 0.3878 0.264 0.2168 0.2 0.2 0.2 0.2 0.2 0.2 0.2 0.2 0.2 0.2
1955 0.4056 0.271 0.2184 0.2 0.2 0.2 0.2 0.2 0.2 0.2 0.2 0.2 0.2
1956 0.5899 0.3425 0.235 0.2 0.2 0.2 0.2 0.2 0.2 0.2 0.2 0.2 0.2
1957 0.7252 0.395 0.2473 0.2 0.2 0.2 0.2 0.2 0.2 0.2 0.2 0.2 0.2
1958 0.5616 0.3315 0.2325 0.2 0.2 0.2 0.2 0.2 0.2 0.2 0.2 0.2 0.2
1959 0.7131 0.3903 0.2462 0.2 0.2 0.2 0.2 0.2 0.2 0.2 0.2 0.2 0.2
1960 0.7036 0.3866 0.2453 0.2 0.2 0.2 0.2 0.2 0.2 0.2 0.2 0.2 0.2
1961 0.6094 0.35 0.2368 0.2 0.2 0.2 0.2 0.2 0.2 0.2 0.2 0.2 0.2
1962 0.5201 0.3154 0.2287 0.2 0.2 0.2 0.2 0.2 0.2 0.2 0.2 0.2 0.2
1963 0.7882 0.4194 0.253 0.2 0.2 0.2 0.2 0.2 0.2 0.2 0.2 0.2 0.2
1964 0.6027 0.3475 0.2362 0.2 0.2 0.2 0.2 0.2 0.2 0.2 0.2 0.2 0.2
1965 0.4164 0.2752 0.2194 0.2 0.2 0.2 0.2 0.2 0.2 0.2 0.2 0.2 0.2
1966 0.3529 0.2505 0.2136 0.2 0.2 0.2 0.2 0.2 0.2 0.2 0.2 0.2 0.2
1967 0.2707 0.2186 0.2062 0.2 0.2 0.2 0.2 0.2 0.2 0.2 0.2 0.2 0.2
1968 0.2242 0.2006 0.202 0.2 0.2 0.2 0.2 0.2 0.2 0.2 0.2 0.2 0.2
1969 0.206 0.2 0.2003 0.2 0.2 0.2 0.2 0.2 0.2 0.2 0.2 0.2 0.2
1970 0.2927 0.2272 0.2082 0.2 0.2 0.2 0.2 0.2 0.2 0.2 0.2 0.2 0.2
1971 0.2562 0.213 0.2049 0.2 0.2 0.2 0.2 0.2 0.2 0.2 0.2 0.2 0.2
1972 0.3234 0.2391 0.211 0.2 0.2 0.2 0.2 0.2 0.2 0.2 0.2 0.2 0.2
1973 0.2172 0.2 0.2014 0.2 0.2 0.2 0.2 0.2 0.2 0.2 0.2 0.2 0.2

ICES | AFWG 2020 | 143
1974 0.2168 0.2 0.2013 0.2 0.2 0.2 0.2 0.2 0.2 0.2 0.2 0.2 0.2
1975 0.2317 0.2035 0.2027 0.2 0.2 0.2 0.2 0.2 0.2 0.2 0.2 0.2 0.2
1976 0.2238 0.2004 0.202 0.2 0.2 0.2 0.2 0.2 0.2 0.2 0.2 0.2 0.2
1977 0.2487 0.2101 0.2042 0.2 0.2 0.2 0.2 0.2 0.2 0.2 0.2 0.2 0.2
1978 0.2342 0.2045 0.2029 0.2 0.2 0.2 0.2 0.2 0.2 0.2 0.2 0.2 0.2
1979 0.2081 0.2 0.2005 0.2 0.2 0.2 0.2 0.2 0.2 0.2 0.2 0.2 0.2
1980 0.2 0.2 0.2 0.2 0.2 0.2 0.2 0.2 0.2 0.2 0.2 0.2 0.2
1981 0.2 0.2 0.2 0.2 0.2 0.2 0.2 0.2 0.2 0.2 0.2 0.2 0.2
1982 0.2 0.2 0.2 0.2 0.2 0.2 0.2 0.2 0.2 0.2 0.2 0.2 0.2
1983 0.2031 0.2 0.2001 0.2 0.2 0.2 0.2 0.2 0.2 0.2 0.2 0.2 0.2
1984 0.2 0.2099 0.2122 0.2 0.2 0.2 0.2 0.2 0.2 0.2 0.2 0.2 0.2
1985 0.2039 0.2145 0.2158 0.2 0.2 0.2 0.2 0.2 0.2 0.2 0.2 0.2 0.2
1986 0.249 0.2209 0.2603 0.2268 0.2 0.2 0.2 0.2 0.2 0.2 0.2 0.2 0.2
1987 0.244 0.209 0.2211 0.2629 0.2 0.2 0.2 0.2 0.2 0.2 0.2 0.2 0.2
1988 0.2145 0.2045 0.2095 0.2 0.2 0.2 0.2 0.2 0.2 0.2 0.2 0.2 0.2
1989 0.2016 0.2171 0.2 0.2164 0.2 0.2 0.2 0.2 0.2 0.2 0.2 0.2 0.2
1990 0.2 0.2029 0.2074 0.2 0.2 0.2 0.2 0.2 0.2 0.2 0.2 0.2 0.2
1991 0.2012 0.2 0.2019 0.2113 0.2 0.2 0.2 0.2 0.2 0.2 0.2 0.2 0.2
1992 0.2087 0.2 0.2 0.2172 0.2 0.2 0.2 0.2 0.2 0.2 0.2 0.2 0.2
1993 0.2443 0.2 0.2159 0.2 0.2 0.2 0.2 0.2 0.2 0.2 0.2 0.2 0.2
1994 0.342 0.2525 0.2178 0.2321 0.2 0.2 0.2 0.2 0.2 0.2 0.2 0.2 0.2
1995 0.5187 0.3108 0.2157 0.2 0.2 0.2 0.2 0.2 0.2 0.2 0.2 0.2 0.2
1996 0.5045 0.3166 0.2303 0.2157 0.2 0.2 0.2 0.2 0.2 0.2 0.2 0.2 0.2
1997 0.4179 0.2699 0.2212 0.2 0.2 0.2 0.2 0.2 0.2 0.2 0.2 0.2 0.2
1998 0.4255 0.2638 0.2134 0.228 0.2 0.2 0.2 0.2 0.2 0.2 0.2 0.2 0.2
1999 0.2583 0.229 0.2292 0.2025 0.2 0.2 0.2 0.2 0.2 0.2 0.2 0.2 0.2
2000 0.2457 0.2092 0.2464 0.2089 0.2 0.2 0.2 0.2 0.2 0.2 0.2 0.2 0.2
2001 0.2356 0.217 0.2011 0.2312 0.2 0.2 0.2 0.2 0.2 0.2 0.2 0.2 0.2
2002 0.2817 0.2083 0.2 0.2231 0.2 0.2 0.2 0.2 0.2 0.2 0.2 0.2 0.2
2003 0.2398 0.2015 0.2 0.2136 0.2 0.2 0.2 0.2 0.2 0.2 0.2 0.2 0.2

144 | ICES SCIENTIFIC REPORTS 2:52 | ICES
2004 0.2517 0.2134 0.2 0.2 0.2 0.2 0.2 0.2 0.2 0.2 0.2 0.2 0.2
2005 0.2989 0.2148 0.2067 0.2 0.2 0.2 0.2 0.2 0.2 0.2 0.2 0.2 0.2
2006 0.2026 0.2305 0.2 0.2 0.2 0.2 0.2 0.2 0.2 0.2 0.2 0.2 0.2
2007 0.2432 0.2 0.2435 0.2 0.2 0.2 0.2 0.2 0.2 0.2 0.2 0.2 0.2
2008 0.2559 0.212 0.2 0.2242 0.2 0.2 0.2 0.2 0.2 0.2 0.2 0.2 0.2
2009 0.2803 0.2134 0.2029 0.2 0.2 0.2 0.2 0.2 0.2 0.2 0.2 0.2 0.2
2010 0.301 0.242 0.2112 0.2045 0.2 0.2 0.2 0.2 0.2 0.2 0.2 0.2 0.2
2011 0.4318 0.3217 0.2072 0.2 0.2 0.2 0.2 0.2 0.2 0.2 0.2 0.2 0.2
2012 0.3776 0.3226 0.2238 0.2 0.2 0.2 0.2 0.2 0.2 0.2 0.2 0.2 0.2
2013 0.405 0.2446 0.2169 0.2 0.2 0.2 0.2 0.2 0.2 0.2 0.2 0.2 0.2
2014 0.3904 0.3065 0.2195 0.2 0.2 0.2 0.2 0.2 0.2 0.2 0.2 0.2 0.2
2015 0.3664 0.2689 0.2458 0.2076 0.2 0.2 0.2 0.2 0.2 0.2 0.2 0.2 0.2
2016 0.2185 0.2604 0.2823 0.2288 0.2 0.2 0.2 0.2 0.2 0.2 0.2 0.2 0.2
2017 0.4398 0.2209 0.2011 0.2 0.2 0.2 0.2 0.2 0.2 0.2 0.2 0.2 0.2
2018 0.2845 0.2077 0.2 0.2191 0.2 0.2 0.2 0.2 0.2 0.2 0.2 0.2 0.2
2019 0.3384 0.2277 0.2064 0.2 0.2 0.2 0.2 0.2 0.2 0.2 0.2 0.2 0.2

ICES | AFWG 2020 | 145
Table 3.18. Northeast Arctic COD. Summary table SAM, Sat Apr 18 11:47:16 2020
Year RECRUITS TOTALBIO TOTSPBIO LANDINGS YIELD/SSB FBAR 5-10
1946 1423343 4199325 990609 706000 0.7127 0.2128
1947 617235 3642007 1021068 882017 0.8638 0.3145
1948 404564 3524255 837031 774295 0.925 0.3132
1949 576298 3003160 624864 800122 1.2805 0.3632
1950 875549 2827763 562163 731982 1.3021 0.3753
1951 2469380 3651316 511069 827180 1.6185 0.4268
1952 2328260 4052439 498837 876795 1.7577 0.52
1953 2588386 4131038 395700 695546 1.7578 0.396
1954 850213 4264867 409262 826021 2.0183 0.4167
1955 388395 3567594 331294 1147841 3.4647 0.5016
1956 743782 3334981 284209 1343068 4.7256 0.6128
1957 1416452 2818520 206967 792557 3.8294 0.525
1958 1032979 2416650 204255 769313 3.7664 0.527
1959 1326289 2764008 442905 744607 1.6812 0.5316
1960 1481044 2422909 402781 622042 1.5444 0.5131
1961 1528761 2398322 405816 783221 1.93 0.647
1962 1250787 2165088 319994 909266 2.8415 0.7577
1963 839041 1960792 214337 776337 3.622 0.8724
1964 482566 1499197 192205 437695 2.2772 0.6753
1965 904964 1471758 106572 444930 4.1749 0.5554
1966 1901765 2279538 121928 483711 3.9672 0.506
1967 1264851 2781268 133496 572605 4.2893 0.5366
1968 186263 3226283 228850 1074084 4.6934 0.5789
1969 110972 2743177 151247 1197226 7.9157 0.7588
1970 213425 2079779 230661 933246 4.046 0.6966
1971 388223 1628945 319457 689048 2.1569 0.5852
1972 992240 1619985 365215 565254 1.5477 0.6905
1973 1870935 2276632 324433 792685 2.4433 0.6078

146 | ICES SCIENTIFIC REPORTS 2:52 | ICES
Year RECRUITS TOTALBIO TOTSPBIO LANDINGS YIELD/SSB FBAR 5-10
1974 642931 2211727 159570 1102433 6.9088 0.6357
1975 598946 2117752 130495 829377 6.3556 0.6354
1976 612521 2015645 167868 867463 5.1675 0.6588
1977 374504 1978696 352518 905301 2.5681 0.8058
1978 625994 1596936 234876 698715 2.9748 0.9716
1979 209854 1108308 165182 440538 2.667 0.7827
1980 129779 835530 102563 380434 3.7093 0.7775
1981 160267 954418 151331 399038 2.6369 0.765
1982 176481 732266 309233 363730 1.1762 0.8139
1983 157359 707797 280971 289992 1.0321 0.7771
1984 415597 812684 227446 277651 1.2207 0.8864
1985 564693 993470 187581 307920 1.6415 0.7902
1986 1123445 1354261 162605 430113 2.6451 0.9064
1987 330792 1212364 110373 523071 4.7391 1.0217
1988 300608 1008056 179294 434939 2.4258 0.9532
1989 190122 1001859 234927 332481 1.4153 0.6492
1990 156070 1019322 332203 212000 0.6382 0.3692
1991 398889 1529167 706951 319158 0.4515 0.3168
1992 744428 1880012 909485 513234 0.5643 0.4476
1993 935483 2319654 777317 581611 0.7482 0.5768
1994 738692 2117002 592996 771086 1.3003 0.7975
1995 503553 1822128 524650 739999 1.4105 0.7823
1996 416490 1684558 547659 732228 1.337 0.7674
1997 679661 1501034 544858 762403 1.3993 0.9471
1998 969301 1275457 377941 592624 1.568 0.9613
1999 550901 1158724 282913 484910 1.714 0.9612
2000 678770 1189540 239293 414868 1.7337 0.8238
2001 557105 1467249 364097 426471 1.1713 0.7084
2002 413451 1623962 507144 535045 1.055 0.6566

ICES | AFWG 2020 | 147
Year RECRUITS TOTALBIO TOTSPBIO LANDINGS YIELD/SSB FBAR 5-10
2003 698613 1724129 596107 551990 0.926 0.5783
2004 249125 1631435 709766 606445 0.8544 0.7229
2005 635063 1562704 614977 641276 1.0428 0.7224
2006 541999 1568359 601333 537642 0.8941 0.6624
2007 1423088 1957075 651662 486883 0.7471 0.4553
2008 1250005 2702921 687443 464171 0.6752 0.3207
2009 708305 3438822 1095497 523430 0.4778 0.2737
2010 288945 3817975 1396260 609983 0.4369 0.2789
2011 480333 4021782 2011119 719830 0.3579 0.2699
2012 569721 4148412 2328107 727663 0.3126 0.2437
2013 640235 4369952 2639228 966209 0.3661 0.2715
2014 777674 3963783 2499243 986449 0.3947 0.2987
2015 454913 3707509 2059938 864384 0.4196 0.3153
2016 303634 3265551 1689689 849422 0.5027 0.321
2017 836999 3335324 1845399 868276 0.4705 0.3642
2018 541513 3018800 1593377 778627 0.4887 0.3738
2019 674702 2924923 1677851 692609 0.4128 0.3381
Arith. Mean 755250 2312711 613494 672200 2.0447 0.5916

148 | ICES SCIENTIFIC REPORTS 2:52 | ICES
Table 3.19. Northeast Arctic COD. Input for the short term prediction
2020
Age N M Mat PF PM SWT Sel CWT 3 583000 0.3542 0 0 0 0.12 0.0093 0.7572 4 460180 0.2188 0.004 0 0 0.475 0.0579 1.0896 5 290834 0.2025 0.026 0 0 0.99 0.1422 1.6561 6 284657 0.2064 0.114 0 0 1.633 0.2319 2.3181 7 111145 0.2 0.387 0 0 2.56 0.3031 3.2894 8 64750 0.2 0.769 0 0 4.135 0.3868 4.5461 9 66937 0.2 0.894 0 0 5.773 0.4224 5.8086
10 29396 0.2 0.931 0 0 7.548 0.5686 7.467 11 11276 0.2 1 0 0 9.511 0.6549 8.647 12 4364 0.2 1 0 0 12.621 0.4578 11.42 13 2529 0.2 1 0 0 14.544 0.2382 12.8 14 3595 0.2 1 0 0 16.466 0.1298 14.18 15 9803 0.2 1 0 0 18.388 0.1298 15.55
2021
Age N M Mat PF PM SWT Sel CWT 3 635000 0.3542 0 0 0 0.187 0.0093 0.8007 4
0.2188 0.003 0 0 0.421 0.0579 1.1678
5
0.2025 0.029 0 0 0.95 0.1422 1.5997 6
0.2064 0.171 0 0 1.642 0.2319 2.3152
7
0.2 0.491 0 0 2.495 0.3031 3.2175 8
0.2 0.788 0 0 3.833 0.3868 4.5025
9
0.2 0.924 0 0 5.58 0.4224 5.9017 10
0.2 0.964 0 0 7.416 0.5686 7.164
11
0.2 0.999 0 0 9.666 0.6549 8.822 12
0.2 0.996 0 0 12.621 0.4578 11.42
13
0.2 1 0 0 14.544 0.2382 12.8 14
0.2 1 0 0 16.466 0.1298 14.18
15
0.2 1 0 0 18.388 0.1298 15.55 2022
Age N M Mat PF PM SWT Sel CWT 3 512000 0.3542 0 0 0 0.195 0.0093 0.8007 4
0.2188 0.003 0 0 0.488 0.0579 1.1678
5
0.2025 0.029 0 0 0.896 0.1422 1.5997 6
0.2064 0.171 0 0 1.602 0.2319 2.3152
7
0.2 0.491 0 0 2.504 0.3031 3.2175 8
0.2 0.788 0 0 3.767 0.3868 4.5025
9
0.2 0.924 0 0 5.278 0.4224 5.9017 10
0.2 0.964 0 0 7.224 0.5686 7.164
11
0.2 0.999 0 0 9.535 0.6549 8.822 12
0.2 0.996 0 0 12.621 0.4578 11.42
13
0.2 1 0 0 14.544 0.2382 12.8 14
0.2 1 0 0 16.466 0.1298 14.18
15
0.2 1 0 0 18.388 0.1298 15.55

ICES | AFWG 2020 | 149
Table 3.20. Northeast Arctic COD. Management option table.
2020
Biomass (t) SSB (t) FMult FBar Landings (t) 2640455 1367955 1 0.338 674200
2021
2022
Biomass SSB FBar Landings Biomass SSB 2579235 1373132 0.00 0 3242131 1898191
0.05 114744 3119245 1799856 0.10 223732 3003052 1707469 0.15 327317 2893125 1620631 0.20 425823 2789066 1538970 0.25 519557 2690506 1462142 0.30 608800 2597101 1389826 0.35 693819 2508530 1321725 0.40 774860 2424497 1257564 0.45 852154 2344724 1197086 0.50 925917 2268952 1140053 0.55 996349 2196941 1086245 0.60 1063639 2128467 1035455 0.65 1127963 2063319 987491 0.70 1189486 2001303 942176 0.75 1248361 1942237 899344 0.80 1304735 1885948 858840 0.85 1358741 1832280 820519 0.90 1410507 1781081 784249 0.95 1460151 1732214 749904 1.00 1507786 1685548 717366
Tonnes Tonnes
Tonnes Tonnes Tonnes
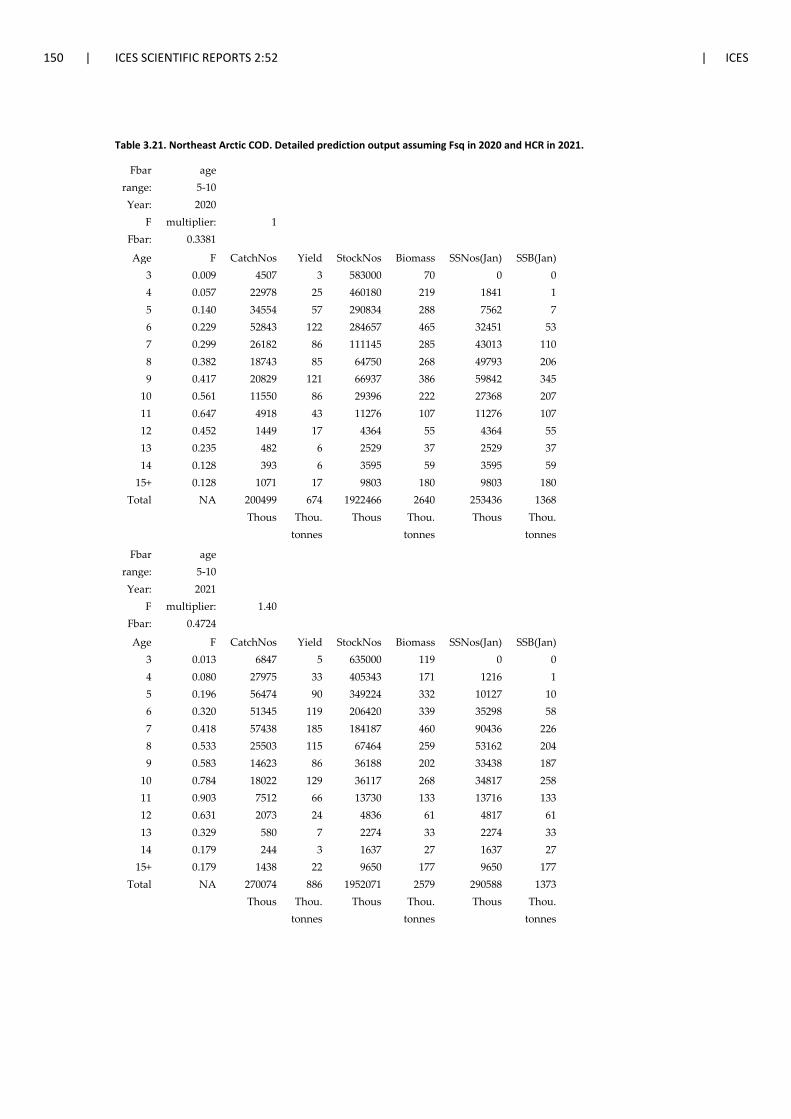
150 | ICES SCIENTIFIC REPORTS 2:52 | ICES
Table 3.21. Northeast Arctic COD. Detailed prediction output assuming Fsq in 2020 and HCR in 2021.
Fbar age
range: 5-10
Year: 2020
F multiplier: 1
Fbar: 0.3381
Age F CatchNos Yield StockNos Biomass SSNos(Jan) SSB(Jan)
3 0.009 4507 3 583000 70 0 0 4 0.057 22978 25 460180 219 1841 1 5 0.140 34554 57 290834 288 7562 7 6 0.229 52843 122 284657 465 32451 53 7 0.299 26182 86 111145 285 43013 110 8 0.382 18743 85 64750 268 49793 206 9 0.417 20829 121 66937 386 59842 345
10 0.561 11550 86 29396 222 27368 207 11 0.647 4918 43 11276 107 11276 107 12 0.452 1449 17 4364 55 4364 55 13 0.235 482 6 2529 37 2529 37 14 0.128 393 6 3595 59 3595 59
15+ 0.128 1071 17 9803 180 9803 180 Total NA 200499 674 1922466 2640 253436 1368
Thous Thou. Thous Thou. Thous Thou. tonnes
tonnes
tonnes
Fbar age
range: 5-10
Year: 2021
F multiplier: 1.40
Fbar: 0.4724
Age F CatchNos Yield StockNos Biomass SSNos(Jan) SSB(Jan)
3 0.013 6847 5 635000 119 0 0 4 0.080 27975 33 405343 171 1216 1 5 0.196 56474 90 349224 332 10127 10 6 0.320 51345 119 206420 339 35298 58 7 0.418 57438 185 184187 460 90436 226 8 0.533 25503 115 67464 259 53162 204 9 0.583 14623 86 36188 202 33438 187
10 0.784 18022 129 36117 268 34817 258 11 0.903 7512 66 13730 133 13716 133 12 0.631 2073 24 4836 61 4817 61 13 0.329 580 7 2274 33 2274 33 14 0.179 244 3 1637 27 1637 27
15+ 0.179 1438 22 9650 177 9650 177 Total NA 270074 886 1952071 2579 290588 1373
Thous Thou. Thous Thou. Thous Thou. tonnes
tonnes
tonnes

ICES | AFWG 2020 | 151
Table 3.22. Northeast Arctic COD. Assessments results by means of TISVPA
Year B(3+) SSB R(3) F(5-10)
1984 809586 249869 409794 0.802
1985 985863 199092 579422 0.636
1986 1356910 181467 1014253 0.782
1987 1217033 134397 283132 1.015
1988 1001566 224335 214512 0.986
1989 912984 237449 180292 0.468
1990 995120 335331 210025 0.311
1991 1564633 723618 404885 0.227
1992 1958328 965373 684120 0.408
1993 2440273 853096 985953 0.617
1994 2213293 642260 719449 0.816
1995 1902837 576346 431787 0.747
1996 1833844 651925 389451 0.711
1997 1697306 713522 604263 1.036
1998 1276192 437677 786630 1.050
1999 1083050 285996 444026 0.964
2000 1055287 229214 553323 0.674
2001 1285059 349191 454658 0.535
2002 1416465 471533 407334 0.519
2003 1507070 530186 648718 0.512
2004 1471639 619783 273719 0.615
2005 1473972 577811 523508 0.622
2006 1506750 593781 538902 0.652
2007 1847705 618866 1328474 0.514
2008 2550027 623291 1295767 0.367
2009 3246987 965332 894311 0.353
2010 3564521 1163437 529199 0.390
2011 3653648 1627961 668755 0.337
2012 3710766 1853477 722864 0.300

152 | ICES SCIENTIFIC REPORTS 2:52 | ICES
2013 3949417 2074203 873627 0.304
2014 3692190 1972477 1116870 0.326
2015 3550303 1620049 478818 0.338
2016 3240280 1389724 342851 0.298
2017 3403634 1755441 747395 0.336
2018 3042954 1601519 531535 0.349
2019 2861021 1734618 525804 0.330

ICES | AFWG 2020 | 153
Table 3.23. NEA cod TISVPA estimates of abundance at age (thousands)
Year\age 3 4 5 6 7 8 9 10 11 12 13 14 151984 409794 138678 72723 41646 24416 12056 8962 1471 682 456 208 37 241985 579422 328609 98706 42232 18163 7028 3359 2492 475 392 178 116 291986 1014253 456717 229303 56569 20034 6799 2328 1322 1068 221 272 108 451987 283132 769747 309228 114267 23290 7140 2193 722 433 369 77 166 561988 214512 213031 518961 154289 36334 6215 2076 712 146 143 112 41 141989 180292 166556 150062 283948 59276 9110 1502 609 184 33 51 55 801990 210025 144038 120660 95127 156610 26002 3500 627 284 104 16 36 141991 404885 170392 110807 84961 60661 96485 14581 2030 358 177 69 10 191992 684120 327872 131974 78421 54093 35760 58870 8739 1271 239 127 52 61993 985953 542679 243750 87626 44340 28162 17244 30725 4451 712 128 92 41994 719449 762404 405521 146795 45227 20164 11581 6780 12507 1786 281 65 141995 431787 503895 533727 241039 65879 14565 6160 3325 1838 3858 557 142 31996 389451 253007 331569 320055 117609 25305 5208 1948 972 510 1398 288 31997 604263 229882 162924 193251 156936 49065 9268 2030 610 314 176 629 31998 786630 387245 145255 80384 77752 47367 12951 2133 474 112 60 58 1401999 444026 493752 235050 71068 30766 24142 10457 3685 504 140 25 22 842000 553323 335522 323752 110407 25391 10386 5842 2050 1136 157 53 4 522001 454658 426162 241723 170659 48270 9070 3659 1694 589 549 66 32 1012002 407334 354219 309805 147564 79877 20291 3303 1642 628 241 323 44 292003 648718 304212 261753 190058 70342 31491 7755 1302 849 318 112 223 52004 273719 503676 229669 164989 96292 30775 12784 3560 598 503 173 72 362005 523508 210290 370574 145024 82167 37194 11206 4520 1369 240 276 107 312006 538902 382766 153149 216601 72239 33384 12831 4155 1525 574 106 186 6392007 1328474 432596 267808 95113 106976 31201 12790 4107 1597 519 247 63 1702008 1295767 1023914 320070 160610 53577 52480 14703 6098 1786 769 202 159 802009 894311 994878 778881 222359 95892 30419 25842 7560 3259 866 422 132 1262010 529199 671086 764811 548660 138756 55885 16710 13330 4225 1819 206 281 2012011 668755 389528 505247 548104 352072 77301 28800 8870 6718 1643 855 74 02012 722864 432250 273267 370017 367912 209404 42480 14295 3926 3181 882 454 1562013 873627 492614 302788 200673 256042 230332 120989 23479 7401 1906 1708 525 8562014 1116870 579572 371043 221376 141455 158011 126447 61258 11741 3689 1006 1071 8012015 478818 751018 408425 261819 148703 88809 83594 64286 29673 5968 1893 599 11362016 342851 328535 544043 279643 166023 90849 51704 44628 30875 12234 2744 1150 14222017 747395 273157 240384 360585 180441 101105 53599 29839 21392 13940 5904 1601 11432018 531535 475311 205559 165900 229142 105181 55188 30073 15975 9070 6351 3329 10742019 525804 393981 355914 141366 99065 133439 58912 29865 16370 8018 4423 3487 19902020 0 371279 294473 245778 88619 56980 73156 32446 16395 9227 4653 2972 2343

154 | ICES SCIENTIFIC REPORTS 2:52 | ICES
Table 3.24. NEA cod TISVPA estimates of fishing mortality coefficients
F(a,y) 3 4 5 6 7 8 9 10 11 12 13 14 15 F(5-10)1984 0.023 0.138 0.326 0.562 1.008 0.973 0.998 0.948 0.276 0.882 0.448 0.448 0.448 0.8021985 0.020 0.124 0.315 0.454 0.621 0.911 0.739 0.774 0.675 0.212 0.365 0.365 0.365 0.6361986 0.021 0.151 0.399 0.644 0.747 0.876 1.117 0.910 0.865 0.736 0.427 0.427 0.427 0.7821987 0.026 0.156 0.497 0.856 1.145 1.081 1.060 1.450 1.017 0.946 0.499 0.499 0.499 1.0151988 0.024 0.164 0.428 0.889 1.236 1.331 1.011 1.020 1.215 0.868 0.481 0.481 0.481 0.9861989 0.014 0.089 0.245 0.374 0.567 0.610 0.549 0.463 0.431 0.480 0.250 0.250 0.250 0.4681990 0.008 0.059 0.158 0.264 0.320 0.404 0.375 0.348 0.277 0.256 0.166 0.166 0.166 0.3111991 0.006 0.038 0.113 0.187 0.251 0.260 0.285 0.270 0.235 0.187 0.122 0.122 0.122 0.2271992 0.009 0.067 0.167 0.318 0.442 0.522 0.469 0.531 0.462 0.390 0.211 0.211 0.211 0.4081993 0.015 0.085 0.252 0.405 0.659 0.808 0.828 0.747 0.786 0.660 0.309 0.309 0.309 0.6171994 0.017 0.115 0.281 0.546 0.725 1.061 1.107 1.174 0.933 0.969 0.391 0.391 0.391 0.8161995 0.016 0.111 0.310 0.469 0.750 0.835 1.022 1.097 1.037 0.822 0.386 0.386 0.386 0.7471996 0.021 0.106 0.303 0.537 0.651 0.893 0.832 1.047 1.006 0.936 0.389 0.389 0.389 0.7111997 0.027 0.180 0.388 0.744 1.153 1.169 1.421 1.338 1.589 1.466 0.541 0.541 0.541 1.0361998 0.030 0.182 0.521 0.686 1.092 1.420 1.144 1.435 1.190 1.356 0.540 0.540 0.540 1.0501999 0.025 0.192 0.493 0.902 0.907 1.197 1.240 1.047 1.143 0.955 0.502 0.502 0.502 0.9642000 0.021 0.121 0.395 0.605 0.842 0.692 0.737 0.775 0.621 0.654 0.353 0.353 0.353 0.6742001 0.015 0.107 0.261 0.528 0.631 0.720 0.514 0.556 0.535 0.433 0.276 0.276 0.276 0.5352002 0.013 0.087 0.267 0.403 0.664 0.662 0.642 0.473 0.471 0.448 0.255 0.255 0.255 0.5192003 0.013 0.079 0.219 0.421 0.509 0.714 0.606 0.601 0.412 0.404 0.240 0.240 0.240 0.5122004 0.015 0.099 0.244 0.429 0.694 0.710 0.868 0.744 0.674 0.450 0.281 0.281 0.281 0.6152005 0.015 0.094 0.271 0.415 0.597 0.832 0.716 0.900 0.701 0.626 0.286 0.286 0.286 0.6222006 0.016 0.106 0.275 0.503 0.626 0.773 0.924 0.810 0.928 0.709 0.312 0.312 0.312 0.6522007 0.013 0.086 0.238 0.380 0.557 0.578 0.604 0.726 0.591 0.655 0.259 0.259 0.259 0.5142008 0.009 0.065 0.175 0.301 0.383 0.471 0.423 0.449 0.489 0.401 0.199 0.199 0.199 0.3672009 0.008 0.055 0.165 0.278 0.387 0.422 0.450 0.413 0.405 0.434 0.193 0.193 0.193 0.3532010 0.007 0.056 0.158 0.298 0.411 0.496 0.468 0.511 0.431 0.417 0.214 0.214 0.214 0.3902011 0.006 0.040 0.132 0.235 0.360 0.425 0.443 0.428 0.430 0.361 0.196 0.196 0.000 0.3372012 0.006 0.037 0.098 0.202 0.293 0.387 0.397 0.422 0.377 0.375 0.187 0.187 0.187 0.3002013 0.007 0.045 0.104 0.173 0.295 0.372 0.431 0.451 0.443 0.390 0.207 0.207 0.207 0.3042014 0.008 0.048 0.134 0.195 0.265 0.397 0.439 0.523 0.506 0.490 0.244 0.244 0.244 0.3262015 0.010 0.058 0.143 0.250 0.296 0.349 0.463 0.525 0.578 0.550 0.284 0.284 0.284 0.3382016 0.010 0.064 0.144 0.223 0.317 0.322 0.333 0.448 0.468 0.507 0.274 0.274 0.274 0.2982017 0.014 0.071 0.195 0.273 0.345 0.427 0.377 0.397 0.499 0.515 0.322 0.322 0.322 0.3362018 0.016 0.093 0.188 0.325 0.367 0.398 0.428 0.386 0.377 0.465 0.327 0.327 0.327 0.3492019 0.010 0.063 0.164 0.267 0.353 0.401 0.396 0.400 0.373 0.344 0.198 0.198 0.198 0.330

ICES | AFWG 2020 | 155
Table 3.25. North East arctic cod. Stock numbers-at-age (in thousands) estimated by VPA including discard estimates, and % increase in stock numbers relative to a VPA without discards. From Dingsør (2001). The discard numbers applied cor-respond to method II (1946–1982) and IIIb (1983–1998) mentioned in Dingsør (2001).
Estimated stock numbers (thousands) Percent increase Year Age 3 Age 4 Age 5 Age 3 Age 4 Age 5 1946 875 346 602 579 407 163 20 % 4 % 1 % 1947 531 993 676 806 465 099 27 % 14 % 0 % 1948 570 356 392 309 497 476 29 % 14 % 5 % 1949 589 367 416 668 285 459 26 % 16 % 3 % 1950 799 732 414 016 291 200 13 % 9 % 1 % 1951 1 235 322 586 054 302 346 14 % 2 % 0 % 1952 1 388 731 889 509 401 768 17 % 3 % 0 % 1953 1 801 114 975 004 600 908 13 % 2 % 0 % 1954 830 653 1 321 053 684 303 29 % 5 % 0 % 1955 381 489 615 696 907 875 40 % 19 % 2 % 1956 567 555 274 235 399 344 29 % 25 % 3 % 1957 914 850 387 496 161 710 14 % 10 % 2 % 1958 552 600 672 221 262 135 11 % 4 % 2 % 1959 757 567 391 906 406 694 11 % 3 % 0 % 1960 855 470 534 350 240 047 8 % 1 % 0 % 1961 1 041 570 620 707 347 043 13 % 1 % 0 % 1962 894 728 739 196 382 556 23 % 4 % 0 % 1963 551 938 614 025 429 068 17 % 10 % 0 % 1964 389 151 396 165 361 790 15 % 5 % 0 % 1965 845 469 293 844 266 134 9 % 8 % 0 % 1966 1 618 188 647 435 203 168 2 % 4 % 2 % 1967 1 404 569 1 249 506 465 035 9 % 0 % 1 % 1968 210 875 1 088 071 876 095 24 % 6 % 0 % 1969 143 791 155 947 699 033 28 % 15 % 2 % 1970 222 635 104 415 92 541 13 % 17 % 4 % 1971 462 474 164 397 65 112 14 % 6 % 2 % 1972 1 221 559 358 357 115 892 20 % 10 % 1 % 1973 1 858 123 947 409 249 400 2 % 19 % 11 % 1974 598 555 1 246 499 583 612 14 % 2 % 9 % 1975 654 442 382 692 627 793 5 % 10 % 3 % 1976 622 230 477 390 233 608 1 % 2 % 1 % 1977 397 826 426 386 280 645 14 % 0 % 0 % 1978 653 256 277 410 198 204 2 % 11 % 0 % 1979 225 935 460 104 164 243 14 % 2 % 1 % 1980 152 937 171 954 300 312 11 % 11 % 0 % 1981 161 752 116 964 116 337 7 % 7 % 4 % 1982 151 642 125 307 81 780 0 % 4 % 1 % 1983 166 310 115 423 82 423 0 % -1 % 3 % 1984 408 525 133 333 77 728 3 % 0 % 0 % 1985 543 828 324 072 96 327 4 % 2 % 0 % 1986 1 114 252 412 683 219 993 7 % 2 % 0 % 1987 307 425 767 656 268 642 7 % 4 % 0 % 1988 222 819 215 720 490 161 9 % 3 % 2 % 1989 180 066 166 955 151 576 4 % 6 % 0 % 1990 249 968 139 922 114 006 3 % 2 % 1 % 1991 418 955 200 700 105 559 2 % 2 % 0 % 1992 748 962 333 517 151 973 4 % 1 % 0 % 1993 1 002 933 576 112 238 980 10 % 2 % 0 % 1994 896 184 744 062 420 039 9 % 8 % 0 % 1995 733 664 584 808 476 048 10 % 6 % 3 % 1996 467 093 341 918 344 124 3 % 7 % 3 % 1997 765 234 238 202 193 102 3 % 0 % 4 % 1998 836 301 429 147 144 629 2 % 1 % -1 %

156 | ICES SCIENTIFIC REPORTS 2:52 | ICES
Table 3.26. Northeast Arctic cod. Number (thousands) of cod by age groups taken as by-catch in the Norwegian shrimp fishery (1984–2006)
Age\Year 1984 1985 1986 1987 1988 1989 1990 1991
0 322 4537 28 1408 259 717 2971 11651 1 4913 19437 2339 3259 1719 668 13731 34450 2 1624 49334 6952 1961 1534 418 1518 2759 3 1073 2720 5245 499 1380 694 1019 87 4 2200 1891 716 2210 1882 2096 403 64 5 161 9306 737 1715 1124 2281 909 33 6 89 6374 520 411 269 1135 2913 293 7 144 266 92 79 186 184 1434 1138 8 38 1 93 28 178 13 185 316 9 1 2 165 6 1 0 3 29 10 0 3 88 1 0 0 9 0 11 0 0 0 0 0 0 0 0
Total('000) 10564 93872 16976 11576 8532 8206 25095 50819
Age\Year 1992 1993 1994 1995 1996 1997 1998 1999
0 6486 604 1042 1138 519 896 506 651
1 5236 6702 1628 1896 9084 17157 40314 7155
2 2922 4032 410 99 359 1805 5248 245
3 242 0 0 0 0 0 0 0
4 0 0 0 0 0 0 0 0 5 0 0 0 0 0 0 0 0
6 0 0 0 0 0 0 0 0
7 0 0 0 0 0 0 0 0
8 0 0 0 0 0 0 0 0
9 0 0 0 0 0 0 0 0
10 0 0 0 0 0 0 0 0
11 0 0 0 0 0 0 0 0
Total('000) 14886 11339 3080 3133 9962 19858 46068 8052
Age\Year 2000 2001 2002 2003 2004 2005 2006
0 66 1188 478 4253 713 945 1355 1 1572 7187 293 8805 1014 3411 2597
2 3152 1348 893 96 323 1628 218
3 218 0 190 0 0 0 0
4 0 0 0 0 0 0 0
5 0 0 0 0 0 0 0
6 0 0 0 0 0 0 0
7 0 0 0 0 0 0 0
8 0 0 0 0 0 0 0
9 0 0 0 0 0 0 0
10 0 0 0 0 0 0 0
11 0 0 0 0 0 0 0
Total('000) 5007 9723 1854 13154 2051 5984 4170

ICES | AFWG 2020 | 157
Figure 3.1. ICES Standard plots for Northeast Arctic cod (subareas 1 and 2)

158 | ICES SCIENTIFIC REPORTS 2:52 | ICES
Figure 3.1 (continued). ICES Standard plots for Northeast Arctic cod (subareas 1 and 2)

ICES | AFWG 2020 | 159
Figure 3.2a. Standardized one-observation-ahead residuals for log-catches and log-indices (Thygesen et al. 2017) in the final SAM run

160 | ICES SCIENTIFIC REPORTS 2:52 | ICES
Figure 3.2b. NEA cod SSB, R and Fbar retrospective pattern for final SAM run.

ICES | AFWG 2020 | 161
Figure 3.2с. NEA cod. Catchability of different fleets used for final SAM run fit.

162 | ICES SCIENTIFIC REPORTS 2:52 | ICES
Figure 3.3. Northeast Arctic cod. Weight in catch predictions.
0
0.2
0.4
0.6
0.8
1
1.2
1984
1986
1988
1990
1992
1994
1996
1998
2000
2002
2004
2006
2008
2010
2012
2014
2016
2018
2020
WECA
pred 2
Obs 2
0
0.2
0.4
0.6
0.8
1
1.2
1.4
1.6
1984
1986
1988
1990
1992
1994
1996
1998
2000
2002
2004
2006
2008
2010
2012
2014
2016
2018
2020
WECA
pred 3
Obs 3
0
0.5
1
1.5
2
2.5
1984
1986
1988
1990
1992
1994
1996
1998
2000
2002
2004
2006
2008
2010
2012
2014
2016
2018
2020
WECA
pred 4
Obs 4
0
0.5
1
1.5
2
2.5
3
1984
1986
1988
1990
1992
1994
1996
1998
2000
2002
2004
2006
2008
2010
2012
2014
2016
2018
2020
2022
WECA
pred 5
Obs 5
0
0.5
1
1.5
2
2.5
3
3.5
1984
1986
1988
1990
1992
1994
1996
1998
2000
2002
2004
2006
2008
2010
2012
2014
2016
2018
2020
2022
WECA
pred 6
Obs 6
0
0.5
1
1.5
2
2.5
3
3.5
4
4.5
5
1984
1986
1988
1990
1992
1994
1996
1998
2000
2002
2004
2006
2008
2010
2012
2014
2016
2018
2020
2022
WECA
pred 7
Obs 7
0
1
2
3
4
5
6
7
8
9
10
1984
1986
1988
1990
1992
1994
1996
1998
2000
2002
2004
2006
2008
2010
2012
2014
2016
2018
2020
2022
WECA
pred 9
Obs 9
0
2
4
6
8
10
12
1984
1986
1988
1990
1992
1994
1996
1998
2000
2002
2004
2006
2008
2010
2012
2014
2016
2018
2020
2022
WECA
pred 10
Obs 10
0
2
4
6
8
10
12
14
1984
1986
1988
1990
1992
1994
1996
1998
2000
2002
2004
2006
2008
2010
2012
2014
2016
2018
2020
2022
WECA
pred 11
Obs 11
0
2
4
6
8
10
12
14
16
18
1984
1986
1988
1990
1992
1994
1996
1998
2000
2002
2004
2006
2008
2010
2012
2014
2016
2018
2020
2022
WECA
pred 12
Obs 12
0
2
4
6
8
10
12
14
16
18
20
1984
1986
1988
1990
1992
1994
1996
1998
2000
2002
2004
2006
2008
2010
2012
2014
2016
2018
2020
2022
WECA
pred 13+
Obs 13+
0
1
2
3
4
5
6
7
1984
1986
1988
1990
1992
1994
1996
1998
2000
2002
2004
2006
2008
2010
2012
2014
2016
2018
2020
2022
WECA
pred 8
Obs 8

ICES | AFWG 2020 | 163
Figure 3.4. Northeast Arctic cod. Weight in stock projections.
0
0.05
0.1
0.15
0.2
0.25
1984
1986
1988
1990
1992
1994
1996
1998
2000
2002
2004
2006
2008
2010
2012
2014
2016
2018
2020
2022
WEST
Pred 2
0bs 2
�
0
0.1
0.2
0.3
0.4
0.5
0.6
1984
1986
1988
1990
1992
1994
1996
1998
2000
2002
2004
2006
2008
2010
2012
2014
2016
2018
2020
WEST
Pred 3
0bs 3
�
0
0.2
0.4
0.6
0.8
1
1.2
1.4
1984
1986
1988
1990
1992
1994
1996
1998
2000
2002
2004
2006
2008
2010
2012
2014
2016
2018
2020
WEST
Pred 4
0bs 4
�
0
0.2
0.4
0.6
0.8
1
1.2
1.4
1.6
1.8
2
1984
1986
1988
1990
1992
1994
1996
1998
2000
2002
2004
2006
2008
2010
2012
2014
2016
2018
2020
2022
WEST
Pred 5
0bs 5
�
0
2
4
6
8
10
12
14
16
18
2019
84
1986
1988
1990
1992
1994
1996
1998
2000
2002
2004
2006
2008
2010
2012
2014
2016
2018
2020
2022
WEST
Pred 13+
0bs 13+
fixedW
�
0
0.5
1
1.5
2
2.5
3
1984
1986
1988
1990
1992
1994
1996
1998
2000
2002
2004
2006
2008
2010
2012
2014
2016
2018
2020
2022
WEST
Pred 6
0bs 6
�
0
1
2
3
4
5
6
7
1984
1986
1988
1990
1992
1994
1996
1998
2000
2002
2004
2006
2008
2010
2012
2014
2016
2018
2020
2022
WEST
Pred 8
0bs 8
�
0
1
2
3
4
5
6
7
8
9
10
1984
1986
1988
1990
1992
1994
1996
1998
2000
2002
2004
2006
2008
2010
2012
2014
2016
2018
2020
2022
WEST
Pred 9
0bs 9
�
0
0.5
1
1.5
2
2.5
3
3.5
4
4.5
1984
1986
1988
1990
1992
1994
1996
1998
2000
2002
2004
2006
2008
2010
2012
2014
2016
2018
2020
2022
WEST
Pred 7
0bs 7
��
0
5
10
15
20
25
30
35
1984
1986
1988
1990
1992
1994
1996
1998
2000
2002
2004
2006
2008
2010
2012
2014
2016
2018
2020
WEST
Pred 12
0bs 12
fixedW
�
0
2
4
6
8
10
12
14
16
18
1984
1986
1988
1990
1992
1994
1996
1998
2000
2002
2004
2006
2008
2010
2012
2014
2016
2018
2020
WEST
Pred 11
0bs 11
�
0
2
4
6
8
10
12
14
1984
1986
1988
1990
1992
1994
1996
1998
2000
2002
2004
2006
2008
2010
2012
2014
2016
2018
2020
2022
WEST
Pred 10
0bs 10
�

164 | ICES SCIENTIFIC REPORTS 2:52 | ICES
Figure 3.5. NEA cod cannibalism mortality vs. capelin abundance.

ICES | AFWG 2020 | 165
Figure 3.6a. Northeast Arctic cod. Fishing mortality (F5-10) (top panel) and trawl efforts in 1985–2019 (bottom panel).
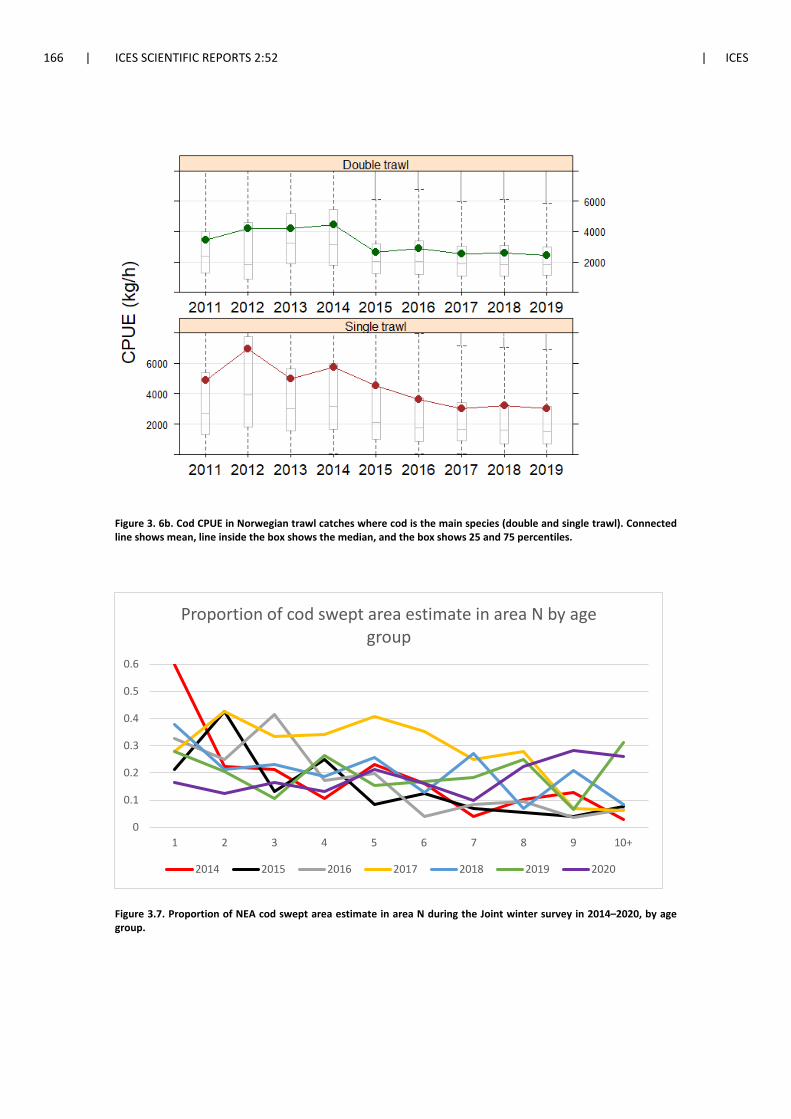
166 | ICES SCIENTIFIC REPORTS 2:52 | ICES
Figure 3. 6b. Cod CPUE in Norwegian trawl catches where cod is the main species (double and single trawl). Connected line shows mean, line inside the box shows the median, and the box shows 25 and 75 percentiles.
Figure 3.7. Proportion of NEA cod swept area estimate in area N during the Joint winter survey in 2014–2020, by age group.
0
0.1
0.2
0.3
0.4
0.5
0.6
1 2 3 4 5 6 7 8 9 10+
Proportion of cod swept area estimate in area N by age group
2014 2015 2016 2017 2018 2019 2020

ICES | AFWG 2020 | 167
Figure 3.8a. Residuals of the TISVPA data approximation (yellow circles are positive residuals, white – negative, maximum bubble size corresponds to residual = 2.4).
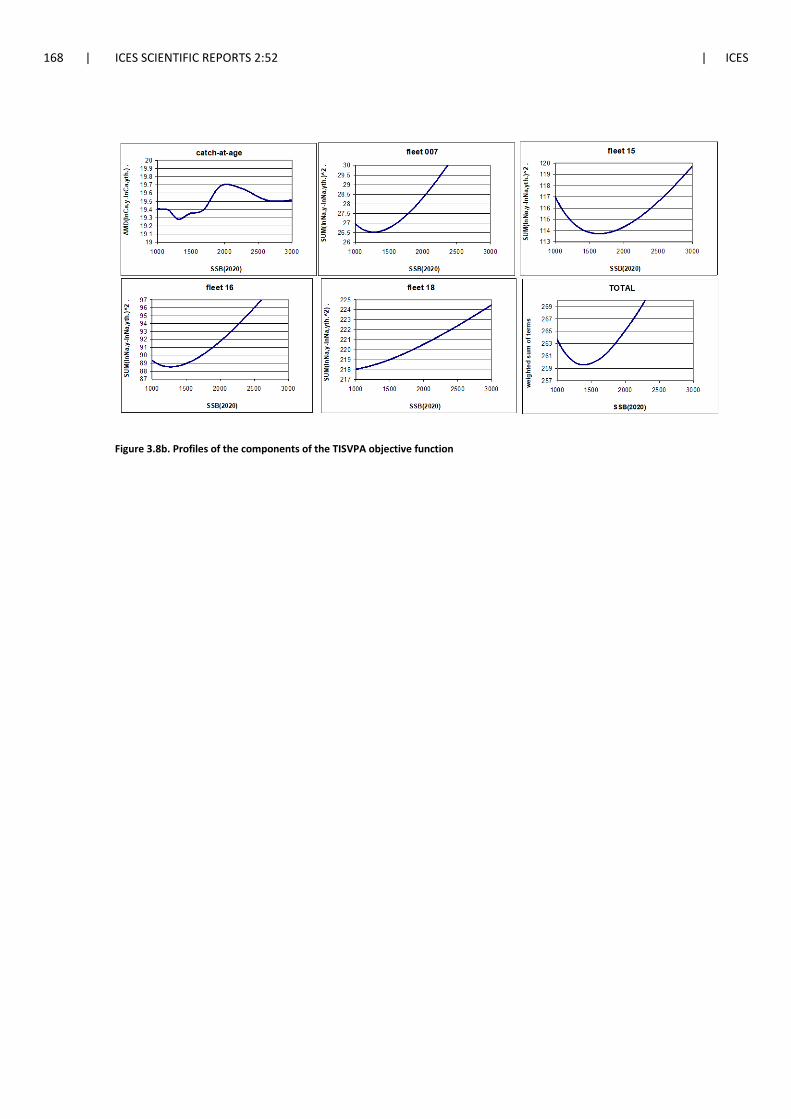
168 | ICES SCIENTIFIC REPORTS 2:52 | ICES
Figure 3.8b. Profiles of the components of the TISVPA objective function
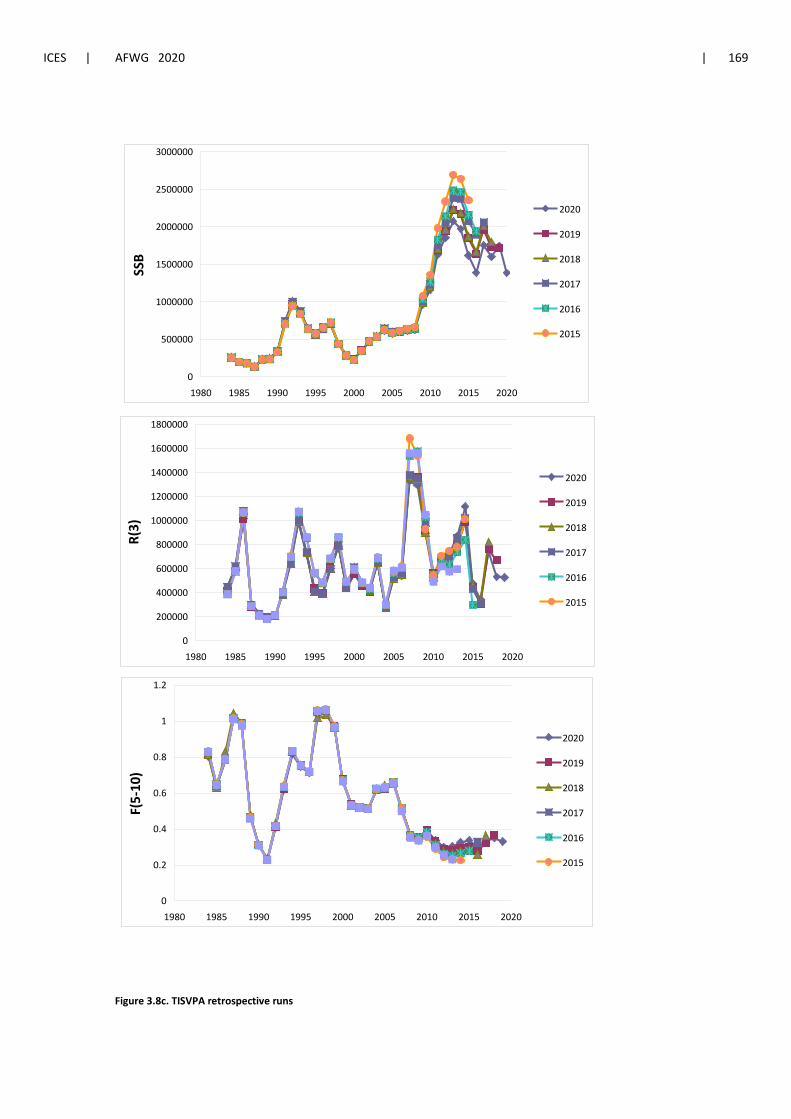
ICES | AFWG 2020 | 169
0
500000
1000000
1500000
2000000
2500000
3000000
1980 1985 1990 1995 2000 2005 2010 2015 2020
SSB
2020
2019
2018
2017
2016
2015
0
200000
400000
600000
800000
1000000
1200000
1400000
1600000
1800000
1980 1985 1990 1995 2000 2005 2010 2015 2020
R(3)
2020
2019
2018
2017
2016
2015
0
0.2
0.4
0.6
0.8
1
1.2
1980 1985 1990 1995 2000 2005 2010 2015 2020
F(5-
10)
2020
2019
2018
2017
2016
2015
Figure 3.8c. TISVPA retrospective runs

170 | ICES SCIENTIFIC REPORTS 2:52 | ICES
Figure 3.9a. Model comparison. F, SSB, TSB and recruitment in SAM, XSA and TISVPA.
00.5
11.5
22.5
33.5
44.5
5
1946
1949
1952
1955
1958
1961
1964
1967
1970
1973
1976
1979
1982
1985
1988
1991
1994
1997
2000
2003
2006
2009
2012
2015
2018
Biom
ass,
10-
6 t
TSB
XSA 2019 SPALY SAM Final SAM TISVPA
0
0.5
1
1.5
2
2.5
3
1946
1949
1952
1955
1958
1961
1964
1967
1970
1973
1976
1979
1982
1985
1988
1991
1994
1997
2000
2003
2006
2009
2012
2015
2018
2021
Biom
ass,
10e
-6 t
SSB
XSA Final SAM 2019 SPALY SAM TISVPA
0
0.5
1
1.5
2
2.5
3
1946
1949
1952
1955
1958
1961
1964
1967
1970
1973
1976
1979
1982
1985
1988
1991
1994
1997
2000
2003
2006
2009
2012
2015
2018
R, 1
0e-9
R
XSA 2019 SPALY SAM Final SAM TISVPA
0
0.2
0.4
0.6
0.8
1
1.2
1946
1949
1952
1955
1958
1961
1964
1967
1970
1973
1976
1979
1982
1985
1988
1991
1994
1997
2000
2003
2006
2009
2012
2015
2018
Fbar 5-10
XSA 2019 SPALY SAM Final SAM TISVPA

ICES | AFWG 2020 | 171
Figure 3.9b. NEA cod biomass dynamic assessed (2013–2018) and predicted (2019–2020) by SAM using two alternative settings from AFWG-2019 and SAM from AFWG-2020.
11.21.41.61.8
22.22.42.62.8
3
2013 2014 2015 2016 2017 2018 2019 2020
Biom
ass,
10e
-6 t
SSB
2019 new par SAM SAM-2020 2019 SPALY SAM
2
2.5
3
3.5
4
4.5
5
2013
2014
2015
2016
2017
2018
2019
2020
Biom
ass,
10-
6 t
TSB
2019 new par SAM 2019 SPALY SAM SAM-2020

172 | ICES SCIENTIFIC REPORTS 2:52 | ICES
Table A1 North-East Arctic COD. Catch per unit effort.
Sub-area |I Division IIb Division IIa Total
Year Norway2 UK3 Russia4 Norway2 UK3 Russia4 Norway2 UK3 Norway
1966 - 0.074 0.42 - 0.078 0.19 - 0.067 1967 - 0.081 0.53 - 0.106 0.87 - 0.052 1968 - 0.110 1.09 - 0.173 1.21 - 0.056 1969 - 0.113 1.00 - 0.135 1.17 - 0.094 1970 - 0.100 0.80 - 0.100 0.80 - 0.066 1971 - 0.056 0.43 - 0.071 0.16 - 0.062 1972 0.90 0.047 0.34 0.59 0.051 0.18 1.08 0.055 1973 1.05 0.057 0.56 0.43 0.054 0.57 0.71 0.043 1974 1.75 0.079 0.86 1.94 0.106 0.77 0.19 0.028 1975 1.82 0.077 0.94 1.67 0.100 0.43 1.36 0.033 1976 1.69 0.060 0.84 1.20 0.081 0.30 1.69 0.035 1977 1.54 0.052 0.63 0.91 0.056 0.25 1.16 0.044 1.17 1978 1.37 0.062 0.52 0.56 0.044 0.08 1.12 0.037 0.94 1979 0.85 0.046 0.43 0.62 - 0.06 1.06 0.042 0.85 1980 1.47 - 0.49 0.41 - 0.16 1.27 - 1.23 Spain5 Russia4 1981 1.42 - 0.41 (0.96) - 0.07 1.02 0.35 1.21 1982 1.30 - 0.35 - 0.86 0.26 1.01 0.34 1.09 1983 1.58 - 0.31 (1.31) 0.92 0.36 1.05 0.38 1.11 1984 1.40 - 0.45 1.20 0.78 0.35 0.73 0.27 0.96 1985 1.86 - 1.04 1.51 1.37 0.50 0.90 0.39 1.29 1986 1.97 - 1.00 2.39 1.73 0.84 1.36 1.14 1.70 1987 1.77 - 0.97 2.00 1.82 1.05 1.73 0.67 1.77 1988 1.58 - 0.66 1.61 (1.36) 0.54 0.97 0.55 1.03 1989 1.49 - 0.71 0.41 2.70 0.45 0.78 0.43 0.76 1990 1.35 - 0.70 0.39 2.69 0.80 0.38 0.60 0.49 1991 1.38 - 0.67 0.29 4.96 0.76 0.50 0.90 0.44 1992 2.19 - 0.79 3.06 2.47 0.23 0.98 0.65 1.29 1993 2.33 - 0.85 2.98 3.38 1.00 1.74 1.03 1.87 1994 2.50 - 1.01 2.82 1.44 1.14 1.27 0.86 1.59 1995 1.57 - 0.59 2.73 1.65 1.10 1.00 1.01 1.92 1996 0.74 1.11 0.85 0.99 1.81 1997 0.61 0.57 0.74 1.36 1998 0.37 0.29 0.40 0.83 1999 0.29 0.34 0.39 0.74 2000 0.34 0.37 0.53 0.92 2001 0.46 0.46 0.69 1.21 2002 0.58 0.66 0.57 1.35 2003 0.70 1.22 0.73 1.67 2004 0.48 0.78 0.84 1.67 2005 0.45 0.62 0.81 1.23 2006 0.49 0.54 0.84 0.88 2007 0.71 0.51 0.88 1.16 2008 0.93 0.79 1.21 2009 1.33 1.16 0.83 2010 1.47 1.18 1.16 2011 1.77 1.69 2.46 4.876 2012 2.25 1.44 2.11 6.976 2013 2.30 1.46 2.60 4.966 2014 2.07 1.54 2.38 5.756

ICES | AFWG 2020 | 173
2015 1.06 1.38 1.93 4.546 2016 1.15 1.06 1.39 3.646 2017 1.00 1.00 1.05 3.016 2018 1.06 1.40 1.31 3.206 20191 1.01 0.89 1.16 3.026
1Preliminary figures. 2Norwegian data - t per 1,000 tonnage*hrs fishing. 3United Kingdom data - t per 100 tonnage*hrs fishing. 4Russian data - t per hr fishing. 5Spanish data - t per hr fishing. 6 2011-2019 Norwegian data on t per hr fishing are from single-trawl only, not comparable to data from previous years
Period Sub-area I Divisions IIa and IIb 1960–1973 RT RT 1974–1980 PST RT 1981– PST PST
Vessel type: RT = side trawlers, 800–1000 HP, PST = stern trawlers, up to 2000 HP.

174 | ICES SCIENTIFIC REPORTS 2:52 | ICES
Table A2. Northeast Arctic COD. Abundance indices (millions) from the Norwegian acoustic survey in the Barents Sea in January-March. New TS and rock-hopper gear (1981–1988 back-calculated from bobbins gear). Corrected for length-de-pendent effective spread of trawl. Data from 1994 onwards from Mehl et al. 2018a.
Year Age1 2 3 4 5 6 7 8 9 10 11 12 13 14 15+ 10+ Total
1981 8.00 82.00 40.00 63.00 106.00 103.00 16.00 3.00 1.00 1.00 423.01982 4.00 5.00 49.00 43.00 40.00 26.00 28.00 2.00 + 0.00 197.01983 60.49 2.78 5.34 14.27 17.37 11.13 5.58 2.98 0.45 0.06 120.51984 745.44 146.11 39.13 13.59 11.26 7.44 2.81 0.19 0.02 0.00 966.01985 69.06 446.29 153.04 141.59 19.66 7.58 3.32 0.22 0.09 0.04 840.91986 353.63 243.90 499.61 134.27 65.90 8.28 2.15 0.37 0.06 0.02 1308.21987 1.62 34.07 62.80 204.93 41.41 10.40 1.22 0.19 0.66 0.00 357.31988 1.98 26.25 50.42 35.53 56.20 6.48 1.35 0.15 0.01 0.00 178.41989 7.53 7.98 17.00 34.39 21.38 53.82 6.88 0.97 0.10 0.05 150.11990 81.13 24.92 14.82 20.63 26.08 24.30 39.78 2.37 0.06 0.03 234.11991 181.04 219.51 50.23 34.64 29.33 28.87 16.89 17.33 0.86 0.03 578.71992 241.38 562.13 176.48 65.79 18.84 13.23 7.58 4.50 2.78 0.21 1092.91993 1074.04 494.68 357.24 191.05 108.24 20.84 8.12 4.98 2.25 2.51 2264.01994 823.50 586.90 307.20 384.40 207.00 68.00 12.10 3.53 2.55 0.81 1.11 0.11 0.12 0.00 0.00 2.15 2397.41995 2106.60 217.90 143.00 138.00 198.30 67.00 16.10 2.46 0.90 0.32 0.53 0.16 0.00 0.00 0.00 1.01 2891.21996 1748.90 261.10 110.00 89.50 115.00 83.30 23.00 2.20 0.27 0.08 0.05 0.05 0.06 0.01 0.00 0.25 2433.41997 1 2832.90 842.90 209.20 49.20 51.50 43.10 24.90 5.73 1.00 0.23 0.22 0.00 0.00 0.03 0.00 0.48 4060.91998 1 2633.10 555.80 444.50 210.80 46.60 44.40 28.60 16.90 1.85 0.46 0.16 0.00 0.02 0.00 0.07 0.71 3983.21999 351.10 227.00 151.60 133.30 51.80 12.00 7.02 3.98 1.54 0.32 0.02 0.01 0.01 0.00 0.00 0.36 939.62000 142.40 248.10 301.10 168.80 147.10 49.00 12.10 4.48 2.85 0.80 0.18 0.12 0.03 0.00 0.00 1.13 1077.02001 348.30 50.80 179.00 162.30 81.10 44.00 11.30 1.73 0.47 0.18 0.10 0.00 0.00 0.00 0.01 0.29 879.42002 18.40 208.80 62.40 105.50 98.00 53.40 20.20 2.96 0.30 0.53 0.12 0.00 0.00 0.00 0.02 0.67 570.62003 1399.70 52.00 307.00 120.60 121.80 118.70 39.10 9.32 1.84 0.33 0.07 0.00 0.07 0.05 0.00 0.52 2170.52004 147.10 111.20 33.30 85.20 33.50 28.50 18.00 5.35 1.15 0.36 0.06 0.01 + 0.00 0.00 0.43 463.82005 438.20 123.20 129.80 34.90 69.10 21.20 15.00 4.95 0.95 0.27 0.04 0.06 0.05 0.03 0.00 0.45 837.72006 2 369.50 158.30 64.40 54.50 18.60 29.70 9.57 4.83 1.22 0.19 0.11 0.22 0.00 0.00 0.00 0.52 711.22007 1 88.90 53.70 63.90 35.70 32.70 9.68 18.80 6.57 2.74 0.51 0.24 0.09 0.04 0.00 0.00 0.88 313.62008 48.50 91.90 196.10 292.00 116.00 73.70 21.10 14.10 2.62 0.72 0.05 0.02 0.01 0.00 0.00 0.80 856.82009 195.50 23.20 104.60 191.60 139.70 40.90 14.10 4.70 4.38 0.48 0.13 0.02 0.01 0.00 0.00 0.64 719.42010 696.10 41.80 21.80 86.90 161.80 153.80 46.20 14.40 3.87 2.86 0.91 0.11 0.14 0.09 0.01 4.12 1230.92011 248.50 88.70 39.10 28.70 65.40 106.60 102.40 19.40 6.71 1.49 1.07 0.28 0.13 0.10 0.02 3.09 708.52012 2 508.10 45.30 87.80 47.60 35.10 70.90 135.80 60.30 8.19 5.19 1.26 0.66 0.45 0.01 0.10 7.67 1006.72013 293.30 82.40 59.10 85.40 70.60 50.20 100.00 129.90 57.00 5.37 3.98 1.63 0.70 0.21 0.05 11.94 939.82014 582.20 154.20 234.00 115.90 96.00 68.40 37.70 84.70 55.30 24.10 2.46 1.51 0.17 0.04 0.16 28.44 1456.82015 1183.00 107.60 110.20 188.00 119.50 130.20 84.90 33.80 51.70 23.00 6.27 0.57 0.14 0.04 0.01 30.03 2038.92016 106.20 111.50 35.20 61.60 101.20 64.50 49.20 23.10 11.90 16.30 7.37 2.25 0.69 0.25 0.09 26.95 591.42017 2 381.50 42.80 80.60 33.00 37.60 58.00 33.00 22.30 10.30 3.81 3.00 3.15 0.59 0.20 0.10 10.85 710.02018 1492.00 221.20 93.30 134.00 46.70 51.90 56.10 35.10 10.00 6.65 1.38 2.14 1.55 0.14 0.25 12.11 2152.42019 1000.30 287.40 182.10 97.70 124.30 53.40 33.70 31.60 8.70 2.83 0.38 0.33 0.20 0.23 0.16 4.13 1823.32020 2 77.80 148.90 97.15 103.90 68.92 81.45 41.35 25.14 17.45 6.44 1.60 0.56 0.64 0.50 0.51 10.25 1372.0
1 Survey covered a larger area2 Adjusted indices

ICES | AFWG 2020 | 175
Table A3. Northeast Arctic COD. Abundance indices (millions) from the Norwegian bottom trawl survey in the Barents Sea in January-March. Rock-hopper gear (1981–1988 back-calculated from bobbins gear). Corrected for length-depend-ent effective spread of trawl. Data from 1994 and onwards from Mehl et al. 2017b..
AgeYear 1 2 3 4 5 6 7 8 9 10 11 12 13 14 15+ 10+ Total
1981 4.60 34.30 16.40 23.30 40.00 38.40 4.80 1.00 0.30 0.00 163.11982 0.80 2.90 28.30 27.70 23.60 15.50 16.00 1.40 0.20 0.00 116.41983 152.90 13.40 24.95 52.34 43.33 16.96 5.82 3.21 0.97 0.05 313.91984 2755.04 379.11 97.49 28.28 21.44 11.74 4.07 0.40 0.08 0.08 3297.71985 49.49 660.04 166.79 125.98 19.92 7.67 3.34 0.21 0.07 0.05 1033.61986 665.79 399.61 805.00 143.93 64.14 8.30 1.91 0.34 0.04 0.03 2089.11987 30.72 444.98 240.38 391.15 54.35 15.70 2.00 0.45 0.03 0.00 1179.81988 3.21 72.83 148.03 80.49 173.31 20.48 3.58 0.53 0.03 0.00 502.51989 8.24 15.62 46.36 75.86 37.79 90.19 9.82 0.94 0.10 0.07 285.01990 207.17 56.72 28.35 34.87 34.59 20.56 27.23 1.61 0.38 0.03 411.51991 460.45 220.14 45.85 33.67 25.65 21.49 12.15 12.67 0.61 0.02 832.71992 126.56 570.92 158.26 57.71 17.82 12.83 7.67 4.29 2.72 0.22 959.01993 534.48 420.40 273.89 140.13 72.48 15.83 6.24 3.89 2.23 2.36 1471.91994 1044.50 545.50 296.80 307.60 152.60 46.80 8.13 2.59 1.32 0.55 0.52 0.11 0.05 0.00 0.00 1.23 2407.01995 5343.80 540.20 280.40 242.10 252.30 77.10 17.90 2.33 1.13 0.55 0.59 0.19 0.00 0.00 0.00 1.33 6758.71996 5908.30 778.60 164.00 116.70 140.70 111.20 24.80 2.79 0.37 0.16 0.08 0.08 0.05 0.02 0.00 0.39 7247.91997 1 5122.80 1413.70 315.40 69.20 75.00 60.70 26.80 4.95 0.63 0.68 0.46 0.00 0.00 0.00 0.00 1.14 7090.21998 1 2512.10 492.50 355.20 167.40 31.70 26.40 17.50 8.26 0.79 0.52 0.65 0.00 0.35 0.00 0.04 1.56 3613.41999 479.70 353.60 189.60 181.90 61.30 12.80 6.83 5.19 0.98 0.27 0.02 0.03 0.02 0.00 0.00 0.34 1292.22000 128.20 242.80 247.50 130.00 112.00 27.00 4.73 1.82 1.23 0.36 0.10 0.03 0.02 0.00 0.00 0.51 895.82001 715.80 77.60 182.00 194.50 81.60 38.00 9.58 1.19 0.45 0.19 0.04 0.00 0.00 0.00 0.01 0.24 1300.92002 34.20 416.20 118.00 137.70 108.60 46.50 14.50 2.19 0.34 0.19 0.05 0.00 0.00 0.00 0.02 0.26 878.52003 3021.40 61.20 380.80 125.40 95.20 66.60 17.90 4.72 1.02 0.16 0.04 0.00 0.02 0.02 0.00 0.24 3774.32004 321.30 236.30 65.50 186.10 53.60 43.20 30.90 6.92 1.66 0.29 0.08 0.01 0.01 0.00 0.00 0.39 945.82005 846.80 216.40 244.80 54.80 102.70 22.40 16.40 3.80 0.88 0.30 0.04 0.02 0.03 0.04 0.00 0.43 1509.52006 2 676.90 283.80 115.60 114.00 28.10 43.30 14.00 5.19 1.34 0.22 0.21 0.08 0.00 0.00 0.00 0.51 1282.62007 1 584.20 369.90 365.80 127.30 68.90 13.70 23.60 6.85 2.20 0.40 0.31 0.08 0.00 0.00 0.00 0.79 1563.22008 69.00 103.30 192.50 300.00 115.60 40.80 18.00 8.29 1.86 0.35 0.02 0.02 0.01 0.00 0.00 0.40 850.02009 389.40 35.50 124.30 196.10 218.00 58.20 17.50 8.44 5.27 0.50 0.18 0.03 0.03 0.00 0.00 0.74 1053.42010 1031.50 96.50 37.00 114.90 155.50 144.50 39.80 11.20 3.70 1.64 0.57 0.05 0.02 0.03 0.02 2.33 1637.02011 615.30 225.60 85.40 50.70 129.90 138.00 103.10 16.70 4.34 1.17 0.79 0.20 0.17 0.04 0.02 2.39 1371.42012 3 728.40 124.80 83.10 70.30 36.40 93.90 136.30 49.60 9.38 2.33 0.87 0.60 0.47 0.02 0.05 4.34 1336.62013 439.10 147.20 70.30 119.80 64.00 41.00 65.00 76.20 33.60 2.21 2.83 0.41 0.35 0.06 0.03 5.89 1062.02014 499.80 148.80 180.60 85.10 67.90 47.80 32.60 46.90 31.70 9.36 1.01 0.97 0.15 0.04 0.07 11.60 1153.02015 1295.00 196.80 125.40 170.20 135.70 99.80 71.20 27.40 52.80 17.00 2.86 0.72 0.10 0.07 0.04 20.79 2194.82016 212.30 232.90 53.40 112.30 151.30 109.00 66.10 26.60 12.80 15.00 6.43 0.96 0.50 0.17 0.14 23.20 1000.02017 3 471.50 71.00 116.10 39.70 48.70 56.60 27.80 18.90 7.63 3.01 2.22 3.49 0.53 0.17 0.06 9.48 867.52018 1686.20 394.80 107.60 148.70 46.10 55.70 53.40 23.90 7.48 5.41 1.13 2.24 1.19 0.13 0.39 10.49 2529.32019 1291.70 446.00 253.70 132.00 188.60 66.40 27.00 28.80 7.60 1.72 0.34 0.17 0.14 0.13 0.10 2.60 2444.32020 3 139.71 259.02 193.71 140.13 103.75 96.43 46.80 18.87 14.86 3.82 1.13 0.31 0.40 0.26 0.33 6.25 1019.5
1 Indices raised to also represent the Russian EEZ.2 Not complete coverage in southeast due to restrictions, strata 7 area set to default and strata 13 as in 20053 Indices raised to also represent uncovered parts of the Russian EEZ.
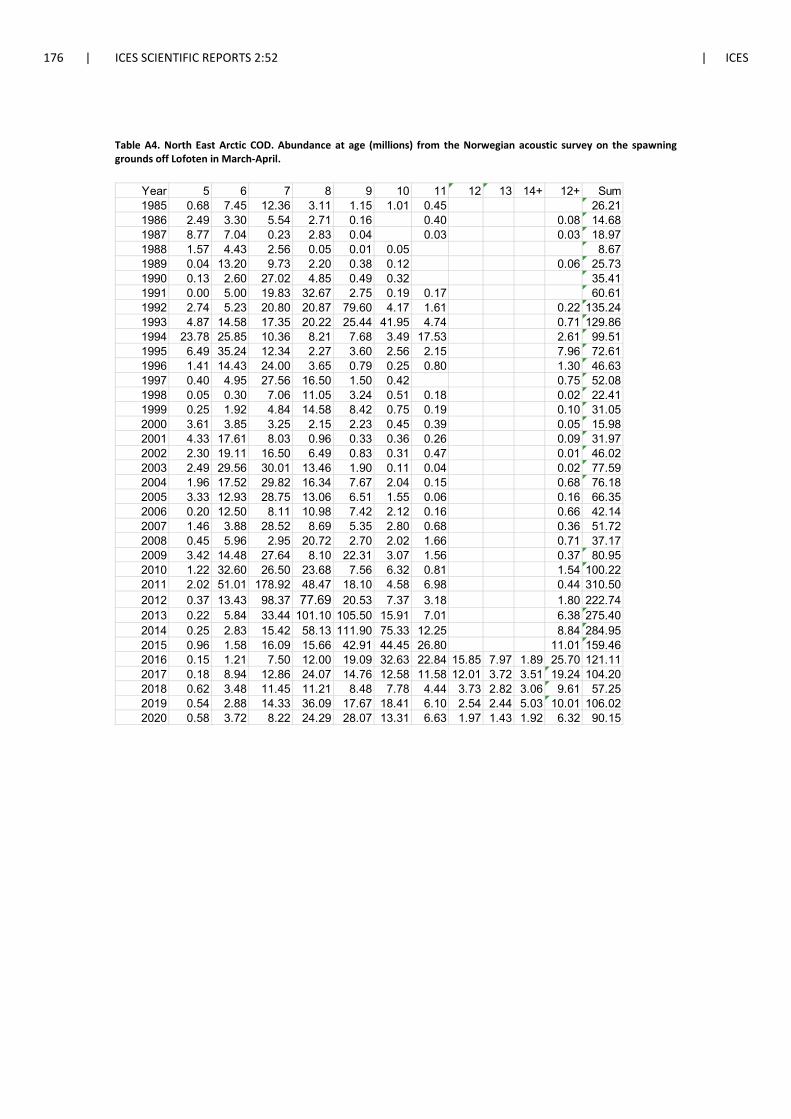
176 | ICES SCIENTIFIC REPORTS 2:52 | ICES
Table A4. North East Arctic COD. Abundance at age (millions) from the Norwegian acoustic survey on the spawning grounds off Lofoten in March-April.
Year 5 6 7 8 9 10 11 12 13 14+ 12+ Sum1985 0.68 7.45 12.36 3.11 1.15 1.01 0.45 26.211986 2.49 3.30 5.54 2.71 0.16 0.40 0.08 14.681987 8.77 7.04 0.23 2.83 0.04 0.03 0.03 18.971988 1.57 4.43 2.56 0.05 0.01 0.05 8.671989 0.04 13.20 9.73 2.20 0.38 0.12 0.06 25.731990 0.13 2.60 27.02 4.85 0.49 0.32 35.411991 0.00 5.00 19.83 32.67 2.75 0.19 0.17 60.611992 2.74 5.23 20.80 20.87 79.60 4.17 1.61 0.22 135.241993 4.87 14.58 17.35 20.22 25.44 41.95 4.74 0.71 129.861994 23.78 25.85 10.36 8.21 7.68 3.49 17.53 2.61 99.511995 6.49 35.24 12.34 2.27 3.60 2.56 2.15 7.96 72.611996 1.41 14.43 24.00 3.65 0.79 0.25 0.80 1.30 46.631997 0.40 4.95 27.56 16.50 1.50 0.42 0.75 52.081998 0.05 0.30 7.06 11.05 3.24 0.51 0.18 0.02 22.411999 0.25 1.92 4.84 14.58 8.42 0.75 0.19 0.10 31.052000 3.61 3.85 3.25 2.15 2.23 0.45 0.39 0.05 15.982001 4.33 17.61 8.03 0.96 0.33 0.36 0.26 0.09 31.972002 2.30 19.11 16.50 6.49 0.83 0.31 0.47 0.01 46.022003 2.49 29.56 30.01 13.46 1.90 0.11 0.04 0.02 77.592004 1.96 17.52 29.82 16.34 7.67 2.04 0.15 0.68 76.182005 3.33 12.93 28.75 13.06 6.51 1.55 0.06 0.16 66.352006 0.20 12.50 8.11 10.98 7.42 2.12 0.16 0.66 42.142007 1.46 3.88 28.52 8.69 5.35 2.80 0.68 0.36 51.722008 0.45 5.96 2.95 20.72 2.70 2.02 1.66 0.71 37.172009 3.42 14.48 27.64 8.10 22.31 3.07 1.56 0.37 80.952010 1.22 32.60 26.50 23.68 7.56 6.32 0.81 1.54 100.222011 2.02 51.01 178.92 48.47 18.10 4.58 6.98 0.44 310.502012 0.37 13.43 98.37 77.69 20.53 7.37 3.18 1.80 222.742013 0.22 5.84 33.44 101.10 105.50 15.91 7.01 6.38 275.402014 0.25 2.83 15.42 58.13 111.90 75.33 12.25 8.84 284.952015 0.96 1.58 16.09 15.66 42.91 44.45 26.80 11.01 159.462016 0.15 1.21 7.50 12.00 19.09 32.63 22.84 15.85 7.97 1.89 25.70 121.112017 0.18 8.94 12.86 24.07 14.76 12.58 11.58 12.01 3.72 3.51 19.24 104.202018 0.62 3.48 11.45 11.21 8.48 7.78 4.44 3.73 2.82 3.06 9.61 57.252019 0.54 2.88 14.33 36.09 17.67 18.41 6.10 2.54 2.44 5.03 10.01 106.022020 0.58 3.72 8.22 24.29 28.07 13.31 6.63 1.97 1.43 1.92 6.32 90.15

ICES | AFWG 2020 | 177
Table A5. COD. Length (cm) at-age in the Barents Sea from the investigations winter survey in February.
Year 1 2 3 4 5 6 7 8 9 10 11 12 13 141981 17.0 26.1 35.5 44.7 52.0 61.3 69.6 77.91982 14.8 25.8 37.6 46.3 54.7 63.1 70.8 82.91983 12.8 27.6 34.8 45.9 54.5 62.7 73.1 78.61984 14.2 28.4 35.8 48.6 56.6 66.2 74.1 79.71985 16.5 23.7 40.3 48.7 61.3 71.1 81.2 85.71986 11.9 21.6 34.4 49.9 59.8 69.4 80.3 93.81987 13.9 21.0 31.8 41.3 56.3 66.3 77.6 87.91988 15.3 23.3 29.7 38.7 47.6 56.8 71.7 79.41989 12.5 25.4 34.7 39.9 46.8 56.2 67.0 83.31990 14.4 27.9 39.4 47.1 53.8 60.6 68.2 79.21991 13.6 27.2 41.6 51.7 59.5 67.1 72.3 77.61992 13.2 23.9 41.3 49.9 60.2 68.4 76.1 82.81993 11.3 20.3 35.9 50.8 59.0 68.2 76.8 85.81994 11.3 17.9 30.2 44.6 55.1 65.5 73.8 78.5 87.5 97.9 97.7 100.8 122.1 -1995 12.2 18.0 28.8 42.1 54.0 63.7 75.7 80.2 83.9 99.1 + 109.0 - -1996 12.1 18.9 28.7 40.6 49.3 60.9 71.7 84.8 92.2 92.2 99.5 104.6 108.7 121.01997 10.9 15.9 26.8 39.9 49.5 59.2 69.9 81.6 91.8 + + - - -1998 9.8 18.0 29.3 40.0 50.9 58.9 67.7 76.7 87.4 + + - + -1999 12.0 18.3 29.0 39.9 50.4 59.4 70.4 78.5 88.7 88.4 + + + -2000 12.9 20.7 28.4 39.7 51.5 61.4 70.5 76.2 84.8 81.8 99.7 + + -2001 11.6 22.6 33.0 41.1 52.2 63.3 70.2 77.7 86.0 96.2 103.8 - - -2002 12.0 19.5 28.6 43.6 52.1 62.0 71.3 79.5 91.0 89.3 102.3 - - -2003 11.4 18.0 28.9 39.4 53.4 61.7 70.6 80.8 89.1 90.6 104.5 - 105.8 111.62004 10.6 18.4 31.7 40.6 51.7 61.6 68.6 79.7 90.9 88.5 91.7 + + -2005 11.2 18.3 29.5 43.5 51.1 60.3 71.0 79.6 88.9 96.2 109.4 + + +2006 12.0 19.5 30.9 42.1 53.6 60.2 66.4 76.5 84.5 98.8 93.2 96.3 - -2007 13.1 21.0 29.4 40.2 53.1 62.9 68.7 76.6 87.6 94.9 102.4 + - -2008 12.1 22.4 33.1 43.2 51.7 64.1 69.0 81.3 88.4 94.6 108.9 + + -2009 11.2 21.2 32.1 42.6 53.1 61.7 76.5 81.8 89.3 97.9 99.9 + + -2010 11.2 18.2 31.5 42.7 52.4 60.7 70.6 80.4 88.5 96.2 102.7 + + +2011 11.9 19.4 29.5 41.9 51.0 60.7 68.1 78.3 85.9 95.2 101.3 111.1 111.7 119.02012 10.6 18.4 29.7 41.0 52.4 58.0 66.5 75.7 86.0 91.4 106.2 113.4 119.7 +2013 11.2 19.2 31.0 41.0 51.6 62.1 69.7 76.5 81.1 95.2 92.2 110.7 110.7 +2014 9.8 17.3 29.1 40.1 51.8 59.5 70.3 77.0 81.9 87.1 96.7 98.1 110.5 +2015 10.5 16.2 30.0 39.9 51.2 60.5 69.0 77.6 80.1 88.9 95.4 101.4 + +2016 12.2 18.5 29.9 40.6 50.0 60.6 68.3 76.7 85.6 86.0 90.0 92.6 111.8 122.22017 12.4 21.8 31.4 42.3 51.9 60.8 69.7 79.5 85.9 90.6 96.3 91.9 106.9 108.72018 11.2 18.6 31.9 42.2 51.1 61.5 68.9 77.6 83.7 87.9 97 98.8 100.1 105.82019 11.8 17.2 31.1 41.6 50.8 59.6 69.6 77.0 83.6 89.6 100.1 102.1 107.3 104.52020 11.9 17.4 24.4 39.1 49.7 58.4 66.5 75.5 83.3 90.1 94.6 100.8 109.2 113.9
In 1997, 1998 and 2012 lengths were adjusted for missing coverage of Russian EEZ.
Age

178 | ICES SCIENTIFIC REPORTS 2:52 | ICES
Table A6. COD. Weight (g) at-age in the Barents Sea from the investigations winter survey in February.
Year \ Age 1 2 3 4 5 6 7 8 9 10 11 12 13 141983 20 190 372 923 1597 2442 3821 47581984 23 219 421 1155 1806 2793 3777 45661985 20 171 576 1003 2019 3353 5015 61541986 20 119 377 997 1623 2926 3838 73851987 21 65 230 490 1380 2300 3970 60001988 24 114 241 492 892 1635 3040 43731989 16 158 374 604 947 1535 2582 4906 10943 52261990 26 217 580 1009 1435 1977 2829 4435 10772 11045 96151991 18 196 805 1364 2067 2806 3557 4502 7404 134471992 20 136 619 1118 1912 2792 3933 5127 6420 8103 17705 220601993 9 71 415 1179 1743 2742 3977 5758 7068 7515 7521 107441994 12 55 260 796 1463 2372 3477 4624 6782 8420 8530 13516 20786 -1995 15 53 239 656 1341 2194 3628 4577 5315 8907 + 12176 - -1996 15 62 232 632 1079 1979 3327 5479 7655 8192 9760 13013 13614 146501997 13 46 181 592 1097 1785 2917 4928 7290 + + - - -1998 8 50 256 608 1184 1749 2601 4040 6383 + + - + -1999 14 58 231 588 1178 1827 2994 4123 6343 7326 + + + -2000 16 74 210 558 1210 1961 3042 3842 5384 5727 9960 + + -2001 14 106 336 642 1288 2233 3090 4332 5727 8571 11022 - - -2002 14 67 233 747 1225 2065 3189 4577 7472 6431 11645 - - -2003 13 59 229 586 1313 2013 2982 4725 6511 7552 12467 - 12885 161122004 10 59 276 607 1142 1946 2618 4139 6684 6988 7957 + + -2005 13 61 245 724 1145 1857 2953 4224 6418 8607 12488 + + +2006 13 69 280 663 1413 1965 2599 4244 5783 10131 8620 10735 - -2007 17 71 226 638 1370 2270 2918 4254 6556 8727 11130 + - -2008 15 90 336 799 1410 2449 3144 5218 6793 9494 12918 + + -2009 13 84 294 704 1293 2030 4061 5082 6884 9504 9614 + + -2010 11 64 307 702 1297 2031 3165 4736 6501 9016 10417 + + +2011 15 65 247 667 1129 1940 2725 4003 5914 8233 9888 13213 13814 +2012 13 62 251 609 1278 1673 2480 3772 5923 7783 12298 14876 17868 +2013 11 65 264 591 1201 2064 2804 3839 4814 8433 8759 15101 14729 +2014 8 49 238 592 1234 1776 2849 3942 4946 6181 8368 9212 12578 +2015 10 47 242 574 1250 1971 2760 4077 4621 6901 8096 11366 + +2016 13 54 239 602 1063 1952 2701 3855 5553 6034 6963 8061 15330 219502017 16 92 297 737 1253 2016 3091 4645 6088 7403 9186 8412 12416 149162018 12 66 305 687 1237 2074 2867 4180 5536 6793 9222 10497 11164 122682019 12 46 272 652 1157 1883 2916 3994 5303 6926 10034 11535 13243 119262020 13 44 137 540 1050 1671 2482 3764 5158 6838 8405 11259 14441 15785
1987: Estimated weights 1997, 1998 and 2012: Adjusted weights due to missing coverage of Russian EEZ.

ICES | AFWG 2020 | 179
Table A7. Northeast Arctic COD. Length at age in cm in the Lofoten survey.
Year/age 5 6 7 8 9 10 11 12 13 14 12+1985 59.6 71.1 79.0 88.2 97.3 105.2 114.01986 62.7 70.0 80.0 89.4 86.6 105.8 115.01987 58.2 64.5 76.7 86.2 88.0 118.5 116.01988 53.1 67.1 71.6 94.0 97.0 119.61989 54.0 59.0 69.8 80.8 96.6 103.0 125.01990 56.9 65.1 69.2 79.5 83.7 100.11991 59.0 67.3 74.4 81.0 91.3 99.8 85.01992 66.3 68.7 78.3 83.9 89.2 92.2 101.9 127.01993 58.3 66.1 72.8 83.6 87.4 92.7 95.4 111.21994 64.3 70.6 82.0 87.3 90.0 95.3 92.4 101.41995 61.5 69.7 77.8 84.4 92.6 96.7 100.3 99.51996 62.2 67.1 75.9 81.0 93.6 100.9 97.4 104.11997 63.7 68.6 74.2 83.8 99.9 108.4 109.01998 55.0 62.6 70.2 80.0 92.0 98.0 96.7 115.01999 52.7 67.0 69.4 78.6 85.8 100.3 102.0 125.02000 58.4 66.5 72.6 77.0 83.9 90.6 93.7 112.42001 59.3 66.9 73.2 87.1 88.7 102.8 98.5 128.22002 58.6 66.0 73.2 80.8 88.2 101.8 91.0 101.42003 62.3 65.0 73.2 80.9 88.9 86.4 120.0 122.02004 58.8 64.7 71.2 80.1 85.6 97.0 102.6 115.82005 56.3 65.4 72.3 76.0 85.3 95.5 110.5 117.82006 56.2 63.7 72.6 77.5 82.9 88.3 89.2 116.32007 63.0 66.4 72.4 82.5 88.2 99.8 103.7 115.02008 63.8 69.1 73.6 80.9 90.0 94.9 94.9 96.52009 60.5 69.3 76.5 82.7 88.7 98.8 92.9 111.62010 60.6 64.2 75.0 82.8 93.9 93.7 102.8 108.12011 56.8 64.5 70.0 79.9 91.1 96.7 101.1 104.82012 59.6 65.4 69.9 77.0 85.4 99.0 105.2 106.02013 63.6 68.8 73.1 78.2 83.5 90.9 99.1 96.62014 57.2 65.8 74.3 77.9 82.8 86.8 93.3 99.02015 60.4 67.8 73.0 78.3 83.0 88.3 94.7 99.22016 58.2 63.0 74.4 80.1 89.1 92.9 95.7 97.12017 57.6 64.9 70.7 80.9 87.3 94.7 98.6 99.3 102.6 106.62018 67.9 66.8 72.8 79.5 89.4 93.6 99.3 104.9 104.3 109.22019 58.8 68.6 74.7 81.4 87.9 93.9 98.1 106.2 111.1 109.62020 66.1 68.2 74.9 81.8 88.9 95.1 96.3 106.0 109.5 111.6

180 | ICES SCIENTIFIC REPORTS 2:52 | ICES
Table A8. Northeast Arctic COD. Mean weight-at-age (kg) in the Lofoten survey.
Year 5 6 7 8 9 10 11 12 13 14+ 12+1985 2.00 3.42 4.61 6.67 8.89 10.73 14.291986 2.22 3.22 4.74 6.40 5.80 10.84 13.481987 1.44 1.94 3.61 5.40 5.64 13.15 12.551988 1.46 2.82 3.39 6.63 7.27 13.641989 1.30 1.77 2.89 4.74 8.28 9.98 26.001990 1.54 2.32 2.55 3.78 4.77 8.801991 2.21 2.52 3.51 5.18 7.40 11.36 5.351992 2.56 2.85 3.99 5.43 6.35 8.03 9.50 17.801993 1.79 2.58 3.55 5.31 6.21 7.69 9.28 14.711994 2.31 3.27 5.06 6.39 6.64 7.92 7.73 10.101995 2.20 3.24 4.83 5.98 7.80 10.03 10.39 10.681996 2.22 2.75 4.11 5.63 7.92 10.53 10.58 12.081997 2.42 2.92 3.86 5.71 9.65 13.41 12.671998 1.88 2.09 2.98 4.85 7.92 9.91 11.05 18.341999 1.51 2.80 2.96 4.22 5.92 9.33 9.17 16.002000 1.71 2.50 3.16 3.85 5.32 7.07 7.62 12.842001 1.90 2.72 3.49 6.23 6.82 10.95 10.29 28.582002 1.87 2.57 3.52 4.71 6.18 10.56 8.70 10.482003 2.30 2.34 3.48 4.59 5.89 8.07 24.50 27.702004 1.74 2.30 3.02 4.50 5.77 7.81 9.95 13.252005 1.56 2.40 3.20 3.71 5.79 8.52 16.27 18.632006 1.54 2.35 3.44 4.19 5.43 6.57 6.19 18.152007 2.34 2.67 3.53 5.30 6.70 9.95 11.24 16.622008 2.21 2.97 3.63 4.88 6.74 8.18 7.70 9.072009 2.04 2.98 4.10 5.19 6.56 9.38 8.58 15.672010 1.91 2.28 3.60 4.70 7.03 7.11 9.09 12.502011 1.61 2.29 2.89 4.51 6.79 8.30 9.46 10.542012 2.34 2.46 2.93 3.93 5.39 8.91 11.68 12.562013 2.49 3.04 3.51 4.43 5.54 7.56 10.25 11.692014 2.00 2.45 3.76 4.05 5.06 5.97 7.34 10.372015 2.14 2.66 3.44 3.91 5.06 6.27 7.89 11.322016 2.55 2.23 3.65 4.80 6.67 7.74 8.68 8.83 12.63 18.02 10.682017 1.96 2.48 2.94 4.80 5.74 7.12 8.16 9.12 10.43 12.312018 3.25 2.72 3.41 4.53 6.51 7.94 9.69 12.06 12.05 13.142019 1.90 2.89 3.72 4.82 6.07 7.43 8.68 11.07 13.87 13.422020 2.75 2.78 3.60 4.69 6.06 7.78 8.71 10.86 12.94 15.00

ICES | AFWG 2020 | 181
Table A9. Northeast Arctic COD. Results from the Russian trawl-acoustic survey in the Barents Sea and adjacent waters in the autumn. Stock number in millions.
Year Age Total1 2 3 4 5 6 7 8 9 10+ 1941
1985 1 77 569 400 568 244 51 20 8 1 3 19981986 1 25 129 899 612 238 69 20 3 2 1 13231987 2 2 58 103 855 198 82 19 4 1 1 6021988 2 3 23 96 100 305 54 16 3 1 1 3321989 1 1 3 17 45 57 91 75 25 13 5 3771990 1 36 27 8 27 62 74 91 39 10 3 4941991 1 63 65 96 45 50 54 66 49 5 1 12221992 1 133 399 380 121 56 58 33 29 11 2 7831993 1 20 44 220 234 164 51 19 13 8 10 13351994 1 105 38 147 275 303 314 100 35 10 8 9711995 1 242 42 111 219 229 97 21 6 2 2 21271996 1,3,5 424 275 189 316 449 314 126 27 3 4 9001997 4,5 72 160 263 198 112 57 27 9 1 1 6721998 1 26 86 279 186 57 23 10 4 1 0 6581999 1 19 79 166 260 98 20 8 5 2 1 6422000 1, rev 24 82 191 159 127 48 6 3 1 1 6562001 1 38 59 148 204 120 70 14 2 1 6722002 1,5,6 83 2 106 85 140 151 67 30 7 1 9082003 69 36 25 218 142 167 163 60 23 4 16692004 375 35 170 85 345 194 229 167 49 19 8032005 112 48 65 154 70 214 68 47 17 8 3412006 7 12 20 39 49 78 32 64 23 13 8 12212007 13 35 165 372 208 189 74 113 32 20
1 October-December2 September-October3 Area IIb not covered4 Areas IIa, IIb covered in October-December, part of Area I covered in February-March 19985 Adjusted for incomplete area coverage6 Area IIa not covered7 Area I not fully covered

182 | ICES SCIENTIFIC REPORTS 2:52 | ICES
Table A10. Northeast Arctic COD. Abundance indices (millions) from the Russian bottom trawl survey in the Barents Sea.
Year Age0 1 2 3 4 5 6 7 8 9 10 11 12 13+ Sum
Total (Sub-area I and Division IIa and IIb)1982 849.3 1905.3 33.2 141.3 152.5 72.1 19.8 55.1 17.4 3.7 1.9 1.5 0.1 0.0 3253.31983 1872.2 2003.4 73.2 52.0 64.2 50.6 35.8 17.9 25.2 9.4 0 0 0 0 4203.91984 363.3 180.5 104.4 118.9 70.0 48.9 35.7 15.4 6.9 6.1 1.7 1.5 0.6 0.2 954.01985 284.6 15.6 129.0 118.8 159.2 106.8 36.5 16.5 3.7 0.8 1.6 0.1 2.1 0.0 875.31986 329.9 7.6 31.7 162.2 153.2 149.3 48.1 18.9 4.2 0.2 0.6 0.0 0.0 0.0 905.91987 7.7 1.3 46.9 55.7 307.6 90.0 70.1 18.4 6.0 2.5 0.4 0.1 0.3 0.0 607.01988 92.5 2.9 31.3 99.3 93.8 287.9 58.3 26.0 4.7 2.4 0.1 0.0 0.0 0.0 699.21989 355.8 3.0 14.7 49.0 97.8 106.2 145.4 116.7 29.9 11.2 4.7 1.8 0.7 0.5 937.41990 1248.4 31.1 51.0 16.7 48.7 62.7 97.2 153.8 67.3 15.3 4.9 0.9 0.2 0.0 1798.21991 974.0 64.0 91.1 107.7 48.4 53.2 58.3 68.5 74.7 9.8 1.4 0.3 0.0 0.0 1551.41992 1204.8 157.7 151.1 67.5 30.8 23.9 27.3 21.8 17.5 2.5 2.5 0.4 0.0 0.0 1707.81993 484.8 38.0 158.6 160.4 113.5 68.1 41.6 35.4 8.7 0.3 0.7 0.1 0.1 0.0 1110.31994 1606.6 833.2 69.9 136.3 130.9 101.9 35.4 12.8 4.9 2.1 1.1 0.6 0.2 0.0 2935.91995 5703.5 471.9 36.9 58.9 106.5 139.5 84.9 25.1 8.3 1.9 1.8 0.9 0.6 0.0 6640.81996 2660.3 396.5 128.5 73.3 78.4 103.5 77.3 34.8 13.2 1.9 0.5 1.2 0.2 0.0 3569.61997 1371.4 353.9 135.3 134.2 83.5 61.3 60.2 34.8 11.6 3.2 3.0 0.0 0.0 0.0 2252.41998 304.8 276.8 89.6 202.8 136.3 78.8 47.0 25.9 13.0 4.8 0.5 0.0 0.1 0.0 1180.41999 266.9 40.1 118.4 158.7 207.2 98.0 30.1 12.3 9.4 4.2 0.4 0.0 0.0 0.0 945.72000 1436.5 37.7 103.6 183.9 128.6 178.6 77.3 11.4 5.2 2.3 0.9 0.4 0.0 0.0 2166.42001 321.6 233.8 77.3 122.4 155.7 129.0 106.1 30.4 5.0 1.4 0.5 2.5 1.3 0.0 1187.12002 1797.9 26.7 135.6 98.0 147.3 147.3 89.6 60.0 18.2 2.9 0.8 0.1 0.1 0.0 2524.42003 489.5 517.5 26.8 124.6 105.7 116.6 120.3 53.5 24.1 4.0 0.9 0.3 0.0 0.1 1583.92004 1770.4 158.4 87.5 32.9 157.6 88.0 111.1 77.6 27.9 9.3 2.3 0.4 0.2 0.0 2523.62005 2298.0 323.9 61.7 140.8 63.1 183.2 74.4 60.5 24.4 8.8 2.8 0.6 0.1 0.0 3242.42006 427.4 52.4 63.2 92.7 161.3 77.7 180.1 66.2 34.2 16.1 4.3 1.7 0.7 0.0 1178.12007 177.5 37.0 148.6 257.9 161.7 190.3 84.6 152.5 55.3 22.6 8.6 4.9 1.1 0.7 1303.32008 1468.6 45.2 86.3 220.3 308.8 163.5 147.2 83.0 86.3 29.1 11.5 3.3 1.7 0.2 2654.92009 1877.7 287.8 21.9 97.4 231.7 368.7 201.6 117.5 62.0 41.3 20.5 6.5 3.2 0.9 3338.72010 * 2210.4 214.9 47.0 33.4 107.0 250.5 371.5 181.7 78.9 39.5 29.9 15.6 5.5 2.0 3587.72011 2296.1 125.9 80.0 88.2 50.8 143.2 306.5 330.0 91.7 43.9 17.6 17.5 7.0 3.5 3602.12012 1096.0 196.2 45.1 81.5 111.4 83.9 212.2 335.8 187.8 43.2 19.5 4.6 5.7 1.9 2424.82013 297.1 654.0 107.6 74.7 117.4 117.7 88.4 234.9 313.2 136.7 30.6 9.2 5.4 4.5 2191.52014 909.7 211.0 72.1 139.9 136.8 172.5 148.3 111.1 192.9 129.7 38.3 9.3 3.5 2.0 2277.12015 572.9 465.4 51.5 65.7 158.3 174.2 193.2 161.0 92.5 115.8 76.1 24.2 6.5 4.9 2162.02016 NA NA NA NA NA NA NA NA NA NA NA NA NA NA2017 4325.9 5257.4 94.5 145.6 88.4 106.3 195.2 123.1 56.7 26.6 12.0 12.0 7.5 2.8 10454.02018 NA NA NA NA NA NA NA NA NA NA NA NA NA NA2019 NA NA NA NA NA NA NA NA NA NA NA NA NA NA
* corrected
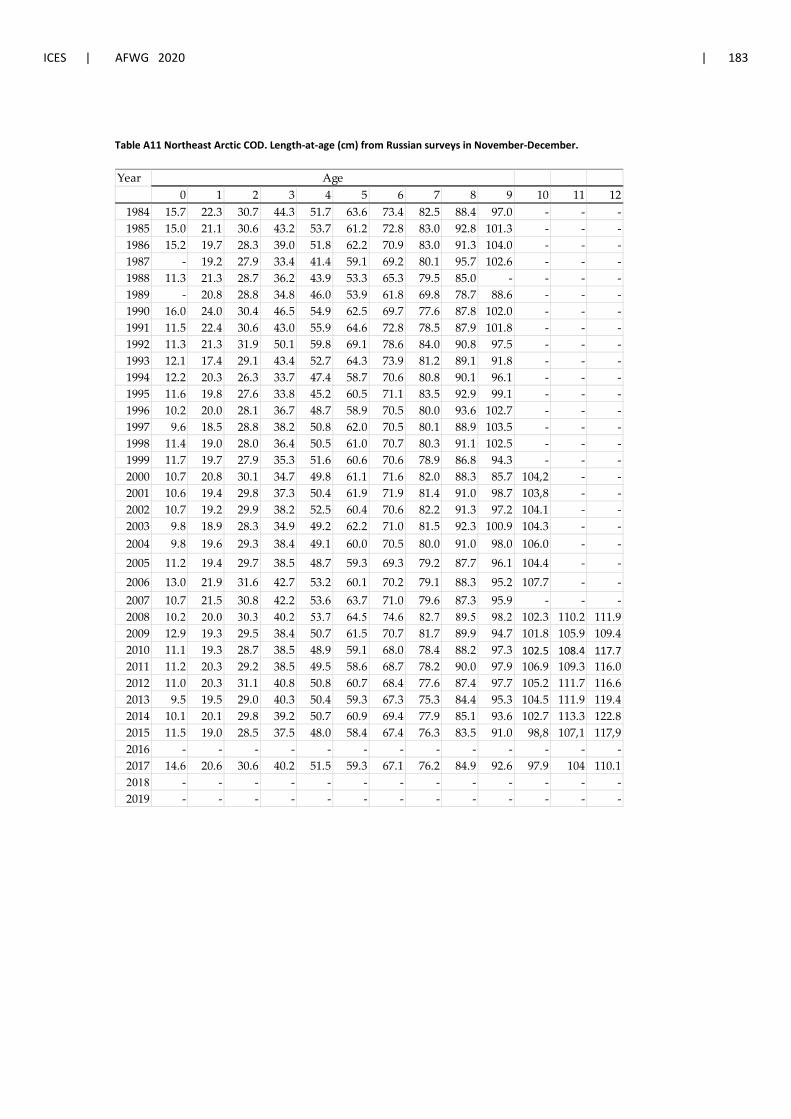
ICES | AFWG 2020 | 183
Table A11 Northeast Arctic COD. Length-at-age (cm) from Russian surveys in November-December.
Year0 1 2 3 4 5 6 7 8 9 10 11 12
1984 15.7 22.3 30.7 44.3 51.7 63.6 73.4 82.5 88.4 97.0 - - -1985 15.0 21.1 30.6 43.2 53.7 61.2 72.8 83.0 92.8 101.3 - - -1986 15.2 19.7 28.3 39.0 51.8 62.2 70.9 83.0 91.3 104.0 - - -1987 - 19.2 27.9 33.4 41.4 59.1 69.2 80.1 95.7 102.6 - - -1988 11.3 21.3 28.7 36.2 43.9 53.3 65.3 79.5 85.0 - - - -1989 - 20.8 28.8 34.8 46.0 53.9 61.8 69.8 78.7 88.6 - - -1990 16.0 24.0 30.4 46.5 54.9 62.5 69.7 77.6 87.8 102.0 - - -1991 11.5 22.4 30.6 43.0 55.9 64.6 72.8 78.5 87.9 101.8 - - -1992 11.3 21.3 31.9 50.1 59.8 69.1 78.6 84.0 90.8 97.5 - - -1993 12.1 17.4 29.1 43.4 52.7 64.3 73.9 81.2 89.1 91.8 - - -1994 12.2 20.3 26.3 33.7 47.4 58.7 70.6 80.8 90.1 96.1 - - -1995 11.6 19.8 27.6 33.8 45.2 60.5 71.1 83.5 92.9 99.1 - - -1996 10.2 20.0 28.1 36.7 48.7 58.9 70.5 80.0 93.6 102.7 - - -1997 9.6 18.5 28.8 38.2 50.8 62.0 70.5 80.1 88.9 103.5 - - -1998 11.4 19.0 28.0 36.4 50.5 61.0 70.7 80.3 91.1 102.5 - - -1999 11.7 19.7 27.9 35.3 51.6 60.6 70.6 78.9 86.8 94.3 - - -2000 10.7 20.8 30.1 34.7 49.8 61.1 71.6 82.0 88.3 85.7 104,2 - -2001 10.6 19.4 29.8 37.3 50.4 61.9 71.9 81.4 91.0 98.7 103,8 - -2002 10.7 19.2 29.9 38.2 52.5 60.4 70.6 82.2 91.3 97.2 104.1 - -2003 9.8 18.9 28.3 34.9 49.2 62.2 71.0 81.5 92.3 100.9 104.3 - -2004 9.8 19.6 29.3 38.4 49.1 60.0 70.5 80.0 91.0 98.0 106.0 - -2005 11.2 19.4 29.7 38.5 48.7 59.3 69.3 79.2 87.7 96.1 104.4 - -2006 13.0 21.9 31.6 42.7 53.2 60.1 70.2 79.1 88.3 95.2 107.7 - -2007 10.7 21.5 30.8 42.2 53.6 63.7 71.0 79.6 87.3 95.9 - - -2008 10.2 20.0 30.3 40.2 53.7 64.5 74.6 82.7 89.5 98.2 102.3 110.2 111.92009 12.9 19.3 29.5 38.4 50.7 61.5 70.7 81.7 89.9 94.7 101.8 105.9 109.42010 11.1 19.3 28.7 38.5 48.9 59.1 68.0 78.4 88.2 97.3 102.5 108.4 117.72011 11.2 20.3 29.2 38.5 49.5 58.6 68.7 78.2 90.0 97.9 106.9 109.3 116.02012 11.0 20.3 31.1 40.8 50.8 60.7 68.4 77.6 87.4 97.7 105.2 111.7 116.62013 9.5 19.5 29.0 40.3 50.4 59.3 67.3 75.3 84.4 95.3 104.5 111.9 119.42014 10.1 20.1 29.8 39.2 50.7 60.9 69.4 77.9 85.1 93.6 102.7 113.3 122.82015 11.5 19.0 28.5 37.5 48.0 58.4 67.4 76.3 83.5 91.0 98,8 107,1 117,92016 - - - - - - - - - - - - -2017 14.6 20.6 30.6 40.2 51.5 59.3 67.1 76.2 84.9 92.6 97.9 104 110.12018 - - - - - - - - - - - - -2019 - - - - - - - - - - - - -
Age
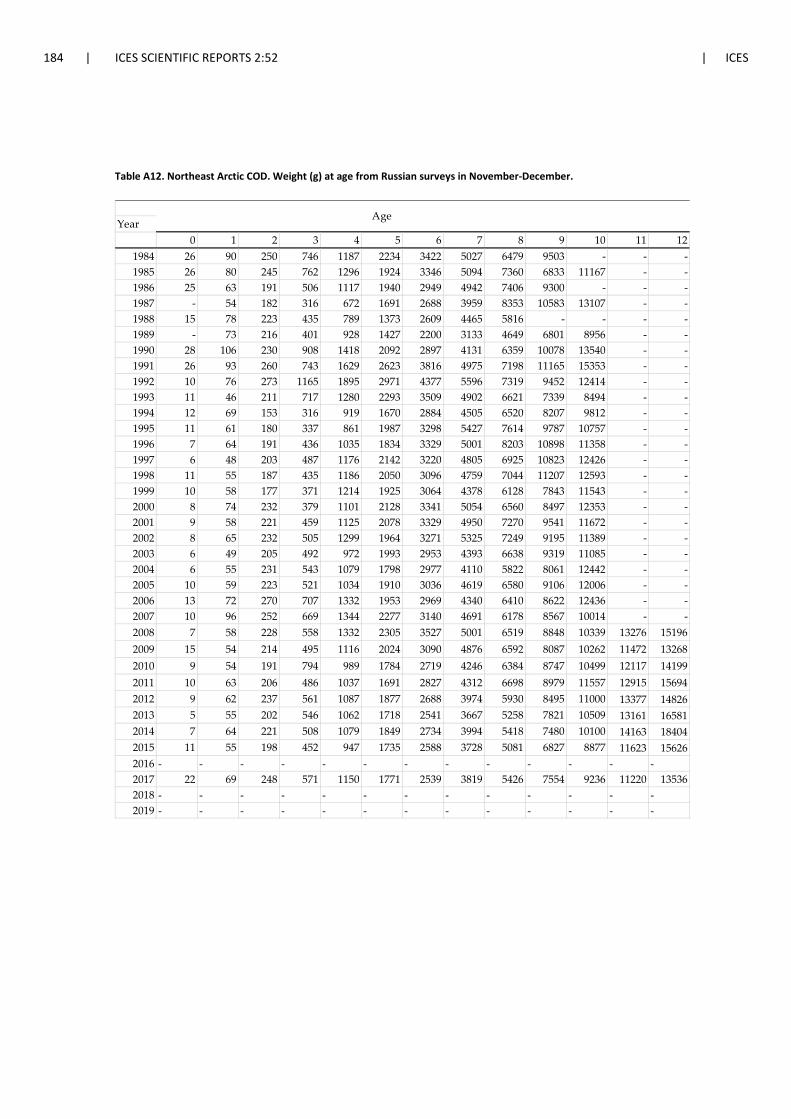
184 | ICES SCIENTIFIC REPORTS 2:52 | ICES
Table A12. Northeast Arctic COD. Weight (g) at age from Russian surveys in November-December.
Year0 1 2 3 4 5 6 7 8 9 10 11 12
1984 26 90 250 746 1187 2234 3422 5027 6479 9503 - - -1985 26 80 245 762 1296 1924 3346 5094 7360 6833 11167 - -1986 25 63 191 506 1117 1940 2949 4942 7406 9300 - - -1987 - 54 182 316 672 1691 2688 3959 8353 10583 13107 - -1988 15 78 223 435 789 1373 2609 4465 5816 - - - -1989 - 73 216 401 928 1427 2200 3133 4649 6801 8956 - -1990 28 106 230 908 1418 2092 2897 4131 6359 10078 13540 - -1991 26 93 260 743 1629 2623 3816 4975 7198 11165 15353 - -1992 10 76 273 1165 1895 2971 4377 5596 7319 9452 12414 - -1993 11 46 211 717 1280 2293 3509 4902 6621 7339 8494 - -1994 12 69 153 316 919 1670 2884 4505 6520 8207 9812 - -1995 11 61 180 337 861 1987 3298 5427 7614 9787 10757 - -1996 7 64 191 436 1035 1834 3329 5001 8203 10898 11358 - -1997 6 48 203 487 1176 2142 3220 4805 6925 10823 12426 - -1998 11 55 187 435 1186 2050 3096 4759 7044 11207 12593 - -1999 10 58 177 371 1214 1925 3064 4378 6128 7843 11543 - -2000 8 74 232 379 1101 2128 3341 5054 6560 8497 12353 - -2001 9 58 221 459 1125 2078 3329 4950 7270 9541 11672 - -2002 8 65 232 505 1299 1964 3271 5325 7249 9195 11389 - -2003 6 49 205 492 972 1993 2953 4393 6638 9319 11085 - -2004 6 55 231 543 1079 1798 2977 4110 5822 8061 12442 - -2005 10 59 223 521 1034 1910 3036 4619 6580 9106 12006 - -2006 13 72 270 707 1332 1953 2969 4340 6410 8622 12436 - -2007 10 96 252 669 1344 2277 3140 4691 6178 8567 10014 - -2008 7 58 228 558 1332 2305 3527 5001 6519 8848 10339 13276 151962009 15 54 214 495 1116 2024 3090 4876 6592 8087 10262 11472 132682010 9 54 191 794 989 1784 2719 4246 6384 8747 10499 12117 141992011 10 63 206 486 1037 1691 2827 4312 6698 8979 11557 12915 156942012 9 62 237 561 1087 1877 2688 3974 5930 8495 11000 13377 148262013 5 55 202 546 1062 1718 2541 3667 5258 7821 10509 13161 165812014 7 64 221 508 1079 1849 2734 3994 5418 7480 10100 14163 184042015 11 55 198 452 947 1735 2588 3728 5081 6827 8877 11623 156262016 - - - - - - - - - - - - -2017 22 69 248 571 1150 1771 2539 3819 5426 7554 9236 11220 135362018 - - - - - - - - - - - - -2019 - - - - - - - - - - - - -
Age
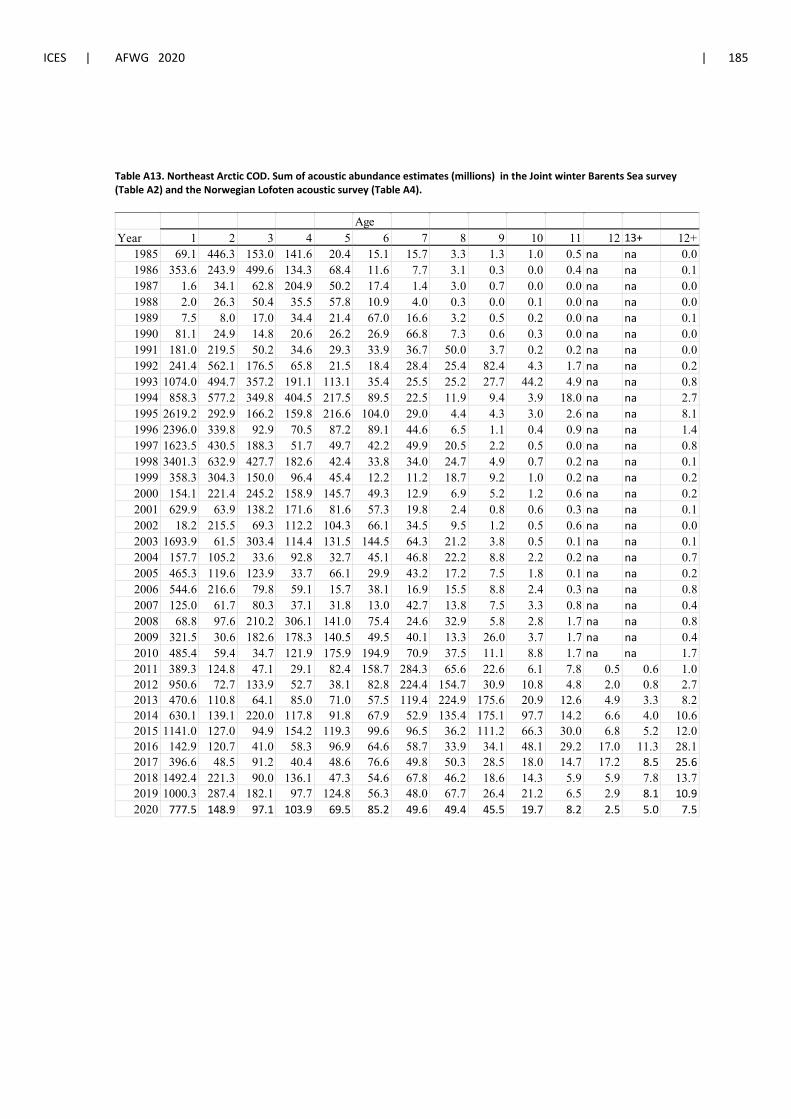
ICES | AFWG 2020 | 185
Table A13. Northeast Arctic COD. Sum of acoustic abundance estimates (millions) in the Joint winter Barents Sea survey (Table A2) and the Norwegian Lofoten acoustic survey (Table A4).
AgeYear 1 2 3 4 5 6 7 8 9 10 11 12 13+ 12+
1985 69.1 446.3 153.0 141.6 20.4 15.1 15.7 3.3 1.3 1.0 0.5 na na 0.01986 353.6 243.9 499.6 134.3 68.4 11.6 7.7 3.1 0.3 0.0 0.4 na na 0.11987 1.6 34.1 62.8 204.9 50.2 17.4 1.4 3.0 0.7 0.0 0.0 na na 0.01988 2.0 26.3 50.4 35.5 57.8 10.9 4.0 0.3 0.0 0.1 0.0 na na 0.01989 7.5 8.0 17.0 34.4 21.4 67.0 16.6 3.2 0.5 0.2 0.0 na na 0.11990 81.1 24.9 14.8 20.6 26.2 26.9 66.8 7.3 0.6 0.3 0.0 na na 0.01991 181.0 219.5 50.2 34.6 29.3 33.9 36.7 50.0 3.7 0.2 0.2 na na 0.01992 241.4 562.1 176.5 65.8 21.5 18.4 28.4 25.4 82.4 4.3 1.7 na na 0.21993 1074.0 494.7 357.2 191.1 113.1 35.4 25.5 25.2 27.7 44.2 4.9 na na 0.81994 858.3 577.2 349.8 404.5 217.5 89.5 22.5 11.9 9.4 3.9 18.0 na na 2.71995 2619.2 292.9 166.2 159.8 216.6 104.0 29.0 4.4 4.3 3.0 2.6 na na 8.11996 2396.0 339.8 92.9 70.5 87.2 89.1 44.6 6.5 1.1 0.4 0.9 na na 1.41997 1623.5 430.5 188.3 51.7 49.7 42.2 49.9 20.5 2.2 0.5 0.0 na na 0.81998 3401.3 632.9 427.7 182.6 42.4 33.8 34.0 24.7 4.9 0.7 0.2 na na 0.11999 358.3 304.3 150.0 96.4 45.4 12.2 11.2 18.7 9.2 1.0 0.2 na na 0.22000 154.1 221.4 245.2 158.9 145.7 49.3 12.9 6.9 5.2 1.2 0.6 na na 0.22001 629.9 63.9 138.2 171.6 81.6 57.3 19.8 2.4 0.8 0.6 0.3 na na 0.12002 18.2 215.5 69.3 112.2 104.3 66.1 34.5 9.5 1.2 0.5 0.6 na na 0.02003 1693.9 61.5 303.4 114.4 131.5 144.5 64.3 21.2 3.8 0.5 0.1 na na 0.12004 157.7 105.2 33.6 92.8 32.7 45.1 46.8 22.2 8.8 2.2 0.2 na na 0.72005 465.3 119.6 123.9 33.7 66.1 29.9 43.2 17.2 7.5 1.8 0.1 na na 0.22006 544.6 216.6 79.8 59.1 15.7 38.1 16.9 15.5 8.8 2.4 0.3 na na 0.82007 125.0 61.7 80.3 37.1 31.8 13.0 42.7 13.8 7.5 3.3 0.8 na na 0.42008 68.8 97.6 210.2 306.1 141.0 75.4 24.6 32.9 5.8 2.8 1.7 na na 0.82009 321.5 30.6 182.6 178.3 140.5 49.5 40.1 13.3 26.0 3.7 1.7 na na 0.42010 485.4 59.4 34.7 121.9 175.9 194.9 70.9 37.5 11.1 8.8 1.7 na na 1.72011 389.3 124.8 47.1 29.1 82.4 158.7 284.3 65.6 22.6 6.1 7.8 0.5 0.6 1.02012 950.6 72.7 133.9 52.7 38.1 82.8 224.4 154.7 30.9 10.8 4.8 2.0 0.8 2.72013 470.6 110.8 64.1 85.0 71.0 57.5 119.4 224.9 175.6 20.9 12.6 4.9 3.3 8.22014 630.1 139.1 220.0 117.8 91.8 67.9 52.9 135.4 175.1 97.7 14.2 6.6 4.0 10.62015 1141.0 127.0 94.9 154.2 119.3 99.6 96.5 36.2 111.2 66.3 30.0 6.8 5.2 12.02016 142.9 120.7 41.0 58.3 96.9 64.6 58.7 33.9 34.1 48.1 29.2 17.0 11.3 28.12017 396.6 48.5 91.2 40.4 48.6 76.6 49.8 50.3 28.5 18.0 14.7 17.2 8.5 25.62018 1492.4 221.3 90.0 136.1 47.3 54.6 67.8 46.2 18.6 14.3 5.9 5.9 7.8 13.72019 1000.3 287.4 182.1 97.7 124.8 56.3 48.0 67.7 26.4 21.2 6.5 2.9 8.1 10.92020 777.5 148.9 97.1 103.9 69.5 85.2 49.6 49.4 45.5 19.7 8.2 2.5 5.0 7.5

186 | ICES SCIENTIFIC REPORTS 2:52 | ICES
Table A14. Swept area estimates (millions) of Northeast Arctic Cod from the Joint Norwegian- Russian ecosystem survey in August-September (2018 data are taken from WD 01 AFWG 2019).
year 0 1 2 3 4 5 6 7 8 9 10 11 12 13+2004 543.0 330.6 329.7 147.7 421.5 150.2 79.8 40.2 10.1 2.2 0.5 0.1 0.1 0.12005 180.2 440.7 146.6 216.6 55.8 100.9 28.0 15.6 5.7 1.2 0.5 0.1 0.0 0.12006 276.0 479.0 509.7 186.1 205.6 59.9 69.8 17.6 8.1 2.6 0.6 0.2 0.0 0.02007 101.0 333.3 505.4 586.2 159.2 79.1 24.6 26.9 6.0 2.2 0.9 0.1 0.2 0.02008 483.4 130.9 372.6 652.6 483.4 132.3 51.1 12.8 17.5 3.3 0.9 0.2 0.2 0.22009 903.3 569.7 93.5 202.3 280.6 289.6 101.7 31.9 12.7 7.3 2.6 0.8 0.3 0.22010 652.6 310.3 84.2 56.8 177.0 397.2 424.9 142.7 38.5 10.5 6.8 1.6 0.3 0.32011 2083.0 509.8 160.0 123.6 101.5 240.2 300.4 178.4 32.3 7.7 1.8 1.3 0.6 0.32012 1412.7 1454.3 255.9 229.1 146.4 70.0 150.8 165.2 84.5 12.7 4.4 1.6 1.4 0.62013 2281.8 914.2 659.0 249.1 183.6 125.7 63.2 118.2 130.2 53.8 9.1 3.3 1.5 0.92014 2445.2 308.2 155.1 190.0 108.6 93.9 52.8 30.4 50.2 36.3 12.1 3.4 1.0 1.4
2014 * 2445.2 339.0 184.0 226.3 122.2 103.4 67.7 42.1 81.3 78.9 28.1 4.7 1.3 1.52015 350.9 725.3 154.0 174.4 225.2 141.3 72.6 48.6 26.2 35.3 26.6 7.9 1.7 1.02016 1164.8 350.8 341.3 77.2 93.7 121.6 70.1 44.4 27.2 13.8 13.2 5.4 1.7 1.42017 2316.3 757.5 260.6 375.0 141.5 104.9 120.9 62.6 28.0 11.2 6.4 4.4 4.5 2.7
2018* 1841.2 2100.3 413.8 183.6 148.9 60.0 37.6 57.1 20.2 14.4 5.8 3.6 3.5 2.82019 313.4 560.2 475.2 416.6 232.3 215.1 76.6 42.2 44.4 16.1 4.9 2.2 1.1 1.8
*data adjasted taking into account not complete area covarage
187 | ICES SCIENTIFIC REPORTS 2:52 | ICES
4 Northeast Arctic haddock (subareas 1 and 2)
4.1 Introductory note
The haddock input data, SAM model configuration and short-term forecast data input were re-vised during a benchmark in 2020 (WKDEM2020).
4.2 Status of the Fisheries
4.2.1 Historical development of the fisheries
Haddock is mainly fished by trawl as bycatch in the fishery for cod. Also, a directed trawl fishery for haddock is conducted. The proportion of the total catches taken by direct fishery varies be-tween years. On average approximately 30% of the catch is with conventional gears, mostly long-line, which in the past was used almost exclusively by Norway. Some of the longline catch are from a directed fishery, which is restricted by national quotas. In the Norwegian management, the quotas are set separately for trawl and other gears. The fishery is also regulated by a mini-mum landing size, a minimum mesh size in trawls and Danish seine, a maximum bycatch of undersized fish, closure of areas with high density/catches of juveniles and other seasonal and area restrictions.
The exploitation rate of haddock has been variable. The highest fishing mortalities for haddock have occurred at low to intermediate stock levels and historically show little relationship with the exploitation rate of cod, despite haddock being primarily caught as bycatch in the cod fishery. However, the more restrictive quota regulations introduced around 1990 have resulted in a more stable pattern in the exploitation rate.
The exceptionally strong year classes 2005—2006 have contributed to the strong increase to all-time high levels of stock size and SSB that we have seen in last decade. Their importance in the catches is now decreasing rapidly. The following year classes have been at a much lower level. The 2016 year-class is strong, and the catches are expected to increase.
4.2.2 Landings prior to 2020 (Tables 4.1–4.3, Figure 4.1)
The highest landing of haddock historically was 322 kt in 1973. Since 1973 the highest catches observed were about 316 kt in 2012. In 2013–2015 stock biomass started to decline and the level of landings in 2018 and 2019 was below 200 kt (Figure 4.1).
In 2006 it was decided to include reported Norwegian landings of haddock from the Norwegian statistical areas 06 and 07 (i.e. between 62°N and Lofoten) not previously included in the total landings of NEA haddock used as input for this stock assessment (ICES CM 2006/ACFM:19; ICES CM 2006/ACFM:25). This practice is continued.
Provisional official landings for 2019 is about 175 kt which is 4% below the realized TAC (about 10 kt transfers included).

ICES | AFWG 2020 | 188
4.2.3 Unreported catches (Table 4.1)
Estimates of unreported catches (IUU catches) of haddock have been added to reported landings for the years from 2002 to 2008. Two estimates of IUU catches were available, one Norwegian and one Russian. At the benchmark in 2011 it was decided to base the final assessment on the Norwegian IUU estimates (ICES CM 2011/ACOM:38).
We continue to include the estimates of IUU catches as in previous years (see Section 4.2.3), but the IUU is negligible for 2009–2019 and therefore set to zero.
4.2.4 Catch advice and TAC for 2020
The catch advice for 2020 was 215 kt (max 25% higher than TAC at 2019) and the Joint Norwe-gian-Russian Fisheries Commission set TAC in accordance to the HCR. Furthermore, Russia and Norway can transfer 10% of unused part of own quotas from 2019 to 2020 and 10% of unused part own quotas from 2020 to the quota in 2021.
4.3 Status of Research
4.3.1 Survey results
Russia provided indices for 1982–2015 and 2017 for the Barents Sea trawl and acoustic survey (TAS) which was carried out in October-December. The survey was discontinued in 2018.
Joint Barents Sea winter survey (bottom trawl NoRu-BTr-Q1 and acoustics NoRu-Aco-Q1)
The swept area estimates and acoustic estimates from the Joint winter survey of cod and haddock in the Barents Sea in winter 2020 are given in WD 10. The survey area has been extended the last years with additional northern areas (N) covered. The extended area is now included in total and standard survey index calculations for haddock (WKDEM 2020).
Like in previous years, the distribution of haddock extends further to the north and to the east than what was common in the 1990s. Overall, this survey tracks both strong and poor year classes well. At the survey in 2020 young haddock (<35 cm) was aggregated in the south-eastern Barents Sea (WD 10). These are from the year classes 2015–2017.
Joint Barents Sea ecosystem survey (Eco-NoRu-Q3 (Btr)
The bottom-trawl estimates from the joint ecosystem survey in August-September started in 2004. This survey covers the main distribution area of haddock. At the benchmark in 2011 it was decided to include this survey as tuning series. Estimates of the abundance of age groups from the joint ecosystem survey are presented in WD 1 (all years 2004-2019 except 2018). The survey in 2019 covered the haddock distribution well.
4.4 Data Used in the Assessment
4.4.1 Catch-at-age (Table 4.4)
Age and length compositions of the landings in 2019 were available from Norway and Russia in Subarea 1 and Division 2.b, from Norway, Russia, and Germany in Division 2.a. The biological sampling of NEA haddock catches is considered good for the most important ages in the fisheries (Table 1 and 2 chapter 02).

189 | ICES SCIENTIFIC REPORTS 2:52 | ICES
Relevant data of estimated catch-at-age obtained from InterCatch for the period 2008–2019 and historical values from 1950-2007 is listed in Table 4.4.
4.4.2 Catch-weight-at-age (Table 4.5)
The mean weight-at-age in the catch (Table 4.5) was obtained from InterCatch as a weighted average of the weight-at-age in the catch for Norway, Russia, and Germany.
4.4.3 Stock-weight-at-age (Table 4.6)
Since 1983 the stock weights at age (Table 4.6) are calculated taking the average of the weight-at-age estimate from the Joint Barents Sea winter survey and the Russian bottom-trawl survey. These averages are assumed to give representative values for the beginning of the year (see stock annex for details). However, the Russian bottom-trawl survey has been discontinued and there-for stock weights-at-age were calculated using a correction factor (WKDEM2020). Since the benchmark in 2006 stock weight at age has been smoothed (ICES 2006, see stock annex for de-tails).
4.4.4 Maturity-at-age (Table 4.7)
The estimates of maturity-at-age are shown in Table 4.7. Since the benchmark 2006, smoothed estimates were produced separately for the Russian autumn survey and the joint winter survey and then combined using arithmetic average. These averages are assumed to give representative values for the beginning of the year. However, the Russian bottom-trawl survey has been dis-continued and therefore stock weights-at-age were calculated using a correction factor (see WKDEM2020 and stock annex).
4.4.5 Natural mortality (Table 4.8)
Natural mortality used in the assessment was 0.2. For ages 3-6 mortality predation by cod are added (see stock annex). For the period from 1984 to 2019 actual estimates of predation by cod have been used (see Table 4.8).
For the previous years (1950–1983) the average natural mortality for 1984–2019 was used (age groups 3-6). The historic estimates of natural mortality have changed slightly with the change of assessment model.
Estimated mortality from predation by cod in this year’s assessment is based on the ‘final run’ cod assessment.
The proportion of F and M before spawning was set to zero.
ICES | AFWG 2020 | 190
4.4.6 Data for tuning (Table 4.9)
The following survey series are included in the data for tuning both for SAM, the last age for all survey is a plus group. Data is lacking for FLT01 in 2016 and 2018, and for FLT007 in 2018.
Name ICES Acronym Place Season Age Year prior weight
FLT01: Russian bottom trawl RU-BTr-Q4 Barents Sea
October-De-cember
3–8 1991–2018
1
FLT02: Joint Barents Sea survey – acoustic
BS-NoRU-Q1(Aco) Barents Sea
February- March
3–9 1993–2020
1
FLT04: Joint Barents Sea survey - bottom trawl
BS-NoRu-Q1 (BTr) Barents Sea
February- March
3–10 1994–2020
1
FLT007: Joint Russian-Norwegian ecosystem autumn survey in the Barents Sea -bottom trawl
Eco-NoRu-Q3 (Btr) Barents Sea
August - Sep-tember
3-9 2004-2019
1
4.4.7 Changes in data from last year (Tables 4.6-4.7, 4.9)
As stock weights and maturity are modelled (see above) and due to the revision undertaken at the last benchmark (WKDEM2020) the values of these variables have changed for 1994 and the years thereafter. The values for 1950-1993 has not been changed since last working group. At the benchmark (WKDEM2020) it was decided that historic values (1950–1993) of weight and ma-turity should not be updated in the following years.
Historic M estimates are not updated prior to 1984. The data from 1984 and onwards are updated every year after the update of the cod assessment.
Following the decisions made at the last benchmark (WKDEM2020) a plus group has been added to all tuning series.
The tuning indices from the NORU winter survey (FLT02 and FLT04) now also include age 3 and new strata has been included in index calculations from this survey for the years from 2014 and onwards. The bottom trawl indices series from the winter survey (FLT02) from 1994 and onwards have been revised and updated (WKDEM2020).
The Russian bottom trawl survey (FLT01) has been discontinued. Last year with survey was in 2017. The data set is still used for tuning but will not be updated.
4.5 Assessment models and settings
At the benchmark in 2020 it was decided to continue using the SAM model as the main model and XSA, with revised settings, will be used as additional. This year the TISVPA model also is used as additional model for comparison.
The SAM configuration was revised during the benchmark. The main changes were 1) including age group 3 to Winter Joint Barents Sea survey indices (Fleet 02 and 04) 2) including a plus group to all survey series (new option in SAM), 3) including a prediction variance link for the observa-tion variances (new option in SAM, Breivik et al in prep) 4) correlation structure in observation variance for the surveys (Berg and Nielsen 2016).

191 | ICES SCIENTIFIC REPORTS 2:52 | ICES
4.5.1 SAM model settings (Table 4.10)
The configuration and tuning of SAM were decided on during the benchmark process (WKDEM2020). These new settings were used in this assessment. The configuration file is given in Table 4.10 and the stock annex.
4.6 Results of the Assessment (Tables 4.11–4.14 and Fig-ures 4.1-4.3)
The stock summary table estimated by SAM (predation included) is given in Table 4.11, the fish-ing mortality in Table 4.12, stock numbers-at-age in Table 4.13 and natural mortality M in Table 4.14.
Standard stock graphs are given in Figure 4.1, the retrospective plots in Figure 4.2 and residuals plot is presented in Figure 4.3.
The estimate of fishing mortality of main ages (4–7) in 2019 was 0.38 and above FMSY = 0.35.
The dominating feature of this assessment is that the stock reached an all-time high level around 2011 due to the strong 2004–2006 year classes. The SSB peaked in 2013: Both TSB and SSB have decreased since the all-time high, but SSB is still well above MSY Btrigger. Fishing mortality (F) has increased since 2013 and was slightly above FMSY in 2018 - 2019. Figures 4.2 a-d show that the retrospective bias is small ≤±5%.
4.7 Comparison with last year’s assessment
The text table below compares this year’s estimates with last year’s estimates. Compared to last year’s assessment the current estimates by SAM model of the total stock (TSB) and spawning stock (SSB) are higher for 2019. The F in 2018 is estimated a bit lower.
Year of assess-ment, model
F (2018)
Numbers 2019 (ages) SSB (2019)
TSB (2019)
3 4 5 6 7 8 9 10 11 12 13+
2019 SAM 0.38 336 232 75 57 17 18 6 7 3 4 5 215 524
2020 SAM 0.37 875 259 100 69 19 20 7 9 4 4 5 259 752
Ratio 2020/2019 0.99 2.6 1.1 1.3 1.2 1.1 1.1 1.2 1.3 1.2 1.2 1 1.2 1.4
4.8 Additional assessment methods (Table 4.15, Figures 4.4-4.6)
4.8.1 XSA (Figure 4.4)
The Extended Survivors Analysis (XSA) was used to tune the VPA by available index series. As last years, FLR was used for the assessment of haddock (see stock annex), and thus all results concerning XSA are obtained using FLR. The settings used were the same as set in the benchmark in 2015 (WKARCT 2015). The biomass estimates of XSA with these settings significantly deviated from estimates of main model SAM. During the WKDEM2020 it was found that changing S.E. of the mean survivor estimates shrinkage F from 1.5 to 0.5 gives estimates of biomass dynamics

ICES | AFWG 2020 | 192
close to SAM estimates. Furthermore, this change improved XSA retrospective pattern. At AFWG 2020 this comparison also done and confirmed that usage of survivor estimates shrinkage 0.5 gave the similar result with SAM estimates.
The estimated consumption of NEA haddock by NEA cod is incorporated into the XSA analysis by first constructing a catch number-at-age matrix, adding the numbers of haddock eaten by cod to the catches for the years where such data are available (1984–2019). The summary of XSA stock estimates with shrinkage value 0.5 are presented in Table 4.15. A retrospective plot for XSA is given in Figure 4.4.
4.8.2 TISVPA (Figure 4.5)
The TISVPA (Triple Instantaneous Separable VPA) model (Vasilyev, 2005; 2006) represents fish-ing mortality coefficients (more precisely – exploitation rates) as a product of three parameters: f(year)*s(age)*g(cohort). The generation-dependent parameters, which are estimated within the model, are intended to adapt traditional separable representation of fishing mortality to situa-tions when several year classes may have peculiarities in their interaction with fishing fleets caused by different spatial distribution, higher attractiveness of more abundant schools to fish-ers, or by some other reasons. To NEA haddock stock the TISVPA model was at benchmark group for arctic stocks (WKARCT) in 2015 and this year it was decided to apply to NEA haddock using the same data as SAM except that natural mortality values from cannibalism were taken from the SAM runs. All the input data, including catch-at-age, weight-at-age in stock and in catches, maturity-at-age were taken the same as for stock assessment by means of SAM. During AFWG 2020 the results of exploratory runs using the TISVPA model were presented. The results are presented in WD04. In generally biomass estimates of this model much higher than SAM, which can be explained different assumptions about indices catchability. A retrospective plot for TISVPA is given in Figure 4.5
4.8.3 Model comparisons (Figure 4.6)
Results from SAM, XSA and TISVPA are compared in Figure 4.6. Comparison of results of SAM, TISVPA and XSA with previous year settings shows that the models demonstrate similar trends. The TSVPA model is more flexible for settings than the others and taking in account a possible decreasing in survey data consistency, it was attempted to do tuning of surveys not at abundance but to age proportions because the probable change in effective survey catchability.
4.9 Predictions, reference points and harvest control rules (Tables 4.16- 4.21)
4.9.1 Recruitment (Tables 4.16, 4.17)
SAM was used to estimate the recruitment at age 3 of the 2017 year-class in 2020. The RCT3 program translation in R was used to estimate the recruiting year-classes 2018–2019 in 2021 and 2022 with survey data for ages 1-2 from the ecosystem survey (not available for 2018), and ages 1-2 for the winter survey. Input data and results are shown in Tables 4.16 and 4.17, respectively. Age 3 for the winter survey was used in RCT3 together with the indices for ages 1-2 (ecosystem survey and winter survey) to predict recruitment of the year-class 2017 and compare the estimate to the recruitment estimate from SAM in the intermediate year. The results were relatively sim-ilar (Recruitment year-class 2017: SAM=497, RCT3=575), but somewhat higher for RCT3. SAM recruitment estimates for the intermediate year are based mainly on the winter survey indices at
193 | ICES SCIENTIFIC REPORTS 2:52 | ICES
age 3, whereas the RCT3 estimates are also based on indices for age 1 and 2 from the ecosystem and winter surveys.
4.9.2 Prediction data (Table 4.18)
The input data for making the prediction are presented in Table 4.18.
Stock numbers for 2021–2022 at age 3 are taken from RCT3, and abundance at ages 3–13+ in 2020 from the SAM assessment. The average fishing pattern observed in 2017–2019 scaled to F status quo was used for distribution of fishing mortality-at-age for 2020–2022. The proportion of M and F before spawning was set to 0.
Weight at age in the stock: for intermediate year (2020) smoothed actual data used for all ages. For the 2021 weight at age 4 and older and is calculated using the fitted parameters and lengths at age of each cohort as input, and the weight - length relationship. For the 2022 weight at age 4 is calculated using the average from the 3 previous years and the weight at age 5 + is calculated using the fitted parameters and lengths at age of each cohort as input, and the weight - length relationship. Weight at age 3 in the 2021 and 2022 is predicted using the coefficient from the regression on the average of the recruitment in the actual year and the two previous years.
Weight at age 3-7 in the catch (weca) is calculated using a linear regression between stock weight (west) at age and catch weight at age.
wecaa, y~west a, y
weight at age 8-13+ in catches are predicted from the coefficients of the regression:
wecaa, y~weca a-1, y-1
Maturity: for 2020 using the predictions from fitted parameters for 2021 age 4 and older, and for 2022 age 5 and older. For age 3 in 2021 and 2022 and age 4 in 2022 used average for the 3 previous years.
4.9.3 Biomass reference points (Figure 4.1)
Biological and fisheries reference points for NEA haddock were last set following a thorough analysis as part of the WKNEAMP-2 (ICES, 2016) Harvest Control Rule evaluation in 2016. The revised model developed during the 2020 benchmark produced better fits to the data but only a small change in the reconstructed stock (WKDEM2020). A brief analysis at WKDEM2020 indi-cated that the reference points from the current model are very similar to the previously esti-mated values. Given the more thorough analysis at WKNEAMP-2 (ICES, 2016), this is taken as indicating that there was no evidence to deviate from the reference points set in 2016.
At the last benchmark (WKDEM2020) it was proposed to keep Blim = 50 000 t and Bpa = 80 000 t with the rationale that Blim is equal to Bloss, and Bpa = Blim*exp (1.645*σ), where σ = 0.3. This gives a 95% probability of maintaining SSB above Blim taking into account the uncertainty in the assess-ments and stock dynamics. BMSY trigger was proposed equal Bpa, Btrigger was then selected as a biomass that is encountered with low probability if FMSY is implemented, as recommended by WKFRAME2 (ICES CM 2011/ACOM:33). Values of reference points compared with current stock values are reflected in Figure 4.1.
4.9.4 Fishing mortality reference points (Figure 4.1)
Biological and fisheries reference points for NEA haddock were last set following a thorough analysis as part of the WKNEAMP-2 (ICES, 2016) Harvest Control Rule evaluation in 2016. The

ICES | AFWG 2020 | 194
revised model developed during the 2020 benchmark produced better fits to the data but only a small change in the reconstructed stock (WKDEM2020). A brief analysis at WKDEM2020 indi-cated that the reference points from the current model are very similar to the previously esti-mated values. Given the more thorough analysis at WKNEAMP-2 (ICES, 2016), this is taken as indicating that there was no evidence to deviate from the reference points set in 2016.
There is no standard method of estimating Flim nor Fpa, and ACOM accepted to use geometric mean recruitment (146 million) and Blim as basis for the Flim estimate. Flim is then based on the slope of line from origin at SSB = 0 to the geometric mean recruitment (146 million) and SSB = Blim. The SPR value of this slope give Flim value on SPR curve; Flim = 0.77 (found using Pasoft). Using the same approach as for Bpa; Fpa = Flim*exp(-1.645*σ) = 0.47.
FMSY = 0.35 has been estimated by long-term stochastic simulations. Values of reference points compared with current stock values are reflected in Figure 4.1.
4.9.5 Harvest control rule
The harvest control rule (HCR) was evaluated by ICES in 2007 (ICES CM 2007/ACFM:16) and found to be in agreement with the precautionary approach. The agreed HCR for haddock with last modifications is as follows (Protocol of the 40th Session of The Joint Norwegian Russian Fisheries Commission (JNRFC), 14 October 2011):
• TAC for the next year will be set at level corresponding to Fmsy. • The TAC should not be changed by more than +/- 25% compared with the previous year
TAC. • If the spawning stock falls below Bpa, the procedure for establishing TAC should be based
on a fishing mortality that is linearly reduced from Fmsy at Bpa to F= 0 at SSB equal to zero. At SSB-levels below Bpa in any of the operational years (current year and a year ahead) there should be no limitations on the year-to-year variations in TAC.
As mentioned above Flim and Fpa were revised in 2011. The new values of Flim = 0.77 and Fpa = 0.47 are higher than the previous values (0.49 and 0.35, respectively). In the 2012 meeting of the JNRFC the proposals of ICES were accepted, and the current HCR management is based on FMSY instead of Fpa. This corresponds to the goal of the management strategy for this stock and should provide maximum sustainable yield.
In 2014, JNRFC decided that from 2015 onwards, Norway and Russia can transfer to next year or borrow from last year 10% of the country’s quota. At its 45th session in October 2015, the Joint Norwegian-Russian Fisheries Commission (JNRFC) decided that a number of alternative harvest control rules (HCRs) for North-east Arctic haddock should be evaluated by ICES. This was done by WKNEAMP (ICES 2015/ACOM:60, ICES C. M. 2016/ACOM:47). Six HCRs for NEA haddock including the existing one were tested. At its 46th session in October 2016, the JNRFC decided not to change the HCR.
4.9.6 Prediction results and catch options for 2021 (Tables 4.19 - 4.21)
The projection shows an increase in SSB in 2021 to 272 kt (Table 4.19). TAC constraint F is used for 2020. The TAC for 2021 is established using the current one-year HCR, in accordance of the management plan. FMSY = 0.35 would give a quota for 2021 of 233 kt, this is an 8% increase from the TAC and advice for 2020. Yield per recruit is given in Table 4.21.
Catch options for 2021 are shown in the text table below (weights in tonnes).

195 | ICES SCIENTIFIC REPORTS 2:52 | ICES
Basis Total catch (2021)
F ages 4-7 (2021)
SSB (2022) % SSB change *
% TAC change **
% Advice change ***
ICES advice basis
Management plan 232537 0.35 272210 9.1 8.2 8.2
Other scenarios
MSY approach: FMSY 232537 0.35 272210 9.1 8.2 8.2
F = 0 0 0 394626 58.1 -100.0 -100.0
F = F2020 245410 0.3732 265779 6.5 14.1 14.1
Fpa 296269 0.4700 240780 -3.5 37.8 37.8
Flim 428690 0.7700 179103 -28.2 99.4 99.4
* SSB 2022 relative to SSB 2021.
** Catch in 2021 relative to TAC in 2020 (215000 tonnes).
*** Catch value for 2021 relative to advice value for 2020 (215000 tonnes).
Detailed information about expected catches by following HCR in 2021 and 2022 is given in Table 4.20. This catch forecast covers all catches. It is then implied that all types of catches are to be counted against this TAC. It also means that if any overfishing is expected to take place, the above calculated TAC should be reduced by the expected amount of overfishing.
4.9.7 Comments to the assessment and predictions (Figures 4.7, 4.8 and 4.9)
This year, there was a haddock benchmark (WKDEM2020). The previous benchmark was in 2015 (ICES 2015). The motivation for the benchmark was the poor retrospective (text table below).
Retrospective bias (Mohn’s Rho), 5-year peel R SSB F TSB
AFWG 2018 -3% 24% -7% 14%
AFWG2019 -5% 18% -7% 7%
WKDEM2020 -2% 3% -3% 1%
AFWG2020 -4% -3% 0% -5%
At the benchmark input data and SAM settings were modified. These modifications (detailed in the benchmark report) improved the retrospective pattern. The greatest improvement was due to the modification of the assessment model SAM to allow for plus groups in tuning series and the increase in the age span of all tuning series by adding plus groups. By adding a new year of data, the retrospective bias increased for TSB and R, decreased for F and switched from positive to negative for TSB and SSB compared to WKDEM2020. The estimates from this year’s assess-ment agree well with WKDEM2020 estimates (Figure 4.7).
The 2017 year-class now appears to be weaker than we predicted last year. This reduction in perceived year-class strength is mainly due to the results from the winter survey in 2020. The

ICES | AFWG 2020 | 196
decline in winter survey indices from age 2 to age 3 was stronger for the 2017 year-class com-pared to the 2016 year-class, indicating a lower survival at age 2 for the 2017 year-class compared to the 2016 year-class.
According to this year’s assessment, the 2016 year-class is the fifth strongest year-class in the time series back to 1950 (strongest year-class: 1950, followed by the year-classes 2005, 2006 and 1969). The 2017 year-class is above the average for year-classes 1990-2017. The 2018 and 2019 year-classes are estimated as below average of the year-classes 1990-2017. The 2019 year-class is estimated as the weakest for the time series back to 1990.
The F’s were above Fmsy in both 2018 and 2019. This might partly be due to overestimation of the stock at the start of the intermediate year for the short-term predictions, as seen from the retro-spective bias (see above). Furthermore, the selection pattern traditionally used for the short-term forecast (Figure 4.8) was different from the actual fishing pattern in 2019 (Figure 4.9). The Fbar range for NEA haddock is 4-7. A lower proportion of 3-year-old haddock (outside the Fbar range), and a higher proportion of 6-year-old haddock was fished than assumed in the forecast (Figure 4.9). This contributed to the Fbar estimate in 2019 to be higher than assumed in the prediction last year, and higher than Fmsy
Catch predictions for 3-year-olds are very uncertain because they depend on individual growth relative to the minimum fishing size limit and gear selectivity. Because the 2017 year-class now appear to be weaker than earlier assumed, and the very strong 2016 year-class is 4-year-old in the intermediate year 2020, we expect the uncertainty in the fishing pattern to be less of an issue in the coming years.
Table 4.1. North-East Arctic HADDOCK. Total nominal catch (t) by fishing areas
Year Subarea 1 Division 2.a Division 2.b un-reported (2 Total (3 Norw. stat.areas 06 and 07 (4
1960 125026 27781 1844 - 154651 6000
1961 165156 25641 2427 - 193224 4000
1962 160561 25125 1723 - 187409 3000
1963 124332 20956 936 - 146224 4000
1964 79262 18784 1112 - 99158 6000
1965 98921 18719 943 - 118583 6000
1966 125009 35143 1626 - 161778 5000
1967 107996 27962 440 - 136398 3000
1968 140970 40031 725 - 181726 3000
1969 89948 40306 566 - 130820 2000
1970 60631 27120 507 - 88258 -
1971 56989 21453 463 - 78905 -
1972 221880 42111 2162 - 266153 -
1973 285644 23506 13077 - 322227 -
1974 159051 47037 15069 - 221157 10000

197 | ICES SCIENTIFIC REPORTS 2:52 | ICES
Year Subarea 1 Division 2.a Division 2.b un-reported (2 Total (3 Norw. stat.areas 06 and 07 (4
1975 121692 44337 9729 - 175758 6000
1976 94054 37562 5648 - 137264 2000
1977 72159 28452 9547 - 110158 2000
1978 63965 30478 979 - 95422 2000
1979 63841 39167 615 - 103623 6000
1980 54205 33616 68 - 87889 5098
1981 36834 39864 455 - 77153 4767
1982 17948 29005 2 - 46955 3335
1983 5837 16859 1904 - 24600 3112
1984 2934 16683 1328 - 20945 3803
1985 27982 14340 2730 - 45052 3583
1986 61729 29771 9063 - 100563 4021
1987 97091 41084 16741 - 154916 3194
1988 45060 49564 631 - 95255 3756
1989 29723 28478 317 - 58518 4701
1990 13306 13275 601 - 27182 2912
1991 17985 17801 430 - 36216 3045
1992 30884 28064 974 - 59922 5634
1993 46918 32433 3028 - 82379 5559
1994 76748 50388 8050 - 135186 6311
1995 75860 53460 13128 - 142448 5444
1996 112749 61722 3657 - 178128 5126
1997 78128 73475 2756 - 154359 5987
1998 45640 53936 1054 - 100630 6338
1999 38291 40819 4085 - 83195 5743
2000 25931 39169 3844 - 68944 4536
2001 35072 47245 7323 - 89640 4542
2002 40721 42774 12567 18736/5310 114798/101372 6898
2003 53653 43564 8483 33226/9417 138926/115117 4279

ICES | AFWG 2020 | 198
Year Subarea 1 Division 2.a Division 2.b un-reported (2 Total (3 Norw. stat.areas 06 and 07 (4
2004 64873 47483 12146 33777/8661 158279/133163 3743
2005 53518 48081 16416 40283/9949 158298/127964 5538
2006 51124 47291 33291 21451/8949 153157/140655 5410
2007 62904 58141 25927 14553/3102 161525/150074 7110
2008 58379 60178 31219 5828/- 155604/149776 6629
2009 57723 66045 76293 0 200061 4498
2010 62604 86279 100318 0 249200 3661
2011 86931 99307 123546 0 309785 4169
2012 90141 96807 128679 0 315627 3869
2013 68416 64810 60520 0 193744 4000
2014 61537 58320 57665 0 177522 3433
2015 75195 61567 57993 0 194756 3902
2016 78714 95140 59561 0 233416 3233
2017 94772 75455 57362 0 227589 2987
2018 80902 58522 51853 0 191276 4437
2019 1) 87446 50967 36989 0 175402
1) Provisional figures, Norwegian catches on Russian quotas are included.
2) Figures based on Norwegian/Russian IUU estimates. From 2009, IUU estimates are made by a Joint Russian-Nor-wegian analysis group under the Russian-Norwegian Fisheries Commission.
3) In 2002–2008, the Norwegian IUU estimates were used in final assessment. 4) Included in total landings and in landings in region 2.a.
Table 4.2. North-East Arctic Haddock. Total nominal catch (‘000 t) by trawl and other gear for each area
Subarea 1 Division 2.a Division 2.b Unreported2
Year Trawl Others Trawl Others Trawl Others
1967 73.7 34.3 20.5 7.5 0.4 - -
1968 98.1 42.9 31.4 8.6 0.7 - -
1969 41.4 47.8 33.2 7.1 1.3 - -
1970 37.4 23.2 20.6 6.5 0.5 - -
1971 27.5 29.2 15.1 6.7 0.4 - -
1972 193.9 27.9 34.5 7.6 2.2 - -
1973 242.9 42.8 14 9.5 13.1 - -

199 | ICES SCIENTIFIC REPORTS 2:52 | ICES
Subarea 1 Division 2.a Division 2.b Unreported2
Year Trawl Others Trawl Others Trawl Others
1974 133.1 25.9 39.9 7.1 15.1 - -
1975 103.5 18.2 34.6 9.7 9.7 - -
1976 77.7 16.4 28.1 9.5 5.6 - -
1977 57.6 14.6 19.9 8.6 9.5 - -
1978 53.9 10.1 15.7 14.8 1 - -
1979 47.8 16 20.3 18.9 0.6 - -
1980 30.5 23.7 14.8 18.9 0.1 - -
1981 18.8 17.7 21.6 18.5 0.5 - -
1982 11.6 11.5 23.9 13.5 - - -
1983 3.6 2.2 8.7 8.2 0.2 1.7 -
1984 1.6 1.3 7.6 9.1 0.1 1.2 -
1985 24.4 3.5 6.2 8.1 0.1 2.6 -
1986 51.7 10.1 14 15.8 0.8 8.3 -
1987 79 18.1 23 18.1 3 13.8 -
1988 28.7 16.4 34.3 15.3 0.6 0 -
1989 20 9.7 13.5 15 0.3 0 -
1990 4.4 8.9 5.1 8.2 0.6 0 -
1991 9 8.9 8.9 8.9 0.2 0.2 -
1992 21.3 9.6 11.9 16.1 1 0 -
1993 35.3 11.6 14.5 17.9 3 0 -
1994 58.6 18.2 26.1 24.3 7.9 0.2 -
1995 63.9 12 29.6 23.8 12.1 1 -
1996 98.3 14.4 36.5 25.2 3.4 0.3 -
1997 57.4 20.7 44.9 28.6 2.5 0.3 -
1998 26 19.6 27.1 26.9 0.7 0.3 -
1999 29.4 8.9 19.1 21.8 4 0.1 -
2000 20.1 5.9 18.8 20.4 3.7 0.1 -
2001 28.4 6.7 23.4 23.8 7 0.3 -
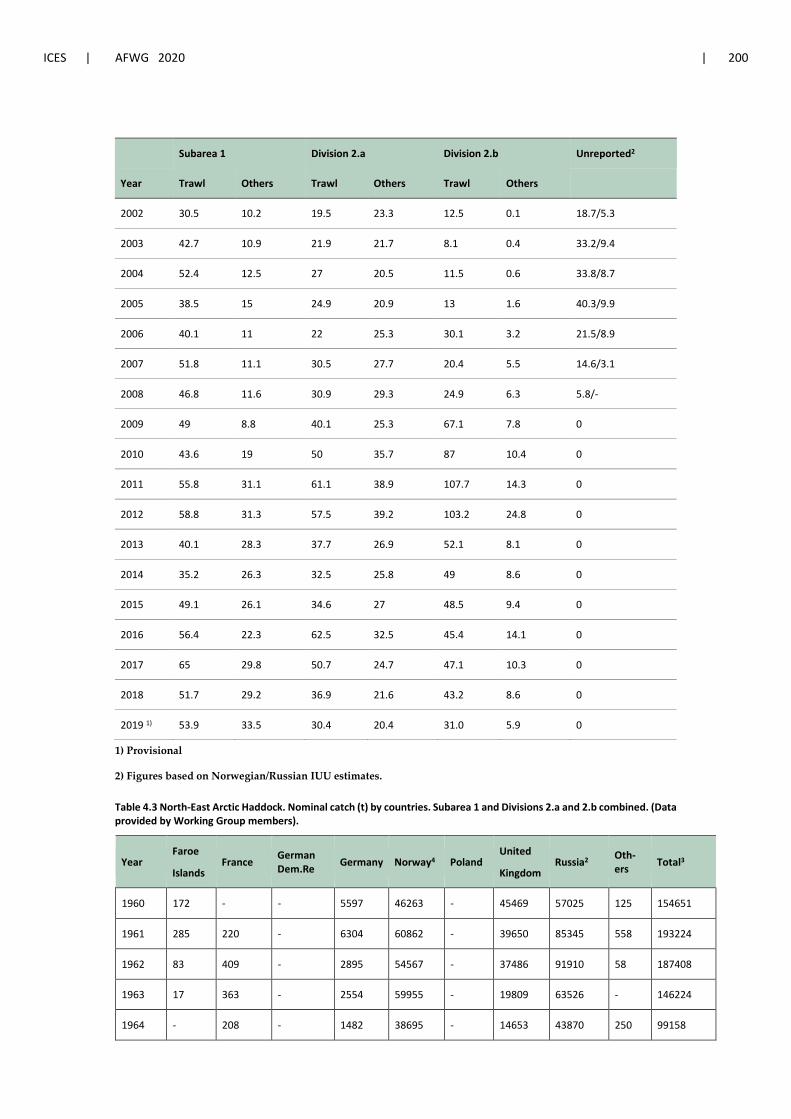
ICES | AFWG 2020 | 200
Subarea 1 Division 2.a Division 2.b Unreported2
Year Trawl Others Trawl Others Trawl Others
2002 30.5 10.2 19.5 23.3 12.5 0.1 18.7/5.3
2003 42.7 10.9 21.9 21.7 8.1 0.4 33.2/9.4
2004 52.4 12.5 27 20.5 11.5 0.6 33.8/8.7
2005 38.5 15 24.9 20.9 13 1.6 40.3/9.9
2006 40.1 11 22 25.3 30.1 3.2 21.5/8.9
2007 51.8 11.1 30.5 27.7 20.4 5.5 14.6/3.1
2008 46.8 11.6 30.9 29.3 24.9 6.3 5.8/-
2009 49 8.8 40.1 25.3 67.1 7.8 0
2010 43.6 19 50 35.7 87 10.4 0
2011 55.8 31.1 61.1 38.9 107.7 14.3 0
2012 58.8 31.3 57.5 39.2 103.2 24.8 0
2013 40.1 28.3 37.7 26.9 52.1 8.1 0
2014 35.2 26.3 32.5 25.8 49 8.6 0
2015 49.1 26.1 34.6 27 48.5 9.4 0
2016 56.4 22.3 62.5 32.5 45.4 14.1 0
2017 65 29.8 50.7 24.7 47.1 10.3 0
2018 51.7 29.2 36.9 21.6 43.2 8.6 0
2019 1) 53.9 33.5 30.4 20.4 31.0 5.9 0
1) Provisional
2) Figures based on Norwegian/Russian IUU estimates.
Table 4.3 North-East Arctic Haddock. Nominal catch (t) by countries. Subarea 1 and Divisions 2.a and 2.b combined. (Data provided by Working Group members).
Year Faroe
Islands France German
Dem.Re Germany Norway4 Poland United
Kingdom Russia2 Oth-
ers Total3
1960 172 - - 5597 46263 - 45469 57025 125 154651
1961 285 220 - 6304 60862 - 39650 85345 558 193224
1962 83 409 - 2895 54567 - 37486 91910 58 187408
1963 17 363 - 2554 59955 - 19809 63526 - 146224
1964 - 208 - 1482 38695 - 14653 43870 250 99158

201 | ICES SCIENTIFIC REPORTS 2:52 | ICES
Year Faroe
Islands France German
Dem.Re Germany Norway4 Poland United
Kingdom Russia2 Oth-
ers Total3
1965 - 226 - 1568 60447 - 14345 41750 242 118578
1966 - 1072 11 2098 82090 - 27723 48710 74 161778
1967 - 1208 3 1705 51954 - 24158 57346 23 136397
1968 - - - 1867 64076 - 40129 75654 - 181726
1969 2 - 309 1490 67549 - 37234 24211 25 130820
1970 541 - 656 2119 37716 - 20423 26802 - 88257
1971 81 - 16 896 45715 43 16373 15778 3 78905
1972 137 - 829 1433 46700 1433 17166 196224 2231 266153
1973 1212 3214 22 9534 86767 34 32408 186534 2501 322226
1974 925 3601 454 23409 66164 3045 37663 78548 7348 221157
1975 299 5191 437 15930 55966 1080 28677 65015 3163 175758
1976 536 4459 348 16660 49492 986 16940 42485 5358 137264
1977 213 1510 144 4798 40118 - 10878 52210 287 110158
1978 466 1411 369 1521 39955 1 5766 45895 38 95422
1979 343 1198 10 1948 66849 2 6454 26365 454 103623
1980 497 226 15 1365 66501 - 2948 20706 246 92504
1981 381 414 22 2402 63435 Spain 1682 13400 - 81736
1982 496 53 - 1258 43702 - 827 2900 - 49236
1983 428 - 1 729 22364 139 259 680 - 24600
1984 297 15 4 400 18813 37 276 1103 - 20945
1985 424 21 20 395 21272 77 153 22690 - 45052
1986 893 12 75 1079 52313 22 431 45738 - 100563
1987 464 7 83 3105 72419 59 563 78211 5 154916
1988 1113 116 78 1323 60823 72 435 31293 2 95255
1989 1217 - 26 171 36451 1 590 20062 - 58518
1990 705 - 5 167 20621 - 494 5190 - 27182
1991 1117 - Greenland 213 22178 - 514 12177 17 36216
1992 1093 151 1719 387 36238 38 596 19699 1 59922
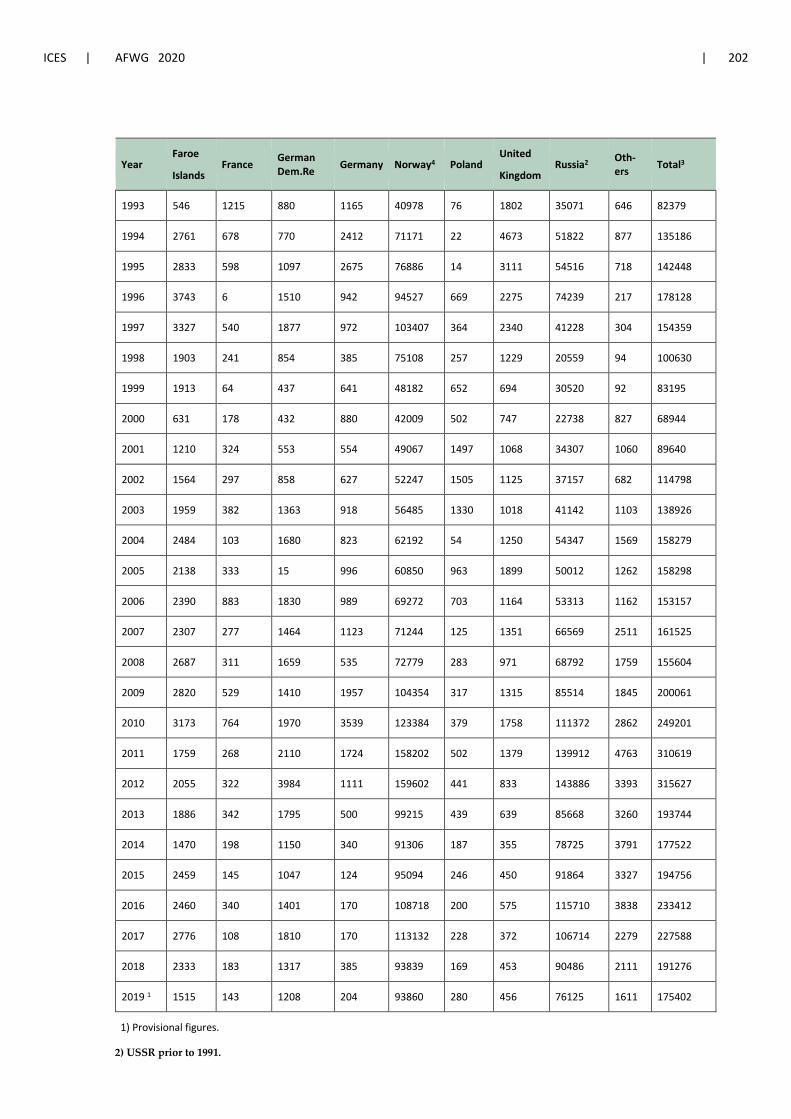
ICES | AFWG 2020 | 202
Year Faroe
Islands France German
Dem.Re Germany Norway4 Poland United
Kingdom Russia2 Oth-
ers Total3
1993 546 1215 880 1165 40978 76 1802 35071 646 82379
1994 2761 678 770 2412 71171 22 4673 51822 877 135186
1995 2833 598 1097 2675 76886 14 3111 54516 718 142448
1996 3743 6 1510 942 94527 669 2275 74239 217 178128
1997 3327 540 1877 972 103407 364 2340 41228 304 154359
1998 1903 241 854 385 75108 257 1229 20559 94 100630
1999 1913 64 437 641 48182 652 694 30520 92 83195
2000 631 178 432 880 42009 502 747 22738 827 68944
2001 1210 324 553 554 49067 1497 1068 34307 1060 89640
2002 1564 297 858 627 52247 1505 1125 37157 682 114798
2003 1959 382 1363 918 56485 1330 1018 41142 1103 138926
2004 2484 103 1680 823 62192 54 1250 54347 1569 158279
2005 2138 333 15 996 60850 963 1899 50012 1262 158298
2006 2390 883 1830 989 69272 703 1164 53313 1162 153157
2007 2307 277 1464 1123 71244 125 1351 66569 2511 161525
2008 2687 311 1659 535 72779 283 971 68792 1759 155604
2009 2820 529 1410 1957 104354 317 1315 85514 1845 200061
2010 3173 764 1970 3539 123384 379 1758 111372 2862 249201
2011 1759 268 2110 1724 158202 502 1379 139912 4763 310619
2012 2055 322 3984 1111 159602 441 833 143886 3393 315627
2013 1886 342 1795 500 99215 439 639 85668 3260 193744
2014 1470 198 1150 340 91306 187 355 78725 3791 177522
2015 2459 145 1047 124 95094 246 450 91864 3327 194756
2016 2460 340 1401 170 108718 200 575 115710 3838 233412
2017 2776 108 1810 170 113132 228 372 106714 2279 227588
2018 2333 183 1317 385 93839 169 453 90486 2111 191276
2019 1 1515 143 1208 204 93860 280 456 76125 1611 175402
1) Provisional figures.
2) USSR prior to 1991.

203 | ICES SCIENTIFIC REPORTS 2:52 | ICES
3) Figures based on Norwegian IUU estimates in 2002-2008 (see table 4.1)
4) Included landings in Norwegian statistical areas 06 and 07 (from 1983)
Table 4.4. Northeast Arctic haddock. Catch numbers-at-age (numbers, ´000).
Year 1 2 3 4 5 6 7 8 9 10 11 12 13+
1950 0 4446 3189 37949 35344 18849 28868 9199 1979 1093 853 867 1257
1951 4069 222 65643 9178 18014 13551 6808 6850 3322 1182 734 178 436
1952 0 13674 6012 151996 13634 9850 4693 3237 2434 606 534 185 161
1953 392 8031 64528 13013 70781 5431 2867 1080 424 315 393 202 410
1954 1726 493 6563 154696 5885 27590 3233 1302 712 319 126 68 349
1955 0 989 1154 10689 176678 4993 28273 1445 271 100 50 30 20
1956 97 3012 16437 5922 14713 127879 3182 8003 450 200 80 60 45
1957 828 243 2074 24704 7942 12535 46619 1087 1971 356 17 40 119
1958 153 2312 1727 5914 31438 5820 12748 17565 822 1072 226 79 296
1959 169 2425 20318 7826 7243 14040 3154 2237 5918 285 316 71 113
1960 2319 3613 39910 70912 13647 7101 6236 1579 2340 2005 497 70 42
1961 362 5531 15429 56855 63351 8706 3578 4407 788 527 1287 67 80
1962 0 4524 39503 30868 48903 33836 3201 1341 1773 242 247 483 28
1963 3 2143 28466 72736 18969 13579 9257 1239 559 409 80 84 212
1964 149 834 22363 49290 30672 5815 3527 2716 833 104 206 235 190
1965 0 3498 5936 46356 40201 12631 1679 974 897 123 204 123 471
1966 0 2577 26345 22631 63176 29048 5752 582 438 189 186 25 30
1967 0 53 15907 41346 13496 25719 8872 1616 218 175 155 75 41
1968 0 33 657 67632 41267 7748 15599 5292 655 182 101 115 70
1969 0 1061 1524 1968 44634 19002 3620 4937 1628 316 43 43 23
1970 480 281 23444 2454 1906 22417 8100 2012 2016 740 166 26 96
1971 15 3535 1978 24358 1257 918 9279 3056 826 1043 369 130 35
1972 133 9399 230942 22315 42981 3206 1611 6758 2638 900 989 538 120
1973 0 5956 70679 260520 24180 6919 422 426 1692 529 147 339 95
1974 281 3713 9685 41706 88120 5829 4138 382 618 2043 935 276 659
1975 1321 4355 10037 14088 33871 49711 2135 1236 92 131 500 147 287

ICES | AFWG 2020 | 204
Year 1 2 3 4 5 6 7 8 9 10 11 12 13+
1976 3475 7499 13994 13454 6810 20796 40057 1247 1350 193 280 652 671
1977 184 18456 55967 22043 7368 2586 7781 11043 311 388 96 101 182
1978 46 2033 47311 18812 4076 1389 1626 2596 6215 162 258 3 139
1979 0 48 17540 35290 10645 1429 812 546 1466 2310 181 87 55
1980 0 0 627 22878 21794 2971 250 504 230 842 1299 111 50
1981 1 68 486 2561 22124 10685 1034 162 162 72 330 564 69
1982 2 29 883 900 3372 12203 2625 344 75 80 91 321 238
1983 3 351 1173 2636 1360 2394 2506 1799 267 37 60 100 132
1984 7 754 1271 1019 1899 657 950 2619 352 87 2 22 53
1985 4 2952 29624 1695 564 1009 943 886 1763 588 124 64 93
1986 506 650 23113 68429 1565 783 896 393 702 1144 443 130 414
1987 9 83 5031 87170 64556 960 597 376 212 230 419 245 73
1988 7 139 1439 12478 47890 20429 397 178 74 88 168 198 80
1989 611 221 2157 4986 16071 25313 3198 147 1 28 28 53 96
1990 2 446 1015 2580 2142 4046 6221 840 134 42 14 13 44
1991 23 533 4421 3564 2416 3299 4633 3953 461 83 9 18 27
1992 49 2793 11571 11567 4099 2642 2894 3327 3498 486 35 32 18
1993 498 272 13487 19457 13704 4103 1747 1886 2105 1965 201 96 25
1994 95 187 3374 47821 36333 13264 2057 903 1453 2769 1802 259 49
1995 2 85 2003 16109 72644 19145 6417 746 361 770 655 804 116
1996 35 478 1662 6818 36473 73579 13426 2944 573 365 533 598 767
1997 70 94 2280 5633 12603 32832 49478 5636 778 245 126 158 463
1998 547 1476 1701 11304 9258 8633 13801 19469 2113 330 59 54 377
1999 104 568 16839 8039 15365 6073 4466 6355 6204 647 117 109 220
2000 46 692 1520 29986 6496 5149 2406 1657 1570 1744 183 70 184
2001 374 1758 12971 5230 32049 5279 2941 1137 1161 1169 747 169 288
2002 59 603 7132 46335 11084 21985 2602 1602 482 448 581 349 98
2003 123 611 6803 31448 56480 11736 14541 1637 2178 858 411 413 395
2004 58 1295 7993 21116 41310 41226 4939 4914 598 1252 296 139 465

205 | ICES SCIENTIFIC REPORTS 2:52 | ICES
Year 1 2 3 4 5 6 7 8 9 10 11 12 13+
2005 102 865 11452 19369 22887 37067 24461 2393 2997 990 201 263 1059
2006 271 2496 4539 35040 27571 15033 16023 8567 1259 1298 222 175 321
2007 575 3914 30707 15213 45992 18516 10642 7889 2570 678 605 197 185
2008 440 2089 14536 44192 15926 31173 9145 4520 2846 1181 274 214 166
2009 483 1364 15379 55013 52498 13679 15382 3800 1669 887 285 353 321
2010 457 620 6545 52006 80622 50306 9273 5324 1954 1114 533 242 621
2011 909 806 1277 8501 90394 100522 39496 4397 2340 668 437 269 708
2012 268 611 7814 4206 18007 93055 82721 14445 1325 448 217 216 568
2013 402 904 1778 12780 3805 12297 58024 29930 4976 957 331 212 535
2014 528 649 6948 4503 14563 6833 16304 39620 16439 2431 619 440 545
2015 303 1334 1645 27317 8526 16624 7950 20538 25534 6677 1556 295 312
2016 294 655 5774 3482 33177 9563 18045 12030 21875 13492 4757 876 248
2017 724 1898 30744 46463 16895 48927 10518 14992 9 485 8447 6 640 1872 317
2018 679 1438 9424 16291 34060 8466 18882 5123 8902 4125 3564 4504 1040
2019 797 968 13908 28572 24171 32555 6278 6803 2601 3618 1225 1715 1400
Table 4.5. Northeast Arctic haddock. Catch weights-at-age (kg).
Year 1 2 3 4 5 6 7 8 9 10 11 12 13+
1950 0.299 0.519 0.75 1.038 1.321 1.617 1.873 2.147 2.418 2.698 2.931 3.094 3.461
1951 0.299 0.519 0.75 1.038 1.321 1.617 1.873 2.147 2.418 2.698 2.931 3.094 3.461
1952 0.299 0.519 0.75 1.038 1.321 1.617 1.873 2.147 2.418 2.698 2.931 3.094 3.461
1953 0.299 0.519 0.75 1.038 1.321 1.617 1.873 2.147 2.418 2.698 2.931 3.094 3.461
1954 0.299 0.519 0.75 1.038 1.321 1.617 1.873 2.147 2.418 2.698 2.931 3.094 3.461
1955 0.299 0.519 0.75 1.038 1.321 1.617 1.873 2.147 2.418 2.698 2.931 3.094 3.461
1956 0.299 0.519 0.75 1.038 1.321 1.617 1.873 2.147 2.418 2.698 2.931 3.094 3.461
1957 0.299 0.519 0.75 1.038 1.321 1.617 1.873 2.147 2.418 2.698 2.931 3.094 3.461
1958 0.299 0.519 0.75 1.038 1.321 1.617 1.873 2.147 2.418 2.698 2.931 3.094 3.461
1959 0.299 0.519 0.75 1.038 1.321 1.617 1.873 2.147 2.418 2.698 2.931 3.094 3.461
1960 0.299 0.519 0.75 1.038 1.321 1.617 1.873 2.147 2.418 2.698 2.931 3.094 3.461
1961 0.299 0.519 0.75 1.038 1.321 1.617 1.873 2.147 2.418 2.698 2.931 3.094 3.461

ICES | AFWG 2020 | 206
Year 1 2 3 4 5 6 7 8 9 10 11 12 13+
1962 0.299 0.519 0.75 1.038 1.321 1.617 1.873 2.147 2.418 2.698 2.931 3.094 3.461
1963 0.299 0.519 0.75 1.038 1.321 1.617 1.873 2.147 2.418 2.698 2.931 3.094 3.461
1964 0.299 0.519 0.75 1.038 1.321 1.617 1.873 2.147 2.418 2.698 2.931 3.094 3.461
1965 0.299 0.519 0.75 1.038 1.321 1.617 1.873 2.147 2.418 2.698 2.931 3.094 3.461
1966 0.299 0.519 0.75 1.038 1.321 1.617 1.873 2.147 2.418 2.698 2.931 3.094 3.461
1967 0.299 0.519 0.75 1.038 1.321 1.617 1.873 2.147 2.418 2.698 2.931 3.094 3.461
1968 0.299 0.519 0.75 1.038 1.321 1.617 1.873 2.147 2.418 2.698 2.931 3.094 3.461
1969 0.299 0.519 0.75 1.038 1.321 1.617 1.873 2.147 2.418 2.698 2.931 3.094 3.461
1970 0.299 0.519 0.75 1.038 1.321 1.617 1.873 2.147 2.418 2.698 2.931 3.094 3.461
1971 0.299 0.519 0.75 1.038 1.321 1.617 1.873 2.147 2.418 2.698 2.931 3.094 3.461
1972 0.299 0.519 0.75 1.038 1.321 1.617 1.873 2.147 2.418 2.698 2.931 3.094 3.461
1973 0.299 0.519 0.75 1.038 1.321 1.617 1.873 2.147 2.418 2.698 2.931 3.094 3.461
1974 0.299 0.519 0.75 1.038 1.321 1.617 1.873 2.147 2.418 2.698 2.931 3.094 3.461
1975 0.299 0.519 0.75 1.038 1.321 1.617 1.873 2.147 2.418 2.698 2.931 3.094 3.461
1976 0.299 0.519 0.75 1.038 1.321 1.617 1.873 2.147 2.418 2.698 2.931 3.094 3.461
1977 0.299 0.519 0.75 1.038 1.321 1.617 1.873 2.147 2.418 2.698 2.931 3.094 3.461
1978 0.299 0.519 0.75 1.038 1.321 1.617 1.873 2.147 2.418 2.698 2.931 3.094 3.461
1979 0.299 0.519 0.75 1.038 1.321 1.617 1.873 2.147 2.418 2.698 2.931 3.094 3.461
1980 0.299 0.519 0.75 1.038 1.321 1.617 1.873 2.147 2.418 2.698 2.931 3.094 3.461
1981 0.299 0.519 0.75 1.038 1.321 1.617 1.873 2.147 2.418 2.698 2.931 3.094 3.461
1982 0.299 0.519 0.75 1.038 1.321 1.617 1.873 2.147 2.418 2.698 2.931 3.094 3.461
1983 0.188 0.689 1.033 1.408 1.71 2.149 2.469 2.748 3.069 3.687 4.516 3.094 3.461
1984 0.408 0.805 1.218 1.632 2.038 2.852 2.845 3.218 3.605 4.065 4.407 4.734 5.099
1985 0.319 0.383 0.835 1.29 1.816 2.174 2.301 2.835 3.253 3.721 4.084 4.137 4.926
1986 0.218 0.325 0.612 1.064 1.539 1.944 2.362 2.794 3.25 3.643 4.14 4.559 5.927
1987 0.143 0.221 0.497 0.765 1.179 1.724 2.135 2.551 3.009 3.414 3.84 4.415 5.195
1988 0.279 0.551 0.55 0.908 1.097 1.357 1.537 1.704 2.403 2.403 2.486 2.531 2.834
1989 0.258 0.55 0.684 0.84 0.998 1.176 1.546 1.713 1.949 2.14 2.389 2.522 2.797
1990 0.319 0.601 0.793 1.172 1.397 1.624 1.885 2.112 2.653 3.102 3.18 3.438 3.319

207 | ICES SCIENTIFIC REPORTS 2:52 | ICES
Year 1 2 3 4 5 6 7 8 9 10 11 12 13+
1991 0.216 0.616 0.941 1.281 1.556 1.797 2.044 2.079 2.311 2.788 3.408 2.896 3.274
1992 0.055 0.458 0.906 1.263 1.535 1.747 2.043 2.2 2.298 2.494 2.49 2.673 2.923
1993 0.381 0.64 0.94 1.204 1.487 1.748 1.994 2.237 2.417 2.654 2.906 3.184 3.363
1994 0.278 0.521 0.614 0.906 1.287 1.602 1.968 2.059 2.39 2.545 2.881 2.918 3.222
1995 0.258 0.446 0.739 0.808 1.107 1.556 1.838 2.234 2.416 2.602 2.965 3.163 3.786
1996 0.287 0.427 0.683 0.868 1.045 1.363 1.71 1.886 2.214 2.37 2.438 2.707 2.896
1997 0.408 0.575 0.682 1.028 1.151 1.369 1.637 1.856 2.073 2.5 2.279 2.532 2.609
1998 0.409 0.593 0.748 0.974 1.262 1.433 1.641 1.863 2.069 2.335 2.511 2.8 2.849
1999 0.435 0.695 0.826 1.079 1.261 1.485 1.634 1.798 2.032 2.237 2.339 2.611 2.865
2000 0.378 0.577 0.853 1.186 1.395 1.588 1.808 1.989 2.264 2.415 2.587 2.647 3.098
2001 0.391 0.647 0.751 1.104 1.459 1.709 1.921 2.182 2.331 2.609 2.757 3.376 3.338
2002 0.159 0.407 0.687 1.001 1.363 1.643 1.975 2.086 2.294 2.487 2.612 2.847 3.501
2003 0.198 0.384 0.594 0.875 1.113 1.364 1.361 1.972 1.636 1.877 2.088 2.351 2.842
2004 0.328 0.429 0.636 0.886 1.183 1.508 1.821 2.075 2.339 2.58 2.527 3.153 3.197
2005 0.285 0.492 0.722 0.906 1.121 1.343 1.619 2.036 2.177 2.382 2.527 2.496 2.81
2006 0.311 0.567 0.745 1.041 1.287 1.504 1.72 2.082 2.377 2.738 3.082 3.02 3.43
2007 0.329 0.431 0.652 0.899 1.197 1.435 1.722 1.99 2.309 2.715 2.987 2.947 3.591
2008 0.383 0.484 0.658 0.901 1.242 1.515 1.781 2.18 2.33 2.664 3.019 3.326 3.829
2009 0.378 0.508 0.707 1.024 1.28 1.538 1.806 2.107 2.398 2.531 2.606 3.089 3.541
2010 0.317 0.499 0.642 0.887 1.137 1.396 1.702 1.907 2.095 2.404 2.534 3.064 3.249
2011 0.423 0.513 0.811 0.953 1.093 1.254 1.462 1.715 1.978 2.328 2.305 2.55 2.76
2012 0.271 0.506 0.756 1.004 1.174 1.371 1.514 1.715 2.051 2.444 2.414 2.615 2.932
2013 0.469 0.542 0.821 1.014 1.217 1.401 1.571 1.714 1.914 2.168 2.24 2.516 2.807
2014 0.469 0.645 0.792 1.033 1.253 1.417 1.625 1.793 1.941 2.081 2.479 2.703 3.011
2015 0.473 0.647 0.876 1.054 1.327 1.571 1.777 1.934 2.025 2.216 2.481 2.99 3.455
2016 0.497 0.743 0.882 1.115 1.369 1.662 1.917 2.089 2.301 2.567 3.076 3.286 3.331
2017 0.449 0.608 0.874 1.088 1.378 1.666 1.879 2.146 2.258 2.476 2.72 2.98 3.713
2018 0.443 0.663 0.820 1.051 1.339 1.629 1.927 2.156 2.372 2.588 2.728 2.773 3.175
2019 0.341 0.508 0.729 0.955 1.275 1.581 1.834 2.151 2.378 2.607 2.868 2.934 3.382

ICES | AFWG 2020 | 208
Table 4.6. Northeast Arctic haddock. Stock weights-at-age (kg). The data from 1950-1993 is unchanged since A, the data from 1994 and onward have been updated this year.
Year 1 2 3 4 5 6 7 8 9 10 11 12 13+
1950 0.031 0.145 0.354 0.653 1.016 1.427 1.867 2.327 2.771 3.195 3.597 3.597 3.597
1951 0.031 0.145 0.354 0.653 1.016 1.427 1.867 2.327 2.771 3.195 3.597 3.597 3.597
1952 0.031 0.145 0.354 0.653 1.016 1.427 1.867 2.327 2.771 3.195 3.597 3.597 3.597
1953 0.031 0.145 0.354 0.653 1.016 1.427 1.867 2.327 2.771 3.195 3.597 3.597 3.597
1954 0.031 0.145 0.354 0.653 1.016 1.427 1.867 2.327 2.771 3.195 3.597 3.597 3.597
1955 0.031 0.145 0.354 0.653 1.016 1.427 1.867 2.327 2.771 3.195 3.597 3.597 3.597
1956 0.031 0.145 0.354 0.653 1.016 1.427 1.867 2.327 2.771 3.195 3.597 3.597 3.597
1957 0.031 0.145 0.354 0.653 1.016 1.427 1.867 2.327 2.771 3.195 3.597 3.597 3.597
1958 0.031 0.145 0.354 0.653 1.016 1.427 1.867 2.327 2.771 3.195 3.597 3.597 3.597
1959 0.031 0.145 0.354 0.653 1.016 1.427 1.867 2.327 2.771 3.195 3.597 3.597 3.597
1960 0.031 0.145 0.354 0.653 1.016 1.427 1.867 2.327 2.771 3.195 3.597 3.597 3.597
1961 0.031 0.145 0.354 0.653 1.016 1.427 1.867 2.327 2.771 3.195 3.597 3.597 3.597
1962 0.031 0.145 0.354 0.653 1.016 1.427 1.867 2.327 2.771 3.195 3.597 3.597 3.597
1963 0.031 0.145 0.354 0.653 1.016 1.427 1.867 2.327 2.771 3.195 3.597 3.597 3.597
1964 0.031 0.145 0.354 0.653 1.016 1.427 1.867 2.327 2.771 3.195 3.597 3.597 3.597
1965 0.031 0.145 0.354 0.653 1.016 1.427 1.867 2.327 2.771 3.195 3.597 3.597 3.597
1966 0.031 0.145 0.354 0.653 1.016 1.427 1.867 2.327 2.771 3.195 3.597 3.597 3.597
1967 0.031 0.145 0.354 0.653 1.016 1.427 1.867 2.327 2.771 3.195 3.597 3.597 3.597
1968 0.031 0.145 0.354 0.653 1.016 1.427 1.867 2.327 2.771 3.195 3.597 3.597 3.597
1969 0.031 0.145 0.354 0.653 1.016 1.427 1.867 2.327 2.771 3.195 3.597 3.597 3.597
1970 0.031 0.145 0.354 0.653 1.016 1.427 1.867 2.327 2.771 3.195 3.597 3.597 3.597
1971 0.031 0.145 0.354 0.653 1.016 1.427 1.867 2.327 2.771 3.195 3.597 3.597 3.597
1972 0.031 0.145 0.354 0.653 1.016 1.427 1.867 2.327 2.771 3.195 3.597 3.597 3.597
1973 0.031 0.145 0.354 0.653 1.016 1.427 1.867 2.327 2.771 3.195 3.597 3.597 3.597
1974 0.031 0.145 0.354 0.653 1.016 1.427 1.867 2.327 2.771 3.195 3.597 3.597 3.597
1975 0.031 0.145 0.354 0.653 1.016 1.427 1.867 2.327 2.771 3.195 3.597 3.597 3.597
1976 0.031 0.145 0.354 0.653 1.016 1.427 1.867 2.327 2.771 3.195 3.597 3.597 3.597

209 | ICES SCIENTIFIC REPORTS 2:52 | ICES
Year 1 2 3 4 5 6 7 8 9 10 11 12 13+
1977 0.031 0.145 0.354 0.653 1.016 1.427 1.867 2.327 2.771 3.195 3.597 3.597 3.597
1978 0.031 0.145 0.354 0.653 1.016 1.427 1.867 2.327 2.771 3.195 3.597 3.597 3.597
1979 0.031 0.145 0.354 0.653 1.016 1.427 1.867 2.327 2.771 3.195 3.597 3.597 3.597
1980 0.063 0.262 0.454 0.878 1.159 1.675 2.292 3.134 3.31 3.553 3.792 3.792 3.792
1981 0.051 0.274 0.603 0.805 1.315 1.582 2.118 2.728 3.51 3.679 3.904 3.904 3.904
1982 0.036 0.224 0.631 1.049 1.217 1.782 2.017 2.553 3.14 3.853 4.016 4.016 4.016
1983 0.035 0.164 0.524 1.098 1.558 1.663 2.255 2.448 2.97 3.524 4.165 4.165 4.165
1984 0.028 0.158 0.391 0.926 1.632 2.093 2.121 2.718 2.865 3.363 3.878 3.878 3.878
1985 0.03 0.127 0.379 0.700 1.394 2.195 2.626 2.572 3.158 3.261 3.728 3.728 3.728
1986 0.035 0.136 0.311 0.682 1.069 1.898 2.761 3.138 3.005 3.568 3.632 3.632 3.632
1987 0.042 0.161 0.331 0.569 1.047 1.473 2.411 3.307 3.616 3.412 3.946 3.946 3.946
1988 0.039 0.189 0.383 0.603 0.887 1.452 1.895 2.915 3.822 4.054 3.787 3.787 3.787
1989 0.037 0.175 0.445 0.689 0.936 1.248 1.878 2.317 3.395 4.297 4.449 4.449 4.449
1990 0.031 0.169 0.413 0.789 1.054 1.312 1.635 2.308 2.728 3.844 4.73 4.73 4.73
1991 0.025 0.141 0.402 0.737 1.193 1.458 1.714 2.035 2.732 3.122 4.256 4.256 4.256
1992 0.023 0.114 0.34 0.721 1.119 1.63 1.881 2.127 2.437 3.142 3.491 3.491 3.491
1993 0.025 0.107 0.279 0.616 1.100 1.537 2.08 2.308 2.54 2.831 3.531 3.531 3.531
1994 0.024 0.104 0.249 0.505 0.935 1.646 2.159 2.701 2.840 2.805 2.966 3.612 4.134
1995 0.030 0.112 0.260 0.468 0.799 1.318 2.102 2.622 3.154 3.282 3.200 3.151 3.909
1996 0.030 0.140 0.277 0.484 0.743 1.138 1.714 2.570 3.066 3.581 3.690 3.376 3.454
1997 0.034 0.140 0.342 0.515 0.771 1.065 1.498 2.123 3.008 3.517 3.997 3.842 3.693
1998 0.026 0.149 0.342 0.626 0.812 1.095 1.412 1.873 2.535 3.453 3.927 4.134 4.152
1999 0.027 0.119 0.362 0.626 0.975 1.154 1.446 1.772 2.264 2.945 3.858 4.064 4.441
2000 0.024 0.123 0.292 0.661 0.975 1.360 1.517 1.822 2.148 2.657 3.354 4.012 4.368
2001 0.021 0.110 0.304 0.537 1.022 1.360 1.763 1.895 2.193 2.527 3.038 3.532 4.313
2002 0.025 0.100 0.272 0.559 0.847 1.427 1.774 2.191 2.287 2.592 2.910 3.225 3.825
2003 0.025 0.116 0.247 0.505 0.878 1.199 1.844 2.191 2.599 2.683 2.966 3.093 3.532
2004 0.026 0.115 0.285 0.460 0.799 1.238 1.572 2.274 2.611 3.016 3.067 3.151 3.407
2005 0.018 0.120 0.283 0.527 0.737 1.131 1.618 1.958 2.691 3.030 3.416 3.255 3.469

ICES | AFWG 2020 | 210
Year 1 2 3 4 5 6 7 8 9 10 11 12 13+
2006 0.018 0.087 0.295 0.527 0.835 1.052 1.498 2.023 2.360 3.118 3.431 3.596 3.564
2007 0.021 0.087 0.222 0.541 0.830 1.184 1.394 1.873 2.421 2.765 3.527 3.596 3.909
2008 0.025 0.100 0.222 0.417 0.854 1.176 1.553 1.751 2.252 2.819 3.155 3.693 3.909
2009 0.026 0.116 0.249 0.414 0.668 1.207 1.544 1.936 2.125 2.657 3.215 3.331 3.995
2010 0.034 0.120 0.289 0.464 0.668 0.964 1.580 1.936 2.335 2.515 3.038 3.407 3.644
2011 0.030 0.153 0.295 0.532 0.737 0.956 1.279 1.979 2.324 2.738 2.881 3.225 3.710
2012 0.036 0.140 0.368 0.545 0.841 1.052 1.279 1.626 2.372 2.724 3.126 3.079 3.532
2013 0.030 0.159 0.342 0.666 0.860 1.191 1.394 1.617 1.981 2.778 3.111 3.300 3.392
2014 0.034 0.138 0.382 0.621 1.037 1.214 1.563 1.761 1.970 2.352 3.171 3.300 3.612
2015 0.030 0.151 0.339 0.692 0.969 1.445 1.589 1.958 2.137 2.341 2.717 3.346 3.612
2016 0.026 0.140 0.365 0.616 1.071 1.360 1.865 1.979 2.347 2.515 2.703 2.909 3.661
2017 0.025 0.120 0.342 0.666 0.961 1.489 1.763 2.298 2.385 2.751 2.895 2.895 3.210
2018 0.024 0.113 0.295 0.626 1.029 1.343 1.917 2.180 2.718 2.778 3.141 3.079 3.210
2019 NA 0.112 0.280 0.545 0.975 1.436 1.753 2.357 2.599 3.148 3.171 3.331 3.392
2020 NA NA 0.277 0.519 0.860 1.360 1.854 2.168 2.785 3.016 3.542 3.361 3.628
Table 4.7. Northeast Arctic haddock. Proportion mature-at-age. The data from 1950-1993 is unchanged since AFWG2019, the data from 1994 and onward have been updated this year.
Year 1 2 3 4 5 6 7 8 9 10 11 12 13+
1950 0 0 0.027 0.101 0.311 0.622 0.845 0.944 0.982 0.994 1 1 1
1951 0 0 0.027 0.101 0.311 0.622 0.845 0.944 0.982 0.994 1 1 1
1952 0 0 0.027 0.101 0.311 0.622 0.845 0.944 0.982 0.994 1 1 1
1953 0 0 0.027 0.101 0.311 0.622 0.845 0.944 0.982 0.994 1 1 1
1954 0 0 0.027 0.101 0.311 0.622 0.845 0.944 0.982 0.994 1 1 1
1955 0 0 0.027 0.101 0.311 0.622 0.845 0.944 0.982 0.994 1 1 1
1956 0 0 0.027 0.101 0.311 0.622 0.845 0.944 0.982 0.994 1 1 1
1957 0 0 0.027 0.101 0.311 0.622 0.845 0.944 0.982 0.994 1 1 1
1958 0 0 0.027 0.101 0.311 0.622 0.845 0.944 0.982 0.994 1 1 1
1959 0 0 0.027 0.101 0.311 0.622 0.845 0.944 0.982 0.994 1 1 1
1960 0 0 0.027 0.101 0.311 0.622 0.845 0.944 0.982 0.994 1 1 1

211 | ICES SCIENTIFIC REPORTS 2:52 | ICES
Year 1 2 3 4 5 6 7 8 9 10 11 12 13+
1961 0 0 0.027 0.101 0.311 0.622 0.845 0.944 0.982 0.994 1 1 1
1962 0 0 0.027 0.101 0.311 0.622 0.845 0.944 0.982 0.994 1 1 1
1963 0 0 0.027 0.101 0.311 0.622 0.845 0.944 0.982 0.994 1 1 1
1964 0 0 0.027 0.101 0.311 0.622 0.845 0.944 0.982 0.994 1 1 1
1965 0 0 0.027 0.101 0.311 0.622 0.845 0.944 0.982 0.994 1 1 1
1966 0 0 0.027 0.101 0.311 0.622 0.845 0.944 0.982 0.994 1 1 1
1967 0 0 0.027 0.101 0.311 0.622 0.845 0.944 0.982 0.994 1 1 1
1968 0 0 0.027 0.101 0.311 0.622 0.845 0.944 0.982 0.994 1 1 1
1969 0 0 0.027 0.101 0.311 0.622 0.845 0.944 0.982 0.994 1 1 1
1970 0 0 0.027 0.101 0.311 0.622 0.845 0.944 0.982 0.994 1 1 1
1971 0 0 0.027 0.101 0.311 0.622 0.845 0.944 0.982 0.994 1 1 1
1972 0 0 0.027 0.101 0.311 0.622 0.845 0.944 0.982 0.994 1 1 1
1973 0 0 0.027 0.101 0.311 0.622 0.845 0.944 0.982 0.994 1 1 1
1974 0 0 0.027 0.101 0.311 0.622 0.845 0.944 0.982 0.994 1 1 1
1975 0 0 0.027 0.101 0.311 0.622 0.845 0.944 0.982 0.994 1 1 1
1976 0 0 0.027 0.101 0.311 0.622 0.845 0.944 0.982 0.994 1 1 1
1977 0 0 0.027 0.101 0.311 0.622 0.845 0.944 0.982 0.994 1 1 1
1978 0 0 0.027 0.101 0.311 0.622 0.845 0.944 0.982 0.994 1 1 1
1979 0 0 0.027 0.101 0.311 0.622 0.845 0.944 0.982 0.994 1 1 1
1980 0 0 0.026 0.076 0.243 0.649 0.86 0.95 0.984 0.995 1 1 1
1981 0 0 0.056 0.104 0.303 0.549 0.857 0.948 0.984 0.995 1 1 1
1982 0 0 0.053 0.161 0.332 0.577 0.77 0.947 0.983 0.995 1 1 1
1983 0 0 0.057 0.183 0.472 0.665 0.8 0.906 0.983 0.995 1 1 1
1984 0 0 0.044 0.196 0.51 0.801 0.862 0.921 0.967 0.995 1 1 1
1985 0 0 0.027 0.149 0.522 0.796 0.928 0.953 0.973 0.989 1 1 1
1986 0 0 0.021 0.103 0.454 0.758 0.928 0.977 0.984 0.991 1 1 1
1987 0 0 0.021 0.076 0.294 0.713 0.918 0.976 0.993 0.994 1 1 1
1988 0 0 0.025 0.074 0.24 0.576 0.898 0.975 0.993 0.998 1 1 1
1989 0 0 0.032 0.09 0.25 0.534 0.822 0.966 0.993 0.998 1 1 1
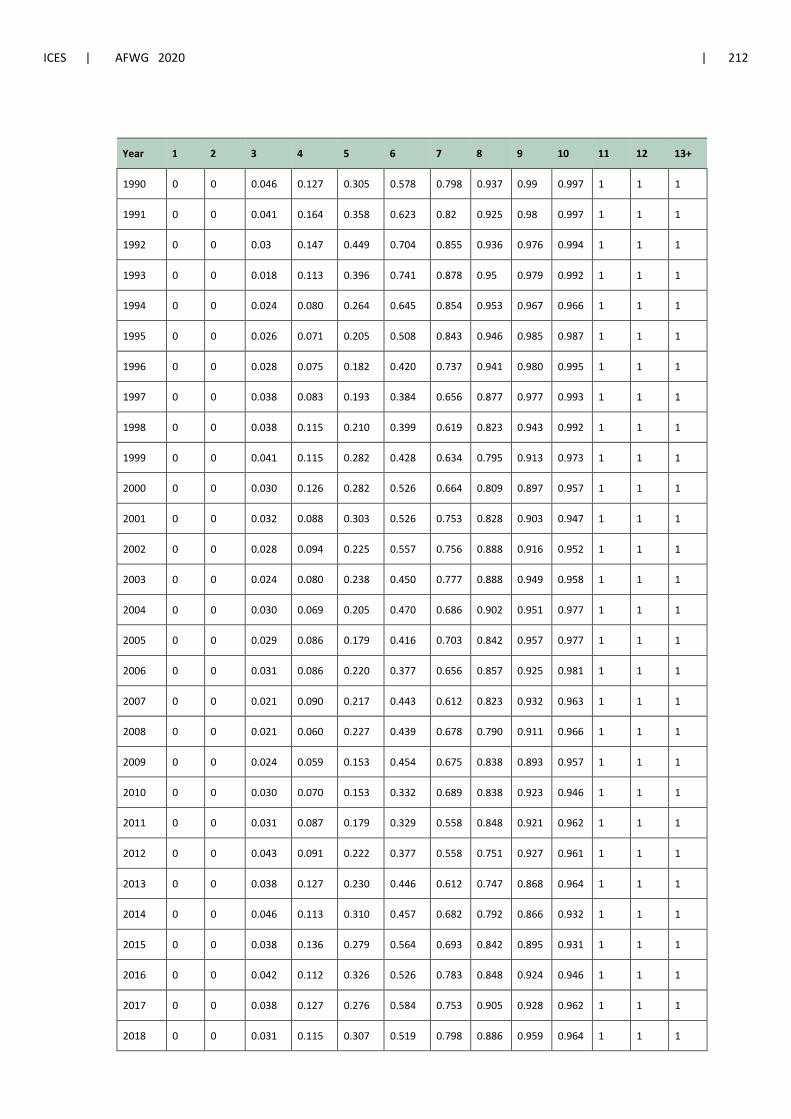
ICES | AFWG 2020 | 212
Year 1 2 3 4 5 6 7 8 9 10 11 12 13+
1990 0 0 0.046 0.127 0.305 0.578 0.798 0.937 0.99 0.997 1 1 1
1991 0 0 0.041 0.164 0.358 0.623 0.82 0.925 0.98 0.997 1 1 1
1992 0 0 0.03 0.147 0.449 0.704 0.855 0.936 0.976 0.994 1 1 1
1993 0 0 0.018 0.113 0.396 0.741 0.878 0.95 0.979 0.992 1 1 1
1994 0 0 0.024 0.080 0.264 0.645 0.854 0.953 0.967 0.966 1 1 1
1995 0 0 0.026 0.071 0.205 0.508 0.843 0.946 0.985 0.987 1 1 1
1996 0 0 0.028 0.075 0.182 0.420 0.737 0.941 0.980 0.995 1 1 1
1997 0 0 0.038 0.083 0.193 0.384 0.656 0.877 0.977 0.993 1 1 1
1998 0 0 0.038 0.115 0.210 0.399 0.619 0.823 0.943 0.992 1 1 1
1999 0 0 0.041 0.115 0.282 0.428 0.634 0.795 0.913 0.973 1 1 1
2000 0 0 0.030 0.126 0.282 0.526 0.664 0.809 0.897 0.957 1 1 1
2001 0 0 0.032 0.088 0.303 0.526 0.753 0.828 0.903 0.947 1 1 1
2002 0 0 0.028 0.094 0.225 0.557 0.756 0.888 0.916 0.952 1 1 1
2003 0 0 0.024 0.080 0.238 0.450 0.777 0.888 0.949 0.958 1 1 1
2004 0 0 0.030 0.069 0.205 0.470 0.686 0.902 0.951 0.977 1 1 1
2005 0 0 0.029 0.086 0.179 0.416 0.703 0.842 0.957 0.977 1 1 1
2006 0 0 0.031 0.086 0.220 0.377 0.656 0.857 0.925 0.981 1 1 1
2007 0 0 0.021 0.090 0.217 0.443 0.612 0.823 0.932 0.963 1 1 1
2008 0 0 0.021 0.060 0.227 0.439 0.678 0.790 0.911 0.966 1 1 1
2009 0 0 0.024 0.059 0.153 0.454 0.675 0.838 0.893 0.957 1 1 1
2010 0 0 0.030 0.070 0.153 0.332 0.689 0.838 0.923 0.946 1 1 1
2011 0 0 0.031 0.087 0.179 0.329 0.558 0.848 0.921 0.962 1 1 1
2012 0 0 0.043 0.091 0.222 0.377 0.558 0.751 0.927 0.961 1 1 1
2013 0 0 0.038 0.127 0.230 0.446 0.612 0.747 0.868 0.964 1 1 1
2014 0 0 0.046 0.113 0.310 0.457 0.682 0.792 0.866 0.932 1 1 1
2015 0 0 0.038 0.136 0.279 0.564 0.693 0.842 0.895 0.931 1 1 1
2016 0 0 0.042 0.112 0.326 0.526 0.783 0.848 0.924 0.946 1 1 1
2017 0 0 0.038 0.127 0.276 0.584 0.753 0.905 0.928 0.962 1 1 1
2018 0 0 0.031 0.115 0.307 0.519 0.798 0.886 0.959 0.964 1 1 1

213 | ICES SCIENTIFIC REPORTS 2:52 | ICES
Year 1 2 3 4 5 6 7 8 9 10 11 12 13+
2019 0 0 0.029 0.091 0.282 0.561 0.749 0.914 0.949 0.982 1 1 1
2020 0 0 0.028 0.084 0.230 0.526 0.780 0.884 0.964 0.977 1 1 1
Table 4.8. Northeast Arctic haddock. Consumption of Haddock by NEA Cod (mln. spec).
Age 0 1 2 3 4 5 6 Biomass consumed
1984 2011.01 995.57 15.52 0.08 0.00 0.00 0.00 52.3
1985 1794.21 1248.77 5.20 0.00 0.00 0.00 0.00 48.4
1986 99.55 600.20 217.97 179.89 0.00 0.00 0.00 114.0
1987 0.00 1001.62 0.00 0.00 0.00 0.00 0.00 5.5
1988 0.00 14.28 0.46 8.51 0.00 0.19 0.00 2.4
1989 18.66 197.02 0.00 0.00 0.00 0.00 0.00 8.8
1990 55.82 156.63 39.28 3.81 0.00 0.00 0.00 16.2
1991 0.00 425.45 14.99 0.00 0.00 0.00 0.00 18.8
1992 139.50 1995.17 141.65 1.09 0.00 0.00 0.00 101.9
1993 794.46 1414.25 151.53 34.84 3.59 3.05 0.00 70.7
1994 1324.15 1467.31 73.09 23.96 7.35 0.85 0.01 48.2
1995 188.34 2883.66 166.86 11.96 26.87 26.65 0.31 112.9
1996 353.18 1567.51 151.85 37.25 5.05 2.37 3.07 66.1
1997 0.00 910.60 36.78 25.78 1.60 0.71 0.48 41.5
1998 0.00 1641.45 27.59 1.79 2.63 0.46 0.00 34.2
1999 0.00 989.24 24.28 0.34 0.00 0.00 0.00 28.2
2000 774.32 1348.50 70.54 2.23 1.17 0.19 0.08 56.2
2001 1058.63 596.09 53.53 4.75 0.08 0.00 0.00 51.6
2002 461.00 2491.55 245.80 40.23 2.31 0.38 0.17 129.8
2003 1170.67 3710.83 227.73 42.08 13.61 1.29 0.00 174.3
2004 5423.01 2906.80 314.71 41.84 10.61 2.65 0.00 201.5
2005 7573.96 6566.44 276.76 56.65 9.73 2.36 0.94 320.4
2006 13698.48 8433.58 375.52 5.56 4.50 1.18 0.48 365.5
2007 1310.49 10853.40 660.84 71.78 3.85 2.20 0.22 391.7
2008 1549.58 1069.70 947.04 239.24 45.53 5.84 3.32 311.4

ICES | AFWG 2020 | 214
Age 0 1 2 3 4 5 6 Biomass consumed
2009 6543.26 2146.75 313.99 292.99 78.17 25.06 1.72 288.4
2010 2340.64 6603.25 202.93 75.00 76.43 69.89 13.10 305.4
2011 2788.43 3085.51 513.66 63.79 85.73 98.80 22.10 322.3
2012 268.70 8436.87 158.19 126.68 17.80 8.07 5.10 259.7
2013 2466.70 1843.46 455.99 37.86 26.74 6.67 5.07 237.5
2014 1378.75 2266.37 162.76 31.84 2.07 0.72 0.00 100.7
2015 5123.77 2718.79 149.24 15.74 52.30 1.73 0.27 192.5
2016 8419.85 2815.58 289.17 25.34 2.90 9.11 2.10 236.1
2017 4674.22 7940.25 246.07 25.80 14.62 7.09 15.62 292.7
2018 2468.65 7379.06 639.33 72.10 7.96 0.67 0.02 296.0
2019 596.33 4719.58 440.02 137.70 9.64 0.39 0.00 229.1
1984-2019 2135.23 2928.92 216.97 48.29 14.25 7.74 2.06 153.7
Table 4.9. Northeast Arctic haddock. Survey indices for SAM tuning. The last age is a plus group.
North-East Arctic haddock
104
RU-BTr-Q4
1991 2019
1 1 0.9 1.00
3 8
1 62 9 3 6 18 17
1 346 50 4 6 9 9
1 1985 356 48 8 4 4
1 442 1014 116 15 1 6
1 31 123 370 40 5 4
1 28 49 362 334 29 6
1 32 32 10 27 10 8
1 38 46 8 5 15 5
1 196 39 37 8 3 14
1 60 109 26 11 2 5
1 334 40 65 11 4 4
1 399 450 47 24 4 3
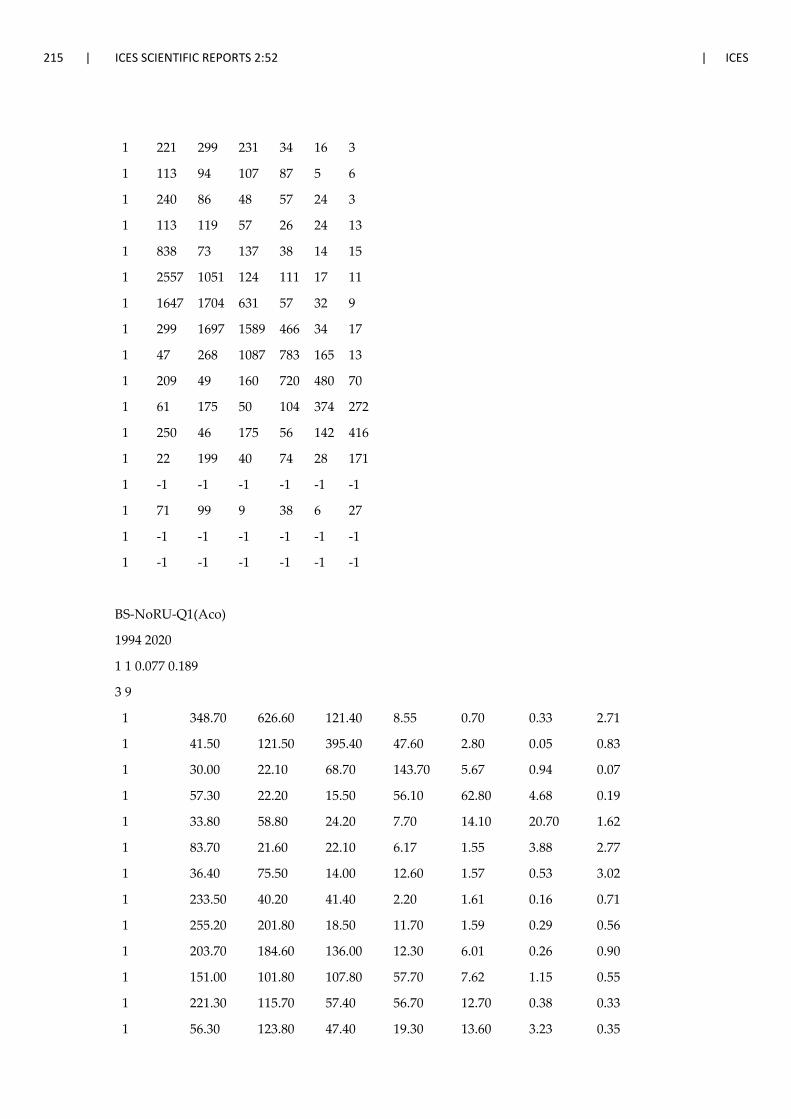
215 | ICES SCIENTIFIC REPORTS 2:52 | ICES
1 221 299 231 34 16 3
1 113 94 107 87 5 6
1 240 86 48 57 24 3
1 113 119 57 26 24 13
1 838 73 137 38 14 15
1 2557 1051 124 111 17 11
1 1647 1704 631 57 32 9
1 299 1697 1589 466 34 17
1 47 268 1087 783 165 13
1 209 49 160 720 480 70
1 61 175 50 104 374 272
1 250 46 175 56 142 416
1 22 199 40 74 28 171
1 -1 -1 -1 -1 -1 -1
1 71 99 9 38 6 27
1 -1 -1 -1 -1 -1 -1
1 -1 -1 -1 -1 -1 -1
BS-NoRU-Q1(Aco)
1994 2020
1 1 0.077 0.189
3 9
1 348.70 626.60 121.40 8.55 0.70 0.33 2.71
1 41.50 121.50 395.40 47.60 2.80 0.05 0.83
1 30.00 22.10 68.70 143.70 5.67 0.94 0.07
1 57.30 22.20 15.50 56.10 62.80 4.68 0.19
1 33.80 58.80 24.20 7.70 14.10 20.70 1.62
1 83.70 21.60 22.10 6.17 1.55 3.88 2.77
1 36.40 75.50 14.00 12.60 1.57 0.53 3.02
1 233.50 40.20 41.40 2.20 1.61 0.16 0.71
1 255.20 201.80 18.50 11.70 1.59 0.29 0.56
1 203.70 184.60 136.00 12.30 6.01 0.26 0.90
1 151.00 101.80 107.80 57.70 7.62 1.15 0.55
1 221.30 115.70 57.40 56.70 12.70 0.38 0.33
1 56.30 123.80 47.40 19.30 13.60 3.23 0.35
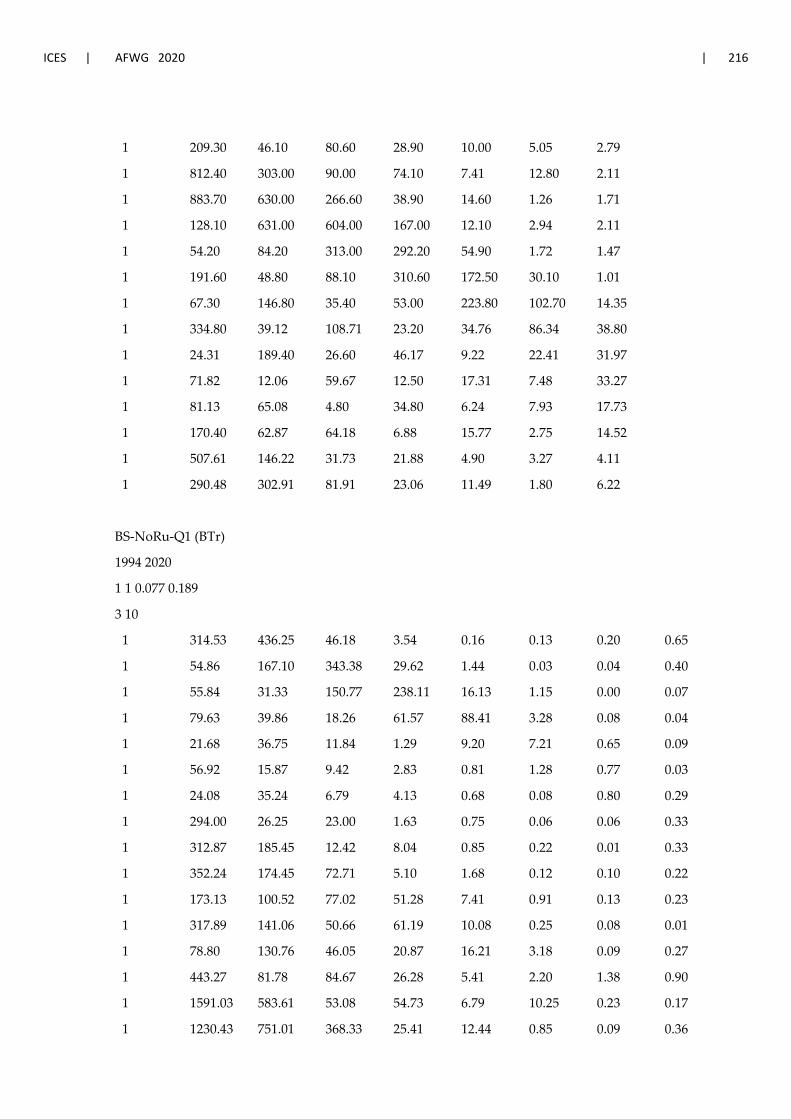
ICES | AFWG 2020 | 216
1 209.30 46.10 80.60 28.90 10.00 5.05 2.79
1 812.40 303.00 90.00 74.10 7.41 12.80 2.11
1 883.70 630.00 266.60 38.90 14.60 1.26 1.71
1 128.10 631.00 604.00 167.00 12.10 2.94 2.11
1 54.20 84.20 313.00 292.20 54.90 1.72 1.47
1 191.60 48.80 88.10 310.60 172.50 30.10 1.01
1 67.30 146.80 35.40 53.00 223.80 102.70 14.35
1 334.80 39.12 108.71 23.20 34.76 86.34 38.80
1 24.31 189.40 26.60 46.17 9.22 22.41 31.97
1 71.82 12.06 59.67 12.50 17.31 7.48 33.27
1 81.13 65.08 4.80 34.80 6.24 7.93 17.73
1 170.40 62.87 64.18 6.88 15.77 2.75 14.52
1 507.61 146.22 31.73 21.88 4.90 3.27 4.11
1 290.48 302.91 81.91 23.06 11.49 1.80 6.22
BS-NoRu-Q1 (BTr)
1994 2020
1 1 0.077 0.189
3 10
1 314.53 436.25 46.18 3.54 0.16 0.13 0.20 0.65
1 54.86 167.10 343.38 29.62 1.44 0.03 0.04 0.40
1 55.84 31.33 150.77 238.11 16.13 1.15 0.00 0.07
1 79.63 39.86 18.26 61.57 88.41 3.28 0.08 0.04
1 21.68 36.75 11.84 1.29 9.20 7.21 0.65 0.09
1 56.92 15.87 9.42 2.83 0.81 1.28 0.77 0.03
1 24.08 35.24 6.79 4.13 0.68 0.08 0.80 0.29
1 294.00 26.25 23.00 1.63 0.75 0.06 0.06 0.33
1 312.87 185.45 12.42 8.04 0.85 0.22 0.01 0.33
1 352.24 174.45 72.71 5.10 1.68 0.12 0.10 0.22
1 173.13 100.52 77.02 51.28 7.41 0.91 0.13 0.23
1 317.89 141.06 50.66 61.19 10.08 0.25 0.08 0.01
1 78.80 130.76 46.05 20.87 16.21 3.18 0.09 0.27
1 443.27 81.78 84.67 26.28 5.41 2.20 1.38 0.90
1 1591.03 583.61 53.08 54.73 6.79 10.25 0.23 0.17
1 1230.43 751.01 368.33 25.41 12.44 0.85 0.09 0.36

217 | ICES SCIENTIFIC REPORTS 2:52 | ICES
1 102.45 510.45 443.76 139.32 7.99 1.02 0.39 0.57
1 52.88 123.63 469.48 290.04 65.24 1.42 1.12 0.18
1 316.08 28.79 74.71 267.95 154.60 24.77 3.12 0.39
1 57.44 143.98 22.02 33.62 191.15 69.39 6.11 0.08
1 381.17 32.73 104.40 23.26 50.04 97.54 38.69 2.43
1 30.62 187.04 43.60 39.44 14.67 18.74 30.74 10.20
1 163.39 34.34 115.60 22.41 41.95 12.44 32.40 33.16
1 134.90 105.50 7.55 55.34 9.69 15.60 2.53 23.86
1 336.31 86.66 65.76 7.77 15.59 3.62 2.56 11.93
1 1075.55 187.22 49.40 17.00 4.04 2.95 0.74 1.91
1 424.23 586.99 99.12 22.08 6.06 2.61 1.04 2.83
FLT007: Eco-NoRu-Q3 (Btr)
2004 2019
1 1 0.65 0.75
3 9
1 123.37 70.30 69.12 31.48 2.99 1.72 0.22
1 324.56 89.53 30.44 32.25 15.04 0.47 1.12
1 107.47 124.64 41.60 18.98 17.48 7.29 1.38
1 1282.94 88.50 90.37 19.23 5.88 7.10 3.21
1 1154.87 406.00 43.13 35.52 4.94 2.51 2.54
1 650.74 619.09 305.88 21.05 6.55 0.87 0.58
1 184.00 865.32 666.44 147.72 15.84 2.73 0.59
1 40.45 73.80 392.93 301.37 37.36 2.97 0.51
1 92.47 20.35 67.61 214.05 152.03 12.74 2.00
1 25.78 65.23 19.58 50.85 150.13 76.43 7.56
1 261.63 40.77 70.16 25.78 60.45 85.77 19.65
1 42.15 213.64 25.13 37.11 20.58 47.87 42.90
1 209.30 34.43 184.09 47.97 56.79 40.37 125.91
1 70.31 70.31 11.47 20.54 3.96 4.03 15.27
1 -1 -1 -1 -1 -1 -1 -1
1 896.98 160.74 38.07 15.13 5.30 5.04 11.56

ICES | AFWG 2020 | 218
Table 4.10 North East Arctic haddock. SAM model configuration used. Updated at WKDEM2020
#Configuration saved: Wed Feb 12 12:57:09 2020
# Where a matrix is specified rows corresponds to fleets and columns to ages.
# Same number indicates same parameter used
# Numbers (integers) starts from zero and must be consecutive
$minAge
# The minimum age class in the assessment
3
$maxAge
# The maximum age class in the assessment
13
$maxAgePlusGroup
# Is last age group considered a plus group for each fleet (1 yes, or 0 no).
1 1 1 1 1
$keyLogFsta
# Coupling of the fishing mortality states (nomally only first row is used).
0 1 2 3 4 5 5 5 5 5 5
-1 -1 -1 -1 -1 -1 -1 -1 -1 -1 -1
-1 -1 -1 -1 -1 -1 -1 -1 -1 -1 -1
-1 -1 -1 -1 -1 -1 -1 -1 -1 -1 -1
-1 -1 -1 -1 -1 -1 -1 -1 -1 -1 -1
$corFlag
# Correlation of fishing mortality across ages (0 independent, 1 compound symmetry, 2 AR(1), 3 separable AR(1).
2
$keyLogFpar
# Coupling of the survey catchability parameters (nomally first row is not used, as that is covered by fishing mortality).
-1 -1 -1 -1 -1 -1 -1 -1 -1 -1 -1
0 1 1 1 1 1 -1 -1 -1 -1 -1
2 3 3 3 3 4 4 -1 -1 -1 -1
5 6 6 6 6 7 7 7 -1 -1 -1
8 9 9 9 9 9 9 -1 -1 -1 -1
$keyQpow
# Density dependent catchability power parameters (if any).
-1 -1 -1 -1 -1 -1 -1 -1 -1 -1 -1
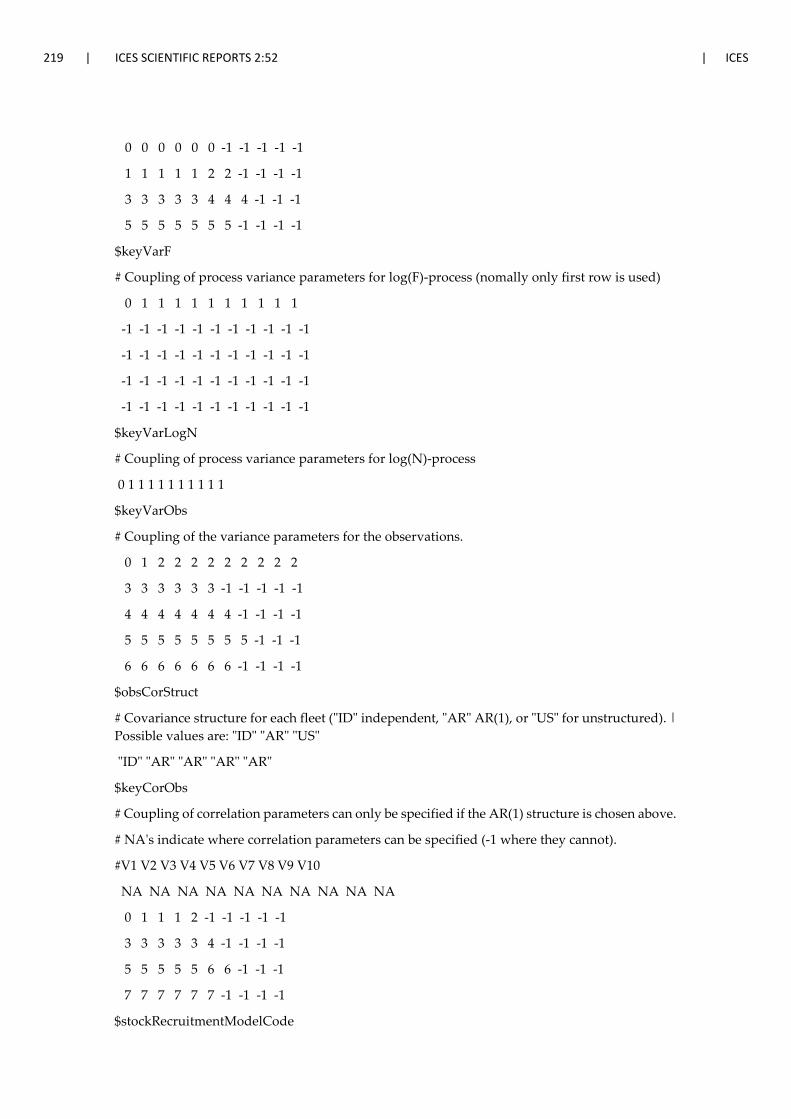
219 | ICES SCIENTIFIC REPORTS 2:52 | ICES
0 0 0 0 0 0 -1 -1 -1 -1 -1
1 1 1 1 1 2 2 -1 -1 -1 -1
3 3 3 3 3 4 4 4 -1 -1 -1
5 5 5 5 5 5 5 -1 -1 -1 -1
$keyVarF
# Coupling of process variance parameters for log(F)-process (nomally only first row is used)
0 1 1 1 1 1 1 1 1 1 1
-1 -1 -1 -1 -1 -1 -1 -1 -1 -1 -1
-1 -1 -1 -1 -1 -1 -1 -1 -1 -1 -1
-1 -1 -1 -1 -1 -1 -1 -1 -1 -1 -1
-1 -1 -1 -1 -1 -1 -1 -1 -1 -1 -1
$keyVarLogN
# Coupling of process variance parameters for log(N)-process
0 1 1 1 1 1 1 1 1 1 1
$keyVarObs
# Coupling of the variance parameters for the observations.
0 1 2 2 2 2 2 2 2 2 2
3 3 3 3 3 3 -1 -1 -1 -1 -1
4 4 4 4 4 4 4 -1 -1 -1 -1
5 5 5 5 5 5 5 5 -1 -1 -1
6 6 6 6 6 6 6 -1 -1 -1 -1
$obsCorStruct
# Covariance structure for each fleet ("ID" independent, "AR" AR(1), or "US" for unstructured). | Possible values are: "ID" "AR" "US"
"ID" "AR" "AR" "AR" "AR"
$keyCorObs
# Coupling of correlation parameters can only be specified if the AR(1) structure is chosen above.
# NA's indicate where correlation parameters can be specified (-1 where they cannot).
#V1 V2 V3 V4 V5 V6 V7 V8 V9 V10
NA NA NA NA NA NA NA NA NA NA
0 1 1 1 2 -1 -1 -1 -1 -1
3 3 3 3 3 4 -1 -1 -1 -1
5 5 5 5 5 6 6 -1 -1 -1
7 7 7 7 7 7 -1 -1 -1 -1
$stockRecruitmentModelCode

ICES | AFWG 2020 | 220
# Stock recruitment code (0 for plain random walk, 1 for Ricker, 2 for Beverton-Holt, and 3 piece-wise constant).
0
$noScaledYears
# Number of years where catch scaling is applied.
0
$keyScaledYears
# A vector of the years where catch scaling is applied.
$keyParScaledYA
# A matrix specifying the couplings of scale parameters (nrow = no scaled years, ncols = no ages).
$fbarRange
# lowest and higest age included in Fbar
4 7
$keyBiomassTreat
# To be defined only if a biomass survey is used (0 SSB index, 1 catch index, 2 FSB index, 3 total catch, 4 total landings and 5 TSB index).
-1 -1 -1 -1 -1
$obsLikelihoodFlag
# Option for observational likelihood | Possible values are: "LN" "ALN"
"LN" "LN" "LN" "LN" "LN"
$fixVarToWeight
# If weight attribute is supplied for observations this option sets the treatment (0 relative weight, 1 fix variance to weight).
0
$fracMixF
# The fraction of t(3) distribution used in logF increment distribution
0
$fracMixN
# The fraction of t(3) distribution used in logN increment distribution
0
$fracMixObs
# A vector with same length as number of fleets, where each element is the fraction of t(3) distri-bution used in the distribution of that fleet
0 0 0 0 0
$constRecBreaks
# This option is only used in combination with stock-recruitment code 3)
$predVarObsLink

221 | ICES SCIENTIFIC REPORTS 2:52 | ICES
# Coupling of parameters used in a mean-variance link for observations.
0 1 2 2 2 2 2 2 2 2 2
3 3 3 3 3 3 -1 -1 -1 -1 -1
4 4 4 4 4 4 4 -1 -1 -1 -1
5 5 5 5 5 5 5 5 -1 -1 -1
6 6 6 6 6 6 6 -1 -1 -1 -1
Table 4.11. Northeast Arctic haddock. SAM model estimated recruitment, spawning-stock-biomass (SSB), and aver-age fishing mortality.
Year R(age 3) Low High SSB Low High Fbar(4-7) Low High TSB Low High
1950 72765 45993 115120 214657 192015 239968 0.753 0.634 0.894 388527 347863 433944
1951 657821 418643 1033644 126320 112029 142434 0.682 0.572 0.812 433665 337405 557389
1952 89596 56731 141501 101702 88528 116836 0.71 0.593 0.851 424647 335841 536935
1953 1239918 801946 1917083 120740 103933 140266 0.536 0.441 0.65 735111 556694 970710
1954 134460 85206 212187 174445 147108 206864 0.43 0.352 0.525 827393 647336 1057534
1955 58888 36937 93883 314997 267616 370767 0.443 0.366 0.537 851794 714523 1015436
1956 231056 146096 365425 369541 313644 435399 0.469 0.388 0.567 692500 592623 809210
1957 60568 38153 96153 253899 216986 297092 0.424 0.352 0.512 435673 377107 503334
1958 73117 46330 115390 182231 157966 210224 0.517 0.428 0.624 315707 277078 359722
1959 391038 253665 602806 125313 108538 144680 0.444 0.365 0.541 333699 272878 408075
1960 323444 208742 501174 112797 99260 128179 0.54 0.449 0.649 419713 347580 506816
1961 146436 94828 226130 124952 111084 140551 0.663 0.559 0.787 403369 349317 465785
1962 296047 192049 456361 125437 111265 141415 0.789 0.668 0.933 377926 323971 440867
1963 317406 207377 485815 94457 82963 107544 0.755 0.631 0.904 354361 294789 425971
1964 355853 231180 547763 84600 74142 96534 0.631 0.522 0.764 387095 318371 470654
1965 127776 81986 199141 103209 89784 118642 0.524 0.431 0.636 387159 325519 460472
1966 315718 203789 489123 146049 126751 168286 0.556 0.461 0.671 452697 384785 532595
1967 342444 220270 532380 151400 130057 176245 0.44 0.362 0.536 465282 389014 556503
1968 18020 11063 29351 168447 145349 195215 0.481 0.395 0.586 427510 360859 506471
1969 20779 12870 33549 168230 143981 196563 0.41 0.334 0.504 317598 270886 372364
1970 211495 135036 331245 155651 131527 184199 0.382 0.308 0.474 287788 241428 343050
1971 110588 69914 174927 127727 107269 152088 0.326 0.259 0.409 264321 223738 312265

ICES | AFWG 2020 | 222
Year R(age 3) Low High SSB Low High Fbar(4-7) Low High TSB Low High
1972 1048060 658218 1668794 128660 111456 148520 0.653 0.532 0.801 600811 448925 804084
1973 312636 202372 482978 124977 106936 146061 0.531 0.432 0.653 635036 503512 800916
1974 66576 42831 103487 153559 133455 176692 0.505 0.415 0.615 462543 397738 537905
1975 59783 38456 92938 194787 166283 228178 0.497 0.413 0.597 379050 327901 438178
1976 62392 39554 98416 196521 168413 229320 0.721 0.605 0.858 296779 259344 339619
1977 121398 76071 193733 118741 99835 141228 0.734 0.604 0.892 201636 172491 235705
1978 215993 140029 333165 81314 67122 98508 0.621 0.503 0.768 200221 164244 244079
1979 162376 105052 250980 62698 52610 74721 0.579 0.465 0.722 207431 171492 250901
1980 22032 13487 35993 63105 53417 74551 0.47 0.375 0.589 213898 177788 257343
1981 10230 6043 17318 73239 61677 86967 0.431 0.344 0.54 168959 141951 201106
1982 16883 10332 27587 68902 56749 83657 0.379 0.3 0.479 123108 102628 147675
1983 8795 5165 14974 58318 47705 71291 0.352 0.275 0.45 87975 73441 105384
1984 13327 8158 21771 53231 43213 65571 0.314 0.243 0.406 71914 59810 86466
1985 358965 231533 556533 49235 40836 59363 0.394 0.308 0.503 191650 139542 263217
1986 486470 314406 752699 55064 46501 65205 0.535 0.424 0.675 377650 294656 484020
1987 90234 57394 141865 78142 66567 91730 0.626 0.501 0.782 356834 296686 429177
1988 38764 24122 62293 80270 67278 95772 0.508 0.405 0.637 254162 214533 301112
1989 29093 17939 47182 84794 69520 103423 0.371 0.293 0.47 193696 161392 232465
1990 38095 24272 59788 85992 69607 106234 0.21 0.164 0.269 154164 128142 185471
1991 112770 78840 161301 100964 84393 120790 0.238 0.189 0.299 187883 159686 221059
1992 335839 237002 475895 111689 96175 129705 0.292 0.235 0.364 295031 246182 353573
1993 871351 625838 1213178 126952 111529 144507 0.314 0.254 0.387 536204 440271 653041
1994 408416 327301 509634 155819 138690 175064 0.368 0.302 0.448 662645 576108 762180
1995 102594 79526 132352 191555 169940 215920 0.294 0.246 0.352 654997 575535 745430
1996 101731 79190 130688 223524 198460 251755 0.361 0.305 0.426 566330 502208 638639
1997 122399 95439 156974 194677 172844 219266 0.439 0.37 0.521 407568 364509 455715
1998 65113 50035 84733 134694 118864 152631 0.447 0.373 0.535 270371 241480 302718
1999 155882 124082 195832 97103 85722 109995 0.458 0.379 0.553 237659 211382 267203
2000 85278 66389 109540 79831 70369 90566 0.338 0.276 0.413 217989 192085 247387

223 | ICES SCIENTIFIC REPORTS 2:52 | ICES
Year R(age 3) Low High SSB Low High Fbar(4-7) Low High TSB Low High
2001 378004 307448 464752 92654 82379 104211 0.364 0.301 0.439 324082 285357 368062
2002 407536 330699 502227 110733 98489 124499 0.348 0.289 0.42 444240 390717 505095
2003 351769 281167 440099 140388 125583 156938 0.42 0.354 0.499 517551 459109 583433
2004 268081 217849 329896 159937 143007 178871 0.383 0.324 0.452 502422 448883 562347
2005 377498 308112 462510 171108 153062 191282 0.399 0.339 0.471 518865 464191 579979
2006 161291 129781 200452 155919 139309 174511 0.364 0.307 0.431 447052 400071 499551
2007 557313 450582 689328 157825 141192 176416 0.378 0.318 0.449 514747 458006 578518
2008 1148507 938634 1405307 167069 148208 188331 0.309 0.257 0.372 758179 661712 868709
2009 1063274 872984 1295042 187975 166808 211827 0.255 0.212 0.307 1026124 894148 1177580
2010 248645 201139 307370 255386 226372 288119 0.24 0.202 0.286 1160660 1013806 1328787
2011 122124 96149 155117 368859 326583 416607 0.251 0.213 0.296 1208916 1063729 1373919
2012 355908 288429 439175 496499 436152 565197 0.216 0.182 0.256 1203184 1060967 1364464
2013 124281 98323 157091 546646 478736 624190 0.145 0.121 0.174 1025928 905514 1162353
2014 424667 345604 521818 544815 480199 618127 0.151 0.126 0.183 1001042 892221 1123136
2015 74893 58233 96319 516995 460419 580522 0.186 0.155 0.223 891008 798768 993900
2016 219046 175116 273996 507532 451563 570437 0.253 0.212 0.303 819532 733422 915752
2017 202078 161953 252145 424640 379553 475083 0.336 0.281 0.402 719573 645647 801963
2018 383993 306983 480320 320136 281963 363476 0.374 0.309 0.454 645597 571708 729036
2019 875345 705907 1085453 259244 222378 302222 0.376 0.297 0.477 752268 651130 869115
2020 497416 386918 639470 243132 196489 300848 797765 664344 957980
Table 4.12. Northeast Arctic haddock. SAM model estimated fishing mortality-at-age.
Year 3 4 5 6 7 8 9 10 11 12 13+
1950 0.096 0.41 0.704 0.848 1.05 0.886 0.886 0.886 0.886 0.886 0.886
1951 0.085 0.357 0.617 0.773 0.98 0.883 0.883 0.883 0.883 0.883 0.883
1952 0.092 0.377 0.64 0.796 1.028 0.932 0.932 0.932 0.932 0.932 0.932
1953 0.066 0.281 0.473 0.588 0.801 0.737 0.737 0.737 0.737 0.737 0.737
1954 0.047 0.206 0.357 0.468 0.689 0.648 0.648 0.648 0.648 0.648 0.648
1955 0.045 0.198 0.367 0.5 0.708 0.598 0.598 0.598 0.598 0.598 0.598

ICES | AFWG 2020 | 224
Year 3 4 5 6 7 8 9 10 11 12 13+
1956 0.05 0.209 0.389 0.548 0.731 0.618 0.618 0.618 0.618 0.618 0.618
1957 0.047 0.197 0.367 0.492 0.642 0.546 0.546 0.546 0.546 0.546 0.546
1958 0.057 0.234 0.45 0.601 0.781 0.689 0.689 0.689 0.689 0.689 0.689
1959 0.058 0.228 0.409 0.521 0.62 0.566 0.566 0.566 0.566 0.566 0.566
1960 0.089 0.316 0.536 0.634 0.673 0.617 0.617 0.617 0.617 0.617 0.617
1961 0.117 0.404 0.681 0.783 0.784 0.695 0.695 0.695 0.695 0.695 0.695
1962 0.146 0.499 0.851 0.94 0.866 0.722 0.722 0.722 0.722 0.722 0.722
1963 0.132 0.468 0.803 0.907 0.843 0.68 0.68 0.68 0.68 0.68 0.68
1964 0.096 0.359 0.634 0.768 0.764 0.647 0.647 0.647 0.647 0.647 0.647
1965 0.076 0.292 0.513 0.635 0.656 0.566 0.566 0.566 0.566 0.566 0.566
1966 0.089 0.328 0.563 0.666 0.669 0.554 0.554 0.554 0.554 0.554 0.554
1967 0.071 0.267 0.446 0.515 0.535 0.464 0.464 0.464 0.464 0.464 0.464
1968 0.083 0.296 0.489 0.553 0.587 0.513 0.513 0.513 0.513 0.513 0.513
1969 0.078 0.266 0.427 0.468 0.48 0.415 0.415 0.415 0.415 0.415 0.415
1970 0.081 0.261 0.401 0.427 0.439 0.38 0.38 0.38 0.38 0.38 0.38
1971 0.072 0.232 0.35 0.354 0.366 0.323 0.323 0.323 0.323 0.323 0.323
1972 0.192 0.501 0.759 0.696 0.655 0.545 0.545 0.545 0.545 0.545 0.545
1973 0.197 0.482 0.639 0.528 0.475 0.38 0.38 0.38 0.38 0.38 0.38
1974 0.178 0.431 0.549 0.516 0.523 0.461 0.461 0.461 0.461 0.461 0.461
1975 0.194 0.458 0.548 0.494 0.486 0.416 0.416 0.416 0.416 0.416 0.416
1976 0.288 0.645 0.785 0.724 0.728 0.641 0.641 0.641 0.641 0.641 0.641
1977 0.321 0.709 0.851 0.719 0.658 0.559 0.559 0.559 0.559 0.559 0.559
1978 0.221 0.543 0.724 0.643 0.576 0.504 0.504 0.504 0.504 0.504 0.504
1979 0.159 0.441 0.669 0.651 0.556 0.502 0.502 0.502 0.502 0.502 0.502
1980 0.1 0.314 0.523 0.562 0.48 0.458 0.458 0.458 0.458 0.458 0.458
1981 0.084 0.272 0.471 0.537 0.443 0.427 0.427 0.427 0.427 0.427 0.427
1982 0.075 0.243 0.411 0.476 0.385 0.38 0.38 0.38 0.38 0.38 0.38
1983 0.078 0.247 0.389 0.428 0.342 0.341 0.341 0.341 0.341 0.341 0.341
1984 0.068 0.226 0.347 0.376 0.308 0.292 0.292 0.292 0.292 0.292 0.292

225 | ICES SCIENTIFIC REPORTS 2:52 | ICES
Year 3 4 5 6 7 8 9 10 11 12 13+
1985 0.075 0.256 0.411 0.48 0.429 0.411 0.411 0.411 0.411 0.411 0.411
1986 0.087 0.314 0.54 0.665 0.619 0.588 0.588 0.588 0.588 0.588 0.588
1987 0.096 0.357 0.641 0.783 0.723 0.657 0.657 0.657 0.657 0.657 0.657
1988 0.071 0.277 0.51 0.654 0.591 0.536 0.536 0.536 0.536 0.536 0.536
1989 0.055 0.219 0.387 0.465 0.413 0.361 0.361 0.361 0.361 0.361 0.361
1990 0.029 0.126 0.214 0.254 0.247 0.23 0.23 0.23 0.23 0.23 0.23
1991 0.03 0.135 0.242 0.29 0.285 0.261 0.261 0.261 0.261 0.261 0.261
1992 0.031 0.145 0.289 0.364 0.371 0.339 0.339 0.339 0.339 0.339 0.339
1993 0.025 0.127 0.288 0.404 0.437 0.396 0.396 0.396 0.396 0.396 0.396
1994 0.023 0.123 0.301 0.472 0.577 0.542 0.542 0.542 0.542 0.542 0.542
1995 0.018 0.097 0.227 0.361 0.493 0.485 0.485 0.485 0.485 0.485 0.485
1996 0.024 0.121 0.281 0.432 0.609 0.615 0.615 0.615 0.615 0.615 0.615
1997 0.031 0.155 0.367 0.525 0.708 0.676 0.676 0.676 0.676 0.676 0.676
1998 0.037 0.175 0.396 0.545 0.671 0.67 0.67 0.67 0.67 0.67 0.67
1999 0.044 0.2 0.427 0.555 0.649 0.62 0.62 0.62 0.62 0.62 0.62
2000 0.032 0.156 0.321 0.408 0.466 0.437 0.437 0.437 0.437 0.437 0.437
2001 0.033 0.16 0.351 0.453 0.49 0.449 0.449 0.449 0.449 0.449 0.449
2002 0.03 0.148 0.317 0.449 0.479 0.422 0.422 0.422 0.422 0.422 0.422
2003 0.035 0.166 0.361 0.527 0.627 0.571 0.571 0.571 0.571 0.571 0.571
2004 0.034 0.155 0.324 0.477 0.575 0.547 0.547 0.547 0.547 0.547 0.547
2005 0.036 0.16 0.33 0.488 0.62 0.602 0.602 0.602 0.602 0.602 0.602
2006 0.035 0.155 0.311 0.437 0.552 0.545 0.545 0.545 0.545 0.545 0.545
2007 0.036 0.155 0.313 0.457 0.585 0.567 0.567 0.567 0.567 0.567 0.567
2008 0.025 0.11 0.225 0.376 0.525 0.519 0.519 0.519 0.519 0.519 0.519
2009 0.02 0.087 0.175 0.301 0.458 0.474 0.474 0.474 0.474 0.474 0.474
2010 0.019 0.082 0.165 0.282 0.432 0.483 0.483 0.483 0.483 0.483 0.483
2011 0.021 0.086 0.181 0.298 0.439 0.482 0.482 0.482 0.482 0.482 0.482
2012 0.02 0.08 0.156 0.26 0.366 0.392 0.392 0.392 0.392 0.392 0.392
2013 0.015 0.06 0.106 0.168 0.247 0.305 0.305 0.305 0.305 0.305 0.305

ICES | AFWG 2020 | 226
Year 3 4 5 6 7 8 9 10 11 12 13+
2014 0.017 0.068 0.118 0.176 0.244 0.338 0.338 0.338 0.338 0.338 0.338
2015 0.022 0.088 0.156 0.22 0.28 0.388 0.388 0.388 0.388 0.388 0.388
2016 0.028 0.113 0.217 0.306 0.377 0.496 0.496 0.496 0.496 0.496 0.496
2017 0.037 0.147 0.29 0.427 0.481 0.567 0.567 0.567 0.567 0.567 0.567
2018 0.036 0.151 0.321 0.495 0.531 0.595 0.595 0.595 0.595 0.595 0.595
2019 0.033 0.146 0.324 0.534 0.501 0.525 0.525 0.525 0.525 0.525 0.525
Table 4.13. Northeast Arctic haddock. SAM model estimated stock numbers-at-age.
Year 3 4 5 6 7 8 9 10 11 12 13+
1950 72765 101082 76215 37154 47009 16698 4865 2683 1382 1460 2060
1951 657821 47705 46108 27504 12801 12528 5446 1949 1017 446 1089
1952 89596 437418 30778 19210 8983 4364 3850 1635 746 360 505
1953 1239918 52291 209646 14030 6350 2640 1336 1048 533 257 311
1954 134460 914469 26034 91232 6888 2333 1093 552 385 198 231
1955 58888 84566 633279 14592 52626 3100 917 454 238 159 168
1956 231056 40688 55886 326034 7237 17862 1446 401 215 115 154
1957 60568 151826 27770 36103 111070 3113 6149 710 167 100 132
1958 73117 39704 93137 15482 20995 40123 1653 2505 357 84 122
1959 391038 51244 26022 39982 7340 7296 14869 736 896 149 89
1960 323444 266325 35784 15685 16922 3490 3691 6130 368 366 110
1961 146436 193339 145366 17688 6983 8051 1601 1508 2786 159 203
1962 296047 86674 92671 59850 6742 2712 3287 660 609 1157 139
1963 317406 177452 38043 26425 17599 2657 1090 1224 274 243 536
1964 355853 199908 75552 12286 7673 5851 1235 440 508 124 347
1965 127776 240740 115078 30338 4164 2785 2262 539 199 218 213
1966 315718 82783 159612 62450 12377 1703 1275 938 275 92 187
1967 342444 201497 43631 72723 24836 4865 790 602 449 135 132
1968 18020 248143 118750 21870 36278 12562 2344 410 314 233 139
1969 20779 11637 142805 55516 10704 15805 5757 1162 197 157 175

227 | ICES SCIENTIFIC REPORTS 2:52 | ICES
Year 3 4 5 6 7 8 9 10 11 12 13+
1970 211495 12615 7421 70740 25218 5949 8041 3010 645 106 187
1971 110588 135519 7120 4474 33481 12314 3377 4541 1696 373 164
1972 1048060 80445 82708 4571 3113 17576 6740 2027 2779 1033 317
1973 312636 606027 47102 23183 1700 1559 7626 2893 927 1384 612
1974 66576 169362 249030 16615 10664 888 1030 4482 1687 551 1238
1975 59783 37520 90437 140336 6781 4937 449 570 2143 813 944
1976 62392 33835 16455 44289 79287 3138 2774 247 340 1149 976
1977 121398 32068 13792 6423 17622 30304 1275 1183 103 152 805
1978 215993 55584 9818 4426 2912 7736 15156 626 564 44 430
1979 162376 118425 23440 3261 2041 1413 4109 7091 338 273 225
1980 22032 103231 59034 8330 1148 1054 720 2176 3498 175 239
1981 10230 15467 64001 26516 3452 549 562 383 1148 1722 215
1982 16883 6658 11057 32002 10548 1717 277 310 220 630 959
1983 8795 11465 4602 6841 13493 5615 983 146 179 129 803
1984 13327 5174 6739 2731 3901 8852 2863 577 79 106 517
1985 358965 8927 2898 3610 1791 2584 5381 1838 370 51 399
1986 486470 278068 5178 1605 1857 997 1484 2797 1027 207 264
1987 90234 250147 157806 2531 659 793 472 682 1204 471 209
1988 38764 69583 135636 46932 1073 234 319 206 304 507 280
1989 29093 25796 49311 71295 12173 557 95 152 100 147 365
1990 38095 21181 17055 26033 32886 5464 363 59 87 57 277
1991 112770 25379 13677 14147 20344 20352 3122 256 40 57 205
1992 335839 85127 16147 10170 10486 12690 12706 1881 170 26 158
1993 871351 227706 58650 10863 5952 6287 7715 7307 1047 105 107
1994 408416 597622 157203 32263 4755 3142 3794 4868 4377 596 118
1995 102594 229209 442382 79122 14909 2131 1430 1899 2234 2180 343
1996 101731 62967 172826 252242 32402 7333 1110 717 957 1128 1295
1997 122399 56555 38980 97909 104076 14050 2528 507 318 426 1125
1998 65113 82240 35416 18473 36996 39616 5250 999 218 135 737

ICES | AFWG 2020 | 228
Year 3 4 5 6 7 8 9 10 11 12 13+
1999 155882 49300 48565 17601 9044 15938 14093 1924 416 98 408
2000 85278 122946 31345 21559 6959 4406 6581 5526 818 192 246
2001 378004 69567 96485 16994 10199 3566 2645 3531 2698 442 250
2002 407536 305093 52629 49155 9211 5543 1929 1479 1940 1413 364
2003 351769 266492 199534 34843 25408 4620 3550 1262 851 1102 1013
2004 268081 175299 168651 114357 16354 11211 2158 1689 637 404 1089
2005 377498 174786 96274 111629 52076 6654 5685 1169 746 323 819
2006 161291 223140 111542 52751 45541 21267 3252 2894 574 353 560
2007 557313 123353 171424 62572 27150 19815 8295 1794 1525 297 463
2008 1148507 476941 100302 107129 22444 14304 7429 3362 930 749 379
2009 1063274 745965 391325 64091 41336 10550 5529 3271 1492 527 637
2010 248645 705082 625084 241464 33024 15629 4926 2834 1674 808 707
2011 122124 200095 576013 440898 125589 14656 6343 2186 1402 871 894
2012 355908 75685 141865 411159 277940 56496 6333 2645 1078 740 1028
2013 124281 206980 59364 97624 283462 133183 24365 3313 1471 625 1081
2014 424667 75256 149601 50831 90363 152287 64069 11174 1964 934 1090
2015 74893 298745 67325 94965 41407 72166 77047 26543 5524 1071 1106
2016 219046 50477 174994 47316 63583 34654 52148 39585 13310 2655 1062
2017 202078 182743 35235 114621 28921 37908 19680 22904 18788 5848 1541
2018 383993 143713 131948 26240 46660 15154 19360 9299 9949 9211 3350
2019 875345 258755 99549 68848 18690 19859 7192 8922 3873 4484 4886
2020 497416 531880 171000 60331 29429 10839 9746 3557 4436 1896 4665
Table 4.14. Northeast Arctic haddock. SAM model natural mortality estimated.
Year 3 4 5 6 7 8 9 10 11 12 13+
1950 0.353 0.259 0.246 0.243 0.2 0.2 0.2 0.2 0.2 0.2 0.2
1951 0.353 0.259 0.246 0.243 0.2 0.2 0.2 0.2 0.2 0.2 0.2
1952 0.353 0.259 0.246 0.243 0.2 0.2 0.2 0.2 0.2 0.2 0.2
1953 0.353 0.259 0.246 0.243 0.2 0.2 0.2 0.2 0.2 0.2 0.2

229 | ICES SCIENTIFIC REPORTS 2:52 | ICES
Year 3 4 5 6 7 8 9 10 11 12 13+
1954 0.353 0.259 0.246 0.243 0.2 0.2 0.2 0.2 0.2 0.2 0.2
1955 0.353 0.259 0.246 0.243 0.2 0.2 0.2 0.2 0.2 0.2 0.2
1956 0.353 0.259 0.246 0.243 0.2 0.2 0.2 0.2 0.2 0.2 0.2
1957 0.353 0.259 0.246 0.243 0.2 0.2 0.2 0.2 0.2 0.2 0.2
1958 0.353 0.259 0.246 0.243 0.2 0.2 0.2 0.2 0.2 0.2 0.2
1959 0.353 0.259 0.246 0.243 0.2 0.2 0.2 0.2 0.2 0.2 0.2
1960 0.353 0.259 0.246 0.243 0.2 0.2 0.2 0.2 0.2 0.2 0.2
1961 0.353 0.259 0.246 0.243 0.2 0.2 0.2 0.2 0.2 0.2 0.2
1962 0.353 0.259 0.246 0.243 0.2 0.2 0.2 0.2 0.2 0.2 0.2
1963 0.353 0.259 0.246 0.243 0.2 0.2 0.2 0.2 0.2 0.2 0.2
1964 0.353 0.259 0.246 0.243 0.2 0.2 0.2 0.2 0.2 0.2 0.2
1965 0.353 0.259 0.246 0.243 0.2 0.2 0.2 0.2 0.2 0.2 0.2
1966 0.353 0.259 0.246 0.243 0.2 0.2 0.2 0.2 0.2 0.2 0.2
1967 0.353 0.259 0.246 0.243 0.2 0.2 0.2 0.2 0.2 0.2 0.2
1968 0.353 0.259 0.246 0.243 0.2 0.2 0.2 0.2 0.2 0.2 0.2
1969 0.353 0.259 0.246 0.243 0.2 0.2 0.2 0.2 0.2 0.2 0.2
1970 0.353 0.259 0.246 0.243 0.2 0.2 0.2 0.2 0.2 0.2 0.2
1971 0.353 0.259 0.246 0.243 0.2 0.2 0.2 0.2 0.2 0.2 0.2
1972 0.353 0.259 0.246 0.243 0.2 0.2 0.2 0.2 0.2 0.2 0.2
1973 0.353 0.259 0.246 0.243 0.2 0.2 0.2 0.2 0.2 0.2 0.2
1974 0.353 0.259 0.246 0.243 0.2 0.2 0.2 0.2 0.2 0.2 0.2
1975 0.353 0.259 0.246 0.243 0.2 0.2 0.2 0.2 0.2 0.2 0.2
1976 0.353 0.259 0.246 0.243 0.2 0.2 0.2 0.2 0.2 0.2 0.2
1977 0.353 0.259 0.246 0.243 0.2 0.2 0.2 0.2 0.2 0.2 0.2
1978 0.353 0.259 0.246 0.243 0.2 0.2 0.2 0.2 0.2 0.2 0.2
1979 0.353 0.259 0.246 0.243 0.2 0.2 0.2 0.2 0.2 0.2 0.2
1980 0.353 0.259 0.246 0.243 0.2 0.2 0.2 0.2 0.2 0.2 0.2
1981 0.353 0.259 0.246 0.243 0.2 0.2 0.2 0.2 0.2 0.2 0.2
1982 0.353 0.259 0.246 0.243 0.2 0.2 0.2 0.2 0.2 0.2 0.2

ICES | AFWG 2020 | 230
Year 3 4 5 6 7 8 9 10 11 12 13+
1983 0.353 0.259 0.246 0.243 0.2 0.2 0.2 0.2 0.2 0.2 0.2
1984 0.216 0.225 0.215 0.2 0.2 0.2 0.2 0.2 0.2 0.2 0.2
1985 0.209 0.2 0.2 0.2 0.2 0.2 0.2 0.2 0.2 0.2 0.2
1986 0.664 0.262 0.2 0.21 0.2 0.2 0.2 0.2 0.2 0.2 0.2
1987 0.2 0.206 0.422 0.2 0.2 0.2 0.2 0.2 0.2 0.2 0.2
1988 0.375 0.2 0.2 0.394 0.2 0.2 0.2 0.2 0.2 0.2 0.2
1989 0.2 0.2 0.2 0.233 0.2 0.2 0.2 0.2 0.2 0.2 0.2
1990 0.346 0.2 0.2 0.2 0.2 0.2 0.2 0.2 0.2 0.2 0.2
1991 0.202 0.217 0.2 0.2 0.2 0.2 0.2 0.2 0.2 0.2 0.2
1992 0.217 0.204 0.203 0.2 0.2 0.2 0.2 0.2 0.2 0.2 0.2
1993 0.257 0.252 0.283 0.261 0.2 0.2 0.2 0.2 0.2 0.2 0.2
1994 0.29 0.218 0.298 0.228 0.2 0.2 0.2 0.2 0.2 0.2 0.2
1995 0.374 0.336 0.318 0.292 0.2 0.2 0.2 0.2 0.2 0.2 0.2
1996 0.715 0.318 0.255 0.285 0.2 0.2 0.2 0.2 0.2 0.2 0.2
1997 0.496 0.266 0.257 0.288 0.2 0.2 0.2 0.2 0.2 0.2 0.2
1998 0.232 0.294 0.268 0.2 0.2 0.2 0.2 0.2 0.2 0.2 0.2
1999 0.2 0.209 0.282 0.262 0.2 0.2 0.2 0.2 0.2 0.2 0.2
2000 0.214 0.201 0.218 0.247 0.2 0.2 0.2 0.2 0.2 0.2 0.2
2001 0.211 0.2 0.228 0.2 0.2 0.2 0.2 0.2 0.2 0.2 0.2
2002 0.324 0.214 0.2 0.204 0.2 0.2 0.2 0.2 0.2 0.2 0.2
2003 0.429 0.255 0.211 0.206 0.2 0.2 0.2 0.2 0.2 0.2 0.2
2004 0.423 0.307 0.205 0.23 0.2 0.2 0.2 0.2 0.2 0.2 0.2
2005 0.4 0.307 0.236 0.272 0.2 0.2 0.2 0.2 0.2 0.2 0.2
2006 0.223 0.216 0.278 0.213 0.2 0.2 0.2 0.2 0.2 0.2 0.2
2007 0.295 0.2 0.241 0.32 0.2 0.2 0.2 0.2 0.2 0.2 0.2
2008 0.374 0.279 0.268 0.34 0.2 0.2 0.2 0.2 0.2 0.2 0.2
2009 0.418 0.256 0.291 0.261 0.2 0.2 0.2 0.2 0.2 0.2 0.2
2010 0.368 0.255 0.283 0.293 0.2 0.2 0.2 0.2 0.2 0.2 0.2
2011 0.554 0.497 0.327 0.234 0.2 0.2 0.2 0.2 0.2 0.2 0.2

231 | ICES SCIENTIFIC REPORTS 2:52 | ICES
Year 3 4 5 6 7 8 9 10 11 12 13+
2012 0.637 0.334 0.212 0.2 0.2 0.2 0.2 0.2 0.2 0.2 0.2
2013 0.498 0.362 0.262 0.203 0.2 0.2 0.2 0.2 0.2 0.2 0.2
2014 0.289 0.209 0.219 0.2 0.2 0.2 0.2 0.2 0.2 0.2 0.2
2015 0.354 0.422 0.214 0.2 0.2 0.2 0.2 0.2 0.2 0.2 0.2
2016 0.306 0.2 0.251 0.235 0.2 0.2 0.2 0.2 0.2 0.2 0.2
2017 0.34 0.289 0.242 0.42 0.2 0.2 0.2 0.2 0.2 0.2 0.2
2018 0.433 0.259 0.236 0.2 0.2 0.2 0.2 0.2 0.2 0.2 0.2
2019 0.433 0.259 0.236 0.2 0.2 0.2 0.2 0.2 0.2 0.2 0.2
Table 4.15. Northeast Arctic haddock. Summary XSA (p-shrinkage not applied, F shrinkage= 0.5) Thu Apr 23 16:16:08 2020
YEAR RECR_a3 TOTBIO TOTSPB LANDINGS YIELDSSB SOPCOFAC FBAR 4-7
1950 83209 243113 134683 132125 0.981 1.5897 0.8298
1951 674472 357861 101236 120077 1.1861 1.2272 0.6228
1952 77621 236352 57606 127660 2.2161 1.7404 0.723
1953 1287368 515705 82856 123920 1.4956 1.4279 0.5148
1954 154318 540572 117711 156788 1.332 1.474 0.3795
1955 69422 487633 179329 202286 1.128 1.536 0.511
1956 210669 476505 244137 213924 0.8762 1.2623 0.4325
1957 66900 327146 186436 123583 0.6629 1.2455 0.432
1958 87974 277808 157131 112672 0.7171 1.1252 0.518
1959 401986 366814 133490 88211 0.6608 0.9405 0.3665
1960 291801 402785 114828 154651 1.3468 1.0411 0.483
1961 131755 392762 130253 193224 1.4835 0.9942 0.6358
1962 293071 347781 119095 187408 1.5736 1.0518 0.799
1963 344184 312241 82787 146224 1.7663 1.1458 0.8632
1964 402123 303671 64018 99158 1.5489 1.3572 0.6515
1965 125515 359695 95756 118578 1.2383 1.1507 0.4928
1966 296535 389504 127902 161778 1.2649 1.1621 0.5825
1967 365674 470175 154872 136397 0.8807 0.9984 0.414

ICES | AFWG 2020 | 232
YEAR RECR_a3 TOTBIO TOTSPB LANDINGS YIELDSSB SOPCOFAC FBAR 4-7
1968 24218 422724 169787 181726 1.0703 0.9976 0.5022
1969 21655 343545 184471 130820 0.7092 0.882 0.3965
1970 204105 287609 156279 88257 0.5647 0.9762 0.357
1971 123601 346657 168684 78905 0.4678 0.7638 0.2462
1972 1261322 622918 123216 266153 2.1601 1.0883 0.6908
1973 344673 606289 114977 322226 2.8025 1.1656 0.5352
1974 69781 606367 201413 221157 1.098 0.8946 0.431
1975 60615 494562 256873 175758 0.6842 0.8957 0.426
1976 67283 307817 206852 137264 0.6636 1.12 0.5698
1977 135087 229350 141862 110158 0.7765 1.09 0.6825
1978 215011 256797 130643 95422 0.7304 0.9219 0.5105
1979 177676 319558 129640 103623 0.7993 0.7684 0.5505
1980 35156 344463 133388 87889 0.6589 0.7568 0.397
1981 13550 293845 148498 77153 0.5196 0.7174 0.4008
1982 17496 212396 127407 46955 0.3685 0.7224 0.3085
1983 9609 104480 71525 24600 0.3439 1.0373 0.2712
1984 13428 83500 64118 20945 0.3267 1.0547 0.2498
1985 288301 182801 62013 45052 0.7265 0.9761 0.32
1986 542267 347476 62386 100563 1.6119 1.0484 0.4388
1987 109762 333914 75054 154916 2.0641 0.992 0.5958
1988 54640 259953 78420 95255 1.2147 0.9955 0.499
1989 26591 212727 91991 58518 0.6361 0.9774 0.3892
1990 37459 171015 95319 27182 0.2852 1.0159 0.1562
1991 104977 195642 110536 36216 0.3276 1.0374 0.2082
1992 208436 269893 125820 59922 0.4763 0.9797 0.2835
1993 663211 443430 130662 82379 0.6305 1.0031 0.3582
1994 290335 542285 145094 135186 0.9317 1.0056 0.425
1995 97081 538430 160732 142448 0.8862 1.0247 0.3828
1996 100984 472224 188383 178128 0.9456 1.0175 0.4238

233 | ICES SCIENTIFIC REPORTS 2:52 | ICES
YEAR RECR_a3 TOTBIO TOTSPB LANDINGS YIELDSSB SOPCOFAC FBAR 4-7
1997 115000 350210 167547 154359 0.9213 1.0519 0.4862
1998 58397 249894 126520 100630 0.7954 1.0113 0.4235
1999 231036 252757 94205 83195 0.8831 1.021 0.421
2000 90497 251643 86439 68944 0.7976 1.026 0.28
2001 366772 358100 111421 89640 0.8045 0.9903 0.279
2002 346197 445522 130488 114798 0.8798 1.011 0.3158
2003 229741 478814 153437 138926 0.9054 1.019 0.4258
2004 228464 459209 161158 158279 0.9821 1.0192 0.3747
2005 349830 474525 171469 158298 0.9232 1.0029 0.4868
2006 157911 420018 146868 153157 1.0428 0.9938 0.4005
2007 680433 504557 144157 161525 1.1205 0.9916 0.4175
2008 1382074 760397 150268 155604 1.0355 0.9928 0.3862
2009 1517989 1115041 173722 200061 1.1516 1.0019 0.3478
2010 551466 1293797 240463 249200 1.0363 0.9994 0.29
2011 252477 1307849 348837 309785 0.8881 0.9978 0.314
2012 412542 1176153 433005 315627 0.7289 0.9994 0.2662
2013 161938 994005 478142 193744 0.4052 0.9967 0.1345
2014 413707 996444 521592 177522 0.3403 0.9968 0.1122
2015 110043 940053 533808 194756 0.3648 0.9953 0.157
2016 286048 854389 500606 233183 0.4658 1.0006 0.2175
2017 230441 747515 417450 227588 0.5452 0.994 0.3262
2018 457421 665803 309877 191276 0.6173 0.9943 0.3625
2019 912622 785956 252171 175402 0.6956 0.9963 0.38
Table 4.16. Northeast Arctic haddock. Input data for recruitment prediction (RCT3) - recruits as 3 year-olds.
yearclass Recr NT1 NT2 NT3 NAK1 NAK2 NAK3 EC01 ECO2
1990 871351 NA NA NA NA NA NA NA NA
1991 408416 NA NA 314.5 NA NA 348.700 NA NA
1992 102594 NA 224.785 54.9 NA 188 41.500 NA NA
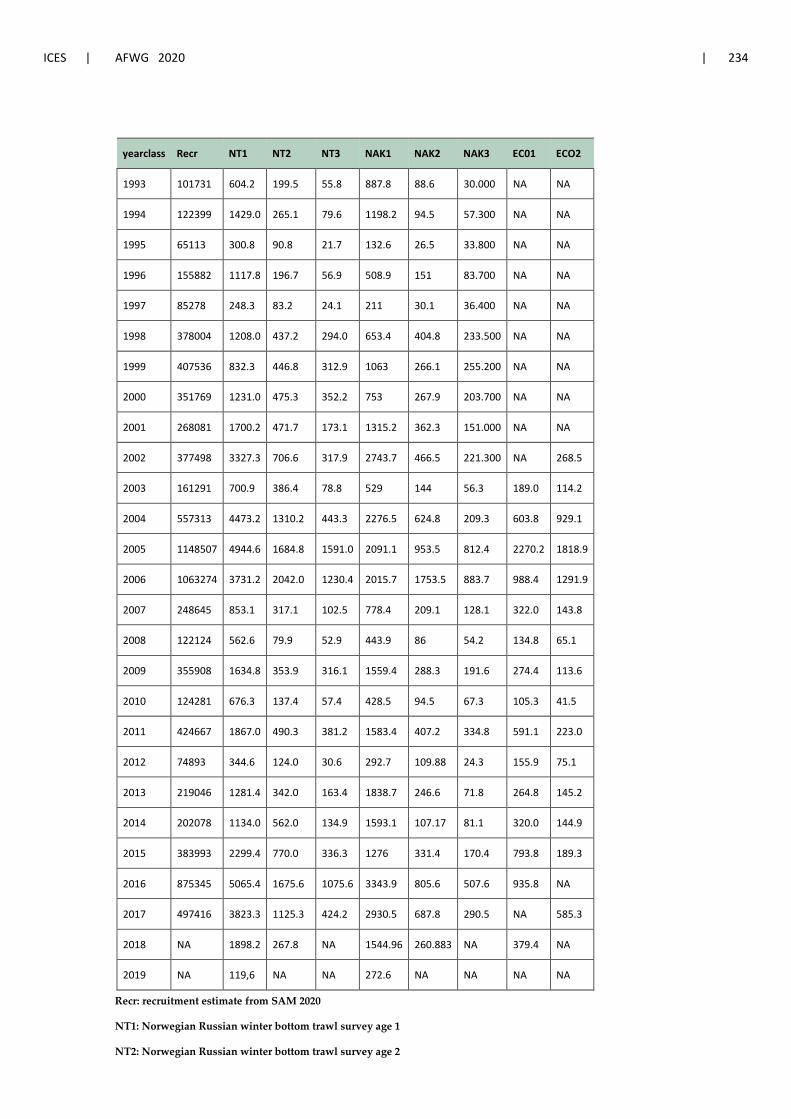
ICES | AFWG 2020 | 234
yearclass Recr NT1 NT2 NT3 NAK1 NAK2 NAK3 EC01 ECO2
1993 101731 604.2 199.5 55.8 887.8 88.6 30.000 NA NA
1994 122399 1429.0 265.1 79.6 1198.2 94.5 57.300 NA NA
1995 65113 300.8 90.8 21.7 132.6 26.5 33.800 NA NA
1996 155882 1117.8 196.7 56.9 508.9 151 83.700 NA NA
1997 85278 248.3 83.2 24.1 211 30.1 36.400 NA NA
1998 378004 1208.0 437.2 294.0 653.4 404.8 233.500 NA NA
1999 407536 832.3 446.8 312.9 1063 266.1 255.200 NA NA
2000 351769 1231.0 475.3 352.2 753 267.9 203.700 NA NA
2001 268081 1700.2 471.7 173.1 1315.2 362.3 151.000 NA NA
2002 377498 3327.3 706.6 317.9 2743.7 466.5 221.300 NA 268.5
2003 161291 700.9 386.4 78.8 529 144 56.3 189.0 114.2
2004 557313 4473.2 1310.2 443.3 2276.5 624.8 209.3 603.8 929.1
2005 1148507 4944.6 1684.8 1591.0 2091.1 953.5 812.4 2270.2 1818.9
2006 1063274 3731.2 2042.0 1230.4 2015.7 1753.5 883.7 988.4 1291.9
2007 248645 853.1 317.1 102.5 778.4 209.1 128.1 322.0 143.8
2008 122124 562.6 79.9 52.9 443.9 86 54.2 134.8 65.1
2009 355908 1634.8 353.9 316.1 1559.4 288.3 191.6 274.4 113.6
2010 124281 676.3 137.4 57.4 428.5 94.5 67.3 105.3 41.5
2011 424667 1867.0 490.3 381.2 1583.4 407.2 334.8 591.1 223.0
2012 74893 344.6 124.0 30.6 292.7 109.88 24.3 155.9 75.1
2013 219046 1281.4 342.0 163.4 1838.7 246.6 71.8 264.8 145.2
2014 202078 1134.0 562.0 134.9 1593.1 107.17 81.1 320.0 144.9
2015 383993 2299.4 770.0 336.3 1276 331.4 170.4 793.8 189.3
2016 875345 5065.4 1675.6 1075.6 3343.9 805.6 507.6 935.8 NA
2017 497416 3823.3 1125.3 424.2 2930.5 687.8 290.5 NA 585.3
2018 NA 1898.2 267.8 NA 1544.96 260.883 NA 379.4 NA
2019 NA 119,6 NA NA 272.6 NA NA NA NA
Recr: recruitment estimate from SAM 2020
NT1: Norwegian Russian winter bottom trawl survey age 1
NT2: Norwegian Russian winter bottom trawl survey age 2

235 | ICES SCIENTIFIC REPORTS 2:52 | ICES
NT3: Norwegian Russian winter bottom trawl survey age 3
NAK1: Norwegian Russian winter acoustic survey age 1
NAK2: Norwegian Russian winter acoustic survey age 2
NAK3: Norwegian Russian winter acoustic survey age 3
ECO1: Ecosystem survey age 1
ECO2: Ecosystem survey age 2
The Russian survey (RT) was discontinued in 2017 and has not been used for recruitment.
Table 4.17. Northeast Arctic haddock Analysis by RCT3 ver3.1 - R translation
Data for 8 surveys over 30 year classes : 1990 - 2019
Regression type = C
Tapered time weighting applied
power = 3 over 20 years
Survey weighting not applied
Final estimates shrunk towards mean
Estimates with S.E.'S greater than that of mean included
Minimum S.E. for any survey taken as 0.2
Minimum of 3 points used for regression
Forecast/Hindcast variance correction used.
yearclass:2017
index slope intercept se rsquare n indices prediction se.pred WAP.weights
NT1 1.0041 5.267 0.2487 0.9249 20 8.249 13.55 0.2979 0.14235
NT2 0.8938 7.132 0.3497 0.8641 20 7.027 13.41 0.4124 0.07430
NAK1 1.2631 3.675 0.5234 0.7356 20 7.983 13.76 0.6320 0.03163
NAK2 0.9581 7.218 0.2973 0.8979 20 6.535 13.48 0.3532 0.10130
NAK3 0.8085 8.560 0.1885 0.9558 20 5.675 13.15 0.2187 0.26426
NT3 0.6901 8.895 0.1164 0.9827 20 6.053 13.07 0.1345 0.31586
EC01 NA NA NA NA NA NA NA NA NA
ECO2 0.8257 8.229 0.4018 0.8139 14 6.374 13.49 0.4938 0.05181
VPA Mean NA NA NA NA 27 NA 12.60 0.8268 0.01848
yearclass:2018
index slope intercept se rsquare n indices prediction se.pred WAP.weights
NT1 0.9725 5.460 0.2473 0.9230 20 7.549 12.80 0.2822 0.33499
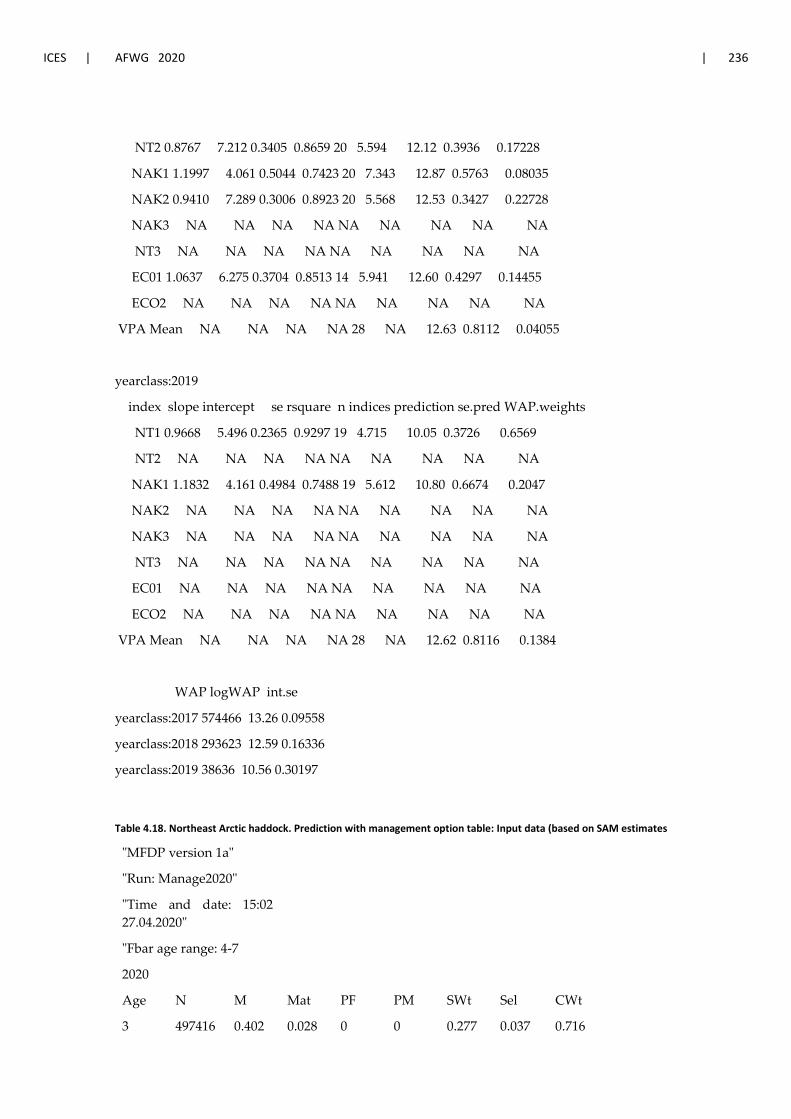
ICES | AFWG 2020 | 236
NT2 0.8767 7.212 0.3405 0.8659 20 5.594 12.12 0.3936 0.17228
NAK1 1.1997 4.061 0.5044 0.7423 20 7.343 12.87 0.5763 0.08035
NAK2 0.9410 7.289 0.3006 0.8923 20 5.568 12.53 0.3427 0.22728
NAK3 NA NA NA NA NA NA NA NA NA
NT3 NA NA NA NA NA NA NA NA NA
EC01 1.0637 6.275 0.3704 0.8513 14 5.941 12.60 0.4297 0.14455
ECO2 NA NA NA NA NA NA NA NA NA
VPA Mean NA NA NA NA 28 NA 12.63 0.8112 0.04055
yearclass:2019
index slope intercept se rsquare n indices prediction se.pred WAP.weights
NT1 0.9668 5.496 0.2365 0.9297 19 4.715 10.05 0.3726 0.6569
NT2 NA NA NA NA NA NA NA NA NA
NAK1 1.1832 4.161 0.4984 0.7488 19 5.612 10.80 0.6674 0.2047
NAK2 NA NA NA NA NA NA NA NA NA
NAK3 NA NA NA NA NA NA NA NA NA
NT3 NA NA NA NA NA NA NA NA NA
EC01 NA NA NA NA NA NA NA NA NA
ECO2 NA NA NA NA NA NA NA NA NA
VPA Mean NA NA NA NA 28 NA 12.62 0.8116 0.1384
WAP logWAP int.se
yearclass:2017 574466 13.26 0.09558
yearclass:2018 293623 12.59 0.16336
yearclass:2019 38636 10.56 0.30197
Table 4.18. Northeast Arctic haddock. Prediction with management option table: Input data (based on SAM estimates
"MFDP version 1a"
"Run: Manage2020"
"Time and date: 15:02 27.04.2020"
"Fbar age range: 4-7
2020
Age N M Mat PF PM SWt Sel CWt
3 497416 0.402 0.028 0 0 0.277 0.037 0.716
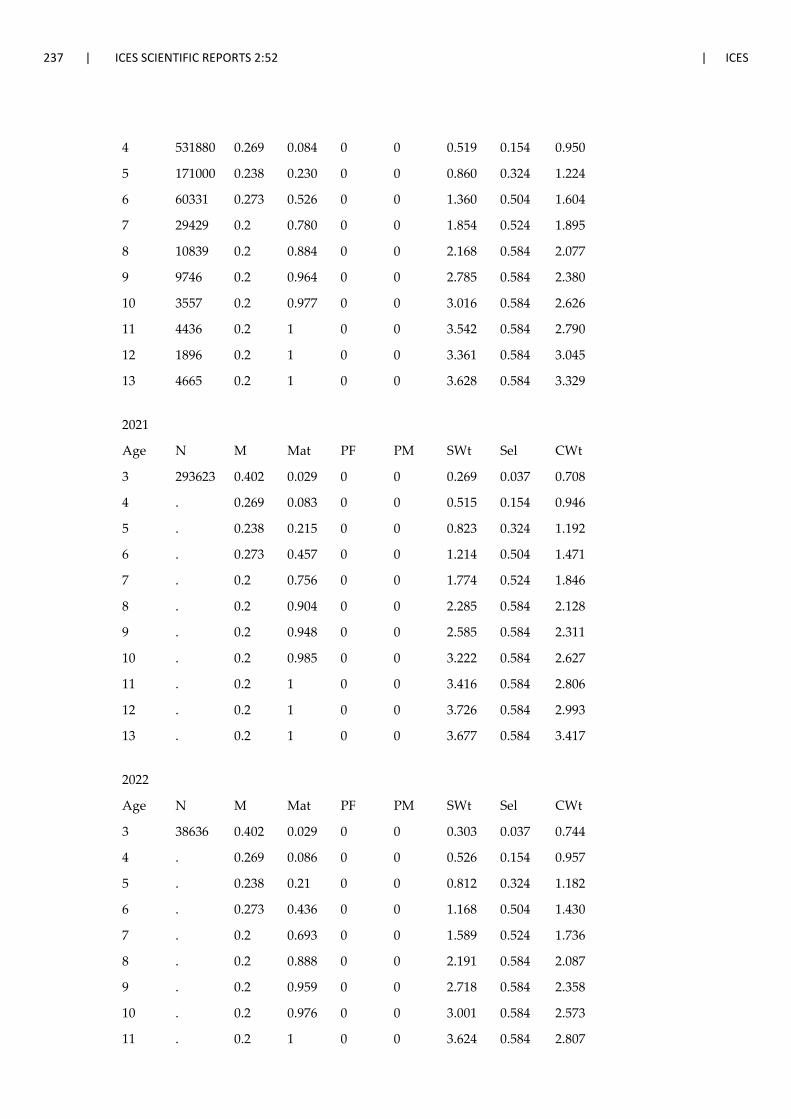
237 | ICES SCIENTIFIC REPORTS 2:52 | ICES
4 531880 0.269 0.084 0 0 0.519 0.154 0.950
5 171000 0.238 0.230 0 0 0.860 0.324 1.224
6 60331 0.273 0.526 0 0 1.360 0.504 1.604
7 29429 0.2 0.780 0 0 1.854 0.524 1.895
8 10839 0.2 0.884 0 0 2.168 0.584 2.077
9 9746 0.2 0.964 0 0 2.785 0.584 2.380
10 3557 0.2 0.977 0 0 3.016 0.584 2.626
11 4436 0.2 1 0 0 3.542 0.584 2.790
12 1896 0.2 1 0 0 3.361 0.584 3.045
13 4665 0.2 1 0 0 3.628 0.584 3.329
2021
Age N M Mat PF PM SWt Sel CWt
3 293623 0.402 0.029 0 0 0.269 0.037 0.708
4 . 0.269 0.083 0 0 0.515 0.154 0.946
5 . 0.238 0.215 0 0 0.823 0.324 1.192
6 . 0.273 0.457 0 0 1.214 0.504 1.471
7 . 0.2 0.756 0 0 1.774 0.524 1.846
8 . 0.2 0.904 0 0 2.285 0.584 2.128
9 . 0.2 0.948 0 0 2.585 0.584 2.311
10 . 0.2 0.985 0 0 3.222 0.584 2.627
11 . 0.2 1 0 0 3.416 0.584 2.806
12 . 0.2 1 0 0 3.726 0.584 2.993
13 . 0.2 1 0 0 3.677 0.584 3.417
2022
Age N M Mat PF PM SWt Sel CWt
3 38636 0.402 0.029 0 0 0.303 0.037 0.744
4 . 0.269 0.086 0 0 0.526 0.154 0.957
5 . 0.238 0.21 0 0 0.812 0.324 1.182
6 . 0.273 0.436 0 0 1.168 0.504 1.430
7 . 0.2 0.693 0 0 1.589 0.524 1.736
8 . 0.2 0.888 0 0 2.191 0.584 2.087
9 . 0.2 0.959 0 0 2.718 0.584 2.358
10 . 0.2 0.976 0 0 3.001 0.584 2.573
11 . 0.2 1 0 0 3.624 0.584 2.807

ICES | AFWG 2020 | 238
12 . 0.2 1 0 0 3.596 0.584 3.004
13 . 0.2 1 0 0 4.029 0.584 3.376
Table 4.19. Northeast Arctic haddock. Prediction with management option table for 2019-2021 (TAC constraint applied for intermediate year
MFDP version 1a
Run: Manage2020
2020MFDP Index file 22.04.2020
Time and date: 15:02 27.04.2020
Fbar age range: 4-7
2020
Bio-mass SSB FMult FBar
Land-ings
797763 243131 0.9912 0.3732 215000
2021 2022
Bio-mass SSB FMult FBar
Land-ings Biomass SSB
783694 249570 0 0 0 882323 394626
. 249570 0.1 0.0377 28926 855824 378815
. 249570 0.2 0.0753 56810 830369 363719
. 249570 0.3 0.113 83695 805912 349302
. 249570 0.4 0.1506 109624 782409 335533
. 249570 0.5 0.1883 134637 759817 322380
. 249570 0.6 0.2259 158771 738098 309813
. 249570 0.7 0.2636 182063 717212 297806
. 249570 0.8 0.3012 204548 697124 286330
. 249570 0.9 0.3389 226258 677798 275361
. 249570 1 0.3765 247226 659202 264875
. 249570 1.1 0.4142 267481 641305 254849
. 249570 1.2 0.4518 287053 624077 245260
. 249570 1.3 0.4895 305968 607488 236090
. 249570 1.4 0.5271 324254 591512 227317
. 249570 1.5 0.5648 341936 576122 218923
. 249570 1.6 0.6024 359037 561295 210891
. 249570 1.7 0.6401 375581 547005 203203
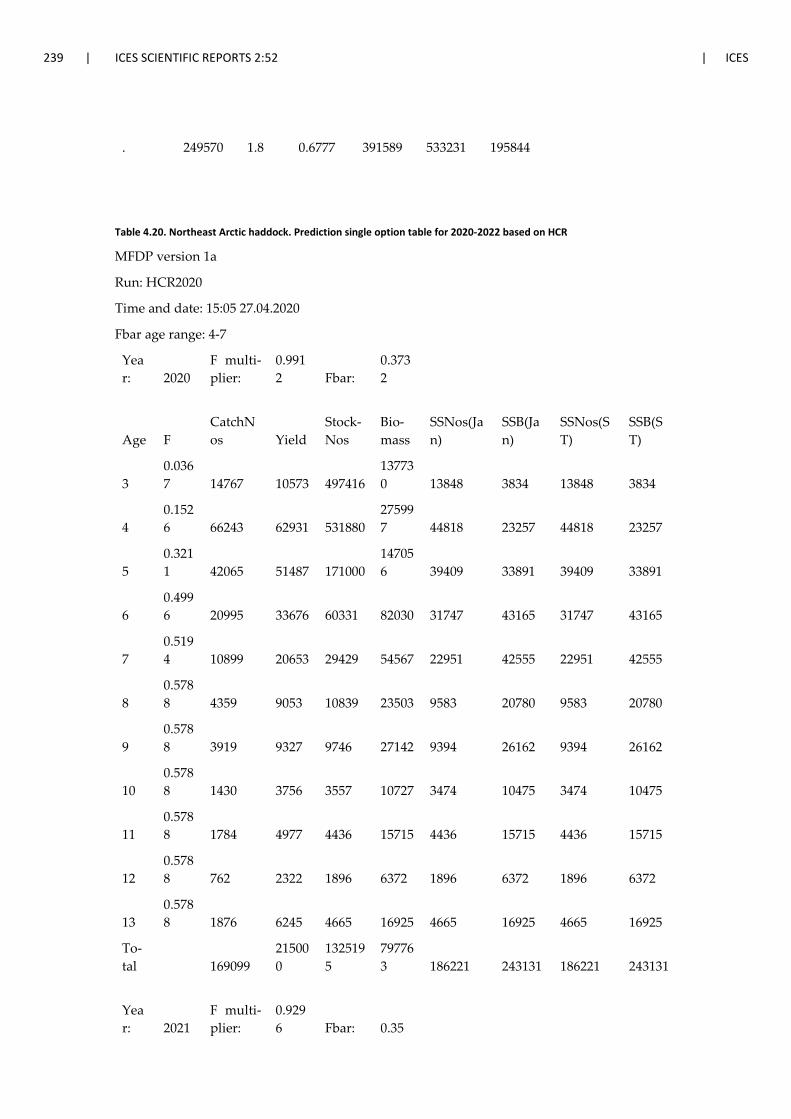
239 | ICES SCIENTIFIC REPORTS 2:52 | ICES
. 249570 1.8 0.6777 391589 533231 195844
Table 4.20. Northeast Arctic haddock. Prediction single option table for 2020-2022 based on HCR
MFDP version 1a
Run: HCR2020
Time and date: 15:05 27.04.2020
Fbar age range: 4-7
Year: 2020
F multi-plier:
0.9912 Fbar:
0.3732
Age F CatchNos Yield
Stock-Nos
Bio-mass
SSNos(Jan)
SSB(Jan)
SSNos(ST)
SSB(ST)
3 0.0367 14767 10573 497416
137730 13848 3834 13848 3834
4 0.1526 66243 62931 531880
275997 44818 23257 44818 23257
5 0.3211 42065 51487 171000
147056 39409 33891 39409 33891
6 0.4996 20995 33676 60331 82030 31747 43165 31747 43165
7 0.5194 10899 20653 29429 54567 22951 42555 22951 42555
8 0.5788 4359 9053 10839 23503 9583 20780 9583 20780
9 0.5788 3919 9327 9746 27142 9394 26162 9394 26162
10 0.5788 1430 3756 3557 10727 3474 10475 3474 10475
11 0.5788 1784 4977 4436 15715 4436 15715 4436 15715
12 0.5788 762 2322 1896 6372 1896 6372 1896 6372
13 0.5788 1876 6245 4665 16925 4665 16925 4665 16925
To-tal
169099
215000
1325195
797763 186221 243131 186221 243131
Year: 2021
F multi-plier:
0.9296 Fbar: 0.35

ICES | AFWG 2020 | 240
Age F CatchNos Yield
Stock-Nos
Bio-mass
SSNos(Jan)
SSB(Jan)
SSNos(ST)
SSB(ST)
3 0.0344 8184 5794 293623 78985 8515 2291 8515 2291
4 0.1432 37634 35602 320779
165201 26625 13712 26625 13712
5 0.3012 81226 96821 348897
287142 75013 61736 75013 61736
6 0.4685 32342 47575 97761
118681 44677 54237 44677 54237
7 0.4871 9816 18121 27863 49429 21064 37368 21064 37368
8 0.5429 5491 11686 14334 32752 12958 29608 12958 29608
9 0.5429 1906 4404 4974 12859 4716 12190 4716 12190
10 0.5429 1714 4502 4473 14411 4406 14195 4406 14195
11 0.5429 625 1755 1632 5576 1632 5576 1632 5576
12 0.5429 780 2334 2036 7586 2036 7586 2036 7586
13 0.5429 1154 3942 3011 11072 3011 11072 3011 11072
To-tal
180873
232537
1119383
783694 204652 249570 204652 249570
Year: 2022
F multi-plier:
0.9296 Fbar: 0.35
Age F CatchNos Yield
Stock-Nos
Bio-mass
SSNos(Jan)
SSB(Jan)
SSNos(ST)
SSB(ST)
3 0.0344 1077 801 38636 11707 1120 339 1120 339
4 0.1432 22266 21309 189787 99828 16322 8585 16322 8585
5 0.3012 49455 58455 212427
172491 44610 36223 44610 36223
6 0.4685 67319 96266 203485
237670 88719 103624 88719 103624

241 | ICES SCIENTIFIC REPORTS 2:52 | ICES
7 0.4871 16408 28484 46573 74004 32275 51285 32275 51285
8 0.5429 5370 11207 14016 30709 12446 27269 12446 27269
9 0.5429 2612 6160 6819 18534 6540 17774 6540 17774
10 0.5429 907 2333 2367 7102 2310 6932 2310 6932
11 0.5429 815 2288 2128 7711 2128 7711 2128 7711
12 0.5429 298 894 777 2793 777 2793 777 2793
13 0.5429
920 3105 2401 9674 2401 9674 2401 9674
To-tal
167446 231303
719414 672222
209647 272210 209647 272210
Table 4.21. Northeast Arctic haddock. Yield-per-recruit. Input data and results.
MFYPR version 2a"
Run: 2020ypr
Time and date: 15:30 27.04.2020
Yield per results
FMult
Fbar CatchNos
Yield
StockNos
Bio-mass
SpwnNosJan
SSBJan
SpwnNosSpwn
SSBSpwn
0 0 0 0 4.2749
6.5205
1.9978 5.1147
1.9978 5.1147
0.1 0.0459
0.1041 0.2102
3.7726
4.9545
1.528 3.5973
1.528 3.5973
0.2 0.0918
0.1724 0.3249
3.4489
4.0043
1.2342 2.6909
1.2342 2.6909
0.3 0.1376
0.2214 0.3936
3.2206
3.3746
1.0339 2.1011
1.0339 2.1011
0.4 0.1835
0.2587 0.4376
3.0496
2.9309
0.889 1.6937
0.889 1.6937
0.5 0.2294
0.2885 0.4674
2.9158
2.6036
0.7795 1.3997
0.7795 1.3997
0.6 0.2753
0.313 0.4885
2.8074
2.3534
0.6941 1.1801
0.6941 1.1801
0.7 0.3212
0.3337 0.504
2.7173
2.1566
0.6257 1.0115
0.6257 1.0115
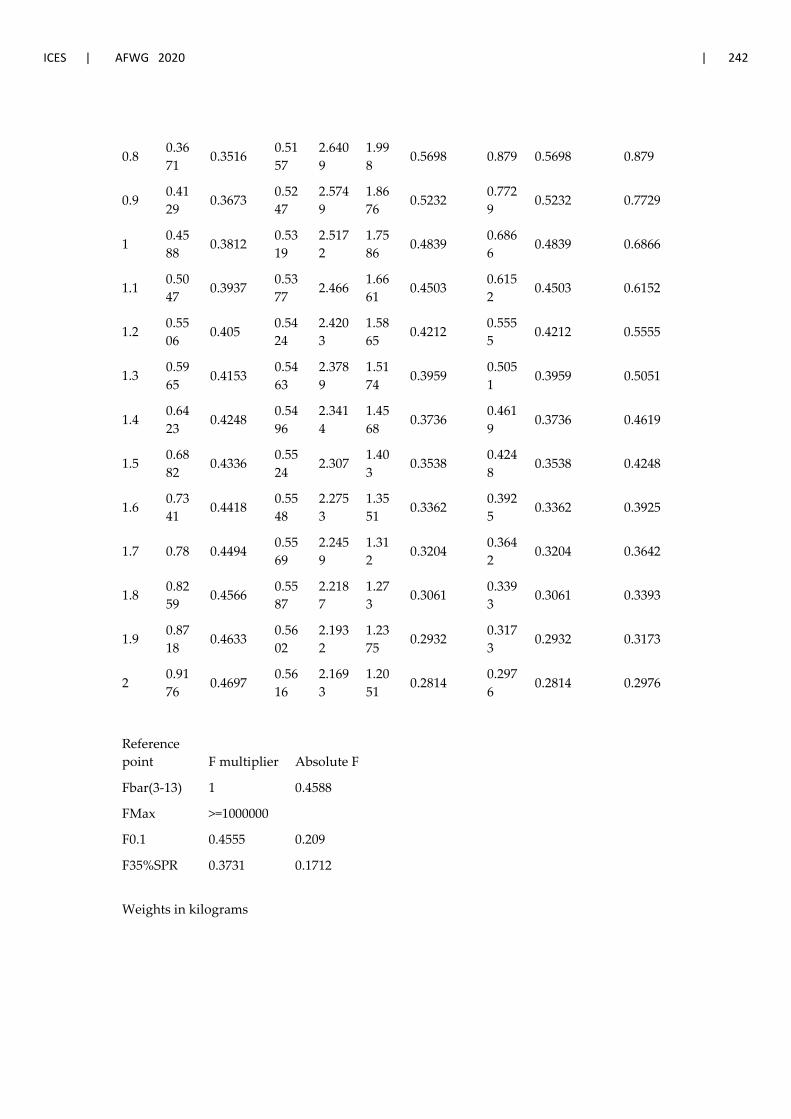
ICES | AFWG 2020 | 242
0.8 0.3671
0.3516 0.5157
2.6409
1.998
0.5698 0.879 0.5698 0.879
0.9 0.4129
0.3673 0.5247
2.5749
1.8676
0.5232 0.7729
0.5232 0.7729
1 0.4588
0.3812 0.5319
2.5172
1.7586
0.4839 0.6866
0.4839 0.6866
1.1 0.5047
0.3937 0.5377
2.466 1.6661
0.4503 0.6152
0.4503 0.6152
1.2 0.5506
0.405 0.5424
2.4203
1.5865
0.4212 0.5555
0.4212 0.5555
1.3 0.5965
0.4153 0.5463
2.3789
1.5174
0.3959 0.5051
0.3959 0.5051
1.4 0.6423
0.4248 0.5496
2.3414
1.4568
0.3736 0.4619
0.3736 0.4619
1.5 0.6882
0.4336 0.5524
2.307 1.403
0.3538 0.4248
0.3538 0.4248
1.6 0.7341
0.4418 0.5548
2.2753
1.3551
0.3362 0.3925
0.3362 0.3925
1.7 0.78 0.4494 0.5569
2.2459
1.312
0.3204 0.3642
0.3204 0.3642
1.8 0.8259
0.4566 0.5587
2.2187
1.273
0.3061 0.3393
0.3061 0.3393
1.9 0.8718
0.4633 0.5602
2.1932
1.2375
0.2932 0.3173
0.2932 0.3173
2 0.9176
0.4697 0.5616
2.1693
1.2051
0.2814 0.2976
0.2814 0.2976
Reference point F multiplier Absolute F
Fbar(3-13) 1 0.4588
FMax >=1000000
F0.1 0.4555 0.209
F35%SPR 0.3731 0.1712
Weights in kilograms

ICES | AFWG 2020 | 243
Figure 4.1 Landings, fishing mortality, recruitment (2018 prediction unshaded), and spawning-stock biomass of Northeast Arctic haddock 1950–2019. Fishing mortality and spawning-stock biomass are given with point wise 95% confidence in-tervals (shaded areas).

244 | ICES SCIENTIFIC REPORTS 2:52 | ICES
Figure 4.2. Northeast Arctic haddock. 5 year retrospective plots of SSB (a), fishing mortality (b), TSB (c), and recruitment (d) for years 2000–2019 (SAM with 95% confidence intervals).
(a) (b)
(c) (d)

ICES | AFWG 2020 | 245
Figure 4.3. Northeast Arctic haddock; Normalized residuals for the final SAM run. Blue circles indicate positive residuals (observations larger than predicted) and red circles indicate negative residuals.
Figure 4.4. Northeast Arctic haddock. Retrospective plots of SSB, fishing mortality and recruitment for assessment years 1950–2019 (XSA without P shrinkage, F shrinkage= 0.5 )

246 | ICES SCIENTIFIC REPORTS 2:52 | ICES
Figure 4.5. Northeast Arctic haddock. Retrospective plots of SSB, fishing mortality and recruitment for assessment years 1990–2019 from TSVPA model (see WD 04).

ICES | AFWG 2020 | 247
Figure 4.6. Results of assessment of NEA haddock - Recruits, biomass, spawning biomass and F in 1990-2019 by different models: medium SAM estimates, XSA with setting mentioned at chapter 4.9 and TISVPA with settings as mentioned at WD4.
Figure 4.7 Results of assessment of NEA haddock. Fbar, TSB, recruits and SSB from AFWG 2019 (last year), AFWG 2020 (this year) and last benchmark (WKDEM2020) from 2001 and onwards.

248 | ICES SCIENTIFIC REPORTS 2:52 | ICES
Figure 4. 8 Standard selection pattern model(red) used for short term forecasts at AFWG.
Figure 4.9 Comparisons of real catches in numbers (CANUM) with forecasts catches for same year from previous WG, predicted using current settings for selection pattern.

ICES | AFWG 2020 | 249
5 Saithe in subareas 1 and 2 (Northeast Arctic)
An assessment based on the decisions of the Inter-Benchmark Protocol (IBP) on Northeast Arctic saithe from March/April 2014 (ICES CM 2014/ACOM: 53) is presented for this stock. The main decisions were to change model from XSA to the state–space assessment model SAM (Nielsen and Berg, 2014) and to leave out the CPUE time-series in its current form.
The last benchmark assessment was done at WKROUND February 2010 (ICES CM 2010/ACOM: 36).
The 2020 assessment (ICES CM 2015/ACOM: 05) showed that the SSB has been above Bpa since 1996, declined considerably from 2007 to 2011, then increased again and is currently (2020) esti-mated to be well above Bpa. The fishing mortality was below Fpa from 1997 to 2009, started to increase in 2005 and was above Fpa from 2010 to 2012, but is currently estimated to be below Fpa. The 2007, 2010, 2013, and 2016 year classes were above average, with the 2013 year class presently contributing a large proportion of the biomass. The 2008, 2009, 2011, 2012 and 2015 year classes were below average strength.
ICES advised that catches in 2020 should be no more than 171 982 t, and The Norwegian Ministry of Trade, Industry and Fisheries set the final TAC at 171 982 t. ICES evaluated the management plan (harvest control rule, HCR) in 2007 and again in 2011 due to changes introduced at the 2010 benchmark and concluded that it is consistent with the precautionary approach. The HCR has not yet been evaluated for the new assessment model that the NEA saithe IBP decided to use.
More details and general information is given in (ICES CM 2010/ACOM: 36) and the Stock Annex (Quality Handbook).
5.1 The Fishery (Tables 5.1-5.2, Figure 5.1) Currently the main fleets targeting saithe include trawl, purse-seine, gillnet, handline, and Dan-ish seine. Landings of saithe were highest in 1970-1976 with an average of 239 000 t and a maxi-mum of 265 000 t in 1970. This period was followed by a sharp decline to a level of about 160 000 t in the years 1978–1984, while in 1985 to 1991 the landings ranged from 67 000-123 000 t. After 1991 landings increased, ranging between 136 000 t (in 2000) and 212 000 t (in 2006), followed by a decline to 132 000 t in 2015. In 2018 landings were 181 282 t and 163 180 t in 2019.
Discarding, although illegal, occurs in the saithe fishery, but is not considered a major problem in the assessment. Due to its nearshore distribution saithe is virtually inaccessible for commercial gears during the first couple of years of life and there are no reports indicating overall high dis-card rates in the Norwegian fisheries. There are reported incidents of slipping in the purse-seine fishery, mainly related to minimum landing size. Observations from non-Norwegian commer-cial trawlers indicate that discarding may occur when vessels targeting other species catch saithe, for which they may not have a quota or have filled it. However, there are no quantitative esti-mates of the level of discarding available.
5.1.1 ICES advice applicable to 2019 and 2020 The advice from ICES for 2019 was as follows:
ICES advised that catches in 2019 should be no more than 149 550 t.
The advice from ICES for 2020 was as follows:
ICES advised that catches in 2020 should be no more than 171 982 t.
250 | ICES SCIENTIFIC REPORTS 2:52 | ICES
5.1.2 Management applicable in 2019 and 2020 Management of Saithe in subareas 1 and 2 is by TAC and technical measures. For 2019, The Nor-wegian Ministry of Trade, Industry and Fisheries set the TAC according to the advice from ICES, i.e. 149 550 t.
For 2020, The Norwegian Ministry of Trade, Industry and Fisheries set the TAC according to the advice from ICES, i.e. 171 982 t.
5.1.3 The fishery in 2019 and expected landings in 2020 Provisional figures show that the landings in 2019 were approximately 163 180 t, approximately 13 500 t higher than the TAC of 149 550 t.
Since the WG does not have any prognosis of total landings in 2020 available, the TAC of 171 982 t is used in the projections. Here it should be mentioned that the Norwegian quota for 2020 was adjusted, based on quota flexibility, down from 156 482 t to 142 740 t, which means that the total quota of 171 892 t will not be caught in 2020.
5.2 Commercial catch-effort data and research vessel surveys
5.2.1 Catch-per-unit-effort The NEA saithe IBP (ICES CM 2014/ACOM: 53) recommended leaving out the CPUE time-series in the model tuning (see Section 5.3.5). A detailed description of the Norwegian trawl CPUE and its previous use is given in the stock annex.
5.2.2 Survey results (Figure 5.2-5.3) An ad hoc subgroup of the AFWG was held to review proposed changes to several survey series using the new “StoX” survey computation methodology on 16 and 17 April 2017 at the JRC, Italy. The survey series reviewed included the coastal survey for saithe for the period 2003 to 2017. StoX is a new program developed at IMR Norway, to produce a more robust, transparent, and automated method of computing survey series. The method is currently used in ICES assess-ments (for example for NSS herring). For the saithe survey series, a WD was presented to the group (Mehl et al., 2018a), examining the differences between the previous survey series and those resulting from StoX in survey indices by age, as well as mean weight and mean length. During the meeting consistency plots were produced for each survey and showed to have a bet-ter fit with the StoX series compared to the old series. The meeting concluded that the new StoX survey series should be used to replace the previous survey series in AFWG stock assessment, but that once the assessment model is run the residuals and fits to the data should be examined to check for unexpected detrimental impacts on model performance. The resulting SAM model fits using the old and the StoX survey series (using data for both survey series up to 2016, but excluding the 2003 StoX estimate, as this was considered abnormally high) were practically the same, without any detrimental impacts on model performance.
The echo abundance observed in 2019 (Staby et al., 2020) decreased by 6.5% compared to 2018 and was about 91% of the average for 2003–2018. The abundance estimated using StoX increased by 12% compared to 2018. This increase is the result of a high estimate of 3 year old saithe (2016 year class), which was 176% higher than in 2018. Estimates for 4, 5 and 7year old saithe were below the long term average, while estimated abundance of 6 year old fish (2013 year class), was well above the long term average. The proportion of saithe in the southern part of the survey area (south of the Lofoten islands between 620 -670N ) increased from about 20% in 1997 to above 60% in 2008, decreased in later years and was 21% in 2019.

ICES | AFWG 2020 | 251
5.2.3 Recruitment indices Owing to the nearshore distribution of juvenile saithe, obtaining early estimates of recruitment for ages 0-2 has not been possible so far. The survey recruitment indices are strongly dependent on the extent to which 2-4 year old saithe have migrated from the coastal areas and become available to the acoustic saithe survey on the banks, and this varies between years. Also, obser-vations from an observer programme, established in 2000 to start a 0-group index series (Borge and Mehl, WD 21 2002). did not seem to reflect the dynamics in year-class strength very well. (Mehl, WD 6 2007; Mehl, WD 7 to WKROUND 2010). The programme was consequently termi-nated in 2010.
5.3 Data used in the Assessment
5.3.1 Catch numbers-at-age (Table 5.3) Total Norwegian landings by gear and landings data for all other countries from 2019 were up-dated based on the official total catch (preliminary) reported to ICES or to Norwegian authorities.
Age composition data for 2019 were available for Norwegian and German landings. An age-length key estimated for Norwegian trawl catches in area 1, 2.b and 2.a was applied to Russian length data from those subareas respectively. Landings from other countries were assumed to have the same age composition as the combined Norwegian trawl catches. The biological sam-pling of some vessel groups, periods and areas had become critically low after the termination of the Norwegian port-sampling program in 2009. Sampling of age data from purse-seine catches had improved by 2016 but catches from areas 3 and 4 and quarter 3 in 2019 were not sampled adequately. Age data from the Danish seine and bottom trawl fishery were combined to increase the number of samples by area and quarter, thereby improving the estimate of catch at age num-bers.
Catch-at-age data were estimated by ECA for the 2020 assessment of NEA saithe. This is the fourth year that catch-at-age estimates from ECA are used as input in the SAM assessment. In previous years catch-at-age was estimated manually, as described in the NEA saithe stock annex.
In 2016, it was not possible due to time constraints to apply the manual method to 2017 to com-pare the 2016 data. A comparison of ECA and manual allocation data using 2015 catch data, showed that ECA produced somewhat lower estimates of number of younger fish, while it pro-duced slightly higher estimates for older fish. However, a comparison of two respective SAM runs with 2016 ECA and manually allocated data showed that estimates of numbers by age for the intermediate year (2016) did not differ substantially. They also showed very similar trends in SSB and estimated fishing mortality (Fbar), though the SSB estimated with ECA data showed a slightly higher SSB estimate than the estimate based on manually allocated data.
5.3.2 Weight-at-age (Table 5.4) Constant weights-at-age values for age groups 3-11 are used for the period 1960–1979, whereas estimated values for the 12+ group vary during this period. For subsequent years, annual esti-mates of weight-at-age in the catches are used. Weight-at-age in the stock is assumed to be the same as weight-at-age in the catch. Compared to 2018, estimated weight-at-age for age groups 3–12+ differed only slightly in 2019, with the most notable difference being that estimated weights for ages 5+ all increased slightly.
5.3.3 Natural mortality A fixed natural mortality of 0.2 for all age groups was used both in the assessment and the fore-cast.
252 | ICES SCIENTIFIC REPORTS 2:52 | ICES
5.3.4 Maturity-at-age (Table 5.5) A 3-year running average is used for the period from 1985 and onwards (2-year average for the first and last year). Inconsistencies between proportion mature fish and trends in SSB and re-cruitment since 2008 resulted in the NEA saithe IBP to recommend the use of a constant maturity ogive for the years from 2007 and onwards based on the average 2005–2007 (ICES CM 2014/ACOM: 53). Table 5.3.3 presents the maturity ogives used in the present assessment. It needs to be clarified why the above mentioned inconsistencies occurred, e.g. are spawning zones not a robust indicator for maturity.
5.3.5 Tuning data (Table 5.6) Until the 2005 WG, the XSA tuning was based on three dataseries: CPUE from Norwegian purse-seine and Norwegian trawl and indices from a Norwegian acoustic survey. The 2005 WG found rather large and variable log q residuals and large S.E. log q for the purse-seine fleet, as well as strong year effects, and in the combined tuning the fleet got low scaled weights. The WG decided not to include the purse-seine tuning fleet in the analysis. This was confirmed by new analyses at the 2010 benchmark assessment (ICES CM 2010/ACOM:36). The trawl CPUE series on the other hand does not show the trends in stock size abundance of NEA saithe in later years (Figure 5.3.2). In the most recent years there are signs of changes in fishing strategy, with fewer and shorter fishing periods and a smaller proportion of directed saithe fishery (Mehl and Fotland, WD 20 2013).
Analyses of the two remaining tuning series done at the 2010 benchmark assessment indicated that there had been a shift in catchability around year 2002. The survey was redesigned in 2003, and the fishery to a larger degree targeted older ages. Permanent breaks were made in both tun-ing series in 2002. The acoustic survey, compared with the trawl CPUE time-series, seems to track the stock changes better, both in abundance and distribution.
The trawl CPUE series does not show the trends in stock size abundance of NEA saithe in later years. In the most recent years there are signs of changes in fishing strategy, with fewer and shorter fishing periods and a smaller proportion of directed saithe fishery (Mehl and Fotland, WD 20 2013). The acoustic survey, on the other hand, seems to track the stock changes better, both in abundance and distribution. The sensitivity runs presented to the IBP (Fotland WD 30 2014 IBP NEA saithe) clearly show that the residual pattern get worse (strong year effects) when using both tuning series in SAM. It becomes obvious that SAM tries to fit something in between both contradicting data sources. Therefore, it had to be decided whether one data source is more reliable or whether both data sources should be taken into account leading to a fit in between both extremes. Given that CPUE series should not be used when larger changes in fishing pat-terns occur (selectivity, spatial distribution of the fleet, change between targeted and bycatch fishery) it was recommended to leave out the CPUE time-series in its current form for now (ICES CM 2014/ACOM: 53). Another reason was that the proportion of catches covered by the index has decreased steadily between 2002 and 2011 further questioning the representativeness of the CPUE index. However, it may be worth trying alternative CPUE indices (e.g. one index for the targeted fishery only and one index for the fishery with saithe bycatches) until the next bench-mark. The following two tuning fleets are thus used in the present assessment:
• NOcoast-Aco-4Q: Indices from the Norwegian acoustic survey 1994–2001, age groups 3 to 7.
• NOcoast-Aco-4Q: Indices from the Norwegian acoustic survey 2002–2019, age groups 3 to 7.

ICES | AFWG 2020 | 253
5.4 SAM runs and settings (Table 5.7) In connection with the NEA saithe IBP a number of exploratory SAM runs were performed. Model settings and results are presented in working documents included in the IBP report (ICES CM 2014/ACOM: 53).
SAM model settings and configuration in 2020 were the same as in previous simulations, but two exploratory runs, using different tuning series data, were done in addition to the final run. The additional runs either excluded the 2018 or the 2017 survey estimate. This was done to get an overview of the impact of each of those estimates on the stock estimators. Both the exploratory runs and the final run showed the same trend of an increasing SSB, but the exploratory run with the 2018 survey estimate excluded estimated a lower SBB as well as higher fishing mortality in recent years. Further investigations into the 2018 survey estimate, which included a comparison of cvs and abundance estimates by strata and age - did not produce sufficient reasons for it to be excluded from the tuning time series, and the final run was therefore performed using the entire tuning time series.
• Catch data age 3–12+; • Tuning data: Acoustic survey series (age 3–7) only, time-series split (1994–2001 and 2002–
present); • Maturity data: Ogives for the years 2007 and later based on the average of the 2005–2007
data; • Flat exploitation pattern for age groups 8+; • Correlated Fs between age groups and time; • Beverton–Holt stock–recruitment relationship used to estimate recent recruitment.
5.5 Final assessment run (Tables 5.8-5.11, Figures 5.4-5.7) The state–space assessment model (SAM) was used for the final. SAM catchabilities and negative log likelihood values are given in Table 5.8. The predictive power (AIC) of the model was esti-mated to 1140.64, compared to 1128.45 for the 2019 run.
Figure 5.4 presents normalized residuals for the total catches and the two parts of the acoustic tuning series. There are both year- and age effects and the second part of the series seems to perform better than the first part. Figure 5.5 shows plots of the stock numbers from the SAM vs. tuning indices, a circle indicates last year’s result.
5.5.1 SAM F, N, and SSB results (Tables 5.9-5.11, Figures 5.6-5.7) The estimated fishing mortality (F4–7) in 2018 was 0.231 (AFWG 2019), which is below 0.239 from this year’s assessment and below the Fpa of 0.35. The fishing mortality (F4–7) in 2019 was estimated at 0.225. From 1997 to 2009 fishing mortality was below Fpa, but started to increase in 2005 and was above Fpa in 2010–2012.
Fishing mortality and stock size have in the last decade generally been considerably over- and underestimated respectively. Due to the changes made to the assessment following the bench-mark assessment workshop in 2010 (ICES CM 2010/ACOM: 36) and later the NEA saithe IBP in 2014 (ICES CM 2014/ACOM: 53), the retrospective patterns have improved considerably, as is illustrated in Figure 5.7. Based on the 2019 assessment the SSB has in recent years been underes-timated and F4-7 overestimated.
The SAM-estimate of the 2014 year class was considered to be reliable enough to be used in the projections. In previous assessments the value of the 3-year olds in the last data year has been set to the long-term geometrical mean, and the value of the year class at age 4 were obtained by

254 | ICES SCIENTIFIC REPORTS 2:52 | ICES
applying Pope’s approximation. Since 2007 the 2008, 2010, and 2013 have been above the long-term geometric mean, while in the other years, year-class strength has been considered average or below.
The total biomass (ages 3+) was above the long-term (1960–2018) average from 1996 to 2010, reached a maximum in 2005, declined below the average level between 2011 and 2015, and has been above the long-term average since 2016. The SSB was above the long-term mean from 2000 to 2009, decreased below the average between 2010 to 2013, and has been above since 2014. SSB has been above Bpa (220 000 t) since 1996 (Figure 5.1).
5.5.2 Recruitment (Table 5.10, Figure 5.1) Catches of age group 3 have varied considerably during the period 2004−2017 (Table 5.10). Until the 2005 WG, RCT3-runs were conducted to estimate the corresponding year classes, with 2 and 3 year olds from the acoustic survey as input together with XSA numbers. However, it was stated several times in the ACOM Technical Minutes that it would be more transparent to use the long-term geometric mean (GM) recruitment. GM values were therefore used in the 2005–2014 since the issue was not discussed at the IBP when SAM was adopted as assessment model. During the 2015 AFWG assessment, analyses were performed to investigate if the last year recruitment value from SAM could be used instead of the long-term GM (for method description refer to Stock Annex). Results from this analysis showed that the retrospective runs of SAM gave better esti-mates of recruitment than the geometric mean and consequently estimates of the recruiting year class (3 year olds in the last data year) from the SAM were accepted for the last year.
5.6 Reference points (Figure 5.1) In 2010 the age span was expanded from 11+ to 15+ and important XSA parameter settings were changed (ICES CM 2010/ACOM: 36). LIM reference points were re-estimated at the 2010 WG according to the methodology outlined in ICES CM 2003/ACFM: 15, while the PA reference point estimation was based on the old procedure (ICES CM 1998/ACFM: 10). The results were not very much different from the previous analyses performed in 2005 (ICES CM 2005/ACFM: 20), and it was decided not to change the existing LIM and PA reference points. The shift from XSA to SAM resulted in only minor changes in estimated fishing mortality, spawning-stock-biomass and re-cruitment and no new reference points were estimated.
5.6.1 Harvest control rule In 2007 ICES evaluated the harvest control rule for setting the annual fishing quota (TAC) for Northeast Arctic saithe. ICES concluded that the HCR was consistent with the precautionary approach for all simulated data and settings, including a rebuilding situation under the condi-tion that the assessment uncertainty and error are not greater than those calculated from historic data. This also held true when an implementation error (difference between TAC and catch) equal to the historic level was included. The HCR was implemented the same year. It contains the following elements:
• Estimate the average TAC level for the coming 3 years based on Fmp. TAC for the next year will be set to this level as a starting value for the 3-year period.
• The year after, the TAC calculation for the next 3 years is repeated based on the updated information about the stock development. However, the TAC should not be changed by more than 15% compared with the previous year’s TAC.
• If the spawning-stock-biomass (SSB) at the beginning of the year for which the quota is set (first year of prediction), is below Bpa, the procedure for establishing TAC should be based on a fishing mortality that is linearly reduced from Fmp at SSB = Bpa to 0 at SSB equal

ICES | AFWG 2020 | 255
to zero. At SSB levels below Bpa in any of the operational years (current year and 3 years of prediction) there should be no limitations on the year-to-year variations in TAC.
In 2011 the evaluation was repeated taking into account the changes made to the assessment after the 2010 benchmark assessment (ICES CM 2010/ACOM: 36). The analyses indicate that the HCR still is in agreement with the precautionary approach (Mehl and Fotland, WD 11 2011).
The fishing mortality used in the harvest control rule (Fmp) was in 2007 set to Fpa = 0.35. In June 2013, after the ICES advice for 2014 for this stock had been given, Fmp was reduced to 0.32.
5.7 Predictions
5.7.1 Input data (Table 5.12) The input data to the predictions based on results from the final model run are given in Table 5.12. The estimates for stock number-at-age in 2020 were taken from the final SAM run for ages 4+ (2016 year class). The geometric mean (GM) for recruitment (age 3) of 160 million was used in 2020 and subsequent year classes. The natural mortality of 0.2 is the same as used in the assess-ment. For exploitation pattern the average of the 2017-2019 fishing mortalities for ages 3 to 12 was used, with mortalities for 8+ being constant. For weight-at-age in stock and catch the average of the last three years (2017-2019) from the final SAM run was used. For maturity-at-age the average of the 2005–2007 annual ogives was applied.
5.7.2 Catch options for 2021 (short-term predictions; Tables 5.13-14) The management option table (Table 5.13) shows that the expected catch of 171 982 t in 2020 will increase the fishing mortality compared to 2019 from 0.23 to 0.24, which well below the Fpa of 0.35. A catch in 2020 corresponding to the Fstatus quo level (3-year average 2017–2019) of 0.23 will be 165 840 t, while a catch in 2021 corresponding to the evaluated and implemented HCR of 197 779 t will result in F of 0.28 (Table 5.13).
For a catch in 2020 corresponding to the TAC of 171982, the SSB is expected to decrease from about 552 168 t at the beginning of 2020 to 529 169 t at the beginning of 2021. At Fstatus quo in 2021 SSB is estimated to decrease to 518 726 t at the beginning of 2022 and for a catch corresponding to the HCR it will decrease to about 489 730 t.
5.7.3 Comparison of the present and last year’s assessment The current assessment estimated the total stock in 2019 to be 7% higher and the SSB at the same level, compared to the previous assessment. The F in 2018 is estimated slightly higher than the estimate from the previous assessment, and the realized F in 2019 is 4% higher compared to the predicted one based on the TAC.
Total stock (3+) by 1 January 2019 (tonnes)
SSB by 1 January 2019 (tonnes)
F4-7 in 2019 F4-7 in 2018
WG 2019 890462 555377 0.216 0.231
WG 2020 951274 555359 0.225 0.239

256 | ICES SCIENTIFIC REPORTS 2:52 | ICES
5.8 Comments to the assessment and the forecast (Figure 5.7).
A statistical model is less sensitive to +group setting than XSA. In addition, the results from XSA were more dependent on the input data (use or no use of CPUE, split of the tuning survey time-series), the shrinkage parameter and whether the number of iterations is capped or not. XSA only converged at a large number of iterations. In contrast results from SAM are much more robust and depend to a lesser degree on subjective choice of model settings (such as shrinkage). In ad-dition, SAM as a stochastic model is not treating catches as known without error. The fishing mortality rates could be considered correlated in time, and to reflect that neighboring age groups have more similar fishing mortalities.
The retrospective pattern has been a major concern in the assessment, but due to the changes done at the benchmark assessment in 2010 (ICES CM 2010/ACOM: 36) and later at the NEA saithe IBP in 2014 (ICES CM 2014/ACOM: 53), the assessment has become somewhat more stable (Figure 5.7)
The biological sampling from the fishery got critically low after the termination of the original Norwegian port-sampling program in 2009. In 2015 this was in particular the case for samples from trawl in quarter two and three in ICES area 1 and age samples from purse-seine fishery south of Lofoten (ICES area 2.a). In 2019 particularly catches from the saithe purse seine fishery in Norwegian statistical areas 3 and 4 (ICES area 2.a) were not sampled adequately, which may affect the precision of the catch and weight at age estimates.
Lack of reliable recruitment estimates is a major problem. Prediction of catches will still, to a large extent, be dependent on assumptions of average recruitment in the intermediate year and the forecast period, since fish from age four to seven constitute major parts of the catches. Since the saithe HCR is a three-year-rule, the estimation of average Fmp catch in the HCR will affect stock numbers up to age five, and thereby affect the total prognosis of the fishable stock and the quotas derived from it. The recruitment-at-age 3 estimated by the SAM has on average been at about the long-term geometric mean level since 2005.

ICES | AFWG 2020 | 257
Table 5.1. Saithe in subareas 1 and 2 (Northeast Arctic). Nominal catch (t) by countries as officially reported to ICES.
Year Faroe
Islands
France Germany
Dem.Rep
Fed.Rep.
Germany
Iceland Norway Poland Portugal Russia3 Spain UK Others 5
Total all
countries
1960 23 1 700 25 948 96 050 9 780 14 133 515
1961 61 3 625
19 757
77 875
4 615 18 105 951
1962 2 544
12 651
101 895
912
4 699 4 120 707
1963
1 110
8 108
135 297
4 112
148 627
1964
1 525
4 420
184 700
84
6 511 186 197 426
1965
1 618
11 387
165 531
137
6 746 181 185 600
1966
2 987 813
11 269
175 037
563
13 078 41 203 788
1967
9 472 304
11 822
150 860
441
8 379 48 181 326
1968
1248
4 753
96 641
8 782
111 424
1969 20 193 6 744
4 355
115 140
13 585 23 140 060
1970 1 097
29 200
23 466
151 759
43 550
15 690
264 924
1971 215 14 536 16 840
12 204
128 499 6 017
39 397 13 097 10 467
241 272
1972 109 14 519 7 474
24 595
143 775 1 111
1 278 9 247 8 348
210 456
1973 7 11320 12 015
30 338
148 789 23
2 411 2 115 6 841
213 859
1974 46 7119 29 466
33 155
152 699 2521
28 931 7 075 3 104 5 264 121
1975 28 3156 28 517
41 260
122 598 3860 6430 13 389 11 397 2 763 55 233 453
1976 20 5609 10 266
49 056
131 675 3164 7233 9 013 21 661 4 724 65 242 486
1977 270 5658 7 164
19 985
139 705 1 783 989 1 327 6 935
182 817
1978 809 4345 6 484
19 190
121 069 35 203 381 121 2 827
155 464
1979 1117 2601 2 435
15 323
141 346
3 685 1 170
164 680
1980 532 1016
12 511
128 878
43 780 794
144 554
1981 236 218
8 431
166 139
121
395
175 540
1982 339 82
7 224
159 643
14
732
168 034
1983 539 418
4 933
149 556
206 33 1 251
156 936
1984 503 431 6
4 532
152 818
161
335
158 786
1985 490 657 11
1 873
103 899
51
202
107 183
1986 426 308
3 470
63 090
27
75
67 396
1987 712 576
4 909
85 710
426
57 1 92 391
1988 441 411
4 574
108 244
130
442
114 242
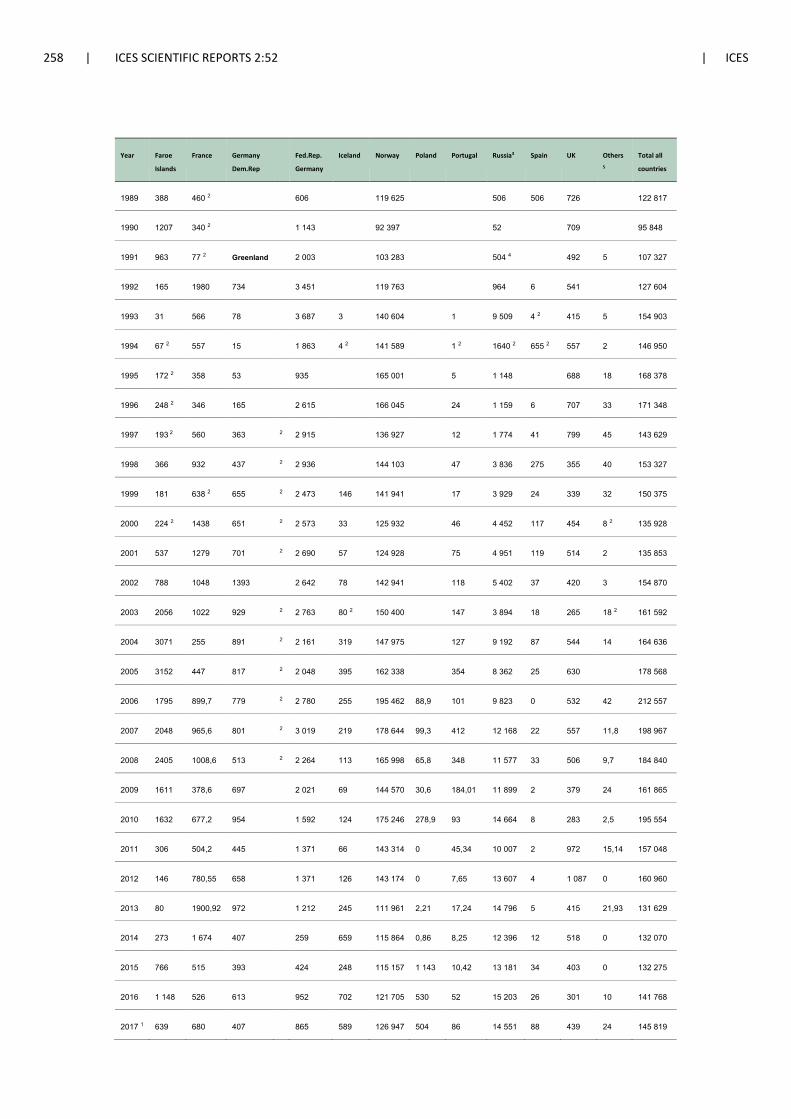
258 | ICES SCIENTIFIC REPORTS 2:52 | ICES
Year Faroe
Islands
France Germany
Dem.Rep
Fed.Rep.
Germany
Iceland Norway Poland Portugal Russia3 Spain UK Others 5
Total all
countries
1989 388 460 2
606
119 625
506 506 726
122 817
1990 1207 340 2
1 143
92 397
52
709
95 848
1991 963 77 2 Greenland
2 003
103 283
504 4
492 5 107 327
1992 165 1980 734
3 451
119 763
964 6 541
127 604
1993 31 566 78
3 687 3 140 604
1 9 509 4 2 415 5 154 903
1994 67 2 557 15
1 863 4 2 141 589
1 2 1640 2 655 2 557 2 146 950
1995 172 2 358 53
935
165 001
5 1 148
688 18 168 378
1996 248 2 346 165
2 615
166 045
24 1 159 6 707 33 171 348
1997 193 2 560 363 2 2 915
136 927
12 1 774 41 799 45 143 629
1998 366 932 437 2 2 936
144 103
47 3 836 275 355 40 153 327
1999 181 638 2 655 2 2 473 146 141 941
17 3 929 24 339 32 150 375
2000 224 2 1438 651 2 2 573 33 125 932
46 4 452 117 454 8 2 135 928
2001 537 1279 701 2 2 690 57 124 928
75 4 951 119 514 2 135 853
2002 788 1048 1393
2 642 78 142 941
118 5 402 37 420 3 154 870
2003 2056 1022 929 2 2 763 80 2 150 400
147 3 894 18 265 18 2 161 592
2004 3071 255 891 2 2 161 319 147 975
127 9 192 87 544 14 164 636
2005 3152 447 817 2 2 048 395 162 338
354 8 362 25 630
178 568
2006 1795 899,7 779 2 2 780 255 195 462 88,9 101 9 823 0 532 42 212 557
2007 2048 965,6 801 2 3 019 219 178 644 99,3 412 12 168 22 557 11,8 198 967
2008 2405 1008,6 513 2 2 264 113 165 998 65,8 348 11 577 33 506 9,7 184 840
2009 1611 378,6 697
2 021 69 144 570 30,6 184,01 11 899 2 379 24 161 865
2010 1632 677,2 954
1 592 124 175 246 278,9 93 14 664 8 283 2,5 195 554
2011 306 504,2 445
1 371 66 143 314 0 45,34 10 007 2 972 15,14 157 048
2012 146 780,55 658
1 371 126 143 174 0 7,65 13 607 4 1 087 0 160 960
2013 80 1900,92 972
1 212 245 111 961 2,21 17,24 14 796 5 415 21,93 131 629
2014 273 1 674 407
259 659 115 864 0,86 8,25 12 396 12 518 0 132 070
2015 766 515 393
424 248 115 157 1 143 10,42 13 181 34 403 0 132 275
2016 1 148 526 613
952 702 121 705 530 52 15 203 26 301 10 141 768
2017 1 639 680 407
865 589 126 947 504 86 14 551 88 439 24 145 819

ICES | AFWG 2020 | 259
Year Faroe
Islands
France Germany
Dem.Rep
Fed.Rep.
Germany
Iceland Norway Poland Portugal Russia3 Spain UK Others 5
Total all
countries
2018 626 937 448
1 642
162 460 404 51 14 171 60 464 17 181 280
2019 618 1 472 424 1 371 144 076 46 131 13 990 199 419 434 163 180
1 Provisional figures.
2 As reported to Norwegian authorities.
3 USSR prior to 1991.
4 Includes Estonia.
5 Includes Denmark, Netherlands, Ireland, and Sweden
6 As reported by Working Group members
Table 5.2 Saithe in subareas 1 and 2 (Northeast Arctic). Catch by fishing gear.
Year
Purse-seine Trawl Gillnet Others Total
1977
75,2 69,5 19,3 12,7 176,7
1978
62,9 57,6 21,1 13,9 155,5
1979
74,7 52,5 21,6 15,9 164,7
1980
61,3 46,8 21,1 15,4 144,6
1981
64,3 72,4 24,0 14,8 175,5
1982
76,4 59,4 16,7 15,5 168,0
1983
54,1 68,2 19,6 15,0 156,9
1984
36,4 85,6 23,7 13,1 158,8
1985
31,1 49,9 14,6 11,6 107,2
1986
7,9 36,2 12,3 8,2 64,6
1987
34,9 27,7 19,0 10,8 92,4
1988
43,5 45,4 15,3 10,0 114,2
1989
49,5 45,0 16,9 11,4 122,8
1990
24,6 44,0 19,3 7,9 95,8
1991
38,9 40,1 18,9 9,4 107,3
1992
27,1 67,0 22,3 11,2 127,6
1993
33,1 84,9 21,2 15,7 154,9
1994
30,2 82,2 21,1 13,5 147,0
1995
21,8 103,5 26,9 16,1 168,4
1996
46,9 72,5 31,6 20,3 171,3
1997
44,4 55,9 24,4 19,0 143,6

260 | ICES SCIENTIFIC REPORTS 2:52 | ICES
1998
44,4 57,7 27,6 23,6 153,3
1999
39,2 57,9 29,7 23,6 150,4
2000
28,3 54,5 29,6 23,5 135,9
2001
28,1 58,1 28,2 21,5 135,9
2002
27,4 75,5 30,4 21,5 154,8
2003
43,3 73,8 25,2 19,3 161,6
2004
41,8 74,6 26,9 21,3 164,6
2005
42,1 91,8 25,6 19,1 178,6
2006
73,5 87,1 29,7 22,5 212,8
2007
41,8 100,7 33,3 23,2 199,0
2008
39,4 91,2 37,0 17,1 184,7
2009
35,5 81,1 33,2 12,1 161,9
2010
54,9 89,8 36,9 13,2 194,8
2011
45,3 67,1 32,1 12,2 156,7
2012
44,2 73,9 28,3 14,5 160,9
2013
34,7 65,2 19,2 12,7 131,8
2014
29,3 54,8 26,7 21,2 132,0
2015
30,4 55,4 23,5 22,5 131,8
2016
28,9 64,1 21,4 26,9 141,3
2017 1 32,4 65,0 21,4 27,3 146,1
2018 36,0 83,6 28,8 33,2 181,5
2019 28,7 68,6 29,4 36,6 163,1
1 Provisional figures.
2 Unresolved discrepancies between Norwegian catch by gear figures and the total reported to ICES for these years.
3 Includes 4300 tonnes not categorized by gear, proportionally adjusted.
4 Reduced by 1200 tonnes not categorized by gear, proportionally adjusted.

ICES | AFWG 2020 | 261
Table 5.3 Catch numbers-at-age (‘000) Northeast Arctic saithe
Age groups
Year 3 4 5 6 7 8 9 10 11 12+
1960 13517 16828 17422 6514 6281 3088 1691 956 481 1481
1961 25237 12929 17707 5379 1886 1371 736 573 538 1202
1962 45932 13720 5449 10218 2991 1262 1156 556 611 1518
1963 51171 35199 7165 5659 4699 1337 1308 848 550 1612
1964 10925 72344 15966 3299 4214 3223 1518 1482 1282 3038
1965 42578 5737 30171 11635 3282 2421 3135 802 1136 2986
1966 25127 61199 14727 14475 5220 1542 1047 1083 530 2724
1967 28457 23826 34493 3957 5388 2797 1356 1340 814 2536
1968 29955 21856 6065 9846 936 2274 1070 686 465 922
1969 76011 11745 16650 4666 4716 1107 1682 663 199 303
1970 43834 63270 14081 16298 5157 8004 2521 3722 1103 1714
1971 61743 47522 21614 7661 7690 2326 3489 1760 2514 1888
1972 55351 44490 24752 8650 4769 3012 1584 1817 1044 1631
1973 62938 20793 22199 13224 5868 3246 2368 2153 1291 1947
1974 36884 44149 15714 20476 12182 4815 3267 2512 1440 2392
1975 70255 13502 18901 5123 9018 7841 3365 2714 2237 2544
1976 135592 33159 8618 9448 3725 3483 2905 1870 1183 1940
1977 105935 36703 10845 2205 4633 1557 1718 1030 495 718
1978 56505 31946 14396 5232 1694 2132 1082 1126 756 1726
1979 75819 28545 17280 5384 3550 1178 1659 536 373 1086
1980 40303 36202 9100 6302 3161 1322 145 721 406 1204
1981 85966 22345 22044 3706 2611 2056 378 286 258 385
1982 35853 67150 13481 8477 1088 1291 476 271 124 338
1983 18216 25108 34543 3408 3178 1243 803 261 215 587
1984 43579 34927 12679 11775 1193 1862 589 585 407 537
1985 48989 11992 7200 5287 3746 776 879 134 274 427
1986 21322 12433 5845 4363 2704 1349 338 438 123 152
1987 18555 51742 4506 3238 3624 784 644 267 263 565

262 | ICES SCIENTIFIC REPORTS 2:52 | ICES
Age groups
Year 3 4 5 6 7 8 9 10 11 12+
1988 8144 35928 32901 4570 2333 1222 968 321 73 30
1989 12607 19400 33343 18578 1762 352 177 189 1 205
1990 23792 16930 9054 10238 7341 1076 160 112 150 118
1991 68682 13630 5752 4883 3877 2381 383 61 90 89
1992 44627 33294 5987 5412 4751 3176 1462 286 93 350
1993 22812 61931 31102 3747 1759 1378 1027 797 76 71
1994 7063 32671 49410 19058 2058 724 421 278 528 129
1995 17178 52109 40145 30451 4177 483 125 259 31 263
1996 10510 54886 18499 18357 17834 2849 485 214 148 325
1997 11789 11698 35011 13567 13452 7058 812 55 48 98
1998 3091 16215 11946 31818 8376 5539 2873 727 111 282
1999 9655 12236 22872 10347 18930 3374 3343 2290 419 170
2000 9175 22768 7747 10676 6123 8303 2530 2652 1022 197
2001 3816 7946 26960 8769 7120 3146 4687 1935 1406 528
2002 6582 17492 11573 25671 5312 4276 2382 3431 965 1420
2003 2345 50653 13600 7123 9594 5494 3545 2519 2327 1813
2004 1002 6129 33840 10613 7494 8307 2792 3088 2377 3072
2005 26093 12543 9841 23141 10799 5659 7852 2674 713 1588
2006 1590 68137 12328 10098 16757 8080 5671 5127 1815 2529
2007 3144 4115 39889 15301 7963 11302 7749 4138 2157 849
2008 25259 18953 5969 24363 9712 5624 7697 4705 1606 1572
2009 9050 34311 9954 6628 15930 4766 3021 4224 2471 1426
2010 26382 43436 28514 7988 3129 12444 2749 1314 1212 1431
2011 6239 45213 13307 15157 6622 2901 5934 1730 647 1115
2012 30742 17841 33911 10496 7058 3522 1570 2586 557 890
2013 17151 15491 15946 21980 5512 3298 1149 729 885 653
2014 7650 24769 13822 9343 12331 3284 2130 904 378 763
2015 13185 15459 30159 9271 7324 7133 1697 723 433 620
2016 8278 20955 13044 15532 6621 4774 4363 1053 718 1382
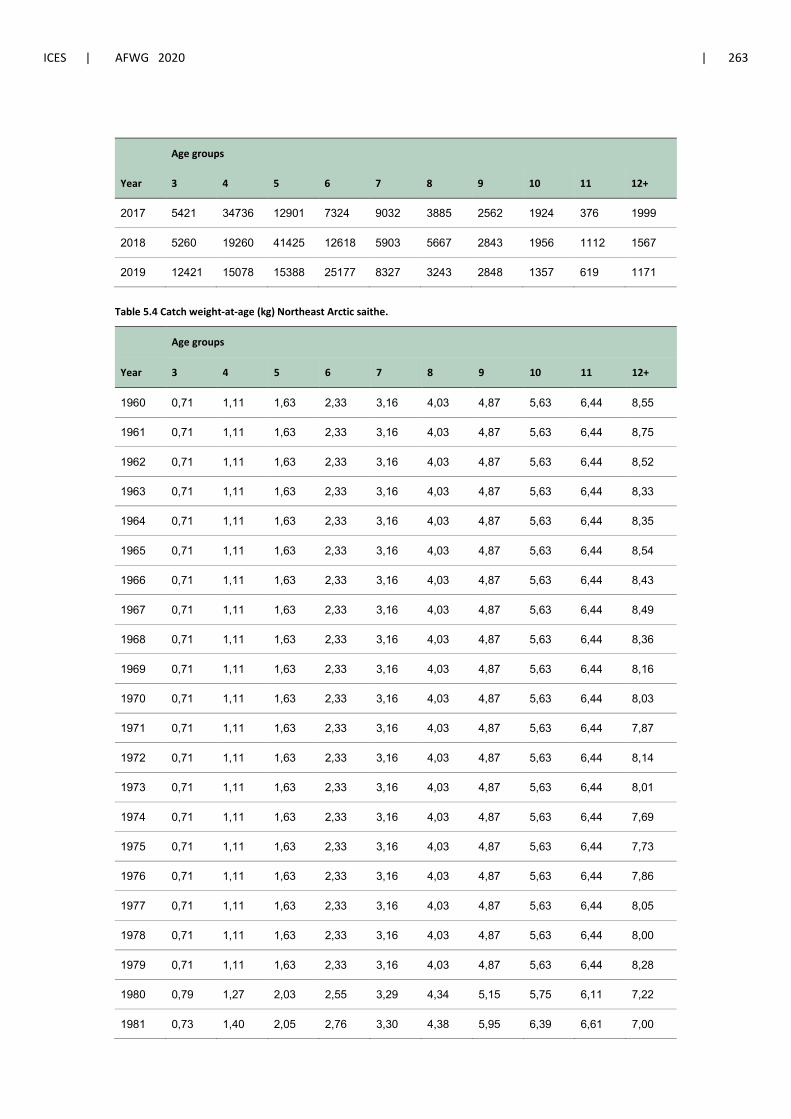
ICES | AFWG 2020 | 263
Age groups
Year 3 4 5 6 7 8 9 10 11 12+
2017 5421 34736 12901 7324 9032 3885 2562 1924 376 1999
2018 5260 19260 41425 12618 5903 5667 2843 1956 1112 1567
2019 12421 15078 15388 25177 8327 3243 2848 1357 619 1171
Table 5.4 Catch weight-at-age (kg) Northeast Arctic saithe.
Age groups
Year 3 4 5 6 7 8 9 10 11 12+
1960 0,71 1,11 1,63 2,33 3,16 4,03 4,87 5,63 6,44 8,55
1961 0,71 1,11 1,63 2,33 3,16 4,03 4,87 5,63 6,44 8,75
1962 0,71 1,11 1,63 2,33 3,16 4,03 4,87 5,63 6,44 8,52
1963 0,71 1,11 1,63 2,33 3,16 4,03 4,87 5,63 6,44 8,33
1964 0,71 1,11 1,63 2,33 3,16 4,03 4,87 5,63 6,44 8,35
1965 0,71 1,11 1,63 2,33 3,16 4,03 4,87 5,63 6,44 8,54
1966 0,71 1,11 1,63 2,33 3,16 4,03 4,87 5,63 6,44 8,43
1967 0,71 1,11 1,63 2,33 3,16 4,03 4,87 5,63 6,44 8,49
1968 0,71 1,11 1,63 2,33 3,16 4,03 4,87 5,63 6,44 8,36
1969 0,71 1,11 1,63 2,33 3,16 4,03 4,87 5,63 6,44 8,16
1970 0,71 1,11 1,63 2,33 3,16 4,03 4,87 5,63 6,44 8,03
1971 0,71 1,11 1,63 2,33 3,16 4,03 4,87 5,63 6,44 7,87
1972 0,71 1,11 1,63 2,33 3,16 4,03 4,87 5,63 6,44 8,14
1973 0,71 1,11 1,63 2,33 3,16 4,03 4,87 5,63 6,44 8,01
1974 0,71 1,11 1,63 2,33 3,16 4,03 4,87 5,63 6,44 7,69
1975 0,71 1,11 1,63 2,33 3,16 4,03 4,87 5,63 6,44 7,73
1976 0,71 1,11 1,63 2,33 3,16 4,03 4,87 5,63 6,44 7,86
1977 0,71 1,11 1,63 2,33 3,16 4,03 4,87 5,63 6,44 8,05
1978 0,71 1,11 1,63 2,33 3,16 4,03 4,87 5,63 6,44 8,00
1979 0,71 1,11 1,63 2,33 3,16 4,03 4,87 5,63 6,44 8,28
1980 0,79 1,27 2,03 2,55 3,29 4,34 5,15 5,75 6,11 7,22
1981 0,73 1,40 2,05 2,76 3,30 4,38 5,95 6,39 6,61 7,00

264 | ICES SCIENTIFIC REPORTS 2:52 | ICES
Age groups
Year 3 4 5 6 7 8 9 10 11 12+
1982 0,77 1,12 2,02 2,61 3,27 3,91 4,69 5,63 7,18 7,69
1983 1,05 1,33 1,86 2,80 4,00 4,18 5,33 5,68 7,31 9,16
1984 0,71 1,26 2,02 2,70 3,88 4,47 5,36 6,06 6,28 7,88
1985 0,75 1,33 2,07 2,63 3,28 3,96 4,54 5,55 6,88 8,74
1986 0,59 1,22 1,97 2,30 2,87 3,72 4,30 4,69 5,84 7,21
1987 0,53 0,84 1,66 2,32 2,97 4,00 4,72 5,44 5,79 7,42
1988 0,62 0,87 1,31 2,43 3,87 5,38 5,83 5,36 6,92 8,82
1989 0,74 0,95 1,40 1,78 2,96 3,73 4,62 4,66 8,34 7,69
1990 0,71 1,00 1,45 2,09 2,49 3,75 3,90 6,74 4,94 7,34
1991 0,68 1,05 1,85 2,39 3,08 3,35 4,48 4,66 5,62 7,31
1992 0,67 1,01 1,92 2,28 2,77 3,20 3,73 6,35 6,90 7,83
1993 0,61 0,99 1,65 2,46 2,85 3,03 3,71 4,49 5,56 7,13
1994 0,52 0,76 1,24 2,12 3,22 3,83 4,69 5,31 5,66 7,29
1995 0,56 0,79 1,19 1,71 2,87 3,78 4,06 5,30 6,86 7,65
1996 0,59 0,82 1,33 1,84 2,48 3,73 4,32 5,34 5,98 7,58
1997 0,62 0,95 1,24 1,72 2,35 3,10 4,19 5,79 6,77 7,75
1998 0,68 1,00 1,48 1,87 2,58 3,07 4,13 5,44 6,70 8,59
1999 0,67 1,05 1,45 1,93 2,27 2,97 3,61 4,10 4,93 6,97
2000 0,60 1,03 1,63 2,10 2,67 3,14 3,81 4,41 5,76 8,07
2001 0,75 1,12 1,54 2,04 2,60 3,14 3,63 4,54 5,05 6,17
2002 0,69 1,01 1,50 1,97 2,54 3,25 3,77 4,31 4,91 6,11
2003 0,66 0,91 1,42 1,89 2,54 2,58 3,49 3,75 4,12 5,90
2004 0,70 1,03 1,37 1,90 2,41 2,98 3,44 3,73 4,14 5,47
2005 0,59 0,89 1,49 2,09 2,16 2,99 3,24 3,82 3,92 6,19
2006 0,63 0,83 1,43 1,78 2,27 2,73 3,02 3,90 4,06 5,82
2007 0,73 1,08 1,41 1,86 2,43 2,94 3,35 3,66 4,17 5,54
2008 0,63 0,98 1,38 1,92 2,31 2,83 3,16 3,43 3,82 4,75
2009 0,73 1,03 1,65 2,00 2,37 2,69 3,23 3,38 3,46 4,67
2010 0,70 0,99 1,45 2,14 2,50 3,13 3,34 3,81 3,99 5,17

ICES | AFWG 2020 | 265
Age groups
Year 3 4 5 6 7 8 9 10 11 12+
2011 0,70 0,82 1,42 2,07 2,68 3,25 3,62 3,97 4,52 5,84
2012 0,59 1,07 1,35 2,15 2,82 3,20 3,67 4,16 4,60 5,70
2013 0,57 1,01 1,50 1,83 2,74 3,33 3,91 4,61 4,50 6,13
2014 0,66 0,92 1,58 2,12 2,54 3,49 4,01 4,22 4,71 5,80
2015 0,61 0,85 1,24 1,91 2,45 3,02 3,97 4,74 4,51 6,05
2016 0,84 1,04 1,46 2,02 2,36 3,12 3,53 4,14 4,65 6,03
2017 0,89 1,12 1,68 2,18 2,63 3,13 3,63 4,16 4,5 5,9
2018 0,91 1,21 1,56 2,02 2,51 3,04 3,44 3,89 4,50 5,60
2019 0,83 1,17 1,64 2,06 2,62 3,18 3,71 4,13 4,88 6,14
Table 5.5. 3-year running average maturity ogive 1985–2006, values for 2007–2017 average of 2005–2007.
Year 3 4 5 6 7 8 9 10 11 12+
1985 0 0.02 0.5 0.92 0.99 1 1 1 1 1
1986 0 0.02 0.51 0.94 0.99 1 1 1 1 1
1987 0 0 0.35 0.98 1 1 1 1 1 1
1988 0 0 0.25 0.96 1 1 1 1 1 1
1989 0 0 0.15 0.92 1 1 1 1 1 1
1990 0 0 0.2 0.85 0.99 1 1 1 1 1
1991 0 0.02 0.25 0.84 0.98 1 1 1 1 1
1992 0 0.02 0.3 0.83 0.93 0.92 0.9 0.95 1 1
1993 0 0.02 0.26 0.88 0.92 0.89 0.87 0.89 1 0.99
1994 0 0.02 0.26 0.84 0.9 0.82 0.87 0.89 1 0.99
1995 0 0.02 0.22 0.8 0.92 0.9 0.97 0.94 1 0.99
1996 0 0.03 0.21 0.65 0.91 0.93 1 1 1 1.00
1997 0 0.03 0.14 0.45 0.83 0.94 0.93 0.97 1 1.00
1998 0 0.04 0.07 0.33 0.74 0.93 0.92 0.96 1 1.00
1999 0 0 0.08 0.32 0.74 0.92 0.92 0.96 0.99 0.98
2000 0 0 0.08 0.46 0.82 0.96 0.98 0.99 0.97 0.95
2001 0 0 0.11 0.64 0.93 0.97 0.98 0.99 0.97 0.94

266 | ICES SCIENTIFIC REPORTS 2:52 | ICES
Year 3 4 5 6 7 8 9 10 11 12+
2002 0 0 0.13 0.78 0.95 0.98 0.98 0.99 0.98 0.97
2003 0 0 0.14 0.82 0.96 0.98 0.98 0.99 1 0.99
2004 0 0 0.21 0.8 0.97 0.99 0.99 1 1 0.98
2005 0 0.03 0.3 0.82 0.97 0.99 0.99 1 1 1.00
2006 0 0.04 0.4 0.86 0.98 0.99 1 1 1 1.00
2007 0 0.05 0.42 0.87 0.97 0.98 0.98 0.97 0.97 0.99
2008 0 0.05 0.42 0.87 0.97 0.98 0.98 0.97 0.97 0.99
2009 0 0.05 0.42 0.87 0.97 0.98 0.98 0.97 0.97 0.99
2010 0 0.05 0.42 0.87 0.97 0.98 0.98 0.97 0.97 0.99
2011 0 0.05 0.42 0.87 0.97 0.98 0.98 0.97 0.97 1.00
2012 0 0.05 0.42 0.87 0.97 0.98 0.98 0.97 0.97 1.00
2013 0 0.05 0.42 0.87 0.97 0.98 0.98 0.97 0.97 1.00
2014 0 0.05 0.42 0.87 0.97 0.98 0.98 0.97 0.97 1.00
2015 0 0.05 0.42 0.87 0.97 0.98 0.98 0.97 0.97 1.00
2016 0 0.05 0.42 0.87 0.97 0.98 0.98 0.97 0.97 1.00
2017 0 0.05 0.42 0.87 0.97 0.98 0.98 0.97 0.97 1.00
2018 0 0.05 0.42 0.87 0.97 0.98 0.98 0.97 0.97 1.00
2019 0 0.05 0.42 0.87 0.97 0.98 0.98 0.97 0.97 1.00

ICES | AFWG 2020 | 267
Table 5.6 Northeast Arctic saithe. Tuning datasets applied in final SAM run
FLT13: Norway Ac Survey (Catch: Unknown) (Effort: Unknown) 1994 2001 1 1 0.75 0.85 3 7 1 87.1 108.9 41.4 8.1 0.7 1 166.1 86.5 46.5 16.5 2.4 1 122.6 207.4 31.7 15.1 4.0 1 38.0 184.8 79.8 50.6 9.6 1 96.7 202.6 69.3 84.3 6.6 1 233.8 72.9 62.2 21.0 19.2 1 142.5 176.3 11.6 11.5 8.0 1 275.9 45.9 53.8 5.6 6.1 FLT14: Norway Ac Survey (Catch: Unknown) (Effort: Unknown) 2002 2019 1 1 0.75 0.85 3 7 1 230.2 92.6 18.9 10.6 2.2 1 87.5 151.7 26.1 6.2 6.4 1 196.0 144.7 48.2 16.9 4.3 1 211.5 49.9 16.1 11.9 7.2 1 42.2 132.1 13.6 4.4 8.9 1 90.1 25.8 58.3 6.8 4.1 1 58.2 17.0 8.2 9.9 3.0 1 97.4 61.5 7.1 4.1 6.1 1 143.0 22.5 17.2 4 1.7 1 42.7 59.6 4.6 4.2 1.1 1 68.6 29.6 18.8 3.5 2.8 1 78.0 16.7 13.0 11.6 2.2 1 40.1 70.8 8.7 5.6 5.4 1 72.4 22.7 30.1 6.0 4.2 1 145.7 32.0 10.5 11.2 4.2 1 91.1 63.9 13.3 2.8 5.4 1 30.6 61.1 45.4 12.3 4.2 1 84.4 50.6 24.2 17.75 3.54
Table 5.7 SAM parameter settings.
Model used: State-space assessment model SAM (https://www.stockassessment.org).
Software used: Template Model Builder (TMB) and R.
Visible stock on (https://www.stockassessment.org) “afwg_saithe_ 2018_001”.
Model Options agreed upon at IBP saithe winter 2014.
$minAge
# The minimium age class in the assessment
3
$maxAge

268 | ICES SCIENTIFIC REPORTS 2:52 | ICES
# The maximum age class in the assessment
12
$maxAgePlusGroup
# Is last age group considered a plus group (1 yes, or 0 no).
1
$keyLogFsta
# Coupling of the fishing mortality states (nomally only first row is used).
0 1 2 3 4 5 5 5 5 5
-1 -1 -1 -1 -1 -1 -1 -1 -1 -1
-1 -1 -1 -1 -1 -1 -1 -1 -1 -1
$corFlag
# Correlation of fishing mortality across ages (0 independent, 1 compound symmetry, or 2 AR(1)
2
$keyLogFpar
# Coupling of the survey catchability parameters (nomally first row is not used, as that is covered by fishing mortality).
-1 -1 -1 -1 -1 -1 -1 -1 -1 -1
0 1 2 3 3 -1 -1 -1 -1 -1
4 5 6 7 7 -1 -1 -1 -1 -1
$keyQpow
# Density dependent catchability power parameters (if any).
-1 -1 -1 -1 -1 -1 -1 -1 -1 -1
-1 -1 -1 -1 -1 -1 -1 -1 -1 -1
-1 -1 -1 -1 -1 -1 -1 -1 -1 -1
$keyVarF
# Coupling of process variance parameters for log(F)-process (nomally only first row is used)
0 0 0 0 0 0 0 0 0 0
-1 -1 -1 -1 -1 -1 -1 -1 -1 -1
-1 -1 -1 -1 -1 -1 -1 -1 -1 -1
$keyVarLogN
# Coupling of process variance parameters for log(N)-process
0 1 1 1 1 1 1 1 1 1
$keyVarObs
# Coupling of the variance parameters for the observations.
0 0 0 0 0 0 0 0 0 0

ICES | AFWG 2020 | 269
1 1 1 1 1 -1 -1 -1 -1 -1
2 2 2 2 2 -1 -1 -1 -1 -1
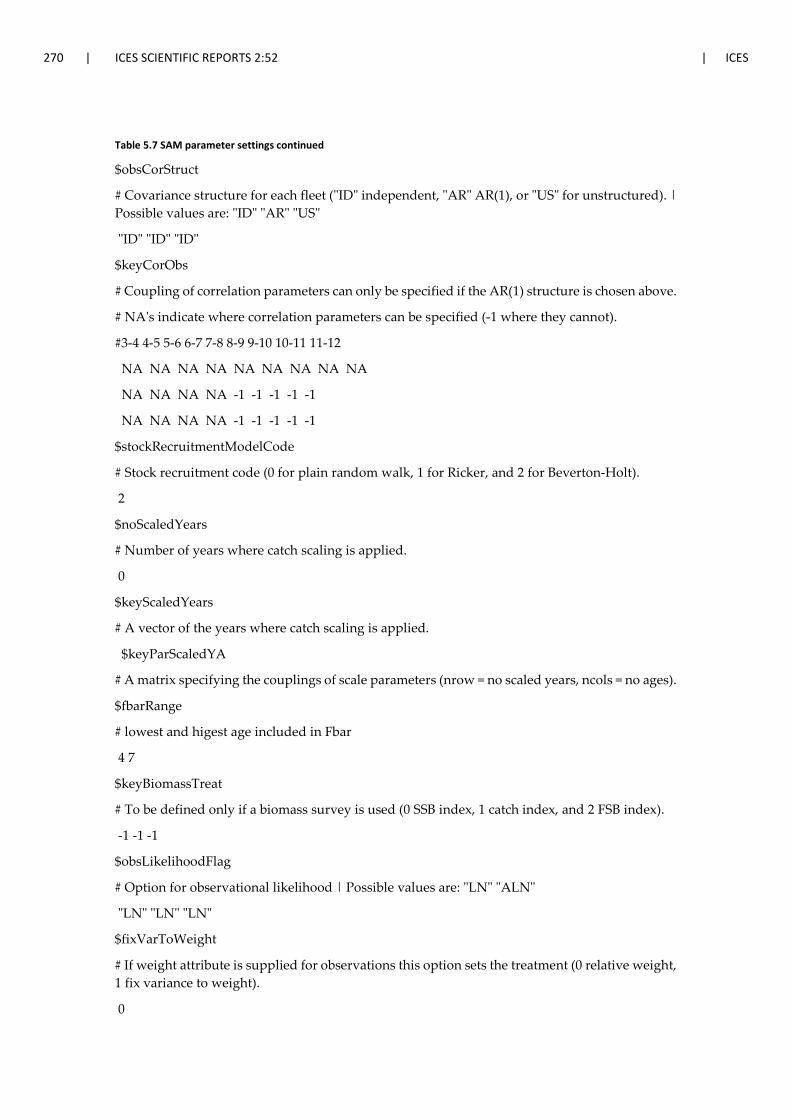
270 | ICES SCIENTIFIC REPORTS 2:52 | ICES
Table 5.7 SAM parameter settings continued
$obsCorStruct
# Covariance structure for each fleet ("ID" independent, "AR" AR(1), or "US" for unstructured). | Possible values are: "ID" "AR" "US"
"ID" "ID" "ID"
$keyCorObs
# Coupling of correlation parameters can only be specified if the AR(1) structure is chosen above.
# NA's indicate where correlation parameters can be specified (-1 where they cannot).
#3-4 4-5 5-6 6-7 7-8 8-9 9-10 10-11 11-12
NA NA NA NA NA NA NA NA NA
NA NA NA NA -1 -1 -1 -1 -1
NA NA NA NA -1 -1 -1 -1 -1
$stockRecruitmentModelCode
# Stock recruitment code (0 for plain random walk, 1 for Ricker, and 2 for Beverton-Holt).
2
$noScaledYears
# Number of years where catch scaling is applied.
0
$keyScaledYears
# A vector of the years where catch scaling is applied.
$keyParScaledYA
# A matrix specifying the couplings of scale parameters (nrow = no scaled years, ncols = no ages).
$fbarRange
# lowest and higest age included in Fbar
4 7
$keyBiomassTreat
# To be defined only if a biomass survey is used (0 SSB index, 1 catch index, and 2 FSB index).
-1 -1 -1
$obsLikelihoodFlag
# Option for observational likelihood | Possible values are: "LN" "ALN"
"LN" "LN" "LN"
$fixVarToWeight
# If weight attribute is supplied for observations this option sets the treatment (0 relative weight, 1 fix variance to weight).
0

ICES | AFWG 2020 | 271
Table 5.8. SAM catchabilities, negative log likelihood values, and number of parameters.
Index Fleet number Age Catchability Low High
1 2 3 0.869 0.592 1.276
2 2 4 1.17 0.799 1.714
3 2 5 0.607 0.414 0.89
4 2 6 0.375 0.279 0.504
5 2 7 0.375 0.279 0.504
6 3 3 0.626 0.51 0.769
7 3 4 0.504 0.411 0.619
8 3 5 0.276 0.225 0.34
9 3 6 0.182 0.152 0.219
10 3 7 0.182 0.152 0.219
Model fitting.
Model log(L) #par AIC
Current -553.32 17 1140.64
base -547.23 17 1128.45
Table 5.9 Estimated fishing mortalities.
Year Age
3 4 5 6 7 8 9 10 11 12
1960 0.237 0.284 0.321 0.277 0.221 0.163 0.163 0.163 0.163 0.163
1961 0.223 0.260 0.273 0.227 0.174 0.127 0.127 0.127 0.127 0.127
1962 0.222 0.262 0.268 0.226 0.177 0.133 0.133 0.133 0.133 0.133
1963 0.225 0.273 0.282 0.239 0.194 0.154 0.154 0.154 0.154 0.154
1964 0.238 0.298 0.319 0.277 0.241 0.208 0.208 0.208 0.208 0.208
1965 0.235 0.292 0.326 0.288 0.254 0.231 0.231 0.231 0.231 0.231
1966 0.260 0.320 0.342 0.288 0.245 0.224 0.224 0.224 0.224 0.224
1967 0.260 0.309 0.318 0.264 0.224 0.217 0.217 0.217 0.217 0.217
1968 0.221 0.241 0.229 0.185 0.153 0.147 0.147 0.147 0.147 0.147
1969 0.230 0.241 0.221 0.175 0.143 0.132 0.132 0.132 0.132 0.132
1970 0.328 0.361 0.340 0.283 0.250 0.239 0.239 0.239 0.239 0.239
1971 0.359 0.384 0.356 0.294 0.269 0.258 0.258 0.258 0.258 0.258

272 | ICES SCIENTIFIC REPORTS 2:52 | ICES
Year Age
3 4 5 6 7 8 9 10 11 12
1972 0.380 0.391 0.350 0.283 0.259 0.245 0.245 0.245 0.245 0.245
1973 0.419 0.429 0.386 0.317 0.299 0.284 0.284 0.284 0.284 0.284
1974 0.542 0.561 0.513 0.429 0.416 0.395 0.395 0.395 0.395 0.395
1975 0.596 0.621 0.567 0.478 0.488 0.477 0.477 0.477 0.477 0.477
1976 0.649 0.683 0.611 0.499 0.495 0.470 0.470 0.470 0.470 0.470
1977 0.576 0.615 0.541 0.431 0.417 0.377 0.377 0.377 0.377 0.377
1978 0.574 0.653 0.597 0.488 0.475 0.430 0.430 0.430 0.430 0.430
1979 0.554 0.678 0.638 0.529 0.508 0.451 0.451 0.451 0.451 0.451
1980 0.494 0.639 0.620 0.519 0.481 0.420 0.420 0.420 0.420 0.420
1981 0.458 0.631 0.621 0.521 0.460 0.391 0.391 0.391 0.391 0.391
1982 0.423 0.622 0.623 0.527 0.450 0.374 0.374 0.374 0.374 0.374
1983 0.403 0.631 0.656 0.596 0.533 0.452 0.452 0.452 0.452 0.452
1984 0.444 0.716 0.733 0.725 0.684 0.591 0.591 0.591 0.591 0.591
1985 0.352 0.593 0.614 0.652 0.683 0.590 0.590 0.590 0.590 0.590
1986 0.243 0.452 0.499 0.574 0.650 0.592 0.592 0.592 0.592 0.592
1987 0.226 0.456 0.532 0.665 0.806 0.746 0.746 0.746 0.746 0.746
1988 0.215 0.456 0.537 0.659 0.766 0.652 0.652 0.652 0.652 0.652
1989 0.201 0.422 0.470 0.525 0.533 0.398 0.398 0.398 0.398 0.398
1990 0.223 0.478 0.525 0.595 0.602 0.451 0.451 0.451 0.451 0.451
1991 0.192 0.428 0.481 0.556 0.571 0.430 0.430 0.430 0.430 0.430
1992 0.172 0.431 0.543 0.692 0.754 0.600 0.600 0.600 0.600 0.600
1993 0.130 0.355 0.476 0.622 0.680 0.540 0.540 0.540 0.540 0.540
1994 0.100 0.296 0.418 0.567 0.627 0.502 0.502 0.502 0.502 0.502
1995 0.081 0.247 0.336 0.437 0.470 0.372 0.372 0.372 0.372 0.372
1996 0.072 0.225 0.312 0.419 0.485 0.415 0.415 0.415 0.415 0.415
1997 0.053 0.163 0.226 0.297 0.338 0.292 0.292 0.292 0.292 0.292
1998 0.046 0.154 0.221 0.297 0.347 0.322 0.322 0.322 0.322 0.322
1999 0.045 0.157 0.228 0.298 0.338 0.322 0.322 0.322 0.322 0.322
2000 0.039 0.140 0.204 0.266 0.295 0.291 0.291 0.291 0.291 0.291
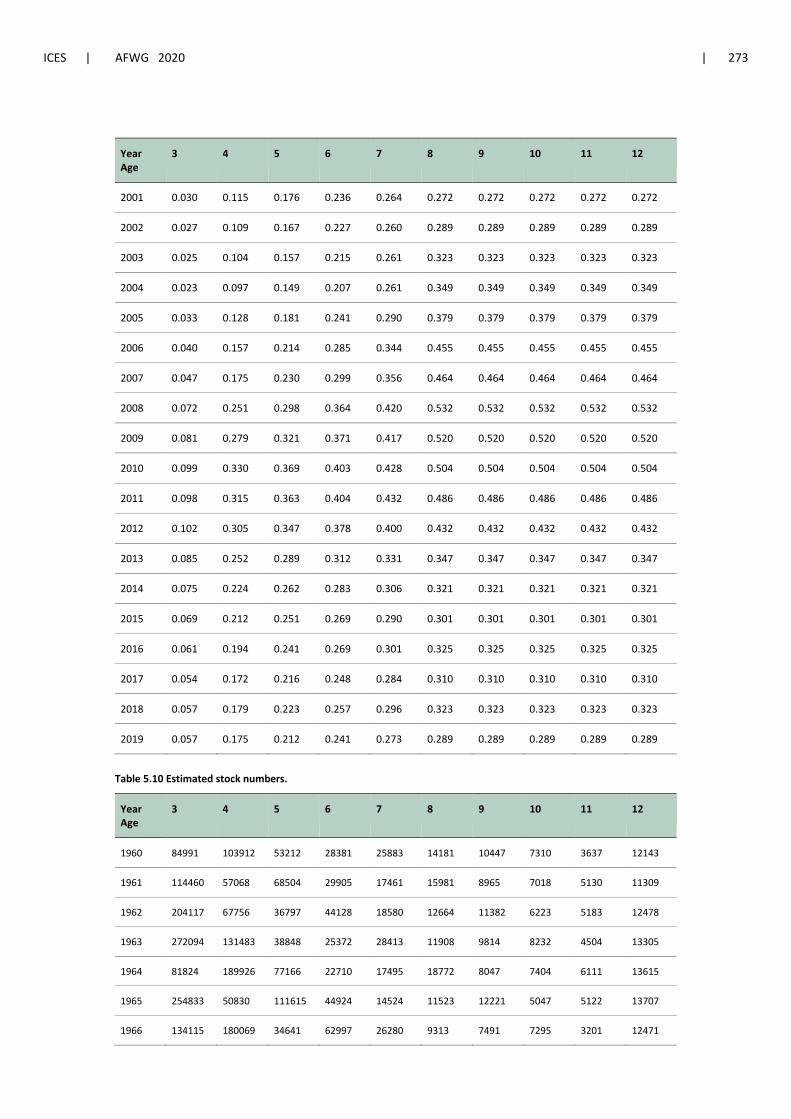
ICES | AFWG 2020 | 273
Year Age
3 4 5 6 7 8 9 10 11 12
2001 0.030 0.115 0.176 0.236 0.264 0.272 0.272 0.272 0.272 0.272
2002 0.027 0.109 0.167 0.227 0.260 0.289 0.289 0.289 0.289 0.289
2003 0.025 0.104 0.157 0.215 0.261 0.323 0.323 0.323 0.323 0.323
2004 0.023 0.097 0.149 0.207 0.261 0.349 0.349 0.349 0.349 0.349
2005 0.033 0.128 0.181 0.241 0.290 0.379 0.379 0.379 0.379 0.379
2006 0.040 0.157 0.214 0.285 0.344 0.455 0.455 0.455 0.455 0.455
2007 0.047 0.175 0.230 0.299 0.356 0.464 0.464 0.464 0.464 0.464
2008 0.072 0.251 0.298 0.364 0.420 0.532 0.532 0.532 0.532 0.532
2009 0.081 0.279 0.321 0.371 0.417 0.520 0.520 0.520 0.520 0.520
2010 0.099 0.330 0.369 0.403 0.428 0.504 0.504 0.504 0.504 0.504
2011 0.098 0.315 0.363 0.404 0.432 0.486 0.486 0.486 0.486 0.486
2012 0.102 0.305 0.347 0.378 0.400 0.432 0.432 0.432 0.432 0.432
2013 0.085 0.252 0.289 0.312 0.331 0.347 0.347 0.347 0.347 0.347
2014 0.075 0.224 0.262 0.283 0.306 0.321 0.321 0.321 0.321 0.321
2015 0.069 0.212 0.251 0.269 0.290 0.301 0.301 0.301 0.301 0.301
2016 0.061 0.194 0.241 0.269 0.301 0.325 0.325 0.325 0.325 0.325
2017 0.054 0.172 0.216 0.248 0.284 0.310 0.310 0.310 0.310 0.310
2018 0.057 0.179 0.223 0.257 0.296 0.323 0.323 0.323 0.323 0.323
2019 0.057 0.175 0.212 0.241 0.273 0.289 0.289 0.289 0.289 0.289
Table 5.10 Estimated stock numbers.
Year Age
3 4 5 6 7 8 9 10 11 12
1960 84991 103912 53212 28381 25883 14181 10447 7310 3637 12143
1961 114460 57068 68504 29905 17461 15981 8965 7018 5130 11309
1962 204117 67756 36797 44128 18580 12664 11382 6223 5183 12478
1963 272094 131483 38848 25372 28413 11908 9814 8232 4504 13305
1964 81824 189926 77166 22710 17495 18772 8047 7404 6111 13615
1965 254833 50830 111615 44924 14524 11523 12221 5047 5122 13707
1966 134115 180069 34641 62997 26280 9313 7491 7295 3201 12471

274 | ICES SCIENTIFIC REPORTS 2:52 | ICES
Year Age
3 4 5 6 7 8 9 10 11 12
1967 175432 83342 109711 20362 36814 16027 6275 5176 4572 10014
1968 143854 116944 47671 63767 13167 23992 10080 4088 3333 8342
1969 262910 89166 80164 31929 42246 10740 17848 7018 2684 6991
1970 222611 166949 58717 54450 22573 29674 9104 13973 5139 7228
1971 230059 143991 87177 35668 32780 14419 17688 6440 9201 7949
1972 153182 138307 85817 46671 23051 19664 9618 10457 4224 10167
1973 201676 80411 79108 52165 27952 15445 12734 6751 6435 8945
1974 100459 111158 41967 45815 32599 16864 10237 8243 4243 9095
1975 167810 44390 53057 20047 23712 17769 9325 5987 4754 7187
1976 218122 75074 19391 25721 10555 11398 8676 4711 3053 5796
1977 201499 89956 30963 8451 13287 5475 5706 4285 2325 4251
1978 135581 89889 38640 14995 4599 7285 3202 3105 2408 3964
1979 196411 59883 38762 17229 7663 2362 4007 1756 1560 3428
1980 118511 95037 23569 16870 8545 3656 1143 2062 958 2679
1981 228438 57050 43360 10037 8274 4399 1851 687 1072 1845
1982 129186 122262 24408 19463 4730 4372 2259 1041 396 1649
1983 102059 69081 52655 9992 9337 2582 2502 1256 607 1285
1984 93223 58461 31023 20189 4362 4546 1304 1334 711 1053
1985 102418 42140 23310 12984 6922 1936 2089 561 610 826
1986 181566 49450 17696 11000 6014 2396 948 955 270 635
1987 144313 132713 22892 8341 5447 2789 853 477 427 462
1988 81537 100593 75935 11210 3440 2032 1316 238 200 302
1989 77433 55360 54925 38810 4890 1197 827 613 58 285
1990 85631 47732 29879 26245 18822 2436 604 465 366 214
1991 223415 48201 22211 15184 11141 8518 1241 302 264 321
1992 283454 141989 22626 10948 7776 4975 4704 650 170 367
1993 213556 212979 75658 10183 4281 3102 1966 2313 283 237
1994 152657 163716 131524 37141 4355 1727 1485 774 1233 268
1995 278265 132204 111972 74780 15629 1855 806 776 316 815

ICES | AFWG 2020 | 275
Year Age
3 4 5 6 7 8 9 10 11 12
1996 159118 244229 88261 68577 40064 7972 1038 486 446 700
1997 163556 120946 177570 57710 39982 21332 4171 512 261 628
1998 104035 134210 84288 126565 32952 24058 12795 2555 333 620
1999 240367 78888 94643 53933 73572 18492 14961 7615 1480 574
2000 157007 192201 51511 55783 31552 40695 11336 9514 4363 1138
2001 212157 107297 139333 35575 33225 19207 24194 7212 5998 3206
2002 348589 176882 78898 93717 24041 20610 12677 15003 4476 5864
2003 147196 306433 124675 52337 57187 17091 12698 8559 9140 6445
2004 150696 119017 206886 86945 35876 36559 10857 7408 5412 9107
2005 418616 117434 79027 125756 57181 23911 22167 6782 3850 7612
2006 72429 333890 79887 48944 74453 35156 14748 12495 3854 6129
2007 109679 53831 213602 52577 29976 40277 19787 8188 6255 4473
2008 193623 75165 38073 115870 30326 16633 20079 10714 4151 5155
2009 141211 150402 46151 25134 63231 15846 7918 9328 5256 4278
2010 263607 96750 90086 28656 14321 33454 7816 3791 4208 4403
2011 112152 196685 50709 47061 15762 8183 16116 3941 1861 4013
2012 148281 91264 123138 31198 24988 9093 4409 7842 1934 2913
2013 205714 91545 63521 77460 18459 13476 5045 2452 4002 2550
2014 105708 168482 60570 42696 46075 11106 7795 3149 1453 3781
2015 159992 79319 120312 42147 28576 27199 6522 4548 1962 3294
2016 250262 117629 54093 74516 27901 17684 15813 3833 2937 3763
2017 168424 217957 81167 34323 43373 16943 10423 8817 2162 4659
2018 110415 139342 177749 59001 24193 25309 10316 6218 5099 4372
2019 189791 95520 98762 121952 35613 14644 14538 6085 3498 5528
pred 146802 65658 65387 78432 22195 8982 8916 3732 5536
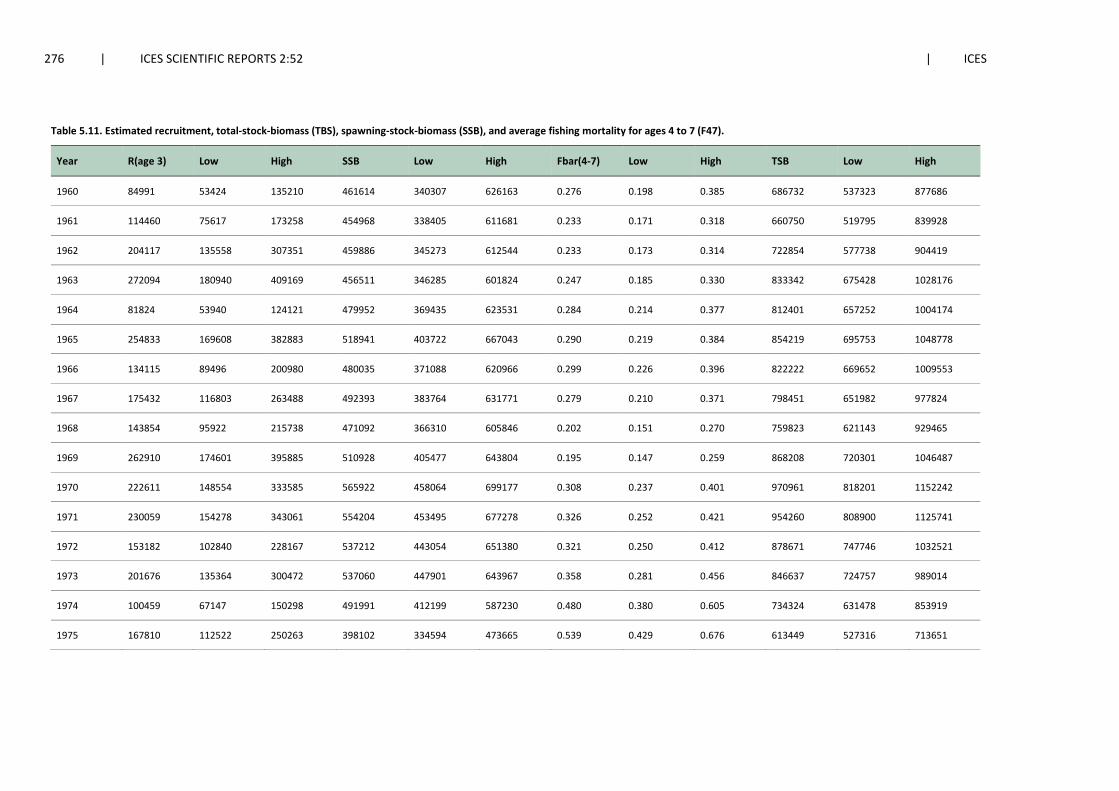
276 | ICES SCIENTIFIC REPORTS 2:52 | ICES
Table 5.11. Estimated recruitment, total-stock-biomass (TBS), spawning-stock-biomass (SSB), and average fishing mortality for ages 4 to 7 (F47).
Year R(age 3) Low High SSB Low High Fbar(4-7) Low High TSB Low High
1960 84991 53424 135210 461614 340307 626163 0.276 0.198 0.385 686732 537323 877686
1961 114460 75617 173258 454968 338405 611681 0.233 0.171 0.318 660750 519795 839928
1962 204117 135558 307351 459886 345273 612544 0.233 0.173 0.314 722854 577738 904419
1963 272094 180940 409169 456511 346285 601824 0.247 0.185 0.330 833342 675428 1028176
1964 81824 53940 124121 479952 369435 623531 0.284 0.214 0.377 812401 657252 1004174
1965 254833 169608 382883 518941 403722 667043 0.290 0.219 0.384 854219 695753 1048778
1966 134115 89496 200980 480035 371088 620966 0.299 0.226 0.396 822222 669652 1009553
1967 175432 116803 263488 492393 383764 631771 0.279 0.210 0.371 798451 651982 977824
1968 143854 95922 215738 471092 366310 605846 0.202 0.151 0.270 759823 621143 929465
1969 262910 174601 395885 510928 405477 643804 0.195 0.147 0.259 868208 720301 1046487
1970 222611 148554 333585 565922 458064 699177 0.308 0.237 0.401 970961 818201 1152242
1971 230059 154278 343061 554204 453495 677278 0.326 0.252 0.421 954260 808900 1125741
1972 153182 102840 228167 537212 443054 651380 0.321 0.250 0.412 878671 747746 1032521
1973 201676 135364 300472 537060 447901 643967 0.358 0.281 0.456 846637 724757 989014
1974 100459 67147 150298 491991 412199 587230 0.480 0.380 0.605 734324 631478 853919
1975 167810 112522 250263 398102 334594 473665 0.539 0.429 0.676 613449 527316 713651

ICES | AFWG 2020 | 277
Year R(age 3) Low High SSB Low High Fbar(4-7) Low High TSB Low High
1976 218122 145846 326213 281760 235292 337405 0.572 0.456 0.717 543005 460830 639832
1977 201499 135129 300466 209817 174600 252138 0.501 0.398 0.630 478238 402760 567861
1978 135581 90814 202414 189243 158540 225892 0.553 0.442 0.692 418158 354464 493298
1979 196411 131763 292779 170615 142872 203745 0.588 0.471 0.735 410810 343927 490700
1980 118511 79524 176613 150432 125881 179771 0.565 0.452 0.706 392092 328431 468092
1981 228438 152260 342730 154651 128719 185807 0.558 0.447 0.698 445184 366930 540125
1982 129186 86397 193168 135906 113168 163214 0.556 0.443 0.697 401060 332136 484288
1983 102059 68069 153023 162642 134312 196948 0.604 0.484 0.753 409779 342473 490313
1984 93223 61884 140432 146275 121158 176598 0.715 0.576 0.887 322101 271165 382606
1985 102418 68019 154215 110818 92092 133352 0.636 0.509 0.793 269642 225409 322555
1986 181566 120487 273610 83483 69295 100576 0.544 0.434 0.681 268502 218820 329463
1987 144313 96629 215528 72124 59981 86725 0.615 0.496 0.762 285175 233063 348941
1988 81537 54012 123090 88261 72887 106878 0.605 0.487 0.752 302025 248831 366592
1989 77433 51176 117162 103382 80188 133286 0.488 0.387 0.614 284163 235011 343594
1990 85631 56148 130594 119687 95580 149874 0.550 0.438 0.691 271574 227579 324074
1991 223415 147965 337338 114732 94097 139892 0.509 0.405 0.640 353563 287596 434660
1992 283454 188268 426764 95052 79918 113052 0.605 0.484 0.755 464902 374120 577713

278 | ICES SCIENTIFIC REPORTS 2:52 | ICES
Year R(age 3) Low High SSB Low High Fbar(4-7) Low High TSB Low High
1993 213556 143251 318367 97144 80926 116612 0.533 0.426 0.667 533548 432523 658169
1994 152657 104298 223438 147692 120052 181696 0.477 0.378 0.602 486274 403288 586336
1995 278265 188514 410744 196641 158077 244613 0.372 0.293 0.474 589051 490414 707527
1996 159118 108547 233249 245799 200688 301050 0.360 0.282 0.460 681862 571233 813916
1997 163556 111813 239245 244842 200602 298840 0.256 0.198 0.331 722906 604247 864868
1998 104035 71389 151608 293322 240548 357673 0.255 0.197 0.330 799552 668684 956031
1999 240367 164861 350454 309213 250514 381665 0.255 0.196 0.332 803662 678048 952546
2000 157007 107744 228794 369362 299642 455304 0.226 0.174 0.294 824773 699428 972581
2001 212157 146844 306521 375395 308712 456482 0.198 0.152 0.257 883779 753606 1036436
2002 348589 246332 493295 450236 376111 538971 0.191 0.147 0.246 1020467 876245 1188426
2003 147196 103802 208732 438966 369956 520848 0.184 0.143 0.238 993421 851810 1158574
2004 150696 105289 215686 519196 441762 610203 0.178 0.137 0.232 1009327 865043 1177677
2005 418616 294826 594383 603514 511156 712560 0.210 0.162 0.272 1086987 933687 1265456
2006 72429 51298 102263 536744 457303 629985 0.250 0.194 0.322 933676 802790 1085901
2007 109679 77995 154233 545160 466132 637586 0.265 0.206 0.340 875563 750229 1021836
2008 193623 138012 271641 470919 396475 559340 0.333 0.261 0.425 728311 627447 845390
2009 141211 100876 197674 363745 305994 432396 0.347 0.274 0.439 672170 580756 777972

ICES | AFWG 2020 | 279
Year R(age 3) Low High SSB Low High Fbar(4-7) Low High TSB Low High
2010 263607 188808 368039 328870 277524 389717 0.383 0.302 0.485 692887 595025 806844
2011 112152 79499 158216 293880 247409 349079 0.379 0.297 0.482 583861 500162 681565
2012 148281 105636 208142 302570 254915 359133 0.358 0.281 0.455 592327 506969 692056
2013 205714 146779 288313 324307 269257 390612 0.296 0.231 0.380 606876 517168 712144
2014 105708 75263 148468 350144 289143 424014 0.269 0.208 0.347 640085 543701 753555
2015 159992 114100 224342 359134 294080 438579 0.256 0.197 0.331 623065 525387 738904
2016 250262 176283 355288 394026 316701 490229 0.251 0.192 0.330 791448 661369 947110
2017 168424 118255 239876 406588 321556 514105 0.230 0.173 0.306 883999 732904 1066245
2018 110415 75217 162084 467110 364963 597846 0.239 0.176 0.325 908773 740430 1115391
2019 189791 118578 303772 555359 417153 739352 0.225 0.158 0.322 951274 751416 1204289

280 | ICES SCIENTIFIC REPORTS 2:52 | ICES
Table 5.12 Northeast Arctic saithe. Prediction input data
MFDP version 1a Run: in Excel Time and date: 10:15 29.04.2019 Fbar age range: 4-7
2020
Age N M Mat PF PM SWt Sel CWt
3 160022 0.2 0 0 0 0.876 0.0560 0.876
4 146802 0.2 0.05 0 0 1.164 0.1753 1.164
5 65658 0.2 0.42 0 0 1.625 0.2170 1.625
6 65387 0.2 0.87 0 0 2.085 0.2487 2.085
7 78432 0.2 0.97 0 0 2.584 0.2843 2.584
8 22195 0.2 0.98 0 0 3.118 0.3073 3.118
9 8982 0.2 0.98 0 0 3.595 0.3073 3.595
10 8916 0.2 0.97 0 0 4.059 0.3073 4.059
11 3732 0.2 0.97 0 0 4.626 0.3073 4.626
12 5536 0.2 0.994 0 0 5.879 0.3073 5.879
2021
Age N M Mat PF PM SWt Sel CWt
3 160022,9 0,2 0 0 0 0,876 0,0560 0,876
4 . 0,2 0,05 0 0 1,164 0,1753 1,164
5 . 0,2 0,42 0 0 1,625 0,2170 1,625
6 . 0,2 0,87 0 0 2,085 0,2487 2,085
7 . 0,2 0,97 0 0 2,584 0,2843 2,584
8 . 0,2 0,98 0 0 3,118 0,3073 3,118
9 . 0,2 0,98 0 0 3,595 0,3073 3,595
10 . 0,2 0,97 0 0 4,059 0,3073 4,059
11 . 0,2 0,97 0 0 4,626 0,3073 4,626
12 . 0,2 0,994 0 0 5,879 0,3073 5,879

ICES | AFWG 2020 | 281
2022
Age N M Mat PF PM SWt Sel CWt
3 160022,9 0,2 0 0 0 0,876 0,0560 0,876
4 . 0,2 0,05 0 0 1,164 0,1753 1,164
5 . 0,2 0,42 0 0 1,625 0,2170 1,625
6 . 0,2 0,87 0 0 2,085 0,2487 2,085
7 . 0,2 0,97 0 0 2,584 0,2843 2,584
8 . 0,2 0,98 0 0 3,118 0,3073 3,118
9 . 0,2 0,98 0 0 3,595 0,3073 3,595
10 . 0,2 0,97 0 0 4,059 0,3073 4,059
11 . 0,2 0,97 0 0 4,626 0,3073 4,626
12 . 0,2 0,994 0 0 5,879 0,3073 5,879
Input units are thousands and kg - output in tonnes
Table 5.13 Northeast Arctic saithe. Short-term prediction
MFDP version 1a Run: In Excel North-East Arctic saithe Time and date: 20.04.2020 Fbar age range: 4-7
2020
Biomass SSB FMult FBar Landings
944239 552168 1.0199 0.236 171983
2021–2022
2021 2022
Biomass SSB FMult FBar Landings Biomass SSB
921391 529 169 0 0 0 1084374 671555
. 529 169 0.1 0.0231 18482 1063950 654359
. 529 169 0.2 0.0463 36509 1044034 637620
. 529 169 0.3 0.0694 54098 1024614 621325
. 529 169 0.4 0.0925 71258 1005675 605462

282 | ICES SCIENTIFIC REPORTS 2:52 | ICES
2021 2022
Biomass SSB FMult FBar Landings Biomass SSB
. 529 169 0.5 0.1157 88002 987205 590020
. 529 169 0.6 0.1388 104340 969193 574986
. 529 169 0.7 0.1619 120283 951625 560351
. 529 169 0.8 0.1851 135840 934490 546103
. 529 169 0.9 0.2082 151023 917778 532231
. 529 169 1 0.2313 165840 901475 518726
. 529 169 1.1 0.2545 180302 885573 505577
. 529 169 1.2 0.2776 194417 870060 492775
. 529 169 1.3 0.3007 208195 854927 480310
. 529 169 1.4 0.3239 221644 840162 468173
. 529 169 1.5 0.347 234773 825758 456356
. 529 169 1.6 0.3701 247590 811704 444849
. 529 169 1.7 0.3933 260103 797990 433645
. 529 169 1.8 0.4164 272320 784610 422734
. 529 169 1.9 0.4395 284283 771552 412110
. 529 169 2 0.4627 295897 758810 401764
Input units are thousands and kg - output in tonnes

ICES | AFWG 2020 | 283
Table 5.14 Northeast arctic saithe. Short-term projection output HCR landings
MFDP version 1a Run: in Excel Time and date: 20.04.2020 Fbar age range: 4-7
2020
Biomass SSB FMult FBar Landings Fmp (0.32)
944239 552168 1.0199 0.236 171982 landings SSB 219418 529169
2021 196530 470180 Biomass SSB FMult FBar Landings 180275 420273
921391 529169 1.2242 0.283 197779 average 198741 The TAC should not be changed by more than 15% compared with the previous year’s TAC. 197779
2022 2023
Biomass SSB FMult FBar Landings Biomass SSB
866366 489730 0 0 0 1027541 619355
. 489730 0.1 0.023 17098 1008684 603631
. 489730 0.2 0.046 33782 990291 588321
. 489730 0.3 0.069 50064 972350 573415
. 489730 0.4 0.093 65953 954849 558900
. 489730 0.5 0.116 81461 937776 544768
. 489730 0.6 0.139 96596 921121 531006
. 489730 0.7 0.162 111368 904872 517606
. 489730 0.8 0.185 125788 889020 504558
. 489730 0.9 0.208 139864 873553 491852
. 489730 1 0.231 153604 858461 479478
. 489730 1.1 0.254 167018 843735 467429
. 489730 1.2 0.278 180115 829366 455694
. 489730 1.3 0.301 1929010 815343 444267
. 489730 1.4 0.324 205386 801659 433138
. 489730 1.5 0.347 217577 788304 422299
. 489730 1.6 0.37 229481 775269 411743
. 489730 1.7 0.393 241106 762548 401462
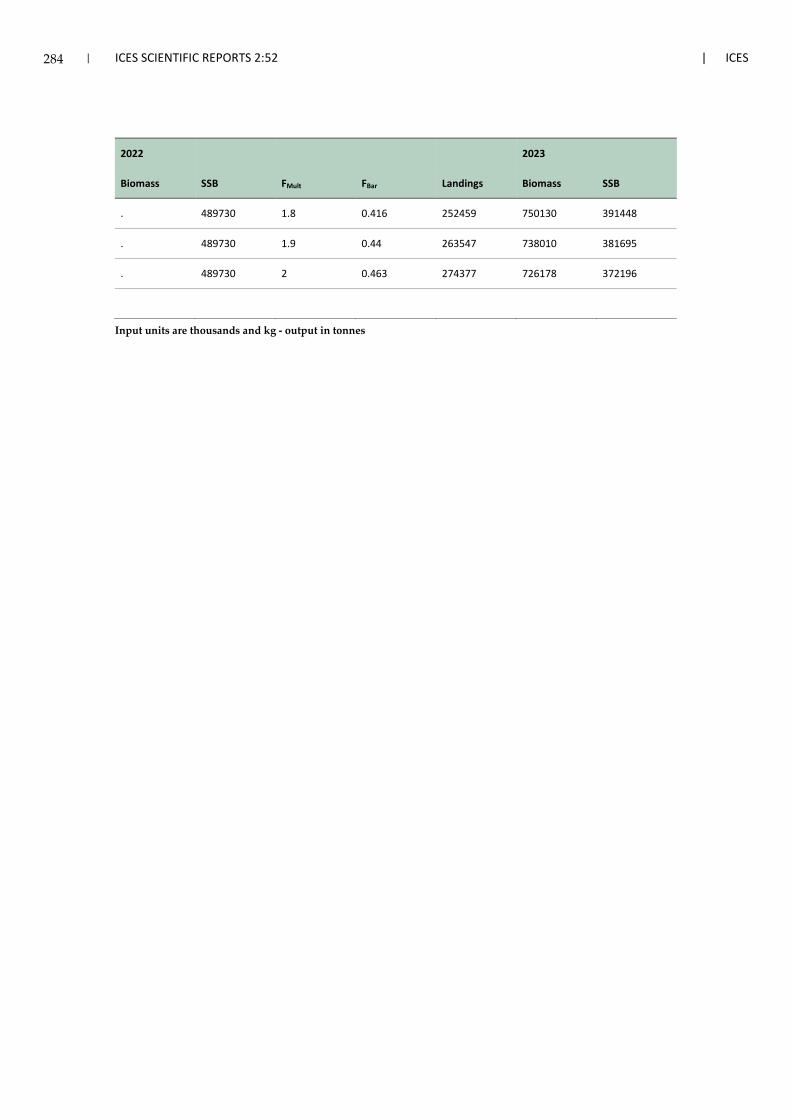
284 | ICES SCIENTIFIC REPORTS 2:52 | ICES
2022 2023
Biomass SSB FMult FBar Landings Biomass SSB
. 489730 1.8 0.416 252459 750130 391448
. 489730 1.9 0.44 263547 738010 381695
. 489730 2 0.463 274377 726178 372196
Input units are thousands and kg - output in tonnes
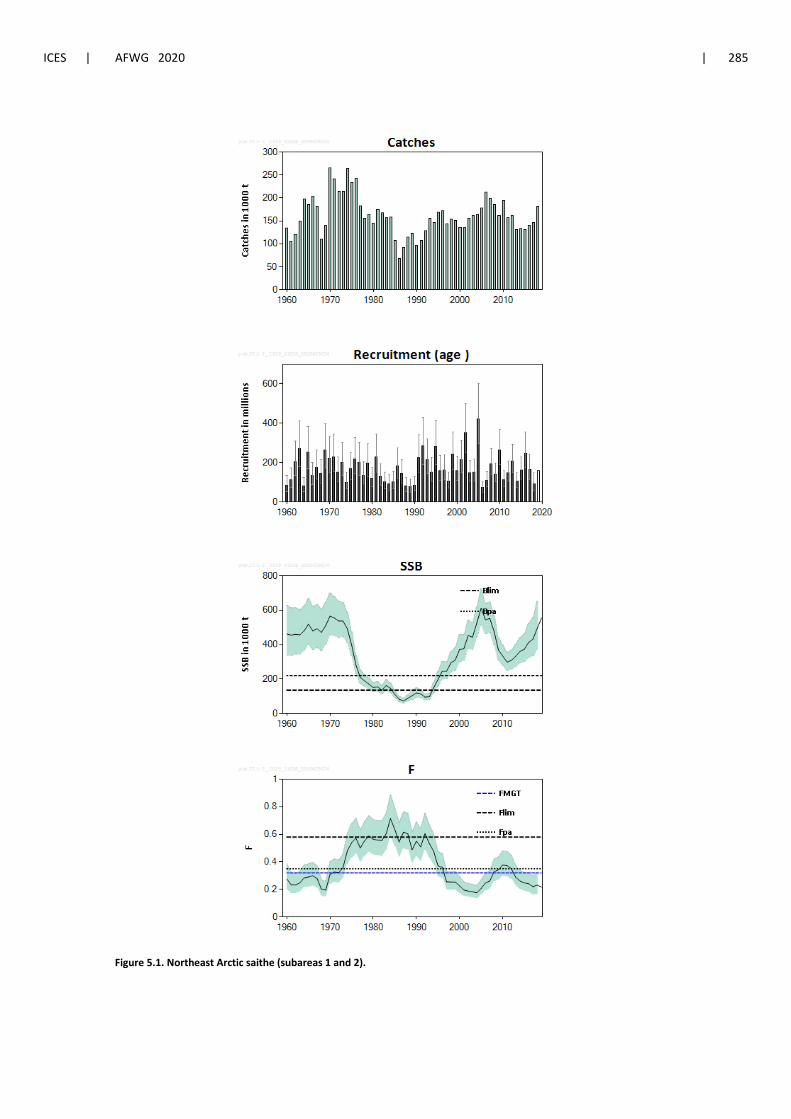
ICES | AFWG 2020 | 285
Figure 5.1. Northeast Arctic saithe (subareas 1 and 2).

286 | ICES SCIENTIFIC REPORTS 2:52 | ICES
Figure 5.1. continued.
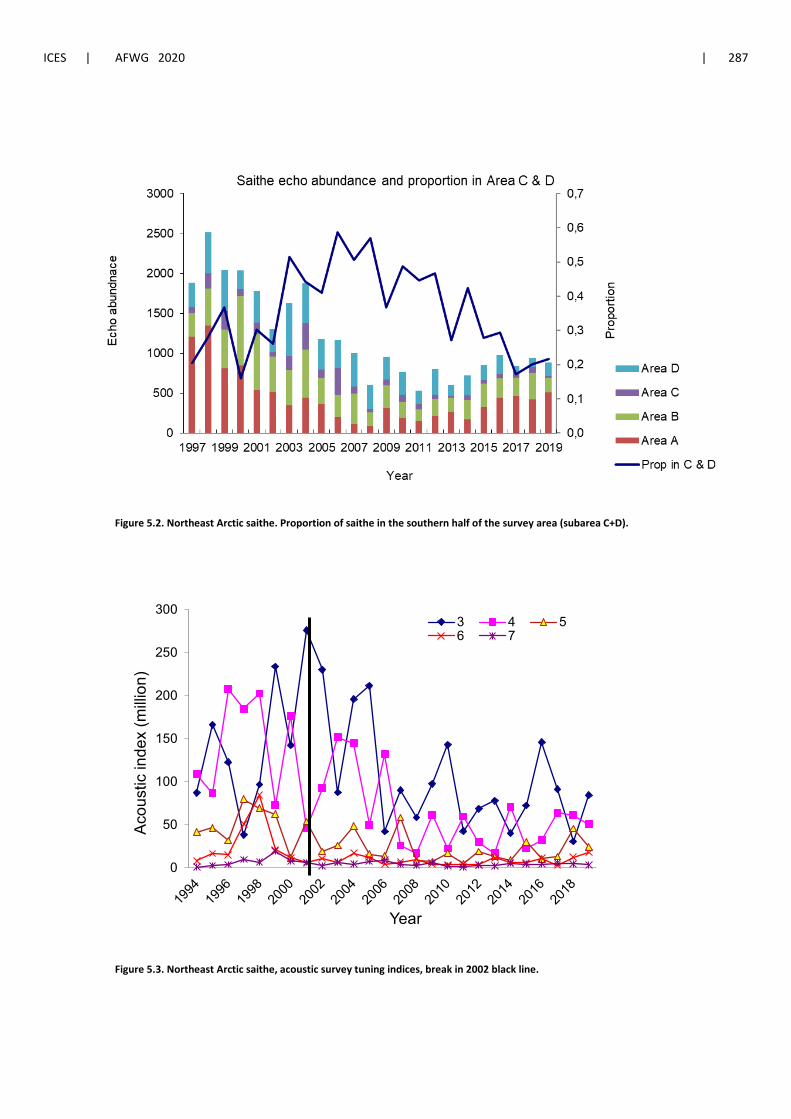
ICES | AFWG 2020 | 287
Figure 5.2. Northeast Arctic saithe. Proportion of saithe in the southern half of the survey area (subarea C+D).
Figure 5.3. Northeast Arctic saithe, acoustic survey tuning indices, break in 2002 black line.
0
50
100
150
200
250
300
Acou
stic
inde
x (m
illion
)
Year
3 4 56 7

288 | ICES SCIENTIFIC REPORTS 2:52 | ICES
Figure 5.4. Northeast Arctic saithe. Final run normalized residuals. Blue circles indicate positive residuals (larger than predicted) and filled red circles indicate negative residuals.

ICES | AFWG 2020 | 289
Figure 5.5. NEA saithe - Acoustic survey vs. SAM, red circles show 2018 data and orange circles 2019 data.

290 | ICES SCIENTIFIC REPORTS 2:52 | ICES
Figure 5.6. F4-7 and SSB. Estimates from the current run and point wise 95% confidence intervals are shown by black line and shaded area.
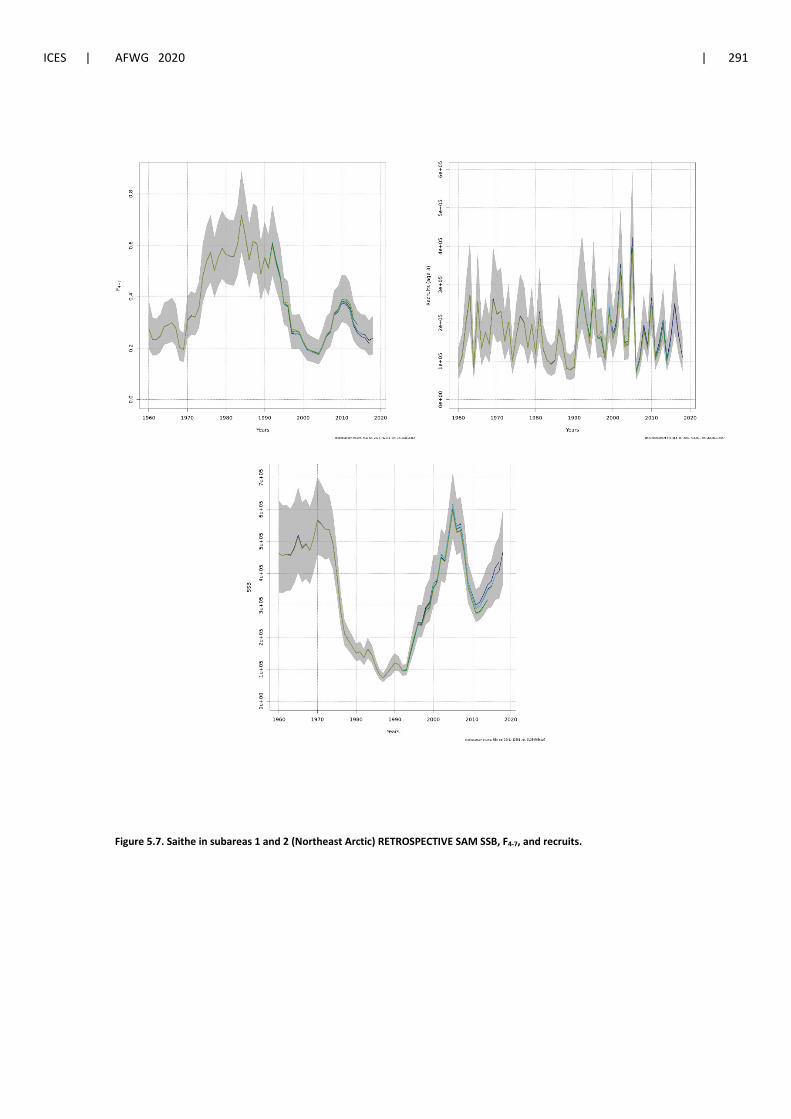
ICES | AFWG 2020 | 291
Figure 5.7. Saithe in subareas 1 and 2 (Northeast Arctic) RETROSPECTIVE SAM SSB, F4-7, and recruits.

292 | ICES SCIENTIFIC REPORTS 2:52 | ICES
6 Beaked redfish (Sebastes mentella) in subareas 1 and 2
Following the recommendation from the benchmark assessment for redfish stocks in January 2018 (WKREDFISH, ICES 2018a) the analytical assessment is conducted using a statistical catch-at-age model (SCAA, for the period 1992–2019). Following a further recommendation of the benchmark, the advice cycle for beaked redfish in subareas 1 and 2 was changed to a two-year cycle and advice should be provided in 2020. The present report therefore updates the assess-ment and provides advice for the next two years.
6.1 Status of the Fisheries
6.1.1 Development of the fishery
A description of the historical development of the fishery in subareas 1 and 2 is found in the stock annex for this stock.
An international pelagic fishery for S. mentella in the Norwegian Sea outside EEZs has developed since 2004 (Figure 6.1). This pelagic fishery, which is further described in the quality handbook for this stock, is managed by the Northeast Atlantic Fisheries Commission (NEAFC). The di-rected demersal and pelagic fisheries are reopened in the Norwegian Economic Zone and in the Fisheries Protection Zone around Svalbard since 2014. The spatial regulation for this fishery is illustrated in Figures 6.2 and 6.3. In 2019, most of the catches of S. mentella from the Russian and Norwegian fisheries were taken in the Norwegian Exclusive Economic Zone or as bycatch in the Fisheries Protection Zone around Svalbard. Catches in international waters were mainly taken by EU nations.
Figure 6.2 shows the distribution of catch among national fishing fleets for 2018 and 2019 and the location of S. mentella catches in the Norwegian EEZ in 2019. The 44th Session of the Joint Norwegian-Russian Fisheries Commission decided to split the total TAC among countries as follows: Norway: 72%, Russia: 18%, Third countries: 10% (as bycatch in the fishery protection zone at Svalbard (Spitsbergen): 4.1%, and international waters of the Norwegian Sea (NEAFC-area): 5.9%). This split was reconducted at the 49th session of the commission in 2019.
6.1.2 Bycatch in other fisheries
During 2003–2013, all catches of S. mentella, except the pelagic fishery in the Norwegian Sea out-side EEZ, were taken as bycatches in other fisheries. Some of the pelagic catches are taken as bycatches in the blue whiting and herring fisheries. From 2014 onwards most of the catch is taken as targeted catch and no longer as bycatch, following the opening of a targeted fishery in the Norwegian EEZ and Svalbard Fisheries Protection Zone. When fishing for other species it has since 2013 been allowed to have up to 20% redfish (both species together) in round weight as bycatch outside 12 nautical miles and only 10% bycatch inside 12 nautical miles in order to give a higher protection to S. norvegicus.

ICES | AFWG 2020 | 293
6.1.3 Landings prior to 2020 (Tables 6.1—6.7, Figure 6.1)
Nominal catches of S. mentella by country for subareas 1 and 2 combined are presented in Table 6.1, while they are presented for Subarea 1 and divisions 2.a and 2.b in Tables 6.2—6.4. The pe-lagic catch of S. mentella in the Norwegian Sea outside EEZs reported to NEAFC and/or ICES amounted to 6 852 in 2017, 7 739 in 2018 and 6 060 in 2019 and is shown by country in Table 6.5. Nominal catches for both redfish species combined (i.e. S. mentella and S. norvegicus) by country are presented in Table 6.6. The sources of information used are catches reported to ICES, NEAFC, Norwegian authorities (foreign vessels fishing in the Norwegian economic zone) or direct re-porting to the AFWG. Where catches are reported as Sebastes sp., they are split into S. norvegicus and S. mentella by AFWG experts based on available correlation between official catches of these two species in the considered areas. All tables have been updated for 2018 and new figures pre-sented for 2019. Total international landings in 1952–2019 are also shown in Figure 6.1.
In 2014, ICES advised that the annual catch in 2015, 2016, and 2017 should be set at no more than 30 000 t and in 2017, ICES advised that the annual catch in 2018 should not exceed 32 658 t. Fol-lowing the benchmark (WKREDFISH, ICES 2018a) and the subsequent evaluation of a manage-ment plan for the stock (WKREBMSE, ICES 2018b) ICES advised an annual catch of no more than 53 757 t for 2019 and 55 860 t in 2020, corresponding to a fishing mortality of F = 0.06.
Because of the novelty of the situation, related with reopening fisheries after 10 years of its ban, the total landings of S. mentella in subareas 1 and 2 in 2014, demersal and pelagic catches, amounted to only 18 780 t. The total landings of the demersal and pelagic fishery increased to 25 856 t in 2015, to 35 646 t in 2016, 30 934 t in 2017, 38 739 t in 2018 and 45 955 t in 2019. Of this, 6 060 t were reported from the pelagic fishery in international waters of the Norwegian Sea. The total landings in 2016 to 2018 were respectively 5429 t, 1201 t and 6107 t above the TAC advised by ICES, but were 7 802 t below TAC in 2019. Norway caught the major share of the demersal catches, but Russian demersal catches increased substantially, particularly in ICES Division 2.b.
The redfish population in Subarea 4 (North Sea) is believed to belong to the Northeast Arctic stock. Since this area is outside the traditional areas handled by this Working Group, the catches are not included in the assessment. The total redfish landings (golden and beaked redfish com-bined) from Subarea 4 have up to 2003 been 1000–3000 t per year. Since 2005 the annual landings from this area have varied between 90 and 333 t (Table 6.7).
6.1.4 Expected landings in 2020
ICES has advised on the basis of precautionary considerations that the annual catch should be set at no more than 55 860 t in 2020. The 49th sessions of the Joint Norwegian-Russian Fisheries Commission decided to follow these advices.
In 2020 Norwegian fishing vessels can catch and land up to 36 219 t of redfish in the Norwegian economic zone (NEZ) in a limited area north of 65°20’N (see map in Figure 6.3), in international waters and the fisheries zone around Jan Mayen. Of this quantity, 100 t are allocated to cover bycatch in other fisheries and 34 t for research/surveillance and education purposes, while the remaining 36 085 t can be taken in a directed fishery. Only vessels with cod and saithe trawl permits can participate in the directed fishery for redfish. Each vessel which has the right to participate is assigned a maximum quota of 1200 t. This quota must also cover catches of redfish (both species) in other fisheries. It is prohibited to fish for redfish with bottom trawls in the pe-riod from 1 March until 10 May. Investigations were conducted in 2015–2016 to see if the protec-tion of females during the main time of larvae release should be improved by extending the period of prohibited fishing until later in May and to see if the area south of Bear Island (Area 20 in Figure 6.3) can be opened for directed fishing, either with or without sorting grid. The hitherto
294 | ICES SCIENTIFIC REPORTS 2:52 | ICES
conclusion is that males dominated the catches (more than 70%) in the main fishing areas south and southwest of Bear Island during the investigations from late April until the directed fishery started on 10 May, and that the area south of Bear Island should stay closed during January-February due to smaller S. mentella inhabiting this area at the beginning of the year.
Since 2015, Russia has had access to the NEZ when fishing their quota share. In 2020 Russia may fish 10 055 t (18%) plus 2000 t transferred from Norway to Russia. Apart from this as well as an additional 2000 t were transferred from Norway to Russia to cover bycatch of redfish (both spe-cies) in Russian fisheries targeting other species. The remaining 5586 t are divided between third countries in the NEZ and Svalbard Zone (2290 t) and the NEAFC areas (3296 t). Catch in the NEAFC areas in 2019 amounted to 5917 t while the catch in the NEZ and Svalbard zone amounted to 40 038 t. The total catch in 2019 was by 7 802 lower than the advised TAC. It is assumed that the total catch in 2020 should not exceed the TAC of 55 860 t set by ICES.
6.2 Data used in the Assessment
Analytical assessment was conducted for this stock following recommendation from the bench-mark assessment working group (WKREDFISH, ICES 2018a). Input datasets were updated with the most recently available data. The analytical assessment, based on a statistical catch-at-age model (SCAA), covers the period 1992—2019. The input data consists of the following tables:
• Total catch in tonnes (Table 6.1) • Catch in tonnes in the pelagic fishery Norwegian Sea outside EEZs (Table 6.5) • Total catch numbers-at-age 6—19+ (Table 6.8) • Catch numbers-at-age 7—19+ in the pelagic fishery (Table 6.9) • Weight-at-age 2—19+ in the population (Table 6.12) • Maturity-at-age 2—19+ in the population (Table 6.14) • Russian autumn survey numbers-at-age 0—11 (Table 6.15) • Ecosystem survey numbers-at-age 2—15 (Table 6.17) • Winter survey numbers-at-age 2—15 (Table 6.18b) • Deep pelagic ecosystem survey proportions-at-age (Table 6.19)
There was no direct observation of catch numbers-at-age for the pelagic fishery in the Norwegian Sea outside EEZs in 2012–2018. Instead, numbers-at-age were estimated based on catch-at-age from previous or following year, and weight-at-age and fleet selectivities (section 6.2.2 in AFWG report 2013). In 2013, 2016 and 2019, observations from the scientific survey in the Norwegian Sea were used to derive numbers-at-age in the pelagic fishery. This was considered appropriate given that the survey operates in the area of the fishery, with a commercial pelagic trawl and at the time of the start of the fishery.
6.2.1 Length- composition from the fishery (Figure 6.4)
Length distributions of the pelagic and demersal catches of S. mentella are shown in Figure 6.4. In 2019, data were available from the Spanish and Lithuanian pelagic fleets and the Polish, Rus-sian and Norwegian demersal fleets.
6.2.2 Catch-at-age (Tables 6.8-6.11, Figure 6.5)
Catch-at-age in the Norwegian fishery was estimated using ECA for 2014. For 2015 and 2018, it was not possible to run ECA and the catch-at-age for the Norwegian Fishery was estimated using

ICES | AFWG 2020 | 295
the older Biomass program in SAS (Table 6.8). Not enough age readings were available to esti-mate catch-at-age in 2016 and 2017. For the demersal fisheries 2016, 2017 and 2019 as well as the pelagic fisheries 2017 and 2018 (Table 6.9) proportions-at-age in the catch were derived from proportions at-age in earlier years, weight-at-age and fleet selectivity (section 6.2.2 in AFWG report 2013).
The procedure for estimating catch-at-age for recent years in which age data are not available is somewhat problematic. This is because the last year of observation has a large impact on the estimated catch-at-age for several years. At the assessment working group in 2017 and at the benchmark assessment in January 2018, the last year of observations for the catch-at-age was 2014 and the values for the years 2015 and 2016 were extrapolated. The new data available for 2015 (demersal) and 2016 (pelagic) were substantially different from these earlier extrapolations.
Catch-at-age in the Russian demersal fishery were calculated using age reading. The estimated Age-Length-Key was then used to estimate the age distribution of the Russian demersal catches depicted in Figure 6.5. Age-Length-Keys for S. mentella are uncertain because of the slow growth rate of individuals and therefore these data should be used with caution. They were not used in the current assessment but may be considered in future. Given that age is difficult to derive from length it is important that age readings are available for the most recent years, at the time of the working group.
6.2.3 Weight-at-age (Tables 6.12, 6.13, Figures 6.6, 6.7)
In earlier assessment, weight-at-age in the stock was set equal to the weight-at-age in the catch. This turned out to be problematic because of important fluctuations in reported weight-at-age in the catch that cannot be explained biologically (i.e. these are noisy data). In 2015, it was advised to either use a fixed weight-at-age for the 19+ group, or use a modelled weight-at-age based on catch and survey records (Planque, 2015). The second option was chosen. Weight-at-age in the population was modelled for each year using mixed-effect models of a von Bertalanffy growth function (in weight). In 2018 an attempt was made to model weight-at-age for each cohort (rather than each year of observation). This showed that the growth function is nearly invariant between cohorts. As a result, it was decided to use a fixed (i.e. common to all years) weight-at-age as input to the Statistical Catch-at-age model. The observed and modelled weight-at-age are presented in Table 6.12 as well as Figures 6.6 and 6.7.
6.2.4 Maturity-at-age (Table 6.14, Figure 6.8)
The proportion maturity-at-age was estimated for individual years using a mixed-effect statisti-cal model (Table 6.14, Figure 6.8). The modelled values of maturity-at-age for individual years are used in the analytical assessment models, except in 2008, 2011 and 2016-2019 when the fixed effects only were considered, at least for 2019 because of an insufficient number of age readings.
6.2.5 Natural mortality
In previous years, natural mortality for S. mentella was set to 0.05 for all ages and all years. This was based on life-history correlates presented in Hoenig (1983). Thirty-nine alternative mortality estimates were explored during the benchmark workshop, based on the review work by Kench-ington (2014) and several additional papers published recently (Then et al., 2014; Hamel, 2014; Charnov et al., 2013). Overall, the mode of these natural mortality estimates is 0.058 which de-parts only slightly from the original estimate of 0.050 (Figure 6.9). WKREDFISH_2018 decided to continue using 0.050 as the value of M in the assessment model.

296 | ICES SCIENTIFIC REPORTS 2:52 | ICES
Figure 6.10 shows cod’s predation on juvenile (5–14 cm) redfish during 1984—2019. This time-series confirms the presence of redfish juveniles and may be used as an indicator of redfish abun-dance. A clear difference is seen between the abundance/consumption ratio in the 1980s and at present. A change in survey trawl catchability (smaller meshes) from 1993 onwards (Jakobsen et al., 1997) and/or a change in the cod’s prey preference may cause this difference. As long as the trawl survey time-series has not been corrected for the change in catchability, the abundance index of juvenile redfish less than 15 cm during the 1980s might have been considerably higher, if this change in catchability had been corrected for. The decrease in the abundance of young redfish in the surveys during the 1990s is consistent with the decline in the consumption of red-fish by cod. It is important that the estimation of the consumption of redfish by cod is being continued.
6.2.6 Scientific surveys
Following a dedicated review, AFWG approves the use of the new SToX versions of the winter and ecosystem surveys for use in the Sebastes mentella assessment (WD 17 and WD 18 in Annex 4). The group recommends that the data be monitored annually to identify if a significant portion of the mentella stock moves east of the strata system. The group further recommends that work continues to investigate redfish-specific strata systems for the winter survey.
The results from the following research vessel survey series were evaluated by the Working Group:
6.2.6.1 Surveys in the Barents Sea and Svalbard area (Tables 1.1, 1.2, 6.15-6.18, Figures 6.11–6.12)
Russian bottom-trawl survey in the Svalbard and Barents Sea areas in October-December for 1978–2015 in fishing depths of 100—900 m (Table 6.15, Figure 6.11). ICES acronym: RU-BTr-Q4
Russian-Norwegian Barents Sea ‘Ecosystem survey’ (bottom-trawl survey, August-September) from 1986—2016 in fishing depths of 100—500 m (Figures 6.11—6.12). Data disaggregated by age for the period 1992—2016 (Table 6.16a,b-6.17). ICES acronym: since 2003 part of Eco-NoRu-Q3 (BTr)
Winter Barents Seabed-trawl survey (February) from 1986—2014 (jointly with Russia since 2000, except 2006 and 2007) in fishing depths of 100—500 m (Figures 6.11—6.12). Data disaggregated by age for the period 1992—2011 and 2013 (Table 6.18b). ICES acronym: BS-NoRu-Q1 (BTr)
The Norwegian survey initially designed for redfish and Greenland halibut is now part of the ecosystem survey and covers the Norwegian Economic Zone (NEZ) and Svalbard incl. north and east of Spitsbergen during August 1996—2012 from less than 100 m to 800 m depth. This survey includes survey no. 2 above, and has been a joint survey with Russia since 2003, and since then called the Ecosystem survey. ICES acronym: Eco-NoRu-Q3 (Btr)
6.2.6.2 Pelagic survey in the Norwegian Sea (Table 6.19, Figures 6.13—6.14) The international deep pelagic ecosystem survey in the Norwegian Sea (WGIDEEPS, ICES 2016, no ICES-acronym) monitors deep pelagic ecosystems, with a particular focus on beaked redfish (Sebastes mentella). The latest survey was conducted in the open Norwegian Sea from 11 August until 28 August 2019, following similar surveys in 2008, 2009, 2013 and 2016. The spatial coverage of the survey and the catch rates of beaked redfish in the trawl are presented in Figure 6.13. The survey is scheduled every third year. Estimated numbers-at-age from this survey were presented at the benchmark assessment in 2018 and used in the SCAA model. Data for 2016 was updated in 2019, using additional age readings and numbers-at-age for the 2019 survey were presented during AFWG 2020 and also used in the assessment. The details of the data preparation, using
ICES | AFWG 2020 | 297
StoX, are available from WD7 of AFWG 2018 (Planque et al., 2018). The data used as input to the analytical assessment consists of proportions-at-age from age 2 to 75 y (Figure 6.14).
6.2.6.3 Additional surveys (Figures 6.15—6.17) The international 0-group survey in the Svalbard and Barents Sea areas in August-September 1980–2019, now part of the Ecosystem survey (Figures 6.15 and 6.16). ICES acronym: Eco-NoRu-Q3
A slope survey “Egga-sør survey” was carried out by IMR from 07 March to 07 April 2020, fol-lowing similar surveys ran in 2009, 2012, 2014,2016 and 2018. The spatial coverage of the 2018 survey and the distribution of beaked redfish registered by acoustic is presented in Figure 6.17. An update for the 2020 survey was not available for AFWG 2020. Egga-Sør and Egga-Nord sur-veys operate on a biennial basis. The length and age distributions of beaked redfish from these surveys show consistent ageing in the population and gradual incoming of new cohorts after the recruitment failure period. These surveys are considered as candidates for data input to the an-alytical assessment of S. mentella (see also Planque, 2016).
6.3 Assessment
The group performed the analytical assessment using the statistical catch-at-age (SCAA) model reviewed at the benchmark in January 2018 (WKREDFISH, ICES 2018a). The model was config-ured as the benchmark baseline model which includes 53 parameters to be estimated and the model converged correctly.
6.3.1 Results of the Assessment (Tables 6.20—6.21, Figures 6.18—6.24)
6.3.1.1 Stock trends The temporal patterns in recruitment-at-age 2 (Figures 6.18, 6.21) confirm the previously re-ported recruitment failure for the year-classes 1996 to 2003 and indicate a return to high levels of recruitment. The estimates of year-class strength for recent years are uncertain due to limited age data from the Winter and ecosystem surveys. Modelled spawning-stock biomass (SSB) has in-creased from 1992 to 2007 (Table 6.21). In the late 2000s the total-stock biomass (TSB) consisted of a larger proportion of mature fish than in the 1990s. This is reversing as individuals from new successful year classes, but still immature, are growing. TSB has increased from 1.0 to approxi-mately 1.4 million tonnes in the last 10 years (Table 6.21 and Figures 6.21-6.22). The concurrent decline in SSB from 2007 to 2014 can be attributed to the weak year classes (1996—2003) entering the mature stock. This trend has levelled off and SSB increases again. SSB at the start of 2020 is estimated at 917 578 t.
6.3.1.2 Fishing mortality (Tables 6.20a,b – 6.21, Figure 6.19) The patterns of fleet selectivity-at-age indicate that most of the fish captured by the demersal fleet in 2019 are of age 9 years and older, while the pelagic fleet mostly captures fish of age 14 and older (Tables 6.20a,b and Figure 6.19). While model results at the benchmark workshop showed a gradual shift in the demersal selectivity towards older ages in recent years, this is no longer observed after the 2015 catch-at-age data were incorporated in the model. The demersal fleet selectivity appears shifted towards later ages only in 2014. In 2019 F19+ is estimated at 0.045 (Table 6.21), with 0.036 for the demersal and 0.008 for the pelagic fleets (Table 6.20a), respectively.

298 | ICES SCIENTIFIC REPORTS 2:52 | ICES
6.3.1.3 Survey selectivity patterns (Figure 6.20) Winter and ecosystem surveys selectivity at age are very similar and show reduced selectivity for age 8 years and older, which is consistent with the known geographical distribution of dif-ferent life stages of S. mentella (Figure 6.20). Conversely, the Russian survey shows a reduced selectivity for age 7 years and younger. This is believed to result from gear selectivity.
6.3.1.4 Residual patterns (Figure 6.23) Residual patterns in catch and survey indices are presented in Figure 6.23a-e. There is generally no visible trend in the residuals for the Russian groundfish survey neither by age nor by year. Trends in residuals are visible in recent years for winter and ecosystem surveys and will need to be investigated further. Alternative methods for the estimation of the survey selectivity patterns will be investigated in the forthcoming benchmark assessment and could resolve the issue. Re-sidual patterns for the demersal fleet indicate a similar fit of the model compared AFWG2018, when a time varying selectivity-at-age for this fleet was introduced.
6.3.1.5 Retrospective patterns (Figure 6.24) The historical retrospective patterns for the years 2007 to 2016 are presented in Figure 6.24. All model parameters were estimated in each individual run. The most recent model run (last year of data 2019) is consistent with previous runs. As in 2018 the SSB time-series is smoother than before, due to fixed weight-at-age for every year. The new estimates for the winter and Ecosys-tem surveys led to an increase in estimated SSB, up to 19% in the early years and later on around 7% to 9%. Retrospective bias (Mohn’s rho) over the last 5 assessments was -38% for recruitment, 1% for F(19+) and -1% for SSB. Note that for F(19+) the average rho was calculated with 4 peels, since F(12-18) was used earlier. The benchmark run stands out and this is due to the unavailabil-ity of recent catch-at-age data during the benchmark assessment (see section 6.2.2). The estimate of SSB in the early years is revised upward and this results from the use of new number-at-age indices from the WGIDEEPS survey.
6.3.1.6 Projections FMSY at age 19+ is approximated using F0.1 and estimated at 0.084 (section 1.4 of the WKREBMSE report 2018b).
The estimated fishing mortality in 2019 is: F19+ = 0.045.
If the fishing mortality is maintained, this is expected to lead to a catch of 48 305 t in 2020, well below the advised TAC of 55 860 t. This would lead to an SSB of 948 178 t in early 2021, catches of 49 703 t in 2021 and SSB of 978 137 t in 2022.
Raising F19+ to FMSY (F19+ = 0.084) in 2021—2023 would lead to average catches of 91 378 t during that period and a SSB of 943 950 t by 2023 (SSB at the start of 2019 is estimated at 855 553 t).
These projections assume that the selectivity patterns of the demersal and pelagic fleets are iden-tical with those estimated for 2019. It is also assumed that the ratio of fishing mortality between these two fleets remains unchanged.
6.3.1.7 Additional considerations Historical fluctuations in the recruitment-at-age 2 (Figures 6.18 and 6.21) are consistent with the 0-group survey index (Figure 6.16), although the 0-group survey index is not used as an input to the SCAA.
The population age structure derived from the model outputs for the old individuals (beyond 19+, Figure 6.22) is consistent with the age structure reported from the slopes surveys although these are not used (yet) as input to the model.

ICES | AFWG 2020 | 299
Recent recruitment levels estimated with SCAA are highly uncertain since they rely on only few years of observations and since the age readings from the winter survey were not available for years 2014-2019. The use of the autoregressive model for recruitment (random effects in the SCAA) which was introduced in this assessment allows for a projection of the recruitment in recent years, despite the current lack of age data.
6.3.1.8 Assessment summary (Table 6.21, Figure 6.21) The history of the stock as described by the SCAA model for the period 1992–2019 is summarized in Table 6.21 and Figure 6.21. The key elements are as follows:
• upward trend in Total-stock biomass from 1992 to 2006 followed by stabilization until 2011 and new upward trend until the present,
• upward trend in spawning-stock biomass from 1992 to 2007 followed by stabilization (or slight decline) until 2014,
• recruitment failure for year classes 1996—2003 (2y old fish in 1998—2005), • good (although uncertain) recruitment for year classes born after 2005. Age data for re-
cruits (at age 2y) after 2014 is limited. • Annual fishing mortality for the 19+ group throughout the assessment period.
6.4 Comments to the assessment
Currently, the survey series used in the SCAA do not appropriately cover the geographical dis-tribution of the adult population. Data from the pelagic survey in the Norwegian Sea has been reviewed in the last benchmark and is now included in the assessment model. Priority should be given to including additional data from the slope surveys that include older age groups, in the analytical assessment in future (WD 5 in 2016).
The SCAA model relies on the availability of reliable age data in surveys and in the catch. Although additional age reading since the last assessment has improved reliability, it requires a continuous effort to keep these data at an appropriate level.
6.5 Biological reference points
The proposed reference points estimated during the workshop on the management plan for S. mentella in (ICES 2018b) were:
Reference point Value
Blim 227 000 t
Bpa 315 000 t
FMSY19+= F0.1 0.084
Which are revised from those set during the benchmark in the same year (ICES 2018a) which were Bpa = 450 kt, Blim = 324 kt and FMSY19+ = F0.1 = 0.08.
6.6 Management advice
The present report updates the assessment and advises that that when the precautionary ap-proach is applied, catches in 2021 should be no more than 66 158 tonnes, and catches in 2022
300 | ICES SCIENTIFIC REPORTS 2:52 | ICES
should be no more than 67 210 tonnes. This would correspond to a fishing mortality of F = 0.06 that is considered as precautionary.
6.7 Possible future development of the assessment
Many developments suggested in earlier years were presented and evaluated at the benchmark in January 2018. These include integrating a stochastic process model i) for recruitment-at-age 2, ii) for the annual component of fishing mortalities, and iii) to account for annual changes in fleet selectivities-at-age. In addition, iv) a right trapezoid population matrix, v) coding of older ages into flexible predefined age-blocks, and vi) integrating of data from pelagic surveys in the Nor-wegian Sea were implemented. The purpose of these new features was to reduce the number of parameters to estimate (i, ii), include new data on the older age fraction of the population (iv, v, vi) and account for possible temporal changes in selectivity linked to changes in the national and international fisheries and their regulations (iii).
Recommendations that have been followed since comprise:
• An increase in the number of age readings from surveys and from the fishery, in partic-ular for recent years.
• Use of a standardized method (StoX) for the determination of numbers-at-age in the surveys. The use of StoX for survey indices was evaluated at the beginning of AFWG 2020.
Future developments for the assessment of S. mentella may possibly include: • Use of a standardized method (ECA) for the determination of numbers-at-age in the
catch. • A genetic-based method for rapidly identifying Sebastes species (S. norvegicus, S. men-
tella, S. viviparus); • Direct use of length information (as in GADGET); • Development of a joint model for S. mentella and S. norvegicus which can include uncer-
tainty in species identification and reporting of catch of Sebastes sp.
Implementing the current model in a more generic framework (SAM or XSAM) would provide a set of diagnostic tools and the wider expertise shared by the groups developing these models.
Further studies of redfish mortality at young age, including a scientific publication, should be carried out. These studies should also take account of historic estimates of bycatch. Variable M by age and possibly time period could then be incorporated in the assessment.

ICES | AFWG 2020 | 301
Table 6.1. Sebastes mentella in subareas 1 and 2. Nominal catch (t) by countries in Subarea 1, divisions 2.a and 2.b combined. Ye
ar
Esto
nia
Faro
e Is
land
s
Fran
ce
Ger
man
y
Gre
enla
nd
Icel
and
Irela
nd
Latv
ia
Lith
uani
a
Net
herla
nds
Nor
way
Pola
nd
Port
ugal
Russ
ia
Spai
n
UK
Tota
l
1998 - 20 73 100 14 - 9 - - - 9 733 13 125 3 646 177 134 14 045
1999 - 73 26 202 50 - 3 - - - 7 884 6 65 2 731 29 140 11 209
2000 - 50 12 62 29 48 1 - - - 6 020 2 115 3 519 87 130 10 075
2001 - 74 16 198 17 3 4 - - - 13 937 5 179 3 775 90 120 18 418
2002 15 75 58 99 18 41 4 - - - 2 152 8 242 3 904 190 188 6 993
2003 - 64 22 32 8 5 5 - - - 1 210 7 44 952 47 124 2 520
2004 Sweden - 1 - 588 13 10 4 10 3 - - - 1 375 42 235 2 879 257 76 5 493
2005 5 1 147 46 33 39 4 4 - - 7 1 760 - 140 5 023 163 95 8 465
2006 Canada - 433 396 3 808 215 2 483 63 2 513 4 341 845 - 4 710 2 496 1 804 11 413 710 1 027 33 261
2007 684 2 197 234 520 29 1 587 17 349 785 - 3 209 1 081 1 483 5 660 2 181 202 20 219
2008 - 1 849 187 16 25 9 9 267 117 13 2 220 8 713 7 117 463 83 13 096
2009 EU - 889 - 1 343 15 42 - 33 - - - 3 2 677 338 806 3 843 177 80 10 246
2010 - 979 175 21 12 2 - 243 457 - 2 065 - 293 6 414 1 184 79 11 924
2011 - 984 175 835 - 2 - 536 565 - 2 471 11 613 5 037 1 678 55 12 962
2012 - 259 - 517 - 36 - 447 449 - 2 114 318 1 038 4 101 1 780 - 11 059
2013 - 697 - 80 21 1 - 280 262 - 1 835 84 1 078 3 677 1 459 - 9 474

302 | ICES SCIENTIFIC REPORTS 2:52 | ICES
2014 - 743 215 446 15 - - 215 167 3 13 503 103 505 1 704 1 162 - 18 780
2015 - 657 49 242 48 3 - 537 192 3 19 720 5 678 1 142 2 529 52 25 857
2016 - 502 134 493 74 24 0 1 243 1 065 - 19 083 208 1 066 8 419 3 213 122 35 646
2017 4 443 45 763 66 3 - 562 790 - 17 228 102 1060 6 593 2 838 436 30 934
2018 - 425 67 2 473 82 10 - 1 020 1 010 374 19 287 275 699 10 497 2 457 63 38 739
20191 - 148 371 1 599 615 10 0 653 243 24 160 471 1 426 13 444 2 226 590 45 955
1 Provisional figures.

ICES | AFWG 2020 | 303
Table 6.2. Sebastes mentella in subareas 1 and 2. Nominal catch (t) by countries in Subarea 1.
Year Fa
roe
Isla
nds
Fran
ce
Ger
man
y
Gre
enla
nd
Icel
and
Lith
uani
a
Nor
way
Pola
nd
Russ
ia
Spai
n
UK
Tota
l
1998 20 - - - 26 - 378 - - 424
1999 69 - - - 69 - 489 - - 627
2000 - - - 482 47 - 406 - - 501
2001 - - - 32 8 - 296 - - 307
2002 - - - - 4 - 587 - - 591
2003 - - - - 6 - 292 - - 298
2004 - - - - 2 - 355 - - 357
2005 - - - - 3 - 327 - - 330
2006 2 - - - 12 - 460 - 2 476
2007 - - - 8 11 - 210 - 20 249
2008 - - - - 5 - 155 - 2 162
2009 - - - 8 3 - 80 - - 91
2010 - - - - 20 - 10 - - 30
2011 - - - - 48 - 13 - - 61
2012 - - - - 34 - 17 - - 51
2013 - - - - 61 - 27 - - 88
2014 - - - - 36 - 63 - - 99
2015 - - 18 - 76 1 125 - - 220
2016 - - - - 176 1 229 342 - 748
2017 - - 12 - 165 3 196 - - 376
2018 - 19 26 3 195 - 376 - - 619
20191 75 3 0 13 - 1 278 16 206 19 3 614
1 Provisional figures.
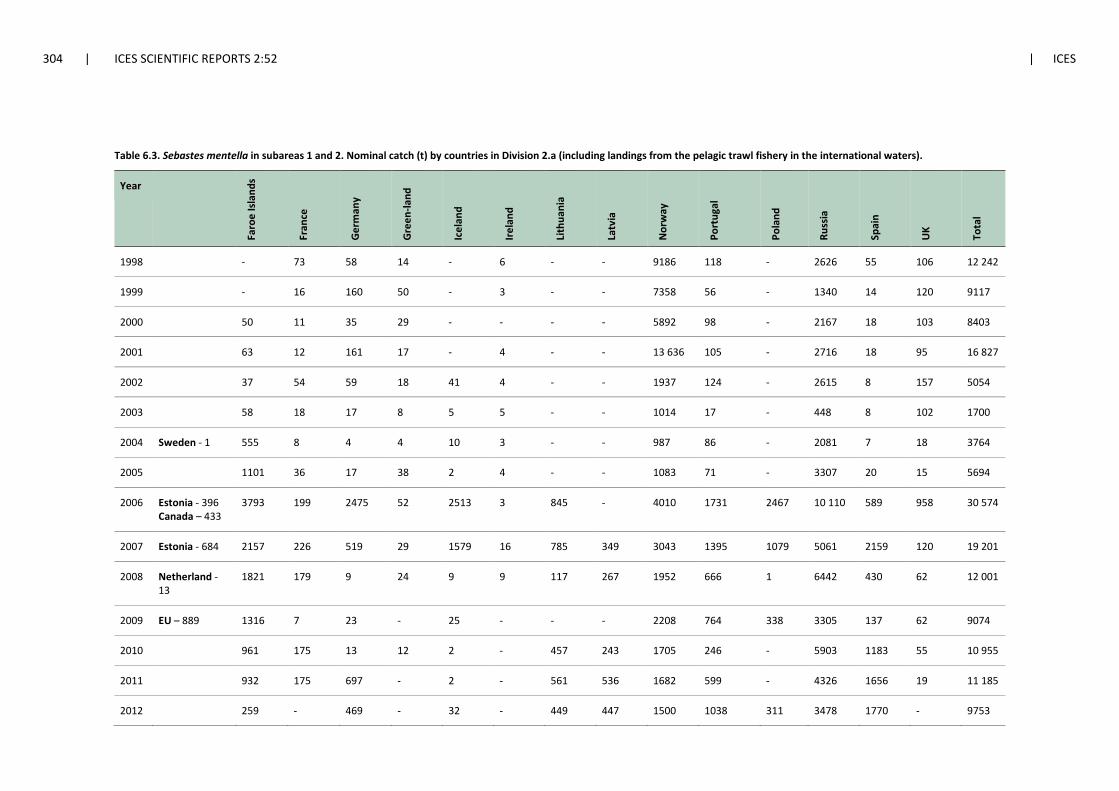
304 | ICES SCIENTIFIC REPORTS 2:52 | ICES
Table 6.3. Sebastes mentella in subareas 1 and 2. Nominal catch (t) by countries in Division 2.a (including landings from the pelagic trawl fishery in the international waters).
Year
Faro
e Is
land
s
Fran
ce
Ger
man
y
Gre
en-la
nd
Icel
and
Irela
nd
Lith
uani
a
Latv
ia
Nor
way
Port
ugal
Pola
nd
Russ
ia
Spai
n
UK
Tota
l
1998 - 73 58 14 - 6 - - 9186 118 - 2626 55 106 12 242
1999 - 16 160 50 - 3 - - 7358 56 - 1340 14 120 9117
2000 50 11 35 29 - - - - 5892 98 - 2167 18 103 8403
2001 63 12 161 17 - 4 - - 13 636 105 - 2716 18 95 16 827
2002 37 54 59 18 41 4 - - 1937 124 - 2615 8 157 5054
2003 58 18 17 8 5 5 - - 1014 17 - 448 8 102 1700
2004 Sweden - 1 555 8 4 4 10 3 - - 987 86 - 2081 7 18 3764
2005 1101 36 17 38 2 4 - - 1083 71 - 3307 20 15 5694
2006 Estonia - 396 Canada – 433
3793 199 2475 52 2513 3 845 - 4010 1731 2467 10 110 589 958 30 574
2007 Estonia - 684 2157 226 519 29 1579 16 785 349 3043 1395 1079 5061 2159 120 19 201
2008 Netherland - 13
1821 179 9 24 9 9 117 267 1952 666 1 6442 430 62 12 001
2009 EU – 889 1316 7 23 - 25 - - - 2208 764 338 3305 137 62 9074
2010 961 175 13 12 2 - 457 243 1705 246 - 5903 1183 55 10 955
2011 932 175 697 - 2 - 561 536 1682 599 - 4326 1656 19 11 185
2012 259 - 469 - 32 - 449 447 1500 1038 311 3478 1770 - 9753

ICES | AFWG 2020 | 305
Year
Faro
e Is
land
s
Fran
ce
Ger
man
y
Gre
en-la
nd
Icel
and
Irela
nd
Lith
uani
a
Latv
ia
Nor
way
Port
ugal
Pola
nd
Russ
ia
Spai
n
UK
Tota
l
2013 Netherland 675 - 24 21 1 - 262 280 921 1055 68 3293 1435 - 8035
2014 2 728 209 411 15 - - 167 215 4367 505 100 1334 1159 - 9212
2015 3 657 49 236 25 3 - 192 537 11 214 678 3 480 2508 47 16 632
2016 495 107 493 61 - 24 1065 1243 9546 1052 183 3949 2862 71 21 151
2017 425 38 763 44 3 - 790 562 7405 1059 94 3922 2813 429 18 347
2018 374 400 47 2 440 51 7 - 1 010 876 14 643 699 272 4 721 2 435 62 28 037
20191 243 74 363 1 599 59 10 - 652 - 18 354 1 425 455 7 366 2 188 570 33 357
1 Provisional figures
Table 6.4. Sebastes mentella in subareas 1 and 2. Nominal catch (t) by countries in Division 2.b.
Year
Netherland Faroe Islands France Germany Greenland Ireland Norway Poland Portugal Russia Spain Denmark UK Total
1998 - - - 42 - 3 521 13 7 642 122 - 29 1379
1999 - 4 10 42 - - 457 6 9 902 15 - 20 1465
2000 - - 1 27 - 1 82 2 17 946 69 - 27 1172
2001 - 11 4 37 - - 293 5 74 763 72 Estonia 25 1284
2002 - 38 4 40 - - 210 8 118 702 182 15 31 1348
2003 - 6 4 15 - - 190 7 27 212 39 - 22 522
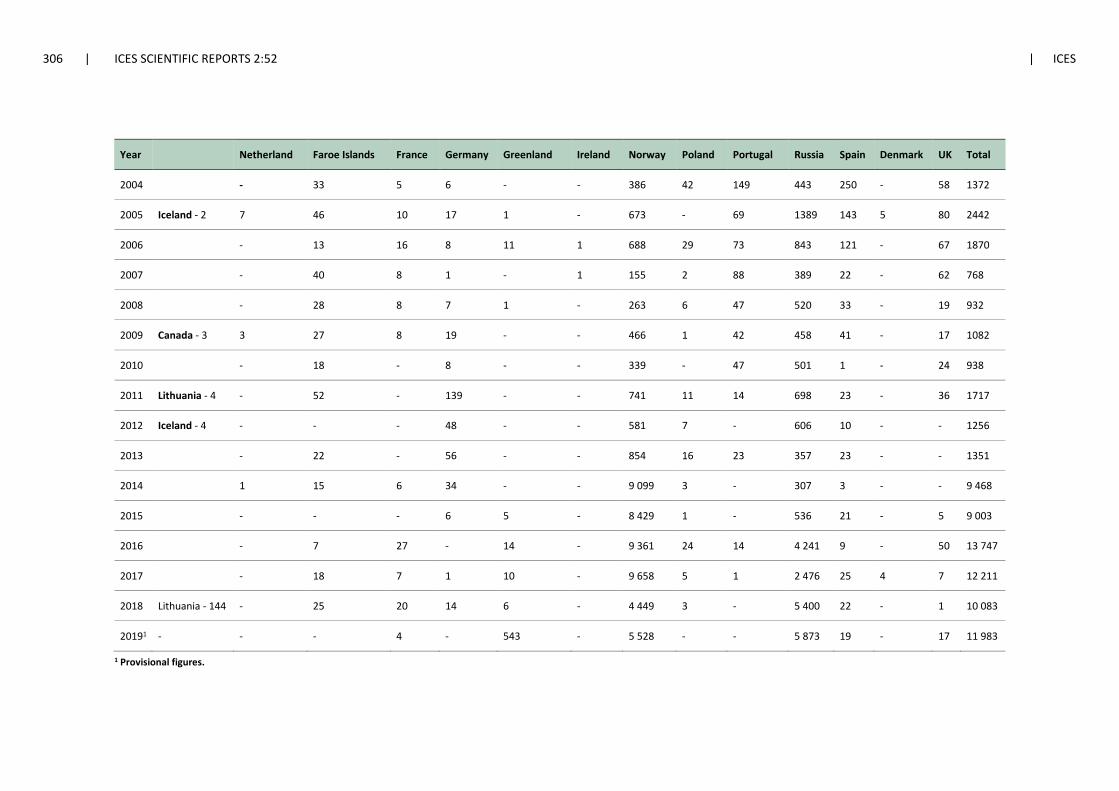
306 | ICES SCIENTIFIC REPORTS 2:52 | ICES
Year
Netherland Faroe Islands France Germany Greenland Ireland Norway Poland Portugal Russia Spain Denmark UK Total
2004 - 33 5 6 - - 386 42 149 443 250 - 58 1372
2005 Iceland - 2 7 46 10 17 1 - 673 - 69 1389 143 5 80 2442
2006 - 13 16 8 11 1 688 29 73 843 121 - 67 1870
2007 - 40 8 1 - 1 155 2 88 389 22 - 62 768
2008 - 28 8 7 1 - 263 6 47 520 33 - 19 932
2009 Canada - 3 3 27 8 19 - - 466 1 42 458 41 - 17 1082
2010 - 18 - 8 - - 339 - 47 501 1 - 24 938
2011 Lithuania - 4 - 52 - 139 - - 741 11 14 698 23 - 36 1717
2012 Iceland - 4 - - - 48 - - 581 7 - 606 10 - - 1256
2013
- 22 - 56 - - 854 16 23 357 23 - - 1351
2014
1 15 6 34 - - 9 099 3 - 307 3 - - 9 468
2015 - - - 6 5 - 8 429 1 - 536 21 - 5 9 003
2016 - 7 27 - 14 - 9 361 24 14 4 241 9 - 50 13 747
2017 - 18 7 1 10 - 9 658 5 1 2 476 25 4 7 12 211
2018 Lithuania - 144 - 25 20 14 6 - 4 449 3 - 5 400 22 - 1 10 083
20191 - - - 4 - 543 - 5 528 - - 5 873 19 - 17 11 983
1 Provisional figures.

ICES | AFWG 2020 | 307
Table 6.5. Sebastes mentella in subareas 1 and 2. Nominal catch (t) by countries of the pelagic fishery in international waters of the Norwegian Sea (see text for further details).
Year Estonia Faroe Islands France Germany Iceland Latvia Lithuania Norway Poland Portugal Russia Spain UK Total
2002 - - - 9 - - - - - - - - - 9
2003 - - - 40 - - - - - - - - - 40
2004 - 500 - 2 - - - - - - 1 510 - - 2 012
2005 - 1 083 - 20 - - - - - - 3 299 - - 4 402
2006 Canada - 433 396 3 766 192 2 475 2 510 341 845 2 862 2 447 1 697 9 390 575 841 28 770
2007 684 1 968 226 497 1 579 349 785 1 813 1 079 1 377 3 645 2 155 - 16 157
2008 - 1 797 - - - 267 117 330 - 641 4 901 390 - 8 443
2009 EU - 889 - 1 253 - - - - - - 337 701 1 975 135 - 5 290
2010 - 912 - - - 243 457 450 - 244 5 103 820 - 8 229
2011 - 740 175 693 - 536 561 342 - 595 3 621 1 648 - 8 911
2012 - 259 - 469 31 447 449 - 311 1 038 2 714 1 768 - 7 486
2013 8 675 - - - 280 262 1 68 1 078 2 720 1 435 - 6 527
2014 - 697 - 409 - 215 167 - 100 505 795 1 146 - 4 034
2015 - 606 - 231 - 537 192 - - 678 - 2 508 - 4 752
2016 - 393 - 493 - 1 243 1 065 9 - 821 512 2 862 - 7 398
2017 Netherland - 296 - 761 - 562 790 - 14 791 1 014 2 624 - 6 852
2018 374 - 400 - 2 192 - 876 1 010 - 116 372 - 2 399 - 7 739

308 | ICES SCIENTIFIC REPORTS 2:52 | ICES
Year Estonia Faroe Islands France Germany Iceland Latvia Lithuania Norway Poland Portugal Russia Spain UK Total
20191 244 - - 298 1 157 - - 652 1 364 1 096 117 1 908 223 6 060
1 Provisional figures.
Table 6.6. REDFISH in subareas 1 and 2. Nominal catch (t) by countries in Subarea 1, divisions 2.a and 2.b combined for both Sebastes mentella and S. norvegicus.
Year
Cana
da
Den
mar
k
Esto
nia
Faro
e Is
land
s
Fran
ce
Ger
man
y4
Gre
enla
nd
Icel
and
Irela
nd
Net
hela
nds
Nor
way
Pola
nd
Port
ugal
Russ
ia5
Spai
n
UK
(E&
W)
UK
(Sco
t.)
Tota
l
1984 - - - - 2970 7457 - - - - 18 650 - 1806 69689 25 716 - 101 313
1985 - - - - 3326 6566 - - - - 20 456 - 2056 59943 38 167 - 92 552
1986 - - - 29 2719 4884 - - - - 23 255 - 1591 20694 - 129 14 53 315
1987 - + - 4503 1611 5829 - - - - 18 051 - 1175 7215 25 230 9 34 595
1988 - - - 973 3349 2355 - - - - 24 662 - 500 9139 26 468 2 41 494
1989 - - - 338 1849 4245 - - - - 25 295 - 340 14344 52 271 1 46 688
1990 - 373 - 386 1821 6741 - - - - 34 090 - 830 18918 - 333 - 63 156
1991 - 23 - 639 791 981 - - - - 49 463 - 166 15354 1 336 13 67 768
1992 - 9 - 58 1301 530 614 - - - 23 451 - 977 4335 16 479 3 31 773
1993 83 4 - 152 921 685 15 - - - 18 319 - 1040 7573 13 734 1 29 465
1994 - 28 - 26 771 1026 6 4 3 - 21 466 - 985 6220 34 259 13 30 841
1995 - - - 30 748 693 7 1 5 1 16 162 - 936 6985 67 252 13 25 900

ICES | AFWG 2020 | 309
Year
Cana
da
Den
mar
k
Esto
nia
Faro
e Is
land
s
Fran
ce
Ger
man
y4
Gre
enla
nd
Icel
and
Irela
nd
Net
hela
nds
Nor
way
Pola
nd
Port
ugal
Russ
ia5
Spai
n
UK
(E&
W)
UK
(Sco
t.)
Tota
l
1996 - - - 423 746 618 37 - 2 - 21 675 - 522 1641 409 305 121 26 118
1997 - - - 7 1011 538 392 - 11 - 18 839 1 535 4556 308 235 29 26 109
1998 - - - 98 567 231 473 - 28 - 26 273 13 131 5278 228 211 94 33 200
1999 - - - 108 613 430 97 14 10 - 24 634 6 68 4422 36 247 62 30 195
2000 - - - 673 25 222 51 65 1 - 19 052 2 131 4631 87 - 2036 24 536
2001 - - Est 1113 46 436 34 3 5 - 23 071 5 186 4738 91 - 2396 28 965
2002 - - 15 1353 89 141 49 44 4 - 10 713 83 276 4736 1932 - 2346 16 636
2003 Swe - - 1733 30 154 443 9 53 89 8063 7 50 1431 472 - 2586 10 360
2004 1 - - 607 173 78 243 40 3 33 760812 42 240 36012 2602 - 1456 12 699
2005 Can Lith 5 1194 56 105 753 122 43 552 784512 - 196 5637 1713 - 1476 15 502
2006 433 845 396 3919 223 2518 1073 25443 123 21 11 015 24962 1873 12126 7192 - 10666 40 649
2007 Latv 785 684 2343 249 587 843 16552 73 20 89932 10812 1708 6550 21862 - 2576 27 591
2008 267 117 - 21233 250 46 963 363 153 15 74361 8 785 7866 4672 EU7 1686 19 695
2009 - - - 1413 16 100 81 99 - 4 8128 338 836 4541 177 889 111 16 733
2010 2433 4573 - 1150 226 52 843 243 - - 8059 13 321 6979 1187 - 123 18 906
2011 536 565 - 10082 228 844 51 24 - 1 7152 59 638 5956 16842 - 68 18 814
2012 447 449 - 346 182 588 58 59 12 5 6361 352 1055 4782 17802 Denm 100 16 576

310 | ICES SCIENTIFIC REPORTS 2:52 | ICES
Year
Cana
da
Den
mar
k
Esto
nia
Faro
e Is
land
s
Fran
ce
Ger
man
y4
Gre
enla
nd
Icel
and
Irela
nd
Net
hela
nds
Nor
way
Pola
nd
Port
ugal
Russ
ia5
Spai
n
UK
(E&
W)
UK
(Sco
t.)
Tota
l
2013 280 262 - 780 353 81 66 9 1 - 5606 103 1114 4474 1459 1 493 15 082
2014 215 167 - 810 434 452 35 29 - 4 16 556 124 510 2510 1162 - 211 23 219
2015 537 192 - 733 102 266 259 38 - 3 22 208 22 678 1806 2531 1 109 29 485
2016 1243 1065 - 685 164 497 161 79 - - 22 322 234 1066 9283 32013 7 198 40 217
2017 562 790 4 566 62 782 127 68 - 2 20 581 129 1150 7890 2882 - 596 36 192
2018 1020 1010 - 571 104 2539 159 77 - 374 23 563 311 766 12 331 2469 1 100 45 395
20191 - 656 - 392 395 1692 671 93 - 244 29 835 491 1495 15 373 2287 - 615 54 239
1 Provisional figures.
2 Working Group figure.
3 As reported to Norwegian authorities or NEAFC.
4 Includes former GDR prior to 1991.
5 USSR prior to 1991.
6 UK(E&W)+UK(Scot.)
7 EU not split on countries.

ICES | AFWG 2020 | 311
Table 6.8. S. mentella in subareas 1 and 2. Catch numbers-at-age 6 to 18 and 19+ (in thousands) and total landings (in tonnes). For the period 2012–2016 age data are missing from the pe-lagic fishery. For the period 2015–2018, age data are missing from all fisheries. The numbers-at-age have been estimated following the method outlined in section 6.2.2.
Year/Age 6 7 8 9 10 11 12 13 14 15 16 17 18 +gp Total No. Tons Land.
1992 1873 2498 1898 1622 1780 1531 2108 2288 2258 2506 2137 1512 677 9258 33 946 15 590
1993 159 159 174 512 2094 3139 2631 2308 2987 1875 1514 1053 527 6022 25 154 12 814
1994 738 730 722 992 2561 2734 3060 1535 2253 2182 3336 1284 734 3257 26 118 12 721
1995 662 941 1279 719 740 1230 2013 4297 3300 2162 1454 757 794 2404 22 752 10 284
1996 223 634 1699 1554 1236 1078 1146 1413 1865 880 621 498 700 2247 15 794 8075
1997 125 533 1287 1247 1297 1244 876 1416 1784 1217 537 1177 342 3568 16 650 8598
1998 37 882 2904 4236 3995 2741 1877 1373 1277 1595 1117 784 786 6241 29 845 14 045
1999 9 83 441 1511 2250 3262 1867 1454 1447 1557 1418 1317 658 3919 21 193 11 209
2000 1 24 390 1235 2460 2149 1816 1205 1001 993 932 505 596 5705 19 012 10 075
2001 117 372 542 976 925 1712 2651 2660 1911 1773 1220 714 814 16 234 32 621 18 418
2002 2 40 252 572 709 532 1382 1893 1617 855 629 163 237 4082 12 965 6993
2003 6 37 103 93 132 220 384 391 434 466 513 199 231 1193 4402 2520
2004 7 16 70 96 278 429 611 433 1063 813 830 841 607 3076 9170 5493
2005 2 20 57 155 244 262 295 754 783 1896 817 1087 1023 6065 13 460 8465
2006 0 4 3 38 64 121 423 1461 1356 2835 4271 3487 3969 32 084 50 116 33 261
2007 0 1 3 22 33 86 235 631 2194 2825 3657 4359 3540 15 824 33 410 20 219

312 | ICES SCIENTIFIC REPORTS 2:52 | ICES
Year/Age 6 7 8 9 10 11 12 13 14 15 16 17 18 +gp Total No. Tons Land.
2008 0 0 1 10 46 100 197 469 612 1502 1384 894 1886 11 906 19 007 13 095
2009 0 1 16 22 42 39 254 258 577 364 823 692 1856 11 706 16 650 10 246
2010 10 4 6 19 34 55 61 241 267 390 566 655 667 13 879 16 854 11 924
2011 4 4 4 25 55 114 11 103 286 394 408 479 567 15 223 17 677 12 962
2012 4 24 29 24 26 66 69 78 80 279 387 365 409 13 332 15 172 11 056
2013 0 3 19 92 88 41 42 42 10 167 144 174 299 11 726 12 847 9474
2014 14 28 346 97 124 96 152 55 111 69 252 293 197 23 744 25 578 18 780
2015 43 41 135 569 849 1384 1259 724 388 952 291 593 875 29 590 37 693 25 856
2016 26 173 180 760 2918 3804 4145 2970 1322 723 1661 832 962 36 360 56 836 35 646
2017 0 22 190 260 1384 5782 6581 5523 3245 1317 697 1567 789 25 404 52 761 30 934
2018 1173 4126 4511 4873 7166 4952 2448 2963 3553 6921 1956 2313 2650 30 536 80 141 38 739
2019 0 791 4578 7795 10 691 15 847 8687 2132 3466 4362 9900 2682 3154 19 642 93 727 45 955

ICES | AFWG 2020 | 313
Table 6.9. Pelagic Sebastes mentella in the Norwegian Sea (outside the EEZ). Catch numbers-at-age.
Numbers 103 Age
YEAR 7 8 9 10 11 12 13 14 15 16 17 18 19+
2006 0 0 0 0 23 93 1083 323 1563 3628 2514 3756 29704
2007 0 0 9 18 25 154 444 1642 2302 3021 3394 3156 12684
2008 0 0 0 0 28 146 115 143 214 594 752 753 13258
2009 0 0 0 0 9 1314 294 471 889 999 869 1150 2981
2010 0 0 0 0 0 0 130 336 254 466 467 508 11510
2011 0 0 0 0 0 223 83 83 168 136 166 136 13182
20121 0 0 0 22 29 19 294 146 132 217 288 126 8939
20132 11 137 98 465 123 158 96 169 246 196 238 598 7968
20143 0 10 125 88 406 103 125 70 113 151 112 130 4398
20153 0 0 0 0 190 59 54 0 0 0 78 21 6323
20163 0 0 138 276 244 248 121 81 97 215 401 206 9607
2017 0 0 0 250 481 399 369 160 95 103 216 388 8349
2018 0 0 0 0 774 1397 1052 865 332 180 184 370 12672
2019 25 4 199 399 219 241 196 278 182 154 135 160 6708
1 no age data in 2012, catch numbers-at-age are estimated from proportions at age in 2011 and in 2013.
2 no age data from the catches in 2013. Age readings from the research survey conducted in September 2013 are used to derive catch numbers-at-age.
3no age data in 2014 – 2018, catch numbers-at-age are estimated from previous year according to protocol described in section 6.2.2.

314 | ICES SCIENTIFIC REPORTS 2:52 | ICES
Table 6.10. S. mentella in subareas 1 and 2. Total catch numbers-at-length, in thousands, for 2011–2019.
Length group
Year
18–2
0
20–2
2
22–2
4
24–2
6
26–2
8
28–3
0
30–3
2
32–3
4
34–3
6
36–3
8
38–4
0
40–4
2
42–4
4
44–4
6
46–4
8
48–5
0
50–5
2
2011 0 12 0 0 1 8 249 2544 6481 6528 3620 829 95 18 1 0 0
2012 0 0 23 19 26 28 41 287 1898 5030 5385 1911 451 197 43 23 0
2013 0 0 4 32 154 137 90 69 1382 4214 4480 1633 497 197 0 0 0
2014 0 5 0 25 29 235 660 697 3358 7667 8544 3808 787 34 0 0 0
2015 Data not available at the time of the working group
2016 Data not available at the time of the working group
2017 Data not available at the time of the working group
2018 Data not available at the time of the working group
2019 Data not available at the time of the working group

ICES | AFWG 2020 | 315
Table 6.11. S. mentella in subareas 1 and 2. Catch numbers-at-length, in thousands, in the pelagic fishery for 2011–2019.
Length group
Year
18–2
0
20–2
2
22–2
4
24–2
6
26–2
8
28–3
0
30–3
2
32–3
4
34–3
6
36–3
8
38–4
0
40–4
2
42–4
4
44–4
6
46–4
8
48–5
0
50–5
2
2011 0 0 0 0 1 8 244 2562 5887 4425 1537 287 13 0 1 0 0
2012 0 0 0 0 0 0 106 2014 5092 3681 952 48 0 0 0 0 0
2013 0 0 0 0 0 0 75 1352 4791 2967 730 87 6 0 0 0 0
2014 0 0 0 0 0 3 14 349 2408 2454 827 80 6 1 0 0 0
2015 Data not available at the time of the working group
2016 Data not available at the time of the working group
2017 Data not available at the time of the working group
2018 Data not available at the time of the working group
2019 Data not available at the time of the working group

316 | ICES SCIENTIFIC REPORTS 2:52 | ICES
Table 6.12. S.mentella in subareas 1 and 2. Observed mean weights-at-age (kg) from the Norwegian data (Catches and surveys combined). Weights-at-age used in the statistical catch-at-age model are identical for every year and given at the bottom line of the table. Modelled numbers and those for 2016 are updated using additional age data.
Year/Age 6 7 8 9 10 11 12 13 14 15 16 17 18 19+
1992 0.167 0.164 0.211 0.241 0.309 0.324 0.378 0.366 0.428 0.454 0.487 0.529 0.571 0.805
1993 0.141 0.181 0.217 0.254 0.306 0.357 0.349 0.400 0.450 0.436 0.460 0.499 0.462 0.846
1994 0.174 0.188 0.235 0.298 0.361 0.396 0.415 0.480 0.492 0.562 0.642 0.636 0.720 0.846
1995 0.158 0.185 0.226 0.261 0.324 0.360 0.432 0.468 0.496 0.519 0.566 0.573 0.621 0.758
1996 0.175 0.189 0.224 0.272 0.323 0.337 0.377 0.518 0.536 0.603 0.690 0.800 0.683 0.958
1997 0.152 0.191 0.228 0.280 0.324 0.367 0.435 0.492 0.521 0.615 0.601 0.611 0.671 0.911
1998 0.120 0.148 0.192 0.261 0.326 0.373 0.427 0.496 0.537 0.566 0.587 0.625 0.658 0.809
1999 0.133 0.170 0.226 0.286 0.343 0.382 0.441 0.483 0.537 0.565 0.620 0.644 0.672 0.757
2000 0.109 0.144 0.199 0.276 0.332 0.392 0.437 0.490 0.540 0.585 0.631 0.650 0.671 0.872
2001 0.115 0.137 0.183 0.262 0.310 0.356 0.400 0.434 0.484 0.534 0.581 0.615 0.624 0.819
2002 0.114 0.139 0.182 0.253 0.329 0.372 0.392 0.434 0.476 0.520 0.545 0.587 0.601 0.833
2003 0.109 0.124 0.196 0.245 0.312 0.371 0.422 0.434 0.477 0.516 0.551 0.591 0.623 0.817
2004 0.104 0.129 0.180 0.264 0.308 0.376 0.413 0.444 0.478 0.521 0.579 0.614 0.688 0.835
2005 0.104 0.136 0.196 0.263 0.322 0.370 0.408 0.451 0.478 0.523 0.550 0.551 0.640 0.797
2006 0.107 0.143 0.200 0.266 0.314 0.374 0.419 0.462 0.489 0.527 0.570 0.602 0.590 0.796
2007 0.115 0.131 0.180 0.252 0.305 0.364 0.409 0.449 0.485 0.513 0.523 0.554 0.569 0.737
2008 - 0.158 0.177 0.242 0.304 0.402 0.465 0.486 0.511 0.546 0.600 0.596 0.635 0.803

ICES | AFWG 2020 | 317
Year/Age 6 7 8 9 10 11 12 13 14 15 16 17 18 19+
2009 0.129 0.179 0.206 0.249 0.326 0.394 0.510 0.550 0.542 0.583 0.609 0.594 0.595 0.809
2010 0.129 0.128 0.175 0.263 0.375 0.447 0.501 0.541 0.582 0.602 0.593 0.608 0.592 0.706
2011 0.136 0.156 0.183 0.261 0.316 0.435 0.512 0.604 0.655 0.609 0.671 0.647 0.677 0.795
2012 0.135 0.178 0.225 0.246 0.249 0.356 0.474 0.582 0.530 0.626 0.654 0.730 0.699 0.833
2013 0.129 0.145 0.189 0.230 0.270 0.282 0.345 0.384 0.534 0.559 0.634 0.627 0.661 0.720
2014 0.129 0.149 0.193 0.168 0.192 0.239 0.333 0.277 0.364 0.516 0.713 0.780 0.797 0.875
2015 0.160 0.167 0.232 0.294 0.346 0.383 0.457 0.436 0.474 0.538 0.665 0.690 0.724 0.824
20161 - - - 0.405 0.394 0.409 0.497 0.488 0.662 0.575 0.618 0.605 0.669 0.730
2017 0.154 0.196 0.254 0.270 0.306 0.413 0.425 0.458 0.533 0.472 0.562 0.650 0.692 0.796
20181 - 0.233 0.135 0.371 0.323 0.280 0.379 0.452 0.524 0.633 0.483 0.589 0.457 0.821
20191 0.127 0.191 0.212 0.274 0.374 0.371 0.497 0.416 - - - 0.688 - 0.800
Modelled 0.141 0.188 0.237 0.286 0.335 0.381 0.425 0.466 0.503 0.538 0.570 0.598 0.624 0.757
1 - Provisional figures
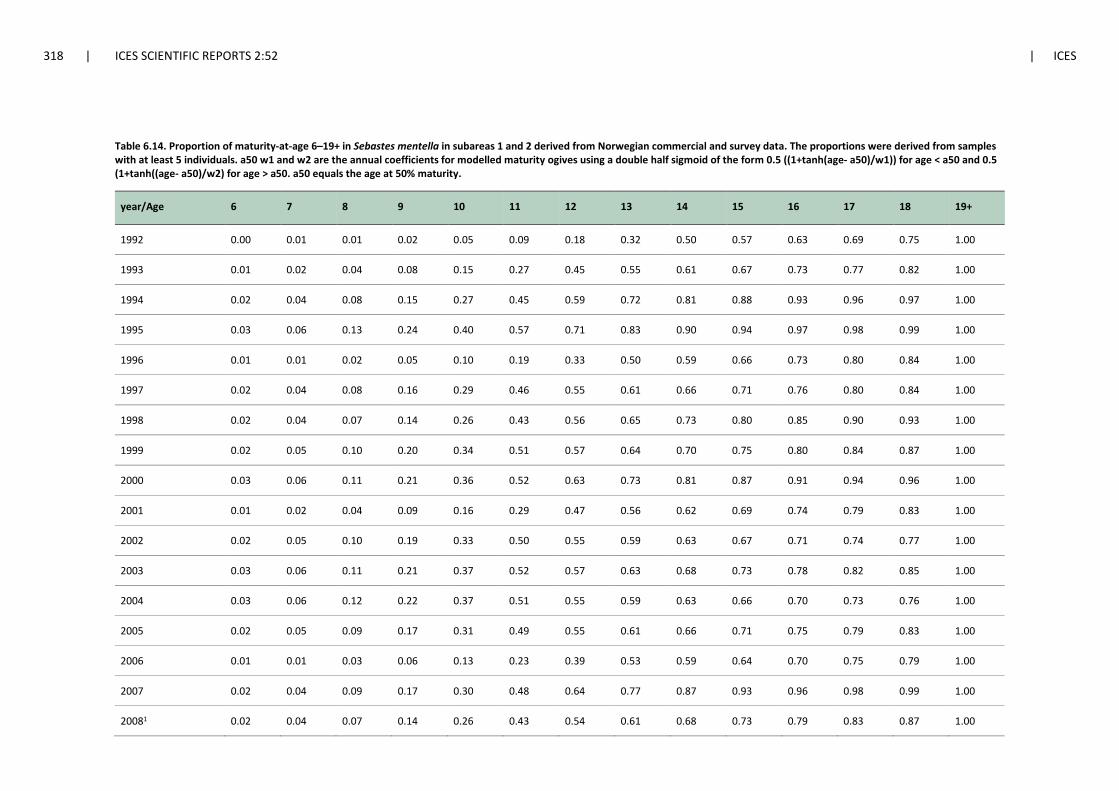
318 | ICES SCIENTIFIC REPORTS 2:52 | ICES
Table 6.14. Proportion of maturity-at-age 6–19+ in Sebastes mentella in subareas 1 and 2 derived from Norwegian commercial and survey data. The proportions were derived from samples with at least 5 individuals. a50 w1 and w2 are the annual coefficients for modelled maturity ogives using a double half sigmoid of the form 0.5 ((1+tanh(age- a50)/w1)) for age < a50 and 0.5 (1+tanh((age- a50)/w2) for age > a50. a50 equals the age at 50% maturity.
year/Age 6 7 8 9 10 11 12 13 14 15 16 17 18 19+
1992 0.00 0.01 0.01 0.02 0.05 0.09 0.18 0.32 0.50 0.57 0.63 0.69 0.75 1.00
1993 0.01 0.02 0.04 0.08 0.15 0.27 0.45 0.55 0.61 0.67 0.73 0.77 0.82 1.00
1994 0.02 0.04 0.08 0.15 0.27 0.45 0.59 0.72 0.81 0.88 0.93 0.96 0.97 1.00
1995 0.03 0.06 0.13 0.24 0.40 0.57 0.71 0.83 0.90 0.94 0.97 0.98 0.99 1.00
1996 0.01 0.01 0.02 0.05 0.10 0.19 0.33 0.50 0.59 0.66 0.73 0.80 0.84 1.00
1997 0.02 0.04 0.08 0.16 0.29 0.46 0.55 0.61 0.66 0.71 0.76 0.80 0.84 1.00
1998 0.02 0.04 0.07 0.14 0.26 0.43 0.56 0.65 0.73 0.80 0.85 0.90 0.93 1.00
1999 0.02 0.05 0.10 0.20 0.34 0.51 0.57 0.64 0.70 0.75 0.80 0.84 0.87 1.00
2000 0.03 0.06 0.11 0.21 0.36 0.52 0.63 0.73 0.81 0.87 0.91 0.94 0.96 1.00
2001 0.01 0.02 0.04 0.09 0.16 0.29 0.47 0.56 0.62 0.69 0.74 0.79 0.83 1.00
2002 0.02 0.05 0.10 0.19 0.33 0.50 0.55 0.59 0.63 0.67 0.71 0.74 0.77 1.00
2003 0.03 0.06 0.11 0.21 0.37 0.52 0.57 0.63 0.68 0.73 0.78 0.82 0.85 1.00
2004 0.03 0.06 0.12 0.22 0.37 0.51 0.55 0.59 0.63 0.66 0.70 0.73 0.76 1.00
2005 0.02 0.05 0.09 0.17 0.31 0.49 0.55 0.61 0.66 0.71 0.75 0.79 0.83 1.00
2006 0.01 0.01 0.03 0.06 0.13 0.23 0.39 0.53 0.59 0.64 0.70 0.75 0.79 1.00
2007 0.02 0.04 0.09 0.17 0.30 0.48 0.64 0.77 0.87 0.93 0.96 0.98 0.99 1.00
20081 0.02 0.04 0.07 0.14 0.26 0.43 0.54 0.61 0.68 0.73 0.79 0.83 0.87 1.00

ICES | AFWG 2020 | 319
year/Age 6 7 8 9 10 11 12 13 14 15 16 17 18 19+
2009 0.02 0.04 0.09 0.17 0.30 0.47 0.61 0.72 0.81 0.87 0.92 0.95 0.97 1.00
2010 0.02 0.04 0.08 0.16 0.28 0.45 0.55 0.60 0.66 0.71 0.76 0.80 0.83 1.00
20111 0.02 0.04 0.07 0.14 0.26 0.43 0.54 0.61 0.68 0.73 0.79 0.83 0.87 1.00
2012 0.02 0.05 0.09 0.18 0.32 0.50 0.59 0.68 0.75 0.81 0.86 0.90 0.93 1.00
2013 0.00 0.01 0.02 0.04 0.08 0.15 0.27 0.44 0.63 0.78 0.88 0.94 0.97 1.00
2014 0.00 0.00 0.01 0.01 0.03 0.06 0.11 0.21 0.36 0.52 0.61 0.68 0.75 1.00
2015 0.01 0.02 0.04 0.09 0.17 0.31 0.49 0.54 0.59 0.63 0.67 0.71 0.74 1.00
20161 0.02 0.04 0.07 0.14 0.26 0.43 0.54 0.61 0.68 0.73 0.79 0.83 0.87 1.00
20171 0.02 0.04 0.07 0.14 0.26 0.43 0.54 0.61 0.68 0.73 0.79 0.83 0.87 1.00
20181 0.02 0.04 0.07 0.14 0.26 0.43 0.54 0.61 0.68 0.73 0.79 0.83 0.87 1.00
20191 0.02 0.04 0.07 0.14 0.26 0.43 0.54 0.61 0.68 0.73 0.79 0.83 0.87 1.00
1 Model parameter estimates were unrealistic and replaced by average parameter values.

320 | ICES SCIENTIFIC REPORTS 2:52 | ICES
Table 6.15. Sebastes mentella. Average catch (numbers of specimens) per hour trawling of different ages of Sebastes mentella in the Russian groundfish survey in the Barents Sea and Sval-bard areas (1976–1983 published in "Annales Biologiques"). The survey was not conducted in 2016 took place in 2017 with insufficient coverage and was terminated after that year.
Year class 0 1 2 3 4 5 6 7 8 9 10 11
1974 - - 4.8 - 4.9 22.8 4.8 4.8 - - - 3
1975 - 7.4 - 1.7 6.4 2.4 3.5 5 - - 4 -
1976 7 - 8.1 1.2 2.5 6.8 4.9 5 1 13 - -
1977 - 0.2 0.2 0.2 0.9 5.1 3.7 1 19 2 - -
1978 0.8 0.02 0.9 1 5 3.8 2 20 6 - - -
1979 - 1.9 1.4 3.6 2.3 9 11 16 1 - - 0.1
1980 0.3 0.4 2 2.5 16 6 11 25 2 - 1.5 2
1981 - 2.2 3.9 20 6 12 47 18 6.3 1.6 0.5 1
1982 19.8 13.2 13 15 34 44 39 32.6 4.3 3.1 4.9 +
1983 12.5 3 5 6 31 34 32.3 13.3 4 4.2 0.6 1.1
1984 - 10 2 - 5 18.3 19 2.2 2.4 0.2 1.7 2.4
1985 107 7 - 1 5.2 16.2 1.7 1.7 0.6 2.8 3.8 0.3
1986 2 - 1 1.8 8.4 3.6 2.1 1.2 5.6 8.2 0.9 0.7
1987 - 3 37.9 1.3 8 4.1 2 10.6 9.6 1.4 2 1.3
1988 4 58.1 4.3 13.3 25.8 3.9 8.6 11.2 2.8 4.2 3 4.7
1989 8.7 9 17 23.4 4.6 5.4 4 6.6 6.6 4.1 7.7 5.3
1990 2.5 6.3 6.1 1 4.3 1.7 11.5 6.5 5.5 6.7 7.4 3.6

ICES | AFWG 2020 | 321
Year class 0 1 2 3 4 5 6 7 8 9 10 11
1991 0.3 1 0.5 1.5 1.2 11.3 3.9 3.3 4.6 5.8 2.7 1.9
1992 0.6 + 0.2 0.1 4.3 1.3 2 2.3 4.9 2.3 1 4.1
19931 - + 1.5 1.8 1 1.2 3 4.2 2.6 2 3.2 2.1
1994 0.3 3.5 1.7 1.7 0.9 3.6 5.2 4.3 3.1 3.3 1.8 1.2
1995 2.8 1 1.1 0.4 2.2 2.6 3.5 3.4 2.9 1.2 1 8.5
19962 + 0.1 0.1 0.4 0.7 1.1 1 1.4 1 0.8 3.7 0.6
1997 - - + 0.4 0.5 0.3 0.9 0.6 1 1.1 0.5 0.4
1998 - 0.1 0.2 0.3 0.2 1.1 0.5 0.7 1 0.4 0.4 0.7
1999 0.1 - 0.1 + 0.1 0.3 0.5 0.8 0.5 0.2 0.4 0.6
2000 - 0.6 0.1 0.5 0.3 0.3 0.6 0.4 0.1 0.1 0.7 0.3
2001 - 0.1 0.4 - 0.1 0.2 0.2 0.3 0.2 0.8 0.1 1
20023 0.1 0.5 0.1 - - 0.1 0.5 0.4 1.5 0.5 1 1.1
2003 - - 0.1 - 0.3 1.0 0.5 4.8 2.1 3.7 1.3 1.9
2004 - 0.2 0.3 0.5 1.5 0.9 4.4 3.7 7.5 4.1 3.1 3.3
2005 - - 1.4 1.9 1.4 2.3 3.9 7.2 6.1 6.8 3.1
20064 0.1 1.8 1.2 1.1 0.8 2.1 4.1 3.0 6.1 5.9
2007 2.5 0.4 0.1 1.2 1.7 2.4 3.6 4.3 7.4
2008 0.1 0.1 1.6 1.8 4.1 2.9 5.8 5.5

322 | ICES SCIENTIFIC REPORTS 2:52 | ICES
Year class 0 1 2 3 4 5 6 7 8 9 10 11
2009 1.6 1.9 1.1 4.4 4.8 2.9 4.8
2010 7.5 0.7 1.2 1.5 1.9 1.6
2011 0.1 0.3 0.6 1.6 1.6
2012 0.2 0.7 0.5 0.3
2013 0.1 0.1 0.4
2014 3.6 1.0
2015 6.6
1 - Not complete area coverage of Division 2.b.
2 - Area surveyed restricted to Subarea 1 and Division 2.a only.
3 - Area surveyed restricted to Subarea 1 and Division 2.b only
4- Area surveyed restricted to Division 2.a and 2.b only.

ICES | AFWG 2020 | 323
Table 6.16a. Sebastes mentella1 in Division 2.b. Abundance indices (on length) from the bottom-trawl survey in the Svalbard area (Division 2.b) in summer/fall 1986–2019 (numbers in mil-lions).
Length group (cm)
Year 5.0-9.9 10.0-14.9 15.0-19.9 20.0-24.9 25.0-29.9 30.0-34.9 35.0-39.9 40.0-44.9 >45.0 Total
19862 6 101 192 17 10 5 2 4 0 337
19872 20 14 140 19 6 2 1 2 0 204
19882 33 23 82 77 7 3 2 2 0 229
1989 556 225 24 72 17 2 2 8 4 910
1990 184 820 59 65 111 23 15 7 3 1287
1991 1533 1426 563 55 138 38 30 7 1 3791
1992 149 446 268 43 22 15 4 7 4 958
1993 9 320 272 89 16 13 3 1 0 723
1994 4 284 613 242 10 9 2 2 1 1167
1995 33 33 417 349 77 18 5 1 0 933
1996 56 69 139 310 97 8 4 1 1 685
1997 3 44 13 65 57 9 5 0 0 195
1998 0 37 35 28 132 73 45 2 0 352
1999 3 3 124 62 260 169 42 1 0 664
2000 0 10 30 59 126 143 21 1 0 391
2001 1 5 3 32 57 227 50 3 0 378

324 | ICES SCIENTIFIC REPORTS 2:52 | ICES
Length group (cm)
Year 5.0-9.9 10.0-14.9 15.0-19.9 20.0-24.9 25.0-29.9 30.0-34.9 35.0-39.9 40.0-44.9 >45.0 Total
2002 1 4 6 21 62 266 47 4 0 410
2003 1 5 7 11 51 244 45 1 0 364
2004 0 2 8 6 14 78 49 2 0 160
2005 22 1 4 4 10 70 47 1 0 158
2006 85 6 5 7 43 200 108 3 0 457
2007 101 55 1 5 10 98 109 3 0 381
2008 127 47 22 3 8 24 78 4 0 313
2009 9 122 88 14 3 27 219 5 0 486
2010 96 18 44 37 2 20 91 7 0 315
2011 126 91 81 48 10 7 67 5 1 436
2012 29 75 69 82 47 8 94 10 0 413
2013 33 43 127 106 67 19 89 13 0 497
20143 3 10 59 49 38 24 66 20 0 268
2015 85 7 28 157 115 65 69 25 0 552
2016 244 33 44 205 138 139 142 48 0 993
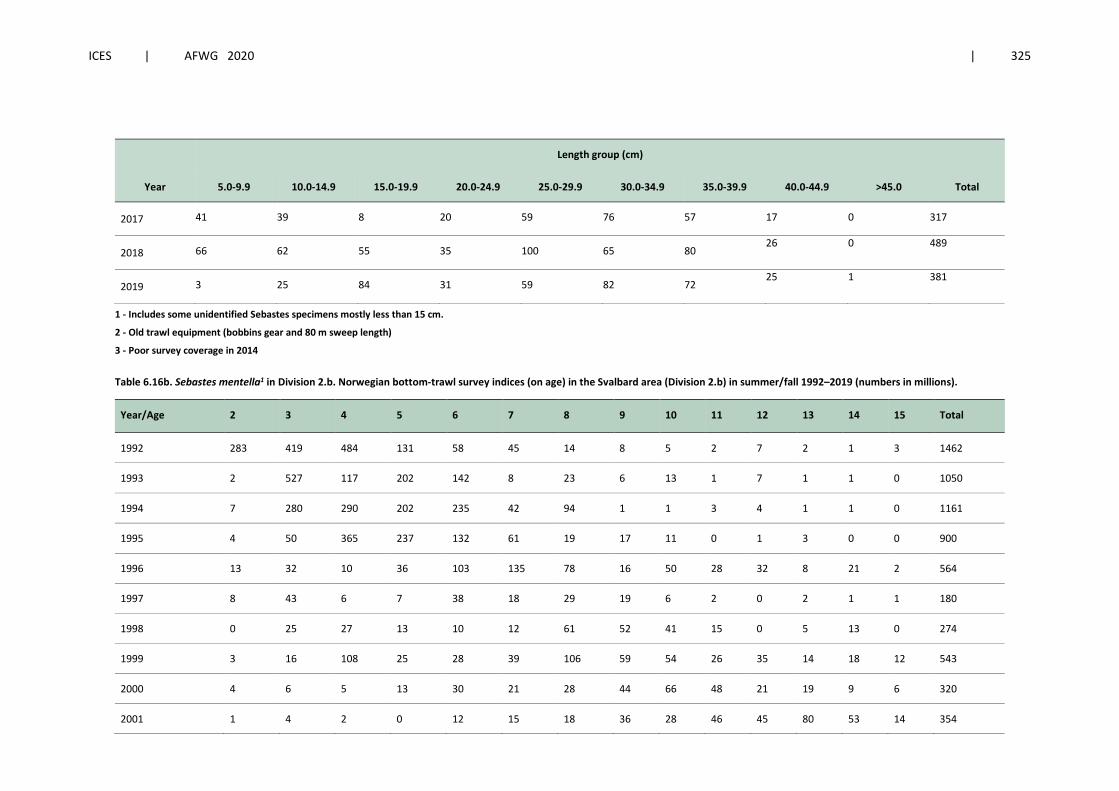
ICES | AFWG 2020 | 325
Length group (cm)
Year 5.0-9.9 10.0-14.9 15.0-19.9 20.0-24.9 25.0-29.9 30.0-34.9 35.0-39.9 40.0-44.9 >45.0 Total
2017 41 39 8 20 59 76 57 17 0 317
2018 66 62 55 35 100 65 80 26 0 489
2019 3 25 84 31 59 82 72 25 1 381
1 - Includes some unidentified Sebastes specimens mostly less than 15 cm.
2 - Old trawl equipment (bobbins gear and 80 m sweep length)
3 - Poor survey coverage in 2014
Table 6.16b. Sebastes mentella1 in Division 2.b. Norwegian bottom-trawl survey indices (on age) in the Svalbard area (Division 2.b) in summer/fall 1992–2019 (numbers in millions).
Year/Age 2 3 4 5 6 7 8 9 10 11 12 13 14 15 Total
1992 283 419 484 131 58 45 14 8 5 2 7 2 1 3 1462
1993 2 527 117 202 142 8 23 6 13 1 7 1 1 0 1050
1994 7 280 290 202 235 42 94 1 1 3 4 1 1 0 1161
1995 4 50 365 237 132 61 19 17 11 0 1 3 0 0 900
1996 13 32 10 36 103 135 78 16 50 28 32 8 21 2 564
1997 8 43 6 7 38 18 29 19 6 2 0 2 1 1 180
1998 0 25 27 13 10 12 61 52 41 15 0 5 13 0 274
1999 3 16 108 25 28 39 106 59 54 26 35 14 18 12 543
2000 4 6 5 13 30 21 28 44 66 48 21 19 9 6 320
2001 1 4 2 0 12 15 18 36 28 46 45 80 53 14 354
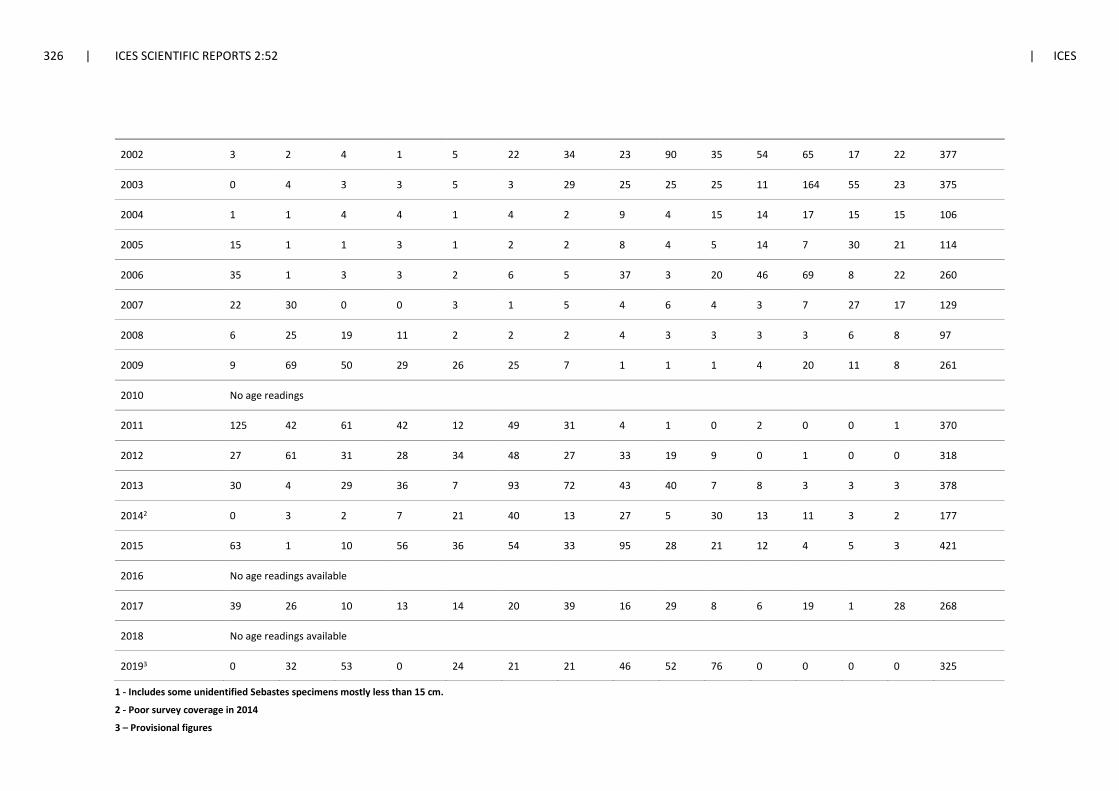
326 | ICES SCIENTIFIC REPORTS 2:52 | ICES
2002 3 2 4 1 5 22 34 23 90 35 54 65 17 22 377
2003 0 4 3 3 5 3 29 25 25 25 11 164 55 23 375
2004 1 1 4 4 1 4 2 9 4 15 14 17 15 15 106
2005 15 1 1 3 1 2 2 8 4 5 14 7 30 21 114
2006 35 1 3 3 2 6 5 37 3 20 46 69 8 22 260
2007 22 30 0 0 3 1 5 4 6 4 3 7 27 17 129
2008 6 25 19 11 2 2 2 4 3 3 3 3 6 8 97
2009 9 69 50 29 26 25 7 1 1 1 4 20 11 8 261
2010 No age readings
2011 125 42 61 42 12 49 31 4 1 0 2 0 0 1 370
2012 27 61 31 28 34 48 27 33 19 9 0 1 0 0 318
2013 30 4 29 36 7 93 72 43 40 7 8 3 3 3 378
20142 0 3 2 7 21 40 13 27 5 30 13 11 3 2 177
2015 63 1 10 56 36 54 33 95 28 21 12 4 5 3 421
2016 No age readings available
2017 39 26 10 13 14 20 39 16 29 8 6 19 1 28 268
2018 No age readings available
20193 0 32 53 0 24 21 21 46 52 76 0 0 0 0 325
1 - Includes some unidentified Sebastes specimens mostly less than 15 cm.
2 - Poor survey coverage in 2014
3 – Provisional figures

ICES | AFWG 2020 | 327
Table 6.17. Sebastes mentella in subareas 1 and 2. Abundance indices (on age) from the Ecosystem survey in August-September 1996–2019 covering the Norwegian Economic Zone (NEZ) and Svalbard incl. the area north and east of Spitsbergen (numbers in thousands and total biomass in thousand tonnes) and the continental slope down to 1000 m.
Year/Age 2 3 4 5 6 7 8 9 10 11 12 13 14 15 16+ Total N Total B
1996 146198 112742 22353 53507 165531 181980 108738 43328 65310 40546 38254 19843 29446 10931 17414 1 056 120 171
1997 62682 130816 12492 23452 74342 55880 76607 82503 17640 14274 675 2238 1723 633 8765 564 723 73
1998 313 78767 85715 39849 25805 23413 84825 100332 54287 24329 11334 7457 15250 576 25212 577 464 105
1999 5359 23240 117170 47851 41608 76797 128677 73306 58018 64781 49890 13565 18458 12171 24672 755 562 155
2000 5964 23169 14336 19960 52666 68081 83857 77513 100442 72294 71148 36599 17183 20590 26501 690 304 178
2001 5026 6541 10957 1093 19766 25591 36594 51644 44407 61704 50083 86122 53952 15699 31877 501 057 162
2002 9112 6646 7379 3821 8635 28215 47456 63903 103368 49964 76133 71970 25241 36765 34957 573 565 181
2003 4036 8613 7002 3135 7911 7980 43544 62831 51793 34642 61698 168687 107721 39232 27193 636 017 213
2004 8554 15793 11443 7399 3554 7560 6164 11686 8566 22973 25920 23199 20392 19472 50960 243 635 111
2005 32526 6856 5546 5616 3772 5980 6985 13151 5803 5700 16554 34393 34987 34336 53165 265 370 103
2006 125437 4833 6844 6602 4255 8486 7424 38309 3983 24756 48733 71491 13957 37991 159909 563 010 184
2007 335297 199057 15305 4867 10970 2862 8387 9973 14017 6320 4686 8295 52422 18971 223524 914 953 172
2008 56276 210594 140764 29365 7581 3775 2810 6479 6160 3681 3668 5473 7405 10175 105726 599 932 89
2009 122459 176405 231265 82701 109509 45607 15812 2775 5807 2950 3929 22097 12431 9299 331974 1 175 019 200
2010 No age reading
2011 423987 378581 236404 62437 55643 77076 48239 12383 3128 2012 2878 831 100 2938 103438 1 410 075 1202
2012 354863 261115 352468 171535 132263 74859 58937 41526 21794 12670 3552 1051 1559 3376 140270 1 631 839 1862
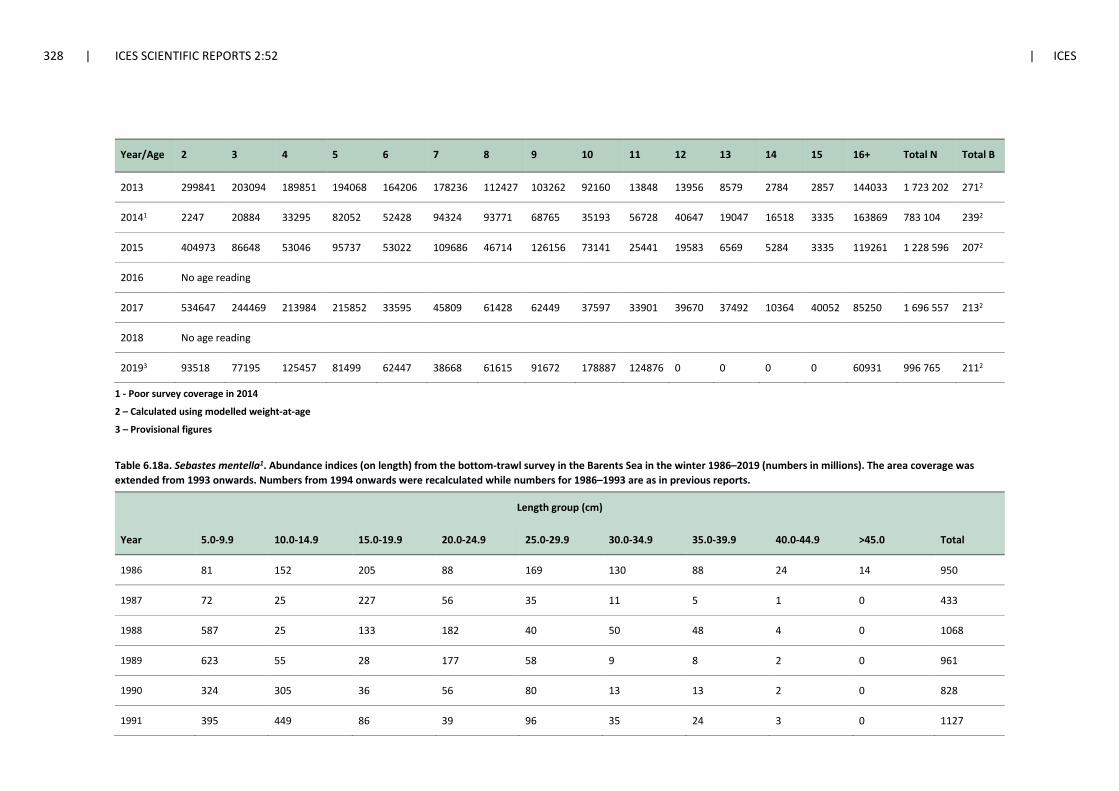
328 | ICES SCIENTIFIC REPORTS 2:52 | ICES
Year/Age 2 3 4 5 6 7 8 9 10 11 12 13 14 15 16+ Total N Total B
2013 299841 203094 189851 194068 164206 178236 112427 103262 92160 13848 13956 8579 2784 2857 144033 1 723 202 2712
20141 2247 20884 33295 82052 52428 94324 93771 68765 35193 56728 40647 19047 16518 3335 163869 783 104 2392
2015 404973 86648 53046 95737 53022 109686 46714 126156 73141 25441 19583 6569 5284 3335 119261 1 228 596 2072
2016 No age reading
2017 534647 244469 213984 215852 33595 45809 61428 62449 37597 33901 39670 37492 10364 40052 85250 1 696 557 2132
2018 No age reading
20193 93518 77195 125457 81499 62447 38668 61615 91672 178887 124876 0 0 0 0 60931 996 765 2112
1 - Poor survey coverage in 2014
2 – Calculated using modelled weight-at-age
3 – Provisional figures
Table 6.18a. Sebastes mentella1. Abundance indices (on length) from the bottom-trawl survey in the Barents Sea in the winter 1986–2019 (numbers in millions). The area coverage was extended from 1993 onwards. Numbers from 1994 onwards were recalculated while numbers for 1986–1993 are as in previous reports.
Length group (cm)
Year 5.0-9.9 10.0-14.9 15.0-19.9 20.0-24.9 25.0-29.9 30.0-34.9 35.0-39.9 40.0-44.9 >45.0 Total
1986 81 152 205 88 169 130 88 24 14 950
1987 72 25 227 56 35 11 5 1 0 433
1988 587 25 133 182 40 50 48 4 0 1068
1989 623 55 28 177 58 9 8 2 0 961
1990 324 305 36 56 80 13 13 2 0 828
1991 395 449 86 39 96 35 24 3 0 1127

ICES | AFWG 2020 | 329
Length group (cm)
Year 5.0-9.9 10.0-14.9 15.0-19.9 20.0-24.9 25.0-29.9 30.0-34.9 35.0-39.9 40.0-44.9 >45.0 Total
1992 139 367 227 35 55 34 8 2 1 867
1993 31 593 320 116 24 25 6 1 0 1117
1994 8 296 479 488 74 74 17 3 0 1440
1995 310 84 571 390 83 58 24 3 0 1522
1996 215 102 198 343 136 42 17 1 0 1054
19972 63 121 26 281 272 71 40 5 0 879
19982 1 87 63 101 204 41 13 2 0 511
1999 2 7 69 37 173 74 22 3 0 388
2000 9 13 40 78 143 97 27 7 2 415
2001 10 23 7 57 78 75 10 1 0 260
2002 17 7 19 36 96 116 24 1 0 317
2003 4 4 10 13 70 198 46 6 0 351
2004 2 3 7 19 33 86 32 2 0 183
2005 0 6 7 11 28 154 86 4 0 296
2006 100 2 10 15 23 104 83 3 1 339
2007 382 121 3 7 12 121 121 7 0 773
2008 858 359 27 5 12 104 165 5 0 1533
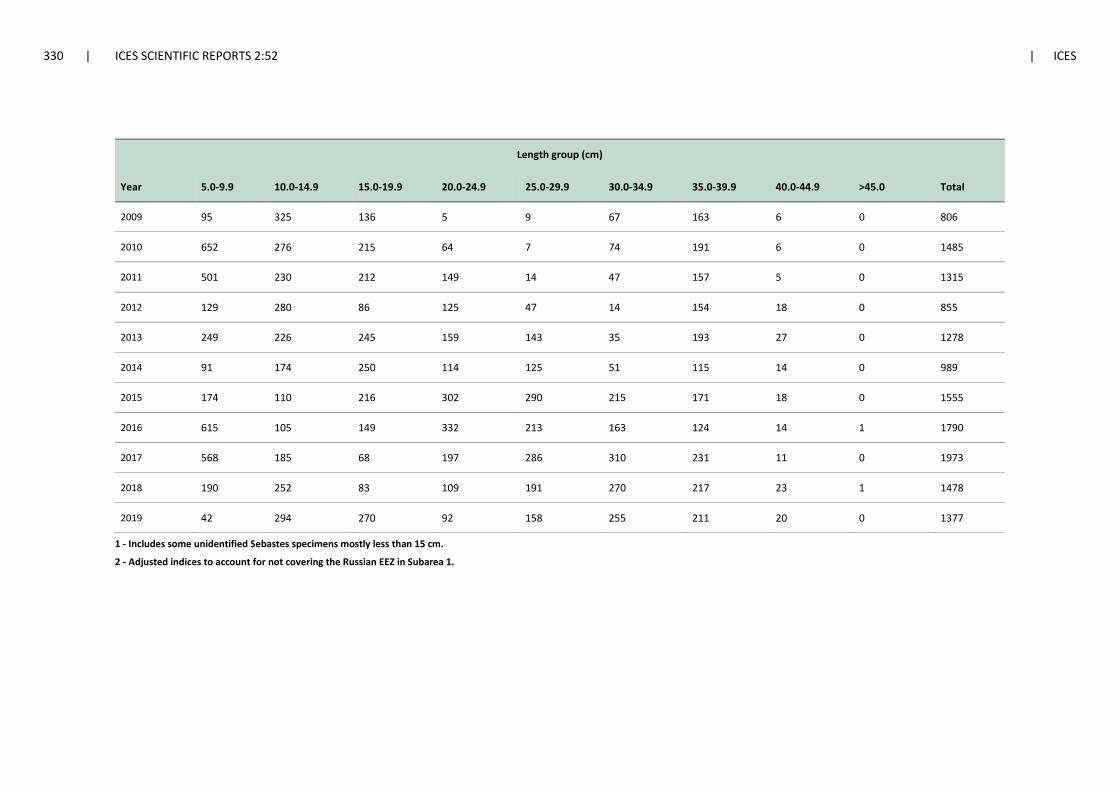
330 | ICES SCIENTIFIC REPORTS 2:52 | ICES
Length group (cm)
Year 5.0-9.9 10.0-14.9 15.0-19.9 20.0-24.9 25.0-29.9 30.0-34.9 35.0-39.9 40.0-44.9 >45.0 Total
2009 95 325 136 5 9 67 163 6 0 806
2010 652 276 215 64 7 74 191 6 0 1485
2011 501 230 212 149 14 47 157 5 0 1315
2012 129 280 86 125 47 14 154 18 0 855
2013 249 226 245 159 143 35 193 27 0 1278
2014 91 174 250 114 125 51 115 14 0 989
2015 174 110 216 302 290 215 171 18 0 1555
2016 615 105 149 332 213 163 124 14 1 1790
2017 568 185 68 197 286 310 231 11 0 1973
2018 190 252 83 109 191 270 217 23 1 1478
2019 42 294 270 92 158 255 211 20 0 1377
1 - Includes some unidentified Sebastes specimens mostly less than 15 cm.
2 - Adjusted indices to account for not covering the Russian EEZ in Subarea 1.

ICES | AFWG 2020 | 331
Table 6.18b. Sebastes mentella1 in subareas 1 and 2. Preliminary Norwegian bottom-trawl indices (on age) from the annual Barents Sea survey in February 1992–2019 (numbers in millions). The area coverage was extended from 1993 onwards.
Year/Age 2 3 4 5 6 7 8 9 10 11 12 13 14 15 Total
1992
1993
1994 4 100 320 168 337 263 92 56 5 31 13 12 24 6 1431
1995 316 49 158 230 319 227 80 24 10 17 19 9 9 9 1476
1996 193 105 78 108 140 144 134 65 22 24 13 7 9 4 1046
19972 60 120 21 51 105 100 135 104 44 48 29 26 8 7 858
19982 2 70 47 24 11 51 112 115 35 17 6 7 4 3 504
1999 0 1 36 39 29 26 54 64 57 38 17 6 6 2 375
2000 19 1 4 31 36 23 28 70 73 47 24 15 10 3 384
2001 1 18 8 2 7 26 36 30 42 18 21 27 5 3 244
2002 18 4 12 8 2 10 42 56 25 13 36 20 37 13 296
2003 0 3 2 4 6 6 14 36 24 17 48 30 61 32 283
2004 2 1 4 2 4 10 11 16 14 12 15 25 26 14 156
2005 0 4 2 3 6 6 8 14 17 9 17 26 42 56 210
2006 75 22 5 4 6 7 10 11 7 14 15 9 43 29 257
2007 242 66 5 1 2 2 5 8 9 5 8 22 33 68 476
2008 703 180 105 13 0 2 4 6 4 6 4 21 20 29 1097
2009 106 108 96 87 68 32 21 14 5 5 20 2 24 7 595
2010 160 250 178 167 91 68 25 22 2 10 4 8 12 18 1015

332 | ICES SCIENTIFIC REPORTS 2:52 | ICES
2011 362 226 131 129 103 65 41 23 2 6 1 2 2 28 1121
2012 No age readings
2013 0 178 249 145 142 124 120 14 32 11 4 25 37 13 1094
2014 No age readings
2015 No age readings
2016 No age readings
2017 No age readings
2018 No age readings
2019 No age readings
1 - Includes some unidentified Sebastes specimens mostly less than 15 cm.
2 - Adjusted indices to account for not covering the Russian EEZ in Subarea 1
Table 6.19. Comparison of results on Sebastes mentella from the Norwegian Sea pelagic surveys in 2008, 2009, 2013, 2016 and 2019. Acoustic results for the 2019 survey were not available at the time of AFWG 2020.
2008 2009 2013 2016 2019
mean length (cm) All/M/F1 37.0/36.4/37.5 36.6/36.0/37.1 37.5/37.0/38.1 37.7/37.0/38.3 37.6/37.2/38.0
mean length (cm) S/DSL/D2 37.2/36.8/39.1 37.2/36.5/38.3 37.1/37.4/38.9 38.1/37.6/38.4 37.4/37.6/37.7
mean weight (g) All/M/F 619/585/648 625/609/666 659/625/706 656/619/694 683/644/724
Mean age (y) All/M/F 25 / 25 / 25 25 / 25 / 24 28 / 29 / 28 27 / 27 / 26 - / - / -
Sex ratio (M/F) 45% / 55% 45% / 55% 59% / 41% 50% / 50% 51% / 49%
Occurrence 96% 100% 95% 80% 99%
Catch rates 3.80 t/NM2 3.94 t/NM2 3.47 t/NM2 1,01 t/NM2 3.40 t/NM2

ICES | AFWG 2020 | 333
mean sA 33 m2/NM2 34 m2/NM2 19 m2/NM2 5.2 m2/NM2 -
Total Area 53 720 NM2 69 520 NM2 69 520 NM2 67 150 NM2 73 364 NM2
Abundance (Acoustics)3 395 000 t 532 000 t 297 000 t 136 000 t -
Abundance (Trawl)4 406,000 t 548,000 t 482,000 t 116,000 t 499 000 t
1 M = males only F = females only 2 S = shallower than DSL DSL = deep scattering layer D = deeper than DSL 3The abundance derived from hydroacoustics is calculated assuming a Length-dependent target strength equation of TS=20log(L)-68.0. In 2016 the TS equation used was TS=20log(L)-69.6 following recommendation from ICES-WKTAR (2010). 4Trawls: Gloria 2048 in 2008 and 2009 Gloria 2560 HO helix in 2013 and Gloria 1024 in 2016. Trawl catchability for redfish set to 0.5 for all trawls based on results from Bethke et al. (2010).
Table 6.20a: S. mentella in subareas 1 and 2. Population matrix with numbers-at-age (in thousands) for each year and separable fishing mortality coefficients for the demersal and pelagic fleet by year (Fy) and selectivity at age for the pelagic fleet (Sa). Numbers are estimated from the statistical catch-at-age model.
sa (demersal) Varies over time
sa (pelagic) 0.000 0.000 0.000 0.000 0.000 0.011 0.021 0.039 0.074 0.135 0.233 0.372 0.537 0.693 0.815 0.896 0.944 1.00
Fy (demer-sal)
Fy (pe-lagic)
Year \ age 2 3 4 5 6 7 8 9 10 11 12 13 14 15 16 17 18 19+
0.044 0 1992 417 153 402 877 364 870 237 695 142 559 97 537 95 796 101 604 126 583 86 789 98 368 73 544 75 579 64 565 46 468 30 447 20 258 201 571
0.031 0 1993 278 015 396 893 383 310 347 149 223 449 133 771 91 346 89 530 94 756 117 795 80 588 91 147 68 008 69 756 59 486 42 744 27 967 202 201
0.027 0 1994 194 668 264 512 377 617 364 693 330 230 212 491 127 100 86 600 84 479 88 751 109 534 74 600 84 202 62 775 64 370 54 887 39 438 212 361
0.021 0 1995 183 773 185 213 251 666 359 277 346 726 313 664 201 430 120 041 81 350 78 904 82 538 101 612 69 120 77 973 58 118 59 588 50 807 233 075
0.014 0 1996 146 256 174 848 176 218 239 443 341 586 329 378 297 477 190 486 113 070 76 317 73 799 77 059 94 781 64 446 72 686 54 172 55 541 264 593
0.014 0 1997 102 907 139 153 166 356 167 659 227 756 324 761 312 774 281 750 179 741 106 348 71 654 69 239 72 279 88 893 60 440 68 168 50 804 300 232

334 | ICES SCIENTIFIC REPORTS 2:52 | ICES
Fy (demer-sal)
Fy (pe-lagic)
Year \ age 2 3 4 5 6 7 8 9 10 11 12 13 14 15 16 17 18 19+
0.019 0 1998 52 516 97 909 132 394 158 276 159 483 216 563 308 480 296 409 266 059 169 174 99 908 67 262 64 976 67 822 83 409 56 711 63 961 329 375
0.015 0 1999 45 519 49 965 93 154 125 964 150 575 151 671 205 637 291 467 278 056 248 646 157 939 93 252 62 778 60 644 63 300 77 848 52 930 367 111
0.012 0 2000 34 891 43 308 47 539 88 630 119 844 143 250 144 241 195 250 275 438 261 368 233 226 148 071 87 418 58 849 56 848 59 338 72 975 393 750
0.021 0 2001 36 120 33 196 41 205 45 230 84 325 114 022 136 272 137 025 184 391 259 142 245 777 219 302 139 231 82 198 55 335 53 454 55 795 438 859
0.007 0 2002 40 387 34 366 31 584 39 203 43 008 80 125 108 180 128 933 129 122 173 003 242 326 229 375 204 466 129 752 76 587 51 553 49 799 460 819
0.003 0 2003 42 998 38 425 32 697 30 050 37 299 40 916 76 205 102 765 122 150 122 060 163 420 228 864 216 625 193 099 122 539 72 329 48 687 482 231
0.006 0 2004 54 143 40 910 36 559 31 109 28 587 35 479 38 911 72 444 97 645 116 008 115 878 155 106 217 193 205 564 183 233 116 276 68 632 503 777
0.008 0 2005 133 043 51 514 38 923 34 783 29 595 27 192 33 737 36 978 68 775 92 586 109 884 109 690 146 776 205 499 194 484 173 352 110 005 541 532
0.005 0.034 2006 244 520 126 582 49 012 37 033 33 092 28 153 25 861 32 062 35 089 65 119 87 497 103 734 103 506 138 479 193 870 183 475 163 538 614 651
0.005 0.019 2007 368 760 232 644 120 434 46 631 35 233 31 484 26 774 24 581 30 443 33 249 61 499 82 265 97 007 96 225 128 036 178 497 168 458 712 241
0.005 0.013 2008 360 302 350 850 221 345 114 585 44 366 33 522 29 948 25 461 23 363 28 902 31 501 58 093 77 438 90 994 89 981 119 448 166 271 818 945
0.003 0.010 2009 368 411 342 803 333 810 210 594 109 019 42 211 31 889 28 484 24 205 22 180 27 364 29 744 54 730 72 794 85 364 84 281 111 766 920 736
0.003 0.010 2010 455 484 350 518 326 154 317 597 200 365 103 723 40 155 30 328 27 073 22 978 21 026 25 905 28 117 51 653 68 600 80 351 79 271 970 221
0.005 0.010 2011 603 049 433 362 333 494 310 313 302 170 190 629 98 667 38 189 28 828 25 708 21 787 19 902 24 477 26 520 48 639 64 515 75 505 985 192
0.004 0.009 2012 436 063 573 760 412 315 317 297 295 241 287 491 181 346 93 846 36 306 27 375 24 359 20 593 18 773 23 047 24 931 45 670 60 529 994 194
0.004 0.009 2013 253 115 414 884 545 894 392 289 301 884 280 896 273 490 172 489 89 236 34 502 25 987 23 086 19 475 17 714 21 705 23 447 42 915 990 107
0.015 0.009 2014 222 022 240 822 394 734 519 381 373 236 287 222 267 227 260 157 164 049 84 839 32 780 24 660 21 865 18 402 16 702 20 435 22 055 970 733
0.026 0.009 2015 346 890 211 239 229 125 375 562 494 140 355 088 273 215 254 148 247 336 155 864 80 514 31 050 23 294 20 580 17 255 15 608 19 049 921 959

ICES | AFWG 2020 | 335
Fy (demer-sal)
Fy (pe-lagic)
Year \ age 2 3 4 5 6 7 8 9 10 11 12 13 14 15 16 17 18 19+
0.036 0.009 2016 443 804 330 042 200 979 217 997 357 312 470 105 337 744 259 766 241 404 234 419 147 081 75 474 28 904 21 571 18 996 15 898 14 366 865 196
0.030 0.009 2017 511 637 422 250 314 013 191 218 207 404 339 930 447 113 321 010 246 414 227 842 219 125 135 999 69 282 26 430 19 681 17 309 14 474 800 057
0.034 0.009 2018 445 345 486 788 401 742 298 762 181 930 197 328 323 368 425 186 304 892 233 038 213 330 203 062 125 375 63 710 24 265 18 049 15 862 745 774
0.036 0.008 2019 423 351 423 715 463 145 382 230 283 234 172 174 186 284 304 316 398 643 284 684 216 679 197 549 187 329 115 274 58 418 22 205 16 495 694 660
Table 6.20b. S. mentella in subareas 1 and 2. Fisheries selectivity at age for the demersal fleet by age (Sa). Numbers are estimated from the statistical catch-at-age model.
Year \age 2 3 4 5 6 7 8 9 10 11 12 13 14 15 16 17 18 19
1992 0.000 0.000 0.000 0.276 0.318 0.363 0.410 0.460 0.510 0.559 0.608 0.655 0.698 0.739 0.776 0.809 0.838 1.000
1993 0.000 0.000 0.000 0.006 0.016 0.044 0.116 0.270 0.510 0.746 0.892 0.959 0.985 0.995 0.998 0.999 1.000 1.000
1994 0.000 0.000 0.000 0.027 0.061 0.134 0.268 0.464 0.672 0.829 0.920 0.965 0.985 0.994 0.997 0.999 1.000 1.000
1995 0.000 0.000 0.000 0.034 0.075 0.155 0.295 0.488 0.684 0.831 0.918 0.962 0.983 0.992 0.997 0.999 0.999 1.000
1996 0.000 0.000 0.000 0.018 0.050 0.135 0.315 0.575 0.799 0.922 0.972 0.990 0.997 0.999 1.000 1.000 1.000 1.000
1997 0.000 0.000 0.000 0.015 0.043 0.118 0.284 0.540 0.777 0.911 0.968 0.989 0.996 0.999 1.000 1.000 1.000 1.000
1998 0.000 0.000 0.000 0.005 0.023 0.103 0.361 0.736 0.932 0.985 0.997 0.999 1.000 1.000 1.000 1.000 1.000 1.000
1999 0.000 0.000 0.000 0.001 0.006 0.030 0.138 0.456 0.815 0.959 0.992 0.998 1.000 1.000 1.000 1.000 1.000 1.000
2000 0.000 0.000 0.000 0.000 0.001 0.013 0.130 0.631 0.951 0.996 1.000 1.000 1.000 1.000 1.000 1.000 1.000 1.000
2001 0.000 0.000 0.000 0.027 0.062 0.133 0.264 0.457 0.663 0.821 0.915 0.962 0.983 0.993 0.997 0.999 0.999 1.000
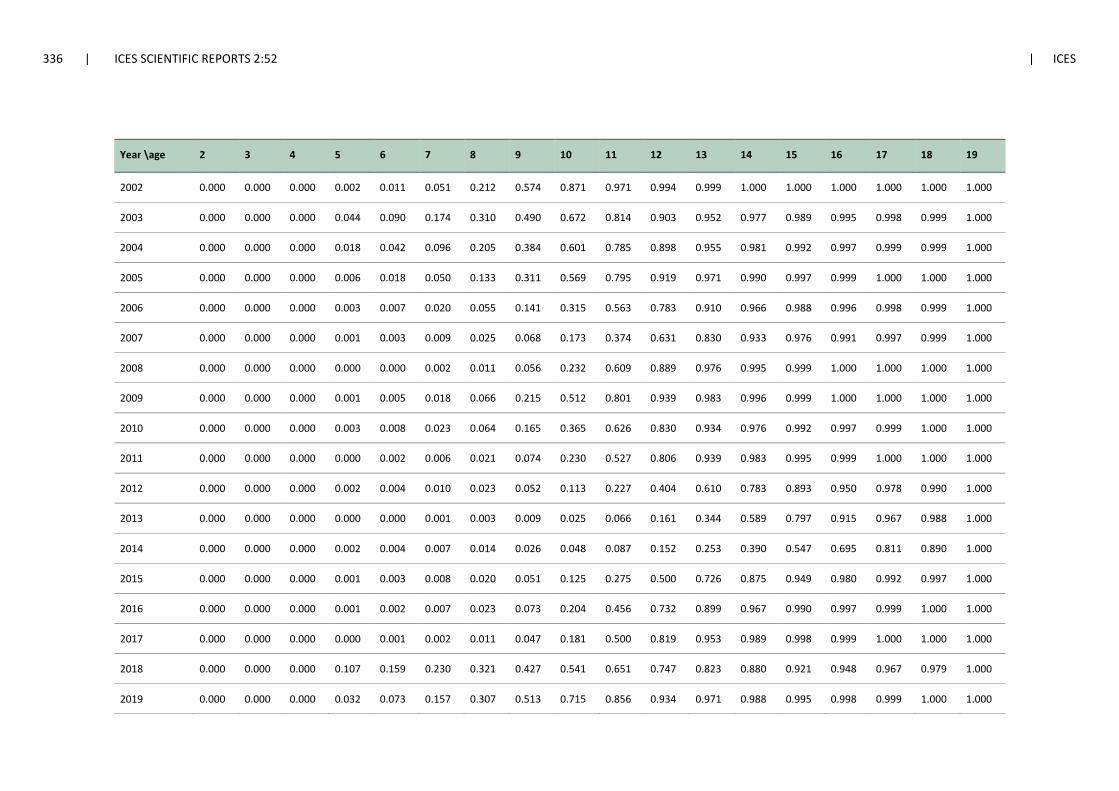
336 | ICES SCIENTIFIC REPORTS 2:52 | ICES
Year \age 2 3 4 5 6 7 8 9 10 11 12 13 14 15 16 17 18 19
2002 0.000 0.000 0.000 0.002 0.011 0.051 0.212 0.574 0.871 0.971 0.994 0.999 1.000 1.000 1.000 1.000 1.000 1.000
2003 0.000 0.000 0.000 0.044 0.090 0.174 0.310 0.490 0.672 0.814 0.903 0.952 0.977 0.989 0.995 0.998 0.999 1.000
2004 0.000 0.000 0.000 0.018 0.042 0.096 0.205 0.384 0.601 0.785 0.898 0.955 0.981 0.992 0.997 0.999 0.999 1.000
2005 0.000 0.000 0.000 0.006 0.018 0.050 0.133 0.311 0.569 0.795 0.919 0.971 0.990 0.997 0.999 1.000 1.000 1.000
2006 0.000 0.000 0.000 0.003 0.007 0.020 0.055 0.141 0.315 0.563 0.783 0.910 0.966 0.988 0.996 0.998 0.999 1.000
2007 0.000 0.000 0.000 0.001 0.003 0.009 0.025 0.068 0.173 0.374 0.631 0.830 0.933 0.976 0.991 0.997 0.999 1.000
2008 0.000 0.000 0.000 0.000 0.000 0.002 0.011 0.056 0.232 0.609 0.889 0.976 0.995 0.999 1.000 1.000 1.000 1.000
2009 0.000 0.000 0.000 0.001 0.005 0.018 0.066 0.215 0.512 0.801 0.939 0.983 0.996 0.999 1.000 1.000 1.000 1.000
2010 0.000 0.000 0.000 0.003 0.008 0.023 0.064 0.165 0.365 0.626 0.830 0.934 0.976 0.992 0.997 0.999 1.000 1.000
2011 0.000 0.000 0.000 0.000 0.002 0.006 0.021 0.074 0.230 0.527 0.806 0.939 0.983 0.995 0.999 1.000 1.000 1.000
2012 0.000 0.000 0.000 0.002 0.004 0.010 0.023 0.052 0.113 0.227 0.404 0.610 0.783 0.893 0.950 0.978 0.990 1.000
2013 0.000 0.000 0.000 0.000 0.000 0.001 0.003 0.009 0.025 0.066 0.161 0.344 0.589 0.797 0.915 0.967 0.988 1.000
2014 0.000 0.000 0.000 0.002 0.004 0.007 0.014 0.026 0.048 0.087 0.152 0.253 0.390 0.547 0.695 0.811 0.890 1.000
2015 0.000 0.000 0.000 0.001 0.003 0.008 0.020 0.051 0.125 0.275 0.500 0.726 0.875 0.949 0.980 0.992 0.997 1.000
2016 0.000 0.000 0.000 0.001 0.002 0.007 0.023 0.073 0.204 0.456 0.732 0.899 0.967 0.990 0.997 0.999 1.000 1.000
2017 0.000 0.000 0.000 0.000 0.001 0.002 0.011 0.047 0.181 0.500 0.819 0.953 0.989 0.998 0.999 1.000 1.000 1.000
2018 0.000 0.000 0.000 0.107 0.159 0.230 0.321 0.427 0.541 0.651 0.747 0.823 0.880 0.921 0.948 0.967 0.979 1.000
2019 0.000 0.000 0.000 0.032 0.073 0.157 0.307 0.513 0.715 0.856 0.934 0.971 0.988 0.995 0.998 0.999 1.000 1.000

ICES | AFWG 2020 | 337
Table 6.21. Stock summary for S. mentella in subareas 1 and 2 as estimated by the statistical catch-at-age model. Stock biomass is for age 2 y+.
Year Rec (age 2) in millions
Rec (age 6) in millions
Stock Biomass (tonnes) SSB (tonnes) F (12-18) F(19+)
1992 417 143 563660 254448 0.032 0.044
1993 278 223 608531 316887 0.030 0.031
1994 195 330 664832 398183 0.027 0.027
1995 184 347 727678 457415 0.020 0.021
1996 146 342 791056 379363 0.014 0.014
1997 103 228 852457 465175 0.014 0.014
1998 53 159 908539 525004 0.019 0.019
1999 46 151 953483 590128 0.015 0.015
2000 35 120 991438 683117 0.012 0.012
2001 36 84 1022777 634228 0.021 0.021
2002 40 43 1035047 714557 0.007 0.007
2003 43 37 1049859 786173 0.003 0.003
2004 54 29 1061966 790256 0.006 0.006
2005 133 30 1067330 844035 0.008 0.008
2006 245 33 1069352 831383 0.027 0.039
2007 369 35 1048755 965725 0.016 0.023
2008 360 44 1043712 904291 0.013 0.018
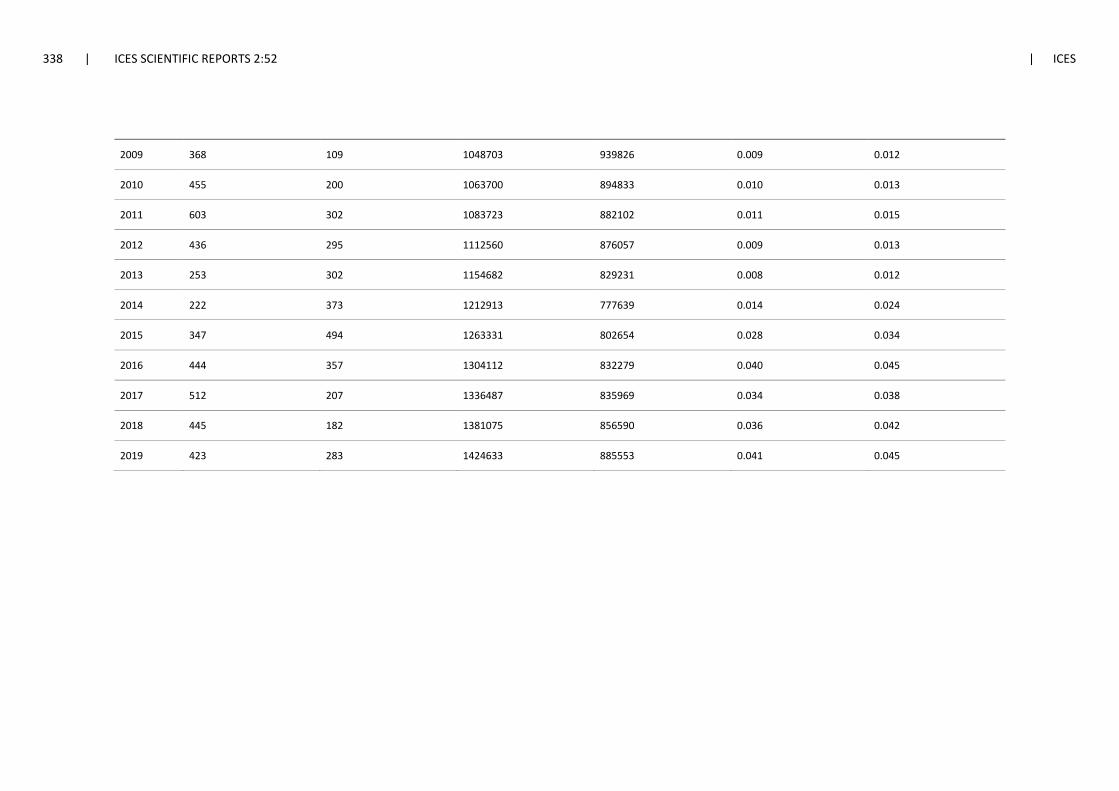
338 | ICES SCIENTIFIC REPORTS 2:52 | ICES
2009 368 109 1048703 939826 0.009 0.012
2010 455 200 1063700 894833 0.010 0.013
2011 603 302 1083723 882102 0.011 0.015
2012 436 295 1112560 876057 0.009 0.013
2013 253 302 1154682 829231 0.008 0.012
2014 222 373 1212913 777639 0.014 0.024
2015 347 494 1263331 802654 0.028 0.034
2016 444 357 1304112 832279 0.040 0.045
2017 512 207 1336487 835969 0.034 0.038
2018 445 182 1381075 856590 0.036 0.042
2019 423 283 1424633 885553 0.041 0.045

ICES | AFWG 2020 | 339
Figure 6.1. Sebastes mentella in subareas 1 and 2. Total international landings 1952–2019 (thousand tonnes).
Figure 6.2. Sebastes mentella in subareas 1 and 2. Left panel: Catch in tonnes reported by national fleets for the Sub-area 27.1 and 27.2 and in the NEACF regulatory area. Right panel: Geographical location of the directed Norwegian fish-ing within the Norwegian Exclusive Economic Zone and bycatches by Norwegian vessels in all areas. Directed fishing with bottom trawl is not permitted to the east of the red line. Directed fishing with pelagic trawl is not permitted to the east of the blue line. Directed fishing is not permitted in the Fishery Protection Zone around Svalbard.

340 | ICES SCIENTIFIC REPORTS 2:52 | ICES
Figure 6.3. Delineation of the geographical limits for directed fishing in the Norwegian Economic Zone in 2014–2018. Directed pelagic trawling is only allowed west of the blue line. Directed demersal trawling is only allowed between the blue and the red line. The area east of the stippled line inside NEZ south of Bear Island is only open for directed demer-sal trawling after 10 May. The other areas for directed fishing are also open during 1 January-last February. Due to high bycatch ratios of golden redfish 72°N was suggested as southern limit for directed demersal fishing marked by the red line along that latitude to the Norwegian directorate of fisheries in November 2018.

ICES | AFWG 2020 | 341
w1
Figure 6.4. Upper panel: Sebastes mentella in Subarea 2. Length-distributions of the commercial pelagic catches by Spain and Lithuania in 2019. Lower panel: Sebastes mentella in subareas 1 and 2. Length-distributions of the commer-cial demersal catches by Norway, Russia and Poland in 2019.

342 | ICES SCIENTIFIC REPORTS 2:52 | ICES
Figure 6.5. Sebastes mentella in subareas 1 and 2. Upper panels: Catch numbers-at-age for the pelagic and demersal fleets 1992–2019. Lower panel: Age composition of the commercial demersal catches by Russia in 2019 (calculated us-ing ALK).

ICES | AFWG 2020 | 343
Figure 6.6. Weight-at-age of S. mentella per year class in subareas 1 and 2 derived from Norwegian commercial and survey data (Table 6.7). The weights were derived from samples with at least five individuals and are expressed in grams. The blue and purple lines show the fitted mixed-effect models.

344 | ICES SCIENTIFIC REPORTS 2:52 | ICES
Figure 6.7. S. mentella in subareas 1 and 2. Weight-at-age 19+ as reported from catches (blue) or modelled from catches and survey observations (red) using a mixed effect model (Figure 6.5). The weights-at-age used in the assess-ment were based on the fixed effects model and are therefore the same for every year. These weights were updated in 2020 and differ only slight from those estimated in 2018 and 2019.
Figure 6.8. Proportion maturity-at-age of S. mentella in subareas 1 and 2 derived from Norwegian commercial and sur-vey data (Table D7). The proportions were derived from samples with at least five individuals. The blue and purple lines show the fitted mixed-effect models. For 2008,2011 and 2016-2019 the common model (fixed effects blue) was used for other years the annual models (random effects purple) were used. Available data for 2019 was insufficient at the time of the meeting and the fixed effect model was used.

ICES | AFWG 2020 | 345
Figure 6.9. Density distribution of natural mortality rates calculated with 30 of the 39 compared methods. The excluded methods are those based on certain taxa or areas. The broken red line indicates the currently used value; the broken green line the most frequent one and the black dotted lines indicate the beginning and end of the distribution’s peak.
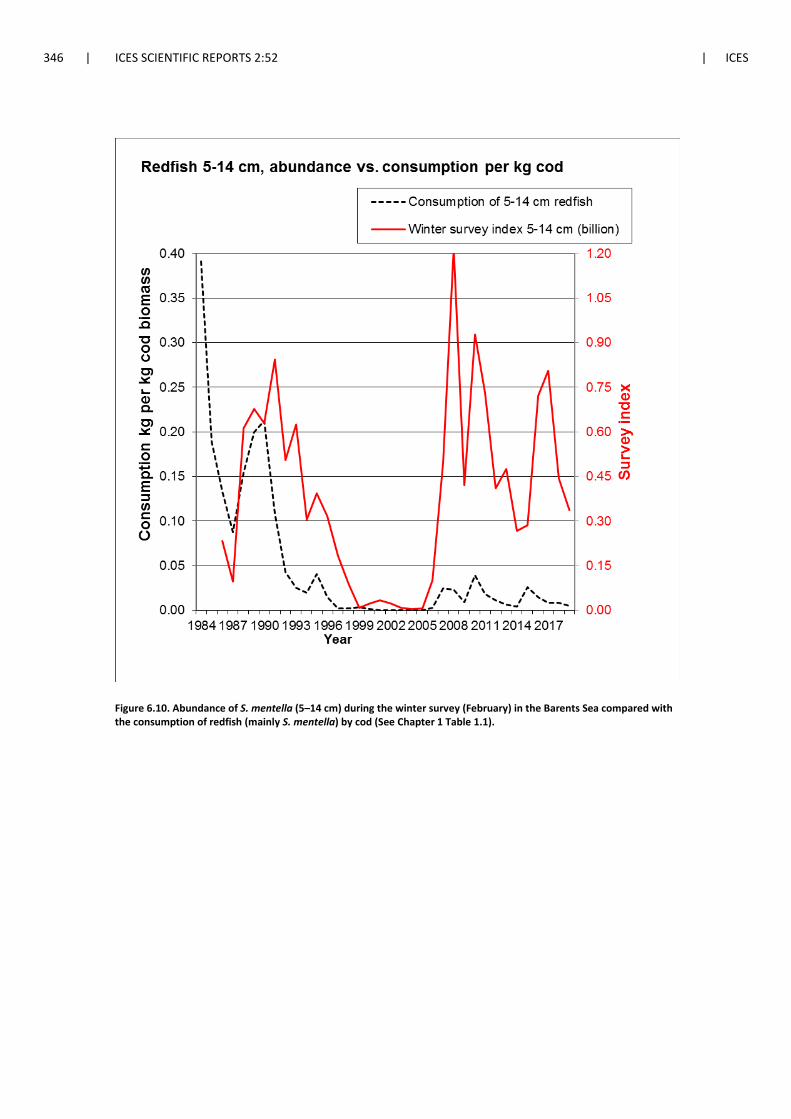
346 | ICES SCIENTIFIC REPORTS 2:52 | ICES
Figure 6.10. Abundance of S. mentella (5–14 cm) during the winter survey (February) in the Barents Sea compared with the consumption of redfish (mainly S. mentella) by cod (See Chapter 1 Table 1.1).

ICES | AFWG 2020 | 347
Figure 6.11. Sebastes mentella in subareas 1 and 2. Age disaggregated abundance indices for bottom-trawl surveys 1992–2018 in the Barents Sea in winter (winter survey top) in summer (Ecosystem survey middle) and in autumn (Rus-sian groundfish survey bottom).
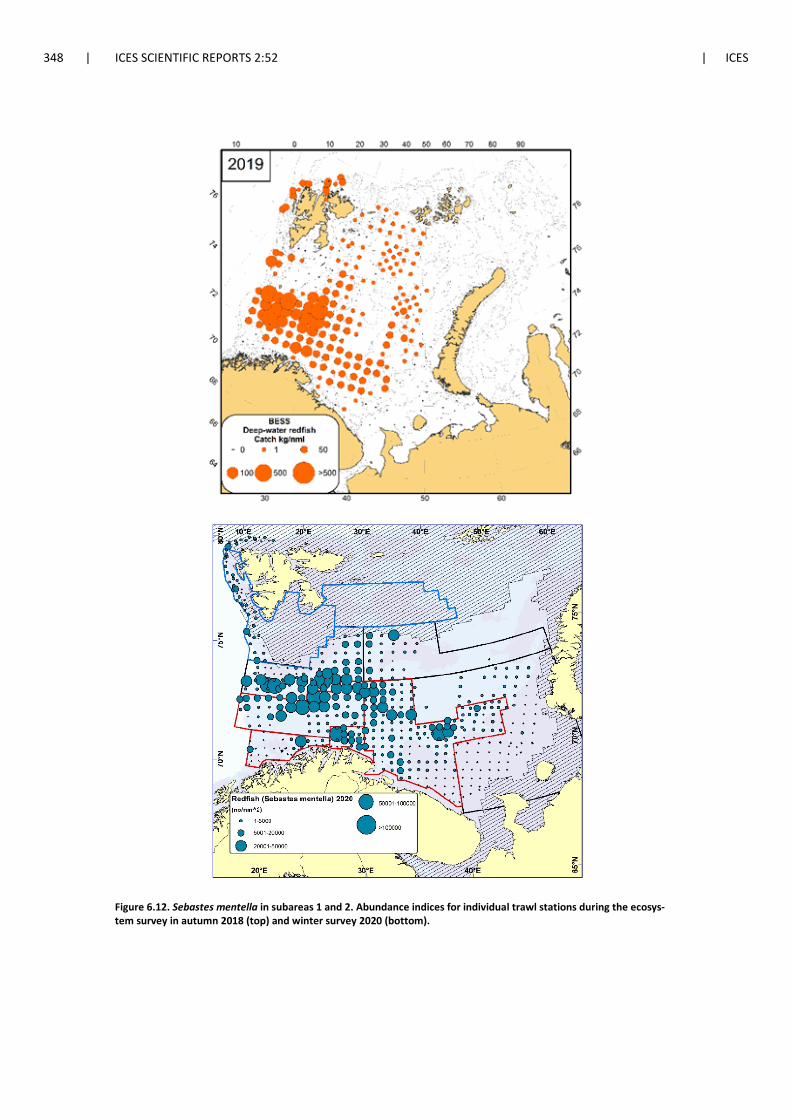
348 | ICES SCIENTIFIC REPORTS 2:52 | ICES
Figure 6.12. Sebastes mentella in subareas 1 and 2. Abundance indices for individual trawl stations during the ecosys-tem survey in autumn 2018 (top) and winter survey 2020 (bottom).

ICES | AFWG 2020 | 349
Figure 6.13. Sebastes mentella in subareas 1 and 2. Left panel: Survey track of the Deep Pelagic Ecosystem Survey in 2019 and categorized trawls. Only trawls in the category “Standard” served as input for the survey index. Right panel: Catch rates in tonnes per square nautical mile for the surveyed depth layers (<=300 m, 301-600 m and >600 m).
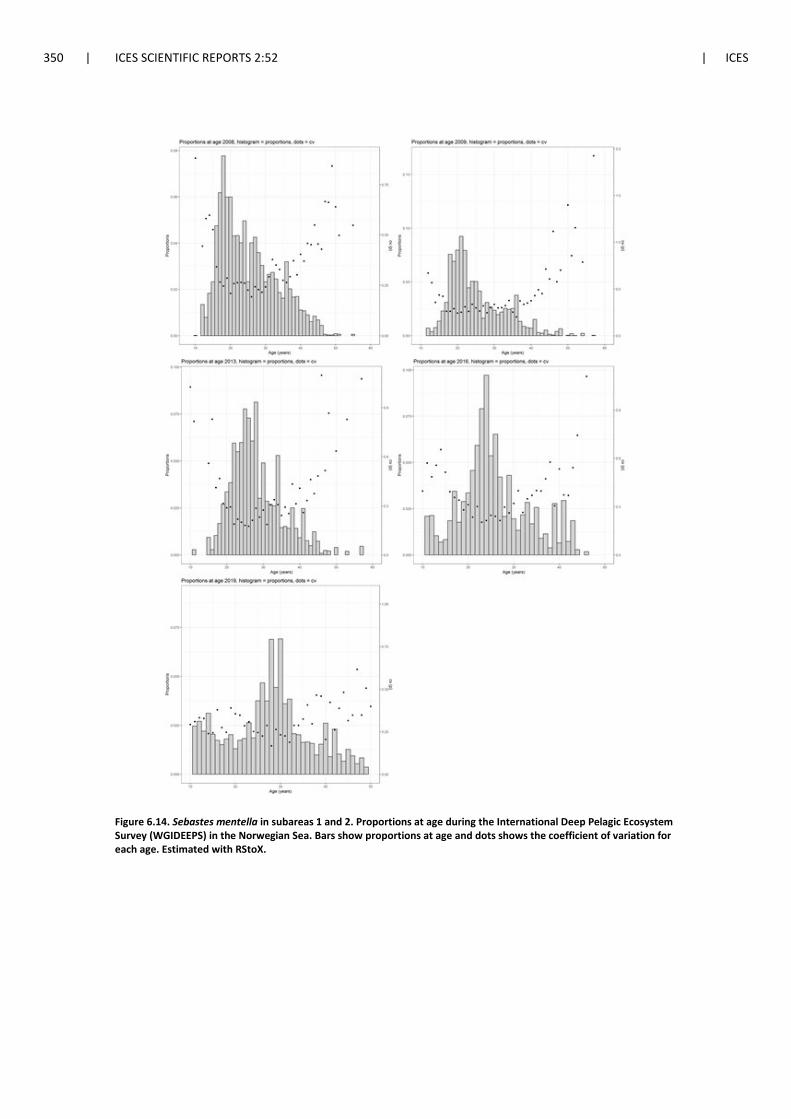
350 | ICES SCIENTIFIC REPORTS 2:52 | ICES
Figure 6.14. Sebastes mentella in subareas 1 and 2. Proportions at age during the International Deep Pelagic Ecosystem Survey (WGIDEEPS) in the Norwegian Sea. Bars show proportions at age and dots shows the coefficient of variation for each age. Estimated with RStoX.

ICES | AFWG 2020 | 351
Figure 6.15. Map showing the specific pelagic 0-group trawl stations and the abundance of 0-group Sebastes mentella during the joint Norwegian-Russian Ecosystem survey in the Barents Sea and Svalbard in 2018 (upper panel) and 2019 (lower panel).

352 | ICES SCIENTIFIC REPORTS 2:52 | ICES
Figure 6.16. Sebastes mentella in subareas 1 and 2. Abundance indices (in billions) with 95% confidence limits of 0-group redfish (believed to be mostly S. mentella) in the international 0-group survey in the Barents Sea and Svalbard areas in August-September 1980–2019. Since 2018 the method of estimation has changed and does not provide confi-dence limits.

ICES | AFWG 2020 | 353
Figure 6.17. Sebastes mentella in subareas 1 and 2. Horizontal distribution of S. mentella hydroacoustic backscattering (sA) during the Norwegian slope survey in spring 2018. The circles are proportional to the sA assigned to redfish along the vessel track. The survey in spring 2020 was too close in time to provide an update for AFWG 2020.

354 | ICES SCIENTIFIC REPORTS 2:52 | ICES
Recruitment-at-age 2 Spawning-stock biomass
Fishing mortality – year component
Figure 6.18. Sebastes mentella in subareas 1 and 2. Results from the statistical catch-at-age assessment run showing the estimated recruitment-at-age 2 spawning-stock biomass from 1992 to 2019 and annual fishing mortality coeffi-cients by year (Fy) from the demersal (blue) and pelagic (red) fleets. Error bars (top) and the colored envelope (bottom) indicate 95% confidence limits.

ICES | AFWG 2020 | 355
Fleet selectivity – age component
Figure 6.19. Sebastes mentella in subareas 1 and 2. Results from the statistical catch-at-age assessment run showing the estimated annual fleet selectivity by age (Fa) from the pelagic (top panel) and demersal (lower panels) fleets. Col-ored envelopes indicate 95% confidence limits.

356 | ICES SCIENTIFIC REPORTS 2:52 | ICES
Figure 6.20. Sebastes mentella in subareas 1 and 2. Results from the statistical catch-at-age assessment run showing the selectivity-at-age for winter (blue) ecosystem (grey) and Russian groundfish (red) surveys.
Figure 6.21. Sebastes mentella in subareas 1 and 2. Results from the statistical catch-at-age model showing the evolu-tion of total biomass (in tonnes light blue left axis) spawning-stock-biomass (in tonnes dark blue left axis) and recruit-ment-at-age 2 (in numbers yellow right axis) for the period 1992–2019 for S. mentella in subareas 1 and 2.

ICES | AFWG 2020 | 357
Figure 6.22. Sebastes mentella in subareas 1 and 2. Modelled distribution of numbers (yellow bars right y-axis) biomass (light blue left y-axis) and spawning-stock-biomass (dark blue left y-axis) at age 2-45+ in 2019.

358 | ICES SCIENTIFIC REPORTS 2:52 | ICES
Figure 6.23a. Diagnostic plots for the demersal fleet catch-at-age data. Top-left: scatterplot of observed vs. fitted indi-ces the dotted red line indicates 1:1 relationship. Top right: boxplot of residuals (observed-fitted) for each age. Bottom left: boxplot of residuals for each year. Bottom right: bubble plot of residuals for each age/year combination bubble size is proportional to mean residuals blue are positive and red are negative residuals.

ICES | AFWG 2020 | 359
Figure 6.23b. Diagnostic plots for the pelagic fleet catch-at-age data. See legend from Figure 6.23a.

360 | ICES SCIENTIFIC REPORTS 2:52 | ICES
Figure 6.23c. Diagnostic plots for the Winter survey data. See legend from Figure 6.23a.

ICES | AFWG 2020 | 361
Figure 6.23d. Diagnostic plots for Ecosystem survey data. See legend from Figure 6.23a.

362 | ICES SCIENTIFIC REPORTS 2:52 | ICES
Figure 6.23e. Diagnostic plots for the Russian groundfish survey data. See legend from Figure 6.23a.

ICES | AFWG 2020 | 363
Figure 6.24. The upper panel shows the retrospective patterns of the spawning-stock biomass of S. mentella estimated by the SCAA model for runs up to years 2007–2017 and the baseline model of the 2018 benchmark. The lower panel presents the baseline the baseline model with fixed weights-at-age and the assessment models for 2019 and 2020. Con-fidence Intervals are shown for the latest assessment.

364 | ICES SCIENTIFIC REPORTS 2:52 | ICES
7 Golden redfish (Sebastes norvegicus) in subareas 1 and 2
Following the recommendation from the benchmark assessment for redfish stocks in January 2018 (WKREDFISH, ICES 2018a) the GADGET model was used in the configuration approved during the benchmark, for the period 1990-2019. Following a further recommendation of the benchmark, the advice cycle for golden redfish in subareas 1 and 2 was changed to a two-year cycle to be provided in 2020. The present report therefore updates the assessment and provides advice for the next two years.
7.1 Status of the Fisheries
7.1.1 Recent regulations of the fishery
A description of the historical development of the fishery and regulations is found in the Stock Annex for this stock. The Stock Annex was last updated in February 2018.
Prior to 1 January 2003 there were no regulations particularly for the S. norvegicus fishery, and the regulations aimed at S. mentella had only marginal effects on the S. norvegicus stock. After this date, all directed trawl fishery for redfish (both S. norvegicus and S. mentella) outside the permanently closed areas were forbidden in the Norwegian Economic Zone north of 62°N and in the Svalbard area. When fishing for other species it was legal to have up to 15% redfish (both species together) in round weight as bycatch per haul and on board at any time. Until 14 April 2004 there were no regulations of the other gears/fleets fishing for S. norvegicus. After this date, a minimum legal catch size of 32 cm has been set for all fisheries, with the allowance to have up to 10% undersized (i.e. less than 32 cm) specimens of S. norvegicus (in numbers) per haul. In ad-dition, a time-limited moratorium (up to 8 months) was enforced in the conventional fisheries (gillnet, longline, handline, Danish seine) except for handline vessels less than 11 metres. From 2016, when trawling outside 12 nm, vessels can have up to 20% by weight of redfish in each catch and upon landing. When trawling inside 12 nm, it is permitted to have up to 10% bycatch. Since 2015 it has been prohibited to fish for redfish with conventional gears north of 62°N. The ban does not, however, apply to vessels less than 15 metres fishing with handline during 1 June - 31 August. When fishing with conventional gears for other species, it is permitted to have up to 10% by weight of redfish. Vessels less than 21 metres can still have up to 30% by weight of redfish in the period 1 August to 31 December. Bycatch of redfish is calculated in live weight per week.
7.1.2 Landings prior to 2020 (Tables 7.1–7.4 and Figures 7.1-7.2)
Nominal catches of S. norvegicus for the years 1998-2019 by country for subareas 1 and 2 com-bined, and for each subarea and division are presented in tables 7.1—7.4. The total landings for both S. norvegicus and S. mentella are presented in section 6 (Tables 6.6 and 6.7). The sources of information used are catches reported to ICES, NEAFC, Norwegian authorities (foreign vessels fishing in the Norwegian economic zone) or direct reporting to the AFWG. Where catches are reported as Sebastes sp., they are split into S. norvegicus and S. mentella by AFWG experts based on available information and prior knowledge. Landings of S. norvegicus showed a decrease from a level of 23 000–30 000 t in 1984–1990 to a stable level of about 16 000–19 000 t in the years 1991–1999. Then the landings decreased further, and the total landings figures for S. norvegicus in 2003–2013 were low but remarkably stable, between 5500–8000 t. In 2014 the landings decreased to

ICES | AFWG 2020 | 365
4436 t, followed by a further decrease in 2015 with landings of 3629 t, mainly due to stronger regulations. This has since reversed with 6656 tonnes in 2018 and 8284 tonnes in 2019 (provi-sional), the latter increase likely due to the increased quota for beaked redfish and therefore in-creased bycatch of golden redfish. The time-series of S. norvegicus landings is given in Figure 7.1. A map of Sebastes norvegicus catches from Norwegian vessels’ logbooks in 2019 is shown in Fig-ure 7.2. Note that species identification from landings and logbooks is not always trusted when the Norwegian final landings data are prepared (see Stock Annex).
The Norwegian landings are presented by gear and month/year in figures 7.3a,b. Reported land-ings continued to decrease in 2015 and were then at the lowest level since World War II. Since 2015 only bycatches of S. norvegicus are allowed except for a limited amount caught by vessels less than 15 metres fishing with handline during 1 June to 31 August.
The reported Russian catches of S. norvegicus have been around 600–900 t since 2001, but in-creased to 1834 tonnes and 1929 tonnes in 2018 and 2019, respectively. Twelve other countries together usually report catches in the 300-600 t range or less (Table 7.1).
The bycatch of redfish (Sebastes spp.) in the Norwegian Barents Sea shrimp fisheries during 1983–2017 were dominated by S. mentella, and hence influenced the S. norvegicus to a much lesser ex-tent. However, these bycatches probably inflicted an extra mortality on S. norvegicus in the coastal areas before the sorting grid was enforced in 1990. From 1 January 2006, the maximum legal bycatch of redfish juveniles in the international shrimp fisheries in the northeast Arctic has been reduced from ten to three redfish per 10 kg shrimp.
Information describing the splitting of the redfish landings by species and area is given in the Stock Annex.
7.1.3 Expected landings in 2020
New regulations were designed and implemented in the Norwegian coastal fisheries with con-ventional gears in 2016. No directed fishery is allowed, but the bycatch-regulations are currently rather liberal with vessels less than 21 metres being allowed to have up to 30% by weight of redfish in the period 1. August – 31. December and calculated in live weight per week. An ob-served increase of S. norvegicus in the trawl catches in 2016-2018 continued in 2019 indicating a peak at age 16, corresponding to the 2003 recruitment. As expected total landings in 2019 in-creased due to the raised quota for S.mentella, and thus an increase in bycatch of S. norvegicus. This trend is expected to continue in 2020.
7.2 Data Used in the Assessment (Table 0.1 and Figure E1)
An overview of the sampling levels (by season, area and gear) of the data used in the assessment is presented in Figure E1 for 2013. Although Table 0.1 (see Section 0) shows a reasonably good total sampling level for this stock, the number of different boats sampled, and the gear and area coverage should be improved.
7.2.1 Catch-at-length and age (Table 7.5 and Figure 7.4)
Age composition data for 2017 and 2018 were only provided by Norway, accounting for >60% of the total landings. Norwegian data for 2017 was updated with revised data and 2018 was added new. Weight-at-age in the catches was not available for 2018 and 2019. Other countries were assumed to have the same relative age distribution and mean weight as Norway. The updated catch numbers-at-age matrix is shown in Table 7.5. Catch at length data were also only available

366 | ICES SCIENTIFIC REPORTS 2:52 | ICES
from Norway, revised for 2017 (Figure 7.4), new for 2018 and preliminary for 2019. For these two years catch-at-length was only available split by gear but not by gear and ICES subareas.
7.2.2 Catch weight-at-Age (Table 7.6)
Weight-at-age data for ages 7–24+ were not available from the Norwegian landings in 2018 and 2019 during the working group (Table 7.6). Variations in the weight-at-age of young individuals (<10 years) must be considered with caution as these numbers are derived from only a small number of aged individuals.
7.2.3 Maturity-at-age (Table E4, Figure 7.5a-b)
A maturity ogive has previously not been available for S. norvegicus, and knife-edge maturity-at-age 15 (age 15 as 100% mature) had hence been assumed. Maturity-at-age and length is available from Norwegian surveys and landings up to 2019, as reported in Table E4 and presented in Fig-ure 7.5a. Only the data up to 2016 was considered in the model, due to insufficient age readings in the later years. The maturity ogive modelled by Gadget is presented (Figure 7.5b). This anal-ysis shows that 50% of the fish at age 12 are mature.
7.2.4 Survey results (Tables E1a,b-E2a,b-E3, Figures 7.6a,b–7.8)
The results from the following research vessel survey series were evaluated by the Working Group:
Winter Norwegian Barents Sea (Division 2.a) bottom-trawl survey (BS-NoRu-Q1 (BTr)) from 1986 to 2019 (joint with Russia some of the years since 2000) in fishing depths of 100—500 m. Length compositions for the years 1986—2019 are shown in Table E1a and Figure 7.6a. Age com-positions for the years 1992—2016 and 2018 are shown in Table E1b and Figure 7.6b. This survey covers important nursery areas for the stock. As described in the stock annex, this survey is used in model tuning.
Norwegian Svalbard (Division 2.b) bottom-trawl survey (August-September) from 1985 to 2017 in fishing depths of 100—500 m (depths down to 800 m incl. in the swept-area). Since 2005 this is part of the Ecosystem survey (Eco-NoRu-Q3 (BTr)). Length compositions for the years 1985—2016 and age compositions for the years 1992—2008, 2012, 2013 and 2016 are shown in Table E2a and E2b, respectively. Data for 2017-2019 were not available in time for AFWG 2020. This survey covers the northernmost part of the species’ distribution. Insufficient number of age readings in 2009 and 2011, and no age samples collected in 2010 did not allow for updating the age compo-sition in these years as well as for the period 2014-2015 and 2019. This survey is not currently included in the model tuning.
Data on length and age from the winter and ecosystem surveys have been combined and are shown in Figures 7.7a,b.
Norwegian Coastal and Fjord survey in 1998—2019 from Finnmark to Møre (NOcoast-Aco-Q4). Length composition from catch rates (numbers/nm2 averaged for all stations within subareas and finally averaged, weighted by subarea, for the total surveyed area) are shown in Figure 7.8 and Table E3. The survey is an acoustic survey designed to obtain indices of abundance and estimates of length and weight-at-age of saithe and cod north of 62°N. The index for golden redfish was previously used in the assessment, but was considered unreliable and stopped in 2010. A new index series was recalculated for the benchmark in 2018 (WKREDFISH 2018a). The aggregated survey index varied too much year-to-year to be driven by the population dynamics, but the length distribution was included in the assessment.
ICES | AFWG 2020 | 367
Following a dedicated review, AFWG approves the use of the new SToX versions of the winter survey in the Sebastes norvegicus assessments (WD 17 in Annex 4). The group recommends that work continues to investigate redfish-specific strata systems for the survey. The coastal survey for S. norvegicus should be converted to SToX in a similar manner, with special attention to the strata system to see if a coherent index of abundance and/or biomass can be obtained for this survey (which is currently only used for annual length distributions).
The bottom-trawl surveys covering the Barents Sea and the Svalbard areas show that the abun-dance indices over the commercial size range (>25 cm) were relatively stable up to 1998 but de-clined to lower levels afterwards. Abundance of prerecruits (<25 cm) has steadily decreased since 1991 and has dropped to very low levels after 2000 (Figure 7.6a). An increase in the number of prerecruits is visible from 2008 onwards. Although this could originally partly result from taxo-nomic misidentification, the confirmation of increased numbers for individuals of size 15 cm and greater gives some confidence that at least some of the increasing numbers are S. norvegicus.
7.3 Assessment with the GADGET model
7.3.1 Description of the model
Since AFWG2005, the GADGET model has been used for this stock, first with experimental runs, and then as analytical assessments following its adoption by WKRED (2012) benchmark (ICES CM 2012/ACOM:48). The model was then approved again at WKREDFISH (2018a), where it was also recommended to switch to a two-year advice cycle. A number of changes have been made to the model at the benchmark WKREDFISH (2018a); the model is moved to a one-year time-step; the fleet structure has been revised to better reflect recent fishing patterns; age–length data are used for tuning in 5 cm (rather than the previous 1 cm) bins to reduce the extensive noise in this series; proportions (but not absolute abundance) by length in the coastal survey is used for tuning; the model weights have been re-calculated; a number of minor errors in the model and data were fixed. Full details are in the WKREDFISH benchmark report (ICES 2018a).
The GADGET model used for the assessment of S. norvegicus in subareas 1 and 2 is closely related to the GADGET model that currently is used by the ICES Northwestern WG on S. norvegicus (Björnsson and Sigurdsson, 2003). The functioning of a Gadget model, including parameter esti-mation and data used for tuning, is described in Bogstad et al. (2004) and in the stock annex for S. norvegicus. In brief, the model is a single species forward simulation age–length structured model, split into mature and immature components. There are three commercial fleets (a gillnet, a trawl and a combined longline and handline fleet). Prior to 2009 the trawl and longline fleets are combined into one, due to difficulties in obtaining data on a finer resolution. The gillfleet has different selectivity from 2009 compared to 2008 and earlier. There are two surveys used in the model, the winter survey and coastal survey. The winter survey tunes to total survey index, the coastal survey to length distributions only. Growth and fishing selectivity within each fleet and survey are assumed constant over time (except for the gilfleet), and recruitment is estimated on annual basis (no SSB-recruit relationship).
The weighting scheme for combining the different datasets into a single likelihood score is a method where weights are selected so that the catch and survey data have approximately equal contribution to the overall likelihood score in the optimized model, and that each dataset within each group gives approximately equal contributions to each other. This ensures that both noise and bias (actually divergence from the consensus) are taken account of in the weighting of da-tasets. The parameters in the model are estimated using a combination of Simulated Annealing (wide area search) and Hooke and Jeeves (local search) repeated in sequence until a converged solution is found.

368 | ICES SCIENTIFIC REPORTS 2:52 | ICES
7.3.2 Data used for tuning
• Annual catch in tonnes from the commercial fishing fleets, i.e. Norwegian gillnet, and trawl fleet, longline since 2009 and “combined trawl and longline” prior to 2009.
• Annual length distribution of total international commercial landings from the com-mercial fishing fleets to 2019. Due to late data submissions, there is one-year time-lag in the inclusion of length distributions from other countries than Norway.
• Annual age–length data (1 year by 5 cm resolution) from the same fishing fleets, up to 2018
• Length disaggregated frequencies from the Barents Sea (Division 2.a) bottom-trawl sur-vey (February) from 1990—2019 (Table E1a)
• Age–length data and aggregated survey indices from the same survey up to 2018, ex-cluding 2017 (Table E1b)
• Length disaggregated frequencies from the Barents Sea (Division 2.a) coastal survey (February) from 1998—2019 (Table E3, Figure 7.8)
7.3.3 Assessment results using the Gadget model (Figures 7.9-7.13)
The general patterns in the stock dynamics of S. norvegicus are similar to those modelled for the past several years, but the recruitment event in 2003 is now beginning to have a noticeable posi-tive effect on the overall stock. The overall stock numbers and biomass have shown a decline over a number of years, but the recent recruitment means that immature numbers and biomass are now starting to improve. Some of the 2003 year class are now starting to mature, and the mature stock numbers are therefore stabilizing. The mature biomass is not responding yet, since the maturing fish are still relatively small.
As in previous years we note that there has been a tendency for some recruitment signal to be reduced in subsequent years, possibly due to misidentification of small S. mentella (which is a larger stock and has had good recent recruitment) as S. norvegicus, and the model has repeatedly revised down the estimates of this recruitment, although not to zero. The largest fish from the 2003 year class are now entering the mature stock and the fishery, and this is providing multiple sources of information that this was a genuinely good recruitment. The WG stresses that the subsequent recruitment signals (for example the high estimated 2009 year class) should be treated with extreme caution until they enter the fishery (c. 12–15 years after recruiting).
The most important conclusions to be drawn from the current assessment using the Gadget model are:
• The recruitment to the stock has been very poor for a long period, and especially prior to 2005 (Figure 7.10)
• There has been somewhat better estimated recruitment in recent years, with a reasona-bly good recruitment in 2003 (Figure 7.13). Indications of a second pulse of good re-cruitment in 2009 have strengthened in the current assessment, but are still highly un-certain, and will need to be tracked for some years to come, to reduce this uncertainty.
• The estimated fishing mortality (F15+) declined between 1990 and 2005 but remained rel-atively stable until around 2015, (Figure 7.11, Table 7.7). The current mortality is esti-mated to F = 0.46 (Figure 7.11), well above a sustainable level for a redfish species, and above the FMSY = 0.05 estimated at WKREDFISH (ICES 2018a). Note that the F estimate is based on the 2003 year class being a good one, and the estimate would be higher if this is not the case.

ICES | AFWG 2020 | 369
According to the model the total-stock biomass (3+) of S. norvegicus has decreased from about 119 000 tonnes in the early 1990s to just under 40 000 tonnes in 2019 (Figure 7.12, Table 7.8). Due to the improved recruitment from the 2003 year class the total biomass is beginning to stabilize, although the SSB is continuing to decline. This reduction is primarily the result of prolonged low recruitment, combined with excessively high fishing pressure.
The average assessment bias (Mohn’s Rho) over the last 5 assessments was 1% for recruit.ment, 56% for F(15+) and -29% for SSB. The retrospective plots (Figure 7.13) exhibit a sharp rise in the estimate of mature biomass compared to earlier assessments and a corresponding decline in F(15+), the reason for which is unclear. Whether these changes persist or are eliminated by up-dated input data in future assessments will have to be monitored.
7.3.4 State of the stock
Survey observations and the Gadget assessment update confirm previous diagnostics that this stock is currently in a very poor situation. This is confirmed by the production model run as a check at WKRED (ICES 2012), which produced similar trends. Indications are that the SSB is continuing to fall. This has led to an upwards trend in F to a level which may place an increasing burden on an already poorly performing stock. Furthermore, in the absence of a substantial pop-ulation of fish in the 10—18 age range, the fishery has become increasingly concentrated on the oldest (18 years and older) individuals, reducing the reproductive capacity of the stock.
There are indications that new recruits from the 2003 year class may have entered the population in recent years as noted in previous AFWG reports. The estimated immature biomass is now beginning to increase, but SSB still declines. However, the total level of this recruitment is still uncertain, and although the 2003 year class is estimated to have been the best since the late 1990s, it is not the largest year class seen in the time-series. Consequently, any rebuilding from this year class is likely to be slow. Rebuilding of this stock is therefore dependent on protecting both the existing SSB and any fish recruiting to it. Note that there are significant uncertainties from misi-dentification between the redfish species in the Barents Sea, and thus the exact values of both stock and F are uncertain, although the trends are clearly defined.
Sebastes norvegicus is currently on the Norwegian Redlist as a threatened (EN) species according to the criteria given by the International Union for Conservation of Nature (IUCN).
Red-listing is understood to mean that a species (or stock) is at risk of extinction. ICES convened two workshops in 2009. The first Workshop WKPOOR1 (ICES CM 2009/ACOM:29) addressed methods for evaluating extinction risk and outlined approaches that could support advice on how to avoid potential extinction. The second Workshop WKPOOR2 (ICES CM 2009/ACOM:49) applied the results of the first workshop to four stocks selected as being of interest to Norway and ICES.
There are three general methods for evaluating extinction risk: (1) screening methods, such as the IUCN redlisting criteria; (2) simple population viability analysis (PVA) based on time-trends; and (3) age structured population viability analysis. None of the methods are considered reliable for accurately estimating the absolute probability of extinction, but they may be useful to evalu-ate the relative probability of extinction between species or between management options.
The fishery is largely concentrated on the mature individuals. With a currently estimated SSB of around 24 000 tonnes, and a FMSY of 0.05, one would expect a sustainable catch to be in the order of 1000 to 1500 tonnes. The current catches are well above this level.

370 | ICES SCIENTIFIC REPORTS 2:52 | ICES
7.3.5 Biological reference points
Reference point calculations were conducted at WKREDFISH benchmark (2018a), based on a BLOSS with reasonable recruitment, and a forecast with constant recruitment to produce a FMSY candidate. Note that the benchmark used preliminary data, and that the results presented here are slightly changed from those at WKREDFISH (2018). We therefore follow the methodology presented at WKREDFISH (2018a), but adjust the Blim based on the revised SSB estimate for 2002. This has the effect of raising the proposed Blim from 44 000 tonnes to 49 000 tonnes. The FMSY cal-culations are unaffected, as these are based on steady state forecasts.
No stock recruitment relationship is presented for this stock. Within the model, recruitment is modelled as an annual recruitment value with no relationship with the SSB.
• Blim: Blim is based on the Lowest Observed Stock Size at which reasonable recruitment was observed. This is assumed to be the 2003 year class, at which time the SSB is esti-mated to be 49 000 tonnes (or 44 000 tonnes using the benchmark values)
• Bpa: Using the ICES default multiplier of 1.4 for Bpa gives a Bpa value of 68 600 tonnes (61 000 tonnes using the benchmark values)
The stock is currently well below the biomass limit reference point, and thus FMSY is not recom-mended as the current fishing level. However, it was considered useful to try to estimate a can-didate FMSY reference point, which can be used to compare against management performance. Using yield-per-recruit analysis WKREDFISH (2018a) proposes F0.1(15+), estimated to be 0.0525, as a candidate FMSY (Figure E2).
Given the poor state of this stock, management should be based on the need to protect and re-cover the stock, not on FMSY.
7.3.6 Management advice
AFWG considers that the stock is severely depleted. There are signs that recruitment in 2003 is now beginning to stabilize and, for the immature fish, improve the stock status. However, the stock remains in a poor state, and as of now there are only weak indications that the mature stock is improving. AFWG therefore recommends that current area closures and low bycatch limits should be maintained. No directed fishery should be conducted on this stock at the moment, and the percent legal bycatch should be set as low as possible for other fisheries to continue. There will be no directed fishery for S. norvegicus in 2020. It is critical that the bycatch regulations do not allow the catch to increase, as this would impair prospects for recovery.
7.3.7 Implementing the ICES FMSY framework
As a long-lived species, S. norvegicus has many year classes contributing to the population, and consequently a relatively stable stock level from year-to-year. This makes it relatively simple to manage to some proxy of MSY (e.g. F0.1) once the biomass has reached close to BMSY, provided adequate measures can be implemented to reduce fishing pressure to an appropriate level. It should be noted that the current fishery is well above the preliminary FMSY for the stock. The main focus should therefore be on reducing total F. The current priority is to stabilize the stock and prevent further decline, and allow the recruiting 2003 year class to grow and reproduce. Only then could a recovery strategy and eventually an MSY fishery be implemented. The recent upturn in immature biomass gives some hope that such recovery may be possible, given low fishing pressure.
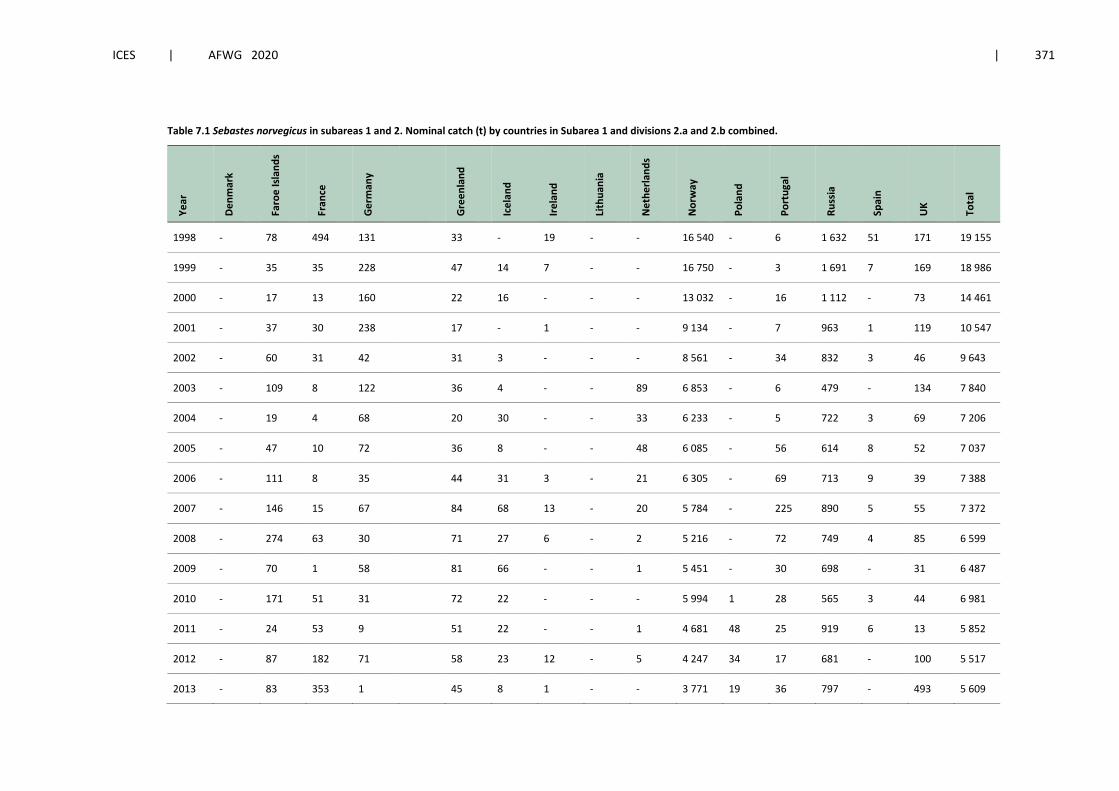
ICES | AFWG 2020 | 371
Table 7.1 Sebastes norvegicus in subareas 1 and 2. Nominal catch (t) by countries in Subarea 1 and divisions 2.a and 2.b combined.
Year
Den
mar
k
Faro
e Is
land
s
Fran
ce
Ger
man
y
Gre
enla
nd
Icel
and
Irela
nd
Lith
uani
a
Net
herla
nds
Nor
way
Pola
nd
Port
ugal
Russ
ia
Spai
n
UK
Tota
l
1998 - 78 494 131 33 - 19 - - 16 540 - 6 1 632 51 171 19 155
1999 - 35 35 228 47 14 7 - - 16 750 - 3 1 691 7 169 18 986
2000 - 17 13 160 22 16 - - - 13 032 - 16 1 112 - 73 14 461
2001 - 37 30 238 17 - 1 - - 9 134 - 7 963 1 119 10 547
2002 - 60 31 42 31 3 - - - 8 561 - 34 832 3 46 9 643
2003 - 109 8 122 36 4 - - 89 6 853 - 6 479 - 134 7 840
2004 - 19 4 68 20 30 - - 33 6 233 - 5 722 3 69 7 206
2005 - 47 10 72 36 8 - - 48 6 085 - 56 614 8 52 7 037
2006 - 111 8 35 44 31 3 - 21 6 305 - 69 713 9 39 7 388
2007 - 146 15 67 84 68 13 - 20 5 784 - 225 890 5 55 7 372
2008 - 274 63 30 71 27 6 - 2 5 216 - 72 749 4 85 6 599
2009 - 70 1 58 81 66 - - 1 5 451 - 30 698 - 31 6 487
2010 - 171 51 31 72 22 - - - 5 994 1 28 565 3 44 6 981
2011 - 24 53 9 51 22 - - 1 4 681 48 25 919 6 13 5 852
2012 - 87 182 71 58 23 12 - 5 4 247 34 17 681 - 100 5 517
2013 - 83 353 1 45 8 1 - - 3 771 19 36 797 - 493 5 609

372 | ICES SCIENTIFIC REPORTS 2:52 | ICES
Year
Den
mar
k
Faro
e Is
land
s
Fran
ce
Ger
man
y
Gre
enla
nd
Icel
and
Irela
nd
Lith
uani
a
Net
herla
nds
Nor
way
Pola
nd
Port
ugal
Russ
ia
Spai
n
UK
Tota
l
2014 - 67 219 6 20 29 - - 1 3 053 21 5 806 - 211 4 436
2015 1 76 53 24 211 35 - - - 2 488 17 - 664 2 57 3 629
2016 7 183 30 4 87 55 - - - 3 239 26 - 864 - 76 4 572
2017 - 123 17 19 61 65 - - 2 3 353 27 90 1 297 44 160 5 258
2018 1 146 37 66 77 67 - - - 4 276 36 67 1 834 12 37 6 656
20191 - 244 24 93 56 83 - 3 1 5 675 20 69 1 929 61 25 8 283
1 - Provisional figures.

ICES | AFWG 2020 | 373
Table 7.2 Sebastes norvegicus in subareas 1 and 2. Nominal catch (t) by countries in Subarea 1.
Year
Faro
e Is
land
s
Fran
ce
Ger
man
y
Gre
enla
nd
Icel
and
Irela
nd
Lith
uani
a
Nor
way
Pola
nd
Port
ugal
Russ
ia
Spai
n
UK
Tota
l
1998 78 - 5 - - - - 2 109 - - 308 - 30 2 530
1999 35 - 18 9 14 - - 2 114 - - 360 - 11 2 561
2000 - - 1 - 16 - - 1 983 - - 146 - 12 2 159
2001 4 - 11 - - - - 1 053 - - 128 - 16 1 212
2002 15 1 5 - - - - 693 - - 220 - 9 943
2003 15 - - 1 - - - 815 - - 140 - 4 975
2004 7 - - - - - - 1 237 - - 213 - 12 1 469
2005 10 1 - - - - - 1 002 - - 61 - 4 1 078
2006 46 - - - - - - 690 - - 136 - - 872
2007 15 - 12 15 - - - 1 034 - - 49 2 20 1 147
2008 45 7 2 - - - 634 - 3 49 - 15 755
2009 - - 3 2 6 - - 701 - 30 19 - 24 768
2010 58 - - - - - - 497 - - 21 1 6 583
2011 24 - - 2 1 - - 674 - - 7 - - 708
2012 17 - 3 1 9 2 - 546 - - 27 - 18 623
2013 28 2 1 - + - - 574 - - 41 - 4 651
2014 59 10 6 17 4 - - 403 2 - 27 - 17 542
2015 57 4 9 211 13 - - 514 2 - 51 2 10 871
2016 161 7 4 74 - 51 - 782 4 - 136 - 60 1 275
2017 81 5 - 8 4 - - 8 44 2 2 211 2 23 1182
2018 146 28 35 29 - - - 926 5 3 302 5 25 1 504
20191 228 11 32 22 30 - 2 1 055 4 2 422 31 11 1 822
1 - Provisional figures.
+ Less than 1 t

374 | ICES SCIENTIFIC REPORTS 2:52 | ICES
Table 7.3 Sebastes norvegicus in subareas 1 and 2. Nominal catch (t) by countries in Division 2.a. Ye
ar
Faro
e Is
land
s
Fran
ce
Ger
man
y
Gre
enla
nd
Icel
and
Irela
nd
Net
herla
nd
Nor
way
Pola
nd
Port
ugal
Russ
ia
Spai
n
UK
Tota
l
1998 - 494 116 33 19 - 14 326 - 6 1 078 51 137
16 260
1999 - 35 210 38 7 - 14 598 - 3 976 7 156
16 030
2000 17 13 159 22 - - 11 038 - 16 658 - 61 11 984
2001 33 30 227 17 1 - 8 002 - 6 612 1 103 9 031
2002 45 30 37 31 3 - - 7 761 - 18 192 2 32 8 151
2003 94 9 122 35 4 - 89 5 970 - 6 264 130 6 722
2004 12 4 68 20 30 - 33 4 872 - 5 396 3 58 5 500
2005 37 9 60 36 8 - 48 4 855 - 56 265 8 48 5 430
2006 60 8 35 44 31 3 21 4 404 - 59 293 9 39 5 006
2007 119 15 55 69 68 13 20 4 101 - 70 599 3 35 5 168
2008 229 56 28 71 27 6 2 4 456 - 68 450 4 70 5 467
2009 70 1 55 79 60 - 1 4 543 - 17 500 - 7 5 333
2010 113 51 31 72 22 - - 5 414 1 26 287 2 38 6 056
2011 - 51 9 49 20 - 1 3 942 - - 695 2 13 4 782

ICES | AFWG 2020 | 375
Year
Faro
e Is
land
s
Fran
ce
Ger
man
y
Gre
enla
nd
Icel
and
Irela
nd
Net
herla
nd
Nor
way
Pola
nd
Port
ugal
Russ
ia
Spai
n
UK
Tota
l
2012 49 182 33 57 13 2 2 3 599 - 1 427 - 33
4 398
2013 55 343 - 45 8 - - 3 076 - 9 475 - 466 Denmark - 1 4 478
2014 8 209 - 3 25 - 1 2 465 - 2 559 - 178 3 449
2015 18 49 15 - 22 - - 1 946 12 - 439 - 47 2 548
2016 22 23 - 13 4 - - 2 417 8 - 545 - 15 3 047
2017 41 12 19 36 61 - 2 2 455 22 88 680 38 137 3 591
2018 - 9 17 43 67 - - 3 275 12 64 489 7 12 - 3 995
20191 15 14 61 34 53 - 1 4 498 16 68 794 57 13 Lithuania - 1 5 625
1 - Provisional figures.

376 | ICES SCIENTIFIC REPORTS 2:52 | ICES
Table 7.4 Sebastes norvegicus in subareas 1 and 2. Nominal catch (t) by countries in Division 2.b.
Year
Den
mar
k
Faro
e Is
land
s
Fran
ce
Ger
man
y
Gre
enla
nd
Icel
and
Irela
nd
Net
herla
nds
Nor
way
Pola
nd
Port
ugal
Russ
ia
Spai
n
UK
Tota
l
1998 - - - 10 - 105 - - 246 - 3 364
1999 - - - - - 38 - - 355 - 2 395
2000 - - - - - 10 - - 308 - - 318
2001 - - - - - 79 - 1 223 - - 303
2002 - - - - - 107 - 16 420 1 5 549
2003 - - - - - 68 - - 75 - - 143
2004 - - - - - 124 - - 113 - - 237
2005 - - - 13 - 2281 - - 288 - - 529
2006 - 5 - - - 1211 - 10 284 - - 1510
2007 - 12 - - - 649 - 155 242 - - 1057
2008 - - - - - 126 - 1 250 - - 377
2009 - - - - - 207 - - 179 - - 386
2010 - - - - - 83 - 22 257 - - 342
2011 - - 2 - - 1 - - 65 48 25 217 4 - 362
2012 - 21 - 35 - 1 8 3 102 34 16 227 - 49 496
2013 - - 9 - - - 1 - 120 19 27 281 - 23 480
2014 - - - - - - - - 185 19 3 221 - 16 444
2015 1 - - - - - - - 28 3 - 175 - - 207
2016 7 - - - - - - - 40 14 - 183 - - 244
2017 - - - - 18 - - - 54 2 - 405 4 - 483
2018 1 - - 14 6 - - - 75 19 - 1043 - - 1158
20191 - - - - - - - - 122 - - 712 1 1 836
1 -Provisional figures.

ICES | AFWG 2020 | 377
Table 7.5. Sebastes norvegicus in subareas 1 and 2. Catch numbers-at-age (in thousands).
Year/Age 7 8 9 10 11 12 13 14 15 16 17 18 19 20 21 22 23 +gp Total Num. Tonnes Land.
1992 5 22 78 114 394 549 783 1718 3102 2495 2104 1837 998 858 688 547 268 3110 19670 16185
1993 0 24 193 359 406 1036 1022 1523 2353 1410 1655 1678 745 716 534 528 576 3482 18240 16651
1994 46 7 292 640 816 1930 2096 2030 1601 2725 2668 1409 617 733 514 256 177 1508 20065 18120
1995 60 85 230 672 908 1610 2038 2295 1783 1406 785 563 670 593 419 368 250 3232 17967 15616
1996 9 119 313 361 879 1234 1638 2134 1675 1614 1390 952 679 439 560 334 490 3135 17955 18043
1997 9 98 156 321 686 1065 1781 2276 2172 1848 1421 851 804 608 511 205 334 2131 17277 17511
1998 28 51 206 470 721 968 1512 1736 1582 1045 1277 970 1018 846 443 764 486 3389 17512 19155
1999 78 593 855 572 1006 1230 1618 1480 1612 1239 1407 1558 1019 394 197 459 174 2131 17622 18986
2000 4 13 70 245 902 958 1782 1409 2121 2203 1715 753 483 458 132 230 224 895 14597 14460
2001 23 23 44 199 347 482 1120 1342 1674 1653 1243 568 119 183 154 112 135 254 9675 10547
2002 14 36 71 143 414 686 1199 1943 1377 1274 1196 388 313 99 104 117 113 253 9740 9643
2003 22 25 30 44 204 359 705 1687 1338 1071 937 481 367 146 84 51 18 69 7637 7841
2004 19 47 46 65 198 277 504 590 677 963 1059 787 436 169 183 108 79 186 6390 7320
2005 40 55 94 80 165 173 393 779 741 916 926 743 376 210 189 129 111 220 6338 7037
2006 45 32 56 70 245 204 201 809 549 779 794 747 496 332 310 188 165 397 6419 7348

378 | ICES SCIENTIFIC REPORTS 2:52 | ICES
Year/Age 7 8 9 10 11 12 13 14 15 16 17 18 19 20 21 22 23 +gp Total Num. Tonnes Land.
2007 15 21 31 68 138 306 448 495 523 637 892 616 510 396 225 322 170 630 6443 7306
2008 1 4 14 12 49 139 265 366 361 443 442 538 547 479 281 223 144 1032 5342 6557
2009 0 11 2 4 9 23 144 277 315 248 406 374 509 404 331 323 253 911 4544 6487
2010 1 0 10 7 4 20 75 261 291 529 359 311 531 502 385 295 247 776 4605 6982
2011 2 1 3 0 2 5 64 304 466 266 312 223 378 289 247 229 253 985 4028 5852
2012 15 10 5 12 0 2 228 226 322 295 191 169 184 283 266 268 262 1152 3891 5517
2013 31 88 138 57 10 44 58 202 241 437 321 205 213 270 258 196 322 1216 4309 5608
2014 5 4 8 8 8 15 26 49 67 204 197 148 167 184 165 156 213 1197 2821 4438
2015 15 16 14 17 26 43 29 96 113 128 170 147 159 115 99 96 220 1156 2661 3628
2016 53 59 60 88 88 147 293 217 266 81 178 176 110 162 110 182 191 1103 3563 4674
20171 106 82 132 69 132 165 311 455 225 132 105 83 85 102 88 138 182 1169 3760 5257
2018 Data not available during AFWG 2020.
2019 Data not available during AFWG 2020.
1 - Provisional figures. Catch at age for 2017 was updated at AFWG 2020, but an update of weight-at-age in the catches was not available during AFWG 2020. Therefore, the weights from AFWG 2018 were used. Weight-at-age in the catches was not available for 2018 or 2019.

ICES | AFWG 2020 | 379
Table 7.6. Sebastes norvegicus in subareas 1 and 2. Catch weights at age (kg).
Year/Age 7 8 9 10 11 12 13 14 15 16 17 18 19 20 21 22 23 +gp
1992 0.18 0.29 0.48 0.42 0.50 0.59 0.58 0.65 0.65 0.71 0.82 0.84 0.94 1.02 1.03 1.15 1.27 1.27
1993 0.2 0.33 0.36 0.43 0.51 0.51 0.64 0.64 0.76 0.86 0.89 0.98 1 1.03 1.21 1.03 1.2 1.14
1994 0.25 0.37 0.38 0.49 0.51 0.64 0.74 0.76 0.86 0.95 1.03 1.07 1.11 1.16 1.15 1.13 1.02 1.36
1995 0.33 0.43 0.64 0.61 0.59 0.65 0.74 0.79 0.84 0.92 1.12 1.01 1.01 1.21 1.14 1.09 1.3 1.01
1996 0.22 0.49 0.56 0.65 0.71 0.81 0.84 0.88 0.96 1 1.02 1.01 1 1.03 1.04 1.14 1.09 1.16
1997 0.23 0.51 0.53 0.74 0.72 0.78 0.8 0.86 0.91 0.99 1.16 1.18 1.21 1.34 1.28 1.54 1.19 1.29
1998 0.37 0.21 0.47 0.62 0.67 0.77 0.77 0.85 1.05 0.96 1.25 1.28 1.3 1.23 1.87 1.46 1.73 1.29
1999 0.14 0.26 0.44 0.57 0.69 0.78 0.86 1.04 1.07 1.12 1.18 1.71 1.09 1.18 1.04 1.34 1.18 1.34
2000 0.19 0.24 0.32 0.44 0.53 0.64 0.73 0.84 0.96 1.11 1.25 1.32 1.53 1.06 1.29 1.32 1.12 1.2
2001 0.15 0.26 0.45 0.55 0.58 0.67 0.8 0.89 1.01 1.14 1.33 1.43 1.62 1.6 1.47 2 2.7 2.31
2002 0.17 0.25 0.33 0.42 0.54 0.67 0.72 0.84 0.98 1.09 1.2 1.3 1.44 1.78 1.68 1.88 2.12 1.84
2003 0.19 0.22 0.31 0.39 0.49 0.58 0.69 0.84 0.96 1.05 1.29 1.36 1.65 1.74 2.09 1.85 2.3 2.38
2004 0.21 0.26 0.36 0.45 0.51 0.59 0.68 0.8 0.96 1.07 1.22 1.34 1.57 1.67 1.75 2.09 1.9 2.04
2005 0.16 0.21 0.36 0.45 0.52 0.58 0.68 0.82 0.94 1.03 1.16 1.36 1.46 1.51 1.67 1.91 2.23 2.27
2006 0.13 0.15 0.28 0.41 0.51 0.58 0.66 0.74 0.83 1 1.14 1.27 1.39 1.46 1.37 1.47 1.64 2.03
2007 0.15 0.21 0.33 0.39 0.5 0.59 0.65 0.77 0.9 1 1.09 1.27 1.42 1.32 1.53 1.47 1.69 1.81

380 | ICES SCIENTIFIC REPORTS 2:52 | ICES
Year/Age 7 8 9 10 11 12 13 14 15 16 17 18 19 20 21 22 23 +gp
2008 0.41 0.55 0.55 0.57 0.52 0.58 0.65 0.81 0.9 1.07 1.14 1.36 1.51 1.81 1.99 2.01 2.26 1.93
2009 0.00 1.01 0.34 0.59 0.61 0.66 0.82 0.92 0.94 1.09 1.22 1.35 1.40 1.57 1.68 1.74 1.73 2.25
2010 0.15 0.00 0.10 0.32 0.52 0.73 0.77 0.89 0.98 1.09 1.25 1.40 1.48 1.64 1.77 1.99 1.82 1.86
2011 0.16 0.20 0.21 0.00 0.54 0.52 0.72 0.91 1.08 1.14 1.20 1.45 1.40 1.43 1.54 1.60 1.74 1.93
2012 0.19 0.25 0.33 0.72 0.61 0.88 0.70 0.86 0.95 1.02 1.13 1.18 1.33 1.48 1.31 1.55 1.50 2.59
2013 0.20 0.27 0.32 0.44 0.47 0.55 0.63 0.88 0.96 1.08 1.08 1.19 1.21 1.39 1.38 1.62 1.41 1.81
2014 0.20 0.26 0.39 0.41 0.56 0.61 0.71 0.87 0.95 1.07 1.14 1.28 1.46 1.35 1.51 1.62 1.69 1.84
2015 0.16 0.22 0.30 0.50 0.51 0.60 0.66 0.88 0.93 1.04 1.15 1.18 1.23 1.34 1.51 1.50 1.48 1.62
2016 0.17 0.21 0.34 0.62 0.53 0.66 0.68 0.86 0.94 1.03 1.11 1.32 1.43 1.29 1.42 1.43 1.48 2.67
20171 0.18 0.23 0.29 0.38 0.55 0.59 0.70 0.80 0.92 1.06 1.15 1.35 1.40 1.56 1.37 1.74 1.83 2.92
2018 Data not available during AFWG 2020.
2019 Data not available during AFWG 2020.
1 - Provisional figures.

ICES | AFWG 2020 | 381
Table 7.7. Sebastes norvegicus in subareas 1 and 2. Fishing mortalities as estimated by Gadget.
Age 1990 1991 1992 1993 1994 1995 1996 1997 1998 1999 2000 2001 2002 2003 2004
4 0.00 0.00 0.00 0.00 0.00 0.00 0.00 0.00 0.00 0.00 0.00 0.00 0.00 0.00 0.00
5 0.00 0.00 0.00 0.00 0.00 0.00 0.00 0.00 0.00 0.00 0.00 0.00 0.00 0.00 0.00
6 0.00 0.00 0.00 0.00 0.00 0.00 0.00 0.00 0.00 0.00 0.00 0.00 0.00 0.00 0.00
7 0.00 0.00 0.00 0.00 0.00 0.00 0.00 0.00 0.00 0.00 0.00 0.00 0.00 0.00 0.00
8 0.02 0.00 0.00 0.00 0.00 0.00 0.00 0.00 0.00 0.00 0.00 0.00 0.00 0.00 0.00
9 0.05 0.04 0.01 0.01 0.01 0.01 0.01 0.01 0.01 0.01 0.01 0.01 0.01 0.01 0.01
10 0.08 0.07 0.05 0.03 0.03 0.02 0.02 0.02 0.02 0.03 0.02 0.02 0.02 0.01 0.01
11 0.11 0.09 0.08 0.08 0.05 0.04 0.04 0.04 0.05 0.05 0.04 0.03 0.03 0.02 0.02
12 0.15 0.12 0.11 0.11 0.11 0.06 0.07 0.07 0.08 0.08 0.06 0.05 0.05 0.04 0.04
13 0.20 0.15 0.13 0.13 0.14 0.12 0.10 0.10 0.11 0.11 0.09 0.07 0.07 0.06 0.06
14 0.25 0.19 0.16 0.16 0.17 0.14 0.16 0.13 0.15 0.15 0.13 0.10 0.09 0.08 0.07
15 0.31 0.23 0.19 0.19 0.19 0.16 0.19 0.18 0.18 0.19 0.16 0.12 0.12 0.10 0.09
16 0.38 0.27 0.22 0.21 0.22 0.18 0.21 0.21 0.24 0.23 0.19 0.15 0.14 0.12 0.11
17 0.44 0.32 0.26 0.24 0.25 0.20 0.23 0.22 0.26 0.28 0.22 0.17 0.16 0.13 0.12
18 0.48 0.36 0.29 0.27 0.27 0.22 0.25 0.24 0.27 0.30 0.25 0.19 0.17 0.15 0.13
19 0.51 0.38 0.32 0.29 0.30 0.24 0.26 0.25 0.29 0.32 0.26 0.20 0.18 0.15 0.14

382 | ICES SCIENTIFIC REPORTS 2:52 | ICES
Age 1990 1991 1992 1993 1994 1995 1996 1997 1998 1999 2000 2001 2002 2003 2004
20 0.54 0.40 0.33 0.31 0.31 0.25 0.28 0.27 0.30 0.33 0.27 0.21 0.19 0.16 0.15
21 0.56 0.42 0.34 0.32 0.33 0.26 0.29 0.28 0.31 0.34 0.28 0.21 0.19 0.16 0.15
22 0.58 0.43 0.34 0.32 0.33 0.26 0.29 0.28 0.32 0.34 0.28 0.21 0.19 0.15 0.14
23 0.59 0.43 0.34 0.32 0.33 0.26 0.29 0.28 0.32 0.34 0.28 0.20 0.18 0.15 0.14
24 0.58 0.42 0.33 0.31 0.32 0.25 0.28 0.27 0.31 0.33 0.27 0.20 0.18 0.14 0.13
25 0.57 0.41 0.32 0.30 0.30 0.24 0.27 0.26 0.29 0.31 0.25 0.19 0.17 0.13 0.12
26 0.55 0.38 0.30 0.28 0.28 0.23 0.26 0.25 0.28 0.29 0.23 0.17 0.16 0.12 0.12
27 0.52 0.36 0.27 0.26 0.26 0.21 0.24 0.23 0.26 0.27 0.20 0.16 0.15 0.11 0.11
28 0.50 0.34 0.25 0.24 0.24 0.19 0.22 0.21 0.24 0.24 0.19 0.14 0.13 0.10 0.10
29 0.47 0.31 0.23 0.22 0.22 0.17 0.20 0.19 0.22 0.22 0.17 0.12 0.11 0.09 0.09
30 0.43 0.27 0.19 0.17 0.17 0.13 0.14 0.13 0.14 0.14 0.10 0.10 0.09 0.06 0.06
15+ 0.500 0.358 0.283 0.266 0.270 0.217 0.242 0.235 0.264 0.280 0.225 0.171 0.156 0.126 0.118
Age 2005 2006 2007 2008 2009 2010 2011 2012 2013 2014 2015 2016 2017 2018 2019
4 0.00 0.00 0.00 0.00 0.00 0.00 0.00 0.00 0.00 0.00 0.00 0.00 0.00 0.00 0.00
5 0.00 0.00 0.00 0.00 0.00 0.00 0.00 0.00 0.00 0.00 0.00 0.00 0.00 0.00 0.00
6 0.00 0.00 0.00 0.00 0.00 0.00 0.00 0.00 0.00 0.00 0.00 0.00 0.00 0.00 0.00

ICES | AFWG 2020 | 383
Age 2005 2006 2007 2008 2009 2010 2011 2012 2013 2014 2015 2016 2017 2018 2019
7 0.00 0.00 0.00 0.00 0.00 0.00 0.00 0.00 0.00 0.00 0.00 0.00 0.00 0.00 0.00
8 0.00 0.00 0.00 0.00 0.00 0.00 0.00 0.00 0.00 0.00 0.00 0.00 0.00 0.00 0.01
9 0.00 0.01 0.01 0.01 0.00 0.01 0.01 0.01 0.01 0.01 0.00 0.01 0.01 0.01 0.02
10 0.01 0.01 0.01 0.01 0.01 0.01 0.01 0.01 0.02 0.01 0.01 0.02 0.02 0.03 0.05
11 0.02 0.02 0.02 0.02 0.02 0.03 0.02 0.03 0.03 0.03 0.02 0.03 0.04 0.06 0.09
12 0.04 0.04 0.04 0.04 0.03 0.05 0.04 0.04 0.05 0.04 0.04 0.06 0.07 0.10 0.14
13 0.05 0.06 0.06 0.06 0.05 0.07 0.06 0.06 0.07 0.06 0.05 0.08 0.10 0.14 0.20
14 0.07 0.08 0.08 0.08 0.07 0.09 0.08 0.09 0.10 0.09 0.07 0.11 0.13 0.19 0.27
15 0.09 0.09 0.10 0.10 0.09 0.12 0.10 0.11 0.12 0.11 0.09 0.13 0.16 0.24 0.35
16 0.11 0.11 0.12 0.11 0.11 0.14 0.12 0.13 0.15 0.13 0.11 0.15 0.19 0.28 0.42
17 0.12 0.13 0.13 0.13 0.12 0.16 0.14 0.15 0.17 0.15 0.12 0.17 0.22 0.32 0.49
18 0.13 0.14 0.14 0.14 0.13 0.18 0.15 0.16 0.18 0.16 0.14 0.19 0.24 0.36 0.55
19 0.14 0.14 0.15 0.15 0.14 0.19 0.16 0.17 0.19 0.17 0.14 0.20 0.25 0.38 0.59
20 0.14 0.15 0.15 0.15 0.15 0.19 0.17 0.17 0.20 0.18 0.15 0.20 0.26 0.39 0.62
21 0.14 0.15 0.15 0.15 0.15 0.20 0.17 0.18 0.20 0.18 0.15 0.21 0.26 0.39 0.62
22 0.14 0.15 0.15 0.15 0.15 0.19 0.16 0.17 0.20 0.17 0.15 0.20 0.25 0.38 0.60

384 | ICES SCIENTIFIC REPORTS 2:52 | ICES
Age 2005 2006 2007 2008 2009 2010 2011 2012 2013 2014 2015 2016 2017 2018 2019
23 0.13 0.14 0.15 0.14 0.14 0.19 0.16 0.17 0.19 0.17 0.14 0.19 0.24 0.36 0.56
24 0.12 0.13 0.14 0.13 0.14 0.18 0.15 0.16 0.18 0.16 0.13 0.18 0.23 0.33 0.52
25 0.12 0.13 0.13 0.12 0.13 0.17 0.15 0.15 0.17 0.15 0.13 0.17 0.21 0.31 0.47
26 0.11 0.12 0.12 0.11 0.12 0.16 0.14 0.14 0.16 0.14 0.12 0.16 0.19 0.28 0.42
27 0.11 0.11 0.12 0.10 0.11 0.15 0.13 0.13 0.15 0.13 0.11 0.15 0.18 0.25 0.37
28 0.10 0.11 0.11 0.09 0.10 0.13 0.12 0.12 0.14 0.12 0.10 0.14 0.16 0.23 0.33
29 0.09 0.10 0.10 0.09 0.10 0.12 0.10 0.11 0.13 0.11 0.09 0.13 0.15 0.21 0.30
30 0.06 0.07 0.07 0.06 0.07 0.09 0.08 0.09 0.10 0.08 0.07 0.09 0.10 0.13 0.18
15+ 0.115 0.123 0.127 0.120 0.122 0.160 0.137 0.144 0.163 0.142 0.122 0.167 0.207 0.302 0.462

ICES | AFWG 2020 | 385
Table 7.8. Sebastes norvegicus in subareas 1 and 2. Stock numbers, biomass, mean weight and maturity ogives as estimated by GADGET.
total stock mature immature recruit
year Number mean wt biomass number mean wt biomass number mean wt biomass F(15+) age 3
(millions) (kg) (1000t) (millions) (kg) (millions) (kg) (1000t) (millions)
1986 384 0.37 141.98 112 0.67 75.09 271 0.25 66.88
3.79
1987 372 0.37 138.88 111 0.66 73.16 261 0.25 65.72
2.97
1988 347 0.38 133.09 108 0.63 68.34 239 0.27 64.75
1.67
1989 324 0.40 129.33 105 0.62 64.98 219 0.29 64.34
1.57
1990 299 0.40 119.60 100 0.58 57.94 199 0.31 61.65 0.50 1.66
1991 281 0.42 118.20 100 0.59 58.40 182 0.33 59.80 0.36 1.58
1992 266 0.45 119.00 101 0.61 61.70 165 0.35 57.30 0.28 1.46
1993 250 0.47 118.50 101 0.64 65.03 149 0.36 53.47 0.27 1.39
1994 237 0.49 115.64 99 0.68 66.98 138 0.35 48.65 0.27 1.69
1995 221 0.52 114.30 97 0.72 69.98 124 0.36 44.31 0.22 1.09
1996 201 0.54 109.31 93 0.75 70.05 108 0.36 39.26 0.24 0.75
1997 182 0.57 103.72 88 0.79 69.03 95 0.37 34.69 0.24 0.76
1998 160 0.59 95.12 80 0.81 65.00 80 0.37 30.12 0.26 0.40
1999 140 0.61 85.40 71 0.83 59.33 69 0.38 26.07 0.28 0.41

386 | ICES SCIENTIFIC REPORTS 2:52 | ICES
total stock mature immature recruit
year Number mean wt biomass number mean wt biomass number mean wt biomass F(15+) age 3
(millions) (kg) (1000t) (millions) (kg) (millions) (kg) (1000t) (millions)
2000 124 0.64 79.18 65 0.86 56.08 58 0.40 23.10 0.23 0.31
2001 112 0.68 76.15 61 0.90 55.28 51 0.41 20.87 0.17 0.40
2002 102 0.72 73.44 57 0.95 54.70 45 0.42 18.74 0.16 0.32
2003 93 0.78 71.76 55 1.01 54.99 38 0.44 16.77 0.13 0.19
2004 86 0.81 70.10 52 1.07 55.18 35 0.43 14.92 0.12 0.44
2005 80 0.85 68.16 49 1.13 55.01 31 0.42 13.15 0.11 0.31
2006 82 0.80 65.69 45 1.19 53.90 37 0.32 11.79 0.12 1.16
2007 75 0.83 62.67 42 1.24 52.16 33 0.32 10.51 0.13 0.24
2008 70 0.85 60.06 39 1.30 50.48 32 0.30 9.57 0.12 0.38
2009 65 0.88 57.39 36 1.34 48.48 29 0.31 8.91 0.12 0.27
2010 59 0.90 53.11 33 1.37 44.81 27 0.31 8.30 0.16 0.21
2011 65 0.78 50.65 30 1.40 42.32 35 0.24 8.33 0.14 1.27
2012 81 0.60 48.88 28 1.40 39.83 53 0.17 9.05 0.14 2.27
2013 75 0.62 46.64 27 1.35 37.15 47 0.20 9.49 0.16 0.10
2014 69 0.66 45.51 27 1.31 35.54 42 0.24 9.97 0.14 0.03

ICES | AFWG 2020 | 387
total stock mature immature recruit
year Number mean wt biomass number mean wt biomass number mean wt biomass F(15+) age 3
(millions) (kg) (1000t) (millions) (kg) (millions) (kg) (1000t) (millions)
2015 63 0.71 45.14 27 1.28 34.75 36 0.29 10.39 0.12 0.04
2016 84 0.53 44.56 27 1.25 33.13 58 0.20 11.43 0.17 2.68
2017 103 0.43 43.91 26 1.18 31.13 76 0.17 12.78 0.21 2.64
2018 99 0.42 41.73 26 1.06 28.11 73 0.19 13.62 0.30 0.61
2019 136 0.29 39.49 26 0.94 23.89 110 0.14 15.60 0.46 4.73

388 | ICES SCIENTIFIC REPORTS 2:52 | ICES
Figure 7.1. Sebastes norvegicus in subareas 1 and 2. Total international landings 1908–2019 (in thousand tonnes).
Figure 7.2. Sebastes norvegicus in subareas 1 and 2. Catches (including bycatch) of Sebastes norvegiucs in 2019 from Norwegian logbooks. Due to reporting on the genus level these catches may contain a considerable amount of Sebastes mentella.

ICES | AFWG 2020 | 389
Figure 7.3a. Illustration of the seasonality in the different Norwegian S. norvegicus fisheries in 2003, 2016 and 2019, also illustrating how the current regulations are working.
2003
0100200300400500600700800
1 2 3 4 5 6 7 8 9 10 11 12
Month
Roun
d w
eigh
t in
tonn
es
Gillnet Longline Trawl Danish seine Handline

390 | ICES SCIENTIFIC REPORTS 2:52 | ICES
Figure 7.3b. Interannual changes in the Norwegian catches by fleet of S. norvegicus fisheries (2003–2019).
Figure 7.4. Sebastes norvegicus. Length frequency of S. norvegicus reported from Norwegian catches in Subarea 1, 2.a and 2.b in 2017, all gears combined. Data separated by gears and areas was not available for 2018 and 2019 during AFWG 2020.

ICES | AFWG 2020 | 391
Figure 7.5a. Proportion maturity-at-age of S. norvegicus in subareas 1 and 2 derived from Norwegian commercial and survey data (Table E4). The proportions were derived from samples with at least five individuals. Updated for the 2020 assessment, but due to a lack of data in 2017-2019 only the data up to 2016 was used in the model.

392 | ICES SCIENTIFIC REPORTS 2:52 | ICES
Figure 7.5b. Sebastes norvegicus in subareas 1 and 2. Estimates of maturity-at-age by Gadget. Input data have been proportions of S. norvegicus mature both at age and length as collected and classified from Norwegian commercial land-ings and surveys.

ICES | AFWG 2020 | 393
Figure 7.6a. Sebastes norvegicus. Abundance indices disaggregated by length for the winter Norwegian Barents Sea (Di-vision 2.a) bottom-trawl survey (BS-NoRu-Q1 (BTr)) (joint with Russia some of the years since 2000), for 1986–2019 (ref. Table E1a). Top: absolute index values, bottom: relative frequencies.

394 | ICES SCIENTIFIC REPORTS 2:52 | ICES
Figure 7.6b. Sebastes norvegicus. Abundance indices by age from the winter Norwegian Barents Sea (Division 2.a) bot-tom-trawl survey (BS-NoRu-Q1 (BTr)) (joint with Russia some of the years since 2000), for 1992-2018 (ref. Table E1b). Age readings for 2017 and 2019 were insufficient to derive numbers at age. Top: absolute index, bottom: relative frequencies.

ICES | AFWG 2020 | 395
Figure 7.7a. Sebastes norvegicus. Abundance indices disaggregated by length when combining the Norwegian bottom-trawl surveys 1986–2019 in the Barents Sea (winter) and at Svalbard (summer/fall). Top: absolute index values. Bottom: relative frequencies. Horizontal line indicates the median length in the surveyed population.
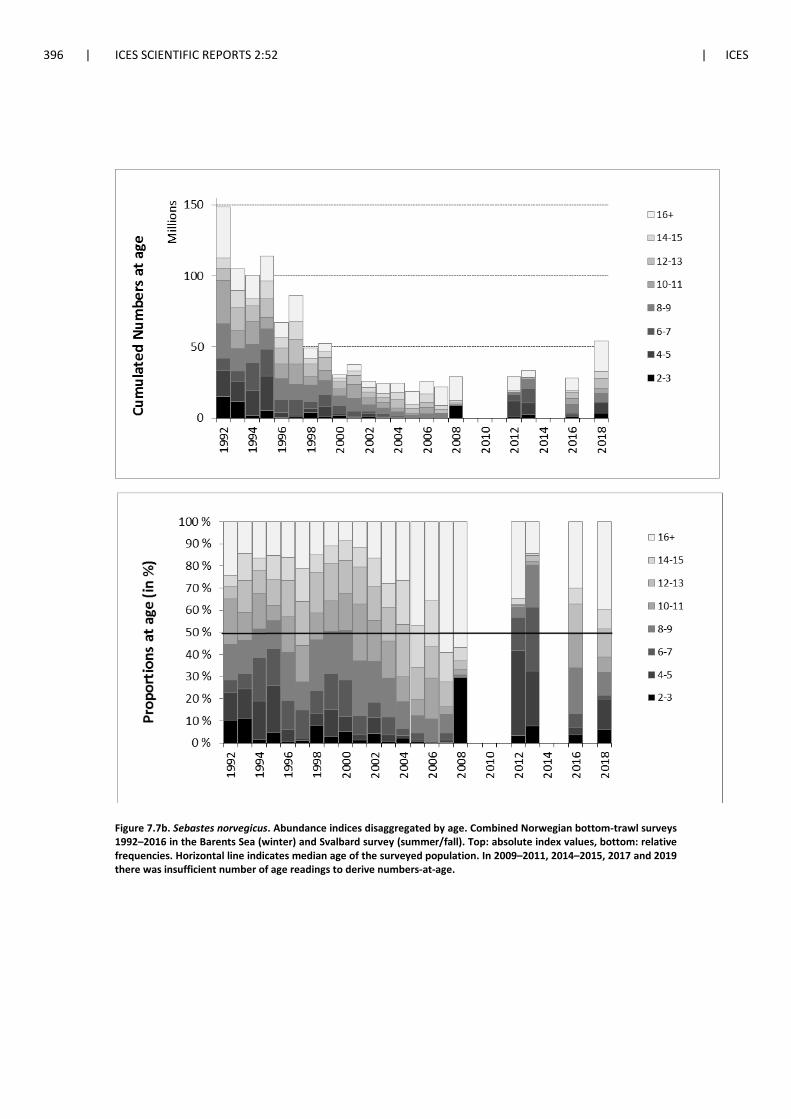
396 | ICES SCIENTIFIC REPORTS 2:52 | ICES
Figure 7.7b. Sebastes norvegicus. Abundance indices disaggregated by age. Combined Norwegian bottom-trawl surveys 1992–2016 in the Barents Sea (winter) and Svalbard survey (summer/fall). Top: absolute index values, bottom: relative frequencies. Horizontal line indicates median age of the surveyed population. In 2009–2011, 2014–2015, 2017 and 2019 there was insufficient number of age readings to derive numbers-at-age.

ICES | AFWG 2020 | 397
Figure 7.8. Sebastes norvegicus. Catch rates (numbers/nm) disaggregated by length for the Barents Sea coastal survey 1998–2019. Top: absolute catch rates. Bottom: relative values.

398 | ICES SCIENTIFIC REPORTS 2:52 | ICES
Figure 7.9. Sebastes norvegicus in subareas 1 and 2. Comparison of observed and modelled survey indices (total number scaled to sum=100 during the period) for the Barents Sea winter survey in February. Dots: survey indices. Plain lines: survey indices estimated by the model.
Figure 7.10. Sebastes norvegicus in subareas 1 and 2. Estimates of abundance at age 3–6 by Gadget. Note that recent year (since 2015) have very little tuning data behind them.

ICES | AFWG 2020 | 399
Figure 7.11. Sebastes norvegicus in subareas 1 and 2. Unweighted average fishing mortality of ages 15+. Solid line shows this years assessment and the dached line shows last assessment.
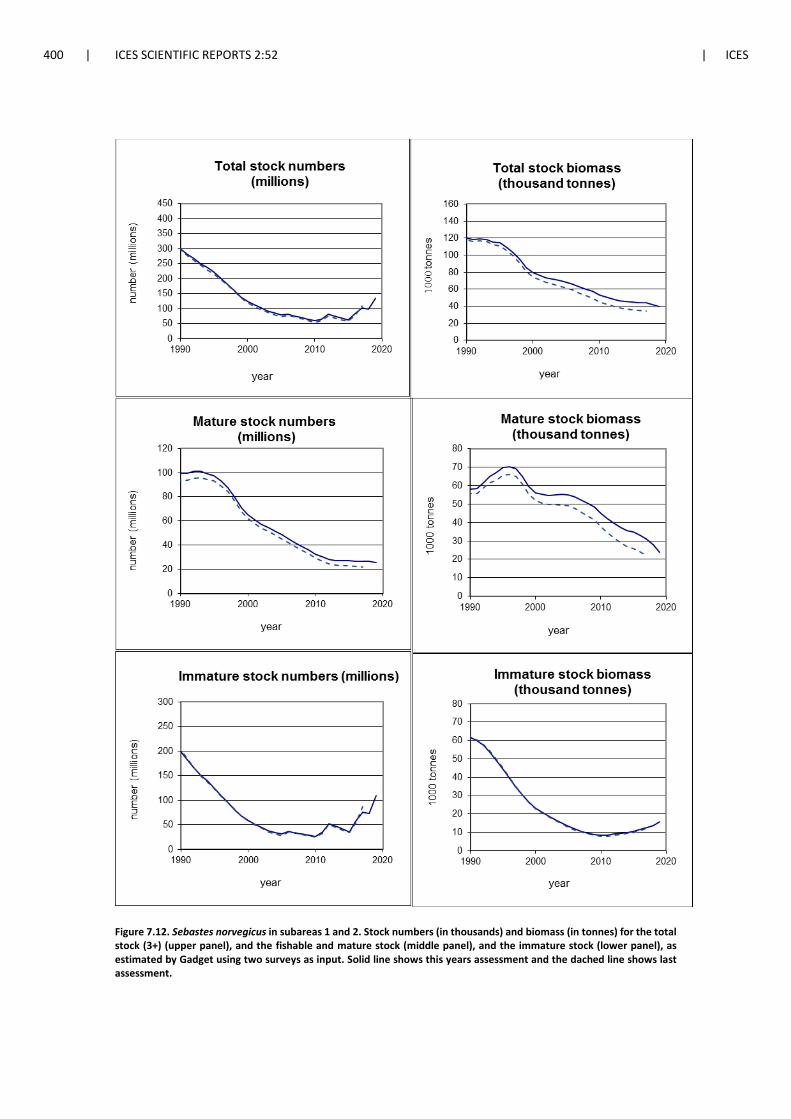
400 | ICES SCIENTIFIC REPORTS 2:52 | ICES
Figure 7.12. Sebastes norvegicus in subareas 1 and 2. Stock numbers (in thousands) and biomass (in tonnes) for the total stock (3+) (upper panel), and the fishable and mature stock (middle panel), and the immature stock (lower panel), as estimated by Gadget using two surveys as input. Solid line shows this years assessment and the dached line shows last assessment.

ICES | AFWG 2020 | 401
Figure 7.13. Gadget retrospective trends 2012 to 2019, immature biomass, mature biomass, recruitment-at-age 3, and F(15+).

402 | ICES SCIENTIFIC REPORTS 2:52 | ICES
Table E1b. Sebastes norvegicus in subareas 1 and 2. Norwegian bottom-trawl indices (numbers in thousands) - on age - from the annual Winter Norwegian Barents Sea (Division 2.a) bottom-trawl survey (BS-NoRu-Q1 (BTr)) from 1986 to 2018. The area coverage was extended from 1993 onwards.
Year/AGE 3 4 5 6 7 8 9 10 11 12 13 14 15 16+ Total
1992 2 509 4 070 6 395 2 375 3 757 10 392 4 299 3 567 11 526 2 276 3 239 3 070 3 666 15 183 76 324
1993 996 1 308 1 661 3 005 1 559 7 689 3 346 4 801 2 712 5 480 6 568 2 735 8 801 28 737 79 398
1994 0 9 311 2 441 5 722 11 251 6 422 3 609 7 824 4 775 2 032 6 095 1 825 2 651 10 838 74 796
1995 3 222 4 925 7 594 9 150 5 735 8 496 3 529 2 029 4 800 8 077 3 967 5 353 6 072 14 877 87 826
1996 336 689 2 157 2 902 4 158 7 448 5 816 3 082 6 290 4 122 6 158 3 136 3 518 9 656 59 468
1997 154 37 512 832 1 670 2 893 3 614 3 063 9 084 5 669 10 848 10 393 2 351 17 500 68 620
1998 1 658 859 664 392 1 032 2 323 2 567 2 256 1 897 3 595 5 099 999 2 703 6 804 32 848
1999 552 1 036 1 300 2 557 1 241 1 577 1 938 2 966 1 848 3 407 4 704 1 786 1 884 5 306 32 102
2000 376 545 814 1 567 2 129 2 621 1 902 2 228 1 907 1 506 2 448 2 096 484 1 957 22 580
2001 350 117 241 611 1 589 2 634 2 885 2 686 2 514 2 529 1 853 1 214 1 000 3 630 23 853
2002 904 1 182 685 972 592 1 706 2 549 2 032 1 742 2 286 919 1 053 2 308 3 235 22 165
2003 165 157 539 1 340 533 1 204 2 469 1 610 2 071 1 350 1 796 825 1 204 4 935 20 198
2004 0 181 91 219 536 1 039 1 426 1 093 1 145 2 060 3 066 1 780 2 606 5 668 20 910
2005 57 96 74 114 394 483 636 435 689 1 131 1 166 1 592 1 661 8 287 16 815

ICES | AFWG 2020 | 403
Year/AGE 3 4 5 6 7 8 9 10 11 12 13 14 15 16+ Total
2006 0 0 0 0 48 955 1 766 2 516 1 918 1 343 1 984 3 163 1 822 7 403 22 918
2007 19 39 256 39 0 297 154 411 324 823 709 866 909 8 881 13 727
2008 826 0 0 0 76 69 144 217 476 340 575 881 606 6 800 11 010
2009 0 0 0 0 0 0 12 53 156 220 1 189 469 1 013 9 429 12 541
2010 0 0 290 1 051 250 0 364 62 0 140 325 278 467 4 793 8 020
2011 1 873 1 635 1 391 134 64 0 439 0 103 0 213 119 249 7 421 13 641
2012 939 3 726 4 933 620 442 267 291 113 102 86 0 465 382 9 715 22 081
2013 1 806 1 633 4 722 2 784 2 570 2 139 1 208 275 0 483 99 166 0 4 970 22 855
2014 676 887 604 1 255 2 735 1 774 943 446 455 53 228 94 621 4 970 15 741
2015 125 441 946 898 1 267 1 585 2 515 349 1 062 442 471 104 53 4 136 14 394
2016 511 487 302 533 1 213 2 366 2 722 2 018 1 178 883 2 425 1 101 555 7 169 23 463
2017 Age data not available during AFWG 2020
2018 1 624 1 044 998 259 318 1 759 2 501 1 042 1 707 2 467 2 690 3 495 1 202 7 892 28 998
16+ group is considered in the calculation since 2005. Values prior to this date were derived by subtracting the sum of abundance in groups 1-15 to the total abundance, available in Table E1a.

404 | ICES SCIENTIFIC REPORTS 2:52 | ICES
Table E2a. Sebastes norvegicus in subareas 1 and 2. Abundance indices (numbers in thousands) - on length – from the Norwegian Svalbard (Division 2.b) bottom-trawl survey (August-September) from 1985 to 2019. Since 2005 this is part of the Ecosystem survey (Eco-NoRu-Q3 (BTr)).
Length group (cm)
Year 5.0-9.9 10.0-14.9 15.0-19.9 20.0-24.9 25.0-29.9 30.0-34.9 35.0-39.9 40.0-44.9 >45.0 Total
19851 - 1 307 795 1 728 2 273 1 417 311 142 194 8 325
19861 200 2 961 1 768 547 643 1 520 639 467 196 8 941
19871 100 1 343 1 964 1 185 1 367 652 352 29 44 7 060
19881 500 1 001 1 953 1 609 684 358 158 68 95 6 450
1989 200 1 629 2 963 2 374 1 320 846 337 323 104 10 100
1990 1 700 3 886 4 478 4 047 2 972 1 509 365 140 122 19 185
1991 100 5 371 5 821 9 171 8 523 4 499 1 531 982 395 36 420
1992 1 700 10 228 8 858 5 330 13 960 12 720 4 547 494 346 58 172
1993 200 10 160 9 078 5 855 7 071 4 327 2 088 1 552 948 41 284
1994 100 3 340 5 883 4 185 3 922 3 315 1 021 845 423 22 985
1995 470 2 000 9 100 5 070 3 060 2 400 1 040 920 780 24 840
1996 80 130 1 260 2 480 1 030 480 550 990 400 7 400
1997 0 810 1 980 5 470 5 560 2 340 590 190 450 17 430
1998 180 2 698 1 741 4 620 4 053 1 761 535 545 241 16 403

ICES | AFWG 2020 | 405
Length group (cm)
Year 5.0-9.9 10.0-14.9 15.0-19.9 20.0-24.9 25.0-29.9 30.0-34.9 35.0-39.9 40.0-44.9 >45.0 Total
1999 0 794 7 057 3 698 4 563 2 449 467 619 369 20 017
2000 40 360 1 240 1 390 2 010 760 400 160 390 6 750
2001 10 110 790 1 470 3 710 4 600 1 880 680 370 13 660
2002 0 0 64 415 459 880 620 565 519 3 522
2003 87 87 104 84 534 635 459 759 738 3 488
2004 0 8 9 192 581 667 607 395 213 2 672
2005 0 52 0 84 267 608 411 274 283 1 980
2006 0 0 75 74 138 437 470 668 1 264 3125
2007 0 47 83 1 251 938 2 012 2 254 373 1 135 8093
2008 8 603 4 255 211 25 50 169 525 180 536 1 4555
2009 216 1 403 108 108 0 0 197 214 220 2 466
2010 868 1 117 1 845 607 0 123 189 0 996 5 745
2011 0 0 850 50 0 0 0 159 578 1 637
2012 0 111 1 565 2 242 2 217 285 0 0 154 6 574
2013 56 489 2 155 3 307 2 738 433 136 34 349 9697

406 | ICES SCIENTIFIC REPORTS 2:52 | ICES
Length group (cm)
Year 5.0-9.9 10.0-14.9 15.0-19.9 20.0-24.9 25.0-29.9 30.0-34.9 35.0-39.9 40.0-44.9 >45.0 Total
2014 64 0 425 167 296 531 74 0 312 1 870
2015 0 0 0 216 198 303 877 18 810 2 421
2016 0 0 121 119 813 1 007 754 300 498 3 612
2017 838 675 577 93 585 291 476 288 262 4 085
2018 826 11 129 5 619 1 000 677 2 741 1 134 127 110 23 362
2019 78 90 104 219 68 0 115 131 182 987
1 - Old trawl equipment (bobbins gear and 80 m sweep length)

ICES | AFWG 2020 | 407
Table E2b. Sebastes norvegicus in subareas 1 and 2. Norwegian bottom-trawl survey indices - on age - from the Norwegian Svalbard (Division 2.b) bottom-trawl survey (August-September) from 1985 to 2016. Since 2005 this is part of the Ecosystem survey (Eco-NoRu-Q3 (BTr)). In 2009–2011, 2014–2015 and 2019, there was insufficient number of age readings to derive numbers-at-age.
Age
Year 2 3 4 5 6 7 8 9 10 11 12 13 14 15 Total
1992 284 12 378 5 576 2 279 371 2 064 3 687 5 704 9 215 6 413 1 454 1 387 696 22 51 530
1993 32 10 704 5 710 5 142 1 855 1 052 1 314 3 520 2 847 2 757 2 074 1 245 844 119 39 215
1994 429 1 150 3 418 2 393 1 723 1 106 1 714 1 256 1 938 1 596 2 039 484 550 319 20 155
1995 600 1 600 6 400 5 100 1 800 2 200 1 800 700 700 400 700 500 400 500 23 400
1996 40 110 - 560 1 050 940 930 400 1 050 280 320 590 160 70 6 500
1997 320 490 - 480 1 500 6 950 2 720 1 680 800 1 310 550 30 - 120 16 950
1998 210 1 817 881 202 1 555 2 187 4 551 1 913 1 010 797 49 264 73 187 15 696
1999 0 760 2 893 1 339 3 534 1 037 3 905 2 603 762 1 663 481 361 258 152 19 748
2000 40 20 400 350 840 480 730 1 670 620 340 510 100 80 70 6 250
2001 0 40 50 450 330 790 1 760 1 970 3 300 1 200 1 810 150 660 430 12 940
2002 0 0 - - 65 160 204 326 364 614 442 328 15 0 2 518
2003 0 0 0 0 95 0 283 227 93 296 285 189 228 341 2 035
2004 0 0 0 0 0 0 359 144 362 152 343 315 316 220 2 209
2005 0 50 0 0 0 73 25 286 106 191 271 167 125 152 1 447
2006 0 0 0 0 0 71 0 0 233 106 174 194 305 179 1 261
2007 0 0 0 0 0 617 1 006 398 0 0 155 799 799 303 4 078

408 | ICES SCIENTIFIC REPORTS 2:52 | ICES
Age
Year 2 3 4 5 6 7 8 9 10 11 12 13 14 15 Total
2008 7 844 0 0 0 0 0 0 37 98 16 18 148 86 164 8 412
2009 - - - - - - - - - - - - - - -
2010 - - - - - - - - - - - - - - -
2011 - - - - - - - - - - - - - - -
2012 0 40 123 2445 2105 1205 642 92 35 0 0 0 0 0 6 687
2013 0 56 383 1532 3963 377 1910 1029 214 121 250 0 0 166 10 000
2014 - - - - - - - - - - - - - - -
2015 - - - - - - - - - - - - - - -
2016 0 0 124 0 0 0 0 813 455 739 0 483 136 263 3 015
2017 356 187 322 97 145 130 193 205 79 292 205 176 278 0 2 667
20181 543 0 1 363 4 066 0 367 885 422 0 970 1 625 0 0 0 10 239
2019 Not available for AFWG 2020
1 – Provisional figures
Table E3. Sebastes norvegicus in Sub-area 1 and 2. Mean catch rates (numbers/nm) of Sebastes norvegicus from the Norwegian Coastal Surveys (NOcoast-Aco-Q4) (Division 2.a) in 1998-2017.
Length range (cm)
0-4
5-9
10-1
4
15-1
9
20-2
4
25-2
9
30-3
4
35-3
9
40-4
4
45-4
9
50-5
4
55-5
9
>60
# H
auls
Tota
l.Dis
t-
ance
(nm
)
# Fi
sh C
augh
t
# Fi
sh S
ampl
ed
Area
(nm
^2)
1998 0 0 692 6 632 73 075 22 255 22 430 130 161 116 216 23 519 2 547 880 0 89 139 778 NA 43 574

ICES | AFWG 2020 | 409
Length range (cm)
0-4
5-9
10-1
4
15-1
9
20-2
4
25-2
9
30-3
4
35-3
9
40-4
4
45-4
9
50-5
4
55-5
9
>60
# H
auls
Tota
l.Dis
t-
ance
(nm
)
# Fi
sh C
augh
t
# Fi
sh S
ampl
ed
Area
(nm
^2)
1999 0 7 587 77 067 317 802 369 258 165 769 67 222 178 802 163 919 20 445 3 642 1 520 0 103 138 2 144 NA 43 574
2000 0 0 1 856 13 048 6 459 13 065 42 990 156 418 171 407 29 117 3 036 331 191 99 144 756 503 43 574
2001 0 295 2 031 11 787 12 305 22 408 14 127 74 790 150 763 26 573 1 787 345 191 81 113 460 325 43 574
2002 0 0 0 0 2 321 7 588 34 283 1 011 273 754 947 26 769 3 195 513 0 109 172 3 289 332 43 574
2003 0 0 2 579 10 118 44 506 72 473 52 479 224 734 228 374 62 121 5 536 481 0 123 160 1 367 1 053 43 574
2004 0 937 3 139 5 591 21 042 66 182 34 613 351 154 552 183 41 851 2 666 1 345 0 104 130 1 290 950 43 574
2005 0 554 5 209 4 627 30 272 46 072 48 379 189 993 170 639 37 468 1 450 0 0 99 132 833 780 43 574
2006 0 0 2 884 496 1 738 3 065 29 933 144 743 256 394 65 959 9 272 0 0 112 112 771 680 43 574
2007 0 0 0 0 4 335 7 308 17 338 129 412 177 332 29 042 1 182 0 0 131 140 637 637 43 574
2008 0 3 644 4 555 955 3 957 4 679 17 440 362 633 490 611 99 469 11 772 1 630 0 110 139 1 156 850 43 574
2009 0 0 6 976 2 285 2 984 4 530 39 275 800 208 945 004 106 479 6 244 663 1 122 114 136 2 947 598 43 574
2010 0 39 758 77 542 20 364 8 814 1 378 2 582 66 948 214 182 99 061 7 417 2 454 0 117 136 833 690 43 574
2011 0 3 654 67 407 55 725 193 640 35 323 10 043 72 244 296 697 107 318 27 832 286 0 113 104 998 571 43 574
2012 0 39 530 59 337 95 227 150 260 89 534 12 686 58 890 356 556 163 645 46 792 4 640 263 98 96 1 191 778 43 574
2013 0 5 176 137 751 72 253 540 679 260 689 38 079 34 628 384 207 190 595 21 534 3 528 2 091 93 95 2 231 1 105 43 574
2014 0 524 28 653 89 876 78 267 144 543 109 523 47 736 302 185 157 358 30 251 2 343 3 361 107 108 1 717 777 43 574
2015 0 5 081 69 615 93 690 193 721 189 891 246 181 77 869 202 765 163 442 41 838 3 335 0 97 103 1 886 984 43 574

410 | ICES SCIENTIFIC REPORTS 2:52 | ICES
Length range (cm)
0-4
5-9
10-1
4
15-1
9
20-2
4
25-2
9
30-3
4
35-3
9
40-4
4
45-4
9
50-5
4
55-5
9
>60
# H
auls
Tota
l.Dis
t-
ance
(nm
)
# Fi
sh C
augh
t
# Fi
sh S
ampl
ed
Area
(nm
^2)
2016 0 0 100 206 49 233 177 926 186 202 81 997 49 197 145 043 163 426 41 278 869 567 99 101 1 648 1 153 43 574
2017 0 1 789 51 611 101 305 67 426 140 593 205 389 193 380 187 158 141 478 22 447 1 130 515 108 144 2 996 1 866 43 574
2018 0 509 5 230 16 112 43 173 50 831 52 728 124 778 273 489 200 310 67 433 4 181 988 154 220 2 182 1 837 43 574
2019 0 646 10 371 6 780 34 448 29 026 41 674 119 672 183 459 122 349 48 964 263 263 139 162 1 185 1 021 43 574

ICES | AFWG 2020 | 411
Table E4. Proportion of maturity-at-age 5 – 30 in S. norvegicus in subareas 1 and 2 derived from Norwegian commercial and survey data. The proportions were derived from samples with at least five individuals. Data for years after 2016 was considered insufficient until further age reading.
Year/Age 5 6 7 8 9 10 11 12 13 14 15 16 17 18
1992 0.00 0.00 0.09 0.15 0.31 0.22 0.21 0.20 0.22 0.26 0.30 0.44 0.45 0.47
1993 - - 0.00 0.00 0.10 0.29 0.54 0.47 0.53 0.67 0.80 0.75 0.78 0.82
1994 0.00 0.00 0.03 0.05 0.28 0.28 0.32 0.70 0.79 0.91 0.94 0.85 0.92 1.00
1995 0.00 0.00 0.00 0.05 0.02 0.22 0.25 0.48 0.61 0.64 0.68 0.80 0.87 0.88
1996 0.00 0.05 0.14 0.13 0.22 0.38 0.43 0.60 0.64 0.75 0.69 0.77 0.90 0.85
1997 0.00 0.05 0.08 0.15 0.17 0.21 0.34 0.35 0.57 0.64 0.72 0.73 0.85 0.93
1998 0.00 0.00 0.03 0.11 0.09 0.26 0.32 0.49 0.52 0.69 0.74 0.77 0.81 0.91
1999 0.00 0.00 0.00 0.04 0.17 0.35 0.22 0.53 0.73 0.71 0.67 0.69 0.74 0.71
2000 0.00 0.08 0.14 0.25 0.40 0.51 0.59 0.62 0.65 0.69 0.78 0.96 0.96 1.00
2001 - 0.00 0.06 0.14 0.28 0.32 0.40 0.52 0.53 0.60 0.76 0.74 0.81 0.85
2002 - 0.00 0.05 0.07 0.23 0.44 0.41 0.63 0.74 0.93 0.77 0.89 0.90 0.94
2003 - 0.00 0.00 0.05 0.13 0.24 0.24 0.47 0.58 0.68 0.75 0.65 0.77 0.78
2004 - 0.00 0.03 0.07 0.13 0.43 0.21 0.51 0.46 0.63 0.64 0.86 0.82 0.96
2005 - - 0.00 0.05 0.29 0.18 0.34 0.39 0.39 0.56 0.73 0.81 0.79 0.82
2006 - - 0.00 0.10 0.06 0.22 0.25 0.39 0.47 0.57 0.67 0.67 0.74 0.86
2007 - - 0.00 0.08 0.30 0.25 0.24 0.66 0.68 0.70 0.88 0.86 0.89 0.99
2008 - - 0.80 0.25 0.82 0.68 0.62 0.80 0.79 0.86 0.88 0.91 0.90 0.92
2009 - - - - - 0.50 0.50 1.00 0.93 0.81 0.86 0.86 0.85 0.85
2010 - - - - - - - - 0.70 0.60 0.81 0.92 0.64 0.90
2011 - - - - - - - - - - 0.73 0.78 0.94 0.93
2012 0.00 0.11 0.10 0.29 0.20 0.20 - - - 0.76 0.72 0.70 0.91 0.78
2013 0.00 0.12 0.05 0.10 0.19 0.38 0.71 - 0.29 0.82 0.92 0.89 0.77 0.86
2014 0.00 0.00 0.02 0.08 0.21 0.43 0.41 0.53 0.33 0.58 0.69 0.71 0.80 0.92
2015 0.00 0.05 0.17 0.17 0.30 0.41 0.44 0.49 0.65 0.67 0.69 0.81 0.91 0.86
2016 0.00 0.04 0.02 0.05 0.23 0.17 0.27 0.41 0.59 0.41 0.62 0.55 0.80 0.74
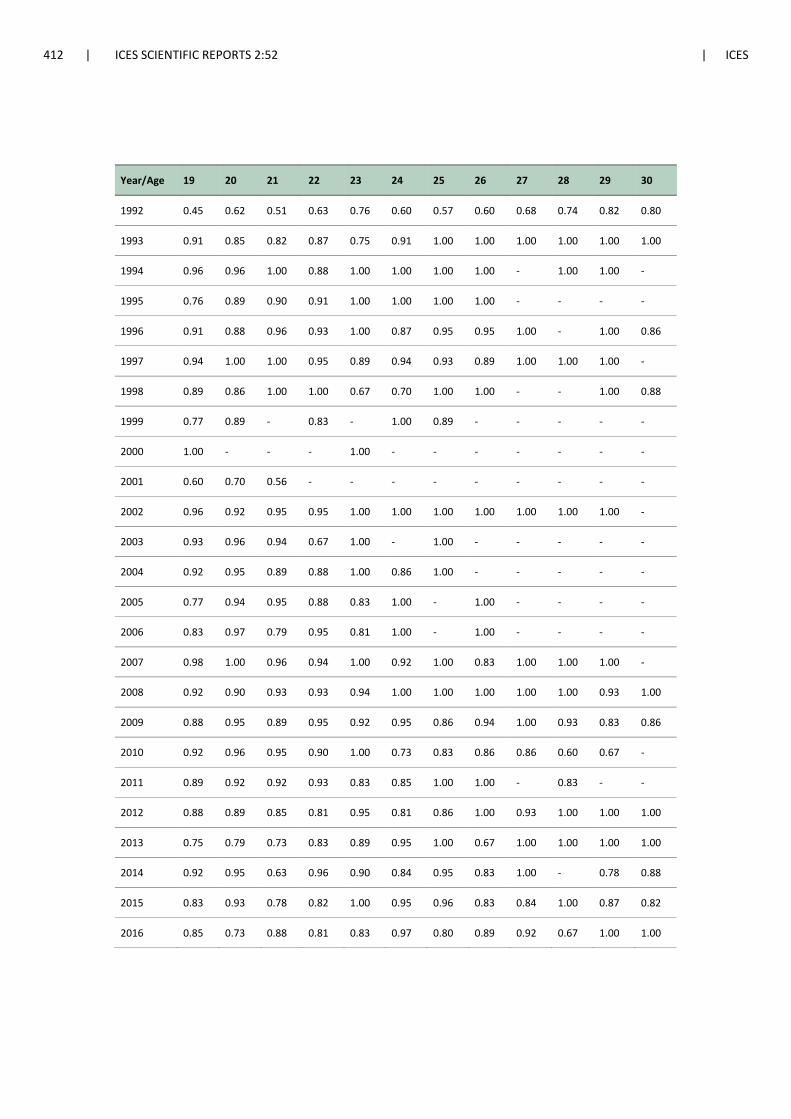
412 | ICES SCIENTIFIC REPORTS 2:52 | ICES
Year/Age 19 20 21 22 23 24 25 26 27 28 29 30
1992 0.45 0.62 0.51 0.63 0.76 0.60 0.57 0.60 0.68 0.74 0.82 0.80
1993 0.91 0.85 0.82 0.87 0.75 0.91 1.00 1.00 1.00 1.00 1.00 1.00
1994 0.96 0.96 1.00 0.88 1.00 1.00 1.00 1.00 - 1.00 1.00 -
1995 0.76 0.89 0.90 0.91 1.00 1.00 1.00 1.00 - - - -
1996 0.91 0.88 0.96 0.93 1.00 0.87 0.95 0.95 1.00 - 1.00 0.86
1997 0.94 1.00 1.00 0.95 0.89 0.94 0.93 0.89 1.00 1.00 1.00 -
1998 0.89 0.86 1.00 1.00 0.67 0.70 1.00 1.00 - - 1.00 0.88
1999 0.77 0.89 - 0.83 - 1.00 0.89 - - - - -
2000 1.00 - - - 1.00 - - - - - - -
2001 0.60 0.70 0.56 - - - - - - - - -
2002 0.96 0.92 0.95 0.95 1.00 1.00 1.00 1.00 1.00 1.00 1.00 -
2003 0.93 0.96 0.94 0.67 1.00 - 1.00 - - - - -
2004 0.92 0.95 0.89 0.88 1.00 0.86 1.00 - - - - -
2005 0.77 0.94 0.95 0.88 0.83 1.00 - 1.00 - - - -
2006 0.83 0.97 0.79 0.95 0.81 1.00 - 1.00 - - - -
2007 0.98 1.00 0.96 0.94 1.00 0.92 1.00 0.83 1.00 1.00 1.00 -
2008 0.92 0.90 0.93 0.93 0.94 1.00 1.00 1.00 1.00 1.00 0.93 1.00
2009 0.88 0.95 0.89 0.95 0.92 0.95 0.86 0.94 1.00 0.93 0.83 0.86
2010 0.92 0.96 0.95 0.90 1.00 0.73 0.83 0.86 0.86 0.60 0.67 -
2011 0.89 0.92 0.92 0.93 0.83 0.85 1.00 1.00 - 0.83 - -
2012 0.88 0.89 0.85 0.81 0.95 0.81 0.86 1.00 0.93 1.00 1.00 1.00
2013 0.75 0.79 0.73 0.83 0.89 0.95 1.00 0.67 1.00 1.00 1.00 1.00
2014 0.92 0.95 0.63 0.96 0.90 0.84 0.95 0.83 1.00 - 0.78 0.88
2015 0.83 0.93 0.78 0.82 1.00 0.95 0.96 0.83 0.84 1.00 0.87 0.82
2016 0.85 0.73 0.88 0.81 0.83 0.97 0.80 0.89 0.92 0.67 1.00 1.00

ICES | AFWG 2020 | 413
Figure E1. Overview of the Norwegian biological age samples (number individuals, number hauls/sets, number of boats) from the commercial fisheries for S. norvegicus in 2013 representing more than 80% of the catches and which the input data to the Gadget model are based upon. The colours denote which sampling platform has been used: High Seas Refer-ence fleet, port sampling, Coast guard, Coastal Reference Fleet, or inspectors/observers at sea. The green crosses show the catch in tonnes for the different seasons, areas and gears.

414 | ICES SCIENTIFIC REPORTS 2:52 | ICES
Figure E2. Sebastes norvegicus in subareas 1 and 2. Yield-per-recruit for S. norvegicus, computed from the GADGET as-sessment model presented at the benchmark assessment in January 2018 (WKREDFISH, ICES 2018a).

ICES | AFWG 2020 | 415
8 Greenland halibut in subareas 1 and 2
The stock is assessed by a GADGET length-based model since 2015. The stock has biennial advice and a draft for advice was last given in 2019 for 2020 and 2021. The draft advice sheet was rejected by ADGANW and a roll-over advice was used for advice in 2020. ADGANW issued a request to repeat the advice process in 2020 with HRpa reference points for use in the 2021 advice. A HRpa proposal is available and was presented to AFWG 2020. However, due to the need for a simpli-fied approach related to the 2020 coronavirus outbreak ACOM decided, in agreement with Ad-vice Requestors, that roll-over advice should be used in 2020 to provide advice on fishing oppor-tunities in 2021. Work on adopting a HRpa is therefore postponed until AFWG 2021. General information about this stock is in the Stock Annex, which was updated after the last benchmark.
8.1 Status of the fisheries
8.1.1 Landings prior to 2020 (Tables 8.1–8.8)
Nominal landings by country for Subareas 1 and 2 combined are presented in Table 8.1. Tables 8.2—8.4 give the landings for Subarea 1 and Divisions 2a and 2b separately, and landings sepa-rated by gear type are presented in Table 8.5. For most countries, the landings listed in the tables are similar to those officially reported to ICES. Some of the values in the tables vary slightly from the official statistics and represent those presented to the Working Group by the members. Catch per unit of effort is presented in Table 8.6 and total catch from 1935-till now in Table 8.7 and Figure 8.1.
The preliminary estimate of the total landings for 2019 is 28 832 t. This is 288 t more than the landings in 2018 and about 5 832 t more than the ICES advised maximum catch for 2019 (23 000 t). The catches from most countries remained fairly stable, compared to 2018.Combined landings exceeded the quotas set by the Joint Russian-Norwegian Fisheries Commission for 2019 by 1 832 t (total TAC 27 000 t). One explanation is the difficulties in bycatch regulation.
Some fishing for Greenland halibut has taken place in the northern part of Division 4a during the past 20–30 years, varying between a few tonnes and up to 1 670 t in 1995. From 2005 to 2011 this catch was mostly below 200 t, taken mostly by Norway, France, and UK. Preliminary num-bers show 279 t in 2019, mainly due to the Norwegian trawl fleets (Table 8.8, figures 8.2 and 8.3). Although there is a continuous distribution of this species from the southern part of Division 2a along the continental slope towards the Shetland area, the stock structure is unclear in this area and these landings have therefore not been added to the total from Subareas 1 and 2. Recent mark-recapture and genetic investigations indicate that the stock might have a more south and westward distribution than the current ICES definition of the stock boundaries (Albert and Vol-len, 2015, Westgaard et al., 2016).
8.1.2 ICES advice applicable to 2020 The roll over advice from ICES for 2020 was as follows:
ICES advises that when the precautionary approach is applied, catches in 2020 should be no more than 23 000 tonnes. This corresponds to a harvest rate of ≈0.036. All catches are assumed to be landed.
Additional considerations The benchmark and data workshop process led to an agreed analytic assessment in 2015.

416 | ICES SCIENTIFIC REPORTS 2:52 | ICES
A benchmark meeting (WKBUT; ICES 2013/ACOM:44) was held for the Northeast Arctic (NEA) Greenland halibut in 2013, but the benchmark process was prolonged due to problems with data. A data workshop was conducted in November 2014 (DCWKNGHD ICES CM 2014/ACOM:65), followed by a benchmark by correspondence that ended in 2015. The assessment is reported in the benchmark by correspondence (IBPHALI; ICES CM 2015/ACOM:54) and in the stock annex.
8.1.3 Management The 38th JRNFC’s session in 2009 decided to cancel the ban against targeted Greenland halibut fishery and established the TAC at 15 000 t for the next three years (2010–2012). The 40th JRNFC Session in 2011 decided to increase the TAC for 2012 up to 18 000 t, and at the 42nd JRNFC Session in 2012, the TAC for 2013 was increased to 19 000 t. The 43rd and 44th session kept the same TAC for 2014 and 2015. For 2016 and 2017 TAC was set to 22 and 24 thousand tonnes, respectively. The TAC for 2018 was 27 thousand tonnes and the same for 2019 and 2020.
The TAC for Greenland halibut set by JNRFC applies to catches in ICES areas 1, 2a and 2b, except the Jan Mayen EEZ and the part of the EU EEZ which is north of 62°N.
In 2019 catches of 91 tonnes were taken in the Jan Mayen area (within ICES Subarea 2), where Greenland halibut fisheries are not regulated by TAC. Norway has a quota for Greenland halibut in the EU EEZ which in 2019 and 2020 is set to 1250 t each year, and can be fished in ICES areas 2a and 6. Thus this TAC is given partly within and partly outside the stock boundary. In 2019, 844 t of this TAC was caught, assumingly mainly in ICES area 2a. Catches in 2018 were 916 t. There is no ICES separate advice for the fishery in this area. However, this quota has until recently not been reported in the advice sheet and when comparing TAC and the total catches in ICES Subareas 1 and 2 this should be kept in mind. Further information on regulations is found in the Stock Annex.
8.1.4 Expected landings in 2020 Catches in 2019 exceeded the TAC and were 28 832 t. The total Greenland halibut landings in the Barents Sea and adjacent waters (ICES Subarea 1 and Divisions 2a and 2b) in 2020 may thus be higher than the TAC of 27 000 t. Discards at present are not regarded as a problem.
8.2 Status of research 8.2.1 Survey results (Tables 8.9-8.13, Figures 8.4-8.14) Survey indices from the Russian autumn survey (Figures 8.4-8.6), the Norwegian slope survey (Figures 8.4-8.5 and 8.7-8.8), the Joint Norwegian-Russian Ecosystem survey (Eco-juv and Eco-south indices) (Figures 8.9-8.10) and the Joint Norwegian-Russian Winter Survey are given here (Figure 8.11). Length distributions from these surveys, along with the Spanish survey are pre-sented in Tables 8.9-8.13.
The Russian bottom-trawl surveys in October-December (ICES acronym: RU-BTr-Q4) are im-portant since they usually cover large parts of the total known distribution area of the Greenland halibut within 100–900 m depth. However, it has been considered imprudent to use the 2002, 2003 and 2013 data from this survey series. During the 2002 survey, no observations were avail-able from the Exclusive Economic Zone of Norway (NEEZ). In 2003, observations on the main spawning grounds were conducted three weeks later than usual because access to NEEZ was obtained too late. The number of trawl stations was also insufficient due to the same reason. Due to technical problems indices in 2013 were not obtained. Technical and practical changes were made in 2003. In 2019 the coverage was insufficient. To include 2019 will imply a recalculation of the index, and this will be addressed before 2021 AFWG. Length distributions by year for this survey are given in Table 8.9. The biomass indices for this survey increased steeply from 2005 to

ICES | AFWG 2020 | 417
2011, fell again until 2014, but showed a steep increase until the last survey was conducted in 2017 (Figures 8.4 and 8.5).
Total biomass indices from the Norwegian autumn slope survey (ICES acronym: NO-GH-Btr-Q3) showed an upward trend in biomass estimates between 1994 and 2003, then a downward trend until 2008 until it increased again in 2009 but leveled out again in 2011, 2013, and 2015 (Figures 8.4, 8.5, and 8.7). Since then there is a downward trend and the index for 2019 is the lowest since the start of the survey. The length distributions from this survey show modes that can be followed through the years with marked changes between 2006 and 2007 and also be-tween 2017 and 2019 (Figure 8.12, Tables 8.10 and 8.11). This survey was conducted every year during 1994—2009, but is now run biennially.
The Joint Ecosystem Survey in autumn covers a large part of the Barents Sea down to 500 m and concerning Greenland halibut it can be regarded to be in the areas where mainly juveniles and immature fish are found. Two indices for Greenland halibut are based on the Joint Ecosystem Survey in the Barents Sea and previous juvenile survey, one for juvenile areas (Figure 8.9) de-noted Eco-juv index in the northernmost survey area, and another denoted Eco-south index for adults defined by the survey area south from 76.5°N and west of Spitsbergen (Figure 8.10). The juvenile index, covering the juvenile area (see section 8.3), indicates a highly variable recruitment success with years between good year classes. The 2015 and 2016 estimates are the lowest regis-tered so far, followed by an increase in 2017. The 2018 estimate, however, dropped down to the 2016 level and further down in 2019. The Eco-south index for females showed an increasing trend towards 2012, followed by a decrease towards 2015. The index has since shown an increasing trend until 2018 but is at a lower level in 2019. The male index shows a similar trend except the increase started a year later, in 2016 - 2018, but is also down in 2019. Length distributions by year for this survey are given in Table 8.11.
The joint winter survey int the Barents Sea (ICES acronym: BS-NoRu-Q1) has been run from 1986 to present (jointly with Russia since 2000, except 2006 and 2007). The vertical coverage is in depths of 100—500 m, so it does not cover the deeper slope areas. The horizontal coverage is the central Barents Sea, and west of Svalbard for some years. The northward coverage is limited by ice in some years. It is conducted in February and can thus give information on the stock at dif-ferent times of year, as the other surveys are run in autumn. The main trend in the biomass index from the survey was downward until 2004, rather steeply upwards until 2008 and a varying and more slowly upward trend since then.
The Spanish bottom-trawl survey (ICES acronym: SP-Svalbard-Q4), (Table 8.13, Figure 8.13) is carried out on a new hired commercial vessel and some changes have been done in the initial standard protocol. In Basterretxea et al. (WD13 2013) an attempt is made to standardize survey indices for Greenland halibut in earlier Spanish surveys (1997–2005) with recent surveys (2008 to present). The conclusion is that it is considered not possible to obtain a reliable standardization of the surveys. This means that biomass estimates from the survey are only available for years 2008 and onwards. The Spanish survey has since 2015 only been run in autumn. The biomass index from the Spanish survey shows a downward trend since around 2012.
Polish bottom-trawl surveys on Greenland halibut were carried out in the Svalbard-Bear Island area (ICES 2b) in October 2006, April 2007, April 2008, June 2009, and March 2011. The main objectives of the survey were to determine the biological structure, distribution, density and standing biomass of Greenland halibut in the survey area (Trella and Janusz, WD6 ICES AFWG 2012). Polish survey index is shown in Figure 8.14, no new data were presented to the meeting.
8.2.2 Commercial catch-per-unit-effort (Table 8.6, Figure 8.15) The CPUE series for the stock has been a subject to the benchmark and following data workshops (see reports from WKBUT 2013, DCWKNGHD 2014 and IBPHALI 2015, and working documents
418 | ICES SCIENTIFIC REPORTS 2:52 | ICES
by Bakanev (WD14 WKBUT 2013) and Nedreaas (WD 2 DCWKNGHD 2014)) (Figure 8.15). An alternative CPUE series for the Russian fisheries for the years 2004–2015 was presented to the 2016 meeting (Mikhaylov, WD14 ICES AFWG 2016). It shows some discrepancies compared to previous CPUE series used for the Russian fisheries for the same years. See Stock Annex for further comments.
8.2.3 Age readings Based on the scientific understanding that the species is more slow growing and vulnerable than the previous age readings suggest, the Norwegian age reading methods were changed in 2006. The new Norwegian age readings are not comparable with older data or the Russian age read-ings.
The report from Workshop on Age Reading of Greenland Halibut (WKARGH) 14—17 February 2011 (ICES CM 2011/ACOM:41) described and evaluated several age reading methods for Green-land Halibut.
The different methods can be classified into two groups: A) Those that produce age–length rela-tionships that broadly compare with the traditional methods described by the joint NAFO-ICES workshop in 1996 (ICES CM 1997/G:1); and B) Several recently developed techniques that show much higher longevity and approximately half the growth rate from 40–50 cm onwards com-pared to the traditional method.
A second workshop on age reading of Greenland halibut (WKARGH 2) was conducted in Au-gust 2016 and worked on further validation on new age reading methods. The workshop recom-mended that two of the new methods can be used to provide age estimations for stock assess-ments. Further, recognizing some bias and low precision in methods, the WKARGH2 suggested that an aging error matrix or growth curve with error be provided for use in future stock assess-ments (WKARGH2 report 2016, ICES CM 2016/SSGIEOM:16).
WKARGH2 recommends regular interlab calibration exercises to improve precision (i.e. ex-change of digital images between readers for each method and between methods). AFWG sug-gests that Russian and Norwegian scientists and age readers meet to work out issues of disagree-ments on Greenland halibut aging.
8.3 Data used in the assessment Catch data are split into four aggregated fleets. Longline/gillnet fleet includes landings from gill-net, longline, and handline. Trawl fleet includes landings from bottom trawl, purse-seine (very minor catches, can be bycatch or misreporting) and Danish seine. Catch in tonnes and length distributions per quarter per fleet per sex from 1992–2018 are used in the assessment. Fleets are split between Norwegian (including 3rd countries) and Russian catches, and selectivities are al-lowed to vary by sex (logistic for gill fleets, asymmetric dome-shaped for trawl fleets), to account for sexually dimorphism influencing vulnerability to fishing. For each fleet listed below, length distributions and reported catch in tonnes are split by quarter and sex (although length distribu-tions are not available for all quarters for some fleets).
• Russian, trawl and minor gears (split by sex) • Russian, gillnet and longline (split by sex) • Norwegian and 3rd countries, trawl and minor gears (split by sex) • Norwegian and 3rd countries, gillnet and longline (split by sex) In addition, the model has four surveys, all modeled with asymmetric dome-shaped selectivities (note that in a model context “selectivity” encompasses all aspects of vulnerability to the fishery, including gear effects, vessel effects, area effects etc.). In each case, data are used as length dis-tribution and biomass index. The biomass index was not available split by sex for all years, so a combined sex index is used. Four survey indices go into the current assessment:

ICES | AFWG 2020 | 419
• Norway slope – based on the Norwegian Greenland halibut slope survey (NO-GH-Btr-Q3) (yearly 1996–2009, biennially since then). Split by sex.
• EcoJuv - a juvenile index based on data from the northern/northeastern areas of the Joint Ecosystem survey (Eco-NoRu-Q3 (Btr)) (2003–present) and the precursory Norwe-gian juvenile Greenland halibut survey north and east of Svalbard (1996—2002) (Hall-fredsson and Vollen, WD 1 ICES IBPhali 2015). Split by sex.
• EcoSouth - an index for the Barents Sea south of 76.5°N, based on data from the Joint Ecosystem survey (Eco-NoRu-Q3 (Btr) (2003—present) (Hallfredsson and Vollen, ICES AFWG, WD 20, April 2015). Split by sex.
• Russian - Russian bottom-trawl survey in the Barents Sea (RU-Btr-Q4) (1992-2015 and 2017). Sex aggregated (can be split by sex in future work).
No age data or CPUE indices are used in the tuning.
8.4 Methods used in the assessment A new assessment method with a length-based GADGET model was benchmarked in 2015 (IPH-ALI 2015) and accepted by ACOM the same year. The model is further described in the IPHALI report and the Stock Annex.
8.4.1 Model settings Model used: Gadget (see ICES, 2015).
Time period: 1992–2018, monthly time-steps
Model structure:
• 1 cm length classes (1—114+ cm) and 1-year age classes (1—30+) • Two sexes, split into mature and immature • Logistic maturity estimated for each sex • Von Bertanlanffy growth estimated separately for males and females • L-W relationship fixed based on data from the Norwegian slope (Females: a = 1.4E-6
and b = 3.47. Males: a = 5.7E-6 and b = 3.12) • Natural mortality set to 0.1 for all fish • Initial size of recruits fixed at 8.5 cm (necessary to fix this in the absence of age data) • Recruitment modeled as annual numbers, no relationship with SSB • Four aggregated fleets (as described above), each with sex-specific selectivity (logistic
for gillnet and longline fleets, asymmetric dome-shaped for trawl) • Four surveys (as described above), all with asymmetric dome-shaped selectivity Note that to avoid the problem of modeled fish not covered by any fleet (and therefore not tuned to any data) the gillnet and longline fleets have been assumed to have logistic (flat topped) se-lectivity.
Estimated parameters: Estimated parameters are L50 and slope for the maturation (male and female separately), two growth parameters per sex, two maturation parameters per sex, one annual recruitment param-eter per year, two parameters for s.d. of length of recruits, parameters governing commercial selectivity (two per sex per gillfleet and three per sex per trawlfleet), one effort parameter per year for each fleet, three parameters per survey per sex governing selectivity, initial population numbers for male and female fish by age, initial population s.d. of lengths by sex and age.
Data used for tuning are:
• Quarterly length distribution of the landings from commercial fishing fleets (by sex)

420 | ICES SCIENTIFIC REPORTS 2:52 | ICES
• Quarterly catch in tonnes for each fleet (by sex) • Length disaggregated survey indices from the four surveys (by sex except for the Rus-
sian survey) • Overall survey index (by biomass) for the four surveys (by sex except for the Russian
survey) • Estimated maturity ogives (maturity at length in the population) for 1992—2014 (by
sex) Note that no age data are used in tuning the model. Although age readings are available for some years there is not a full agreement on which age-reading methodology should be used, and these data are thus not suitable for inclusion in an assessment model yet.
Concerning the recruitment, it should be noted that age 1 is the age for recruitment to the stock, NOT the age for recruitment to the fishery, which is the quantity normally used to describe re-cruitment. But since age 1 recruitment is the quantity estimated by the model and the age of recruitment to the fishery can’t be defined due to lack of age data, we use age 1 as the recruitment age for this stock. Even if adequate age data were available, the strong sexual dimorphism in growth would make it very difficult to define an appropriate recruitment age to the fishery.
8.5 Results of the Assessment The assessment is conducted every two years and advice was given in 2019 for catches in 2020 and 2021. Model results are shown in Figures 8.16 and 8.17, and Table 8.14. The stock abundance and biomass are presented for fish larger than 45 cm, this corresponds to the minimum legal size and is slightly larger than L50 maturity for males. Both 45 cm+ abundance and biomass peaks around 2013-2014 and show a slow downward trend since then. There is a retrospective trend to reduce the stock estimate over time. However, the last 4 years of the retrospective for the 45cm+ biomass are very consistent (Figure 8.18). The modeled recruitment is spiky (Figure 8.17), and this is likely exaggerated due to the lack of age data. However, although the real recruitment is likely more spread out, the modeled peaks show reasonably good agreement to the data from the juvenile survey. This stock is dominated by sporadic recruitment events, and the model does a reasonable job of capturing this. The model has been consistently estimating reasonably good recruitment in 2009-2010, which should be entering the fishery in the coming years.
8.5.1 Biological reference points The last observed year with good recruitment occurred in 1995 at 487 000 tonnes of fishable (45+ cm) biomass. There is evidence (in the estimated initial population for the assessment model) that an earlier good recruitment event occurred in the 1980s from lower biomass, but the exact biomass level is unknown as this is before the model period. The precautionary reference point is therefore taken at 487 000 tonnes, with a note that this is likely to be on the high (precau-tionary) side. Using 45+ cm biomass (rather than total or female SSB) avoids uncertainty around maturation sizes and the different distributions of males and females, and relates directly to the fishable stock, but does not directly relate to the most vulnerable or critical female SSB.
8.5.2 NEA Greenland halibut surplus production models Results of the assessment of the Barents Sea Greenland halibut stock based on a Bayesian surplus production model was provided by Bakanev in 2013, (WKBUT WD 14). Different sets of abun-dance indices were used for tuning the model. The analysis of model run results has shown that K is estimated within the range of 810 to 1139 kilotonnes, BMSY of 405 to 570 kilotonnes and MSY of 23 to 47 kilotonnes. However, the model was sensitive to the choice of prior on K. Taking into consideration a high probability of the stock size being at the level which was quite a bit above BMSY, the risk of the biomass being below this optimal one was very small in 2002–2012 (<1%). The risk analysis of the stock size in the prediction years (2013–2020) under the catch of 0 to

ICES | AFWG 2020 | 421
30 kilotonnes indicated that the probability of the stock size being under the threshold levels (BMSY, Blim) was also minor (less than 1%). It was concluded that further work was needed on the historical CPUE series. Based on scrutiny of the CPUE series it was recommended to examine runs with the surplus production model for the period 1964—1991 and 1964—2005, in addition to runs for the whole 1964—2013 period. Fisheries CPUE series were considered less reliable to reflect stock dynamics than survey indices in the period after regulations of the fishery were introduced in 1992. The Bayesian surplus model was not updated for presentation at the current meeting.
A production model was presented to the 2016 meeting (Mikhaylov, 2016, WD 14), although this model has not been reviewed at a benchmark, nor were biomass trends presented at this meeting. The model has been proposed as a possible method for estimation of long-term reference points. An update was presented to the 2019 meeting (Mikhaylov 2019, AFWG 2019 WD21). In the cur-rent version, the MSY would be around 34 ktonnes, the BMSY around 500 ktonnes and FMSY on the level 0.069. It should be noted that these values are not directly transferable to a different model with different biomass levels and in any case a long-term average. The WD concludes that, in general, the stock can withstand the current fishing load and the fishing regime is ap-proaching optimum, indicating that the results of the exploratory surplus production model are in general alignment with the assessment and advice presented here.
FMSY is not appropriate to this stock given the recent extended run of poor recruitment, and such values have not been evaluated for precautionarity. In a plenary, it was concluded that it would be useful for further development of the production model to conduct separate exploratory runs for CPUE split into before and after 1992 and run with CPUE only before 1992 and survey data after 1992. This production model was not updated for presentation at the current meeting.
At the 2018 meeting, AFWG results from SPiCT production model were presented (AFWG report 2018). In the run that is presented in this report, all available data up to 2016 were used. For run with default priors applied K = 995 421 t and deterministic reference points were BMSY = 419 955 t, F = 0.07 and MSY = 29 742 t. Stochastic reference points for this run were in a similar range. Run with default priors deactivated gives similar MSY estimate but otherwise rather different esti-mates; K = 2 504 006, BMSY = 609 410 t, F = 0.05 and MSY = 28 097 t. Further utilization of this ap-proach demands closer scrutiny of model settings in relation to diagnostics. The SPiCT model can be a flexible tool to examine production model approach to Greenland halibut, however, concerns highlighted below still apply.
In principle, a production model could be used in conjunction with the GADGET assessment model in order to extend the simulations back in time and provide better estimates for Blim. How-ever, the inability of production models to follow variable recruitment, and especially runs of above or below average recruitment, limits their ability to give advice for this stock.
In the benchmark report (IBPHALI 2015) Table 3.3 gives CPUE series and survey estimates that can be helpful for this task (Figure 8.15).
8.6 Comments to the assessment
The draft advice sheet was rejected by ADGANW and a roll-over advice was used for advice in 2020. ADGANW issued a request to repeat the advice process in 2020 with HRpa reference points for use in the 2021 advice (ICES 2017). A working document (Howel 2020, WD 15) was presented to address the definition of a HRpa for the stock. However, due to the need for a simplified approach related to the 2020 corona virus outbreak ACOM decided, in agreement with Advice Requestors, that roll-over advice should be used in 2020 to provide advice on fishing opportuni-ties in 2021.

422 | ICES SCIENTIFIC REPORTS 2:52 | ICES
The ongoing reduction in sex-split length samples in two survey indices, EcoJuv and EcoSouth required a change in methodology for computing the tuning indices used in the assessment. The change was implemented in the 2019 assessment. This increased the absolute biomass estimates by about 10% but did not affect the trend in biomass through years. This change has also acted to reduce the retrospective pattern differences in recent years, likely as a result of the model no longer chasing noise in the data. We stress once again that the absolute biomass levels for this model are rather uncertain. Without age data in the model tuning there is little information on total mortality (Z) at age (number-at-age x in year y minus number-at-age x-1 in year y-1 gives information on Z). Without this, there is little information for the model to translate catch infor-mation into F, and hence inform biomass levels. Furthermore, the conflicting survey signals translate into an uncertainty range of several hundred thousand tonnes (IBPHALI 2015). All the exploratory work suggests that the overall trends are robust, but that care should be taken in interpreting the absolute abundance estimates (and hence absolute estimates of harvest rate).
Although there is little retrospective pattern differences over the last four years, the model ex-hibits a retrospective pattern in earlier years associated with the biomass peak around 2014 (Fig-ure 8.18). The two coastal shelf surveys (the ecosystem survey and the Russian survey) showed a more rapid rise than the other surveys, and then a more rapid reduction. The Russian survey had a very rapid rise and then a rapid decline. The model, therefore, had a series of downward revisions as the peak was passed, where the model now estimates that it had previously been over-optimistic about the size of the peak. It should be noted (ICES IBPHALI REPORT 2015; ICES CM 2015\ACOM:54) that there is an issue with this stock where different surveys give different signals and choosing one survey over the others could affect the biomass level by several hun-dred thousand tonnes. Given this, a retrospective pattern is probably to be expected as the dif-ferent surveys evolve. Note also that one of the surveys is run every two years (in odd-numbered years), this accounts for the grouping of lines in the retrospective pattern into pairs.
To facilitate the calculation of spawning-stock biomass, maturity ogives from the Norwegian Slope survey were derived for years 1994–2015. These ogives give approximately identical length at 50% maturation (L50) for males compared L50 based on Russian fisheries data (Figures 8.19-8.22). L50 for females is higher in the Norwegian data due to new definition on when females are considered mature/immature in accordance to recent research (Kennedy et al., 2009, 2011 and 2014, Nunez et al., 2015). GLM fitted ogives can be used in future assessments.
Future work Further development of the assessment is needed and, in consistency with conclusions of the IBPHALI benchmark and report of the external benchmark reviewer.
AFWG suggest a new benchmark on the stock in 2022, and intersessional work will commence on a possible issues list. Such a benchmark, especially if it can extend the model back in time to a period of lower stock biomass, would allow a more accurate determination of precautionary biomass reference points. It would, therefore, be a precursor to a potential MSE to generate an HCR for this stock and move away from precautionary advice.
At ADGANW 2019 it was suggested that an inter benchmark process should be undertaken where a simple Fmsy proxy is developed as well as Btrigger, or failing that a Fpa to provide precau-tionary advice.
The working document ( Howel 2020, WD 15) proposed an interim HRpa (harvest rate pa) until such time as the stock next undergoes a full benchmark followed by a HCR evaluation to come with a full management plan for this stock. Ideally, such a benchmark would take place in 2022.
The HRpa is based on the method proposed in the 2017 ICES fisheries management reference points for category 1 and 2 stocks (ICES 2017). This method involved projecting the stock forward

ICES | AFWG 2020 | 423
under average recruitment to identify the fishing level Flim that drives the stock to Blim under equilibrium. This method was chosen because the lack of age tuning data makes the variability of recruitment unreliable, and using averages is a more robust approach. There is a modification to allow for the fact that in light of the lack of contrast in the data this stock has Bpa set equal to Blim, and hence the method gives HRpa directly, and there is no need to first compute an HRlim and then adjust this for an HRpa. In using this approach it is necessary to select the recruitment average to use, and the method chosen was to use the full-time series of recruitment, but exclud-ing the extra high peak in 2003, with the justification that such a recruitment peak has not been repeated since and therefore this level of recruitment cannot be expected to enter the fishery in the coming years.
The overall proposal from the WD is: The proposed HRpa for Greenland halibut in areas 1 and 2 is 0.035, with the provison that if a large recruitment event is observed in the surveys then the HRpa should be revised before the incoming good recruitment entering the fishery.
This solution for HRpa, if accepted by ACOM, would apply until a suggested benchmark. The meeting decided to revisit this at the 2021 AFWG meeting, to consider the use of this HRpa in advice for 2022 and 2023.
Further work on biological reference points is a topic to be addressed towards a benchmark.
Table 8.1. GREENLAND HALIBUT in Subareas 1 and 2. Nominal Catch (t) by countries (Subarea 1, Divisions 2a, and 2b combined) as officially reported to ICES.
Year
Denm
ark
Esto
nia
Faro
e Is
land
s
Fran
ce
Fed.
Rep
. Ger
man
y
Gre
enla
nd
Icel
and
Irela
nd
Latv
ia
Lith
uani
a
Nor
way
Pola
nd
Port
ugal
Russ
ia3
Spai
n
GB
UK
(Eng
l. &
Wal
es)
UK
(Sco
t lan
d)
Tota
l
1984 0 0 0 138 2 165 0 0 0 0 0 4 376 0 0 15 181 0 0 23 0 21 883
1985 0 0 0 239 4 000 0 0 0 0 0 5 464 0 0 10 237 0 0 5 0 19 945
1986 0 0 42 13 2 718 0 0 0 0 0 7 890 0 0 12 200 0 0 10 2 22 875
1987 0 0 0 13 2 024 0 0 0 0 0 7 261 0 0 9 733 0 0 61 20 19 112
1988 0 0 186 67 744 0 0 0 0 0 9 076 0 0 9 430 0 0 82 2 19 587
1989 0 0 67 31 600 0 0 0 0 0 10 622 0 0 8 812 0 0 6 0 20 138
1990 0 0 163 49 954 0 0 0 0 0 17 243 0 0 4 764 0 0 10 0 23 183
1991 11 2 564 314 119 101 0 0 0 0 0 27 587 0 0 2 490 132 0 0 2 33 320
1992 0 0 16 111 13 13 0 0 0 0 7 667 0 31 718 23 0 10 0 8 602
1993 2 0 61 80 22 8 56 0 0 30 10 380 0 43 1 235 0 0 16 0 11 933
1994 4 0 18 55 296 3 15 5 0 4 8 428 0 36 283 1 0 76 2 9 226
1995 0 0 12 174 35 12 25 2 0 0 9 368 0 84 794 1106 0 115 7 11 734
1996 0 0 2 219 81 123 70 0 0 0 11 623 0 79 1 576 200 0 317 57 14 347
1997 0 0 27 253 56 0 62 2 0 0 7 661 12 50 1 038 157 0 67 25 9 410

424 | ICES SCIENTIFIC REPORTS 2:52 | ICES
Year
Denm
ark
Esto
nia
Faro
e Is
land
s
Fran
ce
Fed.
Rep
. Ger
man
y
Gre
enla
nd
Icel
and
Irela
nd
Latv
ia
Lith
uani
a
Nor
way
Pola
nd
Port
ugal
Russ
ia3
Spai
n
GB
UK
(Eng
l. &
Wal
es)
UK
(Sco
t lan
d)
Tota
l
1998 0 0 57 67 34 0 23 2 0 0 8 435 31 99 2 659 259 0 182 45 11 893
1999 0 0 94 0 34 38 7 2 0 0 15 004 8 49 3 823 319 0 94 45 19 517
2000 0 0 0 45 15 0 16 1 0 0 9 083 3 37 4 568 375 0 111 43 14 297
2001 0 0 0 122 58 0 9 1 0 0 10 896 2 35 4 694 418 0 100 30 16 365
2002 0 219 0 7 42 22 4 6 0 0 7 143 5 14 5 584 178 0 41 28 13 293
2003 0 0 459 2 18 14 0 1 0 0 8 216 5 19 4 384 230 0 41 58 13 447
2004 0 0 0 0 9 0 9 0 0 0 13 939 1 50 4 662 186 0 43 0 18 899
2005 0 170 0 32 8 0 0 0 0 0 13 011 0 23 4 883 660 0 29 18 18 834
2006 0 0 204 46 8 0 8 0 0 196 11 119 201 26 6055 29 0 10 2 17 904
2007 0 0 203 41 8 198 15 0 0 0 8230 200 47 6484 8 0 11 8 15 453
2008 0 0 663 42 5 0 28 0 0 0 7393 201 46 5294 94 0 16 10 13 792
2009 0 0 422 16 19 16 15 2 0 0 8 446 204 237 3 335 210 0 9 60 12 990
2010 0 0 272 102 14 15 16 0 0 0 7 700 3 11 6 888 182 0 4 22 15 229
2011 0 0 538 46 80 4 7 0 0 234 8 270 169 21 7 053 144 0 36 4 16 606
2012 0 0 564 40 40 12 13 0 0 0 9 331 22 1 10 041 190 0 21 14 20 288
2013 0 0 783 168 49 22 106 1 0 0 10 403 30 7 10 310 196 0 17 75 22 167
2014 0 0 887 269 33 20 86 0 0 0 11 232 19 0 10 061 206 0 28 184 23 025
2015 0 0 312 227 33 14 53 0 0 5 10 874 13 1 12 953 159 0 25 79 24 748
2016 0 359 483 229 9 17 79 0 0 0 12 932 8 19 10 576 198 0 20 19 24 948
2017 0 523 917 177 21 26 10 0 1 72 13 741 27 13 10 714 56 0 83 0 26 380
2018* 2 574 409 150 51 32 0 0 4 177 14 874 27 6 12 072 60 108 0 0 28 544
2019* 0 588 350 105 44 23 9 0 32 377 14 813 122 8 12 198 87 75 0 0 28 832
* Provisional figures.

ICES | AFWG 2020 | 425
Table 8.2. GREENLAND HALIBUT in Subareas 1 and 2. Nominal catch (t) by countries in Subarea 1 as officially reported to ICES.
Year
Esto
nia
Faro
e Is
land
s
Fed.
Rep
. Ger
man
y
Fran
ce
Latv
ia
Lith
uani
a
Gre
enla
nd
Icel
and
Irela
nd
Nor
way
Pola
nd
Port
ugal
Russ
ia3
Spai
n
GB
UK
(Eng
land
&
Wal
es)
UK
(Sco
t lan
d)
Tota
l
1984 0 0 0 0 0 0 0 0 0 593 0 0 81 0 0 17 0 691
1985 0 0 0 0 0 0 0 0 0 602 0 0 122 0 0 1 0 725
1986 0 0 1 0 0 0 0 0 0 557 0 0 615 0 0 5 1 1 179
1987 0 0 2 0 0 0 0 0 0 984 0 0 259 0 0 10 0 1 255
1988 0 9 4 0 0 0 0 0 0 978 0 0 420 0 0 7 0 1 418
1989 0 0 0 0 0 0 0 0 0 2 039 0 0 482 0 0 0 0 2 521
1990 0 7 0 0 0 0 0 0 0 1 304 0 0 321 0 0 0 0 1 632
1991 164 0 0 0 0 0 0 0 0 2 029 0 0 522 0 0 0 0 2 715
1992 0 0 0 0 0 0 0 0 0 2 349 0 0 467 0 0 0 0 2 816
1993 0 32 0 0 0 0 0 56 0 1 754 0 0 867 0 0 0 0 2 709
1994 0 17 217 0 0 0 0 15 0 1 165 0 0 175 0 0 0 0 1 589
1995 0 12 0 0 0 0 0 25 0 1 352 0 0 270 84 0 0 0 1 743
1996 0 2 0 0 0 0 0 70 0 911 0 0 198 0 0 0 0 1 181
1997 0 15 0 0 0 0 0 62 0 610 0 0 170 0 0 0 0 857
1998 0 47 0 0 0 0 0 23 0 859 0 0 491 0 0 2 0 1 422
1999 0 91 0 0 0 0 13 7 0 1 101 0 0 1 203 0 0 0 0 2 415
2000 0 0 0 0 0 0 0 16 0 1 021 0 0 1 169 0 0 0 0 2 206
2001 0 0 0 0 0 0 0 9 0 925 0 0 951 0 0 2 0 1 887
2002 0 0 3 0 0 0 0 0 0 834 0 0 1 167 0 0 0 0 2 004
2003 0 48 0 0 0 0 2 0 1 962 1 0 735 0 0 0.3 0 1 749
2004 0 0 0 0 0 0 0 0.3 0 866 0 0 633 0 0 3 0 1 503
2005 0 0 0 1 0 0 0 0 0 572 0 0 595 0 0 3 0 1 171
2006 0 17 1 0 0 0 0 1 0 575 0 0 626 2 0 2 0 1 224
2007 0 18 0 1 0 0 198 3 0 514 0 3 438 0 0 4 0 1 179
2008 0 13 0 1 0 0 0 5 0 599 0 0 390 0 0 0 0 1 008
2009 0 33 0 0 0 0 16 5 0 734 0 0 483 0 0 1 0 1 272

426 | ICES SCIENTIFIC REPORTS 2:52 | ICES
Year
Esto
nia
Faro
e Is
land
s
Fed.
Rep
. Ger
man
y
Fran
ce
Latv
ia
Lith
uani
a
Gre
enla
nd
Icel
and
Irela
nd
Nor
way
Pola
nd
Port
ugal
Russ
ia3
Spai
n
GB
UK
(Eng
land
&
Wal
es)
UK
(Sco
t lan
d)
Tota
l
2010 0 15 0 0 0 0 0 16 0 659 0 0 708 2 0 0 0 1 399
2011 0 63 0 0 0 0 0 6 0 867 0 0 782 0 0 0 0 1 718
2012 0 8 5 0 0 0 0 7 0 921 0 0 1 368 1 0 7 0 2 318
2013 0 39 1 8 0 0 0 100 0 1 055 4 0 1 442 4 0 8 0 2 661
2014 0 143 8 11 0 0 19 38 0 1 271 7 0 1 261 10 0 14 0 2 782
2015 0 96 14 3 0 5 12 47 0 1 424 5 0 1 681 8 0 4 0 3 299
2016 353 84 2 3 0 0 3 38 0 1 265 7 0 1 172 7 0 20 0 2 954
2017 519 125 4 4 1 72 2 8 0 1 389 9 1 1 124 13 0 21 0 3 293
2018* 574 111 9 6 0 169 2 0 0 1 008 4 1 1 083 2 97 0 0 3 076
2019* 588 116 27 9 32 377 6 6 0 939 119 0 932 16 49 0 0 3 216
* Provisional figures.

ICES | AFWG 2020 | 427
Table 8.3. GREENLAND HALIBUT in Subareas 1 and 2. Nominal catch (t) by countries in Division 2a as officially reported to ICES.
Year
Esto
nia
Faro
e Is
land
s
Fed.
Rep
. Ger
m.
Fran
ce
Lith
uani
a
Gre
enla
nd
Irela
nd
Icel
and
Nor
way
Pola
nd
Port
ugal
Russ
ia5
Spai
n
GB
UK
(Eng
l. &
W
ales
)
UK
(Sco
t-la
nd)
Tota
l
1984 0 0 265 138 0 0 0 0 3 703 0 0 5 459 0 0 1 0 9 566
1985 0 0 254 239 0 0 0 0 4 791 0 0 6 894 0 0 2 0 12 180
1986 0 6 97 13 0 0 0 0 6 389 0 0 5 553 0 0 5 1 12 064
1987 0 0 75 13 0 0 0 0 5 705 0 0 4 739 0 0 44 10 10 586
1988 0 177 150 67 0 0 0 0 7 859 0 0 4 002 0 0 56 2 12 313
1989 0 67 104 31 0 0 0 0 8 050 0 0 4 964 0 0 6 0 13 222
1990 0 133 12 49 0 0 0 0 8 233 0 0 1 246 0 0 1 0 9 674
1991 1 400 314 21 119 0 0 0 0 11 189 0 0 305 0 0 0 1 13 349
1992 0 16 1 108 0 13 0 0 3 586 0 15 58 0 0 1 0 3 798
1993 0 29 14 78 0 8 0 0 7 977 0 17 210 0 0 2 0 8 335
1994 0 0 33 47 0 3 4 0 6 382 0 26 67 0 0 14 0 6 576
1995 0 0 30 174 0 12 2 0 6 354 0 60 227 0 0 83 2 6 944
1996 0 0 34 219 0 123 0 0 9 508 0 55 466 4 0 278 57 10 744
1997 0 0 23 253 0 0 0 0 5 702 0 41 334 1 0 21 25 6 400
1998 0 0 16 67 0 0 1 0 6 661 0 80 530 5 0 74 41 7 475
1999 0 0 20 0 0 25 2 0 13 064 0 33 734 1 0 63 45 13 987
2000 0 0 10 43 0 0 0 0 7 536 0 18 690 1 0 65 43 8 406
2001 0 0 49 122 0 0 1 9 8 740 0 13 726 5 0 56 30 9 751
2002 0 0 9 7 0 22 0 4 5 877 0 3 849 0 0 12 28 6 811
2003 0 390 5 2 0 12 0 0 6 713 0 10 1 762 14 0 5 58 8 971
2004 0 0 4 0 0 0 0 9 11 704 0 24 810 4 0 1 0 12 556
2005 0 0 3 31 0 0 0 0 11 216 0 11 1 406 0 0 5 18 12 690
2006 0 175 0 38 0 0 0 7 8 897 0 6 950 0 0 6 2 10 081
2007 0 162 2 37 0 0 0 12 6 761 0 2 489 1 0 2 8 7 475
2008 0 646 4 38 0 0 0 23 5 566 1 1 1 170 0 0 6 10 7 465
2009 0 379 0 13 0 0 0 10 6 456 0 9 1 531 0 0 0 60 8 459

428 | ICES SCIENTIFIC REPORTS 2:52 | ICES
Year
Esto
nia
Faro
e Is
land
s
Fed.
Rep
. Ger
m.
Fran
ce
Lith
uani
a
Gre
enla
nd
Irela
nd
Icel
and
Nor
way
Pola
nd
Port
ugal
Russ
ia5
Spai
n
GB
UK
(Eng
l. &
W
ales
)
UK
(Sco
t-la
nd)
Tota
l
2010 0 255 0 102 0 15 0 0 6 426 0 0 4 757 0 0 0 22 11 577
2011 0 467 0 45 0 4 0 1 6 637 0 0 3 643 2 0 0 4 10 803
2012 0 553 0 37 0 12 0 6 7 934 0 0 3 878 0 0 0 14 12 434
2013 0 739 0 150 0 22 0 6 8 215 0 2 4 143 0 0 0 75 13 352
2014 0 741 0 255 0 1 0 48 8 640 0 0 4 800 0 0 0 184 14 669
2015 0 215 2 221 0 2 0 6 8 166 0 1 3 691 0 0 0 79 12 383
2016 6 380 6 216 0 14 0 41 10 073 0 6 1 797 7 0 0 19 12 566
2017 0 773 0 161 0 20 0 2 10 122 0 7 1 852 1 0 16 0 12 955
2018* 0 297 1 104 1 21 0 0 11 255 2 5 1 399 0 5 0 0 13 092
2019* 0 232 15 95 0 16 0 4 12 121 3 7 2 755 3 12 0 0 15 263
* Provisional figures.

ICES | AFWG 2020 | 429
Table 8.4. GREENLAND HALIBUT in Subareas 1 and 2. Nominal catch (t) by countries in Division 2b as officially reported to ICES.
Year
Den
mar
k
Esto
nia
Faro
e Is
land
s
Fran
ce
Fed.
rep.
Ger
m.
Gre
enla
nd
Irela
nd
Latv
ia
Lith
uani
a
Nor
way
Pola
nd
Port
ugal
Russ
ia4
Spai
n
GB
UK
(Eng
l. &
W
ales
)
UK
(Sco
t lan
d)
Tota
l
1984 0 0 0 0 1 900 0 0 0 0 80 0 0 9 641 0 0 5 0 11 626
1985 0 0 0 0 3 746 0 0 0 0 71 0 0 3 221 0 0 2 0 7 040
1986 0 0 36 0 2 620 0 0 0 0 944 0 0 6 032 0 0 0 0 9 632
1987 0 0 0 0 1 947 0 0 0 0 572 0 0 4 735 0 0 7 10 7 271
1988 0 0 0 0 590 0 0 0 0 239 0 0 5 008 0 0 19 0 5 856
1989 0 0 0 0 496 0 0 0 0 533 0 0 3 366 0 0 0 0 4 395
1990 0 0 23 0 942 0 0 0 0 7 706 0 0 3 197 0 0 9 0 11 877
1991 11 1 000 0 0 80 0 0 0 0 14 369 0 0 1 663 132 0 0 1 17 256
1992 0 0 0 3 12 0 0 0 0 1 732 0 16 193 23 0 9 0 1 988
1993 2 0 0 2 8 0 0 0 30 649 0 26 158 0 0 14 0 889
1994 4 0 1 8 46 0 1 0 4 881 0 10 41 1 0 62 2 1 061
1995 0 0 0 0 5 0 0 0 0 1 662 0 24 297 1022 0 32 5 3 047
1996 0 0 0 0 47 0 0 0 0 1 204 0 24 912 196 0 39 0 2 422
1997 0 0 12 0 33 0 2 0 0 1 349 12 9 534 156 0 46 0 2 153
1998 0 0 10 0 18 0 1 0 0 915 31 19 1 638 254 0 106 4 2 996
1999 0 0 3 0 14 0 0 0 0 839 8 16 1 886 318 0 31 0 3 115
2000 0 0 0 2 5 0 1 0 0 526 3 19 2 709 374 0 46 0 3 685
2001 0 0 0 0 9 0 0 0 0 1 231 2 22 3 017 413 0 42 0 4 736
2002 0 219 0 0 30 0 6 0 0 432 5 11 3 568 178 0 29 0 4 478
2003 0 0 21 0 13 0 0 0 0 541 4 9 1 887 216 0 35 0 2 726
2004 0 0 0 0 5 0 0 0 0 1 369 1 26 3 219 182 0 39 0 4 840
2005 0 170 0 0 5 0 0 0 0 1 223 0 12 2 882 660 0 21 0 4 973
2006 0 0 12 8 7 0 0 0 196 1 647 201 20 4 479 27 0 2 0 6 600
2007 0 0 23 3 6 0 0 0 0 955 200 45 5 557 7 0 5 0 6 801
2008 0 0 4 3 1 0 0 0 0 1 228 200 45 3 734 94 0 10 0 5 319
2009 0 0 10 3 19 0 2 0 0 1 256 204 228 1 321 210 0 8 0 3 260

430 | ICES SCIENTIFIC REPORTS 2:52 | ICES
2010 0 0 2 0 14 0 0 0 0 615 3 11 1 423 180 0 4 0 2 252
2011 0 0 8 1 80 0 0 0 234 766 169 21 2 628 142 0 36 0 4 085
2012 0 0 2 3 35 0 0 0 0 476 22 1 4 795 189 0 14 0 5 537
2013 0 0 5 10 48 0 1 0 0 1 133 26 5 4 725 192 0 9 0 6 154
2014 0 0 3 3 25 0 0 0 0 1 321 12 0 4 000 196 0 14 0 5 574
2015 0 0 1 3 17 0 0 0 0 1 284 8 0 7 581 151 0 21 0 9 066
2016 2 0 19 10 1 0 0 0 0 1 594 1 13 7 608 183 0 0 0 9 431
2017 0 4 19 12 17 3 0 0 0 2 230 17 5 7 737 42 0 46 0 10 132
2018* 2 0 1 30 40 9 0 4 6 2 611 21 0 9 590 58 6 0 0 12 376
2019* 0 0 2 1 2 1 0 0 0 1 753 0 1 8 511 68 14 0 0 10 353
* Provisional figures.

ICES | AFWG 2020 | 431
Table 8.5. GREENLAND HALIBUT in Subareas 1 and 2. Landings by gear (tonnes). Approximate figures, the total may differ slightly from Table 8.1.
Year Gillnet Longline Trawl Danish seine Other
1980 1 189 336 11 759 - -
1981 730 459 13 829 - -
1982 748 679 15 362 - -
1983 1 648 1 388 19 111 - -
1984 1 200 1 453 19 230 - -
1985 1 668 750 17 527 - -
1986 1 677 497 20 701 - -
1987 2 239 588 16 285 - -
1988 2 815 838 15 934 - -
1989 1 342 197 18 599 - -
1990 1 372 1 491 20 325 - -
1991 1 904 4 552 26 864 - -
1992 1 679 1 787 5 787 - -
1993 1 497 2 493 7 889 - -
1994 1 403 2 392 5 353 - -
1995 1 500 4 034 5 494 - -
1996 1 480 4 616 7 977 - -
1997 998 3 378 5 198 - -
1998 1 327 7 395 6 664 - -
1999 2 565 6 804 10 177 - -
2000 1 707 5 029 7 700 - -
2001 2 041 6 303 7 968 - -
2002 1 737 5 309 6 115 - -
2003 2 046 5 483 6 049 - -
2004 2 290 7 135 8 778 599 -
2005 1 842 7 539 9 420 447 -
2006 1 503 6 146 10 042 205 -
2007 997 4 503 9 618 119 -

432 | ICES SCIENTIFIC REPORTS 2:52 | ICES
Year Gillnet Longline Trawl Danish seine Other
2008 901 3 575 9 285 9 8
2009 1 409 4 952 6 583 34 18
2010 1 449 5 427 8 165 170 10
2011 1 583 5 039 9 351 239 15
2012 1 929 5 602 12 130 413 5
2013 2 398 5 805 13 791 176 0
2014 2 647 6 166 13 673 183 0
2015 2 508 6 287 15 445 489 18
2016 2 646 7 290 14 333 650 304
2017 2 677 7 221 15 774 679 29
2018* 3 021 6 542 17 367 842 20
2019* 3 323 7 028 17 046 1 119 0
Table 8.6. GREENLAND HALIBUT in Subareas 1 and 2. Catch per unit of effort and total effort.
Year USSR
catch/hour trawling (t)
Norway10
catch/hour trawling (t)
Average CPUE
Total ef-fort (in '000 hrs
trawling)5
CPUE 7+6
GDR7
(catch/day tonnage (kg)
RT1 PST2 A8 B9 A3 B4
1965
0.80
-
- - 0.80 - - - -
1966
0.77
-
- - 0.77 - - - -
1967
0.70
-
- - 0.70 - - - -
1968
0.65
-
- - 0.65 - - - -
1969
0.53
-
- - 0.53 - - - -
1970
0.53
-
- - 0.53 - 169 0.50 -
1971
0.46
-
- - 0.46 - 172 0.43 -
1972
0.37
-
- - 0.37 - 116 0.33 -
1973
0.37
-
0.34 - 0.36 - 83 0.36 -
1974
0.40
-
0.36 - 0.38 - 100 0.36 -
1975
0.39
0.51
0.38 - 0.39 0.45 99 0.37 -
1976
0.40
0.56
0.33 - 0.37 0.45 100 0.34 -

ICES | AFWG 2020 | 433
Year USSR
catch/hour trawling (t)
Norway10
catch/hour trawling (t)
Average CPUE
Total ef-fort (in '000 hrs
trawling)5
CPUE 7+6
GDR7
(catch/day tonnage (kg)
RT1 PST2 A8 B9 A3 B4
1977
0.27
0.41
0.33 - 0.30 0.37 96 0.26 -
1978
0.21
0.32
0.21 - 0.21 0.27 123 0.17 -
1979
0.23
0.35
0.28 - 0.26 0.32 67 0.19 -
1980
0.24
0.33
0.32 - 0.28 0.33 47 0.25 -
1981
0.30
0.36
0.36 - 0.33 0.36 42 0.28 -
1982
0.26
0.45
0.41 - 0.34 0.43 39 0.37 -
1983
0.26
0.40
0.35 - 0.31 0.38 58 0.32 -
1984
0.27
0.41
0.32 - 0.30 0.37 59 0.30 -
1985
0.28
0.52
0.37 - 0.33 0.45 44 0.37 -
1986
0.23
0.42
0.37 - 0.30 0.40 57 0.32 -
1987
0.25
0.50
0.35 - 0.30 0.43 44 0.35 -
1988
0.20
0.30
0.31 - 0.26 0.31 63 0.26 4.26
1989
0.20
0.30
0.26 - 0.23 0.28 73 0.19 2.95
1990
-
0.20
0.27 - - 0.24 95 0.16 1.66
1991
-
-
0.24 - - - 134 0.18 -
1992
-
-
0.46 0.72 - - 20 0.29 -
1993
-
-
0.79 1.22 - - 15 0.65 -
1994
-
-
0.77 1.27 - - 11 0.70 -
1995
-
-
1.03 1.48 - - - - -
1996
-
-
1.45 1.82 - - - - -
1997
0.71
-
1.23 1.60 - - - - -
1998
0.71
-
0.98 1.35 - - - - -
1999
0.84
-
0.82 1.77 - - - - -
2000
0.94
-
1.38 1.92 - - - - -
2001
0.82 11 -
1.18 1.57 - - - - -
2002
0.85
-
1.07 1.82 - - - - -
2003
0.97 12 -
0.86 2.45 - - - - -

434 | ICES SCIENTIFIC REPORTS 2:52 | ICES
Year USSR
catch/hour trawling (t)
Norway10
catch/hour trawling (t)
Average CPUE
Total ef-fort (in '000 hrs
trawling)5
CPUE 7+6
GDR7
(catch/day tonnage (kg)
RT1 PST2 A8 B9 A3 B4
2004
0.63 13 -
1.16 1.79 - - - - -
2005
0.61 12 -
1.30 2.29 - - - - -
2006
0.57 12 -
0.96 2.09 - - - - -
2007
0.64 12 -
- - - - - - -
2008
0.48 12 -
- - - - - - -
2009
0.77 13 -
- - - - - - -
2010
1.57 12 - - - - - - -
2011
2.32 12
2012
2.06 12
2013
2.25 12
2014
2.52 12
1 Side trawlers, 800–1000 hp. From 1983 onwards, stern trawlers (SRTM), 1000 hp. From 1997 based on research fishing. 2 Stern trawlers, up to 2000 HP. 3 Arithmetic average of CPUE from USSR RT (or SRTM trawlers) and Norwegian trawlers. 4 Arithmetic average of CPUE from USSR PST and Norwegian trawlers. 5 For the years 1981–1990, based on average CPUE type B. For 1991–1993, based on the Norwegian CPUE, type A. 6 Total catch (t) of seven years and older fish divided by total effort. 7 For the years 1988–1989, frost-trawlers 995 BRT (FAO Code 095). For 1990, factory trawlers FVS IV, 1943 BRT (FAO Code 090). 8 Norwegian trawlers, ISSCFV-code 07, 250–499.9 GRT. 9 Norwegian factory trawlers, ISSCFV-code 09, 1000-1999.9 GRT 10 From 1992 based on research fishing. 1992–1993: two weeks in May/June and October; 1994–1995: 10 days in May/June 11 Based on fishery from April-October only, a period with relatively low CPUE. In previous years fishery was carried out throughout the whole year. 12 Based on fishery from October-December only, a period with relatively high CPUE. 13 Based on fishery from October-November only.

ICES | AFWG 2020 | 435
Table 8.7. GREENLAND HALIBUT in Subareas 1 and 2. Catch history back to 1935. Note two year columns.
Year Norway Russia Others Total Year Norway Russia Others Total
1935 1 534 n/a - 1 534 1979 2 843 10 311 4 088 17 312
1936 830 n/a - 830 1980 3 157 7 670 2 457 13 284
1937 616 n/a - 616 1981 4 201 9 276 1 541 15 018
1938 329 n/a - 329 1982 3 206 12 394 1 189 16 789
1939 459 n/a - 459 1983 4 883 15 152 2 112 22 147
1940 846 n/a - 846 1984 4 376 15 181 2 326 21 883
1941 1 663 n/a - 1 663 1985 5 464 10 237 4 244 19 945
1942 955 n/a - 955 1986 7 890 12 200 2 785 22 875
1943 824 n/a - 824 1987 7 261 9 733 2 118 19 112
1944 678 n/a - 678 1988 9 076 9 430 1 081 19 587
1945 1 148 n/a - 1 148 1989 10 622 8 812 704 20 138
1946 1 337 25 - 1 362 1990 17 243 4 764 1 176 23 183
1947 1 409 28 - 1 437 1991 27 587 2 490 3 243 33 320
1948 1 877 110 - 1 987 1992 7 667 718 217 8 602
1949 198 177 - 375 1993 10 380 1235 318 11 933
1950 1 853 221 - 2 074 1994 8 428 283 515 9 226
1951 2 438 423 - 2 861 1995 9 368 794 1 572 11 734
1952 2 576 377 - 2 953 1996 11 623 1 576 1 148 14 347
1953 2 208 393 - 2 601 1997 7 661 1 038 711 9 410
1954 3 674 416 - 4 090 1998 8 435 2 659 799 11 893
1955 3 010 290 - 3 300 1999 15 004 3 823 690 19 517
1956 3 493 446 - 3 939 2000 9 083 4 568 646 14 297
1957 4 130 505 - 4 635 2001 10 896 4 694 775 16 365
1958 2 931 1 261 - 4 192 2002 7 143 5 584 566 13 293
1959 4 307 3 632 - 7 939 2003 8 216 4 384 847 13 447
1960 6 662 4 299 - 10 961 2004 13 939 4 662 298 18 899
1961 7 977 3 836 - 11 813 2005 13 011 4 883 940 18 834
1962 11 600 1 760 - 13 360 2006 11 119 6 055 730 17 904
1963 11 300 3 240 - 14 540 2007 8 230 6 484 739 15 453

436 | ICES SCIENTIFIC REPORTS 2:52 | ICES
Year Norway Russia Others Total Year Norway Russia Others Total
1964 14 200 26 191 - 40 391 2008 7 393 5 294 1 105 13 792
1965 18 000 16 682 - 34 751 2009 8 446 3 335 1 210 12 990
1966 16 434 9 768 119 26 321 2010 7 700 6 888 641 15 229
1967 17 528 5 737 1 002 24 267 2011 8 270 7 053 1 283 16 606
1968 22 514 3 397 257 26 168 2012 9 331 10 041 916 20 288
1969 14 856 19 760 9 173 43 789 2013 10 403 10 310 1 454 22 167
1970 15 871 35 578 38 035 89 484 2014 11 232 10 061 1 732 23 025
1971 9 466 54 339 15 229 79 034 2015 10 874 12 953 921 24 748
1972 15 983 16 193 10 872 43 055 2016 12 932 10 576 1 440 24 948
1973 13 989 8 561 7 349 29 938 2017 13 741 10 714 1 925 26 380
1974 8 791 16 958 11 972 37 763 2018* 14 874 12 072 1 598 28 544
1975 4 858 20 372 12 914 38 172 2019* 14813 12 198 14 71 28 482
1976 6 005 16 580 13 469 36 074
1977 4 217 15 045 9 613 28 827
1978 4082 14 651 5884 24 617
* Provisional figures.

ICES | AFWG 2020 | 437
Table 8.8. GREENLAND HALIBUT in ICES Division 4a (North Sea). Nominal catch (t) by countries as officially reported to ICES. Not included in the assessment.
Year
Den
mar
k
Faro
e Is
land
s
Fran
ce
Ger
man
y
Gre
enla
nd
Irela
nd
Nor
way
Russ
ia
GB
UK
Engl
and
& W
ales
UK
Scot
land
Net
herla
nds
Tota
l
1973 0 0 0 4 0 0 9 8 0 28 0 0 49
1974 0 0 0 2 0 0 2 0 0 30 0 0 34
1975 0 0 0 1 0 0 4 0 0 12 0 0 17
1976 0 0 0 1 0 0 2 0 0 18 0 0 21
1977 0 0 0 2 0 0 2 0 0 8 0 0 12
1978 0 0 2 30 0 0 0 0 0 1 0 0 33
1979 0 0 2 16 0 0 2 0 0 1 0 0 21
1980 0 177 0 34 0 0 5 0 0 0 0 0 216
1981 0 0 0 0 0 0 7 0 0 0 0 0 7
1982 0 0 2 26 0 0 17 0 0 0 0 0 45
1983 0 0 1 64 0 0 89 0 0 0 0 0 154
1984 0 0 3 50 0 0 32 0 0 0 0 0 85
1985 0 1 2 49 0 0 12 0 0 0 0 0 64
1986 0 0 30 2 0 0 34 0 0 0 0 0 66
1987 0 28 16 1 0 0 35 0 0 0 0 0 80
1988 0 71 62 3 0 0 19 0 0 1 0 0 156
1989 0 21 14 1 0 0 197 0 0 5 0 0 238
1990 0 10 30 3 0 0 29 0 0 4 0 0 76
1991 0 48 291 1 0 0 216 0 0 2 0 0 558
1992 1 15 416 3 0 0 626 0 0 + 1 0 1 062
1993 1 0 78 1 0 0 858 0 0 10 + 0 948
1994 + 103 84 4 0 0 724 0 0 6 0 0 921
1995 + 706 165 2 0 0 460 0 0 52 283 0 1 668
1996 + 0 249 1 0 0 1 496 0 0 105 159 0 514
1997 + 0 316 3 0 0 873 0 0 1 162 0 1 355
1998 + 0 71 10 0 10 804 0 0 35 435 0 1 365
1999 + 0 1 0 18 2 157 0 0 43 358 0 2577

438 | ICES SCIENTIFIC REPORTS 2:52 | ICES
Year
Den
mar
k
Faro
e Is
land
s
Fran
ce
Ger
man
y
Gre
enla
nd
Irela
nd
Nor
way
Russ
ia
GB
UK
Engl
and
& W
ales
UK
Scot
land
Net
herla
nds
Tota
l
2000 + 41 10 0 19 498 0 0 67 192 0 827
2001 + 43 0 0 10 470 0 0 122 202 0 847
2002 + 8 + 0 2 200 0 0 10 246 0 466
2003 0 0 1 + + + 453 0 0 + 122 0 576
2004 0 0 0 0 0 0 413 0 0 90 0 0 503
2005 0 0 2 0 0 0 58 0 0 4 0 0 64
2006 0 0 3 0 0 0 90 0 0 0 7 0 100
2007 0 1 0 0 0 0 133 0 0 1 6 0 141
2008 0 0 0 0 0 0 14 0 0 0 22 0 36
2009 0 9 22 0 0 0 5 0 0 0 129 0 165
2010 + 1 38 0 0 0 10 0 0 0 49 0 98
2011 0 1 39 0 0 0 94 0 0 0 44 0 178
2012 0 0 14 0 0 0 788 0 0 0 43 0 845
2013 0 0 25 0 0 0 122 0 0 0 174 0 321
2014 0 2 27 0 0 0 723 0 0 104 0 856
2015 0 0 34 1 0 0 1 151 0 0 0 127 0 1 313
2016 0 0 31 0 0 0 983 0 0 0 120 0 1 134
2017 0 0 20 0 0 0 753 0 0 0 73 0 846
2018 0 0 15 0 0 0 472 0 42 0 0 0 532
2019* 0 0 21 + 0 0 241 0 14 0 0 1 277

ICES | AFWG 2020 | 439
Table 8.9. Abundance indices of different length groups in 1984–2017 (in thousands), Russian autumn survey.
Year/Length (cm)
≤30
31–35
36–40 41–45 46–50 51–55 56–60 61–65 66–70 71–75
76–80
>80
Total
1984 4 837
5 078
11 690
21 171
15 167
10 886
7 370 6 549 3 751 1 786
1 128
483
89 896
1985 4 003
6 748
16 858
24 897
23 244
15 702
8 376 5 704 3 776 2 054
1 028
698
113 088
1986 3 482
6 062
13 765
18 945
15 997
10 369
4 839 3 022 2 534 1 325
440
205
80 985
1987 2 010
4 828
7 228 10 490
8 831 5 513 2 123 1 784 1 437 645 481
421
45 791
1988 3 374
5 111
9 022 10 147
10 128
5 828 2 265 1 862 1 218 511 361
341
50 168
1989 2 030
7 055
13 962
17 252
16 790
10 028
3 789 1 916 1 279 415 200
388
75 104
1990 2 762
6 056
12 802
13 061
9 527 9 829 4 967 2 094 589 312 115
119
62 233
1991 1 036
5 012
16 237
20 998
17 418
11 728
8 012 4 562 814 181 122
174
86 294
1992 184
2 153
17 185
32 399
22 481
12 977
6 229 3 473 1 869 502 182
106
99 740
1993 - 290 3 593 14 782
21 080
16 013
6 743 3 341 2 031 859 269
164
69 165
1994 49 17 1 651 12 582
16 203
12 566
5 391 3 320 2 019 819 188
106
54 911
1995 - 38 1 245 13 193
20 571
12 445
5 432 2 717 1 587 579 187
82 58 076
1996* - 11 786 13 012
30 573
18 294
5 730 1 795 773 534 169
12 71 689
1997 140
152 1 318 7 744 18 504
17 221
6 932 3 079 1 952 465 195
142
57 844
1998 2 449
2 238
2 949 10 847
24 266
19 640
11 112
5 946 2 158 440 172
90 82 307
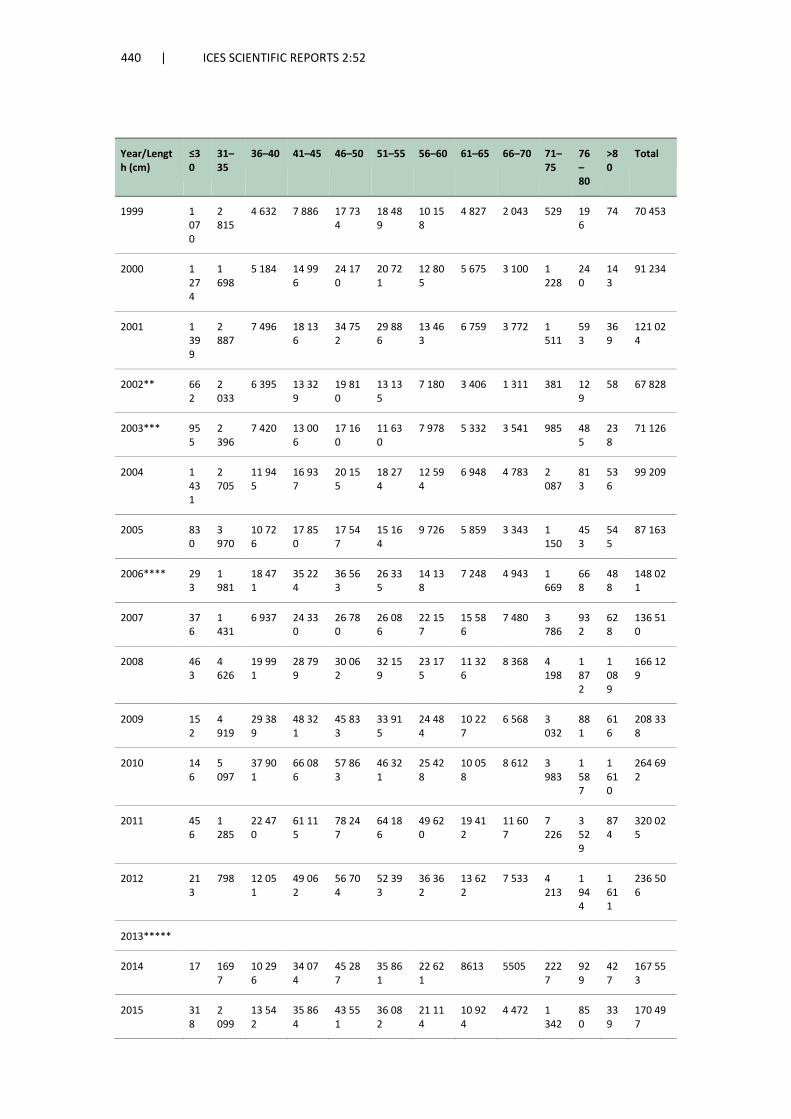
440 | ICES SCIENTIFIC REPORTS 2:52
Year/Length (cm)
≤30
31–35
36–40 41–45 46–50 51–55 56–60 61–65 66–70 71–75
76–80
>80
Total
1999 1 070
2 815
4 632 7 886 17 734
18 489
10 158
4 827 2 043 529 196
74 70 453
2000 1 274
1 698
5 184 14 996
24 170
20 721
12 805
5 675 3 100 1 228
240
143
91 234
2001 1 399
2 887
7 496 18 136
34 752
29 886
13 463
6 759 3 772 1 511
593
369
121 024
2002** 662
2 033
6 395 13 329
19 810
13 135
7 180 3 406 1 311 381 129
58 67 828
2003*** 955
2 396
7 420 13 006
17 160
11 630
7 978 5 332 3 541 985 485
238
71 126
2004 1 431
2 705
11 945
16 937
20 155
18 274
12 594
6 948 4 783 2 087
813
536
99 209
2005 830
3 970
10 726
17 850
17 547
15 164
9 726 5 859 3 343 1 150
453
545
87 163
2006**** 293
1 981
18 471
35 224
36 563
26 335
14 138
7 248 4 943 1 669
668
488
148 021
2007 376
1 431
6 937 24 330
26 780
26 086
22 157
15 586
7 480 3 786
932
628
136 510
2008 463
4 626
19 991
28 799
30 062
32 159
23 175
11 326
8 368 4 198
1 872
1 089
166 129
2009 152
4 919
29 389
48 321
45 833
33 915
24 484
10 227
6 568 3 032
881
616
208 338
2010 146
5 097
37 901
66 086
57 863
46 321
25 428
10 058
8 612 3 983
1 587
1 610
264 692
2011 456
1 285
22 470
61 115
78 247
64 186
49 620
19 412
11 607
7 226
3 529
874
320 025
2012 213
798 12 051
49 062
56 704
52 393
36 362
13 622
7 533 4 213
1 944
1 611
236 506
2013*****
2014 17 1697
10 296
34 074
45 287
35 861
22 621
8613 5505 2227
929
427
167 553
2015 318
2 099
13 542
35 864
43 551
36 082
21 114
10 924
4 472 1 342
850
339
170 497

ICES | AFWG 2020 | 441
Year/Length (cm)
≤30
31–35
36–40 41–45 46–50 51–55 56–60 61–65 66–70 71–75
76–80
>80
Total
2016*****
2017 158
2 198
10 687
32 464
61 577
71 590
40 700
16 830
7 449 3 483
1 206
1 245
249 585
* Only half of the standard area was investigated
** No observations in NEEZ
*** Observations in the NEEZ on the main spawning grounds were conducted considerably later than usual
**** Survey was conducted by one vessel with a reduced number of trawls at depths less than 500 m
*****No indices for 2013 and 2016

442 | ICES SCIENTIFIC REPORTS 2:52 | ICES
Table 8.10. Abundance indices of different length groups in 1994–2017 (in thousands), Norwegian autumn slope survey.
Year <30 30.5 31.5 33 33.5 34.5 35.5 36.5 37.5 38.5 39.5 40.5 41.5 42.5 43.5 44.5 45.5 46.5 47.5 48.5 49.5 51
1994 0 0 0 0 1 15 23 80 197 335 645 1 225 1 611 2 432 3 431 3 511 3 830 3 519 3 940 3 724 2 896 3 020
1995 0 0 1 3 6 15 29 86 141 242 472 931 1 210 2 294 3 092 3 840 4 475 4 540 4 633 4 321 3 836 3 856
1996 0 2 1 6 6 2 18 49 54 166 321 772 957 1 787 2 912 3 769 4 728 5 199 5 944 5 644 5 224 5 132
1997 7 5 11 4 33 27 49 186 250 297 443 862 1 009 1 814 2 888 3 578 5 451 5 402 6 132 5 206 4 125 5 455
1998 7 2 6 15 17 22 51 103 174 219 372 504 727 1 061 1 491 2 103 2 941 3 092 3 609 3 735 3 851 4 850
1999 10 4 18 15 20 40 61 75 110 174 202 377 476 862 1 175 1 655 2 397 2 543 3 485 4 214 3 694 5 274
2000 2 7 11 30 34 46 128 122 163 264 383 677 739 932 1 183 1 439 2 038 2 030 2 268 2 644 2 846 3 888
2001 21 20 35 37 77 147 274 270 440 462 724 986 1 176 1 373 1 630 1 720 2 724 2 655 3 349 3 128 3 973 3 999
2002 97 75 107 122 180 267 399 404 723 669 869 1 026 1 097 1 360 1 883 1 870 2 560 2 185 3 322 3 450 3 597 4 032
2003 38 27 65 97 172 270 383 692 783 894 1 214 1 100 1 481 1 561 2 082 1 792 2 468 2 104 3 193 3 360 3 506 3 117
2004 27 15 47 125 191 402 636 639 951 1 042 1 092 1 206 1 337 1 319 1 398 1 546 2 013 1 967 2 638 2 646 3 337 3 373
2005 66 104 285 317 517 765 861 1 220 1 492 1 540 2 053 2 295 2 293 2 588 2 262 2 677 3 041 2 446 2 854 2 095 3 056 2 336
2006 12 50 80 158 258 456 849 1 022 1 429 1 579 1 603 1 900 1 823 1 824 2 015 1 974 2 529 2 359 2 350 2 137 2 338 2 175
2007 157 96 161 359 766 1 423 2 508 3 142 4 411 5 679 5 346 5 639 5 502 5 038 4 600 3 632 3 667 3 628 3 278 2 571 2 882 2 597
2008 378 384 723 1 323 1 763 1 793 2 441 2 911 3 249 3 685 4 229 4 300 4 257 3 568 3 911 3 534 3 020 3 066 2 769 2 582 2 639 2 284
2009 31 36 93 349 505 934 1 663 2 660 3 050 3 680 4 138 4 885 5 567 4 148 5 327 4 639 3 688 3 752 3 682 3 410 3 553 3 215

ICES | AFWG 2020 | 443
2011 0 0 20 36 57 124 288 563 646 1 414 1 454 2 228 2 680 3 174 3 649 3 750 3 532 3 031 3 299 3 991 3 251 2 454
2013 17 5 3 1 13 64 103 122 324 582 1 022 1 266 2 138 2 207 3 553 3 748 3 476 4 124 3 717 3 045 3 718 3 052
2015 3 24 24 36 131 318 439 721 757 1 043 1 253 1 473 2 602 2 444 3 776 4 459 4 602 4 598 4 371 3 962 4 156 3 694
2017 6 20 45 54 63 144 184 328 593 365 928 955 1 267 1 457 1 764 1 983 2 367 2 465 2 651 2 569 2 816 3 011
2019 0 0 28 43 128 362 372 569 874 1 322 1 290 1 424 1 667 2 285 2 210 2 168 2 208 2 229 2 434 2 119 2 305 2 405
Year 51.5 52.5 53.5 54.5 55.5 56.5 57.5 58.5 59.5 60.5 61.5 62.5 63.5 64.5 65.5 66.5 67.5 68.5
1994 2 545 2 729 2 398 2 092 1 975 1 547 1 488 1 103 920 788 565 702 576 523 577 370 367 386
1995 3 165 3 152 2 963 2 647 2 272 1 756 1 586 1 153 970 880 764 690 680 592 525 461 387 334
1996 4 106 3 638 3 571 2 752 2 177 1 568 1 443 1 017 867 782 512 449 538 404 391 356 281 248
1997 3 644 3 427 3 018 2 302 2 111 1 502 1 131 1 042 617 849 585 576 537 403 446 481 294 230
1998 4 211 3 824 3 166 2 988 2 857 1 974 1 714 1 515 981 1 172 783 613 598 668 641 569 479 364
1999 4 092 5 196 4 136 3 909 4 122 2 631 2 299 1 787 1 374 1 388 895 1 037 865 886 923 791 807 594
2000 3 692 3 681 3 512 3 016 3 197 2 388 2 007 1 545 1 227 1 327 915 1 028 734 630 732 517 509 505
2001 3 649 4 512 4 106 3 005 3 358 2 552 2 589 2 147 1 293 1 350 1 099 939 1 187 684 787 612 751 603
2002 4 241 3 516 3 966 3 602 3 855 2 837 2 511 2 248 1 672 1 787 1 239 1 237 1 139 808 882 604 679 474
2003 4 400 3 465 3 808 3 512 3 907 3 368 3 035 2 319 1 896 1 705 1 612 1 384 1 542 1 130 1 350 972 994 675
2004 3 535 4 405 3 614 3 801 3 249 2 751 2 252 1 911 1 493 1 455 1 372 1 360 1 284 1 162 962 763 891 590
2005 2 400 2 734 2 413 2 084 2 295 1 882 1 681 1 492 1 458 1 168 1 241 1 057 1 065 984 903 782 865 479

444 | ICES SCIENTIFIC REPORTS 2:52 | ICES
2006 2 493 2 125 2 290 2 025 2 189 1 790 1 668 1 542 1 337 1 159 1 188 1 009 925 1 036 807 798 647 678
2007 2 109 2 249 2 123 2 142 1 758 1 609 1 581 1 070 1 008 1 044 625 938 672 558 537 526 394 469
2008 2 288 2 248 2 229 1 815 1 751 1 514 1 150 1 019 861 668 652 657 508 582 629 523 484 361
2009 2 668 2 944 2 850 2 441 2 372 2 233 1 837 1 698 1 503 1 135 845 962 647 858 715 607 653 609
2011 2 905 2 746 2 602 2 713 2 387 1 709 1 704 1 529 978 1 179 577 649 554 440 466 315 440 550
2013 2 498 2 035 1 905 1 631 1 710 1 573 1 424 1 009 790 671 503 506 400 456 234 266 227 176
2015 3 469 2 384 2 546 2 084 2 142 1 734 1 336 1 108 1 020 899 713 621 605 495 274 289 341 291
2017 2 890 2 547 2 501 2 091 1 792 1 786 1 532 1 274 1 269 1 029 765 579 481 446 294 299 247 245
2019 1 653 1 799 1 617 1 490 1 057 1 185 846 840 670 568 461 313 304 312 231 242 179 130
Year 69.5 70.5 71.5 72.5 73.5 74.5 75.5 76.5 77.5 78.5 79.5 >80 SUM
1994 256 253 151 136 122 74 113 47 39 40 30 97 59 436
1995 339 244 181 179 97 100 137 56 53 53 34 101 66 568
1996 232 168 118 123 93 97 61 28 40 39 21 74 70 886
1997 171 207 216 119 109 111 104 61 32 35 40 185 69 818
1998 308 320 235 222 229 144 102 64 65 61 43 192 62 052
1999 478 406 385 319 182 205 223 125 109 145 51 328 69 570
2000 341 376 232 210 168 153 141 77 96 77 47 233 57 187
2001 490 375 279 170 207 178 157 85 133 69 49 306 68 944
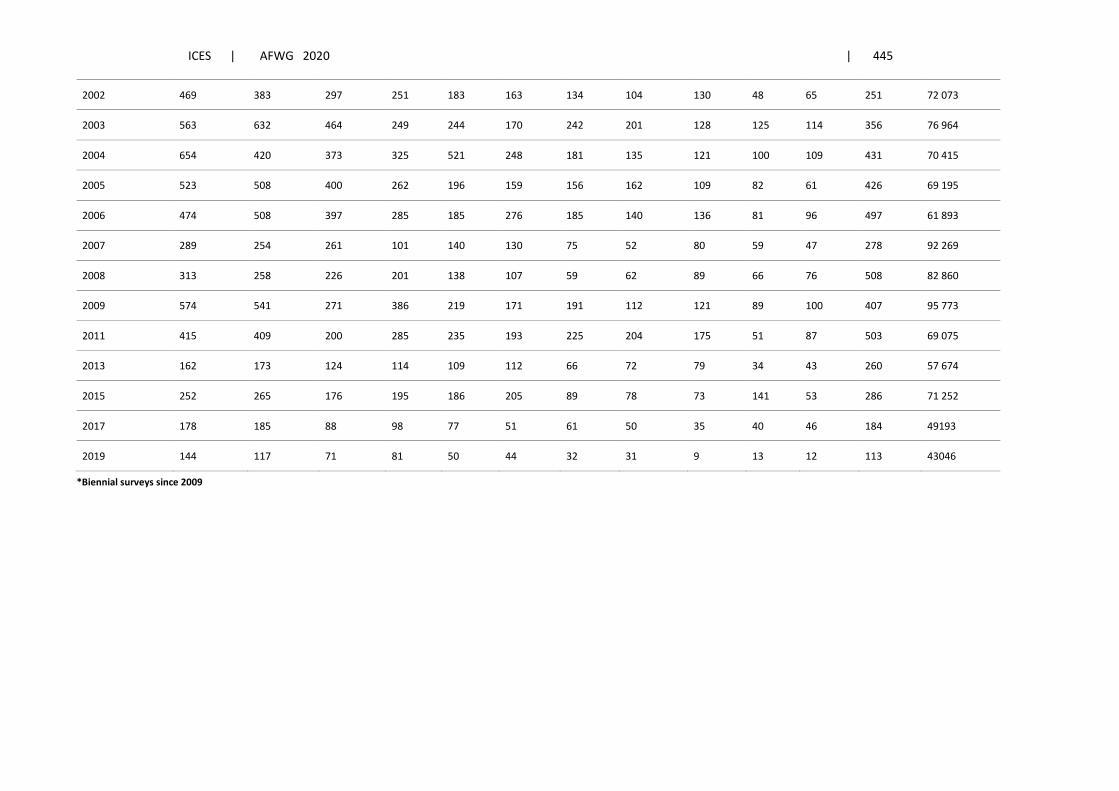
ICES | AFWG 2020 | 445
2002 469 383 297 251 183 163 134 104 130 48 65 251 72 073
2003 563 632 464 249 244 170 242 201 128 125 114 356 76 964
2004 654 420 373 325 521 248 181 135 121 100 109 431 70 415
2005 523 508 400 262 196 159 156 162 109 82 61 426 69 195
2006 474 508 397 285 185 276 185 140 136 81 96 497 61 893
2007 289 254 261 101 140 130 75 52 80 59 47 278 92 269
2008 313 258 226 201 138 107 59 62 89 66 76 508 82 860
2009 574 541 271 386 219 171 191 112 121 89 100 407 95 773
2011 415 409 200 285 235 193 225 204 175 51 87 503 69 075
2013 162 173 124 114 109 112 66 72 79 34 43 260 57 674
2015 252 265 176 195 186 205 89 78 73 141 53 286 71 252
2017 178 185 88 98 77 51 61 50 35 40 46 184 49193
2019 144 117 71 81 50 44 32 31 9 13 12 113 43046
*Biennial surveys since 2009

446 | ICES SCIENTIFIC REPORTS 2:52 | ICES
Table 8.11. Abundance indices of females of different length groups in 1994–2017 (in thousands), Norwegian autumn slope survey.
Year <30 30.5 31.5 33 33.5 34.5 35.5 36.5 37.5 38.5 39.5 40.5 41.5 42.5 43.5 44.5 45.5 46.5 47.5 48.5 49.5 51
1994 0 0 0 0 1 15 23 80 196 335 643 1 223 1 611 2 429 3 426 3 503 3 824 3 510 3 934 3 716 2 886 3 018
1995 0 0 1 3 6 15 29 86 141 242 472 930 1 210 2 291 3 088 3 837 4 470 4 537 4 629 4 317 3 835 3 855
1996 0 0 0 4 0 1 10 26 28 64 123 228 233 424 415 773 937 1020 1 185 1 151 1 037 1 374
1997 6 5 7 4 17 14 36 134 139 146 187 337 331 419 569 685 899 852 1 169 1 058 828 1 226
1998 5 0 0 11 4 7 26 41 78 77 156 170 190 274 290 364 413 526 605 665 743 970
1999 2 0 1 0 7 14 19 12 41 68 93 137 117 227 285 300 336 313 496 574 533 1 049
2000 1 5 6 14 16 16 44 44 65 121 155 201 229 245 268 278 374 311 303 411 410 517
2001 13 6 14 15 38 61 118 123 177 167 293 411 462 355 425 376 544 477 493 379 558 673
2002 51 48 58 60 77 109 178 182 290 275 326 319 306 407 500 378 515 331 483 461 501 575
2003 25 25 27 43 100 124 182 276 413 429 532 504 512 545 610 450 552 394 539 487 523 406
2004 15 3 13 61 83 160 305 278 436 358 434 404 440 384 381 454 413 362 382 309 427 472
2005 30 24 110 99 182 258 322 464 565 537 723 758 619 630 452 633 723 467 593 293 500 329
2006 4 19 48 81 148 187 327 442 595 674 713 686 648 568 649 482 619 501 503 512 468 452
2007 85 67 104 178 371 731 1 321 1 539 2 259 2 654 2 515 2 403 2 454 2 145 1 580 1 242 1 132 988 851 727 640 554
2008 216 210 432 698 829 958 1 190 1 372 1 529 1 597 1 720 1 516 1 625 1 069 1 180 9 28 889 948 834 677 773 615
2009 13 19 33 146 210 343 662 1 001 1 263 1 470 1 491 1 814 1 979 1 441 1 752 1 533 1 044 1 195 1 037 988 922 878
2011 0 0 8 22 24 31 103 175 195 469 311 538 642 722 623 645 686 664 528 665 751 298
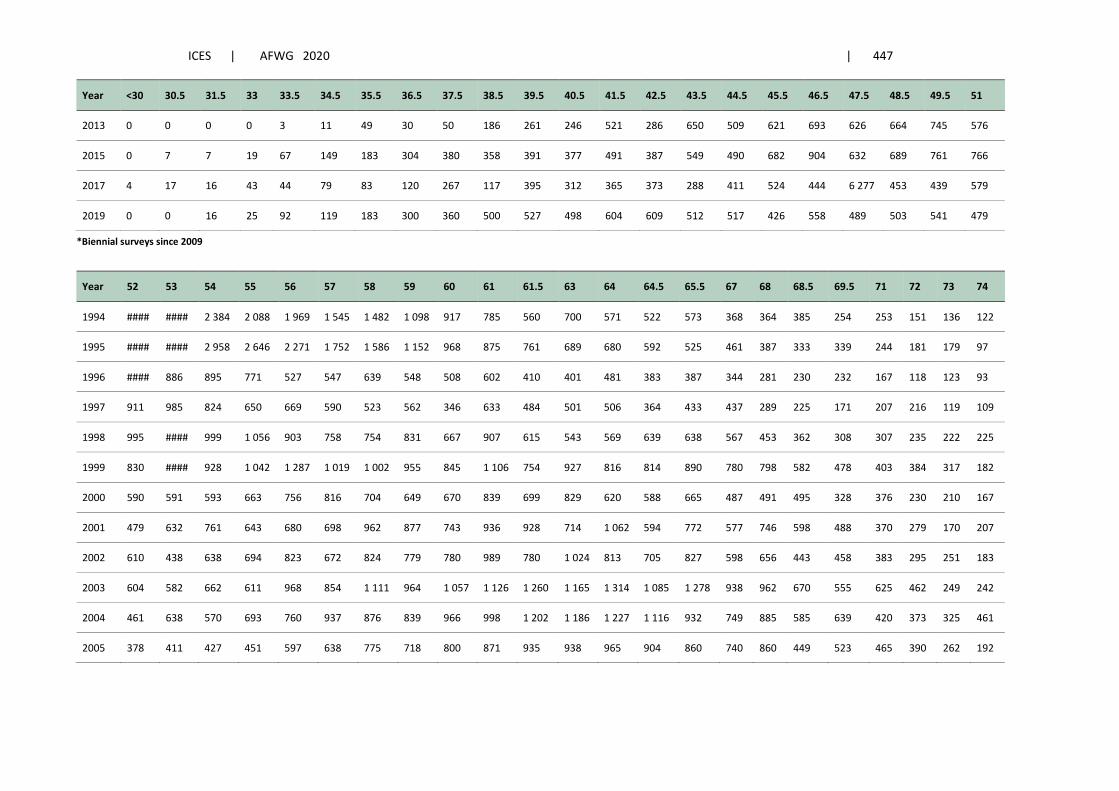
ICES | AFWG 2020 | 447
Year <30 30.5 31.5 33 33.5 34.5 35.5 36.5 37.5 38.5 39.5 40.5 41.5 42.5 43.5 44.5 45.5 46.5 47.5 48.5 49.5 51
2013 0 0 0 0 3 11 49 30 50 186 261 246 521 286 650 509 621 693 626 664 745 576
2015 0 7 7 19 67 149 183 304 380 358 391 377 491 387 549 490 682 904 632 689 761 766
2017 4 17 16 43 44 79 83 120 267 117 395 312 365 373 288 411 524 444 6 277 453 439 579
2019 0 0 16 25 92 119 183 300 360 500 527 498 604 609 512 517 426 558 489 503 541 479
*Biennial surveys since 2009
Year 52 53 54 55 56 57 58 59 60 61 61.5 63 64 64.5 65.5 67 68 68.5 69.5 71 72 73 74
1994 #### #### 2 384 2 088 1 969 1 545 1 482 1 098 917 785 560 700 571 522 573 368 364 385 254 253 151 136 122
1995 #### #### 2 958 2 646 2 271 1 752 1 586 1 152 968 875 761 689 680 592 525 461 387 333 339 244 181 179 97
1996 #### 886 895 771 527 547 639 548 508 602 410 401 481 383 387 344 281 230 232 167 118 123 93
1997 911 985 824 650 669 590 523 562 346 633 484 501 506 364 433 437 289 225 171 207 216 119 109
1998 995 #### 999 1 056 903 758 754 831 667 907 615 543 569 639 638 567 453 362 308 307 235 222 225
1999 830 #### 928 1 042 1 287 1 019 1 002 955 845 1 106 754 927 816 814 890 780 798 582 478 403 384 317 182
2000 590 591 593 663 756 816 704 649 670 839 699 829 620 588 665 487 491 495 328 376 230 210 167
2001 479 632 761 643 680 698 962 877 743 936 928 714 1 062 594 772 577 746 598 488 370 279 170 207
2002 610 438 638 694 823 672 824 779 780 989 780 1 024 813 705 827 598 656 443 458 383 295 251 183
2003 604 582 662 611 968 854 1 111 964 1 057 1 126 1 260 1 165 1 314 1 085 1 278 938 962 670 555 625 462 249 242
2004 461 638 570 693 760 937 876 839 966 998 1 202 1 186 1 227 1 116 932 749 885 585 639 420 373 325 461
2005 378 411 427 451 597 638 775 718 800 871 935 938 965 904 860 740 860 449 523 465 390 262 192

448 | ICES SCIENTIFIC REPORTS 2:52 | ICES
Year 52 53 54 55 56 57 58 59 60 61 61.5 63 64 64.5 65.5 67 68 68.5 69.5 71 72 73 74
2006 490 458 461 392 537 523 545 678 805 796 893 865 820 927 775 768 637 633 468 499 376 285 178
2007 476 499 471 491 469 533 607 549 566 776 494 790 587 534 517 515 394 469 278 254 261 101 133
2008 509 481 515 495 443 547 441 543 466 490 530 572 482 539 610 514 483 361 309 252 226 201 138
2009 640 665 738 639 733 724 698 783 814 605 653 765 534 776 701 525 616 587 561 526 263 378 219
2011 557 468 480 472 466 369 329 469 324 378 341 523 477 348 450 300 415 550 393 409 192 285 235
2013 518 381 477 308 375 529 526 304 296 334 324 377 329 390 218 260 227 174 159 173 120 114 109
2015 826 770 744 579 811 649 471 494 553 537 470 462 420 450 270 283 339 283 251 265 176 195 186
2017 530 438 516 448 392 555 578 498 563 530 473 330 378 371 271 286 243 245 178 185 88 98 77
2019 401 481 431 494 351 391 324 458 402 367 277 254 260 257 210 218 174 123 143 114 71 81 50
*Biennial surveys since 2009

ICES | AFWG 2020 | 449
Year 74.5 75.5 76.5 77.5 78.5 79.5 >80 SUM
1994 74 113 47 39 40 30 95 59 284
1995 100 137 56 53 53 34 99 66 505
1996 92 61 28 40 39 21 74 21 998
1997 111 104 61 29 35 40 185 22 385
1998 144 102 64 65 61 43 192 22 881
1999 205 223 125 109 140 47 328 26 047
2000 153 141 77 96 77 47 233 19 913
2001 178 157 85 131 69 49 306 24 071
2002 163 131 104 130 48 65 251 23 984
2003 170 242 201 128 125 114 356 30 383
2004 241 181 135 119 100 109 431 27 731
2005 149 156 152 109 82 61 426 27 000
2006 259 185 138 136 81 96 491 26 528
2007 124 75 52 80 59 47 275 40 026
2008 107 59 62 89 66 76 506 34 926
2009 171 191 104 121 80 100 385 38 542
2011 193 225 204 175 51 87 503 20 780
2013 112 66 72 79 34 43 260 16 424

450 | ICES SCIENTIFIC REPORTS 2:52 | ICES
Year 74.5 75.5 76.5 77.5 78.5 79.5 >80 SUM
2015 205 89 78 73 141 53 286 22 019
2017 51 61 50 35 40 46 184 14738
2019 44 32 31 9 13 12 113 14443
*Biennial surveys since 2009

ICES | AFWG 2020 | 451 Table 8.12. Abundance indices (numbers in thousands) from bottom-trawl surveys in the Barents Sea standard area winter 1994-2019 (Mehl et al., WD4 AFWG 2019).
Length group (cm) Biomass
(tonnes) Year ≤14 15–19 20–24 25–29 30–34 35–39 40–44 45–49 50–54 55–59 60–64 65–69 70–74 75–79 ≥80 Total
1994 0 0 21 76 148 1 117 3 139 4 740 3 615 1 941 889 541 21 0 0 16 248 19 228
1995 298 0 0 0 90 129 2 877 7 182 5 739 2 027 1 622 839 489 86 0 21 378 27 459
1996 4 121 0 0 0 62 124 1 214 4 086 4 634 1 871 1 112 638 337 74 12 18 285 20 256
19971 0 68 0 0 55 163 949 4 313 5 629 2 912 1 609 643 300 65 21 16 728 24 214
19981 68 220 945 578 481 487 1 088 4 016 6 591 3 076 1 798 707 326 93 44 20 518 27 248
1999 43 84 241 436 566 269 784 1 701 3 097 1 669 1 094 491 89 75 0 10 640 14 681
2000 140 184 344 836 1 722 3 857 2 253 1 560 2 144 1 714 1 191 615 249 76 0 16 883 17 246
2001 68 49 147 179 737 1 525 3 716 3 271 2 302 2 010 1 088 529 160 50 39 15 871 18 224
2002 271 0 70 34 382 1 015 1 916 3 803 3 250 2 279 1 138 976 242 159 114 15 648 21 198
2003 51 0 74 19 304 715 1 842 3 008 4 765 2 235 714 561 245 146 0 14 678 19 635
2004 106 104 15 0 319 1 253 1 229 1 717 2 277 1 227 798 298 148 94 26 9615 11 872
2005 263 70 159 1 139 2 235 2 621 4 206 3 782 3 847 2 037 917 585 336 118 0 22 314 22 293
20062 0 72 94 414 1 968 5 149 4 613 5 743 4 283 2 132 891 449 258 34 18 26 118 25 579
20071 0 18 146 1 869 1 418 3 114 5 710 5 947 4 287 2 205 963 658 391 80 89 26 896 28 006
2008 0 0 0 243 1 708 5 974 4 654 6 136 5 198 3 403 827 638 174 82 50 29 088 30 153
2009 55 0 0 26 1 044 4 327 8 133 4 551 4 084 2 266 996 627 442 253 154 26 960 28 919

452 | ICES SCIENTIFIC REPORTS 2:52 | ICES
Length group (cm) Biomass
(tonnes) Year ≤14 15–19 20–24 25–29 30–34 35–39 40–44 45–49 50–54 55–59 60–64 65–69 70–74 75–79 ≥80 Total
2010 0 0 0 99 678 3 648 5 729 6 560 4 897 2 467 1 064 552 229 128 41 26 092 25 979
2011 51 0 0 0 216 4 396 5 864 5 498 5 237 3 698 699 936 327 252 97 27 271 31 552
20123 77 0 0 0 51 1 145 4 524 5 366 4 517 2 774 1 147 195 73 0 48 19 917 22 656
2013 0 0 0 0 0 511 5 368 4 868 5 374 3 687 1 944 939 348 131 154 23 504 31 748
2014 0 0 46 92 156 368 2 271 5 587 5 903 3 555 2 251 1 369 154 260 79 22 090 31 112
2015 367 0 61 0 284 1 612 3 187 6 452 7 249 6 752 3 350 1 936 587 334 0 32 172 46 828
2016 205 0 124 511 950 1 953 3 486 4 539 5 479 5 613 1 999 1 973 646 98 80 27 657 35 831
20174 52 0 0 78 592 1 328 1 885 3 850 4 852 4 550 1 721 1 455 317 190 23 20 827 29 756
2018 0 0 62 0 383 1 333 2 049 3 445 4 258 3 573 1 904 1 366 736 196 20 19 325 28 688
2019 0 0 0 375 272 1 6 71 3 285 4 034 5 177 4 265 3 570 2 526 1 328 535 137 27 176 45 912
1 Indices raised to also represent the Russian EEZ 2 Not complete coverage in southeast due to restrictions, strata 7 area set to default and strata 13 as in 2005 3 Indices not raised to also represent uncovered parts of the Russian EEZ. 4 Indices raised to also represent uncovered parts of the Russian EEZ

ICES | AFWG 2020 | 453
able 8.13. GREENLAND HALIBUT catch in weight, numbers, and biomass (in tonnes) and abundance (in thousands) esti-mated from Spanish autumn and spring surveys 1997–2013. NB. Absolute biomass and abundance values must not be compared between spring and autumn surveys due to different gears. The trawl used during the spring surveys is con-sidered less efficient on benthic species as Greenland halibut and skates, and better to catch species less associated with bottom.
Autumn survey
Year Catch (Kg) Catch (numbers) Biomass™ Abundance (‘000)
1997 195 056 211 533 344 014 379 444
1998 180 974 187 259 351 466 373 149
1999 198 781 172 687 436 956 377 792
2000 169 389 140 355 340 619 291 265
2001 152 681 129 289 283 511 249 219
2002 144 335 115 213 256 460 207 466
2003 151 952 132 117 283 644 256 327
2004 153 859 135 631 320 485 283 965
2005 144 573 134 566 317 320 313 459
2008 91 573 101 578 129 221* 144 561*
2010 167 862 182 464 191 510* 216 731*
2012 178 607 174 670 336 543* 339 697*
2013 172 762 168 619 264 101* 267 548*
2014 175 553 160 557 321 485* 307 679*
2016 176 015 142 413 247 644* 214 778*
2019 50 880 45 631 209 439* 187 830*
No survey in 2006, 2007, 2009, 2011, 2015, 2017, and 2018.
*New swept-area estimation method

454 | ICES SCIENTIFIC REPORTS 2:52 | ICES
Spring survey
Year Catch (Kg) Catch (numbers) Biomass™ Abundance (‘000)
2008 96 797 109 515 38 406 38 951
2009 200 299 222 018 58 273 65 464
2011 136 610 160 566 98 142 117 666
2015** 111 425 105 385 150 385 155 333
No survey in 2010, 2012, 2013 and 2014
*Different from the one used during the 2014 Spanish “autumn” survey
Table 8.14. Greenland halibut in Subareas 1 and 2. The catch scenarios. Weights in tonnes. No assessment in 2020.
Basis Catches (2021)
Harvest rate (2020–2024)
Mean catch (2020–2024)
Biomass 45cm+ 1 January 2025
% 45cm+ Biomass change 2020–2024*
ICES ADVICE BASIS
Same advice as last year 23 000 0.036 23 000 574 000 -20%
Other scenarios
HR=0 0 0 0 672 000 -6%
HR2017–2018 × 0.5 12 770 0.019 12 500 620 000 -13%
HR2017–2018 × 0.75 19 070 0.028 18 340 596 000 -17%
HR2017–2018 × 1 25 310 0.037 23 930 573 000 -20%
HR2017–2018 × 1.5 37 630 0.053 37 630 532 000 -26%
HR2017–2018 × 2 49 730 0.070 44 000 495 000 -31%
HR2017–2018 × 3 73 290 0.099 60 870 432 000 -40%
* 45 cm+ biomass in 2025 relative to 2020.
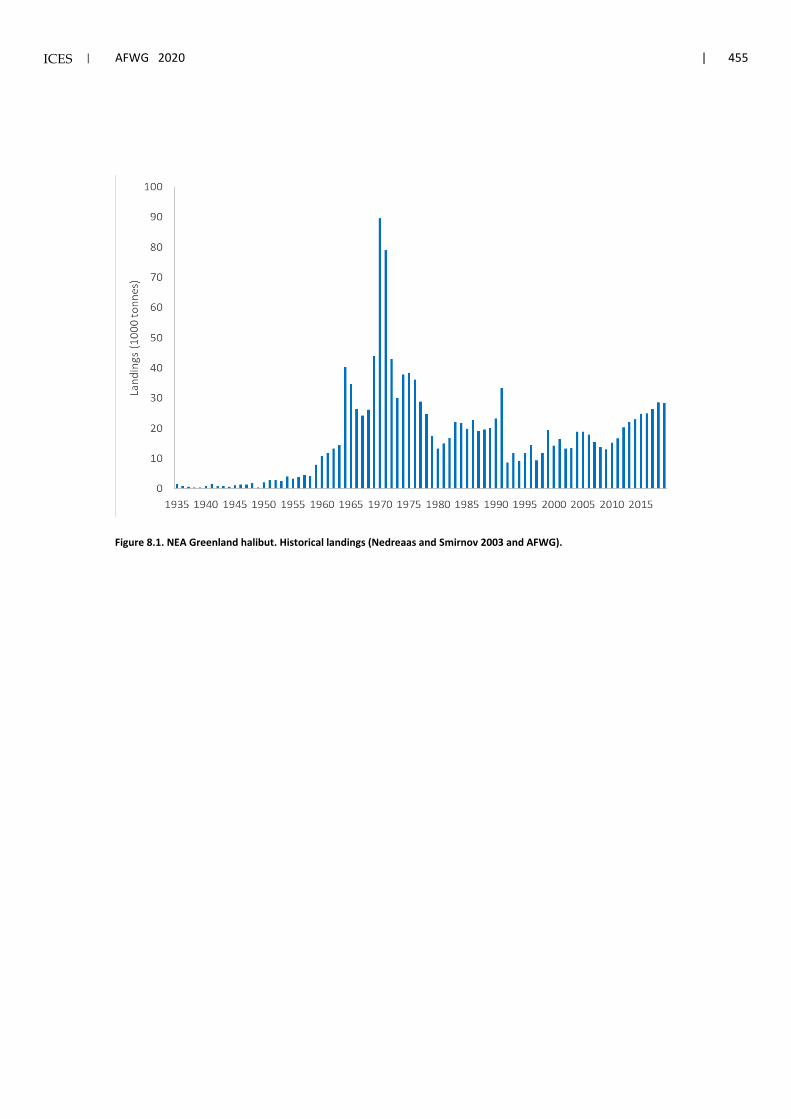
ICES | AFWG 2020 | 455
Figure 8.1. NEA Greenland halibut. Historical landings (Nedreaas and Smirnov 2003 and AFWG).

456 | ICES SCIENTIFIC REPORTS 2:52 | ICES
Figure 8.2. Spatial distribution of Greenland halibut catches in 2019 according to Norwegian electronic logbooks. Bub-ble area is proportional to the size of single catches expressed in metric tonnes. Upper panel (A) shows Greenland hali-but catches in all registered fisheries (including bycatch), and lower panel (B) shows catches where G. halibut make more than 50% of the total catches.

ICES | AFWG 2020 | 457
Figure 8.3. Spatial distribution of catches where Greenland halibut make more than 50% of the total catches, according to Norwegian electronic logbooks from 2019. Bubble area is proportional to the size of single catches expressed in met-ric tonnes. Uppermost (A), middle (B) and lowest (C) panel show longline, gillnet and trawl catches, respectively.
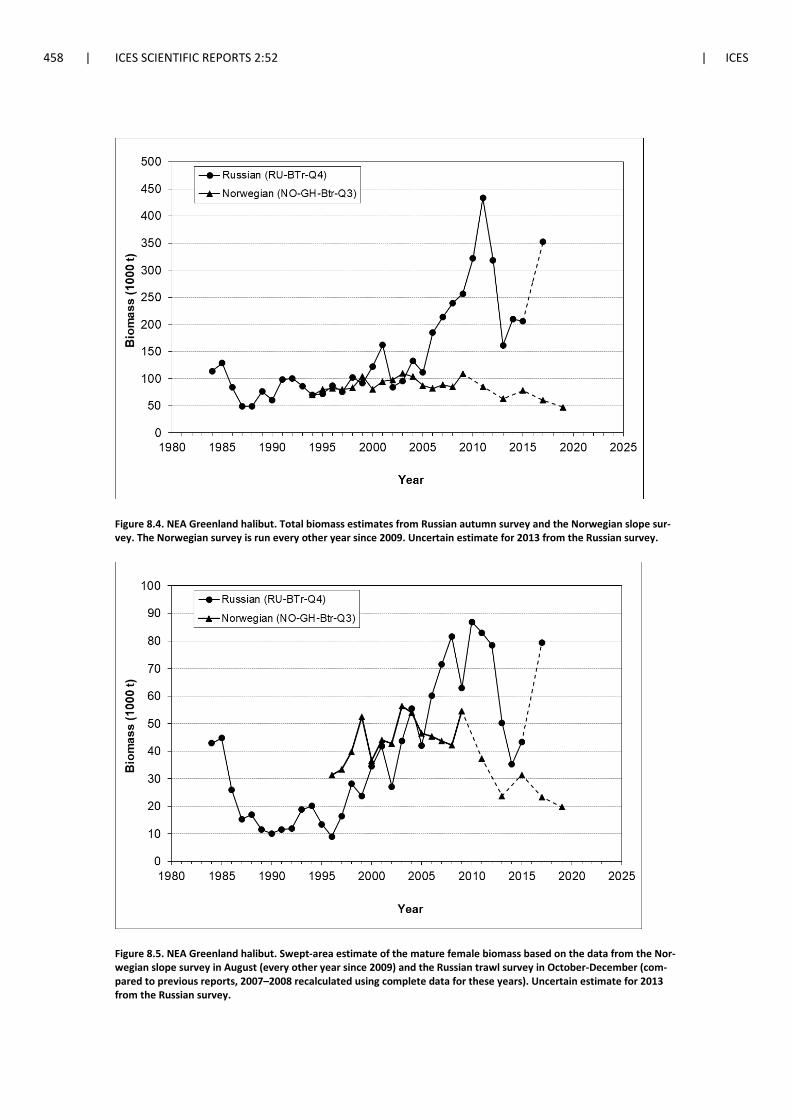
458 | ICES SCIENTIFIC REPORTS 2:52 | ICES
Figure 8.4. NEA Greenland halibut. Total biomass estimates from Russian autumn survey and the Norwegian slope sur-vey. The Norwegian survey is run every other year since 2009. Uncertain estimate for 2013 from the Russian survey.
Figure 8.5. NEA Greenland halibut. Swept-area estimate of the mature female biomass based on the data from the Nor-wegian slope survey in August (every other year since 2009) and the Russian trawl survey in October-December (com-pared to previous reports, 2007–2008 recalculated using complete data for these years). Uncertain estimate for 2013 from the Russian survey.

ICES | AFWG 2020 | 459
Figure 8.6. Russian autumn survey; Greenland halibut abundance by sex (Russkikh and Smirnov, WD16 AFWG 2016).
Figure 8.7. Estimated Greenland halibut total abundance in biomass and by number of individuals from the Norwegian slope surveys 1994–2019. The vertical bars show 95% confidence intervals.

460 | ICES SCIENTIFIC REPORTS 2:52 | ICES
Figure 8.8. Estimated Greenland halibut abundance (upper panel) and biomass (lower panel), by sex, from the Norwe-gian autumn slope survey.
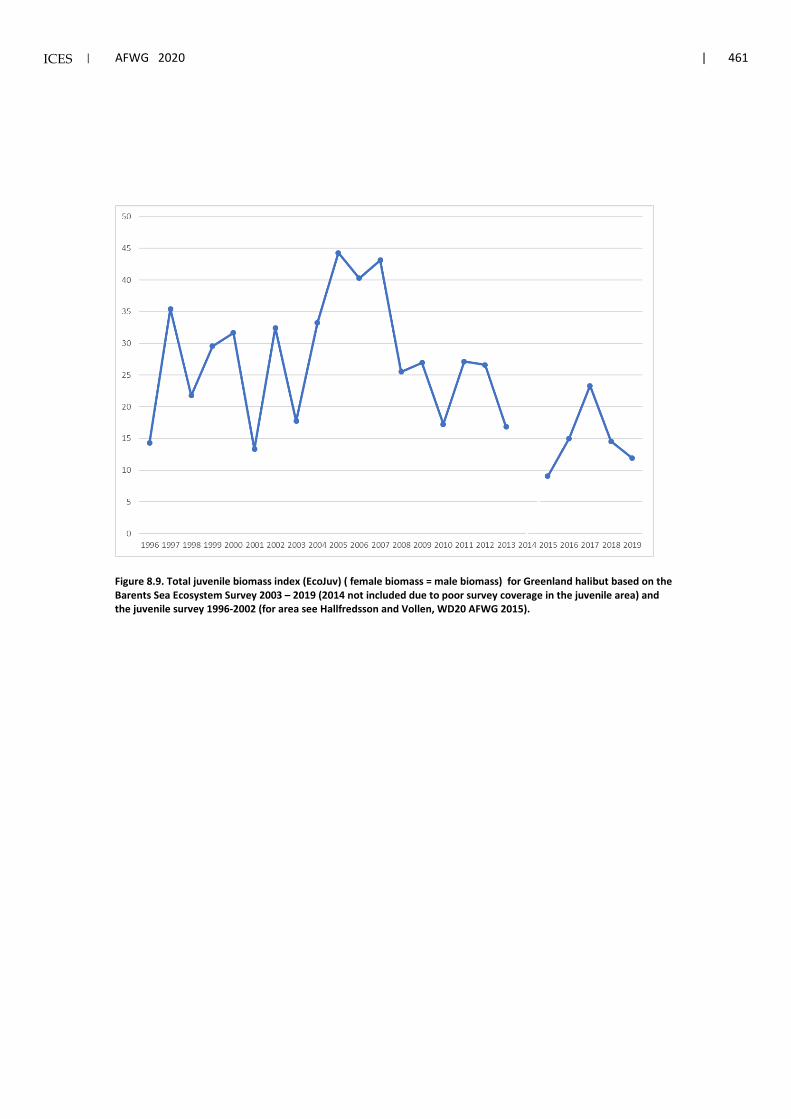
ICES | AFWG 2020 | 461
Figure 8.9. Total juvenile biomass index (EcoJuv) ( female biomass = male biomass) for Greenland halibut based on the Barents Sea Ecosystem Survey 2003 – 2019 (2014 not included due to poor survey coverage in the juvenile area) and the juvenile survey 1996-2002 (for area see Hallfredsson and Vollen, WD20 AFWG 2015).

462 | ICES SCIENTIFIC REPORTS 2:52 | ICES
Figure 8.10. Eco-south biomass index by sex for Greenland halibut in the Barents Sea Ecosystem Survey 2003 – 2019, outside the juvenile area (for area see Hallfredsson and Vollen, WD20 AFWG 2015).
Figure 8.11. Joint Norwegian-Russian winter survey in the Barents Sea 1994-2019; Greenland halibut abundance and biomass estimates.

ICES | AFWG 2020 | 463
Figure 8.12. Length frequency distribution estimates for the entire area covered by the Norwegian Slope survey during autumns 1996-2019. Note biennial surveys after 2009.

464 | ICES SCIENTIFIC REPORTS 2:52 | ICES
Figure 8.13. Abundance and biomass estimates from Spanish autumn surveys (lower panel) (Muñoz et al., WD7 AFWG 2017), and abundance and biomass estimates from Spanish spring surveys (upper panel) (Muñoz et al., WD10 AFWG 2016). Note that X-axis is not continuous.

ICES | AFWG 2020 | 465
Figure 8.14. Biomass estimates from Polish spring survey (based on: Janusz et al., WD8 AFWG 2008; Janusz and Trella, WD10 AFWG 2009; Trella and Janusz, WD6 AFWG 2012). No update presented to the 2020 AFWG.
Figure 8.15. Dynamics of indices of the Barents Sea Greenland halibut stock in 1964−2015 (indices are taken divided by corresponding mean to put them in comparable scale; CPUE series divided by two: 1964−1991 and after 1996). In addi-tion to the standardized CPUE three survey indices are shown; the Russian autumn survey (RUS), the Norwegian au-tumn survey (NOR) and the EcoSouth index (ECO).
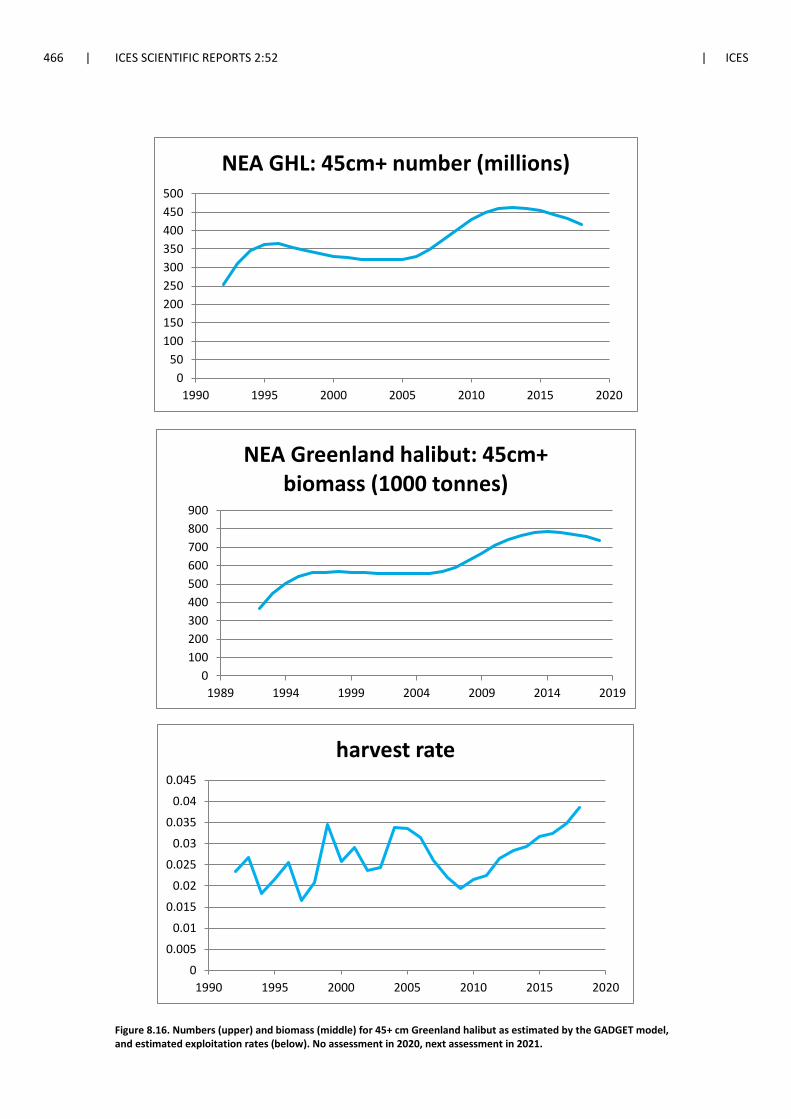
466 | ICES SCIENTIFIC REPORTS 2:52 | ICES
Figure 8.16. Numbers (upper) and biomass (middle) for 45+ cm Greenland halibut as estimated by the GADGET model, and estimated exploitation rates (below). No assessment in 2020, next assessment in 2021.
050
100150200250300350400450500
1990 1995 2000 2005 2010 2015 2020
NEA GHL: 45cm+ number (millions)
0100200300400500600700800900
1989 1994 1999 2004 2009 2014 2019
NEA Greenland halibut: 45cm+ biomass (1000 tonnes)
0
0.005
0.01
0.015
0.02
0.025
0.03
0.035
0.04
0.045
1990 1995 2000 2005 2010 2015 2020
harvest rate

ICES | AFWG 2020 | 467
Figure 8.17. Gadget recruitment estimate (in millions) for the Greenland Halibut stock at 1st January. Note that the most recent year(s) of recruitment are tuned by very few data and should be considered tentative. No assessment in 2020, next assessment in 2021.
Figure 8.18. Retrospective patterns from the GADGET model run. No assessment in 2020, next assessment in 2021.
0100200300400500600700800900
1000
1992 1994 1996 1998 2000 2002 2004 2006 2008 2010 2012 2014 2016 2018
Estimated recruitment at age 1
0.00
200.00
400.00
600.00
800.00
1000.00
1990 1995 2000 2005 2010 2015 2020
Greenland Halibut 45cm+ biomass retrospective to 2018 data
2006 2007 2008 2009 2010 2011 2012
2013 2014 2015 2016 2017 2018

468 | ICES SCIENTIFIC REPORTS 2:52 | ICES
Figure 8.19. Proportion of numbers per maturity stage for Greenland halibut females in the Norwegian slope survey.
Figure 8.20. Greenland halibut maturity at length (Russian actual data, 2000–2009 combined). L50 for males ~43 cm, L50 for females ~57 cm (from Smirnov, 2011, WD21 ICES AFWG 2011).
0
25
50
75
100
10 15 20 25 30 35 40 45 50 55 60 65 70 75 80 85 90 95 100 105 110 115 120
Length, cm
Prop
ortio
n m
atur
e, %
malesfemalesM+F

ICES | AFWG 2020 | 469
Figure 8.21. Maturity ogives for female Greenland halibut based on data from the Norwegian Slope survey, by year in upper panel and all years together (year 1998 omitted) in lower panel. Stage 1 and 2 on special maturity scale for fe-males are taken as immatures; see Kennedy et al., 2009, 2011, 2014, and Nunez et al., 2015.

470 | ICES SCIENTIFIC REPORTS 2:52 | ICES
Figure 8.22. Maturity ogives for male Greenland halibut based on data from the Norwegian Slope survey, by year in upper panel and all years together (year 1998 and 2010 omitted) in lower panel.

ICES | AFWG 2020 | 471
9 Anglerfish in ICES subareas 1 and 2
9.1 General
Our present knowledge about anglerfish (Lophius spp.) in ICES subareas 1 and 2 is based on two master theses (Staalesen 1995 and Dyb 2003), a report from a Nordic project (Thangstad et al. 2006), working documents to the ICES ASC, WGNSDS and WGCSE, and more recent catch data collected by the Norwegian Reference Fleet since 2006 (Anon. 2013, Clegg and Williams 2020). In February 2018, anglerfish in ICES subareas 1 and 2 was subject for a benchmark assessment (WKANGLER 2018). After this benchmark assessment, ICES suggests that this stock (or rather a stock component and a management unit) is considered as a Category 3 stock, for which survey or other indices are available that provide reliable indications of trends in stock metrics, such as total mortality, recruitment, and biomass.
9.1.1 Species composition
Two European anglerfish species of the genus Lophius are distributed in the Northeast Atlantic: white (or white-bellied) anglerfish (L. piscatorius L.) and black (or black-bellied) anglerfish (L. budegassa Spinola). Lophius budegassa are rarely caught in Nordic waters. In Norwegian waters, 1 out of about 2600 anglerfish landed from the Møre coast north of 62°N (2a) and 1 out of about 1000 from the North Sea were L. budegassa back in 2003 (Dyb 2003; K. Nedreaas, pers. comm.). In recent years (2010-2019) this ratio has some years been up to 1 out of 300 anglerfish being L. budegassa in Norwegian waters, but usually about 1 out of 1000.
9.1.2 Stock description and management units
The WGNSDS (Northern Shelf Demersal Stocks) considered the stock structure on a wider Eu-ropean scale in 2004, and found no conclusive evidence to indicate an extension of the stock area northwards to include Division IIa. Anglerfish in IIa has therefore been treated and described separately by the Celtic Sea Ecoregion working group (WGCSE) who is now assessing the an-glerfish in the neighbouring areas. Currently, anglerfish on the Northern Shelf are split into Sub-area VI (including Vb(EC), XII and XIV) and the North Sea (& IIa (EC)) for management pur-poses. However, genetic studies have found no evidence of separate stocks over these two re-gions (including Rockall) and particle-tracking studies have indicated interchange of larvae be-tween the two areas and further towards ICES Divisions IIa, Vb and Va (Hislop et al., 2001). So, at previous WGs, assessments have been made for the whole Northern Shelf area combined, but exclusive ICES Divisions IIa, Vb and Va. In fact, both microsatellite DNA analysis (O’Sullivan et al., 2006) and particle tracking studies carried out as part of EC 98/096 also suggested that an-glerfish from further south (Subarea VII) could also be part of the same stock. Hislop et al. (2001) simulated the dispersal of Lophius eggs and larvae using a particle tracking model. Their results also show the likelihood for Lophius at both Iceland (Solmundsson et al. 2007), Faroe Islands (Of-stad 2013) and Norwegian waters north of 62°N (i.e. subareas 1 and 2) to be recruited from the area west of Scotland including Rockall. This is also supported by research survey data as a mi-gration east-/northeastwards with size is seen in the IBTS- and other survey data (e.g., Dyb 2003).
Results from the use of otolith shape analysis in stock identification of anglerfish (L. piscatorius) in the Northeast Atlantic (Cañás et al. 2012) and previous references on L. piscatorius stock iden-tification find no biological evidence to support the current separation of Lophius stocks in the northeast Atlantic, but find substructures within the area.

472 | ICES SCIENTIFIC REPORTS 2:52 | ICES
Anglerfish were tagged during two IBTS surveys in the North Sea and five one-day trips using a small (15 m) Danish seiner off the Norwegian coast at around 62°40'N (Møre) (Thangstad et al. 2006; Otte Bjelland, IMR, Norway, pers. comm.). A total of 872 individuals were tagged with conventional Floy dart type tags, 123 in the North Sea (25-78 cm) and 749 at Møre (30-102 cm). Some of this is further described in Thangstad et al. (2006). Last year’s AFWG report (2019) shows the tagging locations and the hitherto recaptures. There are migrations in all directions, i.e., re-captures from the southern North Sea, at the Shetland/Faroes and northwards to Lofoten. Most of the recaptures were done at Møre where most of the fish were tagged.
In 2000-2001 a total of 1768 trawl caught L. piscatorius was tagged using conventional dart tags and released on inshore fishing grounds at Shetland (Laurenson et al. 2005). Anglerfish of be-tween 25 and 83 cm total length were tagged. The overall recapture rate was 4.5% and times at liberty ranged from 5 to 1078 days. After this publication, Dr Laurenson reported to www.fishupdate.com about a 104 cm anglerfish caught off the Norwegian coast near Ålesund in 2006. The fish had been tagged and released in the Scalloway Deeps on 13 September 2000 when it was 45cm long and had hence been at liberty for five years and nine months. This is of partic-ular importance as it may indicate a wider mixing of stocks and validate the growth rate of an-glerfish.
WKANGLER (2018) considered that most recruitment in subareas 1 and 2 are from the more southerly stock unit, and this would require further R&D work in collaboration with ICES 3a46 looking at egg and larval dispersion and transportation as well as tagging and genetic studies. To address, stock structure, mixing rates, and growth estimates, WKANGLER (2018) recom-mends a tagging program coordinated between all countries harvesting Lophius. Align tagging methods, measurement protocols and outreach to industry. Recommend a shared site for Lo-phius tagging data and other applicable research projects concerning Lophius. Until the true bio-logical stock structure is better understood, WKANGLER (2018) recommends keeping the an-glerfish in subareas 1 and 2 as a separate management unit for time being.
9.1.3 Biology
Sex ratios in Subarea 2 show that females outnumber males above approximately 75 cm, and above 100 cm all fish were females (Thangstad et al. 2006). This is very similar to sex ratios re-ported from distant Portuguese and Spanish waters (Duarte et al. 1997) and hence supports a sex growth difference independent of latitude.
Spawning has been documented to occur in ICES Division 2a in spring, but the present abun-dance of anglerfish in Subarea 1 and 2 seems to be dependent on influx or migration of juveniles from ICES subareas 4 and 6. Estimation of GSI (gonad-somatic index) for females in Division 2a, indicates developing ovaries from January to June. The highest values of GSI were found in June when some of the ovaries were 20-30% of the round weight. Only females bigger than 90 cm had elevated GSI values indicating developing ovaries. Dyb (2003) found that the length at which 50% of the females were mature (L50) was between 60-65 cm, and that all females above 80 cm were mature.
Some age readings exist of anglerfish in Division 2a, and comparative analyses of different struc-tures, preparations and methods used for age readings were done by Staalesen (1995) and Dyb (2003). The Norwegian Institute of Marine Research adopted the ICES age reading criteria using the first dorsal fin ray (illicium) as its routine method, but few fish have been aged since the above-mentioned projects. The material collected and read was, however, considered sufficient for preliminary yield-per-recruit estimations (ICES 2019). As a very simplified ‘rule of thumb’ one may divide the fish length by 10 to get an approximate age, i.e., a fish of 100 cm is approxi-mately 10 years old and 13 kg while a fish of 70 cm is about 7 years old and 7 kg.

ICES | AFWG 2020 | 473
An exploitation using gillnets with 300 mm mesh size will exploit males and females in a more equal ratio than 360 mm gillnets (Dyb 2003). However, a change to lower mesh size will, without additional regulations, not decrease the effort, but rather increase it, at least towards younger fish. A mesh size of 300 mm will catch more anglerfish down to 50 cm, i.e., more immature fish. Preliminary analyses have also shown that maximum yield-per-recruit will be 22% less using 300 mm instead of 360 mm gillnets (Staalesen 1995). A possible sudden increase in catch rates when going from 360 mm to 300 mm would, therefore, be of short duration. A mesh size of 360 mm is also more in line with the minimum legal catch size of 60 cm, the length at first ma-turity of females and the utilization of the species’ (especially the females’) growth potential.
Some basic biological input parameters for the current assessment approaches are shown in Ta-ble 9.3. Some of these are further described in WKANGLER (2018).
9.1.4 Scientific surveys
Anglerfish appears in demersal trawl surveys along the Norwegian shelf, but in very low num-bers. There has been a change in the surveys, going from single species- to multispecies surveys, during recent years. The procedures for data collection on anglerfish have varied and, at present, no time-series from surveys in Division 2a yields reliable information on the abundance of an-glerfish.
9.1.5 Fishery
In autumn 1992 a direct gillnet fishery for anglerfish (L. piscatorius) started on the continental shelf in ICES Division IIa off the northwestern coast of Norway (Norwegian statistical area 07; Figure 9.1). The anglerfish had previously only been taken as bycatch in trawls and gillnets. Until 2010-2011 there was a geographical expansion of the fishery which was largely due to a north-ward expansion of the Norwegian gillnet fishery (Figure 9.2). It is not known to what extent this northwards expansion of the fishing area is caused by an expansion of favourable environmental conditions for the anglerfish or the fishers discovering new anglerfish grounds. At Iceland, Solmundsson et al. (2007) concluded that changes in the distribution of anglerfish and increased stock size have co-occurred with rising water temperatures that have expanded suitable grounds for the species. Another observed feature of the fisheries is that regional peaks in the catches of anglerfish often culminate after a couple of years’ fishing (Figure 9.2). The recent increase in landings first happened along the coast of western Norway, but did the last year expand to all subareas north of 62˚N as well.
Norway is by far the largest exploiter of the anglerfish in subareas 1 and 2 accounting for 96-99% of the official landings (Table 9.1). The coastal gillnetting accounts for more than 90% of the land-ings (Table 9.2). The landings of anglerfish in Subarea 1 and 2 have been about 1/4-1/3 of the total landings from the other Northern Shelf areas (3a, 4 and 6), but was in 2017 only 7% of the total landings in these areas.
No TAC is given for Subarea 1 and 2, Norwegian waters. Catches of anglerfish in Division 2a, EC waters, are taken as a part of the EC anglerfish quota for ICES areas 3, 4 and 6, or as part of the Norwegian ‘Others’ quota in EC waters. The Norwegian fishery is regulated through:
• A discard ban on anglerfish regardless of size • A prohibition against targeting anglerfish with other fishing gear than 360 mm
(stretc.hed mesh) gillnets • A minimum catch size of 60 cm in all gillnet fisheries, and a maximum permission of 5%
anglerfish (in numbers) below 60 cm when fishing with gillnets • 72 hours maximum soak time in the gillnet fishery
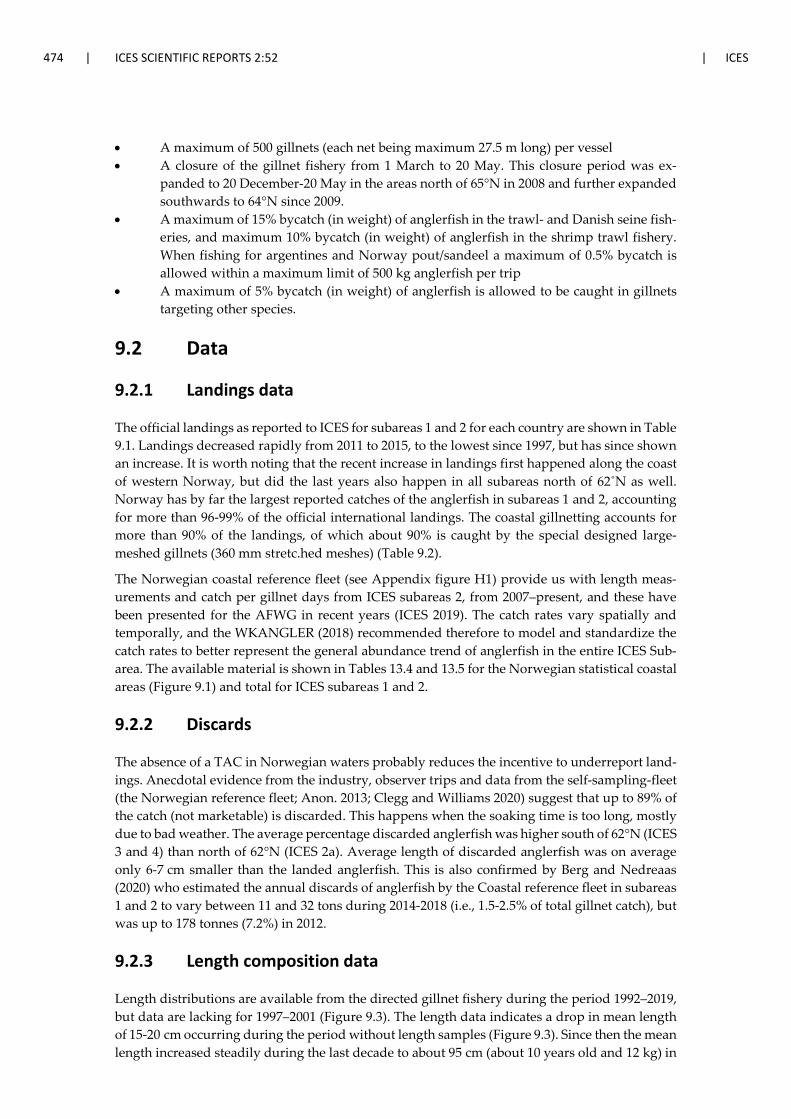
474 | ICES SCIENTIFIC REPORTS 2:52 | ICES
• A maximum of 500 gillnets (each net being maximum 27.5 m long) per vessel • A closure of the gillnet fishery from 1 March to 20 May. This closure period was ex-
panded to 20 December-20 May in the areas north of 65°N in 2008 and further expanded southwards to 64°N since 2009.
• A maximum of 15% bycatch (in weight) of anglerfish in the trawl- and Danish seine fish-eries, and maximum 10% bycatch (in weight) of anglerfish in the shrimp trawl fishery. When fishing for argentines and Norway pout/sandeel a maximum of 0.5% bycatch is allowed within a maximum limit of 500 kg anglerfish per trip
• A maximum of 5% bycatch (in weight) of anglerfish is allowed to be caught in gillnets targeting other species.
9.2 Data
9.2.1 Landings data
The official landings as reported to ICES for subareas 1 and 2 for each country are shown in Table 9.1. Landings decreased rapidly from 2011 to 2015, to the lowest since 1997, but has since shown an increase. It is worth noting that the recent increase in landings first happened along the coast of western Norway, but did the last years also happen in all subareas north of 62˚N as well. Norway has by far the largest reported catches of the anglerfish in subareas 1 and 2, accounting for more than 96-99% of the official international landings. The coastal gillnetting accounts for more than 90% of the landings, of which about 90% is caught by the special designed large-meshed gillnets (360 mm stretc.hed meshes) (Table 9.2).
The Norwegian coastal reference fleet (see Appendix figure H1) provide us with length meas-urements and catch per gillnet days from ICES subareas 2, from 2007–present, and these have been presented for the AFWG in recent years (ICES 2019). The catch rates vary spatially and temporally, and the WKANGLER (2018) recommended therefore to model and standardize the catch rates to better represent the general abundance trend of anglerfish in the entire ICES Sub-area. The available material is shown in Tables 13.4 and 13.5 for the Norwegian statistical coastal areas (Figure 9.1) and total for ICES subareas 1 and 2.
9.2.2 Discards
The absence of a TAC in Norwegian waters probably reduces the incentive to underreport land-ings. Anecdotal evidence from the industry, observer trips and data from the self-sampling-fleet (the Norwegian reference fleet; Anon. 2013; Clegg and Williams 2020) suggest that up to 89% of the catch (not marketable) is discarded. This happens when the soaking time is too long, mostly due to bad weather. The average percentage discarded anglerfish was higher south of 62°N (ICES 3 and 4) than north of 62°N (ICES 2a). Average length of discarded anglerfish was on average only 6-7 cm smaller than the landed anglerfish. This is also confirmed by Berg and Nedreaas (2020) who estimated the annual discards of anglerfish by the Coastal reference fleet in subareas 1 and 2 to vary between 11 and 32 tons during 2014-2018 (i.e., 1.5-2.5% of total gillnet catch), but was up to 178 tonnes (7.2%) in 2012.
9.2.3 Length composition data
Length distributions are available from the directed gillnet fishery during the period 1992–2019, but data are lacking for 1997–2001 (Figure 9.3). The length data indicates a drop in mean length of 15-20 cm occurring during the period without length samples (Figure 9.3). Since then the mean length increased steadily during the last decade to about 95 cm (about 10 years old and 12 kg) in

ICES | AFWG 2020 | 475
2014-2016, i.e., the same size level as seen during the 1990s. One-third of the anglerfish measured during the 1990s were above 100 cm, this proportion was between 1–6% for the early 2000s and 12–17% in 2006-2013. This indicates recruitment into Subarea 2 during 1997—2001 which has not been observed until 2017-2019 when a new drop in mean length is seen, again indicating some recruitment of smaller sized anglerfish to the area.
Length distributions of retained anglerfish (L. piscatorius) caught by the Reference fleet as target species during 2007-2019 by the specially-designed-large-meshed gillnets, and as bycatch in other gillnets or other gears are shown in Appendix figures H2-H4. All subsequent analyses (in the methods and results section) have only used the length distributions from the target fishery since 2007 using the large-meshed gillnets which represent more than 80% of the international landings.
9.2.4 Catch per unit effort (CPUE) data
The Norwegian coastal reference fleet (see Appendix Figure H1) has reported catch per gillnet soaking time (CPUE) from their daily catch operations. For the current modelling and hence standardization of the annual CPUE from subareas 1 and 2, we have used the following data:
• Only catch rates of retained anglerfish from the fishery using special large-meshed an-glerfish gillnets (stretched meshes=360mm)
• Years 2007-2019 • Discards excluded • Adding zero catches where gillnets are used, but anglerfish not present • All coastal areas (i.e. ICES 3a, 4a, 2a and 1) included in the model since it is documented
(e.g., WKANGLER 2018) that anglerfish are migrating across the ICES area borders. • The area (km2) of each subarea inside 12 nautical miles (covering most of the anglerfish
distribution) is calculated and used as a weighing factor when annual CPUEs are esti-mated for each subarea.
9.3 Methods and results
9.3.1 The length-based-spawning-potential-ratio (LBSPR) approach
The LBSPR method has been developed for data-limited fisheries, where only a few data are available: some representative sample of the size structure of the vulnerable portion of the pop-ulation (i.e., the catch) and an understanding of the life history of the species (Hordyk et al. 2016). The LBSPR method does not require knowledge of the natural mortality rate (M), but instead uses the ratio of natural mortality and the von Bertalanffy growth coefficient (K) (M/K), which is believed to vary less across stocks and species than M (Prince et al. 2015) though individual esti-mates of M and K can be used if available. Like any assessment method, the LBSPR model relies on a number of simplifying assumptions. In particular, the model is equilibrium-based, assumes that the length composition data is representative of the exploited population at steady state, and logistic selectivity (see the results section below for more discussion).
The LBSPR model originally developed by Hordyk et al. (2015a, b) used a conventional age-structured equilibrium population model and a size-based selectivity. As a consequence, this approach could not account for “Lee’s phenomenon” – the fact that larger specimen at age gets a higher mortality than its cohort of smaller size because of the size-based selectivity. This is because the age-structured model has a ‘regeneration assumption’ i.e. it redistributes at each time step the length at age using the same distribution. Hordyk et al. (2016) since developed a length-structured version of the LBSPR model that used growth-type-groups (GTG) to account

476 | ICES SCIENTIFIC REPORTS 2:52 | ICES
for the above phenomenon and showed that the new approach reduced bias related to the “Lee’s phenomenon” (https://github.com/AdrianHordyk/LBSPR). GTG LBSPR is therefore used for all subsequent analyses.
Some of the life history parameters for the analysis were taken from WKANGLER (2018). Hordyk et al. (2015a,b) showed that the LBSPR approach was sensitive to the input parameters. We, there-fore, drew 1000 random samples for each input parameter (i.e. from a bivariate normal distribu-tion for Linf and K, an a univariate normal distribution for M, L50, L95 (see Table 9.3)) and rerun the model in order to account for the effect of uncertainty around the input parameters on the results. We will refer to it as the “stochastic LBSPR approach” hereon.
Once the stochastic LBSPR runs were finished, we conducted some simulations through the LBSPR package to calculate some target SPR value. To do this, we used the mean input values from the stochastic LBSPR, the average estimated parameters values (from the stochastic LBSPR approach), and set the “steepness” to a value between 0.7 and 0.9 to perform a YPR analysis and determine the target reference points (which gives the maximum yield). Steepness values be-tween 0.7 and 0.9 was chosen based on a literature search (values close to 1 are also found in the literature but was not included in the test as it seemed unrealistic for the species). The analysis gave a target reference point of SPR=0.4 (with F/M~1) and SPR=0.25 (with F/M~2) and for a steep-ness value of 0.7 and 0.9, respectively. What we obtained from the stochastic LBSPR runs instead is a relatively stable annual estimates of SPR (between 0.15 and 0.5 (the IQR range)) and F/M (between 1.5 and 2.5) (Figure 9.4). This would suggest that ¬- while there is a lot of uncertainty - fishing effort is probably slightly above but close to the effort what would lead to maximum yield.
The relationship between the biomass of reproductively mature individuals (spawning stock) and the resulting offspring added to the population (recruitment), the stock recruitment relation-ship, is a fundamental and challenging problem in all population biology. The steepness of this relationship is the fraction of unfished recruitment obtained when the spawning stock biomass is 20% of its unfished level. Steepness has become widely used in fishery management, where it is usually treated as a statistical quantity. If one has sufficient life history information to construct a density-independent population model then one can derive an associated estimate of steepness (Mace and Doonan 1988, Mangel et al. 2010, 2013).
As mentioned in the introduction, the LBSPR approach is an equilibrium-based method (i.e. as-sumes that the fishery experiences a constant recruitment and F over time) and violation of this assumption can lead to biased SPR estimates. However, some management strategy evaluation conducted by Hordyk et al. (2015) on harvest control rules based on SPR-based size targets showed that while annual assessments of SPR may be imprecise due to the transitory dynamics of a population’s size structure, smoothed trends estimated over several years may provide a robust metric for harvest control rules. SPR estimates in our study were relatively stable, thus large recruitment fluctuations may not be an issue.
9.3.2 CPUE standardization
Raw CPUE data is seldom proportional to population abundance as many factors (e.g. changes in fish distribution, catch efficiency, effort, etc.) potentially affect its value. Therefore, CPUE standardization is an important step that attempts to derive an index that tracks relative popu-lation dynamics.
In the data preparation step, we quickly noticed that there was not enough data from ICES Sub-area 1 to perform model inference. Therefore, we decided to omit data from this Subarea from the analyses. ICES subarea 1 is the northern margin of L. piscatorius distribution, and only 3 tonnes were caught in this area in 2019, mostly as bycatch in other fisheries.
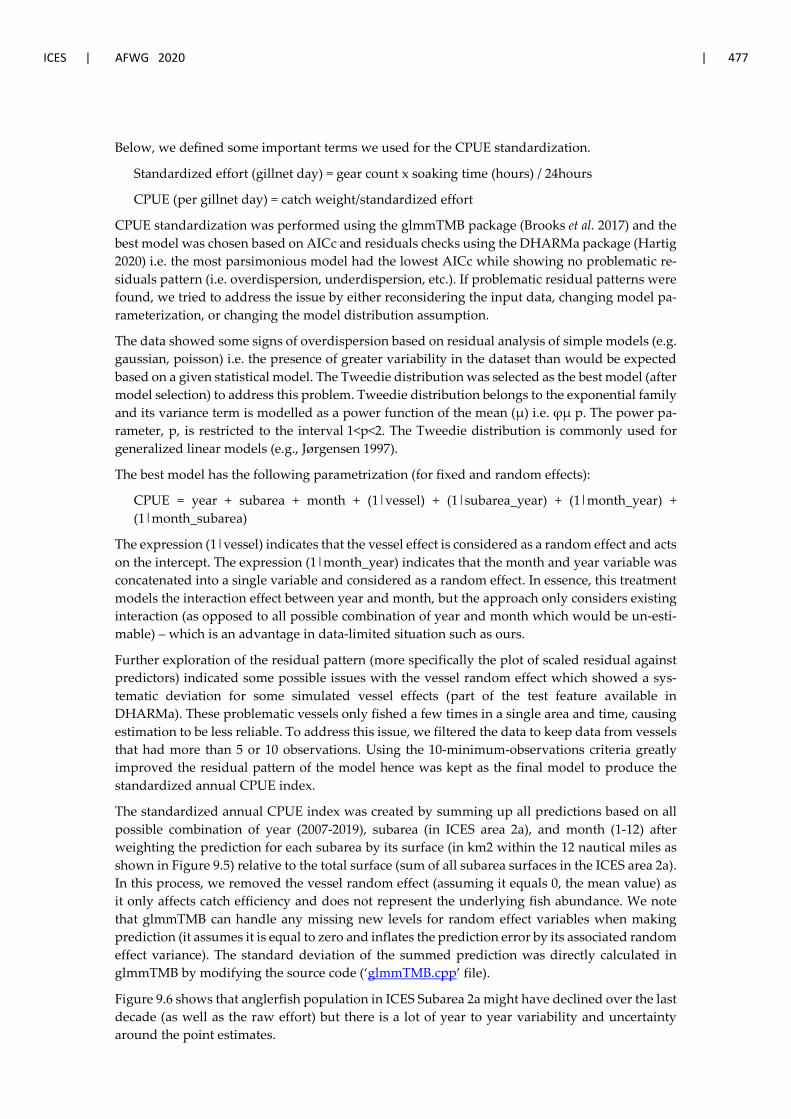
ICES | AFWG 2020 | 477
Below, we defined some important terms we used for the CPUE standardization.
Standardized effort (gillnet day) = gear count x soaking time (hours) / 24hours
CPUE (per gillnet day) = catch weight/standardized effort
CPUE standardization was performed using the glmmTMB package (Brooks et al. 2017) and the best model was chosen based on AICc and residuals checks using the DHARMa package (Hartig 2020) i.e. the most parsimonious model had the lowest AICc while showing no problematic re-siduals pattern (i.e. overdispersion, underdispersion, etc.). If problematic residual patterns were found, we tried to address the issue by either reconsidering the input data, changing model pa-rameterization, or changing the model distribution assumption.
The data showed some signs of overdispersion based on residual analysis of simple models (e.g. gaussian, poisson) i.e. the presence of greater variability in the dataset than would be expected based on a given statistical model. The Tweedie distribution was selected as the best model (after model selection) to address this problem. Tweedie distribution belongs to the exponential family and its variance term is modelled as a power function of the mean (µ) i.e. φµ p. The power pa-rameter, p, is restricted to the interval 1<p<2. The Tweedie distribution is commonly used for generalized linear models (e.g., Jørgensen 1997).
The best model has the following parametrization (for fixed and random effects):
CPUE = year + subarea + month + (1|vessel) + (1|subarea_year) + (1|month_year) + (1|month_subarea)
The expression (1|vessel) indicates that the vessel effect is considered as a random effect and acts on the intercept. The expression (1|month_year) indicates that the month and year variable was concatenated into a single variable and considered as a random effect. In essence, this treatment models the interaction effect between year and month, but the approach only considers existing interaction (as opposed to all possible combination of year and month which would be un-esti-mable) – which is an advantage in data-limited situation such as ours.
Further exploration of the residual pattern (more specifically the plot of scaled residual against predictors) indicated some possible issues with the vessel random effect which showed a sys-tematic deviation for some simulated vessel effects (part of the test feature available in DHARMa). These problematic vessels only fished a few times in a single area and time, causing estimation to be less reliable. To address this issue, we filtered the data to keep data from vessels that had more than 5 or 10 observations. Using the 10-minimum-observations criteria greatly improved the residual pattern of the model hence was kept as the final model to produce the standardized annual CPUE index.
The standardized annual CPUE index was created by summing up all predictions based on all possible combination of year (2007-2019), subarea (in ICES area 2a), and month (1-12) after weighting the prediction for each subarea by its surface (in km2 within the 12 nautical miles as shown in Figure 9.5) relative to the total surface (sum of all subarea surfaces in the ICES area 2a). In this process, we removed the vessel random effect (assuming it equals 0, the mean value) as it only affects catch efficiency and does not represent the underlying fish abundance. We note that glmmTMB can handle any missing new levels for random effect variables when making prediction (it assumes it is equal to zero and inflates the prediction error by its associated random effect variance). The standard deviation of the summed prediction was directly calculated in glmmTMB by modifying the source code (‘glmmTMB.cpp’ file).
Figure 9.6 shows that anglerfish population in ICES Subarea 2a might have declined over the last decade (as well as the raw effort) but there is a lot of year to year variability and uncertainty around the point estimates.

478 | ICES SCIENTIFIC REPORTS 2:52 | ICES
9.3.3 JABBA
JABBA stands for ‘Just Another Bayesian Biomass Assessment’ and is an open-source modelling software that can be used for biomass dynamic stock assessment applications. It has emerged from the development of a Bayesian State-Space Surplus Production Model framework applied in stock assessments of sharks, tuna, and billfishes around the world (Winker et al. 2018). JABBA requires a minimum of two input comma-separated value files (.csv) in the form of catch and abundance indices (and SE) (see Appendix table H1). The Catch input file contains the time series of year and catch by weight, aggregated across fleets for the entire fishery. Missing catch years or catch values are not allowed. JABBA is formulated to accommodate abundance indices from multiple sources (i.e., fleets) in a single CPUE file, which contains all considered abundance in-dices. The first column of the CPUE input is year, which must match the range of years provided in the Catch file. In contrast to the Catch input, missing abundance index (and SE) values are allowed.
The catch data comes from the different fishing countries’ official reporting of annual landings to ICES (see Table 9.1) and the CPUE data (along with its standard deviation) comes from the CPUE standardization process described above and Figure 9.10 for the early years 1992-1994. We assumed that the CPUE index from ICES Subarea 2a calculated using data from the anglerfish targeted fishery is representative of the stock status in ICES areas 1 and 2 together.
In addition to these .csv files, JABBA also require users to define the prior distribution for the model parameters which will be subsequently updated with data to form the posterior distribu-tions (Figure 9.7).
Figure 9.8 shows the trajectory of the population estimates from 1990-2019 based on its estimated biomass and the estimated fishing mortality. In general, population abundance has never fallen below Bmsy (at least the mean trajectory. See also Figure 9.9) but fishing mortality fluctuated above and below the FMSY. Figure 9.8 also shows the credibility intervals of the 2019 estimates of biomass and fishing mortality. The percentage numbers at the top right indicate how much of the 2019 population estimates that falls within the green (not overfished, no overfishing), yellow (overfished, but no overfishing), orange (overfishing, but not overfished), and red (overfished and overfishing) zones, after accounting for all the parameter uncertainty (basically, the area under the oval shaped density plot that falls into each colored quadrant). The model estimates that there is roughly a 40% probability that the 2019 population estimate fall within the red zone, 35% in the orange, and 25% in the green zone. Model sensitivity to prior assumptions (r, K, psi, sigma2 in Figure 6) was also examined but all models showed qualitatively similar results.
9.4 Management considerations and future investigations
The present abundance of anglerfish in subareas 1 and 2 seems to depend on influx or migration of juveniles from ICES subareas 4 and 6. It is therefore expected that an effective discard ban on anglerfish in subareas 4 and 6 will have a positive impact on the abundance north of 62°N. Re-duced mean size of the landed anglerfish in recent years (fishing with the same large-meshed gillnets) indicates a new influx of recruitment to the ICES subareas 1 and 2. Monitoring of the fishery will be important in near future to protect the young specimens from recruitment- and growth overfishing.
The AFWG has previously recommended that the anglerfish stock component in subareas 1 and 2 is annually monitored and a 20% reduction in fishing effort per year (also as an uncertainty cap) should be imposed until the decrease in CPUE is stopped. Despite that the decrease in CPUE has stopped for time being, the current exploratory assessment shows that there is nothing to gain in increasing effort.

ICES | AFWG 2020 | 479
The three approaches tested in this report, all very different (except that JABBA also uses the CPUE as abundance indices), offer corroborative evidence suggesting that the anglerfish popu-lation has declined over time.
The standardized CPUE analysis shows that anglerfish population in ICES Subarea 2a has de-clined over the last decade (as well as the raw effort) with a slight increase in the two most recent years.
The spawning potential ratio, as calculated by the LBSPR method using input biological param-eters and the estimated exploitation parameters suggests that - while there is a lot of uncertainty - fishing effort is probably slightly above but close to the effort what would lead to maximum yield.
The relative population stock status is around BMSY, though fishing intensity seems too high (above FMSY) and should be reduced before the population does fall below the biomass and SPR targets.
The quality of the current exploratory assessment should be further evaluated by analysing more diagnostics, especially the JABBA model sensitivity of priors settings, before being adopted as the routine assessment package to be used for anglerfish in ICES subareas 1 and 2.
When it comes to reference points, it should be further discussed if and which defined values of F/M, F/FMSY, SPR and B/BMSY that may be used.
Any potential harvest control should take account of both recruitment- and growth- overfishing. LBSPR provides measures for both, F/M and SPR, with the SPR values being the transient SPR and thus an estimate of current stock status. While maximum sustainable catch is often a key management objective, it may not be the only one. In that case, it may be worth modifying a reference point to reflect other management objectives.
The AFWG supports that ICES subareas 1, 2, 3, 4 and 6 should be investigated together to get a more complete understanding of migrations and distribution.
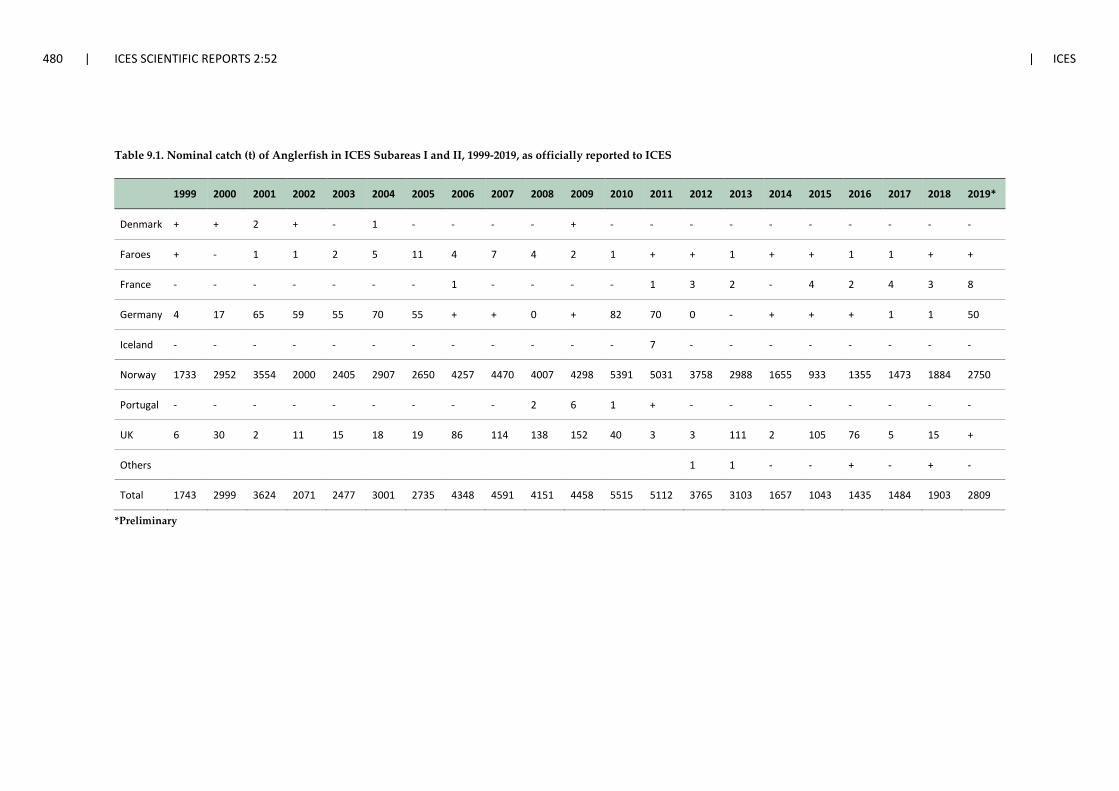
480 | ICES SCIENTIFIC REPORTS 2:52 | ICES
Table 9.1. Nominal catch (t) of Anglerfish in ICES Subareas I and II, 1999-2019, as officially reported to ICES
1999 2000 2001 2002 2003 2004 2005 2006 2007 2008 2009 2010 2011 2012 2013 2014 2015 2016 2017 2018 2019*
Denmark + + 2 + - 1 - - - - + - - - - - - - - - -
Faroes + - 1 1 2 5 11 4 7 4 2 1 + + 1 + + 1 1 + +
France - - - - - - - 1 - - - - 1 3 2 - 4 2 4 3 8
Germany 4 17 65 59 55 70 55 + + 0 + 82 70 0 - + + + 1 1 50
Iceland - - - - - - - - - - - - 7 - - - - - - - -
Norway 1733 2952 3554 2000 2405 2907 2650 4257 4470 4007 4298 5391 5031 3758 2988 1655 933 1355 1473 1884 2750
Portugal - - - - - - - - - 2 6 1 + - - - - - - - -
UK 6 30 2 11 15 18 19 86 114 138 152 40 3 3 111 2 105 76 5 15 +
Others
1 1 - - + - + -
Total 1743 2999 3624 2071 2477 3001 2735 4348 4591 4151 4458 5515 5112 3765 3103 1657 1043 1435 1484 1903 2809
*Preliminary

ICES | AFWG 2020 | 481
Table 9.2. Anglerfish in ICES Subareas I and II. Norwegian landings (tonnes) by fishery in 2007–2019. The coastal area is here defined as the area inside 12 nautical miles from the baseline.
Fleet NORWAY 2007 2008 2009 2010 2011 2012 2013 2014 2015 2016 2017 2018 2019*
Coastal gillnet 4 039 3 574 3 934 4 806 4 557 3 521 2 758 1 506 829 1 231 1 320 1 727 2 567
Offshore gillnet 204 240 171 391 319 115 158 95 52 62 87 68 153
Danish seine 63 75 68 40 26 16 19 11 12 17 23 28 27
Demersal trawl 65 34 36 48 19 11 8 7 3 5 6 10 5
Other gears 98 84 89 106 83 96 45 36 37 40 31 51 63
Total 4 470 4 007 4 298 5 391 5 031 3 759 2 988 1 655 934 1 355 1 468 1 884 2 815
*Preliminary per 4 February 2020

482 | ICES SCIENTIFIC REPORTS 2:52 | ICES
Table 9.3. Basic input parameters and parameters for resampling as used for the LBSPR analysis
Basic input parameters Value
Von Bertalanffy K parameter (mean) 0.12
Von Bertalanffy Linf parameter (mean) 146
Von Bertalanffy t0 parameter -0.34
Length-weight parameter a 0.149
Length-weight parameter b 2.964
Steepness 0.8
Maximum age 25
Length at 50% maturity (L50) (mean) 82
Length at 95% maturity (L95) (mean) 100
∆Mat = L95 - L50 (mean) 18
Length at first capture 40
Length at full selection 60
M (mean) 0.2
M/k (mean) 1.67
Parameters for resampling
Nsamp 1000
CV(M) 0.15
Cor (Linf_K) 0.9
CV(K) 0.3
CV(Linf) 0.15
CV(L50) 0.05
CV(∆Mat) 0.05

ICES | AFWG 2020 | 483
Table 9.4. Number of Coastal reference fleet fishing days with anglerfish, per national stat. subareas (0-7) and total for ICES Subareas 1 and 2. Only large-meshed gillnets included.
Table 9.5. Number of fishing days with length measured anglerfish (left) and number of length measured fish (right). Only large-meshed gillnets included.
Year/Area 0 5 6 7 ICES 1 and 22007 106 26 280 4122008 62 37 6 171 2762009 86 35 36 176 3332010 14 41 37 143 2352011 64 19 51 116 2502012 49 12 24 21 1062013 64 20 18 81 1832014 5 19 107 1312015 108 5 116 2292016 92 22 34 1482017 88 109 1972018 112 88 2002019 86 34 60 180
Year ICES 1 and 22007 912008 482009 572010 792011 1192012 502013 712014 332015 782016 512017 952018 792019 78
Year ICES 1 and 22007 21972008 14072009 23252010 21712011 24232012 9952013 13052014 5462015 10632016 6542017 15932018 14412019 1462

484 | ICES SCIENTIFIC REPORTS 2:52 | ICES
Figure 9.1. Map showing the Norwegian statistical coastal areas. Area 03 is part of ICES Subarea 1, Areas 04, 05, 00, 06 and 07 are part of ICES Subarea 2, Areas 28 and 08 are part of ICES Subarea 4, and Area 09 corresponds roughly with ICES Subarea 3.
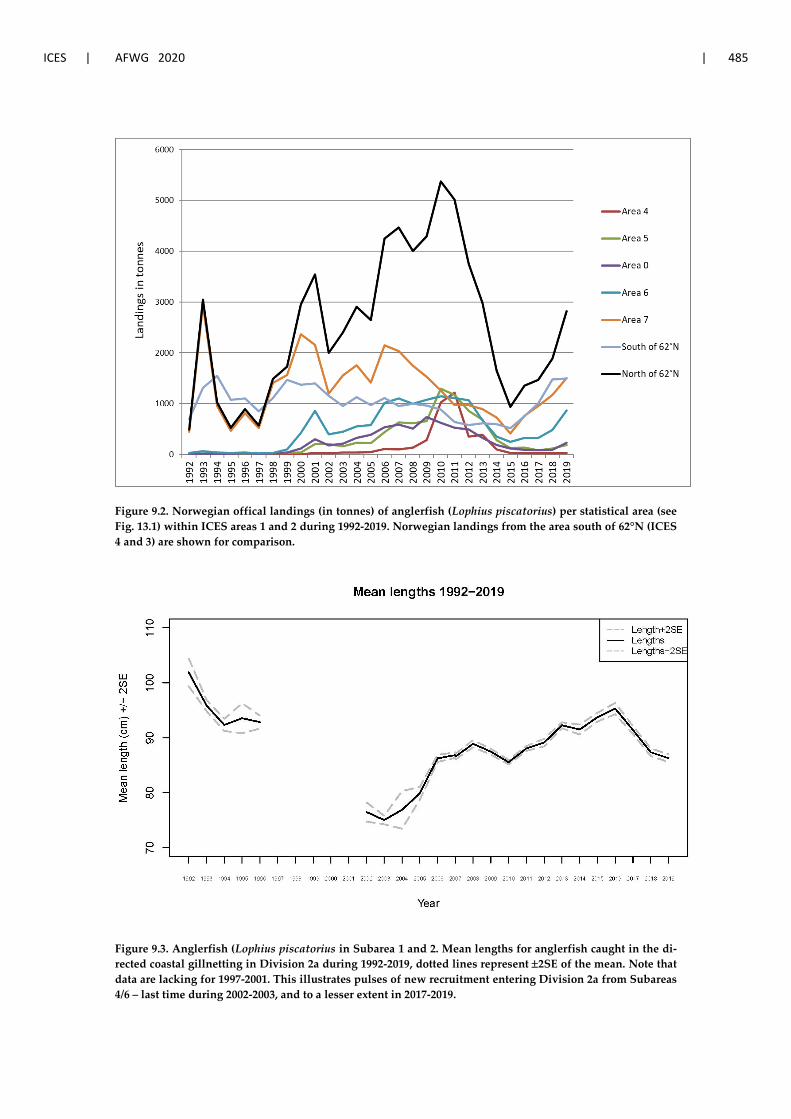
ICES | AFWG 2020 | 485
Figure 9.2. Norwegian offical landings (in tonnes) of anglerfish (Lophius piscatorius) per statistical area (see Fig. 13.1) within ICES areas 1 and 2 during 1992-2019. Norwegian landings from the area south of 62°N (ICES 4 and 3) are shown for comparison.
Figure 9.3. Anglerfish (Lophius piscatorius in Subarea 1 and 2. Mean lengths for anglerfish caught in the di-rected coastal gillnetting in Division 2a during 1992-2019, dotted lines represent ±2SE of the mean. Note that data are lacking for 1997-2001. This illustrates pulses of new recruitment entering Division 2a from Subareas 4/6 – last time during 2002-2003, and to a lesser extent in 2017-2019.
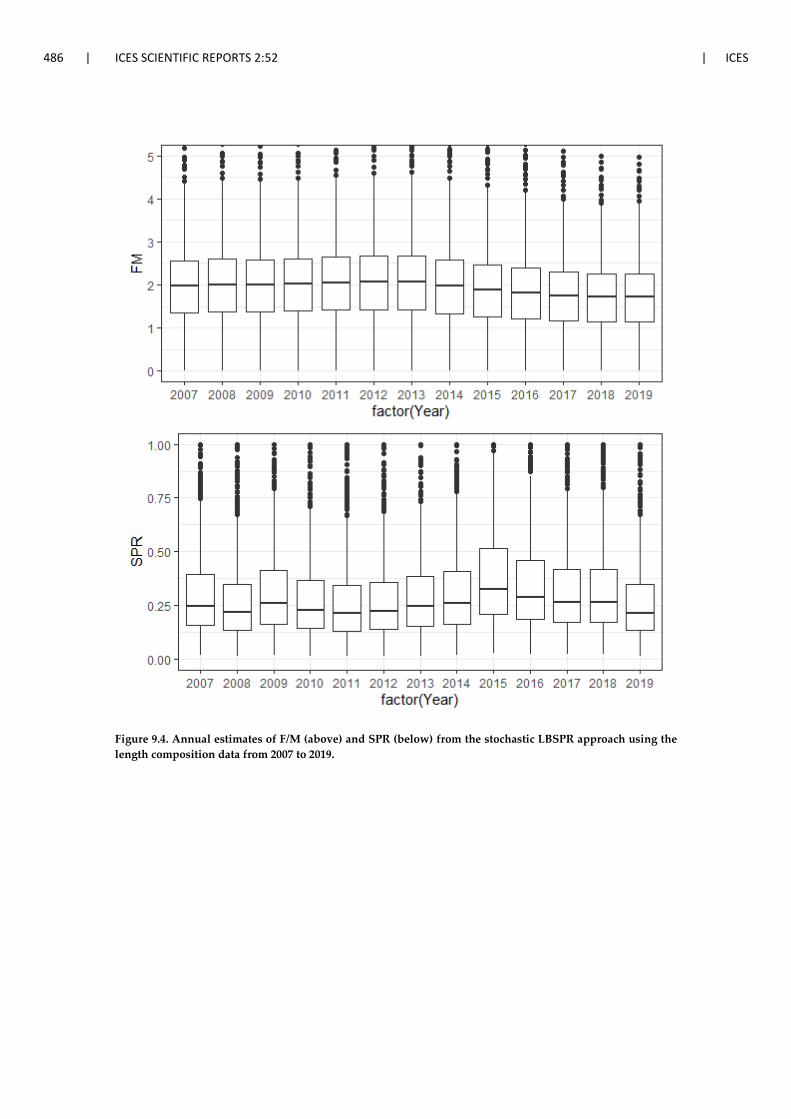
486 | ICES SCIENTIFIC REPORTS 2:52 | ICES
Figure 9.4. Annual estimates of F/M (above) and SPR (below) from the stochastic LBSPR approach using the length composition data from 2007 to 2019.

ICES | AFWG 2020 | 487
Figure 9.5. Map showing the area (km2) of each Norwegian statistical subarea inside 12 nautical miles. The subareas 4, 5, 0, 6, and 7 belong to the ICES Division 2a.

488 | ICES SCIENTIFIC REPORTS 2:52 | ICES
Figure 9.6. Standardized CPUE (kg per gillnet day) +/- SD (solid black line with error bars) and the correspond-ing standardized effort (dash line) for anglerfish based on the data from the Norwegian coastal reference fleet in ICES Subarea 2a, from vessels targeting anglerfish with large meshed gillnets.
Figure 9.7. Prior and posterior distribution of the model parameters for the anglerfish assessment.

ICES | AFWG 2020 | 489
Figure 9.8. Kobe plot for the JABBA scenario showing the estimated trajectories (1990-2019) of B/BMsy and F/FMSY- Different grey shaded areas denote the 50%, 80%, and 95% credibility interval for the terminal as-sessment year. The probability of terminal year points falling within each quadrant is indicated in the figure legend.
Figure 9.9. Estimated trajectories for F/FMSY (left), and B/BMSY (right) for the ICES Subarea 1-2 anglerfish JABBA scenario. Grey-shaded areas denote 95% confidence intervals.
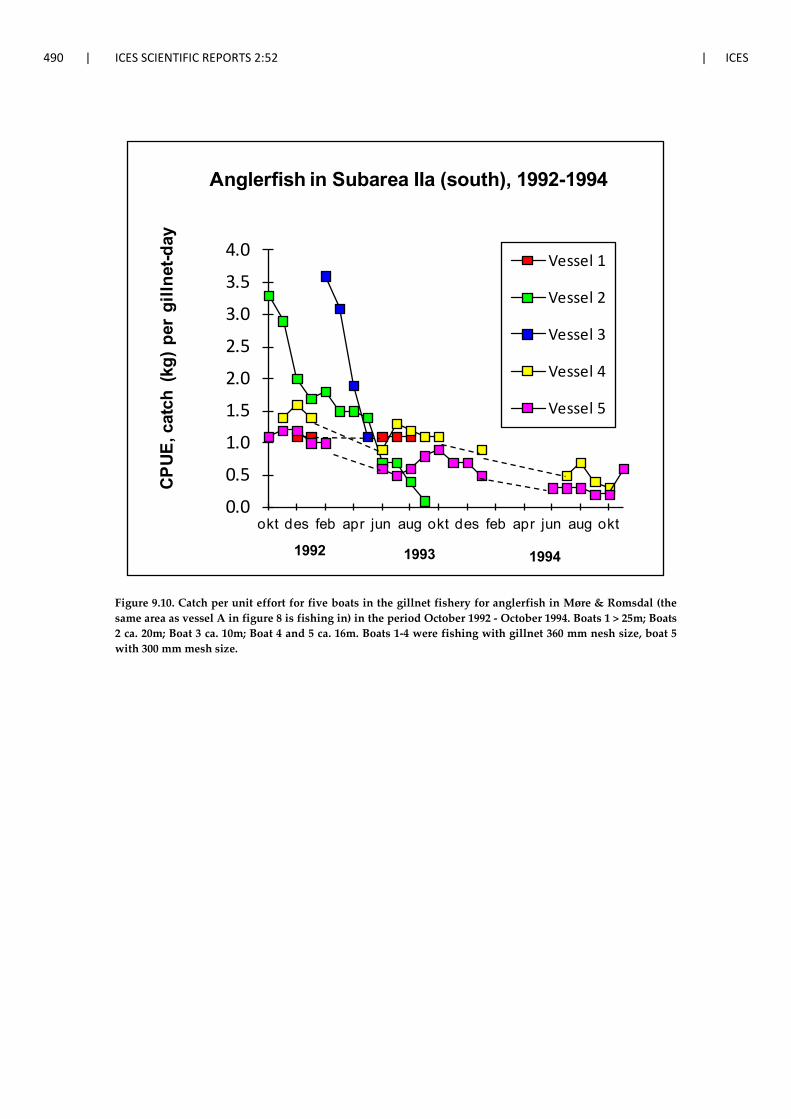
490 | ICES SCIENTIFIC REPORTS 2:52 | ICES
Figure 9.10. Catch per unit effort for five boats in the gillnet fishery for anglerfish in Møre & Romsdal (the same area as vessel A in figure 8 is fishing in) in the period October 1992 - October 1994. Boats 1 > 25m; Boats 2 ca. 20m; Boat 3 ca. 10m; Boat 4 and 5 ca. 16m. Boats 1-4 were fishing with gillnet 360 mm nesh size, boat 5 with 300 mm mesh size.
0.0
0.5
1.0
1.5
2.0
2.5
3.0
3.5
4.0
okt des feb apr jun aug okt des feb apr jun aug okt
CPUE
, cat
ch (
kg) p
er g
illne
t-day
Anglerfish in Subarea IIa (south), 1992-1994
Vessel 1
Vessel 2
Vessel 3
Vessel 4
Vessel 5
1992 1993 1994

ICES | AFWG 2020 | 491
Appendix figure H1.

492 | ICES SCIENTIFIC REPORTS 2:52 | ICES
Appendix table H1. Input data to the JABBA assessment in the form of catch and abundance indices of an-glerfish (L. piscatorius) in ICES Subareas 1 and 2.
Year Catch CPUE (mean) CPUE (SE)
1990 151
1991 180
1992 488 1.5 0.3
1993 3042 1 0.2
1994 1024 0.5 0.1
1995 526
1996 887
1997 601
1998 1549
1999 1743
2000 2999
2001 3624
2002 2071
2003 2477
2004 3001
2005 2735
2006 4348
2007 4591 0.45 0.07
2008 4151 0.47 0.06
2009 4458 0.44 0.058
2010 5515 0.36 0.048
2011 5112 0.42 0.060
2012 3765 0.45 0.067
2013 3103 0.26 0.035
2014 1657 0.36 0.058
2015 1043 0.36 0.066
2016 1435 0.27 0.042
2017 1484 0.25 0.049
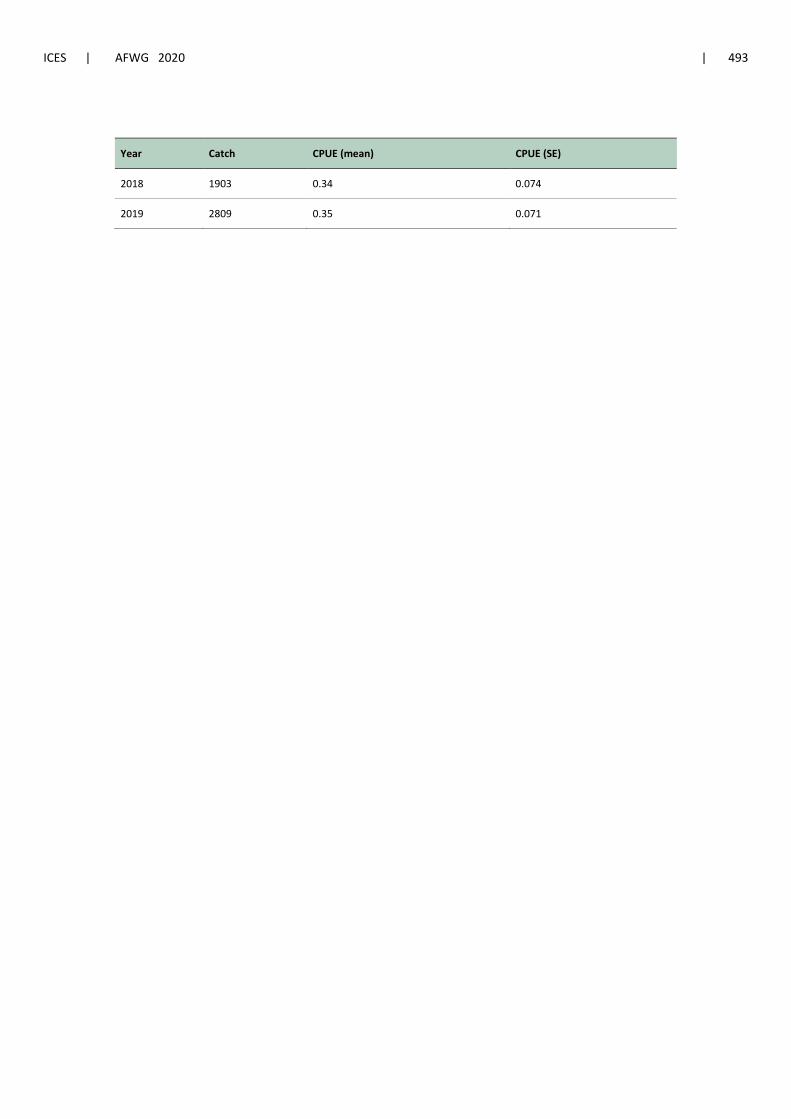
ICES | AFWG 2020 | 493
Year Catch CPUE (mean) CPUE (SE)
2018 1903 0.34 0.074
2019 2809 0.35 0.071

494 | ICES SCIENTIFIC REPORTS 2:52 | ICES
10 Barents Sea capelin
10.1 Regulation of the Barents Sea capelin fishery
Since 1979, the Barents Sea capelin fishery has been regulated by a bilateral fishery management agreement between Russia (former USSR) and Norway. A TAC has been set separately for the winter fishery and for the autumn fishery. From 1999, no autumn fishery has taken place, except for a small Russian experimental fishery in some years. A minimum landing size of 11 cm has been in force since 1979. AFWG strongly recommends capelin fishery only on mature fish during the period from January to April.
10.2 TAC and catch statistics (Table 10.1)
The Joint Russian-Norwegian Fishery Commission set a zero TAC for both 2019 and 2020. Both the quotas were in accordance with the ICES advice. The international historical catch by country and season in the years 1965–2020 is given in Table 10.1. There were no landings in 2020, except very small catches during scientific research by Norway and Russia.
10.3 Sampling
The capelin sampling from the Barents Sea ecosystem survey used in the 2019 capelin assessment is summarised below:
Investigation No. of trawl hauls Length measurements Aged
individuals
Ecosystem survey in autumn 2019 (Norway) 105 9782 2734
Ecosystem survey in autumn 2019 (Russia) 142 8749 529
10.4 Stock assessment
10.4.1 Acoustic stock size estimates in 2019 (Table 10.2, Figure 10.1)
The geographical survey coverage of the Barents Sea capelin stock during the BESS in 2019 was considered to be complete (Figure 10.1). The north-eastern part of the standard survey area was not covered, but based on the rest of the distribution data, no capelin was expected here.
The stock estimate from the area covered by the 2019 survey was 0.41 million tonnes (Table 10.2). About 73% (0.30 million tonnes) of the estimated stock biomass consisted of maturing fish (>14.0 cm). The mean weight at age in the 2019 survey was similar to 2018 for all age groups (Figure. 10.2).
As decided during the 2016 assessment meeting, the capelin abundance was estimated using the software StoX (Johnsen et al. 2019), applying agreed settings.
A fixed sampling variance expressed as Coefficient of Variance (CV) of 0.2 per age group has been applied as input for CapTool in the capelin assessment and was also used this year

ICES | AFWG 2020 | 495
(Tjelmeland 2002; Gjøsæter et al. 2002). The survey design and estimation software now allows for estimation of a direct CV by age group, and for the 2019 survey this was estimated:
• for age group 1 -0.13; • for age group 2 - 0.33, • for age group 3 - 0.36.
These values are higher than previous years for age groups 2 and 3, and lower for age group 1. This can be due to the very patchy distribution of adult capelin this year. Relative sampling error based only on acoustic recordings (Nautical Area Scattering Coefficient (NASC; m2nmi-2) by nau-tical mile) was estimated to 25.37% which was very similar to last year. These values are higher than in 2018. Detailed information about previous CV estimates can be found in AFWG WD5, 2018. Future implementation of direct survey CV in the assessment is discussed under future work (10.4.6).
10.4.2 Recruitment estimation in 2019 (Table 10.3)
The survey coverage of 0-group in 2019 was considered complete. Swept volume 0- index (Dingsør, 2005; Eriksen et al., 2009) was calculated both: without correction and with correction for catching efficiency (Table 10.3). The capelin 0-group index for 2019 was above the long-term average. The mean length of 0-group capelin in the areas covered was the lowest since 1993, and well below the long-term average. Table 10.3 also shows the number of fish in the various year classes at age 0-2, and their “survey mortality” from age one to age two.
10.4.3 Forecast
Probabilistic projections of the maturing stock to the time of spawning at 1 April 2020 were made using the spreadsheet model CapTool (implemented in the @RISK add-on for EXCEL, 50 000 simulations were used). The settings were the same as last year. The projection was based on a maturation and predation model with parameters estimated by the model Bifrost and data on cod abundance and size at age in 2020 from the 2019 Arctic Fisheries Working Group (ICES Sci-entific Reports. 1:30). The assessment which was the basis for advice was used (Tables S_3.15 to S_3.21 in the report.
The methodology is described in the 2009 WKSHORT report (ICES C.M. 2009/ACOM:34) and the WKARCT 2015 report (ICES C.M. 2015/ACOM:31). The natural mortality M for the months October to December is drawn among a set of M-values estimated for different years based on historical data. The same set of M-values was used in 2019 as in 2018 (ICES 2011/ACOM:05, An-nex 12).
With no catch, the estimated median spawning stock size at 01 April 2020 is 85 100 tonnes (Figure 10.3), and the probability for the spawning stock to be below Blim (200 000 t) is 97.8%.
Estimates of stock in number by age group and total biomass for the historical period are shown in Table 10.4. Other data which describe the stock development are shown in Table 10.5. Sum-mary plots are given in Figure 10.4.
10.4.4 Recruitment
The 1-group abundance in 2019 was 17.5 billion which is far below the long-term average and the lowest since 1995 (Figure 10.5). The most recent evaluation of the spawning stock and re-cruitment time series was made by Gjøsæter et al. (2016).
496 | ICES SCIENTIFIC REPORTS 2:52 | ICES
Future recruitment conditions: High abundance of young herring (mainly age groups 1 and 2) has been suggested to be a necessary but not a single factor causing recruitment failure in the capelin stock (Hjermann et al., 2010; Gjøsæter et al. 2016). Based on survey data from the Barents Sea Ecosystem Survey in 2019, a significant proportion of the young herring is 3-year-olds which are expected to leave the Barents Sea in the year to come, and the abundance of young herring in the Barents Sea in 2020 is expected to be below average.
10.4.5 Comments to the assessment
The survey estimate of abundance at age in 2019 is in correspondence with the 2018 estimate, but the ”survey mortality” from age 1 to 2 is very high (Figure 10.6, Table 10.3). This is one of the highest values in the historical period.
Ecological considerations
The number of young herring in the Barents Sea can be an important factor that affects the cap-elin recruitment. It is not currently taken into account in the assessment model. The benchmark for capelin stocks in the Barents Sea (WKARCT, ICES C.M. 2015/ACOM:31) noted the need for further study of this effect as well as better monitoring of the young herring abundance.
The amount of other food than capelin for cod and other predators may also have changed in recent years. This may also indirectly have affected the predation pressure on capelin. A more detailed discussion of interactions between capelin and other species is given in the 2016-2020 WGIBAR reports (ICES C.M. 2016/SSGIEA:04, ICES C.M. 2017/SSGIEA:04, ICES C.M. 2018/SSGIEA:04; ICES Scientific Reports. 1:42, ICES Scientific Reports. 2:30).
10.4.6 Further work on survey and assessment methodology
Survey
Since the only source of information about the capelin stock abundance and composition comes from the BESS, it is crucial for the assessment that the survey results are reliable. While the survey results of 2016 and 2017 revealed inconsistencies related to monitoring issues (Skaret et al. 2018), the results from 2017 and 2018 were consistent—and also the results from 2018 and 2019.
From 26 February to 11 March 2020, IMR carried out a trawl-acoustic monitoring and stock esti-mation of spawning capelin (Skaret et al. 2020). The survey is the second in a planned series of three surveys to evaluate whether such a monitoring can be used in the assessment to improve the advice. The initiative and funding come from the industry, and the idea in the long term is that monitoring closer to when fishery and spawning happens, can reduce uncertainty in stock advice. Monitoring during spawning has been attempted before, last time in 2007–2009, and has proven to be methodologically difficult due to unpredictable timing and location of the spawn-ing migration. The survey was carried out using two fishing vessels ‘Vendla’ and ‘Eros’ in col-laboration with a scouting vessel, the fishing vessel ‘Hovden Viking’, so a bigger effort than in 2019. A stratified design using zig-zag transects with randomized starting points were used and the effort was allocated based on historical and recent information about capelin distribution. The fishery sonar was used actively during the whole survey to estimate size distribution of capelin schools, migration speed and direction. Also, TS measurements were carried out and an autonomous sailbuoy was tried for monitoring through remote control. The coverage of the cap-elin spawning migration was successful and the estimate of 62 000 tonnes was within the ex-pected range from the autumn predictions (Table 10.5, Figure 10.3).
Nevertheless, methodological issues due to timing and patchy distribution of capelin were still very apparent, and this must be handled adequately before such monitoring can be potentially

ICES | AFWG 2020 | 497
implemented in an advisory process. A similar survey will be carried out again in the winter of 2021, and later the evaluation of the three-year series will be carried out. This could preferably be combined with a benchmark for this stock.
To improve survey methodology, the Deep vision camera system was tested this year onboard ‘Johan Hjort’ during BESS for the second time. It was mounted on a frame in the trawl opening and towed after the vessel to obtain image samples of fish. The results can help to validate the classification of acoustic data to species groups which was an issue in particular during the 2016 survey, and can potentially provide size distribution of capelin in different depths. The test was promising, but unfortunately, leakage into the camera housing limited the testing to only a few trawl hauls.
Assessment model
In the present capelin assessment model, the only species interaction in the Barents Sea taken explicitly into account is predation by cod on mature capelin. The model does not take into ac-count possible changes in capelin stock dynamics (e.g. maturation), the current state of the envi-ronment and stock status of other fish species and mammals in the Barents Sea. The ICES work-ing group of Integrated Assessment of the Barents Sea (WGIBAR) has addressed some of these issues.
Consumption of pre-spawning capelin by mature cod in winter-spring season and autumn sea-son is still not included in the assessment model. It may have a significant impact on capelin SSB calculations.
Gjøsæter et al. (2015) calculated what the quota advice and spawning stock would have been in the period 1991—2013, given the present assessment model and knowledge about the cod stock. By exchanging that cod forecast with the actual amount of cod from the cod assessment model run later in time and rerunning the model, they showed that considerably smaller annual quotas would have been advised if the amount of cod had been known and the present assessment model had been used when the capelin quota was set. Following this work, a retrospective anal-ysis of the capelin assessment as well as of the assessment performance should be included an-nually. This is a feature which so far has been missing from the capelin assessment.
The further research should include improvement of the Bifrost model for calculation and inclu-sion interactions between capelin and other species for calculation new target reference point for capelin Btarget.
Some points which are planned to be raised in a future benchmark (preferably to help together with one for IGJM capelin) are briefly discussed in the following:
Implementation of survey CV in the stock prediction. The StoX software allows for a rapid cal-culation of survey CV as part of the capelin biomass estimation process. Potentially this can be included in the stock prediction instead of the fixed CV of 0.2 which is used presently. A more detailed description of the CV estimation and discussion about its implementation is presented in WD5, 2018. The capelin stock projection as currently formulated implements uncertainty in a range of parameters, also related to the cod predation on capelin. A validation of the sensitivity of these uncertainties and their relative contribution to the output of the projection model is needed. At present and from a more practical point of view, the capelin projection model inter-face in use cannot efficiently run such evaluations and sensitivity tests, but potentially these can be available for the benchmark meeting.
Estimating the maturing part of the capelin stock. Presently a cut-off length of 14 cm is used and the proportion of the stock which is above this length is assumed to represent the maturing stock. There has been work investigating whether the cut-off is appropriate, and this will be presented at the benchmark.

498 | ICES SCIENTIFIC REPORTS 2:52 | ICES
Estimation of capelin mortality from cod predation during autumn. At present, the cod preda-tion from 1 January to 1 April is explicitly modelled in the stock prediction model Bifrost. The cod predation during autumn is implemented as a monthly mortality rate based on a subset of historical estimates of capelin survey mortality. This implementation should be improved.
The parameterization for all processes in Bifrost and CapTool should be updated to include re-cent data.
10.5 Reference points
A Blim (SSBlim) management approach has been suggested for this stock (Gjøsæter et al., 2002). In 2002, the JRNFC agreed to adopt a management strategy based on the rule that with 95% prob-ability, at least 200 000 tonnes of capelin should be allowed to spawn. Consequently, 200 000 tonnes was used as a Blim. Alternative harvest control rules of 80, 85 and 90% probability of SSB>Blim were suggested by JNRFC and evaluated by ICES (WKNEAMP-2, ICES C. M. 2016/ACOM:47). ICES considers these rules not to be precautionary. At its 2016 meeting, JNRFC decided not to change the adopted management strategy.

ICES | AFWG 2020 | 499
Table 10.1 Barents Sea capelin. International catch (‘000 t) as used by the Working Group.
Year Winter-Spring Summer-Autumn Total
Norway Russia Others Total Norway Russia Total
1965 217 7 0 224 0 0 0 224
1966 380 9 0 389 0 0 0 389
1967 403 6 0 409 0 0 0 409
1968 460 15 0 475 62 0 62 537
1969 436 1 0 437 243 0 243 680
1970 955 8 0 963 346 5 351 1314
1971 1300 14 0 1314 71 7 78 1392
1972 1208 24 0 1232 347 13 360 1591
1973 1078 34 0 1112 213 12 225 1337
1974 749 63 0 812 237 99 336 1148
1975 559 301 43 903 407 131 538 1441
1976 1252 228 0 1480 739 368 1107 2587
1977 1441 317 2 1760 722 504 1226 2986
1978 784 429 25 1238 360 318 678 1916
1979 539 342 5 886 570 326 896 1782
1980 539 253 9 801 459 388 847 1648
1981 784 429 28 1241 454 292 746 1986
1982 568 260 5 833 591 336 927 1760
1983 751 373 36 1160 758 439 1197 2357
1984 330 257 42 629 481 368 849 1477
1985 340 234 17 591 113 164 277 868
1986 72 51 0 123 0 0 0 123
1987-1990 0 0 0 0 0 0 0 0
1991 528 159 20 707 31 195 226 933
1992 620 247 24 891 73 159 232 1123
1993 402 170 14 586 0 0 0 586
1994-1996 0 0 0 0 0 0 0 0

500 | ICES SCIENTIFIC REPORTS 2:52 | ICES
Year Winter-Spring Summer-Autumn Total
Norway Russia Others Total Norway Russia Total
1997 0 0 0 0 0 1 1 1
1998 0 2 0 2 0 1 1 3
1999 50 33 0 83 0 22 22 105
2000 279 94 8 381 0 29 29 410
2001 376 180 8 564 0 14 14 578
2002 398 228 17 643 0 16 16 659
2003 180 93 9 282 0 0 0 282
2004 0 0 0 0 0 0 0 0
2005 1 0 0 1 0 0 0 1
2006 0 0 0 0 0 0 0 0
2007 2 2 0 4 0 0 0 4
2008 5 5 0 10 0 2 0 12
2009 233 73 0 306 0 1 1 307
2010 246 77 0 323 0 0 0 323
2011 273 87 0 360 0 0 0 360
2012 228 68 0 296 0 0 0 296
2013 116 60 0 177 0 0 0 177
2014 40 26 0 66 0 0 0 66
2015 71 44 0 115 0 0 0 115
2016-2017 0 0 0 0 0 0 0 0
2018 129 66 0 195 0 0 0 195
2019 0 0 0 0 0 0 0 0
2020 0 0 0 0

ICES | AFWG 2020 | 501
Table 10.2. Barents Sea CAPELIN. Stock size estimation table. Estimated stock size (109) by age and length, and biomass (103 tonnes) from the acoustic survey in August-September 2019. TSN: Total stock number. TSB: Total stock biomass. MSN: Maturing stock number. MSB: Maturing stock biomass.
Length (cm)
Age/year class
Mean weight (g) 1 2 3 4 Sum
(109)
Biomass
(103t) 2018 2017 2016 2015
7 - 7.5 1.121 0 0 0 1.121 1.46 1.3
7.5 - 8 1.756 0 0 0 1.756 2.509 1.43
8 - 8.5 0.985 0 0 0 0.985 2.004 2.03
8.5 - 9 1.874 0.0088 0 0 1.883 4.649 2.47
9 - 9.5 1.387 0.042 0 0 1.429 4.137 2.9
9.5 - 10 1.452 0.006 0 0 1.459 5.141 3.52
10 - 10.5 1.522 0 0 0 1.522 6.405 4.21
10.5 - 11 1.598 0.016 0 0 1.615 7.914 4.9
11 - 11.5 0.875 0.015 0.053 0 1.077 6.054 5.62
11.5 - 12 1.112 0.122 0 0 1.234 7.785 6.31
12 - 12.5 0.95 0.271 0 0 1.221 9.28 7.6
12.5 - 13 0.512 0.4185 0.018 0 0.949 8.375 8.83
13 - 13.5 0.747 0.865 0.027 0 1.638 16.516 10.08
13.5 - 14 0.554 1.534 0.278 0 2.369 27.303 11.53
14 - 14.5 0.515 1.094 0.043 0 1.651 21.559 13.06
14.5 - 15 0.317 1.395 0.124 0.059 1.895 27.993 14.77
15 - 15.5 0.146 1.045 0.267 0.002 1.461 24.488 16.77
15.5 - 16 0.01 1.002 1.391 0.041 2.444 46.278 18.94
16 - 16.5 0.0194 0.736 1.195 0.116 2.066 43.827 21.21
16.5 - 17 0.003 0.388 1.537 0.343 2.271 52.693 23.21
17 - 17.5 0 0.049 0.801 0.244 1.095 28.896 26.39
17.5 - 18 0 0.101 0.665 0.179 0.945 28.35 29.99
18 - 18.5 0 0.014 0.551 0.149 0.714 23.057 32.31
18.5 - 19 0 0.003 0.06 0.015 0.008 2.752 35.08
19 - 19.5 0 0 0.024 0.008 0.032 1.213 37.9
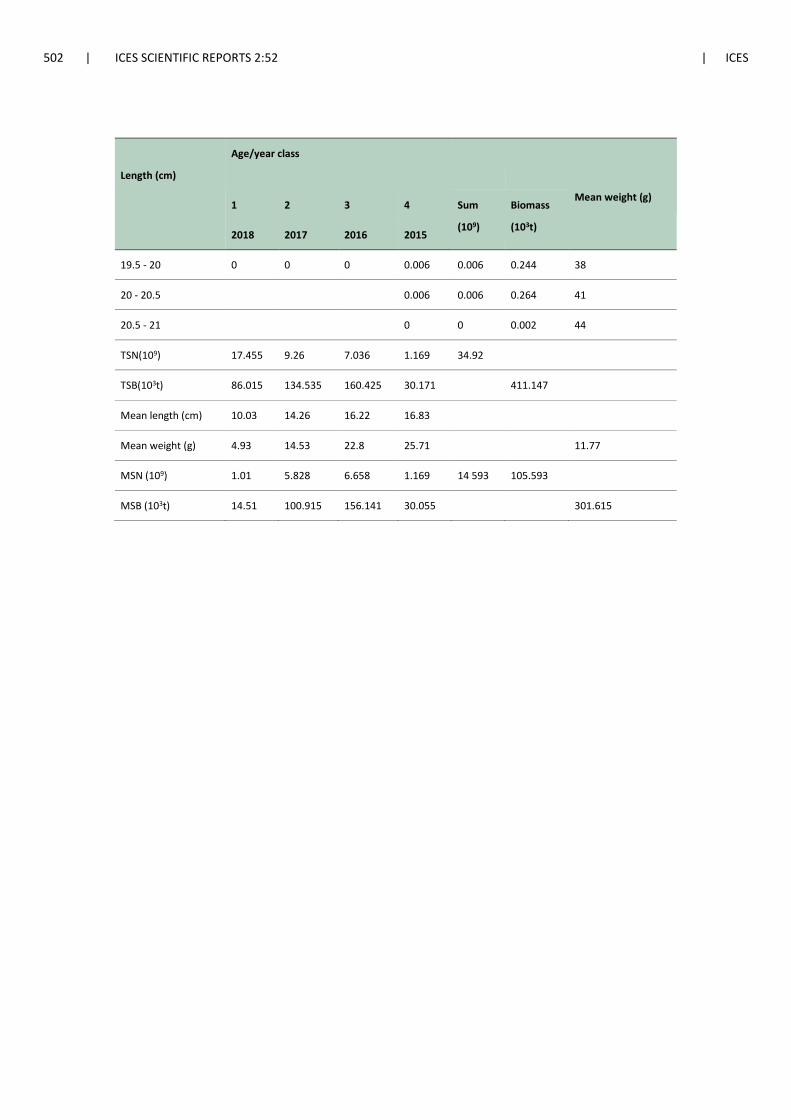
502 | ICES SCIENTIFIC REPORTS 2:52 | ICES
Length (cm)
Age/year class
Mean weight (g) 1 2 3 4 Sum
(109)
Biomass
(103t) 2018 2017 2016 2015
19.5 - 20 0 0 0 0.006 0.006 0.244 38
20 - 20.5 0.006 0.006 0.264 41
20.5 - 21 0 0 0.002 44
TSN(109) 17.455 9.26 7.036 1.169 34.92
TSB(103t) 86.015 134.535 160.425 30.171 411.147
Mean length (cm) 10.03 14.26 16.22 16.83
Mean weight (g) 4.93 14.53 22.8 25.71 11.77
MSN (109) 1.01 5.828 6.658 1.169 14 593 105.593
MSB (103t) 14.51 100.915 156.141 30.055 301.615

ICES | AFWG 2020 | 503
Table 10.3 Barents Sea CAPELIN. Recruitment and natural mortality table. Larval abundance estimate in June, 0-group indices and acoustic estimate in August-September, total mortality from age 1+ to age 2+.
Year
class
Larval
abundance
0-group Index
Acoustic estimate (109ind.) Mortality survey(1—2)
(1012) (109 ind.) 1(Y+1) 2(Y+2) %
1980 - 760 402.6 147.6 63
1981 9.7 536 528.3 200.2 62
1982 9.9 655 514.9 186.5 64
1983 9.9 421 154.8 48.3 69
1984 8.2 295 38.7 4.7 88
1985 8.6 112 6.0 1.7 72
1986 0.0 59 37.6 28.7 24
1987 0.3 4 21.0 17.7 16
1988 0.3 79 189.2 177.6 6
1989 7.3 963 700.4 580.2 17
1990 13.0 130 402.1 196.3 51
1991 3.0 234 351.3 53.4 85
1992 7.3 5 2.2 3.4 --
1993 3.3 2 19.8 8.1 59
1994 0.1 20 7.1 11.5 --
1995 0.0 17 81.9 39.1 52
1996 2.4 172 98.9 72.6 27
1997 6.9 282 179.0 101.5 43
1998 14.1 147 156.0 110.6 29
1999 36.5 428 449.2 218.7 51
2000 19.1 188 113.6 90.8 20
2001 10.7 139 59.7 9.6 84
2002 22.4 100 82.4 24.8 70
2003 11.9 550 51.2 13.0 75
2004 2.5 67 26.9 21.7 19
2005 8.8 231 60.1 54.7 9

504 | ICES SCIENTIFIC REPORTS 2:52 | ICES
Year
class
Larval
abundance
0-group Index
Acoustic estimate (109ind.) Mortality survey(1—2)
(1012) (109 ind.) 1(Y+1) 2(Y+2) %
2006 17.1 819 221.7 231.4 --
2007 - 760 313.0 166.4 46
2008 - 1251 124.0 127.6 --
2009 - 865 248.2 181.1 27
2010 - 416 209.6 156.4 25
2011 - 767 145.9 216.2 -
2012 - 1141 324.5 106.6 67
2013 - 398 105.1 40.5 62
2014 - 268 39.5 8.1 79
2015 - 592 31.6 123.7 -
2016 - 980 86.4 59.6 31
2017 - 273 58.6 7.0 88
2018 - - 17.5
2019 - 564
Average 9.0 402 175.3 104

ICES | AFWG 2020 | 505
Table 10.4 Barents Sea CAPELIN. Stock size in numbers by age, total stock biomass, biomass of the maturing component (MSB) at 1. October.
Year Stock in numbers (109) Biomass (103 tonnes)
Age 1 Age 2 Age 3 Age 4 Age 5 Total Total MSB
1973 528 375 40 17 0 961 5144 1350
1974 305 547 173 3 0 1029 5733 907
1975 190 348 296 86 0 921 7806 2916
1976 211 233 163 77 12 696 6417 3200
1977 360 175 99 40 7 681 4796 2676
1978 84 392 76 9 1 561 4247 1402
1979 12 333 114 5 0 464 4162 1227
1980 270 196 155 33 0 654 6715 3913
1981 403 195 48 14 0 660 3895 1551
1982 528 148 57 2 0 735 3779 1591
1983 515 200 38 0 0 754 4230 1329
1984 155 187 48 3 0 393 2964 1208
1985 39 48 21 1 0 109 860 285
1986 6 5 3 0 0 14 120 65
1987 38 2 0 0 0 39 101 17
1988 21 29 0 0 0 50 428 200
1989 189 18 3 0 0 209 864 175
1990 700 178 16 0 0 894 5831 2617
1991 402 580 33 1 0 1016 7287 2248
1992 351 196 129 1 0 678 5150 2228
1993 2 53 17 2 2 75 796 330
1994 20 3 4 0 0 28 200 94
1995 7 8 2 0 0 17 193 118
1996 82 12 2 0 0 96 503 248
1997 99 39 2 0 0 140 911 312
1998 179 73 11 1 0 263 2056 931
1999 156 101 27 1 0 285 2776 1718

506 | ICES SCIENTIFIC REPORTS 2:52 | ICES
Year Stock in numbers (109) Biomass (103 tonnes)
Age 1 Age 2 Age 3 Age 4 Age 5 Total Total MSB
2000 449 111 34 1 0 595 4273 2099
2001 114 219 31 1 0 364 3630 2019
2002 60 91 50 1 0 201 2210 1290
2003 82 10 11 1 0 104 533 280
2004 51 25 6 1 0 82 628 294
2005 27 13 2 0 0 42 324 174
2006 60 22 6 0 0 88 787 437
2007 222 55 4 0 0 280 1882 844
2008 313 231 25 2 0 571 4427 2468
2009 124 166 61 0 0 352 3756 2323
2010 248 128 61 1 0 438 3500 2051
2011 209 181 55 8 0 454 3707 2115
2012 146 156 88 2 0 392 3586 1997
2013 324 216 59 7 0 610 3956 1471
2014 105 107 39 2 0 253 1949 873
2015 40 40 13 1 0 94 842 375
2016 32 8 3 0 0 43 328 181
2017 86 124 17 0 0 227 2506 1723
2018 59 60 21 0 0 140 1597 1056
2019 17 9 7 1 0 35 411 302

ICES | AFWG 2020 | 507
Table 10.5 Barents Sea CAPELIN. Summary stock and data for prognoses table. Recruitment and total biomass (TSB) are survey estimates back-calculated to 1 August (before the autumn fishing season) for 1985 and earlier; for 1986 and later it is the survey estimate. Maturing biomass (MSB) is the survey estimate of fish above length of maturity (14.0 cm). SSB is the median value of the modelled stochastic spawning-stock biomass (after the winter/spring fishery). * - indicates a very small spawning stock.
Year Estimated stock by autumn acoustic survey (103 t) 1 Oc-tober
SSB, as-sessment
model,
April 1 year+1
(103 t)
SSB, by winter year+1, acoustic sur-vey (103 t)
Re-cruit-ment
Age 1,
survey
assess-ment
1 Octo-ber
109 sp.
Young herring bio-mass age 1+2 (106
tons) source: WGIBAR
Herring 0-group index (109 sp) corr. for catching ef-ficiency
Capelin Landing
(103 t)
TSB MSB
1972 6600 2727 152 0.002 1591
1973 5144 1350 33 529 0.002 1337
1974 5733 907 * 305 0.048 1148
1975 7806 2916 * 190 0.074 1441
1976 6417 3200 253 211 0.039 2587
1977 4796 2676 22 360 0.046 2986
1978 4247 1402 * 84 0.052 1916
1979 4162 1227 * 12 0.039 1782
1980 6715 3913 * 270 0.066 0.08 1648
1981 3895 1551 316 403 0.047 0.04 1986
1982 3779 1591 106 528 0.009 2.52 1760
1983 4230 1329 100 515 0.012 195.45 2357
1984 2964 1208 109 155 1.467 27.35 1477
1985 860 285 * 39 2.638 20.08 868
1986 120 65 * 6 0.191 0.09 123
1987 101 17 34 4 38 0.287 0.05 0
1988 428 200 * 10 21 0.056 60.78 0
1989 864 175 84 378 189 0.156 17.96 0
1990 5831 2617 92 94 700 0.467 15.17 0
1991 7287 2248 643 1769 402 0.955 267.64 933
1992 5150 2228 302 1735 351 2.037 83.91 1123

508 | ICES SCIENTIFIC REPORTS 2:52 | ICES
Year Estimated stock by autumn acoustic survey (103 t) 1 Oc-tober
SSB, as-sessment
model,
April 1 year+1
(103 t)
SSB, by winter year+1, acoustic sur-vey (103 t)
Re-cruit-ment
Age 1,
survey
assess-ment
1 Octo-ber
109 sp.
Young herring bio-mass age 1+2 (106
tons) source: WGIBAR
Herring 0-group index (109 sp) corr. for catching ef-ficiency
Capelin Landing
(103 t)
TSB MSB
1993 796 330 293 1498 2 3.649 291.47 586
1994 200 94 139 187 20 3.000 103.89 0
1995 193 118 60 29 7 0.821 11.02 0
1996 503 248 60 82 0.300 549.61 0
1997 909 312 85 99 0.349 463.24 1
1998 2056 932 94 414 179 0.620 476.07 3
1999 2775 1718 382 156 1.080 35.93 105
2000 4273 2098 599 700 449 2.136 469.63 410
2001 3630 2019 626 114 1.543 10.01 578
2002 2210 1291 496 1417 60 0.664 151.51 659
2003 533 280 427 82 1.695 177.68 282
2004 628 294 94 105 51 3.108 773.89 0
2005 324 174 122 27 2.105 125.93 1
2006 787 437 72 60 2.153 294.65 0
2007 2119 844 189 222 0.916 144 4
2008 4428 2468 330 469 313 0.865 201.05 12
2009 3765 2323 517 180 124 0.375 104.23 307
2010 3500 2051 504 452 248 0.579 117.09 323
2011 3707 2115 487 160 209 0.843 83.05 360
2012 3586 1997 504 146 0.394 177.19 296
2013 3956 1471 479 324 0.468 289.39 177
2014 1949 873 504 105 0.553 136.31 66
2015 842 375 82 40 0.698 82.75 115
2016 328 181 37 32 0.452 79.44 0

ICES | AFWG 2020 | 509
Year Estimated stock by autumn acoustic survey (103 t) 1 Oc-tober
SSB, as-sessment
model,
April 1 year+1
(103 t)
SSB, by winter year+1, acoustic sur-vey (103 t)
Re-cruit-ment
Age 1,
survey
assess-ment
1 Octo-ber
109 sp.
Young herring bio-mass age 1+2 (106
tons) source: WGIBAR
Herring 0-group index (109 sp) corr. for catching ef-ficiency
Capelin Landing
(103 t)
TSB MSB
2017 2506 1723 462 124 0.703 153.76 0
2018 1597 1056 317 295 59
- 195
2019 411 302 85 62 17 0

510 | ICES SCIENTIFIC REPORTS 2:52 | ICES
Figure 10.1. Geographical distribution of capelin in autumn 2019.
Figure 10.2 Weight-at-age (grams) for capelin from the autumn survey.

ICES | AFWG 2020 | 511
Figure 10.3. Probabilistic prognosis 1 October 2019 to 1 April 2020 for Barents Sea capelin maturing stock, with no catch (model CapTool, 50 000 simulations).

512 | ICES SCIENTIFIC REPORTS 2:52 | ICES
Figure 10.4. Capelin in subareas 1 and 2, excluding Division 2a west of 5°W (Barents Sea capelin). Landing and summary of stock assessment (mature and immature stock biomass in tonnes).

ICES | AFWG 2020 | 513
Figure 10.5. Regression of abundance of capelin at age 0 (0-group index without Keff) and age 1 for cohorts 1980—2017. No 0-group estimate was made for the 2018 cohort.
Figure 10.6. Capelin survey mortality from age 1–2. X-axis shows cohort.

514 | ICES SCIENTIFIC REPORTS 2:52 | ICES
11 References
Aanes, S. 2002. Precision in age determination of Northeast Arctic cod. Working document in: Report of the Arctic Fisheries Working Group. ICES Headquarters 16-25 April 2002. ICES CM 2002/ACFM:18. 451 pp.
Aanes, S. and Pennington, M. 2003. On estimating the Age composition of the Commercial Catch of North-east Arctic cod from a Sample of Clusters. ICES Journal of Marine Science, 60: 297-303.
Aanes, S. 2016. Stock Annex: Herring (Clupea harengus) in subareas 1, 2, and 5, and in division 4.a and 14.1 (Norwegian Spring Spawning). WKPELA2016
Aas, C. A.2007. Predation by saithe on juvenile fish (cod and others). Masters thesis, University of Tromsø, 2007 (In Norwegian).
Ajiad, A. M., Aglen, A., Nedreaas, K., and Kvamme, C. 2008. Estimating by-catch at age of Northeast arctic cod from the Norwegian shrimp fishery in the Barents Sea 1984-2006. WD2, AFWG 2008.
Albert, O.T. and Vollen, T., 2015. A major nursery area around the Svalbard archipelago provides recruits for the stocks in both Greenland halibut management areas in the Northeast Atlantic. ICES Journal of Marine Science: Journal du Conseil, 72(3): 872-879.
Anfinsen, L. 2002. Ressursøkologisk betydning av nise (Phocaena phocaena) i norske farvann. Dr. scient thesis. Institute of fisheries and marine biology, University of Bergen, Autumn 2002. 51pp.
Anon. 2013. The Norwegian Reference Fleet – a trustful cooperation between fishermen and scientists. Fo-cus on Marine Research 3/2013, Institute of Marine Research, Norway. 12 pp.
Anfinsen, L. 2002. Ressursøkologisk betydning av nise (Phocaena phocaena) i norske farvann. Dr. scient thesis. Institute of fisheries and marine biology, University of Bergen, Autumn 2002. 51pp. (In Norwe-gian).
Bakanev, S 2013. Assessment of the Barents Sea Greenland halibut stock using the stochastic version of the production model. Working document no 14. in: Report of the Benchmark Workshop on Greenland Halibut Stocks (WKBUT), 26–29 November 2013, Copenhagen, Denmark. ICES CM 2013/ ACOM:44. 367 pp.
Barrett, R.T., T. Anker-Nilssen, G.W. Gabrielsen and G. Chapdelaine. 2002. Food consumption by seabirds in Norwegian waters. ICES Journal of Marine Science 59(1): 43-57.
Basterretxea, M., J. Ruiz, A. Iriondo and E. Mugerza 2013. Spanish Greenland halibut survey 2012. Working document in: Report of the Arctic Fisheries Working Group. ICES Headquarters, Copenhagen, 18-24 April, 2013. ICES CM 2013/ACOM:05. 726 pp.
Berg, E., and Albert, O. T. 2003. Cod in fjords and coastal waters of North Norway: distribution and varia-tion in length and maturity at age. ICES Journal of Marine Science, 60: 787–797.
Berg, E., Sarvas, T. H., Harbitz, A., Fevolden, S.E. and Salberg, A.B. 2005. Accuracy and precision in stock separation of north-east Arctic and Norwegian coastal cod by otoliths - comparing readings, image analyses and a genetic method. Marine and Freshwater Research, No. 56 10 pp.
Berg, H-S. and Nedreaas, K. 2020. Estimering av utkast i norsk kystfiske med garn ved bruk av Kystreferanseflåten. Estimation of discards in the Norwegian coastal gillnet fisheries based on catch reportings from the Coastal reference fleet. Institute of Marine Research report series. 101 pp. In prep. (In Norwegian)
Björnsson, H., and Sigurdsson, T. 2003. Assessment of golden redfish (Sebastes marinus L.) in Icelandic wa-ters. Scienta Marina 67 (Suppl. 1):301-314. Scientia Marina, 67: 301-314.
Bogstad B., and Gjøsæter H., 1994. A method for calculating the consumption of capelin by cod. ICES J. mar. Sci. 51:273-280.

ICES | AFWG 2020 | 515
Bogstad, B., Howell, D., Åsnes, M. N. (2004). A closed life-cycle model for Northeast Arctic cod. ICES C.M.2004/K:26, 12 pp.
Bogstad, B., Haug, T. and Mehl, S. 2000. Who eats whom in the Barents Sea? NAMMCO Sci. Publ. 2: 98-119.
Bogstad, B. and Mehl, S. 1997. Interactions Between Cod (Gadus morhua) and Its Prey Species in the Barents Sea. Forage Fishes in Marine Ecosystems. Proceedings of the International Symposium on the Role of Forage Fishes in Marine Ecosystems. Alaska Sea Grant College Program Report No. 97-01: 591-615. University of Alaska Fairbanks.
Brander, K. 2002. Predicting weight at age. Internal ICES note to assessment working groups. 2003. Software implementation of process models. Working Document No. 2 to the Arctic Fisheries Working Group, San Sebastian, Spain, 23 April- 2 May 2003.
Breivik, O. N., Storvik, G. O., Nedreaas, K. H. 2017. Latent Gaussian models to predict historical bycatch in commercial fishery. Fisheries Research 185: 62-72. doi: 10.1016/j.fishres.2016.09.033.
Brooks, M.E, Kristensen, K., van Benthem, K.J., Magnusson, A., Berg, C.W., Nielsen, A., Skaug, H.J., Maech-lerm M., and Bolker, B.M. 2017. glmmTMB balances speed and flexibility among packages for zero-inflated generalized linear mixed modeling. The R Journal, 9(2), 378-400.
Bulgakova, T., 2005. ‘To recruitment prognosis of NEA cod’. Working document #20 in: Report of the Arctic Fisheries Working Group’, Murmansk, Russia, April 19-28, 2005. ICES C.M. 2005/ACFM:20, 564 pp.
Cañás, L., Stransky, C., Schlickeisen, J., Sampedro, M. P., and Fariña, A. C. 2012. Use of the otolith shape analysis in stock identification of anglerfish (Lophius piscatorius) in the Northeast Atlantic. – ICES Jour-nal of Marine Science, 69: 1–7.
Charnov, E.L., Gislason, H., and Pope, J.G. 2013. Evolutionary assembly rules for fish life histories. Fish Fish. 14(2): 213-224.
Clegg, T. and Williams, T. 2020. Monitoring bycatches in Norwegian fisheries - Species registered by the Norwegian Reference Fleet 2015-2018. Rapport fra Havforskningen 2020-8. ISSN:1893-4536. https://www.hi.no/hi/nettrapporter/rapport-fra-havforskningen-en-2020-8
Dahle, G., Johansen, T., Westgaard, J-I., Aglen, A., Glover, K. 2018. Genetic management of mixed-stock fisheries “real-time”: The case of the largest remaining cod fishery operating in the Atlantic in 2007–2017. Fisheries Research 205 (2018) pp 77-85.
Dahle, G. et al. submitted 2018. Genetic analysis of coastal cod (Gadus morhua L.) sampled on spawning sites reveals a gradient of connectivity throughout Norway´s >2500 km coastline. Submitted to BMC Genetics.
Dingsør, G. E. 2001. Estimation of discards in the commercial trawl fishery for Northeast Arctic cod (Gadus morhua L.) and some effects on assessment. Cand. Scient thesis, University of Bergen, 2001.
Dingsør, G.E. 2005. Estimating abundance indices from the international 0-group fish survey in the Barents Sea. Fisheries Research 72(2-3): 205-218.
Dingsør G.E., Bogstad B., Stiansen J.E., and Subbey S. 2010. How can we assess recruitment models for (age-3) NEA cod? / WD 19, AFWG 2010.
Dolgov, A.V., Yaragina, N.A., Orlova, E.L., Bogstad, B., Johannesen, E., Mehl, S. 2007. 20th anniversary of the PINRO-IMR cooperation in the investigations of fish feeding in the Barents Sea – results and per-spectives. In : Haug,. T., Misund, O.A., Gjøsæter, H., and Røttingen, I. (eds.). Long-term bilateral Rus-sian-Norwegian scientific cooperation as a basis for sustainable management of living marine re-sources in the Barents Sea. Proceeding of the 12th Norwegian-Russian Symposium. Tromsø, 21-22 Au-gust 2007. P.44-78.
Duarte R, Azevedo M, & Pereda P 1997. Study of the growth of southern black and white monkfish stocks. ICES Journal of Marine Science 54(5): 866-874.
Dyb J.E., 2003. Bestandsstudie av breiflabb (Lophius piscatorius L.) langs kysten av Møre og i Nordsjøen. Cand.scient thesis, University of Bergen. 105 pp. (In Norwegian)

516 | ICES SCIENTIFIC REPORTS 2:52 | ICES
Eikeset A.M., Richtera A., Dunlop E.S., Dieckmann U., and Stenseth N. C. 2013. Economic repercussions of fisheries-induced evolution. PNAS vol. 110, no. 30: 12259–12264.
Eriksen, E., Prozorkevich, D. V. and Dingsør, G. E. 2009. An evaluation of 0-group abundance indices of Barents Sea Fish Stocks. The Open fish Science Journal, 2: 6-14.
Gjøsæter, H., Bogstad, B. and Tjelmeland, S. 2002. Assessment methodology for Barents Sea capelin, Mallo-tus villosus (Müller). ICES Journal of Marine Science, 59: 1086-1095.
Gjøsæter, H., Bogstad, B., Tjelmeland, S., and Subbey, S. 2015. Retrospective evaluation of the Barents Sea capelin management advice Marine Biology Research 11(2):135-143.
Gjøsæter, H., Hallfredsson, E. H., Mikkelsen, N., Bogstad, B., and Pedersen, T. 2016. Predation on early life stages is decisive for year class strength in the Barents Sea capelin (Mallotus villosus) stock. ICES Journal of Marine Science 73(2):182-195.
Golovanov S.E., Sokolov A.M., and Yaragina, N.A. 2007. Revised indices of the Northeast Arctic cod abun-dance according to the 1982-2006 data from Russian trawl-acoustic survey (TAS). Working Document #3 for AFWG 2007.
Gulland, J. 1964. The abundance of fish stocks in the Barents Sea. Rapp. P.-v. Réun. Cons. Int. Explor. Mer, 155: 126-137.
Håkon Otterå and Kjell Nedreaas, 2020. Effort and catch-per-unit-effort (CPUE) for Norwegian trawlers fishing cod north of 67˚N in 2011-2019. Working document no 2 in: Report of the Arctic Fisheries Work-ing Group (AFWG), 15-22 April 2020. ICES CM 2015/ACOM:05. 639 pp.
Fall J., 2020. NEA cod and haddock indices from the Barents Sea winter survey 2020. Working document no 10 in: Report of the Arctic Fisheries Working Group (AFWG), 15-22 April 2020. ICES CM 2015/ACOM:05. 639 pp.
Hallfredsson, E. and Vollen, T. 2015. Juvenile index for Barents Sea Greenland halibut. Working document no. 1 in Report of the Inter Benchmark Process on Greenland Halibut in ICES areas I and II (IBPHALI). ICES CM 2015\ACOM:54. 37 pp.
Hallfredsson, E. and Vollen, T. 2015. Two abundance indices for Greenland halibut based on the Joint Eco-system Survey in the Barents Sea and previous surveys in the nursery area. Working document no 20. in: Report of the Arctic Fisheries Working Group (AFWG), 23-29 April 2015, Hamburg, Germany. ICES CM 2015/ACOM:05. 639 pp.
Hamel, O.S. 2014. A method for calculating a meta-analytical prior for the natural mortality rate using mul-tiple life history correlates. ICES J. Mar. Sci. 72(1): 62-69.
Hartig, F. 2020. DHARMa: residual diagnostics for hierarchical (multi-level/mixed) regression models. R package version 0.2.7. https://CRAN.R-project.org/package=DHARMa
Heggebakken 2011
Heino M, Dieckmann U, Godø OR 2002. Reaction norm analysis of fisheries-induced adaptive change and the case of the Northeast Arctic cod. ICES CM 2002/Y: 14.
Hirst, D., Aanes, S., Storvik, G. and Tvete, I.F. 2004. Estimating catch at age from market sampling data using a Bayesian hierarchical model. Journal of the Royal statistical society. Series C, applied statistics, 53: 1-14.
Hirst, D., Storvik, G., Aldrin, M., Aanes, S. and Huseby, R.B. 2005. Estimating catch-at-age by combining data from different sources. Canadian Journal of Fisheries and Aquatic Sciences 62:1377-1385.
Hirst, D., Storvik, G., Rognebakke, H., Aldrin, M., Aanes, S., and Vølstad, J. H. 2012. A Bayesian modelling framework for the estimation of catch-at-age of commercially harvested fish species. Can. J. Fish. Aquat. Sci. 69: 2064–2076.
Hislop, J. R. G., Gallego, A., Heath, M. R., Kennedy, F. M., Reeves, S. A., and Wright, P. J. 2001. A synthesis of the early life history of the anglerfish, Lophius piscatorius (Linnaeus, 1758) in northern British waters. ICES Journal of Marine Science 58:70–86.

ICES | AFWG 2020 | 517
Hjermann, D. Ø., Bogstad, B., Eikeset, A. M., Ottersen, G., Gjøsæter, H., and Stenseth, N. C. 2007. Food web dynamics affect Northeast Arctic cod recruitment. Proceedings of the Royal Society, Series B 274:661-669.
Hjermann, D. Ø., Bogstad, B., Dingsør, G. E., Gjøsæter, H., Ottersen, G., Eikeset, A. M., and Stenseth, N. C. 2010. Trophic interactions affecting a key ecosystem component: a multi-stage analysis of the recruit-ment of the Barents Sea capelin. Canadian Journal of Fisheries and Aquatic Science 67:1363-1375.
Höffle H. and Tranang C. A. 2020. Use of RstoX for recalculating numbers at age of Sebastes mentella from the joint NOR-RUS Barents Sea Ecosystem Survey in summer and autumn. WD18 - ICES AFWG2020. xx pp.
Hoenig, J. M. 1983. Empirical use of longevity data to estimate mortality rates. Fisheries Bulletin U.S. 81:898-903.
Holt, R.E., Bogstad, B., Durant, J. M., Dolgov, A. V., and Ottersen, G. 2019. Barents Sea cod (Gadus morhua) diet composition: long-term interannual, seasonal, and ontogenetic patterns. ICES Journal of Marine Science 76(6): 1641-1652, doi:10.1093/icesjms/fsz082
Hordyk, A.R., Ono, K., Sainsbury, K.J., Loneragan, N., and Prince, J.D. 2015a. Some explorations of the life history ratios to describe length composition, spawning-per-recruit, and the spawning potential ratio. ICES J. Mar. Sci. 72: 204 - 216.
Hordyk, A.R., Ono, K., Valencia, S.R., Loneragan, N.R., and Prince, J.D. 2015b. A novel length-based em-pirical estimation method of spawning potential ratio (SPR), and tests of its performance, for small-scale, data-poor fisheries. ICES J. Mar. Sci. 72: 217 – 231.
Hordyk, A., Ono, K., Prince, J.D., and Walters, C.J. 2016. A simple length-structured model based on life history ratios and incorporating size-dependent selectivity: application to spawning potential ratios for data-poor stocks. Can. J. Fish. Aquat. Sci. 13: 1– 13. doi: 13.1139/cjfas-2015-0422.
Howell, D. 2020. Greenland halibut HRpa proposal. Working document no 15. in: Report of the Arctic Fish-eries Working Group (AFWG), 16-22 April 2020, Copenhagen, Denmark. ICES CM…….
Høie, H., Bernreuther, M., Ågotnes, P., Beußel, F., Koloskova, V., Mjanger, H., Schröder, D., Senneset, H. and Zuykova, N. 2009. Report of Northeast Arctic cod otolith exchange between Russia, Norway and Germany 2008. WD # 6 ICES Arctic Fisheries Working Group 2009, San Sebastian 21-27th April 2009.
ICES 1997. Report of the ICES/NAFO workshop on Greenland halibut age determination. 26-29 November 1996, Reykjavik, Iceland. ICES CM1997/G:1. 16 pp.
ICES 2001. Report of the Arctic Fisheries Working Group. Bergen, Norway, 24 April – 3 May 2001. ICES CM 2001/ACFM:19. 380 pp.
ICES 2003. Study Group on Biological Reference Points for Northeast Arctic Cod. Svanhovd, Norway 13-17 January 2003. ICES CM 2003/ACFM:11.
ICES 2006a. ICES Workshop on Biological Reference Points for North East Arctic Haddock (WKHAD). Svanhovd, Norway, 6-10 March 2006. ICES C.M. 2006/ACFM:19, 102 pp.
ICES 2006b. Report of the Arctic Fisheries Working Group, Copenhagen 19-28 April 2006. ICES C.M. 2006/ACFM:25, 594 pp.
ICES 2007b. Report of the Arctic Fisheries Working Group, Vigo, Spain 18-27 April 2007. ICES C.M. 2007/ACFM:16, 651 pp.
ICES 2009. Report of the Benchmark Workshop on Short-lived Species (WKSHORT). ICES C.M. 2009/ACOM: 34: 1-166.
ICES. 2009. Report of the Workshop on analytical methods for evaluation of extinction risk of stocks in poor condition (WKPOOR1), 18-20 May 2009, Copenhagen, Denmark. ICES CM 2009\ACOM:29. 21 pp.
ICES 2009. Report of the workshop for the exploration of the dynamics of fish stocks in poor conditions (WKPOOR2). ICES CM, 2009/ACOM:49: 30pp.

518 | ICES SCIENTIFIC REPORTS 2:52 | ICES
ICES 2010. Report of the Arctic Fisheries Working Group, Lisbon/Bergen, 22-28 April 2010. ICES C.M. 2010/ACOM:05, 664 pp.
ICES 2010. Report of the Benchmark Workshop on Roundfish (WKROUND), 9-16 February 2010, Copen-hagen, Denmark. ICES CM 2010/ACOM: 36. 183 pp.
ICES 2011. Report of the Arctic Fisheries Working Group, Hamburg, Germany 28 April – 4 May 2011. ICES C.M. 2011/ACOM:05, 659 pp.
ICES 2011. Report of the Workshop of Implementing the ICES Fmsy framework (WKFRAME2), 10-14 Feb-ruary 2011, ICES, Denmark. ICES C. M. 2011/ACOM:33, 110 pp.
ICES 2011. Report of the Benchmark Workshop on Roundfish and Pelagic Stocks, Lisbon 24-31 January 2011. ICES C.M. 2011/ACOM:38, 418 pp.
ICES. 2011. Report of the Planning Group on Commercial Catches, Discards and Biological Sampling (PGCCDBS), 7-11 February 2011, Vienna, Austria. ICES CM 2011/ACOM:40. 174 pp.
ICES. 2011. Report of the Workshop on Age Reading of Greenland Halibut (WKARGH), 14-17 February 2011, Vigo, Spain. ICES CM 2011/ACOM:41. 39 pp.
ICES. 2012. Report of the Study Group on Recruitment Forecasting (SGRF),15–19 October 2012, Barcelona, Spain. ICES CM 2012/ACOM:24. 36 pp.
ICES 2012. Report of the benchmark workshop on redfish (WKRED). ICES CM, 2012/ACOM: 48: 289 pp.
ICES 2013. Report of the Arctic Fisheries Working Group, Copenhagen, 18-24 April 2013. ICES C.M. 2013/ACOM:05, 726 pp.
ICES. 2013. Report of the Study Group on Recruitment Forecasting (SGRF), 18-22 November 2013,Lisbon. ICES CM 2013/ACOM:24. 29 pp.
ICES 2013. Report of the Benchmark Workshop on Greenland Halibut Stocks (WKBUT), 26-29 November 2013, Copenhagen, Denmark. ICES CM 2013/ACOM:44
ICES 2014. Report of the Data Compilation Workshop on Northeast Arctic Greenland Halibut and Assess-ment Methods (DCWKNGHD), 10–12 November 2014, Murmansk, Russia. ICES CM 2014/ACOM:65. 58pp.
ICES 2014. Report of the Working Group on Harp and Hooded Seals Quebec City 17-21 November 2014. ICES C. M. 2014/ACOM:20, 62 pp.
ICES. 2015. Report of the Benchmark Workshop on Arctic Stocks (WKARCT), 26-30 January 2015, ICES Headquarters, Denmark. ICES CM 2015\ACOM:31. 126 pp.
ICES 2015. Report of the Arctic Fisheries Working Group, Hamburg, Germany, 23-29 April 2015. ICES C.M. 2015/ACOM:05, 590 pp.
ICES 2015. Report of the Inter Benchmark Process on Greenland Halibut in ICES areas I and II (IBPHALI). By Correspondence, August 2015. ICES CM 2015/ACOM:54, 41 pp.
ICES 2015. Report of the first Workshop on Management Plan Evaluation on Northeast Arctic cod and haddock and Barents Sea capelin, 24-26 November 2015, Murmansk, Russia. ICES CM 2015/ACOM:60, 27 pp.
ICES 2016. Report of the second Workshop on Management Plan Evaluation on Northeast Arctic cod and haddock and Barents Sea capelin, 25-28 January 2016, Kirkenes, Norway. ICES CM 2016/ACOM:47, 76 pp.
ICES 2016. The Third Report of the Working Group on Integrated Assessments of the Barents Sea (WGIBAR). Murmansk, Russia, 22-25 February 2016. ICES CM 2016/SSGIEA:04, 126 pp.
ICES 2016. Report of the Arctic Fisheries Working Group, ICES HQ, Copenhagen, Denmark. 19-25 April 2016. ICES CM 2016/ACOM:06. 621 pp.
ICES 2016. Final Report of the Working Group on International Deep Pelagic Ecosystem Surveys (WGIDEEPS). ICES CM, ICES CM 2016/SSGIEOM:02: 21pp.

ICES | AFWG 2020 | 519
ICES 2016. Report of the Workshop on age reading of Greenland halibut 2 (WKARGH2), 22-26 August, Reykjavik, Iceland. ICES CM 2016/SSGIEOM:16. 36 pp.
ICES 2017. Report of Inter-benchmark protocol on Northeast Arctic cod (IBP ARCTIC COD 2017), Copen-hagen, 3-6 April 2017. ICES CM 2017/ACOM:29.
ICES 2017, ICES fisheries management reference points for category 1 and 2 stocks. http://ices.dk/sites/pub/Publication%20Reports/Guidelines%20and%20Policies/12.04.03.01_Refer-ence_points_for_category_1_and_2.pdf
ICES. 2018a. Report of the Benchmark Workshop on Redfish Stocks (WKREDFISH), 29 January-2 February 2018, Copenhagen, Denmark. ICES CM 2018/ACOM:34. 174 pp.
ICES. 2018b. Report of the Workshop on the evaluation of harvest control rules for Sebastes mentella in ICES areas 1 and 2 (WKREBMSE), June–August 2018, by correspondence. ICES CM 2018/ACOM:52. 32 pp.
ICES 2018. NAFO/ICES Pandalus Assessment Group Meeting, 17 to 22 October 2018 NAFO Secretariat, Dartmouth, Canada. ICES CM 2018/ACOM:08
ICES 2018. Report of the Arctic Fisheries Working Group, Ispra, Italy, 18-24 April 2018. ICES C.M. 2018/ACOM:06, 865 pp.
ICES. 2019. The Working Group on the Integrated Assessments of the Barents Sea (WGIBAR). ICES Scien-tific Reports. 1:42. 158 pp. http://doi.org/10.17895/ices.pub.5536.
ICES. 2019. Interbenchmark Protocol on assessment model changes for Cod (Gadus morhua) in subareas 1 and 2 (Northeast Arctic) (IBPNEACod2019). ICES Scientific Reports. 1:26. 26 pp. http://doi.org/10.17895/ices.pub.5278
ICES. 2019. Report of the Arctic Fisheries Working Group (AFWG). ICES Scientific Reports. 1:30. 934 pp. http://doi.org/10.17895/ices.pub.5292
ICES. 2020. Benchmark Workshop for Demersal Species (WKDEM). ICES Scientific Reports. 2:31. 136 pp. http://doi.org/10.17895/ices.pub.5548
ICES. 2020. Working Group on the Integrated Assessments of the Barents Sea (WGIBAR). ICES Scientific Reports. 2:30. 206 pp. http://doi.org/10.17895/ices.pub.5998
IUCN. 2001. IUCN red list categories and criteria. Version 3.1. IUCN (World Conservation Union, Gland, Switzerland, and Cambridge UK). (Also available in full text format at: www.iucnredlist.org/static/cat-egories_criteria)
IUCN. 2003. Guidelines for application of IUCN red list criteria at regional levels. IUCN (World Conserva-tion Union, Gland, Switzerland, and Cambridge UK). (Also available in full text format at: www.iu-cnredlist.org/static/categories_criteria)
Jakobsen, T., Korsbrekke, K., Mehl, S., and Nakken, O. 1997. Norwegian combined acoustic and bottom trawl surveys for demersal fish in the Barents Sea during winter. ICES CM 1997/Y:17.
Janusz, J., Trella, K. and Nermer, T. 2008. Report on Polish fishing activity and survey on redfish(Sebastes mentella) in the NEAFC Regulatory Area (ICES IIa) in 2007. Working document no 8. in: Report of the Arctic Fisheries Working Group (AFWG), 21-29 April 2008, ICES Headquarters, Copenhagen. ICES CM 2008\ACOM:01. 531 pp
Janusz, J. and Trella, K. 2009. Results of the Polish fishing survey of Greenland halibut in the Svalbard Protection Zone (ICES IIb) in April 2008. Working document no 10. in: Report of the Arctic Fisheries Working Group (AFWG), 21 -27 April 2009, San-Sebastian, Spain. Diane Lindemann. 579 pp.
Johannesen, E., Johansen, G. O., and Korsbrekke, K. 2016. Seasonal variation in cod feeding and growth in a changing sea. Canadian Journal of Fisheries and Aquatic Sciences 73(2): 235-245.
Johnsen, E., A. Totland, Å. Skålevik, A. J. Holmin, G. E. Dingsør, E. Fuglebakk, and N. O. Handegard. 2019. StoX: An open source software for marine survey analyses. 10:1523-1528.

520 | ICES SCIENTIFIC REPORTS 2:52 | ICES
Johansen, T., Westgaard,J.-I., Seliussen, B.B., Nedreaas, K., Dahle, G., Glover, G.A., Kvalsund, R., and Aglen, A. 2017. “Real-time” genetic monitoring of a commercial fishery on the doorstep of an MPA reveals unique insights into the interaction between coastal and migratory forms of the Atlantic cod. ICES Journal of Marine Science (2017), doi:10.1093/icesjms/fsx22
Jørgensen, B 1997. The theory of dispersion models. Chapman & Hall. ISBN 978-0412997112.
Jørgensen C., Enberg K., Dunlop E.S,. Arlinghaus R., Boukal D.S., Brander K., Ernande B., Gårdmark A., Johnston F., Matsumura S., Pardoe H., Raab K., Silva A., Vainikka A., Dieckmann U., Heino M., Rijnsdorp A.D. 2008. The role of fisheries-induced evolution – response. Science. 320: 48-50.
Kenchington, T.J. Natural mortality estimators for information-limited fisheries. Fish and Fisheries, 2014, 15.4: 533-562.
Kennedy, J., Gundersen, A.C. and Boje, J.2009. When to count your eggs: Is fecundity in Greenland halibut (Reinhardtius hippoglossoides W.) down-regulated? Fisheries Research, 100(3): 260-265.
Kennedy, J., Gundersen, A.C., Høines, Å.S. and Kjesbu, O.S., 2011. Greenland halibut (Reinhardtius hippo-glossoides) spawn annually but successive cohorts of oocytes develop over 2 years, complicating correct assessment of maturity. Canadian Journal of Fisheries and Aquatic Sciences, 68(2): 201-209.
Kennedy, J., Hedeholm, R.B., Gundersen, A.C. and Boje, J., 2014. Estimates of reproductive potential of Greenland halibut (Reinhardtius hippoglossoides) in East Greenland based on an update of maturity sta-tus. Fisheries Research, 154: 73-81.
Korsbrekke, K. 1997. Norwegian acoustic survey of Northeast Arctic cod on the spawning grounds off Lo-foten. ICES C.M 1997/Y:18.
Kovalev, Yu.A., and Yaragina N.A. 2009. The effects of population density on the rate of growth, matura-tion, and productivity of the stock of the Northeast Arctic cod. Journal of Ichthyology 49, № 1: 56-65.
Kovalev, Y., Prozorkevich, D., and Chetyrkin, A. 2017. Estimation of Ecosystem survey 2016 index in situ-ation of not full area coverage. Working Document No. 12 to the Arctic Fisheries Working Group, Co-penhagen, 18-25 April 2017.
Kovalev, Y., and Chetyrkin, A. 2019. What does NEA cod want for prediction - Fsq or TAC constrain?. Working Document No. 11 to the Arctic Fisheries Working Group. ICES. 2019. Arctic Fisheries Work-ing Group (AFWG). ICES Scientific Reports. 1:30. 934 pp
Kuparinen A., Stenseth N. C., Hutchings J. A. 2014. Fundamental population-productivity relationships can be modified through density-dependent feedbacks of life-history evolution. Evol Appl 7(10):1218-25.
Laurenson CH, Johnson A, Priede IG. 2005. Movements and growth of monkfish Lophius pisca-torius tagged at the Shetland Islands, Northeastern Atlantic. Fisheries Research. 2005 Febru-ary 28; 71(2):185–95.
Mace, P. M. and Doonan, I. J. 1988. A generalised bioeco-nomic simulation model for Àsh population dy-namics. New Zealand Fishery Assessment Research Document 88/4. Fisheries Research Centre, MAFFish, POB 297: Wellington, NZ.
Mangel, M., Brodziak, J., and DiNardo, G. 2010. Reproductive ecology and scientific inference of steepness: a fundamental metric of population dynamics and strategic fisheries management. Fish Fish. 11: 89–104. doi:13.1111/j.1467-2979.2009.00345.x
Mangel, M., MacCall, A.D., J. Brodziak, E.J. Dick, R. E. Forrest, R. Pourzand, and S. Ralston 2013. A per-spective on steepness, reference points, and stock assessment. Can. J. Fish. Aquat. Sci. 70: 930–940 (2013) dx.doi.org/13.1139/cjfas-2012-0372
Mehl, S., Aglen, A., Alexandrov, D.I., Bogstad, B., Dingsør, G.E., Gjøsæter, H., Johannesen, E., Korsbrekke, K., Murashko, P.A., Prozorkevich, D.V., Smirnov, O., Staby, A., and Wenneck, T. de Lange, 2013. Fish investigations in the Barents Sea winter 2007-2012. IMR-Pinro Joint Report Series 1-2013, 97 pp.
Mehl, S., Aglen, A., Bogstad, B., Dingsør, G.E., Gjøsæter, H., Godiksen, J., Johannesen, E., Korsbrekke, K., Staby, A., Wenneck, T. de Lange, Wienerroither, R., Murashko, P. A., and Russkikh, A. 2014. Fish investigations in the Barents Sea winter 2013-2014. IMR-PINRO Joint Report Series 2-2014, 73 pp.
ICES | AFWG 2020 | 521
Mehl, S. Aglen, A., Amelkin, A., Dingsør, G.E., Gjøsæter, H., Godiksen, Staby, A., Wenneck, T. de Lange, and Wienerroither, R. 2015. Fish investigations in the Barents Sea, winter 2015. IMR-PINRO report series 2-2015. 61 pp.
Mehl, S., Aglen, A., Bogstad, B., Dingsør, G.E., Korsbrekke, K., Olsen, E., Staby, A., Wenneck, T. de Lange, Wienerroither, R., Amelkin, A. V., and Russkikh, A. A. 2016. Fish investigations in the Barents Sea winter 2016. IMR-PINRO Joint Report Series 4-2016, 78 pp.
Mehl, S., Aglen, A., Berg, E., Dingsør, G. and Korsbrekke, K. 2014. Akustisk mengdemåling av sei, kysttorsk og hyse, Finnmark – Møre, hausten 2014. [Acoustic abundance of saithe, coastal cod and haddock Finn-mark – Møre Autumn 2014]. In Norwegian, legends in English. Toktrapport/Havforskningsinsti-tuttet/ISSN 1503-6294/Nr. 1 – 2014 (38pp).
Mehl, S, Aglen, A., Berg, E. Dingsør, G. and Korsbrekke, K. 2015. Akustisk mengdemåling av sei, kyst-torsk og hyse Finnmark – Møre hausten 2015. Acoustic abundance of saithe, coastal cod and haddock Finn-mark – Møre Autumn 2015. In Norwegian, legends in English. Toktrapport/Havforskningsinsti-tuttet/ISSN 1503-6294, Nr. 4 – 2015. 38pp.
Mehl, S, Aglen, A., Berg, E. Dingsør, G. and Korsbrekke, K. 2016. Akustisk mengdemåling av sei, kyst-torsk og hyse Finnmark – Møre hausten 2016. Acoustic abundance of saithe, coastal cod and haddock Finn-mark – Møre Autumn 2016. In Norwegian, legends in English. Toktrapport/Havforskningsinsti-tuttet/ISSN 1503-6294, Nr. 15 – 2016. 38pp.
Mehl, S., Aglen, A., Bogstad, B., Staby, A., de Lange Wenneck, T. Wienerroither, R., and Russkikh, A.A. 2017a. Fish investigations in the Barents Sea winter 2017. Working Document No. 3 to the Arctic Fish-eries Working Group, Copenhagen, 18-25 April 2017.
Mehl, S., Aglen, A. and Johnsen, E. 2017b. Re-estimation of swept area indices with CVs for main demersal fish species in the Barents Sea winter survey 1994 – 2016 applying the Sea2Data StoX software2017. Fisken og Havet No. 10, 2016. Institute of Marine Research, Bergen, Norway. 43 pp.
Mehl S., Aglen A., Johnsen E. and Å. Skålevik. 2018a. Estimation of acoustic indices with CVs for cod and haddock in the Barents Sea winter survey 1994 – 2017 applying the Sea2Data StoX software. Fisken og Havet, №5, 29 p.
Mehl, S. Berg, E., Korsbrekke, K., Olsen, E., and Staby, A. 2018b. Acoustic abundance of saithe, coastal cod and haddock Finnmark – Møre Autumn 2017. Toktrapport/ Havforskningsinstituttet/ISSN 15036294/Nr. 2–2018.
Mehl, S., de Lange Wenneck, T., Aglen, A., Fuglebakk, E., Gjøsæter, H., Godiksen, J. A., Seim, S. E., and Staby, A. 2019. Fish investigations in the Barents Sea winter 2019. IMR-PINRO Joint Report Series 4-2019, 77 pp.
Mehl, S., and Yaragina, N. A. 1992. Methods and results in the joint PINRO-IMR stomach sampling pro-gram. In: Bogstad, B. and Tjelmeland, S. (eds.), Interrelations between fish populations in the Barents Sea. Proceedings of the fifth PINRO-IMR Symposium. Murmansk, 12–16 August 1991. Institute of Marine Research, Bergen, Norway, 5–15.
Mikhaylov, A. 2016. Long-term HCR-parameters estimation for Greenland halibut based on production model. Working paper no 14. in: Report of the Arctic Fisheries Working Group (AFWG), Dates 19-25 April 2016, ICES HQ, Copenhagen, Denmark. ICES CM 2016/ACOM:06. 621 pp.
Mikhaylov, A. 2019. Update reference point estimation for Greenland halibut based on production model. Working document no. 21 in report of the Arctic Fisheries Working Group, ICES CM 2018/ACOM:06.
Mjanger H. and J.A. Godiksen. 2018. Report of the workshop on age reading of cod (Gadus morhua L.) and haddock (Melanogrammus aeglefinus) between IMR and PINRO May 30 – June 1 2017. Working Doc-ument no. 10. ICES Arctic Fisheries Working Group, ICES CM 2018/ACOM:XX.
Mortensen, E. 2007. Er det variasjon i diett og lengde ved alder hos torsk (Gadus morhua L.) nord for 64°N? [in Norwegian]. Master Thesis, University of Tromsø, June 2007.
Muñoz, P. D., Martinez-Escauriaza, R., González, C., and Ramilo, L. 2016. Spanish bottom trawl spring survey “Fletán Ártico 2015” in the Slope of Svalbard (ICES Division IIb2). Working document no 10.

522 | ICES SCIENTIFIC REPORTS 2:52 | ICES
in: Report of the Arctic Fisheries Working Group (AFWG), Dates 19-25 April 2016, ICES HQ, Copen-hagen, Denmark. ICES CM 2016/ACOM:06. 621 pp.
Muñoz, P. D., Bagués, A. S., González, C., González-Troncoso, D., Nogueira, A., and Ramilo, L. 2017. Span-ish bottom trawl autumn survey “Fletán Ártico 2016” in the Slope of Svalbard (ICES Division IIb2). Working document no 7. in: Report of the Arctic Fisheries Working Group (AFWG), 19–25 April 2017, Copenhagen, Denmark. ICES CM 2017/ACOM:06. 493 pp.
Nedreaas, K. 2014. Review of historic commercial catch-per-unit-of-effort (cpue) series previously used in stock evaluation of Greenland halibut (Reinhardtius hippoglossoides) in ICES Subareas I and II. Are such cpue series appropriate to use in future Greenland halibut stock assessments? Working document no 2. in: Report of the Data Compilation Workshop on Northeast Arctic Greenland Halibut and Assess-ment Methods (DCWKNGHD), 10–12 November 2014, Murmansk, Russia. ICES CM 2014/ACOM:65. 56 pp.
Nedreaas K. and Smirnov O, 2003. Stock characteristics, fisheries and management of Greenland halibut (Reinhardtius hippoglossoides Walbaum) in the northeast Arctic. Proceedings of the 10th Norwegian-Russian Symposium Bergen, Norway 27-29 August 2003.
Nielsen, A., Berg, C.W., 2014. Estimation of time-varying selectivity in stock assessments using state-space models. Fish. Res. 158:96-101.
Núñez, L.A., Hallfredsson, E.H. and Falk-Petersen, I.-B., 2015. Different maturity scales affect estimations of fecundity, TEP and spawning stock size of Greenland halibut, Reinhardtius hippoglossoides (Walbaum, 1792). Marine Biology Research: 1-10.
Ofstad, L. H. 2013. Anglerfish Lophius piscatorius L. in Faroese waters. Life history, ecological importance and stock status. Dr. scient thesis, University of Tromsø. February 2013. 81 pp.
O'Sullivan M., Wright P. J., Verspoor E., Knox D., Piertney S. 2006. Absence of spatial and temporal genetic differentiation at microsatellite loci in north east Atlantic anglerfish (Lophius piscatorius). Journal of Fish Biology 2006; 69:261.
Pedersen, T., Nilsen, M., Berg, E., and Reigstad M. 2007. Trophic model of a lightly exploited cod-dominated ecosystem. In; Nilsen, M: “Trophic interactions and the importance of macrobenthic invertebrate pro-duction in two Arctic fjord systems”. A dissertation for PhD, University of Tromsø, Autumn 2007
Pedersen, T. and Pope, J.G. 2003a. Sampling and a mortality model of a Norwegian cod (Gadus morhua L.) fjord population. Fish. Res. 63, 1-20.
Pedersen, T., and Pope, J. 2003b. How may feeding data be integrated into a model for a Norwegian fjord population of cod (Gadus morhua L.)? Scientia Marina, 67(Suppl. 1): 155-169.
Planque, B. 2015. S. mentella assessment - handling the +group.: WD03 - ICES AFWG2015. 8 pp.
Planque, B. 2016. Possible use of the Pelagic and slope surveys in the analytical assessment of Sebastes men-tella in ICES areas 1 and 2.: WD05 - ICES AFWG2016. 6 pp.
Planque, B., Vollen, T., Höffle, H., Harbitz A., 2018. Use of StoX for estimating numbers@age of Sebastes mentella from the international deep pelagic ecosystem survey in the Norwegian Sea.: WD07 - ICES AFWG2018. 38 pp.
Ponomarenko 1973, 1984
Ponomarenko, I.Ya. and N.A.Yaragina. 1990. Long-term dynamics of the Barents Sea cod feeding on cape-lin, euphausiids, shrimp and the annual consumption of these objects. Feeding resources and interre-lations of fishes in the North Atlantic: Selected papers of PINRO. Murmansk. 1990. p.109-130 (in Rus-sian).
Prince, J.D., Hordyk, A.R., Valencia, S.R., Loneragan, N.R., and Sainsbury, K.J. 2015. Revisiting the concept of Beverton–Holt life-history invariants with the aim of informing data-poor fisheries assessment. ICES J. Mar. Sci. 72: 194 - 203.
Prozorkevich Dmitry, Johannesen Edda, and Johansen Geir Odd. 2020. Barents Sea ecosystem survey 2019: cod and haddock indices. Working document no 1 in: Report of the Arctic Fisheries Working Group (AFWG), 15-22 April 2020. ICES CM 2015/ACOM:05. 639 pp.

ICES | AFWG 2020 | 523
Prozorkevitch, D. and van der Meeren, G. (eds) 2020. Survey report from the joint Norwegian/ Russian ecosystem survey in the Barents Sea and adjacent waters August-October 2019. IMR/PINRO Joint Re-port Series, 1-2020, 93pp.
Russkikh, A. A., amd Smirnov, O. V. 2016. Results of the Russian trawl survey of Greenland halibut in the Barents Sea and adjacent waters in 2015. Working document no 16. in: Report of the Arctic Fisheries Working Group (AFWG), Dates 19-25 April 2016, ICES HQ, Copenhagen, Denmark. ICES CM 2016/ACOM:06. 621 pp.
Skaret, G., D. Prozorkevich, H. Gjøsæter, and B. Bogstad. 2019. Evaluation of potential sources of error leading to an underestimation of the capelin stock in 2016. Pp. 166-175 in Proceedings of the 18th Rus-sian-Norwegian symposium, Murmansk 5-7 June 2018. Edited by Evgeny Shamray, Geir Huse, Alex-ander Trofimov, Svein Sundby, Andrey Dolgov, Hein Rune Skjoldal, Konstantin Sokolov, Lis Lindal Jørgensen, Anatoly Filin, Tore Haug and Vladimir Zabavnikov. IMR/PINRO report Series 1-2019.
Skaret, G. et al. 2020. Testing of trawl-acoustic stock estimation of spawning capelin 2020. IMR Survey re-port Nr. 2–2020, ISSN 15036294.
Skjœraasen, J. E., Kennedy, J., Thorsen, A., Fonn, M., Strand, B. N., Mayer, I., and Kjesbu, O. S. 2009. Mech-anisms regulating oocyte recruitment and skipped spawning in Northeast Arctic cod (Gadus morhua). Canadian Journal of Fisheries and Aquatic Sciences, 66: 1582–1596.
Smirnov, O. 2011. Results of the Russian survey of Greenland halibut in the Barents Sea and adjacent waters 2009. Working document no 21. in: Report of the Arctic Fisheries Working Group (AFWG), 28 April - 4 May 2011, Hamburg, Germany. ICES CM 2011/ACOM:05. 659 pp.
Sokolov A., Russkikh A., Kharlin S., Kovalev Yu. A., and Yaragina N.A. 2018. Results of the Russian trawl-acoustic survey on cod and haddock in the Barents Sea and adjacent waters in October-December 2017. Working Document no. 11. ICES Arctic Fisheries Working Group, ICES CM 2018/ACOM:06.
Solmundsson, J, Jonsson, E and Björnsson, H. 2007. Recent changes in the distribution and abundance of monkfish (Lophius piscatorius) in Icelandic waters. ICES CM 2007/K:02. 16pp.
Staalesen, B.I. 1995. Breiflabb (Lophius piscatorius L.) langs norskekysten. Cand.scient thesis, University of Bergen. 88 pp. (In Norwegian, summary in English)
Staby, A., E. Berg, K, Korsbrekke, A. Aglen. 2020. Akustisk mengdemåling av sei og kysttorsk, Finnmark-Møre høsten 2019. (Acoustic Abundance of saithe and coastal cod Finnmark-Møre 2019). Institute of Marine Research. Norway. 28pp
Stiansen et al., 2005. IMR status report on the Barents Sea ecosystem, 2004-2005. WD1, AFWG 2005.
Subbey, S., JE. Stiansen, B. Bogstad, T. Bulgakova and O. Titov, 2008. Evaluating Recruitment Models for (Age 3) NEA Cod. Working document #27. Report of the Arctic Fisheries Working Group (AFWG). 21-29 April 2008, ICES Headquarters, Copenhagen. ICES CM 2008\ACOM:01.
Svendsen, E., Skogen, M., Budgell, P., Huse, G., Ådlandsvik, B., Vikebø, F., Stiansen, J.E., Asplin, L., and Sundby, S. 2007. An ecosystem modelling approach to predicting cod recruitment. Deep-Sea Research Part II, 54:2810-2821.
Thangstad, T., Bjelland, O., Nedreaas, KH, Jónsson, E., Laurenson, CH and Ofstad, LH 2006. Anglerfish (Lophius spp.) in Nordic waters. TemaNord 2006:570. © Nordic Council of Ministers, Copenhagen 2006. ISBN 92-893-1416-8. 162 pp.
Then, A.Y., Hoenig, J.M., Hall, N.G., and Hewitt, D.A. 2014. Evaluating the predictive performance of em-pirical estimators of natural mortality rate using information on over 200 fish species. ICES J. Mar. Sci. 72(1): 82-92.
Thygesen, U. H., Albertsen, C. M., Berg, C. W., Kristensen, K., and Nielsen, A. 2017. Validation of ecological state space models using the Laplace approximation Environmental and Ecological Statistics 24 (2): 317-339.

524 | ICES SCIENTIFIC REPORTS 2:52 | ICES
Titov, O., Pedchenko, A. and Karsakov, A., 2005. ‘Assessment of Northeast Arctic cod and capelin recruit-ment from data on ecological situation in the Barents Sea in 2004-2005’. Working document #16 in: Report of the Arctic Fisheries Working Group’, Murmansk, Russia, April 19-28, 2005. ICES C.M. 2005/ACFM:20, 564 pp.
Titov O.V. 2010. Assessment of population recruitment abundance of Northeast Arctic cod considering the environment data. WD 22, AFWG 2010.
Titov O. 2018. Assessment of population recruitment abundance of Northeast Arctic cod considering the environment data. Working document 17. ICES Arctic Fisheries Working Group (AFWG), ICES CM 2018\ACOM:XX.
Tjelmeland, S. 2002. A model for the uncertainty around the yearly trawl-acoustic estimate of biomass of Barents Sea capelin, Mallotus villosus (Müller). ICES Journal of Marine Science, 59: 1072-1080.
Tjelmeland, S. 2005. Evaluation of long-term optimal exploitation of cod and capelin in the Barents Sea using the Bifrost model. Pp. 112-129 in: Shibanov, V. (ed.). “Ecosystem Dynamics and Optimal Long-term Harvest in Barents Sea Fisheries”. Proceedings of the 11th Russian-Norwegian Symposium, Mur-mansk, Russia, 15-17 August 2005. IMR/PINRO report series 2/2005, 331 pp.
Tjelmeland, S. and Lindstrøm, U. 2005. An ecosystem element added to the assessment of Norwegian spring spawning herring: implementing predation by minke whales. ICES Journal of Marine Science 62(2):285-294.
Totland, A., and Godø, O. R. 2001. BEAM–an interactive GIS application for acoustic abundance estimation. In Proceedings of the First Symposium on Geographic Information System (GIS) in Fisheries Science. Fishery GIS Research Group. Saitama, Japan (Vol. 52).
Tranang C. A., Vollen T. and Höffle H. 2020. Use of StoX for recalculating numbers at age and numbers at length of Sebastes norvegicus from the Barents Sea NOR-RUS demersal fish cruise in winter.: WD17 - ICES AFWG2020. 60 pp.
Trella, K. and J. Janusz 2012. Results of the Polish fishing survey of Greenland halibut (Reinhardtius hippo-glossoides) in the Svalbard Protection Zone (ICES IIb) in March 2011. Working document no 6. in: Report of the Arctic Fisheries Working Group 2012 (AFWG), 20 - 26 April 2012, ICES Headquarters, Copenha-gen. ICES CM 2012/ACOM:05. 670pp.
Vasilyev D. 2005 Key aspects of robust fish stock assessment. M: VNIRO Publishing, 2005. 105 p.
Vasilyev D. 2006. Change in catchability caused by year class peculiarities: how stock assessment based on separable cohort models is able to take it into account? (Some illustrations for triple-separable case of the ISVPA model - TISVPA). ICES CM 2006/O:18. 35 pp
Vasilyev D. 2020. NEA cod stock assessment by means of TISVPA. Working document no 12 in: Report of the Arctic Fisheries Working Group (AFWG), 15-22 April 2020. ICES CM 2015/ACOM:05. 639 pp.
Westgaard, J.-I., Saha, A., Kent, M.P., Hansen, H.H., Knutsen, H., Hauser, L., Cadrin, S.X., Albert, O.T. and Johansen, T., 2016. Genetic population structure in Greenland halibut (Reinhardtius hippoglossoides) and its relevance to fishery management. Canadian Journal of Fisheries and Aquatic Sciences.
Winker, H., Carvalho, F., Kapur, M. 2018. JABBA: Just Another Bayesian Biomass Assessment. Fisheries Research 204: 275-288.
WKANGLER 2018. Report of the Benchmark Workshop on Anglerfish Stocks in the ICES Area (WKAN-GLER), 12–16 February 2018, Copenhagen, Denmark. ICES CM 2018/ACOM:31. 177 pp.
Yaragina, N. A. 2010. Biological parameters of immature, ripening and non-reproductive mature Northeast Arctic cod in 1984-2006. ICES Journal of Marine Science, 67: 2033-2041.
Yaragina N.A. and B. Bogstad. 2017. Historic difference in stock weight and maturity at age in Northeast Arctic cod. Working document 10. In: Report of the Arctic Fisheries Working Group (AFWG), 19–25 April 2017, Copenhagen, Denmark. ICES CM 2017/ACOM:06. 486 pp
Yaragina N.A. Nedreaas K.H., Koloskova V., Mjanger H., Senneset H., Zuykova N. and Ǻgotnes P. 2009. Fifteen years of annual Norwegian-Russian cod comparative age readings. Marine Biology Research 5(1): 54-65.

ICES | AFWG 2020 | 525
Yaragina N.A. and Bogstad B. 2017. Historic difference in stock weight and maturity at age in Northeast Arctic cod. Working Document No. 10 to the Arctic Fisheries Working Group, Copenhagen, 18-25 April 2017.
Yaragina N. A., Kovalev Yu. A., and Chetyrkin A. 2018. Extrapolating predation mortalities back in time: an example from North-east Arctic cod cannibalism, Marine Biology Research: https://doi.org/10.1080/17451000.2017.1396342
Zuykova N.V., Koloskova V.P., Mjanger H., Nedreaas K.H., Senneset H., Yaragina N.A., Ågotnes P. and Aanes S. 2009. Age determination of Northeast Arctic cod otoliths through 50 years of history. Marine Biology Research 5(1): 66-74.
Zuykova N.V., Mjanger H. at all. 2020. Report on the meeting between Norwegian and Russian age reading specialists at Polar Branch of FSBSI “VNIRO” Murmansk, 20-24 May 2019. Working document no 8 in: Report of the Arctic Fisheries Working Group (AFWG), 15-22 April 2020. ICES CM 2015/ACOM:05. 639 pp.
WD 15. 2019. Updated mean ratios between the combined and Norwegian data on weight at age and ma-turity at age in Northeast Arctic cod. Working document no 8 in: Report of the Arctic Fisheries Working Group (AFWG), 15-22 April 2020. ICES CM 2015/ACOM:05. 639 pp.

526 | ICES SCIENTIFIC REPORTS 2:52 | ICES
Annex 1: List of participants
Name Country
Aas Tranang, Caroline Norway
Aglen, Asgeir Norway
Bernreuther, Matthias Norway
Bogstad, Bjarte Norway
Chetyrkin, Anatolii Russia
Eidset, Elise Norway
Fall, Johanna Norway
Filin, Anatolii Russia
Halldor Hallfredsson, Elvar Norway
Höffle, Hannes Russia
Howell, Daniel Norway
Kovalev, Yuri Russia
Nedreaas, Kjell Norway
Nielsen, Anders Denmark
Russkikh, Aleksei Russia
Staby, Arved Norway
Windsland, Kristin Norway
Yaragina, Natalia Russia

ICES | AFWG 2020 | 527
Annex 2: Resolutions
This resolution was approved 1 October 2019
2019/2/FRSG02 The Arctic Fisheries Working Group (AFWG), chaired by Daniel Howell, Nor-way, will meet at ICES HQ, Denmark, on 15-22 April 2020 to:
a) Address generic ToRs for Regional and Species Working Groups, for all stocks except the Barents Sea capelin, which will be addressed at a meeting in the autumn;
b) For Barents Sea capelin oversee the process of providing intersessional assessment; c) Conduct reviews as required of time any series computed using the STOX and ECA
open source software for use in assessment in the Barents Sea. The assessments will be carried out on the basis of the Stock Annex. The assessments must be available for audit on the first day of the meeting.
Material and data relevant for the meeting must be available to the group on the dates specified in the 2020 ICES data call.
AFWG will report by 7 May 2020 and XX October 2020 for Barents Sea capelin for the attention of ACOM.
Only experts appointed by national Delegates or appointed in consultation with the national Delegates of the expert’s country can attend this Expert Group
Due to the COVID-19 disruption that started early 2020, ACOM drafted a “spring 2020 approach” for recurring fishing opportunities advice. The generic Terms of Reference have been adjusted as described in the letter to ICES chairs below.

528 | ICES SCIENTIFIC REPORTS 2:52 | ICES

ICES | AFWG 2020 | 529
530 | ICES SCIENTIFIC REPORTS 2:52 | ICES

ICES | AFWG 2020 | 531

532 | ICES SCIENTIFIC REPORTS 2:52 | ICES
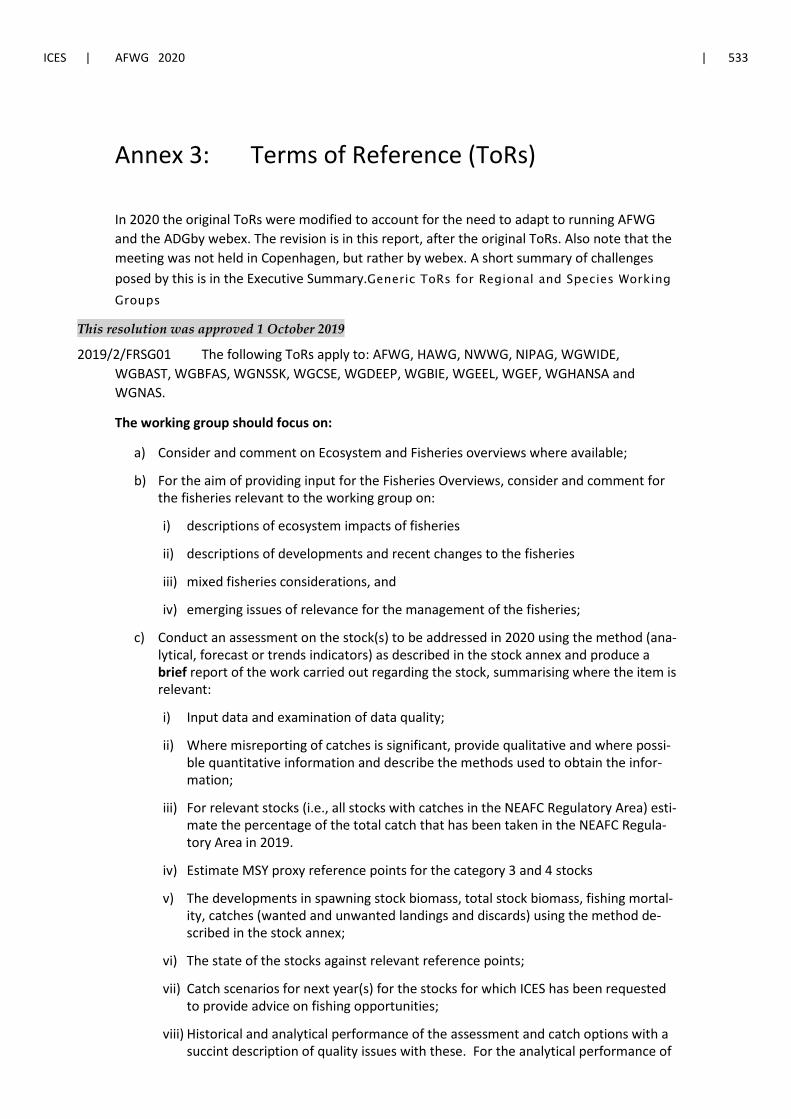
ICES | AFWG 2020 | 533
Annex 3: Terms of Reference (ToRs)
In 2020 the original ToRs were modified to account for the need to adapt to running AFWG and the ADGby webex. The revision is in this report, after the original ToRs. Also note that the meeting was not held in Copenhagen, but rather by webex. A short summary of challenges posed by this is in the Executive Summary.Generic ToRs for Regional and Species Working Groups
This resolution was approved 1 October 2019
2019/2/FRSG01 The following ToRs apply to: AFWG, HAWG, NWWG, NIPAG, WGWIDE, WGBAST, WGBFAS, WGNSSK, WGCSE, WGDEEP, WGBIE, WGEEL, WGEF, WGHANSA and WGNAS.
The working group should focus on:
a) Consider and comment on Ecosystem and Fisheries overviews where available;
b) For the aim of providing input for the Fisheries Overviews, consider and comment for the fisheries relevant to the working group on:
i) descriptions of ecosystem impacts of fisheries
ii) descriptions of developments and recent changes to the fisheries
iii) mixed fisheries considerations, and
iv) emerging issues of relevance for the management of the fisheries;
c) Conduct an assessment on the stock(s) to be addressed in 2020 using the method (ana-lytical, forecast or trends indicators) as described in the stock annex and produce a brief report of the work carried out regarding the stock, summarising where the item is relevant:
i) Input data and examination of data quality;
ii) Where misreporting of catches is significant, provide qualitative and where possi-ble quantitative information and describe the methods used to obtain the infor-mation;
iii) For relevant stocks (i.e., all stocks with catches in the NEAFC Regulatory Area) esti-mate the percentage of the total catch that has been taken in the NEAFC Regula-tory Area in 2019.
iv) Estimate MSY proxy reference points for the category 3 and 4 stocks
v) The developments in spawning stock biomass, total stock biomass, fishing mortal-ity, catches (wanted and unwanted landings and discards) using the method de-scribed in the stock annex;
vi) The state of the stocks against relevant reference points;
vii) Catch scenarios for next year(s) for the stocks for which ICES has been requested to provide advice on fishing opportunities;
viii) Historical and analytical performance of the assessment and catch options with a succint description of quality issues with these. For the analytical performance of

534 | ICES SCIENTIFIC REPORTS 2:52 | ICES
category 1 and 2 age-structured assessment, report the mean Mohn’s rho (assess-ment retrospective (bias) analysis) values for R, SSB and F. The WG report should include a plot of this retrospective analysis. The values should be calculated in ac-cordance with the "Guidance for completing ToR viii) of the Generic ToRs for Re-gional and Species Working Groups - Retrospective bias in assessment" and re-ported using the ICES application for this purpose.
d) Produce a first draft of the advice on the stocks under considerations according to ACOM guidelines.
e) Review progress on benchmark processes of relevance to the Expert Group;
f) Prepare the data calls for the next year update assessment and for planned data evalu-ation workshops;
g) Identify research needs of relevance for the work of the Expert Group.
h) Review and update information regarding operational issues and research priorities and the Fisheries Resources Steering Group SharePoint site.
i) Take 15 minutes, and fill a line in the audit spread sheet ‘Monitor and alert for changes in ecosystem/fisheries productivity’; for stocks with less information that do not fit into this approach (e.g. higher categories >3) briefly note in the report where and how productivity, species interactions, habitat and distributional changes, including those related to climate-change, have been considered in the advice.
Information of the stocks to be considered by each Expert Group is available here.
Adaptions to expert groups’ generic terms of reference for spring 2020.
In light of the disruptions caused by COVID 19 in 2020, the generic terms of reference for the FRSG stock assessment groups have been re-prioritised. This applies to expert groups that feed into the spring advice season process2. ACOM is encouraging expert groups to use virtual meetings (e.g. webex) and subgroups to deliver the high priority terms of reference.
High Priority for spring 2020 advice season
c) Conduct an assessment on the stock(s) to be addressed in 2020 using the method (ana-lytical, forecast or trends indicators) as described in the stock annex and produce a brief report of the work carried out regarding the stock, summarising where the item is rele-vant. Check the list of the stocks to be done in detail and those to roll over.
i) Input data and examination of data quality;
ii) Where misreporting of catches is significant, provide qualitative and where possi-ble quantitative information and describe the methods used to obtain the infor-mation;
iii) For relevant stocks (i.e., all stocks with catches in the NEAFC Regulatory Area) es-timate the percentage of the total catch that has been taken in the NEAFC Regu-latory Area in 2019.
2 These do not apply to WGNAS.

ICES | AFWG 2020 | 535
v) The developments in spawning stock biomass, total stock biomass, fishing mortal-ity, catches (wanted and unwanted landings and discards) using the method de-scribed in the stock annex;
vi) The state of the stocks against relevant reference points;
vii) Catch scenarios for next year(s) for the stocks for which ICES has been requested to provide advice on fishing opportunities;
viii) Historical and analytical performance of the assessment and catch options with a succinct description of quality issues with these. For the analytical performance of category 1 and 2 age-structured assessment, report the mean Mohn’s rho (as-sessment retrospective (bias) analysis) values for R, SSB and F. The WG report should include a plot of this retrospective analysis. The values should be calcu-lated in accordance with the "Guidance for completing ToR viii) of the Generic ToRs for Regional and Species Working Groups - Retrospective bias in assess-ment" and reported using the ICES application for this purpose.
d) Produce a first draft of the advice on the stocks under considerations according to ACOM guidelines. Check list to confirm whether the stock requires a concise advice sheet or a traditional advice sheet.
f) Prepare the data calls for the next year update assessment and for planned data evalua-tion workshops;
j) Audit all data and methods used to produce stock assessments and projections.

536 | ICES SCIENTIFIC REPORTS 2:52 | ICES
Medium Priority for spring 2020 advice season
a) Consider and comment on Ecosystem and Fisheries overviews where available;
b) For the aim of providing input for the Fisheries Overviews, consider and comment for the fisheries relevant to the working group on:
i) descriptions of ecosystem impacts of fisheries ii) descriptions of developments and recent changes to the fisheries iii) mixed fisheries considerations, and iv) emerging issues of relevance for the management of the fisheries; e) Review progress on benchmark processes of relevance to the Expert Group; High
for application;
Low Priority for spring 2020 advice season
c iv) Estimate MSY proxy reference points for the category 3 and 4 stocks
g) Identify research needs of relevance for the work of the Expert Group.
h) Review and update information regarding operational issues and research priorities and the Fisheries Resources Steering Group SharePoint site.
i) Take 15 minutes, and fill a line in the audit spread sheet ‘Monitor and alert for changes in ecosystem/fisheries productivity’; for stocks with less information that do not fit into this approach (e.g. higher categories >3) briefly note in the report where and how productivity, species interactions, habitat and distributional changes, including those related to climate-change, have been considered in the advice. ACOM would encourage expert groups to carry out this term of reference later in the year through a webex.
Responses to Terms of Reference
Under ToR a (address generic ToRs), the stock assessments and advice were conducted ac-cording to generic ToRs c and d, while the generic ToR e benchmark review can be found in further down in this introduction and in the haddock, NEA cod and coastal cod sections. Work on generic ToRs a and b will be conducted intersessionally as it becomes appropriate.
ToR b is handled in detail by the capelin subgroup of AFWG, held in the autumn after the capelin survey. A brief report on the previous capelin assessment is given in this report.
ToR c was addressed with a review of the conversion of redfish data to the SToX system, and is presented in Annex.
Benchmarks A haddock benchmark was conducted in early 2020, at the WKDEM 2020 (ICES 2020b) bench-mark. The haddock work was considered successful in addressing the two main concerns with this stock assessment: the model is now better able to track the years with large catches, and the retrospective pattern has been significantly reduced.
Both NEA cod and coastal cod have been approved for benchmark in 2021.

ICES | AFWG 2020 | 537
Tentative plans are being made for proposing Greenland halibut for benchmark in 2022, fol-lowed by a HCR evaluation. Capelin will need a benchmark at some point, as work is underway to revise the assessment methodology, however no data were proposed at this meeting, and cooperation with Iceland was thought advisable.
Unreported landings, discards, bycatch, and uncertainties in the catch data Total catches In this report, the terms ‘landings’ and ‘catches’ are, somewhat incorrectly, used as synonyms, as discards are in no cases used in the assessments. This does not mean, however, that dis-cards have not occurred, but the WG has no information on the possible extent. In contrast, available information indicates low discard rates at present (less than 5% of catch) and it is as-sumed that discards are negligible in the context of the precision of the advice.
As previous years, a report from the Norwegian-Russian Analysis group dealing with estima-tion of total catch of cod and haddock in the Barents Sea in 2019 was available to AFWG. The report presents estimated catches made by Norwegian, Russian and third countries sepa-rately. According to that report the total catches of both cod and haddock reported to AFWG are very close (within 1%) to the estimates made by the analysis group. Thus, it was decided to set the IUU catches for 2019 to zero.
For further information on under- and misreporting, we refer to the 2016 AFWG report.
Discard estimates (1994–2019) of redfish, cod, haddock and Greenland halibut juveniles in the commercial shrimp fishery in the Barents Sea are presented in Figure 0.1. These estimates are new compared to previous AFWG reports, and are obtained with a spatio-temporal model based procedure elaborated in Breivik et al. (2017). In Breivik et al. (2017) an extensive valida-tion study indicates that the new procedure obtains bycatch estimates with approximately correct uncertainty. Previous estimates for the period 1982–2015 are given in earlier reports (e.g. AFWG 2018), and we have not been able to compare these two time-series in detail. Such a comparison should be performed on a relatively fine spatio-temporal resolution. The bycatch estimates illustrated in Figure 0.1 and are available for each quarter in each main sta-tistical area (not shown in report). Note that it is still work in progress regarding improving the new estimates.
The new time-series in Figure 0.1 are obtained by scaling the estimated bycatch in the Norwe-gian fishery with the international fishery in each ICES area. The scaling procedure assumes that the Norwegian fishery is representative for the international fishery. This assumption is necessary because the international catch data are available only to a low spatio-temporal resolution. If the international vessels in a relatively high degree trawl at locations not trawled by Norwegian vessels, the bycatch estimates illustrated in figure 0.1 may be biased. It was observed during AFWG2019 that scaling the fishery logbooks with the landing statistics in year 2016 and 2017 resulted in a large difference between the obtained shrimp catch and the reported shrimp catch from NIPAG (ICES CM 2018/ACOM:08). Because of this incon-sistency, only logbooks and not the landing statistics are used in year 2016 and 2017 when es-timating the bycatch. Before AFWG2020, this inconsistency should be further investigated.
538 | ICES SCIENTIFIC REPORTS 2:52 | ICES
Uncertainty in catch data For the Norwegian estimates of catch numbers at-age and mean weight-at-age for cod and haddock methods for estimating the precision have been developed, and the work is still in progress (Aanes and Pennington, 2003; Hirst et al., 2004; Hirst et al., 2005; Hirst et al., 2012). The methods are general and can in principle be used for the total catch, including all coun-tries’ catches, and provide estimates both at-age and at-length groups. Typical error coeffi-cients of variation for the catch numbers at-age are in the range 5–40% depending on age and year. It is evident that the estimates of the oldest fish are the most imprecise due to the small numbers in the catches and resulting small number of samples on these age groups. From 2006 onwards, the Norwegian catch-at-age in the assessment has been calculated using the ECA method described by Hirst et al. (2005). The methodology for using ECA to split cod catches into NEA cod and coastal cod is still under development (WKARCT 2015). ECA has now been implemented for saithe, and for S. mentella and S. norvegicus.
Aging error is another source of uncertainty, which causes increased uncertainty in addition to bias in the estimates: An estimated age distribution appears smoother than it would have been in absence of aging error. Some data have been analysed to estimate the precision in ag-ing (Aanes, 2002). If the aging error is known, this can currently be taken into account for the estimation of catch-at-age described above.
For capelin, the uncertainty in the catch data is not evaluated. The catch data are used, how-ever, only when parameters in the predation model are updated at infrequent intervals, and the uncertainty in the catch data is considered small compared with other types of uncertain-ties in the estimation.
We note that the SToX survey methodology reviewed by the group is able to produce uncer-tainty estimates for the survey time-series. The XSAM model can utilize such estimates, and work is ongoing to explore to consequences of utilizing such estimates.
Additional sources of uncertainty arising from sources beyond sampling or age-reading errors have implications for a number of the stocks assessed here. Coastal cod catches, and to a lesser extent catches of the much larger NEA cod stock, have uncertainty issues due to the dif-ficulty of splitting catches between the two stocks. A similar issue applies to small S. norvegi-cus stock and the larger S. mentella stock, where species misidentification can be a significant source of error. In addition, there is considerable noise in the age data for S. norvegicus, likely due to a small sample size. This is reason that this stock is assessed with GADGET, which can take into account both age and length data. Finally, there is no agreement between Norway and Russia on an age-reading methodology for Greenland halibut, and such data are not used for tuning the model. The absence of age data creates an important (but unquantifiable) source of error on the GHL stock estimate.
Sampling effort– commercial fishery
Concerns about commercial sampling: The main Norwegian sampling program for demersal fish in ICES subareas 1 and 2 has been port sampling, carried out on board a vessel travelling from port to port for approximately 6 weeks each quarter. A detailed description of this sam-pling program is given in Hirst et al. (2004). However, this program was, for economic reasons, terminated 1 July 2009. Sampling by the ‘reference fleet’ and the Coast Guard has increased in recent years. However, the reduction in port sampling of many different vessels seems to have increased the uncertainty in the catch-at-age estimates from 2009 onwards (WD6,

ICES | AFWG 2020 | 539
2010). A Norwegian port sampling program was restarted in 2011, although with a lower ef-fort, but this improved the basis for the 2011–2017 catch-at-age estimates. From 2014 this program is run by 4-year contracts of a vessel that sails between fish landing sites along the coast from about 66°N to Varanger (70°N, 30°E) three periods a year during the 1st, 2nd and 4th quarters, altogether up to 120 days. This is a reduction compared to about 180 days a year prior to 2009. The catch sampling is done of landed fish, mainly from the fleet fishing in coastal waters, and usually inside the plant, and the rented vessel acts as a transport, accom-modation and working (age reading, data work) platform. AFWG recommends that such sam-pling is also carried out during the third quarter.
Tables 0.1-0.4 show the development of the Norwegian, Russian, Spanish and German sam-pling of commercial catches in the period 2008–2018. The tables show the total sampling ef-fort, but do not show how well the sampling covers the fishery. Indices of coverage should be developed to indicate this. The main reason for the general strong decrease in numbers of Norwegian samples in the first part of this period is the termination of the port sampling pro-gram in northern Norway. This program is now up and running again. It should be considered whether catch sampling carried out by different countries fishing by trawl for the same time and area could be coordinated and data shared on a detailed level.
Cod, haddock and saithe: Previous concerns regarding poor biological sampling from the fish-ery were less of an issue in 2018, as available catch-at-age and length data covered the largest portion of catches by the respective fisheries. However, the aggregation level (time and space) used when splitting these catches into Northeast arctic cod and Norwegian Coastal Cod is also an important issue. Despite the improvement in sampling coverage in 2016–2018, the number of samples should be increased in coming years, with the aim of covering all quarters and ar-eas contributing highest catches.
S. mentella Data issues: There is still a concern about the biological sampling from the fishery and scien-tific surveys that may have become critically low, however, there is also a lag of several years between collection of age samples and the processing of them. This is elaborated in the sec-tion for this stock.
S. norvegicus Data issues: Despite a recent increase in age-reading for this species, age data are poor, and effort in age sampling from the catches is required. The other main source of uncertainty is species misidentification from S. mentella, and consequently careful monitoring that species composition is being reported correctly is required.
NeA Greenland halibut Data issues: There is still a concern about the biological sampling from the fishery that may have become critically low. Age information is not available, due to disagreements on age reading method, and may affect precision in the assessment which at the moment is length based. NOR landings are split on Greenland halibut by sex for area, gear groups and Quarters. Annual sample level has decreased in the last years and may affect the precision of the catch distribution.

540 | ICES SCIENTIFIC REPORTS 2:52 | ICES
The samples and data basis behind each stock assessment are discussed more in detail under each stock chapter (e.g. the coastal cod). The number of aged individuals per 1000 t is now well below the standard set by EU in their Data collection regulations. For several stocks sam-pling is clearly inadequate for area/quarter/gear combinations making up considerable pro-portions of the total catch.
Due to the adopted amendments of the Russian Federal Law "On fisheries and preservation of aquatic biological resources" coming into force, especially concerning the destruction of bio-logical resources caught under scientific research, sampling activities (age sample numbers and length/weight measurements of fish) on board fishing vessels are also reduced, especially in ICES subareas 2.а and 2.b, which may result in greater uncertainty of the stock assessments due to possible biases in the age–length distributions of the commercial catch.
Age reading In 1992, PINRO, Murmansk and IMR, Bergen began a routine exchange program of cod oto-liths in order to validate age readings and ensure consistency in age interpretations (Yaragina et al., 2009b, AFWG 2008, WD 20). Later, a similar exchange program has been established for haddock, capelin and S. mentella otoliths. Once a year (now every second year, no exchanges of redfish age readers so far) the age readers have come together and evaluated discrepan-cies, which are seldom more than 1 year, and the results show an improvement over the pe-riod, despite still observing discrepancies for cod in the magnitude of 15–30%. An observation that is supported by the results of a NEA cod otolith exchange between Norway, Russia and Germany (Høie et al., 2009; AFWG 2009, WD 6). 100 cod otoliths were read by three Norwe-gian, two Russian and one German readers, reaching nearly 83% agreement (coefficient of variation 8%). The age reading comparisons of these 100 cod otoliths show that there are no reading biases between readers within each country. However, there is a clear trend of bias between the readers from different countries, Russian age readers assign higher ages than the Norwegian and German age readers. This systematic difference is a source of concern and is also discussed in Yaragina et al. (2009b). This seems to be a persistent trend and will be re-vealed in the following annual otolith and age reader exchanges.
From 2009 onwards it was decided to have meetings between cod and haddock otolith read-ers only every second year. The overall percentage agreement for the 2015–2016 exchange was 88.7% for cod (WD 10), which was a little higher than at the previous meeting. The gen-eral trend is that the Russian readers assign slightly lower ages than the Norwegian readers compared to the modal age for all age groups. This is opposite of what we have seen in previ-ous readings, where the Russian readers has tended to be slightly overestimating the age compared to the Norwegian readers.
It is not completely clear what are the main reasons for cod ageing discrepancies between Russian and Norwegian readers, as the interpretation of false zones, edge and centre seemed to be the same. Some increase in the percentage agreement in 2015–2016 is likely to be con-nected with less old fish present in catches and in the samples in later years. It is observed that the percent agreement between age readers decreases as fish age increases.
For haddock, the main reason of discrepancies between PINRO and IMR readers is different interpretation of the latest increments that were very thin in some years.

ICES | AFWG 2020 | 541
For both species the samples collected in autumn were the hardest to interpret. The main rea-son seems to be difficulties in determining if the marginal increment represents summer (opaque) or winter (translucent) growth.
A positive development is seen for haddock age readings showing that the frequency of a dif-ferent reading (usually ±1 year) has decreased from above 25% in 1996–1997 to about 10% at present. The discrepancies are always discussed and a final agreement on the exchanged cod and haddock otoliths is at present achieved for all otoliths except ca. 2–5%. For haddock, the overall percentage agreement for recent data (2015–2016) was 93.0% and the precision CV was 2.0% and considered to be satisfactory.
The next workshop on cod and haddock otolith reading will be held in Murmansk in May-June 2019.
As the EU catches only make up few percent (<10%) of the total, the German and Spanish length and age data do not have a major impact in the assessment of the relevant stocks. But in order to use consistent datasets, regular age-reading comparisons should be made. EU age readers could be invited to the NOR-RUS exchanges and workshops.
To determine the effects of changes in age reading protocols between contemporary and his-torical practices, randomly chosen cod otolith material from each decade for the period 1940s–1980s has been re-read by experts (Zuykova et al., 2009). Although some year-specific differences in age determination were seen between historical and contemporary readers, there was no significant effect on length at-age for the historical period. A small systematic bias in the number spawning zones detection was observed, demonstrating that the age at first maturation in the historic material as determined by the contemporary readers is younger than that determined by historical readers. The difference was largest in the first sampled years constituting approximately 0.6 years in 1947 and 1957. Then it decreased with time and was found to be within the range of 0.0–0.28 years in the 1970–1980s. The study also shows that cod otoliths could be used for age and growth studies even after long storage.
For capelin otoliths there is a very good correspondence between the Norwegian and Russian age readings, with a discrepancy in less than 5% of the otoliths. This was confirmed at the Norwegian-Russian age reading workshop on capelin in October 2011 (WD 13, 2012).
For some of the samples, a very high agreement was reached after the initial reading by the different experts. In other cases, some disagreement was evident after the first reading. After the initial reading, the results were analysed. The otoliths that caused disagreement were read again and discussed among the readers. After discussion about the reasons for disagree-ment, some readers wanted to change their view on some of the otoliths. When the samples were read once more, the agreement was 95%.
It was concluded that experts from all laboratories normally interpret capelin otoliths equally. Difficult otoliths are sometimes interpreted differently, but these samples are few, and should not cause large problems for common work on capelin biology and stock assessment. All par-ticipants noted the great value of conducting joint work on otolith reading, and it was decided to continue the programme of capelin otolith exchange and to involve the labs at Iceland and Newfoundland in the exchange program. Readers from Norway and Russia should continue to meet at Workshops every second year. A capelin age reading Workshop was held in Mur-

542 | ICES SCIENTIFIC REPORTS 2:52 | ICES
mansk in April 2016, and the report from that meeting was presented to the capelin assess-ment meeting in October 2016. The next age reading Workshop for capelin will be held in Murmansk in October 2019.
In order to achieve the most accurate age estimates, ICES recommends methods and best practice for age reading of both redfish and Greenland halibut. Still there continue to be dif-ferences in opinion between PINRO and IMR regarding age reading methods for these species. It is recommended to start annual or biannual exchange of otoliths and age reading experts on these species in order to identify the differences in interpretation and to discuss possibilities for a common approach.
The report from Workshop on Age Reading of Greenland Halibut (WKARGH) (ICES CM 2011/ACOM:41) described and evaluated several age reading methods for Greenland Halibut. A second workshop (WKARGH 2) was conducted in August 2016 and worked on further valida-tion on new age reading methods. The workshop recommended that two of new methods can be used to provide age estimations for stock assessments. Further, recognizing some bias and low precision in methods, the WKARGH2 recommends that an ageing error matrix or growth curve with error be provided for use in future stock assessments (WKARGH2 report 2016, ICES CM 2016/SSGIEOM:16). WKARGH2 recommends regular inter-lab calibration exercises to im-prove precision (i.e. exchange of digital images between readers for each method and be-tween methods). The new age readings are not comparable with older data or the Russian age readings, and the new methods show that the species is more slow-growing and vulnerable than the previous age readings suggest. AFWG suggests that Russian and Norwegian scientists and age readers meet to work out issues of disagreements on Greenland halibut aging.
From 2009 onwards, an exchange of Sebastes mentella otoliths is conducted annually be-tween the Norwegian and Russian laboratories (see Section 6.2.2). In 2011 ICES/PGCCDBS identified differences in the interpretation of age structure by different national laboratories and recommended that an international exchange of otoliths be conducted (ICES C.M. 2011/ACOM:40). The work was conducted during 2011 (Heggebakken, 2011) with participa-tion from Canada, Iceland, Norway, Poland and Spain. Unfortunately, Russia did not respond to the invitation to participate. The agreement in age determination was 79.2% (with allow-ance for ±1 y) for all ages combined, but 38.6% when only fish older than 20 y were consid-ered. It is recommended that 1) future exchanges be conducted every 3–5 y, 2) that these should primarily focus on 20+ year old fish and 3) that Russian scientists contribute to future exchanges. A meeting between S. mentella age readers from Norway and Russia was held in 2013. Otolith exchanges took place in 2014. It is recommended that such meetings and otolith exchanges be conducted regularly in future.
Assessment method issues Following an IBP for NEA cod (ICES C. M. 2017/ACOM:29), the assessment method for NEA cod has been altered to the SAM model. In addition, the age range of the data (both catch and survey) has been extended as recommended by the benchmark. However, due to the increas-ing age structure of the cod, the settings for these older fish recommended by the benchmark were found to be problematic. A suggested revision was rejected at an interbenchmark review in 2019, and there is thus planned a full benchmark in 2021.
For coastal cod, the issues around the difficulties with the assessment model and manage-ment implementation of the management plan were noted. Work is ongoing to attempt to ad-dress these, and will lead to a benchmark in 2021.

ICES | AFWG 2020 | 543
Work is in progress on revising the capelin assessment methodologies. However, it was con-sidered that this would not be ready for a planned benchmark in 2020, and this has now been postponed to an unspecified future date.
Environmental information included in advice of NEA cod For the thirtennth time environmental information has been applied in the advice from AFWG. In this year’s assessment ecosystem information was directly used in the projection of NEA cod. A combination of regression models, which is based on both climate and stock pa-rameters, were used for prediction of recruitment-at-age 3, see section 1.4.
In addition, temperature is part of the NEA cod consumption calculations that goes into the historical back-calculations of the amount of cod, haddock, and capelin eaten by cod.
Proposals for status of assessments in 2020-2021 For anglerfish there is currently no assessment, however following the benchmark in 2018, work is being conducted with a view to a potential future assessment. This has progressed to producing a number of candidate assessment models, but not yet a full assessment. AFWG proposes to set the following status for assessments for each stock. Greenland halibut, which was not assessed in 2020 will receive an update assessment in 2021. Work on adopting a HRpa for this stock was postponed to 2021 due to the coronavirus.

544 | ICES SCIENTIFIC REPORTS 2:52 | ICES
Fish Stock Stock Name Advice in 2019
Previous benchmarks
Next benchmark
cod.27.1-2 Cod in subareas 1 and 2 (Northeast Arctic) Update WKARCT 2015, IBP cod 2017
2021
cod.27.1-2coast Cod in subareas 1 and 2 (Norwegian coastal waters) Update WKARCT 2015 2021
had.27.1-2 Haddock in subareas 1 and 2 (Northeast Arctic) Update WKDEM 2020 -
pok.27.1-2 Saithe in subareas 1 and 2 (Northeast Arctic) Update IBP saithe 2014
WKROUND 2010
-
cap.27.1-2 Capelin in subareas 1 and 2 (Barents Sea),
excluding Division 2.a west of 5°W
Update WKARCT 2015
WKSHORT 2009
?
ghl.27.1-2 Greenland halibut in subareas 1 and 2 Rollover WKBUT 2013
(finished in 2015)
-
reb.27.1-2 Redfish Sebastes mentella subareas 1 and 2 Update WKREDFISH 2018
(WKREDMP 2014)
reg.27.1-2 Redfish Sebastes norvegicus subareas 1 and 2 Update WKREDFISH 2018
anf.27.1-2 Anglerfish in subareas 1 and 2 (Northeast Arctic) None WKANGLERFISH 2018
Stock annexes There was one relevant benchmark between AFWG 2019 and AFWG 20200, WKDEM. There is thus a new stock annex for NEA haddock. Due to the revision in the data series for the redfish species, these have slightly changed stock annexes.
Audit reports Audit reports were made for the 5 stocks for which updated advice is provided this year: northeast Arctic cod, haddock and saithe, Greenland halibut, and Norwegian Coastal cod. All audits were conducted successfully.
InterCatch The assessment of NEA cod, haddock and saithe was partly based on output from InterCatch.
The percentage of the total catch that has been taken in the NEAFC regulatory areas by year in the last year
Generic ToR c-iii asks for the percentage of the total catch that has been taken in the NEAFC regulatory area by year in the last year. In the area where AFWG stocks are distributed, there are two areas outside national EEZs which are part of the NEAFC regulatory area: The Interna-tional area in ICES Subarea 1 in the Barents Sea (“loophole”, denoted as 1.a or 27_1_A) and the International area in ICES divisions 2.a and 2.b in the Norwegian Sea (“banana hole”, de-noted as 2.a.1 and 2.b.1 or 27_2_A_1 and 27_2_B_1). In the table below the WG presents the most likely landings from these areas based on the official reports and discussions within the WG. The text table below shows the percentages for S. mentella, Northeast arctic cod and

ICES | AFWG 2020 | 545
haddock and Greenland halibut. For the other AFWG stocks no catches are taken in those ar-eas. The highest precision in these numbers are probably the S. mentella figures since these figures have been tabulated each year since 2004, and have been given a regular and special attention, also by NEAFC.
Relationship with WGIBAR The WGIBAR group (Working Group on Integrated Assessments of the Barents Sea) met for the sixth time in February 2019 (ICES C. M. 2019/SSGIEA:04). Most of the ecosystem infor-mation which was previously found in Chapter 1 in the AFWG report was from 2017 onwards moved to the WGIBAR report. A summary of the state and trends in the WGIBAR area was presented at AFWG. Chapter 1 in AFWG now only contains ecosystem-related information and data directly relevant to the assessment of AFWG stocks.
Research needs of relevance for the Working Group Agreeing on method for calculation of bottom-trawl indices from ecosystem survey.
Agreeing on an age-reading method for Greenland Halibut
Extending Greenland Halibut data back in time
Routine methods for species and stock identification for Sebastes norvegicus and S. mentella
Time and place of Next Meeting The Working Group proposes to meet next time in the period Wednesday 14th April - Tuesday 20th 2021 at a location to be decided.

546 | ICES SCIENTIFIC REPORTS 2:52 | ICES
Annex 4: Working documents
WD_01 arctic BESS indekser Barents Sea ecosystem survey 2019: cod and haddock indices WD_015 HRpa proposal for GHL
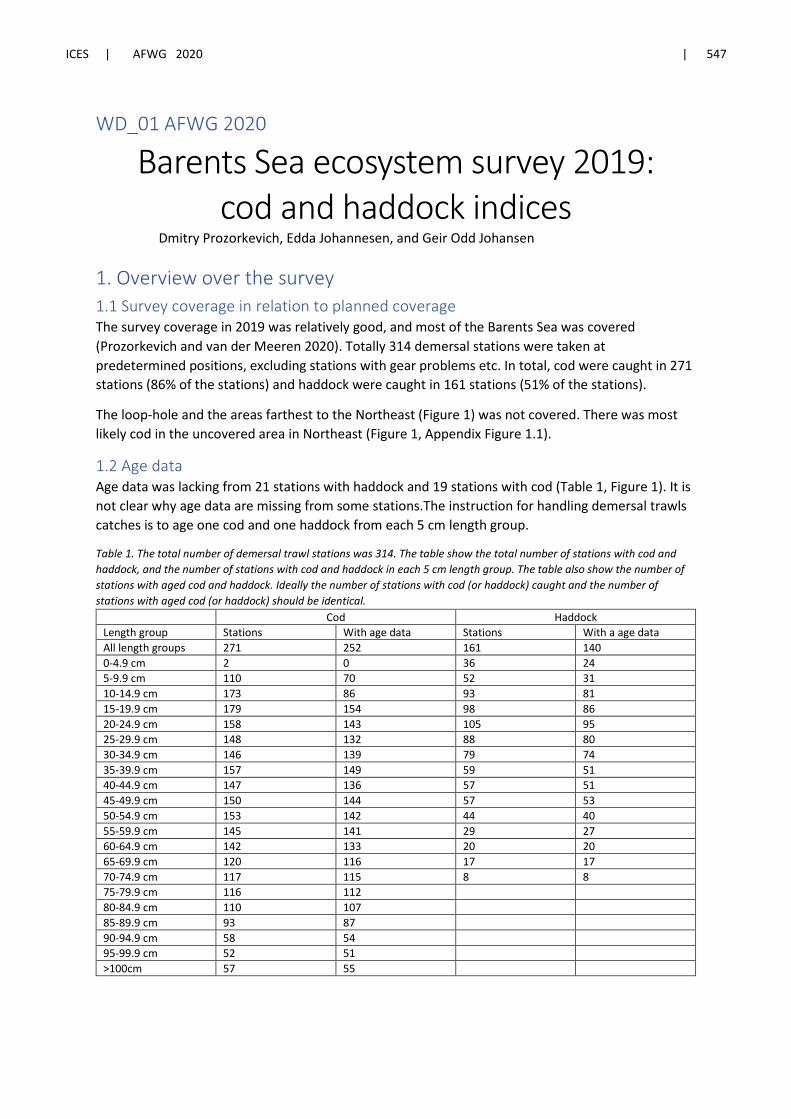
ICES | AFWG 2020 | 547
WD_01 AFWG 2020
Barents Sea ecosystem survey 2019: cod and haddock indices
Dmitry Prozorkevich, Edda Johannesen, and Geir Odd Johansen
1. Overview over the survey 1.1 Survey coverage in relation to planned coverage The survey coverage in 2019 was relatively good, and most of the Barents Sea was covered (Prozorkevich and van der Meeren 2020). Totally 314 demersal stations were taken at predetermined positions, excluding stations with gear problems etc. In total, cod were caught in 271 stations (86% of the stations) and haddock were caught in 161 stations (51% of the stations).
The loop-hole and the areas farthest to the Northeast (Figure 1) was not covered. There was most likely cod in the uncovered area in Northeast (Figure 1, Appendix Figure 1.1).
1.2 Age data Age data was lacking from 21 stations with haddock and 19 stations with cod (Table 1, Figure 1). It is not clear why age data are missing from some stations.The instruction for handling demersal trawls catches is to age one cod and one haddock from each 5 cm length group.
Table 1. The total number of demersal trawl stations was 314. The table show the total number of stations with cod and haddock, and the number of stations with cod and haddock in each 5 cm length group. The table also show the number of stations with aged cod and haddock. Ideally the number of stations with cod (or haddock) caught and the number of stations with aged cod (or haddock) should be identical.
Cod Haddock Length group Stations With age data Stations With a age data All length groups 271 252 161 140 0-4.9 cm 2 0 36 24 5-9.9 cm 110 70 52 31 10-14.9 cm 173 86 93 81 15-19.9 cm 179 154 98 86 20-24.9 cm 158 143 105 95 25-29.9 cm 148 132 88 80 30-34.9 cm 146 139 79 74 35-39.9 cm 157 149 59 51 40-44.9 cm 147 136 57 51 45-49.9 cm 150 144 57 53 50-54.9 cm 153 142 44 40 55-59.9 cm 145 141 29 27 60-64.9 cm 142 133 20 20 65-69.9 cm 120 116 17 17 70-74.9 cm 117 115 8 8 75-79.9 cm 116 112 80-84.9 cm 110 107 85-89.9 cm 93 87 90-94.9 cm 58 54 95-99.9 cm 52 51 >100cm 57 55

548 | ICES Scientific Reports 2:52 | ICES
Figure 1. Stations with haddock (left) in green and cod (right). Crosses are demersal stations without haddock (left) and cod (right). Turquoise indicates that age samples has been taken at the station.

ICES | AFWG 2020 | 549
2. BIOFOX -estimates BIOFOX estimates were run using data from 314 demersal stations (Figure 2a). BIOFOX interpolates to neighbour strata. The strata are depth stratified WMO squares (Prozorkevich and Gjøsæter 2014, Figure 2a). Figure 2b shows the planned demersal stations. Table 2 show gives the estimates for cod and Table 3 gives the estimates for haddock.
Figure 2.a) Realized bottom trawl stations ecosystem survey 2019 used in BIOFOX (n=314) and BIOFOX strata system.

550 | ICES Scientific Reports 2:52 | ICES
Figure 2.b) Planned bottom trawl stations ecosystem survey 2019 and BIOFOX strata system.
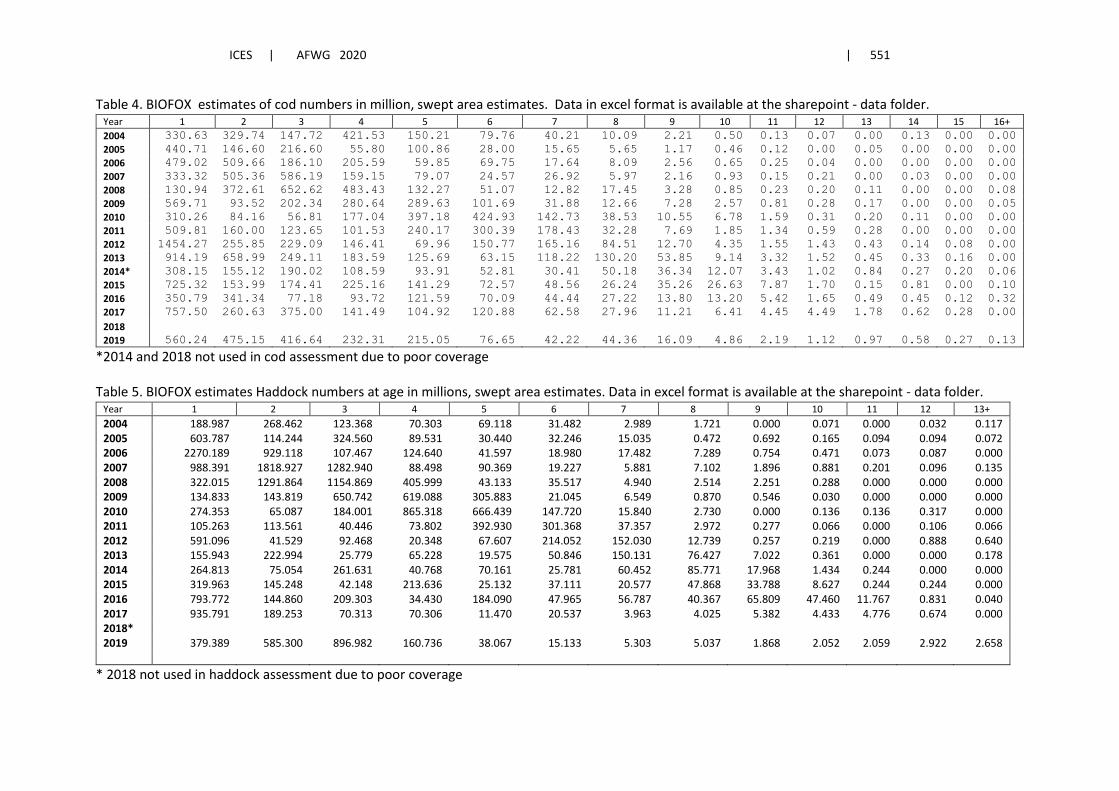
ICES | AFWG 2020 | 551
Table 4. BIOFOX estimates of cod numbers in million, swept area estimates. Data in excel format is available at the sharepoint - data folder. Year 1 2 3 4 5 6 7 8 9 10 11 12 13 14 15 16+ 2004 330.63 329.74 147.72 421.53 150.21 79.76 40.21 10.09 2.21 0.50 0.13 0.07 0.00 0.13 0.00 0.00 2005 440.71 146.60 216.60 55.80 100.86 28.00 15.65 5.65 1.17 0.46 0.12 0.00 0.05 0.00 0.00 0.00 2006 479.02 509.66 186.10 205.59 59.85 69.75 17.64 8.09 2.56 0.65 0.25 0.04 0.00 0.00 0.00 0.00 2007 333.32 505.36 586.19 159.15 79.07 24.57 26.92 5.97 2.16 0.93 0.15 0.21 0.00 0.03 0.00 0.00 2008 130.94 372.61 652.62 483.43 132.27 51.07 12.82 17.45 3.28 0.85 0.23 0.20 0.11 0.00 0.00 0.08 2009 569.71 93.52 202.34 280.64 289.63 101.69 31.88 12.66 7.28 2.57 0.81 0.28 0.17 0.00 0.00 0.05 2010 310.26 84.16 56.81 177.04 397.18 424.93 142.73 38.53 10.55 6.78 1.59 0.31 0.20 0.11 0.00 0.00 2011 509.81 160.00 123.65 101.53 240.17 300.39 178.43 32.28 7.69 1.85 1.34 0.59 0.28 0.00 0.00 0.00 2012 1454.27 255.85 229.09 146.41 69.96 150.77 165.16 84.51 12.70 4.35 1.55 1.43 0.43 0.14 0.08 0.00 2013 914.19 658.99 249.11 183.59 125.69 63.15 118.22 130.20 53.85 9.14 3.32 1.52 0.45 0.33 0.16 0.00 2014* 308.15 155.12 190.02 108.59 93.91 52.81 30.41 50.18 36.34 12.07 3.43 1.02 0.84 0.27 0.20 0.06 2015 725.32 153.99 174.41 225.16 141.29 72.57 48.56 26.24 35.26 26.63 7.87 1.70 0.15 0.81 0.00 0.10 2016 350.79 341.34 77.18 93.72 121.59 70.09 44.44 27.22 13.80 13.20 5.42 1.65 0.49 0.45 0.12 0.32 2017 757.50 260.63 375.00 141.49 104.92 120.88 62.58 27.96 11.21 6.41 4.45 4.49 1.78 0.62 0.28 0.00 2018 2019 560.24 475.15 416.64 232.31 215.05 76.65 42.22 44.36 16.09 4.86 2.19 1.12 0.97 0.58 0.27 0.13
*2014 and 2018 not used in cod assessment due to poor coverage
Table 5. BIOFOX estimates Haddock numbers at age in millions, swept area estimates. Data in excel format is available at the sharepoint - data folder. Year 1 2 3 4 5 6 7 8 9 10 11 12 13+ 2004 188.987 268.462 123.368 70.303 69.118 31.482 2.989 1.721 0.000 0.071 0.000 0.032 0.117 2005 603.787 114.244 324.560 89.531 30.440 32.246 15.035 0.472 0.692 0.165 0.094 0.094 0.072 2006 2270.189 929.118 107.467 124.640 41.597 18.980 17.482 7.289 0.754 0.471 0.073 0.087 0.000 2007 988.391 1818.927 1282.940 88.498 90.369 19.227 5.881 7.102 1.896 0.881 0.201 0.096 0.135 2008 322.015 1291.864 1154.869 405.999 43.133 35.517 4.940 2.514 2.251 0.288 0.000 0.000 0.000 2009 134.833 143.819 650.742 619.088 305.883 21.045 6.549 0.870 0.546 0.030 0.000 0.000 0.000 2010 274.353 65.087 184.001 865.318 666.439 147.720 15.840 2.730 0.000 0.136 0.136 0.317 0.000 2011 105.263 113.561 40.446 73.802 392.930 301.368 37.357 2.972 0.277 0.066 0.000 0.106 0.066 2012 591.096 41.529 92.468 20.348 67.607 214.052 152.030 12.739 0.257 0.219 0.000 0.888 0.640 2013 155.943 222.994 25.779 65.228 19.575 50.846 150.131 76.427 7.022 0.361 0.000 0.000 0.178 2014 264.813 75.054 261.631 40.768 70.161 25.781 60.452 85.771 17.968 1.434 0.244 0.000 0.000 2015 319.963 145.248 42.148 213.636 25.132 37.111 20.577 47.868 33.788 8.627 0.244 0.244 0.000 2016 793.772 144.860 209.303 34.430 184.090 47.965 56.787 40.367 65.809 47.460 11.767 0.831 0.040 2017 935.791 189.253 70.313 70.306 11.470 20.537 3.963 4.025 5.382 4.433 4.776 0.674 0.000 2018* 2019 379.389 585.300 896.982 160.736 38.067 15.133 5.303 5.037 1.868 2.052 2.059 2.922 2.658
* 2018 not used in haddock assessment due to poor coverage

552 | ICES Scientific Reports 2:52 | ICES
3. Stox estimates The strata system had to be modified to account for the lack of spatial coverage in the North East. The modified strata borders were set to be approximately half of the inter-stations distance from the outermost stations (17.5 nm). The Svalbard, Great Bank and North East strata were modified (Fig. 3a) and reduced to 77, 84 and 39%, respectively of the area of the basic area system (Fig.3.b). Table 4 gives the cod estimates, table 5 the haddock estimates and table 6 the cv estimates for 2019.
Figure 3. a) Realized bottom trawl stations 2019 (n=314) with modified strata system used in StoX.

ICES | AFWG 2020 | 553
Figure 3. b) Planned bottom trawl stations 2019 (n=314) with basic ecosystem survey strata system used for cod and haddock in StoX.

554 | ICES Scientific Reports 2:52 | ICES
Table 4.STOX Estimates of cod numbers in million, swept area estimates, mean values from 500 bootstraps. Years 2004-2017 taken from Johannesen et al 2019. The output folder from the StoX estimates can be found at the sharepoint (data folder).
Year 1 2 3 4 5 6 7 8 9 10 11 12 13 14 15 16+ 2004 410.02 290.99 91.39 281.28 155.27 75.82 40.30 10.51 1.97 0.56 0.12 0.05 - 0.16 - - 2005 359.91 124.19 178.94 35.00 96.52 31.15 18.43 6.89 1.79 0.80 0.13 - 0.09 - - - 2006 454.91 432.85 142.67 121.00 36.91 47.49 16.88 8.34 3.32 0.46 0.30 0.03 - - - - 2007 301.31 302.69 301.65 76.16 47.49 9.23 16.47 3.29 1.30 0.31 - 0.29 - 0.05 - - 2008 107.26 266.04 342.90 350.48 89.60 47.01 10.08 15.35 3.39 0.87 0.38 0.18 0.08 - - 0.08 2009 538.89 71.40 213.65 236.63 357.16 128.46 27.58 10.63 8.18 2.62 0.85 0.30 0.17 - - - 2010 383.76 87.13 59.89 151.12 448.60 513.28 160.50 39.71 10.52 7.21 2.05 0.28 0.26 0.21 - - 2011 378.05 150.56 112.78 95.19 218.77 319.56 214.58 29.86 7.71 1.84 1.35 0.65 0.29 - - - 2012 1301.35 245.25 170.88 131.23 77.53 189.52 162.84 99.89 12.83 3.98 1.60 1.33 0.41 0.14 0.18 - 2013 677.38 670.39 250.75 147.61 110.09 50.77 120.36 131.36 56.14 7.68 2.98 1.92 0.35 0.38 0.12 - 2014* 264.91 117.48 175.73 94.18 82.07 41.56 17.25 32.55 19.73 8.00 2.21 0.79 0.53 0.09 0.10 0.07 2015 600.35 178.31 184.19 219.08 148.61 61.65 61.53 32.26 35.71 25.22 7.68 1.42 0.19 0.89 - 0.06 2016 394.23 386.08 82.06 101.12 128.70 73.23 42.64 26.19 12.86 11.21 4.37 1.37 0.35 0.65 0.08 0.23 2017 744.28 203.72 356.39 94.29 68.18 139.29 72.95 27.24 11.80 5.18 4.67 4.00 1.72 0.81 0.33 - 2018 - - - - - - - - - - - - - - - -
2019 521.10 458.27 336.64 188.18 230.67 63.94 49.35 37.65 13.70 3.94 2.12 1.11 1.02 0.65 0.30 0.16
*2014 and 2018 not used in cod assessment due to poor coverage Table 5 STOX Haddock numbers at age in millions, swept area estimates, mean values from 500 bootstraps. Years 2004-2017 taken from Johannesen et al 2019. The output folder from the StoX estimates 2019 can be found at the sharepoint (data folder).
Year 1 2 3 4 5 6 7 8 9 10 11 12 13+ 2004 149.12 237.63 124.05 53.53 46.42 24.68 2.03 1.75 - 0.16 - 0.05 0.14 2005 575.23 92.64 292.08 133.23 14.24 30.11 10.19 0.33 0.45 0.20 0.10 0.08 - 2006 2190.94 872.46 79.60 99.57 41.93 9.69 12.11 4.46 0.58 1.49 0.06 0.07 - 2007 869.81 978.81 511.18 45.27 36.41 7.04 1.36 3.02 7.23 0.43 0.11 0.11 0.09 2008 333.42 1218.49 984.58 513.63 24.31 34.77 4.15 2.34 1.37 0.26 - - - 2009 167.48 103.32 580.40 594.24 153.04 5.60 1.97 0.17 0.64 0.09 - - - 2010 350.45 88.98 194.29 686.80 500.73 108.63 5.91 1.48 - 0.08 0.08 0.08 - 2011 78.99 134.80 24.31 121.84 219.85 224.20 20.36 1.19 0.13 0.11 - 0.02 0.06 2012 587.91 38.59 82.48 14.23 82.67 140.85 76.20 20.93 0.02 - - 0.75 0.23 2013 172.13 231.39 21.15 57.38 24.33 36.46 129.07 58.69 5.13 0.62 - - 0.18 2014 325.96 68.37 282.63 14.69 59.37 29.24 27.85 32.60 7.55 1.48 0.14 - - 2015 308.11 131.74 25.23 129.69 13.05 30.66 12.95 31.11 24.02 6.31 0.10 0.11 - 2016 662.38 72.60 131.31 21.84 103.47 19.76 37.52 25.64 32.57 40.62 5.57 0.18 0.17 2017 910.81 215.49 54.35 57.60 9.04 16.37 4.53 1.96 3.80 3.47 2.93 0.54 - 2018* - - - - - - - - - - - - -
2019 383.94 544.87 663.93 268.24 27.89 19.87 6.43 3.32 0.87 1.02 0.90 1.13 0.95 *2018 not used in haddock assessment due to poor coverage

ICES | AFWG 2020 | 555
Table 6 Stox CV estimates for 2019, Barents Sea Ecosystem Survey
Age Haddock Cod 0 0.31 0.118 1 0.17 0.11 2 0.27 0.16 3 0.25 0.13 4 0.50 0.16 5 0.41 0.26 6 0.46 0.16 7 0.49 0.30 8 0.31 0.13 9 0.38 0.17 10 0.34 0.19 11 0.32 0.25 12 0.32 0.40 13 0.33 0.40 14 0.40 15 0.98 0.50 16 17 0.92 18 1.00
4.Comparing Stox and Biofox Figure 4 compares the BIOFOX and StoX estimates from 2019. The ratios of the estimates are shown in Figure 5.
The largest differences between the two ways of calculating abundance were for the plus group of haddock (9+). The BIOFOX estimates were twice the StoX estimates. The reason for this is unknown. We have previously established (Johannesen et al 2020) that this was not due to the number and size of the strata used in StoX.
Figure 4. Abundance indices (log scale) Stox and Biofox of haddock (left) and cod (right) by age ecosystem survey 2019.

556 | ICES Scientific Reports 2:52 | ICES
Figure 5. Ratio of BIOFOX to StoX estimates. The plus group is 12 for cod and 9 for haddock.
5. Concluding remarks More work is needed to establish the best way of extrapolation and interpolation from areas with samples to areas without samples. The survey design should also be evaluated. Higher CVs for haddock than for cod indicates a more patchy distribution, and given the high CV’s. that the interstation distance may be to large to give reliable haddock estimates. For haddock the area coverage appears to have been adequate in 2019. For cod, the lack of coverage in the Northeast area likely lead to lack of coverage of an unknown proportion of the cod stock, and hence an underestimation of the cod abundance.
6. References Johannesen E, Johnsen E, Johansen GO and Korsbrekke K. 2019 StoX applied to cod and haddock data from the Barents Sea Ecosystem survey Fisken og havet 2019:6.
Johannesen E, Russkikh A, Prozorkevich D, Johansen GO and Kovalev Y. 2020. Ecosystem survey bottom trawl indices from StoX and BIOFOX WD7 WKDEM 2020.
Johnsen E, Totland A, Skålevik Å, et al. 2019. StoX: An open source software for marine survey analyses. Methods in Ecology and Evolution 2019;10:1523–1528 https://doi.org/10.1111/2041-210X.13250
Protozorkevich, D. and Meeren G.I. van der (eds) 2020. Survey report from the joint Norwegian/ Russian ecosystem survey in the Barents Sea and adjacent waters August-October 2019. IMR/PINRO Joint Report Series, 1-2020, 93pp.
Prozorkevich D and Gjøsæter H 2014. WD_02 cod_BESS_assessment. AFWG 2014.
0.5
1
1.5
2
2.5
1 2 3 4 5 6 7 8 9 10 11 Plussgroup
Ratio BIOFOX /StoX
Haddock Cod

ICES | AFWG 2020 | 557
Appendix figure 1.1 Cod catches (ind pr nm2) – top age 1-4 left to right, middle age 5-8 left to right, bottom age 9-12+ left to right. Size of bullets proportional to catch, sorry about the poor legend (cannot be compared across ages).Stations without cod not shown, stations with no catch of cod in that age group=small white dot.

558 | ICES Scientific Reports 2:52 | ICES
Appendix figure 1.2 Haddock catch rates by age top 1-3 (left to righy) middle 4-6, bottom 7-9+

ICES | AFWG 2020 | 559
Greenland Halibut HRpa proposal
Daniel Howell, [email protected]
In 2019, the advice drafting group, ADGANW, requested a HRpa value for Greenland Halibut. Note that this stock uses Harvest Rate rather F for reporting purposes. This document attempts to provide such a value. Note that this is not a full MSE exercise. There are plans for a benchmark to improve the model followed by a full HCR exercise in the coming years. This is simply an attempt to calculate an interim HRpa as a basis on which to give precautionary advice until a HCR is evaluated and agreed.
Background: model and stock
Greenland Halibut (hereafter GHL) is a relatively long-lived species with pronounced sexual dimorphism, males are smaller and mature earlier than females. The stock is managed on areas I and II jointly by Norway and Russia. Given the dimorphism and the lack of an accepted age-reading methodology one cannot give accurate ages of maturity and entry to the fishery, but these are on the order of c. 10 years for females and perhaps c. 7 for males. The Barents Sea Greenland halibut has nursery areas around Svalbard and Franz Josef Land in the northern Barents Sea. The fish then expand southwards into the Barents Sea, before congregating along the shelf break on the western edge for spawning. This is a deep-sea fish, and there is likely connectivity with other stocks. However, this is not presently considered in the assessment.
The GHL stock in areas I and II (the Barents Sea and adjacent waters) is assessed with a two sex, one area Gadget model, which is described in the stock annex (REF) and the benchmark report (ICES 2015). The 2015 benchmark was the first time that an analytical model was approved for this stock by ICES since age based XSA was abandoned in early 2000, and the model is thus at a relatively early stage of development. At the last AFWG the model was run from 1992-2018. Note that the recruitment estimates are presented up to 2016, even though the model is run to 2018. This is because there is considerable noise in the recruitment series, and there is therefore little information to use in tuning the last two years of recruitment estimates. One should also note that there are conflicting signals from the different surveys, and thus the estimates should be considered uncertain until the fish have entered the fishery, although there are no formal estimates of uncertainty from the Gadget model. The only significant change since the benchmark is that because of reduced sampling the model had to move to time-averaged maturity data, rather than separate estimates for each year. The model period begins during a partial fishing moratorium and covers a period of rising and good stock sizes, there is no data in the model on low stock status. The benchmark agreed on a Bpa and Blim value (based on the lowest observed stock size that gave rise to good recruitment) but not an HRpa value. Given the lack of contrast in the stock size data (see below) and the presence of good recruitment events, Bpa has been set equal to Blim (as per ICES 2017). There are indications of a good recruitment event at lower stock sizes prior to the start of the model run, since the model begins in during a rising stock trend. The model reports 45cm+ biomass (the minimum catch size) rather than SSB, partly to avoid questions about using male and/or female biomass, and partly to be consistent with earlier work (not used for assessment) using surplus production models. As with a number of other ICES stocks, we report Harvest Rate (HR), rather than F, that catch as a fraction of the modelled fishable biomass on 1st January. The other “non-standard” feature of the model is that it is tuned only to length data, no
560 | ICES Scientific Reports 2:52 | ICES
age data is used in the tuning. This is due to a lack of agreement between Norway and Russia on what age-reading methodology to use. As can be seen in Figure 1, there have been several large recruitment events which can be traced for multiple years in the length data. This allows the model to estimate those recruitment events and growth rates for the GHL based on the length data alone. However, it is not clear that there is sufficient contrast in the data to accurately estimate the recruitment pattern in between the high recruitment events. There is data from catch levels and stock trends measured in the survey to give information on average recruitment level over time, but likely not to estimate the actual recruitment pattern. Note that there is little information on what the recruitment might be below Blim. This is not considered a problem for this analysis. The stock is currently assessed as well over Blim/Bpa (Figure 2), and the HRpa being calculated is intended to avoid falling below Blim. There is therefore no need to simulate behavior below Blim in order to estimate a HRpa, although such information would of course be needed to model recovery from any potential overfishing.
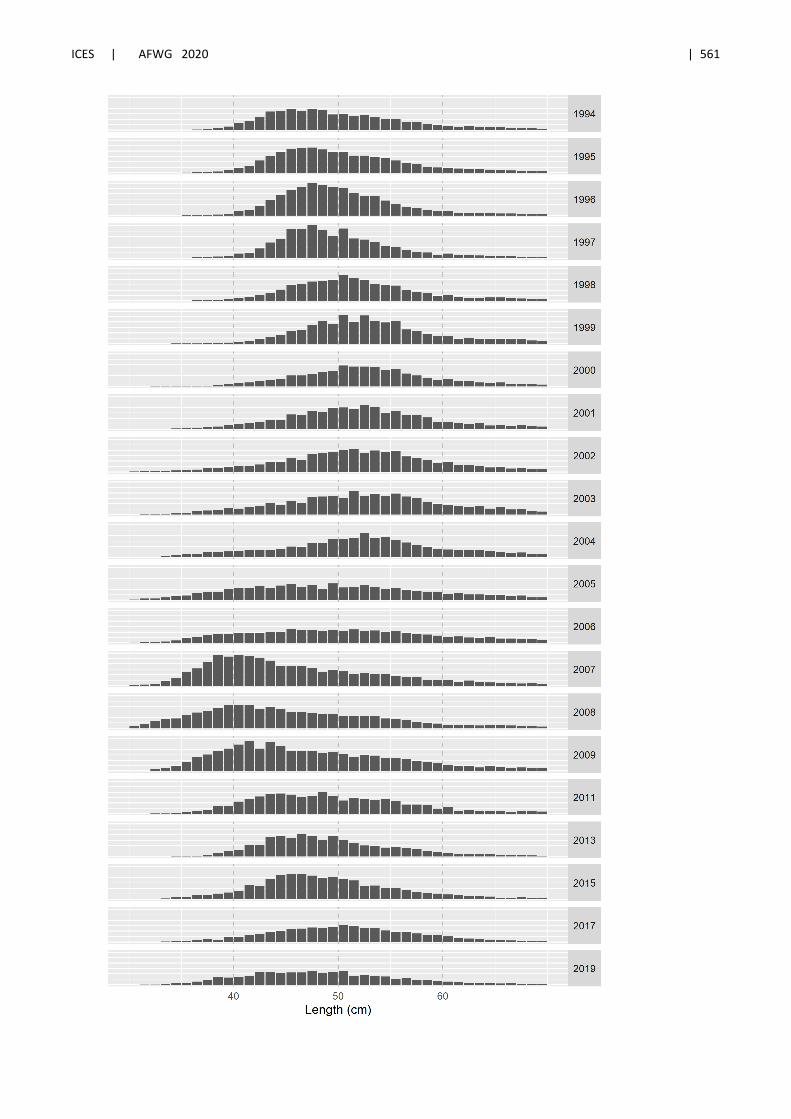
ICES | AFWG 2020 | 561

562 | ICES Scientific Reports 2:52 | ICES
Figure 1. Annual length distributions in the EggaNor survey (from the 2019 cruise report, Vollen et al 2020).
Figure 2. Modelled 45cm+ biomass of Greenland halibut as of the 2018 AFWG assessment.
Methodology
Two different methods have been considered here to compute HRpa. The first method is that described in the ICES guidance of reference points for analytically assessed stocks (ICES 2017), where average recruitment over some time period is used to compute a Flim and hence a HRpa. The second is a F0.05 approach, i.e. a stochastic simulation to identify the fishing level that results in no more than a 5% chance of driving the stock below Blim.
In principle this author prefers the F0.05 approach, as better capturing the dynamics behind this kind of risk analysis. However, there is a difficulty in this case. The simulations require drawing from the assessed recruitment deviations. As previously mentioned, while it is plausible to suggest that the occasional peaks are well determined by the length data, this is not likely to be the case with the smaller recruitment years. Since the last large recruitment was in 2002 (appearing as age 1 in 2003), the majority of the recent years fall into this poorly determined category. Retrospective analysis gives a similar picture – the average recruitment over recent years is relatively stable under retrospective peels, but the pattern of recruitment between years can change. Given this reasoning, the F0.05 is no considered appropriate, and this study therefore choses to use the simpler, average-based approach, detailed in ICES 2017. This is an ICES approved method and will therefore produce a viable basis for ICES advice.
Having chosen the overall method, a question arises over the time period to use for defining the recruitment. Although GHL is a long-lived stock (with significant numbers living to 30+), in areas I and
0100200300400500600700800900
1989 1994 1999 2004 2009 2014 2019
Modelled Greenland halibut: 45cm+ biomass (1000 tonnes)

ICES | AFWG 2020 | 563
II this is a stock where the fishery is largely sustained by occasional good yearclasses. Given the absence of agreed age data it is difficult to pin down the exact year that a fish was recruited. However, in 2018 35% of the catch in biomass was modelled as recruiting in the 2002 yearclass, and 45% coming from +/- 1 year around this (many of which may actually be from the same recruitment). The top three yearclasses in the catch (excluding the plus group) contributed over 58% of the catch in biomass (while the plusgroup at 30+ contributed another 10%, with some indication that this may be largely from a single recruitment pulse prior to the model timeseries). As can be seen in the recruitment plot in Figure 3 there are a number of features that make the choice of recruitment period to average over challenging, and of considerable importance to the overall result. One could choose to average over the entire model period (1993-2016), which gives an average recruitment of 127 million individuals per year. However, this value is highly sensitive to the presence of a single large year class. One could choose to exclude the age 1 recruitment spike in 2003, on the grounds that such an event has not been seen recently and that there is a sufficiently long delay between any good yearclass appearing in the data and entering the fishery for there to be time for a HRpa value to revised if such recruitment were to occur. In such a case, average recruitment is estimated as 94 million. Finally, one could say that the recent recruitment is that which will define the short- and medium-term behavior of the stock and fishery, and then take the recruitment since the spike (2004-2016) or a ten-year average (2007-2016). The ten-year average gives 78 million, while the 2004-2016 period gives 82 million. However, there are several sources of uncertainty in this shorter time period. One problem here is that given the presence of sporadic moderate recruitment events (even excluding the largest peaks), taking a short time period to average over makes the results sensitive to small changes in the time range chosen. For example, choosing an 11-year average rather than a ten-year average gives 71.5 million recruits, a decrease of 10% on the 10- Mentella??
year average. Furthermore, these fish have not yet fully recruited to the fishery, and because of the conflicting survey information there is thus considerable doubt as to the actual magnitude of this recruitment. Nor is it obvious from Figure 3 that there has been any change in recruitment productivity during the model timeseries.
This study therefore chooses to base this analysis on the complete time series, but with the large recruitment event in 2003 excluded. Given the uncertainties discussed above, this is considered to best reflect the recruitment to the fishery that can be expected in the coming years. Should a new large yearclass be observed then there would be time to revise the HRpa value before the fish from the large yearclass could enter the fishery.

564 | ICES Scientific Reports 2:52 | ICES
Figure 3. Model estimates of recruitment at age one, in million individuals.
Computations
According to ICES 2017 and ICES 2018, the following sequence of calculations are required to estimate a Fpa value for a stock such as this with limited contrast in the tuning series:
1. Find Blim and Bpa a. These values are set in the benchmark reports as the 45cm+ biomass in year that gave
rise to a good recruitment event, noting that this gave a biomass of 500 thousand tonnes.
2. Simulate forward under constant average recruitment to find the Flim level that drives the stock to Blim at equilibrium
a. The choice of average recruitment is discussed above, and the single large spike is excluded from this analysis. Note that there is no need to simulate recruitment reduction below Blim.
3. Convert the Flim to Fpa using the standard ICES precautionary formulae a. Given the absence of any explicit uncertainty estimates here, this defaults to dividing
Flim by 1.4 to obtain Fpa.
Given the long-lived nature of the stock, and the relatively low exploitation rates that this implies, the benchmark chose to report this stock using a harvest rate (HR) rather than a F. That is to say, the fraction of the fishable biomass on 1st January which is taken as a catch over the course of the year. Therefore, the calculations performed here are actually for a HRpa, although the process is identical. At the exploitation levels calculated here this is largely a theoretical issue, the value of HRpa is very close to a Fpa.
However, there is an issue of precautionarity here. For stocks with data on recruitment behavior at low stock sizes, Bpa will be higher than Blim and the method is written accordingly. For this stock, no such data exists – the stock has never been at low stock sizes during the model period. Therefore,
0
100
200
300
400
500
600
700
800
900
100019
9319
9419
9519
9619
9719
9819
9920
0020
0120
0220
0320
0420
0520
0620
0720
0820
0920
1020
1120
1220
1320
1420
1520
16
Modelled Greenland halibut recruitment at age 1

ICES | AFWG 2020 | 565
following ICES procedures Blim and Bpa have been set equal. The question then arises if computing HRlim in this way includes too much precautionarity. The HR computed drives the stock to Bpa at equilibrium, and could thus be argued to be a HRpa without further adjustment. For this analysis we omit step three in the above analysis, and present HRpa as the level which is modelled to drive the stock to Bpa at equilibrium recruitment.
The model has been projected forward for 100 years, by which time the stock had reached equilibrium, with recruitment set to a constant level equal to 94 million. Different HRs were applied until the equilibrium biomass reached Blim. These calculations have been conducted, and results in a HRpa of 0.035 ( which be lowered to a HRpa of 0.025. were one to apply the extra precautionary buffer in step three above). For comparison the Harvest Rate in 2018, based on a fishing level which was above the ICES advice, was assessed to be 0.036.
Assuming that no future good yearclasses occurred, the projected long-term catch at this HR= 0.035 is 17.6kt, while under a HR=0.025 the equilibrium catch is 14kt. Note that this is not directly comparable to the current situation or historical situation because the stock has had occasional large yearclasses which support a larger fishery. In the event of the surveys showing an incoming large yearclass the HRpa should be revised to a higher value to take advantage of this situation.
Results
The headline result is that using the recruitment excluding the good yearclass gives a HRpa=0.035 as the value which produces a biomass of around Blim=Bpa, and a HRpa of 0.025 with the additional precautionary buffer. Given that HR=0.035 is the level which is modelled to drive the stock to equilibrium under constant recruitment assuming no large recruitment events, then we believe that this satisfies the precautionarity conditions.
The proposed HRpa for Greenland halibut in areas I and II is 0.035, with the proviso that if a large recruitment event is observed in the surveys then the HRpa should be revised prior to the incoming good recruitment entering the fishery.
Discussion
This analysis explicitly calculates a HRpa value under recent recruitment conditions. Should these recruitment conditions change, then the analysis would need to be revised. However, the presence of a recruitment survey, coupled with relatively late entry to the fishery means that this is not a major problem. There would be some years between a large recruitment event (or a period of recruitment failure) being observed and the fish entering the fishery, allowing for such a revision. In addition, it is not recommended that the HRpa presented here should form the long-term basis for management of this stock, rather it should be considered an intermediated measure prior to the development and testing of a full HCR for this stock.
The length of time since the last large recruitment event means that the stock is now modelled to have passed a recent peak in biomass and is currently headed downwards. No large recruitment to

566 | ICES Scientific Reports 2:52 | ICES
the fishable stock can be expected in the next 5+ years. It is therefore critical that fishing pressure not exceed that which can be supported by the recent recruitment, otherwise the fishery runs the risk of driving the stock into a condition of recruitment overfishing.
Appendix
The computations were repeated using the full time series of recruitment. A further run was taken using the last 10 years of recruitment estimates as the estimate of fish that could recruit to the fishery in the coming years. Using the full time series, including the recruitment spike, gave a recruitment estimate of 127 million, HRpa=0.0716 (HRpa=0.051 with the additional buffer). Using the last 10 years gave a recruitment estimate of 78 million, HRpa=0.017 (HRpa=0.012 with the additional buffer).
As discussed in the document, we explicitly do not recommend either of these as the basis of quota advice in the coming years. In the absence of a new recruitment spike higher value is not precautionary as it is higher than that which can be sustained by recent recruitment. The recruitment survey for this stock indicates that there has not been a particularly high recruitment event since 2003, and the late entry to the fishery gives a high confidence that there will not be strong recruitment to the fishery in at least the coming 5 years. For the 10-year average, the sporadic recruitment to this stock, combined with the poor definition of the recruitment pattern in the model, makes this sensitive to the precise pattern of recruitment and length of time chosen. We therefore do not recommend this is as the basis of management. The values are merely presented here for comparison.
References
ICES. 2015. Report of the Inter Benchmark Process on Greenland Halibut in ICES areas I and II (IBPHALI), August 2015, By correspondence. ICES CM 2015\ACOM:54. 41 pp.
ICES 2018, General context of ICES advice. http://ices.dk/sites/pub/Publication%20Reports/Advice/2018/2018/Introduction_to_advice_2018.pdf
ICES 2017, ICES fisheries management reference points for category 1 and 2 stocks. http://ices.dk/sites/pub/Publication%20Reports/Guidelines%20and%20Policies/12.04.03.01_Reference_points_for_category_1_and_2.pdf
Vollen T, Harbitz A and Vihtakari M, 2020. EGGA NORD 2019 - Toktrapport fra Havforskningsinstituttets tokt med FF Árni Friðriksson 30. august-19. september 2019. IMR survey report, ISSN 15036294/Nr. 1–2020. In Norwegian with English abstract.

ICES | AFWG 2020 | 567
Annex 5: Audit reports
• Audit of Northeast Arctic saithe (AFWG 2020) • Audit of Northeast Arctic cod • Audit of Greenland halibut (Reinhardtius hippoglossoides) in Subareas 1 and 2 (Northeast
Arctic) • Audit of cod in subareas 1 and 2 (Norwegian coastal waters) (AFWG 2020) • Audit of beaked redfish (Sebastes mentella) in subareas 1 and 2 (AFWG 2020) • Audit of beaked redfish (Sebastes mentella) in subareas 1 and 2 (AFWG 2020)
568 | ICES SCIENTIFIC REPORTS 2:52 | ICES
Audit of Northeast Arctic saithe (AFWG 2020) Date: 30 April 2020 Auditor: Matthias Bernreuther General The Northeast Arctic saithe assessment and draft advice have been approved by the Working Group. For single stock summary sheet advice:
1) Assessment type: update 2) Assessment: analytical 3) Forecast: presented 4) Assessment model: SAM – tuning by one acoustic survey (split in two time series) 5) Data issues: The biological sampling from the fishery has become critically low
after the termination of the original Norwegian port-sampling program in 2009. In 2015 this was in particular the case for samples from trawl in quarter two and three in ICES subarea 1 and age samples from purse seine fishery south of Lofoten and in quarter two in ICES subarea 1. The biological sampling has improved since 2016, but the relatively low level of sampling may still affect the precision of the catch, weight and maturity at age data. Lack of reliable recruitment estimates is still a major problem. There was ap-parently an issue with the 2018 Acoustic survey. However, the impact of excluding or including the 2018 survey results in this year´s assessment were investigated in explor-atory runs of the model, resulting in the conclusion that the entire tuning time series were to be used.
6) Consistency: Last year´s assessment was accepted. The assessment, recruitment and forecast models have been applied as specified in the stock annex.
7) Stock status: The SSB has been above Bpa since 1996, declined considerably from 2007 to 2011, then increased again and is presently (2019/2020) estimated to be well above Bpa. The fishing mortality was below Fpa from 1997 to 2009, started to increase in 2005 and was above Fpa in 2010 and 2011, but is presently estimated to be most likely below Fpa. The recruitment has since 2005 been at about the long-term geometric mean level.
8) Management Plan: Agreed 2011 (first time in 2007): FMP=0.32 and SSB above Bpa=220 000 t. The TAC is based on an average TAC for the coming three years based on FMP. There is a 15% constrain on TAC change between years. The plan was evaluated by ICES and was found in agreement with the precautionary approach.
General comments This was a well documented, well ordered and considered section. It was easy to follow and interpret. All data sets described in the stock annex are available. Technical comments No technical comments. Conclusions The assessment has been performed correctly and gives a valid basis for advice. However, the low level of biological sampling is, despite an improvement since 2016, still a source of uncer-tainty in the assessment.

ICES | AFWG 2020 | 569
Audit of Northeast Arctic cod Date: 06.05.2020 Auditor: Elise Eidset General The Northeast Arctic cod assessment and draft advice have been approved by the Working Group. For single stock summary sheet advice:
1) Assessment type: update 2) Assessment: analytical 3) Forecast: presented. 4) Assessment model: SAM (XSA and TISVPA as additional assessment methods). 5) Data issues:
Joint Barents Sea winter survey: The total area covered was smaller than in 2019 as the coverage was limited by ice particularly in the area east and north of Bear Island and by time and weather constraints in parts of the Russian zone. With the recent expansion of the cod distribution it is likely that in recent years the coverage in the February survey (BS-NoRu-Q1 (BTr) and BS-NoRu-Q1 (Aco)) has been incomplete, in particular for the younger ages. This could cause a bias in the assessment, but the magnitude is unknown. Lofoten survey: The survey was carried out from south to north, i.e. in the opposite di-rection to all previous years. Catch-at-age: There is still a concern about the biological sampling from parts of the Nor-wegian fishery that may be too low. Also the split between NEA cod and coastal cod may be affected by the sampling coverage.
6) Consistency: Last year’s assessment was accepted. The assessment, recruitment and forecast models have been applied as specified in the stock annex.
7) Stock status: TSB in 2020 is estimated to 2.652 kt. Fishing mortality has been stable in recent years. SSB is estimated to 1.368 kt. Recruitment is stable; numbers-at-age 3 is cal-culated to be 583-, 635-, 551- and 608 millions for the 2017-, 2018-, 2019-, and 2020 year class, respectively. When the management plan is applied, total catch in 2021 should not be more than 885 600 tonnes.
8) Management Plan: Blim= 220 000 t, Bpa=460 000 t, Flim=0.74, Fpa= 0.40.
General comments This was a well documented, well ordered and considered section. It was easy to follow and interpret. Technical comments No comment. Conclusions The assessment has been performed correctly.

570 | ICES SCIENTIFIC REPORTS 2:52 | ICES
Audit of Greenland halibut (Reinhardtius hippo-glossoides) in Subareas 1 and 2 (Northeast Arctic) Date: 27/04/2020 Auditor: Kjell Nedreaas
11General The stock is assessed by a GADGET length-based model since 2015. There is no agreement on age-reading methodology between Norway and Russia and the model is tuned using only length data. This gives uncertainty on the absolute levels of modelled biomass and F. The peaks of recruitment identified by the model are corroborated by survey length distributions, but the weaker year classes may be poorly modelled. None of the surveys individually covers the complete stock distribution and there are discrepancies between the sur-veys, leading to high uncertainty and a marked retrospective pattern. The last stock assessment was run in 2019 to provide advice for 2020 and 2021. The draft advice sheet was rejected by ADGANW and a roll-over advice was used for advice in 2020. ADGANW issued a request to repeat the advice process in 2020 with HRpa reference points for use in the 2021 advice. A working document (Howel 2020, WD 15) was presented to address the defi-nition of a HRpa for the stock. A HRpa proposal is available and was pre-sented to AFWG 2020. However, due to the need for a simplified approach related to the 2020 corona virus outbreak ACOM decided, in agreement with Advice Requestors, that roll-over advice should be used in 2020 to provide advice on fishing opportunities in 2021.
12For single stock summary sheet advice:
1. Assessment type: GADGET length-based model (benchmark in 2015), supple-mented with stock production models
2. Assessment: No new assessment i 2020. Last assessment in 2019. 3. Forecast: not presented 4. Assessment model: In addition to GADGET, two production
models (one of them SPICT) have been used to assess the stock in the past, however, none of the models was updated for presentation at the current meeting.
5. Data issues: Data available and used as described in stock annex. There was an update of the commercial fishing data and the survey data including 2019.
6. Consistency: No new or updated assessment was conducted this year. An updated assessment will be conducted in 2021, and AFWG suggest a new benchmark on the stock in 2022.
7. Stock status: This stock is assessed in relation to precautionary reference points. On this regard B>Blim, however, it is warned that the lack of reliable age estimations involves that the current assess-ment has important uncertainties in relation to the actual absolute level of biomass and F level. It is concluded that all of the explora-tory work indicates that the overall trends are robust, but that care should be taken in interpreting the absolute abundance estimates, and hence absolute estimates of harvest rate.
8. Management Plan: No

ICES | AFWG 2020 | 571
13 General comments
The assessment done in 2019 is well-documented and structured in the report. The draft advice sheet was, however, rejected by ADGANW and a roll-over advice was used for advice in 2020. In 2019, the advice drafting group, ADGANW, requested a HRpa value for Greenland halibut. Note that this stock uses Harvest Rate rather than F for reporting purposes. WD #15 pre-sented at the AFWG 2020 attempts to provide such a value. There are plans for a benchmark to improve the model followed by a full HCR exercise in the coming years. The WD is simply an attempt to calculate an interim HRpa as a basis on which to give precautionary advice until a HCR is evaluated and agreed, and this will hence be prepared for an update assessment in 2021. There is no information about HRpa in the Stock Annex.
14 Technical comments
Catch- and survey values in text and tables/figures have been ckecked and corrected when necessary and to the extent possible for the auditor. This has been done directly in the draft report using “track changes” and/or writing short notes.
15 Conclusions
No new or updated assessment was conducted this year. An updated assessment will be conducted in 2021, and AFWG suggest a new benchmark on the stock in 2022. The cur-rent audit has therefore only checked catch- and survey values in text and tables/figures, and corrected these when necessary. Checklist for audit process General aspects • Has the EG answered those TORs relevant to providing advice? • Is the assessment according to the stock annex description? • If a management plan is used as the basis of the advice, has been agreed to by the relevant parties and has the plan been evaluated by ICES to be precautionary? • Have the data been used as specified in the stock annex? • Has the assessment, recruitment and forecast model been applied as specified in the stock annex? • Is there any major reason to deviate from the standard procedure for this stock?
• Does the update assessment give a valid basis for advice? If not, suggested what other basis should be sought for the advice?

572 | ICES SCIENTIFIC REPORTS 2:52 | ICES
Audit of cod in subareas 1 and 2 (Norwegian coastal waters) (AFWG 2020) Date: 11 May 2020 Auditor: Johanna Fall General The Norwegian coastal cod assessment and draft advice have been approved by the Working Group. For single stock summary sheet advice:
9) Assessment type: update 10) Assessment: Based on survey SSB index and estimates of F from an exploratory
VPA assessment 11) Forecast: not presented 12) Assessment model: Trial XSA combined with standard VPA – tuning by one acoustic
survey 13) Data issues: There are large uncertainties in the catch-at-age data, partly due to
limited information about recreational fisheries. The assessment is presented with two alternative catch series, one including recreational fisheries and one without. The former series brings in additional uncertainty but scales the stock size to a more realistic level. The results of the 2019 and 2020 assessment are based on a revised catch number-at-age series, approved by AFWG 2019. This caused an upwards stock revision for several years back in time. There are indications of conflicting signals between the annual catch-at-age and survey numbers-at-age. The survey also has large uncertainty since cod contributes to a small fraction of the total observed acoustic values, and the estimates are therefore sensitive to allocation error. The survey is conducted in a period where it can be difficult to define maturity stages. The survey index for SSB is therefore based on a long-term mean of maturity-at-age. Both survey data and catch sampling data have better quality north of 67 than south of 67, but it is also in the north that most of the fishery takes place. The younger ages are poorly represented both in the survey and in the catch data. The VPA-estimates of recruits in latest data year therefore show large retrospective revisions. An upcoming benchmark will consider a separate assessment model for the northern stock component, as well as uncertainty in catch and survey data.
14) Consistency: Last year´s assessment was accepted by the Working Group. The assess-ment has been applied as specified in the stock annex.
15) Stock status: No biological reference points have been defined for this stock. SSBmgt = 60 000 tonnes (acoustic spawning biomass index, see below). The estimate for 2019 was 34311 t (2018: 18423 t).
16) Management Plan: A rebuilding plan for coastal cod, considered provisionally con-sistent with the precautionary approach, was adopted by Norway in 2010 after evalua-tion by an ICES expert group. The plan defines the stock as restored when the survey index of SSB is estimated above 60 000 t for two consecutive years. The regulations aim to annually reduce F by 15 % compared to the F in 2009. If the survey index is higher than the preceding year, the regulations remain unchanged. The regulations have not been successful in constraining catches in 2015-2019.

ICES | AFWG 2020 | 573
General comments Some figure and table references were not consistent with descriptions in text and will be cor-rected. Survey data is available as a survey report (in Norwegian). Catch data and the assessment model itself are not available on SharePoint. Technical comments It is noted that the use of mean maturity-at-age from the acoustic survey is not specified in the stock annex. Conclusions The assessment has been performed correctly. However, the data issues described above give a high level of uncertainty in the assessment. Audit – cod.27.1-2coast – AFWG 2020
Audited by: Bjarte Bogstad
In general the assessment is carried out according to the stock annex. There are, however, some places in the text where updates with information from the last year is missing or the text is somewhat confusing.
2.2.1 second to last paragraph: Comments on catches should be about 2017 and 2018, not 2016 and 2017
2.2.1 Last paragraph: No mentioning of 2018 and 2019
2.2.2 Regulations (should be renumbered from 2.2.1): Last paragraph – what happened in 2019 with these new regulations, were they continued or did they stop by the end of 2018?
Fig 2.18: 2018 in figure text should probably be changed to 2019
Fig 2.19: 1995-2017 in text should be changed to 1995-2018.

574 | ICES SCIENTIFIC REPORTS 2:52 | ICES
Audit of beaked redfish (Sebastes mentella) in subareas 1 and 2 (AFWG 2020) Date: 26.05.2020 Auditor: Kristin Windsland General The beaked redfish assessment and draft advice have been approved by the Working Group. For single stock summary sheet advice:
1) Assessment type: update
2) Assessment: analytical assessment
3) Forecast: presented
4) Assessment model: Statistical catch-at-age model
5) Data issues: There was no direct observation of catch numbers-at-age for the pelagic fishery in the Norwegian Sea outside EEZs in 2012–2018. Instead, numbers-at-age were estimated based on catch-at-age from previous or following year, and weight-at-age and fleet selectivities (section 6.2.2 in AFWG report 2013). In 2013, 2016 and 2019, observations from the scientific survey in the Norwegian Sea were used to derive numbers-at-age in the pelagic fishery. This was considered appropriate given that the survey operates in the area of the fishery, with a commercial pelagic trawl and at the time of the start of the fishery. Age-Length-Keys for S. mentella are uncertain because of the slow growth rate of individuals and therefore these data should be used with caution. They were not used in the current assessment but may be considered in future. Given that age is difficult to derive from length it is important that age readings are available for the most recent years, at the time of the working group. In 2018 it was showed that the growth function is nearly invariant between cohorts and it was decided to use a fixed (i.e. common to all years) weight-at-age as input to the Statistical Catch-at-age model. The results from the Russian bottom-trawl survey, Russian-Norwegian Barents Sea ‘Ecosystem survey’ and the Winter Barents Seabed-trawl survey were evaluated and approved by the Working Group for use in the Sebastes mentella assessment. Currently, the survey series used in the SCAA do not appropriately cover the geographical distribution of the adult population. The group rec-ommended monitoring every year to identify if a significant portion of the mentella stock moves east of the strata system of the survey design.
6) Consistency: Last year´s assessment was accepted by the Working Group. The assessment has been applied as specified in the stock annex.
7) Stock status: The SSB for 2020 is 917 578, well above Bpa. Fishing mortality is 0.045, well below FMSY. Recruitment is good and has since 2007 been higher than the low-recruitment period (1995-2003).
8) Management Plan: Agreed during WKREBMSE in 2018. Blim = 227 000 t, Bpa=315 000 t, FMSY=0.084 (FMSY=F0.1 for 19+ group).
General comments

ICES | AFWG 2020 | 575
This was a well-documented, well ordered and considered section. It was easy to follow and interpret. Survey data is available as a survey report (in Norwegian). Catch data and the assessment model itself are available on SharePoint. Technical comments No comments
Conclusions The assessment has been performed correctly. The survey series used in the SCAA do not appropriately cover the geographical distribution of the adult population. Priority should be given to including additional data from the slope surveys that include older age groups, in the analytical assessment in future. Further-more, additional age readings are required to increase reliability.
576 | ICES SCIENTIFIC REPORTS 2:52 | ICES
Audit of beaked redfish (Sebastes mentella) in subareas 1 and 2 (AFWG 2020) Date: 18 May 2020 Auditor: Alfonso Pérez-Rodríguez General The beaked redfish assessment and draft advice have been approved by the Working Group. For single stock summary sheet advice:
1) Assessment type: update 2) Assessment: Analytical assessment following recommendation from the bench-
mark assessment working group (WKREDFISH, ICES 2018a). 3) Forecast: presented 4) Assessment model: Statistical catch-at-age model. 5) Data issues:
There was no direct observation of catch numbers-at-age for the pelagic fishery operat-ing in 2012–2018. Instead, numbers-at-age were estimated based on catch-at-age from previous or following year, and weight-at-age and fleet selectivity. In 2013, 2016 and 2019, observations from the scientific survey in the Norwegian Sea were used to derive numbers-at-age in the pelagic fishery. This was considered appropriate given that the survey operates in the area of the fishery, with a commercial pelagic trawl and at the time of the start of the fishery. The procedure for estimating catch-at-age for recent years in which age data are not available is somewhat problematic because the last year of observation has a large impact on the estimated catch-at-age for several years. Age-Length-Keys for S. mentella are uncertain because of the slow growth rate of indi-viduals and therefore these data should be used with caution. They were not used in the current assessment but may be considered in future. Given that age is difficult to derive from length it is important that age readings are available for the most recent years, at the time of the working group. In 2018 it was showed that the growth function is nearly invariant between cohorts and it was decided to use a fixed (i.e. common to all years) weight-at-age as input to the Statistical Catch-at-age model. The results from the Russian bottom-trawl survey, Russian-Norwegian Barents Sea ‘Eco-system survey’ and the Winter Barents Seabed-trawl survey were evaluated and ap-proved by the Working Group for use in the Sebastes mentella assessment. Currently, the survey series used in the SCAA do not appropriately cover the geographical distribution of the adult population. The group recommended monitoring every year to identify if a significant portion of the mentella stock moves east of the strata system of the survey design.
6) Consistency: Last year´s assessment was accepted by the Working Group. The assess-
ment has been applied as specified in the stock annex.
7) Stock status: The SSB has been above Bpa since 1994 and is presently estimated to be well above Bpa. The fishing mortality was below FMSY since 1992. Since 2007 the recruitment has been above the low-recruitment period 1995-2003.

ICES | AFWG 2020 | 577
8) Management Plan: Blim= 227 000 t, Bpa=315 000 t, FMSY=0.086 (FMSY=F0.1 for 19+ group), Fmax = 0.236 (for 19+ group). Agreed during WKREBMSE 2018.
General comments This was a well-documented, well ordered and considered section. It was easy to follow and interpret. Some figure and table references were not consistent with descriptions in text and will be corrected. Survey data is available as a survey report (in Norwegian). Catch data and the assessment model itself are available on SharePoint. Technical comments No comment Conclusions The assessment has been performed correctly. However, the data issues described above give a high level of uncertainty in the assessment.